| | |
| UNITED STATES
SECURITIES AND EXCHANGE COMMISSION |
| | |
| CERTIFIED SHAREHOLDER REPORT OF REGISTERED
MANAGEMENT INVESTMENT COMPANIES
|
| | |
| Investment Company Act file number: | (811-05346) |
| | |
| Exact name of registrant as specified in charter: | Putnam Variable Trust |
| | |
| Address of principal executive offices: | One Post Office Square, Boston, Massachusetts 02109 |
| | |
| Name and address of agent for service: | Robert T. Burns, Vice President
One Post Office Square
Boston, Massachusetts 02109 |
| | |
| Copy to: | Bryan Chegwidden, Esq.
Ropes & Gray LLP
1211 Avenue of the Americas
New York, New York 10036 |
| | |
| Registrant's telephone number, including area code: | (617) 292-1000 |
| | |
| Date of fiscal year end: | December 31, 2017 |
| | |
| Date of reporting period: | January 1, 2017 — June 30, 2017 |
| | |
|
Item 1. Report to Stockholders: | |
| | |
| The following is a copy of the report transmitted to stockholders pursuant to Rule 30e-1 under the Investment Company Act of 1940: | |
Message from the Trustees
August 15, 2017
Dear Shareholder:
A fair amount of investor optimism has helped to fuel financial markets in 2017, and global stock and bond markets have generally fared well. At the same time, however, a number of macroeconomic and political risks around the world could disrupt the positive momentum.
While calm markets are generally welcome, we believe investors should continue to remember time-tested strategies: maintain a well-diversified portfolio, keep a long-term view, and speak regularly with your financial advisor. In the following pages, you will find a summary of your fund’s performance for the reporting period.
We would like to take this opportunity to announce some changes to your fund’s Board of Trustees. First, we are pleased to welcome the arrival of Catharine Bond Hill and Manoj P. Singh, who bring extensive professional and directorship experience to their new roles as Putnam Trustees. In addition, we would like to extend our appreciation and best wishes to Robert J. Darretta, John A. Hill, and W. Thomas Stephens, who retired from the Board, effective June 30, 2017. We are grateful for their years of work on behalf of you and your fellow shareholders, and we wish them well in their future endeavors.
Thank you for investing with Putnam.

The views expressed in this report are exclusively those of Putnam Management and are subject to change. They are not meant as investment advice. Please note that the holdings discussed in this report may not have been held by the fund for the entire period. Portfolio composition is subject to review in accordance with the fund’s investment strategy and may vary in the future.
Consider these risks before investing: Funds that invest in government securities are not guaranteed. Mortgage-backed securities are subject to prepayment risk and the risk that they may increase in value less when interest rates decline and decline in value more when interest rates rise. Bond investments are subject to interest-rate risk (the risk of bond prices falling if interest rates rise) and credit risk (the risk of an issuer defaulting on interest or principal payments). Interest-rate risk is greater for longer-term bonds, and credit risk is greater for below-investment-grade bonds. Risks associated with derivatives include increased investment exposure (which may be considered leverage) and, in the case of over-the-counter instruments, the potential inability to terminate or sell derivatives positions and the potential failure of the other party to the instrument to meet its obligations. Unlike bonds, funds that invest in bonds have fees and expenses. Bond prices may fall or fail to rise over time for several reasons, including general financial market conditions, changing market perceptions (including perceptions about the risk of default and expectations about monetary policy or interest rates), changes in government intervention in the financial markets, and factors related to a specific issuer or industry. These and other factors may lead to increased volatility and reduced liquidity in the fund’s portfolio holdings. You can lose money by investing in the fund.
Performance summary (as of 6/30/17)
Investment objective
High current income with preservation of capital as its secondary objective
Net asset value June 30, 2017
| |
| Class IA: $9.48 | Class IB: $9.47 |
|
Total return at net asset value
| | | |
| | | | Bloomberg |
| | | | Barclays |
| | | | Government |
| (as of 6/30/17) | Class IA shares* | Class IB shares* | Bond Index |
|
| 6 months | 1.52% | 1.42% | 1.86% |
|
| 1 year | –0.15 | –0.35 | –2.18 |
|
| 5 years | 6.42 | 5.23 | 6.65 |
| Annualized | 1.25 | 1.03 | 1.30 |
|
| 10 years | 59.36 | 55.62 | 47.08 |
| Annualized | 4.77 | 4.52 | 3.93 |
|
| Life | 132.77 | 123.39 | 126.19 |
| Annualized | 4.97 | 4.72 | 4.80 |
|
For a portion of the periods, the fund had expense limitations, without which returns would have been lower.
* Class inception date: February 1, 2000.
The Bloomberg Barclays Government Bond Index is an unmanaged index of U.S. Treasury and agency securities.
Data represent past performance. Past performance does not guarantee future results. More recent returns may be less or more than those shown. Investment return and principal value will fluctuate, and you may have a gain or a loss when you sell your shares. Performance information does not reflect any deduction for taxes a shareholder may owe on fund distributions or on the redemption of fund shares. All total return figures are at net asset value and exclude contract charges and expenses, which are added to the variable annuity contracts to determine total return at unit value. Had these charges and expenses been reflected, performance would have been lower. For more recent performance, contact your variable annuity provider who can provide you with performance that reflects the charges and expenses at your contract level.
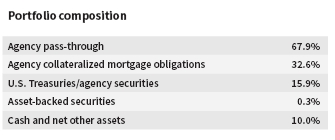
Allocations are shown as a percentage of the fund’s net assets. Cash and net other assets, if any, represent the market value weights of cash, derivatives, short-term securities, and other unclassified assets in the portfolio. Summary information may differ from the portfolio schedule included in the financial statements due to the inclusion of derivative securities, any interest accruals, the use of different classifications of securities for presentation purposes, and rounding. Allocations may not total 100% because the table includes the notional value of certain derivatives (the economic value for purposes of calculating periodic payment obligations), in addition to the market value of securities. Holdings and allocations may vary over time.
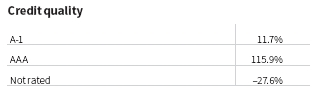
Credit qualities are shown as a percentage of net assets. A bond rated BBB or higher (A-3 or higher, for short-term debt) is considered investment grade. This chart reflects the highest security rating provided by one or more of Standard & Poor’s, Moody’s, and Fitch. To-be-announced (TBA) mortgage commitments, if any, are included based on their issuer ratings. Ratings may vary over time.
Cash, derivative instruments, and net other assets are shown in the not-rated category. Payables and receivables for TBA mortgage commitments are included in the not-rated category and may result in negative weights. The fund itself has not been rated by an independent rating agency.
| |
| Putnam VT American Government Income Fund | 1 |
Understanding your fund’s expenses
As an investor in a variable annuity product that invests in a registered investment company, you pay ongoing expenses, such as management fees, distribution fees (12b-1 fees), and other expenses. In the most recent six-month period, your fund’s expenses were limited; had expenses not been limited, they would have been higher. Using the following information, you can estimate how these expenses affect your investment and compare them with the expenses of other funds. You may also pay onetime transaction expenses, which are not shown in this section and would result in higher total expenses. Charges and expenses at the insurance company separate account level are not reflected. For more information, see your fund’s prospectus or talk to your financial representative.
Review your fund’s expenses
The two left-hand columns of the Expenses per $1,000 table show the expenses you would have paid on a $1,000 investment in your fund from 1/1/17 to 6/30/17. They also show how much a $1,000 investment would be worth at the close of the period, assuming actual returns and expenses. To estimate the ongoing expenses you paid over the period, divide your account value by $1,000, then multiply the result by the number in the first line for the class of shares you own.
Compare your fund’s expenses with those of other funds
The two right-hand columns of the Expenses per $1,000 table show your fund’s expenses based on a $1,000 investment, assuming a hypothetical 5% annualized return. You can use this information to compare the ongoing expenses (but not transaction expenses or total costs) of investing in the fund with those of other funds. All shareholder reports of mutual funds and funds serving as variable annuity vehicles will provide this information to help you make this comparison. Please note that you cannot use this information to estimate your actual ending account balance and expenses paid during the period.
| | |
| Expense ratios | | |
| | Class IA | Class IB |
|
| Total annual operating expenses for the fiscal | | |
| year ended 12/31/16 | 0.64% | 0.89% |
|
| Annualized expense ratio for the six-month | | |
| period ended 6/30/17 | 0.67% | 0.92% |
|
Fiscal-year expense information in this table is taken from the most recent prospectus, is subject to change, and may differ from that shown for the annualized expense ratio and in the financial highlights of this report.
Expenses are shown as a percentage of average net assets.
Expenses per $1,000
| | | | | | | | |
| | | | | | | Expenses and value for a |
| | | Expenses and value for a | | $1,000 investment, assuming |
| | | $1,000 investment, assuming | | a hypothetical 5% annualized |
| | | actual returns for the | | return for the 6 months |
| | | 6 months ended 6/30/17 | | ended 6/30/17 | | |
|
| | | Class IA | | Class IB | | Class IA | | Class IB |
|
| Expenses paid | | | | | | | | |
| per $1,000*† | | $3.35 | | $4.59 | | $3.36 | | $4.61 |
|
| Ending value | | | | | | | | |
| (after | | | | | | | | |
| expenses) | | $1,015.20 | | $1,014.20 | | $1,021.47 | | $1,020.23 |
|
*Expenses for each share class are calculated using the fund’s annualized expense ratio for each class, which represents the ongoing expenses as a percentage of average net assets for the six months ended 6/30/17. The expense ratio may differ for each share class.
†Expenses based on actual returns are calculated by multiplying the expense ratio by the average account value for the period; then multiplying the result by the number of days in the period; and then dividing that result by the number of days in the year. Expenses based on a hypothetical 5% return are calculated by multiplying the expense ratio by the average account value for the six-month period; then multiplying the result by the number of days in the six-month period; and then dividing that result by the number of days in the year.

Your fund’s manager

Portfolio Manager Michael V. Salm is Co-Head of Fixed Income at Putnam. He joined Putnam in 1997 and has been in the investment industry since 1989.
Your fund’s manager also manages other accounts advised by Putnam Management or an affiliate, including retail mutual fund counterparts to the funds in Putnam Variable Trust.
| |
| 2 | Putnam VT American Government Income Fund |
ABOUT DERIVATIVES
Derivatives are an increasingly common type of investment instrument, the performance of which is derived from an underlying security, index, currency, or other area of the capital markets. Derivatives employed by the fund’s managers generally serve one of two main purposes: to implement a strategy that may be difficult or more expensive to invest in through traditional securities, or to hedge unwanted risk associated with a particular position.
For example, the fund’s managers might use currency forward contracts to capitalize on an anticipated change in exchange rates between two currencies. This approach would require a significantly smaller outlay of capital than purchasing traditional bonds denominated in the underlying currencies. In another example, the managers may identify a bond that they believe is undervalued relative to its risk of default, but may seek to reduce the interest-rate risk of that bond by using interest-rate swaps, a derivative through which two parties “swap” payments based on the movement of certain rates.
Like any other investment, derivatives may not appreciate in value and may lose money. Derivatives may amplify traditional investment risks through the creation of leverage and may be less liquid than traditional securities. And because derivatives typically represent contractual agreements between two financial institutions, derivatives entail “counterparty risk,” which is the risk that the other party is unable or unwilling to pay. Putnam monitors the counterparty risks we assume. For example, Putnam often enters into collateral agreements that require the counterparties to post collateral on a regular basis to cover their obligations to the fund. Counterparty risk for exchange-traded futures and centrally cleared swaps is mitigated by the daily exchange of margin and other safeguards against default through their respective clearinghouses.
| |
| Putnam VT American Government Income Fund | 3 |
The fund’s portfolio 6/30/17 (Unaudited)
| | |
| U.S. GOVERNMENT AND AGENCY | | |
| MORTGAGE OBLIGATIONS (90.6%)* | Principal amount | Value |
|
| U.S. Government Guaranteed Mortgage Obligations (18.8%) | |
| Government National Mortgage Association | | |
| Pass-Through Certificates | | |
| 6.50%, with due dates from 4/15/28 to 7/20/36 | $56,999 | $65,855 |
| 6.00%, with due dates from 4/15/28 to 11/20/38 | 132,210 | 149,820 |
| 5.50%, 4/20/38 | 198,264 | 221,273 |
| 5.00%, TBA, 7/1/47 | 1,000,000 | 1,072,344 |
| 4.50%, with due dates from 9/20/44 to 9/20/45 | 1,105,255 | 1,181,065 |
| 4.00%, with due dates from 4/20/45 to 5/20/45 | 2,245,895 | 2,425,830 |
| 3.50%, with due dates from 1/20/45 to 6/20/45 | 6,307,606 | 6,557,268 |
| 3.00%, TBA, 7/1/47 | 1,000,000 | 1,010,391 |
|
| | | 12,683,846 |
| U.S. Government Agency Mortgage Obligations (71.8%) | |
| Federal Home Loan Mortgage Corporation | | |
| Pass-Through Certificates | | |
| 7.50%, with due dates from 9/1/30 to 7/1/31 | 16,059 | 18,913 |
| 7.00%, with due dates from 11/1/26 to 4/1/32 | 172,499 | 198,506 |
| 5.50%, 12/1/33 | 24,754 | 27,501 |
| 4.50%, with due dates from 7/1/44 to 8/1/44 | 219,021 | 239,922 |
| 4.00%, with due dates from 12/1/44 to 9/1/45 | 1,531,169 | 1,625,246 |
| 3.50%, with due dates from 10/1/46 to 5/1/47 | 2,944,608 | 3,045,795 |
| 3.00%, 6/1/46 | 950,600 | 952,791 |
|
| Federal National Mortgage Association | | |
| Pass-Through Certificates | | |
| 7.50%, with due dates from 9/1/30 to 11/1/30 | 17,444 | 20,369 |
| 7.00%, with due dates from 12/1/28 to 12/1/35 | 424,778 | 490,200 |
| 6.50%, 9/1/36 | 11,075 | 12,695 |
| 6.00%, 1/1/38 | 152,868 | 173,463 |
| 5.50%, 1/1/38 | 610,142 | 678,177 |
| 5.00%, 2/1/39 | 17,223 | 18,889 |
| 4.50%, with due dates from 7/1/44 to 5/1/45 | 338,371 | 369,225 |
| 4.50%, TBA, 7/1/47 | 3,000,000 | 3,217,500 |
| 4.00%, 7/1/56 ## | 883,511 | 934,313 |
| 4.00%, 3/1/46 | 489,625 | 521,603 |
| 4.00%, TBA, 7/1/47 | 1,000,000 | 1,051,016 |
| 3.50%, with due dates from 5/1/45 to 6/1/56 | 3,662,440 | 3,785,677 |
| 3.50%, TBA, 8/1/47 | 8,000,000 | 8,201,562 |
| 3.50%, TBA, 7/1/47 | 13,000,000 | 13,349,375 |
| 3.00%, with due dates from 5/1/45 to 1/1/47 | 4,465,226 | 4,479,365 |
| 3.00%, TBA, 7/1/47 | 1,000,000 | 998,672 |
| 2.50%, TBA, 8/1/47 | 1,000,000 | 961,953 |
| 2.50%, TBA, 7/1/47 | 3,000,000 | 2,889,844 |
|
| | | 48,262,572 |
| Total U.S. government and agency mortgage | | |
| obligations (cost $61,294,038) | | $60,946,418 |
| | | |
| |
| U.S. TREASURY OBLIGATIONS (15.7%)* | Principal amount | Value |
|
| U.S. Treasury Bonds | | |
| 6.25%, 8/15/23 | $990,000 | $1,231,514 |
| 4.50%, 8/15/39 # ∆ § | 7,201,000 | 9,328,445 |
| | | |
| Total U.S. treasury obligations (cost $9,764,261) | | $10,559,959 |
| | | |
| |
| MORTGAGE-BACKED | | |
| SECURITIES (31.3%)* | Principal amount | Value |
|
| Agency collateralized mortgage obligations (31.3%) | |
| Federal Home Loan Mortgage Corporation | | |
| IFB Ser. 3408, Class EK, 21.13%, 4/15/37 | $34,337 | $52,902 |
| IFB Ser. 3072, Class SM, 19.547%, 11/15/35 | 46,142 | 66,958 |
| IFB Ser. 3065, Class DC, 16.383%, 3/15/35 | 257,534 | 371,631 |
| IFB Ser. 2990, Class LB, 13.984%, 6/15/34 | 44,501 | 53,480 |
| | |
| MORTGAGE-BACKED | | |
| SECURITIES (31.3%)* cont. | Principal amount | Value |
|
| Agency collateralized mortgage obligations cont. | |
| Federal Home Loan Mortgage Corporation | | |
| IFB Ser. 3232, Class KS, IO, 5.141%, 10/15/36 | $166,646 | $22,601 |
| IFB Ser. 4136, Class ES, IO, 5.091%, 11/15/42 | 408,357 | 57,613 |
| IFB Ser. 4436, Class SC, IO, 4.991%, 2/15/45 | 1,529,878 | 274,919 |
| Ser. 4122, Class TI, IO, 4.50%, 10/15/42 | 355,656 | 69,104 |
| Ser. 4018, Class DI, IO, 4.50%, 7/15/41 | 516,686 | 73,456 |
| Ser. 4329, Class MI, IO, 4.50%, 6/15/26 | 546,444 | 61,792 |
| Ser. 4546, Class PI, IO, 4.00%, 12/15/45 | 750,311 | 114,573 |
| Ser. 4530, Class HI, IO, 4.00%, 11/15/45 | 504,667 | 77,517 |
| Ser. 4500, Class GI, IO, 4.00%, 8/15/45 | 661,875 | 124,849 |
| Ser. 4425, IO, 4.00%, 1/15/45 | 633,016 | 110,284 |
| Ser. 4452, Class QI, IO, 4.00%, 11/15/44 | 503,203 | 98,024 |
| Ser. 4116, Class MI, IO, 4.00%, 10/1/42 | 833,753 | 160,845 |
| Ser. 4019, Class JI, IO, 4.00%, 5/15/41 | 676,906 | 93,142 |
| Ser. 3996, Class IK, IO, 4.00%, 3/15/39 | 671,720 | 57,383 |
| Ser. 4621, Class QI, IO, 3.50%, 10/15/46 | 1,028,138 | 168,399 |
| Ser. 4165, Class AI, IO, 3.50%, 2/15/43 | 450,714 | 74,737 |
| Ser. 4136, Class IQ, IO, 3.50%, 11/15/42 | 747,012 | 99,429 |
| Ser. 4199, Class CI, IO, 3.50%, 12/15/37 | 464,798 | 35,092 |
| Ser. 304, Class C37, IO, 3.50%, 12/15/27 | 458,069 | 44,822 |
| Ser. 4150, Class DI, IO, 3.00%, 1/15/43 | 572,799 | 72,674 |
| Ser. 4141, Class PI, IO, 3.00%, 12/15/42 | 546,413 | 63,865 |
| Ser. 4158, Class TI, IO, 3.00%, 12/15/42 | 1,302,808 | 137,655 |
| Ser. 4165, Class TI, IO, 3.00%, 12/15/42 | 1,386,304 | 142,096 |
| Ser. 4171, Class NI, IO, 3.00%, 6/15/42 | 840,980 | 87,681 |
| Ser. 4183, Class MI, IO, 3.00%, 2/15/42 | 439,740 | 40,676 |
| Ser. 4201, Class JI, IO, 3.00%, 12/15/41 | 656,172 | 60,681 |
| Ser. 315, PO, zero %, 9/15/43 | 1,112,401 | 894,958 |
| Ser. 3835, Class FO, PO, zero %, 4/15/41 | 786,547 | 680,585 |
| Ser. 3391, PO, zero %, 4/15/37 | 8,195 | 6,974 |
| Ser. 3300, PO, zero %, 2/15/37 | 3,928 | 3,404 |
| Ser. 3326, Class WF, zero %, 10/15/35 | 1,314 | 994 |
|
| Federal National Mortgage Association | | |
| IFB Ser. 06-62, Class PS, 32.603%, 7/25/36 | 27,509 | 50,093 |
| IFB Ser. 06-8, Class HP, 20.108%, 3/25/36 | 47,259 | 73,873 |
| IFB Ser. 07-53, Class SP, 19.741%, 6/25/37 | 53,832 | 79,205 |
| IFB Ser. 05-122, Class SE, 18.844%, 11/25/35 | 58,035 | 78,356 |
| IFB Ser. 08-24, Class SP, 18.824%, 2/25/38 | 232,235 | 317,020 |
| IFB Ser. 05-75, Class GS, 16.602%, 8/25/35 | 39,163 | 50,996 |
| IFB Ser. 05-106, Class JC, 16.353%, 12/25/35 | 60,720 | 88,794 |
| IFB Ser. 05-83, Class QP, 14.232%, 11/25/34 | 20,601 | 25,278 |
| IFB Ser. 11-4, Class CS, 10.468%, 5/25/40 | 114,219 | 131,496 |
| IFB Ser. 11-123, Class KS, IO, 5.384%, 10/25/41 | 128,310 | 21,292 |
| Ser. 12-118, Class PI, IO, 4.00%, 6/25/42 | 1,053,185 | 184,177 |
| Ser. 12-96, Class PI, IO, 4.00%, 7/25/41 | 349,842 | 50,282 |
| Ser. 12-62, Class MI, IO, 4.00%, 3/25/41 | 395,224 | 50,405 |
| Ser. 12-104, Class HI, IO, 4.00%, 9/25/27 | 814,720 | 96,523 |
| Ser. 16-70, Class QI, IO, 3.50%, 10/25/46 | 2,883,273 | 456,480 |
| Ser. 15-10, Class AI, IO, 3.50%, 8/25/43 | 857,419 | 126,710 |
| Ser. 12-124, Class JI, IO, 3.50%, 11/25/42 | 288,107 | 37,512 |
| Ser. 13-22, Class PI, IO, 3.50%, 10/25/42 | 724,382 | 134,511 |
| Ser. 12-114, Class NI, IO, 3.50%, 10/25/41 | 1,109,231 | 171,986 |
| Ser. 13-55, Class IK, IO, 3.00%, 4/25/43 | 462,704 | 50,712 |
| Ser. 13-6, Class JI, IO, 3.00%, 2/25/43 | 1,017,844 | 112,917 |
| Ser. 12-151, Class PI, IO, 3.00%, 1/25/43 | 423,808 | 46,068 |
| Ser. 13-8, Class NI, IO, 3.00%, 12/25/42 | 449,542 | 46,821 |
| Ser. 12-145, Class TI, IO, 3.00%, 11/25/42 | 429,971 | 30,614 |
| Ser. 13-35, Class IP, IO, 3.00%, 6/25/42 | 496,465 | 40,214 |
| Ser. 13-55, Class PI, IO, 3.00%, 5/25/42 | 747,554 | 63,856 |
| Ser. 13-53, Class JI, IO, 3.00%, 12/25/41 | 564,735 | 56,304 |
| Ser. 13-23, Class PI, IO, 3.00%, 10/25/41 | 541,688 | 36,033 |
| |
| 4 | Putnam VT American Government Income Fund |
| | |
| MORTGAGE-BACKED | | |
| SECURITIES (31.3%)* cont. | Principal amount | Value |
|
| Agency collateralized mortgage obligations cont. | |
| Federal National Mortgage Association | | |
| Ser. 13-30, Class IP, IO, 3.00%, 10/25/41 | $787,081 | $53,647 |
| Ser. 13-23, Class LI, IO, 3.00%, 6/25/41 | 482,150 | 32,304 |
| Ser. 14-28, Class AI, IO, 3.00%, 3/25/40 | 669,134 | 69,791 |
| FRB Ser. 03-W8, Class 3F2, 1.566%, 5/25/42 | 4,941 | 4,969 |
| FRB Ser. 07-95, Class A3, 1.466%, 8/27/36 | 1,868,618 | 1,805,255 |
| Ser. 08-53, Class DO, PO, zero %, 7/25/38 | 48,593 | 44,305 |
| Ser. 07-44, Class CO, PO, zero %, 5/25/37 | 14,991 | 12,460 |
| FRB Ser. 88-12, Class B, zero %, 2/25/18 | 8 | 8 |
|
| Government National Mortgage Association | | |
| Ser. 16-75, Class LI, IO, 6.00%, 1/20/40 | 597,773 | 139,729 |
| IFB Ser. 11-81, Class SB, IO, 5.533%, 11/16/36 | 362,489 | 30,275 |
| IFB Ser. 13-182, Class SP, IO, 5.488%, 12/20/43 | 511,701 | 96,184 |
| IFB Ser. 11-156, Class SK, IO, 5.388%, 4/20/38 | 1,201,827 | 256,890 |
| Ser. 15-89, Class LI, IO, 5.00%, 12/20/44 | 1,175,123 | 249,443 |
| Ser. 14-133, Class IP, IO, 5.00%, 9/16/44 | 499,842 | 105,827 |
| Ser. 14-76, IO, 5.00%, 5/20/44 | 642,493 | 135,773 |
| Ser. 13-51, Class QI, IO, 5.00%, 2/20/43 | 474,011 | 88,674 |
| Ser. 13-3, Class IT, IO, 5.00%, 1/20/43 | 276,251 | 58,442 |
| Ser. 13-6, Class OI, IO, 5.00%, 1/20/43 | 208,000 | 43,957 |
| Ser. 13-16, Class IB, IO, 5.00%, 10/20/40 | 43,406 | 2,969 |
| Ser. 10-35, Class UI, IO, 5.00%, 3/20/40 | 306,190 | 64,657 |
| Ser. 10-9, Class UI, IO, 5.00%, 1/20/40 | 972,137 | 205,756 |
| Ser. 09-121, Class UI, IO, 5.00%, 12/20/39 | 760,726 | 161,746 |
| Ser. 13-34, Class HI, IO, 4.50%, 3/20/43 | 733,324 | 140,747 |
| Ser. 12-129, IO, 4.50%, 11/16/42 | 560,892 | 129,970 |
| Ser. 12-91, Class IN, IO, 4.50%, 5/20/42 | 1,111,761 | 211,790 |
| Ser. 11-18, Class PI, IO, 4.50%, 8/20/40 | 301,564 | 39,604 |
| Ser. 10-35, Class AI, IO, 4.50%, 3/20/40 | 702,929 | 137,746 |
| Ser. 10-35, Class DI, IO, 4.50%, 3/20/40 | 421,199 | 84,240 |
| Ser. 10-35, Class QI, IO, 4.50%, 3/20/40 | 251,341 | 50,328 |
| Ser. 10-9, Class QI, IO, 4.50%, 1/20/40 | 204,380 | 40,653 |
| Ser. 09-121, Class BI, IO, 4.50%, 12/16/39 | 206,742 | 48,448 |
| Ser. 09-121, Class CI, IO, 4.50%, 12/16/39 | 853,980 | 186,391 |
| Ser. 11-81, Class PI, IO, 4.50%, 12/20/37 | 17,154 | 50 |
| Ser. 16-69, IO, 4.00%, 5/20/46 | 1,157,035 | 185,438 |
| Ser. 15-64, Class IG, IO, 4.00%, 5/20/45 | 713,575 | 139,368 |
| Ser. 15-53, Class MI, IO, 4.00%, 4/16/45 | 578,365 | 124,605 |
| Ser. 15-40, IO, 4.00%, 3/20/45 | 375,836 | 79,474 |
| Ser. 14-100, Class NI, IO, 4.00%, 6/20/43 | 1,193,033 | 157,719 |
| Ser. 13-165, Class IL, IO, 4.00%, 3/20/43 | 231,483 | 40,030 |
| Ser. 12-56, Class IB, IO, 4.00%, 4/20/42 | 651,267 | 116,424 |
| Ser. 12-47, Class CI, IO, 4.00%, 3/20/42 | 289,756 | 50,307 |
| Ser. 14-104, IO, 4.00%, 3/20/42 | 641,193 | 110,907 |
| Ser. 14-4, Class IK, IO, 4.00%, 7/20/39 | 352,717 | 34,415 |
| Ser. 11-71, Class IK, IO, 4.00%, 4/16/39 | 402,126 | 43,560 |
| Ser. 10-114, Class MI, IO, 4.00%, 3/20/39 | 497,885 | 38,431 |
| Ser. 14-182, Class BI, IO, 4.00%, 1/20/39 | 820,655 | 132,264 |
| Ser. 16-156, Class PI, IO, 3.50%, 11/20/46 | 859,971 | 108,715 |
| Ser. 16-111, Class IP, IO, 3.50%, 8/20/46 | 1,540,977 | 195,125 |
| Ser. 16-4, Class JI, IO, 3.50%, 1/20/46 | 985,889 | 154,854 |
| Ser. 13-79, Class PI, IO, 3.50%, 4/20/43 | 557,617 | 84,189 |
| Ser. 15-168, Class IG, IO, 3.50%, 3/20/43 | 778,225 | 118,114 |
| Ser. 13-37, Class JI, IO, 3.50%, 1/20/43 | 341,636 | 53,353 |
| Ser. 13-27, Class PI, IO, 3.50%, 12/20/42 | 310,324 | 48,488 |
| Ser. 12-136, IO, 3.50%, 11/20/42 | 734,958 | 149,359 |
| | |
| MORTGAGE-BACKED | | |
| SECURITIES (31.3%)* cont. | Principal amount | Value |
|
| Agency collateralized mortgage obligations cont. | |
| Government National Mortgage Association | | |
| Ser. 14-46, Class JI, IO, 3.50%, 10/20/41 | $358,091 | $48,262 |
| Ser. 13-18, Class GI, IO, 3.50%, 5/20/41 | 486,938 | 55,316 |
| Ser. 12-71, Class JI, IO, 3.50%, 4/16/41 | 288,212 | 20,812 |
| Ser. 14-102, Class IG, IO, 3.50%, 3/16/41 | 297,900 | 38,774 |
| Ser. 15-52, Class KI, IO, 3.50%, 11/20/40 | 860,339 | 118,211 |
| Ser. 12-48, Class KI, IO, 3.50%, 12/16/39 | 346,236 | 32,589 |
| Ser. 14-147, Class MI, IO, 3.50%, 7/20/39 | 642,284 | 39,642 |
| Ser. 15-99, Class TI, IO, 3.50%, 4/20/39 | 936,129 | 89,073 |
| Ser. 15-24, Class AI, IO, 3.50%, 12/20/37 | 831,800 | 107,200 |
| Ser. 14-160, Class IB, IO, 3.00%, 11/20/40 | 1,287,754 | 106,884 |
| Ser. 14-141, Class CI, IO, 3.00%, 3/20/40 | 396,282 | 33,695 |
| Ser. 14-174, Class AI, IO, 3.00%, 11/16/29 | 691,130 | 68,277 |
| Ser. 16-H13, Class IK, IO, 2.583%, 6/20/66 | 1,570,782 | 207,147 |
| Ser. 15-H22, Class GI, IO, 2.575%, 9/20/65 | 1,655,979 | 212,628 |
| Ser. 17-H03, Class KI, IO, 2.573%, 1/20/67 | 1,490,034 | 191,213 |
| Ser. 16-H23, Class NI, IO, 2.404%, 10/20/66 | 1,995,363 | 255,007 |
| Ser. 17-H04, Class BI, IO, 2.403%, 2/20/67 | 1,041,552 | 145,172 |
| Ser. 16-H04, Class HI, IO, 2.362%, 7/20/65 | 946,249 | 99,167 |
| Ser. 17-H08, Class GI, IO, 2.32%, 2/20/67 | 1,055,605 | 147,785 |
| Ser. 16-H24, Class JI, IO, 2.302%, 11/20/66 | 623,677 | 82,247 |
| Ser. 15-H13, Class AI, IO, 2.29%, 6/20/65 | 1,461,065 | 156,151 |
| Ser. 16-H27, Class GI, IO, 2.276%, 12/20/66 | 1,591,352 | 224,062 |
| Ser. 15-H10, Class HI, IO, 2.271%, 4/20/65 | 2,689,633 | 255,515 |
| Ser. 16-H07, Class PI, IO, 2.251%, 3/20/66 | 2,710,813 | 350,711 |
| Ser. 17-H08, Class NI, IO, 2.194%, 3/20/67 | 1,080,024 | 129,279 |
| Ser. 17-H06, Class MI, IO, 2.173%, 2/20/67 | 1,740,958 | 220,057 |
| Ser. 16-H03, Class AI, IO, 2.165%, 1/20/66 | 1,808,439 | 188,756 |
| FRB Ser. 15-H16, Class XI, IO, 2.128%, 7/20/65 | 975,981 | 104,332 |
| Ser. 16-H24, IO, 2.096%, 9/20/66 | 1,024,549 | 123,586 |
| Ser. 16-H17, Class DI, IO, 2.088%, 7/20/66 | 1,569,007 | 179,024 |
| Ser. 16-H11, Class HI, IO, 2.082%, 1/20/66 | 3,211,340 | 349,233 |
| Ser. 16-H06, Class AI, IO, 2.079%, 2/20/66 | 1,000,491 | 94,446 |
| Ser. 16-H06, Class HI, IO, 2.061%, 2/20/66 | 1,259,247 | 119,754 |
| Ser. 15-H24, Class HI, IO, 2.034%, 9/20/65 | 1,513,725 | 120,190 |
| Ser. 16-H18, Class QI, IO, 2.002%, 6/20/66 | 1,440,023 | 180,867 |
| Ser. 15-H25, Class BI, IO, 1.993%, 10/20/65 | 1,156,032 | 117,222 |
| Ser. 15-H20, Class CI, IO, 1.985%, 8/20/65 | 1,617,748 | 174,550 |
| Ser. 15-H04, Class AI, IO, 1.937%, 12/20/64 | 1,350,606 | 119,866 |
| Ser. 16-H04, Class KI, IO, 1.929%, 2/20/66 | 1,934,578 | 163,230 |
| Ser. 16-H10, Class AI, IO, 1.904%, 4/20/66 | 1,546,283 | 124,940 |
| Ser. 16-H06, Class DI, IO, 1.904%, 7/20/65 | 1,555,361 | 137,961 |
| Ser. 15-H22, Class AI, IO, 1.902%, 9/20/65 | 1,741,131 | 173,068 |
| Ser. 15-H23, Class TI, IO, 1.896%, 9/20/65 | 1,210,827 | 120,841 |
| Ser. 17-H09, IO, 1.775%, 4/20/67 | 972,642 | 107,282 |
| Ser. 14-H21, Class AI, IO, 1.754%, 10/20/64 | 1,665,578 | 153,566 |
| Ser. 17-H10, Class MI, IO, 1.725%, 4/20/67 | 1,163,409 | 114,479 |
| Ser. 14-H25, Class BI, IO, 1.684%, 12/20/64 | 1,245,159 | 108,453 |
| Ser. 17-H06, Class EI, 1.576%, 2/20/67 | 828,485 | 61,018 |
| Ser. 16-H08, Class GI, IO, 1.434%, 4/20/66 | 1,161,779 | 75,283 |
| FRB Ser. 11-H07, Class FI, IO, 1.236%, 2/20/61 | 5,010,540 | 197,415 |
| Ser. 10-151, Class KO, PO, zero %, 6/16/37 | 40,719 | 35,053 |
| Ser. 06-36, Class OD, PO, zero %, 7/16/36 | 2,384 | 2,011 |
|
| | | 21,043,792 |
| | | |
| Total mortgage-backed securities (cost $20,893,918) | $21,043,792 |
| |
| Putnam VT American Government Income Fund | 5 |
| | | |
| PURCHASED SWAP OPTIONS OUTSTANDING (1.0%)* | | |
| Counterparty | | | |
| Fixed right % to receive or (pay)/ | Expiration | Contract | |
| Floating rate index/Maturity date | date/strike | amount | Value |
|
| |
| Bank of America N.A. | | | |
| (2.214)/3 month USD-LIBOR-BBA/ | | | |
| Aug-19 | Aug-17/2.214 | $9,722,000 | $8,750 |
|
| 1.495/3 month USD-LIBOR-BBA/ | | | |
| Jul-18 | Jul-17/1.495 | 11,666,400 | 4,550 |
|
| (1.495)/3 month USD-LIBOR-BBA/ | | | |
| Jul-18 | Jul-17/1.495 | 11,666,400 | 117 |
|
| Citibank, N.A. | | | |
| (2.124)/3 month USD-LIBOR-BBA/ | | | |
| Jul-27 | Jul-17/2.124 | 5,833,200 | 82,015 |
|
| (2.518)/3 month USD-LIBOR-BBA/ | | | |
| May-49 | May-19/2.518 | 855,500 | 78,201 |
|
| 2.25/3 month USD-LIBOR-BBA/ | | | |
| Sep-27 | Sep-17/2.25 | 7,777,600 | 64,710 |
|
| (2.506)/3 month USD-LIBOR-BBA/ | | | |
| Jul-47 | Jul-17/2.506 | 3,158,000 | 48,254 |
|
| (2.57)/3 month USD-LIBOR-BBA/ | | | |
| Nov-22 | Nov-17/2.57 | 3,888,800 | 38,888 |
|
| (1.975)/3 month USD-LIBOR-BBA/ | | | |
| Nov-22 | Nov-17/1.975 | 3,888,800 | 35,816 |
|
| (1.896)/3 month USD-LIBOR-BBA/ | | | |
| Dec-22 | Dec-17/1.896 | 2,496,000 | 30,102 |
|
| (2.488)/3 month USD-LIBOR-BBA/ | | | |
| Jul-47 | Jul-17/2.488 | 1,579,000 | 27,901 |
|
| 2.57/3 month USD-LIBOR-BBA/ | | | |
| Nov-22 | Nov-17/2.57 | 3,888,800 | 25,938 |
|
| 1.975/3 month USD-LIBOR-BBA/ | | | |
| Nov-22 | Nov-17/1.975 | 3,888,800 | 24,849 |
|
| 1.6125/3 month USD-LIBOR-BBA/ | | | |
| Aug-18 | Aug-17/1.6125 | 15,555,200 | 19,600 |
|
| 1.896/3 month USD-LIBOR-BBA/ | | | |
| Dec-22 | Dec-17/1.896 | 2,496,000 | 12,730 |
|
| 2.34/3 month USD-LIBOR-BBA/ | | | |
| Jul-47 | Jul-17/2.34 | 3,158,000 | 4,169 |
|
| 2.326/3 month USD-LIBOR-BBA/ | | | |
| Jul-47 | Jul-17/2.326 | 1,579,000 | 1,705 |
|
| 1.9275/3 month USD-LIBOR-BBA/ | | | |
| Jul-27 | Jul-17/1.9275 | 5,833,200 | 933 |
|
| 2.08475/3 month USD-LIBOR-BBA/ | | | |
| Jul-27 | Jul-17/2.08475 | 3,888,800 | 272 |
|
| (2.491)/3 month USD-LIBOR-BBA/ | | | |
| Jul-27 | Jul-17/2.491 | 3,888,800 | 78 |
|
| Credit Suisse International | | | |
| 2.3724/3 month USD-LIBOR-BBA/ | | | |
| Aug-27 | Aug-17/2.3724 | 1,959,100 | 24,489 |
|
| (2.325)/3 month USD-LIBOR-BBA/ | | | |
| Jul-27 | Jul-17/2.325 | 5,833,200 | 21,875 |
|
| 2.8472/3 month USD-LIBOR-BBA/ | | | |
| Aug-27 | Aug-17/2.8472 | 1,959,100 | 17,103 |
|
| 2.06375/3 month USD-LIBOR-BBA/ | | | |
| Jul-27 | Jul-17/2.06375 | 13,871,800 | 7,213 |
|
| 1.446/3 month USD-LIBOR-BBA/ | | | |
| Jul-18 | Jul-17/1.446 | 11,666,400 | 1,633 |
|
| (2.7225)/3 month USD-LIBOR-BBA/ | | | |
| Jul-27 | Jul-17/2.7225 | 11,666,400 | 350 |
|
| | | |
| PURCHASED SWAP OPTIONS OUTSTANDING (1.0%)* cont. | |
| Counterparty | | | |
| Fixed right % to receive or (pay)/ | Expiration | Contract | |
| Floating rate index/Maturity date | date/strike | amount | Value |
|
| |
| Goldman Sachs International | | | |
| 2.525/3 month USD-LIBOR-BBA/ | | | |
| Aug-37 | Aug-17/2.525 | $1,944,400 | $30,119 |
|
| (1.83)/3 month USD-LIBOR-BBA/ | | | |
| Sep-22 | Sep-17/1.83 | 2,364,000 | 22,529 |
|
| 1.884/3 month USD-LIBOR-BBA/ | | | |
| Jul-18 | Jul-17/1.884 | 11,666,400 | 12,716 |
|
| (2.234)/3 month USD-LIBOR-BBA/ | | | |
| Aug-19 | Aug-17/2.234 | 9,722,000 | 7,680 |
|
| 1.83/3 month USD-LIBOR-BBA/ | | | |
| Sep-22 | Sep-17/1.83 | 2,364,000 | 4,893 |
|
| 1.44/3 month USD-LIBOR-BBA/ | | | |
| Jul-18 | Jul-17/1.44 | 11,666,400 | 1,400 |
|
| JPMorgan Chase Bank N.A. | | | |
| (2.81025)/3 month USD-LIBOR-BBA/ | | | |
| Oct-27 | Oct-17/2.81025 | 7,777,600 | 11,822 |
|
| 1.999/3 month USD-LIBOR-BBA/ | | | |
| Jul-27 | Jul-17/1.999 | 3,888,800 | 428 |
|
| Total purchased swap options outstanding (cost $831,754) | $673,828 |
| | |
| |
| PURCHASED OPTIONS | Expiration | Contract | |
| OUTSTANDING (—%)* | date/strike price | amount | Value |
|
| Federal National Mortgage | | | |
| Association 30 yr 2.50% | | | |
| TBA commitments (Call) | Aug-17/$96.53 | $1,000,000 | $4,201 |
|
| Federal National Mortgage | | | |
| Association 30 yr 3.00% | | | |
| TBA commitments (Put) | Aug-17/99.88 | 2,000,000 | 12,280 |
|
| Total purchased options outstanding (cost $17,657) | $16,481 |
| | |
| |
| ASSET-BACKED SECURITIES (0.3%)* | Principal amount | Value |
|
| |
| Station Place Securitization Trust 144A FRB | | |
| Ser. 17-1, Class A, 2.116%, 2/25/49 | | $222,333 | $222,333 |
|
| Total asset-backed securities (cost $222,333) | | $222,333 |
| | | |
| |
| | Principal amount/ | |
| REPURCHASE AGREEMENTS (11.8%)* | | shares | Value |
|
| |
| Interest in $237,209,000 joint tri-party | | | |
| repurchase agreement dated 6/30/17 with | | |
| Merrill Lynch, Pierce, Fenner and Smith, Inc. | | |
| due 7/3/17 — maturity value of $2,650,241 | | |
| for an effective yield of 1.090% (collateralized | | |
| by various mortgage backed securities with | | |
| coupon rates ranging from 2.500% to 3.500% | | |
| and due dates ranging from 2/1/30 to 5/20/47, | | |
| valued at $241,953,181) | $2,650,000 | $2,650,000 |
|
| Interest in $188,865,000 joint tri-party | | | |
| repurchase agreement dated 6/30/17 with | | |
| Citigroup Global Markets, Inc. due 7/3/17 — | | |
| maturity value of $2,603,236 for an effective | | |
| yield of 1.090% (collateralized by various | | |
| mortgage backed securities and U.S. Treasury | | |
| notes with coupon rates ranging from 1.250% to | | |
| 9.000% and due dates ranging from 5/31/18 to | | |
| 4/1/47, valued at $192,642,300) | 2,603,000 | 2,603,000 |
|
| |
| 6 | Putnam VT American Government Income Fund |
| | |
| REPURCHASE AGREEMENTS (11.8%)* | Principal amount/ | |
| cont. | shares | Value |
|
| Interest in $275,000,000 joint tri-party | | |
| repurchase agreement dated 6/30/17 with | | |
| HSBC Bank USA, National Association due | | |
| 7/3/17 — maturity value of $2,650,239 for an | | |
| effective yield of 1.080% (collateralized by | | |
| various U.S. Treasury notes and bonds with | | |
| coupon rates ranging from 0.125% to 8.125% | | |
| and due dates ranging from 7/31/17 to 11/15/45, | | |
| valued at $280,501,996) | $2,650,000 | $2,650,000 |
|
| Total repurchase agreements (cost $7,903,000) | | $7,903,000 |
| | | |
| |
| SHORT-TERM INVESTMENTS (0.2%)* | Shares | Value |
|
| |
| State Street Institutional U.S. Government | | |
| Money Market Fund, Premier Class 0.88% P | 120,000 | $120,000 |
|
| Total short-term investments (cost $120,000) | | $120,000 |
| |
| Total investments (cost $101,046,961) | | $101,485,811 |
Key to holding’s abbreviations
| |
| FRB | Floating Rate Bonds: the rate shown is the current interest rate at the |
| | close of the reporting period |
| IFB | Inverse Floating Rate Bonds, which are securities that pay interest |
| | rates that vary inversely to changes in the market interest rates. As |
| | interest rates rise, inverse floaters produce less current income. |
| | The rate shown is the current interest rate at the close of the |
| | reporting period. |
| IO | Interest Only |
| PO | Principal Only |
| TBA | To Be Announced Commitments |
Notes to the fund’s portfolio
Unless noted otherwise, the notes to the fund’s portfolio are for the close of the fund’s reporting period, which ran from January 1, 2017 through June 30, 2017 (the reporting period). Within the following notes to the portfolio, references to “ASC 820” represent Accounting Standards Codification 820 Fair Value Measurements and Disclosures, references to “Putnam Management” represent Putnam Investment Management, LLC, the fund’s manager, an indirect wholly-owned subsidiary of Putnam Investments, LLC and references to “OTC”, if any, represent over-the-counter.
* Percentages indicated are based on net assets of $67,235,892.
# This security, in part or in entirety, was pledged and segregated with the broker to cover margin requirements for futures contracts at the close of the reporting period.
∆ This security, in part or in entirety, was pledged and segregated with the custodian for collateral on certain derivative contracts at the close of the reporting period.
§ This security, in part or in entirety, was pledged and segregated with the custodian for collateral on the initial margin on certain centrally cleared derivative contracts at the close of the reporting period.
## Forward commitment, in part or in entirety (Note 1).
P This security was pledged, or purchased with cash that was pledged, to the fund for collateral on certain derivative contracts. The rate quoted in the security description is the annualized 7-day yield of the fund at the close of the reporting period (Note 1).
At the close of the reporting period, the fund maintained liquid assets totaling $37,648,585 to cover certain derivative contracts and delayed delivery securities.
144A after the name of an issuer represents securities exempt from registration under Rule 144A of the Securities Act of 1933, as amended. These securities may be resold in transactions exempt from registration, normally to qualified institutional buyers.
See Note 1 to the financial statements regarding TBA commitments.
The dates shown on debt obligations are the original maturity dates.
| | | | |
| FUTURES CONTRACTS | | | | |
| OUTSTANDING | Number | | | Unrealized |
| at 6/30/17 | of | | Expiration | appreciation/ |
| (Unaudited) | contracts | Value | date | (depreciation) |
|
| U.S. Treasury Bond | | | | |
| Ultra 30 yr (Long) | 22 | $3,649,250 | Sep-17 | $57,706 |
|
| U.S. Treasury Note 5 yr | | | | |
| (Long) | 17 | 2,003,211 | Sep-17 | (4,815) |
|
| U.S. Treasury Note 10 yr | | | | |
| (Long) | 66 | 8,285,063 | Sep-17 | (23,334) |
|
| Total | | | | $29,557 |
| | | |
| WRITTEN SWAP OPTIONS OUTSTANDING at 6/30/17 (premiums $948,252) |
| (Unaudited) | | | |
| Counterparty | | | |
| Fixed Obligation % to receive | | | |
| or (pay)/Floating rate index/ | Expiration | Contract | |
| Maturity date | date/strike | amount | Value |
|
| Bank of America N.A. | | | |
| 2.082/3 month USD-LIBOR-BBA/ | | | |
| Jul-20 | Jul-17/2.082 | $3,888,800 | $4 |
|
| (1.728)/3 month USD-LIBOR-BBA/ | | | |
| Jul-20 | Jul-17/1.728 | 3,888,800 | 1,361 |
|
| 2.404/3 month USD-LIBOR-BBA/ | | | |
| Aug-19 | Aug-17/2.404 | 19,444,000 | 4,083 |
|
| 2.18/3 month USD-LIBOR-BBA/ | | | |
| Jul-27 | Jul-17/2.18 | 3,888,800 | 35,233 |
|
| Citibank, N.A. | | | |
| (1.891)/3 month USD-LIBOR-BBA/ | | | |
| Jul-27 | Jul-17/1.891 | 3,888,800 | 39 |
|
| (2.132)/3 month USD-LIBOR-BBA/ | | | |
| Jul-27 | Jul-17/2.132 | 1,944,400 | 2,411 |
|
| (2.152)/3 month USD-LIBOR-BBA/ | | | |
| Jul-27 | Jul-17/2.152 | 3,888,800 | 6,105 |
|
| 2.291/3 month USD-LIBOR-BBA/ | | | |
| Jul-27 | Jul-17/2.291 | 3,888,800 | 9,255 |
|
| 2.4175/3 month USD-LIBOR-BBA/ | | | |
| Jul-27 | Jul-17/2.4175 | 5,833,200 | 10,091 |
|
| (1.642)/3 month USD-LIBOR-BBA/ | | | |
| Dec-19 | Dec-17/1.642 | 7,777,600 | 12,211 |
|
| (2.0625)/3 month | | | |
| USD-LIBOR-BBA/Aug-18 | Aug-17/2.0625 | 15,555,200 | 16,955 |
|
| 1.642/3 month USD-LIBOR-BBA/ | | | |
| Dec-19 | Dec-17/1.642 | 7,777,600 | 27,066 |
|
| 2.132/3 month USD-LIBOR-BBA/ | | | |
| Jul-27 | Jul-17/2.132 | 1,944,400 | 27,610 |
|
| (2.257)/3 month USD-LIBOR-BBA/ | | | |
| Nov-27 | Nov-17/2.257 | 3,888,800 | 48,960 |
|
| 2.152/3 month USD-LIBOR-BBA/ | | | |
| Jul-27 | Jul-17/2.152 | 3,888,800 | 49,427 |
|
| 2.257/3 month USD-LIBOR-BBA/ | | | |
| Nov-27 | Nov-17/2.257 | 3,888,800 | 72,798 |
|
| 2.208/3 month USD-LIBOR-BBA/ | | | |
| May-24 | May-19/2.208 | 3,888,800 | 80,615 |
|
| 2.204/3 month USD-LIBOR-BBA/ | | | |
| Jul-27 | Jul-17/2.204 | 11,666,400 | 95,198 |
|
| Credit Suisse International | | | |
| (1.8225)/3 month | | | |
| USD-LIBOR-BBA/Jul-18 | Jul-17/1.8225 | 11,666,400 | 933 |
|
| (2.15375)/3 month | | | |
| USD-LIBOR-BBA/Jul-27 | Jul-17/2.15375 | 6,935,900 | 11,097 |
|
| 2.465/3 month USD-LIBOR-BBA/ | | | |
| Jul-27 | Jul-17/2.465 | 17,499,600 | 15,050 |
|
| (2.5816)/3 month | | | |
| USD-LIBOR-BBA/Aug-37 | Aug-17/2.5816 | 1,959,100 | 40,691 |
|
| |
| Putnam VT American Government Income Fund | 7 |
| | | |
| WRITTEN SWAP OPTIONS OUTSTANDING at 6/30/17 (premiums $948,252) |
| (Unaudited) cont. | | | |
| Counterparty | | | |
| Fixed Obligation % to receive | | | |
| or (pay)/Floating rate index/ | Expiration | Contract | |
| Maturity date | date/strike | amount | Value |
|
| Goldman Sachs International | | | |
| (1.674)/3 month USD-LIBOR-BBA/ | | | |
| Jul-18 | Jul-17/1.674 | $11,666,400 | $117 |
|
| (1.9245)/3 month | | | |
| USD-LIBOR-BBA/Jul-18 | Jul-17/1.9245 | 11,666,400 | 583 |
|
| (1.779)/3 month USD-LIBOR-BBA/ | | | |
| Jul-18 | Jul-17/1.779 | 11,666,400 | 3,150 |
|
| 2.419/3 month USD-LIBOR-BBA/ | | | |
| Aug-19 | Aug-17/2.419 | 19,444,000 | 3,694 |
|
| (1.563)/3 month USD-LIBOR-BBA/ | | | |
| Sep-19 | Sep-17/1.563 | 7,777,600 | 4,744 |
|
| (2.805)/3 month USD-LIBOR-BBA/ | | | |
| Aug-27 | Aug-17/2.805 | 1,944,400 | 13,747 |
|
| (2.31)/3 month USD-LIBOR-BBA/ | | | |
| Aug-27 | Aug-17/2.31 | 1,944,400 | 17,791 |
|
| 1.563/3 month USD-LIBOR-BBA/ | | | |
| Sep-19 | Sep-17/1.563 | 7,777,600 | 20,066 |
|
| JPMorgan Chase Bank N.A. | | | |
| (1.799)/3 month USD-LIBOR-BBA/ | | | |
| Jul-27 | Jul-17/1.799 | 7,777,600 | 8 |
|
| 2.534/3 month USD-LIBOR-BBA/ | | | |
| Oct-27 | Oct-17/2.534 | 3,888,800 | 21,194 |
|
| (6.00 Floor)/3 month | | | |
| USD-LIBOR-BBA/Mar-18 | Mar-18/6.00 | 910,000 | 32,000 |
|
| Total | | | $684,287 |
| | | | |
| |
| WRITTEN OPTIONS | | | |
| OUTSTANDING at 6/30/17 | Expiration date/ | Contract | |
| (premiums $17,656) (Unaudited) | strike price | amount | Value |
|
| Federal National Mortgage | | | |
| Association 30 yr 2.50% TBA | | | |
| commitments (Put) | Aug-17/$96.53 | $1,000,000 | $7,400 |
|
| Federal National Mortgage | | | |
| Association 30 yr 3.00% TBA | | | |
| commitments (Call) | Aug-17/99.88 | 2,000,000 | 9,314 |
|
| Total | | | $16,714 |
| | | | |
| FORWARD PREMIUM SWAP OPTION CONTRACTS | | |
| OUTSTANDING at 6/30/17 (Unaudited) | | | |
| Counterparty | | | | |
| Fixed right or | | | | |
| obligation % to | | | | |
| receive or (pay)/ | | | Premium | Unrealized |
| Floating rate index/ | Expiration | Contract | receivable/ | appreciation/ |
| Maturity date | date/strike | amount | (payable) | (depreciation) |
|
| Bank of America N. A. | | | |
| 2.785/3 month | | | | |
| USD-LIBOR-BBA/ | | | | |
| Jan-47 (Purchased) | Jan-27/2.785 | $1,166,600 | $(125,176) | $3,710 |
|
| (2.203)/3 month | | | | |
| USD-LIBOR-BBA/ | | | | |
| Jun-24 (Purchased) | Jun-19/2.203 | 1,944,400 | (38,888) | 3,422 |
|
| (2.647)/3 month | | | | |
| USD-LIBOR-BBA/ | | | | |
| Jun-29 (Purchased) | Jun-24/2.647 | 1,944,400 | (76,026) | 2,994 |
|
| 2.5925/3 month | | | | |
| USD-LIBOR-BBA/ | | | | |
| Jan-27 (Purchased) | Jan-19/2.5925 | 1,166,600 | (41,123) | (280) |
|
| 2.647/3 month | | | | |
| USD-LIBOR-BBA/ | | | | |
| Jun-29 (Purchased) | Jun-24/2.647 | 1,944,400 | (76,026) | (3,655) |
|
| | | | |
| FORWARD PREMIUM SWAP OPTION CONTRACTS | | |
| OUTSTANDING at 6/30/17 (Unaudited) cont. | | |
| Counterparty | | | | |
| Fixed right or | | | | |
| obligation % to | | | | |
| receive or (pay)/ | | | Premium | Unrealized |
| Floating rate index/ | Expiration | Contract | receivable/ | appreciation/ |
| Maturity date | date/strike | amount | (payable) | (depreciation) |
|
| Bank of America N. A. cont. | | | |
| 2.203/3 month | | | | |
| USD-LIBOR-BBA/ | | | | |
| Jun-24 (Purchased) | Jun-19/2.203 | $1,944,400 | $(38,888) | $(5,250) |
|
| (2.785)/3 month | | | | |
| USD-LIBOR-BBA/ | | | | |
| Jan-47 (Purchased) | Jan-27/2.785 | 1,166,600 | (125,176) | (6,428) |
|
| (2.5925)/3 month | | | | |
| USD-LIBOR-BBA/ | | | | |
| Jan-27 (Purchased) | Jan-19/2.5925 | 1,166,600 | (41,123) | (16,752) |
|
| 2.7175/3 month | | | | |
| USD-LIBOR-BBA/ | | | | |
| Jan-47 (Written) | Jan-19/2.7175 | 1,166,600 | 105,402 | 33,598 |
|
| (2.413)/3 month | | | | |
| USD-LIBOR-BBA/ | | | | |
| Jun-29 (Written) | Jun-19/2.413 | 1,944,400 | 74,762 | 9,178 |
|
| (2.7175)/3 month | | | | |
| USD-LIBOR-BBA/ | | | | |
| Jan-47 (Written) | Jan-19/2.7175 | 1,166,600 | 105,402 | 6,743 |
|
| 2.413/3 month | | | | |
| USD-LIBOR-BBA/ | | | | |
| Jun-29 (Written) | Jun-19/2.413 | 1,944,400 | 74,762 | (6,067) |
|
| Barclays Bank PLC | | | | |
| (2.205)/3 month | | | | |
| USD-LIBOR-BBA/ | | | | |
| Jun-24 (Purchased) | Jun-19/2.205 | 1,944,400 | (38,888) | 3,325 |
|
| 2.43/3 month | | | | |
| USD-LIBOR-BBA/ | | | | |
| Feb-22 (Purchased) | Feb-19/2.43 | 1,166,600 | (16,274) | 1,808 |
|
| 2.205/3 month | | | | |
| USD-LIBOR-BBA/ | | | | |
| Jun-24 (Purchased) | Jun-19/2.205 | 1,944,400 | (38,888) | (5,172) |
|
| (2.43)/3 month | | | | |
| USD-LIBOR-BBA/ | | | | |
| Feb-22 (Purchased) | Feb-19/2.43 | 1,166,600 | (16,274) | (8,680) |
|
| Citibank, N.A. | | | | |
| (2.654)/3 month | | | | |
| USD-LIBOR-BBA/ | | | | |
| Jun-29 (Purchased) | Jun-24/2.654 | 1,944,400 | (76,026) | 2,703 |
|
| 2.654/3 month | | | | |
| USD-LIBOR-BBA/ | | | | |
| Jun-29 (Purchased) | Jun-24/2.654 | 1,944,400 | (76,026) | (3,383) |
|
| (2.42)/3 month | | | | |
| USD-LIBOR-BBA/ | | | | |
| Jun-29 (Written) | Jun-19/2.42 | 1,944,400 | 74,859 | 8,711 |
|
| 2.42/3 month | | | | |
| USD-LIBOR-BBA/ | | | | |
| Jun-29 (Written) | Jun-19/2.42 | 1,944,400 | 74,471 | (5,717) |
|
| Goldman Sachs International | | | |
| 2.8175/3 month | | | | |
| USD-LIBOR-BBA/ | | | | |
| Mar-47 (Purchased) | Mar-27/2.8175 | 233,300 | (29,454) | 1,535 |
|
| (2.33)/3 month | | | | |
| USD-LIBOR-BBA/ | | | | |
| Aug-27 (Purchased) | Aug-17/2.33 | 5,833,200 | (44,332) | 350 |
|
| (2.5975)/3 month | | | | |
| USD-LIBOR-BBA/ | | | | |
| Aug-27 (Purchased) | Aug-17/2.5975 | 11,666,400 | (18,666) | (817) |
|
| |
| 8 | Putnam VT American Government Income Fund |
| | | | |
| FORWARD PREMIUM SWAP OPTION CONTRACTS | | |
| OUTSTANDING at 6/30/17 (Unaudited) cont. | | |
| Counterparty | | | | |
| Fixed right or | | | | |
| obligation % to | | | | |
| receive or (pay)/ | | | Premium | Unrealized |
| Floating rate index/ | Expiration | Contract | receivable/ | appreciation/ |
| Maturity date | date/strike | amount | (payable) | (depreciation) |
|
| Goldman Sachs International cont. | | | |
| (2.8175)/3 month | | | | |
| USD-LIBOR-BBA/ | | | | |
| Mar-47 (Purchased) Mar-27/2.8175 | $233,300 | $(29,454) | $(1,502) |
|
| 2.46/3 month | | | | |
| USD-LIBOR-BBA/ | | | | |
| Aug-27 (Written) | Aug-17/2.46 | 17,499,600 | 62,999 | (1,750) |
|
| JPMorgan Chase Bank N.A. | | | |
| 2.8325/3 month | | | | |
| USD-LIBOR-BBA/ | | | | |
| Feb-52 (Purchased) | Feb-22/2.8325 | 1,166,600 | (162,887) | 8,365 |
|
| (2.8325)/3 month | | | | |
| USD-LIBOR-BBA/ | | | | |
| Feb-52 (Purchased) | Feb-22/2.8325 | 1,166,600 | (162,887) | (30,717) |
|
| 2.79/3 month | | | | |
| USD-LIBOR-BBA/ | | | | |
| Feb-49 (Written) | Feb-19/2.79 | 1,166,600 | 110,769 | 41,543 |
|
| (2.79)/3 month | | | | |
| USD-LIBOR-BBA/ | | | | |
| Feb-49 (Written) | Feb-19/2.79 | 1,166,600 | 110,769 | (4,923) |
|
| Total | | | $(478,287) | $26,892 |
| | | |
| TBA SALE COMMITMENTS | | | |
| OUTSTANDING | | | |
| at 6/30/17 (proceeds receivable | Principal | Settlement | |
| $15,417,109) (Unaudited) | amount | date | Value |
|
| Federal Home Loan Mortgage | | | |
| Corporation, 3.00%, 7/1/47 | $1,000,000 | 7/13/17 | $997,852 |
|
| Federal National Mortgage | | | |
| Association, 4.00%, 7/1/47 | 1,000,000 | 7/13/17 | 1,051,016 |
|
| Federal National Mortgage | | | |
| Association, 3.50%, 7/1/47 | 10,000,000 | 7/13/17 | 10,268,750 |
|
| Federal National Mortgage | | | |
| Association, 2.50%, 7/1/47 | 1,000,000 | 7/13/17 | 963,281 |
|
| Government National Mortgage | | | |
| Association, 3.50%, 7/1/47 | 2,000,000 | 7/20/17 | 2,071,249 |
|
| Total | | $15,352,148 |
CENTRALLY CLEARED INTEREST RATE SWAP CONTRACTS OUTSTANDING at 6/30/17 (Unaudited)
| | | | | | |
| | Upfront | | | | Payments received | Unrealized |
| | premium | | Termination | Payments made by | by | appreciation/ |
| Notional amount | received (paid) | | date | fund per annum | fund per annum | (depreciation) |
|
| $17,765,800 E | $35,941 | | 9/20/19 | 1.70% | 3 month | $29,561 |
| | | | | | USD-LIBOR-BBA | |
|
| 14,109,800 E | 73,192 | | 9/20/27 | 2.20% | 3 month | 209,352 |
| | | | | | USD-LIBOR-BBA | |
|
| 1,992,700 E | (4,269) | | 9/20/22 | 3 month USD-LIBOR-BBA | 1.90% | (13,753) |
|
| 1,510,800 E | (16,000) | | 9/20/47 | 3 month USD-LIBOR-BBA | 2.45% | (48,092) |
|
| 4,265,600 | (57) | | 6/27/27 | 2.15% | 3 month | 47,026 |
| | | | | | USD-LIBOR-BBA | |
|
| 2,200,000 | (29) | | 6/26/27 | 3 month USD-LIBOR-BBA | 2.11504% | (31,292) |
|
| 1,944,400 E | (26) | | 7/13/27 | 2.18% | 3 month | 17,305 |
| | | | | | USD-LIBOR-BBA | |
|
| 356,000 | (5) | | 6/30/27 | 2.1965% | 3 month | 2,430 |
| | | | | | USD-LIBOR-BBA | |
|
| 5,205,000 | (20) | | 7/5/19 | 1.60431% | 3 month | 592 |
| | | | | | USD-LIBOR-BBA | |
|
| 5,205,000 | (20) | | 7/5/19 | 1.6076% | 3 month | 241 |
| | | | | | USD-LIBOR-BBA | |
|
| Total | $88,707 | | | | | $213,370 |
E Extended effective date.
OTC TOTAL RETURN SWAP CONTRACTS OUTSTANDING at 6/30/17 (Unaudited)
| | | | | | |
| | Upfront | | | Payments | Total return | Unrealized |
| Swap counterparty/ | premium | | Termination | received (paid) by | received by or | appreciation/ |
| Notional amount | received (paid) | | date | fund per annum | paid by fund | (depreciation) |
|
| Bank of America N.A. | | | | | |
| $207,572 | $— | | 1/12/41 | 4.00% (1 month USD-LIBOR) | Synthetic TRS Index | $1,029 |
| | | | | | 4.00% 30 year Fannie | |
| | | | | | Mae pools | |
|
| 154,824 | — | | 1/12/41 | 4.00% (1 month USD-LIBOR) | Synthetic TRS Index | 767 |
| | | | | | 4.00% 30 year Fannie | |
| | | | | | Mae pools | |
| |
| Putnam VT American Government Income Fund | 9 |
OTC TOTAL RETURN SWAP CONTRACTS OUTSTANDING at 6/30/17 (Unaudited) cont.
| | | | | | |
| | Upfront | | | Payments | Total return | Unrealized |
| Swap counterparty/ | premium | | Termination | received (paid) by | received by or | appreciation/ |
| Notional amount | received (paid) | | date | fund per annum | paid by fund | (depreciation) |
|
| Barclays Bank PLC | | | | | | |
| $212,111 | $— | | 1/12/40 | 4.50% (1 month USD-LIBOR) | Synthetic MBX Index | $(659) |
| | | | | | 4.50% 30 year Fannie | |
| | | | | | Mae pools | |
|
| 185,319 | — | | 1/12/42 | 4.00% (1 month USD-LIBOR) | Synthetic TRS Index | 1,033 |
| | | | | | 4.00% 30 year Fannie | |
| | | | | | Mae pools | |
|
| 44,233 | — | | 1/12/40 | 4.00% (1 month USD-LIBOR) | Synthetic MBX Index | (149) |
| | | | | | 4.00% 30 year Fannie | |
| | | | | | Mae pools | |
|
| 89,726 | — | | 1/12/39 | 6.00% (1 month USD-LIBOR) | Synthetic TRS Index | (51) |
| | | | | | 6.00% 30 year Fannie | |
| | | | | | Mae pools | |
|
| 368,399 | — | | 1/12/40 | 4.00% (1 month USD-LIBOR) | Synthetic MBX Index | (1,237) |
| | | | | | 4.00% 30 year Fannie | |
| | | | | | Mae pools | |
|
| 8,084 | — | | 1/12/38 | 6.50% (1 month USD-LIBOR) | Synthetic TRS Index | 1 |
| | | | | | 6.50% 30 year Fannie | |
| | | | | | Mae pools | |
|
| 65,593 | — | | 1/12/41 | 5.00% (1 month USD-LIBOR) | Synthetic MBX Index | (249) |
| | | | | | 5.00% 30 year Ginnie | |
| | | | | | Mae II pools | |
|
| 8,838 | — | | 1/12/40 | 4.50% (1 month USD-LIBOR) | Synthetic MBX Index | (27) |
| | | | | | 4.50% 30 year Fannie | |
| | | | | | Mae pools | |
|
| 291,759 | — | | 1/12/39 | (6.00%) 1 month USD-LIBOR | Synthetic MBX Index | 778 |
| | | | | | 6.00% 30 year Fannie | |
| | | | | | Mae pools | |
|
| 113,741 | — | | 1/12/38 | 6.50% (1 month USD-LIBOR) | Synthetic TRS Index | 17 |
| | | | | | 6.50% 30 year Fannie | |
| | | | | | Mae pools | |
|
| 133,648 | — | | 1/12/41 | (5.00%) 1 month USD-LIBOR | Synthetic TRS Index | (606) |
| | | | | | 5.00% 30 year Fannie | |
| | | | | | Mae pools | |
|
| 256,901 | — | | 1/12/41 | (4.00%) 1 month USD-LIBOR | Synthetic TRS Index | (1,273) |
| | | | | | 4.00% 30 year Fannie | |
| | | | | | Mae pools | |
|
| 11,112 | — | | 1/12/43 | 3.50% (1 month USD-LIBOR) | Synthetic TRS Index | 40 |
| | | | | | 3.50% 30 year Fannie | |
| | | | | | Mae pools | |
|
| 347,421 | — | | 1/12/40 | 5.00% (1 month USD-LIBOR) | Synthetic MBX Index | (1,427) |
| | | | | | 5.00% 30 year Fannie | |
| | | | | | Mae pools | |
|
| 5,664,430 | — | | 1/12/41 | 5.00% (1 month USD-LIBOR) | Synthetic MBX Index | (19,753) |
| | | | | | 5.00% 30 year Fannie | |
| | | | | | Mae pools | |
|
| 4,553,599 | — | | 1/12/38 | (6.50%) 1 month USD-LIBOR | Synthetic MBX Index | 2,452 |
| | | | | | 6.50% 30 year Fannie | |
| | | | | | Mae pools | |
|
| 407,000 | — | | 7/3/22 | (1.9225%) | USA Non Revised | (582) |
| | | | | | Consumer Price | |
| | | | | | Index-Urban (CPI-U) | |
|
| 407,000 | — | | 7/3/27 | 2.085% | USA Non Revised | 1,144 |
| | | | | | Consumer Price | |
| | | | | | Index-Urban (CPI-U) | |
|
| 466,000 | — | | 7/5/22 | (1.89%) | USA Non Revised | 127 |
| | | | | | Consumer Price | |
| | | | | | Index-Urban (CPI-U) | |
|
| 466,000 | — | | 7/5/27 | 2.05% | USA Non Revised | (344) |
| | | | | | Consumer Price | |
| | | | | | Index-Urban (CPI-U) | |
|
| |
| 10 | Putnam VT American Government Income Fund |
OTC TOTAL RETURN SWAP CONTRACTS OUTSTANDING at 6/30/17 (Unaudited) cont.
| | | | | | |
| | Upfront | | | Payments | Total return | Unrealized |
| Swap counterparty/ | premium | | Termination | received (paid) by | received by or | appreciation/ |
| Notional amount | received (paid) | | date | fund per annum | paid by fund | (depreciation) |
|
| Citibank, N.A. | | | | | | |
| $64,593 | $— | | 1/12/41 | 5.00% (1 month USD-LIBOR) | Synthetic MBX Index | $(225) |
| | | | | | 5.00% 30 year Fannie | |
| | | | | | Mae pools | |
|
| Credit Suisse International | | | | | |
| 202,066 | — | | 1/12/41 | (5.00%) 1 month USD-LIBOR | Synthetic TRS Index | (917) |
| | | | | | 5.00% 30 year Fannie | |
| | | | | | Mae pools | |
|
| 177,779 | — | | 1/12/41 | 4.00% (1 month USD-LIBOR) | Synthetic TRS Index | 881 |
| | | | | | 4.00% 30 year Fannie | |
| | | | | | Mae pools | |
|
| 184,394 | — | | 1/12/44 | 3.50% (1 month USD-LIBOR) | Synthetic TRS Index | 895 |
| | | | | | 3.50% 30 year Fannie | |
| | | | | | Mae pools | |
|
| 23,739 | — | | 1/12/43 | 3.50% (1 month USD-LIBOR) | Synthetic TRS Index | 86 |
| | | | | | 3.50% 30 year Fannie | |
| | | | | | Mae pools | |
|
| 125,090 | — | | 1/12/45 | 4.00% (1 month USD-LIBOR) | Synthetic TRS Index | 678 |
| | | | | | 4.00% 30 year Fannie | |
| | | | | | Mae pools | |
|
| 91,267 | — | | 1/12/45 | 4.00% (1 month USD-LIBOR) | Synthetic TRS Index | 495 |
| | | | | | 4.00% 30 year Fannie | |
| | | | | | Mae pools | |
|
| 92,129 | — | | 1/12/45 | 3.50% (1 month USD-LIBOR) | Synthetic TRS Index | 519 |
| | | | | | 3.50% 30 year Fannie | |
| | | | | | Mae pools | |
|
| 392,468 | — | | 1/12/44 | 4.00% (1 month USD-LIBOR) | Synthetic TRS Index | 1,760 |
| | | | | | 4.00% 30 year Fannie | |
| | | | | | Mae pools | |
|
| 301,590 | — | | 1/12/41 | (4.00%) 1 month USD-LIBOR | Synthetic TRS Index | (1,495) |
| | | | | | 4.00% 30 year Fannie | |
| | | | | | Mae pools | |
|
| Goldman Sachs International | | | | | |
| 226,995 | — | | 1/12/38 | 6.50% (1 month USD-LIBOR) | Synthetic TRS Index | 34 |
| | | | | | 6.50% 30 year Fannie | |
| | | | | | Mae pools | |
|
| 175,121 | — | | 1/12/38 | 6.50% (1 month USD-LIBOR) | Synthetic TRS Index | 26 |
| | | | | | 6.50% 30 year Fannie | |
| | | | | | Mae pools | |
|
| 541,170 | — | | 1/12/39 | 6.00% (1 month USD-LIBOR) | Synthetic TRS Index | (309) |
| | | | | | 6.00% 30 year Fannie | |
| | | | | | Mae pools | |
|
| 219,968 | — | | 1/12/38 | 6.50% (1 month USD-LIBOR) | Synthetic TRS Index | 33 |
| | | | | | 6.50% 30 year Fannie | |
| | | | | | Mae pools | |
|
| 459,901 | — | | 1/12/42 | 4.00% (1 month USD-LIBOR) | Synthetic TRS Index | 2,564 |
| | | | | | 4.00% 30 year Fannie | |
| | | | | | Mae pools | |
|
| 459,901 | — | | 1/12/42 | 4.00% (1 month USD-LIBOR) | Synthetic TRS Index | 2,564 |
| | | | | | 4.00% 30 year Fannie | |
| | | | | | Mae pools | |
|
| 324,935 | — | | 1/12/38 | (6.50%) 1 month USD-LIBOR | Synthetic MBX Index | 175 |
| | | | | | 6.50% 30 year Fannie | |
| | | | | | Mae pools | |
|
| 122,069 | — | | 1/12/38 | (6.50%) 1 month USD-LIBOR | Synthetic MBX Index | 66 |
| | | | | | 6.50% 30 year Fannie | |
| | | | | | Mae pools | |
|
| 96,997 | — | | 1/12/40 | 4.00% (1 month USD-LIBOR) | Synthetic TRS Index | 344 |
| | | | | | 4.00% 30 year Fannie | |
| | | | | | Mae pools | |
|
| |
| Putnam VT American Government Income Fund | 11 |
OTC TOTAL RETURN SWAP CONTRACTS OUTSTANDING at 6/30/17 (Unaudited) cont.
| | | | | | |
| | Upfront | | | Payments | Total return | Unrealized |
| Swap counterparty/ | premium | | Termination | received (paid) by | received by or | appreciation/ |
| Notional amount | received (paid) | | date | fund per annum | paid by fund | (depreciation) |
|
| Goldman Sachs International cont. | | | |
| $872 | $— | | 1/12/39 | 6.00% (1 month USD-LIBOR) | Synthetic TRS Index | $— |
| | | | | | 6.00% 30 year Fannie | |
| | | | | | Mae pools | |
|
| 224,256 | — | | 1/12/39 | 6.00% (1 month USD-LIBOR) | Synthetic TRS Index | (128) |
| | | | | | 6.00% 30 year Fannie | |
| | | | | | Mae pools | |
|
| 445,095 | — | | 1/12/38 | (6.50%) 1 month USD-LIBOR | Synthetic MBX Index | 240 |
| | | | | | 6.50% 30 year Fannie | |
| | | | | | Mae pools | |
|
| 16,493 | — | | 1/12/38 | (6.50%) 1 month USD-LIBOR | Synthetic MBX Index | 9 |
| | | | | | 6.50% 30 year Fannie | |
| | | | | | Mae pools | |
|
| 43,994 | — | | 1/12/38 | (6.50%) 1 month USD-LIBOR | Synthetic MBX Index | 24 |
| | | | | | 6.50% 30 year Fannie | |
| | | | | | Mae pools | |
|
| 49,599 | — | | 1/12/38 | 6.50% (1 month USD-LIBOR) | Synthetic TRS Index | 7 |
| | | | | | 6.50% 30 year Fannie | |
| | | | | | Mae pools | |
|
| 248,769 | — | | 1/12/38 | 6.50% (1 month USD-LIBOR) | Synthetic TRS Index | 37 |
| | | | | | 6.50% 30 year Fannie | |
| | | | | | Mae pools | |
|
| 307,321 | — | | 1/12/42 | 4.00% (1 month USD-LIBOR) | Synthetic TRS Index | 1,713 |
| | | | | | 4.00% 30 year Fannie | |
| | | | | | Mae pools | |
|
| 340,370 | — | | 1/12/42 | 4.00% (1 month USD-LIBOR) | Synthetic TRS Index | 1,898 |
| | | | | | 4.00% 30 year Fannie | |
| | | | | | Mae pools | |
|
| 379,900 | — | | 1/12/39 | 6.00% (1 month USD-LIBOR) | Synthetic TRS Index | (217) |
| | | | | | 6.00% 30 year Fannie | |
| | | | | | Mae pools | |
|
| 363,226 | — | | 1/12/42 | 4.00% (1 month USD-LIBOR) | Synthetic TRS Index | 2,025 |
| | | | | | 4.00% 30 year Fannie | |
| | | | | | Mae pools | |
|
| 258,585 | — | | 1/12/41 | (5.00%) 1 month USD-LIBOR | Synthetic TRS Index | (1,173) |
| | | | | | 5.00% 30 year Fannie | |
| | | | | | Mae pools | |
|
| 355,456 | — | | 1/12/44 | (3.00%) 1 month USD-LIBOR | Synthetic TRS Index | (969) |
| | | | | | 3.00% 30 year Fannie | |
| | | | | | Mae pools | |
|
| 296,217 | — | | 1/12/41 | (4.00%) 1 month USD-LIBOR | Synthetic TRS Index | (1,468) |
| | | | | | 4.00% 30 year Fannie | |
| | | | | | Mae pools | |
|
| JPMorgan Chase Bank N.A. | | | | | | |
| 290,112 | — | | 1/12/41 | 4.00% (1 month USD-LIBOR) | Synthetic TRS Index | 1,438 |
| | | | | | 4.00% 30 year Fannie | |
| | | | | | Mae pools | |
|
| 24,420 | — | | 1/12/41 | 4.00% (1 month USD-LIBOR) | Synthetic TRS Index | 121 |
| | | | | | 4.00% 30 year Fannie | |
| | | | | | Mae pools | |
|
| 258,372 | — | | 1/12/41 | (5.00%) 1 month USD-LIBOR | Synthetic TRS Index | (1,172) |
| | | | | | 5.00% 30 year Fannie | |
| | | | | | Mae pools | |
|
| JPMorgan Securities LLC | | | | | | |
| 207,109 | — | | 1/12/44 | 4.00% (1 month USD-LIBOR) | Synthetic TRS Index | 929 |
| | | | | | 4.00% 30 year Fannie | |
| | | | | | Mae pools | |
|
| 2,116,037 | — | | 1/12/42 | (4.00%) 1 month USD-LIBOR | Synthetic TRS Index | (11,799) |
| | | | | | 4.00% 30 year Fannie | |
| | | | | | Mae pools | |
|
| Total | $— | | | | | $(19,280) |
| |
| 12 | Putnam VT American Government Income Fund |
ASC 820 establishes a three-level hierarchy for disclosure of fair value measurements. The valuation hierarchy is based upon the transparency of inputs to the valuation of the fund’s investments. The three levels are defined as follows:
Level 1: Valuations based on quoted prices for identical securities in active markets.
Level 2: Valuations based on quoted prices in markets that are not active or for which all significant inputs are observable, either directly or indirectly.
Level 3: Valuations based on inputs that are unobservable and significant to the fair value measurement.
The following is a summary of the inputs used to value the fund’s net assets as of the close of the reporting period:
| | | | |
| | | | | Valuation inputs | |
|
| Investments in securities: | | Level 1 | Level 2 | Level 3 |
|
| Asset-backed securities | | $— | $222,333 | $— |
|
| Mortgage-backed securities | | — | 20,784,141 | 259,651 |
|
| Purchased options outstanding | | — | 16,481 | — |
|
| Purchased swap options outstanding | | — | 673,828 | — |
|
| U.S. government and agency mortgage obligations | | — | 60,946,418 | — |
|
| U.S. treasury obligations | | — | 10,559,959 | — |
|
| Repurchase agreements | | — | 7,903,000 | — |
|
| Short-term investments | | 120,000 | — | — |
|
| Totals by level | | $120,000 | $101,106,160 | $259,651 |
|
| |
| | | | | Valuation inputs | |
|
| Other financial instruments: | | Level 1 | Level 2 | Level 3 |
|
| Futures contracts | | $29,557 | $— | $— |
|
| Written options outstanding | | — | (16,714) | — |
|
| Written swap options outstanding | | — | (684,287) | — |
|
| Forward premium swap option contracts | | — | 26,892 | — |
|
| TBA sale commitments | | — | (15,352,148) | — |
|
| Interest rate swap contracts | | — | 124,663 | — |
|
| Total return swap contracts | | — | (19,280) | — |
|
| Totals by level | | $29,557 | $(15,920,874) | $— |
|
During the reporting period, transfers within the fair value hierarchy, if any, did not represent, in the aggregate, more than 1% of the fund’s net assets measured as of the end of the period. Transfers are accounted for using the end of period pricing valuation method.
At the start and close of the reporting period, Level 3 investments in securities represented less than 1% of the fund’s net assets and were not considered a significant portion of the fund’s portfolio.
The accompanying notes are an integral part of these financial statements.
| |
| Putnam VT American Government Income Fund | 13 |
Statement of assets and liabilities
6/30/17 (Unaudited)
| |
| Assets | |
|
| Investment in securities, at value (Note 1): | |
|
| Unaffiliated issuers (identified cost $93,143,961) | $93,582,811 |
|
| Repurchase agreements (identified cost $7,903,000) (Note 1) | 7,903,000 |
|
| Cash | 25,395 |
|
| Interest and other receivables | 626,007 |
|
| Receivable for shares of the fund sold | 16,342 |
|
| Receivable for investments sold | 309,250 |
|
| Receivable for sales of delayed delivery securities (Note 1) | 9,243,207 |
|
| Receivable for variation margin on centrally cleared swap contracts (Note 1) | 400,320 |
|
| Unrealized appreciation on forward premium swap option contracts (Note 1) | 127,985 |
|
| Unrealized appreciation on OTC swap contracts (Note 1) | 26,949 |
|
| Total assets | 112,261,266 |
| |
| Liabilities | |
|
| Payable for purchases of delayed delivery securities (Note 1) | 28,012,311 |
|
| Payable for shares of the fund repurchased | 141,756 |
|
| Payable for compensation of Manager (Note 2) | 21,799 |
|
| Payable for custodian fees (Note 2) | 27,068 |
|
| Payable for investor servicing fees (Note 2) | 7,908 |
|
| Payable for Trustee compensation and expenses (Note 2) | 74,883 |
|
| Payable for administrative services (Note 2) | 279 |
|
| Payable for distribution fees (Note 2) | 6,029 |
|
| Payable for variation margin on futures contracts (Note 1) | 36,610 |
|
| Payable for variation margin on centrally cleared swap contracts (Note 1) | 340,270 |
|
| Unrealized depreciation on OTC swap contracts (Note 1) | 46,229 |
|
| Unrealized depreciation on forward premium swap option contracts (Note 1) | 101,093 |
|
| Written options outstanding, at value (premiums $965,908) (Notes 1 and 3) | 701,001 |
|
| TBA sale commitments, at value (proceeds receivable $15,417,109) (Note 1) | 15,352,148 |
|
| Collateral on certain derivative contracts, at value (Note 1) | 120,000 |
|
| Other accrued expenses | 35,990 |
|
| Total liabilities | 45,025,374 |
| | |
| Net assets | $67,235,892 |
| |
| Represented by | |
|
| Paid-in capital (Unlimited shares authorized) (Notes 1 and 4) | $82,745,415 |
|
| Undistributed net investment income (Note 1) | 620,530 |
|
| Accumulated net realized loss on investments | (17,149,310) |
|
| Net unrealized appreciation of investments | 1,019,257 |
|
| Total — Representing net assets applicable to capital shares outstanding | $67,235,892 |
| |
| Computation of net asset value Class IA | |
|
| Net assets | $38,101,231 |
|
| Number of shares outstanding | 4,017,526 |
|
| Net asset value, offering price and redemption price per share (net assets divided by number of shares outstanding) | $9.48 |
|
| Computation of net asset value Class IB | |
|
| Net assets | $29,134,661 |
|
| Number of shares outstanding | 3,077,512 |
|
| Net asset value, offering price and redemption price per share (net assets divided by number of shares outstanding) | $9.47 |
|
The accompanying notes are an integral part of these financial statements.
| |
| 14 | Putnam VT American Government Income Fund |
Statement of operations
Six months ended 6/30/17 (Unaudited)
| |
| Investment income | |
|
| Interest | $1,187,933 |
|
| Total investment income | 1,187,933 |
| |
| Expenses | |
|
| Compensation of Manager (Note 2) | 137,246 |
|
| Investor servicing fees (Note 2) | 24,520 |
|
| Custodian fees (Note 2) | 24,798 |
|
| Trustee compensation and expenses (Note 2) | 2,524 |
|
| Distribution fees (Note 2) | 38,331 |
|
| Administrative services (Note 2) | 823 |
|
| Auditing and tax fees | 28,181 |
|
| Other | 13,491 |
|
| Fees waived and reimbursed by Manager (Note 2) | (108) |
|
| Total expenses | 269,806 |
| | |
| Expense reduction (Note 2) | (107) |
|
| Net expenses | 269,699 |
| | |
| Net investment income | 918,234 |
| | |
| Net realized loss on securities from unaffiliated issuers (Notes 1 and 3) | (872,565) |
|
| Net realized loss on swap contracts (Note 1) | (795,248) |
|
| Net realized gain on futures contracts (Note 1) | 224,316 |
|
| Net realized gain on written options (Notes 1 and 3) | 585,301 |
|
| Net unrealized depreciation of securities in unaffiliated issuers and TBA sale commitments during the period | (345,151) |
|
| Net unrealized appreciation of swap contracts during the period | 585,964 |
|
| Net unrealized appreciation of futures contracts during the period | 86,883 |
|
| Net unrealized appreciation of written options during the period | 622,610 |
|
| Net gain on investments | 92,110 |
| | |
| Net increase in net assets resulting from operations | $1,010,344 |
Statement of changes in net assets
| | |
| | Six months | Year ended |
| | ended 6/30/17* | 12/31/16 |
|
| Decrease in net assets | | |
|
| Operations: | | |
|
| Net investment income | $918,234 | $1,833,069 |
|
| Net realized loss on investments | (858,196) | (1,793,667) |
|
| Net unrealized appreciation of investments | 950,306 | 236,426 |
|
| Net increase in net assets resulting from operations | 1,010,344 | 275,828 |
|
| Distributions to shareholders (Note 1): | | |
|
| From ordinary income | | |
|
| Net investment income | | |
|
| Class IA | (1,024,324) | (924,299) |
|
| Class IB | (695,766) | (693,310) |
|
| Decrease from capital share transactions (Note 4) | (5,717,403) | (5,085,944) |
|
| Total decrease in net assets | (6,427,149) | (6,427,725) |
|
| Net assets: | | |
|
| Beginning of period | 73,663,041 | 80,090,766 |
|
| End of period (including undistributed net investment income of $620,530 and $1,422,386, respectively) | $67,235,892 | $73,663,041 |
|
* Unaudited.
The accompanying notes are an integral part of these financial statements.
| |
| Putnam VT American Government Income Fund | 15 |
Financial highlights (For a common share outstanding throughout the period)
| | | | | | | | | | | | | | | | | | | | | | | | | | |
| INVESTMENT OPERATIONS: | LESS DISTRIBUTIONS: | RATIOS AND SUPPLEMENTAL DATA: |
|
| Period ended | | Net asset value, beginning of period | | Net investment income (loss)a | | Net realized and unrealized gain (loss) on investments | | Total from investment operations | | From net investment income | | From net realized gain on investments | | Total distributions | | Net asset value, end of period | | Total return at net asset value (%)b,c | | Net assets, end of period (in thousands) | | Ratio of expenses to average net assets (%)b,d | | Ratio of net investment income (loss) to average net assets (%) | | Portfolio turnover (%) |
|
| Class IA | | | | | | | | | | | | | | | | | | | | | | | | | | |
|
| 6/30/17† | | $9.59 | | .13 | | .01 | | .14 | | (.25) | | — | | (.25) | | $9.48 | | 1.52* | | $38,101 | | .33*e | | 1.37*e | | 675*f |
|
| 12/31/16 | | 9.76 | | .24 | | (.20) | | .04 | | (.21) | | — | | (.21) | | 9.59 | | .36 | | 40,362 | | .64e | | 2.43e | | 1,028f |
|
| 12/31/15 | | 10.02 | | .19 | | (.22) | | (.03) | | (.23) | | — | | (.23) | | 9.76 | | (.33) | | 44,229 | | .62 | | 1.92 | | 905f |
|
| 12/31/14 | | 10.01 | | .22 | | .22 | | .44 | | (.43) | | — | | (.43) | | 10.02 | | 4.49 | | 50,935 | | .62 | | 2.17 | | 587f |
|
| 12/31/13 | | 10.19 | | .23 | | (.25) | | (.02) | | (.16) | | — | | (.16) | | 10.01 | | (.19) | | 57,347 | | .63 | | 2.29 | | 390g |
|
| 12/31/12 | | 11.91 | | .23 | | (.01) | | .22 | | (.33) | | (1.61) | | (1.94) | | 10.19 | | 2.16 | | 73,670 | | .64 | | 2.18 | | 456g |
|
| Class IB | | | | | | | | | | | | | | | | | | | | | | | | | | |
|
| 6/30/17† | | $9.56 | | .12 | | .01 | | .13 | | (.22) | | — | | (.22) | | $9.47 | | 1.42* | | $29,135 | | .45*e | | 1.24*e | | 675*f |
|
| 12/31/16 | | 9.72 | | .21 | | (.19) | | .02 | | (.18) | | — | | (.18) | | 9.56 | | .20 | | 33,301 | | .89e | | 2.18e | | 1,028f |
|
| 12/31/15 | | 9.99 | | .16 | | (.22) | | (.06) | | (.21) | | — | | (.21) | | 9.72 | | (.65) | | 35,862 | | .87 | | 1.67 | | 905f |
|
| 12/31/14 | | 9.97 | | .19 | | .23 | | .42 | | (.40) | | — | | (.40) | | 9.99 | | 4.31 | | 41,287 | | .87 | | 1.89 | | 587f |
|
| 12/31/13 | | 10.15 | | .20 | | (.25) | | (.05) | | (.13) | | — | | (.13) | | 9.97 | | (.48) | | 33,075 | | .88 | | 2.04 | | 390g |
|
| 12/31/12 | | 11.87 | | .20 | | (.02) | | .18 | | (.29) | | (1.61) | | (1.90) | | 10.15 | | 1.85 | | 41,454 | | .89 | | 1.94 | | 456g |
* Not annualized.
† Unaudited.
a Per share net investment income (loss) has been determined on the basis of the weighted average number of shares outstanding during the period.
b The charges and expenses at the insurance company separate account level are not reflected.
c Total return assumes dividend reinvestment.
d Includes amounts paid through expense offset arrangements, if any (Note 2). Also excludes acquired fund fees and expenses, if any.
e Reflects a voluntary waiver of certain fund expenses in effect during the period. As a result of such waivers, the expenses of each class reflect a reduction of less than 0.01% as a percentage of average net assets.
f Portfolio turnover includes TBA purchase and sale commitments.
g Portfolio turnover excludes TBA purchase and sale commitments. Including TBA purchase and sale commitments to conform with current year presentation, the portfolio turnover would have been the following:
| | |
| | Portfolio turnover % | |
| |
| December 31, 2013 | 965% | |
| |
| December 31, 2012 | 1,041 | |
| |
The accompanying notes are an integral part of these financial statements.
| |
| 16 | Putnam VT American Government Income Fund |
Notes to financial statements 6/30/17 (Unaudited)
Within the following Notes to financial statements, references to “State Street” represent State Street Bank and Trust Company, references to “the SEC” represent the Securities and Exchange Commission, references to “Putnam Management” represent Putnam Investment Management, LLC, the fund’s manager, an indirect wholly-owned subsidiary of Putnam Investments, LLC and references to “OTC”, if any, represent over-the-counter. Unless otherwise noted, the “reporting period” represents the period from January 1, 2017 through June 30, 2017.
Putnam VT American Government Income Fund (the fund) is a diversified series of Putnam Variable Trust (the Trust), a Massachusetts business trust registered under the Investment Company Act of 1940, as amended, as an open-end management investment company. The goal of the fund is to seek high current income with preservation of capital as its secondary objective. The fund invests mainly in bonds and securitized debt instruments (such as mortgage-backed investments) that are obligations of the U.S. government, its agencies and instrumentalities and accordingly are backed by the full faith and credit of the United States (e.g., U.S. Treasury bonds and Ginnie Mae mortgage-backed bonds) or by only the credit of a federal agency or government-sponsored entity (e.g., Fannie Mae and Freddie Mac mortgage-backed bonds), and that have short- to long-term maturities. Under normal circumstances, the fund invests at least 80% of the fund’s net assets in U.S. government securities. The fund may invest up to 20% of the fund’s net assets in mortgage-backed and other asset-backed securities of private (nongovernmental) issuers and securities issued by money market funds, in each case rated AAA or its equivalent at the time of purchase by a nationally recognized securities rating agency or, if unrated, that Putnam Management determines to be of comparable quality. This policy may be changed only after 60 days’ notice to shareholders. Putnam Management may consider, among other factors, credit, interest rate and prepayment risks, as well as general market conditions, when deciding whether to buy or sell investments. The fund typically uses to a significant extent derivatives, such as futures, options, and swap contracts, for both hedging and non-hedging purposes.
The fund offers class IA and class IB shares of beneficial interest. Class IA shares are offered at net asset value and are not subject to a distribution fee. Class IB shares are offered at net asset value and pay an ongoing distribution fee, which is identified in Note 2.
In the normal course of business, the fund enters into contracts that may include agreements to indemnify another party under given circumstances. The fund’s maximum exposure under these arrangements is unknown as this would involve future claims that may be, but have not yet been, made against the fund. However, the fund’s management team expects the risk of material loss to be remote.
The fund has entered into contractual arrangements with an investment adviser, administrator, distributor, shareholder servicing agent and custodian, who each provide services to the fund. Unless expressly stated otherwise, shareholders are not parties to, or intended beneficiaries of these contractual arrangements, and these contractual arrangements are not intended to create any shareholder right to enforce them against the service providers or to seek any remedy under them against the service providers, either directly or on behalf of the fund.
Under the fund’s Declaration of Trust, any claims asserted against or on behalf of the Putnam Funds, including claims against Trustees and Officers, must be brought in state and federal courts located within the Commonwealth of Massachusetts.
Note 1 — Significant accounting policies
The following is a summary of significant accounting policies consistently followed by the fund in the preparation of its financial statements. The preparation of financial statements is in conformity with accounting principles generally accepted in the United States of America and requires management to make estimates and assumptions that affect the reported amounts of assets and liabilities in the financial statements and the reported amounts of increases and decreases in net assets from operations. Actual results could differ from those estimates. Subsequent events after the Statement of assets and liabilities date through the date that the financial statements were issued have been evaluated in the preparation of the financial statements.
Investment income, realized and unrealized gains and losses and expenses of the fund are borne pro-rata based on the relative net assets of each class to the total net assets of the fund, except that each class bears expenses unique to that class (including the distribution fees applicable to such classes). Each class votes as a class only with respect to its own distribution plan or other matters on which a class vote is required by law or determined by the Trustees. If the fund were liquidated, shares of each class would receive their pro-rata share of the net assets of the fund. In addition, the Trustees declare separate dividends on each class of shares.
Security valuation Portfolio securities and other investments are valued using policies and procedures adopted by the Board of Trustees. The Trustees have formed a Pricing Committee to oversee the implementation of these procedures and have delegated responsibility for valuing the fund’s assets in accordance with these procedures to Putnam Management. Putnam Management has established an internal Valuation Committee that is responsible for making fair value determinations, evaluating the effectiveness of the pricing policies of the fund and reporting to the Pricing Committee.
Investments, including mortgage backed securities and short-term investments with remaining maturities of 60 days or less, are valued on the basis of valuations provided by an independent pricing service approved by the Trustees or dealers selected by Putnam Management. Such service providers use information with respect to transactions in bonds, quotations from bond dealers, market transactions in comparable securities and various relationships between securities in determining value. These securities will generally be categorized as Level 2.
Certain investments, including certain restricted and illiquid securities and derivatives, are also valued at fair value following procedures approved by the Trustees. These valuations consider such factors as significant market or specific security events such as interest rate or credit quality changes, various relationships with other securities, discount rates, U.S. Treasury, U.S. swap and credit yields, index levels, convexity exposures, recovery rates, sales and other multiples and resale restrictions. These securities are classified as Level 2 or as Level 3 depending on the priority of the significant inputs.
To assess the continuing appropriateness of fair valuations, the Valuation Committee reviews and affirms the reasonableness of such valuations on a regular basis after considering all relevant information that is reasonably available. Such valuations and procedures are reviewed periodically by the Trustees. Certain securities may be valued on the basis of a price provided by a single source. The fair value of securities is generally determined as the amount that the fund could reasonably expect to realize from an orderly disposition of such securities over a reasonable period of time. By its nature, a fair value price is a good faith estimate of the value of a security in a current sale and does not reflect an actual market price, which may be different by a material amount.
Joint trading account Pursuant to an exemptive order from the SEC, the fund may transfer uninvested cash balances into a joint trading account along with the cash of other registered investment companies and certain other accounts managed by Putnam Management. These balances may be invested in issues of short-term investments having maturities of up to 90 days.
Repurchase agreements The fund, or any joint trading account, through its custodian, receives delivery of the underlying securities, the fair value of which at the time of purchase is required to be in an amount at least equal to the resale price, including accrued interest. Collateral for certain tri-party repurchase agreements is held at the counterparty’s custodian in a segregated account for the benefit of the fund and the counterparty. Putnam Management is responsible for determining that the value of these underlying securities is at all times at least equal to the resale price, including accrued interest. In the event of default or bankruptcy by the other party to the agreement, retention of the collateral may be subject to legal proceedings.
Security transactions and related investment income Security transactions are recorded on the trade date (the date the order to buy or sell is executed). Gains or losses on securities sold are determined on the identified cost basis.
Interest income, net of any applicable withholding taxes, is recorded on the accrual basis. All premiums/discounts are amortized/accreted on a yield-to-maturity basis.
Securities purchased or sold on a forward commitment or delayed delivery basis may be settled at a future date beyond customary settlement time; interest income is accrued based on the terms of the securities. Losses may arise due to changes in the fair value of the underlying securities or if the counterparty does not perform under the contract.
Stripped securities The fund may invest in stripped securities which represent a participation in securities that may be structured in classes with rights to receive different portions of the interest and principal. Interest-only securities receive all of the interest and principal-only securities receive all of the principal. If the
| |
| Putnam VT American Government Income Fund | 17 |
interest-only securities experience greater than anticipated prepayments of principal, the fund may fail to recoup fully its initial investment in these securities. Conversely, principal-only securities increase in value if prepayments are greater than anticipated and decline if prepayments are slower than anticipated. The fair value of these securities is highly sensitive to changes in interest rates.
Options contracts The fund uses options contracts to hedge duration and convexity, to isolate prepayment risk and to manage downside risks.
The potential risk to the fund is that the change in value of options contracts may not correspond to the change in value of the hedged instruments. In addition, losses may arise from changes in the value of the underlying instruments if there is an illiquid secondary market for the contracts, if interest or exchange rates move unexpectedly or if the counterparty to the contract is unable to perform. Realized gains and losses on purchased options are included in realized gains and losses on investment securities. If a written call option is exercised, the premium originally received is recorded as an addition to sales proceeds. If a written put option is exercised, the premium originally received is recorded as a reduction to the cost of investments.
Exchange-traded options are valued at the last sale price or, if no sales are reported, the last bid price for purchased options and the last ask price for written options. OTC traded options are valued using prices supplied by dealers.
Options on swaps are similar to options on securities except that the premium paid or received is to buy or grant the right to enter into a previously agreed upon interest rate or credit default contract. Forward premium swap option contracts include premiums that have extended settlement dates. The delayed settlement of the premiums is factored into the daily valuation of the option contracts. In the case of interest rate cap and floor contracts, in return for a premium, ongoing payments between two parties are based on interest rates exceeding a specified rate, in the case of a cap contract, or falling below a specified rate in the case of a floor contract.
Written option contracts outstanding at period end, if any, are listed after the fund’s portfolio.
Futures contracts The fund uses futures contracts for hedging treasury term structure risk and for yield curve positioning.
The potential risk to the fund is that the change in value of futures contracts may not correspond to the change in value of the hedged instruments. In addition, losses may arise from changes in the value of the underlying instruments, if there is an illiquid secondary market for the contracts, if interest or exchange rates move unexpectedly or if the counterparty to the contract is unable to perform. With futures, there is minimal counterparty credit risk to the fund since futures are exchange traded and the exchange’s clearinghouse, as counterparty to all exchange traded futures, guarantees the futures against default. Risks may exceed amounts recognized on the Statement of assets and liabilities. When the contract is closed, the fund records a realized gain or loss equal to the difference between the value of the contract at the time it was opened and the value at the time it was closed.
Futures contracts are valued at the quoted daily settlement prices established by the exchange on which they trade. The fund and the broker agree to exchange an amount of cash equal to the daily fluctuation in the value of the futures contract. Such receipts or payments are known as “variation margin.”
Futures contracts outstanding at period end, if any, are listed after the fund’s portfolio.
Interest rate swap contracts The fund entered into OTC and/or centrally cleared interest rate swap contracts, which are arrangements between two parties to exchange cash flows based on a notional principal amount, for hedging term structure risk and for yield curve positioning.
An OTC and centrally cleared interest rate swap can be purchased or sold with an upfront premium. For OTC interest rate swap contracts, an upfront payment received by the fund is recorded as a liability on the fund’s books. An upfront payment made by the fund is recorded as an asset on the fund’s books. OTC and centrally cleared interest rate swap contracts are marked to market daily based upon quotations from an independent pricing service or market makers. Any change is recorded as an unrealized gain or loss on OTC interest rate swaps. Daily fluctuations in the value of centrally cleared interest rate swaps are settled through a central clearing agent and are recorded in variation margin on the Statement of assets and liabilities and recorded as unrealized gain or loss. Payments, including upfront premiums, received or made are recorded as realized gains or losses at the reset date or the closing of the contract. Certain OTC and centrally cleared interest rate swap contracts may include extended effective dates. Payments related to these swap contracts are accrued based on the terms of the contract.
The fund could be exposed to credit or market risk due to unfavorable changes in the fluctuation of interest rates or if the counterparty defaults, in the case of OTC interest rate contracts, or the central clearing agency or a clearing member defaults, in the case of centrally cleared interest rate swap contracts, on its respective obligation to perform under the contract. The fund’s maximum risk of loss from counterparty risk or central clearing risk is the fair value of the contract. This risk may be mitigated for OTC interest rate swap contracts by having a master netting arrangement between the fund and the counterparty and for centrally cleared interest rate swap contracts through the daily exchange of variation margin. There is minimal counterparty risk with respect to centrally cleared interest rate swap contracts due to the clearinghouse guarantee fund and other resources that are available in the event of a clearing member default. Risk of loss may exceed amounts recognized on the Statement of assets and liabilities.
OTC and centrally cleared interest rate swap contracts outstanding, including their respective notional amounts at period end, if any, are listed after the fund’s portfolio.
Total return swap contracts The fund entered into OTC total return swap contracts, which are arrangements to exchange a market-linked return for a periodic payment, both based on a notional principal amount, to hedge sector exposure and for gaining exposure to specific sectors.
To the extent that the total return of the security, index or other financial measure underlying the transaction exceeds or falls short of the offsetting interest rate obligation, the fund will receive a payment from or make a payment to the counterparty. OTC total return swap contracts are marked to market daily based upon quotations from an independent pricing service or market makers and the change, if any, is recorded as an unrealized gain or loss. Payments received or made are recorded as realized gains or losses. Certain OTC total return swap contracts may include extended effective dates. Payments related to these swap contracts are accrued based on the terms of the contract. The fund could be exposed to credit or market risk due to unfavorable changes in the fluctuation of interest rates or in the price of the underlying security or index, the possibility that there is no liquid market for these agreements or that the counterparty may default on its obligation to perform. The fund’s maximum risk of loss from counterparty risk is the fair value of the contract. This risk may be mitigated by having a master netting arrangement between the fund and the counterparty. Risk of loss may exceed amounts recognized on the Statement of assets and liabilities.
OTC total return swap contracts outstanding, including their respective notional amounts at period end, if any, are listed after the fund’s portfolio.
TBA commitments The fund may enter into TBA (to be announced) commitments to purchase securities for a fixed unit price at a future date beyond customary settlement time. Although the unit price and par amount have been established, the actual securities have not been specified. However, it is anticipated that the amount of the commitments will not significantly differ from the principal amount. The fund holds, and maintains until settlement date, cash or high-grade debt obligations in an amount sufficient to meet the purchase price, or the fund may enter into offsetting contracts for the forward sale of other securities it owns. Income on the securities will not be earned until settlement date.
The fund may also enter into TBA sale commitments to hedge its portfolio positions, to sell mortgage-backed securities it owns under delayed delivery arrangements or to take a short position in mortgage-backed securities. Proceeds of TBA sale commitments are not received until the contractual settlement date. During the time a TBA sale commitment is outstanding, either equivalent deliverable securities or an offsetting TBA purchase commitment deliverable on or before the sale commitment date are held as “cover” for the transaction, or other liquid assets in an amount equal to the notional value of the TBA sale commitment are segregated. If the TBA sale commitment is closed through the acquisition of an offsetting TBA purchase commitment, the fund realizes a gain or loss. If the fund delivers securities under the commitment, the fund realizes a gain or a loss from the sale of the securities based upon the unit price established at the date the commitment was entered into.
TBA commitments, which are accounted for as purchase and sale transactions, may be considered securities themselves, and involve a risk of loss due to changes in the value of the security prior to the settlement date as well as the risk that the counterparty to the transaction will not perform its obligations. Counterparty risk is mitigated by having a master agreement between the fund and the counterparty.
Unsettled TBA commitments are valued at their fair value according to the procedures described under “Security valuation” above. The contract is marked to market daily and the change in fair value is recorded by the fund as an unrealized gain or loss. Based on market circumstances, Putnam Management will determine
| |
| 18 | Putnam VT American Government Income Fund |
whether to take delivery of the underlying securities or to dispose of the TBA commitments prior to settlement.
TBA purchase commitments outstanding at period end, if any, are listed within the fund’s portfolio and TBA sale commitments outstanding at period end, if any, are listed after the fund’s portfolio.
Master agreements The fund is a party to ISDA (International Swaps and Derivatives Association, Inc.) Master Agreements that govern OTC derivative and foreign exchange contracts and Master Securities Forward Transaction Agreements that govern transactions involving mortgage-backed and other asset-backed securities that may result in delayed delivery (Master Agreements) with certain counterparties entered into from time to time. The Master Agreements may contain provisions regarding, among other things, the parties’ general obligations, representations, agreements, collateral requirements, events of default and early termination. With respect to certain counterparties, in accordance with the terms of the Master Agreements, collateral posted to the fund is held in a segregated account by the fund’s custodian and, with respect to those amounts which can be sold or repledged, are presented in the fund’s portfolio. Collateral posted to the fund which cannot be sold or repledged totaled $22,017 at the close of the reporting period.
Collateral pledged by the fund is segregated by the fund’s custodian and identified in the fund’s portfolio. Collateral can be in the form of cash or debt securities issued by the U.S. Government or related agencies or other securities as agreed to by the fund and the applicable counterparty. Collateral requirements are determined based on the fund’s net position with each counterparty.
With respect to ISDA Master Agreements, termination events applicable to the fund may occur upon a decline in the fund’s net assets below a specified threshold over a certain period of time. Termination events applicable to counterparties may occur upon a decline in the counterparty’s long-term or short-term credit ratings below a specified level. In each case, upon occurrence, the other party may elect to terminate early and cause settlement of all derivative and foreign exchange contracts outstanding, including the payment of any losses and costs resulting from such early termination, as reasonably determined by the terminating party. Any decision by one or more of the fund’s counterparties to elect early termination could impact the fund’s future derivative activity.
At the close of the reporting period, the fund had a net liability position of $71,139 on open derivative contracts subject to the Master Agreements. Collateral posted by the fund at period end for these agreements totaled $77,726 and may include amounts related to unsettled agreements.
Interfund lending The fund, along with other Putnam funds, may participate in an interfund lending program pursuant to an exemptive order issued by the SEC. This program allows the fund to borrow from or lend to other Putnam funds that permit such transactions. Interfund lending transactions are subject to each fund’s investment policies and borrowing and lending limits. Interest earned or paid on the interfund lending transaction will be based on the average of certain current market rates. During the reporting period, the fund did not utilize the program.
Lines of credit The fund participates, along with other Putnam funds, in a $317.5 million unsecured committed line of credit and a $235.5 million unsecured uncommitted line of credit, both provided by State Street. Borrowings may be made for temporary or emergency purposes, including the funding of shareholder redemption requests and trade settlements. Interest is charged to the fund based on the fund’s borrowing at a rate equal to the higher of (1) the Federal Funds rate and (2) the overnight LIBOR plus 1.25% for the committed line of credit and the Federal Funds rate plus 1.30% for the uncommitted line of credit. A closing fee equal to 0.04% of the committed line of credit plus a $25,000 flat fee and 0.04% of the uncommitted line of credit has been paid by the participating funds. In addition, a commitment fee of 0.21% per annum on any unutilized portion of the committed line of credit is allocated to the participating funds based on their relative net assets and paid quarterly. During the reporting period, the fund had no borrowings against these arrangements.
Federal taxes It is the policy of the fund to distribute all of its taxable income within the prescribed time period and otherwise comply with the provisions of the Internal Revenue Code of 1986, as amended (the Code), applicable to regulated investment companies.
The fund is subject to the provisions of Accounting Standards Codification 740 Income Taxes (ASC 740). ASC 740 sets forth a minimum threshold for financial statement recognition of the benefit of a tax position taken or expected to be taken in a tax return. The fund did not have a liability to record for any unrecognized tax benefits in the accompanying financial statements. No provision has been made for federal taxes on income, capital gains or unrealized appreciation on securities held nor for excise tax on income and capital gains. Each of the fund’s federal tax returns for the prior three fiscal years remains subject to examination by the Internal Revenue Service.
Under the Regulated Investment Company Modernization Act of 2010, the fund will be permitted to carry forward capital losses incurred for an unlimited period and the carry forwards will retain their character as either short-term or long-term capital losses. At December 31, 2016, the fund had the following capital loss carryovers available, to the extent allowed by the Code, to offset future net capital gain, if any:
| | |
| Loss carryover |
|
| Short-term | Long-term | Total |
|
| $14,882,324 | $118,136 | $15,000,460 |
|
The aggregate identified cost on a tax basis is $102,298,203, resulting in gross unrealized appreciation and depreciation of $1,191,585 and $2,003,977, respectively, or net unrealized depreciation of $812,392.
Distributions to shareholders Distributions to shareholders from net investment income are recorded by the fund on the ex-dividend date. Distributions from capital gains, if any, are recorded on the ex-dividend date and paid at least annually. The amount and character of income and gains to be distributed are determined in accordance with income tax regulations, which may differ from generally accepted accounting principles. Dividend sources are estimated at the time of declaration. Actual results may vary. Any non-taxable return of capital cannot be determined until final tax calculations are completed after the end of the fund’s fiscal year. Reclassifications are made to the fund’s capital accounts to reflect income and gains available for distribution (or available capital loss carryovers) under income tax regulations.
Expenses of the Trust Expenses directly charged or attributable to any fund will be paid from the assets of that fund. Generally, expenses of the Trust will be allocated among and charged to the assets of each fund on a basis that the Trustees deem fair and equitable, which may be based on the relative assets of each fund or the nature of the services performed and relative applicability to each fund.
Beneficial interest At the close of the reporting period, insurance companies or their separate accounts were record owners of all but a de minimis number of the shares of the fund. Approximately 35.8% of the fund is owned by accounts of one insurance company.
Note 2 — Management fee, administrative services and other transactions
The fund pays Putnam Management a management fee (based on the fund’s average net assets and computed and paid monthly) at annual rates that may vary based on the average of the aggregate net assets of all open-end mutual funds sponsored by Putnam Management (excluding net assets of funds that are invested in, or that are invested in by, other Putnam funds to the extent necessary to avoid “double counting” of those assets). Such annual rates may vary as follows:
| |
| 0.550% | of the first $5 billion, |
| 0.500% | of the next $5 billion, |
| 0.450% | of the next $10 billion, |
| 0.400% | of the next $10 billion, |
| 0.350% | of the next $50 billion, |
| 0.330% | of the next $50 billion, |
| 0.320% | of the next $100 billion and |
| 0.315% | of any excess thereafter. |
For the reporting period, the management fee represented an effective rate (excluding the impact from any expense waivers in effect) of 0.196% of the fund’s average net assets.
Putnam Management has contractually agreed, through April 30, 2019, to waive fees or reimburse the fund’s expenses to the extent necessary to limit the cumulative expenses of the fund, exclusive of brokerage, interest, taxes, investment-related expenses, extraordinary expenses, acquired fund fees and expenses and payments under the fund’s investor servicing contract, investment management contract and distribution plans, on a fiscal year-to-date basis to an annual rate of 0.20% of the fund’s average net assets over such fiscal year-to-date period. During the reporting period, the fund’s expenses were reduced by $108 as a result of this limit.
Putnam Investments Limited (PIL), an affiliate of Putnam Management, is authorized by the Trustees to manage a separate portion of the assets of the fund as determined by Putnam Management from time to time. PIL did not manage
| |
| Putnam VT American Government Income Fund | 19 |
any portion of the assets of the fund during the reporting period. If Putnam Management were to engage the services of PIL, Putnam Management would pay a quarterly sub-management fee to PIL for its services at an annual rate of 0.25% of the average net assets of the portion of the fund managed by PIL.
The fund reimburses Putnam Management an allocated amount for the compensation and related expenses of certain officers of the fund and their staff who provide administrative services to the fund. The aggregate amount of all such reimbursements is determined annually by the Trustees.
Custodial functions for the fund’s assets are provided by State Street. Custody fees are based on the fund’s asset level, the number of its security holdings and transaction volumes.
Putnam Investor Services, Inc., an affiliate of Putnam Management, provides investor servicing agent functions to the fund. Putnam Investor Services, Inc. was paid a monthly fee for investor servicing at an annual rate of 0.07% of the fund’s average daily net assets. During the reporting period, the expenses for each class of shares related to investor servicing fees were as follows:
| |
| Class IA | $13,692 |
| Class IB | 10,828 |
|
| Total | $24,520 |
The fund has entered into expense offset arrangements with Putnam Investor Services, Inc. and State Street whereby Putnam Investor Services, Inc.’s and State Street’s fees are reduced by credits allowed on cash balances. For the reporting period, the fund’s expenses were reduced by $107 under the expense offset arrangements.
Each Independent Trustee of the fund receives an annual Trustee fee, of which $52, as a quarterly retainer, has been allocated to the fund, and an additional fee for each Trustees meeting attended. Trustees also are reimbursed for expenses they incur relating to their services as Trustees.
The fund has adopted a Trustee Fee Deferral Plan (the Deferral Plan) which allows the Trustees to defer the receipt of all or a portion of Trustees fees payable on or after July 1, 1995. The deferred fees remain invested in certain Putnam funds until distribution in accordance with the Deferral Plan.
The fund has adopted an unfunded noncontributory defined benefit pension plan (the Pension Plan) covering all Trustees of the fund who have served as a Trustee for at least five years and were first elected prior to 2004. Benefits under the Pension Plan are equal to 50% of the Trustee’s average annual attendance and retainer fees for the three years ended December 31, 2005. The retirement benefit is payable during a Trustee’s lifetime, beginning the year following retirement, for the number of years of service through December 31, 2006. Pension expense for the fund is included in Trustee compensation and expenses in the Statement of operations. Accrued pension liability is included in Payable for Trustee compensation and expenses in the Statement of assets and liabilities. The Trustees have terminated the Pension Plan with respect to any Trustee first elected after 2003.
The fund has adopted a distribution plan (the Plan) with respect to its class IB shares pursuant to Rule 12b-1 under the Investment Company Act of 1940. The purpose of the Plan is to compensate Putnam Retail Management Limited Partnership, an indirect wholly-owned subsidiary of Putnam Investments, LLC, for services provided and expenses incurred in distributing shares of the fund. The Plan provides for payment by the fund to Putnam Retail Management Limited Partnership at an annual rate of up to 0.35% of the average net assets attributable to the fund’s class IB shares. The Trustees have approved payment by the fund at an annual rate of 0.25% of the average net assets attributable to the fund’s class IB shares. The expenses related to distribution fees during the reporting period are included in Distribution fees in the Statement of operations.
Note 3 — Purchases and sales of securities
During the reporting period, the cost of purchases and the proceeds from sales, excluding short-term investments, were as follows:
| | |
| | Cost of | Proceeds |
| | purchases | from sales |
|
| Investments in securities, including | | |
| TBA commitments (Long-term) | $557,544,431 | $567,167,339 |
|
| U.S. government securities | | |
| (Long-term) | — | — |
|
| Total | $557,544,431 | $567,167,339 |
|
The fund may purchase or sell investments from or to other Putnam funds in the ordinary course of business, which can reduce the fund’s transaction costs, at prices determined in accordance with SEC requirements and policies approved by the Trustees. During the reporting period, purchases or sales of long-term securities from or to other Putnam funds, if any, did not represent more than 5% of the fund’s total cost of purchases and/or total proceeds from sales.
Written option transactions during the reporting period are summarized as follows:
| | | | |
| | Written swap option | Written swap option | Written option | Written option |
| | contract amounts | premiums | contract amounts | premiums |
|
| Written options outstanding at | | | | |
| the beginning of the reporting | | | | |
| period | $76,741,600 | $330,088 | $17,000,000 | $95,781 |
|
| Options opened | 746,555,600 | 2,332,371 | 65,000,000 | 328,984 |
|
| Options exercised | (27,934,200) | (148,550) | — | — |
|
| Options expired | (256,401,200) | (549,042) | — | — |
|
| Options closed | (273,662,800) | (1,016,615) | (79,000,000) | (407,109) |
|
| Written options outstanding at | | | | |
| the end of the reporting period | $265,299,000 | $948,252 | $3,000,000 | $17,656 |
|
Note 4 — Capital shares
At the close of the reporting period, there were an unlimited number of shares of beneficial interest authorized. Subscriptions and redemptions are presented at the omnibus level. Transactions in capital shares were as follows:
| | | | | | | | |
| | | Class IA shares | | | Class IB shares | |
| | Six months ended 6/30/17 | Year ended 12/31/16 | Six months ended 6/30/17 | Year ended 12/31/16 |
| |
|
| | Shares | Amount | Shares | Amount | Shares | Amount | Shares | Amount |
|
| Shares sold | 120,050 | $1,142,424 | 558,537 | $5,434,808 | 195,268 | $1,862,515 | 998,210 | $9,692,019 |
|
| Shares issued in connection with | | | | | | | | |
| reinvestment of distributions | 109,087 | 1,024,324 | 96,382 | 924,299 | 74,175 | 695,766 | 72,446 | 693,310 |
|
| | 229,137 | 2,166,748 | 654,919 | 6,359,107 | 269,443 | 2,558,281 | 1,070,656 | 10,385,329 |
|
| Shares repurchased | (419,387) | (3,998,149) | (979,542) | (9,511,732) | (675,790) | (6,444,283) | (1,274,898) | (12,318,648) |
|
| Net decrease | (190,250) | $(1,831,401) | (324,623) | $(3,152,625) | (406,347) | $(3,886,002) | (204,242) | $(1,933,319) |
|
| |
| 20 | Putnam VT American Government Income Fund |
Note 5 — Market, credit and other risks
In the normal course of business, the fund trades financial instruments and enters into financial transactions where risk of potential loss exists due to changes in the market (market risk) or failure of the contracting party to the transaction to perform (credit risk). The fund may be exposed to additional credit risk that an institution or other entity with which the fund has unsettled or open transactions will default. The fund may invest a significant portion of its assets in securitized debt instruments, including mortgage-backed and asset-backed investments. The yields and values of these investments are sensitive to changes in interest rates, the rate of principal payments on the underlying assets and the market’s perception of the issuers. The market for these investments may be volatile and limited, which may make them difficult to buy or sell.
Note 6 — Summary of derivative activity
The volume of activity for the reporting period for any derivative type that was held during the period is listed below and was based on an average of the holdings at the end of each fiscal quarter:
| |
| Purchased TBA commitment option contracts (contract amount) | $9,300,000 |
|
| Purchased swap option contracts (contract amount) | $196,300,000 |
|
| Written TBA commitment option contracts (contract amount) (Note 3) | $15,300,000 |
|
| Written swap option contracts (contract amount) (Note 3) | $208,700,000 |
|
| Futures contracts (number of contracts) | 100 |
|
| Centrally cleared interest rate swap contracts (notional) | $48,600,000 |
|
| OTC total return swap contracts (notional) | $24,700,000 |
|
The following is a summary of the fair value of derivative instruments as of the close of the reporting period:
Fair value of derivative instruments as of the close of the reporting period
| | | | |
| | Asset derivatives | Liability derivatives |
|
| Derivatives not accounted | | | | |
| for as hedging instruments | Statement of assets and | | Statement of assets and | |
| under ASC 815 | liabilities location | Fair value | liabilities location | Fair value |
|
| Interest rate contracts | Investments, Receivables, | | | |
| | Net assets — Unrealized | | Payables, Net assets — | |
| | appreciation | $1,106,831* | Unrealized depreciation | $955,691* |
|
| Total | | $1,106,831 | | $955,691 |
|
* Includes cumulative appreciation/depreciation of futures contracts and/or centrally cleared swaps as reported in the fund’s portfolio. Only current day’s variation margin is reported within the Statement of assets and liabilities.
The following is a summary of realized and change in unrealized gains or losses of derivative instruments in the Statement of operations for the reporting period (see Note 1):
Amount of realized gain or (loss) on derivatives recognized in net gain or (loss) on investments
| | | | |
| Derivatives not accounted for as | | | | |
| hedging instruments under ASC 815 | Options | Futures | Swaps | Total |
|
| Interest rate contracts | $(123,956) | $224,316 | $(795,248) | $(694,888) |
|
| Total | $(123,956) | $224,316 | $(795,248) | $(694,888) |
|
Change in unrealized appreciation or (depreciation) on derivatives recognized in net gain or (loss) on investments
| | | | |
| Derivatives not accounted for as | | | | |
| hedging instruments under ASC 815 | Options | Futures | Swaps | Total |
|
| Interest rate contracts | $162,664 | $86,883 | $585,964 | $835,511 |
|
| Total | $162,664 | $86,883 | $585,964 | $835,511 |
|
| |
| Putnam VT American Government Income Fund | 21 |
Note 7 — Offsetting of financial and derivative assets and liabilities
The following table summarizes any derivatives, repurchase agreements and reverse repurchase agreements, at the end of the reporting period, that are subject to an enforceable master netting agreement or similar agreement. For securities lending transactions or borrowing transactions associated with securities sold short, if any, see Note 1. For financial reporting purposes, the fund does not offset financial assets and financial liabilities that are subject to the master netting agreements in the Statement of assets and liabilities.
| | | | | | | | | | | | | | | | | | | | | | | | |
| | | Bank of America N.A. | | Barclays Bank PLC | | Barclays Capital, Inc. (clearing broker) | | Citibank, N.A. | | Citigroup Global Markets, Inc. | | Credit Suisse International | | Goldman Sachs International | | HSBC Bank USA, National Association | | JPMorgan Chase Bank N.A. | | JPMorgan Securities LLC | | Merrill Lynch, Pierce, Fenner & Smith, Inc. | | Total |
|
| Assets: | | | | | | | | | | | | | | | | | | | | | | | | |
|
| Centrally cleared interest rate | | | | | | | | | | | | | | | | | | | | | | | | |
| swap contracts§ | | $— | | $— | | $400,320 | | $— | | $— | | $— | | $— | | $— | | $— | | $— | | $— | | $400,320 |
|
| OTC Total return swap contracts*# | | 1,796 | | 5,592 | | — | | — | | — | | 5,314 | | 11,759 | | — | | 1,559 | | 929 | | — | | 26,949 |
|
| Futures contracts§ | | — | | — | | — | | — | | — | | — | | — | | — | | — | | — | | — | | — |
|
| Forward premium swap | | | | | | | | | | | | | | | | | | | | | | | | |
| option contracts # | | 59,645 | | 5,133 | | — | | 11,414 | | — | | — | | 1,885 | | — | | 49,908 | | — | | — | | 127,985 |
|
| Purchased swap options**# | | 13,417 | | — | | — | | 496,161 | | — | | 72,663 | | 79,337 | | — | | 12,250 | | — | | — | | 673,828 |
|
| Purchased options**# | | — | | — | | — | | — | | — | | — | | — | | — | | 16,481 | | — | | — | | 16,481 |
|
| Repurchase agreements** | | — | | — | | — | | — | | 2,603,000 | | — | | — | | 2,650,000 | | — | | — | | 2,650,000 | | 7,903,000 |
|
| Total Assets | | $74,858 | | $10,725 | | $400,320 | | $507,575 | | $2,603,000 | | $77,977 | | $92,981 | | $2,650,000 | | $80,198 | | $929 | | $2,650,000 | | $9,148,563 |
|
| Liabilities: | | | | | | | | | | | | | | | | | | | | | | | | |
|
| Centrally cleared interest rate | | | | | | | | | | | | | | | | | | | | | | | | |
| swap contracts§ | | — | | — | | 340,270 | | — | | — | | — | | — | | — | | — | | — | | — | | 340,270 |
|
| OTC Total return swap contracts*# | | — | | 26,357 | | — | | 225 | | — | | 2,412 | | 4,264 | | — | | 1,172 | | 11,799 | | — | | 46,229 |
|
| Futures contracts§ | | — | | — | | — | | — | | — | | — | | — | | — | | — | | — | | 36,610 | | 36,610 |
|
| Forward premium swap | | | | | | | | | | | | | | | | | | | | | | | | |
| option contracts # | | 38,432 | | 13,852 | | — | | 9,100 | | — | | — | | 4,069 | | — | | 35,640 | | — | | — | | 101,093 |
|
| Written swap options # | | 40,681 | | — | | — | | 458,741 | | — | | 67,771 | | 63,892 | | — | | 53,202 | | — | | — | | 684,287 |
|
| Written options # | | — | | — | | — | | — | | — | | — | | — | | — | | 16,714 | | — | | — | | 16,714 |
|
| Total Liabilities | | $79,113 | | $40,209 | | $340,270 | | $468,066 | | $— | | $70,183 | | $72,225 | | $— | | $106,728 | | $11,799 | | $36,610 | | $1,225,203 |
|
| Total Financial and Derivative | | | | | | | | | | | | | | | | | | | | | | | | |
| Net Assets | | $(4,255) | | $(29,484) | | $60,050 | | $39,509 | | $2,603,000 | | $7,794 | | $20,756 | | $2,650,000 | | $(26,530) | | $(10,870) | | $2,613,390 | | $7,923,360 |
|
| Total collateral received (pledged)†## | | $— | | $— | | $— | | $39,509 | | $2,603,000 | | $— | | $20,756 | | $2,650,000 | | $(26,530) | | $— | | $2,613,390 | | |
|
| Net amount | | $(4,255) | | $(29,484) | | $60,050 | | $— | | $— | | $7,794 | | $— | | $— | | $— | | $(10,870) | | $— | | |
|
*Excludes premiums, if any. Included in unrealized appreciation and depreciation on OTC swap contracts on the Statement of assets and liabilities.
**Included with Investments in securities on the Statement of assets and liabilities.
†Additional collateral may be required from certain brokers based on individual agreements.
# Covered by master netting agreement (Note 1).
## Any over-collateralization of total financial and derivative net assets is not shown. Collateral may include amounts related to unsettled agreements.
§ Includes current day’s variation margin only as reported on the Statement of assets and liabilities, which is not collateralized. Cumulative appreciation/(depreciation) for futures contracts and centrally cleared swap contracts is represented in the tables listed after the fund’s portfolio.
Note 8 — New pronouncements
In October 2016, the SEC adopted amendments to rules under the Investment Company Act of 1940 (“final rules”) intended to modernize the reporting and disclosure of information by registered investment companies. The final rules amend Regulation S-X and require funds to provide standardized, enhanced derivative disclosure in fund financial statements in a format designed for individual investors. The amendments to Regulation S-X also update the disclosures for other investments and investments in and advances to affiliates and amend the rules regarding the general form and content of fund financial statements. The compliance date for the amendments to Regulation S-X is August 1, 2017. Putnam Management has evaluated the amendments and its adoption will have no effect on the fund’s net assets or results of operations.
| | |
| 22 | Putnam VT American Government Income Fund | Putnam VT American Government Income Fund | 23 |
Trustee approval of management contract
General conclusions
The Board of Trustees of The Putnam Funds oversees the management of each fund and, as required by law, determines annually whether to approve the continuance of your fund’s management contract with Putnam Investment Management, LLC (“Putnam Management”) and the sub-management contract with respect to your fund between Putnam Management and its affiliate, Putnam Investments Limited (“PIL”). The Board, with the assistance of its Contract Committee, requests and evaluates all information it deems reasonably necessary under the circumstances in connection with its annual contract review. The Contract Committee consists solely of Trustees who are not “interested persons” (as this term is defined in the Investment Company Act of 1940, as amended (the “1940 Act”)) of The Putnam Funds (“Independent Trustees”).
At the outset of the review process, members of the Board’s independent staff and independent legal counsel discussed with representatives of Putnam Management the annual contract review materials furnished to the Contract Committee during the course of the previous year’s review, identifying possible changes in these materials that might be necessary or desirable for the coming year. Following these discussions and in consultation with the Contract Committee, the Independent Trustees’ independent legal counsel requested that Putnam Management and its affiliates furnish specified information, together with any additional information that Putnam Management considered relevant, to the Contract Committee. Over the course of several months ending in June 2017, the Contract Committee met on a number of occasions with representatives of Putnam Management, and separately in executive session, to consider the information that Putnam Management provided. Throughout this process, the Contract Committee was assisted by the members of the Board’s independent staff and by independent legal counsel for The Putnam Funds and the Independent Trustees.
In May 2017, the Contract Committee met in executive session to discuss and consider its recommendations with respect to the continuance of the contracts. At the Trustees’ June 2017 meeting, the Contract Committee met in executive session with the other Independent Trustees to review a summary of the key financial, performance and other data that the Contract Committee considered in the course of its review. The Contract Committee then presented its written report, which summarized the key factors that the Committee had considered and set forth its recommendations. The Contract Committee recommended, and the Independent Trustees approved, the continuance of your fund’s management and sub-management contracts, effective July 1, 2017. (Because PIL is an affiliate of Putnam Management and Putnam Management remains fully responsible for all services provided by PIL, the Trustees have not attempted to evaluate PIL as a separate entity, and all subsequent references to Putnam Management below should be deemed to include reference to PIL as necessary or appropriate in the context.)
The Independent Trustees’ approval was based on the following conclusions:
• That the fee schedule in effect for your fund represented reasonable compensation in light of the nature and quality of the services being provided to the fund, the fees paid by competitive funds, the costs incurred by Putnam Management in providing services to the fund, and the continued application of certain reductions and waivers noted below; and
• That the fee schedule in effect for your fund represented an appropriate sharing between fund shareholders and Putnam Management of such economies of scale as may exist in the management of the fund at current asset levels.
These conclusions were based on a comprehensive consideration of all information provided to the Trustees and were not the result of any single factor. Some of the factors that figured particularly in the Trustees’ deliberations and how the Trustees considered these factors are described below, although individual Trustees may have evaluated the information presented differently, giving different weights to various factors. It is also important to recognize that the management arrangements for your fund and the other Putnam funds are the result of many years of review and discussion between the Independent Trustees and Putnam Management, that some aspects of the arrangements may receive greater scrutiny in some years than others, and that the Trustees’ conclusions may be based, in part, on their consideration of fee arrangements in previous years. For example, with some minor exceptions, the funds’ current fee arrangements under the management contracts were first implemented at the beginning of 2010 following extensive review by the Contract Committee and discussions with representatives of Putnam Management, as well as approval by shareholders.
Management fee schedules and total expenses
The Trustees reviewed the management fee schedules in effect for all Putnam funds, including fee levels and breakpoints. The Trustees also reviewed the total expenses of each Putnam fund, recognizing that in most cases management fees represented the major, but not the sole, determinant of total costs to fund shareholders. (In a few instances, funds have implemented so-called “all-in” management fees covering substantially all routine fund operating costs.)
In reviewing fees and expenses, the Trustees generally focus their attention on material changes in circumstances — for example, changes in assets under management, changes in a fund’s investment strategy, changes in Putnam Management’s operating costs or profitability, or changes in competitive practices in the mutual fund industry — that suggest that consideration of fee changes might be warranted. The Trustees concluded that the circumstances did not indicate that changes to the management fee structure for your fund would be appropriate at this time.
Under its management contract, your fund has the benefit of breakpoints in its management fee schedule that provide shareholders with economies of scale in the form of reduced fee rates as assets under management in the Putnam family of funds increase. The Trustees concluded that the fee schedule in effect for your fund represented an appropriate sharing of economies of scale between fund shareholders and Putnam Management.
As in the past, the Trustees also focused on the competitiveness of each fund’s total expense ratio. In order to support the effort to have fund expenses meet competitive standards, the Trustees and Putnam Management have implemented a contractual expense limitation applicable to specified open-end funds, including your fund, of 20 basis points on so-called “other expenses” (i.e., all expenses exclusive of management fees, distribution fees, investor servicing fees, investment-related expenses, interest, taxes, brokerage commissions, acquired fund fees and expenses and extraordinary expenses). This expense limitation attempts to maintain competitive expense levels for the funds. Most funds,
| |
| 24 | Putnam VT American Government Income Fund |
including your fund, had sufficiently low expenses that this expense limitation was not operative during their fiscal years ending in 2016. Putnam Management has agreed to maintain this expense limitation until at least April 30, 2019 and has agreed to implement a contractual expense limitation applicable to specified retail open-end funds, including your fund, of 25 basis points on investor servicing fees and expenses until at least August 31, 2018. Putnam Management’s support for these expense limitation arrangements was an important factor in the Trustees’ decision to approve the continuance of your fund’s management and sub-management contracts.
The Trustees reviewed comparative fee and expense information for a custom group of competitive funds selected by Broadridge Financial Solutions, Inc. (“Broadridge”). This comparative information included your fund’s percentile ranking for effective management fees and total expenses (excluding any applicable 12b-1 fee), which provides a general indication of your fund’s relative standing. In the custom peer group, your fund ranked in the first quintile in effective management fees (determined for your fund and the other funds in the custom peer group based on fund asset size and the applicable contractual management fee schedule) and in the fourth quintile in total expenses (excluding any applicable 12b-1 fees) as of December 31, 2016. The first quintile represents the least expensive funds and the fifth quintile the most expensive funds. The fee and expense data reported by Broadridge as of December 31, 2016 reflected the most recent fiscal year-end data available in Broadridge’s database at that time.
In connection with their review of fund management fees and total expenses, the Trustees also reviewed the costs of the services provided and the profits realized by Putnam Management and its affiliates from their contractual relationships with the funds. This information included trends in revenues, expenses and profitability of Putnam Management and its affiliates relating to the investment management, investor servicing and distribution services provided to the funds. In this regard, the Trustees also reviewed an analysis of Putnam Management’s revenues, expenses and profitability, allocated on a fund-by-fund basis, with respect to the funds’ management, distribution, and investor servicing contracts. For each fund, the analysis presented information about revenues, expenses and profitability for each of the agreements separately and for the agreements taken together on a combined basis. The Trustees concluded that, at current asset levels, the fee schedules in place represented reasonable compensation for the services being provided and represented an appropriate sharing between fund shareholders and Putnam Management of such economies of scale as may exist in the management of the Putnam funds at that time.
The information examined by the Trustees in connection with their annual contract review for the Putnam funds included information regarding fees charged by Putnam Management and its affiliates to institutional clients, including defined benefit pension and profit-sharing plans, charities, college endowments, foundations, sub-advised third-party mutual funds, state, local and non-U.S. government entities, and corporations. This information included, in cases where an institutional product’s investment strategy corresponds with a fund’s strategy, comparisons of those fees with fees charged to the Putnam funds, as well as an assessment of the differences in the services provided to these different types of clients as compared to the services provided to the Putnam Funds. The Trustees observed that the differences in fee rates between these clients and the Putnam funds are by no means uniform when examined by individual asset sectors, suggesting that differences in the pricing of investment management services to these types of clients may reflect, among other things, historical competitive forces operating in separate markets. The Trustees considered the fact that in many cases fee rates across different asset classes are higher on average for mutual funds than for institutional clients, as well as the differences between the services that Putnam Management provides to the Putnam funds and those that it provides to its other clients. The Trustees did not rely on these comparisons to any significant extent in concluding that the management fees paid by your fund are reasonable.
Investment performance
The quality of the investment process provided by Putnam Management represented a major factor in the Trustees’ evaluation of the quality of services provided by Putnam Management under your fund’s management contract. The Trustees were assisted in their review of the Putnam funds’ investment process and performance by the work of the investment oversight committees of the Trustees, which meet on a regular basis with the funds’ portfolio teams and with the Chief Investment Officers and other senior members of Putnam Management’s Investment Division throughout the year. In addition, in response to a request from the Independent Trustees, Putnam Management provided the Trustees with in-depth presentations regarding each of the equity and fixed income investment teams, including the operation of the teams and their investment approaches. The Trustees concluded that Putnam Management generally provides a high-quality investment process — based on the experience and skills of the individuals assigned to the management of fund portfolios, the resources made available to them, and in general Putnam Management’s ability to attract and retain high-quality personnel — but also recognized that this does not guarantee favorable investment results for every fund in every time period.
The Trustees considered that 2016 was a challenging year for the performance of the Putnam funds, with generally disappointing results for the international and global equity funds and taxable fixed income funds, mixed results for small-cap equity, Spectrum, global asset allocation, equity research and tax exempt fixed income funds, but generally strong results for U.S. equity funds. The Trustees noted, however, that they were encouraged by the positive performance trend since mid-year 2016 across most Putnam Funds. In particular, from May 1, 2016 through April 30, 2017, 51% of Putnam Fund assets were in the top quartile and 87% were above the median of the Putnam Funds’ competitive industry rankings. They noted that the longer-term performance of the Putnam funds generally continued to be strong, exemplified by the fact that the Putnam funds were ranked by the Barron’s/Lipper Fund Families survey as the 5th-best performing mutual fund complex out of 54 complexes for the five-year period ended December 31, 2016. In addition, while the survey ranked the Putnam Funds 52nd out of 61 mutual fund complexes for the one-year period ended 2016, the Putnam Funds have ranked 1st or 2nd in the survey for the one-year period three times since 2009 (most recently in 2013). They also noted, however, the disappointing investment performance of some funds for periods ended December 31, 2016 and considered information provided by Putnam Management regarding the factors contributing to the underperformance and actions being taken to improve the performance of these particular funds. The Trustees indicated their intention to continue to monitor closely the performance of those funds, including the effectiveness of any efforts Putnam Management has undertaken to address underperformance and whether additional actions to address areas of underperformance are warranted.
For purposes of the Trustees’ evaluation of the Putnam Funds’ investment performance, the Trustees generally focus on a competitive industry ranking of each fund’s total net return over a one-year, three-year
| |
| Putnam VT American Government Income Fund | 25 |
and five-year period. For a number of Putnam funds with relatively unique investment mandates for which Putnam Management informed the Trustees that meaningful competitive performance rankings are not considered to be available, the Trustees evaluated performance based on their total gross and net returns and, in most cases, comparisons of those returns with the returns of selected investment benchmarks. In the case of your fund, the Trustees considered that its class IA share cumulative total return performance at net asset value was in the following quartiles of its Lipper Inc. (“Lipper”) peer group (Lipper VP (Underlying Funds) — General U.S. Government Funds) for the one-year, three-year and five-year periods ended December 31, 2016 (the first quartile representing the best-performing funds and the fourth quartile the worst-performing funds):
| | |
| One-year period | Three-year period | Five-year period |
|
| 4th | 3rd | 3rd |
|
Over the one-year, three-year and five-year periods ended December 31, 2016, there were 55, 53 and 50 funds, respectively, in your fund’s Lipper peer group. (When considering performance information, shareholders should be mindful that past performance is not a guarantee of future results.)
The Trustees expressed concern about your fund’s fourth quartile performance over the one-year period ended December 31, 2016 and considered the circumstances that may have contributed to this disappointing performance. The Trustees considered Putnam Management’s observation that the fund’s underperformance over the one-year period was largely attributable to the fund’s relative emphasis on shorter duration investments (which reduced the fund’s sensitivity to interest rate changes but detracted from performance).
The Trustees considered that Putnam Management remained confident in the fund’s portfolio managers. The Trustees also considered Putnam Management’s continued efforts to support fund performance through the appointment of an additional portfolio manager in February 2017 and through initiatives including structuring compensation for portfolio managers and research analysts to enhance accountability for fund performance, emphasizing accountability in the portfolio management process, and affirming its commitment to a fundamental-driven approach to investing. The Trustees noted further that Putnam Management continued to strengthen its fundamental research capabilities by adding new investment personnel.
As a general matter, the Trustees believe that cooperative efforts between the Trustees and Putnam Management represent the most effective way to address investment performance concerns that may arise from time to time. The Trustees noted that investors in the Putnam funds have, in effect, placed their trust in the Putnam organization, under the oversight of the funds’ Trustees, to make appropriate decisions regarding the management of the funds. Based on Putnam Management’s willingness to take appropriate measures to address fund performance issues and Putnam Management’s responsiveness to Trustee concerns about investment performance, the Trustees concluded that it continues to be advisable to seek change within Putnam Management to address performance shortcomings. In the Trustees’ view, the alternative of engaging a new investment adviser for an underperforming fund would entail significant disruptions and would not likely provide any greater assurance of improved investment performance.
Brokerage and soft-dollar allocations; investor servicing
The Trustees considered various potential benefits that Putnam Management may receive in connection with the services it provides under the management contract with your fund. These include benefits related to brokerage allocation and the use of soft dollars, whereby a portion of the commissions paid by a fund for brokerage may be used to acquire research services that are expected to be useful to Putnam Management in managing the assets of the fund and of other clients. Subject to policies established by the Trustees, soft dollars generated by these means are used predominantly to acquire brokerage and research services (including third-party research and market data) that enhance Putnam Management’s investment capabilities and supplement Putnam Management’s internal research efforts. However, the Trustees noted that a portion of available soft dollars continues to be used to pay fund expenses. The Trustees indicated their continued intent to monitor regulatory and industry developments in this area with the assistance of their Brokerage Committee, including any developments with respect to the European Union’s updated Markets in Financial Instruments Directive and its potential impact on PIL’s use of client commissions to obtain investment research. The Trustees also indicated their continued intent to monitor the allocation of the Putnam funds’ brokerage in order to ensure that the principle of seeking best price and execution remains paramount in the portfolio trading process.
Putnam Management may also receive benefits from payments that the funds make to Putnam Management’s affiliates for investor or distribution services. In conjunction with the annual review of your fund’s management and sub-management contracts, the Trustees reviewed your fund’s investor servicing agreement with Putnam Investor Services, Inc. (“PSERV”) and its distributor’s contracts and distribution plans with Putnam Retail Management Limited Partnership (“PRM”), both of which are affiliates of Putnam Management. The Trustees concluded that the fees payable by the funds to PSERV and PRM, as applicable, for such services are fair and reasonable in relation to the nature and quality of such services, the fees paid by competitive funds, and the costs incurred by PSERV and PRM, as applicable, in providing such services. Furthermore, the Trustees believed that the services provided were required for the operation of the funds, and that they were of a quality at least equal to those provided by other providers.
| |
| 26 | Putnam VT American Government Income Fund |
|
| This page intentionally left blank. |
| |
| Putnam VT American Government Income Fund | 27 |
|
| This page intentionally left blank. |
| |
| 28 | Putnam VT American Government Income Fund |
Other important information
Proxy voting
Putnam is committed to managing our mutual funds in the best interests of our shareholders. The Putnam funds’ proxy voting guidelines and procedures, as well as information regarding how your fund voted proxies relating to portfolio securities during the 12-month period ended June 30, 2017, are available in the Individual Investors section of putnam.com and on the Securities and Exchange Commission’s [SEC] website, www.sec.gov. If you have questions about finding forms on the SEC’s website, you may call the SEC at 1-800-SEC-0330. You may also obtain the Putnam funds’ proxy voting guidelines and procedures at no charge by calling Putnam’s Shareholder Services at 1-800-225-1581.
Fund portfolio holdings
Each Putnam VT fund will file a complete schedule of its portfolio holdings with the SEC for the first and third quarters of each fiscal year on Form N-Q. Shareholders may obtain the fund’s Form N-Q on the SEC’s website at www.sec.gov. In addition, the fund’s Form N-Q may be reviewed and copied at the SEC’s Public Reference Room in Washington, D.C. You may call the SEC at 1-800-SEC-0330 for information about the SEC’s website or the operation of the Public Reference Room.
Fund information
| | |
| Investment Manager | Investor Servicing Agent | Trustees |
| Putnam Investment Management, LLC | Putnam Investor Services, Inc. | Jameson A. Baxter, Chair |
| One Post Office Square | Mailing address: | Kenneth R. Leibler, Vice Chair |
| Boston, MA 02109 | P.O. Box 8383 | Liaquat Ahamed |
| Boston, MA 02266-8383 | Ravi Akhoury |
| Investment Sub-Advisor | 1-800-225-1581 | Barbara M. Baumann |
| Putnam Investments Limited | | Katinka Domotorffy |
| 57–59 St James’s Street | Custodian | Catharine Bond Hill |
| London, England SW1A 1LD | State Street Bank and Trust Company | Paul L. Joskow |
| | | Robert E. Patterson |
| Marketing Services | Legal Counsel | George Putnam, III |
| Putnam Retail Management | Ropes & Gray LLP | Robert L. Reynolds |
| One Post Office Square | | Manoj P. Singh |
| Boston, MA 02109 | | |
The fund’s Statement of Additional Information contains additional information about the fund’s Trustees and is available without charge upon request by calling 1-800-225-1581.
| |
| Putnam VT American Government Income Fund | 29 |
| |
| | |
| This report has been prepared for the shareholders | H500 |
| of Putnam VT American Government Income Fund. | VTSA027 306801 8/17 |
| |
| Item 3. Audit Committee Financial Expert: |
| |
| Item 4. Principal Accountant Fees and Services: |
| |
| Item 5. Audit Committee of Listed Registrants |
| |
| Item 6. Schedule of Investments: |
| |
| The registrant's schedule of investments in unaffiliated issuers is included in the report to shareholders in Item 1 above. |
| |
| Item 7. Disclosure of Proxy Voting Policies and Procedures For Closed-End Management Investment Companies: |
| |
| Item 8. Portfolio Managers of Closed-End Investment Companies |
| |
| Item 9. Purchases of Equity Securities by Closed-End Management Investment Companies and Affiliated Purchasers: |
| |
| Item 10. Submission of Matters to a Vote of Security Holders: |
| |
| Item 11. Controls and Procedures: |
| |
| (a) The registrant's principal executive officer and principal financial officer have concluded, based on their evaluation of the effectiveness of the design and operation of the registrant's disclosure controls and procedures as of a date within 90 days of the filing date of this report, that the design and operation of such procedures are generally effective to provide reasonable assurance that information required to be disclosed by the registrant in this report is recorded, processed, summarized and reported within the time periods specified in the Commission's rules and forms. |
| |
| (b) Changes in internal control over financial reporting: Not applicable |
| |
| (a)(2) Separate certifications for the principal executive officer and principal financial officer of the registrant as required by Rule 30a-2(a) under the Investment Company Act of 1940, as amended, are filed herewith. |
| |
| (b) The certifications required by Rule 30a-2(b) under the Investment Company Act of 1940, as amended, are filed herewith. |
| |
| Pursuant to the requirements of the Securities Exchange Act of 1934 and the Investment Company Act of 1940, the registrant has duly caused this report to be signed on its behalf by the undersigned, thereunto duly authorized. |
| |
| By (Signature and Title): |
| |
| /s/ Janet C. Smith
Janet C. Smith
Principal Accounting Officer
|
| |
| Pursuant to the requirements of the Securities Exchange Act of 1934 and the Investment Company Act of 1940, this report has been signed below by the following persons on behalf of the registrant and in the capacities and on the dates indicated. |
| |
| By (Signature and Title): |
| |
| /s/ Jonathan S. Horwitz
Jonathan S. Horwitz
Principal Executive Officer
|
| |
| By (Signature and Title): |
| |
| /s/ Janet C. Smith
Janet C. Smith
Principal Financial Officer
|