| | |
| UNITED STATES
SECURITIES AND EXCHANGE COMMISSION |
| | |
| CERTIFIED SHAREHOLDER REPORT OF REGISTERED
MANAGEMENT INVESTMENT COMPANIES
|
| | |
| Investment Company Act file number: | (811-05346) |
| | |
| Exact name of registrant as specified in charter: | Putnam Variable Trust |
| | |
| Address of principal executive offices: | 100 Federal Street, Boston, Massachusetts 02110 |
| | |
| Name and address of agent for service: | Stephen Tate, Vice President
100 Federal Street
Boston, Massachusetts 02110 |
| | |
| Copy to: | Bryan Chegwidden, Esq.
Ropes & Gray LLP
1211 Avenue of the Americas
New York, New York 10036 |
| | |
| Registrant's telephone number, including area code: | (617) 292–1000 |
| | |
| Date of fiscal year end: | December 31, 2021 |
| | |
| Date of reporting period: | January 1, 2021 — June 30, 2021 |
| | |
|
Item 1. Report to Stockholders: | |
| | |
| The following is a copy of the report transmitted to stockholders pursuant to Rule 30e-1 under the Investment Company Act of 1940: | |
Message from the Trustees
August 12, 2021
Dear Shareholder:
The U.S. economy is much improved from a year ago, or even six months ago. Gross domestic product is growing at a pre-pandemic pace. Stock prices are high and interest rates are low. More and more workers are finding jobs, with millions still open. At the same time, vaccinations in many areas have not yet reached enough people to stop the spread of Covid-19. U.S. and global infection rates have recently risen.
While it is too soon to declare the pandemic over, it is worth taking stock of the economy’s transition. Some changes accelerated by the pandemic could be lasting. Dynamic, well-managed companies have adapted to seize new, more sustainable growth opportunities.
An active investment philosophy is well suited to this time. Putnam’s research teams are analyzing the fundamentals of what has stayed the same and what has changed to uncover valuable investment insights or potential risks.
Thank you for investing with Putnam.
The views expressed in this report are exclusively those of Putnam Management and are subject to change. They are not meant as investment advice. Please note that the holdings discussed in this report may not have been held by the fund for the entire period. Portfolio composition is subject to review in accordance with the fund’s investment strategy and may vary in the future.
Consider these risks before investing: Allocation of assets among asset classes may hurt performance. The value of investments in the fund’s portfolio may fall or fail to rise over extended periods of time for a variety of reasons, including general economic, political, or financial market conditions; investor sentiment and market perceptions; government actions; geopolitical events or changes; and factors related to a specific issuer, asset class, geography, industry, or sector. These and other factors may lead to increased volatility and reduced liquidity in the fund’s portfolio holdings. International investing involves currency, economic, and political risks. Emerging-market securities carry illiquidity and volatility risks. Investments in small and/or midsize companies increase the risk of greater price fluctuations. Growth stocks may be more susceptible to earnings disappointments, and value stocks may fail to rebound. Funds that invest in government securities are not guaranteed. Mortgage-backed investments, unlike traditional debt investments, are also subject to prepayment risk, which means that they may increase in value less than other bonds when interest rates decline and decline in value more than other bonds when interest rates rise. Bond investments are subject to interest-rate risk (the risk of bond prices falling if interest rates rise) and credit risk (the risk of an issuer defaulting on interest or principal payments). Default risk is generally higher for non-qualified mortgages. Interest-rate risk is generally greater for longer-term bonds, and credit risk is generally greater for below-investment-grade bonds. Unlike bonds, funds that invest in bonds have fees and expenses. The use of derivatives may increase these risks by increasing investment exposure (which may be considered leverage) or, in the case of over-the-counter instruments, because of the potential inability to terminate or sell derivatives positions and the potential failure of the other party to the instrument to meet its obligations. Our investment techniques, analyses, and judgments may not produce the outcome we intend. The investments we select for the fund may not perform as well as other securities that we do not select for the fund. We, or the fund’s other service providers, may experience disruptions or operating errors that could have a negative effect on the fund. You can lose money by investing in the fund.
Performance summary (as of 6/30/21)
Investment objective
Long-term return consistent with preservation of capital
Net asset value June 30, 2021
| |
| Class IA: $19.29 | Class IB: $19.60 |
Total return at net asset value
| | | | |
| | | | | Putnam |
| | | | | Balanced |
| | | | Russell 3000 | Blended |
| | | | Index | Benchmark |
| | Class IA | Class IB | (primary | (secondary |
| (as of 6/30/21) | shares* | shares† | benchmark) | benchmark) |
| 6 months | 9.92% | 9.80% | 15.11% | 7.89% |
| 1 year | 25.65 | 25.42 | 44.16 | 24.71 |
| 5 years | 65.04 | 62.99 | 127.67 | 72.62 |
| Annualized | 10.54 | 10.26 | 17.89 | 11.54 |
| 10 years | 140.69 | 134.71 | 294.04 | 150.87 |
| Annualized | 9.18 | 8.91 | 14.70 | 9.63 |
| Life | 1,216.25 | 1,139.78 | 3,475.75 | — |
| Annualized | 8.02 | 7.83 | 11.30 | — |
For a portion of the periods, the fund had expense limitations, without which returns would have been lower.
* Class inception date: February 1, 1988.
† Class inception date: April 30, 1998.
The Russell 3000 Index is an unmanaged index of the 3,000 largest U.S. companies.
The Putnam Balanced Blended Benchmark is an unmanaged index administered by Putnam Investment Management, LLC, 50% of which is the Russell 3000 Index, 35% of which is the Bloomberg Barclays U.S. Aggregate Bond Index, 10% of which is the MSCI EAFE Index (ND), and 5% of which is the JPMorgan Developed High Yield Index.
All Bloomberg Barclays indices provided by Bloomberg Index Services Limited.
BLOOMBERG® is a trademark and service mark of Bloomberg Finance L.P. and its affiliates (collectively “Bloomberg”). BARCLAYS® is a trademark and service mark of Barclays Bank Plc (collectively with its affiliates, “Barclays”), used under license. Bloomberg or Bloomberg’s licensors, including Barclays, own all proprietary rights in the Bloomberg Barclays Indices. Neither Bloomberg nor Barclays approves or endorses this material, or guarantees the accuracy of completeness of any information herein, or makes any warranty, express or limited, as to the results to be obtained therefrom and, to the maximum extent allowed by law, neither shall have any liability or responsibility for injury or damages arising in connection therewith.
Frank Russell Company is the source and owner of the trademarks, service marks, and copyrights related to the Russell Indexes. Russell® is a trademark of Frank Russell Company.
Data represent past performance. Past performance does not guarantee future results. More recent returns may be less or more than those shown. Investment return and principal value will fluctuate, and you may have a gain or a loss when you sell your shares. Performance information does not reflect any deduction for taxes a shareholder may owe on fund distributions or on the redemption of fund shares. All total return figures are at net asset value and exclude contract charges and expenses, which are added to the variable annuity contracts to determine total return at unit value. Had these charges and expenses been reflected, performance would have been lower. Performance of class IB shares before their inception is derived from the historical performance of class IA shares, adjusted to reflect the higher operating expenses applicable to such shares. For more recent performance, contact your variable annuity provider who can provide you with performance that reflects the charges and expenses at your contract level.
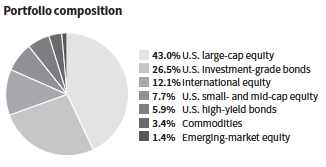
Allocations are shown as a percentage of the fund’s net assets. Cash and net other assets, if any, represent the market value weights of cash, derivatives, short-term securities, and other unclassified assets in the portfolio. Summary information may differ from the portfolio schedule included in the financial statements due to the inclusion of derivative securities, any interest accruals, the exclusion of as-of trades, if any, the use of different classifications of securities for presentation purposes, and rounding. Holdings and allocations may vary over time.
| |
| Putnam VT Global Asset Allocation Fund | 1 |
Understanding your fund’s expenses
As an investor in a variable annuity product that invests in a registered investment company, you pay ongoing expenses, such as management fees, distribution fees (12b-1 fees), and other expenses. In the most recent six-month period, your fund’s expenses were limited; had expenses not been limited, they would have been higher. Using the following information, you can estimate how these expenses affect your investment and compare them with the expenses of other funds. You may also pay onetime transaction expenses, which are not shown in this section and would result in higher total expenses. Charges and expenses at the insurance company separate account level are not reflected. For more information, see your fund’s prospectus or talk to your financial representative.
Review your fund’s expenses
The two left-hand columns of the Expenses per $1,000 table show the expenses you would have paid on a $1,000 investment in your fund from 1/1/21 to 6/30/21. They also show how much a $1,000 investment would be worth at the close of the period, assuming actual returns and expenses. To estimate the ongoing expenses you paid over the period, divide your account value by $1,000, then multiply the result by the number in the first line for the class of shares you own.
Compare your fund’s expenses with those of other funds
The two right-hand columns of the Expenses per $1,000 table show your fund’s expenses based on a $1,000 investment, assuming a hypothetical 5% annualized return. You can use this information to compare the ongoing expenses (but not transaction expenses or total costs) of investing in the fund with those of other funds. All shareholder reports of mutual funds and funds serving as variable annuity vehicles will provide this information to help you make this comparison. Please note that you cannot use this information to estimate your actual ending account balance and expenses paid during the period.
Expense ratios
| | |
| | Class IA | Class IB |
| Total annual operating expenses for the fiscal | | |
| year ended 12/31/20 | 0.87% | 1.12% |
| Annualized expense ratio for the six-month | | |
| period ended 6/30/21 | 0.85% | 1.10% |
Fiscal year expense information in this table is taken from the most recent prospectus, is subject to change, and may differ from that shown for the annualized expense ratio and in the financial highlights of this report.
Expenses are shown as a percentage of average net assets.
Expenses per $1,000
| | | | | | | | |
| | | | | | | Expenses and value for a |
| | | Expenses and value for a | | $1,000 investment, assuming |
| | | $1,000 investment, assuming | | a hypothetical 5% annualized |
| | | actual returns for the | | return for the 6 months |
| | | 6 months ended 6/30/21 | | ended 6/30/21 | | |
| | | Class IA | | Class IB | | Class IA | | Class IB |
| Expenses paid | | | | | | | | |
| per $1,000*† | | $4.42 | | $5.72 | | $4.26 | | $5.51 |
| Ending value | | | | | | | | |
| (after | | | | | | | | |
| expenses) | | $1,099.20 | | $1,098.00 | | $1,020.58 | | $1,019.34 |
*Expenses for each share class are calculated using the fund’s annualized expense ratio for each class, which represents the ongoing expenses as a percentage of average net assets for the six months ended 6/30/21. The expense ratio may differ for each share class.
†Expenses based on actual returns are calculated by multiplying the expense ratio by the average account value for the period; then multiplying the result by the number of days in the period (181); and then dividing that result by the number of days in the year (365). Expenses based on a hypothetical 5% return are calculated by multiplying the expense ratio by the average account value for the six-month period; then multiplying the result by the number of days in the six-month period (181); and then dividing that result by the number of days in the year (365).

| |
| 2 | Putnam VT Global Asset Allocation Fund |
ABOUT DERIVATIVES
Derivatives are an increasingly common type of investment instrument, the performance of which is derived from an underlying security, index, currency, or other area of the capital markets. Derivatives employed by the fund’s managers generally serve one of two main purposes: to implement a strategy that may be difficult or more expensive to invest in through traditional securities, or to hedge unwanted risk associated with a particular position.
For example, the fund’s managers might use currency forward contracts to capitalize on an anticipated change in exchange rates between two currencies. This approach would require a significantly smaller outlay of capital than purchasing traditional bonds denominated in the underlying currencies. In another example, the managers may identify a bond that they believe is undervalued relative to its risk of default, but may seek to reduce the interest-rate risk of that bond by using interest-rate swaps, a derivative through which two parties “swap” payments based on the movement of certain rates. In other examples, the managers may use options and futures contracts to hedge against a variety of risks by establishing a combination of long and short exposures to specific equity markets or sectors.
Like any other investment, derivatives may not appreciate in value and may lose money. Derivatives may amplify traditional investment risks through the creation of leverage and may be less liquid than traditional securities. And because derivatives typically represent contractual agreements between two financial institutions, derivatives entail “counterparty risk,” which is the risk that the other party is unable or unwilling to pay. Putnam monitors the counterparty risks we assume. For example, Putnam often enters into collateral agreements that require the counterparties to post collateral on a regular basis to cover their obligations to the fund. Counterparty risk for exchange-traded futures and centrally cleared swaps is mitigated by the daily exchange of margin and other safeguards against default through their respective clearinghouses.
| |
| Putnam VT Global Asset Allocation Fund | 3 |
The fund’s portfolio 6/30/21 (Unaudited)
| | |
| COMMON STOCKS (67.3%)* | Shares | Value |
| | | |
| Basic materials (2.6%) | | |
| Anglo American PLC (United Kingdom) | 3,602 | $143,127 |
| Axalta Coating Systems, Ltd. † | 4,772 | 145,498 |
| BHP Billiton, Ltd. (Australia) | 611 | 22,256 |
| BHP Group PLC (United Kingdom) | 2,930 | 86,330 |
| Cabot Corp. | 702 | 39,965 |
| Celanese Corp. | 540 | 81,864 |
| Compagnie De Saint-Gobain (France) | 2,395 | 157,726 |
| Covestro AG (Germany) | 1,932 | 124,761 |
| CRH PLC (Ireland) | 2,076 | 104,619 |
| Dow, Inc. | 1,094 | 69,228 |
| DuPont de Nemours, Inc. | 9,362 | 724,712 |
| Eastman Chemical Co. | 1,760 | 205,480 |
| Eiffage SA (France) | 611 | 62,162 |
| FMC Corp. | 330 | 35,706 |
| Fortescue Metals Group, Ltd. (Australia) | 5,930 | 103,798 |
| Holcim, Ltd. (Switzerland) | 1,859 | 111,510 |
| ICL Group, Ltd. (Israel) | 3,816 | 25,880 |
| Nitto Denko Corp. (Japan) | 1,300 | 97,007 |
| Reliance Steel & Aluminum Co. | 638 | 96,274 |
| Rio Tinto PLC (United Kingdom) | 2,472 | 203,427 |
| Sherwin-Williams Co. (The) | 262 | 71,382 |
| Shin-Etsu Chemical Co., Ltd. (Japan) | 600 | 100,347 |
| Stora Enso OYJ (Finland) | 379 | 6,914 |
| Weyerhaeuser Co. R | 13,885 | 477,922 |
| | | 3,297,895 |
| Capital goods (4.2%) | | |
| AGCO Corp. | 1,690 | 220,342 |
| Allegion PLC (Ireland) | 1,614 | 224,830 |
| Allison Transmission Holdings, Inc. | 2,172 | 86,315 |
| Atlas Copco AB Class A (Sweden) | 408 | 24,981 |
| Clean Harbors, Inc. † | 482 | 44,893 |
| CNH Industrial NV (United Kingdom) | 7,943 | 131,151 |
| Crown Holdings, Inc. | 1,655 | 169,158 |
| Cummins, Inc. | 1,976 | 481,769 |
| Daikin Industries, Ltd. (Japan) | 600 | 111,742 |
| Deere & Co. | 1,223 | 431,364 |
| Dover Corp. | 506 | 76,204 |
| Gentex Corp. | 3,105 | 102,744 |
| Honeywell International, Inc. | 3,472 | 761,583 |
| ITT, Inc. | 793 | 72,631 |
| Koito Manufacturing Co., Ltd. (Japan) | 1,400 | 87,079 |
| Legrand SA (France) | 1,458 | 154,315 |
| Lockheed Martin Corp. | 2,706 | 1,023,815 |
| Oshkosh Corp. | 865 | 107,814 |
| Parker Hannifin Corp. | 1,557 | 478,170 |
| Republic Services, Inc. | 1,332 | 146,533 |
| Sandvik AB (Sweden) | 5,687 | 145,263 |
| Toro Co. (The) | 962 | 105,705 |
| Waste Management, Inc. | 2,044 | 286,385 |
| | | 5,474,786 |
| Communication services (2.0%) | | |
| Altice USA, Inc. Class A † | 2,602 | 88,832 |
| AT&T, Inc. | 6,147 | 176,911 |
| BT Group PLC (United Kingdom) † | 18,212 | 48,874 |
| Comcast Corp. Class A | 11,528 | 657,327 |
| | | |
| COMMON STOCKS (67.3%)* cont. | Shares | Value |
| | | |
| Communication services cont. | | |
| Deutsche Telekom AG (Germany) | 9,076 | $191,690 |
| KDDI Corp. (Japan) | 5,400 | 168,423 |
| Koninklijke KPN NV (Netherlands) | 23,587 | 73,668 |
| Nippon Telegraph & Telephone Corp. (Japan) | 3,100 | 80,768 |
| Verizon Communications, Inc. | 20,978 | 1,175,397 |
| | | 2,661,890 |
| Computers (5.3%) | | |
| Apple, Inc. | 33,092 | 4,532,280 |
| Check Point Software Technologies, Ltd. (Israel) † | 339 | 39,368 |
| Cisco Systems, Inc./California | 15,100 | 800,300 |
| Fortinet, Inc. † | 2,752 | 655,499 |
| Fujitsu, Ltd. (Japan) | 700 | 131,059 |
| HP, Inc. | 13,494 | 407,384 |
| Logitech International SA (Switzerland) | 611 | 74,027 |
| ServiceNow, Inc. † | 110 | 60,451 |
| Synopsys, Inc. † | 1,083 | 298,681 |
| | | 6,999,049 |
| Conglomerates (0.2%) | | |
| AMETEK, Inc. | 1,665 | 222,278 |
| | | 222,278 |
| Consumer cyclicals (9.1%) | | |
| Adecco Group AG (Switzerland) | 1,178 | 80,031 |
| Amazon.com, Inc. † | 959 | 3,299,113 |
| Aristocrat Leisure, Ltd. (Australia) | 2,782 | 89,901 |
| Berkeley Group Holdings PLC (The) (United Kingdom) | 676 | 42,968 |
| Best Buy Co., Inc. | 4,133 | 475,212 |
| Bollore SA (France) | 5,319 | 28,508 |
| Booz Allen Hamilton Holding Corp. | 3,003 | 255,796 |
| Brambles, Ltd. (Australia) | 8,049 | 69,056 |
| Brunswick Corp. | 1,687 | 168,059 |
| CK Hutchison Holdings, Ltd. (Hong Kong) | 7,000 | 54,545 |
| Compagnie Generale des Etablissements Michelin | | |
| SCA (France) | 307 | 48,961 |
| Daito Trust Construction Co., Ltd. (Japan) | 200 | 21,873 |
| Daiwa House Industry Co., Ltd. (Japan) | 2,900 | 87,056 |
| Evolution AB (Sweden) | 645 | 101,927 |
| FleetCor Technologies, Inc. † | 235 | 60,174 |
| Ford Motor Co. † | 50,877 | 756,032 |
| Gartner, Inc. † | 1,299 | 314,618 |
| Genting Bhd (Singapore) | 49,500 | 30,737 |
| Hermes International (France) | 127 | 185,000 |
| Hilton Worldwide Holdings, Inc. † | 2,741 | 330,619 |
| iHeartMedia, Inc. Class A † | 214 | 5,763 |
| Industria de Diseno Textil SA (Inditex) (Spain) | 1,555 | 54,781 |
| Knorr-Bremse AG (Germany) | 655 | 75,337 |
| La Francaise des Jeux SAEM (France) | 536 | 31,511 |
| Lowe’s Cos., Inc. | 1,932 | 374,750 |
| LVMH Moet Hennessy Louis Vuitton SA (France) | 76 | 59,594 |
| Marriott International, Inc./MD Class A † | 4,026 | 549,630 |
| Nintendo Co., Ltd. (Japan) | 300 | 174,499 |
| Nitori Holdings Co., Ltd. (Japan) | 800 | 141,573 |
| O’Reilly Automotive, Inc. † | 732 | 414,466 |
| Pandora A/S (Denmark) | 628 | 84,418 |
| PayPal Holdings, Inc. † | 1,577 | 459,664 |
| Polaris, Inc. | 1,636 | 224,067 |
| Porsche Automobil Holding SE | | |
| (Preference) (Germany) | 952 | 102,001 |
| Publicis Groupe SA (France) | 669 | 42,789 |
| PulteGroup, Inc. | 1,465 | 79,945 |
| |
| 4 | Putnam VT Global Asset Allocation Fund |
| | |
| COMMON STOCKS (67.3%)* cont. | Shares | Value |
| | | |
| Consumer cyclicals cont. | | |
| Ryohin Keikaku Co., Ltd. (Japan) | 1,200 | $25,168 |
| SEB SA (France) | 172 | 31,082 |
| Sony Group Corp. (Japan) | 2,000 | 194,698 |
| Spectrum Brands Holdings, Inc. | 450 | 38,268 |
| Stellantis NV (Italy) | 9,193 | 180,296 |
| TABCORP Holdings, Ltd. (Australia) | 10,316 | 40,075 |
| Tempur Sealy International, Inc. | 3,715 | 145,591 |
| TJX Cos., Inc. (The) | 12,735 | 858,594 |
| TransUnion | 403 | 44,253 |
| Volkswagen AG (Preference) (Germany) | 148 | 37,064 |
| Volvo AB (Sweden) | 5,951 | 143,176 |
| Walmart, Inc. | 4,705 | 663,499 |
| Wesfarmers, Ltd. (Australia) | 4,042 | 179,150 |
| | | 11,955,888 |
| Consumer staples (4.9%) | | |
| Altria Group, Inc. | 11,256 | 536,686 |
| Auto Trader Group PLC (United Kingdom) † | 4,522 | 39,621 |
| Campbell Soup Co. | 740 | 33,737 |
| Carlsberg A/S Class B (Denmark) | 580 | 108,116 |
| Coca-Cola Co. (The) | 1,688 | 91,338 |
| Coca-Cola Europacific Partners PLC | | |
| (United Kingdom) | 373 | 22,126 |
| Coca-Cola HBC AG (Switzerland) | 1,818 | 65,738 |
| Coles Group, Ltd. (Australia) | 3,194 | 40,936 |
| Colgate-Palmolive Co. | 1,385 | 112,670 |
| Constellation Brands, Inc. Class A | 368 | 86,072 |
| Costco Wholesale Corp. | 817 | 323,262 |
| Darden Restaurants, Inc. | 473 | 69,053 |
| Endeavour Group, Ltd. (Australia) (Australia) † | 5,193 | 24,496 |
| Ferguson PLC (United Kingdom) | 1,220 | 169,606 |
| Imperial Brands PLC (United Kingdom) | 6,874 | 148,052 |
| ITOCHU Corp. (Japan) | 5,300 | 152,662 |
| Koninklijke Ahold Delhaize NV (Netherlands) | 3,697 | 109,900 |
| L’Oreal SA (France) | 510 | 227,259 |
| ManpowerGroup, Inc. | 956 | 113,678 |
| McDonald’s Corp. | 2,768 | 639,380 |
| Mondelez International, Inc. Class A | 5,839 | 364,587 |
| Nestle SA (Switzerland) | 2,064 | 257,027 |
| NH Foods, Ltd. (Japan) | 900 | 34,997 |
| PepsiCo, Inc. | 4,897 | 725,588 |
| Procter & Gamble Co. (The) | 9,243 | 1,247,158 |
| Sysco Corp. | 3,721 | 289,308 |
| Uber Technologies, Inc. † | 1,217 | 60,996 |
| Unilever PLC (United Kingdom) | 579 | 33,883 |
| WH Group, Ltd. (Hong Kong) | 97,000 | 87,202 |
| Woolworths Group, Ltd. (Australia) | 5,193 | 148,497 |
| Yum! Brands, Inc. | 559 | 64,302 |
| | | 6,427,933 |
| Electronics (3.1%) | | |
| Advanced Micro Devices, Inc. † | 707 | 66,409 |
| Brother Industries, Ltd. (Japan) | 2,000 | 39,912 |
| Garmin, Ltd. | 847 | 122,510 |
| Hoya Corp. (Japan) | 1,300 | 172,366 |
| NVIDIA Corp. | 2,645 | 2,116,265 |
| Omron Corp. (Japan) | 800 | 63,441 |
| Qualcomm, Inc. | 10,248 | 1,464,747 |
| Thales SA (France) | 144 | 14,691 |
| | | 4,060,341 |
| |
| COMMON STOCKS (67.3%)* cont. | Shares | Value |
| | | |
| Energy (1.5%) | | |
| BP PLC (United Kingdom) | 30,675 | $133,663 |
| Chevron Corp. | 3,279 | 343,442 |
| Equinor ASA (Norway) | 6,876 | 145,488 |
| Halliburton Co. | 22,498 | 520,154 |
| Marathon Petroleum Corp. | 4,533 | 273,884 |
| MWO Holdings, LLC (Units) F | 15 | 38 |
| Oasis Petroleum, Inc. | 196 | 19,708 |
| Royal Dutch Shell PLC Class B (United Kingdom) | 13,095 | 253,419 |
| Schlumberger, Ltd. | 1,068 | 34,187 |
| Targa Resources Corp. | 3,740 | 166,243 |
| Thungela Resources, Ltd. (South Africa) † | 292 | 804 |
| TotalEnergies SE (France) | 813 | 36,782 |
| Williams Cos., Inc. (The) | 2,970 | 78,854 |
| | | 2,006,666 |
| Financials (9.2%) | | |
| 3i Group PLC (United Kingdom) | 5,011 | 81,309 |
| Aflac, Inc. | 4,745 | 254,617 |
| Alliance Data Systems Corp. | 1,271 | 132,425 |
| Allianz SE (Germany) | 858 | 213,954 |
| Allstate Corp. (The) | 1,756 | 229,053 |
| Ally Financial, Inc. | 7,719 | 384,715 |
| Ameriprise Financial, Inc. | 1,675 | 416,874 |
| AvalonBay Communities, Inc. R | 676 | 141,026 |
| Aviva PLC (United Kingdom) | 21,941 | 123,195 |
| Banco Bilbao Vizcaya Argenta (Spain) | 24,669 | 152,926 |
| Bank Leumi Le-Israel BM (Israel) † | 11,193 | 85,008 |
| Berkshire Hathaway, Inc. Class B † | 394 | 109,500 |
| BOC Hong Kong Holdings, Ltd. (Hong Kong) | 18,500 | 62,784 |
| Capital One Financial Corp. | 534 | 82,604 |
| CBRE Group, Inc. Class A † | 3,499 | 299,969 |
| Citigroup, Inc. | 17,507 | 1,238,620 |
| CK Asset Holdings, Ltd. (Hong Kong) | 1,633 | 11,273 |
| Commonwealth Bank of Australia (Australia) | 1,763 | 132,044 |
| Corporate Office Properties Trust R | 2,032 | 56,876 |
| DBS Group Holdings, Ltd. (Singapore) | 7,800 | 172,914 |
| Direct Line Insurance Group PLC (United Kingdom) | 14,071 | 55,474 |
| Discover Financial Services | 742 | 87,771 |
| Duke Realty Corp. R | 1,725 | 81,679 |
| Equitable Holdings, Inc. | 7,365 | 224,264 |
| Equity Lifestyle Properties, Inc. R | 1,050 | 78,026 |
| Fidelity National Financial, Inc. | 1,565 | 68,015 |
| First Industrial Realty Trust, Inc. R | 2,174 | 113,548 |
| Gaming and Leisure Properties, Inc. R | 2,845 | 131,809 |
| Gjensidige Forsikring ASA (Norway) | 1,347 | 29,693 |
| Goldman Sachs Group, Inc. (The) | 2,230 | 846,352 |
| Goodman Group (Australia) R | 10,340 | 164,162 |
| Hargreaves Lansdown PLC (United Kingdom) | 1,119 | 24,596 |
| Henderson Land Development Co., Ltd. (Hong Kong) | 9,900 | 46,922 |
| Invitation Homes, Inc. R | 2,146 | 80,024 |
| Israel Discount Bank, Ltd. Class A (Israel) † | 10,628 | 50,595 |
| Jefferies Financial Group, Inc. | 4,807 | 164,399 |
| Jones Lang LaSalle, Inc. † | 671 | 131,154 |
| JPMorgan Chase & Co. | 12,161 | 1,891,522 |
| Lamar Advertising Co. Class A R | 1,106 | 115,489 |
| Lincoln National Corp. | 882 | 55,425 |
| Link REIT (The) (Hong Kong) R | 1,300 | 12,599 |
| Medical Properties Trust, Inc. R | 8,487 | 170,589 |
| |
| Putnam VT Global Asset Allocation Fund | 5 |
| | |
| COMMON STOCKS (67.3%)* cont. | Shares | Value |
| | | |
| Financials cont. | | |
| MetLife, Inc. | 12,655 | $757,402 |
| MGIC Investment Corp. | 3,049 | 41,466 |
| Morgan Stanley | 3,317 | 304,136 |
| NN Group NV (Netherlands) | 282 | 13,302 |
| Nomura Holdings, Inc. (Japan) | 25,400 | 129,818 |
| Partners Group Holding AG (Switzerland) | 111 | 168,135 |
| Persimmon PLC (United Kingdom) | 1,021 | 41,777 |
| Principal Financial Group, Inc. | 2,892 | 182,745 |
| Raymond James Financial, Inc. | 282 | 36,632 |
| Rayonier, Inc. R | 2,032 | 73,010 |
| SEI Investments Co. | 1,025 | 63,519 |
| Simon Property Group, Inc. R | 340 | 44,363 |
| Skandinaviska Enskilda Banken AB (Sweden) | 6,780 | 87,581 |
| SLM Corp. | 8,212 | 171,959 |
| Sumitomo Mitsui Financial Group, Inc. (Japan) | 4,700 | 162,032 |
| Sumitomo Mitsui Trust Holdings, Inc. (Japan) | 1,800 | 57,162 |
| Sumitomo Realty & Development Co., Ltd. (Japan) | 700 | 25,015 |
| Sun Hung Kai Properties, Ltd. (Hong Kong) | 4,000 | 59,606 |
| Synchrony Financial | 10,161 | 493,012 |
| United Overseas Bank, Ltd. (Singapore) | 4,100 | 78,725 |
| Unum Group | 3,490 | 99,116 |
| Zurich Insurance Group AG (Switzerland) | 114 | 45,736 |
| | | 12,142,042 |
| Government (—%) | | |
| Poste Italiane SpA (Italy) | 2,671 | 35,314 |
| | | 35,314 |
| Health care (8.3%) | | |
| 10x Genomics, Inc. Class A † S | 1,655 | 324,082 |
| Abbott Laboratories | 5,233 | 606,662 |
| AbbVie, Inc. | 2,708 | 305,029 |
| ABIOMED, Inc. † | 689 | 215,044 |
| Alexion Pharmaceuticals, Inc. † | 219 | 40,232 |
| Align Technology, Inc. † | 1,219 | 744,809 |
| Alkermes PLC † | 2,774 | 68,018 |
| AmerisourceBergen Corp. | 1,829 | 209,402 |
| Biogen, Inc. † | 283 | 97,994 |
| Bristol-Myers Squibb Co. | 20,651 | 1,379,900 |
| Edwards Lifesciences Corp. † | 5,926 | 613,756 |
| Eurofins Scientific (Luxembourg) † | 603 | 68,927 |
| Fisher & Paykel Healthcare Corp., Ltd. | | |
| (New Zealand) | 1,103 | 23,993 |
| GlaxoSmithKline PLC (United Kingdom) | 3,602 | 70,724 |
| HCA Healthcare, Inc. | 375 | 77,528 |
| Hikma Pharmaceuticals PLC (United Kingdom) | 1,873 | 63,374 |
| Humana, Inc. | 1,005 | 444,934 |
| Incyte Corp. † | 2,076 | 174,654 |
| Ipsen SA (France) | 319 | 33,180 |
| Johnson & Johnson | 2,757 | 454,188 |
| Laboratory Corp. of America Holdings † | 884 | 243,851 |
| M3, Inc. (Japan) | 700 | 51,119 |
| McKesson Corp. | 1,988 | 380,185 |
| Medtronic PLC | 4,624 | 573,977 |
| Merck & Co., Inc. | 16,041 | 1,247,509 |
| Merck KGaA (Germany) | 789 | 151,280 |
| Molina Healthcare, Inc. † | 661 | 167,273 |
| Novartis AG (Switzerland) | 3,266 | 297,638 |
| Novo Nordisk A/S Class B (Denmark) | 2,893 | 242,373 |
| Ono Pharmaceutical Co., Ltd. (Japan) | 3,600 | 80,331 |
| | | |
| COMMON STOCKS (67.3%)* cont. | Shares | Value |
| | | |
| Health care cont. | | |
| Roche Holding AG (Switzerland) | 820 | $308,901 |
| Sartorius Stedim Biotech (France) | 182 | 86,085 |
| Service Corp. International | 1,538 | 82,421 |
| Sonic Healthcare, Ltd. (Australia) | 2,860 | 82,363 |
| Sonova Holding AG (Switzerland) | 371 | 139,539 |
| Vertex Pharmaceuticals, Inc. † | 3,264 | 658,120 |
| Zimmer Biomet Holdings, Inc. | 421 | 67,705 |
| | | 10,877,100 |
| Semiconductor (0.4%) | | |
| Applied Materials, Inc. | 1,569 | 223,426 |
| ASML Holding NV (Netherlands) | 123 | 84,504 |
| Lasertec Corp. (Japan) | 300 | 58,301 |
| Tokyo Electron, Ltd. (Japan) | 300 | 129,835 |
| | | 496,066 |
| Software (5.6%) | | |
| Activision Blizzard, Inc. | 2,905 | 277,253 |
| Adobe, Inc. † | 2,486 | 1,455,901 |
| Autodesk, Inc. † | 2,448 | 714,571 |
| Cadence Design Systems, Inc. † | 3,245 | 443,981 |
| Intuit, Inc. | 2,875 | 1,409,239 |
| Manhattan Associates, Inc. † | 783 | 113,410 |
| Microsoft Corp. | 9,323 | 2,525,601 |
| Sage Group PLC (The) (United Kingdom) | 7,170 | 67,861 |
| Veeva Systems, Inc. Class A † | 1,124 | 349,508 |
| Workday, Inc. † | 163 | 38,915 |
| | | 7,396,240 |
| Technology services (7.2%) | | |
| Accenture PLC Class A | 4,029 | 1,187,709 |
| Alphabet, Inc. Class A † | 1,566 | 3,823,843 |
| Capgemini SE (France) | 638 | 122,554 |
| Cognizant Technology Solutions Corp. Class A | 3,978 | 275,516 |
| DocuSign, Inc. † | 936 | 261,678 |
| Facebook, Inc. Class A † | 1,181 | 410,646 |
| Fidelity National Information Services, Inc. | 3,386 | 479,695 |
| FUJIFILM Holdings Corp. (Japan) | 200 | 14,832 |
| GoDaddy, Inc. Class A † | 3,600 | 313,056 |
| IBM Corp. | 503 | 73,735 |
| Leidos Holdings, Inc. | 2,007 | 202,908 |
| Nomura Research Institute, Ltd. (Japan) | 3,300 | 109,163 |
| Palo Alto Networks, Inc. † | 188 | 69,757 |
| Pinterest, Inc. Class A † | 16,523 | 1,304,491 |
| Roku, Inc. † | 1,825 | 838,131 |
| SCSK Corp. (Japan) | 600 | 35,753 |
| | | 9,523,467 |
| Transportation (1.6%) | | |
| A. P. Moeller-Maersck A/S Class B (Denmark) | 20 | 57,485 |
| CSX Corp. | 19,203 | 616,032 |
| Deutsche Post AG (Germany) | 2,947 | 200,439 |
| FedEx Corp. | 113 | 33,711 |
| Nippon Express Co., Ltd. (Japan) | 1,100 | 83,766 |
| Nippon Yusen KK (Japan) | 2,000 | 101,355 |
| Norfolk Southern Corp. | 264 | 70,068 |
| Old Dominion Freight Line, Inc. | 1,767 | 448,465 |
| Ryder System, Inc. | 1,071 | 79,607 |
| Union Pacific Corp. | 1,169 | 257,098 |
| United Parcel Service, Inc. Class B | 731 | 152,026 |
| Yamato Holdings Co., Ltd. (Japan) | 1,700 | 48,355 |
| | | 2,148,407 |
| |
| 6 | Putnam VT Global Asset Allocation Fund |
| | |
| COMMON STOCKS (67.3%)* cont. | Shares | Value |
| |
| Utilities and power (2.1%) | | |
| AES Corp. (The) | 1,553 | $40,487 |
| AGL Energy, Ltd. (Australia) | 5,940 | 36,529 |
| American Electric Power Co., Inc. | 3,922 | 331,762 |
| CLP Holdings, Ltd. (Hong Kong) | 12,000 | 118,697 |
| E.ON SE (Germany) | 2,660 | 30,765 |
| Edison International | 3,536 | 204,452 |
| Electricite De France SA (France) | 5,730 | 78,271 |
| Entergy Corp. | 1,443 | 143,867 |
| Exelon Corp. | 8,541 | 378,452 |
| Fortum OYJ (Finland) | 4,272 | 117,824 |
| Kinder Morgan, Inc. | 12,783 | 233,034 |
| NRG Energy, Inc. | 5,821 | 234,586 |
| Public Service Enterprise Group, Inc. | 3,484 | 208,134 |
| Southern Co. (The) | 8,441 | 510,765 |
| Texas Competitive Electric Holdings Co., LLC/TCEH | | |
| Finance, Inc. (Rights) | 1,923 | 2,212 |
| Tokyo Gas Co., Ltd. (Japan) | 2,100 | 39,639 |
| | | 2,709,476 |
| | | |
| Total common stocks (cost $59,485,698) | | $88,434,838 |
| |
| U.S. GOVERNMENT AND AGENCY | | |
| MORTGAGE OBLIGATIONS (14.9%)* | Principal amount | Value |
| | | |
| U.S. Government Guaranteed Mortgage Obligations (2.2%) | | |
| Government National Mortgage Association | | |
| Pass-Through Certificates | | |
| 6.50%, with due dates from 5/20/37 to 11/20/39 | $156,265 | $185,084 |
| 3.00%, TBA, 7/1/51 | 1,000,000 | 1,043,224 |
| 3.00%, with due dates from 7/20/50 to 10/20/50 | 1,606,705 | 1,674,657 |
| | | 2,902,965 |
| U.S. Government Agency Mortgage Obligations (12.7%) | | |
| Federal Home Loan Mortgage Corporation | | |
| Pass-Through Certificates 3.00%, 1/1/48 | 995,506 | 1,043,761 |
| Federal National Mortgage Association | | |
| Pass-Through Certificates | | |
| 4.00%, 1/1/57 | 52,285 | 58,049 |
| 4.00%, 1/1/49 | 198,022 | 210,521 |
| 3.00%, with due dates from 4/1/46 to 11/1/48 | 686,901 | 721,252 |
| 2.50%, 5/1/51 ## | 1,000,000 | 1,039,668 |
| 2.50%, 7/1/51 | 1,000,000 | 1,040,202 |
| Uniform Mortgage-Backed Securities | | |
| 6.00%, TBA, 7/1/51 | 1,000,000 | 1,122,637 |
| 4.50%, TBA, 7/1/51 | 1,000,000 | 1,075,858 |
| 3.50%, TBA, 7/1/51 | 2,000,000 | 2,104,999 |
| 3.00%, TBA, 7/1/51 | 1,000,000 | 1,042,500 |
| 2.50%, TBA, 7/1/51 | 4,000,000 | 4,137,187 |
| 2.50%, TBA, 7/1/36 | 2,000,000 | 2,085,626 |
| 2.00%, TBA, 7/1/51 | 1,000,000 | 1,010,405 |
| | | 16,692,665 |
| Total U.S. government and agency mortgage | | |
| obligations (cost $19,486,822) | | $19,595,630 |
| |
| CORPORATE BONDS AND NOTES (14.4%)* | Principal amount | Value |
| | | |
| Basic materials (0.7%) | | |
| Allegheny Technologies, Inc. sr. unsec. | | |
| unsub. notes 7.875%, 8/15/23 | $10,000 | $10,950 |
| ArcelorMittal SA sr. unsec. unsub. notes 7.25%, | | |
| 10/15/39 (France) | 15,000 | 21,169 |
| Beacon Roofing Supply, Inc. 144A company | | |
| guaranty sr. notes 4.50%, 11/15/26 | 5,000 | 5,247 |
| | | |
| CORPORATE BONDS | | |
| AND NOTES (14.4%)* cont. | Principal amount | Value |
| | | |
| Basic materials cont. | | |
| Beacon Roofing Supply, Inc. 144A sr. unsec. | | |
| unsub. notes 4.125%, 5/15/29 | $5,000 | $4,987 |
| Big River Steel, LLC/BRS Finance Corp. 144A | | |
| sr. notes 6.625%, 1/31/29 | 10,000 | 11,013 |
| Boise Cascade Co. 144A company | | |
| guaranty sr. unsec. notes 4.875%, 7/1/30 | 10,000 | 10,626 |
| Builders FirstSource, Inc. 144A sr. notes | | |
| 6.75%, 6/1/27 | 8,000 | 8,570 |
| BWAY Holding Co. 144A sr. unsec. notes | | |
| 7.25%, 4/15/25 | 10,000 | 9,800 |
| Celanese US Holdings, LLC company | | |
| guaranty sr. unsec. notes 3.50%, 5/8/24 (Germany) | 11,000 | 11,753 |
| CF Industries, Inc. company guaranty sr. unsec. | | |
| bonds 4.95%, 6/1/43 | 15,000 | 17,681 |
| CF Industries, Inc. 144A company | | |
| guaranty sr. notes 4.50%, 12/1/26 | 78,000 | 89,530 |
| Coeur Mining, Inc. 144A company | | |
| guaranty sr. unsec. notes 5.125%, 2/15/29 | 10,000 | 9,900 |
| Compass Minerals International, Inc. 144A company | | |
| guaranty sr. unsec. notes 6.75%, 12/1/27 | 15,000 | 16,125 |
| Compass Minerals International, Inc. 144A company | | |
| guaranty sr. unsec. notes 4.875%, 7/15/24 | 30,000 | 31,050 |
| CP Atlas Buyer, Inc. 144A sr. unsec. notes | | |
| 7.00%, 12/1/28 | 5,000 | 5,181 |
| FMG Resources August 2006 Pty, Ltd. 144A company | | |
| guaranty sr. unsec. bonds 4.375%, 4/1/31 (Australia) | 10,000 | 10,698 |
| Freeport-McMoRan, Inc. company | | |
| guaranty sr. unsec. bonds 4.625%, 8/1/30 (Indonesia) | 5,000 | 5,475 |
| Freeport-McMoRan, Inc. company | | |
| guaranty sr. unsec. notes 4.375%, 8/1/28 (Indonesia) | 10,000 | 10,563 |
| GCP Applied Technologies, Inc. 144A sr. unsec. | | |
| notes 5.50%, 4/15/26 | 25,000 | 25,714 |
| Glencore Funding, LLC 144A company | | |
| guaranty sr. unsec. notes 2.50%, 9/1/30 | 54,000 | 53,868 |
| Graphic Packaging International, LLC 144A company | | |
| guaranty sr. unsec. notes 3.50%, 3/1/29 | 5,000 | 4,954 |
| HudBay Minerals, Inc. 144A company | | |
| guaranty sr. unsec. notes 4.50%, 4/1/26 (Canada) | 5,000 | 5,000 |
| HudBay Minerals, Inc. 144A company | | |
| guaranty sr. unsec. notes 6.125%, 4/1/29 (Canada) | 5,000 | 5,325 |
| Huntsman International, LLC sr. unsec. | | |
| bonds 2.95%, 6/15/31 | 15,000 | 15,214 |
| Huntsman International, LLC sr. unsec. | | |
| notes 4.50%, 5/1/29 | 40,000 | 45,478 |
| Ingevity Corp. 144A company guaranty sr. unsec. | | |
| notes 3.875%, 11/1/28 | 10,000 | 9,950 |
| Intelligent Packaging Holdco Issuer LP 144A | | |
| sr. unsec. notes 9.00%, 1/15/26 (Canada) ‡‡ | 5,000 | 5,094 |
| Intelligent Packaging, Ltd., Finco, Inc./Intelligent | | |
| Packaging, Ltd. Co-Issuer, LLC 144A sr. notes 6.00%, | | |
| 9/15/28 (Canada) | 5,000 | 5,200 |
| International Flavors & Fragrances, Inc. | | |
| sr. unsec. notes 4.45%, 9/26/28 | 23,000 | 26,594 |
| International Flavors & Fragrances, Inc. 144A | | |
| company guaranty sr. unsec. bonds 3.468%, 12/1/50 | 7,000 | 7,276 |
| International Flavors & Fragrances, Inc. 144A | | |
| sr. unsec. notes 2.30%, 11/1/30 | 19,000 | 18,893 |
| Kraton Polymers, LLC 144A company | | |
| guaranty sr. unsec. notes 4.25%, 12/15/25 | 10,000 | 10,200 |
| Louisiana-Pacific Corp. 144A sr. unsec. | | |
| notes 3.625%, 3/15/29 | 10,000 | 10,063 |
| |
| Putnam VT Global Asset Allocation Fund | 7 |
| | |
| CORPORATE BONDS | | |
| AND NOTES (14.4%)* cont. | Principal amount | Value |
| | | |
| Basic materials cont. | | |
| Mauser Packaging Solutions Holding Co. 144A | | |
| sr. notes 8.50%, 4/15/24 | $5,000 | $5,175 |
| Mauser Packaging Solutions Holding Co. 144A | | |
| sr. notes 5.50%, 4/15/24 | 10,000 | 10,100 |
| Mercer International, Inc. sr. unsec. | | |
| notes 5.50%, 1/15/26 (Canada) | 10,000 | 10,275 |
| Mercer International, Inc. 144A sr. unsec. | | |
| notes 5.125%, 2/1/29 (Canada) | 5,000 | 5,145 |
| NOVA Chemicals Corp. 144A sr. unsec. | | |
| sub. notes 4.25%, 5/15/29 (Canada) | 5,000 | 5,050 |
| Novelis Corp. 144A company guaranty sr. unsec. | | |
| bonds 5.875%, 9/30/26 | 25,000 | 26,006 |
| Novelis Corp. 144A company guaranty sr. unsec. | | |
| notes 4.75%, 1/30/30 | 25,000 | 26,250 |
| Nutrien, Ltd. sr. unsec. bonds 5.25%, 1/15/45 | | |
| (Canada) | 20,000 | 26,637 |
| Nutrien, Ltd. sr. unsec. bonds 4.125%, 3/15/35 | | |
| (Canada) | 25,000 | 28,544 |
| Nutrien, Ltd. sr. unsec. sub. bonds 4.20%, 4/1/29 | | |
| (Canada) | 24,000 | 27,603 |
| Packaging Corp. of America sr. unsec. | | |
| unsub. notes 4.50%, 11/1/23 | 45,000 | 48,625 |
| SCIH Salt Holdings, Inc. 144A sr. notes 4.875%, 5/1/28 | 5,000 | 4,999 |
| SCIH Salt Holdings, Inc. 144A sr. unsec. | | |
| notes 6.625%, 5/1/29 | 10,000 | 10,025 |
| Sherwin-Williams Co. (The) sr. unsec. | | |
| unsub. bonds 3.45%, 6/1/27 | 35,000 | 38,602 |
| Taseko Mines, Ltd. 144A company | | |
| guaranty sr. notes 7.00%, 2/15/26 (Canada) | 10,000 | 10,425 |
| TMS International Holding Corp. 144A sr. unsec. | | |
| notes 6.25%, 4/15/29 | 15,000 | 15,750 |
| Trinseo Materials Operating SCA/Trinseo Materials | | |
| Finance, Inc. 144A company guaranty sr. unsec. | | |
| notes 5.125%, 4/1/29 (Luxembourg) | 10,000 | 10,225 |
| Tronox, Inc. 144A company guaranty sr. unsec. | | |
| notes 4.625%, 3/15/29 | 10,000 | 10,100 |
| United States Steel Corp. sr. unsec. | | |
| notes 6.875%, 3/1/29 | 10,000 | 10,700 |
| Univar Solutions USA, Inc. 144A company | | |
| guaranty sr. unsec. notes 5.125%, 12/1/27 | 10,000 | 10,513 |
| Victors Merger Corp. 144A sr. unsec. | | |
| notes 6.375%, 5/15/29 | 5,000 | 5,038 |
| W.R. Grace & Co.-Conn. 144A company | | |
| guaranty sr. unsec. notes 5.625%, 10/1/24 | 10,000 | 11,054 |
| W.R. Grace & Co.-Conn. 144A company | | |
| guaranty sr. unsec. notes 4.875%, 6/15/27 | 10,000 | 10,603 |
| WestRock MWV, LLC company guaranty sr. unsec. | | |
| unsub. notes 8.20%, 1/15/30 | 30,000 | 42,442 |
| WestRock MWV, LLC company guaranty sr. unsec. | | |
| unsub. notes 7.95%, 2/15/31 | 10,000 | 14,268 |
| Weyerhaeuser Co. sr. unsec. unsub. notes | | |
| 7.375%, 3/15/32 R | 39,000 | 56,278 |
| | | 1,019,573 |
| Capital goods (0.8%) | | |
| Allison Transmission, Inc. 144A company | | |
| guaranty sr. unsec. bonds 3.75%, 1/30/31 | 5,000 | 4,914 |
| Allison Transmission, Inc. 144A company | | |
| guaranty sr. unsec. notes 4.75%, 10/1/27 | 20,000 | 20,775 |
| Amsted Industries, Inc. 144A company | | |
| guaranty sr. unsec. sub. notes 5.625%, 7/1/27 | 10,000 | 10,538 |
| | | |
| CORPORATE BONDS | | |
| AND NOTES (14.4%)* cont. | Principal amount | Value |
| | | |
| Capital goods cont. | | |
| Amsted Industries, Inc. 144A sr. unsec. | | |
| bonds 4.625%, 5/15/30 | $5,000 | $5,125 |
| Berry Global, Inc. company | | |
| guaranty unsub. notes 5.125%, 7/15/23 | 3,000 | 3,003 |
| Berry Global, Inc. 144A company | | |
| guaranty sr. notes 1.65%, 1/15/27 | 25,000 | 24,784 |
| Berry Global, Inc. 144A company | | |
| guaranty sr. unsub. notes 1.57%, 1/15/26 | 46,000 | 46,014 |
| Boeing Co. (The) sr. unsec. bonds 5.93%, 5/1/60 | 40,000 | 55,235 |
| Bombardier, Inc. 144A sr. unsec. notes 7.875%, | | |
| 4/15/27 (Canada) | 10,000 | 10,375 |
| Bombardier, Inc. 144A sr. unsec. notes 7.50%, | | |
| 3/15/25 (Canada) | 10,000 | 10,284 |
| Bombardier, Inc. 144A sr. unsec. notes 7.125%, | | |
| 6/15/26 (Canada) | 5,000 | 5,235 |
| Clarios Global LP 144A company | | |
| guaranty sr. notes 6.75%, 5/15/25 | 9,000 | 9,585 |
| Crown Cork & Seal Co., Inc. company | | |
| guaranty sr. unsec. bonds 7.375%, 12/15/26 | 10,000 | 12,250 |
| General Dynamics Corp. company | | |
| guaranty sr. unsec. unsub. notes 2.25%, 11/15/22 | 30,000 | 30,635 |
| GFL Environmental, Inc. 144A company | | |
| guaranty sr. notes 3.50%, 9/1/28 (Canada) | 5,000 | 4,963 |
| GFL Environmental, Inc. 144A company | | |
| guaranty sr. unsec. notes 4.75%, 6/15/29 (Canada) | 5,000 | 5,163 |
| GFL Environmental, Inc. 144A company | | |
| guaranty sr. unsec. notes 4.00%, 8/1/28 (Canada) | 5,000 | 4,939 |
| GFL Environmental, Inc. 144A sr. notes 5.125%, | | |
| 12/15/26 (Canada) | 10,000 | 10,579 |
| Granite US Holdings Corp. 144A company | | |
| guaranty sr. unsec. notes 11.00%, 10/1/27 | 10,000 | 11,150 |
| Great Lakes Dredge & Dock Corp. 144A company | | |
| guaranty sr. unsec. notes 5.25%, 6/1/29 | 10,000 | 10,301 |
| Honeywell International, Inc. sr. unsec. | | |
| bonds 3.812%, 11/21/47 | 55,000 | 65,768 |
| Husky III Holding, Ltd. 144A sr. unsec. | | |
| notes 13.00%, 2/15/25 (Canada) ‡‡ | 15,000 | 16,275 |
| Johnson Controls International PLC sr. unsec. | | |
| bonds 4.95%, 7/2/64 | 65,000 | 87,861 |
| Johnson Controls International PLC sr. unsec. | | |
| unsub. bonds 4.50%, 2/15/47 | 6,000 | 7,528 |
| L3Harris Technologies, Inc. sr. unsec. | | |
| bonds 1.80%, 1/15/31 | 5,000 | 4,848 |
| L3Harris Technologies, Inc. sr. unsec. | | |
| notes 3.85%, 12/15/26 | 24,000 | 26,918 |
| L3Harris Technologies, Inc. sr. unsec. | | |
| sub. notes 4.40%, 6/15/28 | 25,000 | 29,021 |
| Madison IAQ, LLC 144A sr. notes 4.125%, 6/30/28 | 5,000 | 5,050 |
| Madison IAQ, LLC 144A sr. unsec. notes | | |
| 5.875%, 6/30/29 | 10,000 | 10,175 |
| Northrop Grumman Corp. sr. unsec. | | |
| unsub. notes 3.25%, 1/15/28 | 60,000 | 65,535 |
| Oshkosh Corp. sr. unsec. sub. notes 4.60%, 5/15/28 | 9,000 | 10,343 |
| Oshkosh Corp. sr. unsec. unsub. notes 3.10%, 3/1/30 | 2,000 | 2,121 |
| Otis Worldwide Corp. sr. unsec. notes | | |
| 2.565%, 2/15/30 | 15,000 | 15,535 |
| Panther BF Aggregator 2 LP/Panther | | |
| Finance Co., Inc. 144A company | | |
| guaranty sr. notes 6.25%, 5/15/26 | 4,000 | 4,261 |
| |
| 8 | Putnam VT Global Asset Allocation Fund |
| | |
| CORPORATE BONDS | | |
| AND NOTES (14.4%)* cont. | Principal amount | Value |
| |
| Capital goods cont. | | |
| Panther BF Aggregator 2 LP/Panther | | |
| Finance Co., Inc. 144A company | | |
| guaranty sr. unsec. notes 8.50%, 5/15/27 | $10,000 | $10,902 |
| Park-Ohio Industries, Inc. company | | |
| guaranty sr. unsec. notes 6.625%, 4/15/27 | 15,000 | 15,267 |
| Raytheon Technologies Corp. sr. unsec. | | |
| bonds 4.875%, 10/15/40 (acquired 6/8/20, | | |
| cost $24,882) ∆∆ | 20,000 | 25,298 |
| Raytheon Technologies Corp. sr. unsec. | | |
| notes 2.50%, 12/15/22 | 50,000 | 51,274 |
| Raytheon Technologies Corp. sr. unsec. | | |
| unsub. notes 4.125%, 11/16/28 | 5,000 | 5,753 |
| RBS Global, Inc./Rexnord, LLC 144A sr. unsec. | | |
| notes 4.875%, 12/15/25 | 15,000 | 15,300 |
| Sensata Technologies BV 144A company | | |
| guaranty sr. unsec. notes 4.00%, 4/15/29 | 10,000 | 10,150 |
| Staples, Inc. 144A sr. notes 7.50%, 4/15/26 | 25,000 | 25,893 |
| Stevens Holding Co, Inc. 144A company | | |
| guaranty sr. unsec. notes 6.125%, 10/1/26 | 20,000 | 21,450 |
| Terex Corp. 144A company guaranty sr. unsec. | | |
| notes 5.00%, 5/15/29 | 5,000 | 5,213 |
| TransDigm, Inc. company guaranty sr. unsec. | | |
| sub. notes 6.375%, 6/15/26 | 10,000 | 10,360 |
| TransDigm, Inc. company guaranty sr. unsec. | | |
| sub. notes 5.50%, 11/15/27 | 15,000 | 15,638 |
| TransDigm, Inc. 144A company | | |
| guaranty sr. notes 6.25%, 3/15/26 | 50,000 | 52,750 |
| TransDigm, Inc. 144A company guaranty sr. unsec. | | |
| sub. notes 4.875%, 5/1/29 | 10,000 | 10,095 |
| TransDigm, Inc. 144A company guaranty sr. unsec. | | |
| sub. notes 4.625%, 1/15/29 | 10,000 | 10,004 |
| Waste Connections, Inc. sr. unsec. | | |
| sub. bonds 3.50%, 5/1/29 | 30,000 | 33,021 |
| Waste Pro USA, Inc. 144A sr. unsec. notes | | |
| 5.50%, 2/15/26 | 20,000 | 20,645 |
| WESCO Distribution, Inc. 144A company | | |
| guaranty sr. unsec. unsub. notes 7.25%, 6/15/28 | 10,000 | 11,139 |
| WESCO Distribution, Inc. 144A company | | |
| guaranty sr. unsec. unsub. notes 7.125%, 6/15/25 | 5,000 | 5,404 |
| | | 1,002,642 |
| Communication services (1.9%) | | |
| American Tower Corp. sr. unsec. bonds | | |
| 2.70%, 4/15/31 R | 74,000 | 76,317 |
| American Tower Corp. sr. unsec. sub. notes | | |
| 2.75%, 1/15/27 R | 100,000 | 105,789 |
| AT&T, Inc. sr. unsec. unsub. bonds 4.35%, 3/1/29 | 7,000 | 8,105 |
| AT&T, Inc. sr. unsec. unsub. bonds 2.25%, 2/1/32 | 33,000 | 32,388 |
| AT&T, Inc. sr. unsec. unsub. notes 4.75%, 5/15/46 | 77,000 | 93,518 |
| AT&T, Inc. 144A sr. unsec. bonds 3.55%, 9/15/55 | 61,000 | 61,204 |
| AT&T, Inc. 144A sr. unsec. unsub. bonds | | |
| 2.55%, 12/1/33 | 187,000 | 185,250 |
| CCO Holdings, LLC/CCO Holdings Capital Corp. | | |
| sr. unsec. bonds 4.50%, 5/1/32 | 10,000 | 10,363 |
| CCO Holdings, LLC/CCO Holdings Capital Corp. 144A | | |
| company guaranty sr. unsec. bonds 5.50%, 5/1/26 | 15,000 | 15,509 |
| CCO Holdings, LLC/CCO Holdings Capital Corp. 144A | | |
| sr. unsec. bonds 5.375%, 6/1/29 | 30,000 | 32,793 |
| CCO Holdings, LLC/CCO Holdings Capital Corp. 144A | | |
| sr. unsec. bonds 4.75%, 3/1/30 | 10,000 | 10,575 |
| CCO Holdings, LLC/CCO Holdings Capital Corp. 144A | | |
| sr. unsec. bonds 4.50%, 8/15/30 | 5,000 | 5,206 |
| | | |
| CORPORATE BONDS | | |
| AND NOTES (14.4%)* cont. | Principal amount | Value |
| | | |
| Communication services cont. | | |
| CCO Holdings, LLC/CCO Holdings Capital Corp. 144A | | |
| sr. unsec. notes 5.75%, 2/15/26 | $2,000 | $2,067 |
| Charter Communications Operating, LLC/Charter | | |
| Communications Operating Capital Corp. company | | |
| guaranty sr. notes 3.75%, 2/15/28 | 2,000 | 2,206 |
| Charter Communications Operating, LLC/Charter | | |
| Communications Operating Capital Corp. company | | |
| guaranty sr. sub. bonds 6.484%, 10/23/45 | 3,000 | 4,132 |
| Charter Communications Operating, LLC/Charter | | |
| Communications Operating Capital Corp. company | | |
| guaranty sr. sub. bonds 4.80%, 3/1/50 | 10,000 | 11,485 |
| Charter Communications Operating, LLC/Charter | | |
| Communications Operating Capital Corp. | | |
| sr. bonds 3.70%, 4/1/51 | 110,000 | 108,797 |
| Charter Communications Operating, LLC/Charter | | |
| Communications Operating Capital Corp. company | | |
| guaranty sr. sub. bonds 5.375%, 5/1/47 | 44,000 | 53,918 |
| Comcast Corp. company guaranty sr. unsec. | | |
| unsub. bonds 3.999%, 11/1/49 | 7,000 | 8,243 |
| Comcast Corp. company guaranty sr. unsec. | | |
| unsub. bonds 3.969%, 11/1/47 | 92,000 | 107,303 |
| Comcast Corp. company guaranty sr. unsec. | | |
| unsub. notes 6.50%, 11/15/35 | 17,000 | 24,726 |
| Comcast Corp. sr. unsec. bonds 3.45%, 2/1/50 | 19,000 | 20,503 |
| CommScope Technologies, LLC 144A company | | |
| guaranty sr. unsec. notes 6.00%, 6/15/25 | 3,000 | 3,064 |
| Cox Communications, Inc. 144A company | | |
| guaranty sr. unsec. bonds 2.95%, 10/1/50 | 32,000 | 30,313 |
| Cox Communications, Inc. 144A sr. unsec. | | |
| bonds 3.50%, 8/15/27 | 25,000 | 27,444 |
| Crown Castle International Corp. sr. unsec. | | |
| bonds 3.80%, 2/15/28 R | 25,000 | 27,777 |
| Crown Castle International Corp. sr. unsec. | | |
| bonds 3.65%, 9/1/27 R | 34,000 | 37,488 |
| Crown Castle International Corp. sr. unsec. | | |
| unsub. bonds 3.70%, 6/15/26 R | 35,000 | 38,473 |
| CSC Holdings, LLC sr. unsec. unsub. bonds | | |
| 5.25%, 6/1/24 | 63,000 | 68,273 |
| CSC Holdings, LLC sr. unsec. unsub. notes | | |
| 6.75%, 11/15/21 | 33,000 | 33,660 |
| Deutsche Telekom International Finance BV company | | |
| guaranty sr. unsec. unsub. bonds 8.75%, 6/15/30 | | |
| (Netherlands) | 73,000 | 109,386 |
| DISH DBS Corp. company guaranty sr. unsec. | | |
| notes 7.75%, 7/1/26 | 15,000 | 16,988 |
| DISH DBS Corp. company guaranty sr. unsec. | | |
| unsub. notes 5.875%, 11/15/24 | 10,000 | 10,738 |
| DISH DBS Corp. 144A company guaranty sr. unsec. | | |
| notes 5.125%, 6/1/29 | 10,000 | 9,874 |
| Equinix, Inc. sr. unsec. sub. notes 3.20%, 11/18/29 R | 25,000 | 26,815 |
| Equinix, Inc. sr. unsec. sub. notes 2.90%, 11/18/26 R | 80,000 | 85,575 |
| Frontier Communications Corp. 144A company | | |
| guaranty sr. notes 5.875%, 10/15/27 | 5,000 | 5,356 |
| Frontier Communications Corp. 144A notes | | |
| 6.75%, 5/1/29 | 15,000 | 15,949 |
| Intelsat Jackson Holdings SA 144A sr. unsec. | | |
| notes 9.75%, 7/15/25 (Luxembourg) (In default) † | 25,000 | 14,500 |
| Level 3 Financing, Inc. 144A company | | |
| guaranty sr. unsec. notes 4.625%, 9/15/27 | 30,000 | 31,137 |
| Level 3 Financing, Inc. 144A company | | |
| guaranty sr. unsec. notes 4.25%, 7/1/28 | 10,000 | 10,148 |
| |
| Putnam VT Global Asset Allocation Fund | 9 |
| | |
| CORPORATE BONDS | | |
| AND NOTES (14.4%)* cont. | Principal amount | Value |
| |
| Communication services cont. | | |
| Level 3 Financing, Inc. 144A company | | |
| guaranty sr. unsec. unsub. notes 3.625%, 1/15/29 | $5,000 | $4,825 |
| Quebecor Media, Inc. sr. unsec. | | |
| unsub. notes 5.75%, 1/15/23 (Canada) | 3,000 | 3,195 |
| Rogers Communications, Inc. company | | |
| guaranty sr. unsec. unsub. notes 4.50%, 3/15/43 | | |
| (Canada) | 85,000 | 97,843 |
| Sprint Capital Corp. company guaranty sr. unsec. | | |
| unsub. notes 6.875%, 11/15/28 | 45,000 | 57,713 |
| Sprint Corp. company guaranty sr. unsec. | | |
| notes 7.625%, 3/1/26 | 10,000 | 12,200 |
| Sprint Corp. company guaranty sr. unsec. | | |
| sub. notes 7.875%, 9/15/23 | 38,000 | 43,171 |
| Sprint Corp. company guaranty sr. unsec. | | |
| sub. notes 7.25%, 9/15/21 | 17,000 | 17,251 |
| T-Mobile USA, Inc. company | | |
| guaranty sr. bonds 2.25%, 11/15/31 | 60,000 | 59,188 |
| T-Mobile USA, Inc. company | | |
| guaranty sr. notes 3.875%, 4/15/30 | 7,000 | 7,825 |
| T-Mobile USA, Inc. company | | |
| guaranty sr. notes 3.75%, 4/15/27 | 73,000 | 80,665 |
| T-Mobile USA, Inc. company | | |
| guaranty sr. notes 2.55%, 2/15/31 | 16,000 | 16,179 |
| T-Mobile USA, Inc. company guaranty sr. unsec. | | |
| bonds 2.875%, 2/15/31 | 10,000 | 9,925 |
| T-Mobile USA, Inc. company guaranty sr. unsec. | | |
| notes 5.375%, 4/15/27 | 10,000 | 10,647 |
| T-Mobile USA, Inc. company guaranty sr. unsec. | | |
| notes 4.00%, 4/15/22 | 5,000 | 5,089 |
| T-Mobile USA, Inc. company guaranty sr. unsec. | | |
| notes 2.625%, 2/15/29 | 5,000 | 4,938 |
| T-Mobile USA, Inc. company guaranty sr. unsec. | | |
| unsub. bonds 4.75%, 2/1/28 | 25,000 | 26,781 |
| TCI Communications, Inc. sr. unsec. | | |
| unsub. notes 7.125%, 2/15/28 | 65,000 | 86,952 |
| Verizon Communications, Inc. sr. unsec. | | |
| bonds 3.70%, 3/22/61 | 70,000 | 74,974 |
| Verizon Communications, Inc. sr. unsec. | | |
| notes 2.55%, 3/21/31 | 35,000 | 35,775 |
| Verizon Communications, Inc. sr. unsec. | | |
| unsub. bonds 5.25%, 3/16/37 | 30,000 | 39,353 |
| Verizon Communications, Inc. sr. unsec. | | |
| unsub. notes 4.40%, 11/1/34 | 65,000 | 77,182 |
| Verizon Communications, Inc. sr. unsec. | | |
| unsub. notes 4.329%, 9/21/28 | 90,000 | 104,719 |
| Videotron, Ltd. company guaranty sr. unsec. | | |
| unsub. notes 5.00%, 7/15/22 (Canada) | 20,000 | 20,800 |
| Videotron, Ltd./Videotron Ltee. 144A sr. unsec. | | |
| notes 5.125%, 4/15/27 (Canada) | 21,000 | 21,945 |
| Videotron, Ltd./Videotron Ltee. 144A sr. unsec. | | |
| notes 3.625%, 6/15/29 (Canada) | 5,000 | 5,099 |
| | | 2,507,589 |
| Conglomerates (—%) | | |
| General Electric Co. jr. unsec. sub. FRN (BBA LIBOR | | |
| USD 3 Month + 3.33%), 3.449%, perpetual maturity | 15,000 | 14,700 |
| | | 14,700 |
| Consumer cyclicals (1.8%) | | |
| Alimentation Couche-Tard, Inc. 144A company | | |
| guaranty sr. unsec. notes 3.55%, 7/26/27 (Canada) | 25,000 | 27,438 |
| Alimentation Couche-Tard, Inc. 144A sr. unsec. | | |
| notes 2.95%, 1/25/30 (Canada) | 14,000 | 14,526 |
| Amazon.com, Inc. sr. unsec. notes 3.15%, 8/22/27 | 90,000 | 99,440 |
| |
| CORPORATE BONDS | | |
| AND NOTES (14.4%)* cont. | Principal amount | Value |
| |
| Consumer cyclicals cont. | | |
| Amazon.com, Inc. sr. unsec. unsub. notes | | |
| 3.30%, 12/5/21 | $75,000 | $75,595 |
| AMC Entertainment Holdings, Inc. 144A company | | |
| guaranty sr. notes 10.50%, 4/15/25 | 5,000 | 5,425 |
| American Builders & Contractors Supply Co., Inc. | | |
| 144A sr. notes 4.00%, 1/15/28 | 5,000 | 5,124 |
| American Builders & Contractors Supply Co., Inc. | | |
| 144A sr. unsec. notes 3.875%, 11/15/29 | 5,000 | 4,950 |
| BCPE Ulysses Intermediate, Inc. 144A sr. unsec. | | |
| notes 7.75%, 4/1/27 ‡‡ | 20,000 | 20,500 |
| Beasley Mezzanine Holdings LLC 144A company | | |
| guaranty sr. notes 8.625%, 2/1/26 | 15,000 | 15,136 |
| BMW US Capital, LLC 144A company | | |
| guaranty sr. unsec. notes 3.95%, 8/14/28 | 35,000 | 39,989 |
| BMW US Capital, LLC 144A company | | |
| guaranty sr. unsec. notes 3.40%, 8/13/21 | 10,000 | 10,036 |
| Boyd Gaming Corp. company guaranty sr. unsec. | | |
| notes 4.75%, 12/1/27 | 5,000 | 5,175 |
| Boyd Gaming Corp. 144A sr. unsec. bonds | | |
| 4.75%, 6/15/31 | 15,000 | 15,563 |
| Boyd Gaming Corp. 144A sr. unsec. notes | | |
| 8.625%, 6/1/25 | 5,000 | 5,512 |
| Brookfield Residential | | |
| Properties, Inc./Brookfield Residential US Corp. | | |
| 144A company guaranty sr. unsec. notes 6.25%, | | |
| 9/15/27 (Canada) | 10,000 | 10,563 |
| Brookfield Residential Properties, Inc./Brookfield | | |
| Residential US Corp. 144A sr. unsec. notes 5.00%, | | |
| 6/15/29 (Canada) | 10,000 | 10,075 |
| Carriage Services, Inc. 144A company | | |
| guaranty sr. unsec. notes 4.25%, 5/15/29 | 5,000 | 4,992 |
| Cengage Learning, Inc. 144A sr. unsec. | | |
| unsub. notes 9.50%, 6/15/24 | 10,000 | 10,238 |
| Cinemark USA, Inc. 144A company | | |
| guaranty sr. unsec. notes 5.25%, 7/15/28 | 10,000 | 10,250 |
| Clear Channel Outdoor Holdings, Inc. 144A company | | |
| guaranty sr. notes 5.125%, 8/15/27 | 10,000 | 10,252 |
| Clear Channel Outdoor Holdings, Inc. 144A company | | |
| guaranty sr. unsec. sub. notes 7.75%, 4/15/28 | 10,000 | 10,475 |
| Clear Channel Outdoor Holdings, Inc. 144A | | |
| sr. unsec. notes 7.50%, 6/1/29 | 10,000 | 10,353 |
| Constellation Merger Sub, Inc. 144A sr. unsec. | | |
| notes 8.50%, 9/15/25 | 15,000 | 14,762 |
| CRC Escrow Issuer, LLC/CRC Finco, Inc. 144A | | |
| company guaranty sr. unsec. notes 5.25%, 10/15/25 | 20,000 | 20,200 |
| Diamond Sports Group, LLC/Diamond Sports | | |
| Finance Co. 144A sr. notes 5.375%, 8/15/26 | 15,000 | 9,713 |
| Diamond Sports Group, LLC/Diamond Sports | | |
| Finance Co. 144A sr. unsec. notes 6.625%, 8/15/27 | 10,000 | 4,911 |
| Discovery Communications, LLC company | | |
| guaranty sr. unsec. unsub. notes 3.625%, 5/15/30 | 10,000 | 10,910 |
| Dollar General Corp. sr. unsec. sub. notes | | |
| 3.25%, 4/15/23 | 65,000 | 67,829 |
| Ecolab, Inc. sr. unsec. unsub. notes 3.25%, 12/1/27 | 70,000 | 77,544 |
| Entercom Media Corp. 144A company | | |
| guaranty notes 6.75%, 3/31/29 | 10,000 | 10,376 |
| Entercom Media Corp. 144A company | | |
| guaranty notes 6.50%, 5/1/27 | 10,000 | 10,400 |
| Ford Motor Co. sr. unsec. unsub. notes 9.00%, 4/22/25 | 5,000 | 6,164 |
| Full House Resorts, Inc. 144A company | | |
| guaranty sr. notes 8.25%, 2/15/28 | 10,000 | 10,900 |
| |
| 10 | Putnam VT Global Asset Allocation Fund |
| | |
| CORPORATE BONDS | | |
| AND NOTES (14.4%)* cont. | Principal amount | Value |
| |
| Consumer cyclicals cont. | | |
| Garda World Security Corp. 144A sr. unsec. | | |
| notes 6.00%, 6/1/29 (Canada) | $10,000 | $9,925 |
| Gartner, Inc. 144A company guaranty sr. unsec. | | |
| bonds 3.75%, 10/1/30 | 10,000 | 10,200 |
| Gartner, Inc. 144A company guaranty sr. unsec. | | |
| notes 3.625%, 6/15/29 | 5,000 | 5,075 |
| General Motors Co. sr. unsec. bonds 5.95%, 4/1/49 | 4,000 | 5,446 |
| General Motors Financial Co., Inc. company | | |
| guaranty sr. unsec. notes 4.00%, 10/6/26 | 79,000 | 87,217 |
| General Motors Financial Co., Inc. company | | |
| guaranty sr. unsec. unsub. notes 4.30%, 7/13/25 | 22,000 | 24,313 |
| General Motors Financial Co., Inc. company | | |
| guaranty sr. unsec. unsub. notes 4.00%, 1/15/25 | 10,000 | 10,894 |
| Global Payments, Inc. sr. unsec. notes 2.90%, 5/15/30 | 21,000 | 21,879 |
| Global Payments, Inc. sr. unsec. | | |
| unsub. notes 4.00%, 6/1/23 | 55,000 | 58,415 |
| GW B-CR Security Corp. 144A sr. unsec. | | |
| notes 9.50%, 11/1/27 (Canada) | 13,000 | 14,398 |
| Hanesbrands, Inc. 144A company | | |
| guaranty sr. unsec. notes 5.375%, 5/15/25 | 5,000 | 5,294 |
| Hanesbrands, Inc. 144A company | | |
| guaranty sr. unsec. unsub. notes 4.625%, 5/15/24 | 10,000 | 10,600 |
| Hilton Worldwide Finance, LLC/Hilton Worldwide | | |
| Finance Corp. company guaranty sr. unsec. | | |
| notes 4.875%, 4/1/27 | 10,000 | 10,425 |
| Hyatt Hotels Corp. sr. unsec. unsub. notes | | |
| 4.85%, 3/15/26 | 47,000 | 52,490 |
| iHeartCommunications, Inc. company | | |
| guaranty sr. notes 6.375%, 5/1/26 | 41,208 | 43,836 |
| iHeartCommunications, Inc. company | | |
| guaranty sr. unsec. notes 8.375%, 5/1/27 | 17,189 | 18,414 |
| IHS Markit, Ltd. sr. unsec. sub. bonds 4.75%, | | |
| 8/1/28 (United Kingdom) | 5,000 | 5,894 |
| IHS Markit, Ltd. 144A company | | |
| guaranty notes 4.75%, 2/15/25 (United Kingdom) | 70,000 | 78,313 |
| IHS Markit, Ltd. 144A company guaranty sr. unsec. | | |
| notes 4.00%, 3/1/26 (United Kingdom) | 5,000 | 5,556 |
| Interpublic Group of Cos., Inc. (The) sr. unsec. | | |
| sub. bonds 4.65%, 10/1/28 | 86,000 | 101,008 |
| Iron Mountain, Inc. 144A company | | |
| guaranty sr. unsec. bonds 5.25%, 3/15/28 R | 5,000 | 5,233 |
| Iron Mountain, Inc. 144A company | | |
| guaranty sr. unsec. notes 4.875%, 9/15/27 R | 20,000 | 20,675 |
| JELD-WEN, Inc. 144A company guaranty sr. unsec. | | |
| notes 4.875%, 12/15/27 | 10,000 | 10,392 |
| JELD-WEN, Inc. 144A sr. notes 6.25%, 5/15/25 | 5,000 | 5,325 |
| L Brands, Inc. company guaranty sr. unsec. | | |
| bonds 6.75%, perpetual maturity | 5,000 | 6,263 |
| L Brands, Inc. company guaranty sr. unsec. | | |
| notes 7.50%, perpetual maturity | 15,000 | 17,663 |
| L Brands, Inc. 144A company guaranty sr. unsec. | | |
| unsub. bonds 6.625%, 10/1/30 | 5,000 | 5,788 |
| LBM Acquisition, LLC 144A company | | |
| guaranty sr. unsec. notes 6.25%, 1/15/29 | 10,000 | 10,077 |
| Lennar Corp. company guaranty sr. unsec. | | |
| unsub. notes 4.75%, 11/29/27 | 38,000 | 43,923 |
| Levi Strauss & Co. 144A sr. unsec. | | |
| sub. bonds 3.50%, 3/1/31 | 10,000 | 9,942 |
| Lions Gate Capital Holdings, LLC 144A company | | |
| guaranty sr. unsec. notes 5.50%, 4/15/29 | 15,000 | 15,769 |
| | | |
| CORPORATE BONDS | | |
| AND NOTES (14.4%)* cont. | Principal amount | Value |
| | | |
| Consumer cyclicals cont. | | |
| Live Nation Entertainment, Inc. 144A company | | |
| guaranty sr. unsec. notes 4.875%, 11/1/24 | $5,000 | $5,080 |
| Live Nation Entertainment, Inc. 144A company | | |
| guaranty sr. unsec. sub. notes 5.625%, 3/15/26 | 10,000 | 10,414 |
| Live Nation Entertainment, Inc. 144A | | |
| sr. notes 6.50%, 5/15/27 | 5,000 | 5,549 |
| MajorDrive Holdings IV, LLC 144A sr. unsec. | | |
| notes 6.375%, 6/1/29 | 30,000 | 29,925 |
| Masonite International Corp. 144A company | | |
| guaranty sr. unsec. notes 5.375%, 2/1/28 | 5,000 | 5,298 |
| Mattamy Group Corp. 144A sr. unsec. notes 5.25%, | | |
| 12/15/27 (Canada) | 15,000 | 15,675 |
| Mattamy Group Corp. 144A sr. unsec. notes 4.625%, | | |
| 3/1/30 (Canada) | 10,000 | 10,215 |
| Mattel, Inc. 144A company guaranty sr. unsec. | | |
| notes 3.75%, 4/1/29 | 10,000 | 10,400 |
| Meredith Corp. company guaranty sr. unsec. | | |
| notes 6.875%, 2/1/26 | 20,000 | 20,800 |
| Meredith Corp. 144A company guaranty sr. unsec. | | |
| notes 6.50%, 7/1/25 | 5,000 | 5,394 |
| Moody’s Corp. sr. unsec. bonds 2.55%, 8/18/60 | 20,000 | 17,723 |
| Navistar International Corp. 144A sr. unsec. | | |
| notes 6.625%, 11/1/25 | 20,000 | 20,663 |
| NESCO Holdings II, Inc. 144A company | | |
| guaranty notes 5.50%, 4/15/29 | 15,000 | 15,656 |
| News Corp. 144A sr. unsec. notes 3.875%, 5/15/29 | 10,000 | 10,100 |
| Nexstar Broadcasting, Inc. 144A sr. unsec. | | |
| notes 4.75%, 11/1/28 | 5,000 | 5,138 |
| Nexstar Escrow, Inc. 144A sr. unsec. | | |
| notes 5.625%, 7/15/27 | 5,000 | 5,300 |
| Nielsen Co. Luxembourg SARL (The) 144A company | | |
| guaranty sr. unsec. notes 5.00%, 2/1/25 (Luxembourg) | 10,000 | 10,288 |
| Nielsen Finance, LLC/Nielsen Finance Co. 144A | | |
| company guaranty sr. unsec. notes 5.625%, 10/1/28 | 10,000 | 10,561 |
| Nielsen Finance, LLC/Nielsen Finance Co. 144A | | |
| company guaranty sr. unsec. notes 4.50%, 7/15/29 | 5,000 | 5,014 |
| Nielsen Finance, LLC/Nielsen Finance Co. 144A | | |
| sr. unsec. bonds 4.75%, 7/15/31 | 5,000 | 5,013 |
| Omnicom Group, Inc. company guaranty sr. unsec. | | |
| unsub. notes 3.60%, 4/15/26 | 65,000 | 71,822 |
| Penn National Gaming, Inc. 144A sr. unsec. | | |
| notes 5.625%, 1/15/27 | 10,000 | 10,388 |
| PM General Purchaser, LLC 144A sr. notes | | |
| 9.50%, 10/1/28 | 15,000 | 15,801 |
| Prime Security Services Borrower, LLC/Prime | | |
| Finance, Inc. 144A company | | |
| guaranty sr. notes 3.375%, 8/31/27 | 5,000 | 4,850 |
| Prime Security Services Borrower, LLC/Prime | | |
| Finance, Inc. 144A notes 6.25%, 1/15/28 | 10,000 | 10,638 |
| PulteGroup, Inc. company guaranty sr. unsec. | | |
| unsub. notes 7.875%, 6/15/32 | 15,000 | 21,600 |
| PulteGroup, Inc. company guaranty sr. unsec. | | |
| unsub. notes 5.50%, 3/1/26 | 23,000 | 26,853 |
| Raptor Acquisition Corp./Raptor Co-Issuer, LLC | | |
| 144A sr. notes 4.875%, 11/1/26 | 5,000 | 5,070 |
| Realogy Group, LLC/Realogy Co-Issuer Corp. 144A | | |
| company guaranty sr. unsec. notes 5.75%, 1/15/29 | 10,000 | 10,454 |
| S&P Global, Inc. company guaranty sr. unsec. | | |
| bonds 2.50%, 12/1/29 | 30,000 | 31,442 |
| S&P Global, Inc. company guaranty sr. unsec. | | |
| notes 1.25%, 8/15/30 | 9,000 | 8,519 |
| |
| Putnam VT Global Asset Allocation Fund | 11 |
| | |
| CORPORATE BONDS | | |
| AND NOTES (14.4%)* cont. | Principal amount | Value |
| |
| Consumer cyclicals cont. | | |
| Sabre GLBL, Inc. 144A company | | |
| guaranty sr. notes 9.25%, 4/15/25 | $15,000 | $17,832 |
| Scientific Games International, Inc. 144A company | | |
| guaranty sr. unsec. notes 7.25%, 11/15/29 | 15,000 | 16,920 |
| Scientific Games International, Inc. 144A | | |
| sr. unsec. notes 7.00%, 5/15/28 | 5,000 | 5,461 |
| Scotts Miracle-Gro, Co. (The) company | | |
| guaranty sr. unsec. notes 4.50%, 10/15/29 | 15,000 | 15,566 |
| Scripps Escrow II, Inc. 144A sr. notes 3.875%, 1/15/29 | 5,000 | 4,960 |
| Scripps Escrow II, Inc. 144A sr. unsec. | | |
| bonds 5.375%, 1/15/31 | 5,000 | 4,984 |
| Shift4 Payments, LLC/Shift4 Payments Finance | | |
| Sub, Inc. 144A company guaranty sr. unsec. | | |
| notes 4.625%, 11/1/26 | 10,000 | 10,438 |
| Sinclair Television Group, Inc. 144A company | | |
| guaranty sr. unsec. bonds 5.50%, 3/1/30 | 10,000 | 10,196 |
| Sinclair Television Group, Inc. 144A | | |
| sr. bonds 4.125%, 12/1/30 | 5,000 | 4,913 |
| Sirius XM Radio, Inc. 144A company | | |
| guaranty sr. unsec. notes 4.00%, 7/15/28 | 20,000 | 20,600 |
| Sirius XM Radio, Inc. 144A sr. unsec. | | |
| bonds 5.50%, 7/1/29 | 5,000 | 5,449 |
| Six Flags Entertainment Corp. 144A company | | |
| guaranty sr. unsec. bonds 5.50%, 4/15/27 | 10,000 | 10,350 |
| Six Flags Theme Parks, Inc. 144A company | | |
| guaranty sr. notes 7.00%, 7/1/25 | 10,000 | 10,777 |
| Spanish Broadcasting System, Inc. 144A | | |
| sr. notes 9.75%, 3/1/26 | 10,000 | 10,100 |
| Spectrum Brands, Inc. 144A company | | |
| guaranty sr. unsec. bonds 5.00%, 10/1/29 | 5,000 | 5,300 |
| Spectrum Brands, Inc. 144A company | | |
| guaranty sr. unsec. bonds 3.875%, 3/15/31 | 10,000 | 9,826 |
| Square, Inc. 144A sr. unsec. bonds 3.50%, 6/1/31 | 35,000 | 35,307 |
| Standard Industries, Inc. 144A sr. unsec. | | |
| bonds 3.375%, 1/15/31 | 5,000 | 4,786 |
| Standard Industries, Inc. 144A sr. unsec. | | |
| notes 5.00%, 2/15/27 | 10,000 | 10,356 |
| Station Casinos, LLC 144A sr. unsec. notes | | |
| 4.50%, 2/15/28 | 10,000 | 10,170 |
| SugarHouse HSP Gaming Prop. Mezz LP/SugarHouse | | |
| HSP Gaming Finance Corp. 144A company | | |
| guaranty sr. unsub. notes 5.875%, 5/15/25 | 10,000 | 9,875 |
| Taylor Morrison Communities, Inc. 144A sr. unsec. | | |
| notes 5.75%, 1/15/28 | 5,000 | 5,645 |
| Terrier Media Buyer, Inc. 144A company | | |
| guaranty sr. unsec. notes 8.875%, 12/15/27 | 20,000 | 21,625 |
| Townsquare Media, Inc. 144A sr. notes 6.875%, 2/1/26 | 15,000 | 16,050 |
| TRI Pointe Group, Inc./TRI Pointe Homes, Inc. | | |
| company guaranty sr. unsec. unsub. notes | | |
| 5.875%, 6/15/24 | 5,000 | 5,563 |
| TWDC Enterprises 18 Corp. sr. unsec. notes | | |
| 2.75%, 8/16/21 | 30,000 | 30,089 |
| Univision Communications, Inc. 144A company | | |
| guaranty sr. notes 9.50%, 5/1/25 | 5,000 | 5,513 |
| Univision Communications, Inc. 144A company | | |
| guaranty sr. notes 6.625%, 6/1/27 | 10,000 | 10,836 |
| Univision Communications, Inc. 144A company | | |
| guaranty sr. notes 4.50%, 5/1/29 | 5,000 | 5,038 |
| Urban One, Inc. 144A company | | |
| guaranty sr. notes 7.375%, 2/1/28 | 10,000 | 10,800 |
| |
| CORPORATE BONDS | | |
| AND NOTES (14.4%)* cont. | Principal amount | Value |
| |
| Consumer cyclicals cont. | | |
| Valvoline, Inc. 144A company guaranty sr. unsec. | | |
| unsub. notes 4.25%, 2/15/30 | $5,000 | $5,162 |
| ViacomCBS, Inc. company guaranty sr. unsec. | | |
| bonds 4.20%, 6/1/29 | 38,000 | 43,833 |
| ViacomCBS, Inc. company guaranty sr. unsec. | | |
| unsub. bonds 2.90%, 1/15/27 | 22,000 | 23,358 |
| ViacomCBS, Inc. company guaranty sr. unsec. | | |
| unsub. notes 4.00%, 1/15/26 | 12,000 | 13,344 |
| Victoria’s Secret & Co. 144A sr. unsec. | | |
| notes 4.625%, 7/15/29 | 5,000 | 5,000 |
| Walt Disney Co. (The) company guaranty sr. unsec. | | |
| bonds 7.75%, 12/1/45 | 40,000 | 70,416 |
| Werner FinCo LP/Werner FinCo, Inc. 144A company | | |
| guaranty sr. unsec. notes 8.75%, 7/15/25 | 20,000 | 20,850 |
| White Cap Buyer, LLC 144A sr. unsec. | | |
| notes 6.875%, 10/15/28 | 10,000 | 10,703 |
| Wolverine World Wide, Inc. 144A company | | |
| guaranty sr. unsec. bonds 5.00%, 9/1/26 | 10,000 | 10,250 |
| Wolverine World Wide, Inc. 144A company | | |
| guaranty sr. unsec. notes 6.375%, 5/15/25 | 5,000 | 5,319 |
| Wynn Las Vegas, LLC/Wynn Las Vegas Capital Corp. | | |
| 144A company guaranty sr. unsec. | | |
| sub. notes 5.25%, 5/15/27 | 15,000 | 16,112 |
| Wynn Resorts Finance, LLC/Wynn Resorts | | |
| Capital Corp. 144A sr. unsec. bonds 5.125%, 10/1/29 | 15,000 | 15,844 |
| Wynn Resorts Finance, LLC/Wynn Resorts | | |
| Capital Corp. 144A sr. unsec. notes 7.75%, 4/15/25 | 5,000 | 5,388 |
| | | 2,428,505 |
| Consumer staples (0.7%) | | |
| 1011778 BC ULC/New Red Finance, Inc. 144A | | |
| bonds 4.00%, 10/15/30 (Canada) | 5,000 | 4,838 |
| 1011778 BC ULC/New Red Finance, Inc. 144A company | | |
| guaranty notes 4.375%, 1/15/28 (Canada) | 5,000 | 5,069 |
| 1011778 BC ULC/New Red Finance, Inc. 144A company | | |
| guaranty sr. notes 3.875%, 1/15/28 (Canada) | 10,000 | 10,113 |
| Albertsons Cos., Inc./Safeway, Inc./New | | |
| Albertsons LP/Albertsons, LLC 144A company | | |
| guaranty sr. unsec. notes 4.875%, 2/15/30 | 5,000 | 5,333 |
| Albertsons Cos., Inc./Safeway, Inc./New | | |
| Albertsons LP/Albertsons, LLC 144A company | | |
| guaranty sr. unsec. notes 4.625%, 1/15/27 | 35,000 | 36,608 |
| Albertsons Cos., LLC/Safeway, Inc./New Albertsons | | |
| LP/Albertsons, LLC 144A company | | |
| guaranty sr. unsec. notes 7.50%, 3/15/26 | 10,000 | 10,975 |
| Anheuser-Busch InBev Worldwide, Inc. company | | |
| guaranty sr. unsec. unsub. bonds 5.55%, 1/23/49 | 13,000 | 17,873 |
| Anheuser-Busch InBev Worldwide, Inc. company | | |
| guaranty sr. unsec. unsub. bonds 4.60%, 4/15/48 | 48,000 | 58,600 |
| Anheuser-Busch InBev Worldwide, Inc. company | | |
| guaranty sr. unsec. unsub. notes 4.75%, 1/23/29 | 15,000 | 17,869 |
| Ascend Learning, LLC 144A sr. unsec. | | |
| notes 6.875%, 8/1/25 | 15,000 | 15,209 |
| Ascend Learning, LLC 144A sr. unsec. | | |
| notes 6.875%, 8/1/25 | 5,000 | 5,094 |
| Brand Energy & Infrastructure Services, Inc. 144A | | |
| sr. unsec. notes 8.50%, 7/15/25 | 5,000 | 5,084 |
| CVS Pass-Through Trust sr. notes 6.036%, 12/10/28 | 2,451 | 2,830 |
| ERAC USA Finance, LLC 144A company | | |
| guaranty sr. unsec. notes 7.00%, 10/15/37 | 50,000 | 74,593 |
| ERAC USA Finance, LLC 144A company | | |
| guaranty sr. unsec. notes 5.625%, 3/15/42 | 60,000 | 81,798 |
| |
| 12 | Putnam VT Global Asset Allocation Fund |
| | |
| CORPORATE BONDS | | |
| AND NOTES (14.4%)* cont. | Principal amount | Value |
| | | |
| Consumer staples cont. | | |
| Fresh Market, Inc. (The) 144A company | | |
| guaranty sr. notes 9.75%, 5/1/23 | $20,000 | $20,507 |
| Golden Nugget, Inc. 144A company | | |
| guaranty sr. unsec. sub. notes 8.75%, 10/1/25 | 10,000 | 10,551 |
| Golden Nugget, Inc. 144A sr. unsec. notes | | |
| 6.75%, 10/15/24 | 20,000 | 20,204 |
| IRB Holding Corp. 144A company | | |
| guaranty sr. notes 7.00%, 6/15/25 | 5,000 | 5,400 |
| Keurig Dr Pepper, Inc. company | | |
| guaranty sr. unsec. notes 2.25%, 3/15/31 | 60,000 | 60,487 |
| Keurig Dr Pepper, Inc. company | | |
| guaranty sr. unsec. unsub. notes 4.597%, 5/25/28 | 31,000 | 36,397 |
| KFC Holding Co./Pizza Hut Holdings, LLC/Taco Bell | | |
| of America, LLC 144A company guaranty sr. unsec. | | |
| notes 4.75%, 6/1/27 | 10,000 | 10,463 |
| Kraft Heinz Foods Co. company guaranty sr. unsec. | | |
| bonds 4.375%, 6/1/46 | 5,000 | 5,666 |
| Kraft Heinz Foods Co. company guaranty sr. unsec. | | |
| notes 5.00%, 7/15/35 | 15,000 | 18,399 |
| Kraft Heinz Foods Co. company guaranty sr. unsec. | | |
| notes 3.00%, 6/1/26 | 28,000 | 29,818 |
| Kraft Heinz Foods Co. company guaranty sr. unsec. | | |
| sub. notes 3.875%, 5/15/27 | 3,000 | 3,296 |
| Lamb Weston Holdings, Inc. 144A company | | |
| guaranty sr. unsec. notes 4.875%, 5/15/28 | 10,000 | 11,063 |
| Lamb Weston Holdings, Inc. 144A company | | |
| guaranty sr. unsec. unsub. notes 4.875%, 11/1/26 | 31,000 | 32,046 |
| Lamb Weston Holdings, Inc. 144A company | | |
| guaranty sr. unsec. unsub. notes 4.625%, 11/1/24 | 5,000 | 5,174 |
| Match Group Holdings II, LLC 144A sr. unsec. bonds | | |
| 5.00%, 12/15/27 | 13,000 | 13,666 |
| Match Group Holdings II, LLC 144A sr. unsec. | | |
| unsub. notes 4.625%, 6/1/28 | 25,000 | 25,996 |
| Nestle Holdings, Inc. 144A company | | |
| guaranty sr. unsec. notes 0.375%, 1/15/24 | 150,000 | 149,271 |
| Netflix, Inc. sr. unsec. notes 6.375%, 5/15/29 | 5,000 | 6,386 |
| Netflix, Inc. sr. unsec. notes 4.875%, 4/15/28 | 10,000 | 11,625 |
| Netflix, Inc. sr. unsec. unsub. notes 5.875%, 11/15/28 | 20,000 | 24,549 |
| Netflix, Inc. sr. unsec. unsub. notes 4.375%, 11/15/26 | 15,000 | 17,058 |
| Netflix, Inc. 144A sr. unsec. bonds 5.375%, 11/15/29 | 25,000 | 30,365 |
| Netflix, Inc. 144A sr. unsec. bonds 4.875%, 6/15/30 | 5,000 | 5,947 |
| Newell Brands, Inc. sr. unsec. notes 4.875%, 6/1/25 | 5,000 | 5,531 |
| Newell Brands, Inc. sr. unsec. | | |
| unsub. notes 4.70%, 4/1/26 | 10,000 | 11,151 |
| Rite Aid Corp. 144A company | | |
| guaranty sr. notes 8.00%, 11/15/26 | 8,000 | 8,120 |
| Rite Aid Corp. 144A company guaranty sr. unsec. | | |
| sub. notes 7.50%, 7/1/25 | 5,000 | 5,063 |
| TripAdvisor, Inc. 144A company | | |
| guaranty sr. unsec. notes 7.00%, 7/15/25 | 10,000 | 10,760 |
| VM Consolidated, Inc. 144A company | | |
| guaranty sr. unsec. notes 5.50%, 4/15/29 | 10,000 | 10,175 |
| Yum! Brands, Inc. sr. unsec. sub. bonds | | |
| 3.625%, 3/15/31 | 5,000 | 4,975 |
| Yum! Brands, Inc. 144A sr. unsec. bonds | | |
| 4.75%, 1/15/30 | 5,000 | 5,413 |
| | | 967,408 |
| |
| CORPORATE BONDS | | |
| AND NOTES (14.4%)* cont. | Principal amount | Value |
| | | |
| Energy (1.1%) | | |
| Antero Midstream Partners LP/Antero Midstream | | |
| Finance Corp. 144A company guaranty sr. unsec. | | |
| notes 7.875%, 5/15/26 | $5,000 | $5,588 |
| Antero Resources Corp. 144A company | | |
| guaranty sr. unsec. notes 8.375%, 7/15/26 | 5,000 | 5,688 |
| Antero Resources Corp. 144A company | | |
| guaranty sr. unsec. notes 7.625%, 2/1/29 | 5,000 | 5,550 |
| Antero Resources Corp. 144A sr. unsec. | | |
| notes 5.375%, 3/1/30 | 5,000 | 5,103 |
| Apache Corp. sr. unsec. unsub. notes 5.10%, 9/1/40 | 10,000 | 10,475 |
| Apache Corp. sr. unsec. unsub. notes | | |
| 4.875%, 11/15/27 | 5,000 | 5,415 |
| Apache Corp. sr. unsec. unsub. notes | | |
| 4.375%, 10/15/28 | 10,000 | 10,645 |
| Baytex Energy Corp. 144A company | | |
| guaranty sr. unsec. sub. notes 5.625%, 6/1/24 (Canada) | 5,000 | 5,038 |
| BP Capital Markets America, Inc. company | | |
| guaranty sr. unsec. notes 3.119%, 5/4/26 | 70,000 | 75,913 |
| BP Capital Markets PLC company | | |
| guaranty sr. unsec. unsub. notes 3.279%, 9/19/27 | | |
| (United Kingdom) | 35,000 | 38,330 |
| Callon Petroleum Co. company guaranty sr. unsec. | | |
| notes 6.125%, 10/1/24 | 15,000 | 14,787 |
| Callon Petroleum Co. 144A company | | |
| guaranty notes 9.00%, 4/1/25 | 5,000 | 5,450 |
| Callon Petroleum Co. 144A company | | |
| guaranty sr. unsec. notes 8.00%, 8/1/28 | 5,000 | 5,056 |
| Cenovus Energy, Inc. sr. unsec. bonds 6.75%, | | |
| 11/15/39 (Canada) | 10,000 | 13,550 |
| Centennial Resource Production, LLC 144A company | | |
| guaranty sr. unsec. notes 6.875%, 4/1/27 | 15,000 | 15,339 |
| Centennial Resource Production, LLC 144A company | | |
| guaranty sr. unsec. notes 5.375%, 1/15/26 | 10,000 | 9,800 |
| ChampionX corp. company guaranty sr. unsec. | | |
| notes 6.375%, 5/1/26 | 12,000 | 12,569 |
| Cheniere Corpus Christi Holdings, LLC company | | |
| guaranty sr. notes 5.125%, 6/30/27 | 25,000 | 29,070 |
| Cheniere Energy Partners LP 144A company | | |
| guaranty sr. unsec. bonds 4.00%, 3/1/31 | 10,000 | 10,450 |
| Comstock Resources, Inc. 144A company | | |
| guaranty sr. unsec. notes 7.50%, 5/15/25 | 4,000 | 4,150 |
| Comstock Resources, Inc. 144A company | | |
| guaranty sr. unsec. notes 5.875%, 1/15/30 | 10,000 | 10,200 |
| Comstock Resources, Inc. 144A sr. unsec. | | |
| notes 6.75%, 3/1/29 | 10,000 | 10,652 |
| ConocoPhillips 144A company guaranty sr. unsec. | | |
| notes 3.75%, 10/1/27 | 10,000 | 11,237 |
| Continental Resources, Inc. company | | |
| guaranty sr. unsec. bonds 4.90%, 6/1/44 | 5,000 | 5,650 |
| Continental Resources, Inc. company | | |
| guaranty sr. unsec. notes 4.375%, 1/15/28 | 15,000 | 16,594 |
| Continental Resources, Inc. company | | |
| guaranty sr. unsec. unsub. notes 4.50%, 4/15/23 | 10,000 | 10,406 |
| Continental Resources, Inc. 144A company | | |
| guaranty sr. unsec. bonds 5.75%, 1/15/31 | 15,000 | 17,963 |
| CrownRock LP/CrownRock Finance, Inc. 144A | | |
| sr. unsec. notes 5.00%, 5/1/29 | 5,000 | 5,251 |
| DCP Midstream Operating LP company | | |
| guaranty sr. unsec. notes 5.625%, 7/15/27 | 5,000 | 5,675 |
| DCP Midstream Operating LP 144A company | | |
| guaranty sr. unsec. unsub. bonds 6.75%, 9/15/37 | 15,000 | 18,038 |
| |
| Putnam VT Global Asset Allocation Fund | 13 |
| | |
| CORPORATE BONDS | | |
| AND NOTES (14.4%)* cont. | Principal amount | Value |
| |
| Energy cont. | | |
| Devon Energy Corp. sr. unsec. unsub. bonds | | |
| 7.95%, 4/15/32 | $5,000 | $7,103 |
| Devon Energy Corp. sr. unsec. | | |
| unsub. bonds 7.875%, 9/30/31 | 5,000 | 6,988 |
| Devon Energy Corp. sr. unsec. unsub. bonds | | |
| 5.60%, 7/15/41 | 5,000 | 6,182 |
| Devon Energy Corp. 144A sr. unsec. notes | | |
| 5.25%, 10/15/27 | 26,000 | 28,025 |
| Diamondback Energy, Inc. company | | |
| guaranty sr. unsec. notes 3.25%, 12/1/26 | 15,000 | 16,079 |
| DT Midstream, Inc. 144A sr. unsec. bonds | | |
| 4.375%, 6/15/31 | 5,000 | 5,109 |
| DT Midstream, Inc. 144A sr. unsec. notes | | |
| 4.125%, 6/15/29 | 5,000 | 5,077 |
| Encino Acquisition Partners Holdings, LLC 144A | | |
| company guaranty sr. unsec. notes 8.50%, 5/1/28 | 10,000 | 10,200 |
| Endeavor Energy Resources LP/EER Finance, Inc. | | |
| 144A sr. unsec. bonds 5.75%, 1/30/28 | 45,000 | 47,982 |
| Endeavor Energy Resources LP/EER Finance, Inc. | | |
| 144A sr. unsec. notes 6.625%, 7/15/25 | 10,000 | 10,700 |
| EnLink Midstream, LLC 144A company | | |
| guaranty sr. unsec. notes 5.625%, 1/15/28 | 15,000 | 15,846 |
| EOG Resources, Inc. sr. unsec. | | |
| unsub. notes 2.625%, 3/15/23 | 50,000 | 51,611 |
| EQT Corp. sr. unsec. notes 8.50%, 2/1/30 | 5,000 | 6,515 |
| Equinor ASA company guaranty sr. unsec. | | |
| notes 5.10%, 8/17/40 (Norway) | 40,000 | 53,225 |
| Hess Midstream Operations LP 144A company | | |
| guaranty sr. unsec. notes 5.125%, 6/15/28 | 10,000 | 10,488 |
| Hess Midstream Operations LP 144A company | | |
| guaranty sr. unsec. sub. notes 5.625%, 2/15/26 | 50,000 | 52,150 |
| Hilcorp Energy I LP/Hilcorp Finance Co. 144A | | |
| sr. unsec. bonds 6.00%, 2/1/31 | 5,000 | 5,300 |
| Hilcorp Energy I LP/Hilcorp Finance Co. 144A | | |
| sr. unsec. notes 5.75%, 2/1/29 | 5,000 | 5,213 |
| Holly Energy Partners LP/Holly Energy | | |
| Finance Corp. 144A company guaranty sr. unsec. | | |
| notes 5.00%, 2/1/28 | 15,000 | 15,338 |
| Indigo Natural Resources, LLC 144A sr. unsec. | | |
| notes 5.375%, 2/1/29 | 20,000 | 20,900 |
| ITT Holdings, LLC 144A sr. unsec. notes | | |
| 6.50%, 8/1/29 | 15,000 | 15,281 |
| MEG Energy Corp. 144A notes 6.50%, 1/15/25 | | |
| (Canada) | 17,000 | 17,574 |
| Nabors Industries, Inc. company | | |
| guaranty sr. unsec. notes 5.75%, 2/1/25 | 10,000 | 9,200 |
| Nabors Industries, Inc. 144A company | | |
| guaranty sr. unsec. notes 9.00%, 2/1/25 | 4,000 | 4,200 |
| Nabors Industries, Ltd. 144A company | | |
| guaranty sr. unsec. notes 7.25%, 1/15/26 | 5,000 | 4,900 |
| Northriver Midstream Finance LP 144A | | |
| sr. notes 5.625%, 2/15/26 (Canada) | 10,000 | 10,350 |
| Oasis Petroleum, Inc. 144A company | | |
| guaranty sr. unsec. notes 6.375%, 6/1/26 | 5,000 | 5,214 |
| Occidental Petroleum Corp. sr. unsec. | | |
| bonds 6.625%, 9/1/30 | 5,000 | 6,000 |
| Occidental Petroleum Corp. sr. unsec. | | |
| bonds 6.125%, 1/1/31 | 5,000 | 5,883 |
| Occidental Petroleum Corp. sr. unsec. | | |
| sub. bonds 6.20%, 3/15/40 | 10,000 | 11,307 |
| |
| CORPORATE BONDS | | |
| AND NOTES (14.4%)* cont. | Principal amount | Value |
| |
| Energy cont. | | |
| Occidental Petroleum Corp. sr. unsec. | | |
| sub. notes 6.45%, 9/15/36 | $15,000 | $17,934 |
| Ovintiv, Inc. company guaranty sr. unsec. | | |
| bonds 6.50%, 8/15/34 | 5,000 | 6,601 |
| Ovintiv, Inc. company guaranty sr. unsec. | | |
| unsub. bonds 7.375%, 11/1/31 | 10,000 | 13,277 |
| Ovintiv, Inc. company guaranty sr. unsec. | | |
| unsub. bonds 6.625%, 8/15/37 | 5,000 | 6,671 |
| PBF Holding Co., LLC/PBF Finance Corp. 144A | | |
| company guaranty sr. notes 9.25%, 5/15/25 | 15,000 | 15,111 |
| Petrobras Global Finance BV company | | |
| guaranty sr. unsec. unsub. notes 6.25%, 3/17/24 | | |
| (Brazil) | 40,000 | 45,150 |
| Petrobras Global Finance BV company | | |
| guaranty sr. unsec. unsub. notes 5.999%, 1/27/28 | | |
| (Brazil) | 8,000 | 9,190 |
| Petrobras Global Finance BV company | | |
| guaranty sr. unsec. unsub. notes 5.60%, 1/3/31 | | |
| (Brazil) | 39,000 | 43,680 |
| Petrobras Global Finance BV company | | |
| guaranty sr. unsec. unsub. notes 5.299%, 1/27/25 | | |
| (Brazil) | 2,000 | 2,253 |
| Petroleos de Venezuela SA company | | |
| guaranty sr. unsec. bonds Ser. REGS, 6.00%, | | |
| 11/15/26 (Venezuela) (In default) † | 40,000 | 1,650 |
| Petroleos Mexicanos company guaranty sr. unsec. | | |
| unsub. FRB 7.69%, 1/23/50 (Mexico) | 37,000 | 35,613 |
| Petroleos Mexicanos company guaranty sr. unsec. | | |
| unsub. notes 6.84%, 1/23/30 (Mexico) | 54,000 | 55,647 |
| Precision Drilling Corp. 144A company | | |
| guaranty sr. unsec. notes 7.125%, 1/15/26 | | |
| (Canada) | 15,000 | 15,488 |
| Precision Drilling Corp. 144A company | | |
| guaranty sr. unsec. notes 6.875%, 1/15/29 | | |
| (Canada) | 5,000 | 5,150 |
| Rattler Midstream LP 144A company | | |
| guaranty sr. unsec. notes 5.625%, 7/15/25 | 10,000 | 10,513 |
| Regency Energy Partners LP/Regency Energy | | |
| Finance Corp. company guaranty sr. unsec. | | |
| unsub. notes 4.50%, 11/1/23 | 9,000 | 9,641 |
| Renewable Energy Group, Inc. 144A company | | |
| guaranty sr. notes 5.875%, 6/1/28 | 5,000 | 5,244 |
| Sabine Pass Liquefaction, LLC sr. notes 5.00%, 3/15/27 | 14,000 | 16,166 |
| Shell International Finance BV company | | |
| guaranty sr. unsec. unsub. notes 2.875%, 5/10/26 | | |
| (Netherlands) | 70,000 | 75,600 |
| SM Energy Co. sr. unsec. unsub. notes 6.75%, 9/15/26 | 10,000 | 10,175 |
| SM Energy Co. sr. unsec. unsub. notes 6.50%, 7/15/28 | 10,000 | 10,275 |
| SM Energy Co. 144A company guaranty notes | | |
| 10.00%, 1/15/25 | 5,000 | 5,642 |
| Spectra Energy Partners LP sr. unsec. | | |
| notes 3.375%, 10/15/26 | 40,000 | 43,480 |
| Tallgrass Energy Partners LP/Tallgrass Energy | | |
| Finance Corp. 144A company guaranty sr. unsec. | | |
| notes 7.50%, 10/1/25 | 5,000 | 5,475 |
| Tallgrass Energy Partners LP/Tallgrass Energy | | |
| Finance Corp. 144A company guaranty sr. unsec. | | |
| notes 6.00%, 12/31/30 | 10,000 | 10,396 |
| Tallgrass Energy Partners LP/Tallgrass Energy | | |
| Finance Corp. 144A company guaranty sr. unsec. | | |
| notes 5.50%, 1/15/28 | 15,000 | 15,263 |
| |
| 14 | Putnam VT Global Asset Allocation Fund |
| | |
| CORPORATE BONDS | | |
| AND NOTES (14.4%)* cont. | Principal amount | Value |
| |
| Energy cont. | | |
| Targa Resources Partners LP/Targa Resources | | |
| Partners Finance Corp. company | | |
| guaranty sr. unsec. notes 6.875%, 1/15/29 | $5,000 | $5,633 |
| Targa Resources Partners LP/Targa Resources | | |
| Partners Finance Corp. company | | |
| guaranty sr. unsec. notes 6.50%, 7/15/27 | 5,000 | 5,419 |
| Targa Resources Partners LP/Targa Resources | | |
| Partners Finance Corp. company | | |
| guaranty sr. unsec. notes 5.50%, 3/1/30 | 5,000 | 5,498 |
| Targa Resources Partners LP/Targa Resources | | |
| Partners Finance Corp. company | | |
| guaranty sr. unsec. unsub. notes 5.00%, 1/15/28 | 10,000 | 10,550 |
| Transcanada Trust company guaranty jr. unsec. | | |
| sub. FRB 5.30%, 3/15/77 (Canada) | 10,000 | 10,616 |
| Transocean Pontus, Ltd. 144A company | | |
| guaranty sr. notes 6.125%, 8/1/25 | | |
| (Cayman Islands) | 3,625 | 3,652 |
| Transocean Poseidon, Ltd. 144A company | | |
| guaranty sr. notes 6.875%, 2/1/27 | 10,000 | 10,050 |
| Transocean, Inc. 144A company guaranty sr. unsec. | | |
| notes 11.50%, 1/30/27 | 5,000 | 5,343 |
| USA Compression Partners LP/USA Compression | | |
| Finance Corp. company guaranty sr. unsec. | | |
| notes 6.875%, 4/1/26 | 10,000 | 10,475 |
| USA Compression Partners LP/USA Compression | | |
| Finance Corp. company guaranty sr. unsec. | | |
| unsub. notes 6.875%, 9/1/27 | 5,000 | 5,341 |
| Viper Energy Partners LP 144A company | | |
| guaranty sr. unsec. notes 5.375%, 11/1/27 | 5,000 | 5,209 |
| | | 1,438,643 |
| Financials (3.5%) | | |
| AG Issuer, LLC 144A sr. notes 6.25%, 3/1/28 | 10,000 | 10,537 |
| Air Lease Corp. sr. unsec. sub. bonds 4.625%, 10/1/28 | 23,000 | 25,912 |
| Air Lease Corp. sr. unsec. sub. notes 3.25%, 10/1/29 | 35,000 | 36,477 |
| Alliant Holdings Intermediate, LLC/Alliant | | |
| Holdings Co-Issuer 144A sr. unsec. notes | | |
| 6.75%, 10/15/27 | 10,000 | 10,510 |
| Ally Financial, Inc. company guaranty sr. unsec. | | |
| notes 8.00%, 11/1/31 | 29,000 | 41,674 |
| American Express Co. sr. unsec. notes 2.65%, 12/2/22 | 96,000 | 99,158 |
| American International Group, Inc. jr. unsec. | | |
| sub. FRB 8.175%, 5/15/58 | 3,000 | 4,338 |
| Ares Capital Corp. sr. unsec. sub. notes | | |
| 3.875%, 1/15/26 | 25,000 | 26,781 |
| Aretec Escrow Issuer, Inc. 144A sr. unsec. | | |
| notes 7.50%, 4/1/29 | 15,000 | 15,417 |
| Bank of America Corp. jr. unsec. sub. FRN | | |
| Ser. AA, 6.10%, perpetual maturity | 74,000 | 82,880 |
| Bank of America Corp. sr. unsec. FRN Ser. MTN, | | |
| 2.496%, 2/13/31 | 5,000 | 5,105 |
| Bank of America Corp. unsec. sub. notes | | |
| 6.11%, 1/29/37 | 195,000 | 267,364 |
| Bank of Montreal unsec. sub. FRN 3.803%, 12/15/32 | | |
| (Canada) | 1,000 | 1,102 |
| Bank of Nova Scotia (The) sr. unsec. notes 2.00%, | | |
| 11/15/22 (Canada) | 78,000 | 79,763 |
| Berkshire Hathaway Finance Corp. company | | |
| guaranty sr. unsec. bonds 2.85%, 10/15/50 | 10,000 | 9,982 |
| Berkshire Hathaway Finance Corp. company | | |
| guaranty sr. unsec. notes 4.30%, 5/15/43 | 29,000 | 36,138 |
| Blackstone Holdings Finance Co., LLC 144A company | | |
| guaranty sr. unsec. unsub. bonds 1.60%, 3/30/31 | 10,000 | 9,497 |
| | | |
| CORPORATE BONDS | | |
| AND NOTES (14.4%)* cont. | Principal amount | Value |
| | | |
| Financials cont. | | |
| Camden Property Trust sr. unsec. | | |
| unsub. notes 4.875%, 6/15/23 R | $65,000 | $69,538 |
| Cantor Fitzgerald LP 144A unsec. notes | | |
| 6.50%, 6/17/22 | 14,000 | 14,765 |
| CIT Group, Inc. sr. unsec. sub. notes 5.00%, 8/1/23 | 5,000 | 5,406 |
| CIT Group, Inc. sr. unsec. unsub. notes 5.25%, 3/7/25 | 28,000 | 31,500 |
| CIT Group, Inc. sr. unsec. unsub. notes 5.00%, 8/15/22 | 2,000 | 2,090 |
| Citigroup, Inc. jr. unsec. sub. FRN 3.875%, | | |
| perpetual maturity | 35,000 | 35,963 |
| Citigroup, Inc. sr. unsec. FRB 3.668%, 7/24/28 | 204,000 | 224,728 |
| Citigroup, Inc. sr. unsec. unsub. FRB 3.887%, 1/10/28 | 50,000 | 55,647 |
| Citigroup, Inc. unsec. sub. bonds 4.75%, 5/18/46 | 10,000 | 12,727 |
| Citigroup, Inc. unsec. sub. bonds 4.45%, 9/29/27 | 50,000 | 57,124 |
| CNO Financial Group, Inc. sr. unsec. notes | | |
| 5.25%, 5/30/29 | 10,000 | 11,885 |
| CNO Financial Group, Inc. sr. unsec. | | |
| unsub. notes 5.25%, 5/30/25 | 10,000 | 11,340 |
| Commonwealth Bank of Australia 144A sr. unsec. | | |
| notes 3.15%, 9/19/27 (Australia) | 75,000 | 81,905 |
| Digital Realty Trust LP company | | |
| guaranty sr. unsec. bonds 4.45%, 7/15/28 R | 25,000 | 28,949 |
| Digital Realty Trust LP company | | |
| guaranty sr. unsec. notes 4.75%, 10/1/25 R | 60,000 | 68,204 |
| Diversified Healthcare Trust company | | |
| guaranty sr. unsec. notes 9.75%, 6/15/25 R | 20,000 | 22,148 |
| Empire Communities Corp. 144A sr. unsec. | | |
| notes 7.00%, 12/15/25 (Canada) | 5,000 | 5,263 |
| ESH Hospitality, Inc. 144A company | | |
| guaranty sr. unsec. notes 5.25%, 5/1/25 R | 10,000 | 10,188 |
| Fairfax Financial Holdings, Ltd. sr. unsec. | | |
| notes 4.85%, 4/17/28 (Canada) | 27,000 | 31,059 |
| Fairfax US, Inc. 144A company guaranty sr. unsec. | | |
| notes 4.875%, 8/13/24 | 30,000 | 32,905 |
| Fifth Third Bancorp jr. unsec. sub. FRB 5.10%, | | |
| perpetual maturity | 11,000 | 11,413 |
| Five Corners Funding Trust 144A sr. unsec. | | |
| bonds 4.419%, 11/15/23 | 135,000 | 147,032 |
| Freedom Mortgage Corp. 144A sr. unsec. | | |
| notes 8.25%, 4/15/25 | 15,000 | 15,656 |
| Freedom Mortgage Corp. 144A sr. unsec. | | |
| notes 8.125%, 11/15/24 | 5,000 | 5,169 |
| Freedom Mortgage Corp. 144A sr. unsec. | | |
| notes 6.625%, 1/15/27 | 5,000 | 5,031 |
| GLP Capital LP/GLP Financing II, Inc. company | | |
| guaranty sr. unsec. notes 5.25%, 6/1/25 | 10,000 | 11,257 |
| goeasy, Ltd. 144A company guaranty sr. unsec. | | |
| notes 5.375%, 12/1/24 (Canada) | 5,000 | 5,157 |
| goeasy, Ltd. 144A company guaranty sr. unsec. | | |
| notes 4.375%, 5/1/26 (Canada) | 5,000 | 5,100 |
| Goldman Sachs Group, Inc. (The) sr. unsec. FRB | | |
| 4.223%, 5/1/29 | 87,000 | 99,223 |
| Goldman Sachs Group, Inc. (The) sr. unsec. | | |
| unsub. notes 2.60%, 2/7/30 | 20,000 | 20,692 |
| Goldman Sachs Group, Inc. (The) unsec. | | |
| sub. notes 6.75%, 10/1/37 | 24,000 | 34,945 |
| Home Point Capital, Inc. 144A company | | |
| guaranty sr. unsec. notes 5.00%, 2/1/26 | 5,000 | 4,663 |
| HUB International, Ltd. 144A sr. unsec. | | |
| notes 7.00%, 5/1/26 | 20,000 | 20,742 |
| |
| Putnam VT Global Asset Allocation Fund | 15 |
| | |
| CORPORATE BONDS | | |
| AND NOTES (14.4%)* cont. | Principal amount | Value |
| | | |
| Financials cont. | | |
| Huntington Bancshares, Inc. unsec. notes | | |
| 4.35%, 2/4/23 | $40,000 | $42,301 |
| Icahn Enterprises LP/Icahn Enterprises | | |
| Finance Corp. company guaranty sr. unsec. | | |
| notes 6.75%, 2/1/24 | 10,000 | 10,214 |
| Icahn Enterprises LP/Icahn Enterprises | | |
| Finance Corp. company guaranty sr. unsec. | | |
| notes 6.25%, 5/15/26 | 10,000 | 10,610 |
| Icahn Enterprises LP/Icahn Enterprises | | |
| Finance Corp. company guaranty sr. unsec. | | |
| notes 5.25%, 5/15/27 | 5,000 | 5,162 |
| Icahn Enterprises LP/Icahn Enterprises | | |
| Finance Corp. 144A company guaranty sr. unsec. | | |
| notes 4.375%, 2/1/29 | 5,000 | 4,975 |
| Intercontinental Exchange, Inc. sr. unsec. | | |
| bonds 2.65%, 9/15/40 | 48,000 | 46,002 |
| Intercontinental Exchange, Inc. sr. unsec. | | |
| bonds 1.85%, 9/15/32 | 18,000 | 17,035 |
| International Lease Finance Corp. sr. unsec. | | |
| unsub. notes 5.875%, 8/15/22 | 14,000 | 14,805 |
| iStar, Inc. sr. unsec. notes 5.50%, 2/15/26 R | 10,000 | 10,475 |
| iStar, Inc. sr. unsec. notes 4.75%, 10/1/24 R | 15,000 | 15,788 |
| iStar, Inc. sr. unsec. notes 4.25%, 8/1/25 R | 15,000 | 15,431 |
| JPMorgan Chase & Co. jr. unsec. bonds 6.10%, | | |
| perpetual maturity | 17,000 | 18,594 |
| JPMorgan Chase & Co. jr. unsec. sub. FRB Ser. HH, | | |
| 4.60%, perpetual maturity | 157,000 | 162,700 |
| JPMorgan Chase & Co. jr. unsec. sub. FRB Ser. W, | | |
| (BBA LIBOR USD 3 Month + 1.00%), 1.156%, 5/15/47 | 13,000 | 11,167 |
| JPMorgan Chase & Co. jr. unsec. sub. FRN 3.65%, | | |
| perpetual maturity | 17,000 | 17,024 |
| JPMorgan Chase & Co. sr. unsec. unsub. FRB | | |
| 3.964%, 11/15/48 | 300,000 | 352,045 |
| JPMorgan Chase & Co. unsec. sub. FRB | | |
| 2.956%, 5/13/31 | 6,000 | 6,303 |
| JPMorgan Chase & Co. unsec. sub. notes | | |
| 3.375%, 5/1/23 | 165,000 | 173,688 |
| KKR Group Finance Co. III, LLC 144A company | | |
| guaranty sr. unsec. unsub. bonds 5.125%, 6/1/44 | 30,000 | 39,050 |
| Ladder Capital Finance Holdings, LLLP/Ladder | | |
| Capital Finance Corp. 144A company | | |
| guaranty sr. unsec. notes 4.75%, 6/15/29 R | 5,000 | 5,000 |
| Ladder Capital Finance Holdings, LLLP/Ladder | | |
| Capital Finance Corp. 144A company | | |
| guaranty sr. unsec. unsub. notes 5.25%, 10/1/25 R | 25,000 | 25,438 |
| Ladder Capital Finance Holdings, LLLP/Ladder | | |
| Capital Finance Corp. 144A sr. unsec. | | |
| notes 4.25%, 2/1/27 R | 10,000 | 9,988 |
| Marsh & McLennan Cos., Inc. sr. unsec. | | |
| sub. notes 4.375%, 3/15/29 | 22,000 | 25,787 |
| Morgan Stanley sr. unsec. unsub. FRN Ser. GMTN, | | |
| 3.772%, 1/24/29 | 185,000 | 207,631 |
| Morgan Stanley sr. unsec. unsub. notes | | |
| 4.375%, 1/22/47 | 40,000 | 50,108 |
| Morgan Stanley sr. unsec. unsub. notes Ser. GMTN, | | |
| 3.125%, 1/23/23 | 183,000 | 190,798 |
| Nationstar Mortgage Holdings, Inc. 144A company | | |
| guaranty sr. unsec. notes 6.00%, 1/15/27 | 10,000 | 10,363 |
| Nationstar Mortgage Holdings, Inc. 144A company | | |
| guaranty sr. unsec. notes 5.50%, 8/15/28 | 10,000 | 10,081 |
| |
| CORPORATE BONDS | | |
| AND NOTES (14.4%)* cont. | Principal amount | Value |
| |
| Financials cont. | | |
| Nationstar Mortgage Holdings, Inc. 144A company | | |
| guaranty sr. unsec. notes 5.125%, 12/15/30 | $5,000 | $4,975 |
| Neuberger Berman Group, LLC/Neuberger Berman | | |
| Finance Corp. 144A sr. unsec. notes 4.875%, 4/15/45 | 30,000 | 34,790 |
| OneMain Finance Corp. company | | |
| guaranty sr. unsec. notes 8.875%, 6/1/25 | 5,000 | 5,543 |
| OneMain Finance Corp. company | | |
| guaranty sr. unsec. sub. notes 7.125%, 3/15/26 | 35,000 | 40,765 |
| OneMain Finance Corp. company | | |
| guaranty sr. unsec. sub. notes 6.625%, 1/15/28 | 5,000 | 5,732 |
| OneMain Finance Corp. company | | |
| guaranty sr. unsec. unsub. notes 6.875%, 3/15/25 | 10,000 | 11,286 |
| OneMain Finance Corp. company | | |
| guaranty sr. unsec. unsub. notes 5.375%, 11/15/29 | 15,000 | 16,316 |
| OneMain Finance Corp. company guaranty sr. unsec. | | |
| notes 4.00%, 9/15/30 | 5,000 | 4,956 |
| PennyMac Financial Services, Inc. 144A company | | |
| guaranty sr. unsec. notes 5.375%, 10/15/25 | 10,000 | 10,525 |
| PennyMac Financial Services, Inc. 144A company | | |
| guaranty sr. unsec. notes 4.25%, 2/15/29 | 5,000 | 4,817 |
| PHH Mortgage Corp. 144A company | | |
| guaranty sr. notes 7.875%, 3/15/26 | 15,000 | 15,504 |
| Prologis LP sr. unsec. unsub. notes 2.25%, 4/15/30 R | 10,000 | 10,214 |
| Prologis LP sr. unsec. unsub. notes 2.125%, 4/15/27 R | 4,000 | 4,169 |
| Provident Funding Associates LP/PFG Finance Corp. | | |
| 144A sr. unsec. notes 6.375%, 6/15/25 | 15,000 | 15,188 |
| Prudential Financial, Inc. jr. unsec. sub. FRN | | |
| 5.625%, 6/15/43 | 11,000 | 11,880 |
| Prudential Financial, Inc. jr. unsec. sub. FRN | | |
| 5.20%, 3/15/44 | 26,000 | 27,983 |
| Royal Bank of Canada sr. unsec. | | |
| unsub. notes Ser. GMTN, 2.80%, 4/29/22 (Canada) | 78,000 | 79,660 |
| Royal Bank of Canada unsec. sub. notes Ser. GMTN, | | |
| 4.65%, 1/27/26 (Canada) | 45,000 | 51,556 |
| Service Properties Trust company | | |
| guaranty sr. unsec. unsub. notes 7.50%, 9/15/25 R | 5,000 | 5,661 |
| Starwood Property Trust, Inc. sr. unsec. | | |
| notes 4.75%, 3/15/25 R | 15,000 | 15,600 |
| Swiss Re Treasury US Corp. 144A company | | |
| guaranty sr. unsec. notes 4.25%, 12/6/42 | 90,000 | 110,245 |
| Toronto-Dominion Bank (The) sr. unsec. | | |
| unsub. notes Ser. MTN, 1.90%, 12/1/22 (Canada) | 78,000 | 79,747 |
| Toronto-Dominion Bank (The) unsec. sub. FRB | | |
| 3.625%, 9/15/31 (Canada) | 62,000 | 68,698 |
| Truist Financial Corp. jr. unsec. sub. FRB | | |
| Ser. N, 4.80%, 9/1/24 | 16,000 | 16,800 |
| UBS Group AG 144A sr. unsec. notes 3.491%, | | |
| 5/23/23 (Switzerland) | 400,000 | 410,798 |
| USIS Merger Sub, Inc. 144A sr. unsec. | | |
| notes 6.875%, 5/1/25 | 20,000 | 20,251 |
| Wells Fargo & Co. jr. unsec. sub. FRB Ser. U, | | |
| 5.875%, perpetual maturity | 9,000 | 10,091 |
| Wells Fargo & Co. jr. unsec. sub. FRN 3.90%, | | |
| perpetual maturity | 15,000 | 15,530 |
| Westpac Banking Corp. unsec. sub. bonds 4.421%, | | |
| 7/24/39 (Australia) | 3,000 | 3,549 |
| Westpac Banking Corp. unsec. sub. bonds 2.963%, | | |
| 11/16/40 (Australia) | 41,000 | 40,283 |
| | | 4,623,724 |
| |
| 16 | Putnam VT Global Asset Allocation Fund |
| | |
| CORPORATE BONDS | | |
| AND NOTES (14.4%)* cont. | Principal amount | Value |
| | | |
| Health care (1.2%) | | |
| AbbVie, Inc. sr. unsec. notes 3.20%, 11/21/29 | $167,000 | $181,369 |
| AbbVie, Inc. sr. unsec. sub. notes 3.80%, 3/15/25 | | |
| (acquired 5/12/20, cost $16,104) ∆∆ | 15,000 | 16,408 |
| Air Methods Corp. 144A sr. unsec. notes | | |
| 8.00%, 5/15/25 | 15,000 | 14,175 |
| Bausch Health Americas, Inc. 144A sr. unsec. | | |
| notes 8.50%, 1/31/27 | 15,000 | 16,313 |
| Bausch Health Cos., Inc. 144A company | | |
| guaranty sr. unsec. notes 7.25%, 5/30/29 | 10,000 | 10,219 |
| Bausch Health Cos., Inc. 144A company | | |
| guaranty sr. unsec. notes 7.00%, 1/15/28 | 5,000 | 5,150 |
| Bausch Health Cos., Inc. 144A company | | |
| guaranty sr. unsec. notes 6.25%, 2/15/29 | 10,000 | 9,891 |
| Bausch Health Cos., Inc. 144A company | | |
| guaranty sr. unsec. notes 6.125%, 4/15/25 | 39,000 | 39,975 |
| Bausch Health Cos., Inc. 144A sr. notes | | |
| 4.875%, 6/1/28 | 10,000 | 10,235 |
| Becton Dickinson and Co. sr. unsec. notes | | |
| 2.823%, 5/20/30 | 7,000 | 7,332 |
| Becton Dickinson and Co. sr. unsec. | | |
| sub. bonds 1.957%, 2/11/31 | 50,000 | 48,785 |
| Bristol-Myers Squibb Co. sr. unsec. notes | | |
| 3.25%, 2/20/23 | 67,000 | 69,992 |
| Bristol-Myers Squibb Co. sr. unsec. notes | | |
| 2.90%, 7/26/24 | 52,000 | 55,473 |
| Bristol-Myers Squibb Co. sr. unsec. notes | | |
| 1.45%, 11/13/30 | 20,000 | 19,311 |
| Bristol-Myers Squibb Co. sr. unsec. | | |
| sub. notes 3.40%, 7/26/29 | 19,000 | 21,293 |
| Centene Corp. sr. unsec. bonds 3.00%, 10/15/30 | 5,000 | 5,136 |
| Centene Corp. sr. unsec. notes 4.625%, 12/15/29 | 25,000 | 27,438 |
| Centene Corp. 144A sr. unsec. notes 5.375%, 8/15/26 | 10,000 | 10,450 |
| Centene Escrow I Corp. 144A sr. unsec. | | |
| notes 5.375%, 6/1/26 | 5,000 | 5,225 |
| Charles River Laboratories International, Inc. | | |
| 144A company guaranty sr. unsec. notes | | |
| 4.00%, 3/15/31 | 5,000 | 5,188 |
| Charles River Laboratories International, Inc. | | |
| 144A company guaranty sr. unsec. notes | | |
| 3.75%, 3/15/29 | 5,000 | 5,056 |
| CHS/Community Health Systems, Inc. 144A company | | |
| guaranty sr. notes 8.00%, 3/15/26 | 5,000 | 5,388 |
| CHS/Community Health Systems, Inc. 144A company | | |
| guaranty sr. notes 5.625%, 3/15/27 | 5,000 | 5,325 |
| CHS/Community Health Systems, Inc. 144A company | | |
| guaranty sr. unsec. sub. notes 6.875%, 4/1/28 | 10,000 | 9,892 |
| CHS/Community Health Systems, Inc. 144A jr. | | |
| notes 6.875%, 4/15/29 | 10,000 | 10,465 |
| CHS/Community Health Systems, Inc. 144A | | |
| sr. notes 6.625%, 2/15/25 | 10,000 | 10,575 |
| Cigna Corp. company guaranty sr. unsec. | | |
| unsub. notes 3.75%, 7/15/23 | 27,000 | 28,753 |
| CVS Health Corp. sr. unsec. unsub. notes | | |
| 4.78%, 3/25/38 | 99,000 | 121,794 |
| CVS Health Corp. sr. unsec. unsub. notes | | |
| 3.70%, 3/9/23 | 6,000 | 6,319 |
| CVS Pass-Through Trust 144A sr. mtge. | | |
| notes 4.704%, 1/10/36 | 38,488 | 43,616 |
| DH Europe Finance II Sarl company | | |
| guaranty sr. unsec. bonds 3.40%, 11/15/49 | | |
| (Luxembourg) | 15,000 | 16,536 |
| | | |
| CORPORATE BONDS | | |
| AND NOTES (14.4%)* cont. | Principal amount | Value |
| | | |
| Health care cont. | | |
| Elanco Animal Health, Inc. sr. unsec. | | |
| notes Ser. WI, 5.90%, 8/28/28 | $10,000 | $11,703 |
| Endo Luxembourg Finance Co. I Sarl/Endo US, Inc. | | |
| 144A company guaranty sr. notes 6.125%, 4/1/29 | | |
| (Luxembourg) | 5,000 | 4,900 |
| Global Medical Response, Inc. 144A | | |
| sr. notes 6.50%, 10/1/25 | 5,000 | 5,144 |
| HCA, Inc. company guaranty sr. bonds 3.50%, 7/15/51 | 40,000 | 39,982 |
| HCA, Inc. company guaranty sr. notes 4.125%, 6/15/29 | 5,000 | 5,630 |
| HCA, Inc. company guaranty sr. sub. bonds | | |
| 5.50%, 6/15/47 | 20,000 | 26,048 |
| HCA, Inc. company guaranty sr. unsec. | | |
| notes 5.375%, 9/1/26 | 10,000 | 11,508 |
| HCA, Inc. company guaranty sr. unsec. | | |
| notes 3.50%, 9/1/30 | 5,000 | 5,327 |
| Mallinckrodt International Finance | | |
| SA/Mallinckrodt CB, LLC 144A company | | |
| guaranty sub. notes 10.00%, 4/15/25 (Luxembourg) | 14,000 | 14,140 |
| Merck & Co., Inc. sr. unsec. notes 2.90%, 3/7/24 | 1,000 | 1,062 |
| Merck & Co., Inc. sr. unsec. unsub. notes | | |
| 3.70%, 2/10/45 | 50,000 | 57,583 |
| Merck & Co., Inc. sr. unsec. unsub. notes | | |
| 2.75%, 2/10/25 | 8,000 | 8,524 |
| Novartis Capital Corp. company | | |
| guaranty sr. unsec. unsub. bonds 4.00%, 11/20/45 | 80,000 | 97,634 |
| Ortho-Clinical Diagnostics, Inc./Ortho-Clinical | | |
| Diagnostics SA 144A sr. unsec. notes 7.375%, 6/1/25 | 3,000 | 3,221 |
| Owens & Minor, Inc. 144A sr. unsec. notes | | |
| 4.50%, 3/31/29 | 15,000 | 15,413 |
| Pfizer, Inc. sr. unsec. unsub. notes 3.00%, 12/15/26 | 40,000 | 43,946 |
| Service Corp. International sr. unsec. | | |
| bonds 5.125%, 6/1/29 | 15,000 | 16,275 |
| Service Corp. International sr. unsec. | | |
| notes 4.625%, 12/15/27 | 6,000 | 6,345 |
| Service Corp. International sr. unsec. | | |
| notes 3.375%, 8/15/30 | 5,000 | 4,899 |
| Service Corp. International sr. unsec. | | |
| sub. notes 4.00%, 5/15/31 | 5,000 | 5,103 |
| Tenet Healthcare Corp. company | | |
| guaranty sr. notes 4.625%, 7/15/24 | 5,000 | 5,074 |
| Tenet Healthcare Corp. 144A company | | |
| guaranty notes 6.25%, 2/1/27 | 5,000 | 5,219 |
| Tenet Healthcare Corp. 144A company | | |
| guaranty sr. notes 7.50%, 4/1/25 | 5,000 | 5,401 |
| Tenet Healthcare Corp. 144A company | | |
| guaranty sr. notes 5.125%, 11/1/27 | 20,000 | 20,975 |
| Tenet Healthcare Corp. 144A company | | |
| guaranty sr. notes 4.875%, 1/1/26 | 30,000 | 31,116 |
| Tenet Healthcare Corp. 144A company | | |
| guaranty sr. notes 4.25%, 6/1/29 | 15,000 | 15,188 |
| UnitedHealth Group, Inc. sr. unsec. | | |
| unsub. notes 2.75%, 2/15/23 | 90,000 | 92,974 |
| UnitedHealth Group, Inc. sr. unsec. | | |
| unsub. notes 2.00%, 5/15/30 | 25,000 | 25,186 |
| Viatris, Inc. 144A company guaranty sr. unsec. | | |
| notes 2.30%, 6/22/27 | 28,000 | 28,581 |
| Zoetis, Inc. sr. unsec. notes 3.90%, 8/20/28 | 35,000 | 39,794 |
| Zoetis, Inc. sr. unsec. sub. notes 2.00%, 5/15/30 | 18,000 | 17,917 |
| | | 1,514,889 |
| |
| Putnam VT Global Asset Allocation Fund | 17 |
| | |
| CORPORATE BONDS | | |
| AND NOTES (14.4%)* cont. | Principal amount | Value |
| | | |
| Technology (1.4%) | | |
| Ahead DB Holdings, LLC 144A company | | |
| guaranty sr. unsec. notes 6.625%, 5/1/28 | $10,000 | $10,345 |
| Alphabet, Inc. sr. unsec. bonds 2.25%, 8/15/60 | 30,000 | 26,457 |
| Alphabet, Inc. sr. unsec. notes 1.998%, 8/15/26 | 35,000 | 36,615 |
| Analog Devices, Inc. sr. unsec. | | |
| unsub. notes 3.90%, 12/15/25 | 25,000 | 27,815 |
| Apple, Inc. sr. unsec. bonds 2.80%, 2/8/61 | 20,000 | 19,479 |
| Apple, Inc. sr. unsec. notes 2.85%, 5/11/24 | 25,000 | 26,532 |
| Apple, Inc. sr. unsec. unsub. notes 4.375%, 5/13/45 | 80,000 | 101,995 |
| Apple, Inc. sr. unsec. unsub. notes 3.85%, 5/4/43 | 27,000 | 32,024 |
| Arches Buyer, Inc. 144A sr. notes 4.25%, 6/1/28 | 5,000 | 4,944 |
| Banff Merger Sub, Inc. 144A sr. unsec. | | |
| notes 9.75%, 9/1/26 | 10,000 | 10,525 |
| Black Knight InfoServ, LLC 144A company | | |
| guaranty sr. unsec. notes 3.625%, 9/1/28 | 5,000 | 4,975 |
| Boxer Parent Co., Inc. 144A company | | |
| guaranty sr. notes 7.125%, 10/2/25 | 5,000 | 5,350 |
| Boxer Parent Co., Inc. 144A notes 9.125%, 3/1/26 | 10,000 | 10,555 |
| Broadcom Corp./Broadcom Cayman Finance, Ltd. | | |
| company guaranty sr. unsec. unsub. notes | | |
| 3.50%, 1/15/28 | 90,000 | 98,735 |
| Broadcom, Inc. company guaranty sr. unsec. | | |
| bonds 4.15%, 11/15/30 | 71,000 | 79,620 |
| Broadcom, Inc. 144A company guaranty sr. unsec. | | |
| bonds 3.75%, 2/15/51 | 10,000 | 10,439 |
| BY Crown Parent LLC/BY Bond Finance, Inc. 144A | | |
| company guaranty sr. notes 4.25%, 1/31/26 | 5,000 | 5,238 |
| Cisco Systems, Inc./California sr. unsec. | | |
| unsub. bonds 5.90%, 2/15/39 | 5,000 | 7,280 |
| Cisco Systems, Inc./California sr. unsec. | | |
| unsub. notes 2.50%, 9/20/26 | 35,000 | 37,553 |
| Clarivate Science Holdings Corp. 144A sr. unsec. | | |
| notes 4.875%, 6/30/29 | 5,000 | 5,131 |
| CommScope Finance, LLC 144A sr. notes | | |
| 6.00%, 3/1/26 | 5,000 | 5,279 |
| CommScope, Inc. 144A company guaranty sr. unsec. | | |
| notes 8.25%, 3/1/27 | 10,000 | 10,688 |
| Crowdstrike Holdings, Inc. company | | |
| guaranty sr. unsec. notes 3.00%, 2/15/29 | 5,000 | 5,005 |
| Dell International, LLC/EMC Corp. company | | |
| guaranty sr. bonds 8.35%, 7/15/46 | 7,000 | 11,449 |
| Dell International, LLC/EMC Corp. company | | |
| guaranty sr. notes 6.02%, 6/15/26 | 17,000 | 20,409 |
| Diamond 1 Finance Corp./Diamond 2 Finance Corp. | | |
| 144A company guaranty sr. unsec. notes | | |
| 7.125%, 6/15/24 | 5,000 | 5,129 |
| Diebold Nixdorf, Inc. company guaranty sr. unsec. | | |
| sub. notes 8.50%, 4/15/24 | 10,000 | 10,238 |
| Diebold Nixdorf, Inc. 144A company | | |
| guaranty sr. notes 9.375%, 7/15/25 | 5,000 | 5,544 |
| Fidelity National Information Services, Inc. | | |
| sr. unsec. bonds 2.25%, 3/1/31 | 10,000 | 9,982 |
| Fiserv, Inc. sr. unsec. bonds 3.50%, 7/1/29 | 15,000 | 16,505 |
| Fiserv, Inc. sr. unsec. sub. bonds 4.20%, 10/1/28 | 55,000 | 63,224 |
| IBM Corp. sr. unsec. unsub. notes 1.875%, 8/1/22 | 140,000 | 142,380 |
| Imola Merger Corp. 144A sr. notes 4.75%, 5/15/29 | 10,000 | 10,288 |
| Microchip Technology, Inc. company | | |
| guaranty sr. notes 4.333%, 6/1/23 | 27,000 | 28,793 |
| | | |
| CORPORATE BONDS | | |
| AND NOTES (14.4%)* cont. | Principal amount | Value |
| | | |
| Technology cont. | | |
| Microchip Technology, Inc. company | | |
| guaranty sr. unsec. notes 4.25%, 9/1/25 | $10,000 | $10,499 |
| Microsoft Corp. sr. unsec. unsub. bonds | | |
| 2.525%, 6/1/50 | 25,000 | 24,562 |
| Microsoft Corp. sr. unsec. unsub. notes | | |
| 1.55%, 8/8/21 | 160,000 | 160,038 |
| Oracle Corp. sr. unsec. unsub. bonds | | |
| 4.00%, 11/15/47 | 35,000 | 38,180 |
| Oracle Corp. sr. unsec. unsub. notes | | |
| 5.375%, 7/15/40 | 35,000 | 45,378 |
| Oracle Corp. sr. unsec. unsub. notes | | |
| 3.625%, 7/15/23 | 144,000 | 152,995 |
| Oracle Corp. sr. unsec. unsub. notes | | |
| 2.50%, 10/15/22 | 80,000 | 82,132 |
| Plantronics, Inc. 144A company | | |
| guaranty sr. unsec. notes 4.75%, 3/1/29 | 15,000 | 14,891 |
| Qorvo, Inc. 144A company guaranty sr. unsec. | | |
| bonds 3.375%, 4/1/31 | 10,000 | 10,422 |
| Rocket Software, Inc. 144A sr. unsec. | | |
| notes 6.50%, 2/15/29 | 15,000 | 14,850 |
| Salesforce.com, Inc. sr. unsec. bonds 3.05%, 7/15/61 | 30,000 | 30,397 |
| Salesforce.com, Inc. sr. unsec. bonds 2.90%, 7/15/51 | 30,000 | 30,292 |
| Salesforce.com, Inc. sr. unsec. | | |
| unsub. notes 3.70%, 4/11/28 | 101,000 | 115,056 |
| Sensata Technologies, Inc. 144A company | | |
| guaranty sr. unsec. notes 3.75%, 2/15/31 | 30,000 | 29,665 |
| ServiceNow, Inc. sr. unsec. notes 1.40%, 9/1/30 | 30,000 | 28,147 |
| SS&C Technologies, Inc. 144A company | | |
| guaranty sr. unsec. notes 5.50%, 9/30/27 | 5,000 | 5,294 |
| Tempo Acquisition, LLC/Tempo Acquisition | | |
| Finance Corp. 144A company | | |
| guaranty sr. notes 5.75%, 6/1/25 | 5,000 | 5,263 |
| Tempo Acquisition, LLC/Tempo Acquisition | | |
| Finance Corp. 144A sr. unsec. notes 6.75%, 6/1/25 | 30,000 | 30,506 |
| TTM Technologies, Inc. 144A company | | |
| guaranty sr. unsec. notes 4.00%, 3/1/29 | 10,000 | 10,000 |
| Twilio, Inc. company guaranty sr. unsec. | | |
| notes 3.875%, 3/15/31 | 5,000 | 5,131 |
| Twilio, Inc. company guaranty sr. unsec. | | |
| notes 3.625%, 3/15/29 | 10,000 | 10,200 |
| Western Digital Corp. company guaranty sr. unsec. | | |
| notes 4.75%, 2/15/26 | 5,000 | 5,556 |
| ZoomInfo Technologies LLC/ZoomInfo Finance Corp. | | |
| 144A company guaranty sr. unsec. notes | | |
| 3.875%, 2/1/29 | 15,000 | 14,906 |
| | | 1,780,880 |
| Transportation (0.2%) | | |
| American Airlines, Inc./AAdvantage Loyalty IP, | | |
| Ltd. 144A company guaranty sr. notes 5.75%, 4/20/29 | 10,000 | 10,813 |
| American Airlines, Inc./AAdvantage Loyalty IP, | | |
| Ltd. 144A company guaranty sr. notes 5.50%, 4/20/26 | 10,000 | 10,588 |
| CSX Corp. sr. unsec. unsub. notes 4.10%, 3/15/44 | 70,000 | 82,192 |
| Delta Air Lines Inc/SkyMiles IP, Ltd. 144A | | |
| company guaranty sr. notes 4.75%, 10/20/28 | 15,000 | 16,676 |
| Penske Truck Leasing Co. LP/PTL Finance Corp. | | |
| 144A sr. unsec. bonds 3.40%, 11/15/26 | 16,000 | 17,330 |
| Penske Truck Leasing Co. LP/PTL Finance Corp. | | |
| 144A sr. unsec. notes 3.90%, 2/1/24 | 20,000 | 21,448 |
| United Airlines, Inc. 144A company | | |
| guaranty sr. notes 4.625%, 4/15/29 | 5,000 | 5,175 |
| |
| 18 | Putnam VT Global Asset Allocation Fund |
| | |
| CORPORATE BONDS | | |
| AND NOTES (14.4%)* cont. | Principal amount | Value |
| |
| Transportation cont. | | |
| United Airlines, Inc. 144A company | | |
| guaranty sr. notes 4.375%, 4/15/26 | $5,000 | $5,176 |
| Watco Cos LLC/Watco Finance Corp. 144A sr. unsec. | | |
| notes 6.50%, 6/15/27 | 30,000 | 32,100 |
| | | 201,498 |
| Utilities and power (1.1%) | | |
| AES Corp. (The) 144A sr. unsec. bonds 2.45%, 1/15/31 | 50,000 | 49,470 |
| American Electric Power Co., Inc. sr. unsec. | | |
| unsub. notes Ser. J, 4.30%, 12/1/28 | 55,000 | 63,298 |
| Buckeye Partners LP sr. unsec. notes 3.95%, 12/1/26 | 5,000 | 5,088 |
| Buckeye Partners LP 144A sr. unsec. notes | | |
| 4.50%, 3/1/28 | 5,000 | 5,127 |
| Calpine Corp. 144A company | | |
| guaranty sr. notes 5.25%, 6/1/26 | 7,000 | 7,201 |
| Calpine Corp. 144A company | | |
| guaranty sr. notes 4.50%, 2/15/28 | 35,000 | 35,700 |
| Colorado Interstate Gas Co., LLC company | | |
| guaranty sr. unsec. notes 6.85%, 6/15/37 | 8,000 | 10,578 |
| Commonwealth Edison Co. 1st mtge. bonds | | |
| 5.90%, 3/15/36 | 28,000 | 39,577 |
| Consolidated Edison Co. of New York, Inc. | | |
| sr. unsec. unsub. notes 4.20%, 3/15/42 | 45,000 | 52,167 |
| Duke Energy Corp. sr. unsec. bonds 4.20%, 6/15/49 | 70,000 | 79,034 |
| Duke Energy Corp. sr. unsec. notes 3.15%, 8/15/27 | 55,000 | 59,356 |
| Duke Energy Indiana LLC sr. bonds 6.45%, 4/1/39 | 5,000 | 7,337 |
| Enbridge, Inc. company guaranty sr. unsec. | | |
| unsub. bonds 4.50%, 6/10/44 (Canada) | 15,000 | 17,698 |
| Enbridge, Inc. sr. unsec. unsub. bonds 4.25%, | | |
| 12/1/26 (Canada) | 30,000 | 33,815 |
| Energy Transfer LP jr. unsec. sub. FRN 6.625%, | | |
| perpetual maturity | 91,000 | 89,067 |
| Energy Transfer Operating LP company | | |
| guaranty sr. unsec. bonds 3.75%, 5/15/30 | 30,000 | 32,589 |
| Energy Transfer Operating LP company | | |
| guaranty sr. unsec. notes 5.875%, 1/15/24 | 12,000 | 13,297 |
| Energy Transfer Operating LP company | | |
| guaranty sr. unsec. notes 2.90%, 5/15/25 | 37,000 | 38,942 |
| Energy Transfer Operating LP sr. unsec. | | |
| unsub. bonds 6.125%, 12/15/45 | 6,000 | 7,648 |
| Enterprise Products Operating, LLC company | | |
| guaranty sr. unsec. notes 2.80%, 1/31/30 | 4,000 | 4,226 |
| Enterprise Products Operating, LLC company | | |
| guaranty sr. unsec. unsub. bonds 4.25%, 2/15/48 | 90,000 | 103,537 |
| IPALCO Enterprises, Inc. sr. notes 4.25%, 5/1/30 | 25,000 | 28,076 |
| IPALCO Enterprises, Inc. sr. sub. notes 3.70%, 9/1/24 | 5,000 | 5,379 |
| Kinder Morgan Energy Partners LP company | | |
| guaranty sr. unsec. notes 5.40%, 9/1/44 | 12,000 | 14,873 |
| Kinder Morgan Energy Partners LP company | | |
| guaranty sr. unsec. unsub. notes 3.45%, 2/15/23 | 25,000 | 26,011 |
| Kinder Morgan, Inc./DE company | | |
| guaranty sr. unsec. notes Ser. GMTN, 7.75%, 1/15/32 | 17,000 | 24,388 |
| NRG Energy, Inc. company guaranty sr. unsec. | | |
| notes 7.25%, 5/15/26 | 10,000 | 10,375 |
| NRG Energy, Inc. company guaranty sr. unsec. | | |
| notes 6.625%, 1/15/27 | 5,000 | 5,176 |
| NRG Energy, Inc. 144A company | | |
| guaranty sr. bonds 4.45%, 6/15/29 | 10,000 | 11,038 |
| NRG Energy, Inc. 144A company | | |
| guaranty sr. notes 3.75%, 6/15/24 | 21,000 | 22,362 |
| NRG Energy, Inc. 144A sr. unsec. bonds 5.25%, 6/15/29 | 5,000 | 5,319 |
| | | |
| CORPORATE BONDS | | |
| AND NOTES (14.4%)* cont. | Principal amount | Value |
| | | |
| Utilities and power cont. | | |
| NSTAR Electric Co. sr. unsec. | | |
| unsub. notes 2.375%, 10/15/22 (Canada) | $75,000 | $76,500 |
| Oncor Electric Delivery Co., LLC sr. notes | | |
| 3.75%, 4/1/45 | 75,000 | 86,630 |
| Pacific Gas and Electric Co. company | | |
| guaranty sr. unsec. unsub. notes 2.95%, 3/1/26 | 10,000 | 10,226 |
| Pacific Gas and Electric Co. notes 2.10%, 8/1/27 | 5,000 | 4,856 |
| Pacific Gas and Electric Co. sr. notes 3.30%, 3/15/27 | 15,000 | 15,521 |
| Pacific Gas and Electric Co. sr. notes 1.367%, 3/10/23 | 100,000 | 100,005 |
| PPL Capital Funding, Inc. company | | |
| guaranty sr. unsec. unsub. notes 4.20%, 6/15/22 | 60,000 | 61,546 |
| Public Service Electric & Gas Co. | | |
| sr. notes Ser. MTN, 5.50%, 3/1/40 | 25,000 | 34,226 |
| Texas Competitive Electric Holdings Co., LLC/TCEH | | |
| Finance, Inc. escrow company | | |
| guaranty sr. notes 11.50%, 10/1/21 F | 13,000 | — |
| Vistra Operations Co., LLC 144A company | | |
| guaranty sr. notes 4.30%, 7/15/29 | 36,000 | 39,129 |
| Vistra Operations Co., LLC 144A company | | |
| guaranty sr. notes 3.55%, 7/15/24 | 23,000 | 24,284 |
| Vistra Operations Co., LLC 144A company | | |
| guaranty sr. unsec. notes 5.625%, 2/15/27 | 10,000 | 10,375 |
| Vistra Operations Co., LLC 144A company | | |
| guaranty sr. unsec. notes 5.50%, 9/1/26 | 15,000 | 15,469 |
| Vistra Operations Co., LLC 144A company | | |
| guaranty sr. unsec. sub. notes 5.00%, 7/31/27 | 5,000 | 5,133 |
| | | 1,391,649 |
| | | |
| Total corporate bonds and notes (cost $17,604,166) | | $18,891,700 |
| |
| MORTGAGE-BACKED SECURITIES (2.9%)* | Principal amount | Value |
| | | |
| Agency collateralized mortgage obligations (0.1%) | | |
| Federal Home Loan Mortgage Corporation | | |
| REMICs IFB Ser. 3408, Class EK, ((-4.024 x | | |
| 1 Month US LIBOR) + 25.79%), 25.50%, 4/15/37 | $6,077 | $11,242 |
| REMICs IFB Ser. 3072, Class SM, ((-3.667 x | | |
| 1 Month US LIBOR) + 23.80%), 23.529%, 11/15/35 | 8,514 | 15,155 |
| REMICs IFB Ser. 3065, Class DC, ((-3 x 1 Month | | |
| US LIBOR) + 19.86%), 19.641%, 3/15/35 | 16,882 | 23,635 |
| REMICs IFB Ser. 2990, Class LB, ((-2.556 x | | |
| 1 Month US LIBOR) + 16.95%), 16.759%, 6/15/34 | 6,186 | 7,547 |
| REMICs IFB Ser. 3829, Class AS, IO, ((-1 x | | |
| 1 Month US LIBOR) + 6.95%), 6.877%, 3/15/41 | 28,818 | 6,031 |
| Federal National Mortgage Association | | |
| REMICs IFB Ser. 06-8, Class HP, ((-3.667 x | | |
| 1 Month US LIBOR) + 24.57%), 24.231%, 3/25/36 | 10,894 | 17,983 |
| REMICs IFB Ser. 07-53, Class SP, ((-3.667 x | | |
| 1 Month US LIBOR) + 24.20%), 23.865%, 6/25/37 | 8,812 | 15,509 |
| REMICs IFB Ser. 18-86, Class DS, IO, ((-1 x | | |
| 1 Month US LIBOR) + 6.10%), 6.009%, 12/25/48 | 84,822 | 8,138 |
| REMICs Ser. 06-46, Class OC, PO, zero %, 6/25/36 | 3,179 | 2,988 |
| Government National Mortgage Association | | |
| IFB Ser. 13-99, Class AS, IO, ((-1 x 1 Month | | |
| US LIBOR) + 6.05%), 5.957%, 6/20/43 | 51,162 | 10,520 |
| Ser. 10-9, Class UI, IO, 5.00%, 1/20/40 | 32,280 | 6,022 |
| Ser. 16-123, Class LI, IO, 3.50%, 3/20/44 | 73,979 | 5,581 |
| Ser. 13-14, IO, 3.50%, 12/20/42 | 105,590 | 9,490 |
| Ser. 12-141, Class WI, IO, 3.50%, 11/20/41 | 39,226 | 611 |
| Ser. 16-H16, Class EI, IO, 2.277%, 6/20/66 W | 148,781 | 11,426 |
| Ser. 15-H26, Class DI, IO, 1.92%, 10/20/65 W | 211,854 | 16,631 |
| | | 168,509 |
| |
| Putnam VT Global Asset Allocation Fund | 19 |
| | |
| MORTGAGE-BACKED | | |
| SECURITIES (2.9%)* cont. | Principal amount | Value |
| | | |
| Commercial mortgage-backed securities (1.7%) | | |
| Banc of America Commercial Mortgage Trust FRB | | |
| Ser. 07-1, Class XW, IO, 0.621%, 1/15/49 W | $20,304 | $— |
| BANK | | |
| FRB Ser. 17-BNK8, Class B, 4.062%, 11/15/50 W | 12,000 | 13,176 |
| FRB Ser. 19-BN22, Class C, 3.577%, 11/15/62 W | 44,000 | 46,804 |
| Barclays Commercial Mortgage Trust Ser. 19-C5, | | |
| Class AS, 3.366%, 11/15/52 W | 30,000 | 32,708 |
| Bear Stearns Commercial Mortgage Securities Trust | | |
| 144A FRB Ser. 06-PW14, Class X1, IO, | | |
| 0.762%, 12/11/38 W | 16,282 | 168 |
| Benchmark Mortgage Trust | | |
| Ser. 18-B8, Class AS, 4.532%, 1/15/52 W | 14,000 | 16,220 |
| Ser. 18-B1, Class B, 4.059%, 1/15/51 W | 15,000 | 16,712 |
| Ser. 19-B11, Class AS, 3.784%, 5/15/52 | 14,000 | 15,697 |
| CD Commercial Mortgage Trust | | |
| FRB Ser. 17-CD6, Class B, 3.911%, 11/13/50 W | 27,000 | 29,131 |
| FRB Ser. 17-CD6, Class AM, 3.709%, 11/13/50 W | 73,000 | 80,136 |
| CFCRE Commercial Mortgage Trust FRB Ser. 17-C8, | | |
| Class B, 4.199%, 6/15/50 W | 14,000 | 15,231 |
| Citigroup Commercial Mortgage Trust | | |
| FRB Ser. 13-GC17, Class C, 5.26%, 11/10/46 W | 11,000 | 11,532 |
| Ser. 18-C6, Class AS, 4.642%, 11/10/51 W | 13,000 | 15,254 |
| Ser. 13-GC11, Class B, 3.732%, 4/10/46 W | 77,000 | 80,097 |
| FRB Ser. 18-C6, Class XA, IO, 0.947%, 11/10/51 W | 1,523,294 | 76,857 |
| Citigroup Commercial Mortgage Trust 144A FRB | | |
| Ser. 06-C5, Class XC, IO, 0.652%, 10/15/49 W | 379,822 | 4 |
| COMM Mortgage Trust | | |
| FRB Ser. 12-LC4, Class C, 5.718%, 12/10/44 W | 29,000 | 26,797 |
| FRB Ser. 13-CR13, Class C, 5.046%, 11/10/46 W | 27,000 | 28,745 |
| FRB Ser. 14-CR17, Class C, 4.946%, 5/10/47 W | 26,000 | 27,594 |
| Ser. 13-CR11, Class AM, 4.715%, 8/10/50 W | 20,000 | 21,463 |
| Ser. 14-CR19, Class B, 4.703%, 8/10/47 W | 16,000 | 17,386 |
| Ser. 14-UBS2, Class B, 4.701%, 3/10/47 | 75,000 | 80,488 |
| FRB Ser. 14-UBS6, Class C, 4.593%, 12/10/47 W | 16,000 | 16,772 |
| Ser. 13-CR13, Class AM, 4.449%, 11/10/46 W | 85,000 | 91,365 |
| Ser. 15-CR27, Class AM, 3.984%, 10/10/48 | 59,000 | 64,626 |
| 3.829%, 2/10/48 W | 18,000 | 19,311 |
| Ser. 12-CR2, Class AM, 3.791%, 8/15/45 | 77,000 | 78,587 |
| Ser. 15-DC1, Class AM, 3.724%, 2/10/48 | 74,000 | 79,125 |
| FRB Ser. 14-CR18, Class XA, IO, 1.167%, 7/15/47 W | 82,957 | 2,140 |
| FRB Ser. 14-CR20, Class XA, IO, 1.154%, 11/10/47 W | 264,839 | 7,384 |
| FRB Ser. 14-CR17, Class XA, IO, 1.124%, 5/10/47 W | 539,778 | 12,506 |
| FRB Ser. 14-UBS6, Class XA, IO, 1.033%, 12/10/47 W | 831,084 | 19,260 |
| FRB Ser. 14-LC17, Class XA, IO, 0.888%, 10/10/47 W | 461,147 | 8,491 |
| Credit Suisse Commercial Mortgage Trust 144A FRB | | |
| Ser. 07-C2, Class AX, IO, 0.048%, 1/15/49 W | 481,887 | — |
| CSAIL Commercial Mortgage Trust | | |
| Ser. 19-C15, Class B, 4.476%, 3/15/52 | 31,000 | 35,009 |
| FRB Ser. 20-C19, Class XA, IO, 1.239%, 3/15/53 W | 1,047,505 | 82,959 |
| CSMC Trust FRB Ser. 16-NXSR, Class C, | | |
| 4.527%, 12/15/49 W | 70,000 | 60,889 |
| Federal Home Loan Mortgage Corporation | | |
| Multifamily Structured Pass-Through Certificates | | |
| FRB Ser. K118, Class X1, IO, 1.054%, 9/25/30 W | 942,764 | 72,532 |
| Multifamily Structured Pass-Through Certificates | | |
| FRB Ser. K740, Class X1, IO, 0.845%, 9/25/27 W | 383,472 | 16,302 |
| GS Mortgage Securities Corp., II 144A Ser. GC10, | | |
| Class B, 3.682%, 2/10/46 | 50,000 | 50,284 |
| | | |
| MORTGAGE-BACKED | | |
| SECURITIES (2.9%)* cont. | Principal amount | Value |
| | | |
| Commercial mortgage-backed securities cont. | | |
| GS Mortgage Securities Trust | | |
| FRB Ser. 15-GC32, Class B, 4.559%, 7/10/48 W | $73,000 | $79,566 |
| Ser. 15-GC32, Class AS, 4.018%, 7/10/48 W | 72,000 | 78,803 |
| Ser. 17-GS7, Class AS, 3.663%, 8/10/50 | 10,000 | 10,846 |
| Ser. 19-GC40, Class AS, 3.412%, 7/10/52 | 15,000 | 16,297 |
| Ser. 19-GC42, Class AS, 3.212%, 9/1/52 | 10,000 | 10,751 |
| Ser. 16-GS3, Class A4, 2.85%, 10/10/49 | 12,000 | 12,807 |
| FRB Ser. 15-GC30, Class XA, IO, 0.876%, 5/10/50 W | 368,297 | 9,079 |
| GS Mortgage Securities Trust 144A | | |
| FRB Ser. 13-GC14, Class B, 4.90%, 8/10/46 W | 13,000 | 13,848 |
| Ser. 12-GCJ9, Class C, 4.448%, 11/10/45 W | 17,000 | 17,332 |
| Ser. 12-GCJ9, Class B, 3.747%, 11/10/45 | 22,000 | 22,535 |
| FRB Ser. 06-GG8, Class X, IO, 1.27%, 11/10/39 W | 783,966 | 8 |
| JPMBB Commercial Mortgage Securities Trust | | |
| FRB Ser. 13-C15, Class C, 5.369%, 11/15/45 W | 43,000 | 45,897 |
| FRB Ser. 14-C22, Class C, 4.705%, 9/15/47 W | 13,000 | 12,219 |
| FRB Ser. 13-C12, Class B, 4.235%, 7/15/45 W | 12,000 | 12,385 |
| JPMorgan Chase Commercial Mortgage | | |
| Securities Trust | | |
| Ser. 06-LDP9, Class AMS, 5.337%, 5/15/47 | 9,291 | 8,023 |
| Ser. 12-C6, Class AS, 4.117%, 5/15/45 | 16,000 | 16,339 |
| FRB Ser. 07-LDPX, Class X, IO, 0.574%, 1/15/49 W | 13,792 | — |
| FRB Ser. 06-LDP8, Class X, IO, 0.297%, 5/15/45 W | 29,495 | — |
| LB-UBS Commercial Mortgage Trust 144A FRB | | |
| Ser. 06-C6, Class XCL, IO, 0.776%, 9/15/39 W | 365,981 | 391 |
| Mezz Cap Commercial Mortgage Trust 144A FRB | | |
| Ser. 06-C4, Class X, IO, 6.11%, 7/15/45 W | 3,443 | — |
| Morgan Stanley Bank of America Merrill Lynch Trust | | |
| FRB Ser. 14-C14, Class C, 5.218%, 2/15/47 W | 10,000 | 10,714 |
| FRB Ser. 15-C24, Class B, 4.489%, 5/15/48 W | 10,000 | 10,893 |
| Ser. 13-C13, Class AS, 4.266%, 11/15/46 | 75,000 | 79,680 |
| FRB Ser. 14-C17, Class XA, IO, 1.228%, 8/15/47 W | 181,843 | 4,468 |
| FRB Ser. 15-C26, Class XA, IO, 1.162%, 10/15/48 W | 643,360 | 21,066 |
| FRB Ser. 13-C12, Class XA, IO, 0.742%, 10/15/46 W | 422,450 | 4,481 |
| Morgan Stanley Bank of America Merrill Lynch | | |
| Trust 144A FRB Ser. 12-C5, Class E, 4.818%, 8/15/45 W | 15,000 | 15,200 |
| Morgan Stanley Capital I Trust FRB Ser. 18-H3, | | |
| Class XA, IO, 0.987%, 7/15/51 W | 1,622,114 | 72,618 |
| UBS-Barclays Commercial Mortgage Trust 144A | | |
| FRB Ser. 12-C4, Class XA, IO, 1.742%, 12/10/45 W | 184,073 | 2,545 |
| Wells Fargo Commercial Mortgage Trust | | |
| FRB Ser. 13-LC12, Class AS, 4.435%, 7/15/46 W | 19,000 | 19,282 |
| FRB Ser. 13-LC12, Class C, 4.435%, 7/15/46 W | 24,000 | 21,049 |
| FRB Ser. 20-C57, Class C, 4.158%, 8/15/53 W | 16,000 | 17,692 |
| Ser. 15-NXS3, Class AS, 3.972%, 9/15/57 W | 16,000 | 17,423 |
| WF-RBS Commercial Mortgage Trust | | |
| FRB Ser. 13-C11, Class C, 4.327%, 3/15/45 W | 47,000 | 48,290 |
| Ser. 13-C12, Class AS, 3.56%, 3/15/48 | 33,000 | 34,371 |
| Ser. 13-C11, Class AS, 3.311%, 3/15/45 | 12,000 | 12,366 |
| WF-RBS Commercial Mortgage Trust 144A | | |
| FRB Ser. 11-C3, Class D, 5.52%, 3/15/44 W | 29,990 | 14,995 |
| FRB Ser. 13-C15, Class D, 4.646%, 8/15/46 W | 43,000 | 21,600 |
| FRB Ser. 11-C5, Class XA, IO, 1.777%, 11/15/44 W | 161,647 | 48 |
| FRB Ser. 12-C10, Class XA, IO, 1.662%, 12/15/45 W | 287,144 | 4,288 |
| | | 2,169,937 |
| |
| 20 | Putnam VT Global Asset Allocation Fund |
| | |
| MORTGAGE-BACKED | | |
| SECURITIES (2.9%)* cont. | Principal amount | Value |
| | | |
| Residential mortgage-backed securities (non-agency) (1.1%) | | |
| Citigroup Mortgage Loan Trust, Inc. FRB | | |
| Ser. 05-2, Class 1A2A, 2.80%, 5/25/35 W | $12,396 | $12,866 |
| Countrywide Alternative Loan Trust | | |
| FRB Ser. 05-27, Class 1A1, 1.494%, 8/25/35 W | 18,611 | 15,853 |
| FRB Ser. 06-OA7, Class 1A2, (1 Month US LIBOR | | |
| + 0.94%), 1.056%, 6/25/46 | 66,319 | 60,802 |
| FRB Ser. 06-OA10, Class 4A1, (1 Month US LIBOR | | |
| + 0.38%), 0.472%, 8/25/46 | 82,879 | 75,008 |
| Ellington Financial Mortgage Trust 144A | | |
| Ser. 20-2, Class A2, 1.486%, 10/25/65 W | 82,557 | 83,126 |
| Federal Home Loan Mortgage Corporation Structured | | |
| Agency Credit Risk Debt FRN Ser. 16-DNA2, | | |
| Class M3, (1 Month US LIBOR + 4.65%), | | |
| 4.742%, 10/25/28 | 113,350 | 118,402 |
| Federal Home Loan Mortgage Corporation 144A | | |
| Structured Agency Credit Risk Trust FRB | | |
| Ser. 18-HRP2, Class M3, (1 Month US LIBOR | | |
| + 2.40%), 2.492%, 2/25/47 | 110,000 | 112,021 |
| Structured Agency Credit Risk Trust REMICs FRB | | |
| Ser. 20-DNA5, Class M1, (US 30 Day Average SOFR | | |
| + 1.30%), 1.318%, 10/25/50 | 8,892 | 8,892 |
| Federal National Mortgage Association | | |
| Connecticut Avenue Securities FRB Ser. 16-C01, | | |
| Class 2M2, (1 Month US LIBOR + 6.95%), | | |
| 7.042%, 8/25/28 | 7,606 | 8,094 |
| Connecticut Avenue Securities FRB Ser. 16-C01, | | |
| Class 1M2, (1 Month US LIBOR + 6.75%), | | |
| 6.842%, 8/25/28 | 29,286 | 31,333 |
| Connecticut Avenue Securities FRB Ser. 16-C02, | | |
| Class 1M2, (1 Month US LIBOR + 6.00%), | | |
| 6.092%, 9/25/28 | 32,635 | 34,429 |
| Connecticut Avenue Securities FRB Ser. 15-C04, | | |
| Class 1M2, (1 Month US LIBOR + 5.70%), | | |
| 5.792%, 4/25/28 | 24,495 | 25,950 |
| Connecticut Avenue Securities FRB Ser. 15-C04, | | |
| Class 2M2, (1 Month US LIBOR + 5.55%), | | |
| 5.642%, 4/25/28 | 43,746 | 46,200 |
| Connecticut Avenue Securities FRB Ser. 15-C03, | | |
| Class 2M2, (1 Month US LIBOR + 5.00%), | | |
| 5.092%, 7/25/25 | 3,578 | 3,633 |
| Connecticut Avenue Securities FRB Ser. 14-C04, | | |
| Class 2M2, (1 Month US LIBOR + 5.00%), | | |
| 5.092%, 11/25/24 | 1,871 | 1,915 |
| Connecticut Avenue Securities FRB Ser. 14-C04, | | |
| Class 1M2, (1 Month US LIBOR + 4.90%), | | |
| 4.992%, 11/25/24 | 3,678 | 3,807 |
| Connecticut Avenue Securities FRB Ser. 16-C05, | | |
| Class 2M2, (1 Month US LIBOR + 4.45%), | | |
| 4.542%, 1/25/29 | 19,301 | 20,178 |
| Connecticut Avenue Securities FRB Ser. 16-C07, | | |
| Class 2M2, (1 Month US LIBOR + 4.35%), | | |
| 4.442%, 5/25/29 | 27,292 | 28,544 |
| Connecticut Avenue Securities FRB Ser. 15-C01, | | |
| Class 1M2, (1 Month US LIBOR + 4.30%), | | |
| 4.392%, 2/25/25 | 7,042 | 7,202 |
| Connecticut Avenue Securities FRB Ser. 16-C06, | | |
| Class 1M2, (1 Month US LIBOR + 4.25%), | | |
| 4.342%, 4/25/29 | 29,160 | 30,368 |
| Connecticut Avenue Securities FRB Ser. 16-C04, | | |
| Class 1M2, (1 Month US LIBOR + 4.25%), | | |
| 4.342%, 1/25/29 | 122,079 | 127,279 |
| Connecticut Avenue Securities FRB Ser. 15-C02, | | |
| Class 1M2, (1 Month US LIBOR + 4.00%), | | |
| 4.092%, 5/25/25 | 2,910 | 2,974 |
| |
| MORTGAGE-BACKED | | |
| SECURITIES (2.9%)* cont. | Principal amount | Value |
| |
| Residential mortgage-backed securities (non-agency) cont. | | |
| Federal National Mortgage Association | | |
| Connecticut Avenue Securities FRB Ser. 17-C01, | | |
| Class 1M2, (1 Month US LIBOR + 3.55%), | | |
| 3.642%, 7/25/29 | $117,807 | $122,347 |
| Connecticut Avenue Securities FRB Ser. 14-C03, | | |
| Class 2M2, (1 Month US LIBOR + 2.90%), | | |
| 2.992%, 7/25/24 | 5,575 | 5,694 |
| Connecticut Avenue Securities FRB Ser. 17-C06, | | |
| Class 1M2, (1 Month US LIBOR + 2.65%), | | |
| 2.742%, 2/25/30 | 73,051 | 74,201 |
| Connecticut Avenue Securities FRB Ser. 14-C02, | | |
| Class 1M2, (1 Month US LIBOR + 2.60%), | | |
| 2.692%, 5/25/24 | 8,611 | 8,659 |
| Connecticut Avenue Securities FRB Ser. 17-C05, | | |
| Class 1M2A, (1 Month US LIBOR + 2.20%), | | |
| 2.292%, 1/25/30 | 33,857 | 33,963 |
| Long Beach Mortgage Loan Trust FRB Ser. 04-1, | | |
| Class A2, (1 Month US LIBOR + 0.80%), | | |
| 0.892%, 2/25/34 | 21,967 | 21,967 |
| New Century Home Equity Loan Trust FRB Ser. 03-4, | | |
| Class M1, (1 Month US LIBOR + 1.13%), | | |
| 1.217%, 10/25/33 | 43,250 | 43,955 |
| Park Place Securities, Inc. Asset-Backed | | |
| Pass-Through Certificates FRB Ser. 04-WCW2, | | |
| Class M3, (1 Month US LIBOR + 1.05%), | | |
| 1.142%, 10/25/34 | 30,000 | 29,784 |
| Verus Securitization Trust 144A Ser. 20-5, | | |
| Class A2, 1.578%, 5/25/65 | 87,668 | 87,895 |
| Visio Trust 144A Ser. 20-1, Class A3, 3.521%, 8/25/55 W | 117,000 | 121,938 |
| WaMu Mortgage Pass-Through Certificates Trust FRB | | |
| Ser. 05-AR9, Class A1C3, (1 Month US LIBOR | | |
| + 0.96%), 1.052%, 7/25/45 | 23,159 | 22,059 |
| | | 1,431,338 |
| | | |
| Total mortgage-backed securities (cost $3,792,606) | | $3,769,784 |
| |
| COMMODITY LINKED NOTES (1.5%)* ††† | Principal amount | Value |
| Goldman Sachs International 144A notes zero %, | | |
| 2022 (Indexed to the S&P GSCI Light Energy | | |
| Excess Return Index multiplied by 3) | $1,271,000 | $1,948,765 |
| Total commodity Linked Notes (cost $1,271,000) | | $1,948,765 |
| |
| FOREIGN GOVERNMENT AND AGENCY | | |
| BONDS AND NOTES (0.5%)* | Principal amount | Value |
| Dominican (Republic of) sr. unsec. | | |
| unsub. notes Ser. REGS, 5.50%, 1/27/25 | | |
| (Dominican Republic) | $130,000 | $142,838 |
| Indonesia (Republic of) sr. unsec. | | |
| unsub. notes Ser. REGS, 5.875%, 1/15/24 | | |
| (Indonesia) | 200,000 | 225,750 |
| Ivory Coast (Republic of) sr. unsec. | | |
| unsub. bonds Ser. REGS, 5.75%, 12/31/32 | | |
| (Ivory Coast) | 102,507 | 102,507 |
| Mexico (Government of) sr. unsec. bonds 5.55%, | | |
| 1/21/45 (Mexico) | 98,000 | 118,336 |
| Uruguay (Oriental Republic of) sr. unsec. | | |
| unsub. bonds 7.625%, 3/21/36 (Uruguay) | 10,000 | 15,250 |
| Venezuela (Republic of) sr. unsec. notes 9.00%, | | |
| 5/7/23 (Venezuela) (In default) † | 23,000 | 2,358 |
| Venezuela (Republic of) sr. unsec. | | |
| unsub. notes 8.25%, 10/13/24 | | |
| (Venezuela) (In default) † | 36,000 | 3,690 |
| Total foreign government and agency bonds | | |
| and notes (cost $612,608) | | $610,729 |
| |
| Putnam VT Global Asset Allocation Fund | 21 |
| | |
| SENIOR LOANS (0.4%)* c | Principal amount | Value |
| Adient US, LLC bank term loan FRN Ser. B, | | |
| (BBA LIBOR USD 3 Month + 3.50%), 3.604%, 4/1/28 | $5,000 | $4,998 |
| Alpha 3 BV bank term loan FRN Ser. B, (BBA LIBOR | | |
| USD 3 Month + 2.50%), 3.00%, 3/18/28 | 5,000 | 4,972 |
| AMC Entertainment Holdings, Inc. bank term loan | | |
| FRN Ser. B, (BBA LIBOR USD 3 Month + 3.00%), | | |
| 3.086%, 4/22/26 | 9,975 | 9,349 |
| American Airlines, Inc. bank term loan FRN | | |
| (BBA LIBOR USD 3 Month + 4.75%), 5.50%, 3/24/28 | 5,000 | 5,209 |
| AppleCaramel Buyer, LLC bank term loan FRN | | |
| (BBA LIBOR USD 3 Month + 4.00%), 4.50%, 10/19/27 | 9,950 | 9,962 |
| Arches Buyer, Inc. bank term loan FRN (BBA LIBOR | | |
| USD 3 Month + 3.25%), 3.75%, 12/6/27 | 14,925 | 14,877 |
| Blackstone CQP Holdco LP bank term loan FRN | | |
| Ser. B, (BBA LIBOR USD 3 Month + 3.75%), | | |
| 4.25%, 5/27/28 | 15,000 | 14,933 |
| Brand Industrial Services, Inc. bank term loan | | |
| FRN (BBA LIBOR USD 3 Month + 4.25%), 5.25%, 6/21/24 | 4,898 | 4,815 |
| Clarios Global LP bank term loan FRN Ser. B, | | |
| (1 Month US LIBOR + 3.25%), 3.354%, 4/30/26 | 32,124 | 31,803 |
| CP Atlas Buyer, Inc. bank term loan FRN Ser. B1, | | |
| (BBA LIBOR USD 3 Month + 3.75%), 4.25%, 11/23/27 | 20,948 | 20,880 |
| CPG International, Inc. bank term loan FRN | | |
| (BBA LIBOR USD 3 Month + 2.50%), 3.25%, 5/5/24 | 2,652 | 2,648 |
| Diamond BC BV bank term loan FRN (BBA LIBOR USD | | |
| 3 Month + 3.00%), 3.186%, 9/6/24 | 4,974 | 4,944 |
| Epicor Software Corp. bank term loan FRN | | |
| (BBA LIBOR USD 3 Month + 7.75%), 8.75%, 7/30/28 | 5,000 | 5,159 |
| Epicor Software Corp. bank term loan FRN Ser. B, | | |
| (BBA LIBOR USD 3 Month + 3.25%), 4.00%, 7/30/27 | 39,700 | 39,639 |
| Global Medical Response, Inc. bank term loan FRN | | |
| (BBA LIBOR USD 3 Month + 4.75%), 5.75%, 10/5/25 | 24,886 | 24,979 |
| Greeneden US Holdings II, LLC bank term loan FRN | | |
| (BBA LIBOR USD 3 Month + 4.00%), 4.75%, 10/8/27 | 9,975 | 9,993 |
| iHeartCommunications, Inc. bank term loan FRN | | |
| (BBA LIBOR USD 3 Month + 4.00%), 4.75%, 5/1/26 | 9,900 | 9,900 |
| IRB Holding Corp. bank term loan FRN Ser. B, | | |
| (BBA LIBOR USD 3 Month + 3.25%), 4.25%, 12/15/27 | 4,975 | 4,972 |
| Jazz Financing Lux Sarl bank term loan FRN | | |
| Ser. B, (1 Month US LIBOR + 3.50%), 4.00%, | | |
| 4/22/28 (Luxembourg) | 25,000 | 25,070 |
| Klockner-Pentaplast of America, Inc. bank term | | |
| loan FRN (BBA LIBOR USD 3 Month + 4.75%), | | |
| 5.25%, 2/9/26 | 9,975 | 10,025 |
| MajorDrive Holdings IV, LLC bank term loan FRN | | |
| (BBA LIBOR USD 3 Month + 4.00%), 4.50%, 5/12/28 | 20,000 | 20,006 |
| Navistar, Inc. bank term loan FRN Ser. B, | | |
| (BBA LIBOR USD 3 Month + 3.50%), 3.60%, 11/6/24 | 26,879 | 26,879 |
| One Call Corp. bank term loan FRN Ser. B, | | |
| (1 Month US LIBOR + 5.50%), 6.25%, 4/7/27 | 10,000 | 10,100 |
| Ortho-Clinical Diagnostics, Inc. bank term loan | | |
| FRN Ser. B, (BBA LIBOR USD 3 Month + 3.00%), | | |
| 3.089%, 6/30/25 | 29,267 | 29,235 |
| Polaris Newco, LLC bank term loan FRN Ser. B, | | |
| (BBA LIBOR USD 3 Month + 4.00%), 4.50%, 6/3/28 | 15,000 | 15,036 |
| Quorum Health Corp. bank term loan FRN (BBA LIBOR | | |
| USD 3 Month + 8.25%), 9.25%, 4/29/25 | 12,522 | 12,663 |
| Robertshaw Holdings Corp. bank term loan FRN | | |
| (BBA LIBOR USD 3 Month + 8.00%), 9.00%, 2/28/26 | 10,000 | 8,600 |
| Robertshaw Holdings Corp. bank term loan FRN | | |
| (BBA LIBOR USD 3 Month + 3.50%), 4.50%, 2/28/25 | 4,739 | 4,573 |
| Rocket Software, Inc. bank term loan FRN (1 Month | | |
| US LIBOR + 4.25%), 4.75%, 11/28/25 | 5,000 | 4,908 |
| |
| SENIOR LOANS (0.4%)* c cont. | Principal amount | Value |
| SCIH Salt Holdings, Inc. bank term loan FRN | | |
| Ser. B, (BBA LIBOR USD 3 Month + 4.00%), | | |
| 4.75%, 3/16/27 | $15,000 | $15,025 |
| Solenis International, LLC bank term loan FRN | | |
| (BBA LIBOR USD 3 Month + 8.50%), 8.635%, 6/26/26 | 5,000 | 4,984 |
| Solenis International, LLC bank term loan FRN | | |
| (BBA LIBOR USD 3 Month + 4.00%), 4.135%, 6/26/25 | 19,640 | 19,619 |
| Starfruit US Holdco, LLC bank term loan FRN | | |
| Ser. B, (1 Month US LIBOR + 3.00%), 3.133%, 10/1/25 | 9,660 | 9,582 |
| Terrier Media Buyer, Inc. bank term loan FRN | | |
| (1 Month US LIBOR + 3.50%), 3.604%, 12/17/26 | 34,737 | 34,544 |
| Titan Acquisition, Ltd. (United Kingdom) bank | | |
| term loan FRN Ser. B, (BBA LIBOR USD 3 Month | | |
| + 3.00%), 3.167%, 3/28/25 | 19,301 | 18,950 |
| United Airlines, Inc. bank term loan FRN Ser. B, | | |
| (BBA LIBOR USD 3 Month + 3.75%), 4.50%, 4/14/28 | 9,975 | 10,097 |
| Vertiv Group Corp. bank term loan FRN Ser. B, | | |
| (1 Month US LIBOR + 2.75%), 2.836%, 3/2/27 | 29,626 | 29,425 |
| Total senior loans (cost $529,354) | | $533,353 |
| |
| ASSET-BACKED SECURITIES (0.3%)* | Principal amount | Value |
| Mello Warehouse Securitization Trust 144A | | |
| FRB Ser. 20-1, Class A, (1 Month US LIBOR | | |
| + 0.90%), 0.992%, 10/25/53 | $25,000 | $25,000 |
| FRB Ser. 20-2, Class A, (1 Month US LIBOR | | |
| + 0.80%), 0.892%, 11/25/53 | 25,000 | 25,000 |
| FRB Ser. 21-2, Class A, (1 Month US LIBOR | | |
| + 0.75%), 0.842%, 4/25/55 | 28,000 | 28,000 |
| NewRez Warehouse Securitization Trust 144A FRB | | |
| Ser. 21-1, Class A, (1 Month US LIBOR + 0.75%), | | |
| 0.842%, 5/25/55 | 25,000 | 25,036 |
| Provident Funding Mortgage Warehouse | | |
| Securitization Trust 144A FRB Ser. 21-1, | | |
| Class A, (1 Month US LIBOR + 0.70%), 0.792%, 2/25/55 | 25,000 | 25,000 |
| RMF Buyout Issuance Trust 144A Ser. 20-HB1, | | |
| Class A1, 1.719%, 10/25/50 W | 119,983 | 119,983 |
| Station Place Securitization Trust 144A | | |
| FRB Ser. 20-15, Class A, (1 Month US LIBOR | | |
| + 1.37%), 1.461%, 12/10/21 | 25,000 | 25,000 |
| FRB Ser. 21-6, Class A, (1 Month US LIBOR | | |
| + 0.80%), 0.891%, 4/25/22 | 46,000 | 46,000 |
| FRB Ser. 21-10, Class A, (1 Month US LIBOR | | |
| + 0.75%), 0.854%, 8/8/22 | 46,000 | 46,000 |
| FRB Ser. 21-WL2, Class A, (1 Month US LIBOR | | |
| + 0.70%), 0.792%, 3/25/54 | 29,000 | 29,000 |
| FRB Ser. 21-WL1, Class A, (1 Month US LIBOR | | |
| + 0.65%), 0.742%, 1/26/54 | 29,000 | 29,000 |
| Towd Point Asset Trust 144A FRB Ser. 18-SL1, | | |
| Class A, (1 Month US LIBOR + 0.60%), 0.692%, | | |
| 1/25/46 | 36,848 | 36,665 |
| Total asset-backed securities (cost $459,683) | | $459,684 |
| |
| COLLATERALIZED LOAN OBLIGATIONS (0.1%)* | Principal amount | Value |
| Venture XXVII CLO, Ltd. 144A FRB Ser. 17-28A, | | |
| Class A2, (BBA LIBOR USD 3 Month + 1.11%), | | |
| 1.298%, 7/20/30 | $100,000 | $99,867 |
| Total collateralized loan obligations (cost $100,000) | | $99,867 |
| |
| CONVERTIBLE BONDS AND NOTES (—%)* | Principal amount | Value |
| DISH Network Corp. cv. sr. unsec. notes | | |
| 3.375%, 8/15/26 | $5,000 | $5,103 |
| fuboTV, Inc. 144A cv. sr. unsec. notes | | |
| 3.25%, 2/15/26 | 5,000 | 4,909 |
| |
| 22 | Putnam VT Global Asset Allocation Fund |
| | |
| CONVERTIBLE BONDS | | |
| AND NOTES (—%)* cont. | Principal amount | Value |
| Nabors Industries, Inc. company | | |
| guaranty cv. sr. unsec. notes 0.75%, 1/15/24 | $15,000 | $13,343 |
| Transocean, Inc. cv. company guaranty sr. unsec. | | |
| sub. notes 0.50%, 1/30/23 | 2,000 | 1,782 |
| Total convertible bonds and notes (cost $21,230) | | $25,137 |
| | | | | |
| PURCHASED OPTIONS | Expiration | | | | |
| OUTSTANDING (—%)* | date/ | Notional | | Contract | |
| Counterparty | strike price | amount | | amount | Value |
| Goldman Sachs International | | | | | |
| EUR/USD (Put) | Aug-21/$1.18 | 2,602,958 | EUR | 2,195,200 | $14,998 |
| Morgan Stanley & Co. International PLC | | | | | |
| GBP/USD (Put) | Aug-21/1.37 | 1,298,227 | GBP | 938,500 | 7,619 |
| Total purchased options outstanding (cost $15,502) | | | | | $22,617 |
| | | |
| PREFERRED STOCKS (—%)* | | Shares | Value |
| GMAC Capital Trust I Ser. 2, $1.91 cum. ARP | | $49 | $1,240 |
| Total preferred stocks (cost $1,225) | | | $1,240 |
| |
| | | Principal amount/ | |
| SHORT-TERM INVESTMENTS (10.1%)* | | shares | Value |
| Putnam Cash Collateral Pool, LLC 0.09% d | Shares | 308,250 | $308,250 |
| Putnam Short Term Investment Fund | | | |
| Class P 0.09% L | Shares | 10,955,004 | 10,955,004 |
| U.S. Treasury Bills 0.050%, 10/14/21 # ∆ § | | $900,000 | 899,875 |
| U.S. Treasury Bills 0.025%, 7/13/21 # | | 100,000 | 99,999 |
| U.S. Treasury Bills 0.016%, 9/2/21 § | | 200,000 | 199,982 |
| U.S. Treasury Bills 0.017%, 9/7/21 § | | 100,000 | 99,992 |
| U.S. Treasury Cash Management Bills | | | |
| 0.028%, 10/5/21 § | | 100,000 | 99,988 |
| U.S. Treasury Cash Management Bills | | | |
| 0.027%, 9/28/21 § | | 100,000 | 99,991 |
| U.S. Treasury Cash Management Bills | | | |
| 0.018%, 9/21/21 # § | | 500,000 | 499,945 |
| Total short-term investments (cost $13,263,083) | | | $13,263,026 |
| | | | |
| Total investments (cost $116,642,977) | | | $147,656,370 |
Key to holding’s currency abbreviations
| |
| EUR | Euro |
| GBP | British Pound |
| USD/$ | United States Dollar |
Key to holding’s abbreviations
| |
| ARP | Adjustable Rate Preferred Stock: the rate shown is the current interest rate at the close of the reporting period |
| FRB | Floating Rate Bonds: the rate shown is the current interest rate at the close of the reporting period. Rates may be subject to a cap or floor. For certain securities, |
| | the rate may represent a fixed rate currently in place at the close of the reporting period. |
| FRN | Floating Rate Notes: the rate shown is the current interest rate or yield at the close of the reporting period. Rates may be subject to a cap or floor. For certain |
| | securities, the rate may represent a fixed rate currently in place at the close of the reporting period. |
| IFB | Inverse Floating Rate Bonds, which are securities that pay interest rates that vary inversely to changes in the market interest rates. As interest rates rise, inverse |
| | floaters produce less current income. The rate shown is the current interest rate at the close of the reporting period. Rates may be subject to a cap or floor. |
| IO | Interest Only |
| PO | Principal Only |
| TBA | To Be Announced Commitments |
Notes to the fund’s portfolio
Unless noted otherwise, the notes to the fund’s portfolio are for the close of the fund’s reporting period, which ran from January 1, 2021 through June 30, 2021 (the reporting period). Within the following notes to the portfolio, references to “Putnam Management” represent Putnam Investment Management, LLC, the fund’s manager, an indirect wholly-owned subsidiary of Putnam Investments, LLC and references to “ASC 820” represent Accounting Standards Codification 820 Fair Value Measurements and Disclosures.
* Percentages indicated are based on net assets of $131,436,395.
††† The value of the commodity linked notes, which are marked to market daily, may be based on a multiple of the performance of the index. The multiple (or leverage) will increase the volatility of the note’s value relative to the change in the underlying index.
† This security is non-income-producing.
∆∆ This security is restricted with regard to public resale. The total fair value of this security and any other restricted securities (excluding 144A securities), if any, held at the close of the reporting period was $41,706, or less than 0.1% of net assets.
‡‡ Income may be received in cash or additional securities at the discretion of the issuer. The rate shown in parenthesis is the rate paid in kind, if applicable.
# This security, in part or in entirety, was pledged and segregated with the broker to cover margin requirements for futures contracts at the close of the reporting period. Collateral at period end totaled $1,138,831 and is included in Investments in securities on the Statement of assets and liabilities (Notes 1 and 9).
∆ This security, in part or in entirety, was pledged and segregated with the custodian for collateral on certain derivative contracts at the close of the reporting period. Collateral at period end totaled $59,988 and is included in Investments in securities on the Statement of assets and liabilities (Notes 1 and 9).
§ This security, in part or in entirety, was pledged and segregated with the custodian for collateral on the initial margin on certain centrally cleared derivative contracts at the close of the reporting period. Collateral at period end totaled $661,921 and is included in Investments in securities on the Statement of assets and liabilities (Notes 1 and 9).
## Forward commitment, in part or in entirety (Note 1).
c Senior loans are exempt from registration under the Securities Act of 1933, as amended, but contain certain restrictions on resale and cannot be sold publicly. These loans pay interest at rates which adjust periodically. The interest rates shown for senior loans are the current interest rates at the close of the reporting period. Senior loans are also subject to mandatory and/or optional prepayment which cannot be predicted. As a result, the remaining maturity may be substantially less than the stated maturity shown (Notes 1 and 7).
d Affiliated company. See Notes 1 and 5 to the financial statements regarding securities lending. The rate quoted in the security description is the annualized 7-day yield of the fund at the close of the reporting period.
F This security is valued by Putnam Management at fair value following procedures approved by the Trustees. Securities are classified as Level 3 for ASC 820 based on the securities’ valuation inputs (Note 1).
L Affiliated company (Note 5). The rate quoted in the security description is the annualized 7-day yield of the fund at the close of the reporting period.
R Real Estate Investment Trust.
S Security on loan, in part or in entirety, at the close of the reporting period (Note 1).
W The rate shown represents the weighted average coupon associated with the underlying mortgage pools. Rates may be subject to a cap or floor.
At the close of the reporting period, the fund maintained liquid assets totaling $24,141,956 to cover certain derivative contracts and delayed delivery securities.
Unless otherwise noted, the rates quoted in Short-term investments security descriptions represent the weighted average yield to maturity.
Debt obligations are considered secured unless otherwise indicated.
144A after the name of an issuer represents securities exempt from registration under Rule 144A of the Securities Act of 1933, as amended. These securities may be resold in transactions exempt from registration, normally to qualified institutional buyers.
See Note 1 to the financial statements regarding TBA commitments.
The dates shown on debt obligations are the original maturity dates.
| |
| Putnam VT Global Asset Allocation Fund | 23 |
| | | | | | |
| FORWARD CURRENCY CONTRACTS at 6/30/21 (aggregate face value $32,677,105) (Unaudited) | Unrealized |
| | | Contract | Delivery | | Aggregate | appreciation/ |
| Counterparty | Currency | type* | date | Value | face value | (depreciation) |
| Bank of America N.A. | | | | | | |
| | Australian Dollar | Buy | 7/21/21 | $69,002 | $69,328 | $(326) |
| | British Pound | Buy | 9/15/21 | 78,861 | 80,647 | (1,786) |
| | Canadian Dollar | Sell | 7/21/21 | 216,196 | 217,894 | 1,698 |
| | Euro | Buy | 9/15/21 | 983,177 | 1,016,891 | (33,714) |
| | Hong Kong Dollar | Buy | 8/18/21 | 55,026 | 55,013 | 13 |
| | Japanese Yen | Sell | 8/18/21 | 679,438 | 680,915 | 1,477 |
| | Swedish Krona | Buy | 9/15/21 | 58,885 | 59,095 | (210) |
| | Swiss Franc | Sell | 9/15/21 | 62,267 | 62,783 | 516 |
| Barclays Bank PLC | | | | | | |
| | Australian Dollar | Buy | 7/21/21 | 259,358 | 268,263 | (8,905) |
| | British Pound | Sell | 9/15/21 | 8,163 | 5,395 | (2,768) |
| | Canadian Dollar | Sell | 7/21/21 | 65,423 | 59,599 | (5,824) |
| | Euro | Sell | 9/15/21 | 383,343 | 394,161 | 10,818 |
| | Japanese Yen | Buy | 8/18/21 | 154,411 | 157,162 | (2,751) |
| | Swedish Krona | Buy | 9/15/21 | 156,533 | 162,109 | (5,576) |
| Citibank, N.A. | | | | | | |
| | Australian Dollar | Buy | 7/21/21 | 116,704 | 120,891 | (4,187) |
| | British Pound | Buy | 9/15/21 | 112,204 | 114,719 | (2,515) |
| | Canadian Dollar | Buy | 7/21/21 | 54,856 | 52,840 | 2,016 |
| | Danish Krone | Sell | 9/15/21 | 73,487 | 75,424 | 1,937 |
| | Euro | Sell | 9/15/21 | 54,509 | 56,056 | 1,547 |
| | Hong Kong Dollar | Sell | 8/18/21 | 30,115 | 30,107 | (8) |
| | Japanese Yen | Buy | 8/18/21 | 222,259 | 226,222 | (3,963) |
| | New Zealand Dollar | Sell | 7/21/21 | 47,321 | 47,724 | 403 |
| Credit Suisse International | | | | | | |
| | Australian Dollar | Sell | 7/21/21 | 80,853 | 80,793 | (60) |
| | British Pound | Sell | 9/15/21 | 797,743 | 804,718 | 6,975 |
| | Canadian Dollar | Sell | 7/21/21 | 105,597 | 108,989 | 3,392 |
| | Euro | Sell | 9/15/21 | 180,508 | 185,620 | 5,112 |
| Goldman Sachs International | | | | | | |
| | Australian Dollar | Buy | 7/21/21 | 220,432 | 230,509 | (10,077) |
| | British Pound | Buy | 9/15/21 | 1,814,085 | 1,858,629 | (44,544) |
| | Canadian Dollar | Sell | 7/21/21 | 87,769 | 122,700 | 34,931 |
| | Euro | Buy | 9/15/21 | 1,066,306 | 1,079,013 | (12,707) |
| | Japanese Yen | Sell | 8/18/21 | 1,010,877 | 1,025,081 | 14,204 |
| | New Zealand Dollar | Sell | 7/21/21 | 889,516 | 900,530 | 11,014 |
| | Norwegian Krone | Buy | 9/15/21 | 364,985 | 369,922 | (4,937) |
| | Swedish Krona | Buy | 9/15/21 | 857,113 | 887,750 | (30,637) |
| | Swiss Franc | Sell | 9/15/21 | 304,730 | 311,396 | 6,666 |
| HSBC Bank USA, National Association | | | | | | |
| | Australian Dollar | Buy | 7/21/21 | 91,727 | 98,052 | (6,325) |
| | British Pound | Buy | 9/15/21 | 36,110 | 37,488 | (1,378) |
| | Canadian Dollar | Buy | 7/21/21 | 172,150 | 171,753 | 397 |
| | Euro | Buy | 9/15/21 | 290,357 | 298,575 | (8,218) |
| | Hong Kong Dollar | Sell | 8/18/21 | 138,943 | 138,909 | (34) |
| | Japanese Yen | Sell | 8/18/21 | 107,861 | 108,490 | 629 |
| | New Zealand Dollar | Buy | 7/21/21 | 78,006 | 80,448 | (2,442) |
| | Swiss Franc | Buy | 9/15/21 | 27,723 | 26,286 | 1,437 |
| JPMorgan Chase Bank N.A. | | | | | | |
| | Australian Dollar | Buy | 7/21/21 | 155,555 | 160,368 | (4,813) |
| | British Pound | Buy | 9/15/21 | 860,556 | 879,785 | (19,229) |
| | Canadian Dollar | Sell | 7/21/21 | 175,296 | 170,039 | (5,257) |
| |
| 24 | Putnam VT Global Asset Allocation Fund |
| | | | | | |
| FORWARD CURRENCY CONTRACTS at 6/30/21 (aggregate face value $32,677,105) (Unaudited) cont. | Unrealized |
| | | Contract | Delivery | | Aggregate | appreciation/ |
| Counterparty | Currency | type* | date | Value | face value | (depreciation) |
| JPMorgan Chase Bank N.A. cont. | | | | | | |
| | Euro | Sell | 9/15/21 | $280,620 | $279,967 | $(653) |
| | Japanese Yen | Sell | 8/18/21 | 320,026 | 324,489 | 4,463 |
| | New Zealand Dollar | Sell | 7/21/21 | 181,664 | 183,172 | 1,508 |
| | Norwegian Krone | Buy | 9/15/21 | 85,240 | 87,073 | (1,833) |
| | Singapore Dollar | Sell | 8/18/21 | 164,943 | 164,392 | (551) |
| | South Korean Won | Sell | 8/18/21 | 245,268 | 246,656 | 1,388 |
| | Swedish Krona | Sell | 9/15/21 | 174,925 | 173,916 | (1,009) |
| | Swiss Franc | Sell | 9/15/21 | 91,938 | 98,327 | 6,389 |
| Morgan Stanley & Co. International PLC | | | | | | |
| | Australian Dollar | Buy | 7/21/21 | 230,858 | 234,398 | (3,540) |
| | British Pound | Buy | 9/15/21 | 1,328,466 | 1,350,856 | (22,390) |
| | Canadian Dollar | Sell | 7/21/21 | 58,244 | 74,055 | 15,811 |
| | Euro | Sell | 9/15/21 | 139,656 | 137,661 | (1,995) |
| | Japanese Yen | Buy | 8/18/21 | 80,127 | 83,860 | (3,733) |
| | New Zealand Dollar | Sell | 7/21/21 | 163,141 | 166,753 | 3,612 |
| | Norwegian Krone | Buy | 9/15/21 | 218,217 | 223,360 | (5,143) |
| | Swedish Krona | Buy | 9/15/21 | 896,587 | 928,654 | (32,067) |
| | Swiss Franc | Sell | 9/15/21 | 196,331 | 202,387 | 6,056 |
| NatWest Markets PLC | | | | | | |
| | Australian Dollar | Sell | 7/21/21 | 80,928 | 80,859 | (69) |
| | British Pound | Buy | 9/15/21 | 215,277 | 220,147 | (4,870) |
| | Canadian Dollar | Sell | 7/21/21 | 242,656 | 241,627 | (1,029) |
| | Euro | Sell | 9/15/21 | 913,824 | 916,578 | 2,754 |
| | Japanese Yen | Sell | 8/18/21 | 91,317 | 91,830 | 513 |
| | New Zealand Dollar | Sell | 7/21/21 | 337,396 | 332,832 | (4,564) |
| | Swedish Krona | Buy | 9/15/21 | 79,348 | 82,178 | (2,830) |
| | Swiss Franc | Sell | 9/15/21 | 537,447 | 540,342 | 2,895 |
| State Street Bank and Trust Co. | | | | | | |
| | Australian Dollar | Buy | 7/21/21 | 154,505 | 166,608 | (12,103) |
| | British Pound | Sell | 9/15/21 | 214,447 | 210,429 | (4,018) |
| | Canadian Dollar | Sell | 7/21/21 | 290,009 | 311,604 | 21,595 |
| | Euro | Buy | 9/15/21 | 292,970 | 310,968 | (17,998) |
| | Hong Kong Dollar | Sell | 8/18/21 | 482,223 | 482,071 | (152) |
| | Japanese Yen | Sell | 8/18/21 | 2,221,439 | 2,256,256 | 34,817 |
| | New Zealand Dollar | Sell | 7/21/21 | 298,043 | 300,310 | 2,267 |
| | Norwegian Krone | Buy | 9/15/21 | 362,847 | 365,074 | (2,227) |
| | Swedish Krona | Sell | 9/15/21 | 282,290 | 292,288 | 9,998 |
| | Swiss Franc | Sell | 9/15/21 | 97,029 | 106,878 | 9,849 |
| Toronto-Dominion Bank | | | | | | |
| | Australian Dollar | Buy | 7/21/21 | 76,503 | 78,711 | (2,208) |
| | British Pound | Sell | 9/15/21 | 219,705 | 224,864 | 5,159 |
| | Canadian Dollar | Buy | 7/21/21 | 30,655 | 24,885 | 5,770 |
| | Chinese Yuan (Offshore) | Sell | 8/18/21 | 690,233 | 686,768 | (3,465) |
| | Euro | Sell | 9/15/21 | 168,514 | 173,283 | 4,769 |
| | Japanese Yen | Buy | 8/18/21 | 480,007 | 488,945 | (8,938) |
| | Norwegian Krone | Buy | 9/15/21 | 389,754 | 405,393 | (15,639) |
| | Swedish Krona | Buy | 9/15/21 | 18,837 | 19,510 | (673) |
| UBS AG | | | | | | |
| | Australian Dollar | Buy | 7/21/21 | 234,457 | 241,808 | (7,351) |
| | British Pound | Buy | 9/15/21 | 225,377 | 230,676 | (5,299) |
| | Canadian Dollar | Sell | 7/21/21 | 46,789 | 50,329 | 3,540 |
| | Euro | Buy | 9/15/21 | 894,942 | 920,115 | (25,173) |
| |
| Putnam VT Global Asset Allocation Fund | 25 |
| | | | | | |
| FORWARD CURRENCY CONTRACTS at 6/30/21 (aggregate face value $32,677,105) (Unaudited) cont. | Unrealized |
| | | Contract | Delivery | | Aggregate | appreciation/ |
| Counterparty | Currency | type* | date | Value | face value | (depreciation) |
| UBS AG cont. | | | | | | |
| | Hong Kong Dollar | Sell | 8/18/21 | $74,669 | $74,651 | $(18) |
| | Japanese Yen | Buy | 8/18/21 | 967,418 | 988,208 | (20,790) |
| | New Zealand Dollar | Sell | 7/21/21 | 394,222 | 395,649 | 1,427 |
| | Norwegian Krone | Buy | 9/15/21 | 256,126 | 266,155 | (10,029) |
| | Swedish Krona | Buy | 9/15/21 | 171,277 | 177,442 | (6,165) |
| WestPac Banking Corp. | | | | | | |
| | Australian Dollar | Sell | 7/21/21 | 295,734 | 296,404 | 670 |
| | British Pound | Sell | 9/15/21 | 47,179 | 48,016 | 837 |
| | Canadian Dollar | Sell | 7/21/21 | 3,711 | 3,658 | (53) |
| | Euro | Sell | 9/15/21 | 27,433 | 28,210 | 777 |
| | Japanese Yen | Buy | 8/18/21 | 215,914 | 219,796 | (3,882) |
| | New Zealand Dollar | Sell | 7/21/21 | 213,949 | 215,693 | 1,744 |
| Unrealized appreciation | | | | | | 253,790 |
| Unrealized (depreciation) | | | | | | (455,648) |
| Total | | | | | | $(201,858) |
* The exchange currency for all contracts listed is the United States Dollar.
| | | | | |
| | | | | | Unrealized |
| | Number of | Notional | | Expiration | appreciation/ |
| FUTURES CONTRACTS OUTSTANDING at 6/30/21 (Unaudited) | contracts | amount | Value | date | (depreciation) |
| MSCI EAFE Index (Long) | 7 | $814,209 | $806,435 | Sep-21 | $(18,683) |
| MSCI Emerging Markets Index (Long) | 27 | 1,859,151 | 1,842,480 | Sep-21 | (7,493) |
| NASDAQ 100 Index E-Mini (Long) | 4 | 1,164,384 | 1,163,920 | Sep-21 | 47,756 |
| Russell 2000 Index E-Mini (Long) | 53 | 6,122,955 | 6,115,670 | Sep-21 | 5,216 |
| S&P 500 Index E-Mini (Long) | 2 | 429,180 | 428,860 | Sep-21 | 5,656 |
| S&P 500 Index E-Mini (Short) | 88 | 18,883,920 | 18,869,840 | Sep-21 | (262,939) |
| U.S. Treasury Bond 30 yr (Long) | 8 | 1,286,000 | 1,286,000 | Sep-21 | 30,505 |
| U.S. Treasury Bond Ultra 30 yr (Long) | 16 | 3,083,000 | 3,083,000 | Sep-21 | 119,628 |
| U.S. Treasury Note 2 yr (Long) | 30 | 6,609,609 | 6,609,609 | Sep-21 | (11,044) |
| U.S. Treasury Note 2 yr (Short) | 17 | 3,745,445 | 3,745,445 | Sep-21 | 6,462 |
| U.S. Treasury Note 5 yr (Long) | 43 | 5,307,477 | 5,307,477 | Sep-21 | (16,222) |
| U.S. Treasury Note 5 yr (Short) | 84 | 10,368,094 | 10,368,094 | Sep-21 | 31,311 |
| U.S. Treasury Note 10 yr (Long) | 18 | 2,385,000 | 2,385,000 | Sep-21 | 8,678 |
| U.S. Treasury Note Ultra 10 yr (Short) | 26 | 3,827,281 | 3,827,281 | Sep-21 | (56,387) |
| Unrealized appreciation | | | | | 255,212 |
| Unrealized (depreciation) | | | | | (372,768) |
| Total | | | | | $(117,556) |
| | | | | |
| WRITTEN OPTIONS OUTSTANDING at 6/30/21 (premiums $15,481) (Unaudited) | Expiration | Notional | | Contract | |
| Counterparty | date/strike price | Amount | | amount | Value |
| Goldman Sachs International | | | | | |
| EUR/USD (Call) | Aug-21/$1.21 | $2,602,958 | EUR | 2,195,200 | $5,154 |
| Morgan Stanley & Co. International PLC | | | | | |
| GBP/USD (Call) | Aug-21/1.42 | 1,298,227 | GBP | 938,500 | 2,326 |
| Total | | | | | $7,480 |
| | | |
| TBA SALE COMMITMENTS OUTSTANDING at 6/30/21 | Principal | Settlement | |
| (proceeds receivable $8,236,367) (Unaudited) | amount | date | Value |
| Uniform Mortgage-Backed Securities, 3.00%, 8/1/51 | $1,000,000 | 8/12/21 | $1,042,109 |
| Uniform Mortgage-Backed Securities, 3.00%, 7/1/51 | 1,000,000 | 7/14/21 | 1,042,500 |
| Uniform Mortgage-Backed Securities, 2.50%, 8/1/51 | 1,000,000 | 8/12/21 | 1,032,344 |
| Uniform Mortgage-Backed Securities, 2.50%, 7/1/51 | 3,000,000 | 7/14/21 | 3,102,891 |
| Uniform Mortgage-Backed Securities, 2.00%, 8/1/51 | 1,000,000 | 8/12/21 | 1,008,413 |
| Uniform Mortgage-Backed Securities, 2.00%, 7/1/51 | 1,000,000 | 7/14/21 | 1,010,405 |
| Total | | | $8,238,662 |
| |
| 26 | Putnam VT Global Asset Allocation Fund |
| | | | | | |
| CENTRALLY CLEARED INTEREST RATE SWAP CONTRACTS OUTSTANDING at 6/30/21 (Unaudited) |
| | | Upfront | | | | Unrealized |
| | | premium | Termination | Payments | Payments | appreciation/ |
| Notional amount | Value | received (paid) | date | made by fund | received by fund | (depreciation) |
| $3,027,000 | $43,770 | $3,596 | 4/20/31 | 1.57% — Semiannually | 3 month USD-LIBOR- | $(47,360) |
| | | | | | BBA — Quarterly | |
| 3,792,000 | 6,788 E | 7,187 | 9/15/23 | 3 month USD-LIBOR-BBA — | 0.30% — Semiannually | 399 |
| | | | | Quarterly | | |
| 2,893,000 | 9,981 E | (11,335) | 9/15/26 | 0.95% — Semiannually | 3 month USD-LIBOR- | (1,354) |
| | | | | | BBA — Quarterly | |
| 1,523,000 | 5,254 E | 5,998 | 9/15/26 | 3 month USD-LIBOR-BBA — | 0.95% — Semiannually | 743 |
| | | | | Quarterly | | |
| 3,291,000 | 57,198 E | (50,315) | 9/15/31 | 3 month USD-LIBOR-BBA — | 1.65% — Semiannually | 6,882 |
| | | | | Quarterly | | |
| 703,000 | 38,806 E | (36,654) | 9/15/51 | 3 month USD-LIBOR-BBA — | 2.00% — Semiannually | 2,152 |
| | | | | Quarterly | | |
| 277,000 | 15,290 E | 14,456 | 9/15/51 | 2.00% — Semiannually | 3 month USD-LIBOR- | (834) |
| | | | | | BBA — Quarterly | |
| Total | | $(67,067) | | | | $(39,372) |
E Extended effective date.
| | | | | | |
| OTC TOTAL RETURN SWAP CONTRACTS OUTSTANDING at 6/30/21 (Unaudited) |
| | | Upfront | | Payments | Total return | Unrealized |
| Swap counterparty/ | | premium | Termination | received (paid) | received by | appreciation/ |
| Notional amount | Value | received (paid) | date | by fund | or paid by fund | (depreciation) |
| Barclays Bank PLC | | | | | | |
| $76,109 | $75,838 | $— | 1/12/41 | 5.00% (1 month USD- | Synthetic MBX Index | $(98) |
| | | | | LIBOR) — Monthly | 5.00% 30 year Fannie Mae | |
| | | | | | pools — Monthly | |
| 20,820 | 20,733 | — | 1/12/40 | 5.00% (1 month USD- | Synthetic MBX Index | (39) |
| | | | | LIBOR) — Monthly | 5.00% 30 year Fannie Mae | |
| | | | | | pools — Monthly | |
| 14,880 | 14,820 | — | 1/12/38 | (6.50%) 1 month USD- | Synthetic MBX Index | 19 |
| | | | | LIBOR — Monthly | 6.50% 30 year Fannie Mae | |
| | | | | | pools — Monthly | |
| 1,103 | 1,105 | — | 1/12/43 | 3.50% (1 month USD- | Synthetic TRS Index | 15 |
| | | | | LIBOR) — Monthly | 3.50% 30 year Fannie Mae | |
| | | | | | pools — Monthly | |
| 7,126 | 7,119 | — | 1/12/41 | 4.00% (1 month USD- | Synthetic TRS Index | 83 |
| | | | | LIBOR) — Monthly | 4.00% 30 year Fannie Mae | |
| | | | | | pools — Monthly | |
| 5,772 | 5,767 | — | 1/12/41 | 4.00% (1 month USD- | Synthetic TRS Index | 67 |
| | | | | LIBOR) — Monthly | 4.00% 30 year Fannie Mae | |
| | | | | | pools — Monthly | |
| 650 | 650 | — | 1/12/42 | 4.00% (1 month USD- | Synthetic TRS Index | 8 |
| | | | | LIBOR) — Monthly | 4.00% 30 year Fannie Mae | |
| | | | | | pools — Monthly | |
| 2,501 | 2,454 | — | 1/12/41 | (5.00%) 1 month USD- | Synthetic TRS Index | 11 |
| | | | | LIBOR — Monthly | 5.00% 30 year Fannie Mae | |
| | | | | | pools — Monthly | |
| Citibank, N.A. | | | | | | |
| 2,764 | 2,754 | — | 1/12/41 | 5.00% (1 month USD- | Synthetic MBX Index | (4) |
| | | | | LIBOR) — Monthly | 5.00% 30 year Fannie Mae | |
| | | | | | pools — Monthly | |
| Credit Suisse International | | | | | | |
| 10,191 | 10,181 | — | 1/12/41 | (4.00%) 1 month USD- | Synthetic TRS Index | (118) |
| | | | | LIBOR — Monthly | 4.00% 30 year Fannie Mae | |
| | | | | | pools — Monthly | |
| Goldman Sachs International | | | | | | |
| 1,743,894 | 1,729,394 | — | 12/15/25 | (1 month USD-LIBOR- | A basket (GSGLPHCL) | (14,793) |
| | | | | BBA plus 0.35%) — | of common stocks — | |
| | | | | Monthly | Monthly* | |
| 5,229,101 | 5,120,708 | — | 12/15/25 | (1 month USD-LIBOR- | A basket (GSGLPWDL) | (101,736) |
| | | | | BBA plus 0.50%) — | of common stocks — | |
| | | | | Monthly | Monthly* | |
| |
| Putnam VT Global Asset Allocation Fund | 27 |
| | | | | | |
| OTC TOTAL RETURN SWAP CONTRACTS OUTSTANDING at 6/30/21 (Unaudited) cont. |
| | | Upfront | | Payments | Total return | Unrealized |
| Swap counterparty/ | | premium | Termination | received (paid) | received by | appreciation/ |
| Notional amount | Value | received (paid) | date | by fund | or paid by fund | (depreciation) |
| Goldman Sachs International cont. | | | | | |
| $5,165,157 | $5,028,007 | $— | 12/15/25 | 1 month USD-LIBOR- | A basket (GSGLPWDS) | $132,487 |
| | | | | BBA minus 0.15% — | of common stocks — | |
| | | | | Monthly | Monthly* | |
| 1,605 | 1,605 | — | 1/12/42 | 4.00% (1 month USD- | Synthetic TRS Index | 20 |
| | | | | LIBOR) — Monthly | 4.00% 30 year Fannie Mae | |
| | | | | | pools — Monthly | |
| 1,605 | 1,605 | — | 1/12/42 | 4.00% (1 month USD- | Synthetic TRS Index | 20 |
| | | | | LIBOR) — Monthly | 4.00% 30 year Fannie Mae | |
| | | | | | pools — Monthly | |
| JPMorgan Chase Bank N.A. | | | | | | |
| 3,071,544 | 3,022,397 | — | 2/5/22 | (1 month USD-LIBOR- | Russell 1000 Value Total | (49,199) |
| | | | | BBA plus 0.35%) — | Return Index — Monthly | |
| | | | | Monthly | | |
| JPMorgan Securities LLC | | | | | | |
| 2,707 | 2,705 | — | 1/12/41 | (4.00%) 1 month USD- | Synthetic TRS Index | (31) |
| | | | | LIBOR — Monthly | 4.00% 30 year Fannie Mae | |
| | | | | | pools — Monthly | |
| 3,859 | 3,859 | — | 1/12/42 | (4.00%) 1 month USD- | Synthetic TRS Index | (48) |
| | | | | LIBOR — Monthly | 4.00% 30 year Fannie Mae | |
| | | | | | pools — Monthly | |
| Upfront premium received | | — | | Unrealized appreciation | | 132,730 |
| Upfront premium (paid) | | — | | Unrealized (depreciation) | | (166,066) |
| Total | | $— | | Total | | $(33,336) |
* The 50 largest components, and any individual component greater than 1% of basket value, are shown below.
| | | | |
| A BASKET (GSGLPHCL) OF COMMON STOCKS | | | | |
| | | | | Percentage |
| Common stocks | Sector | Shares | Value | value |
| Waters Corp. | Health care | 258 | $89,241 | 5.16% |
| Mettler-Toledo International, Inc. | Health care | 60 | 83,185 | 4.81% |
| IQVIA Holdings, Inc. | Health care | 342 | 82,835 | 4.79% |
| Agilent Technologies, Inc. | Technology | 537 | 79,330 | 4.59% |
| Merck KGaA (Germany) | Health care | 412 | 79,057 | 4.57% |
| PerkinElmer, Inc. | Health care | 483 | 75,275 | 4.35% |
| Thermo Fisher Scientific, Inc. | Health care | 134 | 67,742 | 3.92% |
| Zoetis, Inc. | Health care | 347 | 64,657 | 3.74% |
| Illumina, Inc. | Health care | 131 | 62,564 | 3.62% |
| Alexion Pharmaceuticals, Inc. | Health care | 331 | 60,885 | 3.52% |
| Ipsen SA (France) | Health care | 574 | 59,676 | 3.45% |
| Pfizer, Inc. | Health care | 1,462 | 57,260 | 3.31% |
| Merck & Co., Inc. | Health care | 621 | 48,320 | 2.79% |
| Johnson & Johnson | Health care | 287 | 47,291 | 2.73% |
| Sumitomo Dainippon Pharma Co., Ltd. (Japan) | Health care | 2,216 | 46,481 | 2.69% |
| GlaxoSmithKline PLC (United Kingdom) | Health care | 2,285 | 44,804 | 2.59% |
| AbbVie, Inc. | Health care | 386 | 43,472 | 2.51% |
| Sanofi (France) | Health care | 412 | 43,210 | 2.50% |
| Biogen, Inc. | Health care | 118 | 40,688 | 2.35% |
| Viatris, Inc. | Health care | 2,751 | 39,944 | 2.31% |
| Perrigo Co. PLC | Health care | 847 | 39,079 | 2.26% |
| Sartorius Stedim Biotech (France) | Health care | 78 | 36,858 | 2.13% |
| Bayer AG (Germany) | Health care | 582 | 35,366 | 2.04% |
| Bristol-Myers Squibb Co. | Health care | 503 | 33,598 | 1.94% |
| AstraZeneca PLC (United Kingdom) | Health care | 278 | 33,302 | 1.93% |
| CSL, Ltd. (Australia) | Health care | 135 | 28,926 | 1.67% |
| Taisho Pharmaceutical Holdings Co., Ltd. (Japan) | Health care | 531 | 28,466 | 1.65% |
| Teva Pharmaceutical Industries, Ltd. ADR (Israel) | Health care | 2,608 | 26,160 | 1.51% |
| |
| 28 | Putnam VT Global Asset Allocation Fund |
| | | | |
| A BASKET (GSGLPHCL) OF COMMON STOCKS cont. | | | | |
| | | | | Percentage |
| Common stocks | Sector | Shares | Value | value |
| Amgen, Inc. | Health care | 107 | $26,037 | 1.51% |
| Gilead Sciences, Inc. | Health care | 370 | 25,481 | 1.47% |
| Eli Lilly and Co. | Health care | 104 | 23,835 | 1.38% |
| Eisai Co., Ltd. (Japan) | Health care | 206 | 20,284 | 1.17% |
| Galenica AG (Switzerland) | Health care | 151 | 19,547 | 1.13% |
| Hisamitsu Pharmaceutical Co., Inc. (Japan) | Health care | 360 | 17,727 | 1.03% |
| Takeda Pharmaceutical Co., Ltd. (Japan) | Health care | 511 | 17,125 | 0.99% |
| Shionogi & Co., Ltd. (Japan) | Health care | 245 | 12,790 | 0.74% |
| Hikma Pharmaceuticals PLC (United Kingdom) | Health care | 373 | 12,609 | 0.73% |
| Galapagos NV (Belgium) | Health care | 164 | 11,407 | 0.66% |
| Astellas Pharma, Inc. (Japan) | Health care | 598 | 10,426 | 0.60% |
| H Lundbeck A/S (Denmark) | Health care | 317 | 10,090 | 0.58% |
| UCB SA (Belgium) | Health care | 81 | 8,455 | 0.49% |
| Eurofins Scientific (Luxembourg) | Health care | 64 | 7,353 | 0.43% |
| Incyte Corp. | Health care | 86 | 7,274 | 0.42% |
| Grifols SA (Spain) | Health care | 235 | 6,373 | 0.37% |
| Regeneron Pharmaceuticals, Inc. | Health care | 8 | 4,601 | 0.27% |
| Novartis AG (Switzerland) | Health care | 46 | 4,156 | 0.24% |
| Daiichi Sankyo Co., Ltd. (Japan) | Health care | 124 | 2,680 | 0.15% |
| Recordati SpA (Italy) | Health care | 36 | 2,045 | 0.12% |
| Organon & Co. | Health care | 62 | 1,880 | 0.11% |
| Orion Oyj Class B (Finland) | Health care | 37 | 1,592 | 0.09% |
| |
| A BASKET (GSGLPWDL) OF COMMON STOCKS | | | | |
| | | | | Percentage |
| Common stocks | Sector | Shares | Value | value |
| Royal Bank of Canada (Canada) | Financials | 436 | $44,137 | 0.86% |
| Toronto-Dominion Bank (Canada) | Financials | 624 | 43,779 | 0.85% |
| Canadian Imperial Bank of Commerce (Canada) | Financials | 379 | 42,898 | 0.84% |
| Arrow Electronics, Inc. | Technology | 374 | 42,697 | 0.83% |
| Annaly Capital Management, Inc. | Financials | 4,742 | 42,107 | 0.82% |
| AGNC Investment Corp. | Financials | 2,445 | 41,292 | 0.81% |
| MetLife, Inc. | Financials | 687 | 41,135 | 0.80% |
| Segro PLC (United Kingdom) | Financials | 2,717 | 41,130 | 0.80% |
| Dover Corp. | Capital goods | 270 | 40,733 | 0.80% |
| Swisscom AG (Switzerland) | Communication services | 69 | 39,446 | 0.77% |
| Nippon Telegraph & Telephone Corp. (Japan) | Communication services | 1,483 | 38,642 | 0.75% |
| Mettler-Toledo International, Inc. | Health care | 27 | 38,039 | 0.74% |
| ITOCHU Corp. (Japan) | Consumer staples | 1,313 | 37,824 | 0.74% |
| NN Group NV (Netherlands) | Financials | 779 | 36,759 | 0.72% |
| Dexus Property Group (Australia) | Financials | 4,576 | 36,616 | 0.72% |
| Accenture PLC Class A | Technology | 115 | 33,915 | 0.66% |
| Ally Financial, Inc. | Financials | 675 | 33,633 | 0.66% |
| Ageas SA/NV (Belgium) | Financials | 606 | 33,613 | 0.66% |
| Church & Dwight Co., Inc. | Consumer staples | 384 | 32,577 | 0.64% |
| Knight-Swift Transportation Holdings, Inc. | Transportation | 708 | 32,430 | 0.63% |
| Sun Hung Kai Properties, Ltd. (Hong Kong) | Financials | 2,139 | 31,879 | 0.62% |
| 3i Group PLC (United Kingdom) | Financials | 1,947 | 31,597 | 0.62% |
| Allstate Corp. (The) | Financials | 239 | 31,128 | 0.61% |
| Rio Tinto PLC (United Kingdom) | Basic materials | 378 | 31,117 | 0.61% |
| CMS Energy Corp. | Utilities and power | 521 | 30,651 | 0.60% |
| Chubu Electric Power Co., Inc. (Japan) | Utilities and power | 2,444 | 29,872 | 0.58% |
| Mizuho Financial Group, Inc. (Japan) | Financials | 2,077 | 29,679 | 0.58% |
| National Bank of Canada (Canada) | Financials | 384 | 28,994 | 0.57% |
| AMETEK, Inc. | Conglomerates | 215 | 28,647 | 0.56% |
| Swiss Life Holding AG (Switzerland) | Financials | 58 | 28,038 | 0.55% |
| |
| Putnam VT Global Asset Allocation Fund | 29 |
| | | | |
| A BASKET (GSGLPWDL) OF COMMON STOCKS cont. | | | | |
| | | | | Percentage |
| Common stocks | Sector | Shares | Value | value |
| Open Text Corp. (Canada) | Technology | 539 | $27,917 | 0.55% |
| Comcast Corp. Class A | Communication services | 489 | 27,863 | 0.54% |
| Amphenol Corp. Class A | Technology | 402 | 27,535 | 0.54% |
| Kinder Morgan, Inc. | Utilities and power | 1,499 | 27,320 | 0.53% |
| DTE Energy Co. | Utilities and power | 211 | 27,284 | 0.53% |
| Power Assets Holdings, Ltd. (Hong Kong) | Utilities and power | 4,438 | 27,236 | 0.53% |
| Iberdrola SA (Spain) | Utilities and power | 2,224 | 27,106 | 0.53% |
| Canadian Apartment Properties REIT (Canada) | Financials | 572 | 26,887 | 0.53% |
| Old Dominion Freight Line, Inc. | Transportation | 106 | 26,802 | 0.52% |
| Metro, Inc. (Canada) | Consumer staples | 557 | 26,656 | 0.52% |
| Trane Technologies PLC | Capital goods | 144 | 26,348 | 0.51% |
| Zoetis, Inc. | Health care | 141 | 26,283 | 0.51% |
| AutoZone, Inc. | Consumer cyclicals | 17 | 25,306 | 0.49% |
| McDonald’s Corp. | Consumer staples | 109 | 25,256 | 0.49% |
| KDDI Corp. (Japan) | Communication services | 807 | 25,167 | 0.49% |
| Repsol SA (Spain) | Energy | 1,987 | 24,866 | 0.49% |
| Fujitsu, Ltd. (Japan) | Technology | 132 | 24,695 | 0.48% |
| Hershey Co. (The) | Consumer staples | 143 | 24,603 | 0.48% |
| Goodman Group (Australia) | Financials | 1,533 | 24,332 | 0.48% |
| Wolters Kluwer NV (Netherlands) | Consumer cyclicals | 242 | 24,262 | 0.47% |
| |
| A BASKET (GSGLPWDS) OF COMMON STOCKS | | | | |
| | | | | Percentage |
| Common stocks | Sector | Shares | Value | value |
| American Express Co. | Financials | 270 | $44,298 | 0.88% |
| Hang Seng Bank, Ltd. (Hong Kong) | Financials | 2,130 | 42,548 | 0.85% |
| Markel Corp. | Financials | 34 | 41,221 | 0.82% |
| U.S. Bancorp | Financials | 701 | 39,710 | 0.79% |
| Emera, Inc. (Canada) | Utilities and power | 845 | 38,404 | 0.76% |
| Equity Lifestyle Properties, Inc. | Financials | 514 | 38,231 | 0.76% |
| Zurich Insurance Group AG (Switzerland) | Financials | 93 | 37,271 | 0.74% |
| Lonza Group AG (Switzerland) | Health care | 52 | 37,081 | 0.74% |
| Xylem, Inc. | Capital goods | 309 | 36,797 | 0.73% |
| Ferrovial SA (Spain) | Basic materials | 1,185 | 34,764 | 0.69% |
| Fortis, Inc. (Canada) | Utilities and power | 759 | 33,819 | 0.67% |
| Essex Property Trust, Inc. | Financials | 110 | 33,298 | 0.66% |
| Southern Co. (The) | Utilities and power | 537 | 32,495 | 0.65% |
| Berkshire Hathaway, Inc. Class B | Financials | 116 | 32,370 | 0.64% |
| Edison International | Utilities and power | 559 | 32,315 | 0.64% |
| Ecolab, Inc. | Consumer cyclicals | 156 | 32,176 | 0.64% |
| Mid-America Apartment Communities, Inc. | Financials | 185 | 31,383 | 0.62% |
| ASML Holding NV (Netherlands) | Technology | 45 | 31,140 | 0.62% |
| Mitsubishi Estate Co., Ltd. (Japan) | Financials | 1,896 | 30,652 | 0.61% |
| Boeing Co. (The) | Capital goods | 126 | 30,270 | 0.60% |
| Exelon Corp. | Utilities and power | 668 | 29,589 | 0.59% |
| Alliant Energy Corp. | Utilities and power | 528 | 29,442 | 0.59% |
| Liberty Media Corp.-Liberty Formula One Class C | Consumer cyclicals | 598 | 29,344 | 0.58% |
| Aeon Co., Ltd. (Japan) | Consumer cyclicals | 1,086 | 29,173 | 0.58% |
| Autodesk, Inc. | Technology | 100 | 29,091 | 0.58% |
| T-Mobile US, Inc. | Communication services | 199 | 28,848 | 0.57% |
| Ventas, Inc. | Health care | 494 | 28,591 | 0.57% |
| Alexandria Real Estate Equities, Inc. | Financials | 156 | 28,442 | 0.57% |
| Telus Corp. (Canada) | Communication services | 1,263 | 28,409 | 0.57% |
| UDR, Inc. | Financials | 572 | 28,297 | 0.56% |
| Accor SA (France) | Consumer cyclicals | 739 | 27,593 | 0.55% |
| Svenska Handelsbanken AB (Sweden) | Financials | 2,432 | 27,435 | 0.55% |
| |
| 30 | Putnam VT Global Asset Allocation Fund |
| | | | |
| A BASKET (GSGLPWDS) OF COMMON STOCKS cont. | | | | |
| | | | | Percentage |
| Common stocks | Sector | Shares | Value | value |
| Novartis AG (Switzerland) | Health care | 291 | $26,501 | 0.53% |
| AIA Group, Ltd. (Hong Kong) | Financials | 2,114 | 26,274 | 0.52% |
| Enbridge, Inc. (Canada) | Utilities and power | 650 | 25,907 | 0.52% |
| American Tower Corp. | Communication services | 94 | 25,384 | 0.50% |
| Analog Devices, Inc. | Technology | 145 | 24,863 | 0.49% |
| KBC Group NV (Belgium) | Financials | 325 | 24,786 | 0.49% |
| Phillips 66 | Energy | 286 | 24,574 | 0.49% |
| Anheuser-Busch InBev SA/NV (Belgium) | Consumer staples | 339 | 24,439 | 0.49% |
| Agnico-Eagle Mines, Ltd. (Canada) | Basic materials | 388 | 23,536 | 0.47% |
| Heineken NV (Netherlands) | Consumer staples | 189 | 22,904 | 0.46% |
| Boston Scientific Corp. | Health care | 530 | 22,674 | 0.45% |
| Koninklijke KPN NV (Netherlands) | Communication services | 7,194 | 22,470 | 0.45% |
| Brookfield Asset Management, Inc. (Canada) | Conglomerates | 425 | 22,215 | 0.44% |
| Essity AB Class B (Sweden) | Consumer staples | 658 | 21,818 | 0.43% |
| BASF SE (Germany) | Basic materials | 275 | 21,670 | 0.43% |
| Marathon Petroleum Corp. | Energy | 359 | 21,668 | 0.43% |
| Hennes & Mauritz AB (Sweden) | Consumer cyclicals | 892 | 21,160 | 0.42% |
| James Hardie Industries PLC (CDI) (Australia) | Basic materials | 618 | 20,967 | 0.42% |
CENTRALLY CLEARED TOTAL RETURN SWAP CONTRACTS OUTSTANDING at 6/30/21 (Unaudited)
| | | | | | |
| | | Upfront | | Payments | Total return | Unrealized |
| | | premium | Termination | received (paid) | received by | appreciation/ |
| Notional amount | Value | received (paid) | date | by fund | or paid by fund | (depreciation) |
| $2,758,000 | $33,317 | $(46) | 4/1/31 | 2.686% — At maturity | USA Non Revised | $33,270 |
| | | | | | Consumer Price Index- | |
| | | | | | Urban (CPI-U) — At | |
| | | | | | maturity | |
| 8,385,000 | 4,696 | (85) | 4/15/26 | 2.79% — At maturity | USA Non Revised | (4,780) |
| | | | | | Consumer Price Index- | |
| | | | | | Urban (CPI-U) — At | |
| | | | | | maturity | |
| Total | | $(131) | | | | $28,490 |
OTC CREDIT DEFAULT CONTRACTS OUTSTANDING — PROTECTION SOLD at 6/30/21 (Unaudited)
| | | | | | | |
| | | Upfront | | | | | |
| | | premium | | | Termi- | | Unrealized |
| Swap counterparty/ | | received | Notional | | nation | Payments | appreciation/ |
| Referenced debt* | Rating*** | (paid)** | amount | Value | date | received by fund | (depreciation) |
| Bank of America N.A. | | | | | | | |
| CMBX NA BBB–.6 Index | BB–/P | $273 | $4,000 | $1,058 | 5/11/63 | 300 bp — Monthly | $(783) |
| CMBX NA BBB–.6 Index | BB–/P | 482 | 8,000 | 2,116 | 5/11/63 | 300 bp — Monthly | (1,630) |
| CMBX NA BBB–.6 Index | BB–/P | 926 | 15,000 | 3,968 | 5/11/63 | 300 bp — Monthly | (3,034) |
| CMBX NA BBB–.6 Index | BB–/P | 912 | 16,000 | 4,232 | 5/11/63 | 300 bp — Monthly | (3,312) |
| Citigroup Global Markets, Inc. | | | | | | | |
| CMBX NA A.6 Index | A-/P | 120 | 1,000 | 85 | 5/11/63 | 200 bp — Monthly | 35 |
| CMBX NA A.6 Index | A-/P | 239 | 2,000 | 169 | 5/11/63 | 200 bp — Monthly | 70 |
| CMBX NA A.6 Index | A-/P | 2,681 | 22,000 | 1,863 | 5/11/63 | 200 bp — Monthly | 825 |
| CMBX NA A.6 Index | A-/P | 3,929 | 33,000 | 2,795 | 5/11/63 | 200 bp — Monthly | 1,145 |
| CMBX NA A.6 Index | A-/P | 6,040 | 51,000 | 4,320 | 5/11/63 | 200 bp — Monthly | 1,738 |
| CMBX NA BB.11 Index | BB–/P | 1,130 | 2,000 | 178 | 11/18/54 | 500 bp — Monthly | 953 |
| CMBX NA BB.6 Index | B-/P | 2,008 | 13,583 | 6,057 | 5/11/63 | 500 bp — Monthly | (4,037) |
| CMBX NA BB.7 Index | B/P | 970 | 19,000 | 6,589 | 1/17/47 | 500 bp — Monthly | (5,604) |
| CMBX NA BBB–.10 Index | BBB–/P | 545 | 5,000 | 442 | 11/17/59 | 300 bp — Monthly | 106 |
| CMBX NA BBB–.11 Index | BBB–/P | 63 | 1,000 | 35 | 11/18/54 | 300 bp — Monthly | 29 |
| CMBX NA BBB–.12 Index | BBB–/P | 118 | 2,000 | 73 | 8/17/61 | 300 bp — Monthly | 46 |
| Credit Suisse International | | | | | | | |
| CMBX NA A.7 Index | BBB+/P | 37 | 1,000 | 56 | 1/17/47 | 200 bp — Monthly | (19) |
| CMBX NA A.7 Index | BBB+/P | 291 | 7,000 | 393 | 1/17/47 | 200 bp — Monthly | (99) |
| CMBX NA BB.7 Index | B/P | 401 | 3,000 | 1,040 | 1/17/47 | 500 bp — Monthly | (637) |
| |
| Putnam VT Global Asset Allocation Fund | 31 |
OTC CREDIT DEFAULT CONTRACTS OUTSTANDING — PROTECTION SOLD at 6/30/21 (Unaudited) cont.
| | | | | | | |
| | | Upfront | | | | | |
| | | premium | | | Termi- | | Unrealized |
| Swap counterparty/ | | received | Notional | | nation | Payments | appreciation/ |
| Referenced debt* | Rating*** | (paid)** | amount | Value | date | received by fund | (depreciation) |
| Credit Suisse International cont. | | | | | | |
| CMBX NA BBB–.6 Index | BB–/P | $6,863 | $73,000 | $19,309 | 5/11/63 | 300 bp — Monthly | $(12,409) |
| CMBX NA BBB–.7 Index | BB/P | 237 | 3,000 | 533 | 1/17/47 | 300 bp — Monthly | (295) |
| CMBX NA BBB–.7 Index | BB/P | 1,379 | 21,000 | 3,734 | 1/17/47 | 300 bp — Monthly | (2,344) |
| Goldman Sachs International | | | | | | | |
| CMBX NA A.13 Index | A-/P | (5) | 1,000 | 16 | 12/16/72 | 200 bp — Monthly | 11 |
| CMBX NA A.6 Index | A-/P | 61 | 2,000 | 169 | 5/11/63 | 200 bp — Monthly | (108) |
| CMBX NA A.6 Index | A-/P | 121 | 2,000 | 169 | 5/11/63 | 200 bp — Monthly | (48) |
| CMBX NA A.6 Index | A-/P | 1,969 | 23,000 | 1,948 | 5/11/63 | 200 bp — Monthly | 29 |
| CMBX NA A.6 Index | A-/P | 1,537 | 25,000 | 2,118 | 5/11/63 | 200 bp — Monthly | (572) |
| CMBX NA BBB–.14 Index | BBB–/P | 45 | 1,000 | 17 | 12/16/72 | 300 bp — Monthly | 28 |
| CMBX NA BBB–.6 Index | BB–/P | 110 | 1,000 | 265 | 5/11/63 | 300 bp — Monthly | (154) |
| CMBX NA BBB–.6 Index | BB–/P | 52 | 1,000 | 265 | 5/11/63 | 300 bp — Monthly | (212) |
| CMBX NA BBB–.6 Index | BB–/P | 122 | 1,000 | 265 | 5/11/63 | 300 bp — Monthly | (142) |
| CMBX NA BBB–.6 Index | BB–/P | 145 | 3,000 | 794 | 5/11/63 | 300 bp — Monthly | (647) |
| CMBX NA BBB–.6 Index | BB–/P | 325 | 3,000 | 794 | 5/11/63 | 300 bp — Monthly | (467) |
| CMBX NA BBB–.6 Index | BB–/P | 248 | 5,000 | 1,323 | 5/11/63 | 300 bp — Monthly | (1,072) |
| CMBX NA BBB–.6 Index | BB–/P | 1,313 | 14,000 | 3,703 | 5/11/63 | 300 bp — Monthly | (2,383) |
| CMBX NA BBB–.6 Index | BB–/P | 1,804 | 24,000 | 6,348 | 5/11/63 | 300 bp — Monthly | (4,532) |
| CMBX NA BBB–.7 Index | BB/P | 887 | 12,000 | 2,134 | 1/17/47 | 300 bp — Monthly | (1,241) |
| JPMorgan Securities LLC | | | | | | | |
| CMBX NA A.13 Index | A-/P | 242 | 3,000 | 47 | 12/16/72 | 200 bp — Monthly | 290 |
| CMBX NA BB.6 Index | B-/P | 3,089 | 5,821 | 2,596 | 5/11/63 | 500 bp — Monthly | 498 |
| CMBX NA BBB– .13 Index | BBB–/P | 92 | 1,000 | 36 | 12/16/72 | 300 bp — Monthly | 56 |
| CMBX NA BBB–.12 Index | BBB–/P | 63 | 1,000 | 36 | 8/17/61 | 300 bp — Monthly | 28 |
| Morgan Stanley & Co. International PLC | | | | | | |
| CMBX NA BB.6 Index | B-/P | 737 | 2,911 | 1,298 | 5/11/63 | 500 bp — Monthly | (559) |
| CMBX NA BB.6 Index | B-/P | 1,478 | 5,821 | 2,596 | 5/11/63 | 500 bp — Monthly | (1,112) |
| CMBX NA BBB–.12 Index | BBB–/P | 59 | 1,000 | 36 | 8/17/61 | 300 bp — Monthly | 23 |
| CMBX NA BBB–.12 Index | BBB–/P | 215 | 5,000 | 182 | 8/17/61 | 300 bp — Monthly | 36 |
| Upfront premium received | | 44,358 | | Unrealized appreciation | | 5,946 |
| Upfront premium (paid) | | (5) | | Unrealized (depreciation) | | (47,452) |
| Total | | $44,353 | | Total | | $(41,506) |
* Payments related to the referenced debt are made upon a credit default event.
** Upfront premium is based on the difference between the original spread on issue and the market spread on day of execution.
*** Ratings for an underlying index represent the average of the ratings of all the securities included in that index. The Moody’s, Standard & Poor’s or Fitch ratings are believed to be the most recent ratings available at June 30, 2021. Securities rated by Fitch are indicated by “/F.” Securities rated by Putnam are indicated by “/P.” The Putnam rating categories are comparable to the Standard & Poor’s classifications.
OTC CREDIT DEFAULT CONTRACTS OUTSTANDING — PROTECTION PURCHASED at 6/30/21 (Unaudited)
| | | | | | |
| | Upfront | | | | | |
| | premium | | | Termi- | Payments | Unrealized |
| Swap counterparty/ | received | Notional | | nation | (paid) | appreciation/ |
| Referenced debt* | (paid)** | amount | Value | date | by fund | (depreciation) |
| Citigroup Global Markets, Inc. | | | | | | |
| CMBX NA BB.10 Index | $(1,785) | $7,000 | $1,707 | 11/17/59 | (500 bp) — Monthly | $(84) |
| CMBX NA BB.10 Index | (219) | 2,000 | 488 | 11/17/59 | (500 bp) — Monthly | 267 |
| CMBX NA BB.10 Index | (209) | 2,000 | 488 | 11/17/59 | (500 bp) — Monthly | 277 |
| CMBX NA BB.11 Index | (518) | 4,000 | 356 | 11/18/54 | (500 bp) — Monthly | (165) |
| CMBX NA BB.11 Index | (189) | 2,000 | 178 | 11/18/54 | (500 bp) — Monthly | (12) |
| CMBX NA BB.11 Index | (69) | 1,000 | 89 | 11/18/54 | (500 bp) — Monthly | 20 |
| CMBX NA BB.8 Index | (248) | 1,931 | 693 | 10/17/57 | (500 bp) — Monthly | 443 |
| CMBX NA BB.9 Index | (929) | 9,000 | 1,991 | 9/17/58 | (500 bp) — Monthly | 1,054 |
| CMBX NA BB.9 Index | (258) | 4,000 | 885 | 9/17/58 | (500 bp) — Monthly | 623 |
| CMBX NA BB.9 Index | (121) | 3,000 | 664 | 9/17/58 | (500 bp) — Monthly | 540 |
| CMBX NA BBB– .10 Index | (946) | 6,000 | 530 | 11/17/59 | (300 bp) — Monthly | (419) |
| |
| 32 | Putnam VT Global Asset Allocation Fund |
OTC CREDIT DEFAULT CONTRACTS OUTSTANDING — PROTECTION PURCHASED at 6/30/21 (Unaudited) cont.
| | | | | | |
| | Upfront | | | | | |
| | premium | | | Termi- | Payments | Unrealized |
| Swap counterparty/ | received | Notional | | nation | (paid) | appreciation/ |
| Referenced debt* | (paid)** | amount | Value | date | by fund | (depreciation) |
| Citigroup Global Markets, Inc. cont. | | | | | | |
| CMBX NA BBB– .10 Index | $(437) | $2,000 | $177 | 11/17/59 | (300 bp) — Monthly | $(261) |
| CMBX NA BBB– .6 Index | (2,545) | 8,000 | 2,116 | 5/11/63 | (300 bp) — Monthly | (433) |
| CMBX NA BBB–.10 Index | (127) | 1,000 | 88 | 11/17/59 | (300 bp) — Monthly | (40) |
| CMBX NA BBB–.12 Index | (60) | 1,000 | 36 | 8/17/61 | (300 bp) — Monthly | (24) |
| CMBX NA BBB–.12 Index | (352) | 1,000 | 36 | 8/17/61 | (300 bp) — Monthly | (317) |
| CMBX NA BBB–.6 Index | (700) | 11,000 | 2,910 | 5/11/63 | (300 bp) — Monthly | 2,204 |
| CMBX NA BBB–.8 Index | (316) | 2,000 | 277 | 10/17/57 | (300 bp) — Monthly | (40) |
| CMBX NA BBB–.8 Index | (317) | 2,000 | 277 | 10/17/57 | (300 bp) — Monthly | (42) |
| CMBX NA BBB–.8 Index | (313) | 2,000 | 277 | 10/17/57 | (300 bp) — Monthly | (37) |
| CMBX NA BBB–.8 Index | (286) | 2,000 | 277 | 10/17/57 | (300 bp) — Monthly | (10) |
| CMBX NA BBB–.8 Index | (157) | 1,000 | 138 | 10/17/57 | (300 bp) — Monthly | (19) |
| Credit Suisse International | | | | | | |
| CMBX NA BB.10 Index | (476) | 4,000 | 975 | 11/17/59 | (500 bp) — Monthly | 496 |
| CMBX NA BB.10 Index | (534) | 4,000 | 975 | 11/17/59 | (500 bp) — Monthly | 438 |
| CMBX NA BB.10 Index | (249) | 2,000 | 488 | 11/17/59 | (500 bp) — Monthly | 237 |
| CMBX NA BB.7 Index | (512) | 28,136 | 12,546 | 5/11/63 | (500 bp) — Monthly | 12,011 |
| CMBX NA BB.7 Index | (1,151) | 7,000 | 2,428 | 1/17/47 | (500 bp) — Monthly | 1,270 |
| CMBX NA BB.7 Index | (1,291) | 7,000 | 2,428 | 1/17/47 | (500 bp) — Monthly | 1,131 |
| CMBX NA BB.9 Index | (1,203) | 12,000 | 2,654 | 9/17/58 | (500 bp) — Monthly | 1,441 |
| Goldman Sachs International | | | | | | |
| CMBX NA BB.7 Index | (303) | 2,000 | 694 | 1/17/47 | (500 bp) — Monthly | 389 |
| CMBX NA BB.10 Index | (603) | 2,000 | 488 | 11/17/59 | (500 bp) — Monthly | (117) |
| CMBX NA BB.10 Index | (783) | 2,000 | 488 | 11/17/59 | (500 bp) — Monthly | (297) |
| CMBX NA BB.11 Index | (263) | 2,000 | 178 | 11/18/54 | (500 bp) — Monthly | (86) |
| CMBX NA BB.7 Index | (2,234) | 11,000 | 3,815 | 1/17/47 | (500 bp) — Monthly | 1,572 |
| CMBX NA BB.7 Index | (983) | 6,000 | 2,081 | 1/17/47 | (500 bp) — Monthly | 1,093 |
| CMBX NA BB.8 Index | (113) | 965 | 347 | 10/17/57 | (500 bp) — Monthly | 233 |
| CMBX NA BBB– .10 Index | (1,312) | 6,000 | 530 | 11/17/59 | (300 bp) — Monthly | (785) |
| CMBX NA BBB– .10 Index | (624) | 4,000 | 354 | 11/17/59 | (300 bp) — Monthly | (272) |
| CMBX NA BBB– .12 Index | (780) | 4,000 | 145 | 8/17/61 | (300 bp) — Monthly | (637) |
| CMBX NA BBB–.6 Index | (3,543) | 13,000 | 3,439 | 5/11/63 | (300 bp) — Monthly | (111) |
| CMBX NA BBB–.6 Index | (400) | 8,000 | 2,116 | 5/11/63 | (300 bp) — Monthly | 1,712 |
| JPMorgan Securities LLC | | | | | | |
| CMBX NA A.7 Index | (169) | 8,000 | 449 | 1/17/47 | (200 bp) — Monthly | 277 |
| CMBX NA BB.11 Index | (1,636) | 3,000 | 267 | 11/18/54 | (500 bp) — Monthly | (1,371) |
| CMBX NA BB.17 Index | (979) | 2,000 | 694 | 1/17/47 | (500 bp) — Monthly | (287) |
| CMBX NA BBB– .10 Index | (165) | 1,000 | 88 | 11/17/59 | (300 bp) — Monthly | (77) |
| CMBX NA BBB–.10 Index | (2,613) | 23,000 | 2,033 | 11/17/59 | (300 bp) — Monthly | (591) |
| CMBX NA BBB–.10 Index | (563) | 2,000 | 177 | 11/17/59 | (300 bp) — Monthly | (388) |
| CMBX NA BBB–.10 Index | (298) | 1,000 | 88 | 11/17/59 | (300 bp) — Monthly | (210) |
| CMBX NA BBB–.11 Index | (403) | 2,000 | 69 | 11/18/54 | (300 bp) — Monthly | (335) |
| CMBX NA BBB–.6 Index | (15,346) | 48,000 | 12,696 | 5/11/63 | (300 bp) — Monthly | (2,674) |
| CMBX NA BBB–.7 Index | (6,573) | 28,000 | 4,978 | 1/17/47 | (300 bp) — Monthly | (1,609) |
| Merrill Lynch International | | | | | | |
| CMBX NA BB.10 Index | (228) | 4,000 | 975 | 11/17/59 | (500 bp) — Monthly | 744 |
| CMBX NA BB.11 Index | (1,483) | 3,000 | 267 | 11/18/54 | (500 bp) — Monthly | (1,218) |
| CMBX NA BB.9 Index | (117) | 3,000 | 664 | 9/17/58 | (500 bp) — Monthly | 544 |
| CMBX NA BBB–.7 Index | (328) | 4,000 | 711 | 1/17/47 | (300 bp) — Monthly | 381 |
| CMBX NA BBB–.9 Index | (185) | 1,000 | 78 | 9/17/58 | (300 bp) — Monthly | (108) |
| Morgan Stanley & Co. International PLC | | | | | | |
| CMBX NA BBB–.7 Index | (408) | 4,000 | 711 | 1/17/47 | (300 bp) — Monthly | 302 |
| CMBX NA BB.10 Index | (210) | 2,000 | 488 | 11/17/59 | (500 bp) — Monthly | 276 |
| CMBX NA BB.7 Index | (804) | 4,000 | 1,387 | 1/17/47 | (500 bp) — Monthly | 579 |
| |
| Putnam VT Global Asset Allocation Fund | 33 |
OTC CREDIT DEFAULT CONTRACTS OUTSTANDING — PROTECTION PURCHASED at 6/30/21 (Unaudited) cont.
| | | | | | |
| | Upfront | | | | | |
| | premium | | | Termi- | Payments | Unrealized |
| Swap counterparty/ | received | Notional | | nation | (paid) | appreciation/ |
| Referenced debt* | (paid)** | amount | Value | date | by fund | (depreciation) |
| Morgan Stanley & Co. International PLC cont. | | | | | | |
| CMBX NA BB.7 Index | $(193) | $1,000 | $347 | 1/17/47 | (500 bp) — Monthly | $153 |
| CMBX NA BB.9 Index | (61) | 1,000 | 221 | 9/17/58 | (500 bp) — Monthly | 160 |
| CMBX NA BB.9 Index | (62) | 1,000 | 221 | 9/17/58 | (500 bp) — Monthly | 159 |
| CMBX NA BBB– . 8 Index | (311) | 2,000 | 277 | 10/17/57 | (300 bp) — Monthly | (35) |
| CMBX NA BBB– . 8 Index | (157) | 1,000 | 138 | 10/17/57 | (300 bp) — Monthly | (19) |
| CMBX NA BBB– .10 Index | (6,792) | 39,000 | 3,448 | 11/17/59 | (300 bp) — Monthly | (3,364) |
| CMBX NA BBB– .10 Index | (859) | 6,000 | 530 | 11/17/59 | (300 bp) — Monthly | (332) |
| CMBX NA BBB– .10 Index | (970) | 6,000 | 530 | 11/17/59 | (300 bp) — Monthly | (442) |
| CMBX NA BBB– .10 Index | (240) | 2,000 | 177 | 11/17/59 | (300 bp) — Monthly | (64) |
| CMBX NA BBB– .10 Index | (218) | 1,000 | 88 | 11/17/59 | (300 bp) — Monthly | (130) |
| CMBX NA BBB–.10 Index | (247) | 2,000 | 177 | 11/17/59 | (300 bp) — Monthly | (71) |
| CMBX NA BBB–.10 Index | (127) | 1,000 | 88 | 11/17/59 | (300 bp) — Monthly | (39) |
| CMBX NA BBB–.13 Index | (62) | 1,000 | 36 | 12/16/72 | (300 bp) — Monthly | (26) |
| CMBX NA BBB–.8 Index | (429) | 3,000 | 415 | 10/17/57 | (300 bp) — Monthly | (16) |
| CMBX NA BBB–.8 Index | (156) | 1,000 | 138 | 10/17/57 | (300 bp) — Monthly | (18) |
| CMBX NA BBB–.8 Index | (155) | 1,000 | 138 | 10/17/57 | (300 bp) — Monthly | (17) |
| CMBX NA BBB–.8 Index | (156) | 1,000 | 138 | 10/17/57 | (300 bp) — Monthly | (18) |
| Upfront premium received | — | | | Unrealized appreciation | 31,026 |
| Upfront premium (paid) | (72,161) | | | Unrealized (depreciation) | (17,667) |
| Total | $(72,161) | | | Total | $13,359 |
* Payments related to the referenced debt are made upon a credit default event.
** Upfront premium is based on the difference between the original spread on issue and the market spread on day of execution.
CENTRALLY CLEARED CREDIT DEFAULT CONTRACTS OUTSTANDING — PROTECTION SOLD at 6/30/21 (Unaudited)
| | | | | | | |
| | | Upfront | | | | | |
| | | premium | | | Termi- | Payments | Unrealized |
| | | received | Notional | | nation | received | appreciation/ |
| Referenced debt* | Rating*** | (paid)** | amount | Value | date | by fund | (depreciation) |
| NA HY Series 36 Index | B+/P | $(170,422) | $1,991,000 | $203,082 | 6/20/26 | 500 bp — | $35,426 |
| | | | | | | Quarterly | |
| NA IG Series 36 Index | BBB+/P | (133,236) | 5,950,000 | 151,428 | 6/20/26 | 100 bp — | 19,844 |
| | | | | | | Quarterly | |
| Total | | $(303,658) | | | | | $55,270 |
* Payments related to the referenced debt are made upon a credit default event.
** Upfront premium is based on the difference between the original spread on issue and the market spread on day of execution.
*** Ratings for an underlying index represent the average of the ratings of all the securities included in that index. The Moody’s, Standard & Poor’s or Fitch ratings are believed to be the most recent ratings available at June 30, 2021. Securities rated by Fitch are indicated by “/F.” Securities rated by Putnam are indicated by “/P.” The Putnam rating categories are comparable to the Standard & Poor’s classifications.
| |
| 34 | Putnam VT Global Asset Allocation Fund |
ASC 820 establishes a three-level hierarchy for disclosure of fair value measurements. The valuation hierarchy is based upon the transparency of inputs to the valuation of the fund’s investments. The three levels are defined as follows:
Level 1: Valuations based on quoted prices for identical securities in active markets.
Level 2: Valuations based on quoted prices in markets that are not active or for which all significant inputs are observable, either directly or indirectly.
Level 3: Valuations based on inputs that are unobservable and significant to the fair value measurement.
The following is a summary of the inputs used to value the fund’s net assets as of the close of the reporting period:
| | | |
| | | | Valuation inputs | |
| Investments in securities: | Level 1 | Level 2 | Level 3 |
| Common stocks*: | | | |
| Basic materials | $3,297,895 | $— | $— |
| Capital goods | 5,474,786 | — | — |
| Communication services | 2,661,890 | — | — |
| Conglomerates | 222,278 | — | — |
| Consumer cyclicals | 11,955,888 | — | — |
| Consumer staples | 6,427,933 | — | — |
| Energy | 2,006,628 | — | 38 |
| Financials | 12,142,042 | — | — |
| Government | 35,314 | — | — |
| Health care | 10,877,100 | — | — |
| Technology | 28,475,163 | — | — |
| Transportation | 2,148,407 | — | — |
| Utilities and power | 2,707,264 | 2,212 | — |
| Total common stocks | 88,432,588 | 2,212 | 38 |
| Asset-backed securities | — | 459,684 | — |
| Collateralized loan obligations | — | 99,867 | — |
| Commodity linked notes | — | 1,948,765 | — |
| Convertible bonds and notes | — | 25,137 | — |
| Corporate bonds and notes | — | 18,891,700 | — |
| Foreign government and agency bonds and notes | — | 610,729 | — |
| Mortgage-backed securities | — | 3,769,784 | — |
| Preferred stocks | — | 1,240 | — |
| Purchased options outstanding | — | 22,617 | — |
| Senior loans | — | 533,353 | — |
| U.S. government and agency mortgage obligations | — | 19,595,630 | — |
| Short-term investments | — | 13,263,026 | — |
| Totals by level | $88,432,588 | $59,223,744 | $38 |
| |
| | | | Valuation inputs | |
| Other financial instruments: | Level 1 | Level 2 | Level 3 |
| Forward currency contracts | $— | $(201,858) | $— |
| Futures contracts | (117,556) | — | — |
| Written options outstanding | — | (7,480) | — |
| TBA sale commitments | — | (8,238,662) | — |
| Interest rate swap contracts | — | 27,695 | — |
| Total return swap contracts | — | (4,715) | — |
| Credit default contracts | — | 358,589 | — |
| Totals by level | $(117,556) | $(8,066,431) | $— |
* Common stock classifications are presented at the sector level, which may differ from the fund’s portfolio presentation.
At the start and close of the reporting period, Level 3 investments in securities represented less than 1% of the fund’s net assets and were not considered a significant portion of the fund’s portfolio.
The accompanying notes are an integral part of these financial statements.
| |
| Putnam VT Global Asset Allocation Fund | 35 |
Statement of assets and liabilities
6/30/21 (Unaudited)
| |
| Assets | |
| Investment in securities, at value, including $293,730 of securities on loan (Notes 1 and 9): | |
| Unaffiliated issuers (identified cost $105,379,723) | $136,393,116 |
| Affiliated issuers (identified cost $11,263,254) (Notes 1 and 5) | 11,263,254 |
| Cash | 11,545 |
| Foreign currency (cost $178,792) (Note 1) | 181,476 |
| Dividends, interest and other receivables | 371,044 |
| Foreign tax reclaim | 33,228 |
| Receivable for shares of the fund sold | 8,649 |
| Receivable for investments sold | 26,196 |
| Receivable for sales of TBA securities (Note 1) | 7,199,785 |
| Receivable for variation margin on futures contracts (Note 1) | 40,023 |
| Receivable for variation margin on centrally cleared swap contracts (Note 1) | 14,805 |
| Unrealized appreciation on forward currency contracts (Note 1) | 253,790 |
| Unrealized appreciation on OTC swap contracts (Note 1) | 169,702 |
| Premium paid on OTC swap contracts (Note 1) | 72,166 |
| Total assets | 156,038,779 |
| |
| Liabilities | |
| Payable for investments purchased | 1,221,080 |
| Payable for purchases of delayed delivery securities (Note 1) | 1,038,520 |
| Payable for purchases of TBA securities (Note 1) | 12,616,636 |
| Payable for shares of the fund repurchased | 37,559 |
| Payable for compensation of Manager (Note 2) | 62,338 |
| Payable for custodian fees (Note 2) | 44,330 |
| Payable for investor servicing fees (Note 2) | 15,144 |
| Payable for Trustee compensation and expenses (Note 2) | 107,364 |
| Payable for administrative services (Note 2) | 384 |
| Payable for distribution fees (Note 2) | 8,427 |
| Payable for variation margin on futures contracts (Note 1) | 67,862 |
| Payable for variation margin on centrally cleared swap contracts (Note 1) | 21,034 |
| Unrealized depreciation on OTC swap contracts (Note 1) | 231,185 |
| Premium received on OTC swap contracts (Note 1) | 44,358 |
| Unrealized depreciation on forward currency contracts (Note 1) | 455,648 |
| Written options outstanding, at value (premiums $15,481) (Note 1) | 7,480 |
| TBA sale commitments, at value (proceeds receivable $8,236,367) (Note 1) | 8,238,662 |
| Collateral on securities loaned, at value (Note 1) | 308,250 |
| Other accrued expenses | 76,123 |
| Total liabilities | 24,602,384 |
| | |
| Net assets | $131,436,395 |
| |
| Represented by | |
| Paid-in capital (Unlimited shares authorized) (Notes 1 and 4) | $93,900,165 |
| Total distributable earnings (Note 1) | 37,536,230 |
| Total — Representing net assets applicable to capital shares outstanding | $131,436,395 |
| Computation of net asset value Class IA | |
| Net assets | $90,089,905 |
| Number of shares outstanding | 4,670,609 |
| Net asset value, offering price and redemption price per share (net assets divided by number of shares outstanding) | $19.29 |
| | |
| Computation of net asset value Class IB | |
| Net assets | $41,346,490 |
| Number of shares outstanding | 2,110,029 |
| Net asset value, offering price and redemption price per share (net assets divided by number of shares outstanding) | $19.60 |
The accompanying notes are an integral part of these financial statements.
| |
| 36 | Putnam VT Global Asset Allocation Fund |
Statement of operations
Six months ended 6/30/21 (Unaudited)
| |
| Investment income | |
| Dividends (net of foreign tax of $22,470) | $806,342 |
| Interest (including interest income of $5,929 from investments in affiliated issuers) (Note 5) | 560,972 |
| Securities lending (net of expenses) (Notes 1 and 5) | 946 |
| Total investment income | 1,368,260 |
| |
| Expenses | |
| Compensation of Manager (Note 2) | 368,683 |
| Investor servicing fees (Note 2) | 44,739 |
| Custodian fees (Note 2) | 33,083 |
| Trustee compensation and expenses (Note 2) | 2,833 |
| Distribution fees (Note 2) | 49,085 |
| Administrative services (Note 2) | 1,138 |
| Auditing and tax fees | 68,620 |
| Other | 23,177 |
| Fees waived and reimbursed by Manager (Note 2) | (149) |
| Total expenses | 591,209 |
| | |
| Expense reduction (Note 2) | (8) |
| Net expenses | 591,201 |
| | |
| Net investment income | 777,059 |
| | |
| Realized and unrealized gain (loss) | |
| Net realized gain (loss) on: | |
| Securities from unaffiliated issuers (Notes 1 and 3) | 7,720,158 |
| Foreign currency transactions (Note 1) | (7,841) |
| Forward currency contracts (Note 1) | 140,498 |
| Futures contracts (Note 1) | (1,333,190) |
| Swap contracts (Note 1) | 442,709 |
| Total net realized gain | 6,962,334 |
| Change in net unrealized appreciation (depreciation) on: | |
| Securities from unaffiliated issuers and TBA sale commitments | 4,808,911 |
| Assets and liabilities in foreign currencies | 1,442 |
| Forward currency contracts | (352,397) |
| Futures contracts | (87,476) |
| Swap contracts | (56,823) |
| Written options | 8,001 |
| Total change in net unrealized appreciation | 4,321,658 |
| | |
| Net gain on investments | 11,283,992 |
| | |
| Net increase in net assets resulting from operations | $12,061,051 |
The accompanying notes are an integral part of these financial statements.
| |
| Putnam VT Global Asset Allocation Fund | 37 |
Statement of changes in net assets
| | |
| | Six months | |
| | ended | Year ended |
| | 6/30/21* | 12/31/20 |
| Increase in net assets | | |
| Operations: | | |
| Net investment income | $777,059 | $1,472,756 |
| Net realized gain on investments and foreign currency transactions | 6,962,334 | 2,846,902 |
| Change in net unrealized appreciation of investments and assets and liabilities in foreign currencies | 4,321,658 | 9,754,339 |
| Net increase in net assets resulting from operations | 12,061,051 | 14,073,997 |
| Distributions to shareholders (Note 1): | | |
| From ordinary income | | |
| Net investment income | | |
| Class IA | (829,820) | (1,802,438) |
| Class IB | (277,928) | (649,646) |
| Net realized short-term gain on investments | | |
| Class IA | (1,321,221) | (140,974) |
| Class IB | (582,424) | (58,115) |
| From net realized long-term gain on investments | | |
| Class IA | (1,005,982) | (1,485,248) |
| Class IB | (443,459) | (612,287) |
| Decrease from capital share transactions (Note 4) | (2,325,981) | (8,657,923) |
| Total increase in net assets | 5,274,236 | 667,366 |
| Net assets: | | |
| Beginning of period | 126,162,159 | 125,494,793 |
| End of period | $131,436,395 | $126,162,159 |
* Unaudited.
The accompanying notes are an integral part of these financial statements.
| |
| 38 | Putnam VT Global Asset Allocation Fund |
Financial highlights (For a common share outstanding throughout the period)
| | | | | | | | | | | | | | |
| INVESTMENT OPERATIONS: | LESS DISTRIBUTIONS: | RATIOS AND SUPPLEMENTAL DATA: |
| Period ended | Net asset value, beginning of period | Net investment
income (loss)a | Net realized and unrealized gain (loss) on investments | Total from investment operations | From net investment income | From net realized gain on investments | Total distributions | Non-recurring reimbursements | Net asset value,
end of period | Total return at net
asset value (%)b,c | Net assets, end of period (in thousands) | Ratio of expenses to average net assets (%)b,d | Ratio of net investment income (loss) to average net assets (%) | Portfolio
turnover (%)e |
| Class IA | | | | | | | | | | | | | | |
| 6/30/21† | $18.21 | .12 | 1.64 | 1.76 | (.18) | (.50) | (.68) | — | $19.29 | 9.92* | $90,090 | .42*f | .65*f | 163* |
| 12/31/20 | 16.95 | .22 | 1.72 | 1.94 | (.36) | (.32) | (.68) | — | 18.21 | 12.58 | 87,732 | .86 | 1.32 | 320 |
| 12/31/19 | 15.17 | .32 | 2.26 | 2.58 | (.29) | (.51) | (.80) | — | 16.95 | 17.42 | 88,722 | .86f | 1.98f | 164 |
| 12/31/18 | 18.14 | .33 | (1.53) | (1.20) | (.38) | (1.39) | (1.77) | — | 15.17 | (7.02) | 86,731 | .85 | 1.97 | 132 |
| 12/31/17 | 16.55 | .32 | 2.18 | 2.50 | (.30) | (.61) | (.91) | —g | 18.14 | 15.67 | 104,826 | .86 | 1.87 | 208 |
| 12/31/16 | 17.06 | .27 | .81 | 1.08 | (.38) | (1.21) | (1.59) | — | 16.55 | 6.98 | 103,689 | .87f,h | 1.66f,h | 384 |
| Class IB | | | | | | | | | | | | | | |
| 6/30/21† | $18.47 | .10 | 1.67 | 1.77 | (.14) | (.50) | (.64) | — | $19.60 | 9.80* | $41,346 | .55*f | .52*f | 163* |
| 12/31/20 | 17.17 | .18 | 1.75 | 1.93 | (.31) | (.32) | (.63) | — | 18.47 | 12.31 | 38,431 | 1.11 | 1.06 | 320 |
| 12/31/19 | 15.35 | .28 | 2.29 | 2.57 | (.24) | (.51) | (.75) | — | 17.17 | 17.13 | 36,773 | 1.11f | 1.72f | 164 |
| 12/31/18 | 18.33 | .29 | (1.54) | (1.25) | (.34) | (1.39) | (1.73) | — | 15.35 | (7.26) | 36,889 | 1.10 | 1.71 | 132 |
| 12/31/17 | 16.72 | .28 | 2.20 | 2.48 | (.26) | (.61) | (.87) | —g | 18.33 | 15.34 | 46,701 | 1.11 | 1.61 | 208 |
| 12/31/16 | 17.21 | .23 | .82 | 1.05 | (.33) | (1.21) | (1.54) | — | 16.72 | 6.71 | 40,859 | 1.12f,h | 1.41f,h | 384 |
* Not annualized.
† Unaudited.
a Per share net investment income (loss) has been determined on the basis of weighted average number of shares outstanding during the period.
b The charges and expenses at the insurance company separate account level are not reflected.
c Total return assumes dividend reinvestment.
d Includes amounts paid through expense offset and/or brokerage/service arrangements, if any (Note 2). Also excludes acquired fund fees and expenses, if any.
e Portfolio turnover includes TBA purchase and sale commitments.
f Reflects an involuntary contractual expense limitation in effect during the period. As a result of such limitation, the expenses of each class reflect a reduction of the following amounts:
| | | |
| | Percentage of average | | |
| | net assets | | |
| June 30, 2021 | <0.01% | | |
| December 31, 2019 | 0.01 | | |
| December 31, 2016 | 0.02 | | |
g Reflects a non-recurring reimbursement pursuant to a settlement between the Securities and Exchange Commission (the SEC) and Countrywide Financial which amounted to less than $0.01 per share outstanding on November 29, 2017.
h Reflects a voluntary waiver of certain fund expenses in effect during the period. As a result of such waivers, the expenses of each class reflect a reduction of less than 0.01% as a percentage of average net assets.
The accompanying notes are an integral part of these financial statements.
| |
| Putnam VT Global Asset Allocation Fund | 39 |
Notes to financial statements 6/30/21 (Unaudited)
Within the following Notes to financial statements, references to “State Street” represent State Street Bank and Trust Company, references to “the SEC” represent the Securities and Exchange Commission, references to “Putnam Management” represent Putnam Investment Management, LLC, the fund’s manager, an indirect wholly-owned subsidiary of Putnam Investments, LLC and references to “OTC”, if any, represent over-the-counter. Unless otherwise noted, the “reporting period” represents the period from January 1, 2021 through June 30, 2021.
Putnam VT Global Asset Allocation Fund (the fund) is a diversified series of Putnam Variable Trust (the Trust), a Massachusetts business trust registered under the Investment Company Act of 1940, as amended, as an open-end management investment company. The goal of the fund is to seek long-term return consistent with preservation of capital. The fund invests a majority of its assets in a diversified portfolio of equity securities (growth or value stocks or both) of both U.S. and foreign companies of any size. Putnam Management may consider, among other factors, a company’s valuation, financial strength, growth potential, competitive position in its industry, projected future earnings, cash flows and dividends when deciding whether to buy or sell equity investments. The fund also invests in a diversified portfolio of fixed-income investments, including both U.S. and foreign government obligations, corporate obligations and securitized debt instruments (such as mortgage-backed investments). Putnam Management may consider, among other factors, credit, interest rate and prepayment risks, as well as general market conditions, when deciding whether to buy or sell fixed-income investments. Putnam Management may also select other investments that do not fall within these asset classes. Putnam Management may also use to a significant extent derivatives, such as futures, options, certain foreign currency transactions, warrants and swap contracts, for both hedging and non-hedging purposes.
The fund offers class IA and class IB shares of beneficial interest. Class IA shares are offered at net asset value and are not subject to a distribution fee. Class IB shares are offered at net asset value and pay an ongoing distribution fee, which is identified in Note 2.
In the normal course of business, the fund enters into contracts that may include agreements to indemnify another party under given circumstances. The fund’s maximum exposure under these arrangements is unknown as this would involve future claims that may be, but have not yet been, made against the fund. However, the fund’s management team expects the risk of material loss to be remote.
The fund has entered into contractual arrangements with an investment adviser, administrator, distributor, shareholder servicing agent and custodian, who each provide services to the fund. Unless expressly stated otherwise, shareholders are not parties to, or intended beneficiaries of these contractual arrangements, and these contractual arrangements are not intended to create any shareholder right to enforce them against the service providers or to seek any remedy under them against the service providers, either directly or on behalf of the fund.
Under the fund’s Amended and Restated Agreement and Declaration of Trust, any claims asserted against or on behalf of the Putnam Funds, including claims against Trustees and Officers, must be brought in state and federal courts located within the Commonwealth of Massachusetts.
Note 1 — Significant accounting policies
The following is a summary of significant accounting policies consistently followed by the fund in the preparation of its financial statements. The preparation of financial statements is in conformity with accounting principles generally accepted in the United States of America and requires management to make estimates and assumptions that affect the reported amounts of assets and liabilities in the financial statements and the reported amounts of increases and decreases in net assets from operations. Actual results could differ from those estimates. Subsequent events after the Statement of assets and liabilities date through the date that the financial statements were issued have been evaluated in the preparation of the financial statements.
Investment income, realized and unrealized gains and losses and expenses of the fund are borne pro-rata based on the relative net assets of each class to the total net assets of the fund, except that each class bears expenses unique to that class (including the distribution fees applicable to such classes). Each class votes as a class only with respect to its own distribution plan or other matters on which a class vote is required by law or determined by the Trustees. If the fund were liquidated, shares of each class would receive their pro-rata share of the net assets of the fund. In addition, the Trustees declare separate dividends on each class of shares.
Security valuation Portfolio securities and other investments are valued using policies and procedures adopted by the Board of Trustees. The Trustees have formed a Pricing Committee to oversee the implementation of these procedures and have delegated responsibility for valuing the fund’s assets in accordance with these procedures to Putnam Management. Putnam Management has established an internal Valuation Committee that is responsible for making fair value determinations, evaluating the effectiveness of the pricing policies of the fund and reporting to the Pricing Committee.
Investments for which market quotations are readily available are valued at the last reported sales price on their principal exchange, or official closing price for certain markets, and are classified as Level 1 securities under Accounting Standards Codification 820 Fair Value Measurements and Disclosures (ASC 820). If no sales are reported, as in the case of some securities that are traded OTC, a security is valued at its last reported bid price and is generally categorized as a Level 2 security.
Investments in open-end investment companies (excluding exchange-traded funds), if any, which can be classified as Level 1 or Level 2 securities, are valued based on their net asset value. The net asset value of such investment companies equals the total value of their assets less their liabilities and divided by the number of their outstanding shares.
Market quotations are not considered to be readily available for certain debt obligations (including short-term investments with remaining maturities of 60 days or less) and other investments; such investments are valued on the basis of valuations furnished by an independent pricing service approved by the Trustees or dealers selected by Putnam Management. Such services or dealers determine valuations for normal institutional-size trading units of such securities using methods based on market transactions for comparable securities and various relationships, generally recognized by institutional traders, between securities (which consider such factors as security prices, yields, maturities and ratings). These securities will generally be categorized as Level 2.
Many securities markets and exchanges outside the U.S. close prior to the scheduled close of the New York Stock Exchange and therefore the closing prices for securities in such markets or on such exchanges may not fully reflect events that occur after such close but before the scheduled close of the New York Stock Exchange. Accordingly, on certain days, the fund will fair value certain foreign equity securities taking into account multiple factors including movements in the U.S. securities markets, currency valuations and comparisons to the valuation of American Depository Receipts, exchange-traded funds and futures contracts. The foreign equity securities, which would generally be classified as Level 1 securities, will be transferred to Level 2 of the fair value hierarchy when they are valued at fair value. The number of days on which fair value prices will be used will depend on market activity and it is possible that fair value prices will be used by the fund to a significant extent. Securities quoted in foreign currencies, if any, are translated into U.S. dollars at the current exchange rate.
To the extent a pricing service or dealer is unable to value a security or provides a valuation that Putnam Management does not believe accurately reflects the security’s fair value, the security will be valued at fair value by Putnam Management in accordance with policies and procedures approved by the Trustees. Certain investments, including certain restricted and illiquid securities and derivatives, are also valued at fair value following procedures approved by the Trustees. These valuations consider such factors as significant market or specific security events such as interest rate or credit quality changes, various relationships with other securities, discount rates, U.S. Treasury, U.S. swap and credit yields, index levels, convexity exposures, recovery rates, sales and other multiples and resale restrictions. These securities are classified as Level 2 or as Level 3 depending on the priority of the significant inputs.
To assess the continuing appropriateness of fair valuations, the Valuation Committee reviews and affirms the reasonableness of such valuations on a regular basis after considering all relevant information that is reasonably available. Such valuations and procedures are reviewed periodically by the Trustees. Certain securities may be valued on the basis of a price provided by a single source. The fair value of securities is generally determined as the amount that the fund could reasonably expect to realize from an orderly disposition of such securities over a reasonable period of time. By its nature, a fair value price is a good faith estimate of the value of a security in a current sale and does not reflect an actual market price, which may be different by a material amount.
| |
| 40 | Putnam VT Global Asset Allocation Fund |
��
Security transactions and related investment income Security transactions are recorded on the trade date (the date the order to buy or sell is executed). Gains or losses on securities sold are determined on the identified cost basis.
Interest income, net of any applicable withholding taxes, if any, and including amortization and accretion of premiums and discounts on debt securities, is recorded on the accrual basis. Dividend income, net of any applicable withholding taxes, is recognized on the ex-dividend date except that certain dividends from foreign securities, if any, are recognized as soon as the fund is informed of the ex-dividend date. Non-cash dividends, if any, are recorded at the fair value of the securities received. Dividends representing a return of capital or capital gains, if any, are reflected as a reduction of cost and/or as a realized gain.
The fund may have earned certain fees in connection with its senior loan purchasing activities. These fees, if any, are treated as market discount and are amortized into income in the Statement of operations.
Securities purchased or sold on a forward commitment or delayed delivery basis may be settled at a future date beyond customary settlement time; interest income is accrued based on the terms of the securities. Losses may arise due to changes in the fair value of the underlying securities or if the counterparty does not perform under the contract.
Stripped securities The fund may invest in stripped securities which represent a participation in securities that may be structured in classes with rights to receive different portions of the interest and principal. Interest-only securities receive all of the interest and principal-only securities receive all of the principal. If the interest-only securities experience greater than anticipated prepayments of principal, the fund may fail to recoup fully its initial investment in these securities. Conversely, principal-only securities increase in value if prepayments are greater than anticipated and decline if prepayments are slower than anticipated. The fair value of these securities is highly sensitive to changes in interest rates.
Foreign currency translation The accounting records of the fund are maintained in U.S. dollars. The fair value of foreign securities, currency holdings, and other assets and liabilities is recorded in the books and records of the fund after translation to U.S. dollars based on the exchange rates on that day. The cost of each security is determined using historical exchange rates. Income and withholding taxes are translated at prevailing exchange rates when earned or incurred. The fund does not isolate that portion of realized or unrealized gains or losses resulting from changes in the foreign exchange rate on investments from fluctuations arising from changes in the market prices of the securities. Such gains and losses are included with the net realized and unrealized gain or loss on investments. Net realized gains and losses on foreign currency transactions represent net realized exchange gains or losses on disposition of foreign currencies, currency gains and losses realized between the trade and settlement dates on securities transactions and the difference between the amount of investment income and foreign withholding taxes recorded on the fund’s books and the U.S. dollar equivalent amounts actually received or paid. Net unrealized appreciation and depreciation of assets and liabilities in foreign currencies arise from changes in the value of assets and liabilities other than investments at the period end, resulting from changes in the exchange rate.
Options contracts The fund uses options contracts to hedge duration and convexity, to isolate prepayment risk, to gain exposure to interest rates, to hedge against changes in values of securities it owns, owned or expects to own, to hedge prepayment risk, to generate additional income for the portfolio, to enhance returns on securities owned, to enhance the return on a security owned, to gain exposure to securities and to manage downside risks.
The potential risk to the fund is that the change in value of options contracts may not correspond to the change in value of the hedged instruments. In addition, losses may arise from changes in the value of the underlying instruments if there is an illiquid secondary market for the contracts, if interest or exchange rates move unexpectedly or if the counterparty to the contract is unable to perform. Realized gains and losses on purchased options are included in realized gains and losses on investment securities. If a written call option is exercised, the premium originally received is recorded as an addition to sales proceeds. If a written put option is exercised, the premium originally received is recorded as a reduction to the cost of investments.
Exchange-traded options are valued at the last sale price or, if no sales are reported, the last bid price for purchased options and the last ask price for written options. OTC traded options are valued using prices supplied by dealers.
Options on swaps are similar to options on securities except that the premium paid or received is to buy or grant the right to enter into a previously agreed upon interest rate or credit default contract. Forward premium swap option contracts include premiums that have extended settlement dates. The delayed settlement of the premiums is factored into the daily valuation of the option contracts. In the case of interest rate cap and floor contracts, in return for a premium, ongoing payments between two parties are based on interest rates exceeding a specified rate, in the case of a cap contract, or falling below a specified rate in the case of a floor contract.
Written option contracts outstanding at period end, if any, are listed after the fund’s portfolio.
Futures contracts The fund uses futures contracts to manage exposure to market risk, to hedge prepayment risk, to hedge interest rate risk, to gain exposure to interest rates, and to equitize cash.
The potential risk to the fund is that the change in value of futures contracts may not correspond to the change in value of the hedged instruments. In addition, losses may arise from changes in the value of the underlying instruments, if there is an illiquid secondary market for the contracts, if interest or exchange rates move unexpectedly or if the counterparty to the contract is unable to perform. With futures, there is minimal counterparty credit risk to the fund since futures are exchange traded and the exchange’s clearinghouse, as counterparty to all exchange traded futures, guarantees the futures against default. Risks may exceed amounts recognized on the Statement of assets and liabilities. When the contract is closed, the fund records a realized gain or loss equal to the difference between the value of the contract at the time it was opened and the value at the time it was closed.
Futures contracts are valued at the quoted daily settlement prices established by the exchange on which they trade. The fund and the broker agree to exchange an amount of cash equal to the daily fluctuation in the value of the futures contract. Such receipts or payments are known as “variation margin.”
Futures contracts outstanding at period end, if any, are listed after the fund’s portfolio.
Forward currency contracts The fund buys and sells forward currency contracts, which are agreements between two parties to buy and sell currencies at a set price on a future date. These contracts are used to hedge foreign exchange risk and to gain exposure to currencies.
The U.S. dollar value of forward currency contracts is determined using current forward currency exchange rates supplied by a quotation service. The fair value of the contract will fluctuate with changes in currency exchange rates. The contract is marked to market daily and the change in fair value is recorded as an unrealized gain or loss. The fund records a realized gain or loss equal to the difference between the value of the contract at the time it was opened and the value at the time it was closed when the contract matures or by delivery of the currency. The fund could be exposed to risk if the value of the currency changes unfavorably, if the counterparties to the contracts are unable to meet the terms of their contracts or if the fund is unable to enter into a closing position. Risks may exceed amounts recognized on the Statement of assets and liabilities.
Forward currency contracts outstanding at period end, if any, are listed after the fund’s portfolio.
Interest rate swap contracts The fund entered into OTC and/or centrally cleared interest rate swap contracts, which are arrangements between two parties to exchange cash flows based on a notional principal amount to, hedge interest rate risk, to gain exposure on interest rates and to hedge prepayment risk.
An OTC and centrally cleared interest rate swap can be purchased or sold with an upfront premium. For OTC interest rate swap contracts, an upfront payment received by the fund is recorded as a liability on the fund’s books. An upfront payment made by the fund is recorded as an asset on the fund’s books. OTC and centrally cleared interest rate swap contracts are marked to market daily based upon quotations from an independent pricing service or market makers. Any change is recorded as an unrealized gain or loss on OTC interest rate swaps. Daily fluctuations in the value of centrally cleared interest rate swaps are settled through a central clearing agent and are recorded in variation margin on the Statement of assets and liabilities and recorded as unrealized gain or loss. Payments, including upfront premiums, received or made are recorded as realized gains or losses at the reset date or the closing of the contract. Certain OTC and centrally cleared interest rate swap contracts may include extended effective dates. Payments related to these swap contracts are accrued based on the terms of the contract.
The fund could be exposed to credit or market risk due to unfavorable changes in the fluctuation of interest rates or if the counterparty defaults, in the case of OTC interest rate contracts, or the central clearing agency or a clearing member defaults, in the case of centrally cleared interest rate swap contracts, on its respective obligation to perform under the contract. The fund’s maximum risk of loss from counterparty risk or central clearing risk is the fair value of the contract.
| |
| Putnam VT Global Asset Allocation Fund | 41 |
This risk may be mitigated for OTC interest rate swap contracts by having a master netting arrangement between the fund and the counterparty and for centrally cleared interest rate swap contracts through the daily exchange of variation margin. There is minimal counterparty risk with respect to centrally cleared interest rate swap contracts due to the clearinghouse guarantee fund and other resources that are available in the event of a clearing member default. Risk of loss may exceed amounts recognized on the Statement of assets and liabilities.
OTC and centrally cleared interest rate swap contracts outstanding, including their respective notional amounts at period end, if any, are listed after the fund’s portfolio.
Total return swap contracts The fund entered into OTC and/or centrally cleared total return swap contracts, which are arrangements to exchange a market-linked return for a periodic payment, both based on a notional principal amount, to hedge sector exposure, to manage exposure to specific sectors or industries, to manage exposure to specific securities, to gain exposure to a basket of securities, to gain exposure to specific markets or countries and to gain exposure to specific sectors or industries.
To the extent that the total return of the security, index or other financial measure underlying the transaction exceeds or falls short of the offsetting interest rate obligation, the fund will receive a payment from or make a payment to the counterparty. OTC and/or centrally cleared total return swap contracts are marked to market daily based upon quotations from an independent pricing service or market maker. Any change is recorded as an unrealized gain or loss on OTC total return swaps. Daily fluctuations in the value of centrally cleared total return swaps are settled through a central clearing agent and are recorded in variation margin on the Statement of assets and liabilities and recorded as unrealized gain or loss. Payments received or made are recorded as realized gains or losses. Certain OTC and/or centrally cleared total return swap contracts may include extended effective dates. Payments related to these swap contracts are accrued based on the terms of the contract. The fund could be exposed to credit or market risk due to unfavorable changes in the fluctuation of interest rates or in the price of the underlying security or index, the possibility that there is no liquid market for these agreements or that the counterparty may default on its obligation to perform. The fund’s maximum risk of loss from counterparty risk or central clearing risk is the fair value of the contract. This risk may be mitigated for OTC total return swap contracts by having a master netting arrangement between the fund and the counterparty and for centrally cleared total return swap contracts through the daily exchange of variation margin. There is minimal counterparty risk with respect to centrally cleared total return swap contracts due to the clearinghouse guarantee fund and other resources that are available in the event of a clearing member default. Risk of loss may exceed amounts recognized on the Statement of assets and liabilities.
OTC and/or centrally cleared total return swap contracts outstanding, including their respective notional amounts at period end, if any, are listed after the fund’s portfolio.
Credit default contracts The fund entered into OTC and/or centrally cleared credit default contracts to hedge credit risk, to hedge market risk and to gain exposure on individual names and/or baskets of securities.
In OTC and centrally cleared credit default contracts, the protection buyer typically makes a periodic stream of payments to a counterparty, the protection seller, in exchange for the right to receive a contingent payment upon the occurrence of a credit event on the reference obligation or all other equally ranked obligations of the reference entity. Credit events are contract specific but may include bankruptcy, failure to pay, restructuring and obligation acceleration. For OTC credit default contracts, an upfront payment received by the fund is recorded as a liability on the fund’s books. An upfront payment made by the fund is recorded as an asset on the fund’s books. Centrally cleared credit default contracts provide the same rights to the protection buyer and seller except the payments between parties, including upfront premiums, are settled through a central clearing agent through variation margin payments. Upfront and periodic payments received or paid by the fund for OTC and centrally cleared credit default contracts are recorded as realized gains or losses at the reset date or close of the contract. The OTC and centrally cleared credit default contracts are marked to market daily based upon quotations from an independent pricing service or market makers. Any change in value of OTC credit default contracts is recorded as an unrealized gain or loss. Daily fluctuations in the value of centrally cleared credit default contracts are recorded in variation margin on the Statement of assets and liabilities and recorded as unrealized gain or loss. Upon the occurrence of a credit event, the difference between the par value and fair value of the reference obligation, net of any proportional amount of the upfront payment, is recorded as a realized gain or loss.
In addition to bearing the risk that the credit event will occur, the fund could be exposed to market risk due to unfavorable changes in interest rates or in the price of the underlying security or index or the possibility that the fund may be unable to close out its position at the same time or at the same price as if it had purchased the underlying reference obligations. In certain circumstances, the fund may enter into offsetting OTC and centrally cleared credit default contracts which would mitigate its risk of loss. Risks of loss may exceed amounts recognized on the Statement of assets and liabilities. The fund’s maximum risk of loss from counterparty risk, either as the protection seller or as the protection buyer, is the fair value of the contract. This risk may be mitigated for OTC credit default contracts by having a master netting arrangement between the fund and the counterparty and for centrally cleared credit default contracts through the daily exchange of variation margin. Counterparty risk is further mitigated with respect to centrally cleared credit default swap contracts due to the clearinghouse guarantee fund and other resources that are available in the event of a clearing member default. Where the fund is a seller of protection, the maximum potential amount of future payments the fund may be required to make is equal to the notional amount.
OTC and centrally cleared credit default contracts outstanding, including their respective notional amounts at period end, if any, are listed after the fund’s portfolio.
TBA commitments The fund may enter into TBA (to be announced) commitments to purchase securities for a fixed unit price at a future date beyond customary settlement time. Although the unit price and par amount have been established, the actual securities have not been specified. However, it is anticipated that the amount of the commitments will not significantly differ from the principal amount. The fund holds, and maintains until settlement date, cash or high-grade debt obligations in an amount sufficient to meet the purchase price, or the fund may enter into offsetting contracts for the forward sale of other securities it owns. Income on the securities will not be earned until settlement date.
The fund may also enter into TBA sale commitments to hedge its portfolio positions, to sell mortgage-backed securities it owns under delayed delivery arrangements or to take a short position in mortgage-backed securities. Proceeds of TBA sale commitments are not received until the contractual settlement date. During the time a TBA sale commitment is outstanding, either equivalent deliverable securities or an offsetting TBA purchase commitment deliverable on or before the sale commitment date are held as “cover” for the transaction, or other liquid assets in an amount equal to the notional value of the TBA sale commitment are segregated. If the TBA sale commitment is closed through the acquisition of an offsetting TBA purchase commitment, the fund realizes a gain or loss. If the fund delivers securities under the commitment, the fund realizes a gain or a loss from the sale of the securities based upon the unit price established at the date the commitment was entered into.
TBA commitments, which are accounted for as purchase and sale transactions, may be considered securities themselves, and involve a risk of loss due to changes in the value of the security prior to the settlement date as well as the risk that the counterparty to the transaction will not perform its obligations. Counterparty risk is mitigated by having a master agreement between the fund and the counterparty.
Unsettled TBA commitments are valued at their fair value according to the procedures described under “Security valuation” above. The contract is marked to market daily and the change in fair value is recorded by the fund as an unrealized gain or loss. Based on market circumstances, Putnam Management will determine whether to take delivery of the underlying securities or to dispose of the TBA commitments prior to settlement.
TBA purchase commitments outstanding at period end, if any, are listed within the fund’s portfolio and TBA sale commitments outstanding at period end, if any, are listed after the fund’s portfolio.
Master agreements The fund is a party to ISDA (International Swaps and Derivatives Association, Inc.) Master Agreements that govern OTC derivative and foreign exchange contracts and Master Securities Forward Transaction Agreements that govern transactions involving mortgage-backed and other asset-backed securities that may result in delayed delivery (Master Agreements) with certain counterparties entered into from time to time. The Master Agreements may contain provisions regarding, among other things, the parties’ general obligations, representations, agreements, collateral requirements, events of default and early termination. With respect to certain counterparties, in accordance with the terms of the Master Agreements, collateral pledged to the fund is held in a segregated account by the fund’s custodian and, with respect to those amounts which can be sold or repledged, are presented in the fund’s portfolio.
| |
| 42 | Putnam VT Global Asset Allocation Fund |
Collateral pledged by the fund is segregated by the fund’s custodian and identified in the fund’s portfolio. Collateral can be in the form of cash or debt securities issued by the U.S. Government or related agencies or other securities as agreed to by the fund and the applicable counterparty. Collateral requirements are determined based on the fund’s net position with each counterparty.
With respect to ISDA Master Agreements, termination events applicable to the fund may occur upon a decline in the fund’s net assets below a specified threshold over a certain period of time. Termination events applicable to counterparties may occur upon a decline in the counterparty’s long-term or short-term credit ratings below a specified level. In each case, upon occurrence, the other party may elect to terminate early and cause settlement of all derivative and foreign exchange contracts outstanding, including the payment of any losses and costs resulting from such early termination, as reasonably determined by the terminating party. Any decision by one or more of the fund’s counterparties to elect early termination could impact the fund’s future derivative activity.
At the close of the reporting period, the fund had a net liability position of $296,718 on open derivative contracts subject to the Master Agreements. Collateral pledged by the fund at period end for these agreements totaled $59,988 and may include amounts related to unsettled agreements.
Securities lending The fund may lend securities, through its agent, to qualified borrowers in order to earn additional income. The loans are collateralized by cash in an amount at least equal to the fair value of the securities loaned. The fair value of securities loaned is determined daily and any additional required collateral is allocated to the fund on the next business day. The remaining maturities of the securities lending transactions are considered overnight and continuous. The risk of borrower default will be borne by the fund’s agent; the fund will bear the risk of loss with respect to the investment of the cash collateral. Income from securities lending, net of expenses, is included in investment income on the Statement of operations. Cash collateral is invested in Putnam Cash Collateral Pool, LLC, a limited liability company managed by an affiliate of Putnam Management. Investments in Putnam Cash Collateral Pool, LLC are valued at its closing net asset value each business day. There are no management fees charged to Putnam Cash Collateral Pool, LLC. At the close of the reporting period, the fund received cash collateral of $308,250 and the value of securities loaned amounted to $293,730.
Interfund lending The fund, along with other Putnam funds, may participate in an interfund lending program pursuant to an exemptive order issued by the SEC. This program allows the fund to borrow from or lend to other Putnam funds that permit such transactions. Interfund lending transactions are subject to each fund’s investment policies and borrowing and lending limits. Interest earned or paid on the interfund lending transaction will be based on the average of certain current market rates. During the reporting period, the fund did not utilize the program.
Lines of credit The fund participates, along with other Putnam funds, in a $317.5 million unsecured committed line of credit and a $235.5 million unsecured uncommitted line of credit, both provided by State Street. Borrowings may be made for temporary or emergency purposes, including the funding of shareholder redemption requests and trade settlements. Interest is charged to the fund based on the fund’s borrowing at a rate equal to 1.25% plus the higher of (1) the Federal Funds rate and (2) the Overnight Bank Funding Rate for the committed line of credit and 1.30% plus the higher of (1) the Federal Funds rate and (2) the Overnight Bank Funding Rate for the uncommitted line of credit. A closing fee equal to 0.04% of the committed line of credit and 0.04% of the uncommitted line of credit has been paid by the participating funds. In addition, a commitment fee of 0.21% per annum on any unutilized portion of the committed line of credit is allocated to the participating funds based on their relative net assets and paid quarterly. During the reporting period, the fund had no borrowings against these arrangements.
Federal taxes It is the policy of the fund to distribute all of its taxable income within the prescribed time period and otherwise comply with the provisions of the Internal Revenue Code of 1986, as amended (the Code), applicable to regulated investment companies.
The fund is subject to the provisions of Accounting Standards Codification 740 Income Taxes (ASC 740). ASC 740 sets forth a minimum threshold for financial statement recognition of the benefit of a tax position taken or expected to be taken in a tax return. The fund did not have a liability to record for any unrecognized tax benefits in the accompanying financial statements. No provision has been made for federal taxes on income, capital gains or unrealized appreciation on securities held nor for excise tax on income and capital gains. Each of the fund’s federal tax returns for the prior three fiscal years remains subject to examination by the Internal Revenue Service.
The fund may also be subject to taxes imposed by governments of countries in which it invests. Such taxes are generally based on either income or gains earned or repatriated. The fund accrues and applies such taxes to net investment income, net realized gains and net unrealized gains as income and/or capital gains are earned. In some cases, the fund may be entitled to reclaim all or a portion of such taxes, and such reclaim amounts, if any, are reflected as an asset on the fund’s books. In many cases, however, the fund may not receive such amounts for an extended period of time, depending on the country of investment.
Tax cost of investments includes adjustments to net unrealized appreciation (depreciation) which may not necessarily be final tax cost basis adjustments, but closely approximate the tax basis unrealized gains and losses that may be realized and distributed to shareholders. The aggregate identified cost on a tax basis is $88,685,739, resulting in gross unrealized appreciation and depreciation of $52,474,411 and $1,687,767, respectively, or net unrealized appreciation of $50,786,644.
Distributions to shareholders Distributions to shareholders from net investment income are recorded by the fund on the ex-dividend date. Distributions from capital gains, if any, are recorded on the ex-dividend date and paid at least annually. The amount and character of income and gains to be distributed are determined in accordance with income tax regulations, which may differ from generally accepted accounting principles. Dividend sources are estimated at the time of declaration. Actual results may vary. Any non-taxable return of capital cannot be determined until final tax calculations are completed after the end of the fund’s fiscal year. Reclassifications are made to the fund’s capital accounts to reflect income and gains available for distribution (or available capital loss carryovers) under income tax regulations.
Expenses of the Trust Expenses directly charged or attributable to any fund will be paid from the assets of that fund. Generally, expenses of the Trust will be allocated among and charged to the assets of each fund on a basis that the Trustees deem fair and equitable, which may be based on the relative assets of each fund or the nature of the services performed and relative applicability to each fund.
Beneficial interest At the close of the reporting period, insurance companies or their separate accounts were record owners of all but a de minimis number of the shares of the fund. Approximately 40.5% of the fund is owned by accounts of one insurance company.
Note 2 — Management fee, administrative services and other transactions
The fund pays Putnam Management a management fee (based on the fund’s average net assets and computed and paid monthly) at annual rates that may vary based on the average of the aggregate net assets of all open-end mutual funds sponsored by Putnam Management (excluding net assets of funds that are invested in, or that are invested in by, other Putnam funds to the extent necessary to avoid “double counting” of those assets). Such annual rates may vary as follows:
| |
| 0.750% | of the first $5 billion, |
| 0.700% | of the next $5 billion, |
| 0.650% | of the next $10 billion, |
| 0.600% | of the next $10 billion, |
| 0.550% | of the next $50 billion, |
| 0.530% | of the next $50 billion, |
| 0.520% | of the next $100 billion and |
| 0.515% | of any excess thereafter. |
For the reporting period, the management fee represented an effective rate (excluding the impact from any expense waivers in effect) of 0.288% of the fund’s average net assets.
Putnam Management has contractually agreed, through April 30, 2023, to waive fees and/or reimburse the fund’s expenses to the extent necessary to limit the cumulative expenses of the fund, exclusive of brokerage, interest, taxes, investment-related expenses, extraordinary expenses, acquired fund fees and expenses and payments under the fund’s investor servicing contract, investment management contract and distribution plans, on a fiscal year-to-date basis to an annual rate of 0.20% of the fund’s average net assets over such fiscal year-to-date period. During the reporting period, the fund’s expenses were reduced by $149 as a result of this limit.
Putnam Investments Limited (PIL), an affiliate of Putnam Management, is authorized by the Trustees to manage a separate portion of the assets of the fund as determined by Putnam Management from time to time. PIL did not manage any portion of the assets of the fund during the reporting period. If Putnam Management were to engage the services of PIL, Putnam Management would pay a quarterly sub-management fee to PIL for its services at an annual rate of 0.35% of the average net assets of the portion of the fund managed by PIL.
| |
| Putnam VT Global Asset Allocation Fund | 43 |
The Putnam Advisory Company, LLC (PAC), an affiliate of Putnam Management, is authorized by the Trustees to manage a separate portion of the assets of the fund, as designated from time to time by Putnam Management or PIL. PAC did not manage any portion of the assets of the fund during the reporting period. If Putnam Management or PIL were to engage the services of PAC, Putnam Management or PIL, as applicable, would pay a quarterly sub-advisory fee to PAC for its services at the annual rate of 0.35% of the average net assets of the portion of the fund’s assets for which PAC is engaged as sub-adviser.
The fund reimburses Putnam Management an allocated amount for the compensation and related expenses of certain officers of the fund and their staff who provide administrative services to the fund. The aggregate amount of all such reimbursements is determined annually by the Trustees.
Custodial functions for the fund’s assets are provided by State Street. Custody fees are based on the fund’s asset level, the number of its security holdings and transaction volumes.
Putnam Investor Services, Inc., an affiliate of Putnam Management, provides investor servicing agent functions to the fund. Putnam Investor Services, Inc. was paid a monthly fee for investor servicing at an annual rate of 0.07% of the fund’s average daily net assets. During the reporting period, the expenses for each class of shares related to investor servicing fees were as follows:
| |
| Class IA | $30,880 |
| Class IB | 13,859 |
| Total | $44,739 |
The fund has entered into expense offset arrangements with Putnam Investor Services, Inc. and State Street whereby Putnam Investor Services, Inc.’s and State Street’s fees are reduced by credits allowed on cash balances. For the reporting period, the fund’s expenses were reduced by $8 under the expense offset arrangements.
Each Independent Trustee of the fund receives an annual Trustee fee, of which $84, as a quarterly retainer, has been allocated to the fund, and an additional fee for each Trustees meeting attended. Trustees also are reimbursed for expenses they incur relating to their services as Trustees.
The fund has adopted a Trustee Fee Deferral Plan (the Deferral Plan) which allows the Trustees to defer the receipt of all or a portion of Trustees fees payable on or after July 1, 1995. The deferred fees remain invested in certain Putnam funds until distribution in accordance with the Deferral Plan.
The fund has adopted an unfunded noncontributory defined benefit pension plan (the Pension Plan) covering all Trustees of the fund who have served as a Trustee for at least five years and were first elected prior to 2004. Benefits under the Pension Plan are equal to 50% of the Trustee’s average annual attendance and retainer fees for the three years ended December 31, 2005. The retirement benefit is payable during a Trustee’s lifetime, beginning the year following retirement, for the number of years of service through December 31, 2006. Pension expense for the fund is included in Trustee compensation and expenses in the Statement of operations. Accrued pension liability is included in Payable for Trustee compensation and expenses in the Statement of assets and liabilities. The Trustees have terminated the Pension Plan with respect to any Trustee first elected after 2003.
The fund has adopted a distribution plan (the Plan) with respect to its class IB shares pursuant to Rule 12b–1 under the Investment Company Act of 1940. The purpose of the Plan is to compensate Putnam Retail Management Limited Partnership, an indirect wholly-owned subsidiary of Putnam Investments, LLC, for services provided and expenses incurred in distributing shares of the fund. The Plan provides for payment by the fund to Putnam Retail Management Limited Partnership at an annual rate of up to 0.35% of the average net assets attributable to the fund’s class IB shares. The Trustees have approved payment by the fund at an annual rate of 0.25% of the average net assets attributable to the fund’s class IB shares. The expenses related to distribution fees during the reporting period are included in Distribution fees in the Statement of operations.
Note 3 — Purchases and sales of securities
During the reporting period, the cost of purchases and the proceeds from sales, excluding short-term investments, were as follows:
| | |
| | Cost of | Proceeds |
| | purchases | from sales |
| Investments in securities, including | | |
| TBA commitments (Long-term) | $201,990,072 | $209,359,697 |
| U.S. government securities | | |
| (Long-term) | — | — |
| Total | $201,990,072 | $209,359,697 |
The fund may purchase or sell investments from or to other Putnam funds in the ordinary course of business, which can reduce the fund’s transaction costs, at prices determined in accordance with SEC requirements and policies approved by the Trustees. During the reporting period, purchases or sales of long-term securities from or to other Putnam funds, if any, did not represent more than 5% of the fund’s total cost of purchases and/or total proceeds from sales.
Note 4 — Capital shares
At the close of the reporting period, there were an unlimited number of shares of beneficial interest authorized. Subscriptions and redemptions are presented at the omnibus level. Transactions in capital shares were as follows:
| | | | | | | | |
| | | Class IA shares | | | Class IB shares | |
| | Six months ended 6/30/21 | Year ended 12/31/20 | Six months ended 6/30/21 | Year ended 12/31/20 |
| | Shares | Amount | Shares | Amount | Shares | Amount | Shares | Amount |
| Shares sold | 13,369 | $248,699 | 18,982 | $304,927 | 69,229 | $1,324,164 | 178,196 | $2,872,126 |
| Shares issued in connection with | | | | | | | | |
| reinvestment of distributions | 174,614 | 3,157,023 | 241,285 | 3,428,660 | 70,975 | 1,303,811 | 91,416 | 1,320,048 |
| | 187,983 | 3,405,722 | 260,267 | 3,733,587 | 140,204 | 2,627,975 | 269,612 | 4,192,174 |
| Shares repurchased | (335,786) | (6,248,889) | (677,450) | (11,085,478) | (111,159) | (2,110,789) | (330,594) | (5,498,206) |
| Net increase (decrease) | (147,803) | $(2,843,167) | (417,183) | $(7,351,891) | 29,045 | $517,186 | (60,982) | $(1,306,032) |
| |
| 44 | Putnam VT Global Asset Allocation Fund |
Note 5 — Affiliated transactions
Transactions during the reporting period with any company which is under common ownership or control were as follows:
| | | | | |
| | | | | | Shares outstanding |
| | Fair value as of | | | | and fair value as of |
| Name of affiliate | 12/31/20 | Purchase cost | Sale proceeds | Investment income | 6/30/21 |
| Short-term investments | | | | | |
| Putnam Cash Collateral Pool, LLC* | $895,250 | $2,599,958 | $3,186,958 | $278 | $308,250 |
| Putnam Short Term Investment | | | | | |
| Fund** | 14,566,068 | 7,624,447 | 11,235,511 | 5,929 | 10,955,004 |
| Total Short-term investments | $15,461,318 | $10,224,405 | $14,422,469 | $6,207 | $11,263,254 |
*No management fees are charged to Putnam Cash Collateral Pool, LLC (Note 1). Investment income shown is included in securities lending income on the Statement of operations. There were no realized or unrealized gains or losses during the period.
**Management fees charged to Putnam Short Term Investment Fund have been waived by Putnam Management. There were no realized or unrealized gains or losses during the period.
Note 6 — Market, credit and other risks
In the normal course of business, the fund trades financial instruments and enters into financial transactions where risk of potential loss exists due to changes in the market (market risk) or failure of the contracting party to the transaction to perform (credit risk). The fund may be exposed to additional credit risk that an institution or other entity with which the fund has unsettled or open transactions will default. Investments in foreign securities involve certain risks, including those related to economic instability, unfavorable political developments, and currency fluctuations. The fund may invest a significant portion of its assets in securitized debt instruments, including mortgage-backed and asset-backed investments. The yields and values of these investments are sensitive to changes in interest rates, the rate of principal payments on the underlying assets and the market’s perception of the issuers. The market for these investments may be volatile and limited, which may make them difficult to buy or sell.
On July 27, 2017, the United Kingdom’s Financial Conduct Authority (“FCA”), which regulates LIBOR, announced a desire to phase out the use of LIBOR by the end of 2021. On March 5, 2021, the FCA and LIBOR’s administrator, ICE Benchmark Administration, announced that most LIBOR settings will no longer be published after the end of 2021 and a majority of U.S. dollar LIBOR settings will no longer be published after June 30, 2023. LIBOR has historically been a common benchmark interest rate index used to make adjustments to variable-rate loans. It is used throughout global banking and financial industries to determine interest rates for a variety of financial instruments and borrowing arrangements. The transition process might lead to increased volatility and illiquidity in markets that currently rely on LIBOR to determine interest rates. It could also lead to a reduction in the value of some LIBOR-based investments and reduce the effectiveness of new hedges placed against existing LIBOR-based investments. While some LIBOR-based instruments may contemplate a scenario where LIBOR is no longer available by providing for an alternative rate-setting methodology, not all may have such provisions and there may be significant uncertainty regarding the effectiveness of any such alternative methodologies. Since the usefulness of LIBOR as a benchmark could deteriorate during the transition period, these effects could occur prior to the date on which the applicable rate ceases to be published.
Beginning in January 2020, global financial markets have experienced, and may continue to experience, significant volatility resulting from the spread of a virus known as Covid–19. The outbreak of Covid–19 has resulted in travel and border restrictions, quarantines, supply chain disruptions, lower consumer demand, and general market uncertainty. The effects of Covid–19 have adversely affected, and may continue to adversely affect, the global economy, the economies of certain nations, and individual issuers, all of which may negatively impact the fund’s performance.
Note 7 — Senior loan commitments
Senior loans are purchased or sold on a when-issued or delayed delivery basis and may be settled a month or more after the trade date, which from time to time can delay the actual investment of available cash balances; interest income is accrued based on the terms of the securities. Senior loans can be acquired through an agent, by assignment from another holder of the loan, or as a participation interest in another holder’s portion of the loan. When the fund invests in a loan or participation, the fund is subject to the risk that an intermediate participant between the fund and the borrower will fail to meet its obligations to the fund, in addition to the risk that the borrower under the loan may default on its obligations.
Note 8 — Summary of derivative activity
The volume of activity for the reporting period for any derivative type that was held during the period is listed below and was based on an average of the holdings at the end of each fiscal quarter:
| |
| Purchased currency option contracts (contract amount) | $1,700,000 |
| Written currency option contracts (contract amount) | $1,700,000 |
| Futures contracts (number of contracts) | 400 |
| Forward currency contracts (contract amount) | $51,300,000 |
| Centrally cleared interest rate swap contracts (notional) | $17,000,000 |
| OTC total return swap contracts (notional) | $14,500,000 |
| Centrally cleared total return swap contracts (notional) | $12,000,000 |
| OTC credit default contracts (notional) | $910,000 |
| Centrally cleared credit default contracts (notional) | $7,300,000 |
| |
| Putnam VT Global Asset Allocation Fund | 45 |
The following is a summary of the fair value of derivative instruments as of the close of the reporting period:
Fair value of derivative instruments as of the close of the reporting period
| | | | |
| | Asset derivatives | Liability derivatives |
| Derivatives not accounted for as hedging | Statement of assets and | | Statement of assets and | |
| instruments under ASC 815 | liabilities location | Fair value | liabilities location | Fair value |
| | Receivables, Net assets — | | | |
| Credit contracts | Unrealized appreciation | $444,512* | Payables | $85,923 |
| Foreign exchange contracts | Investments, Receivables | 276,407 | Payables | 463,128 |
| | Receivables, Net assets — | | Payables, Net assets — | |
| Equity contracts | Unrealized appreciation | 191,115* | Unrealized depreciation | 454,843* |
| | Receivables, Net assets — | | Payables, Net assets — | |
| Interest rate contracts | Unrealized appreciation | 336,127* | Unrealized depreciation | 166,975* |
| Total | | $1,248,161 | | $1,170,869 |
*Includes cumulative appreciation/depreciation of futures contracts and/or centrally cleared swaps as reported in the fund’s portfolio. Only current day’s variation margin is reported within the Statement of assets and liabilities.
The following is a summary of realized and change in unrealized gains or losses of derivative instruments in the Statement of operations for the reporting period (Note 1):
Amount of realized gain or (loss) on derivatives recognized in net gain or (loss) on investments
| | | | | |
| Derivatives not accounted for as hedging | | | Forward currency | | |
| instruments under ASC 815 | Options | Futures | contracts | Swaps | Total |
| Credit contracts | $— | $— | $— | $65,430 | $65,430 |
| Foreign exchange contracts | — | — | 140,498 | — | $140,498 |
| Equity contracts | — | (637,746) | — | 618,783 | $(18,963) |
| Interest rate contracts | — | (695,444) | — | (241,504) | $(936,948) |
| Total | $— | $(1,333,190) | $140,498 | $442,709 | $(749,983) |
Change in unrealized appreciation or (depreciation) on derivatives recognized in net gain or (loss) on investments
| | | | | |
| Derivatives not accounted for as hedging | | | Forward currency | | |
| instruments under ASC 815 | Options | Futures | contracts | Swaps | Total |
| Credit contracts | $— | $— | $— | $21,252 | $21,252 |
| Foreign exchange contracts | 15,116 | — | (352,397) | — | $(337,281) |
| Equity contracts | — | (245,832) | — | (65,735) | $(311,567) |
| Interest rate contracts | — | 158,356 | — | (12,340) | $146,016 |
| Total | $15,116 | $(87,476) | $(352,397) | $(56,823) | $(481,580) |
| |
| 46 | Putnam VT Global Asset Allocation Fund |
|
| This page intentionally left blank. |
| |
| Putnam VT Global Asset Allocation Fund | 47 |
Note 9 — Offsetting of financial and derivative assets and liabilities
The following table summarizes any derivatives, repurchase agreements and reverse repurchase agreements, at the end of the reporting period, that are subject to an enforceable master netting agreement or similar agreement. For securities lending transactions or borrowing transactions associated with securities sold short, if any, see Note 1. For financial reporting purposes, the fund does not offset financial assets and financial liabilities that are subject to the master netting agreements in the Statement of assets and liabilities.
| | | | | | | | | | | | | | | | | | | |
| | Bank of America N.A. | Barclays Bank PLC | Barclays Capital, Inc. (clearing broker) | BofA Securities, Inc. | Citibank, N.A. | Citigroup Global Markets, Inc. | Credit Suisse International | Goldman Sachs International | HSBC Bank USA, National Association | JPMorgan Chase Bank N.A. | JPMorgan Securities LLC | Merrill Lynch International | Morgan Stanley & Co. International PLC | NatWest Markets PLC | State Street Bank and Trust Co. | Toronto- Dominion Bank | UBS AG | WestPac Banking Corp. | Total |
| Assets: | | | | | | | | | | | | | | | | | | | |
| Centrally cleared interest rate | | | | | | | | | | | | | | | | | | | |
| swap contracts§ | $— | $— | $14,023 | $— | $— | $— | $— | $— | $— | $— | $— | $— | $— | $— | $— | $— | $— | $— | $14,023 |
| OTC Total return | | | | | | | | | | | | | | | | | | | |
| swap contracts*# | — | 203 | — | — | — | — | — | 132,527 | — | — | — | — | — | — | — | — | — | — | 132,730 |
| Centrally cleared total return | | | | | | | | | | | | | | | | | | | |
| swap contracts§ | — | — | — | — | — | — | — | — | — | — | — | — | — | — | — | — | — | — | — |
| OTC Credit default contracts — | | | | | | | | | | | | | | | | | | | |
| protection sold*# | — | — | — | — | — | — | — | 16 | — | — | 48 | — | — | — | — | — | — | — | 64 |
| OTC Credit default contracts — | | | | | | | | | | | | | | | | | | | |
| protection purchased*# | — | — | — | — | — | 14,626 | 22,440 | 14,635 | — | — | 21,480 | 2,684 | 9,655 | — | — | — | — | — | 85,520 |
| Centrally cleared credit | | | | | | | | | | | | | | | | | | | |
| default contracts§ | — | — | 782 | — | — | — | — | — | — | — | — | — | — | — | — | — | — | — | 782 |
| Futures contracts§ | — | — | — | 9,169 | — | — | — | — | — | — | 30,854 | — | — | — | — | — | — | — | 40,023 |
| Forward currency contracts# | 3,704 | 10,818 | — | — | 5,903 | — | 15,479 | 66,815 | 2,463 | 13,748 | — | — | 25,479 | 6,162 | 78,526 | 15,698 | 4,967 | 4,028 | 253,790 |
| Purchased options**# | — | — | — | — | — | — | — | 14,998 | — | — | — | — | 7,619 | — | — | — | — | — | 22,617 |
| Total Assets | $3,704 | $11,021 | $14,805 | $9,169 | $5,903 | $14,626 | $37,919 | $228,991 | $2,463 | $13,748 | $52,382 | $2,684 | $42,753 | $6,162 | $78,526 | $15,698 | $4,967 | $4,028 | $549,549 |
| Liabilities: | | | | | | | | | | | | | | | | | | | |
| Centrally cleared interest rate | | | | | | | | | | | | | | | | | | | |
| swap contracts§ | — | — | 12,297 | — | — | — | — | — | — | — | — | — | — | — | — | — | — | — | 12,297 |
| OTC Total return | | | | | | | | | | | | | | | | | | | |
| swap contracts*# | — | 137 | — | — | 4 | — | 118 | 116,529 | — | 49,199 | 79 | — | — | — | — | — | — | — | 166,066 |
| Centrally cleared total return | | | | | | | | | | | | | | | | | | | |
| swap contracts§ | — | — | 8,737 | — | — | — | — | — | — | — | — | — | — | — | — | — | — | — | 8,737 |
| OTC Credit default contracts — | | | | | | | | | | | | | | | | | | | |
| protection sold*# | 11,352 | — | — | — | — | 22,537 | 25,011 | 20,260 | — | — | 2,662 | — | 4,101 | — | — | — | — | — | 85,923 |
| OTC Credit default contracts — | | | | | | | | | | | | | | | | | | | |
| protection purchased*# | — | — | — | — | — | — | — | — | — | — | — | — | — | — | — | — | — | — | — |
| Centrally cleared credit | | | | | | | | | | | | | | | | | | | |
| default contracts§ | — | — | — | — | — | — | — | — | — | — | — | — | — | — | — | — | — | — | — |
| Futures contracts§ | — | — | — | 49,620 | — | — | — | — | — | — | 18,242 | — | — | — | — | — | — | — | 67,862 |
| Forward currency contracts# | 36,036 | 25,824 | — | — | 10,673 | — | 60 | 102,902 | 18,397 | 33,345 | — | — | 68,868 | 13,362 | 36,498 | 30,923 | 74,825 | 3,935 | 455,648 |
| Written options # | — | — | — | — | — | — | — | 5,154 | — | — | — | — | 2,326 | — | — | — | — | — | 7,480 |
| Total Liabilities | $47,388 | $25,961 | $21,034 | $49,620 | $10,677 | $22,537 | $25,189 | $244,845 | $18,397 | $82,544 | $20,983 | $— | $75,295 | $13,362 | $36,498 | $30,923 | $74,825 | $3,935 | $804,013 |
| Total Financial and Derivative | | | | | | | | | | | | | | | | | | | |
| Net Assets | $(43,684) | $(14,940) | $(6,229) | $(40,451) | $(4,774) | $(7,911) | $12,730 | $(15,854) | $(15,934) | $(68,796) | $31,399 | $2,684 | $(32,542) | $(7,200) | $42,028 | $(15,225) | $(69,858) | $93 | $(254,464) |
| Total collateral | | | | | | | | | | | | | | | | | | | |
| received (pledged)†## | $— | $— | $— | $— | $— | $— | $— | $— | $— | $(59,988) | $— | $— | $— | $— | $— | $— | $— | $— | |
| Net amount | $(43,684) | $(14,940) | $(6,229) | $(40,451) | $(4,774) | $(7,911) | $12,730 | $(15,854) | $(15,934) | $(8,808) | $31,399 | $2,684 | $(32,542) | $(7,200) | $42,028 | $(15,225) | $(69,858) | $93 | |
| Controlled collateral received | | | | | | | | | | | | | | | | | | | |
| (including TBA commitments)** | $— | $— | $— | $— | $— | $— | $— | $— | $— | $— | $— | $— | $— | $— | $— | $— | $— | $— | $— |
| Uncontrolled collateral received | $— | $— | $— | $— | $— | $— | $— | $— | $— | $— | $— | $— | $— | $— | $— | $— | $— | $— | $— |
| Collateral (pledged) (including | | | | | | | | | | | | | | | | | | | |
| TBA commitments)** | $— | $— | $— | $— | $— | $— | $— | $— | $— | $(59,988) | $— | $— | $— | $— | $— | $— | $— | $— | $(59,988) |
*Excludes premiums, if any. Included in unrealized appreciation and depreciation on OTC swap contracts on the Statement of assets and liabilities.
**Included with Investments in securities on the Statement of assets and liabilities.
†Additional collateral may be required from certain brokers based on individual agreements.
# Covered by master netting agreement (Note 1).
## Any over-collateralization of total financial and derivative net assets is not shown. Collateral may include amounts related to unsettled agreements.
§ Includes current day’s variation margin only as reported on the Statement of assets and liabilities, which is not collateralized. Cumulative appreciation/ (depreciation) for futures contracts and centrally cleared swap contracts is represented in the tables listed after the fund’s portfolio. Collateral pledged for initial margin on futures contracts and centrally cleared swap contracts, which is not included in the table above, amounted to $1,138,831 and $661,921, respectively.
| | |
| 48 | Putnam VT Global Asset Allocation Fund | Putnam VT Global Asset Allocation Fund | 49 |
Note 10 — New accounting pronouncements
In March 2020, the Financial Accounting Standards Board (FASB) issued Accounting Standards Update (ASU) 2020–04, Reference Rate Reform (Topic 848) — Facilitation of the Effects of Reference Rate Reform on Financial Reporting. The amendments in ASU 2020–04 provide optional temporary financial reporting relief from the effect of certain types of contract modifications due to the planned discontinuation of LIBOR and other interbank-offered based reference rates as of the end of 2021. The discontinuation of LIBOR was subsequently extended to June 30, 2023. ASU 2020–04 is effective for certain reference rate-related contract modifications that occur during the period March 12, 2020 through December 31, 2022. Management is currently evaluating the impact, if any, of applying this provision.
| |
| 50 | Putnam VT Global Asset Allocation Fund |
Trustee approval of management contract
General conclusions
The Board of Trustees of The Putnam Funds oversees the management of each fund and, as required by law, determines annually whether to approve the continuance of your fund’s management contract with Putnam Investment Management, LLC (“Putnam Management”), the sub-management contract with respect to your fund between Putnam Management and its affiliate, Putnam Investments Limited (“PIL”), and the sub-advisory contract among Putnam Management, PIL, and another affiliate, The Putnam Advisory Company (“PAC”). The Board, with the assistance of its Contract Committee, requests and evaluates all information it deems reasonably necessary under the circumstances in connection with its annual contract review. The Contract Committee consists solely of Trustees who are not “interested persons” (as this term is defined in the Investment Company Act of 1940, as amended (the “1940 Act”)) of The Putnam Funds (“Independent Trustees”).
At the outset of the review process, members of the Board’s independent staff and independent legal counsel considered any possible changes to the annual contract review materials furnished to the Contract Committee during the course of the previous year’s review and, as applicable, identified those changes to Putnam Management. Following these discussions and in consultation with the Contract Committee, the Independent Trustees’ independent legal counsel requested that Putnam Management and its affiliates furnish specified information, together with any additional information that Putnam Management considered relevant, to the Contract Committee. Over the course of several months ending in June 2021, the Contract Committee met on a number of occasions with representatives of Putnam Management, and separately in executive session, to consider the information that Putnam Management provided. Throughout this process, the Contract Committee was assisted by the members of the Board’s independent staff and by independent legal counsel for The Putnam Funds and the Independent Trustees.
In May 2021, the Contract Committee met in executive session to discuss and consider its recommendations with respect to the continuance of the contracts. At the Trustees’ June 2021 meeting, the Contract Committee met in executive session with the other Independent Trustees to review a summary of the key financial, performance and other data that the Contract Committee considered in the course of its review. The Contract Committee then presented its written report, which summarized the key factors that the Committee had considered and set forth its recommendations. The Contract Committee recommended, and the Independent Trustees approved, the continuance of your fund’s management, sub-management and sub-advisory contracts, effective July 1, 2021. (Because PIL and PAC are affiliates of Putnam Management and Putnam Management remains fully responsible for all services provided by PIL and PAC, the Trustees have not attempted to evaluate PIL or PAC as separate entities, and all subsequent references to Putnam Management below should be deemed to include reference to PIL and PAC as necessary or appropriate in the context.)
The Independent Trustees’ approval was based on the following conclusions:
• That the fee schedule in effect for your fund represented reasonable compensation in light of the nature and quality of the services being provided to the fund, the fees paid by competitive funds, the costs incurred by Putnam Management in providing services to the fund, and the application of certain reductions and waivers noted below; and
• That the fee schedule in effect for your fund represented an appropriate sharing between fund shareholders and Putnam Management of any economies of scale as may exist in the management of the fund at current asset levels.
These conclusions were based on a comprehensive consideration of all information provided to the Trustees and were not the result of any single factor. Some of the factors that figured particularly in the Trustees’ deliberations and how the Trustees considered these factors are described below, although individual Trustees may have evaluated the information presented differently, giving different weights to various factors. It is also important to recognize that the management arrangements for your fund and the other Putnam funds are the result of many years of review and discussion between the Independent Trustees and Putnam Management, that some aspects of the arrangements may receive greater scrutiny in some years than others, and that the Trustees’ conclusions may be based, in part, on their consideration of fee arrangements in previous years. For example, with certain exceptions primarily involving newly launched or repositioned funds, the current fee arrangements under the vast majority of the funds’ management contracts were first implemented at the beginning of 2010 following extensive review by the Contract Committee and discussions with representatives of Putnam Management, as well as approval by shareholders.
Management fee schedules and total expenses
The Trustees reviewed the management fee schedules in effect for all Putnam funds, including fee levels and breakpoints. Under its management contract, your fund has the benefit of breakpoints in its management fee schedule that provide shareholders with reduced fee levels as assets under management in the Putnam family of funds increase. The Trustees also reviewed the total expenses of each Putnam fund, recognizing that in most cases management fees represented the major, but not the sole, determinant of total costs to fund shareholders. (Two funds have implemented so-called “all-in” management fees covering substantially all routine fund operating costs.) In reviewing fees and expenses, the Trustees generally focus their attention on material changes in circumstances — for example, changes in assets under management, changes in a fund’s investment strategy, changes in Putnam Management’s operating costs or profitability, or changes in competitive practices in the mutual fund industry — that suggest that consideration of fee changes might be warranted. The Trustees concluded that the circumstances did not indicate that changes to the management fee schedule for your fund would be appropriate at this time.
As in the past, the Trustees also focused on the competitiveness of each fund’s total expense ratio. In order to support the effort to have fund expenses meet competitive standards, the Trustees and Putnam Management and the funds’ investor servicing agent, Putnam Investor Services, Inc. (“PSERV”), have implemented expense limitations that were in effect during your fund’s fiscal year ending in 2020. These expense limitations were: (i) a contractual expense limitation applicable to specified open-end funds, including your fund, of 25 basis points on investor servicing fees and expenses and (ii) a contractual expense limitation applicable to specified open-end funds, including your fund, of 20 basis points on so-called “other expenses” (i.e., all expenses exclusive of management fees, distribution fees, investor servicing fees, investment-related
| |
| Putnam VT Global Asset Allocation Fund | 51 |
expenses, interest, taxes, brokerage commissions, acquired fund fees and expenses and extraordinary expenses). These expense limitations attempt to maintain competitive expense levels for the funds. Most funds, including your fund, had sufficiently low expenses that these expense limitations were not operative during their fiscal years ending in 2020. Putnam Management and PSERV have agreed to maintain these expense limitations until at least April 30, 2023. The support of Putnam Management and PSERV for these expense limitation arrangements was an important factor in the Trustees’ decision to approve the continuance of your fund’s management, sub-management and sub-advisory contracts.
The Trustees reviewed comparative fee and expense information for a custom group of competitive funds selected by Broadridge Financial Solutions, Inc. (“Broadridge”). This comparative information included your fund’s percentile ranking for effective management fees and total expenses (excluding any applicable 12b-1 fees), which provides a general indication of your fund’s relative standing. In the custom peer group, your fund ranked in the second quintile in effective management fees (determined for your fund and the other funds in the custom peer group based on fund asset size and the applicable contractual management fee schedule) and in the fourth quintile in total expenses (excluding any applicable 12b-1 fees) as of December 31, 2020. The first quintile represents the least expensive funds and the fifth quintile the most expensive funds. The fee and expense data reported by Broadridge as of December 31, 2020 reflected the most recent fiscal year-end data available in Broadridge’s database at that time.
In connection with their review of fund management fees and total expenses, the Trustees also reviewed the costs of the services provided and the profits realized by Putnam Management and its affiliates from their contractual relationships with the funds. This information included trends in revenues, expenses and profitability of Putnam Management and its affiliates relating to the investment management, investor servicing and distribution services provided to the funds. In this regard, the Trustees also reviewed an analysis of the revenues, expenses and profitability of Putnam Management and its affiliates, allocated on a fund-by-fund basis, with respect to the funds’ management, distribution, and investor servicing contracts. For each fund, the analysis presented information about revenues, expenses and profitability for each of the agreements separately and for the agreements taken together on a combined basis. The Trustees concluded that, at current asset levels, the fee schedules in place for the Putnam funds, including the fee schedule for your fund, represented reasonable compensation for the services being provided and represented an appropriate sharing between fund shareholders and Putnam Management of any economies of scale as may exist in the management of the Putnam funds at that time.
The information examined by the Trustees in connection with their annual contract review for the Putnam funds included information regarding services provided and fees charged by Putnam Management and its affiliates to other clients, including defined benefit pension and profit-sharing plans, sub-advised mutual funds, private funds sponsored by affiliates of Putnam Management, model-only separately managed accounts and Putnam Management’s newly launched exchange-traded funds. This information included, in cases where a product’s investment strategy corresponds with a fund’s strategy, comparisons of those fees with fees charged to the Putnam funds, as well as an assessment of the differences in the services provided to these clients as compared to the services provided to the Putnam funds. The Trustees observed that the differences in fee rates between these clients and the Putnam funds are by no means uniform when examined by individual asset sectors, suggesting that differences in the pricing of investment management services to these types of clients may reflect, among other things, historical competitive forces operating in separate marketplaces. The Trustees considered the fact that in many cases fee rates across different asset classes are higher on average for mutual funds than for other clients, and the Trustees also considered the differences between the services that Putnam Management provides to the Putnam funds and those that it provides to its other clients. The Trustees did not rely on these comparisons to any significant extent in concluding that the management fees paid by your fund are reasonable.
Investment performance
The quality of the investment process provided by Putnam Management represented a major factor in the Trustees’ evaluation of the quality of services provided by Putnam Management under your fund’s management contract. The Trustees were assisted in their review of Putnam Management’s investment process and performance by the work of the investment oversight committees of the Trustees and the full Board of Trustees, which meet on a regular basis with individual portfolio managers and with senior management of Putnam Management’s Investment Division throughout the year. The Trustees concluded that Putnam Management generally provides a high-quality investment process — based on the experience and skills of the individuals assigned to the management of fund portfolios, the resources made available to them, and in general Putnam Management’s ability to attract and retain high-quality personnel — but also recognized that this does not guarantee favorable investment results for every fund in every time period.
The Trustees considered that, in the aggregate, The Putnam Funds generally performed well in 2020, which Putnam Management characterized as a challenging year with significant volatility and varied market dynamics. On an asset-weighted basis, the Putnam funds ranked in the second quartile of their peers as determined by Lipper Inc. (“Lipper”) for the year ended December 31, 2020 and, on an asset-weighted-basis, delivered a gross return that was 2.3% ahead of their benchmarks in 2020. In addition to the performance of the individual Putnam funds, the Trustees considered, as they had in prior years, the performance of The Putnam Fund complex versus competitor fund complexes. In this regard, the Trustees observed that The Putnam Funds’ relative performance, as reported in the Barron’s/Lipper Fund Families survey, continued to be exceptionally strong over the long term, with The Putnam Funds ranking as the 3rd best performing mutual fund complex out of 44 complexes for the ten-year period, with 2020 marking the fourth consecutive year that The Putnam Funds have ranked in the top ten fund complexes for the ten-year period. The Trustees noted that The Putnam Funds’ performance was solid over the one- and five-year periods, with The Putnam Funds ranking 22nd out of 53 complexes and 14th out of 50 complexes, respectively. In addition to the Barron’s/Lipper Fund Families Survey, the Trustees also considered the funds’ ratings assigned by Morningstar Inc., noting that 26 of the funds were four- or five-star rated at the end of 2020 (representing an increase of four funds year-over-year) and that this included seven funds that had achieved a five-star rating (representing an increase of two funds year-over-year). They also noted, however, the disappointing investment performance of some funds for periods ended December 31, 2020 and considered information provided by Putnam Management regarding the factors contributing to the underperformance and actions being taken to improve the performance of these particular funds. The Trustees indicated their intention to continue to monitor closely the performance of those funds and evaluate whether additional actions to address areas of underperformance may be warranted.
| |
| 52 | Putnam VT Global Asset Allocation Fund |
For purposes of the Trustees’ evaluation of the Putnam funds’ investment performance, the Trustees generally focus on a competitive industry ranking of each fund’s total net return over a one-year, three-year and five-year period. For a number of Putnam funds with relatively unique investment mandates for which Putnam Management informed the Trustees that meaningful competitive performance rankings are not considered to be available, the Trustees evaluated performance based on their total gross and net returns and comparisons of those returns to the returns of selected investment benchmarks. In the case of your fund, the Trustees considered that its class IA share cumulative total return performance at net asset value was in the following quartiles of its Lipper peer group (Lipper VP (Underlying Funds) — Mixed-Asset Target Allocation Moderate Funds) for the one-year, three-year and five-year periods ended December 31, 2020 (the first quartile representing the best-performing funds and the fourth quartile the worst-performing funds):
| | |
| One-year period | Three-year period | Five-year period |
| 2nd | 3rd | 2nd |
Over the one-year, three-year and five-year periods ended December 31, 2020, there were 286, 261 and 231 funds, respectively, in your fund’s Lipper peer group. (When considering performance information, shareholders should be mindful that past performance is not a guarantee of future results.)
The Trustees considered Putnam Management’s continued efforts to support fund performance through certain initiatives, including structuring compensation for portfolio managers to enhance accountability for fund performance, emphasizing accountability in the portfolio management process, and affirming its commitment to a fundamental-driven approach to investing. The Trustees noted further that Putnam Management had made selective hires and internal promotions in 2020 to strengthen its investment team.
Brokerage and soft-dollar allocations; investor servicing
The Trustees considered various potential benefits that Putnam Management may receive in connection with the services it provides under the management contract with your fund. These include benefits related to brokerage allocation and the use of soft dollars, whereby a portion of the commissions paid by a fund for brokerage may be used to acquire research services that are expected to be useful to Putnam Management in managing the assets of the fund and of other clients. Subject to policies established by the Trustees, soft dollars generated by these means are used predominantly to acquire brokerage and research services (including third-party research and market data) that enhance Putnam Management’s investment capabilities and supplement Putnam Management’s internal research efforts. The Trustees indicated their continued intent to monitor regulatory and industry developments in this area with the assistance of their Brokerage Committee. In addition, with the assistance of their Brokerage Committee, the Trustees indicated their continued intent to monitor the allocation of the Putnam funds’ brokerage in order to ensure that the principle of seeking best price and execution remains paramount in the portfolio trading process.
Putnam Management may also receive benefits from payments that the funds make to Putnam Management’s affiliates for investor or distribution services. In conjunction with the annual review of your fund’s management, sub-management and sub-advisory contracts, the Trustees reviewed your fund’s investor servicing agreement with PSERV and its distributor’s contract and distribution plans with Putnam Retail Management Limited Partnership (“PRM”), both of which are affiliates of Putnam Management. The Trustees concluded that the fees payable by the funds to PSERV and PRM, as applicable, for such services are fair and reasonable in relation to the nature and quality of such services, the fees paid by competitive funds, and the costs incurred by PSERV and PRM, as applicable, in providing such services. Furthermore, the Trustees were of the view that the investor services provided by PSERV were required for the operation of the funds, and that they were of a quality at least equal to those provided by other providers.
| |
| Putnam VT Global Asset Allocation Fund | 53 |
Other important information
Proxy voting
Putnam is committed to managing our mutual funds in the best interests of our shareholders. The Putnam funds’ proxy voting guidelines and procedures, as well as information regarding how your fund voted proxies relating to portfolio securities during the 12-month period ended June 30, 2021, are available in the Individual Investors section of putnam.com and on the Securities and Exchange Commission’s (SEC) website at www.sec.gov. If you have questions about finding forms on the SEC’s website, you may call the SEC at 1-800-SEC-0330. You may also obtain the Putnam funds’ proxy voting guidelines and procedures at no charge by calling Putnam’s Shareholder Services at 1-800-225-1581.
Fund portfolio holdings
The fund will file a complete schedule of its portfolio holdings with the SEC for the first and third quarters of each fiscal year on Form N-PORT within 60 days of the end of such fiscal quarter. Shareholders may obtain the fund’s Form N-PORT from the SEC’s website at www.sec.gov.
Prior to its use of Form N-PORT, the fund filed its complete schedule of its portfolio holdings with the SEC on Form N-Q, which is available online at www.sec.gov.
Liquidity risk management program
Putnam, as the administrator of the fund’s liquidity risk management program (appointed by the Board of Trustees), presented the most recent annual report on the program to the Trustees in April 2021. The report covered the structure of the program, including the program documents and related policies and procedures adopted to comply with Rule 22e-4 under the Investment Company Act of 1940, and reviewed the operation of the program from January 2020 through December 2020. The report included a description of the annual liquidity assessment of the fund that Putnam performed in November 2020. The report noted that there were no material compliance exceptions identified under Rule 22e-4 during the period. The report included a review of the governance of the program and the methodology for classification of the fund’s investments. The report also included a discussion of liquidity monitoring during the period, including during the market liquidity challenges caused by the Covid-19 pandemic, and the impact those challenges had on the liquidity of the fund’s investments. Putnam concluded that the program has been operating effectively and adequately to ensure compliance with Rule 22e-4.
Fund information
| | |
| Investment Manager | Investor Servicing Agent | Trustees |
| Putnam Investment Management, LLC | Putnam Investments | Kenneth R. Leibler, Chair |
| 100 Federal Street | Mailing address: | Liaquat Ahamed |
| Boston, MA 02110 | P.O. Box 219697 | Ravi Akhoury |
| Kansas City, MO 64121-9697 | Barbara M. Baumann |
| Investment Sub-Advisors | 1-800-225-1581 | Katinka Domotorffy |
| Putnam Investments Limited | | Catharine Bond Hill |
| 16 St James’s Street | Custodian | Paul L. Joskow |
| London, England SW1A 1ER | State Street Bank and Trust Company | George Putnam, III |
| | | Robert L. Reynolds |
| The Putnam Advisory Company, LLC | Legal Counsel | Manoj P. Singh |
| 100 Federal Street | Ropes & Gray LLP | Mona K. Sutphen |
| Boston, MA 02110 | | |
| | | |
| Marketing Services | | |
| Putnam Retail Management | | |
| 100 Federal Street | | |
| Boston, MA 02110 | | |
The fund’s Statement of Additional Information contains additional information about the fund’s Trustees and is available without charge upon request by calling 1-800-225-1581.
| |
| This report has been prepared for the shareholders | |
| of Putnam VT Global Asset Allocation Fund. | VTSA062 326457 8/21 |
| |
| Item 3. Audit Committee Financial Expert: |
| |
| Item 4. Principal Accountant Fees and Services: |
| |
| Item 5. Audit Committee of Listed Registrants |
| |
| Item 6. Schedule of Investments: |
| |
| The registrant's schedule of investments in unaffiliated issuers is included in the report to shareholders in Item 1 above. |
| |
| Item 7. Disclosure of Proxy Voting Policies and Procedures For Closed-End Management Investment Companies: |
| |
| Item 8. Portfolio Managers of Closed-End Investment Companies |
| |
| Item 9. Purchases of Equity Securities by Closed-End Management Investment Companies and Affiliated Purchasers: |
| |
| Item 10. Submission of Matters to a Vote of Security Holders: |
| |
| Item 11. Controls and Procedures: |
| |
| (a) The registrant's principal executive officer and principal financial officer have concluded, based on their evaluation of the effectiveness of the design and operation of the registrant's disclosure controls and procedures as of a date within 180 days of the filing date of this report, that the design and operation of such procedures are generally effective to provide reasonable assurance that information required to be disclosed by the registrant in this report is recorded, processed, summarized and reported within the time periods specified in the Commission's rules and forms. |
| |
| (b) Changes in internal control over financial reporting: Not applicable |
| |
| Item 12. Disclosures of Securities Lending Activities for Closed-End Investment Companies: |
| |
| Pursuant to the requirements of the Securities Exchange Act of 1934 and the Investment Company Act of 1940, the registrant has duly caused this report to be signed on its behalf by the undersigned, thereunto duly authorized. |
| |
| By (Signature and Title): |
| |
| /s/ Janet C. Smith
Janet C. Smith
Principal Accounting Officer
|
| |
| Pursuant to the requirements of the Securities Exchange Act of 1934 and the Investment Company Act of 1940, this report has been signed below by the following persons on behalf of the registrant and in the capacities and on the dates indicated. |
| |
| By (Signature and Title): |
| |
| /s/ Jonathan S. Horwitz
Jonathan S. Horwitz
Principal Executive Officer
|
| |
| By (Signature and Title): |
| |
| /s/ Janet C. Smith
Janet C. Smith
Principal Financial Officer
|