| | |
| UNITED STATES
SECURITIES AND EXCHANGE COMMISSION |
| | |
| CERTIFIED SHAREHOLDER REPORT OF REGISTERED
MANAGEMENT INVESTMENT COMPANIES
|
| | |
| Investment Company Act file number: | (811-05346) |
| | |
| Exact name of registrant as specified in charter: | Putnam Variable Trust |
| | |
| Address of principal executive offices: | 100 Federal Street, Boston, Massachusetts 02110 |
| | |
| Name and address of agent for service: | Stephen Tate, Vice President
100 Federal Street
Boston, Massachusetts 02110 |
| | |
| Copy to: | Bryan Chegwidden, Esq.
Ropes & Gray LLP
1211 Avenue of the Americas
New York, New York 10036 |
| | |
| Registrant's telephone number, including area code: | (617) 292–1000 |
| | |
| Date of fiscal year end: | December 31, 2021 |
| | |
| Date of reporting period: | January 1, 2021 — June 30, 2021 |
| | |
|
Item 1. Report to Stockholders: | |
| | |
| The following is a copy of the report transmitted to stockholders pursuant to Rule 30e-1 under the Investment Company Act of 1940: | |
Message from the Trustees
August 12, 2021
Dear Shareholder:
The U.S. economy is much improved from a year ago, or even six months ago. Gross domestic product is growing at a pre-pandemic pace. Stock prices are high and interest rates are low. More and more workers are finding jobs, with millions still open. At the same time, vaccinations in many areas have not yet reached enough people to stop the spread of Covid-19. U.S. and global infection rates have recently risen.
While it is too soon to declare the pandemic over, it is worth taking stock of the economy’s transition. Some changes accelerated by the pandemic could be lasting. Dynamic, well-managed companies have adapted to seize new, more sustainable growth opportunities.
An active investment philosophy is well suited to this time. Putnam’s research teams are analyzing the fundamentals of what has stayed the same and what has changed to uncover valuable investment insights or potential risks.
Thank you for investing with Putnam.
The views expressed in this report are exclusively those of Putnam Management and are subject to change. They are not meant as investment advice. Please note that the holdings discussed in this report may not have been held by the fund for the entire period. Portfolio composition is subject to review in accordance with the fund’s investment strategy and may vary in the future.
Consider these risks before investing: Emerging-market securities carry illiquidity and volatility risks. Lower-rated bonds may offer higher yields in return for more risk. Funds that invest in government securities are not guaranteed. Mortgage-backed investments, unlike traditional debt investments, are subject to prepayment risk, which means that they may increase in value less than other bonds when interest rates decline and decline in value more than other bonds when interest rates rise. The fund’s investments in mortgage-backed securities and asset-backed securities, and in certain other securities and derivatives, may be or become illiquid. The fund’s concentration in an industry group comprising mortgage-backed securities may make the fund’s net asset value more susceptible to economic, market, political, and other developments affecting the housing or real estate markets and the servicing of mortgage loans secured by real estate properties. The fund currently has significant investment exposure to commercial mortgage-backed securities. Bond investments are subject to interest-rate risk (the risk of bond prices falling if interest rates rise) and credit risk (the risk of an issuer defaulting on interest or principal payments). Interest-rate risk is generally greater for longer-term bonds, and credit risk is generally greater for below-investment-grade bonds. Risks associated with derivatives include increased investment exposure (which may be considered leverage) and, in the case of over-the-counter instruments, the potential inability to terminate or sell derivatives positions and the potential failure of the other party to the instrument to meet its obligations. Unlike bonds, funds that invest in bonds have fees and expenses. The value of investments in the fund’s portfolio may fall or fail to rise over time for a variety of reasons, including general economic, political, or financial market conditions; investor sentiment and market perceptions; government actions; geopolitical events or changes; and factors related to a specific issuer, geography, industry, or sector. International investing involves currency, economic, and political risks. These and other factors may lead to increased volatility and reduced liquidity in the fund’s portfolio holdings. Our investment techniques, analyses, and judgments may not produce the outcome we intend. We, or the fund’s other service providers, may experience disruptions or operating errors that could have a negative effect on the fund. You can lose money by investing in the fund.
Performance summary (as of 6/30/21)
Investment objective
As high a level of current income as Putnam Investment Management, LLC, (Putnam Management) believes is consistent with preservation of capital
Net asset value June 30, 2021
| |
| Class IA: $5.56 | Class IB: $5.59 |
Total return at net asset value
| | | | |
| | | | | | Bloomberg |
| | | | | ICE BofA | | Barclays U.S. |
| | | Class IA | | Class IB | | U.S. Treasury | | Aggregate |
| (as of 6/30/21) | | shares* | | shares† | | Bill Index | | Bond Index |
| 6 months | –1.41% | –1.49% | 0.03% | –1.60% |
| 1 year | 5.05 | 4.95 | 0.10 | –0.33 |
| 5 years | 26.17 | 24.84 | 6.10 | 16.08 |
| Annualized | 4.76 | 4.54 | 1.19 | 3.03 |
| 10 years | 38.27 | 35.02 | 6.74 | 39.62 |
| Annualized | 3.29 | 3.05 | 0.65 | 3.39 |
| Life | 291.14 | 272.40 | 96.92 | 297.94 |
| Annualized | 5.03 | 4.84 | 2.47 | 5.10 |
Recent performance may have benefited from one or more legal settlements.
For a portion of the periods, the fund had expense limitations, without which returns would have been lower.
* Class inception date: September 15, 1993.
† Class inception date: April 6, 1998.
The ICE BofA (Intercontinental Exchange Bank of America) U.S. Treasury Bill Index is an unmanaged index that tracks the performance of U.S.-dollar-denominated U.S. Treasury bills publicly issued in the U.S. domestic market. Qualifying securities must have a remaining term of at least one month to final maturity and a minimum amount outstanding of $1 billion.
The Bloomberg Barclays U.S. Aggregate Bond Index is an unmanaged index of U.S. investment-grade fixed-income securities.
All Bloomberg Barclays indices provided by Bloomberg Index Services Limited.
BLOOMBERG® is a trademark and service mark of Bloomberg Finance L.P. and its affiliates (collectively “Bloomberg”). BARCLAYS® is a trademark and service mark of Barclays Bank Plc (collectively with its affiliates, “Barclays”), used under license. Bloomberg or Bloomberg’s licensors, including Barclays, own all proprietary rights in the Bloomberg Barclays Indices. Neither Bloomberg nor Barclays approves or endorses this material, or guarantees the accuracy of completeness of any information herein, or makes any warranty, express or limited, as to the results to be obtained therefrom and, to the maximum extent allowed by law, neither shall have any liability or responsibility for injury or damages arising in connection therewith.
ICE Data Indices, LLC (“ICE BofA”), used with permission. ICE BofA permits use of the ICE BofA indices and related data on an “as is” basis; makes no warranties regarding same; does not guarantee the suitability, quality, accuracy, timeliness, and/or completeness of the ICE BofA indices or any data included in, related to, or derived therefrom; assumes no liability in connection with the use of the foregoing; and does not sponsor, endorse, or recommend Putnam Investments, or any of its products or services.
Data represent past performance. Past performance does not guarantee future results. More recent returns may be less or more than those shown. Investment return and principal value will fluctuate, and you may have a gain or a loss when you sell your shares. Performance information does not reflect any deduction for taxes a shareholder may owe on fund distributions or on the redemption of fund shares. All total return figures are at net asset value and exclude contract charges and expenses, which are added to the variable annuity contracts to determine total return at unit value. Had these charges and expenses been reflected, performance would have been lower. Performance of class IB shares before their inception is derived from the historical performance of class IA shares, adjusted to reflect the higher operating expenses applicable to such shares. For more recent performance, contact your variable annuity provider who can provide you with performance that reflects the charges and expenses at your contract level.
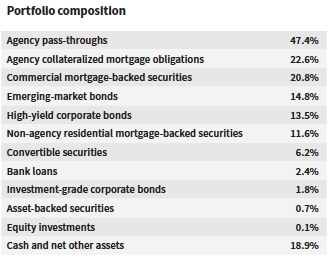
Allocations are shown as a percentage of the fund’s net assets. Cash and net other assets, if any, represent the market value weights of cash, derivatives, short-term securities, and other unclassified assets in the portfolio. Summary information may differ from the portfolio schedule included in the financial statements due to the inclusion of derivative securities, any interest accruals, the use of different classifications of securities for presentation purposes, and rounding. Allocations may not total 100% because the table includes the notional value of certain derivatives (the economic value for purposes of calculating periodic payment obligations), in addition to the market value of securities. Holdings and allocations may vary over time.
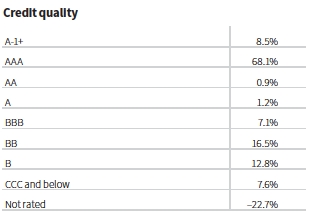
Credit qualities are shown as a percentage of net assets. A bond rated BBB or higher (A-3 or higher, for short-term debt) is considered investment grade. This chart reflects the highest security rating provided by one or more of Standard & Poor’s, Moody’s, and Fitch. To-be-announced (TBA) mortgage commitments, if any, are included based on their issuer ratings. Ratings may vary over time.
Cash, derivative instruments, and net other assets are shown in the not-rated category. Payables and receivables for TBA mortgage commitments are included in the not-rated category and may result in negative weights. The fund itself has not been rated by an independent rating agency.
| |
| Putnam VT Diversified Income Fund 1 |
Understanding your fund’s expenses
As an investor in a variable annuity product that invests in a registered investment company, you pay ongoing expenses, such as management fees, distribution fees (12b-1 fees), and other expenses. Using the following information, you can estimate how these expenses affect your investment and compare them with the expenses of other funds. You may also pay one-time transaction expenses, which are not shown in this section and would result in higher total expenses. Charges and expenses at the insurance company separate account level are not reflected. For more information, see your fund’s prospectus or talk to your financial representative.
Review your fund’s expenses
The two left-hand columns of the Expenses per $1,000 table show the expenses you would have paid on a $1,000 investment in your fund from 1/1/21 to 6/30/21. They also show how much a $1,000 investment would be worth at the close of the period, assuming actual returns and expenses. To estimate the ongoing expenses you paid over the period, divide your account value by $1,000, then multiply the result by the number in the first line for the class of shares you own.
Compare your fund’s expenses with those of other funds
The two right-hand columns of the Expenses per $1,000 table show your fund’s expenses based on a $1,000 investment, assuming a hypothetical 5% annualized return. You can use this information to compare the ongoing expenses (but not transaction expenses or total costs) of investing in the fund with those of other funds. All shareholder reports of mutual funds and funds serving as variable annuity vehicles will provide this information to help you make this comparison. Please note that you cannot use this information to estimate your actual ending account balance and expenses paid during the period.
Expense ratios
| | |
| | Class IA | Class IB |
| Total annual operating expenses for the fiscal | | |
| year ended 12/31/20 | 0.80% | 1.05% |
| Annualized expense ratio for the six-month | | |
| period ended 6/30/21 | 0.79% | 1.04% |
Fiscal year expense information in this table is taken from the most recent prospectus, is subject to change, and may differ from that shown for the annualized expense ratio and in the financial highlights of this report.
Expenses are shown as a percentage of average net assets.
Expenses per $1,000
| | | | |
| | | | Expenses and value for a |
| | Expenses and value for a | $1,000 investment, assuming |
| | $1,000 investment, assuming | a hypothetical 5% annualized |
| | actual returns for the | return for the 6 months |
| | 6 months ended 6/30/21 | ended 6/30/21 | |
| | Class IA | Class IB | Class IA | Class IB |
| Expenses paid | | | | |
| per $1,000*† | $3.89 | $5.12 | $3.96 | $5.21 |
| Ending value | | | | |
| (after | | | | |
| expenses) | $985.90 | $985.10 | $1,020.88 | $1,019.64 |
*Expenses for each share class are calculated using the fund’s annualized expense ratio for each class, which represents the ongoing expenses as a percentage of average net assets for the six months ended 6/30/21. The expense ratio may differ for each share class.
†Expenses based on actual returns are calculated by multiplying the expense ratio by the average account value for the period; then multiplying the result by the number of days in the period (181); and then dividing that result by the number of days in the year (365). Expenses based on a hypothetical 5% return are calculated by multiplying the expense ratio by the average account value for the six-month period; then multiplying the result by the number of days in the six-month period (181); and then dividing that result by the number of days in the year (365).

Your fund’s managers also manage other accounts advised by Putnam Management or an affiliate, including retail mutual fund counterparts to the funds in Putnam Variable Trust.
| |
| 2 Putnam VT Diversified Income Fund |
ABOUT DERIVATIVES
Derivatives are an increasingly common type of investment instrument, the performance of which is derived from an underlying security, index, currency, or other area of the capital markets. Derivatives employed by the fund’s managers generally serve one of two main purposes: to implement a strategy that may be difficult or more expensive to invest in through traditional securities, or to hedge unwanted risk associated with a particular position.
For example, the fund’s managers might use currency forward contracts to capitalize on an anticipated change in exchange rates between two currencies. This approach would require a significantly smaller outlay of capital than purchasing traditional bonds denominated in the underlying currencies. In another example, the managers may identify a bond that they believe is undervalued relative to its risk of default, but may seek to reduce the interest-rate risk of that bond by using interest-rate swaps, a derivative through which two parties “swap” payments based on the movement of certain rates. In other examples, the managers may use options and futures contracts to hedge against a variety of risks by establishing a combination of long and short exposures to specific equity markets or sectors.
Like any other investment, derivatives may not appreciate in value and may lose money. Derivatives may amplify traditional investment risks through the creation of leverage and may be less liquid than traditional securities. And because derivatives typically represent contractual agreements between two financial institutions, derivatives entail “counterparty risk,” which is the risk that the other party is unable or unwilling to pay. Putnam monitors the counterparty risks we assume. For example, Putnam often enters into collateral agreements that require the counterparties to post collateral on a regular basis to cover their obligations to the fund. Counterparty risk for exchange-traded futures and centrally cleared swaps is mitigated by the daily exchange of margin and other safeguards against default through their respective clearinghouses.
| |
| Putnam VT Diversified Income Fund 3 |
The fund’s portfolio 6/30/21 (Unaudited)
| | |
| U.S. GOVERNMENT AND AGENCY | | |
| MORTGAGE OBLIGATIONS (60.0%)* | Principal amount | Value |
| | | |
| U.S. Government Guaranteed Mortgage Obligations (2.0%) | | |
| Government National Mortgage Association | | |
| Pass-Through Certificates | | |
| 5.50%, 5/20/49 | $29,082 | $33,284 |
| 5.00%, with due dates from 5/20/49 to 3/20/50 | 192,780 | 213,510 |
| 4.00%, TBA, 7/1/51 | 3,000,000 | 3,167,280 |
| 3.50%, with due dates from 9/20/49 to 11/20/49 | 200,662 | 216,847 |
| | | 3,630,921 |
| U.S. Government Agency Mortgage Obligations (58.0%) | | |
| Federal National Mortgage Association | | |
| Pass-Through Certificates | | |
| 5.00%, with due dates from 1/1/49 to 5/1/49 | 52,524 | 58,061 |
| 4.50%, 5/1/49 | 22,417 | 24,378 |
| Uniform Mortgage-Backed Securities | | |
| 5.50%, TBA, 7/1/51 | 3,000,000 | 3,347,414 |
| 4.50%, TBA, 7/1/51 | 2,000,000 | 2,151,717 |
| 4.00%, TBA, 7/1/51 | 18,000,000 | 19,165,779 |
| 3.50%, TBA, 7/1/51 | 22,000,000 | 23,154,989 |
| 3.00%, TBA, 7/1/51 | 10,000,000 | 10,425,002 |
| 2.50%, TBA, 7/1/51 | 17,000,000 | 17,583,046 |
| 2.00%, TBA, 8/1/51 | 6,000,000 | 6,050,479 |
| 2.00%, TBA, 7/1/51 | 21,000,000 | 21,218,513 |
| | | 103,179,378 |
| Total U.S. government and agency mortgage | | |
| obligations (cost $106,888,614) | | $106,810,299 |
| | |
| U.S. TREASURY OBLIGATIONS (0.1%)* | Principal amount | Value |
| | | |
| U.S. Treasury Notes 1.375%, 1/31/25 i | $108,000 | $111,594 |
| Total U.S. treasury obligations (cost $111,594) | | $111,594 |
| |
| MORTGAGE-BACKED SECURITIES (40.9%)* | Principal amount | Value |
| | | |
| Agency collateralized mortgage obligations (21.9%) | | |
| Federal Home Loan Mortgage Corporation | | |
| REMICs IFB Ser. 5011, Class SA, IO, ((-1 x | | |
| 1 Month US LIBOR) + 6.25%), 6.159%, 9/25/50 | $3,757,278 | $732,669 |
| REMICs IFB Ser. 4742, Class S, IO, ((-1 x 1 Month | | |
| US LIBOR) + 6.20%), 6.127%, 12/15/47 | 952,226 | 114,267 |
| REMICs IFB Ser. 4839, Class WS, IO, ((-1 x | | |
| 1 Month US LIBOR) + 6.10%), 6.027%, 8/15/56 | 2,492,821 | 570,332 |
| REMICs IFB Ser. 4678, Class MS, IO, ((-1 x | | |
| 1 Month US LIBOR) + 6.10%), 6.027%, 4/15/47 | 680,204 | 134,131 |
| REMICs IFB Ser. 5004, Class SG, IO, ((-1 x | | |
| 1 Month US LIBOR) + 6.10%), 6.009%, 8/25/50 | 5,381,287 | 1,029,171 |
| REMICs IFB Ser. 4945, Class SL, IO, ((-1 x | | |
| 1 Month US LIBOR) + 6.05%), 5.959%, 1/25/50 | 3,214,145 | 552,044 |
| REMICs Ser. 5007, Class IC, IO, 5.00%, 8/25/50 | 4,053,492 | 654,615 |
| REMICs Ser. 4077, Class IK, IO, 5.00%, 7/15/42 | 537,446 | 80,617 |
| REMICs Ser. 5091, Class IL, IO, 4.50%, 3/25/51 | 4,553,936 | 665,882 |
| REMICs Ser. 5093, Class YI, IO, 4.50%, 12/25/50 | 3,163,124 | 452,022 |
| REMICs Ser. 5115, Class IK, IO, 4.50%, 12/25/50 | 3,370,788 | 582,904 |
| REMICs Ser. 5024, Class HI, IO, 4.50%, 10/25/50 | 4,488,383 | 702,015 |
| REMICs Ser. 4122, Class TI, IO, 4.50%, 10/15/42 | 536,693 | 65,606 |
| REMICs Ser. 4000, Class PI, IO, 4.50%, 1/15/42 | 262,527 | 31,057 |
| REMICs Ser. 4024, Class PI, IO, 4.50%, 12/15/41 | 523,860 | 53,680 |
| REMICs Ser. 4546, Class TI, IO, 4.00%, 12/15/45 | 345,107 | 40,795 |
| REMICs Ser. 4425, IO, 4.00%, 1/15/45 | 1,243,454 | 140,759 |
| REMICs Ser. 4452, Class QI, IO, 4.00%, 11/15/44 | 955,127 | 137,414 |
| REMICs Ser. 4403, Class CI, IO, 4.00%, 10/15/44 | 337,542 | 43,755 |
| REMICs Ser. 4000, Class LI, IO, 4.00%, 2/15/42 | 415,212 | 38,997 |
| REMICs Ser. 4604, Class QI, IO, 3.50%, 7/15/46 | 1,022,412 | 91,138 |
| | |
| MORTGAGE-BACKED | | |
| SECURITIES (40.9%)* cont. | Principal amount | Value |
| | | |
| Agency collateralized mortgage obligations cont. | | |
| Federal Home Loan Mortgage Corporation | | |
| REMICs Ser. 4580, Class ID, IO, 3.50%, 8/15/45 | $758,106 | $41,616 |
| REMICs Ser. 4105, Class HI, IO, 3.50%, 7/15/41 | 428,744 | 30,539 |
| Strips Ser. 304, Class C37, IO, 3.50%, 12/15/27 | 407,434 | 24,365 |
| REMICs Ser. 5051, Class BI, IO, 3.00%, 11/25/50 | 5,652,469 | 745,228 |
| REMICs Ser. 4210, Class PI, IO, 3.00%, 12/15/41 | 309,707 | 8,009 |
| Structured Pass-Through Certificates FRB | | |
| Ser. 57, Class 1AX, IO, 0.38%, 7/25/43 W | 701,650 | 7,017 |
| Federal National Mortgage Association | | |
| REMICs IFB Ser. 13-90, Class SD, IO, ((-1 x | | |
| 1 Month US LIBOR) + 6.60%), 6.509%, 9/25/43 | 1,107,360 | 229,455 |
| REMICs IFB Ser. 10-35, Class SG, IO, ((-1 x | | |
| 1 Month US LIBOR) + 6.40%), 6.309%, 4/25/40 | 399,616 | 80,215 |
| REMICs IFB Ser. 18-20, Class SB, IO, ((-1 x | | |
| 1 Month US LIBOR) + 6.25%), 6.159%, 3/25/48 | 2,133,031 | 392,369 |
| REMICs IFB Ser. 18-38, Class SA, IO, ((-1 x | | |
| 1 Month US LIBOR) + 6.20%), 6.109%, 6/25/48 | 3,369,185 | 508,383 |
| REMICs IFB Ser. 15-42, Class LS, IO, ((-1 x | | |
| 1 Month US LIBOR) + 6.20%), 6.109%, 6/25/45 | 2,219,143 | 385,228 |
| REMICs IFB Ser. 17-32, Class SA, IO, ((-1 x | | |
| 1 Month US LIBOR) + 6.15%), 6.059%, 5/25/47 | 4,294,983 | 700,598 |
| REMICs IFB Ser. 18-86, Class DS, IO, ((-1 x | | |
| 1 Month US LIBOR) + 6.10%), 6.009%, 12/25/48 | 1,163,480 | 111,621 |
| REMICs IFB Ser. 16-96, Class ST, IO, ((-1 x | | |
| 1 Month US LIBOR) + 6.10%), 6.009%, 12/25/46 | 1,595,224 | 292,841 |
| REMICs Ser. 16-3, Class NI, IO, 6.00%, 2/25/46 | 911,464 | 194,953 |
| REMICs IFB Ser. 20-12, Class SK, IO, ((-1 x | | |
| 1 Month US LIBOR) + 6.05%), 5.959%, 3/25/50 | 2,171,405 | 396,281 |
| REMICs IFB Ser. 19-57, Class KS, IO, ((-1 x | | |
| 1 Month US LIBOR) + 6.05%), 5.959%, 10/25/49 | 5,094,206 | 850,743 |
| REMICs IFB Ser. 19-43, Class JS, IO, ((-1 x | | |
| 1 Month US LIBOR) + 6.05%), 5.959%, 8/25/49 | 2,113,344 | 330,283 |
| REMICs IFB Ser. 10-140, Class GS, IO, ((-1 x | | |
| 1 Month US LIBOR) + 6.00%), 5.909%, 7/25/39 | 290,118 | 6,288 |
| REMICs Ser. 13-107, Class SB, IO, ((-1 x 1 Month | | |
| US LIBOR) + 5.95%), 5.859%, 2/25/43 | 959,871 | 193,397 |
| Interest Strip Ser. 374, Class 6, IO, 5.50%, 8/25/36 | 74,536 | 12,465 |
| REMICs Ser. 15-30, IO, 5.50%, 5/25/45 | 1,509,687 | 279,292 |
| Interest Strip Ser. 378, Class 19, IO, | | |
| 5.00%, 6/25/35 | 225,300 | 37,425 |
| REMICs Ser. 20-45, Class EI, IO, 5.00%, 7/25/50 | 1,876,221 | 299,479 |
| REMICs Ser. 21-15, Class IJ, IO, 4.50%, 4/25/51 | 2,987,685 | 541,966 |
| REMICs Ser. 20-76, Class BI, IO, 4.50%, 11/25/50 | 4,275,073 | 686,247 |
| REMICs Ser. 12-127, Class BI, IO, 4.50%, 11/25/42 | 189,839 | 35,840 |
| REMICs Ser. 12-30, Class HI, IO, 4.50%, 12/25/40 | 491,610 | 19,664 |
| REMICs Ser. 20-75, Class MI, IO, 4.00%, 11/25/50 | 6,233,472 | 903,853 |
| REMICs Ser. 17-7, Class JI, IO, 4.00%, 2/25/47 | 505,575 | 63,894 |
| REMICs Ser. 15-88, Class QI, IO, 4.00%, 10/25/44 | 386,230 | 23,851 |
| REMICs Ser. 15-83, IO, 4.00%, 10/25/43 | 1,397,334 | 161,394 |
| REMICs Ser. 13-41, Class IP, IO, 4.00%, 5/25/43 | 572,744 | 66,851 |
| REMICs Ser. 13-44, Class PI, IO, 4.00%, 1/25/43 | 433,583 | 49,554 |
| REMICs Ser. 13-35, Class IP, IO, 3.00%, 6/25/42 | 487,782 | 24,706 |
| REMICs Ser. 13-53, Class JI, IO, 3.00%, 12/25/41 | 782,702 | 42,480 |
| REMICs Ser. 13-23, Class PI, IO, 3.00%, 10/25/41 | 314,792 | 5,842 |
| Grantor Trust Ser. 00-T6, IO, 0.717%, 11/25/40 W | 546,756 | 11,591 |
| Government National Mortgage Association | | |
| IFB Ser. 21-98, Class SK, IO, ((-1 x 1 Month | | |
| US LIBOR) + 6.30%), 6.225%, 6/20/51 | 3,465,000 | 452,598 |
| IFB Ser. 21-77, Class SM, IO, ((-1 x 1 Month | | |
| US LIBOR) + 6.30%), 6.207%, 5/20/51 | 4,874,395 | 641,373 |
| IFB Ser. 21-59, Class SQ, IO, ((-1 x 1 Month | | |
| US LIBOR) + 6.30%), 6.207%, 4/20/51 | 4,019,991 | 587,727 |
| |
| 4 Putnam VT Diversified Income Fund |
| | |
| MORTGAGE-BACKED | | |
| SECURITIES (40.9%)* cont. | Principal amount | Value |
| | | |
| Agency collateralized mortgage obligations cont. | | |
| Government National Mortgage Association | | |
| IFB Ser. 20-133, Class CS, IO, ((-1 x 1 Month | | |
| US LIBOR) + 6.30%), 6.207%, 9/20/50 | $3,506,370 | $659,092 |
| IFB Ser. 14-60, Class SD, IO, ((-1 x 1 Month | | |
| US LIBOR) + 6.18%), 6.087%, 4/20/44 | 2,111,791 | 443,226 |
| IFB Ser. 20-97, Class QS, IO, ((-1 x 1 Month | | |
| US LIBOR) + 6.15%), 6.057%, 7/20/50 | 4,200,102 | 689,633 |
| IFB Ser. 18-139, Class SA, IO, ((-1 x 1 Month | | |
| US LIBOR) + 6.15%), 6.057%, 10/20/48 | 2,407,097 | 361,528 |
| IFB Ser. 13-129, Class SN, IO, ((-1 x 1 Month | | |
| US LIBOR) + 6.15%), 6.057%, 9/20/43 | 387,537 | 72,314 |
| IFB Ser. 13-99, Class VS, IO, ((-1 x 1 Month | | |
| US LIBOR) + 6.10%), 6.025%, 7/16/43 | 237,390 | 37,612 |
| IFB Ser. 20-63, Class PS, IO, ((-1 x 1 Month | | |
| US LIBOR) + 6.10%), 6.007%, 4/20/50 | 4,097,685 | 717,946 |
| IFB Ser. 19-96, Class SY, IO, ((-1 x 1 Month | | |
| US LIBOR) + 6.10%), 6.007%, 8/20/49 | 3,454,519 | 509,542 |
| IFB Ser. 19-83, Class SY, IO, ((-1 x 1 Month | | |
| US LIBOR) + 6.10%), 6.007%, 7/20/49 | 3,376,855 | 490,691 |
| IFB Ser. 19-89, Class PS, IO, ((-1 x 1 Month | | |
| US LIBOR) + 6.10%), 6.007%, 7/20/49 | 4,279,761 | 636,992 |
| IFB Ser. 20-15, Class CS, IO, ((-1 x 1 Month | | |
| US LIBOR) + 6.05%), 5.957%, 2/20/50 | 398,271 | 48,277 |
| IFB Ser. 20-7, Class SK, IO, ((-1 x 1 Month | | |
| US LIBOR) + 6.05%), 5.957%, 1/20/50 | 1,928,363 | 320,987 |
| IFB Ser. 19-152, Class ES, IO, ((-1 x 1 Month | | |
| US LIBOR) + 6.05%), 5.957%, 12/20/49 | 1,967,447 | 298,762 |
| IFB Ser. 19-99, Class KS, IO, ((-1 x 1 Month | | |
| US LIBOR) + 6.05%), 5.957%, 8/20/49 | 127,708 | 18,417 |
| IFB Ser. 19-78, Class SJ, IO, ((-1 x 1 Month | | |
| US LIBOR) + 6.05%), 5.957%, 6/20/49 | 152,789 | 19,594 |
| IFB Ser. 20-63, Class AS, IO, ((-1 x 1 Month | | |
| US LIBOR) + 6.00%), 5.907%, 8/20/43 | 3,010,696 | 597,563 |
| IFB Ser. 14-119, Class SA, IO, ((-1 x 1 Month | | |
| US LIBOR) + 5.60%), 5.507%, 8/20/44 | 996,439 | 174,491 |
| Ser. 17-38, Class DI, IO, 5.00%, 3/16/47 | 475,754 | 80,264 |
| Ser. 16-42, IO, 5.00%, 2/20/46 | 777,184 | 136,382 |
| Ser. 18-127, Class ID, IO, 5.00%, 7/20/45 | 531,035 | 77,791 |
| Ser. 18-127, Class IC, IO, 5.00%, 10/20/44 | 1,389,435 | 272,482 |
| Ser. 14-76, IO, 5.00%, 5/20/44 | 418,323 | 70,874 |
| Ser. 13-3, Class IT, IO, 5.00%, 1/20/43 | 442,843 | 78,605 |
| Ser. 12-146, IO, 5.00%, 12/20/42 | 694,896 | 128,716 |
| Ser. 10-35, Class UI, IO, 5.00%, 3/20/40 | 226,390 | 41,536 |
| Ser. 10-20, Class UI, IO, 5.00%, 2/20/40 | 341,127 | 62,300 |
| Ser. 10-9, Class UI, IO, 5.00%, 1/20/40 | 1,520,962 | 283,751 |
| Ser. 09-121, Class UI, IO, 5.00%, 12/20/39 | 869,469 | 160,069 |
| Ser. 17-26, Class MI, IO, 5.00%, 11/20/39 | 1,342,700 | 248,921 |
| Ser. 15-79, Class GI, IO, 5.00%, 10/20/39 | 282,033 | 51,045 |
| Ser. 18-94, Class AI, IO, 4.50%, 7/20/48 | 2,327,430 | 329,375 |
| Ser. 16-104, Class GI, IO, 4.50%, 1/20/46 | 585,206 | 83,275 |
| Ser. 18-127, Class IB, IO, 4.50%, 6/20/45 | 341,226 | 34,771 |
| Ser. 13-182, Class IQ, IO, 4.50%, 12/16/43 | 670,059 | 117,314 |
| Ser. 13-34, Class IH, IO, 4.50%, 3/20/43 | 995,734 | 162,972 |
| Ser. 13-183, Class JI, IO, 4.50%, 2/16/43 | 274,174 | 19,539 |
| Ser. 14-108, Class IP, IO, 4.50%, 12/20/42 | 118,835 | 8,304 |
| Ser. 17-42, Class IC, IO, 4.50%, 8/20/41 | 549,704 | 93,495 |
| Ser. 10-35, Class AI, IO, 4.50%, 3/20/40 | 639,813 | 56,341 |
| Ser. 10-35, Class QI, IO, 4.50%, 3/20/40 | 661,304 | 109,422 |
| Ser. 13-151, Class IB, IO, 4.50%, 2/20/40 | 689,691 | 111,735 |
| Ser. 10-9, Class QI, IO, 4.50%, 1/20/40 | 330,303 | 50,801 |
| Ser. 09-121, Class BI, IO, 4.50%, 12/16/39 | 399,873 | 73,649 |
| Ser. 15-186, Class AI, IO, 4.00%, 12/20/45 | 1,822,716 | 267,648 |
| | |
| MORTGAGE-BACKED | | |
| SECURITIES (40.9%)* cont. | Principal amount | Value |
| | | |
| Agency collateralized mortgage obligations cont. | | |
| Government National Mortgage Association | | |
| Ser. 16-27, Class IB, IO, 4.00%, 11/20/45 | $540,412 | $66,880 |
| Ser. 15-79, Class CI, IO, 4.00%, 5/20/45 | 1,195,961 | 182,481 |
| Ser. 15-64, Class YI, IO, 4.00%, 11/20/44 | 655,935 | 66,951 |
| Ser. 17-63, Class PI, IO, 4.00%, 12/20/43 | 587,628 | 35,258 |
| Ser. 13-165, Class IL, IO, 4.00%, 3/20/43 | 415,935 | 58,938 |
| Ser. 12-47, Class CI, IO, 4.00%, 3/20/42 | 705,696 | 102,736 |
| Ser. 12-8, Class PI, IO, 4.00%, 5/20/41 | 1,366,739 | 129,748 |
| Ser. 20-167, Class PI, IO, 3.50%, 11/20/50 | 4,561,382 | 536,043 |
| Ser. 20-138, Class IC, IO, 3.50%, 8/20/50 | 7,001,457 | 808,852 |
| Ser. 18-127, Class IE, IO, 3.50%, 1/20/46 | 731,863 | 70,544 |
| Ser. 16-75, Class EI, IO, 3.50%, 8/20/45 | 620,588 | 47,480 |
| Ser. 13-102, Class IP, IO, 3.50%, 6/20/43 | 143,928 | 2,769 |
| Ser. 13-76, IO, 3.50%, 5/20/43 | 886,919 | 105,144 |
| Ser. 13-28, IO, 3.50%, 2/20/43 | 269,528 | 26,691 |
| Ser. 13-54, Class JI, IO, 3.50%, 2/20/43 | 391,798 | 40,206 |
| Ser. 13-37, Class JI, IO, 3.50%, 1/20/43 | 696,873 | 69,771 |
| Ser. 13-27, Class PI, IO, 3.50%, 12/20/42 | 276,387 | 26,387 |
| Ser. 12-136, Class BI, IO, 3.50%, 11/20/42 | 815,947 | 125,637 |
| Ser. 12-140, Class IC, IO, 3.50%, 11/20/42 | 987,309 | 152,269 |
| Ser. 12-128, Class IA, IO, 3.50%, 10/20/42 | 1,180,465 | 164,431 |
| Ser. 15-69, Class IK, IO, 3.50%, 3/20/38 | 684,153 | 29,077 |
| Ser. 14-44, Class IA, IO, 3.50%, 5/20/28 | 1,303,464 | 81,154 |
| Ser. 21-59, Class IM, IO, 3.00%, 4/20/51 | 5,204,062 | 443,800 |
| Ser. 21-59, Class IP, IO, 3.00%, 4/20/51 | 5,502,247 | 419,546 |
| Ser. 21-67, Class PI, IO, 3.00%, 4/20/51 | 9,268,985 | 765,759 |
| Ser. 21-55, Class PI, IO, 3.00%, 3/20/51 | 4,644,508 | 477,629 |
| Ser. 20-36, Class MI, IO, 3.00%, 3/20/50 | 2,056,571 | 225,368 |
| Ser. 17-H02, Class BI, IO, 2.441%, 1/20/67 W | 2,142,473 | 162,609 |
| Ser. 18-H05, Class BI, IO, 2.396%, 2/20/68 W | 2,885,582 | 268,720 |
| Ser. 18-H05, Class AI, IO, 2.389%, 2/20/68 W | 2,349,202 | 218,769 |
| Ser. 16-H23, Class NI, IO, 2.369%, 10/20/66 W | 7,887,804 | 595,529 |
| Ser. 17-H06, Class BI, IO, 2.366%, 2/20/67 W | 2,377,155 | 183,730 |
| Ser. 16-H22, Class AI, IO, 2.354%, 10/20/66 W | 2,663,674 | 201,637 |
| Ser. 18-H03, Class XI, IO, 2.315%, 2/20/68 W | 2,543,934 | 221,322 |
| Ser. 16-H16, Class EI, IO, 2.277%, 6/20/66 W | 2,036,031 | 156,367 |
| Ser. 17-H08, Class NI, IO, 2.262%, 3/20/67 W | 3,049,757 | 229,952 |
| Ser. 17-H12, Class QI, IO, 2.259%, 5/20/67 W | 2,411,679 | 164,252 |
| Ser. 17-H16, Class JI, IO, 2.241%, 8/20/67 W | 3,243,624 | 294,472 |
| Ser. 16-H24, Class JI, IO, 2.209%, 11/20/66 W | 2,511,678 | 211,850 |
| Ser. 17-H11, Class TI, IO, 2.203%, 4/20/67 W | 1,816,489 | 162,939 |
| Ser. 16-H14, Class AI, IO, 2.186%, 6/20/66 W | 1,963,467 | 137,690 |
| Ser. 16-H17, Class KI, IO, 2.121%, 7/20/66 W | 1,349,297 | 98,443 |
| Ser. 15-H24, Class AI, IO, 2.114%, 9/20/65 W | 2,429,788 | 159,627 |
| Ser. 16-H03, Class DI, IO, 2.034%, 12/20/65 W | 2,694,968 | 172,031 |
| Ser. 16-H06, Class DI, IO, 1.919%, 7/20/65 W | 4,113,720 | 226,423 |
| Ser. 17-H16, Class IB, IO, 1.857%, 8/20/67 W | 2,845,867 | 181,817 |
| Ser. 17-H11, Class DI, IO, 1.854%, 5/20/67 W | 2,176,515 | 169,487 |
| Ser. 15-H25, Class EI, IO, 1.852%, 10/20/65 W | 2,108,498 | 149,703 |
| Ser. 17-H10, Class MI, IO, 1.85%, 4/20/67 W | 4,062,802 | 259,207 |
| Ser. 17-H09, IO, 1.822%, 4/20/67 W | 2,952,897 | 179,223 |
| Ser. 15-H10, Class BI, IO, 1.80%, 4/20/65 W | 1,847,290 | 125,800 |
| FRB Ser. 15-H08, Class CI, IO, 1.786%, 3/20/65 W | 1,378,056 | 85,302 |
| Ser. 16-H03, Class AI, IO, 1.758%, 1/20/66 W | 2,168,474 | 135,152 |
| Ser. 15-H23, Class BI, IO, 1.746%, 9/20/65 W | 3,025,418 | 198,165 |
| Ser. 17-H16, Class IG, IO, 1.744%, 7/20/67 W | 2,860,294 | 171,017 |
| Ser. 16-H09, Class BI, IO, 1.721%, 4/20/66 W | 3,738,219 | 287,469 |
| Ser. 16-H24, Class CI, IO, 1.69%, 10/20/66 W | 1,974,393 | 121,623 |
| Ser. 16-H14, IO, 1.675%, 6/20/66 W | 1,546,914 | 82,222 |
| Ser. 13-H08, Class CI, IO, 1.615%, 2/20/63 W | 2,896,550 | 112,676 |
| Ser. 15-H25, Class AI, IO, 1.608%, 9/20/65 W | 4,186,828 | 262,933 |
| |
| Putnam VT Diversified Income Fund 5 |
| | |
| MORTGAGE-BACKED | | |
| SECURITIES (40.9%)* cont. | Principal amount | Value |
| | | |
| Agency collateralized mortgage obligations cont. | | |
| Government National Mortgage Association | | |
| Ser. 16-H10, Class AI, IO, 1.552%, 4/20/66 W | $4,212,196 | $211,103 |
| Ser. 16-H02, Class HI, IO, 1.542%, 1/20/66 W | 3,013,231 | 169,042 |
| Ser. 14-H21, Class BI, IO, 1.532%, 10/20/64 W | 2,577,315 | 140,464 |
| Ser. 16-H06, Class CI, IO, 1.516%, 2/20/66 W | 4,311,683 | 190,995 |
| | | 39,060,746 |
| Commercial mortgage-backed securities (7.4%) | | |
| BANK 144A Ser. 17-BNK9, Class D, 2.80%, 11/15/54 | 278,000 | 249,154 |
| Bear Stearns Commercial Mortgage Securities Trust | | |
| FRB Ser. 07-T26, Class AJ, 5.54%, 1/12/45 W | 997,000 | 807,570 |
| Ser. 05-PWR7, Class B, 5.214%, 2/11/41 W | 263,411 | 262,094 |
| CD Commercial Mortgage Trust 144A Ser. 17-CD3, | | |
| Class D, 3.25%, 2/10/50 | 271,000 | 225,233 |
| CFCRE Commercial Mortgage Trust 144A | | |
| FRB Ser. 11-C2, Class E, 5.971%, 12/15/47 W | 326,000 | 320,790 |
| FRB Ser. 11-C2, Class F, 5.25%, 12/15/47 W | 822,000 | 783,700 |
| COMM Mortgage Trust FRB Ser. 14-CR16, Class C, | | |
| 5.09%, 4/10/47 W | 276,000 | 291,461 |
| COMM Mortgage Trust 144A | | |
| FRB Ser. 14-UBS3, Class D, 4.927%, 6/10/47 W | 116,000 | 117,215 |
| FRB Ser. 12-CR3, Class E, 4.908%, 10/15/45 W | 138,000 | 61,029 |
| Ser. 12-CR3, Class F, 4.75%, 10/15/45 W | 700,000 | 203,054 |
| FRB Ser. 13-CR9, Class D, 4.413%, 7/10/45 W | 452,000 | 263,022 |
| CSAIL Commercial Mortgage Trust 144A FRB | | |
| Ser. 15-C1, Class D, 3.905%, 4/15/50 W | 307,000 | 224,069 |
| GS Mortgage Securities Corp., II 144A | | |
| FRB Ser. 13-GC10, Class D, 4.548%, 2/10/46 W | 237,000 | 215,948 |
| Ser. 13-GC10, Class C, 4.285%, 2/10/46 W | 195,000 | 201,142 |
| GS Mortgage Securities Trust 144A FRB | | |
| Ser. 14-GC24, Class D, 4.669%, 9/10/47 W | 675,000 | 418,500 |
| JPMBB Commercial Mortgage Securities Trust 144A | | |
| FRB Ser. 14-C18, Class D, 4.96%, 2/15/47 W | 887,000 | 441,636 |
| FRB Ser. C14, Class D, 4.723%, 8/15/46 W | 350,000 | 248,070 |
| FRB Ser. 14-C18, Class E, 4.46%, 2/15/47 W | 381,000 | 172,042 |
| FRB Ser. 14-C25, Class D, 4.095%, 11/15/47 W | 294,000 | 221,870 |
| Ser. 14-C25, Class E, 3.332%, 11/15/47 W | 656,000 | 340,013 |
| JPMDB Commercial Mortgage Securities Trust | | |
| Ser. 17-C5, Class C, 4.512%, 3/15/50 W | 291,000 | 282,264 |
| JPMorgan Chase Commercial Mortgage Securities | | |
| Trust FRB Ser. 13-LC11, Class D, 4.305%, 4/15/46 W | 408,000 | 329,695 |
| JPMorgan Chase Commercial Mortgage Securities | | |
| Trust 144A | | |
| FRB Ser. 07-CB20, Class E, 6.374%, 2/12/51 W | 403,000 | 60,450 |
| FRB Ser. 11-C3, Class F, 5.707%, 2/15/46 W | 401,000 | 74,630 |
| FRB Ser. 11-C4, Class C, 5.575%, 7/15/46 W | 123,774 | 124,337 |
| FRB Ser. 13-LC11, Class E, 3.25%, 4/15/46 W | 715,000 | 454,348 |
| Mezz Cap Commercial Mortgage Trust 144A FRB | | |
| Ser. 07-C5, Class X, IO, 7.004%, 12/15/49 W | 11,396 | — |
| Morgan Stanley Bank of America Merrill Lynch | | |
| Trust 144A | | |
| FRB Ser. 13-C11, Class D, 4.496%, 8/15/46 W | 750,000 | 67,425 |
| FRB Ser. 15-C23, Class D, 4.282%, 7/15/50 W | 237,000 | 239,531 |
| FRB Ser. 13-C10, Class D, 4.217%, 7/15/46 W | 478,000 | 266,536 |
| Ser. 14-C17, Class E, 3.50%, 8/15/47 | 369,000 | 231,840 |
| Morgan Stanley Capital I Trust Ser. 06-HQ10, | | |
| Class B, 5.448%, 11/12/41 W | 204,856 | 201,858 |
| Multifamily Connecticut Avenue Securities | | |
| Trust 144A | | |
| FRB Ser. 20-01, Class M10, 3.842%, 3/25/50 | 577,000 | 600,799 |
| FRB Ser. 19-01, Class M10, 3.342%, 10/15/49 | 207,000 | 209,886 |
| | |
| MORTGAGE-BACKED | | |
| SECURITIES (40.9%)* cont. | Principal amount | Value |
| | | |
| Commercial mortgage-backed securities cont. | | |
| TIAA Real Estate CDO, Ltd. 144A Ser. 03-1A, | | |
| Class E, 8.00%, 12/28/38 (In default) † | $472,775 | $5 |
| UBS-Barclays Commercial Mortgage Trust 144A | | |
| Ser. 12-C2, Class F, 5.00%, 5/10/63 W | 490,000 | 33,320 |
| Ser. 13-C6, Class B, 3.875%, 4/10/46 W | 422,000 | 429,354 |
| Wells Fargo Commercial Mortgage Trust FRB | | |
| Ser. 16-NXS5, Class D, 5.151%, 1/15/59 W | 206,000 | 223,007 |
| Wells Fargo Commercial Mortgage Trust 144A | | |
| FRB Ser. 13-LC12, Class D, 4.435%, 7/15/46 W | 649,000 | 324,500 |
| Ser. 14-LC16, Class D, 3.938%, 8/15/50 | 828,000 | 182,567 |
| Ser. 16-C33, Class D, 3.123%, 3/15/59 | 216,000 | 204,836 |
| WF-RBS Commercial Mortgage Trust 144A | | |
| Ser. 11-C4, Class F, 5.00%, 6/15/44 W | 1,331,000 | 372,680 |
| FRB Ser. 12-C7, Class E, 4.957%, 6/15/45 W | 875,000 | 437,500 |
| FRB Ser. 13-C15, Class D, 4.646%, 8/15/46 W | 1,231,000 | 618,357 |
| FRB Ser. 12-C10, Class D, 4.573%, 12/15/45 W | 848,000 | 466,617 |
| Ser. 12-C7, Class F, 4.50%, 6/15/45 W | 2,626,000 | 558,288 |
| | | 13,062,242 |
| Residential mortgage-backed securities (non-agency) (11.6%) | | |
| BCAP, LLC Trust 144A FRB Ser. 11-RR3, Class 3A6, | | |
| 2.64%, 11/27/36 W | 335,638 | 268,510 |
| Bear Stearns Alt-A Trust FRB Ser. 05-8, | | |
| Class 21A1, 2.555%, 10/25/35 W | 222,760 | 196,992 |
| Bellemeade Re, Ltd. 144A FRB Ser. 17-1, Class B1, | | |
| (1 Month US LIBOR + 4.75%), 4.842%, 10/25/27 | | |
| (Bermuda) | 220,000 | 228,905 |
| Chevy Chase Funding, LLC Mortgage-Backed | | |
| Certificates 144A FRB Ser. 06-4A, Class A2, | | |
| (1 Month US LIBOR + 0.18%), 0.272%, 11/25/47 | 161,792 | 128,546 |
| Citigroup Mortgage Loan Trust, Inc. FRB | | |
| Ser. 07-AMC3, Class A2D, (1 Month US LIBOR | | |
| + 0.35%), 0.442%, 3/25/37 | 680,411 | 632,329 |
| Countrywide Alternative Loan Trust | | |
| FRB Ser. 06-OA7, Class 1A1, 2.223%, 6/25/46 W | 688,158 | 749,266 |
| FRB Ser. 05-38, Class A1, (1 Month US LIBOR | | |
| + 1.50%), 1.616%, 9/25/35 | 179,880 | 172,645 |
| FRB Ser. 06-OA7, Class 1A2, (1 Month US LIBOR | | |
| + 0.94%), 1.056%, 6/25/46 | 241,789 | 221,675 |
| FRB Ser. 05-59, Class 1A1, (1 Month US LIBOR | | |
| + 0.66%), 0.751%, 11/20/35 | 221,699 | 212,218 |
| FRB Ser. 06-OA10, Class 2A1, (1 Month US LIBOR | | |
| + 0.38%), 0.472%, 8/25/46 | 170,610 | 150,953 |
| FRB Ser. 06-OA10, Class 3A1, (1 Month US LIBOR | | |
| + 0.38%), 0.472%, 8/25/46 | 242,069 | 223,228 |
| FRB Ser. 06-OA10, Class 4A1, (1 Month US LIBOR | | |
| + 0.38%), 0.472%, 8/25/46 | 1,124,122 | 1,017,356 |
| FRB Ser. 07-OH1, Class A1D, (1 Month US LIBOR | | |
| + 0.21%), 0.302%, 4/25/47 | 113,785 | 95,614 |
| Deutsche Alt-A Securities Mortgage Loan Trust FRB | | |
| Ser. 06-AR4, Class A2, (1 Month US LIBOR | | |
| + 0.38%), 0.472%, 12/25/36 | 339,433 | 176,292 |
| Federal Home Loan Mortgage Corporation | | |
| Structured Agency Credit Risk Debt FRN | | |
| Ser. 16-DNA1, Class B, (1 Month US LIBOR | | |
| + 10.00%), 10.092%, 7/25/28 | 1,022,782 | 1,161,166 |
| Structured Agency Credit Risk Debt FRN | | |
| Ser. 15-DNA3, Class B, (1 Month US LIBOR | | |
| + 9.35%), 9.442%, 4/25/28 | 518,480 | 586,205 |
| Structured Agency Credit Risk Debt Notes FRB | | |
| Ser. 15-HQA1, Class B, (1 Month US LIBOR | | |
| + 8.80%), 8.892%, 3/25/28 | 324,238 | 351,276 |
| |
| 6 Putnam VT Diversified Income Fund |
| | |
| MORTGAGE-BACKED | | |
| SECURITIES (40.9%)* cont. | Principal amount | Value |
| |
| Residential mortgage-backed securities (non-agency) cont. | | |
| Federal Home Loan Mortgage Corporation | | |
| Structured Agency Credit Risk Debt FRN | | |
| Ser. 15-DNA2, Class B, (1 Month US LIBOR | | |
| + 7.55%), 7.642%, 12/25/27 | $417,327 | $454,877 |
| Structured Agency Credit Risk Debt FRN | | |
| Ser. 16-HQA2, Class M3, (1 Month US LIBOR | | |
| + 5.15%), 5.242%, 11/25/28 | 497,380 | 520,751 |
| Structured Agency Credit Risk Debt FRN | | |
| Ser. 14-DN1, Class M3, (1 Month US LIBOR | | |
| + 4.50%), 4.592%, 2/25/24 | 204,542 | 210,298 |
| Structured Agency Credit Risk Debt FRN | | |
| Ser. 17-HQA1, Class M2, (1 Month US LIBOR | | |
| + 3.55%), 3.642%, 8/25/29 | 422,409 | 436,996 |
| Federal Home Loan Mortgage Corporation 144A | | |
| Structured Agency Credit Risk Trust FRB | | |
| Ser. 18-HQA2, Class B2, (1 Month US LIBOR | | |
| + 11.00%), 11.092%, 10/25/48 | 168,000 | 199,505 |
| Structured Agency Credit Risk Trust FRB | | |
| Ser. 19-DNA2, Class B2, (1 Month US LIBOR | | |
| + 10.50%), 10.592%, 3/25/49 | 152,000 | 172,997 |
| Structured Agency Credit Risk Trust REMICs FRB | | |
| Ser. 20-DNA4, Class B2, (1 Month US LIBOR | | |
| + 10.00%), 10.092%, 8/25/50 | 135,000 | 166,050 |
| Structured Agency Credit Risk Debt FRN | | |
| Ser. 20-DNA3, Class B2, (1 Month US LIBOR | | |
| + 9.35%), 9.442%, 6/25/50 | 237,000 | 286,770 |
| Structured Agency Credit Risk Trust FRB | | |
| Ser. 19-DNA3, Class B2, (1 Month US LIBOR | | |
| + 8.15%), 8.242%, 7/25/49 | 104,000 | 114,632 |
| Structured Agency Credit Risk Trust FRB | | |
| Ser. 18-DNA3, Class B2, (1 Month US LIBOR | | |
| + 7.75%), 7.842%, 9/25/48 | 389,000 | 416,281 |
| Seasoned Credit Risk Transfer Trust Ser. 19-2, | | |
| Class M, 4.75%, 8/25/58 W | 253,000 | 268,055 |
| Structured Agency Credit Risk Trust FRB | | |
| Ser. 18-HQA2, Class B1, (1 Month US LIBOR | | |
| + 4.25%), 4.342%, 10/25/48 | 163,000 | 169,928 |
| Structured Agency Credit Risk Trust REMICs FRB | | |
| Ser. 20-HQA2, Class M2, (1 Month US LIBOR | | |
| + 3.10%), 3.192%, 3/25/50 | 206,000 | 209,078 |
| Structured Agency Credit Risk Trust FRB | | |
| Ser. 19-DNA1, Class M2, (1 Month US LIBOR | | |
| + 2.65%), 2.742%, 1/25/49 | 220,787 | 223,949 |
| Structured Agency Credit Risk Trust FRB | | |
| Ser. 19-DNA2, Class M2, (1 Month US LIBOR | | |
| + 2.45%), 2.542%, 3/25/49 | 88,620 | 89,838 |
| Structured Agency Credit Risk Trust FRB | | |
| Ser. 18-HQA2, Class M2, (1 Month US LIBOR | | |
| + 2.30%), 2.392%, 10/25/48 | 110,600 | 111,838 |
| Federal National Mortgage Association | | |
| Connecticut Avenue Securities FRB Ser. 16-C02, | | |
| Class 1B, (1 Month US LIBOR + 12.25%), | | |
| 12.342%, 9/25/28 | 968,533 | 1,204,955 |
| Connecticut Avenue Securities FRB Ser. 16-C03, | | |
| Class 1B, (1 Month US LIBOR + 11.75%), | | |
| 11.842%, 10/25/28 | 496,824 | 611,656 |
| Connecticut Avenue Securities FRB Ser. 16-C01, | | |
| Class 1B, (1 Month US LIBOR + 11.75%), | | |
| 11.842%, 8/25/28 | 271,530 | 331,050 |
| Connecticut Avenue Securities FRB Ser. 16-C05, | | |
| Class 2B, (1 Month US LIBOR + 10.75%), | | |
| 10.842%, 1/25/29 | 89,707 | 106,296 |
| Connecticut Avenue Securities FRB Ser. 16-C03, | | |
| Class 2M2, (1 Month US LIBOR + 5.90%), | | |
| 5.992%, 10/25/28 | 511,153 | 539,146 |
| | |
| MORTGAGE-BACKED | | |
| SECURITIES (40.9%)* cont. | Principal amount | Value |
| |
| Residential mortgage-backed securities (non-agency) cont. | | |
| Federal National Mortgage Association | | |
| Connecticut Avenue Securities FRB Ser. 15-C04, | | |
| Class 1M2, (1 Month US LIBOR + 5.70%), | | |
| 5.792%, 4/25/28 | $636,581 | $674,385 |
| Connecticut Avenue Securities FRB Ser. 15-C04, | | |
| Class 2M2, (1 Month US LIBOR + 5.55%), | | |
| 5.642%, 4/25/28 | 74,689 | 78,878 |
| Connecticut Avenue Securities FRB Ser. 17-C02, | | |
| Class 2B1, (1 Month US LIBOR + 5.50%), | | |
| 5.592%, 9/25/29 | 405,000 | 440,351 |
| Connecticut Avenue Securities FRB Ser. 15-C03, | | |
| Class 2M2, (1 Month US LIBOR + 5.00%), | | |
| 5.092%, 7/25/25 | 28,865 | 29,303 |
| Connecticut Avenue Securities FRB Ser. 17-C03, | | |
| Class 1B1, (1 Month US LIBOR + 4.85%), | | |
| 4.942%, 10/25/29 | 407,000 | 436,108 |
| Connecticut Avenue Securities FRB Ser. 18-C04, | | |
| Class 2B1, (1 Month US LIBOR + 4.50%), | | |
| 4.592%, 12/25/30 | 451,000 | 470,366 |
| Connecticut Avenue Securities FRB Ser. 17-C07, | | |
| Class 2B1, (1 Month US LIBOR + 4.45%), | | |
| 4.542%, 5/25/30 | 22,000 | 22,861 |
| Connecticut Avenue Securities FRB Ser. 17-C06, | | |
| Class 2B1, (1 Month US LIBOR + 4.45%), | | |
| 4.542%, 2/25/30 | 30,000 | 31,125 |
| Connecticut Avenue Securities FRB Ser. 18-C05, | | |
| Class 1B1, (1 Month US LIBOR + 4.25%), | | |
| 4.342%, 1/25/31 | 620,000 | 648,063 |
| Connecticut Avenue Securities FRB Ser. 15-C02, | | |
| Class 1M2, (1 Month US LIBOR + 4.00%), | | |
| 4.092%, 5/25/25 | 12,698 | 12,978 |
| Connecticut Avenue Securities FRB Ser. 15-C02, | | |
| Class 2M2, (1 Month US LIBOR + 4.00%), | | |
| 4.092%, 5/25/25 | 12,132 | 12,257 |
| Connecticut Avenue Securities FRB Ser. 18-C01, | | |
| Class 1B1, (1 Month US LIBOR + 3.55%), | | |
| 3.642%, 7/25/30 | 120,000 | 123,000 |
| Connecticut Avenue Securities FRB Ser. 17-C03, | | |
| Class 1M2, (1 Month US LIBOR + 3.00%), | | |
| 3.092%, 10/25/29 | 662,279 | 682,616 |
| Connecticut Avenue Securities FRB Ser. 17-C04, | | |
| Class 2M2, (1 Month US LIBOR + 2.85%), | | |
| 2.942%, 11/25/29 | 200,231 | 205,232 |
| Federal National Mortgage Association 144A | | |
| Connecticut Avenue Securities Trust FRB | | |
| Ser. 19-R03, Class 1B1, (1 Month US LIBOR | | |
| + 4.10%), 4.192%, 9/25/31 | 505,000 | 519,489 |
| Connecticut Avenue Securities Trust FRB | | |
| Ser. 20-SBT1, Class 1M2, (1 Month US LIBOR | | |
| + 3.65%), 3.742%, 2/25/40 | 276,000 | 284,673 |
| Connecticut Avenue Securities Trust FRB | | |
| Ser. 20-R01, Class 1B1, (1 Month US LIBOR | | |
| + 3.25%), 3.342%, 1/25/40 | 155,000 | 155,324 |
| GSAA Home Equity Trust FRB Ser. 06-8, Class 2A2, | | |
| (1 Month US LIBOR + 0.36%), 0.452%, 5/25/36 | 546,954 | 186,223 |
| GSR Mortgage Loan Trust FRB Ser. 07-OA1, | | |
| Class 2A3A, (1 Month US LIBOR + 0.31%), | | |
| 0.402%, 5/25/37 | 172,432 | 143,091 |
| HarborView Mortgage Loan Trust FRB Ser. 05-2, | | |
| Class 1A, (1 Month US LIBOR + 0.52%), | | |
| 0.613%, 5/19/35 | 194,309 | 93,625 |
| JPMorgan Alternative Loan Trust FRB Ser. 07-A2, | | |
| Class 12A1, IO, (1 Month US LIBOR + 0.20%), | | |
| 0.292%, 6/25/37 | 242,140 | 124,785 |
| |
| Putnam VT Diversified Income Fund 7 |
| | |
| MORTGAGE-BACKED | | |
| SECURITIES (40.9%)* cont. | Principal amount | Value |
| |
| Residential mortgage-backed securities (non-agency) cont. | | |
| Morgan Stanley Re-REMIC Trust 144A FRB | | |
| Ser. 10-R4, Class 4B, (1 Month US LIBOR | | |
| + 0.23%), 0.648%, 2/26/37 | $220,881 | $211,613 |
| MortgageIT Trust FRB Ser. 05-3, Class M2, | | |
| (1 Month US LIBOR + 0.80%), 0.887%, 8/25/35 | 70,052 | 68,819 |
| Oaktown Re, Ltd. 144A FRB Ser. 17-1A, Class B1, | | |
| (1 Month US LIBOR + 6.00%), 5.842%, 4/25/27 | | |
| (Bermuda) | 280,000 | 285,690 |
| Residential Accredit Loans, Inc. Trust FRB | | |
| Ser. 06-QO10, Class A1, (1 Month US LIBOR | | |
| + 0.16%), 0.412%, 1/25/37 | 303,168 | 291,301 |
| Structured Asset Mortgage Investments II Trust | | |
| FRB Ser. 07-AR1, Class 2A1, (1 Month US LIBOR | | |
| + 0.18%), 0.272%, 1/25/37 | 261,894 | 249,737 |
| Towd Point Mortgage Trust 144A Ser. 19-2, | | |
| Class A2, 3.75%, 12/25/58 W | 202,000 | 219,231 |
| WaMu Asset-Backed Certificates Trust FRB | | |
| Ser. 07-HE4, Class 1A, (1 Month US LIBOR | | |
| + 0.17%), 0.262%, 7/25/47 | 136,677 | 114,782 |
| WaMu Mortgage Pass-Through Certificates Trust | | |
| FRB Ser. 05-AR17, Class A1B3, (1 Month US LIBOR | | |
| + 0.70%), 0.792%, 12/25/45 | 443,765 | 425,052 |
| | | 20,659,080 |
| | | |
| Total mortgage-backed securities (cost $84,579,905) | | $72,782,068 |
| | |
| CORPORATE BONDS AND NOTES (17.0%)* | Principal amount | Value |
| | | |
| Basic materials (0.9%) | | |
| Allegheny Technologies, Inc. sr. unsec. | | |
| unsub. notes 7.875%, 8/15/23 | $102,000 | $111,690 |
| Beacon Roofing Supply, Inc. 144A company | | |
| guaranty sr. notes 4.50%, 11/15/26 | 34,000 | 35,679 |
| Beacon Roofing Supply, Inc. 144A sr. unsec. | | |
| unsub. notes 4.125%, 5/15/29 | 35,000 | 34,911 |
| Big River Steel, LLC/BRS Finance Corp. 144A | | |
| sr. notes 6.625%, 1/31/29 | 95,000 | 104,619 |
| Boise Cascade Co. 144A company | | |
| guaranty sr. unsec. notes 4.875%, 7/1/30 | 40,000 | 42,502 |
| Compass Minerals International, Inc. 144A company | | |
| guaranty sr. unsec. notes 6.75%, 12/1/27 | 140,000 | 150,500 |
| Compass Minerals International, Inc. 144A company | | |
| guaranty sr. unsec. notes 4.875%, 7/15/24 | 48,000 | 49,680 |
| CVR Partners LP/CVR Nitrogen Finance Corp. 144A | | |
| company guaranty sr. notes 6.125%, 6/15/28 | 15,000 | 15,375 |
| FMG Resources August 2006 Pty, Ltd. 144A company | | |
| guaranty sr. unsec. bonds 4.375%, 4/1/31 (Australia) | 95,000 | 101,634 |
| Freeport-McMoRan, Inc. company | | |
| guaranty sr. unsec. bonds 4.625%, 8/1/30 (Indonesia) | 50,000 | 54,750 |
| Freeport-McMoRan, Inc. company | | |
| guaranty sr. unsec. notes 4.375%, 8/1/28 (Indonesia) | 50,000 | 52,813 |
| Freeport-McMoRan, Inc. company guaranty sr. | | |
| unsec. unsub. notes 5.45%, 3/15/43 (Indonesia) | 20,000 | 24,446 |
| GCP Applied Technologies, Inc. 144A sr. unsec. | | |
| notes 5.50%, 4/15/26 | 170,000 | 174,854 |
| HudBay Minerals, Inc. 144A company | | |
| guaranty sr. unsec. notes 6.125%, 4/1/29 (Canada) | 25,000 | 26,625 |
| HudBay Minerals, Inc. 144A company | | |
| guaranty sr. unsec. notes 4.50%, 4/1/26 (Canada) | 40,000 | 40,000 |
| Ingevity Corp. 144A company guaranty sr. unsec. | | |
| notes 3.875%, 11/1/28 | 50,000 | 49,750 |
| | |
| CORPORATE BONDS | | |
| AND NOTES (17.0%)* cont. | Principal amount | Value |
| |
| Basic materials cont. | | |
| Intelligent Packaging, Ltd., Finco, Inc./ | | |
| Intelligent Packaging, Ltd. Co-Issuer, | | |
| LLC 144A sr. notes 6.00%, 9/15/28 (Canada) | $20,000 | $20,800 |
| Louisiana-Pacific Corp. 144A sr. unsec. | | |
| notes 3.625%, 3/15/29 | 125,000 | 125,781 |
| Mauser Packaging Solutions Holding Co. 144A | | |
| sr. notes 8.50%, 4/15/24 | 30,000 | 31,050 |
| NOVA Chemicals Corp. 144A sr. unsec. | | |
| sub. notes 4.25%, 5/15/29 (Canada) | 45,000 | 45,450 |
| Novelis Corp. 144A company guaranty sr. unsec. | | |
| bonds 5.875%, 9/30/26 | 40,000 | 41,610 |
| Novelis Corp. 144A company guaranty sr. unsec. | | |
| notes 4.75%, 1/30/30 | 21,000 | 22,050 |
| SCIH Salt Holdings, Inc. 144A sr. notes 4.875%, 5/1/28 | 35,000 | 34,996 |
| Taseko Mines, Ltd. 144A company | | |
| guaranty sr. notes 7.00%, 2/15/26 (Canada) | 85,000 | 88,613 |
| Trinseo Materials Operating SCA/Trinseo Materials | | |
| Finance, Inc. 144A company guaranty sr. unsec. | | |
| notes 5.125%, 4/1/29 (Luxembourg) | 90,000 | 92,025 |
| W.R. Grace & Co.-Conn. 144A company | | |
| guaranty sr. unsec. notes 4.875%, 6/15/27 | 65,000 | 68,920 |
| | | 1,641,123 |
| Capital goods (1.3%) | | |
| Amsted Industries, Inc. 144A company | | |
| guaranty sr. unsec. sub. notes 5.625%, 7/1/27 | 75,000 | 79,031 |
| Clarios Global LP 144A company | | |
| guaranty sr. notes 6.75%, 5/15/25 | 58,000 | 61,769 |
| GFL Environmental, Inc. 144A company | | |
| guaranty sr. unsec. notes 4.75%, 6/15/29 (Canada) | 15,000 | 15,488 |
| GFL Environmental, Inc. 144A company | | |
| guaranty sr. unsec. notes 4.00%, 8/1/28 (Canada) | 20,000 | 19,757 |
| GFL Environmental, Inc. 144A sr. notes 5.125%, | | |
| 12/15/26 (Canada) | 95,000 | 100,502 |
| Great Lakes Dredge & Dock Corp. 144A company | | |
| guaranty sr. unsec. notes 5.25%, 6/1/29 | 33,000 | 33,993 |
| Husky III Holding, Ltd. 144A sr. unsec. | | |
| notes 13.00%, 2/15/25 (Canada) ‡‡ | 210,000 | 227,850 |
| Madison IAQ, LLC 144A sr. notes 4.125%, 6/30/28 | 30,000 | 30,300 |
| Panther BF Aggregator 2 LP/Panther | | |
| Finance Co., Inc. 144A company | | |
| guaranty sr. notes 6.25%, 5/15/26 | 92,000 | 98,009 |
| Panther BF Aggregator 2 LP/Panther | | |
| Finance Co., Inc. 144A company | | |
| guaranty sr. unsec. notes 8.50%, 5/15/27 | 100,000 | 109,020 |
| Park-Ohio Industries, Inc. company | | |
| guaranty sr. unsec. notes 6.625%, 4/15/27 | 239,000 | 243,254 |
| RBS Global, Inc./Rexnord, LLC 144A sr. unsec. | | |
| notes 4.875%, 12/15/25 | 125,000 | 127,500 |
| Sensata Technologies BV 144A company | | |
| guaranty sr. unsec. notes 4.00%, 4/15/29 | 95,000 | 96,425 |
| Staples, Inc. 144A sr. notes 7.50%, 4/15/26 | 210,000 | 217,504 |
| Stevens Holding Co, Inc. 144A company | | |
| guaranty sr. unsec. notes 6.125%, 10/1/26 | 132,000 | 141,570 |
| TransDigm, Inc. company guaranty sr. unsec. | | |
| sub. notes 5.50%, 11/15/27 | 123,000 | 128,228 |
| TransDigm, Inc. 144A company | | |
| guaranty sr. notes 6.25%, 3/15/26 | 311,000 | 328,105 |
| TransDigm, Inc. 144A company guaranty sr. unsec. | | |
| sub. notes 4.875%, 5/1/29 | 100,000 | 100,950 |
| |
| 8 Putnam VT Diversified Income Fund |
| | |
| CORPORATE BONDS | | |
| AND NOTES (17.0%)* cont. | Principal amount | Value |
| |
| Capital goods cont. | | |
| TransDigm, Inc. 144A company guaranty sr. unsec. | | |
| sub. notes 4.625%, 1/15/29 | $65,000 | $65,023 |
| WESCO Distribution, Inc. 144A company | | |
| guaranty sr. unsec. unsub. notes 7.125%, 6/15/25 | 50,000 | 54,035 |
| | | 2,278,313 |
| Communication services (1.5%) | | |
| CCO Holdings, LLC/CCO Holdings Capital Corp. | | |
| sr. unsec. bonds 4.50%, 5/1/32 | 70,000 | 72,538 |
| CCO Holdings, LLC/CCO Holdings Capital Corp. 144A | | |
| sr. unsec. bonds 5.375%, 6/1/29 | 623,000 | 681,001 |
| CCO Holdings, LLC/CCO Holdings Capital Corp. 144A | | |
| sr. unsec. bonds 4.75%, 3/1/30 | 50,000 | 52,875 |
| CCO Holdings, LLC/CCO Holdings Capital Corp. 144A | | |
| sr. unsec. bonds 4.50%, 8/15/30 | 50,000 | 52,061 |
| CommScope Technologies, LLC 144A company | | |
| guaranty sr. unsec. notes 6.00%, 6/15/25 | 68,000 | 69,445 |
| CSC Holdings, LLC sr. unsec. unsub. bonds | | |
| 5.25%, 6/1/24 | 98,000 | 106,203 |
| DISH DBS Corp. company guaranty sr. unsec. | | |
| unsub. notes 5.875%, 11/15/24 | 135,000 | 144,956 |
| DISH DBS Corp. 144A company guaranty sr. unsec. | | |
| notes 5.125%, 6/1/29 | 66,000 | 65,170 |
| Frontier Communications Corp. 144A company | | |
| guaranty sr. notes 5.875%, 10/15/27 | 75,000 | 80,344 |
| Frontier Communications Corp. 144A notes | | |
| 6.75%, 5/1/29 | 85,000 | 90,378 |
| Level 3 Financing, Inc. company | | |
| guaranty sr. unsec. unsub. notes 5.25%, 3/15/26 | 29,000 | 29,885 |
| Level 3 Financing, Inc. 144A company | | |
| guaranty sr. unsec. notes 4.625%, 9/15/27 | 71,000 | 73,692 |
| Level 3 Financing, Inc. 144A company | | |
| guaranty sr. unsec. notes 4.25%, 7/1/28 | 30,000 | 30,443 |
| Level 3 Financing, Inc. 144A company | | |
| guaranty sr. unsec. unsub. notes 3.625%, 1/15/29 | 45,000 | 43,425 |
| Quebecor Media, Inc. sr. unsec. | | |
| unsub. notes 5.75%, 1/15/23 (Canada) | 36,000 | 38,340 |
| Sprint Capital Corp. company guaranty sr. unsec. | | |
| unsub. notes 6.875%, 11/15/28 | 106,000 | 135,945 |
| Sprint Corp. company guaranty sr. unsec. | | |
| notes 7.625%, 3/1/26 | 105,000 | 128,100 |
| Sprint Corp. company guaranty sr. unsec. | | |
| sub. notes 7.875%, 9/15/23 | 93,000 | 105,655 |
| T-Mobile USA, Inc. company | | |
| guaranty sr. notes 3.875%, 4/15/30 | 40,000 | 44,713 |
| T-Mobile USA, Inc. company | | |
| guaranty sr. notes 3.75%, 4/15/27 | 55,000 | 60,775 |
| T-Mobile USA, Inc. company guaranty sr. unsec. | | |
| bonds 2.875%, 2/15/31 | 65,000 | 64,513 |
| T-Mobile USA, Inc. company guaranty sr. unsec. | | |
| notes 5.375%, 4/15/27 | 16,000 | 17,035 |
| T-Mobile USA, Inc. company guaranty sr. unsec. | | |
| notes 2.625%, 2/15/29 | 45,000 | 44,438 |
| T-Mobile USA, Inc. company guaranty sr. unsec. | | |
| unsub. bonds 4.75%, 2/1/28 | 116,000 | 124,265 |
| T-Mobile USA, Inc. company guaranty sr. unsec. | | |
| unsub. notes 4.50%, 2/1/26 | 45,000 | 45,860 |
| Videotron, Ltd./Videotron Ltee. 144A sr. unsec. | | |
| notes 5.125%, 4/15/27 (Canada) | 60,000 | 62,700 |
| | | |
| CORPORATE BONDS | | | |
| AND NOTES (17.0%)* cont. | | Principal amount | Value |
| |
| Communication services cont. | | | |
| Videotron, Ltd./Videotron Ltee. 144A sr. unsec. | | | |
| notes 3.625%, 6/15/29 (Canada) | | $20,000 | $20,394 |
| Virgin Media Secured Finance PLC 144A company | | | |
| guaranty sr. bonds 5.00%, 4/15/27 | | | |
| (United Kingdom) | GBP | 100,000 | 143,570 |
| | | | 2,628,719 |
| Consumer cyclicals (3.6%) | | | |
| American Builders & Contractors Supply Co., Inc. | | | |
| 144A sr. notes 4.00%, 1/15/28 | | $45,000 | 46,112 |
| American Builders & Contractors Supply Co., Inc. | | | |
| 144A sr. unsec. notes 3.875%, 11/15/29 | | 45,000 | 44,550 |
| BCPE Ulysses Intermediate, Inc. 144A sr. unsec. | | | |
| notes 7.75%, 4/1/27 ‡‡ | | 85,000 | 87,125 |
| Boyd Gaming Corp. company guaranty sr. unsec. | | | |
| notes 4.75%, 12/1/27 | | 45,000 | 46,575 |
| Boyd Gaming Corp. 144A sr. unsec. bonds | | | |
| 4.75%, 6/15/31 | | 85,000 | 88,188 |
| Brookfield Residential Properties, Inc./Brookfield | | | |
| Residential US Corp. 144A sr. unsec. notes 5.00%, | | | |
| 6/15/29 (Canada) | | 65,000 | 65,488 |
| Carriage Services, Inc. 144A company | | | |
| guaranty sr. unsec. notes 4.25%, 5/15/29 | | 45,000 | 44,932 |
| Cengage Learning, Inc. 144A sr. unsec. | | | |
| unsub. notes 9.50%, 6/15/24 | | 85,000 | 87,019 |
| Cinemark USA, Inc. 144A company | | | |
| guaranty sr. notes 8.75%, 5/1/25 | | 20,000 | 21,900 |
| Cinemark USA, Inc. 144A company | | | |
| guaranty sr. unsec. notes 5.25%, 7/15/28 | | 70,000 | 71,750 |
| Clear Channel Outdoor Holdings, Inc. 144A company | | | |
| guaranty sr. notes 5.125%, 8/15/27 | | 65,000 | 66,639 |
| CRC Escrow Issuer, LLC/CRC Finco, Inc. 144A | | | |
| company guaranty sr. unsec. notes 5.25%, 10/15/25 | | 245,000 | 247,450 |
| Diamond Sports Group, LLC/Diamond Sports | | | |
| Finance Co. 144A sr. notes 5.375%, 8/15/26 | | 120,000 | 77,700 |
| Diamond Sports Group, LLC/Diamond Sports | | | |
| Finance Co. 144A sr. unsec. notes 6.625%, 8/15/27 | | 79,000 | 38,800 |
| Entercom Media Corp. 144A company | | | |
| guaranty notes 6.75%, 3/31/29 | | 90,000 | 93,385 |
| Entercom Media Corp. 144A company | | | |
| guaranty notes 6.50%, 5/1/27 | | 50,000 | 52,000 |
| Ford Motor Co. sr. unsec. unsub. notes | | | |
| 9.00%, 4/22/25 | | 125,000 | 154,109 |
| Gartner, Inc. 144A company guaranty sr. unsec. | | | |
| bonds 3.75%, 10/1/30 | | 110,000 | 112,200 |
| Gartner, Inc. 144A company guaranty sr. unsec. | | | |
| notes 3.625%, 6/15/29 | | 15,000 | 15,225 |
| Hanesbrands, Inc. 144A company | | | |
| guaranty sr. unsec. notes 5.375%, 5/15/25 | | 40,000 | 42,350 |
| Hanesbrands, Inc. 144A company | | | |
| guaranty sr. unsec. unsub. notes 4.625%, 5/15/24 | | 90,000 | 95,400 |
| Hilton Worldwide Finance, LLC/Hilton Worldwide | | | |
| Finance Corp. company guaranty sr. unsec. | | | |
| notes 4.875%, 4/1/27 | | 73,000 | 76,103 |
| iHeartCommunications, Inc. company | | | |
| guaranty sr. notes 6.375%, 5/1/26 | | 24,000 | 25,530 |
| iHeartCommunications, Inc. company | | | |
| guaranty sr. unsec. notes 8.375%, 5/1/27 | | 222,931 | 238,815 |
| IHS Markit, Ltd. 144A company | | | |
| guaranty notes 4.75%, 2/15/25 (United Kingdom) | | 45,000 | 50,344 |
| Iron Mountain, Inc. 144A company | | | |
| guaranty sr. unsec. notes 4.875%, 9/15/27 R | | 79,000 | 81,666 |
| |
| Putnam VT Diversified Income Fund 9 |
| | | |
| CORPORATE BONDS | | | |
| AND NOTES (17.0%)* cont. | Principal amount | Value |
| |
| Consumer cyclicals cont. | | | |
| L Brands, Inc. company guaranty sr. unsec. | | | |
| sub. bonds 6.875%, 11/1/35 | | $85,000 | $107,631 |
| L Brands, Inc. 144A company guaranty sr. unsec. | | | |
| notes 9.375%, 7/1/25 | | 20,000 | 25,850 |
| L Brands, Inc. 144A company guaranty sr. unsec. | | | |
| unsub. bonds 6.625%, 10/1/30 | | 45,000 | 52,088 |
| La Financiere Atalian SASU company | | | |
| guaranty sr. unsec. notes Ser. REGS, 4.00%, | | | |
| 5/15/24 (France) | EUR | 100,000 | 117,653 |
| Levi Strauss & Co. 144A sr. unsec. | | | |
| sub. bonds 3.50%, 3/1/31 | | $47,000 | 46,727 |
| Live Nation Entertainment, Inc. 144A company | | | |
| guaranty sr. unsec. notes 4.875%, 11/1/24 | | 27,000 | 27,432 |
| Live Nation Entertainment, Inc. 144A company | | | |
| guaranty sr. unsec. sub. notes 5.625%, 3/15/26 | | 49,000 | 51,028 |
| Live Nation Entertainment, Inc. 144A | | | |
| sr. notes 6.50%, 5/15/27 | | 50,000 | 55,490 |
| MajorDrive Holdings IV, LLC 144A sr. unsec. | | | |
| notes 6.375%, 6/1/29 | | 85,000 | 84,788 |
| Masonite International Corp. 144A company | | | |
| guaranty sr. unsec. notes 5.375%, 2/1/28 | | 35,000 | 37,089 |
| Mattamy Group Corp. 144A sr. unsec. notes 5.25%, | | | |
| 12/15/27 (Canada) | | 70,000 | 73,150 |
| Mattamy Group Corp. 144A sr. unsec. notes 4.625%, | | | |
| 3/1/30 (Canada) | | 105,000 | 107,258 |
| Mattel, Inc. 144A company guaranty sr. unsec. | | | |
| notes 3.75%, 4/1/29 | | 155,000 | 161,200 |
| Mattel, Inc. 144A company guaranty sr. unsec. | | | |
| notes 3.375%, 4/1/26 | | 20,000 | 20,750 |
| Meredith Corp. company guaranty sr. unsec. | | | |
| notes 6.875%, 2/1/26 | | 49,000 | 50,960 |
| Meredith Corp. 144A company guaranty sr. unsec. | | | |
| notes 6.50%, 7/1/25 | | 90,000 | 97,088 |
| Navistar International Corp. 144A sr. unsec. | | | |
| notes 6.625%, 11/1/25 | | 53,000 | 54,756 |
| NESCO Holdings II, Inc. 144A company | | | |
| guaranty notes 5.50%, 4/15/29 | | 70,000 | 73,063 |
| News Corp. 144A sr. unsec. notes 3.875%, 5/15/29 | | 75,000 | 75,750 |
| Nexstar Broadcasting, Inc. 144A sr. unsec. | | | |
| notes 4.75%, 11/1/28 | | 45,000 | 46,238 |
| Nexstar Escrow, Inc. 144A sr. unsec. | | | |
| notes 5.625%, 7/15/27 | | 140,000 | 148,400 |
| Nielsen Co. Luxembourg SARL (The) 144A company | | | |
| guaranty sr. unsec. notes 5.00%, 2/1/25 | | | |
| (Luxembourg) | | 49,000 | 50,409 |
| Nielsen Finance, LLC/Nielsen Finance Co. 144A | | | |
| company guaranty sr. unsec. notes 5.625%, 10/1/28 | | 65,000 | 68,646 |
| Nielsen Finance, LLC/Nielsen Finance Co. 144A | | | |
| company guaranty sr. unsec. notes 4.50%, 7/15/29 | | 35,000 | 35,098 |
| Nielsen Finance, LLC/Nielsen Finance Co. 144A | | | |
| sr. unsec. bonds 4.75%, 7/15/31 | | 35,000 | 35,088 |
| PM General Purchaser, LLC 144A sr. notes | | | |
| 9.50%, 10/1/28 | | 230,000 | 242,287 |
| Prime Security Services Borrower, LLC/Prime | | | |
| Finance, Inc. 144A company | | | |
| guaranty sr. notes 3.375%, 8/31/27 | | 45,000 | 43,650 |
| Prime Security Services Borrower, LLC/Prime | | | |
| Finance, Inc. 144A notes 6.25%, 1/15/28 | | 95,000 | 101,056 |
| PulteGroup, Inc. company guaranty sr. unsec. | | | |
| unsub. notes 7.875%, 6/15/32 | | 9,000 | 12,960 |
| QVC, Inc. company guaranty sr. notes 4.375%, 9/1/28 | | 85,000 | 86,700 |
| | |
| CORPORATE BONDS | | |
| AND NOTES (17.0%)* cont. | Principal amount | Value |
| |
| Consumer cyclicals cont. | | |
| Raptor Acquisition Corp./Raptor Co-Issuer, LLC | | |
| 144A sr. notes 4.875%, 11/1/26 | $20,000 | $20,280 |
| Sabre GLBL, Inc. 144A company | | |
| guaranty sr. notes 9.25%, 4/15/25 | 232,000 | 275,809 |
| Scientific Games International, Inc. 144A company | | |
| guaranty sr. notes 5.00%, 10/15/25 | 55,000 | 56,788 |
| Scotts Miracle-Gro, Co. (The) company | | |
| guaranty sr. unsec. notes 4.50%, 10/15/29 | 141,000 | 146,319 |
| Shift4 Payments, LLC/Shift4 Payments Finance | | |
| Sub, Inc. 144A company guaranty sr. unsec. | | |
| notes 4.625%, 11/1/26 | 20,000 | 20,875 |
| Signal Parent, Inc. 144A sr. unsec. notes | | |
| 6.125%, 4/1/29 | 85,000 | 81,600 |
| Sinclair Television Group, Inc. 144A company | | |
| guaranty sr. unsec. bonds 5.50%, 3/1/30 | 80,000 | 81,567 |
| Sinclair Television Group, Inc. 144A | | |
| sr. bonds 4.125%, 12/1/30 | 45,000 | 44,213 |
| Sirius XM Radio, Inc. 144A company | | |
| guaranty sr. unsec. notes 4.00%, 7/15/28 | 100,000 | 103,000 |
| Sirius XM Radio, Inc. 144A sr. unsec. | | |
| bonds 5.50%, 7/1/29 | 40,000 | 43,588 |
| Six Flags Theme Parks, Inc. 144A company | | |
| guaranty sr. notes 7.00%, 7/1/25 | 95,000 | 102,382 |
| Spectrum Brands, Inc. 144A company | | |
| guaranty sr. unsec. bonds 5.00%, 10/1/29 | 50,000 | 53,000 |
| Square, Inc. 144A sr. unsec. bonds 3.50%, 6/1/31 | 60,000 | 60,525 |
| Standard Industries, Inc. 144A sr. unsec. | | |
| bonds 3.375%, 1/15/31 | 35,000 | 33,502 |
| Standard Industries, Inc. 144A sr. unsec. | | |
| notes 4.75%, 1/15/28 | 10,000 | 10,467 |
| Station Casinos, LLC 144A sr. unsec. notes | | |
| 4.50%, 2/15/28 | 95,000 | 96,619 |
| SugarHouse HSP Gaming Prop. Mezz LP/SugarHouse | | |
| HSP Gaming Finance Corp. 144A company | | |
| guaranty sr. unsub. notes 5.875%, 5/15/25 | 90,000 | 88,875 |
| Taylor Morrison Communities, Inc. 144A sr. unsec. | | |
| bonds 5.125%, 8/1/30 | 105,000 | 113,807 |
| Taylor Morrison Communities, Inc. 144A sr. unsec. | | |
| notes 5.75%, 1/15/28 | 40,000 | 45,160 |
| Univision Communications, Inc. 144A company | | |
| guaranty sr. notes 9.50%, 5/1/25 | 54,000 | 59,535 |
| Univision Communications, Inc. 144A company | | |
| guaranty sr. notes 6.625%, 6/1/27 | 95,000 | 102,937 |
| Univision Communications, Inc. 144A company | | |
| guaranty sr. notes 4.50%, 5/1/29 | 35,000 | 35,263 |
| Urban One, Inc. 144A company | | |
| guaranty sr. notes 7.375%, 2/1/28 | 10,000 | 10,800 |
| Valvoline, Inc. 144A company guaranty sr. unsec. | | |
| unsub. notes 4.25%, 2/15/30 | 50,000 | 51,624 |
| Victoria’s Secret & Co. 144A sr. unsec. | | |
| notes 4.625%, 7/15/29 | 20,000 | 20,000 |
| Wolverine World Wide, Inc. 144A company | | |
| guaranty sr. unsec. notes 6.375%, 5/15/25 | 60,000 | 63,832 |
| Wynn Las Vegas, LLC/Wynn Las Vegas Capital Corp. | | |
| 144A company guaranty sr. unsec. | | |
| sub. notes 5.25%, 5/15/27 | 126,000 | 135,337 |
| Wynn Resorts Finance, LLC/Wynn Resorts | | |
| Capital Corp. 144A sr. unsec. bonds 5.125%, 10/1/29 | 115,000 | 121,469 |
| Wynn Resorts Finance, LLC/Wynn Resorts | | |
| Capital Corp. 144A sr. unsec. notes 7.75%, 4/15/25 | 30,000 | 32,325 |
| | | 6,373,136 |
| |
| 10 Putnam VT Diversified Income Fund |
| | | |
| CORPORATE BONDS | | | |
| AND NOTES (17.0%)* cont. | Principal amount | Value |
| | | | |
| Consumer staples (1.1%) | | | |
| 1011778 BC ULC/New Red Finance, Inc. 144A | | | |
| bonds 4.00%, 10/15/30 (Canada) | | $65,000 | $62,888 |
| 1011778 BC ULC/New Red Finance, Inc. 144A company | | | |
| guaranty notes 4.375%, 1/15/28 (Canada) | | 63,000 | 63,866 |
| 1011778 BC ULC/New Red Finance, Inc. 144A company | | | |
| guaranty sr. notes 3.875%, 1/15/28 (Canada) | | 80,000 | 80,900 |
| Albertsons Cos., Inc./Safeway, Inc./New | | | |
| Albertsons LP/Albertsons, LLC 144A company | | | |
| guaranty sr. unsec. notes 4.875%, 2/15/30 | | 30,000 | 31,995 |
| CDW, LLC/CDW Finance Corp. company | | | |
| guaranty sr. unsec. notes 3.25%, 2/15/29 | | 15,000 | 15,198 |
| Golden Nugget, Inc. 144A sr. unsec. notes | | | |
| 6.75%, 10/15/24 | | 180,000 | 181,840 |
| IRB Holding Corp. 144A company | | | |
| guaranty sr. notes 7.00%, 6/15/25 | | 50,000 | 54,001 |
| Kraft Heinz Foods Co. company guaranty sr. unsec. | | | |
| notes 5.00%, 7/15/35 | | 129,000 | 158,234 |
| Kraft Heinz Foods Co. company guaranty sr. unsec. | | | |
| notes 3.00%, 6/1/26 | | 52,000 | 55,377 |
| Lamb Weston Holdings, Inc. 144A company | | | |
| guaranty sr. unsec. notes 4.875%, 5/15/28 | | 70,000 | 77,438 |
| Lamb Weston Holdings, Inc. 144A company | | | |
| guaranty sr. unsec. unsub. notes 4.875%, 11/1/26 | | 130,000 | 134,388 |
| Loxam SAS notes 3.75%, 7/15/26 (France) | EUR | 100,000 | 121,178 |
| Match Group Holdings II, LLC 144A sr. unsec. | | | |
| bonds 5.00%, 12/15/27 | | $73,000 | 76,741 |
| Match Group Holdings II, LLC 144A sr. unsec. | | | |
| notes 4.125%, 8/1/30 | | 105,000 | 106,838 |
| Match Group Holdings II, LLC 144A sr. unsec. | | | |
| unsub. notes 4.625%, 6/1/28 | | 50,000 | 51,994 |
| Netflix, Inc. sr. unsec. notes 6.375%, 5/15/29 | | 50,000 | 63,863 |
| Netflix, Inc. sr. unsec. notes 4.875%, 4/15/28 | | 30,000 | 34,875 |
| Netflix, Inc. sr. unsec. unsub. notes 5.875%, 11/15/28 | | 150,000 | 184,115 |
| Netflix, Inc. 144A sr. unsec. bonds 4.875%, 6/15/30 | | 30,000 | 35,679 |
| Newell Brands, Inc. sr. unsec. | | | |
| unsub. notes 4.70%, 4/1/26 | | 85,000 | 94,785 |
| Prestige Brands, Inc. 144A company | | | |
| guaranty sr. unsec. notes 5.125%, 1/15/28 | | 80,000 | 84,221 |
| TripAdvisor, Inc. 144A company | | | |
| guaranty sr. unsec. notes 7.00%, 7/15/25 | | 48,000 | 51,648 |
| Yum! Brands, Inc. sr. unsec. sub. bonds 3.625%, | | | |
| 3/15/31 | | 45,000 | 44,775 |
| Yum! Brands, Inc. 144A sr. unsec. bonds | | | |
| 4.75%, 1/15/30 | | 45,000 | 48,713 |
| | | | 1,915,550 |
| Energy (3.2%) | | | |
| Antero Midstream Partners LP/Antero Midstream | | | |
| Finance Corp. 144A company guaranty sr. unsec. | | | |
| notes 7.875%, 5/15/26 | | 55,000 | 61,469 |
| Antero Resources Corp. 144A company | | | |
| guaranty sr. unsec. notes 8.375%, 7/15/26 | | 10,000 | 11,375 |
| Antero Resources Corp. 144A sr. unsec. | | | |
| notes 5.375%, 3/1/30 | | 35,000 | 35,722 |
| Apache Corp. sr. unsec. unsub. notes 5.10%, 9/1/40 | | 52,000 | 54,470 |
| Apache Corp. sr. unsec. unsub. notes | | | |
| 4.875%, 11/15/27 | | 30,000 | 32,490 |
| Apache Corp. sr. unsec. unsub. notes | | | |
| 4.375%, 10/15/28 | | 32,000 | 34,064 |
| Callon Petroleum Co. company guaranty sr. unsec. | | | |
| notes 6.125%, 10/1/24 | | 85,000 | 83,792 |
| | |
| CORPORATE BONDS | | |
| AND NOTES (17.0%)* cont. | Principal amount | Value |
| | | |
| Energy cont. | | |
| Callon Petroleum Co. 144A company | | |
| guaranty notes 9.00%, 4/1/25 | $45,000 | $49,050 |
| ChampionX corp. company guaranty sr. unsec. | | |
| notes 6.375%, 5/1/26 | 84,000 | 87,982 |
| Cheniere Energy Partners LP 144A company | | |
| guaranty sr. unsec. bonds 4.00%, 3/1/31 | 75,000 | 78,375 |
| Comstock Resources, Inc. 144A company | | |
| guaranty sr. unsec. notes 5.875%, 1/15/30 | 65,000 | 66,300 |
| Continental Resources, Inc. company | | |
| guaranty sr. unsec. bonds 4.90%, 6/1/44 | 65,000 | 73,450 |
| Continental Resources, Inc. company | | |
| guaranty sr. unsec. notes 4.375%, 1/15/28 | 76,000 | 84,075 |
| Continental Resources, Inc. company | | |
| guaranty sr. unsec. notes 3.80%, 6/1/24 | 85,000 | 89,888 |
| Continental Resources, Inc. company | | |
| guaranty sr. unsec. unsub. notes 4.50%, 4/15/23 | 86,000 | 89,490 |
| Continental Resources, Inc. 144A company | | |
| guaranty sr. unsec. bonds 5.75%, 1/15/31 | 95,000 | 113,763 |
| DCP Midstream Operating LP 144A company | | |
| guaranty sr. unsec. unsub. bonds 6.75%, 9/15/37 | 44,000 | 52,910 |
| Devon Energy Corp. sr. unsec. | | |
| unsub. bonds 7.875%, 9/30/31 | 45,000 | 62,888 |
| Devon Energy Corp. sr. unsec. unsub. bonds | | |
| 5.60%, 7/15/41 | 35,000 | 43,277 |
| DT Midstream, Inc. 144A sr. unsec. bonds | | |
| 4.375%, 6/15/31 | 25,000 | 25,545 |
| DT Midstream, Inc. 144A sr. unsec. notes | | |
| 4.125%, 6/15/29 | 20,000 | 20,307 |
| Encino Acquisition Partners Holdings, LLC 144A | | |
| company guaranty sr. unsec. notes 8.50%, 5/1/28 | 203,000 | 207,060 |
| Endeavor Energy Resources LP/EER Finance, Inc. | | |
| 144A sr. unsec. bonds 5.75%, 1/30/28 | 166,000 | 176,998 |
| Endeavor Energy Resources LP/EER Finance, Inc. | | |
| 144A sr. unsec. notes 6.625%, 7/15/25 | 95,000 | 101,650 |
| EnLink Midstream, LLC 144A company | | |
| guaranty sr. unsec. notes 5.625%, 1/15/28 | 126,000 | 133,105 |
| EQT Corp. sr. unsec. notes 5.00%, 1/15/29 | 10,000 | 11,150 |
| Global Partners LP/GLP Finance Corp. company | | |
| guaranty sr. unsec. notes 6.875%, 1/15/29 | 15,000 | 16,088 |
| Hess Midstream Operations LP 144A company | | |
| guaranty sr. unsec. notes 5.125%, 6/15/28 | 90,000 | 94,388 |
| Hess Midstream Operations LP 144A company | | |
| guaranty sr. unsec. sub. notes 5.625%, 2/15/26 | 168,000 | 175,224 |
| Holly Energy Partners LP/Holly Energy | | |
| Finance Corp. 144A company guaranty sr. unsec. | | |
| notes 5.00%, 2/1/28 | 144,000 | 147,240 |
| Indigo Natural Resources, LLC 144A sr. unsec. | | |
| notes 5.375%, 2/1/29 | 185,000 | 193,325 |
| ITT Holdings, LLC 144A sr. unsec. notes 6.50%, 8/1/29 | 70,000 | 71,313 |
| MEG Energy Corp. 144A notes 6.50%, 1/15/25 | | |
| (Canada) | 85,000 | 87,869 |
| Nabors Industries, Inc. 144A company | | |
| guaranty sr. unsec. notes 9.00%, 2/1/25 | 56,689 | 59,523 |
| Northriver Midstream Finance LP 144A | | |
| sr. notes 5.625%, 2/15/26 (Canada) | 71,000 | 73,485 |
| Oasis Petroleum, Inc. 144A company | | |
| guaranty sr. unsec. notes 6.375%, 6/1/26 | 35,000 | 36,496 |
| Occidental Petroleum Corp. sr. unsec. | | |
| sub. bonds 6.20%, 3/15/40 | 25,000 | 28,268 |
| Occidental Petroleum Corp. sr. unsec. | | |
| sub. notes 6.45%, 9/15/36 | 115,000 | 137,494 |
| |
| Putnam VT Diversified Income Fund 11 |
| | |
| CORPORATE BONDS | | |
| AND NOTES (17.0%)* cont. | Principal amount | Value |
| |
| Energy cont. |
| Ovintiv, Inc. company guaranty sr. unsec. | | |
| unsub. bonds 7.375%, 11/1/31 | $35,000 | $46,470 |
| Ovintiv, Inc. company guaranty sr. unsec. | | |
| unsub. bonds 6.625%, 8/15/37 | 60,000 | 80,057 |
| PBF Holding Co., LLC/PBF Finance Corp. 144A | | |
| company guaranty sr. notes 9.25%, 5/15/25 | 50,000 | 50,370 |
| Pertamina Persero PT 144A sr. unsec. | | |
| unsub. notes 4.875%, 5/3/22 (Indonesia) | 200,000 | 207,000 |
| Pertamina Persero PT 144A sr. unsec. | | |
| unsub. notes 4.30%, 5/20/23 (Indonesia) | 285,000 | 302,822 |
| Petrobras Global Finance BV company | | |
| guaranty sr. unsec. unsub. notes 6.25%, 3/17/24 | | |
| (Brazil) | 432,000 | 487,620 |
| Petrobras Global Finance BV company | | |
| guaranty sr. unsec. unsub. notes 5.999%, 1/27/28 | | |
| (Brazil) | 169,000 | 194,139 |
| Petrobras Global Finance BV company | | |
| guaranty sr. unsec. unsub. notes 5.60%, 1/3/31 | | |
| (Brazil) | 323,000 | 361,760 |
| Petrobras Global Finance BV company | | |
| guaranty sr. unsec. unsub. notes 5.299%, 1/27/25 | | |
| (Brazil) | 35,000 | 39,419 |
| Petroleos de Venezuela SA company | | |
| guaranty sr. unsec. bonds Ser. REGS, 6.00%, | | |
| 11/15/26 (Venezuela) (In default) † | 1,138,000 | 46,943 |
| Petroleos de Venezuela SA company | | |
| guaranty sr. unsec. unsub. notes 5.375%, 4/12/27 | | |
| (Venezuela) (In default) † �� | 297,000 | 12,251 |
| Petroleos Mexicanos company guaranty sr. unsec. | | |
| unsub. FRB 7.69%, 1/23/50 (Mexico) | 311,000 | 299,338 |
| Precision Drilling Corp. 144A company | | |
| guaranty sr. unsec. notes 6.875%, 1/15/29 (Canada) | 15,000 | 15,450 |
| Regency Energy Partners LP/Regency Energy | | |
| Finance Corp. company guaranty sr. unsec. | | |
| unsub. notes 4.50%, 11/1/23 | 69,000 | 73,916 |
| SM Energy Co. sr. unsec. notes 6.625%, 1/15/27 | 60,000 | 61,650 |
| SM Energy Co. sr. unsec. unsub. notes | | |
| 6.75%, 9/15/26 | 20,000 | 20,350 |
| SM Energy Co. sr. unsec. unsub. notes | | |
| 6.50%, 7/15/28 | 50,000 | 51,375 |
| SM Energy Co. 144A company guaranty notes | | |
| 10.00%, 1/15/25 | 25,000 | 28,209 |
| Tallgrass Energy Partners LP/Tallgrass Energy | | |
| Finance Corp. 144A company guaranty sr. unsec. | | |
| notes 5.50%, 1/15/28 | 106,000 | 107,855 |
| Targa Resources Partners LP/Targa Resources | | |
| Partners Finance Corp. company | | |
| guaranty sr. unsec. notes 6.875%, 1/15/29 | 30,000 | 33,799 |
| Targa Resources Partners LP/Targa Resources | | |
| Partners Finance Corp. company | | |
| guaranty sr. unsec. notes 5.50%, 3/1/30 | 30,000 | 32,990 |
| Targa Resources Partners LP/Targa Resources | | |
| Partners Finance Corp. company | | |
| guaranty sr. unsec. unsub. notes 5.00%, 1/15/28 | 56,000 | 59,080 |
| Transocean Pontus, Ltd. 144A company | | |
| guaranty sr. notes 6.125%, 8/1/25 (Cayman Islands) | 33,350 | 33,600 |
| Transocean Poseidon, Ltd. 144A company | | |
| guaranty sr. notes 6.875%, 2/1/27 | 70,000 | 70,350 |
| USA Compression Partners LP/USA Compression | | |
| Finance Corp. company guaranty sr. unsec. | | |
| notes 6.875%, 4/1/26 | 42,000 | 43,995 |
| | | 5,762,166 |
| | | | | |
| CORPORATE BONDS | | | | | |
| AND NOTES (17.0%)* cont. | | | | Principal amount | Value |
| |
| Financials (2.6%) | | | | | |
| AG Issuer, LLC 144A sr. notes 6.25%, 3/1/28 | | | $85,000 | $89,563 |
| Alliant Holdings Intermediate, LLC/Alliant | | | | |
| Holdings Co-Issuer 144A sr. notes 4.25%, 10/15/27 | | | 25,000 | 25,375 |
| Ally Financial, Inc. company guaranty sr. unsec. | | | | |
| notes 8.00%, 11/1/31 | | | | 285,000 | 409,559 |
| Banca Monte dei Paschi di Siena SpA sr. unsec. | | | | |
| unsub. notes Ser. EMTN, 2.625%, 4/28/25 | | | | |
| (Italy) | | | EUR | 100,000 | 120,092 |
| Bank of America Corp. jr. unsec. sub. FRN | | | | |
| Ser. AA, 6.10%, perpetual maturity | | | | $50,000 | 56,000 |
| CIT Group, Inc. sr. unsec. unsub. notes 5.25%, 3/7/25 | | | 65,000 | 73,125 |
| CNO Financial Group, Inc. sr. unsec. notes | | | | |
| 5.25%, 5/30/29 | | | | 85,000 | 101,021 |
| Diversified Healthcare Trust company | | | | |
| guaranty sr. unsec. notes 9.75%, 6/15/25 R | | | 190,000 | 210,403 |
| ESH Hospitality, Inc. 144A company | | | | | |
| guaranty sr. unsec. notes 5.25%, 5/1/25 R | | | 35,000 | 35,656 |
| Freedom Mortgage Corp. 144A sr. unsec. | | | | |
| notes 8.125%, 11/15/24 | | | | 45,000 | 46,519 |
| Freedom Mortgage Corp. 144A sr. unsec. | | | | |
| notes 6.625%, 1/15/27 | | | | 35,000 | 35,219 |
| goeasy, Ltd. 144A company guaranty sr. unsec. | | | | |
| notes 5.375%, 12/1/24 (Canada) | | | | 30,000 | 30,944 |
| goeasy, Ltd. 144A company guaranty sr. unsec. | | | | |
| notes 4.375%, 5/1/26 (Canada) | | | | 55,000 | 56,100 |
| Icahn Enterprises LP/Icahn Enterprises | | | | |
| Finance Corp. company guaranty sr. unsec. | | | | |
| notes 6.75%, 2/1/24 | | | | 15,000 | 15,321 |
| Icahn Enterprises LP/Icahn Enterprises | | | | |
| Finance Corp. company guaranty sr. unsec. | | | | |
| notes 6.25%, 5/15/26 | | | | 87,000 | 92,307 |
| Icahn Enterprises LP/Icahn Enterprises | | | | |
| Finance Corp. 144A company guaranty sr. unsec. | | | | |
| notes 5.25%, 5/15/27 | | | | 20,000 | 20,650 |
| Icahn Enterprises LP/Icahn Enterprises | | | | |
| Finance Corp. 144A company guaranty sr. unsec. | | | | |
| notes 4.375%, 2/1/29 | | | | 113,000 | 112,435 |
| Intesa Sanpaolo SpA 144A company guaranty jr. | | | | |
| unsec. sub. FRB 7.70%, perpetual maturity (Italy) | | | 200,000 | 229,124 |
| iStar, Inc. sr. unsec. notes 5.50%, 2/15/26 R | | | 75,000 | 78,563 |
| iStar, Inc. sr. unsec. notes 4.75%, 10/1/24 R | | | 120,000 | 126,300 |
| Itau Unibanco Holding SA/Cayman Islands 144A | | | | |
| unsec. sub. FRB 3.875%, 4/15/31 (Brazil) | | | 980,000 | 972,660 |
| Ladder Capital Finance Holdings, LLLP/Ladder | | | | |
| Capital Finance Corp. 144A company | | | | |
| guaranty sr. unsec. notes 4.75%, 6/15/29 R | | | 32,000 | 32,000 |
| Ladder Capital Finance Holdings, LLLP/Ladder | | | | |
| Capital Finance Corp. 144A company | | | | |
| guaranty sr. unsec. unsub. notes 5.25%, 10/1/25 R | | | 100,000 | 101,750 |
| Ladder Capital Finance Holdings, LLLP/Ladder | | | | |
| Capital Finance Corp. 144A sr. unsec. | | | | |
| notes 4.25%, 2/1/27 R | | | | 95,000 | 94,881 |
| Nationstar Mortgage Holdings, Inc. 144A company | | | | |
| guaranty sr. unsec. notes 6.00%, 1/15/27 | | | 25,000 | 25,907 |
| Nationstar Mortgage Holdings, Inc. 144A company | | | | |
| guaranty sr. unsec. notes 5.50%, 8/15/28 | | | 77,000 | 77,626 |
| Nationstar Mortgage Holdings, Inc. 144A company | | | | |
| guaranty sr. unsec. notes 5.125%, 12/15/30 | | | 30,000 | 29,850 |
| OneMain Finance Corp. company guaranty | | | | |
| sr. unsec. notes 8.875%, 6/1/25 | | | | 40,000 | 44,348 |
| |
| 12 Putnam VT Diversified Income Fund |
| | | |
| CORPORATE BONDS | | | |
| AND NOTES (17.0%)* cont. | Principal amount | Value |
| |
| Financials cont. | | | |
| OneMain Finance Corp. company guaranty | | | |
| sr. unsec. sub. notes 7.125%, 3/15/26 | | $50,000 | $58,236 |
| OneMain Finance Corp. company guaranty | | | |
| sr. unsec. unsub. notes 6.875%, 3/15/25 | | 17,000 | 19,186 |
| OneMain Finance Corp. company guaranty | | | |
| sr. unsec. unsub. notes 5.375%, 11/15/29 | | 100,000 | 108,774 |
| PennyMac Financial Services, Inc. 144A company | | | |
| guaranty sr. unsec. notes 5.375%, 10/15/25 | | 90,000 | 94,725 |
| PHH Mortgage Corp. 144A company | | | |
| guaranty sr. notes 7.875%, 3/15/26 | | 85,000 | 87,856 |
| Provident Funding Associates LP/PFG Finance Corp. | | | |
| 144A sr. unsec. notes 6.375%, 6/15/25 | | 160,000 | 162,000 |
| Service Properties Trust company | | | |
| guaranty sr. unsec. unsub. notes 7.50%, 9/15/25 R | | 35,000 | 39,627 |
| Starwood Property Trust, Inc. sr. unsec. | | | |
| notes 4.75%, 3/15/25 R | | 120,000 | 124,800 |
| Stichting AK Rabobank Certificaten jr. | | | |
| unsec. sub. FRN 2.188%, perpetual | | | |
| maturity (Netherlands) | EUR | 94,525 | 150,752 |
| TMX Finance, LLC/TitleMax Finance Corp. 144A | | | |
| sr. notes 11.125%, 4/1/23 | | $65,000 | 66,300 |
| VTB Bank OJSC Via VTB Capital SA 144A unsec. | | | |
| sub. bonds 6.95%, 10/17/22 (Russia) | | 300,000 | 317,625 |
| | | | 4,573,179 |
| Health care (1.3%) | | | |
| Bausch Health Americas, Inc. 144A sr. unsec. | | | |
| notes 8.50%, 1/31/27 | | 115,000 | 125,063 |
| Bausch Health Cos., Inc. 144A company | | | |
| guaranty sr. unsec. notes 7.25%, 5/30/29 | | 85,000 | 86,862 |
| Bausch Health Cos., Inc. 144A company | | | |
| guaranty sr. unsec. notes 7.00%, 1/15/28 | | 45,000 | 46,350 |
| Bausch Health Cos., Inc. 144A company | | | |
| guaranty sr. unsec. notes 6.25%, 2/15/29 | | 70,000 | 69,234 |
| Bausch Health Cos., Inc. 144A company | | | |
| guaranty sr. unsec. notes 6.125%, 4/15/25 | | 145,000 | 148,625 |
| Bausch Health Cos., Inc. 144A company | | | |
| guaranty sr. unsec. notes 5.00%, 2/15/29 | | 40,000 | 37,300 |
| Bausch Health Cos., Inc. 144A sr. notes 4.875%, 6/1/28 | | 50,000 | 51,175 |
| Centene Corp. sr. unsec. bonds 3.00%, 10/15/30 | | 45,000 | 46,228 |
| Centene Corp. 144A sr. unsec. notes 5.375%, 8/15/26 | | 75,000 | 78,375 |
| Centene Escrow I Corp. 144A sr. unsec. | | | |
| notes 5.375%, 6/1/26 | | 68,000 | 71,060 |
| Charles River Laboratories International, Inc. | | | |
| 144A company guaranty sr. unsec. notes | | | |
| 4.00%, 3/15/31 | | 45,000 | 46,688 |
| Charles River Laboratories International, Inc. | | | |
| 144A company guaranty sr. unsec. notes | | | |
| 3.75%, 3/15/29 | | 45,000 | 45,506 |
| CHS/Community Health Systems, Inc. 144A company | | | |
| guaranty sr. notes 6.00%, 1/15/29 | | 10,000 | 10,675 |
| CHS/Community Health Systems, Inc. 144A company | | | |
| guaranty sr. notes 5.625%, 3/15/27 | | 35,000 | 37,275 |
| CHS/Community Health Systems, Inc. 144A company | | | |
| guaranty sr. unsec. sub. notes 6.875%, 4/1/28 | | 85,000 | 84,082 |
| Elanco Animal Health, Inc. sr. unsec. | | | |
| notes Ser. WI, 5.90%, 8/28/28 | | 105,000 | 122,878 |
| Endo Luxembourg Finance Co. I Sarl/Endo US, Inc. | | | |
| 144A company guaranty sr. notes 6.125%, 4/1/29 | | | |
| (Luxembourg) | | 40,000 | 39,200 |
| Global Medical Response, Inc. 144A | | | |
| sr. notes 6.50%, 10/1/25 | | 45,000 | 46,294 |
| | |
| CORPORATE BONDS | | |
| AND NOTES (17.0%)* cont. | Principal amount | Value |
| |
| Health care cont. | | |
| Jazz Securities DAC 144A company | | |
| guaranty sr. unsub. notes 4.375%, 1/15/29 | | |
| (Ireland) | $200,000 | $207,360 |
| Mallinckrodt International Finance | | |
| SA/Mallinckrodt CB, LLC 144A company | | |
| guaranty sub. notes 10.00%, 4/15/25 | | |
| (Luxembourg) | 85,000 | 85,850 |
| Owens & Minor, Inc. 144A sr. unsec. notes | | |
| 4.50%, 3/31/29 | 50,000 | 51,375 |
| Service Corp. International sr. unsec. | | |
| bonds 5.125%, 6/1/29 | 130,000 | 141,050 |
| Service Corp. International sr. unsec. | | |
| notes 3.375%, 8/15/30 | 35,000 | 34,293 |
| Service Corp. International sr. unsec. | | |
| sub. notes 4.00%, 5/15/31 | 35,000 | 35,724 |
| Tenet Healthcare Corp. company | | |
| guaranty sr. notes 4.625%, 7/15/24 | 55,000 | 55,809 |
| Tenet Healthcare Corp. 144A company | | |
| guaranty sr. notes 7.50%, 4/1/25 | 25,000 | 27,003 |
| Tenet Healthcare Corp. 144A company | | |
| guaranty sr. notes 5.125%, 11/1/27 | 195,000 | 204,506 |
| Tenet Healthcare Corp. 144A company | | |
| guaranty sr. notes 4.875%, 1/1/26 | 190,000 | 197,068 |
| Tenet Healthcare Corp. 144A company | | |
| guaranty sr. notes 4.25%, 6/1/29 | 80,000 | 81,000 |
| | | 2,313,908 |
| Technology (0.8%) | | |
| Ahead DB Holdings, LLC 144A company | | |
| guaranty sr. unsec. notes 6.625%, 5/1/28 | 90,000 | 93,109 |
| CommScope Finance, LLC 144A sr. notes | | |
| 6.00%, 3/1/26 | 60,000 | 63,342 |
| CommScope Finance, LLC 144A sr. notes | | |
| 5.50%, 3/1/24 | 30,000 | 30,863 |
| Crowdstrike Holdings, Inc. company | | |
| guaranty sr. unsec. notes 3.00%, 2/15/29 | 66,000 | 66,063 |
| Dell International, LLC/EMC Corp. company | | |
| guaranty sr. notes 6.02%, 6/15/26 | 182,000 | 218,496 |
| Diamond 1 Finance Corp./Diamond 2 Finance Corp. | | |
| 144A company guaranty sr. unsec. notes | | |
| 7.125%, 6/15/24 | 71,000 | 72,825 |
| Diebold Nixdorf, Inc. 144A company | | |
| guaranty sr. notes 9.375%, 7/15/25 | 43,000 | 47,676 |
| Imola Merger Corp. 144A sr. notes 4.75%, 5/15/29 | 101,000 | 103,904 |
| Microchip Technology, Inc. company | | |
| guaranty sr. unsec. notes 4.25%, 9/1/25 | 75,000 | 78,740 |
| Plantronics, Inc. 144A company | | |
| guaranty sr. unsec. notes 4.75%, 3/1/29 | 127,000 | 126,077 |
| Qorvo, Inc. 144A company guaranty sr. unsec. | | |
| bonds 3.375%, 4/1/31 | 45,000 | 46,900 |
| Rocket Software, Inc. 144A sr. unsec. | | |
| notes 6.50%, 2/15/29 | 90,000 | 89,100 |
| SS&C Technologies, Inc. 144A company | | |
| guaranty sr. unsec. notes 5.50%, 9/30/27 | 32,000 | 33,880 |
| Tempo Acquisition, LLC/Tempo Acquisition | | |
| Finance Corp. 144A company | | |
| guaranty sr. notes 5.75%, 6/1/25 | 40,000 | 42,100 |
| TTM Technologies, Inc. 144A company | | |
| guaranty sr. unsec. notes 4.00%, 3/1/29 | 70,000 | 70,000 |
| Twilio, Inc. company guaranty sr. unsec. | | |
| notes 3.875%, 3/15/31 | 50,000 | 51,313 |
| |
| Putnam VT Diversified Income Fund 13 |
| | |
| CORPORATE BONDS | | |
| AND NOTES (17.0%)* cont. | Principal amount | Value |
| | | |
| Technology cont. | | |
| Twilio, Inc. company guaranty sr. unsec. | | |
| notes 3.625%, 3/15/29 | $95,000 | $96,900 |
| Western Digital Corp. company guaranty sr. unsec. | | |
| notes 4.75%, 2/15/26 | 33,000 | 36,671 |
| | | 1,367,959 |
| Transportation (0.2%) | | |
| American Airlines, Inc./AAdvantage Loyalty IP, | | |
| Ltd. 144A company guaranty sr. notes 5.75%, 4/20/29 | 95,000 | 102,719 |
| American Airlines, Inc./AAdvantage Loyalty IP, | | |
| Ltd. 144A company guaranty sr. notes 5.50%, 4/20/26 | 95,000 | 100,581 |
| United Airlines, Inc. 144A company | | |
| guaranty sr. notes 4.625%, 4/15/29 | 35,000 | 36,225 |
| United Airlines, Inc. 144A company | | |
| guaranty sr. notes 4.375%, 4/15/26 | 35,000 | 36,231 |
| | | 275,756 |
| Utilities and power (0.5%) | | |
| Buckeye Partners LP sr. unsec. bonds | | |
| 5.85%, 11/15/43 | 43,000 | 42,678 |
| Buckeye Partners LP sr. unsec. notes 3.95%, 12/1/26 | 24,000 | 24,420 |
| Buckeye Partners LP 144A sr. unsec. notes | | |
| 4.50%, 3/1/28 | 35,000 | 35,886 |
| Calpine Corp. 144A company | | |
| guaranty sr. notes 5.25%, 6/1/26 | 44,000 | 45,265 |
| Calpine Corp. 144A company | | |
| guaranty sr. notes 4.50%, 2/15/28 | 75,000 | 76,500 |
| Calpine Corp. 144A sr. unsec. notes 4.625%, 2/1/29 | 10,000 | 9,831 |
| Colorado Interstate Gas Co., LLC company | | |
| guaranty sr. unsec. notes 6.85%, 6/15/37 | 290,000 | 383,462 |
| Energy Transfer LP jr. unsec. sub. FRN 6.625%, | | |
| perpetual maturity | 13,000 | 12,724 |
| NRG Energy, Inc. company guaranty sr. unsec. | | |
| notes 6.625%, 1/15/27 | 23,000 | 23,810 |
| NRG Energy, Inc. 144A company | | |
| guaranty sr. notes 3.75%, 6/15/24 | 70,000 | 74,538 |
| NRG Energy, Inc. 144A sr. unsec. bonds | | |
| 5.25%, 6/15/29 | 40,000 | 42,550 |
| Pacific Gas and Electric Co. company | | |
| guaranty sr. unsec. unsub. notes 2.95%, 3/1/26 | 90,000 | 92,030 |
| Pacific Gas and Electric Co. sr. notes 3.30%, 3/15/27 | 25,000 | 25,868 |
| PG&E Corp. sr. sub. notes 5.00%, 7/1/28 | 85,000 | 85,945 |
| Texas Competitive Electric Holdings Co., LLC/TCEH | | |
| Finance, Inc. escrow company | | |
| guaranty sr. notes 11.50%, 10/1/21 F | 119,000 | 4 |
| Vistra Operations Co., LLC 144A company | | |
| guaranty sr. notes 4.30%, 7/15/29 | 40,000 | 43,477 |
| Vistra Operations Co., LLC 144A company | | |
| guaranty sr. notes 3.55%, 7/15/24 | 11,000 | 11,615 |
| Vistra Operations Co., LLC 144A company | | |
| guaranty sr. unsec. notes 5.625%, 2/15/27 | 56,000 | 58,100 |
| | | 1,088,703 |
| | | |
| Total corporate bonds and notes (cost $29,513,741) | | $30,218,512 |
| | | |
| FOREIGN GOVERNMENT AND AGENCY | | | |
| BONDS AND NOTES (12.7%)* | | Principal amount | Value |
| |
| Angola (Republic of) sr. unsec. notes Ser. REGS, | | | |
| 8.25%, 5/9/28 (Angola) | | $730,000 | $761,029 |
| Argentina (Republic of) 144A sr. unsec. | | | |
| notes 3.00%, 2/1/29 (Argentina) | | 288,948 | 182,040 |
| Bahrain (Kingdom of) 144A sr. unsec. | | | |
| notes 7.375%, 5/14/30 (Bahrain) | | 750,000 | 845,604 |
| Buenos Aires (Province of) sr. unsec. | | | |
| unsub. notes Ser. REGS, 6.50%, 2/15/23 | | | |
| (Argentina) (In default) † | | $215,000 | $94,457 |
| Buenos Aires (Province of) 144A sr. unsec. | | | |
| unsub. bonds 7.875%, 6/15/27 | | | |
| (Argentina) (In default) † | | 390,000 | 175,094 |
| |
| FOREIGN GOVERNMENT AND AGENCY | | | |
| BONDS AND NOTES (12.7%)* | | Principal amount | Value |
| |
| Buenos Aires (Province of) 144A sr. unsec. | | | |
| unsub. notes 10.875%, 1/26/22 | | | |
| (Argentina) (In default) † | | 260,000 | 127,946 |
| Cordoba (Province of) sr. unsec. | | | |
| unsub. notes Ser. REGS, 5.00%, 6/1/27 | | | |
| (Argentina) | | 483,736 | 330,426 |
| Development Bank of Mongolia, LLC unsec. | | | |
| notes Ser. REGS, 7.25%, 10/23/23 (Mongolia) | | 260,000 | 282,100 |
| Dominican (Republic of) sr. unsec. | | | |
| unsub. bonds Ser. REGS, 5.875%, 1/30/60 | | | |
| (Dominican Republic) | | 485,000 | 483,303 |
| Dominican (Republic of) sr. unsec. | | | |
| unsub. notes Ser. REGS, 8.625%, 4/20/27 | | | |
| (Dominican Republic) | | 360,000 | 441,900 |
| Dominican (Republic of) sr. unsec. | | | |
| unsub. notes Ser. REGS, 5.95%, 1/25/27 | | | |
| (Dominican Republic) | | 390,000 | 439,238 |
| Dominican (Republic of) sr. unsec. | | | |
| unsub. notes Ser. REGS, 5.50%, 1/27/25 | | | |
| (Dominican Republic) | | 270,000 | 296,663 |
| Dominican (Republic of) 144A sr. unsec. | | | |
| notes 4.50%, 1/30/30 (Dominican Republic) | | 250,000 | 255,628 |
| Egypt (Arab Republic of) sr. unsec. | | | |
| bonds Ser. REGS, 7.053%, 1/15/32 (Egypt) | | 700,000 | 717,521 |
| Egypt (Arab Republic of) sr. unsec. | | | |
| unsub. notes Ser. REGS, 5.875%, 6/11/25 (Egypt) | | 200,000 | 213,250 |
| Egypt (Arab Republic of) 144A sr. unsec. | | | |
| bonds 8.875%, 5/29/50 (Egypt) | | 340,000 | 365,895 |
| Egypt (Arab Republic of) 144A sr. unsec. | | | |
| bonds 7.053%, 1/15/32 (Egypt) | | 380,000 | 389,310 |
| Egypt (Arab Republic of) 144A sr. unsec. | | | |
| bonds 5.875%, 2/16/31 (Egypt) | | 610,000 | 592,310 |
| Egypt (Arab Republic of) 144A sr. unsec. | | | |
| notes 5.75%, 5/29/24 (Egypt) | | 285,000 | 303,326 |
| Ghana (Republic of) sr. unsec. bonds Ser. REGS, | | | |
| 8.95%, 3/26/51 (Ghana) | | 650,000 | 641,063 |
| Ghana (Republic of) sr. unsec. bonds Ser. REGS, | | | |
| 8.125%, 3/26/32 (Ghana) | | 720,000 | 729,000 |
| Ghana (Republic of) 144A sr. unsec. notes 7.75%, | | | |
| 4/7/29 (Ghana) | | 480,000 | 490,200 |
| Indonesia (Republic of) sr. unsec. | | | |
| unsub. bonds 2.85%, 2/14/30 (Indonesia) | | 1,285,000 | 1,332,284 |
| Indonesia (Republic of) sr. unsec. | | | |
| unsub. notes Ser. REGS, 4.75%, 1/8/26 | | | |
| (Indonesia) | | 1,045,000 | 1,191,300 |
| Indonesia (Republic of) 144A sr. unsec. | | | |
| unsub. bonds 6.625%, 2/17/37 (Indonesia) | | 133,000 | 183,374 |
| Indonesia (Republic of) 144A sr. unsec. | | | |
| unsub. notes 4.35%, 1/8/27 (Indonesia) | | 220,000 | 248,878 |
| Ivory Coast (Republic of) sr. unsec. unsub. | | | |
| bonds Ser. REGS, 6.125%, 6/15/33 (Ivory Coast) | | 1,390,000 | 1,466,450 |
| Ivory Coast (Republic of) sr. unsec. unsub. | | | |
| bonds Ser. REGS, 5.75%, 12/31/32 (Ivory Coast) | | 586,764 | 586,764 |
| Ivory Coast (Republic of) sr. unsec. unsub. | | | |
| bonds Ser. REGS, 5.25%, 3/22/30 | | | |
| (Ivory Coast) | EUR | 250,000 | 308,947 |
| |
| 14 Putnam VT Diversified Income Fund |
| | |
| FOREIGN GOVERNMENT AND AGENCY | | |
| BONDS AND NOTES (12.7%)* cont. | Principal amount | Value |
| |
| Ivory Coast (Republic of) sr. unsec. | | |
| unsub. notes Ser. REGS, 5.375%, 7/23/24 | | |
| (Ivory Coast) | $275,000 | $295,625 |
| Ivory Coast (Republic of) 144A sr. unsec. | | |
| unsub. bonds 5.25%, 3/22/30 | | |
| (Ivory Coast) | EUR | 245,000 | 302,120 |
| Jamaica (Government of) sr. unsec. | | |
| unsub. bonds 8.00%, 3/15/39 (Jamaica) | $211,000 | 295,400 |
| Kenya (Republic of) sr. unsec. notes Ser. REGS, | | |
| 7.00%, 5/22/27 (Kenya) | 240,000 | 263,243 |
| Kenya (Republic of) sr. unsec. | | |
| unsub. notes Ser. REGS, 6.875%, 6/24/24 (Kenya) | 260,000 | 285,997 |
| Mexico (Government of) sr. unsec. bonds 5.55%, | | |
| 1/21/45 (Mexico) | 664,000 | 801,787 |
| Mongolia (Government of) sr. unsec. | | |
| notes Ser. REGS, 5.125%, 4/7/26 (Mongolia) | 200,000 | 213,503 |
| Saudi Arabia (Kingdom of) sr. unsec. | | |
| notes Ser. REGS, 2.90%, 10/22/25 (Saudi Arabia) | 747,000 | 799,701 |
| Senegal (Republic of) sr. unsec. | | |
| unsub. bonds Ser. REGS, 6.75%, 3/13/48 (Senegal) | 1,490,000 | 1,503,038 |
| Senegal (Republic of) unsec. bonds Ser. REGS, | | |
| 6.25%, 5/23/33 (Senegal) | 1,240,000 | 1,308,200 |
| South Africa (Republic of) sr. unsec. | | |
| unsub. bonds 6.30%, 6/22/48 (South Africa) | 240,000 | 263,701 |
| Tunisia (Central Bank of) sr. unsec. | | |
| unsub. notes Ser. REGS, 5.75%, 1/30/25 (Tunisia) | 590,000 | 549,438 |
| Turkey (Republic of) sr. unsec. | | |
| unsub. notes 6.35%, 8/10/24 (Turkey) | 320,000 | 335,523 |
| Venezuela (Bolivarian Republic of) sr. unsec. | | |
| bonds 7.00%, 3/31/38 (Venezuela) | 265,000 | 26,500 |
| Venezuela (Republic of) sr. unsec. notes 9.00%, | | |
| 5/7/23 (Venezuela) (In default) † | 576,000 | 59,040 |
| Venezuela (Republic of) sr. unsec. notes 7.65%, | | |
| 4/21/25 (Venezuela) (In default) † | 134,000 | 13,735 |
| Venezuela (Republic of) sr. unsec. | | |
| unsub. notes 8.25%, 10/13/24 | | |
| (Venezuela) (In default) † | 932,000 | 95,530 |
| Vietnam (Socialist Republic of) sr. unsec. | | |
| notes Ser. REGS, 4.80%, 11/19/24 (Vietnam) | 600,000 | 668,414 |
| Total foreign government and agency bonds | | |
| and notes (cost $22,645,267) | | $22,555,795 |
| | |
| CONVERTIBLE BONDS AND NOTES (6.2%)* | Principal amount | Value |
| | | |
| Capital goods (0.1%) | | |
| John Bean Technologies Corp. 144A cv. sr. unsec. | | |
| notes 0.25%, 5/15/26 | $86,000 | $91,246 |
| Middleby Corp. (The) 144A cv. sr. unsec. | | |
| unsub. notes 1.00%, 9/1/25 | 68,000 | 97,886 |
| | | 189,132 |
| Communication services (0.4%) | | |
| Cable One, Inc. 144A company | | |
| guaranty cv. sr. unsec. notes 1.125%, 3/15/28 | 138,000 | 140,348 |
| DISH Network Corp. cv. sr. unsec. notes | | |
| 3.375%, 8/15/26 | 247,000 | 252,064 |
| Liberty Media Corp. cv. sr. unsec. bonds | | |
| 1.375%, 10/15/23 | 30,000 | 39,862 |
| Liberty Media Corp. cv. sr. unsec. | | |
| unsub. bonds 0.50%, 12/1/50 | 61,000 | 70,181 |
| Liberty Media Corp. 144A cv. sr. unsec. | | |
| unsub. bonds 2.75%, 12/1/49 | 151,000 | 158,248 |
| | | 660,703 |
| | |
| CONVERTIBLE BONDS | | |
| AND NOTES (6.2%)* cont. | Principal amount | Value |
| | | |
| Consumer cyclicals (1.1%) | | |
| Alarm.com Holdings, Inc. 144A cv. sr. unsec. | | |
| notes zero %, 1/15/26 | $60,000 | $55,020 |
| Booking Holdings, Inc. cv. sr. unsec. | | |
| notes 0.75%, 5/1/25 | 152,000 | 214,928 |
| Burlington Stores, Inc. cv. sr. unsec. | | |
| notes 2.25%, 4/15/25 | 90,000 | 142,988 |
| DraftKings, Inc. 144A cv. sr. unsec. | | |
| unsub. notes zero %, 3/15/28 | 134,000 | 120,734 |
| Expedia Group, Inc. 144A company guaranty | | |
| cv. sr. unsec. unsub. notes zero %, 2/15/26 | 141,000 | 152,280 |
| Ford Motor Co. 144A cv. sr. unsec. notes | | |
| zero %, 3/15/26 | 177,000 | 195,696 |
| Live Nation Entertainment, Inc. cv. sr. unsec. | | |
| notes 2.50%, 3/15/23 | 129,000 | 180,123 |
| National Vision Holdings, Inc. cv. sr. unsec. | | |
| sub. notes 2.50%, 5/15/25 | 51,000 | 89,792 |
| NCL Corp, Ltd. 144A cv. company | | |
| guaranty notes 5.375%, 8/1/25 | 30,000 | 54,555 |
| Realogy Group, LLC/Realogy Co-Issuer Corp. | | |
| 144A cv. sr. unsec. notes 0.25%, 6/15/26 | 95,000 | 95,686 |
| Royal Caribbean Cruises, Ltd. 144A cv. sr. unsec. | | |
| notes 2.875%, 11/15/23 | 180,000 | 225,673 |
| Shift4 Payments, Inc. 144A cv. sr. unsec. | | |
| sub. notes zero %, 12/15/25 | 85,000 | 114,589 |
| Square, Inc. 144A cv. sr. unsec. | | |
| sub. notes 0.25%, 11/1/27 | 66,000 | 76,560 |
| Square, Inc. 144A cv. sr. unsec. | | |
| sub. notes zero %, 5/1/26 | 66,000 | 74,456 |
| Vail Resorts, Inc. 144A cv. sr. unsec. | | |
| sub. notes zero %, 1/1/26 | 112,000 | 116,200 |
| Winnebago Industries, Inc. cv. sr. unsec. | | |
| notes 1.50%, 4/1/25 | 66,000 | 84,604 |
| | | 1,993,884 |
| Consumer staples (0.5%) | | |
| Airbnb, Inc. 144A cv. sr. unsec. | | |
| sub. notes zero %, 3/15/26 | 115,000 | 108,388 |
| Cheesecake Factory, Inc. (The) cv. sr. unsec. | | |
| sub. notes 0.375%, 6/15/26 | 85,000 | 83,672 |
| Chegg, Inc. 144A cv. sr. unsec. notes zero %, 9/1/26 | 89,000 | 92,471 |
| Etsy, Inc. 144A cv. sr. unsec. notes 0.25%, 6/15/28 | 169,000 | 186,238 |
| Lyft, Inc. cv. sr. unsec. notes 1.50%, 5/15/25 | 65,000 | 110,955 |
| Shake Shack, Inc. 144A cv. sr. unsec. notes | | |
| zero %, 3/1/28 | 70,000 | 66,290 |
| Uber Technologies, Inc. 144A cv. sr. unsec. | | |
| notes zero %, 12/15/25 | 69,000 | 69,966 |
| Wayfair, Inc. 144A cv. sr. unsec. notes | | |
| 0.625%, 10/1/25 | 111,000 | 118,215 |
| | | 836,195 |
| Energy (0.3%) | | |
| Enphase Energy, Inc. 144A cv. sr. unsec. | | |
| notes zero %, 3/1/28 | 133,000 | 128,893 |
| Pioneer Natural Resources Co. cv. sr. unsec. | | |
| notes 0.25%, 5/15/25 | 129,000 | 205,820 |
| SolarEdge Technologies, Inc. 144A cv. sr. unsec. | | |
| notes zero %, 9/15/25 (Israel) | 57,000 | 71,393 |
| Sunrun, Inc. 144A cv. sr. unsec. notes zero %, | | |
| 2/1/26 | 78,000 | 69,763 |
| Transocean, Inc. cv. company guaranty sr. unsec. | | |
| sub. notes 0.50%, 1/30/23 | 83,000 | 73,941 |
| | | 549,810 |
| |
| Putnam VT Diversified Income Fund 15 |
| | |
| CONVERTIBLE BONDS | | |
| AND NOTES (6.2%)* cont. | Principal amount | Value |
| | | |
| Financials (0.2%) | | |
| Blackstone Mortgage Trust, Inc. cv. sr. unsec. | | |
| notes 4.75%, 3/15/23 R | $87,000 | $88,636 |
| JPMorgan Chase Financial Co., LLC cv. company | | |
| guaranty sr. unsec. notes 0.25%, 5/1/23 | 87,000 | 94,178 |
| LendingTree, Inc. 144A cv. sr. unsec. | | |
| notes 0.50%, 7/15/25 | 77,000 | 69,593 |
| Redfin Corp. 144A cv. sr. unsec. notes | | |
| zero %, 10/15/25 | 105,000 | 117,758 |
| | | 370,165 |
| Health care (1.0%) | | |
| 1Life Healthcare, Inc. cv. sr. unsec. | | |
| notes 3.00%, 6/15/25 | 64,000 | 70,682 |
| BioMarin Pharmaceutical, Inc. cv. sr. unsec. | | |
| sub. notes 1.25%, 5/15/27 | 73,000 | 73,141 |
| DexCom, Inc. cv. sr. unsec. unsub. notes | | |
| 0.25%, 11/15/25 | 112,000 | 116,970 |
| Exact Sciences Corp. cv. sr. unsec. | | |
| sub. notes 0.375%, 3/1/28 | 206,000 | 254,668 |
| Guardant Health, Inc. 144A cv. sr. unsec. | | |
| sub. notes zero %, 11/15/27 | 111,000 | 126,332 |
| Halozyme Therapeutics, Inc. 144A cv. sr. unsec. | | |
| notes 0.25%, 3/1/27 | 133,000 | 123,441 |
| Insulet Corp. cv. sr. unsec. notes 0.375%, 9/1/26 | 59,000 | 80,203 |
| Integra LifeSciences Holdings Corp. cv. sr. | | |
| unsec. notes 0.50%, 8/15/25 | 88,000 | 97,143 |
| Ironwood Pharmaceuticals, Inc. cv. sr. unsec. | | |
| notes 1.50%, 6/15/26 | 62,000 | 73,746 |
| Jazz Investments I, Ltd. cv. company guaranty | | |
| sr. unsec. sub. notes 1.50%, 8/15/24 (Ireland) | 122,000 | 133,915 |
| NeoGenomics, Inc. cv. sr. unsec. notes 0.25%, | | |
| 1/15/28 | 94,000 | 91,298 |
| Neurocrine Biosciences, Inc. cv. sr. unsec. | | |
| notes 2.25%, 5/15/24 | 35,000 | 46,792 |
| Novocure, Ltd. 144A cv. sr. unsec. notes zero %, | | |
| 11/1/25 (Jersey) | 42,000 | 63,026 |
| Omnicell, Inc. 144A cv. sr. unsec. notes 0.25%, 9/15/25 | 57,000 | 92,312 |
| Pacira Pharmaceuticals, Inc. 144A cv. sr. unsec. | | |
| notes 0.75%, 8/1/25 | 110,000 | 120,588 |
| Revance Therapeutics, Inc. cv. sr. unsec. | | |
| notes 1.75%, 2/15/27 | 60,000 | 69,999 |
| Tandem Diabetes Care, Inc. 144A cv. sr. unsec. | | |
| notes 1.50%, 5/1/25 | 51,000 | 57,951 |
| Teladoc Health, Inc. cv. sr. unsec. | | |
| sub. notes 1.25%, 6/1/27 | 86,000 | 96,268 |
| | | 1,788,475 |
| Technology (2.3%) | | |
| Akamai Technologies, Inc. cv. sr. unsec. | | |
| notes 0.375%, 9/1/27 | 143,000 | 165,451 |
| Akamai Technologies, Inc. cv. sr. unsec. | | |
| notes 0.125%, 5/1/25 | 77,000 | 100,639 |
| Bentley Systems, Inc. 144A cv. sr. unsec. | | |
| sub. notes 0.375%, 7/1/27 | 127,000 | 130,175 |
| Bill.com Holdings, Inc. 144A cv. sr. unsec. | | |
| notes zero %, 12/1/25 | 124,000 | 165,540 |
| Blackline, Inc. 144A cv. sr. unsec. notes | | |
| zero %, 3/15/26 | 86,000 | 82,560 |
| Box, Inc. 144A cv. sr. unsec. notes zero %, 1/15/26 | 85,000 | 100,836 |
| Ceridian HCM Holding, Inc. 144A cv. sr. unsec. | | |
| notes 0.25%, 3/15/26 | 106,000 | 105,934 |
| Coupa Software, Inc. cv. sr. unsec. notes | | |
| 0.375%, 6/15/26 | 133,000 | 153,432 |
| | |
| CONVERTIBLE BONDS | | |
| AND NOTES (6.2%)* cont. | Principal amount | Value |
| | | |
| Technology cont. | | |
| CyberArk Software, Ltd. cv. sr. unsec. | | |
| notes zero %, 11/15/24 (Israel) | $72,000 | $77,854 |
| Datadog, Inc. cv. sr. unsec. notes 0.125%, 6/15/25 | 102,000 | 135,851 |
| Envestnet, Inc. 144A cv. company | | |
| guaranty sr. unsec. notes 0.75%, 8/15/25 | 75,000 | 74,535 |
| Everbridge, Inc. 144A cv. sr. unsec. | | |
| notes zero %, 3/15/26 | 97,000 | 99,061 |
| Five9, Inc. 144A cv. sr. unsec. notes 0.50%, 6/1/25 | 63,000 | 93,122 |
| Guidewire Software, Inc. cv. sr. unsec. | | |
| sub. notes 1.25%, 3/15/25 | 86,000 | 100,566 |
| j2 Global, Inc. 144A cv. sr. unsec. notes | | |
| 1.75%, 11/1/26 | 68,000 | 86,659 |
| LivePerson, Inc. 144A cv. sr. unsec. | | |
| notes zero %, 12/15/26 | 72,000 | 77,040 |
| Lumentum Holdings, Inc. cv. sr. unsec. | | |
| notes 0.50%, 12/15/26 | 112,000 | 120,826 |
| Okta, Inc. cv. sr. unsec. notes 0.375%, 6/15/26 | 118,000 | 147,028 |
| ON Semiconductor Corp. 144A cv. sr. unsec. | | |
| notes zero %, 5/1/27 | 91,000 | 94,695 |
| Palo Alto Networks, Inc. cv. sr. unsec. | | |
| notes 0.375%, 6/1/25 | 288,000 | 391,680 |
| Pegasystems, Inc. 144A cv. sr. unsec. | | |
| notes 0.75%, 3/1/25 | 58,000 | 69,093 |
| Rapid7, Inc. 144A cv. sr. unsec. notes 0.25%, 3/15/27 | 83,000 | 92,080 |
| RingCentral, Inc. cv. sr. unsec. notes zero %, 3/1/25 | 99,000 | 109,333 |
| Silicon Laboratories, Inc. cv. sr. unsec. | | |
| notes 0.625%, 6/15/25 | 60,000 | 83,178 |
| Snap, Inc. 144A cv. sr. unsec. notes zero %, 5/1/27 | 145,000 | 155,005 |
| Splunk, Inc. cv. sr. unsec. notes 1.125%, 6/15/27 | 231,000 | 225,081 |
| Twitter, Inc. 144A cv. sr. unsec. sub. notes | | |
| zero %, 3/15/26 | 271,000 | 258,466 |
| Viavi Solutions, Inc. cv. sr. unsec. | | |
| unsub. notes 1.00%, 3/1/24 | 90,000 | 126,844 |
| Zendesk, Inc. cv. sr. unsec. notes 0.625%, 6/15/25 | 75,000 | 109,223 |
| Zscaler, Inc. 144A cv. sr. unsec. notes 0.125%, 7/1/25 | 82,000 | 128,335 |
| Zynga, Inc. 144A cv. sr. unsec. | | |
| unsub. notes zero %, 12/15/26 | 180,000 | 191,925 |
| | | 4,052,047 |
| Transportation (0.2%) | | |
| American Airlines Group, Inc. cv. company | | |
| guaranty notes 6.50%, 7/1/25 | 80,000 | 125,400 |
| JetBlue Airways Corp. 144A cv. sr. unsec. | | |
| notes 0.50%, 4/1/26 | 121,000 | 120,577 |
| Southwest Airlines Co. cv. sr. unsec. | | |
| notes 1.25%, 5/1/25 | 118,000 | 178,696 |
| | | 424,673 |
| Utilities and power (0.1%) | | |
| NextEra Energy Partners LP 144A company | | |
| guaranty cv. sr. unsec. notes zero %, 11/15/25 | 102,000 | 109,752 |
| NRG Energy, Inc. cv. company guaranty sr. unsec. | | |
| bonds 2.75%, 6/1/48 | 103,000 | 119,686 |
| | | 229,438 |
| | | |
| Total convertible bonds and notes (cost $10,262,191) | | $11,094,522 |
| | |
| SENIOR LOANS (2.4%)* c | Principal amount | Value |
| | | |
| Basic materials (0.3%) | | |
| Alpha 3 BV bank term loan FRN Ser. B, (BBA LIBOR | | |
| USD 3 Month + 2.50%), 3.00%, 3/18/28 | $55,000 | $54,691 |
| Diamond BC BV bank term loan FRN (BBA LIBOR USD | | |
| 3 Month + 3.00%), 3.186%, 9/6/24 | 16,442 | 16,343 |
| |
| 16 Putnam VT Diversified Income Fund |
| | |
| SENIOR LOANS (2.4%)* c cont. | Principal amount | Value |
| |
| Basic materials cont. | | |
| Klockner-Pentaplast of America, Inc. bank term | | |
| loan FRN (BBA LIBOR USD 3 Month + 4.75%), | | |
| 5.25%, 2/9/26 | $24,938 | $25,062 |
| PQ Corp. bank term loan FRN Ser. B, (1 Month US | | |
| LIBOR + 2.75%), 3.25%, 6/3/28 | 15,000 | 14,988 |
| PQ Corp. bank term loan FRN Ser. B, (1 Month US | | |
| LIBOR + 2.25%), 2.436%, 2/7/27 | 5,199 | 5,176 |
| SCIH Salt Holdings, Inc. bank term loan FRN | | |
| Ser. B, (BBA LIBOR USD 3 Month + 4.00%), | | |
| 4.75%, 3/16/27 | 110,000 | 110,184 |
| Solenis International, LLC bank term loan FRN | | |
| (BBA LIBOR USD 3 Month + 8.50%), 8.635%, 6/26/26 | 70,000 | 69,773 |
| Solenis International, LLC bank term loan FRN | | |
| (BBA LIBOR USD 3 Month + 4.00%), 4.135%, 6/26/25 | 117,326 | 117,200 |
| Starfruit US Holdco, LLC bank term loan FRN | | |
| Ser. B, (1 Month US LIBOR + 3.00%), 3.133%, 10/1/25 | 72,450 | 71,862 |
| W.R. Grace & Co./CT bank term loan FRN Ser. B3, | | |
| (BBA LIBOR USD 3 Month + 2.00%), 2.147%, 3/30/28 | 110,000 | 109,450 |
| | | 594,729 |
| Capital goods (0.4%) | | |
| Adient US, LLC bank term loan FRN Ser. B, | | |
| (BBA LIBOR USD 3 Month + 3.50%), 3.604%, 4/1/28 | 45,000 | 44,986 |
| American Axle and Manufacturing, Inc. bank term | | |
| loan FRN (BBA LIBOR USD 3 Month + 2.25%), | | |
| 3.00%, 4/6/24 | 17,875 | 17,795 |
| BWAY Corp. bank term loan FRN Ser. B, (BBA LIBOR | | |
| USD 3 Month + 3.25%), 3.354%, 4/3/24 | 110,596 | 107,849 |
| Filtration Group Corp. bank term loan FRN Ser. B, | | |
| (BBA LIBOR USD 3 Month + 3.75%), 4.50%, 3/29/25 | 54,588 | 54,588 |
| Titan Acquisition, Ltd. (United Kingdom) bank | | |
| term loan FRN Ser. B, (BBA LIBOR USD 3 Month | | |
| + 3.00%), 3.167%, 3/28/25 | 96,743 | 94,981 |
| TK Elevator US Newco, Inc. bank term loan FRN | | |
| Ser. B, (1 Month US LIBOR + 4.25%), 4.478%, 6/30/27 | 39,800 | 39,817 |
| Vertiv Group Corp. bank term loan FRN Ser. B, | | |
| (1 Month US LIBOR + 2.75%), 2.836%, 3/2/27 | 292,311 | 290,326 |
| | | 650,342 |
| Communication services (—%) | | |
| Intelsat Jackson Holdings SA bank term loan FRN | | |
| Ser. B3, (BBA LIBOR USD 3 Month + 3.75%), | | |
| 8.00%, 11/27/23 | 55,000 | 55,779 |
| | | 55,779 |
| Consumer cyclicals (0.7%) | | |
| AppleCaramel Buyer, LLC bank term loan FRN | | |
| (BBA LIBOR USD 3 Month + 4.00%), 4.50%, 10/19/27 | 74,625 | 74,718 |
| Cengage Learning, Inc. bank term loan FRN Ser. B, | | |
| (1 Month US LIBOR + 4.75%), 5.75%, 6/29/26 | 145,000 | 145,091 |
| Cengage Learning, Inc. bank term loan FRN Ser. B, | | |
| (BBA LIBOR USD 3 Month + 4.25%), 5.25%, 6/7/23 | 149,606 | 149,687 |
| Clear Channel Outdoor Holdings, Inc. bank term | | |
| loan FRN Ser. B, (1 Month US LIBOR + 3.50%), | | |
| 3.686%, 8/21/26 | 68,775 | 67,085 |
| Cornerstone Building Brands, Inc. bank term loan | | |
| FRN (BBA LIBOR USD 3 Month + 3.25%), | | |
| 3.75%, 4/12/28 | 79,800 | 79,680 |
| CPG International, Inc. bank term loan FRN | | |
| (BBA LIBOR USD 3 Month + 2.50%), 3.25%, 5/5/24 | 64,304 | 64,212 |
| Diamond Sports Group, LLC bank term loan FRN | | |
| Ser. B, (1 Month US LIBOR + 3.25%), 3.36%, 8/24/26 | 78,600 | 47,072 |
| Garda World Security Corp. bank term loan FRN | | |
| Ser. B, (1 Month US LIBOR + 4.25%), 4.35%, 10/30/26 | 68,707 | 68,977 |
| Golden Nugget, LLC bank term loan FRN Ser. B, | | |
| (BBA LIBOR USD 3 Month + 2.50%), 3.25%, 10/4/23 | 72,212 | 71,629 |
| | |
| SENIOR LOANS (2.4%)* c cont. | Principal amount | Value |
| |
| Consumer cyclicals cont. | | |
| iHeartCommunications, Inc. bank term loan FRN | | |
| Ser. B, (1 Month US LIBOR + 3.00%), 3.104%, 5/1/26 | $9,627 | $9,537 |
| Navistar, Inc. bank term loan FRN Ser. B, | | |
| (BBA LIBOR USD 3 Month + 3.50%), 3.60%, 11/6/24 | 198,248 | 198,248 |
| Robertshaw Holdings Corp. bank term loan FRN | | |
| (BBA LIBOR USD 3 Month + 8.00%), 9.00%, 2/28/26 | 75,000 | 64,500 |
| Scientific Games International, Inc. bank term | | |
| loan FRN Ser. B5, (1 Month US LIBOR + 2.75%), | | |
| 2.854%, 8/14/24 | 58,785 | 58,344 |
| Terrier Media Buyer, Inc. bank term loan FRN | | |
| ( 1 Month US LIBOR + 3.50%), 3.604%, 12/17/26 | 99,590 | 99,036 |
| Werner Finco LP bank term loan FRN Ser. B, | | |
| (BBA LIBOR USD 3 Month + 4.00%), 5.00%, 7/24/24 | 86,192 | 85,977 |
| | | 1,283,793 |
| Consumer staples (0.2%) | | |
| Ascend Learning, LLC bank term loan FRN Ser. B, | | |
| (BBA LIBOR USD 3 Month + 3.00%), 4.00%, 7/12/24 | 133,871 | 133,731 |
| Brand Industrial Services, Inc. bank term loan | | |
| FRN (BBA LIBOR USD 3 Month + 4.25%), | | |
| 5.25%, 6/21/24 | 159,451 | 156,735 |
| IRB Holding Corp. bank term loan FRN Ser. B, | | |
| (BBA LIBOR USD 3 Month + 3.25%), 4.25%, 12/15/27 | 34,825 | 34,803 |
| IRB Holding Corp. bank term loan FRN Ser. B, | | |
| (BBA LIBOR USD 3 Month + 2.75%), 3.75%, 2/5/25 | 83,068 | 82,869 |
| | | 408,138 |
| Energy (0.1%) | | |
| Blackstone CQP Holdco LP bank term loan FRN | | |
| Ser. B, (BBA LIBOR USD 3 Month + 3.75%), | | |
| 4.25%, 5/27/28 | 80,000 | 79,640 |
| | | 79,640 |
| Financials (—%) | | |
| HUB International, Ltd. bank term loan FRN | | |
| Ser. B, (BBA LIBOR USD 3 Month + 3.25%), | | |
| 4.00%, 4/25/25 | 34,477 | 34,453 |
| | | 34,453 |
| Health care (0.4%) | | |
| Elanco Animal Health, Inc. bank term loan FRN | | |
| Ser. B, (1 Month US LIBOR + 1.75%), 1.85%, 2/4/27 | 53,261 | 52,419 |
| Enterprise Merger Sub, Inc. bank term loan FRN | | |
| (BBA LIBOR USD 3 Month + 3.75%), 3.854%, 10/10/25 | 84,270 | 71,937 |
| Global Medical Response, Inc. bank term loan FRN | | |
| (BBA LIBOR USD 3 Month + 4.75%), 5.75%, 10/5/25 | 194,025 | 194,753 |
| Jazz Financing Lux Sarl bank term loan FRN | | |
| Ser. B, (1 Month US LIBOR + 3.50%), 4.00%, | | |
| 4/22/28 (Luxembourg) | 205,000 | 205,576 |
| One Call Corp. bank term loan FRN Ser. B, | | |
| ( 1 Month US LIBOR + 5.50%), 6.25%, 4/7/27 | 110,000 | 111,100 |
| Ortho-Clinical Diagnostics, Inc. bank term loan | | |
| FRN Ser. B, (BBA LIBOR USD 3 Month + 3.00%), | | |
| 3.089%, 6/30/25 | 22,039 | 22,016 |
| Quorum Health Corp. bank term loan FRN | | |
| (BBA LIBOR USD 3 Month + 8.25%), 9.25%, 4/29/25 | 70,953 | 71,751 |
| | | 729,552 |
| Technology (0.2%) | | |
| Epicor Software Corp. bank term loan FRN Ser. B, | | |
| (BBA LIBOR USD 3 Month + 3.25%), 4.00%, 7/30/27 | 74,438 | 74,323 |
| Greeneden US Holdings II, LLC bank term loan FRN | | |
| (BBA LIBOR USD 3 Month + 4.00%), 4.75%, 10/8/27 | 74,813 | 74,946 |
| Polaris Newco, LLC bank term loan FRN Ser. B, | | |
| (BBA LIBOR USD 3 Month + 4.00%), 4.50%, 6/3/28 | 75,000 | 75,179 |
| Rocket Software, Inc. bank term loan FRN (1 Month | | |
| US LIBOR + 4.25%), 4.75%, 11/28/25 | 50,000 | 49,075 |
| | | 273,523 |
| |
| Putnam VT Diversified Income Fund 17 |
| | |
| SENIOR LOANS (2.4%)* c cont. | Principal amount | Value |
| | | |
| Transportation (0.1%) | | |
| American Airlines, Inc. bank term loan FRN | | |
| (BBA LIBOR USD 3 Month + 4.75%), 5.50%, 3/24/28 | $45,000 | $46,879 |
| United Airlines, Inc. bank term loan FRN Ser. B, | | |
| (BBA LIBOR USD 3 Month + 3.75%), 4.50%, 4/14/28 | 94,763 | 95,921 |
| | | 142,800 |
| | | |
| Total senior loans (cost $4,257,499) | | $4,252,749 |
| | | | |
| PURCHASED SWAP OPTIONS OUTSTANDING (2.2%)* | | | | |
| Counterparty | | Notional/ | |
| Fixed right % to receive or (pay)/ | Expiration | | contract | |
| Floating rate index/Maturity date | date/strike | | amount | Value |
| | | | | |
| Bank of America N.A. | | | | |
| 0.485/3 month USD- | | | | |
| LIBOR-BBA/Jan-25 | Jan-24/0.485 | $15,045,100 | $14,142 |
| Goldman Sachs International | | | | |
| 1.869/3 month USD- | | | | |
| LIBOR-BBA/Sep-31 | Sep-21/1.869 | | 18,564,700 | 749,457 |
| 2.988/3 month USD- | | | | |
| LIBOR-BBA/Feb-39 | Feb-29/2.988 | | 2,141,800 | 236,112 |
| (2.988)/3 month USD- | | | | |
| LIBOR-BBA/Feb-39 | Feb-29/2.988 | | 2,141,800 | 69,244 |
| JPMorgan Chase Bank N.A. | | | | |
| 2.795/3 month USD- | | | | |
| LIBOR-BBA/Dec-37 | Dec-27/2.795 | | 2,557,500 | 250,558 |
| 2.7575/3 month USD- | | | | |
| LIBOR-BBA/Dec-37 | Dec-27/2.7575 | | 2,557,500 | 244,727 |
| (2.7575)/3 month USD- | | | | |
| LIBOR-BBA/Dec-37 | Dec-27/2.7575 | | 2,557,500 | 88,848 |
| (2.795)/3 month USD- | | | | |
| LIBOR-BBA/Dec-37 | Dec-27/2.795 | | 2,557,500 | 86,469 |
| Morgan Stanley & Co. International PLC | | | | |
| 3.00/3 month USD- | | | | |
| LIBOR-BBA/Apr-72 | Apr-47/3.00 | | 2,490,200 | 637,690 |
| 3.00/3 month USD- | | | | |
| LIBOR-BBA/Feb-73 | Feb-48/3.00 | | 2,490,200 | 629,747 |
| 2.75/3 month USD- | | | | |
| LIBOR-BBA/May-73 | May-48/2.75 | | 2,490,200 | 532,704 |
| (1.613)/3 month USD- | | | | |
| LIBOR-BBA/Aug-34 | Aug-24/1.613 | | 2,817,200 | 166,187 |
| 1.613/3 month USD- | | | | |
| LIBOR-BBA/Aug-34 | Aug-24/1.613 | | 2,817,200 | 90,798 |
| Toronto-Dominion Bank | | | | |
| (1.724)/3 month USD- | | | | |
| LIBOR-BBA/Aug-26 (Canada) | Aug-21/1.724 | | 2,734,100 | 1,934 |
| UBS AG | | | | |
| (0.153)/6 month EUR-EURIBOR-Reuters/Sep-29 | Sep-24/0.153 | EUR | 4,016,900 | 90,545 |
| 0.153/6 month EUR-EURIBOR-Reuters/Sep-29 | Sep-24/0.153 | EUR | 4,016,900 | 76,257 |
| Total purchased swap options outstanding (cost $2,603,753) | | | | $3,965,419 |
| | | | | |
| PURCHASED OPTIONS OUTSTANDING (0.1%)* | | | | | |
| | Expiration | | | | |
| | date/ | Notional | | Contract | |
| Counterparty | strike price | amount | | amount | Value |
| |
| Goldman Sachs International | | | | | |
| EUR/USD (Call) | Aug-21/$1.29 | $11,945,720 | EUR | 10,074,400 | $12 |
| EUR/USD (Put) | Aug-21/1.18 | 11,945,720 | EUR | 10,074,400 | 68,831 |
| | | | | |
| PURCHASED OPTIONS OUTSTANDING (0.1%)* cont. | | | | | |
| | Expiration | | | | |
| | date/ | Notional | | Contract | |
| Counterparty | strike price | amount | | amount | Value |
| |
| JPMorgan Chase Bank N.A. | | | | | |
| Uniform Mortgage-Backed Securities 30 yr 2.50% | | | | | |
| TBA commitments | | | | | |
| (Call) | Aug-21/$103.41 | $14,000,000 | | $14,000,000 | $40,628 |
| Uniform Mortgage-Backed Securities 30 yr 2.50% | | | | | |
| TBA commitments | | | | | |
| (Call) | Aug-21/103.28 | 11,000,000 | | 11,000,000 | 39,710 |
| Morgan Stanley & Co. International PLC | | | | | |
| GBP/USD (Put) | Aug-21/1.37 | 5,957,596 | GBP | 4,306,800 | 34,965 |
| Total purchased options outstanding (cost $150,647) | | | | | $184,146 |
| | |
| ASSET-BACKED SECURITIES (0.7%)* | Principal amount | Value |
| |
| 1Sharpe Mortgage Trust 144A FRB Ser. 20-1, | | |
| Class NOTE, (BBA LIBOR USD 3 Month + 2.90%), | | |
| 3.047%, 7/25/24 | $495,000 | $495,000 |
| Mortgage Repurchase Agreement Financing Trust | | |
| FRB Ser. 20-4, Class A1, (1 Month US LIBOR + 1.35%), | | |
| 1.427%, 4/23/23 | 123,000 | 123,059 |
| Nationstar HECM Loan Trust 144A Ser. 19-2A, | | |
| Class M4, 5.682%, 11/25/29 W | 425,000 | 424,405 |
| RMF Buyout Issuance Trust 144A Ser. 20-2, | | |
| Class M3, 4.571%, 6/25/30 W | 158,000 | 158,000 |
| Total asset-backed securities (cost $1,200,999) | | $1,200,464 |
| | |
| COMMON STOCKS (0.1%)* | Shares | Value |
| | | |
| iHeartMedia, Inc. Class A † | 5,164 | $139,067 |
| MWO Holdings, LLC (Units) F | 98 | 250 |
| Oasis Petroleum, Inc. | 313 | 31,472 |
| Texas Competitive Electric Holdings Co., LLC/TCEH | | |
| Finance, Inc. (Rights) | 10,369 | 11,924 |
| Tribune Media Co. Class 1C | 55,356 | 5,536 |
| Total common stocks (cost $211,267) | | $188,249 |
| | |
| PREFERRED STOCKS (—%)* | Shares | Value |
| | | |
| GMAC Capital Trust I Ser. 2, $1.91 cum. ARP | 507 | $12,832 |
| Total preferred stocks (cost $13,344) | | $12,832 |
| | | |
| | | Principal amount/ | |
| SHORT-TERM INVESTMENTS (25.5%)* | | shares | Value |
| | | | |
| Putnam Short Term Investment Fund | | | |
| Class P 0.09% L | Shares | 30,021,312 | $30,021,312 |
| State Street Institutional U.S. Government | | | |
| Money Market Fund, Premier Class 0.03% P | Shares | 110,000 | 110,000 |
| U.S. Treasury Bills 0.025%, 7/20/21 # ∆ Ф | | $500,000 | 499,987 |
| U.S. Treasury Bills 0.021%, 8/3/21 ∆ § | | 1,900,000 | 1,899,918 |
| U.S. Treasury Bills 0.016%, 9/2/21 # ∆ § | | 2,100,000 | 2,099,807 |
| U.S. Treasury Bills 0.016%, 7/27/21 # ∆ § Ф | | 1,300,000 | 1,299,957 |
| U.S. Treasury Bills 0.010%, 7/6/21 ∆ Ф | | 1,100,000 | 1,099,994 |
| U.S. Treasury Cash Management Bills 0.019%, | | | |
| 9/28/21 ∆ § | | 1,900,000 | 1,899,812 |
| U.S. Treasury Cash Management Bills 0.015%, | | | |
| 9/7/21 # ∆ § | | 2,200,000 | 2,199,801 |
| U.S. Treasury Cash Management Bills 0.011%, | | | |
| 9/21/21 # ∆ § | | 4,100,000 | 4,099,552 |
| U.S. Treasury Cash Management Bills 0.008%, | | | |
| 9/14/21 ∆ | | 100,000 | 99,990 |
| Total short-term investments (cost $45,330,935) | | | $45,330,130 |
| | | | |
| Total investments (cost $307,769,756) | | | $298,706,779 |
| |
| 18 Putnam VT Diversified Income Fund |
Key to holding’s currency abbreviations
| |
| AUD | Australian Dollar |
| CAD | Canadian Dollar |
| CHF | Swiss Franc |
| EUR | Euro |
| GBP | British Pound |
| JPY | Japanese Yen |
| NOK | Norwegian Krone |
| NZD | New Zealand Dollar |
| SEK | Swedish Krona |
| USD/$ | United States Dollar |
Key to holding’s abbreviations
| |
| ARP | Adjustable Rate Preferred Stock: the rate shown is the current interest rate at the close of the reporting period |
| bp | Basis Points |
| DAC | Designated Activity Company |
| EMTN | Euro Medium Term Notes |
| FRB | Floating Rate Bonds: the rate shown is the current interest rate at the close of the reporting period. Rates may be subject to a cap or floor. For certain securities, |
| | the rate may represent a fixed rate currently in place at the close of the reporting period. |
| FRN | Floating Rate Notes: the rate shown is the current interest rate or yield at the close of the reporting period. Rates may be subject to a cap or floor. For certain |
| | securities, the rate may represent a fixed rate currently in place at the close of the reporting period. |
| IFB | Inverse Floating Rate Bonds, which are securities that pay interest rates that vary inversely to changes in the market interest rates. As interest rates rise, inverse |
| | floaters produce less current income. The rate shown is the current interest rate at the close of the reporting period. Rates may be subject to a cap or floor. |
| IO | Interest Only |
| OJSC | Open Joint Stock Company |
| OTC | Over-the-counter |
| REGS | Securities sold under Regulation S may not be offered, sold or delivered within the United States except pursuant to an exemption from, or in a transaction not |
| | subject to, the registration requirements of the Securities Act of 1933. |
| TBA | To Be Announced Commitments |
Notes to the fund’s portfolio
Unless noted otherwise, the notes to the fund’s portfolio are for the close of the fund’s reporting period, which ran from January 1, 2021 through June 30, 2021 (the reporting period). Within the following notes to the portfolio, references to “Putnam Management” represent Putnam Investment Management, LLC, the fund’s manager, an indirect wholly-owned subsidiary of Putnam Investments, LLC and references to “ASC 820” represent Accounting Standards Codification 820 Fair Value Measurements and Disclosures.
* Percentages indicated are based on net assets of $178,034,784.
† This security is non-income-producing.
‡‡ Income may be received in cash or additional securities at the discretion of the issuer. The rate shown in parenthesis is the rate paid in kind, if applicable.
# This security, in part or in entirety, was pledged and segregated with the broker to cover margin requirements for futures contracts at the close of the reporting period. Collateral at period end totaled $551,967 and is included in Investments in securities on the Statement of assets and liabilities (Notes 1 and 9).
∆ This security, in part or in entirety, was pledged and segregated with the custodian for collateral on certain derivative contracts at the close of the reporting period. Collateral at period end totaled $10,757,171 and is included in Investments in securities on the Statement of assets and liabilities (Notes 1 and 9).
ФThis security, in part or in entirety, was pledged and segregated with the custodian for collateral on certain TBA commitments at the close of the reporting period. Collateral at period end totaled $104,000 and is included in Investments in securities on the Statement of assets and liabilities (Notes 1 and 9).
§ This security, in part or in entirety, was pledged and segregated with the custodian for collateral on the initial margin on certain centrally cleared derivative contracts at the close of the reporting period. Collateral at period end totaled $2,726,825 and is included in Investments in securities on the Statement of assets and liabilities (Notes 1 and 9).
c Senior loans are exempt from registration under the Securities Act of 1933, as amended, but contain certain restrictions on resale and cannot be sold publicly. These loans pay interest at rates which adjust periodically. The interest rates shown for senior loans are the current interest rates at the close of the reporting period. Senior loans are also subject to mandatory and/or optional prepayment which cannot be predicted. As a result, the remaining maturity may be substantially less than the stated maturity shown (Notes 1 and 7).
F This security is valued by Putnam Management at fair value following procedures approved by the Trustees. Securities are classified as Level 3 for ASC 820 based on the securities’ valuation inputs (Note 1).
i This security was pledged, or purchased with cash that was pledged, to the fund for collateral on certain derivative contracts (Note 1).
L Affiliated company (Note 5). The rate quoted in the security description is the annualized 7-day yield of the fund at the close of the reporting period.
P This security was pledged, or purchased with cash that was pledged, to the fund for collateral on certain derivative contracts. The rate quoted in the security description is the annualized 7-day yield of the fund at the close of the reporting period.
R Real Estate Investment Trust.
W The rate shown represents the weighted average coupon associated with the underlying mortgage pools. Rates may be subject to a cap or floor.
At the close of the reporting period, the fund maintained liquid assets totaling $132,813,045 to cover certain derivative contracts and delayed delivery securities.
Unless otherwise noted, the rates quoted in Short-term investments security descriptions represent the weighted average yield to maturity.
Debt obligations are considered secured unless otherwise indicated.
144A after the name of an issuer represents securities exempt from registration under Rule 144A of the Securities Act of 1933, as amended. These securities may be resold in transactions exempt from registration, normally to qualified institutional buyers.
See Note 1 to the financial statements regarding TBA commitments.
The dates shown on debt obligations are the original maturity dates.
| | | | | | |
| FORWARD CURRENCY CONTRACTS at 6/30/21 (aggregate face value $148,186,057) (Unaudited) | | | Unrealized |
| | | Contract | Delivery | | Aggregate | appreciation/ |
| Counterparty | Currency | type* | date | Value | face value | (depreciation) |
| Bank of America N.A. | | | | | | |
| | British Pound | Buy | 9/15/21 | $363,454 | $371,682 | $(8,228) |
| | Canadian Dollar | Sell | 7/21/21 | 165,132 | 180,692 | 15,560 |
| | Euro | Buy | 9/15/21 | 2,657,748 | 2,758,626 | (100,878) |
| | Hong Kong Dollar | Sell | 8/18/21 | 109,730 | 109,704 | (26) |
| | Japanese Yen | Buy | 8/18/21 | 1,120,411 | 1,140,324 | (19,913) |
| | Norwegian Krone | Buy | 9/15/21 | 311,020 | 323,669 | (12,649) |
| |
| Putnam VT Diversified Income Fund 19 |
| | | | | | |
| FORWARD CURRENCY CONTRACTS at 6/30/21 (aggregate face value $148,186,057) (Unaudited) cont. | | | Unrealized |
| | | Contract | Delivery | | Aggregate | appreciation/ |
| Counterparty | Currency | type* | date | Value | face value | (depreciation) |
| Barclays Bank PLC | | | | | | |
| | Australian Dollar | Buy | 7/21/21 | $1,014,633 | $1,052,204 | $(37,571) |
| | British Pound | Sell | 9/15/21 | 78,722 | 69,778 | (8,944) |
| | Canadian Dollar | Buy | 7/21/21 | 58,324 | 72,957 | (14,633) |
| | Euro | Sell | 9/15/21 | 2,310,626 | 2,375,836 | 65,210 |
| | Japanese Yen | Buy | 8/18/21 | 914,382 | 933,938 | (19,556) |
| Citibank, N.A. | | | | | | |
| | Australian Dollar | Buy | 7/21/21 | 672,846 | 696,986 | (24,140) |
| | British Pound | Sell | 9/15/21 | 1,619,976 | 1,656,284 | 36,308 |
| | Canadian Dollar | Sell | 7/21/21 | 429,327 | 427,676 | (1,651) |
| | Euro | Sell | 9/15/21 | 1,491,569 | 1,534,150 | 42,581 |
| | Japanese Yen | Buy | 8/18/21 | 489,991 | 498,729 | (8,738) |
| | New Zealand Dollar | Sell | 7/21/21 | 461,184 | 465,119 | 3,935 |
| Credit Suisse International | | | | | | |
| | Australian Dollar | Sell | 7/21/21 | 374,938 | 374,659 | (279) |
| | British Pound | Sell | 9/15/21 | 1,034,881 | 1,057,583 | 22,702 |
| | Canadian Dollar | Sell | 7/21/21 | 959,814 | 946,117 | (13,697) |
| | Euro | Sell | 9/15/21 | 587,127 | 603,754 | 16,627 |
| Goldman Sachs International | | | | | | |
| | Australian Dollar | Buy | 7/21/21 | 1,993,786 | 2,045,388 | (51,602) |
| | British Pound | Buy | 9/15/21 | 5,934,516 | 6,086,153 | (151,637) |
| | Canadian Dollar | Sell | 7/21/21 | 955,942 | 1,138,729 | 182,787 |
| | Euro | Buy | 9/15/21 | 5,872,578 | 5,954,515 | (81,937) |
| | Japanese Yen | Sell | 8/18/21 | 3,949,575 | 3,993,525 | 43,950 |
| | New Zealand Dollar | Sell | 7/21/21 | 4,105,849 | 4,149,698 | 43,849 |
| | Norwegian Krone | Buy | 9/15/21 | 3,647,943 | 3,756,105 | (108,162) |
| | Swedish Krona | Buy | 9/15/21 | 2,169,464 | 2,243,346 | (73,882) |
| | Swiss Franc | Sell | 9/15/21 | 354,544 | 352,894 | (1,650) |
| HSBC Bank USA, National Association | | | | | | |
| | Australian Dollar | Sell | 7/21/21 | 232,208 | 225,758 | (6,450) |
| | British Pound | Sell | 9/15/21 | 179,305 | 180,701 | 1,396 |
| | Canadian Dollar | Buy | 7/21/21 | 951,909 | 946,290 | 5,619 |
| | Euro | Buy | 9/15/21 | 940,662 | 989,514 | (48,852) |
| | Hong Kong Dollar | Sell | 8/18/21 | 519,216 | 519,091 | (125) |
| | Japanese Yen | Buy | 8/18/21 | 1,608,983 | 1,635,560 | (26,577) |
| | New Zealand Dollar | Buy | 7/21/21 | 166,007 | 177,040 | (11,033) |
| | Norwegian Krone | Buy | 9/15/21 | 28,579 | 26,133 | 2,446 |
| | Swiss Franc | Buy | 9/15/21 | 893,400 | 910,484 | (17,084) |
| JPMorgan Chase Bank N.A. | | | | | | |
| | Australian Dollar | Buy | 7/21/21 | 1,348,543 | 1,390,020 | (41,477) |
| | British Pound | Buy | 9/15/21 | 2,559,255 | 2,617,127 | (57,872) |
| | Canadian Dollar | Sell | 7/21/21 | 1,854,932 | 1,823,382 | (31,550) |
| | Euro | Buy | 9/15/21 | 1,724,924 | 1,802,013 | (77,089) |
| | Japanese Yen | Sell | 8/18/21 | 1,163,882 | 1,178,789 | 14,907 |
| | New Zealand Dollar | Sell | 7/21/21 | 1,044,269 | 1,052,941 | 8,672 |
| | Norwegian Krone | Buy | 9/15/21 | 245,682 | 249,652 | (3,970) |
| | Swedish Krona | Sell | 9/15/21 | 931,280 | 930,897 | (383) |
| | Swiss Franc | Buy | 9/15/21 | 449,840 | 437,495 | 12,345 |
| Morgan Stanley & Co. International PLC | | | | | | |
| | Australian Dollar | Sell | 7/21/21 | 461,637 | 470,913 | 9,276 |
| | British Pound | Buy | 9/15/21 | 5,150,469 | 5,223,404 | (72,935) |
| | Canadian Dollar | Buy | 7/21/21 | 400,689 | 356,996 | 43,693 |
| | Euro | Buy | 9/15/21 | 4,560,211 | 4,716,994 | (156,783) |
| |
| 20 Putnam VT Diversified Income Fund |
| | | | | | |
| FORWARD CURRENCY CONTRACTS at 6/30/21 (aggregate face value $148,186,057) (Unaudited) cont. | | | Unrealized |
| | | Contract | Delivery | | Aggregate | appreciation/ |
| Counterparty | Currency | type* | date | Value | face value | (depreciation) |
| Morgan Stanley & Co. International PLC cont. | | | | | |
| | Japanese Yen | Buy | 8/18/21 | $1,292,739 | $1,326,397 | $(33,658) |
| | New Zealand Dollar | Sell | 7/21/21 | 1,041,753 | 1,073,164 | 31,411 |
| | Norwegian Krone | Buy | 9/15/21 | 1,329,135 | 1,369,444 | (40,309) |
| | Swedish Krona | Buy | 9/15/21 | 84,516 | 84,187 | 329 |
| | Swiss Franc | Sell | 9/15/21 | 428,398 | 441,293 | 12,895 |
| NatWest Markets PLC | | | | | | |
| | Australian Dollar | Sell | 7/21/21 | 237,533 | 227,010 | (10,523) |
| | British Pound | Buy | 9/15/21 | 1,853,239 | 1,895,158 | (41,919) |
| | Canadian Dollar | Sell | 7/21/21 | 1,778,375 | 1,766,995 | (11,380) |
| | Euro | Sell | 9/15/21 | 5,644,449 | 5,704,291 | 59,842 |
| | Japanese Yen | Sell | 8/18/21 | 635,779 | 643,588 | 7,809 |
| | New Zealand Dollar | Sell | 7/21/21 | 1,942,731 | 1,945,419 | 2,688 |
| | Swedish Krona | Buy | 9/15/21 | 610,334 | 632,104 | (21,770) |
| State Street Bank and Trust Co. | | | | | | |
| | Australian Dollar | Buy | 7/21/21 | 1,112,061 | 1,168,782 | (56,721) |
| | British Pound | Sell | 9/15/21 | 279,335 | 232,075 | (47,260) |
| | Canadian Dollar | Sell | 7/21/21 | 2,467,702 | 2,520,649 | 52,947 |
| | Euro | Sell | 9/15/21 | 4,418,180 | 4,507,373 | 89,193 |
| | Hong Kong Dollar | Sell | 8/18/21 | 3,249,745 | 3,248,720 | (1,025) |
| | Japanese Yen | Sell | 8/18/21 | 10,189,012 | 10,346,094 | 157,082 |
| | New Zealand Dollar | Sell | 7/21/21 | 1,381,245 | 1,364,559 | (16,686) |
| | Norwegian Krone | Buy | 9/15/21 | 1,118,248 | 1,125,990 | (7,742) |
| | Swedish Krona | Buy | 9/15/21 | 163,853 | 169,705 | (5,852) |
| | Swiss Franc | Buy | 9/15/21 | 427,099 | 420,449 | 6,650 |
| Toronto-Dominion Bank | | | | | | |
| | Australian Dollar | Buy | 7/21/21 | 1,491,046 | 1,531,564 | (40,518) |
| | British Pound | Sell | 9/15/21 | 548,985 | 562,113 | 13,128 |
| | Canadian Dollar | Sell | 7/21/21 | 451,108 | 477,473 | 26,365 |
| | Euro | Sell | 9/15/21 | 3,908,006 | 4,018,603 | 110,597 |
| | Hong Kong Dollar | Sell | 8/18/21 | 119,725 | 119,692 | (33) |
| | Japanese Yen | Buy | 8/18/21 | 1,200,048 | 1,224,633 | (24,585) |
| | Norwegian Krone | Buy | 9/15/21 | 923,023 | 960,059 | (37,036) |
| | Swedish Krona | Sell | 9/15/21 | 25,432 | 26,340 | 908 |
| UBS AG | | | | | | |
| | Australian Dollar | Sell | 7/21/21 | 564,616 | 557,689 | (6,927) |
| | British Pound | Buy | 9/15/21 | 1,511,092 | 1,545,979 | (34,887) |
| | Canadian Dollar | Sell | 7/21/21 | 1,310,811 | 1,364,679 | 53,868 |
| | Euro | Buy | 9/15/21 | 2,670,692 | 2,745,818 | (75,126) |
| | Hong Kong Dollar | Sell | 8/18/21 | 590,974 | 590,830 | (144) |
| | Japanese Yen | Buy | 8/18/21 | 5,630,451 | 5,739,544 | (109,093) |
| | New Zealand Dollar | Sell | 7/21/21 | 1,660,625 | 1,670,711 | 10,086 |
| | Norwegian Krone | Buy | 9/15/21 | 182,155 | 188,652 | (6,497) |
| | Swedish Krona | Buy | 9/15/21 | 4,404,548 | 4,563,081 | (158,533) |
| WestPac Banking Corp. | | | | | | |
| | British Pound | Buy | 9/15/21 | 227,867 | 234,096 | (6,229) |
| | Canadian Dollar | Buy | 7/21/21 | 398,027 | 392,377 | 5,650 |
| | Euro | Sell | 9/15/21 | 649,830 | 668,243 | 18,413 |
| | Japanese Yen | Sell | 8/18/21 | 161,992 | 164,905 | 2,913 |
| | New Zealand Dollar | Sell | 7/21/21 | 1,382,294 | 1,393,516 | 11,222 |
| Unrealized appreciation | | | | | | 1,245,859 |
| Unrealized (depreciation) | | | | | | (2,086,406) |
| Total | | | | | | $(840,547) |
* The exchange currency for all contracts listed is the United States Dollar.
| |
| Putnam VT Diversified Income Fund 21 |
| | | | | |
| | | | | | Unrealized |
| | Number of | Notional | | Expiration | appreciation/ |
| FUTURES CONTRACTS OUTSTANDING at 6/30/21 (Unaudited) | contracts | amount | Value | date | (depreciation) |
| Euro-Bund 10 yr (Long) | 1 | $204,672 | $204,672 | Sep-21 | $1,065 |
| U.S. Treasury Note 2 yr (Short) | 470 | 103,550,547 | 103,550,547 | Sep-21 | 178,669 |
| U.S. Treasury Note Ultra 10 yr (Short) | 149 | 21,933,266 | 21,933,266 | Sep-21 | (323,101) |
| Unrealized appreciation | | | | | 179,734 |
| Unrealized (depreciation) | | | | | (323,101) |
| Total | | | | | $(143,367) |
| | | | |
| WRITTEN SWAP OPTIONS OUTSTANDING at 6/30/21 (premiums $5,285,155) (Unaudited) | | | | |
| Counterparty | | | Notional/ | |
| Fixed Obligation % to receive or (pay)/ | Expiration | | contract | |
| Floating rate index/Maturity date | date/strike | | amount | Value |
| Bank of America N.A. | | | | |
| 1.8775/3 month USD-LIBOR-BBA/Sep-31 | Sep-21/1.8775 | | $4,068,500 | $7,039 |
| 1.88/3 month USD-LIBOR-BBA/Aug-31 | Aug-21/1.88 | | 7,465,200 | 10,899 |
| 0.985/3 month USD-LIBOR-BBA/Jan-25 | Jan-24/0.985 | | 15,045,100 | 88,014 |
| Citibank, N.A. | | | | |
| (1.865)/3 month USD-LIBOR-BBA/Oct-39 | Oct-29/1.865 | | 2,578,300 | 137,372 |
| 1.865/3 month USD-LIBOR-BBA/Oct-39 | Oct-29/1.865 | | 2,578,300 | 180,661 |
| Goldman Sachs International | | | | |
| 2.317/3 month USD-LIBOR-BBA/Dec-31 | Dec-21/2.317 | | 18,564,700 | 43,070 |
| 1.722/6 month GBP-LIBOR-BBA/Feb-39 | Feb-29/1.722 | GBP | 1,390,800 | 83,535 |
| (1.722)/6 month GBP-LIBOR-BBA/Feb-39 | Feb-29/1.722 | GBP | 1,390,800 | 154,296 |
| (1.519)/3 month USD-LIBOR-BBA/Sep-31 | Sep-21/1.519 | | $18,564,700 | 289,424 |
| JPMorgan Chase Bank N.A. | | | | |
| (0.968)/3 month USD-LIBOR-BBA/Mar-35 | Mar-25/0.968 | | 1,407,300 | 22,714 |
| (1.07)/3 month USD-LIBOR-BBA/Mar-32 | Mar-27/1.07 | | 2,242,700 | 28,976 |
| 1.667/6 month EUR-EURIBOR-Reuters/Feb-36 | Feb-26/1.667 | EUR | 3,059,700 | 60,298 |
| 3.229/3 month USD-LIBOR-BBA/Nov-33 | Nov-23/3.229 | | $9,328,700 | 74,630 |
| 1.07/3 month USD-LIBOR-BBA/Mar-32 | Mar-27/1.07 | | 2,242,700 | 121,128 |
| 0.968/3 month USD-LIBOR-BBA/Mar-35 | Mar-25/0.968 | | 1,407,300 | 146,767 |
| (1.667)/6 month EUR-EURIBOR-Reuters/Feb-36 | Feb-26/1.667 | EUR | 3,059,700 | 433,805 |
| (3.229)/3 month USD-LIBOR-BBA/Nov-33 | Nov-23/3.229 | | $9,328,700 | 1,267,957 |
| Morgan Stanley & Co. International PLC | | | | |
| 3.01/3 month USD-LIBOR-BBA/Feb-36 | Feb-26/3.01 | | 1,100,100 | 24,928 |
| 2.97/3 month USD-LIBOR-BBA/Feb-36 | Feb-26/2.97 | | 1,100,100 | 25,577 |
| (1.512)/3 month USD-LIBOR-BBA/Aug-32 | Aug-22/1.512 | | 2,817,200 | 61,105 |
| 1.512/3 month USD-LIBOR-BBA/Aug-32 | Aug-22/1.512 | | 2,817,200 | 98,095 |
| (2.97)/3 month USD-LIBOR-BBA/Feb-36 | Feb-26/2.97 | | 1,100,100 | 120,934 |
| (3.01)/3 month USD-LIBOR-BBA/Feb-36 | Feb-26/3.01 | | 1,100,100 | 123,915 |
| (2.75)/3 month USD-LIBOR-BBA/May-49 | May-25/2.75 | | 2,490,200 | 485,265 |
| (3.00)/3 month USD-LIBOR-BBA/Jan-49 | Jan-24/3.00 | | 2,490,200 | 598,246 |
| (3.00)/3 month USD-LIBOR-BBA/Apr-48 | Apr-23/3.00 | | 2,490,200 | 604,446 |
| Toronto-Dominion Bank | | | | |
| (1.17)/3 month USD-LIBOR-BBA/Mar-55 | Mar-25/1.17 | | 202,900 | 9,999 |
| 1.17/3 month USD-LIBOR-BBA/Mar-55 | Mar-25/1.17 | | 405,900 | 88,754 |
| UBS AG | | | | |
| (1.9875)/3 month USD-LIBOR-BBA/Oct-36 | Oct-26/1.9875 | | 2,990,900 | 159,714 |
| 1.9875/3 month USD-LIBOR-BBA/Oct-36 | Oct-26/1.9875 | | 2,990,900 | 167,461 |
| Total | | | | $5,719,024 |
| |
| 22 Putnam VT Diversified Income Fund |
| | | | | |
| WRITTEN OPTIONS OUTSTANDING at 6/30/21 (premiums $149,169) (Unaudited) | Expiration | Notional | | Contract | |
| Counterparty | date/strike price | Amount | | amount | Value |
| Goldman Sachs International | | | | | |
| EUR/USD (Call) | Aug-21/$1.21 | $11,945,720 | EUR | 10,074,400 | $23,653 |
| JPMorgan Chase Bank N.A. | | | | | |
| Uniform Mortgage-Backed Securities 30 yr 2.50% TBA commitments (Put) | Aug-21/103.41 | 14,000,000 | | $14,000,000 | 62,510 |
| Uniform Mortgage-Backed Securities 30 yr 2.50% TBA commitments (Put) | Aug-21/103.28 | 11,000,000 | | 11,000,000 | 43,120 |
| Morgan Stanley & Co. International PLC | | | | | |
| GBP/USD (Call) | Aug-21/1.42 | 5,957,596 | GBP | 4,306,800 | 10,676 |
| Total | | | | | $139,959 |
| | | | | | |
| FORWARD PREMIUM SWAP OPTION CONTRACTS OUTSTANDING at 6/30/21 (Unaudited) | | | | | |
| Counterparty | | | Notional/ | | Premium | Unrealized |
| Fixed right or obligation % to receive or (pay)/ | Expiration | | contract | | receivable/ | appreciation/ |
| Floating rate index/Maturity date | date/strike | | amount | | (payable) | (depreciation) |
| Bank of America N.A. | | | | | | |
| 2.2275/3 month USD-LIBOR-BBA/May-24 (Purchased) | May-22/2.2275 | | $17,185,600 | | $(158,537) | $367,944 |
| 2.35/3 month USD-LIBOR-BBA/Apr-56 (Purchased) | Apr-26/2.35 | | 5,511,400 | | (716,482) | 303,182 |
| 1.304/6 month EUR-EURIBOR-Reuters/Jun-54 (Purchased) | Jun-24/1.304 | EUR | 1,453,000 | | (235,473) | 178,423 |
| (0.925)/3 month USD-LIBOR-BBA/Mar-40 (Purchased) | Mar-30/0.925 | | $2,832,600 | | (202,814) | 158,456 |
| 2.17/3 month USD-LIBOR-BBA/Apr-34 (Purchased) | Apr-24/2.17 | | 10,000,600 | | (483,029) | 101,906 |
| (1.275)/3 month USD-LIBOR-BBA/Mar-50 (Purchased) | Mar-30/1.275 | | 1,717,500 | | (223,704) | 89,155 |
| (0.765)/3 month USD-LIBOR-BBA/Sep-31 (Purchased) | Sep-21/0.765 | | 1,955,900 | | (46,355) | 85,610 |
| (0.85)/3 month USD-LIBOR-BBA/Mar-40 (Purchased) | Mar-30/0.85 | | 1,442,500 | | (105,303) | 85,569 |
| 1.053/6 month EUR-EURIBOR-Reuters/Jun-54 (Purchased) | Jun-24/1.053 | EUR | 768,400 | | (175,251) | 82,366 |
| 2.29/3 month USD-LIBOR-BBA/Mar-34 (Purchased) | Mar-24/2.29 | | $3,500,200 | | (172,160) | 57,438 |
| (1.76)/3 month USD-LIBOR-BBA/Jan-29 (Purchased) | Jan-28/1.76 | | 14,504,300 | | (93,734) | 21,611 |
| (0.305)/3 month USD-LIBOR-BBA/May-23 (Purchased) | May-22/0.305 | | 20,100,300 | | (24,120) | 14,070 |
| (2.3075)/3 month USD-LIBOR-BBA/Jun-52 (Purchased) | Jun-22/2.3075 | | 1,288,200 | | (29,145) | 2,035 |
| 1.76/3 month USD-LIBOR-BBA/Jan-29 (Purchased) | Jan-28/1.76 | | 14,504,300 | | (93,734) | (2,466) |
| (2.2875)/3 month USD-LIBOR-BBA/May-32 (Purchased) | May-22/2.2875 | | 4,020,100 | | (52,261) | (28,101) |
| 0.765/3 month USD-LIBOR-BBA/Sep-31 (Purchased) | Sep-21/0.765 | | 1,955,900 | | (46,355) | (45,846) |
| (1.053)/6 month EUR-EURIBOR-Reuters/Jun-54 (Purchased) | Jun-24/1.053 | EUR | 768,400 | | (175,251) | (48,363) |
| 0.85/3 month USD-LIBOR-BBA/Mar-40 (Purchased) | Mar-30/0.85 | | $1,442,500 | | (105,303) | (59,316) |
| (1.304)/6 month EUR-EURIBOR-Reuters/Jun-54 (Purchased) | Jun-24/1.304 | EUR | 1,453,000 | | (117,737) | (66,280) |
| 1.275/3 month USD-LIBOR-BBA/Mar-50 (Purchased) | Mar-30/1.275 | | $1,717,500 | | (223,704) | (97,228) |
| 0.925/3 month USD-LIBOR-BBA/Mar-40 (Purchased) | Mar-30/0.925 | | 2,832,600 | | (202,814) | (108,630) |
| (1.5275)/3 month USD-LIBOR-BBA/Sep-31 (Purchased) | Sep-21/1.5275 | | 30,000,000 | | (405,750) | (117,300) |
| (2.2275)/3 month USD-LIBOR-BBA/May-24 (Purchased) | May-22/2.2275 | | 17,185,600 | | (158,537) | (155,530) |
| (2.35)/3 month USD-LIBOR-BBA/Apr-56 (Purchased) | Apr-26/2.35 | | 5,511,400 | | (716,482) | (248,785) |
| 2.3075/3 month USD-LIBOR-BBA/Jun-52 (Purchased) | Jun-22/2.3075 | | 1,288,200 | | (605,680) | (423,225) |
| 1.7875/3 month USD-LIBOR-BBA/May-32 (Written) | May-22/1.7875 | | 2,010,000 | | 56,280 | 22,693 |
| (1.115)/3 month USD-LIBOR-BBA/Jan-26 (Written) | Jan-25/1.115 | | 14,504,300 | | 61,099 | 16,245 |
| 1.67/3 month USD-LIBOR-BBA/Aug-31 (Written) | Aug-21/1.67 | | 1,367,100 | | 19,276 | 14,929 |
| 0.805/3 month USD-LIBOR-BBA/May-23 (Written) | May-22/0.805 | | 40,200,700 | | 13,065 | (6,030) |
| (1.67)/3 month USD-LIBOR-BBA/Aug-31 (Written) | Aug-21/1.67 | | 1,367,100 | | 19,276 | (13,261) |
| (1.29)/3 month USD-LIBOR-BBA/Mar-34 (Written) | Mar-24/1.29 | | 5,000,300 | | 78,005 | (22,901) |
| (1.085)/3 month USD-LIBOR-BBA/Apr-34 (Written) | Apr-24/1.085 | | 20,001,300 | | 274,518 | (37,602) |
| 1.115/3 month USD-LIBOR-BBA/Jan-26 (Written) | Jan-25/1.115 | | 14,504,300 | | 61,099 | (48,444) |
| (1.5275)/3 month USD-LIBOR-BBA/Sep-31 (Written) | Sep-21/1.5275 | | 30,000,000 | | 405,000 | (54,000) |
| Barclays Bank PLC | | | | | | |
| 1.11125/6 month JPY-LIBOR-BBA/Aug-43 (Purchased) | Aug-23/1.11125 | JPY | 94,062,100 | | (47,579) | 68,386 |
| 2.232/3 month USD-LIBOR-BBA/Jun-51 (Purchased) | Jun-31/2.232 | | $1,909,000 | | (231,275) | 42,991 |
| (2.232)/3 month USD-LIBOR-BBA/Jun-51 (Purchased) | Jun-31/2.232 | | 1,909,000 | | (231,275) | (30,143) |
| (1.11125)/6 month JPY-LIBOR-BBA/Aug-43 (Purchased) | Aug-23/1.11125 | JPY | 94,062,100 | | (47,579) | (45,467) |
| Citibank, N.A. | | | | | | |
| 2.689/3 month USD-LIBOR-BBA/Nov-49 (Purchased) | Nov-24/2.689 | | $725,000 | | (93,344) | 46,371 |
| 1.355/3 month USD-LIBOR-BBA/Aug-31 (Purchased) | Aug-21/1.355 | | 30,257,200 | | (144,304) | 42,058 |
| |
| Putnam VT Diversified Income Fund 23 |
| | | | | | |
| FORWARD PREMIUM SWAP OPTION CONTRACTS OUTSTANDING at 6/30/21 (Unaudited) cont. | | | | | |
| Counterparty | | | Notional/ | | Premium | Unrealized |
| Fixed right or obligation % to receive or (pay)/ | Expiration | | contract | | receivable/ | appreciation/ |
| Floating rate index/Maturity date | date/strike | | amount | | (payable) | (depreciation) |
| Citibank, N.A. cont. | | | | | | |
| (1.102)/3 month USD-LIBOR-BBA/Nov-32 (Purchased) | Nov-22/1.102 | | $722,200 | | $(22,948) | $24,396 |
| 2.427/3 month USD-LIBOR-BBA/Jun-41 (Purchased) | Jun-31/2.427 | | 1,498,600 | | (109,173) | 23,078 |
| 1.504/3 month USD-LIBOR-BBA/Sep-31 (Purchased) | Sep-21/1.504 | | 7,866,400 | | (108,360) | 7,945 |
| (1.625)/3 month USD-LIBOR-BBA/Jan-61 (Purchased) | Jan-41/1.625 | | 1,533,900 | | (226,250) | 3,191 |
| 1.026/3 month USD-LIBOR-BBA/Sep-22 (Purchased) | Sep-21/1.026 | | 25,553,500 | | (21,720) | 51 |
| 1.90/3 month USD-LIBOR-BBA/Jun-28 (Purchased) | Jun-26/1.90 | | 7,582,000 | | (101,068) | (1,896) |
| 0.98/3 month USD-LIBOR-BBA/Jul-26 (Purchased) | Jul-21/0.98 | | 15,730,000 | | (54,269) | (3,775) |
| 1.625/3 month USD-LIBOR-BBA/Jan-61 (Purchased) | Jan-41/1.625 | | 1,533,900 | | (226,250) | (6,396) |
| (0.98)/3 month USD-LIBOR-BBA/Jul-26 (Purchased) | Jul-21/0.98 | | 15,730,000 | | (54,269) | (6,449) |
| (1.90)/3 month USD-LIBOR-BBA/Jun-28 (Purchased) | Jun-26/1.90 | | 7,582,000 | | (101,068) | (8,340) |
| (1.504)/3 month USD-LIBOR-BBA/Sep-31 (Purchased) | Sep-21/1.504 | | 7,866,400 | | (108,360) | (13,058) |
| 1.102/3 month USD-LIBOR-BBA/Nov-32 (Purchased) | Nov-22/1.102 | | 722,200 | | (22,948) | (15,621) |
| (2.427)/3 month USD-LIBOR-BBA/Jun-41 (Purchased) | Jun-31/2.427 | | 1,498,600 | | (109,173) | (19,991) |
| (2.689)/3 month USD-LIBOR-BBA/Nov-49 (Purchased) | Nov-24/2.689 | | 725,000 | | (93,344) | (61,415) |
| 1.245/3 month USD-LIBOR-BBA/Aug-24 (Written) | Aug-22/1.245 | | 12,029,900 | | 110,074 | 81,202 |
| (1.177)/3 month USD-LIBOR-BBA/Jul-40 (Written) | Jul-30/1.177 | | 552,800 | | 41,902 | 19,729 |
| (1.918)/3 month USD-LIBOR-BBA/Jan-51 (Written) | Jan-31/1.918 | | 1,846,400 | | 220,829 | 5,502 |
| (1.194)/3 month USD-LIBOR-BBA/Jun-25 (Written) | Jun-23/1.194 | | 7,582,000 | | 57,472 | 4,928 |
| (1.321)/3 month USD-LIBOR-BBA/Sep-31 (Written) | Sep-21/1.321 | | 2,915,800 | | 21,032 | (329) |
| 1.194/3 month USD-LIBOR-BBA/Jun-25 (Written) | Jun-23/1.194 | | 7,582,000 | | 57,472 | (2,805) |
| (1.005)/3 month USD-LIBOR-BBA/May-33 (Written) | May-23/1.005 | | 13,964,900 | | 134,994 | (7,960) |
| 1.918/3 month USD-LIBOR-BBA/Jan-51 (Written) | Jan-31/1.918 | | 1,846,400 | | 220,829 | (11,522) |
| (1.245)/3 month USD-LIBOR-BBA/Aug-24 (Written) | Aug-22/1.245 | | 12,029,900 | | 110,074 | (15,037) |
| 1.177/3 month USD-LIBOR-BBA/Jul-40 (Written) | Jul-30/1.177 | | 552,800 | | 41,902 | (20,653) |
| Goldman Sachs International | | | | | | |
| 2.8175/3 month USD-LIBOR-BBA/Mar-47 (Purchased) | Mar-27/2.8175 | | 596,900 | | (75,359) | 34,847 |
| 1.727/3 month USD-LIBOR-BBA/Jan-55 (Purchased) | Jan-25/1.727 | | 1,089,200 | | (99,880) | 1,819 |
| 1.473/3 month USD-LIBOR-BBA/Aug-31 (Purchased) | Aug-21/1.473 | | 3,722,800 | | (35,255) | 1,377 |
| -0.197/6 month EUR-EURIBOR-Reuters/Jun-25 (Purchased) | Jun-23/-0.197 | EUR | 10,645,700 | | (47,297) | (2,525) |
| (-0.197)/6 month EUR-EURIBOR-Reuters/Jun-25 (Purchased) | Jun-23/-0.197 | EUR | 10,645,700 | | (47,297) | (2,651) |
| (1.473)/3 month USD-LIBOR-BBA/Aug-31 (Purchased) | Aug-21/1.473 | | $3,722,800 | | (35,255) | (7,222) |
| (1.727)/3 month USD-LIBOR-BBA/Jan-55 (Purchased) | Jan-25/1.727 | | 1,089,200 | | (162,835) | (15,085) |
| (2.8175)/3 month USD-LIBOR-BBA/Mar-47 (Purchased) | Mar-27/2.8175 | | 596,900 | | (75,359) | (42,810) |
| (0.555)/6 month EUR-EURIBOR-Reuters/Mar-40 (Written) | Mar-30/0.555 | EUR | 1,180,250 | | 178,232 | 27,108 |
| (0.26)/6 month EUR-EURIBOR-Reuters/Jun-28 (Written) | Jun-26/0.26 | EUR | 10,645,700 | | 118,718 | 3,661 |
| 0.26/6 month EUR-EURIBOR-Reuters/Jun-28 (Written) | Jun-26/0.26 | EUR | 10,645,700 | | 118,718 | 3,282 |
| 0.555/6 month EUR-EURIBOR-Reuters/Mar-40 (Written) | Mar-30/0.555 | EUR | 1,180,250 | | 178,232 | (15,240) |
| JPMorgan Chase Bank N.A. | | | | | | |
| 2.8325/3 month USD-LIBOR-BBA/Feb-52 (Purchased) | Feb-22/2.8325 | | $2,984,300 | | (416,683) | 339,733 |
| 1.921/6 month EUR-EURIBOR-Reuters/Oct-48 (Purchased) | Oct-28/1.921 | EUR | 979,500 | | (125,262) | 181,789 |
| 2.902/3 month USD-LIBOR-BBA/Nov-49 (Purchased) | Nov-24/2.902 | | $725,000 | | (112,085) | 51,250 |
| (1.445)/6 month AUD-BBR-BBSW/Mar-40 (Purchased) | Mar-30/1.445 | AUD | 1,311,400 | | (49,158) | 46,637 |
| 2.50/3 month USD-LIBOR-BBA/Nov-39 (Purchased) | Nov-29/2.50 | | $1,208,400 | | (69,846) | 35,684 |
| (1.441)/6 month AUD-BBR-BBSW/Jul-45 (Purchased) | Jul-25/1.441 | AUD | 628,200 | | (37,153) | 35,249 |
| (1.692)/6 month AUD-BBR-BBSW/Jan-35 (Purchased) | Jan-25/1.692 | AUD | 941,400 | | (29,371) | 20,326 |
| 2.032/3 month USD-LIBOR-BBA/Jan-55 (Purchased) | Jan-25/2.032 | | $1,078,500 | | (124,567) | 13,837 |
| 1.692/6 month AUD-BBR-BBSW/Jan-35 (Purchased) | Jan-25/1.692 | AUD | 941,400 | | (29,371) | (16,746) |
| (2.032)/3 month USD-LIBOR-BBA/Jan-55 (Purchased) | Jan-25/2.032 | | $1,078,500 | | (124,567) | (17,698) |
| 1.441/6 month AUD-BBR-BBSW/Jul-45 (Purchased) | Jul-25/1.441 | AUD | 628,200 | | (37,153) | (26,981) |
| 1.445/6 month AUD-BBR-BBSW/Mar-40 (Purchased) | Mar-30/1.445 | AUD | 1,311,400 | | (49,158) | (31,383) |
| (2.902)/3 month USD-LIBOR-BBA/Nov-49 (Purchased) | Nov-24/2.902 | | $725,000 | | (77,793) | (52,795) |
| (2.50)/3 month USD-LIBOR-BBA/Nov-39 (Purchased) | Nov-29/2.50 | | 1,208,400 | | (125,674) | (58,184) |
| |
| 24 Putnam VT Diversified Income Fund |
| | | | | | |
| FORWARD PREMIUM SWAP OPTION CONTRACTS OUTSTANDING at 6/30/21 (Unaudited) cont. | | | | | |
| Counterparty | | | Notional/ | | Premium | Unrealized |
| Fixed right or obligation % to receive or (pay)/ | Expiration | | contract | | receivable/ | appreciation/ |
| Floating rate index/Maturity date | date/strike | | amount | | (payable) | (depreciation) |
| JPMorgan Chase Bank N.A. cont. | | | | | | |
| (1.921)/6 month EUR-EURIBOR-Reuters/Oct-48 (Purchased) | Oct-28/1.921 | EUR | 979,500 | | $(125,262) | $(88,084) |
| (2.8325)/3 month USD-LIBOR-BBA/Feb-52 (Purchased) | Feb-22/2.8325 | | $2,984,300 | | (416,683) | (405,775) |
| (1.168)/3 month USD-LIBOR-BBA/Jun-37 (Written) | Jun-27/1.168 | | 2,144,200 | | 137,979 | 73,417 |
| (1.232)/3 month USD-LIBOR-BBA/Jun-37 (Written) | Jun-27/1.232 | | 1,915,100 | | 123,045 | 62,394 |
| (1.204)/3 month USD-LIBOR-BBA/Jun-40 (Written) | Jun-30/1.204 | | 1,518,600 | | 113,212 | 51,617 |
| 1.204/3 month USD-LIBOR-BBA/Jun-40 (Written) | Jun-30/1.204 | | 1,518,600 | | 113,212 | (56,036) |
| 1.232/3 month USD-LIBOR-BBA/Jun-37 (Written) | Jun-27/1.232 | | 1,915,100 | | 123,045 | (70,303) |
| 1.168/3 month USD-LIBOR-BBA/Jun-37 (Written) | Jun-27/1.168 | | 2,144,200 | | 137,979 | (87,033) |
| Morgan Stanley & Co. International PLC | | | | | | |
| 3.27/3 month USD-LIBOR-BBA/Oct-53 (Purchased) | Oct-23/3.27 | | 948,300 | | (108,201) | 215,312 |
| 2.505/3 month USD-LIBOR-BBA/Nov-49 (Purchased) | Nov-24/2.505 | | 725,000 | | (78,010) | 40,941 |
| (2.505)/3 month USD-LIBOR-BBA/Nov-49 (Purchased) | Nov-24/2.505 | | 725,000 | | (111,070) | (72,043) |
| (3.27)/3 month USD-LIBOR-BBA/Oct-53 (Purchased) | Oct-23/3.27 | | 948,300 | | (108,201) | (94,214) |
| 2.39/3 month USD-LIBOR-BBA/Jun-34 (Written) | Jun-24/2.39 | | 5,588,400 | | 294,229 | 146,975 |
| (2.39)/3 month USD-LIBOR-BBA/Jun-34 (Written) | Jun-24/2.39 | | 5,588,400 | | 294,229 | (108,750) |
| Toronto-Dominion Bank | | | | | | |
| (1.50)/3 month USD-LIBOR-BBA/Feb-33 (Purchased) | Feb-23/1.50 | | 3,515,700 | | (120,852) | 33,048 |
| 2.405/3 month USD-LIBOR-BBA/Mar-41 (Purchased) | Mar-31/2.405 | | 487,500 | | (34,003) | 8,054 |
| (1.937)/3 month USD-LIBOR-BBA/Feb-36 (Purchased) | Feb-26/1.937 | | 1,406,300 | | (73,549) | 5,316 |
| 1.937/3 month USD-LIBOR-BBA/Feb-36 (Purchased) | Feb-26/1.937 | | 1,406,300 | | (73,549) | (1,364) |
| (2.405)/3 month USD-LIBOR-BBA/Mar-41 (Purchased) | Mar-31/2.405 | | 487,500 | | (34,003) | (5,109) |
| 1.50/3 month USD-LIBOR-BBA/Feb-33 (Purchased) | Feb-23/1.50 | | 3,515,700 | | (120,852) | (41,134) |
| 1.775/3 month USD-LIBOR-BBA/Mar-32 (Written) | Mar-22/1.775 | | 1,267,400 | | 34,537 | 17,414 |
| 2.095/3 month USD-LIBOR-BBA/Feb-56 (Written) | Feb-26/2.095 | | 607,400 | | 79,873 | 15,319 |
| (1.775)/3 month USD-LIBOR-BBA/Mar-32 (Written) | Mar-22/1.775 | | 1,267,400 | | 34,537 | (8,416) |
| (2.095)/3 month USD-LIBOR-BBA/Feb-56 (Written) | Feb-26/2.095 | | 607,400 | | 79,873 | (10,478) |
| UBS AG | | | | | | |
| (0.271)/6 month EUR-EURIBOR-Reuters/Jan-36 (Purchased) | Jan-26/0.271 | EUR | 2,251,600 | | (117,762) | 63,649 |
| (0.44)/6 month EUR-EURIBOR-Reuters/Feb-41 (Purchased) | Feb-31/0.44 | EUR | 1,688,700 | | (132,482) | 52,202 |
| (0.902)/3 month USD-LIBOR-BBA/Apr-35 (Purchased) | Apr-25/0.902 | | $955,300 | | (53,449) | 51,968 |
| (0.87)/3 month USD-LIBOR-BBA/Apr-28 (Purchased) | Apr-27/0.87 | | 7,960,900 | | (53,696) | 44,263 |
| (0.45)/6 month EUR-EURIBOR-Reuters/Jan-41 (Purchased) | Jan-31/0.45 | EUR | 1,350,900 | | (106,268) | 40,510 |
| (0.983)/3 month USD-LIBOR-BBA/Apr-32 (Purchased) | Apr-30/0.983 | | $3,184,300 | | (50,471) | 34,486 |
| (0.8925)/3 month USD-LIBOR-BBA/Apr-28 (Purchased) | Apr-23/0.8925 | | 2,388,300 | | (50,632) | 34,105 |
| (0.296)/6 month EUR-EURIBOR-Reuters/Jan-51 (Purchased) | Jan-31/0.296 | EUR | 562,900 | | (85,176) | 27,639 |
| 1.6125/3 month USD-LIBOR-BBA/Aug-34 (Purchased) | Aug-24/1.6125 | | $2,817,200 | | (77,276) | 13,466 |
| (0.762)/6 month GBP-LIBOR-BBA/Aug-39 (Purchased) | Aug-29/0.762 | GBP | 575,800 | | (53,104) | 11,008 |
| (1.715)/3 month USD-LIBOR-BBA/Feb-53 (Purchased) | Feb-23/1.715 | | $703,100 | | (63,455) | 5,154 |
| (1.175)/6 month GBP-LIBOR-BBA/Jan-40 (Purchased) | Jan-30/1.175 | GBP | 1,344,800 | | (122,248) | 3,702 |
| 1.175/6 month GBP-LIBOR-BBA/Jan-40 (Purchased) | Jan-30/1.175 | GBP | 1,344,800 | | (122,248) | (16,966) |
| 1.715/3 month USD-LIBOR-BBA/Feb-53 (Purchased) | Feb-23/1.715 | | $703,100 | | (63,455) | (18,421) |
| 0.296/6 month EUR-EURIBOR-Reuters/Jan-51 (Purchased) | Jan-31/0.296 | EUR | 562,900 | | (85,176) | (22,467) |
| 0.983/3 month USD-LIBOR-BBA/Apr-32 (Purchased) | Apr-30/0.983 | | $3,184,300 | | (50,471) | (25,092) |
| 0.45/6 month EUR-EURIBOR-Reuters/Jan-41 (Purchased) | Jan-31/0.45 | EUR | 1,350,900 | | (106,268) | (25,725) |
| 0.762/6 month GBP-LIBOR-BBA/Aug-39 (Purchased) | Aug-29/0.762 | GBP | 575,800 | | (53,104) | (27,511) |
| 0.87/3 month USD-LIBOR-BBA/Apr-28 (Purchased) | Apr-27/0.87 | | $7,960,900 | | (53,696) | (32,162) |
| 0.44/6 month EUR-EURIBOR-Reuters/Feb-41 (Purchased) | Feb-31/0.44 | EUR | 1,688,700 | | (132,482) | (32,579) |
| 0.271/6 month EUR-EURIBOR-Reuters/Jan-36 (Purchased) | Jan-26/0.271 | EUR | 2,251,600 | | (117,762) | (36,016) |
| 0.8925/3 month USD-LIBOR-BBA/Apr-28 (Purchased) | Apr-23/0.8925 | | $2,388,300 | | (50,632) | (37,663) |
| 0.902/3 month USD-LIBOR-BBA/Apr-35 (Purchased) | Apr-25/0.902 | | 955,300 | | (53,449) | (37,954) |
| (1.6125)/3 month USD-LIBOR-BBA/Aug-34 (Purchased) | Aug-24/1.6125 | | 2,817,200 | | (206,008) | (39,723) |
| 1.30/3 month USD-LIBOR-BBA/Aug-26 (Written) | Aug-21/1.30 | | 5,986,600 | | 177,837 | 170,858 |
| |
| Putnam VT Diversified Income Fund 25 |
| | | | | | |
| FORWARD PREMIUM SWAP OPTION CONTRACTS OUTSTANDING at 6/30/21 (Unaudited) cont. | | | | | |
| Counterparty | | | Notional/ | | Premium | Unrealized |
| Fixed right or obligation % to receive or (pay)/ | Expiration | | contract | | receivable/ | appreciation/ |
| Floating rate index/Maturity date | date/strike | | amount | | (payable) | (depreciation) |
| UBS AG cont. | | | | | | |
| (0.958)/3 month USD-LIBOR-BBA/May-30 (Written) | May-25/0.958 | | $1,910,600 | | $50,774 | $32,423 |
| (0.43)/6 month EUR-EURIBOR-Reuters/Aug-39 (Written) | Aug-29/0.43 | EUR | 535,600 | | 42,938 | 18,354 |
| 0.43/6 month EUR-EURIBOR-Reuters/Aug-39 (Written) | Aug-29/0.43 | EUR | 535,600 | | 42,938 | (7,907) |
| (1.30)/3 month USD-LIBOR-BBA/Aug-26 (Written) | Aug-21/1.30 | | $5,986,600 | | 47,858 | (45,438) |
| 0.958/3 month USD-LIBOR-BBA/May-30 (Written) | May-25/0.958 | | 1,910,600 | | 50,774 | (47,001) |
| Wells Fargo Bank, N.A. | | | | | | |
| (1.405)/3 month USD-LIBOR-BBA/Feb-29 (Purchased) | Feb-24/1.405 | | 4,922,000 | | (100,778) | 39,228 |
| (1.3875)/3 month USD-LIBOR-BBA/Feb-29 (Purchased) | Feb-24/1.3875 | | 3,515,700 | | (72,160) | 29,497 |
| (1.96)/3 month USD-LIBOR-BBA/Jan-41 (Purchased) | Jan-31/1.96 | | 2,902,200 | | (196,479) | 21,592 |
| 2.16/3 month USD-LIBOR-BBA/Feb-35 (Purchased) | Feb-25/2.16 | | 2,079,900 | | (103,735) | 20,279 |
| 1.96/3 month USD-LIBOR-BBA/Jan-41 (Purchased) | Jan-31/1.96 | | 2,902,200 | | (196,479) | (4,644) |
| (2.16)/3 month USD-LIBOR-BBA/Feb-35 (Purchased) | Feb-25/2.16 | | 2,079,900 | | (103,735) | (20,841) |
| 1.3875/3 month USD-LIBOR-BBA/Feb-29 (Purchased) | Feb-24/1.3875 | | 3,515,700 | | (72,160) | (21,165) |
| 1.405/3 month USD-LIBOR-BBA/Feb-29 (Purchased) | Feb-24/1.405 | | 4,922,000 | | (100,778) | (27,564) |
| Unrealized appreciation | | | | | | 4,152,249 |
| Unrealized (depreciation) | | | | | | (3,719,063) |
| Total | | | | | | $433,186 |
| | | |
| TBA SALE COMMITMENTS OUTSTANDING at 6/30/21 | | | |
| (proceeds receivable $24,343,437) (Unaudited) | Principal | Settlement | |
| Agency | amount | date | Value |
| Uniform Mortgage-Backed Securities, 2.50%, 7/1/51 | $7,000,000 | 7/14/21 | $7,240,078 |
| Uniform Mortgage-Backed Securities, 2.00%, 7/1/51 | 17,000,000 | 7/14/21 | 17,176,891 |
| Total | | | $24,416,969 |
| | | | | | |
| CENTRALLY CLEARED INTEREST RATE SWAP CONTRACTS OUTSTANDING at 6/30/21 (Unaudited) | | |
| | | Upfront | | | | Unrealized |
| | | premium | Termination | Payments | Payments | appreciation/ |
| Notional amount | Value | received (paid) | date | made by fund | received by fund | (depreciation) |
| $4,033,600 | $509,565 | $(121,612) | 3/2/31 | 3 month USD-LIBOR-BBA — | 2.7725% — Semiannually | $427,522 |
| | | | | Quarterly | | |
| 3,717,300 | 190,474 | (752) | 12/2/23 | 3 month USD-LIBOR-BBA — | 2.536% — Semiannually | 196,923 |
| | | | | Quarterly | | |
| 1,061,300 | 225,272 E | (36) | 11/29/53 | 2.793% — Semiannually | 3 month USD-LIBOR- | (225,308) |
| | | | | | BBA — Quarterly | |
| 700,900 | 28,092 E | (16) | 11/20/39 | 3 month USD-LIBOR-BBA — | 2.55% — Semiannually | 28,076 |
| | | | | Quarterly | | |
| 2,674,400 | 191,220 | (38) | 12/7/30 | 2.184% — Semiannually | 3 month USD-LIBOR- | (194,918) |
| | | | | | BBA — Quarterly | |
| 1,684,700 | 38,664 E | (19) | 6/5/29 | 3 month USD-LIBOR-BBA — | 2.2225% — Semiannually | 38,645 |
| | | | | Quarterly | | |
| 140,900 | 16,453 E | (5) | 6/22/52 | 2.3075% — Semiannually | 3 month USD-LIBOR- | (16,458) |
| | | | | | BBA — Quarterly | |
| 742,900 | 76,006 E | (25) | 7/5/52 | 2.25% — Semiannually | 3 month USD-LIBOR- | (76,031) |
| | | | | | BBA — Quarterly | |
| 774,100 | 44,875 | (11) | 1/22/31 | 2.035% — Semiannually | 3 month USD-LIBOR- | (51,567) |
| | | | | | BBA — Quarterly | |
| 1,032,500 | 21,848 E | (35) | 8/8/52 | 1.9185% — Semiannually | 3 month USD-LIBOR- | (21,883) |
| | | | | | BBA — Quarterly | |
| 1,380,600 | 69,555 E | (47) | 9/12/52 | 1.626% — Semiannually | 3 month USD-LIBOR- | 69,508 |
| | | | | | BBA — Quarterly | |
| 25,783,200 | 87,921 | (72,255) | 10/15/21 | 3 month USD-LIBOR-BBA — | 1.316% — Semiannually | 77,163 |
| | | | | Quarterly | | |
| 26,814,500 | 112,085 | (71,536) | 10/21/21 | 3 month USD-LIBOR-BBA — | 1.5025% — Semiannually | 109,052 |
| | | | | Quarterly | | |
| 118,200 | 3,288 E | (4) | 1/16/55 | 2.032% — Semiannually | 3 month USD-LIBOR- | (3,292) |
| | | | | | BBA — Quarterly | |
| 65,300 | 983 E | (2) | 1/24/55 | 3 month USD-LIBOR-BBA — | 1.977% — Semiannually | 981 |
| | | | | Quarterly | | |
| |
| 26 Putnam VT Diversified Income Fund |
| | | | | | |
| CENTRALLY CLEARED INTEREST RATE SWAP CONTRACTS OUTSTANDING at 6/30/21 (Unaudited) cont. | | |
| | | Upfront | | | | Unrealized |
| | | premium | Termination | Payments | Payments | appreciation/ |
| Notional amount | Value | received (paid) | date | made by fund | received by fund | (depreciation) |
| $527,900 | $68,748 E | $(18) | 3/4/52 | 1.265% — Semiannually | 3 month USD-LIBOR- | $68,730 |
| | | | | | BBA — Quarterly | |
| 24,211,500 | 24,938 | (91) | 9/8/21 | 0.68% — Semiannually | 3 month USD-LIBOR- | (74,685) |
| | | | | | BBA — Quarterly | |
| 52,366,500 | 64,934 | (197) | 10/15/21 | 0.571% — Semiannually | 3 month USD-LIBOR- | (107,676) |
| | | | | | BBA — Quarterly | |
| 2,990,500 | 349,709 E | (102) | 1/27/47 | 3 month USD-LIBOR-BBA — | 1.27% — Semiannually | (349,811) |
| | | | | Quarterly | | |
| 252,600 | 27,483 E | (9) | 3/7/50 | 1.275% — Semiannually | 3 month USD-LIBOR- | 27,474 |
| | | | | | BBA — Quarterly | |
| 610,000 | 137,464 E | (21) | 3/10/52 | 0.8725% — Semiannually | 3 month USD-LIBOR- | 137,443 |
| | | | | | BBA — Quarterly | |
| 623,100 | 163,850 E | (21) | 3/11/52 | 0.717% — Semiannually | 3 month USD-LIBOR- | 163,829 |
| | | | | | BBA — Quarterly | |
| 1,046,400 | 52,864 E | (15) | 3/17/32 | 3 month USD-LIBOR-BBA — | 1.03% — Semiannually | (52,879) |
| | | | | Quarterly | | |
| 4,033,600 | 504,805 | (537,890) | 2/18/31 | 3 month USD-LIBOR-BBA — | 2.764% — Semiannually | 7,174 |
| | | | | Quarterly | | |
| 403,700 | 16,628 E | (5) | 3/24/32 | 3 month USD-LIBOR-BBA — | 1.07% — Semiannually | (16,633) |
| | | | | Quarterly | | |
| 228,700 | 20,183 E | (3) | 3/24/35 | 3 month USD-LIBOR-BBA — | 0.968% — Semiannually | (20,186) |
| | | | | Quarterly | | |
| 1,162,600 | 86,997 E | (16) | 4/25/32 | 0.7925% — Semiannually | 3 month USD-LIBOR- | 86,981 |
| | | | | | BBA — Quarterly | |
| 202,300 | 14,086 E | (4) | 6/21/37 | 3 month USD-LIBOR-BBA — | 1.232% — Semiannually | (14,090) |
| | | | | Quarterly | | |
| 161,800 | 11,546 E | (3) | 6/20/40 | 3 month USD-LIBOR-BBA — | 1.204% — Semiannually | (11,549) |
| | | | | Quarterly | | |
| 203,700 | 15,318 E | (4) | 6/28/37 | 3 month USD-LIBOR-BBA — | 1.168% — Semiannually | (15,322) |
| | | | | Quarterly | | |
| 45,200 | 3,324 E | (1) | 7/3/40 | 3 month USD-LIBOR-BBA — | 1.177% — Semiannually | (3,325) |
| | | | | Quarterly | | |
| 7,724,800 | 151,715 | (62) | 7/14/25 | 3 month USD-LIBOR-BBA — | 0.30% — Semiannually | (144,136) |
| | | | | Quarterly | | |
| 3,565,200 | 223,895 | (47) | 7/15/30 | 3 month USD-LIBOR-BBA — | 0.645% — Semiannually | (214,740) |
| | | | | Quarterly | | |
| 4,619,400 | 95,991 | (44) | 8/31/25 | 0.3084% — Semiannually | 3 month USD-LIBOR- | 91,629 |
| | | | | | BBA — Quarterly | |
| 5,496,500 | 118,450 | (44) | 8/12/25 | 3 month USD-LIBOR-BBA — | 0.277% — Semiannually | (113,894) |
| | | | | Quarterly | | |
| 2,048,400 | 317,768 E | 159,105 | 9/2/52 | 3 month USD-LIBOR-BBA — | 1.188% — Semiannually | (158,663) |
| | | | | Quarterly | | |
| 7,026,600 | 147,067 | (66) | 10/13/25 | 0.344% — Semiannually | 3 month USD-LIBOR- | 144,654 |
| | | | | | BBA — Quarterly | |
| 12,783,400 | 3,452 | (48) | 9/16/22 | 3 month USD-LIBOR-BBA — | 0.214% — Semiannually | 10,754 |
| | | | | Quarterly | | |
| 7,427,700 | 134,590 | (60) | 10/13/25 | 0.41% — Semiannually | 3 month USD-LIBOR- | 130,988 |
| | | | | | BBA — Quarterly | |
| 5,923,000 | 117,808 | (89,171) | 10/16/25 | 0.37% — Semiannually | 3 month USD-LIBOR- | 27,993 |
| | | | | | BBA — Quarterly | |
| 3,326,000 | 188,152 | (16,260) | 10/16/30 | 0.75% — Semiannually | 3 month USD-LIBOR- | 168,209 |
| | | | | | BBA — Quarterly | |
| 5,571,000 | 802,614 | (15,012) | 10/16/50 | 1.16% — Semiannually | 3 month USD-LIBOR- | 776,299 |
| | | | | | BBA — Quarterly | |
| 2,625,300 | 109,606 | — | 12/7/30 | 3 month USD-LIBOR-BBA — | 0.932% — Semiannually | (108,204) |
| | | | | Quarterly | | |
| 2,152,800 | 101,741 | — | 12/7/30 | 0.871% — Semiannually | 3 month USD-LIBOR- | 100,679 |
| | | | | | BBA — Quarterly | |
| 7,427,700 | 122,854 | (60) | 11/16/25 | 0.471% — Semiannually | 3 month USD-LIBOR- | 119,965 |
| | | | | | BBA — Quarterly | |
| |
| Putnam VT Diversified Income Fund 27 |
| | | | | | |
| CENTRALLY CLEARED INTEREST RATE SWAP CONTRACTS OUTSTANDING at 6/30/21 (Unaudited) cont. | | |
| | | Upfront | | | | Unrealized |
| | | premium | Termination | Payments | Payments | appreciation/ |
| Notional amount | Value | received (paid) | date | made by fund | received by fund | (depreciation) |
| $809,500 | $88,826 | $(28) | 12/17/50 | 1.305% — Semiannually | 3 month USD-LIBOR- | $88,427 |
| | | | | | BBA — Quarterly | |
| 9,844,300 | 28,647 | (62) | 12/2/23 | 0.300% — Semiannually | 3 month USD-LIBOR- | 27,248 |
| | | | | | BBA — Quarterly | |
| 10,688,100 | 652,402 | (204) | 12/2/33 | 3 month USD-LIBOR-BBA — | 1.02% — Semiannually | (644,955) |
| | | | | Quarterly | | |
| 7,594,500 | 146,650 | (61) | 12/16/25 | 3 month USD-LIBOR-BBA — | 0.428% — Semiannually | (145,730) |
| | | | | Quarterly | | |
| 1,501,100 | 60,479 | (21) | 6/22/31 | 3 month USD-LIBOR-BBA — | 1.0025% — Semiannually | (60,175) |
| | | | | Quarterly | | |
| 168,000 | 10,201 | (6) | 1/8/51 | 3 month USD-LIBOR-BBA — | 1.509% — Semiannually | (9,066) |
| | | | | Quarterly | | |
| 168,000 | 8,701 | (6) | 1/8/51 | 3 month USD-LIBOR-BBA — | 1.546% — Semiannually | (7,536) |
| | | | | Quarterly | | |
| 7,147,800 | 102,214 | (58) | 1/13/26 | 0.5615% — Semiannually | 3 month USD-LIBOR- | 86,367 |
| | | | | | BBA — Quarterly | |
| 1,065,000 | 29,969 | (36) | 1/14/51 | 3 month USD-LIBOR-BBA — | 1.644% — Semiannually | (22,312) |
| | | | | Quarterly | | |
| 1,384,900 | 32,365 | (20) | 4/15/31 | 1.165% — Semiannually | 3 month USD-LIBOR- | 29,484 |
| | | | | | BBA — Quarterly | |
| 1,340,200 | 34,457 E | (19) | 7/15/31 | 1.165% — Semiannually | 3 month USD-LIBOR- | 34,438 |
| | | | | | BBA — Quarterly | |
| 3,722,800 | 17,497 | 11,119 | 4/15/31 | 3 month USD-LIBOR-BBA — | 1.465% — Semiannually | 38,667 |
| | | | | Quarterly | | |
| 1,500,000 | 44,985 | (20) | 1/27/31 | 1.075% — Semiannually | 3 month USD-LIBOR- | 38,558 |
| | | | | | BBA — Quarterly | |
| 10,531,600 | 61,083 E | (59) | 1/31/25 | 0.735% — Semiannually | 3 month USD-LIBOR- | 61,025 |
| | | | | | BBA — Quarterly | |
| 1,200,000 | 27,660 | (16) | 2/4/31 | 1.153% — Semiannually | 3 month USD-LIBOR- | 22,335 |
| | | | | | BBA — Quarterly | |
| 602,000 | 18,289 | (21) | 2/4/51 | 3 month USD-LIBOR-BBA — | 1.635% — Semiannually | (14,461) |
| | | | | Quarterly | | |
| 4,366,000 | 69,769 | (58) | 2/9/31 | 3 month USD-LIBOR-BBA — | 1.231% — Semiannually | (49,649) |
| | | | | Quarterly | | |
| 7,445,600 | 104,685 | (16,999) | 3/9/26 | 0.5996% — Semiannually | 3 month USD-LIBOR- | 74,357 |
| | | | | | BBA — Quarterly | |
| 1,504,000 | 21,176 | (12) | 2/10/26 | 0.584% — Semiannually | 3 month USD-LIBOR- | 18,076 |
| | | | | | BBA — Quarterly | |
| 1,230,000 | 21,980 | (16) | 2/16/31 | 1.212% — Semiannually | 3 month USD-LIBOR- | 16,613 |
| | | | | | BBA — Quarterly | |
| 3,602,000 | 9,617 | (48) | 2/18/31 | 3 month USD-LIBOR-BBA — | 1.377% — Semiannually | 7,976 |
| | | | | Quarterly | | |
| 2,976,000 | 11,279 | (39) | 2/22/31 | 1.3659% — Semiannually | 3 month USD-LIBOR- | (2,855) |
| | | | | | BBA — Quarterly | |
| 2,617,000 | 4,449 | (35) | 2/24/31 | 1.4255% — Semiannually | 3 month USD-LIBOR- | (17,229) |
| | | | | | BBA — Quarterly | |
| 1,063,000 | 10,981 | (14) | 3/2/31 | 1.51882% — Semiannually | 3 month USD-LIBOR- | (16,219) |
| | | | | | BBA — Quarterly | |
| 4,500,000 | 52,065 | (60) | 3/5/31 | 3 month USD-LIBOR-BBA — | 1.5324% — Semiannually | 73,833 |
| | | | | Quarterly | | |
| 3,722,800 | 40,020 | (49) | 3/15/31 | 1.525% — Semiannually | 3 month USD-LIBOR- | (56,589) |
| | | | | | BBA — Quarterly | |
| 840,100 | 32,369 E | (13) | 3/20/34 | 2.29% — Semiannually | 3 month USD-LIBOR- | (32,382) |
| | | | | | BBA — Quarterly | |
| 4,708,400 | 6,451 | (44) | 4/1/26 | 0.94375% — Semiannually | 3 month USD-LIBOR- | (15,204) |
| | | | | | BBA — Quarterly | |
| 7,445,600 | 43,780 | (70) | 4/15/26 | 1.045% — Semiannually | 3 month USD-LIBOR- | (57,350) |
| | | | | | BBA — Quarterly | |
| 3,370,100 | 100,631 | (45) | 4/15/31 | 3 month USD-LIBOR-BBA — | 1.734% — Semiannually | 111,599 |
| | | | | Quarterly | | |
| |
| 28 Putnam VT Diversified Income Fund |
| | | | | | |
| CENTRALLY CLEARED INTEREST RATE SWAP CONTRACTS OUTSTANDING at 6/30/21 (Unaudited) cont. | | |
| | | Upfront | | | | Unrealized |
| | | premium | Termination | Payments | Payments | appreciation/ |
| Notional amount | Value | received (paid) | date | made by fund | received by fund | (depreciation) |
| $1,263,800 | $112,706 | $(43) | 4/15/51 | 2.127% — Semiannually | 3 month USD-LIBOR- | $(117,927) |
| | | | | | BBA — Quarterly | |
| 3,722,800 | 99,883 | (49) | 4/21/31 | 1.702% — Semiannually | 3 month USD-LIBOR- | (110,887) |
| | | | | | BBA — Quarterly | |
| 3,917,300 | 63,734 | (52) | 5/5/31 | 3 month USD-LIBOR-BBA — | 1.591% — Semiannually | 72,283 |
| | | | | Quarterly | | |
| 3,722,800 | 53,869 | (49) | 5/17/31 | 3 month USD-LIBOR-BBA — | 1.573% — Semiannually | 60,251 |
| | | | | Quarterly | | |
| 246,000 | 2,984 | (3) | 5/10/31 | 1.5475% — Semiannually | 3 month USD-LIBOR- | (3,469) |
| | | | | | BBA — Quarterly | |
| 3,722,800 | 78,737 | (49) | 5/21/31 | 3 month USD-LIBOR-BBA — | 1.644% — Semiannually | 84,855 |
| | | | | Quarterly | | |
| 2,361,000 | 42,663 | (31) | 5/27/31 | 1.612% — Semiannually | 3 month USD-LIBOR- | (45,971) |
| | | | | | BBA — Quarterly | |
| 7,834,600 | 32,200 | (74) | 6/4/23 | 3 month USD-LIBOR-BBA — | 0.857% — Semiannually | (28,026) |
| | | | | Quarterly | | |
| 1,552,800 | 25,171 E | (22) | 9/1/31 | 1.63% — Semiannually | 3 month USD-LIBOR- | (25,193) |
| | | | | | BBA — Quarterly | |
| 78,774,000 | 141,005 E | 149,297 | 9/15/23 | 3 month USD-LIBOR-BBA — | 0.30% — Semiannually | 8,292 |
| | | | | Quarterly | | |
| 78,483,000 | 270,766 E | (307,491) | 9/15/26 | 0.95% — Semiannually | 3 month USD-LIBOR- | (36,725) |
| | | | | | BBA — Quarterly | |
| 7,908,000 | 137,441 E | 120,660 | 9/15/31 | 1.65% — Semiannually | 3 month USD-LIBOR- | (16,781) |
| | | | | | BBA — Quarterly | |
| 7,023,000 | 387,670 E | (366,175) | 9/15/51 | 3 month USD-LIBOR-BBA — | 2.00% — Semiannually | 21,495 |
| | | | | Quarterly | | |
| 895,100 | 14,008 E | (13) | 9/7/31 | 1.6275% — Semiannually | 3 month USD-LIBOR- | (14,021) |
| | | | | | BBA — Quarterly | |
| 3,722,800 | 47,391 | (49) | 6/16/31 | 3 month USD-LIBOR-BBA — | 1.558% — Semiannually | 49,576 |
| | | | | Quarterly | | |
| 267,300 | 10,286 E | (9) | 6/11/51 | 2.232% — Semiannually | 3 month USD-LIBOR- | (10,295) |
| | | | | | BBA — Quarterly | |
| 2,865,000 | 4,985 | (11) | 6/10/23 | 3 month USD-LIBOR-BBA — | 0.2215% — Semiannually | (4,840) |
| | | | | Quarterly | | |
| 2,428,000 | 9,445 | (32) | 6/14/31 | 3 month USD-LIBOR-BBA — | 1.465% — Semiannually | 10,956 |
| | | | | Quarterly | | |
| 2,480,000 | 8,829 | (33) | 6/11/31 | 1.461% — Semiannually | 3 month USD-LIBOR- | (10,703) |
| | | | | | BBA — Quarterly | |
| 2,765,000 | 62,517 E | 54,754 | 9/15/31 | 1.45% — Annually | Secured Overnight | (7,763) |
| | | | | | Financing Rate — | |
| | | | | | Annually | |
| 2,940,000 | 5,145 | (39) | 6/15/31 | 1.4425% — Semiannually | 3 month USD-LIBOR- | (6,914) |
| | | | | | BBA — Quarterly | |
| 3,722,800 | 8,637 | (49) | 6/23/31 | 3 month USD-LIBOR-BBA — | 1.45% — Semiannually | 9,673 |
| | | | | Quarterly | | |
| 1,071,000 | 9,639 | (14) | 6/21/31 | 1.52% — Semiannually | 3 month USD-LIBOR- | (10,065) |
| | | | | | BBA — Quarterly | |
| 4,059,000 | 16,885 | (54) | 6/29/31 | 3 month USD-LIBOR-BBA — | 1.47% — Semiannually | 17,130 |
| | | | | Quarterly | | |
| 4,880,000 | 10,394 | (65) | 6/23/31 | 1.448% — Semiannually | 3 month USD-LIBOR- | (11,880) |
| | | | | | BBA — Quarterly | |
| 5,360,500 | 5,146 | (51) | 6/28/26 | 0.933% — Semiannually | 3 month USD-LIBOR- | 4,744 |
| | | | | | BBA — Quarterly | |
| 582,000 | 1,827 | (8) | 7/6/31 | 3 month USD-LIBOR-BBA — | 1.463% — Semiannually | 1,820 |
| | | | | Quarterly | | |
| 7,157,200 | 1,789 | (68) | 7/6/26 | 0.963% — Semiannually | 3 month USD-LIBOR- | (1,857) |
| | | | | | BBA — Quarterly | |
| 2,561,300 | 6,198 E | (34) | 7/9/31 | 3 month USD-LIBOR-BBA — | 1.457% — Semiannually | 6,164 |
| | | | | Quarterly | | |
| |
| Putnam VT Diversified Income Fund 29 |
| | | | | | | |
| CENTRALLY CLEARED INTEREST RATE SWAP CONTRACTS OUTSTANDING at 6/30/21 (Unaudited) cont. | | |
| | | | Upfront | | | | Unrealized |
| | | | premium | Termination | Payments | Payments | appreciation/ |
| Notional amount | | Value | received (paid) | date | made by fund | received by fund | (depreciation) |
| | $53,000 | $228 | $(1) | 6/30/31 | 1.4715% — Semiannually | 3 month USD-LIBOR- | $(231) |
| | | | | | | BBA — Quarterly | |
| | 3,003,500 | 7,268 E | (40) | 7/15/31 | 3 month USD-LIBOR-BBA — | 1.46% — Semiannually | 7,229 |
| | | | | | Quarterly | | |
| AUD | 53,800 | 2,169 E | (1) | 1/30/35 | 1.692% — Semiannually | 6 month AUD-BBR- | 2,169 |
| | | | | | | BBSW — Semiannually | |
| AUD | 181,000 | 10,105 E | (2) | 3/5/35 | 1.47% — Semiannually | 6 month AUD-BBR- | 10,103 |
| | | | | | | BBSW — Semiannually | |
| AUD | 67,200 | 4,083 E | (1) | 3/25/35 | 1.4025% — Semiannually | 6 month AUD-BBR- | 4,082 |
| | | | | | | BBSW — Semiannually | |
| AUD | 104,900 | 6,652 E | (1) | 3/28/40 | 1.445% — Semiannually | 6 month AUD-BBR- | 6,650 |
| | | | | | | BBSW — Semiannually | |
| AUD | 391,500 | 31,310 E | (5) | 4/1/40 | 1.1685% — Semiannually | 6 month AUD-BBR- | 31,305 |
| | | | | | | BBSW — Semiannually | |
| AUD | 25,100 | 2,607 E | (1) | 7/2/45 | 1.441% — Semiannually | 6 month AUD-BBR- | 2,606 |
| | | | | | | BBSW — Semiannually | |
| AUD | 1,200,000 | 25,774 | (13) | 4/6/31 | 6 month AUD-BBR-BBSW — | 1.87% — Semiannually | 29,646 |
| | | | | | Semiannually | | |
| AUD | 4,500,000 | 26,290 E | 23,259 | 9/15/31 | 6 month AUD-BBR-BBSW — | 1.55% — Semiannually | (3,031) |
| | | | | | Semiannually | | |
| CAD | 601,500 | 359 E | (5) | 8/16/26 | 3 month CAD-BA-CDOR — | 1.474% — Semiannually | (364) |
| | | | | | Semiannually | | |
| CAD | 2,734,100 | 32,092 | (14,720) | 6/15/31 | 3 month CAD-BA-CDOR — | 1.99% — Semiannually | 18,435 |
| | | | | | Semiannually | | |
| CAD | 1,093,600 | 7,411 | (12) | 6/15/31 | 1.924% — Semiannually | 3 month CAD-BA-CDOR — | (8,002) |
| | | | | | | Semiannually | |
| CAD | 820,300 | 3,706 | (9) | 6/15/31 | 1.894% — Semiannually | 3 month CAD-BA-CDOR — | (4,141) |
| | | | | | | Semiannually | |
| CAD | 546,800 | 1,235 | (6) | 6/15/31 | 1.864% — Semiannually | 3 month CAD-BA-CDOR — | (1,519) |
| | | | | | | Semiannually | |
| CAD | 4,986,000 | 15,244 E | 17,692 | 9/15/31 | 3 month CAD-BA-CDOR — | 1.84% — Semiannually | 2,448 |
| | | | | | Semiannually | | |
| CAD | 273,400 | 307 | (3) | 6/15/31 | 1.819% — Semiannually | 3 month CAD-BA-CDOR — | 169 |
| | | | | | | Semiannually | |
| CHF | 237,000 | 2,293 E | 2,301 | 9/15/31 | 0.05% plus 6 month CHF- | — | 8 |
| | | | | | LIBOR-BBA — Semiannually | | |
| EUR | 347,600 | 104,690 E | (13) | 11/29/58 | 1.484% — Annually | 6 month EUR-EURIBOR- | (104,704) |
| | | | | | | REUTERS — Semiannually | |
| EUR | 472,900 | 134,830 | (18) | 2/19/50 | 6 month EUR-EURIBOR- | 1.354% — Annually | 138,722 |
| | | | | | REUTERS — Semiannually | | |
| EUR | 522,000 | 134,228 | (20) | 3/11/50 | 1.267% — Annually | 6 month EUR-EURIBOR- | (137,688) |
| | | | | | | REUTERS — Semiannually | |
| EUR | 528,600 | 126,323 | (20) | 3/12/50 | 1.2115% — Annually | 6 month EUR-EURIBOR- | (129,692) |
| | | | | | | REUTERS — Semiannually | |
| EUR | 653,200 | 135,156 | (25) | 3/26/50 | 1.113% — Annually | 6 month EUR-EURIBOR- | (138,582) |
| | | | | | | REUTERS — Semiannually | |
| EUR | 636,800 | 162,041 E | (24) | 11/29/58 | 6 month EUR-EURIBOR- | 1.343% — Annually | 162,017 |
| | | | | | REUTERS — Semiannually | | |
| EUR | 679,000 | 126,099 | (26) | 2/19/50 | 1.051% — Annually | 6 month EUR-EURIBOR- | (130,831) |
| | | | | | | REUTERS — Semiannually | |
| EUR | 503,000 | 85,499 E | (19) | 6/7/54 | 1.054% — Annually | 6 month EUR-EURIBOR- | (85,518) |
| | | | | | | REUTERS — Semiannually | |
| EUR | 458,800 | 63,003 | (18) | 2/19/50 | 0.9035% — Annually | 6 month EUR-EURIBOR- | (65,903) |
| | | | | | | REUTERS — Semiannually | |
| EUR | 307,000 | 31,732 | (12) | 2/21/50 | 0.80% — Annually | 6 month EUR-EURIBOR- | (33,487) |
| | | | | | | REUTERS — Semiannually | |
| EUR | 1,018,300 | 22,277 E | (39) | 8/8/54 | 0.49% — Annually | 6 month EUR-EURIBOR- | 22,239 |
| | | | | | | REUTERS — Semiannually | |
| EUR | 614,700 | 71,700 E | (23) | 6/6/54 | 6 month EUR-EURIBOR- | 0.207% — Annually | (71,723) |
| | | | | | REUTERS — Semiannually | | |
| |
| 30 Putnam VT Diversified Income Fund |
| | | | | | | |
| CENTRALLY CLEARED INTEREST RATE SWAP CONTRACTS OUTSTANDING at 6/30/21 (Unaudited) cont. | | |
| | | | Upfront | | | | Unrealized |
| | | | premium | Termination | Payments | Payments | appreciation/ |
| Notional amount | | Value | received (paid) | date | made by fund | received by fund | (depreciation) |
| EUR | 864,500 | $71,448 | $(32) | 2/19/50 | 0.233% — Annually | 6 month EUR-EURIBOR- | $68,542 |
| | | | | | | REUTERS — Semiannually | |
| EUR | 3,365,700 | 121,562 | (127) | 2/19/50 | 6 month EUR-EURIBOR- | 0.595% — Annually | 137,997 |
| | | | | | REUTERS — Semiannually | | |
| EUR | 401,600 | 56,167 E | (15) | 3/4/54 | 0.134% — Annually | 6 month EUR-EURIBOR- | 56,152 |
| | | | | | | REUTERS — Semiannually | |
| EUR | 189,700 | 49,790 E | (7) | 3/13/54 | — | 0.2275% plus 6 month | 49,782 |
| | | | | | | EUR-EURIBOR- | |
| | | | | | | REUTERS — Semiannually | |
| EUR | 1,164,500 | 78,941 E | (25) | 5/13/40 | 6 month EUR-EURIBOR- | 0.276% — Annually | (78,965) |
| | | | | | REUTERS — Semiannually | | |
| EUR | 550,400 | 34,910 E | (12) | 6/24/40 | 0.315% — Annually | 6 month EUR-EURIBOR- | 34,898 |
| | | | | | | REUTERS — Semiannually | |
| EUR | 766,600 | 48,113 E | (18) | 1/16/40 | 0.315% — Annually | 6 month EUR-EURIBOR- | 48,095 |
| | | | | | | REUTERS — Semiannually | |
| EUR | 262,300 | 16,478 E | (6) | 3/28/40 | 0.3175% — Annually | 6 month EUR-EURIBOR- | 16,472 |
| | | | | | | REUTERS — Semiannually | |
| EUR | 746,600 | 9,570 | (30) | 5/21/51 | 6 month EUR-EURIBOR- | 0.516% — Annually | 10,586 |
| | | | | | REUTERS — Semiannually | | |
| EUR | 730,000 | 6,232 | (13) | 6/14/31 | 0.171% — Annually | 6 month EUR-EURIBOR- | (6,529) |
| | | | | | | REUTERS — Semiannually | |
| EUR | 683,800 | 3,292 E | (12) | 7/15/31 | 0.0675% — Annually | 6 month EUR-EURIBOR- | 3,280 |
| | | | | | | REUTERS — Semiannually | |
| EUR | 1,448,000 | 13,839 E | (7,285) | 9/15/31 | 0.05% — Annually | 6 month EUR-EURIBOR- | 6,554 |
| | | | | | | REUTERS — Semiannually | |
| GBP | 477,400 | 3,104 | (9) | 5/19/31 | Sterling Overnight | 0.754% — Annually | 3,652 |
| | | | | | Index Average — Annually | | |
| GBP | 1,719,000 | 56,285 E | 38,883 | 9/15/31 | 0.975% — Annually | Sterling Overnight | (17,402) |
| | | | | | | Index Average — Annually | |
| JPY | 39,192,500 | 22,098 E | (11) | 8/29/43 | 0.7495% — Semiannually | 6 month JPY-LIBOR- | (22,110) |
| | | | | | | BBA — Semiannually | |
| JPY | 81,219,900 | 5,169 | (6,405) | 2/25/31 | 0.003% — Semiannually | 6 month JPY-LIBOR- | (1,363) |
| | | | | | | BBA — Semiannually | |
| JPY | 49,066,800 | 20,454 E | (15) | 8/29/43 | 0.194% — Semiannually | 6 month JPY-LIBOR- | 20,439 |
| | | | | | | BBA — Semiannually | |
| NOK | 16,694,000 | 562 E | 4,923 | 9/15/31 | 6 month NOK-NIBOR-NIBR — | 1.70% — Annually | 4,361 |
| | | | | | Semiannually | | |
| NZD | 2,341,000 | 12,878 E | 2,617 | 9/15/31 | 3 month NZD-BBR-FRA — | 1.83% — Semiannually | (10,261) |
| | | | | | Quarterly | | |
| SEK | 13,752,000 | 2,250 E | 88 | 9/15/31 | 0.77% — Annually | 3 month SEK-STIBOR- | 2,344 |
| | | | | | | SIDE — Quarterly | |
| Total | | | $(1,062,774) | | | | $325,570 |
E Extended effective date.
| | | | | | |
| OTC TOTAL RETURN SWAP CONTRACTS OUTSTANDING at 6/30/21 (Unaudited) | | | |
| | | Upfront | | Payments | Total return | Unrealized |
| Swap counterparty/ | | premium | Termination | received (paid) | received by | appreciation/ |
| Notional amount | Value | received (paid) | date | by fund | or paid by fund | (depreciation) |
| Barclays Bank PLC | | | | | | |
| $329,897 | $328,949 | $— | 1/12/40 | 4.00% (1 month USD- | Synthetic MBX Index | $(320) |
| | | | | LIBOR) — Monthly | 4.00% 30 year Fannie Mae | |
| | | | | | pools — Monthly | |
| 57,468 | 57,303 | — | 1/12/40 | 4.00% (1 month USD- | Synthetic MBX Index | (56) |
| | | | | LIBOR) — Monthly | 4.00% 30 year Fannie Mae | |
| | | | | | pools — Monthly | |
| 49,683 | 49,540 | — | 1/12/40 | 4.00% (1 month USD- | Synthetic MBX Index | (48) |
| | | | | LIBOR) — Monthly | 4.00% 30 year Fannie Mae | |
| | | | | | pools — Monthly | |
| 4,697,539 | 4,680,840 | — | 1/12/41 | 5.00% (1 month USD- | Synthetic MBX Index | (6,032) |
| | | | | LIBOR) — Monthly | 5.00% 30 year Fannie Mae | |
| | | | | | pools — Monthly | |
| |
| Putnam VT Diversified Income Fund 31 |
| | | | | | |
| OTC TOTAL RETURN SWAP CONTRACTS OUTSTANDING at 6/30/21 (Unaudited) cont. | | | |
| | | Upfront | | Payments | Total return | Unrealized |
| Swap counterparty/ | | premium | Termination | received (paid) | received by | appreciation/ |
| Notional amount | Value | received (paid) | date | by fund | or paid by fund | (depreciation) |
| Barclays Bank PLC cont. | | | | | | |
| $575,174 | $572,787 | $— | 1/12/40 | 5.00% (1 month USD- | Synthetic MBX Index | $(1,065) |
| | | | | LIBOR) — Monthly | 5.00% 30 year Fannie Mae | |
| | | | | | pools — Monthly | |
| 203,367 | 202,855 | — | 1/12/39 | (6.00%) 1 month USD- | Synthetic MBX Index | (26) |
| | | | | LIBOR — Monthly | 6.00% 30 year Fannie Mae | |
| | | | | | pools — Monthly | |
| 3,535,913 | 3,521,603 | — | 1/12/38 | (6.50%) 1 month USD- | Synthetic MBX Index | 4,627 |
| | | | | LIBOR — Monthly | 6.50% 30 year Fannie Mae | |
| | | | | | pools — Monthly | |
| 53,930 | 54,034 | — | 1/12/43 | (3.50%) 1 month USD- | Synthetic TRS Index | (716) |
| | | | | LIBOR — Monthly | 3.50% 30 year Fannie Mae | |
| | | | | | pools — Monthly | |
| 37,920 | 37,920 | — | 1/12/42 | 4.00% (1 month USD- | Synthetic TRS Index | 474 |
| | | | | LIBOR) — Monthly | 4.00% 30 year Fannie Mae | |
| | | | | | pools — Monthly | |
| 30,884 | 30,855 | — | 1/12/41 | (4.00%) 1 month USD- | Synthetic TRS Index | (358) |
| | | | | LIBOR — Monthly | 4.00% 30 year Fannie Mae | |
| | | | | | pools — Monthly | |
| 69,628 | 68,317 | — | 1/12/41 | (5.00%) 1 month USD- | Synthetic TRS Index | 307 |
| | | | | LIBOR — Monthly | 5.00% 30 year Fannie Mae | |
| | | | | | pools — Monthly | |
| 37,389 | 37,054 | — | 1/12/41 | 5.00% (1 month USD- | Synthetic TRS Index 5.00% | 135 |
| | | | | LIBOR) — Monthly | 30 year Ginnie Mae II | |
| | | | | | pools — Monthly | |
| 28,547 | 28,291 | — | 1/12/41 | 5.00% (1 month USD- | Synthetic TRS Index 5.00% | 103 |
| | | | | LIBOR) — Monthly | 30 year Ginnie Mae II | |
| | | | | | pools — Monthly | |
| 22,499 | 22,297 | — | 1/12/41 | 5.00% (1 month USD- | Synthetic TRS Index 5.00% | 81 |
| | | | | LIBOR) — Monthly | 30 year Ginnie Mae II | |
| | | | | | pools — Monthly | |
| 33,681 | 32,401 | — | 1/12/39 | 6.00% (1 month USD- | Synthetic TRS Index | (869) |
| | | | | LIBOR) — Monthly | 6.00% 30 year Fannie Mae | |
| | | | | | pools — Monthly | |
| 60,714 | 58,553 | — | 1/12/38 | 6.50% (1 month USD- | Synthetic TRS Index | (1,434) |
| | | | | LIBOR) — Monthly | 6.50% 30 year Fannie Mae | |
| | | | | | pools — Monthly | |
| 8,709 | 8,399 | — | 1/12/38 | 6.50% (1 month USD- | Synthetic TRS Index | (206) |
| | | | | LIBOR) — Monthly | 6.50% 30 year Fannie Mae | |
| | | | | | pools — Monthly | |
| 5,404 | 5,212 | — | 1/12/38 | 6.50% (1 month USD- | Synthetic TRS Index | (128) |
| | | | | LIBOR) — Monthly | 6.50% 30 year Fannie Mae | |
| | | | | | pools — Monthly | |
| Citibank, N.A. | | | | | | |
| 438,776 | 437,216 | — | 1/12/41 | 5.00% (1 month USD- | Synthetic MBX Index | (563) |
| | | | | LIBOR) — Monthly | 5.00% 30 year Fannie Mae | |
| | | | | | pools — Monthly | |
| 280,385 | 279,389 | — | 1/12/41 | 5.00% (1 month USD- | Synthetic MBX Index | (360) |
| | | | | LIBOR) — Monthly | 5.00% 30 year Fannie Mae | |
| | | | | | pools — Monthly | |
| 169,908 | 169,304 | — | 1/12/41 | 5.00% (1 month USD- | Synthetic MBX Index | (218) |
| | | | | LIBOR) — Monthly | 5.00% 30 year Fannie Mae | |
| | | | | | pools — Monthly | |
| Credit Suisse International | | | | | | |
| 184,282 | 183,627 | — | 1/12/41 | 5.00% (1 month USD- | Synthetic MBX Index | (1,601) |
| | | | | LIBOR) — Monthly | 5.00% 30 year Fannie Mae | |
| | | | | | pools — Monthly | |
| 96,964 | 96,095 | — | 1/12/41 | 5.00% (1 month USD- | Synthetic MBX Index | 350 |
| | | | | LIBOR) — Monthly | 5.00% 30 year Ginnie Mae II | |
| | | | | | pools — Monthly | |
| |
| 32 Putnam VT Diversified Income Fund |
| | | | | | |
| OTC TOTAL RETURN SWAP CONTRACTS OUTSTANDING at 6/30/21 (Unaudited) cont. | | | |
| | | Upfront | | Payments | Total return | Unrealized |
| Swap counterparty/ | | premium | Termination | received (paid) | received by | appreciation/ |
| Notional amount | Value | received (paid) | date | by fund | or paid by fund | (depreciation) |
| Credit Suisse International cont. | | | | | | |
| $50,837 | $50,382 | $— | 1/12/41 | 5.00% (1 month USD- | Synthetic MBX Index | $184 |
| | | | | LIBOR) — Monthly | 5.00% 30 year Ginnie Mae II | |
| | | | | | pools — Monthly | |
| 68,866 | 68,999 | — | 1/12/43 | 3.50% (1 month USD- | Synthetic TRS Index | 914 |
| | | | | LIBOR) — Monthly | 3.50% 30 year Fannie Mae | |
| | | | | | pools — Monthly | |
| 35,786 | 35,855 | — | 1/12/43 | 3.50% (1 month USD- | Synthetic TRS Index | 475 |
| | | | | LIBOR) — Monthly | 3.50% 30 year Fannie Mae | |
| | | | | | pools — Monthly | |
| 28,736 | 28,791 | — | 1/12/43 | 3.50% (1 month USD- | Synthetic TRS Index | 382 |
| | | | | LIBOR) — Monthly | 3.50% 30 year Fannie Mae | |
| | | | | | pools — Monthly | |
| 151,877 | 141,761 | — | 1/12/45 | 4.00% (1 month USD- | Synthetic TRS Index | (8,140) |
| | | | | LIBOR) — Monthly | 4.00% 30 year Fannie Mae | |
| | | | | | pools — Monthly | |
| 62,221 | 58,077 | — | 1/12/45 | 4.00% (1 month USD- | Synthetic TRS Index | (3,335) |
| | | | | LIBOR) — Monthly | 4.00% 30 year Fannie Mae | |
| | | | | | pools — Monthly | |
| 49,014 | 48,090 | — | 1/12/41 | (5.00%) 1 month USD- | Synthetic TRS Index | 216 |
| | | | | LIBOR — Monthly | 5.00% 30 year Fannie Mae | |
| | | | | | pools — Monthly | |
| 54,002 | 52,985 | — | 1/12/41 | (5.00%) 1 month USD- | Synthetic TRS Index | 238 |
| | | | | LIBOR — Monthly | 5.00% 30 year Fannie Mae | |
| | | | | | pools — Monthly | |
| 51,996 | 51,531 | — | 1/12/41 | 5.00% (1 month USD- | Synthetic TRS Index 5.00% | 188 |
| | | | | LIBOR) — Monthly | 30 year Ginnie Mae II | |
| | | | | | pools — Monthly | |
| Deutsche Bank AG | | | | | | |
| 240,355 | 239,383 | — | 1/12/38 | (6.50%) 1 month USD- | Synthetic MBX Index | 315 |
| | | | | LIBOR — Monthly | 6.50% 30 year Fannie Mae | |
| | | | | | pools — Monthly | |
| Goldman Sachs International | | | | | | |
| 10,816 | 10,772 | — | 1/12/38 | (6.50%) 1 month USD- | Synthetic MBX Index | 14 |
| | | | | LIBOR — Monthly | 6.50% 30 year Fannie Mae | |
| | | | | | pools — Monthly | |
| 28,821 | 28,704 | — | 1/12/38 | (6.50%) 1 month USD- | Synthetic MBX Index | 38 |
| | | | | LIBOR — Monthly | 6.50% 30 year Fannie Mae | |
| | | | | | pools — Monthly | |
| 63,235 | 62,979 | — | 1/12/38 | (6.50%) 1 month USD- | Synthetic MBX Index | 83 |
| | | | | LIBOR — Monthly | 6.50% 30 year Fannie Mae | |
| | | | | | pools — Monthly | |
| 117,534 | 117,058 | — | 1/12/38 | (6.50%) 1 month USD- | Synthetic MBX Index | 154 |
| | | | | LIBOR — Monthly | 6.50% 30 year Fannie Mae | |
| | | | | | pools — Monthly | |
| 141,023 | 140,452 | — | 1/12/38 | (6.50%) 1 month USD- | Synthetic MBX Index | 185 |
| | | | | LIBOR — Monthly | 6.50% 30 year Fannie Mae | |
| | | | | | pools — Monthly | |
| 168,336 | 167,655 | — | 1/12/38 | (6.50%) 1 month USD- | Synthetic MBX Index | 220 |
| | | | | LIBOR — Monthly | 6.50% 30 year Fannie Mae | |
| | | | | | pools — Monthly | |
| 230,610 | 229,677 | — | 1/12/38 | (6.50%) 1 month USD- | Synthetic MBX Index | 302 |
| | | | | LIBOR — Monthly | 6.50% 30 year Fannie Mae | |
| | | | | | pools — Monthly | |
| 55,880 | 56,127 | — | 1/12/44 | (3.00%) 1 month USD- | Synthetic TRS Index | (871) |
| | | | | LIBOR — Monthly | 3.00% 30 year Fannie Mae | |
| | | | | | pools — Monthly | |
| 50,489 | 50,586 | — | 1/12/43 | (3.50%) 1 month USD- | Synthetic TRS Index | (670) |
| | | | | LIBOR — Monthly | 3.50% 30 year Fannie Mae | |
| | | | | | pools — Monthly | |
| |
| Putnam VT Diversified Income Fund 33 |
| | | | | | |
| OTC TOTAL RETURN SWAP CONTRACTS OUTSTANDING at 6/30/21 (Unaudited) cont. | | | |
| | | Upfront | | Payments | Total return | Unrealized |
| Swap counterparty/ | | premium | Termination | received (paid) | received by | appreciation/ |
| Notional amount | Value | received (paid) | date | by fund | or paid by fund | (depreciation) |
| Goldman Sachs International cont. | | | | | | |
| $122,554 | $122,554 | $— | 1/12/42 | 4.00% (1 month USD- | Synthetic TRS Index | $1,531 |
| | | | | LIBOR) — Monthly | 4.00% 30 year Fannie Mae | |
| | | | | | pools — Monthly | |
| 105,940 | 105,940 | — | 1/12/42 | 4.00% (1 month USD- | Synthetic TRS Index | 1,324 |
| | | | | LIBOR) — Monthly | 4.00% 30 year Fannie Mae | |
| | | | | | pools — Monthly | |
| 111,132 | 103,730 | — | 1/12/45 | 4.00% (1 month USD- | Synthetic TRS Index | (5,957) |
| | | | | LIBOR) — Monthly | 4.00% 30 year Fannie Mae | |
| | | | | | pools — Monthly | |
| 94,119 | 94,119 | — | 1/12/42 | 4.00% (1 month USD- | Synthetic TRS Index | 1,176 |
| | | | | LIBOR) — Monthly | 4.00% 30 year Fannie Mae | |
| | | | | | pools — Monthly | |
| 94,119 | 94,119 | — | 1/12/42 | 4.00% (1 month USD- | Synthetic TRS Index | 1,176 |
| | | | | LIBOR) — Monthly | 4.00% 30 year Fannie Mae | |
| | | | | | pools — Monthly | |
| 61,756 | 57,643 | — | 1/12/45 | 4.00% (1 month USD- | Synthetic TRS Index | (3,310) |
| | | | | LIBOR) — Monthly | 4.00% 30 year Fannie Mae | |
| | | | | | pools — Monthly | |
| 173,355 | 173,193 | — | 1/12/41 | (4.00%) 1 month USD- | Synthetic TRS Index | (2,011) |
| | | | | LIBOR — Monthly | 4.00% 30 year Fannie Mae | |
| | | | | | pools — Monthly | |
| 71,688 | 70,338 | — | 1/12/41 | (5.00%) 1 month USD- | Synthetic TRS Index | 316 |
| | | | | LIBOR — Monthly | 5.00% 30 year Fannie Mae | |
| | | | | | pools — Monthly | |
| 61,851 | 59,501 | — | 1/12/39 | 6.00% (1 month USD- | Synthetic TRS Index | (1,597) |
| | | | | LIBOR) — Monthly | 6.00% 30 year Fannie Mae | |
| | | | | | pools — Monthly | |
| 47,453 | 45,650 | — | 1/12/39 | 6.00% (1 month USD- | Synthetic TRS Index | (1,225) |
| | | | | LIBOR) — Monthly | 6.00% 30 year Fannie Mae | |
| | | | | | pools — Monthly | |
| 24,232 | 23,312 | — | 1/12/39 | 6.00% (1 month USD- | Synthetic TRS Index | (625) |
| | | | | LIBOR) — Monthly | 6.00% 30 year Fannie Mae | |
| | | | | | pools — Monthly | |
| 23,729 | 22,827 | — | 1/12/39 | 6.00% (1 month USD- | Synthetic TRS Index | (612) |
| | | | | LIBOR) — Monthly | 6.00% 30 year Fannie Mae | |
| | | | | | pools — Monthly | |
| 9,046 | 8,702 | — | 1/12/39 | 6.00% (1 month USD- | Synthetic TRS Index | (233) |
| | | | | LIBOR) — Monthly | 6.00% 30 year Fannie Mae | |
| | | | | | pools — Monthly | |
| 34,157 | 32,941 | — | 1/12/38 | 6.50% (1 month USD- | Synthetic TRS Index | (806) |
| | | | | LIBOR) — Monthly | 6.50% 30 year Fannie Mae | |
| | | | | | pools — Monthly | |
| 25,185 | 24,288 | — | 1/12/38 | 6.50% (1 month USD- | Synthetic TRS Index | (595) |
| | | | | LIBOR) — Monthly | 6.50% 30 year Fannie Mae | |
| | | | | | pools — Monthly | |
| 1,786 | 1,723 | — | 1/12/38 | 6.50% (1 month USD- | Synthetic TRS Index | (42) |
| | | | | LIBOR) — Monthly | 6.50% 30 year Fannie Mae | |
| | | | | | pools — Monthly | |
| JPMorgan Chase Bank N.A. | | | | | | |
| 144,540 | 144,406 | — | 1/12/41 | 4.00% (1 month USD- | Synthetic TRS Index | 1,677 |
| | | | | LIBOR) — Monthly | 4.00% 30 year Fannie Mae | |
| | | | | | pools — Monthly | |
| 36,905 | 36,871 | — | 1/12/41 | 4.00% (1 month USD- | Synthetic TRS Index | 428 |
| | | | | LIBOR) — Monthly | 4.00% 30 year Fannie Mae | |
| | | | | | pools — Monthly | |
| 22,793 | 22,772 | — | 1/12/41 | 4.00% (1 month USD- | Synthetic TRS Index | 264 |
| | | | | LIBOR) — Monthly | 4.00% 30 year Fannie Mae | |
| | | | | | pools — Monthly | |
| 71,688 | 70,338 | — | 1/12/41 | (5.00%) 1 month USD- | Synthetic TRS Index | 316 |
| | | | | LIBOR — Monthly | 5.00% 30 year Fannie Mae | |
| | | | | | pools — Monthly | |
| |
| 34 Putnam VT Diversified Income Fund |
| | | | | | |
| OTC TOTAL RETURN SWAP CONTRACTS OUTSTANDING at 6/30/21 (Unaudited) cont. | | | |
| | | Upfront | | Payments | Total return | Unrealized |
| Swap counterparty/ | | premium | Termination | received (paid) | received by | appreciation/ |
| Notional amount | Value | received (paid) | date | by fund | or paid by fund | (depreciation) |
| JPMorgan Securities LLC | | | | | | |
| $187,775 | $186,093 | $— | 1/12/41 | (5.00%) 1 month USD- | Synthetic MBX Index | $(678) |
| | | | | LIBOR — Monthly | 5.00% 30 year Ginnie Mae II | |
| | | | | | pools — Monthly | |
| 28,970 | 29,026 | — | 1/12/43 | (3.50%) 1 month USD- | Synthetic TRS Index | (385) |
| | | | | LIBOR — Monthly | 3.50% 30 year Fannie Mae | |
| | | | | | pools — Monthly | |
| 59,215 | 59,054 | — | 1/12/44 | 4.00% (1 month USD- | Synthetic TRS Index | 560 |
| | | | | LIBOR) — Monthly | 4.00% 30 year Fannie Mae | |
| | | | | | pools — Monthly | |
| 454,652 | 454,652 | — | 1/12/42 | (4.00%) 1 month USD- | Synthetic TRS Index | (5,681) |
| | | | | LIBOR — Monthly | 4.00% 30 year Fannie Mae | |
| | | | | | pools — Monthly | |
| Morgan Stanley & Co. International PLC | | | | | |
| 854,414 | 851,345 | — | 7/17/24 | 3.825% (3 month USD- | Pera Funding DAC, 3.825%, | (2,576) |
| | | | | LIBOR-BBA minus | Series 2019–01, 7/10/24 — | |
| | | | | 0.12%) — Quarterly | Quarterly | |
| Upfront premium received | | — | | Unrealized appreciation | | 18,753 |
| Upfront premium (paid) | | — | | Unrealized (depreciation) | | (53,349) |
| Total | | $— | | Total | | $(34,596) |
| | | | | | | |
| CENTRALLY CLEARED TOTAL RETURN SWAP CONTRACTS OUTSTANDING at 6/30/21 (Unaudited) | | |
| | | | Upfront | | Payments | Total return | Unrealized |
| | | | premium | Termination | received (paid) | received by | appreciation/ |
| Notional amount | | Value | received (paid) | date | by fund | or paid by fund | (depreciation) |
| EUR | 5,511,000 | $583,219 | $(102) | 5/15/30 | (.655%) — At maturity | Eurostat Eurozone HICP | $583,117 |
| | | | | | | excluding tobacco — At | |
| | | | | | | maturity | |
| EUR | 5,511,000 | 577,926 | (102) | 5/15/30 | (.6625%) — At maturity | Eurostat Eurozone HICP | 577,824 |
| | | | | | | excluding tobacco — At | |
| | | | | | | maturity | |
| EUR | 2,753,000 | 508,262 | (98) | 5/15/40 | (.961%) — At maturity | Eurostat Eurozone HICP | 508,164 |
| | | | | | | excluding tobacco — At | |
| | | | | | | maturity | |
| EUR | 1,558,000 | 89,525 | — | 7/15/37 | 1.71% — At maturity | Eurostat Eurozone HICP | 89,525 |
| | | | | | | excluding tobacco — At | |
| | | | | | | maturity | |
| EUR | 1,558,000 | 11,251 | — | 7/15/27 | (1.40%) — At maturity | Eurostat Eurozone HICP | (11,251) |
| | | | | | | excluding tobacco — At | |
| | | | | | | maturity | |
| EUR | 3,399,000 | 50,380 | (40) | 9/15/23 | (1.4375%) — At maturity | Eurostat Eurozone HICP | (50,419) |
| | | | | | | excluding tobacco — At | |
| | | | | | | maturity | |
| EUR | 3,399,000 | 51,186 | (40) | 9/15/23 | (1.44125%) — At maturity | Eurostat Eurozone HICP | (51,225) |
| | | | | | | excluding tobacco — At | |
| | | | | | | maturity | |
| EUR | 3,399,000 | 51,468 | (40) | 9/15/23 | (1.4425%) — At maturity | Eurostat Eurozone HICP | (51,508) |
| | | | | | | excluding tobacco — At | |
| | | | | | | maturity | |
| EUR | 3,399,000 | 51,750 | (40) | 9/15/23 | (1.44375%) — At maturity | Eurostat Eurozone HICP | (51,790) |
| | | | | | | excluding tobacco — At | |
| | | | | | | maturity | |
| EUR | 2,753,000 | 729,880 | (130) | 5/15/50 | 1.13% — At maturity | Eurostat Eurozone HICP | (730,010) |
| | | | | | | excluding tobacco — At | |
| | | | | | | maturity | |
| EUR | 5,511,000 | 1,055,676 | (196) | 5/15/40 | 0.935% — At maturity | Eurostat Eurozone HICP | (1,055,871) |
| | | | | | | excluding tobacco — At | |
| | | | | | | maturity | |
| EUR | 5,511,000 | 1,062,994 | (196) | 5/15/40 | 0.93% — At maturity | Eurostat Eurozone HICP | (1,063,190) |
| | | | | | | excluding tobacco — At | |
| | | | | | | maturity | |
| |
| Putnam VT Diversified Income Fund 35 |
| | | | | | | |
| CENTRALLY CLEARED TOTAL RETURN SWAP CONTRACTS OUTSTANDING at 6/30/21 (Unaudited) cont. | | |
| | | | Upfront | | Payments | Total return | Unrealized |
| | | | premium | Termination | received (paid) | received by | appreciation/ |
| Notional amount | Value | received (paid) | date | by fund | or paid by fund | (depreciation) |
| GBP | 3,154,000 | $190,660 | $(67) | 12/15/28 | 3.665% — At maturity | GBP Non-revised UK Retail | $190,593 |
| | | | | | | Price Index — At maturity | |
| GBP | 3,493,000 | 55,663 | (46) | 11/15/24 | 3.385% — At maturity | GBP Non-revised UK Retail | 55,617 |
| | | | | | | Price Index — At maturity | |
| GBP | 2,460,000 | 48,492 | (57) | 3/15/28 | 3.4025% — At maturity | GBP Non-revised UK Retail | 48,435 |
| | | | | | | Price Index — At maturity | |
| GBP | 3,532,000 | 29,999 | (83) | 3/15/28 | 3.34% — At maturity | GBP Non-revised UK Retail | 29,916 |
| | | | | | | Price Index — At maturity | |
| GBP | 1,892,000 | 24,680 | (44) | 2/15/28 | 3.34% — At maturity | GBP Non-revised UK Retail | 24,636 |
| | | | | | | Price Index — At maturity | |
| GBP | 883,000 | 15,024 | (21) | 3/15/28 | 3.3875% — At maturity | GBP Non-revised UK Retail | 15,003 |
| | | | | | | Price Index — At maturity | |
| | $9,114,000 | 122,492 | (153) | 5/12/31 | 2.67% — At maturity | USA Non Revised | 122,339 |
| | | | | | | Consumer Price Index- | |
| | | | | | | Urban (CPI-U) — At | |
| | | | | | | maturity | |
| | 8,996,000 | 108,672 | (151) | 4/1/31 | 2.686% — At maturity | USA Non Revised | 108,521 |
| | | | | | | Consumer Price Index- | |
| | | | | | | Urban (CPI-U) — At | |
| | | | | | | maturity | |
| | 27,558,000 | 15,432 | (347) | 4/15/26 | 2.79% — At maturity | USA Non Revised | (15,781) |
| | | | | | | Consumer Price Index- | |
| | | | | | | Urban (CPI-U) — At | |
| | | | | | | maturity | |
| Total | | | $(1,953) | | | | $(727,355) |
| | | | | | | |
| OTC CREDIT DEFAULT CONTRACTS OUTSTANDING — PROTECTION SOLD at 6/30/21 (Unaudited) | | | | |
| | | Upfront | | | | | |
| | | premium | | | Termi- | | Unrealized |
| Swap counterparty/ | | received | Notional | | nation | Payments | appreciation/ |
| Referenced debt* | Rating*** | (paid)** | amount | Value | date | received by fund | (depreciation) |
| Bank of America N.A. | | | | | | | |
| CMBX NA BBB–.6 Index | BB–/P | $5,468 | $80,000 | $21,160 | 5/11/63 | 300 bp — Monthly | $(15,652) |
| CMBX NA BBB–.6 Index | BB–/P | 10,546 | 175,000 | 46,288 | 5/11/63 | 300 bp — Monthly | (35,654) |
| CMBX NA BBB–.6 Index | BB–/P | 21,545 | 349,000 | 92,311 | 5/11/63 | 300 bp — Monthly | (70,591) |
| CMBX NA BBB–.6 Index | BB–/P | 20,577 | 361,000 | 95,485 | 5/11/63 | 300 bp — Monthly | (74,727) |
| Citigroup Global Markets, Inc. | | | | | | | |
| CMBX NA A.6 Index | A-/P | 5,899 | 39,000 | 3,303 | 5/11/63 | 200 bp — Monthly | 2,608 |
| CMBX NA A.6 Index | A-/P | 4,583 | 39,000 | 3,303 | 5/11/63 | 200 bp — Monthly | 1,292 |
| CMBX NA A.6 Index | A-/P | 5,202 | 41,000 | 3,473 | 5/11/63 | 200 bp — Monthly | 1,743 |
| CMBX NA A.6 Index | A-/P | 8,464 | 61,000 | 5,167 | 5/11/63 | 200 bp — Monthly | 3,317 |
| CMBX NA A.6 Index | A-/P | 17,444 | 113,000 | 9,571 | 5/11/63 | 200 bp — Monthly | 7,911 |
| CMBX NA A.6 Index | A-/P | 19,263 | 115,000 | 9,741 | 5/11/63 | 200 bp — Monthly | 9,560 |
| CMBX NA A.6 Index | A-/P | 42,096 | 238,000 | 20,159 | 5/11/63 | 200 bp — Monthly | 22,017 |
| CMBX NA A.6 Index | A-/P | 46,218 | 278,000 | 23,547 | 5/11/63 | 200 bp — Monthly | 22,764 |
| CMBX NA BB.11 Index | BB–/P | 57,630 | 102,000 | 9,088 | 11/18/54 | 500 bp — Monthly | 48,627 |
| CMBX NA BB.13 Index | BB–/P | 10,497 | 105,000 | 8,820 | 12/16/72 | 500 bp — Monthly | 1,765 |
| CMBX NA BB.13 Index | BB–/P | 10,661 | 117,000 | 9,828 | 12/16/72 | 500 bp — Monthly | 931 |
| CMBX NA BB.13 Index | BB–/P | 17,931 | 190,000 | 15,960 | 12/16/72 | 500 bp — Monthly | 2,129 |
| CMBX NA BB.13 Index | BB–/P | 32,549 | 357,000 | 29,988 | 12/16/72 | 500 bp — Monthly | 2,858 |
| CMBX NA BB.6 Index | B-/P | 165,112 | 1,116,721 | 497,946 | 5/11/63 | 500 bp — Monthly | (331,903) |
| CMBX NA BB.7 Index | B/P | 46,032 | 902,000 | 312,814 | 1/17/47 | 500 bp — Monthly | (266,030) |
| CMBX NA BBB– .12 Index | BBB–/P | 41,215 | 260,000 | 9,438 | 8/17/61 | 300 bp — Monthly | 31,907 |
| CMBX NA BBB– .13 Index | BBB–/P | 6,139 | 70,000 | 2,513 | 12/16/72 | 300 bp — Monthly | 3,661 |
| CMBX NA BBB– .14 Index | BBB–/P | 312 | 10,000 | 171 | 12/16/72 | 300 bp — Monthly | 146 |
| CMBX NA BBB– .14 Index | BBB–/P | 5,489 | 168,000 | 2,873 | 12/16/72 | 300 bp — Monthly | 2,701 |
| CMBX NA BBB– .14 Index | BBB–/P | 8,225 | 268,000 | 4,583 | 12/16/72 | 300 bp — Monthly | 3,777 |
| CMBX NA BBB– .6 Index | BB–/P | 25,235 | 103,000 | 27,244 | 5/11/63 | 300 bp — Monthly | (1,957) |
| CMBX NA BBB–.10 Index | BBB–/P | 12,109 | 111,000 | 9,812 | 11/17/59 | 300 bp — Monthly | 2,352 |
| |
| 36 Putnam VT Diversified Income Fund |
| | | | | | | |
| OTC CREDIT DEFAULT CONTRACTS OUTSTANDING — PROTECTION SOLD at 6/30/21 (Unaudited) cont. | | | |
| | | Upfront | | | | | |
| | | premium | | | Termi- | | Unrealized |
| Swap counterparty/ | | received | Notional | | nation | Payments | appreciation/ |
| Referenced debt* | Rating*** | (paid)** | amount | Value | date | received by fund | (depreciation) |
| Citigroup Global Markets, Inc. cont. | | | | | | |
| CMBX NA BBB–.11 Index | BBB–/P | $689 | $11,000 | $381 | 11/18/54 | 300 bp — Monthly | $314 |
| CMBX NA BBB–.12 Index | BBB–/P | 1,460 | 35,000 | 1,271 | 8/17/61 | 300 bp — Monthly | 207 |
| CMBX NA BBB–.12 Index | BBB–/P | 4,715 | 80,000 | 2,904 | 8/17/61 | 300 bp — Monthly | 1,851 |
| CMBX NA BBB–.13 Index | BBB–/P | 8,181 | 161,000 | 5,780 | 12/16/72 | 300 bp — Monthly | 2,482 |
| CMBX NA BBB–.14 Index | BBB–/P | 2,411 | 57,000 | 975 | 12/16/72 | 300 bp — Monthly | 1,465 |
| CMBX NA BBB–.14 Index | BBB–/P | 4,750 | 95,000 | 1,625 | 12/16/72 | 300 bp — Monthly | 3,173 |
| CMBX NA BBB–.14 Index | BBB–/P | 6,793 | 149,000 | 2,548 | 12/16/72 | 300 bp — Monthly | 4,319 |
| CMBX NA BBB–.6 Index | BB–/P | 3,825 | 58,000 | 15,341 | 5/11/63 | 300 bp — Monthly | (11,487) |
| CMBX NA BBB–.6 Index | BB–/P | 4,145 | 63,000 | 16,664 | 5/11/63 | 300 bp — Monthly | (12,487) |
| CMBX NA BBB–.6 Index | BB–/P | 10,756 | 158,000 | 41,791 | 5/11/63 | 300 bp — Monthly | (30,956) |
| CMBX NA BBB–.6 Index | BB–/P | 250,386 | 3,932,000 | 1,040,014 | 5/11/63 | 300 bp — Monthly | (787,662) |
| Credit Suisse International | | | | | | | |
| CMBX NA BB.7 Index | B/P | 22,204 | 166,000 | 57,569 | 1/17/47 | 500 bp — Monthly | (35,226) |
| CMBX NA BBB–.6 Index | BB–/P | 8,950 | 81,000 | 21,425 | 5/11/63 | 300 bp — Monthly | (12,434) |
| CMBX NA BBB–.6 Index | BB–/P | 19,778 | 179,000 | 47,346 | 5/11/63 | 300 bp — Monthly | (27,478) |
| CMBX NA BBB–.6 Index | BB–/P | 667,321 | 7,102,000 | 1,878,479 | 5/11/63 | 300 bp — Monthly | (1,207,607) |
| CMBX NA BBB–.7 Index | BB/P | 13,231 | 179,000 | 31,826 | 1/17/47 | 300 bp — Monthly | (18,506) |
| CMBX NA BBB–.7 Index | BB/P | 34,676 | 528,000 | 93,878 | 1/17/47 | 300 bp — Monthly | (58,938) |
| Goldman Sachs International | | | | | | | |
| CMBX NA BBB–.6 Index | BB–/P | 13,478 | 87,000 | 23,012 | 5/11/63 | 300 bp — Monthly | (9,490) |
| CMBX NA BB.13 Index | BB–/P | 7,982 | 83,000 | 6,972 | 12/16/72 | 500 bp — Monthly | 1,079 |
| CMBX NA BB.6 Index | B-/P | 48,449 | 109,635 | 48,886 | 5/11/63 | 500 bp — Monthly | (346) |
| CMBX NA BB.9 Index | B+/P | 21,836 | 54,000 | 11,945 | 9/17/58 | 500 bp — Monthly | 9,936 |
| CMBX NA BBB– .13 Index | BBB–/P | 105 | 1,000 | 36 | 12/16/72 | 300 bp — Monthly | 70 |
| CMBX NA BBB– .13 Index | BBB–/P | 1,013 | 17,000 | 610 | 12/16/72 | 300 bp — Monthly | 411 |
| CMBX NA BBB– .13 Index | BBB–/P | 1,007 | 17,000 | 610 | 12/16/72 | 300 bp — Monthly | 405 |
| CMBX NA BBB– .13 Index | BBB–/P | 2,192 | 30,000 | 1,077 | 12/16/72 | 300 bp — Monthly | 1,130 |
| CMBX NA BBB– .13 Index | BBB–/P | 5,540 | 35,000 | 1,257 | 12/16/72 | 300 bp — Monthly | 4,301 |
| CMBX NA BBB– .13 Index | BBB–/P | 6,425 | 41,000 | 1,472 | 12/16/72 | 300 bp — Monthly | 4,974 |
| CMBX NA BBB– .13 Index | BBB–/P | 3,490 | 59,000 | 2,118 | 12/16/72 | 300 bp — Monthly | 1,401 |
| CMBX NA BBB– .13 Index | BBB–/P | 12,696 | 75,000 | 2,693 | 12/16/72 | 300 bp — Monthly | 10,041 |
| CMBX NA BBB–.11 Index | BBB–/P | 64 | 1,000 | 35 | 11/18/54 | 300 bp — Monthly | 29 |
| CMBX NA BBB–.13 Index | BBB–/P | 3,267 | 71,000 | 2,549 | 12/16/72 | 300 bp — Monthly | 753 |
| CMBX NA BBB–.13 Index | BBB–/P | 6,235 | 97,000 | 3,482 | 12/16/72 | 300 bp — Monthly | 2,801 |
| CMBX NA BBB–.13 Index | BBB–/P | 8,045 | 128,000 | 4,595 | 12/16/72 | 300 bp — Monthly | 3,514 |
| CMBX NA BBB–.14 Index | BBB–/P | 1,008 | 35,000 | 599 | 12/16/72 | 300 bp — Monthly | 427 |
| CMBX NA BBB–.14 Index | BBB–/P | 2,266 | 51,000 | 872 | 12/16/72 | 300 bp — Monthly | 1,420 |
| CMBX NA BBB–.14 Index | BBB–/P | 4,542 | 101,000 | 1,727 | 12/16/72 | 300 bp — Monthly | 2,865 |
| CMBX NA BBB–.14 Index | BBB–/P | 4,731 | 103,000 | 1,761 | 12/16/72 | 300 bp — Monthly | 3,021 |
| CMBX NA BBB–.14 Index | BBB–/P | 3,226 | 112,000 | 1,915 | 12/16/72 | 300 bp — Monthly | 1,367 |
| CMBX NA BBB–.6 Index | BB–/P | 420 | 5,000 | 1,323 | 5/11/63 | 300 bp — Monthly | (900) |
| CMBX NA BBB–.6 Index | BB–/P | 1,607 | 12,000 | 3,174 | 5/11/63 | 300 bp — Monthly | (1,561) |
| CMBX NA BBB–.6 Index | BB–/P | 1,597 | 12,000 | 3,174 | 5/11/63 | 300 bp — Monthly | (1,571) |
| CMBX NA BBB–.6 Index | BB–/P | 1,947 | 22,000 | 5,819 | 5/11/63 | 300 bp — Monthly | (3,861) |
| CMBX NA BBB–.6 Index | BB–/P | 3,254 | 28,000 | 7,406 | 5/11/63 | 300 bp — Monthly | (4,138) |
| CMBX NA BBB–.6 Index | BB–/P | 2,849 | 36,000 | 9,522 | 5/11/63 | 300 bp — Monthly | (6,655) |
| CMBX NA BBB–.6 Index | BB–/P | 6,209 | 59,000 | 15,606 | 5/11/63 | 300 bp — Monthly | (9,367) |
| CMBX NA BBB–.6 Index | BB–/P | 5,920 | 59,000 | 15,606 | 5/11/63 | 300 bp — Monthly | (9,656) |
| CMBX NA BBB–.6 Index | BB–/P | 6,856 | 62,000 | 16,399 | 5/11/63 | 300 bp — Monthly | (9,512) |
| CMBX NA BBB–.6 Index | BB–/P | 5,978 | 69,000 | 18,251 | 5/11/63 | 300 bp — Monthly | (12,238) |
| CMBX NA BBB–.6 Index | BB–/P | 4,769 | 70,000 | 18,515 | 5/11/63 | 300 bp — Monthly | (13,711) |
| CMBX NA BBB–.6 Index | BB–/P | 8,842 | 79,000 | 20,896 | 5/11/63 | 300 bp — Monthly | (12,014) |
| CMBX NA BBB–.6 Index | BB–/P | 9,574 | 87,000 | 23,012 | 5/11/63 | 300 bp — Monthly | (13,394) |
| |
| Putnam VT Diversified Income Fund 37 |
| | | | | | | |
| OTC CREDIT DEFAULT CONTRACTS OUTSTANDING — PROTECTION SOLD at 6/30/21 (Unaudited) cont. | | | |
| | | Upfront | | | | | |
| | | premium | | | Termi- | | Unrealized |
| Swap counterparty/ | | received | Notional | | nation | Payments | appreciation/ |
| Referenced debt* | Rating*** | (paid)** | amount | Value | date | received by fund | (depreciation) |
| Goldman Sachs International cont. | | | | | | |
| CMBX NA BBB–.6 Index | BB–/P | $8,117 | $94,000 | $24,863 | 5/11/63 | 300 bp — Monthly | $(16,699) |
| CMBX NA BBB–.6 Index | BB–/P | 16,293 | 98,000 | 25,921 | 5/11/63 | 300 bp — Monthly | (9,579) |
| CMBX NA BBB–.6 Index | BB–/P | 8,608 | 102,000 | 26,979 | 5/11/63 | 300 bp — Monthly | (18,320) |
| CMBX NA BBB–.6 Index | BB–/P | 13,886 | 102,000 | 26,979 | 5/11/63 | 300 bp — Monthly | (13,042) |
| CMBX NA BBB–.6 Index | BB–/P | 5,606 | 111,000 | 29,360 | 5/11/63 | 300 bp — Monthly | (23,698) |
| CMBX NA BBB–.6 Index | BB–/P | 16,916 | 113,000 | 29,889 | 5/11/63 | 300 bp — Monthly | (12,916) |
| CMBX NA BBB–.6 Index | BB–/P | 16,910 | 115,000 | 30,418 | 5/11/63 | 300 bp — Monthly | (13,450) |
| CMBX NA BBB–.6 Index | BB–/P | 13,259 | 119,000 | 31,476 | 5/11/63 | 300 bp — Monthly | (18,157) |
| CMBX NA BBB–.6 Index | BB–/P | 13,360 | 123,000 | 32,534 | 5/11/63 | 300 bp — Monthly | (19,112) |
| CMBX NA BBB–.6 Index | BB–/P | 13,309 | 123,000 | 32,534 | 5/11/63 | 300 bp — Monthly | (19,163) |
| CMBX NA BBB–.6 Index | BB–/P | 10,717 | 127,000 | 33,592 | 5/11/63 | 300 bp — Monthly | (22,811) |
| CMBX NA BBB–.6 Index | BB–/P | 10,857 | 131,000 | 34,650 | 5/11/63 | 300 bp — Monthly | (23,727) |
| CMBX NA BBB–.6 Index | BB–/P | 13,452 | 134,000 | 35,443 | 5/11/63 | 300 bp — Monthly | (21,924) |
| CMBX NA BBB–.6 Index | BB–/P | 6,776 | 139,000 | 36,766 | 5/11/63 | 300 bp — Monthly | (29,920) |
| CMBX NA BBB–.6 Index | BB–/P | 15,957 | 143,000 | 37,824 | 5/11/63 | 300 bp — Monthly | (21,795) |
| CMBX NA BBB–.6 Index | BB–/P | 15,957 | 143,000 | 37,824 | 5/11/63 | 300 bp — Monthly | (21,795) |
| CMBX NA BBB–.6 Index | BB–/P | 21,242 | 153,000 | 40,469 | 5/11/63 | 300 bp — Monthly | (19,150) |
| CMBX NA BBB–.6 Index | BB–/P | 17,887 | 160,000 | 42,320 | 5/11/63 | 300 bp — Monthly | (24,353) |
| CMBX NA BBB–.6 Index | BB–/P | 8,601 | 166,000 | 43,907 | 5/11/63 | 300 bp — Monthly | (35,223) |
| CMBX NA BBB–.6 Index | BB–/P | 25,922 | 172,000 | 45,494 | 5/11/63 | 300 bp — Monthly | (19,486) |
| CMBX NA BBB–.6 Index | BB–/P | 9,024 | 173,000 | 45,759 | 5/11/63 | 300 bp — Monthly | (36,648) |
| CMBX NA BBB–.6 Index | BB–/P | 20,787 | 192,000 | 50,784 | 5/11/63 | 300 bp — Monthly | (29,901) |
| CMBX NA BBB–.6 Index | BB–/P | 23,498 | 193,000 | 51,049 | 5/11/63 | 300 bp — Monthly | (27,454) |
| CMBX NA BBB–.6 Index | BB–/P | 10,604 | 207,000 | 54,752 | 5/11/63 | 300 bp — Monthly | (44,044) |
| CMBX NA BBB–.6 Index | BB–/P | 31,126 | 222,000 | 58,719 | 5/11/63 | 300 bp — Monthly | (27,482) |
| CMBX NA BBB–.6 Index | BB–/P | 11,031 | 228,000 | 60,306 | 5/11/63 | 300 bp — Monthly | (49,161) |
| CMBX NA BBB–.6 Index | BB–/P | 11,359 | 229,000 | 60,571 | 5/11/63 | 300 bp — Monthly | (49,097) |
| CMBX NA BBB–.6 Index | BB–/P | 30,867 | 280,000 | 74,060 | 5/11/63 | 300 bp — Monthly | (43,053) |
| CMBX NA BBB–.6 Index | BB–/P | 32,901 | 315,000 | 83,318 | 5/11/63 | 300 bp — Monthly | (50,259) |
| CMBX NA BBB–.7 Index | BB/P | 151,525 | 2,050,000 | 364,490 | 1/17/47 | 300 bp — Monthly | (211,940) |
| JPMorgan Securities LLC | | | | | | | |
| CMBX NA BB.10 Index | B+/P | 8,906 | 111,000 | 27,062 | 5/11/63 | 500 bp — Monthly | (18,063) |
| CMBX NA BB.6 Index | B-/P | 289,832 | 546,233 | 243,565 | 5/11/63 | 500 bp — Monthly | 46,722 |
| CMBX NA BBB– .13 Index | BBB–/P | 473 | 8,000 | 287 | 12/16/72 | 300 bp — Monthly | 190 |
| CMBX NA BBB– .13 Index | BBB–/P | 1,841 | 19,000 | 682 | 12/16/72 | 300 bp — Monthly | 1,168 |
| CMBX NA BBB– .13 Index | BBB–/P | 1,835 | 20,000 | 718 | 12/16/72 | 300 bp — Monthly | 1,127 |
| CMBX NA BBB– .13 Index | BBB–/P | 4,189 | 23,000 | 826 | 12/16/72 | 300 bp — Monthly | 3,375 |
| CMBX NA BBB–.6 Index | BB–/P | 2,246,548 | 7,027,000 | 1,858,642 | 5/11/63 | 300 bp — Monthly | 391,420 |
| Merrill Lynch International | | | | | | | |
| CMBX NA BB.6 Index | B-/P | 5,703 | 49,481 | 22,064 | 5/11/63 | 500 bp — Monthly | (16,320) |
| CMBX NA BBB– .6 Index | BB–/P | 418,453 | 1,553,000 | 410,769 | 5/11/63 | 300 bp — Monthly | 8,461 |
| Morgan Stanley & Co. International PLC | | | | | | |
| CMBX NA A.6 Index | A-/P | 31,775 | 205,000 | 17,364 | 5/11/63 | 200 bp — Monthly | 14,480 |
| CMBX NA BB.13 Index | BB–/P | 4,218 | 44,000 | 3,696 | 12/16/72 | 500 bp — Monthly | 558 |
| CMBX NA BB.13 Index | BB–/P | 5,481 | 57,000 | 4,788 | 12/16/72 | 500 bp — Monthly | 741 |
| CMBX NA BB.13 Index | BB–/P | 6,232 | 67,000 | 5,628 | 12/16/72 | 500 bp — Monthly | 659 |
| CMBX NA BB.13 Index | BB–/P | 10,914 | 119,000 | 9,996 | 12/16/72 | 500 bp — Monthly | 1,018 |
| CMBX NA BB.13 Index | BB–/P | 12,929 | 137,000 | 11,508 | 12/16/72 | 500 bp — Monthly | 1,535 |
| CMBX NA BB.13 Index | BB–/P | 15,587 | 162,000 | 13,608 | 12/16/72 | 500 bp — Monthly | 2,114 |
| CMBX NA BB.13 Index | BB–/P | 18,497 | 203,000 | 17,052 | 12/16/72 | 500 bp — Monthly | 1,614 |
| CMBX NA BB.13 Index | BB–/P | 22,815 | 247,000 | 20,748 | 12/16/72 | 500 bp — Monthly | 2,273 |
| CMBX NA BB.13 Index | BB–/P | 24,422 | 266,000 | 22,344 | 12/16/72 | 500 bp — Monthly | 2,300 |
| CMBX NA BB.6 Index | B-/P | 7,658 | 61,124 | 27,255 | 5/11/63 | 500 bp — Monthly | (19,546) |
| |
| 38 Putnam VT Diversified Income Fund |
| | | | | | | |
| OTC CREDIT DEFAULT CONTRACTS OUTSTANDING — PROTECTION SOLD at 6/30/21 (Unaudited) cont. | | | |
| | | Upfront | | | | | |
| | | premium | | | Termi- | | Unrealized |
| Swap counterparty/ | | received | Notional | | nation | Payments | appreciation/ |
| Referenced debt* | Rating*** | (paid)** | amount | Value | date | received by fund | (depreciation) |
| Morgan Stanley & Co. International PLC cont. | | | | | | |
| CMBX NA BB.6 Index | B-/P | $35,608 | $140,682 | $62,730 | 5/11/63 | 500 bp — Monthly | $(27,005) |
| CMBX NA BB.6 Index | B-/P | 98,879 | 226,061 | 100,801 | 5/11/63 | 500 bp — Monthly | (1,733) |
| CMBX NA BB.6 Index | B-/P | 105,000 | 242,555 | 108,155 | 5/11/63 | 500 bp — Monthly | (2,953) |
| CMBX NA BB.6 Index | B-/P | 71,706 | 282,333 | 125,892 | 5/11/63 | 500 bp — Monthly | (53,952) |
| CMBX NA BB.9 Index | B+/P | 1,602 | 4,000 | 885 | 9/17/58 | 500 bp — Monthly | 721 |
| CMBX NA BBB– .13 Index | BBB–/P | 1,214 | 13,000 | 467 | 12/16/72 | 300 bp — Monthly | 754 |
| CMBX NA BBB– .13 Index | BBB–/P | 769 | 13,000 | 467 | 12/16/72 | 300 bp — Monthly | 309 |
| CMBX NA BBB– .13 Index | BBB–/P | 4,672 | 23,000 | 826 | 12/16/72 | 300 bp — Monthly | 3,857 |
| CMBX NA BBB– .13 Index | BBB–/P | 4,042 | 44,000 | 1,580 | 12/16/72 | 300 bp — Monthly | 2,484 |
| CMBX NA BBB– .14 Index | BBB–/P | 182 | 6,000 | 103 | 12/16/72 | 300 bp — Monthly | 83 |
| CMBX NA BBB– .14 Index | BBB–/P | 1,353 | 48,000 | 821 | 12/16/72 | 300 bp — Monthly | 556 |
| CMBX NA BBB–.12 Index | BBB–/P | 1,945 | 33,000 | 1,198 | 8/17/61 | 300 bp — Monthly | 763 |
| CMBX NA BBB–.12 Index | BBB–/P | 5,925 | 138,000 | 5,009 | 8/17/61 | 300 bp — Monthly | 985 |
| CMBX NA BBB–.13 Index | BBB–/P | 1,180 | 18,000 | 646 | 12/16/72 | 300 bp — Monthly | 542 |
| CMBX NA BBB–.14 Index | BBB–/P | 1,077 | 25,000 | 428 | 12/16/72 | 300 bp — Monthly | 662 |
| CMBX NA BBB–.6 Index | BB–/P | 7,485 | 114,000 | 30,153 | 5/11/63 | 300 bp — Monthly | (22,611) |
| CMBX NA BBB–.6 Index | BB–/P | 7,592 | 115,000 | 30,418 | 5/11/63 | 300 bp — Monthly | (22,768) |
| CMBX NA BBB–.6 Index | BB–/P | 120,750 | 350,000 | 92,575 | 5/11/63 | 300 bp — Monthly | 28,350 |
| CMBX NA BBB–.6 Index | BB–/P | 451,855 | 6,820,500 | 1,804,022 | 5/11/63 | 300 bp — Monthly | (1,348,754) |
| Upfront premium received | | 6,595,629 | Unrealized appreciation | | | 755,643 |
| Upfront premium (paid) | | — | Unrealized (depreciation) | | (5,614,773) |
| Total | | $6,595,629 | Total | | | $(4,859,130) |
* Payments related to the referenced debt are made upon a credit default event.
** Upfront premium is based on the difference between the original spread on issue and the market spread on day of execution.
*** Ratings for an underlying index represent the average of the ratings of all the securities included in that index. The Moody’s, Standard & Poor’s or Fitch ratings are believed to be the most recent ratings available at June 30, 2021. Securities rated by Putnam are indicated by “/P.” The Putnam rating categories are comparable to the Standard & Poor’s classifications.
| | | | | | |
| OTC CREDIT DEFAULT CONTRACTS OUTSTANDING — PROTECTION PURCHASED at 6/30/21 (Unaudited) | | | |
| | Upfront | | | | | |
| | premium | | | Termi- | Payments | Unrealized |
| Swap counterparty/ | received | Notional | | nation | (paid) | appreciation/ |
| Referenced debt* | (paid)** | amount | Value | date | by fund | (depreciation) |
| Citigroup Global Markets, Inc. | | | | | | |
| CMBX NA BB.10 Index | $(39,270) | $154,000 | $37,545 | 11/17/59 | (500 bp) — Monthly | $(1,853) |
| CMBX NA BB.10 Index | (10,541) | 101,000 | 24,624 | 11/17/59 | (500 bp) — Monthly | 13,999 |
| CMBX NA BB.10 Index | (9,210) | 84,000 | 20,479 | 11/17/59 | (500 bp) — Monthly | 11,199 |
| CMBX NA BB.11 Index | (33,038) | 255,000 | 22,721 | 11/18/54 | (500 bp) — Monthly | (10,530) |
| CMBX NA BB.11 Index | (9,803) | 104,000 | 9,266 | 11/18/54 | (500 bp) — Monthly | (624) |
| CMBX NA BB.11 Index | (3,316) | 65,000 | 5,792 | 11/18/54 | (500 bp) — Monthly | 2,422 |
| CMBX NA BB.11 Index | (2,075) | 40,000 | 3,564 | 11/18/54 | (500 bp) — Monthly | 1,456 |
| CMBX NA BB.12 Index | (2,610) | 8,000 | 756 | 8/17/61 | (500 bp) — Monthly | (1,861) |
| CMBX NA BB.8 Index | (6,208) | 48,265 | 17,332 | 10/17/57 | (500 bp) — Monthly | 11,083 |
| CMBX NA BB.9 Index | (50,474) | 489,000 | 108,167 | 9/17/58 | (500 bp) — Monthly | 57,285 |
| CMBX NA BB.9 Index | (6,258) | 97,000 | 21,456 | 9/17/58 | (500 bp) — Monthly | 15,117 |
| CMBX NA BB.9 Index | (2,630) | 67,000 | 14,820 | 9/17/58 | (500 bp) — Monthly | 12,135 |
| CMBX NA BB.9 Index | (1,668) | 46,000 | 10,175 | 9/17/58 | (500 bp) — Monthly | 8,469 |
| CMBX NA BB.9 Index | (1,854) | 46,000 | 10,175 | 9/17/58 | (500 bp) — Monthly | 8,282 |
| CMBX NA BBB– .10 Index | (117,433) | 683,000 | 60,377 | 11/17/59 | (300 bp) — Monthly | (57,397) |
| CMBX NA BBB– .10 Index | (28,552) | 123,000 | 10,873 | 11/17/59 | (300 bp) — Monthly | (17,740) |
| CMBX NA BBB– .10 Index | (21,710) | 91,000 | 8,044 | 11/17/59 | (300 bp) — Monthly | (13,711) |
| CMBX NA BBB– .10 Index | (12,443) | 57,000 | 5,039 | 11/17/59 | (300 bp) — Monthly | (7,432) |
| CMBX NA BBB– .10 Index | (11,535) | 53,000 | 4,685 | 11/17/59 | (300 bp) — Monthly | (6,876) |
| CMBX NA BBB– .10 Index | (3,428) | 27,000 | 2,387 | 11/17/59 | (300 bp) — Monthly | (1,055) |
| CMBX NA BBB– .12 Index | (4,819) | 70,000 | 2,541 | 8/17/61 | (300 bp) — Monthly | (2,313) |
| |
| Putnam VT Diversified Income Fund 39 |
| | | | | | |
| OTC CREDIT DEFAULT CONTRACTS OUTSTANDING — PROTECTION PURCHASED at 6/30/21 (Unaudited) cont. | | | |
| | Upfront | | | | | |
| | premium | | | Termi- | Payments | Unrealized |
| Swap counterparty/ | received | Notional | | nation | (paid) | appreciation/ |
| Referenced debt* | (paid)** | amount | Value | date | by fund | (depreciation) |
| Citigroup Global Markets, Inc. cont. | | | | | | |
| CMBX NA BBB–.10 Index | $(14,314) | $117,000 | $10,343 | 11/17/59 | (300 bp) — Monthly | $(4,029) |
| CMBX NA BBB–.10 Index | (5,991) | 47,000 | 4,155 | 11/17/59 | (300 bp) — Monthly | (1,860) |
| CMBX NA BBB–.10 Index | (3,569) | 28,000 | 2,475 | 11/17/59 | (300 bp) — Monthly | (1,108) |
| CMBX NA BBB–.11 Index | (32,007) | 100,000 | 3,460 | 11/18/54 | (300 bp) — Monthly | (28,597) |
| CMBX NA BBB–.12 Index | (60,146) | 180,000 | 6,534 | 8/17/61 | (300 bp) — Monthly | (53,702) |
| CMBX NA BBB–.12 Index | (54,225) | 156,000 | 5,663 | 8/17/61 | (300 bp) — Monthly | (48,640) |
| CMBX NA BBB–.12 Index | (29,175) | 83,000 | 3,013 | 8/17/61 | (300 bp) — Monthly | (26,204) |
| CMBX NA BBB–.12 Index | (334) | 1,000 | 36 | 8/17/61 | (300 bp) — Monthly | (298) |
| CMBX NA BBB–.13 Index | (2,273) | 30,000 | 1,077 | 12/16/72 | (300 bp) — Monthly | (1,211) |
| CMBX NA BBB–.8 Index | (18,652) | 118,000 | 16,331 | 10/17/57 | (300 bp) — Monthly | (2,380) |
| CMBX NA BBB–.8 Index | (18,725) | 118,000 | 16,331 | 10/17/57 | (300 bp) — Monthly | (2,453) |
| CMBX NA BBB–.8 Index | (12,500) | 80,000 | 11,072 | 10/17/57 | (300 bp) — Monthly | (1,468) |
| CMBX NA BBB–.8 Index | (7,586) | 53,000 | 7,335 | 10/17/57 | (300 bp) — Monthly | (277) |
| CMBX NA BBB–.8 Index | (1,722) | 11,000 | 1,522 | 10/17/57 | (300 bp) — Monthly | (205) |
| CMBX NA BBB–.9 Index | (4,259) | 18,000 | 1,400 | 9/17/58 | (300 bp) — Monthly | (2,867) |
| Credit Suisse International | | | | | | |
| CMBX NA BB.10 Index | (24,973) | 210,000 | 51,198 | 11/17/59 | (500 bp) — Monthly | 26,050 |
| CMBX NA BB.10 Index | (28,019) | 210,000 | 51,198 | 11/17/59 | (500 bp) — Monthly | 23,004 |
| CMBX NA BB.10 Index | (13,797) | 111,000 | 27,062 | 11/17/59 | (500 bp) — Monthly | 13,172 |
| CMBX NA BB.7 Index | (9,602) | 527,799 | 235,345 | 5/11/63 | (500 bp) — Monthly | 225,304 |
| CMBX NA BB.7 Index | (46,385) | 282,000 | 97,798 | 1/17/47 | (500 bp) — Monthly | 51,177 |
| CMBX NA BB.7 Index | (25,825) | 140,000 | 48,552 | 1/17/47 | (500 bp) — Monthly | 22,610 |
| CMBX NA BB.9 Index | (72,579) | 724,000 | 160,149 | 9/17/58 | (500 bp) — Monthly | 86,967 |
| Goldman Sachs International | | | | | | |
| CMBX NA BB.6 Index | (29,155) | 276,512 | 123,297 | 5/11/63 | (500 bp) — Monthly | 93,911 |
| CMBX NA BB.7 Index | (27,088) | 179,000 | 62,077 | 1/17/47 | (500 bp) — Monthly | 34,840 |
| CMBX NA A .6 Index | (6,956) | 105,000 | 8,894 | 5/11/63 | (200 bp) — Monthly | 1,902 |
| CMBX NA BB.6 Index | (36,089) | 239,644 | 106,857 | 5/11/63 | (500 bp) — Monthly | 70,569 |
| CMBX NA BB.7 Index | (38,548) | 228,000 | 79,070 | 1/17/47 | (500 bp) — Monthly | 40,332 |
| CMBX NA BB.7 Index | (35,390) | 216,000 | 74,909 | 1/17/47 | (500 bp) — Monthly | 39,339 |
| CMBX NA BB.7 Index | (26,396) | 130,000 | 45,084 | 1/17/47 | (500 bp) — Monthly | 18,579 |
| CMBX NA BB.7 Index | (6,572) | 36,000 | 12,485 | 1/17/47 | (500 bp) — Monthly | 5,883 |
| CMBX NA BB.8 Index | (57,836) | 159,273 | 57,195 | 10/17/57 | (500 bp) — Monthly | (774) |
| CMBX NA BB.8 Index | (57,936) | 159,273 | 57,195 | 10/17/57 | (500 bp) — Monthly | (873) |
| CMBX NA BB.8 Index | (1,813) | 15,445 | 5,546 | 10/17/57 | (500 bp) — Monthly | 3,721 |
| CMBX NA BB.9 Index | (3,025) | 19,000 | 4,203 | 9/17/58 | (500 bp) — Monthly | 1,162 |
| CMBX NA BB.9 Index | (1,438) | 9,000 | 1,991 | 9/17/58 | (500 bp) — Monthly | 546 |
| CMBX NA BB.9 Index | (1,264) | 8,000 | 1,770 | 9/17/58 | (500 bp) — Monthly | 499 |
| CMBX NA BB.9 Index | (39) | 1,000 | 221 | 9/17/58 | (500 bp) — Monthly | 182 |
| CMBX NA BBB– .10 Index | (4,812) | 22,000 | 1,945 | 11/17/59 | (300 bp) — Monthly | (2,878) |
| CMBX NA BBB– .12 Index | (4,289) | 22,000 | 799 | 8/17/61 | (300 bp) — Monthly | (3,501) |
| CMBX NA BBB–.12 Index | (11,482) | 34,000 | 1,234 | 8/17/61 | (300 bp) — Monthly | (10,265) |
| CMBX NA BBB–.13 Index | (6,290) | 83,000 | 2,980 | 12/16/72 | (300 bp) — Monthly | (3,351) |
| CMBX NA BBB–.6 Index | (71,123) | 261,000 | 69,035 | 5/11/63 | (300 bp) — Monthly | (2,219) |
| CMBX NA BBB–.8 Index | (11,604) | 74,000 | 10,242 | 10/17/57 | (300 bp) — Monthly | (1,400) |
| CMBX NA BBB–.8 Index | (3,086) | 20,000 | 2,768 | 10/17/57 | (300 bp) — Monthly | (328) |
| JPMorgan Securities LLC | | | | | | |
| CMBX NA BB.11 Index | (129,802) | 238,000 | 21,206 | 11/18/54 | (500 bp) — Monthly | (108,794) |
| CMBX NA BB.17 Index | (201,248) | 411,000 | 142,535 | 1/17/47 | (500 bp) — Monthly | (59,056) |
| CMBX NA BB.8 Index | (27,259) | 53,091 | 19,065 | 10/17/57 | (500 bp) — Monthly | (8,239) |
| CMBX NA BB.9 Index | (14,826) | 30,000 | 6,636 | 9/17/58 | (500 bp) — Monthly | (8,215) |
| CMBX NA BBB– .10 Index | (8,576) | 52,000 | 4,597 | 11/17/59 | (300 bp) — Monthly | (4,005) |
| CMBX NA BBB–.10 Index | (18,029) | 64,000 | 5,658 | 11/17/59 | (300 bp) — Monthly | (12,404) |
| |
| 40 Putnam VT Diversified Income Fund |
| | | | | | |
| OTC CREDIT DEFAULT CONTRACTS OUTSTANDING — PROTECTION PURCHASED at 6/30/21 (Unaudited) cont. | | | |
| | Upfront | | | | | |
| | premium | | | Termi- | Payments | Unrealized |
| Swap counterparty/ | received | Notional | | nation | (paid) | appreciation/ |
| Referenced debt* | (paid)** | amount | Value | date | by fund | (depreciation) |
| JPMorgan Securities LLC cont. | | | | | | |
| CMBX NA BBB–.10 Index | $(13,109) | $44,000 | $3,890 | 11/17/59 | (300 bp) — Monthly | $(9,241) |
| CMBX NA BBB–.11 Index | (22,315) | 71,000 | 2,457 | 11/18/54 | (300 bp) — Monthly | (19,894) |
| CMBX NA BBB–.11 Index | (4,708) | 15,000 | 519 | 11/18/54 | (300 bp) — Monthly | (4,196) |
| CMBX NA BBB–.11 Index | (4,715) | 15,000 | 519 | 11/18/54 | (300 bp) — Monthly | (4,203) |
| CMBX NA BBB–.12 Index | (2,032) | 52,000 | 1,888 | 8/17/61 | (300 bp) — Monthly | (170) |
| CMBX NA BBB–.7 Index | (499,810) | 2,129,000 | 378,536 | 1/17/47 | (300 bp) — Monthly | (122,338) |
| Merrill Lynch International | | | | | | |
| CMBX NA BB.10 Index | (11,494) | 202,000 | 49,248 | 11/17/59 | (500 bp) — Monthly | 37,586 |
| CMBX NA BB.11 Index | (7,414) | 15,000 | 1,337 | 11/18/54 | (500 bp) — Monthly | (6,090) |
| CMBX NA BB.9 Index | (15,037) | 386,000 | 85,383 | 9/17/58 | (500 bp) — Monthly | 70,024 |
| CMBX NA BBB– .10 Index | (11,267) | 52,000 | 4,597 | 11/17/59 | (300 bp) — Monthly | (6,696) |
| CMBX NA BBB–.7 Index | (20,241) | 247,000 | 43,917 | 1/17/47 | (300 bp) — Monthly | 23,552 |
| Morgan Stanley & Co. International PLC | | | | | | |
| CMBX NA BBB–.7 Index | (5,502) | 54,000 | 9,601 | 1/17/47 | (300 bp) — Monthly | 4,072 |
| CMBX NA BB.10 Index | (10,593) | 101,000 | 24,624 | 11/17/59 | (500 bp) — Monthly | 13,947 |
| CMBX NA BB.12 Index | (4,892) | 67,000 | 6,332 | 8/17/61 | (500 bp) — Monthly | 1,384 |
| CMBX NA BB.12 Index | (715) | 10,000 | 945 | 8/17/61 | (500 bp) — Monthly | 222 |
| CMBX NA BB.7 Index | (32,981) | 164,000 | 56,875 | 1/17/47 | (500 bp) — Monthly | 23,757 |
| CMBX NA BB.7 Index | (13,305) | 69,000 | 23,929 | 1/17/47 | (500 bp) — Monthly | 10,567 |
| CMBX NA BB.7 Index | (404) | 2,000 | 694 | 1/17/47 | (500 bp) — Monthly | 288 |
| CMBX NA BB.8 Index | (28,090) | 77,223 | 27,731 | 10/17/57 | (500 bp) — Monthly | (423) |
| CMBX NA BB.8 Index | (16,314) | 31,855 | 11,439 | 10/17/57 | (500 bp) — Monthly | (4,902) |
| CMBX NA BB.9 Index | (4,057) | 115,000 | 25,438 | 9/17/58 | (500 bp) — Monthly | 21,285 |
| CMBX NA BB.9 Index | (1,916) | 49,000 | 10,839 | 9/17/58 | (500 bp) — Monthly | 8,882 |
| CMBX NA BB.9 Index | (2,565) | 17,000 | 3,760 | 9/17/58 | (500 bp) — Monthly | 1,181 |
| CMBX NA BB.9 Index | (694) | 14,000 | 3,097 | 9/17/58 | (500 bp) — Monthly | 2,391 |
| CMBX NA BB.9 Index | (1,641) | 12,000 | 2,654 | 9/17/58 | (500 bp) — Monthly | 1,004 |
| CMBX NA BB.9 Index | (1,464) | 11,000 | 2,433 | 9/17/58 | (500 bp) — Monthly | 960 |
| CMBX NA BB.9 Index | (1,223) | 9,000 | 1,991 | 9/17/58 | (500 bp) — Monthly | 761 |
| CMBX NA BB.9 Index | (908) | 6,000 | 1,327 | 9/17/58 | (500 bp) — Monthly | 414 |
| CMBX NA BB.9 Index | (908) | 6,000 | 1,327 | 9/17/58 | (500 bp) — Monthly | 414 |
| CMBX NA BBB– . 8 Index | (2,956) | 19,000 | 2,630 | 10/17/57 | (300 bp) — Monthly | (336) |
| CMBX NA BBB– . 8 Index | (1,568) | 10,000 | 1,384 | 10/17/57 | (300 bp) — Monthly | (189) |
| CMBX NA BBB– .10 Index | (35,401) | 210,000 | 18,564 | 11/17/59 | (300 bp) — Monthly | (16,942) |
| CMBX NA BBB– .10 Index | (15,610) | 66,000 | 5,834 | 11/17/59 | (300 bp) — Monthly | (9,808) |
| CMBX NA BBB– .10 Index | (13,896) | 57,000 | 5,039 | 11/17/59 | (300 bp) — Monthly | (8,886) |
| CMBX NA BBB– .10 Index | (5,991) | 50,000 | 4,420 | 11/17/59 | (300 bp) — Monthly | (1,596) |
| CMBX NA BBB– .10 Index | (7,117) | 31,000 | 2,740 | 11/17/59 | (300 bp) — Monthly | (4,393) |
| CMBX NA BBB– .10 Index | (6,112) | 28,000 | 2,475 | 11/17/59 | (300 bp) — Monthly | (3,651) |
| CMBX NA BBB– .10 Index | (2,182) | 17,000 | 1,503 | 11/17/59 | (300 bp) — Monthly | (688) |
| CMBX NA BBB– .10 Index | (3,252) | 15,000 | 1,326 | 11/17/59 | (300 bp) — Monthly | (1,934) |
| CMBX NA BBB– .10 Index | (3,027) | 14,000 | 1,238 | 11/17/59 | (300 bp) — Monthly | (1,797) |
| CMBX NA BBB–.10 Index | (11,105) | 90,000 | 7,956 | 11/17/59 | (300 bp) — Monthly | (3,194) |
| CMBX NA BBB–.10 Index | (11,288) | 89,000 | 7,868 | 11/17/59 | (300 bp) — Monthly | (3,464) |
| CMBX NA BBB–.10 Index | (6,214) | 49,000 | 4,332 | 11/17/59 | (300 bp) — Monthly | (1,907) |
| CMBX NA BBB–.11 Index | (30,700) | 97,000 | 3,356 | 11/18/54 | (300 bp) — Monthly | (27,392) |
| CMBX NA BBB–.11 Index | (18,102) | 58,000 | 2,007 | 11/18/54 | (300 bp) — Monthly | (16,124) |
| CMBX NA BBB–.11 Index | (2,667) | 47,000 | 1,626 | 11/18/54 | (300 bp) — Monthly | (1,064) |
| CMBX NA BBB–.11 Index | (320) | 1,000 | 35 | 11/18/54 | (300 bp) — Monthly | (286) |
| CMBX NA BBB–.13 Index | (7,765) | 126,000 | 4,523 | 12/16/72 | (300 bp) — Monthly | (3,305) |
| CMBX NA BBB–.7 Index | (5,016) | 79,000 | 14,046 | 1/17/47 | (300 bp) — Monthly | 8,991 |
| CMBX NA BBB–.8 Index | (15,120) | 97,000 | 13,425 | 10/17/57 | (300 bp) — Monthly | (1,744) |
| CMBX NA BBB–.8 Index | (13,168) | 92,000 | 12,733 | 10/17/57 | (300 bp) — Monthly | (481) |
| |
| Putnam VT Diversified Income Fund 41 |
| | | | | | |
| OTC CREDIT DEFAULT CONTRACTS OUTSTANDING — PROTECTION PURCHASED at 6/30/21 (Unaudited) cont. | | | |
| | Upfront | | | | | |
| | premium | | | Termi- | Payments | Unrealized |
| Swap counterparty/ | received | Notional | | nation | (paid) | appreciation/ |
| Referenced debt* | (paid)** | amount | Value | date | by fund | (depreciation) |
| Morgan Stanley & Co. International PLC cont. | | | | | | |
| CMBX NA BBB–.8 Index | $(5,156) | $33,000 | $4,567 | 10/17/57 | (300 bp) — Monthly | $(606) |
| CMBX NA BBB–.8 Index | (4,958) | 32,000 | 4,429 | 10/17/57 | (300 bp) — Monthly | (545) |
| CMBX NA BBB–.8 Index | (2,944) | 19,000 | 2,630 | 10/17/57 | (300 bp) — Monthly | (327) |
| Upfront premium received | — | | Unrealized appreciation | 1,132,878 |
| Upfront premium (paid) | (2,679,453) | | Unrealized (depreciation) | (811,805) |
| Total | $(2,679,453) | | Total | | $321,073 |
* Payments related to the referenced debt are made upon a credit default event.
** Upfront premium is based on the difference between the original spread on issue and the market spread on day of execution.
ASC 820 establishes a three-level hierarchy for disclosure of fair value measurements. The valuation hierarchy is based upon the transparency of inputs to the valuation of the fund’s investments. The three levels are defined as follows:
Level 1: Valuations based on quoted prices for identical securities in active markets.
Level 2: Valuations based on quoted prices in markets that are not active or for which all significant inputs are observable, either directly or indirectly.
Level 3: Valuations based on inputs that are unobservable and significant to the fair value measurement.
The following is a summary of the inputs used to value the fund’s net assets as of the close of the reporting period:
| | | |
| | | Valuation inputs | |
| Investments in securities: | Level 1 | Level 2 | Level 3 |
| Common stocks*: | | | |
| Consumer cyclicals | $139,067 | $5,536 | $— |
| Energy | 31,472 | — | 250 |
| Utilities and power | — | 11,924 | — |
| Total common stocks | 170,539 | 17,460 | 250 |
| Asset-backed securities | — | 705,464 | 495,000 |
| Convertible bonds and notes | — | 11,094,522 | — |
| Corporate bonds and notes | — | 30,218,508 | 4 |
| Foreign government and agency bonds and notes | — | 22,555,795 | — |
| Mortgage-backed securities | — | 72,782,068 | — |
| Preferred stocks | — | 12,832 | — |
| Purchased options outstanding | — | 184,146 | — |
| Purchased swap options outstanding | — | 3,965,419 | — |
| Senior loans | — | 4,252,749 | — |
| U.S. government and agency mortgage obligations | — | 106,810,299 | — |
| U.S. treasury obligations | — | 111,594 | — |
| Short-term investments | 110,000 | 45,220,130 | — |
| Totals by level | $280,539 | $297,930,986 | $495,254 |
| |
| | | Valuation inputs | |
| Other financial instruments: | Level 1 | Level 2 | Level 3 |
| Forward currency contracts | $— | $(840,547) | $— |
| Futures contracts | (143,367) | — | — |
| Written options outstanding | — | (139,959) | — |
| Written swap options outstanding | — | (5,719,024) | — |
| Forward premium swap option contracts | — | 433,186 | — |
| TBA sale commitments | — | (24,416,969) | — |
| Interest rate swap contracts | — | 1,388,344 | — |
| Total return swap contracts | — | (759,998) | — |
| Credit default contracts | — | (8,454,233) | — |
| Totals by level | $(143,367) | $(38,509,200) | $— |
* Common stock classifications are presented at the sector level, which may differ from the fund’s portfolio presentation.
At the start and close of the reporting period, Level 3 investments in securities represented less than 1% of the fund’s net assets and were not considered a significant portion of the fund’s portfolio.
The accompanying notes are an integral part of these financial statements.
| |
| 42 Putnam VT Diversified Income Fund |
Statement of assets and liabilities
6/30/21 (Unaudited)
| |
| Assets | |
| Investment in securities, at value (Notes 1 and 9): | |
| Unaffiliated issuers (identified cost $277,748,444) | $268,685,467 |
| Affiliated issuers (identified cost $30,021,312) (Note 5) | 30,021,312 |
| Cash | 53,179 |
| Foreign currency (cost $8,418) (Note 1) | 8,079 |
| Interest and other receivables | 1,797,300 |
| Receivable for shares of the fund sold | 67,820 |
| Receivable for investments sold | 150,677 |
| Receivable for sales of TBA securities (Note 1) | 15,212,024 |
| Receivable for variation margin on futures contracts (Note 1) | 663 |
| Receivable for variation margin on centrally cleared swap contracts (Note 1) | 617,362 |
| Unrealized appreciation on forward currency contracts (Note 1) | 1,245,859 |
| Unrealized appreciation on forward premium swap option contracts (Note 1) | 4,152,249 |
| Unrealized appreciation on OTC swap contracts (Note 1) | 1,907,274 |
| Premium paid on OTC swap contracts (Note 1) | 2,679,453 |
| Total assets | 326,598,718 |
| |
| Liabilities | |
| Payable for investments purchased | 503,403 |
| Payable for purchases of TBA securities (Note 1) | 97,322,750 |
| Payable for shares of the fund repurchased | 219,463 |
| Payable for compensation of Manager (Note 2) | 79,008 |
| Payable for custodian fees (Note 2) | 60,500 |
| Payable for investor servicing fees (Note 2) | 21,279 |
| Payable for Trustee compensation and expenses (Note 2) | 114,408 |
| Payable for administrative services (Note 2) | 568 |
| Payable for distribution fees (Note 2) | 25,659 |
| Payable for variation margin on futures contracts (Note 1) | 83,187 |
| Payable for variation margin on centrally cleared swap contracts (Note 1) | 635,360 |
| Unrealized depreciation on forward currency contracts (Note 1) | 2,086,406 |
| Unrealized depreciation on forward premium swap option contracts (Note 1) | 3,719,063 |
| Written options outstanding, at value (premiums $5,434,324) (Note 1) | 5,858,983 |
| TBA sale commitments, at value (proceeds receivable $24,343,437) (Note 1) | 24,416,969 |
| Unrealized depreciation on OTC swap contracts (Note 1) | 6,479,927 |
| Premium received on OTC swap contracts (Note 1) | 6,595,629 |
| Collateral on certain derivative contracts, at value (Notes 1 and 9) | 221,594 |
| Other accrued expenses | 119,778 |
| Total liabilities | 148,563,934 |
| | |
| Net assets | $178,034,784 |
| |
| Represented by | |
| Paid-in capital (Unlimited shares authorized) (Notes 1 and 4) | $244,987,123 |
| Total distributable earnings (Note 1) | (66,952,339) |
| Total — Representing net assets applicable to capital shares outstanding | $178,034,784 |
| | |
| Computation of net asset value Class IA | |
| Net assets | $55,415,978 |
| Number of shares outstanding | 9,960,321 |
| Net asset value, offering price and redemption price per share (net assets divided by number of shares outstanding) | $5.56 |
| | |
| Computation of net asset value Class IB | |
| Net assets | $122,618,806 |
| Number of shares outstanding | 21,945,138 |
| Net asset value, offering price and redemption price per share (net assets divided by number of shares outstanding) | $5.59 |
The accompanying notes are an integral part of these financial statements.
| |
| Putnam VT Diversified Income Fund 43 |
Statement of operations
Six months ended 6/30/21 (Unaudited)
| |
| Investment income | |
| Interest (including interest income of $17,634 from investments in affiliated issuers) (Note 5) | $4,214,839 |
| Dividends | 5,630 |
| Total investment income | 4,220,469 |
| |
| Expenses | |
| Compensation of Manager (Note 2) | 486,715 |
| Investor servicing fees (Note 2) | 64,621 |
| Custodian fees (Note 2) | 44,666 |
| Trustee compensation and expenses (Note 2) | 4,112 |
| Distribution fees (Note 2) | 157,489 |
| Administrative services (Note 2) | 1,675 |
| Auditing and tax fees | 77,408 |
| Other | 40,847 |
| Total expenses | 877,533 |
| | |
| Expense reduction (Note 2) | (48) |
| Net expenses | 877,485 |
| | |
| Net investment income | 3,342,984 |
| | |
| Realized and unrealized gain (loss) | |
| Net realized gain (loss) on: | |
| Securities from unaffiliated issuers (Notes 1 and 3) | 5,515,913 |
| Foreign currency transactions (Note 1) | (31,600) |
| Forward currency contracts (Note 1) | (241,106) |
| Futures contracts (Note 1) | (265,197) |
| Swap contracts (Note 1) | (5,227,239) |
| Written options (Note 1) | 313,127 |
| Total net realized gain | 63,898 |
| Change in net unrealized appreciation (depreciation) on: | |
| Securities from unaffiliated issuers and TBA sale commitments | (7,676,977) |
| Assets and liabilities in foreign currencies | (1,457) |
| Forward currency contracts | (994,644) |
| Futures contracts | (74,867) |
| Swap contracts | 2,201,159 |
| Written options | 429,815 |
| Total change in net unrealized depreciation | (6,116,971) |
| | |
| Net loss on investments | (6,053,073) |
| | |
| Net decrease in net assets resulting from operations | $(2,710,089) |
The accompanying notes are an integral part of these financial statements.
| |
| 44 Putnam VT Diversified Income Fund |
Statement of changes in net assets
| | | |
| | | Six months | |
| | | ended | Year ended |
| | | 6/30/21* | 12/31/20 |
| Decrease in net assets | | | |
| Operations: | | | |
| Net investment income | | $3,342,984 | $7,260,224 |
| Net realized gain on investments and foreign currency transactions | | 63,898 | 2,418,999 |
| Change in net unrealized depreciation of investments and assets and liabilities in foreign currencies | | (6,116,971) | (12,682,319) |
| Net decrease in net assets resulting from operations | | (2,710,089) | (3,003,096) |
| Distributions to shareholders (Note 1): | | | |
| From ordinary income | | | |
| Net investment income | | | |
| Class IA | | (511,935) | (4,703,731) |
| Class IB | | (795,004) | (9,864,028) |
| Decrease from capital share transactions (Note 4) | | (1,417,353) | (9,612,440) |
| Total decrease in net assets | | (5,434,381) | (27,183,295) |
| Net assets: | | | |
| Beginning of period | | 183,469,165 | 210,652,460 |
| End of period | | $178,034,784 | $183,469,165 |
* Unaudited.
The accompanying notes are an integral part of these financial statements.
| |
| Putnam VT Diversified Income Fund 45 |
Financial highlights (For a common share outstanding throughout the period)
| | | | | | | | | | | | |
| | | | | LESS | | | |
| INVESTMENT OPERATIONS: | | | | | DISTRIBUTIONS: | | | RATIOS AND SUPPLEMENTAL DATA: |
| Period ended | Net asset value, beginning of period | Net investment income (loss)a | Net realized and unrealized gain (loss) on investments | Total from investment operations | From net investment income | Total distributions | Net asset value, end of period | Total return at net asset value (%)b,c | Net assets, end of period (in thousands) | Ratio of expenses to average net assets (%)b,d | Ratio of net investment income (loss) to average net assets (%) | Portfolio turnover (%)e |
| Class IA | | | | | | | | | | | | |
| 6/30/21† | $5.69 | .11 | (.19) | (.08) | (.05) | (.05) | $5.56 | (1.41)* | $55,416 | .39* | 1.90* | 558* |
| 12/31/20 | 6.26 | .22 | (.33)f | (.11) | (.46) | (.46) | 5.69 | (.76)f | 58,536 | .79 | 4.06 | 1,184 |
| 12/31/19 | 5.82 | .27 | .39 | .66 | (.22) | (.22) | 6.26 | 11.56 | 66,012 | .79 | 4.53 | 987 |
| 12/31/18 | 6.13 | .32 | (.36) | (.04) | (.27) | (.27) | 5.82 | (.74) | 65,046 | .80 | 5.28 | 790 |
| 12/31/17 | 6.06 | .32 | .11 | .43 | (.36) | (.36) | 6.13 | 7.42 | 73,119 | .78 | 5.30 | 1,100 |
| 12/31/16 | 6.21 | .34 | (.03) | .31 | (.46) | (.46) | 6.06 | 5.76 | 77,226 | .79g | 5.89g | 846 |
| Class IB | | | | | | | | | | | | |
| 6/30/21† | $5.71 | .10 | (.18) | (.08) | (.04) | (.04) | $5.59 | (1.49)* | $122,619 | .51* | 1.77* | 558* |
| 12/31/20 | 6.27 | .21 | (.32)f | (.11) | (.45) | (.45) | 5.71 | (.90)f | 124,933 | 1.04 | 3.80 | 1,184 |
| 12/31/19 | 5.83 | .26 | .38 | .64 | (.20) | (.20) | 6.27 | 11.23 | 144,640 | 1.04 | 4.26 | 987 |
| 12/31/18 | 6.14 | .30 | (.35) | (.05) | (.26) | (.26) | 5.83 | (.98) | 130,502 | 1.05 | 5.02 | 790 |
| 12/31/17 | 6.07 | .30 | .12 | .42 | (.35) | (.35) | 6.14 | 7.12 | 136,889 | 1.03 | 5.04 | 1,100 |
| 12/31/16 | 6.22 | .33 | (.04) | .29 | (.44) | (.44) | 6.07 | 5.42 | 139,483 | 1.04g | 5.63g | 846 |
* Not annualized.
† Unaudited.
a Per share net investment income (loss) has been determined on the basis of the weighted average number of shares outstanding during the period.
b The charges and expenses at the insurance company separate account level are not reflected.
c Total return assumes dividend reinvestment.
d Includes amounts paid through expense offset and/or brokerage/service arrangements, if any (Note 2). Also excludes acquired fund fees and expenses, if any.
e Portfolio turnover includes TBA purchase and sale commitments.
f Reflects a non-recurring litigation payment received by the fund from an ISDA Fix Anti-Trust Settlement which amounted to the following amounts per share outstanding on May 4, 2020:
| | | |
| | Per share | | |
| Class IA | $0.03 | | |
| Class IB | 0.03 | | |
This payment resulted in an increase to total returns of 0.52% for the period ended December 31, 2020.
g Reflects a voluntary waiver of certain fund expenses in effect during the period. As a result of such waiver, the expenses of each class reflect a reduction of less than 0.01% as a percentage of average net assets.
The accompanying notes are an integral part of these financial statements.
| |
| 46 Putnam VT Diversified Income Fund |
Notes to financial statements 6/30/21 (Unaudited)
Within the following Notes to financial statements, references to “State Street” represent State Street Bank and Trust Company, references to “the SEC” represent the Securities and Exchange Commission, references to “Putnam Management” represent Putnam Investment Management, LLC, the fund’s manager, an indirect wholly-owned subsidiary of Putnam Investments, LLC and references to “OTC”, if any, represent over-the-counter. Unless otherwise noted, the “reporting period” represents the period from January 1, 2021 through June 30, 2021.
Putnam VT Diversified Income Fund (the fund) is a diversified series of Putnam Variable Trust (the Trust), a Massachusetts business trust registered under the Investment Company Act of 1940, as amended, as an open-end management investment company. The goal of the fund is to seek as high a level of current income as Putnam Management believes is consistent with preservation of capital. The fund invests mainly in bonds that are securitized debt instruments (such as mortgage-backed investments) and other obligations of companies and governments worldwide, are either investment-grade or below-investment-grade in quality (sometimes referred to as “junk bonds”) and have intermediate- to long-term maturities (three years or longer). The fund currently has significant investment exposure to residential and commercial mortgage-backed investments. Putnam Management may consider, among other factors, credit, interest rate and prepayment risks, as well as general market conditions, when deciding whether to buy or sell investments. The fund typically uses to a significant extent derivatives, such as futures, options, certain foreign currency transactions and swap contracts, for both hedging and non-hedging purposes.
The fund offers class IA and class IB shares of beneficial interest. Class IA shares are offered at net asset value and are not subject to a distribution fee. Class IB shares are offered at net asset value and pay an ongoing distribution fee, which is identified in Note 2.
In the normal course of business, the fund enters into contracts that may include agreements to indemnify another party under given circumstances. The fund’s maximum exposure under these arrangements is unknown as this would involve future claims that may be, but have not yet been, made against the fund. However, the fund’s management team expects the risk of material loss to be remote.
The fund has entered into contractual arrangements with an investment adviser, administrator, distributor, shareholder servicing agent and custodian, who each provide services to the fund. Unless expressly stated otherwise, shareholders are not parties to, or intended beneficiaries of these contractual arrangements, and these contractual arrangements are not intended to create any shareholder right to enforce them against the service providers or to seek any remedy under them against the service providers, either directly or on behalf of the fund.
Under the fund’s Amended and Restated Agreement and Declaration of Trust, any claims asserted against or on behalf of the Putnam Funds, including claims against Trustees and Officers, must be brought in state and federal courts located within the Commonwealth of Massachusetts.
Note 1 — Significant accounting policies
The following is a summary of significant accounting policies consistently followed by the fund in the preparation of its financial statements. The preparation of financial statements is in conformity with accounting principles generally accepted in the United States of America and requires management to make estimates and assumptions that affect the reported amounts of assets and liabilities in the financial statements and the reported amounts of increases and decreases in net assets from operations. Actual results could differ from those estimates. Subsequent events after the Statement of assets and liabilities date through the date that the financial statements were issued have been evaluated in the preparation of the financial statements.
Investment income, realized and unrealized gains and losses and expenses of the fund are borne pro-rata based on the relative net assets of each class to the total net assets of the fund, except that each class bears expenses unique to that class (including the distribution fees applicable to such classes). Each class votes as a class only with respect to its own distribution plan or other matters on which a class vote is required by law or determined by the Trustees. If the fund were liquidated, shares of each class would receive their pro-rata share of the net assets of the fund. In addition, the Trustees declare separate dividends on each class of shares.
Security valuation Portfolio securities and other investments are valued using policies and procedures adopted by the Board of Trustees. The Trustees have formed a Pricing Committee to oversee the implementation of these procedures and have delegated responsibility for valuing the fund’s assets in accordance with these procedures to Putnam Management. Putnam Management has established an internal Valuation Committee that is responsible for making fair value determinations, evaluating the effectiveness of the pricing policies of the fund and reporting to the Pricing Committee.
Investments for which market quotations are readily available are valued at the last reported sales price on their principal exchange, or official closing price for certain markets, and are classified as Level 1 securities under Accounting Standards Codification 820 Fair Value Measurements and Disclosures (ASC 820). If no sales are reported, as in the case of some securities that are traded OTC, a security is valued at its last reported bid price and is generally categorized as a Level 2 security.
Investments in open-end investment companies (excluding exchange-traded funds), if any, which can be classified as Level 1 or Level 2 securities, are valued based on their net asset value. The net asset value of such investment companies equals the total value of their assets less their liabilities and divided by the number of their outstanding shares.
Market quotations are not considered to be readily available for certain debt obligations (including short-term investments with remaining maturities of 60 days or less) and other investments; such investments are valued on the basis of valuations furnished by an independent pricing service approved by the Trustees or dealers selected by Putnam Management. Such services or dealers determine valuations for normal institutional-size trading units of such securities using methods based on market transactions for comparable securities and various relationships, generally recognized by institutional traders, between securities (which consider such factors as security prices, yields, maturities and ratings). These securities will generally be categorized as Level 2.
Many securities markets and exchanges outside the U.S. close prior to the scheduled close of the New York Stock Exchange and therefore the closing prices for securities in such markets or on such exchanges may not fully reflect events that occur after such close but before the scheduled close of the New York Stock Exchange. Accordingly, on certain days, the fund will fair value certain foreign equity securities taking into account multiple factors including movements in the U.S. securities markets, currency valuations and comparisons to the valuation of American Depository Receipts, exchange-traded funds and futures contracts. The foreign equity securities, which would generally be classified as Level 1 securities, will be transferred to Level 2 of the fair value hierarchy when they are valued at fair value. The number of days on which fair value prices will be used will depend on market activity and it is possible that fair value prices will be used by the fund to a significant extent. Securities quoted in foreign currencies, if any, are translated into U.S. dollars at the current exchange rate.
To the extent a pricing service or dealer is unable to value a security or provides a valuation that Putnam Management does not believe accurately reflects the security’s fair value, the security will be valued at fair value by Putnam Management in accordance with policies and procedures approved by the Trustees. Certain investments, including certain restricted and illiquid securities and derivatives, are also valued at fair value following procedures approved by the Trustees. These valuations consider such factors as significant market or specific security events such as interest rate or credit quality changes, various relationships with other securities, discount rates, U.S. Treasury, U.S. swap and credit yields, index levels, convexity exposures, recovery rates, sales and other multiples and resale restrictions. These securities are classified as Level 2 or as Level 3 depending on the priority of the significant inputs.
To assess the continuing appropriateness of fair valuations, the Valuation Committee reviews and affirms the reasonableness of such valuations on a regular basis after considering all relevant information that is reasonably available. Such valuations and procedures are reviewed periodically by the Trustees. Certain securities may be valued on the basis of a price provided by a single source. The fair value of securities is generally determined as the amount that the fund could reasonably expect to realize from an orderly disposition of such securities over a reasonable period of time. By its nature, a fair value price is a good faith estimate of the value of a security in a current sale and does not reflect an actual market price, which may be different by a material amount.
Security transactions and related investment income Security transactions are recorded on the trade date (the date the order to buy or sell is executed). Gains or losses on securities sold are determined on the identified cost basis.
Interest income, net of any applicable withholding taxes, if any, and including amortization and accretion of premiums and discounts on debt securities, is
| |
| Putnam VT Diversified Income Fund 47 |
recorded on the accrual basis. Dividend income, net of any applicable withholding taxes, is recognized on the ex-dividend date except that certain dividends from foreign securities, if any, are recognized as soon as the fund is informed of the ex-dividend date. Non-cash dividends, if any, are recorded at the fair value of the securities received. Dividends representing a return of capital or capital gains, if any, are reflected as a reduction of cost and/or as a realized gain.
The fund may have earned certain fees in connection with its senior loan purchasing activities. These fees, if any, are treated as market discount and are amortized into income in the Statement of operations.
Stripped securities The fund may invest in stripped securities which represent a participation in securities that may be structured in classes with rights to receive different portions of the interest and principal. Interest-only securities receive all of the interest and principal-only securities receive all of the principal. If the interest-only securities experience greater than anticipated prepayments of principal, the fund may fail to recoup fully its initial investment in these securities. Conversely, principal-only securities increase in value if prepayments are greater than anticipated and decline if prepayments are slower than anticipated. The fair value of these securities is highly sensitive to changes in interest rates.
Foreign currency translation The accounting records of the fund are maintained in U.S. dollars. The fair value of foreign securities, currency holdings, and other assets and liabilities is recorded in the books and records of the fund after translation to U.S. dollars based on the exchange rates on that day. The cost of each security is determined using historical exchange rates. Income and withholding taxes are translated at prevailing exchange rates when earned or incurred. The fund does not isolate that portion of realized or unrealized gains or losses resulting from changes in the foreign exchange rate on investments from fluctuations arising from changes in the market prices of the securities. Such gains and losses are included with the net realized and unrealized gain or loss on investments. Net realized gains and losses on foreign currency transactions represent net realized exchange gains or losses on disposition of foreign currencies, currency gains and losses realized between the trade and settlement dates on securities transactions and the difference between the amount of investment income and foreign withholding taxes recorded on the fund’s books and the U.S. dollar equivalent amounts actually received or paid. Net unrealized appreciation and depreciation of assets and liabilities in foreign currencies arise from changes in the value of assets and liabilities other than investments at the period end, resulting from changes in the exchange rate.
Options contracts The fund uses options contracts to hedge duration and convexity, to isolate prepayment risk and to manage downside risks.
The potential risk to the fund is that the change in value of options contracts may not correspond to the change in value of the hedged instruments. In addition, losses may arise from changes in the value of the underlying instruments if there is an illiquid secondary market for the contracts, if interest or exchange rates move unexpectedly or if the counterparty to the contract is unable to perform. Realized gains and losses on purchased options are included in realized gains and losses on investment securities. If a written call option is exercised, the premium originally received is recorded as an addition to sales proceeds. If a written put option is exercised, the premium originally received is recorded as a reduction to the cost of investments.
Exchange-traded options are valued at the last sale price or, if no sales are reported, the last bid price for purchased options and the last ask price for written options. OTC traded options are valued using prices supplied by dealers.
Options on swaps are similar to options on securities except that the premium paid or received is to buy or grant the right to enter into a previously agreed upon interest rate or credit default contract. Forward premium swap option contracts include premiums that have extended settlement dates. The delayed settlement of the premiums is factored into the daily valuation of the option contracts. In the case of interest rate cap and floor contracts, in return for a premium, ongoing payments between two parties are based on interest rates exceeding a specified rate, in the case of a cap contract, or falling below a specified rate in the case of a floor contract.
Written option contracts outstanding at period end, if any, are listed after the fund’s portfolio.
Futures contracts The fund uses futures contracts for hedging treasury term structure risk and for yield curve positioning.
The potential risk to the fund is that the change in value of futures contracts may not correspond to the change in value of the hedged instruments. In addition, losses may arise from changes in the value of the underlying instruments, if there is an illiquid secondary market for the contracts, if interest or exchange rates move unexpectedly or if the counterparty to the contract is unable to perform. With futures, there is minimal counterparty credit risk to the fund since futures are exchange traded and the exchange’s clearinghouse, as counterparty to all exchange traded futures, guarantees the futures against default. Risks may exceed amounts recognized on the Statement of assets and liabilities. When the contract is closed, the fund records a realized gain or loss equal to the difference between the value of the contract at the time it was opened and the value at the time it was closed.
Futures contracts are valued at the quoted daily settlement prices established by the exchange on which they trade. The fund and the broker agree to exchange an amount of cash equal to the daily fluctuation in the value of the futures contract. Such receipts or payments are known as “variation margin.”
Futures contracts outstanding at period end, if any, are listed after the fund’s portfolio.
Forward currency contracts The fund buys and sells forward currency contracts, which are agreements between two parties to buy and sell currencies at a set price on a future date. These contracts are used for hedging currency exposures and to gain exposure to currencies.
The U.S. dollar value of forward currency contracts is determined using current forward currency exchange rates supplied by a quotation service. The fair value of the contract will fluctuate with changes in currency exchange rates. The contract is marked to market daily and the change in fair value is recorded as an unrealized gain or loss. The fund records a realized gain or loss equal to the difference between the value of the contract at the time it was opened and the value at the time it was closed when the contract matures or by delivery of the currency. The fund could be exposed to risk if the value of the currency changes unfavorably, if the counterparties to the contracts are unable to meet the terms of their contracts or if the fund is unable to enter into a closing position. Risks may exceed amounts recognized on the Statement of assets and liabilities.
Forward currency contracts outstanding at period end, if any, are listed after the fund’s portfolio.
Interest rate swap contracts The fund entered into OTC and/or centrally cleared interest rate swap contracts, which are arrangements between two parties to exchange cash flows based on a notional principal amount, for hedging term structure risk, for yield curve positioning and for gaining exposure to rates in various countries.
An OTC and centrally cleared interest rate swap can be purchased or sold with an upfront premium. For OTC interest rate swap contracts, an upfront payment received by the fund is recorded as a liability on the fund’s books. An upfront payment made by the fund is recorded as an asset on the fund’s books. OTC and centrally cleared interest rate swap contracts are marked to market daily based upon quotations from an independent pricing service or market makers. Any change is recorded as an unrealized gain or loss on OTC interest rate swaps. Daily fluctuations in the value of centrally cleared interest rate swaps are settled through a central clearing agent and are recorded in variation margin on the Statement of assets and liabilities and recorded as unrealized gain or loss. Payments, including upfront premiums, received or made are recorded as realized gains or losses at the reset date or the closing of the contract. Certain OTC and centrally cleared interest rate swap contracts may include extended effective dates. Payments related to these swap contracts are accrued based on the terms of the contract.
The fund could be exposed to credit or market risk due to unfavorable changes in the fluctuation of interest rates or if the counterparty defaults, in the case of OTC interest rate contracts, or the central clearing agency or a clearing member defaults, in the case of centrally cleared interest rate swap contracts, on its respective obligation to perform under the contract. The fund’s maximum risk of loss from counterparty risk or central clearing risk is the fair value of the contract. This risk may be mitigated for OTC interest rate swap contracts by having a master netting arrangement between the fund and the counterparty and for centrally cleared interest rate swap contracts through the daily exchange of variation margin. There is minimal counterparty risk with respect to centrally cleared interest rate swap contracts due to the clearinghouse guarantee fund and other resources that are available in the event of a clearing member default. Risk of loss may exceed amounts recognized on the Statement of assets and liabilities.
OTC and centrally cleared interest rate swap contracts outstanding, including their respective notional amounts at period end, if any, are listed after the fund’s portfolio.
Total return swap contracts The fund entered into OTC and/or centrally cleared total return swap contracts, which are arrangements to exchange a market-linked return for a periodic payment, both based on a notional principal amount, to
| |
| 48 Putnam VT Diversified Income Fund |
hedge sector exposure, for gaining exposure to specific sectors, for hedging inflation and for gaining exposure to inflation.
To the extent that the total return of the security, index or other financial measure underlying the transaction exceeds or falls short of the offsetting interest rate obligation, the fund will receive a payment from or make a payment to the counterparty. OTC and/or centrally cleared total return swap contracts are marked to market daily based upon quotations from an independent pricing service or market maker. Any change is recorded as an unrealized gain or loss on OTC total return swaps. Daily fluctuations in the value of centrally cleared total return swaps are settled through a central clearing agent and are recorded in variation margin on the Statement of assets and liabilities and recorded as unrealized gain or loss. Payments received or made are recorded as realized gains or losses. Certain OTC and/or centrally cleared total return swap contracts may include extended effective dates. Payments related to these swap contracts are accrued based on the terms of the contract. The fund could be exposed to credit or market risk due to unfavorable changes in the fluctuation of interest rates or in the price of the underlying security or index, the possibility that there is no liquid market for these agreements or that the counterparty may default on its obligation to perform. The fund’s maximum risk of loss from counterparty risk or central clearing risk is the fair value of the contract. This risk may be mitigated for OTC total return swap contracts by having a master netting arrangement between the fund and the counterparty and for centrally cleared total return swap contracts through the daily exchange of variation margin. There is minimal counterparty risk with respect to centrally cleared total return swap contracts due to the clearinghouse guarantee fund and other resources that are available in the event of a clearing member default. Risk of loss may exceed amounts recognized on the Statement of assets and liabilities.
OTC and/or centrally cleared total return swap contracts outstanding, including their respective notional amounts at period end, if any, are listed after the fund’s portfolio.
Credit default contracts The fund entered into OTC and/or centrally cleared credit default contracts to hedge credit risk, for gaining liquid exposure to individual names, to hedge market risk and for gaining exposure to specific sectors.
In OTC and centrally cleared credit default contracts, the protection buyer typically makes a periodic stream of payments to a counterparty, the protection seller, in exchange for the right to receive a contingent payment upon the occurrence of a credit event on the reference obligation or all other equally ranked obligations of the reference entity. Credit events are contract specific but may include bankruptcy, failure to pay, restructuring and obligation acceleration. For OTC credit default contracts, an upfront payment received by the fund is recorded as a liability on the fund’s books. An upfront payment made by the fund is recorded as an asset on the fund’s books. Centrally cleared credit default contracts provide the same rights to the protection buyer and seller except the payments between parties, including upfront premiums, are settled through a central clearing agent through variation margin payments. Upfront and periodic payments received or paid by the fund for OTC and centrally cleared credit default contracts are recorded as realized gains or losses at the reset date or close of the contract. The OTC and centrally cleared credit default contracts are marked to market daily based upon quotations from an independent pricing service or market makers. Any change in value of OTC credit default contracts is recorded as an unrealized gain or loss. Daily fluctuations in the value of centrally cleared credit default contracts are recorded in variation margin on the Statement of assets and liabilities and recorded as unrealized gain or loss. Upon the occurrence of a credit event, the difference between the par value and fair value of the reference obligation, net of any proportional amount of the upfront payment, is recorded as a realized gain or loss.
In addition to bearing the risk that the credit event will occur, the fund could be exposed to market risk due to unfavorable changes in interest rates or in the price of the underlying security or index or the possibility that the fund may be unable to close out its position at the same time or at the same price as if it had purchased the underlying reference obligations. In certain circumstances, the fund may enter into offsetting OTC and centrally cleared credit default contracts which would mitigate its risk of loss. Risks of loss may exceed amounts recognized on the Statement of assets and liabilities. The fund’s maximum risk of loss from counterparty risk, either as the protection seller or as the protection buyer, is the fair value of the contract. This risk may be mitigated for OTC credit default contracts by having a master netting arrangement between the fund and the counterparty and for centrally cleared credit default contracts through the daily exchange of variation margin. Counterparty risk is further mitigated with respect to centrally cleared credit default swap contracts due to the clearinghouse guarantee fund and other resources that are available in the event of a clearing member default. Where the fund is a seller of protection, the maximum potential amount of future payments the fund may be required to make is equal to the notional amount.
OTC and centrally cleared credit default contracts outstanding, including their respective notional amounts at period end, if any, are listed after the fund’s portfolio.
TBA commitments The fund may enter into TBA (to be announced) commitments to purchase securities for a fixed unit price at a future date beyond customary settlement time. Although the unit price and par amount have been established, the actual securities have not been specified. However, it is anticipated that the amount of the commitments will not significantly differ from the principal amount. The fund holds, and maintains until settlement date, cash or high-grade debt obligations in an amount sufficient to meet the purchase price, or the fund may enter into offsetting contracts for the forward sale of other securities it owns. Income on the securities will not be earned until settlement date.
The fund may also enter into TBA sale commitments to hedge its portfolio positions, to sell mortgage-backed securities it owns under delayed delivery arrangements or to take a short position in mortgage-backed securities. Proceeds of TBA sale commitments are not received until the contractual settlement date. During the time a TBA sale commitment is outstanding, either equivalent deliverable securities or an offsetting TBA purchase commitment deliverable on or before the sale commitment date are held as “cover” for the transaction, or other liquid assets in an amount equal to the notional value of the TBA sale commitment are segregated. If the TBA sale commitment is closed through the acquisition of an offsetting TBA purchase commitment, the fund realizes a gain or loss. If the fund delivers securities under the commitment, the fund realizes a gain or a loss from the sale of the securities based upon the unit price established at the date the commitment was entered into.
TBA commitments, which are accounted for as purchase and sale transactions, may be considered securities themselves, and involve a risk of loss due to changes in the value of the security prior to the settlement date as well as the risk that the counterparty to the transaction will not perform its obligations. Counterparty risk is mitigated by having a master agreement between the fund and the counterparty.
Unsettled TBA commitments are valued at their fair value according to the procedures described under “Security valuation” above. The contract is marked to market daily and the change in fair value is recorded by the fund as an unrealized gain or loss. Based on market circumstances, Putnam Management will determine whether to take delivery of the underlying securities or to dispose of the TBA commitments prior to settlement.
TBA purchase commitments outstanding at period end, if any, are listed within the fund’s portfolio and TBA sale commitments outstanding at period end, if any, are listed after the fund’s portfolio.
Master agreements The fund is a party to ISDA (International Swaps and Derivatives Association, Inc.) Master Agreements that govern OTC derivative and foreign exchange contracts and Master Securities Forward Transaction Agreements that govern transactions involving mortgage-backed and other asset-backed securities that may result in delayed delivery (Master Agreements) with certain counterparties entered into from time to time. The Master Agreements may contain provisions regarding, among other things, the parties’ general obligations, representations, agreements, collateral requirements, events of default and early termination. With respect to certain counterparties, in accordance with the terms of the Master Agreements, collateral pledged to the fund is held in a segregated account by the fund’s custodian and, with respect to those amounts which can be sold or repledged, are presented in the fund’s portfolio.
Collateral pledged by the fund is segregated by the fund’s custodian and identified in the fund’s portfolio. Collateral can be in the form of cash or debt securities issued by the U.S. Government or related agencies or other securities as agreed to by the fund and the applicable counterparty. Collateral requirements are determined based on the fund’s net position with each counterparty.
With respect to ISDA Master Agreements, termination events applicable to the fund may occur upon a decline in the fund’s net assets below a specified threshold over a certain period of time. Termination events applicable to counterparties may occur upon a decline in the counterparty’s long-term or short-term credit ratings below a specified level. In each case, upon occurrence, the other party may elect to terminate early and cause settlement of all derivative and foreign exchange contracts outstanding, including the payment of any losses and costs resulting from such early termination, as reasonably determined by the terminating party. Any decision by one or more of the fund’s counterparties to elect early termination could impact the fund’s future derivative activity.
| |
| Putnam VT Diversified Income Fund 49 |
At the close of the reporting period, the fund had a net liability position of $10,859,602 on open derivative contracts subject to the Master Agreements. Collateral pledged by the fund at period end for these agreements totaled $10,757,171 and may include amounts related to unsettled agreements.
Interfund lending The fund, along with other Putnam funds, may participate in an interfund lending program pursuant to an exemptive order issued by the SEC. This program allows the fund to borrow from or lend to other Putnam funds that permit such transactions. Interfund lending transactions are subject to each fund’s investment policies and borrowing and lending limits. Interest earned or paid on the interfund lending transaction will be based on the average of certain current market rates. During the reporting period, the fund did not utilize the program.
Lines of credit The fund participates, along with other Putnam funds, in a $317.5 million unsecured committed line of credit and a $235.5 million unsecured uncommitted line of credit, both provided by State Street. Borrowings may be made for temporary or emergency purposes, including the funding of shareholder redemption requests and trade settlements. Interest is charged to the fund based on the fund’s borrowing at a rate equal to 1.25% plus the higher of (1) the Federal Funds rate and (2) the Overnight Bank Funding Rate for the committed line of credit and 1.30% plus the higher of (1) the Federal Funds rate and (2) the Overnight Bank Funding Rate for the uncommitted line of credit. A closing fee equal to 0.04% of the committed line of credit and 0.04% of the uncommitted line of credit has been paid by the participating funds. In addition, a commitment fee of 0.21% per annum on any unutilized portion of the committed line of credit is allocated to the participating funds based on their relative net assets and paid quarterly. During the reporting period, the fund had no borrowings against these arrangements.
Federal taxes It is the policy of the fund to distribute all of its taxable income within the prescribed time period and otherwise comply with the provisions of the Internal Revenue Code of 1986, as amended (the Code), applicable to regulated investment companies.
The fund is subject to the provisions of Accounting Standards Codification 740 Income Taxes (ASC 740). ASC 740 sets forth a minimum threshold for financial statement recognition of the benefit of a tax position taken or expected to be taken in a tax return. The fund did not have a liability to record for any unrecognized tax benefits in the accompanying financial statements. No provision has been made for federal taxes on income, capital gains or unrealized appreciation on securities held nor for excise tax on income and capital gains. Each of the fund’s federal tax returns for the prior three fiscal years remains subject to examination by the Internal Revenue Service.
The fund may also be subject to taxes imposed by governments of countries in which it invests. Such taxes are generally based on either income or gains earned or repatriated. The fund accrues and applies such taxes to net investment income, net realized gains and net unrealized gains as income and/or capital gains are earned. In some cases, the fund may be entitled to reclaim all or a portion of such taxes, and such reclaim amounts, if any, are reflected as an asset on the fund’s books. In many cases, however, the fund may not receive such amounts for an extended period of time, depending on the country of investment.
Under the Regulated Investment Company Modernization Act of 2010, the fund will be permitted to carry forward capital losses incurred for an unlimited period and the carry forwards will retain their character as either short-term or long-term capital losses. At December 31, 2020, the fund had the following capital loss carryovers available, to the extent allowed by the Code, to offset future net capital gain, if any:
| | |
| | Loss carryover | |
| Short-term | Long-term | Total |
| $31,354,169 | $14,052,908 | $45,407,077 |
Tax cost of investments includes adjustments to net unrealized appreciation (depreciation) which may not necessarily be final tax cost basis adjustments, but closely approximate the tax basis unrealized gains and losses that may be realized and distributed to shareholders. The aggregate identified cost on a tax basis is $283,902,303, resulting in gross unrealized appreciation and depreciation of $15,864,176 and $39,712,268, respectively, or net unrealized depreciation of $23,848,092.
Distributions to shareholders Distributions to shareholders from net investment income are recorded by the fund on the ex-dividend date. Distributions from capital gains, if any, are recorded on the ex-dividend date and paid at least annually. The amount and character of income and gains to be distributed are determined in accordance with income tax regulations, which may differ from generally accepted accounting principles. Dividend sources are estimated at the time of declaration. Actual results may vary. Any non-taxable return of capital cannot be determined until final tax calculations are completed after the end of the fund’s fiscal year. Reclassifications are made to the fund’s capital accounts to reflect income and gains available for distribution (or available capital loss carryovers) under income tax regulations.
Expenses of the Trust Expenses directly charged or attributable to any fund will be paid from the assets of that fund. Generally, expenses of the Trust will be allocated among and charged to the assets of each fund on a basis that the Trustees deem fair and equitable, which may be based on the relative assets of each fund or the nature of the services performed and relative applicability to each fund.
Beneficial interest At the close of the reporting period, insurance companies or their separate accounts were record owners of all but a de minimis number of the shares of the fund. Approximately 44.5% of the fund is owned by accounts of one insurance company.
Note 2 — Management fee, administrative services and other transactions
The fund pays Putnam Management a management fee (based on the fund’s average net assets and computed and paid monthly) at annual rates that may vary based on the average of the aggregate net assets of all open-end mutual funds sponsored by Putnam Management (excluding net assets of funds that are invested in, or that are invested in by, other Putnam funds to the extent necessary to avoid “double counting” of those assets). Such annual rates may vary as follows:
| |
| 0.700% | of the first $5 billion, |
| 0.650% | of the next $5 billion, |
| 0.600% | of the next $10 billion, |
| 0.550% | of the next $10 billion, |
| 0.500% | of the next $50 billion, |
| 0.480% | of the next $50 billion, |
| 0.470% | of the next $100 billion and |
| 0.465% | of any excess thereafter. |
For the reporting period, the management fee represented an effective rate (excluding the impact from any expense waivers in effect) of 0.264% of the fund’s average net assets.
Putnam Management has contractually agreed, through April 30, 2023, to waive fees and/or reimburse the fund’s expenses to the extent necessary to limit the cumulative expenses of the fund, exclusive of brokerage, interest, taxes, investment-related expenses, extraordinary expenses, acquired fund fees and expenses and payments under the fund’s investor servicing contract, investment management contract and distribution plan, on a fiscal year-to-date basis to an annual rate of 0.20% of the fund’s average net assets over such fiscal year-to-date period. During the reporting period, the fund’s expenses were not reduced as a result of this limit.
Putnam Investments Limited (PIL), an affiliate of Putnam Management, is authorized by the Trustees to manage a separate portion of the assets of the fund as determined by Putnam Management from time to time. PIL did not manage any portion of the assets of the fund during the reporting period. If Putnam Management were to engage the services of PIL, Putnam Management would pay a quarterly sub-management fee to PIL for its services at an annual rate of 0.40% of the average net assets of the portion of the fund managed by PIL.
The fund reimburses Putnam Management an allocated amount for the compensation and related expenses of certain officers of the fund and their staff who provide administrative services to the fund. The aggregate amount of all such reimbursements is determined annually by the Trustees.
Custodial functions for the fund’s assets are provided by State Street. Custody fees are based on the fund’s asset level, the number of its security holdings and transaction volumes.
Putnam Investor Services, Inc., an affiliate of Putnam Management, provides investor servicing agent functions to the fund. Putnam Investor Services, Inc. was paid a monthly fee for investor servicing at an annual rate of 0.07% of the fund’s average daily net assets. During the reporting period, the expenses for each class of shares related to investor servicing fees were as follows:
| |
| Class IA | $20,156 |
| Class IB | 44,465 |
| Total | $64,621 |
The fund has entered into expense offset arrangements with Putnam Investor Services, Inc. and State Street whereby Putnam Investor Services, Inc.’s and
| |
| 50 Putnam VT Diversified Income Fund |
State Street’s fees are reduced by credits allowed on cash balances. For the reporting period, the fund’s expenses were reduced by $48 under the expense offset arrangements.
Each Independent Trustee of the fund receives an annual Trustee fee, of which $124, as a quarterly retainer, has been allocated to the fund, and an additional fee for each Trustees meeting attended. Trustees also are reimbursed for expenses they incur relating to their services as Trustees.
The fund has adopted a Trustee Fee Deferral Plan (the Deferral Plan) which allows the Trustees to defer the receipt of all or a portion of Trustees fees payable on or after July 1, 1995. The deferred fees remain invested in certain Putnam funds until distribution in accordance with the Deferral Plan.
The fund has adopted an unfunded noncontributory defined benefit pension plan (the Pension Plan) covering all Trustees of the fund who have served as a Trustee for at least five years and were first elected prior to 2004. Benefits under the Pension Plan are equal to 50% of the Trustee’s average annual attendance and retainer fees for the three years ended December 31, 2005. The retirement benefit is payable during a Trustee’s lifetime, beginning the year following retirement, for the number of years of service through December 31, 2006. Pension expense for the fund is included in Trustee compensation and expenses in the Statement of operations. Accrued pension liability is included in Payable for Trustee compensation and expenses in the Statement of assets and liabilities. The Trustees have terminated the Pension Plan with respect to any Trustee first elected after 2003.
The fund has adopted a distribution plan (the Plan) with respect to its class IB shares pursuant to Rule 12b–1 under the Investment Company Act of 1940. The purpose of the Plan is to compensate Putnam Retail Management Limited Partnership, an indirect wholly-owned subsidiary of Putnam Investments, LLC, for services provided and expenses incurred in distributing shares of the fund. The Plan provides for payment by the fund to Putnam Retail Management Limited Partnership at an annual rate of up to 0.35% of the average net assets attributable to the fund’s class IB shares. The Trustees have approved payment by the fund at an annual rate of 0.25% of the average net assets attributable to the fund’s class IB shares. The expenses related to distribution fees during the reporting period are included in Distribution fees in the Statement of operations.
Note 3 — Purchases and sales of securities
During the reporting period, the cost of purchases and the proceeds from sales, excluding short-term investments, were as follows:
| | |
| | Cost of | Proceeds |
| | purchases | from sales |
| Investments in securities, including | | |
| TBA commitments (Long-term) | $1,268,820,349 | $1,266,943,636 |
| U.S. government securities | | |
| (Long-term) | — | — |
| Total | $1,268,820,349 | $1,266,943,636 |
The fund may purchase or sell investments from or to other Putnam funds in the ordinary course of business, which can reduce the fund’s transaction costs, at prices determined in accordance with SEC requirements and policies approved by the Trustees. During the reporting period, purchases or sales of long-term securities from or to other Putnam funds, if any, did not represent more than 5% of the fund’s total cost of purchases and/or total proceeds from sales.
Note 4 — Capital shares
At the close of the reporting period, there were an unlimited number of shares of beneficial interest authorized. Subscriptions and redemptions are presented at the omnibus level. Transactions in capital shares were as follows:
| | | | | | | | |
| | | Class IA shares | | | Class IB shares | |
| | Six months ended 6/30/21 | Year ended 12/31/20 | Six months ended 6/30/21 | Year ended 12/31/20 |
| | Shares | Amount | Shares | Amount | Shares | Amount | Shares | Amount |
| Shares sold | 196,538 | $1,121,152 | 199,839 | $1,134,515 | 2,137,121 | $12,268,061 | 4,045,680 | $22,379,970 |
| Shares issued in connection with | | | | | | | | |
| reinvestment of distributions | 89,813 | 511,935 | 935,135 | 4,703,731 | 138,744 | 795,004 | 1,949,413 | 9,864,028 |
| | 286,351 | 1,633,087 | 1,134,974 | 5,838,246 | 2,275,865 | 13,063,065 | 5,995,093 | 32,243,998 |
| Shares repurchased | (606,766) | (3,465,791) | (1,397,116) | (7,797,250) | (2,209,679) | (12,647,714) | (7,169,392) | (39,897,434) |
| Net increase (decrease) | (320,415) | $(1,832,704) | (262,142) | $(1,959,004) | 66,186 | $415,351 | (1,174,299) | $(7,653,436) |
Note 5 — Affiliated transactions
Transactions during the reporting period with any company which is under common ownership or control were as follows:
| | | | | |
| | | | | | Shares outstanding |
| | Fair value as of | | | | and fair value as of |
| Name of affiliate | 12/31/20 | Purchase cost | Sale proceeds | Investment income | 6/30/21 |
| Short-term investments | | | | | |
| Putnam Short Term Investment | | | | | |
| Fund** | $31,347,766 | $34,154,724 | $35,481,178 | $17,634 | $30,021,312 |
| Total Short-term investments | $31,347,766 | $34,154,724 | $35,481,178 | $17,634 | $30,021,312 |
**Management fees charged to Putnam Short Term Investment Fund have been waived by Putnam Management. There were no realized or unrealized gains or losses during the period.
Note 6 — Market, credit and other risks
In the normal course of business, the fund trades financial instruments and enters into financial transactions where risk of potential loss exists due to changes in the market (market risk) or failure of the contracting party to the transaction to perform (credit risk). The fund may be exposed to additional credit risk that an institution or other entity with which the fund has unsettled or open transactions will default. Investments in foreign securities involve certain risks, including those related to economic instability, unfavorable political developments, and currency fluctuations. The fund may invest in higher-yielding, lower-rated bonds that may have a higher rate of default. The fund may invest a significant portion of its assets in securitized debt instruments, including mortgage-backed and asset-backed investments. The yields and values of these investments are sensitive to changes in interest rates, the rate of principal payments on the underlying assets and the market’s perception of the issuers. The market for these investments may be volatile and limited, which may make them difficult to buy or sell.
On July 27, 2017, the United Kingdom’s Financial Conduct Authority (“FCA”), which regulates LIBOR, announced a desire to phase out the use of LIBOR by the end of 2021. On March 5, 2021, the FCA and LIBOR’s administrator, ICE Benchmark Administration, announced that most LIBOR settings will no longer be published after the end of 2021 and a majority of U.S. dollar LIBOR settings will no longer be published after June 30, 2023. LIBOR has historically been a common benchmark interest rate index used to make adjustments to variable-rate loans. It is used throughout global banking and financial industries to determine interest rates for a variety of financial instruments and borrowing arrangements. The transition process might lead to increased volatility and illiquidity in markets that currently rely on LIBOR to determine interest rates. It could also lead to a reduction in the value of some LIBOR-based investments and reduce the effectiveness of new hedges placed against existing LIBOR-based
| |
| Putnam VT Diversified Income Fund 51 |
investments. While some LIBOR-based instruments may contemplate a scenario where LIBOR is no longer available by providing for an alternative rate-setting methodology, not all may have such provisions and there may be significant uncertainty regarding the effectiveness of any such alternative methodologies. Since the usefulness of LIBOR as a benchmark could deteriorate during the transition period, these effects could occur prior to the date on which the applicable rate ceases to be published.
Beginning in January 2020, global financial markets have experienced, and may continue to experience, significant volatility resulting from the spread of a virus known as Covid–19. The outbreak of Covid–19 has resulted in travel and border restrictions, quarantines, supply chain disruptions, lower consumer demand, and general market uncertainty. The effects of Covid–19 have adversely affected, and may continue to adversely affect, the global economy, the economies of certain nations, and individual issuers, all of which may negatively impact the fund’s performance.
Note 7 — Senior loan commitments
Senior loans are purchased or sold on a when-issued or delayed delivery basis and may be settled a month or more after the trade date, which from time to time can delay the actual investment of available cash balances; interest income is accrued based on the terms of the securities. Senior loans can be acquired through an agent, by assignment from another holder of the loan, or as a participation interest in another holder’s portion of the loan. When the fund invests in a loan or participation, the fund is subject to the risk that an intermediate participant between the fund and the borrower will fail to meet its obligations to the fund, in addition to the risk that the borrower under the loan may default on its obligations.
Note 8 — Summary of derivative activity
The volume of activity for the reporting period for any derivative type that was held during the period is listed below and was based on an average of the holdings at the end of each fiscal quarter:
| |
| Purchased TBA commitment option contracts (contract amount) | $43,700,000 |
| Purchased currency option contracts (contract amount) | $19,800,000 |
| Purchased swap option contracts (contract amount) | $510,700,000 |
| Written TBA commitment option contracts (contract amount) | $43,700,000 |
| Written currency option contracts (contract amount) | $14,200,000 |
| Written swap option contracts (contract amount) | $404,600,000 |
| Futures contracts (number of contracts) | 600 |
| Forward currency contracts (contract amount) | $231,900,000 |
| Centrally cleared interest rate swap contracts (notional) | $630,300,000 |
| OTC total return swap contracts (notional) | $17,700,000 |
| Centrally cleared total return swap contracts (notional) | $133,600,000 |
| OTC credit default contracts (notional) | $62,700,000 |
The following is a summary of the fair value of derivative instruments as of the close of the reporting period:
Fair value of derivative instruments as of the close of the reporting period
| | | | |
| | Asset derivatives | Liability derivatives |
| Derivatives not accounted for as hedging | Statement of assets and | | Statement of assets and | |
| instruments under ASC 815 | liabilities location | Fair value | liabilities location | Fair value |
| Credit contracts | Receivables | $3,000,526 | Payables | $11,457,335 |
| Foreign exchange contracts | Investments, Receivables | 1,349,667 | Payables | 2,120,735 |
| | Investments, Receivables, | | | |
| | Net assets — Unrealized | | Payables, Net assets — | |
| Interest rate contracts | appreciation | 17,319,929* | Unrealized depreciation | 18,178,085* |
| Total | | $21,670,122 | | $31,756,155 |
*Includes cumulative appreciation/depreciation of futures contracts and/or centrally cleared swaps as reported in the fund’s portfolio. Only current day’s variation margin is reported within the Statement of assets and liabilities.
The following is a summary of realized and change in unrealized gains or losses of derivative instruments in the Statement of operations for the reporting period (Note 1):
Amount of realized gain or (loss) on derivatives recognized in net gain or (loss) on investments
| | | | | |
| Derivatives not accounted for as hedging | | | Forward currency | | |
| instruments under ASC 815 | Options | Futures | contracts | Swaps | Total |
| Credit contracts | $— | $— | $— | $(801,018) | $(801,018) |
| Foreign exchange contracts | 208,975 | — | (241,106) | — | $(32,131) |
| Interest rate contracts | 3,766,517 | (265,197) | — | (4,426,221) | $(924,901) |
| Total | $3,975,492 | $(265,197) | $(241,106) | $(5,227,239) | $(1,758,050) |
Change in unrealized appreciation or (depreciation) on derivatives recognized in net gain or (loss) on investments
| | | | | |
| Derivatives not accounted for as hedging | | | Forward currency | | |
| instruments under ASC 815 | Options | Futures | contracts | Swaps | Total |
| Credit contracts | $— | $— | $— | $248,489 | $248,489 |
| Foreign exchange contracts | (191,163) | — | (994,644) | — | $(1,185,807) |
| Interest rate contracts | (1,291,240) | (74,867) | — | 1,952,670 | $586,563 |
| Total | $(1,482,403) | $(74,867) | $(994,644) | $2,201,159 | $(350,755) |
| |
| 52 Putnam VT Diversified Income Fund |
|
| This page intentionally left blank. |
| |
| Putnam VT Diversified Income Fund 53 |
Note 9 — Offsetting of financial and derivative assets and liabilities
The following table summarizes any derivatives, repurchase agreements and reverse repurchase agreements, at the end of the reporting period, that are subject to an enforceable master netting agreement or similar agreement. For securities lending transactions or borrowing transactions associated with securities sold short, if any, see Note 1. For financial reporting purposes, the fund does not offset financial assets and financial liabilities that are subject to the master netting agreements in the Statement of assets and liabilities.
| | | | | | | | | | | | | | | | | | | | |
| | Bank of America N.A. | Barclays Bank PLC | Barclays Capital, Inc. (clearing broker) | Citibank, N.A. | Citigroup Global Markets, Inc. | Credit Suisse International | Deutsche Bank AG | Goldman Sachs International | HSBC Bank USA, National Association | JPMorgan Chase Bank N.A. | JPMorgan Securities LLC | Merrill Lynch International | Morgan Stanley & Co. International PLC | NatWest Markets PLC | State Street Bank and Trust Co. | Toronto-Dominion Bank | UBS AG | Wells Fargo Bank, N.A. | WestPac Banking Corp. | Total |
| Assets: | | | | | | | | | | | | | | | | | | | | |
| Centrally cleared interest | | | | | | | | | | | | | | | | | | | | |
| rate swap contracts§ | $— | $— | $562,730 | $— | $— | $— | $— | $— | $— | $— | $— | $— | $— | $— | $— | $— | $— | $— | $— | $562,730 |
| OTC Total return | | | | | | | | | | | | | | | | | | | | |
| swap contracts*# | — | 5,727 | — | — | — | 2,947 | 315 | 6,519 | — | 2,685 | 560 | — | — | — | — | — | — | — | — | 18,753 |
| Centrally cleared total | | | | | | | | | | | | | | | | | | | | |
| return swap contracts§ | — | — | 54,632 | — | — | — | — | — | — | — | — | — | — | — | — | — | — | — | — | 54,632 |
| OTC Credit | | | | | | | | | | | | | | | | | | | | |
| default contracts — | | | | | | | | | | | | | | | | | | | | |
| protection sold*# | — | — | — | — | — | — | — | — | — | — | — | — | — | — | — | — | — | — | — | — |
| OTC Credit | | | | | | | | | | | | | | | | | | | | |
| default contracts — | | | | | | | | | | | | | | | | | | | | |
| protection purchased*# | — | — | — | — | 489,109 | 669,464 | — | 728,107 | — | — | 585,674 | 183,829 | 344,343 | — | — | — | — | — | — | 3,000,526 |
| Futures contracts§ | — | — | — | — | — | — | — | — | — | — | 663 | — | — | — | — | — | — | — | — | 663 |
| Forward currency | | | | | | | | | | | | | | | | | | | | |
| contracts# | 15,560 | 65,210 | — | 82,824 | — | 39,329 | — | 270,586 | 9,461 | 35,924 | — | — | 97,604 | 70,339 | 305,872 | 150,998 | 63,954 | — | 38,198 | 1,245,859 |
| Forward premium swap | | | | | | | | | | | | | | | | | | | | |
| option contracts# | 1,601,632 | 111,377 | — | 258,451 | — | — | — | 72,094 | — | 911,933 | — | — | 403,228 | — | — | 79,151 | 603,787 | 110,596 | — | 4,152,249 |
| Purchased swap | | | | | | | | | | | | | | | | | | | | |
| options**# | 14,142 | — | — | — | — | — | — | 1,054,813 | — | 670,602 | — | — | 2,057,126 | — | — | 1,934 | 166,802 | — | — | 3,965,419 |
| Purchased options**# | — | — | — | — | — | — | — | 68,843 | — | 80,338 | — | — | 34,965 | — | — | — | — | — | — | 184,146 |
| Total Assets | $1,631,334 | $182,314 | $617,362 | $341,275 | $489,109 | $711,740 | $315 | $2,200,962 | $9,461 | $1,701,482 | $586,897 | $183,829 | $2,937,266 | $70,339 | $305,872 | $232,083 | $834,543 | $110,596 | $38,198 | $13,184,977 |
| Liabilities: | | | | | | | | | | | | | | | | | | | | |
| Centrally cleared interest | | | | | | | | | | | | | | | | | | | | |
| rate swap contracts§ | $— | $— | $578,198 | $— | $— | $— | $— | $— | $— | $— | $— | $— | $— | $— | $— | $— | $— | $— | $— | $578,198 |
| OTC Total return | | | | | | | | | | | | | | | | | | | | |
| swap contracts*# | — | 11,258 | — | 1,141 | — | 13,076 | — | 18,554 | — | — | 6,744 | — | 2,576 | — | — | — | — | — | — | 53,349 |
| Centrally cleared total | | | | | | | | | | | | | | | | | | | | |
| return swap contracts§ | — | — | 57,162 | — | — | — | — | — | — | — | — | — | — | — | — | — | — | — | — | 57,162 |
| OTC Credit | | | | | | | | | | | | | | | | | | | | |
| default contracts — | | | | | | | | | | | | | | | | | | | | |
| protection sold*# | 254,760 | — | — | — | 2,143,021 | 2,126,349 | — | 1,855,601 | — | — | 2,127,685 | 432,015 | 2,515,328 | — | — | — | — | — | — | 11,454,759 |
| OTC Credit | | | | | | | | | | | | | | | | | | | | |
| default contracts — | | | | | | | | | | | | | | | | | | | | |
| protection purchased*# | — | — | — | — | — | — | — | — | — | — | — | — | — | — | — | — | — | — | — | — |
| Futures contracts§ | — | — | — | — | — | — | — | — | — | — | 83,187 | — | — | — | — | — | — | — | — | 83,187 |
| Forward currency | | | | | | | | | | | | | | | | | | | | |
| contracts# | 141,694 | 80,704 | — | 34,529 | — | 13,976 | — | 468,870 | 110,121 | 212,341 | — | — | 303,685 | 85,592 | 135,286 | 102,172 | 391,207 | — | 6,229 | 2,086,406 |
| Forward premium swap | | | | | | | | | | | | | | | | | | | | |
| option contracts# | 1,583,308 | 75,610 | — | 195,247 | — | — | — | 85,533 | — | 911,018 | — | — | 275,007 | — | — | 66,501 | 452,625 | 74,214 | — | 3,719,063 |
| Written swap options# | 105,952 | — | — | 318,033 | — | — | — | 570,325 | — | 2,156,275 | — | — | 2,142,511 | — | — | 98,753 | 327,175 | — | — | 5,719,024 |
| Written options# | — | — | — | — | — | — | — | 23,653 | — | 105,630 | — | — | 10,676 | — | — | — | — | — | — | 139,959 |
| Total Liabilities | $2,085,714 | $167,572 | $635,360 | $548,950 | $2,143,021 | $2,153,401 | $— | $3,022,536 | $110,121 | $3,385,264 | $2,217,616 | $432,015 | $5,249,783 | $85,592 | $135,286 | $267,426 | $1,171,007 | $74,214 | $6,229 | $23,891,107 |
| Total Financial and | | | | | | | | | | | | | | | | | | | | |
| Derivative Net Assets | $(454,380) | $14,742 | $(17,998) | $(207,675) | $(1,653,912) | $(1,441,661) | $315 | $(821,574) | $(100,660) | $(1,683,782) | $(1,630,719) | $(248,186) | $(2,312,517) | $(15,253) | $170,586 | $(35,343) | $(336,464) | $36,382 | $31,969 | $(10,706,130) |
| Total collateral | | | | | | | | | | | | | | | | | | | | |
| received (pledged)†## | $(301,970) | $— | $— | $(207,675) | $(1,639,845) | $(1,431,894) | $— | $(821,574) | $— | $(1,683,782) | $(1,578,861) | $(248,186) | $(2,256,858) | $(15,253) | $111,594 | $(35,343) | $(201,980) | $36,382 | $— | |
| Net amount | $(152,410) | $14,742 | $(17,998) | $��� | $(14,067) | $(9,767) | $315 | $— | $(100,660) | $— | $(51,858) | $— | $(55,659) | $— | $58,992 | $— | $(134,484) | $— | $31,969 | |
| | |
| 54 Putnam VT Diversified Income Fund | Putnam VT Diversified Income Fund 55 |
| | | | | | | | | | | | | | | | | | | | |
| | Bank of America N.A. | Barclays Bank PLC | Barclays Capital, Inc. (clearing broker) | Citibank, N.A. | Citigroup Global Markets, Inc. | Credit Suisse International | Deutsche Bank AG | Goldman Sachs International | HSBC Bank USA, National Association | JPMorgan Chase Bank N.A. | JPMorgan Securities LLC | Merrill Lynch International | Morgan Stanley & Co. International PLC | NatWest Markets PLC | State Street Bank and Trust Co. | Toronto-Dominion Bank | UBS AG | Wells Fargo Bank, N.A. | WestPac Banking Corp. | Total |
| Controlled collateral | | | | | | | | | | | | | | | | | | | | |
| received (including | | | | | | | | | | | | | | | | | | | | |
| TBA commitments)** | $— | $— | $— | $— | $— | $— | $— | $— | $— | $— | $— | $— | $— | $— | $111,594 | $— | $— | $110,000 | $— | $221,594 |
| Uncontrolled collateral | | | | | | | | | | | | | | | | | | | | |
| received | $— | $— | $— | $— | $— | $— | $— | $— | $— | $— | $— | $— | $— | $— | $— | $— | $— | $— | $— | $— |
| Collateral (pledged) | | | | | | | | | | | | | | | | | | | | |
| (including TBA | | | | | | | | | | | | | | | | | | | | |
| commitments)** | $(301,970) | $— | $— | $(271,984) | $(1,639,845) | $(1,431,894) | $— | $(845,941) | $— | $(1,753,849) | $(1,682,861) | $(252,000) | $(2,256,858) | $(110,989) | $— | $(111,000) | $(201,980) | $— | $— | $(10,861,171) |
*Excludes premiums, if any. Included in unrealized appreciation and depreciation on OTC swap contracts on the Statement of assets and liabilities.
**Included with Investments in securities on the Statement of assets and liabilities.
†Additional collateral may be required from certain brokers based on individual agreements.
# Covered by master netting agreement (Note 1).
## Any over-collateralization of total financial and derivative net assets is not shown. Collateral may include amounts related to unsettled agreements.
§ Includes current day’s variation margin only as reported on the Statement of assets and liabilities, which is not collateralized. Cumulative appreciation/(depreciation) for futures contracts and centrally cleared swap contracts is represented in the tables listed after the fund’s portfolio. Collateral pledged for initial margin on futures contracts and centrally cleared swap contracts, which is not included in the table above, amounted to $551,967 and $2,726,825, respectively.
Note 10 — New accounting pronouncements
In March 2020, the Financial Accounting Standards Board (FASB) issued Accounting Standards Update (ASU) 2020–04, Reference Rate Reform (Topic 848) — Facilitation of the Effects of Reference Rate Reform on Financial Reporting. The amendments in ASU 2020–04 provide optional temporary financial reporting relief from the effect of certain types of contract modifications due to the planned discontinuation of LIBOR and other interbank-offered based reference rates as of the end of 2021. The discontinuation of LIBOR was subsequently extended to June 30, 2023. ASU 2020–04 is effective for certain reference rate-related contract modifications that occur during the period March 12, 2020 through December 31, 2022. Management is currently evaluating the impact, if any, of applying this provision.
| | |
| 56 Putnam VT Diversified Income Fund | Putnam VT Diversified Income Fund 57 |
Trustee approval of management contract
General conclusions
The Board of Trustees of The Putnam Funds oversees the management of each fund and, as required by law, determines annually whether to approve the continuance of your fund’s management contract with Putnam Investment Management, LLC (“Putnam Management”) and the sub-management contract with respect to your fund between Putnam Management and its affiliate, Putnam Investments Limited (“PIL”). The Board, with the assistance of its Contract Committee, requests and evaluates all information it deems reasonably necessary under the circumstances in connection with its annual contract review. The Contract Committee consists solely of Trustees who are not “interested persons” (as this term is defined in the Investment Company Act of 1940, as amended (the “1940 Act”)) of The Putnam Funds (“Independent Trustees”).
At the outset of the review process, members of the Board’s independent staff and independent legal counsel considered any possible changes to the annual contract review materials furnished to the Contract Committee during the course of the previous year’s review and, as applicable, identified those changes to Putnam Management. Following these discussions and in consultation with the Contract Committee, the Independent Trustees’ independent legal counsel requested that Putnam Management and its affiliates furnish specified information, together with any additional information that Putnam Management considered relevant, to the Contract Committee. Over the course of several months ending in June 2021, the Contract Committee met on a number of occasions with representatives of Putnam Management, and separately in executive session, to consider the information that Putnam Management provided. Throughout this process, the Contract Committee was assisted by the members of the Board’s independent staff and by independent legal counsel for The Putnam Funds and the Independent Trustees.
In May 2021, the Contract Committee met in executive session to discuss and consider its recommendations with respect to the continuance of the contracts. At the Trustees’ June 2021 meeting, the Contract Committee met in executive session with the other Independent Trustees to review a summary of the key financial, performance and other data that the Contract Committee considered in the course of its review. The Contract Committee then presented its written report, which summarized the key factors that the Committee had considered and set forth its recommendations. The Contract Committee recommended, and the Independent Trustees approved, the continuance of your fund’s management and sub-management contracts, effective July 1, 2021. (Because PIL is an affiliate of Putnam Management and Putnam Management remains fully responsible for all services provided by PIL, the Trustees have not attempted to evaluate PIL as a separate entity, and all subsequent references to Putnam Management below should be deemed to include reference to PIL as necessary or appropriate in the context.)
The Independent Trustees’ approval was based on the following conclusions:
• That the fee schedule in effect for your fund represented reasonable compensation in light of the nature and quality of the services being provided to the fund, the fees paid by competitive funds, the costs incurred by Putnam Management in providing services to the fund, and the application of certain reductions and waivers noted below; and
• That the fee schedule in effect for your fund represented an appropriate sharing between fund shareholders and Putnam Management of any economies of scale as may exist in the management of the fund at current asset levels.
These conclusions were based on a comprehensive consideration of all information provided to the Trustees and were not the result of any single factor. Some of the factors that figured particularly in the Trustees’ deliberations and how the Trustees considered these factors are described below, although individual Trustees may have evaluated the information presented differently, giving different weights to various factors. It is also important to recognize that the management arrangements for your fund and the other Putnam funds are the result of many years of review and discussion between the Independent Trustees and Putnam Management, that some aspects of the arrangements may receive greater scrutiny in some years than others, and that the Trustees’ conclusions may be based, in part, on their consideration of fee arrangements in previous years. For example, with certain exceptions primarily involving newly launched or repositioned funds, the current fee arrangements under the vast majority of the funds’ management contracts were first implemented at the beginning of 2010 following extensive review by the Contract Committee and discussions with representatives of Putnam Management, as well as approval by shareholders.
Management fee schedules and total expenses
The Trustees reviewed the management fee schedules in effect for all Putnam funds, including fee levels and breakpoints. Under its management contract, your fund has the benefit of breakpoints in its management fee schedule that provide shareholders with reduced fee levels as assets under management in the Putnam family of funds increase. The Trustees also reviewed the total expenses of each Putnam fund, recognizing that in most cases management fees represented the major, but not the sole, determinant of total costs to fund shareholders. (Two funds have implemented so-called “all-in” management fees covering substantially all routine fund operating costs.)
In reviewing fees and expenses, the Trustees generally focus their attention on material changes in circumstances — for example, changes in assets under management, changes in a fund’s investment strategy, changes in Putnam Management’s operating costs or profitability, or changes in competitive practices in the mutual fund industry — that suggest that consideration of fee changes might be warranted. The Trustees concluded that the circumstances did not indicate that changes to the management fee schedule for your fund would be appropriate at this time.
As in the past, the Trustees also focused on the competitiveness of each fund’s total expense ratio. In order to support the effort to have fund expenses meet competitive standards, the Trustees and Putnam Management and the funds’ investor servicing agent, Putnam Investor Services, Inc. (“PSERV”), have implemented expense limitations that were in effect during your fund’s fiscal year ending in 2020. These expense limitations were: (i) a contractual expense limitation applicable to specified open-end funds, including your fund, of 25 basis points on investor servicing fees and expenses and (ii) a contractual expense limitation applicable to specified open-end funds, including your fund, of 20 basis points on so-called “other expenses” (i.e., all expenses exclusive of management fees, distribution fees, investor servicing fees, investment-related expenses, interest, taxes, brokerage commissions, acquired fund fees and expenses and extraordinary expenses). These expense limitations attempt to maintain competitive expense levels for the funds.
| |
| 58 Putnam VT Diversified Income Fund |
Most funds, including your fund, had sufficiently low expenses that these expense limitations were not operative during their fiscal years ending in 2020. Putnam Management and PSERV have agreed to maintain these expense limitations until at least April 30, 2023. The support of Putnam Management and PSERV for these expense limitation arrangements was an important factor in the Trustees’ decision to approve the continuance of your fund’s management and sub-management contracts.
The Trustees reviewed comparative fee and expense information for a custom group of competitive funds selected by Broadridge Financial Solutions, Inc. (“Broadridge”). This comparative information included your fund’s percentile ranking for effective management fees and total expenses (excluding any applicable 12b-1 fees), which provides a general indication of your fund’s relative standing. In the custom peer group, your fund ranked in the first quintile in effective management fees (determined for your fund and the other funds in the custom peer group based on fund asset size and the applicable contractual management fee schedule) and in the fifth quintile in total expenses (excluding any applicable 12b-1 fees) as of December 31, 2020. The first quintile represents the least expensive funds and the fifth quintile the most expensive funds. The fee and expense data reported by Broadridge as of December 31, 2020 reflected the most recent fiscal year-end data available in Broadridge’s database at that time.
In connection with their review of fund management fees and total expenses, the Trustees also reviewed the costs of the services provided and the profits realized by Putnam Management and its affiliates from their contractual relationships with the funds. This information included trends in revenues, expenses and profitability of Putnam Management and its affiliates relating to the investment management, investor servicing and distribution services provided to the funds. In this regard, the Trustees also reviewed an analysis of the revenues, expenses and profitability of Putnam Management and its affiliates, allocated on a fund-by-fund basis, with respect to the funds’ management, distribution, and investor servicing contracts. For each fund, the analysis presented information about revenues, expenses and profitability for each of the agreements separately and for the agreements taken together on a combined basis. The Trustees concluded that, at current asset levels, the fee schedules in place for the Putnam funds, including the fee schedule for your fund, represented reasonable compensation for the services being provided and represented an appropriate sharing between fund shareholders and Putnam Management of any economies of scale as may exist in the management of the Putnam funds at that time.
The information examined by the Trustees in connection with their annual contract review for the Putnam funds included information regarding services provided and fees charged by Putnam Management and its affiliates to other clients, including defined benefit pension and profit-sharing plans, sub-advised mutual funds, private funds sponsored by affiliates of Putnam Management, model-only separately managed accounts and Putnam Management’s newly launched exchange-traded funds. This information included, in cases where a product’s investment strategy corresponds with a fund’s strategy, comparisons of those fees with fees charged to the Putnam funds, as well as an assessment of the differences in the services provided to these clients as compared to the services provided to the Putnam funds. The Trustees observed that the differences in fee rates between these clients and the Putnam funds are by no means uniform when examined by individual asset sectors, suggesting that differences in the pricing of investment management services to these types of clients may reflect, among other things, historical competitive forces operating in separate marketplaces. The Trustees considered the fact that in many cases fee rates across different asset classes are higher on average for mutual funds than for other clients, and the Trustees also considered the differences between the services that Putnam Management provides to the Putnam funds and those that it provides to its other clients. The Trustees did not rely on these comparisons to any significant extent in concluding that the management fees paid by your fund are reasonable.
Investment performance
The quality of the investment process provided by Putnam Management represented a major factor in the Trustees’ evaluation of the quality of services provided by Putnam Management under your fund’s management contract. The Trustees were assisted in their review of Putnam Management’s investment process and performance by the work of the investment oversight committees of the Trustees and the full Board of Trustees, which meet on a regular basis with individual portfolio managers and with senior management of Putnam Management’s Investment Division throughout the year. The Trustees concluded that Putnam Management generally provides a high-quality investment process — based on the experience and skills of the individuals assigned to the management of fund portfolios, the resources made available to them, and in general Putnam Management’s ability to attract and retain high-quality personnel — but also recognized that this does not guarantee favorable investment results for every fund in every time period.
The Trustees considered that, in the aggregate, The Putnam Funds generally performed well in 2020, which Putnam Management characterized as a challenging year with significant volatility and varied market dynamics. On an asset-weighted basis, the Putnam funds ranked in the second quartile of their peers as determined by Lipper Inc. (“Lipper”) for the year ended December 31, 2020 and, on an asset-weighted-basis, delivered a gross return that was 2.3% ahead of their benchmarks in 2020. In addition to the performance of the individual Putnam funds, the Trustees considered, as they had in prior years, the performance of The Putnam Fund complex versus competitor fund complexes. In this regard, the Trustees observed that The Putnam Funds’ relative performance, as reported in the Barron’s/Lipper Fund Families survey, continued to be exceptionally strong over the long term, with The Putnam Funds ranking as the 3rd best performing mutual fund complex out of 44 complexes for the ten-year period, with 2020 marking the fourth consecutive year that The Putnam Funds have ranked in the top ten fund complexes for the ten-year period. The Trustees noted that The Putnam Funds’ performance was solid over the one- and five-year periods, with The Putnam Funds ranking 22nd out of 53 complexes and 14th out of 50 complexes, respectively. In addition to the Barron’s/Lipper Fund Families Survey, the Trustees also considered the funds’ ratings assigned by Morningstar Inc., noting that 26 of the funds were four- or five-star rated at the end of 2020 (representing an increase of four funds year-over-year) and that this included seven funds that had achieved a five-star rating (representing an increase of two funds year-over-year). They also noted, however, the disappointing investment performance of some funds for periods ended December 31, 2020 and considered information provided by Putnam Management regarding the factors contributing to the underperformance and actions being taken to improve the performance of these particular funds. The Trustees indicated their intention to continue to monitor closely the performance of those funds and evaluate whether additional actions to address areas of underperformance may be warranted.
For purposes of the Trustees’ evaluation of the Putnam funds’ investment performance, the Trustees generally focus on a competitive industry
| | |
| Putnam VT Diversified Income Fund 59 |
ranking of each fund’s total net return over a one-year, three-year and five-year period. For a number of Putnam funds with relatively unique investment mandates for which Putnam Management informed the Trustees that meaningful competitive performance rankings are not considered to be available, the Trustees evaluated performance based on their total gross and net returns and comparisons of those returns to the returns of selected investment benchmarks. In the case of your fund, the Trustees considered that its class IA share cumulative total return performance at net asset value was in the following quartiles of its Lipper peer group (Lipper VP (Underlying Funds) — General Bond Funds) for the one-year, three-year and five-year periods ended December 31, 2020 (the first quartile representing the best-performing funds and the fourth quartile the worst-performing funds):
| | |
| One-year period | Three-year period | Five-year period |
| 4th | 4th | 3rd |
Over the one-year, three-year and five-year periods ended December 31, 2020, there were 34, 34 and 24 funds, respectively, in your fund’s Lipper peer group. (When considering performance information, shareholders should be mindful that past performance is not a guarantee of future results.)
The Trustees expressed concern about your fund’s fourth quartile performance over the one-year and three-year periods ended December 31, 2020 and considered the circumstances that may have contributed to this disappointing performance. The Trustees considered Putnam Management’s observation that the fund’s underperformance was driven by significant underperformance in the securitized sector in 2020, which resulted from the outsized impact of the COVID-19 pandemic on the commercial mortgage space. The Trustees also noted Putnam Management’s view that the commercial real estate sector was not supported by monetary and fiscal policies to the same extent as other sectors and did not recover as strongly from the downturn in March 2020. The Trustees considered Putnam Management’s observation that several of the fund’s other sector exposures and strategies had performed well in 2020, including the fund’s prepayment strategy and corporate credit exposure.
In addition, the Trustees noted the fund’s strong performance prior to the onset of the COVID-19 pandemic. The Trustees considered Putnam Management’s observation that the fund’s positioning in corporate credit and residential mortgage-backed investments and the rebound in commercial mortgage-backed investments contributed to the fund’s top decile performance year to date, as of March 31, 2021. The Trustees also considered that the fund’s long term performance had improved as of March 31, 2021, as the fund had first quartile performance over the five-year period then-ended. The Trustees noted that Putnam Management remained confident in the fund’s portfolio managers. The Trustees also considered Putnam Management’s continued efforts to support fund performance through certain initiatives, including structuring compensation for portfolio managers to enhance accountability for fund performance, emphasizing accountability in the portfolio management process, and affirming its commitment to a fundamental-driven approach to investing. The Trustees noted further that Putnam Management had made selective hires and internal promotions in 2020 to strengthen its investment team.
As a general matter, the Trustees believe that cooperative efforts between the Trustees and Putnam Management represent the most effective way to address investment performance concerns that may arise from time to time. The Trustees noted that investors in the Putnam funds have, in effect, placed their trust in the Putnam organization, under the oversight of the funds’ Trustees, to make appropriate decisions regarding the management of the funds. Based on Putnam Management’s willingness to take appropriate measures to address fund performance issues and Putnam Management’s responsiveness to Trustee concerns about investment performance, the Trustees concluded that it continued to be advisable to seek change within Putnam Management to address performance shortcomings. In the Trustees’ view, the alternative of engaging a new investment adviser for an underperforming fund, with all the attendant risks and disruptions, would not likely provide any greater assurance of improved investment performance.
Brokerage and soft-dollar allocations; investor servicing
The Trustees considered various potential benefits that Putnam Management may receive in connection with the services it provides under the management contract with your fund. These include benefits related to brokerage allocation and the use of soft dollars, whereby a portion of the commissions paid by a fund for brokerage may be used to acquire research services that are expected to be useful to Putnam Management in managing the assets of the fund and of other clients. Subject to policies established by the Trustees, soft dollars generated by these means are used predominantly to acquire brokerage and research services (including third-party research and market data) that enhance Putnam Management’s investment capabilities and supplement Putnam Management’s internal research efforts. The Trustees indicated their continued intent to monitor regulatory and industry developments in this area with the assistance of their Brokerage Committee. In addition, with the assistance of their Brokerage Committee, the Trustees indicated their continued intent to monitor the allocation of the Putnam funds’ brokerage in order to ensure that the principle of seeking best price and execution remains paramount in the portfolio trading process.
Putnam Management may also receive benefits from payments that the funds make to Putnam Management’s affiliates for investor or distribution services. In conjunction with the annual review of your fund’s management and sub-management contracts, the Trustees reviewed your fund’s investor servicing agreement with PSERV and its distributor’s contract and distribution plans with Putnam Retail Management Limited Partnership (“PRM”), both of which are affiliates of Putnam Management. The Trustees concluded that the fees payable by the funds to PSERV and PRM, as applicable, for such services are fair and reasonable in relation to the nature and quality of such services, the fees paid by competitive funds, and the costs incurred by PSERV and PRM, as applicable, in providing such services. Furthermore, the Trustees were of the view that the investor services provided by PSERV were required for the operation of the funds, and that they were of a quality at least equal to those provided by other providers.
| |
| 60 Putnam VT Diversified Income Fund |
Other important information
Proxy voting
Putnam is committed to managing our mutual funds in the best interests of our shareholders. The Putnam funds’ proxy voting guidelines and procedures, as well as information regarding how your fund voted proxies relating to portfolio securities during the 12-month period ended June 30, 2021, are available in the Individual Investors section of putnam.com and on the Securities and Exchange Commission’s (SEC) website at www.sec.gov. If you have questions about finding forms on the SEC’s website, you may call the SEC at 1-800-SEC-0330. You may also obtain the Putnam funds’ proxy voting guidelines and procedures at no charge by calling Putnam’s Shareholder Services at 1-800-225-1581.
Fund portfolio holdings
The fund will file a complete schedule of its portfolio holdings with the SEC for the first and third quarters of each fiscal year on Form N-PORT within 60 days of the end of such fiscal quarter. Shareholders may obtain the fund’s Form N-PORT from the SEC’s website at www.sec.gov.
Prior to its use of Form N-PORT, the fund filed its complete schedule of its portfolio holdings with the SEC on Form N-Q, which is available online at www.sec.gov.
Liquidity risk management program
Putnam, as the administrator of the fund’s liquidity risk management program (appointed by the Board of Trustees), presented the most recent annual report on the program to the Trustees in April 2021. The report covered the structure of the program, including the program documents and related policies and procedures adopted to comply with Rule 22e-4 under the Investment Company Act of 1940, and reviewed the operation of the program from January 2020 through December 2020. The report included a description of the annual liquidity assessment of the fund that Putnam performed in November 2020. The report noted that there were no material compliance exceptions identified under Rule 22e-4 during the period. The report included a review of the governance of the program and the methodology for classification of the fund’s investments. The report also included a discussion of liquidity monitoring during the period, including during the market liquidity challenges caused by the Covid-19 pandemic, and the impact those challenges had on the liquidity of the fund’s investments. Putnam concluded that the program has been operating effectively and adequately to ensure compliance with Rule 22e-4.
Fund information
| | |
| Investment Manager | Investor Servicing Agent | Trustees |
| Putnam Investment Management, LLC | Putnam Investments | Kenneth R. Leibler, Chair |
| 100 Federal Street | Mailing address: | Liaquat Ahamed |
| Boston, MA 02110 | P.O. Box 219697 | Ravi Akhoury |
| | Kansas City, MO 64121-9697 | Barbara M. Baumann |
| Investment Sub-Advisor | 1-800-225-1581 | Katinka Domotorffy |
| Putnam Investments Limited | | Catharine Bond Hill |
| 16 St James’s Street | Custodian | Paul L. Joskow |
| London, England SW1A 1ER | State Street Bank and Trust Company | George Putnam, III |
| | | Robert L. Reynolds |
| Marketing Services | Legal Counsel | Manoj P. Singh |
| Putnam Retail Management | Ropes & Gray LLP | Mona K. Sutphen |
| 100 Federal Street | | |
| Boston, MA 02110 | | |
The fund’s Statement of Additional Information contains additional information about the fund’s Trustees and is available without charge upon request by calling 1-800-225-1581.
| |
| Putnam VT Diversified Income Fund 61 |
| |
| This report has been prepared for the shareholders | |
| of Putnam VT Diversified Income Fund. | VTSA028 326460 8/21 |
| |
| Item 3. Audit Committee Financial Expert: |
| |
| Item 4. Principal Accountant Fees and Services: |
| |
| Item 5. Audit Committee of Listed Registrants |
| |
| Item 6. Schedule of Investments: |
| |
| The registrant's schedule of investments in unaffiliated issuers is included in the report to shareholders in Item 1 above. |
| |
| Item 7. Disclosure of Proxy Voting Policies and Procedures For Closed-End Management Investment Companies: |
| |
| Item 8. Portfolio Managers of Closed-End Investment Companies |
| |
| Item 9. Purchases of Equity Securities by Closed-End Management Investment Companies and Affiliated Purchasers: |
| |
| Item 10. Submission of Matters to a Vote of Security Holders: |
| |
| Item 11. Controls and Procedures: |
| |
| (a) The registrant's principal executive officer and principal financial officer have concluded, based on their evaluation of the effectiveness of the design and operation of the registrant's disclosure controls and procedures as of a date within 180 days of the filing date of this report, that the design and operation of such procedures are generally effective to provide reasonable assurance that information required to be disclosed by the registrant in this report is recorded, processed, summarized and reported within the time periods specified in the Commission's rules and forms. |
| |
| (b) Changes in internal control over financial reporting: Not applicable |
| |
| Item 12. Disclosures of Securities Lending Activities for Closed-End Investment Companies: |
| |
| Pursuant to the requirements of the Securities Exchange Act of 1934 and the Investment Company Act of 1940, the registrant has duly caused this report to be signed on its behalf by the undersigned, thereunto duly authorized. |
| |
| By (Signature and Title): |
| |
| /s/ Janet C. Smith
Janet C. Smith
Principal Accounting Officer
|
| |
| Pursuant to the requirements of the Securities Exchange Act of 1934 and the Investment Company Act of 1940, this report has been signed below by the following persons on behalf of the registrant and in the capacities and on the dates indicated. |
| |
| By (Signature and Title): |
| |
| /s/ Jonathan S. Horwitz
Jonathan S. Horwitz
Principal Executive Officer
|
| |
| By (Signature and Title): |
| |
| /s/ Janet C. Smith
Janet C. Smith
Principal Financial Officer
|