| | |
| UNITED STATES
SECURITIES AND EXCHANGE COMMISSION |
| | |
| CERTIFIED SHAREHOLDER REPORT OF REGISTERED
MANAGEMENT INVESTMENT COMPANIES
|
| | |
| Investment Company Act file number: | (811-05346) |
| | |
| Exact name of registrant as specified in charter: | Putnam Variable Trust |
| | |
| Address of principal executive offices: | 100 Federal Street, Boston, Massachusetts 02110 |
| | |
| Name and address of agent for service: | Stephen Tate, Vice President
100 Federal Street
Boston, Massachusetts 02110 |
| | |
| Copy to: | Bryan Chegwidden, Esq.
Ropes & Gray LLP
1211 Avenue of the Americas
New York, New York 10036 |
| | |
| Registrant’s telephone number, including area code: | (617) 292-1000 |
| | |
| Date of fiscal year end: | December 31, 2022 |
| | |
| Date of reporting period: | January 1, 2022 – December 31, 2022 |
| | |
|
Item 1. Report to Stockholders: | |
| | |
| The following is a copy of the report transmitted to stockholders pursuant to Rule 30e-1 under the Investment Company Act of 1940: | |

Message from the Trustees
February 13, 2023
Dear Shareholder:
As an investor, you might be happy to see 2022 in the rearview mirror. High inflation and aggressive interest-rate increases from the U.S. Federal Reserve contributed to market volatility and negative returns for stocks and bonds. Fortunately, toward the end of the year, we saw both inflation levels and Fed actions begin to moderate somewhat.
Although we still face high inflation and uncertainty on how much the economy will slow because of higher interest rates, we believe financial market performance might be better in 2023 as compared with 2022. Historically, stocks and bonds have recovered from bear markets like the one we are experiencing. Be assured that our investment teams are actively researching securities with attractive potential and working to keep portfolio risks in check.
Thank you for investing with Putnam.
Performance summary (as of 12/31/22)
Investment objective
As high a level of current income as Putnam Investment Management, LLC, (Putnam Management) believes is consistent with the preservation of capital
Net asset value December 31, 2022
| |
| Class IA: $4.70 | Class IB: $4.72 |
Annualized total return at net asset value (as of 12/31/22)
| | | | |
| | | | | | Bloomberg |
| | | Class IA | | Class IB | | ICE BofA U.S. | | U.S. |
| | | shares | | shares | | Treasury Bill | | Aggregate |
| | | (9/15/93) | | (4/6/98) | | Index | | Bond Index |
| 1 year | –2.06% | –2.35% | 1.33% | –13.01% |
| 5 years | 0.08 | –0.17 | 1.27 | 0.02 |
| 10 years | 1.94 | 1.70 | 0.77 | 1.06 |
| Life of fund | 4.49 | 4.30 | 2.39 | 4.33 |
Recent performance may have benefited from one or more legal settlements.
For a portion of the periods, the fund had expense limitations, without which returns would have been lower.
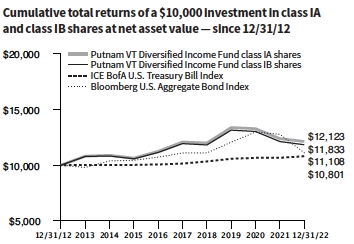
The Bloomberg U.S. Aggregate Bond Index is an unmanaged index of U.S. investment-grade fixed income securities.
The ICE BofA (Intercontinental Exchange Bank of America) U.S. Treasury Bill Index is an unmanaged index that tracks the performance of U.S. dollar-denominated U.S. Treasury bills publicly issued in the U.S. domestic market. Qualifying securities must have a remaining term of at least one month to final maturity and a minimum amount outstanding of $1 billion.
All Bloomberg indices are provided by Bloomberg Index Services Limited.
BLOOMBERG® is a trademark and service mark of Bloomberg Finance L.P. and its affiliates (collectively “Bloomberg”). Bloomberg or Bloomberg’s licensors own all proprietary rights in the Bloomberg Indices. Neither Bloomberg nor Bloomberg’s licensors approve or endorse this material, or guarantee the accuracy or completeness of any information herein, or make any warranty, express or implied, as to the results to be obtained therefrom, and to the maximum extent allowed by law, neither shall have any liability or responsibility for injury or damages arising in connection therewith.
ICE Data Indices, LLC (“ICE BofA”), used with permission. ICE BofA permits use of the ICE BofA indices and related data on an “as is” basis; makes no warranties regarding same; does not guarantee the suitability, quality, accuracy, timeliness, and/or completeness of the ICE BofA indices or any data included in, related to, or derived therefrom; assumes no liability in connection with the use of the foregoing; and does not sponsor, endorse, or recommend Putnam Investments, or any of its products or services.
Data represent past performance. Past performance does not guarantee future results. More recent returns may be less or more than those shown. Investment return and principal value will fluctuate, and you may have a gain or a loss when you sell your shares. Performance information does not reflect any deduction for taxes a shareholder may owe on fund distributions or on the redemption of fund shares. All total return figures are at net asset value and exclude contract charges and expenses, which are added to the variable annuity contracts to determine total return at unit value. Had these charges and expenses been reflected, performance would have been lower. Performance of class IB shares before their inception is derived from the historical performance of class IA shares, adjusted to reflect the higher operating expenses applicable to such shares. For more recent performance, contact your variable annuity provider who can provide you with performance that reflects the charges and expenses at your contract level.
| |
| Putnam VT Diversified Income Fund | 1 |
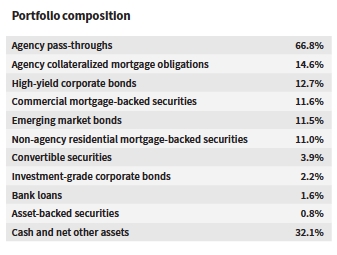
Allocations are shown as a percentage of the fund’s net assets. Cash and net other assets, if any, represent the market value weights of cash, derivatives, short-term securities, and other unclassified assets in the portfolio. Summary information may differ from the portfolio schedule included in the financial statements due to the inclusion of derivative securities, any interest accruals, the use of different classifications of securities for presentation purposes, and rounding. Allocations may not total 100% because the table includes the notional value of certain derivatives (the economic value for purposes of calculating periodic payment obligations), in addition to the market value of securities. Holdings and allocations may vary over time.
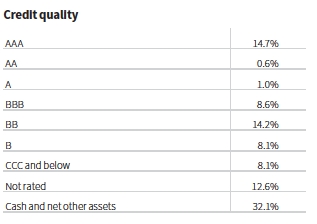
Credit qualities are shown as a percentage of the fund’s net assets. A bond rated BBB or higher is considered investment grade. This table reflects the highest security rating provided by one or more of Standard & Poor’s, Moody’s, and Fitch. Ratings and portfolio credit quality will vary over time. Cash and net other assets, if any, represent the market value weights of cash, derivatives, and short-term securities in the portfolio. The fund itself has not been rated by an independent rating agency. Data in the table reflect a new calculation methodology put into effect on 6/30/22.
| |
| 2 | Putnam VT Diversified Income Fund |
Report from your fund’s managers
How was the investment environment during the 12-month reporting period ended December 31, 2022?
Interest rates rose significantly during the period due to aggressive monetary policy by central banks to tame soaring inflation. Bond prices fell, and yields rose. The yield on the benchmark 10-year U.S. Treasury more than doubled, rising from 1.52% at the beginning of 2022 to 3.88% by period-end. Geopolitical risks and Covid-19 concerns also contributed to a risk-off market environment.
How did Putnam VT Diversified Income Fund perform during the reporting period?
For the 12-month reporting period, the fund’s class IA shares posted a return of –2.06%, underperforming the 1.33% return for the fund’s benchmark, the ICE BofA U.S. Treasury Bill Index.
What were some holdings or strategies that detracted from fund performance relative to the benchmark during the reporting period?
Term structure risk strategies were the largest detractor in 2022. Interest rates rose meaningfully throughout the year on the back of aggressive monetary policy actions from the Federal Reserve. This weighed on returns, as the portfolio was positioned with a positive duration. With that said, our protective interest-rate-volatility strategy offset some of that underperformance, as U.S. Treasury yields fluctuated significantly.
Corporate credit risk strategies also weighed on returns. Both high-yield and investment-grade corporate spreads widened during the period, as investors looked to reduce their risk exposure. [Spreads are the yield advantage credit-sensitive bonds offer over comparable-maturity U.S. Treasuries.] Exposure to high yield was especially challenging in June 2022, when spreads widened substantially. Exposure to convertible securities also weighed on performance as equity markets faced headwinds due to growing expectations about a U.S. recession.
Emerging market risk strategies detracted as well. Higher interest rates, the stronger U.S. dollar, and increased recession risk negatively impacted the asset class.
What were some holdings or strategies that helped fund performance relative to the benchmark during the reporting period?
Mortgage credit strategies added the most to returns. The fund’s exposure across the commercial mortgage credit market, including CMBX, a group of tradable indexes that each reference a basket of 25 commercial mortgage-backed securities [CMBS] issued in a particular year, and CMBS mezzanine bonds added to returns. Technicals [supply/demand metrics] remained strong, and fundamentals within the sector improved, with forbearance deals on commercial properties proving to work well, in our view. The outlook for certain property types has continued to improve, including hotel properties, which outperformed our initial Covid stress scenarios. Positions in agency credit risk transfer securities also aided performance, as they continued to be tendered by issuers and received some upgrades by credit-rating agencies.
Prepayment strategies augmented returns as well. Our mortgage basis positioning was the primary driver of these returns. [Mortgage basis is a strategy that seeks to exploit the yield differential between current-coupon, 30-year agency pass-throughs, and 30-year U.S. Treasuries.] At the beginning of the period, our short mortgage basis positioning benefited the fund as the spread between mortgage rates and U.S. Treasuries widened. Our mortgage basis positioning changed over the course of the year. In November, our long mortgage basis positioning proved beneficial, as the spread between mortgage rates and U.S. Treasuries tightened during the month. Prepayment speeds slowed during the period as rates moved higher. We expected this to be more of a tailwind than it was, but contributions from the agency interest-only positions took time to materialize.
Currency risk strategies modestly added to relative returns. The strategy employed a hedge of safe-haven currencies, which typically do well in risk-off environments.
How did you use derivatives during the reporting period?
We used bond futures and interest-rate swaps to take tactical positions at various points along the yield curve, and to hedge the risk associated with the fund’s curve positioning. We also employed interest-rate swaps to gain exposure to rates in various countries. We utilized options to hedge the fund’s duration and convexity, to isolate the prepayment risk associated with our holdings of collateralized mortgage obligations, and to help manage overall downside risk. We used currency forward contracts to hedge the foreign exchange risk associated with non-U.S. bonds and to efficiently gain exposure to foreign currencies. Finally, we used credit default swaps to gain exposure to CMBS via CMBX, to gain liquid exposure to individual names, and to hedge the fund’s credit and market risks.
What is your near-term outlook?
Given our expectations for further tightening of monetary policy, higher interest rates, and less liquidity in the market, conditions are likely to remain volatile across fixed income markets for the foreseeable future, in our view.
We have a cautious outlook for fixed income markets and expect volatility to remain elevated. We are maintaining tactical term structure positioning that offers risk mitigation, while focusing on opportunities in credit and prepayment. We expect fundamentals across corporate and mortgage credit to be mixed. Risks to our moderately constructive outlook include policy missteps from global central banks, a more severe economic slowdown or recession, ongoing supply chain disruptions, commodity price volatility, heightened geopolitical tension, and the impact of Covid-19 outbreaks.
The views expressed in this report are exclusively those of Putnam Management and are subject to change. They are not meant as investment advice. Please note that the holdings discussed in this report may not have been held by the fund for the entire period. Portfolio composition is subject to review in accordance with the fund’s investment strategy and may vary in the future. Current and future portfolio holdings are subject to risk.
Consider these risks before investing: Emerging market securities carry illiquidity and volatility risks. Lower-rated bonds may offer higher
| |
| Putnam VT Diversified Income Fund | 3 |
yields in return for more risk. Funds that invest in government securities are not guaranteed. Mortgage-backed investments, unlike traditional debt investments, are subject to prepayment risk, which means that they may increase in value less than other bonds when interest rates decline and decline in value more than other bonds when interest rates rise.
The fund’s investments in mortgage-backed securities and asset-backed securities, and in certain other securities and derivatives, may be or become illiquid. The fund’s concentration in an industry group comprising mortgage-backed securities may make the fund’s net asset value more susceptible to economic, market, political, and other developments affecting the housing or real estate markets and the servicing of mortgage loans secured by real estate properties. The fund currently has significant investment exposure to commercial mortgage-backed securities. Bond investments are subject to interest-rate risk (the risk of bond prices falling if interest rates rise) and credit risk (the risk of an issuer defaulting on interest or principal payments). Interest-rate risk is generally greater for longer-term bonds, and credit risk is generally greater for below-investment-grade bonds. Risks associated with derivatives include increased investment exposure (which may be considered leverage) and, in the case of over-the-counter instruments, the potential inability to terminate or sell derivatives positions and the potential failure of the other party to the instrument to meet its obligations. Unlike bonds, funds that invest in bonds have fees and expenses. The value of investments in the fund’s portfolio may fall or fail to rise over time for a variety of reasons, including general economic, political, or financial market conditions; investor sentiment and market perceptions; government actions; geopolitical events or changes; and factors related to a specific issuer, geography, industry, or sector. International investing involves currency, economic, and political risks. These and other factors may lead to increased volatility and reduced liquidity in the fund’s portfolio holdings.
Our investment techniques, analyses, and judgments may not produce the outcome we intend. We, or the fund’s other service providers, may experience disruptions or operating errors that could have a negative effect on the fund. You can lose money by investing in the fund.

Your fund’s managers also manage other accounts advised by Putnam Management or an affiliate, including retail mutual fund counterparts to the funds in Putnam Variable Trust.
ABOUT DERIVATIVES
Derivatives are an increasingly common type of investment instrument, the performance of which is derived from an underlying security, index, currency, or other area of the capital markets. Derivatives employed by the fund’s managers generally serve one of two main purposes: to implement a strategy that may be difficult or more expensive to invest in through traditional securities, or to hedge unwanted risk associated with a particular position.
For example, the fund’s managers might use currency forward contracts to capitalize on an anticipated change in exchange rates between two currencies. This approach would require a significantly smaller outlay of capital than purchasing traditional bonds denominated in the underlying currencies. In another example, the managers may identify a bond that they believe is undervalued relative to its risk of default but may seek to reduce the interest-rate risk of that bond by using interest-rate swaps, a derivative through which two parties “swap” payments based on the movement of certain rates. In other examples, the managers may use options and futures contracts to hedge against a variety of risks by establishing a combination of long and short exposures to specific equity markets or sectors.
Like any other investment, derivatives may not appreciate in value and may lose money. Derivatives may amplify traditional investment risks through the creation of leverage and may be less liquid than traditional securities. And because derivatives typically represent contractual agreements between two financial institutions, derivatives entail “counterparty risk,” which is the risk that the other party is unable or unwilling to pay. Putnam monitors the counterparty risks we assume. For example, Putnam often enters into collateral agreements that require the counterparties to post collateral on a regular basis to cover their obligations to the fund. Counterparty risk for exchange-traded futures and centrally cleared swaps is mitigated by the daily exchange of margin and other safeguards against default through their respective clearinghouses.
| |
| 4 | Putnam VT Diversified Income Fund |
Understanding your fund’s expenses
As an investor in a variable annuity product that invests in a registered investment company, you pay ongoing expenses, such as management fees, distribution fees (12b-1 fees), and other expenses. In the most recent six-month period, your fund’s expenses were limited; had expenses not been limited, they would have been higher. Using the following information, you can estimate how these expenses affect your investment and compare them with the expenses of other funds. You may also pay onetime transaction expenses, which are not shown in this section and would result in higher total expenses. Charges and expenses at the insurance company separate account level are not reflected. For more information, see your fund’s prospectus or talk to your financial representative.
Review your fund’s expenses
The two left-hand columns of the Expenses per $1,000 table show the expenses you would have paid on a $1,000 investment in your fund from 7/1/22 to 12/31/22. They also show how much a $1,000 investment would be worth at the close of the period, assuming actual returns and expenses. To estimate the ongoing expenses you paid over the period, divide your account value by $1,000, then multiply the result by the number in the first line for the class of shares you own.
Compare your fund’s expenses with those of other funds
The two right-hand columns of the Expenses per $1,000 table show your fund’s expenses based on a $1,000 investment, assuming a hypothetical 5% annualized return. You can use this information to compare the ongoing expenses (but not transaction expenses or total costs) of investing in the fund with those of other funds. All shareholder reports of mutual funds and funds serving as variable annuity vehicles will provide this information to help you make this comparison. Please note that you cannot use this information to estimate your actual ending account balance and expenses paid during the period.
Expense ratios
| | |
| | Class IA | Class IB |
| Total annual operating expenses for the fiscal | | |
| year ended 12/31/21 | 0.77% | 1.02% |
| Annualized expense ratio for the six-month | | |
| period ended 12/31/22* | 0.81% | 1.06% |
Fiscal year expense information in this table is taken from the most recent prospectus, is subject to change, and may differ from that shown for the annualized expense ratio and in the financial highlights of this report.
Expenses are shown as a percentage of average net assets.
*Expense ratios for each class are for the fund’s most recent fiscal half year. As a result of this, ratios may differ from expense ratios based on one-year data in the financial highlights.
Expenses per $1,000
| | | | | | | | |
| | | | | | | Expenses and value for a |
| | | Expenses and value for a | | $1,000 investment, assuming |
| | | $1,000 investment, assuming | | a hypothetical 5% annualized |
| | | actual returns for the | | return for the 6 months |
| | | 6 months ended 12/31/22 | | ended 12/31/22 | | |
| | | Class IA | | Class IB | | Class IA | | Class IB |
| Expenses paid | | | | | | | | |
| per $1,000*† | | $4.09 | | $5.34 | | $4.13 | | $5.40 |
| Ending value | | | | | | | | |
| (after | | | | | | | | |
| expenses) | | $1,002.10 | | $1,000.00 | | $1,021.12 | | $1,019.86 |
*Expenses for each share class are calculated using the fund’s annualized expense ratio for each class, which represents the ongoing expenses as a percentage of average net assets for the six months ended 12/31/22. The expense ratio may differ for each share class.
†Expenses based on actual returns are calculated by multiplying the expense ratio by the average account value for the period; then multiplying the result by the number of days in the period (184); and then dividing that result by the number of days in the year (365). Expenses based on a hypothetical 5% return are calculated by multiplying the expense ratio by the average account value for the six-month period; then multiplying the result by the number of days in the six-month period (184); and then dividing that result by the number of days in the year (365).
| |
| Putnam VT Diversified Income Fund | 5 |
Report of Independent Registered Public Accounting Firm
To the Board of Trustees of Putnam Variable Trust and Shareholders of
Putnam VT Diversified Income Fund:
Opinion on the Financial Statements
We have audited the accompanying statement of assets and liabilities, including the fund’s portfolio, of Putnam VT Diversified Income Fund (one of the funds constituting Putnam Variable Trust, referred to hereafter as the “Fund”) as of December 31, 2022, the related statement of operations for the year ended December 31, 2022, the statement of changes in net assets for each of the two years in the period ended December 31, 2022, including the related notes, and the financial highlights for each of the five years in the period ended December 31, 2022 (collectively referred to as the “financial statements”). In our opinion, the financial statements present fairly, in all material respects, the financial position of the Fund as of December 31, 2022, the results of its operations for the year then ended, the changes in its net assets for each of the two years in the period ended December 31, 2022 and the financial highlights for each of the five years in the period ended December 31, 2022 in conformity with accounting principles generally accepted in the United States of America.
Basis for Opinion
These financial statements are the responsibility of the Fund’s management. Our responsibility is to express an opinion on the Fund’s financial statements based on our audits. We are a public accounting firm registered with the Public Company Accounting Oversight Board (United States) (“PCAOB”) and are required to be independent with respect to the Fund in accordance with the U.S. federal securities laws and the applicable rules and regulations of the Securities and Exchange Commission and the PCAOB.
We conducted our audits of these financial statements in accordance with the standards of the PCAOB. Those standards require that we plan and perform the audit to obtain reasonable assurance about whether the financial statements are free of material misstatement, whether due to error or fraud.
Our audits included performing procedures to assess the risks of material misstatement of the financial statements, whether due to error or fraud, and performing procedures that respond to those risks. Such procedures included examining, on a test basis, evidence regarding the amounts and disclosures in the financial statements. Our audits also included evaluating the accounting principles used and significant estimates made by management, as well as evaluating the overall presentation of the financial statements. Our procedures included confirmation of securities owned as of December 31, 2022 by correspondence with the custodian, transfer agent, agent banks and brokers; when replies were not received from agent banks and brokers, we performed other auditing procedures. We believe that our audits provide a reasonable basis for our opinion.
PricewaterhouseCoopers LLP
Boston, Massachusetts
February 13, 2023
We have served as the auditor of one or more investment companies in the Putnam Investments family of funds since at least 1957. We have not been able to determine the specific year we began serving as auditor.
| |
| 6 | Putnam VT Diversified Income Fund |
The fund’s portfolio 12/31/22
| | |
| U.S. GOVERNMENT AND AGENCY | Principal | |
| MORTGAGE OBLIGATIONS (90.0%)* | amount | Value |
| | |
| U.S. Government Guaranteed Mortgage Obligations (8.3%) | |
| Government National Mortgage Association | | |
| Pass-Through Certificates | | |
| 5.50%, 5/20/49 | $16,219 | $16,502 |
| 5.00%, with due dates from 5/20/49 to 3/20/50 | 111,635 | 111,354 |
| 4.50%, TBA, 1/1/53 | 4,000,000 | 3,881,286 |
| 4.00%, TBA, 1/1/53 | 3,000,000 | 2,840,016 |
| 3.50%, with due dates from 9/20/49 to 11/20/49 | 152,222 | 140,511 |
| 3.00%, TBA, 1/1/53 | 3,000,000 | 2,672,030 |
| | | 9,661,699 |
| U.S. Government Agency Mortgage Obligations (81.7%) | |
| Federal National Mortgage Association | | |
| Pass-Through Certificates | | |
| 5.00%, with due dates from 1/1/49 to 5/1/49 | 37,692 | 37,176 |
| 4.50%, 5/1/49 | 6,917 | 6,767 |
| Uniform Mortgage-Backed Securities | | |
| 6.00%, TBA, 1/1/53 | 7,000,000 | 7,108,284 |
| 5.50%, TBA, 1/1/53 | 25,000,000 | 25,074,230 |
| 5.00%, TBA, 1/1/53 | 45,000,000 | 44,374,239 |
| 4.50%, TBA, 1/1/53 | 17,000,000 | 16,386,405 |
| 3.50%, TBA, 1/1/53 | 3,000,000 | 2,728,358 |
| | | 95,715,459 |
| Total U.S. government and agency mortgage obligations | |
| (cost $106,174,658) | | $105,377,158 |
| |
| | Principal | |
| U.S. TREASURY OBLIGATIONS (0.9%)* | amount | Value |
| | | |
| U.S. Treasury Notes | | |
| 2.50%, 8/15/23 i | $111,000 | $110,543 |
| 1.75%, 5/15/23 i | 162,000 | 160,660 |
| 1.625%, 5/15/31 i | 680,000 | 573,294 |
| 1.625%, 5/15/26 i | 132,000 | 121,944 |
| 0.25%, 7/31/25 i | 120,000 | 108,467 |
| Total U.S. treasury obligations (cost $1,074,908) | | $1,074,908 |
| |
| | Principal | |
| MORTGAGE-BACKED SECURITIES (36.8%)* | amount | Value |
| | |
| Agency collateralized mortgage obligations (14.4%) | |
| Federal Home Loan Mortgage Corporation | | |
| REMICs Ser. 4077, Class IK, IO, 5.00%, 7/15/42 | $281,330 | $55,084 |
| REMICs Ser. 5091, Class IL, IO, 4.50%, 3/25/51 | 2,509,884 | 443,611 |
| REMICs Ser. 5093, Class YI, IO, 4.50%, 12/25/50 | 1,868,440 | 400,140 |
| REMICs Ser. 5024, Class HI, IO, 4.50%, 10/25/50 | 2,673,278 | 567,328 |
| REMICs Ser. 4122, Class TI, IO, 4.50%, 10/15/42 | 359,355 | 70,981 |
| REMICs Ser. 4000, Class PI, IO, 4.50%, 1/15/42 | 175,794 | 26,601 |
| REMICs Ser. 4024, Class PI, IO, 4.50%, 12/15/41 | 319,855 | 36,957 |
| REMICs Ser. 5134, Class IC, IO, 4.00%, 8/25/51 | 3,378,315 | 625,306 |
| REMICs Ser. 4546, Class TI, IO, 4.00%, 12/15/45 | 239,900 | 43,735 |
| REMICs Ser. 4425, IO, 4.00%, 1/15/45 | 781,412 | 122,674 |
| REMICs Ser. 4452, Class QI, IO, 4.00%, 11/15/44 | 704,200 | 146,543 |
| REMICs Ser. 4403, Class CI, IO, 4.00%, 10/15/44 | 231,617 | 42,590 |
| REMICs Ser. 4000, Class LI, IO, 4.00%, 2/15/42 | 143,659 | 22,770 |
| REMICs Ser. 4604, Class QI, IO, 3.50%, 7/15/46 | 493,520 | 64,641 |
| REMICs Ser. 4580, Class ID, IO, 3.50%, 8/15/45 | 397,747 | 51,723 |
| REMICs Ser. 4105, Class HI, IO, 3.50%, 7/15/41 | 273,439 | 21,459 |
| Strips Ser. 304, Class C37, IO, 3.50%, 12/15/27 | 196,401 | 7,668 |
| REMICs Ser. 4210, Class PI, IO, 3.00%, 12/15/41 | 91,782 | 911 |
| | |
| | Principal | |
| MORTGAGE-BACKED SECURITIES (36.8%)* cont. | amount | Value |
| | | |
| Agency collateralized mortgage obligations cont. | | |
| Federal Home Loan Mortgage Corporation | | |
| REMICs IFB Ser. 4742, Class S, IO, | | |
| ((-1 x ICE LIBOR USD 1 Month) + 6.20%), | | |
| 1.882%, 12/15/47 | $526,831 | $55,058 |
| REMICs IFB Ser. 5011, Class SA, IO, ((-1 x ICE | | |
| LIBOR USD 1 Month) + 6.25%), 1.861%, 9/25/50 | 2,415,988 | 267,546 |
| REMICs IFB Ser. 4839, Class WS, IO, ((-1 x ICE | | |
| LIBOR USD 1 Month) + 6.10%), 1.782%, 8/15/56 | 1,868,885 | 214,772 |
| REMICs IFB Ser. 4678, Class MS, IO, ((-1 x ICE | | |
| LIBOR USD 1 Month) + 6.10%), 1.782%, 4/15/47 | 459,111 | 53,882 |
| REMICs IFB Ser. 5002, Class SJ, IO, ((-1 x ICE | | |
| LIBOR USD 1 Month) + 6.10%), 1.711%, 7/25/50 | 2,396,241 | 269,166 |
| REMICs IFB Ser. 4945, Class SL, IO, ((-1 x ICE | | |
| LIBOR USD 1 Month) + 6.05%), 1.661%, 1/25/50 | 1,838,274 | 170,332 |
| Structured Pass-Through Certificates FRB | | |
| Ser. 57, Class 1AX, IO, 0.395%, 7/25/43 W | 567,280 | 5,673 |
| Federal National Mortgage Association | | |
| REMICs Ser. 16-3, Class NI, IO, 6.00%, 2/25/46 | 639,789 | 113,117 |
| Interest Strip Ser. 374, Class 6, IO, | | |
| 5.50%, 8/25/36 | 50,896 | 8,473 |
| REMICs Ser. 15-30, IO, 5.50%, 5/25/45 | 1,027,198 | 166,879 |
| Interest Strip Ser. 378, Class 19, IO, | | |
| 5.00%, 6/25/35 | 155,753 | 24,123 |
| REMICs Ser. 20-76, Class BI, IO, 4.50%, 11/25/50 | 2,500,207 | 460,407 |
| REMICs Ser. 12-127, Class BI, IO, | | |
| 4.50%, 11/25/42 | 120,887 | 23,590 |
| REMICs Ser. 15-88, Class QI, IO, | | |
| 4.00%, 10/25/44 | 170,053 | 11,435 |
| REMICs Ser. 15-83, IO, 4.00%, 10/25/43 | 750,700 | 112,212 |
| REMICs Ser. 13-41, Class IP, IO, 4.00%, 5/25/43 | 409,748 | 54,914 |
| REMICs Ser. 13-44, Class PI, IO, 4.00%, 1/25/43 | 298,215 | 38,049 |
| REMICs Ser. 13-23, Class PI, IO, 3.00%, 10/25/41 | 34,046 | 73 |
| REMICs IFB Ser. 13-90, Class SD, IO, ((-1 x ICE | | |
| LIBOR USD 1 Month) + 6.60%), 2.211%, 9/25/43 | 757,678 | 83,011 |
| REMICs IFB Ser. 10-35, Class SG, IO, ((-1 x ICE | | |
| LIBOR USD 1 Month) + 6.40%), 2.011%, 4/25/40 | 280,980 | 29,982 |
| REMICs IFB Ser. 18-20, Class SB, IO, ((-1 x ICE | | |
| LIBOR USD 1 Month) + 6.25%), 1.861%, 3/25/48 | 1,455,481 | 135,069 |
| REMICs IFB Ser. 18-38, Class SA, IO, ((-1 x ICE | | |
| LIBOR USD 1 Month) + 6.20%), 1.811%, 6/25/48 | 1,857,824 | 200,036 |
| REMICs IFB Ser. 15-42, Class LS, IO, ((-1 x ICE | | |
| LIBOR USD 1 Month) + 6.20%), 1.811%, 6/25/45 | 1,519,029 | 93,539 |
| REMICs IFB Ser. 17-32, Class SA, IO, ((-1 x ICE | | |
| LIBOR USD 1 Month) + 6.15%), 1.761%, 5/25/47 | 2,890,840 | 260,638 |
| REMICs IFB Ser. 16-96, Class ST, IO, ((-1 x ICE | | |
| LIBOR USD 1 Month) + 6.10%), 1.711%, 12/25/46 | 1,135,296 | 85,168 |
| REMICs IFB Ser. 20-12, Class SK, IO, ((-1 x ICE | | |
| LIBOR USD 1 Month) + 6.05%), 1.661%, 3/25/50 | 1,423,653 | 145,924 |
| REMICs IFB Ser. 19-43, Class JS, IO, ((-1 x ICE | | |
| LIBOR USD 1 Month) + 6.05%), 1.661%, 8/25/49 | 1,255,787 | 96,796 |
| REMICs Ser. 13-107, Class SB, IO, ((-1 x ICE LIBOR | | |
| USD 1 Month) + 5.95%), 1.561%, 2/25/43 | 709,967 | 74,818 |
| Grantor Trust Ser. 00-T6, IO, 0.717%, 11/25/40 W | 413,885 | 2,690 |
| Government National Mortgage Association | | |
| Ser. 17-38, Class DI, IO, 5.00%, 3/16/47 | 335,403 | 65,206 |
| Ser. 16-42, IO, 5.00%, 2/20/46 | 526,437 | 100,086 |
| Ser. 18-127, Class ID, IO, 5.00%, 7/20/45 | 317,893 | 48,539 |
| Ser. 18-127, Class IC, IO, 5.00%, 10/20/44 | 951,186 | 193,890 |
| Ser. 14-76, IO, 5.00%, 5/20/44 | 287,116 | 57,550 |
| Ser. 13-3, Class IT, IO, 5.00%, 1/20/43 | 307,801 | 65,508 |
| Ser. 12-146, IO, 5.00%, 12/20/42 | 481,279 | 94,995 |
| Ser. 10-35, Class UI, IO, 5.00%, 3/20/40 | 158,115 | 32,800 |
| |
| Putnam VT Diversified Income Fund | 7 |
| | |
| | Principal | |
| MORTGAGE-BACKED SECURITIES (36.8%)* cont. | amount | Value |
| | | |
| Agency collateralized mortgage obligations cont. | | |
| Government National Mortgage Association | | |
| Ser. 10-20, Class UI, IO, 5.00%, 2/20/40 | $237,673 | $48,381 |
| Ser. 10-9, Class UI, IO, 5.00%, 1/20/40 | 1,043,914 | 218,575 |
| Ser. 09-121, Class UI, IO, 5.00%, 12/20/39 | 595,648 | 123,948 |
| Ser. 17-26, Class MI, IO, 5.00%, 11/20/39 | 924,259 | 184,002 |
| Ser. 15-79, Class GI, IO, 5.00%, 10/20/39 | 193,852 | 38,271 |
| Ser. 18-94, Class AI, IO, 4.50%, 7/20/48 | 1,244,829 | 237,075 |
| Ser. 13-34, Class IH, IO, 4.50%, 3/20/43 | 686,097 | 126,678 |
| Ser. 13-183, Class JI, IO, 4.50%, 2/16/43 | 125,823 | 9,051 |
| Ser. 14-108, Class IP, IO, 4.50%, 12/20/42 | 50,407 | 2,788 |
| Ser. 17-42, Class IC, IO, 4.50%, 8/20/41 | 381,022 | 75,125 |
| Ser. 10-35, Class AI, IO, 4.50%, 3/20/40 | 442,338 | 76,845 |
| Ser. 10-35, Class QI, IO, 4.50%, 3/20/40 | 441,401 | 83,821 |
| Ser. 13-151, Class IB, IO, 4.50%, 2/20/40 | 468,915 | 83,547 |
| Ser. 09-121, Class BI, IO, 4.50%, 12/16/39 | 281,726 | 50,161 |
| Ser. 15-186, Class AI, IO, 4.00%, 12/20/45 | 1,185,347 | 194,658 |
| Ser. 15-79, Class CI, IO, 4.00%, 5/20/45 | 820,879 | 140,903 |
| Ser. 15-64, Class YI, IO, 4.00%, 11/20/44 | 408,290 | 49,554 |
| Ser. 17-63, Class PI, IO, 4.00%, 12/20/43 | 190,578 | 7,900 |
| Ser. 13-165, Class IL, IO, 4.00%, 3/20/43 | 275,445 | 43,082 |
| Ser. 12-8, Class PI, IO, 4.00%, 5/20/41 | 783,752 | 71,593 |
| Ser. 21-156, IO, 3.50%, 7/20/51 | 3,522,118 | 603,058 |
| Ser. 20-167, Class PI, IO, 3.50%, 11/20/50 | 2,793,313 | 508,199 |
| Ser. 16-75, Class EI, IO, 3.50%, 8/20/45 | 332,700 | 39,873 |
| Ser. 13-28, IO, 3.50%, 2/20/43 | 157,045 | 19,194 |
| Ser. 13-54, Class JI, IO, 3.50%, 2/20/43 | 225,620 | 25,082 |
| Ser. 13-37, Class JI, IO, 3.50%, 1/20/43 | 388,408 | 44,636 |
| Ser. 12-140, Class IC, IO, 3.50%, 11/20/42 | 741,349 | 121,970 |
| Ser. 12-128, Class IA, IO, 3.50%, 10/20/42 | 851,016 | 134,584 |
| Ser. 21-59, Class IP, IO, 3.00%, 4/20/51 | 3,187,435 | 464,154 |
| Ser. 17-H02, Class BI, IO, 2.674%, 1/20/67 W | 1,602,955 | 49,217 |
| Ser. 17-H06, Class BI, IO, 2.474%, 2/20/67 W | 1,686,485 | 59,750 |
| Ser. 18-H05, Class BI, IO, 2.473%, 2/20/68 W | 2,012,535 | 106,145 |
| Ser. 18-H03, Class XI, IO, 2.281%, 2/20/68 W | 1,878,780 | 93,116 |
| Ser. 18-H05, Class AI, IO, 2.101%, 2/20/68 W | 1,703,862 | 93,818 |
| Ser. 17-H08, Class NI, IO, 2.097%, 3/20/67 W | 2,203,631 | 91,067 |
| Ser. 16-H03, Class DI, IO, 2.037%, 12/20/65 W | 2,041,206 | 93,275 |
| IFB Ser. 21-98, Class SK, IO, ((-1 x ICE LIBOR USD | | |
| 1 Month) + 6.30%), 1.947%, 6/20/51 | 1,940,685 | 226,206 |
| IFB Ser. 21-77, Class SM, IO, ((-1 x ICE LIBOR USD | | |
| 1 Month) + 6.30%), 1.947%, 5/20/51 | 2,747,071 | 327,932 |
| IFB Ser. 21-59, Class SQ, IO, ((-1 x ICE LIBOR USD | | |
| 1 Month) + 6.30%), 1.947%, 4/20/51 | 2,175,399 | 224,288 |
| IFB Ser. 20-133, Class CS, IO, ((-1 x ICE LIBOR | | |
| USD 1 Month) + 6.30%), 1.947%, 9/20/50 | 2,500,215 | 319,287 |
| FRB Ser. 21-116, Class ES, IO, ((-1 x ICE LIBOR | | |
| USD 1 Month) + 6.20%), 1.874%, 11/20/47 | 2,923,210 | 400,995 |
| IFB Ser. 14-60, Class SD, IO, ((-1 x ICE LIBOR USD | | |
| 1 Month) + 6.18%), 1.827%, 4/20/44 | 1,465,795 | 148,241 |
| Ser. 15-H25, Class EI, IO, 1.826%, 10/20/65 W | 1,601,634 | 72,874 |
| IFB Ser. 20-97, Class QS, IO, ((-1 x ICE LIBOR USD | | |
| 1 Month) + 6.15%), 1.797%, 7/20/50 | 2,392,690 | 310,844 |
| IFB Ser. 18-139, Class SA, IO, ((-1 x ICE LIBOR | | |
| USD 1 Month) + 6.15%), 1.797%, 10/20/48 | 1,323,697 | 110,840 |
| IFB Ser. 13-129, Class SN, IO, ((-1 x ICE LIBOR | | |
| USD 1 Month) + 6.15%), 1.797%, 9/20/43 | 264,743 | 24,293 |
| Ser. 17-H10, Class MI, IO, 1.787%, 4/20/67 W | 2,933,919 | 81,270 |
| Ser. 17-H09, IO, 1.762%, 4/20/67 W | 2,170,300 | 64,623 |
| IFB Ser. 20-63, Class PS, IO, ((-1 x ICE LIBOR USD | | |
| 1 Month) + 6.10%), 1.747%, 4/20/50 | 2,496,419 | 284,133 |
| | |
| | Principal | |
| MORTGAGE-BACKED SECURITIES (36.8%)* cont. | amount | Value |
| | | |
| Agency collateralized mortgage obligations cont. | | |
| Government National Mortgage Association | | |
| IFB Ser. 19-96, Class SY, IO, ((-1 x ICE LIBOR USD | | |
| 1 Month) + 6.10%), 1.747%, 8/20/49 | $4,076,441 | $396,352 |
| IFB Ser. 19-83, Class SY, IO, ((-1 x ICE LIBOR USD | | |
| 1 Month) + 6.10%), 1.747%, 7/20/49 | 1,744,533 | 159,869 |
| IFB Ser. 19-89, Class PS, IO, ((-1 x ICE LIBOR USD | | |
| 1 Month) + 6.10%), 1.747%, 7/20/49 | 2,699,188 | 232,992 |
| FRB Ser. 15-H08, Class CI, IO, 1.74%, 3/20/65 W | 1,092,376 | 45,224 |
| IFB Ser. 20-15, Class CS, IO, ((-1 x ICE LIBOR USD | | |
| 1 Month) + 6.05%), 1.697%, 2/20/50 | 172,268 | 12,030 |
| IFB Ser. 20-7, Class SK, IO, ((-1 x ICE LIBOR USD | | |
| 1 Month) + 6.05%), 1.697%, 1/20/50 | 1,293,668 | 124,628 |
| IFB Ser. 19-152, Class ES, IO, ((-1 x ICE LIBOR | | |
| USD 1 Month) + 6.05%), 1.697%, 12/20/49 | 1,096,258 | 99,404 |
| IFB Ser. 19-99, Class KS, IO, ((-1 x ICE LIBOR USD | | |
| 1 Month) + 6.05%), 1.697%, 8/20/49 | 82,191 | 7,097 |
| IFB Ser. 19-78, Class SJ, IO, ((-1 x ICE LIBOR USD | | |
| 1 Month) + 6.05%), 1.697%, 6/20/49 | 79,948 | 5,833 |
| Ser. 15-H23, Class BI, IO, 1.696%, 9/20/65 W | 2,225,515 | 86,127 |
| IFB Ser. 20-63, Class AS, IO, ((-1 x ICE LIBOR USD | | |
| 1 Month) + 6.00%), 1.647%, 8/20/43 | 2,092,152 | 190,156 |
| Ser. 16-H16, Class EI, IO, 1.64%, 6/20/66 W | 1,538,735 | 65,396 |
| Ser. 16-H24, Class CI, IO, 1.63%, 10/20/66 W | 1,535,821 | 65,887 |
| Ser. 16-H14, IO, 1.613%, 6/20/66 W | 1,132,580 | 40,165 |
| Ser. 17-H11, Class DI, IO, 1.591%, 5/20/67 W | 1,441,811 | 73,659 |
| Ser. 15-H25, Class AI, IO, 1.546%, 9/20/65 W | 3,366,334 | 121,188 |
| Ser. 13-H08, Class CI, IO, 1.534%, 2/20/63 W | 1,582,066 | 49,360 |
| Ser. 14-H21, Class BI, IO, 1.47%, 10/20/64 W | 1,899,727 | 65,161 |
| Ser. 17-H12, Class QI, IO, 1.437%, 5/20/67 W | 1,609,589 | 60,245 |
| Ser. 17-H11, Class TI, IO, 1.274%, 4/20/67 W | 1,301,826 | 78,630 |
| IFB Ser. 14-119, Class SA, IO, ((-1 x ICE LIBOR | | |
| USD 1 Month) + 5.60%), 1.247%, 8/20/44 | 643,101 | 50,701 |
| Ser. 16-H22, Class AI, IO, 1.102%, 10/20/66 W | 1,869,834 | 65,143 |
| Ser. 16-H23, Class NI, IO, 1.057%, 10/20/66 W | 5,637,907 | 186,051 |
| Ser. 16-H24, Class JI, IO, 0.988%, 11/20/66 W | 1,849,329 | 90,176 |
| Ser. 16-H17, Class KI, IO, 0.689%, 7/20/66 W | 900,784 | 36,358 |
| Ser. 15-H24, Class AI, IO, 0.623%, 9/20/65 W | 1,859,797 | 53,090 |
| Ser. 17-H16, Class JI, IO, 0.492%, 8/20/67 W | 2,387,891 | 128,652 |
| Ser. 16-H06, Class DI, IO, 0.362%, 7/20/65 W | 2,969,547 | 61,348 |
| Ser. 17-H16, Class IB, IO, 0.292%, 8/20/67 W | 2,001,258 | 75,628 |
| Ser. 17-H16, Class IG, IO, 0.118%, 7/20/67 W | 2,205,748 | 63,317 |
| Ser. 16-H09, Class BI, IO, 0.067%, 4/20/66 W | 2,821,732 | 133,750 |
| Ser. 15-H10, Class BI, IO, 0.03%, 4/20/65 W | 1,398,830 | 53,995 |
| Ser. 16-H03, Class AI, IO, 0.021%, 1/20/66 W | 1,470,364 | 48,032 |
| Ser. 16-H02, Class HI, IO, 0.017%, 1/20/66 W | 2,213,395 | 54,892 |
| Ser. 16-H06, Class CI, IO, 0.001%, 2/20/66 W | 3,238,116 | 56,955 |
| Ser. 16-H10, Class AI, IO, zero %, 4/20/66 W | 3,106,102 | 59,476 |
| | | 16,872,557 |
| Commercial mortgage-backed securities (11.4%) | |
| BBCMS Mortgage Trust 144A Ser. 21-C10, Class E, | | |
| 2.00%, 7/15/54 | 261,000 | 125,863 |
| Bear Stearns Commercial Mortgage Securities | | |
| Trust FRB Ser. 07-T26, Class AJ, 5.566%, 1/12/45 W | 8,960 | 8,646 |
| Benchmark Mortgage Trust 144A FRB Ser. 18-B3, | | |
| Class D, 3.036%, 4/10/51 W | 261,000 | 174,576 |
| BWAY Mortgage Trust 144A FRB Ser. 22-26BW, | | |
| Class F, 4.866%, 2/10/44 W | 420,000 | 276,898 |
| CD Commercial Mortgage Trust FRB Ser. 17-CD3, | | |
| Class C, 4.547%, 2/10/50 W | 174,000 | 132,172 |
| CD Commercial Mortgage Trust 144A | | |
| Ser. 17-CD3, Class D, 3.25%, 2/10/50 | 460,000 | 324,357 |
| |
| 8 | Putnam VT Diversified Income Fund |
| | |
| | Principal | |
| MORTGAGE-BACKED SECURITIES (36.8%)* cont. | amount | Value |
| | | |
| Commercial mortgage-backed securities cont. | | |
| CFCRE Commercial Mortgage Trust 144A | | |
| FRB Ser. 11-C2, Class F, 5.25%, 12/15/47 W | $822,000 | $818,630 |
| FRB Ser. 11-C2, Class E, 5.08%, 12/15/47 W | 326,000 | 273,276 |
| Citigroup Commercial Mortgage Trust | | |
| Ser. 13-GC11, Class C, 4.134%, 4/10/46 W | 246,000 | 241,594 |
| COMM Mortgage Trust | | |
| Ser. 12-LC4, Class B, 4.934%, 12/10/44 W | 175,004 | 174,678 |
| FRB Ser. 14-CR16, Class C, 4.917%, 4/10/47 W | 283,000 | 256,134 |
| COMM Mortgage Trust 144A | | |
| FRB Ser. 14-UBS3, Class D, 4.766%, 6/10/47 W | 116,000 | 104,106 |
| Ser. 12-CR3, Class F, 4.75%, 10/15/45 W | 700,000 | 304,571 |
| FRB Ser. 13-CR9, Class D, 4.289%, 7/10/45 W | 289,000 | 254,710 |
| FRB Ser. 15-LC19, Class E, 4.215%, 2/10/48 W | 257,000 | 213,125 |
| Credit Suisse Mortgage Trust 144A FRB | | |
| Ser. 22-NWPT, Class A, 7.479%, 9/9/24 | 158,000 | 157,506 |
| CSAIL Commercial Mortgage Trust 144A FRB | | |
| Ser. 15-C1, Class D, 3.758%, 4/15/50 W | 307,000 | 205,894 |
| GS Mortgage Securities Corp., II 144A | | |
| FRB Ser. 13-GC10, Class D, 4.339%, 2/10/46 W | 237,000 | 235,801 |
| Ser. 13-GC10, Class C, 4.285%, 2/10/46 W | 195,000 | 194,480 |
| GS Mortgage Securities Trust Ser. 14-GC18, | | |
| Class B, 4.885%, 1/10/47 W | 265,000 | 242,604 |
| JPMBB Commercial Mortgage | | |
| Securities Trust 144A | | |
| FRB Ser. 14-C18, Class D, 4.735%, 2/15/47 W | 787,000 | 549,237 |
| FRB Ser. 14-C19, Class C19, 4.647%, 4/15/47 W | 208,000 | 189,747 |
| FRB Ser. 14-C18, Class E, 4.235%, 2/15/47 W | 381,000 | 211,916 |
| FRB Ser. 14-C25, Class D, 3.936%, 11/15/47 W | 194,000 | 131,431 |
| Ser. 14-C25, Class E, 3.332%, 11/15/47 W | 656,000 | 394,892 |
| JPMDB Commercial Mortgage Securities Trust | | |
| Ser. 17-C5, Class C, 4.512%, 3/15/50 W | 291,000 | 224,452 |
| JPMorgan Chase Commercial Mortgage | | |
| Securities Trust FRB Ser. 13-LC11, Class D, | | |
| 4.231%, 4/15/46 W | 408,000 | 294,192 |
| JPMorgan Chase Commercial Mortgage | | |
| Securities Trust 144A FRB Ser. 11-C3, Class F, | | |
| 5.525%, 2/15/46 W | 401,000 | 71,479 |
| Mezz Cap Commercial Mortgage Trust 144A FRB | | |
| Ser. 07-C5, Class X, IO, 6.571%, 12/15/49 W | 11,396 | — |
| Morgan Stanley Bank of America Merrill Lynch | | |
| Trust Ser. 12-C6, Class C, 4.536%, 11/15/45 W | 232,000 | 220,762 |
| Morgan Stanley Bank of America Merrill | | |
| Lynch Trust 144A | | |
| FRB Ser. 13-C11, Class D, 4.398%, 8/15/46 W | 750,000 | 52,307 |
| FRB Ser. 15-C23, Class D, 4.142%, 7/15/50 W | 347,000 | 293,237 |
| FRB Ser. 13-C10, Class D, 4.07%, 7/15/46 W | 478,000 | 315,270 |
| Ser. 14-C17, Class E, 3.50%, 8/15/47 | 369,000 | 265,452 |
| Ser. 14-C19, Class D, 3.25%, 12/15/47 | 240,000 | 207,286 |
| Morgan Stanley Capital I Trust | | |
| Ser. 06-HQ10, Class B, 5.448%, 11/12/41 W | 92,521 | 85,243 |
| FRB Ser. 18-H3, Class C, 4.863%, 7/15/51 W | 178,000 | 155,373 |
| Multifamily Connecticut Avenue | | |
| Securities Trust 144A | | |
| FRB Ser. 20-01, Class M10, 8.139%, 3/25/50 | 577,000 | 532,885 |
| FRB Ser. 19-01, Class M10, 7.639%, 10/25/49 | 332,039 | 311,747 |
| Ready Capital Mortgage Financing, LLC 144A | | |
| FRB Ser. 22-FL9, Class A, 6.79%, 6/25/37 | 357,548 | 355,190 |
| RIAL Issuer, Ltd. 144A FRB Ser. 22-FL8, Class B, | | |
| 7.575%, 1/19/37 | 217,000 | 209,948 |
| TIAA Real Estate CDO, Ltd. 144A Ser. 03-1A, | | |
| Class E, 8.00%, 12/28/38 (In default) † | 472,775 | 5 |
| | |
| | Principal | |
| MORTGAGE-BACKED SECURITIES (36.8%)* cont. | amount | Value |
| | | |
| Commercial mortgage-backed securities cont. | | |
| UBS-Barclays Commercial Mortgage Trust 144A | | |
| Ser. 12-C2, Class F, 5.00%, 5/10/63 W | $490,000 | $5 |
| Wells Fargo Commercial Mortgage Trust FRB | | |
| Ser. 15-C29, Class D, 4.218%, 6/15/48 W | 213,000 | 180,688 |
| Wells Fargo Commercial Mortgage Trust 144A | | |
| FRB Ser. 15-C30, Class D, 4.498%, 9/15/58 W | 191,000 | 160,133 |
| FRB Ser. 13-LC12, Class D, 4.296%, 7/15/46 W | 513,000 | 207,116 |
| Ser. 14-LC16, Class D, 3.938%, 8/15/50 | 828,000 | 132,861 |
| Ser. 16-C33, Class D, 3.123%, 3/15/59 | 534,000 | 419,936 |
| WF-RBS Commercial Mortgage Trust 144A | | |
| FRB Ser. 13-UBS1, Class D, 5.024%, 3/15/46 W | 160,000 | 153,279 |
| FRB Ser. 13-UBS1, Class E, 5.024%, 3/15/46 W | 192,000 | 182,062 |
| Ser. 11-C4, Class F, 5.00%, 6/15/44 W | 1,331,000 | 806,719 |
| FRB Ser. 12-C7, Class E, 4.651%, 6/15/45 | | |
| (In default) † W | 844,486 | 62,637 |
| FRB Ser. 13-C15, Class D, 4.529%, 8/15/46 W | 1,231,000 | 729,208 |
| FRB Ser. 12-C10, Class D, 4.422%, 12/15/45 W | 694,000 | 509,576 |
| | | 13,335,892 |
| Residential mortgage-backed securities (non-agency) (11.0%) | |
| BCAP, LLC Trust 144A FRB Ser. 11-RR3, Class 3A6, | | |
| 3.991%, 11/27/36 W | 269,462 | 175,150 |
| Bear Stearns Alt-A Trust FRB Ser. 05-8, | | |
| Class 21A1, 3.354%, 10/25/35 W | 157,768 | 130,202 |
| Bellemeade Re, Ltd. 144A FRB Ser. 17-1, Class B1, | | |
| (ICE LIBOR USD 1 Month + 4.75%), 9.139%, | | |
| 10/25/27 (Bermuda) | 220,000 | 220,797 |
| Chevy Chase Funding, LLC Mortgage-Backed | | |
| Certificates 144A FRB Ser. 06-4A, Class A2, (ICE | | |
| LIBOR USD 1 Month + 0.18%), 4.569%, 11/25/47 | 114,701 | 93,792 |
| Countrywide Alternative Loan Trust | | |
| FRB Ser. 05-59, Class 1A1, (ICE LIBOR USD | | |
| 1 Month + 0.66%), 5.013%, 11/20/35 | 159,533 | 139,367 |
| FRB Ser. 05-65CB, Class 2A1, (ICE LIBOR USD | | |
| 1 Month + 0.43%), 4.814%, 12/25/35 | 311,667 | 210,937 |
| FRB Ser. 06-OA10, Class 2A1, (ICE LIBOR USD | | |
| 1 Month + 0.38%), 4.769%, 8/25/46 | 132,789 | 107,046 |
| FRB Ser. 06-OA10, Class 4A1, (ICE LIBOR USD | | |
| 1 Month + 0.38%), 4.769%, 8/25/46 | 918,183 | 725,179 |
| FRB Ser. 07-OH1, Class A1D, (ICE LIBOR USD | | |
| 1 Month + 0.21%), 4.599%, 4/25/47 | 85,731 | 68,868 |
| FRB Ser. 05-38, Class A1, (Federal Reserve | | |
| US 12 Month Cumulative Avg 1 yr CMT + 1.50%), | | |
| 3.548%, 9/25/35 | 266,116 | 233,350 |
| FRB Ser. 06-OA7, Class 1A2, (Federal Reserve | | |
| US 12 Month Cumulative Avg 1 yr CMT + 0.94%), | | |
| 2.988%, 6/25/46 | 174,496 | 142,456 |
| FRB Ser. 06-OA7, Class 1A1, 2.746%, 6/25/46 W | 580,374 | 520,421 |
| Federal Home Loan Mortgage Corporation | | |
| Structured Agency Credit Risk Debt FRN | | |
| Ser. 16-DNA1, Class B, (ICE LIBOR USD 1 Month | | |
| + 10.00%), 14.389%, 7/25/28 | 1,020,787 | 1,067,551 |
| Structured Agency Credit Risk Debt FRN | | |
| Ser. 15-DNA3, Class B, (ICE LIBOR USD 1 Month | | |
| + 9.35%), 13.739%, 4/25/28 | 517,507 | 531,281 |
| Structured Agency Credit Risk Debt FRN | | |
| Ser. 15-HQA1, Class B, (ICE LIBOR USD 1 Month | | |
| + 8.80%), 13.189%, 3/25/28 | 323,678 | 323,837 |
| Structured Agency Credit Risk Debt FRN | | |
| Ser. 15-DNA2, Class B, (ICE LIBOR USD 1 Month | | |
| + 7.55%), 11.939%, 12/25/27 | 395,488 | 394,969 |
| Structured Agency Credit Risk Debt FRN | | |
| Ser. 14-DN1, Class M3, (ICE LIBOR USD 1 Month | | |
| + 4.50%), 8.889%, 2/25/24 | 143,538 | 144,869 |
| |
| Putnam VT Diversified Income Fund | 9 |
| | |
| | Principal | |
| MORTGAGE-BACKED SECURITIES (36.8%)* cont. | amount | Value |
| | |
| Residential mortgage-backed securities (non-agency) cont. | |
| Federal Home Loan Mortgage Corporation 144A | | |
| Structured Agency Credit Risk Trust FRB | | |
| Ser. 18-HQA2, Class B2, (ICE LIBOR USD | | |
| 1 Month + 11.00%), 15.389%, 10/25/48 | $333,000 | $359,881 |
| Structured Agency Credit Risk Trust FRB | | |
| Ser. 19-DNA2, Class B2, (ICE LIBOR USD | | |
| 1 Month + 10.50%), 14.889%, 3/25/49 | 152,000 | 162,824 |
| Structured Agency Credit Risk Trust REMICs | | |
| FRB Ser. 20-DNA4, Class B2, (ICE LIBOR USD | | |
| 1 Month + 10.00%), 14.389%, 8/25/50 | 135,000 | 146,644 |
| Structured Agency Credit Risk Trust REMICs | | |
| FRB Ser. 20-DNA3, Class B2, (ICE LIBOR USD | | |
| 1 Month + 9.35%), 13.739%, 6/25/50 | 237,000 | 250,628 |
| Structured Agency Credit Risk Trust FRB | | |
| Ser. 18-DNA3, Class B2, (ICE LIBOR USD | | |
| 1 Month + 7.75%), 12.139%, 9/25/48 | 389,000 | 385,619 |
| Structured Agency Credit Risk Trust FRB | | |
| Ser. 18-HQA2, Class B1, (ICE LIBOR USD | | |
| 1 Month + 4.25%), 8.639%, 10/25/48 | 163,000 | 166,832 |
| Structured Agency Credit Risk Trust REMICs | | |
| FRB Ser. 20-HQA2, Class M2, (ICE LIBOR USD | | |
| 1 Month + 3.10%), 7.489%, 3/25/50 | 85,656 | 86,531 |
| Seasoned Credit Risk Transfer Trust Ser. 19-2, | | |
| Class M, 4.75%, 8/25/58 W | 253,000 | 215,801 |
| Federal National Mortgage Association | | |
| Connecticut Avenue Securities FRB | | |
| Ser. 16-C02, Class 1B, (ICE LIBOR USD 1 Month | | |
| + 12.25%), 16.639%, 9/25/28 | 965,841 | 1,065,556 |
| Connecticut Avenue Securities FRB | | |
| Ser. 16-C03, Class 1B, (ICE LIBOR USD 1 Month | | |
| + 11.75%), 16.139%, 10/25/28 | 496,134 | 537,834 |
| Connecticut Avenue Securities FRB | | |
| Ser. 16-C01, Class 1B, (ICE LIBOR USD 1 Month | | |
| + 11.75%), 16.139%, 8/25/28 | 270,744 | 292,854 |
| Connecticut Avenue Securities FRB | | |
| Ser. 16-C05, Class 2B, (ICE LIBOR USD 1 Month | | |
| + 10.75%), 15.139%, 1/25/29 | 89,648 | 93,597 |
| Connecticut Avenue Securities FRB | | |
| Ser. 17-C02, Class 2B1, (ICE LIBOR USD 1 Month | | |
| + 5.50%), 9.889%, 9/25/29 | 242,000 | 262,465 |
| Connecticut Avenue Securities FRB | | |
| Ser. 17-C03, Class 1B1, (ICE LIBOR USD 1 Month | | |
| + 4.85%), 9.239%, 10/25/29 | 407,000 | 428,787 |
| Connecticut Avenue Securities FRB | | |
| Ser. 18-C04, Class 2B1, (ICE LIBOR USD 1 Month | | |
| + 4.50%), 8.889%, 12/25/30 | 451,000 | 468,327 |
| Connecticut Avenue Securities FRB | | |
| Ser. 17-C07, Class 2B1, (ICE LIBOR USD 1 Month | | |
| + 4.45%), 8.839%, 5/25/30 | 22,000 | 22,641 |
| Connecticut Avenue Securities FRB | | |
| Ser. 17-C06, Class 2B1, (ICE LIBOR USD 1 Month | | |
| + 4.45%), 8.839%, 2/25/30 | 30,000 | 30,769 |
| Connecticut Avenue Securities FRB | | |
| Ser. 15-C02, Class 1M2, (ICE LIBOR USD | | |
| 1 Month + 4.00%), 8.389%, 5/25/25 | 6,377 | 6,557 |
| Federal National Mortgage Association 144A | | |
| Connecticut Avenue Securities Trust FRB | | |
| Ser. 19-R03, Class 1B1, (ICE LIBOR USD 1 Month | | |
| + 4.10%), 8.489%, 9/25/31 | 505,000 | 512,933 |
| Connecticut Avenue Securities Trust FRB | | |
| Ser. 22-R02, Class 2B1, (US 30 Day Average | | |
| SOFR + 4.50%), 8.428%, 1/25/42 | 148,000 | 139,860 |
| | |
| | Principal | |
| MORTGAGE-BACKED SECURITIES (36.8%)* cont. | amount | Value |
| | |
| Residential mortgage-backed securities (non-agency) cont. | |
| Federal National Mortgage Association 144A | | |
| Connecticut Avenue Securities Trust FRB | | |
| Ser. 20-SBT1, Class 1M2, (ICE LIBOR USD | | |
| 1 Month + 3.65%), 8.039%, 2/25/40 | $276,000 | $272,587 |
| Connecticut Avenue Securities Trust FRB | | |
| Ser. 20-R01, Class 1B1, (ICE LIBOR USD 1 Month | | |
| + 3.25%), 7.639%, 1/25/40 | 155,000 | 144,387 |
| GSAA Home Equity Trust FRB Ser. 06-8, | | |
| Class 2A2, (ICE LIBOR USD 1 Month + 0.36%), | | |
| 4.749%, 5/25/36 | 508,061 | 126,862 |
| GSR Mortgage Loan Trust FRB Ser. 07-OA1, | | |
| Class 2A3A, (ICE LIBOR USD 1 Month + 0.31%), | | |
| 4.699%, 5/25/37 | 128,227 | 92,032 |
| HarborView Mortgage Loan Trust FRB Ser. 05-2, | | |
| Class 1A, (ICE LIBOR USD 1 Month + 0.52%), | | |
| 4.859%, 5/19/35 | 171,957 | 57,913 |
| JPMorgan Alternative Loan Trust FRB Ser. 07-A2, | | |
| Class 12A1, IO, (ICE LIBOR USD 1 Month + 0.20%), | | |
| 4.789%, 6/25/37 | 214,020 | 89,772 |
| Morgan Stanley Re-REMIC Trust 144A FRB | | |
| Ser. 10-R4, Class 4B, (ICE LIBOR USD 1 Month | | |
| + 0.23%), 2.702%, 2/26/37 | 159,833 | 136,281 |
| MortgageIT Trust FRB Ser. 05-3, Class M2, (ICE | | |
| LIBOR USD 1 Month + 0.80%), 5.184%, 8/25/35 | 40,630 | 37,421 |
| Structured Asset Mortgage Investments II Trust | | |
| FRB Ser. 07-AR1, Class 2A1, (ICE LIBOR USD | | |
| 1 Month + 0.18%), 4.569%, 1/25/37 | 214,904 | 180,924 |
| Towd Point Mortgage Trust 144A Ser. 19-2, | | |
| Class A2, 3.75%, 12/25/58 W | 202,000 | 172,467 |
| WaMu Asset-Backed Certificates Trust FRB | | |
| Ser. 07-HE4, Class 1A, (ICE LIBOR USD 1 Month | | |
| + 0.17%), 4.559%, 7/25/47 | 121,791 | 94,263 |
| WaMu Mortgage Pass-Through Certificates Trust | | |
| FRB Ser. 05-AR17, Class A1B3, (ICE LIBOR USD | | |
| 1 Month + 0.70%), 5.089%, 12/25/45 | 331,890 | 292,341 |
| Washington Mutual Asset-Backed Certificates | | |
| Trust FRB Ser. 06-HE2, Class A3, (ICE LIBOR USD | | |
| 1 Month + 0.30%), 4.689%, 5/25/36 | 410,041 | 294,029 |
| | | 12,858,291 |
| | | |
| Total mortgage-backed securities (cost $49,132,183) | $43,066,740 |
| |
| | Principal | |
| CORPORATE BONDS AND NOTES (15.3%)* | amount | Value |
| | | |
| Basic materials (1.8%) | | |
| Beacon Roofing Supply, Inc. | | |
| 144A company guaranty sr. notes | | |
| 4.50%, 11/15/26 | $34,000 | $31,759 |
| Big River Steel, LLC/BRS Finance | | |
| Corp. 144A sr. notes 6.625%, 1/31/29 | 76,000 | 72,407 |
| Builders FirstSource, Inc. 144A | | |
| company guaranty sr. unsec. bonds | | |
| 6.375%, 6/15/32 | 25,000 | 23,481 |
| Builders FirstSource, Inc. 144A | | |
| company guaranty sr. unsec. bonds | | |
| 4.25%, 2/1/32 | 60,000 | 48,644 |
| Celanese US Holdings, LLC company | | |
| guaranty sr. unsec. notes 6.33%, | | |
| 7/15/29 (Germany) | 75,000 | 72,873 |
| Celanese US Holdings, LLC company | | |
| guaranty sr. unsec. notes 6.165%, | | |
| 7/15/27 (Germany) | 30,000 | 29,590 |
| CF Industries, Inc. company guaranty | | |
| sr. unsec. bonds 4.95%, 6/1/43 | 410,000 | 350,766 |
| |
| 10 | Putnam VT Diversified Income Fund |
| | | |
| | | Principal | |
| CORPORATE BONDS AND NOTES (15.3%)* cont. | amount | Value |
| | | | |
| Basic materials cont. | | | |
| Constellium SE sr. unsec. notes | | | |
| Ser. REGS, 3.125%, 7/15/29 (France) | EUR | 150,000 | $126,378 |
| Freeport-McMoRan, Inc. company | | | |
| guaranty sr. unsec. bonds 4.625%, | | | |
| 8/1/30 (Indonesia) | | $50,000 | 46,570 |
| Freeport-McMoRan, Inc. company | | | |
| guaranty sr. unsec. notes 4.375%, | | | |
| 8/1/28 (Indonesia) | | 50,000 | 46,669 |
| Freeport-McMoRan, Inc. company | | | |
| guaranty sr. unsec. unsub. notes | | | |
| 5.45%, 3/15/43 (Indonesia) | | 240,000 | 216,490 |
| IHS Holding, Ltd. company guaranty | | | |
| sr. unsec. notes Ser. REGS, 6.25%, | | | |
| 11/29/28 (Nigeria) | | 560,000 | 452,200 |
| Kleopatra Holdings 2 SCA company | | | |
| guaranty sr. unsec. notes Ser. REGS, | | | |
| 6.50%, 9/1/26 (Luxembourg) | EUR | 100,000 | 58,434 |
| LSF11 A5 HoldCo, LLC 144A sr. unsec. | | | |
| notes 6.625%, 10/15/29 | | $95,000 | 78,481 |
| Mauser Packaging Solutions Holding | | | |
| Co. 144A sr. notes 8.50%, 4/15/24 | | 30,000 | 29,399 |
| Mauser Packaging Solutions Holding | | | |
| Co. 144A sr. notes 5.50%, 4/15/24 | | 15,000 | 14,585 |
| Novelis Corp. 144A company guaranty | | | |
| sr. unsec. bonds 3.875%, 8/15/31 | | 15,000 | 12,246 |
| Novelis Corp. 144A company guaranty | | | |
| sr. unsec. notes 4.75%, 1/30/30 | | 21,000 | 18,618 |
| Novelis Corp. 144A company guaranty | | | |
| sr. unsec. notes 3.25%, 11/15/26 | | 66,000 | 59,170 |
| Sylvamo Corp. 144A company | | | |
| guaranty sr. unsec. notes | | | |
| 7.00%, 9/1/29 | | 90,000 | 85,500 |
| WR Grace Holdings, LLC 144A | | | |
| company guaranty sr. notes | | | |
| 5.625%, 10/1/24 | | 245,000 | 241,325 |
| WR Grace Holdings, LLC 144A | | | |
| company guaranty sr. notes | | | |
| 4.875%, 6/15/27 | | 51,000 | 45,193 |
| | | | 2,160,778 |
| Capital goods (1.1%) | | | |
| Chart Industries, Inc. 144A company | | | |
| guaranty sr. notes 7.50%, 1/1/30 | | 100,000 | 100,529 |
| Clarios Global LP 144A company | | | |
| guaranty sr. notes 6.75%, 5/15/25 | | 58,000 | 58,134 |
| Great Lakes Dredge & Dock Corp. 144A | | | |
| company guaranty sr. unsec. notes | | | |
| 5.25%, 6/1/29 | | 185,000 | 143,819 |
| Roller Bearing Co. of America, Inc. | | | |
| 144A sr. notes 4.375%, 10/15/29 | | 20,000 | 17,294 |
| Sensata Technologies BV 144A | | | |
| company guaranty sr. unsec. notes | | | |
| 4.00%, 4/15/29 | | 95,000 | 81,938 |
| Sensata Technologies BV 144A | | | |
| company guaranty sr. unsec. unsub. | | | |
| notes 5.875%, 9/1/30 | | 20,000 | 18,955 |
| TransDigm, Inc. company guaranty sr. | | | |
| unsec. sub. notes 5.50%, 11/15/27 | | 318,000 | 298,618 |
| TransDigm, Inc. company guaranty sr. | | | |
| unsec. sub. notes 4.875%, 5/1/29 | | 100,000 | 87,225 |
| TransDigm, Inc. company guaranty sr. | | | |
| unsec. sub. notes 4.625%, 1/15/29 | | 65,000 | 57,153 |
| TransDigm, Inc. 144A company | | | |
| guaranty sr. notes 6.25%, 3/15/26 | | 140,000 | 138,067 |
| | | |
| | | Principal | |
| CORPORATE BONDS AND NOTES (15.3%)* cont. | amount | Value |
| | | | |
| Capital goods cont. | | | |
| Vertiv Group Corp. 144A company | | | |
| guaranty sr. notes 4.125%, 11/15/28 | | $270,000 | $229,500 |
| WESCO Distribution, Inc. 144A | | | |
| company guaranty sr. unsec. unsub. | | | |
| notes 7.125%, 6/15/25 | | 111,000 | 112,389 |
| | | | 1,343,621 |
| Communication services (0.7%) | | | |
| CCO Holdings, LLC/CCO Holdings | | | |
| Capital Corp. 144A sr. unsec. bonds | | | |
| 5.375%, 6/1/29 | | 463,000 | 418,677 |
| DIRECTV Holdings, LLC/DIRECTV | | | |
| Financing Co., Inc. 144A sr. notes | | | |
| 5.875%, 8/15/27 | | 74,000 | 66,205 |
| Frontier Communications Corp. | | | |
| 144A company guaranty sr. notes | | | |
| 5.875%, 10/15/27 | | 75,000 | 69,643 |
| Lumen Technologies, Inc. 144A sr. | | | |
| unsec. unsub. notes 4.50%, 1/15/29 | | 200,000 | 138,042 |
| T-Mobile USA, Inc. company guaranty | | | |
| sr. unsec. bonds 2.875%, 2/15/31 | | 65,000 | 53,711 |
| T-Mobile USA, Inc. company guaranty | | | |
| sr. unsec. notes 5.375%, 4/15/27 | | 16,000 | 16,153 |
| | | | 762,431 |
| Consumer cyclicals (2.9%) | | | |
| Bath & Body Works, Inc. 144A | | | |
| company guaranty sr. unsec. unsub. | | | |
| bonds 6.625%, 10/1/30 | | 45,000 | 42,228 |
| Boyd Gaming Corp. company | | | |
| guaranty sr. unsec. notes | | | |
| 4.75%, 12/1/27 | | 45,000 | 41,912 |
| Caesars Resort Collection, LLC/CRC | | | |
| Finco, Inc. 144A company guaranty sr. | | | |
| notes 5.75%, 7/1/25 | | 235,000 | 230,043 |
| Cinemark USA, Inc. 144A company | | | |
| guaranty sr. notes 8.75%, 5/1/25 | | 20,000 | 20,196 |
| Ford Motor Credit Co., LLC sr. unsec. | | | |
| unsub. notes 4.00%, 11/13/30 | | 200,000 | 164,168 |
| Gartner, Inc. 144A company guaranty | | | |
| sr. unsec. bonds 3.75%, 10/1/30 | | 110,000 | 94,816 |
| Gartner, Inc. 144A company guaranty | | | |
| sr. unsec. notes 3.625%, 6/15/29 | | 15,000 | 13,181 |
| Hanesbrands, Inc. 144A company | | | |
| guaranty sr. unsec. unsub. notes | | | |
| 4.625%, 5/15/24 | | 90,000 | 87,167 |
| Hilton Domestic Operating Co., Inc. | | | |
| company guaranty sr. unsec. bonds | | | |
| 4.875%, 1/15/30 | | 153,000 | 138,650 |
| La Financiere Atalian SASU company | | | |
| guaranty sr. unsec. notes Ser. REGS, | | | |
| 4.00%, 5/15/24 (France) | EUR | 100,000 | 90,791 |
| Levi Strauss & Co. 144A sr. unsec. sub. | | | |
| bonds 3.50%, 3/1/31 | | $47,000 | 37,303 |
| Masonite International Corp. 144A | | | |
| company guaranty sr. unsec. notes | | | |
| 5.375%, 2/1/28 | | 35,000 | 32,361 |
| Masonite International Corp. 144A | | | |
| company guaranty sr. unsec. notes | | | |
| 3.50%, 2/15/30 | | 50,000 | 40,446 |
| Mattel, Inc. 144A company guaranty | | | |
| sr. unsec. notes 3.75%, 4/1/29 | | 70,000 | 61,483 |
| Mattel, Inc. 144A company guaranty | | | |
| sr. unsec. notes 3.375%, 4/1/26 | | 20,000 | 18,388 |
| McGraw-Hill Education, Inc. 144A sr. | | | |
| notes 5.75%, 8/1/28 | | 80,000 | 67,230 |
| |
| Putnam VT Diversified Income Fund | 11 |
| | | |
| | | Principal | |
| CORPORATE BONDS AND NOTES (15.3%)* cont. | amount | Value |
| | | | |
| Consumer cyclicals cont. | | | |
| Neptune Bidco US, Inc. 144A sr. notes | | | |
| 9.29%, 4/15/29 | | $535,000 | $504,238 |
| News Corp. 144A company | | | |
| guaranty sr. unsec. unsub. bonds | | | |
| 5.125%, 2/15/32 | | 8,000 | 7,280 |
| News Corp. 144A sr. unsec. notes | | | |
| 3.875%, 5/15/29 | | 75,000 | 65,054 |
| Sabre GLBL, Inc. 144A company | | | |
| guaranty sr. notes 9.25%, 4/15/25 | | 160,000 | 159,380 |
| Sirius XM Radio, Inc. 144A company | | | |
| guaranty sr. unsec. bonds | | | |
| 3.875%, 9/1/31 | | 195,000 | 152,133 |
| Sirius XM Radio, Inc. 144A | | | |
| company guaranty sr. unsec. notes | | | |
| 4.00%, 7/15/28 | | 100,000 | 87,030 |
| Spectrum Brands, Inc. 144A | | | |
| company guaranty sr. unsec. bonds | | | |
| 5.00%, 10/1/29 | | 50,000 | 43,271 |
| Standard Industries, Inc. 144A sr. | | | |
| unsec. bonds 3.375%, 1/15/31 | | 35,000 | 26,338 |
| Standard Industries, Inc. 144A sr. | | | |
| unsec. notes 5.00%, 2/15/27 | | 375,000 | 346,025 |
| Standard Industries, Inc. 144A sr. | | | |
| unsec. notes 4.75%, 1/15/28 | | 10,000 | 8,999 |
| Station Casinos, LLC 144A sr. unsec. | | | |
| notes 4.50%, 2/15/28 | | 95,000 | 82,591 |
| Techem Verwaltungsgesell notes | | | |
| Ser. REGS, 2.00%, 7/15/25 (Germany) | EUR | 310,000 | 303,932 |
| Univision Communications, Inc. 144A | | | |
| sr. notes 7.375%, 6/30/30 | | $19,000 | 18,158 |
| Verisure Holding AB company | | | |
| guaranty sr. notes Ser. REGS, 3.25%, | | | |
| 2/15/27 (Sweden) | EUR | 300,000 | 277,461 |
| Victoria’s Secret & Co. 144A sr. unsec. | | | |
| notes 4.625%, 7/15/29 | | $40,000 | 31,400 |
| Wynn Resorts Finance, LLC/Wynn | | | |
| Resorts Capital Corp. 144A sr. unsec. | | | |
| bonds 5.125%, 10/1/29 | | 97,000 | 83,142 |
| | | | 3,376,795 |
| Consumer staples (0.9%) | | | |
| 1011778 BC ULC/New Red Finance, | | | |
| Inc. 144A company guaranty sr. notes | | | |
| 3.875%, 1/15/28 (Canada) | | 80,000 | 71,600 |
| Albertsons Cos., Inc./Safeway, Inc./ | | | |
| New Albertsons LP/Albertsons, LLC | | | |
| 144A company guaranty sr. unsec. | | | |
| notes 4.875%, 2/15/30 | | 30,000 | 26,774 |
| Albertsons Cos., Inc./Safeway, Inc./ | | | |
| New Albertsons LP/Albertsons, LLC | | | |
| 144A company guaranty sr. unsec. | | | |
| notes 3.50%, 3/15/29 | | 213,000 | 178,705 |
| Lamb Weston Holdings, Inc. 144A | | | |
| company guaranty sr. unsec. notes | | | |
| 4.875%, 5/15/28 | | 70,000 | 66,325 |
| Lamb Weston Holdings, Inc. 144A | | | |
| company guaranty sr. unsec. notes | | | |
| 4.125%, 1/31/30 | | 70,000 | 61,824 |
| Loxam SAS company guaranty | | | |
| sr. notes Ser. REGS, 4.25%, | | | |
| 4/15/24 (France) | EUR | 300,000 | 318,431 |
| Loxam SAS notes 3.75%, | | | |
| 7/15/26 (France) | EUR | 250,000 | 240,541 |
| | |
| | Principal | |
| CORPORATE BONDS AND NOTES (15.3%)* cont. | amount | Value |
| | | |
| Consumer staples cont. | | |
| Match Group Holdings II, LLC 144A sr. | | |
| unsec. bonds 5.00%, 12/15/27 | $28,000 | $25,760 |
| Match Group Holdings II, LLC 144A sr. | | |
| unsec. bonds 3.625%, 10/1/31 | 25,000 | 19,172 |
| Match Group Holdings II, LLC 144A sr. | | |
| unsec. notes 4.125%, 8/1/30 | 20,000 | 16,327 |
| Yum! Brands, Inc. sr. unsec. sub. | | |
| bonds 3.625%, 3/15/31 | 45,000 | 37,733 |
| Yum! Brands, Inc. 144A sr. unsec. | | |
| bonds 4.75%, 1/15/30 | 45,000 | 41,288 |
| | | 1,104,480 |
| Energy (4.9%) | | |
| Antero Midstream Partners LP/ | | |
| Antero Midstream Finance Corp. 144A | | |
| company guaranty sr. unsec. notes | | |
| 7.875%, 5/15/26 | 55,000 | 55,675 |
| Apache Corp. sr. unsec. unsub. notes | | |
| 5.10%, 9/1/40 | 327,000 | 270,989 |
| Apache Corp. sr. unsec. unsub. notes | | |
| 4.375%, 10/15/28 | 32,000 | 28,802 |
| Callon Petroleum Co. 144A | | |
| company guaranty sr. unsec. notes | | |
| 7.50%, 6/15/30 | 201,000 | 183,915 |
| Centennial Resource Production, LLC | | |
| 144A company guaranty sr. unsec. | | |
| notes 6.875%, 4/1/27 | 190,000 | 179,025 |
| Cheniere Energy Partners | | |
| LP company guaranty sr. unsec. notes | | |
| 4.50%, 10/1/29 | 295,000 | 265,270 |
| Cheniere Energy Partners | | |
| LP company guaranty sr. unsec. | | |
| unsub. notes 4.00%, 3/1/31 | 75,000 | 63,852 |
| Cheniere Energy Partners | | |
| LP company guaranty sr. unsec. | | |
| unsub. notes 3.25%, 1/31/32 | 5,000 | 3,974 |
| Continental Resources, Inc. | | |
| company guaranty sr. unsec. notes | | |
| 4.375%, 1/15/28 | 76,000 | 69,636 |
| Continental Resources, Inc. 144A | | |
| company guaranty sr. unsec. bonds | | |
| 5.75%, 1/15/31 | 75,000 | 69,815 |
| Encino Acquisition Partners Holdings, | | |
| LLC 144A company guaranty sr. | | |
| unsec. notes 8.50%, 5/1/28 | 165,000 | 150,808 |
| Endeavor Energy Resources LP/EER | | |
| Finance, Inc. 144A sr. unsec. bonds | | |
| 5.75%, 1/30/28 | 470,000 | 450,034 |
| Energy Transfer LP/Regency Energy | | |
| Finance Corp. sr. unsec. unsub. notes | | |
| 4.50%, 11/1/23 | 69,000 | 68,396 |
| EnLink Midstream, LLC 144A | | |
| company guaranty sr. unsec. notes | | |
| 5.625%, 1/15/28 | 41,000 | 39,052 |
| EQT Corp. sr. unsec. notes | | |
| 5.00%, 1/15/29 | 10,000 | 9,388 |
| Hess Midstream Operations LP 144A | | |
| company guaranty sr. unsec. notes | | |
| 5.125%, 6/15/28 | 90,000 | 83,223 |
| Hess Midstream Operations LP 144A | | |
| company guaranty sr. unsec. notes | | |
| 4.25%, 2/15/30 | 25,000 | 21,373 |
| Hess Midstream Operations LP 144A | | |
| company guaranty sr. unsec. sub. | | |
| notes 5.625%, 2/15/26 | 282,000 | 274,692 |
| |
| 12 | Putnam VT Diversified Income Fund |
| | |
| | Principal | |
| CORPORATE BONDS AND NOTES (15.3%)* cont. | amount | Value |
| | | |
| Energy cont. | | |
| Holly Energy Partners LP/Holly | | |
| Energy Finance Corp. 144A | | |
| company guaranty sr. unsec. notes | | |
| 5.00%, 2/1/28 | $144,000 | $131,113 |
| Nabors Industries, Inc. 144A | | |
| company guaranty sr. unsec. notes | | |
| 9.00%, 2/1/25 | 56,689 | 57,397 |
| Occidental Petroleum Corp. sr. unsec. | | |
| sub. notes 6.45%, 9/15/36 | 555,000 | 566,100 |
| Occidental Petroleum Corp. sr. unsec. | | |
| sub. notes 5.875%, 9/1/25 | 20,000 | 19,928 |
| Ovintiv, Inc. company guaranty sr. | | |
| unsec. unsub. bonds 7.375%, 11/1/31 | 160,000 | 170,302 |
| Ovintiv, Inc. company guaranty sr. | | |
| unsec. unsub. bonds 6.625%, 8/15/37 | 60,000 | 60,345 |
| Patterson-UTI Energy, Inc. sr. unsec. | | |
| sub. notes 5.15%, 11/15/29 | 57,000 | 51,087 |
| Petrobras Global Finance | | |
| BV company guaranty sr. unsec. | | |
| unsub. notes 6.25%, 3/17/24 (Brazil) | 70,000 | 70,276 |
| Petrobras Global Finance | | |
| BV company guaranty sr. unsec. | | |
| unsub. notes 5.60%, 1/3/31 (Brazil) | 246,000 | 233,872 |
| Petrobras Global Finance | | |
| BV company guaranty sr. unsec. | | |
| unsub. notes 5.299%, 1/27/25 (Brazil) | 35,000 | 34,785 |
| Petroleos Mexicanos company | | |
| guaranty sr. unsec. unsub. notes | | |
| 6.70%, 2/16/32 (Mexico) | 1,293,000 | 1,015,324 |
| Rockcliff Energy II, LLC 144A sr. unsec. | | |
| notes 5.50%, 10/15/29 | 151,000 | 138,157 |
| SM Energy Co. sr. unsec. unsub. notes | | |
| 6.75%, 9/15/26 | 150,000 | 145,628 |
| SM Energy Co. sr. unsec. unsub. notes | | |
| 6.50%, 7/15/28 | 12,000 | 11,505 |
| SM Energy Co. sr. unsec. unsub. notes | | |
| 5.625%, 6/1/25 | 125,000 | 119,999 |
| Southwestern Energy Co. company | | |
| guaranty sr. unsec. bonds | | |
| 4.75%, 2/1/32 | 147,000 | 125,625 |
| Southwestern Energy Co. | | |
| company guaranty sr. unsec. notes | | |
| 5.375%, 3/15/30 | 278,000 | 253,541 |
| Southwestern Energy Co. | | |
| company guaranty sr. unsec. notes | | |
| 5.375%, 2/1/29 | 185,000 | 171,506 |
| Transocean Pontus, Ltd. 144A | | |
| company guaranty sr. notes 6.125%, | | |
| 8/1/25 (Cayman Islands) | 25,760 | 25,245 |
| | | 5,689,654 |
| Financials (1.2%) | | |
| Alliant Holdings Intermediate, LLC/ | | |
| Alliant Holdings Co-Issuer 144A sr. | | |
| notes 4.25%, 10/15/27 | 25,000 | 22,391 |
| Credit Suisse Group AG 144A jr. unsec. | | |
| sub. FRN 7.50%, perpetual maturity | | |
| (Switzerland) | 200,000 | 174,000 |
| goeasy, Ltd. 144A company | | |
| guaranty sr. unsec. notes 4.375%, | | |
| 5/1/26 (Canada) | 55,000 | 48,675 |
| iStar, Inc. sr. unsec. notes | | |
| 4.75%, 10/1/24 R | 55,000 | 54,587 |
| | | |
| | | Principal | |
| CORPORATE BONDS AND NOTES (15.3%)* cont. | amount | Value |
| | | | |
| Financials cont. | | | |
| Itau Unibanco Holding SA/Cayman | | | |
| Islands 144A unsec. sub. FRB 3.875%, | | | |
| 4/15/31 (Brazil) | | $980,000 | $891,251 |
| Nationstar Mortgage Holdings, Inc. | | | |
| 144A company guaranty sr. unsec. | | | |
| notes 5.75%, 11/15/31 | | 105,000 | 81,638 |
| Nationstar Mortgage Holdings, Inc. | | | |
| 144A company guaranty sr. unsec. | | | |
| notes 5.50%, 8/15/28 | | 77,000 | 62,787 |
| Stichting AK Rabobank Certificaten | | | |
| jr. unsec. sub. FRN 6.50%, perpetual | | | |
| maturity (Netherlands) | EUR | 94,525 | 96,996 |
| | | | 1,432,325 |
| Health care (0.7%) | | | |
| Bausch Health Cos., Inc. 144A | | | |
| company guaranty sub. notes | | | |
| 14.00%, 10/15/30 | | $3,000 | 1,781 |
| Charles River Laboratories | | | |
| International, Inc. 144A company | | | |
| guaranty sr. unsec. notes | | | |
| 4.00%, 3/15/31 | | 45,000 | 39,038 |
| Charles River Laboratories | | | |
| International, Inc. 144A company | | | |
| guaranty sr. unsec. notes | | | |
| 3.75%, 3/15/29 | | 45,000 | 39,600 |
| Jazz Securities DAC 144A company | | | |
| guaranty sr. unsub. notes 4.375%, | | | |
| 1/15/29 (Ireland) | | 200,000 | 178,230 |
| Owens & Minor, Inc. 144A sr. unsec. | | | |
| notes 4.50%, 3/31/29 | | 50,000 | 39,865 |
| Service Corp. International sr. unsec. | | | |
| bonds 5.125%, 6/1/29 | | 130,000 | 121,878 |
| Service Corp. International sr. unsec. | | | |
| sub. notes 4.00%, 5/15/31 | | 35,000 | 29,478 |
| Tenet Healthcare Corp. company | | | |
| guaranty sr. notes 4.625%, 7/15/24 | | 23,000 | 22,431 |
| Tenet Healthcare Corp. 144A | | | |
| company guaranty sr. notes | | | |
| 5.125%, 11/1/27 | | 110,000 | 102,326 |
| Tenet Healthcare Corp. 144A | | | |
| company guaranty sr. notes | | | |
| 4.875%, 1/1/26 | | 102,000 | 96,456 |
| Tenet Healthcare Corp. 144A | | | |
| company guaranty sr. notes | | | |
| 4.25%, 6/1/29 | | 45,000 | 38,984 |
| Tenet Healthcare Corp. 144A | | | |
| company guaranty sr. unsub. notes | | | |
| 6.125%, 6/15/30 | | 70,000 | 66,696 |
| | | | 776,763 |
| Technology (0.6%) | | | |
| Crowdstrike Holdings, Inc. | | | |
| company guaranty sr. unsec. notes | | | |
| 3.00%, 2/15/29 | | 201,000 | 169,597 |
| Imola Merger Corp. 144A sr. notes | | | |
| 4.75%, 5/15/29 | | 256,000 | 222,109 |
| Picard Midco, Inc. 144A sr. notes. | | | |
| 6.50%, 3/31/29 | | 160,000 | 134,765 |
| ZoomInfo Technologies, LLC/ | | | |
| ZoomInfo Finance Corp. 144A | | | |
| company guaranty sr. unsec. notes | | | |
| 3.875%, 2/1/29 | | 178,000 | 149,588 |
| | | | 676,059 |
| |
| Putnam VT Diversified Income Fund | 13 |
| | | |
| | | Principal | |
| CORPORATE BONDS AND NOTES (15.3%)* cont. | amount | Value |
| | | | |
| Utilities and power (0.5%) | | | |
| Buckeye Partners LP sr. unsec. bonds | | | |
| 5.85%, 11/15/43 | | $43,000 | $32,038 |
| Buckeye Partners LP sr. unsec. notes | | | |
| 3.95%, 12/1/26 | | 24,000 | 21,473 |
| Buckeye Partners LP 144A sr. unsec. | | | |
| notes 4.50%, 3/1/28 | | 33,000 | 29,007 |
| Calpine Corp. 144A company | | | |
| guaranty sr. notes 5.25%, 6/1/26 | | 22,000 | 20,956 |
| Calpine Corp. 144A company | | | |
| guaranty sr. notes 4.50%, 2/15/28 | | 75,000 | 66,898 |
| Energy Transfer LP jr. unsec. sub. FRN | | | |
| 6.625%, perpetual maturity | | 13,000 | 9,653 |
| NRG Energy, Inc. 144A company | | | |
| guaranty sr. unsec. bonds | | | |
| 3.875%, 2/15/32 | | 175,000 | 131,434 |
| NRG Energy, Inc. 144A sr. unsec. | | | |
| bonds 5.25%, 6/15/29 | | 118,000 | 104,163 |
| ReNew Wind Energy AP2/ReNew | | | |
| Power Pvt, Ltd. other 9 Subsidiaries | | | |
| company guaranty sr. notes | | | |
| Ser. REGS, 4.50%, 7/14/28 (India) | | 200,000 | 168,232 |
| Vistra Operations Co., LLC 144A | | | |
| company guaranty sr. notes | | | |
| 4.30%, 7/15/29 | | 40,000 | 36,034 |
| | | | 619,888 |
| | | | |
| Total corporate bonds and notes (cost $20,042,431) | $17,942,794 |
| |
| FOREIGN GOVERNMENT AND AGENCY | | Principal | |
| BONDS AND NOTES (8.6%)* | | amount | Value |
| | | | |
| Cote d’lvoire (Republic of) sr. unsec. | | | |
| notes Ser. REGS, 4.875%, 1/30/32 | | | |
| (Cote d’lvoire) | EUR | 830,000 | $697,531 |
| Cote d’lvoire (Republic of) sr. unsec. | | | |
| unsub. bonds Ser. REGS, 6.125%, | | | |
| 6/15/33 (Cote d’lvoire) | | $1,180,000 | 1,047,250 |
| Cote d’lvoire (Republic of) sr. unsec. | | | |
| unsub. notes Ser. REGS, 5.375%, | | | |
| 7/23/24 (Cote d’lvoire) | | 275,000 | 265,375 |
| Development Bank of Mongolia, | | | |
| LLC unsec. notes Ser. REGS, 7.25%, | | | |
| 10/23/23 (Mongolia) | | 260,000 | 231,482 |
| Dominican (Republic of) sr. unsec. | | | |
| bonds Ser. REGS, 4.875%, 9/23/32 | | | |
| (Dominican Republic) | | 185,000 | 153,564 |
| Dominican (Republic of) sr. unsec. | | | |
| unsub. notes Ser. REGS, 6.875%, | | | |
| 1/29/26 (Dominican Republic) | | 365,000 | 368,314 |
| Dominican (Republic of) sr. unsec. | | | |
| unsub. notes Ser. REGS, 6.00%, | | | |
| 7/19/28 (Dominican Republic) | | 390,000 | 375,343 |
| Dominican (Republic of) sr. unsec. | | | |
| unsub. notes Ser. REGS, 5.95%, | | | |
| 1/25/27 (Dominican Republic) | | 205,000 | 200,543 |
| Dominican (Republic of) 144A | | | |
| sr. unsec. notes 4.50%, 1/30/30 | | | |
| (Dominican Republic) | | 250,000 | 212,830 |
| Egypt (Arab Republic of) sr. | | | |
| unsec. bonds Ser. REGS, 7.30%, | | | |
| 9/30/33 (Egypt) | | 290,000 | 205,532 |
| Egypt (Arab Republic of) sr. unsec. | | | |
| notes Ser. REGS, 7.60%, 3/1/29 (Egypt) | | 880,000 | 714,985 |
| | |
| FOREIGN GOVERNMENT AND AGENCY | Principal | |
| BONDS AND NOTES (8.6%)* cont. | amount | Value |
| | | |
| Ghana (Republic of) sr. unsec. unsub. | | |
| notes Ser. REGS, 8.125%, 1/18/26 | | |
| (Ghana) (In default) † | $1,130,000 | $453,413 |
| Ghana (Republic of) sr. unsec. unsub. | | |
| notes Ser. REGS, 6.375%, 2/11/27 | | |
| (Ghana) (In default) † | 850,000 | 318,750 |
| Indonesia (Republic of) sr. unsec. | | |
| unsub. bonds 2.85%, 2/14/30 | | |
| (Indonesia) | 1,285,000 | 1,150,099 |
| Indonesia (Republic of) sr. unsec. | | |
| unsub. notes 4.65%, 9/20/32 | | |
| (Indonesia) | 1,045,000 | 1,024,061 |
| Mongolia (Government of) sr. | | |
| unsec. notes Ser. REGS, 5.125%, | | |
| 4/7/26 (Mongolia) | 200,000 | 172,002 |
| Senegal (Republic of) unsec. bonds | | |
| Ser. REGS, 6.25%, 5/23/33 (Senegal) | 400,000 | 330,000 |
| Tunisia (Central Bank of) sr. unsec. | | |
| unsub. notes Ser. REGS, 5.75%, | | |
| 1/30/25 (Tunisia) | 1,310,000 | 899,621 |
| United Mexican States sr. unsec. | | |
| unsub. bonds 4.28%, 8/14/41 (Mexico) | 790,000 | 609,108 |
| Vietnam (Socialist Republic of) | | |
| sr. unsec. notes Ser. REGS, 4.80%, | | |
| 11/19/24 (Vietnam) | 600,000 | 590,400 |
| Total foreign government and agency bonds and notes | |
| (cost $11,664,536) | | $10,020,203 |
| |
| | Principal | |
| CONVERTIBLE BONDS AND NOTES (3.9%)* | amount | Value |
| | | |
| Capital goods (0.1%) | | |
| Axon Enterprise, Inc. 144A cv. sr. unsec. notes | | |
| 0.50%, 12/15/27 | $31,000 | $30,721 |
| John Bean Technologies Corp. cv. sr. unsec. | | |
| notes 0.25%, 5/15/26 | 31,000 | 26,614 |
| Middleby Corp. (The) cv. sr. unsec. notes | | |
| 1.00%, 9/1/25 | 35,000 | 41,143 |
| | | 98,478 |
| Communication services (0.2%) | | |
| DISH Network Corp. cv. sr. unsec. notes | | |
| 3.375%, 8/15/26 | 83,000 | 52,000 |
| Liberty Media Corp. cv. sr. unsec. bonds | | |
| 1.375%, 10/15/23 | 30,000 | 36,945 |
| Liberty Media Corp. cv. sr. unsec. unsub. bonds | | |
| 0.50%, 12/1/50 | 51,000 | 50,860 |
| Liberty Media Corp. 144A cv. sr. unsec. unsub. | | |
| bonds 2.75%, 12/1/49 | 112,000 | 102,088 |
| | | 241,893 |
| Consumer cyclicals (0.7%) | | |
| Alarm.com Holdings, Inc. cv. sr. unsec. notes | | |
| zero %, 1/15/26 | 52,000 | 42,219 |
| Block, Inc. cv. sr. unsec. sub. notes | | |
| 0.25%, 11/1/27 | 80,000 | 60,300 |
| Block, Inc. cv. sr. unsec. sub. notes zero %, 5/1/26 | 36,000 | 29,142 |
| Booking Holdings, Inc. cv. sr. unsec. notes | | |
| 0.75%, 5/1/25 | 68,000 | 90,569 |
| Burlington Stores, Inc. cv. sr. unsec. notes | | |
| 2.25%, 4/15/25 | 42,000 | 48,300 |
| DraftKings, Inc. cv. sr. unsec. unsub. notes | | |
| zero %, 3/15/28 | 43,000 | 26,596 |
| Expedia Group, Inc. company guaranty cv. sr. | | |
| unsec. unsub. notes zero %, 2/15/26 | 61,000 | 53,127 |
| Ford Motor Co. cv. sr. unsec. notes | | |
| zero %, 3/15/26 | 78,000 | 73,593 |
| |
| 14 | Putnam VT Diversified Income Fund |
| | |
| | Principal | |
| CONVERTIBLE BONDS AND NOTES (3.9%)* cont. | amount | Value |
| | | |
| Consumer cyclicals cont. | | |
| Liberty TripAdvisor Holdings, Inc. 144A cv. sr. | | |
| unsec. bonds 0.50%, 6/30/51 | $78,000 | $55,926 |
| National Vision Holdings, Inc. cv. sr. unsec. sub. | | |
| notes 2.50%, 5/15/25 | 30,000 | 41,163 |
| NCL Corp., Ltd. company guaranty cv. sr. unsec. | | |
| notes 5.375%, 8/1/25 | 30,000 | 30,255 |
| NCL Corp., Ltd. 144A company guaranty cv. sr. | | |
| unsec. notes 2.50%, 2/15/27 | 65,000 | 46,638 |
| Royal Caribbean Cruises, Ltd. 144A cv. sr. unsec. | | |
| unsub. notes 6.00%, 8/15/25 | 64,000 | 80,384 |
| Shift4 Payments, Inc. cv. sr. unsec. sub. notes | | |
| zero %, 12/15/25 | 60,000 | 59,438 |
| Vail Resorts, Inc. cv. sr. unsec. sub. notes | | |
| zero %, 1/1/26 | 101,000 | 93,678 |
| Winnebago Industries, Inc. cv. sr. unsec. notes | | |
| 1.50%, 4/1/25 | 30,000 | 31,463 |
| | | 862,791 |
| Consumer staples (0.4%) | | |
| Airbnb, Inc. cv. sr. unsec. sub. notes | | |
| zero %, 3/15/26 | 115,000 | 94,645 |
| Beauty Health Co. (The) 144A cv. sr. unsec. sub. | | |
| notes 1.25%, 10/1/26 | 36,000 | 27,216 |
| Cheesecake Factory, Inc. (The) cv. sr. unsec. sub. | | |
| notes 0.375%, 6/15/26 | 55,000 | 45,066 |
| Chegg, Inc. cv. sr. unsec. notes zero %, 9/1/26 | 33,000 | 25,885 |
| Etsy, Inc. cv. sr. unsec. notes 0.25%, 6/15/28 | 68,000 | 58,058 |
| Lyft, Inc. cv. sr. unsec. notes 1.50%, 5/15/25 | 40,000 | 35,218 |
| Shake Shack, Inc. cv. sr. unsec. notes | | |
| zero %, 3/1/28 | 60,000 | 39,488 |
| Uber Technologies, Inc. cv. sr. unsec. notes | | |
| zero %, 12/15/25 | 63,000 | 53,062 |
| Upwork, Inc. cv. sr. unsec. notes 0.25%, 8/15/26 | 60,000 | 44,992 |
| Wayfair, Inc. cv. sr. unsec. notes 0.625%, 10/1/25 | 61,000 | 39,437 |
| Zillow Group, Inc. cv. sr. unsec. notes | | |
| 2.75%, 5/15/25 | 36,000 | 34,236 |
| | | 497,303 |
| Energy (0.2%) | | |
| Enphase Energy, Inc. cv. sr. unsec. sub. notes | | |
| zero %, 3/1/28 | 76,000 | 88,874 |
| Pioneer Natural Resources Co. cv. sr. unsec. | | |
| notes 0.25%, 5/15/25 | 11,000 | 25,652 |
| SolarEdge Technologies, Inc. cv. sr. unsec. notes | | |
| zero %, 9/15/25 (Israel) | 42,000 | 52,143 |
| Transocean, Inc. company guaranty cv. sr. unsec. | | |
| sub. notes 0.50%, 1/30/23 | 83,000 | 79,784 |
| | | 246,453 |
| Financials (0.1%) | | |
| Blackstone Mortgage Trust, Inc. cv. sr. unsec. | | |
| notes 4.75%, 3/15/23 R | 48,000 | 47,070 |
| SoFi Technologies, Inc. 144A cv. sr. unsec. notes | | |
| zero %, 10/15/26 | 55,000 | 37,648 |
| | | 84,718 |
| Health care (0.6%) | | |
| BioMarin Pharmaceutical, Inc. cv. sr. unsec. sub. | | |
| notes 1.25%, 5/15/27 | 27,000 | 29,013 |
| Dexcom, Inc. cv. sr. unsec. unsub. notes | | |
| 0.25%, 11/15/25 | 71,000 | 77,213 |
| Exact Sciences Corp. cv. sr. unsec. sub. notes | | |
| 0.375%, 3/1/28 | 92,000 | 72,110 |
| Guardant Health, Inc. cv. sr. unsec. sub. notes | | |
| zero %, 11/15/27 | 37,000 | 23,010 |
| Halozyme Therapeutics, Inc. cv. sr. unsec. notes | | |
| 0.25%, 3/1/27 | 87,000 | 84,227 |
| | |
| | Principal | |
| CONVERTIBLE BONDS AND NOTES (3.9%)* cont. | amount | Value |
| | | |
| Health care cont. | | |
| Insulet Corp. cv. sr. unsec. notes 0.375%, 9/1/26 | $47,000 | $66,364 |
| Ironwood Pharmaceuticals, Inc. cv. sr. unsec. | | |
| notes 1.50%, 6/15/26 | 42,000 | 45,806 |
| Jazz Investments I, Ltd. company guaranty cv. sr. | | |
| unsec. sub. notes 1.50%, 8/15/24 (Ireland) | 94,000 | 92,531 |
| Lantheus Holdings, Inc. 144A cv. company | | |
| guaranty sr. unsec. unsub. notes | | |
| 2.625%, 12/15/27 | 35,000 | 35,242 |
| Neurocrine Biosciences, Inc. cv. sr. unsec. notes | | |
| 2.25%, 5/15/24 | 17,000 | 26,801 |
| Pacira Pharmaceuticals, Inc. cv. sr. unsec. sub. | | |
| notes 0.75%, 8/1/25 | 28,000 | 25,218 |
| Teladoc Health, Inc. cv. sr. unsec. sub. notes | | |
| 1.25%, 6/1/27 | 58,000 | 44,555 |
| | | 622,090 |
| Technology (1.3%) | | |
| 3D Systems Corp. cv. sr. unsec. notes | | |
| zero %, 11/15/26 | 47,000 | 32,054 |
| Akamai Technologies, Inc. cv. sr. unsec. notes | | |
| 0.375%, 9/1/27 | 119,000 | 114,597 |
| Akamai Technologies, Inc. cv. sr. unsec. notes | | |
| 0.125%, 5/1/25 | 48,000 | 50,400 |
| Bentley Systems, Inc. cv. sr. unsec. sub. notes | | |
| 0.375%, 7/1/27 | 34,000 | 27,676 |
| Bill.com Holdings, Inc. cv. sr. unsec. unsub. notes | | |
| zero %, 4/1/27 | 73,000 | 57,707 |
| Blackline, Inc. cv. sr. unsec. notes zero %, 3/15/26 | 38,000 | 32,371 |
| Box, Inc. cv. sr. unsec. notes zero %, 1/15/26 | 52,000 | 68,198 |
| Ceridian HCM Holding, Inc. cv. sr. unsec. notes | | |
| 0.25%, 3/15/26 | 57,000 | 49,961 |
| CyberArk Software, Ltd. cv. sr. unsec. notes | | |
| zero %, 11/15/24 (Israel) | 42,000 | 44,443 |
| Datadog, Inc. cv. sr. unsec. notes 0.125%, 6/15/25 | 40,000 | 43,650 |
| DigitalOcean Holdings, Inc. cv. sr. unsec. notes | | |
| zero %, 12/1/26 | 47,000 | 35,133 |
| Everbridge, Inc. cv. sr. unsec. notes | | |
| zero %, 3/15/26 | 31,000 | 26,313 |
| Five9, Inc. cv. sr. unsec. notes 0.50%, 6/1/25 | 39,000 | 35,724 |
| Guidewire Software, Inc. cv. sr. unsec. sub. notes | | |
| 1.25%, 3/15/25 | 30,000 | 27,765 |
| Impinj, Inc. cv. sr. unsec. notes 1.125%, 5/15/27 | 47,000 | 56,400 |
| Lumentum Holdings, Inc. cv. sr. unsec. notes | | |
| 0.50%, 12/15/26 | 75,000 | 64,313 |
| MongoDB, Inc. cv. sr. unsec. notes | | |
| 0.25%, 1/15/26 | 30,000 | 35,175 |
| Okta, Inc. cv. sr. unsec. notes 0.375%, 6/15/26 | 79,000 | 66,360 |
| ON Semiconductor Corp. cv. sr. unsec. notes | | |
| zero %, 5/1/27 | 29,000 | 38,425 |
| Palo Alto Networks, Inc. cv. sr. unsec. notes | | |
| 0.375%, 6/1/25 | 27,000 | 39,866 |
| Perficient, Inc. cv. sr. unsec. notes | | |
| 0.125%, 11/15/26 | 28,000 | 21,630 |
| Rapid7, Inc. cv. sr. unsec. notes 0.25%, 3/15/27 | 52,000 | 40,612 |
| RingCentral, Inc. cv. sr. unsec. notes | | |
| zero %, 3/1/25 | 74,000 | 63,548 |
| Silicon Laboratories, Inc. cv. sr. unsec. notes | | |
| 0.625%, 6/15/25 | 22,000 | 27,487 |
| Snap, Inc. cv. sr. unsec. notes zero %, 5/1/27 | 78,000 | 54,483 |
| Splunk, Inc. cv. sr. unsec. notes 1.125%, 6/15/27 | 121,000 | 102,100 |
| Spotify USA, Inc. company guaranty cv. sr. | | |
| unsec. notes zero %, 3/15/26 | 56,000 | 45,080 |
| Tyler Technologies, Inc. cv. sr. unsec. sub. notes | | |
| 0.25%, 3/15/26 | 34,000 | 31,586 |
| |
| Putnam VT Diversified Income Fund | 15 |
| | |
| | Principal | |
| CONVERTIBLE BONDS AND NOTES (3.9%)* cont. | amount | Value |
| | | |
| Technology cont. | | |
| Unity Software, Inc. cv. sr. unsec. notes | | |
| zero %, 11/15/26 | $64,000 | $47,904 |
| Viavi Solutions, Inc. cv. sr. unsec. unsub. notes | | |
| 1.00%, 3/1/24 | 27,000 | 27,108 |
| Wolfspeed, Inc. 144A cv. sr. unsec. notes | | |
| 1.875%, 12/1/29 | 42,000 | 37,821 |
| Ziff Davis, Inc. 144A cv. sr. unsec. notes | | |
| 1.75%, 11/1/26 | 53,000 | 52,841 |
| Zscaler, Inc. cv. sr. unsec. notes 0.125%, 7/1/25 | 36,000 | 37,800 |
| | | 1,536,531 |
| Transportation (0.2%) | | |
| American Airlines Group, Inc. company guaranty | | |
| cv. notes 6.50%, 7/1/25 | 24,000 | 25,296 |
| JetBlue Airways Corp. cv. sr. unsec. notes | | |
| 0.50%, 4/1/26 | 61,000 | 44,474 |
| Southwest Airlines Co. cv. sr. unsec. notes | | |
| 1.25%, 5/1/25 | 75,000 | 90,075 |
| | | 159,845 |
| Utilities and power (0.1%) | | |
| NextEra Energy Partners LP 144A company | | |
| guaranty cv. sr. unsec. notes zero %, 11/15/25 | 87,000 | 86,478 |
| NRG Energy, Inc. company guaranty cv. sr. unsec. | | |
| bonds 2.75%, 6/1/48 | 75,000 | 74,138 |
| | | 160,616 |
| | | |
| Total convertible bonds and notes (cost $5,251,504) | $4,510,718 |
| |
| | Principal | |
| SENIOR LOANS (1.5%)*c | amount | Value |
| | | |
| AppleCaramel Buyer, LLC bank term loan FRN | | |
| (CME Term SOFR 3 Month Plus CSA + 0.00%), | | |
| 8.073%, 10/19/27 | $73,507 | $70,961 |
| Asurion, LLC bank term loan FRN Ser. B9, (ICE | | |
| LIBOR USD 1 Month + 3.25%), 7.634%, 7/31/27 | 24,624 | 21,500 |
| Axalta Coating Systems US Holdings, Inc. bank | | |
| term loan FRN Ser. B, (CME Term SOFR 1 Month | | |
| + 3.00%), 7.506%, 12/7/29 | 120,000 | 120,000 |
| Brand Industrial Services, Inc. bank term | | |
| loan FRN (ICE LIBOR USD 3 Month + 4.25%), | | |
| 8.496%, 6/21/24 | 156,959 | 140,086 |
| BWAY Corp. bank term loan FRN Ser. B, (ICE | | |
| LIBOR USD 3 Month + 3.25%), 7.37%, 4/3/24 | 124,670 | 121,571 |
| Cengage Learning, Inc. bank term loan FRN | | |
| Ser. B, (ICE LIBOR USD 3 Month + 4.75%), | | |
| 7.814%, 6/29/26 | 143,188 | 128,466 |
| Chart Industries, Inc. bank term loan FRN | | |
| Ser. B, (CME Term SOFR 1 Month + 3.75%), | | |
| 8.033%, 12/8/29 | 269,000 | 265,807 |
| Clear Channel Outdoor Holdings, Inc. bank | | |
| term loan FRN Ser. B, (ICE LIBOR USD 3 Month | | |
| + 3.50%), 7.915%, 8/21/26 | 167,211 | 151,983 |
| CQP Holdco LP bank term loan FRN (ICE LIBOR | | |
| USD 3 Month + 3.75%), 8.48%, 5/27/28 | 78,800 | 78,330 |
| Diamond Sports Group, LLC bank term | | |
| loan FRN (ICE LIBOR USD 3 Month + 3.25%), | | |
| 7.567%, 8/24/26 | 77,418 | 9,290 |
| DIRECTV Financing, LLC bank term loan FRN (ICE | | |
| LIBOR USD 3 Month + 5.00%), 9.384%, 7/22/27 | 179,597 | 174,471 |
| Envision Healthcare Corp. bank term loan FRN | | |
| (US SOFR + 4.25%), 8.83%, 3/31/27 | 22,629 | 7,694 |
| Envision Healthcare Corp. bank term loan | | |
| FRN (CME Term SOFR 1 Month + 3.75%), | | |
| 8.33%, 3/31/27 | 55,406 | 13,852 |
| | | |
| | | Principal | |
| SENIOR LOANS (1.5%)*c cont. | | amount | Value |
| | | |
| Global Medical Response, Inc. bank term | | |
| loan FRN (ICE LIBOR USD 1 Month + 4.25%), | | |
| 8.422%, 10/2/25 | | $60,433 | $42,115 |
| Proofpoint, Inc. bank term loan FRN Ser. B, (ICE | | |
| LIBOR USD 3 Month + 6.25%), 10.985%, 8/31/29 | 45,000 | 43,050 |
| Robertshaw Holdings Corp. bank term | | |
| loan FRN (ICE LIBOR USD 3 Month + 8.00%), | | |
| 12.75%, 2/28/26 | | 55,000 | 28,325 |
| TAMKO Building Products, Inc. bank term loan | | |
| FRN Ser. B, (ICE LIBOR USD 3 Month + 3.00%), | | |
| 7.57%, 5/3/26 | | 93,788 | 90,388 |
| TIBCO Software, Inc. bank term loan FRN | | |
| Ser. B, (CME Term SOFR 1 Month + 4.50%), | | |
| 9.18%, 3/30/29 | | 105,000 | 93,581 |
| Vision Solutions, Inc. bank term loan FRN | | |
| (US SOFR + 4.00%), 8.358%, 4/24/28 | | 164,583 | 135,946 |
| Werner Finco LP bank term loan FRN Ser. B, (ICE | | |
| LIBOR USD 3 Month + 4.00%), 8.73%, 7/24/24 | 30,138 | 27,024 |
| Total senior loans (cost $1,931,525) | | | $1,764,440 |
| |
| | | Principal | |
| ASSET-BACKED SECURITIES (0.8%)* | | amount | Value |
| | | |
| 1Sharpe Mortgage Trust 144A FRB Ser. 20-1, | | |
| Class NOTE, (ICE LIBOR USD 3 Month + 2.90%), | | |
| 3.025%, 7/25/24 | | $179,996 | $177,746 |
| Mello Warehouse Securitization Trust 144A | | |
| FRB Ser. 21-3, Class E, (ICE LIBOR USD 1 Month | | |
| + 3.25%), 7.639%, 11/25/55 | | 469,000 | 425,046 |
| FRB Ser. 21-3, Class D, (ICE LIBOR USD 1 Month | | |
| + 2.00%), 6.389%, 11/25/55 | | 350,000 | 317,380 |
| Total asset-backed securities (cost $950,570) | | $920,172 |
| |
| COMMON STOCKS (—%)* | | Shares | Value |
| | | |
| Texas Competitive Electric Holdings Co., LLC/ | | |
| TCEH Finance, Inc. (Rights) | | 10,369 | $11,924 |
| Total common stocks (cost $10,414) | | $11,924 |
| |
| | | Principal | |
| | | amount/ | |
| SHORT-TERM INVESTMENTS (32.9%)* | shares | Value |
| | | |
| Mizuho Bank, Ltd./New York, NY commercial | | |
| paper 4.374%, 2/6/23 | | $500,000 | $497,717 |
| NRW.Bank commercial paper 4.444%, | | |
| 2/21/23 (Germany) | | 500,000 | 496,768 |
| Putnam Short Term Investment Fund | | | |
| Class P 4.53% L | Shares | 28,953,866 | 28,953,866 |
| Societe Generale SA commercial paper | | |
| 4.246%, 1/31/23 (France) | | $500,000 | 498,085 |
| State Street Institutional U.S. Government | | |
| Money Market Fund, Premier Class 4.12% P | | |
| | Shares | 2,777,000 | 2,777,000 |
| Sumitomo Mitsui Trust Bank, Ltd./Singapore | | |
| commercial paper 4.377%, 1/17/23 (Singapore) | $1,000,000 | 997,861 |
| Toronto-Dominion Bank (The) commercial | | |
| paper 4.334%, 1/27/23 (Canada) | | 500,000 | 498,326 |
| U.S. Treasury Bills 4.002%, 1/10/23 # ∆ § Φ | 3,100,000 | 3,097,819 |
| U.S. Treasury Bills 3.961%, 1/17/23 ∆ § | 500,000 | 499,285 |
| U.S. Treasury Bills 3.768%, 1/24/23 ∆ | | 100,000 | 99,776 |
| U.S. Treasury Bills zero%, 2/23/23 i | | 131,000 | 130,227 |
| Total short-term investments (cost $38,546,392) | | $38,546,730 |
| |
| Total investments (cost $234,779,121) | | $223,235,787 |
| |
| 16 | Putnam VT Diversified Income Fund |
Key to holding’s currency abbreviations
| |
| AUD | Australian Dollar |
| CAD | Canadian Dollar |
| CHF | Swiss Franc |
| EUR | Euro |
| GBP | British Pound |
| NOK | Norwegian Krone |
| NZD | New Zealand Dollar |
| SEK | Swedish Krona |
| USD/$ | United States Dollar |
Key to holding’s abbreviations
| |
| bp | Basis Points |
| CME | Chicago Mercantile Exchange |
| DAC | Designated Activity Company |
| FRB | Floating Rate Bonds: The rate shown is the current interest rate |
| | at the close of the reporting period. Rates may be subject to a cap |
| | or floor. For certain securities, the rate may represent a fixed rate |
| | currently in place at the close of the reporting period. |
| FRN | Floating Rate Notes: The rate shown is the current interest rate or |
| | yield at the close of the reporting period. Rates may be subject to |
| | a cap or floor. For certain securities, the rate may represent a fixed |
| rate currently in place at the close of the reporting period. |
| ICE | Intercontinental Exchange |
| IFB | Inverse Floating Rate Bonds, which are securities that pay interest |
| | rates that vary inversely to changes in the market interest rates. As |
| | interest rates rise, inverse floaters produce less current income. The |
| | rate shown is the current interest rate at the close of the reporting |
| | period. Rates may be subject to a cap or floor. |
| IO | Interest Only |
| LIBOR | London Interbank Offered Rate |
| OTC | Over-the-counter |
| REGS | Securities sold under Regulation S may not be offered, sold |
| | or delivered within the United States except pursuant to an |
| | exemption from, or in a transaction not subject to, the registration |
| | requirements of the Securities Act of 1933. |
| REMICs | Real Estate Mortgage Investment Conduits |
| SOFR | Secured Overnight Financing Rate |
| TBA | To Be Announced Commitments |
Notes to the fund’s portfolio
Unless noted otherwise, the notes to the fund’s portfolio are for the close of the fund’s reporting period, which ran from January 1, 2022 through December 31, 2022 (the reporting period). Within the following notes to the portfolio, references to “Putnam Management” represent Putnam Investment Management, LLC, the fund’s manager, an indirect wholly-owned subsidiary of Putnam Investments, LLC and references to “ASC 820” represent Accounting Standards Codification 820 Fair Value Measurements and Disclosures.
* Percentages indicated are based on net assets of $117,117,759.
† This security is non-income-producing.
# This security, in part or in entirety, was pledged and segregated with the broker to cover margin requirements for futures contracts at the close of the reporting period. Collateral at period end totaled $320,647 and is included in Investments in securities on the Statement of assets and liabilities (Notes 1 and 9).
∆ This security, in part or in entirety, was pledged and segregated with the custodian for collateral on certain derivative contracts at the close of the reporting period. Collateral at period end totaled $1,101,656 and is included in Investments in securities on the Statement of assets and liabilities (Notes 1 and 9).
Φ This security, in part or in entirety, was pledged and segregated with the custodian for collateral on certain TBA commitments at the close of the reporting period. Collateral at period end totaled $215,762 and is included in Investments in securities on the Statement of assets and liabilities (Notes 1 and 9).
§ This security, in part or in entirety, was pledged and segregated with the custodian for collateral on the initial margin on certain centrally cleared derivative contracts at the close of the reporting period. Collateral at period end totaled $1,469,032 and is included in Investments in securities on the Statement of assets and liabilities (Notes 1 and 9).
c Senior loans are exempt from registration under the Securities Act of 1933, as amended, but contain certain restrictions on resale and cannot be sold publicly. These loans pay interest at rates which adjust periodically. The interest rates shown for senior loans are the current interest rates at the close of the reporting period. Senior loans are also subject to mandatory and/or optional prepayment which cannot be predicted. As a result, the remaining maturity may be substantially less than the stated maturity shown (Notes 1 and 7).
i This security was pledged, or purchased with cash that was pledged, to the fund for collateral on certain derivative contracts (Note 1).
L Affiliated company (Note 5). The rate quoted in the security description is the annualized 7-day yield of the fund at the close of the reporting period.
P This security was pledged, or purchased with cash that was pledged, to the fund for collateral on certain derivative contracts and TBA commitments. The rate quoted in the security description is the annualized 7-day yield of the fund at the close of the reporting period.
R Real Estate Investment Trust.
W The rate shown represents the weighted average coupon associated with the underlying mortgage pools. Rates may be subject to a cap or floor.
Unless otherwise noted, the rates quoted in Short-term investments security descriptions represent the weighted average yield to maturity.
Debt obligations are considered secured unless otherwise indicated.
144A after the name of an issuer represents securities exempt from registration under Rule 144A of the Securities Act of 1933, as amended. These securities may be resold in transactions exempt from registration, normally to qualified institutional buyers.
See Note 1 to the financial statements regarding TBA commitments.
The dates shown on debt obligations are the original maturity dates.
| | | | | | |
| FORWARD CURRENCY CONTRACTS at 12/31/22 (aggregate face value $12,769,035) | Unrealized |
| | | Contract | Delivery | | Aggregate | appreciation/ |
| Counterparty | Currency | type* | date | Value | face value | (depreciation) |
| Bank of America N.A. | | | | | | |
| | Australian Dollar | Buy | 1/18/23 | $6,335 | $5,819 | $516 |
| | Canadian Dollar | Sell | 1/18/23 | 3,545 | 3,609 | 64 |
| | New Zealand Dollar | Sell | 1/18/23 | 4,255 | 3,802 | (453) |
| | Swedish Krona | Sell | 3/15/23 | 85,226 | 85,303 | 77 |
| Barclays Bank PLC | | | | | | |
| | Canadian Dollar | Sell | 1/18/23 | 50,004 | 49,583 | (421) |
| | Swiss Franc | Buy | 3/15/23 | 45,771 | 44,854 | 917 |
| |
| Putnam VT Diversified Income Fund | 17 |
| | | | | | |
| FORWARD CURRENCY CONTRACTS at 12/31/22 (aggregate face value $12,769,035) cont. | Unrealized |
| | | Contract | Delivery | | Aggregate | appreciation/ |
| Counterparty | Currency | type* | date | Value | face value | (depreciation) |
| Citibank, N.A. | | | | | | |
| | Australian Dollar | Sell | 1/18/23 | $7,630 | $7,258 | $(372) |
| | Norwegian Krone | Sell | 3/15/23 | 1,689 | 1,663 | (26) |
| | Swedish Krona | Sell | 3/15/23 | 3,175 | 3,177 | 2 |
| Goldman Sachs International | | | | | | |
| | Swiss Franc | Buy | 3/15/23 | 907,438 | 889,276 | 18,162 |
| HSBC Bank USA, National Association | | | | | | |
| | Australian Dollar | Sell | 1/18/23 | 57,224 | 54,700 | (2,524) |
| | Canadian Dollar | Sell | 1/18/23 | 26,221 | 26,139 | (82) |
| | New Zealand Dollar | Sell | 1/18/23 | 9,081 | 8,115 | (966) |
| | Norwegian Krone | Buy | 3/15/23 | 15,572 | 15,887 | (315) |
| | Swedish Krona | Sell | 3/15/23 | 60,067 | 61,556 | 1,489 |
| | Swiss Franc | Sell | 3/15/23 | 19,942 | 19,763 | (179) |
| JPMorgan Chase Bank N.A. | | | | | | |
| | Canadian Dollar | Sell | 1/18/23 | 115,961 | 115,194 | (767) |
| | Norwegian Krone | Sell | 3/15/23 | 7,689 | 7,515 | (174) |
| | Swiss Franc | Buy | 3/15/23 | 10,353 | 10,148 | 205 |
| Morgan Stanley & Co. International PLC | | | | | | |
| | Australian Dollar | Buy | 1/18/23 | 103,480 | 96,439 | 7,041 |
| | Canadian Dollar | Buy | 1/18/23 | 72,236 | 69,921 | 2,315 |
| | Euro | Sell | 3/15/23 | 3,177,920 | 3,122,554 | (55,366) |
| | Japanese Yen | Sell | 2/15/23 | 64,439 | 57,192 | (7,247) |
| | New Zealand Dollar | Sell | 1/18/23 | 1,233,327 | 1,102,937 | (130,390) |
| NatWest Markets PLC | | | | | | |
| | British Pound | Buy | 3/15/23 | 456,567 | 458,857 | (2,290) |
| State Street Bank and Trust Co. | | | | | | |
| | Australian Dollar | Sell | 1/18/23 | 960,882 | 916,662 | (44,220) |
| | British Pound | Sell | 3/15/23 | 548,123 | 554,266 | 6,143 |
| | Canadian Dollar | Sell | 1/18/23 | 143,363 | 142,214 | (1,149) |
| | Euro | Sell | 3/15/23 | 627,065 | 615,755 | (11,310) |
| | New Zealand Dollar | Buy | 1/18/23 | 35,752 | 33,224 | 2,528 |
| | Norwegian Krone | Sell | 3/15/23 | 159,910 | 157,408 | (2,502) |
| | Swedish Krona | Sell | 3/15/23 | 800,569 | 800,624 | 55 |
| | Swiss Franc | Buy | 3/15/23 | 58,953 | 59,213 | (260) |
| Toronto-Dominion Bank | | | | | | |
| | British Pound | Sell | 3/15/23 | 25,553 | 25,793 | 240 |
| | Canadian Dollar | Sell | 1/18/23 | 1,707,583 | 1,693,729 | (13,854) |
| | Japanese Yen | Buy | 2/15/23 | 3,182 | 2,861 | 321 |
| | Norwegian Krone | Sell | 3/15/23 | 179,803 | 177,034 | (2,769) |
| UBS AG | | | | | | |
| | British Pound | Buy | 3/15/23 | 242 | 244 | (2) |
| | Canadian Dollar | Sell | 1/18/23 | 21,641 | 21,462 | (179) |
| | Euro | Buy | 3/15/23 | 323 | 321 | 2 |
| | Japanese Yen | Buy | 2/15/23 | 720,914 | 648,416 | 72,498 |
| | New Zealand Dollar | Sell | 1/18/23 | 20,320 | 19,510 | (810) |
| | Swedish Krona | Sell | 3/15/23 | 4,754 | 4,757 | 3 |
| WestPac Banking Corp. | | | | | | |
| | Australian Dollar | Sell | 1/18/23 | 132,228 | 125,795 | (6,433) |
| | Euro | Sell | 3/15/23 | 6,561 | 6,545 | (16) |
| | Japanese Yen | Sell | 2/15/23 | 22,361 | 20,326 | (2,035) |
| |
| 18 | Putnam VT Diversified Income Fund |
| | | | | | |
| FORWARD CURRENCY CONTRACTS at 12/31/22 (aggregate face value $12,769,035) cont. | Unrealized |
| | | Contract | Delivery | | Aggregate | appreciation/ |
| Counterparty | Currency | type* | date | Value | face value | (depreciation) |
| WestPac Banking Corp. cont. | | | | | | |
| | New Zealand Dollar | Buy | 1/18/23 | $411,554 | $418,963 | $(7,409) |
| | Swiss Franc | Sell | 3/15/23 | 2,614 | 2,652 | 38 |
| Unrealized appreciation | | | | | | 112,616 |
| Unrealized (depreciation) | | | | | | (294,520) |
| Total | | | | | | $(181,904) |
* The exchange currency for all contracts listed is the United States Dollar.
| | | | | |
| | | | | | Unrealized |
| | Number of | Notional | | Expiration | appreciation/ |
| FUTURES CONTRACTS OUTSTANDING at 12/31/22 | contracts | amount | Value | date | (depreciation) |
| U.S. Treasury Note 2 yr (Short) | 214 | $43,886,719 | $43,886,719 | Mar-23 | $(47,560) |
| U.S. Treasury Note Ultra 10 yr (Short) | 11 | 1,301,094 | 1,301,094 | Mar-23 | 8,374 |
| Unrealized appreciation | | | | | 8,374 |
| Unrealized (depreciation) | | | | | (47,560) |
| Total | | | | | $(39,186) |
FORWARD PREMIUM SWAP OPTION CONTRACTS OUTSTANDING at 12/31/22
| | | | |
| Counterparty | | Notional/ | Premium | Unrealized |
| Fixed right or obligation % to receive or (pay)/ | Expiration | Contract | receivable/ | appreciation/ |
| Floating rate index/Maturity date | date/strike | amount | (payable) | (depreciation) |
| Bank of America N.A. | | | | |
| (1.39)/US SOFR/Dec-26 (Purchased) | Dec-24/1.39 | $34,881,900 | $(401,142) | $893,674 |
| 1.39/US SOFR/Dec-26 (Purchased) | Dec-24/1.39 | 34,881,900 | (401,142) | (246,266) |
| (1.085)/3 month USD-LIBOR-ICE/Apr-34 (Written) | Apr-24/1.085 | 20,001,300 | 274,518 | 219,614 |
| 2.17/3 month USD-LIBOR-ICE/Apr-34 (Purchased) | Apr-24/2.17 | 10,000,600 | (483,029) | (369,322) |
| (2.35)/3 month USD-LIBOR-ICE/Apr-56 (Purchased) | Apr-26/2.35 | 5,511,400 | (716,482) | 479,657 |
| 2.35/3 month USD-LIBOR-ICE/Apr-56 (Purchased) | Apr-26/2.35 | 5,511,400 | (716,482) | (367,225) |
| (1.29)/3 month USD-LIBOR-ICE/Mar-34 (Written) | Mar-24/1.29 | 5,000,300 | 78,005 | 62,854 |
| (3.073)/US SOFR/Jun-37 (Written) | Jun-27/3.073 | 4,211,100 | 306,358 | 48,259 |
| 3.073/US SOFR/Jun-37 (Written) | Jun-27/3.073 | 4,211,100 | 306,358 | (46,575) |
| 2.29/3 month USD-LIBOR-ICE/Mar-34 (Purchased) | Mar-24/2.29 | 3,500,200 | (172,160) | (131,748) |
| (3.343)/US SOFR/Dec-35 (Purchased) | Dec-25/3.343 | 2,847,800 | (184,680) | 256 |
| 3.343/US SOFR/Dec-35 (Purchased) | Dec-25/3.343 | 2,847,800 | (184,680) | (114) |
| (0.925)/3 month USD-LIBOR-ICE/Mar-40 (Purchased) | Mar-30/0.925 | 2,832,600 | (202,814) | 378,407 |
| 0.925/3 month USD-LIBOR-ICE/Mar-40 (Purchased) | Mar-30/0.925 | 2,832,600 | (202,814) | (129,563) |
| (3.17)/US SOFR/Dec-35 (Purchased) | Dec-25/3.17 | 2,770,500 | (144,066) | 48,428 |
| 2.67/US SOFR/Dec-35 (Purchased) | Dec-25/2.67 | 2,770,500 | (141,296) | (31,085) |
| (2.558)/US SOFR/Dec-57 (Purchased) | Dec-27/2.558 | 2,723,200 | (402,489) | 62,007 |
| 2.558/US SOFR/Dec-57 (Purchased) | Dec-27/2.558 | 2,723,200 | (402,489) | (91,962) |
| (3.18)/US SOFR/Dec-35 (Purchased) | Dec-25/3.18 | 2,687,400 | (135,714) | 49,529 |
| 2.68/US SOFR/Dec-35 (Purchased) | Dec-25/2.68 | 2,687,400 | (135,714) | (28,191) |
| (1.275)/3 month USD-LIBOR-ICE/Mar-50 (Purchased) | Mar-30/1.275 | 1,717,500 | (223,704) | 268,291 |
| 1.275/3 month USD-LIBOR-ICE/Mar-50 (Purchased) | Mar-30/1.275 | 1,717,500 | (223,704) | (139,495) |
| (3.101)/US SOFR/Jun-39 (Written) | Jun-29/3.101 | 1,667,600 | 130,240 | 15,692 |
| 3.101/US SOFR/Jun-39 (Written) | Jun-29/3.101 | 1,667,600 | 130,240 | (18,244) |
| (0.85)/3 month USD-LIBOR-ICE/Mar-40 (Purchased) | Mar-30/0.85 | 1,442,500 | (105,303) | 197,377 |
| 0.85/3 month USD-LIBOR-ICE/Mar-40 (Purchased) | Mar-30/0.85 | 1,442,500 | (105,303) | (68,288) |
| (2.47)/US SOFR/Dec-57 (Purchased) | Dec-27/2.47 | 1,021,200 | (151,648) | 31,034 |
| 2.47/US SOFR/Dec-57 (Purchased) | Dec-27/2.47 | 1,021,200 | (151,648) | (41,318) |
| (1.405)/US SOFR/Dec-58 (Purchased) | Dec-28/1.405 | 799,300 | (122,593) | 113,812 |
| 1.405/US SOFR/Dec-58 (Purchased) | Dec-28/1.405 | 799,300 | (122,593) | (68,820) |
| Barclays Bank PLC | | | | |
| (2.232)/3 month USD-LIBOR-ICE/Jun-51 (Purchased) | Jun-31/2.232 | 1,909,000 | (231,275) | 138,116 |
| 2.232/3 month USD-LIBOR-ICE/Jun-51 (Purchased) | Jun-31/2.232 | 1,909,000 | (231,275) | (87,222) |
| |
| Putnam VT Diversified Income Fund | 19 |
FORWARD PREMIUM SWAP OPTION CONTRACTS OUTSTANDING at 12/31/22 cont.
| | | | | |
| Counterparty | | | Notional/ | Premium | Unrealized |
| Fixed right or obligation % to receive or (pay)/ | Expiration | | Contract | receivable/ | appreciation/ |
| Floating rate index/Maturity date | date/strike | | amount | (payable) | (depreciation) |
| Citibank, N.A. | | | | | |
| 4.108/US SOFR/Jan-28 (Purchased) | Jan-23/4.108 | | $13,318,200 | $(191,116) | $49,144 |
| (4.108)/US SOFR/Jan-28 (Purchased) | Jan-23/4.108 | | 13,318,200 | (191,116) | (176,067) |
| (1.752)/3 month USD-LIBOR-ICE/Dec-31 (Purchased) | Dec-26/1.752 | | 12,778,300 | (416,573) | 687,728 |
| 1.752/3 month USD-LIBOR-ICE/Dec-31 (Purchased) | Dec-26/1.752 | | 12,778,300 | (416,573) | (228,604) |
| 2.394/US SOFR/Sep-33 (Purchased) | Sep-23/2.394 | | 8,029,300 | (97,155) | (27,059) |
| (1.90)/3 month USD-LIBOR-ICE/Jun-28 (Purchased) | Jun-26/1.90 | | 7,582,000 | (101,068) | 161,497 |
| 1.90/3 month USD-LIBOR-ICE/Jun-28 (Purchased) | Jun-26/1.90 | | 7,582,000 | (101,068) | (44,810) |
| (1.826)/US SOFR/Jan-42 (Purchased) | Jan-32/1.826 | | 5,420,500 | (400,304) | 351,357 |
| 1.826/US SOFR/Jan-42 (Purchased) | Jan-32/1.826 | | 5,420,500 | (400,304) | (161,965) |
| (1.75)/US SOFR/Mar-53 (Purchased) | Mar-23/1.75 | | 3,368,400 | (252,125) | 658,253 |
| 1.75/US SOFR/Mar-53 (Purchased) | Mar-23/1.75 | | 3,368,400 | (252,125) | (249,834) |
| (1.724)/US SOFR/Mar-53 (Purchased) | Mar-23/1.724 | | 2,907,200 | (219,348) | 580,481 |
| 1.724/US SOFR/Mar-53 (Purchased) | Mar-23/1.724 | | 2,907,200 | (219,348) | (217,400) |
| (1.735)/US SOFR/Mar-53 (Purchased) | Mar-23/1.735 | | 2,850,600 | (210,731) | 567,469 |
| 1.735/US SOFR/Mar-53 (Purchased) | Mar-23/1.735 | | 2,850,600 | (210,731) | (208,778) |
| (1.625)/3 month USD-LIBOR-ICE/Jan-61 (Purchased) | Jan-41/1.625 | | 1,533,900 | (226,250) | 70,038 |
| 1.625/3 month USD-LIBOR-ICE/Jan-61 (Purchased) | Jan-41/1.625 | | 1,533,900 | (226,250) | (49,069) |
| (2.427)/3 month USD-LIBOR-ICE/Jun-41 (Purchased) | Jun-31/2.427 | | 1,498,600 | (109,173) | 78,047 |
| 2.427/3 month USD-LIBOR-ICE/Jun-41 (Purchased) | Jun-31/2.427 | | 1,498,600 | (109,173) | (38,334) |
| (2.689)/3 month USD-LIBOR-ICE/Nov-49 (Purchased) | Nov-24/2.689 | | 725,000 | (93,344) | 27,449 |
| 2.689/3 month USD-LIBOR-ICE/Nov-49 (Purchased) | Nov-24/2.689 | | 725,000 | (93,344) | (56,818) |
| (0.055)/3 month EUR-EURIBOR/Mar-25 (Written) | Mar-24/0.055 | EUR | 81,528,100 | 261,576 | 244,361 |
| 0.555/3 month EUR-EURIBOR/Mar-25 (Purchased) | Mar-24/0.555 | EUR | 40,764,100 | (257,143) | (239,561) |
| Goldman Sachs International | | | | | |
| (2.40)/US SOFR/May-57 (Purchased) | May-27/2.40 | | $5,162,000 | (665,898) | 273,792 |
| 2.40/US SOFR/May-57 (Purchased) | May-27/2.40 | | 5,162,000 | (665,898) | (176,747) |
| 3.92/US SOFR/Feb-33 (Purchased) | Feb-23/3.92 | | 4,002,000 | (87,444) | 54,707 |
| (3.92)/US SOFR/Feb-33 (Purchased) | Feb-23/3.92 | | 4,002,000 | (87,444) | (70,115) |
| (2.8175)/3 month USD-LIBOR-ICE/Mar-47 (Purchased) | Mar-27/2.8175 | | 596,900 | (75,359) | 17,650 |
| 2.8175/3 month USD-LIBOR-ICE/Mar-47 (Purchased) | Mar-27/2.8175 | | 596,900 | (75,359) | (32,149) |
| JPMorgan Chase Bank N.A. | | | | | |
| (1.70)/US SOFR/Jan-29 (Written) | Jan-24/1.70 | | 8,128,800 | 173,448 | 135,263 |
| 1.70/US SOFR/Jan-29 (Written) | Jan-24/1.70 | | 8,128,800 | 173,448 | (463,260) |
| (3.0175)/US SOFR/Dec-42 (Purchased) | Dec-32/3.0175 | | 5,446,300 | (458,851) | 52,176 |
| 3.0175/US SOFR/Dec-42 (Purchased) | Dec-32/3.0175 | | 5,446,300 | (458,851) | (47,383) |
| (2.317)/US SOFR/Apr-42 (Written) | Apr-32/2.317 | | 1,715,600 | 145,311 | 48,500 |
| 2.317/US SOFR/Apr-42 (Written) | Apr-32/2.317 | | 1,715,600 | 145,311 | (60,355) |
| (1.81)/US SOFR/Jan-37 (Written) | Jan-27/1.81 | | 1,334,500 | 78,869 | 42,931 |
| 1.81/US SOFR/Jan-37 (Written) | Jan-27/1.81 | | 1,334,500 | 78,869 | (109,229) |
| (3.315)/6 month AUD-BBR-BBSW/May-52 (Purchased) | May-32/3.315 | AUD | 3,645,300 | (306,536) | 61,452 |
| 3.315/6 month AUD-BBR-BBSW/May-52 (Purchased) | May-32/3.315 | AUD | 3,645,300 | (306,536) | (58,771) |
| (2.495)/6 month AUD-BBR-BBSW/Nov-46 (Purchased) | Nov-26/2.495 | AUD | 2,121,400 | (131,925) | 235,777 |
| 2.495/6 month AUD-BBR-BBSW/Nov-46 (Purchased) | Nov-26/2.495 | AUD | 2,121,400 | (131,925) | (83,339) |
| (1.445)/6 month AUD-BBR-BBSW/Mar-40 (Purchased) | Mar-30/1.445 | AUD | 1,311,400 | (49,158) | 134,100 |
| 1.445/6 month AUD-BBR-BBSW/Mar-40 (Purchased) | Mar-30/1.445 | AUD | 1,311,400 | (49,158) | (35,777) |
| (1.692)/6 month AUD-BBR-BBSW/Jan-35 (Purchased) | Jan-25/1.692 | AUD | 941,400 | (29,371) | 118,685 |
| 1.692/6 month AUD-BBR-BBSW/Jan-35 (Purchased) | Jan-25/1.692 | AUD | 941,400 | (29,371) | (25,978) |
| (1.441)/6 month AUD-BBR-BBSW/Jul-45 (Purchased) | Jul-25/1.441 | AUD | 628,200 | (37,153) | 121,410 |
| 1.441/6 month AUD-BBR-BBSW/Jul-45 (Purchased) | Jul-25/1.441 | AUD | 628,200 | (37,153) | (32,065) |
| |
| 20 | Putnam VT Diversified Income Fund |
FORWARD PREMIUM SWAP OPTION CONTRACTS OUTSTANDING at 12/31/22 cont.
| | | | | |
| Counterparty | | | Notional/ | Premium | Unrealized |
| Fixed right or obligation % to receive or (pay)/ | Expiration | | Contract | receivable/ | appreciation/ |
| Floating rate index/Maturity date | date/strike | | amount | (payable) | (depreciation) |
| Morgan Stanley & Co. International PLC | | | | | |
| (3.27)/3 month USD-LIBOR-ICE/Oct-53 (Purchased) | Oct-23/3.27 | | $948,300 | $(108,201) | $(25,177) |
| 3.27/3 month USD-LIBOR-ICE/Oct-53 (Purchased) | Oct-23/3.27 | | 948,300 | (108,201) | (48,923) |
| (2.505)/3 month USD-LIBOR-ICE/Nov-49 (Purchased) | Nov-24/2.505 | | 725,000 | (111,070) | 26,463 |
| 2.505/3 month USD-LIBOR-ICE/Nov-49 (Purchased) | Nov-24/2.505 | | 725,000 | (78,010) | (48,234) |
| (2.3825)/US SOFR/Jul-56 (Purchased) | Jul-26/2.3825 | | 339,500 | (43,032) | 18,757 |
| 2.3825/US SOFR/Jul-56 (Purchased) | Jul-26/2.3825 | | 339,500 | (43,032) | (14,599) |
| Toronto-Dominion Bank | | | | | |
| (1.937)/3 month USD-LIBOR-ICE/Feb-36 (Purchased) | Feb-26/1.937 | | 1,406,300 | (73,549) | 132,375 |
| 1.937/3 month USD-LIBOR-ICE/Feb-36 (Purchased) | Feb-26/1.937 | | 1,406,300 | (73,549) | (45,705) |
| (2.405)/3 month USD-LIBOR-ICE/Mar-41 (Purchased) | Mar-31/2.405 | | 487,500 | (34,003) | 27,203 |
| 2.405/3 month USD-LIBOR-ICE/Mar-41 (Purchased) | Mar-31/2.405 | | 487,500 | (34,003) | (11,827) |
| UBS AG | | | | | |
| (2.00)/6 month AUD-BBR-BBSW/Sep-46 (Purchased) | Sep-36/2.00 | AUD | 1,703,900 | (90,690) | 67,228 |
| 2.00/6 month AUD-BBR-BBSW/Sep-46 (Purchased) | Sep-36/2.00 | AUD | 1,703,900 | (90,690) | (28,515) |
| (2.70)/6 month AUD-BBR-BBSW/Apr-47 (Purchased) | Apr-37/2.70 | AUD | 800,600 | (48,611) | 14,358 |
| 2.70/6 month AUD-BBR-BBSW/Apr-47 (Purchased) | Apr-37/2.70 | AUD | 800,600 | (48,611) | (10,368) |
| (3.292)/6 month EUR-EURIBOR/Oct-24 (Purchased) | Oct-23/3.292 | EUR | 20,831,200 | (120,144) | (12,933) |
| 3.292/6 month EUR-EURIBOR/Oct-24 (Purchased) | Oct-23/3.292 | EUR | 20,831,200 | (120,144) | (70,241) |
| (0.44)/6 month EUR-EURIBOR/Feb-41 (Purchased) | Feb-31/0.44 | EUR | 1,688,700 | (132,482) | 224,693 |
| 0.44/6 month EUR-EURIBOR/Feb-41 (Purchased) | Feb-31/0.44 | EUR | 1,688,700 | (132,482) | (64,226) |
| (1.325)/6 month EUR-EURIBOR/Apr-49 (Purchased) | Apr-29/1.325 | EUR | 1,143,800 | (158,580) | 102,775 |
| 1.325/6 month EUR-EURIBOR/Apr-49 (Purchased) | Apr-29/1.325 | EUR | 1,143,800 | (158,580) | (65,994) |
| (0.296)/6 month EUR-EURIBOR/Jan-51 (Purchased) | Jan-31/0.296 | EUR | 562,900 | (85,176) | 101,320 |
| 0.296/6 month EUR-EURIBOR/Jan-51 (Purchased) | Jan-31/0.296 | EUR | 562,900 | (85,176) | (40,781) |
| Wells Fargo Bank, N.A. | | | | | |
| 3.0575/US SOFR/Jan-33 (Purchased) | Jan-23/3.0575 | | $9,113,300 | (68,805) | (66,620) |
| Unrealized appreciation | | | | | 8,494,446 |
| Unrealized (depreciation) | | | | | (5,313,048) |
| Total | | | | | $3,181,398 |
| | | |
| TBA SALE COMMITMENTS OUTSTANDING at 12/31/22 | |
| (proceeds receivable $27,636,718) | Principal | Settlement | |
| Agency | amount | date | Value |
| Uniform Mortgage-Backed Securities, 5.00%, 1/1/53 | $7,000,000 | 1/12/23 | $6,902,659 |
| Uniform Mortgage-Backed Securities, 4.50%, 1/1/53 | 5,000,000 | 1/12/23 | 4,819,531 |
| Uniform Mortgage-Backed Securities, 4.00%, 1/1/53 | 2,000,000 | 1/12/23 | 1,877,499 |
| Uniform Mortgage-Backed Securities, 3.00%, 1/1/53 | 5,000,000 | 1/12/23 | 4,392,578 |
| Uniform Mortgage-Backed Securities, 2.50%, 1/1/53 | 6,000,000 | 1/12/23 | 5,086,875 |
| Uniform Mortgage-Backed Securities, 2.00%, 1/1/53 | 5,000,000 | 1/12/23 | 4,081,094 |
| Total | | | $27,160,236 |
CENTRALLY CLEARED INTEREST RATE SWAP CONTRACTS OUTSTANDING at 12/31/22
| | | | | | |
| | | Upfront | | | | Unrealized |
| | | premium | Termination | Payments | Payments | appreciation/ |
| Notional amount | Value | received (paid) | date | made by fund | received by fund | (depreciation) |
| $2,817,200 | $529,211 | $118,004 | 9/1/32 | 3 month USD-LIBOR-ICE — | 1.512% — Semiannually | $(408,558) |
| | | | | Quarterly | | |
| 8,610,000 | 346,208 | 416 | 12/23/23 | 0.695% — Annually | US SOFR — Annually | 354,387 |
| 6,867,000 | 697,619 | 590 | 12/23/26 | 1.085% — Annually | US SOFR — Annually | 703,731 |
| 3,221,000 | 559,101 | 389 | 12/23/31 | 1.285% — Annually | US SOFR — Annually | 561,919 |
| 1,426,000 | 470,851 | (2,539) | 12/23/51 | US SOFR — Annually | 1.437% — Annually | (474,411) |
| 11,649,000 | 468,173 | (1,185) | 12/24/23 | 0.697% — Annually | US SOFR — Annually | 471,652 |
| 2,714,000 | 274,738 | (363) | 12/24/26 | 1.096% — Annually | US SOFR — Annually | 275,341 |
| 5,265,000 | 914,057 | (2,350) | 12/24/31 | 1.285% — Annually | US SOFR — Annually | 913,470 |
| 6,694,000 | 2,212,702 | (3,618) | 12/24/51 | 1.435% — Annually | US SOFR — Annually | 2,211,215 |
| |
| Putnam VT Diversified Income Fund | 21 |
CENTRALLY CLEARED INTEREST RATE SWAP CONTRACTS OUTSTANDING at 12/31/22 cont.
| | | | | | |
| | | Upfront | | | | Unrealized |
| | | premium | Termination | Payments | Payments | appreciation/ |
| Notional amount | Value | received (paid) | date | made by fund | received by fund | (depreciation) |
| $3,035,000 | $953,051 | $(495) | 12/31/51 | 1.525% — Annually | US SOFR — Annually | $953,024 |
| 1,201,000 | 120,256 | (159) | 12/31/26 | US SOFR — Annually | 1.135% — Annually | (120,627) |
| 315,000 | 53,093 | 5,672 | 12/31/31 | US SOFR — Annually | 1.355% — Annually | (47,473) |
| 813,100 | 53,632 E | (18) | 1/15/47 | 1.724% — Annually | US SOFR — Annually | 53,614 |
| 1,953,000 | 558,480 | (67) | 1/21/52 | 1.679% — Annually | US SOFR — Annually | 555,393 |
| 1,337,000 | 395,324 | (46) | 1/19/52 | US SOFR — Annually | 1.626% — Annually | (396,384) |
| 967,000 | 280,933 | (33) | 2/1/52 | 1.6545% — Annually | US SOFR — Annually | 279,819 |
| 3,248,100 | 821,282 | (111) | 2/24/52 | US SOFR — Annually | 1.86% — Annually | (815,379) |
| 2,170,000 | 585,661 | (74) | 2/29/52 | 1.7674% — Annually | US SOFR — Annually | 585,056 |
| 2,392,000 | 335,956 | (32) | 2/29/32 | US SOFR — Annually | 1.75% — Annually | (334,204) |
| 8,640,000 | 712,541 | (70) | 2/28/27 | 1.675% — Annually | US SOFR — Annually | 730,675 |
| 16,660,000 | 633,913 | (63) | 2/29/24 | US SOFR — Annually | 1.47709% — Annually | (696,796) |
| 1,267,400 | 184,736 | (17) | 3/7/32 | 3 month USD-LIBOR-ICE — | 1.9575% — Semiannually | (181,054) |
| | | | | Quarterly | | |
| 6,645,800 | 1,040,267 | (88) | 3/9/32 | 1.5475% — Annually | US SOFR — Annually | 1,053,521 |
| 6,890,200 | 1,081,761 | (91) | 3/9/32 | 1.5415% — Annually | US SOFR — Annually | 1,096,697 |
| 3,632,000 | 515,453 | (48) | 3/11/32 | 1.737% — Annually | US SOFR — Annually | 516,690 |
| 471,000 | 13,758 | (2) | 4/7/24 | US SOFR — Annually | 2.4485% — Annually | (11,898) |
| 98,000 | 5,201 | (1) | 4/7/27 | 2.469% — Annually | US SOFR — Annually | 4,828 |
| 103,000 | 9,941 | (1) | 4/7/23 | 2.3305% — Annually | US SOFR — Annually | 9,661 |
| 41,000 | 8,553 | (1) | 4/7/52 | US SOFR — Annually | 2.1005% — Annually | (8,509) |
| 4,954,000 | 414,204 | (66) | 4/14/32 | 2.4975% — Annually | US SOFR — Annually | 387,763 |
| 4,078,000 | 670,790 | (139) | 4/14/52 | US SOFR — Annually | 2.3395% — Annually | (654,637) |
| 1,064,000 | 56,020 | (9) | 4/14/27 | 2.483% — Annually | US SOFR — Annually | 51,823 |
| 2,385,000 | 71,812 | (9) | 4/14/24 | US SOFR — Annually | 2.403% — Annually | (63,639) |
| 10,918,500 | 491,442 | (103) | 5/2/27 | US SOFR — Annually | 2.685% — Annually | (468,258) |
| 17,016,700 | 502,333 | (64) | 5/25/24 | 2.5945% — Annually | US SOFR — Annually | 496,866 |
| 867,000 | 116,629 | (30) | 5/25/52 | US SOFR — Annually | 2.501% — Annually | (115,419) |
| 688,300 | 61,858 E | (23) | 5/28/57 | 2.40% — Annually | US SOFR — Annually | 61,834 |
| 899,000 | 57,635 | (12) | 6/7/32 | US SOFR — Annually | 2.7565% — Annually | (55,141) |
| 1,407,000 | 157,682 | (48) | 6/7/52 | US SOFR — Annually | 2.622% — Annually | (156,043) |
| 26,491,500 | 1,555,051 | (351) | 6/8/32 | US SOFR — Annually | 2.825% — Annually | (1,514,108) |
| 1,288,200 | 285,504 | (161,687) | 6/22/52 | 2.3075% — Semiannually | 3 month USD-LIBOR-ICE — | 124,764 |
| | | | | | Quarterly | |
| 20,580,500 | 409,758 | (78) | 6/15/24 | US SOFR — Annually | 3.3385% — Annually | (339,956) |
| 14,265,000 | 361,475 | (115) | 6/15/27 | 3.185% — Annually | US SOFR — Annually | 325,089 |
| 1,947,800 | 77,815 | (28) | 9/8/32 | US SOFR — Annually | 3.07% — Annually | (79,272) |
| 2,988,500 | 172,138 E | (42) | 2/3/33 | 3.13% — Semiannually | 3 month USD-LIBOR-ICE — | 172,095 |
| | | | | | Quarterly | |
| 6,692,200 | 557,460 E | (95) | 1/31/33 | 2.545% — Annually | US SOFR — Annually | 557,366 |
| 6,692,200 | 554,716 E | (95) | 1/31/33 | 2.55% — Annually | US SOFR — Annually | 554,622 |
| 6,303,100 | 551,017 E | (89) | 2/1/33 | 2.495% — Annually | US SOFR — Annually | 550,928 |
| 6,769,000 | 618,010 | (90) | 8/2/32 | US SOFR — Annually | 2.4275% — Annually | (633,923) |
| 6,163,000 | 583,574 E | (87) | 2/1/33 | 2.4075% — Annually | US SOFR — Annually | 583,487 |
| 620,700 | 27,938 E | (12) | 4/1/42 | US SOFR — Annually | 2.63% — Annually | (27,950) |
| 887,900 | 64,098 E | (13) | 3/24/35 | US SOFR — Annually | 2.39% — Annually | (64,111) |
| 1,827,800 | 213,012 | (54) | 8/10/42 | 2.645% — Annually | US SOFR — Annually | 216,591 |
| 3,098,000 | 378,483 | (6,907) | 8/10/42 | US SOFR — Annually | 2.605% — Annually | (391,441) |
| 1,270,300 | 157,606 | (37) | 8/10/42 | 2.5915% — Annually | US SOFR — Annually | 160,111 |
| 5,122,000 | 216,507 E | (48) | 2/6/29 | 2.40% — Annually | US SOFR — Annually | 216,459 |
| 10,439,000 | 799,836 | (138) | 8/16/32 | US SOFR — Annually | 2.613% — Annually | (820,557) |
| 1,205,300 | 31,097 E | (27) | 1/15/47 | 2.49% — Annually | US SOFR — Annually | 31,070 |
| 176,000 | 10,263 | (2) | 8/25/32 | US SOFR — Annually | 2.8415% — Annually | (10,481) |
| 752,000 | 31,328 E | (11) | 2/21/35 | 2.785% — Annually | US SOFR — Annually | 31,317 |
| 10,126,400 | 199,794 | (38) | 9/6/24 | US SOFR — Annually | 3.413% — Annually | (195,848) |
| |
| 22 | Putnam VT Diversified Income Fund |
CENTRALLY CLEARED INTEREST RATE SWAP CONTRACTS OUTSTANDING at 12/31/22 cont.
| | | | | | |
| | | Upfront | | | | Unrealized |
| | | premium | Termination | Payments | Payments | appreciation/ |
| Notional amount | Value | received (paid) | date | made by fund | received by fund | (depreciation) |
| $5,999,300 | $52,014 E | $(33) | 1/15/27 | US SOFR — Annually | 2.73% — Annually | $(52,047) |
| 5,101,400 | 215,126 | (67) | 9/13/32 | 3.043% — Annually | US SOFR — Annually | 219,330 |
| 1,042,200 | 23,241 E | (20) | 1/15/41 | 3.0500% — Annually | US SOFR — Annually | 23,221 |
| 613,600 | 14,837 E | (12) | 1/15/42 | 2.9825% — Annually | US SOFR — Annually | 14,825 |
| 2,091,000 | 122,700 | (71) | 9/26/52 | 2.905% — Annually | US SOFR — Annually | 125,575 |
| 10,872,000 | 145,685 | (102) | 9/26/27 | US SOFR — Annually | 3.465% — Annually | (144,699) |
| 659,000 | 17,272 | (9) | 9/19/32 | 3.24% — Annually | US SOFR — Annually | 17,560 |
| 2,740,000 | 25,235 | (36) | 9/26/32 | US SOFR — Annually | 3.449% — Annually | (25,115) |
| 1,605,900 | 4,513 E | (23) | 10/3/33 | 3.394% — Annually | US SOFR — Annually | 4,490 |
| 3,781,000 | 4,121 | (30) | 10/4/27 | 3.75% — Annually | US SOFR — Annually | 1,435 |
| 11,579,000 | 90,432 | (153) | 10/5/32 | US SOFR — Annually | 3.466% — Annually | (91,696) |
| 1,103,000 | 20,560 E | (17) | 10/21/36 | US SOFR — Annually | 3.116% — Annually | (20,576) |
| 539,000 | 9,605 E | (8) | 1/11/33 | US SOFR — Annually | 3.34% — Annually | (9,613) |
| 1,868,000 | 32,765 E | (26) | 1/31/33 | US SOFR — Annually | 3.337% — Annually | (32,791) |
| 1,868,000 | 33,381 E | (26) | 1/31/33 | US SOFR — Annually | 3.333% — Annually | (33,408) |
| 4,396,000 | 76,007 E | (62) | 8/23/33 | US SOFR — Annually | 3.237% — Annually | (76,069) |
| 1,743,000 | 32,176 E | (25) | 2/1/33 | US SOFR — Annually | 3.3255% — Annually | (32,200) |
| 4,227,000 | 75,579 E | (60) | 9/1/33 | US SOFR — Annually | 3.225% — Annually | (75,638) |
| 184,000 | 3,231 | (3) | 11/14/32 | 3.347% — Annually | US SOFR — Annually | 3,312 |
| 547,000 | 28,335 E | (19) | 2/3/53 | 2.9275% — Annually | US SOFR — Annually | 28,316 |
| 1,463,000 | 29,143 E | (21) | 2/1/33 | US SOFR — Annually | 3.308% — Annually | (29,164) |
| 32,880,000 | 227,858 | (123) | 10/7/24 | US SOFR — Annually | 4.1845% — Annually | (181,041) |
| 6,487,000 | 32,435 | (86) | 10/7/32 | 3.5005% — Annually | US SOFR — Annually | 30,373 |
| 65,760,000 | 449,798 | 15,056 | 10/7/24 | 4.19% — Annually | US SOFR — Annually | 370,091 |
| 29,244,000 | 56,148 | (6,914) | 10/7/27 | US SOFR — Annually | 3.73% — Annually | (53,056) |
| 53,861,000 | 271,459 | (21,174) | 10/7/32 | 3.50% — Annually | US SOFR — Annually | 261,448 |
| 12,974,000 | 54,880 | (12,424) | 10/7/32 | US SOFR — Annually | 3.51% — Annually | (69,684) |
| 15,987,000 | 503,910 | 10,707 | 10/7/52 | US SOFR — Annually | 3.05% — Annually | (513,704) |
| 5,321,000 | 8,992 E | (37) | 4/8/28 | 3.44% — Annually | US SOFR — Annually | (9,029) |
| 14,062,000 | 17,578 E | (53) | 1/31/25 | US SOFR — Annually | 4.035% — Annually | 17,525 |
| 1,822,700 | 15,930 E | (26) | 1/17/33 | 3.6575% — Annually | US SOFR — Annually | (15,956) |
| 465,000 | 4,748 E | (16) | 1/16/55 | 2.97% — Annually | US SOFR — Annually | 4,732 |
| 10,609,000 | 34,373 E | (59) | 1/16/26 | US SOFR — Annually | 3.605% — Annually | 34,314 |
| 2,104,000 | 15,380 | (72) | 10/20/52 | US SOFR — Annually | 3.2571% — Annually | 14,403 |
| 4,361,600 | 58,009 E | (148) | 10/9/54 | 3.115% — Annually | US SOFR — Annually | (58,158) |
| 17,737,100 | 242,821 E | (250) | 10/10/33 | US SOFR — Annually | 3.594% — Annually | 242,571 |
| 160,000 | 3,573 | (5) | 10/20/52 | US SOFR — Annually | 3.3375% — Annually | 3,525 |
| 618,100 | 11,732 E | (21) | 1/24/55 | 3.135% — Annually | US SOFR — Annually | (11,753) |
| 2,079,200 | 28,028 E | (20) | 4/13/28 | 3.965% — Annually | US SOFR — Annually | (28,047) |
| 687,600 | 12,397 E | (10) | 4/4/35 | 3.5575% — Annually | US SOFR — Annually | (12,408) |
| 1,375,200 | 15,787 E | (15) | 5/8/30 | US SOFR — Annually | 3.52% — Annually | 15,772 |
| 1,882,600 | 4,612 E | (16) | 4/4/32 | 3.515% — Annually | US SOFR — Annually | (4,629) |
| 12,801,600 | 314,151 E | (181) | 11/24/33 | US SOFR — Annually | 3.708% — Annually | 313,971 |
| 3,343,800 | 81,221 E | (47) | 6/6/34 | US SOFR — Annually | 3.645% — Annually | 81,174 |
| 255,200 | 5,076 E | (4) | 2/19/36 | US SOFR — Annually | 3.6145% — Annually | 5,072 |
| 189,100 | 3,733 E | (3) | 3/3/36 | US SOFR — Annually | 3.614% — Annually | 3,730 |
| 2,746,000 | 124,531 | (93) | 10/24/52 | US SOFR — Annually | 3.4605% — Annually | 123,798 |
| 6,903,300 | 27,406 E | (26) | 6/26/25 | US SOFR — Annually | 4.31% — Annually | 27,380 |
| 1,524,000 | 85,466 | (52) | 10/27/32 | 3.5176% — Annually | US SOFR — Annually | (85,526) |
| 3,483,000 | 104,107 E | (49) | 12/4/33 | US SOFR — Annually | 3.77% — Annually | 104,058 |
| 1,247,800 | 16,621 E | (14) | 3/24/32 | US SOFR — Annually | 3.64% — Annually | 16,607 |
| 2,429,900 | 54,478 E | (36) | 6/28/37 | US SOFR — Annually | 3.70% — Annually | 54,442 |
| 552,200 | 12,292 E | (11) | 6/20/40 | US SOFR — Annually | 3.75% — Annually | 12,281 |
| 8,236,000 | 32,779 | (31) | 11/9/24 | US SOFR — Annually | 4.7655% — Annually | 48,294 |
| 10,032,100 | 264,446 | (132) | 11/14/32 | 3.88% — Annually | US SOFR — Annually | (267,147) |
| |
| Putnam VT Diversified Income Fund | 23 |
CENTRALLY CLEARED INTEREST RATE SWAP CONTRACTS OUTSTANDING at 12/31/22 cont.
| | | | | | | |
| | | | Upfront | | | | Unrealized |
| | | | premium | Termination | Payments | Payments | appreciation/ |
| Notional amount | Value | received (paid) | date | made by fund | received by fund | (depreciation) |
| | $5,700,000 | $50,958 | $(75) | 11/21/32 | 3.4515% — Annually | US SOFR — Annually | $54,093 |
| | 624,400 | 4,265 | (8) | 11/25/32 | 3.477% — Annually | US SOFR — Annually | 4,235 |
| | 20,040,000 | 56,112 | (75) | 12/5/24 | 4.3515% — Annually | US SOFR — Annually | 44,557 |
| | 1,000,000 | 34,720 | (13) | 12/9/32 | 3.14% — Annually | US SOFR — Annually | 34,756 |
| | 272,300 | 20,036 E | (9) | 12/10/57 | 2.47% — Annually | US SOFR — Annually | 20,027 |
| | 680,800 | 40,351 E | (23) | 12/13/57 | 2.558% — Annually | US SOFR — Annually | 40,328 |
| | 4,120,000 | 105,802 E | (18,680) | 3/15/33 | US SOFR — Annually | 3.22% — Annually | (124,481) |
| | 4,766,000 | 13,440 E | 16,885 | 3/15/25 | 4.19% — Annually | US SOFR — Annually | 30,326 |
| | 48,690,000 | 250,754 E | (334,378) | 3/15/30 | US SOFR — Annually | 3.50% — Annually | (585,131) |
| | 53,189,000 | 240,414 E | (172,470) | 3/15/25 | 4.10% — Annually | US SOFR — Annually | 67,945 |
| | 33,667,000 | 14,477 E | 135,139 | 3/15/28 | 3.70% — Annually | US SOFR — Annually | 120,662 |
| | 48,162,000 | 917,968 E | (674,173) | 3/15/33 | 3.30% — Annually | US SOFR — Annually | 243,795 |
| | 9,807,000 | 535,266 E | 479,369 | 3/15/53 | US SOFR — Annually | 2.90% — Annually | (55,897) |
| | 1,823,000 | 6,964 | (62) | 12/29/52 | US SOFR — Annually | 3.1925% — Annually | (7,194) |
| | 1,469,000 | 4,201 | (19) | 12/29/32 | 3.5235% — Annually | US SOFR — Annually | 4,277 |
| | 573,000 | 5,730 | (19) | 12/30/52 | 3.1595% — Annually | US SOFR — Annually | 5,747 |
| | 16,685,000 | 3,504 | (63) | 1/4/25 | 4.446% — Annually | US SOFR — Annually | 3,441 |
| | 9,359,000 | 3,276 | (75) | 1/4/28 | US SOFR — Annually | 3.7525% — Annually | 3,200 |
| AUD | 53,800 | 8,269 E | (1) | 1/30/35 | 1.692% — Semiannually | 6 month AUD-BBR-BBSW — | 8,268 |
| | | | | | | Semiannually | |
| AUD | 181,000 | 29,821 E | (2) | 3/5/35 | 1.47% — Semiannually | 6 month AUD-BBR-BBSW — | 29,820 |
| | | | | | | Semiannually | |
| AUD | 67,200 | 11,296 E | (1) | 3/25/35 | 1.4025% — Semiannually | 6 month AUD-BBR-BBSW — | 11,296 |
| | | | | | | Semiannually | |
| AUD | 104,900 | 14,352 E | (1) | 3/28/40 | 1.445% — Semiannually | 6 month AUD-BBR-BBSW — | 14,351 |
| | | | | | | Semiannually | |
| AUD | 391,500 | 57,962 E | (5) | 4/1/40 | 1.1685% — Semiannually | 6 month AUD-BBR-BBSW — | 57,957 |
| | | | | | | Semiannually | |
| AUD | 25,100 | 6,348 E | (1) | 7/2/45 | 1.441% — Semiannually | 6 month AUD-BBR-BBSW — | 6,348 |
| | | | | | | Semiannually | |
| AUD | 1,200,000 | 148,444 | (13) | 4/6/31 | 6 month AUD-BBR-BBSW — | 1.87% — Semiannually | (151,320) |
| | | | | | Semiannually | | |
| AUD | 1,315,300 | 245,749 | 228,856 | 11/24/42 | 6 month AUD-BBR-BBSW — | 2.50% — Semiannually | (17,937) |
| | | | | | Semiannually | | |
| AUD | 1,661,000 | 48,323 E | 3,614 | 3/15/33 | 6 month AUD-BBR-BBSW — | 4.05% — Semiannually | (44,709) |
| | | | | | Semiannually | | |
| AUD | 4,154,000 | 20,279 E | (2,698) | 3/15/25 | 3.72% — Quarterly | 3 month AUD-BBR-BBSW — | 17,580 |
| | | | | | | Quarterly | |
| CAD | 2,951,000 | 10,592 E | 12,188 | 3/15/25 | 4.15% — Semiannually | 3 month CAD-BA-CDOR — | 22,780 |
| | | | | | | Semiannually | |
| CAD | 557,000 | 16,467 E | (9,203) | 3/15/33 | 3.24% — Semiannually | 3 month CAD-BA-CDOR — | 7,264 |
| | | | | | | Semiannually | |
| CHF | 988,000 | 54,612 E | 1,636 | 3/15/33 | Swiss Average Rate | 1.55% — Annually | (52,975) |
| | | | | | Overnight — Annually | | |
| EUR | 347,600 | 39,933 E | (13) | 11/29/58 | 1.484% — Annually | 6 month EUR-EURIBOR — | 39,919 |
| | | | | | | Semiannually | |
| EUR | 472,900 | 119,801 | (18) | 2/19/50 | 6 month EUR-EURIBOR — | 1.354% — Annually | (115,578) |
| | | | | | Semiannually | | |
| EUR | 522,000 | 141,627 | (20) | 3/11/50 | 1.267% — Annually | 6 month EUR-EURIBOR — | 138,416 |
| | | | | | | Semiannually | |
| EUR | 528,600 | 149,336 | (20) | 3/12/50 | 1.2115% — Annually | 6 month EUR-EURIBOR — | 146,378 |
| | | | | | | Semiannually | |
| EUR | 653,200 | 197,802 | (26) | 3/26/50 | 1.113% — Annually | 6 month EUR-EURIBOR — | 195,344 |
| | | | | | | Semiannually | |
| EUR | 636,800 | 90,177 E | (24) | 11/29/58 | 6 month EUR-EURIBOR — | 1.343% — Annually | (90,201) |
| | | | | | Semiannually | | |
| EUR | 679,000 | 213,464 | (26) | 2/19/50 | 1.051% — Annually | 6 month EUR-EURIBOR — | 209,146 |
| | | | | | | Semiannually | |
| |
| 24 | Putnam VT Diversified Income Fund |
CENTRALLY CLEARED INTEREST RATE SWAP CONTRACTS OUTSTANDING at 12/31/22 cont.
| | | | | | | |
| | | | Upfront | | | | Unrealized |
| | | | premium | Termination | Payments | Payments | appreciation/ |
| Notional amount | Value | received (paid) | date | made by fund | received by fund | (depreciation) |
| EUR | 503,000 | $142,750 E | $(19) | 6/7/54 | 1.054% — Annually | 6 month EUR-EURIBOR — | $142,731 |
| | | | | | | Semiannually | |
| EUR | 458,800 | 157,871 | (18) | 2/19/50 | 0.9035% — Annually | 6 month EUR-EURIBOR — | 155,544 |
| | | | | | | Semiannually | |
| EUR | 307,000 | 112,062 | (12) | 2/21/50 | 0.80% — Annually | 6 month EUR-EURIBOR — | 110,847 |
| | | | | | | Semiannually | |
| EUR | 1,018,300 | 404,688 E | (39) | 8/8/54 | 0.49% — Annually | 6 month EUR-EURIBOR — | 404,649 |
| | | | | | | Semiannually | |
| EUR | 614,700 | 283,594 E | (23) | 6/6/54 | 6 month EUR-EURIBOR — | 0.207% — Annually | (283,617) |
| | | | | | Semiannually | | |
| EUR | 864,500 | 414,257 | (33) | 2/19/50 | 0.233% — Annually | 6 month EUR-EURIBOR — | 414,936 |
| | | | | | | Semiannually | |
| EUR | 3,365,700 | 1,367,340 | (127) | 2/19/50 | 6 month EUR-EURIBOR — | 0.595% — Annually | (1,359,595) |
| | | | | | Semiannually | | |
| EUR | 401,600 | 194,552 E | (15) | 3/4/54 | 0.134% — Annually | 6 month EUR-EURIBOR — | 194,537 |
| | | | | | | Semiannually | |
| EUR | 189,700 | 106,199 E | (7) | 3/13/54 | — | 0.2275% plus 6 month EUR- | 106,191 |
| | | | | | | EURIBOR — Semiannually | |
| EUR | 1,164,500 | 225,848 E | (25) | 5/13/40 | 6 month EUR-EURIBOR — | 0.276% — Annually | (225,873) |
| | | | | | Semiannually | | |
| EUR | 550,400 | 104,355 E | (12) | 6/24/40 | 0.315% — Annually | 6 month EUR-EURIBOR — | 104,343 |
| | | | | | | Semiannually | |
| EUR | 766,600 | 149,515 E | (18) | 1/16/40 | 0.315% — Annually | 6 month EUR-EURIBOR — | 149,497 |
| | | | | | | Semiannually | |
| EUR | 262,300 | 50,481 E | (6) | 3/28/40 | 0.3175% — Annually | 6 month EUR-EURIBOR — | 50,475 |
| | | | | | | Semiannually | |
| EUR | 746,600 | 319,487 | (30) | 5/21/51 | 6 month EUR-EURIBOR — | 0.516% — Annually | (319,206) |
| | | | | | Semiannually | | |
| EUR | 730,000 | 173,321 | (13) | 6/14/31 | 0.171% — Annually | 6 month EUR-EURIBOR — | 173,596 |
| | | | | | | Semiannually | |
| EUR | 683,800 | 168,991 | (12) | 7/15/31 | 0.0675% — Annually | 6 month EUR-EURIBOR — | 169,951 |
| | | | | | | Semiannually | |
| EUR | 255,600 | 118,341 | (10) | 9/14/52 | 6 month EUR-EURIBOR — | 0.374% — Annually | (119,236) |
| | | | | | Semiannually | | |
| EUR | 2,046,000 | 446,110 | (33) | 3/7/32 | 6 month EUR-EURIBOR — | 0.60% — Annually | (444,655) |
| | | | | | Semiannually | | |
| EUR | 1,588,700 | 33,230 E | (25) | 2/2/36 | 2.875% — Annually | 6 month EUR-EURIBOR — | 33,205 |
| | | | | | | Semiannually | |
| EUR | 2,726,900 | 135,530 | (41) | 9/8/32 | 2.615% — Annually | 6 month EUR-EURIBOR — | 124,603 |
| | | | | | | Semiannually | |
| EUR | 8,644,100 | 309,608 E | (33) | 6/28/25 | 1.718% — Annually | 6 month EUR-EURIBOR — | 309,575 |
| | | | | | | Semiannually | |
| EUR | 872,000 | 166,170 | (30) | 8/29/52 | 6 month EUR-EURIBOR — | 1.636% — Annually | (164,321) |
| | | | | | Semiannually | | |
| EUR | 2,733,500 | 178,374 E | (31) | 9/12/29 | 1.71% — Annually | 6 month EUR-EURIBOR — | 178,342 |
| | | | | | | Semiannually | |
| EUR | 10,052,000 | 844,135 | (96) | 9/2/27 | 6 month EUR-EURIBOR — | 1.372% — Annually | (839,234) |
| | | | | | Semiannually | | |
| EUR | 319,800 | 27,051 E | (11) | 6/6/54 | 2.005% — Annually | 6 month EUR-EURIBOR — | 27,040 |
| | | | | | | Semiannually | |
| EUR | 473,000 | 34,040 E | (16) | 6/7/54 | 2.065% — Annually | 6 month EUR-EURIBOR — | 34,024 |
| | | | | | | Semiannually | |
| EUR | 1,250,300 | 16,730 E | (18) | 2/18/36 | 6 month EUR-EURIBOR — | 3.285% — Annually | 16,711 |
| | | | | | Semiannually | | |
| EUR | 319,800 | 4,159 E | (6) | 8/22/39 | 6 month EUR-EURIBOR — | 3.14% — Annually | 4,153 |
| | | | | | Semiannually | | |
| EUR | 7,679,100 | 19,646 E | (52) | 6/26/28 | 6 month EUR-EURIBOR — | 3.26% — Annually | 19,594 |
| | | | | | Semiannually | | |
| EUR | 584,700 | 7,611 E | (11) | 3/28/40 | 6 month EUR-EURIBOR — | 3.09% — Annually | 7,600 |
| | | | | | Semiannually | | |
| |
| Putnam VT Diversified Income Fund | 25 |
CENTRALLY CLEARED INTEREST RATE SWAP CONTRACTS OUTSTANDING at 12/31/22 cont.
| | | | | | | |
| | | | Upfront | | | | Unrealized |
| | | | premium | Termination | Payments | Payments | appreciation/ |
| Notional amount | Value | received (paid) | date | made by fund | received by fund | (depreciation) |
| EUR | 462,000 | $24,841 E | $459 | 3/15/33 | 2.625% — Annually | 6 month EUR-EURIBOR — | $25,300 |
| | | | | | | Semiannually | |
| EUR | 5,519,000 | 67,349 E | 51 | 3/15/25 | 2.90% — Annually | 6 month EUR-EURIBOR — | 67,400 |
| | | | | | | Semiannually | |
| GBP | 477,400 | 123,551 | (9) | 5/19/31 | Sterling | 0.754% — Annually | (127,511) |
| | | | | | Overnight Index Average — | | |
| | | | | | Annually | | |
| GBP | 34,143,500 | 979,109 | 28,282 | 9/15/23 | Sterling | 0.84% — Annually | (1,134,077) |
| | | | | | Overnight Index Average — | | |
| | | | | | Annually | | |
| GBP | 34,143,500 | 1,024,102 | 42,471 | 9/15/23 | Sterling | 0.68% — Annually | (1,183,730) |
| | | | | | Overnight Index Average — | | |
| | | | | | Annually | | |
| GBP | 34,143,500 | 1,069,095 | (66,309) | 9/15/23 | 0.52% — Annually | Sterling | 1,223,735 |
| | | | | | | Overnight Index Average — | |
| | | | | | | Annually | |
| GBP | 13,657,400 | 366,382 | (70) | 9/15/23 | 1.065% — Annually | Sterling | 427,111 |
| | | | | | | Overnight Index Average — | |
| | | | | | | Annually | |
| GBP | 5,950,000 | 135,161 | (90) | 9/21/32 | 3.522% — Annually | Sterling | 117,449 |
| | | | | | | Overnight Index Average — | |
| | | | | | | Annually | |
| GBP | 509,000 | 3,329 E | (11) | 1/14/40 | 3.306% — Annually | Sterling | 3,318 |
| | | | | | | Overnight Index Average — | |
| | | | | | | Annually | |
| GBP | 262,000 | 1,818 E | (6) | 8/20/39 | 3.299% — Annually | Sterling | 1,813 |
| | | | | | | Overnight Index Average — | |
| | | | | | | Annually | |
| GBP | 19,875,000 | 423,131 | (83) | 11/7/24 | 5.495% — Annually | Sterling | (518,299) |
| | | | | | | Overnight Index Average — | |
| | | | | | | Annually | |
| GBP | 7,917,000 | 459,325 | (124) | 11/9/32 | Sterling | 4.35% — Annually | 482,784 |
| | | | | | Overnight Index Average — | | |
| | | | | | Annually | | |
| GBP | 375,100 | 11,799 E | (8) | 2/26/39 | Sterling | 3.778% — Annually | 11,791 |
| | | | | | Overnight Index Average — | | |
| | | | | | Annually | | |
| GBP | 1,426,000 | 7,206 E | 155 | 3/15/25 | 4.29% — Annually | Sterling | 7,361 |
| | | | | | | Overnight Index Average — | |
| | | | | | | Annually | |
| GBP | 389,000 | 11,155 E | (366) | 3/15/33 | Sterling | 3.45% — Annually | (11,522) |
| | | | | | Overnight Index Average — | | |
| | | | | | Annually | | |
| NOK | 5,840,000 | 16,244 E | (1,365) | 3/15/33 | 6 month NOK-NIBOR-NIBR — | 2.965% — Annually | (17,609) |
| | | | | | Semiannually | | |
| NZD | 915,000 | 20,693 E | (961) | 3/15/33 | 3 month NZD-BBR-FRA — | 4.36% — Semiannually | (21,653) |
| | | | | | Quarterly | | |
| SEK | 16,940,000 | 85,294 E | 2,473 | 3/15/33 | 2.52% — Annually | 3 month SEK-STIBOR-SIDE — | 87,767 |
| | | | | | | Quarterly | |
| Total | | | $(405,016) | | | | $6,011,940 |
E Extended effective date.
| |
| 26 | Putnam VT Diversified Income Fund |
OTC TOTAL RETURN SWAP CONTRACTS OUTSTANDING at 12/31/22
| | | | | | |
| | | Upfront | | Payments | Total return | Unrealized |
| Swap counterparty/ | | premium | Termination | received (paid) | received by | appreciation/ |
| Notional amount | Value | received (paid) | date | by fund | or paid by fund | (depreciation) |
| Morgan Stanley & Co. International PLC | | | | | |
| $878,944 | $778,919 | $— | 9/29/25 | (0.165%) — Annually | Ephesus Funding DAC, | $(95,874) |
| | | | | | 3.80%, Series 2020–01, | |
| | | | | | 9/22/25 — Annually | |
| 854,414 | 814,310 | — | 7/17/24 | 3.825% (3 month | Pera Funding DAC, 3.825%, | (39,967) |
| | | | | USD-LIBOR-ICE minus | Series 2019–01, 7/10/24 — | |
| | | | | 0.12%) — Quarterly | Quarterly | |
| Upfront premium received | | — | | Unrealized appreciation | | — |
| Upfront premium (paid) | | — | | Unrealized (depreciation) | | (135,841) |
| Total | | $— | | Total | | $(135,841) |
OTC CREDIT DEFAULT CONTRACTS OUTSTANDING — PROTECTION SOLD at 12/31/22
| | | | | | | |
| | | Upfront | | | | | |
| | | premium | | | Termi- | | Unrealized |
| Swap counterparty/ | | received | Notional | | nation | Payments | appreciation/ |
| Referenced debt* | Rating*** | (paid)** | amount | Value | date | received by fund | (depreciation) |
| Bank of America N.A. | | | | | | | |
| CMBX NA BBB–.6 Index | BB–/P | $904 | $9,504 | $2,330 | 5/11/63 | 300 bp — Monthly | $(1,421) |
| CMBX NA BBB–.6 Index | BB–/P | 5,468 | 50,687 | 12,429 | 5/11/63 | 300 bp — Monthly | (6,929) |
| Citigroup Global Markets, Inc. | | | | | | | |
| CMBX NA A.6 Index | A/P | 5,899 | 17,889 | 2,408 | 5/11/63 | 200 bp — Monthly | 3,499 |
| CMBX NA A.6 Index | A/P | 4,583 | 17,889 | 2,408 | 5/11/63 | 200 bp — Monthly | 2,182 |
| CMBX NA A.6 Index | A/P | 5,202 | 18,806 | 2,531 | 5/11/63 | 200 bp — Monthly | 2,679 |
| CMBX NA A.6 Index | A/P | 6,484 | 19,265 | 2,593 | 5/11/63 | 200 bp — Monthly | 3,899 |
| CMBX NA A.6 Index | A/P | 14,740 | 40,365 | 5,433 | 5/11/63 | 200 bp — Monthly | 9,324 |
| CMBX NA A.6 Index | A/P | 26,268 | 72,473 | 9,755 | 5/11/63 | 200 bp — Monthly | 16,544 |
| CMBX NA A.6 Index | A/P | 38,559 | 99,995 | 13,459 | 5/11/63 | 200 bp — Monthly | 25,142 |
| CMBX NA BB.11 Index | BB–/P | 57,630 | 102,000 | 21,838 | 11/18/54 | 500 bp — Monthly | 35,891 |
| CMBX NA BB.13 Index | BB–/P | 7,267 | 77,000 | 20,305 | 12/16/72 | 500 bp — Monthly | (12,963) |
| CMBX NA BB.13 Index | BB–/P | 10,661 | 117,000 | 30,853 | 12/16/72 | 500 bp — Monthly | (20,078) |
| CMBX NA BB.13 Index | BB–/P | 47,351 | 183,000 | 48,257 | 12/16/27 | 500 bp — Monthly | (728) |
| CMBX NA BB.13 Index | BB–/P | 32,549 | 357,000 | 94,141 | 12/16/72 | 500 bp — Monthly | (61,245) |
| CMBX NA BB.6 Index | B/P | 86,542 | 147,680 | 56,502 | 5/11/63 | 500 bp — Monthly | 30,183 |
| CMBX NA BB.6 Index | B/P | 165,112 | 786,941 | 301,084 | 5/11/63 | 500 bp — Monthly | (135,206) |
| CMBX NA BB.7 Index | B-/P | 46,032 | 902,000 | 300,907 | 1/17/47 | 500 bp — Monthly | (253,998) |
| CMBX NA BB.9 Index | B/P | 2,240 | 11,000 | 3,423 | 9/17/58 | 500 bp — Monthly | (1,173) |
| CMBX NA BB.9 Index | B/P | 15,521 | 76,000 | 23,651 | 9/17/58 | 500 bp — Monthly | (8,056) |
| CMBX NA BBB–.10 Index | BB+/P | 7,693 | 62,000 | 10,745 | 11/17/59 | 300 bp — Monthly | (3,015) |
| CMBX NA BBB–.10 Index | BB+/P | 12,109 | 111,000 | 19,236 | 11/17/59 | 300 bp — Monthly | (7,062) |
| CMBX NA BBB–.11 Index | BBB–/P | 689 | 11,000 | 1,670 | 11/18/54 | 300 bp — Monthly | (974) |
| CMBX NA BBB–.14 Index | BBB–/P | 247 | 5,000 | 930 | 12/16/72 | 300 bp — Monthly | (680) |
| CMBX NA BBB–.14 Index | BBB–/P | 813 | 25,000 | 4,650 | 12/16/72 | 300 bp — Monthly | (3,822) |
| CMBX NA BBB–.14 Index | BBB–/P | 2,500 | 50,000 | 9,300 | 12/16/72 | 300 bp — Monthly | (6,771) |
| CMBX NA BBB–.15 Index | BBB–/P | 3,656 | 35,000 | 6,710 | 11/18/64 | 300 bp — Monthly | (3,033) |
| CMBX NA BBB–.15Index | BBB–/P | 1,359 | 8,000 | 1,534 | 11/18/64 | 300 bp — Monthly | (170) |
| Credit Suisse International | | | | | | | |
| CMBX NA BB.7 Index | B-/P | 22,204 | 166,000 | 55,378 | 1/17/47 | 500 bp — Monthly | (33,012) |
| CMBX NA BBB–.7 Index | BB–/P | 13,231 | 179,000 | 38,324 | 1/17/47 | 300 bp — Monthly | (24,989) |
| CMBX NA BBB–.7 Index | BB–/P | 34,676 | 528,000 | 113,045 | 1/17/47 | 300 bp — Monthly | (78,061) |
| Goldman Sachs International | | | | | | | |
| CMBX NA BB.9 Index | B/P | 21,836 | 54,000 | 16,805 | 9/17/58 | 500 bp — Monthly | 5,084 |
| CMBX NA BBB–.11 Index | BBB–/P | 64 | 1,000 | 152 | 11/18/54 | 300 bp — Monthly | (88) |
| CMBX NA BBB–.13 Index | BBB–/P | 138 | 3,000 | 609 | 12/16/72 | 300 bp — Monthly | (469) |
| CMBX NA BBB–.13 Index | BBB–/P | 677 | 4,000 | 812 | 12/16/72 | 300 bp — Monthly | (133) |
| CMBX NA BBB–.13 Index | BBB–/P | 1,425 | 9,000 | 1,827 | 12/16/72 | 300 bp — Monthly | (397) |
| CMBX NA BBB–.13 Index | BBB–/P | 754 | 12,000 | 2,436 | 12/16/72 | 300 bp — Monthly | (1,675) |
| CMBX NA BBB–.13 Index | BBB–/P | 1,315 | 18,000 | 3,654 | 12/16/72 | 300 bp — Monthly | (2,328) |
| |
| Putnam VT Diversified Income Fund | 27 |
OTC CREDIT DEFAULT CONTRACTS OUTSTANDING — PROTECTION SOLD at 12/31/22 cont.
| | | | | | | |
| | | Upfront | | | | | |
| | | premium | | | Termi- | | Unrealized |
| Swap counterparty/ | | received | Notional | | nation | Payments | appreciation/ |
| Referenced debt* | Rating*** | (paid)** | amount | Value | date | received by fund | (depreciation) |
| Goldman Sachs International cont. | | | | | | |
| CMBX NA BBB–.13 Index | BBB–/P | $4,545 | $29,000 | $5,887 | 12/16/72 | 300 bp — Monthly | $(1,326) |
| CMBX NA BBB–.13 Index | BBB–/P | 2,780 | 47,000 | 9,541 | 12/16/72 | 300 bp — Monthly | (6,734) |
| CMBX NA BBB–.13 Index | BBB–/P | 4,435 | 69,000 | 14,007 | 12/16/72 | 300 bp — Monthly | (9,532) |
| CMBX NA BBB–.14 Index | BBB–/P | 17,291 | 101,000 | 18,786 | 12/16/72 | 300 bp — Monthly | (1,436) |
| CMBX NA BBB–.14 Index | BBB–/P | 35,855 | 236,000 | 43,896 | 12/16/72 | 300 bp — Monthly | (7,904) |
| CMBX NA BBB–.15 Index | BBB–/P | 1,864 | 30,000 | 5,751 | 11/18/64 | 300 bp — Monthly | (3,870) |
| CMBX NA BBB–.15 Index | BBB–/P | 5,916 | 64,000 | 12,269 | 11/18/64 | 300 bp — Monthly | (6,316) |
| CMBX NA BBB–.15 Index | BBB–/P | 5,699 | 64,000 | 12,269 | 11/18/64 | 300 bp — Monthly | (6,533) |
| CMBX NA BBB–.7 Index | BB–/P | 151,525 | 2,050,000 | 438,905 | 1/17/47 | 300 bp — Monthly | (286,184) |
| JPMorgan Securities LLC | | | | | | | |
| CMBX NA BB.10 Index | B/P | 8,906 | 111,000 | 35,387 | 5/11/63 | 500 bp — Monthly | (26,372) |
| CMBX NA BB.6 Index | B/P | 289,832 | 384,924 | 147,272 | 5/11/63 | 500 bp — Monthly | 142,934 |
| CMBX NA BBB–.11 Index | BBB–/P | 2,864 | 26,000 | 3,947 | 11/18/54 | 300 bp — Monthly | (1,068) |
| CMBX NA BBB–.13 Index | BBB–/P | 5,155 | 39,000 | 7,917 | 12/16/72 | 300 bp — Monthly | (2,739) |
| CMBX NA BBB–.8 Index | BB/P | 9,980 | 64,000 | 10,176 | 10/17/57 | 300 bp — Monthly | (159) |
| Merrill Lynch International | | | | | | | |
| CMBX NA BB.6 Index | B/P | 5,703 | 34,869 | 13,341 | 5/11/63 | 500 bp — Monthly | (7,604) |
| Morgan Stanley & Co. International PLC | | | | | | |
| CMBX NA BB.13 Index | BB–/P | 820 | 9,000 | 2,373 | 12/16/72 | 500 bp — Monthly | (1,544) |
| CMBX NA BB.13 Index | BB–/P | 837 | 9,000 | 2,373 | 12/16/72 | 500 bp — Monthly | (1,527) |
| CMBX NA BB.13 Index | BB–/P | 6,096 | 66,000 | 17,404 | 12/16/72 | 500 bp — Monthly | (11,244) |
| CMBX NA BB.13 Index | BB–/P | 15,517 | 169,000 | 44,565 | 12/16/72 | 500 bp — Monthly | (28,884) |
| CMBX NA BB.6 Index | B/P | 7,658 | 43,073 | 16,480 | 5/11/63 | 500 bp — Monthly | (8,779) |
| CMBX NA BB.6 Index | B/P | 58,576 | 118,280 | 45,254 | 5/11/63 | 500 bp — Monthly | 13,437 |
| CMBX NA BB.6 Index | B/P | 76,812 | 123,750 | 47,347 | 5/11/63 | 500 bp — Monthly | 29,585 |
| CMBX NA BB.6 Index | B/P | 84,420 | 137,424 | 52,578 | 5/11/63 | 500 bp — Monthly | 31,975 |
| CMBX NA BB.9 Index | B/P | 1,602 | 4,000 | 1,245 | 9/17/58 | 500 bp — Monthly | 361 |
| CMBX NA BBB–.13 Index | BBB–/P | 328 | 5,000 | 1,015 | 12/16/72 | 300 bp — Monthly | (684) |
| CMBX NA BBB–.13 Index | BBB–/P | 769 | 13,000 | 2,639 | 12/16/72 | 300 bp — Monthly | (1,863) |
| CMBX NA BBB–.13 Index | BBB–/P | 2,388 | 26,000 | 5,278 | 12/16/72 | 300 bp — Monthly | (2,874) |
| CMBX NA BBB–.14 Index | BBB–/P | 4,672 | 29,000 | 5,394 | 12/16/72 | 300 bp — Monthly | (705) |
| CMBX NA BBB–.14 Index | BBB–/P | 19,251 | 117,000 | 21,762 | 12/16/72 | 300 bp — Monthly | (2,443) |
| CMBX NA BBB–.14 Index | BBB–/P | 38,849 | 234,000 | 43,524 | 12/16/72 | 300 bp — Monthly | (4,539) |
| CMBX NA BBB–.15 Index | BBB–/P | 21,125 | 134,000 | 25,688 | 11/18/64 | 300 bp — Monthly | (4,986) |
| CMBX NA BBB–.9 Index | BB+/P | 777 | 8,000 | 1,509 | 9/17/58 | 300 bp — Monthly | (727) |
| Upfront premium received | | 1,597,245 | Unrealized appreciation | | 352,719 |
| Upfront premium (paid) | | — | Unrealized (depreciation) | | (1,107,052) |
| Total | | $1,597,245 | Total | | $(754,333) |
* Payments related to the referenced debt are made upon a credit default event.
** Upfront premium is based on the difference between the original spread on issue and the market spread on day of execution.
***Ratings for an underlying index represent the average of the ratings of all the securities included in that index. The Moody’s, Standard & Poor’s or Fitch ratings are believed to be the most recent ratings available at December 31, 2022. Securities rated by Putnam are indicated by “/P.” The Putnam rating categories are comparable to the Standard & Poor’s classifications.
OTC CREDIT DEFAULT CONTRACTS OUTSTANDING — PROTECTION PURCHASED at 12/31/22
| | | | | | |
| | Upfront | | | | | |
| | premium | | | Termi- | Payments | Unrealized |
| Swap counterparty/ | received | Notional | | nation | (paid) | appreciation/ |
| Referenced debt* | (paid)** | amount | Value | date | by fund | (depreciation) |
| Citigroup Global Markets, Inc. | | | | | | |
| CMBX NA BB.10 Index | $(67,991) | $282,000 | $89,902 | 11/17/59 | (500 bp) — Monthly | $21,637 |
| CMBX NA BB.10 Index | (39,270) | 154,000 | 49,095 | 11/17/59 | (500 bp) — Monthly | 9,675 |
| CMBX NA BB.10 Index | (10,541) | 101,000 | 32,199 | 11/17/59 | (500 bp) — Monthly | 21,560 |
| CMBX NA BB.10 Index | (9,210) | 84,000 | 26,779 | 11/17/59 | (500 bp) — Monthly | 17,487 |
| |
| 28 | Putnam VT Diversified Income Fund |
OTC CREDIT DEFAULT CONTRACTS OUTSTANDING — PROTECTION PURCHASED at 12/31/22 cont.
| | | | | | |
| | Upfront | | | | | |
| | premium | | | Termi- | Payments | Unrealized |
| Swap counterparty/ | received | Notional | | nation | (paid) | appreciation/ |
| Referenced debt* | (paid)** | amount | Value | date | by fund | (depreciation) |
| Citigroup Global Markets, Inc. cont. | | | | |
| CMBX NA BB.11 Index | $(5,960) | $46,000 | $9,849 | 11/18/54 | (500 bp) — Monthly | $3,844 |
| CMBX NA BB.11 Index | (2,075) | 40,000 | 8,564 | 11/18/54 | (500 bp) — Monthly | 6,450 |
| CMBX NA BB.11 Index | (1,508) | 16,000 | 3,426 | 11/18/54 | (500 bp) — Monthly | 1,902 |
| CMBX NA BB.8 Index | (25,152) | 70,541 | 25,465 | 10/17/57 | (500 bp) — Monthly | 244 |
| CMBX NA BB.8 Index | (4,594) | 35,754 | 12,907 | 10/17/57 | (500 bp) — Monthly | 8,278 |
| CMBX NA BB.9 Index | (1,854) | 46,000 | 14,315 | 9/17/58 | (500 bp) — Monthly | 12,416 |
| CMBX NA BB.9 Index | (2,271) | 22,000 | 6,846 | 9/17/58 | (500 bp) — Monthly | 4,554 |
| CMBX NA BB.9 Index | (774) | 12,000 | 3,734 | 9/17/58 | (500 bp) — Monthly | 2,948 |
| CMBX NA BB.9 Index | (353) | 9,000 | 2,801 | 9/17/58 | (500 bp) — Monthly | 2,439 |
| CMBX NA BB.9 Index | (109) | 3,000 | 934 | 9/17/58 | (500 bp) — Monthly | 822 |
| CMBX NA BBB–.10 Index | (40,233) | 234,000 | 40,552 | 11/17/59 | (300 bp) — Monthly | 182 |
| CMBX NA BBB–.10 Index | (28,552) | 123,000 | 21,316 | 11/17/59 | (300 bp) — Monthly | (7,308) |
| CMBX NA BBB–.10 Index | (12,443) | 57,000 | 9,878 | 11/17/59 | (300 bp) — Monthly | (2,598) |
| CMBX NA BBB–.10 Index | (11,535) | 53,000 | 9,185 | 11/17/59 | (300 bp) — Monthly | (2,381) |
| CMBX NA BBB–.10 Index | (5,991) | 47,000 | 8,145 | 11/17/59 | (300 bp) — Monthly | 2,126 |
| CMBX NA BBB–.10 Index | (7,396) | 31,000 | 5,372 | 11/17/59 | (300 bp) — Monthly | (2,042) |
| CMBX NA BBB–.10 Index | (3,569) | 28,000 | 4,852 | 11/17/59 | (300 bp) — Monthly | 1,267 |
| CMBX NA BBB–.10 Index | (3,428) | 27,000 | 4,679 | 11/17/59 | (300 bp) — Monthly | 1,235 |
| CMBX NA BBB–.10 Index | (1,835) | 15,000 | 2,600 | 11/17/59 | (300 bp) — Monthly | 756 |
| CMBX NA BBB–.11 Index | (320) | 1,000 | 152 | 11/18/54 | (300 bp) — Monthly | (169) |
| CMBX NA BBB–.12 Index | (57,473) | 172,000 | 31,098 | 8/17/61 | (300 bp) — Monthly | (26,476) |
| CMBX NA BBB–.12 Index | (54,225) | 156,000 | 28,205 | 8/17/61 | (300 bp) — Monthly | (26,111) |
| CMBX NA BBB–.12 Index | (29,175) | 83,000 | 15,006 | 8/17/61 | (300 bp) — Monthly | (14,217) |
| CMBX NA BBB–.12 Index | (4,819) | 70,000 | 12,656 | 8/17/61 | (300 bp) — Monthly | 7,796 |
| CMBX NA BBB–.12 Index | (10,193) | 60,000 | 10,848 | 8/17/61 | (300 bp) — Monthly | 620 |
| CMBX NA BBB–.12 Index | (334) | 1,000 | 181 | 8/17/61 | (300 bp) — Monthly | (154) |
| CMBX NA BBB–.13 Index | (2,924) | 50,000 | 10,150 | 12/16/72 | (300 bp) — Monthly | 7,197 |
| CMBX NA BBB–.13 Index | (1,273) | 25,000 | 5,075 | 12/16/72 | (300 bp) — Monthly | 3,787 |
| CMBX NA BBB–.13 Index | (1,261) | 25,000 | 5,075 | 12/16/72 | (300 bp) — Monthly | 3,800 |
| CMBX NA BBB–.13 Index | (1,516) | 20,000 | 4,060 | 12/16/72 | (300 bp) — Monthly | 2,533 |
| CMBX NA BBB–.13 Index | (986) | 18,000 | 3,654 | 12/16/72 | (300 bp) — Monthly | 2,658 |
| CMBX NA BBB–.6 Index | (17,795) | 60,191 | 14,759 | 5/11/63 | (300 bp) — Monthly | (3,073) |
| CMBX NA BBB–.8 Index | (10,050) | 67,000 | 10,653 | 10/17/57 | (300 bp) — Monthly | 564 |
| CMBX NA BBB–.8 Index | (158) | 1,000 | 159 | 10/17/57 | (300 bp) — Monthly | — |
| CMBX NA BBB–.9 Index | (4,259) | 18,000 | 3,395 | 9/17/58 | (300 bp) — Monthly | (874) |
| Credit Suisse International | | | | | | |
| CMBX NA BB.10 Index | (24,973) | 210,000 | 66,948 | 11/17/59 | (500 bp) — Monthly | 41,771 |
| CMBX NA BB.10 Index | (28,019) | 210,000 | 66,948 | 11/17/59 | (500 bp) — Monthly | 38,725 |
| CMBX NA BB.10 Index | (13,797) | 111,000 | 35,387 | 11/17/59 | (500 bp) — Monthly | 21,482 |
| CMBX NA BB.7 Index | (9,602) | 371,934 | 142,302 | 5/11/63 | (500 bp) — Monthly | 132,338 |
| CMBX NA BB.7 Index | (46,385) | 282,000 | 94,075 | 1/17/47 | (500 bp) — Monthly | 47,416 |
| CMBX NA BB.7 Index | (25,825) | 140,000 | 46,704 | 1/17/47 | (500 bp) — Monthly | 20,743 |
| CMBX NA BB.9 Index | (1,804) | 18,000 | 5,602 | 9/17/58 | (500 bp) — Monthly | 3,780 |
| Goldman Sachs International | | | | | | |
| CMBX NA A.6 Index | (6,956) | 48,163 | 6,483 | 5/11/63 | (200 bp) — Monthly | (494) |
| CMBX NA A.6 Index | (9,028) | 42,200 | 5,680 | 5/11/63 | (200 bp) — Monthly | (3,365) |
| CMBX NA A.6 Index | (5,363) | 25,228 | 3,396 | 5/11/63 | (200 bp) — Monthly | (1,978) |
| CMBX NA A.6 Index | (5,004) | 23,393 | 3,149 | 5/11/63 | (200 bp) — Monthly | (1,866) |
| CMBX NA A.6 Index | (4,570) | 20,641 | 2,778 | 5/11/63 | (200 bp) — Monthly | (1,801) |
| CMBX NA A.6 Index | (3,197) | 15,137 | 2,037 | 5/11/63 | (200 bp) — Monthly | (1,166) |
| CMBX NA A.6 Index | (2,906) | 13,761 | 1,852 | 5/11/63 | (200 bp) — Monthly | (1,060) |
| CMBX NA A.6 Index | (2,906) | 13,761 | 1,852 | 5/11/63 | (200 bp) — Monthly | (1,060) |
| CMBX NA A.6 Index | (2,864) | 13,302 | 1,790 | 5/11/63 | (200 bp) — Monthly | (1,079) |
| |
| Putnam VT Diversified Income Fund | 29 |
OTC CREDIT DEFAULT CONTRACTS OUTSTANDING — PROTECTION PURCHASED at 12/31/22 cont.
| | | | | | |
| | Upfront | | | | | |
| | premium | | | Termi- | Payments | Unrealized |
| Swap counterparty/ | received | Notional | | nation | (paid) | appreciation/ |
| Referenced debt* | (paid)** | amount | Value | date | by fund | (depreciation) |
| Goldman Sachs International cont. | | | | | |
| CMBX NA A.6 Index | $(1,467) | $6,880 | $926 | 5/11/63 | (200 bp) — Monthly | $(544) |
| CMBX NA A.6 Index | (1,272) | 5,963 | 803 | 5/11/63 | (200 bp) — Monthly | (471) |
| CMBX NA A.6 Index | (81) | 459 | 62 | 5/11/63 | (200 bp) — Monthly | (20) |
| CMBX NA A.6 Index | (86) | 459 | 62 | 5/11/63 | (200 bp) — Monthly | (24) |
| CMBX NA A.6 Index | (87) | 459 | 62 | 5/11/63 | (200 bp) — Monthly | (26) |
| CMBX NA BB.10 Index | (9,276) | 41,000 | 13,071 | 11/17/59 | (500 bp) — Monthly | 3,755 |
| CMBX NA BB.6 Index | (23,816) | 111,443 | 42,638 | 5/11/63 | (500 bp) — Monthly | 18,714 |
| CMBX NA BB.7 Index | (35,390) | 216,000 | 72,058 | 1/17/47 | (500 bp) — Monthly | 36,457 |
| CMBX NA BB.7 Index | (11,198) | 74,000 | 24,686 | 1/17/47 | (500 bp) — Monthly | 13,416 |
| CMBX NA BB.7 Index | (12,183) | 60,000 | 20,016 | 1/17/47 | (500 bp) — Monthly | 7,775 |
| CMBX NA BB.7 Index | (8,623) | 51,000 | 17,014 | 1/17/47 | (500 bp) — Monthly | 8,341 |
| CMBX NA BB.7 Index | (6,572) | 36,000 | 12,010 | 1/17/47 | (500 bp) — Monthly | 5,403 |
| CMBX NA BB.9 Index | (39) | 1,000 | 311 | 9/17/58 | (500 bp) — Monthly | 271 |
| CMBX NA BBB–.12 Index | (11,482) | 34,000 | 6,147 | 8/17/61 | (300 bp) — Monthly | (5,355) |
| CMBX NA BBB–.12 Index | (4,289) | 22,000 | 3,978 | 8/17/61 | (300 bp) — Monthly | (324) |
| JPMorgan Securities LLC | | | | | | |
| CMBX NA A.6 Index | (4,454) | 26,145 | 3,519 | 5/11/63 | (200 bp) — Monthly | (946) |
| CMBX NA BB.7 Index | (78,835) | 161,000 | 53,710 | 1/17/47 | (500 bp) — Monthly | (25,281) |
| CMBX NA BB.9 Index | (14,826) | 30,000 | 9,336 | 9/17/58 | (500 bp) — Monthly | (5,519) |
| CMBX NA BBB–.12 Index | (4,445) | 37,000 | 6,690 | 8/17/61 | (300 bp) — Monthly | 2,223 |
| CMBX NA BBB–.7 Index | (499,810) | 2,129,000 | 455,819 | 1/17/47 | (300 bp) — Monthly | (45,233) |
| Merrill Lynch International | | | | | | |
| CMBX NA BB.10 Index | (11,494) | 202,000 | 64,398 | 11/17/59 | (500 bp) — Monthly | 52,708 |
| CMBX NA BBB–.7 Index | (20,241) | 247,000 | 52,883 | 1/17/47 | (300 bp) — Monthly | 32,498 |
| Morgan Stanley & Co. International PLC | | | | | |
| CMBX NA A.6 Index | (5,070) | 23,852 | 3,210 | 5/11/63 | (200 bp) — Monthly | (1,870) |
| CMBX NA A.6 Index | (778) | 3,670 | 494 | 5/11/63 | (200 bp) — Monthly | (285) |
| CMBX NA A.6 Index | (291) | 1,376 | 185 | 5/11/63 | (200 bp) — Monthly | (106) |
| CMBX NA A.6 Index | (86) | 459 | 62 | 5/11/63 | (200 bp) — Monthly | (24) |
| CMBX NA A.6 Index | (98) | 459 | 62 | 5/11/63 | (200 bp) — Monthly | (36) |
| CMBX NA A.6 Index | (97) | 459 | 62 | 5/11/63 | (200 bp) — Monthly | (35) |
| CMBX NA A.6 Index | (96) | 459 | 62 | 5/11/63 | (200 bp) — Monthly | (34) |
| CMBX NA BB.10 Index | (31,705) | 135,000 | 43,038 | 11/17/59 | (500 bp) — Monthly | 11,202 |
| CMBX NA BB.10 Index | (10,593) | 101,000 | 32,199 | 11/17/59 | (500 bp) — Monthly | 21,508 |
| CMBX NA BB.10 Index | (29,160) | 96,000 | 30,605 | 11/17/59 | (500 bp) — Monthly | 1,351 |
| CMBX NA BB.7 Index | (15,485) | 77,000 | 25,687 | 1/17/47 | (500 bp) — Monthly | 10,127 |
| CMBX NA BB.7 Index | (13,305) | 69,000 | 23,018 | 1/17/47 | (500 bp) — Monthly | 9,646 |
| CMBX NA BB.7 Index | (404) | 2,000 | 667 | 1/17/47 | (500 bp) — Monthly | 262 |
| CMBX NA BB.9 Index | (156) | 4,000 | 1,245 | 9/17/58 | (500 bp) — Monthly | 1,085 |
| CMBX NA BBB–.10 Index | (10,652) | 123,000 | 21,316 | 11/17/59 | (300 bp) — Monthly | 10,592 |
| CMBX NA BBB–.10 Index | (11,105) | 90,000 | 15,597 | 11/17/59 | (300 bp) — Monthly | 4,440 |
| CMBX NA BBB–.10 Index | (11,288) | 89,000 | 15,424 | 11/17/59 | (300 bp) — Monthly | 4,084 |
| CMBX NA BBB–.10 Index | (5,991) | 50,000 | 8,665 | 11/17/59 | (300 bp) — Monthly | 2,645 |
| CMBX NA BBB–.10 Index | (2,182) | 17,000 | 2,946 | 11/17/59 | (300 bp) — Monthly | 754 |
| CMBX NA BBB–.10 Index | (3,252) | 15,000 | 2,600 | 11/17/59 | (300 bp) — Monthly | (662) |
| CMBX NA BBB–.11 Index | (14,559) | 46,000 | 6,983 | 11/18/54 | (300 bp) — Monthly | (7,603) |
| CMBX NA BBB–.11 Index | (11,860) | 38,000 | 5,768 | 11/18/54 | (300 bp) — Monthly | (6,114) |
| CMBX NA BBB–.12 Index | (1,107) | 20,000 | 3,616 | 8/17/61 | (300 bp) — Monthly | 2,497 |
| CMBX NA BBB–.13 Index | (7,765) | 126,000 | 25,578 | 12/16/72 | (300 bp) — Monthly | 17,739 |
| CMBX NA BBB–.7 Index | (5,016) | 79,000 | 16,914 | 1/17/47 | (300 bp) — Monthly | 11,852 |
| CMBX NA BBB–.7 Index | (5,500) | 54,000 | 11,561 | 1/17/47 | (300 bp) — Monthly | 6,029 |
| Upfront premium received | — | | Unrealized appreciation | 752,406 |
| Upfront premium (paid) | (1,634,171) | | Unrealized (depreciation) | (199,784) |
| Total | $(1,634,171) | | Total | $552,622 |
* Payments related to the referenced debt are made upon a credit default event.
** Upfront premium is based on the difference between the original spread on issue and the market spread on day of execution.
| |
| 30 | Putnam VT Diversified Income Fund |
CENTRALLY CLEARED CREDIT DEFAULT CONTRACTS OUTSTANDING — PROTECTION SOLD at 12/31/22
| | | | | | | |
| | | Upfront | | | | | |
| | | premium | | | Termi- | Payments | Unrealized |
| | | received | Notional | | nation | received | appreciation/ |
| Referenced debt* | Rating*** | (paid)** | amount | Value | date | by fund | (depreciation) |
| CDX NA HY Series 38 Index | B+/P | $(6,189) | $2,421,540 | $50,877 | 6/20/27 | 500 bp — | $48,724 |
| | | | | | | Quarterly | |
| Total | | $(6,189) | | | | | $48,724 |
* Payments related to the referenced debt are made upon a credit default event.
** Upfront premium is based on the difference between the original spread on issue and the market spread on day of execution.
***Ratings for an underlying index represent the average of the ratings of all the securities included in that index. The Moody’s, Standard & Poor’s or Fitch ratings are believed to be the most recent ratings available at December 31, 2022. Securities rated by Putnam are indicated by “/P.” The Putnam rating categories are comparable to the Standard & Poor’s classifications.
ASC 820 establishes a three-level hierarchy for disclosure of fair value measurements. The valuation hierarchy is based upon the transparency of inputs to the valuation of the fund’s investments. The three levels are defined as follows:
Level 1: Valuations based on quoted prices for identical securities in active markets.
Level 2: Valuations based on quoted prices in markets that are not active or for which all significant inputs are observable, either directly or indirectly.
Level 3: Valuations based on inputs that are unobservable and significant to the fair value measurement.
The following is a summary of the inputs used to value the fund’s net assets as of the close of the reporting period:
| | | |
| | | Valuation inputs | |
| Investments in securities: | Level 1 | Level 2 | Level 3 |
| Common stocks*: | | | |
| Utilities and power | $— | $11,924 | $— |
| Total common stocks | — | 11,924 | — |
| Asset-backed securities | — | 920,172 | — |
| Convertible bonds and notes | — | 4,510,718 | — |
| Corporate bonds and notes | — | 17,942,794 | — |
| Foreign government and agency bonds and notes | — | 10,020,203 | — |
| Mortgage-backed securities | — | 43,066,740 | — |
| Senior loans | — | 1,764,440 | — |
| U.S. government and agency mortgage obligations | — | 105,377,158 | — |
| U.S. treasury obligations | — | 1,074,908 | — |
| Short-term investments | 2,777,000 | 35,769,730 | — |
| Totals by level | $2,777,000 | $220,458,787 | $— |
| |
| | | Valuation inputs | |
| Other financial instruments: | Level 1 | Level 2 | Level 3 |
| Forward currency contracts | $— | $(181,904) | $— |
| Futures contracts | (39,186) | — | — |
| Forward premium swap option contracts | — | 3,181,398 | — |
| TBA sale commitments | — | (27,160,236) | — |
| Interest rate swap contracts | — | 6,416,956 | — |
| Total return swap contracts | — | (135,841) | — |
| Credit default contracts | — | (109,872) | — |
| Totals by level | $(39,186) | $(17,989,499) | $— |
* Common stock classifications are presented at the sector level, which may differ from the fund’s portfolio presentation.
At the start and close of the reporting period, Level 3 investments in securities represented less than 1% of the fund’s net assets and were not considered a significant portion of the fund’s portfolio.
The accompanying notes are an integral part of these financial statements.
| |
| Putnam VT Diversified Income Fund | 31 |
Statement of assets and liabilities
12/31/22
| |
| Assets | |
| Investment in securities, at value (Notes 1 and 9): | |
| Unaffiliated issuers (identified cost $205,825,255) | $194,281,921 |
| Affiliated issuers (identified cost $28,953,866) (Note 5) | 28,953,866 |
| Cash | 73,251 |
| Foreign currency (cost $7,516) (Note 1) | 7,584 |
| Interest and other receivables | 1,247,102 |
| Receivable for shares of the fund sold | 70,708 |
| Receivable for investments sold | 98,335 |
| Receivable for sales of TBA securities (Note 1) | 26,702,228 |
| Receivable for variation margin on futures contracts (Note 1) | 34,092 |
| Receivable for variation margin on centrally cleared swap contracts (Note 1) | 1,578,775 |
| Unrealized appreciation on forward currency contracts (Note 1) | 112,616 |
| Unrealized appreciation on forward premium swap option contracts (Note 1) | 8,494,446 |
| Unrealized appreciation on OTC swap contracts (Note 1) | 1,105,125 |
| Premium paid on OTC swap contracts (Note 1) | 1,634,171 |
| Total assets | 264,394,220 |
| |
| Liabilities | |
| Payable for investments purchased | 419,519 |
| Payable for purchases of TBA securities (Note 1) | 105,036,174 |
| Payable for shares of the fund repurchased | 68,603 |
| Payable for compensation of Manager (Note 2) | 56,782 |
| Payable for custodian fees (Note 2) | 44,393 |
| Payable for investor servicing fees (Note 2) | 14,312 |
| Payable for Trustee compensation and expenses (Note 2) | 96,526 |
| Payable for administrative services (Note 2) | 1,431 |
| Payable for distribution fees (Note 2) | 15,377 |
| Payable for variation margin on centrally cleared swap contracts (Note 1) | 1,576,559 |
| Unrealized depreciation on forward currency contracts (Note 1) | 294,520 |
| Unrealized depreciation on forward premium swap option contracts (Note 1) | 5,313,048 |
| TBA sale commitments, at value (proceeds receivable $27,636,718) (Note 1) | 27,160,236 |
| Unrealized depreciation on OTC swap contracts (Note 1) | 1,442,677 |
| Premium received on OTC swap contracts (Note 1) | 1,597,245 |
| Collateral on certain derivative contracts and TBA commitments, at value (Notes 1 and 9) | 3,982,135 |
| Other accrued expenses | 156,924 |
| Total liabilities | 147,276,461 |
| | |
| Net assets | $117,117,759 |
| |
| Represented by | |
| Paid-in capital (Unlimited shares authorized) (Notes 1 and 4) | $206,221,340 |
| Total distributable earnings (Note 1) | (89,103,581) |
| Total — Representing net assets applicable to capital shares outstanding | $117,117,759 |
| Computation of net asset value Class IA | |
| Net assets | $45,180,621 |
| Number of shares outstanding | 9,612,091 |
| Net asset value, offering price and redemption price per share (net assets divided by number of shares outstanding) | $4.70 |
| | |
| Computation of net asset value Class IB | |
| Net assets | $71,937,138 |
| Number of shares outstanding | 15,246,637 |
| Net asset value, offering price and redemption price per share (net assets divided by number of shares outstanding) | $4.72 |
The accompanying notes are an integral part of these financial statements.
| |
| 32 | Putnam VT Diversified Income Fund |
Statement of operations
Year ended 12/31/22
| |
| Investment income | |
| Interest (net of foreign tax of $570) (including interest income of $453,340 from investments in affiliated issuers) (Note 5) | $5,868,447 |
| Dividends | 7,312 |
| Total investment income | 5,875,759 |
| |
| Expenses | |
| Compensation of Manager (Note 2) | 802,803 |
| Investor servicing fees (Note 2) | 104,490 |
| Custodian fees (Note 2) | 97,971 |
| Trustee compensation and expenses (Note 2) | 6,442 |
| Distribution fees (Note 2) | 254,250 |
| Administrative services (Note 2) | 4,434 |
| Auditing and tax fees | 153,543 |
| Other | 99,788 |
| Fees waived and reimbursed by Manager (Note 2) | (62,582) |
| Total expenses | 1,461,139 |
| | |
| Expense reduction (Note 2) | (1,117) |
| Net expenses | 1,460,022 |
| | |
| Net investment income | 4,415,737 |
| | |
| Realized and unrealized gain (loss) | |
| Net realized gain (loss) on: | |
| Securities from unaffiliated issuers (Notes 1 and 3) | (9,209,213) |
| Foreign currency transactions (Note 1) | 11,832 |
| Forward currency contracts (Note 1) | 631,915 |
| Futures contracts (Note 1) | 4,708,242 |
| Swap contracts (Note 1) | (3,992,872) |
| Written options (Note 1) | (16,347,865) |
| Total net realized loss | (24,197,961) |
| Change in net unrealized appreciation (depreciation) on: | |
| Securities from unaffiliated issuers and TBA sale commitments | 3,634,380 |
| Assets and liabilities in foreign currencies | (1,924) |
| Forward currency contracts | (167,651) |
| Futures contracts | 239,573 |
| Swap contracts | 10,575,334 |
| Written options | 1,579,058 |
| Total change in net unrealized appreciation | 15,858,770 |
| | |
| Net loss on investments | (8,339,191) |
| | |
| Net decrease in net assets resulting from operations | $(3,923,454) |
The accompanying notes are an integral part of these financial statements.
| |
| Putnam VT Diversified Income Fund | 33 |
Statement of changes in net assets
| | |
| | Year ended | Year ended |
| | 12/31/22 | 12/31/21 |
| Decrease in net assets | | |
| Operations: | | |
| Net investment income | $4,415,737 | $6,904,275 |
| Net realized loss on investments and foreign currency transactions | (24,197,961) | (9,987,515) |
| Change in net unrealized appreciation (depreciation) of investments and assets and liabilities in foreign currencies | 15,858,770 | (9,275,418) |
| Net decrease in net assets resulting from operations | (3,923,454) | (12,358,658) |
| Distributions to shareholders (Note 1): | | |
| From ordinary income | | |
| Net investment income | | |
| Class IA | (3,337,580) | (511,935) |
| Class IB | (7,198,629) | (795,004) |
| Net realized short-term gain on investments | | |
| Class IA | (560,938) | — |
| Class IB | (1,262,917) | — |
| From net realized long-term gain on investments | | |
| Class IA | (448,750) | — |
| Class IB | (1,010,334) | — |
| Decrease from capital share transactions (Note 4) | (28,479,592) | (6,463,615) |
| Total decrease in net assets | (46,222,194) | (20,129,212) |
| Net assets: | | |
| Beginning of year | 163,339,953 | 183,469,165 |
| End of year | $117,117,759 | $163,339,953 |
The accompanying notes are an integral part of these financial statements.
| |
| 34 | Putnam VT Diversified Income Fund |
Financial highlights
(For a common share outstanding throughout the period)
| | | | | | | | | | | | | |
| INVESTMENT OPERATIONS: | LESS DISTRIBUTIONS: | RATIOS AND SUPPLEMENTAL DATA: |
| Period ended | Net asset value, beginning of period | Net investment income (loss)a | Net realized and unrealized gain (loss) on investments | Total from investment operations | From net investment income | From net realized gain on investments | Total distributions | Net asset value, end of period | Total return at net asset value (%)b,c | Net assets, end of period (in thousands) | Ratio of expenses to average net assets (%)b,d | Ratio of net investment income (loss) to average net assets (%) | Portfolio turnover (%)e |
| Class IA | | | | | | | | | | | | | |
| 12/31/22 | $5.26 | .15 | (.24) | (.09) | (.36) | (.11) | (.47) | $4.70 | (2.06) | $45,181 | .81f | 3.17f | 1,417 |
| 12/31/21 | 5.69 | .23 | (.61) | (.38) | (.05) | — | (.05) | 5.26 | (6.73) | 50,798 | .77 | 4.07 | 1,115 |
| 12/31/20 | 6.26 | .22 | (.33)g | (.11) | (.46) | — | (.46) | 5.69 | (.76)g | 58,536 | .79 | 4.06 | 1,184 |
| 12/31/19 | 5.82 | .27 | .39 | .66 | (.22) | — | (.22) | 6.26 | 11.56 | 66,012 | .79 | 4.53 | 987 |
| 12/31/18 | 6.13 | .32 | (.36) | (.04) | (.27) | — | (.27) | 5.82 | (.74) | 65,046 | .80 | 5.28 | 790 |
| Class IB | | | | | | | | | | | | | |
| 12/31/22 | $5.28 | .14 | (.25) | (.11) | (.34) | (.11) | (.45) | $4.72 | (2.35) | $71,937 | 1.06f | 2.86f | 1,417 |
| 12/31/21 | 5.71 | .21 | (.60) | (.39) | (.04) | — | (.04) | 5.28 | (6.95) | 112,542 | 1.02 | 3.81 | 1,115 |
| 12/31/20 | 6.27 | .21 | (.32)g | (.11) | (.45) | — | (.45) | 5.71 | (.90)g | 124,933 | 1.04 | 3.80 | 1,184 |
| 12/31/19 | 5.83 | .26 | .38 | .64 | (.20) | — | (.20) | 6.27 | 11.23 | 144,640 | 1.04 | 4.26 | 987 |
| 12/31/18 | 6.14 | .30 | (.35) | (.05) | (.26) | — | (.26) | 5.83 | (.98) | 130,502 | 1.05 | 5.02 | 790 |
a Per share net investment income (loss) has been determined on the basis of the weighted average number of shares outstanding during the period.
b The charges and expenses at the insurance company separate account level are not reflected.
c Total return assumes dividend reinvestment.
d Includes amounts paid through expense offset and/or brokerage/service arrangements, if any (Note 2). Also excludes acquired fund fees and expenses, if any.
e Portfolio turnover includes TBA purchase and sale commitments.
f Reflects an involuntary contractual expense limitation in effect during the period. As a result of such limitation, the expenses of each class reflect a reduction of 0.04% as a percentage of average net assets (Note 2).
g Reflects a non-recurring litigation payment received by the fund from an ISDA Fix Anti-Trust Settlement which amounted to the following amounts per share outstanding on May 4, 2020:
| | | |
| | Per share | | |
| Class IA | $0.03 | | |
| Class IB | 0.03 | | |
This payment resulted in an increase to total returns of 0.52% for the period ended December 31, 2020.
The accompanying notes are an integral part of these financial statements.
| |
| Putnam VT Diversified Income Fund | 35 |
Notes to financial statements 12/31/22
Within the following Notes to financial statements, references to “State Street” represent State Street Bank and Trust Company, references to “the SEC” represent the Securities and Exchange Commission, references to “Putnam Management” represent Putnam Investment Management, LLC, the fund’s manager, an indirect wholly-owned subsidiary of Putnam Investments, LLC and references to “OTC”, if any, represent over-the-counter. Unless otherwise noted, the “reporting period” represents the period from January 1, 2022 through December 31, 2022.
Putnam VT Diversified Income Fund (the fund) is a diversified series of Putnam Variable Trust (the Trust), a Massachusetts business trust registered under the Investment Company Act of 1940, as amended, as an open-end management investment company. The goal of the fund is to seek as high a level of current income as Putnam Management believes is consistent with preservation of capital. The fund invests mainly in bonds that are securitized debt instruments (such as mortgage-backed investments) and other obligations of companies and governments worldwide, are either investment-grade or below-investment-grade in quality (sometimes referred to as “junk bonds”) and have intermediate-to long-term maturities (three years or longer). The fund currently has significant investment exposure to residential and commercial mortgage-backed securities. Putnam Management may consider, among other factors, credit, interest rate and prepayment risks, as well as general market conditions, when deciding whether to buy or sell investments. The fund typically uses to a significant extent derivatives, such as futures, options, certain foreign currency transactions and swap contracts, for both hedging and non-hedging purposes.
The fund offers class IA and class IB shares of beneficial interest. Class IA shares are offered at net asset value and are not subject to a distribution fee. Class IB shares are offered at net asset value and pay an ongoing distribution fee, which is identified in Note 2.
In the normal course of business, the fund enters into contracts that may include agreements to indemnify another party under given circumstances. The fund’s maximum exposure under these arrangements is unknown as this would involve future claims that may be, but have not yet been, made against the fund. However, the fund’s management team expects the risk of material loss to be remote.
The fund has entered into contractual arrangements with an investment adviser, administrator, distributor, shareholder servicing agent and custodian, who each provide services to the fund. Unless expressly stated otherwise, shareholders are not parties to, or intended beneficiaries of these contractual arrangements, and these contractual arrangements are not intended to create any shareholder right to enforce them against the service providers or to seek any remedy under them against the service providers, either directly or on behalf of the fund.
Under the fund’s Amended and Restated Agreement and Declaration of Trust, any claims asserted against or on behalf of the Putnam Funds, including claims against Trustees and Officers, must be brought in state and federal courts located within the Commonwealth of Massachusetts.
Note 1 — Significant accounting policies
The following is a summary of significant accounting policies consistently followed by the fund in the preparation of its financial statements. The preparation of financial statements is in conformity with accounting principles generally accepted in the United States of America and requires management to make estimates and assumptions that affect the reported amounts of assets and liabilities in the financial statements and the reported amounts of increases and decreases in net assets from operations. Actual results could differ from those estimates. Subsequent events after the Statement of assets and liabilities date through the date that the financial statements were issued have been evaluated in the preparation of the financial statements.
Investment income, realized and unrealized gains and losses and expenses of the fund are borne pro-rata based on the relative net assets of each class to the total net assets of the fund, except that each class bears expenses unique to that class (including the distribution fees applicable to such classes). Each class votes as a class only with respect to its own distribution plan or other matters on which a class vote is required by law or determined by the Trustees. If the fund were liquidated, shares of each class would receive their pro-rata share of the net assets of the fund. In addition, the Trustees declare separate dividends on each class of shares.
Security valuation Portfolio securities and other investments are valued using policies and procedures adopted by the Board of Trustees. The Trustees have formed a Pricing Committee to oversee the implementation of these procedures and have delegated responsibility for valuing the fund’s assets in accordance with these procedures to Putnam Management. Putnam Management has established an internal Valuation Committee that is responsible for making fair value determinations, evaluating the effectiveness of the pricing policies of the fund and reporting to the Pricing Committee.
Investments for which market quotations are readily available are valued at the last reported sales price on their principal exchange, or official closing price for certain markets, and are classified as Level 1 securities under Accounting Standards Codification 820 Fair Value Measurements and Disclosures (ASC 820). If no sales are reported, as in the case of some securities that are traded OTC, a security is valued at its last reported bid price and is generally categorized as a Level 2 security.
Investments in open-end investment companies (excluding exchange-traded funds), if any, which can be classified as Level 1 or Level 2 securities, are valued based on their net asset value. The net asset value of such investment companies equals the total value of their assets less their liabilities and divided by the number of their outstanding shares.
Market quotations are not considered to be readily available for certain debt obligations (including short-term investments with remaining maturities of 60 days or less) and other investments; such investments are valued on the basis of valuations furnished by an independent pricing service approved by the Trustees or dealers selected by Putnam Management. Such services or dealers determine valuations for normal institutional-size trading units of such securities using methods based on market transactions for comparable securities and various relationships, generally recognized by institutional traders, between securities (which consider such factors as security prices, yields, maturities and ratings). These securities will generally be categorized as Level 2.
Many securities markets and exchanges outside the U.S. close prior to the scheduled close of the New York Stock Exchange and therefore the closing prices for securities in such markets or on such exchanges may not fully reflect events that occur after such close but before the scheduled close of the New York Stock Exchange. Accordingly, on certain days, the fund will fair value certain foreign equity securities taking into account multiple factors including movements in the U.S. securities markets, currency valuations and comparisons to the valuation of American Depository Receipts, exchange-traded funds and futures contracts. The foreign equity securities, which would generally be classified as Level 1 securities, will be transferred to Level 2 of the fair value hierarchy when they are valued at fair value. The number of days on which fair value prices will be used will depend on market activity and it is possible that fair value prices will be used by the fund to a significant extent. Securities quoted in foreign currencies, if any, are translated into U.S. dollars at the current exchange rate.
To the extent a pricing service or dealer is unable to value a security or provides a valuation that Putnam Management does not believe accurately reflects the security’s fair value, the security will be valued at fair value by Putnam Management in accordance with policies and procedures approved by the Trustees. Certain investments, including certain restricted and illiquid securities and derivatives, are also valued at fair value following procedures approved by the Trustees. These valuations consider such factors as significant market or specific security events such as interest rate or credit quality changes, various relationships with other securities, discount rates, U.S. Treasury, U.S. swap and credit yields, index levels, convexity exposures, recovery rates, sales and other multiples and resale restrictions. These securities are classified as Level 2 or as Level 3 depending on the priority of the significant inputs.
To assess the continuing appropriateness of fair valuations, the Valuation Committee reviews and affirms the reasonableness of such valuations on a regular basis after considering all relevant information that is reasonably available. Such valuations and procedures are reviewed periodically by the Trustees. Certain securities may be valued on the basis of a price provided by a single source. The fair value of securities is generally determined as the amount that the fund could reasonably expect to realize from an orderly disposition of such securities over a reasonable period of time. By its nature, a fair value price is a good faith estimate of the value of a security in a current sale and does not reflect an actual market price, which may be different by a material amount.
Joint trading account Pursuant to an exemptive order from the SEC, the fund may transfer uninvested cash balances into a joint trading account along with the cash of other registered investment companies and certain other accounts managed by Putnam Management. These balances may be invested in issues of short-term investments having maturities of up to 90 days.
Repurchase agreements The fund, or any joint trading account, through its custodian, receives delivery of the underlying securities, the fair value of which at the time of purchase is required to be in an amount at least equal to the resale price, including accrued interest. Collateral for certain tri-party repurchase
| |
| 36 | Putnam VT Diversified Income Fund |
agreements is held at the counterparty’s custodian in a segregated account for the benefit of the fund and the counterparty. Putnam Management is responsible for determining that the value of these underlying securities is at all times at least equal to the resale price, including accrued interest. In the event of default or bankruptcy by the other party to the agreement, retention of the collateral may be subject to legal proceedings.
Security transactions and related investment income Security transactions are recorded on the trade date (the date the order to buy or sell is executed). Gains or losses on securities sold are determined on the identified cost basis.
Interest income, net of any applicable withholding taxes, if any, is recorded on the accrual basis. Amortization and accretion of premiums and discounts on debt securities, if any, is recorded on the accrual basis.
Dividend income, net of any applicable withholding taxes, is recognized on the ex-dividend date except that certain dividends from foreign securities, if any, are recognized as soon as the fund is informed of the ex-dividend date. Non-cash dividends, if any, are recorded at the fair value of the securities received. Dividends representing a return of capital or capital gains, if any, are reflected as a reduction of cost and/or as a realized gain.
The fund may have earned certain fees in connection with its senior loan purchasing activities. These fees, if any, are treated as market discount and are amortized into income in the Statement of operations.
Stripped securities The fund may invest in stripped securities which represent a participation in securities that may be structured in classes with rights to receive different portions of the interest and principal. Interest-only securities receive all of the interest and principal-only securities receive all of the principal. If the interest-only securities experience greater than anticipated prepayments of principal, the fund may fail to recoup fully its initial investment in these securities. Conversely, principal-only securities increase in value if prepayments are greater than anticipated and decline if prepayments are slower than anticipated. The fair value of these securities is highly sensitive to changes in interest rates.
Foreign currency translation The accounting records of the fund are maintained in U.S. dollars. The fair value of foreign securities, currency holdings, and other assets and liabilities is recorded in the books and records of the fund after translation to U.S. dollars based on the exchange rates on that day. The cost of each security is determined using historical exchange rates. Income and withholding taxes are translated at prevailing exchange rates when earned or incurred. The fund does not isolate that portion of realized or unrealized gains or losses resulting from changes in the foreign exchange rate on investments from fluctuations arising from changes in the market prices of the securities. Such gains and losses are included with the net realized and unrealized gain or loss on investments. Net realized gains and losses on foreign currency transactions represent net realized exchange gains or losses on disposition of foreign currencies, currency gains and losses realized between the trade and settlement dates on securities transactions and the difference between the amount of investment income and foreign withholding taxes recorded on the fund’s books and the U.S. dollar equivalent amounts actually received or paid. Net unrealized appreciation and depreciation of assets and liabilities in foreign currencies arise from changes in the value of assets and liabilities other than investments at the period end, resulting from changes in the exchange rate.
Options contracts The fund uses options contracts to hedge duration and convexity, to isolate prepayment risk and to manage downside risks.
The potential risk to the fund is that the change in value of options contracts may not correspond to the change in value of the hedged instruments. In addition, losses may arise from changes in the value of the underlying instruments if there is an illiquid secondary market for the contracts, if interest or exchange rates move unexpectedly or if the counterparty to the contract is unable to perform. Realized gains and losses on purchased options are included in realized gains and losses on investment securities. If a written call option is exercised, the premium originally received is recorded as an addition to sales proceeds. If a written put option is exercised, the premium originally received is recorded as a reduction to the cost of investments.
Exchange-traded options are valued at the last sale price or, if no sales are reported, the last bid price for purchased options and the last ask price for written options. OTC traded options are valued using prices supplied by dealers.
Options on swaps are similar to options on securities except that the premium paid or received is to buy or grant the right to enter into a previously agreed upon interest rate or credit default contract. Forward premium swap option contracts include premiums that have extended settlement dates. The delayed settlement of the premiums is factored into the daily valuation of the option contracts. In the case of interest rate cap and floor contracts, in return for a premium, ongoing payments between two parties are based on interest rates exceeding a specified rate, in the case of a cap contract, or falling below a specified rate in the case of a floor contract.
Written option contracts outstanding at period end, if any, are listed after the fund’s portfolio.
Futures contracts The fund uses futures contracts for hedging treasury term structure risk and for yield curve positioning.
The potential risk to the fund is that the change in value of futures contracts may not correspond to the change in value of the hedged instruments. In addition, losses may arise from changes in the value of the underlying instruments, if there is an illiquid secondary market for the contracts, if interest or exchange rates move unexpectedly or if the counterparty to the contract is unable to perform. With futures, there is minimal counterparty credit risk to the fund since futures are exchange traded and the exchange’s clearinghouse, as counterparty to all exchange traded futures, guarantees the futures against default. Risks may exceed amounts recognized on the Statement of assets and liabilities. When the contract is closed, the fund records a realized gain or loss equal to the difference between the value of the contract at the time it was opened and the value at the time it was closed.
Futures contracts are valued at the quoted daily settlement prices established by the exchange on which they trade. The fund and the broker agree to exchange an amount of cash equal to the daily fluctuation in the value of the futures contract. Such receipts or payments are known as “variation margin.”
Futures contracts outstanding at period end, if any, are listed after the fund’s portfolio.
Forward currency contracts The fund buys and sells forward currency contracts, which are agreements between two parties to buy and sell currencies at a set price on a future date. These contracts are used for hedging currency exposures and to gain exposure to currencies.
The U.S. dollar value of forward currency contracts is determined using current forward currency exchange rates supplied by a quotation service. The fair value of the contract will fluctuate with changes in currency exchange rates. The contract is marked to market daily and the change in fair value is recorded as an unrealized gain or loss. The fund records a realized gain or loss equal to the difference between the value of the contract at the time it was opened and the value at the time it was closed when the contract matures or by delivery of the currency. The fund could be exposed to risk if the value of the currency changes unfavorably, if the counterparties to the contracts are unable to meet the terms of their contracts or if the fund is unable to enter into a closing position. Risks may exceed amounts recognized on the Statement of assets and liabilities.
Forward currency contracts outstanding at period end, if any, are listed after the fund’s portfolio.
Interest rate swap contracts The fund entered into OTC and/or centrally cleared interest rate swap contracts, which are arrangements between two parties to exchange cash flows based on a notional principal amount, for hedging term structure risk, for yield curve positioning and for gaining exposure to rates in various countries.
An OTC and centrally cleared interest rate swap can be purchased or sold with an upfront premium. For OTC interest rate swap contracts, an upfront payment received by the fund is recorded as a liability on the fund’s books. An upfront payment made by the fund is recorded as an asset on the fund’s books. OTC and centrally cleared interest rate swap contracts are marked to market daily based upon quotations from an independent pricing service or market makers. Any change is recorded as an unrealized gain or loss on OTC interest rate swaps. Daily fluctuations in the value of centrally cleared interest rate swaps are settled through a central clearing agent and are recorded in variation margin on the Statement of assets and liabilities and recorded as unrealized gain or loss. Payments, including upfront premiums, received or made are recorded as realized gains or losses at the reset date or the closing of the contract. Certain OTC and centrally cleared interest rate swap contracts may include extended effective dates. Payments related to these swap contracts are accrued based on the terms of the contract.
The fund could be exposed to credit or market risk due to unfavorable changes in the fluctuation of interest rates or if the counterparty defaults, in the case of OTC interest rate contracts, or the central clearing agency or a clearing member defaults, in the case of centrally cleared interest rate swap contracts, on its respective obligation to perform under the contract. The fund’s maximum risk of loss from counterparty risk or central clearing risk is the fair value of the contract. This risk may be mitigated for OTC interest rate swap contracts by having a master
| |
| Putnam VT Diversified Income Fund | 37 |
netting arrangement between the fund and the counterparty and for centrally cleared interest rate swap contracts through the daily exchange of variation margin. There is minimal counterparty risk with respect to centrally cleared interest rate swap contracts due to the clearinghouse guarantee fund and other resources that are available in the event of a clearing member default. Risk of loss may exceed amounts recognized on the Statement of assets and liabilities.
OTC and centrally cleared interest rate swap contracts outstanding, including their respective notional amounts at period end, if any, are listed after the fund’s portfolio.
Total return swap contracts The fund entered into OTC and/or centrally cleared total return swap contracts, which are arrangements to exchange a market-linked return for a periodic payment, both based on a notional principal amount, to hedge sector exposure, for gaining exposure to specific sectors, for hedging inflation and for gaining exposure to inflation.
To the extent that the total return of the security, index or other financial measure underlying the transaction exceeds or falls short of the offsetting interest rate obligation, the fund will receive a payment from or make a payment to the counterparty. OTC and/or centrally cleared total return swap contracts are marked to market daily based upon quotations from an independent pricing service or market maker. Any change is recorded as an unrealized gain or loss on OTC total return swaps. Daily fluctuations in the value of centrally cleared total return swaps are settled through a central clearing agent and are recorded in variation margin on the Statement of assets and liabilities and recorded as unrealized gain or loss. Payments received or made are recorded as realized gains or losses. Certain OTC and/or centrally cleared total return swap contracts may include extended effective dates. Payments related to these swap contracts are accrued based on the terms of the contract. The fund could be exposed to credit or market risk due to unfavorable changes in the fluctuation of interest rates or in the price of the underlying security or index, the possibility that there is no liquid market for these agreements or that the counterparty may default on its obligation to perform. The fund’s maximum risk of loss from counterparty risk or central clearing risk is the fair value of the contract. This risk may be mitigated for OTC total return swap contracts by having a master netting arrangement between the fund and the counterparty and for centrally cleared total return swap contracts through the daily exchange of variation margin. There is minimal counterparty risk with respect to centrally cleared total return swap contracts due to the clearinghouse guarantee fund and other resources that are available in the event of a clearing member default. Risk of loss may exceed amounts recognized on the Statement of assets and liabilities.
OTC and/or centrally cleared total return swap contracts outstanding, including their respective notional amounts at period end, if any, are listed after the fund’s portfolio.
Credit default contracts The fund entered into OTC and/or centrally cleared credit default contracts to hedge credit risk, for gaining liquid exposure to individual names, to hedge market risk and for gaining exposure to specific sectors.
In OTC and centrally cleared credit default contracts, the protection buyer typically makes a periodic stream of payments to a counterparty, the protection seller, in exchange for the right to receive a contingent payment upon the occurrence of a credit event on the reference obligation or all other equally ranked obligations of the reference entity. Credit events are contract specific but may include bankruptcy, failure to pay, restructuring and obligation acceleration. For OTC credit default contracts, an upfront payment received by the fund is recorded as a liability on the fund’s books. An upfront payment made by the fund is recorded as an asset on the fund’s books. Centrally cleared credit default contracts provide the same rights to the protection buyer and seller except the payments between parties, including upfront premiums, are settled through a central clearing agent through variation margin payments. Upfront and periodic payments received or paid by the fund for OTC and centrally cleared credit default contracts are recorded as realized gains or losses at the reset date or close of the contract. The OTC and centrally cleared credit default contracts are marked to market daily based upon quotations from an independent pricing service or market makers. Any change in value of OTC credit default contracts is recorded as an unrealized gain or loss. Daily fluctuations in the value of centrally cleared credit default contracts are recorded in variation margin on the Statement of assets and liabilities and recorded as unrealized gain or loss. Upon the occurrence of a credit event, the difference between the par value and fair value of the reference obligation, net of any proportional amount of the upfront payment, is recorded as a realized gain or loss.
In addition to bearing the risk that the credit event will occur, the fund could be exposed to market risk due to unfavorable changes in interest rates or in the price of the underlying security or index or the possibility that the fund may be unable to close out its position at the same time or at the same price as if it had purchased the underlying reference obligations. In certain circumstances, the fund may enter into offsetting OTC and centrally cleared credit default contracts which would mitigate its risk of loss. Risks of loss may exceed amounts recognized on the Statement of assets and liabilities. The fund’s maximum risk of loss from counterparty risk, either as the protection seller or as the protection buyer, is the fair value of the contract. This risk may be mitigated for OTC credit default contracts by having a master netting arrangement between the fund and the counterparty and for centrally cleared credit default contracts through the daily exchange of variation margin. Counterparty risk is further mitigated with respect to centrally cleared credit default swap contracts due to the clearinghouse guarantee fund and other resources that are available in the event of a clearing member default. Where the fund is a seller of protection, the maximum potential amount of future payments the fund may be required to make is equal to the notional amount.
OTC and centrally cleared credit default contracts outstanding, including their respective notional amounts at period end, if any, are listed after the fund’s portfolio.
TBA commitments The fund may enter into TBA (to be announced) commitments to purchase securities for a fixed unit price at a future date beyond customary settlement time. Although the unit price and par amount have been established, the actual securities have not been specified. However, it is anticipated that the amount of the commitments will not significantly differ from the principal amount. The fund holds, and maintains until settlement date, cash or high-grade debt obligations in an amount sufficient to meet the purchase price, or the fund may enter into offsetting contracts for the forward sale of other securities it owns. Income on the securities will not be earned until settlement date.
The fund may also enter into TBA sale commitments to hedge its portfolio positions, to sell mortgage-backed securities it owns under delayed delivery arrangements or to take a short position in mortgage-backed securities. Proceeds of TBA sale commitments are not received until the contractual settlement date. During the time a TBA sale commitment is outstanding, either equivalent deliverable securities or an offsetting TBA purchase commitment deliverable on or before the sale commitment date are held as “cover” for the transaction, or other liquid assets in an amount equal to the notional value of the TBA sale commitment are segregated. If the TBA sale commitment is closed through the acquisition of an offsetting TBA purchase commitment, the fund realizes a gain or loss. If the fund delivers securities under the commitment, the fund realizes a gain or a loss from the sale of the securities based upon the unit price established at the date the commitment was entered into.
TBA commitments, which are accounted for as purchase and sale transactions, may be considered securities themselves, and involve a risk of loss due to changes in the value of the security prior to the settlement date as well as the risk that the counterparty to the transaction will not perform its obligations. Counterparty risk is mitigated by having a master agreement between the fund and the counterparty.
Unsettled TBA commitments are valued at their fair value according to the procedures described under “Security valuation” above. The contract is marked to market daily and the change in fair value is recorded by the fund as an unrealized gain or loss. Based on market circumstances, Putnam Management will determine whether to take delivery of the underlying securities or to dispose of the TBA commitments prior to settlement.
TBA purchase commitments outstanding at period end, if any, are listed within the fund’s portfolio and TBA sale commitments outstanding at period end, if any, are listed after the fund’s portfolio.
Master agreements The fund is a party to ISDA (International Swaps and Derivatives Association, Inc.) Master Agreements that govern OTC derivative and foreign exchange contracts and Master Securities Forward Transaction Agreements that govern transactions involving mortgage-backed and other asset-backed securities that may result in delayed delivery (Master Agreements) with certain counterparties entered into from time to time. The Master Agreements may contain provisions regarding, among other things, the parties’ general obligations, representations, agreements, collateral requirements, events of default and early termination. With respect to certain counterparties, in accordance with the terms of the Master Agreements, collateral pledged to the fund is held in a segregated account by the fund’s custodian and, with respect to those amounts which can be sold or repledged, are presented in the fund’s portfolio.
Collateral pledged by the fund is segregated by the fund’s custodian and identified in the fund’s portfolio. Collateral can be in the form of cash or debt securities issued by the U.S. Government or related agencies or other securities as agreed to by the fund and the applicable counterparty. Collateral requirements are determined based on the fund’s net position with each counterparty.
| |
| 38 | Putnam VT Diversified Income Fund |
With respect to ISDA Master Agreements, termination events applicable to the fund may occur upon a decline in the fund’s net assets below a specified threshold over a certain period of time. Termination events applicable to counterparties may occur upon a decline in the counterparty’s long-term or short-term credit ratings below a specified level. In each case, upon occurrence, the other party may elect to terminate early and cause settlement of all derivative and foreign exchange contracts outstanding, including the payment of any losses and costs resulting from such early termination, as reasonably determined by the terminating party. Any decision by one or more of the fund’s counterparties to elect early termination could impact the fund’s future derivative activity.
At the close of the reporting period, the fund had a net liability position of $1,291,615 on open derivative contracts subject to the Master Agreements. Collateral pledged by the fund at period end for these agreements totaled $1,101,656 and may include amounts related to unsettled agreements.
Interfund lending The fund, along with other Putnam funds, may participate in an interfund lending program pursuant to an exemptive order issued by the SEC. This program allows the fund to borrow from or lend to other Putnam funds that permit such transactions. Interfund lending transactions are subject to each fund’s investment policies and borrowing and lending limits. Interest earned or paid on the interfund lending transaction will be based on the average of certain current market rates. During the reporting period, the fund did not utilize the program.
Lines of credit The fund participates, along with other Putnam funds, in a $100 million ($317.5 million prior to October 14, 2022) unsecured committed line of credit and a $235.5 million unsecured uncommitted line of credit, both provided by State Street. Borrowings may be made for temporary or emergency purposes, including the funding of shareholder redemption requests and trade settlements. Interest is charged to the fund based on the fund’s borrowing at a rate equal to 1.25% plus the higher of (1) the Federal Funds rate and (2) the Overnight Bank Funding Rate for the committed line of credit and 1.30% plus the higher of (1) the Federal Funds rate and (2) the Overnight Bank Funding Rate for the uncommitted line of credit. A closing fee equal to 0.04% of the committed line of credit and 0.04% of the uncommitted line of credit has been paid by the participating funds. In addition, a commitment fee of 0.21% per annum on any unutilized portion of the committed line of credit is allocated to the participating funds based on their relative net assets and paid quarterly. During the reporting period, the fund had no borrowings against these arrangements.
Federal taxes It is the policy of the fund to distribute all of its taxable income within the prescribed time period and otherwise comply with the provisions of the Internal Revenue Code of 1986, as amended (the Code), applicable to regulated investment companies.
The fund is subject to the provisions of Accounting Standards Codification 740 Income Taxes (ASC 740). ASC 740 sets forth a minimum threshold for financial statement recognition of the benefit of a tax position taken or expected to be taken in a tax return. The fund did not have a liability to record for any unrecognized tax benefits in the accompanying financial statements. No provision has been made for federal taxes on income, capital gains or unrealized appreciation on securities held nor for excise tax on income and capital gains. Each of the fund’s federal tax returns for the prior three fiscal years remains subject to examination by the Internal Revenue Service.
The fund may also be subject to taxes imposed by governments of countries in which it invests. Such taxes are generally based on either income or gains earned or repatriated. The fund accrues and applies such taxes to net investment income, net realized gains and net unrealized gains as income and/or capital gains are earned. In some cases, the fund may be entitled to reclaim all or a portion of such taxes, and such reclaim amounts, if any, are reflected as an asset on the fund’s books. In many cases, however, the fund may not receive such amounts for an extended period of time, depending on the country of investment.
Under the Regulated Investment Company Modernization Act of 2010, the fund will be permitted to carry forward capital losses incurred for an unlimited period and the carry forwards will retain their character as either short-term or long-term capital losses. At December 31, 2022, the fund had the following capital loss carryovers available, to the extent allowed by the Code, to offset future net capital gain, if any:
| | |
| | Loss carryover | |
| Short-term | Long-term | Total |
| $39,807,975 | $34,333,831 | $74,141,806 |
Distributions to shareholders Distributions to shareholders from net investment income are recorded by the fund on the ex-dividend date. Distributions from capital gains, if any, are recorded on the ex-dividend date and paid at least annually. The amount and character of income and gains to be distributed are determined in accordance with income tax regulations, which may differ from generally accepted accounting principles. These differences include temporary and/or permanent differences from foreign currency gains and losses, from realized gains and losses on certain futures contracts, from income on swap contracts, from interest-only securities and from litigation and/or restitution payments. Reclassifications are made to the fund’s capital accounts to reflect income and gains available for distribution (or available capital loss carryovers) under income tax regulations. At the close of the reporting period, the fund reclassified $431,912 to decrease undistributed net investment income and $431,912 to decrease accumulated net realized loss.
Tax cost of investments includes adjustments to net unrealized appreciation (depreciation) which may not necessarily be final tax cost basis adjustments, but closely approximate the tax basis unrealized gains and losses that may be realized and distributed to shareholders. The tax basis components of distributable earnings and the federal tax cost as of the close of the reporting period were as follows:
| |
| Unrealized appreciation | $38,042,993 |
| Unrealized depreciation | (59,660,016) |
| Net unrealized depreciation | (21,617,023) |
| Undistributed ordinary income | 6,728,252 |
| Capital loss carryforward | (74,141,806) |
| Cost for federal income tax purposes | $226,824,125 |
Expenses of the Trust Expenses directly charged or attributable to any fund will be paid from the assets of that fund. Generally, expenses of the Trust will be allocated among and charged to the assets of each fund on a basis that the Trustees deem fair and equitable, which may be based on the relative assets of each fund or the nature of the services performed and relative applicability to each fund.
Beneficial interest At the close of the reporting period, insurance companies or their separate accounts were record owners of all but a de minimis number of the shares of the fund. Approximately 52.5% of the fund is owned by accounts of one insurance company.
Note 2 — Management fee, administrative services and other transactions
The fund pays Putnam Management a management fee (based on the fund’s average net assets and computed and paid monthly) at annual rates that may vary based on the average of the aggregate net assets of all open-end mutual funds sponsored by Putnam Management (excluding net assets of funds that are invested in, or that are invested in by, other Putnam funds to the extent necessary to avoid “double counting” of those assets). Such annual rates may vary as follows:
| |
| 0.700% | of the first $5 billion, |
| 0.650% | of the next $5 billion, |
| 0.600% | of the next $10 billion, |
| 0.550% | of the next $10 billion, |
| 0.500% | of the next $50 billion, |
| 0.480% | of the next $50 billion, |
| 0.470% | of the next $100 billion and |
| 0.465% | of any excess thereafter. |
For the reporting period, the management fee represented an effective rate (excluding the impact from any expense waivers in effect) of 0.538% of the fund’s average net assets.
Putnam Management has contractually agreed, through April 30, 2024, to waive fees and/or reimburse the fund’s expenses to the extent necessary to limit the cumulative expenses of the fund, exclusive of brokerage, interest, taxes, investment-related expenses, extraordinary expenses, acquired fund fees and expenses and payments under the fund’s investor servicing contract, investment management contract and distribution plan, on a fiscal year-to-date basis to an annual rate of 0.20% of the fund’s average net assets over such fiscal year-to-date period. During the reporting period, the fund’s expenses were reduced by $62,582 as a result of this limit.
Putnam Investments Limited (PIL), an affiliate of Putnam Management, is authorized by the Trustees to manage a separate portion of the assets of the fund as determined by Putnam Management from time to time. PIL did not manage any portion of the assets of the fund during the reporting period. If Putnam Management were to engage the services of PIL, Putnam Management would pay a quarterly sub-management fee to PIL for its services at an annual rate of 0.20% (prior to July 1, 2022, the annual rate was 0.40%) of the average net assets of the portion of the fund managed by PIL.
| |
| Putnam VT Diversified Income Fund | 39 |
The fund reimburses Putnam Management an allocated amount for the compensation and related expenses of certain officers of the fund and their staff who provide administrative services to the fund. The aggregate amount of all such reimbursements is determined annually by the Trustees.
Custodial functions for the fund’s assets are provided by State Street. Custody fees are based on the fund’s asset level, the number of its security holdings and transaction volumes.
Putnam Investor Services, Inc., an affiliate of Putnam Management, provides investor servicing agent functions to the fund. Putnam Investor Services, Inc. was paid a monthly fee for investor servicing at an annual rate of 0.07% of the fund’s average daily net assets. During the reporting period, the expenses for each class of shares related to investor servicing fees were as follows:
| |
| Class IA | $33,283 |
| Class IB | 71,207 |
| Total | $104,490 |
The fund has entered into expense offset arrangements with Putnam Investor Services, Inc. and State Street whereby Putnam Investor Services, Inc.’s and State Street’s fees are reduced by credits allowed on cash balances. For the reporting period, the fund’s expenses were reduced by $1,117 under the expense offset arrangements.
Each Independent Trustee of the fund receives an annual Trustee fee, of which $125, as a quarterly retainer, has been allocated to the fund, and an additional fee for each Trustees meeting attended. Trustees also are reimbursed for expenses they incur relating to their services as Trustees.
The fund has adopted a Trustee Fee Deferral Plan (the Deferral Plan) which allows the Trustees to defer the receipt of all or a portion of Trustees fees payable on or after July 1, 1995. The deferred fees remain invested in certain Putnam funds until distribution in accordance with the Deferral Plan.
The fund has adopted an unfunded noncontributory defined benefit pension plan (the Pension Plan) covering all Trustees of the fund who have served as a Trustee for at least five years and were first elected prior to 2004. Benefits under the Pension Plan are equal to 50% of the Trustee’s average annual attendance and retainer fees for the three years ended December 31, 2005. The retirement benefit is payable during a Trustee’s lifetime, beginning the year following retirement, for the number of years of service through December 31, 2006. Pension expense for the fund is included in Trustee compensation and expenses in the Statement of operations. Accrued pension liability is included in Payable for Trustee compensation and expenses in the Statement of assets and liabilities. The Trustees have terminated the Pension Plan with respect to any Trustee first elected after 2003.
The fund has adopted a distribution plan (the Plan) with respect to its class IB shares pursuant to Rule 12b–1 under the Investment Company Act of 1940. The purpose of the Plan is to compensate Putnam Retail Management Limited Partnership, an indirect wholly-owned subsidiary of Putnam Investments, LLC, for services provided and expenses incurred in distributing shares of the fund. The Plan provides for payment by the fund to Putnam Retail Management Limited Partnership at an annual rate of up to 0.35% of the average net assets attributable to the fund’s class IB shares. The Trustees have approved payment by the fund at an annual rate of 0.25% of the average net assets attributable to the fund’s class IB shares. The expenses related to distribution fees during the reporting period are included in Distribution fees in the Statement of operations.
Note 3 — Purchases and sales of securities
During the reporting period, the cost of purchases and the proceeds from sales, excluding short-term investments, were as follows:
| | |
| | Cost of | Proceeds |
| | purchases | from sales |
| Investments in securities, including | | |
| TBA commitments (Long-term) | $2,225,296,130 | $2,214,124,396 |
| U.S. government securities | | |
| (Long-term) | — | — |
| Total | $2,225,296,130 | $2,214,124,396 |
The fund may purchase or sell investments from or to other Putnam funds in the ordinary course of business, which can reduce the fund’s transaction costs, at prices determined in accordance with SEC requirements and policies approved by the Trustees. During the reporting period, purchases or sales of long-term securities from or to other Putnam funds, if any, did not represent more than 5% of the fund’s total cost of purchases and/or total proceeds from sales.
Note 4 — Capital shares
At the close of the reporting period, there were an unlimited number of shares of beneficial interest authorized. Subscriptions and redemptions are presented at the omnibus level. Transactions in capital shares were as follows:
| | | | | | | | |
| | | Class IA shares | | | Class IB shares | |
| | Year ended 12/31/22 | Year ended 12/31/21 | Year ended 12/31/22 | Year ended 12/31/21 |
| | Shares | Amount | Shares | Amount | Shares | Amount | Shares | Amount |
| Shares sold | 412,415 | $1,947,799 | 337,780 | $1,886,834 | 2,286,108 | $11,188,924 | 3,178,405 | $17,944,128 |
| Shares issued in connection with | | | | | | | | |
| reinvestment of distributions | 898,196 | 4,347,268 | 89,813 | 511,935 | 1,944,945 | 9,471,880 | 138,744 | 795,004 |
| | 1,310,611 | 6,295,067 | 427,593 | 2,398,769 | 4,231,053 | 20,660,804 | 3,317,149 | 18,739,132 |
| Shares repurchased | (1,347,262) | (6,542,606) | (1,059,587) | (5,902,419) | (10,296,581) | (48,892,857) | (3,883,936) | (21,699,097) |
| Net decrease | (36,651) | $(247,539) | (631,994) | $(3,503,650) | (6,065,528) | $(28,232,053) | (566,787) | $(2,959,965) |
Note 5 — Affiliated transactions
Transactions during the reporting period with any company which is under common ownership or control were as follows:
| | | | | |
| | | | | | Shares outstanding |
| | Fair value as of | | | | and fair value as of |
| Name of affiliate | 12/31/21 | Purchase cost | Sale proceeds | Investment income | 12/31/22 |
| Short-term investments | | | | | |
| Putnam Short Term Investment | | | | | |
| Fund** | $27,865,699 | $99,789,300 | $98,701,133 | $453,340 | $28,953,866 |
| Total Short-term investments | $27,865,699 | $99,789,300 | $98,701,133 | $453,340 | $28,953,866 |
**Management fees charged to Putnam Short Term Investment Fund have been waived by Putnam Management. There were no realized or unrealized gains or losses during the period.
| |
| 40 | Putnam VT Diversified Income Fund |
Note 6 — Market, credit and other risks
In the normal course of business, the fund trades financial instruments and enters into financial transactions where risk of potential loss exists due to changes in the market (market risk) or failure of the contracting party to the transaction to perform (credit risk). The fund may be exposed to additional credit risk that an institution or other entity with which the fund has unsettled or open transactions will default. Investments in foreign securities involve certain risks, including those related to economic instability, unfavorable political developments, and currency fluctuations. The fund may invest in higher-yielding, lower-rated bonds that may have a higher rate of default. The fund may invest a significant portion of its assets in securitized debt instruments, including mortgage-backed and asset-backed investments. The yields and values of these investments are sensitive to changes in interest rates, the rate of principal payments on the underlying assets and the market’s perception of the issuers. The market for these investments may be volatile and limited, which may make them difficult to buy or sell.
On July 27, 2017, the United Kingdom’s Financial Conduct Authority (“FCA”), which regulates LIBOR, announced its intention to cease compelling banks to provide the quotations needed to sustain LIBOR after 2021. ICE Benchmark Administration, the administrator of LIBOR, ceased publication of most LIBOR settings on a representative basis at the end of 2021 and is expected to cease publication of a majority of U.S. dollar LIBOR settings on a representative basis after June 30, 2023. In addition, global regulators have announced that, with limited exceptions, no new LIBOR-based contracts should be entered into after 2021. LIBOR has historically been a common benchmark interest rate index used to make adjustments to variable-rate loans. It is used throughout global banking and financial industries to determine interest rates for a variety of financial instruments and borrowing arrangements. Actions by regulators have resulted in the establishment of alternative reference rates to LIBOR in most major currencies. Various financial industry groups have been planning for the transition away from LIBOR, but there are obstacles to converting certain longer-term securities and transactions to new reference rates. Markets are developing slowly and questions around liquidity in these rates and how to appropriately adjust these rates to mitigate any economic value transfer at the time of transition remain a significant concern. Neither the effect of the transition process nor its ultimate success can yet be known. The transition process might lead to increased volatility and illiquidity in markets that rely on LIBOR to determine interest rates. It could also lead to a reduction in the value of some LIBOR-based investments and reduce the effectiveness of related transactions, such as hedges. While some LIBOR-based instruments may contemplate a scenario where LIBOR is no longer available by providing for an alternative rate-setting methodology, not all may have such provisions and there may be significant uncertainty regarding the effectiveness of any such alternative methodologies. Since the usefulness of LIBOR as a benchmark could deteriorate during the transition period, these effects could occur at any time.
The Covid-19 pandemic and efforts to contain its spread have resulted in, among other effects, significant market volatility, exchange trading suspensions and closures, declines in global financial markets, higher default rates, significant changes in fiscal and monetary policies, and economic downturns and recessions. The effects of the Covid-19 pandemic have negatively affected, and may continue to negatively affect, the global economy, the economies of the United States and other individual countries, the financial performance of individual issuers, sectors, industries, asset classes, and markets, and the value, volatility, and liquidity of particular securities and other assets. The effects of the Covid-19 pandemic also are likely to exacerbate other risks that apply to the fund, which could negatively impact the fund’s performance and lead to losses on your investment in the fund. The duration of the Covid-19 pandemic and its effects cannot be determined with certainty.
Note 7 — Senior loan commitments
Senior loans are purchased or sold on a when-issued or delayed delivery basis and may be settled a month or more after the trade date, which from time to time can delay the actual investment of available cash balances; interest income is accrued based on the terms of the securities. Senior loans can be acquired through an agent, by assignment from another holder of the loan, or as a participation interest in another holder’s portion of the loan. When the fund invests in a loan or participation, the fund is subject to the risk that an intermediate participant between the fund and the borrower will fail to meet its obligations to the fund, in addition to the risk that the borrower under the loan may default on its obligations.
Note 8 — Summary of derivative activity
The volume of activity for the reporting period for any derivative type that was held during the period is listed below and was based on an average of the holdings at the end of each fiscal quarter:
| |
| Purchased TBA commitment option contracts (contract amount) | $21,900,000 |
| Purchased swap option contracts (contract amount) | $579,000,000 |
| Written TBA commitment option contracts (contract amount) | $21,900,000 |
| Written swap option contracts (contract amount) | $490,600,000 |
| Futures contracts (number of contracts) | 300 |
| Forward currency contracts (contract amount) | $45,100,000 |
| Centrally cleared interest rate swap contracts (notional) | $669,600,000 |
| OTC total return swap contracts (notional) | $1,800,000 |
| Centrally cleared total return swap contracts (notional) | $1,100,000 |
| OTC credit default contracts (notional) | $32,300,000 |
| Centrally cleared credit default contracts (notional) | $1,100,000 |
| |
| Putnam VT Diversified Income Fund | 41 |
The following is a summary of the fair value of derivative instruments as of the close of the reporting period:
Fair value of derivative instruments as of the close of the reporting period
| | | | |
| | Asset derivatives | Liability derivatives |
| Derivatives not accounted for as hedging | Statement of assets and | | Statement of assets and | |
| instruments under ASC 815 | liabilities location | Fair value | liabilities location | Fair value |
| | Receivables, Net assets — | | | |
| Credit contracts | Unrealized appreciation | $2,241,706* | Payables | $2,487,419 |
| Foreign exchange contracts | Receivables | 112,616 | Payables | 294,520 |
| | Investments, Receivables, | | | |
| | Net assets — Unrealized | | Payables, Net assets — | |
| Interest rate contracts | appreciation | 34,499,863* | Unrealized depreciation | 24,940,695* |
| Total | | $36,854,185 | | $27,722,634 |
*Includes cumulative appreciation/depreciation of futures contracts and/or centrally cleared swaps as reported in the fund’s portfolio. Only current day’s variation margin is reported within the Statement of assets and liabilities.
The following is a summary of realized and change in unrealized gains or losses of derivative instruments in the Statement of operations for the reporting period (Note 1):
Amount of realized gain or (loss) on derivatives recognized in net gain or (loss) on investments
| | | | | |
| Derivatives not accounted for as hedging | | | Forward currency | | |
| instruments under ASC 815 | Options | Futures | contracts | Swaps | Total |
| Credit contracts | $— | $— | $— | $(1,977,248) | $(1,977,248) |
| Foreign exchange contracts | — | — | 631,915 | — | $631,915 |
| Interest rate contracts | (10,603,857) | 4,708,242 | — | (2,015,624) | $(7,911,239) |
| Total | $(10,603,857) | $4,708,242 | $631,915 | $(3,992,872) | $(9,256,572) |
Change in unrealized appreciation or (depreciation) on derivatives recognized in net gain or (loss) on investments
| | | | | |
| Derivatives not accounted for as hedging | | | Forward currency | | |
| instruments under ASC 815 | Options | Futures | contracts | Swaps | Total |
| Credit contracts | $— | $— | $— | $3,884,801 | $3,884,801 |
| Foreign exchange contracts | — | — | (167,651) | — | $(167,651) |
| Interest rate contracts | 2,557,900 | 239,573 | — | 6,690,533 | $9,488,006 |
| Total | $2,557,900 | $239,573 | $(167,651) | $10,575,334 | $13,205,156 |
| |
| 42 | Putnam VT Diversified Income Fund |
|
| This page intentionally left blank. |
| |
| Putnam VT Diversified Income Fund | 43 |
Note 9 — Offsetting of financial and derivative assets and liabilities
The following table summarizes any derivatives, repurchase agreements and reverse repurchase agreements, at the end of the reporting period, that are subject to an enforceable master netting agreement or similar agreement. For securities lending transactions or borrowing transactions associated with securities sold short, if any, see Note 1. For financial reporting purposes, the fund does not offset financial assets and financial liabilities that are subject to the master netting agreements in the Statement of assets and liabilities.
| | | | | | | | | | | | | | | | | | | | |
| | Bank of America N.A. | Barclays Bank PLC | Barclays Capital, Inc. (clearing broker) | BofA
Securities, Inc. | Citibank, N.A. | Citigroup Global Markets, Inc. | Credit Suisse International | Goldman Sachs International | HSBC Bank USA, National Association | JPMorgan Chase Bank N.A. | JPMorgan Securities LLC | Merrill Lynch International | Morgan Stanley & Co. International PLC | NatWest Markets PLC | State Street Bank and
Trust Co. | Toronto- Dominion Bank | UBS AG | Wells Fargo Bank, N.A. | WestPac Banking Corp. | Total |
| Assets: | | | | | | | | | | | | | | | | | | | | |
| Centrally cleared interest | | | | | | | | | | | | | | | | | | | | |
| rate swap contracts§ | $— | $— | $1,578,775 | $— | $— | $— | $— | $— | $— | $— | $— | $— | $— | $— | $— | $— | $— | $— | $— | $1,578,775 |
| OTC Total return | | | | | | | | | | | | | | | | | | | | |
| swap contracts*# | — | — | — | — | — | — | — | — | — | — | — | — | — | — | — | — | — | — | — | — |
| OTC Credit default | | | | | | | | | | | | | | | | | | | | |
| contracts — | | | | | | | | | | | | | | | | | | | | |
| protection sold*# | — | — | — | — | — | — | — | — | — | — | — | — | — | — | — | — | — | — | — | — |
| OTC Credit default | | | | | | | | | | | | | | | | | | | | |
| contracts — protection | | | | | | | | | | | | | | | | | | | | |
| purchased*# | — | — | — | — | — | 546,779 | 456,660 | 242,154 | — | — | 527,614 | 116,941 | 296,645 | — | — | — | — | — | — | 2,186,793 |
| Centrally cleared credit | | | | | | | | | | | | | | | | | | | | |
| default contracts§ | — | — | — | — | — | — | — | — | — | — | — | — | — | — | — | — | — | — | — | — |
| Futures contracts§ | — | — | — | — | — | — | — | — | — | — | 34,092 | — | — | — | — | — | — | — | — | 34,092 |
| Forward currency | | | | | | | | | | | | | | | | | | | | |
| contracts# | 657 | 917 | — | — | 2 | — | — | 18,162 | 1,489 | 205 | — | — | 9,356 | — | 8,726 | 561 | 72,503 | — | 38 | 112,616 |
| Forward premium swap | | | | | | | | | | | | | | | | | | | | |
| option contracts# | 2,868,891 | 138,116 | — | — | 3,475,824 | — | — | 346,149 | — | 950,294 | — | — | 45,220 | — | — | 159,578 | 510,374 | — | — | 8,494,446 |
| Total Assets | $2,869,548 | $139,033 | $1,578,775 | $— | $3,475,826 | $546,779 | $456,660 | $606,465 | $1,489 | $950,499 | $561,706 | $116,941 | $351,221 | $— | $8,726 | $160,139 | $582,877 | $— | $38 | $12,406,722 |
| Liabilities: | | | | | | | | | | | | | | | | | | | | |
| Centrally cleared interest | | | | | | | | | | | | | | | | | | | | |
| rate swap contracts§ | $— | $— | $1,576,499 | $— | $— | $— | $— | $— | $— | $— | $— | $— | $— | $— | $— | $— | $— | $— | $— | $1,576,499 |
| OTC Total return | | | | | | | | | | | | | | | | | | | | |
| swap contracts*# | — | — | — | — | — | — | — | — | — | — | — | — | 135,841 | — | — | — | — | — | — | 135,841 |
| OTC Credit default | | | | | | | | | | | | | | | | | | | | |
| contracts — | | | | | | | | | | | | | | | | | | | | |
| protection sold*# | 14,722 | — | — | — | — | 991,337 | 206,173 | 585,960 | — | — | 204,141 | 13,307 | 335,938 | — | — | — | — | — | — | 2,351,578 |
| OTC Credit default | | | | | | | | | | | | | | | | | | | | |
| contracts — | | | | | | | | | | | | | | | | | | | | |
| protection purchased*# | — | — | — | — | — | — | — | — | — | — | — | — | — | — | — | — | — | — | — | — |
| Centrally cleared credit | | | | | | | | | | | | | | | | | | | | |
| default contracts§ | — | — | 60 | — | — | — | — | — | — | — | — | — | — | — | — | — | — | — | — | 60 |
| Futures contracts§ | — | — | — | — | — | — | — | — | — | — | — | — | — | — | — | — | — | — | — | — |
| Forward currency | | | | | | | | | | | | | | | | | | | | |
| contracts# | 453 | 421 | — | — | 398 | — | — | — | 4,066 | 941 | — | — | 193,003 | 2,290 | 59,441 | 16,623 | 991 | — | 15,893 | 294,520 |
| Forward premium swap | | | | | | | | | | | | | | | | | | | | |
| option contracts# | 1,778,216 | 87,222 | — | — | 1,698,299 | — | — | 279,011 | — | 916,157 | — | — | 136,933 | — | — | 57,532 | 293,058 | 66,620 | — | 5,313,048 |
| Total Liabilities | $1,793,391 | $87,643 | $1,576,559 | $— | $1,698,697 | $991,337 | $206,173 | $864,971 | $4,066 | $917,098 | $204,141 | $13,307 | $801,715 | $2,290 | $59,441 | $74,155 | $294,049 | $66,620 | $15,893 | $9,671,546 |
| Total Financial and | | | | | | | | | | | | | | | | | | | | |
| Derivative Net Assets | $1,076,157 | $51,390 | $2,216 | $— | $1,777,129 | $(444,558) | $250,487 | $(258,506) | $(2,577) | $33,401 | $357,565 | $103,634 | $(450,494) | $(2,290) | $(50,715) | $85,984 | $288,828 | $(66,620) | $(15,855) | $2,735,176 |
| Total collateral received | | | | | | | | | | | | | | | | | | | | |
| (pledged)†## | $1,076,157 | $— | $— | $— | $1,777,129 | $(444,558) | $250,487 | $(233,612) | $(999) | $20,000 | $230,000 | $103,634 | $(360,603) | $— | $(40,955) | $85,984 | $280,000 | $— | $— | |
| Net amount | $— | $51,390 | $2,216 | $— | $— | $— | $—�� | $(24,894) | $(1,578) | $13,401 | $127,565 | $— | $(89,891) | $(2,290) | $(9,760) | $— | $8,828 | $(66,620) | $(15,855) | |
| | |
| 44 | Putnam VT Diversified Income Fund | Putnam VT Diversified Income Fund | 45 |
| | | | | | | | | | | | | | | | | | | | |
| | Bank of America N.A. | Barclays Bank
PLC | Barclays Capital, Inc. (clearing broker) | BofA Securities, Inc. | Citibank, N.A. | Citigroup Global Markets, Inc. | Credit Suisse International | Goldman Sachs International | HSBC Bank USA, National Association | JPMorgan Chase Bank N.A. | JPMorgan Securities LLC | Merrill Lynch International | Morgan Stanley & Co. International PLC | NatWest Markets PLC | State Street Bank and
Trust Co. | Toronto- Dominion Bank | UBS AG | Wells Fargo Bank, N.A. | WestPac Banking Corp. | Total |
| Controlled collateral | | | | | | | | | | | | | | | | | | | | |
| received (including | | | | | | | | | | | | | | | | | | | | |
| TBA commitments)** | $1,096,668 | $— | $— | $51,000 | $1,786,000 | $— | $290,000 | $— | $— | $20,000 | $230,000 | $108,467 | $— | $— | $— | $120,000 | $280,000 | $— | $— | $3,982,135 |
| Uncontrolled collateral | | | | | | | | | | | | | | | | | | | | |
| received | $— | $— | $— | $— | $— | $— | $— | $— | $— | $— | $— | $— | $— | $— | $— | $— | $— | $— | $— | $— |
| Collateral (pledged) | | | | | | | | | | | | | | | | | | | | |
| (including TBA | | | | | | | | | | | | | | | | | | | | |
| commitments)** | $— | $— | $— | $— | $— | $(465,487) | $— | $(233,612) | $(999) | $— | $(215,762) | $— | $(360,603) | $— | $(40,955) | $— | $— | $— | $— | $(1,317,418) |
*Excludes premiums, if any. Included in unrealized appreciation and depreciation on OTC swap contracts on the Statement of assets and liabilities.
**Included with Investments in securities on the Statement of assets and liabilities.
†Additional collateral may be required from certain brokers based on individual agreements.
#Covered by master netting agreement (Note 1).
##Any over-collateralization of total financial and derivative net assets is not shown. Collateral may include amounts related to unsettled agreements.
§Includes current day’s variation margin only as reported on the Statement of assets and liabilities, which is not collateralized. Cumulative appreciation/(depreciation) for futures contracts and centrally cleared swap contracts is represented in the tables listed after the fund’s portfolio. Collateral pledged for initial margin on futures contracts and centrally cleared swap contracts, which is not included in the table above, amounted to $320,647 and $1,469,032, respectively.
| | |
| 46 | Putnam VT Diversified Income Fund | Putnam VT Diversified Income Fund | 47 |
| |
| 48 | Putnam VT Diversified Income Fund |

*Mr. Reynolds is an “interested person” (as defined in the Investment Company Act of 1940) of the fund and Putnam Investments. He is President and Chief Executive Officer of Putnam Investments, as well as the President of your fund and each of the other Putnam funds.
The address of each Trustee is 100 Federal Street, Boston, MA 02110.
As of December 31, 2022, there were 92 mutual funds, 4 closed-end funds, and 7 exchange-traded funds in the Putnam funds complex. Each Trustee serves as Trustee of all funds in the Putnam funds complex.
Each Trustee serves for an indefinite term, until his or her resignation, retirement at age 75, removal, or death.
| |
| Putnam VT Diversified Income Fund | 49 |
Officers
In addition to Robert L. Reynolds, the other officers of the fund are shown below:
| | |
| James F. Clark (Born 1974) | Richard T. Kircher (Born 1962) | Denere P. Poulack (Born 1968) |
| Vice President and Chief Compliance Officer | Vice President and BSA Compliance Officer | Assistant Vice President, Assistant Clerk, |
| Since 2016 | Since 2019 | and Assistant Treasurer |
| Chief Compliance Officer and Chief Risk Officer, | Assistant Director, Operational Compliance, | Since 2004 |
| Putnam Investments, and Chief Compliance | Putnam Investments and Putnam | |
| Officer, Putnam Management | Retail Management | Janet C. Smith (Born 1965) |
| | | Vice President, Principal Financial |
| Nancy E. Florek (Born 1957) | Martin Lemaire (Born 1984) | Officer, Principal Accounting Officer, |
| Vice President, Director of Proxy Voting | Vice President and Derivatives Risk Manager | and Assistant Treasurer |
| and Corporate Governance, Assistant Clerk, | Since 2022 | Since 2007 |
| and Assistant Treasurer | Risk Manager and Risk Analyst, | Head of Fund Administration Services, Putnam |
| Since 2000 | Putnam Investments | Investments and Putnam Management |
| |
| Michael J. Higgins (Born 1976) | Susan G. Malloy (Born 1957) | Stephen J. Tate (Born 1974) |
| Vice President, Treasurer, and Clerk | Vice President and Assistant Treasurer | Vice President and Chief Legal Officer |
| Since 2010 | Since 2007 | Since 2021 |
| | Head of Accounting and Middle Office Services, | General Counsel, Putnam Investments, Putnam |
| Jonathan S. Horwitz (Born 1955) | Putnam Investments and Putnam Management | Management, and Putnam Retail Management |
| Executive Vice President, Principal Executive | | |
| Officer, and Compliance Liaison | Alan G. McCormack (Born 1964) | Mark C. Trenchard (Born 1962) |
| Since 2004 | Vice President and Derivatives Risk Manager | Vice President |
| | Since 2022 | Since 2002 |
| | Head of Quantitative Equities and Risk, | Director of Operational Compliance, Putnam |
| | Putnam Investments | Investments and Putnam Retail Management |
The principal occupations of the officers for the past five years have been with the employers as shown above, although in some cases they have held different positions with such employers. The address of each officer is 100 Federal Street, Boston, MA 02110.
| |
| 50 | Putnam VT Diversified Income Fund |
|
| This page intentionally left blank. |
| |
| Putnam VT Diversified Income Fund | 51 |
|
| This page intentionally left blank. |
| |
| 52 | Putnam VT Diversified Income Fund |
Other important information
Proxy voting
Putnam is committed to managing our mutual funds in the best interests of our shareholders. The Putnam funds’ proxy voting guidelines and procedures, as well as information regarding how your fund voted proxies relating to portfolio securities during the 12-month period ended June 30, 2022, are available in the Individual Investors section of putnam.com and on the Securities and Exchange Commission’s (SEC) website at www.sec.gov. If you have questions about finding forms on the SEC’s website, you may call the SEC at 1-800-SEC-0330. You may also obtain the Putnam funds’ proxy voting guidelines and procedures at no charge by calling Putnam’s Shareholder Services at 1-800-225-1581.
Fund portfolio holdings
The fund will file a complete schedule of its portfolio holdings with the SEC for the first and third quarters of each fiscal year on Form N-PORT within 60 days of the end of such fiscal quarter. Shareholders may obtain the fund’s Form N-PORT from the SEC’s website at www.sec.gov.
Prior to its use of Form N-PORT, the fund filed its complete schedule of its portfolio holdings with the SEC on Form N-Q, which is available online at www.sec.gov.
Fund information
| | |
| Investment Manager | Investor Servicing Agent | Trustees |
| Putnam Investment Management, LLC | Putnam Investments | Kenneth R. Leibler, Chair |
| 100 Federal Street | Mailing address: | Barbara M. Baumann, Vice Chair |
| Boston, MA 02110 | P.O. Box 219697 | Liaquat Ahamed |
| Kansas City, MO 64121-9697 | Katinka Domotorffy |
| Investment Sub-Advisor | 1-800-225-1581 | Catharine Bond Hill |
| Putnam Investments Limited | | Jennifer Williams Murphy |
| 16 St James’s Street | Custodian | Marie Pillai |
| London, England SW1A 1ER | State Street Bank and Trust Company | George Putnam III |
| | | Robert L. Reynolds |
| Marketing Services | Legal Counsel | Manoj P. Singh |
| Putnam Retail Management | Ropes & Gray LLP | Mona K. Sutphen |
| Limited Partnership | | |
| 100 Federal Street | Independent Registered | |
| Boston, MA 02110 | Public Accounting Firm | |
| PricewaterhouseCoopers LLP | |
The fund’s Statement of Additional Information contains additional information about the fund’s Trustees and is available without charge upon request by calling 1-800-225-1581.
| |
| Putnam VT Diversified Income Fund | 53 |
| |
| This report has been prepared for the shareholders | |
| of Putnam VT Diversified Income Fund. | VTAN28 332123 2/23 |
| |
| (a) The fund’s principal executive, financial and accounting officers are employees of Putnam Investment Management, LLC, the Fund’s investment manager. As such they are subject to a comprehensive Code of Ethics adopted and administered by Putnam Investments which is designed to protect the interests of the firm and its clients. The Fund has adopted a Code of Ethics which incorporates the Code of Ethics of Putnam Investments with respect to all of its officers and Trustees who are employees of Putnam Investment Management, LLC. For this reason, the Fund has not adopted a separate code of ethics governing its principal executive, financial and accounting officers. |
| |
| (c) In January 2023, the Code of Ethics of Putnam Investments and Code of Ethics of Putnam Funds were amended. The key changes to the Putnam Investments Code of Ethics are as follows: (i) Prohibition on investments in a single stock ETFs and (ii) Revision to the 7-day blackout rule for Analysts. The key change to the Putnam Funds Code of Ethics was that the provisions of the Code of Ethics for employees of PanAgora Asset Management, inc. and any of its subsidiaries are excluded from the Putnam Funds’ Code of Ethics. |
| |
| Item 3. Audit Committee Financial Expert: |
| |
| The Funds’ Audit, Compliance and Risk Committee is comprised solely of Trustees who are “independent” (as such term has been defined by the Securities and Exchange Commission (“SEC”) in regulations implementing Section 407 of the Sarbanes-Oxley Act (the “Regulations”)). The Trustees believe that each member of the Audit, Compliance and Risk Committee also possesses a combination of knowledge and experience with respect to financial accounting matters, as well as other attributes, that qualifies him or her for service on the Committee. In addition, the Trustees have determined that each of Dr. Hill, Ms. Murphy and Mr. Singh qualifies as an “audit committee financial expert” (as such term has been defined by the Regulations) based on their review of his or her pertinent experience and education.The SEC has stated, and the funds’ amended and restated agreement and Declaration of Trust provides, that the designation or identification of a person as an audit committee financial expert pursuant to this Item 3 of Form N-CSR does not impose on such person any duties, obligations or liability that are greater than the duties, obligations and liability imposed on such person as a member of the Audit, Compliance and Risk Committee and the Board of Trustees in the absence of such designation or identification. |
| |
| Item 4. Principal Accountant Fees and Services: |
| |
| The following table presents fees billed in each of the last two fiscal years for services rendered to the fund by the fund’s independent auditor: |
| | | | | |
| Fiscal year ended | Audit Fees | Audit-Related Fees | Tax Fees | All Other Fees |
|
|
| | | | | |
| December 31, 2022 | $135,654 | $ — | $15,192 | $ — |
| December 31, 2021 | $128,043 | $ — | $10,717 | $ — |
| |
| For the fiscal years ended December 31, 2022 and December 31, 2021, the fund’s independent auditor billed aggregate non-audit fees in the amounts of $257,203 and $304,137 respectively, to the fund, Putnam Management and any entity controlling, controlled by or under common control with Putnam Management that provides ongoing services to the fund. |
| |
| Audit Fees represent fees billed for the fund’s last two fiscal years relating to the audit and review of the financial statements included in annual reports and registration statements, and other services that are normally provided in connection with statutory and regulatory filings or engagements. |
| |
| Audit-Related Fees represent fees billed in the fund’s last two fiscal years for services traditionally performed by the fund’s auditor, including accounting consultation for proposed transactions or concerning financial accounting and reporting standards and other audit or attest services not required by statute or regulation. |
| |
| Tax Fees represent fees billed in the fund’s last two fiscal years for tax compliance, tax planning and tax advice services. Tax planning and tax advice services include assistance with tax audits, employee benefit plans and requests for rulings or technical advice from taxing authorities. |
| |
| Pre-Approval Policies of the Audit, Compliance and Risk Committee. The Audit, Compliance and Risk Committee of the Putnam funds has determined that, as a matter of policy, all work performed for the funds by the funds’ independent auditors will be pre-approved by the Committee itself and thus will generally not be subject to pre-approval procedures. |
| |
| The Audit, Compliance and Risk Committee also has adopted a policy to pre-approve the engagement by Putnam Management and certain of its affiliates of the funds’ independent auditors, even in circumstances where pre-approval is not required by applicable law. Any such requests by Putnam Management or certain of its affiliates are typically submitted in writing to the Committee and explain, among other things, the nature of the proposed engagement, the estimated fees, and why this work should be performed by that particular audit firm as opposed to another one. In reviewing such requests, the Committee considers, among other things, whether the provision of such services by the audit firm are compatible with the independence of the audit firm. |
| |
| The following table presents fees billed by the fund’s independent auditor for services required to be approved pursuant to paragraph (c)(7)(ii) of Rule 2–01 of Regulation S-X. |
| | | | | |
| Fiscal year ended | Audit-Related Fees | Tax Fees | All Other Fees | Total Non-Audit Fees |
|
|
| December 31, 2022 | $ — | $242,011 | $ — | $ — |
| December 31, 2021 | $ — | $293,420 | $ — | $ — |
| |
| Item 5. Audit Committee of Listed Registrants |
| |
| Item 6. Schedule of Investments: |
| |
| The registrant’s schedule of investments in unaffiliated issuers is included in the report to shareholders in Item 1 above. |
| |
| Item 7. Disclosure of Proxy Voting Policies and Procedures For Closed-End Management Investment Companies: |
| |
| Item 8. Portfolio Managers of Closed-End Investment Companies |
| |
| Item 9. Purchases of Equity Securities by Closed-End Management Investment Companies and Affiliated Purchasers: |
| |
| Item 10. Submission of Matters to a Vote of Security Holders: |
| |
| Item 11. Controls and Procedures: |
| |
| (a) The registrant’s principal executive officer and principal financial officer have concluded, based on their evaluation of the effectiveness of the design and operation of the registrant’s disclosure controls and procedures as of a date within 90 days of the filing date of this report, that the design and operation of such procedures are generally effective to provide reasonable assurance that information required to be disclosed by the registrant in this report is recorded, processed, summarized and reported within the time periods specified in the Commission’s rules and forms. |
| |
| (b) Changes in internal control over financial reporting: Not applicable |
| |
| Item 12. Disclosures of Securities Lending Activities for Closed-End Management Investment Companies: |
| |
| (a)(1) The Code of Ethics of The Putnam Funds, which incorporates the Code of Ethics of Putnam Investments, is filed herewith. |
| |
| Pursuant to the requirements of the Securities Exchange Act of 1934 and the Investment Company Act of 1940, the registrant has duly caused this report to be signed on its behalf by the undersigned, thereunto duly authorized. |
| |
| By (Signature and Title): |
| |
| /s/ Janet C. Smith
Janet C. Smith
Principal Accounting Officer
|
| |
| Pursuant to the requirements of the Securities Exchange Act of 1934 and the Investment Company Act of 1940, this report has been signed below by the following persons on behalf of the registrant and in the capacities and on the dates indicated. |
| |
| By (Signature and Title): |
| |
| /s/ Jonathan S. Horwitz
Jonathan S. Horwitz
Principal Executive Officer
|
| |
| By (Signature and Title): |
| |
| /s/ Janet C. Smith
Janet C. Smith
Principal Financial Officer
|