| |
| SECURITIES AND EXCHANGE COMMISSION |
| |
| CERTIFIED SHAREHOLDER REPORT OF REGISTERED |
| |
| MANAGEMENT INVESTMENT COMPANIES |
| | |
| Investment Company Act file number: | (811-05346) |
| | |
| Exact name of registrant as specified in charter: | Putnam Variable Trust |
| | |
| Address of principal executive offices: | 100 Federal Street, Boston, Massachusetts 02110 |
| | |
| Name and address of agent for service: | Stephen Tate, Vice President |
| | |
| | Boston, Massachusetts 02110 |
| | |
| Copy to: | Bryan Chegwidden, Esq. |
| | |
| | 1211 Avenue of the Americas |
| | |
| | Boston, Massachusetts 02199 |
| | |
| Registrant’s telephone number, including area code: | (617) 292-1000 |
| | |
| Date of fiscal year end: | December 31, 2024 |
| | |
| Date of reporting period: | January 1, 2024 – December 31, 2024 |
| |
| Item 1. Report to Stockholders: |
| |
| The following is a copy of the report transmitted to stockholders pursuant to Rule 30e-1 under the Investment Company Act of 1940: |
| | |
Putnam VT Income Fund | |
Class IA true |
| Annual Shareholder Report | December 31, 2024 |
|
This annual shareholder report contains important information about Putnam VT Income Fund for the period January 1, 2024, to December 31, 2024.
You can find additional information about the Fund at https://www.franklintempleton.com/regulatory-fund-documents. You can also request this information by contacting us at (800) 225-1581.
This report describes changes to the Fund that occurred during the reporting period.
WHAT WERE THE FUND COSTS FOR THE LAST YEAR? (based on a hypothetical $10,000 investment)
| | |
Class Name | Costs of a $10,000 investment | Costs paid as a percentage of a $10,000 investment |
Class IA1 | $60 | 0.59% |
| 1 | Does not reflect expenses incurred from investing through variable annuity or variable life insurance products. |
HOW DID THE FUND PERFORM LAST YEAR AND WHAT AFFECTED ITS PERFORMANCE?
For the twelve months ended December 31, 2024, Class IA shares of Putnam VT Income Fund returned 2.56%. The Fund compares its performance to the Bloomberg U.S. Aggregate Index, which returned 1.25% for the same period.
| |
Top contributors to performance: |
| ↑ | Mortgage credit strategies added value, driven by positioning in both residential (RMBS) and commercial mortgage-backed securities (CMBS). RMBS continued to benefit from U.S. housing market strength, solid borrower fundamentals, and low expectations for a U.S. recession. Additionally, demand for CMBS improved substantially in 2024 despite changes to expectations for the timing and number of rate cuts. |
| ↑ | Corporate credit strategies contributed to returns, as both investment-grade and high yield spreads tightened during the year. |
| ↑ | Prepayment strategies contributed to returns, as seasoned interest-only (IO) and inverse IO bonds are still well “out-of-the-money” and thus benefited from stable prepayment speeds and a strong carry profile. |
| |
Top detractors from performance: |
| ↓ | Term structure strategies were the primary detractor, particularly in the third quarter, as the Fund had a slightly short duration posture in an environment where U.S. Treasury yields rallied across the curve. |
Use of derivatives and the impact on performance:
The Fund utilized futures for hedging treasury term structure risk and for yield curve positioning, which detracted from performance.
| Putnam VT Income Fund | PAGE 1 | 38921-ATSIA-0225 |
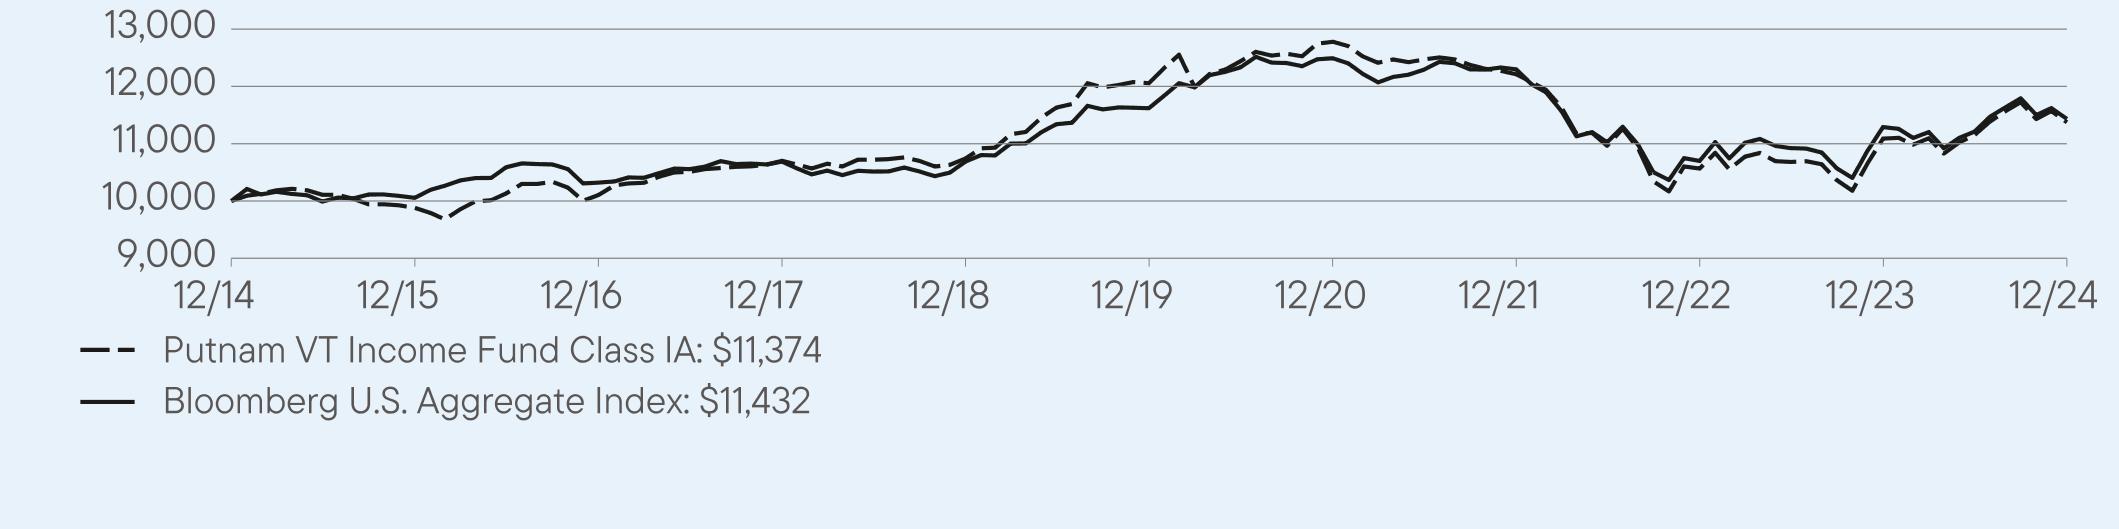
HOW DID THE FUND PERFORM OVER THE LAST 10 YEARS?
The Fund’s past performance is not necessarily an indication of how the Fund will perform in the future. The graph and table do not reflect the deduction of taxes that a shareholder would pay on Fund distributions or redemption of Fund shares.
VALUE OF A $10,000 INVESTMENT – Class IA 12/31/2014 — 12/31/2024
AVERAGE ANNUAL TOTAL RETURNS (%) Period Ended December 31, 2024
| | | |
| | 1 Year | 5 Year | 10 Year |
Class IA | 2.56 | -1.16 | 1.30 |
Bloomberg U.S. Aggregate Index | 1.25 | -0.33 | 1.35 |
Performance does not reflect expenses incurred from investing through variable annuity or variable life insurance products, which if reflected, would reduce performance of the Fund.
Fund performance figures may reflect fee waivers and/or expense reimbursements, without which the performance would have been lower.
Important data provider notices and terms available at www.franklintempletondatasources.com.
KEY FUND STATISTICS (as of December 31, 2024)
| |
Total Net Assets | $138,075,010 |
Total Number of Portfolio Holdings* | 838 |
Total Management Fee Paid | $543,719 |
Portfolio Turnover Rate | 461% |
| * | Includes derivatives, if applicable. |
| Putnam VT Income Fund | PAGE 2 | 38921-ATSIA-0225 |
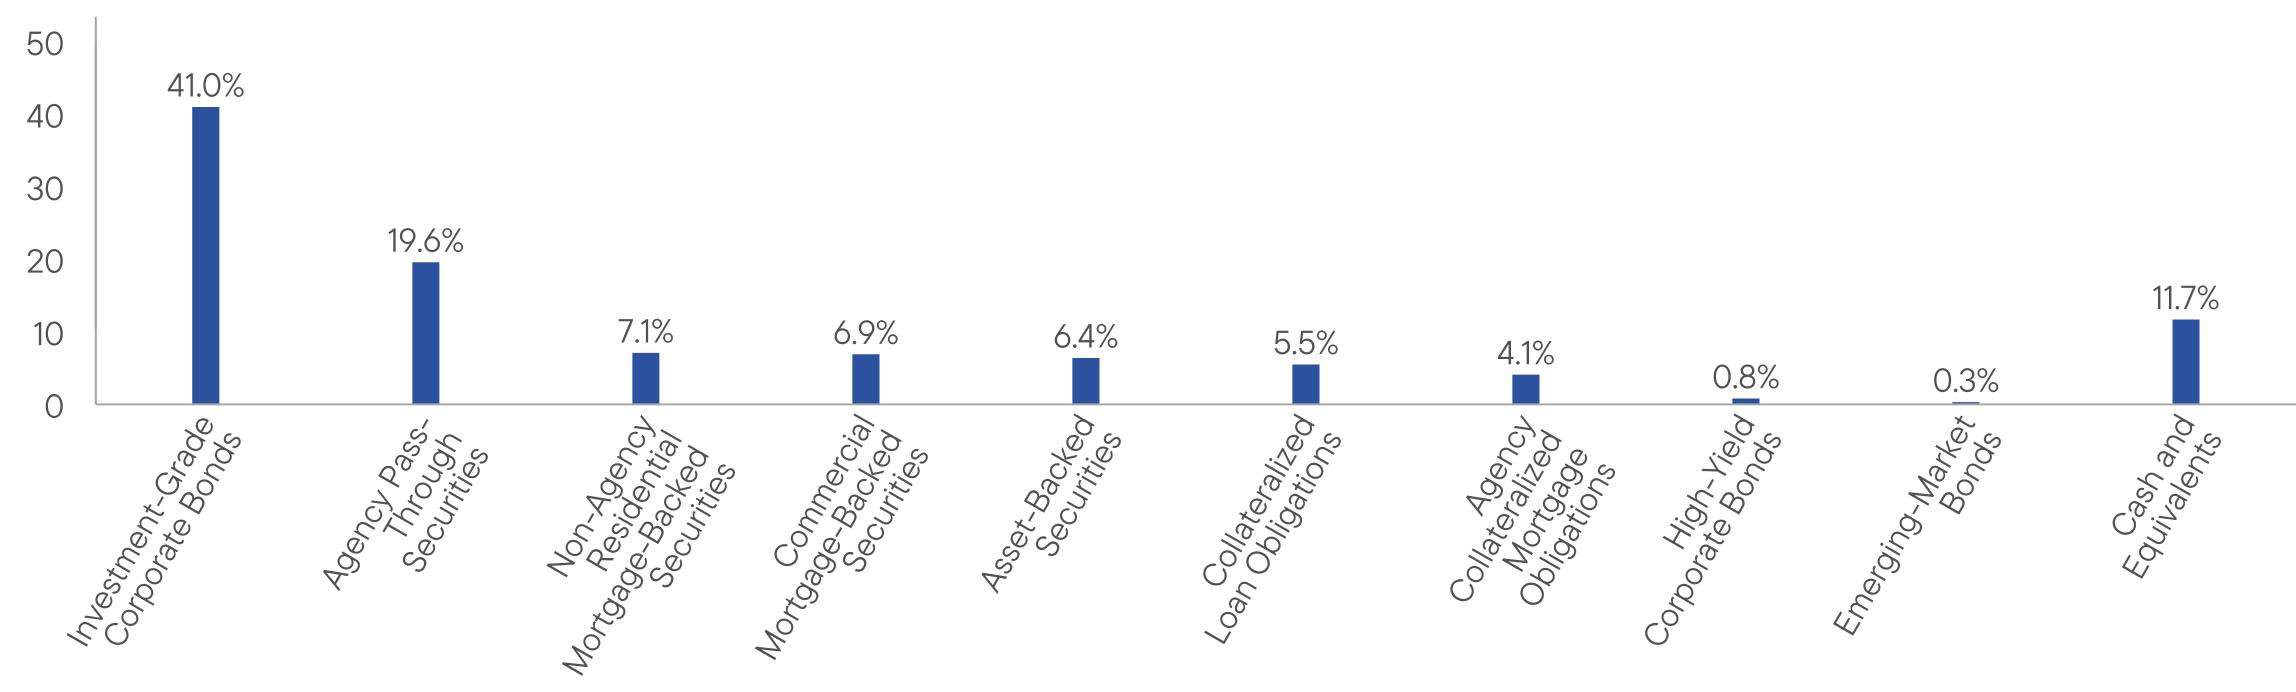
WHAT DID THE FUND INVEST IN? (as of December 31, 2024)
Portfolio Composition (% of Total Net Assets)
| Cash and Equivalents, if any, represent the market value weights of cash, derivatives, short-term securities, and other unclassified assets in the portfolio. Allocations may not total 100% because the chart includes the notional value of certain derivatives (the economic value for purposes of calculating periodic payment obligations), including to-be-announced mortgage security trades, if any, in addition to the market value of securities. Holdings and allocations may vary over time. |
HOW HAS THE FUND CHANGED?
On May 31, 2023, Franklin Resources, Inc. (“Franklin Templeton”) and Great-West Lifeco Inc., the parent company of Putnam U.S. Holdings I, LLC (“Putnam Holdings”), announced that they had entered into a definitive agreement for a subsidiary of Franklin Templeton to acquire Putnam Holdings in a stock and cash transaction (the “Transaction”). The Transaction was completed on January 1, 2024. As part of the Transaction, your Fund’s then-current investment advisor, Putnam Investment Management, LLC (“Putnam Management”), a wholly-owned subsidiary of Putnam Holdings, and your Fund’s then-current sub-advisor, Putnam Investments Limited (“PIL”), an indirect, wholly-owned subsidiary of Putnam Holdings, became indirect, wholly-owned subsidiaries of Franklin Templeton. In connection with the Transaction, shareholders of your Fund approved a new management contract with Putnam Management and a new sub-advisory contract with PIL. The new contracts were identical to the previous contracts, except for the effective dates, initial terms, updates to fund names as necessary to reflect previous name changes, and certain non-substantive changes.
Effective July 15, 2024, Putnam Management transferred its management contract for your Fund to Franklin Advisers, Inc. (“Franklin Advisers”), and Franklin Advisers replaced Putnam Management as the investment advisor to your Fund. In connection with the transfer, your Fund’s portfolio managers, along with supporting research analysts and certain other investment staff of Putnam Management, also became employees of Franklin Advisers. Putnam Management also transferred to Franklin Advisers its sub-management agreement with PIL in respect of your Fund. Franklin Advisers is a direct, wholly-owned subsidiary of Franklin Templeton. In addition, effective July 15, 2024, Franklin Advisers retained Putnam Management as a sub-advisor to your Fund pursuant to a new sub-advisory agreement.
Effective November 1, 2024 (the “Effective Date”), PIL, a sub-advisor of the Fund prior to the Effective Date, merged with and into Franklin Templeton Investment Management Limited (“FTIML”), a wholly-owned subsidiary of Franklin Templeton (the “Merger”). As of the Effective Date, PIL investment professionals became employees of FTIML, and the sub-advisory agreement between Franklin Advisers and PIL with respect to the Fund was terminated. In connection with the Merger, the Fund’s Trustees approved a new sub-advisory agreement between Franklin Advisers and FTIML, pursuant to which FTIML became a sub-advisor of the Fund on the Effective Date.
Effective September 30, 2024, the portfolio managers for the Fund are Albert Chan, Tina Chou, Patrick Klein, Michael Salm and Matthew Walkup.
This is a summary of certain changes to the Fund since January 1, 2024. For more complete information, you may review the Fund’s current prospectus and any applicable supplements and the Fund’s next prospectus, which we expect to be available by May 1, 2025, at https://www.franklintempleton.com/regulatory-fund-documents or upon request at (800) 225-1581 or
funddocuments@putnam.com.
| Putnam VT Income Fund | PAGE 3 | 38921-ATSIA-0225 |
| |
| WHERE CAN I FIND ADDITIONAL INFORMATION ABOUT THE FUND? |
Additional information is available on https://www.franklintempleton.com/regulatory-fund-documents, including its: |
| • prospectus • proxy voting information • financial information • holdings • tax information |
| Putnam VT Income Fund | PAGE 4 | 38921-ATSIA-0225 |
100009881101051070110741120561278012213105661109011374100001005510321106871068811620124921229910699112911143241.019.67.16.96.45.54.10.80.311.7
| | |
Putnam VT Income Fund | |
Class IB true |
| Annual Shareholder Report | December 31, 2024 |
|
This annual shareholder report contains important information about Putnam VT Income Fund for the period January 1, 2024, to December 31, 2024.
You can find additional information about the Fund at https://www.franklintempleton.com/regulatory-fund-documents. You can also request this information by contacting us at (800) 225-1581.
This report describes changes to the Fund that occurred during the reporting period.
WHAT WERE THE FUND COSTS FOR THE LAST YEAR? (based on a hypothetical $10,000 investment)
| | |
Class Name | Costs of a $10,000 investment | Costs paid as a percentage of a $10,000 investment |
Class IB1 | $85 | 0.84% |
| 1 | Does not reflect expenses incurred from investing through variable annuity or variable life insurance products. |
HOW DID THE FUND PERFORM LAST YEAR AND WHAT AFFECTED ITS PERFORMANCE?
For the twelve months ended December 31, 2024, Class IB shares of Putnam VT Income Fund returned 2.32%. The Fund compares its performance to the Bloomberg U.S. Aggregate Index, which returned 1.25% for the same period.
| |
Top contributors to performance: |
| ↑ | Mortgage credit strategies added value, driven by positioning in both residential (RMBS) and commercial mortgage-backed securities (CMBS). RMBS continued to benefit from U.S. housing market strength, solid borrower fundamentals, and low expectations for a U.S. recession. Additionally, demand for CMBS improved substantially in 2024 despite changes to expectations for the timing and number of rate cuts. |
| ↑ | Corporate credit strategies contributed to returns, as both investment-grade and high yield spreads tightened during the year. |
| ↑ | Prepayment strategies contributed to returns, as seasoned interest-only (IO) and inverse IO bonds are still well “out-of-the-money” and thus benefited from stable prepayment speeds and a strong carry profile. |
| |
Top detractors from performance: |
| ↓ | Term structure strategies were the primary detractor, particularly in the third quarter, as the Fund had a slightly short duration posture in an environment where U.S. Treasury yields rallied across the curve. |
Use of derivatives and the impact on performance:
The Fund utilized futures for hedging treasury term structure risk and for yield curve positioning, which detracted from performance.
| Putnam VT Income Fund | PAGE 1 | 38921-ATSIB-0225 |
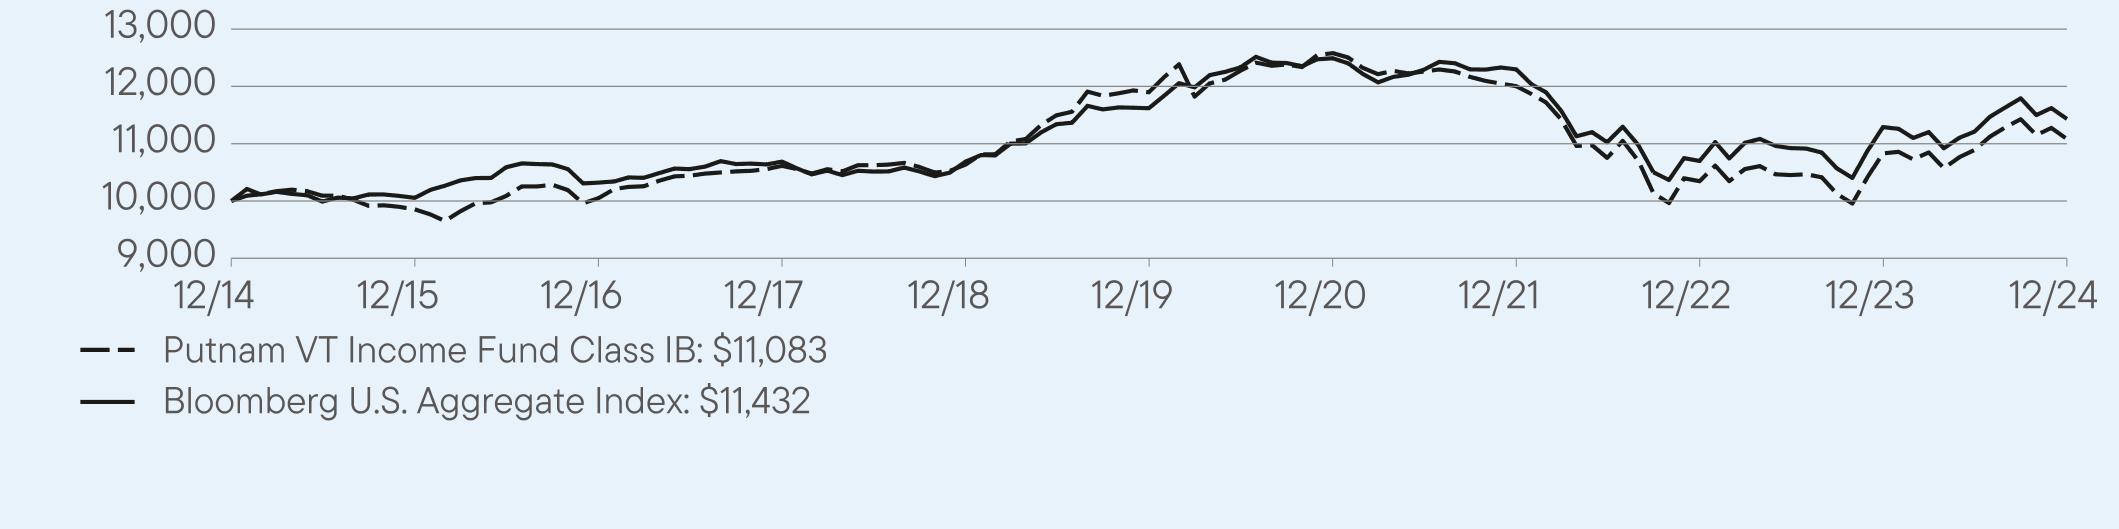
HOW DID THE FUND PERFORM OVER THE LAST 10 YEARS?
The Fund’s past performance is not necessarily an indication of how the Fund will perform in the future. The graph and table do not reflect the deduction of taxes that a shareholder would pay on Fund distributions or redemption of Fund shares.
VALUE OF A $10,000 INVESTMENT – Class IB 12/31/2014 — 12/31/2024
AVERAGE ANNUAL TOTAL RETURNS (%) Period Ended December 31, 2024
| | | |
| | 1 Year | 5 Year | 10 Year |
Class IB | 2.32 | -1.41 | 1.03 |
Bloomberg U.S. Aggregate Index | 1.25 | -0.33 | 1.35 |
Performance does not reflect expenses incurred from investing through variable annuity or variable life insurance products, which if reflected, would reduce performance of the Fund.
Fund performance figures may reflect fee waivers and/or expense reimbursements, without which the performance would have been lower.
Important data provider notices and terms available at www.franklintempletondatasources.com.
KEY FUND STATISTICS (as of December 31, 2024)
| |
Total Net Assets | $138,075,010 |
Total Number of Portfolio Holdings* | 838 |
Total Management Fee Paid | $543,719 |
Portfolio Turnover Rate | 461% |
| * | Includes derivatives, if applicable. |
| Putnam VT Income Fund | PAGE 2 | 38921-ATSIB-0225 |
WHAT DID THE FUND INVEST IN? (as of December 31, 2024)
Portfolio Composition (% of Total Net Assets)
| Cash and Equivalents, if any, represent the market value weights of cash, derivatives, short-term securities, and other unclassified assets in the portfolio. Allocations may not total 100% because the chart includes the notional value of certain derivatives (the economic value for purposes of calculating periodic payment obligations), including to-be-announced mortgage security trades, if any, in addition to the market value of securities. Holdings and allocations may vary over time. |
HOW HAS THE FUND CHANGED?
On May 31, 2023, Franklin Resources, Inc. (“Franklin Templeton”) and Great-West Lifeco Inc., the parent company of Putnam U.S. Holdings I, LLC (“Putnam Holdings”), announced that they had entered into a definitive agreement for a subsidiary of Franklin Templeton to acquire Putnam Holdings in a stock and cash transaction (the “Transaction”). The Transaction was completed on January 1, 2024. As part of the Transaction, your Fund’s then-current investment advisor, Putnam Investment Management, LLC (“Putnam Management”), a wholly-owned subsidiary of Putnam Holdings, and your Fund’s then-current sub-advisor, Putnam Investments Limited (“PIL”), an indirect, wholly-owned subsidiary of Putnam Holdings, became indirect, wholly-owned subsidiaries of Franklin Templeton. In connection with the Transaction, shareholders of your Fund approved a new management contract with Putnam Management and a new sub-advisory contract with PIL. The new contracts were identical to the previous contracts, except for the effective dates, initial terms, updates to fund names as necessary to reflect previous name changes, and certain non-substantive changes.
Effective July 15, 2024, Putnam Management transferred its management contract for your Fund to Franklin Advisers, Inc. (“Franklin Advisers”), and Franklin Advisers replaced Putnam Management as the investment advisor to your Fund. In connection with the transfer, your Fund’s portfolio managers, along with supporting research analysts and certain other investment staff of Putnam Management, also became employees of Franklin Advisers. Putnam Management also transferred to Franklin Advisers its sub-management agreement with PIL in respect of your Fund. Franklin Advisers is a direct, wholly-owned subsidiary of Franklin Templeton. In addition, effective July 15, 2024, Franklin Advisers retained Putnam Management as a sub-advisor to your Fund pursuant to a new sub-advisory agreement.
Effective November 1, 2024 (the “Effective Date”), PIL, a sub-advisor of the Fund prior to the Effective Date, merged with and into Franklin Templeton Investment Management Limited (“FTIML”), a wholly-owned subsidiary of Franklin Templeton (the “Merger”). As of the Effective Date, PIL investment professionals became employees of FTIML, and the sub-advisory agreement between Franklin Advisers and PIL with respect to the Fund was terminated. In connection with the Merger, the Fund’s Trustees approved a new sub-advisory agreement between Franklin Advisers and FTIML, pursuant to which FTIML became a sub-advisor of the Fund on the Effective Date.
Effective September 30, 2024, the portfolio managers for the Fund are Albert Chan, Tina Chou, Patrick Klein, Michael Salm and Matthew Walkup.
This is a summary of certain changes to the Fund since January 1, 2024. For more complete information, you may review the Fund’s current prospectus and any applicable supplements and the Fund’s next prospectus, which we expect to be available by May 1, 2025, at https://www.franklintempleton.com/regulatory-fund-documents or upon request at (800) 225-1581 or
funddocuments@putnam.com.
| Putnam VT Income Fund | PAGE 3 | 38921-ATSIB-0225 |
| |
| WHERE CAN I FIND ADDITIONAL INFORMATION ABOUT THE FUND? |
Additional information is available on https://www.franklintempleton.com/regulatory-fund-documents, including its: |
| • prospectus • proxy voting information • financial information • holdings • tax information |
| Putnam VT Income Fund | PAGE 4 | 38921-ATSIB-0225 |
100009854100511061310635118991258112004103461083211083100001005510321106871068811620124921229910699112911143241.019.67.16.96.45.54.10.80.311.7
| |
| (a) The fund’s principal executive, financial and accounting officers are employees of Putnam Investment Management, LLC, the Fund’s investment manager, or Franklin Templeton. As such they are subject to a comprehensive Code of Ethics adopted and administered by Putnam Investment Management, LLC and Franklin Templeton which is designed to protect the interests of the firm and its clients. The Fund has adopted a Code of Ethics which incorporates the Code of Ethics of Franklin Templeton with respect to all of its officers and Trustees who are employees of Putnam Investment Management, LLC and Franklin Templeton. For this reason, the Fund has not adopted a separate code of ethics governing its principal executive, financial and accounting officers. |
| |
| (c) In connection with the acquisition of Putnam Investments by Franklin Templeton, the Putnam Investments Code of Ethics was amended effective January 1, 2024 to reflect revised compliance processes, including: (i) Compliance with the Putnam Investments Code of Ethics will be viewed as compliance with the Franklin Templeton Code for certain Putnam employees who are dual-hatted in Franklin Templeton advisory entities (ii) Certain Franklin Templeton employees are required to hold shares of Putnam mutual funds at Putnam Investor Services, Inc. and (iii) Certain provisions of the Putnam Investments Code of Ethics are amended that are no longer needed due to organizational changes. Effective March 4, 2024, the majority of legacy Putnam employees transitioned to Franklin Templeton policies outlined in the Franklin Templeton Code. |
| |
| Item 3. Audit Committee Financial Expert: |
| |
| The Funds’ Audit, Compliance and Risk Committee is comprised solely of Trustees who are “independent” (as such term has been defined by the Securities and Exchange Commission (“SEC”) in regulations implementing Section 407 of the Sarbanes-Oxley Act (the “Regulations”)). The Trustees believe that each member of the Audit, Compliance and Risk Committee also possesses a combination of knowledge and experience with respect to financial accounting matters, as well as other attributes, that qualifies him or her for service on the Committee. In addition, the Trustees have determined that each of Mr. McGreevey and Mr. Singh qualifies as an “audit committee financial expert” (as such term has been defined by the Regulations) based on their review of his or her pertinent experience and education.The SEC has stated, and the funds’ amended and restated agreement and Declaration of Trust provides, that the designation or identification of a person as an audit committee financial expert pursuant to this Item 3 of Form N-CSR does not impose on such person any duties, obligations or liability that are greater than the duties, obligations and liability imposed on such person as a member of the Audit, Compliance and Risk Committee and the Board of Trustees in the absence of such designation or identification. |
| |
| Item 4. Principal Accountant Fees and Services: |
| |
| The following table presents fees billed in each of the last two fiscal years for services rendered to the fund by the fund’s independent auditor: |
Fiscal year ended | Audit Fees | Audit-Related Fees | Tax Fees | All Other Fees |
December 31, 2024 | $101,381 | $ — | $8,640 | $ — |
December 31, 2023 | $117,403 | $ — | $9,640 | $ — |
| |
| For the fiscal years ended December 31, 2024 and December 31, 2023, the fund’s independent auditor billed aggregate non-audit fees in the amounts of $872,876 and $369,772 respectively, to the fund, the fund’s investment manager and any entity controlling, controlled by or under common control with the fund’s investment manager that provides ongoing services to the fund. |
| |
| Audit Fees represent fees billed for the fund’s last two fiscal years relating to the audit and review of the financial statements included in annual reports and registration statements, and other services that are normally provided in connection with statutory and regulatory filings or engagements. |
| |
| Audit-Related Fees represent fees billed in the fund’s last two fiscal years for services traditionally performed by the fund’s auditor, including accounting consultation for proposed transactions or concerning financial accounting and reporting standards and other audit or attest services not required by statute or regulation. |
| |
| Tax Fees represent fees billed in the fund’s last two fiscal years for tax compliance, tax planning and tax advice services. Tax planning and tax advice services include assistance with tax audits, employee benefit plans and requests for rulings or technical advice from taxing authorities. |
| |
| Pre-Approval Policies of the Audit, Compliance and Risk Committee. The Audit, Compliance and Risk Committee of the Putnam funds has determined that, as a matter of policy, all work performed for the funds by the funds’ independent auditors will be pre-approved by the Committee itself and thus will generally not be subject to pre-approval procedures. |
| |
| The Audit, Compliance and Risk Committee also has adopted a policy to pre-approve the engagement by the fund’s investment manager and certain of its affiliates of the funds’ independent auditors, even in circumstances where pre-approval is not required by applicable law. Any such requests by the fund’s investment manager or certain of its affiliates are typically submitted in writing to the Committee and explain, among other things, the nature of the proposed engagement, the estimated fees, and why this work should be performed by that particular audit firm as opposed to another one. In reviewing such requests, the Committee considers, among other things, whether the provision of such services by the audit firm are compatible with the independence of the audit firm. |
| |
| The following table presents fees billed by the fund’s independent auditor for services required to be approved pursuant to paragraph (c)(7)(ii) of Rule 2–01 of Regulation S-X. |
Fiscal year ended | Audit-Related Fees | Tax Fees | All Other Fees | Total Non-Audit Fees |
December 31, 2024 | $ — | $791,963 | $72,273 | $864,236 |
December 31, 2023 | $ — | $360,132 | $ — | $360,132 |
| |
| Item 5. Audit Committee of Listed Registrants |
| |
| The registrant’s schedule of investments in unaffiliated issuers is included in the Financial Statements and Other Important Information in Item 7 below. |
| |
| Item 7. Financial Statements and Financial Highlights for Open-End Management Investment Companies. |

Putnam
VT Income
Fund
Financial Statements and Other Important Information
Annual | December 31, 2024

Table of Contents
| | Financial Statements and Other Important Information—Annual | franklintempleton.com |
Report of Independent Registered Public Accounting Firm
To the Board of Trustees of Putnam Variable Trust and Shareholders of
Putnam VT Income Fund:
Opinion on the Financial Statements
We have audited the accompanying statement of assets and liabilities, including the fund's portfolio, of Putnam VT Income Fund (one of the funds constituting Putnam Variable Trust, referred to hereafter as the “Fund”) as of December 31, 2024, the related statement of operations for the year ended December 31, 2024, the statement of changes in net assets for each of the two years in the period ended December 31, 2024, including the related notes, and the financial highlights for each of the five years in the period ended December 31, 2024 (collectively referred to as the “financial statements”). In our opinion, the financial statements present fairly, in all material respects, the financial position of the Fund as of December 31, 2024, the results of its operations for the year then ended, the changes in its net assets for each of the two years in the period ended December 31, 2024 and the financial highlights for each of the five years in the period ended December 31, 2024 in conformity with accounting principles generally accepted in the United States of America.
Basis for Opinion
These financial statements are the responsibility of the Fund's management. Our responsibility is to express an opinion on the Fund's financial statements based on our audits. We are a public accounting firm registered with the Public Company Accounting Oversight Board (United States) (“PCAOB”) and are required to be independent with respect to the Fund in accordance with the U.S. federal securities laws and the applicable rules and regulations of the Securities and Exchange Commission and the PCAOB.
We conducted our audits of these financial statements in accordance with the standards of the PCAOB. Those standards require that we plan and perform the audit to obtain reasonable assurance about whether the financial statements are free of material misstatement, whether due to error or fraud.
Our audits included performing procedures to assess the risks of material misstatement of the financial statements, whether due to error or fraud, and performing procedures that respond to those risks. Such procedures included examining, on a test basis, evidence regarding the amounts and disclosures in the financial statements. Our audits also included evaluating the accounting principles used and significant estimates made by management, as well as evaluating the overall presentation of the financial statements. Our procedures included confirmation of securities owned as of December 31, 2024 by correspondence with the custodian, transfer agent and brokers; when replies were not received from brokers, we performed other auditing procedures. We believe that our audits provide a reasonable basis for our opinion.
PricewaterhouseCoopers LLP
Boston, Massachusetts
February 18, 2025
We have served as the auditor of one or more investment companies in the Putnam Funds family of funds since at least 1957. We have not been able to determine the specific year we began serving as auditor.
| The fund’s portfolio 12/31/24 |
| | CORPORATE BONDS AND NOTES (41.5%)* | Principal amount | Value |
| | Banking (8.4%) | | | |
| | ABN AMRO Bank NV 144A unsec. sub. notes 4.75%, 7/28/25 (Netherlands) | | $200,000 | $199,400 |
| | Australia and New Zealand Banking Group, Ltd./United Kingdom 144A jr. unsec. sub. FRB 6.75%, perpetual maturity | | 200,000 | 203,207 |
| | Banco Santander SA jr. unsec. sub. FRB 9.625%, 11/21/53 (Spain) | | 200,000 | 231,027 |
| | Banco Santander SA sr. unsec. unsub. notes 4.379%, 4/12/28 (Spain) | | 200,000 | 195,245 |
| | Banco Santander SA unsec. sub. bonds 6.921%, 8/8/33 (Spain) | | 200,000 | 210,026 |
| | Bank of America Corp. jr. unsec. sub. FRN Ser. AA, 6.10%, perpetual maturity | | 245,000 | 244,960 |
| | Bank of America Corp. sr. unsec. bonds 5.468%, 1/23/35 | | 50,000 | 50,077 |
| | Bank of America Corp. sr. unsec. FRN Ser. MTN, 2.496%, 2/13/31 | | 195,000 | 171,529 |
| | Bank of America Corp. sr. unsec. notes 6.204%, 11/10/28 | | 100,000 | 103,546 |
| | Bank of America Corp. unsec. sub. FRB 3.846%, 3/8/37 | | 550,000 | 487,533 |
| | Bank of America Corp. unsec. sub. FRN (CME Term SOFR 3 Month + 1.02%), 5.38%, 9/15/26 | | 100,000 | 100,166 |
| | Bank of America Corp. unsec. sub. notes 6.11%, 1/29/37 | | 300,000 | 311,025 |
| | Bank of America Corp. unsec. sub. notes Ser. MTN, 5.425%, 8/15/35 | | 100,000 | 97,381 |
| | BPCE SA 144A unsec. sub. notes 4.50%, 3/15/25 (France) | | 317,000 | 316,445 |
| | CaixaBank SA 144A sr. unsec. notes 5.673%, 3/15/30 (Spain) | | 200,000 | 202,027 |
| | Citigroup, Inc. jr. unsec. sub. bonds Ser. CC, 7.125%, 5/29/74 | | 70,000 | 71,475 |
| | Citigroup, Inc. jr. unsec. sub. FRN 3.875%, perpetual maturity | | 90,000 | 87,608 |
| | Citigroup, Inc. sr. unsec. FRN 5.61%, 9/29/26 | | 105,000 | 105,598 |
| | Citigroup, Inc. sr. unsec. FRN 3.106%, 4/8/26 | | 21,000 | 20,901 |
| | Citigroup, Inc. sr. unsec. unsub. FRB 3.887%, 1/10/28 | | 64,000 | 62,751 |
| | Citigroup, Inc. sub. unsec. bonds 6.174%, 5/25/34 | | 76,000 | 77,456 |
| | Citigroup, Inc. unsec. sub. bonds 4.45%, 9/29/27 | | 500,000 | 493,400 |
| | Citizens Bank NA sr. unsec. unsub. FRN 5.284%, 1/26/26 | | 250,000 | 249,988 |
| | Commonwealth Bank of Australia 144A unsec. sub. notes 5.837%, 3/13/34 (Australia) | | 200,000 | 202,319 |
| | Credit Agricole SA 144A jr. unsec. sub. notes 8.125%, 12/23/25 (France) | | 200,000 | 204,265 |
| | Credit Agricole SA 144A unsec. sub. FRN 4.00%, 1/10/33 (France) | | 250,000 | 235,880 |
| | Danske Bank A/S 144A sr. unsec. FRN 6.466%, 1/9/26 (Denmark) | | 200,000 | 200,044 |
| | Deutsche Bank AG unsec. sub. notes 4.50%, 4/1/25 (Germany) | | 200,000 | 199,726 |
| | Fifth Third Bancorp sr. unsec. notes 4.895%, 9/6/30 | | 60,000 | 59,201 |
| | Fifth Third Bancorp sr. unsec. unsub. FRN 6.339%, 7/27/29 | | 115,000 | 119,348 |
| | First-Citizens Bank & Trust Co. unsec. sub. notes 6.125%, 3/9/28 | | 107,000 | 110,171 |
| | ING Groep NV sr. unsec. unsub. FRN 6.083%, 9/11/27 (Netherlands) | | 200,000 | 203,950 |
| | Intesa Sanpaolo SpA 144A unsec. sub. bonds 4.198%, 6/1/32 (Italy) | | 210,000 | 182,797 |
| | JPMorgan Chase & Co. jr. unsec. sub. FRB Ser. HH, 4.60%, perpetual maturity | | 429,000 | 428,158 |
| | JPMorgan Chase & Co. jr. unsec. sub. FRB Ser. W, (CME Term SOFR 3 Month + 1.26%), 5.785%, 5/15/47 | | 63,000 | 59,912 |
| | JPMorgan Chase & Co. jr. unsec. sub. FRN 3.65%, perpetual maturity | | 87,000 | 84,615 |
| | JPMorgan Chase & Co. sr. unsec. unsub. bonds 5.294%, 7/22/35 | | 125,000 | 123,729 |
| | JPMorgan Chase & Co. sr. unsec. unsub. notes 6.07%, 10/22/27 | | 155,000 | 158,671 |
| | JPMorgan Chase & Co. unsec. sub. FRB 5.717%, 9/14/33 | | 380,000 | 388,260 |
| | JPMorgan Chase & Co. unsec. sub. FRB 2.956%, 5/13/31 | | 300,000 | 268,463 |
| | Lloyds Banking Group PLC unsec. sub. FRB 3.369%, 12/14/46 (United Kingdom) | | 305,000 | 211,115 |
| | NatWest Group PLC sr. unsec. unsub. FRN 5.847%, 3/2/27 (United Kingdom) | | 200,000 | 202,012 |
| | PNC Financial Services Group, Inc. (The) unsec. sub. FRB 4.626%, 6/6/33 | | 350,000 | 329,681 |
| | Royal Bank of Canada sr. unsec. notes Ser. GMTN, 5.20%, 8/1/28 (Canada) | | 140,000 | 141,198 |
| | Royal Bank of Canada unsec. sub. notes Ser. GMTN, 4.65%, 1/27/26 (Canada) | | 140,000 | 139,898 |
| | Societe Generale SA 144A jr. unsec. sub. FRB 10.00%, 11/14/73 (France) | | 200,000 | 213,723 |
| | Toronto-Dominion Bank (The) jr. sub. unsec. FRB 8.125%, 10/31/82 (Canada) | | 200,000 | 208,964 |
| | Toronto-Dominion Bank (The) unsec. sub. FRB 3.625%, 9/15/31 (Canada) | | 180,000 | 175,013 |
| | Truist Financial Corp. sr. unsec. unsub. bonds Ser. MTN, 5.711%, 1/24/35 | | 120,000 | 120,975 |
| | Truist Financial Corp. sr. unsec. unsub. FRN Ser. MTN, 4.26%, 7/28/26 | | 105,000 | 104,616 |
| | UBS Group AG jr. unsec. sub. FRN Ser. REGS, 6.875%, perpetual maturity | | 247,000 | 247,646 |
| | UBS Group AG 144A jr. unsec. sub. bonds 6.85%, 9/10/54 (Switzerland) | | 200,000 | 198,315 |
| | UBS Group AG 144A sr. unsec. FRB 9.016%, 11/15/33 (Switzerland) | | 370,000 | 447,013 |
| | UBS Group AG 144A sr. unsec. FRN 2.193%, 6/5/26 (Switzerland) | | 250,000 | 247,066 |
| | US Bancorp unsec. sub. FRB 2.491%, 11/3/36 | | 260,000 | 210,651 |
| | Wells Fargo & Co. jr. unsec. sub. FRN 3.90%, perpetual maturity | | 50,000 | 48,612 |
| | Wells Fargo & Co. sr. unsec. unsub. FRN Ser. MTN, 5.574%, 7/25/29 | | 125,000 | 126,945 |
| | | | |
| | CORPORATE BONDS AND NOTES (41.5%)* cont. | Principal amount | Value |
| | Banking cont. | | | |
| | Wells Fargo Bank, NA unsec. sub. notes Ser. BKNT, 6.60%, 1/15/38 | | $495,000 | $540,289 |
| | Westpac Banking Corp. unsec. sub. bonds 4.421%, 7/24/39 (Australia) | | 185,000 | 163,843 |
| | | | | 11,599,855 |
| | Basic materials (1.0%) | | | |
| | Celanese US Holdings, LLC company guaranty sr. unsec. bonds 6.379%, 7/15/32 (Germany) | | 90,000 | 91,461 |
| | Celanese US Holdings, LLC company guaranty sr. unsec. notes 6.80%, 11/15/30 (Germany) | | 5,000 | 5,178 |
| | Celanese US Holdings, LLC company guaranty sr. unsec. notes 6.33%, 7/15/29 (Germany) | | 14,000 | 14,294 |
| | Celanese US Holdings, LLC company guaranty sr. unsec. notes 6.165%, 7/15/27 (Germany) | | 73,000 | 74,112 |
| | Celanese US Holdings, LLC company guaranty sr. unsec. notes 1.40%, 8/5/26 (Germany) | | 65,000 | 60,846 |
| | CF Industries, Inc. company guaranty sr. unsec. bonds 4.95%, 6/1/43 | | 227,000 | 200,347 |
| | FMC Corp. sr. unsec. unsub. notes 5.65%, 5/18/33 | | 135,000 | 133,615 |
| | Glencore Funding, LLC 144A company guaranty sr. unsec. bonds 5.634%, 4/4/34 | | 20,000 | 19,923 |
| | Glencore Funding, LLC 144A company guaranty sr. unsec. notes 6.375%, 10/6/30 | | 70,000 | 73,548 |
| | Glencore Funding, LLC 144A company guaranty sr. unsec. notes 4.00%, 3/27/27 | | 124,000 | 121,632 |
| | Huntsman International, LLC sr. unsec. bonds 5.70%, 10/15/34 | | 15,000 | 14,309 |
| | Huntsman International, LLC sr. unsec. notes 4.50%, 5/1/29 | | 150,000 | 143,181 |
| | International Flavors & Fragrances, Inc. sr. unsec. notes 4.45%, 9/26/28 | | 75,000 | 73,395 |
| | International Flavors & Fragrances, Inc. 144A company guaranty sr. unsec. bonds 3.468%, 12/1/50 | | 20,000 | 13,115 |
| | International Flavors & Fragrances, Inc. 144A sr. unsec. notes 2.30%, 11/1/30 | | 35,000 | 29,740 |
| | Nutrien, Ltd. sr. unsec. bonds 5.25%, 1/15/45 (Canada) | | 44,000 | 40,608 |
| | Nutrien, Ltd. sr. unsec. notes 2.95%, 5/13/30 (Canada) | | 25,000 | 22,508 |
| | Nutrien, Ltd. sr. unsec. sub. bonds 4.20%, 4/1/29 (Canada) | | 95,000 | 92,215 |
| | Sherwin-Williams Co. (The) sr. unsec. unsub. bonds 3.30%, 5/15/50 | | 50,000 | 33,125 |
| | WestRock MWV, LLC company guaranty sr. unsec. unsub. notes 8.20%, 1/15/30 | | 105,000 | 119,223 |
| | WestRock MWV, LLC company guaranty sr. unsec. unsub. notes 7.95%, 2/15/31 | | 39,000 | 44,031 |
| | Weyerhaeuser Co. sr. unsec. unsub. notes 7.375%, 3/15/32 R | | 32,000 | 35,653 |
| | | | | 1,456,059 |
| | Capital goods (2.6%) | | | |
| | BAE Systems PLC 144A sr. unsec. bonds 5.50%, 3/26/54 (United Kingdom) | | 200,000 | 194,924 |
| | Berry Global, Inc. company guaranty sr. notes 5.50%, 4/15/28 | | 13,000 | 13,131 |
| | Berry Global, Inc. 144A company guaranty sr. notes 4.875%, 7/15/26 | | 3,000 | 2,990 |
| | Berry Global, Inc. 144A company guaranty sr. notes 1.65%, 1/15/27 | | 155,000 | 145,186 |
| | Berry Global, Inc. 144A company guaranty sr. notes 1.57%, 1/15/26 | | 104,000 | 100,411 |
| | Boeing Co. (The) sr. unsec. bonds 3.95%, 8/1/59 | | 70,000 | 46,287 |
| | Boeing Co. (The) sr. unsec. bonds 5.805%, 5/1/50 | | 45,000 | 41,924 |
| | Boeing Co. (The) sr. unsec. notes 2.95%, 2/1/30 | | 25,000 | 22,342 |
| | Boeing Co. (The) sr. unsec. notes 2.196%, 2/4/26 | | 357,000 | 346,419 |
| | Boeing Co. (The) sr. unsec. unsub. bonds 3.375%, 6/15/46 | | 205,000 | 132,142 |
| | Boeing Co. (The) sr. unsec. unsub. bonds 6.858%, 5/1/54 | | 80,000 | 85,109 |
| | Boeing Co. (The) sr. unsec. unsub. notes 6.528%, 5/1/34 | | 30,000 | 31,444 |
| | Boeing Co. (The) sr. unsec. unsub. notes 6.298%, 5/1/29 | | 30,000 | 31,112 |
| | Boeing Co. (The) sr. unsec. unsub. notes 6.259%, 5/1/27 | | 20,000 | 20,481 |
| | Boeing Co. (The) sr. unsec. unsub. notes 6.125%, 2/15/33 | | 55,000 | 56,891 |
| | Daimler Trucks Finance North America, LLC 144A company guaranty sr. unsec. notes 5.125%, 9/25/27 | | 355,000 | 357,170 |
| | Howmet Aerospace, Inc. sr. unsec. unsub. bonds 5.95%, 2/1/37 | | 16,000 | 16,617 |
| | Howmet Aerospace, Inc. sr. unsec. unsub. notes 6.75%, 1/15/28 | | 135,000 | 141,253 |
| | Howmet Aerospace, Inc. sr. unsec. unsub. notes 3.00%, 1/15/29 | | 142,000 | 132,114 |
| | Johnson Controls International PLC sr. unsec. notes 3.90%, 2/14/26 | | 138,000 | 136,723 |
| | MasTec, Inc. company guaranty sr. unsec. unsub. notes 5.90%, 6/15/29 | | 320,000 | 325,993 |
| | Northrop Grumman Corp. sr. unsec. bonds 5.25%, 5/1/50 | | 45,000 | 42,215 |
| | Oshkosh Corp. sr. unsec. sub. notes 4.60%, 5/15/28 | | 125,000 | 123,458 |
| | Oshkosh Corp. sr. unsec. unsub. notes 3.10%, 3/1/30 | | 15,000 | 13,749 |
| | Republic Services, Inc. sr. unsec. unsub. notes 5.00%, 11/15/29 | | 335,000 | 336,996 |
| | RTX Corp. sr. unsec. notes 5.15%, 2/27/33 | | 30,000 | 29,761 |
| | RTX Corp. sr. unsec. unsub. bonds 6.40%, 3/15/54 | | 50,000 | 54,434 |
| | RTX Corp. sr. unsec. unsub. notes 4.125%, 11/16/28 | | 370,000 | 360,337 |
| | Waste Connections, Inc. sr. unsec. bonds 5.00%, 3/1/34 | | 40,000 | 39,062 |
| | Waste Connections, Inc. sr. unsec. bonds 3.20%, 6/1/32 | | 22,000 | 19,265 |
| | Waste Connections, Inc. sr. unsec. sub. bonds 3.50%, 5/1/29 | | 110,000 | 104,138 |
| | Waste Management, Inc. company guaranty sr. unsec. notes 4.875%, 2/15/29 | | 93,000 | 93,480 |
| | | | | 3,597,558 |
| | | | |
| | CORPORATE BONDS AND NOTES (41.5%)* cont. | Principal amount | Value |
| | Communication services (2.7%) | | | |
| | American Tower Corp. sr. unsec. bonds 5.55%, 7/15/33 R | | $250,000 | $252,275 |
| | American Tower Corp. sr. unsec. bonds 2.70%, 4/15/31 R | | 195,000 | 168,470 |
| | American Tower Corp. sr. unsec. notes 2.90%, 1/15/30 R | | 48,000 | 43,253 |
| | American Tower Corp. sr. unsec. unsub. notes 3.55%, 7/15/27 R | | 118,000 | 114,440 |
| | AT&T, Inc. sr. unsec. unsub. bonds 2.55%, 12/1/33 | | 162,000 | 130,551 |
| | AT&T, Inc. sr. unsec. unsub. notes 4.75%, 5/15/46 | | 335,000 | 291,193 |
| | Charter Communications Operating, LLC/Charter Communications Operating Capital Corp. company guaranty sr. notes 2.25%, 1/15/29 | | 83,000 | 73,223 |
| | Charter Communications Operating, LLC/Charter Communications Operating Capital Corp. company guaranty sr. sub. notes 4.908%, 7/23/25 | | 57,000 | 56,952 |
| | Comcast Corp. company guaranty sr. unsec. notes 3.45%, 2/1/50 | | 135,000 | 92,513 |
| | Comcast Corp. company guaranty sr. unsec. unsub. bonds 2.35%, 1/15/27 | | 172,000 | 164,462 |
| | Crown Castle, Inc. sr. unsec. bonds 3.65%, 9/1/27 R | | 130,000 | 126,103 |
| | Crown Castle, Inc. sr. unsec. notes 4.90%, 9/1/29 R | | 230,000 | 227,584 |
| | Crown Castle, Inc. sr. unsec. notes 4.75%, 5/15/47 R | | 25,000 | 21,289 |
| | Equinix, Inc. sr. unsec. sub. notes 3.20%, 11/18/29 R | | 193,000 | 177,557 |
| | Equinix, Inc. sr. unsec. sub. notes 2.50%, 5/15/31 R | | 70,000 | 59,867 |
| | Rogers Communications, Inc. company guaranty sr. unsec. notes 5.00%, 2/15/29 (Canada) | | 90,000 | 89,463 |
| | Rogers Communications, Inc. company guaranty sr. unsec. unsub. bonds 4.30%, 2/15/48 (Canada) | | 100,000 | 78,280 |
| | Rogers Communications, Inc. company guaranty sr. unsec. unsub. notes Ser. REGS, 3.80%, 3/15/32 (Canada) | | 38,000 | 34,190 |
| | Sprint Capital Corp. company guaranty sr. unsec. unsub. notes 6.875%, 11/15/28 | | 149,000 | 158,276 |
| | T-Mobile USA, Inc. company guaranty sr. bonds 4.50%, 4/15/50 | | 261,000 | 214,269 |
| | T-Mobile USA, Inc. company guaranty sr. notes 3.875%, 4/15/30 | | 7,000 | 6,590 |
| | T-Mobile USA, Inc. company guaranty sr. unsec. bonds 5.75%, 1/15/54 | | 115,000 | 112,290 |
| | T-Mobile USA, Inc. company guaranty sr. unsec. bonds 5.05%, 7/15/33 | | 255,000 | 249,787 |
| | Time Warner Cable Enterprises, LLC company guaranty sr. unsub. notes 8.375%, 7/15/33 | | 155,000 | 174,630 |
| | Verizon Communications, Inc. sr. unsec. unsub. bonds 4.272%, 1/15/36 | | 150,000 | 134,987 |
| | Verizon Communications, Inc. sr. unsec. unsub. notes 4.40%, 11/1/34 | | 85,000 | 78,794 |
| | Verizon Communications, Inc. sr. unsec. unsub. notes 4.329%, 9/21/28 | | 117,000 | 114,647 |
| | Verizon Communications, Inc. sr. unsec. unsub. notes 2.10%, 3/22/28 | | 250,000 | 229,965 |
| | | | | 3,675,900 |
| | Consumer cyclicals (3.1%) | | | |
| | Alimentation Couche-Tard, Inc. 144A company guaranty sr. unsec. notes 3.55%, 7/26/27 (Canada) | | 260,000 | 251,345 |
| | Alimentation Couche-Tard, Inc. 144A sr. unsec. notes 2.95%, 1/25/30 (Canada) | | 134,000 | 120,863 |
| | Amazon.com, Inc. sr. unsec. unsub. bonds 2.70%, 6/3/60 | | 453,000 | 260,130 |
| | Amazon.com, Inc. sr. unsec. unsub. notes 2.10%, 5/12/31 | | 101,000 | 86,302 |
| | Autonation, Inc. company guaranty sr. unsec. notes 4.50%, 10/1/25 | | 16,000 | 15,945 |
| | BMW US Capital, LLC 144A company guaranty sr. unsec. notes 3.95%, 8/14/28 | | 104,000 | 100,517 |
| | Brunswick Corp./DE sr. unsec. bonds 5.10%, 4/1/52 | | 85,000 | 66,160 |
| | Brunswick Corp/DE sr. unsec. notes 5.85%, 3/18/29 | | 50,000 | 50,806 |
| | Carnival Corp. 144A company guaranty sr. sub. notes 4.00%, 8/1/28 | | 192,000 | 182,106 |
| | D.R. Horton, Inc. company guaranty sr. unsec. bonds 5.00%, 10/15/34 | | 225,000 | 217,381 |
| | Dick’s Sporting Goods, Inc. sr. unsec. bonds 4.10%, 1/15/52 | | 60,000 | 43,875 |
| | Discovery Communications, LLC company guaranty sr. unsec. unsub. notes 3.625%, 5/15/30 | | 18,000 | 16,020 |
| | Global Payments, Inc. sr. unsec. notes 2.15%, 1/15/27 | | 60,000 | 56,903 |
| | Home Depot, Inc. (The) sr. unsec. unsub. bonds 5.30%, 6/25/54 | | 92,000 | 88,217 |
| | Home Depot, Inc. (The) sr. unsec. unsub. notes 4.95%, 6/25/34 | | 92,000 | 90,812 |
| | Hyatt Hotels Corp. sr. unsec. notes 5.75%, 1/30/27 | | 22,000 | 22,344 |
| | Hyatt Hotels Corp. sr. unsec. notes 5.375%, 12/15/31 | | 75,000 | 74,687 |
| | Hyatt Hotels Corp. sr. unsec. notes 5.25%, 6/30/29 | | 105,000 | 105,126 |
| | Hyundai Capital America 144A sr. unsec. notes 6.375%, 4/8/30 (South Korea) | | 8,000 | 8,363 |
| | Hyundai Capital America 144A sr. unsec. notes 5.40%, 1/8/31 (South Korea) | | 20,000 | 20,004 |
| | Hyundai Capital America 144A sr. unsec. notes 4.55%, 9/26/29 (South Korea) | | 50,000 | 48,560 |
| | Hyundai Capital America 144A sr. unsec. notes 6.50%, 1/16/29 (South Korea) | | 295,000 | 308,038 |
| | Hyundai Capital America 144A sr. unsec. notes 5.35%, 3/19/29 (South Korea) | | 41,000 | 41,246 |
| | Interpublic Group of Cos., Inc. (The) sr. unsec. sub. bonds 4.65%, 10/1/28 | | 150,000 | 148,912 |
| | Moody’s Corp. sr. unsec. bonds 5.25%, 7/15/44 | | 108,000 | 102,762 |
| | Netflix, Inc. sr. unsec. bonds 5.40%, 8/15/54 | | 20,000 | 19,473 |
| | Netflix, Inc. sr. unsec. bonds 4.90%, 8/15/34 | | 15,000 | 14,698 |
| | Netflix, Inc. 144A sr. unsec. bonds 5.375%, 11/15/29 | | 310,000 | 316,183 |
| | Paramount Global sr. unsec. unsub. FRB 4.375%, 3/15/43 | | 20,000 | 14,574 |
| | | | |
| | CORPORATE BONDS AND NOTES (41.5%)* cont. | Principal amount | Value |
| | Consumer cyclicals cont. | | | |
| | Paramount Global sr. unsec. unsub. notes 4.20%, 6/1/29 | | $230,000 | $217,255 |
| | Paramount Global sr. unsec. unsub. notes 3.70%, 6/1/28 | | 55,000 | 51,829 |
| | Paramount Global sr. unsec. unsub. notes 2.90%, 1/15/27 | | 31,000 | 29,677 |
| | PulteGroup, Inc. company guaranty sr. unsec. unsub. notes 6.375%, 5/15/33 | | 95,000 | 100,221 |
| | S&P Global, Inc. company guaranty sr. unsec. bonds 2.50%, 12/1/29 | | 70,000 | 62,936 |
| | S&P Global, Inc. company guaranty sr. unsec. notes 4.75%, 8/1/28 | | 65,000 | 65,111 |
| | S&P Global, Inc. company guaranty sr. unsec. notes 1.25%, 8/15/30 | | 41,000 | 33,935 |
| | Stellantis Finance US, Inc. 144A company guaranty sr. unsec. notes 1.711%, 1/29/27 | | 200,000 | 186,594 |
| | Tapestry, Inc. sr. unsec. bonds 5.50%, 3/11/35 | | 113,000 | 109,970 |
| | Tapestry, Inc. sr. unsec. notes 5.10%, 3/11/30 | | 92,000 | 91,026 |
| | Toll Brothers Finance Corp. company guaranty sr. unsec. notes 3.80%, 11/1/29 | | 145,000 | 136,637 |
| | Toll Brothers Finance Corp. company guaranty sr. unsec. unsub. notes 4.35%, 2/15/28 | | 73,000 | 71,347 |
| | Warnermedia Holdings, Inc. company guaranty sr. unsec. notes 4.279%, 3/15/32 | | 274,000 | 241,523 |
| | | | | 4,290,413 |
| | Consumer finance (1.4%) | | | |
| | AerCap Ireland Capital DAC/AerCap Global Aviation Trust company guaranty sr. unsec. bonds 3.30%, 1/30/32 (Ireland) | | 245,000 | 213,561 |
| | AerCap Ireland Capital DAC/AerCap Global Aviation Trust company guaranty sr. unsec. notes 5.10%, 1/19/29 (Ireland) | | 150,000 | 149,954 |
| | Air Lease Corp. sr. unsec. sub. bonds 4.625%, 10/1/28 | | 40,000 | 39,355 |
| | Air Lease Corp. sr. unsec. sub. notes 3.25%, 10/1/29 | | 260,000 | 240,216 |
| | Aircastle, Ltd. 144A sr. unsec. notes 6.50%, 7/18/28 | | 75,000 | 77,551 |
| | American Express Co. sr. unsec. unsub. notes 5.098%, 2/16/28 | | 50,000 | 50,297 |
| | Aviation Capital Group, LLC 144A sr. unsec. notes 5.375%, 7/15/29 | | 210,000 | 210,255 |
| | Capital One Financial Corp. sr. unsec. unsub. FRN 7.624%, 10/30/31 | | 132,000 | 145,788 |
| | Capital One Financial Corp. unsec. sub. FRB 2.359%, 7/29/32 | | 225,000 | 181,782 |
| | Ford Motor Co. sr. unsec. unsub. notes 5.80%, 3/5/27 | | 305,000 | 307,953 |
| | General Motors Financial Co., Inc. sr. sub. notes 5.80%, 1/7/29 | | 140,000 | 142,887 |
| | General Motors Financial Co., Inc. sr. unsec. notes 4.90%, 10/6/29 | | 91,000 | 89,690 |
| | Macquarie Airfinance Holdings, Ltd. 144A sr. unsec. notes 5.15%, 3/17/30 (United Kingdom) | | 100,000 | 97,994 |
| | | | | 1,947,283 |
| | Consumer staples (1.4%) | | | |
| | Ashtead Capital, Inc. 144A company guaranty sr. unsec. bonds 5.95%, 10/15/33 | | 200,000 | 202,392 |
| | Ashtead Capital, Inc. 144A notes 4.375%, 8/15/27 | | 200,000 | 196,644 |
| | Conagra Brands, Inc. sr. unsec. bonds 5.30%, 11/1/38 | | 65,000 | 61,142 |
| | ERAC USA Finance, LLC 144A company guaranty sr. unsec. bonds 4.20%, 11/1/46 | | 88,000 | 71,808 |
| | ERAC USA Finance, LLC 144A company guaranty sr. unsec. notes 7.00%, 10/15/37 | | 83,000 | 93,929 |
| | ERAC USA Finance, LLC 144A company guaranty sr. unsec. unsub. notes 3.30%, 12/1/26 | | 40,000 | 38,988 |
| | Haleon US Capital, LLC company guaranty sr. unsec. unsub. notes 3.375%, 3/24/29 | | 250,000 | 235,305 |
| | JBS USA LUX SA/JBS USA Food Co./JBS Luxembourg SARL company guaranty sr. unsec. notes 6.75%, 3/15/34 (Luxembourg) | | 65,000 | 68,769 |
| | JBS USA LUX SA/JBS USA Food Co./JBS USA Finance, Inc. company guaranty sr. unsec. notes 5.75%, 4/1/33 (Luxembourg) | | 19,000 | 18,926 |
| | JBS USA LUX SA/JBS USA Food Co./JBS USA Finance, Inc. company guaranty sr. unsec. notes 3.00%, 2/2/29 (Luxembourg) | | 157,000 | 143,336 |
| | Kenvue, Inc. company guaranty sr. unsec. notes Ser. REGS, 4.90%, 3/22/33 | | 315,000 | 309,985 |
| | Kenvue, Inc. company guaranty sr. unsec. unsub. notes Ser. REGS, 5.05%, 3/22/53 | | 24,000 | 22,267 |
| | Mars, Inc. 144A sr. unsec. unsub. notes 4.65%, 4/20/31 | | 46,000 | 44,904 |
| | Philip Morris International, Inc. sr. unsec. unsub. notes 5.125%, 2/15/30 | | 296,000 | 297,654 |
| | Philip Morris International, Inc. sr. unsec. unsub. notes 4.75%, 11/1/31 | | 110,000 | 107,629 |
| | | | | 1,913,678 |
| | Energy (2.4%) | | | |
| | 6297782 LLC 144A company guaranty sr. unsec. bonds 5.584%, 10/1/34 | | 35,000 | 34,064 |
| | 6297782 LLC 144A company guaranty sr. unsec. notes 5.026%, 10/1/29 | | 180,000 | 176,949 |
| | Aker BP ASA 144A sr. unsec. bonds 5.80%, 10/1/54 (Norway) | | 75,000 | 68,009 |
| | Canadian Natural Resources, Ltd. sr. unsec. unsub. notes 7.20%, 1/15/32 (Canada) | | 110,000 | 120,252 |
| | Canadian Natural Resources, Ltd. 144A sr. unsec. notes 5.00%, 12/15/29 (Canada) | | 124,000 | 122,676 |
| | Cheniere Energy Partners LP company guaranty sr. unsec. notes 4.50%, 10/1/29 | | 195,000 | 188,928 |
| | Cheniere Energy Partners LP company guaranty sr. unsec. unsub. notes 3.25%, 1/31/32 | | 89,000 | 77,252 |
| | Columbia Pipelines Operating Co., LLC 144A sr. unsec. bonds 6.544%, 11/15/53 | | 45,000 | 47,202 |
| | Columbia Pipelines Operating Co., LLC 144A sr. unsec. notes 5.927%, 8/15/30 | | 50,000 | 51,485 |
| | | | |
| | CORPORATE BONDS AND NOTES (41.5%)* cont. | Principal amount | Value |
| | Energy cont. | | | |
| | DCP Midstream Operating LP company guaranty sr. unsec. notes 8.125%, 8/16/30 | | $85,000 | $96,691 |
| | Diamondback Energy, Inc. company guaranty sr. unsec. notes 6.25%, 3/15/33 | | 75,000 | 77,998 |
| | DT Midstream, Inc. 144A sr. bonds 5.80%, 12/15/34 | | 200,000 | 201,537 |
| | EQT Corp. sr. unsec. notes 7.00%, 2/1/30 | | 210,000 | 223,553 |
| | Occidental Petroleum Corp. sr. unsec. sub. notes 8.50%, 7/15/27 | | 109,000 | 116,736 |
| | Occidental Petroleum Corp. sr. unsec. sub. notes 7.50%, 5/1/31 | | 235,000 | 257,087 |
| | Occidental Petroleum Corp. sr. unsec. unsub. bonds 5.55%, 10/1/34 | | 30,000 | 29,200 |
| | Occidental Petroleum Corp. sr. unsec. unsub. notes 5.20%, 8/1/29 | | 65,000 | 64,535 |
| | ONEOK, Inc. company guaranty sr. unsec. notes 4.75%, 10/15/31 | | 15,000 | 14,516 |
| | ONEOK, Inc. company guaranty sr. unsec. unsub. notes 6.10%, 11/15/32 | | 205,000 | 212,255 |
| | Ovintiv, Inc. company guaranty sr. unsec. bonds 6.25%, 7/15/33 | | 93,000 | 95,306 |
| | Ovintiv, Inc. company guaranty sr. unsec. notes 5.65%, 5/15/28 | | 29,000 | 29,416 |
| | Ovintiv, Inc. company guaranty sr. unsec. notes 5.65%, 5/15/25 | | 23,000 | 23,058 |
| | Spectra Energy Partners LP sr. unsec. notes 3.375%, 10/15/26 | | 145,000 | 141,689 |
| | Targa Resources Partners LP/Targa Resources Partners Finance Corp. company guaranty sr. unsec. unsub. notes 5.00%, 1/15/28 | | 220,000 | 217,753 |
| | Targa Resources Partners LP/Targa Resources Partners Finance Corp. company guaranty sr. unsec. unsub. notes 4.875%, 2/1/31 | | 205,000 | 198,083 |
| | Venture Global Calcasieu Pass, LLC 144A company guaranty sr. notes 6.25%, 1/15/30 | | 365,000 | 368,661 |
| | | | | 3,254,891 |
| | Financial (0.7%) | | | |
| | Ally Financial, Inc. company guaranty sr. unsec. notes 8.00%, 11/1/31 | | 145,000 | 160,501 |
| | Ally Financial, Inc. sr. unsec. notes 4.75%, 6/9/27 | | 20,000 | 19,870 |
| | Berkshire Hathaway Finance Corp. company guaranty sr. unsec. notes 4.30%, 5/15/43 | | 210,000 | 181,932 |
| | Intercontinental Exchange, Inc. sr. unsec. bonds 1.85%, 9/15/32 | | 118,000 | 93,483 |
| | Intercontinental Exchange, Inc. sr. unsec. notes 4.35%, 6/15/29 | | 49,000 | 48,002 |
| | Intercontinental Exchange, Inc. sr. unsec. notes 4.00%, 9/15/27 | | 200,000 | 196,864 |
| | Intercontinental Exchange, Inc. sr. unsec. notes 3.65%, 5/23/25 | | 20,000 | 19,920 |
| | Jefferies Financial Group, Inc. sr. unsec. notes Ser. MTN, 5.15%, 9/15/25 | | 55,000 | 55,027 |
| | Jefferies Financial Group, Inc. sr. unsec. notes 6.20%, 4/14/34 | | 75,000 | 77,336 |
| | KKR Group Finance Co. VI, LLC 144A company guaranty sr. unsec. bonds 3.75%, 7/1/29 | | 110,000 | 104,218 |
| | LPL Holdings, Inc. company guaranty sr. unsec. notes 6.75%, 11/17/28 | | 41,000 | 43,079 |
| | Nasdaq, Inc. sr. unsec. sub. bonds 5.55%, 2/15/34 | | 21,000 | 21,197 |
| | | | | 1,021,429 |
| | Health care (4.0%) | | | |
| | AbbVie, Inc. sr. unsec. bonds 5.05%, 3/15/34 | | 61,000 | 60,291 |
| | AbbVie, Inc. sr. unsec. notes 4.95%, 3/15/31 | | 212,000 | 212,013 |
| | Amgen, Inc. sr. unsec. sub. notes 3.20%, 11/2/27 | | 218,000 | 209,742 |
| | Amgen, Inc. sr. unsec. unsub. bonds 5.75%, 3/2/63 | | 75,000 | 71,992 |
| | Amgen, Inc. sr. unsec. unsub. bonds 5.65%, 3/2/53 | | 98,000 | 94,423 |
| | Amgen, Inc. sr. unsec. unsub. notes 5.25%, 3/2/30 | | 273,000 | 275,607 |
| | Becton, Dickinson and Co. sr. unsec. notes 2.823%, 5/20/30 | | 45,000 | 40,378 |
| | Biogen, Inc. sr. unsec. bonds 3.25%, 2/15/51 | | 105,000 | 67,465 |
| | Biogen, Inc. sr. unsec. sub. notes 2.25%, 5/1/30 | | 145,000 | 125,404 |
| | Centene Corp. sr. unsec. sub. notes 2.625%, 8/1/31 | | 180,000 | 148,349 |
| | CVS Health Corp. jr. unsec. sub. bonds 7.00%, 3/10/55 | | 45,000 | 45,263 |
| | CVS Health Corp. sr. unsec. unsub. notes 4.78%, 3/25/38 | | 292,000 | 252,733 |
| | CVS Pass-Through Trust sr. notes 6.036%, 12/10/28 | | 11,338 | 11,403 |
| | CVS Pass-Through Trust 144A sr. mtge. notes 4.704%, 1/10/36 | | 85,040 | 78,896 |
| | DH Europe Finance II SARL company guaranty sr. unsec. notes 2.60%, 11/15/29 (Luxembourg) | | 335,000 | 303,115 |
| | Elevance Health, Inc. sr. unsec. unsub. bonds 5.125%, 2/15/53 | | 65,000 | 57,874 |
| | Elevance Health, Inc. sr. unsec. unsub. notes 2.25%, 5/15/30 | | 215,000 | 186,857 |
| | Eli Lilly and Co. sr. unsec. unsub. bonds 4.875%, 2/27/53 | | 70,000 | 63,417 |
| | GE HealthCare Technologies, Inc. sr. unsec. notes 4.80%, 8/14/29 | | 225,000 | 222,978 |
| | HCA, Inc. company guaranty sr. bonds 5.25%, 6/15/26 | | 35,000 | 35,103 |
| | HCA, Inc. company guaranty sr. notes 4.50%, 2/15/27 | | 66,000 | 65,400 |
| | HCA, Inc. company guaranty sr. notes 4.125%, 6/15/29 | | 30,000 | 28,633 |
| | HCA, Inc. company guaranty sr. unsec. bonds 6.00%, 4/1/54 | | 54,000 | 51,485 |
| | HCA, Inc. company guaranty sr. unsec. bonds 5.60%, 4/1/34 | | 41,000 | 40,409 |
| | HCA, Inc. company guaranty sr. unsec. sub. notes 3.625%, 3/15/32 | | 50,000 | 44,082 |
| | HCA, Inc. company guaranty sr. unsec. unsub. notes 5.375%, 2/1/25 | | 95,000 | 95,022 |
| | | | |
| | CORPORATE BONDS AND NOTES (41.5%)* cont. | Principal amount | Value |
| | Health care cont. | | | |
| | Humana, Inc. sr. unsec. unsub. notes 5.75%, 3/1/28 | | $165,000 | $168,210 |
| | Icon Investments Six DAC company guaranty sr. notes 5.849%, 5/8/29 (Ireland) | | 200,000 | 203,884 |
| | Illumina, Inc. sr. unsec. sub. notes 4.65%, 9/9/26 | | 105,000 | 104,674 |
| | Merck & Co., Inc. sr. unsec. unsub. notes 3.70%, 2/10/45 | | 205,000 | 158,905 |
| | Novartis Capital Corp. company guaranty sr. unsec. unsub. bonds 4.00%, 11/20/45 | | 265,000 | 217,655 |
| | Pfizer Investment Enterprises PTE, Ltd. company guaranty sr. unsec. notes 5.30%, 5/19/53 (Singapore) | | 120,000 | 112,452 |
| | Pfizer Investment Enterprises PTE, Ltd. company guaranty sr. unsec. notes 4.75%, 5/19/33 (Singapore) | | 240,000 | 233,298 |
| | Pfizer Investment Enterprises PTE, Ltd. company guaranty sr. unsec. notes 4.45%, 5/19/28 (Singapore) | | 57,000 | 56,511 |
| | Pharmacia, LLC company guaranty sr. unsec. notes 6.60%, 12/1/28 | | 120,000 | 127,603 |
| | Royalty Pharma PLC company guaranty sr. unsec. bonds 5.40%, 9/2/34 | | 103,000 | 100,286 |
| | Royalty Pharma PLC company guaranty sr. unsec. notes 5.15%, 9/2/29 | | 82,000 | 81,861 |
| | Service Corp. International sr. unsec. notes 3.375%, 8/15/30 | | 15,000 | 13,135 |
| | Thermo Fisher Scientific, Inc. sr. unsec. notes 2.60%, 10/1/29 | | 135,000 | 122,874 |
| | UnitedHealth Group, Inc. sr. unsec. unsub. bonds 4.75%, 7/15/45 | | 50,000 | 44,107 |
| | UnitedHealth Group, Inc. sr. unsec. unsub. bonds 2.90%, 5/15/50 | | 160,000 | 99,283 |
| | UnitedHealth Group, Inc. sr. unsec. unsub. notes 3.85%, 6/15/28 | | 370,000 | 359,782 |
| | Viatris, Inc. company guaranty sr. unsec. notes 2.30%, 6/22/27 | | 110,000 | 103,174 |
| | Wyeth, LLC company guaranty sr. unsec. bonds 5.95%, 4/1/37 | | 225,000 | 235,089 |
| | Zoetis, Inc. sr. unsec. sub. notes 2.00%, 5/15/30 | | 74,000 | 63,705 |
| | | | | 5,494,822 |
| | Insurance (1.6%) | | | |
| | Arthur J Gallagher & Co. sr. unsec. notes 4.85%, 12/15/29 | | 95,000 | 94,607 |
| | Athene Global Funding 144A notes 5.526%, 7/11/31 | | 80,000 | 80,232 |
| | Athene Global Funding 144A notes 5.322%, 11/13/31 | | 74,000 | 72,821 |
| | Athene Holding, Ltd. sr. unsec. bonds 6.25%, 4/1/54 | | 35,000 | 35,096 |
| | Athene Holding, Ltd. sr. unsec. bonds 5.875%, 1/15/34 | | 40,000 | 40,569 |
| | CNA Financial Corp. sr. unsec. notes 5.125%, 2/15/34 | | 65,000 | 63,837 |
| | CNO Financial Group, Inc. sr. unsec. bonds 6.45%, 6/15/34 | | 125,000 | 129,283 |
| | CNO Financial Group, Inc. sr. unsec. unsub. notes 5.25%, 5/30/25 | | 70,000 | 70,011 |
| | CNO Global Funding 144A notes 4.95%, 9/9/29 | | 175,000 | 173,553 |
| | Corebridge Financial, Inc. sr. unsec. notes 3.85%, 4/5/29 | | 100,000 | 95,520 |
| | Corebridge Global Funding 144A sr. unsec. unsub. notes 5.20%, 6/24/29 | | 305,000 | 306,884 |
| | F&G Annuities & Life, Inc. company guaranty sr. unsec. notes 6.50%, 6/4/29 | | 60,000 | 61,300 |
| | Fairfax Financial Holdings, Ltd. sr. unsec. notes 4.85%, 4/17/28 (Canada) | | 220,000 | 218,598 |
| | Fidelity National Financial, Inc. sr. unsec. bonds 3.20%, 9/17/51 | | 89,000 | 54,900 |
| | Liberty Mutual Group, Inc. 144A company guaranty sr. unsec. bonds 5.50%, 6/15/52 | | 200,000 | 184,889 |
| | Marsh & McLennan Cos., Inc. sr. unsec. sub. notes 4.375%, 3/15/29 | | 194,000 | 190,660 |
| | Massachusetts Mutual Life Insurance Co. 144A unsec. sub. bonds 3.729%, 10/15/70 | | 29,000 | 18,754 |
| | Mutual of Omaha Cos. Global Funding 144A notes 5.80%, 7/27/26 | | 125,000 | 126,647 |
| | Teachers Insurance & Annuity Association of America 144A unsec. sub. notes 6.85%, 12/16/39 | | 170,000 | 188,788 |
| | | | | 2,206,949 |
| | Investment banking/Brokerage (1.5%) | | | |
| | Ares Capital Corp. sr. unsec. notes 5.95%, 7/15/29 | | 58,000 | 58,672 |
| | Ares Capital Corp. sr. unsec. sub. notes 7.00%, 1/15/27 | | 35,000 | 36,285 |
| | Ares Capital Corp. sr. unsec. sub. notes 3.875%, 1/15/26 | | 175,000 | 173,097 |
| | Blackstone Private Credit Fund sr. unsec. unsub. notes 3.25%, 3/15/27 | | 112,000 | 107,253 |
| | Deutsche Bank AG/New York, NY sr. unsec. unsub. FRN 2.311%, 11/16/27 (Germany) | | 150,000 | 142,624 |
| | Goldman Sachs Group, Inc. (The) sr. unsec. FRB 4.223%, 5/1/29 | | 353,000 | 343,659 |
| | Morgan Stanley sr. unsec. notes 5.123%, 2/1/29 | | 35,000 | 35,103 |
| | Morgan Stanley sr. unsec. sub. bonds 5.942%, 2/7/39 | | 60,000 | 60,229 |
| | Morgan Stanley unsec. unsub. notes 3.95%, 4/23/27 | | 760,000 | 745,027 |
| | Morgan Stanley unsec. sub. notes 5.297%, 4/20/37 | | 314,000 | 305,257 |
| | Neuberger Berman Group, LLC/Neuberger Berman Finance Corp. 144A sr. unsec. notes 4.875%, 4/15/45 | | 75,000 | 62,105 |
| | | | | 2,069,311 |
| | Real estate (0.8%) | | | |
| | EPR Properties company guaranty sr. unsec. unsub. notes 4.50%, 6/1/27 R | | 24,000 | 23,601 |
| | Extra Space Storage LP company guaranty sr. unsec. notes 5.90%, 1/15/31 R | | 130,000 | 134,156 |
| | GLP Capital LP/GLP Financing II, Inc. company guaranty sr. unsec. sub. notes 6.75%, 12/1/33 R | | 60,000 | 63,560 |
| | GLP Capital LP/GLP Financing II, Inc. company guaranty sr. unsec. unsub. notes 5.375%, 4/15/26 R | | 88,000 | 88,061 |
| | Prologis LP sr. unsec. unsub. bonds 5.00%, 3/15/34 R | | 110,000 | 107,481 |
| | Prologis LP sr. unsec. unsub. notes 2.25%, 4/15/30 R | | 54,000 | 47,252 |
| | | | |
| | CORPORATE BONDS AND NOTES (41.5%)* cont. | Principal amount | Value |
| | Real estate cont. | | | |
| | VICI Properties LP sr. unsec. unsub. bonds 5.75%, 4/1/34 R | | $70,000 | $70,692 |
| | VICI Properties LP sr. unsec. unsub. notes 4.75%, 2/15/28 R | | 58,000 | 57,553 |
| | VICI Properties LP/VICI Note Co., Inc. 144A company guaranty sr. unsec. notes 4.50%, 9/1/26 R | | 145,000 | 143,808 |
| | VICI Properties LP/VICI Note Co., Inc. 144A company guaranty sr. unsec. notes 3.875%, 2/15/29 R | | 410,000 | 386,637 |
| | VICI Properties LP/VICI Note Co., Inc. 144A company guaranty sr. unsec. notes 3.75%, 2/15/27 R | | 22,000 | 21,361 |
| | | | | 1,144,162 |
| | Technology (3.4%) | | | |
| | Analog Devices, Inc. sr. unsec. notes 5.05%, 4/1/34 | | 95,000 | 94,954 |
| | Apple, Inc. sr. unsec. unsub. notes 4.375%, 5/13/45 | | 468,000 | 413,487 |
| | AppLovin Corp. sr. unsec. sub. bonds 5.95%, 12/1/54 | | 13,000 | 12,818 |
| | AppLovin Corp. sr. unsec. sub. notes 5.375%, 12/1/31 | | 133,000 | 133,098 |
| | AppLovin Corp. sr. unsec. sub. notes 5.125%, 12/1/29 | | 29,000 | 28,940 |
| | Atlassian Corp. sr. unsec. bonds 5.50%, 5/15/34 | | 18,000 | 18,088 |
| | Atlassian Corp. sr. unsec. notes 5.25%, 5/15/29 | | 27,000 | 27,213 |
| | Broadcom Corp./Broadcom Cayman Finance, Ltd. company guaranty sr. unsec. unsub. notes 3.875%, 1/15/27 | | 122,000 | 120,124 |
| | Broadcom, Inc. company guaranty sr. unsec. bonds 4.15%, 11/15/30 | | 158,000 | 151,248 |
| | Broadcom, Inc. sr. unsec. notes 5.05%, 7/12/29 | | 240,000 | 240,990 |
| | Broadcom, Inc. 144A sr. unsec. bonds 4.926%, 5/15/37 | | 400,000 | 380,701 |
| | Cisco Systems, Inc. sr. unsec. bonds 5.30%, 2/26/54 | | 75,000 | 72,957 |
| | Cisco Systems, Inc. sr. unsec. notes 5.05%, 2/26/34 | | 105,000 | 104,664 |
| | Dell International, LLC/EMC Corp. company guaranty sr. bonds 8.35%, 7/15/46 | | 5,000 | 6,367 |
| | Flex, Ltd. sr. unsec. notes 5.25%, 1/15/32 | | 80,000 | 78,698 |
| | Gartner, Inc. 144A company guaranty sr. unsec. bonds 3.75%, 10/1/30 | | 49,000 | 44,766 |
| | Gartner, Inc. 144A company guaranty sr. unsec. notes 3.625%, 6/15/29 | | 80,000 | 74,380 |
| | Hewlett Packard Enterprise Co. sr. unsec. bonds 5.60%, 10/15/54 | | 55,000 | 51,811 |
| | Hewlett Packard Enterprise Co. sr. unsec. bonds 5.00%, 10/15/34 | | 28,000 | 26,928 |
| | Hewlett Packard Enterprise Co. sr. unsec. notes 4.85%, 10/15/31 | | 55,000 | 53,664 |
| | Hewlett Packard Enterprise Co. sr. unsec. notes 4.55%, 10/15/29 | | 101,000 | 98,490 |
| | Marvell Technology, Inc. sr. unsec. notes 5.95%, 9/15/33 | | 67,000 | 69,591 |
| | Marvell Technology, Inc. sr. unsec. notes 5.75%, 2/15/29 | | 68,000 | 69,727 |
| | Meta Platforms, Inc. sr. unsec. bonds 5.75%, 5/15/63 | | 60,000 | 60,636 |
| | Meta Platforms, Inc. sr. unsec. bonds 5.40%, 8/15/54 | | 297,000 | 287,873 |
| | Meta Platforms, Inc. sr. unsec. bonds 5.55%, 8/15/64 | | 30,000 | 29,271 |
| | Meta Platforms, Inc. sr. unsec. notes 4.95%, 5/15/33 | | 242,000 | 242,422 |
| | Meta Platforms, Inc. sr. unsec. notes 4.75%, 8/15/34 | | 30,000 | 29,218 |
| | MSCI, Inc. 144A company guaranty sr. unsec. bonds 3.25%, 8/15/33 | | 250,000 | 211,393 |
| | MSCI, Inc. 144A company guaranty sr. unsec. notes 3.625%, 9/1/30 | | 109,000 | 99,635 |
| | Oracle Corp. sr. unsec. bonds 3.95%, 3/25/51 | | 55,000 | 40,784 |
| | Oracle Corp. sr. unsec. bonds 3.65%, 3/25/41 | | 475,000 | 370,667 |
| | Oracle Corp. sr. unsec. notes 2.875%, 3/25/31 | | 45,000 | 39,618 |
| | Oracle Corp. sr. unsec. notes 1.65%, 3/25/26 | | 130,000 | 125,391 |
| | Oracle Corp. sr. unsec. unsub. bonds 6.50%, 4/15/38 | | 55,000 | 59,160 |
| | Oracle Corp. sr. unsec. unsub. bonds 4.30%, 7/8/34 | | 80,000 | 73,594 |
| | Oracle Corp. sr. unsec. unsub. bonds 4.00%, 11/15/47 | | 110,000 | 83,924 |
| | Sensata Technologies, Inc. 144A company guaranty sr. unsec. notes 3.75%, 2/15/31 | | 84,000 | 73,528 |
| | ServiceNow, Inc. sr. unsec. notes 1.40%, 9/1/30 | | 240,000 | 199,531 |
| | Xilinx, Inc. company guaranty sr. unsec. sub. notes 2.375%, 6/1/30 | | 320,000 | 282,152 |
| | | | | 4,682,501 |
| | Transportation (0.6%) | | | |
| | AS Mileage Plan IP, Ltd. 144A sr. notes 5.021%, 10/20/29 (Cayman Islands) | | 230,000 | 224,269 |
| | Penske Truck Leasing Co. LP/PTL Finance Corp. 144A sr. unsec. bonds 3.40%, 11/15/26 | | 133,000 | 129,525 |
| | Penske Truck Leasing Co. LP/PTL Finance Corp. 144A sr. unsec. notes 4.40%, 7/1/27 | | 110,000 | 108,607 |
| | Ryder System, Inc. sr. unsec. unsub. notes 4.95%, 9/1/29 | | 200,000 | 199,399 |
| | Westinghouse Air Brake Technologies Corp. company guaranty sr. unsec. unsub. bonds 5.611%, 3/11/34 | | 130,000 | 131,790 |
| | | | | 793,590 |
| | Utilities and power (5.9%) | | | |
| | AES Corp. (The) sr. unsec. notes 1.375%, 1/15/26 | | 140,000 | 134,911 |
| | Alexander Funding Trust II 144A sr. notes 7.467%, 7/31/28 | | 100,000 | 105,699 |
| | Ameren Corp. sr. unsec. unsub. notes 5.00%, 1/15/29 | | 75,000 | 75,148 |
| | American Electric Power Co., Inc. sr. unsec. unsub. bonds 5.625%, 3/1/33 | | 45,000 | 45,484 |
| | | | |
| | CORPORATE BONDS AND NOTES (41.5%)* cont. | Principal amount | Value |
| | Utilities and power cont. | | | |
| | American Electric Power Co., Inc. sr. unsec. unsub. bonds 3.25%, 3/1/50 | | $100,000 | $64,307 |
| | American Electric Power Co., Inc. sr. unsec. unsub. notes Ser. J, 4.30%, 12/1/28 | | 210,000 | 205,288 |
| | American Transmission Systems, Inc. 144A sr. unsec. bonds 2.65%, 1/15/32 | | 65,000 | 55,210 |
| | Berkshire Hathaway Energy Co. sr. unsec. bonds 4.25%, 10/15/50 | | 100,000 | 79,066 |
| | CenterPoint Energy Resources Corp. sr. unsec. unsub. bonds 5.40%, 7/1/34 | | 115,000 | 114,779 |
| | Consolidated Edison Co. of New York, Inc. sr. unsec. unsub. notes 4.20%, 3/15/42 | | 85,000 | 71,185 |
| | Constellation Energy Generation, LLC sr. unsec. bonds 6.50%, 10/1/53 | | 106,000 | 112,418 |
| | Constellation Energy Generation, LLC sr. unsec. bonds 6.125%, 1/15/34 | | 44,000 | 46,086 |
| | Constellation Energy Generation, LLC sr. unsec. bonds 5.75%, 3/15/54 | | 43,000 | 41,859 |
| | Constellation Energy Generation, LLC sr. unsec. notes 5.60%, 3/1/28 | | 545,000 | 556,024 |
| | Dominion Energy, Inc. sr. unsec. unsub. bonds 4.90%, 8/1/41 | | 135,000 | 121,048 |
| | DTE Energy Co. sr. unsec. unsub. notes 4.95%, 7/1/27 | | 145,000 | 145,579 |
| | Duke Energy Carolinas, LLC sr. notes 4.95%, 1/15/33 | | 90,000 | 88,549 |
| | Duke Energy Corp. sr. unsec. bonds 5.80%, 6/15/54 | | 21,000 | 20,486 |
| | Duke Energy Corp. sr. unsec. bonds 4.20%, 6/15/49 | | 65,000 | 50,473 |
| | Duke Energy Corp. sr. unsec. notes 5.45%, 6/15/34 | | 29,000 | 28,981 |
| | Duke Energy Corp. sr. unsec. notes 4.85%, 1/5/29 | | 25,000 | 24,895 |
| | Duke Energy Corp. sr. unsec. notes 3.15%, 8/15/27 | | 180,000 | 172,920 |
| | Duke Energy Ohio, Inc. sr. bonds 5.25%, 4/1/33 | | 65,000 | 64,909 |
| | Duke Energy Ohio, Inc. sr. bonds 3.65%, 2/1/29 | | 97,000 | 92,706 |
| | El Paso Natural Gas Co., LLC company guaranty sr. unsec. unsub. notes 8.375%, 6/15/32 | | 200,000 | 235,628 |
| | Electricite De France SA 144A sr. unsec. unsub. bonds 4.75%, 10/13/35 (France) | | 95,000 | 87,514 |
| | Enbridge, Inc. company guaranty sr. unsec. unsub. bonds 4.50%, 6/10/44 (Canada) | | 90,000 | 74,582 |
| | Enbridge, Inc. sr. unsec. unsub. bonds 4.25%, 12/1/26 (Canada) | | 95,000 | 94,147 |
| | Enel Finance International NV 144A company guaranty sr. unsec. unsub. notes 7.50%, 10/14/32 (Netherlands) | | 200,000 | 222,976 |
| | Energy Transfer LP company guaranty sr. unsec. notes 5.50%, 6/1/27 | | 182,000 | 184,397 |
| | Energy Transfer LP company guaranty sr. unsec. notes 2.90%, 5/15/25 | | 37,000 | 36,722 |
| | Energy Transfer LP jr. unsec. sub. FRN 6.625%, perpetual maturity | | 125,000 | 123,403 |
| | Energy Transfer LP sr. unsec. notes 5.25%, 7/1/29 | | 30,000 | 30,162 |
| | Energy Transfer LP sr. unsec. unsub. notes 6.50%, 2/1/42 | | 20,000 | 20,737 |
| | Evergy Kansas Central, Inc. sr. bonds 5.70%, 3/15/53 | | 60,000 | 59,160 |
| | Evergy Missouri West, Inc. 144A sr. notes 5.15%, 12/15/27 | | 165,000 | 166,330 |
| | Eversource Energy sr. unsec. unsub. notes 5.45%, 3/1/28 | | 165,000 | 167,196 |
| | Eversource Energy sr. unsec. unsub. notes 5.125%, 5/15/33 | | 90,000 | 87,488 |
| | Exelon Corp. sr. unsec. unsub. bonds 5.45%, 3/15/34 | | 225,000 | 224,657 |
| | Exelon Corp. sr. unsec. unsub. notes 5.15%, 3/15/29 | | 280,000 | 281,538 |
| | FirstEnergy Transmission, LLC 144A sr. unsec. notes 4.55%, 1/15/30 | | 45,000 | 43,829 |
| | Florida Power & Light Co. sr. bonds 4.125%, 2/1/42 | | 203,000 | 169,494 |
| | Georgia Power Co. sr. unsec. unsub. bonds 5.25%, 3/15/34 | | 10,000 | 9,928 |
| | Georgia Power Co. sr. unsec. unsub. notes 4.95%, 5/17/33 | | 270,000 | 264,534 |
| | IPALCO Enterprises, Inc. sr. notes 4.25%, 5/1/30 | | 105,000 | 99,055 |
| | Kinder Morgan Energy Partners LP company guaranty sr. unsec. notes 5.40%, 9/1/44 | | 86,000 | 78,607 |
| | NextEra Energy Capital Holdings, Inc. company guaranty sr. unsec. unsub. notes 6.051%, 3/1/25 | | 70,000 | 70,130 |
| | NextEra Energy Capital Holdings, Inc. company guaranty sr. unsec. unsub. notes 3.55%, 5/1/27 | | 100,000 | 97,480 |
| | NiSource, Inc. sr. unsec. unsub. notes 5.20%, 7/1/29 | | 230,000 | 231,972 |
| | NRG Energy, Inc. 144A sr. notes 2.00%, 12/2/25 | | 191,000 | 185,556 |
| | Oncor Electric Delivery Co., LLC sr. bonds 4.95%, 9/15/52 | | 95,000 | 84,937 |
| | Oncor Electric Delivery Co., LLC sr. notes 5.75%, 3/15/29 | | 161,000 | 166,928 |
| | Oncor Electric Delivery Co., LLC sr. notes 3.70%, 11/15/28 | | 90,000 | 86,598 |
| | Pacific Gas and Electric Co. notes 2.10%, 8/1/27 | | 100,000 | 93,319 |
| | Pacific Gas and Electric Co. sr. bonds 6.75%, 1/15/53 | | 75,000 | 81,807 |
| | Pacific Gas and Electric Co. sr. bonds 5.90%, 6/15/32 | | 64,000 | 65,737 |
| | Pacific Gas and Electric Co. sr. bonds 4.95%, 7/1/50 | | 145,000 | 126,085 |
| | Pacific Gas and Electric Co. sr. notes 6.10%, 1/15/29 | | 45,000 | 46,600 |
| | Pacific Gas and Electric Co. sr. notes 3.30%, 12/1/27 | | 190,000 | 181,597 |
| | PacifiCorp sr. bonds 2.70%, 9/15/30 | | 133,000 | 117,577 |
| | Puget Sound Energy, Inc. sr. bonds 5.448%, 6/1/53 | | 160,000 | 152,909 |
| | Sempra Energy sr. unsec. unsub. bonds 5.50%, 8/1/33 | | 50,000 | 50,142 |
| | Southern Co. (The) sr. unsec. bonds 5.70%, 3/15/34 | | 85,000 | 86,803 |
| | Southern Co. (The) sr. unsec. notes 5.50%, 3/15/29 | | 10,000 | 10,206 |
| | Southern Co. Gas Capital Corp. company guaranty sr. unsec. unsub. notes 4.95%, 9/15/34 | | 45,000 | 43,583 |
| | | | |
| | CORPORATE BONDS AND NOTES (41.5%)* cont. | Principal amount | Value |
| | Utilities and power cont. | | | |
| | Virginia Electric and Power Co. sr. unsec. unsub. notes 5.05%, 8/15/34 | | $120,000 | $117,107 |
| | Vistra Operations Co., LLC 144A company guaranty sr. notes 6.00%, 4/15/34 | | 80,000 | 81,118 |
| | Vistra Operations Co., LLC 144A company guaranty sr. notes 4.30%, 7/15/29 | | 82,000 | 78,366 |
| | Vistra Operations Co., LLC 144A company guaranty sr. notes 3.70%, 1/30/27 | | 465,000 | 453,024 |
| | Xcel Energy, Inc. sr. unsec. bonds 5.45%, 8/15/33 | | 170,000 | 168,730 |
| | | | | 8,158,405 |
| | Total corporate bonds and notes (cost $59,364,276) | $57,306,806 |
| | U.S. GOVERNMENT AND AGENCY MORTGAGE OBLIGATIONS (25.7%)* | Principal amount | Value |
| | U.S. Government Guaranteed Mortgage Obligations (12.8%) | | |
| | Government National Mortgage Association Pass-Through Certificates | | |
| | 6.00%, 11/20/53 | $1,028,104 | $1,053,424 |
| | 5.50%, with due dates from 6/20/53 to 4/20/54 | 1,689,734 | 1,689,020 |
| | 5.00%, TBA, 1/1/55 | 3,000,000 | 2,910,586 |
| | 5.00%, with due dates from 5/20/48 to 6/20/48 | 246,264 | 242,696 |
| | 4.50%, TBA, 1/1/55 | 3,000,000 | 2,835,938 |
| | 4.50%, with due dates from 7/20/47 to 5/20/48 | 997,762 | 958,180 |
| | 4.00%, TBA, 1/1/55 | 2,000,000 | 1,842,276 |
| | 4.00%, with due dates from 2/20/48 to 5/20/48 | 646,538 | 591,860 |
| | 3.50%, with due dates from 11/15/47 to 11/20/49 | 678,802 | 613,807 |
| | 3.00%, 2/20/53 | 1,009,703 | 879,759 |
| | 2.50%, with due dates from 9/20/52 to 2/20/53 | 4,801,274 | 4,018,652 |
| | | | 17,636,198 |
| | U.S. Government Agency Mortgage Obligations (12.9%) | | |
| | Federal Home Loan Mortgage Corporation Pass-Through Certificates | | |
| | 6.00%, 9/1/53 | 372,504 | 377,003 |
| | 5.50%, with due dates from 9/1/53 to 11/1/53 | 1,742,483 | 1,734,404 |
| | 4.50%, with due dates from 8/1/44 to 3/1/45 | 196,594 | 189,754 |
| | 4.00%, 9/1/45 | 279,661 | 262,557 |
| | 3.50%, with due dates from 8/1/43 to 2/1/47 | 1,010,235 | 917,166 |
| | 3.00%, with due dates from 3/1/43 to 6/1/46 | 562,217 | 491,493 |
| | Federal National Mortgage Association Pass-Through Certificates | | |
| | 5.50%, with due dates from 9/1/53 to 11/1/53 | 991,053 | 984,814 |
| | 5.28%, 12/1/28 | 226,000 | 230,302 |
| | 5.00%, 3/1/38 | 3,358 | 3,348 |
| | 4.50%, with due dates from 7/1/44 to 5/1/45 | 461,137 | 443,654 |
| | 4.00%, with due dates from 9/1/45 to 6/1/46 | 452,189 | 419,655 |
| | 3.50%, with due dates from 6/1/56 to 9/1/57 | 1,911,600 | 1,691,417 |
| | 3.50%, 7/1/43 | 186,315 | 169,166 |
| | 3.00%, with due dates from 9/1/42 to 4/1/52 | 2,944,655 | 2,557,991 |
| | 2.00%, 1/1/51 | 1,161,960 | 912,294 |
| | 2.00%, 2/1/37 | 879,837 | 782,539 |
| | Uniform Mortgage-Backed Securities | | |
| | 5.00%, TBA, 1/1/55 | 1,000,000 | 965,231 |
| | 2.00%, TBA, 1/1/55 | 5,000,000 | 3,891,016 |
| | 1.50%, TBA, 1/1/40 | 1,000,000 | 857,398 |
| | | | 17,881,202 |
| | Total U.S. government and agency mortgage obligations (cost $36,974,039) | $35,517,400 |
| | U.S. TREASURY OBLIGATIONS (0.1%)* | Principal amount | Value |
| | U.S. Treasury Notes 2.375%, 5/15/27 i | $113,000 | $108,585 |
| | Total U.S. treasury obligations (cost $108,585) | $108,585 |
| | MORTGAGE-BACKED SECURITIES (18.0%)* | Principal amount | Value |
| | Agency collateralized mortgage obligations (4.0%) | | | |
| | Federal Home Loan Mortgage Corporation | | | |
| | REMICs IFB Ser. 3408, Class EK, ((-4.024 x US 30 Day Average SOFR) + 25.33%), 6.832%, 4/15/37 | | $60,709 | $66,039 |
| | REMICs IFB Ser. 3065, Class DC, ((-3 x US 30 Day Average SOFR) + 19.52%), 5.724%, 3/15/35 | | 74,470 | 74,928 |
| | Strips FRB Ser. 406, Class F30, (US 30 Day Average SOFR + 1.15%), 5.719%, 10/25/53 | | 167,488 | 168,722 |
| | | | |
| | MORTGAGE-BACKED SECURITIES (18.0%)* cont. | Principal amount | Value |
| | Agency collateralized mortgage obligations cont. | | | |
| | Federal Home Loan Mortgage Corporation | | | |
| | REMICs Ser. 4132, Class IP, IO, 4.50%, 11/15/42 | | $130,512 | $10,718 |
| | REMICs Ser. 4018, Class DI, IO, 4.50%, 7/15/41 | | 34,881 | 924 |
| | REMICs Ser. 23-5349, Class IB, IO, 4.00%, 12/15/46 | | 442,907 | 89,870 |
| | REMICs Ser. 5050, Class IM, IO, 3.50%, 10/25/50 | | 3,596,118 | 712,917 |
| | REMICs IFB Ser. 4945, Class SL, IO, ((-1 x US 30 Day Average SOFR) + 5.94%), 1.367%, 1/25/50 | | 3,512,247 | 367,493 |
| | REMICs Ser. 3369, Class BO, PO, zero %, 9/15/37 | | 1,148 | 947 |
| | REMICs Ser. 3391, PO, zero %, 4/15/37 | | 10,403 | 8,814 |
| | REMICs FRB Ser. 3117, Class AF, zero %, 2/15/36 | | 3,554 | 3,043 |
| | Federal National Mortgage Association | | | |
| | REMICs Ser. 15-33, Class AI, IO, 5.00%, 6/25/45 | | 631,928 | 86,425 |
| | REMICs Ser. 23-49, Class IB, IO, 3.50%, 3/25/47 | | 267,585 | 42,577 |
| | REMICs Ser. 23-49, Class IA, IO, 3.00%, 8/25/46 | | 744,504 | 94,552 |
| | REMICs Ser. 21-12, Class NI, IO, 2.50%, 3/25/51 | | 3,474,037 | 574,465 |
| | REMICs IFB Ser. 10-35, Class SG, IO, ((-1 x US 30 Day Average SOFR) + 6.29%), 1.717%, 4/25/40 | | 216,414 | 22,318 |
| | Interest Strip Ser. 372, Class 1, PO, zero %, 8/25/36 | | 6,566 | 5,276 |
| | Government National Mortgage Association | | | |
| | Ser. 09-79, Class IC, IO, 6.00%, 8/20/39 | | 246,920 | 31,512 |
| | FRB Ser. 23-152, Class FB, IO, 5.755%, 4/20/51 W | | 228,222 | 233,085 |
| | Ser. 14-180, IO, 5.00%, 12/20/44 | | 754,665 | 153,791 |
| | Ser. 14-76, IO, 5.00%, 5/20/44 | | 218,093 | 46,830 |
| | Ser. 20-46, Class MI, IO, 4.00%, 4/20/50 | | 675,096 | 137,995 |
| | Ser. 15-53, Class MI, IO, 4.00%, 4/16/45 | | 605,587 | 113,864 |
| | Ser. 12-38, Class MI, IO, 4.00%, 3/20/42 | | 1,331,344 | 236,635 |
| | IFB Ser. 23-66, Class PS, IO, ((-2.5 x US 30 Day Average SOFR) + 15.38%), 3.864%, 5/20/53 | | 444,466 | 441,000 |
| | Ser. 12-136, IO, 3.50%, 11/20/42 | | 558,984 | 75,931 |
| | Ser. 12-113, Class ID, IO, 3.50%, 9/20/42 | | 396,611 | 61,819 |
| | Ser. 15-52, Class KI, IO, 3.50%, 11/20/40 | | 164,240 | 9,288 |
| | Ser. 14-100, Class JI, IO, 3.50%, 7/16/29 | | 238,667 | 9,301 |
| | Ser. 16-H23, Class NI, IO, 2.51%, 10/20/66 W | | 2,479,587 | 103,200 |
| | Ser. 17-H18, Class CI, IO, 2.49%, 9/20/67 W | | 1,295,780 | 85,704 |
| | FRB Ser. 15-H16, Class XI, IO, 2.476%, 7/20/65 W | | 531,947 | 28,525 |
| | Ser. 16-H24, Class JI, IO, 2.253%, 11/20/66 W | | 527,808 | 28,850 |
| | Ser. 15-H13, Class AI, IO, 2.126%, 6/20/65 W | | 1,332,332 | 63,359 |
| | Ser. 19-H02, Class DI, IO, 2.08%, 11/20/68 W | | 1,823,201 | 87,335 |
| | Ser. 16-H11, Class HI, IO, 2.017%, 1/20/66 W | | 665,000 | 15,295 |
| | Ser. 15-H12, Class GI, IO, 1.84%, 5/20/65 W | | 1,289,372 | 41,538 |
| | Ser. 15-H12, Class AI, IO, 1.83%, 5/20/65 W | | 969,196 | 20,245 |
| | IFB Ser. 20-112, Class MS, IO, ((-1 x CME Term SOFR 1 Month) + 6.19%), 1.815%, 8/20/50 | | 3,674,245 | 457,561 |
| | Ser. 15-H10, Class CI, IO, 1.805%, 4/20/65 W | | 757,028 | 18,723 |
| | Ser. 15-H20, Class AI, IO, 1.796%, 8/20/65 W | | 618,122 | 15,001 |
| | Ser. 15-H25, Class CI, IO, 1.751%, 10/20/65 W | | 835,050 | 30,262 |
| | Ser. 15-H12, Class EI, IO, 1.696%, 4/20/65 W | | 1,617,878 | 36,184 |
| | IFB Ser. 14-131, Class BS, IO, ((-1 x CME Term SOFR 1 Month) + 6.09%), 1.688%, 9/16/44 | | 609,620 | 68,456 |
| | IFB Ser. 19-123, Class SL, IO, ((-1 x CME Term SOFR 1 Month) + 6.04%), 1.665%, 10/20/49 | | 952,856 | 98,315 |
| | Ser. 17-H12, Class QI, IO, 1.662%, 5/20/67 W | | 1,226,959 | 42,629 |
| | Ser. 15-H25, Class AI, IO, 1.604%, 9/20/65 W | | 1,248,677 | 21,255 |
| | Ser. 15-H01, Class CI, IO, 1.576%, 12/20/64 W | | 282,679 | 6,502 |
| | IFB Ser. 19-119, Class KS, IO, ((-1 x CME Term SOFR 1 Month) + 5.94%), 1.538%, 9/16/49 | | 1,282,449 | 147,101 |
| | IFB Ser. 19-121, Class SD, IO, ((-1 x CME Term SOFR 1 Month) + 5.89%), 1.515%, 10/20/49 | | 122,647 | 11,655 |
| | Ser. 14-H11, Class GI, IO, 1.507%, 6/20/64 W | | 2,870,775 | 68,052 |
| | Ser. 10-H19, Class GI, IO, 1.442%, 8/20/60 W | | 647,544 | 20,848 |
| | Ser. 17-H08, Class NI, IO, 1.404%, 3/20/67 W | | 1,507,190 | 49,576 |
| | Ser. 17-H10, Class MI, IO, 1.156%, 4/20/67 W | | 1,511,297 | 42,336 |
| | Ser. 15-H04, Class AI, IO, 0.875%, 12/20/64 W | | 1,228,947 | 38,358 |
| | | | | 5,527,944 |
| | Commercial mortgage-backed securities (7.0%) | | | |
| | ACRES Commercial Realty, Ltd. 144A FRB Ser. 21-FL1, Class A, (CME Term SOFR 1 Month + 1.31%), 5.696%, 6/15/36 | | 182,891 | 182,720 |
| | Banc of America Commercial Mortgage Trust FRB Ser. 15-UBS7, Class B, 4.334%, 9/15/48 W | | 483,000 | 455,347 |
| | BANK FRB Ser. 18-BN13, Class XA, IO, 0.449%, 8/15/61 W | | 6,784,572 | 96,440 |
| | | | |
| | MORTGAGE-BACKED SECURITIES (18.0%)* cont. | Principal amount | Value |
| | Commercial mortgage-backed securities cont. | | | |
| | Barclays Commercial Mortgage Trust 144A FRB Ser. 19-C5, Class F, 2.574%, 11/15/52 W | | $234,000 | $127,423 |
| | BDS, Ltd. 144A | | | |
| | FRB Ser. 21-FL10, Class A, (CME Term SOFR 1 Month + 1.46%), 5.84%, 12/16/36 (Cayman Islands) | | 201,367 | 201,493 |
| | FRB Ser. 21-FL9, Class A, (CME Term SOFR 1 Month + 1.18%), 5.56%, 11/16/38 (Cayman Islands) | | 93,607 | 93,967 |
| | CFCRE Commercial Mortgage Trust 144A FRB Ser. 11-C2, Class D, 5.08%, 12/15/47 W | | 25,203 | 24,218 |
| | COMM Mortgage Trust | | | |
| | Ser. 12-LC4, Class B, 4.934%, 12/10/44 W | | 89,863 | 86,146 |
| | FRB Ser. 14-CR17, Class C, 4.779%, 5/10/47 W | | 227,000 | 208,148 |
| | FRB Ser. 15-CR23, Class C, 4.332%, 5/10/48 W | | 293,000 | 277,750 |
| | FRB Ser. 14-UBS6, Class C, 4.259%, 12/10/47 W | | 51,009 | 48,774 |
| | Ser. 15-CR23, Class AM, 3.801%, 5/10/48 | | 276,000 | 274,635 |
| | FRB Ser. 15-CR23, Class XA, IO, 0.837%, 5/10/48 W | | 3,116,079 | 2,305 |
| | COMM Mortgage Trust 144A | | | |
| | FRB Ser. 12-CR1, Class D, 5.336%, 5/15/45 W | | 66,512 | 54,411 |
| | FRB Ser. 13-CR13, Class D, 4.944%, 11/10/46 W | | 389,000 | 238,383 |
| | FRB Ser. 14-CR17, Class D, 4.843%, 5/10/47 W | | 198,000 | 158,498 |
| | FRB Ser. 14-CR19, Class D, 4.512%, 8/10/47 W | | 68,772 | 65,546 |
| | Credit Suisse Commercial Mortgage Trust 144A FRB Ser. 07-C2, Class AX, IO, zero %, 1/15/49 W | | 2,978,255 | 418 |
| | CSAIL Commercial Mortgage Trust | | | |
| | FRB Ser. 15-C1, Class C, 4.064%, 4/15/50 W | | 116,000 | 103,839 |
| | FRB Ser. 15-C3, Class XA, IO, 0.651%, 8/15/48 W | | 12,259,431 | 11,821 |
| | CSMC Trust FRB Ser. 16-NXSR, Class XA, IO, 0.672%, 12/15/49 W | | 5,680,714 | 48,646 |
| | DBUBS Mortgage Trust 144A FRB Ser. 11-LC3A, Class D, 5.353%, 8/10/44 W | | 270,410 | 253,448 |
| | Government National Mortgage Association FRB Ser. 24-32, IO, 0.706%, 6/16/63 W | | 2,595,993 | 128,947 |
| | GS Mortgage Securities Corp., II 144A Ser. 13-GC10, Class C, 4.285%, 2/10/46 W | | 221,922 | 219,065 |
| | GS Mortgage Securities Trust | | | |
| | FRB Ser. 15-GS1, Class XA, IO, 0.752%, 11/10/48 W | | 18,643,852 | 70,481 |
| | FRB Ser. 14-GC22, Class XA, IO, 0.594%, 6/10/47 W | | 2,760,081 | 28 |
| | FRB Ser. 13-GC13, Class XA, IO, zero %, 7/10/46 W | | 4,554,970 | 46 |
| | GS Mortgage Securities Trust 144A | | | |
| | FRB Ser. 14-GC24, Class D, 4.44%, 9/10/47 W | | 154,000 | 60,519 |
| | FRB Ser. 11-GC5, Class XA, IO, zero %, 8/10/44 W | | 544,527 | 321 |
| | JPMBB Commercial Mortgage Securities Trust | | | |
| | FRB Ser. 13-C12, Class C, 3.939%, 7/15/45 W | | 112,781 | 106,516 |
| | FRB Ser. 14-C25, Class XA, IO, 0.544%, 11/15/47 W | | 669,866 | 7 |
| | FRB Ser. 14-C22, Class XA, IO, 0.402%, 9/15/47 W | | 1,143,314 | 11 |
| | JPMBB Commercial Mortgage Securities Trust 144A FRB Ser. C14, Class D, 4.038%, 8/15/46 W | | 122,000 | 93,952 |
| | JPMorgan Chase Commercial Mortgage Securities Trust FRB Ser. 13-LC11, Class XA, IO, 1.157%, 4/15/46 W | | 139,069 | 749 |
| | JPMorgan Chase Commercial Mortgage Securities Trust 144A | | | |
| | FRB Ser. 11-C3, Class B, 5.013%, 2/15/46 W | | 172,650 | 163,939 |
| | FRB Ser. 12-C6, Class E, 4.964%, 5/15/45 W | | 138,000 | 129,272 |
| | FRB Ser. 12-LC9, Class D, 3.567%, 12/15/47 W | | 127,000 | 111,314 |
| | FRB Ser. 13-LC11, Class E, 3.25%, 4/15/46 (In default) † W | | 498,000 | 36,603 |
| | FRB Ser. 07-CB20, Class E, zero %, 2/12/51 W | | 11,116 | 13,513 |
| | Ladder Capital Commercial Mortgage Trust 144A FRB Ser. 17-LC26, Class XA, IO, 1.514%, 7/12/50 W | | 5,833,085 | 158,195 |
| | Morgan Stanley Bank of America Merrill Lynch Trust | | | |
| | FRB Ser. 15-C27, Class C, 4.484%, 12/15/47 W | | 390,000 | 377,166 |
| | FRB Ser. 14-C16, Class B, 4.274%, 6/15/47 W | | 75,829 | 73,061 |
| | FRB Ser. 15-C23, Class B, 4.137%, 7/15/50 W | | 355,000 | 346,014 |
| | FRB Ser. 15-C25, Class XA, IO, 1.019%, 10/15/48 W | | 4,408,972 | 12,592 |
| | FRB Ser. 15-C26, Class XA, IO, 0.952%, 10/15/48 W | | 3,759,033 | 4,686 |
| | Morgan Stanley Bank of America Merrill Lynch Trust | | | |
| | Ser. 15-C25, Class AS, PO, 4.069%, 10/15/48 | | 214,000 | 209,487 |
| | 144A FRB Ser. 13-C10, Class F, 3.981%, 7/15/46 W | | 273,000 | 17,861 |
| | Morgan Stanley Capital I Trust | | | |
| | FRB Ser. 18-L1, Class C, 4.78%, 10/15/51 W | | 205,000 | 190,467 |
| | Ser. 15-UBS8, Class B, 4.315%, 12/15/48 W | | 412,000 | 387,810 |
| | Ser. 15-UBS8, Class A4, 3.809%, 12/15/48 | | 88,000 | 86,774 |
| | FRB Ser. 16-BNK2, Class XA, IO, 0.949%, 11/15/49 W | | 3,151,723 | 41,041 |
| | FRB Ser. 16-UB12, Class XA, IO, 0.644%, 12/15/49 W | | 8,075,415 | 71,869 |
| | Morgan Stanley Capital I Trust 144A FRB Ser. 11-C3, Class E, 4.942%, 7/15/49 W | | 74,335 | 72,729 |
| | | | |
| | MORTGAGE-BACKED SECURITIES (18.0%)* cont. | Principal amount | Value |
| | Commercial mortgage-backed securities cont. | | | |
| | Multifamily Connecticut Avenue Securities Trust 144A | | | |
| | FRB Ser. 20-01, Class M10, 8.433%, 3/25/50 | | $386,348 | $393,568 |
| | FRB Ser. 19-01, Class M10, 7.933%, 10/25/49 | | 222,515 | 225,241 |
| | Multifamily Structured Credit Risk 144A FRB Ser. 21-MN3, Class M2, 8.569%, 11/25/51 | | 337,000 | 344,940 |
| | Ready Capital Mortgage Financing, LLC 144A | | | |
| | FRB Ser. 22-FL10, Class AS, 7.409%, 10/25/39 | | 243,000 | 243,912 |
| | FRB Ser. 22-FL8, Class AS, 6.669%, 1/25/37 | | 379,000 | 378,610 |
| | FRB Ser. 22-FL8, Class A, 6.219%, 1/25/37 | | 61,339 | 61,337 |
| | Shelter Growth CRE Issuer, Ltd. 144A FRB Ser. 23-FL5, Class A, 7.12%, 5/19/38 (Bermuda) | | 150,961 | 151,292 |
| | TIAA Real Estate CDO, Ltd. 144A Ser. 03-1A, Class E, 8.00%, 12/28/38 (In default) † | | 859,373 | 64 |
| | UBS Commercial Mortgage Trust | | | |
| | Ser. 17-C7, Class A4, 3.679%, 12/15/50 | | 128,000 | 123,129 |
| | FRB Ser. 19-C17, Class XA, IO, 1.436%, 10/15/52 W | | 5,610,199 | 301,126 |
| | FRB Ser. 17-C7, Class XA, IO, 0.973%, 12/15/50 W | | 4,048,346 | 98,738 |
| | FRB Ser. 18-C12, Class XA, IO, 0.853%, 8/15/51 W | | 4,257,726 | 107,947 |
| | VMC Finance, LLC 144A FRB Ser. 21-FL4, Class A, 5.59%, 6/16/36 | | 13,772 | 13,652 |
| | Wachovia Bank Commercial Mortgage Trust FRB Ser. 06-C29, IO, 0.293%, 11/15/48 W | | 12,145 | 32 |
| | Wells Fargo Commercial Mortgage Trust | | | |
| | Ser. 19-C49, Class B, 4.546%, 3/15/52 | | 148,000 | 140,525 |
| | FRB Ser. 20-C57, Class C, 4.023%, 8/15/53 W | | 122,000 | 107,392 |
| | FRB Ser. 19-C50, Class XA, IO, 1.404%, 5/15/52 W | | 2,221,538 | 99,800 |
| | FRB Ser. 17-C41, Class XA, IO, 1.152%, 11/15/50 W | | 3,112,153 | 81,422 |
| | FRB Ser. 15-LC20, Class XB, IO, 0.60%, 4/15/50 W | | 13,766,000 | 15,348 |
| | FRB Ser. 18-C43, Class XA, IO, 0.571%, 3/15/51 W | | 13,028,160 | 204,172 |
| | Wells Fargo Commercial Mortgage Trust 144A | | | |
| | Ser. 14-LC16, Class D, 3.938%, 8/15/50 | | 75,170 | 9,464 |
| | Ser. 19-C53, Class D, 2.50%, 10/15/52 | | 218,000 | 161,123 |
| | WF-RBS Commercial Mortgage Trust | | | |
| | Ser. 13-C11, Class B, 3.714%, 3/15/45 W | | 85,824 | 84,787 |
| | FRB Ser. 13-C14, Class XA, IO, 0.348%, 6/15/46 W | | 308,197 | 3 |
| | FRB Ser. 14-C22, Class XA, IO, 0.275%, 9/15/57 W | | 1,697,334 | 17 |
| | WF-RBS Commercial Mortgage Trust 144A FRB Ser. 13-C15, Class D, 4.186%, 8/15/46 W | | 322,000 | 132,825 |
| | | | | 9,679,877 |
| | Residential mortgage-backed securities (non-agency) (7.0%) | | | |
| | A&D Mortgage Trust 144A Ser. 23-NQM4, Class A1, 7.472%, 9/25/68 | | 576,330 | 588,757 |
| | Angel Oak Mortgage Trust 144A Ser. 23-3, Class A1, 4.80%, 9/26/67 | | 94,049 | 92,502 |
| | Arroyo Mortgage Trust 144A Ser. 19-3, Class M1, 4.204%, 10/25/48 W | | 330,000 | 287,003 |
| | BRAVO Residential Funding Trust 144A | | | |
| | Ser. 23-NQM8, Class A1, 6.394%, 10/25/63 | | 105,498 | 106,429 |
| | Ser. 24-NQM2, Class A1, stepped‑coupon 6.285% (7.285%, 2/1/28), 2/25/64 †† | | 123,106 | 124,154 |
| | Ser. 20-RPL1, Class M1, 3.25%, 5/26/59 W | | 353,000 | 329,604 |
| | Bunker Hill Loan Depositary Trust 144A FRB Ser. 20-1, Class A3, 3.253%, 2/25/55 W | | 332,000 | 302,432 |
| | Chevy Chase Funding, LLC Mortgage-Backed Certificates 144A FRB Ser. 04-3A, Class A2, (CME Term SOFR 1 Month + 0.41%), 4.753%, 8/25/35 | | 39,685 | 37,888 |
| | Citigroup Mortgage Loan Trust, Inc. 144A Ser. 22-A, Class A1, 6.17%, perpetual maturity | | 126,662 | 126,749 |
| | COLT Mortgage Loan Trust 144A | | | |
| | Ser. 23-3, Class A1, 7.18%, 9/25/68 | | 549,549 | 557,850 |
| | Ser. 20-2, Class A2, 3.094%, 3/25/65 W | | 105,384 | 103,814 |
| | Ellington Financial Mortgage Trust 144A FRB Ser. 20-1, Class A2, 3.149%, 5/25/65 W | | 179,000 | 173,173 |
| | Federal Home Loan Mortgage Corporation Seasoned Credit Risk Transfer Trust Ser. 19-3, Class M, 4.75%, 10/25/58 W | | 333,147 | 321,355 |
| | Federal Home Loan Mortgage Corporation 144A | | | |
| | Structured Agency Credit Risk Trust REMICs FRB Ser. 22-HQA1, Class M2, (US 30 Day Average SOFR + 5.25%), 9.819%, 3/25/42 | | 911,000 | 982,546 |
| | Structured Agency Credit Risk Trust REMICs FRB Ser. 22-HQA3, Class M1A, (US 30 Day Average SOFR + 2.30%), 6.869%, 8/25/42 | | 6,695 | 6,845 |
| | Structured Agency Credit Risk Trust REMICs FRB Ser. 21-DNA3, Class M2, (US 30 Day Average SOFR + 2.10%), 6.669%, 10/25/33 | | 30,734 | 31,579 |
| | Structured Agency Credit Risk Trust REMICs FRB Ser. 23-DNA1, Class M1A, (US 30 Day Average SOFR + 2.10%), 6.66%, 3/25/43 | | 33,985 | 34,494 |
| | Structured Agency Credit Risk Trust REMICs FRB Ser. 23-HQA3, Class M1, (US 30 Day Average SOFR + 1.85%), 6.419%, 11/25/43 | | 15,589 | 15,698 |
| | | | |
| | MORTGAGE-BACKED SECURITIES (18.0%)* cont. | Principal amount | Value |
| | Residential mortgage-backed securities (non-agency) cont. | | | |
| | Federal Home Loan Mortgage Corporation 144A | | | |
| | Structured Agency Credit Risk Trust REMICs FRB Ser. 22-DNA1, Class M1B, (US 30 Day Average SOFR + 1.85%), 6.419%, 1/25/42 | | $17,000 | $17,256 |
| | Structured Agency Credit Risk Debt FRN Ser. 21-DNA7, Class M2, (US 30 Day Average SOFR + 1.80%), 6.369%, 11/25/41 | | 108,000 | 109,089 |
| | Structured Agency Credit Risk Trust REMICs FRB Ser. 21-DNA5, Class M2, (US 30 Day Average SOFR + 1.65%), 6.219%, 1/25/34 | | 5,584 | 5,623 |
| | Structured Agency Credit Risk Trust REMICs FRB Ser. 21-DNA6, Class M2, (US 30 Day Average SOFR + 1.50%), 6.069%, 10/25/41 | | 63,000 | 63,403 |
| | Structured Agency Credit Risk Debt FRN Ser. 22-DNA2, Class M1A, (US 30 Day Average SOFR + 1.30%), 5.869%, 2/25/42 | | 3,472 | 3,479 |
| | Structured Agency Credit Risk Trust REMICs FRB Ser. 22-DNA1, Class M1A, (US 30 Day Average SOFR + 1.00%), 5.569%, 1/25/42 | | 95,767 | 95,835 |
| | Structured Agency Credit Risk Trust REMICs FRB Ser. 21-HQA4, Class M1, (US 30 Day Average SOFR + 0.95%), 5.519%, 12/25/41 | | 17,063 | 17,072 |
| | Structured Agency Credit Risk Trust REMICs FRB Ser. 21-DNA6, Class M1, (US 30 Day Average SOFR + 0.80%), 5.369%, 10/25/41 | | 1,134 | 1,133 |
| | Seasoned Credit Risk Transfer Trust Ser. 19-2, Class M, 4.75%, 8/25/58 W | | 235,000 | 223,782 |
| | Federal National Mortgage Association 144A | | | |
| | Connecticut Avenue Securities Trust FRB Ser. 22-R03, Class 1M2, (US 30 Day Average SOFR + 3.50%), 8.069%, 3/25/42 | | 19,000 | 19,967 |
| | Connecticut Avenue Securities Trust FRB Ser. 22-R04, Class 1M2, (US 30 Day Average SOFR + 3.10%), 7.669%, 3/25/42 | | 19,000 | 19,771 |
| | Connecticut Avenue Securities Trust FRB Ser. 22-R08, Class 1M1, (US 30 Day Average SOFR + 2.55%), 7.119%, 7/25/42 | | 12,762 | 13,112 |
| | Connecticut Avenue Securities Trust FRB Ser. 23-R01, Class 1M1, (US 30 Day Average SOFR + 2.40%), 6.96%, 12/25/42 | | 8,712 | 8,960 |
| | Connecticut Avenue Securities Trust FRB Ser. 23-R02, Class 1M1, (US 30 Day Average SOFR + 2.30%), 6.869%, 1/25/43 | | 17,260 | 17,670 |
| | Connecticut Avenue Securities Trust FRB Ser. 19-HRP1, Class M2, (US 30 Day Average SOFR + 2.26%), 6.833%, 11/25/39 | | 27,896 | 28,033 |
| | Connecticut Avenue Securities Trust FRB Ser. 23-R06, Class 1M1, (US 30 Day Average SOFR + 1.70%), 6.269%, 7/25/43 | | 10,140 | 10,182 |
| | Connecticut Avenue Securities Trust FRB Ser. 21-R03, Class 1M2, (US 30 Day Average SOFR + 1.65%), 6.219%, 12/25/41 | | 24,000 | 24,262 |
| | Connecticut Avenue Securities Trust FRB Ser. 24-R06, Class 1A1, (US 30 Day Average SOFR + 1.15%), 5.719%, 9/25/44 | | 56,785 | 57,008 |
| | Connecticut Avenue Securities Trust FRB Ser. 24-R04, Class 1M1, (US 30 Day Average SOFR + 1.10%), 5.669%, 5/25/44 | | 8,057 | 8,063 |
| | Connecticut Avenue Securities Trust FRB Ser. 24-R06, Class 1M1, (US 30 Day Average SOFR + 1.05%), 5.619%, 9/25/44 | | 15,756 | 15,777 |
| | GCAT Trust 144A Ser. 20-NQM2, Class A3, 3.935%, 4/25/65 | | 29,861 | 28,908 |
| | Imperial Fund Mortgage Trust 144A Ser. 22-NQM7, Class A1, 7.369%, 11/25/67 | | 297,008 | 300,139 |
| | JPMorgan Mortgage Trust 144A FRB Ser. 23-HE3, Class A1, (US 30 Day Average SOFR + 1.60%), 6.205%, 5/25/54 | | 382,486 | 385,988 |
| | JPMorgan Mortgage Trust 144A FRB Ser. 24-9, Class A11, (US 30 Day Average SOFR + 1.35%), 5.919%, 2/25/55 | | 226,333 | 227,108 |
| | Morgan Stanley Resecuritization Trust 144A Ser. 15-R4, Class CB1, 4.687%, 8/26/47 W | | 63,478 | 63,168 |
| | Morgan Stanley Residential Mortgage Loan Trust 144A FRB Ser. 24-4, Class AF, (US 30 Day Average SOFR + 1.35%), 5.919%, 9/25/54 | | 149,575 | 149,922 |
| | New Residential Mortgage Loan Trust 144A FRB Ser. 20-NQM2, Class A2, 2.891%, 5/24/60 W | | 212,000 | 192,859 |
| | NYMT Loan Trust 144A Ser. 22-SP1, Class A1, 5.25%, 7/25/62 | | 136,245 | 135,435 |
| | OBX Trust 144A Ser. 23-NQM7, Class A1, 6.844%, 4/25/63 | | 367,270 | 372,773 |
| | Onslow Bay Financial, LLC Trust 144A Ser. 22-NQM7, Class A1, 5.35%, 8/25/62 | | 247,028 | 246,218 |
| | PRKCM Trust 144A Ser. 23-AFC2, Class A1, 6.482%, 6/25/58 | | 541,233 | 544,554 |
| | Residential Mortgage Loan Trust 144A Ser. 20-2, Class A3, 2.911%, 5/25/60 W | | 464,000 | 441,224 |
| | RMF Proprietary Issuance Trust 144A Ser. 22-3, Class A, 4.00%, 8/25/62 W | | 116,000 | 108,424 |
| | Towd Point Mortgage Trust 144A Ser. 18-5, Class M1, 3.25%, 7/25/58 W | | 153,000 | 127,047 |
| | Verus Securitization Trust 144A FRB Ser. 24-1, Class A1, 5.712%, 1/25/69 | | 382,629 | 383,380 |
| | Visio Trust 144A Ser. 22-1, Class A2, 5.85%, 8/25/57 | | 115,461 | 115,060 |
| | WaMu Mortgage Pass-Through Certificates Trust | | | |
| | FRB Ser. 05-AR13, Class A1C4, (CME Term SOFR 1 Month + 0.97%), 5.313%, 10/25/45 | | 550,420 | 528,058 |
| | FRB Ser. 05-AR17, Class A1B2, (CME Term SOFR 1 Month + 0.93%), 5.273%, 12/25/45 | | 423,207 | 380,092 |
| | | | | 9,712,706 |
| | Total mortgage-backed securities (cost $26,593,177) | $24,920,527 |
| | ASSET-BACKED SECURITIES (6.4%)* | Principal amount | Value |
| | BA Credit Card Trust Ser. 24-A1, Class A, 4.93%, 5/15/29 | | $687,000 | $694,118 |
| | Capital One Multi-Asset Execution Trust Ser. 22-A3, Class A, 4.95%, 10/15/27 | | 400,000 | 401,574 |
| | CarMax Auto Owner Trust Ser. 24-3, Class A3, 4.89%, 7/16/29 | | 680,000 | 684,257 |
| | Chase Auto Owner Trust 144A Ser. 24-3A, Class A3, 5.22%, 7/25/29 | | 689,000 | 696,828 |
| | Discover Card Execution Note Trust Ser. 22-A4, Class A, 5.03%, 10/15/27 | | 695,000 | 698,675 |
| | Ford Credit Auto Owner Trust Ser. 24-B, Class A3, 5.10%, 4/15/29 | | 688,000 | 696,410 |
| | GM Financial Consumer Automobile Receivables Trust Ser. 23-1, Class A3, 4.66%, 2/16/28 | | 683,296 | 684,096 |
| | Golden Credit Card Trust 144A Ser. 22-4A, Class A, 4.31%, 9/15/27 | | 483,000 | 482,286 |
| | Harley-Davidson Motorcycle Trust Ser. 24-B, Class A3, 4.31%, 7/16/29 | | 702,000 | 698,884 |
| | Hyundai Auto Receivables Trust | | | |
| | Ser. 23-B, Class A3, 5.48%, 4/17/28 | | 680,000 | 687,625 |
| | Ser. 23-A, Class A3, 4.58%, 4/15/27 | | 654,235 | 654,538 |
| | Lendbuzz Securitization Trust 144A Ser. 24-3A, Class A2, 4.97%, 10/15/29 | | 288,000 | 288,064 |
| | Station Place Securitization Trust 144A | | | |
| | FRB Ser. 24-2, Class A, (CME Term SOFR 1 Month + 0.90%), 5.643%, 6/22/25 | | 320,000 | 320,219 |
| | FRB Ser. 24-10, Class A, (CME Term SOFR 1 Month + 0.90%), 5.237%, 10/27/25 | | 325,000 | 326,728 |
| | FRB Ser. 24-5, Class A, (CME Term SOFR 1 Month + 0.90%), 5.237%, 8/4/25 | | 325,000 | 325,265 |
| | Toyota Auto Receivables Owner Trust Ser. 22-C, Class A3, 3.76%, 4/15/27 | | 491,329 | 489,692 |
| | Total asset-backed securities (cost $8,774,346) | $8,829,259 |
| | COLLATERALIZED LOAN OBLIGATIONS (5.5%)* | Principal amount | Value |
| | AGL Core CLO 31, Ltd. 144A FRB Ser. 24-31A, Class A, (CME Term SOFR 3 Month + 1.40%), 6.60%, 7/20/37 (Cayman Islands) | | $250,000 | $250,657 |
| | AIMCO CLO 17, Ltd. 144A FRB Ser. 24-17A, Class AIR, (CME Term SOFR 3 Month + 1.35%), 5.982%, 7/20/37 (Jersey) | | 250,000 | 250,678 |
| | Allegro CLO XII, Ltd. 144A FRB Ser. 24-1A, Class A1R, (CME Term SOFR 3 Month + 1.44%), 6.724%, 7/21/37 (Cayman Islands) | | 250,000 | 250,563 |
| | Apex Credit CLO II, Ltd. 144A FRB Ser. 24-2A, Class A, (CME Term SOFR 3 Month + 1.52%), 6.689%, 7/25/37 (Cayman Islands) | | 250,000 | 252,428 |
| | Birch Grove CLO 2, Ltd. 144A FRB Ser. 24-2A, Class A1R, (CME Term SOFR 3 Month + 1.40%), 6.017%, 10/19/37 (Cayman Islands) | | 175,000 | 176,213 |
| | Birch Grove CLO 8, Ltd. 144A FRB Ser. 24-8A, Class A1, (CME Term SOFR 3 Month + 1.63%), 6.247%, 4/20/37 (Jersey) | | 150,000 | 151,293 |
| | CBAM CLO Management, Ltd. 144A FRB Ser. 21-2A, Class AR, (CME Term SOFR 3 Month + 1.45%), 6.099%, 7/17/34 (Cayman Islands) | | 175,000 | 175,252 |
| | CIFC Funding II, Ltd. 144A FRB Ser. 24-2RA, Class AR, (CME Term SOFR 3 Month + 1.36%), 5.995%, 10/24/37 (Cayman Islands) | | 250,000 | 250,114 |
| | CIFC Funding, Ltd. 144A FRB Ser. 21-1A, Class BRR, (CME Term SOFR 3 Month + 1.96%), 7.244%, 10/21/31 | | 250,000 | 250,000 |
| | CIFC Funding, Ltd. 144A FRB Ser. 24-4A, Class AR, (CME Term SOFR 3 Month + 1.36%), 6.533%, 7/23/37 (Cayman Islands) | | 250,000 | 250,577 |
| | Crown Point CLO 10, Ltd. 144A FRB Ser. 21-10A, Class A, (CME Term SOFR 3 Month + 1.43%), 6.049%, 7/20/34 (Cayman Islands) | | 250,000 | 250,367 |
| | Diameter Capital CLO, Ltd. 144A FRB Ser. 24-7A, Class A1A, (CME Term SOFR 3 Month + 1.48%), 6.806%, 7/20/37 (Cayman Islands) | | 250,000 | 251,592 |
| | Ellington CLO III, Ltd. 144A FRB Ser. 18-3A, Class B, (CME Term SOFR 3 Month + 2.26%), 6.879%, 7/20/30 | | 250,000 | 250,574 |
| | Elmwood CLO 27, Ltd. 144A FRB Ser. 24-3A, Class A, (CME Term SOFR 3 Month + 1.52%), 6.152%, 4/18/37 | | 250,000 | 251,870 |
| | Elmwood CLO I, Ltd. 144A FRB Ser. 24-1A, Class A1RR, (CME Term SOFR 3 Month + 1.52%), 6.137%, 4/20/37 (Cayman Islands) | | 100,000 | 100,721 |
| | Elmwood CLO III, Ltd. 144A FRB Ser. 24-3A, Class A1RR, (CME Term SOFR 3 Month + 1.38%), 6.012%, 7/18/37 (Cayman Islands) | | 250,000 | 251,431 |
| | GoldenTree Loan Management US CLO 9, Ltd. 144A FRB Ser. 24-9A, Class AR, (CME Term SOFR 3 Month + 1.50%), 6.117%, 4/20/37 | | 250,000 | 251,954 |
| | Hayfin US XIV, Ltd. 144A FRB Ser. 21-14A, Class A1, (CME Term SOFR 3 Month + 1.49%), 6.109%, 7/20/34 (Cayman Islands) | | 150,000 | 150,234 |
| | ICG US CLO, Ltd. 144A FRB Ser. 21-1A, Class ARR, (CME Term SOFR 3 Month + 1.43%), 6.049%, 7/28/34 | | 250,000 | 250,381 |
| | Magnetite XL, Ltd. 144A FRB Ser. 24-40A, Class A1, (CME Term SOFR 3 Month + 1.45%), 6.782%, 7/15/37 (Cayman Islands) | | 250,000 | 251,791 |
| | Nassau, Ltd. 144A FRB Ser. 21-1A, Class A1, (CME Term SOFR 3 Month + 1.51%), 6.168%, 8/26/34 (Cayman Islands) | | 250,000 | 250,384 |
| | Neuberger Berman CLO XVII, Ltd. 144A FRB Ser. 24-17A, Class AR3, (CME Term SOFR 3 Month + 1.40%), 6.032%, 7/22/38 (Cayman Islands) | | 250,000 | 251,636 |
| | Neuberger Berman Loan Advisers CLO, Ltd. 144A FRB Ser. 24-25A, Class AR2, (CME Term SOFR 3 Month + 1.40%), 6.032%, 7/18/38 (Cayman Islands) | | 250,000 | 251,630 |
| | | | |
| | COLLATERALIZED LOAN OBLIGATIONS (5.5%)* cont. | Principal amount | Value |
| | Oaktree CLO, Ltd. 144A FRB Ser. 24-1A, Class A1R, (CME Term SOFR 3 Month + 1.35%), 5.848%, 1/15/38 (Cayman Islands) | | $250,000 | $250,424 |
| | Oaktree CLO, Ltd. 144A FRB Ser. 24-4A, Class ARR, (CME Term SOFR 3 Month + 1.51%), 6.127%, 7/20/37 (Cayman Islands) | | 250,000 | 252,240 |
| | Palmer Square CLO, Ltd. 144A FRB Ser. 21-3A, Class B, (CME Term SOFR 3 Month + 1.91%), 6.568%, 1/15/35 (Cayman Islands) | | 250,000 | 250,599 |
| | Rockland Park CLO, Ltd. 144A FRB Ser. 21-1A, Class B, (CME Term SOFR 3 Month + 1.91%), 6.529%, 4/20/34 (Cayman Islands) | | 250,000 | 250,614 |
| | RR 29, Ltd. 144A FRB Ser. 24-29RA, Class A1R, (CME Term SOFR 3 Month + 1.39%), 6.046%, 7/15/39 (Cayman Islands) | | 250,000 | 250,675 |
| | Sound Point CLO XXVI, Ltd. 144A FRB Ser. 21-1A, Class AR, (CME Term SOFR 3 Month + 1.43%), 6.049%, 7/20/34 (Cayman Islands) | | 250,000 | 250,536 |
| | Sound Point CLO XXXII, Ltd. 144A FRB Ser. 21-4A, Class A, (CME Term SOFR 3 Month + 1.41%), 6.037%, 10/25/34 (Cayman Islands) | | 250,000 | 250,374 |
| | Voya CLO, Ltd. 144A FRB Ser. 24-4A, Class A1, (CME Term SOFR 3 Month + 1.35%), 6.534%, 7/20/37 (Cayman Islands) | | 250,000 | 250,585 |
| | Wise CLO, Ltd. 144A FRB Ser. 24-2A, Class A, (CME Term SOFR 3 Month + 1.46%), 6.76%, 7/15/37 (Cayman Islands) | | 250,000 | 250,637 |
| | Total collateralized loan obligations (cost $7,493,041) | $7,529,024 |
| | SHORT-TERM INVESTMENTS (11.8%)* | Principal amount/shares | Value |
| | Putnam Short Term Investment Fund Class P 4.56% L | Shares 14,594,739 | $14,594,739 |
| | State Street Institutional U.S. Government Money Market Fund, Premier Class 4.43% P | Shares 348,000 | 348,000 |
| | U.S. Treasury Bills 4.628%, 1/16/25 #Ф | $1,300,000 | 1,297,861 |
| | U.S. Treasury Bills 4.280%, 3/25/25 Ф | 100,000 | 99,052 |
| | Total short-term investments (cost $16,339,330) | $16,339,652 |
| | TOTAL INVESTMENTS |
| | Total investments (cost $155,646,794) | $150,551,253 |
| | Key to holding’s abbreviations |
| | BKNT | Bank Note |
| | bp | Basis Points |
| | CME | Chicago Mercantile Exchange |
| | DAC | Designated Activity Company |
| | FRB | Floating Rate Bonds: The rate shown is the current interest rate at the close of the reporting period. Rates may be subject to a cap or floor. For certain securities, the rate may represent a fixed rate currently in place at the close of the reporting period. |
| | FRN | Floating Rate Notes: The rate shown is the current interest rate or yield at the close of the reporting period. Rates may be subject to a cap or floor. For certain securities, the rate may represent a fixed rate currently in place at the close of the reporting period. |
| | GMTN | Global Medium Term Notes |
| | IFB | Inverse Floating Rate Bonds, which are securities that pay interest rates that vary inversely to changes in the market interest rates. As interest rates rise, inverse floaters produce less current income. The rate shown is the current interest rate at the close of the reporting period. Rates may be subject to a cap or floor. |
| | IO | Interest Only |
| | MTN | Medium Term Notes |
| | OTC | Over-the-counter |
| | PO | Principal Only |
| | REGS | Securities sold under Regulation S may not be offered, sold or delivered within the United States except pursuant to an exemption from, or in a transaction not subject to, the registration requirements of the Securities Act of 1933. |
| | REMICs | Real Estate Mortgage Investment Conduits |
| | SOFR | Secured Overnight Financing Rate |
| | TBA | To Be Announced Commitments |
| | Notes to the fund’s portfolio |
| | Unless noted otherwise, the notes to the fund’s portfolio are for the close of the fund’s reporting period, which ran from January 1, 2024 through December 31, 2024 (the reporting period). Within the following notes to the portfolio, references to “Franklin Advisers” represent Franklin Advisers, Inc., the fund’s investment manager, a direct wholly-owned subsidiary of Franklin Resources, Inc., and references to “ASC 820” represent Accounting Standards Codification 820 Fair Value Measurements and Disclosures. |
| * | Percentages indicated are based on net assets of $138,075,010. |
| † | This security is non-income-producing. |
| †† | The interest rate and date shown parenthetically represent the new interest rate to be paid and the date the fund will begin accruing interest at this rate. |
| # | This security, in part or in entirety, was pledged and segregated with the broker to cover margin requirements for futures contracts at the close of the reporting period. Collateral at period end totaled $1,160,790 and is included in Investments in securities on the Statement of assets and liabilities (Notes 1 and 8). |
| Ф | This security, in part or in entirety, was pledged and segregated with the custodian for collateral on certain TBA commitments at the close of the reporting period. Collateral at period end totaled $182,860 and is included in Investments in securities on the Statement of assets and liabilities (Notes 1 and 8). |
| i | This security was pledged, or purchased with cash that was pledged, to the fund for collateral on certain derivative contracts (Note 1). |
| L | Affiliated company (Note 5). The rate quoted in the security description is the annualized 7-day yield of the fund at the close of the reporting period. |
| P | This security was pledged, or purchased with cash that was pledged, to the fund for collateral on certain derivative contracts. The rate quoted in the security description is the annualized 7-day yield of the fund at the close of the reporting period. |
| R | Real Estate Investment Trust. |
| W | The rate shown represents the weighted average coupon associated with the underlying mortgage pools. Rates may be subject to a cap or floor. |
| | Unless otherwise noted, the rates quoted in Short-term investments security descriptions represent the weighted average yield to maturity. |
| | Debt obligations are considered secured unless otherwise indicated. |
| | 144A after the name of an issuer represents securities exempt from registration under Rule 144A of the Securities Act of 1933, as amended. These securities may be resold in transactions exempt from registration, normally to qualified institutional buyers. |
| | See Note 1 to the financial statements regarding TBA commitments. |
| | The dates shown on debt obligations are the original maturity dates. |
| | FUTURES CONTRACTS OUTSTANDING at 12/31/24 |
| | | Number of contracts | Notional amount | Value | Expiration date | Unrealized appreciation/ (depreciation) |
| | U.S. Treasury Bond 30 yr (Long) | 37 | $4,212,219 | $4,212,219 | Mar-25 | $(151,182) |
| | U.S. Treasury Bond Ultra 30 yr (Long) | 82 | 9,750,313 | 9,750,313 | Mar-25 | (515,274) |
| | U.S. Treasury Note 2 yr (Long) | 1 | 205,609 | 205,609 | Mar-25 | (111) |
| | U.S. Treasury Note 2 yr (Short) | 88 | 18,093,625 | 18,093,625 | Mar-25 | 10,866 |
| | U.S. Treasury Note 5 yr (Long) | 119 | 12,650,258 | 12,650,258 | Mar-25 | (105,236) |
| | U.S. Treasury Note 5 yr (Short) | 17 | 1,807,180 | 1,807,180 | Mar-25 | 15,029 |
| | U.S. Treasury Note 10 yr (Long) | 86 | 9,352,500 | 9,352,500 | Mar-25 | (156,019) |
| | U.S. Treasury Note 10 yr (Short) | 20 | 2,175,000 | 2,175,000 | Mar-25 | 38,404 |
| | U.S. Treasury Note Ultra 10 yr (Long) | 21 | 2,337,563 | 2,337,563 | Mar-25 | (55,159) |
| | Unrealized appreciation | | | | | 64,299 |
| | Unrealized (depreciation) | | | | | (982,981) |
| | Total | $(918,682) |
| | FORWARD PREMIUM SWAP OPTION CONTRACTS OUTSTANDING at 12/31/24 |
| | Counterparty Fixed right or obligation % to receive or (pay)/Floating rate index/ Maturity date | Expiration date/strike | | Notional/ Contract amount | Premium receivable/ (payable) | Unrealized appreciation/ (depreciation) |
| | Bank of America N.A. |
| | 3.725/US SOFR/Nov-36 (Purchased) | Nov-26/3.725 | | $701,800 | $(116,622) | $(11,523) |
| | (4.225)/US SOFR/Nov-36 (Purchased) | Nov-26/4.225 | | 701,800 | (122,107) | (6,944) |
| | (3.428)/US SOFR/Aug-37 (Purchased) | Aug-27/3.428 | | 384,300 | (22,116) | 8,962 |
| | 3.428/US SOFR/Aug-37 (Purchased) | Aug-27/3.428 | | 384,300 | (22,116) | (10,248) |
| | Barclays Bank PLC |
| | 1.945/US SOFR/Jun-51 (Purchased) | Jun-31/1.945 | | 1,717,000 | (96,858) | (39,688) |
| | (1.945)/US SOFR/Jun-51 (Purchased) | Jun-31/1.945 | | 1,717,000 | (380,964) | 116,263 |
| | Citibank, N.A. |
| | 4.50/US SOFR/Dec-30 (Written) | Dec-25/4.50 | | 4,475,300 | 25,845 | (19,136) |
| | (4.00)/US SOFR/Dec-30 (Purchased) | Dec-25/4.00 | | 2,237,700 | (25,286) | 16,722 |
| | Goldman Sachs International |
| | 2.35/US SOFR/Mar-59 (Purchased) | Mar-29/2.35 | | 1,865,500 | (337,685) | (38,739) |
| | Mizuho Capital Markets LLC |
| | 3.5475/US SOFR/Aug-36 (Purchased) | Aug-26/3.5475 | | 357,500 | (35,616) | (9,017) |
| | (4.0475)/US SOFR/Aug-36 (Purchased) | Aug-26/4.0475 | | 357,500 | (37,003) | (2,756) |
| | Unrealized appreciation | 141,947 |
| | Unrealized (depreciation) | (138,051) |
| | Total | $3,896 |
| | TBA SALE COMMITMENTS OUTSTANDING at 12/31/24 (proceeds receivable $8,720,059) |
| | Agency | Principal amount | Settlement date | Value |
| | Uniform Mortgage-Backed Securities, 5.50%, 1/1/55 | $4,000,000 | 1/14/25 | $3,947,619 |
| | Uniform Mortgage-Backed Securities, 4.50%, 1/1/55 | 3,000,000 | 1/14/25 | 2,821,886 |
| | Uniform Mortgage-Backed Securities, 4.00%, 1/1/55 | 1,000,000 | 1/14/25 | 914,535 |
| | Uniform Mortgage-Backed Securities, 3.50%, 1/1/55 | 1,000,000 | 1/14/25 | 884,572 |
| | Total | $8,568,612 |
| | CENTRALLY CLEARED INTEREST RATE SWAP CONTRACTS OUTSTANDING at 12/31/24 |
| | Notional amount | Value | Upfront premium received (paid) | Termination date | Payments made by fund | Payments received by fund | Unrealized appreciation/ (depreciation) |
| | | $461,200 | $11,428E | $(7) | 3/18/36 | 3.757% — Annually | US SOFR — Annually | $11,421 |
| | | 490,100 | 22,649E | (17) | 2/20/59 | 3.485% — Annually | US SOFR — Annually | 22,632 |
| | | 7,245,500 | 21,316 | (27) | 3/18/26 | US SOFR — Annually | 4.413% — Annually | (22,048) |
| | | 278,000 | 3,275E | (4) | 4/17/35 | 3.919% — Annually | US SOFR — Annually | 3,271 |
| | | 775,000 | 7,313E | (11) | 4/17/35 | 3.948% — Annually | US SOFR — Annually | 7,302 |
| | | 87,900 | 1,212E | (1) | 3/31/38 | US SOFR — Annually | 3.93% — Annually | (1,214) |
| | | 418,300 | 13,903E | (14) | 3/14/59 | US SOFR — Annually | 3.57% — Annually | (13,918) |
| | | 109,000 | 5,457E | (4) | 3/14/59 | US SOFR — Annually | 3.456% — Annually | (5,461) |
| | | 26,599,000 | 191,672 | 206,689 | 9/18/26 | 4.55% — Annually | US SOFR — Annually | 23,416 |
| | | 17,365,000 | 223,036 | (334,275) | 9/18/29 | US SOFR — Annually | 4.35% — Annually | (126,852) |
| | | 1,951,100 | 12,118 | 53,777 | 9/18/34 | 4.15% — Annually | US SOFR — Annually | 44,551 |
| | | 1,956,000 | 4,029 | 119,862 | 9/18/54 | 3.95% — Annually | US SOFR — Annually | 119,873 |
| | | 6,899,000 | 30,783 | (25,809) | 12/18/26 | US SOFR — Annually | 3.85% — Annually | (56,430) |
| | | 4,455,000 | 78,573 | 28,762 | 12/18/29 | 3.65% — Annually | US SOFR — Annually | 107,576 |
| | | 93,000 | 4,720 | (1,474) | 12/18/34 | US SOFR — Annually | 3.45% — Annually | (6,206) |
| | | 932,000 | 110,164 | 42,448 | 12/18/54 | US SOFR — Annually | 3.25% — Annually | (67,912) |
| | | 1,284,000 | 4,705E | 3,124 | 3/19/27 | US SOFR — Annually | 3.85% — Annually | (1,581) |
| | | 6,292,000 | 77,996E | (52,347) | 3/19/30 | 3.75% — Annually | US SOFR — Annually | 25,649 |
| | | 7,102,000 | 182,109E | 85,924 | 3/19/35 | US SOFR — Annually | 3.75% — Annually | (96,185) |
| | | 957,000 | 61,152E | (34,422) | 3/19/55 | 3.55% — Annually | US SOFR — Annually | 26,732 |
| | Total | $92,174 | $(5,384) |
| E | Extended effective date. |
| | OTC CREDIT DEFAULT CONTRACTS OUTSTANDING — PROTECTION SOLD at 12/31/24 |
| | Swap counterparty/ Referenced debt* | Rating*** | Upfront premium received (paid)** | | Notional amount | Value | Termination date | Payments received by fund | Unrealized appreciation/ (depreciation) |
| | Bank of America N.A. |
| | CMBX NA BBB–.6 Index | CCC/P | $3,281 | | $21,033 | $2,903 | 5/11/63 | 300 bp — Monthly | $391 |
| | CMBX NA BBB–.6 Index | CCC/P | 6,388 | | 46,447 | 6,410 | 5/11/63 | 300 bp — Monthly | 5 |
| | CMBX NA BBB–.6 Index | CCC/P | 7,467 | | 57,402 | 7,921 | 5/11/63 | 300 bp — Monthly | (421) |
| | Citigroup Global Markets, Inc. |
| | CMBX NA BB.13 Index | B+/P | 51,734 | | 121,000 | 40,644 | 12/16/72 | 500 bp — Monthly | 11,208 |
| | CMBX NA BB.6 Index | CCC-/P | 24,342 | | 71,649 | 17,783 | 5/11/63 | 500 bp — Monthly | 6,629 |
| | JPMorgan Securities LLC |
| | CMBX NA BB.10 Index | CCC+/P | 5,777 | | 72,000 | 29,930 | 5/11/63 | 500 bp — Monthly | (24,083) |
| | Merrill Lynch International |
| | CMBX NA A.13 Index | A-/P | 6,123 | | 46,000 | 3,376 | 12/16/72 | 200 bp — Monthly | 2,765 |
| | CMBX NA A.13 Index | A-/P | 5,996 | | 46,000 | 3,376 | 12/16/72 | 200 bp — Monthly | 2,637 |
| | CMBX NA BB.6 Index | CCC-/P | 5,518 | | 13,818 | 3,430 | 5/11/63 | 500 bp — Monthly | 2,102 |
| | Morgan Stanley & Co. International PLC |
| | CMBX NA A.13 Index | A-/P | 2,902 | | 23,000 | 1,688 | 12/16/72 | 200 bp — Monthly | 1,223 |
| | CMBX NA BB.13 Index | B+/P | 56,828 | | 126,000 | 42,323 | 12/16/72 | 500 bp — Monthly | 14,627 |
| | Upfront premium received | 176,356 | Unrealized appreciation | 41,587 |
| | Upfront premium (paid) | — | Unrealized (depreciation) | (24,504) |
| | Total | $176,356 | Total | $17,083 |
| * | Payments related to the referenced debt are made upon a credit default event. |
| ** | Upfront premium is based on the difference between the original spread on issue and the market spread on day of execution. |
| *** | Ratings for an underlying index represent the average of the ratings of all the securities included in that index. The Moody’s, Standard & Poor’s or Fitch ratings are believed to be the most recent ratings available at December 31, 2024. Securities rated by Fitch are indicated by “/F.” Securities rated by Putnam are indicated by “/P.” The Putnam rating categories are comparable to the Standard & Poor’s classifications. |
| | OTC CREDIT DEFAULT CONTRACTS OUTSTANDING — PROTECTION PURCHASED at 12/31/24 |
| | Swap counterparty/ Referenced debt* | | Upfront premium received (paid)** | | Notional amount | Value | Termination date | Payments (paid) by fund | Unrealized appreciation/ (depreciation) |
| | Citigroup Global Markets, Inc. |
| | CMBX NA BB.10 Index | | $(175,417) | | $378,000 | $157,135 | 11/17/59 | (500 bp) — Monthly | $(18,650) |
| | CMBX NA BB.10 Index | | (63,272) | | 157,000 | 65,265 | 11/17/59 | (500 bp) — Monthly | 1,840 |
| | CMBX NA BB.10 Index | | (63,272) | | 157,000 | 65,265 | 11/17/59 | (500 bp) — Monthly | 1,840 |
| | CMBX NA BB.10 Index | | (33,449) | | 83,000 | 34,503 | 11/17/59 | (500 bp) — Monthly | 973 |
| | CMBX NA BB.8 Index | | (3,897) | | 8,389 | 3,554 | 10/17/57 | (500 bp) — Monthly | (352) |
| | CMBX NA BBB–.12 Index | | (23,271) | | 82,000 | 14,637 | 8/17/61 | (300 bp) — Monthly | (8,682) |
| | CMBX NA BBB–.6 Index | | (53,386) | | 124,882 | 17,234 | 5/11/63 | (300 bp) — Monthly | (36,225) |
| | JPMorgan Securities LLC |
| | CMBX NA BB.11 Index | | (85,971) | | 85,467 | 21,213 | 5/11/63 | (500 bp) — Monthly | (64,842) |
| | Merrill Lynch International |
| | CMBX NA BB.10 Index | | (8,592) | | 151,000 | 62,771 | 11/17/59 | (500 bp) — Monthly | 54,032 |
| | Morgan Stanley & Co. International PLC |
| | CMBX NA BB.10 Index | | (9,017) | | 19,000 | 7,898 | 11/17/59 | (500 bp) — Monthly | (1,137) |
| | CMBX NA BBB–.10 Index | | (6,468) | | 20,000 | 3,516 | 11/17/59 | (300 bp) — Monthly | (2,964) |
| | Upfront premium received | — | Unrealized appreciation | 58,685 |
| | Upfront premium (paid) | (526,012) | Unrealized (depreciation) | (132,852) |
| | Total | $(526,012) | Total | $(74,167) |
| * | Payments related to the referenced debt are made upon a credit default event. |
| ** | Upfront premium is based on the difference between the original spread on issue and the market spread on day of execution. |
| | ASC 820 establishes a three-level hierarchy for disclosure of fair value measurements. The valuation hierarchy is based upon the transparency of inputs to the valuation of the fund’s investments. The three levels are defined as follows: |
| | Level 1: Valuations based on quoted prices for identical securities in active markets. |
| | Level 2: Valuations based on quoted prices in markets that are not active or for which all significant inputs are observable, either directly or indirectly. |
| | Level 3: Valuations based on inputs that are unobservable and significant to the fair value measurement. |
| | The following is a summary of the inputs used to value the fund’s net assets as of the close of the reporting period: |
| | | Valuation inputs |
| | Investments in securities: | Level 1 | Level 2 | Level 3 |
| | Asset-backed securities | $— | $8,829,259 | $— |
| | Collateralized loan obligations | — | 7,529,024 | — |
| | Corporate bonds and notes | — | 57,306,806 | — |
| | Mortgage-backed securities | — | 24,920,527 | — |
| | U.S. government and agency mortgage obligations | — | 35,517,400 | — |
| | U.S. treasury obligations | — | 108,585 | — |
| | Short-term investments | 348,000 | 15,991,652 | — |
| | Totals by level | $348,000 | $150,203,253 | $— |
| | | Valuation inputs |
| | Other financial instruments: | Level 1 | Level 2 | Level 3 |
| | Futures contracts | $(918,682) | $— | $— |
| | Forward premium swap option contracts | — | 3,896 | — |
| | TBA sale commitments | — | (8,568,612) | — |
| | Interest rate swap contracts | — | (97,558) | — |
| | Credit default contracts | — | 292,572 | — |
| | Totals by level | $(918,682) | $(8,369,702) | $— |
The accompanying notes are an integral part of these financial statements.
Financial statements
Statement of assets and liabilities
12/31/24
| Assets | |
| Investment in securities, at value (Notes 1 and 8): | |
| Unaffiliated issuers (identified cost $141,052,055) | $135,956,514 |
| Affiliated issuers (identified cost $14,594,739) (Note 5) | 14,594,739 |
| Cash | 255,273 |
| Interest and other receivables | 1,359,239 |
| Receivable for shares of the fund sold | 176,163 |
| Receivable for sales of TBA securities (Note 1) | 8,735,671 |
| Receivable for variation margin on futures contracts (Note 1) | 7,344 |
| Receivable for variation margin on centrally cleared swap contracts (Note 1) | 19,195 |
| Unrealized appreciation on forward premium swap option contracts (Note 1) | 141,947 |
| Unrealized appreciation on OTC swap contracts (Note 1) | 100,272 |
| Premium paid on OTC swap contracts (Note 1) | 526,012 |
| Deposits with broker (Note 1) | 121,827 |
| Receivable from broker (Note 1) | 559 |
| Total assets | 161,994,755 |
| | |
| Liabilities | |
| Payable for investments purchased | 255,701 |
| Payable for purchases of TBA securities (Note 1) | 13,604,484 |
| Payable for shares of the fund repurchased | 92,522 |
| Payable for compensation of Manager (Note 2) | 44,265 |
| Payable for custodian fees (Note 2) | 30,627 |
| Payable for investor servicing fees (Note 2) | 16,325 |
| Payable for Trustee compensation and expenses (Note 2) | 119,654 |
| Payable for administrative services (Note 2) | 1,179 |
| Payable for distribution fees (Note 2) | 13,159 |
| Payable for variation margin on futures contracts (Note 1) | 80,458 |
| Payable for variation margin on centrally cleared swap contracts (Note 1) | 30,286 |
| Unrealized depreciation on forward premium swap option contracts (Note 1) | 138,051 |
| Unrealized depreciation on OTC swap contracts (Note 1) | 157,356 |
| Premium received on OTC swap contracts (Note 1) | 176,356 |
| TBA sale commitments, at value (proceeds receivable $8,720,059) (Note 1) | 8,568,612 |
| Collateral on certain derivative contracts and TBA commitments, at value (Notes 1 and 8) | 456,585 |
| Other accrued expenses | 134,125 |
| Total liabilities | 23,919,745 |
| Net assets | $138,075,010 |
| | |
| Represented by | |
| Paid-in capital (Unlimited shares authorized) (Notes 1 and 4) | $231,474,687 |
| Total distributable earnings (Note 1) | (93,399,677) |
| Total — Representing net assets applicable to capital shares outstanding | $138,075,010 |
| | |
| Computation of net asset value Class IA | |
| Net assets | $76,688,144 |
| Number of shares outstanding | 9,437,270 |
| Net asset value, offering price and redemption price per share (net assets divided by number of shares outstanding) | $8.13 |
| | |
| Computation of net asset value Class IB | |
| Net assets | $61,386,866 |
| Number of shares outstanding | 7,653,209 |
| Net asset value, offering price and redemption price per share (net assets divided by number of shares outstanding) | $8.02 |
The accompanying notes are an integral part of these financial statements.
Statement of operations
Year ended 12/31/24
| Investment income | |
| Interest (including interest income of $1,123,493 from investments in affiliated issuers) (Note 5) | $8,175,092 |
| Total investment income | 8,175,092 |
| | |
| Expenses | |
| Compensation of Manager (Note 2) | 543,719 |
| Investor servicing fees (Note 2) | 100,420 |
| Custodian fees (Note 2) | 47,853 |
| Trustee compensation and expenses (Note 2) | 6,588 |
| Distribution fees (Note 2) | 160,195 |
| Administrative services (Note 2) | 2,614 |
| Auditing and tax fees | 110,283 |
| Other | 36,595 |
| Total expenses | 1,008,267 |
| Expense reduction (Note 2) | (2,096) |
| Net expenses | 1,006,171 |
| Net investment income | 7,168,921 |
| | |
| Realized and unrealized gain (loss) | |
| Net realized gain (loss) on: | |
| Securities from unaffiliated issuers (Notes 1 and 3) | (4,241,586) |
| Futures contracts (Note 1) | 68,801 |
| Swap contracts (Note 1) | (157,431) |
| Written options (Note 1) | 280,328 |
| Total net realized loss | (4,049,888) |
| Change in net unrealized appreciation (depreciation) on: | |
| Securities from unaffiliated issuers and TBA sale commitments | 3,037,659 |
| Futures contracts | (2,424,337) |
| Swap contracts | (25,403) |
| Written options | (219,768) |
| Total change in net unrealized appreciation | 368,151 |
| Net loss on investments | (3,681,737) |
| Net increase in net assets resulting from operations | $3,487,184 |
The accompanying notes are an integral part of these financial statements.
Statement of changes in net assets
| | Year ended 12/31/24 | Year ended 12/31/23 |
| Decrease in net assets | | |
| Operations: | | |
| Net investment income | $7,168,921 | $7,539,507 |
| Net realized loss on investments | (4,049,888) | (10,362,004) |
| Change in net unrealized appreciation of investments | 368,151 | 9,699,356 |
| Net increase in net assets resulting from operations | 3,487,184 | 6,876,859 |
| Distributions to shareholders (Note 1): | | |
| From ordinary income | | |
| Net investment income | | |
| Class IA | (4,511,418) | (5,014,154) |
| Class IB | (3,570,142) | (3,908,177) |
| Decrease from capital share transactions (Note 4) | (5,128,486) | (7,067,952) |
| Total decrease in net assets | (9,722,862) | (9,113,424) |
| Net assets: | | |
| Beginning of year | 147,797,872 | 156,911,296 |
| End of year | $138,075,010 | $147,797,872 |
The accompanying notes are an integral part of these financial statements.
Financial highlights
(For a common share outstanding throughout the period)
| INVESTMENT OPERATIONS: | LESS DISTRIBUTIONS: | RATIOS AND SUPPLEMENTAL DATA: |
| Period ended | Net asset value, beginning of period | Net investment income (loss)a | Net realized and unrealized gain (loss) on investments | Total from investment operations | From net investment income | From net realized gain on investments | Total distributions | Net asset value, end of period | Total return at net asset value (%)b,c | Net assets, end of period (in thousands) | Ratio of expenses to average net assets (%)c,d | Ratio of net investment income (loss) to average net assets (%) | Portfolio turnover (%)e |
| Class IA |
| 12/31/24 | $8.40 | .42 | (.22) | .20 | (.47) | — | (.47) | $8.13 | 2.56 | $76,688 | .59 | 5.11 | 461 |
| 12/31/23 | 8.50 | .42 | (.02) | .40 | (.50) | — | (.50) | 8.40 | 4.96 | 81,851 | .63 | 5.13 | 890 |
| 12/31/22 | 10.40 | .34 | (1.69) | (1.35) | (.55) | — | (.55) | 8.50 | (13.48) | 85,874 | .62f | 3.78 | 793 |
| 12/31/21 | 11.60 | .36 | (.87) | (.51) | (.18) | (.51) | (.69) | 10.40 | (4.44) | 111,757 | .56 | 3.36 | 800 |
| 12/31/20 | 11.63 | .33 | .32 | .65 | (.58) | (.10) | (.68) | 11.60 | 6.00 | 126,631 | .57 | 2.88 | 842 |
| Class IB |
| 12/31/24 | $8.29 | .39 | (.21) | .18 | (.45) | — | (.45) | $8.02 | 2.32 | $61,387 | .84 | 4.86 | 461 |
| 12/31/23 | 8.39 | .39 | (.01) | .38 | (.48) | — | (.48) | 8.29 | 4.69 | 65,947 | .88 | 4.88 | 890 |
| 12/31/22 | 10.28 | .32 | (1.69) | (1.37) | (.52) | — | (.52) | 8.39 | (13.81) | 71,037 | .87f | 3.53 | 793 |
| 12/31/21 | 11.46 | .33 | (.85) | (.52) | (.15) | (.51) | (.66) | 10.28 | (4.59) | 99,028 | .81 | 3.12 | 800 |
| 12/31/20 | 11.50 | .30 | .32 | .62 | (.56) | (.10) | (.66) | 11.46 | 5.72 | 114,913 | .82 | 2.62 | 842 |
| a | Per share net investment income (loss) has been determined on the basis of the weighted average number of shares outstanding during the period. |
| b | Total return assumes dividend reinvestment. |
| c | The charges and expenses at the insurance company separate account level are not reflected. |
| d | Includes amounts paid through expense offset and/or brokerage/service arrangements, if any (Note 2). Also excludes acquired fund fees and expenses, if any. |
| e | Portfolio turnover includes TBA purchase and sale commitments. |
| f | Includes one-time proxy cost of 0.01%. |
The accompanying notes are an integral part of these financial statements.
Notes to financial statements 12/31/24
Unless otherwise noted, the “reporting period” represents the period from January 1, 2024 through December 31, 2024. The following table defines commonly used references within the Notes to financial statements:
| References to | Represent |
| 1940 Act | Investment Company Act of 1940, as amended |
| Franklin Advisers | Franklin Advisers, Inc., a direct wholly-owned subsidiary of Franklin Templeton, and the fund’s investment manager for periods on or after July 15, 2024 |
| Franklin Distributors | Franklin Distributors, LLC, an indirect wholly-owned subsidiary of Franklin Templeton, and the fund’s distributor and principal underwriter for periods on or after August 2, 2024 |
| Franklin Templeton | Franklin Resources, Inc. |
| Franklin Templeton Services | Franklin Templeton Services, LLC, a wholly-owned subsidiary of Franklin Templeton |
| FTIML | Franklin Templeton Investment Management Limited |
| JPMorgan | JPMorgan Chase Bank, N.A. |
| OTC | Over-the-counter |
| PIL | Putnam Investments Limited, an indirect wholly-owned subsidiary of Franklin Templeton |
| PSERV | Putnam Investor Services, Inc., a wholly-owned subsidiary of Franklin Templeton |
| Putnam Management | Putnam Investment Management, LLC, an indirect wholly-owned subsidiary of Franklin Templeton, and the fund’s investment manager for periods prior to July 15, 2024 |
| Putnam Retail Management | Putnam Retail Management Limited Partnership, an indirect wholly-owned subsidiary of Franklin Templeton, and the fund’s distributor and principal underwriter for periods prior to August 2, 2024 |
| SEC | Securities and Exchange Commission |
| State Street | State Street Bank and Trust Company |
Putnam VT Income Fund (the fund) is a diversified series of Putnam Variable Trust (the Trust), a Massachusetts business trust registered under the 1940 Act as an open-end management investment company. The goal of the fund is to seek high current income consistent with what the fund’s investment manager believes to be prudent risk. The fund invests mainly in bonds that are securitized debt instruments (such as mortgage-backed investments) and related derivative instruments, and other obligations of companies and governments worldwide denominated in U.S. dollars or (to a lesser extent) foreign currencies, are either investment-grade or below-investment-grade in quality (sometimes referred to as “junk bonds”) and have intermediate- to long-term maturities (three years or longer). The fund currently has significant investment exposure to residential and commercial mortgage-backed securities. The fund’s investment manager may consider, among other factors, credit, interest rate and prepayment risks, as well as general market conditions, when deciding whether to buy or sell investments. The fund’s investment manager typically uses to a significant extent derivatives, including credit default swaps, interest rate swaps, total return swaps, to-be-announced (TBA) commitments, futures, options and swaptions, including on mortgage-backed securities and indices, and certain foreign currency transactions, for both hedging and non-hedging purposes, including to obtain or adjust exposure to mortgage-backed investments.
The fund offers class IA and class IB shares of beneficial interest. Class IA shares are offered at net asset value and are not subject to a distribution fee. Class IB shares are offered at net asset value and pay an ongoing distribution fee, which is identified in Note 2.
In the normal course of business, the fund enters into contracts that may include agreements to indemnify another party under given circumstances. The fund’s maximum exposure under these arrangements is unknown as this would involve future claims that may be, but have not yet been, made against the fund. However, the fund’s management team expects the risk of material loss to be remote.
The fund has entered into contractual arrangements with an investment adviser, administrator, distributor, shareholder servicing agent and custodian, who each provide services to the fund. Unless expressly stated otherwise, shareholders are not parties to, or intended beneficiaries of these contractual arrangements, and these contractual arrangements are not intended to create any shareholder right to enforce them against the service providers or to seek any remedy under them against the service providers, either directly or on behalf of the fund.
Under the Trust’s Agreement and Declaration of Trust, any claims asserted by a shareholder against or on behalf of the Trust (or its series), including claims against Trustees and Officers, must be brought in courts located within the Commonwealth of Massachusetts.
Note 1: Significant accounting policies
The fund follows the accounting and reporting guidance in Financial Accounting Standards Board (FASB) Accounting Standards Codification Topic 946, Financial Services – Investment Companies (ASC 946) and applies the specialized accounting and reporting guidance in U.S. Generally Accepted Accounting Principles (U.S. GAAP), including, but not limited to, ASC 946. The following is a summary of significant accounting policies consistently followed by the fund in the preparation of its financial statements. The preparation of financial statements is in conformity with accounting principles generally accepted in the United States of America and requires management to make estimates and assumptions that affect the reported amounts of assets and liabilities in the financial statements and the reported amounts of increases and decreases in net assets from operations. Actual results could differ from those estimates. Subsequent events after the Statement of assets and liabilities date through the date that the financial statements were issued have been evaluated in the preparation of the financial statements.
Investment income, realized and unrealized gains and losses and expenses of the fund are borne pro-rata based on the relative net assets of each class to the total net assets of the fund, except that each class bears expenses unique to that class (including the distribution fees applicable to such classes). Each class votes as a class only with respect to its own distribution plan or other matters on which a class vote is required by law or determined by the Trustees. If the fund were liquidated, shares of each class would receive their pro-rata share of the net assets of the fund. In addition, the Trustees declare separate dividends on each class of shares.
Security valuation Portfolio securities and other investments are valued using policies and procedures adopted by the Board of Trustees (Trustees). The Trustees have formed a Pricing Committee to oversee the implementation of these procedures. Under compliance policies and procedures approved by the Trustees, the Trustees have designated the fund’s investment manager as the valuation designee and has responsibility for oversight of valuation. The investment manager is assisted by the fund’s administrator in performing this responsibility, including leading the cross-functional Valuation Committee (VC). The VC is responsible for making fair value determinations, evaluating the effectiveness of the pricing policies of the fund and reporting to the Trustees.
Market quotations are not considered to be readily available for certain debt obligations (including short-term investments with remaining maturities of 60 days or less) and other investments; such investments are valued on the basis of valuations furnished by an independent pricing service approved by the Trustees or dealers selected by the fund’s investment manager. Such services or dealers determine valuations for normal institutional-size trading units of such securities using methods based on market transactions for comparable securities and various relationships, generally recognized by institutional traders, between securities (which consider such factors as security prices, yields, maturities and ratings). These securities will generally be categorized as Level 2. Securities quoted in foreign currencies, if any, are translated into U.S. dollars at the current exchange rate.
Investments in open-end investment companies (excluding exchange-traded funds), if any, which can be classified as Level 1 or Level 2 securities, are valued based on their net asset value. The net asset value of such investment companies equals the total value of their assets less their liabilities and divided by the number of their outstanding shares.
To the extent a pricing service or dealer is unable to value a security or provides a valuation that the fund’s investment manager does not believe accurately reflects the security’s fair value, the security will be valued at fair value by the fund’s investment manager, which has been designated as valuation designee pursuant to Rule 2a–5 under the 1940 Act, in accordance with policies and procedures approved by the Trustees. Certain investments, including certain restricted and illiquid securities and derivatives, are also valued at fair value following procedures approved by the Trustees. These valuations consider such factors as significant market or specific security events such as interest rate or credit quality changes, various
relationships with other securities, discount rates, U.S. Treasury, U.S. swap and credit yields, index levels, convexity exposures, recovery rates, sales and other multiples and resale restrictions. These securities are classified as Level 2 or as Level 3 depending on the priority of the significant inputs.
To assess the continuing appropriateness of fair valuations, the Valuation Committee reviews and affirms the reasonableness of such valuations on a regular basis after considering all relevant information that is reasonably available. Such valuations and procedures are reviewed periodically by the Trustees. Certain securities may be valued on the basis of a price provided by a single source. The fair value of securities is generally determined as the amount that the fund could reasonably expect to realize from an orderly disposition of such securities over a reasonable period of time. By its nature, a fair value price is a good faith estimate of the value of a security in a current sale and does not reflect an actual market price, which may be different by a material amount.
Security transactions and related investment income Security transactions are recorded on the trade date (the date the order to buy or sell is executed). Gains or losses on securities sold are determined on the identified cost basis.
Interest income, net of any applicable withholding taxes, if any, is recorded on the accrual basis. Amortization and accretion of premiums and discounts on debt securities, if any, is recorded on the accrual basis.
Securities purchased or sold on a forward commitment or delayed delivery basis may be settled at a future date beyond customary settlement time; interest income is accrued based on the terms of the securities. Losses may arise due to changes in the fair value of the underlying securities or if the counterparty does not perform under the contract.
Stripped securities The fund may invest in stripped securities which represent a participation in securities that may be structured in classes with rights to receive different portions of the interest and principal. Interest-only securities receive all of the interest and principal-only securities receive all of the principal. If the interest-only securities experience greater than anticipated prepayments of principal, the fund may fail to recoup fully its initial investment in these securities. Conversely, principal-only securities increase in value if prepayments are greater than anticipated and decline if prepayments are slower than anticipated. The fair value of these securities is highly sensitive to changes in interest rates.
Options contracts The fund uses options contracts for hedging duration and convexity, for isolating prepayment risk and for managing downside risks.
The potential risk to the fund is that the change in value of options contracts may not correspond to the change in value of the hedged instruments. In addition, losses may arise from changes in the value of the underlying instruments if there is an illiquid secondary market for the contracts, if interest or exchange rates move unexpectedly or if the counterparty to the contract is unable to perform. Realized gains and losses on purchased options are included in realized gains and losses on investment securities. If a written call option is exercised, the premium originally received is recorded as an addition to sales proceeds. If a written put option is exercised, the premium originally received is recorded as a reduction to the cost of investments.
Exchange-traded options are valued at the last sale price. OTC traded options are valued using quotations from an independent pricing service.
Options on swaps are similar to options on securities except that the premium paid or received is to buy or grant the right to enter into a previously agreed upon interest rate or credit default contract. Forward premium swap option contracts include premiums that have extended settlement dates. The delayed settlement of the premiums is factored into the daily valuation of the option contracts. In the case of interest rate cap and floor contracts, in return for a premium, ongoing payments between two parties are based on interest rates exceeding a specified rate, in the case of a cap contract, or falling below a specified rate in the case of a floor contract.
Written option contracts outstanding at period end, if any, are listed after the fund’s portfolio.
Futures contracts The fund uses futures contracts for hedging treasury term structure risk and for yield curve positioning.
The potential risk to the fund is that the change in value of futures contracts may not correspond to the change in value of the hedged instruments. In addition, losses may arise from changes in the value of the underlying instruments, if there is an illiquid secondary market for the contracts, if interest or exchange rates move unexpectedly or if the counterparty to the contract is unable to perform. With futures, there is minimal counterparty credit risk to the fund since futures are exchange traded and the exchange’s clearinghouse, as counterparty to all exchange traded futures, guarantees the futures against default. Risks may exceed amounts recognized on the Statement of assets and liabilities. When the contract is closed, the fund records a realized gain or loss equal to the difference between the value of the contract at the time it was opened and the value at the time it was closed.
Futures contracts are valued at the quoted daily settlement prices established by the exchange on which they trade. The fund and the broker agree to exchange an amount of cash equal to the daily fluctuation in the value of the futures contract. Such receipts or payments are known as “variation margin.”
Futures contracts outstanding at period end, if any, are listed after the fund’s portfolio.
Interest rate swap contracts The fund entered into OTC and/or centrally cleared interest rate swap contracts, which are arrangements between two parties to exchange cash flows based on a notional principal amount, for hedging term structure risk and for yield curve positioning.
An OTC and centrally cleared interest rate swap can be purchased or sold with an upfront premium. For OTC interest rate swap contracts, an upfront payment received by the fund is recorded as a liability on the fund’s books. An upfront payment made by the fund is recorded as an asset on the fund’s books. OTC and centrally cleared interest rate swap contracts are marked to market daily based upon quotations from an independent pricing service or market makers. Any change is recorded as an unrealized gain or loss on OTC interest rate swaps. Daily fluctuations in the value of centrally cleared interest rate swaps are settled through a central clearing agent and are recorded in variation margin on the Statement of assets and liabilities and recorded as unrealized gain or loss. Payments, including upfront premiums, received or made are recorded as realized gains or losses at the reset date or the closing of the contract. Certain OTC and centrally cleared interest rate swap contracts may include extended effective dates. Payments related to these swap contracts are accrued based on the terms of the contract.
The fund could be exposed to credit or market risk due to unfavorable changes in the fluctuation of interest rates or if the counterparty defaults, in the case of OTC interest rate contracts, or the central clearing agency or a clearing member defaults, in the case of centrally cleared interest rate swap contracts, on its respective obligation to perform under the contract. The fund’s maximum risk of loss from counterparty risk or central clearing risk is the fair value of the contract. This risk may be mitigated for OTC interest rate swap contracts by having a master netting arrangement between the fund and the counterparty and for centrally cleared interest rate swap contracts through the daily exchange of variation margin. There is minimal counterparty risk with respect to centrally cleared interest rate swap contracts due to the clearinghouse guarantee fund and other resources that are available in the event of a clearing member default. Risk of loss may exceed amounts recognized on the Statement of assets and liabilities.
OTC and centrally cleared interest rate swap contracts outstanding, including their respective notional amounts at period end, if any, are listed after the fund’s portfolio.
At the close of the reporting period, the fund has deposited cash valued at $121,827 in a segregated account to cover margin requirements on open centrally cleared interest rate swap contracts.
Credit default contracts The fund entered into OTC and/or centrally cleared credit default contracts for hedging credit risk, for gaining liquid exposure to individual names, for hedging market risk and for gaining exposure to specific sectors.
In OTC and centrally cleared credit default contracts, the protection buyer typically makes a periodic stream of payments to a counterparty, the protection seller, in exchange for the right to receive a contingent payment upon the occurrence of a credit event on the reference obligation or all other equally ranked obligations of the reference entity. Credit events are contract specific but may include bankruptcy, failure to pay, restructuring and obligation acceleration. For OTC credit default contracts, an upfront payment received by the fund is recorded as a liability on the fund’s books. An upfront payment made by the fund is recorded as an asset on the fund’s books. Centrally cleared credit default contracts provide the same rights to the protection buyer and seller except the payments between parties, including upfront premiums, are settled through a central clearing agent through variation margin payments. Upfront and periodic payments received or paid by the fund for OTC and centrally cleared credit default contracts are recorded as realized gains or losses at the reset date or close of the contract. The OTC and centrally cleared credit default contracts are marked to market daily based upon quotations from an independent pricing service or market makers. Any change in value of OTC credit default contracts is recorded as an unrealized gain or loss. Daily fluctuations in the value of centrally cleared credit default contracts are recorded in variation margin on the Statement of assets and liabilities and recorded as unrealized gain or loss. Upon the occurrence of a credit
event, the difference between the par value and fair value of the reference obligation, net of any proportional amount of the upfront payment, is recorded as a realized gain or loss.
In addition to bearing the risk that the credit event will occur, the fund could be exposed to market risk due to unfavorable changes in interest rates or in the price of the underlying security or index or the possibility that the fund may be unable to close out its position at the same time or at the same price as if it had purchased the underlying reference obligations. In certain circumstances, the fund may enter into offsetting OTC and centrally cleared credit default contracts which would mitigate its risk of loss. Risks of loss may exceed amounts recognized on the Statement of assets and liabilities. The fund’s maximum risk of loss from counterparty risk, either as the protection seller or as the protection buyer, is the fair value of the contract. This risk may be mitigated for OTC credit default contracts by having a master netting arrangement between the fund and the counterparty and for centrally cleared credit default contracts through the daily exchange of variation margin. Counterparty risk is further mitigated with respect to centrally cleared credit default swap contracts due to the clearinghouse guarantee fund and other resources that are available in the event of a clearing member default. Where the fund is a seller of protection, the maximum potential amount of future payments the fund may be required to make is equal to the notional amount.
OTC and centrally cleared credit default contracts outstanding, including their respective notional amounts at period end, if any, are listed after the fund’s portfolio.
TBA commitments The fund may enter into TBA (to be announced) commitments to purchase securities for a fixed unit price at a future date beyond customary settlement time. Although the unit price and par amount have been established, the actual securities have not been specified. However, it is anticipated that the amount of the commitments will not significantly differ from the principal amount. The fund holds, and maintains until settlement date, cash or high-grade debt obligations in an amount sufficient to meet the purchase price, or the fund may enter into offsetting contracts for the forward sale of other securities it owns. Income on the securities will not be earned until settlement date.
The fund may also enter into TBA sale commitments to hedge its portfolio positions, to sell mortgage-backed securities it owns under delayed delivery arrangements or to take a short position in mortgage-backed securities. Proceeds of TBA sale commitments are not received until the contractual settlement date. During the time a TBA sale commitment is outstanding, either equivalent deliverable securities or an offsetting TBA purchase commitment deliverable on or before the sale commitment date are held as “cover” for the transaction, or other liquid assets in an amount equal to the notional value of the TBA sale commitment are segregated. If the TBA sale commitment is closed through the acquisition of an offsetting TBA purchase commitment, the fund realizes a gain or loss. If the fund delivers securities under the commitment, the fund realizes a gain or a loss from the sale of the securities based upon the unit price established at the date the commitment was entered into.
TBA commitments, which are accounted for as purchase and sale transactions, may be considered securities themselves, and involve a risk of loss due to changes in the value of the security prior to the settlement date as well as the risk that the counterparty to the transaction will not perform its obligations. Counterparty risk is mitigated by having a master agreement between the fund and the counterparty.
Unsettled TBA commitments are valued at their fair value according to the procedures described under “Security valuation” above. The contract is marked to market daily and the change in fair value is recorded by the fund as an unrealized gain or loss. Based on market circumstances, Franklin Advisers will determine whether to take delivery of the underlying securities or to dispose of the TBA commitments prior to settlement.
TBA purchase commitments outstanding at period end, if any, are listed within the fund’s portfolio and TBA sale commitments outstanding at period end, if any, are listed after the fund’s portfolio.
Master agreements The fund is a party to ISDA (International Swaps and Derivatives Association, Inc.) Master Agreements that govern OTC derivative and foreign exchange contracts and Master Securities Forward Transaction Agreements that govern transactions involving mortgage-backed and other asset-backed securities that may result in delayed delivery (Master Agreements) with certain counterparties entered into from time to time. The Master Agreements may contain provisions regarding, among other things, the parties’ general obligations, representations, agreements, collateral requirements, events of default and early termination. With respect to certain counterparties, in accordance with the terms of the Master Agreements, collateral pledged to the fund is held in a segregated account by the fund’s custodian and, with respect to those amounts which can be sold or repledged, is presented in the fund’s portfolio. Collateral pledged to the fund which cannot be sold or repledged totaled $104,696 at the close of the reporting period.
Collateral pledged by the fund is segregated by the fund’s custodian and identified in the fund’s portfolio. Collateral can be in the form of cash or debt securities issued by the U.S. Government or related agencies or other securities as agreed to by the fund and the applicable counterparty. Collateral requirements are determined based on the fund’s net position with each counterparty.
With respect to ISDA Master Agreements, termination events applicable to the fund may occur upon a decline in the fund’s net assets below a specified threshold over a certain period of time. Termination events applicable to counterparties may occur upon a decline in the counterparty’s long-term or short-term credit ratings below a specified level. In each case, upon occurrence, the other party may elect to terminate early and cause settlement of all derivative and foreign exchange contracts outstanding, including the payment of any losses and costs resulting from such early termination, as reasonably determined by the terminating party. Any decision by one or more of the fund’s counterparties to elect early termination could impact the fund’s future derivative activity.
At the close of the reporting period, the fund had a net liability position of $131,067 on open derivative contracts subject to the Master Agreements. There was no collateral pledged by the fund at period end for these agreements.
Interfund lending The fund, along with other Putnam funds, may participate in an interfund lending program pursuant to an exemptive order issued by the SEC. This program allows the fund to borrow from or lend to other Putnam funds that permit such transactions. Interfund lending transactions are subject to each fund’s investment policies and borrowing and lending limits. Interest earned or paid on the interfund lending transaction will be based on the average of certain current market rates. During the reporting period, the fund did not utilize the program.
Lines of credit Prior to January 31, 2025, the fund participated, along with other Putnam funds, in a $320 million syndicated unsecured committed line of credit, provided by State Street ($160 million) and JPMorgan ($160 million), and a $235.5 million unsecured uncommitted line of credit, provided by State Street. Borrowings could be made for temporary or emergency purposes, including the funding of shareholder redemption requests and trade settlements. Interest is charged to the fund based on the fund’s borrowing at a rate equal to 1.25% plus the higher of (1) the Federal Funds rate and (2) the Overnight Bank Funding Rate for the committed line of credit and 1.30% plus the higher of (1) the Federal Funds rate and (2) the Overnight Bank Funding Rate for the uncommitted line of credit. A closing fee equal to 0.04% of the committed line of credit and 0.04% of the uncommitted line of credit was paid by the participating funds and a $75,000 fee was paid by the participating funds to State Street as agent of the syndicated committed line of credit. In addition, a commitment fee of 0.21% per annum on any unutilized portion of the committed line of credit is allocated to the participating funds based on their relative net assets and paid quarterly. During the reporting period, the fund had no borrowings against these arrangements.
Effective January 31, 2025, the fund, together with other U.S. registered and foreign investment funds managed by an affiliate of Franklin Templeton are borrowers in a joint syndicated senior unsecured credit facility totaling $2.995 billion, which matures on January 30, 2026.
Federal taxes It is the policy of the fund to distribute all of its taxable income within the prescribed time period and otherwise comply with the provisions of the Internal Revenue Code of 1986, as amended (the Code), applicable to regulated investment companies.
The fund is subject to the provisions of Accounting Standards Codification 740 Income Taxes (ASC 740). ASC 740 sets forth a minimum threshold for financial statement recognition of the benefit of a tax position taken or expected to be taken in a tax return. The fund did not have a liability to record for any unrecognized tax benefits in the accompanying financial statements. No provision has been made for federal taxes on income, capital gains or unrealized appreciation on securities held nor for excise tax on income and capital gains. Each of the fund’s federal tax returns for the prior three fiscal years remains subject to examination by the Internal Revenue Service.
Under the Regulated Investment Company Modernization Act of 2010, the fund will be permitted to carry forward capital losses incurred for an unlimited period and the carry forwards will retain their character as either short-term or long-term capital losses. At December 31, 2024, the fund had the following capital loss
carryovers available, to the extent allowed by the Code, to offset future net capital gain, if any:
| Loss carryover |
| Short-term | Long-term | Total |
| $48,568,512 | $38,803,467 | $87,371,979 |
Distributions to shareholders Distributions to shareholders from net investment income, if any, are recorded by the fund on the ex-dividend date. Distributions from capital gains, if any, are recorded on the ex-dividend date and paid at least annually. The amount and character of income and gains to be distributed are determined in accordance with income tax regulations, which may differ from generally accepted accounting principles. These differences include temporary and/or permanent differences from unrealized gains and losses on certain futures contracts, income on swap contracts and interest-only securities. Reclassifications are made to the fund’s capital accounts to reflect income and gains available for distribution (or available capital loss carryovers) under income tax regulations. At the close of the reporting period, the fund reclassified $16,624 to decrease undistributed net investment income and $16,624 to decrease accumulated net realized loss.
Tax cost of investments includes adjustments to net unrealized appreciation (depreciation) which may not necessarily be final tax cost basis adjustments, but closely approximate the tax basis unrealized gains and losses that may be realized and distributed to shareholders. The tax basis components of distributable earnings and the federal tax cost as of the close of the reporting period were as follows:
| Unrealized appreciation | $3,743,201 |
| Unrealized depreciation | (16,459,353) |
| Net unrealized depreciation | (12,716,152) |
| Undistributed ordinary income | 6,694,295 |
| Capital loss carryforward | (87,371,979) |
| Cost for federal income tax purposes | $153,979,021 |
Expenses of the Trust Expenses directly charged or attributable to any fund will be paid from the assets of that fund. Generally, expenses of the Trust will be allocated among and charged to the assets of each fund on a basis that the Trustees deem fair and equitable, which may be based on the relative assets of each fund or the nature of the services performed and relative applicability to each fund.
Beneficial interest At the close of the reporting period, insurance companies or their separate accounts were record owners of all but a de minimis number of the shares of the fund. Approximately 32.8% of the fund is owned by accounts of one insurance company.
Note 2: Management fee, administrative services and other transactions
Effective July 15, 2024, Putnam Management transferred its management contract with the fund to Franklin Advisers. As a result of the transfer, Franklin Advisers replaced Putnam Management as the investment adviser of the fund. In connection with the transfer, the fund’s portfolio managers, along with supporting research analysts and certain other investment staff of Putnam Management, also became employees of Franklin Advisers.
In addition, Putnam Management transferred to Franklin Advisers the sub-management contract between Putnam Management and PIL in respect of the fund.
The fund pays Franklin Advisers a management fee (based on the fund’s average net assets and computed and paid monthly) at annual rates that may vary based on the average of the aggregate net assets of all open-end mutual funds sponsored by Putnam Management (including open-end funds managed by affiliates of Putnam Management that have been deemed to be sponsored by Putnam Management for this purpose) (excluding net assets of such funds that are invested in, or that are invested in by, other such funds to the extent necessary to avoid “double counting” of those assets). Such annual rates may vary as follows:
| 0.550% | of the first $5 billion, |
| 0.500% | of the next $5 billion, |
| 0.450% | of the next $10 billion, |
| 0.400% | of the next $10 billion, |
| 0.350% | of the next $50 billion, |
| 0.330% | of the next $50 billion, |
| 0.320% | of the next $100 billion and |
| 0.315% | of any excess thereafter. |
For the reporting period, the management fee represented an effective rate (excluding the impact from any expense waivers in effect) of 0.379% of the fund’s average net assets.
Franklin Advisers has contractually agreed, through April 30, 2026, to waive fees and/or reimburse the fund’s expenses to the extent necessary to limit the cumulative expenses of the fund, exclusive of brokerage, interest, taxes, investment-related expenses, extraordinary expenses, acquired fund fees and expenses and payments under the fund’s investor servicing contract, investment management contract and distribution plan, on a fiscal year-to-date basis to an annual rate of 0.20% of the fund’s average net assets over such fiscal year-to-date period. During the reporting period, the fund’s expenses were not reduced as a result of this limit.
Effective July 15, 2024, Franklin Advisers retained Putnam Management as sub-advisor for the fund pursuant to a new sub-advisory agreement. Pursuant to the agreement, Putnam Management provides certain advisory and related services to the fund. Franklin Advisers pays a monthly fee to Putnam Management based on the costs of Putnam Management in providing these services to the fund, which may include a mark-up not to exceed 15% over such costs.
Effective November 1, 2024, FTIML is authorized by the Trustees to manage a separate portion of the assets of the fund as determined by Franklin Advisers from time to time. FTIML did not manage any portion of the assets of the fund during the reporting period. If Franklin Advisers were to engage the services of FTIML, Franklin Advisers (and not the fund) would pay a monthly sub-management fee to FTIML for its services at an annual rate of 0.20% of the average net assets of the portion of the fund managed by FTIML.
Prior to November 1, 2024, PIL was authorized by the Trustees to manage a separate portion of the assets of the fund as determined by Franklin Advisers from time to time. PIL did not manage any portion of the assets of the fund during the reporting period. If Franklin Advisers had engaged the services of PIL, Franklin Advisers (and not the fund) would have paid a quarterly sub-management fee to PIL for its services at an annual rate of 0.20% of the average net assets of the portion of the fund managed by PIL. Effective November 1, 2024, PIL merged into FTIML, and PIL investment professionals became employees of FTIML.
Effective June 1, 2024, Franklin Templeton Services provides certain administrative services to the fund. The fee for those services is paid by the fund’s investment manager based on the fund’s average daily net assets and is not an additional expense of the fund.
The fund reimburses Franklin Advisers an allocated amount for the compensation and related expenses of certain officers of the fund and their staff who provide administrative services to the fund. The aggregate amount of all such reimbursements is determined annually by the Trustees.
Custodial functions for the fund’s assets are provided by State Street. Custodian fees are based on the fund’s asset level, the number of its security holdings and transaction volumes.
PSERV, an affiliate of Franklin Advisers, provides investor servicing agent functions to the fund. PSERV was paid a monthly fee for investor servicing at an annual rate of 0.07% of the fund’s average daily net assets. During the reporting period, the expenses for each class of shares related to investor servicing fees were as follows:
| Class IA | $55,561 |
| Class IB | 44,859 |
| Total | $100,420 |
The fund has entered into expense offset arrangements with PSERV and State Street whereby PSERV’s and State Street’s fees are reduced by credits allowed on cash balances. For the reporting period, the fund’s expenses were reduced by $2,096 under the expense offset arrangements.
Each Independent Trustee of the fund receives an annual Trustee fee, of which $100, as a quarterly retainer, has been allocated to the fund, and an additional fee for each Trustees meeting attended. Trustees also are reimbursed for expenses they incur relating to their services as Trustees.
The fund has adopted a Trustee Fee Deferral Plan (the Deferral Plan) which allows the Trustees to defer the receipt of all or a portion of Trustees fees payable from July 1, 1995 through December 31, 2023. The deferred fees remain invested in certain Putnam funds until distribution in accordance with the Deferral Plan.
The fund has adopted an unfunded noncontributory defined benefit pension plan (the Pension Plan) covering all Trustees of the fund who have served as a Trustee for at least five years and were first elected prior to 2004. Benefits under the Pension Plan are equal to 50% of the Trustee’s average annual attendance and
retainer fees for the three years ended December 31, 2005. The retirement benefit is payable during a Trustee’s lifetime, beginning the year following retirement, for the number of years of service through December 31, 2006. Pension expense for the fund is included in Trustee compensation and expenses in the Statement of operations. Accrued pension liability is included in Payable for Trustee compensation and expenses in the Statement of assets and liabilities. The Trustees have terminated the Pension Plan with respect to any Trustee first elected after 2003.
The fund has adopted a distribution plan (the Plan) with respect to its class IB shares pursuant to Rule 12b–1 under the 1940 Act. The purpose of the Plan is to compensate Franklin Distributors, or prior to August 2, 2024, Putnam Retail Management, for services provided and expenses incurred in distributing shares of the fund. The Plan provides for payment by the fund to Franklin Distributors and to Putnam Retail Management at an annual rate of up to 0.35% of the average net assets attributable to the fund’s class IB shares. The Trustees have approved payment by the fund at an annual rate of 0.25% of the average net assets attributable to the fund’s class IB shares. The expenses related to distribution fees during the reporting period are included in Distribution fees in the Statement of operations and were paid out as follows:
| Franklin Distributors | $66,434 |
| Putnam Retail Management | 93,761 |
| Total | $160,195 |
Note 3: Purchases and sales of securities
During the reporting period, the cost of purchases and the proceeds from sales, excluding short-term investments, were as follows:
| | Cost of purchases | Proceeds from sales |
| Investments in securities, including TBA commitments (Long-term) | $610,829,913 | $625,716,047 |
| U.S. government securities (Long-term) | — | — |
| Total | $610,829,913 | $625,716,047 |
The fund may purchase or sell investments from or to other Putnam funds in the ordinary course of business, which can reduce the fund’s transaction costs, at prices determined in accordance with SEC requirements and policies approved by the Trustees. During the reporting period, purchases or sales of long-term securities from or to other Putnam funds, if any, did not represent more than 5% of the fund’s total cost of purchases and/or total proceeds from sales.
Note 4: Capital shares
At the close of the reporting period, there were an unlimited number of shares of beneficial interest authorized. Subscriptions and redemptions are presented at the omnibus level. Transactions in capital shares were as follows:
| | Class IA shares | Class IB shares |
| | Year ended 12/31/24 | Year ended 12/31/23 | Year ended 12/31/24 | Year ended 12/31/23 |
| | Shares | Amount | Shares | Amount | Shares | Amount | Shares | Amount |
| Shares sold | 627,283 | $5,140,042 | 361,191 | $2,944,636 | 666,419 | $5,392,360 | 505,082 | $4,117,214 |
| Shares issued in connection with reinvestment of distributions | 568,905 | 4,511,417 | 617,507 | 5,014,154 | 455,375 | 3,570,142 | 486,092 | 3,908,177 |
| | 1,196,188 | 9,651,459 | 978,698 | 7,958,790 | 1,121,794 | 8,962,502 | 991,174 | 8,025,391 |
| Shares repurchased | (1,508,175) | (12,307,245) | (1,337,404) | (10,886,211) | (1,421,554) | (11,435,202) | (1,502,861) | (12,165,922) |
| Net decrease | (311,987) | $(2,655,786) | (358,706) | $(2,927,421) | (299,760) | $(2,472,700) | (511,687) | $(4,140,531) |
Note 5: Affiliated transactions
Transactions during the reporting period with any company which is under common ownership or control were as follows:
| Name of affiliate | Fair value as of 12/31/23 | Purchase cost | Sale proceeds | Investment income | Shares outstanding and fair value as of 12/31/24 |
| Short-term investments | | | | | |
| Putnam Short Term Investment Fund Class P * | $22,700,905 | $45,064,905 | $53,171,071 | $1,123,493 | $14,594,739 |
| Total Short-term investments | $22,700,905 | $45,064,905 | $53,171,071 | $1,123,493 | $14,594,739 |
| * Management fees charged to Putnam Short Term Investment Fund have been waived by Putnam Management and Franklin Advisers, as applicable. There were no realized or unrealized gains or losses during the period. |
Note 6: Market, credit and other risks
In the normal course of business, the fund trades financial instruments and enters into financial transactions where risk of potential loss exists due to changes in the market (market risk) or failure of the contracting party to the transaction to perform (credit risk). The fund may be exposed to additional credit risk that an institution or other entity with which the fund has unsettled or open transactions will default. The fund may invest in higher-yielding, lower-rated bonds that may have a higher rate of default. The fund may invest a significant portion of its assets in securitized debt instruments, including mortgage-backed and asset-backed investments. The yields and values of these investments are sensitive to changes in interest rates, the rate of principal payments on the underlying assets and the market’s perception of the issuers. The market for these investments may be volatile and limited, which may make them difficult to buy or sell.
Note 7: Summary of derivative activity
The volume of activity for the reporting period for any derivative type that was held during the period is listed below and was based on an average of the holdings at the end of each fiscal quarter:
| Purchased swap option contracts (contract amount) | $21,000,000 |
| Written swap option contracts (contract amount) | $14,100,000 |
| Futures contracts (number of contracts) | 500 |
| Centrally cleared interest rate swap contracts (notional) | $90,500,000 |
| OTC credit default contracts (notional) | $4,200,000 |
The following is a summary of the fair value of derivative instruments as of the close of the reporting period:
| Fair value of derivative instruments as of the close of the reporting period |
| | Asset derivatives | Liability derivatives |
| Derivatives not accounted for as hedging instruments under ASC 815 | Statement of assets and liabilities location | Fair value | Statement of assets and liabilities location | Fair value |
| Credit contracts | Receivables | $451,845 | Payables | $159,273 |
| Interest rate contracts | Receivables, Net assets — Unrealized appreciation | 676,309* | Payables, Net assets — Unrealized depreciation | 1,688,653* |
| Total | | $1,128,154 | | $1,847,926 |
| * Includes cumulative appreciation/depreciation of futures contracts and/or centrally cleared swaps as reported in the fund’s portfolio. Only current day’s variation margin is reported within the Statement of assets and liabilities. |
The following is a summary of realized and change in unrealized gains or losses of derivative instruments in the Statement of operations for the reporting period (Note 1):
| Amount of realized gain or (loss) on derivatives recognized in net gain or (loss) on investments |
| Derivatives not accounted for as hedging instruments under ASC 815 | Options | Futures | Swaps | Total |
| Credit contracts | $— | $— | $16,281 | $16,281 |
| Interest rate contracts | 234,524 | 68,801 | (173,712) | $129,613 |
| Total | $234,524 | $68,801 | $(157,431) | $145,894 |
| Change in unrealized appreciation or (depreciation) on derivatives recognized in net gain or (loss) on investments |
| Derivatives not accounted for as hedging instruments under ASC 815 | Options | Futures | Swaps | Total |
| Credit contracts | $— | $— | $(120,629) | $(120,629) |
| Interest rate contracts | (302,971) | (2,424,337) | 95,226 | $(2,632,082) |
| Total | $(302,971) | $(2,424,337) | $(25,403) | $(2,752,711) |
Note 8: Offsetting of financial and derivative assets and liabilities
The following table summarizes any derivatives, repurchase agreements and reverse repurchase agreements, at the end of the reporting period, that are subject to an enforceable master netting agreement or similar agreement. For securities lending transactions or borrowing transactions associated with securities sold short, if any, see Note 1. For financial reporting purposes, the fund does not offset financial assets and financial liabilities that are subject to the master netting agreements in the Statement of assets and liabilities.
| | | | | | |
| | Bank of America N.A. | Barclays Bank PLC | Barclays Capital, Inc. (clearing broker) | Citibank, N.A. | Citigroup Global Markets, Inc. |
| Assets: | | | | | |
| Centrally cleared interest rate swap contracts § | $— | $— | $19,195 | $— | $— |
| OTC Credit default contracts — protection sold *# | — | — | — | — | — |
| OTC Credit default contracts — protection purchased *# | — | — | — | — | 356,708 |
| Futures contracts § | — | — | — | — | — |
| Forward premium swap option contracts # | 8,962 | 116,263 | — | 16,722 | — |
| Total Assets | $8,962 | $116,263 | $19,195 | $16,722 | $356,708 |
| Liabilities: | | | | | |
| Centrally cleared interest rate swap contracts § | — | — | 30,286 | — | — |
| OTC Credit default contracts — protection sold *# | 17,161 | — | — | — | 58,239 |
| OTC Credit default contracts — protection purchased *# | — | — | — | — | — |
| Futures contracts § | — | — | — | — | — |
| Forward premium swap option contracts # | 28,715 | 39,688 | — | 19,136 | — |
| Total Liabilities | $45,876 | $39,688 | $30,286 | $19,136 | $58,239 |
| Total Financial and Derivative Net Assets | $(36,914) | $76,575 | $(11,091) | $(2,414) | $298,469 |
| Total collateral received (pledged) †## | $— | $10,000 | $— | $— | $290,000 |
| Net amount | $(36,914) | $66,575 | $(11,091) | $(2,414) | $8,469 |
| Controlled collateral received (including TBA commitments) ** | $— | $10,000 | $— | $— | $290,000 |
| Uncontrolled collateral received | $— | $— | $— | $— | $— |
| Collateral (pledged) (including TBA commitments) ** | $— | $— | $— | $— | $— |
Note 8: Offsetting of financial and derivative assets and liabilities cont.
| | | | | | | |
| | Goldman Sachs International | JPMorgan Securities LLC | Merrill Lynch International | Mizuho Capital Markets LLC | Morgan Stanley & Co. International PLC | Total |
| Assets: | | | | | | |
| Centrally cleared interest rate swap contracts § | $— | $— | $— | $— | $— | $19,195 |
| OTC Credit default contracts — protection sold *# | — | — | — | — | — | — |
| OTC Credit default contracts — protection purchased *# | — | 21,129 | 62,624 | — | 11,384 | 451,845 |
| Futures contracts § | — | 7,344 | — | — | — | 7,344 |
| Forward premium swap option contracts # | — | — | — | — | — | 141,947 |
| Total Assets | $— | $28,473 | $62,624 | $— | $11,384 | $620,331 |
| Liabilities: | | | | | | |
| Centrally cleared interest rate swap contracts § | — | — | — | — | — | 30,286 |
| OTC Credit default contracts — protection sold *# | — | 29,860 | 10,133 | — | 43,880 | 159,273 |
| OTC Credit default contracts — protection purchased *# | — | — | — | — | — | — |
| Futures contracts § | — | 80,458 | — | — | — | 80,458 |
| Forward premium swap option contracts # | 38,739 | — | — | 11,773 | — | 138,051 |
| Total Liabilities | $38,739 | $110,318 | $10,133 | $11,773 | $43,880 | $408,068 |
| Total Financial and Derivative Net Assets | $(38,739) | $(81,845) | $52,491 | $(11,773) | $(32,496) | $212,263 |
| Total collateral received (pledged) ##† | $104,696 | $— | $52,491 | $— | $48,000 | |
| Net amount | $(143,435) | $(81,845) | $— | $(11,773) | $(80,496) | |
| Controlled collateral received (including TBA commitments)** | $— | $— | $108,585 | $— | $48,000 | $456,585 |
| Uncontrolled collateral received | $104,696 | $— | $— | $— | $— | $104,696 |
| Collateral (pledged) (including TBA commitments)** | $— | $(182,860) | $— | $— | $— | $(182,860) |
| * | Excludes premiums, if any. Included in unrealized appreciation and depreciation on OTC swap contracts on the Statement of assets and liabilities. |
| ** | Included with Investments in securities on the Statement of assets and liabilities. |
| † | Additional collateral may be required from certain brokers based on individual agreements. |
| # | Covered by master netting agreement (Note 1). |
| ## | Any over-collateralization of total financial and derivative net assets is not shown. Collateral may include amounts related to unsettled agreements. |
| § | Includes current day’s variation margin only as reported on the Statement of assets and liabilities, which is not collateralized. Cumulative appreciation/(depreciation) for futures contracts and centrally cleared swap contracts is represented in the tables listed after the fund’s portfolio. Collateral pledged for initial margin on futures contracts and centrally cleared swap contracts, which is not included in the table above, amounted to $1,160,790 and $121,827, respectively. |
Note 9: Operating segments
The fund has adopted the Financial Accounting Standards Board (FASB) Accounting Standards Update (ASU) 2023-07, Segment Reporting (Topic 280) - Improvements to Reportable Segment Disclosures. The update is limited to disclosure requirements and does not impact the fund’s financial position or results of operations.
The fund operates as a single operating segment, which is an investment portfolio. The fund’s investment manager serves as the Chief Operating Decision Maker (CODM), evaluating fund-wide results and performance under a unified investment strategy. The CODM uses these measures to assess fund performance and allocate resources effectively. Internal reporting provided to the CODM aligns with the accounting policies and measurement principles used in the financial statements.
For information regarding segment assets, segment profit or loss, and significant expenses, refer to the Statement of assets and liabilities and the Statement of operations, along with the related notes to the financial statements. The fund’s portfolio provides details of the fund’s investments that generate returns such as interest, dividends, and realized and unrealized gains or losses. Performance metrics, including portfolio turnover and expense ratios, are disclosed in the Financial highlights.
Changes in and disagreements with accountants
Not applicable
Results of any shareholder votes
Not applicable
Remuneration paid to directors, officers, and others
Remuneration paid to directors, officers, and others is included in the Notes to financial statements above.
Board approval of management and subadvisory agreements (Unaudited)
At its meeting on September 27, 2024, the Board of Trustees of your fund, including all of the Trustees who are not “interested persons” (as this term is defined in the Investment Company Act of 1940, as amended (the “1940 Act”)) of the Putnam mutual funds, closed-end funds and exchange-traded funds (collectively, the “funds”) (the “Independent Trustees”), approved a new Sub-Advisory Agreement with respect to your fund (the “New FTIML Sub-Advisory Agreement”) between Franklin Advisers, Inc. (“Franklin Advisers”) and its affiliate, Franklin Templeton Investment Management Limited (“FTIML”). Franklin Advisers and FTIML are each direct or indirect, wholly-owned subsidiaries of Franklin Resources, Inc. (“Franklin Templeton”). (Because FTIML is an affiliate of Franklin Advisers and Franklin Advisers remains fully responsible for all services provided by FTIML, the Trustees did not attempt to evaluate FTIML as a separate entity.)
The Board of Trustees, with the assistance of its Contract Committee (which consists solely of Independent Trustees) and its independent legal counsel (as that term is defined in Rule 0-1(a)(6)(i) under the 1940 Act), requested and evaluated all information it deemed reasonably necessary under the circumstances in connection with its review of the New FTIML Sub-Advisory Agreement. At its September 2024 meeting, the Contract Committee met with representatives of Franklin Templeton, and separately in executive session, to consider the information provided. At the September Trustees’ meetings, the Contract Committee also met in executive session with the other Independent Trustees to discuss its observations and recommendations. Throughout this process, the Contract Committee was assisted by the members of the Board of Trustees’ independent staff and by independent legal counsel for the Independent Trustees.
Considerations in connection with the Trustees’ approval of the New FTIML Sub-Advisory Agreement
The Trustees considered the proposed New FTIML Sub-Advisory Agreement in connection with the planned November 1, 2024 merger (the “Merger”) of Putnam Investments Limited (“PIL”), an affiliate of Franklin Advisers and a sub-adviser to your fund prior to the Merger, with and into FTIML. The Trustees considered that, in connection with the Merger, PIL investment professionals would become employees of FTIML, and, upon consummation of the Merger, PIL would cease to exist as a separate legal entity.
The Trustees noted that Franklin Templeton viewed the Merger as a further step in the integration of the legacy Putnam and Franklin Templeton organizations, offering potential operational efficiencies and enhanced investment resources for the funds. The Trustees also considered, among other factors, that:
• The Merger and the New FTIML Sub-Advisory Agreement would not result in any reduction or material change in the nature or the level of the sub-advisory services provided to the funds;
• The PIL portfolio managers who are responsible for the day-to-day management of the applicable funds would be the same immediately prior to, and immediately after, the Merger, and these investment personnel would have access to the same research and other resources to support their respective investment advisory functions and operate under the same conditions both immediately before and after the Merger;
• Despite a change in the sub-advisory fee structure for certain funds, the New FTIML Sub-Advisory Agreement would not result in an increase in the advisory fee rates payable by each fund, as Franklin Advisers would be responsible for overseeing the investment advisory services provided to the applicable funds by FTIML under the New FTIML Sub-Advisory Agreement and would compensate FTIML for such services out of the fees it receives under each fund’s Management Contract with Franklin Advisers; and
• The terms of the New FTIML Sub-Advisory Agreement were substantially similar to those under the sub-management contract between Franklin Advisers and PIL with respect to the fund (the “PIL Sub-Management Contract”). 1
The Trustees also considered that, prior to the Merger, counsel to Franklin Advisers and FTIML had provided a legal opinion that the Merger and the appointment of FTIML as sub-adviser to the funds would not result in an “assignment” under the 1940 Act of the PIL Sub-Management Contract and that the New FTIML Sub-Advisory Agreement did not require shareholder approval.
The Trustees also took into account that they had most recently approved the fund’s PIL Sub-Management Contract in June 2024. Because, other than the parties to the contract, the revised sub-advisory fee structure for certain funds, and certain other non-substantive changes to contractual terms, the New FTIML Sub-Advisory Agreement was substantially similar to the PIL Sub-Management Contract, the Trustees relied to a considerable extent on their previous approval of the PIL Sub-Management Contract.
Board of Trustees’ Conclusions
After considering the factors described above, as well as other factors, the Board of Trustees, including all of the Independent Trustees, concluded that the fees payable under the New FTIML Sub-Advisory Agreement represented reasonable compensation in light of the nature and quality of the services that would be provided to the funds, and determined to approve the New FTIML Sub-Advisory Agreement for your fund. These conclusions were based on a comprehensive consideration of all information provided to the Trustees and were not the result of any single factor.
1 The New PIL Sub-Management Contract was operative until the effective date of the Merger, November 1, 2024, and was replaced by the New FTIML Sub-Advisory Agreement effective as of that date.
| |
 | | |
| © 2024 Franklin Templeton. All rights reserved. | 38921-AFSOI 2/25 |
| |
| Item 8. Changes in and Disagreements with Accountants for Open-End Management Investment Companies. |
| |
| Included in Item 7 above. |
| |
| Item 9. Proxy Disclosure for Open-End Management Investment Companies. |
| |
| Included in Item 7 above. |
| |
| Item 10. Remuneration Paid to Directors, Officers, and Others of Open-End Management Investment Companies. |
| |
| Included in Item 7 above. |
| |
| Item 11. Statement Regarding Basis for Approval of Investment Advisory Contract. |
| |
| Included in Item 7 above. |
| |
| Item 12. Disclosure of Proxy Voting Policies and Procedures For Closed-End Management Investment Companies: |
| |
| Item 13. Portfolio Managers of Closed-End Investment Companies |
| |
| Item 14. Purchases of Equity Securities by Closed-End Management Investment Companies and Affiliated Purchasers: |
| |
| Item 15. Submission of Matters to a Vote of Security Holders: |
| |
| Item 16. Controls and Procedures: |
| |
| (a) The registrant’s principal executive officer and principal financial officer have concluded, based on their evaluation of the effectiveness of the design and operation of the registrant’s disclosure controls and procedures as of a date within 90 days of the filing date of this report, that the design and operation of such procedures are generally effective to provide reasonable assurance that information required to be disclosed by the registrant in this report is recorded, processed, summarized and reported within the time periods specified in the Commission’s rules and forms. |
| |
| (b) Changes in internal control over financial reporting: Not applicable |
| |
| Item 17. Disclosures of Securities Lending Activities for Closed-End Investment Companies: |
| |
| Item 18. Recovery of Erroneously Awarded Compensation. |
| |
| (a)(1) The Code of Ethics of The Putnam Funds and Franklin Templeton are filed herewith. |
| |
| (a)(2) Any policy required by the listing standards adopted pursuant to Rule 10D-1 under the Exchange Act (17 CFR 240.10D-1) by the registered national securities exchange or registered national securities association upon which the registrant’s securities are listed. |
| |
| Pursuant to the requirements of the Securities Exchange Act of 1934 and the Investment Company Act of 1940, the registrant has duly caused this report to be signed on its behalf by the undersigned, thereunto duly authorized. |
| |
| By (Signature and Title): |
| |
| Jeffrey White
Principal Accounting Officer |
| |
| Pursuant to the requirements of the Securities Exchange Act of 1934 and the Investment Company Act of 1940, this report has been signed below by the following persons on behalf of the registrant and in the capacities and on the dates indicated. |
| |
| By (Signature and Title): |
| |
| Jonathan S. Horwitz
Principal Executive Officer |
| |
| By (Signature and Title): |
| |
| Jeffrey White
Principal Financial Officer |