UNITED STATES
SECURITIES AND EXCHANGE COMMISSION
Washington, D.C. 20549
FORM N-CSR
CERTIFIED SHAREHOLDER REPORT OF REGISTERED MANAGEMENT INVESTMENT
COMPANIES
Investment Company Act file number 811-5349
Goldman Sachs Trust
(Exact name of registrant as specified in charter)
4900 Sears Tower, Chicago, Illinois 60606-6303
(Address of principal executive offices) (Zip code)
| Howard B. Surloff, Esq. | Copies to: | |
| Goldman, Sachs & Co. | Jeffrey A. Dalke, Esq. | |
| One New York Plaza | Drinker Biddle & Reath LLP | |
| New York, New York 10004 | One Logan Square | |
| 18th and Cherry Streets | ||
| Philadelphia, PA 19103 | ||
| (Name and address of agents for service) | ||
Registrant’s telephone number, including area code: (312) 655-4400
Date of fiscal year end: DECEMBER 31
Date of reporting period: JUNE 30, 2004
| ITEM 1. | REPORTS TO STOCKHOLDERS. | |
| The Semi-Annual Report to Stockholders is filed herewith. |

| Goldman Sachs Funds |
| R E A L E S T A T E S E C U R I T I E S F U N D Semiannual Report June 30, 2004 |
| Long-term growth of capital and dividend income through a diversified portfolio of Real Estate Investment Trusts (REITs). |

| Goldman Sachs Real Estate Securities Fund |
| NOT FDIC-INSURED May Lose Value No Bank Guarantee |
| G O L D M A N S A C H S R E A L E S T A T E S E C U R I T I E S F U N D |
| Performance Overview |
| Dear Shareholder, |
| This report provides an overview on the performance of the Goldman Sachs Real Estate Securities Fund during the six- |
| month reporting period that ended June 30, 2004. |
| Performance Review |
| Over the six-month period that ended June 30, 2004, the Fund’s Class A, B, C, Institutional, and Service Shares generated cumulative total returns, without sales charges, of 6.25%, 5.85%, 5.82%, 6.36%, and 6.16%, respectively. These returns compare to the 6.95% cumulative total return of the Fund’s benchmark, the Wilshire Real Estate Securities Index (with dividends reinvested), over the same period. |
| Real Estate Investment Trust (“REIT”) Market Review |
| Although there has been an unusually high level of volatility in the REIT market recently, the Wilshire Real Estate Securities Index was still up a solid 6.95% during the reporting period, outperforming the overall market as measured by the Russell 3000 Index, which gained 3.59%. |
| We believe that March 2004’s strong employment report eased concerns regarding a “jobless economic recovery.” Although this was good news for Americans seeking employment, investors perceived it as confirmation that the Federal Reserve Board’s (the Fed) feared interest rate hikes would come sooner than expected. Consequently, bond yields soared and immediately affected the U.S. REIT market. Historically, REITs have done well in periods of economic recovery and expansion, but can struggle over shorter periods when interest rates rise sharply. Some investors view REITs as substitutes for other income-producing instruments. This trend was especially pronounced over the last two years, as investors were attracted to the historically high spread between REIT yields and yields generally available on fixed income securities. However, as bond yields rose, the gap between REITs and bonds narrowed, making REIT yields relatively less attractive. We believe that these yield-oriented investors, in addition to momentum-oriented hedge funds, contributed significantly to the increased level of near term volatility. |
| More often than not, economic conditions, not interest rates, have been the largest determinant of REIT performance. Over the last ten years, there has been virtually no relationship, or correlation, between the performance of REITs and the performance of the Lehman Brothers Aggregate Bond Index. Unlike fixed income securities, whose performance is largely determined by interest rates, REIT performance is a function of underlying property values and operating fundamentals. The conditions that typically cause higher interest rates and lower bond prices — economic growth, job creation, and inflation — are generally positive for real estate fundamentals over the long term. For this reason, we believe the near-term volatility in REITs does not necessarily foreshadow a bear market in real estate fundamentals. 1 |

| G O L D M A N S A C H S R E A L E S T A T E S E C U R I T I E S F U N D |
| Portfolio Positioning |
| The Fund underperformed its benchmark during the six-month reporting period. Stock selection in the office and industrial sectors contributed positively to performance. The Fund’s overweight position in hotels contributed positively to performance for the period as this sector of the market generated strong returns. However, within the sector, stock selection slightly detracted from returns, as did stock selection within the retail sector. |
| The best performing property types in the first three months of 2004 experienced the worst results in the second quarter. After a 15.2% gain in the first quarter, the Retail sector declined 9.8% in the second quarter. In our view, the prospects for retail seem less exciting now than they did in the recent past, as we believe acquisition prices have eliminated most external growth opportunities. In addition, with occupancies at near-peak levels, internal growth should also moderate. We continue to focus on those companies that manage and, in some cases, develop high quality assets based in favorable geographies. Examples of Fund holdings include General Growth Properties, Inc. and Simon Property Group, Inc. The Fund’s underweight in the retail sector enhanced results, while stock selection detracted from returns. |
| Consistently the worst performing sector for several years, the apartment sector significantly outperformed the broader REIT market in the second quarter 2004. We believe this sector still has somewhat weak underlying fundamentals given that new construction levels remain stubbornly high. However, we believe that a meaningful increase in mortgage rates and continued job growth should make apartment fundamentals and valuations more attractive over the long term. Given that the apartment sector’s performance slightly lagged the broader REIT Index, the Fund’s underweight contributed positively to performance. |
| The office/industrial sector modestly underperformed the broader REIT market during the reporting period. Sector allocation detracted slightly from performance, given the Fund’s modest overweight position. However, stock selection contributed positively to performance, largely due to the Fund’s underweight position in Equity Office Properties Trust and a lack of exposure to some of the worst performing stocks in the sector, including Crescent Real Estate, CarrAmerica, and Arden Realty. |
| Growth in the hotel sector was stronger than expected during the reporting period. Of all property types, hotels are the most highly leveraged to improving economic growth. Revenue per available room (REVPAR) increased for the second straight quarter, as both occupancy and room rates increased. Year-to-date luxury REVPAR growth has been twice the industry average. Rising job growth and corporate spending have recently increased demand from the higher-margin transient business segment. Average daily rates also are rising, which we believe may lead to improved operating margins. We remain focused on the luxury segment within the major metropolitan markets where the two largest portfolio holdings in the hotel sector, Starwood Hotels and Host Marriott, reflect what we believe to be some of the best operators and properties in the lodging industry. The Fund’s overweight in the hotel sector contributed positively to performance for the period, while stock selection detracted slightly from results. |
| 2 |

| G O L D M A N S A C H S R E A L E S TAT E S E C U R I T I E S F U N D |
| Portfolio Highlights |
| # Starwood Hotels & Resorts Worldwide, Inc. — Starwood is the Fund’s largest holding for a number of reasons. First, we believe its management has shown a keen ability to generate earnings even in a difficult economic environment. This has been accomplished through aggressive expense reduction, thoughtful investment in existing assets and brands, and appropriate capital allocation. Second, new supply in the upscale segment, in which most of Starwood’s properties reside, continues to drop. As the economy rebounds and demand increases, new supply in this segment will take years to complete, providing what we believe to be competitive advantage for Starwood. |
| # General Growth Properties, Inc. — General Growth Properties is the second largest mall owner in the U.S. Its strategy is to develop, acquire, and renovate regional malls to create a geographically diverse and productive national mall portfolio. We maintained the Fund’s position in General Growth Properties during the reporting period because, among other factors, we believe the firm’s management is excellent and that it has demonstrated an ability to create value through highly disciplined acquisitions, which has helped generate very good returns on invested capital. Additionally, although retail stock valuations are relatively high, General Growth Properties and its peers continue to have what we feel are the best earnings momentum and property fundamentals versus other real estate sectors. |
| # United Dominion Realty Trust, Inc., St. Joe Co., and Global Signal, Inc. — Each stock was recently added to the portfolio. United Dominion Trust is the fourth largest multi-family REIT with 265 properties in 55 different markets and was purchased due to its attractive relative valuation combined with improving fundamentals in the apartment sector. St. Joe, a unique non-REIT company, is the largest private landowner in the state of Florida, with approximately 875,000 acres or over 2% of the state’s vacant land. Today, the company is involved with residential, resort, and commercial development along with providing other real estate services. Global Signal is the reincarnation of Pinnacle Holdings Inc. which went into voluntary bankruptcy in May 2002. We purchased Global Signal for the Fund during the reporting period because it has one of the best balance sheets and capital strategy in its peer group, now owns or manages approximately 3,231 communication sites containing more than 12,000 leases with over 2,600 tenants. |
| We remain confident and focused on our fundamental premise that good companies with superior management and strategies will outperform over time. We thank you for your investment and look forward to your continued confidence. Goldman Sachs Real Estate Securities Investment Team July 16, 2004 3 |
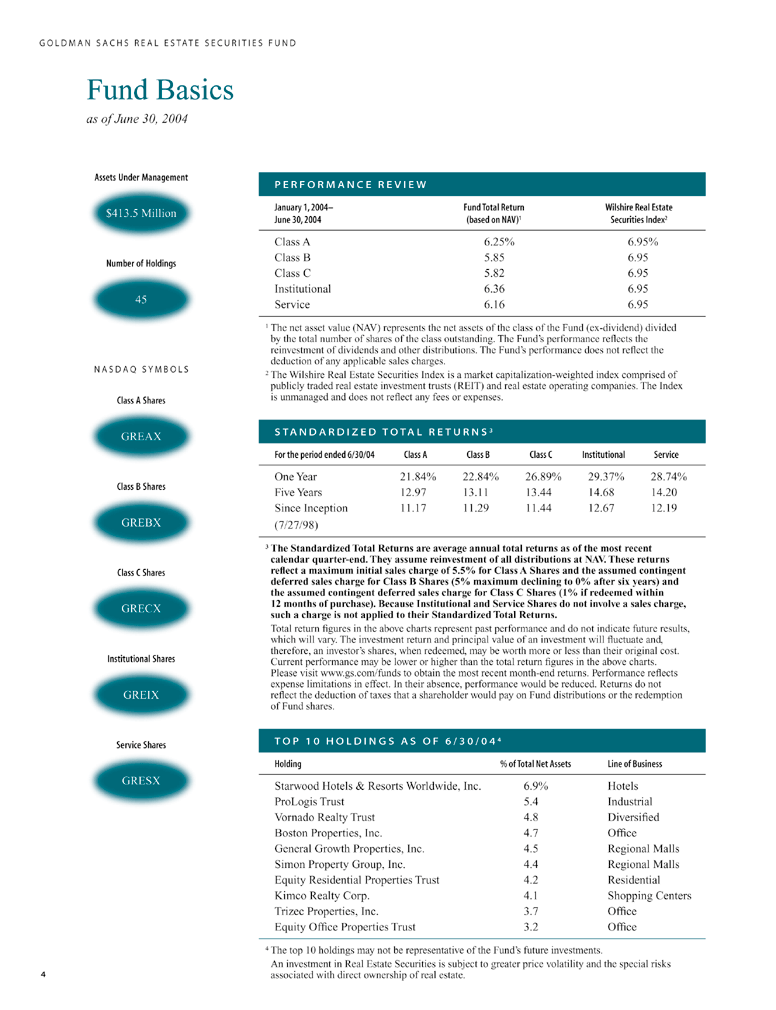
| G O L D M A N S A C H S R E A L E S TAT E S E C U R I T I E S F U N D Fund Basics as of June 30, 2004 Assets Under Management P E R F O R M A N C E R E V I E W |
| January 1, 2004– Fund Total Return Wilshire Real Estate $413.5 Million |
| June 30, 2004 (based on NAV)1 Securities Index2 Class A 6.25% 6.95% Class B 5.85 6.95 Number of Holdings Class C 5.82 6.95 Institutional 6.36 6.95 45 Service 6.16 6.95 |
| 1 The net |
| asset value (NAV) represents the net assets of the class of the Fund (ex-dividend) divided by the total number of shares of the class outstanding. The Fund’s performance reflects the reinvestment of dividends and other distributions. The Fund’s performance does not reflect the deduction of any applicable sales charges. N A S D A Q S Y M B O L S 2 The Wilshire Real Estate Securities Index is a market capitalization-weighted index comprised of publicly traded real estate investment trusts (REIT) and real estate operating companies. The Index is unmanaged and does not reflect any fees or expenses. |
| Class A Shares S T A N D A R D I Z E D T O T A L R E T U R N S 3 |
| GREAX For the period ended 6/30/04 Class A Class B Class C InstitutionalService One Year 21.84% 22.84% 26.89% 29.37% 28.74% Class B Shares Five Years 12.97 13.11 13.44 14.68 14.20 Since Inception 11.17 11.29 11.44 12.67 12.19 GREBX (7/27/98) |
| 3 The Standardized Total Returns are average annual total returns as of the most recent calendar quarter-end. They assume reinvestment of all distributions at NAV. These returns Class C Shares reflect a maximum initial sales charge of 5.5% for Class A Shares and the assumed contingent deferred sales charge for Class B Shares (5% maximum declining to 0% after six years) and the assumed contingent deferred sales charge for Class C Shares (1% if redeemed within 12 months of purchase). Because Institutional and Service Shares do not involve a sales charge, GRECX such a charge is not applied to their Standardized Total Returns. Total return figures in the above charts represent past performance and do not indicate future results, which will vary. The investment return and principal value of an investment will fluctuate and, therefore, an investor’s shares, when redeemed, may be worth more or less than their original cost. Institutional Shares Current performance may be lower or higher than the total return figures in the above charts. Please visit www.gs.com/funds to obtain the most recent month-end returns. Performance reflects expense limitations in effect. In their absence, performance would be reduced. Returns do not GREIX reflect the deduction of taxes that a shareholder would pay on Fund distributions or the redemption of Fund shares. |
| T O P 1 0 H O L D I N G S A S O F 6 / 3 0 / 0 4 4 Service Shares Holding % of Total Net Assets Line of Business |
| GRESX Starwood Hotels & Resorts Worldwide, Inc. 6.9% Hotels ProLogis Trust 5.4 Industrial Vornado Realty Trust 4.8 Diversified Boston Properties, Inc. 4.7 Office General Growth Properties, Inc. 4.5 Regional Malls Simon Property Group, Inc. 4.4 Regional Malls Equity Residential Properties Trust 4.2 Residential Kimco Realty Corp. 4.1 Shopping Centers Trizec Properties, Inc. 3.7 Office Equity Office Properties Trust 3.2 Office |
| 4 The top 10 holdings may not be representative of the Fund’s future investments. An investment in Real Estate Securities is subject to greater price volatility and the special risks 4 associated with direct ownership of real estate. |
| Shares | Description | Value | ||||||||
Common Stocks – 97.7% | ||||||||||
| Diversified – 12.6% | ||||||||||
| 500,855 | Catellus Development Corp. | $ | 12,346,076 | |||||||
| 102,763 | Cousins Properties, Inc. | 3,386,041 | ||||||||
| 225,087 | Duke Realty Corp. | 7,160,017 | ||||||||
| 230,287 | Liberty Property Trust | 9,259,840 | ||||||||
| 345,600 | Vornado Realty Trust | 19,737,216 | ||||||||
| 51,889,190 | ||||||||||
| Factory Outlet – 1.7% | ||||||||||
| 110,538 | Chelsea Property Group, Inc. | 7,209,288 | ||||||||
| Hotels – 12.4% | ||||||||||
| 234,634 | Equity Inns, Inc. | 2,179,750 | ||||||||
| 299,400 | FelCor Lodging Trust, Inc.* | 3,622,740 | ||||||||
| 884,234 | Host Marriott Corp.* | 10,929,132 | ||||||||
| 73,355 | Innkeepers Usa Trust | 756,290 | ||||||||
| 336,489 | Interstate Hotels & Resorts, Inc.* | 1,813,676 | ||||||||
| 467,322 | MeriStar Hospitality Corp.* | 3,196,482 | ||||||||
| 640,736 | Starwood Hotels & Resorts Worldwide, Inc. | 28,737,010 | ||||||||
| 51,235,080 | ||||||||||
| Industrial – 6.3% | ||||||||||
| 196,391 | First Potomac Realty Trust | 3,764,815 | ||||||||
| 676,879 | ProLogis Trust | 22,282,857 | ||||||||
| 26,047,672 | ||||||||||
| Manufactured Housing – 0.8% | ||||||||||
| 185,724 | Affordable Residential Communities | 3,083,019 | ||||||||
| Office – 22.6% | ||||||||||
| 389,467 | Boston Properties, Inc. | 19,504,507 | ||||||||
| 297,223 | Brandywine Realty Trust | 8,081,493 | ||||||||
| 393,742 | Brookfield Properties Corp. | 11,320,083 | ||||||||
| 487,352 | Equity Office Properties Trust | 13,255,974 | ||||||||
| 226,900 | Parkway Properties, Inc. | 10,085,705 | ||||||||
| 212,200 | Prentiss Properties Trust | 7,112,944 | ||||||||
| 183,200 | SL Green Realty Corp. | 8,573,760 | ||||||||
| 941,060 | Trizec Properties, Inc. | 15,301,636 | ||||||||
| 93,236,102 | ||||||||||
| Other REIT – 2.7% | ||||||||||
| 151,977 | Global Signal, Inc.@ | 3,335,895 | ||||||||
| 104,556 | iStar Financial, Inc. | 4,182,240 | ||||||||
| 96,222 | St. Joe Co. | 3,820,014 | ||||||||
| 11,338,149 | ||||||||||
| Regional Malls – 13.9% | ||||||||||
| 186,839 | CBL & Associates Properties, Inc. | 10,276,145 | ||||||||
| 623,243 | General Growth Properties, Inc. | 18,429,296 | ||||||||
| 224,000 | Rouse Co. | 10,640,000 | ||||||||
| 355,498 | Simon Property Group, Inc. | 18,279,707 | ||||||||
| 57,625,148 | ||||||||||
| Residential – 14.1% | ||||||||||
| 93,207 | Apartment Investment & Management Co. | 2,901,534 | ||||||||
| 333,344 | Archstone-Smith Trust | 9,776,979 | ||||||||
| 166,342 | AvalonBay Communities, Inc. | 9,401,650 | ||||||||
| 140,355 | BRE Properties, Inc. | 4,877,336 | ||||||||
| 583,000 | Equity Residential Properties Trust | 17,332,590 | ||||||||
| 102,474 | Home Properties of New York, Inc. | 3,994,437 | ||||||||
| 28,139 | Mid-America Apartment Communities, Inc. | 1,066,187 | ||||||||
| 160,034 | Summit Properties, Inc. | 4,103,272 | ||||||||
| 252,334 | United Dominion Realty Trust, Inc. | 4,991,166 | ||||||||
| 58,445,151 | ||||||||||
| Shopping Centers – 10.6% | ||||||||||
| 264,745 | Developers Diversified Realty Corp. | 9,364,031 | ||||||||
| 369,500 | Kimco Realty Corp. | 16,812,250 | ||||||||
| 201,700 | Pan Pacific Retail Properties, Inc. | 10,189,884 | ||||||||
| 176,218 | Regency Centers Corp. | 7,559,752 | ||||||||
| 43,925,917 | ||||||||||
| TOTAL COMMON STOCKS | ||||||||||
| (Cost $308,009,174) | $ | 404,034,716 | ||||||||
| Principal | Interest | Maturity | ||||||||||||||
| Amount | Rate | Date | Value | |||||||||||||
Repurchase Agreement – 2.8% | ||||||||||||||||
| Joint Repurchase Agreement Account II^ | ||||||||||||||||
| $ | 11,400,000 | 1.55 | % | 07/01/2004 | $ | 11,400,000 | ||||||||||
| Maturity Value: $11,400,489 | ||||||||||||||||
| TOTAL REPURCHASE AGREEMENT | ||||||||||||||||
| (Cost $11,400,000) | $ | 11,400,000 | ||||||||||||||
| TOTAL INVESTMENTS BEFORE SECURITIES LENDING COLLATERAL | ||||||||||||||||
| (Cost $319,409,174) | $ | 415,434,716 | ||||||||||||||
| Shares | Description | Value | ||||||||
Securities Lending Collateral – 0.6% | ||||||||||
| 2,438,800 | Boston Global Investment Trust – Enhanced Portfolio | $ | 2,438,800 | |||||||
| TOTAL SECURITIES LENDING COLLATERAL | ||||||||||
| (Cost $2,438,800) | $ | 2,438,800 | ||||||||
| TOTAL INVESTMENTS – 101.1% | ||||||||||
| (Cost $321,847,974) | $ | 417,873,516 | ||||||||
| @ | All or a portion of security is on loan. | |
| * | Non-income producing security. | |
| ^ | Joint repurchase agreement was entered into on June 30, 2004. |
| The percentage shown for each investment category reflects the value of investments in that category as a percentage of net assets. | |
| Investment Abbreviation: REIT — Real Estate Investment Trust |
| Assets: | |||||||
| Investment in securities, at value (identified cost $319,409,174) | $ | 415,434,716 | |||||
| Securities lending collateral, at value (which approximates cost) | 2,438,800 | ||||||
| Cash | 3,580 | ||||||
| Receivables: | |||||||
| Fund shares sold | 2,011,348 | ||||||
| Dividends and interest | 2,001,095 | ||||||
| Reimbursement from adviser | 24,466 | ||||||
| Securities lending income | 2,940 | ||||||
| Other assets | 4,568 | ||||||
Total assets | 421,921,513 | ||||||
| Liabilities: | |||||||
| Payables: | |||||||
| Fund shares repurchased | 5,443,238 | ||||||
| Payable upon return of securities loaned | 2,438,800 | ||||||
| Amounts owed to affiliates | 445,099 | ||||||
| Accrued expenses | 67,010 | ||||||
Total liabilities | 8,394,147 | ||||||
| Net Assets: | |||||||
| Paid-in capital | 306,675,570 | ||||||
| Accumulated distributions in excess of net investment income | (134,608 | ) | |||||
| Accumulated net realized gain from investment transactions | 10,960,862 | ||||||
| Net unrealized gain on investments | 96,025,542 | ||||||
NET ASSETS | $ | 413,527,366 | |||||
Net asset value, offering and redemption price per share:(a) | |||||||
| Class A | $14.63 | ||||||
| Class B | $14.69 | ||||||
| Class C | $14.59 | ||||||
| Institutional | $14.66 | ||||||
| Service | $14.69 | ||||||
| Shares outstanding: | |||||||
| Class A | 14,274,948 | ||||||
| Class B | 1,378,845 | ||||||
| Class C | 1,042,706 | ||||||
| Institutional | 11,477,336 | ||||||
| Service | 66,438 | ||||||
| Total shares outstanding, $.001 par value (unlimited number of shares authorized) | 28,240,273 | ||||||
| (a) | Maximum public offering price per share (NAV per share multiplied by 1.0582) for Class A Shares is $15.48. At redemption, Class B and Class C Shares may be subject to a contingent deferred sales charge, assessed on the amount equal to the lesser of the current net asset value or the original purchase price of the shares. |
| Investment Income: | ||||||
Dividends(a) | $ | 8,516,060 | ||||
| Interest (including securities lending income of $10,149) | 79,026 | |||||
Total income | 8,595,086 | |||||
| Expenses: | ||||||
| Management fees | 1,929,897 | |||||
Distribution and Service fees(b) | 624,373 | |||||
Transfer Agent fees(c) | 250,902 | |||||
| Custody and accounting fees | 62,509 | |||||
| Registration fees | 35,467 | |||||
| Printing fees | 27,256 | |||||
| Professional fees | 25,770 | |||||
| Trustee fees | 7,062 | |||||
| Service Share fees | 1,558 | |||||
| Other | 5,604 | |||||
Total expenses | 2,970,398 | |||||
| Less — expense reductions | (362,250 | ) | ||||
Net expenses | 2,608,148 | |||||
NET INVESTMENT INCOME | 5,986,938 | |||||
| Realized and unrealized gain on investment transactions: | ||||||
| Net realized gain from investment transactions | 9,587,099 | |||||
| Net change in unrealized gain on investments | 6,040,234 | |||||
Net realized and unrealized gain on investment transactions | 15,627,333 | |||||
NET INCREASE IN NET ASSETS RESULTING FROM OPERATIONS | $ | 21,614,271 | ||||
| (a) | Net of foreign taxes withheld on dividends of $19,452. |
| (b) | Class A, Class B and Class C Shares had Distribution and Service fees of $492,034, $100,025 and $71,949, respectively. |
| (c) | Class A, Class B, Class C, Institutional Class and Service Class Shares had Transfer Agent fees of $187,353, $19,005, $13,670, $30,749 and $125, respectively. |
| From operations: | |||||||
| Net investment income | $ | 5,986,938 | |||||
| Net realized gain from investment transactions | 9,587,099 | ||||||
| Net change in unrealized gain on investments | 6,040,234 | ||||||
Net increase in net assets resulting from operations | 21,614,271 | ||||||
| Distributions to shareholders: | |||||||
| From net investment income | |||||||
| Class A Shares | (3,222,725 | ) | |||||
| Class B Shares | (244,047 | ) | |||||
| Class C Shares | (179,316 | ) | |||||
| Institutional Shares | (2,873,349 | ) | |||||
| Service Shares | (13,080 | ) | |||||
Total distributions to shareholders | (6,532,517 | ) | |||||
| From share transactions: | |||||||
| Proceeds from sales of shares | 118,577,431 | ||||||
| Reinvestment of dividends and distributions | 5,505,541 | ||||||
| Cost of shares repurchased | (73,779,251 | ) | |||||
Net increase in net assets resulting from share transactions | 50,303,721 | ||||||
TOTAL INCREASE | 65,385,475 | ||||||
| Net assets: | |||||||
| Beginning of period | 348,141,891 | ||||||
| End of period | $ | 413,527,366 | |||||
Accumulated distributions in excess of net investment income | $ | (134,608 | ) | ||||
| From operations: | |||||||
| Net investment income | $ | 9,084,122 | |||||
| Net realized gain from investment transactions | 7,600,230 | ||||||
| Net change in unrealized gain on investments | 72,288,220 | ||||||
Net increase in net assets resulting from operations | 88,972,572 | ||||||
| Distributions to shareholders: | |||||||
| From net investment income | |||||||
| Class A Shares | (5,027,516 | ) | |||||
| Class B Shares | (440,441 | ) | |||||
| Class C Shares | (295,854 | ) | |||||
| Institutional Shares | (3,690,832 | ) | |||||
| Service Shares | (1,379 | ) | |||||
| From net realized gain on investment transactions | |||||||
| Class A Shares | (2,096,286 | ) | |||||
| Class B Shares | (223,472 | ) | |||||
| Class C Shares | (154,146 | ) | |||||
| Institutional Shares | (1,396,577 | ) | |||||
| Service Shares | (720 | ) | |||||
Total distributions to shareholders | (13,327,223 | ) | |||||
| From share transactions: | |||||||
| Proceeds from sales of shares | 219,256,817 | ||||||
| Reinvestment of dividends and distributions | 10,699,302 | ||||||
| Cost of shares repurchased | (181,096,665 | ) | |||||
Net increase in net assets resulting from share transactions | 48,859,454 | ||||||
TOTAL INCREASE | 124,504,803 | ||||||
| Net assets: | |||||||
| Beginning of year | 223,637,088 | ||||||
| End of year | $ | 348,141,891 | |||||
Accumulated undistributed net investment income | $ | 410,971 | |||||
| 1. ORGANIZATION |
| 2. SIGNIFICANT ACCOUNTING POLICIES |
A. Investment Valuation — Investments in securities traded on a U.S. or foreign securities exchange or the NASDAQ system are valued daily at their last sale price or official closing price on the principal exchange or system on which they are traded. If no sale occurs, securities are valued at the last bid price. Unlisted equity and debt securities for which market quotations are available are valued at the last sale price on valuation date, or if no sale occurs, at the last bid price. Short-term debt obligations maturing in sixty days or less are valued at amortized cost, which approximates market value. Securities for which quotations are not readily available or deemed to be inaccurate by the investment adviser are valued at fair value using methods approved by the Trust’s Board of Trustees.
B. Security Transactions and Investment Income — Security transactions are recorded as of the trade date. Realized gains and losses on sales of portfolio securities are calculated using the identified-cost basis. Dividend income is recorded on the ex-dividend date net of foreign withholding taxes which are reduced by any amounts reclaimable by the Funds, where applicable. Interest income is recorded on the basis of interest accrued, premium amortized and discount accreted.
C. Federal Taxes — It is the Fund’s policy to comply with the requirements of the Internal Revenue Code applicable to regulated investment companies and to distribute each year substantially all of its investment company taxable income and capital gains to its shareholders. Accordingly, no federal tax provision is required. Dividends and distributions to shareholders are recorded on ex-dividend date. Income distributions, if any, are declared and paid quarterly. Capital gains distributions, if any, are declared and paid annually.
| 2. SIGNIFICANT ACCOUNTING POLICIES (continued) |
D. Expenses — Expenses incurred by the Trust that do not specifically relate to an individual fund of the Trust are allocated to the funds on a straight-line or pro-rata basis depending upon the nature of the expense.
Class A, Class B and Class C shareholders of the Fund bear all expenses and fees relating to their respective Distribution and Service Plans. Each class of shares of the Fund separately bears its respective class-specific Transfer Agency fees. Service Shares bear all expenses and fees relating to its Service and Shareholder Administration Plans.
E. Segregation Transactions — The Fund may enter into certain derivative transactions to seek to increase total return. Forward foreign currency exchange contracts, futures contracts, written options, mortgage dollar rolls, when-issued securities and forward commitments represent examples of such transactions. As a result of entering into these transactions, the Fund is required to segregate liquid assets on the accounting records equal to or greater than the market value of the corresponding transactions.
F. Repurchase Agreements — Repurchase agreements involve the purchase of securities subject to the seller’s agreement to repurchase them at a mutually agreed upon date and price. During the term of a repurchase agreement, the value of the underlying securities held as collateral on behalf of the Fund, including accrued interest, is required to equal or exceed the value of the repurchase agreement, including accrued interest. If the seller defaults or becomes insolvent, realization of the collateral by the Fund may be delayed or limited and there may be a decline in the value of the collateral during the period while the Fund seeks to assert its rights. The underlying securities for all repurchase agreements are held in safekeeping at the Fund’s custodian or designated subcustodians under triparty repurchase agreements.
| 3. AGREEMENTS |
| 3. AGREEMENTS (continued) |
| 4. PORTFOLIO SECURITIES TRANSACTIONS |
| 5. SECURITIES LENDING |
| 6. JOINT REPURCHASE AGREEMENT ACCOUNT |
| 6. JOINT REPURCHASE AGREEMENT ACCOUNT (continued) |
| Principal | Interest | Maturity | Maturity | |||||||||||||
| Repurchase Agreements | Amount | Rate | Date | Value | ||||||||||||
| Banc of America Securities LLC | $ | 750,000,000 | 1.55 | 07/01/2004 | $ | 750,032,292 | ||||||||||
| Bear Stearns & Co. | 675,000,000 | 1.55 | 07/01/2004 | 675,029,063 | ||||||||||||
| Greenwich Capital Markets | 400,000,000 | 1.53 | 07/01/2004 | 400,017,000 | ||||||||||||
| J.P. Morgan Chase & Co. | 700,000,000 | 1.55 | 07/01/2004 | 700,030,139 | ||||||||||||
| Morgan Stanley & Co. | 775,000,000 | 1.55 | 07/01/2004 | 775,033,368 | ||||||||||||
| UBS LLC | 950,500,000 | 1.55 | 07/01/2004 | 950,540,924 | ||||||||||||
| Westdeutsche Landesbank AG | 500,000,000 | 1.52 | 07/01/2004 | 500,021,111 | ||||||||||||
TOTAL JOINT REPURCHASE AGREEMENT ACCOUNT II | $ | 4,750,500,000 | $ | 4,750,703,897 | ||||||||||||
| 7. LINE OF CREDIT FACILITY |
| 8. ADDITIONAL TAX INFORMATION |
At June 30, 2004, the Fund’s aggregate security unrealized gains and losses based on cost for U.S. federal income tax purposes was as follows:
| Tax Cost | $ | 322,789,739 | |||
| Gross unrealized gain | 96,007,181 | ||||
| Gross unrealized loss | (923,404 | ) | |||
| Net unrealized security gain | $ | 95,083,777 | |||
The difference between book-basis and tax-basis unrealized gains (losses) are primarily attributable to wash sales.
| 9. OTHER MATTERS |
Legal Proceedings — Purported class and derivative action lawsuits were filed in April and May in the United States District Court for the Southern District of New York against GSAM and certain related parties, including certain Goldman Sachs Funds and the Trustees and Officers of the Trust. The actions allege violations of the Act, the Investment Advisers Act of 1940 and common law breach of fiduciary duty. The complaints allege, among other things, that between April 2, 1999 and January 9, 2004 (the “Class Period”), GSAM charged the Goldman Sachs Funds improper Rule 12b-1 fees; made improper brokerage commission and other payments to brokers that sold shares of the Goldman Sachs Funds; and made untrue statements of material fact in registration statements and reports filed pursuant to the Act. Based on currently available information, GSAM believes that the likelihood that the purported class action lawsuits will have a material adverse financial impact on the Funds is remote, and the pending actions are not likely to materially affect its ability to provide investment management services to its clients, including the Goldman Sachs Funds.
Notes to Financial Statements (continued)
| 10. SUMMARY OF SHARE TRANSACTIONS |
| For the Six Months Ended | ||||||||
| June 30, 2004 (Unaudited) | ||||||||
| Shares | Dollars | |||||||
Class A Shares | ||||||||
| Shares sold | 3,882,790 | $ | 55,926,970 | |||||
| Reinvestment of dividends and distributions | 184,757 | 2,747,173 | ||||||
| Shares repurchased | (3,321,851 | ) | (46,908,212 | ) | ||||
| 745,696 | 11,765,931 | |||||||
Class B Shares | ||||||||
| Shares sold | 178,686 | 2,599,590 | ||||||
| Reinvestment of dividends and distributions | 13,115 | 196,013 | ||||||
| Shares repurchased | (217,982 | ) | (3,072,738 | ) | ||||
| (26,181 | ) | (277,135 | ) | |||||
Class C Shares | ||||||||
| Shares sold | 150,167 | 2,144,196 | ||||||
| Reinvestment of dividends and distributions | 9,858 | 146,132 | ||||||
| Shares repurchased | (101,702 | ) | (1,434,044 | ) | ||||
| 58,323 | 856,284 | |||||||
Institutional Shares | ||||||||
| Shares sold | 3,939,262 | 57,008,392 | ||||||
| Reinvestment of dividends and distributions | 161,947 | 2,412,212 | ||||||
| Shares repurchased | (1,569,361 | ) | (22,294,026 | ) | ||||
| 2,531,848 | 37,126,578 | |||||||
Service Shares | ||||||||
| Shares sold | 61,969 | 898,283 | ||||||
| Reinvestment of dividends and distributions | 268 | 4,011 | ||||||
| Shares repurchased | (5,027 | ) | (70,231 | ) | ||||
| 57,210 | 832,063 | |||||||
NET INCREASE | 3,366,986 | $ | 50,303,721 | |||||
| 10. SUMMARY OF SHARE TRANSACTIONS (continued) |
| For the Year Ended | ||||||||
| December 31, 2003 | ||||||||
| Shares | Dollars | |||||||
Class A Shares | ||||||||
| Shares sold | 13,865,162 | $ | 164,389,297 | |||||
| Reinvestment of dividends and distributions | 470,684 | 5,814,245 | ||||||
| Shares repurchased | (12,537,256 | ) | (145,576,592 | ) | ||||
| 1,798,590 | 24,626,950 | |||||||
Class B Shares | ||||||||
| Shares sold | 460,212 | 5,559,134 | ||||||
| Reinvestment of dividends and distributions | 41,958 | 518,520 | ||||||
| Shares repurchased | (445,757 | ) | (5,274,182 | ) | ||||
| 56,413 | 803,472 | |||||||
Class C Shares | ||||||||
| Shares sold | 263,160 | 3,276,926 | ||||||
| Reinvestment of dividends and distributions | 30,293 | 371,830 | ||||||
| Shares repurchased | (172,462 | ) | (2,046,527 | ) | ||||
| 120,991 | 1,602,229 | |||||||
Institutional Shares | ||||||||
| Shares sold | 3,721,790 | 45,932,976 | ||||||
| Reinvestment of dividends and distributions | 323,077 | 3,992,614 | ||||||
| Shares repurchased | (2,377,723 | ) | (28,184,538 | ) | ||||
| 1,667,144 | 21,741,052 | |||||||
Service Shares | ||||||||
| Shares sold | 7,428 | 98,484 | ||||||
| Reinvestment of dividends and distributions | 166 | 2,093 | ||||||
| Shares repurchased | (1,247 | ) | (14,826 | ) | ||||
| 6,347 | 85,751 | |||||||
NET INCREASE | 3,649,485 | $ | 48,859,454 | |||||
| Income (loss) from | ||||||||||||||||||||||||||||||||||||||||
| investment operations | Distributions to shareholders | |||||||||||||||||||||||||||||||||||||||
| Net asset | In excess | |||||||||||||||||||||||||||||||||||||||
| value, | Net | Net realized | Total from | From net | of net | From | From tax | |||||||||||||||||||||||||||||||||
| beginning | investment | and unrealized | investment | investment | investment | realized | return of | Total | ||||||||||||||||||||||||||||||||
| of period | income(b) | gain (loss) | operations | income | income | gains | capital | distributions | ||||||||||||||||||||||||||||||||
| FOR THE SIX MONTHS ENDED JUNE 30, (Unaudited) | ||||||||||||||||||||||||||||||||||||||||
| 2004 - Class A Shares | $ | 13.98 | $ | 0.21 | $ | 0.67 | $ | 0.88 | $ | (0.23 | ) | $ | — | $ | — | $ | — | $ | (0.23 | ) | ||||||||||||||||||||
| 2004 - Class B Shares | 14.04 | 0.16 | 0.66 | 0.82 | (0.17 | ) | — | — | — | (0.17 | ) | |||||||||||||||||||||||||||||
| 2004 - Class C Shares | 13.95 | 0.16 | 0.65 | 0.81 | (0.17 | ) | — | — | — | (0.17 | ) | |||||||||||||||||||||||||||||
| 2004 - Institutional Shares | 14.02 | 0.25 | 0.65 | 0.90 | (0.26 | ) | — | — | — | (0.26 | ) | |||||||||||||||||||||||||||||
| 2004 - Service Shares | 14.05 | 0.25 | 0.62 | 0.87 | (0.23 | ) | — | — | — | (0.23 | ) | |||||||||||||||||||||||||||||
| FOR THE YEARS ENDED DECEMBER 31, | ||||||||||||||||||||||||||||||||||||||||
| 2003 - Class A Shares | 10.53 | 0.41 | 3.63 | 4.04 | (0.43 | ) | — | (0.16 | ) | — | (0.59 | ) | ||||||||||||||||||||||||||||
| 2003 - Class B Shares | 10.57 | 0.31 | 3.66 | 3.97 | (0.34 | ) | — | (0.16 | ) | — | (0.50 | ) | ||||||||||||||||||||||||||||
| 2003 - Class C Shares | 10.51 | 0.31 | 3.63 | 3.94 | (0.34 | ) | — | (0.16 | ) | — | (0.50 | ) | ||||||||||||||||||||||||||||
| 2003 - Institutional Shares | 10.55 | 0.46 | 3.65 | 4.11 | (0.48 | ) | — | (0.16 | ) | — | (0.64 | ) | ||||||||||||||||||||||||||||
| 2003 - Service Shares | 10.57 | 0.47 | 3.59 | 4.06 | (0.42 | ) | — | (0.16 | ) | — | (0.58 | ) | ||||||||||||||||||||||||||||
| 2002 - Class A Shares | 10.85 | 0.46 | (0.14 | ) | 0.32 | (0.31 | ) | — | (0.27 | ) | (0.06 | ) | (0.64 | ) | ||||||||||||||||||||||||||
| 2002 - Class B Shares | 10.90 | 0.40 | (0.16 | ) | 0.24 | (0.24 | ) | — | (0.27 | ) | (0.06 | ) | (0.57 | ) | ||||||||||||||||||||||||||
| 2002 - Class C Shares | 10.84 | 0.39 | (0.16 | ) | 0.23 | (0.23 | ) | — | (0.27 | ) | (0.06 | ) | (0.56 | ) | ||||||||||||||||||||||||||
| 2002 - Institutional Shares | 10.87 | 0.51 | (0.14 | ) | 0.37 | (0.36 | ) | — | (0.27 | ) | (0.06 | ) | (0.69 | ) | ||||||||||||||||||||||||||
| 2002 - Service Shares | 10.90 | 0.42 | (0.11 | ) | 0.31 | (0.31 | ) | — | (0.27 | ) | (0.06 | ) | (0.64 | ) | ||||||||||||||||||||||||||
| 2001 - Class A Shares | 11.00 | 0.37 | 0.34 | 0.71 | (0.39 | ) | — | (0.47 | ) | — | (0.86 | ) | ||||||||||||||||||||||||||||
| 2001 - Class B Shares | 11.05 | 0.30 | 0.34 | 0.64 | (0.32 | ) | — | (0.47 | ) | — | (0.79 | ) | ||||||||||||||||||||||||||||
| 2001 - Class C Shares | 10.98 | 0.30 | 0.35 | 0.65 | (0.32 | ) | — | (0.47 | ) | — | (0.79 | ) | ||||||||||||||||||||||||||||
| 2001 - Institutional Shares | 11.03 | 0.41 | 0.34 | 0.75 | (0.44 | ) | — | (0.47 | ) | — | (0.91 | ) | ||||||||||||||||||||||||||||
| 2001 - Service Shares | 11.04 | 0.37 | 0.34 | 0.71 | (0.38 | ) | — | (0.47 | ) | — | (0.85 | ) | ||||||||||||||||||||||||||||
| 2000 - Class A Shares | 8.68 | 0.44 | 2.28 | 2.72 | (0.36 | ) | — | — | (0.04 | ) | (0.40 | ) | ||||||||||||||||||||||||||||
| 2000 - Class B Shares | 8.73 | 0.40 | 2.27 | 2.67 | (0.31 | ) | — | — | (0.04 | ) | (0.35 | ) | ||||||||||||||||||||||||||||
| 2000 - Class C Shares | 8.66 | 0.39 | 2.27 | 2.66 | (0.30 | ) | — | — | (0.04 | ) | (0.34 | ) | ||||||||||||||||||||||||||||
| 2000 - Institutional Shares | 8.69 | 0.48 | 2.30 | 2.78 | (0.40 | ) | — | — | (0.04 | ) | (0.44 | ) | ||||||||||||||||||||||||||||
| 2000 - Service Shares | 8.69 | 0.44 | 2.30 | 2.74 | (0.35 | ) | — | — | (0.04 | ) | (0.39 | ) | ||||||||||||||||||||||||||||
| 1999 - Class A Shares | 9.20 | 0.38 | (0.48 | ) | (0.10 | ) | (0.38 | ) | (0.02 | ) | — | (0.02 | ) | (0.42 | ) | |||||||||||||||||||||||||
| 1999 - Class B Shares | 9.27 | 0.28 | (0.45 | ) | (0.17 | ) | (0.28 | ) | (0.07 | ) | — | (0.02 | ) | (0.37 | ) | |||||||||||||||||||||||||
| 1999 - Class C Shares | 9.21 | 0.30 | (0.48 | ) | (0.18 | ) | (0.30 | ) | (0.05 | ) | — | (0.02 | ) | (0.37 | ) | |||||||||||||||||||||||||
| 1999 - Institutional Shares | 9.21 | 0.40 | (0.47 | ) | (0.07 | ) | (0.40 | ) | (0.03 | ) | — | (0.02 | ) | (0.45 | ) | |||||||||||||||||||||||||
| 1999 - Service Shares | 9.21 | 0.38 | (0.49 | ) | (0.11 | ) | (0.38 | ) | (0.01 | ) | — | (0.02 | ) | (0.41 | ) | |||||||||||||||||||||||||
| (a) | Assumes investment at the net asset value at the beginning of the period, reinvestment of all dividends and distributions, a complete redemption of the investment at the net asset value at the end of the period and no sales or redemption charges. Total return would be reduced if a sales or redemption charge were taken into account. Total returns for periods less than one full year are not annualized. Returns do not reflect the deduction of taxes that a shareholder would pay on Fund distributions or the redemption of Fund shares. |
| (b) | Calculated based on the average shares outstanding methodology. |
| (c) | Annualized. |
| Ratios assuming no | ||||||||||||||||||||||||||||||||||
| expense reductions | ||||||||||||||||||||||||||||||||||
| Ratio of | Ratio of | Ratio of | ||||||||||||||||||||||||||||||||
| Net assets | Ratio of | net investment | total | net investment | ||||||||||||||||||||||||||||||
| Net asset | at end of | net expenses | income to | expenses to | income | Portfolio | ||||||||||||||||||||||||||||
| value, end | Total | period | to average | average | average | to average | turnover | |||||||||||||||||||||||||||
| of period | return(a) | (in 000s) | net assets | net assets | net assets | net assets | rate | |||||||||||||||||||||||||||
| $ | 14.63 | 6.25 | % | $ | 208,775 | 1.44 | %(c) | 3.00 | %(c) | 1.73 | %(c) | 2.71 | %(c) | 11 | % | |||||||||||||||||||
| 14.69 | 5.85 | 20,251 | 2.19 | (c) | 2.22 | (c) | 2.27 | (c) | 2.14 | (c) | 11 | |||||||||||||||||||||||
| 14.59 | 5.82 | 15,211 | 2.19 | (c) | 2.23 | (c) | 2.27 | (c) | 2.15 | (c) | 11 | |||||||||||||||||||||||
| 14.66 | 6.36 | 168,314 | 1.04 | (c) | 3.43 | (c) | 1.12 | (c) | 3.35 | (c) | 11 | |||||||||||||||||||||||
| 14.69 | 6.16 | 976 | 1.54 | (c) | 3.36 | (c) | 1.62 | (c) | 3.28 | (c) | 11 | |||||||||||||||||||||||
| 13.98 | 39.25 | 189,164 | 1.44 | 3.37 | 1.81 | 3.00 | 17 | |||||||||||||||||||||||||||
| 14.04 | 38.27 | 19,728 | 2.19 | 2.58 | 2.31 | 2.46 | 17 | |||||||||||||||||||||||||||
| 13.95 | 38.24 | 13,732 | 2.19 | 2.62 | 2.31 | 2.50 | 17 | |||||||||||||||||||||||||||
| 14.02 | 39.90 | 125,388 | 1.04 | 3.81 | 1.16 | 3.69 | 17 | |||||||||||||||||||||||||||
| 14.05 | 39.24 | 130 | 1.54 | 3.78 | 1.66 | 3.66 | 17 | |||||||||||||||||||||||||||
| 10.53 | 2.91 | 123,487 | 1.45 | 4.08 | 1.84 | 3.69 | 37 | |||||||||||||||||||||||||||
| 10.57 | 2.12 | 14,256 | 2.20 | 3.61 | 2.34 | 3.47 | 37 | |||||||||||||||||||||||||||
| 10.51 | 2.11 | 9,072 | 2.20 | 3.56 | 2.34 | 3.42 | 37 | |||||||||||||||||||||||||||
| 10.55 | 3.31 | 76,792 | 1.05 | 4.53 | 1.19 | 4.39 | 37 | |||||||||||||||||||||||||||
| 10.57 | 2.78 | 30 | 1.55 | 3.97 | 1.69 | 3.83 | 37 | |||||||||||||||||||||||||||
| 10.85 | 6.75 | 144,286 | 1.44 | 3.36 | 1.83 | 2.97 | 50 | |||||||||||||||||||||||||||
| 10.90 | 5.98 | 7,559 | 2.19 | 2.71 | 2.33 | 2.57 | 50 | |||||||||||||||||||||||||||
| 10.84 | 6.13 | 5,594 | 2.19 | 2.74 | 2.33 | 2.60 | 50 | |||||||||||||||||||||||||||
| 10.87 | 7.16 | 74,923 | 1.04 | 3.75 | 1.18 | 3.61 | 50 | |||||||||||||||||||||||||||
| 10.90 | 6.83 | 2 | 1.54 | 3.32 | 1.68 | 3.18 | 50 | |||||||||||||||||||||||||||
| 11.00 | 31.86 | 122,964 | 1.44 | 4.43 | 1.99 | 3.88 | 49 | |||||||||||||||||||||||||||
| 11.05 | 31.04 | 5,355 | 2.19 | 3.93 | 2.49 | 3.63 | 49 | |||||||||||||||||||||||||||
| 10.98 | 31.14 | 2,991 | 2.19 | 3.90 | 2.49 | 3.60 | 49 | |||||||||||||||||||||||||||
| 11.03 | 32.45 | 74,125 | 1.04 | 4.89 | 1.34 | 4.59 | 49 | |||||||||||||||||||||||||||
| 11.04 | 31.99 | 2 | 1.34 | 4.46 | 1.84 | 4.16 | 49 | |||||||||||||||||||||||||||
| 8.68 | (1.02 | ) | 93,443 | 1.44 | 4.14 | 1.96 | 3.62 | 37 | ||||||||||||||||||||||||||
| 8.73 | (1.73 | ) | 457 | 2.19 | 3.21 | 2.46 | 2.94 | 37 | ||||||||||||||||||||||||||
| 8.66 | (1.80 | ) | 697 | 2.19 | 3.38 | 2.46 | 3.11 | 37 | ||||||||||||||||||||||||||
| 8.69 | (0.64 | ) | 42,790 | 1.04 | 4.43 | 1.31 | 4.16 | 37 | ||||||||||||||||||||||||||
| 8.69 | (1.12 | ) | 1 | 1.54 | 4.17 | 1.81 | 3.90 | 37 | ||||||||||||||||||||||||||
(This page intentionally left blank)

| F U N D S P R O F I L E |
| Goldman Sachs Funds |
| Goldman Sachs is a premier financial services firm, known since 1869 for creating thoughtful and customized investment solutions in complex global markets. |
| Today, Goldman Sachs Asset Management, L.P. and other units of the Investment Management Division of Goldman Sachs serve a diverse set of clients worldwide, including private institutions, public entities and individuals. With portfolio management teams located around the world — and $400.1 billion in assets under management as of THE GOLDMAN March 31, 2004 — our investment professionals bring firsthand knowledge of local markets SACHS ADVANTAGE to every investment decision, making us one of the few truly global asset managers. |
| Our goal is to deliver: G O L D M A N S A C H S F U N D S Strong, Consistent In building a globally diversified INTERNATIONAL |
| Investment Results portfolio, you can select from more than EQUITY 50 Goldman Sachs Funds and gain access Global Resources and Global Research to investment opportunities across borders, investment styles, asset classes Team Approach and security capitalizations. Disciplined Processes DOMESTIC EQUITY |
| Innovative, Value-Added Investment Products SPECIALTY FIXED ALLOCATION Thoughtful Solutions INCOME ASSET Risk Management |
| MONEY Outstanding MARKET Asset Allocation Funds Client Service Risk/Return Balanced Fund Domestic Equity Funds Lower Asset Allocation Portfolios Small Cap Value Fund Dedicated Service CORESM Small Cap Equity Fund Fixed Income Funds Teams Mid Cap Value Fund Emerging Markets Debt Fund Excellence and Concentrated Growth Fund High Yield Fund Integrity International Equity Funds Growth Opportunities Fund High Yield Municipal Fund Asia Growth Fund Research Select FundSM Global Income Fund Emerging Markets Equity Fund Strategic Growth Fund Investment Grade Credit Fund International Growth Capital Growth Fund Core Fixed Income Fund Opportunities Fund Large Cap Value Fund U.S. Mortgages Fund Japanese Equity Fund Growth and Income Fund Municipal Income Fund European Equity Fund CORESM Large Cap Growth Fund Government Income Fund International Equity Fund CORESM Large Cap Value Fund Short Duration Tax-Free Fund CORESM International Equity Fund CORESM U.S. Equity Fund Short Duration Government Fund Ultra-Short Duration Government Specialty Funds Fund Internet Tollkeeper FundSM Enhanced Income Fund CORESM Tax-Managed Equity Fund Real Estate Securities Fund Money Market Funds1 |
| 1 An investment in a money market fund is neither insured nor guaranteed by the Federal Deposit Insurance Corporation or any other government agency. Although the Funds seek to preserve the value of your investment at $1.00 per share, it is possible to lose money by investing in the Funds. The Goldman Sachs Research Select FundSM, Internet Tollkeeper FundSM and CORESM are service marks of Goldman, Sachs & Co. |

| GOLDMAN SACHS ASSET MANAGEMENT, L.P. 32 OLD SLIP, 32ND FLOOR, NEW YORK, NEW YORK 10005 T R U S T E E S O F F I C E R S Ashok N. Bakhru, Chairman Kaysie P. Uniacke, President |
| John P. Coblentz, Jr. James A. Fitzpatrick, Vice President Patrick T. Harker James A. McNamara, Vice President Mary Patterson McPherson John M. Perlowski, Treasurer Alan A. Shuch Howard B. |
| Surloff, Secretary Wilma |
| J. Smelcer Richard P. Strubel Kaysie P. Uniacke |
| G O L D M A N , S AC H S & CO. G O L D M A N S AC H S A S S E T M A N AG E M E N T, L . P. |
| Distributor and Transfer Agent Investment Adviser |
| Visit our Web site at www.gs.com/funds to obtain the most recent month end returns. |
| The reports concerning the Fund included in this shareholder report may contain certain forward-looking statements about the factors that may affect the performance of the Fund in the future. These statements are based on Fund management’s predictions and expectations concerning certain future events and their expected impact on the Fund, such as performance of the economy as a whole and of specific industry sectors, changes in the levels of interest rates, the impact of developing world events, and other factors that may influence the future performance of the Fund. Management believes these forward-looking statements to be reasonable, although they are inherently uncertain and difficult to predict. Actual events may cause adjustments in portfolio management strategies from those currently expected to be employed. |
| A description of the policies and procedures that the Funds use to determine how to vote proxies relating to portfolio securities is available (i) without charge, upon request by calling 1-800-526-7384 (for Retail Shareholders) or 1-800-621-2550 (for Institutional Shareholders); and (ii) on the Securities and Exchange Commission Web site at http://www.sec.gov. |
| This material is not authorized for distribution to prospective investors unless preceded or accompanied by a current Prospectus. Investors should read the Prospectus carefully before investing or sending money. |
| Holdings are as of June 30, 2004 and are subject to change in the future. Fund holdings of stocks or bonds should not be relied on in making investment decisions and should not be construed as research or investment advice regarding particular securities. |
| The Fund may participate in the Initial Public Offer (IPO) market, and a portion of the Fund’s returns consequently may be attributable to its investments in IPOs, which may have a magnified impact due to the Fund’s small asset base. As the Fund’s assets grow, it is probable that the effect of the Fund’s investment in IPOs on its total return may not be as significant. |
| An investment in the Real Estate Securities Fund is subject to certain risks associated with the direct ownership of real estate and with concentrating its investments in the real estate industry in general and may be suitable only for those investors who are financially able to assume greater risk and share price volatility than presented by funds that do not concentrate in the real estate industry. |
| Goldman, Sachs & Co. is the distributor of the Fund. |
| Copyright 2004 Goldman, Sachs & Co. All rights reserved. Date of first use: August 29, 2004 04-1133 / REITSAR / 9.0K / 07-04 |
| ITEM 2. | CODE OF ETHICS. |
| Not applicable to the semi-annual report for the period ending June 30, 2004. |
| ITEM 3. | AUDIT COMMITTEE FINANCIAL EXPERT. |
| Not applicable to the semi-annual report for the period ending June 30, 2004. |
| ITEM 4. | PRINCIPAL ACCOUNTANT FEES AND SERVICES. |
| Not applicable to the semi-annual report for the period ended June 30, 2004. |
| ITEM 5. | AUDIT COMMITTEE OF LISTED REGISTRANTS. |
| Not applicable. |
| ITEM 6. | SCHEDULE OF INVESTMENTS |
| Not applicable to the semi-annual report for the period ended June 30, 2004. |
| ITEM 7. | DISCLOSURE OF PROXY VOTING POLICIES AND PROCEDURES FOR CLOSED-END MANAGEMENT INVESTMENT COMPANIES. |
| Not applicable. |
| ITEM 8. | PURCHASES OF EQUITY SECURITIES BY CLOSED-END MANAGEMENT INVESTMENT COMPANY AND AFFILIATED PURCHASERS |
| Not applicable. |
| ITEM 9. | SUBMISSION OF MATTERS TO A VOTE OF SECURITY HOLDERS. |
| There have been no material changes to the procedures by which shareholders may recommend nominees to the registrant’s board of trustees. |
| ITEM 10. | CONTROLS AND PROCEDURES. |
| (a) | The registrant’s principal executive and principal financial officers or persons performing similar functions have concluded that the registrant’s disclosure controls and procedures (as defined in Rule 30a-3(c) under the Investment Company Act of 1940, as amended (the “1940 Act”)) are effective as of a date within 90 days of the filing date of this report that includes the disclosure required by this paragraph, based on the evaluation of these controls and procedures required by Rule 30a-3(b) under the 1940 Act and 15d-15(b) under the Securities Exchange Act of 1934, as amended. | ||
| (b) | There were no changes in the registrant’s internal control over financial reporting (as defined in Rule 30a-3(d) under the 1940 Act) that occurred during the registrant’s last fiscal half-year (the registrant’s second fiscal half-year in the case of an annual report) that has materially affected, or is reasonably likely to materially affect the registrant’s internal control over financial reporting. |
| ITEM 11. | EXHIBITS. |
| (a)(1) | Exhibit 99.CODE | Goldman Sachs Trust's Code of Ethics for Principal Executive and Senior Financial Officers is incorporated by reference to Exhibit 11(a)(1) of the registrants's Form N-CSR filed on March 8, 2004 for its Real Estate Securites Fund (Accession Number 0000950123-04-0002984) | ||
| (a)(2) | Exhibit 99.CERT Exhibit 99.906CERT | Certifications pursuant to Section 302 of the Sarbanes-Oxley Act of 2002 filed herewith Certifications pursuant to Section 906 of the Sarbanes-Oxley Act of 2002 filed herewith |
SIGNATURES
Pursuant to the requirements of the Securities Exchange Act of 1934 and the Investment Company Act of 1940, the registrant has duly caused this report to be signed on its behalf by the undersigned, thereunto duly authorized.
| Goldman Sachs Trust | ||
| /s/ Kaysie Uniacke | ||
| By: Kaysie Uniacke | ||
| Chief Executive Officer of | ||
| Goldman Sachs Trust | ||
| Date: August 26, 2004 | ||
| Pursuant to the requirements of the Securities Exchange Act of 1934 and the Investment Company Act of 1940, the report has been signed below by the following persons on behalf of the registrant and in the capacities and on the dates indicated. | ||
/s/ Kaysie Uniacke | ||
| By: Kaysie Uniacke | ||
| Chief Executive Officer of | ||
| Goldman Sachs Trust | ||
| Date: August 26, 2004 | ||
/s/ John M. Perlowski | ||
| By: John M. Perlowski | ||
| Chief Financial Officer of | ||
| Goldman Sachs Trust | ||
| Date: August 26, 2004 | ||