UNITED STATES
SECURITIES AND EXCHANGE COMMISSION
Washington, D.C. 20549
FORM N-CSR
CERTIFIED SHAREHOLDER REPORT OF REGISTERED MANAGEMENT INVESTMENT
COMPANIES
Investment Company Act file number 811-5349
Goldman Sachs Trust
(Exact name of registrant as specified in charter)
4900 Sears Tower, Chicago, Illinois 60606-6303
(Address of principal executive offices) (Zip code)
| Howard B. Surloff, Esq. | Copies to: | |
| Goldman, Sachs & Co. | Jeffrey A. Dalke, Esq. | |
| One New York Plaza | Drinker Biddle & Reath LLP | |
| New York, New York 10004 | One Logan Square | |
| 18th and Cherry Streets | ||
| Philadelphia, PA 19103 | ||
| (Name and address of agents for service) | ||
Registrant’s telephone number, including area code: (312) 655-4400
Date of fiscal year end: August 31
Date of reporting period: February 28, 2005
| ITEM 1. | REPORTS TO STOCKHOLDERS. | |
| The Semi-Annual Report to Stockholders is filed herewith. |

| Goldman Sachs Funds GROWTH EQUITY FUNDS Semiannual Report February 28, 2005 Long-term capital growth potential from a diversified portfolio of equity investments. |
| Goldman Sachs Growth Equity Funds GOLDMAN SACHS CAPITAL GROWTH FUND GOLDMAN SACHS STRATEGIC GROWTH FUND GOLDMAN SACHS CONCENTRATED GROWTH FUND GOLDMAN SACHS GROWTH OPPORTUNITIES FUND NOT FDIC-INSURED May Lose Value No Bank Guarantee |
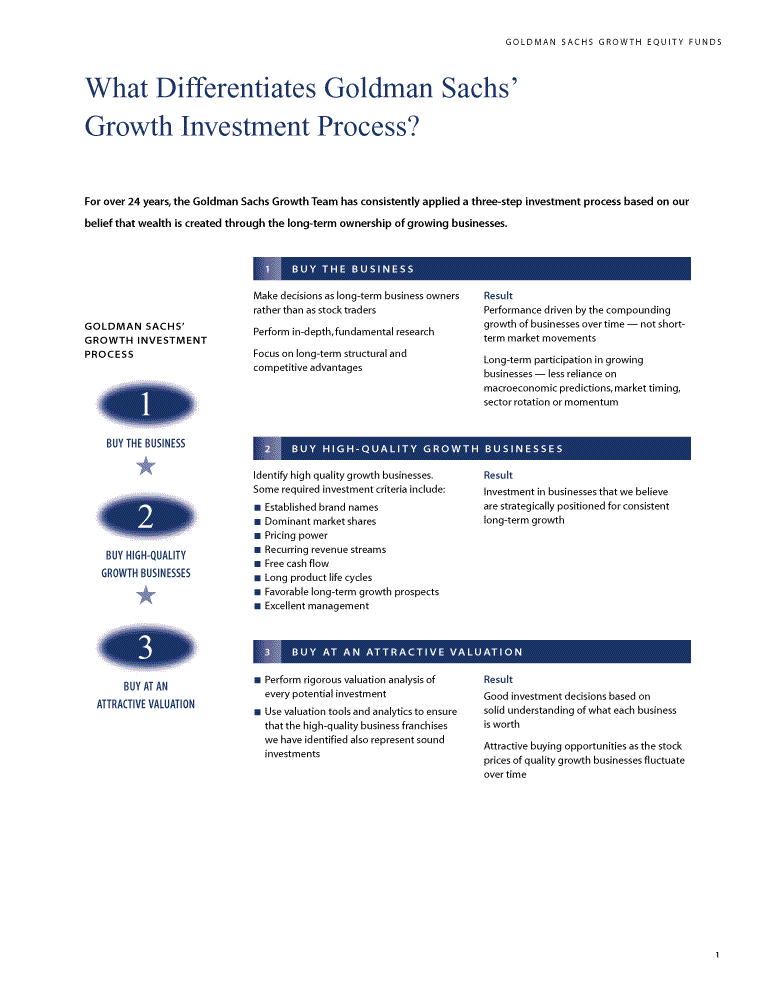
| GOLDMAN SACHS GROWTH EQUITY FUNDS What Differentiates Goldman Sachs’ Growth Investment Process? For over 24 years, the Goldman Sachs Growth Team has consistently applied a three-step investment process based on our belief that wealth is created through the long-term ownership of growing businesses. GOLDMAN SACHS’ GROWTH INVESTMENT PROCESS 1 BUY THE BUSINESS ? 2 BUY HIGH-QUALITY GROWTH BUSINESSES ? 3 BUY AT AN ATTRACTIVE VALUATION 1 BUY THE BUSINESS Make decisions as long-term business owners rather than as stock traders Perform in-depth, fundamental research Focus on long-term structural and competitive advantages Result Performance driven by the compounding growth of businesses over time — not short-term market movements Long-term participation in growing businesses — less reliance on macroeconomic predictions, market timing, sector rotation or momentum 2 BUY HIGH-QUALITY GROWTH BUSINESSES Identify high quality growth businesses. Result Some required investment criteria include: Investment in businesses that we believe Established brand names are strategically positioned for consistent Dominant market shares long-term growth Pricing power Recurring revenue streams Free cash flow Long product life cycles Favorable long-term growth prospects Excellent management 3 BUY AT AN ATTRACTIVE VALUATION Perform rigorous valuation analysis of every potential investment Use valuation tools and analytics to ensure that the high-quality business franchises we have identified also represent sound investments Result Good investment decisions based on solid understanding of what each business is worth Attractive buying opportunities as the stock prices of quality growth businesses fluctuate over time 1 |
| PORTFOLIO RESULTS Capital Growth Fund Dear Shareholder, This report provides an overview on the performance of the Goldman Sachs Capital Growth Fund during the six-month reporting period that ended February 28, 2005. Performance Review Over the six-month period that ended February 28, 2005, the Fund’s Class A, B, C, Institutional, and Service Shares generated cumulative total returns, without sales charges, of 5.13%, 4.73%, 4.74%, 5.38%, and 5.13%, respectively. These returns compare to the 7.67% cumulative total returns of the Fund’s benchmark, the Russell 1000 Growth Index (with dividends reinvested), over the same time period. While the Fund generated positive absolute results during the period, it lagged its benchmark on a relative basis. This was largely the result of weakness in both the Media and Finance sectors. Conversely, the portfolio benefited from strength in the Consumer Discretionary sector. Detractors from performance in the Media sector included Lamar Advertising Co. and Univision Communications, Inc. Lamar Advertising reported continued strength in revenue growth during the fourth quarter 2004. However, the company had to take a large one-time depreciation expense due to billboards destroyed during last year’s hurricanes in the Southern U.S. We believe the one-time charge does not change the fundamentals of the business which generates strong operating free cash flow. Univision’s stock fell after it indicated that fourth quarter 2004 revenues would come in below expectations due to a weak television network scatter business. The scatter market is where national advertisers make a national purchase for a short period of time to supplement their other advertising commitments on a specific network. Univision’s weakness is primarily due to several advertisers, particularly retailers, who were absent from 2004’s scatter market. The company has more exposure to the network scatter business than a traditional broadcast network because it does not sell out its entire television inventory. Univision is willing to run fewer minutes of commercials in order to maintain pricing power. Importantly, the businesses that represent 90% of Univision’s revenues remain strong. These include the upfront advertising commitments on the network, its television station group, and a radio station group. Towards the end of the reporting period, its stock rallied strongly. Overall, Fannie Mae and Freddie Mac also hurt results during the period. Fannie Mae’s stock pulled back sharply after it announced that it would cut its dividend in half. While the move is expected to add $250 million per quarter to retained earnings, it is more of a symbolic gesture to its regulator and Congress, suggesting a cultural change at Fannie Mae. Importantly, we believe that the dividend reduction neither diminishes the firm’s earnings power, nor does it hurt cash flow. Although Fannie Mae’s and Freddie Mac’s stock generally is susceptible to headline risk, we believe their Congressional charters, which give the companies their competitive advantages, remain intact. Within the Consumer Discretionary sector, Marriot International, Inc., Starwood Hotels & Resorts Worldwide, Inc., and Harrah’s Entertainment, Inc. were top contributors to performance. We believe the Fund’s holdings that are exposed to the U.S. lodging industry are favorably positioned. While demand slowed in 2001 and 2002 as the U.S. economy cooled, supply growth in the lodging industry slowed as well. As it generally takes two to three years 2 |
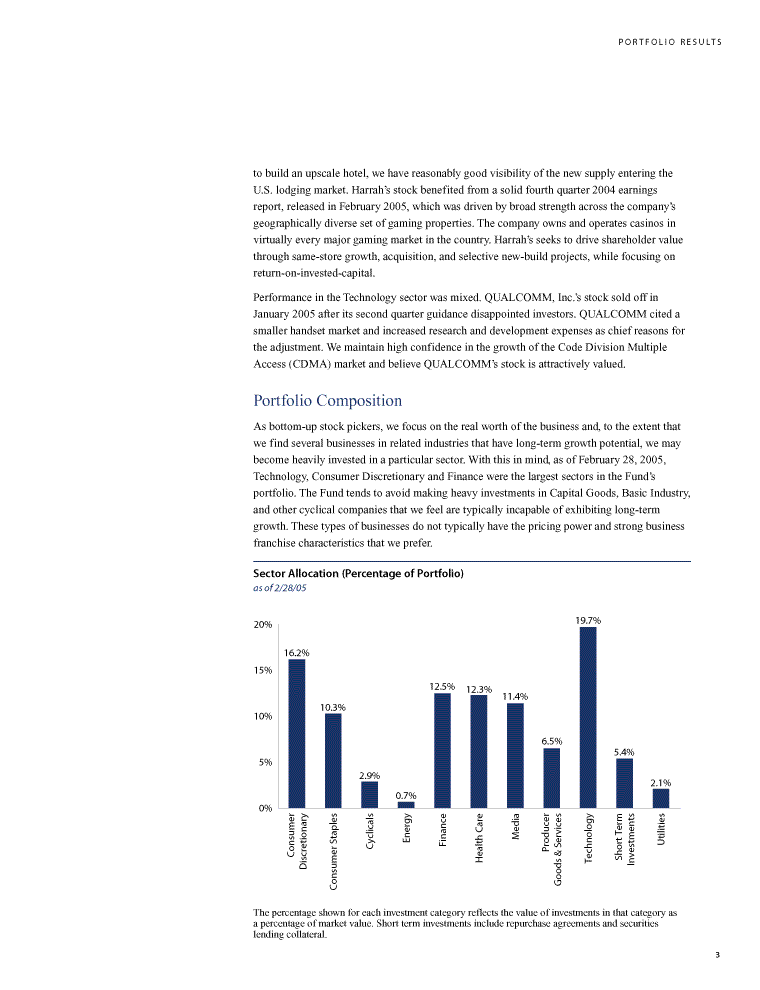
| PORTFOLIO RESULTS to build an upscale hotel, we have reasonably good visibility of the new supply entering the U.S. lodging market. Harrah’s stock benefited from a solid fourth quarter 2004 earnings report, released in February 2005, which was driven by broad strength across the company’s geographically diverse set of gaming properties. The company owns and operates casinos in virtually every major gaming market in the country. Harrah’s seeks to drive shareholder value through same-store growth, acquisition, and selective new-build projects, while focusing on return-on-invested-capital. Performance in the Technology sector was mixed. QUALCOMM, Inc.’s stock sold off in January 2005 after its second quarter guidance disappointed investors. QUALCOMM cited a smaller handset market and increased research and development expenses as chief reasons for the adjustment. We maintain high confidence in the growth of the Code Division Multiple Access (CDMA) market and believe QUALCOMM’s stock is attractively valued. Portfolio Composition As bottom-up stock pickers, we focus on the real worth of the business and, to the extent that we find several businesses in related industries that have long-term growth potential, we may become heavily invested in a particular sector. With this in mind, as of February 28, 2005, Technology, Consumer Discretionary and Finance were the largest sectors in the Fund’s portfolio. The Fund tends to avoid making heavy investments in Capital Goods, Basic Industry, and other cyclical companies that we feel are typically incapable of exhibiting long-term growth. These types of businesses do not typically have the pricing power and strong business franchise characteristics that we prefer. Sector Allocation (Percentage of Portfolio) as of 2/28/05 19.7% 20% 16.2% 15% 12.5% 12.3% 11.4% 10.3% 10% 6.5% 5.4% 5% 2.9% 2.1% 0.7% 0% Staples Cyclicals Energy Finance Media Producer Services Technology Investments Utilities Consumer Consumer Health Care Short Term Discretionary Goods & The percentage shown for each investment category reflects the value of investments in that category as a percentage of market value. Short term investments include repurchase agreements and securities lending collateral. 3 |

| PORTFOLIO RESULTS Portfolio Highlights During the reporting period, there were a number of holdings that enhanced results, including the following: Dell, Inc. — Dell posted record third quarter 2004 sales during the period and saw profits surge 25%, fueled by the double-digit growth in the corporate and government sectors, both domestically and abroad. Dell also reported that the company spent $1.3 billion to buy back 38 million shares of its own stock during the third quarter, bringing the total amount of repurchased stock to $3.3 billion for 2004. PepsiCo, Inc. — Pepsi’s strength has been driven by its dominance in the fast-growing global snack food and non-carbonated beverage categories. Its Frito-Lay unit boasts nine of the top ten selling snack food brands in the U.S. Pepsi also benefits from owning the top sports drink (Gatorade), bottled water (Aquafina), and juice businesses (Tropicana). Pepsi’s recent success is due to a strategy that focuses on enhancing its core Frito-Lay business, focusing its soft drink efforts on markets where it has some advantages of scale, and making strategic acquisitions that leverage its distribution system. Checkfree Corp. — Checkfree Corp. continued to rise throughout the reporting period. As a leader in electronic bill pay services, Checkfree has benefited from the trend for banks to offer free bill payment services to its customers in order to lower account attrition and increase revenue per customer. Wachovia-First Union, the third largest bank in the U.S., was the most recent to announce that it will use Checkfree to offer free bill payment to its customers. Given the stock’s strong appreciation, we subsequently sold it to capture profits. We thank you for your investment and look forward to your continued confidence. Goldman Sachs Growth Equity Investment Team New York, March 18, 2005 4 |
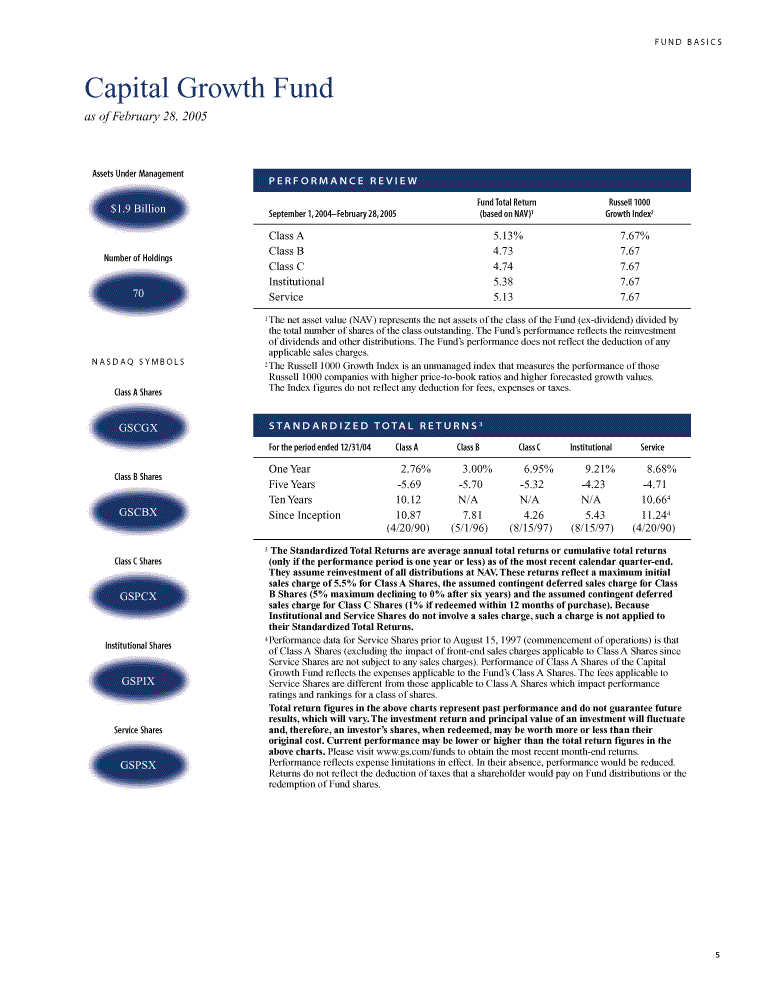
| FUND BASICS Capital Growth Fund as of February 28, 2005 Assets Under Management $1.9 Billion Number of Holdings 70 NASDAQ SYMBOLS Class A Shares GSCGX Class B Shares GSCBX Class C Shares GSPCX Institutional Shares GSPIX Service Shares GSPSX PERFORMANCE REVIEW Fund Total Return Russell 1000 September 1, 2004–February 28, 2005 (based on NAV)1 Growth Index2 Class A 5.13% 7.67% Class B 4.73 7.67 Class C 4.74 7.67 Institutional 5.38 7.67 Service 5.13 7.67 1The net asset value (NAV) represents the net assets of the class of the Fund (ex-dividend) divided by the total number of shares of the class outstanding. The Fund’s performance reflects the reinvestment of dividends and other distributions. The Fund’s performance does not reflect the deduction of any applicable sales charges. 2The Russell 1000 Growth Index is an unmanaged index that measures the performance of those Russell 1000 companies with higher price-to-book ratios and higher forecasted growth values. The Index figures do not reflect any deduction for fees, expenses or taxes. STANDARDIZED TOTAL RETURNS 3 For the period ended 12/31/04 Class A Class B Class C Institutional Service One Year 2.76% 3.00% 6.95% 9.21% 8.68% Five Years -5.69 -5.70 -5.32 -4.23 -4.71 Ten Years 10.12 N/A N/A N/A 10.664 Since Inception 10.87 7.81 4.26 5.43 11.244 (4/20/90) (5/1/96) (8/15/97) (8/15/97) (4/20/90) 3 The Standardized Total Returns are average annual total returns or cumulative total returns (only if the performance period is one year or less) as of the most recent calendar quarter-end. They assume reinvestment of all distributions at NAV. These returns reflect a maximum initial sales charge of 5.5% for Class A Shares, the assumed contingent deferred sales charge for Class B Shares (5% maximum declining to 0% after six years) and the assumed contingent deferred sales charge for Class C Shares (1% if redeemed within 12 months of purchase). Because Institutional and Service Shares do not involve a sales charge, such a charge is not applied to their Standardized Total Returns. 4Performance data for Service Shares prior to August 15, 1997 (commencement of operations) is that of Class A Shares (excluding the impact of front-end sales charges applicable to Class A Shares since Service Shares are not subject to any sales charges). Performance of Class A Shares of the Capital Growth Fund reflects the expenses applicable to the Fund’s Class A Shares. The fees applicable to Service Shares are different from those applicable to Class A Shares which impact performance ratings and rankings for a class of shares. Total return figures in the above charts represent past performance and do not guarantee future results, which will vary. The investment return and principal value of an investment will fluctuate and, therefore, an investor’s shares, when redeemed, may be worth more or less than their original cost. Current performance may be lower or higher than the total return figures in the above charts. Please visit www.gs.com/funds to obtain the most recent month-end returns. Performance reflects expense limitations in effect. In their absence, performance would be reduced. Returns do not reflect the deduction of taxes that a shareholder would pay on Fund distributions or the redemption of Fund shares. 5 |
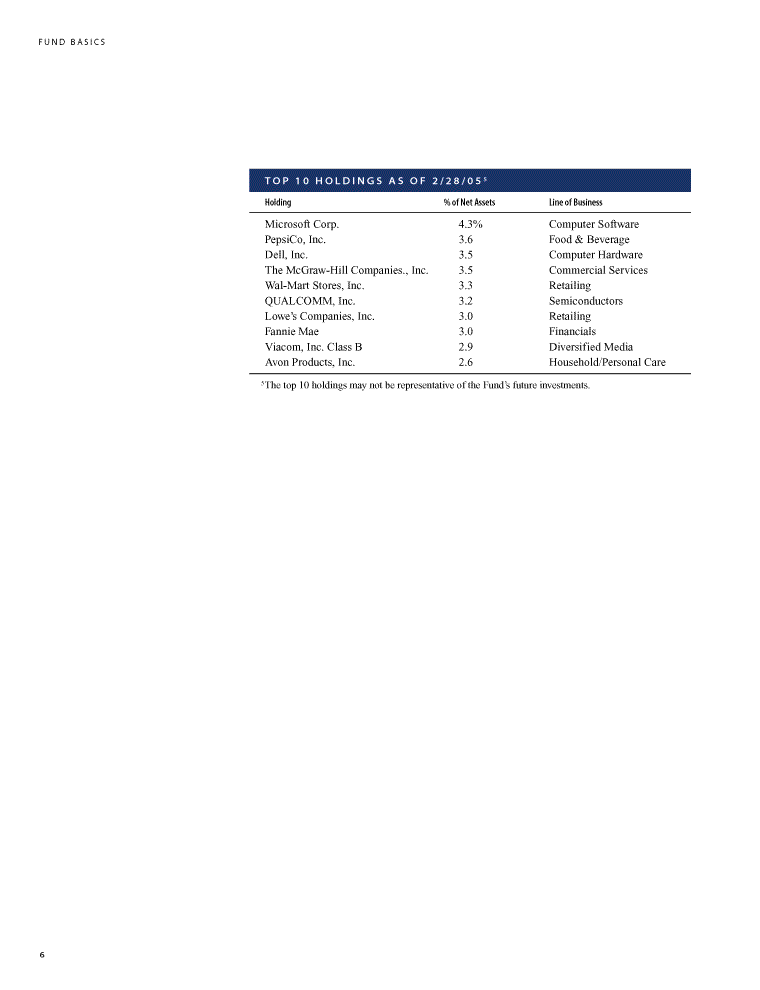
| FUND BASICS TOP 10 HOLDINGS AS OF 2 / 2 8 / 0 5 5 Holding % of Net Assets Line of Business Microsoft Corp. 4.3% Computer Software PepsiCo, Inc. 3.6 Food & Beverage Dell, Inc. 3.5 Computer Hardware The McGraw-Hill Companies., Inc. 3.5 Commercial Services Wal-Mart Stores, Inc. 3.3 Retailing QUALCOMM, Inc. 3.2 Semiconductors Lowe’s Companies, Inc. 3.0 Retailing Fannie Mae 3.0 Financials Viacom, Inc. Class B 2.9 Diversified Media Avon Products, Inc. 2.6 Household/Personal Care 5The top 10 holdings may not be representative of the Fund’s future investments. 6 |
| PORTFOLIO RESULTS Strategic Growth Fund Dear Shareholder, This report provides an overview on the performance of the Goldman Sachs Strategic Growth Fund during the six-month reporting period that ended February 28, 2005. Performance Review Over the six-month period that ended February 28, 2005, the Fund’s Class A, B, C, Institutional, and Service Shares generated cumulative total returns, without sales charges, of 4.11%, 3.74%, 3.60%, 4.32%, and 3.95%, respectively. These returns compare to the 7.67% cumulative total return of the Fund’s benchmark, the Russell 1000 Growth Index (with dividends reinvested), over the same time period. While the Fund generated positive absolute results during the period, it lagged its benchmark on a relative basis. This was largely the result of weakness in both the Finance and Media sectors. On the positive side, the Fund benefited from strength in the Consumer Discretionary and Consumer Staples sectors. The Fund’s holdings in Freddie Mac and Fannie Mae detracted from results during the period. We believe their shares have been weak due to legislation under consideration in Congress which would strengthen the powers of their regulator, the Office of Federal Housing Enterprise Oversight (OFHEO). We feel the majority of the weakness can be traced to comments made by Federal Reserve Board Chairman Greenspan, in which he said that the purpose of Freddie Mac’s and Fannie Mae’s large mortgage portfolios did not make sense and that the companies’ should shrink their portfolios over the next five to seven years. With the exception of the Bush Administration, whose current position is not known, we believe that most influential policy makers are focused on strengthening OFHEO and not impairing the companies’ business models, as Mr. Greenspan has suggested. Even if Mr. Greenspan’s ideas about decreasing Freddie Mac’s and Fannie Mae’s portfolios were passed by Congress, we believe the firms are still trading slightly below their liquidation values. Detractors from performance in the Media sector included Lamar Advertising Co. and Univision Communications, Inc. Lamar Advertising reported continued strength in revenue growth during the fourth quarter 2004. However, the company had to take a large one-time depreciation expense due to billboards destroyed during last year’s hurricanes in the Southern U.S. We believe the one-time charge does not change the fundamentals of the business which generates strong operating free cash flow. Univision’s stock fell after it indicated that fourth quarter 2004 revenues would come in below expectations due to a weak television network scatter business. The scatter market is where national advertisers make a national purchase for a short period of time to supplement their other advertising commitments on a specific network. Univision’s weakness is primarily due to several advertisers, particularly retailers, who were absent from 2004’s scatter market. The company has more exposure to the network scatter business than a traditional broadcast network because it does not sell out its entire television inventory. Univision is willing to run fewer minutes of commercials in order to maintain pricing power. Importantly, the businesses that represent 90% of Univision’s revenues remain strong. 7 |
| PORTFOLIO RESULTS These include the upfront advertising commitments on the network, its television station group, and a radio station group. Towards the end of the reporting period, its stock rallied strongly. Several holdings in the Consumer Discretionary sector, including Harrah’s Entertainment, Inc. and Lowe’s Companies, Inc., contributed to performance. Harrah’s stock benefited from a solid quarterly earnings report, released in February 2005, which was driven by broad strength across the company’s geographically diverse set of gaming properties. The company owns and operates casinos in virtually every major gaming market in the country. Harrah’s seeks to drive shareholder value through same-store growth, acquisition, and selective new-build projects, while focusing on return-on-invested-capital. Lowe’s also positively impacted performance. The company is the second largest home improvement retailer after Home Depot and has benefited from increased remodeling of an aging housing stock, as well as an increasing rate of home ownership. Within Consumer Staples, PepsiCo, Inc. and Wm. Wrigley Jr. Co. contributed positively to performance. Pepsi’s strength has been driven by its dominance in the fast-growing global snack food and non-carbonated beverage categories. Its Frito-Lay unit boasts nine of the top ten selling snack food brands in the U.S. Pepsi also benefits from owning the top sports drink (Gatorade), bottled water (Aquafina), and juice businesses (Tropicana). Pepsi’s recent success is due to a strategy that focuses on enhancing its core Frito-Lay business, focusing its soft drink efforts on markets where it has some advantages of scale, and making strategic acquisitions that leverage its distribution system. Wrigley also aided performance. The company has an extremely strong global consumer franchise and enjoys better than 50% worldwide market share of the chewing gum category. The company continues to penetrate the world’s markets. Portfolio Composition The Strategic Growth Fund invests primarily in large-cap growth stocks. More specifically, we seek businesses with dominant market share, established brand name, pricing power, recurring revenue stream, and free cash flow. Additionally, we seek companies with high returns on invested capital, predictable growth, sustainable growth, long product life cycle, enduring competitive advantage, favorable demographic trends and excellent management. The Fund is more selective and focused than many mutual funds and there are typically 50 to 70 holdings in the portfolio. 8 |
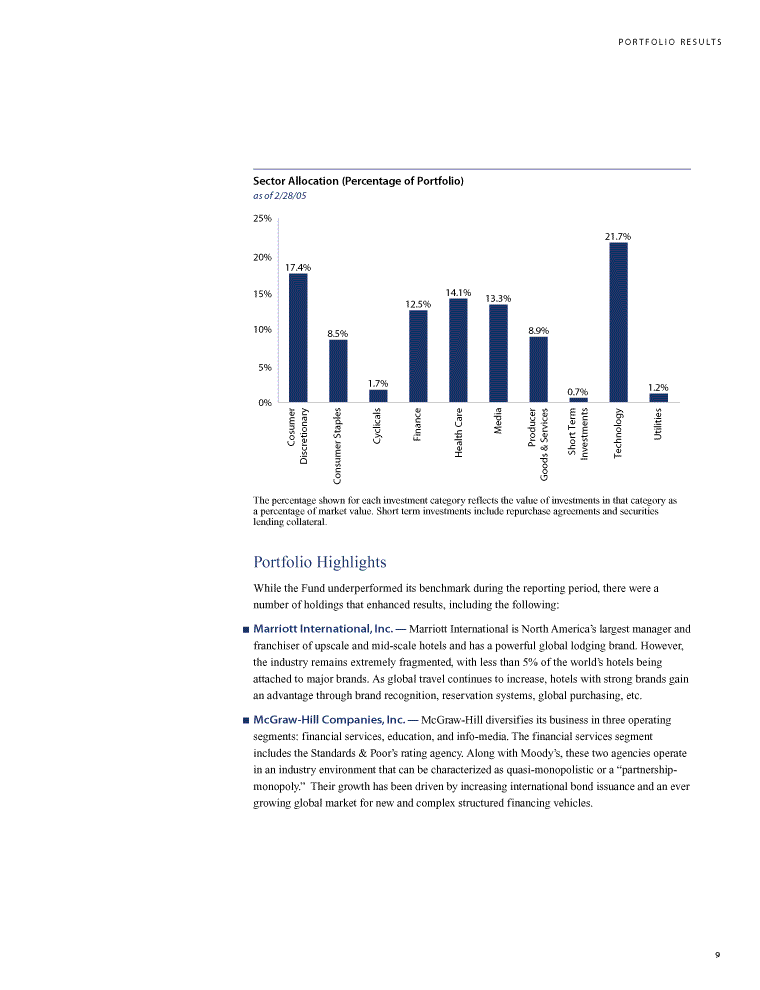
| PORTFOLIO RESULTS Sector Allocation (Percentage of Portfolio) as of 2/28/05 25% 21.7% 20% 17.4% 15% 14.1% 13.3% 12.5% 10% 8.9% 8.5% 5% 1.7% 1.2% 0.7% 0% Cosumer Staples Cyclicals Finance Media Producer Services Technology Utilities Discretionary Consumer Health Care Goods & Short Term Investments The percentage shown for each investment category reflects the value of investments in that category as a percentage of market value. Short term investments include repurchase agreements and securities lending collateral. Portfolio Highlights While the Fund underperformed its benchmark during the reporting period, there were a number of holdings that enhanced results, including the following: Marriott International, Inc. — Marriott International is North America’s largest manager and franchiser of upscale and mid-scale hotels and has a powerful global lodging brand. However, the industry remains extremely fragmented, with less than 5% of the world’s hotels being attached to major brands. As global travel continues to increase, hotels with strong brands gain an advantage through brand recognition, reservation systems, global purchasing, etc. McGraw-Hill Companies, Inc. — McGraw-Hill diversifies its business in three operating segments: financial services, education, and info-media. The financial services segment includes the Standards & Poor’s rating agency. Along with Moody’s, these two agencies operate in an industry environment that can be characterized as quasi-monopolistic or a “partnership-monopoly.” Their growth has been driven by increasing international bond issuance and an ever growing global market for new and complex structured financing vehicles. 9 |
| PORTFOLIO RESULTS Dell, Inc. — Dell posted record third quarter 2004 sales during the period and saw profits surge 25%, fueled by the double-digit growth in the corporate and government sectors, both domestically and abroad. Dell also reported that the company spent $1.3 billion to buy back 38 million shares of its own stock during the third quarter, bringing the total amount of repurchased stock to $3.3 billion for 2004. We thank you for your investment and look forward to your continued confidence. Goldman Sachs Growth Equity Investment Team New York, March 18, 2005 10 |
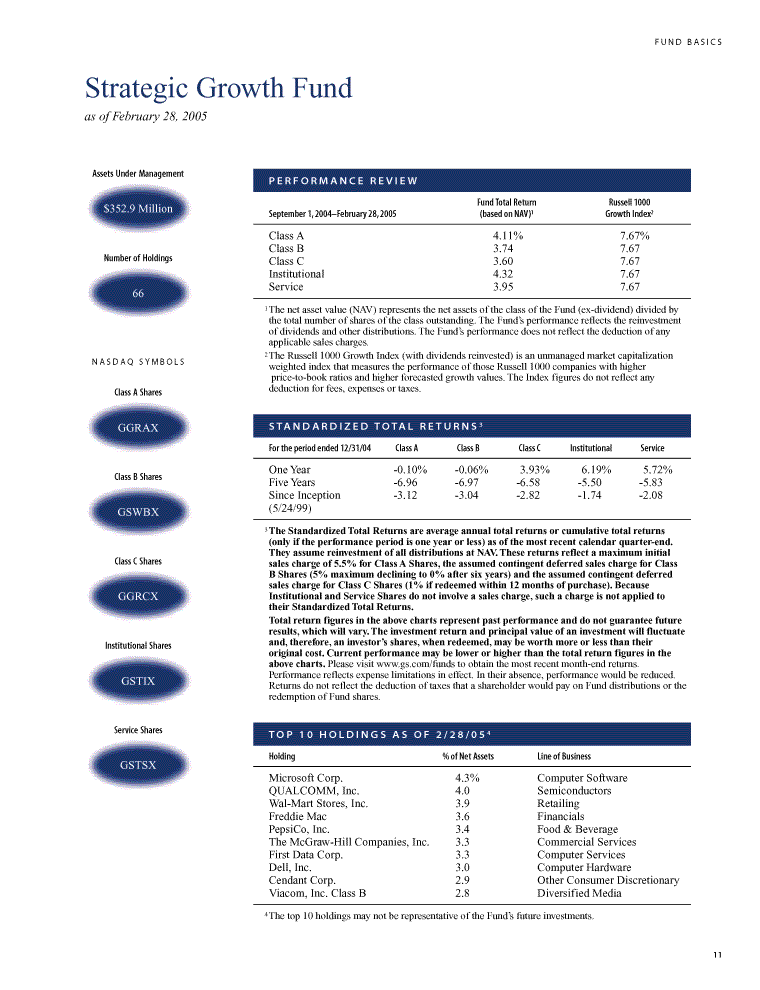
| FUND BASICS Strategic Growth Fund as of February 28, 2005 Assets Under Management $352.9 Million Number of Holdings 66 NASDAQ SYMBOLS Class A Shares GGRAX Class B Shares GSWBX Class C Shares GGRCX Institutional Shares GSTIX Service Shares GSTSX PERFORMANCE REVIEW Fund Total Return Russell 1000 September 1, 2004–February 28, 2005 (based on NAV)1 Growth Index2 Class A 4.11% 7.67% Class B 3.74 7.67 Class C 3.60 7.67 Institutional 4.32 7.67 Service 3.95 7.67 1The net asset value (NAV) represents the net assets of the class of the Fund (ex-dividend) divided by the total number of shares of the class outstanding. The Fund’s performance reflects the reinvestment of dividends and other distributions. The Fund’s performance does not reflect the deduction of any applicable sales charges. 2The Russell 1000 Growth Index (with dividends reinvested) is an unmanaged market capitalization weighted index that measures the performance of those Russell 1000 companies with higher price-to-book ratios and higher forecasted growth values. The Index figures do not reflect any deduction for fees, expenses or taxes. STANDARDIZED TOTAL RETURNS 3 For the period ended 12/31/04 Class A Class B Class C Institutional Service One Year -0.10% -0.06% 3.93% 6.19% 5.72% Five Years -6.96 -6.97 -6.58 -5.50 -5.83 Since Inception -3.12 -3.04 -2.82 -1.74 -2.08 (5/24/99) 3The Standardized Total Returns are average annual total returns or cumulative total returns (only if the performance period is one year or less) as of the most recent calendar quarter-end. They assume reinvestment of all distributions at NAV. These returns reflect a maximum initial sales charge of 5.5% for Class A Shares, the assumed contingent deferred sales charge for Class B Shares (5% maximum declining to 0% after six years) and the assumed contingent deferred sales charge for Class C Shares (1% if redeemed within 12 months of purchase). Because Institutional and Service Shares do not involve a sales charge, such a charge is not applied to their Standardized Total Returns. Total return figures in the above charts represent past performance and do not guarantee future results, which will vary. The investment return and principal value of an investment will fluctuate and, therefore, an investor’s shares, when redeemed, may be worth more or less than their original cost. Current performance may be lower or higher than the total return figures in the above charts. Please visit www.gs.com/funds to obtain the most recent month-end returns. Performance reflects expense limitations in effect. In their absence, performance would be reduced. Returns do not reflect the deduction of taxes that a shareholder would pay on Fund distributions or the redemption of Fund shares. TOP 10 HOLDINGS AS OF 2/28/05 4 Holding % of Net Assets Line of Business Microsoft Corp. 4.3% Computer Software QUALCOMM, Inc. 4.0 Semiconductors Wal-Mart Stores, Inc. 3.9 Retailing Freddie Mac 3.6 Financials PepsiCo, Inc. 3.4 Food & Beverage The McGraw-Hill Companies, Inc. 3.3 Commercial Services First Data Corp. 3.3 Computer Services Dell, Inc. 3.0 Computer Hardware Cendant Corp. 2.9 Other Consumer Discretionary Viacom, Inc. Class B 2.8 Diversified Media 4The top 10 holdings may not be representative of the Fund’s future investments. 11 |
| PORTFOLIO RESULTS Concentrated Growth Fund Dear Shareholder, This report provides an overview on the performance of the Goldman Sachs Concentrated Growth Fund during the six-month reporting period that ended February 28, 2005. Performance Review Over the six-month period that ended February 28, 2005, the Fund’s Class A, B, C, Institutional, and Service Shares generated cumulative total returns, without sales charges, of 5.14%, 4.78%, 4.79%, 5.35%, and 5.14%, respectively. These returns compare to the 7.67% cumulative total return of the Fund’s benchmark, the Russell 1000 Growth Index (with dividends reinvested), over the same time period. While the Fund generated positive absolute results during the period, it lagged its benchmark on a relative basis. This was largely the result of weakness in both the Technology and Finance sectors. On the positive side, the Fund benefited from strength in the Consumer Discretionary and Consumer Staples sectors. Within Technology, Cisco Systems, Inc. and QUALCOMM, Inc. detracted from performance. In the case of QUALCOMM, its stock performed well during most of the period, but sold off in January 2005 after the company’s second quarter guidance disappointed investors. QUALCOMM cited a smaller handset market and increased research and development expenses as chief reasons for the adjustment. We maintain high confidence in the growth of the Code Division Multiple Access (CDMA) market and believe QUALCOMM’s stock is attractively valued. The Fund’s holdings in Freddie Mac and Fannie Mae detracted from results during the month. We believe their shares have been weak due to legislation under consideration in Congress that would strengthen the powers of their regulator, the Office of Federal Housing Enterprise Oversight (OFHEO). We feel the majority of the weakness can be traced to comments made by Federal Reserve Board Chairman Greenspan, in which he said that the purpose of Freddie Mac’s and Fannie Mae’s large mortgage portfolios did not make sense and that the companies’ should shrink their portfolios over the next five to seven years. With the exception of the Bush Administration, whose current position is not known, we believe that most influential policy makers are focused on strengthening OFHEO and not impairing the companies’ business models, as Mr. Greenspan has suggested. Even if Mr. Greenspan’s ideas about decreasing Freddie Mac’s and Fannie Mae’s portfolios were passed by Congress, we believe the firms are still trading slightly below their liquidation values. Several of the Fund’s Consumer Discretionary businesses, including Harrah’s Entertainment, Inc. and Starwood Hotels & Resorts Worldwide, Inc., contributed positively to performance. Harrah’s stock benefited from a solid quarterly earnings report, released in February 2005, which was driven by broad strength across the company’s geographically diverse set of gaming properties. The company owns and operates casinos in virtually every major gaming market in the country. Harrah’s seeks to drive shareholder value through same-store growth, acquisition, and selective new-build projects, while focusing on return-on-invested-capital. Lodging company Starwood also positively impacted performance over the period. While business and 12 |
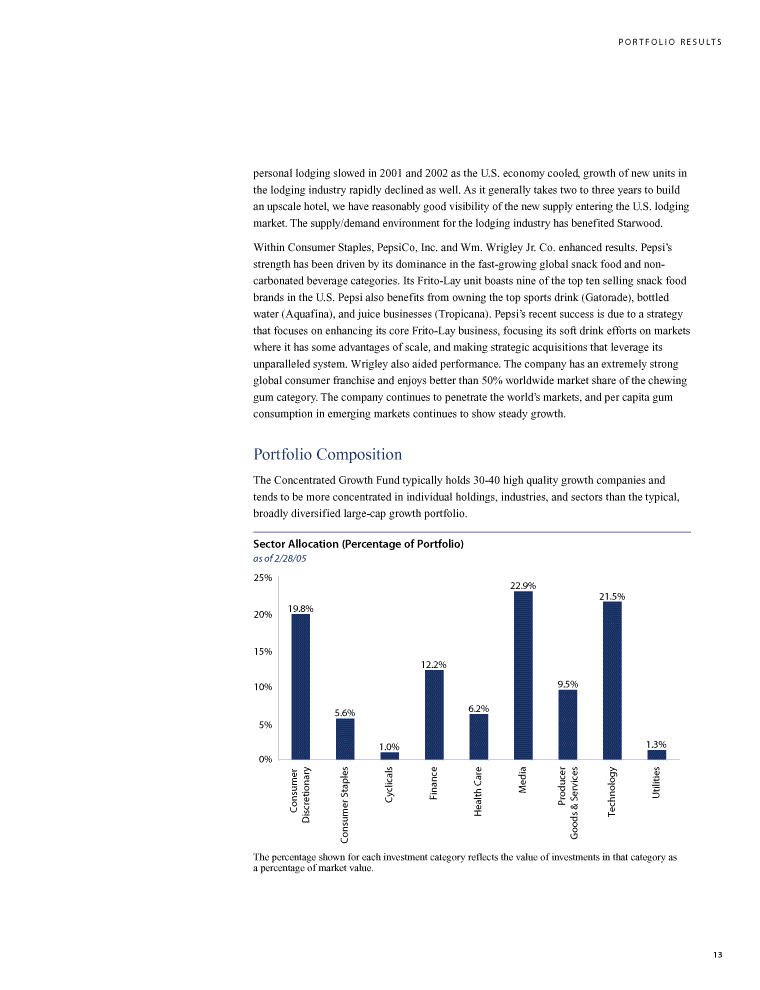
| PORTFOLIO RESULTS personal lodging slowed in 2001 and 2002 as the U.S. economy cooled, growth of new units in the lodging industry rapidly declined as well. As it generally takes two to three years to build an upscale hotel, we have reasonably good visibility of the new supply entering the U.S. lodging market. The supply/demand environment for the lodging industry has benefited Starwood. Within Consumer Staples, PepsiCo, Inc. and Wm. Wrigley Jr. Co. enhanced results. Pepsi’s strength has been driven by its dominance in the fast-growing global snack food and non-carbonated beverage categories. Its Frito-Lay unit boasts nine of the top ten selling snack food brands in the U.S. Pepsi also benefits from owning the top sports drink (Gatorade), bottled water (Aquafina), and juice businesses (Tropicana). Pepsi’s recent success is due to a strategy that focuses on enhancing its core Frito-Lay business, focusing its soft drink efforts on markets where it has some advantages of scale, and making strategic acquisitions that leverage its unparalleled system. Wrigley also aided performance. The company has an extremely strong global consumer franchise and enjoys better than 50% worldwide market share of the chewing gum category. The company continues to penetrate the world’s markets, and per capita gum consumption in emerging markets continues to show steady growth. Portfolio Composition The Concentrated Growth Fund typically holds 30-40 high quality growth companies and tends to be more concentrated in individual holdings, industries, and sectors than the typical, broadly diversified large-cap growth portfolio. Sector Allocation (Percentage of Portfolio) as of 2/28/05 25% 22.9% 21.5% 19.8% 20% 15% 12.2% 10% 9.5% 6.2% 5.6% 5% 1.0% 1.3% 0% Cyclicals Finance Producer Services Technology Utilities Consumer Staples Media Discretionary Consumer Health Care Goods & The percentage shown for each investment category reflects the value of investments in that category as a percentage of market value. 13 |
| PORTFOLIO RESULTS Portfolio Highlights While the Fund underperformed its benchmark during the reporting period, there were a number of holdings that enhanced results, including the following: Caremark Rx, Inc. — Caremark is a leading pharmacy benefit management (PBM) company. PBMs plan and administer programs for reducing drug costs, primarily by designing drug prescription plans and approved drug lists. Now that Caremark has completed its acquisition of Advanced PCS, it ranks as the largest PBM in terms of covered lives and the second largest in terms of prescriptions processed. The stock performed well over the reporting period and we feel it is well positioned in its industry. Google, Inc. — Search engine Google has one of the most recognized brands on the Internet. Additionally, Google is the dominant beneficiary of secular growth in online advertising, specifically the search market, with a commanding market share. The company generates strong free cash flow and, combined with low capital expenditures, operates with very high margins — over 50%. Lowe’s Companies, Inc. — Lowe’s is the second largest home improvement retailer after Home Depot and is the low cost operator in its industry. Its business is similar to that of Wal-Mart Stores, Inc., in that it has an extremely efficient distribution system. We thank you for your investment and look forward to your continued confidence. Goldman Sachs Growth Equity Investment Team New York, March 18, 2005 14 |

| FUND BASICS Concentrated Growth Fund as of February 28, 2005 Assets Under Management $119.7 Million Number of Holdings 39 NASDAQ SYMBOLS Class A Shares GCGAX Class B Shares GCGBX Class C Shares GCGCX Institutional Shares GCRIX Service Shares GCGSX PERFORMANCE REVIEW Fund Total Return Russell 1000 September 1, 2004–February 28, 2005 (based on NAV)1 Growth Index2 Class A 5.14% 7.67% Class B 4.78 7.67 Class C 4.79 7.67 Institutional 5.35 7.67 Service 5.14 7.67 1The net asset value (NAV) represents the net assets of the class of the Fund (ex-dividend) divided by the total number of shares of the class outstanding. The Fund’s performance reflects the reinvestment of dividends and other distributions. The Fund’s performance does not reflect the deduction of any applicable sales charges. 2The Russell 1000 Growth Index (with dividends reinvested) is an unmanaged market capitalization weighted index that measures the performance of those Russell 1000 companies with higher price-to-book ratios and higher forecasted growth values. The Index figures do not reflect any deduction for fees, expenses or taxes. STANDARDIZED TOTAL RETURNS 3 For the period ended 12/31/04 Class A Class B Class C Institutional Service One Year -2.25% -2.41% 1.65% 3.89% 3.35% Since Inception 9.32 10.03 11.10 12.44 11.99 (9/3/02) 3The Standardized Total Returns are average annual total returns or cumulative total returns (only if the performance period is one year or less) as of the most recent calendar quarter-end. They assume reinvestment of all distributions at NAV. These returns reflect a maximum initial sales charge of 5.5% for Class A Shares, the assumed contingent deferred sales charge for Class B Shares (5% maximum declining to 0% after six years) and the assumed contingent deferred sales charge for Class C Shares (1% if redeemed within 12 months of purchase). Because Institutional and Service Shares do not involve a sales charge, such a charge is not applied to their Standardized Total Returns. Total return figures in the above charts represent past performance and do not guarantee future results, which will vary. The investment return and principal value of an investment will fluctuate and, therefore, an investor’s shares, when redeemed, may be worth more or less than their original cost. Current performance may be lower or higher than the total return figures in the above charts. Please visit www.gs.com/funds to obtain the most recent month-end returns. Performance reflects expense limitations in effect. In their absence, performance would be reduced. Returns do not reflect the deduction of taxes that a shareholder would pay on Fund distributions or the redemption of Fund shares. TOP 10 HOLDINGS AS OF 2/28/05 4 Holding % of Net Assets Line of Business QUALCOMM, Inc. 5.8% Semiconductors Viacom, Inc. Class B 5.3 Diversified Media Microsoft Corp. 5.0 Computer Software Cendant Corp. 5.0 Other Consumer Discretionary Harrah’s Entertainment, Inc. 4.6 Gaming/Lodging Univision Communications, Inc. 4.3 Broadcasting & Cable/Satellite TV The McGraw-Hill Companies, Inc. 4.2 Commercial Services Freddie Mac 3.9 Financials First Data Corp. 3.8 Computer Services PepsiCo, Inc. 3.7 Food & Beverage 4The top 10 holdings may not be representative of the Fund’s future investments. 15 |
| PORTFOLIO RESULTS Growth Opportunities Fund Dear Shareholder, This report provides an overview on the performance of the Goldman Sachs Growth Opportunities Fund during the six-month reporting period that ended February 28, 2005. Performance Review Over the six-month period that ended February 28, 2005, the Fund’s Class A, B, C, Institutional and Service Shares generated cumulative total returns, without sales charges, of 14.21%, 13.79%, 13.83%, 14.44%, and 14.19%, respectively. These returns compare to the 17.94% cumulative total return of the Fund’s benchmark, the Russell Midcap Growth Index (with dividends reinvested), over the same time period. The Fund generated positive absolute returns during the reporting period, but lagged its benchmark. This was largely due to the weakness of the Fund’s holdings in the Media and Health Care sectors. Conversely, a number of the Fund’s Consumer Discretionary, Producer Goods & Services, and Technology stocks enhanced results. Detractors from performance in the Media sector included Lamar Advertising Co. and Univision Communications, Inc. Lamar Advertising reported continued strength in revenue growth during the fourth quarter 2004. However, the company had to take a large one-time depreciation expense due to billboards destroyed during last year’s hurricanes in the Southern U.S. We believe the one-time charge does not change the fundamentals of the business which generates strong operating free cash flow. Univision’s stock fell after it indicated that fourth quarter 2004 revenues would come in below expectations due to a weak television network scatter business. The scatter market is where national advertisers make a national purchase for a short period of time to supplement their other advertising commitments on a specific network. Univision’s weakness is primarily due to several advertisers, particularly retailers, who were absent from 2004’s scatter market. The company has more exposure to the network scatter business than a traditional broadcast network because it does not sell out its entire television inventory. Univision is willing to run fewer minutes of commercials in order to maintain pricing power. Importantly, the businesses that represent 90% of Univision’s revenues remain strong. These include the upfront advertising commitments on the network, its television station group, and a radio station group. Towards the end of the reporting period, its stock rallied strongly. Several of the Fund’s Health Care holdings detracted from performance over the period. Specifically, Biogen Idec, Inc., Eyetech Pharmaceuticals, Inc. and Millipore Corp. generated disappointing results. Shares of Biogen Idec declined after its multiple sclerosis drug was pulled from the market after one death and one serious infection were attributed to the drug’s use. Conversely, many of the Fund’s Technology holdings had strong performance and contributed positively to results. For example, Tessera Technologies, Inc., Marvell Technology Group Ltd. and CheckFree Corp. boosted returns. CheckFree Corp. is a leader in electronic bill pay services. The firm is positioned to benefit from the trend for banks to offer free bill payment services to its customers in order to lower account attrition and increase revenue per customer. Wachovia-First Union, the third largest bank in the U.S., was the most recent to announce that it will use CheckFree to offer free bill payment to its customers. 16 |
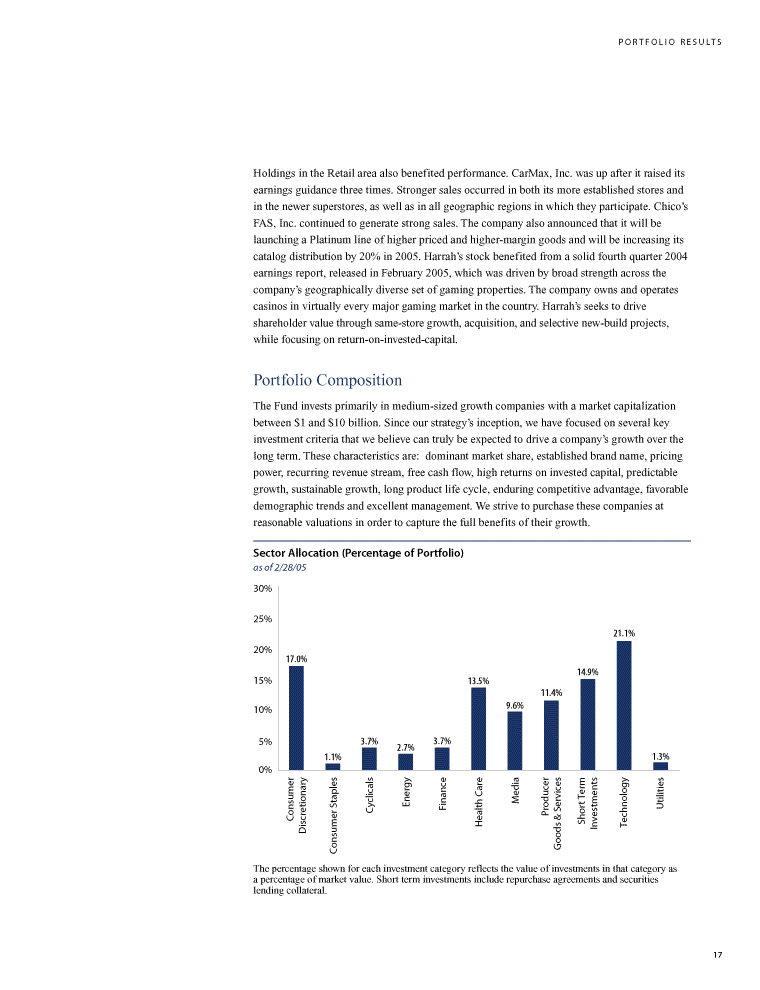
| PORTFOLIO RESULTS Holdings in the Retail area also benefited performance. CarMax, Inc. was up after it raised its earnings guidance three times. Stronger sales occurred in both its more established stores and in the newer superstores, as well as in all geographic regions in which they participate. Chico’s FAS, Inc. continued to generate strong sales. The company also announced that it will be launching a Platinum line of higher priced and higher-margin goods and will be increasing its catalog distribution by 20% in 2005. Harrah’s stock benefited from a solid fourth quarter 2004 earnings report, released in February 2005, which was driven by broad strength across the company’s geographically diverse set of gaming properties. The company owns and operates casinos in virtually every major gaming market in the country. Harrah’s seeks to drive shareholder value through same-store growth, acquisition, and selective new-build projects, while focusing on return-on-invested-capital. Portfolio Composition The Fund invests primarily in medium-sized growth companies with a market capitalization between $1 and $10 billion. Since our strategy’s inception, we have focused on several key investment criteria that we believe can truly be expected to drive a company’s growth over the long term. These characteristics are: dominant market share, established brand name, pricing power, recurring revenue stream, free cash flow, high returns on invested capital, predictable growth, sustainable growth, long product life cycle, enduring competitive advantage, favorable demographic trends and excellent management. We strive to purchase these companies at reasonable valuations in order to capture the full benefits of their growth. Sector Allocation (Percentage of Portfolio) as of 2/28/05 30% 25% 21.1% 20% 17.0% 14.9% 15% 13.5% 11.4% 9.6% 10% 5% 3.7% 3.7% 2.7% 1.1% 1.3% 0% Staples Cyclicals Energy Finance Media Producer Services Technology Utilities Consumer Discretionary Consumer Health Care Goods & Short Term Investments The percentage shown for each investment category reflects the value of investments in that category as a percentage of market value. Short term investments include repurchase agreements and securities lending collateral. 17 |

| PORTFOLIO RESULTS Portfolio Highlights While the Fund underperformed its benchmark during the reporting period, there were a number of holdings that enhanced results, including the following: Tessera Technologies, Inc. — Tessera’s stock rose to an all-time high during the period after uncertainties lifted surrounding the company’s legal claim on royalties from Samsung Electronics. We believe the ruling will help Tessera collect royalties on its chip packaging intellectual property from Samsung and any other future distributor. This favorable outcome helped drive the stock during the period. Chico’s FAS, Inc. — Chico’s continues to execute its business plan well and generate strong sales. The company announced that it will be launching a Platinum line of higher priced and higher margin goods and will be increasing its catalog distribution by 20% in 2005. Caremark Rx, Inc. — Caremark is a leading pharmacy benefit management (PBM) company. PBMs plan and administer programs for reducing drug costs, primarily by designing drug prescription plans and approved drug lists. Now that Caremark has completed its acquisition of Advanced PCS, it ranks as the largest PBM in terms of covered lives and the second largest in terms of prescriptions processed. The stock performed well over the reporting period and we feel it is well positioned in its industry. We thank you for your investment and look forward to your continued confidence. Goldman Sachs Growth Equity Investment Team New York, March 18, 2005 18 |
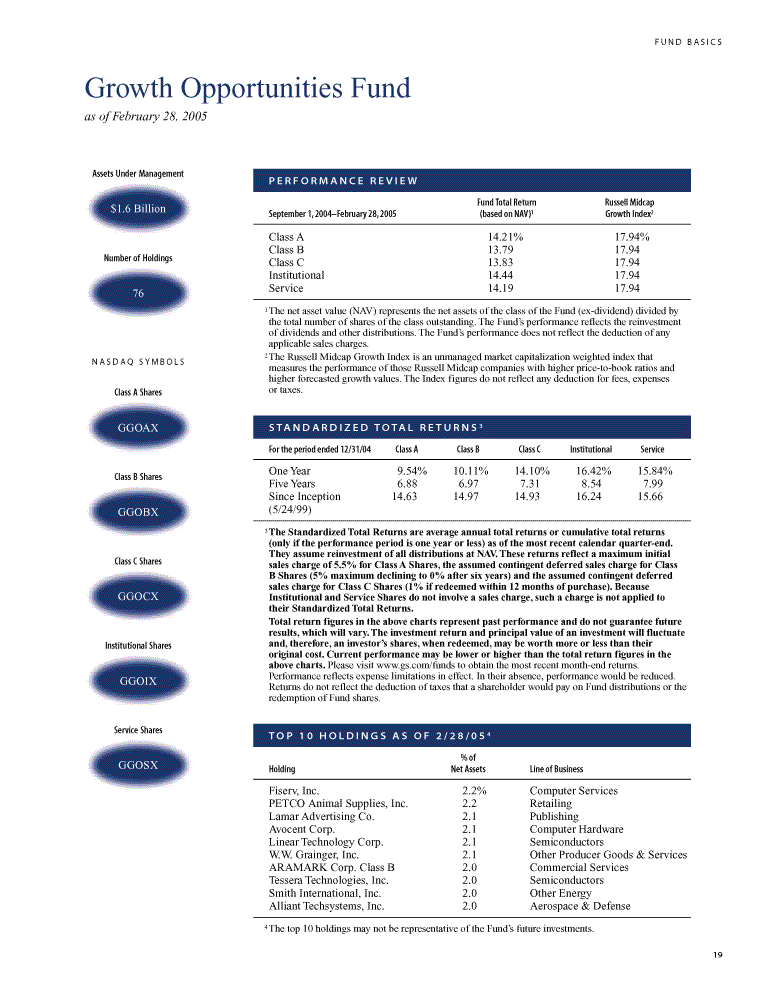
| FUND BASICS Growth Opportunities Fund as of February 28, 2005 Assets Under Management $1.6 Billion Number of Holdings 76 NASDAQ SYMBOLS Class A Shares GGOAX Class B Shares GGOBX Class C Shares GGOCX Institutional Shares GGOIX Service Shares GGOSX PERFORMANCE REVIEW Fund Total Return Russell Midcap September 1, 2004–February 28, 2005 (based on NAV)1 Growth Index2 Class A 14.21% 17.94% Class B 13.79 17.94 Class C 13.83 17.94 Institutional 14.44 17.94 Service 14.19 17.94 1The net asset value (NAV) represents the net assets of the class of the Fund (ex-dividend) divided by the total number of shares of the class outstanding. The Fund’s performance reflects the reinvestment of dividends and other distributions. The Fund’s performance does not reflect the deduction of any applicable sales charges. 2The Russell Midcap Growth Index is an unmanaged market capitalization weighted index that measures the performance of those Russell Midcap companies with higher price-to-book ratios and higher forecasted growth values. The Index figures do not reflect any deduction for fees, expenses or taxes. STANDARDIZED TOTAL RETURNS 3 For the period ended 12/31/04 Class A Class B Class C Institutional Service One Year 9.54% 10.11% 14.10% 16.42% 15.84% Five Years 6.88 6.97 7.31 8.54 7.99 Since Inception 14.63 14.97 14.93 16.24 15.66 (5/24/99) 3The Standardized Total Returns are average annual total returns or cumulative total returns (only if the performance period is one year or less) as of the most recent calendar quarter-end. They assume reinvestment of all distributions at NAV. These returns reflect a maximum initial sales charge of 5.5% for Class A Shares, the assumed contingent deferred sales charge for Class B Shares (5% maximum declining to 0% after six years) and the assumed contingent deferred sales charge for Class C Shares (1% if redeemed within 12 months of purchase). Because Institutional and Service Shares do not involve a sales charge, such a charge is not applied to their Standardized Total Returns. Total return figures in the above charts represent past performance and do not guarantee future results, which will vary. The investment return and principal value of an investment will fluctuate and, therefore, an investor’s shares, when redeemed, may be worth more or less than their original cost. Current performance may be lower or higher than the total return figures in the above charts. Please visit www.gs.com/funds to obtain the most recent month-end returns. Performance reflects expense limitations in effect. In their absence, performance would be reduced. Returns do not reflect the deduction of taxes that a shareholder would pay on Fund distributions or the redemption of Fund shares. TOP 10 HOLDINGS AS OF 2/28/054 % of Holding Net Assets Line of Business Fiserv, Inc. 2.2% Computer Services PETCO Animal Supplies, Inc. 2.2 Retailing Lamar Advertising Co. 2.1 Publishing Avocent Corp. 2.1 Computer Hardware Linear Technology Corp. 2.1 Semiconductors W.W. Grainger, Inc. 2.1 Other Producer Goods & Services ARAMARK Corp. Class B 2.0 Commercial Services Tessera Technologies, Inc. 2.0 Semiconductors Smith International, Inc. 2.0 Other Energy Alliant Techsystems, Inc. 2.0 Aerospace & Defense 4The top 10 holdings may not be representative of the Fund’s future investments. 19 |
Statement of Investments
| Shares | Description | Value | ||||||||
Common Stocks – 100.9% | ||||||||||
| Banks – 1.4% | ||||||||||
| 160,600 | Citigroup, Inc. | $ | 7,663,832 | |||||||
| 523,424 | J.P. Morgan Chase & Co. | 19,131,147 | ||||||||
| 26,794,979 | ||||||||||
| Biotechnology – 2.5% | ||||||||||
| 780,700 | Amgen, Inc.* | 48,098,927 | ||||||||
| Broadcasting & Cable/ Satellite TV – 2.2% | ||||||||||
| 382,452 | Clear Channel Communications, Inc.(a) | 12,728,002 | ||||||||
| 775,300 | Univision Communications, Inc.* | 20,460,167 | ||||||||
| 419,070 | Westwood One, Inc.* | 9,152,489 | ||||||||
| 42,340,658 | ||||||||||
| Commercial Services – 4.9% | ||||||||||
| 317,900 | Moody’s Corp. | 26,674,989 | ||||||||
| 723,599 | The McGraw-Hill Companies, Inc. | 66,462,568 | ||||||||
| 93,137,557 | ||||||||||
| Computer Hardware – 3.5% | ||||||||||
| 1,659,490 | Dell, Inc.* | 66,528,954 | ||||||||
| Computer Services – 2.0% | ||||||||||
| 943,020 | First Data Corp. | 38,682,680 | ||||||||
| Computer Software – 5.4% | ||||||||||
| 322,100 | Electronic Arts, Inc.* | 20,772,229 | ||||||||
| 3,212,200 | Microsoft Corp. | 80,883,196 | ||||||||
| 101,655,425 | ||||||||||
| Diversified Media – 6.8% | ||||||||||
| 1,050,100 | Liberty Media Corp.* | 10,648,014 | ||||||||
| 436,450 | The E.W. Scripps Co. | 20,146,532 | ||||||||
| 2,595,940 | Time Warner, Inc.* | 44,728,046 | ||||||||
| 1,562,330 | Viacom, Inc. Class B | 54,525,317 | ||||||||
| 130,047,909 | ||||||||||
| Drugs & Medicine – 5.8% | ||||||||||
| 289,600 | Eli Lilly & Co. | 16,217,600 | ||||||||
| 1,888,710 | Pfizer, Inc. | 49,654,186 | ||||||||
| 514,000 | Schering-Plough Corp. | 9,740,300 | ||||||||
| 833,700 | Wyeth | 34,031,634 | ||||||||
| 109,643,720 | ||||||||||
| Electrical Equipment – 2.3% | ||||||||||
| 215,900 | General Electric Co. | 7,599,680 | ||||||||
| 1,090,200 | Tyco International Ltd.(a) | 36,499,896 | ||||||||
| 44,099,576 | ||||||||||
| Financials – 11.2% | ||||||||||
| 977,400 | Fannie Mae | 57,138,804 | ||||||||
| 777,200 | Freddie Mac | 48,186,400 | ||||||||
| 185,800 | Golden West Financial Corp. | 11,499,162 | ||||||||
| 1,834,216 | MBNA Corp. | 46,534,060 | ||||||||
| 255,400 | Merrill Lynch & Co., Inc. | 14,961,332 | ||||||||
| 278,600 | Morgan Stanley | 15,732,542 | ||||||||
| 1,708,100 | The Charles Schwab Corp. | 17,935,050 | ||||||||
| 211,987,350 | ||||||||||
| Food & Beverage – 5.8% | ||||||||||
| 1,259,250 | PepsiCo, Inc. | 67,823,205 | ||||||||
| 313,900 | The Coca-Cola Co. | 13,434,920 | ||||||||
| 442,260 | Wm. Wrigley Jr. Co. | 29,436,826 | ||||||||
| 110,694,951 | ||||||||||
| Gaming/ Lodging – 5.6% | ||||||||||
| 172,800 | Carnival Corp.(a) | 9,396,864 | ||||||||
| 701,000 | GTECH Holdings Corp. | 16,368,350 | ||||||||
| 463,410 | Harrah’s Entertainment, Inc.(a) | 30,395,062 | ||||||||
| 75,400 | Las Vegas Sands Corp.* | 3,611,660 | ||||||||
| 399,540 | Marriott International, Inc. | 25,610,514 | ||||||||
| 351,680 | Starwood Hotels & Resorts Worldwide, Inc. Class B | 20,130,163 | ||||||||
| 105,512,613 | ||||||||||
| Household/ Personal Care – 5.1% | ||||||||||
| 1,167,900 | Avon Products, Inc. | 49,951,083 | ||||||||
| 172,560 | Colgate-Palmolive Co. | 9,131,875 | ||||||||
| 726,460 | The Procter & Gamble Co. | 38,567,762 | ||||||||
| 97,650,720 | ||||||||||
| Insurance – 0.7% | ||||||||||
| 359,219 | Willis Group Holdings Ltd. | 14,207,111 | ||||||||
| Internet & Online – 3.2% | ||||||||||
| 475,800 | eBay, Inc.* | 20,383,272 | ||||||||
| 150,108 | Google, Inc.*(a) | 28,218,803 | ||||||||
| 367,000 | Yahoo!, Inc.* | 11,843,090 | ||||||||
| 60,445,165 | ||||||||||
| Manufacturing – 0.8% | ||||||||||
| 170,800 | 3M Co. | 14,336,952 | ||||||||
| Medical Products – 2.0% | ||||||||||
| 589,700 | Medtronic, Inc. | 30,735,164 | ||||||||
| 198,550 | St. Jude Medical, Inc.* | 7,763,305 | ||||||||
| 38,498,469 | ||||||||||
| Networking Telecom Equipment – 2.6% | ||||||||||
| 2,814,980 | Cisco Systems, Inc.* | 49,036,952 | ||||||||
| Oil & Gas – 0.8% | ||||||||||
| 231,212 | Exxon Mobil Corp. | 14,638,032 | ||||||||
| Other Consumer Discretionary – 1.9% | ||||||||||
| 1,666,500 | Cendant Corp. | 36,862,980 | ||||||||
| Other Health Care – 2.8% | ||||||||||
| 862,273 | Caremark Rx, Inc.* | 33,007,810 | ||||||||
| 437,600 | Medco Health Solutions, Inc.*(a) | 19,438,192 | ||||||||
| 52,446,002 | ||||||||||
| Publishing – 3.1% | ||||||||||
| 255,800 | Gannett Co., Inc. | 20,144,250 | ||||||||
| 750,600 | Lamar Advertising Co.* | 29,491,074 | ||||||||
| 244,700 | Valassis Communications, Inc.* | 9,154,227 | ||||||||
| 58,789,551 | ||||||||||
20
| Shares | Description | Value | ||||||||
Common Stocks – (continued) | ||||||||||
| Retailing – 9.8% | ||||||||||
| 393,000 | Dollar Tree Stores, Inc.*(a) | $ | 10,591,350 | |||||||
| 862,800 | Family Dollar Stores, Inc.(a) | 28,403,376 | ||||||||
| 975,900 | Lowe’s Companies, Inc. | 57,363,402 | ||||||||
| 530,585 | PETCO Animal Supplies, Inc.* | 18,803,932 | ||||||||
| 157,100 | Target Corp. | 7,983,822 | ||||||||
| 1,216,800 | Wal-Mart Stores, Inc.(a) | 62,799,048 | ||||||||
| 185,944,930 | ||||||||||
| Semiconductors – 6.4% | ||||||||||
| 579,160 | Intel Corp. | 13,888,257 | ||||||||
| 1,194,900 | Linear Technology Corp. | 46,672,794 | ||||||||
| 1,661,752 | QUALCOMM, Inc. | 60,005,865 | ||||||||
| 120,566,916 | ||||||||||
| Telecommunications – 2.3% | ||||||||||
| 819,900 | American Tower Corp.*(a) | 15,028,767 | ||||||||
| 871,405 | Crown Castle International Corp.* | 14,238,758 | ||||||||
| 237,200 | Nextel Communications, Inc.* | 6,980,796 | ||||||||
| 283,500 | Sprint Corp.(a) | 6,713,280 | ||||||||
| 42,961,601 | ||||||||||
| TOTAL COMMON STOCKS | ||||||||||
| (Cost $1,547,165,400) | $ | 1,915,610,680 | ||||||||
| Principal | Interest | Maturity | ||||||||||||||
| Amount | Rate | Date | Value | |||||||||||||
Repurchase Agreement(b) – 0.6% | ||||||||||||||||
| Joint Repurchase Agreement Account II | ||||||||||||||||
| $ | 11,000,000 | 2.64 | % | 03/01/2005 | $ | 11,000,000 | ||||||||||
| Maturity Value: $11,000,808 | ||||||||||||||||
| (Cost $11,000,000) | ||||||||||||||||
| TOTAL INVESTMENTS BEFORE SECURITIES LENDING COLLATERAL | ||||||||||||||||
| (Cost $1,558,165,400) | $ | 1,926,610,680 | ||||||||||||||
| Shares | ||||||||||||||||
| Description | Value | |||||||||||||||
Securities Lending Collateral – 5.2% | ||||||||||||||||
| 98,518,300 | Boston Global Investment Trust – | |||||||||||||||
| Enhanced Portfolio | $ | 98,518,300 | ||||||||||||||
| (Cost $98,518,300) | ||||||||||||||||
| TOTAL INVESTMENTS – 106.7% | ||||||||||||||||
| (Cost $1,656,683,700) | $ | 2,025,128,980 | ||||||||||||||
| The percentage shown for each investment category reflects the value of investments in that category as a percentage of net assets. |
| * | Non-income producing security. | |
| (a) | All or a portion of security is on loan. | |
| (b) | Joint repurchase agreement was entered into on February 28, 2005. |
21
| ADDITIONAL INVESTMENT INFORMATION |
JOINT REPURCHASE AGREEMENT ACCOUNT II — At February 28, 2005, the Capital Growth Fund had an undivided interest in the following Joint Repurchase Agreement Account II which equaled $11,000,000 in principal amount.
| Principal | Interest | Maturity | Maturity | |||||||||||
| Repurchase Agreements | Amount | Rate | Date | Value | ||||||||||
| Banc of America Securities LLC | $ | 1,900,000,000 | 2.64 | % | 03/01/2005 | $ | 1,900,139,333 | |||||||
| Barclays Capital PLC | 2,500,000,000 | 2.65 | 03/01/2005 | 2,500,184,028 | ||||||||||
| Greenwich Capital Markets | 400,000,000 | 2.65 | 03/01/2005 | 400,029,444 | ||||||||||
| J.P. Morgan Securities, Inc. | 697,000,000 | 2.65 | 03/01/2005 | 697,051,307 | ||||||||||
| Morgan Stanley & Co. | 1,500,000,000 | 2.64 | 03/01/2005 | 1,500,110,000 | ||||||||||
| UBS Securities LLC | 800,000,000 | 2.64 | 03/01/2005 | 800,058,667 | ||||||||||
| Westdeutsche Landesbank AG | 500,000,000 | 2.64 | 03/01/2005 | 500,036,667 | ||||||||||
TOTAL | $ | 8,297,000,000 | $ | 8,297,609,446 | ||||||||||
| At February 28, 2005, the Joint Repurchase Agreement Account II was fully collateralized by Federal Farm Credit Bank, 0.00% to 2.38%, due 03/01/2005 to 10/02/2006; Federal Home Loan Bank, 0.00% to 7.63%, due 02/15/2006 to 11/14/2014; Federal Home Loan Mortgage Association, 0.00% to 12.00%, due 04/04/2005 to 03/01/2035; Federal National Mortgage Association, 0.00% to 9.50%, due 03/22/2005 to 03/01/2035 and Government National Mortgage Association, 4.50% to 5.50%, due 09/15/2019 to 11/15/2033. |
22
Statement of Investments
| Shares | Description | Value | ||||||||
Common Stocks – 99.4% | ||||||||||
| Banks – 0.7% | ||||||||||
| 13,600 | Citigroup, Inc. | $ | 648,992 | |||||||
| 49,010 | J.P. Morgan Chase & Co. | 1,791,316 | ||||||||
| 2,440,308 | ||||||||||
| Biotechnology – 2.1% | ||||||||||
| 121,550 | Amgen, Inc.* | 7,488,695 | ||||||||
| Broadcasting & Cable/ Satellite TV – 5.9% | ||||||||||
| 217,610 | Clear Channel Communications, Inc. | 7,242,061 | ||||||||
| 20,200 | Comcast Corp.* | 657,510 | ||||||||
| 100,400 | Comcast Corp. Special Class A* | 3,198,744 | ||||||||
| 78,500 | EchoStar Communications Corp.* | 2,335,375 | ||||||||
| 276,297 | Univision Communications, Inc.* | 7,291,478 | ||||||||
| 20,725,168 | ||||||||||
| Commercial Services – 4.7% | ||||||||||
| 59,800 | Moody’s Corp. | 5,017,818 | ||||||||
| 127,600 | The McGraw-Hill Companies, Inc. | 11,720,060 | ||||||||
| 16,737,878 | ||||||||||
| Computer Hardware – 3.7% | ||||||||||
| 268,200 | Dell, Inc.* | 10,752,138 | ||||||||
| 172,200 | EMC Corp.* | 2,180,052 | ||||||||
| 12,932,190 | ||||||||||
| Computer Services – 3.9% | ||||||||||
| 282,840 | First Data Corp. | 11,602,097 | ||||||||
| 108,540 | Sabre Holdings Corp. | 2,288,023 | ||||||||
| 13,890,120 | ||||||||||
| Computer Software – 4.8% | ||||||||||
| 31,650 | Electronic Arts, Inc.* | 2,041,109 | ||||||||
| 596,030 | Microsoft Corp. | 15,008,035 | ||||||||
| 17,049,144 | ||||||||||
| Diversified Media – 5.2% | ||||||||||
| 232,700 | Liberty Media Corp.* | 2,359,578 | ||||||||
| 368,500 | Time Warner, Inc.* | 6,349,255 | ||||||||
| 279,834 | Viacom, Inc. Class B | 9,766,207 | ||||||||
| 18,475,040 | ||||||||||
| Drugs & Medicine – 6.0% | ||||||||||
| 64,770 | Eli Lilly & Co. | 3,627,120 | ||||||||
| 13,400 | Johnson & Johnson | 879,040 | ||||||||
| 340,750 | Pfizer, Inc. | 8,958,317 | ||||||||
| 191,180 | Wyeth | 7,803,968 | ||||||||
| 21,268,445 | ||||||||||
| Electrical Equipment – 1.5% | ||||||||||
| 155,050 | Tyco International Ltd. | 5,191,074 | ||||||||
| Financials – 11.0% | ||||||||||
| 166,020 | Fannie Mae | 9,705,529 | ||||||||
| 206,910 | Freddie Mac | 12,828,420 | ||||||||
| 35,400 | Golden West Financial Corp. | 2,190,906 | ||||||||
| 256,550 | MBNA Corp. | 6,508,674 | ||||||||
| 719,010 | The Charles Schwab Corp. | 7,549,605 | ||||||||
| 38,783,134 | ||||||||||
| Food & Beverage – 5.3% | ||||||||||
| 220,000 | PepsiCo, Inc. | 11,849,200 | ||||||||
| 13,300 | The Coca-Cola Co. | 569,240 | ||||||||
| 96,400 | Wm. Wrigley Jr. Co. | 6,416,384 | ||||||||
| 18,834,824 | ||||||||||
| Gaming/ Lodging – 5.5% | ||||||||||
| 51,100 | Carnival Corp. | 2,778,818 | ||||||||
| 102,860 | Harrah’s Entertainment, Inc. | 6,746,587 | ||||||||
| 106,100 | Marriott International, Inc. | 6,801,010 | ||||||||
| 51,900 | Starwood Hotels & Resorts Worldwide, Inc. Class B | 2,970,756 | ||||||||
| 19,297,171 | ||||||||||
| Household/ Personal Care – 3.2% | ||||||||||
| 159,300 | Avon Products, Inc. | 6,813,261 | ||||||||
| 21,000 | The Gillette Co. | 1,055,250 | ||||||||
| 64,600 | The Procter & Gamble Co. | 3,429,614 | ||||||||
| 11,298,125 | ||||||||||
| Insurance – 0.9% | ||||||||||
| 8,600 | American International Group, Inc. | 574,480 | ||||||||
| 62,450 | Willis Group Holdings Ltd. | 2,469,898 | ||||||||
| 3,044,378 | ||||||||||
| Internet & Online – 4.0% | ||||||||||
| 111,400 | eBay, Inc.* | 4,772,376 | ||||||||
| 21,500 | Google, Inc.*(a) | 4,041,785 | ||||||||
| 168,800 | Yahoo!, Inc.* | 5,447,176 | ||||||||
| 14,261,337 | ||||||||||
| Manufacturing – 0.2% | ||||||||||
| 7,800 | 3M Co. | 654,732 | ||||||||
| Medical Products – 2.7% | ||||||||||
| 114,100 | Medtronic, Inc. | 5,946,892 | ||||||||
| 35,690 | Stryker Corp. | 1,772,365 | ||||||||
| 21,450 | Zimmer Holdings, Inc.* | 1,842,555 | ||||||||
| 9,561,812 | ||||||||||
| Networking Telecom Equipment – 2.5% | ||||||||||
| 507,600 | Cisco Systems, Inc.* | 8,842,392 | ||||||||
| Other Consumer Discretionary – 3.1% | ||||||||||
| 460,600 | Cendant Corp. | 10,188,472 | ||||||||
| 7,200 | Harman International Industries, Inc. | 807,624 | ||||||||
| 10,996,096 | ||||||||||
| Other Health Care – 3.3% | ||||||||||
| 195,100 | Caremark Rx, Inc.* | 7,468,428 | ||||||||
| 91,470 | Medco Health Solutions, Inc.* | 4,063,097 | ||||||||
| 11,531,525 | ||||||||||
23
| Shares | Description | Value | ||||||||
Common Stocks – (continued) | ||||||||||
| Other Producer Goods & Services – 0.2% | ||||||||||
| 10,100 | W.W. Grainger, Inc. | $ | 634,078 | |||||||
| Publishing – 2.2% | ||||||||||
| 23,900 | Gannett Co., Inc. | 1,882,125 | ||||||||
| 74,200 | Lamar Advertising Co.* | 2,915,318 | ||||||||
| 81,800 | Valassis Communications, Inc.* | 3,060,138 | ||||||||
| 7,857,581 | ||||||||||
| Retailing – 8.9% | ||||||||||
| 134,190 | Family Dollar Stores, Inc. | 4,417,535 | ||||||||
| 161,860 | Lowe’s Companies, Inc. | 9,514,131 | ||||||||
| 71,580 | Target Corp. | 3,637,695 | ||||||||
| 265,380 | Wal-Mart Stores, Inc. | 13,696,262 | ||||||||
| 31,265,623 | ||||||||||
| Semiconductors – 6.7% | ||||||||||
| 148,600 | Intel Corp. | 3,563,428 | ||||||||
| 152,800 | Linear Technology Corp. | 5,968,368 | ||||||||
| 389,630 | QUALCOMM, Inc. | 14,069,539 | ||||||||
| 23,601,335 | ||||||||||
| Telecommunications – 1.2% | ||||||||||
| 254,900 | Crown Castle International Corp.* | 4,165,066 | ||||||||
| TOTAL COMMON STOCKS | ||||||||||
| (Cost $323,350,834) | $ | 350,827,271 | ||||||||
| Principal | Interest | Maturity | ||||||||||||||
| Amount | Rate | Date | Value | |||||||||||||
Repurchase Agreement(b) – 0.1% | ||||||||||||||||
| Joint Repurchase Agreement Account II | ||||||||||||||||
| $ | 400,000 | 2.64 | % | 03/01/2005 | $ | 400,000 | ||||||||||
| Maturity Value: $400,029 | ||||||||||||||||
| (Cost $400,000) | ||||||||||||||||
| TOTAL INVESTMENTS BEFORE SECURITIES LENDING COLLATERAL | ||||||||||||||||
| (Cost $323,750,834) | $ | 351,227,271 | ||||||||||||||
| Shares | Description | Value | ||||||||
Securities Lending Collateral – 0.6% | ||||||||||
| 2,087,250 | Boston Global Investment Trust – Enhanced Portfolio | $ | 2,087,250 | |||||||
| (Cost $2,087,250) | ||||||||||
| TOTAL INVESTMENTS – 100.1% | ||||||||||
| (Cost $325,838,084) | $ | 353,314,521 | ||||||||
| The percentage shown for each investment category reflects the value of investments in that category as a percentage of net assets. |
| * | Non-income producing security. | |
| (a) | All or portion of security is on loan. | |
| (b) | Joint repurchase agreement was entered into on February 28, 2005. |
24
| ADDITIONAL INVESTMENT INFORMATION |
JOINT REPURCHASE AGREEMENT ACCOUNT II — At February 28, 2005, the Strategic Growth Fund had an undivided interest in the following Joint Repurchase Agreement Account II which equaled $400,000 in principal amount.
| Principal | Interest | Maturity | Maturity | |||||||||||
| Repurchase Agreements | Amount | Rate | Date | Value | ||||||||||
| Banc of America Securities LLC | $ | 1,900,000,000 | 2.64 | % | 03/01/2005 | $ | 1,900,139,333 | |||||||
| Barclays Capital PLC | 2,500,000,000 | 2.65 | 03/01/2005 | 2,500,184,028 | ||||||||||
| Greenwich Capital Markets | 400,000,000 | 2.65 | 03/01/2005 | 400,029,444 | ||||||||||
| J.P. Morgan Securities, Inc. | 697,000,000 | 2.65 | 03/01/2005 | 697,051,307 | ||||||||||
| Morgan Stanley & Co. | 1,500,000,000 | 2.64 | 03/01/2005 | 1,500,110,000 | ||||||||||
| UBS Securities LLC | 800,000,000 | 2.64 | 03/01/2005 | 800,058,667 | ||||||||||
| Westdeutsche Landesbank AG | 500,000,000 | 2.64 | 03/01/2005 | 500,036,667 | ||||||||||
TOTAL | $ | 8,297,000,000 | $ | 8,297,609,446 | ||||||||||
| At February 28, 2005, the Joint Repurchase Agreement Account II was fully collateralized by Federal Farm Credit Bank, 0.00% to 2.38%, due 03/01/2005 to 10/02/2006; Federal Home Loan Bank, 0.00% to 7.63%, due 02/15/2006 to 11/14/2014; Federal Home Loan Mortgage Association, 0.00% to 12.00%, due 04/04/2005 to 03/01/2035; Federal National Mortgage Association, 0.00% to 9.50%, due 03/22/2005 to 03/01/2035 and Government National Mortgage Association, 4.50% to 5.50%, due 09/15/2019 to 11/15/2033. |
25
Statement of Investments
| Shares | Description | Value | ||||||||
Common Stocks – 98.6% | ||||||||||
| Broadcasting & Cable/ Satellite TV – 14.2% | ||||||||||
| 99,290 | Cablevision Systems New York Group* | $ | 3,083,947 | |||||||
| 109,370 | Clear Channel Communications, Inc. | 3,639,834 | ||||||||
| 55,350 | Comcast Corp. Special Class A* | 1,763,451 | ||||||||
| 61,490 | EchoStar Communications Corp. | 1,829,327 | ||||||||
| 33,340 | Entravision Communications Corp.* | 273,388 | ||||||||
| 193,790 | Univision Communications, Inc.* | 5,114,118 | ||||||||
| 59,390 | Westwood One, Inc.* | 1,297,078 | ||||||||
| 17,001,143 | ||||||||||
| Commercial Services – 5.6% | ||||||||||
| 20,330 | Moody’s Corp. | 1,705,890 | ||||||||
| 54,150 | The McGraw-Hill Companies, Inc. | 4,973,678 | ||||||||
| 6,679,568 | ||||||||||
| Computer Hardware – 2.8% | ||||||||||
| 82,080 | Dell, Inc.* | 3,290,587 | ||||||||
| Computer Services – 3.8% | ||||||||||
| 110,620 | First Data Corp. | 4,537,632 | ||||||||
| Computer Software – 5.0% | ||||||||||
| 236,560 | Microsoft Corp. | 5,956,581 | ||||||||
| Diversified Media – 8.4% | ||||||||||
| 26,160 | The E.W. Scripps Co. | 1,207,545 | ||||||||
| 145,190 | Time Warner, Inc.* | 2,501,624 | ||||||||
| 180,940 | Viacom, Inc. Class B | 6,314,806 | ||||||||
| 10,023,975 | ||||||||||
| Drugs & Medicine – 1.5% | ||||||||||
| 67,890 | Pfizer, Inc. | 1,784,828 | ||||||||
| Electrical Equipment – 1.0% | ||||||||||
| 35,390 | Tyco International Ltd. | 1,184,857 | ||||||||
| Financials – 12.0% | ||||||||||
| 60,300 | Fannie Mae | 3,525,138 | ||||||||
| 75,620 | Freddie Mac | 4,688,440 | ||||||||
| 116,130 | MBNA Corp. | 2,946,218 | ||||||||
| 309,770 | The Charles Schwab Corp. | 3,252,585 | ||||||||
| 14,412,381 | ||||||||||
| Food & Beverage – 5.6% | ||||||||||
| 82,410 | PepsiCo, Inc. | 4,438,603 | ||||||||
| �� | 33,290 | Wm. Wrigley Jr. Co. | 2,215,782 | |||||||
| 6,654,385 | ||||||||||
| Gaming/ Lodging – 7.2% | ||||||||||
| 24,600 | Carnival Corp. | 1,337,748 | ||||||||
| 84,640 | Harrah’s Entertainment, Inc. | 5,551,538 | ||||||||
| 30,160 | Starwood Hotels & Resorts Worldwide, Inc. Class B | 1,726,358 | ||||||||
| 8,615,644 | ||||||||||
| Internet & Online – 4.2% | ||||||||||
| 37,320 | eBay, Inc.* | 1,598,789 | ||||||||
| 11,030 | Google, Inc.* | 2,073,530 | ||||||||
| 43,060 | Yahoo!, Inc.* | 1,389,546 | ||||||||
| 5,061,865 | ||||||||||
| Networking Telecom Equipment – 2.4% | ||||||||||
| 167,660 | Cisco Systems, Inc.* | 2,920,637 | ||||||||
| Other Consumer Discretionary – 5.0% | ||||||||||
| 268,400 | Cendant Corp. | 5,937,008 | ||||||||
| Other Health Care – 4.6% | ||||||||||
| 111,670 | Caremark Rx, Inc.* | 4,274,728 | ||||||||
| 27,440 | Medco Health Solutions, Inc.* | 1,218,885 | ||||||||
| 5,493,613 | ||||||||||
| Retailing – 7.3% | ||||||||||
| 62,650 | Family Dollar Stores, Inc. | 2,062,438 | ||||||||
| 42,860 | Lowe’s Companies, Inc. | 2,519,311 | ||||||||
| 81,640 | Wal-Mart Stores, Inc. | 4,213,440 | ||||||||
| 8,795,189 | ||||||||||
| Semiconductors – 6.8% | ||||||||||
| 32,290 | Linear Technology Corp. | 1,261,247 | ||||||||
| 191,340 | QUALCOMM, Inc. | 6,909,288 | ||||||||
| 8,170,535 | ||||||||||
| Telecommunications – 1.2% | ||||||||||
| 89,970 | Crown Castle International Corp.* | 1,470,110 | ||||||||
| TOTAL INVESTMENTS – 98.6% | ||||||||||
| (Cost $107,493,432) | $ | 117,990,538 | ||||||||
| The percentage shown for each investment category reflects the value of investments in that category as a percentage of net assets. |
| * | Non-income producing security. |
26
Statement of Investments
| Shares | Description | Value | ||||||||
Common Stocks – 96.6% | ||||||||||
| Aerospace & Defense – 3.7% | ||||||||||
| 461,505 | Alliant Techsystems, Inc.* | $ | 31,949,991 | |||||||
| 853,458 | FLIR Systems, Inc.*(a) | 26,670,563 | ||||||||
| 58,620,554 | ||||||||||
| Auto Parts & Related – 1.9% | ||||||||||
| 898,875 | Gentex Corp.(a) | 30,480,851 | ||||||||
| Banks – 1.1% | ||||||||||
| 177,300 | M&T Bank Corp. | 17,554,473 | ||||||||
| Biotechnology – 4.5% | ||||||||||
| 192,893 | Allergan, Inc. | 14,501,696 | ||||||||
| 541,725 | Amylin Pharmaceuticals, Inc.*(a) | 11,603,749 | ||||||||
| 115,800 | Biogen Idec, Inc.* | 4,475,670 | ||||||||
| 503,405 | Eyetech Pharmaceuticals, Inc.*(a) | 16,682,842 | ||||||||
| 325,600 | MedImmune, Inc.* | 7,840,448 | ||||||||
| 308,092 | OSI Pharmaceuticals, Inc.* | 16,831,066 | ||||||||
| 71,935,471 | ||||||||||
| Broadcasting & Cable/ Satellite TV – 6.3% | ||||||||||
| 727,769 | Cablevision Systems New York Group* | 22,604,505 | ||||||||
| 1,362,627 | Citadel Broadcasting Co.*(a) | 19,240,293 | ||||||||
| 595,141 | EchoStar Communications Corp. | 17,705,445 | ||||||||
| 2,750,400 | Entravision Communications Corp.* | 22,553,280 | ||||||||
| 737,200 | Univision Communications, Inc.*(a) | 19,454,708 | ||||||||
| 101,558,231 | ||||||||||
| Commercial Services – 5.7% | ||||||||||
| 1,156,855 | ARAMARK Corp. Class B | 32,426,646 | ||||||||
| 809,911 | Iron Mountain, Inc.*(a) | 21,908,092 | ||||||||
| 187,919 | Moody’s Corp. | 15,768,283 | ||||||||
| 472,900 | Pitney Bowes, Inc. | 21,687,194 | ||||||||
| 91,790,215 | ||||||||||
| Computer Hardware – 2.1% | ||||||||||
| 976,125 | Avocent Corp.* | 33,442,042 | ||||||||
| Computer Services – 2.3% | ||||||||||
| 948,388 | Fiserv, Inc.* | 35,981,841 | ||||||||
| Computer Software – 5.2% | ||||||||||
| 579,315 | Cognos, Inc.* | 24,858,407 | ||||||||
| 235,300 | Dolby Laboratories, Inc.* | 5,430,724 | ||||||||
| 185,828 | Manhattan Associates, Inc.* | 3,692,402 | ||||||||
| 400,565 | Mercury Interactive Corp.* | 18,377,922 | ||||||||
| 237,498 | NAVTEQ* | 10,378,663 | ||||||||
| 1,281,535 | Salesforce.com, Inc.*(a) | 20,581,452 | ||||||||
| 83,319,570 | ||||||||||
| Diversified Media – 1.9% | ||||||||||
| 649,618 | The E.W. Scripps Co. | 29,986,367 | ||||||||
| Financial Services – 1.4% | ||||||||||
| 1,095,791 | Moneygram International, Inc. | 22,551,379 | ||||||||
| Financial Technology – 1.3% | ||||||||||
| 524,014 | CheckFree Corp.*(a) | 20,195,500 | ||||||||
| Gaming/ Lodging – 3.3% | ||||||||||
| 608,111 | GTECH Holdings Corp. | 14,199,392 | ||||||||
| 363,600 | Harrah’s Entertainment, Inc.(a) | 23,848,524 | ||||||||
| 242,100 | Marriott International, Inc.(a) | 15,518,610 | ||||||||
| 53,566,526 | ||||||||||
| Insurance – 1.7% | ||||||||||
| 699,970 | Willis Group Holdings Ltd.(a) | 27,683,814 | ||||||||
| Internet & Online – 1.1% | ||||||||||
| 1,963,665 | CNET Networks, Inc.* | 17,771,168 | ||||||||
| Manufacturing – 1.3% | ||||||||||
| 242,530 | American Standard Companies, Inc. | 11,107,874 | ||||||||
| 247,905 | York International Corp. | 9,586,486 | ||||||||
| 20,694,360 | ||||||||||
| Medical Products – 8.9% | ||||||||||
| 280,755 | Biomet, Inc. | 11,853,476 | ||||||||
| 283,470 | C.R. Bard, Inc. | 18,850,755 | ||||||||
| 637,128 | Charles River Laboratories International, Inc.*(a) | 29,371,601 | ||||||||
| 434,029 | Fisher Scientific International, Inc.* | 26,323,859 | ||||||||
| 117,100 | Kinetic Concepts, Inc.* | 7,638,433 | ||||||||
| 540,690 | Millipore Corp.* | 24,471,629 | ||||||||
| 597,950 | St. Jude Medical, Inc.* | 23,379,845 | ||||||||
| 141,889,598 | ||||||||||
| Movies & Entertainment – 0.5% | ||||||||||
| 442,324 | LodgeNet Entertainment Corp.* | 7,807,019 | ||||||||
| Networking Telecom Equipment – 2.0% | ||||||||||
| 1,057,509 | ADTRAN, Inc. | 19,785,993 | ||||||||
| 595,800 | Juniper Networks, Inc.* | 12,833,532 | ||||||||
| 32,619,525 | ||||||||||
| Oil & Gas – 1.1% | ||||||||||
| 380,471 | XTO Energy, Inc. | 17,319,040 | ||||||||
| Other Consumer Discretionary – 3.1% | ||||||||||
| 216,216 | Harman International Industries, Inc. | 24,252,949 | ||||||||
| 516,695 | ITT Educational Services, Inc.* | 25,157,879 | ||||||||
| 49,410,828 | ||||||||||
| Other Energy – 2.0% | ||||||||||
| 497,426 | Smith International, Inc.* | 31,964,595 | ||||||||
| Other Health Care – 1.9% | ||||||||||
| 800,753 | Caremark Rx, Inc.* | 30,652,825 | ||||||||
| Other Producer Goods & Services – 3.0% | ||||||||||
| 263,655 | Global Payments, Inc. | 14,638,126 | ||||||||
| 529,080 | W.W. Grainger, Inc. | 33,215,642 | ||||||||
| 47,853,768 | ||||||||||
27
| Shares | Description | Value | ||||||||
Common Stocks – (continued) | ||||||||||
| Other Technology – 2.3% | ||||||||||
| 705,638 | Amphenol Corp. | $ | 28,154,956 | |||||||
| 157,350 | Zebra Technologies Corp.* | 7,847,045 | ||||||||
| 36,002,001 | ||||||||||
| Publishing – 2.1% | ||||||||||
| 872,447 | Lamar Advertising Co.*(a) | 34,278,443 | ||||||||
| Restaurants – 1.5% | ||||||||||
| 450,696 | P.F. Chang’s China Bistro, Inc.*(a) | 24,702,648 | ||||||||
| Retailing – 11.3% | ||||||||||
| 369,000 | Bed Bath & Beyond, Inc.* | 13,844,880 | ||||||||
| 733,845 | CarMax, Inc.* | 24,216,885 | ||||||||
| 1,084,082 | Chico’s FAS, Inc.* | 31,926,215 | ||||||||
| 675,686 | Dollar Tree Stores, Inc.*(a) | 18,209,737 | ||||||||
| 388,113 | Ethan Allen Interiors, Inc. | 13,638,291 | ||||||||
| 977,027 | PETCO Animal Supplies, Inc.* | 34,625,837 | ||||||||
| 561,745 | Select Comfort Corp.*(a) | 11,571,947 | ||||||||
| 112,200 | Urban Outfitters, Inc.* | 4,666,398 | ||||||||
| 831,949 | Williams-Sonoma, Inc.*(a) | 28,860,311 | ||||||||
| 181,560,501 | ||||||||||
| Semiconductors – 8.3% | ||||||||||
| 526,500 | KLA-Tencor Corp.*(a) | 26,014,365 | ||||||||
| 853,300 | Linear Technology Corp. | 33,329,898 | ||||||||
| 690,550 | Marvell Technology Group Ltd.* | 25,267,224 | ||||||||
| 597,009 | Microchip Technology, Inc. | 16,393,867 | ||||||||
| 788,143 | Tessera Technologies, Inc.* | 32,108,946 | ||||||||
| 133,114,300 | ||||||||||
| Telecommunications – 1.5% | ||||||||||
| 1,434,750 | Crown Castle International Corp.* | 23,443,815 | ||||||||
| Tobacco – 1.3% | ||||||||||
| 380,079 | UST, Inc.(a) | 20,771,317 | ||||||||
| Transportation – 1.0% | ||||||||||
| 294,085 | C.H. Robinson Worldwide, Inc. | 16,115,858 | ||||||||
| TOTAL COMMON STOCKS | ||||||||||
| (Cost $1,335,107,562) | $ | 1,546,638,443 | ||||||||
| Principal | Interest | Maturity | ||||||||||||||
| Amount | Rate | Date | Value | |||||||||||||
Repurchase Agreement(b) – 2.7% | ||||||||||||||||
| Joint Repurchase Agreement Account II | ||||||||||||||||
| $ | 43,800,000 | 2.64 | % | 03/01/2005 | $ | 43,800,000 | ||||||||||
| (Cost $43,800,000) | ||||||||||||||||
| TOTAL INVESTMENTS BEFORE SECURITIES LENDING COLLATERAL | ||||||||||||||||
| (Cost $1,378,907,562) | $ | 1,590,438,443 | ||||||||||||||
| Shares | Description | Value | ||||||||
Securities Lending Collateral – 14.2% | ||||||||||
| 226,978,350 | Boston Global Investment Trust – | |||||||||
| Enhanced Portfolio | $ | 226,978,350 | ||||||||
| (Cost $226,978,350) | ||||||||||
| TOTAL INVESTMENTS – 113.5% | ||||||||||
| (Cost $1,605,885,912) | $ | 1,817,416,793 | ||||||||
| The percentage shown for each investment category reflects the value of investments in that category as a percentage of net assets. |
| * | Non-income producing security. | |
| (a) | All or portion of security is on loan. | |
| (b) | Joint repurchase agreement was entered into on February 28, 2005. |
28
| ADDITIONAL INVESTMENT INFORMATION |
JOINT REPURCHASE AGREEMENT ACCOUNT II — At February 28, 2005, the Growth Opportunities Fund had an undivided interest in the following Joint Repurchase Agreement Account II which equaled $43,800,000 in principal amount.
| Principal | Interest | Maturity | Maturity | |||||||||||
| Repurchase Agreements | Amount | Rate | Date | Value | ||||||||||
| Banc of America Securities LLC | $ | 1,900,000,000 | 2.64 | % | 03/01/2005 | $ | 1,900,139,333 | |||||||
| Barclays Capital PLC | 2,500,000,000 | 2.65 | 03/01/2005 | 2,500,184,028 | ||||||||||
| Greenwich Capital Markets | 400,000,000 | 2.65 | 03/01/2005 | 400,029,444 | ||||||||||
| J.P. Morgan Securities, Inc. | 697,000,000 | 2.65 | 03/01/2005 | 697,051,307 | ||||||||||
| Morgan Stanley & Co. | 1,500,000,000 | 2.64 | 03/01/2005 | 1,500,110,000 | ||||||||||
| UBS Securities LLC | 800,000,000 | 2.64 | 03/01/2005 | 800,058,667 | ||||||||||
| Westdeutsche Landesbank AG | 500,000,000 | 2.64 | 03/01/2005 | 500,036,667 | ||||||||||
TOTAL | $ | 8,297,000,000 | 03/01/2005 | $ | 8,297,609,446 | |||||||||
| At February 28, 2005, the Joint Repurchase Agreement Account II was fully collateralized by Federal Farm Credit Bank, 0.00% to 2.38%, due 03/01/2005 to 10/02/2006; Federal Home Loan Bank, 0.00% to 7.63%, due 02/15/2006 to 11/14/2014; Federal Home Loan Mortgage Association, 0.00% to 12.00%, due 04/04/2005 to 03/01/2035; Federal National Mortgage Association, 0.00% to 9.50%, due 03/22/2005 to 03/01/2035 and Government National Mortgage Association, 4.50% to 5.50%, due 09/15/2019 to 11/15/2033. |
29
Statements of Assets and Liabilities
| Capital | Strategic | Concentrated | Growth | ||||||||||||||||
| Growth | Growth | Growth | Opportunities | ||||||||||||||||
| Fund | Fund | Fund | Fund | ||||||||||||||||
| Assets: | |||||||||||||||||||
| Investment in securities, at value (identified cost $1,558,165,400, $323,750,834, $107,493,432, and $1,378,907,562, respectively) | $ | 1,926,610,680 | $ | 351,227,271 | $ | 117,990,538 | $ | 1,590,438,443 | |||||||||||
| Securities lending collateral, at value | 98,518,300 | 2,087,250 | — | 226,978,350 | |||||||||||||||
| Cash | 10,571 | 63,401 | 48,524 | 18,197 | |||||||||||||||
| Receivables: | |||||||||||||||||||
| Investment securities sold | — | 1,469,853 | 2,666,096 | 10,198,721 | |||||||||||||||
| Fund shares sold | 3,994,738 | 514,204 | 686,469 | 9,418,739 | |||||||||||||||
| Dividends and interest | 2,073,094 | 385,294 | 108,852 | 560,530 | |||||||||||||||
| Reimbursement from investment adviser | 117,084 | 37,072 | — | — | |||||||||||||||
| Securities lending income | 6,692 | 171 | — | 12,588 | |||||||||||||||
| Other assets | 29,785 | 5,759 | 1,889 | 19,717 | |||||||||||||||
Total assets | 2,031,360,944 | 355,790,275 | 121,502,368 | 1,837,645,285 | |||||||||||||||
| Liabilities: | |||||||||||||||||||
| Payables: | |||||||||||||||||||
| Payable upon return of securities loaned | 98,518,300 | 2,087,250 | — | 226,978,350 | |||||||||||||||
| Fund shares repurchased | 26,877,820 | 373,150 | — | 3,866,529 | |||||||||||||||
| Investment securities purchased | 5,027,676 | — | 1,590,627 | 3,626,032 | |||||||||||||||
| Amounts owed to affiliates | 2,144,919 | 358,684 | 153,272 | 1,661,502 | |||||||||||||||
| Accrued expenses | 169,093 | 102,214 | 89,036 | 174,690 | |||||||||||||||
Total liabilities | 132,737,808 | 2,921,298 | 1,832,935 | 236,307,103 | |||||||||||||||
| Net Assets: | |||||||||||||||||||
| Paid-in capital | 1,948,397,414 | 397,922,965 | 108,785,682 | 1,412,408,165 | |||||||||||||||
| Accumulated undistributed net investment income (loss) | 7,573,686 | 673,773 | 437,584 | (5,027,040 | ) | ||||||||||||||
| Accumulated net realized loss on investment transactions | (425,793,244 | ) | (73,204,198 | ) | (50,939 | ) | (17,573,824 | ) | |||||||||||
| Net unrealized gain on investments | 368,445,280 | 27,476,437 | 10,497,106 | 211,530,881 | |||||||||||||||
NET ASSETS | $ | 1,898,623,136 | $ | 352,868,977 | $ | 119,669,433 | $ | 1,601,338,182 | |||||||||||
| Net assets: Class A | $ | 1,363,678,548 | $ | 168,592,162 | $ | 63,062,923 | $ | 784,180,764 | |||||||||||
| Class B | 182,557,309 | 10,905,253 | 104,827 | 93,918,158 | |||||||||||||||
| Class C | 84,162,529 | 11,346,804 | 332,180 | 94,276,929 | |||||||||||||||
| Institutional | 263,024,736 | 161,726,080 | 56,167,652 | 626,005,210 | |||||||||||||||
| Service | 5,200,014 | 298,678 | 1,851 | 2,957,121 | |||||||||||||||
| Shares Outstanding: | |||||||||||||||||||
| Class A | 70,845,040 | 20,062,972 | 5,202,615 | 36,946,648 | |||||||||||||||
| Class B | 10,174,701 | 1,354,395 | 8,809 | 4,589,830 | |||||||||||||||
| Class C | 4,697,920 | 1,407,093 | 27,962 | 4,638,092 | |||||||||||||||
| Institutional | 13,296,852 | 18,879,359 | 4,589,001 | 28,830,988 | |||||||||||||||
| Service | 272,737 | 35,454 | 153 | 140,253 | |||||||||||||||
| Total shares outstanding, $0.001 par value (unlimited number of shares authorized) | 99,287,250 | 41,739,273 | 9,828,540 | 75,145,811 | |||||||||||||||
Net asset value, offering and redemption price per share:(a) Class A | $ | 19.25 | $ | 8.40 | $ | 12.12 | $ | 21.22 | |||||||||||
| Class B | 17.94 | 8.05 | 11.90 | 20.46 | |||||||||||||||
| Class C | 17.91 | 8.06 | 11.88 | 20.33 | |||||||||||||||
| Institutional | 19.78 | 8.57 | 12.24 | 21.71 | |||||||||||||||
| Service | 19.07 | 8.42 | 12.12 | 21.08 | |||||||||||||||
| (a) | Maximum public offering price per share (NAV per share multiplied by 1.0582) for Class A Shares of the Capital Growth, Strategic Growth, Concentrated Growth and Growth Opportunities Funds is $20.37, $8.89, $12.83 and $22.46, respectively. At redemption, Class B and Class C Shares may be subject to a contingent deferred sales charge, assessed on the amount equal to the lesser of the current NAV or the original purchase price of the shares. |
30
Statements of Operations
| Capital | Strategic | Concentrated | Growth | |||||||||||||||
| Growth | Growth | Growth | Opportunities | |||||||||||||||
| Fund | Fund | Fund | Fund | |||||||||||||||
| Investment income: | ||||||||||||||||||
| Dividends | $ | 21,132,569 | $ | 3,776,922 | $ | 1,168,629 | $ | 3,162,830 | ||||||||||
| Interest (including securities lending income of $62,203, $4,067, $0, and $143,445, respectively) | 147,295 | 16,195 | 20,650 | 532,922 | ||||||||||||||
Total income | 21,279,864 | 3,793,117 | 1,189,279 | 3,695,752 | ||||||||||||||
| Expenses: | ||||||||||||||||||
| Management fees | 9,587,728 | 1,795,526 | 575,689 | 6,531,722 | ||||||||||||||
Distribution and Service fees(a) | 3,114,133 | 330,261 | 81,106 | 1,736,130 | ||||||||||||||
Transfer Agent fees(a) | 1,626,912 | 218,642 | 70,855 | 913,803 | ||||||||||||||
| Custody and accounting fees | 111,380 | 53,362 | 31,764 | 104,193 | ||||||||||||||
| Registration fees | 46,476 | 33,276 | 19,204 | 43,203 | ||||||||||||||
| Printing fees | 39,124 | 39,124 | 10,124 | 39,124 | ||||||||||||||
| Professional fees | 28,815 | 21,891 | 20,851 | 25,422 | ||||||||||||||
| Trustee fees | 7,674 | 7,674 | 7,674 | 7,674 | ||||||||||||||
| Service share fees | 13,887 | 755 | 5 | 4,884 | ||||||||||||||
| Other | 138,729 | 13,246 | 131 | 63,454 | ||||||||||||||
Total expenses | 14,714,858 | 2,513,757 | 817,403 | 9,469,609 | ||||||||||||||
| Less — expense reductions | (777,626 | ) | (163,386 | ) | (65,708 | ) | (15,010 | ) | ||||||||||
Net expenses | 13,937,232 | 2,350,371 | 751,695 | 9,454,599 | ||||||||||||||
NET INVESTMENT INCOME (LOSS) | 7,342,632 | 1,442,746 | 437,584 | (5,758,847 | ) | |||||||||||||
| Realized and unrealized gain (loss) on investment transactions: | ||||||||||||||||||
| Net realized gain (loss) from investment transactions | 81,402,414 | (659,171 | ) | 166,399 | 67,753,581 | |||||||||||||
| Net change in unrealized gain on investments | 9,817,016 | 14,562,209 | 5,001,255 | 98,053,626 | ||||||||||||||
Net realized and unrealized gain on investment transactions | 91,219,430 | 13,903,038 | 5,167,654 | 165,807,207 | ||||||||||||||
NET INCREASE IN NET ASSETS RESULTING FROM OPERATIONS | $ | 98,562,062 | $ | 15,345,784 | $ | 5,605,238 | $ | 160,048,360 | ||||||||||
| (a) | Class specific Distribution and Service, and Transfer Agent fees were as follows: |
| Distribution and Service Fees | Transfer Agent Fees | ||||||||||||||||||||||||||||||
| Fund | Class A | Class B | Class C | Class A | Class B | Class C | Institutional | Service | |||||||||||||||||||||||
| Capital Growth | $ | 1,710,959 | $ | 963,758 | $ | 439,416 | $ | 1,300,329 | $ | 183,114 | $ | 83,489 | $ | 58,869 | $1,111 | ||||||||||||||||
| Strategic Growth | 216,181 | 56,564 | 57,516 | 164,298 | 10,747 | 10,928 | 32,609 | 60 | |||||||||||||||||||||||
| Concentrated Growth | 79,249 | 478 | 1,379 | 60,229 | 91 | 262 | 10,273 | — | |||||||||||||||||||||||
| Growth Opportunities | 871,366 | 458,120 | 406,644 | 662,238 | 87,043 | 77,262 | 86,869 | 391 | |||||||||||||||||||||||
31
Statements of Changes in Net Assets
| Capital Growth Fund | |||||||||||
| For the | |||||||||||
| Six Months | |||||||||||
| Ended | For the | ||||||||||
| February 28, | Year Ended | ||||||||||
| 2005 | August 31, | ||||||||||
| (Unaudited) | 2004 | ||||||||||
| From operations: | |||||||||||
| Net investment income (loss) | $ | 7,342,632 | $ | (6,507,372 | ) | ||||||
| Net realized gain (loss) from investment transactions | 81,402,414 | 46,974,726 | |||||||||
| Net increase from payments by affiliates for voluntary investments | — | 25,891 | |||||||||
| Net change in unrealized gain (loss) on investments | 9,817,016 | 108,254,487 | |||||||||
Net increase (decrease) in net assets resulting from operations | 98,562,062 | 148,747,732 | |||||||||
| Distributions to shareholders: | |||||||||||
| From net investment income | |||||||||||
| Class A Shares | — | — | |||||||||
| Institutional Shares | — | — | |||||||||
| Service Shares | — | — | |||||||||
| From net realized gain | |||||||||||
| Class A Shares | — | — | |||||||||
| Class B Shares | — | — | |||||||||
| Class C Shares | — | — | |||||||||
| Institutional Shares | — | — | |||||||||
| Service Shares | — | — | |||||||||
Total distributions to shareholders | — | — | |||||||||
| From share transactions: | |||||||||||
| Proceeds from sales of shares | 148,377,938 | 313,328,359 | |||||||||
| Proceeds received in connection with merger | — | — | |||||||||
| Reinvestment of dividends and distributions | — | — | |||||||||
| Cost of shares repurchased | (272,991,430 | ) | (657,684,172 | ) | |||||||
Net increase (decrease) in net assets resulting from share transactions | (124,613,492 | ) | (344,355,813 | ) | |||||||
TOTAL INCREASE (DECREASE) | (26,051,430 | ) | (195,608,081 | ) | |||||||
| Net assets: | |||||||||||
| Beginning of period | 1,924,674,566 | 2,120,282,647 | |||||||||
| End of period | $ | 1,898,623,136 | $ | 1,924,674,566 | |||||||
Accumulated undistributed net investment income (loss) | $ | 7,573,686 | $ | 231,054 | |||||||
32
| Strategic Growth Fund | Concentrated Growth Fund | Growth Opportunities Fund | ||||||||||||||||||||||||
| For the | For the | For the | ||||||||||||||||||||||||
| Six Months | Six Months | Six Months | ||||||||||||||||||||||||
| Ended | For the | Ended | For the | Ended | For the | |||||||||||||||||||||
| February 28, | Year Ended | February 28, | Year Ended | February 28, | Year Ended | |||||||||||||||||||||
| 2005 | August 31, | 2005 | August 31, | 2005 | August 31, | |||||||||||||||||||||
| (Unaudited) | 2004 | (Unaudited) | 2004 | (Unaudited) | 2004 | |||||||||||||||||||||
| $ | 1,442,746 | $ | (1,195,883 | ) | $ | 437,584 | $ | (443,582 | ) | $ | (5,758,847 | ) | $ | (7,858,365 | ) | |||||||||||
| (659,171 | ) | (7,492,332 | ) | 166,399 | 2,632,353 | 67,753,581 | 77,432,377 | |||||||||||||||||||
| — | — | — | — | — | — | |||||||||||||||||||||
| 14,562,209 | 15,858,915 | 5,001,255 | (2,547,374 | ) | 98,053,626 | (18,375,575 | ) | |||||||||||||||||||
| 15,345,784 | 7,170,700 | 5,605,238 | (358,603 | ) | 160,048,360 | 51,198,437 | ||||||||||||||||||||
| (30,630 | ) | — | — | — | — | — | ||||||||||||||||||||
| (739,578 | ) | — | — | — | — | — | ||||||||||||||||||||
| (4 | ) | — | — | — | — | — | ||||||||||||||||||||
| — | — | (954,804 | ) | (162,223 | ) | — | — | |||||||||||||||||||
| — | — | (1,401 | ) | (337 | ) | — | — | |||||||||||||||||||
| — | — | (4,248 | ) | (804 | ) | — | — | |||||||||||||||||||
| — | — | (759,009 | ) | (108,680 | ) | — | — | |||||||||||||||||||
| — | — | (28 | ) | (6 | ) | — | — | |||||||||||||||||||
| (770,212 | ) | — | (1,719,490 | ) | (272,050 | ) | — | — | ||||||||||||||||||
| 38,949,405 | 152,814,293 | 25,895,182 | 68,515,518 | 555,645,587 | 526,358,755 | |||||||||||||||||||||
| 42,856,797 | — | — | — | — | — | |||||||||||||||||||||
| 592,451 | — | 1,579,642 | 230,631 | — | — | |||||||||||||||||||||
| (69,755,876 | ) | (95,438,994 | ) | (18,716,341 | ) | (38,508,678 | ) | (176,966,870 | ) | (295,128,596 | ) | |||||||||||||||
| 12,642,777 | 57,375,299 | 8,758,483 | 30,237,471 | 378,678,717 | 231,230,159 | |||||||||||||||||||||
| 27,218,349 | 64,545,999 | 12,644,231 | 29,606,818 | 538,727,077 | 282,428,596 | |||||||||||||||||||||
| 325,650,628 | 261,104,629 | 107,025,202 | 77,418,384 | 1,062,611,105 | 780,182,509 | |||||||||||||||||||||
| $ | 352,868,977 | $ | 325,650,628 | $ | 119,669,433 | $ | 107,025,202 | $ | 1,601,338,182 | $ | 1,062,611,105 | |||||||||||||||
| $ | 673,773 | $ | 1,239 | $ | 437,584 | $ | — | $ | (5,027,040 | ) | $ | 731,807 | ||||||||||||||
33
Notes to Financial Statements
| 1. ORGANIZATION |
| 2. SIGNIFICANT ACCOUNTING POLICIES |
A. Investment Valuation — Investments in securities and investment companies traded on a U.S. securities exchange or the NASDAQ system are valued daily at their last sale price or official closing price on the principal exchange or system on which they are traded. If no sale occurs, securities are valued at the last bid price. Debt securities are valued at prices supplied by independent pricing services, broker/dealer-supplied valuations or matrix pricing systems. Unlisted equity and debt securities for which market quotations are available are valued at the last sale price on valuation date, or if no sale occurs, at the last bid price. Investments in investment companies (other than those that are exchange traded) are valued at the net asset value per share on the valuation date. Short-term debt obligations maturing in sixty days or less are valued at amortized cost, which approximates market value. Securities for which quotations are not readily available or are deemed to be inaccurate by the investment adviser are valued at fair value using methods approved by the Trust’s Board of Trustees.
B. Security Transactions and Investment Income — Security transactions are recorded as of the trade date. Realized gains and losses on sales of portfolio securities are calculated using the identified-cost basis. Dividend income is recorded on the ex-dividend date, net of foreign withholding taxes, if any, which are reduced by any amounts reclaimable by the Funds, where applicable. Interest income is recorded on the basis of interest accrued, premium amortized and discount accreted.
C. Expenses — Expenses incurred by the Trust that do not specifically relate to an individual Fund of the Trust are allocated to the Funds on a straight-line or pro-rata basis depending upon the nature of the expense.
| 2. SIGNIFICANT ACCOUNTING POLICIES (continued) |
D. Federal Taxes — It is each Fund’s policy to comply with the requirements of the Internal Revenue Code (the “Code”) applicable to regulated investment companies and to distribute each year substantially all of its investment company taxable income and capital gains to its shareholders. Accordingly, no federal tax provisions are required. Dividends and distributions to shareholders are recorded on the ex-dividend date. Income and capital gain distributions, if any, are declared and paid annually.
E. Segregation Transactions — As set forth in the prospectus, the Funds may enter into certain derivative transactions to seek to increase total return. Forward foreign currency exchange contracts, futures contracts, written options, when-issued securities and forward commitments represent examples of such transactions. As a result of entering into these transactions, the Funds are required to segregate liquid assets on the accounting records equal to or greater than the market value of the corresponding transactions.
F. Repurchase Agreements — Repurchase agreements involve the purchase of securities subject to the seller’s agreement to repurchase them at a mutually agreed upon date and price. During the term of a repurchase agreement, the value of the underlying securities held as collateral on behalf of the Funds, including accrued interest, is required to equal or exceed the value of the repurchase agreement, including accrued interest. If the seller defaults or becomes insolvent, realization of the collateral by each Fund may be delayed or limited and there may be a decline in the value of the collateral during the period while the Fund seeks to assert its rights. The underlying securities for all repurchase agreements are held in safekeeping at the Funds’ custodian or designated subcustodians under triparty repurchase agreements.
| 3. AGREEMENTS |
Notes to Financial Statements (continued)
| 3. AGREEMENTS (continued) |
| Management Fee | ||||||||||
| Contractual | Other | |||||||||
| Fund | Annual Rate | Expense Limit | ||||||||
| Capital Growth | 1.00 | % | First $1 Billion of average daily net assets | 0.004 | % | |||||
| 0.90 | Next $1��Billion of average daily net assets | |||||||||
| 0.80 | Over $2 Billion of average daily net assets | |||||||||
| Strategic Growth | 1.00 | 0.004 | ||||||||
| Concentrated Growth | 1.00 | 0.044 | ||||||||
| Growth Opportunities | 1.00 | 0.114 | ||||||||
| Contingent Deferred Sales Charge | ||||||||||||
| Sales Load | ||||||||||||
| Fund | Class A | Class B | Class C | |||||||||
| Capital Growth | $ | 163,500 | $ | 500 | $ | 100 | ||||||
| Strategic Growth | 5,400 | 600 | — | |||||||||
| Concentrated Growth | 1,200 | — | — | |||||||||
| Growth Opportunities | 201,900 | 200 | — | |||||||||
| 3. AGREEMENTS (continued) |
| Management | Other Expense | Transfer Agent | Custody Fee | Total Expense | ||||||||||||||||
| Fund | Fee Waiver | Reimbursements | Credit | Reduction | Reductions | |||||||||||||||
| Capital Growth | $ | 323 | $ | 333 | $ | 122 | $ | — | $ | 778 | ||||||||||
| Strategic Growth | — | 161 | 2 | — | 163 | |||||||||||||||
| Concentrated Growth | — | 65 | 1 | — | 66 | |||||||||||||||
| Growth Opportunities | — | — | 14 | 1 | 15 | |||||||||||||||
| Management | Distribution and | Transfer | Over Reimbursement | |||||||||||||||||
| Fund | Fees | Service Fees | Agent Fees | of “Other Expenses” | Total | |||||||||||||||
| Capital Growth | $ | 1,421 | $ | 474 | $ | 250 | $ | — | $ | 2,145 | ||||||||||
| Strategic Growth | 275 | 50 | 34 | — | 359 | |||||||||||||||
| Concentrated Growth | 93 | 13 | 11 | 36 | 153 | |||||||||||||||
| Growth Opportunities | 1,211 | 292 | 159 | — | 1,662 | |||||||||||||||
Notes to Financial Statements (continued)
| 4. PORTFOLIO SECURITIES TRANSACTIONS |
| Fund | Purchases | Sales and Maturities | ||||||
| Capital Growth | $ | 278,599,155 | $ | 378,071,694 | ||||
| Strategic Growth | 106,601,708 | 94,733,027 | ||||||
| Concentrated Growth | 25,605,089 | 18,738,622 | ||||||
| Growth Opportunities | 683,512,004 | 333,804,116 | ||||||
| 5. SECURITIES LENDING |
| Earnings Received | Amounts Payable to | |||||||||||||||||||
| Earnings of BGA | From Lending to | Goldman Sachs | ||||||||||||||||||
| Market Value of | Cash Collateral | Relating to Securities | Goldman Sachs | Upon Return of | ||||||||||||||||
| Securities on Loan | Received for Loans | Loaned for the | for the | Securities Loaned | ||||||||||||||||
| as of | Outstanding as of | Six Months Ended | Six Months Ended | as of | ||||||||||||||||
| Fund | February 28, 2005 | February 28, 2005 | February 28, 2005 | February 28, 2005 | February 28, 2005 | |||||||||||||||
| Capital Growth | $ | 95,585,617 | $ | 98,518,300 | $ | 10,975 | $ | 345 | $ | — | ||||||||||
| Strategic Growth | 2,067,890 | 2,087,250 | 718 | 200 | — | |||||||||||||||
| Growth Opportunities | 221,303,180 | 226,978,350 | 25,310 | 15,093 | 6,520,500 | |||||||||||||||
| 6. LINE OF CREDIT FACILITY |
| 7. ADDITIONAL TAX INFORMATION |
| Capital Growth | Strategic Growth | Concentrated Growth | Growth Opportunities | ||||||||||||||
| Fund | Fund | Fund | Fund | ||||||||||||||
| Capital loss carryforward: | |||||||||||||||||
| Expiring 2010 | $ | (196,669,376 | ) | $ | (14,302,712 | ) | $ | — | $ | — | |||||||
| Expiring 2011 | (264,243,165 | ) | (31,652,440 | ) | — | (83,409,757 | ) | ||||||||||
| Expiring 2012 | — | (13,060,848 | ) | — | — | ||||||||||||
| Total capital loss carryforward | $ | (460,912,541 | ) | $ | (59,016,000 | ) | $ | — | $ | (83,409,757 | ) | ||||||
| Timing differences (post October losses) | — | (4,398,378 | ) | — | — | ||||||||||||
| Capital Growth | Strategic Growth | Concentrated Growth | Growth Opportunities | |||||||||||||
| Fund | Fund | Fund | Fund | |||||||||||||
| Tax Cost | $ | 1,702,575,288 | $ | 334,887,560 | $ | 107,998,831 | $ | 1,607,803,560 | ||||||||
| Gross unrealized gain | 352,794,962 | 36,515,044 | 14,158,728 | 238,862,474 | ||||||||||||
| Gross unrealized loss | (30,241,270 | ) | (18,088,083 | ) | (4,167,021 | ) | (29,249,241 | ) | ||||||||
| Net unrealized security gain | $ | 322,553,692 | $ | 18,426,961 | $ | 9,991,707 | $ | 209,613,233 | ||||||||
Notes to Financial Statements (continued)
| 8. OTHER MATTERS |
In addition, on March 10, 2005 Jeanne and Don Masden filed a purported class action lawsuit in the United States District Court for the Southern District of New York against Goldman Sachs Group, Inc., GSAM, Goldman, Sachs & Co., the Trustees of the Trust and John Doe Defendants (collectively the “Defendants”). The lawsuit amends a previously-filed complaint, and alleges that the Defendants breached their fiduciary duties and duties of care owed under federal and state law by failing to ensure that equity securities held by the Goldman Sachs Funds participated in class action settlements for which they were eligible. Plaintiffs seek compensatory damages, disgorgement of the fees paid to the investment advisers and punitive damages. Based on currently available information, GSAM believes that the likelihood that the pending purported class action lawsuit will have a material adverse financial impact on the Goldman Sachs Funds is remote, and the pending action is not likely to materially affect its ability to provide investment management services to its clients, including the Goldman Sachs Funds.
Mergers and Reorganizations — At a meeting held on August 5, 2004, the Board of Trustees of the Trust approved an Agreement and Plan of Organization (“the Agreement”) providing for the tax-free acquisition of the Golden Oak Growth Portfolio by the Goldman Sachs Strategic Growth Fund. The acquisition was completed on September 28, 2004.
| Acquired Fund’s | ||||||||||||
| Exchanged Shares | Value of | Shares Outstanding | ||||||||||
| Survivor/Acquired Fund | of Survivor Issued | Exchanged Shares | as of September 28, 2004 | |||||||||
| Goldman Sachs Strategic Growth Class A/Golden Oak Growth Class A | 682,200 | $ | 5,491,389 | 723,164 | ||||||||
| Goldman Sachs Strategic Growth Institutional Class/ Golden Oak Growth Institutional Class | 4,540,293 | 37,365,408 | 4,719,198 | |||||||||
| 8. OTHER MATTERS (continued) |
| Survivor Fund’s | ||||||||||||||||||||
| Survivor Fund’s | Acquired Fund’s | Aggregate | ||||||||||||||||||
| Aggregate | Aggregate | Acquired Fund’s | Acquired Fund’s | Net Assets | ||||||||||||||||
| Net Assets | Net Assets | Unrealized | Capital Loss | Immediately | ||||||||||||||||
| Survivor/Acquired Fund | Before Acquisition | Before Acquisition | Appreciation | Carryforward | After Acquisition | |||||||||||||||
| Goldman Sachs Strategic Growth/ Golden Oak Growth | $ | 329,499,240 | $ | 42,856,797 | $ | 909,037 | $ | (31,352,095 | ) | $ | 372,356,037 | |||||||||
Notes to Financial Statements (continued)
| 9. SUMMARY OF SHARE TRANSACTIONS |
| Capital Growth Fund | Strategic Growth Fund | Concentrated Growth Fund | Growth Opportunities Fund | |||||||||||||||||||||||||||||
| Shares | Dollars | Shares | Dollars | Shares | Dollars | Shares | Dollars | |||||||||||||||||||||||||
Class A Shares | ||||||||||||||||||||||||||||||||
| Shares sold | 5,429,632 | $ | 104,337,045 | 2,087,167 | $ | 17,566,086 | 832,731 | $ | 10,247,080 | 9,232,218 | $ | 190,536,741 | ||||||||||||||||||||
| Shares issued in connection with merger | — | — | 682,200 | 5,491,389 | — | — | — | — | ||||||||||||||||||||||||
| Reinvestments of distributions | — | — | 2,512 | 21,829 | 69,024 | 858,655 | — | — | ||||||||||||||||||||||||
Shares converted from Class B (a) | 46,570 | 886,695 | 708 | 5,809 | 223 | 2,822 | 3,219 | 68,831 | ||||||||||||||||||||||||
| Shares repurchased | (8,042,429 | ) | (154,420,582 | ) | (4,167,342 | ) | (34,581,441 | ) | (932,982 | ) | (11,423,221 | ) | (5,421,991 | ) | (110,748,953 | ) | ||||||||||||||||
| (2,566,227 | ) | (49,196,842 | ) | (1,394,755 | ) | (11,496,328 | ) | (31,004 | ) | (314,664 | ) | 3,813,446 | 79,856,619 | |||||||||||||||||||
Class B Shares | ||||||||||||||||||||||||||||||||
| Shares sold | 202,272 | 3,627,462 | 31,172 | 256,413 | 1,453 | 17,621 | 289,325 | 5,700,537 | ||||||||||||||||||||||||
| Reinvestments of distributions | — | — | — | — | 86 | 1,048 | — | — | ||||||||||||||||||||||||
Shares converted to Class A (a) | (49,839 | ) | (886,695 | ) | (737 | ) | (5,809 | ) | (226 | ) | (2,822 | ) | (3,334 | ) | (68,831 | ) | ||||||||||||||||
| Shares repurchased | (1,475,067 | ) | (26,442,413 | ) | (162,200 | ) | (1,312,046 | ) | (835 | ) | (10,000 | ) | (478,423 | ) | (9,410,103 | ) | ||||||||||||||||
| (1,322,634 | ) | (23,701,646 | ) | (131,765 | ) | (1,061,442 | ) | 478 | 5,847 | (192,432 | ) | (3,778,397 | ) | |||||||||||||||||||
Class C Shares | ||||||||||||||||||||||||||||||||
| Shares sold | 350,686 | 6,288,871 | 143,882 | 1,175,217 | 7,179 | 87,390 | 1,194,142 | 23,545,352 | ||||||||||||||||||||||||
| Reinvestments of distributions | — | — | — | — | 343 | 4,193 | — | — | ||||||||||||||||||||||||
| Shares repurchased | (862,190 | ) | (15,470,539 | ) | (214,626 | ) | (1,742,686 | ) | (1,021 | ) | (12,491 | ) | (423,814 | ) | (8,290,627 | ) | ||||||||||||||||
| (511,504 | ) | (9,181,668 | ) | (70,744 | ) | (567,469 | ) | 6,501 | 79,092 | 770,328 | 15,254,725 | |||||||||||||||||||||
Institutional Shares | ||||||||||||||||||||||||||||||||
| Shares sold | 1,713,980 | 33,758,349 | 2,331,312 | 19,942,085 | 1,257,204 | 15,543,016 | 15,778,686 | 334,190,455 | ||||||||||||||||||||||||
| Shares issued in connection with merger | — | — | 4,540,293 | 37,365,408 | — | — | — | — | ||||||||||||||||||||||||
| Reinvestments of distributions | — | — | 64,477 | 570,622 | 57,029 | 715,718 | — | — | ||||||||||||||||||||||||
| Shares repurchased | (3,823,372 | ) | (75,612,163 | ) | (3,709,109 | ) | (32,099,473 | ) | (582,066 | ) | (7,270,556 | ) | (2,269,636 | ) | (48,119,217 | ) | ||||||||||||||||
| (2,109,392 | ) | (41,853,814 | ) | 3,226,973 | 25,778,642 | 732,167 | 8,988,178 | 13,509,050 | 286,071,238 | |||||||||||||||||||||||
Service Shares | ||||||||||||||||||||||||||||||||
| Shares sold | 19,313 | 366,211 | 1,140 | 9,604 | 6 | 75 | 80,118 | 1,672,502 | ||||||||||||||||||||||||
| Reinvestments of distributions | — | — | — | — | 2 | 28 | — | — | ||||||||||||||||||||||||
| Shares repurchased | (54,886 | ) | (1,045,733 | ) | (2,372 | ) | (20,230 | ) | (5 | ) | (73 | ) | (19,177 | ) | (397,970 | ) | ||||||||||||||||
| (35,573 | ) | (679,522 | ) | (1,232 | ) | (10,626 | ) | 3 | 30 | 60,941 | 1,274,532 | |||||||||||||||||||||
NET INCREASE (DECREASE) | (6,545,330 | ) | $ | (124,613,492 | ) | 1,628,477 | $ | 12,642,777 | 708,145 | $ | 8,758,483 | 17,961,333 | $ | 378,678,717 | ||||||||||||||||||
| (a) | Class B Shares automatically convert into Class A Shares at the end of the calendar quarter that is eight years after the initial purchase date of either the Fund or another Goldman Sachs Fund. |
| 9. SUMMARY OF SHARE TRANSACTIONS (continued) |
| Capital Growth Fund | Strategic Growth Fund | Concentrated Growth Fund | Growth Opportunities Fund | |||||||||||||||||||||||||||||
| Shares | Dollars | Shares | Dollars | Shares | Dollars | Shares | Dollars | |||||||||||||||||||||||||
Class A Shares | ||||||||||||||||||||||||||||||||
| Shares sold | 12,322,402 | $ | 225,194,591 | 8,513,583 | $ | 71,048,493 | 3,443,190 | $ | 42,060,240 | 17,523,657 | $ | 330,319,134 | ||||||||||||||||||||
| Reinvestments of distributions | — | — | — | — | 10,850 | 128,356 | — | — | ||||||||||||||||||||||||
Shares converted from Class B(a) | 28,859 | 543,993 | — | — | — | — | — | — | ||||||||||||||||||||||||
| Shares repurchased | (25,840,576 | ) | (469,353,768 | ) | (5,899,965 | ) | (48,658,693 | ) | (2,472,099 | ) | (30,186,150 | ) | (9,778,619 | ) | (183,518,842 | ) | ||||||||||||||||
| (13,489,315 | ) | (243,615,184 | ) | 2,613,618 | 22,389,800 | 981,941 | 12,002,446 | 7,745,038 | 146,800,292 | |||||||||||||||||||||||
Class B Shares | ||||||||||||||||||||||||||||||||
| Shares sold | 573,185 | 9,792,118 | 292,155 | 2,319,155 | 6,136 | 74,182 | 752,102 | 13,386,817 | ||||||||||||||||||||||||
| Reinvestments of distributions | — | — | — | — | 29 | 337 | — | — | ||||||||||||||||||||||||
Shares converted to Class A(a) | (30,804 | ) | (543,993 | ) | — | — | — | — | — | — | ||||||||||||||||||||||
| Shares repurchased | (3,128,568 | ) | (53,696,607 | ) | (322,691 | ) | (2,557,127 | ) | (5,831 | ) | (71,581 | ) | (1,022,004 | ) | (18,569,840 | ) | ||||||||||||||||
| (2,586,187 | ) | (44,448,482 | ) | (30,536 | ) | (237,972 | ) | 334 | 2,938 | (269,902 | ) | (5,183,023 | ) | |||||||||||||||||||
Class C Shares | ||||||||||||||||||||||||||||||||
| Shares sold | 847,971 | 14,562,617 | 644,477 | 5,071,513 | 19,652 | 221,898 | 1,164,534 | 20,885,352 | ||||||||||||||||||||||||
| Reinvestments of distributions | — | — | — | — | 68 | 792 | — | — | ||||||||||||||||||||||||
| Shares repurchased | (1,862,902 | ) | (32,061,730 | ) | (353,953 | ) | (2,819,654 | ) | (1 | ) | (6 | ) | (1,061,554 | ) | (19,149,072 | ) | ||||||||||||||||
| (1,014,931 | ) | (17,499,113 | ) | 290,524 | 2,251,859 | 19,719 | 222,684 | 102,980 | 1,736,280 | |||||||||||||||||||||||
Institutional Shares | ||||||||||||||||||||||||||||||||
| Shares sold | 3,362,723 | 62,812,467 | 8,743,063 | 74,057,039 | 2,125,858 | 26,159,198 | 8,435,963 | 160,658,930 | ||||||||||||||||||||||||
| Reinvestments of distributions | — | — | — | — | 8,506 | 101,140 | — | — | ||||||||||||||||||||||||
| Shares repurchased | (5,377,822 | ) | (100,785,750 | ) | (4,920,761 | ) | (41,401,519 | ) | (657,894 | ) | (8,250,941 | ) | (3,837,216 | ) | (73,703,876 | ) | ||||||||||||||||
| (2,015,099 | ) | (37,973,283 | ) | 3,822,302 | 32,655,520 | 1,476,470 | 18,009,397 | 4,598,747 | 86,955,054 | |||||||||||||||||||||||
Service Shares | ||||||||||||||||||||||||||||||||
| Shares sold | 53,329 | 966,566 | 36,777 | 318,093 | — | — | 58,161 | 1,108,522 | ||||||||||||||||||||||||
| Reinvestments of distributions | — | — | — | — | — | (b) | 6 | — | — | |||||||||||||||||||||||
| Shares repurchased | (98,440 | ) | (1,786,317 | ) | (241 | ) | (2,001 | ) | — | — | (10,022 | ) | (186,966 | ) | ||||||||||||||||||
| (45,111 | ) | (819,751 | ) | 36,536 | 316,092 | — | (b) | 6 | 48,139 | 921,556 | ||||||||||||||||||||||
NET INCREASE (DECREASE) | (19,150,643 | ) | $ | (344,355,813 | ) | 6,732,444 | $ | 57,375,299 | 2,478,464 | $ | 30,237,471 | 12,225,002 | $ | 231,230,159 | ||||||||||||||||||
| (a) | Class B Shares automatically convert into Class A Shares at the end of the calendar quarter that is eight years after the initial purchase date of either the Fund or another Goldman Sachs Fund. |
| (b) | Less than 0.5 shares. |
Financial Highlights
| Income (loss) from | Distributions | |||||||||||||||||||||||||||||||
| investment operations | to shareholders | |||||||||||||||||||||||||||||||
| Net asset | Net | |||||||||||||||||||||||||||||||
| value, | investment | Net realized | Total from | From net | Net asset | |||||||||||||||||||||||||||
| beginning | income | and unrealized | investment | realized | value, end | Total | ||||||||||||||||||||||||||
| Year - Share Class | of period | (loss)(c) | gain (loss) | operations | gains | of period | return(a) | |||||||||||||||||||||||||
| FOR THE SIX MONTHS ENDED FEBRUARY 28, (Unaudited) | ||||||||||||||||||||||||||||||||
| 2005 - Class A Shares | $ | 18.31 | $ | 0.08 | $ | 0.86 | $ | 0.94 | $ | — | $ | 19.25 | 5.13 | % | ||||||||||||||||||
| 2005 - Class B Shares | 17.13 | — | (d) | 0.81 | 0.81 | — | 17.94 | 4.73 | ||||||||||||||||||||||||
| 2005 - Class C Shares | 17.10 | — | (d) | 0.81 | 0.81 | — | 17.91 | 4.74 | ||||||||||||||||||||||||
| 2005 - Institutional Shares | 18.77 | 0.12 | 0.89 | 1.01 | — | 19.78 | 5.38 | |||||||||||||||||||||||||
| 2005 - Service Shares | 18.14 | 0.07 | 0.86 | 0.93 | — | 19.07 | 5.13 | |||||||||||||||||||||||||
| FOR THE YEARS ENDED AUGUST 31, | ||||||||||||||||||||||||||||||||
| 2004 - Class A Shares | 17.07 | (0.05 | ) | 1.29 | 1.24 | — | 18.31 | 7.26 | ||||||||||||||||||||||||
| 2004 - Class B Shares | 16.09 | (0.17 | ) | 1.21 | 1.04 | — | 17.13 | 6.46 | ||||||||||||||||||||||||
| 2004 - Class C Shares | 16.07 | (0.17 | ) | 1.20 | 1.03 | — | 17.10 | 6.41 | ||||||||||||||||||||||||
| 2004 - Institutional Shares | 17.44 | 0.03 | 1.30 | 1.33 | — | 18.77 | 7.63 | |||||||||||||||||||||||||
| 2004 - Service Shares | 16.94 | (0.07 | ) | 1.27 | 1.20 | — | 18.14 | 7.08 | ||||||||||||||||||||||||
| 2003 - Class A Shares | 15.44 | — | (d) | 1.63 | 1.63 | — | 17.07 | 10.56 | ||||||||||||||||||||||||
| 2003 - Class B Shares | 14.66 | (0.11 | ) | 1.54 | 1.43 | — | 16.09 | 9.75 | ||||||||||||||||||||||||
| 2003 - Class C Shares | 14.64 | (0.11 | ) | 1.54 | 1.43 | — | 16.07 | 9.77 | ||||||||||||||||||||||||
| 2003 - Institutional Shares | 15.71 | 0.06 | 1.67 | 1.73 | — | 17.44 | 11.01 | |||||||||||||||||||||||||
| 2003 - Service Shares | 15.33 | (0.01 | ) | 1.62 | 1.61 | — | 16.94 | 10.50 | ||||||||||||||||||||||||
| 2002 - Class A Shares | 19.76 | (0.05 | ) | (4.24 | ) | (4.29 | ) | (0.03 | ) | 15.44 | (21.74 | ) | ||||||||||||||||||||
| 2002 - Class B Shares | 18.90 | (0.18 | ) | (4.03 | ) | (4.21 | ) | (0.03 | ) | 14.66 | (22.31 | ) | ||||||||||||||||||||
| 2002 - Class C Shares | 18.88 | (0.18 | ) | (4.03 | ) | (4.21 | ) | (0.03 | ) | 14.64 | (22.33 | ) | ||||||||||||||||||||
| 2002 - Institutional Shares | 20.02 | 0.02 | (4.30 | ) | (4.28 | ) | (0.03 | ) | 15.71 | (21.41 | ) | |||||||||||||||||||||
| 2002 - Service Shares | 19.63 | (0.07 | ) | (4.20 | ) | (4.27 | ) | (0.03 | ) | 15.33 | (21.78 | ) | ||||||||||||||||||||
| 2001 - Class A Shares | 28.95 | (0.06 | ) | (7.23 | ) | (7.29 | ) | (1.90 | ) | 19.76 | (26.48 | ) | ||||||||||||||||||||
| 2001 - Class B Shares | 27.99 | (0.23 | ) | (6.96 | ) | (7.19 | ) | (1.90 | ) | 18.90 | (27.06 | ) | ||||||||||||||||||||
| 2001 - Class C Shares | 27.94 | (0.22 | ) | (6.94 | ) | (7.16 | ) | (1.90 | ) | 18.88 | (27.00 | ) | ||||||||||||||||||||
| 2001 - Institutional Shares | 29.19 | 0.03 | (7.30 | ) | (7.27 | ) | (1.90 | ) | 20.02 | (26.18 | ) | |||||||||||||||||||||
| 2001 - Service Shares | 28.81 | (0.08 | ) | (7.20 | ) | (7.28 | ) | (1.90 | ) | 19.63 | (26.58 | ) | ||||||||||||||||||||
| 2000 - Class A Shares | 24.96 | (0.11 | ) | 6.29 | 6.18 | (2.19 | ) | 28.95 | 25.70 | |||||||||||||||||||||||
| 2000 - Class B Shares | 24.37 | (0.30 | ) | 6.11 | 5.81 | (2.19 | ) | 27.99 | 24.75 | |||||||||||||||||||||||
| 2000 - Class C Shares | 24.33 | (0.30 | ) | 6.10 | 5.80 | (2.19 | ) | 27.94 | 24.75 | |||||||||||||||||||||||
| 2000 - Institutional Shares | 25.06 | — | (d) | 6.32 | 6.32 | (2.19 | ) | 29.19 | 26.18 | |||||||||||||||||||||||
| 2000 - Service Shares | 24.88 | (0.13 | ) | 6.25 | 6.12 | (2.19 | ) | 28.81 | 25.53 | |||||||||||||||||||||||
| (a) | Assumes investment at the net asset value at the beginning of the period, reinvestment of all dividends and distributions, a complete redemption of the investment at the net asset value at the end of the period and no sales or redemption charges. Total return would be reduced if a sales or redemption charge were taken into account. Total returns for periods less than one full year are not annualized. Returns do not reflect the deduction of taxes that a shareholder would pay on Fund distributions or the redemption of Fund shares. |
| (b) | Annualized. |
| (c) | Calculated based on the average shares outstanding methodology. |
| (d) | Amount is less than $0.005 per share. |
44
| Ratios assuming | ||||||||||||||||||||||||||
| no expense reductions | ||||||||||||||||||||||||||
| Ratio of | Ratio of | |||||||||||||||||||||||||
| Net assets, | Ratio of | net investment | Ratio of | net investment | ||||||||||||||||||||||
| at end | net expenses | income (loss) | total expenses | income (loss) | Portfolio | |||||||||||||||||||||
| of period | to average | to average | to average | to average | turnover | |||||||||||||||||||||
| (in 000s) | net assets | net assets | net assets | net assets | rate | |||||||||||||||||||||
| $ | 1,363,679 | 1.38 | %(b) | 0.80 | %(b) | 1.46 | %(b) | 0.72 | %(b) | 14 | % | |||||||||||||||
| 182,557 | 2.13 | (b) | 0.05 | (b) | 2.21 | (b) | (0.03 | )(b) | 14 | |||||||||||||||||
| 84,162 | 2.13 | (b) | 0.05 | (b) | 2.21 | (b) | (0.03 | )(b) | 14 | |||||||||||||||||
| 263,025 | 0.98 | (b) | 1.22 | (b) | 1.06 | (b) | 1.14 | (b) | 14 | |||||||||||||||||
| 5,200 | 1.48 | (b) | 0.71 | (b) | 1.56 | (b) | 0.63 | (b) | 14 | |||||||||||||||||
| 1,343,848 | 1.39 | (0.26 | ) | 1.47 | (0.34 | ) | 43 | |||||||||||||||||||
| 196,910 | 2.14 | (1.01 | ) | 2.22 | (1.09 | ) | 43 | |||||||||||||||||||
| 89,086 | 2.14 | (1.01 | ) | 2.22 | (1.09 | ) | 43 | |||||||||||||||||||
| 289,239 | 0.99 | 0.14 | 1.07 | 0.06 | 43 | |||||||||||||||||||||
| 5,592 | 1.49 | (0.36 | ) | 1.57 | (0.44 | ) | 43 | |||||||||||||||||||
| 1,483,768 | 1.40 | 0.00 | 1.48 | (0.08 | ) | 17 | ||||||||||||||||||||
| 226,663 | 2.15 | (0.74 | ) | 2.23 | (0.82 | ) | 17 | |||||||||||||||||||
| 100,027 | 2.15 | (0.74 | ) | 2.23 | (0.82 | ) | 17 | |||||||||||||||||||
| 303,840 | 1.00 | 0.41 | 1.08 | 0.33 | 17 | |||||||||||||||||||||
| 5,985 | 1.50 | (0.10 | ) | 1.58 | (0.18 | ) | 17 | |||||||||||||||||||
| 1,388,868 | 1.43 | (0.29 | ) | 1.47 | (0.33 | ) | 11 | |||||||||||||||||||
| 238,335 | 2.18 | (1.04 | ) | 2.22 | (1.08 | ) | 11 | |||||||||||||||||||
| 101,783 | 2.18 | (1.04 | ) | 2.22 | (1.08 | ) | 11 | |||||||||||||||||||
| 316,020 | 1.03 | 0.11 | 1.07 | 0.07 | 11 | |||||||||||||||||||||
| 5,976 | 1.53 | (0.39 | ) | 1.57 | (0.43 | ) | 11 | |||||||||||||||||||
| 2,001,259 | 1.44 | (0.25 | ) | 1.46 | (0.27 | ) | 18 | |||||||||||||||||||
| 338,673 | 2.19 | (1.00 | ) | 2.21 | (1.02 | ) | 18 | |||||||||||||||||||
| 127,839 | 2.19 | (1.00 | ) | 2.21 | (1.02 | ) | 18 | |||||||||||||||||||
| 444,195 | 1.04 | 0.15 | 1.06 | 0.13 | 18 | |||||||||||||||||||||
| 8,979 | 1.54 | (0.35 | ) | 1.56 | (0.37 | ) | 18 | |||||||||||||||||||
| 2,736,484 | 1.45 | (0.41 | ) | 1.47 | (0.44 | ) | 34 | |||||||||||||||||||
| 451,666 | 2.20 | (1.16 | ) | 2.22 | (1.19 | ) | 34 | |||||||||||||||||||
| 143,126 | 2.20 | (1.16 | ) | 2.22 | (1.19 | ) | 34 | |||||||||||||||||||
| 497,986 | 1.05 | — | 1.07 | (0.03 | ) | 34 | ||||||||||||||||||||
| 13,668 | 1.55 | (0.49 | ) | 1.57 | (0.52 | ) | 34 | |||||||||||||||||||
Financial Highlights
| Income (loss) from | Distributions | |||||||||||||||||||||||||||||||||||||||
| investment operations | to shareholders | |||||||||||||||||||||||||||||||||||||||
| Net asset | Net | |||||||||||||||||||||||||||||||||||||||
| value, | investment | Net realized | Total from | From net | From net | Net asset | ||||||||||||||||||||||||||||||||||
| beginning | income | and unrealized | investment | investment | realized | Total | value, end | Total | ||||||||||||||||||||||||||||||||
| Year - Share Class | of period | (loss)(c) | gain (loss) | operations | income | gains | distributions | of period | return(a) | |||||||||||||||||||||||||||||||
| FOR THE SIX MONTHS ENDED FEBRUARY 28, (Unaudited) | ||||||||||||||||||||||||||||||||||||||||
| 2005 - Class A Shares | $ | 8.07 | $ | 0.03 | $ | 0.30 | $ | 0.33 | $ | — | (d) | $ | — | $ | — | $ | 8.40 | 4.11 | % | |||||||||||||||||||||
| 2005 - Class B Shares | 7.76 | — | (d) | 0.29 | 0.29 | — | — | — | 8.05 | 3.74 | ||||||||||||||||||||||||||||||
| 2005 - Class C Shares | 7.78 | — | (d) | 0.28 | 0.28 | — | — | — | 8.06 | 3.60 | ||||||||||||||||||||||||||||||
| 2005 - Institutional Shares | 8.25 | 0.05 | 0.31 | 0.36 | (0.04 | ) | — | — | 8.57 | 4.32 | ||||||||||||||||||||||||||||||
| 2005 - Service Shares | 8.10 | 0.02 | 0.30 | 0.32 | — | (d) | — | — | 8.42 | 3.95 | ||||||||||||||||||||||||||||||
| FOR THE YEARS ENDED AUGUST 31, | ||||||||||||||||||||||||||||||||||||||||
| 2004 - Class A Shares | 7.79 | (0.04 | ) | 0.32 | 0.28 | — | — | — | 8.07 | 3.59 | ||||||||||||||||||||||||||||||
| 2004 - Class B Shares | 7.55 | (0.10 | ) | 0.31 | 0.21 | — | — | — | 7.76 | 2.78 | ||||||||||||||||||||||||||||||
| 2004 - Class C Shares | 7.56 | (0.10 | ) | 0.32 | 0.22 | — | — | — | 7.78 | 2.91 | ||||||||||||||||||||||||||||||
| 2004 - Institutional Shares | 7.93 | (0.01 | ) | 0.33 | 0.32 | — | — | — | 8.25 | 4.04 | ||||||||||||||||||||||||||||||
| 2004 - Service Shares | 7.82 | (0.05 | ) | 0.33 | 0.28 | — | — | — | 8.10 | 3.58 | ||||||||||||||||||||||||||||||
| 2003 - Class A Shares | 6.95 | (0.03 | ) | 0.87 | 0.84 | — | — | — | 7.79 | 12.09 | ||||||||||||||||||||||||||||||
| 2003 - Class B Shares | 6.79 | (0.08 | ) | 0.84 | 0.76 | — | — | — | 7.55 | 11.19 | ||||||||||||||||||||||||||||||
| 2003 - Class C Shares | 6.80 | (0.09 | ) | 0.85 | 0.76 | — | — | — | 7.56 | 11.18 | ||||||||||||||||||||||||||||||
| 2003 - Institutional Shares | 7.05 | (0.01 | ) | 0.89 | 0.88 | — | — | — | 7.93 | 12.48 | ||||||||||||||||||||||||||||||
| 2003 - Service Shares | 6.97 | (0.03 | ) | 0.88 | 0.85 | — | — | — | 7.82 | 12.20 | ||||||||||||||||||||||||||||||
| 2002 - Class A Shares | 9.22 | (0.06 | ) | (2.21 | ) | (2.27 | ) | — | — | (d) | — | 6.95 | (24.59 | ) | ||||||||||||||||||||||||||
| 2002 - Class B Shares | 9.07 | (0.12 | ) | (2.16 | ) | (2.28 | ) | — | — | (d) | — | 6.79 | (25.11 | ) | ||||||||||||||||||||||||||
| 2002 - Class C Shares | 9.08 | (0.12 | ) | (2.16 | ) | (2.28 | ) | — | — | (d) | — | 6.80 | (25.08 | ) | ||||||||||||||||||||||||||
| 2002 - Institutional Shares | 9.30 | (0.02 | ) | (2.23 | ) | (2.25 | ) | — | — | (d) | — | 7.05 | (24.17 | ) | ||||||||||||||||||||||||||
| 2002 - Service Shares | 9.23 | (0.05 | ) | (2.21 | ) | (2.26 | ) | — | — | (d) | — | 6.97 | (24.46 | ) | ||||||||||||||||||||||||||
| 2001 - Class A Shares | 12.52 | (0.06 | ) | (3.24 | ) | (3.30 | ) | — | — | — | 9.22 | (26.35 | ) | |||||||||||||||||||||||||||
| 2001 - Class B Shares | 12.40 | (0.13 | ) | (3.20 | ) | (3.33 | ) | — | — | — | 9.07 | (26.84 | ) | |||||||||||||||||||||||||||
| 2001 - Class C Shares | 12.42 | (0.13 | ) | (3.21 | ) | (3.34 | ) | — | — | — | 9.08 | (26.88 | ) | |||||||||||||||||||||||||||
| 2001 - Institutional Shares | 12.58 | (0.02 | ) | (3.26 | ) | (3.28 | ) | — | — | — | 9.30 | (26.06 | ) | |||||||||||||||||||||||||||
| 2001 - Service Shares | 12.52 | (0.04 | ) | (3.25 | ) | (3.29 | ) | — | — | — | 9.23 | (26.27 | ) | |||||||||||||||||||||||||||
| 2000 - Class A Shares | 10.06 | (0.06 | ) | 2.52 | 2.46 | — | — | — | 12.52 | 24.46 | ||||||||||||||||||||||||||||||
| 2000 - Class B Shares | 10.04 | (0.14 | ) | 2.50 | 2.36 | — | — | — | 12.40 | 23.51 | ||||||||||||||||||||||||||||||
| 2000 - Class C Shares | 10.05 | (0.14 | ) | 2.51 | 2.37 | — | — | — | 12.42 | 23.58 | ||||||||||||||||||||||||||||||
| 2000 - Institutional Shares | 10.07 | (0.01 | ) | 2.52 | 2.51 | — | — | — | 12.58 | 24.93 | ||||||||||||||||||||||||||||||
| 2000 - Service Shares | 10.06 | (0.04 | ) | 2.50 | 2.46 | — | — | — | 12.52 | 24.45 | ||||||||||||||||||||||||||||||
| (a) | Assumes investment at the net asset value at the beginning of the period, reinvestment of all dividends and distributions, a complete redemption of the investment at the net asset value at the end of the period and no sales or redemption charges. Total return would be reduced if a sales or redemption charge were taken into account. Total returns for periods less than one full year are not annualized. Returns do not reflect the deduction of taxes that a shareholder would pay on Fund distributions or the redemption of Fund shares. |
| (b) | Annualized. |
| (c) | Calculated based on the average shares outstanding methodology. |
| (d) | Less than $0.005 per share. |
46
| Ratios assuming no | ||||||||||||||||||||||||||
| expense reductions | ||||||||||||||||||||||||||
| Ratio of | Ratio of | |||||||||||||||||||||||||
| Net assets, | Ratio of | net investment | Ratio of | net investment | ||||||||||||||||||||||
| end | net expenses | income (loss) | total expenses | income (loss) | Portfolio | |||||||||||||||||||||
| of period | to average | to average | to average | to average | turnover | |||||||||||||||||||||
| (in 000s) | net assets | net assets | net assets | net assets | rate | |||||||||||||||||||||
| $ | 168,592 | 1.44 | %(b) | 0.64 | %(b) | 1.53 | %(b) | 0.55 | %(b) | 27 | % | |||||||||||||||
| 10,905 | 2.19 | (b) | (0.10 | )(b) | 2.28 | (b) | (0.19 | )(b) | 27 | |||||||||||||||||
| 11,347 | 2.19 | (b) | (0.11 | )(b) | 2.28 | (b) | (0.20 | )(b) | 27 | |||||||||||||||||
| 161,726 | 1.04 | (b) | 1.10 | (b) | 1.13 | (b) | 1.01 | (b) | 27 | |||||||||||||||||
| 299 | 1.54 | (b) | 0.56 | (b) | 1.63 | (b) | 0.47 | (b) | 27 | |||||||||||||||||
| 173,243 | 1.44 | (0.47 | ) | 1.55 | (0.58 | ) | 19 | |||||||||||||||||||
| 11,537 | 2.19 | (1.22 | ) | 2.30 | (1.33 | ) | 19 | |||||||||||||||||||
| 11,491 | 2.19 | (1.22 | ) | 2.30 | (1.33 | ) | 19 | |||||||||||||||||||
| 129,083 | 1.04 | (0.07 | ) | 1.15 | (0.18 | ) | 19 | |||||||||||||||||||
| 297 | 1.54 | (0.58 | ) | 1.65 | (0.69 | ) | 19 | |||||||||||||||||||
| 146,867 | 1.45 | (0.49 | ) | 1.62 | (0.66 | ) | 14 | |||||||||||||||||||
| 11,452 | 2.20 | (1.24 | ) | 2.37 | (1.41 | ) | 14 | |||||||||||||||||||
| 8,979 | 2.20 | (1.24 | ) | 2.37 | (1.41 | ) | 14 | |||||||||||||||||||
| 93,806 | 1.05 | (0.09 | ) | 1.22 | (0.26 | ) | 14 | |||||||||||||||||||
| 1 | 1.55 | (0.44 | ) | 1.72 | (0.61 | ) | 14 | |||||||||||||||||||
| 113,813 | 1.45 | (0.66 | ) | 1.63 | (0.84 | ) | 40 | |||||||||||||||||||
| 9,781 | 2.20 | (1.41 | ) | 2.38 | (1.59 | ) | 40 | |||||||||||||||||||
| 5,109 | 2.20 | (1.41 | ) | 2.38 | (1.59 | ) | 40 | |||||||||||||||||||
| 59,130 | 1.05 | (0.27 | ) | 1.23 | (0.45 | ) | 40 | |||||||||||||||||||
| 1 | 1.55 | (0.58 | ) | 1.73 | (0.76 | ) | 40 | |||||||||||||||||||
| 109,315 | 1.44 | (0.52 | ) | 1.67 | (0.75 | ) | 25 | |||||||||||||||||||
| 14,235 | 2.19 | (1.27 | ) | 2.42 | (1.50 | ) | 25 | |||||||||||||||||||
| 5,613 | 2.19 | (1.27 | ) | 2.42 | (1.50 | ) | 25 | |||||||||||||||||||
| 45,898 | 1.04 | (0.15 | ) | 1.27 | (0.38 | ) | 25 | |||||||||||||||||||
| 1 | 1.54 | (0.37 | ) | 1.77 | (0.60 | ) | 25 | |||||||||||||||||||
| 92,271 | 1.44 | (0.50 | ) | 1.63 | (0.69 | ) | 19 | |||||||||||||||||||
| 17,149 | 2.19 | (1.24 | ) | 2.38 | (1.43 | ) | 19 | |||||||||||||||||||
| 7,287 | 2.19 | (1.24 | ) | 2.38 | (1.43 | ) | 19 | |||||||||||||||||||
| 22,910 | 1.04 | (0.09 | ) | 1.23 | (0.28 | ) | 19 | |||||||||||||||||||
| 2 | 1.54 | (0.35 | ) | 1.73 | (0.54 | ) | 19 | |||||||||||||||||||
Financial Highlights
| Income (loss) from | Distributions | |||||||||||||||||||||||||||||||
| investment operations | to shareholders | |||||||||||||||||||||||||||||||
| Net asset | Net | |||||||||||||||||||||||||||||||
| value, | investment | Net realized | Total from | From net | Net asset | |||||||||||||||||||||||||||
| beginning | income | and unrealized | investment | realized | value, end | Total | ||||||||||||||||||||||||||
| Year - Share Class | of period | (loss)(c) | gain | operations | gains | of period | return(a) | |||||||||||||||||||||||||
| FOR THE SIX MONTHS ENDED FEBRUARY 28, (Unaudited) | ||||||||||||||||||||||||||||||||
| 2005 - Class A Shares | $ | 11.70 | $ | 0.04 | $ | 0.57 | $ | 0.61 | $ | (0.19 | ) | $ | 12.12 | 5.14 | % | |||||||||||||||||
| 2005 - Class B Shares | 11.53 | (0.01 | ) | 0.57 | 0.56 | (0.19 | ) | 11.90 | 4.78 | |||||||||||||||||||||||
| 2005 - Class C Shares | 11.51 | (0.01 | ) | 0.57 | 0.56 | (0.19 | ) | 11.88 | 4.79 | |||||||||||||||||||||||
| 2005 - Institutional Shares | 11.79 | 0.06 | 0.58 | 0.64 | (0.19 | ) | 12.24 | 5.35 | ||||||||||||||||||||||||
| 2005 - Service Shares | 11.70 | 0.03 | 0.58 | 0.61 | (0.19 | ) | 12.12 | 5.14 | ||||||||||||||||||||||||
| FOR THE YEAR ENDED AUGUST 31, | ||||||||||||||||||||||||||||||||
| 2004 - Class A Shares | 11.64 | (0.07 | ) | 0.17 | 0.10 | (0.04 | ) | 11.70 | 0.84 | |||||||||||||||||||||||
| 2004 - Class B Shares | 11.56 | (0.16 | ) | 0.17 | 0.01 | (0.04 | ) | 11.53 | 0.06 | |||||||||||||||||||||||
| 2004 - Class C Shares | 11.55 | (0.16 | ) | 0.16 | — | (0.04 | ) | 11.51 | (0.02 | ) | ||||||||||||||||||||||
| 2004 - Institutional Shares | 11.68 | (0.02 | ) | 0.17 | 0.15 | (0.04 | ) | 11.79 | 1.26 | |||||||||||||||||||||||
| 2004 - Service Shares | 11.64 | (0.07 | ) | 0.17 | 0.10 | (0.04 | ) | 11.70 | 0.84 | |||||||||||||||||||||||
| FOR THE PERIOD ENDED AUGUST 31, | ||||||||||||||||||||||||||||||||
| 2003 - Class A Shares (commenced September 3, 2002) | 10.00 | (0.08 | ) | 1.72 | 1.64 | — | 11.64 | 16.40 | ||||||||||||||||||||||||
| 2003 - Class B Shares (commenced September 3, 2002) | 10.00 | (0.16 | ) | 1.72 | 1.56 | — | 11.56 | 15.60 | ||||||||||||||||||||||||
| 2003 - Class C Shares (commenced September 3, 2002) | 10.00 | (0.16 | ) | 1.71 | 1.55 | — | 11.55 | 15.50 | ||||||||||||||||||||||||
| 2003 - Institutional Shares (commenced September 3, 2002) | 10.00 | (0.03 | ) | 1.71 | 1.68 | — | 11.68 | 16.80 | ||||||||||||||||||||||||
| 2003 - Service Shares (commenced September 3, 2002) | 10.00 | (0.07 | ) | 1.71 | 1.64 | — | 11.64 | 16.40 | ||||||||||||||||||||||||
| (a) | Assumes investment at the net asset value at the beginning of the period, reinvestment of all dividends and distributions, a complete redemption of the investment at the net asset value at the end of the period and no sales or redemption charges. Total return would be reduced if a sales or redemption charge were taken into account. Total returns for periods less than one full year are not annualized. Returns do not reflect the deduction of taxes that a shareholder would pay on Fund distributions or the redemption of Fund shares. |
| (b) | Annualized. |
| (c) | Calculated based on the average shares outstanding methodology. |
48
| Ratios assuming no | ||||||||||||||||||||||||||
| expense reductions | ||||||||||||||||||||||||||
| Ratio of | Ratio of | |||||||||||||||||||||||||
| Net assets, | Ratio of | net investment | Ratio of | net investment | ||||||||||||||||||||||
| end | net expenses | income (loss) | total expenses | income (loss) | Portfolio | |||||||||||||||||||||
| of period | to average | to average | to average | to average | turnover | |||||||||||||||||||||
| (in 000s) | net assets | net assets | net assets | net assets | rate | |||||||||||||||||||||
| $ | 63,063 | 1.48 | %(b) | 0.58 | %(b) | 1.59 | %(b) | 0.47 | %(b) | 16 | % | |||||||||||||||
| 105 | 2.23 | (b) | (0.16 | )(b) | 2.34 | (b) | (0.27 | )(b) | 16 | |||||||||||||||||
| 332 | 2.23 | (b) | (0.19 | )(b) | 2.34 | (b) | (0.30 | )(b) | 16 | |||||||||||||||||
| 56,167 | 1.08 | (b) | 0.99 | (b) | 1.19 | (b) | 0.88 | (b) | 16 | |||||||||||||||||
| 2 | 1.58 | (b) | 0.45 | (b) | 1.69 | (b) | 0.34 | (b) | 16 | |||||||||||||||||
| 61,216 | 1.48 | (0.61 | ) | 1.79 | (0.92 | ) | 28 | |||||||||||||||||||
| 96 | 2.23 | (1.38 | ) | 2.54 | (1.69 | ) | 28 | |||||||||||||||||||
| 247 | 2.23 | (1.34 | ) | 2.54 | (1.65 | ) | 28 | |||||||||||||||||||
| 45,464 | 1.08 | (0.20 | ) | 1.39 | (0.51 | ) | 28 | |||||||||||||||||||
| 2 | 1.58 | (0.61 | ) | 1.89 | (0.92 | ) | 28 | |||||||||||||||||||
| 49,494 | 1.48 | (b) | (0.76 | )(b) | 2.65 | (b) | (1.93 | )(b) | 19 | |||||||||||||||||
| 92 | 2.23 | (b) | (1.50 | )(b) | 3.40 | (b) | (2.67 | )(b) | 19 | |||||||||||||||||
| 20 | 2.23 | (b) | (1.53 | )(b) | 3.40 | (b) | (2.70 | )(b) | 19 | |||||||||||||||||
| 27,810 | 1.08 | (b) | (0.32 | )(b) | 2.25 | (b) | (1.49 | )(b) | 19 | |||||||||||||||||
| 2 | 1.58 | (b) | (0.72 | )(b) | 2.75 | (b) | (1.89 | )(b) | 19 | |||||||||||||||||
Financial Highlights
| Income (loss) from | Distributions | |||||||||||||||||||||||||||||||
| investment operations | to shareholders | |||||||||||||||||||||||||||||||
| Net asset | ||||||||||||||||||||||||||||||||
| value, | Net | Net realized | Total from | From net | Net asset | |||||||||||||||||||||||||||
| beginning | investment | and unrealized | investment | realized | value, end | Total | ||||||||||||||||||||||||||
| Year - Share Class | of period | loss(c) | gain (loss) | operations | gains | of period | return(a) | |||||||||||||||||||||||||
| FOR THE SIX MONTHS ENDED FEBRUARY 28, (Unaudited) | ||||||||||||||||||||||||||||||||
| 2005 - Class A Shares | $ | 18.58 | $ | (0.09 | ) | $ | 2.73 | $ | 2.64 | $ | — | $ | 21.22 | 14.21 | % | |||||||||||||||||
| 2005 - Class B Shares | 17.98 | (0.16 | ) | 2.64 | 2.48 | — | 20.46 | 13.79 | ||||||||||||||||||||||||
| 2005 - Class C Shares | 17.86 | (0.16 | ) | 2.63 | 2.47 | — | 20.33 | 13.83 | ||||||||||||||||||||||||
| 2005 - Institutional Shares | 18.97 | (0.05 | ) | 2.79 | 2.74 | — | 21.71 | 14.44 | ||||||||||||||||||||||||
| 2005 - Service Shares | 18.46 | (0.10 | ) | 2.72 | 2.62 | — | 21.08 | 14.19 | ||||||||||||||||||||||||
| FOR THE YEARS ENDED AUGUST 31, | ||||||||||||||||||||||||||||||||
| 2004 - Class A Shares | 17.38 | (0.15 | ) | 1.35 | 1.20 | — | 18.58 | 6.90 | ||||||||||||||||||||||||
| 2004 - Class B Shares | 16.94 | (0.28 | ) | 1.32 | 1.04 | — | 17.98 | 6.14 | ||||||||||||||||||||||||
| 2004 - Class C Shares | 16.83 | (0.28 | ) | 1.31 | 1.03 | — | 17.86 | 6.12 | ||||||||||||||||||||||||
| 2004 - Institutional Shares | 17.67 | (0.08 | ) | 1.38 | 1.30 | — | 18.97 | 7.36 | ||||||||||||||||||||||||
| 2004 - Service Shares | 17.29 | (0.17 | ) | 1.34 | 1.17 | — | 18.46 | 6.77 | ||||||||||||||||||||||||
| 2003 - Class A Shares | 14.09 | (0.12 | ) | 3.41 | 3.29 | — | 17.38 | 23.35 | ||||||||||||||||||||||||
| 2003 - Class B Shares | 13.84 | (0.22 | ) | 3.32 | 3.10 | — | 16.94 | 22.40 | ||||||||||||||||||||||||
| 2003 - Class C Shares | 13.74 | (0.22 | ) | 3.31 | 3.09 | — | 16.83 | 22.49 | ||||||||||||||||||||||||
| 2003 - Institutional Shares | 14.27 | (0.06 | ) | 3.46 | 3.40 | — | 17.67 | 23.83 | ||||||||||||||||||||||||
| 2003 - Service Shares | 14.03 | (0.13 | ) | 3.39 | 3.26 | — | 17.29 | 23.24 | ||||||||||||||||||||||||
| 2002 - Class A Shares | 18.11 | (0.15 | ) | (3.87 | ) | (4.02 | ) | — | 14.09 | (22.20 | ) | |||||||||||||||||||||
| 2002 - Class B Shares | 17.92 | (0.27 | ) | (3.81 | ) | (4.08 | ) | — | 13.84 | (22.77 | ) | |||||||||||||||||||||
| 2002 - Class C Shares | 17.80 | (0.27 | ) | (3.79 | ) | (4.06 | ) | — | 13.74 | (22.81 | ) | |||||||||||||||||||||
| 2002 - Institutional Shares | 18.26 | (0.08 | ) | (3.91 | ) | (3.99 | ) | — | 14.27 | (21.89 | ) | |||||||||||||||||||||
| 2002 - Service Shares | 18.05 | (0.16 | ) | (3.86 | ) | (4.02 | ) | — | 14.03 | (22.27 | ) | |||||||||||||||||||||
| 2001 - Class A Shares | 19.50 | (0.14 | ) | (0.66 | ) | (0.80 | ) | (0.59 | ) | 18.11 | (4.17 | ) | ||||||||||||||||||||
| 2001 - Class B Shares | 19.45 | (0.28 | ) | (0.66 | ) | (0.94 | ) | (0.59 | ) | 17.92 | (4.92 | ) | ||||||||||||||||||||
| 2001 - Class C Shares | 19.31 | (0.28 | ) | (0.64 | ) | (0.92 | ) | (0.59 | ) | 17.80 | (4.85 | ) | ||||||||||||||||||||
| 2001 - Institutional Shares | 19.59 | (0.07 | ) | (0.67 | ) | (0.74 | ) | (0.59 | ) | 18.26 | (3.79 | ) | ||||||||||||||||||||
| 2001 - Service Shares | 19.45 | (0.16 | ) | (0.65 | ) | (0.81 | ) | (0.59 | ) | 18.05 | (4.24 | ) | ||||||||||||||||||||
| 2000 - Class A Shares | 10.13 | (0.11 | ) | 9.71 | 9.60 | (0.23 | ) | 19.50 | 95.73 | |||||||||||||||||||||||
| 2000 - Class B Shares | 10.18 | (0.24 | ) | 9.74 | 9.50 | (0.23 | ) | 19.45 | 94.27 | |||||||||||||||||||||||
| 2000 - Class C Shares | 10.10 | (0.24 | ) | 9.68 | 9.44 | (0.23 | ) | 19.31 | 94.43 | |||||||||||||||||||||||
| 2000 - Institutional Shares | 10.13 | (0.04 | ) | 9.73 | 9.69 | (0.23 | ) | 19.59 | 96.67 | |||||||||||||||||||||||
| 2000 - Service Shares | 10.12 | (0.12 | ) | 9.68 | 9.56 | (0.23 | ) | 19.45 | 95.41 | |||||||||||||||||||||||
| (a) | Assumes investment at the net asset value at the beginning of the period, reinvestment of all dividends and distributions, a complete redemption of the investment at the net asset value at the end of the period and no sales or redemption charges. Total return would be reduced if a sales or redemption charge were taken into account. Total returns for periods less than one full year are not annualized. Returns do not reflect the deduction of taxes that a shareholder would pay on Fund distributions or the redemption of Fund shares. |
| (b) | Annualized. |
| (c) | Calculated based on the average shares outstanding methodology. |
50
| Ratios assuming no | ||||||||||||||||||||||||||
| expense reductions | ||||||||||||||||||||||||||
| Ratio of | Ratio of | |||||||||||||||||||||||||
| Net assets, | Ratio of | net investment | Ratio of | net investment | ||||||||||||||||||||||
| end | net expenses | loss | total expenses | loss | Portfolio | |||||||||||||||||||||
| of period | to average | to average | to average | to average | turnover | |||||||||||||||||||||
| (in 000s) | net assets | net assets | net assets | net assets | rate | |||||||||||||||||||||
| $ | 784,181 | 1.48 | %(b) | (0.92 | )%(b) | 1.48 | %(b) | (0.92 | )%(b) | 26 | % | |||||||||||||||
| 93,918 | 2.23 | (b) | (1.67 | )(b) | 2.23 | (b) | (1.67 | )(b) | 26 | |||||||||||||||||
| 94,277 | 2.23 | (b) | (1.67 | )(b) | 2.23 | (b) | (1.67 | )(b) | 26 | |||||||||||||||||
| 626,005 | 1.08 | (b) | (0.51 | )(b) | 1.08 | (b) | (0.51 | )(b) | 26 | |||||||||||||||||
| 2,957 | 1.58 | (b) | (1.02 | )(b) | 1.58 | (b) | (1.02 | )(b) | 26 | |||||||||||||||||
| 615,510 | 1.49 | (0.80 | ) | 1.49 | (0.80 | ) | 51 | |||||||||||||||||||
| 85,969 | 2.24 | (1.55 | ) | 2.24 | (1.55 | ) | 51 | |||||||||||||||||||
| 69,067 | 2.24 | (1.55 | ) | 2.24 | (1.55 | ) | 51 | |||||||||||||||||||
| 290,601 | 1.09 | (0.40 | ) | 1.09 | (0.40 | ) | 51 | |||||||||||||||||||
| 1,464 | 1.59 | (0.87 | ) | 1.59 | (0.87 | ) | 51 | |||||||||||||||||||
| 441,187 | 1.53 | (0.80 | ) | 1.53 | (0.80 | ) | 66 | |||||||||||||||||||
| 85,601 | 2.28 | (1.56 | ) | 2.28 | (1.56 | ) | 66 | |||||||||||||||||||
| 63,358 | 2.28 | (1.56 | ) | 2.28 | (1.56 | ) | 66 | |||||||||||||||||||
| 189,498 | 1.13 | (0.41 | ) | 1.13 | (0.41 | ) | 66 | |||||||||||||||||||
| 539 | 1.63 | (0.90 | ) | 1.63 | (0.90 | ) | 66 | |||||||||||||||||||
| 368,361 | 1.51 | (0.87 | ) | 1.51 | (0.87 | ) | 69 | |||||||||||||||||||
| 68,639 | 2.26 | (1.62 | ) | 2.26 | (1.62 | ) | 69 | |||||||||||||||||||
| 47,581 | 2.26 | (1.62 | ) | 2.26 | (1.62 | ) | 69 | |||||||||||||||||||
| 134,954 | 1.11 | (0.47 | ) | 1.11 | (0.47 | ) | 69 | |||||||||||||||||||
| 471 | 1.61 | (0.99 | ) | 1.61 | (0.99 | ) | 69 | |||||||||||||||||||
| 428,981 | 1.54 | (0.74 | ) | 1.54 | (0.74 | ) | 66 | |||||||||||||||||||
| 73,776 | 2.29 | (1.49 | ) | 2.29 | (1.49 | ) | 66 | |||||||||||||||||||
| 47,738 | 2.29 | (1.49 | ) | 2.29 | (1.49 | ) | 66 | |||||||||||||||||||
| 128,182 | 1.14 | (0.34 | ) | 1.14 | (0.34 | ) | 66 | |||||||||||||||||||
| 232 | 1.64 | (0.84 | ) | 1.64 | (0.84 | ) | 66 | |||||||||||||||||||
| 188,199 | 1.52 | (0.64 | ) | 1.61 | (0.73 | ) | 73 | |||||||||||||||||||
| 42,061 | 2.27 | (1.38 | ) | 2.36 | (1.47 | ) | 73 | |||||||||||||||||||
| 26,826 | 2.27 | (1.38 | ) | 2.36 | (1.47 | ) | 73 | |||||||||||||||||||
| 49,921 | 1.12 | (0.23 | ) | 1.21 | (0.32 | ) | 73 | |||||||||||||||||||
| 3 | 1.62 | (0.69 | ) | 1.71 | (0.78 | ) | 73 | |||||||||||||||||||
Fund Expenses (Unaudited) — Six Month Period Ended February 28, 2005
As a shareholder of Class A, Class B, Class C, Institutional or Service Shares of the Funds you incur two types of costs: (1) transaction costs, including sales charges (loads) on purchase payments (with respect to Class A Shares) or contingent deferred sales charges (loads) on redemptions (with respect to Class B and Class C Shares); and (2) ongoing costs, including management fees; distribution and service (12b-1) fees (with respect to Class A, Class B and Class C Shares); and other Fund expenses. This Example is intended to help you understand your ongoing costs (in dollars) of investing in Class A, Class B, Class C, Institutional and Service Shares of the Fund and to compare these costs with the ongoing costs of investing in other mutual funds.
The Example is based on an investment of $1,000 invested at the beginning of the period and held for the entire period from September 1, 2004 through February 28, 2005.
Actual Expenses — The first line under each share class in the table below provides information about actual account values and actual expenses. You may use the information in this line, together with the amount you invested, to estimate the expenses that you paid over the period. Simply divide your account value by $1,000 (for example, an $8,600 account value divided by $1,000=8.6), then multiply the result by the number in the first line under the heading entitled “Expenses Paid” to estimate the expenses you paid on your account during this period.
Hypothetical Example for Comparison Purposes — The second line under each share class in the table below provides information about hypothetical account values and hypothetical expenses based on the Funds’ actual expense ratio and an assumed rate of return of 5% per year before expenses, which is not the Funds’ actual return. The hypothetical account values and expenses may not be used to estimate the actual ending account balance or expenses you paid for the period. You may use this information to compare the ongoing costs of investing in the Funds and other funds. To do so, compare this 5% hypothetical example with the 5% hypothetical examples that appear in the shareholder reports of the other funds.
Please note that the expenses shown in the table are meant to highlight your ongoing costs only and do not reflect any transactional costs, such as sales charges (loads). Therefore, the second line of the table is useful in comparing ongoing costs only, and will not help you determine the relative total costs of owning different funds. In addition, if these transactional costs were included, your costs would have been higher.
| Capital Growth Fund | Strategic Growth Fund | |||||||||||||||||||||||
| Expenses | Expenses | |||||||||||||||||||||||
| Beginning | Ending | Paid for the | Beginning | Ending | Paid for the | |||||||||||||||||||
| Account Value | Account Value | 6 months ended | Account Value | Account Value | 6 months ended | |||||||||||||||||||
| Share Class | 9/1/04 | 2/28/05 | 2/28/05* | 9/1/04 | 2/28/05 | 2/28/05* | ||||||||||||||||||
Class A | ||||||||||||||||||||||||
| Actual | $ | 1,000 | $ | 1,051.30 | $ | 7.03 | $ | 1,000 | $ | 1,041.10 | $ | 7.30 | ||||||||||||
| Hypothetical 5% return | 1,000 | 1,017.94 | + | 6.92 | 1,000 | 1,017.64 | + | 7.22 | ||||||||||||||||
Class B | ||||||||||||||||||||||||
| Actual | 1,000 | 1,047.30 | 10.82 | 1,000 | 1,037.40 | 11.08 | ||||||||||||||||||
| Hypothetical 5% return | 1,000 | 1,014.22 | + | 10.64 | 1,000 | 1,013.92 | + | 10.95 | ||||||||||||||||
Class C | ||||||||||||||||||||||||
| Actual | 1,000 | 1,047.40 | 10.82 | 1,000 | 1,036.00 | 11.07 | ||||||||||||||||||
| Hypothetical 5% return | 1,000 | 1,014.22 | + | 10.64 | 1,000 | 1,013.92 | + | 10.95 | ||||||||||||||||
Institutional | ||||||||||||||||||||||||
| Actual | 1,000 | 1,053.80 | 5.00 | 1,000 | 1,043.20 | 5.29 | ||||||||||||||||||
| Hypothetical 5% return | 1,000 | 1,019.92 | + | 4.92 | 1,000 | 1,019.62 | + | 5.23 | ||||||||||||||||
Service | ||||||||||||||||||||||||
| Actual | 1,000 | 1,051.30 | 7.54 | 1,000 | 1,039.50 | 7.81 | ||||||||||||||||||
| Hypothetical 5% return | 1,000 | 1,017.45 | + | 7.41 | 1,000 | 1,017.14 | + | 7.72 | ||||||||||||||||
[Additional columns below]
[Continued from above table, first column(s) repeated]
| Concentrated Growth Fund | Growth Opportunities Fund | |||||||||||||||||||||||
| Expenses | Expenses | |||||||||||||||||||||||
| Beginning | Ending | Paid for the | Beginning | Ending | Paid for the | |||||||||||||||||||
| Account Value | Account Value | 6 months ended | Account Value | Account Value | 6 months ended | |||||||||||||||||||
| Share Class | 9/1/04 | 2/28/05 | 2/28/05* | 9/1/04 | 2/28/05 | 2/28/05* | ||||||||||||||||||
Class A | ||||||||||||||||||||||||
| Actual | $ | 1,000 | $ | 1,051.40 | $ | 7.53 | $ | 1,000 | $ | 1,142.10 | $ | 7.86 | ||||||||||||
| Hypothetical 5% return | 1,000 | 1,017.45 | + | 7.41 | 1,000 | 1,017.45 | + | 7.40 | ||||||||||||||||
Class B | ||||||||||||||||||||||||
| Actual | 1,000 | 1,047.80 | 11.32 | 1,000 | 1,137.90 | 11.81 | ||||||||||||||||||
| Hypothetical 5% return | 1,000 | 1,013.74 | + | 11.13 | 1,000 | 1,013.74 | + | 11.13 | ||||||||||||||||
Class C | ||||||||||||||||||||||||
| Actual | 1,000 | 1,047.90 | 11.34 | 1,000 | 1,138.30 | 11.83 | ||||||||||||||||||
| Hypothetical 5% return | 1,000 | 1,013.72 | + | 11.15 | 1,000 | 1,013.73 | + | 11.14 | ||||||||||||||||
Institutional | ||||||||||||||||||||||||
| Actual | 1,000 | 1,053.50 | 5.51 | 1,000 | 1,144.40 | 5.76 | ||||||||||||||||||
| Hypothetical 5% return | 1,000 | 1,019.42 | + | 5.42 | 1,000 | 1,019.42 | + | 5.42 | ||||||||||||||||
Service | ||||||||||||||||||||||||
| Actual | 1,000 | 1,051.40 | 8.05 | 1,000 | 1,141.90 | 8.41 | ||||||||||||||||||
| Hypothetical 5% return | 1,000 | 1,016.95 | + | 7.91 | 1,000 | 1,016.94 | + | 7.92 | ||||||||||||||||
| * | Expenses for each share class are calculated using the fund’s annualized expense ratio for each class, which represents the ongoing expenses as a percentage of net assets for the six months ended 2/28/05. Expenses are calculated by multiplying the annualized expense ratio by the average account value for the period; then multiplying the result by the number of days in the most recent fiscal half year; and then dividing that result by the number of days in the calendar year. The expense ratios for the period were as follows: |
| Fund | Class A | Class B | Class C | Institutional | Service | |||||||||||||||
| Capital Growth Fund | 1.38 | % | 2.13 | % | 2.13 | % | 0.98 | % | 1.48 | % | ||||||||||
| Strategic Growth Fund | 1.44 | 2.19 | 2.19 | 1.04 | 1.54 | |||||||||||||||
| Concentrated Growth Fund | 1.48 | 2.23 | 2.23 | 1.08 | 1.58 | |||||||||||||||
| Growth Opportunities Fund | 1.48 | 2.23 | 2.23 | 1.08 | 1.58 | |||||||||||||||
| + | Hypothetical expenses are based on each Fund’s actual annualized expense ratios and an assumed rate of return of 5% per year before expenses. |
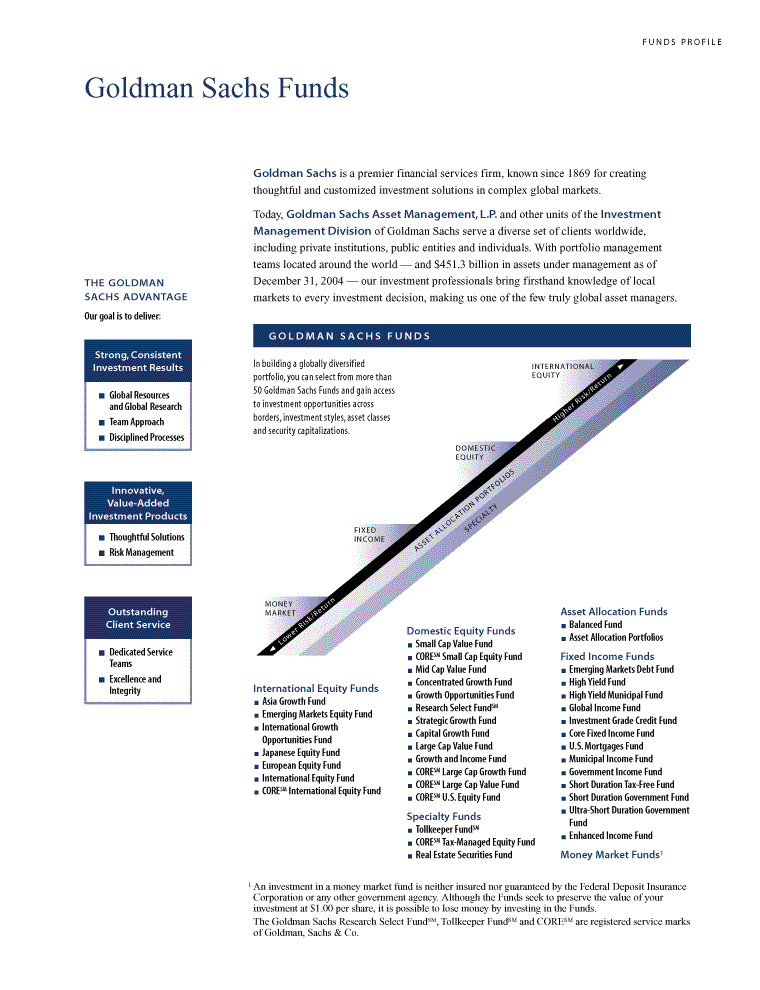
| FUNDS PROFILE Goldman Sachs Funds THE GOLDMAN SACHS ADVANTAGE Our goal is to deliver: Strong, Consistent Investment Results Global Resources and Global Research Team Approach Disciplined Processes Innovative, Value-Added Investment Products Thoughtful Solutions Risk Management Outstanding Client Service Dedicated Service Teams Excellence and Integrity Goldman Sachs is a premier financial services firm, known since 1869 for creating thoughtful and customized investment solutions in complex global markets. Today, Goldman Sachs Asset Management, L.P. and other units of the Investment Management Division of Goldman Sachs serve a diverse set of clients worldwide, including private institutions, public entities and individuals. With portfolio management teams located around the world — and $451.3 billion in assets under management as of December 31, 2004 — our investment professionals bring firsthand knowledge of local markets to every investment decision, making us one of the few truly global asset managers. GOLDMAN SACHS FUNDS In building a globally diversified portfolio, you can select from more than 50 Goldman Sachs Funds and gain access to investment opportunities across borders, investment styles, asset classes and security capitalizations. FIXED INCOME MONEY Risk/Return MARKET Lower International Equity Funds Asia Growth Fund Emerging Markets Equity Fund International Growth Opportunities Fund Japanese Equity Fund European Equity Fund International Equity Fund CORESM International Equity Fund INTERNATIONAL EQUITY Risk/Return Higher DOMESTIC EQUITY PORTFOLIOS SPECIALTY ALLOCATION ASSET Asset Allocation Funds Balanced Fund Domestic Equity Funds Asset Allocation Portfolios Small Cap Value Fund CORESM Small Cap Equity Fund Fixed Income Funds Mid Cap Value Fund Emerging Markets Debt Fund Concentrated Growth Fund High Yield Fund Growth Opportunities Fund High Yield Municipal Fund Research Select FundSM Global Income Fund Strategic Growth Fund Investment Grade Credit Fund Capital Growth Fund Core Fixed Income Fund Large Cap Value Fund U.S. Mortgages Fund Growth and Income Fund Municipal Income Fund CORESM Large Cap Growth Fund Government Income Fund CORESM Large Cap Value Fund Short Duration Tax-Free Fund CORESM U.S. Equity Fund Short Duration Government Fund Ultra-Short Duration Government Fund Specialty Funds Tollkeeper FundSM Enhanced Income Fund CORESM Tax-Managed Equity Fund Real Estate Securities Fund Money Market Funds1 1 An investment in a money market fund is neither insured nor guaranteed by the Federal Deposit Insurance Corporation or any other government agency. Although the Funds seek to preserve the value of your investment at $1.00 per share, it is possible to lose money by investing in the Funds. The Goldman Sachs Research Select FundSM, Tollkeeper FundSM and CORESM are registered service marks of Goldman, Sachs & Co. |
| GOLDMAN SACHS ASSET MANAGEMENT, L.P. 32 OLD SLIP, 32ND FLOOR, NEW YORK, NEW YORK 10005 TRUSTEES OFFICERS Ashok N. Bakhru, Chairman Kaysie P. Uniacke, President John P. Coblentz, Jr. James A. Fitzpatrick, Vice President Patrick T. Harker James A. McNamara, Vice President Mary Patterson McPherson John M. Perlowski, Treasurer Alan A. Shuch Howard B. Surloff, Secretary Wilma J. Smelcer Richard P. Strubel Kaysie P. Uniacke GOLDMAN, SACHS & CO. GOLDMAN SACHS ASSET MANAGEMENT, L.P. Distributor and Transfer Agent Investment Adviser Visit our Web site at www.gs.com/funds to obtain the most recent month-end returns The reports concerning the Funds included in this shareholder report may contain certain forward-looking statements about the factors that may affect the performance of the Funds in the future. These statements are based on Fund management’s predictions and expectations concerning certain future events and their expected impact on the Funds, such as performance of the economy as a whole and of specific industry sectors, changes in the levels of interest rates, the impact of developing world events, and other factors that may influence the future performance of the Funds. Management believes these forward-looking statements to be reasonable, although they are inherently uncertain and difficult to predict. Actual events may cause adjustments in portfolio management strategies from those currently expected to be employed. A description of the policies and procedures that the Funds use to determine how to vote proxies relating to portfolio securities and information regarding how a Fund voted proxies relating to portfolio securities during the most recent 12-month period ended June 30 is available (I) without charge, upon request by calling 1-800-526-7384 (for Retail Shareholders) or 1-800-621-2550 (for Institutional Shareholders); and (II) on the Securities and Exchange Commission Web site at http://www.sec.gov. The Funds file their complete schedule of portfolio holdings with the Securities and Exchange Commission (the “Commission”) for the first and third quarters of each fiscal year on Form N-Q. The Fund’s Form N-Q is available on the Commission’s website at http://www.sec.gov. The Funds’ Form N-Q may be reviewed and copied at the Commission’s Public Reference Room in Washington, D.C. and information on the operation of the Public Reference Room may be obtained by calling 1-800-SEC-0330. Form N-Q may be obtained upon request and without charge by calling 1-800-526-7384 (for Retail Shareholders) or 1-800-621-2550 (for Institutional Shareholders). The Funds are subject to the risk of rising and falling stock prices. In recent years, the U.S. stock market has experienced substantial price volatility. The Strategic Growth Fund may participate in the Initial Public Offering (IPO) market, and a portion of the Fund’s returns consequently may be attributable to its investment in IPOs, which may have a magnified impact due to the Fund’s small asset base. As the Fund’s assets grow, it is probable that the effect of the Fund’s investment in IPOs on its total returns may not be as significant. The Concentrated Growth Fund is not diversified. Due to the smaller number of stocks generally held in the portfolio, the Fund may be subject to greater risks than a more diversified fund. A change in the value of any single holding may affect the overall value more than it would affect a diversified fund that holds more investments. Holdings and allocations shown are unaudited, and may not be representative of current or future investments. Holdings and allocations may not include the Fund’s entire investment portfolio, which may change at any time. Fund holdings should not be relied on in making investment decisions and should not be construed as research or investment advice regarding particular securities. This material is not authorized for distribution to prospective investors unless preceded or accompanied by a current Prospectus. Please consider a Fund’ s objectives, risks, and charges and expenses, and read the Prospectus carefully before investing. The Prospectus contains this and other information about the Funds. Copyright 2005 Goldman, Sachs & Co. All rights reserved. Date of first use: April 29, 2005 / 05-606 G ROWTHSAR / 159.4 /04-05 |
| ITEM 2. | CODE OF ETHICS. — Not applicable to the Semi-Annual Report for the period ended February 28, 2005 | ||
| ITEM 3. | AUDIT COMMITTEE FINANCIAL EXPERT. — Not applicable to the Semi-Annual Report for the period ended February 28, 2005 |
| ITEM 4. | PRINCIPAL ACCOUNTANT FEES AND SERVICES. — Not applicable to the Semi-Annual Report for the period ended February 28, 2005 |
| ITEM 5. | AUDIT COMMITTEE OF LISTED REGISTRANTS. | |
| Not applicable. |
| ITEM 6. | SCHEDULE OF INVESTMENTS. | |
| Schedule of Investments is included as part of the Report to Shareholders filed under Item 1. |
| ITEM 7. | DISCLOSURE OF PROXY VOTING POLICIES AND PROCEDURES FOR CLOSED-END MANAGEMENT INVESTMENT COMPANIES. | |
| Not applicable. |
| ITEM 8. | PORTFOLIO MANAGERS OF CLOSED END MANAGEMENT INVESTMENT COMPANIES. | |
| Not applicable. |
| ITEM 9. | PURCHASES OF EQUITY SECURITIES BY CLOSED-END MANAGEMENT INVESTMENT COMPANY AND AFFILIATED PURCHASERS. | |
| Not applicable. |
| ITEM 10. | SUBMISSION OF MATTERS TO A VOTE OF SECURITY HOLDERS. There have been no material changes to the procedures by which shareholders may recommend nominees to the registrant’s board of trustees. | |
| ITEM 11. | CONTROLS AND PROCEDURES. | |
| (a) | The Registrant’s Principal Executive Officer and Principal Financial Officer concluded that the Registrant’s disclosure controls and procedures (as defined in Rule 30a-3(c) under the Investment Company Act of 1940), as enhanced as described below, were effective as of a date within 90 days prior to the filing date of this report (the “Evaluation Date”), based on their evaluation of the effectiveness of the Registrant's disclosure controls and procedures as of the Evaluation Date. | ||
| (b) | During the filing period of this report, the Registrant enhanced its control environment to ensure the increased tracking and filing of class action claims with respect to securities owned by the Funds and the recognition of gain contingencies on the financial statements. See the footnotes to the financial statements of the CORE Large Cap Growth Fund and Growth and Income Fund regarding related receivables for these Funds. Fund management has discussed these matters with the Registrant’s Audit Committee and auditors. | ||
| ITEM 12. | EXHIBITS. |
| (a)(1) | Goldman Sachs Trust’s Code of Ethics for Principal Executive and Senior Financial Officers is incorporated by reference to Exhibit 11(a)(1) of the registrant’s Form N-CSR filed on March 8, 2004 for its Real Estate Securities Fund (Accession Number 0000950123-04-0002984). | ||
| (a)(2) | Exhibit 99.CERT | Certifications pursuant to Section 302 of the Sarbanes-Oxley Act of 2002 filed herewith. | ||
| (b) | Exhibit 99.906CERT | Certifications pursuant to Section 906 of the Sarbanes-Oxley Act of 2002 filed herewith. |
SIGNATURES
| Pursuant to the requirements of the Securities Exchange Act of 1934 and the Investment Company Act of 1940, the registrant has duly caused this report to be signed on its behalf by the undersigned, thereunto duly authorized. |
| Goldman Sachs Trust | ||||||
| By: | /s/ Kaysie P. Uniacke | |||||
| Kaysie P. Uniacke | ||||||
| President/Principal Executive Officer | ||||||
| Goldman Sachs Trust | ||||||
| Date: | May 9, 2005 | |||||
| Pursuant to the requirements of the Securities Exchange Act of 1934 and the Investment Company Act of 1940, this report has been signed below by the following persons on behalf of the registrant and in the capacities and on the dates indicated. |
| By: | /s/ Kaysie P. Uniacke | |||||
| Kaysie P. Uniacke | ||||||
| President/Principal Executive Officer | ||||||
| Goldman Sachs Trust | ||||||
| Date: | May 9, 2005 | |||||
| By: | /s/ John M. Perlowski | |||||
| John M. Perlowski | ||||||
| Treasurer/Principal Financial Officer | ||||||
| Goldman Sachs Trust | ||||||
| Date: | May 9, 2005 |