UNITED STATES
SECURITIES AND EXCHANGE COMMISSION
Washington, D.C. 20549
FORM N-CSR
CERTIFIED SHAREHOLDER REPORT OF REGISTERED
MANAGEMENT INVESTMENT COMPANIES
Investment Company Act file number 811-05349
Goldman Sachs Trust
(Exact name of registrant as specified in charter)71 South Wacker Drive, Chicago, Illinois 60606
(Address of principal executive offices) (Zip code)| | | |
| Peter V. Bonanno, Esq. | | Copies to: |
| Goldman, Sachs & Co. | | Jack W. Murphy, Esq. |
| One New York Plaza | | Dechert LLP |
| New York, New York 10004 | | 1775 I Street, NW |
| | | Washington, D.C. 20006 |
|
(Name and address of agents for service)
|
Registrant’s telephone number, including area code: (312) 655-4400
Date of fiscal year end: October 31
Date of reporting period: April 30, 2009
| | | |
| ITEM 1. | | REPORTS TO STOCKHOLDERS. |
| | | |
| | | The Semi-Annual Report to Stockholders is filed herewith. |
Goldman Sachs Funds
| | | | |
| | | | |
Semi-Annual Report | | | April 30, 2009 |
| | | | |
| | | | |
| | | | |
| | | | Structured International Equity Funds |
| | | | Structured International Equity Flex Fund |
| | | | Structured Emerging Markets Equity Fund |
| | | | Structured International Equity Fund |
| | | | Structured International Small Cap Fund
|
| | | | |
Goldman Sachs Structured International
Equity Funds
| | |
| n | STRUCTURED INTERNATIONAL EQUITY FLEX FUND | |
| |
| n | STRUCTURED EMERGING MARKETS EQUITY FUND | |
| |
| n | STRUCTURED INTERNATIONAL EQUITY FUND | |
| |
| n | STRUCTURED INTERNATIONAL SMALL CAP FUND | |
TABLE OF CONTENTS
| | | |
| Principal Investment Strategies and Risks | | 1 |
| Investment Process | | 2 |
| Portfolio Review and Results | | 4 |
| Schedules of Investments | | 25 |
| Financial Statements | | 62 |
| Notes to Financial Statements | | 66 |
| Financial Highlights | | 84 |
| Other Information | | 92 |
| | | | | | | |
NOT FDIC-INSURED | | | May Lose Value | | | No Bank Guarantee |
| | | | | | | |
GOLDMAN SACHS STRUCTURED INTERNATIONAL EQUITY FUNDS
Principal Investment Strategies and Risks
This is not a complete list of risks that may affect the Funds. For additional information concerning the risks applicable to the Funds, please see the Funds’ Prospectuses.
The Goldman Sachs Structured International Equity Flex Fund invests in a broadly diversified portfolio of equity investments in companies that are organized outside the United States or whose securities are principally traded outside the United States. Foreign and emerging market securities may be more volatile than U.S. securities and are subject to the risks of currency fluctuations and sudden economic or political developments. At times, the Fund may be unable to sell certain of its portfolio securities without a substantial drop in price, if at all. The Fund engages in derivative transactions, including short sales of securities. Derivative instruments involve sophisticated investment techniques and involve risks different from, and possibly greater than, the risks associated with investing directly in securities. Derivative instruments often involve leverage of the Fund’s assets, which magnifies the effect of changes in market values. A short sale transaction involves the sale of a borrowed security to a third party, with the understanding that the security must later be returned to the lender. Short sales involve the risk of an unlimited increase in the market value of the security sold short, which could result in a theoretically unlimited loss. Other risks associated with the Fund’s investments in derivative instruments include risks of default by a counterparty and the risks that transactions may not be liquid.
The Goldman Sachs Structured Emerging Markets Equity Fund invests primarily in a diversified portfolio of equity investments in emerging country issuers. The Fund’s investments are subject to market risk, which means that the value of the securities in which it invests may go up or down in response to the prospects of individual companies, particular industry sectors and/or general economic conditions. Emerging markets securities are volatile, less liquid and are subject to substantial currency fluctuations and sudden economic and political developments. The securities markets of emerging countries have less government regulation and are subject to less extensive accounting and financial reporting requirements than the markets of more developed countries. At times, the Fund may be unable to sell certain of its portfolio securities without a substantial drop in price, if at all.
The Goldman Sachs Structured International Equity Fund invests primarily in a broadly diversified portfolio of equity investments in companies that are organized outside the United States or whose securities are principally traded outside the United States. The Fund’s equity investments will be subject to market risk, which means that the value of the securities in which it invests may go up or down in response to the prospects of individual companies, particular industry sectors and/or general economic conditions. The Fund may also invest in fixed income securities, which are subject to the risks associated with debt securities generally, including credit, liquidity and interest rate risk. Foreign and emerging market securities may be more volatile than investments in U.S. securities and are subject to the risks of currency fluctuations and sudden economic or political developments. At times, the Fund may be unable to sell certain of its portfolio securities without a substantial drop in price, if at all.
The Goldman Sachs Structured International Small Cap Fund invests primarily in a broadly diversified portfolio of equity investments in small cap non-U.S. issuers. The Fund’s investments are subject to market risk, which means that the value of the securities in which it invests may go up or down in response to the prospects of individual companies, particular industry sectors and/or general economic conditions. Stocks of small cap companies involve greater risks than those associated with larger, more established companies and may be subject to more abrupt or erratic price movements. Foreign and emerging market securities may be more volatile than investments in U.S. securities and are subject to the risks of currency fluctuations and sudden economic or political developments. At times, the Fund may be unable to sell certain of its portfolio securities without a substantial drop in price, if at all.
GOLDMAN SACHS STRUCTURED INTERNATIONAL EQUITY FUNDS
Goldman Sachs’ Structured International Equity
Investment Process
| | | |
| | 
n Comprehensive – We forecast returns on approximately 10,000 stocks globally, 20 countries and 10 currencies on a daily basis.
n Rigorous – We evaluate stocks, countries and currencies based on fundamental investment criteria that have outperformed historically.
n Objective – Our stock and equity market selection process is free from emotion that may lead to biased investment decisions.

n Our computer optimization process allocates risk to our best investment ideas and constructs funds that strive to neutralize systematic risks and deliver better returns.
n We use unique, proprietary risk models that are designed to be more precise, more focused and faster to respond because they seek to identify, track and manage risk specific to our process, using daily data.

Fully invested, well-diversified international portfolio that seeks to:
n Blend top-down market views with bottom-up stock selection.
n Maintain style, sector, risk and capitalization characteristics similar to the benchmark.
n Achieve excess returns by taking intentional country bets and many small diversified stock positions.
|
Enhancements Made to Proprietary Quantitative Model
During the Six-Month Period Ended April 30, 2009
We continuously look for ways to improve our investment process. Accordingly, we introduced a number of enhancements to our proprietary quantitative model during the reporting period. During the fourth quarter of 2008, we expanded the signals within our Momentum theme to exploit cross-company linkages. Using new data sources, we
identified additional lead-lag effects among groups of stocks through which stock returns for one group of companies can help our model predict the stock returns of economically-related companies.
GOLDMAN SACHS STRUCTURED INTERNATIONAL EQUITY FUNDS
We made this enhancement because we found that investors take time to incorporate into their decision-making company-specific information and information about related companies. Our research has shown that a company’s stock returns tend to lag information about other companies. As part of our stock selection process, we identify these lead-lag relationships between companies in the same industry and between companies across linked industries. Furthermore, because our new cross-company component captures investor under-reaction to different news (that is, cross-company versus company-specific), it has a low correlation to the prior components of our Momentum theme. We have found these new signals effective in multiple regions and over different historical time periods.
In addition, we extended existing data sources to multiple regions, creating new signals for other themes. For example, we enhanced our Management theme in Europe and extended a sector-specific signal from the United States to the United Kingdom. We believe that sector-specific research is a priority because: 1) new and unique data sources are increasingly available; 2) in our opinion, these types of signals are less “crowded” with our competitors; and 3) these metrics are more specific to, and relevant for, particular industries.
Changes Made to the Team’s Management
Mark Carhart and Ray Iwanowski, formerly co-heads of Quantitative Investment Strategies (QIS), have retired, each to pursue separate personal and professional objectives. Giorgio De Santis, co-head of QIS Research, also decided to retire.
Katinka Domotorffy, Head of Strategy for QIS, has assumed the role of Chief Investment Officer (CIO) and Head of QIS. Since joining Goldman Sachs in 1998, she has been a senior portfolio manager, researcher and strategist with the QIS team. Bob Jones will remain as co-CIO of the QIS equity team. Kent Daniel, senior portfolio manager and co-head of QIS Research, has joined Katinka and Bob as co-CIO of the equity business.
Bill Fallon, senior portfolio manager, has joined Katinka as co-CIO of our macro/fixed income strategies and will also serve as co-head of Research. Bob Litterman will remain as the Chairman of QIS. The QIS team includes more than 115 professionals across all areas of the company, with 30 more in the information technology division.
PORTFOLIO REVIEW
Goldman Sachs Structured International
Equity Funds
Market Review
The global financial markets experienced unprecedented levels of distress during the six-month period ended April 30, 2009. Credit spreads1 widened dramatically and volatility increased, driving many investors to the sidelines. By the end of 2008, global equity markets had declined more than 40% on average for the year, and the markets continued to struggle in early 2009 as persistently weak conditions delayed an economic recovery. Around the world, unemployment rates continued to rise, with U.S. unemployment reaching 8.9% in April, its highest level in more than 25 years. Meanwhile, major retailers and automakers warned of additional sales and profit declines. Shares of large banks fell sharply through the beginning of March on speculation world governments would nationalize some of the most troubled financial institutions.
The Morgan Stanley Capital International Europe, Australasia, Far East Index (the “MSCI EAFE Index”) declined 2.64% for six-month period ended April 30, 2009. Ten of the 21 countries in the MSCI EAFE Index were down for the period, with Ireland (−23.05%)2 and Switzerland (−9.57%) posting the largest losses. The United Kingdom (−8.35%), being a greater component of the MSCI EAFE Index than these other European markets, was the chief detractor.
In terms of sectors, six of the MSCI EAFE Index’s ten sectors turned in negative results, with health care (−12.61%) and utilities (−10.01%) losing the most ground. Financials (−7.07%), being a bigger component of the MSCI EAFE Index, was the largest detractor.
Emerging Markets Equity
The Morgan Stanley Capital International Emerging Markets Index (the “MSCI Emerging Markets Index”) gained 17.38% during the six-month period ended April 30, 2009. Seventeen of the 23 countries in the MSCI Emerging Markets Index were up for the period, with Indonesia (+46.71%) and Peru (+43.88%) posting the largest gains. China (+31.81%) was the most significant contributor on the basis of impact, which takes both weightings and total returns into account.
All ten sectors in the MSCI Emerging Markets Index were positive for the period, with industrials (+25.27%) and materials (+25.06%) gaining the most. Financials (+19.76%) was the largest contributor on the basis of impact.
| | |
| 1 | | Credit spread is the difference between the yield on the debt securities of a particular corporate or sovereign bond (or a class of bonds with a specified credit rating) and the yield of similar maturity Treasury debt securities. |
| |
| 2 | | All regional and country market returns as well as sector returns are expressed in U.S. dollar terms (unless otherwise specified) and are based on country-specific and sector-specific stock market indices that compose the applicable MSCI Index. |
PORTFOLIO REVIEW
International Small Cap
The Morgan Stanley Capital International Small Cap EAFE Index (“MSCI Small Cap EAFE Index”) gained 6.52% during the six-month period ended April 30, 2009. Seventeen of the 21 countries in the MSCI Small Cap EAFE Index were up, with Hong Kong (+33.45%) and Austria (+32.97%) posting the greatest gains. The United Kingdom (+10.92%) was the largest contributor on the basis of impact.
Seven of the ten sectors in the MSCI Small Cap EAFE Index posted positive results for the period, with energy (+14.51%), telecommunication services (+12.59%) and consumer discretionary (+12.14%) increasing the most. The consumer discretionary sector was the primary contributor on the basis of impact.
Looking Ahead
In the coming months, we strongly believe investors will use fundamentally-based criteria to build their portfolios. That is, investors will choose to overweight those stocks with less expensive valuations, higher quality earnings, and higher profitability. Stocks with good momentum are likely, in our view, to outperform those with poor momentum. Our focus will remain on companies with strong fundamentals, sustainable earnings and a track record of using capital to enhance shareholder value. As such, we anticipate remaining fully invested, with long-term performance likely to be the result of stock selection rather than sector or capitalization allocations.
We stand behind our investment philosophy that sound economic investment principles, coupled with a disciplined quantitative approach, can provide strong, uncorrelated returns over the long term. Our research agenda is robust, and we continue to enhance our existing models, add new proprietary forecasting signals, and improve our trading execution as we seek to provide the most value to our shareholders.
PORTFOLIO RESULTS
Structured International Equity Flex Fund
Portfolio Management Discussion and Analysis
Below, the Goldman Sachs Quantitative Investment Strategies Team discusses the Fund’s performance and
positioning for the six-month period ended April 30, 2009.
| |
| Q | How did the Goldman Sachs International Equity Flex Fund (the “Fund”) perform during the semi-annual period ended April 30, 2009? |
| |
| A | During the six-month reporting period ended April 30, 2009, the Fund’s Class A, C, Institutional, IR and R Shares generated cumulative total returns, without sales charges, of −5.58%, −5.81%, −5.25%, −5.44% and −5.61%, respectively. These returns compare to the −2.64% cumulative total return of the Fund’s benchmark, the MSCI EAFE Index, during the same period. |
| |
| Q | What key factors were most responsible for the Fund’s performance during the six-month reporting period? |
| |
| A | As expected, and in keeping with our investment approach, our quantitative model and its six investment themes had the greatest impact on relative performance. We use these themes to take a long-term view of market patterns and look for inefficiencies, selecting stocks for the Fund and overweighting or underweighting the ones chosen by the model. Over time and by design, the performance of any one of the model’s investment themes tends to have a low correlation with the model’s other themes, demonstrating the diversification benefit of the Fund’s theme-driven quantitative model. The variance in performance supports our research indicating that the diversification provided by our different investment themes is a significant investment advantage over the long term, even though the Fund may experience underperformance in the short term. |
Overall, the Fund underperformed during the six months, with our Momentum theme hurting results the most. The Momentum theme predicts drift in stock prices caused by under-reaction to company-specific information. Another detractor was our Sentiment theme, which looks at how Wall Street analysts’ views about a company’s earnings and prospects are changing over time.
Valuation, Quality and Management also hurt relative returns, though to a lesser extent. The Valuation theme attempts to capture potential mispricings of securities, typically by comparing a measure of the company’s intrinsic value to its market value. Quality evaluates whether the company’s earnings are coming from more persistent, cash-based sources, as opposed to accruals. Management assesses the characteristics, policies and strategic decisions of company management.
Profitability, which we use to assess whether a company is earning more than its cost of capital, was the best-performing theme during the reporting period.
| |
| Q | How did the Fund’s sector allocations affect relative performance? |
| |
| A | In constructing the Fund’s portfolio, we focus on picking stocks rather than on making industry or sector bets. Consequently, the Fund is similar to its benchmark, the MSCI EAFE Index, in terms of its sector allocation and style. Changes in its sector weights generally do not have a meaningful impact on relative performance. |
| |
| Q | Which stock positions contributed most to the Fund’s relative returns during the first half of the fiscal year? |
| |
| A | We seek to outpace the MSCI EAFE Index by overweighting stocks that we expect to outperform and underweighting those that we think may lag. We also build positions based on our thematic views. For example, the Fund aims to hold a basket of stocks with better Momentum characteristics than the benchmark. |
Fund positions in the information technology, consumer discretionary and consumer staples sectors were particularly advantageous during the reporting period. An underweight in German carmaker Volkswagen AG — assumed because of our negative views on Valuation and Momentum — also added to relative results. Further, negative views on Valuation and Quality led us to underweight multinational mining company Rio Tinto Ltd. The Fund was effectively overweight leisure travel company Thomas Cook Group PLC because of our positive views on Valuation and Quality.
| |
| Q | Which Fund positions detracted most from results during the reporting period? |
| |
| A | Security selection within the industrials, telecommunication services and health care sectors detracted from the Fund’s relative performance. In addition, the Fund’s |
PORTFOLIO RESULTS
| |
| underweight positions in three strongly-performing stocks particularly hurt during the reporting period. Our negative views on Momentum and Management led us to underweight Deutsche Postbank AG, a German bank, and Mitchells & Butlers PLC, a U.K.-based operator of pubs, bars and restaurants. The Fund was also underweight Natixis, a French brokerage and investment banking advisory firm, because of our negative views on Momentum and Profitability. |
| |
| Q | Were there any notable changes in the Fund’s country weightings during the reporting period? |
| |
| A | During the reporting period, the Fund was country neutral, that is, we maintained country weightings similar to the MSCI EAFE Index. Thus, the Fund’s positions within countries had no perceivable impact on relative performance. By the end of the period, we had increased the Fund’s weightings in Germany, Austria and Portugal and decreased its weightings in Japan, Switzerland and Spain. |
| |
| Q | What were the Fund’s sector and country weightings at the end of the reporting period? |
| |
| A | Throughout the reporting period, the Fund was overweight energy, materials, consumer staples, consumer discretionary and financials relative to the MSCI EAFE Index. It was underweight information technology, utilities, health care and telecommunication services. The Fund was relatively neutral to the benchmark index in the industrials sector at the end of the reporting period. |
In terms of countries, the Fund was slightly overweight Germany, Sweden, France, Portugal and Austria relative to the MSCI EAFE Index at the end of the reporting period. It was underweight Denmark, Greece, Switzerland, the Netherlands, Spain, Italy and Japan. The Fund was relatively neutral to the MSCI EAFE Index in Australia, Norway, Ireland, Hong Kong, Singapore, Belgium, the U.K., New Zealand and Finland.
Goldman Sachs Quantitative Investment Strategies Team
New York, May 5, 2009
FUND BASICS
Structured International Equity Flex Fund
as of April 30, 2009
PERFORMANCE REVIEW
| | | | | | | | | | | |
| | | Fund Cumulative Total Return
| | | | | | |
| November 1, 2008-April 30, 2009 | | (based on NAV)1 | | | MSCI EAFE (Net) Index2 | | | |
|
| |
| Class A | | | -5.58 | % | | | -2.64 | % | | |
| Class C | | | -5.81 | | | | -2.64 | | | |
| Institutional | | | -5.25 | | | | -2.64 | | | |
| Class IR | | | -5.44 | | | | -2.64 | | | |
| Class R | | | -5.61 | | | | -2.64 | | | |
|
| |
| 1 | The net asset value (NAV) represents the net assets of the class of the Fund (ex-dividend) divided by the total number of shares of the class outstanding. The Fund’s performance reflects the reinvestment of dividends and other distributions. The Fund’s performance does not reflect the deduction of any applicable sales charges. |
| 2 | The Morgan Stanley Capital International (MSCI) Europe, Australasia, Far East (EAFE) (Net) Index (unhedged and net of dividend withholding taxes) is a market capitalization-weighted composite of securities in 21 developed markets. The Index is unmanaged and does not include any deduction for fees, expenses or taxes. It is not possible to invest directly in an index. |
STANDARDIZED AVERAGE ANNUAL TOTAL RETURNS3
| | | | | | | | | | | | | |
| For the period ended 3/31/09 | | One Year | | | Since Inception | | | Inception Date | | |
|
| |
| Class A | | | -49.87 | % | | | -19.93 | % | | 7/31/06 | | |
| Class C | | | -48.42 | | | | -19.09 | | | 7/31/06 | | |
| Institutional | | | -47.28 | | | | -18.20 | | | 7/31/06 | | |
| Class IR | | | -47.40 | | | | -43.20 | | | 11/30/07 | | |
| Class R | | | -47.63 | | | | -43.42 | | | 11/30/07 | | |
|
| |
| 3 | The Standardized Average Annual Total Returns are average annual total returns as of the most recent calendar quarter-end. They assume reinvestment of all distributions at NAV. These returns reflect a maximum initial sales charge of 5.5% for Class A Shares and the assumed contingent deferred sales charge for Class C Shares (1% if redeemed within 12 months of purchase). Because Institutional, Class IR and R Shares do not involve a sales charge, such a charge is not applied to their Standardized Average Annual Total Returns. The Fund will charge a 2% redemption fee on the redemption of shares (including by exchange) held for 30 calendar days or less. The performance figures do not reflect the deduction of the redemption fee. If reflected, the redemption fee would reduce the performance quoted. |
| | Total returns represent past performance. Past performance does not guarantee future results. The Fund’s investment return and principal value will fluctuate so that an investor’s shares, when redeemed, may be worth more or less than their original cost. Current performance may be lower or higher than the performance quoted above. Please visit our Web site at: www.goldmansachsfunds.com to obtain the most recent month-end returns. Performance reflects fee waivers and/or expense limitations in effect. In their absence, performance would be reduced. Returns do not reflect the deduction of taxes that a shareholder would pay on Fund distributions or the redemption of Fund shares. |
FUND BASICS
EXPENSE RATIOS4
| | | | | | | | | | | |
| | | Net Expense Ratio (Current) | | | Gross Expense Ratio (Before Waivers) | | | |
|
| |
| Class A | | | 1.60 | % | | | 1.83 | % | | |
| Class C | | | 2.35 | | | | 2.58 | | | |
| Institutional | | | 1.20 | | | | 1.43 | | | |
| Class IR | | | 1.35 | | | | 1.58 | | | |
| Class R | | | 1.85 | | | | 2.08 | | | |
|
| |
| 4 | The expense ratios of the Fund, both current (net of applicable fee waivers and/or expense limitations) and before waivers (gross of applicable fee waivers and/or expense limitations), are as set forth above according to the most recent publicly available Prospectuses for the Fund and may differ from the expense ratios disclosed in the Financial Highlights in this report. Applicable waivers and expense limitations are voluntary and may be modified or terminated at any time at the option of the investment adviser. If this occurs, the expense ratios may change without shareholder approval. |
SECTOR ALLOCATIONS AS OF 4/30/095
Percentage of Investment Portfolio
| |
| 5 | The Fund is actively managed and, as such, its composition may differ over time. The above graph categorizes investments using Global Industry Classification Standard (“GICS”), however, the sector classifications used by the portfolio management team in the schedule of investments may differ from GICS. The percentage shown for each investment category reflects the value of investments in that category as a percentage of total value of investments (excluding securities lending collateral, if any). Securities lending collateral represented 5.0% of the Fund’s net assets at April 30, 2009. |
FUND BASICS
TOP 10 OVERWEIGHTS AS OF 4/30/096
| | | | | | | | | |
| | | Portfolio Weighting
| | | | | |
| Company | | Relative to Benchmark | | | Line of Business | | |
|
| |
| Total SA | | | +2.24 | % | | Energy | | |
| Sanofi-Aventis | | | +2.15 | | | Health Care | | |
| Banco Bilbao Vizcaya Argentaria | | | +1.89 | | | Financial | | |
| BASF SE | | | +1.88 | | | Materials | | |
| Vivendi SA | | | +1.82 | | | Consumer Discretionary | | |
| Koninklijke | | | +1.71 | | | Materials | | |
| Parmalat | | | +1.31 | | | Consumer Staples | | |
| Honda Motor Co Ltd | | | +1.30 | | | Consumer Discretionary | | |
| Telefonaktiebolaget LM Ericsson | | | +1.27 | | | Telecommunications Services | | |
| Nippon Telegraph & Telephone Corp | | | +1.21 | | | Telecommunications Services | | |
|
| |
| 6 | If a stock holding comprises a larger proportion of the Fund’s portfolio when compared to its proportionate position in the benchmark, it is considered an overweight. Conversely, when a stock holding comprises a smaller proportion of the Fund’s portfolio compared to its proportionate position in the benchmark, the stock is considered an underweight. The top 10 overweights may not be representative of the Fund’s future investments. |
TOP 10 UNDERWEIGHTS AS OF 4/30/097
| | | | | | | | | |
| | | Portfolio Weighting
| | | | | |
| Company | | Relative to Benchmark | | | Line of Business | | |
|
| |
| Colruyt SA | | | -1.73 | % | | FOODRET | | |
| Roche Holding AG | | | -1.19 | | | Health Care | | |
| Natexis | | | -1.17 | | | Financials | | |
| Toyota Motor Corp | | | -1.14 | | | Consumer Discretionary | | |
| Deutsche Postbank AG | | | -1.11 | | | Financials | | |
| Novartis AG | | | -1.09 | | | Health Care | | |
| Telefonica SA | | | -1.08 | | | Telecommunications Services | | |
| Intercontinental Hotels Group PLC | | | -1.03 | | | Health Care | | |
| ITV PLC | | | -1.03 | | | Telecommunications Services | | |
| Royal Dutch Shell PLC | | | -0.93 | | | Energy | | |
|
| |
| 7 | If a stock holding comprises a larger proportion of the Fund’s portfolio when compared to its proportionate position in the benchmark, it is considered an overweight. Conversely, when a stock holding comprises a smaller proportion of the Fund’s portfolio compared to its proportionate position in the benchmark, the stock is considered an underweight. The top 10 underweights may not be representative of the Fund’s future investments. |
PORTFOLIO RESULTS
Structured Emerging Markets Equity Fund
Portfolio Management Discussion and Analysis
Below, the Goldman Sachs Quantitative Investment Strategies Team discusses the Fund’s performance and positioning for the six-month period ended April 30, 2009.
| |
| Q | How did the Goldman Sachs Structured Emerging Markets Equity Fund (the “Fund”) perform during the semi-annual period ended April 30, 2009? |
| |
| A | During the six-month period ended April 30, 2009, the Fund’s Class A, C and Institutional Shares generated cumulative total returns, without sales charges, of 16.50%, 16.59% and 16.77%, respectively. These returns compare to the 17.38% cumulative total return of the Fund’s benchmark, the MSCI Emerging Markets Index (net of dividend withholding taxes), during the same period. |
| |
| Q | What key factors were most responsible for the Fund’s performance during the six-month reporting period? |
| |
| A | We use two distinct strategies — a bottom-up stock selection strategy and a top-down country/currency selection strategy — to manage the Fund. Both strategies tend to perform differently from each other over time, which enables us to greater diversify the portfolio. |
During the six-month period, our stock selection strategy, which uses proprietary models based on five investment themes, detracted most from relative performance. We use these themes to take a long-term view of market patterns and look for inefficiencies, selecting stocks for the Fund and overweighting or underweighting the ones chosen by the model. Over time and by design, the performance of any one of the model’s investment themes tends to have a low correlation with the model’s other themes, demonstrating the diversification benefit of the Fund’s theme-driven quantitative model. The variance in performance supports our research indicating that the diversification provided by our different investment themes is a significant investment advantage over the long term, even though the Fund may experience underperformance in the short term. On the upside, the Fund benefited from our country/currency selection strategy.
| |
| Q | Which investment themes hurt and which helped within the Team’s stock selection strategy? |
| |
| A | Our bottom-up stock selection strategy and its five investment themes — Valuation, Profitability, Quality, Momentum and Sentiment — had the greatest impact on relative results during the six-month reporting period. |
Profitability was the best-performing theme during the reporting period. Profitability assesses whether a company is earning more than its cost of capital. Quality and Valuation also added value. Quality evaluates whether the company’s earnings are coming from more persistent, cash-based sources, as opposed to accruals. Valuation attempts to capture potential mispricings of securities, typically by comparing a measure of the company’s intrinsic value to its market value.
Our Momentum theme was most detrimental. The Momentum theme predicts drift in stock prices caused by under-reaction to company-specific information. Another detractor, though to a lesser extent, was Sentiment. Sentiment reflects selected investment views and decisions of individuals and financial intermediaries.
| |
| Q | How did the Fund’s sector allocations affect relative results? |
| |
| A | In constructing the portfolio, we focus on picking stocks rather than on making industry or sector bets. Consequently, the Fund is similar to its benchmark, the MSCI Emerging Markets Index, in terms of its sector allocation and style. Changes in its sector weights generally do not have a meaningful impact on relative returns. |
| |
| Q | Which stock positions contributed the most to the Fund’s relative returns during the six-month period? |
| |
| A | We seek to outpace the MSCI Emerging Markets Index by overweighting stocks that we expect to outperform and underweighting those that we think may lag. We also build positions based on our thematic views. For example, the Fund aims to hold a basket of stocks with more favorable Momentum characteristics than the benchmark. |
PORTFOLIO RESULTS
Stock selection in the information technology and telecommunication services sectors added meaningfully to the Fund’s relative returns during the reporting period. Overweight positions in semiconductor manufacturer Macronix International Co. Ltd. and Chinese automaker Dongfeng Motor Group Co. Ltd. also enhanced results. The Fund owned both stocks because of our positive views on Valuation and Momentum. Our positive views of Momentum and Sentiment led us to effectively overweight global metals and mining company Companhia Vale do Rio Doce.
| |
| Q | Which Fund positions detracted most from results during the reporting period? |
| |
| A | Fund holdings in the materials, energy and industrials sectors detracted from relative performance most. The Fund’s overweight positions in three weakly-performing stocks particularly hurt during the reporting period. As a result of our positive views on Quality and Valuation, the Fund was overweight Gold Fields Ltd., a South Africa-based gold producing company. Our positive views on Quality and Profitability led us to overweight construction company Aveng Ltd. The Fund assumed an overweight in Brazilian oil and gas company Petroleo Brasileiro SA because of our positive views on Profitability and Valuation. |
| |
| Q | How did the Team’s country/currency selection contribute to the Fund’s performance relative to the MSCI EMF Index during the reporting period? |
| |
| A | Our country/currency selection strategy contributed positively to the Fund’s relative returns. Overweights in Indonesia, Brazil and China helped the most. |
We made our picks using our proprietary models, which are based on five investment themes — Valuation, Momentum, Risk Premium, Fund Flows and Macro. Valuation favors equity and currency markets which appear cheap relative to accounting measures of value and purchasing power. The Momentum factor favors countries and currencies that have had strong recent outperformance. Risk Premium evaluates whether a country is overcompensating investors for political and financial risk, while Fund Flows evaluates the strength of capital market inflows. Finally, Macro assesses a market’s interest rate environment and growth prospects.
| |
| Q | What changes did you make to the Fund’s country weightings during the reporting period? |
| |
| A | The largest shifts we made during the reporting period were to increase the Fund’s weightings in Taiwan, Korea and Mexico and to decrease its weightings in Turkey, Malaysia and Thailand. |
| |
| Q | What were the Fund’s sector and country weightings at the end of the period? |
| |
| A | Throughout the reporting period (and adjusted according to our country views), the Fund was overweight the energy, utilities, information technology, health care and industrials sectors relative to the benchmark MSCI Emerging Markets Index. It was underweight materials, financials, consumer staples, telecommunication services and consumer discretionary. |
In terms of countries, the Fund was overweight Taiwan, Indonesia, China, Mexico, Egypt, Turkey, Brazil and South Africa relative to the MSCI Emerging Markets Index at the end of the reporting period. The Fund was underweight Korea, Malaysia, India, Thailand, Poland, Czech Republic, Peru, Colombia, Philippines, Morocco, Israel, Russia, Chile and Hungary. The Fund was relatively neutral to the MSCI Emerging Markets Index in Argentina.
Goldman Sachs Quantitative Investment Strategies Team
New York, May 5, 2009
FUND BASICS
Structured Emerging Markets Equity Fund
as of April 30, 2009
PERFORMANCE REVIEW
| | | | | | | | | | | |
| | | Fund Cumulative Total Return
| | | MSCI Emerging
| | | |
| November 1, 2008-April 30, 2009 | | (based on NAV)1 | | | Markets (EM)-Net2 | | | |
|
| |
| Class A | | | 16.50 | % | | | 17.38 | % | | |
| Class C | | | 16.59 | | | | 17.38 | | | |
| Institutional | | | 16.77 | | | | 17.38 | | | |
|
| |
| 1 | The net asset value (NAV) represents the net assets of the class of the Fund (ex-dividend) divided by the total number of shares of the class outstanding. The Fund’s performance reflects the reinvestment of dividends and other distributions. The Fund’s performance does not reflect the deduction of any applicable sales charges. |
| 2 | The Morgan Stanley Capital International (MSCI) Emerging Markets Index is a free float-adjusted market capitalization index that is designed to measure equity market performance in the global emerging markets. The Index figures do not reflect any deduction for fees, expenses or taxes. It is not possible to invest directly in an unmanaged index. As of January 2009, the MSCI Emerging Markets Index consisted of the following 23 emerging market country indices: Argentina, Brazil, Chile, China, Colombia, Czech Republic, Egypt, Hungary, India, Indonesia, Israel, Korea, Malaysia, Mexico, Morocco, Pakistan, Peru, Philippines, Poland, Russia, South Africa, Taiwan, Thailand, and Turkey. |
STANDARDIZED AVERAGE ANNUAL TOTAL RETURNS3
| | | | | | | | | | | | | |
| For the period ended 3/31/09 | | One Year | | | Since Inception | | | Inception Date | | |
|
| |
| Class A | | | -51.23 | % | | | -43.66 | % | | 10/05/07 | | |
| Class C | | | -49.05 | | | | -41.74 | | | 10/05/07 | | |
| Institutional | | | -48.20 | | | | -41.26 | | | 10/05/07 | | |
|
| |
| 3 | The Standardized Average Annual Total Returns are average annual total returns as of the most recent calendar quarter-end. They assume reinvestment of all distributions at NAV. These returns reflect a maximum initial sales charge of 5.5% for Class A Shares and the assumed contingent deferred sales charge for Class C Shares (1% if redeemed within 12 months of purchase). Because Institutional Shares do not involve a sales charge, such a charge is not applied to their Standardized Average Annual Total Returns. The Fund will charge a 2% redemption fee on the redemption of shares (including by exchange) held for 30 calendar days or less. Performance figures do not reflect the deduction of the redemption fee. If reflected, the redemption fee would reduce the performance quoted. |
| | The returns represent past performance. Past performance does not guarantee future results. The Fund’s investment return and principal value will fluctuate so that an investor’s shares, when redeemed, may be worth more or less than their original cost. Current performance may be lower or higher than the performance quoted above. Please visit our Web site at: www.goldmansachsfunds.com to obtain the most recent month-end returns. Performance reflects fee waivers and/or expense limitations in effect. In their absence, performance would be reduced. Returns do not reflect the deduction of taxes that a shareholder would pay on Fund distributions or the redemption of Fund shares. |
FUND BASICS
EXPENSE RATIOS4
| | | | | | | | | | | |
| | | Net Expense Ratio (Current) | | Gross Expense Ratio (Before Waivers) | | |
|
| |
| Class A | | | 1.45 | % | | | 1.89 | % | | |
| Class C | | | 2.20 | | | | 2.64 | | | |
| Institutional | | | 1.05 | | | | 1.49 | | | |
|
| |
| 4 | The expense ratios of the Fund, both current (net of any fee waivers and/or expense limitations) and before waivers (gross of applicable fee waivers and/or expense limitations), are as set forth above according to the most recent publicly available Prospectuses for the Fund and may differ from the expense ratios disclosed in the Financial Highlights in this report. Applicable waivers and expense limitations are voluntary and may be modified or terminated at any time at the option of the investment adviser. If this occurs, the expense ratios may change without shareholder approval. |
TOP 10 HOLDINGS AS OF 4/30/095
| | | | | | | |
| | | % of Net
| | | |
| Holding | | Assets | | | Line of Business |
|
| |
| | | | | | | |
Taiwan Semiconductor
Manufacturing Co. Ltd. ADR | | | 6.3 | % | | Semiconductors & Semiconductor
Equipment |
| America Movil SAB de CV ADR Series L | | | 3.6 | | | Telecommunication Services |
| Petroleo Brasileiro SA Preference Shares | | | 3.1 | | | Energy |
| Petroleo Brasileiro SA ADR | | | 3.1 | | | Energy |
| Quanta Computer, Inc. | | | 2.7 | | | Technology Hardware & Equipment |
| China Construction Bank Corp. Class H | | | 2.6 | | | Banks |
| China Mobile Ltd. | | | 2.4 | | | Telecommunication Services |
| CNOOC Ltd. | | | 2.3 | | | Energy |
| PetroChina Co. Ltd. Class H | | | 2.2 | | | Energy |
| OAO Gazprom ADR | | | 2.2 | | | Energy |
|
5The top 10 holdings may not be representative of the Fund’s future investments.
FUND BASICS
SECTOR ALLOCATIONS AS OF 4/30/096
Percentage of Investment Portfolio
| |
| 6 | The Fund is actively managed and, as such, its composition may differ over time. The above graph categorizes investments using Global Industry Classification Standard (“GICS”), however, the sector classifications used by the portfolio management team in the schedule of investments may differ from GICS. The percentage shown for each investment category reflects the value of investments in that category as a percentage of total value of investments (excluding securities lending collateral, if any). Securities lending collateral represented 3.2% of the Fund’s net assets at April 30, 2009. |
PORTFOLIO RESULTS
Structured International Equity Fund
Portfolio Management Discussion and Analysis
Below, the Goldman Sachs Quantitative Investment Strategies Team discusses the Fund’s performance and positioning for the six-month period ended April 30, 2009.
| |
| Q | How did the Goldman Sachs Structured International Equity Fund (the “Fund”) perform during the semi-annual period ended April 30, 2009? |
| |
| A | During the six-month reporting period ended April 30, 2009, the Fund’s Class A, B, C, Institutional, Service, IR and R Shares generated cumulative total returns, without sales charges, of −3.97%, −4.30%, −4.28%, −3.75%, −3.99%, −3.83% and −4.08%, respectively. These returns compare to the −2.64% cumulative total return of the Fund’s benchmark, the MSCI EAFE Index, during the same period. |
| |
| Q | What key factors were most responsible for the Fund’s performance during the six-month reporting period? |
| |
| A | We use two distinct strategies — a bottom-up stock selection strategy and a top-down country/currency selection strategy — to manage the Fund. Both strategies tend to perform differently from each other over time, which enables us to greater diversify the portfolio. |
During the six-month period, our stock selection strategy, which uses stock selection models based on six investment themes, detracted most from the Fund’s relative performance. We use these themes to take a long-term view of market patterns and look for inefficiencies, selecting stocks for the Fund and overweighting or underweighting the ones chosen by the model. Over time and by design, the performance of any one of the model’s investment themes tends to have a low correlation with the model’s other themes, demonstrating the diversification benefit of the Fund’s theme-driven quantitative model. The variance in performance supports our research indicating that the diversification provided by our different investment themes is a significant investment advantage over the long term, even though the Fund may experience underperformance in the short term. On the upside, the Fund benefited from our country/currency selection strategy.
| |
| Q | Which investment themes hurt and which helped within the Team’s stock selection strategy? |
| |
| A | Our bottom-up stock selection strategy and its six investment themes underperformed overall during the six-month period, with our Momentum theme hampering results the most. The Momentum theme predicts drift in stock prices caused by under-reaction to company-specific information. Also detracting were Valuation, Sentiment and Quality. Valuation attempts to capture potential mispricings of securities, typically by comparing a measure of the company’s intrinsic value to its market value. Sentiment reflects selected investment views and decisions of individuals and financial intermediaries. Quality evaluates whether the company’s earnings are coming from more persistent, cash-based sources, as opposed to accruals. |
On the positive side, Profitability added to relative returns. The Profitability theme assesses whether a company is earning more than its cost of capital. Management, which assesses the company’s management strategy and behavior, also added value, though to a lesser extent.
| |
| Q | How did the Fund’s sector allocations affect relative performance? |
| |
| A | In constructing the portfolio, we focus on picking stocks rather than on making industry or sector bets. Consequently, the Fund is similar to its benchmark, the MSCI EAFE Index, in terms of its sector allocation and style. Changes in its sector weights generally do not have a meaningful impact on relative returns. |
| |
| Q | Which stock positions contributed the most to the Fund’s relative returns during the six-month period? |
| |
| A | We seek to outpace the MSCI EAFE Index by overweighting stocks that we expect to outperform and underweighting those that we think may lag. We also build positions based on our thematic views. For example, the Fund aims to hold a basket of stocks with more favorable Momentum characteristics than the benchmark. |
Stock picks in the consumer discretionary, information technology and energy sectors were most effective during
PORTFOLIO RESULTS
the reporting period. An underweight in German carmaker Volkswagen AG — assumed because of our negative views on Valuation and Management — also boosted relative results. The Fund was effectively overweight leisure travel company Thomas Cook Group PLC and Japanese engineering firm AMADA Co. Ltd. because of our positive views on Valuation and Profitability.
| |
| Q | Which Fund positions detracted most from results during the reporting period? |
| |
| A | Security selection within the financials, industrials and utilities sectors hampered the Fund’s relative performance most during the reporting period. The Fund’s overweight positions in three weakly-performing stocks particularly hurt during the reporting period. Our positive views on Management and Momentum led us to overweight global financial services company HSBC Holdings PLC and North American corn refiner Tate & Lyle PLC. Our overweight to William Morrison Supermarkets PLC, assumed because of our positive views on Profitability and Momentum, also detracted. |
| |
| Q | How did the Team’s country/currency selection contribute to the Fund’s performance relative to the MSCI EAFE Index during the reporting period? |
| |
| A | Our country/currency selection strategy enhanced the Fund’s relative returns. Underweights in Italy and Finland as well as an overweight in Hong Kong helped most. |
We made our picks using our proprietary models, which are based on five investment themes — Valuation, Momentum, Risk Premium, Fund Flows and Macro. Valuation favors equity and currency markets that appear cheap relative to accounting measures of value and purchasing power. The Momentum factor favors countries and currencies that have had strong recent outperformance. Risk Premium evaluates whether a country is overcompensating investors for political and financial risk, while Fund Flows evaluates the strength of capital market inflows. Finally, Macro assesses a market’s interest rate environment and growth prospects.
| |
| Q | What changes did you make to the Fund’s country weightings during the reporting period? |
| |
| A | The largest shifts we made during the reporting period were to increase the Fund’s weightings in Spain, Italy and Sweden and to decrease its weightings in France, the Netherlands and Switzerland. |
| |
| Q | What were the Fund’s sector and country weightings at the end of the reporting period? |
| |
| A | Throughout the reporting period (and adjusted according to our country views), the Fund was overweight consumer staples, energy, telecommunication services and consumer discretionary relative to the benchmark MSCI EAFE Index. The Fund was underweight information technology, utilities, financials and industrials. The Fund was relatively neutral to the MSCI EAFE Index in the health care and materials sectors. |
In terms of countries, the Fund was overweight Spain, Hong Kong, Sweden, Austria, Belgium, Italy, Norway, Denmark and Finland relative to the MSCI EAFE Index at the end of the reporting period. It was underweight Switzerland, the United Kingdom, the Netherlands, Australia, France, Singapore, Germany, Japan and Portugal. The Fund was relatively neutral to the MSCI EAFE Index in Ireland, New Zealand and Greece.
Goldman Sachs Quantitative Investment Strategies Team
New York, May 5, 2009
FUND BASICS
Structured International Equity Fund
as of April 30, 2009
PERFORMANCE REVIEW
| | | | | | | | | | | |
| | | Fund Cumulative Total Return
| | | | | | |
| November 1, 2008-April 30, 2009 | | (based on NAV)1 | | | MSCI EAFE (Net) Index2 | | | |
|
| |
| Class A | | | -3.97 | % | | | -2.64 | % | | |
| Class B | | | -4.30 | | | | -2.64 | | | |
| Class C | | | -4.28 | | | | -2.64 | | | |
| Institutional | | | -3.75 | | | | -2.64 | | | |
| Service | | | -3.99 | | | | -2.64 | | | |
| Class IR | | | -3.83 | | | | -2.64 | | | |
| Class R | | | -4.08 | | | | -2.64 | | | |
|
| |
| 1 | The net asset value (NAV) represents the net assets of the class of the Fund (ex-dividend) divided by the total number of shares of the class outstanding. The Fund’s performance reflects the reinvestment of dividends and other distributions. The Fund’s performance does not reflect the deduction of any applicable sales charges. |
| 2 | The Morgan Stanley Capital International (MSCI) Europe, Australasia, Far East (EAFE) (Net) Index (unhedged, with dividends reinvested) is a market capitalization-weighted composite of securities in 21 developed markets. The Index figures do not reflect any deduction for fees, expenses or taxes. It is not possible to invest directly in an index. |
STANDARDIZED AVERAGE ANNUAL TOTAL RETURNS3
| | | | | | | | | | | | | | | | | | | | | |
| For the period ended 3/31/09 | | One Year | | Five Years | | Ten Years | | Since Inception | | Inception Date | | |
|
| |
| Class A | | | -49.42 | % | | | -3.44 | % | | | -1.21 | % | | | -0.91 | % | | 8/15/97 | | |
| Class B | | | -49.49 | | | | -3.45 | | | | -1.25 | | | | -1.00 | | | 8/15/97 | | |
| Class C | | | -47.31 | | | | -3.03 | | | | -1.24 | | | | -0.99 | | | 8/15/97 | | |
| Institutional | | | -46.18 | | | | -1.95 | | | | -0.11 | | | | 0.13 | | | 8/15/97 | | |
| Service | | | -46.46 | | | | -2.41 | | | | -0.60 | | | | -0.36 | | | 8/15/97 | | |
| Class IR | | | -46.26 | | | | N/A | | | | N/A | | | | -42.70 | | | 11/30/07 | | |
| Class R | | | -46.55 | | | | N/A | | | | N/A | | | | -42.98 | | | 11/30/07 | | |
|
| |
| 3 | The Standardized Average Annual Total Returns are average annual total returns as of the most recent calendar quarter-end. They assume reinvestment of all distributions at NAV. These returns reflect a maximum initial sales charge of 5.5% for Class A Shares, the assumed contingent deferred sales charge for Class B Shares (5% maximum declining to 0% after six years) and the assumed contingent deferred sales charge for Class C Shares (1% if redeemed within 12 months of purchase). Because Institutional, Service, Class IR and Class R Shares do not involve a sales charge, such a charge is not applied to their Standardized Average Annual Total Returns. The Fund will charge a 2% redemption fee on the redemption of shares (including by exchange) held for 30 calendar days or less. Performance figures do not reflect the deduction of the redemption fee. If reflected, the redemption fee would reduce the performance quoted. |
| |
| | Total returns represent past performance. Past performance does not guarantee future results. The Fund’s investment return and principal value will fluctuate so that an investor’s shares, when redeemed, may be worth more or less than their original cost. Current performance may be lower or higher than the performance quoted above. Please visit our Web site at: www.goldmansachsfunds.com to obtain the most recent month-end returns. Performance reflects fee waivers and/or expense limitations in effect. In their absence, performance would be reduced. Returns do not reflect the deduction of taxes that a shareholder would pay on Fund distributions or the redemption of Fund shares. |
FUND BASICS
EXPENSE RATIOS4
| | | | | | | | | | | |
| | | Net Expense Ratio (Current) | | | Gross Expense Ratio (Before Waivers) | | | |
|
| |
| Class A | | | 1.20 | % | | | 1.25 | % | | |
| Class B | | | 1.95 | | | | 2.00 | | | |
| Class C | | | 1.95 | | | | 2.00 | | | |
| Institutional | | | 0.80 | | | | 0.85 | | | |
| Service | | | 1.30 | | | | 1.35 | | | |
| Class IR | | | 0.95 | | | | 1.00 | | | |
| Class R | | | 1.45 | | | | 1.50 | | | |
|
| |
| 4 | The expense ratios of the Fund, both current (net of applicable fee waivers and/or expense limitations) and before waivers (gross of applicable fee waivers and/or expense limitations), are as set forth above according to the most recent publicly available Prospectuses for the Fund and may differ from the expense ratios disclosed in the Financial Highlights in this report. Applicable waivers and expense limitations are voluntary and may be modified or terminated at any time at the option of the investment adviser. If this occurs, the expense ratios may change without shareholder approval. |
TOP TEN HOLDINGS AS OF 4/30/095
| | | | | | | | | |
| | | % of Net
| | | | | |
| Holding | | Assets | | | Line of Business | | |
| | |
| |
| BP PLC ADR | | | 3.0 | % | | Oil, Gas & Consumable Fuels | | |
| Banco Santander SA | | | 2.3 | | | Commercial Banks | | |
| HSBC Holdings PLC | | | 2.2 | | | Commercial Banks | | |
| Sanofi-Aventis | | | 2.1 | | | Pharmaceuticals | | |
| Telefonica SA | | | 1.9 | | | Diversified Telecommunication Services | | |
| Banco Bilbao Vizcaya Argentaria SA | | | 1.4 | | | Commercial Banks | | |
| Honda Motor Co. Ltd. | | | 1.3 | | | Automobiles | | |
| Vivendi SA | | | 1.3 | | | Media | | |
| Astellas Pharma, Inc. | | | 1.3 | | | Pharmaceuticals | | |
| William Morrison Supermarkets PLC | | | 1.3 | | | Food & Staples Retailing | | |
| | |
| |
| 5 | The top 10 holdings may not be representative of the Fund’s future investments. |
FUND BASICS
SECTOR ALLOCATION AS OF 4/30/096
Percentage of Investment Portfolio
| |
| 6 | The Fund is actively managed and, as such, its composition may differ over time. The above graph categorizes investments using Global Industry Classification Standard (“GICS”), however, the sector classifications used by the portfolio management team in the schedule of investments may differ from GICS. The percentage shown for each investment category reflects the value of investments in that category as a percentage of total value of investments (excluding securities lending collateral, if any). Securities lending collateral represented 16.1% of the Fund’s net assets at April 30, 2009. |
PORTFOLIO RESULTS
Structured International Small Cap Fund
Portfolio Management Discussion and Analysis
Below, the Goldman Sachs Quantitative Investment Strategies Team discusses the Fund’s performance and positioning for the six-month period ended April 30, 2009.
| |
| Q | How did the Goldman Sachs Structured International Small Cap Fund (the “Fund”) perform during the semi-annual period ended April 30, 2009? |
| |
| A | During the six-month period ended April 30, 2009, the Fund’s Class A, C and Institutional Shares generated cumulative total returns, without sales charges, of 2.65%, 2.41% and 2.94%, respectively. These returns compare to the 6.52% cumulative total return of the Fund’s benchmark, the MSCI EAFE Small Cap Index (unhedged and net of dividend withholding taxes), during the same period. |
| |
| Q | What key factors were most responsible for the Fund’s performance during the six-month reporting period? |
| |
| A | As expected, and in keeping with our investment approach, our quantitative model and its six investment themes had the greatest impact on relative performance. We use these themes to take a long-term view of market patterns and look for inefficiencies, selecting stocks for the Fund and overweighting or underweighting the ones chosen by the model. Over time and by design, the performance of any one of the model’s investment themes tends to have a low correlation with the model’s other themes, demonstrating the diversification benefit of the Fund’s theme-driven quantitative model. The variance in performance supports our research indicating that the diversification provided by our different investment themes is a significant investment advantage over the long term, even though the Fund may experience underperformance in the short term. |
Overall, the Fund underperformed its benchmark index, with our Momentum theme hurting results the most. The Momentum theme predicts drift in stock prices caused by under-reaction to company-specific information. Other detractors were our Sentiment and Management themes. Sentiment reflects selected investment views and decisions of individuals and financial intermediaries. Management assesses the company’s management strategy and behavior. Valuation was the best-performing theme during the reporting period. Valuation attempts to capture potential mispricings of securities, typically by comparing a measure of the company’s intrinsic value to its market value. Quality and Profitability also boosted relative returns, though to a lesser extent. Quality evaluates whether the company’s earnings are coming from more persistent, cash-based sources, as opposed to accruals. Profitability assesses whether a company is earning more than its cost of capital.
| |
| Q | How did the Fund’s sector allocations affect relative performance? |
| |
| A | In constructing the portfolio, we focus on picking stocks rather than on making industry or sector bets. Consequently, the Fund is similar to its benchmark, the MSCI EAFE Small Cap Index, in terms of its sector allocation and style. Changes in its sector weights generally do not have a meaningful impact on relative performance. |
| |
| Q | Which stock positions contributed the most to the Fund’s relative returns during the six-month period? |
| |
| A | We seek to outpace the MSCI EAFE Small Cap Index by overweighting stocks that we expect to outperform and underweighting those that we think may lag. We also build positions based on our thematic views. For example, the Fund aims to hold a basket of stocks with more favorable Momentum characteristics than the benchmark. |
Security selection in the industrials and financials sectors added to the Fund’s relative returns. Contributing the most were overweights in Regus PLC, a provider of offices and business centers around the world; Nippon Signal Co. Ltd., a Japan-based maker of railway station operations and data processing equipment; and MTU Aero Engines Holding AG, a German engine manufacturer. Our positive views on Profitability and Valuation led to the overweight positions in Regus PLC and Nippon Signal Co. Ltd., while the overweight in MTU Aero Engines Holding AG was driven by our positive views on Management and Sentiment.
| |
| Q | Which Fund positions detracted most from results during the reporting period? |
| |
| A | Stock selection in the information technology, consumer discretionary and energy sectors hampered the Fund’s relative performance most during the reporting period. In addition, the Fund’s overweight positions in three weakly-performing stocks particularly hurt during the reporting |
PORTFOLIO RESULTS
| |
| period. The most significant detractors were overweight positions in The Okinawa Electric Power Co., Inc., a Japanese electric power provider; International Personal Finance PLC, a British-based international home credit business; and Baron de Ley SA, a Spanish winemaker. The Fund was overweight The Okinawa Electric Power Co., Inc. because of our positive views on Momentum and Valuation. Our positive views of Momentum and Sentiment led to the Fund’s overweight in International Personal Finance PLC, while our positive views on Momentum and Profitability led to the Fund’s overweight in Baron de Ley SA. |
| |
| Q | What impact did country selection have on the Fund’s relative performance during the semi-annual period? |
| |
| A | An underweight in Italy and overweights in Japan and Sweden added to the Fund’s relative performance. However, an overweight in Australia, an underweight in the United Kingdom, and a neutral weight in France detracted. Effective security selection in several of these markets helped offset some of this underperformance. |
| |
| Q | What changes did you make to the Fund’s country weightings during the reporting period? |
| |
| A | The largest shifts we made during the reporting period were to increase the Fund’s weightings in Germany, Austria and Australia and to decrease the Fund’s weightings in the Netherlands, Italy and Switzerland. |
| |
| Q | What were the Fund’s sector and country weightings at the end of the reporting period? |
| |
| A | Throughout the reporting period, the Fund was overweight energy, materials, consumer staples, information technology and industrials relative to the MSCI EAFE Small Cap Index benchmark. The Fund held underweights in financials, telecommunication services and utilities and was relatively neutral to the benchmark index in consumer discretionary and health care at the end of the reporting period. |
In terms of countries, the Fund was overweight Germany, Sweden, Australia, Austria, Belgium, France and Finland relative to the MSCI EAFE Small Cap Index. The Fund was underweight Denmark, Netherlands, Spain, Switzerland, Italy, the United Kingdom, Norway and Japan. The Fund was relatively neutral to the benchmark index in Greece, Ireland, New Zealand, Hong Kong, Singapore and Portugal at the end of the reporting period.
Goldman Sachs Quantitative Investment Strategies Team
New York, May 5, 2009
FUND BASICS
Structured International Small Cap Fund
as of April 30, 2009
PERFORMANCE REVIEW
| | | | | | | | | | | |
| | | Fund Cumulative Total Return
| | | MSCI EAFE
| | | |
| November 1, 2008-April 30, 2009 | | (based on NAV)1 | | | Small Cap Index2 | | | |
|
| |
| Class A | | | 2.65 | % | | | 6.52 | % | | |
| Class C | | | 2.41 | | | | 6.52 | | | |
| Institutional | | | 2.94 | | | | 6.52 | | | |
|
|
| |
| 1 | The net asset value (NAV) represents the net assets of the class of the Fund (ex-dividend) divided by the total number of shares of the class outstanding. The Fund’s performance reflects the reinvestment of dividends and other distributions. The Fund’s performance does not reflect the deduction of any applicable sales charge. |
| 2 | The Morgan Stanley Capital International (MSCI) EAFE Small Cap Index (Europe, Australasia, Far East) is a free float-adjusted market capitalization index that is designed to measure developed market equity performance, excluding the US and Canada. MSCI selects the most liquid securities across developed markets relative to their market capitalization, and targets for index inclusion 40% of the full market capitalization of the eligible small cap universe within each industry group, within each country. Its returns include net reinvested dividends but, unlike Fund returns, do not reflect the payment of sales commissions or other expenses incurred in the purchase or sale of the securities included in the Index. |
STANDARDIZED AVERAGE ANNUAL TOTAL RETURNS3
| | | | | | | | | | | | | |
| For the period ended 3/31/09 | | One Year | | | Since Inception | | | Inception Date | | |
|
| |
| Class A | | | -50.72 | % | | | -42.98 | % | | 9/28/07 | | |
| Class C | | | -48.71 | | | | -41.17 | | | 9/28/07 | | |
| Institutional | | | -47.64 | | | | -40.51 | | | 9/28/07 | | |
|
| |
| 3 | The Standardized Average Annual Total Returns are average annual total returns as of the most recent calendar quarter-end. They assume reinvestment of all distributions at NAV. These returns reflect a maximum initial sales charge of 5.5% for Class A Shares and the assumed contingent deferred sales charge for Class C Shares (1% if redeemed within 12 months of purchase). Because Institutional Shares do not involve a sales charge, such a charge is not applied to their Standardized Average Annual Total Returns. The Fund will charge a 2% redemption fee on the redemption of shares (including by exchange) held for 30 calendar days or less. Performance figures do not reflect the deduction of the redemption fee. If reflected, the redemption fee would reduce the performance quoted. |
| | The returns represent past performance. Past performance does not guarantee future results. The Fund’s investment return and principal value will fluctuate so that an investor’s shares, when redeemed, may be worth more or less than their original cost. Current performance may be lower or higher than the performance quoted above. Please visit our Web site at: www.goldmansachsfunds.com to obtain the most recent month-end returns. Performance reflects fee waivers and/or expense limitations in effect. In their absence, performance would be reduced. Returns do not reflect the deduction of taxes that a shareholder would pay on Fund distributions or the redemption of Fund shares. |
EXPENSE RATIOS4
| | | | | | | | | | | |
| | | Net Expense Ratio (Current) | | | Gross Expense Ratio (Before Waivers) | | | |
|
| |
| Class A | | | 1.30 | % | | | 1.70 | % | | |
| Class C | | | 2.05 | | | | 2.45 | | | |
| Institutional | | | 0.90 | | | | 1.30 | | | |
|
| |
| 4 | The expense ratios of the Fund, both current (net of any fee waivers and/or expense limitations) and before waivers (gross of applicable fee waivers and/or expense limitations), are as set forth above according to the most recent publicly available Prospectuses for the Fund and may differ from the expense ratios disclosed in the Financial Highlights in this report. Applicable waivers and expense limitations are voluntary and may be modified or terminated at any time at the option of the investment adviser. If this occurs, the expense ratios may change without shareholder approval. |
FUND BASICS
TOP 10 HOLDINGS AS OF 4/30/095
| | | | | | | | | |
| | | % of Net
| | | | | |
| Holding | | Assets | | | Line of Business | | |
|
| |
| | | | | | | | | |
| Petrofac Ltd. | | | 1.2 | % | | Energy | | |
| | | | | | | | | |
| Rallye SA | | | 0.9 | | | Food & Staples Retailing | | |
| | | | | | | | | |
| Mothercare PLC | | | 0.9 | | | Retailing | | |
| | | | | | | | | |
| Daiichikosho Co. Ltd. | | | 0.9 | | | Media | | |
| | | | | | | | | |
| De La Rue PLC | | | 0.8 | | | Commercial & Professional Services | | |
| | | | | | | | | |
| MTU Aero Engines Holding AG | | | 0.8 | | | Capital Goods | | |
| | | | | | | | | |
| Close Brothers Group PLC | | | 0.7 | | | Diversified Financials | | |
| | | | | | | | | |
| Kaken Pharmaceutical Co. Ltd. | | | 0.7 | | | Pharmaceuticals, Biotechnology &
Life Sciences | | |
| | | | | | | | | |
| Clariant AG (Registered) | | | 0.7 | | | Materials | | |
| | | | | | | | | |
| Nippon Soda Co. Ltd. | | | 0.7 | | | Materials | | |
| |
|
| |
| 5 | The top 10 holdings may not be representative of the Fund’s future investments. |
SECTOR ALLOCATIONS AS OF 4/30/096
Percentage of Investment Portfolio
| |
| 6 | The Fund is actively managed and, as such, its composition may differ over time. The above graph categorizes investments using Global Industry Classification Standard (“GICS”), however, the sector classifications used by the portfolio management team in the schedule of investments may differ from GICS. The percentage shown for each investment category reflects the value of investments in that category as a percentage of total value of investments (excluding securities lending collateral, if any). Securities lending collateral represented 4.0% of the Fund’s net assets at April 30, 2009. |
GOLDMAN SACHS STRUCTURED INTERNATIONAL EQUITY FLEX FUND
Schedule of Investments
April 30, 2009 (Unaudited)
| | | | | | | | | | | |
| | | Shares | | Description | | Value |
| |
Common Stocks – 96.0% |
| | | | | | | | | | | |
| | | | | | | | | | | |
| | | Australia – 7.3% |
| | | | 21,131 | | | AGL Energy Ltd. (Multi-Utilities) | | $ | 232,490 | |
| | | | 5,381 | | | ASX Ltd. (Diversified Financial Services) | | | 127,563 | |
| | | | 25,339 | | | Australia and New Zealand Banking Group Ltd. (Commercial Banks) | | | 292,215 | |
| | | | 11,269 | | | Bendigo and Adelaide Bank Ltd. (Commercial Banks) | | | 56,114 | |
| | | | 46,272 | | | BHP Billiton Ltd.(a) (Metals & Mining) | | | 1,117,819 | |
| | | | 7,108 | | | Billabong International Ltd. (Textiles, Apparel & Luxury Goods) | | | 53,939 | |
| | | | 12,923 | | | Caltex Australia Ltd. (Oil, Gas & Consumable Fuels) | | | 92,279 | |
| | | | 63,950 | | | Challenger Financial Services Group Ltd. (Diversified Financial Services) | | | 92,666 | |
| | | | 6,837 | | | Coca-Cola Amatil Ltd. (Beverages) | | | 45,388 | |
| | | | 13,438 | | | Commonwealth Bank of Australia (Commercial Banks) | | | 343,357 | |
| | | | 14,921 | | | Computershare Ltd. (IT Services) | | | 98,912 | |
| | | | 55,163 | | | Downer EDI Ltd.(a) (Commercial Services & Supplies) | | | 201,732 | |
| | | | 10,189 | | | Gloucester Coal Ltd. (Oil, Gas & Consumable Fuels) | | | 38,365 | |
| | | | 5,039 | | | Lion Nathan Ltd. (Beverages) | | | 42,905 | |
| | | | 5,694 | | | Macquarie Group Ltd. (Capital Markets) | | | 137,750 | |
| | | | 83,349 | | | Metcash Ltd. (Food & Staples Retailing) | | | 251,735 | |
| | | | 56,941 | | | Qantas Airways Ltd. (Airlines) | | | 82,148 | |
| | | | 20,694 | | | QBE Insurance Group Ltd.(a) (Insurance) | | | 327,272 | |
| | | | 66,748 | | | Resolute Mining Ltd.* (Metals & Mining) | | | 32,798 | |
| | | | 4,211 | | | Rio Tinto Ltd. (Metals & Mining) | | | 196,092 | |
| | | | 202,498 | | | Sigma Pharmaceuticals Ltd. (Health Care Providers & Services) | | | 164,739 | |
| | | | 118,276 | | | Tatts Group Ltd. (Hotels, Restaurants & Leisure) | | | 237,167 | |
| | | | 1,577 | | | Wesfarmers Ltd. (Food & Staples Retailing) | | | 25,917 | |
| | | | 33,374 | | | Westfield Group (Real Estate Investment Trusts) | | | 260,508 | |
| | | | 4,008 | | | Westpac Banking Corp. (Commercial Banks) | | | 55,871 | |
| | | | 7,582 | | | Woodside Petroleum Ltd. (Oil, Gas & Consumable Fuels) | | | 208,458 | |
| | | | 10,517 | | | Woolworths Ltd. (Food & Staples Retailing) | | | 204,021 | |
| | | | | | | | | | | |
| | | | | | | | | | 5,020,220 | |
| | | |
| | | |
| | | Austria – 0.7% |
| | | | 3,274 | | | OMV AG (Oil, Gas & Consumable Fuels) | | | 101,429 | |
| | | | 31,030 | | | Telekom Austria AG (Diversified Telecommunication Services) | | | 408,156 | |
| | | | | | | | | | | |
| | | | | | | | | | 509,585 | |
| | | |
| | | |
| | | Belgium – 1.2% |
| | | | 3,292 | | | Euronav SA(b) (Oil, Gas & Consumable Fuels) | | | 47,385 | |
| | | | 13,286 | | | Mobistar SA(a) (Wireless Telecommunication Services) | | | 795,048 | |
| | | | 280 | | | Tessenderlo Chemie NV (Chemicals) | | | 8,313 | |
| | | | | | | | | | | |
| | | | | | | | | | 850,746 | |
| | | |
| | | |
| | | Denmark – 0.8% |
| | | | 6,052 | | | Danisco A/S (Food Products) | | | 198,204 | |
| | | | 12,951 | | | H. Lundbeck A/S (Pharmaceuticals) | | | 234,313 | |
| | | | 1,699 | | | Novozymes A/S Class B* (Chemicals) | | | 114,553 | |
| | | | | | | | | | | |
| | | | | | | | | | 547,070 | |
| | | |
| | | |
| | | Finland – 0.9% |
| | | | 6,526 | | | Nokia Oyj(a)(c) (Communications Equipment) | | | 92,692 | |
| | | | 13,569 | | | Outotec Oyj (Construction & Engineering) | | | 287,765 | |
| | | | 15,480 | | | TietoEnator Oyj (IT Services) | | | 198,869 | |
| | | | | | | | | | | |
| | | | | | | | | | 579,326 | |
| | | |
| | | |
| | | France – 13.9% |
| | | | 2,578 | | | Alstom SA (Electrical Equipment) | | | 160,706 | |
| | | | 11,947 | | | BNP Paribas (Commercial Banks) | | | 628,935 | |
| | | | 6,726 | | | Boiron SA (Pharmaceuticals) | | | 170,167 | |
| | | | 3,353 | | | Casino Guichard-Perrachon SA (Food & Staples Retailing) | | | 209,170 | |
| | | | 4,270 | | | Christian Dior SA(a)(c) (Textiles, Apparel & Luxury Goods) | | | 286,122 | |
| | | | 355 | | | CNP Assurances (Insurance) | | | 27,990 | |
| | | | 13,809 | | | France Telecom SA (Diversified Telecommunication Services) | | | 306,560 | |
| | | | 10,598 | | | Nexity* (Household Durables) | | | 341,859 | |
| | | | 34,295 | | | Sanofi-Aventis(a) (Pharmaceuticals) | | | 1,986,094 | |
| | | | 10,659 | | | Schneider Electric SA (Electrical Equipment) | | | 811,133 | |
| | | | 23,844 | | | SCOR SE (Insurance) | | | 500,424 | |
| | | | 48,724 | | | Total SA (Oil, Gas & Consumable Fuels) | | | 2,437,939 | |
| | | | 8,195 | | | Valeo SA* (Auto Components) | | | 168,870 | |
| | | | 674 | | | Virbac SA (Pharmaceuticals) | | | 45,433 | |
| | | | 55,548 | | | Vivendi SA(a) (Media) | | | 1,493,632 | |
| | | | | | | | | | | |
| | | | | | | | | | 9,575,034 | |
| | | |
| | | |
| | | Germany – 11.0% |
| | | | 15,325 | | | Adidas AG(a)(c) (Textiles, Apparel & Luxury Goods) | | | 579,014 | |
| | | | 1,978 | | | Allianz SE(b) (Insurance) | | | 182,516 | |
| | | | 41,472 | | | BASF SE(a) (Chemicals) | | | 1,565,052 | |
| | | | 7,756 | | | Bauer AG (Construction & Engineering) | | | 292,722 | |
| | | | 14,727 | | | Bechtle AG (IT Services) | | | 221,537 | |
| | | | 2,607 | | | Carl Zeiss Meditec AG (Health Care Equipment & Supplies) | | | 30,796 | |
| | | | 1,739 | | | Daimler AG (Automobiles) | | | 62,343 | |
| | | |
| | | |
The accompanying notes are an integral part of these financial statements.
GOLDMAN SACHS STRUCTURED INTERNATIONAL EQUITY FLEX FUND
Schedule of Investments (continued)
April 30, 2009 (Unaudited)
| | | | | | | | | | | |
| | | Shares | | Description | | Value |
| |
Common Stocks – (continued) |
| | | Germany – (continued) |
| | | | | | | | | | | |
| | | | 4,696 | | | Demag Cranes AG (Machinery) | | $ | 99,071 | |
| | | | 6,124 | | | Deutsche Bank AG (Capital Markets) | | | 326,576 | |
| | | | 2,316 | | | Deutsche Boerse AG (Diversified Financial Services) | | | 171,093 | |
| | | | 59,906 | | | Deutsche Lufthansa AG(a) (Airlines) | | | 764,203 | |
| | | | 10,500 | | | E.ON AG(b) (Electric Utilities) | | | 355,078 | |
| | | | 1,467 | | | KWS Saat AG(b) (Food Products) | | | 184,108 | |
| | | | 19,407 | | | MorphoSys AG*(a) (Life Sciences Tools & Services) | | | 354,253 | |
| | | | 15,124 | | | MTU Aero Engines Holding AG* (Aerospace & Defense) | | | 509,266 | |
| | | | 4,121 | | | Muenchener Rueckversicherungs-Gesellschaft AG (Insurance) | | | 569,398 | |
| | | | 3,377 | | | Roth & Rau AG* (Electrical Equipment) | | | 80,459 | |
| | | | 5,987 | | | RWE AG(b) (Multi-Utilities) | | | 431,593 | |
| | | | 4,439 | | | Salzgitter AG (Metals & Mining) | | | 315,756 | |
| | | | 4,163 | | | Suedzucker AG (Food Products) | | | 80,573 | |
| | | | 17,859 | | | ThyssenKrupp AG(a) (Metals & Mining) | | | 382,070 | |
| | | | | | | | | | | |
| | | | | | | | | | 7,557,477 | |
| | | |
| | | |
| | | Greece – 0.1% |
| | | | 1,673 | | | Eurobank Properties Real Estate Investment Co. (Real Estate Investment Trusts) | | | 15,395 | |
| | | | 4,582 | | | Hellenic Petroleum SA (Oil, Gas & Consumable Fuels) | | | 44,405 | |
| | | | | | | | | | | |
| | | | | | | | | | 59,800 | |
| | | |
| | | |
| | | Hong Kong – 2.0% |
| | | | 59,000 | | | Boc Hong Kong Holdings Ltd. (Commercial Banks) | | | 83,481 | |
| | | | 18,000 | | | Cheung Kong (Holdings) Ltd. (Real Estate Management & Development) | | | 187,291 | |
| | | | 21,500 | | | CLP Holdings Ltd. (Electric Utilities) | | | 145,227 | |
| | | | 18,300 | | | Esprit Holdings Ltd. (Specialty Retail) | | | 112,129 | |
| | | | 26,000 | | | Hang Lung Group Ltd. (Real Estate Management & Development) | | | 95,223 | |
| | | | 28,500 | | | Hong Kong Electric Holdings Ltd. (Electric Utilities) | | | 168,617 | |
| | | | 7,900 | | | Hong Kong Exchanges & Clearing Ltd. (Diversified Financial Services) | | | 90,945 | |
| | | | 2,500 | | | Hopewell Holdings Ltd. (Real Estate Management & Development) | | | 6,420 | |
| | | | 31,000 | | | Hutchison Whampoa Ltd. (Industrial Conglomerates) | | | 181,795 | |
| | | | 4,000 | | | Li & Fung Ltd. (Distributors) | | | 11,238 | |
| | | | 6,000 | | | Orient Overseas International Ltd. (Marine) | | | 17,225 | |
| | | | 7,000 | | | Pacific Basin Shipping Ltd. (Marine) | | | 3,461 | |
| | | | 13,000 | | | Swire Pacific Ltd. (Real Estate Management & Development) | | | 101,619 | |
| | | |
| | | |
| | | | 20,787 | | | The Link (Real Estate Investment Trusts) | | | 40,462 | |
| | | | 64,000 | | | Wheelock & Co. Ltd. (Real Estate Management & Development) | | | 138,269 | |
| | | | 4,500 | | | Yue Yuen Industrial (Holdings) Ltd. (Textiles, Apparel & Luxury Goods) | | | 9,978 | |
| | | | | | | | | | | |
| | | | | | | | | | 1,393,380 | |
| | | |
| | | |
| | | Ireland(a) – 0.4% |
| | | | 12,494 | | | Kerry Group PLC (Food Products) | | | 255,235 | |
| | | |
| | | |
| | | Italy – 3.7% |
| | | | 15,088 | | | Astaldi SpA (Construction & Engineering) | | | 82,041 | |
| | | | 158,575 | | | Enel SpA (Electric Utilities) | | | 859,553 | |
| | | | 2,600 | | | Exor SpA* (Diversified Financial Services) | | | 33,265 | |
| | | | 139,893 | | | Intesa Sanpaolo (Commercial Banks) | | | 445,679 | |
| | | | 46,631 | | | Intesa Sanpaolo RNC (Commercial Banks) | | | 103,559 | |
| | | | 454,409 | | | Parmalat SpA (Food Products) | | | 902,509 | |
| | | | 44,099 | | | Terna — Rete Elettrica Nationale SpA (Electric Utilities) | | | 141,615 | |
| | | | | | | | | | | |
| | | | | | | | | | 2,568,221 | |
| | | |
| | | |
| | | Japan – 29.4% |
| | | | 26,600 | | | Aloka Co. Ltd. (Health Care Equipment & Supplies) | | | 192,606 | |
| | | | 13,000 | | | AMADA Co. Ltd. (Machinery) | | | 80,501 | |
| | | | 18,400 | | | Aoyama Trading Co. Ltd. (Specialty Retail) | | | 264,722 | |
| | | | 183,000 | | | Asahi Kasei Corp. (Chemicals) | | | 735,668 | |
| | | | 28,800 | | | Astellas Pharma, Inc. (Pharmaceuticals) | | | 936,492 | |
| | | | 14,300 | | | Brother Industries Ltd. (Office Electronics) | | | 116,228 | |
| | | | 16,300 | | | CAC Corp. (IT Services) | | | 98,384 | |
| | | | 23,300 | | | Canon, Inc.(a)(c) (Office Electronics) | | | 697,269 | |
| | | | 55,000 | | | Dai Nippon Printing Co. Ltd. (Commercial Services & Supplies) | | | 582,220 | |
| | | | 8,000 | | | Daicel Chemical Industries Ltd. (Chemicals) | | | 33,614 | |
| | | | 6,900 | | | Daito Trust Construction Co. Ltd. (Real Estate Management & Development) | | | 287,717 | |
| | | | 28,000 | | | Fuji Heavy Industries Ltd. (Automobiles) | | | 112,757 | |
| | | | 87 | | | Fuji Media Holdings, Inc. (Media) | | | 96,994 | |
| | | | 12,000 | | | Fujikura Ltd. (Electrical Equipment) | | | 41,424 | |
| | | | 26,000 | | | Fuyo General Lease Co. Ltd. (Diversified Financial Services) | | | 437,278 | |
| | | | 30,000 | | | Hitachi Ltd. (Electronic Equipment, Instruments & Components) | | | 104,829 | |
| | | | 44,900 | | | Honda Motor Co. Ltd. (Automobiles) | | | 1,315,880 | |
| | | | 7,200 | | | Itochu-Shokuhin Co. Ltd.(b) (Food & Staples Retailing) | | | 229,503 | |
| | | |
| | | |
The accompanying notes are an integral part of these financial statements.
GOLDMAN SACHS STRUCTURED INTERNATIONAL EQUITY FLEX FUND
| | | | | | | | | | | |
| | | Shares | | Description | | Value |
| |
Common Stocks – (continued) |
| | | Japan – (continued) |
| | | | | | | | | | | |
| | | | 7,000 | | | Kasumi Co. Ltd. (Food & Staples Retailing) | | $ | 28,695 | |
| | | | 20,000 | | | Kawasaki Kisen Kaisha Ltd. (Marine) | | | 75,356 | |
| | | | 21,700 | | | Komori Corp. (Machinery) | | | 203,672 | |
| | | | 76,000 | | | Kubota Corp. (Machinery) | | | 456,793 | |
| | | | 48,600 | | | Leopalace21 Corp. (Real Estate Management & Development) | | | 356,009 | |
| | | | 5,200 | | | Matsui Securities Co. Ltd. (Capital Markets) | | | 36,862 | |
| | | | 47,000 | | | Mitsubishi Electric Corp. (Electrical Equipment) | | | 250,313 | |
| | | | 30,000 | | | Mitsubishi Tanabe Pharma Corp. (Pharmaceuticals) | | | 286,351 | |
| | | | 7,900 | | | Mitsubishi UFJ Financial Group, Inc. (Commercial Banks) | | | 43,093 | |
| | | | 16,400 | | | Mitsui & Co. Ltd. (Trading Companies & Distributors) | | | 173,947 | |
| | | | 95,000 | | | Mitsui O.S.K. Lines Ltd. (Marine) | | | 542,876 | |
| | | | 451,400 | | | Mizuho Financial Group, Inc.(b) (Commercial Banks) | | | 951,864 | |
| | | | 110,000 | | | NEC Corp.* (Computers & Peripherals) | | | 365,714 | |
| | | | 1,900 | | | Nintendo Co. Ltd. (Software) | | | 510,836 | |
| | | | 51,000 | | | Nippon Express Co. Ltd. (Road & Rail) | | | 181,881 | |
| | | | 92,000 | | | Nippon Soda Co. Ltd. (Chemicals) | | | 301,878 | |
| | | | 26,400 | | | Nippon Telephone & Telegraph Corp. (Diversified Telecommunication Services) | | | 994,765 | |
| | | | 86,000 | | | Nippon Yusen Kabushiki Kaisha (Marine) | | | 352,283 | |
| | | | 165,400 | | | Nissan Motor Co. Ltd.(a) (Automobiles) | | | 863,303 | |
| | | | 45,000 | | | Nisshin Seifun Group, Inc. (Food Products) | | | 463,327 | |
| | | | 200,000 | | | Nisshin Steel Co. Ltd. (Metals & Mining) | | | 385,880 | |
| | | | 5,600 | | | Nomura Real Estate Holdings, Inc.(b) (Real Estate Management & Development) | | | 91,672 | |
| | | | 8 | | | NTT DoCoMo, Inc. (Wireless Telecommunication Services) | | | 11,163 | |
| | | | 800 | | | Ono Pharmaceutical Co. Ltd. (Pharmaceuticals) | | | 33,941 | |
| | | | 241,000 | | | Osaka Gas Co. Ltd.(a) (Gas Utilities) | | | 763,711 | |
| | | | 70,000 | | | Ricoh Co. Ltd. (Office Electronics) | | | 865,471 | |
| | | | 1,000 | | | Rohm Co. Ltd. (Semiconductors & Semiconductor Equipment) | | | 61,329 | |
| | | | 4,700 | | | Sanshin Electronics Co. Ltd. (Electronic Equipment, Instruments & Components) | | | 29,065 | |
| | | | 32,000 | | | Sekisui Chemical Co. Ltd. (Household Durables) | | | 168,015 | |
| | | | 12,000 | | | Sekisui House Ltd. (Household Durables) | | | 103,564 | |
| | | |
| | | |
| | | | 8,800 | | | Seven & I Holdings Co. Ltd. (Food & Staples Retailing) | | | 198,850 | |
| | | | 8,500 | | | Shizuoka Gas Co. Ltd. (Gas Utilities) | | | 47,538 | |
| | | | 83,000 | | | Sompo Japan Insurance, Inc. (Insurance) | | | 500,202 | |
| | | | 14,500 | | | Sumitomo Corp. (Trading Companies & Distributors) | | | 126,216 | |
| | | | 38,200 | | | Sumitomo Electric Industries Ltd. (Electrical Equipment) | | | 372,142 | |
| | | | 5,800 | | | Sumitomo Mitsui Financial Group, Inc. (Commercial Banks) | | | 201,151 | |
| | | | 8,300 | | | Takeda Pharmaceutical Co. Ltd. (Pharmaceuticals) | | | 294,357 | |
| | | | 28,000 | | | Takihyo Co. Ltd.(b) (Distributors) | | | 118,012 | |
| | | | 138,000 | | | The Bank of Yokohama Ltd. (Commercial Banks) | | | 585,187 | |
| | | | 3,100 | | | The Okinawa Electric Power Co., Inc. (Electric Utilities) | | | 147,416 | |
| | | | 15,000 | | | The Sumitomo Trust & Banking Co. Ltd. (Commercial Banks) | | | 62,770 | |
| | | | 14,000 | | | Toho Gas Co. Ltd. (Gas Utilities) | | | 59,597 | |
| | | | 22,800 | | | Tokio Marine Holdings, Inc. (Insurance) | | | 601,311 | |
| | | | 14,100 | | | Tokyo Steel Manufacturing Co. Ltd.(a) (Metals & Mining) | | | 144,417 | |
| | | | 4,000 | | | Toppan Printing Co. Ltd. (Commercial Services & Supplies) | | | 30,311 | |
| | | | 125 | | | West Japan Railway Co. (Road & Rail) | | | 383,333 | |
| | | | 7,000 | | | Yokogawa Electric Corp. (Electronic Equipment, Instruments & Components) | | | 36,124 | |
| | | | | | | | | | | |
| | | | | | | | | | 20,226,649 | |
| | | |
| | | |
| | | Netherlands – 4.5% |
| | | | 9,544 | | | Aegon NV (Insurance) | | | 48,003 | |
| | | | 6,062 | | | ArcelorMittal (Metals & Mining) | | | 141,998 | |
| | | | 1,297 | | | ASML Holding NV (Semiconductors & Semiconductor Equipment) | | | 27,216 | |
| | | | 15,636 | | | Crucell NV*(a) (Biotechnology) | | | 327,286 | |
| | | | 49,172 | | | European Aeronautic Defence & Space Co.(a) (Aerospace & Defense) | | | 709,729 | |
| | | | 2,048 | | | Grontmij NV* (Construction & Engineering) | | | 45,058 | |
| | | | 18,905 | | | ING Groep NV (Diversified Financial Services) | | | 172,323 | |
| | | | 37,935 | | | Koninklijke DSM NV (Chemicals) | | | 1,176,447 | |
| | | | 18,351 | | | Royal Dutch Shell PLC(a) (Oil, Gas & Consumable Fuels) | | | 420,875 | |
| | | | | | | | | | | |
| | | | | | | | | | 3,068,935 | |
| | | |
| | | |
| | | Norway – 0.5% |
| | | | 34,500 | | | Seadrill Ltd. (Energy Equipment & Services) | | | 368,210 | |
| | | |
| | | |
The accompanying notes are an integral part of these financial statements.
GOLDMAN SACHS STRUCTURED INTERNATIONAL EQUITY FLEX FUND
Schedule of Investments (continued)
April 30, 2009 (Unaudited)
| | | | | | | | | | | |
| | | Shares | | Description | | Value |
| |
Common Stocks – (continued) |
| | | | | | | | | | | |
| | | Portugal – 0.3% |
| | | | 46,499 | | | Redes Energeticas Nacionais SA (Multi-Utilities) | | $ | 192,407 | |
| | | |
| | | |
| | | Singapore – 1.1% |
| | | | 21,000 | | | Ascendas Real Estate Investment Trust (Real Estate Investment Trusts) | | | 18,866 | |
| | | | 6,000 | | | Capitaland Ltd. (Real Estate Management & Development) | | | 11,068 | |
| | | | 18,000 | | | DBS Group Holdings Ltd. (Commercial Banks) | | | 114,432 | |
| | | | 96,720 | | | Golden Agri-Resources Ltd. (Food Products) | | | 23,867 | |
| | | | 4,673 | | | Jardine Cycle & Carriage Ltd. (Distributors) | | | 44,695 | |
| | | | 17,000 | | | Keppel Corp. Ltd. (Industrial Conglomerates) | | | 67,869 | |
| | | | 3,000 | | | Neptune Orient Lines Ltd. (Marine) | | | 2,608 | |
| | | | 46,000 | | | Noble Group Ltd. (Trading Companies & Distributors) | | | 39,851 | |
| | | | 27,000 | | | Oversea-Chinese Banking Corp. Ltd. (Commercial Banks) | | | 106,412 | |
| | | | 5,000 | | | SembCorp Industries Ltd. (Industrial Conglomerates) | | | 9,147 | |
| | | | 5,340 | | | Singapore Airlines Ltd. (Airlines) | | | 38,406 | |
| | | | 6,000 | | | Singapore Exchange Ltd. (Diversified Financial Services) | | | 25,168 | |
| | | | 4,000 | | | Singapore Technologies Engineering Ltd. (Aerospace & Defense) | | | 6,901 | |
| | | | 78,000 | | | Singapore Telecommunications Ltd. (Diversified Telecommunication Services) | | | 134,026 | |
| | | | 7,000 | | | United Overseas Bank Ltd. (Commercial Banks) | | | 53,954 | |
| | | | 39,000 | | | UOL Group Ltd. (Real Estate Management & Development) | | | 58,075 | |
| | | | | | | | | | | |
| | | | | | | | | | 755,345 | |
| | | |
| | | |
| | | Spain – 5.6% |
| | | | 147,313 | | | Banco Bilbao Vizcaya Argentaria SA(a) (Commercial Banks) | | | 1,596,527 | |
| | | | 6,514 | | | Banco Popular Espanol SA (Commercial Banks) | | | 53,688 | |
| | | | 138,963 | | | Banco Santander SA(a) (Commercial Banks) | | | 1,336,676 | |
| | | | 40,037 | | | Iberdrola SA (Electric Utilities) | | | 315,284 | |
| | | | 183,731 | | | Iberia Lineas Aereas de Espana SA (Airlines) | | | 342,992 | |
| | | | 65,889 | | | Mapfre SA (Insurance) | | | 187,808 | |
| | | | | | | | | | | |
| | | | | | | | | | 3,832,975 | |
| | | |
| | | |
| | | Sweden – 3.4% |
| | | | 11,440 | | | Alfa Laval AB(b) (Machinery) | | | 101,335 | |
| | | | 75,784 | | | Nordea Bank AB (Commercial Banks) | | | 563,707 | |
| | | | 11,188 | | | Swedish Match AB(a) (Tobacco) | | | 159,654 | |
| | | |
| | | |
| | | | 123,452 | | | Telefonaktiebolaget LM Ericsson Class B(b) (Communications Equipment) | | | 1,048,588 | |
| | | | 45,402 | | | TeliaSonera AB* (Diversified Telecommunication Services) | | | 213,025 | |
| | | | 3,350 | | | TradeDoubler AB (Internet Software & Services) | | | 21,189 | |
| | | | 19,800 | | | Wihlborgs Fastigheter AB(b) (Real Estate Management & Development) | | | 248,790 | |
| | | | | | | | | | | |
| | | | | | | | | | 2,356,288 | |
| | | |
| | | |
| | | Switzerland – 7.2% |
| | | | 47,789 | | | ABB Ltd.* (Electrical Equipment) | | | 676,517 | |
| | | | 7,966 | | | Actelion Ltd.* (Biotechnology) | | | 362,928 | |
| | | | 4,139 | | | Baloise Holding AG(b) (Insurance) | | | 303,851 | |
| | | | 32,858 | | | Compagnie Financiere Richemont SA (Textiles, Apparel & Luxury Goods) | | | 588,211 | |
| | | | 18,794 | | | Credit Suisse Group(b) (Capital Markets) | | | 734,404 | |
| | | | 51 | | | Elektrizitaets-Gesellschaft Laufenburg AG (Electric Utilities) | | | 45,770 | |
| | | | 48,129 | | | Nestle SA(a) (Food Products) | | | 1,568,847 | |
| | | | 2,093 | | | Novartis AG (Pharmaceuticals) | | | 79,216 | |
| | | | 562 | | | Sulzer AG (Machinery) | | | 30,545 | |
| | | | 2,056 | | | Syngenta AG (Chemicals) | | | 438,936 | |
| | | | 663 | | | Valora Holding AG (Specialty Retail) | | | 115,819 | |
| | | | | | | | | | | |
| | | | | | | | | | 4,945,044 | |
| | | |
| | | |
| | | United Kingdom – 2.0% |
| | | | 131,185 | | | BP PLC(a) (Oil, Gas & Consumable Fuels) | | | 927,035 | |
| | | | 10,619 | | | BP PLC ADR(c) (Oil, Gas & Consumable Fuels) | | | 450,883 | |
| | | | | | | | | | | |
| | | | | | | | | | 1,377,918 | |
| | | |
| | | |
| | | TOTAL COMMON STOCKS |
| | | (Cost $85,818,436) | | $ | 66,039,865 | |
| | | |
| | | |
| | | | | | | | | | | |
| | | | | | | | | | | |
Preferred Stock – 0.2% |
| | | | | | | | | | | |
| | | | | | | | | | | |
| | | Germany – 0.2% |
| | | | 3,911 | | | Draegerwerk AG (Health Care Equipment & Supplies)
(Cost $238,731) | | $ | 96,704 | |
| | | |
| | | |
| | | TOTAL INVESTMENTS BEFORE SECURITIES LENDING REINVESTMENT VEHICLE |
| | | (Cost $86,057,167) | | $ | 66,136,569 | |
| | | |
| | | |
The accompanying notes are an integral part of these financial statements.
GOLDMAN SACHS STRUCTURED INTERNATIONAL EQUITY FLEX FUND
| | | | | | | | | | | | | |
| | | Shares | | Rate | | Value |
| |
Securities Lending Reinvestment Vehicle(d)(e) – 5.0% |
| | | | | | | | | | | | | |
| | | | | | | | | | | | | |
| | | Boston Global Investment Trust – Enhanced Portfolio II |
| | | | 3,488,152 | | | | 0.456% | | | $ | 3,456,759 | |
| | | (Cost $3,442,134) |
| | | |
| | | TOTAL INVESTMENTS – 101.2% |
| | | (Cost $89,499,301) | | $ | 69,593,328 | |
| | | |
| | | |
| | | LIABILITIES IN EXCESS OF OTHER ASSETS – (1.2)% | | | (804,483 | ) |
| | | |
| | | |
| | | NET ASSETS – 100.0% | | $ | 68,788,845 | |
| | | |
| | | |
The percentage shown for each investment category reflects the value of investments in that category as a percentage of net assets.
| | |
| * | | Non-income producing security. |
| |
| (a) | | All or a portion of this security is pledged as collateral for short positions within the total return swap. |
| |
| (b) | | All or a portion of security is on loan. |
| |
| (c) | | All or a portion of security is segregated for initial margin requirements on futures transaction. |
| |
| (d) | | Variable rate security. Interest rate disclosed is that which is in effect at April 30, 2009. |
| |
| (e) | | Represents an affiliated issuer. |
| | | | | | | |
| | | |
| | | |
| | | Investment Abbreviations: |
| | | ADR | | — | | American Depositary Receipt |
| | | |
| | | |
The accompanying notes are an integral part of these financial statements.
GOLDMAN SACHS STRUCTURED INTERNATIONAL EQUITY FLEX FUND
Schedule of Investments (continued)
April 30, 2009 (Unaudited)
| | | | | | | | | | | | | | | |
| | | | | Notional
| | Current
| | Unrealized
|
| | | | | Value | | Value | | Gain (Loss) |
| |
Total Return Swap Long Positions |
| | | | | | | | | | | | | | | |
| | | | | | | | | | | | | | | |
| | | Australia – 5.5% |
| | | Amcor Ltd. (Containers & Packaging) | | $ | 152,350 | | | $ | 151,327 | | | | (1,023 | ) |
| | | Cochlear Ltd. (Health Care Equipment & Supplies) | | | 210,577 | | | | 208,278 | | | | (2,299 | ) |
| | | Felix Resources Ltd. (Oil, Gas & Consumable Fuels) | | | 28,761 | | | | 28,242 | | | | (519 | ) |
| | | Fortescue Metals Group Ltd. (Metals & Mining) | | | 35,886 | | | | 35,242 | | | | (644 | ) |
| | | Goodman Fielder Ltd. (Food Products) | | | 56,212 | | | | 55,488 | | | | (724 | ) |
| | | James Hardie Industries NV (Construction Materials) | | | 33,373 | | | | 33,052 | | | | (321 | ) |
| | | JB Hi-Fi Ltd. (Specialty Retail) | | | 130,147 | | | | 128,409 | | | | (1,738 | ) |
| | | Leighton Holdings Ltd. (Construction & Engineering) | | | 47,698 | | | | 47,036 | | | | (662 | ) |
| | | Macquarie Airports (Transportation Infrastructure) | | | 121,462 | | | | 120,541 | | | | (921 | ) |
| | | National Australia Bank Ltd. (Commercial Banks) | | | 251,629 | | | | 248,586 | | | | (3,043 | ) |
| | | Santos Ltd. (Oil, Gas & Consumable Fuels) | | | 133,683 | | | | 130,774 | | | | (2,909 | ) |
| | | United Group Ltd. (Construction & Engineering) | | | 130,295 | | | | 128,666 | | | | (1,629 | ) |
| | | | | | | | | | | | | | | |
| | | | | | | | | | | | | | (16,432 | ) |
| | | |
| | | |
| | | Belgium – 3.7% |
| | | Compagnie d’Entreprises CFE (Construction & Engineering) | | | 101,175 | | | | 100,033 | | | | (1,142 | ) |
| | | Delhaize Group (Food & Staples Retailing) | | | 462,965 | | | | 459,973 | | | | (2,992 | ) |
| | | Omega Pharma SA (Health Care Equipment & Supplies) | | | 65,935 | | | | 65,234 | | | | (701 | ) |
| | | UCB SA (Pharmaceuticals) | | | 251,689 | | | | 249,422 | | | | (2,267 | ) |
| | | | | | | | | | | | | | | |
| | | | | | | | | | | | | | (7,102 | ) |
| | | |
| | | |
| | | Denmark – 0.5% |
| | | A.P. Moller – Maersk A/S Class B (Marine) | | | 111,938 | | | | 110,365 | | | | (1,573 | ) |
| | | |
| | | |
| | | Finland – 2.7% |
| | | Elisa Oyj (Diversified Telecommunication Services) | | | 211,134 | | | | 209,160 | | | | (1,974 | ) |
| | | Kesko Oyj Class B (Food & Staples Retailing) | | | 443,762 | | | | 439,112 | | | | (4,650 | ) |
| | | | | | | | | | | | | | | |
| | | | | | | | | | | | | | (6,624 | ) |
| | | |
| | | |
| | | France – 4.8% |
| | | AXA SA (Insurance) | | | 511,519 | | | | 508,603 | | | | (2,916 | ) |
| | | Rallye SA (Food & Staples Retailing) | | | 253,696 | | | | 250,480 | | | | (3,216 | ) |
| | | Safran SA (Aerospace & Defense) | | | 40,432 | | | | 40,066 | | | | (366 | ) |
| | | Unibail-Rodamco (REIT) | | | 352,517 | | | | 349,550 | | | | (2,967 | ) |
| | | | | | | | | | | | | | | |
| | | | | | | | | | | | | | (9,465 | ) |
| | | |
| | | |
| | | Hong Kong – 0.8% |
| | | Hang Seng Bank Ltd. (Commercial Banks) | | | 87,157 | | | | 86,503 | | | | (654 | ) |
| | | Mongolia Energy Corp. Ltd. (Oil, Gas & Consumable Fuels) | | | 9,538 | | | | 9,352 | | | | (186 | ) |
| | | New World Development Co. Ltd. (Real Estate Management & Development) | | | 95,317 | | | | 94,355 | | | | (962 | ) |
| | | Sun Hung Kai Properties Ltd. (Real Estate Management & Development) | | | 10,419 | | | | 10,325 | | | | (94 | ) |
| | | | | | | | | | | | | | | |
| | | | | | | | | | | | | | (1,896 | ) |
| | | |
| | | |
| | | Italy – 0.3% |
| | | Trevi Finanziaria SpA (Construction & Engineering) | | | 73,581 | | | | 72,341 | | | | (1,240 | ) |
| | | |
| | | |
| | | Japan – 6.0% |
| | | Asahi Diamond Industrial Co. Ltd. (Machinery) | | | 28,735 | | | | 28,531 | | | | (204 | ) |
| | | ASKA Pharmaceutical Co. Ltd. (Pharmaceuticals) | | | 24,376 | | | | 24,215 | | | | (161 | ) |
| | | Daiwa Industries Ltd. (Machinery) | | | 73,619 | | | | 73,302 | | | | (317 | ) |
| | | FUJIFILM Holdings Corp. (Electronic Equipment, Instruments & Components) | | | 150,942 | | | | 151,797 | | | | 855 | |
| | | Hitachi Transport System Ltd. (Road & Rail) | | | 15,534 | | | | 15,383 | | | | (151 | ) |
| | | |
| | | |
The accompanying notes are an integral part of these financial statements.
GOLDMAN SACHS STRUCTURED INTERNATIONAL EQUITY FLEX FUND
| | | | | | | | | | | | | | | |
| | | | | Notional
| | Current
| | Unrealized
|
| | | | | Value | | Value | | Gain (Loss) |
| |
Total Return Swap Long Positions – (continued) |
| | | Japan – (continued) |
| | | | | | | | | | | | | | | |
| | | Idemitsu Kosan Co. Ltd. (Oil, Gas & Consumable Fuels) | | $ | 111,594 | | | $ | 110,790 | | | | (804 | ) |
| | | JFE Holdings, Inc. (Metals & Mining) | | | 60,223 | | | | 60,089 | | | | (134 | ) |
| | | Mitsubishi Heavy Industries Ltd. (Machinery) | | | 29,564 | | | | 29,460 | | | | (104 | ) |
| | | Mitsui Sugar Co. Ltd. (Food Products) | | | 40,677 | | | | 40,295 | | | | (382 | ) |
| | | Nippon Shinyaku Co. Ltd. (Pharmaceuticals) | | | 126,075 | | | | 124,978 | | | | (1,097 | ) |
| | | Nisshinbo Industries, Inc. (Textiles, Apparel & Luxury Goods) | | | 95,139 | | | | 94,925 | | | | (214 | ) |
| | | Okabe Co. Ltd. (Construction Materials) | | | 74,233 | | | | 73,820 | | | | (413 | ) |
| | | Sankyo Co. Ltd. (Leisure Equipment & Products) | | | 112,116 | | | | 111,601 | | | | (515 | ) |
| | | Sharp Corp. (Household Durables) | | | 62,996 | | | | 63,178 | | | | 182 | |
| | | Sojitz Corp. (Trading Companies & Distributors) | | | 90,684 | | | | 90,350 | | | | (334 | ) |
| | | Sorun Corp. (Software) | | | 19,706 | | | | 19,619 | | | | (87 | ) |
| | | Sumitomo Heavy Industries Ltd. (Machinery) | | | 33,402 | | | | 33,268 | | | | (134 | ) |
| | | Taikisha Ltd. (Construction & Engineering) | | | 24,026 | | | | 23,950 | | | | (76 | ) |
| | | Toyota Motor Corp. (Automobiles) | | | 200,931 | | | | 201,852 | | | | 921 | |
| | | Warabeya Nichiyo Co. Ltd. (Food Products) | | | 18,875 | | | | 18,779 | | | | (96 | ) |
| | | Watabe Wedding Corp. (Diversified Consumer Services) | | | 35,053 | | | | 34,879 | | | | (174 | ) |
| | | | | | | | | | | | | | | |
| | | | | | | | | | | | | | (3,439 | ) |
| | | |
| | | |
| | | Netherlands – 1.7% |
| | | Imtech NV (Construction & Engineering) | | | 93,420 | | | | 92,570 | | | | (850 | ) |
| | | Royal Dutch Shell PLC Class B (Oil, Gas & Consumable Fuels) | | | 242,803 | | | | 237,959 | | | | (4,844 | ) |
| | | USG People NV (Professional Services) | | | 71,704 | | | | 72,248 | | | | 544 | |
| | | | | | | | | | | | | | | |
| | | | | | | | | | | | | | (5,150 | ) |
| | | |
| | | |
| | | Norway – 1.0% |
| | | Petroleum Geo-Services ASA (Energy Equipment & Services) | | | 54,197 | | | | 53,215 | | | | (982 | ) |
| | | Sparebanken 1 SMN (Commercial Banks) | | | 30,657 | | | | 30,446 | | | | (211 | ) |
| | | Telenor ASA (Diversified Telecommunication Services) | | | 155,377 | | | | 154,233 | | | | (1,144 | ) |
| | | | | | | | | | | | | | | |
| | | | | | | | | | | | | | (2,337 | ) |
| | | |
| | | |
| | | Portugal – 1.6% |
| | | Portugal Telecom, SGPS SA (Diversified Telecommunication Services) | | | 381,408 | | | | 377,536 | | | | (3,872 | ) |
| | | |
| | | |
| | | Singapore – 0.2% |
| | | CapitaMall Trust (REIT) | | | 7,621 | | | | 7,531 | | | | (90 | ) |
| | | Cosco Corp. (Singapore) Ltd. (Machinery) | | | 29,713 | | | | 29,315 | | | | (398 | ) |
| | | Olam International Ltd. (Food & Staples Retailing) | | | 4,796 | | | | 4,717 | | | | (79 | ) |
| | | Wilmar International Ltd. (Food Products) | | | 9,701 | | | | 9,558 | | | | (143 | ) |
| | | | | | | | | | | | | | | |
| | | | | | | | | | | | | | (710 | ) |
| | | |
| | | |
| | | Sweden – 0.7% |
| | | Betsson AB (Hotels, Restaurants & Leisure) | | | 176,807 | | | | 174,538 | | | | (2,269 | ) |
| | | |
| | | |
| | | Switzerland – 0.7% |
| | | Banque Cantonale Vaudoise (Commercial Banks) | | | 48,416 | | | | 48,116 | | | | (300 | ) |
| | | Julius Baer Holding AG (Capital Markets) | | | 127,779 | | | | 125,609 | | | | (2,170 | ) |
| | | | | | | | | | | | | | | |
| | | | | | | | | | | | | | (2,470 | ) |
| | | |
| | | |
| | | United Kingdom – 69.8% |
| | | Antofagasta PLC (Metals & Mining) | | | 221,305 | | | | 217,056 | | | | (4,249 | ) |
| | | AstraZeneca PLC (Pharmaceuticals) | | | 1,079,867 | | | | 1,069,016 | | | | (10,851 | ) |
| | | Aviva PLC (Insurance) | | | 30,610 | | | | 30,120 | | | | (490 | ) |
| | | BAE Systems PLC (Aerospace & Defense) | | | 883,488 | | | | 874,713 | | | | (8,775 | ) |
| | | Barclays PLC (Commercial Banks) | | | 138,136 | | | | 134,340 | | | | (3,796 | ) |
| | | Bellway PLC (Household Durables) | | | 121,316 | | | | 120,028 | | | | (1,288 | ) |
| | | BG Group PLC (Oil, Gas & Consumable Fuels) | | | 379,372 | | | | 373,710 | | | | (5,662 | ) |
| | | |
| | | |
The accompanying notes are an integral part of these financial statements.
GOLDMAN SACHS STRUCTURED INTERNATIONAL EQUITY FLEX FUND
Schedule of Investments (continued)
April 30, 2009 (Unaudited)
| | | | | | | | | | | | | | | |
| | | | | Notional
| | Current
| | Unrealized
|
| | | | | Value | | Value | | Gain (Loss) |
| |
Total Return Swap Long Positions – (continued) |
| | | United Kingdom – (continued) |
| | | | | | | | | | | | | | | |
| | | BHP Billiton PLC (Metals & Mining) | | $ | 1,104,165 | | | $ | 1,085,150 | | | | (19,015 | ) |
| | | BP PLC (Oil, Gas & Consumable Fuels) | | | 548,992 | | | | 542,158 | | | | (6,834 | ) |
| | | Brit Insurance Holdings PLC (Insurance) | | | 195,280 | | | | 193,071 | | | | (2,209 | ) |
| | | British Airways PLC (Airlines) | | | 51,938 | | | | 51,274 | | | | (664 | ) |
| | | Cadbury PLC (Food Products) | | | 131,375 | | | | 130,516 | | | | (859 | ) |
| | | Centrica PLC (Multi-Utilities) | | | 173,833 | | | | 172,637 | | | | (1,196 | ) |
| | | Close Brothers Group PLC (Capital Markets) | | | 80,476 | | | | 79,723 | | | | (753 | ) |
| | | De La Rue PLC (Commercial Services & Supplies) | | | 20,187 | | | | 20,014 | | | | (173 | ) |
| | | Devro PLC (Food Products) | | | 30,717 | | | | 30,564 | | | | (153 | ) |
| | | Drax Group PLC (Independent Power Producers & Energy Traders) | | | 561,257 | | | | 556,185 | | | | (5,072 | ) |
| | | Dunelm Group PLC (Specialty Retail) | | | 13,893 | | | | 13,840 | | | | (53 | ) |
| | | Eurasian Natural Resources Corp. (Metals & Mining) | | | 61,530 | | | | 60,718 | | | | (812 | ) |
| | | Filtrona PLC (Chemicals) | | | 31,059 | | | | 30,699 | | | | (360 | ) |
| | | Game Group PLC (Specialty Retail) | | | 464,768 | | | | 459,827 | | | | (4,941 | ) |
| | | GlaxoSmithKline PLC (Pharmaceuticals) | | | 488,589 | | | | 483,752 | | | | (4,837 | ) |
| | | HSBC Holdings PLC (Commercial Banks) | | | 1,844,064 | | | | 1,840,267 | | | | (3,797 | ) |
| | | ICAP PLC (Capital Markets) | | | 83,771 | | | | 82,504 | | | | (1,267 | ) |
| | | J Sainsbury PLC (Food & Staples Retailing) | | | 757,071 | | | | 748,499 | | | | (8,572 | ) |
| | | Lamprell PLC (Energy Equipment & Services) | | | 272,370 | | | | 268,941 | | | | (3,429 | ) |
| | | Man Group PLC (Capital Markets) | | | 71,306 | | | | 70,107 | | | | (1,199 | ) |
| | | Marshalls PLC (Construction Materials) | | | 17,846 | | | | 17,661 | | | | (185 | ) |
| | | Marston’s PLC (Hotels, Restaurants & Leisure) | | | 123,008 | | | | 121,896 | | | | (1,112 | ) |
| | | McBride PLC (Household Products) | | | 4,722 | | | | 4,710 | | | | (12 | ) |
| | | Mothercare PLC (Multiline Retail) | | | 484,925 | | | | 481,233 | | | | (3,692 | ) |
| | | |
| | | |
| | | National Grid PLC (Multi-Utilities) | | | 255,884 | | | | 253,947 | | | | (1,937 | ) |
| | | Old Mutual PLC (Insurance) | | | 129,006 | | | | 126,891 | | | | (2,115 | ) |
| | | Petrofac Ltd. (Energy Equipment & Services) | | | 265,069 | | | | 262,440 | | | | (2,629 | ) |
| | | Rexam PLC (Containers & Packaging) | | | 718,664 | | | | 709,190 | | | | (9,474 | ) |
| | | Rio Tinto PLC (Metals & Mining) | | | 237,788 | | | | 234,848 | | | | (2,940 | ) |
| | | Royal Dutch Shell PLC (Oil, Gas & Consumable Fuels) | | | 6,789 | | | | 6,700 | | | | (89 | ) |
| | | Smiths News PLC (Distributors) | | | 26,165 | | | | 26,040 | | | | (125 | ) |
| | | Standard Chartered PLC (Commercial Banks) | | | 166,337 | | | | 163,989 | | | | (2,348 | ) |
| | | Sthree PLC (Professional Services) | | | 197,184 | | | | 196,000 | | | | (1,184 | ) |
| | | Tate & Lyle PLC (Food Products) | | | 613,309 | | | | 607,301 | | | | (6,008 | ) |
| | | Thomas Cook Group PLC (Hotels, Restaurants & Leisure) | | | 700,034 | | | | 693,479 | | | | (6,555 | ) |
| | | Thomson Reuters PLC (Media) | | | 378,310 | | | | 373,859 | | | | (4,451 | ) |
| | | Tui Travel PLC (Hotels, Restaurants & Leisure) | | | 663,109 | | | | 658,089 | | | | (5,020 | ) |
| | | Vedanta Resources PLC (Metals & Mining) | | | 169,028 | | | | 165,991 | | | | (3,037 | ) |
| | | Vodafone Group PLC (Wireless Telecommunication Services) | | | 811,441 | | | | 806,423 | | | | (5,018 | ) |
| | | William Morrison Supermarkets PLC (Food & Staples Retailing) | | | 730,054 | | | | 722,652 | | | | (7,402 | ) |
| | | WPP PLC (Media) | | | 209,724 | | | | 207,406 | | | | (2,318 | ) |
| | | WS Atkins PLC (Professional Services) | | | 43,239 | | | | 42,972 | | | | (267 | ) |
| | | | | | | | | | | | | | | |
| | | | | | | | | | | | | | (169,224 | ) |
| | | |
| | | |
| | | TOTAL LONG POSITIONS OF TOTAL RETURN SWAP | | | 24,070,116 | | | | 23,836,313 | | | | (233,803 | ) |
| | | |
| | | |
| | | | | | | | | | | | | | | |
| | | | | | | | | | | | | | | |
| | | | | | | | | | | | | | | |
The accompanying notes are an integral part of these financial statements.
GOLDMAN SACHS STRUCTURED INTERNATIONAL EQUITY FLEX FUND
| | | | | | | | | | | | | | | |
| | | | | Notional
| | Current
| | Unrealized
|
| | | | | Value | | Value | | Gain (Loss) |
| |
Total Return Swap Short Positions |
| | | | | | | | | | | | | | | |
| | | | | | | | | | | | | | | |
| | | Australia – 7.5% |
| | | ABB Grain Ltd. (Food & Staples Retailing) | | $ | (135,295 | ) | | $ | (134,126 | ) | | | 1,169 | |
| | | Adelaide Brighton Ltd. (Construction Materials) | | | (113,250 | ) | | | (111,775 | ) | | | 1,475 | |
| | | Alumina Ltd. (Metals & Mining) | | | (32,022 | ) | | | (26,622 | ) | | | 5,400 | |
| | | Asciano Group (Road & Rail) | | | (17,675 | ) | | | (17,376 | ) | | | 299 | |
| | | Ausenco Ltd. (Construction & Engineering) | | | (106,036 | ) | | | (104,420 | ) | | | 1,616 | |
| | | Bradken Ltd. (Machinery) | | | (118,624 | ) | | | (116,838 | ) | | | 1,786 | |
| | | Consolidated Media Holdings Ltd. (Media) | | | (113,658 | ) | | | (112,244 | ) | | | 1,414 | |
| | | Crown Ltd. (Hotels, Restaurants & Leisure) | | | (93,640 | ) | | | (92,220 | ) | | | 1,420 | |
| | | CSR Ltd. (Industrial Conglomerates) | | | (11,298 | ) | | | (11,099 | ) | | | 199 | |
| | | Gunns Ltd. (Paper & Forest Products) | | | (93,565 | ) | | | (92,365 | ) | | | 1,200 | |
| | | Hastie Group Ltd. (Building Products) | | | (31,854 | ) | | | (31,479 | ) | | | 375 | |
| | | Fairfax Media Ltd. (Media) | | | (68,841 | ) | | | (68,095 | ) | | | 746 | |
| | | OneSteel Ltd. (Metals & Mining) | | | (48,656 | ) | | | (48,000 | ) | | | 656 | |
| | | Origin Energy Ltd. (Oil, Gas & Consumable Fuels) | | | (103,052 | ) | | | (101,928 | ) | | | 1,124 | |
| | | Pharmaxis Ltd. (Pharmaceuticals) | | | (22,771 | ) | | | (22,469 | ) | | | 302 | |
| | | Seek Ltd. (Professional Services) | | | (100,102 | ) | | | (98,963 | ) | | | 1,139 | |
| | | Sims Metal Management Ltd. (Metals & Mining) | | | (31,744 | ) | | | (31,415 | ) | | | 329 | |
| | | Sonic Healthcare Ltd. (Health Care Providers & Services) | | | (262,048 | ) | | | (259,784 | ) | | | 2,264 | |
| | | SP Ausnet (Electric Utilities) | | | (30,941 | ) | | | (30,600 | ) | | | 341 | |
| | | Spark Infrastructure Group (Electric Utilities) | | | (47,260 | ) | | | (46,846 | ) | | | 414 | |
| | | TABCORP Holdings Ltd. (Hotels, Restaurants & Leisure) | | | (122,429 | ) | | | (120,918 | ) | | | 1,511 | |
| | | Toll Holdings Ltd. (Air Freight & Logistics) | | | (65,656 | ) | | | (64,892 | ) | | | 764 | |
| | | | | | | | | | | | | | | |
| | | | | | | | | | | | | | 25,943 | |
| | | |
| | | |
| | | Belgium – 4.8% |
| | | Colruyt SA (Food & Staples Retailing) | | | (1,125,706 | ) | | | (1,120,337 | ) | | | 5,369 | |
| | | Telenet Group Holding NV (Diversified Telecommunication Services) | | | (3,437 | ) | | | (3,406 | ) | | | 31 | |
| | | | | | | | | | | | | | | |
| | | | | | | | | | | | | | 5,400 | |
| | | |
| | | |
| | | Denmark – 1.6% |
| | | Genmab A/S (Biotechnology) | | | (100,414 | ) | | | (99,397 | ) | | | 1,017 | |
| | | NKT Holding A/S (Machinery) | | | (274,394 | ) | | | (269,963 | ) | | | 4,431 | |
| | | | | | | | | | | | | | | |
| | | | | | | | | | | | | | 5,448 | |
| | | |
| | | |
| | | Finland – 2.1% |
| | | Outokumpu Oyj (Metals & Mining) | | | (338,936 | ) | | | (334,363 | ) | | | 4,573 | |
| | | Stora Enso Oyj Class R (Paper & Forest Products) | | | (103,249 | ) | | | (101,948 | ) | | | 1,301 | |
| | | Talvivaara Mining Co. PLC (Metals & Mining) | | | (49,241 | ) | | | (48,759 | ) | | | 482 | |
| | | | | | | | | | | | | | | |
| | | | | | | | | | | | | | 6,356 | |
| | | |
| | | |
| | | France – 16.8% |
| | | Air Liquide SA (Chemicals) | | | (272,685 | ) | | | (270,550 | ) | | | 2,135 | |
| | | Arkema (Chemicals) | | | (355,063 | ) | | | (352,173 | ) | | | 2,890 | |
| | | Compagnie Generale des Etablissements Michelin Class B (Auto Components) | | | (133,338 | ) | | | (132,015 | ) | | | 1,323 | |
| | | Electricity de France SA (Electric Utilities) | | | (123,313 | ) | | | (122,009 | ) | | | 1,304 | |
| | | Essilor International SA (Health Care Equipment & Supplies) | | | (391,369 | ) | | | (388,447 | ) | | | 2,922 | |
| | | Eurofins Scientific (Life Sciences Tools & Services) | | | (85,037 | ) | | | (84,274 | ) | | | 763 | |
| | | Iliad SA (Diversified Telecommunication Services) | | | (378,351 | ) | | | (375,597 | ) | | | 2,754 | |
| | | Ingenico SA (Electronic Equipment, Instruments & Components) | | | (82,844 | ) | | | (82,241 | ) | | | 603 | |
| | | Klepierre (REIT) | | | (380,066 | ) | | | (376,422 | ) | | | 3,644 | |
| | | Natixis (Commercial Banks) | | | (762,124 | ) | | | (748,389 | ) | | | 13,735 | |
| | | UbiSoft Entertainment SA (Software) | | | (311,619 | ) | | | (308,173 | ) | | | 3,446 | |
| | | Vallourec SA (Machinery) | | | (303,163 | ) | | | (299,705 | ) | | | 3,458 | |
| | | |
| | | |
The accompanying notes are an integral part of these financial statements.
GOLDMAN SACHS STRUCTURED INTERNATIONAL EQUITY FLEX FUND
Schedule of Investments (continued)
April 30, 2009 (Unaudited)
| | | | | | | | | | | | | | | |
| | | | | Notional
| | Current
| | Unrealized
|
| | | | | Value | | Value | | Gain (Loss) |
| |
Total Return Swap Short Positions – (continued) |
| | | France – (continued) |
| | | | | | | | | | | | | | | |
| | | Veolia Environnement (Multi-Utilities) | | $ | (405,688 | ) | | $ | (399,809 | ) | | | 5,879 | |
| | | | | | | | | | | | | | | |
| | | | | | | | | | | | | | 44,856 | |
| | | |
| | | |
| | | Germany – 7.3% |
| | | Deutsche Postbank AG (Commercial Banks) | | | (749,073 | ) | | | (745,237 | ) | | | 3,836 | |
| | | ElringKlinger AG (Auto Components) | | | (123,076 | ) | | | (122,520 | ) | | | 556 | |
| | | Fraport AG (Transportation Infrastructure) | | | (105,272 | ) | | | (104,759 | ) | | | 513 | |
| | | Generali Deutschland Holding AG (Insurance) | | | (49,157 | ) | | | (49,047 | ) | | | 110 | |
| | | Linde AG (Chemicals) | | | (346,510 | ) | | | (345,467 | ) | | | 1,043 | |
| | | United Internet AG (Internet Software & Services) | | | (351,672 | ) | | | (350,498 | ) | | | 1,174 | |
| | | | | | | | | | | | | | | |
| | | | | | | | | | | | | | 7,232 | |
| | | |
| | | |
| | | Gibraltar – 0.6% |
| | | 888 Holdings PLC (Hotels, Restaurants & Leisure) | | | (135,798 | ) | | | (134,597 | ) | | | 1,201 | |
| | | |
| | | |
| | | Italy – 1.8% |
| | | Cementir Holding SpA (Construction Materials) | | | (81,936 | ) | | | (80,801 | ) | | | 1,135 | |
| | | Geox SpA (Textiles, Apparel & Luxury Goods) | | | (205,440 | ) | | | (202,724 | ) | | | 2,716 | |
| | | Kerself SpA (Machinery) | | | (23,508 | ) | | | (23,350 | ) | | | 158 | |
| | | Saipem SpA (Energy Equipment & Services) | | | (111,169 | ) | | | (109,479 | ) | | | 1,690 | |
| | | | | | | | | | | | | | | |
| | | | | | | | | | | | | | 5,699 | |
| | | |
| | | |
| | | Japan – 25.0% |
| | | Advantest Corp. (Semiconductors & Semiconductor Equipment) | | | (50,561 | ) | | | (50,661 | ) | | | (100 | ) |
| | | Aeon Mall Co. Ltd. (Real Estate Management & Development) | | | (58,039 | ) | | | (57,598 | ) | | | 441 | |
| | | All Nippon Airways Co. Ltd. (Airlines) | | | (165,780 | ) | | | (164,312 | ) | | | 1,468 | |
| | | Capcom Co. Ltd. (Software) | | | (90,569 | ) | | | (90,694 | ) | | | (125 | ) |
| | | Chiyoda Corp. (Construction & Engineering) | | | (234,271 | ) | | | (234,587 | ) | | | (316 | ) |
| | | |
| | | |
| | | Citizen Holdings Co. Ltd. (Electronic Equipment, Instruments & Components) | | | (435,930 | ) | | | (435,999 | ) | | | (69 | ) |
| | | Daikin Industries Ltd. (Building Products) | | | (113,682 | ) | | | (112,992 | ) | | | 690 | |
| | | Hitachi Capital Corp. (Consumer Finance) | | | (86,605 | ) | | | (86,091 | ) | | | 514 | |
| | | Hitachi Chemical Co. Ltd. (Chemicals) | | | (78,050 | ) | | | (77,811 | ) | | | 239 | |
| | | Hitachi Metals Ltd. (Metals & Mining) | | | (313,549 | ) | | | (315,441 | ) | | | (1,892 | ) |
| | | Japan Securities Finance Co. Ltd. (Diversified Financial Services) | | | (67,792 | ) | | | (67,473 | ) | | | 319 | |
| | | Keyence Corp. (Electronic Equipment, Instruments & Components) | | | (117,317 | ) | | | (116,554 | ) | | | 763 | |
| | | Kyowa Hakko Kirin Co. Ltd. (Pharmaceuticals) | | | (177,446 | ) | | | (176,876 | ) | | | 570 | |
| | | MISUMI Group, Inc. (Trading Companies & Distributors) | | | (98,982 | ) | | | (98,564 | ) | | | 418 | |
| | | Mitsubishi Estate Co. Ltd. (Real Estate Management & Development) | | | (459,527 | ) | | | (457,490 | ) | | | 2,037 | |
| | | Nagoya Railroad Co. Ltd. (Road & Rail) | | | (225,665 | ) | | | (223,633 | ) | | | 2,032 | |
| | | NGK Spark Plug Co. Ltd. (Auto Components) | | | (174,621 | ) | | | (173,668 | ) | | | 953 | |
| | | Nomura Real Estate Office Fund, Inc. (REIT) | | | (15,626 | ) | | | (15,544 | ) | | | 82 | |
| | | Olympus Corp. (Health Care Equipment & Supplies) | | | (245,753 | ) | | | (245,810 | ) | | | (57 | ) |
| | | ORIX Corp. (Consumer Finance) | | | (33,495 | ) | | | (33,252 | ) | | | 243 | |
| | | Rakuten, Inc. (Internet & Catalog Retail) | | | (70,327 | ) | | | (70,207 | ) | | | 120 | |
| | | Shimizu Corp (Construction & Engineering) | | | (48,301 | ) | | | (47,898 | ) | | | 403 | |
| | | Shionogi & Co. Ltd. (Pharmaceuticals) | | | (52,036 | ) | | | (51,613 | ) | | | 423 | |
| | | SOFTBANK Corp. (Wireless Telecommunication Services) | | | (407,644 | ) | | | (406,573 | ) | | | 1,071 | |
| | | |
| | | |
The accompanying notes are an integral part of these financial statements.
GOLDMAN SACHS STRUCTURED INTERNATIONAL EQUITY FLEX FUND
| | | | | | | | | | | | | | | |
| | | | | Notional
| | Current
| | Unrealized
|
| | | | | Value | | Value | | Gain (Loss) |
| |
Total Return Swap Short Positions – (continued) |
| | | Japan – (continued) |
| | | | | | | | | | | | | | | |
| | | Sony Financial Holdings, Inc. (Insurance) | | $ | (56,918 | ) | | $ | (56,632 | ) | | | 286 | |
| | | Square Enix Holdings Co. Ltd. (Software) | | | (72,370 | ) | | | (71,982 | ) | | | 388 | |
| | | Sugi Holdings Co. Ltd. (Food & Staples Retailing) | | | (260,906 | ) | | | (258,741 | ) | | | 2,165 | |
| | | Sysmex Corp. (Health Care Equipment & Supplies) | | | (178,715 | ) | | | (177,757 | ) | | | 958 | |
| | | The Bank of Kyoto Ltd. (Commercial Banks) | | | (129,022 | ) | | | (128,425 | ) | | | 597 | |
| | | The Joyo Bank Ltd. (Commercial Banks) | | | (78,981 | ) | | | (78,538 | ) | | | 443 | |
| | | THK Co. Ltd. (Machinery) | | | (547,133 | ) | | | (546,426 | ) | | | 707 | |
| | | Tokyu Corp. (Road & Rail) | | | (98,854 | ) | | | (98,108 | ) | | | 746 | |
| | | Trend Micro, Inc. (Software) | | | (336,011 | ) | | | (334,959 | ) | | | 1,052 | |
| | | Unicharm Corp. (Household Products) | | | (105,454 | ) | | | (104,389 | ) | | | 1,065 | |
| | | Yamada Denki Co. Ltd. (Specialty Retail) | | | (171,899 | ) | | | (170,427 | ) | | | 1,472 | |
| | | | | | | | | | | | | | | |
| | | | | | | | | | | | | | 20,106 | |
| | | |
| | | |
| | | Netherlands – 3.4% |
| | | Draka Holding NV (Electrical Equipment) | | | (63,040 | ) | | | (62,440 | ) | | | 600 | |
| | | Randstad Holding NV (Professional Services) | | | (176,404 | ) | | | (175,047 | ) | | | 1,357 | |
| | | SBM Offshore NV (Energy Equipment & Services) | | | (390,642 | ) | | | (386,084 | ) | | | 4,558 | |
| | | STMicroelectronics NV (Semiconductors & Semiconductor Equipment) | | | (182,688 | ) | | | (181,259 | ) | | | 1,429 | |
| | | | | | | | | | | | | | | |
| | | | | | | | | | | | | | 7,944 | |
| | | |
| | | |
| | | Norway – 0.3% |
| | | Norsk Hydro ASA (Metals & Mining) | | | (38,579 | ) | | | (37,920 | ) | | | 659 | |
| | | ODIM ASA (Machinery) | | | (40,061 | ) | | | (39,481 | ) | | | 580 | |
| | | | | | | | | | | | | | | |
| | | | | | | | | | | | | | 1,239 | |
| | | |
| | | |
| | | Spain – 4.9% |
| | | Cintra Concesiones de Infraestructuras de Transporte SA (Transportation Infrastructure) | | | (112,373 | ) | | | (111,339 | ) | | | 1,034 | |
| | | |
| | | |
| | | Gamesa Corp. Tecnologica SA (Electrical Equipment) | | | (3,625 | ) | | | (3,586 | ) | | | 39 | |
| | | Grifols SA (Biotechnology) | | | (599,524 | ) | | | (595,255 | ) | | | 4,269 | |
| | | Grupo Catalana Occidente SA (Insurance) | | | (283,032 | ) | | | (281,269 | ) | | | 1,763 | |
| | | Laboratorios Farmaceuticos Rovi SA (Pharmaceuticals) | | | (26,876 | ) | | | (26,759 | ) | | | 117 | |
| | | Obrascon Huarte Lain SA (Construction & Engineering) | | | (140,645 | ) | | | (138,846 | ) | | | 1,799 | |
| | | | | | | | | | | | | | | |
| | | | | | | | | | | | | | 9,021 | |
| | | |
| | | |
| | | Sweden – 2.3% |
| | | Holmen AB (Paper & Forest Products) | | | (161,282 | ) | | | (158,687 | ) | | | 2,595 | |
| | | Investor AB Class B (Diversified Financial Services) | | | (59,764 | ) | | | (58,845 | ) | | | 919 | |
| | | Kinnevik Investment AB (Diversified Financial Services) | | | (244,691 | ) | | | (240,033 | ) | | | 4,658 | |
| | | Tele2 AB Class B (Diversified Telecommunication Services) | | | (90,878 | ) | | | (89,079 | ) | | | 1,799 | |
| | | | | | | | | | | | | | | |
| | | | | | | | | | | | | | 9,971 | |
| | | |
| | | |
| | | Switzerland – 1.0% |
| | | Givaudan SA (Chemicals) | | | (58,737 | ) | | | (58,247 | ) | | | 490 | |
| | | Swatch Group AG (Textiles, Apparel & Luxury Goods) | | | (174,420 | ) | | | (172,386 | ) | | | 2,034 | |
| | | | | | | | | | | | | | | |
| | | | | | | | | | | | | | 2,524 | |
| | | |
| | | |
| | | United Kingdom – 20.6% |
| | | BTG PLC (Life Sciences Tools & Services) | | | (116,354 | ) | | | (115,193 | ) | | | 1,161 | |
| | | Burberry Group PLC (Textiles, Apparel & Luxury Goods) | | | (367,498 | ) | | | (363,292 | ) | | | 4,206 | |
| | | Chloride Group PLC (Electrical Equipment) | | | (80,196 | ) | | | (79,508 | ) | | | 688 | |
| | | Daily Mail and General Trust PLC (Media) | | | (91,899 | ) | | | (90,895 | ) | | | 1,004 | |
| | | Dignity PLC (Diversified Consumer Services) | | | (83,511 | ) | | | (82,810 | ) | | | 701 | |
| | | easyJet PLC (Airlines) | | | (33,434 | ) | | | (33,034 | ) | | | 400 | |
| | | Fresnillo PLC (Metals & Mining) | | | (309,945 | ) | | | (306,853 | ) | | | 3,092 | |
| | | |
| | | |
The accompanying notes are an integral part of these financial statements.
GOLDMAN SACHS STRUCTURED INTERNATIONAL EQUITY FLEX FUND
Schedule of Investments (continued)
April 30, 2009 (Unaudited)
| | | | | | | | | | | | | | | |
| | | | | Notional
| | Current
| | Unrealized
|
| | | | | Value | | Value | | Gain (Loss) |
| |
Total Return Swap Short Positions – (continued) |
| | | United Kingdom – (continued) |
| | | | | | | | | | | | | | | |
| | | Gem Diamonds Ltd. (Metals & Mining) | | $ | (43,061 | ) | | $ | (42,566 | ) | | | 495 | |
| | | Go-Ahead Group PLC (Road & Rail) | | | (96,946 | ) | | | (96,246 | ) | | | 700 | |
| | | Hikma Pharmaceuticals PLC (Pharmaceuticals) | | | (366,332 | ) | | | (364,287 | ) | | | 2,045 | |
| | | Hochschild Mining PLC (Metals & Mining) | | | (196,536 | ) | | | (194,468 | ) | | | 2,068 | |
| | | InterContinental Hotels Group PLC (Hotels, Restaurants & Leisure) | | | (668,140 | ) | | | (661,562 | ) | | | 6,578 | |
| | | ITV PLC (Media) | | | (675,366 | ) | | | (668,146 | ) | | | 7,220 | |
| | | Lonmin PLC (Metals & Mining) | | | (114,623 | ) | | | (112,782 | ) | | | 1,841 | |
| | | Melrose PLC (Machinery) | | | (66,886 | ) | | | (66,176 | ) | | | 710 | |
| | | Morgan Crucible Co. PLC (Machinery) | | | (120,058 | ) | | | (118,955 | ) | | | 1,103 | |
| | | Pennon Group PLC (Water Utilities) | | | (536,524 | ) | | | (531,949 | ) | | | 4,575 | |
| | | Randgold Resources Ltd. (Metals & Mining) | | | (107,579 | ) | | | (106,773 | ) | | | 806 | |
| | | SABMiller PLC (Beverages) | | | (100,026 | ) | | | (99,031 | ) | | | 995 | |
| | | Serco Group PLC (Commercial Services & Supplies) | | | (167,769 | ) | | | (166,186 | ) | | | 1,583 | |
| | | Severn Trent PLC (Water Utilities) | | | (115,651 | ) | | | (114,487 | ) | | | 1,164 | |
| | | |
| | | |
| | | Shire PLC (Pharmaceuticals) | | | (48,322 | ) | | | (47,902 | ) | | | 420 | |
| | | St. Modwen Properties PLC (Real Estate Management & Development) | | | (59,113 | ) | | | (58,512 | ) | | | 601 | |
| | | The Carphone Warehouse Group PLC (Specialty Retail) | | | (91,683 | ) | | | (90,404 | ) | | | 1,279 | |
| | | Wincanton PLC (Air Freight & Logistics) | | | (188,543 | ) | | | (186,665 | ) | | | 1,878 | |
| | | | | | | | | | | | | | | |
| | | | | | | | | | | | | | 47,313 | |
| | | |
| | | |
| | | TOTAL SHORT POSITIONS OF TOTAL RETURN SWAP | | | (23,584,152 | ) | | | (23,383,899 | ) | | | 200,253 | |
| | | |
| | | |
| | | NET LONG AND SHORT POSITIONS OF TOTAL RETURN SWAP | | $ | (33,550 | ) |
| | | |
| | | |
| | | NET FINANCING COST | | $ | 7,125 | |
| | | |
| | | |
| | | CORPORATE ACTIONS | | $ | (24,594 | ) |
| | | |
| | | |
| | | NET SWAP CONTRACT | | $ | (51,019 | ) |
| | | |
| | | |
The percentage shown for each investment category reflects the value of investments in that category as a percentage of the current swap value.
Credit Suisse First Boston Corp. acts as the counterparty for the Fund’s swap contract. Termination date for this contract is January 5, 2014.
The accompanying notes are an integral part of these financial statements.
GOLDMAN SACHS STRUCTURED INTERNATIONAL EQUITY FLEX FUND
ADDITIONAL INVESTMENT INFORMATION
FORWARD FOREIGN CURRENCY EXCHANGE CONTRACTS — At April 30, 2009, the Fund had outstanding forward foreign currency exchange contracts, both to purchase and sell foreign currencies:
| | | | | | | | | | | | | | | | | |
Open Forward Foreign Currency
| | Contract
| | Expiration
| | Value on
| | | Current
| | | Unrealized
| |
| Contracts with Unrealized Gain | | Type | | Date | | Settlement Date | | | Value | | | Gain | |
| | |
| Australian Dollar | | Purchase | | 05/01/09 | | $ | 21,187 | | | $ | 21,800 | | | $ | 613 | |
| Euro | | Purchase | | 05/04/09 | | | 26,142 | | | | 26,462 | | | | 320 | |
| Japanese Yen | | Sale | | 05/07/09 | | | 242,955 | | | | 238,009 | | | | 4,946 | |
| |
| |
TOTAL | | | | | | | | | | | | | | $ | 5,879 | |
| |
| |
| | | | | | | | | | | | | | | | | |
Open Forward Foreign Currency
| | Contract
| | Expiration
| | Value on
| | | Current
| | | Unrealized
| |
| Contracts with Unrealized Loss | | Type | | Date | | Settlement Date | | | Value | | | Loss | |
| | |
| Danish Krone | | Sale | | 05/01/09 | | $ | 33,354 | | | $ | 33,747 | | | $ | (393 | ) |
| Norwegian Krone | | Sale | | 05/04/09 | | | 28,385 | | | | 28,935 | | | | (550 | ) |
| Swedish Krona | | Sale | | 05/04/09 | | | 91,865 | | | | 93,233 | | | | (1,368 | ) |
| |
| |
TOTAL | | | | | | | | | | | | | | $ | (2,311 | ) |
| |
| |
FUTURES CONTRACTS — At April 30, 2009, the following futures contracts were open:
| | | | | | | | | | | | | | | |
| | | Number of
| | | Settlement
| | Notional
| | | Unrealized
| |
| Type | | Contracts Long | | | Month | | Value | | | Gain | |
| | |
| Dow Jones Euro Stoxx 50 Index | | | 32 | | | June 2009 | | $ | 985,656 | | | $ | 160,366 | |
| FTSE 100 Index | | | 7 | | | June 2009 | | | 435,653 | | | | 42,335 | |
| SPI 200 Index | | | 2 | | | June 2009 | | | 136,847 | | | | 13,146 | |
| TOPIX Index | | | 6 | | | June 2009 | | | 511,661 | | | | 73,399 | |
| |
| |
TOTAL | | | | | | | | | | | | $ | 289,246 | |
| |
| |
The accompanying notes are an integral part of these financial statements.
GOLDMAN SACHS STRUCTURED EMERGING MARKETS EQUITY FUND
Schedule of Investments
April 30, 2009 (Unaudited)
| | | | | | | | | | | |
| | | Shares | | Description | | Value |
| |
Common Stocks – 97.2% |
| | | | | | | | | | | |
| | | | | | | | | | | |
| | | Argentina – 0.0% |
| | | | 3,475 | | | Banco Macro SA ADR (Banks) | | $ | 41,700 | |
| | | |
| | | |
| | | Brazil – 14.8% |
| | | | 235,900 | | | Banco do Brasil SA (Banks) | | | 2,020,661 | |
| | | | 252,600 | | | Banco do Estado do Rio Grande do Sul SA Preference B Shares (Banks) | | | 825,094 | |
| | | | 186,400 | | | Centrais Eletricas Brasileiras SA (Utilities)* | | | 2,467,791 | |
| | | | 205,500 | | | Centrais Eletricas Brasileiras SA Preference B Shares (Utilities)* | | | 2,649,311 | |
| | | | 19,000 | | | Companhia de Saneamento de Minas Gerais – Copasa MG (Utilities) | | | 205,802 | |
| | | | 93,400 | | | Companhia Vale do Rio Doce ADR (Materials)(a) | | | 1,542,034 | |
| | | | 210,000 | | | Companhia Vale do Rio Doce Preference A Shares (Materials) | | | 2,949,085 | |
| | | | 43,500 | | | Equatorial Energia SA (Utilities) | | | 270,863 | |
| | | | 54,200 | | | Investimentos Itau SA Preference Shares (Banks) | | | 231,761 | |
| | | | 79,825 | | | Itau Unibanco Banco Multiplo SA ADR Preference Shares (Banks) | | | 1,096,001 | |
| | | | 161,750 | | | Petroleo Brasileiro SA ADR (Energy) | | | 5,429,947 | |
| | | | 402,500 | | | Petroleo Brasileiro SA Preference Shares (Energy) | | | 5,446,470 | |
| | | | 48,800 | | | Souza Cruz SA (Food, Beverage & Tobacco) | | | 1,038,891 | |
| | | | | | | | | | | |
| | | | | | | | | | 26,173,711 | |
| | | |
| | | |
| | | Chile – 1.0% |
| | | | 914,416 | | | Centros Comerciales Sudamericanos SA (Food & Staples Retailing) | | | 1,809,184 | |
| | | | 2,007 | | | Empresas CMPC SA (Materials) | | | 44,815 | |
| | | | | | | | | | | |
| | | | | | | | | | 1,853,999 | |
| | | |
| | | |
| | | China – 11.8% |
| | | | 1,178,000 | | | Agile Property Holdings Ltd. Class H (Real Estate) | | | 876,030 | |
| | | | 372,000 | | | Angang Steel Co. Ltd. Class H (Materials) | | | 441,856 | |
| | | | 3,282,000 | | | Bank of China Ltd. Class H (Banks) | | | 1,216,885 | |
| | | | 8,068,000 | | | China Construction Bank Corp. Class H (Banks) | | | 4,657,805 | |
| | | | 5,106,000 | | | China Telecom Corp. Ltd. Class H (Telecommunication Services) | | | 2,513,516 | |
| | | | 2,346,000 | | | Dongfeng Motor Group Co. Ltd. Class H (Automobiles & Components) | | | 1,745,765 | |
| | | | 320,000 | | | Harbin Power Equipment Co. Ltd. Class H (Capital Goods) | | | 239,385 | |
| | | | 9,700 | | | Netease.com, Inc. ADR Class H (Software & Services)* | | | 292,746 | |
| | | |
| | | |
| | | | 4,496,000 | | | PetroChina Co. Ltd. Class H (Energy) | | | 3,918,575 | |
| | | | 55,000 | | | Ping An Insurance Group Co. of China Ltd. Class H (Insurance) | | | 339,762 | |
| | | | 1,331,000 | | | Shui On Land Ltd. Class H (Real Estate) | | | 570,516 | |
| | | | 1,556,500 | | | Sino-Ocean Land Holdings Ltd. Class H (Real Estate) | | | 1,143,800 | |
| | | | 2,096,000 | | | Yanzhou Coal Mining Co. Ltd. Class H (Energy) | | | 1,976,974 | |
| | | | 1,236,000 | | | Zijin Mining Group Co. Ltd. Class H (Materials) | | | 946,661 | |
| | | | | | | | | | | |
| | | | | | | | | | 20,880,276 | |
| | | |
| | | |
| | | Egypt – 1.4% |
| | | | 874,403 | | | Telecom Egypt (Telecommunication Services) | | | 2,481,569 | |
| | | |
| | | |
| | | Hong Kong – 8.1% |
| | | | 528,000 | | | Chaoda Modern Agriculture Holdings Ltd. (Food, Beverage & Tobacco) | | | 300,174 | |
| | | | 86,000 | | | China Everbright Ltd. (Diversified Financials) | | | 166,424 | |
| | | | 494,000 | | | China Mobile Ltd. (Telecommunication Services) | | | 4,265,804 | |
| | | | 1,666,000 | | | China Pharmaceutical Group Ltd. (Pharmaceuticals, Biotechnology & Life Sciences) | | | 829,333 | |
| | | | 3,589,000 | | | CNOOC Ltd. (Energy) | | | 4,006,469 | |
| | | | 2,770,000 | | | Guangdong Investment Ltd. (Utilities) | | | 1,141,052 | |
| | | | 202,800 | | | Lee & Man Paper Manufacturing Ltd. (Materials) | | | 150,311 | |
| | | | 643,000 | | | Nine Dragons Paper Holdings Ltd. (Materials) | | | 291,032 | |
| | | | 8,554,000 | | | Shenzhen Investment Ltd. (Real Estate) | | | 2,466,501 | |
| | | | 566,500 | | | Shimao Property Holdings Ltd. (Real Estate) | | | 629,143 | |
| | | | | | | | | | | |
| | | | | | | | | | 14,246,243 | |
| | | |
| | | |
| | | Hungary – 0.2% |
| | | | 6,508 | | | Egis Gyogyszergyar Nyrt (Pharmaceuticals, Biotechnology & Life Sciences)* | | | 359,801 | |
| | | |
| | | |
| | | India – 4.0% |
| | | | 10,875 | | | Bajaj Holdings and Investment Ltd. (Diversified Financials) | | | 74,368 | |
| | | | 476,921 | | | Bank of India (Banks) | | | 2,254,039 | |
| | | | 29,379 | | | Bharat Petroleum Corp. Ltd. (Energy) | | | 228,346 | |
| | | | 134,338 | | | CESC Ltd. (Utilities) | | | 628,396 | |
| | | | 12,497 | | | Hindustan Zinc Ltd. (Materials) | | | 121,304 | |
| | | | 94,129 | | | Housing Development & Infrastructure Ltd. (Real Estate) | | | 278,258 | |
| | | |
| | | |
The accompanying notes are an integral part of these financial statements.
GOLDMAN SACHS STRUCTURED EMERGING MARKETS EQUITY FUND
| | | | | | | | | | | |
| | | Shares | | Description | | Value |
| |
Common Stocks – (continued) |
| | | India – (continued) |
| | | | | | | | | | | |
| | | | 85,731 | | | ICICI Bank Ltd. (Banks) | | $ | 829,686 | |
| | | | 133,749 | | | Indiabulls Financial Services Ltd. (Diversified Financials) | | | 303,634 | |
| | | | 330,659 | | | Indiabulls Real Estate Ltd. (Real Estate) | | | 860,935 | |
| | | | 56,415 | | | Steel Authority of India Ltd. (Materials) | | | 124,272 | |
| | | | 128,881 | | | Sterlite Industries India Ltd. (Materials) | | | 1,076,010 | |
| | | | 71,374 | | | The Great Eastern Shipping Co. Ltd. (Energy) | | | 295,552 | |
| | | | | | | | | | | |
| | | | | | | | | | 7,074,800 | |
| | | |
| | | |
| | | Indonesia – 5.4% |
| | | | 226,000 | | | PT Astra Agro Lestari Tbk (Food, Beverage & Tobacco) | | | 333,988 | |
| | | | 1,191,500 | | | PT Astra International Tbk (Automobiles & Components) | | | 2,007,581 | |
| | | | 6,529,000 | | | PT Bakrieland Development Tbk (Real Estate)* | | | 100,579 | |
| | | | 3,912,500 | | | PT Bank Central Asia Tbk (Banks) | | | 1,226,499 | |
| | | | 5,073,500 | | | PT Bank Mandiri Persero Tbk (Banks) | | | 1,318,577 | |
| | | | 4,847,000 | | | PT Bank Negara Indonesia Persero Tbk (Banks) | | | 566,252 | |
| | | | 1,006,500 | | | PT Bank Rakyat Indonesia (Banks) | | | 546,069 | |
| | | | 2,005,500 | | | PT Indah Kiat Pulp and Paper Corp. Tbk (Materials)* | | | 211,814 | |
| | | | 659,000 | | | PT Indosat Tbk (Telecommunication Services) | | | 345,410 | |
| | | | 3,845,000 | | | PT Telekomunikasi Indonesia Tbk (Telecommunication Services) | | | 2,793,718 | |
| | | | | | | | | | | |
| | | | | | | | | | 9,450,487 | |
| | | |
| | | |
| | | Israel – 2.7% |
| | | | 15,355 | | | Harel Insurance Investments & Financial Services Ltd. (Insurance)* | | | 478,226 | |
| | | | 12,467 | | | Mizrahi Tefahot Bank Ltd. (Banks) | | | 68,986 | |
| | | | 10,262 | | | Nice Systems Ltd. ADR (Technology Hardware & Equipment)* | | | 262,810 | |
| | | | 63,857 | | | Teva Pharmaceutical Industries Ltd. ADR (Pharmaceuticals, Biotechnology & Life Sciences) | | | 2,802,683 | |
| | | | 2,804 | | | The Israel Corp. Ltd. (Materials) | | | 1,180,847 | |
| | | | | | | | | | | |
| | | | | | | | | | 4,793,552 | |
| | | |
| | | |
| | | Malaysia – 0.3% |
| | | | 197,100 | | | PPB Group Berhad (Food, Beverage & Tobacco) | | | 585,427 | |
| | | |
| | | |
| | | Mexico – 6.5% |
| | | | 195,265 | | | America Movil SAB de CV ADR Series L (Telecommunication Services) | | | 6,414,455 | |
| | | | 196,350 | | | Cemex SAB de CV ADR (Materials)*(a) | | | 1,468,698 | |
| | | | 431,700 | | | Controladora Comercial Mexicana SA de CV (Food & Staples Retailing)* | | | 160,410 | |
| | | | 1,240 | | | Fomento Economico Mexicano SAB de CV ADR (Food, Beverage & Tobacco) | | | 35,104 | |
| | | | 57,980 | | | Grupo Aeroportuario del Pacifico SAB de CV ADR (Transportation)(a) | | | 1,192,069 | |
| | | | 5,190 | | | Grupo Elektra SA de CV (Retailing) | | | 219,156 | |
| | | | 159,400 | | | Grupo Financiero Banorte SAB de CV Class O (Banks) | | | 245,923 | |
| | | | 2,152,969 | | | Grupo Mexico SAB de CV Series B (Materials) | | | 1,668,606 | |
| | | | | | | | | | | |
| | | | | | | | | | 11,404,421 | |
| | | |
| | | |
| | | Poland – 0.4% |
| | | | 36,704 | | | KGHM Polska Miedz SA (Materials) | | | 643,185 | |
| | | |
| | | |
| | | Russia – 5.8% |
| | | | 108,300 | | | Mechel ADR (Materials)(a) | | | 576,156 | |
| | | | 49,538 | | | Novolipetsk Steel OJSC (Registered) GDR (Materials) | | | 748,776 | |
| | | | 213,977 | | | OAO Gazprom ADR (Energy) | | | 3,787,393 | |
| | | | 582,445 | | | Sberbank RF (Banks) | | | 484,148 | |
| | | | 535,088 | | | Surgutneftegaz ADR (Energy)*(a) | | | 3,772,370 | |
| | | | 2,587,084 | | | Surgutneftegaz Preference Shares (Energy)* | | | 773,117 | |
| | | | | | | | | | | |
| | | | | | | | | | 10,141,960 | |
| | | |
| | | |
| | | South Africa – 7.7% |
| | | | 273,109 | | | Gold Fields Ltd. ADR (Materials) | | | 2,840,333 | |
| | | | 33,983 | | | Harmony Gold Mining Co. Ltd. ADR (Materials)* | | | 316,722 | |
| | | | 29,846 | | | Impala Platinum Holdings Ltd. (Materials) | | | 570,268 | |
| | | | 292,699 | | | JD Group Ltd. (Retailing) | | | 1,172,978 | |
| | | | 159,969 | | | MTN Group Ltd. (Telecommunication Services) | | | 2,076,908 | |
| | | | 158,392 | | | Nedbank Group Ltd. (Banks) | | | 1,615,483 | |
| | | | 247,866 | | | Remgro Ltd. (Diversified Financials) | | | 2,109,681 | |
| | | | 204,941 | | | Shoprite Holdings Ltd. (Food & Staples Retailing) | | | 1,227,802 | |
| | | | 128,078 | | | Standard Bank Group Ltd. (Banks) | | | 1,237,516 | |
| | | | 27,368 | | | Telkom South Africa Ltd. (Telecommunication Services) | | | 344,831 | |
| | | | | | | | | | | |
| | | | | | | | | | 13,512,522 | |
| | | |
| | | |
The accompanying notes are an integral part of these financial statements.
GOLDMAN SACHS STRUCTURED EMERGING MARKETS EQUITY FUND
Schedule of Investments (continued)
April 30, 2009 (Unaudited)
| | | | | | | | | | | |
| | | Shares | | Description | | Value |
| |
Common Stocks – (continued) |
| | | | | | | | | | | |
| | | South Korea – 8.3% |
| | | | 19,940 | | | Binggrae Co. Ltd. (Food, Beverage & Tobacco) | | $ | 626,155 | |
| | | | 58,740 | | | Daishin Securities Co. Ltd. (Diversified Financials)* | | | 817,096 | |
| | | | 2,166 | | | Hyundai Heavy Industries Co. Ltd. (Capital Goods) | | | 388,345 | |
| | | | 29,085 | | | Hyundai Mipo Dockyard Co. Ltd. (Capital Goods) | | | 3,388,743 | |
| | | | 1,099 | | | KCC Corp. (Capital Goods) | | | 304,838 | |
| | | | 398 | | | Lotte Confectionery Co. Ltd. (Food, Beverage & Tobacco) | | | 320,422 | |
| | | | 11,498 | | | Lotte Shopping Co. Ltd. (Retailing) | | | 2,008,284 | |
| | | | 6,541 | | | Samsung Electronics Co. Ltd. (Semiconductors & Semiconductor Equipment) | | | 3,020,353 | |
| | | | 40,010 | | | SK Holdings Co. Ltd. (Capital Goods) | | | 3,700,965 | |
| | | | | | | | | | | |
| | | | | | | | | | 14,575,201 | |
| | | |
| | | |
| | | Taiwan – 16.8% |
| | | | 495,000 | | | Asia Optical Co., Inc. (Consumer Durables & Apparel) | | | 564,660 | |
| | | | 91,196 | | | AU Optronics Corp. (Technology Hardware & Equipment) | | | 97,022 | |
| | | | 4,051,000 | | | BES Engineering Corp. (Capital Goods) | | | 988,931 | |
| | | | 928,000 | | | China Life Insurance Co. Ltd. (Insurance)* | | | 395,438 | |
| | | | 491,000 | | | Compal Electronics, Inc. (Technology Hardware & Equipment) | | | 416,387 | |
| | | | 447,000 | | | Coretronic Corp. (Technology Hardware & Equipment) | | | 386,167 | |
| | | | 920,000 | | | CTCI Corp. (Capital Goods) | | | 679,205 | |
| | | | 297,000 | | | Evergreen Marine Corp. (Transportation) | | | 148,031 | |
| | | | 519,000 | | | Formosa Plastics Corp. (Materials) | | | 914,438 | |
| | | | 335,000 | | | Formosa Taffeta Co. Ltd. (Consumer Durables & Apparel) | | | 215,303 | |
| | | | 2,387,000 | | | Fubon Financial Holding Co. Ltd. (Diversified Financials) | | | 1,850,210 | |
| | | | 114,200 | | | HTC Corp. (Technology Hardware & Equipment) | | | 1,546,456 | |
| | | | 98,000 | | | LITE-ON IT Corp. (Technology Hardware & Equipment) | | | 51,478 | |
| | | | 81,000 | | | Lite-On Technology Corp. (Technology Hardware & Equipment) | | | 64,824 | |
| | | | 2,476,925 | | | Macronix International Co. Ltd. (Semiconductors & Semiconductor Equipment) | | | 1,031,113 | |
| | | | 203,000 | | | MediaTek, Inc. (Semiconductors & Semiconductor Equipment) | | | 2,111,215 | |
| | | |
| | | |
| | | | 680,000 | | | Micro-Star International Co. Ltd. (Technology Hardware & Equipment) | | | 416,995 | |
| | | | 922,000 | | | Polaris Securities Co. Ltd. (Diversified Financials) | | | 344,513 | |
| | | | 3,144,000 | | | Quanta Computer, Inc. (Technology Hardware & Equipment) | | | 4,680,981 | |
| | | | 225,000 | | | Shihlin Electric & Engineering Corp. (Capital Goods) | | | 224,868 | |
| | | | 128,000 | | | Soft-World International Corp. (Software & Services) | | | 506,987 | |
| | | | 326,000 | | | Taiwan Cement Corp. (Materials) | | | 311,457 | |
| | | | 1,049,175 | | | Taiwan Semiconductor Manufacturing Co. Ltd. ADR (Semiconductors & Semiconductor Equipment) | | | 11,089,779 | |
| | | | 1,244,000 | | | Waterland Financial Holdings (Diversified Financials) | | | 300,950 | |
| | | | 830,000 | | | Yieh Phui Enterprise (Materials) | | | 268,708 | |
| | | | | | | | | | | |
| | | | | | | | | | 29,606,116 | |
| | | |
| | | |
| | | Turkey – 2.0% |
| | | | 1,478,478 | | | Eczacibasi Ilac Sanayi (Pharmaceuticals, Biotechnology & Life Sciences) | | | 1,116,860 | |
| | | | 55,913 | | | Haci Omer Sabanci Holding AS (Diversified Financials) | | | 142,982 | |
| | | | 136,723 | | | Koc Holding AS (Capital Goods)* | | | 249,544 | |
| | | | 416,352 | | | Turk Hava Yollari Anonim Ortakligi (Transportation)* | | | 2,038,084 | |
| | | | | | | | | | | |
| | | | | | | | | | 3,547,470 | |
| | | |
| | | |
| | | TOTAL COMMON STOCKS |
| | | (Cost $161,816,314) | | $ | 171,372,440 | |
| | | |
| | | |
Exchange Traded Fund – 1.6% |
| | | | | | | | | | | |
| | | | | | | | | | | |
| | | Other – 1.6% |
| | | | 95,000 | | | iShares MSCI Emerging Markets Index Fund | | $ | 2,721,750 | |
| | | (Cost $2,164,206) | | | | |
| | | |
| | | |
The accompanying notes are an integral part of these financial statements.
GOLDMAN SACHS STRUCTURED EMERGING MARKETS EQUITY FUND
| | | | | | | | | | | | | |
| | | Shares | | Rate | | Value |
| |
Investment Company(b) – 0.0% |
| | | | | | | | | | | | | |
| | | | | | | | | | | | | |
| | | JPMorgan U.S. Government Money Market Fund – Capital Shares |
| | | | 43,570 | | | | 0.377 | % | | $ | 43,570 | |
| | | (Cost $43,570) | | | | |
| | | |
| | | |
| | | TOTAL INVESTMENTS BEFORE SECURITIES LENDING REINVESTMENT VEHICLE |
| | | (Cost $164,024,090) | | $ | 174,137,760 | |
| | | |
| | | |
Securities Lending Reinvestment Vehicle(b)(c) – 3.2% |
| | | | | | | | | | | | | |
| | | | | | | | | | | | | |
| | | Boston Global Investment Trust – Enhanced Portfolio II |
| | | | 5,748,421 | | | | 0.463 | % | | $ | 5,685,189 | |
| | | (Cost $5,663,347) | | | | |
| | | |
| | | |
| | | TOTAL INVESTMENTS – 102.0% |
| | | (Cost $169,687,437) | | $ | 179,822,949 | |
| | | |
| | | |
| | | LIABILITIES IN EXCESS OF
OTHER ASSETS – (2.0)% | | | (3,580,472 | ) |
| | | |
| | | |
| | | NET ASSETS – 100.0% | | $ | 176,242,477 | |
| | | |
| | | |
The percentage shown for each investment category reflects the value of investments in that category as a percentage of net assets.
| | |
| * | | Non-income producing security. |
| |
| (a) | | All or a portion of security is on loan. |
| |
| (b) | | Variable rate security. Interest rate disclosed is that which is in effect at April 30, 2009. |
| |
| (c) | | Represents an affiliated issuer. |
| | | | | | | |
| | | |
| | | |
| | | Investment Abbreviations: |
| | | ADR | | — | | American Depositary Receipt |
| | | GDR | | — | | Global Depositary Receipt |
| | | |
| | | |
The accompanying notes are an integral part of these financial statements.
GOLDMAN SACHS STRUCTURED INTERNATIONAL EQUITY FUND
Schedule of Investments
April 30, 2009 (Unaudited)
| | | | | | | | | | | |
| | | Shares | | Description | | Value |
| |
Common Stocks – 96.7% |
| | | | | | | | | | | |
| | | | | | | | | | | |
| | | Australia – 4.2% |
| | | | 242,044 | | | AGL Energy Ltd. (Multi-Utilities) | | $ | 2,663,045 | |
| | | | 515,552 | | | Amcor Ltd. (Containers & Packaging) | | | 1,799,951 | |
| | | | 207,168 | | | ASX Ltd. (Diversified Financial Services) | | | 4,911,173 | |
| �� | | | 258,394 | | | Australia and New Zealand Banking Group Ltd. (Commercial Banks) | | | 2,979,855 | |
| | | | 81,363 | | | Bendigo and Adelaide Bank Ltd. (Commercial Banks) | | | 405,147 | |
| | | | 809,992 | | | BHP Billiton Ltd. (Metals & Mining) | | | 19,567,442 | |
| | | | 466,259 | | | Caltex Australia Ltd. (Oil, Gas & Consumable Fuels) | | | 3,329,421 | |
| | | | 134,434 | | | Coca-Cola Amatil Ltd. (Beverages) | | | 892,443 | |
| | | | 17,472 | | | Cochlear Ltd. (Health Care Equipment & Supplies) | | | 630,244 | |
| | | | 304,920 | | | Commonwealth Bank of Australia (Commercial Banks) | | | 7,791,064 | |
| | | | 81,100 | | | Computershare Ltd. (IT Services) | | | 537,616 | |
| | | | 1,320,483 | | | Goodman Fielder Ltd. (Food Products) | | | 1,099,974 | |
| | | | 633,192 | | | Macquarie Airports (Transportation Infrastructure) | | | 834,614 | |
| | | | 138,367 | | | Macquarie Group Ltd. (Capital Markets) | | | 3,347,388 | |
| | | | 2,163,479 | | | Metcash Ltd. (Food & Staples Retailing) | | | 6,534,241 | |
| | | | 310,794 | | | National Australia Bank Ltd. (Commercial Banks) | | | 4,648,002 | |
| | | | 15,034 | | | QBE Insurance Group Ltd. (Insurance) | | | 237,760 | |
| | | | 1,098,700 | | | Tatts Group Ltd. (Hotels, Restaurants & Leisure) | | | 2,203,117 | |
| | | | 134,153 | | | Wesfarmers Ltd. (Food & Staples Retailing) | | | 2,204,312 | |
| | | | 499,810 | | | Westfield Group (REIT) | | | 3,901,371 | |
| | | | 99,112 | | | WorleyParsons Ltd. (Energy Equipment & Services) | | | 1,307,308 | |
| | | | | | | | | | | |
| | | | | | | | | | 71,825,488 | |
| | | |
| | | |
| | | Austria – 2.1% |
| | | | 235,456 | | | Erste Groupe Bank AG(a) (Commercial Banks) | | | 4,912,925 | |
| | | | 102,552 | | | Oesterreichische Elektrizitaetswirtschafts AG (Verbund) (Electric Utilities) | | | 4,211,046 | |
| | | | 419,858 | | | OMV AG (Oil, Gas & Consumable Fuels) | | | 13,007,231 | |
| | | | 30,242 | | | Strabag SE (Construction & Engineering) | | | 699,400 | |
| | | |
| | | |
| | | | 653,215 | | | Telekom Austria AG (Diversified Telecommunication Services) | | | 8,592,126 | |
| | | | 30,397 | | | Vienna Insurance Group (Insurance) | | | 1,185,008 | |
| | | | 135,018 | | | voestalpine AG(a) (Metals & Mining) | | | 2,583,257 | |
| | | | 5,939 | | | Wienerberger AG (Building Products) | | | 69,891 | |
| | | | | | | | | | | |
| | | | | | | | | | 35,260,884 | |
| | | |
| | | |
| | | Belgium – 2.6% |
| | | | 312,517 | | | Anheuser-Busch InBev NV(a) (Beverages) | | | 9,566,824 | |
| | | | 201,831 | | | Delhaize Group (Food & Staples Retailing) | | | 13,612,431 | |
| | | | 76,389 | | | KBC GROEP NV (Commercial Banks) | | | 1,679,137 | |
| | | | 157,680 | | | Mobistar SA (Wireless Telecommunication Services) | | | 9,435,735 | |
| | | | 293,336 | | | UCB SA(a) (Pharmaceuticals) | | | 7,983,879 | |
| | | | 88,400 | | | Umicore(a) (Chemicals) | | | 1,732,488 | |
| | | | | | | | | | | |
| | | | | | | | | | 44,010,494 | |
| | | |
| | | |
| | | Denmark – 1.5% |
| | | | 303 | | | A.P. Moller – Maersk A/S(a) (Marine) | | | 1,730,897 | |
| | | | 1,461 | | | A.P. Moller – Maersk A/S Class B (Marine) | | | 8,486,460 | |
| | | | 14,819 | | | Carlsberg A/S Class B (Beverages) | | | 721,222 | |
| | | | 137,472 | | | Danisco A/S (Food Products) | | | 4,502,221 | |
| | | | 54,387 | | | Danske Bank A/S* (Commercial Banks) | | | 606,189 | |
| | | | 70,922 | | | FLSmidth & Co. A/S* (Construction & Engineering) | | | 2,299,022 | |
| | | | 70,812 | | | Novo Nordisk A/S Class B (Pharmaceuticals) | | | 3,389,729 | |
| | | | 30,062 | | | Novozymes A/S Class B* (Chemicals) | | | 2,047,776 | |
| | | | 13,140 | | | Vestas Wind Systems A/S* (Electrical Equipment) | | | 867,069 | |
| | | | 15,132 | | | William Demant Holding A/S* (Health Care Equipment & Supplies) | | | 720,328 | |
| | | | | | | | | | | |
| | | | | | | | | | 25,370,913 | |
| | | |
| | | |
| | | Finland – 1.8% |
| | | | 376,000 | | | Elisa Oyj (Diversified Telecommunication Services) | | | 4,978,116 | |
| | | | 313,998 | | | Kesko Oyj Class B(a) (Food & Staples Retailing) | | | 8,164,866 | |
| | | | 47,604 | | | Metso Corp. (Machinery) | | | 728,973 | |
| | | | 736,908 | | | Nokia Oyj(a) (Communications Equipment) | | | 10,466,630 | |
| | | |
| | | |
The accompanying notes are an integral part of these financial statements.
GOLDMAN SACHS STRUCTURED INTERNATIONAL EQUITY FUND
| | | | | | | | | | | |
| | | Shares | | Description | | Value |
| |
Common Stocks – (continued) |
| | | Finland – (continued) |
| | | | | | | | | | | |
| | | | 112,552 | | | Orion Oyj Class B (Pharmaceuticals) | | $ | 1,630,009 | |
| | | | 90,678 | | | Rautaruukki Oyj (Metals & Mining) | | | 1,687,205 | |
| | | | 47,662 | | | Sampo Oyj(a) (Insurance) | | | 889,118 | |
| | | | 76,650 | | | Wartsila Corp. (Machinery) | | | 2,527,157 | |
| | | | | | | | | | | |
| | | | | | | | | | 31,072,074 | |
| | | |
| | | |
| | | France – 9.1% |
| | | | 87,825 | | | Alstom SA (Electrical Equipment) | | | 5,474,780 | |
| | | | 368,776 | | | AXA SA(a) (Insurance) | | | 6,196,054 | |
| | | | 240,242 | | | BNP Paribas (Commercial Banks) | | | 12,647,244 | |
| | | | 100,756 | | | Casino Guichard-Perrachon SA (Food & Staples Retailing) | | | 6,285,470 | |
| | | | 86,366 | | | Christian Dior SA (Textiles, Apparel & Luxury Goods) | | | 5,787,173 | |
| | | | 149,396 | | | Compagnie Generale de Geophysique-Veritas* (Energy Equipment & Services) | | | 2,158,342 | |
| | | | 47,902 | | | PPR(a) (Multiline Retail) | | | 3,669,913 | |
| | | | 59,584 | | | PSA Peugeot Citroen (Automobiles) | | | 1,375,955 | |
| | | | 72,779 | | | Publicis Groupe(a) (Media) | | | 2,224,478 | |
| | | | 626,054 | | | Sanofi-Aventis(a) (Pharmaceuticals) | | | 36,256,083 | |
| | | | 128,546 | | | Schneider Electric SA(a) (Electrical Equipment) | | | 9,782,142 | |
| | | | 165,657 | | | SCOR SE (Insurance) | | | 3,476,713 | |
| | | | 33,530 | | | SES (Media) | | | 605,275 | |
| | | | 49,383 | | | Societe BIC SA (Commercial Services & Supplies) | | | 2,651,034 | |
| | | | 42,134 | | | Technip SA(a) (Energy Equipment & Services) | | | 1,810,082 | |
| | | | 415,709 | | | Total SA (Oil, Gas & Consumable Fuels) | | | 20,800,288 | |
| | | | 16,046 | | | Unibail-Rodamco (REIT) | | | 2,392,867 | |
| | | | 464,760 | | | Valeo SA*(a) (Auto Components) | | | 9,577,067 | |
| | | | 842,202 | | | Vivendi SA(a) (Media) | | | 22,645,998 | |
| | | | | | | | | | | |
| | | | | | | | | | 155,816,958 | |
| | | |
| | | |
| | | Germany – 7.2% |
| | | | 195,955 | | | Adidas AG(a) (Textiles, Apparel & Luxury Goods) | | | 7,403,628 | |
| | | | 154,012 | | | Allianz SE(a) (Insurance) | | | 14,211,144 | |
| | | | 552,046 | | | BASF SE(a) (Chemicals) | | | 20,832,871 | |
| | | | 23,279 | | | Bayerische Motoren Werke (BMW) AG (Automobiles) | | | 806,595 | |
| | | | 272,083 | | | Daimler AG(a) (Automobiles) | | | 9,754,203 | |
| | | | 135,026 | | | Deutsche Bank AG(a) (Capital Markets) | | | 7,200,553 | |
| | | | 13,591 | | | Deutsche Boerse AG (Diversified Financial Services) | | | 1,004,029 | |
| | | | 802,195 | | | Deutsche Lufthansa AG (Airlines) | | | 10,233,357 | |
| | | |
| | | |
| | | | 496,552 | | | Deutsche Telekom AG(a) (Diversified Telecommunication Services) | | | 6,004,868 | |
| | | | 188,579 | | | E.ON AG(a) (Electric Utilities) | | | 6,377,164 | |
| | | | 177,806 | | | GEA Group AG (Machinery) | | | 2,338,573 | |
| | | | 3,902 | | | HeidelbergCement AG (Construction Materials) | | | 164,547 | |
| | | | 40,291 | | | Hochtief AG (Construction & Engineering) | | | 1,973,273 | |
| | | | 71,135 | | | Muenchener Rueckversicherungs-Gesellschaft AG (Insurance) | | | 9,828,721 | |
| | | | 15,964 | | | Q-Cells SE* (Electrical Equipment) | | | 335,628 | |
| | | | 78,693 | | | RWE AG(a) (Multi-Utilities) | | | 5,672,852 | |
| | | | 22,404 | | | Salzgitter AG (Metals & Mining) | | | 1,593,644 | |
| | | | 112,553 | | | Siemens AG (Industrial Conglomerates) | | | 7,567,471 | |
| | | | 156,478 | | | Suedzucker AG(a) (Food Products) | | | 3,028,580 | |
| | | | 293,501 | | | ThyssenKrupp AG (Metals & Mining) | | | 6,279,075 | |
| | | | 9,933 | | | Wacker Chemie AG (Chemicals) | | | 1,028,102 | |
| | | | | | | | | | | |
| | | | | | | | | | 123,638,878 | |
| | | |
| | | |
| | | Greece – 0.3% |
| | | | 87,290 | | | Hellenic Petroleum SA (Oil, Gas & Consumable Fuels) | | | 845,949 | |
| | | | 705,777 | | | Marfin Investment Group SA* (Capital Markets) | | | 3,026,292 | |
| | | | 76,629 | | | National Bank of Greece SA (Commercial Banks) | | | 1,593,565 | |
| | | | | | | | | | | |
| | | | | | | | | | 5,465,806 | |
| | | |
| | | |
| | | Hong Kong – 4.3% |
| | | | 1,758,000 | | | Boc Hong Kong Holdings Ltd. (Commercial Banks) | | | 2,487,456 | |
| | | | 408,000 | | | Cathay Pacific Airways Ltd. (Airlines) | | | 473,803 | |
| | | | 449,000 | | | Cheung Kong (Holdings) Ltd. (Real Estate Management & Development) | | | 4,671,876 | |
| | | | 129,000 | | | Cheung Kong Infrastructure Holdings Ltd. (Electric Utilities) | | | 500,184 | |
| | | | 1,250,000 | | | Chinese Estates Holdings Ltd. (Real Estate Management & Development) | | | 1,554,576 | |
| | | | 1,132,500 | | | CLP Holdings Ltd. (Electric Utilities) | | | 7,649,749 | |
| | | | 442,900 | | | Esprit Holdings Ltd. (Specialty Retail) | | | 2,713,756 | |
| | | | 1,452,000 | | | Foxconn International Holdings Ltd.* (Communications Equipment) | | | 892,968 | |
| | | |
| | | |
The accompanying notes are an integral part of these financial statements.
GOLDMAN SACHS STRUCTURED INTERNATIONAL EQUITY FUND
Schedule of Investments (continued)
April 30, 2009 (Unaudited)
| | | | | | | | | | | |
| | | Shares | | Description | | Value |
| |
Common Stocks – (continued) |
| | | Hong Kong – (continued) |
| | | | | | | | | | | |
| | | | 834,000 | | | Hang Lung Group Ltd. (Real Estate Management & Development) | | $ | 3,054,451 | |
| | | | 310,000 | | | Hang Lung Properties Ltd. (Real Estate Management & Development) | | | 881,994 | |
| | | | 372,300 | | | Hang Seng Bank Ltd. (Commercial Banks) | | | 4,128,848 | |
| | | | 130,000 | | | Hong Kong & China Gas Co. Ltd. (Gas Utilities) | | | 243,224 | |
| | | | 628,000 | | | Hong Kong Electric Holdings Ltd. (Electric Utilities) | | | 3,715,489 | |
| | | | 408,900 | | | Hong Kong Exchanges & Clearing Ltd. (Diversified Financial Services) | | | 4,707,260 | |
| | | | 342,000 | | | Hopewell Holdings Ltd. (Real Estate Management & Development) | | | 878,207 | |
| | | | 1,499,000 | | | Hutchison Telecommunications Hong Kong Holdings Ltd.* (Wireless Telecommunication Services) | | | 145,064 | |
| | | | 1,499,000 | | | Hutchison Telecommunications International Ltd. (Wireless Telecommunication Services) | | | 280,456 | |
| | | | 1,342,000 | | | Hutchison Whampoa Ltd. (Industrial Conglomerates) | | | 7,869,963 | |
| | | | 325,000 | | | Hysan Development Co. Ltd. (Real Estate Management & Development) | | | 590,243 | |
| | | | 50,500 | | | Kerry Properties Ltd. (Real Estate Management & Development) | | | 154,431 | |
| | | | 684,739 | | | Kingboard Chemical Holdings Ltd. (Electronic Equipment, Instruments & Components) | | | 1,659,898 | |
| | | | 850,000 | | | Li & Fung Ltd. (Distributors) | | | 2,388,001 | |
| | | | 776,000 | | | Mongolia Energy Corp. Ltd.* (Oil, Gas & Consumable Fuels) | | | 224,288 | |
| | | | 99,000 | | | MTR Corp. Ltd. (Road & Rail) | | | 251,650 | |
| | | | 637,000 | | | New World Development Co. Ltd. (Real Estate Management & Development) | | | 843,300 | |
| | | | 230,000 | | | Orient Overseas International Ltd. (Marine) | | | 660,286 | |
| | | | 857,000 | | | Pacific Basin Shipping Ltd. (Marine) | | | 423,759 | |
| | | | 100,000 | | | Sino Land Co. Ltd. (Real Estate Management & Development) | | | 129,031 | |
| | | | 404,000 | | | Sun Hung Kai Properties Ltd. (Real Estate Management & Development) | | | 4,209,392 | |
| | | | 1,386,500 | | | Swire Pacific Ltd. (Real Estate Management & Development) | | | 10,838,107 | |
| | | | 882,016 | | | The Link (REIT) | | | 1,716,869 | |
| | | |
| | | |
| | | | 913,000 | | | Wheelock & Co. Ltd. (Real Estate Management & Development) | | | 1,972,493 | |
| | | | 151,500 | | | Yue Yuen Industrial (Holdings) Ltd. (Textiles, Apparel & Luxury Goods) | | | 337,794 | |
| | | | | | | | | | | |
| | | | | | | | | | 73,248,866 | |
| | | |
| | | |
| | | Ireland – 0.3% |
| | | | 54,448 | | | CRH PLC (Construction Materials) | | | 1,404,801 | |
| | | | 160,421 | | | Kerry Group PLC (Food Products) | | | 3,277,183 | |
| | | | | | | | | | | |
| | | | | | | | | | 4,681,984 | |
| | | |
| | | |
| | | Italy – 4.7% |
| | | | 3,387,828 | | | Enel SpA (Electric Utilities) | | | 18,363,648 | |
| | | | 574,371 | | | Eni SpA (Oil, Gas & Consumable Fuels) | | | 12,325,499 | |
| | | | 148,113 | | | Exor SpA* (Diversified Financial Services) | | | 1,895,013 | |
| | | | 90,385 | | | Fiat SpA* (Automobiles) | | | 883,637 | |
| | | | 3,442,583 | | | Intesa Sanpaolo (Commercial Banks) | | | 10,967,578 | |
| | | | 62,135 | | | Italcementi SpA (Construction Materials) | | | 747,992 | |
| | | | 8,174,336 | | | Parmalat SpA(a) (Food Products) | | | 16,235,185 | |
| | | | 870,216 | | | Telecom Italia SpA (Diversified Telecommunication Services) | | | 777,420 | |
| | | | 4,999,311 | | | Telecom Italia SpA(a) (Diversified Telecommunication Services) | | | 6,321,600 | |
| | | | 4,650,211 | | | UniCredit SpA (Commercial Banks) | | | 11,323,126 | |
| | | | | | | | | | | |
| | | | | | | | | | 79,840,698 | |
| | | |
| | | |
| | | Japan – 22.9% |
| | | | 53,600 | | | Aisin Seiki Co. Ltd. (Auto Components) | | | 1,100,750 | |
| | | | 868,400 | | | Alps Electric Co. Ltd. (Electronic Equipment, Instruments & Components) | | | 4,644,018 | |
| | | | 1,818,000 | | | AMADA Co. Ltd. (Machinery) | | | 11,257,768 | |
| | | | 2,213,000 | | | Asahi Kasei Corp. (Chemicals) | | | 8,896,363 | |
| | | | 683,000 | | | Astellas Pharma, Inc. (Pharmaceuticals) | | | 22,209,169 | |
| | | | 278,400 | | | Brother Industries Ltd. (Office Electronics) | | | 2,262,788 | |
| | | | 214,200 | | | Canon Marketing Japan, Inc. (Distributors) | | | 2,590,109 | |
| | | | 352,400 | | | Canon, Inc. (Office Electronics) | | | 10,545,813 | |
| | | | 22,000 | | | Credit Saison Co. Ltd. (Consumer Finance) | | | 247,150 | |
| | | | 236,000 | | | Dai Nippon Printing Co. Ltd. (Commercial Services & Supplies) | | | 2,498,252 | |
| | | |
| | | |
The accompanying notes are an integral part of these financial statements.
GOLDMAN SACHS STRUCTURED INTERNATIONAL EQUITY FUND
| | | | | | | | | | | |
| | | Shares | | Description | | Value |
| |
Common Stocks – (continued) |
| | | Japan – (continued) |
| | | | | | | | | | | |
| | | | 93,000 | | | Daicel Chemical Industries Ltd. (Chemicals) | | $ | 390,761 | |
| | | | 209,200 | | | Dainippon Sumitomo Pharma Co. Ltd. (Pharmaceuticals) | | | 1,660,407 | |
| | | | 103,800 | | | Daito Trust Construction Co. Ltd. (Real Estate Management & Development) | | | 4,328,266 | |
| | | | 61,000 | | | Daiwa House Industry Co. Ltd. (Real Estate Management & Development) | | | 532,741 | |
| | | | 31,100 | | | Denso Corp. (Auto Components) | | | 735,168 | |
| | | | 2,500 | | | Elpida Memory, Inc.* (Semiconductors & Semiconductor Equipment) | | | 26,567 | |
| | | | 795,000 | | | Fuji Heavy Industries Ltd. (Automobiles) | | | 3,201,498 | |
| | | | 1,774 | | | Fuji Media Holdings, Inc. (Media) | | | 1,977,785 | |
| | | | 274,900 | | | FUJIFILM Holdings Corp. (Electronic Equipment, Instruments & Components) | | | 7,072,696 | |
| | | | 618,000 | | | Fukuoka Financial Group, Inc. (Commercial Banks) | | | 1,904,414 | |
| | | | 625,000 | | | Hitachi Ltd. (Electronic Equipment, Instruments & Components) | | | 2,183,948 | |
| | | | 773,800 | | | Honda Motor Co. Ltd. (Automobiles) | | | 22,677,682 | |
| | | | 52,900 | | | Idemitsu Kosan Co. Ltd. (Oil, Gas & Consumable Fuels) | | | 3,907,191 | |
| | | | 52,000 | | | Isuzu Motors Ltd. (Automobiles) | | | 85,946 | |
| | | | 25,500 | | | Japan Petroleum Exploration Co. Ltd. (Oil, Gas & Consumable Fuels) | | | 1,006,551 | |
| | | | 346 | | | Japan Prime Realty Investment Corp. (REIT) | | | 595,997 | |
| | | | 185,900 | | | JFE Holdings, Inc. (Metals & Mining) | | | 5,077,521 | |
| | | | 303,000 | | | Kaneka Corp. (Chemicals) | | | 1,757,061 | |
| | | | 13,000 | | | Kao Corp. (Household Products) | | | 243,997 | |
| | | | 515,000 | | | Kawasaki Kisen Kaisha Ltd. (Marine) | | | 1,940,428 | |
| | | | 107,000 | | | Keisei Electric Railway Co. Ltd. (Road & Rail) | | | 508,754 | |
| | | | 66,000 | | | Konica Minolta Holdings, Inc. (Office Electronics) | | | 545,196 | |
| | | | 1,093,000 | | | Kubota Corp.(a) (Machinery) | | | 6,569,401 | |
| | | | 606,100 | | | Leopalace21 Corp. (Real Estate Management & Development) | | | 4,439,855 | |
| | | | 57,400 | | | Makita Corp. (Household Durables) | | | 1,325,461 | |
| | | | 40,400 | | | Marui Group Co. Ltd. (Multiline Retail) | | | 222,851 | |
| | | | 284,000 | | | Matsui Securities Co. Ltd. (Capital Markets) | | | 2,013,237 | |
| | | |
| | | |
| | | | 1,859,000 | | | Mazda Motor Corp. (Automobiles) | | | 4,629,319 | |
| | | | 539,000 | | | Mitsubishi Electric Corp. (Electrical Equipment) | | | 2,870,615 | |
| | | | 7,000 | | | Mitsubishi Gas Chemical Co., Inc. (Chemicals) | | | 32,438 | |
| | | | 319,000 | | | Mitsubishi Heavy Industries Ltd. (Machinery) | | | 1,044,198 | |
| | | | 58,000 | | | Mitsubishi Tanabe Pharma Corp. (Pharmaceuticals) | | | 553,613 | |
| | | | 1,827,100 | | | Mitsubishi UFJ Financial Group, Inc. (Commercial Banks) | | | 9,966,589 | |
| | | | 61,700 | | | Mitsui & Co. Ltd. (Trading Companies & Distributors) | | | 654,425 | |
| | | | 1,068,000 | | | Mitsui O.S.K. Lines Ltd. (Marine) | | | 6,103,071 | |
| | | | 21,000 | | | Mitsui Sumitomo Insurance Group Holdings, Inc. (Insurance) | | | 572,955 | |
| | | | 4,500 | | | Mitsumi Electric Co. Ltd. (Computers & Peripherals) | | | 74,057 | |
| | | | 4,666,600 | | | Mizuho Financial Group, Inc.(a) (Commercial Banks) | | | 9,840,425 | |
| | | | 134,800 | | | Namco Bandai Holdings, Inc. (Leisure Equipment & Products) | | | 1,341,294 | |
| | | | 1,184,000 | | | NEC Corp.* (Computers & Peripherals) | | | 3,936,415 | |
| | | | 164,400 | | | NEC Electronics Corp.* (Semiconductors & Semiconductor Equipment) | | | 1,733,052 | |
| | | | 39,700 | | | Nintendo Co. Ltd. (Software) | | | 10,673,777 | |
| | | | 163 | | | Nippon Building Fund, Inc. (REIT) | | | 1,324,329 | |
| | | | 1,725,000 | | | Nippon Express Co. Ltd. (Road & Rail) | | | 6,151,846 | |
| | | | 206,500 | | | Nippon Mining Holdings, Inc. (Oil, Gas & Consumable Fuels) | | | 937,639 | |
| | | | 565,100 | | | Nippon Telephone & Telegraph Corp. (Diversified Telecommunication Services) | | | 21,293,241 | |
| | | | 2,783,000 | | | Nippon Yusen Kabushiki Kaisha (Marine) | | | 11,400,058 | |
| | | | 1,087,800 | | | Nissan Motor Co. Ltd. (Automobiles) | | | 5,677,755 | |
| | | | 729,000 | | | Nisshin Seifun Group, Inc. (Food Products) | | | 7,505,894 | |
| | | | 3,284,000 | | | Nisshin Steel Co. Ltd. (Metals & Mining) | | | 6,336,155 | |
| | | | 75,000 | | | Nisshinbo Industries, Inc. (Textiles, Apparel & Luxury Goods) | | | 791,039 | |
| | | | 231,500 | | | Nomura Real Estate Holdings, Inc.(a) (Real Estate Management & Development) | | | 3,789,675 | |
| | | | 1,818 | | | NTT DoCoMo, Inc. (Wireless Telecommunication Services) | | | 2,536,816 | |
| | | |
| | | |
The accompanying notes are an integral part of these financial statements.
GOLDMAN SACHS STRUCTURED INTERNATIONAL EQUITY FUND
Schedule of Investments (continued)
April 30, 2009 (Unaudited)
| | | | | | | | | | | |
| | | Shares | | Description | | Value |
| |
Common Stocks – (continued) |
| | | Japan – (continued) |
| | | | | | | | | | | |
| | | | 5,581,000 | | | Osaka Gas Co. Ltd. (Gas Utilities) | | $ | 17,685,762 | |
| | | | 458,000 | | | Ricoh Co. Ltd. (Office Electronics) | | | 5,662,652 | |
| | | | 36,000 | | | Rohm Co. Ltd. (Semiconductors & Semiconductor Equipment) | | | 2,207,828 | |
| | | | 819,000 | | | Sekisui Chemical Co. Ltd. (Household Durables) | | | 4,300,137 | |
| | | | 555,000 | | | Sekisui House Ltd. (Household Durables) | | | 4,789,833 | |
| | | | 148,000 | | | Sharp Corp. (Household Durables) | | | 1,558,401 | |
| | | | 10,800 | | | Shin-Etsu Chemical Co. Ltd. (Chemicals) | | | 524,910 | |
| | | | 921,000 | | | Sompo Japan Insurance, Inc. (Insurance) | | | 5,550,439 | |
| | | | 20,800 | | | Sony Corp. (Household Durables) | | | 533,604 | |
| | | | 55,600 | | | STEKT Corp. (Electric Utilities) | | | 1,147,437 | |
| | | | 796,000 | | | Sumitomo Corp. (Trading Companies & Distributors) | | | 6,928,803 | |
| | | | 98,300 | | | Sumitomo Electric Industries Ltd. (Electrical Equipment) | | | 957,633 | |
| | | | 217,100 | | | Sumitomo Mitsui Financial Group, Inc.(a) (Commercial Banks) | | | 7,529,283 | |
| | | | 32,400 | | | Sumitomo Rubber Industries Ltd. (Auto Components) | | | 223,320 | |
| | | | 39,550 | | | T&D Holdings, Inc. (Insurance) | | | 1,182,445 | |
| | | | 238,600 | | | Takeda Pharmaceutical Co. Ltd. (Pharmaceuticals) | | | 8,461,887 | |
| | | | 1,989,000 | | | The Bank of Yokohama Ltd. (Commercial Banks) | | | 8,434,322 | |
| | | | 957,000 | | | The Sumitomo Trust & Banking Co. Ltd. (Commercial Banks) | | | 4,004,732 | |
| | | | 540,000 | | | Toho Gas Co. Ltd. (Gas Utilities) | | | 2,298,754 | |
| | | | 235,700 | | | Tokio Marine Holdings, Inc. (Insurance) | | | 6,216,180 | |
| | | | 877,000 | | | Tokyo Gas Co. Ltd. (Gas Utilities) | | | 3,324,879 | |
| | | | 346,300 | | | Tokyo Steel Manufacturing Co. Ltd. (Metals & Mining) | | | 3,546,914 | |
| | | | 424,000 | | | Tokyu Land Corp. (Real Estate Management & Development) | | | 1,418,897 | |
| | | | 1,088,000 | | | Toppan Printing Co. Ltd. (Commercial Services & Supplies) | | | 8,244,472 | |
| | | | 29,500 | | | Toyo Seikan Kaisha Ltd. (Containers & Packaging) | | | 488,524 | |
| | | | 69,000 | | | Toyo Suisan Kaisha Ltd. (Food Products) | | | 1,349,027 | |
| | | | 3,400 | | | Toyoda Gosei Co. Ltd. (Auto Components) | | | 66,228 | |
| | | |
| | | |
| | | | 167,700 | | | Toyota Motor Corp. (Automobiles) | | | 6,637,358 | |
| | | | 781 | | | West Japan Railway Co. (Road & Rail) | | | 2,395,064 | |
| | | | 273,500 | | | Yamaha Corp. (Leisure Equipment & Products) | | | 3,125,168 | |
| | | | 403,300 | | | Yamaha Motor Co. Ltd. (Automobiles) | | | 4,263,283 | |
| | | | 2,200 | | | Yamato Kogyo Co. Ltd. (Metals & Mining) | | | 49,858 | |
| | | | 5,600 | | | Yokogawa Electric Corp. (Electronic Equipment, Instruments & Components) | | | 28,619 | |
| | | | | | | | | | | |
| | | | | | | | | | 390,090,903 | |
| | | |
| | | |
| | | Luxembourg(a) – 0.0% |
| | | | 22,268 | | | ArcelorMittal (Metals & Mining) | | | 521,613 | |
| | | |
| | | |
| | | Netherlands – 1.3% |
| | | | 370,353 | | | European Aeronautic Defence & Space Co.(a) (Aerospace & Defense) | | | 5,345,528 | |
| | | | 446,807 | | | Royal Dutch Shell PLC (Oil, Gas & Consumable Fuels) | | | 10,247,385 | |
| | | | 271,709 | | | Royal Dutch Shell PLC Class B (Oil, Gas & Consumable Fuels) | | | 6,148,902 | |
| | | | | | | | | | | |
| | | | | | | | | | 21,741,815 | |
| | | |
| | | |
| | | New Zealand – 0.0% |
| | | | 143,452 | | | Auckland International Airport Ltd. (Transportation Infrastructure) | | | 134,710 | |
| | | |
| | | |
| | | Norway – 1.7% |
| | | | 586,600 | | | Aker Solutions ASA (Energy Equipment & Services) | | | 3,546,508 | |
| | | | 222,100 | | | Den Norske Bank (Commercial Banks) | | | 1,382,405 | |
| | | | 83,800 | | | Frontline Ltd. (Oil, Gas & Consumable Fuels) | | | 1,657,536 | |
| | | | 58,000 | | | Renewable Energy Corp. A/S* (Electrical Equipment) | | | 534,481 | |
| | | | 283,550 | | | Seadrill Ltd.(a) (Energy Equipment & Services) | | | 3,026,261 | |
| | | | 677,650 | | | StatoilHydro ASA (Oil, Gas & Consumable Fuels) | | | 12,629,695 | |
| | | | 758,400 | | | Telenor ASA (Diversified Telecommunication Services) | | | 4,716,565 | |
| | | | 72,300 | | | Yara International ASA (Chemicals) | | | 1,937,688 | |
| | | | | | | | | | | |
| | | | | | | | | | 29,431,139 | |
| | | |
| | | |
| | | Singapore – 0.6% |
| | | | 171,000 | | | Ascendas Real Estate Investment Trust (REIT) | | | 153,622 | |
| | | | 203,000 | | | CapitaMall Trust (REIT) | | | 171,395 | |
| | | |
| | | |
The accompanying notes are an integral part of these financial statements.
GOLDMAN SACHS STRUCTURED INTERNATIONAL EQUITY FUND
| | | | | | | | | | | |
| | | Shares | | Description | | Value |
| |
Common Stocks – (continued) |
| | | Singapore – (continued) |
| | | | | | | | | | | |
| | | | 54,000 | | | City Developments Ltd. (Real Estate Management & Development) | | $ | 236,353 | |
| | | | 74,000 | | | ComfortDelGro Corp. Ltd. (Road & Rail) | | | 70,547 | |
| | | | 131,000 | | | DBS Group Holdings Ltd. (Commercial Banks) | | | 832,810 | |
| | | | 3,556,000 | | | Golden Agri-Resources Ltd. (Food Products) | | | 877,483 | |
| | | | 72,523 | | | Jardine Cycle & Carriage Ltd. (Distributors) | | | 693,644 | |
| | | | 541,600 | | | Noble Group Ltd. (Trading Companies & Distributors) | | | 469,207 | |
| | | | 214,000 | | | Oversea-Chinese Banking Corp. Ltd. (Commercial Banks) | | | 849,929 | |
| | | | 373,000 | | | SembCorp Industries Ltd. (Industrial Conglomerates) | | | 682,334 | |
| | | | 136,520 | | | Singapore Airlines Ltd. (Airlines) | | | 981,863 | |
| | | | 56,000 | | | Singapore Exchange Ltd. (Diversified Financial Services) | | | 234,898 | |
| | | | 704,780 | | | Singapore Telecommunications Ltd. (Diversified Telecommunication Services) | | | 1,211,009 | |
| | | | 188,000 | | | United Overseas Bank Ltd. (Commercial Banks) | | | 1,449,045 | |
| | | | 419,000 | | | UOL Group Ltd. (Real Estate Management & Development) | | | 623,935 | |
| | | | | | | | | | | |
| | | | | | | | | | 9,538,074 | |
| | | |
| | | |
| | | Spain – 7.4% |
| | | | 2,273,498 | | | Banco Bilbao Vizcaya Argentaria SA (Commercial Banks) | | | 24,639,371 | |
| | | | 354,467 | | | Banco Popular Espanol SA (Commercial Banks) | | | 2,921,503 | |
| | | | 3,992,997 | | | Banco Santander SA (Commercial Banks) | | | 38,408,375 | |
| | | | 16,040 | | | Fomento de Construcciones y Contratas SA (Construction & Engineering) | | | 576,191 | |
| | | | 2,277,581 | | | Iberdrola SA (Electric Utilities) | | | 17,935,502 | |
| | | | 435,724 | | | Repsol YPF SA (Oil, Gas & Consumable Fuels) | | | 8,282,099 | |
| | | | 1,730,815 | | | Telefonica SA (Diversified Telecommunication Services) | | | 32,792,214 | |
| | | | | | | | | | | |
| | | | | | | | | | 125,555,255 | |
| | | |
| | | |
| | | Sweden – 4.1% |
| | | | 744,570 | | | Alfa Laval AB(a) (Machinery) | | | 6,595,394 | |
| | | | 288,732 | | | Electrolux AB Series B*(a) (Household Durables) | | | 3,253,346 | |
| | | | 28,709 | | | Investor AB Class B (Diversified Financial Services) | | | 419,339 | |
| | | | 16,614 | | | Millicom International Cellular SA(a) (Wireless Telecommunication Services) | | | 817,353 | |
| | | |
| | | |
| | | | 61,531 | | | Modern Times Group MTG AB Class B (Media) | | | 1,686,598 | |
| | | | 777,682 | | | Nordea Bank AB(a) (Commercial Banks) | | | 5,784,664 | |
| | | | 48,242 | | | Sandvik AB (Machinery) | | | 320,840 | |
| | | | 14,322 | | | Scania AB Class B (Machinery) | | | 153,558 | |
| | | | 127,394 | | | Skandinaviska Enskilda Banken AB* (Commercial Banks) | | | 494,559 | |
| | | | 841,842 | | | Skanska AB Class B (Construction & Engineering) | | | 9,080,131 | |
| | | | 426,381 | | | SSAB Svenskt Stal AB (Metals & Mining) | | | 4,121,044 | |
| | | | 19,071 | | | SSAB Svenskt Stal AB Series B (Metals & Mining) | | | 174,249 | |
| | | | 25,721 | | | Svenska Cellulosa AB Class B (Paper & Forest Products) | | | 250,996 | |
| | | | 61,270 | | | Svenska Handelsbanken AB (Commercial Banks) | | | 1,067,352 | |
| | | | 125,684 | | | Swedbank AB* (Commercial Banks) | | | 707,755 | |
| | | | 830,879 | | | Swedish Match AB(a) (Tobacco) | | | 11,856,750 | |
| | | | 1,319,945 | | | Telefonaktiebolaget LM Ericsson Class B(a) (Communications Equipment) | | | 11,211,471 | |
| | | | 2,073,757 | | | TeliaSonera AB* (Diversified Telecommunication Services) | | | 9,729,994 | |
| | | | 422,097 | | | Volvo AB Class B (Machinery) | | | 2,752,187 | |
| | | | | | | | | | | |
| | | | | | | | | | 70,477,580 | |
| | | |
| | | |
| | | Switzerland – 4.1% |
| | | | 473,046 | | | ABB Ltd.* (Electrical Equipment) | | | 6,696,599 | |
| | | | 69,483 | | | Actelion Ltd.* (Biotechnology) | | | 3,165,622 | |
| | | | 47,888 | | | Baloise Holding AG (Insurance) | | | 3,515,533 | |
| | | | 334,176 | | | Compagnie Financiere Richemont SA (Textiles, Apparel & Luxury Goods) | | | 5,982,284 | |
| | | | 160,697 | | | Credit Suisse Group(a) (Capital Markets) | | | 6,279,481 | |
| | | | 60,097 | | | Julius Baer Holding AG (Capital Markets) | | | 1,971,463 | |
| | | | 27,373 | | | Lonza Group AG(a) (Life Sciences Tools & Services) | | | 2,511,146 | |
| | | | 383,739 | | | Nestle SA(a) (Food Products) | | | 12,508,626 | |
| | | | 177,528 | | | Novartis AG (Pharmaceuticals) | | | 6,719,131 | |
| | | | 35,696 | | | Roche Holding AG (Pharmaceuticals) | | | 4,501,413 | |
| | | | 4,925 | | | Sulzer AG (Machinery) | | | 267,676 | |
| | | | 32,336 | | | Syngenta AG (Chemicals) | | | 6,903,424 | |
| | | | 28,481 | | | Synthes, Inc. (Health Care Equipment & Supplies) | | | 2,881,598 | |
| | | | 424,800 | | | UBS AG* (Capital Markets) | | | 5,835,257 | |
| | | | | | | | | | | |
| | | | | | | | | | 69,739,253 | |
| | | |
| | | |
The accompanying notes are an integral part of these financial statements.
GOLDMAN SACHS STRUCTURED INTERNATIONAL EQUITY FUND
Schedule of Investments (continued)
April 30, 2009 (Unaudited)
| | | | | | | | | | | |
| | | Shares | | Description | | Value |
| |
Common Stocks – (continued) |
| | | | | | | | | | | |
| | | United Kingdom – 16.5% |
| | | | 338,306 | | | Antofagasta PLC (Metals & Mining) | | $ | 2,903,341 | |
| | | | 564,738 | | | AstraZeneca PLC (Pharmaceuticals) | | | 19,774,458 | |
| | | | 565,070 | | | Aviva PLC (Insurance) | | | 2,601,593 | |
| | | | 2,914,651 | | | BAE Systems PLC (Aerospace & Defense) | | | 15,331,737 | |
| | | | 888,558 | | | Barclays PLC (Commercial Banks) | | | 3,607,615 | |
| | | | 632,022 | | | BG Group PLC (Oil, Gas & Consumable Fuels) | | | 10,092,000 | |
| | | | 868,449 | | | BHP Billiton PLC (Metals & Mining) | | | 18,024,582 | |
| | | | 15,700 | | | BP PLC (Oil, Gas & Consumable Fuels) | | | 110,946 | |
| | | | 1,209,844 | | | BP PLC ADR(a)(b) (Oil, Gas & Consumable Fuels) | | | 51,369,976 | |
| | | | 1,623,633 | | | Centrica PLC (Multi-Utilities) | | | 5,428,373 | |
| | | | 363,515 | | | Drax Group PLC (Independent Power Producers & Energy Traders) | | | 2,756,658 | |
| | | | 292,105 | | | Eurasian Natural Resources Corp. (Metals & Mining) | | | 2,543,521 | |
| | | | 17,258 | | | GlaxoSmithKline PLC ADR (Pharmaceuticals) | | | 530,856 | |
| | | | 749,022 | | | Home Retail Group PLC (Internet & Catalog Retail) | | | 2,756,217 | |
| | | | 5,157,315 | | | HSBC Holdings PLC (Commercial Banks) | | | 36,675,872 | |
| | | | 43,893 | | | ICAP PLC (Capital Markets) | | | 243,012 | |
| | | | 3,342,350 | | | J Sainsbury PLC (Food & Staples Retailing) | | | 16,197,037 | |
| | | | 8,014 | | | Kazakhmys PLC (Metals & Mining) | | | 63,427 | |
| | | | 1,077,254 | | | Kingfisher PLC (Specialty Retail) | | | 2,932,511 | |
| | | | 381,225 | | | Land Securities Group PLC (REIT) | | | 3,143,805 | |
| | | | 23,065 | | | Man Group PLC (Capital Markets) | | | 86,497 | |
| | | | 3,339,772 | | | Old Mutual PLC (Insurance) | | | 3,327,396 | |
| | | | 988,076 | | | Rexam PLC (Containers & Packaging) | | | 4,576,789 | |
| | | | 126,294 | | | Rio Tinto PLC (Metals & Mining) | | | 5,131,477 | |
| | | | 878,611 | | | RSA Insurance Group PLC (Insurance) | | | 1,690,328 | |
| | | | 85,213 | | | Schroders PLC (Capital Markets) | | | 1,032,034 | |
| | | | 93,966 | | | Standard Chartered PLC (Commercial Banks) | | | 1,453,582 | |
| | | | 1,910,669 | | | Tate & Lyle PLC (Food Products) | | | 7,744,146 | |
| | | | 3,663,635 | | | Thomas Cook Group PLC (Hotels, Restaurants & Leisure) | | | 14,142,407 | |
| | | |
| | | |
| | | | 77,587 | | | Thomson Reuters PLC (Media) | | | 1,995,637 | |
| | | | 749,900 | | | Tui Travel PLC (Hotels, Restaurants & Leisure) | | | 2,795,152 | |
| | | | 35,790 | | | Vedanta Resources PLC (Metals & Mining) | | | 568,639 | |
| | | | 256,413 | | | Vodafone Group PLC (Wireless Telecommunication Services) | | | 471,277 | |
| | | | 891,610 | | | Vodafone Group PLC ADR (Wireless Telecommunication Services) | | | 16,361,044 | |
| | | | 6,072,844 | | | William Morrison Supermarkets PLC (Food & Staples Retailing) | | | 21,997,654 | |
| | | | 89,249 | | | Xstrata PLC (Metals & Mining) | | | 786,830 | |
| | | | | | | | | | | |
| | | | | | | | | | 281,248,426 | |
| | | |
| | | |
| | | TOTAL COMMON STOCKS |
| | | (Cost $1,929,244,719) | | $ | 1,648,711,811 | |
| | | |
| | | |
Preferred Stocks – 0.3% |
| | | | | | | | | | | |
| | | | | | | | | | | |
| | | Germany – 0.3% |
| | | | 39,809 | | | Fresenius SE(a) (Health Care Equipment & Supplies) | | $ | 2,053,126 | |
| | | | 43,202 | | | Porsche Automobil Holding SE (Automobiles) | | | 3,112,060 | |
| | | | | | | | | | | |
| | | | | | | | | | 5,165,186 | |
| | | |
| | | |
| | | TOTAL PREFERRED STOCKS |
| | | (Cost $5,923,372) | | $ | 5,165,186 | |
| | | |
| | | |
| | | | | | | | | | | | | | | |
| | | Units | | Description | | Expiration Month | | Value |
| |
Rights* – 0.0% |
| | | | | | | | | | | | | | | |
| | | | | | | | | | | | | | | |
| | | Belgium – 0.0% |
| | | | 211,257 | | | Fortis (Commercial Banks) | | | 07/14 | | | $ | — | |
| | | Italy – 0.0% |
| | | | 351,707 | | | Snam Rete Gas SpA (Gas Utilities) | | | 05/09 | | | | 269,899 | |
| | | |
| | | |
| | | TOTAL RIGHTS |
| | | (Cost $314,781) | | | | | | $ | 269,899 | |
| | | |
| | | |
| | | TOTAL INVESTMENTS BEFORE SECURITIES LENDING REINVESTMENT VEHICLE |
| | | (Cost $1,935,482,872) | | | | | | $ | 1,654,146,896 | |
| | | |
| | | |
The accompanying notes are an integral part of these financial statements.
GOLDMAN SACHS STRUCTURED INTERNATIONAL EQUITY FUND
| | | | | | | | | | | | | |
| | | Shares | | Rate | | Value |
| |
Securities Lending Reinvestment Vehicle(c)(d) – 16.1% |
| | | | | | | | | | | | | |
| | | | | | | | | | | | | |
| | | Boston Global Investment Trust – Enhanced Portfolio II |
| | | | | | | | | | | | | |
| | | | 277,231,955 | | | | 0.456 | % | | $ | 274,736,868 | |
| | | (Cost $273,459,290) | | | | |
| | | |
| | | |
| | | TOTAL INVESTMENTS – 113.1% |
| | | (Cost $2,208,942,162) | | $ | 1,928,883,764 | |
| | | |
| | | |
| | | LIABILITIES IN EXCESS OF
OTHER ASSETS – (13.1)% | | | (224,021,549 | ) |
| | | |
| | | |
| | | NET ASSETS – 100.0% | | $ | 1,704,862,215 | |
| | | |
| | | |
The percentage shown for each investment category reflects the value of investments in that category as a percentage of net assets.
| | |
| * | | Non-income producing security. |
| |
| (a) | | All or a portion of security is on loan. |
| |
| (b) | | All or a portion of security is segregated as collateral for initial margin requirements on futures transactions. |
| |
| (c) | | Variable rate security. Interest rate disclosed is that which is in effect at April 30, 2009. |
| |
| (d) | | Represents an affiliated issuer. |
| | | | | | | | | | | |
| | | |
| | | |
| | | Investment Abbreviations: |
| | | ADR | | — | | American Depositary Receipt | | | | |
| | | REIT | | — | | Real Estate Investment Trust | | | | |
| | | |
| | | |
ADDITIONAL INVESTMENT INFORMATION
FORWARD FOREIGN CURRENCY EXCHANGE CONTRACTS — At April 30, 2009, the Fund had outstanding forward foreign currency exchange contracts, both to purchase and sell foreign currencies:
| | | | | | | | | | | | | | | | | | | |
Open Forward Foreign Currency
| | Contract
| | | Expiration
| | Value on
| | | Current
| | | Unrealized
| |
| Contracts with Unrealized Gain | | Type | | | Date | | Settlement Date | | | Value | | | Gain | |
| | |
| Australian Dollar | | | Sale | | | 05/05/09 | | $ | 9,694,296 | | | $ | 9,676,885 | | | $ | 17,411 | |
| Danish Krone | | | Purchase | | | 05/05/09 | | | 18,696,235 | | | | 18,701,409 | | | | 5,174 | |
| Hong Kong Dollar | | | Purchase | | | 05/05/09 | | | 19,673,548 | | | | 19,674,259 | | | | 711 | |
| Japanese Yen | | | Sale | | | 05/08/09 | | | 364,210 | | | | 363,256 | | | | 954 | |
| Norwegian Krone | | | Purchase | | | 05/06/09 | | | 5,470,609 | | | | 5,497,217 | | | | 26,608 | |
| Swedish Krona | | | Purchase | | | 05/06/09 | | | 19,595,651 | | | | 19,627,367 | | | | 31,716 | |
| |
| |
TOTAL | | | | | | | | | | | | | | | | $ | 82,574 | |
| |
| |
| | | | | | | | | | | | | | | | | | | |
Open Forward Foreign Currency
| | Contract
| | | Expiration
| | Value on
| | | Current
| | | Unrealized
| |
| Contracts with Unrealized Loss | | Type | | | Date | | Settlement Date | | | Value | | | Loss | |
| | |
| British Pound | | | Sale | | | 05/06/09 | | $ | 10,299,276 | | | $ | 10,340,580 | | | $ | (41,304 | ) |
| Euro | | | Sale | | | 05/05/09 | | | 15,099,030 | | | | 15,122,762 | | | | (23,732 | ) |
| Euro | | | Sale | | | 05/06/09 | | | 25,772,613 | | | | 25,813,127 | | | | (40,514 | ) |
| New Zealand Dollar | | | Purchase | | | 05/05/09 | | | 442,026 | | | | 441,105 | | | | (921 | ) |
| Singapore Dollar | | | Purchase | | | 05/06/09 | | | 6,222,523 | | | | 6,213,991 | | | | (8,532 | ) |
| Swiss Franc | | | Sale | | | 05/06/09 | | | 7,161,054 | | | | 7,167,567 | | | | (6,513 | ) |
| |
| |
TOTAL | | | | | | | | | | | | | | | | $ | (121,516 | ) |
| |
| |
FUTURES CONTRACTS — At April 30, 2009, the following futures contracts were open:
| | | | | | | | | | | | | | | |
| | | Number of
| | | Settlement
| | Notional
| | | Unrealized
| |
| Type | | Contracts Long | | | Month | | Value | | | Gain | |
| | |
| Dow Jones Euro Stoxx 50 Index | | | 661 | | | June 2009 | | $ | 20,359,962 | | | $ | 1,599,674 | |
| FTSE 100 Index | | | 155 | | | June 2009 | | | 9,646,613 | | | | 563,182 | |
| Hang Seng Index | | | 9 | | | May 2009 | | | 893,433 | | | | 28,129 | |
| SGX MSCI Singapore Index | | | 16 | | | May 2009 | | | 497,345 | | | | 27,326 | |
| SPI 200 Index | | | 41 | | | June 2009 | | | 2,805,364 | | | | 6,412 | |
| TOPIX Index | | | 124 | | | June 2009 | | | 10,574,326 | | | | 36,160 | |
| |
| |
TOTAL | | | | | | | | | | | | $ | 2,260,883 | |
| |
| |
The accompanying notes are an integral part of these financial statements.
GOLDMAN SACHS STRUCTURED INTERNATIONAL SMALL CAP FUND
Schedule of Investments
April 30, 2009 (Unaudited)
| | | | | | | | | | | |
| | | Shares | | Description | | Value |
| |
Common Stocks – 96.6% |
| | | | | | | | | | | |
| | | | | | | | | | | |
| | | Australia – 6.2% |
| | | | 28,614 | | | AED Oil Ltd. (Energy) | | $ | 13,561 | |
| | | | 6,613 | | | Andean Resources Ltd. (Materials)* | | | 7,744 | |
| | | | 25,576 | | | APA Group (Utilities) | | | 54,961 | |
| | | | 31,749 | | | APN News & Media Ltd. (Media) | | | 32,271 | |
| | | | 14,146 | | | Arrow Energy Ltd. (Energy)* | | | 34,053 | |
| | | | 183,958 | | | Australian Infrastructure Fund (Transportation) | | | 201,621 | |
| | | | 41,058 | | | Australian Worldwide Exploration Ltd. (Energy) | | | 72,210 | |
| | | | 30,733 | | | AWB Ltd. (Food & Staples Retailing) | | | 29,709 | |
| | | | 248,439 | | | Beach Petroleum Ltd. (Energy) | | | 137,700 | |
| | | | 23,298 | | | Bunnings Warehouse Property Trust (REIT) | | | 29,878 | |
| | | | 169,961 | | | Challenger Financial Services Group Ltd. (Diversified Financials) | | | 246,280 | |
| | | | 274,012 | | | Commonwealth Property Office Fund (REIT) | | | 162,083 | |
| | | | 79,155 | | | David Jones Ltd. (Retailing) | | | 173,556 | |
| | | | 80,017 | | | Downer EDI Ltd. (Commercial & Professional Services) | | | 292,623 | |
| | | | 17,061 | | | Felix Resources Ltd. (Energy) | | | 137,316 | |
| | | | 10,567 | | | Fleetwood Corp. Ltd. (Automobiles & Components) | | | 47,759 | |
| | | | 38,524 | | | Gindalbie Metals Ltd. (Materials)* | | | 18,975 | |
| | | | 72,051 | | | Gloucester Coal Ltd. (Energy) | | | 271,297 | |
| | | | 108,850 | | | Hastings Diversified Utilities Fund (Utilities) | | | 54,364 | |
| | | | 93,300 | | | Iluka Resources Ltd. (Materials)* | | | 221,895 | |
| | | | 230,983 | | | ING Office Fund (REIT) | | | 72,984 | |
| | | | 31,595 | | | JB Hi-Fi Ltd. (Retailing) | | | 312,010 | |
| | | | 7,003 | | | Karoon Gas Australia Ltd. (Energy)* | | | 27,863 | |
| | | | 10,824 | | | Kingsgate Consolidated Ltd. (Materials)* | | | 47,258 | |
| | | | 15,776 | | | Linc Energy Ltd. (Energy)* | | | 28,633 | |
| | | | 40,911 | | | MacArthur Coal Ltd. (Materials) | | | 125,495 | |
| | | | 7,458 | | | Macquarie Communications Infrastructure Group (Media) | | | 12,169 | |
| | | | 39,220 | | | Macquarie Leisure Trust Group (REIT) | | | 34,318 | |
| | | | 136,824 | | | Mincor Resources NL (Materials) | | | 96,779 | |
| | | | 6,819 | | | Mirabela Nickel Ltd. (Materials)* | | | 9,157 | |
| | | | 17,049 | | | Monadelphous Group Ltd. (Capital Goods) | | | 124,903 | |
| | | | 157,246 | | | Mount Gibson Iron Ltd. (Materials)* | | | 71,372 | |
| | | | 93,232 | | | Panoramic Resources Ltd. (Materials) | | | 102,216 | |
| | | | 6,254 | | | Ramsay Health Care Ltd. (Health Care Equipment & Services) | | | 41,994 | |
| | | | 244,097 | | | Resolute Mining Ltd. (Materials)* | | | 119,941 | |
| | | | 14,711 | | | Salmat Ltd. (Commercial & Professional Services) | | | 42,059 | |
| | | | 38,868 | | | Seven Network Ltd. (Media) | | | 177,595 | |
| | | |
| | | |
| | | | 455,049 | | | Sigma Pharmaceuticals Ltd. (Health Care Equipment & Services) | | | 370,197 | |
| | | | 92,552 | | | Straits Resources Ltd. (Materials) | | | 102,944 | |
| | | | 54,008 | | | Tower Australia Group Ltd. (Insurance) | | | 80,501 | |
| | | | 34,939 | | | United Group Ltd. (Capital Goods) | | | 243,050 | |
| | | | | | | | | | | |
| | | | | | | | | | 4,483,294 | |
| | | |
| | | |
| | | Austria – 1.6% |
| | | | 1,268 | | | Agrana Beteiligungs AG (Food, Beverage & Tobacco) | | | 81,226 | |
| | | | 13,247 | | | A-TEC Industries AG (Capital Goods)* | | | 136,761 | |
| | | | 7,202 | | | Austrian Airlines AG (Transportation)*(a) | | | 37,884 | |
| | | | 4,703 | | | Conwert Immobilien Invest SE (Real Estate)* | | | 34,937 | |
| | | | 726 | | | Flughafen Wien AG (Transportation) | | | 21,723 | |
| | | | 27,165 | | | Immoeast AG (Real Estate)* | | | 61,235 | |
| | | | 114,231 | | | Immofinanz Immobilien Anlagen AG (Real Estate)*(a) | | | 221,136 | |
| | | | 5,648 | | | Oesterreichische Post AG (Transportation) | | | 164,642 | |
| | | | 1,148 | | | Rosenbauer International AG (Capital Goods) | | | 40,712 | |
| | | | 2,456 | | | Semperit AG Holding (Automobiles & Components) | | | 55,425 | |
| | | | 35,502 | | | Zumtobel AG (Capital Goods) | | | 316,641 | |
| | | | | | | | | | | |
| | | | | | | | | | 1,172,322 | |
| | | |
| | | |
| | | Belgium – 1.8% |
| | | | 1,486 | | | Barco NV (Technology Hardware & Equipment) | | | 33,970 | |
| | | | 1,386 | | | Befimmo SCA Sicafi (REIT) | | | 123,279 | |
| | | | 2,591 | | | Bekaert SA (Capital Goods) | | | 240,446 | |
| | | | 5,115 | | | Compagnie d’ Enterprises CFE (Capital Goods) | | | 173,330 | |
| | | | 5,986 | | | Econocom Group (Software & Services) | | | 47,382 | |
| | | | 14,771 | | | Euronav NV (Energy)(a) | | | 212,614 | |
| | | | 1,530 | | | KBC Ancora (Diversified Financials) | | | 22,967 | |
| | | | 14,352 | | | Nyrstar (Materials) | | | 92,437 | |
| | | | 4,398 | | | Omega Pharma SA (Health Care Equipment & Services) | | | 116,912 | |
| | | | 5,102 | | | Recticel SA (Materials) | | | 22,177 | |
| | | | 1,125 | | | Sipef SA (Food, Beverage & Tobacco) | | | 41,883 | |
| | | | 6,673 | | | Tessenderlo Chemie NV (Materials) | | | 198,121 | |
| | | | | | | | | | | |
| | | | | | | | | | 1,325,518 | |
| | | |
| | | |
| | | Bermuda – 0.2% |
| | | | 28,248 | | | Hiscox Ltd. (Insurance) | | | 139,843 | |
| | | |
| | | |
The accompanying notes are an integral part of these financial statements.
GOLDMAN SACHS STRUCTURED INTERNATIONAL SMALL CAP FUND
| | | | | | | | | | | |
| | | Shares | | Description | | Value |
| |
Common Stocks – (continued) |
| | | | | | | | | | | |
| | | China – 0.0% |
| | | | 191,000 | | | Synear Food Holdings Ltd. Class H (Food, Beverage & Tobacco) | | $ | 24,878 | |
| | | |
| | | |
| | | Cyprus – 0.3% |
| | | | 100,800 | | | Deep Sea Supply PLC (Energy)(a) | | | 116,122 | |
| | | | 19,700 | | | ProSafe SE (Energy)* | | | 80,939 | |
| | | | | | | | | | | |
| | | | | | | | | | 197,061 | |
| | | |
| | | |
| | | Denmark – 0.7% |
| | | | 5,608 | | | Amagerbanken A/S (Banks)*(a) | | | 45,736 | |
| | | | 8,792 | | | Auriga Industries A/S Class B (Materials) | | | 149,688 | |
| | | | 5,686 | | | Bang & Olufsen A/S Class B (Consumer Durables & Apparel) | | | 38,527 | |
| | | | 2,705 | | | Dampskibsselskabet Norden A/S (Transportation) | | | 90,971 | |
| | | | 8,492 | | | Dampskibsselskabet Torm A/S (Energy) | | | 77,371 | |
| | | | 17,767 | | | GN Store Nord A/S (Health Care Equipment & Services)* | | | 56,741 | |
| | | | 870 | | | Rockwool International A/S Class B (Capital Goods) | | | 67,159 | |
| | | | | | | | | | | |
| | | | | | | | | | 526,193 | |
| | | |
| | | |
| | | Finland – 1.7% |
| | | | 22,437 | | | F-Secure Oyj (Software & Services) | | | 67,432 | |
| | | | 4,302 | | | HKScan Oyj (Food, Beverage & Tobacco) | | | 27,766 | |
| | | | 17,448 | | | KCI Konecranes Oyj (Capital Goods) | | | 354,513 | |
| | | | 14,253 | | | Kemira Oyj (Materials)(a) | | | 118,553 | |
| | | | 1,657 | | | Lemminkainen Oyj (Capital Goods) | | | 43,100 | |
| | | | 10,381 | | | Outotec Oyj (Capital Goods) | | | 220,155 | |
| | | | 65,031 | | | Raisio PLC Class V (Food, Beverage & Tobacco) | | | 133,890 | |
| | | | 10,779 | | | Tietoenator Oyj (Software & Services) | | | 138,476 | |
| | | | 13,438 | | | YIT Oyj NPV (Capital Goods) | | | 128,441 | |
| | | | | | | | | | | |
| | | | | | | | | | 1,232,326 | |
| | | |
| | | |
| | | France – 4.5% |
| | | | 32,111 | | | Assystem (Commercial & Professional Services)(a) | | | 253,320 | |
| | | | 6,596 | | | Beneteau SA (Consumer Durables & Apparel)(a) | | | 65,551 | |
| | | | 18,409 | | | Boiron SA (Pharmaceuticals, Biotechnology & Life Sciences) | | | 465,746 | |
| | | | 4,753 | | | Carbone Lorraine SA (Capital Goods) | | | 123,692 | |
| | | | 8,703 | | | Cegid Group (Software & Services) | | | 116,882 | |
| | | | 831 | | | Esso S.A.F. (Energy) | | | 88,771 | |
| | | | 439 | | | Financiere de L’Odet (Transportation) | | | 94,749 | |
| | | | 5,958 | | | Groupe Steria SCA (Software & Services) | | | 113,608 | |
| | | | 5,483 | | | Mercialys SA (REIT) | | | 168,374 | |
| | | | 605 | | | Nexans SA (Capital Goods)* | | �� | 28,029 | |
| | | |
| | | |
| | | | 14,513 | | | Nexity (Consumer Durables & Apparel) | | | 468,145 | |
| | | | 33,263 | | | Rallye SA (Food & Staples Retailing) | | | 676,220 | |
| | | | 4,371 | | | Remy Cointreau SA (Food, Beverage & Tobacco) | | | 144,091 | |
| | | | 5,879 | | | Rhodia SA (Materials) | | | 33,802 | |
| | | | 5,425 | | | SEB SA (Consumer Durables & Apparel) | | | 182,839 | |
| | | | 2,110 | | | Sperian Protection (Commercial & Professional Services) | | | 106,253 | |
| | | | 1,452 | | | Virbac SA (Pharmaceuticals, Biotechnology & Life Sciences) | | | 97,876 | |
| | | | | | | | | | | |
| | | | | | | | | | 3,227,948 | |
| | | |
| | | |
| | | Germany – 6.2% |
| | | | 3,597 | | | Aareal Bank AG (Banks) | | | 33,498 | |
| | | | 6,574 | | | Bauer AG (Capital Goods) | | | 248,112 | |
| | | | 15,179 | | | Bechtle AG (Software & Services) | | | 228,337 | |
| | | | 7,859 | | | Bilfinger Berger AG (Capital Goods)(a) | | | 373,191 | |
| | | | 2,173 | | | Biotest AG (Pharmaceuticals, Biotechnology & Life Sciences) | | | 107,496 | |
| | | | 1,976 | | | Biotest AG Preference Shares (Pharmaceuticals, Biotechnology & Life Sciences) | | | 81,204 | |
| | | | 15,943 | | | Carl Zeiss Meditec AG (Health Care Equipment & Services)* | | | 188,333 | |
| | | | 10,902 | | | Demag Cranes AG (Capital Goods) | | | 229,998 | |
| | | | 4,457 | | | Deutsche Euroshop AG (Real Estate) | | | 126,379 | |
| | | | 8,402 | | | Draegerwerk AG & Co. KGaA Preference Shares (Health Care Equipment & Services) | | | 207,750 | |
| | | | 1,244 | | | Duerr AG (Capital Goods) | | | 23,577 | |
| | | | 6,721 | | | Gildemeister AG (Capital Goods) | | | 65,882 | |
| | | | 9,582 | | | Heidelberger Druckmaschinen AG (Capital Goods) | | | 69,325 | |
| | | | 19,177 | | | IDS Scheer AG (Software & Services) | | | 212,881 | |
| | | | 65,160 | | | Infineon Technologies AG (Semiconductors & Semiconductor Equipment)* | | | 173,233 | |
| | | | 5,849 | | | Jenoptik AG (Technology Hardware & Equipment)* | | | 26,793 | |
| | | | 41,649 | | | Kizoo AG (Software & Services)(a) | | | 266,600 | |
| | | | 2,552 | | | Krones AG (Capital Goods) | | | 88,653 | |
| | | | 5,215 | | | Lanxess AG (Materials) | | | 112,653 | |
| | | | 3,056 | | | Leoni AG (Automobiles & Components) | | | 45,239 | |
| | | | 24,124 | | | Loewe AG (Consumer Durables & Apparel) | | | 267,549 | |
| | | | 4,832 | | | Medion AG (Retailing) | | | 37,209 | |
| | | | 6,983 | | | Morphosys AG (Pharmaceuticals, Biotechnology & Life Sciences)* | | | 127,467 | |
| | | |
| | | |
The accompanying notes are an integral part of these financial statements.
GOLDMAN SACHS STRUCTURED INTERNATIONAL SMALL CAP FUND
Schedule of Investments (continued)
April 30, 2009 (Unaudited)
| | | | | | | | | | | |
| | | Shares | | Description | | Value |
| |
Common Stocks – (continued) |
| | | Germany – (continued) |
| | | | | | | | | | | |
| | | | 17,813 | | | MTU Aero Engines Holding AG (Capital Goods) | | $ | 599,812 | |
| | | | 21,567 | | | Praktiker Bau- und Heimwerkermaerkte AG (Retailing) | | | 156,483 | |
| | | | 7,060 | | | Roth & Rau AG (Capital Goods)* | | | 168,210 | |
| | | | 2,272 | | | SGL Carbon AG (Capital Goods)* | | | 66,179 | |
| | | | 3,318 | | | Symrise AG (Materials)* | | | 45,386 | |
| | | | 3,824 | | | Tognum AG (Capital Goods) | | | 46,739 | |
| | | | 3,231 | | | Versatel AG (Telecommunication Services)* | | | 23,484 | |
| | | | | | | | | | | |
| | | | | | | | | | 4,447,652 | |
| | | |
| | | |
| | | Greece – 1.2% |
| | | | 21,511 | | | Eurobank Properties Real Estate Investment Co. (REIT) | | | 198,222 | |
| | | | 6,728 | | | EYDAP Athens Water Supply & Sewage Co. SA (Utilities) | | | 54,136 | |
| | | | 11,500 | | | J&P-Avax SA (Capital Goods) | | | 38,433 | |
| | | | 4,798 | | | Jumbo SA (Consumer Durables & Apparel) | | | 40,958 | |
| | | | 94,596 | | | Michaniki SA (Capital Goods) | | | 195,597 | |
| | | | 20,128 | | | Motor Oil Hellas Corinth Refineries SA (Energy) | | | 212,511 | |
| | | | 19,977 | | | Sarantis SA (Household & Personal Products) | | | 94,158 | |
| | | | | | | | | | | |
| | | | | | | | | | 834,015 | |
| | | |
| | | |
| | | Hong Kong – 2.0% |
| | | | 18,000 | | | AAC Acoustic Technologies Holdings, Inc. (Technology Hardware & Equipment)* | | | 9,783 | |
| | | | 32,000 | | | C C Land Holdings Ltd. (Consumer Durables & Apparel)* | | | 10,579 | |
| | | | 378,000 | | | China Ting Group Holdings Ltd. (Consumer Durables & Apparel) | | | 32,524 | |
| | | | 840,000 | | | China WindPower Group Ltd. (Food & Staples Retailing)* | | | 33,379 | |
| | | | 118,000 | | | Chow Sang Sang Holdings International Ltd. (Retailing) | | | 70,874 | |
| | | | 13,757 | | | Dah Sing Financial Holdings Ltd. (Banks) | | | 40,176 | |
| | | | 302,000 | | | First Pacific Co. Ltd. (Food, Beverage & Tobacco) | | | 137,887 | |
| | | | 136,000 | | | First Shanghai Investments Ltd. (Diversified Financials) | | | 13,330 | |
| | | | 12,000 | | | Fubon Bank Hong Kong Ltd. (Banks) | | | 4,085 | |
| | | | 98,000 | | | Goldin Properties Holdings Ltd. (Retailing)* | | | 36,779 | |
| | | | 95,000 | | | Great Eagle Holdings Ltd. (Real Estate) | | | 131,153 | |
| | | | 450,000 | | | Hutchison Harbour Ring Ltd. (Consumer Durables & Apparel) | | | 33,567 | |
| | | | 745,500 | | | Johnson Electric Holdings Ltd. (Capital Goods) | | | 162,238 | |
| | | |
| | | |
| | | | 30,000 | | | Midland Holdings Ltd. (Real Estate) | | | 12,295 | |
| | | | 110,000 | | | Natural Beauty Bio-Technology Ltd. (Household & Personal Products) | | | 13,684 | |
| | | | 140,000 | | | Norstar Founders Group Ltd. (Automobiles & Components) | | | — | |
| | | | 1,234,000 | | | Oriental Press Group Ltd. (Media) | | | 115,824 | |
| | | | 374,000 | | | Pico Far East Holdings Ltd. (Media) | | | 35,052 | |
| | | | 14,500 | | | Ports Design Ltd. (Consumer Durables & Apparel) | | | 22,019 | |
| | | | 249,000 | | | Prosperity REIT (REIT) | | | 27,797 | |
| | | | 46,200 | | | Regal Hotels International Holdings Ltd. (Consumer Services) | | | 8,905 | |
| | | | 309,000 | | | Regal Real Estate Investment Trust (REIT) | | | 41,184 | |
| | | | 233,000 | | | Samson Holding Ltd. (Consumer Durables & Apparel) | | | 22,744 | |
| | | | 68,000 | | | Shell Electric Manufacturing Co. Ltd. (Consumer Durables & Apparel) | | | 20,488 | |
| | | | 55,000 | | | Shenyin Wanguo HK Ltd. (Diversified Financials) | | | 23,803 | |
| | | | 18,000 | | | Shui On Construction and Materials Ltd. (Capital Goods) | | | 19,085 | |
| | | | 12,000 | | | Shun Tak Holdings Ltd. (Transportation) | | | 5,295 | |
| | | | 40,000 | | | Tai Fook Securities Group Ltd. (Diversified Financials) | | | 7,577 | |
| | | | 147,500 | | | Techtronic Industries Co. Ltd. (Consumer Durables & Apparel) | | | 87,231 | |
| | | | 86,000 | | | Texwinca Holdings Ltd. (Consumer Durables & Apparel) | | | 52,340 | |
| | | | 100,000 | | | Tian An China Investments Co. Ltd. (Real Estate) | | | 32,394 | |
| | | | 80,000 | | | Value Partners Group Ltd. (Diversified Financials) | | | 24,202 | |
| | | | 23,000 | | | VTech Holdings Ltd. (Technology Hardware & Equipment) | | | 115,036 | |
| | | | 19,000 | | | Wing On Co. International Ltd. (Retailing) | | | 18,231 | |
| | | | 72,000 | | | Xinyi Glass Holdings Co. Ltd. (Automobiles & Components) | | | 44,703 | |
| | | | | | | | | | | |
| | | | | | | | | | 1,466,243 | |
| | | |
| | | |
| | | Ireland – 1.0% |
| | | | 56,289 | | | Allied Irish Banks PLC (Banks) | | | 68,822 | |
| | | | 44,451 | | | C&C Group PLC (Food, Beverage & Tobacco) | | | 103,219 | |
| | | | 4,338 | | | DCC PLC (Capital Goods) | | | 78,429 | |
| | | | 108,242 | | | Fyffes PLC (Food & Staples Retailing) | | | 42,974 | |
| | | | 7,410 | | | Glanbia PLC (Food, Beverage & Tobacco) | | | 21,502 | |
| | | |
| | | |
The accompanying notes are an integral part of these financial statements.
GOLDMAN SACHS STRUCTURED INTERNATIONAL SMALL CAP FUND
| | | | | | | | | | | |
| | | Shares | | Description | | Value |
| |
Common Stocks – (continued) |
| | | Ireland – (continued) |
| | | | | | | | | | | |
| | | | 2,833 | | | Irish Continental Group PLC (Transportation)* | | $ | 43,482 | |
| | | | 18,380 | | | Kingspan Group PLC (Capital Goods) | | | 95,056 | |
| | | | 6,697 | | | Paddy Power PLC (Consumer Services) | | | 123,339 | |
| | | | 14,700 | | | Smurfit Kappa Group PLC (Materials) | | | 43,059 | |
| | | | 87,193 | | | The Governor and Co. of the Bank of Ireland (Banks) | | | 86,915 | |
| | | | 20,174 | | | Total Produce PLC (Food & Staples Retailing) | | | 7,493 | |
| | | | | | | | | | | |
| | | | | | | | | | 714,290 | |
| | | |
| | | |
| | | Italy – 3.0% |
| | | | 37,482 | | | Astaldi SpA (Capital Goods) | | | 203,809 | |
| | | | 36,212 | | | Banca Piccolo Credito Valtellinese Scarl (Banks) | | | 283,551 | |
| | | | 6,653 | | | Benetton Group SpA (Consumer Durables & Apparel) | | | 52,720 | |
| | | | 133,996 | | | Beni Stabili SpA (Real Estate) | | | 83,765 | |
| | | | 125,683 | | | Buongiorno SpA (Software & Services)* | | | 116,153 | |
| | | | 13,787 | | | Danieli & Co. SpA (Capital Goods) | | | 94,858 | |
| | | | 33,911 | | | Davide Campari-Milano SpA (Food, Beverage & Tobacco) | | | 228,056 | |
| | | | 23,125 | | | De’Longhi SpA (Consumer Durables & Apparel) | | | 55,050 | |
| | | | 5,264 | | | Engineering Ingegneria Informatica SpA (Software & Services) | | | 120,698 | |
| | | | 18,977 | | | Esprinet SpA (Technology Hardware & Equipment) | | | 140,117 | |
| | | | 5,871 | | | Fiera Milano SpA (Commercial & Professional Services)* | | | 39,388 | |
| | | | 2,717 | | | Gewiss SpA (Capital Goods)* | | | 9,962 | |
| | | | 152,193 | | | IMMSI SpA (Automobiles & Components) | | | 143,189 | |
| | | | 6,906 | | | Interpump Group SpA (Capital Goods) | | | 29,399 | |
| | | | 31,424 | | | Maire Tecnimont SpA (Capital Goods) | | | 64,009 | |
| | | | 50,506 | | | Piaggio & C. SpA (Automobiles & Components) | | | 84,902 | |
| | | | 4,459 | | | Pirelli & C. Real Estate SpA (Real Estate)* | | | 25,802 | |
| | | | 61,356 | | | Premafin Finanziaria SpA (Insurance) | | | 78,668 | |
| | | | 33,686 | | | Recordati SpA (Pharmaceuticals, Biotechnology & Life Sciences) | | | 193,893 | |
| | | | 13,245 | | | Sogefi SpA (Automobiles & Components)* | | | 18,747 | |
| | | | 6,945 | | | Trevi Finanziaria SpA (Capital Goods) | | | 65,180 | |
| | | | | | | | | | | |
| | | | | | | | | | 2,131,916 | |
| | | |
| | | |
| | | Japan – 31.2% |
| | | | 7,300 | | | Aida Engineering Ltd. (Capital Goods) | | | 20,280 | |
| | | | 28,450 | | | Aiful Corp. (Diversified Financials) | | | 56,219 | |
| | | | 16,500 | | | Aloka Co. Ltd. (Health Care Equipment & Services) | | | 119,474 | |
| | | | 20,200 | | | Alpen Co. Ltd. (Retailing) | | | 333,560 | |
| | | | 3,900 | | | Arc Land Sakamoto Co. Ltd. (Retailing) | | | 29,259 | |
| | | | 29,000 | | | Asahi Diamond Industrial Co. Ltd. (Capital Goods) | | | 137,900 | |
| | | | 201,000 | | | Atsugi Co. Ltd. (Consumer Durables & Apparel) | | | 274,712 | |
| | | | 29,500 | | | Bank of the Ryukyus Ltd. (Banks)* | | | 229,547 | |
| | | | 11,200 | | | Belluna Co. Ltd. (Retailing) | | | 34,903 | |
| | | | 2,900 | | | Canon Finetech, Inc. (Technology Hardware & Equipment) | | | 27,149 | |
| | | | 30,000 | | | Central Glass Co. Ltd. (Capital Goods) | | | 113,883 | |
| | | | 11,000 | | | Chugoku Marine Paints Ltd. (Materials) | | | 62,869 | |
| | | | 12,600 | | | CKD Corp. (Capital Goods) | | | 46,428 | |
| | | | 2,200 | | | cocokara fine HOLDINGS, Inc. (Food & Staples Retailing) | | | 19,226 | |
| | | | 27,000 | | | Daifuku Co. Ltd. (Capital Goods) | | | 162,341 | |
| | | | 79,500 | | | Daiichikosho Co. Ltd. (Media) | | | 637,728 | |
| | | | 19,000 | | | Dainippon Screen Manufacturing Co. Ltd. (Technology Hardware & Equipment)* | | | 41,791 | |
| | | | 33,000 | | | Daiwa Industries Ltd. (Capital Goods) | | | 109,952 | |
| | | | 7,100 | | | DCM Japan Holdings Co. Ltd. (Retailing) | | | 36,490 | |
| | | | 11,400 | | | Doshisha Co. Ltd. (Retailing) | | | 137,766 | |
| | | | 3,800 | | | Doutor Nichires Holdings Co. Ltd. (Consumer Services) | | | 46,802 | |
| | | | 34,900 | | | DTS Corp. (Software & Services) | | | 250,730 | |
| | | | 900 | | | Dydo Drinco, Inc. (Food, Beverage & Tobacco) | | | 23,891 | |
| | | | 2,000 | | | F.C.C. Co. Ltd. (Automobiles & Components) | | | 25,342 | |
| | | | 37,000 | | | Fuji Machine Manufacturing Co. Ltd. (Capital Goods) | | | 331,755 | |
| | | | 102,000 | | | Fujikura Ltd. (Capital Goods) | | | 352,102 | |
| | | | 13,000 | | | FUJISOFT, Inc. (Software & Services)(a) | | | 184,505 | |
| | | | 11,000 | | | Fujitec Co. Ltd. (Capital Goods) | | | 43,541 | |
| | | | 13,900 | | | Fujitsu Business Systems Ltd. (Retailing) | | | 164,956 | |
| | | | 16,000 | | | Fujitsu General Ltd. (Consumer Durables & Apparel) | | | 45,777 | |
| | | | 32,000 | | | Fukuyama Transporting Co. Ltd. (Transportation) | | | 124,258 | |
| | | | 18,300 | | | Furuno Electric Co. Ltd. (Technology Hardware & Equipment) | | | 88,440 | |
| | | |
| | | |
The accompanying notes are an integral part of these financial statements.
GOLDMAN SACHS STRUCTURED INTERNATIONAL SMALL CAP FUND
Schedule of Investments (continued)
April 30, 2009 (Unaudited)
| | | | | | | | | | | |
| | | Shares | | Description | | Value |
| |
Common Stocks – (continued) |
| | | Japan – (continued) |
| | | | | | | | | | | |
| | | | 12,700 | | | Futaba Industrial Co. Ltd. (Automobiles & Components) | | $ | 57,235 | |
| | | | 13,500 | | | Fuyo General Lease Co. Ltd. (Diversified Financials) | | | 227,048 | |
| | | | 48 | | | Global One Real Estate Investment Corp. (REIT) | | | 285,133 | |
| | | | 7,300 | | | Glory Ltd. (Capital Goods) | | | 133,964 | |
| | | | 5,000 | | | Godo Steel Ltd. (Materials) | | | 12,974 | |
| | | | 7,230 | | | Goldcrest Co. Ltd. (Consumer Durables & Apparel) | | | 165,748 | |
| | | | 34,000 | | | GS Yuasa Corp. (Capital Goods)(a) | | | 228,394 | |
| | | | 52,000 | | | Gunze Ltd. (Consumer Durables & Apparel) | | | 169,376 | |
| | | | 6,800 | | | Hakuto Co. Ltd. (Technology Hardware & Equipment) | | | 39,485 | |
| | | | 8,000 | | | Hitachi Information Systems Ltd. (Software & Services) | | | 141,582 | |
| | | | 5,300 | | | Hitachi Systems & Services Ltd. (Software & Services) | | | 55,429 | |
| | | | 17,000 | | | Hokuetsu Paper Mills Ltd. (Materials) | | | 74,778 | |
| | | | 13,700 | | | Hosiden Corp. (Technology Hardware & Equipment) | | | 168,192 | |
| | | | 46,600 | | | Ines Corp. (Software & Services) | | | 248,167 | |
| | | | 43,400 | | | Inui Steamship Co. Ltd. (Transportation) | | | 285,154 | |
| | | | 1,000 | | | Itochu-Shokuhin Co. Ltd. (Food & Staples Retailing) | | | 31,876 | |
| | | | 55,600 | | | Itoki Corp. (Commercial & Professional Services) | | | 141,893 | |
| | | | 16,000 | | | Izumiya Co. Ltd. (Food & Staples Retailing) | | | 82,842 | |
| | | | 8 | | | Japan Excellent, Inc. (REIT) | | | 29,010 | |
| | | | 11 | | | Japan Logistics Fund, Inc. (REIT) | | | 65,737 | |
| | | | 23,800 | | | Kaga Electronics Co. Ltd. (Technology Hardware & Equipment) | | | 215,948 | |
| | | | 59,000 | | | Kaken Pharmaceutical Co. Ltd. (Pharmaceuticals, Biotechnology & Life Sciences) | | | 491,207 | |
| | | | 71,000 | | | Kansai Urban Banking Corp. (Banks)(a) | | | 145,505 | |
| | | | 63,000 | | | Kasumi Co. Ltd. (Food & Staples Retailing) | | | 258,253 | |
| | | | 7,000 | | | Kato Sangyo Co. Ltd. (Retailing) | | | 97,289 | |
| | | | 38,000 | | | Kato Works Co. Ltd. (Capital Goods) | | | 69,548 | |
| | | | 5,900 | | | Keihin Corp. (Automobiles & Components) | | | 74,917 | |
| | | | 11 | | | Kenedix Realty Investment Corp. (REIT) | | | 26,201 | |
| | | | 223 | | | Kenedix, Inc. (Real Estate)* | | | 34,508 | |
| | | | 16,000 | | | Kitz Corp. (Capital Goods) | | | 49,911 | |
| | | | 287,000 | | | Kiyo Holdings, Inc. (Banks) | | | 344,527 | |
| | | | 10,700 | | | Kohnan Shoji Co. Ltd. (Retailing) | | | 93,955 | |
| | | | 29,800 | | | Komori Corp. (Capital Goods) | | | 279,698 | |
| | | |
| | | |
| | | | 24,000 | | | Krosaki Harima Corp. (Materials) | | | 45,760 | |
| | | | 19,000 | | | Kurabo Industries Ltd. (Consumer Durables & Apparel) | | | 37,076 | |
| | | | 26,000 | | | Kureha Corp. (Materials) | | | 110,746 | |
| | | | 4,200 | | | Kyoritsu Maintenance Co. Ltd. (Consumer Services) | | | 64,631 | |
| | | | 9,000 | | | Kyudenko Corp. (Capital Goods) | | | 55,961 | |
| | | | 9,000 | | | Marudai Food Co. Ltd. (Food, Beverage & Tobacco) | | | 20,007 | |
| | | | 39,000 | | | Maruzen Showa Unyu Co. Ltd. (Transportation) | | | 102,897 | |
| | | | 36 | | | MID REIT, Inc. (REIT) | | | 70,911 | |
| | | | 4,900 | | | Mimasu Semiconductor Industry Co. Ltd. (Semiconductors & Semiconductor Equipment) | | | 56,237 | |
| | | | 8,800 | | | Miraca Holdings, Inc. (Health Care Equipment & Services) | | | 179,608 | |
| | | | 37,000 | | | Mitsubishi Kakoki Kaisha Ltd. (Capital Goods) | | | 86,913 | |
| | | | 15,000 | | | Mitsubishi Paper Mills Ltd. (Materials) | | | 22,291 | |
| | | | 6,000 | | | Mitsui High-Tec, Inc. (Semiconductors & Semiconductor Equipment) | | | 48,280 | |
| | | | 8,000 | | | Mitsui Home Co. Ltd. (Consumer Durables & Apparel) | | | 35,745 | |
| | | | 91,000 | | | Mitsui Sugar Co. Ltd. (Food, Beverage & Tobacco) | | | 244,456 | |
| | | | 11,800 | | | Mori Seiki Co. Ltd. (Capital Goods) | | | 113,827 | |
| | | | 6 | | | MORI TRUST Sogo Reit, Inc. (REIT) | | | 41,464 | |
| | | | 4,100 | | | Nafco Co. Ltd. (Retailing) | | | 39,708 | |
| | | | 10,000 | | | Nakayama Steel Works Ltd. (Materials) | | | 23,608 | |
| | | | 34,100 | | | Namura Shipbuilding Co. Ltd. (Capital Goods) | | | 140,227 | |
| | | | 16,500 | | | NEC Fielding Ltd. (Software & Services) | | | 170,026 | |
| | | | 5,200 | | | Nidec Copal Corp. (Consumer Durables & Apparel) | | | 33,803 | |
| | | | 3,800 | | | Nihon Kohden Corp. (Health Care Equipment & Services) | | | 41,650 | |
| | | | 138,000 | | | Nippon Beet Sugar Manufacturing Co. Ltd. (Food, Beverage & Tobacco) | | | 306,921 | |
| | | | 35,000 | | | Nippon Flour Mills Co. Ltd. (Food, Beverage & Tobacco) | | | 135,172 | |
| | | | 53,000 | | | Nippon Kayaku Co. Ltd. (Materials) | | | 285,548 | |
| | | | 29,000 | | | Nippon Konpo Unyu Soko Co. Ltd. (Transportation) | | | 238,502 | |
| | | | 48,000 | | | Nippon Shinyaku Co. Ltd. (Pharmaceuticals, Biotechnology & Life Sciences) | | | 428,497 | |
| | | |
| | | |
The accompanying notes are an integral part of these financial statements.
GOLDMAN SACHS STRUCTURED INTERNATIONAL SMALL CAP FUND
| | | | | | | | | | | |
| | | Shares | | Description | | Value |
| |
Common Stocks – (continued) |
| | | Japan – (continued) |
| | | | | | | | | | | |
| | | | 6,000 | | | Nippon Shokubai Co. Ltd. (Materials) | | $ | 36,795 | |
| | | | 14,500 | | | Nippon Signal Co. Ltd. (Capital Goods) | | | 87,719 | |
| | | | 145,000 | | | Nippon Soda Co. Ltd. (Materials) | | | 475,785 | |
| | | | 10,000 | | | Nippon Valqua Industries Ltd. (Materials) | | | 20,777 | |
| | | | 17,000 | | | Nissan Shatai Co. Ltd. (Automobiles & Components) | | | 107,247 | |
| | | | 30,000 | | | Nissin Corp. (Transportation) | | | 54,273 | |
| | | | 21,000 | | | Nissin Electric Co. Ltd. (Capital Goods) | | | 81,626 | |
| | | | 5,300 | | | Nissin Kogyo Co. Ltd. (Automobiles & Components) | | | 60,478 | |
| | | | 47,000 | | | Nitto Boseki Co. Ltd. (Capital Goods) | | | 90,196 | |
| | | | 9,700 | | | Nitto Kogyo Corp. (Capital Goods) | | | 80,504 | |
| | | | 24,000 | | | NOF Corp. (Materials) | | | 88,817 | |
| | | | 2,600 | | | NS Solutions Corp. (Software & Services) | | | 30,297 | |
| | | | 6,000 | | | Okamura Corp. (Commercial & Professional Services) | | | 29,315 | |
| | | | 5,000 | | | Okuwa Co. Ltd. (Food & Staples Retailing) | | | 54,164 | |
| | | | 92,500 | | | Orient Corp. (Diversified Financials)* | | | 92,280 | |
| | | | 37 | | | ORIX JREIT, Inc. (REIT) | | | 138,795 | |
| | | | 14,700 | | | Osaka Steel Co. Ltd. (Materials) | | | 235,807 | |
| | | | 11,100 | | | Otsuka Kagu Ltd. (Retailing) | | | 81,861 | |
| | | | 9,300 | | | Pioneer Corp. (Consumer Durables & Apparel)* | | | 29,777 | |
| | | | 3,800 | | | Plenus Co. Ltd. (Consumer Services) | | | 52,291 | |
| | | | 43,000 | | | Press Kogyo Co. Ltd. (Automobiles & Components) | | | 75,211 | |
| | | | 6,500 | | | Resorttrust, Inc. (Consumer Services) | | | 62,848 | |
| | | | 16,200 | | | Right On Co. Ltd. (Retailing) | | | 111,753 | |
| | | | 6,000 | | | Riso Kagaku Corp. (Technology Hardware & Equipment) | | | 53,650 | |
| | | | 7,900 | | | Round One Corp. (Consumer Services) | | | 58,366 | |
| | | | 57,000 | | | Ryobi Ltd. (Capital Goods) | | | 132,852 | |
| | | | 17,000 | | | Sakai Chemical Industry Co. Ltd. (Materials) | | | 51,078 | |
| | | | 95,000 | | | San-Ai Oil Co. Ltd. (Energy) | | | 357,358 | |
| | | | 26,000 | | | Sanken Electric Co. Ltd. (Semiconductors & Semiconductor Equipment) | | | 81,394 | |
| | | | 5,000 | | | Sanki Engineering Co. Ltd. (Capital Goods) | | | 33,731 | |
| | | | 11,000 | | | Sankyu, Inc. (Transportation) | | | 32,305 | |
| | | | 30,400 | | | Sanshin Electronics Co. Ltd. (Technology Hardware & Equipment) | | | 187,992 | |
| | | | 36,000 | | | Seika Corp. (Capital Goods) | | | 73,579 | |
| | | |
| | | |
| | | | 22,000 | | | Sekisui Jushi Corp. (Capital Goods) | | | 145,893 | |
| | | | 46,000 | | | Senko Co. Ltd. (Transportation) | | | 122,142 | |
| | | | 2,400 | | | Senshukai Co. Ltd. (Retailing) | | | 15,366 | |
| | | | 8,300 | | | Shinko Plantech Co. Ltd. (Energy) | | | 55,226 | |
| | | | 9,400 | | | Shinko Shoji Co. Ltd. (Technology Hardware & Equipment) | | | 60,939 | |
| | | | 17,500 | | | Shizuoka Gas Co. Ltd. (Utilities) | | | 97,873 | |
| | | | 5,500 | | | Sintokogio Ltd. (Capital Goods) | | | 35,541 | |
| | | | 473 | | | SKY Perfect JSAT Holdings, Inc. (Media) | | | 170,794 | |
| | | | 26,500 | | | Star Micronics Co. Ltd. (Technology Hardware & Equipment) | | | 215,911 | |
| | | | 43,000 | | | Sumitomo Osaka Cement Co. Ltd. (Materials) | | | 96,636 | |
| | | | 7,000 | | | Tadano Ltd. (Capital Goods) | | | 30,755 | |
| | | | 89,000 | | | Taihei Kogyo Co. Ltd. (Capital Goods) | | | 292,144 | |
| | | | 8,700 | | | Taikisha Ltd. (Capital Goods) | | | 99,220 | |
| | | | 6,000 | | | Taiyo Yuden Co. Ltd. (Technology Hardware & Equipment) | | | 46,142 | |
| | | | 7,900 | | | Takata Corp. (Automobiles & Components) | | | 91,898 | |
| | | | 2,700 | | | Takeuchi Manufacturing Co. Ltd. (Capital Goods) | | | 19,109 | |
| | | | 2,400 | | | Tamron Co. Ltd. (Consumer Durables & Apparel) | | | 24,790 | |
| | | | 75,000 | | | The Bank of Nagoya Ltd. (Banks) | | | 317,290 | |
| | | | 12,600 | | | The Bank of Okinawa Ltd. (Banks) | | | 339,878 | |
| | | | 3,800 | | | The Chiba Kogyo Bank Ltd. (Banks)* | | | 35,727 | |
| | | | 16,950 | | | The Daiei, Inc. (Retailing)*(a) | | | 65,484 | |
| | | | 57,000 | | | The Ehime Bank Ltd. (Banks) | | | 141,998 | |
| | | | 10,000 | | | The Eighteenth Bank Ltd. (Banks) | | | 29,157 | |
| | | | 117,000 | | | The Fuji Fire & Marine Insurance Co. Ltd. (Insurance)*(a) | | | 120,310 | |
| | | | 33,000 | | | The Higashi-Nippon Bank Ltd. (Banks) | | | 83,040 | |
| | | | 7,000 | | | The Higo Bank Ltd. (Banks) | | | 38,288 | |
| | | | 30,000 | | | The Kagoshima Bank Ltd. (Banks) | | | 201,050 | |
| | | | 72,000 | | | The Keiyo Bank Ltd. (Banks) | | | 268,053 | |
| | | | 38,000 | | | The Nisshin Oillio Group Ltd. (Food, Beverage & Tobacco) | | | 150,183 | |
| | | | 4,100 | | | The Okinawa Electric Power Co., Inc. (Utilities) | | | 194,969 | |
| | | | 1,400 | | | The Shimizu Bank Ltd. (Banks) | | | 55,029 | |
| | | | 37,000 | | | The Sumitomo Warehouse Co. Ltd. (Transportation) | | | 132,935 | |
| | | | 7,600 | | | TKC Corp. (Software & Services) | | | 138,293 | |
| | | | 111,000 | | | Toa Corp. (Capital Goods) | | | 133,579 | |
| | | | 74,000 | | | Toagosei Co. Ltd. (Materials) | | | 184,409 | |
| | | | 6,000 | | | Toenec Corp. (Capital Goods) | | | 27,734 | |
| | | | 3,100 | | | Tokyo Ohka Kogyo Co. Ltd. (Materials) | | | 52,448 | |
| | | | 29 | | | Tokyu REIT, Inc. (REIT) | | | 133,668 | |
| | | | 7 | | | Top REIT, Inc. (REIT) | | | 24,743 | |
| | | |
| | | |
The accompanying notes are an integral part of these financial statements.
GOLDMAN SACHS STRUCTURED INTERNATIONAL SMALL CAP FUND
Schedule of Investments (continued)
April 30, 2009 (Unaudited)
| | | | | | | | | | | |
| | | Shares | | Description | | Value |
| |
Common Stocks – (continued) |
| | | Japan – (continued) |
| | | | | | | | | | | |
| | | | 17,200 | | | Topre Corp. (Automobiles & Components) | | $ | 141,617 | |
| | | | 78,000 | | | Topy Industries Ltd. (Materials) | | | 120,577 | |
| | | | 17,100 | | | Torii Pharmaceutical Co. Ltd. (Pharmaceuticals, Biotechnology & Life Sciences) | | | 226,521 | |
| | | | 23,000 | | | Toshiba Machine Co. Ltd. (Capital Goods) | | | 68,255 | �� |
| | | | 80,000 | | | Toshiba TEC Corp. (Technology Hardware & Equipment) | | | 283,337 | |
| | | | 24,000 | | | Toyo Kanetsu K.K. (Energy) | | | 39,889 | |
| | | | 32,000 | | | Toyo Kohan Co. Ltd. (Materials) | | | 126,531 | |
| | | | 27,000 | | | Toyo Securities Co. Ltd. (Diversified Financials)* | | | 44,555 | |
| | | | 9,700 | | | TS Tech Co. Ltd. (Automobiles & Components) | | | 119,841 | |
| | | | 10,000 | | | ULVAC, Inc. (Semiconductors & Semiconductor Equipment) | | | 186,336 | |
| | | | 21,100 | | | Unipres Corp. (Automobiles & Components) | | | 154,680 | |
| | | | 24,030 | | | Usen Corp. (Media)* | | | 28,484 | |
| | | | 2,000 | | | Yamatake Corp. (Technology Hardware & Equipment) | | | 33,520 | |
| | | | 59,000 | | | Yodogawa Steel Works Ltd. (Materials) | | | 268,307 | |
| | | | 20,000 | | | Yokohama Reito Co. Ltd. (Retailing) | | | 115,734 | |
| | | | 19,500 | | | Yonekyu Corp. (Food, Beverage & Tobacco) | | | 185,257 | |
| | | | 21,000 | | | Yurtec Corp. (Capital Goods) | | | 110,060 | |
| | | | 59,000 | | | Zeon Corp. (Materials) | | | 180,598 | |
| | | | | | | | | | | |
| | | | | | | | | | 22,483,196 | |
| | | |
| | | |
| | | Jersey(a) – 0.1% |
| | | | 20,579 | | | Atrium European Real Estate Ltd. (Real Estate)* | | | 81,929 | |
| | | |
| | | |
| | | Luxembourg – 0.6% |
| | | | 407,270 | | | Regus PLC (Commercial & Professional Services) | | | 461,133 | |
| | | |
| | | |
| | | Netherlands – 1.8% |
| | | | 19,437 | | | BinckBank NV (Diversified Financials) | | | 215,678 | |
| | | | 9,540 | | | Crucell NV (Pharmaceuticals, Biotechnology & Life Sciences)* | | | 199,688 | |
| | | | 796 | | | Eurocommercial Properties NV CVA (REIT) | | | 23,459 | |
| | | | 7,728 | | | Imtech NV (Capital Goods) | | | 120,617 | |
| | | | 47,144 | | | Koninklijke Wessanen NV (Food, Beverage & Tobacco) | | | 210,768 | |
| | | | 12,510 | | | Oce NV (Technology Hardware & Equipment) | | | 79,174 | |
| | | | 27,696 | | | Ordina NV (Software & Services) | | | 121,202 | |
| | | | 21,017 | | | USG People NV (Commercial & Professional Services) | | | 197,636 | |
| | | |
| | | |
| | | | 5,045 | | | VastNed Offices/Industrial NV (REIT) | | | 58,115 | |
| | | | 1,220 | | | VastNed Retail NV (REIT) | | | 53,883 | |
| | | | 324 | | | Wereldhave NV (REIT) | | | 22,229 | |
| | | | | | | | | | | |
| | | | | | | | | | 1,302,449 | |
| | | |
| | | |
| | | New Zealand – 0.5% |
| | | | 31,247 | | | Air New Zealand Ltd. (Transportation) | | | 18,527 | |
| | | | 138,418 | | | Goodman Property Trust (REIT) | | | 62,628 | |
| | | | 105,277 | | | New Zealand Oil & Gas Ltd. (Energy) | | | 82,861 | |
| | | | 67,720 | | | PGG Wrightson Ltd. (Food, Beverage & Tobacco) | | | 51,722 | |
| | | | 11,207 | | | Tower Ltd. (Insurance) | | | 8,627 | |
| | | | 94,542 | | | Vector Ltd. (Utilities) | | | 115,396 | |
| | | | | | | | | | | |
| | | | | | | | | | 339,761 | |
| | | |
| | | |
| | | Norway – 1.2% |
| | | | 24,000 | | | BW Offshore Ltd. (Energy)* | | | 20,589 | |
| | | | 1,200 | | | Fred Olsen Energy ASA (Energy) | | | 37,830 | |
| | | | 120,000 | | | Marine Harvest (Food, Beverage & Tobacco)* | | | 54,072 | |
| | | | 17,500 | | | Norwegian Energy Co. AS (Energy)* | | | 41,128 | |
| | | | 54,700 | | | Petroleum Geo-Services ASA (Energy)* | | | 264,624 | |
| | | | 3,369 | | | Sparebanken 1 Nord-Norge (Banks) | | | 30,482 | |
| | | | 27,778 | | | Sparebanken 1 SMN (Banks) | | | 125,852 | |
| | | | 15,500 | | | Storebrand ASA (Insurance)* | | | 56,238 | |
| | | | 15,800 | | | TGS Nopec Geophysical Co. ASA (Energy)* | | | 116,669 | |
| | | | 18,000 | | | Veidekke ASA (Capital Goods) | | | 85,532 | |
| | | | | | | | | | | |
| | | | | | | | | | 833,016 | |
| | | |
| | | |
| | | Portugal – 0.6% |
| | | | 104,834 | | | REN — Redes Energeticas Nacionais SA (Utilities) | | | 433,790 | |
| | | |
| | | |
| | | Singapore – 1.7% |
| | | | 162,000 | | | Biosensors International Group Ltd. (Health Care Equipment & Services)* | | | 46,787 | |
| | | | 64,000 | | | CapitaCommercial Trust (REIT) | | | 36,629 | |
| | | | 7,950 | | | Creative Technology Ltd. (Technology Hardware & Equipment)* | | | 17,696 | |
| | | | 44,000 | | | Ezra Holdings Ltd. (Energy) | | | 27,324 | |
| | | | 133,000 | | | Fortune Real Estate Investment Trust (REIT) | | | 51,405 | |
| | | | 11,000 | | | Haw Par Corp. Ltd. (Capital Goods) | | | 28,143 | |
| | | | 28,000 | | | Hong Leong Asia Ltd. (Capital Goods) | | | 13,608 | |
| | | | 89,000 | | | Kim Eng Holdings Ltd. (Diversified Financials) | | | 89,076 | |
| | | | 83,000 | | | KS Energy Services Ltd. (Capital Goods) | | | 44,670 | |
| | | |
| | | |
The accompanying notes are an integral part of these financial statements.
GOLDMAN SACHS STRUCTURED INTERNATIONAL SMALL CAP FUND
| | | | | | | | | | | |
| | | Shares | | Description | | Value |
| |
Common Stocks – (continued) |
| | | Singapore – (continued) |
| | | | | | | | | | | |
| | | | 459,000 | | | Lippo-Mapletree Indonesia Retail Trust (REIT) | | $ | 89,139 | |
| | | | 390,000 | | | Metro Holdings Ltd. (Retailing) | | | 89,498 | |
| | | | 97,000 | | | Orchard Parade Holdings Ltd. (Real Estate) | | | 42,543 | |
| | | | 16,000 | | | Singapore Airport Terminal Services Ltd. (Transportation) | | | 14,107 | |
| | | | 24,000 | | | Singapore Land Ltd. (Real Estate) | | | 56,069 | |
| | | | 69,000 | | | Singapore Petroleum Co. Ltd. (Energy) | | | 154,814 | |
| | | | 44,000 | | | Sino-Environment Technology Group Ltd. (Utilities)* | | | 2,511 | |
| | | | 111,000 | | | SMRT Corp. Ltd. (Transportation) | | | 115,856 | |
| | | | 72,000 | | | Stamford Land Corp. Ltd. (Consumer Services) | | | 12,350 | |
| | | | 243,000 | | | Starhill Global REIT (REIT) | | | 78,530 | |
| | | | 17,000 | | | Suntec Real Estate Investment Trust (REIT) | | | 8,403 | |
| | | | 14,000 | | | United Engineers Ltd. (Capital Goods)* | | | 13,562 | |
| | | | 13,000 | | | UOB-Kay Hian Holdings Ltd. (Diversified Financials) | | | 11,046 | |
| | | | 18,000 | | | Venture Corp. Ltd. (Technology Hardware & Equipment) | | | 72,011 | |
| | | | 24,000 | | | Wheelock Properties (S) Ltd. (Real Estate) | | | 17,721 | |
| | | | 168,000 | | | Wing Tai Holdings Ltd. (Real Estate) | | | 99,322 | |
| | | | 28,000 | | | Yanlord Land Group Ltd. (Real Estate) | | | 26,949 | |
| | | | | | | | | | | |
| | | | | | | | | | 1,259,769 | |
| | | |
| | | |
| | | Spain – 2.0% |
| | | | 7,190 | | | Baron de Ley SA (Food, Beverage & Tobacco)* | | | 258,620 | |
| | | | 10,825 | | | Corp. Financiera Alba SA (Diversified Financials) | | | 466,360 | |
| | | | 4,883 | | | Dinamia Capital Privado, Sociedad de Capital Riesgo SA (Diversified Financials) | | | 57,447 | |
| | | | 251,303 | | | Ercros SA (Materials)* | | | 49,601 | |
| | | | 3,848 | | | Miquel y Costas & Miquel SA (Materials) | | | 67,685 | |
| | | | 52,649 | | | Service Point Solutions SA (Commercial & Professional Services) | | | 55,166 | |
| | | | 7,801 | | | Tecnicas Reunidas SA (Energy) | | | 275,076 | |
| | | | 39,727 | | | Tubos Reunidos SA (Materials) | | | 102,144 | |
| | | | 5,655 | | | Viscofan SA (Food, Beverage & Tobacco) | | | 104,989 | |
| | | | | | | | | | | |
| | | | | | | | | | 1,437,088 | |
| | | |
| | | |
| | | Sweden – 3.9% |
| | | | 11,500 | | | AF AB Class B (Commercial & Professional Services)*(a) | | | 173,074 | |
| | | | 35,267 | | | Betsson AB (Consumer Services)* | | | 404,325 | |
| | | |
| | | |
| | | | 41,218 | | | Boliden AB (Materials) | | | 259,044 | |
| | | | 3,593 | | | Cardo AB (Capital Goods) | | | 79,423 | |
| | | | 24,072 | | | Castellum AB (Real Estate) | | | 151,804 | |
| | | | 8,200 | | | D. Carnegie & Co. AB (Diversified Financials)* | | | — | |
| | | | 55,252 | | | Eniro AB (Media)(a) | | | 121,565 | |
| | | | 46,940 | | | Fabege AB (Real Estate) | | | 197,252 | |
| | | | 12,830 | | | Gunnebo AB (Commercial & Professional Services)* | | | 40,374 | |
| | | | 22,162 | | | Hexpol AB (Capital Goods)* | | | 84,008 | |
| | | | 32,803 | | | KappAhl Holding AB (Retailing) | | | 122,666 | |
| | | | 10,477 | | | Mekonomen AB (Retailing) | | | 127,362 | |
| | | | 16,572 | | | NCC AB Class B (Capital Goods) | | | 145,383 | |
| | | | 21,881 | | | Ratos AB Class B (Diversified Financials) | | | 374,596 | |
| | | | 103,507 | | | RNB Retail and Brands AB (Retailing)* | | | 75,351 | |
| | | | 42,649 | | | SAS AB (Transportation)*(a) | | | 19,699 | |
| | | | 13,220 | | | TradeDoubler AB (Software & Services) | | | 83,616 | |
| | | | 7,887 | | | Trelleborg AB Class B (Capital Goods)* | | | 32,200 | |
| | | | 5,498 | | | Wallenstam Byggnads AB Class B (Real Estate) | | | 60,085 | |
| | | | 22,428 | | | Wihlborgs Fastigheter AB (Real Estate)(a) | | | 281,812 | |
| | | | | | | | | | | |
| | | | | | | | | | 2,833,639 | |
| | | |
| | | |
| | | Switzerland – 4.0% |
| | | | 41 | | | Athris Holding AG (Diversified Financials)* | | | 27,804 | |
| | | | 3,274 | | | Bank Sarasin & Cie AG Class B (Diversified Financials)* | | | 78,046 | |
| | | | 779 | | | Banque Cantonale Vaudoise (BCV) (Registered) (Banks)* | | | 265,830 | |
| | | | 84,705 | | | Clariant AG (Registered) (Materials)* | | | 477,894 | |
| | | | 5,287 | | | Coltene Holding AG (Health Care Equipment & Services) | | | 180,051 | |
| | | | 367 | | | Compagnie Financiere Tradition (CFT) (Diversified Financials) | | | 34,185 | |
| | | | 53,451 | | | Ferrexpo PLC (Materials) | | | 114,629 | |
| | | | 392 | | | Gurit Holding AG (Materials) | | | 158,891 | |
| | | | 883 | | | Helvetia Holding AG (Insurance) | | | 228,900 | |
| | | | 3,241 | | | Implenia AG (Capital Goods)* | | | 73,260 | |
| | | | 2,648 | | | Inficon Holding AG (Registered) (Technology Hardware & Equipment)* | | | 214,473 | |
| | | | 4,847 | | | Kardex AG (Capital Goods)* | | | 128,459 | |
| | | | 335 | | | Phoenix Mecano AG (Technology Hardware & Equipment) | | | 73,350 | |
| | | | 7,394 | | | PSP Swiss Property AG (Registered) (Real Estate)* | | | 347,528 | |
| | | | 365 | | | Rieter Holding AG (Registered) (Automobiles & Components) | | | 54,012 | |
| | | |
| | | |
The accompanying notes are an integral part of these financial statements.
GOLDMAN SACHS STRUCTURED INTERNATIONAL SMALL CAP FUND
Schedule of Investments (continued)
April 30, 2009 (Unaudited)
| | | | | | | | | | | |
| | | Shares | | Description | | Value |
| |
Common Stocks – (continued) |
| | | Switzerland – (continued) |
| | | | | | | | | | | |
| | | | 6,461 | | | Tecan Group AG (Registered) (Pharmaceuticals, Biotechnology & Life Sciences) | | $ | 205,221 | |
| | | | 1,130 | | | Valora Holding AG (Registered) (Retailing) | | | 197,398 | |
| | | | | | | | | | | |
| | | | | | | | | | 2,859,931 | |
| | | |
| | | |
| | | United Kingdom – 18.6% |
| | | | 26,600 | | | Acergy SA (Energy)(a) | | | 205,457 | |
| | | | 71,051 | | | Afren PLC (Energy)* | | | 40,015 | |
| | | | 16,331 | | | Amlin PLC (Insurance) | | | 86,423 | |
| | | | 137,993 | | | Anite PLC (Software & Services) | | | 58,319 | |
| | | | 105,844 | | | ARM Holdings PLC (Semiconductors & Semiconductor Equipment) | | | 185,898 | |
| | | | 48,362 | | | Ashmore Group PLC (Diversified Financials) | | | 160,677 | |
| | | | 65,568 | | | Ashtead Group PLC (Capital Goods) | | | 60,685 | |
| | | | 13,943 | | | Atkins WS PLC (Commercial & Professional Services) | | | 125,768 | |
| | | | 39,347 | | | Barratt Developments PLC (Consumer Durables & Apparel)* | | | 80,333 | |
| | | | 92,554 | | | BBA Aviation PLC (Transportation) | | | 142,898 | |
| | | | 35,312 | | | Bellway PLC (Consumer Durables & Apparel) | | | 372,022 | |
| | | | 76,274 | | | BowLeven PLC (Energy)* | | | 64,924 | |
| | | | 129,262 | | | Brit Insurance Holdings PLC (Insurance) | | | 351,119 | |
| | | | 53,686 | | | Cape PLC (Commercial & Professional Services)* | | | 93,290 | |
| | | | 23,491 | | | Carillion PLC (Capital Goods) | | | 91,748 | |
| | | | 44,142 | | | Charter International PLC (Capital Goods) | | | 363,184 | |
| | | | 57,838 | | | Close Brothers Group PLC (Diversified Financials) | | | 534,484 | |
| | | | 11,059 | | | CLS Holdings PLC (Real Estate)* | | | 49,100 | |
| | | | 18,857 | | | Collins Stewart PLC (Diversified Financials) | | | 26,264 | |
| | | | 77,061 | | | Computacenter PLC (Software & Services) | | | 171,761 | |
| | | | 935,106 | | | Cookson Group PLC (Capital Goods) | | | 267,114 | |
| | | | 1,362 | | | Cranswick PLC (Food, Beverage & Tobacco) | | | 12,175 | |
| | | | 32,738 | | | Dairy Crest Group PLC (Food, Beverage & Tobacco) | | | 149,840 | |
| | | | 15,220 | | | Dana Petroleum PLC (Energy)* | | | 281,393 | |
| | | | 55,727 | | | Davis Service Group PLC (Commercial & Professional Services) | | | 214,982 | |
| | | | 42,584 | | | De La Rue PLC (Commercial & Professional Services) | | | 603,602 | |
| | | | 72,764 | | | Debenhams PLC (Retailing) | | | 97,878 | |
| | | | 83,891 | | | Delta PLC (Materials) | | | 143,189 | |
| | | | 17,551 | | | Derwent London PLC (REIT) | | | 216,182 | |
| | | |
| | | |
| | | | 118,734 | | | Devro PLC (Food, Beverage & Tobacco) | | | 161,197 | |
| | | | 113,427 | | | Domino’s Pizza UK & IRL PLC (Consumer Services) | | | 341,225 | |
| | | | 223,342 | | | DS Smith PLC (Materials) | | | 254,826 | |
| | | | 45,864 | | | Dunelm Group PLC (Retailing) | | | 176,177 | |
| | | | 21,654 | | | Eaga PLC (Consumer Durables & Apparel) | | | 42,801 | |
| | | | 247,254 | | | Elementis PLC (Materials) | | | 94,449 | |
| | | | 20,562 | | | Enterprise Inns PLC (Consumer Services) | | | 49,400 | |
| | | | 3,216 | | | Fidessa Group PLC (Software & Services) | | | 52,219 | |
| | | | 141,624 | | | Filtrona PLC (Materials) | | | 249,125 | |
| | | | 136,142 | | | Galliford Try PLC (Capital Goods) | | | 108,903 | |
| | | | 110,578 | | | Game Group PLC (Retailing) | | | 321,654 | |
| | | | 22,640 | | | Hampson Industries PLC (Capital Goods) | | | 33,001 | |
| | | | 14,890 | | | Hill & Smith Holdings PLC (Materials) | | | 49,598 | |
| | | | 8,805 | | | Hunting PLC (Energy) | | | 60,114 | |
| | | | 603,287 | | | Inchcape PLC (Retailing) | | | 139,946 | |
| | | | 27,558 | | | International Personal Finance PLC (Diversified Financials) | | | 59,092 | |
| | | | 99,487 | | | ITE Group PLC (Commercial & Professional Services) | | | 140,172 | |
| | | | 27,299 | | | J.D. Wetherspoon PLC (Consumer Services) | | | 164,315 | |
| | | | 13,030 | | | JKX Oil & Gas PLC (Energy) | | | 39,040 | |
| | | | 20,180 | | | Keller Group PLC (Capital Goods) | | | 176,577 | |
| | | | 74,916 | | | Kofax PLC (Software & Services) | | | 138,061 | |
| | | | 38,099 | | | Laird PLC (Technology Hardware & Equipment) | | | 86,966 | |
| | | | 13,848 | | | Lookers PLC (Retailing) | | | 9,458 | |
| | | | 34,372 | | | Marshalls PLC (Materials) | | | 56,627 | |
| | | | 105,699 | | | Marston’s PLC (Consumer Services) | | | 266,017 | |
| | | | 80,671 | | | McBride PLC (Household & Personal Products) | | | 150,344 | |
| | | | 6,294 | | | Mears Group PLC (Commercial & Professional Services) | | | 24,146 | |
| | | | 14,812 | | | Mitie Group PLC (Commercial & Professional Services) | | | 45,617 | |
| | | | 28,163 | | | Mondi PLC (Materials) | | | 73,031 | |
| | | | 56,509 | | | Moneysupermarket.com Group PLC (Software & Services) | | | 44,478 | |
| | | | 119,421 | | | Mothercare PLC (Retailing) | | | 673,598 | |
| | | | 250,214 | | | Northern Foods PLC (Food, Beverage & Tobacco) | | | 227,857 | |
| | | | 182,131 | | | Pendragon PLC (Retailing) | | | 37,570 | |
| | | | 98,615 | | | Petrofac Ltd. (Energy) | | | 831,877 | |
| | | | 64,078 | | | Premier Foods PLC (Food, Beverage & Tobacco) | | | 33,906 | |
| | | | 13,075 | | | Premier Oil PLC (Energy)* | | | 200,329 | |
| | | | 11,246 | | | Psion PLC (Technology Hardware & Equipment) | | | 10,251 | |
| | | |
| | | |
The accompanying notes are an integral part of these financial statements.
GOLDMAN SACHS STRUCTURED INTERNATIONAL SMALL CAP FUND
| | | | | | | | | | | |
| | | Shares | | Description | | Value |
| |
Common Stocks – (continued) |
| | | United Kingdom – (continued) |
| | | | | | | | | | | |
| | | | 127,933 | | | PV Crystalox Solar PLC (Capital Goods) | | $ | 212,493 | |
| | | | 24,277 | | | QinetiQ PLC (Capital Goods) | | | 47,417 | |
| | | | 104,409 | | | Raymarine PLC (Technology Hardware & Equipment) | | | 25,691 | |
| | | | 83,617 | | | Restaurant Group PLC (Consumer Services) | | | 196,955 | |
| | | | 31,585 | | | Rightmove PLC (Media) | | | 150,731 | |
| | | | 22,094 | | | Robert Wiseman Dairies PLC (Food, Beverage & Tobacco) | | | 113,038 | |
| | | | 4,505 | | | RPC Group PLC (Materials) | | | 9,904 | |
| | | | 7,032 | | | SDL PLC (Software & Services)* | | | 33,923 | |
| | | | 66,234 | | | Senior PLC (Capital Goods) | | | 34,326 | |
| | | | 5,023 | | | Shaftesbury PLC (REIT) | | | 25,910 | |
| | | | 82,288 | | | Sibir Energy PLC (Energy)* | | | 212,728 | |
| | | | 40,524 | | | Southern Cross Healthcare Ltd. (Health Care Equipment & Services) | | | 60,859 | |
| | | | 7,061 | | | Speedy Hire PLC (Capital Goods) | | | 24,815 | |
| | | | 73,111 | | | Spirent Communications PLC (Technology Hardware & Equipment) | | | 60,733 | |
| | | | 60,143 | | | Sports Direct International PLC (Retailing) | | | 60,863 | |
| | | | 25,057 | | | St. Ives Group PLC (Media) | | | 23,704 | |
| | | | 127,589 | | | Sthree PLC (Commercial & Professional Services) | | | 431,655 | |
| | | | 12,800 | | | Stolt-Nielsen SA (Transportation) | | | 111,736 | |
| | | | 5,000 | | | Subsea 7, Inc. (Energy)* | | | 37,377 | |
| | | | 92,863 | | | Taylor Wimpey PLC (Consumer Durables & Apparel) | | | 60,954 | |
| | | | 21,920 | | | The Weir Group PLC (Capital Goods) | | | 155,500 | |
| | | | 123,199 | | | TT electronics PLC (Technology Hardware & Equipment) | | | 51,589 | |
| | | | 62,457 | | | Tullett Prebon PLC (Diversified Financials) | | | 244,915 | |
| | | | 23,780 | | | Vectura Group PLC (Pharmaceuticals, Biotechnology & Life Sciences)* | | | 24,939 | |
| | | | 11,272 | | | WH Smith PLC (Retailing) | | | 69,470 | |
| | | | 162,431 | | | Yell Group PLC (Media) | | | 94,614 | |
| | | | | | | | | | | |
| | | | | | | | | | 13,451,527 | |
| | | |
| | | |
| | | TOTAL COMMON STOCKS |
| | | (Cost $76,738,472) | | $ | 69,700,727 | |
| | | |
| | | |
| | | | | | | | | | | |
| | | | | | | | | | | |
Closed-End Funds – 0.1% |
| | | | | | | | | | | |
| | | | | | | | | | | |
| | | Guernsey – 0.0% |
| | | | 22,427 | | | HSBC Infrastructure Co. Ltd. (Diversified Financials) | | $ | 39,034 | |
| | | |
| | | |
| | | Jersey – 0.1% |
| | | | 34,835 | | | 3i Infrastructure PLC (Diversified Financials) | | | 47,755 | |
| | | |
| | | |
| | | TOTAL CLOSED-END FUNDS |
| | | (Cost $117,006) | | $ | 86,789 | |
| | | |
| | | |
| | | | | | | | | | | | | | | |
| | | | | | | Expiration
| | |
| | | Units | | Description | | Month | | Value |
| |
Right* – 0.1% |
| | | | | | | | | | | | | | | |
| | | | | | | | | | | | | | | |
| | | Sweden – 0.1% |
| | | | 15,774 | | | Trelleborg AB (Capital Goods) | | | 05/09 | | | $ | 41,571 | |
| | | (Cost $33,265) | | | | |
| | | |
| | | |
| | | | | | | | | | | | | | | |
| | | | | | | | | | | | | | | |
Warrant* – 0.0% |
| | | | | | | | | | | | | | | |
| | | | | | | | | | | | | | | |
| | | France – 0.0% |
| | | | 13,992 | | | Carbone Lorraine SA
(Capital Goods) | | | 11/12 | | | $ | — | |
| | | (Cost $0) | | | | |
| | | |
| | | |
| | | | | | | | | | | | | |
| | | Shares | | Rate | | Value |
| |
Investment Company(b) – 1.8% |
| | | | | | | | | | | | | |
| | | | | | | | | | | | | |
| | | JPMorgan U.S. Government Money Market Fund – Capital Shares |
| | | | 1,310,578 | | | | 0.377 | % | | $ | 1,310,578 | |
| | | (Cost $1,310,578) | | | | |
| | | |
| | | |
| | | TOTAL INVESTMENTS BEFORE SECURITIES LENDING REINVESTMENT VEHICLE |
| | | (Cost $78,199,321) | | $ | 71,139,665 | |
| | | |
| | | |
| | | | | | | | | | | | | |
| | | | | | | | | | | | | |
Securities Lending Reinvestment Vehicle(b)(c) – 4.0% |
| | | | | | | | | | | | | |
| | | | | | | | | | | | | |
| | | Boston Global Investment Trust – Enhanced Portfolio II |
| | | | 2,931,299 | | | | 0.463 | % | | $ | 2,899,055 | |
| | | (Cost $2,890,175) | | | | |
| | | |
| | | |
| | | TOTAL INVESTMENTS – 102.6% |
| | | (Cost $81,089,496) | | $ | 74,038,720 | |
| | | |
| | | |
| | | LIABILITIES IN EXCESS OF
OTHER ASSETS – (2.6)% | | | (1,859,199 | ) |
| | | |
| | | |
| | | NET ASSETS – 100.0% | | $ | 72,179,521 | |
| | | |
| | | |
The accompanying notes are an integral part of these financial statements.
GOLDMAN SACHS STRUCTURED INTERNATIONAL SMALL CAP FUND
Schedule of Investments (continued)
April 30, 2009 (Unaudited)
The percentage shown for each investment category reflects the value of investments in that category as a percentage of net assets.
| | |
| * | | Non-income producing security. |
| |
| (a) | | All or a portion of security is on loan. |
| |
| (b) | | Variable rate security. Interest rate disclosed is that which is in effect at April 30, 2009. |
| |
| (c) | | Represents an affiliated issuer. |
| | | | | | | |
| | | |
| | | |
| | | Investment Abbreviations: |
| | | CVA | | — | | Dutch Certification |
| | | REIT | | — | | Real Estate Investment Trust |
| | | |
| | | |
The accompanying notes are an integral part of these financial statements.
GOLDMAN SACHS STRUCTURED INTERNATIONAL SMALL CAP FUND
ADDITIONAL INVESTMENT INFORMATION
FUTURES CONTRACTS — At April 30, 2009, the following futures contracts were open:
| | | | | | | | | | | | | | | |
| | | Number of
| | | | | | | | | |
| | | Contracts
| | | Settlement
| | Notional
| | | Unrealized
| |
| Type | | Long | | | Month | | Value | | | Gain | |
| | |
| Dow Jones EURO STOXX 50 Index | | | 22 | | | June 2009 | | $ | 677,639 | | | $ | 104,991 | |
| FTSE 100 Index | | | 5 | | | June 2009 | | | 311,181 | | | | 26,931 | |
| SGX MSCI Singapore Index | | | 1 | | | May 2009 | | | 31,084 | | | | 1,706 | |
| SPI 200 Index | | | 1 | | | June 2009 | | | 68,424 | | | | 3,333 | |
| TSE TOPIX Index | | | 8 | | | June 2009 | | | 682,215 | | | | 80,430 | |
| |
| |
TOTAL | | | | | | | | | | | | $ | 217,391 | |
| |
| |
The accompanying notes are an integral part of these financial statements.
GOLDMAN SACHS STRUCTURED INTERNATIONAL EQUITY FUNDS
Statements of Assets and Liabilities
April 30, 2009 (Unaudited)
| | | | | | | | | | | | | | | | | | | | | |
| | | | | Structured
| | | Structured
| | | Structured
| | | Structured
| | | |
| | | | | International
| | | Emerging
| | | International
| | | International
| | | |
| | | | | Equity
| | | Markets
| | | Equity
| | | Small Cap
| | | |
| | | | | Flex Fund | | | Equity Fund | | | Fund | | | Fund | | | |
|
| | | Assets: |
| | | | | | | | | | | | | | | | | | | | | |
| | | Investments in securities of unaffiliated issuers, at value (identified cost $86,057,167, $164,024,090,
$1,935,482,872, and $78,199,321, respectively)(a) | | $ | 66,136,569 | | | $ | 174,137,760 | | | $ | 1,654,146,896 | | | $ | 71,139,665 | | | |
| | | Investments in affiliated securities lending reinvestment vehicle, at value (identified cost $3,442,134, $5,663,347, $273,459,290 and $2,890,175, respectively) | | | 3,456,759 | | | | 5,685,189 | | | | 274,736,868 | | | | 2,899,055 | | | |
| | | Cash | | | 2,577,496 | | | | — | | | | 35,474,094 | | | | — | | | |
| | | Foreign currencies, at value (identified cost $492,191, $2,446,033, $9,682,054, and $284,724, respectively) | | | 495,851 | | | | 2,446,108 | | | | 9,763,166 | | | | 296,450 | | | |
| | | Receivables: | | | | | | | | | | | | | | | | | | |
| | | Investment securities sold, at value | | | 988,074 | | | | 4,275,480 | | | | 144,804,779 | | | | 3,231,416 | | | |
| | | Dividends and interest, at value | | | 382,289 | | | | 439,114 | | | | 7,242,443 | | | | 550,144 | | | |
| | | Due from broker — variation margin, at value(b) | | | 55,237 | | | | — | | | | 992,782 | | | | 228,703 | | | |
| | | Securities lending income | | | 21,151 | | | | 3,367 | | | | 862,300 | | | | 16,034 | | | |
| | | Foreign tax reclaims, at value | | | 145,114 | | | | 806 | | | | 581,198 | | | | 82,406 | | | |
| | | Reimbursement from adviser | | | 19,190 | | | | 57,814 | | | | 419 | | | | 52,263 | | | |
| | | Fund shares sold | | | 11,578 | | | | 3,674 | | | | 662,562 | | | | 6,980 | | | |
| | | Due from broker | | | — | | | | 19,020 | | | | — | | | | — | | | |
| | | Forward foreign currency exchange contracts, at value | | | 5,879 | | | | — | | | | 82,574 | | | | — | | | |
| | | Other assets | | | 1,561 | | | | 1,215 | | | | 487,794 | | | | 457 | | | |
| | | |
| | | |
| | | Total assets | | | 74,296,748 | | | | 187,069,547 | | | | 2,129,837,875 | | | | 78,503,573 | | | |
| | | |
| | | |
| | | | | | | | | | | | | | | | | | | | | |
| | | | | | | | | | | | | | | | | | | | | |
|
| | | Liabilities: |
| | | | | | | | | | | | | | | | | | | | | |
| | | Due to custodian | | | — | | | | 801,749 | | | | — | | | | — | | | |
| | | Payables: | | | | | | | | | | | | | | | | | | |
| | | Payable upon return of securities loaned | | | 3,499,847 | | | | 5,676,200 | | | | 278,061,824 | | | | 3,025,226 | | | |
| | | Investment securities purchased, at value | | | 756,245 | | | | 4,042,222 | | | | 142,663,044 | | | | 3,037,534 | | | |
| | | Amounts owed to affiliates | | | 80,266 | | | | 144,650 | | | | 1,330,881 | | | | 55,402 | | | |
| | | Due to broker | | | 867,923 | | | | — | | | | — | | | | — | | | |
| | | Fund shares redeemed | | | 67,215 | | | | 648 | | | | 2,371,042 | | | | 39,790 | | | |
| | | Net swap contracts, at value | | | 51,019 | | | | — | | | | — | | | | — | | | |
| | | Forward foreign currency exchange contracts, at value | | | 2,311 | | | | — | | | | 121,516 | | | | — | | | |
| | | Accrued expenses | | | 183,077 | | | | 161,601 | | | | 427,353 | | | | 166,100 | | | |
| | | |
| | | |
| | | Total liabilities | | | 5,507,903 | | | | 10,827,070 | | | | 424,975,660 | | | | 6,324,052 | | | |
| | | |
| | | |
| | | | | | | | | | | | | | | | | | | | | |
| | | | | | | | | | | | | | | | | | | | | |
|
| | | Net Assets: |
| | | | | | | | | | | | | | | | | | | | | |
| | | Paid-in capital | | | 200,324,065 | | | | 309,376,393 | | | | 3,606,172,536 | | | | 167,136,531 | | | |
| | | Accumulated undistributed net investment income | | | 678,880 | | | | 465,820 | | | | 15,892,614 | | | | 380,319 | | | |
| | | Accumulated net realized loss from investment, futures, swap and foreign currency related transactions | | | (112,534,576 | ) | | | (143,746,606 | ) | | | (1,639,262,747 | ) | | | (88,509,175 | ) | | |
| | | Net unrealized gain (loss) on investments, futures, swap and translation of assets and liabilities denominated in foreign currencies | | | (19,679,524 | ) | | | 10,146,870 | | | | (277,940,188 | ) | | | (6,828,154 | ) | | |
| | | |
| | | |
| | | NET ASSETS | | $ | 68,788,845 | | | $ | 176,242,477 | | | $ | 1,704,862,215 | | | $ | 72,179,521 | | | |
| |
| |
| | | | | | | | | | | | | | | | | | | | | |
| | | Net Assets: | | | | | | | | | | | | | | | | | | |
| | | Class A | | $ | 47,648,055 | | | $ | 1,192,005 | | | $ | 464,766,911 | | | $ | 13,598,193 | | | |
| | | Class B | | | — | | | | — | | | | 6,352,771 | | | | — | | | |
| | | Class C | | | 1,869,457 | | | | 322,866 | | | | 4,891,877 | | | | 22,129 | | | |
| | | Institutional | | | 19,260,975 | | | | 174,727,606 | | | | 1,211,350,473 | | | | 58,559,199 | | | |
| | | Service | | | — | | | | — | | | | 17,489,648 | | | | — | | | |
| | | Class IR | | | 5,196 | | | | — | | | | 5,284 | | | | — | | | |
| | | Class R | | | 5,162 | | | | — | | | | 5,251 | | | | — | | | |
| |
| |
| | | | | | | | | | | | | | | | | | | | | |
| | | | | | | | | | | | | | | | | | | | | |
| | | Total Net Assets | | | 68,788,845 | | | | 176,242,477 | | | | 1,704,862,215 | | | | 72,179,521 | | | |
| |
| |
| | | Shares outstanding $0.001 par value (unlimited shares authorized): | | | | | | | | | | | | | | | | | | |
| | | Class A | | | 7,609,563 | | | | 231,875 | | | | 63,247,020 | | | | 2,790,078 | | | |
| | | Class B | | | — | | | | — | | | | 873,034 | | | | — | | | |
| | | Class C | | | 303,665 | | | | 62,790 | | | | 672,969 | | | | 4,579 | | | |
| | | Institutional | | | 3,048,415 | | | | 33,886,031 | | | | 160,981,772 | | | | 12,021,279 | | | |
| | | Service | | | — | | | | — | | | | 2,364,633 | | | | — | | | |
| | | Class IR | | | 829 | | | | — | | | | 724 | | | | — | | | |
| | | Class R | | | 829 | | | | — | | | | 718 | | | | — | | | |
| |
| |
| | | Net asset value, offering and redemption price per share:(c) | | | | | | | | | | | | | | | | | | |
| | | Class A | | | $6.26 | | | | $5.14 | | | | $7.35 | | | | $4.87 | | | |
| | | Class B | | | — | | | | — | | | | 7.28 | | | | — | | | |
| | | Class C | | | 6.16 | | | | 5.14 | | | | 7.27 | | | | 4.83 | | | |
| | | Institutional | | | 6.32 | | | | 5.16 | | | | 7.52 | | | | 4.87 | | | |
| | | Service | | | — | | | | — | | | | 7.40 | | | | — | | | |
| | | Class IR | | | 6.26 | | | | — | | | | 7.30 | | | | — | | | |
| | | Class R | | | 6.22 | | | | — | | | | 7.31 | | | | — | | | |
| |
| |
| |
| (a) | Includes loaned securities having a market value of $3,301,234, $5,516,848, $267,645,828 and $2,854,928 for the Structured International Equity Flex, Structured Emerging Markets Equity, Structured International Equity and Structured International Small Cap Funds, respectively. |
| (b) | Includes amount on deposit with counterparty of $145,989 for the Structured International Small Cap Fund relating to initial margin requirements on futures transactions. |
| |
| (c) | Maximum public offering price per share (NAV per share multiplied by 1.0582) for Class A Shares of Structured International Equity Flex, Structured Emerging Markets Equity, Structured International Equity and Structured International Small Cap Funds is $6.62, $5.44, $7.78 and $5.15, respectively. At redemption, Class C Shares may be subject to a contingent deferred sales charge assessed on the amount equal to the lesser of the current net asset value or the original purchase price of the shares. |
The accompanying notes are an integral part of these financial statements.
GOLDMAN SACHS STRUCTURED INTERNATIONAL EQUITY FUNDS
Statements of Operations
For the Six Months Ended April 30, 2009 (Unaudited)
| | | | | | | | | | | | | | | | | | | |
| | | | | Structured
| | | Structured
| | | Structured
| | | Structured
| |
| | | | | International Equity
| | | Emerging Markets
| | | International
| | | International
| |
| | | | | Flex Fund | | | Equity Fund | | | Equity Fund | | | Small Cap Fund | |
| |
|
| | | Investment income: |
| | | | | | | | | | | | | | | | | | | |
| | | Dividends(a) | | $ | 1,181,492 | | | $ | 1,880,572 | | | $ | 30,863,005 | | | $ | 1,163,462 | |
| | | Securities lending income — affiliated issuer | | | 42,989 | | | | 32,062 | | | | 1,637,310 | | | | 49,484 | |
| | | Interest | | | 15,009 | | | | 3,351 | | | | 15,259 | | | | 352 | |
| | | |
| | | |
| | | Total investment income | | | 1,239,490 | | | | 1,915,985 | | | | 32,515,574 | | | | 1,213,298 | |
| | | |
| | | |
| | | | | | | | | | | | | | | | | | | |
| | | | | | | | | | | | | | | | | | | |
|
| | | Expenses: |
| | | | | | | | | | | | | | | | | | | |
| | | Management fees | | | 417,361 | | | | 746,306 | | | | 7,373,662 | | | | 310,482 | |
| | | Custody and accounting fees | | | 132,774 | | | | 223,046 | | | | 379,511 | | | | 142,867 | |
| | | Distribution and Service fees(b) | | | 76,798 | | | | 1,696 | | | | 690,611 | | | | 18,896 | |
| | | Professional fees | | | 69,944 | | | | 52,698 | | | | 87,341 | | | | 58,002 | |
| | | Transfer Agent fees(b) | | | 56,727 | | | | 30,484 | | | | 750,192 | | | | 25,888 | |
| | | Printing fees | | | 41,586 | | | | 17,495 | | | | 75,475 | | | | 11,841 | |
| | | Registration fees | | | 22,487 | | | | 19,854 | | | | 30,553 | | | | 23,770 | |
| | | Trustee fees | | | 8,065 | | | | 8,065 | | | | 8,065 | | | | 8,065 | |
| | | Service share fees — Service Plan | | | — | | | | — | | | | 23,458 | | | | — | |
| | | Service share fees — Shareholder Administration Plan | | | — | | | | — | | | | 23,458 | | | | — | |
| | | Other | | | 13,060 | | | | 2,425 | | | | 111,351 | | | | 42,787 | |
| | | |
| | | |
| | | Total expenses | | | 838,802 | | | | 1,102,069 | | | | 9,553,677 | | | | 642,598 | |
| | | |
| | | |
| | | Less — expense reductions | | | (263,640 | ) | | | (313,128 | ) | | | (656,858 | ) | | | (282,224 | ) |
| | | |
| | | |
| | | Net expenses | | | 575,162 | | | | 788,941 | | | | 8,896,819 | | | | 360,374 | |
| | | |
| | | |
| | | NET INVESTMENT INCOME | | | 664,328 | | | | 1,127,044 | | | | 23,618,755 | | | | 852,924 | |
| | | |
| | | |
| | | | | | | | | | | | | | | | | | | |
| | | | | | | | | | | | | | | | | | | |
|
| | | Realized and unrealized gain (loss) from investment, futures, swap contract and foreign currency related transactions: |
| | | | | | | | | | | | | | | | | | | |
| | | Net realized gain (loss) from: | | | | | | | | | | | | | | | | |
| | | Investment transactions — unaffiliated issuers | | | (33,232,598 | ) | | | (74,309,770 | ) | | | (994,768,532 | ) | | | (41,815,624 | ) |
| | | Securities lending reinvestment vehicle transactions — affiliated issuer | | | (2,458 | ) | | | 60,366 | | | | 136,789 | | | | 6,914 | |
| | | Futures transactions | | | (4,126,401 | ) | | | — | | | | (8,100,527 | ) | | | (277,634 | ) |
| | | Swap contract | | | (2,032,730 | ) | | | — | | | | — | | | | — | |
| | | Foreign currency related transactions | | | (4,065,341 | ) | | | (263,230 | ) | | | 849,515 | | | | 49,077 | |
| | | Net change in unrealized gain (loss) on: | | | | | | | | | | | | | | | | |
| | | Investments — unaffiliated issuers | | | 29,378,517 | | | | 97,502,590 | | | | 859,496,858 | | | | 42,505,842 | |
| | | Securities lending reinvestment vehicle — affiliated issuer | | | 14,638 | | | | 18,351 | | | | 1,168,502 | | | | 5,297 | |
| | | Futures | | | 4,541,165 | | | | — | | | | 3,091,061 | | | | 316,044 | |
| | | Swap contract | | | (122,633 | ) | | | — | | | | — | | | | — | |
| | | Translation of assets and liabilities denominated in foreign currencies | | | 2,560,863 | | | | 12,917 | | | | (623,286 | ) | | | (56,545 | ) |
| | | |
| | | |
| | | Net realized and unrealized gain (loss) from investment, futures, swap and foreign currency related transactions | | | (7,086,978 | ) | | | 23,021,224 | | | | (138,749,620 | ) | | | 733,371 | |
| | | |
| | | |
| | | NET INCREASE (DECREASE) IN NET ASSETS RESULTING FROM OPERATIONS | | $ | (6,422,650 | ) | | $ | 24,148,268 | | | $ | (115,130,865 | ) | | $ | 1,586,295 | |
| | | |
| | | |
| |
| (a) | Foreign taxes withheld on dividends were $150,784, $76,840, $3,009,278 and $112,173 for the Structured International Equity Flex, Structured Emerging Markets Equity, Structured International Equity and Structured International Small Cap Funds, respectively. |
| (b) | Class specific Distribution and Service, and Transfer Agent fees were as follows: |
| | | | | | | | | | | | | | | | | | | | | | | | | | | | | | | | | | | | | | | | | | | | | |
| | | Distribution and Service Fees | | | Transfer Agent Fees | |
Fund | | Class A | | | Class B | | | Class C | | | Class R | | | Class A | | | Class B | | | Class C | | | Institutional | | | Service | | | Class IR | | | Class R | |
| Structured International Equity Flex | | $ | 66,723 | | | $ | — | | | $ | 10,063 | | | $ | 12 | | | $ | 50,709 | | | $ | — | | | $ | 1,911 | | | $ | 4,097 | | | $ | — | | | $ | 5 | | | $ | 5 | |
| Structured Emerging Markets Equity | | | 899 | | | | — | | | | 797 | | | | — | | | | 682 | | | | — | | | | 151 | | | | 29,651 | | | | — | | | | — | | | | — | |
| Structured International Equity | | | 630,789 | | | | 33,642 | | | | 26,167 | | | | 13 | | | | 479,399 | | | | 6,392 | | | | 4,972 | | | | 255,666 | | | | 3,753 | | | | 5 | | | | 5 | |
| Structured International Small Cap | | | 18,794 | | | | — | | | | 102 | | | | — | | | | 14,284 | | | | — | | | | 19 | | | | 11,585 | | | | — | | | | — | | | | — | |
The accompanying notes are an integral part of these financial statements.
GOLDMAN SACHS STRUCTURED INTERNATIONAL EQUITY FUNDS
Statements of Changes in Net Assets
| | | | | | | | | | | |
| | | | | Structured
| |
| | | | | International Equity
| |
| | | | | Flex Fund | |
| | | | | For the
| | | | |
| | | | | Six Months Ended
| | | For the
| |
| | | | | April 30, 2009
| | | Fiscal Year Ended
| |
| | | | | (Unaudited) | | | October 31, 2008 | |
| |
|
| | | From operations: |
| | | | | | | | | | | |
| | | Net investment income | | $ | 664,328 | | | $ | 4,739,009 | |
| | | Net realized loss from investment, futures, swap contract and foreign currency related transactions | | | (43,459,528 | ) | | | (77,290,826 | ) |
| | | Unrealized gain (loss) on investments, futures, swap contracts and translation of assets and liabilities denominated in foreign currencies | | | 36,372,550 | | | | (82,657,135 | ) |
| | | |
| | | |
| | | Net increase (decrease) in net assets resulting from operations | | | (6,422,650 | ) | | | (155,208,952 | ) |
| | | |
| | | |
| | | | | | | | | | | |
| | | | | | | | | | | |
|
| | | Distributions to shareholders: |
| | | | | | | | | | | |
| | | From net investment income | | | | | | | | |
| | | Class A Shares | | | — | | | | (4,887,530 | ) |
| | | Class B Shares | | | — | | | | — | |
| | | Class C Shares | | | — | | | | (76,478 | ) |
| | | Institutional Shares | | | — | | | | (2,583,241 | ) |
| | | Service Shares | | | — | | | | — | |
| | | Class IR Shares(a) | | | — | | | | (196 | ) |
| | | Class R Shares(a) | | | — | | | | (196 | ) |
| | | From net realized gains | | | | | | | | |
| | | Class A Shares | | | — | | | | (610,355 | ) |
| | | Class B Shares | | | — | | | | — | |
| | | Class C Shares | | | — | | | | (11,053 | ) |
| | | Institutional Shares | | | — | | | | (281,022 | ) |
| | | Service Shares | | | — | | | | — | |
| | | Class IR Shares(a) | | | — | | | | (21 | ) |
| | | Class R Shares(a) | | | — | | | | (21 | ) |
| | | |
| | | |
| | | Total distributions to shareholders | | | — | | | | (8,450,113 | ) |
| | | |
| | | |
| | | | | | | | | | | |
| | | | | | | | | | | |
|
| | | From share transactions: |
| | | | | | | | | | | |
| | | Net proceeds from sales of shares | | | 6,488,093 | | | | 68,108,900 | |
| | | Reinvestment of distributions | | | — | | | | 7,690,976 | |
| | | Cost of shares redeemed | | | (35,443,642 | )(b) | | | (270,978,622 | )(c) |
| | | |
| | | |
| | | Net increase (decrease) in net assets resulting from share transactions | | | (28,955,549 | ) | | | (195,178,746 | ) |
| | | |
| | | |
| | | TOTAL INCREASE (DECREASE) | | | (35,378,199 | ) | | | (358,837,811 | ) |
| | | |
| | | |
| | | | | | | | | | | |
| | | | | | | | | | | |
|
| | | Net assets: |
| | | | | | | | | | | |
| | | Beginning of period | | | 104,167,044 | | | | 463,004,855 | |
| | | |
| | | |
| | | End of period | | $ | 68,788,845 | | | $ | 104,167,044 | |
| | | |
| | | |
| | | Accumulated undistributed net investment income | | $ | 678,880 | | | $ | 14,552 | |
| | | |
| | | |
| |
| * | The Fund changed its fiscal year end from August 31 to October 31. |
| (a) | Commenced operations on November 30, 2007. |
| (b) | Net of $2,720, $56, $67,726 and $523 redemption fees remitted to the Structured International Equity Flex, Structured Emerging Markets Equity, Structured International Equity and Structured International Small Cap Funds, respectively. |
| (c) | Net of $8,338 and $566 redemption fees remitted to the Structured International Equity Flex and Structured International Small Cap Funds, respectively. |
| (d) | Net of $71,116 redemption fees remitted to the Structured International Equity Fund. |
The accompanying notes are an integral part of these financial statements.
GOLDMAN SACHS STRUCTURED INTERNATIONAL EQUITY FUNDS
| | | | | | | | | | | | | | | | | | | | | | | | | | | | | |
| | | Structured
| | | Structured
| | | Structured
| |
| | | Emerging Markets
| | | International
| | | International
| |
| | | Equity Fund | | | Equity Fund | | | Small Cap Fund | |
| | | For the
| | | | | | For the
| | | | | | | | | For the
| | | | |
| | | Six Months Ended
| | | For the
| | | Six Months Ended
| | | For the
| | | For the
| | | Six Months Ended
| | | For the
| |
| | | April 30, 2009
| | | Fiscal Year Ended
| | | April 30, 2009
| | | Fiscal Period Ended
| | | Fiscal Year Ended
| | | April 30, 2009
| | | Fiscal Year Ended
| |
| | | (Unaudited) | | | October 31, 2008 | | | (Unaudited) | | | October 31, 2008* | | | August 31, 2008 | | | (Unaudited) | | | October 31, 2008 | |
| |
|
| | | |
| | | | | | | | | | | | | | | | | | | | | | | | | | | | | |
| | | $ | 1,127,044 | | | $ | 3,415,559 | | | $ | 23,618,755 | | | $ | 9,977,631 | | | $ | 186,257,366 | | | $ | 852,924 | | | $ | 4,189,668 | |
| | | | (74,512,634 | ) | | | (70,933,870 | ) | | | (1,001,882,755 | ) | | | (431,937,696 | ) | | | (19,677,510 | ) | | | (42,037,267 | ) | | | (46,609,164 | ) |
| | | | 97,533,858 | | | | (95,708,903 | ) | | | 863,133,135 | | | | (685,019,874 | ) | | | (938,326,583 | ) | | | 42,770,638 | | | | (57,472,056 | ) |
| | | |
| | | |
| | | | 24,148,268 | | | | (163,227,214 | ) | | | (115,130,865 | ) | | | (1,106,979,939 | ) | | | (771,746,727 | ) | | | 1,586,295 | | | | (99,891,552 | ) |
| | | |
| | | |
| | | | | | | | | | | | | | | | | | | | | | | | | | | | | |
| | | | | | | | | | | | | | | | | | | | | | | | | | | | | |
|
| | | |
| | | | | | | | | | | | | | | | | | | | | | | | | | | | | |
| | | | | | | | | | | | | | | | | | | | | | | | | | | | | |
| | | | (4,966 | ) | | | (757 | ) | | | (29,084,478 | ) | | | — | | | | (44,992,964 | ) | | | (707,218 | ) | | | (106,200 | ) |
| | | | — | | | | — | | | | (290,522 | ) | | | — | | | | (466,559 | ) | | | — | | | | — | |
| | | | (235 | ) | | | (254 | ) | | | (222,207 | ) | | | — | | | | (334,209 | ) | | | (844 | ) | | | (5 | ) |
| | | | (1,823,206 | ) | | | (524,634 | ) | | | (80,894,685 | ) | | | — | | | | (110,244,232 | ) | | | (2,991,648 | ) | | | (458,965 | ) |
| | | | — | | | | — | | | | (984,147 | ) | | | — | | | | (1,784,615 | ) | | | — | | | | — | |
| | | | — | | | | — | | | | (297 | ) | | | — | | | | (330 | ) | | | — | | | | — | |
| | | | — | | | | — | | | | (257 | ) | | | — | | | | (326 | ) | | | — | | | | — | |
| | | | | | | | | | | | | | | | | | | | | | | | | | | | | |
| | | | — | | | | (803 | ) | | | — | | | | — | | | | (128,178,330 | ) | | | — | | | | — | |
| | | | — | | | | — | | | | — | | | | — | | | | (1,662,907 | ) | | | — | | | | — | |
| | | | — | | | | (307 | ) | | | — | | | | — | | | | (1,208,317 | ) | | | — | | | | — | |
| | | | — | | | | (478,372 | ) | | | — | | | | — | | | | (279,705,713 | ) | | | — | | | | — | |
| | | | — | | | | — | | | | — | | | | — | | | | (5,249,964 | ) | | | — | | | | — | |
| | | | — | | | | — | | | | — | | | | — | | | | (833 | ) | | | — | | | | — | |
| | | | — | | | | — | | | | — | | | | — | | | | (833 | ) | | | — | | | | — | |
| | | |
| | | |
| | | | (1,828,407 | ) | | | (1,005,127 | ) | | | (111,476,593 | ) | | | — | | | | (573,830,132 | ) | | | (3,699,710 | ) | | | (565,170 | ) |
| | | |
| | | |
| | | | | | | | | | | | | | | | | | | | | | | | | | | | | |
| | | | | | | | | | | | | | | | | | | | | | | | | | | | | |
|
| | | |
| | | | | | | | | | | | | | | | | | | | | | | | | | | | | |
| | | | 25,150,379 | | | | 236,410,344 | | | | 131,736,943 | | | | 82,690,646 | | | | 1,287,684,660 | | | | 7,846,992 | | | | 47,922,925 | |
| | | | 1,828,158 | | | | 1,004,794 | | | | 104,270,634 | | | | — | | | | 548,615,707 | | | | 3,646,229 | | | | 565,124 | |
| | | | (29,692,217 | )(b) | | | (14,016,651 | ) | | | (525,938,393 | )(b) | | | (534,646,065 | ) | | | (1,549,529,573 | )(d) | | | (23,609,406 | )(b) | | | (49,022,223 | )(c) |
| | | |
| | | |
| | | | (2,713,680 | ) | | | 223,398,487 | | | | (289,930,816 | ) | | | (451,955,419 | ) | | | 286,770,794 | | | | (12,116,185 | ) | | | (534,174 | ) |
| | | |
| | | |
| | | | 19,606,181 | | | | 59,166,146 | | | | (516,538,274 | ) | | | (1,558,935,358 | ) | | | (1,058,806,065 | ) | | | (14,229,600 | ) | | | (100,990,896 | ) |
| | | |
| | | |
| | | | | | | | | | | | | | | | | | | | | | | | | | | | | |
| | | | | | | | | | | | | | | | | | | | | | | | | | | | | |
|
| | | |
| | | | | | | | | | | | | | | | | | | | | | | | | | | | | |
| | | | 156,636,296 | | | | 97,470,150 | | | | 2,221,400,489 | | | | 3,780,335,847 | | | | 4,839,141,912 | | | | 86,409,121 | | | | 187,400,017 | |
| | | |
| | | |
| | | $ | 176,242,477 | | | $ | 156,636,296 | | | $ | 1,704,862,215 | | | $ | 2,221,400,489 | | | $ | 3,780,335,847 | | | $ | 72,179,521 | | | $ | 86,409,121 | |
| | | |
| | | |
| | | $ | 465,820 | | | $ | 1,167,183 | | | $ | 15,892,614 | | | $ | 103,750,452 | | | $ | 97,105,865 | | | $ | 380,319 | | | $ | 3,227,105 | |
| | | |
| | | |
The accompanying notes are an integral part of these financial statements.
GOLDMAN SACHS STRUCTURED INTERNATIONAL EQUITY FUNDS
Notes to Financial Statements
April 30, 2009 (Unaudited)
1. ORGANIZATION
Goldman Sachs Trust (the “Trust”) is a Delaware statutory trust registered under the Investment Company Act of 1940, as amended (the “Act”), as an open-end management investment company. The following table lists those series of the Trust that are included in this report (collectively, the “Funds” or individually a “Fund”), along with their corresponding share classes and respective diversification status under the Act:
| | | | | | | |
| | | | | Diversified/
| |
| Fund | | Share Classes Offered | | Non-diversified | |
| | |
| Structured International Equity Flex | | A, C, Institutional, IR and R | | | Diversified | |
| |
| |
Structured Emerging Markets Equity and
Structured International Small Cap | | A, C and Institutional | | | Diversified | |
| |
| |
| Structured International Equity | | A, B, C, Institutional, Service, IR and R | | | Diversified | |
| |
| |
Class A Shares of the Funds are sold with a front-end sales charge of up to 5.50%. Class B Shares of the Structured International Equity Fund are sold with a contingent deferred sales charge that declines from 5.00% to zero, depending upon the period of time the shares are held. Class C Shares of the Funds are sold with a contingent deferred sales charge of 1.00% during the first 12 months. Institutional, Service, Class IR and Class R Shares of the Funds are not subject to a sales charge. Goldman, Sachs & Co. (“Goldman Sachs” or the “Distributor”) serves as distributor of the shares of the Funds pursuant to a Distribution Agreement. Goldman Sachs may retain a portion of such sales charges it receives as a Distributor.
Goldman Sachs Asset Management, L.P., (“GSAM”), an affiliate of Goldman Sachs, serves as investment adviser pursuant to a Management Agreement (the “Agreement”) with the Trust on behalf of the Funds.
2. SIGNIFICANT ACCOUNTING POLICIES
The following is a summary of the significant accounting policies consistently followed by the Funds. The preparation of financial statements in conformity with accounting principles generally accepted in the United States of America (“GAAP”) requires management to make estimates and assumptions that may affect the amounts and disclosures on the financial statements. Actual results could differ from those estimates and assumptions.
A. Investment Valuation — The investment valuation policy of the Funds is to value investments at market value. Investments in equity securities traded on a foreign securities exchange are valued daily at fair value determined by an independent fair value service (if available) under valuation procedures approved by the trustees consistent with applicable regulatory guidance. The independent fair value service takes into account multiple factors including, but not limited to, movements in the United States (“U.S.”) securities markets, certain depositary receipts, futures contracts and foreign currency exchange rates that have occurred subsequent to the close of the foreign securities exchanges. While the independent service may not take into account market or security specific information, under the valuation procedures, these securities might also be fair valued by GSAM by taking into consideration market or security specific information as discussed below.
Investments in equity securities and investment companies traded on a U.S. securities exchange or the NASDAQ system are valued daily at their last sale price or official closing price on the principal exchange or system on which they are traded. Investments in equity securities and investment companies traded on a foreign securities exchange for which an independent fair value service cannot provide a quote are valued daily at their last sale price or official closing price on the
GOLDMAN SACHS STRUCTURED INTERNATIONAL EQUITY FUNDS
| |
| 2. SIGNIFICANT ACCOUNTING POLICIES (continued) | |
principal exchange on which they are traded. If no sale occurs, such securities and investment companies are valued at the last bid price for long positions and at the last ask price for short positions. Debt securities for which market quotations are readily available are valued on the basis of quotations furnished by an independent pricing service approved by the trustees or provided by securities dealers. The pricing services may use valuation models or matrix pricing, which consider either (i) yield or price with respect to bonds that are considered comparable in characteristics such as rating, interest rate and maturity date or (ii) quotations from bond dealers, to determine current value. If accurate quotations are not readily available, or if GSAM believes that such quotations do not accurately reflect fair value, the fair value of the Funds’ investments may be determined based on yield equivalents, a pricing matrix or other sources, under valuation procedures established by the trustees. Unlisted equity securities for which market quotations are available are valued at the last sale price on valuation date, or if no sale occurs, at the last bid price. In the absence of market quotations, broker quotes will be utilized or the security will be fair valued. Investments in investment companies (other than those that are exchange traded) are valued at the net asset value per share (“NAV”) on the valuation date. Short-term debt obligations that mature in sixty days or less and that do not exhibit signs of credit deterioration are valued at amortized cost, which approximates market value.
GSAM, consistent with its procedures and applicable regulatory guidance, may make an adjustment to the previous closing prices of either domestic or foreign securities in light of significant events to reflect what it believes to be the fair value of the securities at the time of determining the Funds’ NAV. Significant events that could affect a large number of securities in a particular market may include, but are not limited to: situations relating to one or more single issuers in a market sector; significant fluctuations in U.S. or foreign markets; market dislocations; market disruptions or market closings; equipment failures; natural or man-made disasters or acts of God; armed conflicts; government actions or other developments; as well as the same or similar events which may affect specific issuers or the securities markets even though not tied directly to the securities markets. Other significant events that could relate to a single issuer may include, but are not limited to: corporate actions such as reorganizations, mergers and buy-outs; corporate announcements, including those relating to earnings, products and regulatory news; significant litigation; low trading volume; and trading limits or suspensions.
B. Security Transactions and Investment Income — Security transactions are reflected for financial reporting purposes as of the trade date. Realized gains and losses on sales of portfolio securities are calculated using the identified cost basis. Dividend income is recognized on the ex-dividend date, net of foreign withholding taxes, if any, which are reduced by any amounts reclaimable by the Funds, where applicable. Interest income is recorded on the basis of interest accrued, premium amortized and discount accreted. In addition, it is the Funds’ policy to accrue for estimated capital gains taxes, if any, on securities held by the Funds, which are subject to such taxes.
Net investment income (other than class specific expenses) and unrealized and realized gains or losses are allocated daily to each class of shares of the respective Fund based upon the relative proportion of net assets of each class.
C. Expenses — Expenses incurred by the Trust that do not specifically relate to an individual Fund of the Trust are allocated to the Funds on a straight-line and/or “pro-rata” basis depending upon the nature of the expense.
GOLDMAN SACHS STRUCTURED INTERNATIONAL EQUITY FUNDS
Notes to Financial Statements (continued)
April 30, 2009 (Unaudited)
| |
| 2. SIGNIFICANT ACCOUNTING POLICIES (continued) | |
D. Federal Taxes and Distributions to Shareholders — It is each Fund’s policy to comply with the requirements of the Internal Revenue Code of 1986, as amended (the “Code”) applicable to regulated investment companies (mutual funds) and to distribute each year substantially all of its investment company taxable income and capital gains to its shareholders. Accordingly, no federal tax provisions are required. Distributions to shareholders are recorded on the ex-dividend date. Income and capital gain distributions, if any, are declared and paid according to the following schedule:
| | | | | | | | | |
| | | Income
| | | Capital Gains
| |
| | | Distributions
| | | Distributions
| |
| Fund | | Declared/Paid | | | Declared/Paid | |
| | |
| Structured International Equity Flex, Structured Emerging Markets Equity, Structured International Equity and Structured International Small Cap Equity | | | Annually | | | | Annually | |
| |
| |
Net capital losses are carried forward to future fiscal years and may be used to the extent allowed by the Code to offset any future capital gains. Utilization of capital loss carryforwards will reduce the requirement of future capital gains distributions.
The characterization of distributions to shareholders for financial reporting purposes is determined in accordance with federal income tax rules, which may differ from GAAP. The source of each Fund’s distributions may be shown in the accompanying financial statements as either from net investment income, net realized gain or capital. Financial statements are adjusted for permanent book/tax differences to reflect the appropriate tax character, and are not adjusted for temporary differences.
GAAP establishes financial statement accounting and disclosure requirements for recognition and measurement of tax positions taken or expected to be taken on a U.S. income tax return. GSAM has reviewed the tax positions for the Funds for the open tax years (tax years ended October 31, 2007-8, except for Structured International Equity Flex Fund with open tax years of October 31, 2006-8 and Structured International Equity Fund with open tax years of August 31, 2006-8 and October 31, 2008) and determined that they did not have a material impact on the Funds’ financial statements.
E. Foreign Currency Translations — The books and records of the Funds are accounted for in U.S. dollars. Amounts denominated in foreign currencies are translated into U.S. dollars on the following basis: (i) investment valuations, foreign currency and other assets and liabilities initially expressed in foreign currencies are converted into U.S. dollars based upon 4:00 p.m. Eastern Time exchange rates; and (ii) purchases and sales of foreign investments, income and expenses are converted into U.S. dollars based upon currency exchange rates prevailing on the respective dates of such transactions as of 4:00 p.m. Eastern Time.
Net realized and unrealized gain (loss) on foreign currency transactions represents: (i) foreign exchange gains and losses from the sale and holdings of foreign currencies; (ii) currency gains and losses between trade date and settlement date on investment security transactions and forward exchange contracts; and (iii) gains and losses from the difference between amounts of dividends, interest and foreign withholding taxes recorded and the amounts actually received. The effect of changes in foreign currency exchange rates on equity securities and derivative instruments are not segregated in the Statements of Operations from the effects of changes in market prices of those investments, but are included with the net realized and unrealized gain (loss) on investments. The effect of changes in foreign currency exchange rates on fixed income securities are segregated in the Statements of Operations from the effects of changes in market prices of those investments, and are included with the net realized and unrealized gain (loss) on foreign currency related transactions. Net unrealized foreign exchange gains and losses arising from changes in the value of other assets and liabilities as a result of changes in
GOLDMAN SACHS STRUCTURED INTERNATIONAL EQUITY FUNDS
| |
| 2. SIGNIFICANT ACCOUNTING POLICIES (continued) | |
foreign exchange rates are included as increases and decreases in unrealized gain (loss) on foreign currency related transactions.
F. Forward Foreign Currency Exchange Contracts — The Funds may enter into forward foreign currency exchange contracts for the purchase or sale of a specific foreign currency at a fixed price on a future date as a hedge or cross-hedge against either specific transactions, portfolio positions or to seek to increase total return. All contracts are “marked-to-market” daily at the applicable forward rate and any resulting unrealized gains or losses are recorded by the Funds. The Funds record realized gains or losses on the settlement date of a contract.
Risks may arise upon entering into these contracts from the potential inability of counterparties to meet the terms of their contracts and from unanticipated movements in the value of a foreign currency relative to the U.S. dollar.
The contractual amounts of forward foreign currency contracts do not necessarily represent the amounts potentially subject to risk. The measurement of the risks associated with these instruments is meaningful only when all related and offsetting transactions are considered. The Funds must set aside liquid assets, or engage in other appropriate measures to cover their obligations under these contracts.
G. Futures Contracts — The Funds may purchase or sell futures contracts to hedge against changes in interest rates, securities prices, currency exchange rates or to seek to increase total return. Futures contracts are valued at the last settlement price, or in the absence of a sale, the last bid price, at the end of each day on the board of trade or exchange upon which they are traded. Upon entering into a futures contract, the Funds deposit cash or securities in an account on behalf of the broker in an amount sufficient to meet the initial margin requirement. Subsequent payments are made or received by the Funds equal to the daily change in the contract value and are recorded as variation margin receivable or payable with a corresponding offset in unrealized gains or losses. The Funds recognize a realized gain or loss when a contract is closed or expires.
The use of futures contracts involves, to varying degrees, elements of market and counterparty risk which may exceed the amounts recognized in the Statements of Assets and Liabilities. Futures contracts may be illiquid, and exchanges may limit fluctuations in futures contract prices during a single day. Changes in the value of a futures contract may not directly correlate with changes in the value of the underlying securities. These risks may decrease the effectiveness of the Funds’ strategies and potentially result in a loss. The Funds must set aside liquid assets, or engage in other appropriate measures to cover their obligations under these contracts.
H. Redemption Fees — All classes of the Funds charge a 2% redemption fee on the redemption of shares (including by exchange) held for 30 calendar days or less. For this purpose, the Funds use a first-in first-out method so that shares held longest will be treated as being redeemed first and shares held shortest will be treated as being redeemed last. Redemption fees are reimbursed to a Fund and are reflected as a reduction in share redemptions. Redemption fees are credited to Paid-in capital and are allocated to each share class of a Fund on a pro-rata basis at the time of payment.
I. Total Return Swap Transactions — The use of total return swaps is a highly specialized activity which involves investment techniques, risk analyses and tax planning different from those associated with ordinary portfolio securities transactions. The Structured International Equity Flex Fund’s transactions in total return swaps may be significant. These transactions can result in sizeable realized and unrealized capital gains and losses relative to the gains and losses from the Fund’s direct investments in equity securities.
Transactions in total return swaps can involve greater risks than if the Fund had invested in securities directly since, in addition to general market risks, swaps are leveraged and are also subject to illiquidity risk, counterparty risk, credit risk and pricing risk. Because they have terms of greater than seven days, swap transactions may be considered to be illiquid.
GOLDMAN SACHS STRUCTURED INTERNATIONAL EQUITY FUNDS
Notes to Financial Statements (continued)
April 30, 2009 (Unaudited)
| |
| 2. SIGNIFICANT ACCOUNTING POLICIES (continued) | |
Moreover, the Fund will bear the risk of loss of the amount expected to be received under a total return swap in the event of the default, by, or bankruptcy of a swap counterparty. Total return swaps may also be subject to pricing or “basis” risk, which exists when a particular swap becomes extraordinarily expensive relative to historical prices or the price of corresponding cash market instruments. Under certain market conditions it may not be economically feasible to initiate a transaction or liquidate a position in time to avoid a loss or take advantage of an opportunity. If a swap transaction is particularly large or if the relevant market is illiquid, it may not be possible to initiate a transaction or liquidate a position at an advantageous time or price, which may result in significant losses.
The prices of total return swaps can be volatile, and a variance in the degree of volatility or in the direction of securities prices from the investment adviser’s expectations may produce significant losses in the Fund’s investments in swaps. In addition, a perfect correlation between a total return swap and a security’s position may be impossible to achieve. As a result, the investment adviser’s use of total return swaps may not be effective in fulfilling the investment adviser’s investment strategies and may contribute to losses that would not have been incurred otherwise.
Total return swaps are valued based on the market value of the underlying long and short positions in the swap, valued daily at the last sale price or official closing price on the principal exchange or system on which they are traded. The total market value of the underlying securities plus financing fees, the value of corporate actions, and dividend accruals comprises the total market value of the total return swap position. Total return swaps are reset monthly with change in market value reflected as realized gain or loss. The Fund must also set aside liquid assets, or engage in other appropriate measures to cover their obligations for short positions held within the total return swap.
3. AGREEMENTS
A. Management Agreement — Under the Agreement, GSAM manages the Funds, subject to the general supervision of the trustees.
As compensation for the services rendered pursuant to the Agreement, the assumption of the expenses related thereto and administering the Funds’ business affairs, including providing facilities, GSAM is entitled to a management fee computed daily and payable monthly, equal to an annual percentage rate of each Fund’s average daily net assets.
For the six months ended April 30, 2009, contractual management fees with GSAM were at the following annual rates:
| | | | | | | | | | | | | | | | | | | | | | | | | |
| | | Contractual Management Rate | |
| | | Up to
| | | Next
| | | Next
| | | Next
| | | Over
| | | Effective
| |
| Fund | | $1 billion | | | $1 billion | | | $3 billion | | | $3 billion | | | $8 billion | | | Rate | |
| | |
| Structured International Equity Flex | | | 1.10 | % | | | 0.99 | % | | | 0.94 | % | | | 0.92 | % | | | 0.90 | % | | | 1.10 | % |
| |
| |
| Structured Emerging Markets Equity | | | 1.00 | | | | 1.00 | | | | 0.90 | | | | 0.86 | | | | 0.84 | | | | 1.00 | |
| |
| |
| Structured International Equity | | | 0.85 | | | | 0.77 | | | | 0.73 | | | | 0.72 | | | | 0.71 | | | | 0.81 | |
| |
| |
| Structured International Small Cap | | | 0.85 | | | | 0.85 | | | | 0.77 | | | | 0.73 | | | | 0.72 | | | | 0.85 | |
| |
| |
GOLDMAN SACHS STRUCTURED INTERNATIONAL EQUITY FUNDS
| |
| 3. AGREEMENTS (continued) | |
B. Distribution Agreement and Service Plan — The Trust, on behalf of each Fund, has adopted Distribution and Service Plans (the “Plans”). Under the Plans, Goldman Sachs and/or authorized dealers are entitled to a fee accrued daily and paid monthly for distribution services and account maintenance services at the following annual rates calculated on a Fund’s average daily net assets of each respective share class:
| | | | | | | | | | | | | | | | | |
| | | Distribution and Service Plan Rates | |
| | | Class A* | | | Class B | | | Class C | | | Class R* | |
| | |
| Distribution Plan | | | 0.25 | % | | | 0.75 | % | | | 0.75 | % | | | 0.50 | % |
| |
| |
| Service Plan | | | — | | | | 0.25 | % | | | 0.25 | % | | | — | |
| |
| |
| |
| * | With respect to Class A and Class R Shares, the Distributor at its discretion may use compensation for distribution services paid under the Plans to compensate service organizations for personal and account maintenance services and expenses so long as such total compensation under the Plans does not exceed the maximum cap on “service fees” imposed by the Financial Industry Regulatory Authority. |
Goldman Sachs may retain a portion of the Class A front end sales load and Class B and Class C contingent deferred sales charges. During the six months ended April 30, 2009, Goldman Sachs advised the Funds that it retained the following approximate amounts:
| | | | | | | | | | | | | |
| | | Front End
| | | Contingent Deferred
| |
| | | Sales Load | | | Sales Charge | |
| Fund | | Class A | | | Class B | | | Class C | |
| | |
| Structured International Equity Flex | | $ | 400 | | | | N/A | | | $ | — | |
| |
| |
| Structured Emerging Markets Equity | | | 400 | | | | N/A | | | | — | |
| |
| |
| Structured International Equity | | | 20,600 | | | $ | 100 | | | | — | |
| |
| |
| Structured International Small Cap | | | 100 | | | | N/A | | | | — | |
| |
| |
C. Transfer Agency Agreement — Goldman Sachs also serves as the transfer agent for the Funds for a fee pursuant to a Transfer Agency Agreement. The fees charged for such transfer agency services are calculated daily and payable monthly at an annual rate as follows: 0.19% of the average daily net assets for Class A, Class B, Class C, Class IR and Class R Shares and 0.04% of average daily net assets for Institutional and Service Shares.
D. Service Plan and Shareholder Administration Plan — The Trust, on behalf of the Structured International Equity Fund, has adopted a Service Plan and Shareholder Administration Plan for Service Shares. These plans allow for Service Shares to compensate service organizations for providing varying levels of personal and account administration and shareholder administration services to their customers who are beneficial owners of such shares. The Service Plan and Shareholder Administration Plan each provide for compensation to the service organizations in an amount equal to, on an annualized basis, 0.25% (0.50% in aggregate) of the average daily net assets of the Service Shares.
GOLDMAN SACHS STRUCTURED INTERNATIONAL EQUITY FUNDS
Notes to Financial Statements (continued)
April 30, 2009 (Unaudited)
| |
| 3. AGREEMENTS (continued) | |
E. Other Agreements — GSAM has voluntarily agreed to limit certain “Other Expenses” of the Funds (excluding management fees, distribution and service fees, transfer agent fees and expenses, Service Share fees, taxes, interest, brokerage fees and litigation, indemnification, shareholder meetings and other extraordinary expenses, exclusive of any custody and transfer agent fee credit reductions) to the extent such expenses exceed, on an annual basis, a percentage rate of the average daily net assets of each Fund. Such expense reimbursements, if any, are computed daily and paid monthly. In addition, the Funds are not obligated to reimburse GSAM for prior period expense reimbursements, if any. The Other Expenses limitations for the Structured International Equity Flex, Structured Emerging Markets Equity, Structured International Equity and Structured International Small Cap Funds as an annual percentage rate of average daily net assets are 0.064%, 0.014%, 0.004% and 0.014%, respectively. In addition, the Funds have entered into certain offset arrangements with the custodian and the transfer agent resulting in a reduction in the Funds’ expenses.
For the six months ended April 30, 2009, these expense reductions, including any fee waivers and Other Expense reimbursements, were as follows (in thousands):
| | | | | | | | | | | | | |
| | | Other Expense
| | | Custody Fee
| | | Total Expense
| |
| Fund | | Reimbursement | | | Expense Credits | | | Reductions | |
| | |
| Structured International Equity Flex | | $ | 264 | | | $ | — | | | $ | 264 | |
| |
| |
| Structured Emerging Markets Equity | | | 313 | | | | — | | | | 313 | |
| |
| |
| Structured International Equity | | | 656 | | | | 1 | | | | 657 | |
| |
| |
| Structured International Small Cap | | | 282 | | | | — | | | | 282 | |
| |
| |
As of April 30, 2009, the amounts owed to affiliates of the Funds were as follows (in thousands):
| | | | | | | | | | | | | | | | | |
| | | Management
| | | Distribution and
| | | Transfer Agent
| | | | |
| Fund | | Fees | | | Service Fees | | | Fees | | | Total | |
| | |
| Structured International Equity Flex | | $ | 61 | | | $ | 11 | | | $ | 8 | | | $ | 80 | |
| |
| |
| Structured Emerging Markets Equity | | | 139 | | | | — | * | | | 6 | | | | 145 | |
| |
| |
| Structured International Equity | | | 1,116 | | | | 103 | | | | 112 | | | | 1,331 | |
| |
| |
| Structured International Small Cap | | | 49 | | | | 2 | | | | 4 | | | | 55 | |
| |
| |
* Amount less than $500.
GOLDMAN SACHS STRUCTURED INTERNATIONAL EQUITY FUNDS
| |
| 3. AGREEMENTS (continued) | |
F. Line of Credit Facility — The Funds participate in a $700,000,000 committed, unsecured revolving line of credit facility (the “facility”) together with other funds of the Trust and registered investment companies having management agreements with GSAM or its affiliates. Pursuant to the terms of the facility, the Funds and other borrowers may increase the credit amount by an additional $300,000,000, for a total of up to $1 billion. This facility is to be used solely for temporary or emergency purposes. The interest rate on borrowings is based on the federal funds rate. The facility also requires a fee to be paid by the Funds based on the amount of the commitment that has not been utilized. For the six months ended April 30, 2009, the Funds did not have any borrowings under the facility. Effective May 12, 2009, the facility decreased to $660,000,000.
4. FAIR VALUE OF INVESTMENTS
The fair value of a financial instrument is the amount that would be received to sell an asset or paid to transfer a liability in an orderly transaction between market participants at the measurement date (exit price). Fair value measurements do not include transaction costs. Financial Accounting Standards Board (“FASB”) Statement of Financial Accounting Standards No. 157, Fair Value Measurements (“FAS 157”) establishes a fair value hierarchy that prioritizes the inputs to valuation techniques used to measure fair value. The hierarchy gives the highest priority to unadjusted quoted prices in active markets for identical assets or liabilities (Level 1 measurements) and the lowest priority to unobservable inputs (Level 3 measurements). The three levels of the fair value hierarchy under FAS 157 are described below:
Level 1 — Unadjusted quoted prices in active markets that are accessible at the measurement date for identical, unrestricted assets or liabilities;
Level 2 — Quoted prices in markets that are not active or financial instruments for which all significant inputs are observable, either directly or indirectly;
Level 3 — Prices or valuations that require inputs that are both significant to the fair value measurement and unobservable.
The following is a summary of the Funds’ investments categorized in the fair value hierarchy:
| | | | | | | | | | | | | | | | | |
| | | | | | Structured Emerging
| |
| | | Structured International Equity Flex | | | Markets Equity | |
| | | Investments in
| | | | | | | | | Investments in
| |
| | | Securities
| | | Derivatives—
| | | Derivatives—
| | | Securities
| |
| Level | | Long—Assets | | | Assets(a) | | | Liabilities(a) | | | Long—Assets | |
| | |
| Level 1 | | $ | 450,883 | | | $ | 289,246 | | | $ | — | | | $ | 55,878,424 | |
| |
| |
Level 2(b) | | | 69,142,445 | | | | 5,879 | | | | (53,330 | ) | | | 123,944,525 | |
| |
| |
| Level 3 | | | — | | | | — | | | | — | | | | — | |
| |
| |
Total | | $ | 69,593,328 | | | $ | 295,125 | | | $ | (53,330 | ) | | $ | 179,822,949 | |
| |
| |
GOLDMAN SACHS STRUCTURED INTERNATIONAL EQUITY FUNDS
Notes to Financial Statements (continued)
April 30, 2009 (Unaudited)
| |
| 4. FAIR VALUE OF INVESTMENTS (continued) | |
| | | | | | | | | | | | | | | | | | | | | |
| | | | | | Structured International
| |
| | | Structured International Equity | | | Small Cap | |
| | | Investments in
| | | | | | | | | Investments in
| | | | |
| | | Securities
| | | Derivatives—
| | | Derivatives—
| | | Securities
| | | Derivatives—
| |
| Level | | Long—Assets | | | Assets(a) | | | Liabilities(a) | | | Long—Assets | | | Assets(a) | |
| | |
| Level 1 | | $ | 68,261,876 | | | $ | 2,260,883 | | | $ | — | | | $ | 1,310,578 | | | $ | 217,391 | |
| |
| |
Level 2(b) | | | 1,860,476,824 | | | | 82,574 | | | | (121,516 | ) | | | 72,515,414 | | | | — | |
| |
| |
| Level 3 | | | 145,064 | | | | — | | | | — | | | | 212,728 | | | | — | |
| |
| |
Total | | $ | 1,928,883,764 | | | $ | 2,343,457 | | | $ | (121,516 | ) | | $ | 74,038,720 | | | $ | 217,391 | |
| |
| |
| |
| (a) | Derivatives may include open forward foreign currency contracts, futures contracts, swap contracts and written options. |
| |
| (b) | To adjust for the time difference between local market close and the calculation of the net asset value, the Funds may utilize fair value model prices for international equities provided by an independent service resulting in a Level 2 classification. |
The following is a reconciliation of Level 3 investments for the period ended April 30, 2009. All the amounts in the following table reflect Investments in Securities Long-Assets:
| | | | | | | | | |
| | | Structured
| | | Structured
| |
| | | International
| | | International
| |
| Level 3 | | Equity | | | Small Cap | |
| | |
| Beginning Balance as of October 31, 2008 | | $ | — | | | $ | — | |
| Realized gain (loss) | | | — | | | | — | |
| Unrealized gains/(losses) relating to instruments still held at reporting date | | | 145,064 | | | | 34,373 | |
| Net purchase (sales) | | | — | | | | 20,333 | |
| Net transfers into Level 3 | | | — | | | | 158,022 | |
| |
| |
| Ending Balance as of April 30, 2009 | | $ | 145,064 | | | $ | 212,728 | |
| |
| |
GOLDMAN SACHS STRUCTURED INTERNATIONAL EQUITY FUNDS
5. SECURITIES LENDING
Pursuant to exemptive relief granted by the SEC and the terms and conditions contained therein, the Funds may lend their securities through a securities lending agent, Goldman Sachs Agency Lending (“GSAL”), a wholly-owned subsidiary of Goldman Sachs, to certain qualified borrowers including Goldman Sachs and affiliates. In accordance with the Funds’ securities lending procedures, the Funds receive cash collateral at least equal to the market value of the securities on loan. The market value of the loaned securities is determined at the close of business of the Funds, at their last sale price or official closing price on the principal exchange or system on which they are traded, and any additional required collateral is delivered to the Funds on the next business day. As with other extensions of credit, the Funds bear the risk of delay on recovery or loss of rights in the collateral should the borrower of the securities fail financially.
The Funds invest the cash collateral received in connection with securities lending transactions in the Enhanced Portfolio II of Boston Global Investment Trust (“Enhanced Portfolio II”), a Delaware statutory trust. The Enhanced Portfolio II, deemed an affiliate of the Trust, is exempt from registration under Section 3(c)(7) of the Act and is managed by GSAM, for which GSAM may receive an investment advisory fee of up to 0.10% on an annualized basis of the average daily net assets of the Enhanced Portfolio II. The Enhanced Portfolio II primarily invests in short-term investments, but is not a “money market fund” subject to the requirements of Rule 2a-7 of the Act. The Funds’ investment of cash collateral in the Enhanced Portfolio II is subject to a net asset value that may fall or rise due to market and credit conditions.
Both the Funds and GSAL receive compensation relating to the lending of the Funds’ securities. The amounts earned by the Funds for the six months ended April 30, 2009 are reported under Investment Income on the Statement of Operations.
The table below details securities lending activity with affiliates of Goldman Sachs as of, and for the six months ended April 30, 2009:
| | | | | | | | | | | | | |
| | | | | | Amounts Received by
| | | | |
| | | Earnings of GSAL
| | | the Funds from Lending to
| | | Amount Payable to
| |
| | | Relating to Securities Loaned
| | | Goldman Sachs for the
| | | Goldman Sachs upon Return
| |
| | | for the Six Months Ended
| | | Six Months Ended
| | | of Securities Loaned as of
| |
| Fund | | April 30, 2009 | | | April 30, 2009 | | | April 30, 2009 | |
| | |
| Structured International Equity Flex | | $ | 4,776 | | | $ | 7,097 | | | $ | 689,000 | |
| |
| |
| Structured Emerging Markets Equity | | | 3,529 | | | | 5,190 | | | | 322,500 | |
| |
| |
| Structured International Equity | | | 180,086 | | | | 211,651 | | | | 25,590,008 | |
| |
| |
| Structured International Small Cap | | | 5,602 | | | | 19,075 | | | | 932,025 | |
| |
| |
GOLDMAN SACHS STRUCTURED INTERNATIONAL EQUITY FUNDS
Notes to Financial Statements (continued)
April 30, 2009 (Unaudited)
| |
| 5. SECURITIES LENDING (continued) | |
The following table provides information about the Funds’ investment in the Enhanced Portfolio II for the six months ended April 30, 2009 (in thousands):
| | | | | | | | | | | | | | | | | | | | | |
| | | Number of
| | | | | | | | | Number of
| | | | |
| | | Shares Held
| | | Shares
| | | Shares
| | | Shares Held
| | | Value at
| |
| Fund | | Beginning of Period | | | Bought | | | Sold | | | End of Period | | | End of Period | |
| | |
| Structured International Equity Flex | | | 13 | | | | 13,333 | | | | (9,858 | ) | | | 3,488 | | | $ | 3,457 | |
| |
| |
| Structured Emerging Markets Equity | | | 11,056 | | | | 79,032 | | | | (84,340 | ) | | | 5,748 | | | | 5,685 | |
| |
| |
| Structured International Equity | | | 143,072 | | | | 567,008 | | | | (432,848 | ) | | | 277,232 | | | | 274,737 | |
| |
| |
| Structured International Small Cap | | | 2,421 | | | | 7,209 | | | | (6,699 | ) | | | 2,931 | | | | 2,899 | |
| |
| |
6. PORTFOLIO SECURITIES TRANSACTIONS
The cost of purchases and proceeds from sales and maturities of long-term securities for the six months ended April 30, 2009, were as follows:
| | | | | | | | | |
| | | | | | Sales and
| |
| Fund | | Purchases | | | Maturities | |
| | |
| Structured International Equity Flex | | $ | 30,313,338 | | | $ | 57,250,158 | |
| |
| |
| Structured Emerging Markets Equity | | | 173,141,331 | | | | 176,930,421 | |
| |
| |
| Structured International Equity | | | 1,413,888,515 | | | | 1,782,368,681 | |
| |
| |
| Structured International Small Cap | | | 70,277,765 | | | | 85,159,830 | |
| |
| |
For the six months ended April 30, 2009, Goldman Sachs earned approximately $46,300 and $100 of brokerage commissions from portfolio transactions, including futures transactions executed with Goldman Sachs as the Futures Commission Merchant, on behalf of the Structured International Equity and Structured International Small Cap Funds, respectively. Goldman Sachs did not earn any brokerage commissions with respect to the Structured International Equity Flex and the Structured Emerging Markets Equity Funds.
GOLDMAN SACHS STRUCTURED INTERNATIONAL EQUITY FUNDS
7. TAX INFORMATION
As of the Funds’ most recent fiscal period end, October 31, 2008, the Funds’ capital loss carryforwards on a tax basis were as follows:
| | | | | | | | | | | | | | | | | |
| | | Structured
| | | Structured
| | | Structured
| | | Structured
| |
| | | International
| | | Emerging Markets
| | | International
| | | International
| |
| | | Equity Flex | | | Equity | | | Equity | | | Small Cap | |
| | |
Capital loss carryforward expiring 2016(1) | | $ | (67,252,387 | ) | | $ | (59,568,423 | ) | | $ | (542,562,114 | ) | | $ | (44,061,383 | ) |
| |
| |
| Timing differences (swap payments) | | | 20,142 | | | | — | | | | — | | | | — | |
| |
| |
(1) Expiration occurs on October 31 of the year indicated.
At April 30, 2009, the Funds’ aggregate security unrealized gains and losses based on cost for U.S. federal income tax purposes were as follows:
| | | | | | | | | | | | | | | | | |
| | | Structured
| | | | | | Structured
| | | Structured
| |
| | | International
| | | Structured Emerging
| | | International
| | | International
| |
| | | Equity Flex | | | Markets Equity | | | Equity | | | Small Cap | |
| | |
| Tax cost | | $ | 91,327,552 | | | $ | 179,358,359 | | | $ | 2,303,086,730 | | | $ | 83,421,010 | |
| |
| |
| Gross unrealized gain | | | 1,710,434 | | | | 10,797,369 | | | | 72,221,508 | | | | 6,195,661 | |
| Gross unrealized loss | | | (23,444,658 | ) | | | (10,332,779 | ) | | | (446,424,474 | ) | | | (15,577,951 | ) |
| |
| |
| Net unrealized security gain (loss) | | | (21,734,224 | ) | | | 464,590 | | | | (374,202,966 | ) | | | (9,382,290 | ) |
| |
| |
The difference between book-basis and tax-basis unrealized gains (losses) is attributable primarily to wash sales, differences related to the tax treatment of Passive Foreign Investment Company investments, partnership investments, securities out on loan and net mark to market gains (losses) on foreign currency contracts recognized for tax purposes as of the most recent fiscal year end.
GOLDMAN SACHS STRUCTURED INTERNATIONAL EQUITY FUNDS
Notes to Financial Statements (continued)
April 30, 2009 (Unaudited)
8. OTHER RISKS
Funds’ Shareholder Concentration — Certain Goldman Sachs Fund of Funds Portfolios invest a significant percentage of their assets in the Funds. In the event the Fund of Funds Portfolios experience significant redemptions and/or reallocations, the Funds may be exposed to liquidity risk. In particular, the Funds may encounter difficulty meeting redemptions if unusual market conditions create an unfavorable environment in which the Funds are forced to liquidate their securities. As of April 30, 2009, the following Fund of Fund Portfolios were the beneficial owners of 5% or more of total outstanding shares of the following funds:
| | | | | | | | | | | | | | | | | |
| | | Goldman Sachs
| | | Goldman Sachs
| | | Goldman Sachs
| | | Goldman Sachs
| |
| | | Balanced Strategy
| | | Equity Growth
| | | Growth Strategy
| | | Growth & Income
| |
| Fund | | Portfolio | | | Strategy Portfolio | | | Portfolio | | | Strategy Portfolio | |
| | |
| Structured Emerging Markets Equity | | | 9 | % | | | 14 | % | | | 33 | % | | | 38 | % |
| |
| |
| Structured International Equity | | | — | | | | 9 | | | | 20 | | | | 18 | |
| |
| |
| Structured International Small Cap | | | 9 | | | | 10 | | | | 25 | | | | 30 | |
| |
| |
Market and Credit Risks — In the normal course of business, the Funds trade financial instruments and enter into financial transactions where risk of potential loss exists due to changes in the market (market risk). Additionally, the Funds may also be exposed to credit risk in the event that an issuer fails to perform or that an institution or entity with which the Funds have unsettled or open transactions defaults.
Investing in foreign markets may involve special risks and considerations not typically associated with investing in the U.S. These risks include revaluation of currencies, high rates of inflation, repatriation restrictions on income and capital, and adverse political and economic developments. Moreover, securities issued in these markets may be less liquid, be subject to government ownership controls, have delayed settlements, and their prices may be more volatile than those of comparable securities in the U.S.
GOLDMAN SACHS STRUCTURED INTERNATIONAL EQUITY FUNDS
9. OTHER MATTERS
Indemnifications — Under the Trust’s organizational documents, its trustees, officers, employees and agents are indemnified, to the extent permitted by the Act, against certain liabilities that may arise out of performance of their duties to the Funds. Additionally, in the course of business, the Funds enter into contracts that contain a variety of indemnification clauses. The Funds’ maximum exposure under these arrangements is unknown; as this would involve future claims that may be against the Funds that have not yet occurred. However, the Funds believe the risk of loss under these arrangements to be remote.
New Accounting Pronouncements — In March 2008, the FASB issued Statement of Financial Accounting Standards No. 161, “Disclosures about Derivative Instruments and Hedging Activities” (“FAS 161”). FAS 161 is effective for the first interim or annual period beginning after November 15, 2008. FAS 161 requires enhanced disclosures about the Funds’ derivative and hedging activities. GSAM does not believe the adoption of FAS 161 will impact the amounts reported in the financial statements; however, additional disclosures will be required.
In April 2009, the FASB issued a new FASB Staff Position FSP FAS 157-4, which amends FAS 157 and is effective for interim and annual periods ending after June 15, 2009. FSP FAS 157-4 provides additional guidance when the volume and level of activity for the asset or liability measured at fair value has significantly decreased. Additionally, FSP FAS 157-4 expands disclosure by reporting entities with respect to categories of assets and liabilities carried at fair value. GSAM believes applying the provisions of FSP FAS 157-4 will not have a material impact on the Funds’ financial statements.
GOLDMAN SACHS STRUCTURED INTERNATIONAL EQUITY FUNDS
Notes to Financial Statements (continued)
April 30, 2009 (Unaudited)
10. SUMMARY OF SHARE TRANSACTIONS
Share activity is as follows:
| | | | | | | | | | | | | | | | | |
| | | Structured International Equity Flex Fund | |
| | | For the Six Months Ended
| | | For the Fiscal Year Ended
| |
| | | April 30, 2009 (Unaudited) | | | October 31, 2008 | |
| | | | |
| | | Shares | | | Dollars | | | Shares | | | Dollars | |
| | | | |
Class A Shares | | | | | | | | | | | | | | | | |
| Shares sold | | | 788,038 | | | $ | 4,930,733 | | | | 4,598,203 | | | $ | 50,740,307 | |
| Reinvestment of distributions | | | — | | | | — | | | | 398,005 | | | | 4,883,515 | |
| Shares redeemed | | | (4,154,234 | ) | | | (25,072,163 | ) | | | (18,021,256 | ) | | | (183,404,101 | ) |
| |
| |
| | | | (3,366,196 | ) | | | (20,141,430 | ) | | | (13,025,048 | ) | | | (127,780,279 | ) |
| |
| |
Class C Shares | | | | | | | | | | | | | | | | |
| Shares sold | | | 66,775 | | | | 434,482 | | | | 106,296 | | | | 1,191,853 | |
| Reinvestment of distributions | | | — | | | | — | | | | 5,040 | | | | 61,437 | |
| Shares redeemed | | | (109,779 | ) | | | (643,320 | ) | | | (166,506 | ) | | | (1,653,070 | ) |
| |
| |
| | | | (43,004 | ) | | | (208,838 | ) | | | (55,170 | ) | | | (399,780 | ) |
| |
| |
Institutional Shares | | | | | | | | | | | | | | | | |
| Shares sold | | | 182,399 | | | | 1,122,878 | | | | 1,459,845 | | | | 16,156,740 | |
| Reinvestment of distributions | | | — | | | | — | | | | 223,037 | | | | 2,745,590 | |
| Shares redeemed | | | (1,511,305 | ) | | | (9,728,159 | ) | | | (8,246,684 | ) | | | (85,921,451 | ) |
| |
| |
| | | | (1,328,906 | ) | | | (8,605,281 | ) | | | (6,563,802 | ) | | | (67,019,121 | ) |
| |
| |
Class IR Shares(a) | | | | | | | | | | | | | | | | |
| Shares sold | | | — | | | | — | | | | 811 | | | | 10,000 | |
| Reinvestment of distributions | | | — | | | | — | | | | 18 | | | | 217 | |
| Shares redeemed | | | — | | | | — | | | | — | | | | — | |
| |
| |
| | | | — | | | | — | | | | 829 | | | | 10,217 | |
| |
| |
Class R Shares(a) | | | | | | | | | | | | | | | | |
| Shares sold | | | — | | | | — | | | | 811 | | | | 10,000 | |
| Reinvestment of distributions | | | — | | | | — | | | | 18 | | | | 217 | |
| Shares redeemed | | | — | | | | — | | | | — | | | | — | |
| |
| |
| | | | — | | | | — | | | | 829 | | | | 10,217 | |
| |
| |
NET (DECREASE) | | | (4,738,106 | ) | | $ | (28,955,549 | ) | | | (19,642,362 | ) | | $ | (195,178,746 | ) |
| |
| |
| | |
| (a) | | Commenced operations on November 30, 2007. |
GOLDMAN SACHS STRUCTURED INTERNATIONAL EQUITY FUNDS
| |
| 10. SUMMARY OF SHARE TRANSACTIONS (continued) | |
Share activity is as follows:
| | | | | | | | | | | | | | | | | |
| | | Structured Emerging Markets Equity Fund | |
| | | For the Six Months Ended
| | | For the Period Ended
| |
| | | April 30, 2009 (Unaudited) | | | October 31, 2008 | |
| | | | |
| | | Shares | | | Dollars | | | Shares | | | Dollars | |
| | | | |
Class A Shares | | | | | | | | | | | | | | | | |
| Shares sold | | | 179,562 | | | $ | 783,228 | | | | 68,911 | | | $ | 570,923 | |
| Reinvestment of distributions | | | 1,120 | | | | 4,917 | | | | 124 | | | | 1,277 | |
| Shares redeemed | | | (26,406 | ) | | | (102,671 | ) | | | (5,681 | ) | | | (53,108 | ) |
| |
| |
| | | | 154,276 | | | | 685,474 | | | | 63,354 | | | | 519,092 | |
| |
| |
Class C Shares | | | | | | | | | | | | | | | | |
| Shares sold | | | 59,791 | | | | 269,250 | | | | 8,776 | | | | 79,483 | |
| Reinvestment of distributions | | | 49 | | | | 213 | | | | 55 | | | | 560 | |
| Shares redeemed | | | (6,882 | ) | | | (27,048 | ) | | | — | | | | — | |
| |
| |
| | | | 52,958 | | | | 242,415 | | | | 8,831 | | | | 80,043 | |
| |
| |
Institutional Shares | | | | | | | | | | | | | | | | |
| Shares sold | | | 5,534,899 | | | | 24,097,901 | | | | 28,598,826 | | | | 235,759,938 | |
| Reinvestment of distributions | | | 414,324 | | | | 1,823,028 | | | | 97,754 | | | | 1,002,957 | |
| Shares redeemed | | | (7,043,542 | ) | | | (29,562,498 | ) | | | (2,531,663 | ) | | | (13,963,543 | ) |
| |
| |
| | | | (1,094,319 | ) | | | (3,641,569 | ) | | | 26,164,917 | | | | 222,799,352 | |
| |
| |
NET INCREASE (DECREASE) | | | (887,085 | ) | | $ | (2,713,680 | ) | | | 26,237,102 | | | $ | 223,398,487 | |
| |
| |
GOLDMAN SACHS STRUCTURED INTERNATIONAL EQUITY FUNDS
Notes to Financial Statements (continued)
April 30, 2009 (Unaudited)
| |
| 10. SUMMARY OF SHARE TRANSACTIONS (continued) | |
Share activity is as follows:
| | | | | | | | | | | | | | | | | | | | | | | | | |
| | | Structured International Equity Fund | |
| | | For the Six Months Ended
| | | For the Fiscal Period Ended
| | | For the Fiscal Year Ended
| |
| | | April 30, 2009 (Unaudited) | | | October 31, 2008(a) | | | August 31, 2008 | |
| | | | |
| | | Shares | | | Dollars | | | Shares | | | Dollars | | | Shares | | | Dollars | |
| | | | |
Class A Shares | | | | | | | | | | | | | | | | | | | | | | | | |
| Shares sold | | | 8,281,083 | | | $ | 59,902,395 | | | | 3,993,749 | | | $ | 37,743,274 | | | | 34,569,241 | | | $ | 490,195,738 | |
| Reinvestment of distributions | | | 3,634,751 | | | | 26,897,159 | | | | — | | | | — | | | | 11,333,262 | | | | 165,238,965 | |
Shares converted from Class B(b) | | | 26,938 | | | | 176,330 | | | | 8,516 | | | | 91,204 | | | | 107,980 | | | | 1,522,891 | |
| Shares redeemed | | | (26,038,792 | ) | | | (183,562,026 | ) | | | (14,162,795 | ) | | | (131,834,616 | ) | | | (52,526,785 | ) | | | (722,272,017 | ) |
| |
| |
| | | | (14,096,020 | ) | | | (96,586,142 | ) | | | (10,160,530 | ) | | | (94,000,138 | ) | | | (6,516,302 | ) | | | (65,314,423 | ) |
| |
| |
Class B Shares | | | | | | | | | | | | | | | | | | | | | | | | |
| Shares sold | | | 41,940 | | | | 299,372 | | | | 10,312 | | | | 90,648 | | | | 302,473 | | | | 4,365,666 | |
| Reinvestment of distributions | | | 37,390 | | | | 274,813 | | | | — | | | | — | | | | 138,928 | | | | 2,000,562 | |
Shares converted from Class A(b) | | | (27,180 | ) | | | (176,330 | ) | | | (8,670 | ) | | | (91,204 | ) | | | (109,677 | ) | | | (1,522,891 | ) |
| Shares redeemed | | | (209,323 | ) | | | (1,425,662 | ) | | | (118,545 | ) | | | (1,105,087 | ) | | | (405,194 | ) | | | (5,504,204 | ) |
| |
| |
| | | | (157,173 | ) | | | (1,027,807 | ) | | | (116,903 | ) | | | (1,105,643 | ) | | | (73,470 | ) | | | (660,867 | ) |
| |
| |
Class C Shares | | | | | | | | | | | | | | | | | | | | | | | | |
| Shares sold | | | 58,212 | | | | 427,354 | | | | 8,586 | | | | 77,143 | | | | 236,427 | | | | 3,420,729 | |
| Reinvestment of distributions | | | 24,336 | | | | 178,624 | | | | — | | | | — | | | | 87,251 | | | | 1,254,667 | |
| Shares redeemed | | | (183,518 | ) | | | (1,276,426 | ) | | | (88,564 | ) | | | (796,087 | ) | | | (362,185 | ) | | | (5,004,137 | ) |
| |
| |
| | | | (100,970 | ) | | | (670,448 | ) | | | (79,978 | ) | | | (718,944 | ) | | | (38,507 | ) | | | (328,741 | ) |
| |
| |
Institutional Shares | | | | | | | | | | | | | | | | | | | | | | | | |
| Shares sold | | | 9,382,860 | | | | 69,660,334 | | | | 4,492,938 | | | | 44,173,848 | | | | 52,089,676 | | | | 761,444,949 | |
| Reinvestment of distributions | | | 10,117,737 | | | | 76,490,096 | | | | — | | | | — | | | | 25,258,673 | | | | 377,111,993 | |
| Shares redeemed | | | (46,792,870 | ) | | | (334,659,934 | ) | | | (37,318,868 | ) | | | (385,691,718 | ) | | | (56,199,255 | ) | | | (797,322,672 | ) |
| |
| |
| | | | (27,292,273 | ) | | | (188,509,504 | ) | | | (32,825,930 | ) | | | (341,517,870 | ) | | | 21,149,094 | | | | 341,234,270 | |
| |
| |
Service Shares | | | | | | | | | | | | | | | | | | | | | | | | |
| Shares sold | | | 200,466 | | | | 1,447,488 | | | | 61,806 | | | | 605,733 | | | | 1,965,600 | | | | 28,237,576 | |
| Reinvestment of distributions | | | 57,636 | | | | 429,386 | | | | — | | | | — | | | | 205,691 | | | | 3,007,198 | |
| Shares redeemed | | | (739,344 | ) | | | (5,014,345 | ) | | | (1,398,682 | ) | | | (15,218,557 | ) | | | (1,461,443 | ) | | | (19,426,543 | ) |
| |
| |
| | | | (481,242 | ) | | | (3,137,471 | ) | | | (1,336,876 | ) | | | (14,612,824 | ) | | | 709,848 | | | | 11,818,231 | |
| |
| |
Class IR Shares(c) | | | | | | | | | | | | | | | | | | | | | | | | |
| Shares sold | | | — | | | | — | | | | — | | | | — | | | | 604 | | | | 10,001 | |
| Reinvestment of distributions | | | 40 | | | | 298 | | | | — | | | | — | | | | 80 | | | | 1,163 | |
| Shares redeemed | | | — | | | | — | | | | — | | | | — | | | | — | | | | — | |
| |
| |
| | | | 40 | | | | 298 | | | | — | | | | — | | | | 684 | | | | 11,164 | |
| |
| |
Class R Shares(c) | | | | | | | | | | | | | | | | | | | | | | | | |
| Shares sold | | | 2 | | | | — | | | | — | | | | — | | | | 604 | | | | 10,001 | |
| Reinvestment of distributions | | | 35 | | | | 258 | | | | — | | | | — | | | | 79 | | | | 1,159 | |
| Shares redeemed | | | (2 | ) | | | — | | | | — | | | | — | | | | — | | | | — | |
| |
| |
| | | | 35 | | | | 258 | | | | — | | | | — | | | | 683 | | | | 11,160 | |
| |
| |
NET INCREASE (DECREASE) | | | (42,127,603 | ) | | $ | (289,930,816 | ) | | | (44,520,217 | ) | | $ | (451,955,419 | ) | | | 15,232,030 | | | $ | 286,770,794 | |
| |
| |
| | |
| (a) | | The Fund changed its fiscal year end from August 31 to October 31. |
| | |
| (b) | | Class B Shares automatically convert into Class A Shares on or about the fifteenth day of the last month of the calendar quarter that is eight years after the initial purchase date of either the Fund or another Goldman Sachs Fund. |
| | |
| (c) | | Commenced operations on November 30, 2007. |
GOLDMAN SACHS STRUCTURED INTERNATIONAL EQUITY FUNDS
| |
| 10. SUMMARY OF SHARE TRANSACTIONS (continued) | |
Share activity is as follows:
| | | | | | | | | | | | | | | | | |
| | | Structured International Small Cap Fund | |
| | | For the Six Months Ended
| | | For the Fiscal Year Ended
| |
| | | April 30, 2009 (Unaudited) | | | October 31, 2008 | |
| | | | |
| | | Shares | | | Dollars | | | Shares | | | Dollars | |
| | | | |
Class A Shares | | | | | | | | | | | | | | | | |
| Shares sold | | | 455,288 | | | $ | 2,118,452 | | | | 1,771,912 | | | $ | 14,048,145 | |
| Reinvestment of distributions | | | 150,452 | | | | 705,618 | | | | 11,061 | | | | 106,186 | |
| Shares redeemed | | | (1,616,573 | ) | | | (7,441,551 | ) | | | (2,147,363 | ) | | | (16,700,074 | ) |
| |
| |
| | | | (1,010,833 | ) | | | (4,617,481 | ) | | | (364,390 | ) | | | (2,545,743 | ) |
| |
| |
Class C Shares | | | | | | | | | | | | | | | | |
| Shares sold | | | 143 | | | | 667 | | | | 3,397 | | | | 25,000 | |
| Reinvestment of distributions | | | 41 | | | | 192 | | | | 1 | | | | 5 | |
| Shares redeemed | | | (4 | ) | | | (15 | ) | | | — | | | | — | |
| |
| |
| | | | 180 | | | | 844 | | | | 3,398 | | | | 25,005 | |
| |
| |
Institutional Shares | | | | | | | | | | | | | | | | |
| Shares sold | | | 1,235,843 | | | | 5,727,873 | | | | 4,040,036 | | | | 33,849,780 | |
| Reinvestment of distributions | | | 628,294 | | | | 2,940,419 | | | | 47,756 | | | | 458,933 | |
| Shares redeemed | | | (3,483,800 | ) | | | (16,167,840 | ) | | | (4,184,136 | ) | | | (32,322,149 | ) |
| |
| |
| | | | (1,619,663 | ) | | | (7,499,548 | ) | | | (96,344 | ) | | | 1,986,564 | |
| |
| |
NET DECREASE | | | (2,630,316 | ) | | $ | (12,116,185 | ) | | | (457,336 | ) | | $ | (534,174 | ) |
| |
| |
GOLDMAN SACHS STRUCTURED INTERNATIONAL EQUITY FLEX FUND
Financial Highlights
Selected Data for a Share Outstanding Throughout Each Period
| | | | | | | | | | | | | | | | | | | | | | | | | | | | | | | | | |
| | | | | | | | Income (loss) from
| | | Distributions
| | | |
| | | | | | | | investment operations | | | to shareholders | | | |
| | | | | Net asset
| | | | | | | | | | | | | | | | | | | | | |
| | | | | value,
| | | Net
| | | Net realized
| | | Total from
| | | From net
| | | From net
| | | | | | |
| | | | | beginning
| | | investment
| | | and unrealized
| | | investment
| | | investment
| | | realized
| | | Total
| | | |
| | | Year - Share Class | | of period | | | income (loss)(a) | | | gain (loss) | | | operations | | | income | | | gains | | | distributions | | | |
| |
| FOR THE SIX MONTHS ENDED APRIL 30, (UNAUDITED) |
| | | | | | | | | | | | | | | | | | | | | | | | | | | | | | | | | |
| | | | | | | | | | | | | | | | | | | | | | | | | | | | | | | | | |
| | | 2009 - A | | $ | 6.62 | | | $ | 0.05 | | | $ | (0.41 | ) | | $ | (0.36 | ) | | $ | — | | | $ | — | | | $ | — | | | |
| | | 2009 - C | | | 6.54 | | | | 0.03 | | | | (0.41 | ) | | | (0.38 | ) | | | — | | | | — | | | | — | | | |
| | | 2009 - Institutional | | | 6.67 | | | | 0.06 | | | | (0.41 | ) | | | (0.35 | ) | | | — | | | | — | | | | — | | | |
| | | 2009 - IR | | | 6.62 | | | | 0.06 | | | | (0.42 | ) | | | (0.36 | ) | | | — | | | | — | | | | — | | | |
| | | 2009 - R | | | 6.59 | | | | 0.05 | | | | (0.42 | ) | | | (0.37 | ) | | | — | | | | — | | | | — | | | |
| | | | | | | | | | | | | | | | | | | | | | | | | | | | | | | | | |
| | | | | | | | | | | | | | | | | | | | | | | | | | | | | | | | | |
| FOR THE FISCAL YEARS ENDED OCTOBER 31, |
| | | | | | | | | | | | | | | | | | | | | | | | | | | | | | | | | |
| | | | | | | | | | | | | | | | | | | | | | | | | | | | | | | | | |
| | | 2008 - A | | | 13.08 | | | | 0.19 | | | | (6.41 | ) | | | (6.22 | ) | | | (0.21 | ) | | | (0.03 | ) | | | (0.24 | ) | | |
| | | 2008 - C | | | 12.98 | | | | 0.13 | | | | (6.36 | ) | | | (6.23 | ) | | | (0.18 | ) | | | (0.03 | ) | | | (0.21 | ) | | |
| | | 2008 - Institutional | | | 13.15 | | | | 0.19 | | | | (6.40 | ) | | | (6.21 | ) | | | (0.24 | ) | | | (0.03 | ) | | | (0.27 | ) | | |
| | | 2008 - IR (commenced November 30, 2007) | | | 12.32 | | | | 0.24 | | | | (5.67 | ) | | | (5.43 | ) | | | (0.24 | ) | | | (0.03 | ) | | | (0.27 | ) | | |
| | | 2008 - R (commenced November 30, 2007) | | | 12.32 | | | | 0.20 | | | | (5.66 | ) | | | (5.46 | ) | | | (0.24 | ) | | | (0.03 | ) | | | (0.27 | ) | | |
| | | | | | | | | | | | | | | | | | | | | | | | | | | | | | | | | |
| | | | | | | | | | | | | | | | | | | | | | | | | | | | | | | | | |
| | | |
| | | |
| | | 2007 - A | | | 10.67 | | | | 0.30 | | | | 2.14 | | | | 2.44 | | | | — | | | | (0.03 | ) | | | (0.03 | ) | | |
| | | 2007 - C | | | 10.66 | | | | 0.26 | | | | 2.09 | | | | 2.35 | | | | — | | | | (0.03 | ) | | | (0.03 | ) | | |
| | | 2007 - Institutional | | | 10.69 | | | | 0.38 | | | | 2.11 | | | | 2.49 | | | | — | | | | (0.03 | ) | | | (0.03 | ) | | |
| | | | | | | | | | | | | | | | | | | | | | | | | | | | | | | | | |
| | | | | | | | | | | | | | | | | | | | | | | | | | | | | | | | | |
| FOR THE PERIOD ENDED OCTOBER 31, |
| | | | | | | | | | | | | | | | | | | | | | | | | | | | | | | | | |
| | | | | | | | | | | | | | | | | | | | | | | | | | | | | | | | | |
| | | 2006 - A (commenced July 31, 2006) | | | 10.00 | | | | — | (d) | | | 0.67 | | | | 0.67 | | | | — | | | | — | | | | — | | | |
| | | 2006 - C (commenced July 31, 2006) | | | 10.00 | | | | (0.02 | ) | | | 0.68 | | | | 0.68 | | | | — | | | | — | | | | — | | | |
| | | 2006 - Institutional (commenced July 31, 2006) | | | 10.00 | | | | 0.02 | | | | 0.67 | | | | 0.69 | | | | — | | | | — | | | | — | | | |
| | | | | | | | | | | | | | | | | | | | | | | | | | | | | | | | | |
| | | | | | | | | | | | | | | | | | | | | | | | | | | | | | | | | |
| | | |
| | | |
| |
| (a) | Calculated based on the average shares outstanding methodology. |
| (b) | Assumes investment at the net asset value at the beginning of the period, reinvestment of all dividends and distributions, a complete redemption of the investment at the net asset value at the end of the period and no sales or redemption charges. Total return would be reduced if a sales or redemption charge were taken into account. Returns do not reflect the deduction of taxes that a shareholder would pay on Fund distributions or the redemption of Fund shares. Total returns for periods less than one full year are not annualized. |
| (c) | Annualized. |
| (d) | Less than $0.005 per share. |
The accompanying notes are an integral part of these financial statements.
GOLDMAN SACHS STRUCTURED INTERNATIONAL EQUITY FLEX FUND
| | | | | | | | | | | | | | | | | | | | | | | | | | | | | | | | | | | |
| | | | | | | | | | | | | | | | | | Ratios assuming no
| | | | | | |
| | | | | | | | | | | | | | | | | | expense reductions | | | | | | |
| | | | | | | | | | | | | | | Ratio of
| | | | | | Ratio of
| | | | | | |
| | | | | | | | | Net assets,
| | | Ratio of
| | | net investment
| | | Ratio of
| | | net investment
| | | | | | |
| | | Net asset
| | | | | | end of
| | | net expenses
| | | income (loss)
| | | total expenses
| | | income (loss)
| | | Portfolio
| | | |
| | | value, end
| | | Total
| | | period
| | | to average
| | | to average
| | | to average
| | | to average
| | | turnover
| | | |
| | | of period | | | return(b) | | | (in 000s) | | | net assets | | | net assets | | | net assets | | | net assets | | | rate | | | |
| |
| |
| | | | | | | | | | | | | | | | | | | | | | | | | | | | | | | | | | | |
| | | | | | | | | | | | | | | | | | | | | | | | | | | | | | | | | | | |
| | | $ | 6.26 | | | | (5.58 | )% | | $ | 47,648 | | | | 1.60 | %(c) | | | 1.64 | %(c) | | | 2.29 | %(c) | | | 0.95 | %(c) | | | 42 | % | | |
| | | | 6.16 | | | | (5.81 | ) | | | 1,870 | | | | 2.35 | (c) | | | 0.96 | (c) | | | 3.04 | (c) | | | 0.27 | (c) | | | 42 | | | |
| | | | 6.32 | | | | (5.25 | ) | | | 19,261 | | | | 1.20 | (c) | | | 2.11 | (c) | | | 1.89 | (c) | | | 1.42 | (c) | | | 42 | | | |
| | | | 6.26 | | | | (5.44 | ) | | | 5 | | | | 1.35 | (c) | | | 2.05 | (c) | | | 2.12 | (c) | | | 1.36 | (c) | | | 42 | | | |
| | | | 6.22 | | | | (5.61 | ) | | | 5 | | | | 1.85 | (c) | | | 1.59 | (c) | | | 2.54 | (c) | | | 0.90 | (c) | | | 42 | | | |
| | | | | | | | | | | | | | | | | | | | | | | | | | | | | | | | | | | |
| | | | | | | | | | | | | | | | | | | | | | | | | | | | | | | | | | | |
| |
| | | | | | | | | | | | | | | | | | | | | | | | | | | | | | | | | | | |
| | | | | | | | | | | | | | | | | | | | | | | | | | | | | | | | | | | |
| | | | 6.62 | | | | (48.25 | ) | | | 72,697 | | | | 1.60 | | | | 1.72 | | | | 1.82 | | | | 1.50 | | | | 122 | | | |
| | | | 6.54 | | | | (48.67 | ) | | | 2,266 | | | | 2.35 | | | | 1.25 | | | | 2.57 | | | | 1.03 | | | | 122 | | | |
| | | | 6.67 | | | | (48.09 | ) | | | 29,194 | | | | 1.20 | | | | 1.77 | | | | 1.42 | | | | 1.55 | | | | 122 | | | |
| | | | 6.62 | | | | (45.09 | ) | | | 5 | | | | 1.35 | (c) | | | 2.54 | (c) | | | 1.57 | (c) | | | 2.32 | (c) | | | 122 | | | |
| | | | 6.59 | | | | (45.34 | ) | | | 5 | | | | 1.85 | (c) | | | 2.08 | (c) | | | 2.07 | (c) | | | 1.86 | (c) | | | 122 | | | |
| | | | | | | | | | | | | | | | | | | | | | | | | | | | | | | | | | | |
| | | | | | | | | | | | | | | | | | | | | | | | | | | | | | | | | | | |
| |
| |
| | | | 13.08 | | | | 22.88 | | | | 313,922 | | | | 1.60 | | | | 2.49 | | | | 1.90 | | | | 2.19 | | | | 75 | | | |
| | | | 12.98 | | | | 22.06 | | | | 5,215 | | | | 2.35 | | | | 2.20 | | | | 2.65 | | | | 1.90 | | | | 75 | | | |
| | | | 13.15 | | | | 23.31 | | | | 143,867 | | | | 1.20 | | | | 3.15 | | | | 1.50 | | | | 2.85 | | | | 75 | | | |
| | | | | | | | | | | | | | | | | | | | | | | | | | | | | | | | | | | |
| | | | | | | | | | | | | | | | | | | | | | | | | | | | | | | | | | | |
| |
| | | | | | | | | | | | | | | | | | | | | | | | | | | | | | | | | | | |
| | | | | | | | | | | | | | | | | | | | | | | | | | | | | | | | | | | |
| | | | 10.67 | | | | 6.70 | | | | 31,009 | | | | 1.60 | (c) | | | 0.10 | (c) | | | 4.53 | (c) | | | (2.83 | )(c) | | | 11 | | | |
| | | | 10.66 | | | | 6.60 | | | | 113 | | | | 2.35 | (c) | | | (0.62 | )(c) | | | 5.58 | (c) | | | (3.85 | )(c) | | | 11 | | | |
| | | | 10.69 | | | | 6.90 | | | | 23,212 | | | | 1.20 | (c) | | | 0.82 | (c) | | | 4.48 | (c) | | | (2.46 | )(c) | | | 11 | | | |
| | | | | | | | | | | | | | | | | | | | | | | | | | | | | | | | | | | |
| | | | | | | | | | | | | | | | | | | | | | | | | | | | | | | | | | | |
| |
| |
GOLDMAN SACHS STRUCTURED EMERGING MARKETS EQUITY FUND
Financial Highlights
Selected Data for a Share Outstanding Throughout each Period
| | | | | | | | | | | | | | | | | | | | | | | | | | | | | | | | | |
| | | | | | | | Income (loss) from
| | | Distributions
| | | |
| | | | | | | | Investment operations | | | to shareholders | | | |
| | | | | Net asset
| | | | | | | | | | | | | | | | | | | | | |
| | | | | value,
| | | Net
| | | Net realized
| | | Total from
| | | From net
| | | From net
| | | | | | |
| | | | | beginning
| | | investment
| | | and unrealized
| | | investment
| | | investment
| | | realized
| | | Total
| | | |
| | | Year - Share Class | | of period | | | income(a) | | | gain (loss) | | | operations | | | income | | | gains | | | distributions | | | |
| |
| | | | | | | | | | | | | | | | | | | | | | | | | | | | | | | | | |
| |
| FOR THE SIX MONTHS ENDED APRIL 30, (UNAUDITED) |
| | | | | | | | | | | | | | | | | | | | | | | | | | | | | | | | | |
| | | | | | | | | | | | | | | | | | | | | | | | | | | | | | | | | |
| | | 2009 - A | | $ | 4.45 | | | $ | 0.02 | | | $ | 0.71 | | | $ | 0.73 | | | $ | (0.04 | ) | | $ | — | | | $ | (0.04 | ) | | |
| | | 2009 - C | | | 4.41 | | | | — | (c) | | | 0.74 | | | | 0.74 | | | | (0.01 | ) | | | — | | | | (0.01 | ) | | |
| | | 2009 - Institutional | | | 4.47 | | | | 0.03 | | | | 0.71 | | | | 0.74 | | | | (0.05 | ) | | | — | | | | (0.05 | ) | | |
| | | | | | | | | | | | | | | | | | | | | | | | | | | | | | | | | |
| | | | | | | | | | | | | | | | | | | | | | | | | | | | | | | | | |
| FOR THE FISCAL YEAR ENDED OCTOBER 31, |
| | | | | | | | | | | | | | | | | | | | | | | | | | | | | | | | | |
| | | | | | | | | | | | | | | | | | | | | | | | | | | | | | | | | |
| | | 2008 - A | | | 11.04 | | | | 0.15 | (d) | | | (6.64 | ) | | | (6.49 | ) | | | (0.05 | ) | | | (0.05 | ) | | | (0.10 | ) | | |
| | | 2008 - C | | | 11.03 | | | | 0.10 | (d) | | | (6.63 | ) | | | (6.53 | ) | | | (0.04 | ) | | | (0.05 | ) | | | (0.09 | ) | | |
| | | 2008 - Institutional | | | 11.04 | | | | 0.18 | (d) | | | (6.65 | ) | | | (6.47 | ) | | | (0.05 | ) | | | (0.05 | ) | | | (0.10 | ) | | |
| | | | | | | | | | | | | | | | | | | | | | | | | | | | | | | | | |
| | | | | | | | | | | | | | | | | | | | | | | | | | | | | | | | | |
| FOR THE PERIOD ENDED OCTOBER 31, |
| | | | | | | | | | | | | | | | | | | | | | | | | | | | | | | | | |
| | | | | | | | | | | | | | | | | | | | | | | | | | | | | | | | | |
| | | 2007 - A (commenced October 5, 2007) | | | 10.00 | | | | 0.01 | | | | 1.03 | | | | 1.04 | | | | — | | | | — | | | | — | | | |
| | | 2007 - C (commenced October 5, 2007) | | | 10.00 | | | | — | (c) | | | 1.03 | | | | 1.03 | | | | — | | | | — | | | | — | | | |
| | | 2007 - Institutional (commenced October 5, 2007) | | | 10.00 | | | | — | (c) | | | 1.04 | | | | 1.04 | | | | — | | | | — | | | | — | | | |
| | | | | | | | | | | | | | | | | | | | | | | | | | | | | | | | | |
| | | | | | | | | | | | | | | | | | | | | | | | | | | | | | | | | |
| |
| |
| |
| (a) | Calculated based on the average shares outstanding methodology. |
| (b) | Assumes investment at the net asset value at the beginning of the period, reinvestment of all distributions, a complete redemption of the investment at the net asset value at the end of the period and no sales or redemption charges. Total return would be reduced if a sales or redemption charge were taken into account. Returns do not reflect the deduction of taxes that a shareholder would pay on Fund distributions or the redemption of Fund shares. Total returns for periods less than one full year are not annualized. |
| (c) | Amount is less than $0.005 per share. |
| (d) | Reflects income recognized from special dividends which amounted to $0.02 per share and 0.26% of average net assets. |
| (e) | Annualized. |
GOLDMAN SACHS STRUCTURED EMERGING MARKETS EQUITY FUND
| | | | | | | | | | | | | | | | | | | | | | | | | | | | | | | | | | | |
| | | | | | | | | | | | | | | | | | Ratios assuming no
| | | | | | |
| | | | | | | | | | | | | | | | | | expense reductions | | | | | | |
| | | | | | | | | | | | | | | Ratio of
| | | | | | Ratio of
| | | | | | |
| | | | | | | | | Net assets,
| | | Ratio of
| | | net investment
| | | Ratio of
| | | net investment
| | | | | | |
| | | Net asset
| | | | | | end of
| | | net expenses
| | | income (loss)
| | | total expenses
| | | income (loss)
| | | Portfolio
| | | |
| | | value, end
| | | Total
| | | period
| | | to average
| | | to average
| | | to average
| | | to average
| | | turnover
| | | |
| | | of period | | | return(b) | | | (in 000s) | | | net assets | | | net assets | | | net assets | | | net assets | | | rate | | | |
| |
| |
| | | | | | | | | | | | | | | | | | | | | | | | | | | | | | | | | | | |
| | | | | | | | | | | | | | | | | | | | | | | | | | | | | | | | | | | |
| | | $ | 5.14 | | | | 16.50 | % | | $ | 1,192 | | | | 1.45 | %(e) | | | 1.11 | %(e) | | | 1.87 | %(e) | | | 0.69 | %(e) | | | 114 | % | | |
| | | | 5.14 | | | | 16.59 | | | | 323 | | | | 2.20 | (e) | | | (0.02 | )(e) | | | 2.62 | (e) | | | (0.44 | )(e) | | | 114 | | | |
| | | | 5.16 | | | | 16.77 | | | | 174,728 | | | | 1.05 | (e) | | | 1.51 | (e) | | | 1.47 | (e) | | | 1.09 | (e) | | | 114 | | | |
| | | | | | | | | | | | | | | | | | | | | | | | | | | | | | | | | | | |
| | | | | | | | | | | | | | | | | | | | | | | | | | | | | | | | | | | |
| |
| | | | | | | | | | | | | | | | | | | | | | | | | | | | | | | | | | | |
| | | | | | | | | | | | | | | | | | | | | | | | | | | | | | | | | | | |
| | | | 4.45 | | | | (59.22 | ) | | | 345 | | | | 1.45 | | | | 1.92 | (d) | | | 1.89 | | | | 1.48 | (d) | | | 190 | | | |
| | | | 4.41 | | | | (59.48 | ) | | | 43 | | | | 2.20 | | | | 1.24 | (d) | | | 2.64 | | | | 0.80 | (d) | | | 190 | | | |
| | | | 4.47 | | | | (59.01 | ) | | | 156,248 | | | | 1.05 | | | | 2.28 | (d) | | | 1.49 | | | | 1.84 | (d) | | | 190 | | | |
| | | | | | | | | | | | | | | | | | | | | | | | | | | | | | | | | | | |
| | | | | | | | | | | | | | | | | | | | | | | | | | | | | | | | | | | |
| |
| | | | | | | | | | | | | | | | | | | | | | | | | | | | | | | | | | | |
| | | | | | | | | | | | | | | | | | | | | | | | | | | | | | | | | | | |
| | | | 11.04 | | | | 10.40 | | | | 157 | | | | 1.45 | (e) | | | 0.77 | (e) | | | 2.79 | (e) | | | (0.57 | )(e) | | | 16 | | | |
| | | | 11.03 | | | | 10.30 | | | | 11 | | | | 2.20 | (e) | | | (0.60 | )(e) | | | 3.54 | (e) | | | (1.94 | )(e) | | | 16 | | | |
| | | | 11.04 | | | | 10.40 | | | | 97,302 | | | | 1.05 | (e) | | | 0.58 | (e) | | | 2.39 | (e) | | | (0.76 | )(e) | | | 16 | | | |
| | | | | | | | | | | | | | | | | | | | | | | | | | | | | | | | | | | |
| | | | | | | | | | | | | | | | | | | | | | | | | | | | | | | | | | | |
| |
| |
GOLDMAN SACHS STRUCTURED INTERNATIONAL EQUITY FUND
Financial Highlights
Selected Data for a Share Outstanding Throughout Each Period
| | | | | | | | | | | | | | | | | | | | | | | | | | | | | | | | | |
| | | | | | | | Income (loss) from
| | | Distributions
| | | |
| | | | | | | | investment operations | | | to shareholders | | | |
| | | | | Net asset
| | | | | | | | | | | | | | | | | | | | | |
| | | | | value,
| | | Net
| | | Net realized
| | | Total from
| | | From net
| | | From net
| | | | | | |
| | | | | beginning
| | | investment
| | | and unrealized
| | | investment
| | | investment
| | | realized
| | | Total
| | | |
| | | Year - Share Class | | of period | | | income(a) | | | gain (loss) | | | operations | | | income | | | gains | | | distributions | | | |
| |
| FOR THE SIX MONTHS ENDED APRIL 30, (UNAUDITED) |
| | | | | | | | | | | | | | | | | | | | | | | | | | | | | | | | | |
| | | | | | | | | | | | | | | | | | | | | | | | | | | | | | | | | |
| | | 2009 - A | | $ | 8.06 | | | $ | 0.08 | | | $ | (0.40 | ) | | $ | (0.32 | ) | | $ | (0.39 | ) | | $ | — | | | $ | (0.39 | ) | | |
| | | 2009 - B | | | 7.91 | | | | 0.05 | | | | (0.39 | ) | | | (0.34 | ) | | | (0.29 | ) | | | — | | | | (0.29 | ) | | |
| | | 2009 - C | | | 7.90 | | | | 0.06 | | | | (0.40 | ) | | | (0.34 | ) | | | (0.29 | ) | | | — | | | | (0.29 | ) | | |
| | | 2009 - Institutional | | | 8.29 | | | | 0.10 | | | | (0.42 | ) | | | (0.32 | ) | | | (0.45 | ) | | | — | | | | (0.45 | ) | | |
| | | 2009 - Service | | | 8.08 | | | | 0.08 | | | | (0.40 | ) | | | (0.32 | ) | | | (0.36 | ) | | | — | | | | (0.36 | ) | | |
| | | 2009 - IR | | | 8.04 | | | | 0.10 | | | | (0.41 | ) | | | (0.31 | ) | | | (0.43 | ) | | | — | | | | (0.43 | ) | | |
| | | 2009 - R | | | 8.01 | | | | 0.08 | | | | (0.40 | ) | | | (0.32 | ) | | | (0.38 | ) | | | — | | | | (0.38 | ) | | |
| | | | | | | | | | | | | | | | | | | | | | | | | | | | | | | | | |
| | | | | | | | | | | | | | | | | | | | | | | | | | | | | | | | | |
| FOR THE PERIOD SEPTEMBER 1, 2008 TO OCTOBER 31, 2008* |
| | | | | | | | | | | | | | | | | | | | | | | | | | | | | | | | | |
| | | | | | | | | | | | | | | | | | | | | | | | | | | | | | | | | |
| | | 2008 - A | | | 11.79 | | | | 0.03 | | | | (3.76 | ) | | | (3.73 | ) | | | — | | | | — | | | | — | | | |
| | | 2008 - B | | | 11.58 | | | | 0.02 | | | | (3.69 | ) | | | (3.67 | ) | | | — | | | | — | | | | — | | | |
| | | 2008 - C | | | 11.56 | | | | 0.02 | | | | (3.68 | ) | | | (3.66 | ) | | | — | | | | — | | | | — | | | |
| | | 2008 - Institutional | | | 12.11 | | | | 0.04 | | | | (3.86 | ) | | | (3.82 | ) | | | — | | | | — | | | | — | | | |
| | | 2008 - Service | | | 11.81 | | | | 0.03 | | | | (3.76 | ) | | | (3.73 | ) | | | — | | | | — | | | | — | | | |
| | | 2008 - IR | | | 11.75 | | | | 0.03 | | | | (3.74 | ) | | | (3.71 | ) | | | — | | | | — | | | | — | | | |
| | | 2008 - R | | | 11.72 | | | | 0.03 | | | | (3.74 | ) | | | (3.71 | ) | | | — | | | | — | | | | — | | | |
| | | | | | | | | | | | | | | | | | | | | | | | | | | | | | | | | |
| | | | | | | | | | | | | | | | | | | | | | | | | | | | | | | | | |
| FOR THE FISCAL YEARS ENDED AUGUST 31, |
| | | | | | | | | | | | | | | | | | | | | | | | | | | | | | | | | |
| | | | | | | | | | | | | | | | | | | | | | | | | | | | | | | | | |
| | | 2008 - A | | | 15.90 | | | | 0.52 | | | | (2.77 | ) | | | (2.25 | ) | | | (0.48 | ) | | | (1.38 | ) | | | (1.86 | ) | | |
| | | 2008 - B | | | 15.67 | | | | 0.41 | | | | (2.73 | ) | | | (2.32 | ) | | | (0.39 | ) | | | (1.38 | ) | | | (1.77 | ) | | |
| | | 2008 - C | | | 15.64 | | | | 0.41 | | | | (2.73 | ) | | | (2.32 | ) | | | (0.38 | ) | | | (1.38 | ) | | | (1.76 | ) | | |
| | | 2008 - Institutional | | | 16.28 | | | | 0.59 | | | | (2.84 | ) | | | (2.25 | ) | | | (0.54 | ) | | | (1.38 | ) | | | (1.92 | ) | | |
| | | 2008 - Service | | | 15.93 | | | | 0.49 | | | | (2.76 | ) | | | (2.27 | ) | | | (0.47 | ) | | | (1.38 | ) | | | (1.85 | ) | | |
| | | 2008 - IR (Commenced November 30, 2007) | | | 16.57 | | | | 0.30 | | | | (3.19 | ) | | | (2.89 | ) | | | (0.55 | ) | | | (1.38 | ) | | | (1.93 | ) | | |
| | | 2008 - R (Commenced November 30, 2007) | | | 16.57 | | | | 0.25 | | | | (3.18 | ) | | | (2.93 | ) | | | (0.54 | ) | | | (1.38 | ) | | | (1.92 | ) | | |
| | | | | | | | | | | | | | | | | | | | | | | | | | | | | | | | | |
| | | | | | | | | | | | | | | | | | | | | | | | | | | | | | | | | |
| | | |
| | | |
| | | 2007 - A | | | 14.29 | | | | 0.30 | | | | 2.33 | | | | 2.63 | | | | (0.17 | ) | | | (0.85 | ) | | | (1.02 | ) | | |
| | | 2007 - B | | | 14.09 | | | | 0.15 | | | | 2.34 | | | | 2.49 | | | | (0.06 | ) | | | (0.85 | ) | | | (0.91 | ) | | |
| | | 2007 - C | | | 14.09 | | | | 0.15 | | | | 2.33 | | | | 2.48 | | | | (0.08 | ) | | | (0.85 | ) | | | (0.93 | ) | | |
| | | 2007 - Institutional | | | 14.59 | | | | 0.38 | | | | 2.38 | | | | 2.76 | | | | (0.22 | ) | | | (0.85 | ) | | | (1.07 | ) | | |
| | | 2007 - Service | | | 14.31 | | | | 0.26 | | | | 2.37 | | | | 2.63 | | | | (0.16 | ) | | | (0.85 | ) | | | (1.01 | ) | | |
| | | | | | | | | | | | | | | | | | | | | | | | | | | | | | | | | |
| | | | | | | | | | | | | | | | | | | | | | | | | | | | | | | | | |
| | | |
| | | |
| | | 2006 - A | | | 11.70 | | | | 0.21 | | | | 2.57 | | | | 2.78 | | | | (0.11 | ) | | | (0.08 | ) | | | (0.19 | ) | | |
| | | 2006 - B | | | 11.53 | | | | 0.08 | | | | 2.57 | | | | 2.65 | | | | (0.01 | ) | | | (0.08 | ) | | | (0.09 | ) | | |
| | | 2006 - C | | | 11.54 | | | | 0.09 | | | | 2.56 | | | | 2.65 | | | | (0.02 | ) | | | (0.08 | ) | | | (0.10 | ) | | |
| | | 2006 - Institutional | | | 11.93 | | | | 0.27 | | | | 2.61 | | | | 2.88 | | | | (0.14 | ) | | | (0.08 | ) | | | (0.22 | ) | | |
| | | 2006 - Service | | | 11.73 | | | | 0.18 | | | | 2.59 | | | | 2.77 | | | | (0.11 | ) | | | (0.08 | ) | | | (0.19 | ) | | |
| | | | | | | | | | | | | | | | | | | | | | | | | | | | | | | | | |
| | | | | | | | | | | | | | | | | | | | | | | | | | | | | | | | | |
| | | |
| | | |
| | | 2005 - A | | | 9.49 | | | | 0.18 | | | | 2.10 | | | | 2.28 | | | | (0.07 | ) | | | — | | | | (0.07 | ) | | |
| | | 2005 - B | | | 9.37 | | | | 0.08 | | | | 2.08 | | | | 2.16 | | | | — | | | | — | | | | — | | | |
| | | 2005 - C | | | 9.37 | | | | 0.08 | | | | 2.09 | | | | 2.17 | | | | — | | | | — | | | | — | | | |
| | | 2005 - Institutional | | | 9.68 | | | | 0.22 | | | | 2.14 | | | | 2.36 | | | | (0.11 | ) | | | — | | | | (0.11 | ) | | |
| | | 2005 - Service | | | 9.54 | | | | 0.29 | | | | 1.98 | | | | 2.27 | | | | (0.08 | ) | | | — | | | | (0.08 | ) | | |
| | | | | | | | | | | | | | | | | | | | | | | | | | | | | | | | | |
| | | | | | | | | | | | | | | | | | | | | | | | | | | | | | | | | |
| | | |
| | | |
| | | 2004 - A | | | 7.66 | | | | 0.10 | | | | 1.80 | | | | 1.90 | | | | (0.07 | ) | | | — | | | | (0.07 | ) | | |
| | | 2004 - B | | | 7.56 | | | | 0.04 | | | | 1.80 | | | | 1.84 | | | | (0.03 | ) | | | — | | | | (0.03 | ) | | |
| | | 2004 - C | | | 7.56 | | | | 0.04 | | | | 1.79 | | | | 1.83 | | | | (0.02 | ) | | | — | | | | (0.02 | ) | | |
| | | 2004 - Institutional | | | 7.80 | | | | 0.15 | | | | 1.84 | | | | 1.99 | | | | (0.11 | ) | | | — | | | | (0.11 | ) | | |
| | | 2004 - Service | | | 7.70 | | | | 0.15 | | | | 1.77 | | | | 1.92 | | | | (0.08 | ) | | | — | | | | (0.08 | ) | | |
| | | | | | | | | | | | | | | | | | | | | | | | | | | | | | | | | |
| | | | | | | | | | | | | | | | | | | | | | | | | | | | | | | | | |
| | | |
| | | |
| |
| * | The Fund changed its fiscal year end from August 31 to October 31. |
| (a) | Calculated based on the average shares outstanding methodology. |
| (b) | Assumes investment at the net asset value at the beginning of the period, reinvestment of all dividends and distributions, a complete redemption of the investment at the net asset value at the end of the period and no sales or redemption charges. Total return would be reduced if a sales or redemption charge were taken into account. Returns do not reflect the deduction of taxes that a shareholder would pay on Fund distributions or the redemption of Fund shares. Total returns for periods less than one full year are not annualized. |
| (c) | Annualized. |
GOLDMAN SACHS STRUCTURED INTERNATIONAL EQUITY FUND
| | | | | | | | | | | | | | | | | | | | | | | | | | | | | | | | | | | |
| | | | | | | | | | | | | | | | | | Ratios assuming no
| | | | | | |
| | | | | | | | | | | | | | | | | | expense reductions | | | | | | |
| | | | | | | | | | | | | | | Ratio of
| | | | | | Ratio of
| | | | | | |
| | | | | | | | | Net assets,
| | | Ratio of
| | | net investment
| | | Ratio of
| | | net investment
| | | | | | |
| | | Net asset
| | | | | | end of
| | | net expenses
| | | income
| | | total expenses
| | | income
| | | Portfolio
| | | |
| | | value, end
| | | Total
| | | period
| | | to average
| | | to average
| | | to average
| | | to average
| | | turnover
| | | |
| | | of period | | | return(b) | | | (in 000s) | | | net assets | | | net assets | | | net assets | | | net assets | | | rate | | | |
| |
| |
| | | | | | | | | | | | | | | | | | | | | | | | | | | | | | | | | | | |
| | | | | | | | | | | | | | | | | | | | | | | | | | | | | | | | | | | |
| | | $ | 7.35 | | | | (3.97 | )% | | $ | 464,767 | | | | 1.25 | %(c) | | | 2.30 | %(c) | | | 1.32 | %(c) | | | 2.23 | %(c) | | | 72 | % | | |
| | | | 7.28 | | | | (4.30 | ) | | | 6,353 | | | | 2.00 | (c) | | | 1.57 | (c) | | | 2.07 | (c) | | | 1.50 | (c) | | | 72 | | | |
| | | | 7.27 | | | | (4.28 | ) | | | 4,892 | | | | 2.00 | (c) | | | 1.58 | (c) | | | 2.07 | (c) | | | 1.51 | (c) | | | 72 | | | |
| | | | 7.52 | | | | (3.75 | ) | | | 1,211,350 | | | | 0.85 | (c) | | | 2.74 | (c) | | | 0.92 | (c) | | | 2.67 | (c) | | | 72 | | | |
| | | | 7.40 | | | | (3.99 | ) | | | 17,490 | | | | 1.35 | (c) | | | 2.21 | (c) | | | 1.42 | (c) | | | 2.14 | (c) | | | 72 | | | |
| | | | 7.30 | | | | (3.83 | ) | | | 5 | | | | 1.00 | (c) | | | 2.65 | (c) | | | 1.07 | (c) | | | 2.58 | (c) | | | 72 | | | |
| | | | 7.31 | | | | (4.08 | ) | | | 5 | | | | 1.50 | (c) | | | 2.21 | (c) | | | 1.57 | (c) | | | 2.14 | (c) | | | 72 | | | |
| | | | | | | | | | | | | | | | | | | | | | | | | | | | | | | | | | | |
| | | | | | | | | | | | | | | | | | | | | | | | | | | | | | | | | | | |
| |
| | | | | | | | | | | | | | | | | | | | | | | | | | | | | | | | | | | |
| | | | | | | | | | | | | | | | | | | | | | | | | | | | | | | | | | | |
| | | | 8.06 | | | | (31.64 | ) | | | 623,459 | | | | 1.20 | (c) | | | 1.76 | (c) | | | 1.28 | (c) | | | 1.68 | (c) | | | 25 | | | |
| | | | 7.91 | | | | (31.69 | ) | | | 8,149 | | | | 1.95 | (c) | | | 1.00 | (c) | | | 2.03 | (c) | | | 0.92 | (c) | | | 25 | | | |
| | | | 7.90 | | | | (31.66 | ) | | | 6,116 | | | | 1.95 | (c) | | | 1.00 | (c) | | | 2.03 | (c) | | | 0.92 | (c) | | | 25 | | | |
| | | | 8.29 | | | | (31.54 | ) | | | 1,560,672 | | | | 0.80 | (c) | | | 2.20 | (c) | | | 0.88 | (c) | | | 2.12 | (c) | | | 25 | | | |
| | | | 8.08 | | | | (31.58 | ) | | | 22,994 | | | | 1.30 | (c) | | | 1.68 | (c) | | | 1.38 | (c) | | | 1.60 | (c) | | | 25 | | | |
| | | | 8.04 | | | | (31.57 | ) | | | 5 | | | | 0.95 | (c) | | | 1.98 | (c) | | | 1.03 | (c) | | | 1.90 | (c) | | | 25 | | | |
| | | | 8.01 | | | | (31.66 | ) | | | 5 | | | | 1.45 | (c) | | | 1.47 | (c) | | | 1.53 | (c) | | | 1.39 | (c) | | | 25 | | | |
| | | | | | | | | | | | | | | | | | | | | | | | | | | | | | | | | | | |
| | | | | | | | | | | | | | | | | | | | | | | | | | | | | | | | | | | |
| |
| | | | | | | | | | | | | | | | | | | | | | | | | | | | | | | | | | | |
| | | | | | | | | | | | | | | | | | | | | | | | | | | | | | | | | | | |
| | | | 11.79 | | | | (16.33 | ) | | | 1,031,252 | | | | 1.20 | | | | 3.70 | | | | 1.25 | | | | 3.65 | | | | 161 | | | |
| | | | 11.58 | | | | (16.99 | ) | | | 13,280 | | | | 1.95 | | | | 2.93 | | | | 2.00 | | | | 2.88 | | | | 161 | | | |
| | | | 11.56 | | | | (16.99 | ) | | | 9,875 | | | | 1.95 | | | | 2.97 | | | | 2.00 | | | | 2.92 | | | | 161 | | | |
| | | | 12.11 | | | | (15.99 | ) | | | 2,676,502 | | | | 0.80 | | | | 4.13 | | | | 0.85 | | | | 4.08 | | | | 161 | | | |
| | | | 11.81 | | | | (16.50 | ) | | | 49,411 | | | | 1.30 | | | | 3.54 | | | | 1.35 | | | | 3.49 | | | | 161 | | | |
| | | | 11.75 | | | | (19.67 | ) | | | 8 | | | | 0.95 | (c) | | | 3.02 | (c) | | | 1.00 | (c) | | | 2.97 | (c) | | | 161 | | | |
| | | | 11.72 | | | | (19.92 | ) | | | 8 | | | | 1.45 | (c) | | | 2.55 | (c) | | | 1.50 | (c) | | | 2.50 | (c) | | | 161 | | | |
| | | | | | | | | | | | | | | | | | | | | | | | | | | | | | | | | | | |
| | | | | | | | | | | | | | | | | | | | | | | | | | | | | | | | | | | |
| | | |
| | | |
| | | | 15.90 | | | | 19.12 | | | | 1,495,073 | | | | 1.22 | | | | 1.96 | | | | 1.26 | | | | 1.92 | | | | 56 | | | |
| | | | 15.67 | | | | 18.28 | | | | 19,124 | | | | 1.97 | | | | 0.98 | | | | 2.01 | | | | 0.94 | | | | 56 | | | |
| | | | 15.64 | | | | 18.21 | | | | 13,961 | | | | 1.97 | | | | 0.98 | | | | 2.01 | | | | 0.94 | | | | 56 | | | |
| | | | 16.28 | | | | 19.63 | | | | 3,255,644 | | | | 0.82 | | | | 2.38 | | | | 0.86 | | | | 2.34 | | | | 56 | | | |
| | | | 15.93 | | | | 19.11 | | | | 55,340 | | | | 1.32 | | | | 1.67 | | | | 1.36 | | | | 1.63 | | | | 56 | | | |
| | | | | | | | | | | | | | | | | | | | | | | | | | | | | | | | | | | |
| | | | | | | | | | | | | | | | | | | | | | | | | | | | | | | | | | | |
| | | |
| | | |
| | | | 14.29 | | | | 24.02 | | | | 739,861 | | | | 1.26 | | | | 1.63 | | | | 1.35 | | | | 1.54 | | | | 59 | | | |
| | | | 14.09 | | | | 23.18 | | | | 10,306 | | | | 2.02 | | | | 0.64 | | | | 2.11 | | | | 0.55 | | | | 59 | | | |
| | | | 14.09 | | | | 23.10 | | | | 7,110 | | | | 2.02 | | | | 0.67 | | | | 2.11 | | | | 0.58 | | | | 59 | | | |
| | | | 14.59 | | | | 24.52 | | | | 1,661,909 | | | | 0.86 | | | | 2.01 | | | | 0.95 | | | | 1.92 | | | | 59 | | | |
| | | | 14.31 | | | | 23.87 | | | | 40,369 | | | | 1.37 | | | | 1.38 | | | | 1.46 | | | | 1.29 | | | | 59 | | | |
| | | | | | | | | | | | | | | | | | | | | | | | | | | | | | | | | | | |
| | | | | | | | | | | | | | | | | | | | | | | | | | | | | | | | | | | |
| | | |
| | | |
| | | | 11.70 | | | | 24.12 | | | | 293,591 | | | | 1.39 | | | | 1.64 | | | | 1.40 | | | | 1.63 | | | | 73 | | | |
| | | | 11.53 | | | | 23.05 | | | | 8,075 | | | | 2.14 | | | | 0.75 | | | | 2.15 | | | | 0.74 | | | | 73 | | | |
| | | | 11.54 | | | | 23.16 | | | | 4,824 | | | | 2.14 | | | | 0.75 | | | | 2.15 | | | | 0.74 | | | | 73 | | | |
| | | | 11.93 | | | | 24.51 | | | | 697,144 | | | | 0.99 | | | | 1.96 | | | | 1.00 | | | | 1.95 | | | | 73 | | | |
| | | | 11.73 | | | | 23.93 | | | | 22,429 | | | | 1.49 | | | | 2.33 | | | | 1.50 | | | | 2.32 | | | | 73 | | | |
| | | | | | | | | | | | | | | | | | | | | | | | | | | | | | | | | | | |
| | | | | | | | | | | | | | | | | | | | | | | | | | | | | | | | | | | |
| | | |
| | | |
| | | | 9.49 | | | | 24.85 | | | | 130,291 | | | | 1.59 | | | | 1.08 | | | | 1.68 | | | | 0.99 | | | | 99 | | | |
| | | | 9.37 | | | | 24.31 | | | | 6,408 | | | | 2.16 | | | | 0.45 | | | | 2.25 | | | | 0.36 | | | | 99 | | | |
| | | | 9.37 | | | | 24.28 | | | | 3,747 | | | | 2.16 | | | | 0.43 | | | | 2.25 | | | | 0.34 | | | | 99 | | | |
| | | | 9.68 | | | | 25.71 | | | | 261,118 | | | | 1.01 | | | | 1.65 | | | | 1.10 | | | | 1.56 | | | | 99 | | | |
| | | | 9.54 | | | | 25.08 | | | | 144 | | | | 1.51 | | | | 1.55 | | | | 1.60 | | | | 1.46 | | | | 99 | | | |
| | | | | | | | | | | | | | | | | | | | | | | | | | | | | | | | | | | |
| | | | | | | | | | | | | | �� | | | | | | | | | | | | | | | | | | | | | |
| |
| |
GOLDMAN SACHS STRUCTURED INTERNATIONAL SMALL CAP FUND
Financial Highlights
Selected Data for a Share Outstanding Throughout each Period
| | | | | | | | | | | | | | | | | | | | | | | | | |
| | | | | | | | Income (loss) from
| | | | | | |
| | | | | | | | investment operations | | | Distributions
| | | |
| | | | | Net asset
| | | Net
| | | | | | | | | to shareholders
| | | |
| | | | | value,
| | | investment
| | | Net realized
| | | Total from
| | | from net
| | | |
| | | | | beginning
| | | income
| | | and unrealized
| | | investment
| | | investment
| | | |
| | | Year - Share Class | | of period | | | (loss)(a) | | | gain (loss) | | | operations | | | income | | | |
| |
| FOR THE SIX MONTHS ENDED APRIL 30, (UNAUDITED) |
| | | | | | | | | | | | | | | | | | | | | | | | | |
| | | | | | | | | | | | | | | | | | | | | | | | | |
| | | 2009 - A | | $ | 4.94 | | | $ | 0.04 | | | $ | 0.08 | | | $ | 0.12 | | | $ | (0.19 | ) | | |
| | | 2009 - C | | | 4.91 | | | | 0.03 | | | | 0.08 | | | | 0.11 | | | | (0.19 | ) | | |
| | | 2009 - Institutional | | | 4.96 | | | | 0.06 | | | | 0.08 | | | | 0.14 | | | | (0.23 | ) | | |
| | | | | | | | | | | | | | | | | | | | | | | | | |
| | | | | | | | | | | | | | | | | | | | | | | | | |
| FOR THE FISCAL YEAR ENDED OCTOBER 31, |
| | | | | | | | | | | | | | | | | | | | | | | | | |
| | | | | | | | | | | | | | | | | | | | | | | | | |
| | | 2008 - A | | | 10.46 | | | | 0.20 | (c) | | | (5.69 | ) | | | (5.49 | ) | | | (0.03 | ) | | |
| | | 2008 - C | | | 10.46 | | | | 0.13 | (c) | | | (5.68 | ) | | | (5.55 | ) | | | — | (d) | | |
| | | 2008 - Institutional | | | 10.47 | | | | 0.23 | (c) | | | (5.71 | ) | | | (5.48 | ) | | | (0.03 | ) | | |
| | | | | | | | | | | | | | | | | | | | | | | | | |
| | | | | | | | | | | | | | | | | | | | | | | | | |
| FOR THE PERIOD ENDED OCTOBER 31, |
| | | | | | | | | | | | | | | | | | | | | | | | | |
| | | | | | | | | | | | | | | | | | | | | | | | | |
| | | 2007 - A (commenced September 28, 2007) | | | 10.00 | | | | (0.01 | ) | | | 0.47 | | | | 0.46 | | | | — | | | |
| | | 2007 - C (commenced September 28, 2007) | | | 10.00 | | | | (0.01 | ) | | | 0.47 | | | | 0.46 | | | | — | | | |
| | | 2007 - Institutional (commenced September 28, 2007) | | | 10.00 | | | | — | (d) | | | 0.47 | | | | 0.47 | | | | — | | | |
| | | | | | | | | | | | | | | | | | | | | | | | | |
| | | | | | | | | | | | | | | | | | | | | | | | | |
| | | |
| | | |
| |
| (a) | Calculated based on the average shares outstanding methodology. |
| (b) | Assumes investment at the net asset value at the beginning of the period, reinvestment of all distributions, a complete redemption of the investment at the net asset value at the end of the period and no sales or redemption charges. Total return would be reduced if a sales or redemption charge were taken into account. Returns do not reflect the deduction of taxes that a shareholder would pay on Fund distributions or the redemption of Fund shares. Total returns for periods less than one full year are not annualized. |
| (c) | Reflects income recognized from special dividends which amounted to $0.02 per share and 0.20% of average net assets. |
| (d) | Amount is less than $0.005 per share. |
| (e) | Annualized. |
GOLDMAN SACHS STRUCTURED INTERNATIONAL SMALL CAP FUND
| | | | | | | | | | | | | | | | | | | | | | | | | | | | | | | | | | | |
| | | | | | | | | | | | | | | | | | Ratios assuming no
| | | | | | |
| | | | | | | | | | | | | | | | | | expense reductions | | | | | | |
| | | | | | | | | | | | | | | Ratio of
| | | | | | Ratio of
| | | | | | |
| | | | | | | | | Net assets,
| | | Ratio of
| | | net investment
| | | Ratio of
| | | net investment
| | | | | | |
| | | Net asset
| | | | | | end of
| | | net expenses
| | | income (loss)
| | | total expenses
| | | income (loss)
| | | Portfolio
| | | |
| | | value, end
| | | Total
| | | period
| | | to average
| | | to average
| | | to average
| | | to average
| | | turnover
| | | |
| | | of period | | | return(b) | | | (in 000s) | | | net assets | | | net assets | | | net assets | | | net assets | | | rate | | | |
| |
| |
| | | | | | | | | | | | | | | | | | | | | | | | | | | | | | | | | | | |
| | | | | | | | | | | | | | | | | | | | | | | | | | | | | | | | | | | |
| | | $ | 4.87 | | | | 2.65 | % | | $ | 13,598 | | | | 1.30 | %(e) | | | 1.88 | %(e) | | | 2.07 | %(e) | | | 1.11 | %(e) | | | 97 | % | | |
| | | | 4.83 | | | | 2.41 | | | | 22 | | | | 2.05 | (e) | | | 1.44 | (e) | | | 2.82 | (e) | | | 0.67 | (e) | | | 97 | | | |
| | | | 4.87 | | | | 2.94 | | | | 58,559 | | | | 0.90 | (e) | | | 2.47 | (e) | | | 1.67 | (e) | | | 1.70 | (e) | | | 97 | | | |
| | | | | | | | | | | | | | | | | | | | | | | | | | | | | | | | | | | |
| | | | | | | | | | | | | | | | | | | | | | | | | | | | | | | | | | | |
| |
| | | | | | | | | | | | | | | | | | | | | | | | | | | | | | | | | | | |
| | | | | | | | | | | | | | | | | | | | | | | | | | | | | | | | | | | |
| | | | 4.94 | | | | (52.55 | ) | | | 18,763 | | | | 1.30 | | | | 2.39 | (c) | | | 1.70 | | | | 1.99 | (c) | | | 117 | | | |
| | | | 4.91 | | | | (52.94 | ) | | | 21 | | | | 2.05 | | | | 1.70 | (c) | | | 2.45 | | | | 1.30 | (c) | | | 117 | | | |
| | | | 4.96 | | | | (52.37 | ) | | | 67,625 | | | | 0.90 | | | | 2.83 | (c) | | | 1.30 | | | | 2.43 | (c) | | | 117 | | | |
| | | | | | | | | | | | | | | | | | | | | | | | | | | | | | | | | | | |
| | | | | | | | | | | | | | | | | | | | | | | | | | | | | | | | | | | |
| |
| | | | | | | | | | | | | | | | | | | | | | | | | | | | | | | | | | | |
| | | | | | | | | | | | | | | | | | | | | | | | | | | | | | | | | | | |
| | | | 10.46 | | | | 4.60 | | | | 43,572 | | | | 1.30 | (e) | | | (0.58 | )(e) | | | 1.90 | (e) | | | (1.18 | )(e) | | | 4 | | | |
| | | | 10.46 | | | | 4.60 | | | | 10 | | | | 2.05 | (e) | | | (1.06 | )(e) | | | 2.65 | (e) | | | (1.66 | )(e) | | | 4 | | | |
| | | | 10.47 | | | | 4.70 | | | | 143,817 | | | | 0.90 | (e) | | | 0.09 | (e) | | | 1.50 | (e) | | | (0.51 | )(e) | | | 4 | | | |
| | | | | | | | | | | | | | | | | | | | | | | | | | | | | | | | | | | |
| | | | | | | | | | | | | | | | | | | | | | | | | | | | | | | | | | | |
| |
| |
GOLDMAN SACHS STRUCTURED INTERNATIONAL EQUITY FUNDS
Fund Expenses — Six Month Period Ended April 30, 2009 (Unaudited)
As a shareholder of Class A, Class B, Class C, Institutional, Service, Class IR, and Class R Shares of a Fund, you incur two types of costs: (1) transaction costs, including sales charges (loads) on purchase payments (with respect to Class A Shares), contingent deferred sales charges (loads) on redemptions (with respect to Class B and Class C Shares), and redemption fees (with respect to Class A, Class B, Class C, Institutional, Service, Class IR, and Class R Shares, if any); and (2) ongoing costs, including management fees; distribution and service (12b-1) fees (with respect to Class A, Class B, Class C, and Class R Shares); and other Fund expenses. This Example is intended to help you understand your ongoing costs (in dollars) of investing in Class A, Class B, Class C, Institutional, Service, Class IR, and Class R Shares of the Funds and to compare these costs with the ongoing costs of investing in other mutual funds.
The Example is based on an investment of $1,000 invested at the beginning of the period and held for the entire period from November 1, 2008 through April 30, 2009.
Actual Expenses — The first line under each share class in the table below provides information about actual account values and actual expenses. You may use the information in this line, together with the amount you invested, to estimate the expenses that you paid over the period. Simply divide your account value by $1,000 (for example, an $8,600 account value divided by $1,000 = 8.6), then multiply the result by the number in the first line under the heading “Expenses Paid” to estimate the expenses you paid on your account during this period.
Hypothetical Example for Comparison Purposes — The second line under each share class in the table below provides information about hypothetical account values and hypothetical expenses based on the Funds’ actual expense ratio and an assumed rate of return of 5% per year before expenses, which is not the Funds’ actual return. The hypothetical account values and expenses may not be used to estimate the actual ending account balance or expenses you paid for the period. You may use this information to compare the ongoing costs of investing in the Funds and other funds. To do so, compare this 5% hypothetical example with the 5% hypothetical examples that appear in the shareholder reports of the other funds.
Please note that the expenses shown in the table are meant to highlight your ongoing costs only and do not reflect any transactional costs, such as sales charges (loads), redemption fees, or exchange fees. Therefore, the second line of the table is useful in comparing ongoing costs only, and will not help you determine the relative total costs of owning different funds. In addition, if these transactional costs were included, your costs would have been higher.
| | | | | | | | | | | | | | | | | | | | | | | | | | | | | | | | | | | | | | | | | | | | | | | | | | | | | | | | | | | | | |
| | | | Structured International Equity Flex Fund | | | Structured Emerging Markets Equity Fund | | | Structured International Equity Fund | | | Structured International Small Cap Fund |
| | | | | | | | | | Expenses
| | | | | | | | | Expenses
| | | | | | | | | Expenses
| | | | | | | | | Expenses
|
| | | | Beginning
| | | Ending
| | | Paid for the
| | | Beginning
| | | Ending
| | | Paid for the
| | | Beginning
| | | Ending
| | | Paid for the
| | | Beginning
| | | Ending
| | | Paid for the
|
| | | | Account Value
| | | Account Value
| | | 6 months ended
| | | Account Value
| | | Account Value
| | | 6 months ended
| | | Account Value
| | | Account Value
| | | 6 months ended
| | | Account Value
| | | Account Value
| | | 6 months ended
|
| Share Class | | | 11/1/08 | | | 4/30/09 | | | 4/30/09* | | | 11/1/08 | | | 4/30/09 | | | 4/30/09* | | | 11/1/08 | | | 4/30/09 | | | 4/30/09* | | | 11/1/08 | | | 4/30/09 | | | 4/30/09* |
Class A | | | | | | | | | | | | | | | | | | | | | | | | | | | | | | | | | | | | | | | | | | | | | | | | | | | | | | | | | | | | |
| Actual | | | $ | 1,000 | | | | $ | 944.20 | | | | $ | 7.73 | | | | $ | 1,000 | | | | $ | 1,165.00 | | | | $ | 7.78 | | | | $ | 1,000 | | | | $ | 960.30 | | | | $ | 6.11 | | | | $ | 1,000 | | | | $ | 1,026.50 | | | | $ | 6.58 | |
| Hypothetical 5% return | | | | 1,000 | | | | | 1,016.84 | + | | | | 8.02 | | | | | 1,000 | | | | | 1,017.60 | + | | | | 7.25 | | | | | 1,000 | | | | | 1,018.56 | + | | | | 6.29 | | | | | 1,000 | | | | | 1,018.30 | + | | | | 6.56 | |
| |
Class B | | | | | | | | | | | | | | | | | | | | | | | | | | | | | | | | | | | | | | | | | | | | | | | | | | | | | | | | | | | | |
| Actual | | | | N/A | | | | | N/A | | | | | N/A | | | | | N/A | | | | | N/A | | | | | N/A | | | | | 1,000 | | | | | 957.00 | | | | | 9.74 | | | | | N/A | | | | | N/A | | | | | N/A | |
| Hypothetical 5% return | | | | N/A | | | | | N/A | | | | | N/A | | | | | N/A | | | | | N/A | | | | | N/A | | | | | 1,000 | | | | | 1,014.84 | + | | | | 10.03 | | | | | N/A | | | | | N/A | | | | | N/A | |
| |
Class C | | | | | | | | | | | | | | | | | | | | | | | | | | | | | | | | | | | | | | | | | | | | | | | | | | | | | | | | | | | | |
| Actual | | | | 1,000 | | | | | 941.90 | | | | | 11.35 | | | | | 1,000 | | | | | 1,165.90 | | | | | 11.76 | | | | | 1,000 | | | | | 957.20 | | | | | 9.74 | | | | | 1,000 | | | | | 1,024.10 | | | | | 10.34 | |
| Hypothetical 5% return | | | | 1,000 | | | | | 1,013.10 | + | | | | 11.77 | | | | | 1,000 | | | | | 1,013.93 | + | | | | 10.94 | | | | | 1,000 | | | | | 1,014.84 | + | | | | 10.03 | | | | | 1,000 | | | | | 1,014.58 | + | | | | 10.29 | |
| |
Institutional | | | | | | | | | | | | | | | | | | | | | | | | | | | | | | | | | | | | | | | | | | | | | | | | | | | | | | | | | | | | |
| Actual | | | | 1,000 | | | | | 947.50 | | | | | 5.82 | | | | | 1,000 | | | | | 1,167.70 | | | | | 5.64 | | | | | 1,000 | | | | | 962.50 | | | | | 4.17 | | | | | 1,000 | | | | | 1,029.40 | | | | | 4.53 | |
| Hypothetical 5% return | | | | 1,000 | | | | | 1,018.82 | + | | | | 6.03 | | | | | 1,000 | | | | | 1,019.59 | + | | | | 5.26 | | | | | 1,000 | | | | | 1,020.54 | + | | | | 4.29 | | | | | 1,000 | | | | | 1,020.33 | + | | | | 4.51 | |
| |
Service | | | | | | | | | | | | | | | | | | | | | | | | | | | | | | | | | | | | | | | | | | | | | | | | | | | | | | | | | | | | |
| Actual | | | | N/A | | | | | N/A | | | | | N/A | | | | | N/A | | | | | N/A | | | | | N/A | | | | | 1,000 | | | | | 960.10 | | | | | 6.60 | | | | | N/A | | | | | N/A | | | | | N/A | |
| Hypothetical 5% return | | | | N/A | | | | | N/A | | | | | N/A | | | | | N/A | | | | | N/A | | | | | N/A | | | | | 1,000 | | | | | 1,018.06 | + | | | | 6.79 | | | | | N/A | | | | | N/A | | | | | N/A | |
| |
Class IR | | | | | | | | | | | | | | | | | | | | | | | | | | | | | | | | | | | | | | | | | | | | | | | | | | | | | | | | | | | | |
| Actual | | | | 1,000 | | | | | 945.60 | | | | | 6.79 | | | | | N/A | | | | | N/A | | | | | N/A | | | | | 1,000 | | | | | 961.70 | | | | | 5.16 | | | | | N/A | | | | | N/A | | | | | N/A | |
| Hypothetical 5% return | | | | 1,000 | | | | | 1,017.82 | + | | | | 7.04 | | | | | N/A | | | | | N/A | | | | | N/A | | | | | 1,000 | | | | | 1,019.54 | + | | | | 5.31 | | | | | N/A | | | | | N/A | | | | | N/A | |
| |
Class R | | | | | | | | | | | | | | | | | | | | | | | | | | | | | | | | | | | | | | | | | | | | | | | | | | | | | | | | | | | | |
| Actual | | | | 1,000 | | | | | 943.90 | | | | | 8.89 | | | | | N/A | | | | | N/A | | | | | N/A | | | | | 1,000 | | | | | 959.20 | | | | | 7.24 | | | | | N/A | | | | | N/A | | | | | N/A | |
| Hypothetical 5% Return | | | | 1,000 | | | | | 1,015.65 | + | | | | 9.22 | | | | | N/A | | | | | N/A | | | | | N/A | | | | | 1,000 | | | | | 1,017.41 | + | | | | 7.45 | | | | | N/A | | | | | N/A | | | | | N/A | |
| |
| |
| * | Expenses for each share class are calculated using each Fund’s annualized net expense ratio for each class, which represents the ongoing expenses as a percentage of net assets for the six months ended April 30, 2009. Expenses are calculated by multiplying the annualized net expense ratio by the average account value for the period; then multiplying the result by the number of days in the most recent fiscal half year; and then dividing that result by the number of days in the fiscal period. The annualized net expense ratios for the period were as follows: |
| | | | | | | | | | | | | | | | | | | | | | | | | | | | | |
| Fund | | Class A | | | Class B | | | Class C | | | Institutional | | | Service | | | Class IR | | | Class R | |
| | |
| Structured International Equity Flex | | | 1.60 | % | | | N/A | | | | 2.35 | % | | | 1.20 | % | | | N/A | | | | 1.35 | % | | | 1.85 | % |
| Structured Emerging Markets Equity | | | 1.45 | | | | N/A | | | | 2.20 | | | | 1.05 | | | | N/A | | | | N/A | | | | N/A | |
| Structured International Equity | | | 1.25 | | | | 2.00 | % | | | 2.00 | | | | 0.85 | | | | 1.35 | % | | | 1.00 | | | | 1.50 | |
| Structured International Small Cap | | | 1.30 | | | | N/A | | | | 2.05 | | | | 0.90 | | | | N/A | | | | N/A | | | | N/A | |
| |
| |
| |
| + | Hypothetical expenses are based on each Fund’s actual annualized net expense ratios and an assumed rate of return of 5% per year before expenses. |
92
FUNDS PROFILE
Goldman Sachs Funds
Goldman Sachs is a premier financial services firm, known since 1869 for creating thoughtful and customized investment solutions in complex global markets.
Today, the Investment Management Division of Goldman Sachs serves a diverse set of clients worldwide, including private institutions, public entities and individuals. With portfolio management teams located around the world — and $712.6 billion in assets under management as of March 31, 2009 — our investment professionals bring firsthand knowledge of local markets to every investment decision, making us one of the few truly global asset managers.
GOLDMAN SACHS FUNDS
In building a globally diversified portfolio, you can select from more than 80 Goldman Sachs Funds and gain access to investment opportunities across borders, investment styles, asset classes and security capitalizations.
![[GRAPHIC]](https://capedge.com/proxy/N-CSRS/0000950123-09-019686/y77382y7738215.gif)
| | | | | |
Money Market1
Fixed Income
n Enhanced Income Fund
n Ultra-Short Duration
Government Fund
n Short Duration Government
Fund
n Short Duration Tax-Free Fund
n Municipal Income Fund
n Government Income Fund
n Inflation Protected Securities
Fund
n U.S. Mortgages Fund
n Core Fixed Income Fund
n Core Plus Fixed Income Fund
n Investment Grade Credit Fund
n Global Income Fund
n High Yield Municipal Fund
n High Yield Fund
n Emerging Markets Debt Fund
n Local Emerging Markets
Debt Fund
| | Domestic Equity
n Balanced Fund
n Growth and Income Fund
n Structured Large Cap Value Fund
n Large Cap Value Fund
n Structured U.S. Equity Fund
n Structured Large Cap
Growth Fund
n Capital Growth Fund
n Strategic Growth Fund
n All Cap Growth Fund
n Concentrated Growth Fund
n Tollkeeper FundSM
n Mid Cap Value Fund
n Growth Opportunities Fund
n Small/Mid Cap Growth Fund
n Structured Small Cap Equity Fund
n Structured Small Cap Value Fund
n Structured Small Cap Growth Fund
n Small Cap Value Fund
Fund of Funds2
n Asset Allocation Portfolios
n Income Strategies Portfolio
n Satellite Strategies Portfolio
n Enhanced Dividend Global Equity Portfolio
n Tax-Advantaged Global Equity Portfolio
| | Retirement Strategies2
International Equity
n Structured International Equity Fund
n Structured International Equity Flex Fund
n Strategic International Equity Fund
n Concentrated International Equity Fund
n Structured International Small Cap Fund
n International Small Cap Fund
n Asia Equity Fund
n Structured Emerging Markets Equity Fund
n Emerging Markets Equity Fund
n BRIC Fund (Brazil, Russia, India, China)
Specialty2
n U.S. Equity Dividend and Premium Fund
n International Equity Dividend and
Premium Fund
n Structured Tax-Managed Equity Fund
n Structured International Tax-Managed Equity Fund
n Real Estate Securities Fund
n International Real Estate Securities Fund
n Commodity Strategy Fund
n Absolute Return Tracker Fund
|
| |
1 | An investment in a money market fund is neither insured nor guaranteed by the Federal Deposit Insurance Corporation or any other government agency. Although the Funds seek to preserve the value of your investment at $1.00 per share, it is possible to lose money by investing in the Funds. |
| |
| 2 | Individual Funds within the Fund of Funds, Retirement Strategies and Specialty categories will have various placement on the risk/return spectrum and may have greater or lesser risk than that indicated by the placement of the general Fund of Funds, Retirement Strategies or Specialty category. |
The Goldman Sachs Tollkeeper FundSM is a registered service mark of Goldman, Sachs & Co.
| | | |
TRUSTEES
Ashok N. Bakhru, Chairman
John P. Coblentz, Jr.
Diana M. Daniels
Patrick T. Harker
James A. McNamara
Jessica Palmer
Alan A. Shuch
Richard P. Strubel | | OFFICERS
James A. McNamara, President
John M. Perlowski, Senior Vice President and Treasurer
Peter V. Bonanno, Secretary |
| | | |
| | | |
GOLDMAN, SACHS & CO.
Distributor and Transfer Agent | | GOLDMAN SACHS ASSET MANAGEMENT INTERNATIONAL
Investment Adviser |
Visit our Web site at www.goldmansachsfunds.com to obtain the most recent month-end returns.
Goldman Sachs Asset Management, L.P. 32 Old Slip, 32nd Floor, New York, New York 10005
A prospectus for the Fund containing more complete information may be obtained from your authorized dealer or from Goldman, Sachs & Co. by calling (retail – 1-800-526-7384) (institutional – 1-800-621-2550). Please consider a fund’s objectives, risks, and charges and expenses, and read the prospectus carefully before investing. The prospectus contains this and other information about the Fund.
The reports concerning the Funds included in this shareholder report may contain certain forward-looking statements about the factors that may affect the performance of the Funds in the future. These statements are based on Fund management’s predictions and expectations concerning certain future events and their expected impact on the Funds, such as performance of the economy as a whole and of specific industry sectors, changes in the levels of interest rates, the impact of developing world events, and other factors that may influence the future performance of the Funds. Management believes these forward-looking statements to be reasonable, although they are inherently uncertain and difficult to predict. Actual events may cause adjustments in portfolio management strategies from those currently expected to be employed.
A description of the policies and procedures that the Funds use to determine how to vote proxies relating to portfolio securities and information regarding how a Fund voted proxies relating to portfolio securities during the most recent 12-month period ended June 30 is available (I) without charge, upon request by calling 1-800-526-7384 (for Retail Shareholders) or 1-800-621-2550 (for Institutional Shareholders); and (II) on the Securities and Exchange Commission Web site at http://www.sec.gov.
The Funds file their complete schedule of portfolio holdings with the SEC for the first and third quarters of each fiscal year on Form N-Q. The Funds’ Forms N-Q are available on the SEC’s website at http://www.sec.gov within 60 days after the Funds’ first and third fiscal quarters. The Funds’ Forms N-Q may be reviewed and copied at the SEC’s Public Reference Room in Washington, D.C., and information on the operation of the Public Reference Room may also be obtained by calling 1-800-SEC-0330. Forms N-Q may be obtained upon request and without charge by calling 1-800-526-7384 (for Retail Shareholders) or 1-800-621-2550 (for
Institutional Shareholders). Holdings and allocations shown are unaudited, and may not be representative of current or future investments.
Holdings and allocations may not include the Funds’ entire investment portfolio, which may change at any time. Fund holdings should not be relied on in making investment decisions and should not be construed as research or investment advice regarding particular securities.
The Global Industry Classification Standard (GICS) was developed by and is the exclusive property and a service mark of Morgan Stanley Capital International Inc. (MSCI) and Standard & Poor’s, a division of The McGraw-Hill Companies, Inc. (S&P) and is licensed for use by Goldman Sachs. Neither MSCI, S&P nor any other party involved in making or compiling the GICS or any GICS classifications makes any express or implied warranties or representations with respect to such standard or classification (or the results to be obtained by the use thereof), and all such parties hereby expressly disclaim all warranties of originality, accuracy, completeness, merchantability or fitness for a particular purpose with respect to any of such standard or classification. Without limiting any of the foregoing, in no event shall MSCI, S&P, any of their affiliates or any third party involved in making or compiling the GICS or any GICS classifications have any liability for any direct, indirect, special, punitive, consequential or any other damages (including lost profits) even if notified of the possibility of such damages.
The economic and market forecasts presented herein have been generated by GSAM for informational purposes as of the date of this presentation. They are based on proprietary models and there can be no assurance that the forecasts will be achieved.
This material is not authorized for distribution to prospective investors unless preceded or accompanied by a current Prospectus. Please consider a Fund’s objectives, risks, and charges and expenses, and read the Prospectus carefully before investing. The Prospectus contains this and other information about the Funds.
Copyright 2009 Goldman, Sachs & Co. All rights reserved. 23652.MF.TMPL STINTSAR / 73.3K / 05-09
| | (a) | | The information required by this Item is only required in an annual report on this Form N-CSR. |
| | | |
| | (b) | | During the period covered by this report, no amendments were made to the provisions of the Code of Ethics. |
| | | |
| | (c) | | During the period covered by this report, the registrant did not grant any waivers, including an implicit waiver, from any provision of the Code of Ethics. |
| | | |
| | (d) | | A copy of the Code of Ethics is available as provided in Item 12(a)(1) of this report. |
| | | |
| | | |
| ITEM 3. | | AUDIT COMMITTEE FINANCIAL EXPERT. |
The information required by this Item is only required in an annual report on this Form N-CSR.
| | | |
| ITEM 4. | | PRINCIPAL ACCOUNTANT FEES AND SERVICES. |
The information required by this Item is only required in an annual report on this Form N-CSR.
| | | |
| ITEM 5. | | AUDIT COMMITTEE OF LISTED REGISTRANTS. |
| | | |
| | | The information required by this Item is only required in an annual report on this Form N-CSR. |
| | | |
| ITEM 6. | | SCHEDULE OF INVESTMENTS. |
| | | |
| | | The Schedule of Investments is included as part of the Semi-Annual Report to Stockholders filed under Item 1 of this Form N-CSR. |
| | | |
| ITEM 7. | | DISCLOSURE OF PROXY VOTING POLICIES AND PROCEDURES FOR CLOSED-END MANAGEMENT INVESTMENT COMPANIES. |
| | | |
| | | Not applicable. |
| | | |
| ITEM 8. | | PORTFOLIO MANAGERS OF CLOSED-END MANAGEMENT INVESTMENT COMPANIES. |
| | | |
| | | Not applicable. |
| | | |
| ITEM 9. | | PURCHASES OF EQUITY SECURITIES BY CLOSED-END MANAGEMENT INVESTMENT COMPANY AND AFFILIATED PURCHASERS. |
| | | |
| | | Not applicable. |
| | | |
| ITEM 10. | | SUBMISSION OF MATTERS TO A VOTE OF SECURITY HOLDERS.
There have been no material changes to the procedures by which shareholders may recommend nominees to the registrant’s board of trustees. |
| | | |
| | | |
| ITEM 11. | | CONTROLS AND PROCEDURES. |
| | | |
| | (a) | | The registrant’s principal executive and principal financial officers, or persons performing similar functions have concluded that the registrant’s disclosure controls and procedures (as defined in Rule 30a-3(c) under the Investment Company Act of 1940, as amended (the “1940 Act”)) are effective as of a date within 90 days of the filing of this report that includes the disclosure required by this paragraph, based on the evaluation of these controls and procedures required by Rule 30a-3(b) under the 1940 Act and 15d-15(b) under the Securities Exchange Act of 1934, as amended. |
| | | |
| | (b) | | There were no changes in the registrant’s internal control over financial reporting (as defined in Rule 30a-3(d) under the 1940 Act) that occurred during the registrant’s second fiscal quarter of the period covered by this report that have materially affected, or are reasonably likely to materially affect, the registrant’s internal control over financial reporting. |
| | | |
| | (a)(1) | | | Goldman Sachs Trust's Code of Ethics for Principal Executive and Senior Financial Officers is incorporated by reference to Exhibit 11(a)(1) of the registrant's Form N-CSR filed on March 8, 2004 for its Real Estate Securities Fund (Accession Number 0000950123-04-0002984). |
| | | |
| | (a)(2) | | Exhibit 99.CERT | Certifications pursuant to Section 302 of the Sarbanes-Oxley Act of 2002 filed herewith. |
| | | |
| | (b) | | Exhibit 99.906CERT | Certifications pursuant to Section 906 of the Sarbanes-Oxley Act of 2002 filed herewith. |
SIGNATURES
| | | | Pursuant to the requirements of the Securities Exchange Act of 1934, as amended, and the Investment Company Act of 1940, as amended, the Registrant has duly caused this report to be signed on its behalf by the undersigned, thereunto duly authorized. |
| | | | | | | |
| | | | | Goldman Sachs Trust | | |
| | | | | | | |
| By: | | | | /s/ James A. McNamara | | |
| | | | |
| | |
| | | | | James A. McNamara | | |
| | | | | President/Principal Executive Officer | | |
| | | | | Goldman Sachs Trust | | |
| | | | | | | |
| Date: | | | | July 1, 2009 | | |
| | | | Pursuant to the requirements of the Securities Exchange Act of 1934, as amended, and the Investment Company Act of 1940, as amended, this report has been signed below by the following persons on behalf of the Registrant and in the capacities and on the dates indicated. |
| | | | | | | |
| By: | | | | /s/ James A. McNamara | | |
| | | | |
| | |
| | | | | James A. McNamara | | |
| | | | | President/Principal Executive Officer | | |
| | | | | Goldman Sachs Trust | | |
| | | | | | | |
| Date: | | | | July 1, 2009 | | |
| | | | | | | |
| By: | | | | /s/ John M. Perlowski | | |
| | | | |
| | |
| | | | | John M. Perlowski | | |
| | | | | Treasurer/Principal Financial Officer | | |
| | | | | Goldman Sachs Trust | | |
| | | | | | | |
| Date: | | | | July 1, 2009 | | |


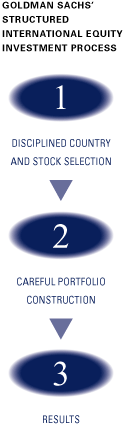
![[GRAPHIC]](https://capedge.com/proxy/N-CSRS/0000950123-09-019686/y77382y7738202.gif)
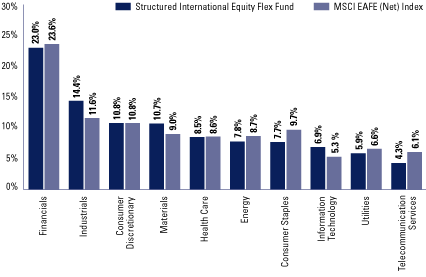
![[GRAPHIC]](https://capedge.com/proxy/N-CSRS/0000950123-09-019686/y77382y7738204.gif)
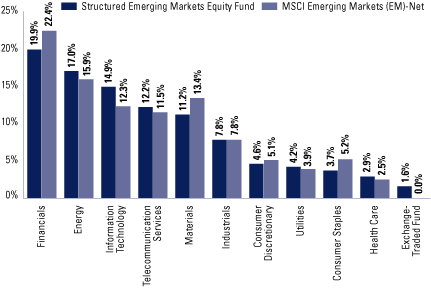
![[GRAPHIC]](https://capedge.com/proxy/N-CSRS/0000950123-09-019686/y77382y7738206.gif)
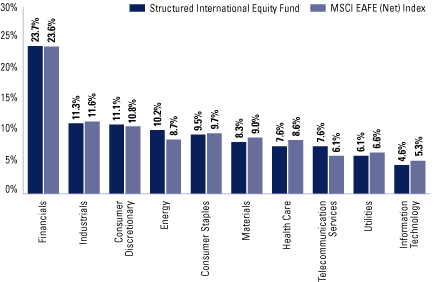
![[GRAPHIC]](https://capedge.com/proxy/N-CSRS/0000950123-09-019686/y77382y7738208.gif)
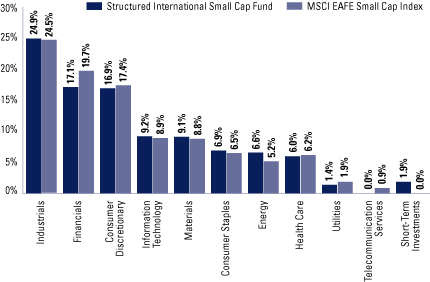
![[GRAPHIC]](https://capedge.com/proxy/N-CSRS/0000950123-09-019686/y77382y7738210.gif)