UNITED STATES
SECURITIES AND EXCHANGE COMMISSION
Washington, D.C. 20549
FORM N-CSR
CERTIFIED SHAREHOLDER REPORT OF REGISTERED
MANAGEMENT INVESTMENT COMPANIES
Investment Company Act file number 811-05349
Goldman Sachs Trust
(Exact name of registrant as specified in charter)71 South Wacker Drive, Chicago, Illinois 60606
(Address of principal executive offices) (Zip code)| | | |
| Peter V. Bonanno, Esq. | | Copies to: |
| Goldman, Sachs & Co. | | Geoffrey R.T. Kenyon, Esq. |
| 200 West Street | | Dechert LLP |
| New York, New York 10282 | | 200 Clarendon Street |
| | | 27th Floor
Boston, MA 02116-5021 |
|
(Name and address of agents for service)
|
Registrant’s telephone number, including area code: (312) 655-4400
Date of fiscal year end: December 31
Date of reporting period: June 30, 2011
| | | |
| ITEM 1. | | REPORTS TO STOCKHOLDERS. |
| | | |
| | | The Semi-Annual Report to Stockholders is filed herewith. |
Goldman Sachs Funds
| | | | |
| | | | |
Semi-Annual Report | | | June 30, 2011 |
| | | | |
| | | | |
| | | | |
| | | | |
| | | | Select Satellite Funds |
| | | | Absolute Return Tracker |
| | | | Commodity Strategy |
| | | | Dynamic Allocation |
| | | | International Real Estate Securities |
| | | | Real Estate Securities |
| | | | |
Goldman Sachs Select Satellite Funds
| |
| n | ABSOLUTE RETURN TRACKER |
| |
| n | COMMODITY STRATEGY |
| |
| n | DYNAMIC ALLOCATION |
| |
| n | INTERNATIONAL REAL ESTATE SECURITIES |
| |
| n | REAL ESTATE SECURITIES |
| | | |
| TABLE OF CONTENTS | | |
| |
| | | |
| Principal Investment Strategies and Risks | | 1 |
| | | |
| Portfolio Management Discussions and Performance Summaries | | 4 |
| | | |
| Schedules of Investments | | 31 |
| | | |
| Financial Statements | | 42 |
| | | |
| Financial Highlights | | 48 |
| | | |
| Notes to Financial Statements | | 58 |
| | | |
| Other Information | | 82 |
| | | | | | | |
NOT FDIC-INSURED | | | May Lose Value | | | No Bank Guarantee |
| | | | | | | |
GOLDMAN SACHS SELECT SATELLITE FUNDS
Principal Investment Strategies and Risks
This is not a complete list of risks that may affect the Funds. For additional information concerning the risks applicable to the Funds, please see the Funds’ Prospectuses.
The Goldman Sachs Absolute Return Tracker Fund seeks to achieve investment results that approximate the performance of the Goldman Sachs Absolute Return Tracker Index (the “GS-ART Index”). The GS-ART Index is a benchmark index that seeks to replicate the investment returns of hedge fund betas (i.e., that portion of the returns of hedge funds, as a broad asset class, that results from market exposure rather than manager skill). The Fund intends to invest in financial instruments that may provide short or long exposure to the various indices that comprise the GS-ART Index. The Fund’s performance may not match, and may vary substantially from, that of the GS-ART Index. The Fund may make investments in swaps, futures and forward contracts, structured notes, other derivative instruments and exchange-traded funds (“ETFs”). As a result of the Fund’s use of derivatives, the Fund may also hold significant amounts of U.S. Treasury or short-term instruments. Derivative instruments may involve a high degree of financial risk. These risks include the risk that a small movement in the price of the underlying security or benchmark may result in a disproportionately large movement, unfavorable or favorable, in the price of the derivative instrument; the risk of default by a counterparty; and the risk that transactions may not be liquid. The Fund is subject to the risks associated with short selling of securities. Short selling involves leverage of the Fund’s assets and presents various other risks. Because the Fund must first borrow a security to establish a short position, there is the risk that a security will not be available at a particular time or an acceptable price and therefore the Fund may not be able to implement its investment strategy. In addition, the Fund may be obligated to cover its short position at a higher price than the short price, resulting in a loss. Losses on short sales are potentially unlimited as a loss occurs when the value of a security sold short increases. Note that short selling involves sophisticated investment techniques that have the potential to add additional risk to a portfolio. The Fund is not appropriate for all investors. The Fund is non-diversified and may invest more of its assets in fewer issuers than diversified funds. Accordingly, the Fund may be more susceptible to adverse developments affecting any single issuer held in its portfolio and to greater losses resulting from these developments.
The Goldman Sachs Commodity Strategy Fund primarily gains exposure to the performance of the commodity markets through investments in a wholly-owned subsidiary of the Fund organized as a company under the laws of the Cayman Islands (the “Subsidiary”). The Subsidiary invests primarily in commodity-linked swaps (which may include total return swaps), as well as other commodity-linked securities and derivative instruments that provide exposure to the performance of the commodities markets, and in fixed income and debt instruments. The Fund is subject to the risk that exposure to the commodities markets may subject the Fund to greater volatility than investments in traditional securities. Derivative instruments may involve a high degree of financial risk. These risks include the risk that a small movement in the price of the underlying security or benchmark may result in a disproportionately large movement, unfavorable or favorable, in the price of the derivative instrument; the risk of default by a counterparty; and the risk that the transactions may not be liquid. The Fund may also invest in foreign securities, which may be more volatile than investments in U.S. securities and will be subject to the risks of currency fluctuations and sudden economic or political developments. The Fund’s fixed income investments are subject to the risks associated with debt securities generally, including credit, liquidity and interest rate risk. The Fund may also invest in non-investment grade fixed income securities, which are considered speculative. Non-investment grade fixed income securities and unrated securities of comparable credit quality are subject to the increased risk of an issuer’s inability to meet principal and interest payment obligations. Securities of issuers held by the Fund may lack sufficient market liquidity to enable the Fund to sell the securities at an advantageous time or without a substantial drop in price. The Fund is non-diversified and may invest more of its assets in fewer issuers than diversified funds. Accordingly, the Fund may be more susceptible to adverse developments affecting any single issuer held in its portfolio and to greater losses resulting from these developments.
GOLDMAN SACHS SELECT SATELLITE FUNDS
The Goldman Sachs Dynamic Allocation Fund invests primarily in exchange-traded funds (“ETFs”), futures, swaps and other derivatives that provide exposure to a broad spectrum of asset classes, including but not limited to equities (both in U.S. and non-U.S. companies), fixed income (U.S. and non-U.S., investment grade and high yield) and commodities. As a result of the Fund’s use of derivatives, the Fund may also hold significant amounts of U.S. Treasury or short-term instruments. Derivative investments may involve a high degree of financial risk. These risks include the risk that a small movement in the price of the underlying security or benchmark may result in a disproportionately large movement, unfavorable or favorable, in the price of the derivative instrument; risk of default by a counterparty; and liquidity risk. The Fund’s equity investments are subject to market risk, which means that the value of its investments may go up or down in response to the prospects of individual companies, particular industry sectors and/or general economic conditions. The Fund’s fixed income investments are subject to the risks associated with debt securities generally, including credit, liquidity and interest rate risk. High yield, lower rated securities involve greater price volatility and present greater risks than higher rated fixed income securities. The Fund is subject to the risk that exposure to the commodities markets may subject the Fund to greater volatility than investments in traditional securities. The Fund may also invest in foreign securities, including emerging markets securities, which may be more volatile and less liquid than investments in U.S. securities and are subject to the risks of currency fluctuations and sudden economic or political developments. Securities of issuers held by the Fund may lack sufficient market liquidity to enable the Fund to sell the securities at an advantageous time or without a substantial drop in price. The Fund is non-diversified and may invest more of its assets in fewer issuers than diversified funds. Accordingly, the Fund may be more susceptible to adverse developments affecting any single issuer held in its portfolio and to greater losses resulting from these developments.
The Goldman Sachs International Real Estate Securities Fund invests primarily in a portfolio of equity investments in issuers that are primarily engaged in or related to the real estate industry outside the United States, including real estate investment trusts (“REITs”). Investing in REITs involves certain unique risks in addition to those risks associated with investing in the real estate industry in general. REITs whose underlying properties are concentrated in a particular industry or geographic region are also subject to risks affecting such industries and regions. The securities of REITs involve greater risks than those associated with larger, more established companies and may be subject to more abrupt or erratic price movements because of interest rate changes, economic conditions and other factors. The Fund’s investments, especially in real estate industry companies that hold mortgages, may be subject to interest rate risks. Foreign and emerging markets securities may be more volatile than U.S. securities and are subject to the risks of currency fluctuations and sudden economic or political developments. Because the Fund concentrates its investments in specific industry sectors, the Fund is subject to greater risk of loss as a result of adverse economic, business or other developments affecting these sectors than if its investments were diversified across different industry sectors. The Fund may be especially subject to the risk that the liquidity of particular portfolio securities will shrink or disappear suddenly and without warning as a result of adverse economic, market or political events, or adverse investor perceptions, whether or not accurate. At times, the Fund may be unable to sell certain of its portfolio securities without a substantial drop in price, if at all. Because the Fund invests primarily in issuers related to the real estate industry, its net asset value may fluctuate substantially over time and its performance may be substantially different from the returns of the broader stock market. The Fund may make investments in derivative instruments, including options and financial futures. Derivative investments may involve a high degree of financial risk. These risks include the risk that a small movement in the price of the underlying security or benchmark may result in a disproportionately large movement, unfavorable or favorable, in the price of the derivative instrument; risk of default by a counterparty; and liquidity risk. The Fund may participate in the initial public offering (“IPO”) market. The market value of IPO shares may fluctuate considerably due to factors such as the absence of a prior public market, unseasoned trading, the small number of shares available for trading and limited information about the issuer. The Fund is non-diversified and may invest more of its assets in fewer issuers than diversified funds. Accordingly, the Fund may be more susceptible to adverse developments affecting any single issuer held in its portfolio and to greater losses resulting from these developments.
GOLDMAN SACHS SELECT SATELLITE FUNDS
The Goldman Sachs Real Estate Securities Fund invests primarily in a portfolio of equity investments in issuers that are primarily engaged in or related to the real estate industry, including real estate investment trusts (“REITs”). Investing in REITs involves certain unique risks in addition to those risks associated with investing in the real estate industry in general. REITs whose underlying properties are concentrated in a particular industry or geographic region are also subject to risks affecting such industries and regions. The securities of REITs involve greater risks than those associated with larger, more established companies and may be subject to more abrupt or erratic price movements because of interest rate changes, economic conditions and other factors. The Fund’s investments, especially in real estate industry companies that hold mortgages, may be subject to interest rate risks. Because the Fund concentrates its investments in specific industry sectors, the Fund is subject to greater risk of loss as a result of adverse economic, business or other developments affecting these sectors than if its investments were diversified across different industry sectors. The Fund may be especially subject to the risk that the liquidity of particular portfolio securities will shrink or disappear suddenly and without warning as a result of adverse economic, market or political events, or adverse investor perceptions, whether or not accurate. At times, the Fund may be unable to sell certain of its portfolio securities without a substantial drop in price, if at all. Because the Fund invests primarily in issuers related to the real estate industry, its net asset value may fluctuate substantially over time and its performance may be substantially different from the returns of the broader stock market. The Fund may participate in the initial public offering (“IPO”) market. The market value of IPO shares may fluctuate considerably due to factors such as the absence of a prior public market, unseasoned trading, and the small number of shares available for trading and limited information about the issuer. The Fund is non-diversified and may invest more of its assets in fewer issuers than diversified funds. Accordingly, the Fund may be more susceptible to adverse developments affecting any single issuer held in its portfolio and to greater losses resulting from these developments.
PORTFOLIO RESULTS
Goldman Sachs Absolute Return Tracker Fund
Investment Objective
The Fund seeks to achieve investment results that approximate the returns of the GS-ART Index.
Portfolio Management Discussion and Analysis
Below, the Goldman Sachs Quantitative Investment Strategies Team discusses the Goldman Sachs Absolute Return Tracker Fund’s (the “Fund”) performance and positioning for the six-month period ended June 30, 2011 (“the Reporting Period”).
| |
| Q | How did the Fund perform during the Reporting Period? |
| |
| A | During the Reporting Period, the Fund’s Class A, C, Institutional, IR and R Shares generated cumulative total returns, without sales charges, of 0.43%, 0.00%, 0.54%, 0.43% and 0.22%, respectively. These returns compare to the 1.07% and -2.12% cumulative total returns of the Fund’s benchmarks, the Goldman Sachs Absolute Return Tracker Index (the “GS-ART Index”) and the HFRX Global Hedge Fund Index, respectively, during the same time period. The Fund’s former secondary benchmark, the Dow Jones Credit Suisse AllHedge Index (formerly the Credit Suisse/Tremont AllHedge Index) returned -0.38% during the Reporting Period. |
| |
| Q | Were there any changes made to the Fund during the Reporting Period? |
| |
| A | Effective April 29, 2011, the Fund changed its secondary benchmark from the Dow Jones Credit Suisse AllHedge Index to the HFRX Global Hedge Fund Index. In the Investment Adviser’s opinion, the HFRX Global Hedge Fund Index is a more appropriate secondary benchmark against which to measure the performance of the Fund given that, also in the Investment Adviser’s opinion, the HFRX Global Hedge Fund Index is more liquid and investable than the Dow Jones Credit Suisse AllHedge Index. |
| |
| Q | What economic and market factors most influenced the hedge fund asset class as a whole during the Reporting Period? |
| |
| A | The first quarter of 2011 saw reasonably strong global economic growth. However, by the second quarter, some distressing world events began to erode confidence. More specifically, political upheaval across the Middle East and North Africa drove oil prices higher, and Japan’s devastating natural disasters and subsequent nuclear crisis raised concerns about a disruption in the global supply chain. Uncertainty over the Greek sovereign debt situation exacerbated an already skittish market. These world developments, in conjunction with mixed economic data, had a profound impact during the Reporting Period upon all the major asset classes, including equities, fixed income and commodities. Equities and commodities had strong first quarters and difficult second quarters, but both asset classes managed to finish on a strong note in the last week of June, such that each ended in solid positive territory for the Reporting Period overall. Within fixed income, U.S. Treasuries outperformed most non-Treasury sectors during the Reporting Period, with 10-year U.S. Treasury yields declining as investors flew to quality. |
PORTFOLIO RESULTS
| |
| Q | What key factors were responsible for the Fund’s performance during the Reporting Period? |
| |
| A | The Fund seeks to achieve its objective by investing in financial instruments that may provide short or long exposure to the various indices that comprise the GS-ART Index, each such index being a “Component Market Factor.” During the Reporting Period, the Fund’s Component Market Factors were investable indices reflecting the following categories—Equities, Fixed Income and Commodities. |
Positioning in the Equities and Commodities categories contributed positively to the Fund’s absolute returns during the Reporting Period. Positioning in the Fixed Income category detracted. All told, although the Fund modestly underperformed one of its benchmarks and modestly outperformed another, its results from both a risk and return perspective were within expectations, especially in light of both the bear and bull markets experienced during the Reporting Period. Indeed, from a broad investment portfolio construction perspective, the Fund continued to be an effective volatility dampener. Actual volatility (annualized, using daily returns) of the Fund was 5.14% for the Reporting Period versus S&P 500® Index volatility of 12.66%.
| |
| Q | How was the Fund positioned within the Equities category during the Reporting Period? |
| |
| A | Throughout the Reporting Period, the Fund maintained a net long exposure to global equities. Such positioning was the largest positive contributor to the Fund’s performance, since, though volatile, most global equity markets finished the Reporting Period with positive performance. U.S. equity markets were strong, with the S&P® 500 Index and Russell 2000® Index, which measure large-cap and small-cap equities, respectively, returning 6.02% and 6.21%, respectively. International equities also finished in solid positive territory, with the MSCI EAFE® Index up 5.35% in U.S. dollar terms for the Reporting Period. Emerging market equities were weaker, gaining 1.03% in U.S. dollar terms for the Reporting Period. |
| |
| Q | How did developments within the Fixed Income category affect the Fund’s absolute return? |
| |
| A | With world events causing market uncertainty, investors favored higher quality, lower risk asset classes during the Reporting Period. In turn, 10-year U.S. Treasury yields fell approximately 14 basis points (a basis point is 1/100th of a percentage point) during the Reporting Period. However, the Fund maintained its net short position in the 10-year U.S. Treasury throughout the Reporting Period, and thus such positioning was the greatest detractor from the Fund’s absolute return. Please note that a short exposure to this Component Market Factor of the Fund usually generates negative results when 10-year Treasury notes rally and their yields decline. |
| |
| Q | Was the Fund positioned net long or short in the Commodities category during the Reporting Period? |
| |
| A | The Fund held a net long exposure in the Commodities category during the Reporting Period via a position in precious metals, as measured by the S&P GSCI® Precious Metals Index. The Fund’s exposure to precious metals contributed positively to its performance, as the S&P GSCI® Precious Metals Index posted a gain of 6.51% for the Reporting Period. Viewed more as a quasi-currency than a commodity by many, precious metals’ strong performance was supported by global political unrest, low interest rates and a weak U.S. dollar, as measured by the 5.86% decline in the U.S. Dollar Index. The spot price of both gold and silver rose during the Reporting Period. As a reminder, the Fund’s position in broad commodities, as measured by the S&P GSCI® Index, had been removed during the fourth quarter of 2010, following the steps taken in the annual rebalancing process of the GS-ART Index. |
| |
| Q | How did the Credit category affect the Fund’s results? |
| |
| A | Although the Credit category is a component of the GS-ART Index’s market factor universe, it has not been a statistically significant factor in explaining hedge fund performance since late 2009. As a result, it was not part of the GS-ART Index or the Fund during the Reporting Period. |
PORTFOLIO RESULTS
| |
| Q | Did Volatility impact the Fund’s returns during the Reporting Period? |
| |
| A | Although Volatility is a component of the GS-ART Index’s market factor universe, it has so far not been a statistically significant factor in explaining hedge fund performance. As a result, it was not part of the GS-ART Index or the Fund during the Reporting Period. |
| |
| Q | Was the Fund invested in any other asset classes during the Reporting Period? |
| |
| A | The Fund had a net long exposure to cash throughout the Reporting Period. Given that interest rates were anchored at extremely low levels, such positioning contributed modestly but positively to the Fund’s performance. |
| |
| Q | How did the Fund use derivatives and similar instruments during the Reporting Period? |
| |
| A | During the Reporting Period, the Fund used exchange-traded index futures contracts to gain exposure to U.S. large-cap and small-cap equities, non-U.S. developed market equities including those in Europe, the U.K. and Japan, and the 10-year U.S. Treasury Index. The Fund used commodity index-linked structured notes to gain exposure to the S&P GSCI® Precious Metals Index. The Fund used currency forward contracts to gain exposure to select currencies of non-U.S. developed markets. |
| |
| Q | Were there any changes made in the Fund’s investment strategy during the Reporting Period? |
| |
| A | The Fund’s exposure to each Component Market Factor is adjusted monthly in accordance with the rebalancing process that occurs in the GS-ART Index. The set of Component Market Factors are further adjusted in the GS-ART Index once per year, in late October. During the Reporting Period, exposures to Component Market Factors were neither added nor removed. The only changes made were minor adjustments in weightings to the various underlying market indices. |
| |
| Q | What is the Fund’s tactical view and strategy going forward? |
| |
| A | As a passive index strategy fund, active management decisions regarding asset class allocation or security selection do not apply nor are investment decisions regarding Component Market Factors made based on any economic or financial market outlooks. |
FUND BASICS
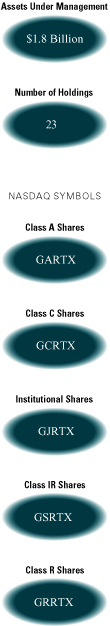
Absolute Return Tracker Fund
as of June 30, 2011
| | | | | | | | | | | | | | | | | | | |
| | | | | Goldman Sachs
| | | | Dow Jones
| | |
January 1, 2011–
| | Fund Total Return
| | Absolute Return
| | HFRX Global
| | Credit Suisse
| | |
| June 30, 2011 | | (based on NAV)1 | | Tracker Index2 | | Hedge Fund Index3 | | AllHedge Index4 | | |
|
| |
| Class A | | | 0.43 | % | | | 1.07 | % | | | -2.12 | % | | | -0.38 | % | | |
| Class C | | | 0.00 | | | | 1.07 | | | | -2.12 | | | | -0.38 | | | |
| Institutional | | | 0.54 | | | | 1.07 | | | | -2.12 | | | | -0.38 | | | |
| Class IR | | | 0.43 | | | | 1.07 | | | | -2.12 | | | | -0.38 | | | |
| Class R | | | 0.22 | | | | 1.07 | | | | -2.12 | | | | -0.38 | | | |
|
| | |
| 1 | | The net asset value (“NAV”) represents the net assets of the class of the Fund (ex-dividend) divided by the total number of shares of the class outstanding. The Fund’s performance reflects the reinvestment of dividends and other distributions. The Fund’s performance does not reflect the deduction of any applicable sales charges. |
| |
| 2 | | The Goldman Sachs Absolute Return Tracker Index is a benchmark index that seeks to replicate the investment returns of hedge fund betas (i.e., that portion of the returns of hedge funds, as a broad asset class, that results from market exposure rather than manager skill). It is not possible to invest directly in an index. |
| |
| 3 | | The HFRX Global Hedge Fund Index is designed to be representative of the overall composition of the hedge fund universe. It is comprised of all eligible hedge fund strategies, including but not limited to convertible arbitrage, distressed securities, equity hedge, equity market neutral, event driven, macro, merger arbitrage, and relative value arbitrage. The strategies are asset weighted based on the distribution of assets in the hedge fund industry. This is an investable index. |
| |
| 4 | | The Dow Jones Credit Suisse AllHedge Index (formerly known as the Credit Suisse/Tremont AllHedge Index) is an asset weighted hedge fund index derived from the market leading Dow Jones/Credit Suisse hedge fund index. The Dow Jones/Credit Suisse AllHedge Index provides a rules-based and fully investable Index. Index performance data is published on a monthly basis and the constituents are re-balanced semi-annually according to the sector weights of the Dow Jones Credit Suisse hedge fund index. It is comprised of all 10 Dow Jones Credit Suisse AllHedge Strategy Indexes. |
| |
| STANDARDIZED AVERAGE ANNUAL TOTAL RETURNS5 | |
| | | | | | | | | | | | | |
| For the period ended 6/30/11 | | One Year | | Since Inception | | Inception Date | | |
|
| |
| Class A | | | 0.62 | % | | | -3.88 | % | | 5/30/08 | | |
| Class C | | | 4.63 | | | | -2.85 | | | 5/30/08 | | |
| Institutional | | | 6.88 | | | | -1.72 | | | 5/30/08 | | |
| Class IR | | | 6.66 | | | | -1.86 | | | 5/30/08 | | |
| Class R | | | 6.15 | | | | -2.37 | | | 5/30/08 | | |
|
| | |
| 5 | | The Standardized Average Annual Total Returns are average annual total returns as of the most recent calendar quarter-end. They assume reinvestment of all distributions at NAV. These returns reflect a maximum initial sales charge of 5.5% for Class A Shares, and the assumed contingent deferred sales charge for Class C Shares (1% if redeemed within 12 months of purchase). Because Institutional, Class IR and Class R Shares do not involve a sales charge, such a charge is not applied to their Standardized Average Annual Total Returns. |
| |
| | The returns represent past performance. Past performance does not guarantee future results. The Fund’s investment return and principal value will fluctuate so that an investor’s shares, when redeemed, may be worth more or less than their original cost. Current performance may be lower or higher than the performance quoted above. Please visit our Website at www.goldmansachsfunds.com to obtain the most recent month-end returns. Performance reflects expense limitations in effect. In their absence, performance would be reduced. Returns do not reflect the deduction of taxes that a shareholder would pay on Fund distributions or the redemption of Fund shares. |
FUND BASICS
| | | | | | | | | | | |
| | | Net Expense Ratio (Current) | | Gross Expense Ratio (Before Waivers) | | |
|
| |
| Class A | | | 1.66 | % | | | 1.70 | % | | |
| Class C | | | 2.41 | | | | 2.45 | | | |
| Institutional | | | 1.26 | | | | 1.30 | | | |
| Class IR | | | 1.41 | | | | 1.45 | | | |
| Class R | | | 1.91 | | | | 1.95 | | | |
|
| | |
| 6 | | The expense ratios of the Fund, both current (net of any fee waivers or expense limitations) and before waivers (gross of any fee waivers or expense limitations) are as set forth above. The Fund’s waivers and/or expense limitations will remain in place through at least April 29, 2012, and prior to such date the investment adviser may not terminate the arrangements without the approval of the Fund’s Board of Trustees. The expense ratios set forth above may differ from the expense ratios disclosed in the Financial Highlights in this report. |
| | |
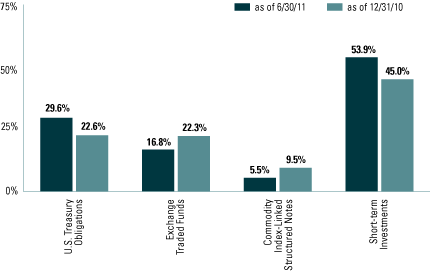
| 7 | | The percentage shown for each investment category reflects the value of investments in that category as a percentage of net assets. Figures in the above graph may not sum to 100% due to the exclusion of other assets and liabilities. The above graph depicts the Fund’s investments but may not represent the Fund’s market exposure due to the exclusion of derivatives, if any, as listed in the Additional Investment Information section of the Schedule of Investments. Short-term investments represent investments in investment companies other than those that are exchange traded and repurchase agreements. |
| |
| 8 | | “Agency Debentures” include agency securities offered by companies such as the Federal National Mortgage Association (“FNMA”) and Federal Home Loan Mortgage Corp. (“FHLMC”), which operate under a government charter. While they are required to report to a government regulator, their assets are not explicitly guaranteed by the government and they otherwise operate like any other publicly traded company. |
GOLDMAN SACHS COMMODITY STRATEGY FUND
What Differentiates the Goldman Sachs Commodity Investment Process?
At Goldman Sachs Asset Management, L.P. (GSAM), the goal of our commodity investment process is to provide consistent, strong performance by actively managing our portfolios within a research-intensive, risk-managed framework.
Goldman Sachs’ Commodity Investment Process
Our commodity investment process emphasizes the importance of both short-term, tactical opportunities and long-term investment views. Our team-based approach to managing the Fund ensures continuity and idea sharing among some of the industry’s most experienced fixed income specialists. We pursue strong, consistent performance across commodity markets through:

The Goldman Sachs Commodity Strategy Fund primarily gains exposure to the performance of the commodity markets through investment in a wholly-owned subsidiary of the Fund organized as a company under the laws of the Cayman Islands (the “Subsidiary”). The Subsidiary invests primarily in commodity-linked swaps (which may include total return swaps), as well as other commodity-linked securities and derivative instruments that provide exposure to the performance of the commodities markets, and in fixed income and debt instruments. The Fund’s portfolio is designed to provide exposure that corresponds to the investment return of assets that trade in the commodity markets without direct investment in physical commodities.
The Fund implements enhanced cash strategies that capitalize on GSAM’s global fixed income expertise. The Fixed Income Team will employ the full spectrum of capabilities offered, including bottom-up strategies (credit, mortgages, governments /municipals, high yield, and emerging markets debt) and top-down strategies (duration, cross-sector, currency and country) in an attempt to enhance the return of the Fund.
A Commodity Fund that:
| |
| n | Provides exposure to the commodity markets without direct investment in physical commodities |
| |
| n | Utilizes commodity-linked swaps that provide economic exposure to movements in commodity prices. |
PORTFOLIO RESULTS
Goldman Sachs Commodity Strategy Fund
Investment Objective
The Fund seeks long-term total return.
Portfolio Management Discussion and Analysis
Below, the Goldman Sachs Commodities Team discusses the Goldman Sachs Commodity Strategy Fund’s (the “Fund”) performance and positioning for the six-month period ended June 30, 2011 (the “Reporting Period”).
| |
| Q | How did the Fund perform during the Reporting Period? |
| |
| A | During the Reporting Period, the Fund’s Class A, C, Institutional, IR and R Shares generated cumulative total returns, without sales charges, of 5.37%, 4.94%, 5.44%, 5.42% and 5.18%, respectively. These returns compare to the 2.71% cumulative total return of the Fund’s benchmark, the S&P GSCI® (Goldman Sachs Commodity Index) (the “GSCI®”) during the same period. |
| |
| Q | What economic and market factors most influenced the commodities markets as a whole during the Reporting Period? |
| |
| A | Commodities prices benefited from strong global demand and supply disruptions in the Middle East and North Africa during the first quarter of 2011, but the gains were partially offset by heightened risk aversion in the second quarter of 2011 after economic data proved weaker than expected. The positive performance in the commodities markets, as measured by the GSCI®, for the Reporting Period as a whole coincided with a 5.86% decline in the U.S. Dollar Index, a measure of the general international value of the U.S. dollar as calculated by averaging the exchange rates between the U.S. dollar and six major world currencies, and a 6.02% gain in the S&P® 500 Index, a common measure for the broad U.S. equity market. |
| |
| Q | Of those commodity subsectors where the Fund is most heavily weighted, which were strongest during the Reporting Period? |
| |
| A | The precious metals component of the GSCI® was the strongest subsector during the Reporting Period, posting a gain of 6.51%. A weak U.S. dollar and global geopolitical risks, including Middle East and North African turmoil, supported the rise in precious metals prices. Prices for silver surged 12.41% during the Reporting Period. Gold prices rallied 5.42%, ending the Reporting Period trading at slightly more than $1,500 per ounce. |
Energy ended the Reporting Period as the second best-performing subsector in the first half of 2011 with the S&P GSCI® Energy Index up 6.30%. Energy is the heaviest weighting in the GSCI®, comprising 69.30% of the GSCI® at the end of June. As with precious metals, energy prices were boosted by Middle East and North Africa unrest and a weaker U.S. dollar. Oil prices peaked in April when Brent crude oil topped $126 per barrel. Brent crude oil and unleaded gasoline were the best performing commodities in the GSCI® during the Reporting Period, with gains of 19.83% and 19.81%, respectively. Gas Oil and Heating Oil also ended the Reporting Period higher, by 18.83% and 13.84%, respectively. WTI (West Texas Intermediate) crude oil prices fell 12.07%, and natural gas prices were down 6.60% during the Reporting Period.
| |
| Q | Which commodity subsectors were weakest during the Reporting Period? |
| |
| A | The agriculture subsector, as measured by the S&P GSCI® Agriculture Index, ended the Reporting Period down 8.58%, reversing strong gains garnered in early 2011. The decline was due primarily to increased supply expectations. Corn prices were additionally reacting to political pressure to reduce the corn-based U.S. ethanol subsidy and increased U.S. government estimates of planted acreage and inventories. The S&P GSCI® Corn Index fell 10.03% in June, but was up 4.51% for the Reporting Period overall. The S&P GSCI® Soybeans and Wheat Indices declined sharply during the Reporting Period, by 8.79% and 31.98%, respectively. Coffee was the best performing single commodity within the subsector during the Reporting Period, posting a price gain of 7.08%. |
PORTFOLIO RESULTS
The livestock subsector was also weak, down 3.13% for the Reporting Period, though, notably, it was the only GSCI® sector to post a positive return in June, rebounding from unseasonal weakness in April and May. High feed costs, signs of slacking U.S. demand and drought induced ranchers to sell off herds earlier in the year—which pressured prices, but increased export demand in the midst of diminished supplies—helped to boost prices in June.
| |
| Q | How did the industrial metals subsector perform during the Reporting Period? |
| |
| A | The S&P GSCI® Industrial Metals Index was down 1.55% during the Reporting Period on slower global growth and supply chain interruptions following Japan’s earthquake and tsunami. Weakness in nickel, zinc and copper prices was partially offset by increases in lead and aluminum prices. |
| |
| Q | What key factors were responsible for the Fund’s performance during the Reporting Period? |
| |
| A | During the Reporting Period, the Fund generated positive returns that outpaced the benchmark index. Forward roll-timing strategies in crude oil contributed most to the Fund’s relative returns during the Reporting Period, as near-month crude futures underperformed deferred futures. (The GSCI® holds exposure to commodities solely in near-month futures contracts.) |
| |
| Q | How did the Fund’s enhanced roll-timing strategies add value overall to the Fund’s returns? |
| |
| A | Our enhanced roll-timing strategies added value to the Fund via exposure to swaps. We employ an approach whereby we do not take active views on individual commodities but rather gain Fund exposure to commodities through investments whose performance is linked to commodity indices. |
We often implement commodity roll-timing strategies by deviating from the GSCI® roll convention, which typically calls for rolling forward exposure at the front, or near- month, end of the futures curve on a monthly basis. The roll occurs during business days 5 through 9. To the extent our team believes fundamental or technical developments will impact the futures roll-timing decision, we will incorporate those views into the portfolio by electing to roll positions earlier, later, forward or in different weights versus the GSCI® roll. Roll-timing strategies employed may include 1) alternative roll date modifications, which avoid the market impact of plain vanilla GSCI® rolls during business days 5 to 9; 2) forward exposure roll modifications, which avoid the market impact of plain vanilla GSCI® rolls and move exposure out the curve to mitigate the returns impact often associated with persistent contango; and 3) seasonal roll modifications, which take advantage of seasonal relationships in commodity markets to increase returns. (Contango is defined as a common market condition in which futures prices get progressively higher in the distant delivery months, often reflecting carrying costs.) During the Reporting Period, we employed a forward roll-timing strategy that rolled commodity exposures underlying the GSCI® a few months out on the futures curve instead of rolling at the very front of the futures curve.
| |
| Q | How did you implement the Fund’s enhanced cash management strategy? |
| |
| A | In addition to seeking value through management of the commodities portion of the Fund’s portfolio, we also attempt to add excess return through thoughtful management of collateral held in the Fund. The cash portion of the Fund’s portfolio may be allocated to collateral that includes U.S. Treasury securities, agency debentures, mortgage-backed securities, corporate bonds and other fixed income instruments. During the Reporting Period, long exposure to agency mortgage-backed securities in June contributed positively to the Fund’s performance, as spreads, or the differential in yields between these securities and duration-equivalent U.S. Treasuries, tightened sharply at the end of the Reporting Period as investors generally shifted their preference back toward risk assets. |
| |
| Q | How did the Fund use derivatives and similar instruments during the Reporting Period? |
| |
| A | As mentioned earlier in some detail, the Fund used derivatives, including interest rate swaps and total return swaps, in implementing our enhanced roll-timing strategies in order to gain exposure to the commodities markets. The Fund also used futures on an opportunistic basis during the Reporting Period. In implementing our enhanced cash management strategy, the Fund used TBAs, a derivative used in purchasing a future issuance of agency mortgage-backed securities. |
PORTFOLIO RESULTS
| |
| Q | Did you make any changes in the Fund’s strategy or allocations during the Reporting Period? |
| |
| A | The Fund continued to hold exposure to the commodities markets primarily in the form of swaps linked to the GSCI®. During the Reporting Period, the Fund moved all exposure to commodity markets six months forward on the futures curve versus the benchmark index. One of the main reasons for forward positioning was our view on crude oil. We expected near-term futures to underperform longer-dated futures because of persistently high—and rising—inventories at the physical delivery point for WTI futures. |
| |
| Q | How was the Fund positioned at the end of the Reporting Period? |
| |
| A | At the end of the Reporting Period, the Fund’s overall commodity positioning was generally in line with the weightings of the GSCI®. As described earlier, the Fund employed forward roll-timing strategies, whereby the Fund was positioned further out on the futures curve than the plain vanilla GSCI® rolls. At the end of the Reporting Period, the Fund held exposure to the commodities underlying the GSCI® through six-month forward roll swaps in the Subsidiary and held no commodity exposure at the front of the underlying futures curve. (The Subsidiary has the same objective as the Fund but unlike the Fund may invest without limitation in commodity index-linked securities, such as swaps and futures, that provide exposure to the performance of the commodity markets.) |
The cash portion of the Fund’s portfolio was allocated across various fixed income sectors, with an emphasis on the higher quality, lower volatility segments of the market, such as U.S. government and government-sponsored bonds.
| |
| Q | What is the Fund’s tactical view and strategy going forward? |
| |
| A | We are constructive in our view for the commodities markets as a whole over both the near term and the long term, as we believe geopolitical, demographic, economic and other trends should support higher prices across much of the commodities complex. We believe increasing demand from emerging economies for commodities such as oil and industrial metals as well as constrained supply in select commodity markets creates a bullish backdrop for the sector. |
FUND BASICS
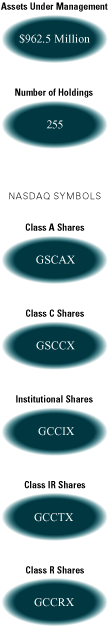
Commodity Strategy Fund
as of June 30, 2011
| | | | | | | | | | | |
January 1, 2011–
| | Fund Total Return
| | | | |
| June 30, 2011 | | (based on NAV)1 | | S&P GSCI2 | | |
|
| |
| Class A | | | 5.37 | % | | | 2.71 | % | | |
| Class C | | | 4.94 | | | | 2.71 | | | |
| Institutional | | | 5.44 | | | | 2.71 | | | |
| Class IR | | | 5.42 | | | | 2.71 | | | |
| Class R | | | 5.18 | | | | 2.71 | | | |
|
| | |
| 1 | | The net asset value (“NAV”) represents the net assets of the class of the Fund (ex-dividend) divided by the total number of shares of the class outstanding. The Fund’s performance reflects the reinvestment of dividends and other distributions. The Fund’s performance does not reflect the deduction of any applicable sales charges. |
| |
| 2 | | The S&P GSCI is a composite index of commodity sector returns, representing an unleveraged, long-only investment in commodity futures that is broadly diversified across the spectrum of commodities. Individual components qualify for inclusion in the GSCI on the basis of liquidity and are weighted by their respective world production quantities. The Index is unmanaged and the figures for the Index do not include any deduction for fees, expenses or taxes. It is not possible to invest directly in an index. |
| |
| STANDARDIZED AVERAGE ANNUAL TOTAL RETURNS3 | |
| | | | | | | | | | | | | |
| For the period ended 6/30/11 | | One Year | | Since Inception | | Inception Date | | |
|
| |
| Class A | | | 21.78 | % | | | -4.96 | % | | 3/30/07 | | |
| Class C | | | 25.49 | | | | -4.68 | | | 3/30/07 | | |
| Institutional | | | 28.04 | | | | -3.65 | | | 3/30/07 | | |
| Class IR | | | 27.72 | | | | -8.58 | | | 11/30/07 | | |
| Class R | | | 27.20 | | | | -9.06 | | | 11/30/07 | | |
|
| | |
| 3 | | The Standardized Average Annual Total Returns are average annual total returns as of the most recent calendar quarter-end. They assume reinvestment of all distributions at NAV. These returns reflect a maximum initial sales charge of 4.5% for Class A Shares and the assumed contingent deferred sales charge for Class C Shares (1% if redeemed within 12 months of purchase). Because Institutional, Class IR and Class R Shares do not involve a sales charge, such a charge is not applied to their Standardized Average Annual Total Returns. |
| |
| | The returns represent past performance. Past performance does not guarantee future results. The Fund’s investment return and principal value will fluctuate so that an investor’s shares, when redeemed, may be worth more or less than their original cost. Current performance may be lower or higher than the performance quoted above. Please visit our Website at www.goldmansachsfunds.com to obtain the most recent month-end returns. Performance reflects fee waivers and expense limitations in effect. In their absence, performance would be reduced. Returns do not reflect the deduction of taxes that a shareholder would pay on Fund distributions or the redemption of Fund shares. |
FUND BASICS
| | | | | | | | | | | |
| | | Net Expense Ratio (Current) | | Gross Expense Ratio (Before Waivers) | | |
|
| |
| Class A | | | 0.97 | % | | | 1.12 | % | | |
| Class C | | | 1.72 | | | | 1.87 | | | |
| Institutional | | | 0.63 | | | | 0.78 | | | |
| Class IR | | | 0.72 | | | | 0.87 | | | |
| Class R | | | 1.22 | | | | 1.37 | | | |
|
| | |
| 4 | | The expense ratios of the Fund, both current (net of any fee waivers or expense limitations) and before waivers (gross of any fee waivers or expense limitations) are as set forth above. The Fund’s waivers and/or expense limitations will remain in place through at least April 29, 2012, and prior to such date the investment adviser may not terminate the arrangements without the approval of the Fund’s Board of Trustees. The expense ratios set forth above may differ from the expense ratios disclosed in the Financial Highlights in this report. |
| | |
| 5 | | The percentage shown for each investment category reflects the value of investments in that category as a percentage of net assets. Figures in the above graph may not sum to 100% due to the exclusion of other assets and liabilities. The above graph depicts the Fund’s investments but may not represent the Fund’s market exposure due to the exclusion of derivatives, if any, as listed in the Additional Investment Information section of the Schedule of Investments. Short-term investments represent investments in investment companies other than those that are exchange traded. |
| |
| 6 | | “Federal Agencies” are mortgage-backed securities guaranteed by the Government National Mortgage Association (“GNMA”), Federal National Mortgage Association (“FNMA”) and Federal Home Loan Mortgage Corp. (“FHLMC”). GNMA instruments are backed by the full faith and credit of the United States Government. |
| |
| 7 | | “Government Guarantee Obligations” are guaranteed under the Federal Deposit Insurance Corporation’s (“FDIC”) Temporary Liquidity Guarantee Program and are backed by the full faith and credit of the United States. The expiration date of the FDIC’s guarantee is the earlier of the maturity date of the debt or June 30, 2012. |
| |
| 8 | | “Agency Debentures” include agency securities offered by companies such as FNMA and FHLMC, which operate under a government charter. While they are required to report to a government regulator, their assets are not explicitly guaranteed by the government and they otherwise operate like any other publicly traded company. |
PORTFOLIO RESULTS
Goldman Sachs Dynamic Allocation Fund
Investment Objective
The Fund seeks long-term capital appreciation.
Portfolio Management Discussion and Analysis
Below, the Goldman Sachs Quantitative Investment Strategies Team discusses the Goldman Sachs Dynamic Allocation Fund’s (the “Fund”) performance and positioning for the six-month period ended June 30, 2011 (the “Reporting Period”).
| |
| Q | How did the Fund perform during the Reporting Period? |
| |
| A | During the Reporting Period, the Fund’s Class A, C, Institutional, IR and R Shares generated cumulative total returns, without sales charges, of 2.75%, 2.29%, 2.93%, 2.84% and 2.57%, respectively. These returns compare to the 0.15%, 6.02% and 2.72% cumulative total returns of the Fund’s benchmarks, the Bank of America Merrill Lynch USD LIBOR 1-Month Constant Maturity Index (LUS1) (the “LIBOR 1-Month Index”), Standard & Poor’s 500 Index (with dividends reinvested) (the “S&P 500 Index”) and the Barclays Capital U.S. Aggregate Bond Index, respectively, during the same time period. |
A blended composite, comprised 40% of the S&P® 500 Index, 20% of the MSCI EAFE Index and 40% of the Barclays Capital U.S. Aggregate Bond Index, representing a traditional balanced portfolio, returned 4.75% during the same period.
Importantly, the Fund’s overall volatility was 8.28% during the Reporting Period, well within its target long-term volatility range of 8% to 10%.
| |
| Q | What strategic, risk-based factors were responsible for the Fund’s performance during the Reporting Period? |
| |
| A | The Fund seeks to achieve its investment objective by investing primarily in exchange-traded funds (“ETFs”), futures, swaps and other derivatives that provide exposure to a broad spectrum of asset classes, including but not limited to equities (both in U.S. and non-U.S. companies), fixed income (U.S. and non-U.S., investment grade and high yield) and commodities. Our team manages the Fund dynamically by changing its allocations to these asset classes based on our tactical views and in response to changing market conditions. Our team uses a disciplined, rigorous and quantitative approach in allocation to the asset classes in which the Fund invests. Allocations are adjusted within the Fund at least monthly based on continuous analysis to help determine which investments are relatively attractive and provide the best opportunities for growth in any given period of time. Since the markets represented by each investment are constantly changing, so are the Fund’s allocations. |
Overall, the Fund’s strategic, risk-based allocations returned a net gain during the Reporting Period. The Fund’s top three strategic, risk-based contributors were U.S. Treasury inflation-protected securities (TIPS), U.S. large-cap equities and U.S. investment grade fixed income, respectively. Commodities was the only asset class among the Fund’s strategic, risk-based allocations to yield a negative return during the Reporting Period.
| |
| Q | How did the Goldman Sachs Market Sentiment Indicator factor into risk allocation decisions that were made during the Reporting Period? |
| |
| A | The Goldman Sachs Market Sentiment Indicator (“MSI”) is a proprietary tool that analyzes how the markets will potentially respond to future global changes in financial, economic and sociopolitical events. With the help of the MSI, the Fund seeks to mitigate risk in unstable markets by reducing volatility. |
Throughout the Reporting Period, the MSI indicated relatively benign levels of market turbulence. MSI levels rose slightly in March following the Japanese earthquake and tsunami and subsequent nuclear crisis, but declined again over the remainder of the Reporting Period. The MSI never approached a threshold that would trigger a systematic, active reduction in overall portfolio risk.
PORTFOLIO RESULTS
| |
| Q | What tactical allocation decisions were the primary contributors to and detractors from performance during the Reporting Period? |
| |
| A | For the Reporting Period overall, the Fund’s tactical allocations modestly detracted from its performance. The Fund’s underweighted positions in U.S. high yield corporate bonds, U.S. small-cap equities and international fixed income detracted most from returns during the Reporting Period. However, this was partially offset by the positive impact of the Fund’s top three tactical contributors to results, which were overweighted positions in U.S. large-cap equities, U.S. investment grade fixed income and emerging market equities, respectively. |
| |
| Q | How did the Fund use derivatives and similar instruments during the Reporting Period? |
| |
| A | The Fund invested in futures and credit default swaps to achieve exposure to equities (both in U.S. and non-U.S. companies) and fixed income (U.S. and non-U.S., investment grade and high yield) during the Reporting Period. The Fund also used commodity index-linked structured notes to gain exposure to commodities. |
| |
| Q | What changes did you make within the Fund during the Reporting Period? |
| |
| A | During the Reporting Period, the greatest change made was a relatively sharp increase in the Fund’s overweight to emerging market equities. We made this change entering the second quarter of 2011 based on strong short-term momentum within the asset class as well as attractive valuations from a longer-term perspective despite a recent rally. The Fund’s overall weightings at that point also reflected our bullish outlook on U.S. investment grade fixed income, as it appeared attractive based on both longer-term momentum and value. Additionally, our negative views on international fixed income and high yield corporate bonds were a result of weak momentum at the end of the first quarter. U.S. small-cap stocks also appeared relatively expensive, which contributed to our bearish view on the asset class entering the second quarter. In commodities, we remained bullish given short-term momentum over the first quarter, but slightly reduced this view as valuations looked relatively less attractive than other asset classes. |
| |
| Q | What is the Fund’s tactical asset allocation view and strategy for the months ahead? |
| |
| A | At the end of June 2011, the Fund’s largest overweight was in U.S. large-cap equities, a tactical view driven by what we believe are attractive longer-term valuations and strong momentum. The Fund also had an overweighted exposure to emerging market equities, as they appeared less expensive relative to other asset classes represented in the Fund. We were also bullish at the end of the Reporting Period on U.S. investment grade fixed income, a position that reflects both what we believe are attractive valuations and strong recent momentum. Conversely, we were relatively bearish on international fixed income due to weak momentum and what we believe are relatively expensive valuations. The Fund also held an underweighted position in international equities primarily given weak momentum moving into the third quarter of 2011. Lastly, we were bearish on commodities for the months ahead, a reversal of our views in the prior Reporting Period, as commodities appeared relatively expensive and ranked poorly in momentum compared to other asset classes represented in the Fund. |
We continue to believe that the Fund’s dynamic allocation approach is important because it can adapt to changing markets, seeking what we believe are the best opportunities for investment and attempting to mitigate risk when the markets become unstable.
FUND BASICS
Dynamic Allocation Fund
as of June 30, 2011
| | | | | | | | | | | | | | | | | | | |
| | | | | | | | | Barclays Capital
| | |
January 1, 2011–
| | Fund Total Return
| | LIBOR 1-Month
| | | | US Aggregate
| | |
| June 30, 2011 | | (based on NAV)1 | | Index2 | | S&P 500 Index3 | | Bond Index4 | | |
|
| |
| Class A | | | 2.75 | % | | | 0.15 | % | | | 6.02 | % | | | 2.72 | % | | |
| Class C | | | 2.29 | | | | 0.15 | | | | 6.02 | | | | 2.72 | | | |
| Institutional | | | 2.93 | | | | 0.15 | | | | 6.02 | | | | 2.72 | | | |
| Class IR | | | 2.84 | | | | 0.15 | | | | 6.02 | | | | 2.72 | | | |
| Class R | | | 2.57 | | | | 0.15 | | | | 6.02 | | | | 2.72 | | | |
|
| | |
| 1 | | The net asset value (“NAV”) represents the net assets of the class of the Fund (ex-dividend) divided by the total number of shares of the class outstanding. The Fund’s performance reflects the reinvestment of dividends and other distributions. The Fund’s performance does not reflect the deduction of any applicable sales charges. |
| |
| 2 | | The Bank of America Merrill Lynch US Dollar 1-Month LIBOR Constant Maturity Index tracks the performance of a synthetic asset paying Libor to a stated maturity. The Index is based on the assumed purchase at par of a synthetic instrument having exactly its stated maturity and with a coupon equal to that day’s fixing rate. That issue is assumed to be sold the following business day (priced at a yield equal to the current day fixing rate) and rolled into a new instrument. |
| |
| 3 | | The S&P 500 Index is an unmanaged index of 500 common stock prices. The Index is unmanaged and the figures for the Index do not include any deduction for fees, expenses or taxes. It is not possible to invest directly in an index. |
| |
| 4 | | The Barclays Capital U.S. Aggregate Bond Index represents an unmanaged diversified portfolio of fixed income securities, including U.S. Treasuries, investment-grade corporate bonds, and mortgage backed and asset-backed securities. The Index figures do not reflect any deduction for fees, expenses or taxes. It is not possible to invest directly in an index. |
| |
| STANDARDIZED AVERAGE ANNUAL TOTAL RETURNS5 | |
| | | | | | | | | | | | | |
| For the period ended 6/30/11 | | One Year | | Since Inception | | Inception Date | | |
|
| |
| Class A | | | 6.83 | % | | | 2.81 | % | | 1/5/10 | | |
| Class C | | | 11.16 | | | | 6.00 | | | 1/5/10 | | |
| Institutional | | | 13.45 | | | | 7.25 | | | 1/5/10 | | |
| Class IR | | | 13.26 | | | | 7.05 | | | 1/5/10 | | |
| Class R | | | 12.66 | | | | 6.53 | | | 1/5/10 | | |
|
| | |
| 5 | | The Standardized Average Annual Total Returns are average annual total returns as of the most recent calendar quarter-end. They assume reinvestment of all distributions at NAV. These returns reflect a maximum initial sales charge of 5.5% for Class A Shares and the assumed contingent deferred sales charge for Class C Shares (1% if redeemed within 12 months of purchase). Because Institutional, Class IR and Class R Shares do not involve a sales charge, such a charge is not applied to their Standardized Average Annual Total Returns. |
| |
| | The returns represent past performance. Past performance does not guarantee future results. The Fund’s investment return and principal value will fluctuate so that an investor’s shares, when redeemed, may be worth more or less than their original cost. Current performance may be lower or higher than the performance quoted above. Please visit our Website at www.goldmansachsfunds.com to obtain the most recent month-end returns. Performance reflects expense limitations in effect. In their absence, performance would be reduced. Returns do not reflect the deduction of taxes that a shareholder would pay on Fund distributions or the redemption of Fund shares. |
FUND BASICS
| | | | | | | | | | | |
| | | Net Expense Ratio (Current) | | Gross Expense Ratio (Before Waivers) | | |
|
| |
| Class A | | | 1.53 | % | | | 1.86 | % | | |
| Class C | | | 2.28 | | | | 2.61 | | | |
| Institutional | | | 1.13 | | | | 1.46 | | | |
| Class IR | | | 1.28 | | | | 1.61 | | | |
| Class R | | | 1.78 | | | | 2.11 | | | |
|
| | |
| 6 | | The expense ratios of the Fund, both current (net of any fee waivers or expense limitations) and before waivers (gross of any fee waivers or expense limitations) are as set forth above. The Fund’s waivers and/or expense limitations will remain in place through at least April 29, 2012, and prior to such date the investment adviser may not terminate the arrangements without the approval of the Fund’s Board of Trustees. The expense ratios set forth above may differ from the expense ratios disclosed in the Financial Highlights in this report. |
| | |
| 7 | | The Fund is actively managed and, as such, its composition may differ over time. The percentage shown for each investment category reflects the value of investments in that category as a percentage of net assets. Figures in the above graph may not sum to 100% due to the exclusion of other assets and liabilities. The above graph depicts the Fund’s investments but may not represent the Fund’s market exposure due to the exclusion of derivatives, if any, as listed in the Additional Investment Information section of the Schedule of Investments. Short-term investments represent investments in investment companies other than those that are exchange traded. |
GOLDMAN SACHS REAL ESTATE SECURITIES FUNDS
What Differentiates the Goldman Sachs
Real Estate Securities Investment Process?
The Goldman Sachs International Real Estate Securities and Real Estate Securities Funds seek to generate long-term growth of capital and dividend income by investing primarily in real estate industry companies, including REITs, on an international or domestic basis, respectively. REITs which offer daily liquidity have historically strong returns, low volatility and low correlation to traditional asset classes.
Goldman Sachs’ Real Estate Securities Investment Process
Buy high quality companies.
We seek to purchase those companies that combine the best market exposures, management teams, capital structures and growth prospects.
Buy at a reasonable price.
We seek to consistently select securities that are trading at discounts to their intrinsic value.
Diversification reduces risk.
We seek to diversify the portfolio holdings based on property type and geographic markets to manage risk without compromising returns.
Team Based:
Portfolio decisions are made by the entire team.
Continuous Scrutiny:
Market, industry and company developments are reviewed daily.
Fundamental Analysis:
Portfolio holdings are determined by the risk/reward characteristics of an issuer and the team’s conviction in the overall business and management’s ability to create value.
Real estate securities portfolio that:
| |
| n | is a high quality portfolio that is strategically positioned for long-term growth potential |
| n | is a result of bottom-up stock selection with a focus on long-term investing |
PORTFOLIO RESULTS
Goldman Sachs International Real Estate Securities Fund
Investment Objective
The Fund seeks total return comprised of long-term growth of capital and dividend income.
Portfolio Management Discussion and Analysis
Below, the Goldman Sachs Real Estate Securities Investment Team discusses the Goldman Sachs International Real Estate Securities Fund’s (the “Fund”) performance and positioning for the six-month period ended June 30, 2011 (the “Reporting Period”).
| |
| Q | How did the Fund perform during the Reporting Period? |
| |
| A | During the Reporting Period, the Fund’s Class A, C, Institutional and IR Shares generated cumulative total returns, without sales charges, of 2.10%, 1.55%, 2.37% and 2.26%, respectively. These returns compare to the 3.35% cumulative total return of the Fund’s benchmark, the FTSE EPRA/NAREIT Developed ex-US Real Estate Index (with dividends reinvested) (the “Real Estate Index”) during the same period. |
| |
| Q | What economic and market factors most influenced the international real estate securities market as a whole during the Reporting Period? |
| |
| A | For the Reporting Period overall, the international real estate securities market, as measured by the Real Estate Index, lagged the broad international equity market, as measured by the MSCI EAFE® Index (net), by slightly more than 1.50 percentage points. The United Kingdom was the strongest absolute performer during the Reporting Period, driven by its retail sector and by numerous companies reporting earnings and other numbers that were stronger than expected. Conversely, Japan had the worst absolute performance, as an earthquake and tsunami led to a significant decline in all local equity markets within the nation and created investor concern over the impact of the disasters and the consequent economic slowdown on the real estate sector. |
| |
| Q | What key factors were responsible for the Fund’s performance during the Reporting Period? |
| |
| A | The Fund underperformed the Real Estate Index during the Reporting Period due primarily to security selection in China, Singapore and the United Kingdom, which detracted from results. Only partially offsetting these factors were effective stock selection in Australia and Japan, which contributed positively to the Fund’s relative returns during the Reporting Period. |
| |
| Q | What were some of the Fund’s best-performing individual holdings? |
| |
| A | The Fund’s position in Hong Kong shopping mall operator Hang Lung Properties, which rebounded from prior weakness, was a strong contributor to results during the Reporting Period. Shares of Hang Lung Properties rose as investors anticipated that tax reforms on luxury items and a reduction in income tax brackets would drive an increase in discretionary spending. In addition, there was positive sentiment around commercial real estate operators that were not under government property tightening policies as it was felt they would have a comparative advantage over residential developers. |
During the Reporting Period, stock selection was strongest in Australia due primarily to the Fund’s positioning in retail REIT CFS Retail Property Trust. CFS Retail Property Trust was a new addition to the Fund’s portfolio during the Reporting Period. Shares of CFS Retail Property Trust rose due to the company’s high quality portfolio, which operated near full occupancy, with diversified exposure across most retail asset classes. In our view, CFS Retail Property Trust also has an effective management team that has been strengthening the company’s balance sheet and consistently beating guidance.
PORTFOLIO RESULTS
Canadian office REIT Allied Properties REIT was another of the Fund’s best-performing holdings during the Reporting Period, having rebounded from prior weakness. Shares of Allied Properties struggled during the first quarter of 2011 as the market was concerned with the increasing vacancies in their properties. Since then, however, management appears to have made excellent progress in filling the vacated space at attractive rents, and its stock rose accordingly.
| |
| Q | Which positions detracted significantly from the Fund’s performance during the Reporting Period? |
| |
| A | Chinese residential property company KWG Property Holding was a major detractor from the Fund’s results relative to its benchmark index during the Reporting Period. KWG Property Holding performed poorly due to worries about a global economic slowdown and a tighter lending environment. However, we held the position in the Fund, as we maintained conviction in the company. In our view, KWG Property Holding has a high level of cash on its balance sheet, a strong management team and contracted sales that are on track with projections. In addition, we considered the company to be trading at an attractive valuation supported by high quality land with good replacement value. |
The Fund’s holding in Hong Kong diversified real estate company Sun Hung Kai Properties was another detractor from performance during the Reporting Period. Similar to KWG Property Holding, Sun Hung Kai Properties’ shares underperformed the Real Estate Index on the back of tightening measures on the housing market by the Hong Kong government. We maintained the Fund’s position in the company, however, as we believe its diversified rental stream should provide strong support to value going forward.
The Fund’s underweighted position in RioCan, Canada’s largest REIT, detracted from results, as the retail company performed strongly during the Reporting Period. RioCan benefited from a recovery in retail sales given employment growth and rising consumer confidence.
| |
| Q | How did the Fund use derivatives and similar instruments during the Reporting Period? |
| |
| A | The Fund did not use derivatives during the Reporting Period. |
| |
| Q | Did the Fund make any significant purchases or sales during the Reporting Period? |
| |
| A | As mentioned earlier, during the Reporting Period, we initiated a Fund position in Australian REIT CFS Retail Property Trust. In our view, CFS Retail Property Trust has a high quality portfolio, as demonstrated through near full occupancy with diversified exposure across most retail asset classes. In addition, we believe CFS Retail Property Trust has an effective management team that has been strengthening the company’s balance sheet and consistently beating guidance. |
We added to the Fund’s position in Singapore diversified REIT CapitaLand, which had underperformed due to concerns over the Chinese government’s actions to curb property prices. We believed that worries over this topic were overblown, as Chinese residential exposure is a small portion of CapitaLand’s portfolio and the company, in our view, has a solid development pipeline. Additionally, in the short term, CapitaLand should benefit, we believe, from a shift of Japanese capital abroad.
We exited the Fund’s position in Hong Kong diversified real estate company Wharf Holdings during the Reporting Period, as the stock had approached our price target. Shares of Wharf Holdings rose as its portfolio of prime retail properties benefited from strong tourism and retail sales.
We sold the Fund’s position in Singapore REIT CDL Hospitality Trust to pursue what we considered more attractive opportunities elsewhere. We believed that CDL Hospitality Trust’s valuations were stretched and that it was likely to face operating cost pressures in the near future.
| |
| Q | Were there any changes made in the Fund’s investment strategy during the Reporting Period? |
| |
| A | In constructing the Fund’s portfolio, we focus on picking securities rather than on making regional, country or subsector bets. We seek to outpace the benchmark index by overweighting stocks that we expect to outperform and underweighting those that we think may lag. Consequently, changes in its regional or subsector weights are generally the direct result of individual stock selection or of real estate securities’ appreciation or depreciation. That said, during the Reporting Period, the Fund’s exposure to China, Canada and Japan increased relative to the Real Estate Index. The Fund’s exposure to Singapore, Australia and the Netherlands relative to the benchmark index decreased. |
PORTFOLIO RESULTS
| |
| Q | How was the Fund positioned relative to its benchmark index at the end of the Reporting Period? |
| |
| A | From a country perspective, the Fund was overweighted relative to the Real Estate Index in China, France, Norway and Poland and underweighted relative to the Real Estate Index in Singapore, the Netherlands, Sweden, Germany, the United Kingdom and Australia at the end of the Reporting Period. The Fund was rather neutrally weighted compared to the Real Estate Index in most other constituent countries of the Real Estate Index at the end of June 2011. |
| |
| Q | What is the Fund’s tactical view and strategy for the months ahead? |
| |
| A | Global real estate securities have experienced a significant rally during the past couple of years, as companies once priced for bankruptcy during the credit crisis were able to tap the capital markets to reduce leverage. As a result, we believe that management teams of REITs and public real estate companies are likely to now shift their strategy from balance sheet repair to growth through acquisition, using their financing advantage over the private real estate sector to acquire distressed assets. REITs should also, in our view, be able to grow internally, as rents in high quality properties rise and improvements on existing assets are made. More broadly, we believe the real estate sector may well benefit as investors search for an attractive relative yield in a still low interest rate environment. |
While the real estate sector had many positive attributes at the end of the Reporting Period, we do acknowledge that current market conditions include risks as well, as macroeconomic and political events can swing sentiment dramatically and the broad direction of some of the developed economies over the near term is unclear. As fundamental, bottom-up investors, we believe we are seeing opportunities that go beyond the headline risks associated with certain regions. We intend to continue to focus our approach on those companies that have recapitalized their balance sheets and that possess quality attributes, such as a robust business model, a high quality asset exposure, and a strong management team.
FUND BASICS
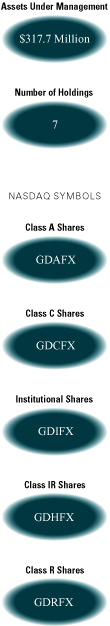
International Real Estate Securities Fund
as of June 30, 2011
| | | | | | | | | | | |
January 1, 2011–
| | Fund Total Return
| | FTSE EPRA/NAREIT Developed
| | |
| June 30, 2011 | | (based on NAV)1 | | ex-US Real Estate Index (Gross)2 | | |
|
| |
| Class A | | | 2.10 | % | | | 3.35 | % | | |
| Class C | | | 1.55 | | | | 3.35 | | | |
| Institutional | | | 2.37 | | | | 3.35 | | | |
| Class IR | | | 2.26 | | | | 3.35 | | | |
|
| | |
| 1 | | The net asset value (“NAV”) represents the net assets of the class of the Fund (ex-dividend) divided by the total number of shares of the class outstanding. The Fund’s performance reflects the reinvestment of dividends and other distributions. The Fund’s performance does not reflect the deduction of any applicable sales charges. |
| |
| 2 | | The FTSE EPRA/NAREIT Developed ex-US Real Estate Index (Gross) is a market capitalization weighted index comprised of REITs and non-REITs within the international (global ex us) real estate securities market. The market capitalization for each constituent is adjusted for free float. It is not possible to invest directly in an index. |
| |
| STANDARDIZED AVERAGE ANNUAL TOTAL RETURNS3 | |
| | | | | | | | | | | | | |
| For the period ended 6/30/11 | | One Year | | Since Inception | | Inception Date | | |
|
| |
| Class A | | | 23.65 | % | | | -3.95 | % | | 7/31/06 | | |
| Class C | | | 28.77 | | | | -3.53 | | | 7/31/06 | | |
| Institutional | | | 31.55 | | | | -2.71 | | | 7/31/06 | | |
| Class IR | | | 31.23 | | | | -9.54 | | | 11/30/07 | | |
|
| | |
| 3 | | The Standardized Average Annual Total Returns are average annual total returns as of the most recent calendar quarter-end. They assume reinvestment of all distributions at NAV. These returns reflect a maximum initial sales charge of 5.5% for Class A Shares and the assumed contingent deferred sales charge for Class C Shares (1% if redeemed within 12 months of purchase). Because Institutional and Class IR Shares do not involve a sales charge, such a charge is not applied to their Standardized Average Annual Total Returns. |
| |
| | The returns represent past performance. Past performance does not guarantee future results. The Fund’s investment return and principal value will fluctuate so that an investor’s shares, when redeemed, may be worth more or less than their original cost. Current performance may be lower or higher than the performance quoted above. Please visit our Website at www.goldmansachsfunds.com to obtain the most recent month-end returns. Performance reflects fee waivers and expense limitations in effect. In their absence, performance would be reduced. Returns do not reflect the deduction of taxes that a shareholder would pay on Fund distributions or the redemption of Fund shares. |
| | | | | | | | | | | |
| | | Net Expense Ratio (Current) | | Gross Expense Ratio (Before Waivers) | | |
|
| |
| Class A | | | 1.52 | % | | | 1.62 | % | | |
| Class C | | | 2.27 | | | | 2.37 | | | |
| Institutional | | | 1.12 | | | | 1.22 | | | |
| Class IR | | | 1.27 | | | | 1.37 | | | |
|
| | |
| 4 | | The expense ratios of the Fund, both current (net of any fee waivers or expense limitations) and before waivers (gross of any fee waivers or expense limitations) are as set forth above. The Fund’s waivers and/or expense limitations will remain in place through at least April 29, 2012, and prior to such date the investment adviser may not terminate the arrangements without the approval of the Fund’s Board of Trustees. The expense ratios set forth above may differ from the expense ratios disclosed in the Financial Highlights in this report. |
FUND BASICS
| |
| TOP TEN HOLDINGS AS OF 6/30/115 | |
| | | | | | | | | | | |
| | | % of Total
| | | | | | |
| Holding | | Net Assets | | Line of Business | | Country | | |
|
| |
| Sun Hung Kai Properties Ltd. | | | 7.6 | % | | Diversified | | Hong Kong | | |
| CapitaLand Ltd. | | | 5.2 | | | Residential | | Singapore | | |
| Unibail-Rodamco SE (REIT) | | | 4.6 | | | Diversified | | France | | |
| Mitsui Fudosan Co. Ltd. | | | 4.0 | | | Office | | Japan | | |
| Mitsubishi Estate Co. Ltd. | | | 4.0 | | | Diversified | | Japan | | |
| CFS Retail Property Trust (REIT) | | | 4.0 | | | Retail | | Australia | | |
| Hang Lung Properties Ltd. | | | 3.7 | | | Retail | | Hong Kong | | |
| Westfield Group (REIT) | | | 3.4 | | | Retail | | Australia | | |
| Henderson Land Development Co. Ltd. | | | 3.3 | | | Diversified | | Hong Kong | | |
| China Resources Land Ltd. Class H | | | 3.1 | | | Diversified | | China | | |
|
| | |
| 5 | | The top 10 holdings may not be representative of the Fund’s future investments. |
| |
| FUND VS. BENCHMARK SECTOR ALLOCATION6 | |
As of June 30, 2011
| | |
| 6 | | The Fund is actively managed and, as such, its composition may differ over time. Consequently, the Fund’s overall industry sector allocations may differ from percentages contained in the graph above. The percentage shown for each investment category reflects the value of investments in that category as a percentage of market value. The above graph depicts the Fund’s investments but may not represent the Fund’s market exposure due to the exclusion of derivatives, if any, as listed in the Additional Investment Information section of the Schedule of Investments. Short-term investments represent investments in investment companies other than those that are exchange traded. |
PORTFOLIO RESULTS
Goldman Sachs Real Estate Securities Fund
Investment Objective
The Fund seeks total return comprised of long-term growth of capital and dividend income.
Portfolio Management Discussion and Analysis
Below, the Goldman Sachs Real Estate Securities Investment Team discusses the Goldman Sachs Real Estate Securities Fund’s (the “Fund”) performance and positioning for the six-month period ended June 30, 2011 (the “Reporting Period”).
| |
| Q | How did the Fund perform during the Reporting Period? |
| |
| A | During the Reporting Period, the Fund’s Class A, B, C, Institutional, Service, IR and R Shares generated cumulative total returns, without sales charges, of 10.22%, 9.80%, 9.83%, 10.55%, 10.17%, 10.34% and 10.13%, respectively. These returns compare to the 10.72% cumulative total return of the Fund’s benchmark, the Wilshire Real Estate Securities Index (with dividends reinvested) (the “Wilshire Index”) during the same period. |
| |
| Q | What economic and market factors most influenced the U.S. real estate securities market as a whole during the Reporting Period? |
| |
| A | For the Reporting Period overall, the U.S. real estate securities market, as measured by the Wilshire Index, outpaced the broad equity market, as measured by the S&P 500® Index, by more than 4.50 percentage points. The multifamily subsector was the top performer during the Reporting Period, driven by strong rental trends, fundamentals that continued to beat expectations and limited supply. Conversely, the hotel subsector was the worst performer within the Wilshire Index during the Reporting Period. As the hotel subsector is highly sensitive to macroeconomic conditions, it was negatively impacted by concerns over an economic slowdown. |
| |
| Q | What key factors were responsible for the Fund’s performance during the Reporting Period? |
| |
| A | The Fund only modestly underperformed the Wilshire Index during the Reporting Period as effective stock selection in the office, multifamily and industrial real estate subsectors, which contributed positively to relative returns, was just more than offset by weaker security selection in the hotel, retail and health care real estate subsectors. |
| |
| Q | What were some of the Fund’s best-performing individual holdings? |
| |
| A | Commercial REIT Boston Properties was a top contributor to the Fund’s performance during the Reporting Period. Boston Properties’ central business district office portfolio benefited from a decrease in vacancy rates as well as an increase in rents. At the end of the Reporting Period, we maintained conviction in office companies with exposure to the central business district area, as we expect supply to remain limited and fundamentals to continue to improve. |
The Fund’s position in multifamily REIT Equity Residential, which has a diversified portfolio of apartment properties, was also a strong contributor to the Fund’s results during the Reporting Period. Equity Residential benefited from a general trend away from home ownership, which led to lower tenant turnover. In our view, limited apartment supply anticipated for the near term should further benefit rental trends going forward.
Shares of multifamily REIT Camden Property Trust rose during the Reporting Period, as the company beat earnings expectations and raised its guidance for the year. Also, while most apartment stocks performed well during the Reporting Period, Camden Property Trust outperformed most of its peers due to its exposure to markets that have not yet turned and due to a lower starting valuation.
PORTFOLIO RESULTS
| |
| Q | What were some of the Fund’s weakest-performing individual holdings? |
| |
| A | Shopping center REIT Kimco Realty was a major detractor from the Fund’s results during the Reporting Period. Shares of Kimco Realty were negatively affected during the Reporting Period by renewed investor concern that internet retailing will lead to store closures in shopping centers. However, we held the position in the Fund at the end of the Reporting Period as we believe that Kimco Realty’s portfolio, which is concentrated in supply constrained areas, should perform well despite the internet shopping trend. In addition, the company is restructuring in what we consider to be a positive way in part by shedding its non-core assets. |
The Fund’s position in mortgage REIT MFA Financial also detracted from the Fund’s performance during the Reporting Period. Shares of MFA Financial lagged the gains of the broader U.S. real estate market due primarily to its defensive characteristics. We maintained the Fund’s position in the mortgage REIT, as we look to position the Fund’s portfolio a bit more defensively after the recent run-up in the market.
Leisure REIT Host Hotels & Resorts was also a weak-performing holding for the Fund during the Reporting Period. As mentioned earlier, the hotel subsector overall underperformed during the Reporting Period due to macroeconomic concerns, high expectations and consensus buys from sell-side analysts. In our view, these factors together set the subsector up both for disappointment and continued equity issuance to lower leverage, which resulted in earnings misses. At the end of the Reporting Period, we maintained conviction in Host Hotels & Resorts, as we believe it has high cyclical upside, is well managed and has a quality balance sheet.
| |
| Q | How did the Fund use derivatives and similar instruments during the Reporting Period? |
| |
| A | The Fund did not use derivatives during the Reporting Period. |
| |
| Q | Did the Fund make any significant purchases or sales during the Reporting Period? |
| |
| A | During the Reporting Period, we added to the Fund’s position in multifamily REIT Avalon Bay Communities, as we wanted to increase the Fund’s exposure to the company’s San Francisco portfolio. In our view, Avalon Bay Communities has some of the highest quality assets in the area with limited capital expenditure requirements. |
We initiated a Fund position in office property operator and developer Brookfield Properties, which has a large concentration of its portfolio in downtown New York City. Shares of Brookfield Properties had recently suffered based on investor concerns around increased supply and the expiration of certain sizable leases. However, we believe this represented an attractive opportunity for investment, as the wide spread between midtown and downtown rents seen during the Reporting Period should, in our view, narrow and reach more normalized levels. Also, there are numerous positive developments occurring in the downtown area of New York City, inclusive of a major transit hub, which should be beneficial to fundamentals.
In the diversified subsector, we established a Fund position in Duke Realty, which has a combination of suburban office and industrial exposure. At the time of purchase, the company was trading at what we considered to be an attractive valuation versus its competitors in both of these spaces. We also believe Duke Realty’s management has done a better job of managing lease rollovers than many of its competitors.
We eliminated the Fund’s position in multifamily REIT UDR, which had benefited during the Reporting Period both from strategic acquisitions that enhanced its portfolio and from improved core fundamentals. In turn, the stock reached our price target, and so we sold, taking profits. We redeployed the proceeds into higher conviction ideas.
In the health care subsector, we sold the Fund’s position in Nationwide Health Properties, which was acquired during the Reporting Period by Ventas. This sale was part of our effort to reduce the Fund’s exposure to the health care subsector broadly, as we have concerns regarding the premiums being paid by acquirers as the industry consolidates.
We exited the Fund’s position in multifamily REIT Home Properties, which was trading during the Reporting Period at a premium from an implied cap rate perspective. (Implied cap rate is the net operating income divided by the sum of a REIT’s equity market capitalization and its total outstanding debt.) Also, in our view, the company’s balance sheet was weaker than those of its peers and its management had not indicated a plan to reduce its leverage going forward.
PORTFOLIO RESULTS
| |
| Q | Were there any changes made in the Fund’s investment strategy during the Reporting Period? |
| |
| A | In constructing the Fund’s portfolio, we focus on picking securities rather than on making real estate subsector bets. We seek to outpace the benchmark index by overweighting stocks that we expect to outperform and underweighting those that we think may lag. Consequently, changes in its real estate subsector weights are generally the direct result of individual stock selection or of real estate securities’ appreciation or depreciation. That said, during the Reporting Period, the Fund’s exposure to the office, diversified and leisure REIT subsectors increased relative to the Wilshire Index. The Fund’s exposure to the multifamily subsector decreased compared to the benchmark index. |
| |
| Q | How was the Fund positioned relative to its benchmark index at the end of the Reporting Period? |
| |
| A | From a subsector perspective, the Fund had an overweighted exposure compared to the Wilshire Index in the office subsector at the end of the annual period. The Fund was underweighted compared to its benchmark index in the health care, industrial and leisure subsectors. The Fund was rather neutrally weighted in the remaining real estate subsectors. |
| |
| Q | What is the Fund’s tactical view and strategy for the months ahead? |
| |
| A | U.S. real estate securities experienced a significant rally during the past couple of years, as companies once priced for bankruptcy during the credit crisis were able to tap the capital markets to reduce leverage. As a result, we believe that management teams of REITs and public real estate companies are likely to now shift their strategy from balance sheet repair to growth through acquisition, using their financing advantage over the private real estate sector to acquire distressed assets. REITs should also, in our view, be able to grow internally, as rents in high quality properties rise and improvements on existing assets are made. More broadly, we believe the real estate sector may well benefit as investors search for an attractive relative yield in a still low interest rate environment. |
While the real estate sector had many positive attributes at the end of the Reporting Period, we do acknowledge that current market conditions include risks as well, as macroeconomic and political events can swing sentiment dramatically. As fundamental, bottom-up investors, we believe we are seeing opportunities that go beyond the headline risks associated with certain subsectors. We intend to continue to focus our approach on those companies that have recapitalized their balance sheets and that possess quality attributes, such as a robust business model, a high quality asset exposure, and a strong management team.
FUND BASICS
Real Estate Securities Fund
as of June 30, 2011
| | | | | | | | | | | |
January 1, 2011–
| | Fund Total Return
| | Wilshire Real Estate
| | |
| June 30, 2011 | | (based on NAV)1 | | Securities Index (Gross)2 | | |
|
| |
| Class A | | | 10.22 | % | | | 10.72 | % | | |
| Class B | | | 9.80 | | | | 10.72 | | | |
| Class C | | | 9.83 | | | | 10.72 | | | |
| Institutional | | | 10.55 | | | | 10.72 | | | |
| Service | | | 10.17 | | | | 10.72 | | | |
| Class IR | | | 10.34 | | | | 10.72 | | | |
| Class R | | | 10.13 | | | | 10.72 | | | |
|
| | |
| 1 | | The net asset value (“NAV”) represents the net assets of the class of the Fund (ex-dividend) divided by the total number of shares of the class outstanding. The Fund’s performance reflects the reinvestment of dividends and other distributions. The Fund’s performance does not reflect the deduction of any applicable sales charges. |
| |
| 2 | | The Wilshire Real Estate Securities Index (Gross) is a market capitalization-weighted index comprised of publicly traded REITs and real estate operating companies. The Index is unmanaged and does not reflect any fees or expenses. It is not possible to invest directly in an index. |
| |
| STANDARDIZED AVERAGE ANNUAL TOTAL RETURNS3 | |
| | | | | | | | | | | | | | | | | | | | | |
| For the period ended 6/30/11 | | One Year | | Five Years | | Ten Years | | Since Inception | | Inception Date | | |
|
| |
| Class A | | | 25.96 | % | | | -0.60 | % | | | 9.00 | % | | | 9.19 | % | | 7/27/98 | | |
| Class B | | | 27.21 | | | | -0.60 | | | | 8.96 | | | | 9.17 | | | 7/27/98 | | |
| Class C | | | 31.22 | | | | -0.19 | | | | 8.83 | | | | 8.89 | | | 7/27/98 | | |
| Institutional | | | 33.96 | | | | 0.99 | | | | 10.08 | | | | 10.13 | | | 7/27/98 | | |
| Service | | | 33.11 | | | | 0.44 | | | | 9.53 | | | | 9.60 | | | 7/27/98 | | |
| Class IR | | | 33.57 | | | | N/A | | | | N/A | | | | -0.12 | | | 11/30/07 | | |
| Class R | | | 33.00 | | | | N/A | | | | N/A | | | | -0.60 | | | 11/30/07 | | |
|
| | |
| 3 | | The Standardized Average Annual Total Returns are average annual total returns as of the most recent calendar quarter-end. They assume reinvestment of all distributions at NAV. These returns reflect a maximum initial sales charge of 5.5% for Class A Shares, the assumed contingent deferred sales charge for Class B Shares (5% maximum declining to 0% after six years) and the assumed contingent deferred sales charge for Class C Shares (1% if redeemed within 12 months of purchase). Class B Shares convert automatically to Class A Shares on or about the fifteenth day of the last month of the calendar year that is eight years after purchase. Returns for Class B Shares for the period after the conversion reflect the performance of Class A Shares. Because Institutional, Service, Class IR and Class R Shares do not involve a sales charge, such a charge is not applied to their Standardized Average Annual Total Returns. The Fund’s Class B Shares are no longer available for purchase by new or existing shareholders (although current Class B shareholders may continue to reinvest income and capital gains distributions into Class B Shares, and Class B shareholders may continue to exchange their shares for Class B Shares of certain other Goldman Sachs Funds). |
| |
| | The returns represent past performance. Past performance does not guarantee future results. The Fund’s investment return and principal value will fluctuate so that an investor’s shares, when redeemed, may be worth more or less than their original cost. Current performance may be lower or higher than the performance quoted above. Please visit our Website at www.goldmansachsfunds.com to obtain the most recent month-end returns. Performance reflects fee waivers and expense limitations in effect. In their absence, performance would be reduced. Returns do not reflect the deduction of taxes that a shareholder would pay on Fund distributions or the redemption of Fund shares. |
FUND BASICS
| | | | | | | | | | | |
| | | Net Expense Ratio (Current) | | Gross Expense Ratio (Before Waivers) | | |
|
| |
| Class A | | | 1.44 | % | | | 1.50 | % | | |
| Class B | | | 2.19 | | | | 2.25 | | | |
| Class C | | | 2.19 | | | | 2.25 | | | |
| Institutional | | | 1.04 | | | | 1.10 | | | |
| Service | | | 1.54 | | | | 1.60 | | | |
| Class IR | | | 1.19 | | | | 1.25 | | | |
| Class R | | | 1.69 | | | | 1.75 | | | |
|
| | |
| 4 | | The expense ratios of the Fund, both current (net of any fee waivers or expense limitations) and before waivers (gross of any fee waivers or expense limitations) are as set forth above. The Fund’s waivers and/or expense limitations will remain in place through at least April 29, 2012, and prior to such date the investment adviser may not terminate the arrangements without the approval of the Fund’s Board of Trustees. The expense ratios set forth above may differ from the expense ratios disclosed in the Financial Highlights in this report. |
| |
| TOP TEN HOLDINGS AS OF 6/30/115 | |
| | | | | | | | | |
| Holding | | % of Total Net Assets | | Subsectors | | |
|
| |
| Simon Property Group, Inc. (REIT) | | | 12.0 | % | | Retail | | |
| Public Storage, Inc. (REIT) | | | 6.3 | | | Self Storage | | |
| Equity Residential (REIT) | | | 6.3 | | | Multifamily | | |
| HCP, Inc. (REIT) | | | 5.3 | | | Health Care | | |
| Boston Properties, Inc. (REIT) | | | 5.1 | | | Commercial | | |
| Host Hotels & Resorts, Inc. (REIT) | | | 4.7 | | | Leisure | | |
| Vornado Realty Trust (REIT) | | | 4.6 | | | Commercial | | |
| Kimco Realty Corp. (REIT) | | | 4.2 | | | Retail | | |
| ProLogis, Inc. (REIT) | | | 3.9 | | | Commercial | | |
| Ventas, Inc. (REIT) | | | 3.4 | | | Health Care | | |
|
| | |
| 5 | | The top 10 holdings may not be representative of the Fund’s future investments. |
FUND BASICS
| |
| FUND VS. BENCHMARK SECTOR ALLOCATION6 | |
As of June 30, 2011
| | |
| 6 | | The Fund is actively managed and, as such, its composition may differ over time. Consequently, the Fund’s overall industry sector allocations may differ from percentages contained in the graph above. The percentage shown for each investment category reflects the value of investments in that category as a percentage of market value. The above graph depicts the Fund’s investments but may not represent the Fund’s market exposure due to the exclusion of derivatives, if any, as listed in the Additional Investment Information section of the Schedule of Investments. Short-term investments represent investments in investment companies other than those that are exchange traded. |
GOLDMAN SACHS ABSOLUTE RETURN TRACKER FUND
Schedule of Investments
June 30, 2011 (Unaudited)
| | | | | | | | | | | | | | | |
Principal
| | Interest
| | Maturity
| | |
| Amount | | Rate | | Date | | Value |
| |
Commodity Index Linked Structured Notes(a)(b)(c)(d) – 3.3% |
| Citigroup Funding, Inc. |
| $ | 13,000,000 | | | | 0.000 | % | | | 01/12/12 | | | $ | 18,017,857 | |
UBS AG(e) |
| | 1,500,000 | | | | 0.036 | | | | 09/27/11 | | | | 3,070,330 | |
| | 1,400,000 | | | | 0.035 | | | | 11/16/11 | | | | 2,125,188 | |
| | 2,300,000 | | | | 0.036 | | | | 11/23/11 | | | | 3,466,004 | |
| | 4,000,000 | | | | 0.040 | | | | 01/12/12 | | | | 5,451,693 | |
| | 10,800,000 | | | | 0.040 | | | | 03/09/12 | | | | 14,140,798 | |
| | 5,500,000 | | | | 0.036 | | | | 05/29/12 | | | | 6,210,954 | |
| | 6,100,000 | | | | 0.036 | | | | 07/27/12 | | | | 5,953,289 | |
| |
| |
TOTAL COMMODITY INDEX LINKED
STRUCTURED NOTES |
(Cost $44,600,000) | | $ | 58,436,113 | |
| |
| |
| | | | | | | | | | | | | | | |
| | | | | | | | | |
| Shares | | Description | | Value |
| |
Exchange Traded Fund – 4.3% |
| | 1,577,469 | | | iShares MSCI Emerging Markets Index Fund | | $ | 75,087,524 | |
(Cost $66,546,848) | | | | |
| |
| |
| | | | | | | | | |
| | | | | | | | | | | | | | | |
Principal
| | Interest
| | Maturity
| | |
| Amount | | Rate | | Date | | Value |
| |
U.S. Government Obligations(f) – 73.4% |
| United States Treasury Bills |
| $ | 195,000,000 | | | | 0.000 | % | | | 08/18/11 | | | $ | 194,996,102 | |
| | 402,500,000 | | | | 0.000 | (g) | | | 04/05/12 | | | | 402,110,066 | |
| | 402,500,000 | | | | 0.000 | | | | 10/06/11 | | | | 402,462,044 | |
| | 290,000,000 | | | | 0.000 | | | | 05/03/12 | | | | 289,616,681 | |
| |
| |
TOTAL U.S. GOVERNMENT OBLIGATIONS |
(Cost $1,288,489,711) | | $ | 1,289,184,893 | |
| |
| |
| | | | | | | | | | | | | | | |
| | | | | | | | | | | |
| Shares | | Rate | | Value |
| |
Short-term Investment(a) – 5.2% |
| JPMorgan U.S. Government Money Market Fund – Capital Shares |
| | 90,616,950 | | | | 0.010 | % | | $ | 90,616,950 | |
(Cost $90,616,950) | | | | |
| |
| |
TOTAL INVESTMENTS BEFORE
REPURCHASE AGREEMENTS |
(Cost $1,490,253,509) | | $ | 1,513,325,480 | |
| |
| |
| | | | | | | | | | | |
| | | | | | | | | | | | | | | |
Principal
| | Interest
| | Maturity
| | |
| Amount | | Rate | | Date | | Value |
| |
Repurchase Agreements(h) – 13.1% |
| Barclays PLC |
| $ | 180,000,000 | | | | 0.080 | % | | | 07/01/11 | | | $ | 180,000,000 | |
| Maturity Value: $180,000,400 |
| Collateralized by GNMA, 2.75%-6.475%, due 1/20/33-6/20/41, FNMA, 3.500%-25.577%, due 2/25/33-6/25/41 and FHLMC, 1.287%-6.385%, due 11/15/36-6/15/41. The aggregate market value of the collateral including accrued interest was $189,095,503. |
| Barclays PLC |
| | 49,900,000 | | | | 0.010 | | | | 07/01/11 | | | | 49,900,000 | |
| Maturity Value: $49,900,014 |
| Collateralized by United States Treasury Note, 1.125%, due 12/15/12. The aggregate market value of the collateral including accrued interest was $50,898,023. |
| |
TOTAL REPURCHASE AGREEMENTS |
(Cost $229,900,000) | | $ | 229,900,000 | |
| |
| |
TOTAL INVESTMENTS – 99.3% |
(Cost $1,720,153,509) | | $ | 1,743,225,480 | |
| |
| |
OTHER ASSETS IN EXCESS OF LIABILITIES – 0.7% | | | 11,763,878 | |
| |
| |
NET ASSETS – 100.0% | | $ | 1,754,989,358 | |
| |
| |
The percentage shown for each investment category reflects the value of investments in that category as a percentage of net assets.
| | |
| (a) | | Variable rate security. Interest rate disclosed is that which is in effect at June 30, 2011. |
| |
| (b) | | These Structured Notes take into consideration a leverage factor of 300% on the return of the underlying linked index. |
| |
| (c) | | Security is linked to the S&P GSCI Precious Metals Total Return Index (the “GSCI Precious Metals Index”). The GSCI Precious Metals Index represents an unleveraged, long-only investment in commodity futures. The GSCI Precious Metals Index is a part of a series of sub-indices calculated by Standard and Poor’s that represents components of the S&P GSCI from a number of commodity sectors. The GSCI Precious Metals Index comprises gold and silver. |
| |
| (d) | | Interest rate disclosed is contingent upon LIBOR minus a spread as of June 30, 2011. |
| |
| (e) | | Exempt from registration under Rule 144A of the Securities Act of 1933. Under procedures approved by the Board of Trustees, such securities have been determined to be liquid by the Investment Adviser and may be resold, normally to qualified institutional buyers in transactions exempt from registration. Total market value of Rule 144A securities amounts to $40,418,256, which represents approximately 2.3% of net assets as of June 30, 2011. |
| |
| (f) | | Issued with zero coupon. Income is recognized through the accretion of discount. |
| |
| (g) | | All or a portion of this security is segregated as collateral for initial margin requirements or futures transactions. |
| |
| (h) | | Unless noted, all repurchase agreements were entered into on June 30, 2011. |
| | | | | |
| |
| |
Investment Abbreviations: |
| FHLMC | | — | | Federal Home Loan Mortgage Corp. |
| FNMA | | — | | Federal National Mortgage Association |
| GNMA | | — | | Government National Mortgage Association |
| |
| |
| | | | | |
| |
| |
Currency Abbreviations: |
| EUR | | — | | Euro Dollar |
| GBP | | — | | British Pound |
| JPY | | — | | Japanese Yen |
| USD | | — | | United States Dollar |
| |
| |
The accompanying notes are an integral part of these financial statements. 31
GOLDMAN SACHS ABSOLUTE RETURN TRACKER FUND
Schedule of Investments (continued)
June 30, 2011 (Unaudited)
| |
| ADDITIONAL INVESTMENT INFORMATION | |
FORWARD FOREIGN CURRENCY EXCHANGE CONTRACTS — At June 30, 2011, the Fund had outstanding forward foreign currency exchange contracts to purchase foreign currencies:
FORWARD FOREIGN CURRENCY EXCHANGE CONTRACTS WITH UNREALIZED GAIN
| | | | | | | | | | | | | | | |
| | | Contracts
| | Expiration
| | Current
| | Unrealized
|
| Counterparty | | to Buy/Sell | | Date | | Value | | Gain |
| |
| Societe Generale | | | EUR/USD | | | 9/21/11 | | $ | 3,798,191 | | | $ | 35,149 | |
| |
| |
FORWARD FOREIGN CURRENCY EXCHANGE CONTRACTS WITH UNREALIZED LOSS
| | | | | | | | | | | | | | | |
| | | Contracts
| | Expiration
| | Current
| | Unrealized
|
| Counterparty | | to Buy/Sell | | Date | | Value | | Loss |
| |
| Societe Generale | | | EUR/USD | | | 9/21/11 | | $ | 46,663,493 | | | $ | (541,639 | ) |
| | | | GBP/USD | | | 9/21/11 | | | 54,617,516 | | | | (1,259,313 | ) |
| | | | JPY/USD | | | 9/21/11 | | | 49,708,892 | | | | (190,997 | ) |
| |
| |
TOTAL | | | | | | | | | | | | $ | (1,991,949 | ) |
| |
| |
FUTURES CONTRACTS — At June 30, 2011, the following futures contracts were open:
| | | | | | | | | | | | | | | |
| | | Number of
| | | | | | |
| | | Contracts
| | Expiration
| | Current
| | Unrealized
|
| Type | | Long (Short) | | Date | | Value | | Gain (Loss) |
| |
| Dow Jones EURO STOXX 50 Index | | | 1,258 | | | September 2011 | | $ | 51,995,742 | | | $ | 1,802,610 | |
| FTSE 100 Index | | | 596 | | | September 2011 | | | 56,460,376 | | | | 1,351,967 | |
| Russell 2000 Mini Index | | | 198 | | | September 2011 | | | 16,342,920 | | | | 887,287 | |
S&P 500 E-mini Index | | | 4,085 | | | September 2011 | | | 268,690,875 | | | | 10,031,356 | |
| TSE TOPIX Index | | | 496 | | | September 2011 | | | 52,338,613 | | | | 2,459,091 | |
| 10 Year U.S. Treasury Notes | | | (3,678 | ) | | September 2011 | | | (449,922,844 | ) | | | 589,853 | |
| |
| |
TOTAL | | | | | | | | | | | | $ | 17,122,164 | |
| |
| |
32 The accompanying notes are an integral part of these financial statements.
GOLDMAN SACHS COMMODITY STRATEGY FUND
Consolidated Schedule of Investments
June 30, 2011 (Unaudited)
| | | | | | | | | | | | | | | |
Principal
| | Interest
| | Maturity
| | |
| Amount | | Rate | | Date | | Value |
| |
Mortgage-Backed Obligations – 12.0% |
Collateralized Mortgage Obligations – 3.2% |
Regular Floater(a) – 2.4% |
FDIC Structured Sale Guaranteed Notes Series 2010-S1, Class 1A(b) |
| $ | 679,162 | | | | 0.736 | % | | | 02/25/48 | | | $ | 678,424 | |
National Credit Union Administration Guaranteed Notes Series 2011-R3, Class 1A |
| | 2,737,948 | | | | 0.590 | | | | 03/11/20 | | | | 2,742,440 | |
National Credit Union Administration Guaranteed Notes Series 2011-R4, Class 1A |
| | 3,544,621 | | | | 0.570 | | | | 03/06/20 | | | | 3,547,113 | |
National Credit Union Administration Guaranteed Notes Series 2011-R5, Class 1A |
| | 3,621,557 | | | | 0.570 | | | | 04/06/20 | | | | 3,624,244 | |
National Credit Union Administration Guaranteed Notes Series 2011-R6, Class 1A |
| | 3,500,568 | | | | 0.570 | | | | 05/07/20 | | | | 3,503,302 | |
National Credit Union Administration Guaranteed Notes Series 2010-A1, Class A |
| | 1,215,848 | | | | 0.540 | | | | 12/07/20 | | | | 1,218,139 | |
National Credit Union Administration Guaranteed Notes Series 2010-R1, Class 1A |
| | 1,338,718 | | | | 0.640 | | | | 10/07/20 | | | | 1,341,751 | |
National Credit Union Administration Guaranteed Notes Series 2010-R2, Class 1A |
| | 2,296,635 | | | | 0.560 | | | | 11/06/17 | | | | 2,298,789 | |
National Credit Union Administration Guaranteed Notes Series 2011-R2, Class 1A |
| | 3,440,649 | | | | 0.590 | | | | 02/06/20 | | | | 3,443,740 | |
| | | | | | | | | | | | | | | |
| | | | | | | | | | | | | | 22,397,942 | |
| |
| |
Sequential Fixed Rate – 0.8% |
FDIC Structured Sale Guaranteed Notes Series 2010 A-1(b)(c) |
| | 1,000,000 | | | | 0.000 | | | | 10/25/11 | | | | 999,410 | |
FNMA REMIC Series 2009-70, Class AL |
| | 6,073,124 | | | | 5.000 | | | | 08/25/19 | | | | 6,552,445 | |
National Credit Union Administration Guaranteed Notes Series 2010-R1, Class 2A |
| | 369,638 | | | | 1.840 | | | | 10/07/20 | | | | 373,103 | |
| | | | | | | | | | | | | | | |
| | | | | | | | | | | | | | 7,924,958 | |
| |
| |
TOTAL COLLATERALIZED MORTGAGE OBLIGATIONS | | $ | 30,322,900 | |
| |
| |
Federal Agencies – 8.8% |
FHLMC – 0.2% |
| $ | 1,931 | | | | 5.000 | % | | | 09/01/16 | | | $ | 2,065 | |
| | 24,967 | | | | 5.000 | | | | 11/01/16 | | | | 26,765 | |
| | 5,064 | | | | 5.000 | | | | 12/01/16 | | | | 5,431 | |
| | 32,019 | | | | 5.000 | | | | 01/01/17 | | | | 34,345 | |
| | 27,624 | | | | 5.000 | | | | 01/01/18 | | | | 29,614 | |
| | 306,212 | | | | 5.000 | | | | 02/01/18 | | | | 328,261 | |
| | 212,830 | | | | 5.000 | | | | 03/01/18 | | | | 228,245 | |
| | 128,825 | | | | 5.000 | | | | 04/01/18 | | | | 138,252 | |
| | 81,848 | | | | 5.000 | | | | 05/01/18 | | | | 87,824 | |
| | 61,801 | | | | 5.000 | | | | 06/01/18 | | | | 66,354 | |
| | 124,953 | | | | 5.000 | | | | 07/01/18 | | | | 134,210 | |
| | 41,964 | | | | 5.000 | | | | 08/01/18 | | | | 45,065 | |
| | 20,001 | | | | 5.000 | | | | 10/01/18 | | | | 21,511 | |
| | 33,043 | | | | 5.000 | | | | 11/01/18 | | | | 35,539 | |
| | 5,402 | | | | 5.000 | | | | 02/01/19 | | | | 5,832 | |
| | 571,349 | | | | 5.500 | | | | 01/01/20 | | | | 619,422 | |
| | | | | | | | | | | | | | | |
| | | | | | | | | | | | | | 1,808,735 | |
| |
| |
FNMA – 8.6% |
| | 447,763 | | | | 4.000 | | | | 12/01/14 | | | | 467,281 | |
| | 542,162 | | | | 4.000 | | | | 02/01/15 | | | | 560,918 | |
| | 939,022 | | | | 4.000 | | | | 03/01/15 | | | | 980,049 | |
| | 193,032 | | | | 5.000 | | | | 03/01/18 | | | | 207,109 | |
| | 524,972 | | | | 5.000 | | | | 04/01/18 | | | | 563,258 | |
| | 6,939 | | | | 5.500 | | | | 01/01/19 | | | | 7,548 | |
| | 116,061 | | | | 5.500 | | | | 02/01/19 | | | | 126,248 | |
| | 114,872 | | | | 5.500 | | | | 03/01/19 | | | | 124,954 | |
| | 79,644 | | | | 5.500 | | | | 04/01/19 | | | | 86,635 | |
| | 53,760 | | | | 5.500 | | | | 05/01/19 | | | | 58,479 | |
| | 203,156 | | | | 5.500 | | | | 06/01/19 | | | | 220,987 | |
| | 746,876 | | | | 5.500 | | | | 07/01/19 | | | | 812,426 | |
| | 711,330 | | | | 5.500 | | | | 08/01/19 | | | | 773,724 | |
| | 618,591 | | | | 5.500 | | | | 09/01/19 | | | | 672,841 | |
| | 169,344 | | | | 5.500 | | | | 10/01/19 | | | | 184,206 | |
| | 190,081 | | | | 5.500 | | | | 11/01/19 | | | | 206,765 | |
| | 272,890 | | | | 5.500 | | | | 12/01/19 | | | | 296,841 | |
| | 30,717 | | | | 5.500 | | | | 01/01/20 | | | | 33,413 | |
| | 14,623 | | | | 5.500 | | | | 06/01/20 | | | | 15,899 | |
| | 3,681,523 | | | | 5.500 | | | | 07/01/20 | | | | 3,998,766 | |
| | 249,318 | | | | 5.000 | | | | 03/01/38 | | | | 265,042 | |
| | 245,301 | | | | 5.000 | | | | 04/01/38 | | | | 260,772 | |
| | 74,499 | | | | 4.000 | | | | 02/01/40 | | | | 74,716 | |
| | 42,860,135 | | | | 3.500 | | | | 03/01/41 | | | | 41,068,602 | |
| | 20,000,000 | | | | 3.500 | | | | TBA-15yr | (d) | | | 20,362,500 | |
| | 6,000,000 | | | | 4.000 | | | | TBA-30yr | (d) | | | 6,000,000 | |
| | 4,000,000 | | | | 6.000 | | | | TBA-30yr | (d) | | | 4,395,625 | |
| | | | | | | | | | | | | | | |
| | | | | | | | | | | | | | 82,825,604 | |
| |
| |
TOTAL FEDERAL AGENCIES | | $ | 84,634,339 | |
| |
| |
TOTAL MORTGAGE-BACKED OBLIGATIONS |
(Cost $114,843,039) | | $ | 114,957,239 | |
| |
| |
| | | | | | | | | | | | | | | |
| | | | | | | | | | | | | | | |
Agency Debenture – 0.3% |
| FHLB |
| $ | 2,800,000 | | | | 1.750 | % | | | 08/22/12 | | | $ | 2,846,654 | |
(Cost $2,790,540) | | | | |
| |
| |
| | | | | | | | | | | | | | | |
| | | | | | | | | | | | | | | |
Asset-Backed Securities – 0.0% |
Home Equity – 0.0% |
GMAC Mortgage Corp. Loan Trust Series 2007-HE3, Class 1A1 |
| $ | 173,945 | | | | 7.000 | % | | | 09/25/37 | | | | 126,110 | |
The accompanying notes are an integral part of these financial statements. 33
GOLDMAN SACHS COMMODITY STRATEGY FUND
Consolidated Schedule of Investments (continued)
June 30, 2011 (Unaudited)
| | | | | | | | | | | | | | | |
Principal
| | Interest
| | Maturity
| | |
| Amount | | Rate | | Date | | Value |
| |
Asset-Backed Securities – (continued) |
Home Equity – (continued) |
| | | | | | | | | | | | | | | |
GMAC Mortgage Corp. Loan Trust Series 2007-HE3, Class 2A1 |
| $ | 223,475 | | | | 7.000 | % | | | 09/25/37 | | | $ | 156,209 | |
| |
| |
TOTAL ASSET-BACKED SECURITIES |
(Cost $398,165) | | $ | 282,319 | |
| |
| |
| | | | | | | | | | | | | | | |
| | | | | | | | | | | | | | | |
Government Guarantee Obligations(e) – 4.1% |
| Citibank NA |
| $ | 11,000,000 | | | | 1.375 | % | | | 08/10/11 | | | $ | 11,013,706 | |
| Citigroup Funding, Inc. |
| | 7,400,000 | | | | 0.603 | (a) | | | 04/30/12 | | | | 7,425,478 | |
| | 1,800,000 | | | | 1.875 | | | | 10/22/12 | | | | 1,835,158 | |
| General Electric Capital Corp. |
| | 2,200,000 | | | | 0.450 | (a) | | | 03/12/12 | | | | 2,206,136 | |
| | 7,400,000 | | | | 0.424 | (a) | | | 06/01/12 | | | | 7,416,569 | |
| | 7,800,000 | | | | 2.625 | | | | 12/28/12 | | | | 8,051,817 | |
| U.S. Central Federal Credit Union |
| | 1,400,000 | | | | 1.250 | | | | 10/19/11 | | | | 1,404,693 | |
| |
| |
TOTAL GOVERNMENT GUARANTEE OBLIGATIONS |
(Cost $39,076,317) | | $ | 39,353,557 | |
| |
| |
| | | | | | | | | | | | | | | |
| | | | | | | | | | | | | | | |
U.S. Treasury Obligations – 52.2% |
United States Treasury Bills(c) |
| $ | 13,000,000 | | | | 0.000 | %(f) | | | 07/21/11 | | | $ | 12,999,855 | |
| | 450,000,000 | | | | 0.000 | | | | 11/03/11 | | | | 449,929,688 | |
| United States Treasury Bonds |
| | 200,000 | | | | 4.750 | | | | 02/15/41 | | | | 212,618 | |
| | 100,000 | | | | 4.375 | | | | 05/15/41 | | | | 99,859 | |
| United States Treasury Notes |
| | 9,900,000 | | | | 1.000 | | | | 03/31/12 | | | | 9,960,687 | |
| | 17,600,000 | | | | 0.625 | | | | 06/30/12 | | | | 17,668,112 | |
| | 12,000,000 | | | | 3.125 | | | | 05/15/21 | | | | 11,966,280 | |
| |
| |
TOTAL U.S. TREASURY OBLIGATIONS |
(Cost $502,790,123) | | $ | 502,837,099 | |
| |
| |
| | | | | | | | | | | | | | | |
| | | | | | | | | | | |
| Shares | | Rate | | Value |
| |
Short-term Investment(a) – 17.8% |
| JPMorgan U.S. Government Money Market Fund – Capital Shares |
| | 170,973,016 | | | | 0.010 | % | | $ | 170,973,016 | |
(Cost $170,973,016) | | | | |
| |
| |
TOTAL INVESTMENTS – 86.4% |
(Cost $830,871,200) | | $ | 831,249,884 | |
| |
| |
OTHER ASSETS IN EXCESS OF LIABILITIES – 13.6% | | | 131,243,227 | |
| |
| |
NET ASSETS – 100.0% | | $ | 962,493,111 | |
| |
| |
The percentage shown for each investment category reflects the value of investments in that category as a percentage of net assets.
| | |
| (a) | | Variable rate security. Interest rate disclosed is that which is in effect at June 30, 2011. |
| |
| (b) | | Exempt from registration under Rule 144A of the Securities Act of 1933. Under procedures approved by the Board of Trustees, such securities have been determined to be liquid by the Investment Adviser and may be resold, normally to qualified institutional buyers in transactions exempt from registration. Total market value of Rule 144A securities amounts to $1,677,834, which represents approximately 0.2% of net assets as of June 30, 2011. |
| |
| (c) | | Issued with zero coupon. Income is recognized through the accretion of discount. |
| |
| (d) | | TBA (To Be Announced) Securities are purchased/sold on a forward commitment basis with an approximate principal amount and no defined maturity date. The actual principal and maturity date will be determined upon settlement when the specific mortgage pools are assigned. Total market value of TBA securities (excluding forward sales contracts, if any) amounts to $30,758,125 which represents approximately 3.2% of net assets as of June 30, 2011. |
| |
| (e) | | Guaranteed under the Federal Deposit Insurance Corporation’s (“FDIC”) Temporary Liquidity Guarantee Program and is backed by the full faith and credit of the United States. The expiration date of the FDIC’s guarantee is the earlier of the maturity date of the debt or June 30, 2012. |
| |
| (f) | | All or a portion of this security is segregated as collateral for initial margin requirements or futures transactions. |
| | | | | |
| |
| |
Investment Abbreviations: |
| FDIC | | — | | Federal Deposit Insurance Corp. |
| FHLB | | — | | Federal Home Loan Bank |
| FHLMC | | — | | Federal Home Loan Mortgage Corp. |
| FNMA | | — | | Federal National Mortgage Association |
| LIBOR | | — | | London Interbank Offered Rate |
| REMIC | | — | | Real Estate Mortgage Investment Conduit |
| |
| |
34 The accompanying notes are an integral part of these financial statements.
GOLDMAN SACHS COMMODITY STRATEGY FUND
| |
| ADDITIONAL INVESTMENT INFORMATION | |
FORWARD SALES CONTRACTS — At June 30, 2011, the Fund had the following forward sales contracts:
| | | | | | | | | | | | | | | | | | | |
| | | Interest
| | Maturity
| | Settlement
| | Principal
| | |
| Description | | Rate | | Date(d) | | Date | | Amount | | Value |
| |
| FNMA | | | 3.500 | % | | TBA-30yr | | | 7/14/11 | | | $ | (17,000,000 | ) | | $ | (16,260,235 | ) |
| FNMA | | | 3.500 | | | TBA-30yr | | | 8/11/11 | | | | (25,000,000 | ) | | | (23,845,702 | ) |
| |
| |
TOTAL (Proceeds Receivable: $40,477,813) | | | | | | | | | | | | | | | | $ | (40,105,937 | ) |
| |
| |
FUTURES CONTRACTS — At June 30, 2011, the following futures contracts were open:
| | | | | | | | | | | | | | | |
| | | Number of
| | | | | | |
| | | Contracts
| | Expiration
| | Current
| | Unrealized
|
| Type | | Long (Short) | | Date | | Value | | Gain (Loss) |
| |
| Eurodollars | | | (155 | ) | | September 2011 | | $ | (38,616,313 | ) | | $ | (187,839 | ) |
| Eurodollars | | | (75 | ) | | December 2011 | | | (18,671,250 | ) | | | (230,594 | ) |
| Eurodollars | | | (75 | ) | | March 2012 | | | (18,659,063 | ) | | | (266,446 | ) |
| Eurodollars | | | 5 | | | June 2012 | | | 1,242,313 | | | | (562 | ) |
| Eurodollars | | | 5 | | | September 2012 | | | 1,239,750 | | | | (1,312 | ) |
| Eurodollars | | | 5 | | | December 2012 | | | 1,236,625 | | | | (1,875 | ) |
| Eurodollars | | | 5 | | | March 2013 | | | 1,233,500 | | | | (2,500 | ) |
| Eurodollars | | | 5 | | | June 2013 | | | 1,230,188 | | | | (2,875 | ) |
| U.S. Treasury Bonds | | | (70 | ) | | September 2011 | | | (8,612,188 | ) | | | 164,114 | |
| 2 Year U.S. Treasury Notes | | | 242 | | | September 2011 | | | 53,081,188 | | | | (64,306 | ) |
| 5 Year U.S. Treasury Notes | | | (304 | ) | | September 2011 | | | (36,235,375 | ) | | | 170,241 | |
| 10 Year U.S. Treasury Notes | | | (1 | ) | | September 2011 | | | (122,328 | ) | | | 170 | |
| |
| |
TOTAL | | | | | | | | | | | | $ | (423,784 | ) |
| |
| |
SWAP CONTRACTS — At June 30, 2011, the Fund had outstanding swap contracts with the following terms:
INTEREST RATE SWAP CONTRACTS
| | | | | | | | | | | | | | | | | | | | | | | | | |
| | | | | Rates Exchanged | | | | | | | | |
| | | Notional
| | | | Payments
| | Payments
| | | | Upfront Payments
| | |
| | | Amount
| | Termination
| | Received by
| | Made by
| | Market
| | Made (Received)
| | Unrealized
|
| Counterparty | | (000s)(a) | | Date | | the Fund | | the Fund | | Value | | by the Fund | | Gain (Loss) |
| |
| Bank of America, N.A. | | $ | 5,000 | | | | 07/01/24 | | | 4.479% | | 3 Month LIBOR | | $ | (27,287 | ) | | $ | — | | | $ | (27,287 | ) |
| | | | 2,800 | | | | 07/01/44 | | | 3 Month LIBOR | | 4.595% | | | 20,676 | | | | — | | | | 20,676 | |
| Deutsche Bank AG | | | 15,900 | | | | 12/21/21 | | | 3 Month LIBOR | | 3.500 | | | (11,993 | ) | | | (114,635 | ) | | | 102,642 | |
| | | | 12,100 | | | | 12/21/16 | | | 3 Month LIBOR | | 2.500 | | | (69,568 | ) | | | (129,730 | ) | | | 60,162 | |
| | | | 1,900 | | | | 12/21/16 | | | 2.500 | | 3 Month LIBOR | | | 10,924 | | | | 35,882 | | | | (24,958 | ) |
| JPMorgan Chase Bank, N.A. | | | 95,400 | | | | 06/30/13 | | | 3 Month LIBOR | | 0.750 | | | (1,547 | ) | | | (64,223 | ) | | | 62,676 | |
| | | | 61,200 | | | | 12/21/13 | | | 1.250 | | 3 Month LIBOR | | | 267,333 | | | | 367,781 | | | | (100,448 | ) |
| | | | 61,200 | | | | 12/21/13 | | | 3 Month LIBOR | | 1.250 | | | (267,333 | ) | | | (384,215 | ) | | | 116,882 | |
| | | | 5,600 | | | | 12/21/18 | | | 3 Month LIBOR | | 3.250 | | | (101,975 | ) | | | (166,532 | ) | | | 64,557 | |
| | | | 1,900 | | | | 12/21/16 | | | 2.500 | | 3 Month LIBOR | | | 10,924 | | | | 37,844 | | | | (26,920 | ) |
| | | | 1,400 | | | | 12/21/18 | | | 3.250 | | 3 Month LIBOR | | | 25,493 | | | | 51,878 | | | | (26,385 | ) |
| Morgan Stanley Capital Services, Inc. | | | 27,000 | | | | 06/30/13 | | | 3 Month LIBOR | | 0.750 | | | (438 | ) | | | (16,475 | ) | | | 16,037 | |
| | | | 23,300 | | | | 12/21/13 | | | 1.250 | | 3 Month LIBOR | | | 101,779 | | | | 136,784 | | | | (35,005 | ) |
| | | | 23,300 | | | | 12/21/13 | | | 3 Month LIBOR | | 1.250 | | | (101,779 | ) | | | (134,385 | ) | | | 32,606 | |
| | | | 5,500 | | | | 06/24/24 | | | 4.350 | | 3 Month LIBOR | | | (82,869 | ) | | | — | | | | (82,869 | ) |
| | | | 3,000 | | | | 06/24/44 | | | 3 Month LIBOR | | 4.473 | | | 77,967 | | | | — | | | | 77,967 | |
| |
| |
TOTAL | | | | | | | | | | | | | | $ | (149,693 | ) | | $ | (380,026 | ) | | $ | 230,333 | |
| |
| |
| | |
| (a) | | Represents forward starting interest rate swaps whose effective dates of commencement of accruals and cash flows occur subsequent to June 30, 2011. |
The accompanying notes are an integral part of these financial statements. 35
GOLDMAN SACHS COMMODITY STRATEGY FUND
Consolidated Schedule of Investments (continued)
June 30, 2011 (Unaudited)
| |
| ADDITIONAL INVESTMENT INFORMATION (continued) | |
TOTAL RETURN SWAP CONTRACTS ON COMMODITY INDICES(a)
| | | | | | | | | | | | | | | | | | | |
| | | | | Notional
| | | | | | |
| | | | | Amount
| | Rate Paid by
| | Termination
| | Market
|
| Counterparty | | Referenced Obligation | | (000s) | | the Fund | | Date | | Value(b) |
| |
| Merrill Lynch & Co., Inc. | | Merrill Lynch Commodity Index Extra GB6
Excess Return Index | | $ | 385,379 | | | | 0.370 | % | | | 12/15/11 | | | $ | 5,818,125 | |
| UBS AG | | S&P GSCI Total Return Index 6 Month Forward | | | 10,000 | | | | 0.400 | | | | 10/12/11 | | | | 29,819 | |
| | | | | | 416,768 | | | | 0.400 | | | | 10/12/11 | | | | (19,059,290 | ) |
| | | | | | 167,697 | | | | 0.400 | | | | 04/13/12 | | | | 5,781,927 | |
| |
| |
TOTAL | | | | | | | | | | | | | | | | $ | (7,429,419 | ) |
| |
| |
| | |
| (a) | | The Fund receives monthly payments based on any positive monthly return of the Referenced Obligation. The Fund makes payments on any negative monthly return of such Referenced Obligation. |
| (b) | | There are no upfront payments on the swap contracts listed above, therefore the unrealized gains (losses) on the swap contracts are equal to their market value. |
36 The accompanying notes are an integral part of these financial statements.
GOLDMAN SACHS DYNAMIC ALLOCATION FUND
Schedule of Investments
June 30, 2011 (Unaudited)
| | | | | | | | | | | | | | | |
Principal
| | Interest
| | Maturity
| | |
| Amount | | Rate | | Date | | Value |
| |
Commodity Index Linked Structured Notes(a)(b)(c)(d)(e) – 5.5% |
| Bank of America Corp. |
| $ | 6,200,000 | | | | (0.060 | )% | | | 04/02/12 | | | $ | 5,197,649 | |
| UBS AG |
| | 5,000,000 | | | | 0.040 | | | | 04/02/12 | | | | 4,196,051 | |
| | 6,300,000 | | | | 0.000 | | | | 08/06/12 | | | | 6,410,650 | |
| | 1,600,000 | | | | 0.110 | | | | 08/06/12 | | | | 1,600,000 | |
| |
| |
TOTAL COMMODITY INDEX LINKED
STRUCTURED NOTES |
(Cost $19,100,000) | | $ | 17,404,350 | |
| |
| |
| | | | | | | | | | | | | | | |
| | | | | | | | | |
| Shares | | Description | | Value |
| |
Exchange Traded Fund – 16.8% |
| | 1,123,613 | | | iShares MSCI Emerging Markets Index Fund | | $ | 53,483,979 | |
(Cost $52,511,122) | | | | |
| |
| |
| | | | | | | | | |
| | | | | | | | | | | | | | | |
Principal
| | Interest
| | Maturity
| | |
| Amount | | Rate | | Date | | Value |
| |
U.S. Treasury Obligation(f) – 29.6% |
| United States Treasury Inflation Indexed Bond |
| $ | 90,208,126 | | | | 1.125 | % | | | 01/15/21 | | | $ | 93,858,849 | |
(Cost $91,655,759) | | | | |
| |
| |
| | | | | | | | | | | | | | | |
| | | | | | | | | | | |
| Shares | | Rate | | Value |
| |
Short-term Investment(d) – 53.9% |
| JPMorgan U.S. Government Money Market Fund – Capital Shares |
| | 171,342,601 | | | | 0.010 | % | | $ | 171,342,601 | |
(Cost $171,342,601) | | | | |
| |
| |
TOTAL INVESTMENTS – 105.8% |
(Cost $334,609,482) | | $ | 336,089,779 | |
| |
| |
LIABILITIES IN EXCESS OF OTHER ASSETS – (5.8)% | | | (18,377,882 | ) |
| |
| |
NET ASSETS – 100.0% | | $ | 317,711,897 | |
| |
| |
The percentage shown for each investment category reflects the value of investments in that category as a percentage of net assets.
| | |
| (a) | | Exempt from registration under Rule 144A of the Securities Act of 1933. Under procedures approved by the Board of Trustees, such securities have been determined to be liquid by the Investment Adviser and may be resold, normally to qualified institutional buyers in transactions exempt from registration. Total market value of Rule 144A securities amounts to $17,404,350, which represents approximately 5.5% of net assets as of June 30, 2011. |
| |
| (b) | | Security is linked to the Dow Jones-UBS Commodity Index Total Return (the “DJ-UBSCI Total Return”). The DJ-UBSCI Total Return is a composite of commodity sector returns, representing an unleveraged, long-only investment in commodity futures that is diversified across the spectrum of commodities. The DJ-UBSCI Total Return is composed of nineteen commodities in eight diverse sectors: energy, petroleum, precious metals, industrial metals, grains, livestock, softs, and agriculture. |
| |
| (c) | | These Structured Notes take into consideration a leverage factor of 300% on the return of the underlying linked index. |
| |
| (d) | | Variable rate security. Interest rate disclosed is that which is in effect at June 30, 2011. |
| |
| (e) | | Interest rate disclosed is contingent upon LIBOR minus a spread as of June 30, 2011. |
| |
| (f) | | All or a portion of security is segregated as collateral for initial margin requirements on futures transactions. |
The accompanying notes are an integral part of these financial statements. 37
GOLDMAN SACHS DYNAMIC ALLOCATION FUND
Schedule of Investments (continued)
June 30, 2011 (Unaudited)
| |
| ADDITIONAL INVESTMENT INFORMATION | |
FUTURES CONTRACTS — At June 30, 2011, the following futures contracts were open:
| | | | | | | | | | | | | | | |
| | | Number of
| | | | | | |
| | | Contracts
| | Expiration
| | Current
| | Unrealized
|
| Type | | Long (Short) | | Date | | Value | | Gain (Loss) |
| |
| CAC 40 Index | | | 1 | | | July 2011 | | $ | 57,709 | | | $ | 2,520 | |
| Euro-Bund | | | (17 | ) | | September 2011 | | | (3,093,402 | ) | | | (2,961 | ) |
| FTSE 100 Index | | | 2 | | | September 2011 | | | 189,464 | | | | 5,985 | |
| Long Gilt | | | (3 | ) | | September 2011 | | | (578,504 | ) | | | (1,302 | ) |
| OMX Stockholm 30 Index | | | 1 | | | July 2011 | | | 17,628 | | | | 698 | |
S&P 500 E-mini Index | | | 1,245 | | | September 2011 | | | 81,889,875 | | | | 2,944,503 | |
| S&P/TSX 60 Index | | | 1 | | | September 2011 | | | 158,059 | | | | 3,547 | |
| SPI 200 Index | | | 1 | | | September 2011 | | | 123,370 | | | | 3,129 | |
| TSE TOPIX Index | | | 1 | | | September 2011 | | | 105,521 | | | | 2,101 | |
| 10 Year Australian Treasury Bonds | | | (1 | ) | | September 2011 | | | (113,751 | ) | | | 448 | |
| 10 Year Canadian Government Bonds | | | (2 | ) | | September 2011 | | | (257,121 | ) | | | (696 | ) |
| 10 Year Japanese Government Bonds | | | (2 | ) | | September 2011 | | | (3,503,882 | ) | | | (10,716 | ) |
| 10 Year U.S. Treasury Notes | | | 757 | | | September 2011 | | | 92,602,391 | | | | 486,380 | |
| |
| |
TOTAL | | | | | | | | | | | | $ | 3,433,636 | |
| |
| |
SWAP CONTRACTS — At June 30, 2011, the Fund had outstanding swap contracts with the following terms:
CREDIT DEFAULT SWAP CONTRACTS
| | | | | | | | | | | | | | | | | | | | | | | | | | | | | | | |
| | | | | | | | | | | Credit
| | | | | | |
| | | | | | | | | | | Spread at
| | | | Upfront
| | |
| | | | | Notional
| | Rates Received
| | | | June 30,
| | | | Payments
| | |
| | | Referenced
| | Amount
| | (Paid) by
| | Termination
| | 2011(a)
| | Market
| | Made (Received)
| | Unrealized
|
| Counterparty | | Obligation | | (000s) | | the Fund | | Date | | (Basis Points) | | Value | | by the Fund | | Gain (Loss) |
| |
Protection Purchased: | | | | | | | | | | | | | | | | | | | | | | | | | | | | | | |
| Credit Suisse International | | CDX Emerging
Markets Index | | $ | 500 | | | | (5.000 | )% | | | 06/20/16 | | | | 214 | | | $ | (65,932 | ) | | $ | (62,266 | ) | | $ | (3,666 | ) |
| | | | | | 100 | | | | (5.000 | ) | | | 06/20/16 | | | | 214 | | | | (13,186 | ) | | | (13,203 | ) | | | 17 | |
Protection Sold: | | | | | | | | | | | | | | | | | | | | | | | | | | | | | | |
| Credit Suisse International | | CDX North America
High Yield Index | | | 1,500 | | | | 5.000 | | | | 06/20/16 | | | | 462 | | | | 26,025 | | | | 1,875 | | | | 24,150 | |
| | | | | | 3,800 | | | | 5.000 | | | | 06/20/16 | | | | 462 | | | | 65,928 | | | | 69,931 | | | | (4,003 | ) |
| | | | | | 39,700 | | | | 5.000 | | | | 06/20/16 | | | | 462 | | | | 688,774 | | | | 827,673 | | | | (138,899 | ) |
| |
| |
TOTAL | | | | | | | | | | | | | | | | | | | | $ | 701,609 | | | $ | 824,010 | | | $ | (122,401 | ) |
| |
| |
| | |
| (a) | | Credit spread on the Referenced Obligation, together with the period of expiration, are indicators of payment/performance risk. The likelihood of a credit event occurring which would require a fund make a payment or otherwise be required to perform under the swap contract is generally greater as the credit spread and term of the swap contract increase. |
38 The accompanying notes are an integral part of these financial statements.
GOLDMAN SACHS INTERNATIONAL REAL ESTATE SECURITIES FUND
Schedule of Investments
June 30, 2011 (Unaudited)
| | | | | | | | | |
| Shares | | Description | | Value |
| |
Common Stocks – 97.9% |
Australia – 13.5% |
| | 2,350,367 | | | BWP Trust (REIT) (Retail) | | $ | 4,621,281 | |
| | 7,618,404 | | | CFS Retail Property Trust (REIT) (Retail) | | | 14,850,560 | |
| | 2,127,857 | | | Commonwealth Property Office Fund (REIT) (Office) | | | 2,148,665 | |
| | 3,183,115 | | | GPT Group (REIT) (Diversified) | | | 10,820,213 | |
| | 1,452,144 | | | Stockland (REIT) (Diversified) | | | 5,326,434 | |
| | 1,359,998 | | | Westfield Group (REIT) (Retail) | | | 12,675,913 | |
| | | | | | | | | |
| | | | | | | | 50,443,066 | |
| |
| |
Austria – 1.6% |
| | 887,333 | | | Atrium European Real Estate Ltd. (Retail) | | | 5,843,418 | |
| |
| |
Canada – 8.1% |
| | 193,700 | | | Allied Properties Real Estate Investment Trust (REIT) (Office) | | | 4,788,022 | |
| | 155,000 | | | Canadian Apartment Properties Real Estate Investment Trust (REIT) (Residential) | | | 3,108,196 | |
| | 183,800 | | | Dundee Real Estate Investment Trust (REIT) (Office) | | | 6,193,686 | |
| | 1,140,500 | | | InnVest Real Estate Investment Trust (REIT) (Hotels) | | | 8,017,616 | |
| | 187,100 | | | Primaris Retail Real Estate Investment Trust (REIT) (Retail) | | | 4,083,628 | |
| | 359,900 | | | TransGlobe Apartment REIT (REIT) (Residential)(a) | | | 4,254,093 | |
| | | | | | | | | |
| | | | | | | | 30,445,241 | |
| |
| |
China – 7.3% |
| | 6,350,000 | | | China Resources Land Ltd. Class H (Diversified) | | | 11,526,344 | |
| | 4,206,000 | | | Hopson Development Holdings Ltd. (Diversified) | | | 3,787,885 | |
| | 10,540,500 | | | KWG Property Holding Ltd. Class H (Residential) | | | 7,048,548 | |
| | 3,922,000 | | | Shimao Property Holdings Ltd. Class H (Diversified) | | | 4,859,538 | |
| | | | | | | | | |
| | | | | | | | 27,222,315 | |
| |
| |
France – 10.1% |
| | 50,302 | | | Fonciere Des Regions (REIT) (Diversified) | | | 5,328,377 | |
| | 166,335 | | | Nexity SA (Residential) | | | 7,947,892 | |
| | 51,078 | | | Societe Immobiliere de Location pour l’Industrie et le Commerce (REIT) (Office) | | | 7,316,743 | |
| | 74,747 | | | Unibail-Rodamco SE (REIT) (Diversified) | | | 17,270,349 | |
| | | | | | | | | |
| | | | | | | | 37,863,361 | |
| |
| |
Germany – 0.5% |
| | 124,547 | | | Alstria Office REIT-AG (REIT) (Office) | | | 1,878,363 | |
| |
| |
Hong Kong – 19.2% |
| | 3,407,000 | | | Hang Lung Properties Ltd. (Retail) | | | 14,008,381 | |
| | 1,896,000 | | | Henderson Land Development Co. Ltd. (Diversified) | | | 12,260,569 | |
| | 882,000 | | | Hongkong Land Holdings Ltd. (Office) | | | 6,289,649 | |
| | 2,307,000 | | | Kerry Properties Ltd. (Diversified) | | | 11,150,780 | |
| | 1,936,475 | | | Sun Hung Kai Properties Ltd. (Diversified) | | | 28,306,572 | |
| | | | | | | | | |
| | | | | | | | 72,015,951 | |
| |
| |
Japan – 16.6% |
| | 232 | | | Frontier Real Estate Investment Corp. (REIT) (Diversified) | | | 2,039,967 | |
| | 82,410 | | | Goldcrest Co. Ltd. (Diversified) | | | 1,714,042 | |
| | 859,000 | | | Mitsubishi Estate Co. Ltd. (Diversified) | | | 15,075,412 | |
| | 878,000 | | | Mitsui Fudosan Co. Ltd. (Office) | | | 15,121,704 | |
| | 656 | | | Nippon Building Fund, Inc. (REIT) (Office) | | | 6,410,489 | |
| | 458,000 | | | Sumitomo Realty & Development Co. Ltd. (Office) | | | 10,236,135 | |
| | 473,200 | | | The Sankei Building Co. Ltd. (Diversified) | | | 2,608,636 | |
| | 7,744 | | | United Urban Investment Corp. (REIT) (Diversified) | | | 8,917,908 | |
| | | | | | | | | |
| | | | | | | | 62,124,293 | |
| |
| |
Norway – 1.8% |
| | 3,229,504 | | | Norwegian Property ASA (Diversified) | | | 6,754,240 | |
| |
| |
Poland – 1.5% |
| | 800,312 | | | Globe Trade Centre SA (Diversified)* | | | 5,428,344 | |
| |
| |
Russia – 0.6% |
| | 344,722 | | | Etalon Group Ltd. GDR (Residential)*(a) | | | 2,375,135 | |
| |
| |
Singapore – 5.2% |
| | 8,237,000 | | | CapitaLand Ltd. (Residential) | | | 19,568,116 | |
| |
| |
Sweden – 0.5% |
| | 145,107 | | | Hufvudstaden AB Class A (Diversified) | | | 1,741,206 | |
| |
| |
Switzerland – 2.1% |
| | 84,052 | | | PSP Swiss Property AG (Registered) (Office)* | | | 7,984,670 | |
| |
| |
United Kingdom – 9.3% |
| | 282,676 | | | Derwent London PLC (REIT) (Office) | | | 8,283,898 | |
| | 1,342,592 | | | Hammerson PLC (REIT) (Retail) | | | 10,379,907 | |
| | 88,054 | | | Intercontinental Hotels Group PLC (Hotels) | | | 1,802,536 | |
| | 509,039 | | | Land Securities Group PLC (REIT) (Diversified) | | | 6,963,674 | |
| | 2,178,326 | | | Metric Property Investments PLC (REIT) (Retail) | | | 3,723,351 | |
The accompanying notes are an integral part of these financial statements. 39
GOLDMAN SACHS INTERNATIONAL REAL ESTATE SECURITIES FUND
Schedule of Investments (continued)
June 30, 2011 (Unaudited)
| | | | | | | | | |
| Shares | | Description | | Value |
| |
Common Stocks – (continued) |
United Kingdom – (continued) |
| | | | | | | | | |
| | 979,092 | | | Safestore Holdings PLC (Industrial) | | $ | 2,168,523 | |
| | 267,672 | | | Segro PLC (REIT) (Industrial) | | | 1,342,067 | |
| | | | | | | | | |
| | | | | | | | 34,663,956 | |
| |
| |
TOTAL COMMON STOCKS |
(Cost $312,148,533) | | $ | 366,351,675 | |
| |
| |
| | | | | | | | | |
| | | | | | | | | | | |
| Shares | | Rate | | Value |
| |
Short-term Investment(b) – 0.8% |
| JPMorgan U.S. Government Money Market Fund – Capital Shares |
| | 3,040,745 | | | | 0.010 | % | | $ | 3,040,745 | |
(Cost $3,040,745) | | | | |
| |
| |
TOTAL INVESTMENTS – 98.7% |
(Cost $315,189,278) | | $ | 369,392,420 | |
| |
| |
OTHER ASSETS IN EXCESS OF LIABILITIES – 1.3% | | | 4,793,014 | |
| |
| |
NET ASSETS – 100.0% | | $ | 374,185,434 | |
| |
| |
The percentage shown for each investment category reflects the value of investments in that category as a percentage of net assets.
| | |
| * | | Non-income producing security. |
| |
| (a) | | Exempt from registration under Rule 144A of the Securities Act of 1933. Under procedures approved by the Board of Trustees, such securities have been determined to be liquid by the investment adviser and may be resold, normally to qualified institutional buyers in transactions exempt from registration. Total market value of Rule 144A securities amounts to $2,375,135, which represents approximately 0.6% of net assets as of June 30, 2011. |
| |
| (b) | | Variable rate security. Interest rate disclosed is that which is in effect at June 30, 2011. |
| | | | | |
| |
| |
Investment Abbreviations: |
| GDR | | — | | Global Depositary Receipt |
| REIT | | — | | Real Estate Investment Trust |
| |
| |
40 The accompanying notes are an integral part of these financial statements.
GOLDMAN SACHS REAL ESTATE SECURITIES FUND
Schedule of Investments
June 30, 2011 (Unaudited)
| | | | | | | | | |
| Shares | | Description | | Value |
| |
Common Stocks – 98.8% |
Commercial – 33.1% |
| | 212,429 | | | Alexandria Real Estate Equities, Inc. (REIT) | | $ | 16,446,253 | |
| | 305,790 | | | Boston Properties, Inc. (REIT) | | | 32,462,666 | |
| | 951,492 | | | Brookfield Office Properties, Inc. | | | 18,344,766 | |
| | 295,885 | | | Digital Realty Trust, Inc. (REIT) | | | 18,279,775 | |
| | 462,347 | | | Douglas Emmett, Inc. (REIT) | | | 9,196,082 | |
| | 1,045,589 | | | Duke Realty Corp. (REIT) | | | 14,648,702 | |
| | 47,913 | | | EastGroup Properties, Inc. (REIT) | | | 2,036,782 | |
| | 507,538 | | | Hudson Pacific Properties, Inc. (REIT) | | | 7,882,065 | |
| | 316,869 | | | Kilroy Realty Corp. (REIT) | | | 12,513,157 | |
| | 518,989 | | | Liberty Property Trust (REIT) | | | 16,908,662 | |
| | 110,556 | | | Parkway Properties, Inc. (REIT) | | | 1,886,085 | |
| | 679,971 | | | ProLogis, Inc. (REIT) | | | 24,370,161 | |
| | 61,601 | | | SL Green Realty Corp. (REIT) | | | 5,104,875 | |
| | 313,092 | | | Vornado Realty Trust (REIT) | | | 29,173,912 | |
| | | | | | | | | |
| | | | | | | | 209,253,943 | |
| |
| |
Health Care – 10.7% |
| | 916,707 | | | HCP, Inc. (REIT) | | | 33,633,980 | |
| | 239,162 | | | Health Care REIT, Inc. (REIT) | | | 12,539,263 | |
| | 413,431 | | | Ventas, Inc. (REIT) | | | 21,791,948 | |
| | | | | | | | | |
| | | | | | | | 67,965,191 | |
| |
| |
Leisure – 6.5% |
| | 470,273 | | | DiamondRock Hospitality Co. (REIT) | | | 5,046,029 | |
| | 1,742,357 | | | Host Hotels & Resorts, Inc. (REIT) | | | 29,532,951 | |
| | 252,851 | | | LaSalle Hotel Properties (REIT) | | | 6,660,096 | |
| | | | | | | | | |
| | | | | | | | 41,239,076 | |
| |
| |
Multifamily – 17.4% |
| | 396,187 | | | American Campus Communities, Inc. (REIT) | | | 14,072,562 | |
| | 156,650 | | | AvalonBay Communities, Inc. (REIT) | | | 20,113,860 | |
| | 337,286 | | | Camden Property Trust (REIT) | | | 21,458,135 | |
| | 663,370 | | | Equity Residential (REIT) | | | 39,802,200 | |
| | 108,898 | | | Essex Property Trust, Inc. (REIT) | | | 14,732,811 | |
| | | | | | | | | |
| | | | | | | | 110,179,568 | |
| |
| |
Other – 1.0% |
| | 793,151 | | | MFA Financial, Inc. (REIT) | | | 6,376,934 | |
| |
| |
Retail – 23.8% |
| | 586,229 | | | CBL & Associates Properties, Inc. (REIT) | | | 10,628,332 | |
| | 654,273 | | | Developers Diversified Realty Corp. (REIT) | | | 9,225,249 | |
| | 441,655 | | | General Growth Properties, Inc. (REIT) | | | 7,371,222 | |
| | 1,439,535 | | | Kimco Realty Corp. (REIT) | | | 26,832,932 | |
| | 653,342 | | | Simon Property Group, Inc. (REIT) | | | 75,937,941 | |
| | 516,172 | | | Tanger Factory Outlet Centers, Inc. (REIT) | | | 13,817,925 | |
| | 125,144 | | | The Macerich Co. (REIT) | | | 6,695,204 | |
| | | | | | | | | |
| | | | | | | | 150,508,805 | |
| |
| |
Self Storage – 6.3% |
| | 350,556 | | | Public Storage, Inc. (REIT) | | | 39,966,890 | |
| |
| |
TOTAL COMMON STOCKS |
(Cost $454,714,440) | | $ | 625,490,407 | |
| |
| |
| | | | | | | | | |
| | | | | | | | | | | |
| Shares | | Rate | | Value |
| |
Short-term Investment(a) – 2.2% |
| JPMorgan U.S. Government Money Market Fund – Capital Shares |
| | 14,075,020 | | | | 0.010 | % | | $ | 14,075,020 | |
(Cost $14,075,020) | | | | |
| |
| |
TOTAL INVESTMENTS – 101.0% |
(Cost $468,789,460) | | $ | 639,565,427 | |
| |
| |
LIABILITIES IN EXCESS OF OTHER ASSETS – (1.0)% | | | (6,062,430 | ) |
| |
| |
NET ASSETS – 100.0% | | $ | 633,502,997 | |
| |
| |
The percentage shown for each investment category reflects the value of investments in that category as a percentage of net assets.
| | |
| (a) | | Variable rate security. Interest rate disclosed is that which is in effect at June 30, 2011. |
| | | | | |
| |
| |
Investment Abbreviation: |
| REIT | | — | | Real Estate Investment Trust |
| |
| |
The accompanying notes are an integral part of these financial statements. 41
GOLDMAN SACHS SELECT SATELLITE FUNDS
Statements of Assets and Liabilities
June 30, 2011 (Unaudited)
| | | | | | | |
| | | Absolute Return
| | |
| | | Tracker Fund | | |
Assets: |
| | | | | | | |
| Investments in securities, at value (identified cost $1,490,253,509, $830,871,200, $334,609,482, $315,189,278 and $468,789,460, respectively) | | $ | 1,513,325,480 | | | |
| Repurchase Agreement, at value which equals cost | | | 229,900,000 | | | |
| Cash | | | — | | | |
| Foreign currencies, at value (identified cost $175,518 and $1,149,091 for Absolute Return Tracker and International Real Estate Securities Funds, respectively) | | | 187,633 | | | |
| Receivables: | | | | | | |
| Fund shares sold | | | 10,412,517 | | | |
| Due from broker — variation margin, at value | | | 6,177,834 | | | |
| Due from broker — forward foreign currency exchange contracts collateral, at value | | | 2,560,000 | | | |
| Reimbursement from investment adviser | | | 173,070 | | | |
| Forward foreign currency exchange contracts, at value | | | 35,149 | | | |
| Dividends and interest, at value | | | 744 | | | |
| Due from broker — collateral for swap contracts, at value | | | — | | | |
| Investment securities sold on an extended delivery basis | | | — | | | |
| Swap contracts, at value (includes upfront payments made/(received) of $630,169 and $899,479 for Commodity Strategy and Dynamic Allocation Funds, respectively) | | | — | | | |
| Investment securities sold, at value | | | — | | | |
| Due from broker — upfront payment | | | — | | | |
| Foreign tax reclaims, at value | | | — | | | |
| Other assets | | | 7,657 | | | |
| |
| |
Total assets | | | 1,762,780,084 | | | |
| |
| |
| | | | | | | |
| | | | | | | |
Liabilities: |
| | | | | | | |
| Payables: | | | | | | |
| Fund shares redeemed | | | 3,708,586 | | | |
| Forward foreign currency exchange contracts, at value | | | 1,991,949 | | | |
| Amounts owed to affiliates | | | 1,887,035 | | | |
| Investment securities purchased on an extended delivery basis | | | — | | | |
| Forward Sale Contracts, at value (proceeds receivable $40,477,813 for Commodity Strategy Fund) | | | — | | | |
| Investment securities purchased, at value | | | — | | | |
| Swap contracts at value (includes upfront payments made/(received) of $1,010,195 and $75,469 for Commodity Strategy and Dynamic Allocation Funds, respectively) | | | — | | | |
| Due to broker — collateral for swap contracts, at value | | | — | | | |
| Accrued expenses | | | 203,156 | | | |
| |
| |
Total liabilities | | | 7,790,726 | | | |
| |
| |
| | | | | | | |
| | | | | | | |
Net Assets: |
| | | | | | | |
| Paid-in capital | | | 1,710,581,208 | | | |
| Accumulated undistributed (distributions in excess of) net investment income (loss) | | | (12,420,242 | ) | | |
| Accumulated net realized gain (loss) from investment, futures, swaps and foreign currency related transactions | | | 18,581,891 | | | |
| Net unrealized gain (loss) on investments, futures, swaps and translation of assets and liabilities denominated in foreign currencies | | | 38,246,501 | | | |
| |
| |
NET ASSETS | | $ | 1,754,989,358 | | | |
| | | | | | | |
| Net Assets: | | | | | | |
| Class A | | $ | 625,520,151 | | | |
| Class B | | | — | | | |
| Class C | | | 74,642,233 | | | |
| Institutional | | | 1,048,341,705 | | | |
| Service | | | — | | | |
| Class IR | | | 5,490,949 | | | |
| Class R | | | 994,320 | | | |
| | | | | | | |
| | | | | | | |
| Total Net Assets | | $ | 1,754,989,358 | | | |
| | | | | | | |
| Shares outstanding $0.001 par value (unlimited shares authorized): | | | | | | |
| Class A | | | 67,367,466 | | | |
| Class B | | | — | | | |
| Class C | | | 8,221,588 | | | |
| Institutional | | | 111,701,338 | | | |
| Service | | | — | | | |
| Class IR | | | 587,352 | | | |
| Class R | | | 107,871 | | | |
| | | | | | | |
Net asset value, offering and redemption price per share:(b) | | | | | | |
| Class A | | | $9.29 | | | |
| Class B | | | — | | | |
| Class C | | | 9.08 | | | |
| Institutional | | | 9.39 | | | |
| Service | | | — | | | |
| Class IR | | | 9.35 | | | |
| Class R | | | 9.22 | | | |
| | | | | | | |
| | |
| (a) | | Statement of Assets and Liabilities for Commodity Strategy Fund is consolidated and includes the balances of Goldman Sachs Cayman Commodity Fund, Ltd. (wholly-owned subsidiary). Accordingly, all interfund balances have been eliminated. |
| (b) | | Maximum public offering price per share (NAV per share multiplied by 1.0582) for Class A Shares of the Absolute Return Tracker, Dynamic Allocation, International Real Estate Securities and Real Estate Securities and (NAV per share multiplied by 1.0471) for Commodity Strategy Fund is $9.83, $11.46, $6.74 and $14.40 and $6.58, respectively. At redemption, Class B and Class C Shares may be subject to a contingent deferred sales charge assessed on the amount equal to the lesser of the current net asset value or the original purchase price of the shares. |
42 The accompanying notes are an integral part of these financial statements.
GOLDMAN SACHS SELECT SATELLITE FUNDS
| | | | | | | | | | | | | | | | | |
| | | | | International
| | | | |
Commodity
| | Dynamic
| | Real Estate
| | Real Estate
| | |
| Strategy Fund(a) | | Allocation Fund | | Securities Fund | | Securities Fund | | |
| |
| | | | | | | | | | | | | | | | | |
| $ | 831,249,884 | | | $ | 336,089,779 | | | $ | 369,392,420 | | | $ | 639,565,427 | | | |
| | — | | | | — | | | | — | | | | — | | | |
| | 85,908,521 | | | | — | | | | — | | | | — | | | |
| | — | | | | — | | | | 1,207,711 | | | | — | | | |
| | | | | | | | | | | | | | | | | |
| | 4,055,620 | | | | 2,919,381 | | | | 8,928,056 | | | | 11,759,988 | | | |
| | 83,036 | | | | 313,544 | | | | — | | | | — | | | |
| | — | | | | — | | | | — | | | | — | | | |
| | 87,579 | | | | 41,420 | | | | 40,970 | | | | 38,286 | | | |
| | — | | | | — | | | | — | | | | — | | | |
| | 390,222 | | | | 469,508 | | | | 1,739,407 | | | | 1,519,378 | | | |
| | 102,890,000 | | | | — | | | | — | | | | — | | | |
| | 86,046,406 | | | | — | | | | — | | | | — | | | |
| | 12,144,967 | | | | 780,727 | | | | — | | | | — | | | |
| | 22,199 | | | | — | | | | — | | | | — | | | |
| | — | | | | 4,322 | | | | — | | | | — | | | |
| | — | | | | — | | | | 4,140 | | | | — | | | |
| | 4,324 | | | | 874 | | | | 2,088 | | | | 3,351 | | | |
| |
| |
| | 1,122,882,758 | | | | 340,619,555 | | | | 381,314,792 | | | $ | 652,886,430 | | | |
| |
| |
| | | | | | | | | | | | | | | | | |
| | | | | | | | | | | | | | | | | |
| |
| | | | | | | | | | | | | | | | | |
| | | | | | | | | | | | | | | | | |
| | 23,424,511 | | | | 1,082,068 | | | | 4,169,908 | | | | 7,429,437 | | | |
| | — | | | | — | | | | — | | | | — | | | |
| | 520,517 | | | | 295,440 | | | | 365,448 | | | | 603,038 | | | |
| | 76,315,078 | | | | — | | | | — | | | | — | | | |
| | 40,105,937 | | | | — | | | | — | | | | — | | | |
| | — | | | | 21,341,619 | | | | 2,473,532 | | | | 11,223,336 | | | |
| | 19,724,079 | | | | 79,118 | | | | — | | | | — | | | |
| | 99,998 | | | | — | | | | — | | | | — | | | |
| | 199,527 | | | | 109,413 | | | | 120,470 | | | | 127,622 | | | |
| |
| |
| | 160,389,647 | | | | 22,907,658 | | | | 7,129,358 | | | | 19,383,433 | | | |
| |
| |
| | | | | | | | | | | | | | | | | |
| | | | | | | | | | | | | | | | | |
| |
| | | | | | | | | | | | | | | | | |
| | 1,000,001,620 | | | | 306,734,316 | | | | 938,547,359 | | | | 632,503,025 | | | |
| | (59,281,532 | ) | | | 1,200,436 | | | | (22,990,712 | ) | | | (25,625 | ) | | |
| | 28,645,333 | | | | 4,980,234 | | | | (595,651,997 | ) | | | (169,750,370 | ) | | |
| | (6,872,310 | ) | | | 4,796,911 | | | | 54,280,784 | | | | 170,775,967 | | | |
| |
| |
| $ | 962,493,111 | | | $ | 317,711,897 | | | $ | 374,185,434 | | | $ | 633,502,997 | | | |
| | | | | | | | | | | | | | | | | |
| | | | | | | | | | | | | | | | | |
| $ | 177,127,360 | | | $ | 110,111,730 | | | $ | 125,547,668 | | | $ | 174,772,837 | | | |
| | — | | | | — | | | | — | | | | 2,648,590 | | | |
| | 17,694,490 | | | | 26,430,635 | | | | 2,747,498 | | | | 11,609,303 | | | |
| | 735,637,125 | | | | 153,335,003 | | | | 245,880,107 | | | | 438,452,644 | | | |
| | — | | | | — | | | | — | | | | 5,457,348 | | | |
| | 31,189,043 | | | | 27,823,544 | | | | 10,161 | | | | 206,430 | | | |
| | 845,093 | | | | 10,985 | | | | — | | | | 355,845 | | | |
| | | | | | | | | | | | | | | | | |
| | | | | | | | | | | | | | | | | |
| $ | 962,493,111 | | | $ | 317,711,897 | | | $ | 374,185,434 | | | $ | 633,502,997 | | | |
| | | | | | | | | | | | | | | | | |
| | | | | | | | | | | | | | | | | |
| | 28,194,497 | | | | 10,168,190 | | | | 19,708,078 | | | | 12,838,194 | | | |
| | — | | | | — | | | | — | | | | 194,945 | | | |
| | 2,861,143 | | | | 2,466,578 | | | | 430,397 | | | | 867,800 | | | |
| | 116,978,520 | | | | 14,070,229 | | | | 39,346,963 | | | | 31,807,672 | | | |
| | — | | | | — | | | | — | | | | 398,290 | | | |
| | 4,949,295 | | | | 2,559,039 | | | | 1,601 | | | | 15,133 | | | |
| | 135,231 | | | | 1,018 | | | | — | | | | 26,213 | | | |
| | | | | | | | | | | | | | | | | |
| | | | | | | | | | | | | | | | | |
| | $6.28 | | | | $10.83 | | | | $6.37 | | | | $13.61 | | | |
| | — | | | | — | | | | — | | | | 13.59 | | | |
| | 6.18 | | | | 10.72 | | | | 6.38 | | | | 13.38 | | | |
| | 6.29 | | | | 10.90 | | | | 6.25 | | | | 13.78 | | | |
| | — | | | | — | | | | — | | | | 13.70 | | | |
| | 6.30 | | | | 10.87 | | | | 6.35 | | | | 13.64 | | | |
| | 6.25 | | | | 10.79 | | | | — | | | | 13.58 | | | |
| | | | | | | | | | | | | | | | | |
The accompanying notes are an integral part of these financial statements. 43
GOLDMAN SACHS SELECT SATELLITE FUNDS
Statements of Operations
For the Six Months Ended June 30, 2011 (Unaudited)
| | | | | |
| | | Absolute Return
|
| | | Tracker Fund |
| |
Investment income: |
| | | | | |
| Interest | | $ | 1,113,674 | |
| Dividends (net of foreign taxes withheld of $0, $0, $0, $686,967 and $32,426, respectively) | | | 735,378 | |
| |
| |
Total investment income | | | 1,849,052 | |
| |
| |
| | | | | |
| | | | | |
Expenses: |
| | | | | |
| Management fees | | | 8,665,831 | |
Distribution and Service fees(b) | | | 1,078,373 | |
Transfer Agent fees(b) | | | 791,210 | |
| Registration fees | | | 126,966 | |
| Printing and mailing costs | | | 121,450 | |
| Custody and accounting fees | | | 62,398 | |
| Professional fees | | | 52,220 | |
| Trustee fees | | | 10,069 | |
| Amortization of offering costs | | | — | |
| Service share fees — Service Plan | | | — | |
| Service share fees — Shareholder Administration Plan | | | — | |
| Other | | | 23,683 | |
| |
| |
Total expenses | | | 10,932,200 | |
| |
| |
| Less — expense reductions | | | (287,323 | ) |
| |
| |
Net expenses | | | 10,644,877 | |
| |
| |
NET INVESTMENT INCOME (LOSS) | | | (8,795,825 | ) |
| |
| |
| | | | | |
| | | | | |
Realized and unrealized gain (loss) from investment, futures, swap and foreign currency related transactions: |
| | | | | |
| Net realized gain (loss) from: | | | | |
| Investment transactions | | | 7,132,953 | |
| Futures transactions | | | (5,134,530 | ) |
| Swap contracts | | | — | |
| Foreign currency related transactions (includes $8,578,984 of gains on forward foreign currency exchange contracts for the Absolute Return Tracker Fund) | | | 8,305,137 | |
| Net change in unrealized gain (loss) on: | | | | |
| Investments | | | 2,822,737 | |
| Futures | | | 3,245,290 | |
| Swap contracts | | | — | |
| Translation of assets and liabilities denominated in foreign currencies (includes $3,364,336 of unrealized losses on forward foreign currency exchange contracts for the Absolute Return Tracker Fund) | | | (3,362,212 | ) |
| |
| |
Net realized and unrealized gain from investment, futures, swap and foreign currency related transactions | | | 13,009,375 | |
| |
| |
NET INCREASE IN NET ASSETS RESULTING FROM OPERATIONS | | $ | 4,213,550 | |
| |
| |
| | |
| (a) | | Statement of Operations for Commodity Strategy Fund is consolidated and includes the balances of Goldman Sachs Cayman Commodity Fund, Ltd. (wholly-owned subsidiary). Accordingly, all interfund balances and transactions have been eliminated. |
| (b) | | Class specific Distribution and Service, and Transfer Agent fees were as follows: |
| | | | | | | | | | | | | | | | | | | | | | | | | | | | | | | | | | | | | | | | | | | | | |
| | | Distribution and Service Fees | | Transfer Agent Fees |
Fund | | Class A | | Class B | | Class C | | Class R | | Class A | | Class B | | Class C | | Institutional | | Service | | Class IR | | Class R |
| Absolute Return Tracker | | $ | 694,832 | | | $ | — | | | $ | 381,190 | | | $ | 2,351 | | | $ | 528,076 | | | $ | — | | | $ | 72,426 | | | $ | 184,620 | | | $ | — | | | $ | 5,194 | | | $ | 894 | |
| Commodity Strategy | | | 219,522 | | | | — | | | | 79,082 | | | | 1,756 | | | | 114,150 | | | | — | | | | 10,280 | | | | 148,715 | | | | — | | | | 15,392 | | | | 457 | |
| Dynamic Allocation | | | 93,958 | | | | — | | | | 76,776 | | | | 27 | | | | 71,409 | | | | — | | | | 14,587 | | | | 23,391 | | | | — | | | | 24,206 | | | | 11 | |
| International Real Estate Securities | | | 175,977 | | | | — | | | | 14,581 | | | | — | | | | 133,743 | | | | — | | | | 2,770 | | | | 47,927 | | | | — | | | | 10 | | | | — | |
| Real Estate Securities | | | 211,553 | | | | 14,277 | | | | 57,177 | | | | 765 | | | | 160,781 | | | | 2,713 | | | | 10,864 | | | | 81,385 | | | | 1,098 | | | | 128 | | | | 291 | |
44 The accompanying notes are an integral part of these financial statements.
GOLDMAN SACHS SELECT SATELLITE FUNDS
| | | | | | | | | | | | | | | |
| | | | | International
| | |
Commodity
| | Dynamic
| | Real Estate
| | Real Estate
|
| Strategy Fund(a) | | Allocation Fund | | Securities Fund | | Securities Fund |
| |
| |
| | | | | | | | | | | | | | | |
| $ | 1,737,954 | | | $ | 1,912,883 | | | $ | 230 | | | $ | — | |
| | 36,006 | | | | 487,868 | | | | 7,577,405 | | | | 9,371,072 | |
| |
| |
| | 1,773,960 | | | | 2,400,751 | | | | 7,577,635 | | | | 9,371,072 | |
| |
| |
| | | | | | | | | | | | | | | |
| | | | | | | | | | | | | | | |
| |
| | | | | | | | | | | | | | | |
| | 2,398,452 | | | | 1,048,360 | | | | 2,012,530 | | | | 2,981,939 | |
| | 300,360 | | | | 170,761 | | | | 190,558 | | | | 283,772 | |
| | 288,994 | | | | 133,604 | | | | 184,450 | | | | 257,260 | |
| | 86,473 | | | | 38,852 | | | | 31,148 | | | | 51,115 | |
| | 82,786 | | | | 50,033 | | | | 49,563 | | | | 41,193 | |
| | 80,163 | | | | 32,949 | | | | 127,037 | | | | 49,014 | |
| | 63,369 | | | | 67,365 | | | | 48,643 | | | | 45,168 | |
| | 9,407 | | | | 8,975 | | | | 10,093 | | | | 9,390 | |
| | — | | | | 14,866 | | | | — | | | | — | |
| | — | | | | — | | | | — | | | | 6,862 | |
| | — | | | | — | | | | — | | | | 6,862 | |
| | 19,760 | | | | 8,038 | | | | 13,042 | | | | 17,578 | |
| |
| |
| | 3,329,764 | | | | 1,573,803 | | | | 2,667,064 | | | | 3,750,153 | |
| |
| |
| | (126,791 | ) | | | (157,944 | ) | | | (195,313 | ) | | | (201,522 | ) |
| |
| |
| | 3,202,973 | | | | 1,415,859 | | | | 2,471,751 | | | | 3,548,631 | |
| |
| |
| | (1,429,013 | ) | | | 984,892 | | | | 5,105,884 | | | | 5,822,441 | |
| |
| |
| | | | | | | | | | | | | | | |
| | | | | | | | | | | | | | | |
| |
| | | | | | | | | | | | | | | |
| | | | | | | | | | | | | | | |
| | 970,874 | | | | 2,742,803 | | | | 28,056,202 | | | | 28,181,127 | |
| | (2,518,197 | ) | | | 1,573,583 | | | | — | | | | — | |
| | 114,045,424 | | | | (487,242 | ) | | | — | | | | — | |
| |
— | | | | 58,268 | | | | (29,439 | ) | | | — | |
| | | | | | | | | | | | | | | |
| | (187,735 | ) | | | (3,662,983 | ) | | | (24,647,525 | ) | | | 24,761,289 | |
| | (183,693 | ) | | | 4,185,777 | | | | — | | | | — | |
| | (66,198,861 | ) | | | 28,937 | | | | — | | | | — | |
| |
— | | | | (18,469 | ) | | | 40,878 | | | | — | |
| |
| |
| | 45,927,812 | | | | 4,420,674 | | | | 3,420,116 | | | | 52,942,416 | |
| |
| |
| $ | 44,498,799 | | | $ | 5,405,566 | | | $ | 8,526,000 | | | $ | 58,764,857 | |
| |
| |
The accompanying notes are an integral part of these financial statements. 45
GOLDMAN SACHS SELECT SATELLITE FUNDS
Statements of Changes in Net Assets
| | | | | | | | | | | | | | | | | |
| | | Absolute Return Tracker Fund | | Commodity Strategy Fund(a) |
| | | For the
| | | | For the
| | |
| | | Six Months Ended
| | For the Fiscal
| | Six Months Ended
| | For the Fiscal
|
| | | June 30, 2011
| | Year Ended
| | June 30, 2011
| | Year Ended
|
| | | (Unaudited) | | December 31, 2010 | | (Unaudited) | | December 31, 2010 |
| |
From operations: |
| | | | | | | | | | | | | | | | | |
| Net investment income (loss) | | $ | (8,795,825 | ) | | $ | (12,491,730 | ) | | $ | (1,429,013 | ) | | $ | (580,100 | ) |
| Net realized gain from investment, securities sold short, futures, swaps and foreign currency related transactions | | | 10,303,560 | | | | 18,516,640 | | | | 112,498,101 | | | | 46,973,939 | |
| Net change in unrealized gain (loss) on investments, futures, swaps and translation of assets and liabilities denominated in foreign currencies | | | 2,705,815 | | | | 32,705,444 | | | | (66,570,289 | ) | | | 25,145,509 | |
| |
| |
Net increase in net assets resulting from operations | | | 4,213,550 | | | | 38,730,354 | | | | 44,498,799 | | | | 71,539,348 | |
| |
| |
| | | | | | | | | | | | | | | | | |
| | | | | | | | | | | | | | | | | |
Distributions to shareholders: |
| | | | | | | | | | | | | | | | | |
| From net investment income | | | | | | | | | | | | | | | | |
| Class A Shares | | | — | | | | — | | | | (2,190,042 | ) | | | (14,274,120 | ) |
| Class B Shares | | | — | | | | — | | | | — | | | | — | |
| Class C Shares | | | — | | | | — | | | | (169,395 | ) | | | (1,027,390 | ) |
| Institutional Shares | | | — | | | | — | | | | (10,229,310 | ) | | | (63,002,437 | ) |
| Service Shares | | | — | | | | — | | | | — | | | | — | |
| Class IR Shares | | | — | | | | — | | | | (343,897 | ) | | | (573,610 | ) |
| Class R Shares | | | — | | | | — | | | | (8,345 | ) | | | (39,635 | ) |
| From net realized gains | | | | | | | | | | | | | | | | |
| Class A Shares | | | — | | | | (2,895,763 | ) | | | — | | | | — | |
| Class C Shares | | | — | | | | (492,996 | ) | | | — | | | | — | |
| Institutional Shares | | | — | | | | (4,596,410 | ) | | | — | | | | — | |
| Class IR Shares | | | — | | | | (34,395 | ) | | | — | | | | — | |
| Class R Shares | | | — | | | | (5,280 | ) | | | — | | | | — | |
| |
| |
Total distributions to shareholders | | | — | | | | (8,024,844 | ) | | | (12,940,989 | ) | | | (78,917,192 | ) |
| |
| |
| | | | | | | | | | | | | | | | | |
| | | | | | | | | | | | | | | | | |
From share transactions: |
| | | | | | | | | | | | | | | | | |
| Proceeds from sales of shares | | | 699,617,515 | | | | 1,308,474,174 | | | | 381,559,113 | | | | 390,513,408 | |
| Reinvestment of distributions | | | — | | | | 5,685,036 | | | | 11,113,643 | | | | 69,003,196 | |
| Cost of shares redeemed | | | (310,053,330 | ) | | | (660,831,606 | )(c) | | | (267,875,821 | ) | | | (238,848,507 | )(c) |
| |
| |
Net increase (decrease) in net assets resulting from share transactions | | | 389,564,185 | | | | 653,327,604 | | | | 124,796,935 | | | | 220,668,097 | |
| |
| |
TOTAL INCREASE (DECREASE) | | | 393,777,735 | | | | 684,033,114 | | | | 156,354,745 | | | | 213,290,253 | |
| |
| |
| | | | | | | | | | | | | | | | | |
| | | | | | | | | | | | | | | | | |
Net assets: |
| | | | | | | | | | | | | | | | | |
| Beginning of period | | | 1,361,211,623 | | | | 677,178,509 | | | | 806,138,366 | | | | 592,848,113 | |
| |
| |
| End of period | | $ | 1,754,989,358 | | | $ | 1,361,211,623 | | | $ | 962,493,111 | | | $ | 806,138,366 | |
| |
| |
Accumulated undistributed (distributions in excess of) net investment income (loss) | | $ | (12,420,242 | ) | | $ | (3,624,417 | ) | | $ | (59,281,532 | ) | | $ | (44,911,530 | ) |
| |
| |
| | |
| (a) | | Statement of Changes in Net Assets for Commodity Strategy Fund is consolidated and includes the balances of Goldman Sachs Cayman Commodity Fund, Ltd. (wholly-owned subsidiary). Accordingly, all interfund balances and transactions have been eliminated. |
| (b) | | Commenced operations on January 5, 2010. |
| (c) | | Net of $77,374, $19,024 and $3,199 of redemption fees remitted to the Absolute Return Tracker, Commodity Strategy and International Real Estate Securities Funds, respectively. |
46 The accompanying notes are an integral part of these financial statements.
GOLDMAN SACHS SELECT SATELLITE FUNDS
| | | | | | | | | | | | | | | | | | | | | | | |
| Dynamic Allocation Fund | | International Real Estate Securities Fund | | Real Estate Securities Fund |
For the
| | | | For the
| | | | For the
| | |
Six Months Ended
| | For the
| | Six Months Ended
| | For the Fiscal
| | Six Months Ended
| | For the Fiscal
|
June 30, 2011
| | Period Ended
| | June 30, 2011
| | Year Ended
| | June 30, 2011
| | Year Ended
|
| (Unaudited) | | December 31, 2010(b) | | (Unaudited) | | December 31, 2010 | | (Unaudited) | | December 31, 2010 |
| |
| |
| | | | | | | | | | | | | | | | | | | | | | | |
| $ | 984,892 | | | $ | (154,892 | ) | | $ | 5,105,884 | | | $ | 13,735,056 | | | $ | 5,822,441 | | | $ | 7,041,050 | |
| | | | | | | | | | | | | | | | | | | | | | | |
| | 3,887,412 | | | | 4,239,481 | | | | 28,026,763 | | | | 3,769,345 | | | | 28,181,127 | | | | 63,280,853 | |
| | | | | | | | | | | | | | | | | | | | | | | |
| | 533,262 | | | | 4,263,649 | | | | (24,606,647 | ) | | | 23,998,760 | | | | 24,761,289 | | | | 68,464,875 | |
| |
| |
| | 5,405,566 | | | | 8,348,238 | | | | 8,526,000 | | | | 41,503,161 | | | | 58,764,857 | | | | 138,786,778 | |
| |
| |
| | | | | | | | | | | | | | | | | | | | | | | |
| | | | | | | | | | | | | | | | | | | | | | | |
| |
| | | | | | | | | | | | | | | | | | | | | | | |
| | | | | | | | | | | | | | | | | | | | | | | |
| | — | | | | — | | | | (1,592,196 | ) | | | (9,055,756 | ) | | | (1,692,608 | ) | | | (2,737,164 | ) |
| | — | | | | — | | | | — | | | | — | | | | (16,283 | ) | | | (42,781 | ) |
| | — | | | | — | | | | (24,466 | ) | | | (169,035 | ) | | | (72,864 | ) | | | (115,188 | ) |
| | — | | | | — | | | | (3,647,607 | ) | | | (16,549,686 | ) | | | (4,878,437 | ) | | | (8,502,338 | ) |
| | — | �� | | | — | | | | — | | | | — | | | | (49,974 | ) | | | (91,110 | ) |
| | — | | | | — | | | | (144 | ) | | | (559 | ) | | | (1,764 | ) | | | (580 | ) |
| | — | | | | — | | | | — | | | | — | | | | (2,832 | ) | | | (2,659 | ) |
| | | | | | | | | | | | | | | | | | | | | | | |
| | — | | | | (666,661 | ) | | | — | | | | — | | | | — | | | | — | |
| | — | | | | (130,129 | ) | | | — | | | | — | | | | — | | | | — | |
| | — | | | | (1,357,506 | ) | | | — | | | | — | | | | — | | | | — | |
| | — | | | | (402,682 | ) | | | — | | | | — | | | | — | | | | — | |
| | — | | | | (187 | ) | | | — | | | | — | | | | — | | | | — | |
| |
| |
| | — | | | | (2,557,165 | ) | | | (5,264,413 | ) | | | (25,775,036 | ) | | | (6,714,762 | ) | | | (11,491,820 | ) |
| |
| |
| | | | | | | | | | | | | | | | | | | | | | | |
| | | | | | | | | | | | | | | | | | | | | | | |
| |
| | | | | | | | | | | | | | | | | | | | | | | |
| | 188,609,479 | | | | 199,847,451 | | | | 52,610,366 | | | | 109,361,043 | | | | 83,778,495 | | | | 194,803,609 | |
| | — | | | | 1,583,487 | | | | 4,942,662 | | | | 22,250,360 | | | | 6,333,290 | | | | 10,710,436 | |
| | (36,508,385 | ) | | | (47,016,774 | ) | | | (68,901,055 | ) | | | (104,840,335 | )(c) | | | (63,001,891 | ) | | | (290,861,663 | ) |
| |
| |
| | | | | | | | | | | | | | | | | | | | | | | |
| | 152,101,094 | | | | 154,414,164 | | | | (11,348,027 | ) | | | 26,771,068 | | | | 27,109,894 | | | | (85,347,618 | ) |
| |
| |
| | 157,506,660 | | | | 160,205,237 | | | | (8,086,440 | ) | | | 42,499,193 | | | | 79,159,989 | | | | 41,947,340 | |
| |
| |
| | | | | | | | | | | | | | | | | | | | | | | |
| | | | | | | | | | | | | | | | | | | | | | | |
| |
| | | | | | | | | | | | | | | | | | | | | | | |
| | 160,205,237 | | | | — | | | | 382,271,874 | | | | 339,772,681 | | | | 554,343,008 | | | | 512,395,668 | |
| |
| |
| $ | 317,711,897 | | | $ | 160,205,237 | | | $ | 374,185,434 | | | $ | 382,271,874 | | | $ | 633,502,997 | | | $ | 554,343,008 | |
| |
| |
| | | | | | | | | | | | | | | | | | | | | | | |
| $ | 1,200,436 | | | $ | 215,544 | | | $ | (22,990,712 | ) | | $ | (22,832,183 | ) | | $ | (25,625 | ) | | $ | 866,696 | |
| |
| |
The accompanying notes are an integral part of these financial statements. 47
GOLDMAN SACHS ABSOLUTE RETURN TRACKER FUND
Financial Highlights
Selected Data for a Share Outstanding Throughout Each Period
| | | | | | | | | | | | | | | | | | | | | | | | | | | | | | | |
| | | | | Income (loss) from
| | Distributions
| | |
| | | | | investment operations | | to shareholders | | |
| | | | |
| | | | | |
| | | | | | |
| | | Net asset
| |
| | | | | |
| | | | | | |
| | | value,
| | Net
| | Net realized
| | Total from
| | From net
| | From net
| | | | |
| | | beginning
| | investment
| | and unrealized
| | investment
| | investment
| | realized
| | Total
| | |
| Year - Share Class | | of period | | income (loss)(a) | | gain (loss) | | operations | | income | | gains | | distributions | | |
| |
FOR THE SIX MONTHS ENDED JUNE 30, (UNAUDITED) |
| 2011 - A | | $ | 9.25 | | | $ | (0.06 | ) | | $ | 0.10 | | | $ | 0.04 | | | $ | — | | | $ | — | | | $ | — | | | |
| 2011 - C | | | 9.08 | | | | (0.09 | ) | | | 0.09 | | | | — | (d) | | | — | | | | — | | | | — | | | |
| 2011 - Institutional | | | 9.34 | | | | (0.04 | ) | | | 0.09 | | | | 0.05 | | | | — | | | | — | | | | — | | | |
| 2011 - IR | | | 9.31 | | | | (0.05 | ) | | | 0.09 | | | | 0.04 | | | | — | | | | — | | | | — | | | |
| 2011 - R | | | 9.20 | | | | (0.07 | ) | | | 0.09 | | | | 0.02 | | | | — | | | | — | | | | — | | | |
| | | | | | | | | | | | | | | | | | | | | | | | | | | | | | | |
| | | | | | | | | | | | | | | | | | | | | | | | | | | | | | | |
FOR THE FISCAL YEARS ENDED DECEMBER 31, |
| 2010 - A | | | 9.06 | | | | (0.13 | ) | | | 0.38 | | | | 0.25 | | | | — | | | | (0.06 | ) | | | (0.06 | ) | | |
| 2010 - C | | | 8.96 | | | | (0.19 | ) | | | 0.37 | | | | 0.18 | | | | — | | | | (0.06 | ) | | | (0.06 | ) | | |
| 2010 - Institutional | | | 9.11 | | | | (0.09 | ) | | | 0.38 | | | | 0.29 | | | | — | | | | (0.06 | ) | | | (0.06 | ) | | |
| 2010 - IR | | | 9.09 | | | | (0.10 | ) | | | 0.38 | | | | 0.28 | | | | — | | | | (0.06 | ) | | | (0.06 | ) | | |
| 2010 - R | | | 9.03 | | | | (0.14 | ) | | | 0.37 | | | | 0.23 | | | | — | | | | (0.06 | ) | | | (0.06 | ) | | |
| |
|
| 2009 - A | | | 8.58 | | | | (0.12 | ) | | | 0.62 | | | | 0.50 | | | | (0.01 | ) | | | (0.01 | ) | | | (0.02 | ) | | |
| 2009 - C | | | 8.54 | | | | (0.19 | ) | | | 0.62 | | | | 0.43 | | | | — | | | | (0.01 | ) | | | (0.01 | ) | | |
| 2009 - Institutional | | | 8.60 | | | | (0.08 | ) | | | 0.62 | | | | 0.54 | | | | (0.02 | ) | | | (0.01 | ) | | | (0.03 | ) | | |
| 2009 - IR | | | 8.59 | | | | (0.11 | ) | | | 0.64 | | | | 0.53 | | | | (0.02 | ) | | | (0.01 | ) | | | (0.03 | ) | | |
| 2009 - R | | | 8.57 | | | | (0.14 | ) | | | 0.61 | | | | 0.47 | | | | — | | | | (0.01 | ) | | | (0.01 | ) | | |
| | | | | | | | | | | | | | | | | | | | | | | | | | | | | | | |
| | | | | | | | | | | | | | | | | | | | | | | | | | | | | | | |
FOR THE PERIOD ENDED DECEMBER 31, |
| 2008 - A (Commenced May 30, 2008) | | | 10.00 | | | | 0.01 | | | | (1.43 | ) | | | (1.42 | ) | | | — | | | | — | | | | — | | | |
| 2008 - C (Commenced May 30, 2008) | | | 10.00 | | | | (0.03 | ) | | | (1.43 | ) | | | (1.46 | ) | | | — | | | | — | | | | — | | | |
| 2008 - Institutional (Commenced May 30, 2008) | | | 10.00 | | | | 0.04 | | | | (1.44 | ) | | | (1.40 | ) | | | — | | | | — | | | | — | | | |
| 2008 - IR (Commenced May 30, 2008) | | | 10.00 | | | | 0.04 | | | | (1.45 | ) | | | (1.41 | ) | | | — | | | | — | | | | — | | | |
| 2008 - R (Commenced May 30, 2008) | | | 10.00 | | | | 0.01 | | | | (1.44 | ) | | | (1.43 | ) | | | — | | | | — | | | | — | | | |
| |
|
| | |
| (a) | | Calculated based on the average shares outstanding methodology. |
| (b) | | Assumes investment at the net asset value at the beginning of the period, reinvestment of all distributions, a complete redemption of the investment at the net asset value at the end of the period and no sales or redemption charges. Total returns would be reduced if a sales or redemption charge was taken into account. Returns do not reflect the deduction of taxes that a shareholder would pay on Fund distributions or the redemption of Fund shares. Total returns for periods less than one full year are not annualized. |
| (c) | | Annualized. |
| (d) | | Amount is less than $0.005 per share. |
48 The accompanying notes are an integral part of these financial statements.
GOLDMAN SACHS ABSOLUTE RETURN TRACKER FUND
| | | | | | | | | | | | | | | | | | | | | | | | | | | | | |
| | | | | | | | | | |
| | | | |
| | | | | | | | | | |
| | | | |
| | | | | | | | | | | Ratio of
| | | | |
| | | | | Net assets,
| | Ratio of
| | Ratio of
| | net investment
| | | | |
Net asset
| | | | end of
| | net expenses
| | total expenses
| | income (loss)
| | Portfolio
| | |
value, end
| | Total
| | period
| | to average
| | to average
| | to average
| | turnover
| | |
| of period | | return(b) | | (in 000s) | | net assets | | net assets | | net assets | | rate | | |
| |
| |
| $ | 9.29 | | | | 0.43 | % | | $ | 625,520 | | | | 1.56 | %(c) | | | 1.60 | %(c) | | | (1.33 | )%(c) | | | 15 | % | | |
| | 9.08 | | | | 0.00 | | | | 74,642 | | | | 2.31 | (c) | | | 2.35 | (c) | | | (2.09 | )(c) | | | 15 | | | |
| | 9.39 | | | | 0.54 | | | | 1,048,342 | | | | 1.16 | (c) | | | 1.20 | (c) | | | (0.92 | )(c) | | | 15 | | | |
| | 9.35 | | | | 0.43 | | | | 5,491 | | | | 1.31 | (c) | | | 1.35 | (c) | | | (1.09 | )(c) | | | 15 | | | |
| | 9.22 | | | | 0.22 | | | | 994 | | | | 1.81 | (c) | | | 1.85 | (c) | | | (1.58 | )(c) | | | 15 | | | |
| | | | | | | | | | | | | | | | | | | | | | | | | | | | | |
| | | | | | | | | | | | | | | | | | | | | | | | | | | | | |
| |
| | 9.25 | | | | 2.73 | | | | 490,567 | | | | 1.59 | | | | 1.63 | | | | (1.39 | ) | | | 132 | | | |
| | 9.08 | | | | 1.98 | | | | 78,423 | | | | 2.34 | | | | 2.38 | | | | (2.13 | ) | | | 132 | | | |
| | 9.34 | | | | 3.16 | | | | 786,120 | | | | 1.19 | | | | 1.23 | | | | (0.97 | ) | | | 132 | | | |
| | 9.31 | | | | 3.05 | | | | 5,206 | | | | 1.34 | | | | 1.38 | | | | (1.12 | ) | | | 132 | | | |
| | 9.20 | | | | 2.52 | | | | 895 | | | | 1.84 | | | | 1.88 | | | | (1.60 | ) | | | 132 | | | |
| |
|
| | 9.06 | | | | 5.75 | | | | 322,502 | | | | 1.60 | | | | 1.86 | | | | (1.36 | ) | | | 126 | | | |
| | 8.96 | | | | 5.01 | | | | 47,012 | | | | 2.35 | | | | 2.61 | | | | (2.13 | ) | | | 126 | | | |
| | 9.11 | | | | 6.28 | | | | 305,992 | | | | 1.20 | | | | 1.46 | | | | (0.93 | ) | | | 126 | | | |
| | 9.09 | | | | 6.15 | | | | 1,642 | | | | 1.35 | | | | 1.61 | | | | (1.18 | ) | | | 126 | | | |
| | 9.03 | | | | 5.46 | | | | 31 | | | | 1.85 | | | | 2.11 | | | | (1.60 | ) | | | 126 | | | |
| | | | | | | | | | | | | | | | | | | | | | | | | | | | | |
| | | | | | | | | | | | | | | | | | | | | | | | | | | | | |
| |
| | 8.58 | | | | (14.20 | ) | | | 41,900 | | | | 1.60 | (c) | | | 3.58 | (c) | | | 0.08 | (c) | | | 331 | | | |
| | 8.54 | | | | (14.60 | ) | | | 2,985 | | | | 2.35 | (c) | | | 4.33 | (c) | | | (0.68 | )(c) | | | 331 | | | |
| | 8.60 | | | | (14.00 | ) | | | 72,903 | | | | 1.20 | (c) | | | 3.18 | (c) | | | 0.72 | (c) | | | 331 | | | |
| | 8.59 | | | | (14.10 | ) | | | 9 | | | | 1.35 | (c) | | | 3.33 | (c) | | | 0.98 | (c) | | | 331 | | | |
| | 8.57 | | | | (14.30 | ) | | | 9 | | | | 1.85 | (c) | | | 3.83 | (c) | | | 0.48 | (c) | | | 331 | | | |
| |
|
The accompanying notes are an integral part of these financial statements. 49
GOLDMAN SACHS COMMODITY STRATEGY FUND
Financial Highlights
Selected Data for a Share Outstanding Throughout Each Period
| | | | | | | | | | | | | | | | | | | | | | | | | | | | | | | |
| | | | | Income (loss) from
| | Distributions
| | |
| | | Net asset
| | investment operations | | to shareholders | | |
| | | value,
| | Net
| | Net realized
| | Total from
| | From net
| | From net
| | | | |
| | | beginning
| | investment
| | and unrealized
| | investment
| | investment
| | realized
| | Total
| | |
| Year - Share Class | | of period | | income (loss)(a) | | gain (loss) | | operations | | income | | gains | | distributions | | |
| |
FOR THE SIX MONTHS ENDED JUNE 30, (UNAUDITED) |
| 2011 - A | | $ | 6.03 | | | $ | (0.01 | ) | | $ | 0.34 | | | $ | 0.33 | | | $ | (0.08 | ) | | $ | — | | | $ | (0.08 | ) | | |
| 2011 - C | | | 5.95 | | | | (0.04 | ) | | | 0.34 | | | | 0.30 | | | | (0.07 | ) | | | — | | | | (0.07 | ) | | |
| 2011 - Institutional | | | 6.04 | | | | (0.01 | ) | | | 0.34 | | | | 0.33 | | | | (0.08 | ) | | | — | | | | (0.08 | ) | | |
| 2011 - IR | | | 6.05 | | | | (0.01 | ) | | | 0.34 | | | | 0.33 | | | | (0.08 | ) | | | — | | | | (0.08 | ) | | |
| 2011 - R | | | 6.01 | | | | (0.02 | ) | | | 0.33 | | | | 0.31 | | | | (0.07 | ) | | | — | | | | (0.07 | ) | | |
| | | | | | | | | | | | | | | | | | | | | | | | | | | | | | | |
| | | | | | | | | | | | | | | | | | | | | | | | | | | | | | | |
FOR THE FISCAL YEARS ENDED DECEMBER 31, |
| 2010 - A | | | 6.19 | | | | (0.02 | ) | | | 0.52 | | | | 0.50 | | | | (0.66 | ) | | | — | | | | (0.66 | ) | | |
| 2010 - C | | | 6.14 | | | | (0.06 | ) | | | 0.51 | | | | 0.45 | | | | (0.64 | ) | | | — | | | | (0.64 | ) | | |
| 2010 - Institutional | | | 6.19 | | | | — | (d) | | | 0.52 | | | | 0.52 | | | | (0.67 | ) | | | — | | | | (0.67 | ) | | |
| 2010 - IR | | | 6.20 | | | | (0.01 | ) | | | 0.53 | | | | 0.52 | | | | (0.67 | ) | | | — | | | | (0.67 | ) | | |
| 2010 - R | | | 6.18 | | | | (0.04 | ) | | | 0.52 | | | | 0.48 | | | | (0.65 | ) | | | — | | | | (0.65 | ) | | |
| |
|
| 2009 - A | | | 5.40 | | | | 0.02 | | | | 0.91 | | | | 0.93 | | | | (0.14 | ) | | | — | | | | (0.14 | ) | | |
| 2009 - C | | | 5.38 | | | | (0.02 | ) | | | 0.90 | | | | 0.88 | | | | (0.12 | ) | | | — | | | | (0.12 | ) | | |
| 2009 - Institutional | | | 5.43 | | | | 0.04 | | | | 0.88 | | | | 0.92 | | | | (0.16 | ) | | | — | | | | (0.16 | ) | | |
| 2009 - IR | | | 5.40 | | | | 0.05 | | | | 0.90 | | | | 0.95 | | | | (0.15 | ) | | | — | | | | (0.15 | ) | | |
| 2009 - R | | | 5.40 | | | | — | (d) | | | 0.92 | | | | 0.92 | | | | (0.14 | ) | | | — | | | | (0.14 | ) | | |
| |
|
| 2008 - A | | | 12.22 | | | | 0.20 | | | | (6.19 | ) | | | (5.99 | ) | | | (0.21 | )(e) | | | (0.62 | ) | | | (0.83 | ) | | |
| 2008 - C | | | 12.20 | | | | 0.11 | | | | (6.18 | ) | | | (6.07 | ) | | | (0.13 | )(e) | | | (0.62 | ) | | | (0.75 | ) | | |
| 2008 - Institutional | | | 12.26 | | | | 0.25 | | | | (6.21 | ) | | | (5.96 | ) | | | (0.25 | )(e) | | | (0.62 | ) | | | (0.87 | ) | | |
| 2008 - IR | | | 12.21 | | | | 0.23 | | | | (6.18 | ) | | | (5.95 | ) | | | (0.24 | )(e) | | | (0.62 | ) | | | (0.86 | ) | | |
| 2008 - R | | | 12.21 | | | | 0.17 | | | | (6.18 | ) | | | (6.01 | ) | | | (0.18 | )(e) | | | (0.62 | ) | | | (0.80 | ) | | |
| | | | | | | | | | | | | | | | | | | | | | | | | | | | | | | |
| | | | | | | | | | | | | | | | | | | | | | | | | | | | | | | |
FOR THE PERIOD ENDED DECEMBER 31, |
| 2007 - A (Commenced May 30, 2007) | | | 10.00 | | | | 0.19 | | | | 2.22 | | | | 2.41 | | | | (0.19 | ) | | | — | | | | (0.19 | ) | | |
| 2007 - C (Commenced May 30, 2007) | | | 10.00 | | | | 0.13 | | | | 2.22 | | | | 2.35 | | | | (0.15 | ) | | | — | | | | (0.15 | ) | | |
| 2007 - Institutional (Commenced May 30, 2007) | | | 10.00 | | | | 0.23 | | | | 2.24 | | | | 2.47 | | | | (0.21 | ) | | | — | | | | (0.21 | ) | | |
| 2007 - IR (Commenced November 30, 2007) | | | 11.62 | | | | 0.03 | | | | 0.63 | | | | 0.66 | | | | (0.07 | ) | | | — | | | | (0.07 | ) | | |
| 2007 - R (Commenced November 30, 2007) | | | 11.62 | | | | 0.02 | | | | 0.64 | | | | 0.66 | | | | (0.07 | ) | | | — | | | | (0.07 | ) | | |
| |
|
| | |
| (a) | | Calculated based on the average shares outstanding methodology. |
| (b) | | Assumes investment at the net asset value at the beginning of the period, reinvestment of all distributions, a complete redemption of the investment at the net asset value at the end of the period and no sales or redemption charges. Total returns would be reduced if a sales or redemption charge was taken into account. Returns do not reflect the deduction of taxes that a shareholder would pay on Fund distributions or the redemption of Fund shares. Total returns for periods less than one full year are not annualized. |
| (c) | | Annualized. |
| (d) | | Amount is less than $0.005 per share. |
| (e) | | Includes distribution of capital of less than $0.005 per share. |
50 The accompanying notes are an integral part of these financial statements.
GOLDMAN SACHS COMMODITY STRATEGY FUND
| | | | | | | | | | | | | | | | | | | | | | | | | | | | | | | | | |
| | | | | | | | | | |
| | | | | | |
| | | | | | | | | | |
| | | | | | |
| | | | | | | | | | | Ratio of
| | Portfolio
| | Portfolio
| | |
| | | | | Net assets,
| | Ratio of
| | Ratio of
| | net investment
| | turnover rate
| | turnover rate
| | |
Net asset
| | | | end of
| | net expenses
| | total expenses
| | income (loss)
| | (including the
| | (excluding the
| | |
value, end
| | Total
| | period
| | to average
| | to average
| | to average
| | effect of mortgage
| | effect of mortgage
| | |
| of period | | return(b) | | (in 000s) | | net assets | | net assets | | net assets | | dollar rolls) | | dollar rolls) | | |
| |
| |
| $ | 6.28 | | | | 5.37 | % | | $ | 177,127 | | | | 0.92 | %(c) | | | 0.95 | %(c) | | | (0.46 | )%(c) | | | 175 | % | | | 117 | % | | |
| | 6.18 | | | | 4.94 | | | | 17,694 | | | | 1.67 | (c) | | | 1.70 | (c) | | | (1.21 | )(c) | | | 175 | | | | 117 | | | |
| | 6.29 | | | | 5.44 | | | | 735,637 | | | | 0.58 | (c) | | | 0.61 | (c) | | | (0.24 | )(c) | | | 175 | | | | 117 | | | |
| | 6.30 | | | | 5.42 | | | | 31,189 | | | | 0.67 | (c) | | | 0.70 | (c) | | | (0.22 | )(c) | | | 175 | | | | 117 | | | |
| | 6.25 | | | | 5.18 | | | | 845 | | | | 1.17 | (c) | | | 1.20 | (c) | | | (0.71 | )(c) | | | 175 | | | | 117 | | | |
| | | | | | | | | | | | | | | | | | | | | | | | | | | | | | | | | |
| | | | | | | | | | | | | | | | | | | | | | | | | | | | | | | | | |
| |
| | 6.03 | | | | 8.46 | | | | 145,288 | | | | 0.92 | | | | 0.96 | | | | (0.34 | ) | | | 162 | | | | 124 | | | |
| | 5.95 | | | | 7.70 | | | | 11,455 | | | | 1.67 | | | | 1.71 | | | | (1.10 | ) | | | 162 | | | | 124 | | | |
| | 6.04 | | | | 8.85 | | | | 641,978 | | | | 0.58 | | | | 0.62 | | | | (0.02 | ) | | | 162 | | | | 124 | | | |
| | 6.05 | | | | 8.79 | | | | 6,957 | | | | 0.67 | | | | 0.71 | | | | (0.23 | ) | | | 162 | | | | 124 | | | |
| | 6.01 | | | | 8.20 | | | | 459 | | | | 1.17 | | | | 1.21 | | | | (0.56 | ) | | | 162 | | | | 124 | | | |
| |
|
| | 6.19 | | | | 17.12 | | | | 111,685 | | | | 0.92 | | | | 1.04 | | | | 0.37 | | | | 104 | | | | 104 | | | |
| | 6.14 | | | | 16.15 | | | | 5,669 | | | | 1.67 | | | | 1.79 | | | | (0.35 | ) | | | 104 | | | | 104 | | | |
| | 6.19 | | | | 16.84 | | | | 475,318 | | | | 0.58 | | | | 0.70 | | | | 0.65 | | | | 104 | | | | 104 | | | |
| | 6.20 | | | | 17.76 | | | | 67 | | | | 0.68 | | | | 0.79 | | | | 0.81 | | | | 104 | | | | 104 | | | |
| | 6.18 | | | | 17.07 | | | | 109 | | | | 1.17 | | | | 1.29 | | | | 0.01 | | | | 104 | | | | 104 | | | |
| |
|
| | 5.40 | | | | (49.23 | ) | | | 40,118 | | | | 0.92 | | | | 1.06 | | | | 1.62 | | | | 279 | | | | 279 | | | |
| | 5.38 | | | | (49.66 | ) | | | 2,208 | | | | 1.67 | | | | 1.81 | | | | 0.91 | | | | 279 | | | | 279 | | | |
| | 5.43 | | | | (48.96 | ) | | | 127,630 | | | | 0.58 | | | | 0.72 | | | | 1.97 | | | | 279 | | | | 279 | | | |
| | 5.40 | | | | (49.14 | ) | | | 17 | | | | 0.67 | | | | 0.81 | | | | 1.90 | | | | 279 | | | | 279 | | | |
| | 5.40 | | | | (49.39 | ) | | | 9 | | | | 1.17 | | | | 1.31 | | | | 1.43 | | | | 279 | | | | 279 | | | |
| | | | | | | | | | | | | | | | | | | | | | | | | | | | | | | | | |
| | | | | | | | | | | | | | | | | | | | | | | | | | | | | | | | | |
| |
| | 12.22 | | | | 24.27 | | | | 86,648 | | | | 0.93 | (c) | | | 1.09 | (c) | | | 2.36 | (c) | | | 83 | | | | 83 | | | |
| | 12.20 | | | | 23.66 | | | | 684 | | | | 1.68 | (c) | | | 1.84 | (c) | | | 1.48 | (c) | | | 83 | | | | 83 | | | |
| | 12.26 | | | | 24.95 | | | | 290,380 | | | | 0.58 | (c) | | | 0.74 | (c) | | | 2.73 | (c) | | | 83 | | | | 83 | | | |
| | 12.21 | | | | 5.71 | | | | 11 | | | | 0.67 | (c) | | | 0.83 | (c) | | | 2.56 | (c) | | | 83 | | | | 83 | | | |
| | 12.21 | | | | 5.67 | | | | 11 | | | | 1.17 | (c) | | | 1.33 | (c) | | | 2.08 | (c) | | | 83 | | | | 83 | | | |
| |
|
The accompanying notes are an integral part of these financial statements. 51
GOLDMAN SACHS DYNAMIC ALLOCATION FUND
Financial Highlights
Selected Data for a Share Outstanding Throughout Each Period
| | | | | | | | | | | | | | | | | | | | | | | |
| | | | |
| | | | |
| | | | |
| | | | |
| | | | |
| | | | |
| | | | |
| | | | |
| | | | |
| | | | |
| | | | | Income (loss) from
| | | | |
| | | | | investment operations | | | | |
| | | | |
| | | | | | Distributions
| | |
| | | Net asset
| |
| | | | | | to shareholders
| | |
| | | value,
| | Net
| | Net realized
| | Total from
| | from net
| | |
| | | beginning
| | investment
| | and unrealized
| | investment
| | realized
| | |
| Year - Share Class | | of period | | income (loss)(a) | | gain | | operations | | gains | | |
| |
FOR THE SIX MONTHS ENDED JUNE 30, (UNAUDITED) |
| 2011 - A | | $ | 10.54 | | | $ | 0.04 | | | $ | 0.25 | | | $ | 0.29 | | | $ | — | | | |
| 2011 - C | | | 10.47 | | | | 0.01 | | | | 0.24 | | | | 0.25 | | | | — | | | |
| 2011 - Institutional | | | 10.59 | | | | 0.05 | | | | 0.26 | | | | 0.31 | | | | — | | | |
| 2011 - IR | | | 10.57 | | | | 0.04 | | | | 0.26 | | | | 0.30 | | | | — | | | |
| 2011 - R | | | 10.52 | | | | 0.01 | | | | 0.26 | | | | 0.27 | | | | — | | | |
| | | | | | | | | | | | | | | | | | | | | | | |
| | | | | | | | | | | | | | | | | | | | | | | |
FOR THE PERIOD ENDED DECEMBER 31, |
| 2010 - A (Commenced January 5, 2010) | | | 10.00 | | | | (0.04 | ) | | | 0.77 | | | | 0.73 | | | | (0.19 | ) | | |
| 2010 - C (Commenced January 5, 2010) | | | 10.00 | | | | (0.11 | ) | | | 0.77 | | | | 0.66 | | | | (0.19 | ) | | |
| 2010 - Institutional (Commenced January 5, 2010) | | | 10.00 | | | | (0.01 | ) | | | 0.79 | | | | 0.78 | | | | (0.19 | ) | | |
| 2010 - IR (Commenced January 5, 2010) | | | 10.00 | | | | (0.04 | ) | | | 0.80 | | | | 0.76 | | | | (0.19 | ) | | |
| 2010 - R (Commenced January 5, 2010) | | | 10.00 | | | | (0.07 | ) | | | 0.78 | | | | 0.71 | | | | (0.19 | ) | | |
| |
|
| | |
| (a) | | Calculated based on the average shares outstanding methodology. |
| (b) | | Assumes investment at the net asset value at the beginning of the period, reinvestment of all distributions, a complete redemption of the investment at the net asset value at the end of the period and no sales or redemption charges. Total returns would be reduced if a sales or redemption charge was taken into account. Returns do not reflect the deduction of taxes that a shareholder would pay on Fund distributions or the redemption of Fund shares. Total returns for periods less than one full year are not annualized. |
| (c) | | Annualized. |
52 The accompanying notes are an integral part of these financial statements.
GOLDMAN SACHS DYNAMIC ALLOCATION FUND
| | | | | | | | | | | | | | | | | | | | | | | | | | | | | | | | | | | | | | | | | |
| | | | | | | | | | |
| | | | | | | | | | |
| | | | | | | | | | |
| | | | | | | | | | |
| | | | | | | Ratio of
| | Ratio of
| | Ratio of
| | Ratio of
| | | | | | | | |
| | | | | | | net expenses
| | net expenses
| | total expenses
| | total expenses
| | | | | | | | |
| | | | | | | to average
| | to average
| | to average
| | to average
| | | | | | | | |
| | | | | | | net assets
| | net assets
| | net assets
| | net assets
| | | | | | | | |
| | | | | | | (including
| | (excluding
| | (including
| | (excluding
| | Ratio of
| | | | | | |
Net
| | | | | | interest and
| | interest and
| | interest and
| | interest and
| | net
| | Portfolio
| | Portfolio
| | |
asset
| | | | Net assets,
| | dividend
| | dividend
| | dividend
| | dividend
| | investment
| | turnover rate
| | turnover rate
| | |
value,
| | | | end of
| | expense for
| | expense for
| | expense for
| | expense for
| | income (loss)
| | (including
| | (excluding
| | |
end of
| | Total
| | period
| | securities
| | securities
| | securities
| | securities
| | to average
| | securities
| | securities
| | |
| period | | return(b) | | (in 000s) | | sold short)(c) | | sold short)(c) | | sold short)(c) | | sold short)(c) | | net assets(c) | | sold short) | | sold short) | | |
| |
| |
| $ | 10.83 | | | | 2.75 | % | | $ | 110,112 | | | | 1.39 | % | | | 1.39 | % | | | 1.52 | % | | | 1.52 | % | | | 0.76 | % | | | 97 | % | | | 97 | % | | |
| | 10.72 | | | | 2.29 | | | | 26,431 | | | | 2.14 | | | | 2.14 | | | | 2.27 | | | | 2.27 | | | | 0.14 | | | | 97 | | | | 97 | | | |
| | 10.90 | | | | 2.93 | | | | 153,335 | | | | 0.99 | | | | 0.99 | | | | 1.12 | | | | 1.12 | | | | 1.02 | | | | 97 | | | | 97 | | | |
| | 10.87 | | | | 2.84 | | | | 27,824 | | | | 1.14 | | | | 1.14 | | | | 1.27 | | | | 1.27 | | | | 0.72 | | | | 97 | | | | 97 | | | |
| | 10.79 | | | | 2.57 | | | | 11 | | | | 1.64 | | | | 1.64 | | | | 1.77 | | | | 1.77 | | | | 0.20 | | | | 97 | | | | 97 | | | |
| | | | | | | | | | | | | | | | | | | | | | | | | | | | | | | | | | | | | | | | | |
| | | | | | | | | | | | | | | | | | | | | | | | | | | | | | | | | | | | | | | | | |
| |
| | 10.54 | | | | 7.29 | | | | 43,222 | | | | 1.41 | | | | 1.39 | | | | 2.13 | | | | 2.11 | | | | (0.39 | ) | | | 180 | | | | 175 | | | |
| | 10.47 | | | | 6.59 | | | | 8,567 | | | | 2.16 | | | | 2.14 | | | | 2.88 | | | | 2.86 | | | | (1.06 | ) | | | 180 | | | | 175 | | | |
| | 10.59 | | | | 7.80 | | | | 84,928 | | | | 1.01 | | | | 0.99 | | | | 1.73 | | | | 1.71 | | | | (0.14 | ) | | | 180 | | | | 175 | | | |
| | 10.57 | | | | 7.60 | | | | 23,477 | | | | 1.16 | | | | 1.14 | | | | 1.88 | | | | 1.86 | | | | (0.38 | ) | | | 180 | | | | 175 | | | |
| | 10.52 | | | | 7.10 | | | | 11 | | | | 1.66 | | | | 1.64 | | | | 2.38 | | | | 2.36 | | | | (0.66 | ) | | | 180 | | | | 175 | | | |
| |
|
The accompanying notes are an integral part of these financial statements. 53
GOLDMAN SACHS INTERNATIONAL REAL ESTATE SECURITIES FUND
Financial Highlights
Selected Data for a Share Outstanding Throughout Each Period
| | | | | | | | | | | | | | | | | | | | | | | | | | | | | | | | | | | |
| | | | | Income (loss) from
| | Distributions
| | |
| | | | | investment operations | | to shareholders | | |
| | | | |
| | | | | |
| | | | | | | | |
| | | Net asset
| |
| | | | | |
| | | | | | | | |
| | | value,
| | Net
| | Net realized
| | Total from
| | From net
| | From net
| | | | | | |
| | | beginning
| | investment
| | and unrealized
| | investment
| | investment
| | realized
| | From
| | Total
| | |
| Year - Share Class | | of period | | income(a) | | gain (loss) | | operations | | income | | gains | | capital | | distributions | | |
| |
FOR THE SIX MONTHS ENDED JUNE 30, (UNAUDITED) |
| 2011 - A | | $ | 6.32 | | | $ | 0.08 | | | $ | 0.05 | | | $ | 0.13 | | | $ | (0.08 | ) | | $ | — | | | $ | — | | | $ | (0.08 | ) | | |
| 2011 - C | | | 6.34 | | | | 0.05 | | | | 0.05 | | | | 0.10 | | | | (0.06 | ) | | | — | | | | — | | | | (0.06 | ) | | |
| 2011 - Institutional | | | 6.20 | | | | 0.09 | | | | 0.06 | | | | 0.15 | | | | (0.10 | ) | | | — | | | | — | | | | (0.10 | ) | | |
| 2011 - IR | | | 6.30 | | | | 0.09 | | | | 0.05 | | | | 0.14 | | | | (0.09 | ) | | | — | | | | — | | | | (0.09 | ) | | |
| | | | | | | | | | | | | | | | | | | | | | | | | | | | | | | | | | | |
| | | | | | | | | | | | | | | | | | | | | | | | | | | | | | | | | | | |
FOR THE FISCAL YEARS ENDED DECEMBER 31, |
| 2010 - A | | | 6.01 | | | | 0.22 | | | | 0.51 | | | | 0.73 | | | | (0.42 | ) | | | — | | | | — | | | | (0.42 | ) | | |
| 2010 - C | | | 5.98 | | | | 0.16 | | | | 0.54 | | | | 0.70 | | | | (0.34 | ) | | | — | | | | — | | | | (0.34 | ) | | |
| 2010 - Institutional | | | 5.92 | | | | 0.25 | | | | 0.49 | | | | 0.74 | | | | (0.46 | ) | | | — | | | | — | | | | (0.46 | ) | | |
| 2010 - IR | | | 6.00 | | | | 0.27 | | | | 0.48 | | | | 0.75 | | | | (0.45 | ) | | | — | | | | — | | | | (0.45 | ) | | |
| |
|
| 2009 - A | | | 5.14 | | | | 0.14 | (d) | | | 1.56 | | | | 1.70 | | | | (0.81 | ) | | | — | | | | (0.02 | ) | | | (0.83 | ) | | |
| 2009 - C | | | 5.10 | | | | 0.10 | (d) | | | 1.54 | | | | 1.64 | | | | (0.74 | ) | | | — | | | | (0.02 | ) | | | (0.76 | ) | | |
| 2009 - Institutional | | | 5.10 | | | | 0.16 | (d) | | | 1.53 | | | | 1.69 | | | | (0.85 | ) | | | — | | | | (0.02 | ) | | | (0.87 | ) | | |
| 2009 - IR | | | 5.14 | | | | 0.15 | (d) | | | 1.56 | | | | 1.71 | | | | (0.83 | ) | | | — | | | | (0.02 | ) | | | (0.85 | ) | | |
| |
|
| 2008 - A | | | 10.85 | | | | 0.15 | | | | (5.77 | ) | | | (5.62 | ) | | | — | | | | — | | | | (0.09 | ) | | | (0.09 | ) | | |
| 2008 - C | | | 10.80 | | | | 0.10 | | | | (5.73 | ) | | | (5.63 | ) | | | — | | | | — | | | | (0.07 | ) | | | (0.07 | ) | | |
| 2008 - Institutional | | | 10.84 | | | | 0.19 | | | | (5.82 | ) | | | (5.63 | ) | | | — | | | | — | | | | (0.11 | ) | | | (0.11 | ) | | |
| 2008 - IR | | | 10.81 | | | | 0.17 | | | | (5.74 | ) | | | (5.57 | ) | | | — | | | | — | | | | (0.10 | ) | | | (0.10 | ) | | |
| |
|
| 2007 - A | | | 12.01 | | | | 0.16 | | | | (0.44 | ) | | | (0.28 | ) | | | (0.84 | ) | | | (0.04 | ) | | | — | | | | (0.88 | ) | | |
| 2007 - C | | | 11.98 | | | | 0.07 | | | | (0.43 | ) | | | (0.36 | ) | | | (0.78 | ) | | | (0.04 | ) | | | — | | | | (0.82 | ) | | |
| 2007 - Institutional | | | 12.03 | | | | 0.21 | | | | (0.45 | ) | | | (0.24 | ) | | | (0.91 | ) | | | (0.04 | ) | | | — | | | | (0.95 | ) | | |
| 2007 - IR (Commenced November 30, 2007) | | | 12.40 | | | | 0.03 | | | | (0.77 | ) | | | (0.74 | ) | | | (0.81 | ) | | | (0.04 | ) | | | — | | | | (0.85 | ) | | |
| | | | | | | | | | | | | | | | | | | | | | | | | | | | | | | | | | | |
| | | | | | | | | | | | | | | | | | | | | | | | | | | | | | | | | | | |
FOR THE PERIOD ENDED DECEMBER 31, |
| 2006 - A (Commenced July 31, 2006) | | | 10.00 | | | | 0.07 | | | | 2.04 | | | | 2.11 | | | | (0.10 | ) | | | — | | | | — | | | | (0.10 | ) | | |
| 2006 - C (Commenced July 31, 2006) | | | 10.00 | | | | 0.06 | | | | 2.01 | | | | 2.07 | | | | (0.09 | ) | | | — | | | | — | | | | (0.09 | ) | | |
| 2006 - Institutional (Commenced July 31, 2006) | | | 10.00 | | | | 0.09 | | | | 2.05 | | | | 2.14 | | | | (0.11 | ) | | | — | | | | — | | | | (0.11 | ) | | |
| |
|
| | |
| (a) | | Calculated based on the average shares outstanding methodology. |
| (b) | | Assumes investment at the net asset value at the beginning of the period, reinvestment of all distributions, a complete redemption of the investment at the net asset value at the end of the period and no sales or redemption charges. Total returns would be reduced if a sales or redemption charge was taken into account. Returns do not reflect the deduction of taxes that a shareholder would pay on Fund distributions or the redemption of Fund shares. Total returns for periods less than one full year are not annualized. |
| (c) | | Annualized. |
| (d) | | Reflects income recognized from non-recurring special dividends which amounted to $0.01 per share and 0.15% of net assets. |
| (e) | | The ratio is not annualized as the Fund’s income for the year ended December 31, 2007 did not correlate to the income earned during the class’s period of operation due to timing of income recognition. |
54 The accompanying notes are an integral part of these financial statements.
GOLDMAN SACHS INTERNATIONAL REAL ESTATE SECURITIES FUND
| | | | | | | | | | | | | | | | | | | | | | | | | | | | | |
| | | | | | | | | | |
| | | | |
| | | | | | | | | | |
| | | | |
| | | | | | | | | | | Ratio of
| | | | |
| | | | | Net assets,
| | Ratio of
| | Ratio of
| | net investment
| | | | |
Net asset
| | | | end of
| | net expenses
| | total expenses
| | income
| | Portfolio
| | |
value, end
| | Total
| | period
| | to average
| | to average
| | to average
| | turnover
| | |
| of period | | return(b) | | (in 000s) | | net assets | | net assets | | net assets | | rate | | |
| |
| |
| $ | 6.37 | | | | 2.10 | % | | $ | 125,548 | | | | 1.53 | %(c) | | | 1.64 | %(c) | | | 2.39 | %(c) | | | 34 | % | | |
| | 6.38 | | | | 1.55 | | | | 2,747 | | | | 2.28 | (c) | | | 2.39 | (c) | | | 1.60 | (c) | | | 34 | | | |
| | 6.25 | | | | 2.37 | | | | 245,880 | | | | 1.13 | (c) | | | 1.24 | (c) | | | 2.84 | (c) | | | 34 | | | |
| | 6.35 | | | | 2.26 | | | | 10 | | | | 1.28 | (c) | | | 1.39 | (c) | | | 2.70 | (c) | | | 34 | | | |
| | | | | | | | | | | | | | | | | | | | | | | | | | | | | |
| | | | | | | | | | | | | | | | | | | | | | | | | | | | | |
| |
| | 6.32 | | | | 12.73 | | | | 140,955 | | | | 1.53 | | | | 1.62 | | | | 3.74 | | | | 69 | | | |
| | 6.34 | | | | 12.08 | | | | 3,157 | | | | 2.28 | | | | 2.37 | | | | 2.78 | | | | 69 | | | |
| | 6.20 | | | | 13.10 | | | | 238,149 | | | | 1.13 | | | | 1.22 | | | | 4.19 | | | | 69 | | | |
| | 6.30 | | | | 13.07 | | | | 10 | | | | 1.28 | | | | 1.37 | | | | 4.46 | | | | 69 | | | |
| |
|
| | 6.01 | | | | 33.46 | | | | 128,398 | | | | 1.53 | | | | 1.62 | | | | 2.48 | (d) | | | 115 | | | |
| | 5.98 | | | | 32.47 | | | | 4,370 | | | | 2.28 | | | | 2.37 | | | | 1.79 | (d) | | | 115 | | | |
| | 5.92 | | | | 33.46 | | | | 206,999 | | | | 1.13 | | | | 1.22 | | | | 2.82 | (d) | | | 115 | | | |
| | 6.00 | | | | 33.74 | | | | 6 | | | | 1.28 | | | | 1.37 | | | | 2.70 | (d) | | | 115 | | | |
| |
|
| | 5.14 | | | | (52.04 | ) | | | 127,811 | | | | 1.53 | | | | 1.60 | | | | 1.77 | | | | 96 | | | |
| | 5.10 | | | | (52.33 | ) | | | 5,175 | | | | 2.28 | | | | 2.35 | | | | 1.20 | | | | 96 | | | |
| | 5.10 | | | | (52.25 | ) | | | 162,396 | | | | 1.13 | | | | 1.20 | | | | 2.21 | | | | 96 | | | |
| | 5.14 | | | | (51.78 | ) | | | 5 | | | | 1.28 | | | | 1.35 | | | | 2.11 | | | | 96 | | | |
| |
|
| | 10.85 | | | | (2.56 | ) | | | 599,660 | | | | 1.54 | | | | 1.58 | | | | 1.24 | | | | 86 | | | |
| | 10.80 | | | | (3.22 | ) | | | 16,999 | | | | 2.29 | | | | 2.33 | | | | 0.56 | | | | 86 | | | |
| | 10.84 | | | | (2.23 | ) | | | 620,012 | | | | 1.14 | | | | 1.18 | | | | 1.64 | | | | 86 | | | |
| | 10.81 | | | | (6.20 | ) | | | 9 | | | | 1.29 | (c) | | | 1.33 | (c) | | | 0.23 | (e) | | | 86 | | | |
| | | | | | | | | | | | | | | | | | | | | | | | | | | | | |
| | | | | | | | | | | | | | | | | | | | | | | | | | | | | |
| |
| | 12.01 | | | | 21.14 | | | | 283,571 | | | | 1.53 | (c) | | | 1.76 | (c) | | | 1.55 | (c) | | | 13 | | | |
| | 11.98 | | | | 20.73 | | | | 833 | | | | 2.28 | (c) | | | 2.51 | (c) | | | 1.19 | (c) | | | 13 | | | |
| | 12.03 | | | | 21.33 | | | | 347,684 | | | | 1.13 | (c) | | | 1.36 | (c) | | | 1.89 | (c) | | | 13 | | | |
| |
|
The accompanying notes are an integral part of these financial statements. 55
GOLDMAN SACHS REAL ESTATE SECURITIES FUND
Financial Highlights
Selected Data for a Share Outstanding Throughout Each Period
| | | | | | | | | | | | | | | | | | | | | | | | | | | | | | | | | | | |
| | | | | Income (loss) from
| | Distributions
| | |
| | | | | investment operations | | to shareholders | | |
| | | | |
| | | | | |
| | | | | | | | |
| | | Net asset
| |
| | | | | |
| | | | | | | | |
| | | value,
| | Net
| | Net realized
| | Total from
| | From net
| | From net
| | | | | | |
| | | beginning
| | investment
| | and unrealized
| | investment
| | investment
| | realized
| | From
| | Total
| | |
| Year - Share Class | | of period | | income (loss)(a) | | gain (loss) | | operations | | income | | gains | | capital | | distributions | | |
| |
FOR THE SIX MONTHS ENDED JUNE 30, (UNAUDITED) |
| 2011 - A | | $ | 12.47 | | | $ | 0.11 | | | $ | 1.16 | | | $ | 1.27 | | | $ | (0.13 | ) | | $ | — | | | $ | — | | | $ | (0.13 | ) | | |
| 2011 - B | | | 12.45 | | | | 0.06 | | | | 1.16 | | | | 1.22 | | | | (0.08 | ) | | | — | | | | — | | | | (0.08 | ) | | |
| 2011 - C | | | 12.26 | | | | 0.06 | | | | 1.14 | | | | 1.20 | | | | (0.08 | ) | | | — | | | | — | | | | (0.08 | ) | | |
| 2011 - Institutional | | | 12.62 | | | | 0.14 | | | | 1.18 | | | | 1.32 | | | | (0.16 | ) | | | — | | | | — | | | | (0.16 | ) | | |
| 2011 - Service | | | 12.55 | | | | 0.10 | | | | 1.17 | | | | 1.27 | | | | (0.12 | ) | | | — | | | | — | | | | (0.12 | ) | | |
| 2011 - IR | | | 12.50 | | | | 0.14 | | | | 1.15 | | | | 1.29 | | | | (0.15 | ) | | | — | | | | — | | | | (0.15 | ) | | |
| 2011 - R | | | 12.44 | | | | 0.10 | | | | 1.16 | | | | 1.26 | | | | (0.12 | ) | | | — | | | | — | | | | (0.12 | ) | | |
| | | | | | | | | | | | | | | | | | | | | | | | | | | | | | | | | | | |
| | | | | | | | | | | | | | | | | | | | | | | | | | | | | | | | | | | |
FOR THE FISCAL YEARS ENDED DECEMBER 31, |
| 2010 - A | | | 9.99 | | | | 0.10 | | | | 2.58 | | | | 2.68 | | | | (0.20 | ) | | | — | | | | — | | | | (0.20 | ) | | |
| 2010 - B | | | 9.98 | | | | 0.01 | | | | 2.59 | | | | 2.60 | | | | (0.13 | ) | | | — | | | | — | | | | (0.13 | ) | | |
| 2010 - C | | | 9.84 | | | | 0.02 | | | | 2.54 | | | | 2.56 | | | | (0.14 | ) | | | — | | | | — | | | | (0.14 | ) | | |
| 2010 - Institutional | | | 10.09 | | | | 0.15 | | | | 2.61 | | | | 2.76 | | | | (0.23 | ) | | | — | | | | — | | | | (0.23 | ) | | |
| 2010 - Service | | | 10.05 | | | | 0.09 | | | | 2.60 | | | | 2.69 | | | | (0.19 | ) | | | — | | | | — | | | | (0.19 | ) | | |
| 2010 - IR | | | 10.00 | | | | 0.18 | | | | 2.54 | | | | 2.72 | | | | (0.22 | ) | | | — | | | | — | | | | (0.22 | ) | | |
| 2010 - R | | | 9.97 | | | | 0.08 | | | | 2.57 | | | | 2.65 | | | | (0.18 | ) | | | — | | | | — | | | | (0.18 | ) | | |
| |
|
| 2009 - A | | | 8.25 | | | | 0.21 | | | | 1.75 | | | | 1.96 | | | | (0.22 | ) | | | — | | | | — | | | | (0.22 | ) | | |
| 2009 - B | | | 8.25 | | | | 0.16 | | | | 1.74 | | | | 1.90 | | | | (0.17 | ) | | | — | | | | — | | | | (0.17 | ) | | |
| 2009 - C | | | 8.15 | | | | 0.16 | | | | 1.71 | | | | 1.87 | | | | (0.18 | ) | | | — | | | | — | | | | (0.18 | ) | | |
| 2009 - Institutional | | | 8.34 | | | | 0.25 | | | | 1.75 | | | | 2.00 | | | | (0.25 | ) | | | — | | | | — | | | | (0.25 | ) | | |
| 2009 - Service | | | 8.31 | | | | 0.21 | | | | 1.74 | | | | 1.95 | | | | (0.21 | ) | | | — | | | | — | | | | (0.21 | ) | | |
| 2009 - IR | | | 8.27 | | | | 0.24 | | | | 1.73 | | | | 1.97 | | | | (0.24 | ) | | | — | | | | — | | | | (0.24 | ) | | |
| 2009 - R | | | 8.25 | | | | 0.20 | | | | 1.73 | | | | 1.93 | | | | (0.21 | ) | | | — | | | | — | | | | (0.21 | ) | | |
| |
|
| 2008 - A | | | 15.50 | | | | 0.22 | | | | (6.50 | ) | | | (6.28 | ) | | | (0.26 | ) | | | (0.59 | ) | | | (0.12 | ) | | | (0.97 | ) | | |
| 2008 - B | | | 15.51 | | | | 0.11 | | | | (6.49 | ) | | | (6.38 | ) | | | (0.20 | ) | | | (0.59 | ) | | | (0.09 | ) | | | (0.88 | ) | | |
| 2008 - C | | | 15.34 | | | | 0.11 | | | | (6.42 | ) | | | (6.31 | ) | | | (0.20 | ) | | | (0.59 | ) | | | (0.09 | ) | | | (0.88 | ) | | |
| 2008 - Institutional | | | 15.61 | | | | 0.29 | | | | (6.55 | ) | | | (6.26 | ) | | | (0.29 | ) | | | (0.59 | ) | | | (0.13 | ) | | | (1.01 | ) | | |
| 2008 - Service | | | 15.59 | | | | 0.23 | | | | (6.55 | ) | | | (6.32 | ) | | | (0.26 | ) | | | (0.59 | ) | | | (0.11 | ) | | | (0.96 | ) | | |
| 2008 - IR | | | 15.50 | | | | 0.27 | | | | (6.50 | ) | | | (6.23 | ) | | | (0.29 | ) | | | (0.59 | ) | | | (0.12 | ) | | | (1.00 | ) | | |
| 2008 - R | | | 15.50 | | | | 0.22 | | | | (6.53 | ) | | | (6.31 | ) | | | (0.24 | ) | | | (0.59 | ) | | | (0.11 | ) | | | (0.94 | ) | | |
| |
|
| 2007 - A | | | 22.40 | | | | 0.16 | | | | (3.61 | ) | | | (3.45 | ) | | | (0.31 | ) | | | (3.14 | ) | | | — | | | | (3.45 | ) | | |
| 2007 - B | | | 22.44 | | | | (0.04 | ) | | | (3.58 | ) | | | (3.62 | ) | | | (0.17 | ) | | | (3.14 | ) | | | — | | | | (3.31 | ) | | |
| 2007 - C | | | 22.24 | | | | (0.02 | ) | | | (3.56 | ) | | | (3.58 | ) | | | (0.18 | ) | | | (3.14 | ) | | | — | | | | (3.32 | ) | | |
| 2007 - Institutional | | | 22.51 | | | | 0.25 | | | | (3.64 | ) | | | (3.39 | ) | | | (0.37 | ) | | | (3.14 | ) | | | — | | | | (3.51 | ) | | |
| 2007 - Service | | | 22.51 | | | | 0.12 | | | | (3.62 | ) | | | (3.50 | ) | | | (0.28 | ) | | | (3.14 | ) | | | — | | | | (3.42 | ) | | |
| 2007 - IR (Commenced November 30, 2007) | | | 19.47 | | | | (0.11 | ) | | | (0.72 | ) | | | (0.83 | ) | | | — | | | | (3.14 | ) | | | — | | | | (3.14 | ) | | |
| 2007 - R (Commenced November 30, 2007) | | | 19.47 | | | | (0.11 | ) | | | (0.72 | ) | | | (0.83 | ) | | | — | | | | (3.14 | ) | | | — | | | | (3.14 | ) | | |
| |
|
| 2006 - A | | | 18.04 | | | | 0.22 | | | | 5.94 | | | | 6.16 | | | | (0.33 | ) | | | (1.47 | ) | | | — | | | | (1.80 | ) | | |
| 2006 - B | | | 18.10 | | | | 0.05 | | | | 5.97 | | | | 6.02 | | | | (0.21 | ) | | | (1.47 | ) | | | — | | | | (1.68 | ) | | |
| 2006 - C | | | 17.96 | | | | 0.06 | | | | 5.90 | | | | 5.96 | | | | (0.21 | ) | | | (1.47 | ) | | | — | | | | (1.68 | ) | | |
| 2006 - Institutional | | | 18.10 | | | | 0.31 | | | | 5.96 | | | | 6.27 | | | | (0.39 | ) | | | (1.47 | ) | | | — | | | | (1.86 | ) | | |
| 2006 - Service | | | 18.13 | | | | 0.22 | | | | 5.94 | | | | 6.16 | | | | (0.31 | ) | | | (1.47 | ) | | | — | | | | (1.78 | ) | | |
| |
|
| | |
| (a) | | Calculated based on the average shares outstanding methodology. |
| (b) | | Assumes investment at the net asset value at the beginning of the period, reinvestment of all distributions, a complete redemption of the investment at the net asset value at the end of the period and no sales or redemption charges. Total returns would be reduced if a sales or redemption charge was taken into account. Returns do not reflect the deduction of taxes that a shareholder would pay on Fund distributions or the redemption of Fund shares. Total returns for periods less than one full year are not annualized. |
| (c) | | Annualized. |
| (d) | | The ratio is not annualized as the Fund’s income for the year ended December 31, 2007 did not correlate to the income earned during the class’s period of operation due to timing of income recognition. |
56 The accompanying notes are an integral part of these financial statements.
GOLDMAN SACHS REAL ESTATE SECURITIES FUND
| | | | | | | | | | | | | | | | | | | | | | | | | | | | | |
| | | | | | |
| | | | | | | | |
| | | | | | |
| | Ratio of
| | Ratio of
| | | | |
Net asset
| | | | Net assets,
| | Ratio of
| | total
| | net investment
| | | | |
value,
| | | | end of
| | net expenses
| | expenses
| | income (loss)
| | Portfolio
| | |
end of
| | Total
| | period
| | to average
| | to average
| | to average
| | turnover
| | |
| period | | return(b) | | (in 000s) | | net assets | | net assets | | net assets | | rate | | |
| |
| |
| $ | 13.61 | | | | 10.22 | % | | $ | 174,773 | | | | 1.44 | %(c) | | | 1.51 | %(c) | | | 1.69 | %(c) | | | 25 | % | | |
| | 13.59 | | | | 9.80 | | | | 2,649 | | | | 2.19 | (c) | | | 2.26 | (c) | | | 0.89 | (c) | | | 25 | | | |
| | 13.38 | | | | 9.83 | | | | 11,609 | | | | 2.19 | (c) | | | 2.26 | (c) | | | 0.93 | (c) | | | 25 | | | |
| | 13.78 | | | | 10.55 | | | | 438,453 | | | | 1.04 | (c) | | | 1.11 | (c) | | | 2.10 | (c) | | | 25 | | | |
| | 13.70 | | | | 10.17 | | | | 5,457 | | | | 1.54 | (c) | | | 1.61 | (c) | | | 1.56 | (c) | | | 25 | | | |
| | 13.64 | | | | 10.34 | | | | 206 | | | | 1.19 | (c) | | | 1.26 | (c) | | | 2.06 | (c) | | | 25 | | | |
| | 13.58 | | | | 10.13 | | | | 356 | | | | 1.69 | (c) | | | 1.76 | (c) | | | 1.52 | (c) | | | 25 | | | |
| | | | | | | | | | | | | | | | | | | | | | | | | | | | | |
| | | | | | | | | | | | | | | | | | | | | | | | | | | | | |
| |
| | 12.47 | | | | 27.07 | | | | 161,065 | | | | 1.44 | | | | 1.50 | | | | 0.95 | | | | 59 | | | |
| | 12.45 | | | | 26.18 | | | | 2,923 | | | | 2.19 | | | | 2.25 | | | | 0.13 | | | | 59 | | | |
| | 12.26 | | | | 26.18 | | | | 10,907 | | | | 2.19 | | | | 2.25 | | | | 0.21 | | | | 59 | | | |
| | 12.62 | | | | 27.67 | | | | 373,776 | | | | 1.04 | | | | 1.10 | | | | 1.33 | | | | 59 | | | |
| | 12.55 | | | | 26.99 | | | | 5,345 | | | | 1.54 | | | | 1.60 | | | | 0.83 | | | | 59 | | | |
| | 12.50 | | | | 27.39 | | | | 90 | | | | 1.19 | | | | 1.25 | | | | 1.50 | | | | 59 | | | |
| | 12.44 | | | | 26.80 | | | | 237 | | | | 1.69 | | | | 1.75 | | | | 0.78 | | | | 59 | | | |
| |
|
| | 9.99 | | | | 25.12 | | | | 138,409 | | | | 1.44 | | | | 1.55 | | | | 2.76 | | | | 114 | | | |
| | 9.98 | | | | 24.20 | | | | 4,058 | | | | 2.19 | | | | 2.30 | | | | 2.08 | | | | 114 | | | |
| | 9.84 | | | | 24.09 | | | | 8,192 | | | | 2.19 | | | | 2.30 | | | | 2.08 | | | | 114 | | | |
| | 10.09 | | | | 25.48 | | | | 356,025 | | | | 1.04 | | | | 1.15 | | | | 3.18 | | | | 114 | | | |
| | 10.05 | | | | 24.84 | | | | 5,589 | | | | 1.54 | | | | 1.65 | | | | 2.73 | | | | 114 | | | |
| | 10.00 | | | | 25.39 | | | | 7 | | | | 1.19 | | | | 1.30 | | | | 3.07 | | | | 114 | | | |
| | 9.97 | | | | 24.81 | | | | 116 | | | | 1.69 | | | | 1.80 | | | | 2.44 | | | | 114 | | | |
| |
|
| | 8.25 | | | | (40.89 | ) | | | 129,634 | | | | 1.44 | | | | 1.51 | | | | 1.60 | | | | 39 | | | |
| | 8.25 | | | | (41.29 | ) | | | 4,742 | | | | 2.19 | | | | 2.26 | | | | 0.81 | | | | 39 | | | |
| | 8.15 | | | | (41.27 | ) | | | 7,208 | | | | 2.19 | | | | 2.26 | | | | 0.90 | | | | 39 | | | |
| | 8.34 | | | | (40.54 | ) | | | 247,916 | | | | 1.04 | | | | 1.11 | | | | 2.19 | | | | 39 | | | |
| | 8.31 | | | | (40.88 | ) | | | 4,389 | | | | 1.54 | | | | 1.61 | | | | 1.72 | | | | 39 | | | |
| | 8.27 | | | | (40.64 | ) | | | 6 | | | | 1.19 | | | | 1.26 | | | | 2.04 | | | | 39 | | | |
| | 8.25 | | | | (41.00 | ) | | | 7 | | | | 1.69 | | | | 1.76 | | | | 1.76 | | | | 39 | | | |
| |
|
| | 15.50 | | | | (15.97 | ) | | | 317,274 | | | | 1.45 | | | | 1.49 | | | | 0.71 | | | | 42 | | | |
| | 15.51 | | | | (16.59 | ) | | | 12,074 | | | | 2.20 | | | | 2.24 | | | | (0.20 | ) | | | 42 | | | |
| | 15.34 | | | | (16.58 | ) | | | 16,065 | | | | 2.20 | | | | 2.24 | | | | (0.12 | ) | | | 42 | | | |
| | 15.61 | | | | (15.63 | ) | | | 413,030 | | | | 1.05 | | | | 1.09 | | | | 1.12 | | | | 42 | | | |
| | 15.59 | | | | (16.07 | ) | | | 7,262 | | | | 1.55 | | | | 1.59 | | | | 0.53 | | | | 42 | | | |
| | 15.50 | | | | (4.69 | ) | | | 10 | | | | 1.19 | (c) | | | 1.23 | (c) | | | (0.48 | )(d) | | | 42 | | | |
| | 15.50 | | | | (4.69 | ) | | | 10 | | | | 1.69 | (c) | | | 1.73 | (c) | | | (0.52 | )(d) | | | 42 | | | |
| |
|
| | 22.40 | | | | 34.31 | | | | 442,983 | | | | 1.44 | | | | 1.50 | | | | 1.05 | | | | 30 | | | |
| | 22.44 | | | | 33.33 | | | | 23,799 | | | | 2.19 | | | | 2.25 | | | | 0.24 | | | | 30 | | | |
| | 22.24 | | | | 33.29 | | | | 25,948 | | | | 2.19 | | | | 2.25 | | | | 0.27 | | | | 30 | | | |
| | 22.51 | | | | 34.86 | | | | 557,831 | | | | 1.04 | | | | 1.10 | | | | 1.47 | | | | 30 | | | |
| | 22.51 | | | | 34.17 | | | | 12,081 | | | | 1.54 | | | | 1.60 | | | | 1.05 | | | | 30 | | | |
| |
|
The accompanying notes are an integral part of these financial statements. 57
GOLDMAN SACHS SELECT SATELLITE FUNDS
Notes to Financial Statements
June 30, 2011 (Unaudited)
Goldman Sachs Trust (the “Trust”) is a Delaware statutory trust registered under the Investment Company Act of 1940, as amended (the “Act”), as an open-end management investment company. The following table lists those series of the Trust that are included in this report (collectively, the “Funds” or individually a “Fund”), along with their corresponding share classes and respective diversification status under the Act:
| | | | | |
| Fund | | Share Classes Offered* | | Diversified/Non-diversified |
| |
Absolute Return Tracker, Commodity Strategy
and Dynamic Allocation | | A, C, Institutional, IR and R | | Non-diversified |
| |
| |
| International Real Estate Securities | | A, C, Institutional and IR | | Non-diversified |
| |
| |
| Real Estate Securities | | A, B, C, Institutional, Service, IR and R | | Non-diversified |
| |
| |
| | |
| * | | Class B Shares are generally no longer available for purchase by current or prospective investors. |
Class A Shares of the Absolute Return Tracker, Dynamic Allocation, International Real Estate Securities and Real Estate Securities Funds are sold with a front-end sales charge of up to 5.50%. Class A Shares of Commodity Strategy Fund are sold with a front-end sales charge of up to 4.50%. Class B Shares were sold with a contingent deferred sales charge that declines from 5.00% to zero, depending upon the period of time the shares are held. Class C Shares are sold with a contingent deferred sales charge of 1.00%, which is imposed on redemptions made within 12 months of purchase. Institutional, Service, Class IR and Class R Shares are not subject to a sales charge.
Goldman Sachs Asset Management, L.P. (“GSAM”), an affiliate of Goldman, Sachs & Co. (“Goldman Sachs”), serves as investment adviser to each Fund pursuant to management agreements (the “Agreements”) with the Trust.
| |
| 2. BASIS FOR CONSOLIDATION FOR THE COMMODITY STRATEGY FUND | |
Goldman Sachs Cayman Commodity Fund, Ltd. (the “Subsidiary”), a Cayman Islands exempted company, was incorporated on April 2, 2009 and is currently a wholly-owned subsidiary of the Commodity Strategy Fund. The Subsidiary acts as an investment vehicle for the Fund to enable the Fund to gain exposure to certain types of commodity-linked derivative instruments. The Fund is the sole shareholder of the Subsidiary pursuant to a subscription agreement dated as of June 17, 2009, and it is intended that the Fund will remain the sole shareholder and will continue to control the Subsidiary. Under the Articles of Association of the Subsidiary, shares issued by the Subsidiary confer upon a shareholder the right to vote at general meetings of the Subsidiary and certain rights in connection with any winding-up or repayment of capital, as well as the right to participate in the profits or assets of the Subsidiary. All inter-fund balances and transactions have been eliminated in consolidation. As of June 30, 2011, the Fund’s net assets were approximately $962,493,000, of which approximately $180,987,000, or approximately 19%, represented the Fund’s ownership of the shares of the Subsidiary.
| |
| 3. SIGNIFICANT ACCOUNTING POLICIES | |
The following is a summary of the significant accounting policies consistently followed by the Funds. The preparation of financial statements in conformity with accounting principles generally accepted in the United States of America (“GAAP”) requires management to make estimates and assumptions that may affect the amounts and disclosures in the financial statements. Actual results could differ from those estimates and assumptions.
A. Investment Valuation — The investment valuation policy of the Funds is to value investments at market value. Investments in equity securities and investment companies traded on certain foreign securities exchanges are valued daily at fair value determined by an independent fair value service (if available) under valuation procedures approved by the trustees consistent with applicable regulatory guidance. The independent fair value service takes into account multiple factors including, but not limited to, movements in the United States (“U.S.”) securities markets, certain depositary receipts, futures contracts and foreign currency
GOLDMAN SACHS SELECT SATELLITE FUNDS
| |
| 3. SIGNIFICANT ACCOUNTING POLICIES (continued) | |
exchange rates that have occurred subsequent to the close of the foreign securities exchanges. While the independent fair value service may not take into account market or security specific information, under the valuation procedures, these securities might also be fair valued by GSAM by taking into consideration market or security specific information as discussed below.
Investments in equity securities and investment companies traded on a U.S. securities exchange, the NASDAQ system, or those located on certain foreign exchanges including, but not limited to the Americas, are valued daily at their last sale price or official closing price on the principal exchange or system on which they are traded. Investments in equity securities and investment companies traded on a foreign securities exchange for which an independent fair value service cannot provide a quote are valued daily at their last sale price or official closing price on the principal exchange on which they are traded. If no sale occurs, such securities and investment companies are valued at the last bid price for long positions and at the last ask price for short positions. Debt securities for which market quotations are readily available are valued on the basis of quotations furnished by an independent pricing service approved by the trustees or provided by securities dealers. The pricing services may use valuation models or matrix pricing, which consider: (i) yield or price with respect to bonds that are considered comparable in characteristics such as rating, interest rate and maturity date or (ii) quotations from securities dealers to determine current value. If accurate quotations are not readily available, or if GSAM believes that such quotations do not accurately reflect fair value, the fair value of the Funds’ investments may be determined based on yield equivalents, a pricing matrix or other sources, under valuation procedures established by the trustees. Unlisted equity securities for which market quotations are available are valued at the last sale price on the valuation date, or if no sale occurs, at the last bid price. In the absence of market quotations, broker quotes will be utilized or the security will be fair valued. Short-term debt obligations that mature in sixty days or less and that do not exhibit signs of credit deterioration are valued at amortized cost, which approximates market value.
GSAM, consistent with its procedures and applicable regulatory guidance, may make an adjustment to the previous closing prices of either domestic or foreign securities in light of significant events to reflect what it believes to be the fair value of the securities at the time of determining the Funds’ NAV. Significant events that could affect a large number of securities in a particular market may include, but are not limited to: situations relating to one or more single issuers in a market sector; significant fluctuations in U.S. or foreign markets; market dislocations; market disruptions or market closings; equipment failures; natural or man-made disasters or acts of God; armed conflicts; government actions or other developments; as well as the same or similar events which may affect specific issuers or the securities markets even though not tied directly to the securities markets. Other significant events that could relate to a single issuer may include, but are not limited to: corporate actions such as reorganizations, mergers and buy-outs; corporate announcements, including those relating to earnings, products and regulatory news; significant litigation; low trading volume; and trading limits or suspensions.
B. Security and Fund Share Transactions, and Investment Income — Security and Fund share transactions are reflected for financial reporting purposes as of the trade date, which may cause the NAV as stated in the accompanying financial statements to be different than the NAV applied to Fund share transactions. Realized gains and losses on sales of portfolio securities are calculated using the identified cost basis. Dividend income is recognized on the ex-dividend date, net of foreign withholding taxes, if any, which are reduced by any amounts reclaimable by the Funds, where applicable. Certain dividends from foreign securities will be recorded when the Fund is informed of the dividend, if such information is obtained subsequent to the ex-dividend date. Interest income is recorded on the basis of interest accrued, premium amortized and discount accreted. Realized gains and losses resulting from principal paydowns on mortgage-backed and asset-backed securities are included in interest income. Market discounts, original issue discount and market premiums on debt securities are accreted/amortized to interest income over the life of the security with a corresponding adjustment in the cost basis of that security. In addition, it is the Funds’ policy to accrue for foreign capital gains taxes, if applicable, on certain foreign securities held by the Funds. An estimated foreign capital gains tax is recorded daily on net unrealized gains on these securities and is payable upon the sale of such securities when a gain is realized.
Investment income and unrealized and realized gains or losses are allocated daily to each class of shares of the respective Fund based upon the relative proportion of net assets of each class.
In addition, distributions received from the Funds’ investments in U.S. real estate investment trusts (“REITs”) often include a “return of capital”, which is recorded by the Funds as a reduction of the cost basis of the securities held. The Internal Revenue Code of 1986, as amended (the “Code”) requires a REIT to distribute at least 95% of its taxable income to investors. In many
GOLDMAN SACHS SELECT SATELLITE FUNDS
Notes to Financial Statements (continued)
June 30, 2011 (Unaudited)
| |
| 3. SIGNIFICANT ACCOUNTING POLICIES (continued) | |
cases, however, because of “non-cash” expenses such as property depreciation, a REIT’s cash flow will exceed its taxable income. The REIT may distribute this excess cash to offer a more competitive yield. This portion of the Funds’ distributions is deemed a return of capital and is generally not taxable to shareholders.
C. Expenses — Expenses incurred by the Funds, which may not specifically relate to the Funds, may be shared with other registered investment companies having management agreements with GSAM or its affiliates, as appropriate. These expenses are allocated to the Funds on a straight-line and/or pro-rata basis depending upon the nature of the expenses and are accrued daily. Non-class specific expenses are allocated daily to each share class of the respective Fund based upon the relative proportion of net assets of each class. Class specific expenses, where applicable, are borne by the respective share classes and include Distribution and Service, Transfer Agent, and Service fees.
D. Offering Costs — Offering costs paid in connection with the offering of shares of the Dynamic Allocation Fund have been amortized on a straight line basis over 12 months from the date of commencement of operations.
E. Redemption Fees — Prior to October 1, 2010, all classes of the Absolute Return Tracker, Commodity Strategy and International Real Estate Securities Funds charged a 2% redemption fee on the redemption of shares (including by exchange) held for 30 calendar days or less. For this purpose, the Funds used a first-in first-out method so that shares held longest were treated as being redeemed first and shares held shortest were treated as being redeemed last. Redemption fees were reimbursed to a Fund and were reflected as a reduction in share redemptions. Redemption fees were credited to Paid-in capital and were allocated to each share class of the Fund a pro-rata basis. Effective October 1, 2010, the redemption fee for each Fund was eliminated.
F. Federal Taxes and Distributions to Shareholders — It is each Fund’s policy to comply with the requirements of the Code, applicable to regulated investment companies (mutual funds) and to distribute each year substantially all of its investment company taxable income and capital gains to its shareholders. Accordingly, the Funds are not required to make any provisions for the payment of federal income tax. Distributions to shareholders are recorded on the ex-dividend date. Income and capital gains distributions, if any, are declared and paid according to the following schedule:
| | | | | |
| | | Income Distributions
| | Capital Gains Distributions
|
| Fund | | Declared/Paid | | Declared/Paid |
| |
| Absolute Return Tracker and Dynamic Allocation | | Annually | | Annually |
| |
| |
| Commodity Strategy and Real Estate Securities | | Quarterly | | Annually |
| |
| |
| International Real Estate Securities | | Semi-Annually | | Annually |
| |
| |
Net capital losses are carried forward to future fiscal years and may be used to the extent allowed by the Code to offset any future capital gains. Utilization of capital loss carryforwards will reduce the requirement of future capital gains distributions.
The Subsidiary is classified as a controlled foreign corporation under the Code. Therefore, the Commodity Strategy Fund is required to increase its taxable income by its share of the Subsidiary’s income. Net losses of the Subsidiary cannot be deducted by the Fund in the current period nor carried forward to offset taxable income in future periods.
The characterization of distributions to shareholders for financial reporting purposes is determined in accordance with federal income tax rules, which may differ from GAAP. The source of each Fund’s distributions may be shown in the accompanying financial statements as either from net investment income, net realized gain or capital. Certain components of the Funds’ net assets on the Statements of Assets and Liabilities reflect permanent GAAP/tax differences based on the appropriate tax character.
G. Commodity Index-Linked Structured Notes — The Absolute Return Tracker, Commodity Strategy and Dynamic Allocation Funds may invest in structured notes whose values are based on the price movements of a commodity index. These commodity index-linked structured notes are valued daily by the issuing counterparties under procedures approved by the trustees. The value of these notes will rise and fall in response to changes in the underlying commodity or related index or investment. These notes are often leveraged, increasing the volatility of each note’s value relative to the change in the underlying linked index. Commodity index-linked investments may be more volatile and less liquid than the underlying index and their value may be
GOLDMAN SACHS SELECT SATELLITE FUNDS
| |
| 3. SIGNIFICANT ACCOUNTING POLICIES (continued) | |
affected by the performance of commodities as well as other factors including liquidity, quality, maturity and other economic variables. These notes are subject to prepayment, credit and interest rate risks. These notes have an automatic redemption feature if the underlying index declines from the entrance date by the amount specified in the agreement. The Funds have the option to request prepayment from the issuer at any time. Interim payments received/(paid) are recorded as net realized gains (losses), and at maturity, or when a structured note is sold, the Funds record a realized gain or loss.
H. Foreign Currency Translations — The books and records of the Funds are maintained in U.S. dollars. Amounts denominated in foreign currencies are translated into U.S. dollars on the following basis: (i) investment valuations, foreign currency and other assets and liabilities initially expressed in foreign currencies are converted into U.S. dollars based upon 4:00 p.m. Eastern Time exchange rates; and (ii) purchases and sales of foreign investments, income and expenses are converted into U.S. dollars based upon currency exchange rates prevailing on the respective dates of such transactions as of 4:00 p.m. Eastern Time.
Net realized and unrealized gain (loss) on foreign currency transactions represents: (i) foreign exchange gains and losses from the sale and holdings of foreign currencies; (ii) currency gains and losses between trade date and settlement date on investment security transactions and forward foreign currency exchange contracts; and (iii) gains and losses from the difference between amounts of dividends, interest and foreign withholding taxes recorded and the amounts actually received. The effect of changes in foreign currency exchange rates on securities and derivative instruments is included with the net realized and change in unrealized gain (loss) on investments on the Statements of Operations, however, the effect of changes in foreign currency exchange rates on fixed income securities sold during the period is included with the net realized gain (loss) on foreign currency related transactions. Changes in the value of other assets and liabilities as a result of fluctuations in foreign exchange rates are included as an increase or decrease to net change in unrealized gain (loss) on translation of assets and liabilities denominated in foreign currencies.
I. Forward Foreign Currency Exchange Contracts — All forward foreign currency exchange contracts are marked to market daily at the applicable forward rate. Unrealized gains or losses on forward foreign currency exchange contracts are recorded by the Funds on a daily basis and realized gains or losses are recorded on the settlement date of a contract.
Risks may arise upon entering into these contracts from the potential inability of counterparties to meet the terms of their contracts and from unanticipated movements in the value of a foreign currency relative to the U.S. dollar.
The contractual amounts of forward foreign currency exchange contracts do not necessarily represent the amounts potentially subject to risk. The measurement of the risks associated with these instruments is meaningful only when all related and offsetting transactions are considered. The Funds must set aside liquid assets, or engage in other appropriate measures to cover their obligations under these contracts.
J. Futures Contracts — Futures contracts are valued at the last settlement price, or in the absence of a sale, the last bid price, at the end of each day on the board of trade or exchange upon which they are traded. Upon entering into a futures contract, the Funds deposit cash or securities in an account on behalf of the broker in an amount sufficient to meet the initial margin requirement. Subsequent payments are made or received by the Funds equal to the daily change in the contract value and are recorded as variation margin receivable or payable with a corresponding offset in unrealized gains or losses. The Funds recognize a realized gain or loss when a contract is closed or expires.
The use of futures contracts involves, to varying degrees, elements of market and counterparty risk which may exceed the amounts recognized in the Statements of Assets and Liabilities. Futures contracts may be illiquid, and exchanges may limit fluctuations in futures contract prices during a single day. Changes in the value of a futures contract may not directly correlate with changes in the value of the underlying securities. These risks may decrease the effectiveness of the Funds’ strategies and potentially result in a loss. The Funds must set aside liquid assets, or engage in other appropriate measures, to cover their obligations under these contracts.
K. Mortgage-Backed and Asset-Backed Securities — The Commodity Strategy, Dynamic Allocation, Real Estate Securities and International Real Estate Securities Funds may invest in mortgage-backed and/or asset-backed securities. Mortgage-backed securities represent direct or indirect participations in, or are collateralized by and payable from, mortgage loans secured by
GOLDMAN SACHS SELECT SATELLITE FUNDS
Notes to Financial Statements (continued)
June 30, 2011 (Unaudited)
| |
| 3. SIGNIFICANT ACCOUNTING POLICIES (continued) | |
residential and/or commercial real property. These securities may include mortgage pass-through securities, collateralized mortgage obligations, real estate mortgage investment conduit pass-through or participation certificates and stripped mortgage-backed securities. Asset-backed securities include securities whose principal and interest payments are collateralized by pools of assets such as auto loans, credit card receivables, leases, installment contracts and personal property. Asset-backed securities also include home equity line of credit loans and other second-lien mortgages.
The value of certain mortgage-backed and asset-backed securities (including adjustable rate mortgage loans) may be particularly sensitive to changes in prevailing interest rates. The value of these securities may also fluctuate in response to the market’s perception of the creditworthiness of the issuers. Early repayment of principal on mortgage-backed or asset-backed securities may expose a Fund to the risk of earning a lower rate of return upon reinvestment of principal. Asset-backed securities may present credit risks that are not presented by mortgage-backed securities because they generally do not have the benefit of a security interest in collateral that is comparable to mortgage assets. Some asset-backed securities may only have a subordinated claim on collateral. In addition, while mortgage-backed and asset-backed securities may be supported by some form of government or private guarantee and/or insurance, there is no assurance that private guarantors or insurers, if any, will meet their obligations.
Stripped mortgage-backed securities are usually structured with two different classes: one that receives substantially all of the interest payments (the interest-only, or “IO” and/or the high coupon rate with relatively low principal amount, or “IOette”), and the other that receives substantially all of the principal payments (the principal-only, or “PO”) from a pool of mortgage loans. Little to no principal will be received at the maturity of an IO; as a result, periodic adjustments are recorded to reduce the cost of the security through maturity. These adjustments are included in interest income. Payments received for PO’s are treated as a proportionate reduction to the cost basis of the securities and excess amounts are recorded as gains.
L. Mortgage Dollar Rolls — Funds may enter into mortgage dollar rolls (“dollar rolls”) in which the Funds sell securities in the current month for delivery and simultaneously contracts with the same counterparty to repurchase similar (same type, coupon and maturity) but not identical securities on a specified future date. The Funds treat dollar rolls as two separate transactions: one involving the purchase of a security and a separate transaction involving a sale.
During the settlement period between sale and repurchase, the Funds will not be entitled to accrue interest and principal payments on the securities sold. Dollar roll transactions involve the risk that the market value of the securities sold by the Funds may decline below the repurchase price of those securities. In the event the buyer of the securities in a dollar roll transaction files for bankruptcy or becomes insolvent, the Funds’ use of proceeds from the transaction may be restricted pending a determination by, or with respect to, the other counterparty.
M. Repurchase Agreements — The Funds may enter into repurchase agreements which involve the purchase of securities subject to the seller’s agreement to repurchase the securities at a mutually agreed upon date and price. During the term of a repurchase agreement, the value of the underlying securities held as collateral on behalf of the Funds, including accrued interest is required to exceed the value of the repurchase agreement, including accrued interest. If the seller defaults or becomes insolvent, realization of the collateral by the Funds may be delayed or limited and there may be a decline in the value of the collateral during the period while the Funds seek to assert their rights.
N. Short Sales — The Absolute Return Tracker and Dynamic Allocation Funds may engage in short selling. In these transactions, the Funds sell a financial instrument they do not own in anticipation of a decline in the market value of the instrument, then must borrow the instrument to make delivery to the buyer. The Funds are obligated to replace the financial instrument borrowed by purchasing it at the market price at the time of replacement. The price at such time may be more or less than the price at which the instrument was sold by the Funds, which may result in a loss or gain, respectively. Unlike purchasing a financial instrument like a stock, where potential losses are limited to the purchase price and there is no upside limit on potential gain, short sales involve no cap on maximum losses, while gains are limited to the price of the stock at the time of the short sale. Liabilities for securities sold short are reported at market value on the Statements of Assets and Liabilities and the change in market value is recorded as unrealized gain or loss on the Statements of Operations. The Funds will record a realized loss if the
GOLDMAN SACHS SELECT SATELLITE FUNDS
| |
| 3. SIGNIFICANT ACCOUNTING POLICIES (continued) | |
price of the security increases between the date of the short sale and the date on which the Funds close the short position. The Funds will record a realized gain if the price of the security declines between those dates.
The Funds may, during the term of any short sale, withdraw the cash proceeds of such short sale and use these cash proceeds to purchase additional securities or for any other purposes of the Fund. Because cash proceeds are Fund assets which are typically used to satisfy the collateral requirements for the short sale, the reinvestment of these cash proceeds may require the Funds to post as collateral other securities that it owns. If the Funds reinvest the cash proceeds, the Funds might be required to post an amount greater than their net assets (but less than their total assets) as collateral. For these or other reasons, the Funds might be required to liquidate long and short positions at times that may be disadvantageous to the Funds. Cash collateral posted by the Funds is recorded as an asset on the Statements of Assets and Liabilities. Securities segregated as collateral are denoted in the Schedule of Investments.
Short sales involve other costs. The Funds must normally repay to the lender an amount equal to any dividend and financing cost that accrues while the loan is outstanding. Dividends on short positions are recorded on the Statements of Operations as dividend expense on securities sold short on ex-dividend date. In addition, to borrow the security, the Funds may be required to pay a premium. The Funds will also incur transaction costs in effecting short sales. These costs incurred by the Funds are recorded as interest expense on securities sold short in the Statements of Operations. The amount of any ultimate gain for the Funds resulting from a short sale will be decreased, and the amount of any ultimate loss will be increased, by the amount of premiums, dividends, interest or expenses the Funds may be required to pay in connection with short sale.
O. Swap Contracts — Swaps are marked to market daily using either pricing vendor quotations, counterparty prices or model prices, and the change in value, if any, is recorded as an unrealized gain or loss. Upfront payments made and/or received by the Funds are recorded as an asset and/or liability, and realized gains or losses are recognized ratably over the contract’s term/event, with the exception of forward starting interest rate swaps, whose realized gains or losses are recognized ratably from the effective start date. Periodic payments received or made on swap contracts are recorded as realized gains or losses. Gains or losses are realized upon termination of a swap contract and are recorded on the Statements of Operations.
Risks may arise as a result of the failure of the counterparty to the swap contract to comply with the terms of the swap contract. The loss incurred by the failure of a counterparty is generally limited to the net payment to be received by the Funds and/or the termination value at the end of the contract. Therefore, GSAM considers the creditworthiness of each counterparty to a contract in evaluating potential credit risk. Additionally, risks may arise from unanticipated movements in interest rates or in the value of the underlying reference asset or index. Entering into these agreements involves, to varying degrees, market risk, liquidity risk and elements of credit, legal and documentation risk in excess of amounts recognized in the Statements of Assets and Liabilities. The Funds may pay or receive cash as collateral on these contracts which is recorded as an asset and/or liability. The Funds must set aside liquid assets, or engage in other appropriate measures, to cover their obligations under these contracts. The Funds may invest in the following types of swaps:
An interest rate swap is an agreement that obligates two parties to exchange a series of cash flows at specified intervals, based upon or calculated by reference to changes in specified prices, rates or indices for a specified amount of an underlying asset or notional principal amount. The payment flows are usually netted against each other, with the difference being paid by one party to the other.
A credit default swap is an agreement that involves one party making a stream of payments to another party in exchange for the right to receive protection on a reference security or obligation. A Fund may use credit default swaps to provide a measure of protection against defaults of the reference security or obligation or to take a short position with respect to the likelihood of default. A Fund’s investment in credit default swaps may involve greater risks than if the Fund had invested in the referenced obligation directly. Credit events are contract specific but may include bankruptcy, failure to pay, restructuring and obligation acceleration. If a Fund buys protection through a credit default swap and no credit event occurs, its payments are limited to the periodic payments previously made to the counterparty. Upon the occurrence of a specified credit event, a Fund, as a buyer of credit protection, is entitled to receive an amount equal to the notional amount of the swap and deliver to the seller the defaulted reference obligation in a physically settled trade. A Fund may also receive a net settlement amount in the form of cash or
GOLDMAN SACHS SELECT SATELLITE FUNDS
Notes to Financial Statements (continued)
June 30, 2011 (Unaudited)
| |
| 3. SIGNIFICANT ACCOUNTING POLICIES (continued) | |
securities equal to the notional amount of the swap reduced by the recovery value of the reference obligation in a cash settled trade.
As a seller of protection, a Fund generally receives a payment stream throughout the term of the swap, provided that there is no credit event. In addition, if the Fund sells protection through a credit default swap, the Fund could suffer a loss because the value of the referenced obligation may be less than the premium payments received. Upon the occurrence of a specified credit event, a Fund, as a seller of credit protection, may be required to take possession of the defaulted reference obligation and pay the buyer an amount equal to the notional amount of the swap in a physically settled trade. A Fund may also pay a net settlement amount in the form of cash or securities equal to the notional amount of the swap reduced by the recovery value of the reference obligation in a cash settled trade. Recovery values are at times established through the credit event auction process in which market participants are ensured that a transparent price has been set for the defaulted security or obligation. In addition, a Fund is entitled to a return of any assets, which have been pledged as collateral to the counterparty.
The maximum potential amount of future payments (undiscounted) that the Funds as sellers of protection could be required to make under a credit default swap would be an amount equal to the notional amount of the agreement. These potential amounts would be partially offset by any recovery values of the respective referenced obligations or net amounts received from a settlement of a credit default swap for the same reference security or obligation where the Funds bought credit protection.
A total return swap is an agreement that gives a Fund the right to receive the appreciation in the value of a specified security, index or other instrument in return for a fee paid to the counterparty, which will typically be an agreed upon interest rate. If the underlying asset declines in value over the term of the swap, a Fund may also be required to pay the dollar value of that decline to the counterparty.
P. Treasury Inflation Protected Securities — The Funds may invest in treasury inflation protected securities (“TIPS”), including structured bonds in which the principal amount is adjusted daily to keep pace with inflation, as measured by the U.S. Consumer Pricing Index for Urban Consumers. The adjustments to principal due to inflation/deflation are reflected as increases/decreases to interest income with a corresponding adjustment to cost. Such adjustments may have a significant impact on the Funds’ distributions and may result in a return of capital to shareholders. The repayment of the original bond principal upon maturity is guaranteed by the full faith and credit of the U.S. Government.
Q. When-Issued Securities and Forward Commitments — The Funds may purchase when-issued securities, including TBA (“To Be Announced”) securities that have been authorized, but not yet issued in the market. When-issued securities are purchased in order to secure what is considered to be an advantageous price or yield to the Fund at the time of entering into the transaction. A forward commitment involves entering into a contract to purchase or sell securities, typically on an extended delivery basis, for a fixed price at a future date. The purchase of securities on a when-issued or forward commitment basis involves a risk of loss if the value of the security to be purchased declines before the settlement date. Conversely, the sale of securities on a forward commitment basis involves the risk that the value of the securities sold may increase before the settlement date. Although the Funds will generally purchase securities on a when-issued or forward commitment basis with the intention of acquiring the securities for their portfolios, the Funds may dispose of when-issued securities or forward commitments prior to settlement which may result in a realized gain or loss. When purchasing a security on a when-issued basis or entering into a forward commitment, the Funds must “set aside” liquid assets, or engage in other appropriate measures to “cover” their obligations under these contracts.
| |
| 4. FAIR VALUE OF INVESTMENTS | |
The fair value of a financial instrument is the amount that would be received to sell an asset or paid to transfer a liability in an orderly transaction between market participants at the measurement date (i.e., the exit price). GAAP establishes a fair value hierarchy that prioritizes the inputs to valuation techniques used to measure fair value. The hierarchy gives the highest priority to
GOLDMAN SACHS SELECT SATELLITE FUNDS
| |
| 4. FAIR VALUE OF INVESTMENTS (continued) | |
unadjusted quoted prices in active markets for identical assets or liabilities (Level 1 measurements) and the lowest priority to unobservable inputs (Level 3 measurements). The three levels of the fair value hierarchy are described below:
Level 1 — Unadjusted quoted prices in active markets that are accessible at the measurement date for identical, unrestricted assets or liabilities;
Level 2 — Quoted prices in markets that are not active or financial instruments for which significant inputs are observable (including, but not limited to, quoted prices for similar securities, interest rates, foreign exchange rates, volatility and credit spreads), either directly or indirectly;
Level 3 — Prices or valuations that require significant unobservable inputs (including GSAM’s assumptions in determining fair value measurement).
The following is a summary of the Funds’ investments and derivatives categorized in the fair value hierarchy as of June 30, 2011:
| | | | | | | | | | | | | |
| ABSOLUTE RETURN TRACKER |
| Investment Type | | Level 1 | | Level 2 | | Level 3 |
| |
Assets | | | | | | | | | | | | |
| Fixed Income | | | | | | | | | | | | |
| Commodity Index Linked Structured Notes | | $ | — | | | $ | 58,436,113 | | | $ | — | |
U.S. Treasury Obligations and/or Other U.S. Government Agencies | | | 1,289,184,893 | | | | — | | | | — | |
Common Stock and/or Other Equity Investments | | | 75,087,524 | | | | — | | | | — | |
| Repurchase Agreements | | | — | | | | 229,900,000 | | | | — | |
| Short-term Investment | | | 90,616,950 | | | | — | | | | — | |
| |
| |
Total | | $ | 1,454,889,367 | | | $ | 288,336,113 | | | $ | — | |
| |
| |
| | | | | | | | | | | | | |
| Derivative Type | | | | | | |
| |
Assets | | | | | | | | | | | | |
Futures Contracts(a) | | $ | 17,122,164 | | | $ | — | | | $ | — | |
Forward Foreign Currency Exchange Contracts(a) | | | — | | | | 35,149 | | | | — | |
| |
| |
Liabilities | | | | | | | | | | | | |
Forward Foreign Currency Exchange Contracts(a) | | $ | — | | | $ | (1,991,949 | ) | | $ | — | |
| |
| |
| | | | | | | | | | | | | |
| COMMODITY STRATEGY |
| Investment Type | | Level 1 | | Level 2 | | Level 3 |
| |
Assets | | | | | | | | | | | | |
| Fixed Income | | | | | | | | | | | | |
| Mortgage-Backed Obligations | | $ | — | | | $ | 114,957,239 | | | $ | — | |
U.S. Treasury Obligations and/or Other U.S. Government Agencies | | | 502,837,099 | | | | 2,846,654 | | | | — | |
| Asset-Backed Securities | | | — | | | | 282,319 | | | | — | |
| Government Guarantee Obligations | | | — | | | | 39,353,557 | | | | — | |
| Short-term Investment | | | 170,973,016 | | | | — | | | | — | |
| |
| |
Total | | $ | 673,810,115 | | | $ | 157,439,769 | | | $ | — | |
| |
| |
Liabilities | | | | | | | | | | | | |
| Fixed Income | | | | | | | | | | | | |
| Mortgage-Backed Obligations — Forward Sale Contracts | | $ | — | | | $ | (40,105,937 | ) | | $ | — | |
| |
| |
| | | | | | | | | | | | | |
GOLDMAN SACHS SELECT SATELLITE FUNDS
Notes to Financial Statements (continued)
June 30, 2011 (Unaudited)
| |
| 4. FAIR VALUE OF INVESTMENTS (continued) | |
| | | | | | | | | | | | | |
| COMMODITY STRATEGY (continued) |
| Derivative Type | | Level 1 | | Level 2 | | Level 3 |
| |
Assets | | | | | | | | | | | | |
Futures Contracts(a) | | $ | 334,525 | | | $ | — | | | $ | — | |
| Interest Rate Swap Contracts | | | — | | | | 515,096 | | | | — | |
| Total Return Swap Contracts | | | — | | | | 11,629,871 | | | | — | |
| |
| |
Total | | $ | 334,525 | | | $ | 12,144,967 | | | $ | — | |
| |
| |
Liabilities | | | | | | | | | | | | |
Futures Contracts(a) | | $ | (758,309 | ) | | $ | — | | | $ | — | |
| Interest Rate Swap Contracts | | | — | | | | (664,789 | ) | | | — | |
| Total Return Swap Contracts | | | — | | | | (19,059,290 | ) | | | — | |
| |
| |
Total | | $ | (758,309 | ) | | $ | (19,724,079 | ) | | $ | — | |
| |
| |
| | | | | | | | | | | | | |
| DYNAMIC ALLOCATION |
| Investment Type | | | | | | |
| |
Assets | | | | | | | | | | | | |
| Fixed Income | | | | | | | | | | | | |
| Commodity Index Linked Structured Notes | | $ | — | | | $ | 17,404,350 | | | $ | — | |
U.S. Treasury Obligations and/or Other U.S. Government Agencies | | | 93,858,849 | | | | — | | | | — | |
Common Stock and/or Other Equity Investments | | | 53,483,979 | | | | — | | | | — | |
| Short-term Investment | | | 171,342,601 | | | | — | �� | | | — | |
| |
| |
Total | | $ | 318,685,429 | | | $ | 17,404,350 | | | $ | — | |
| |
| |
| | | | | | | | | | | | | |
| Derivative Type | | | | | | |
| |
Assets | | | | | | | | | | | | |
Futures Contracts(a) | | $ | 3,449,311 | | | $ | — | | | $ | — | |
| Credit Default Swap Contracts | | | — | | | | 780,727 | | | | — | |
| |
| |
Liabilities | | | | | | | | | | | | |
Futures Contracts(a) | | $ | (15,675 | ) | | $ | — | | | $ | — | |
| Credit Default Swap Contracts | | | — | | | | (79,118 | ) | | | — | |
| |
| |
| | | | | | | | | | | | | |
| INTERNATIONAL REAL ESTATE SECURITIES |
| Investment Type | | Level 1 | | Level 2 | | Level 3 |
| |
Assets | | | | | | | | | | | | |
Common Stock and/or Other Equity Investments | | $ | 32,820,376 | | | $ | 333,531,299 | (b) | | $ | — | |
| Short-term Investment | | | 3,040,745 | | | | — | | | | — | |
| |
| |
Total | | $ | 35,861,121 | | | $ | 333,531,299 | | | $ | — | |
| |
| |
| | | | | | | | | | | | | |
| | | | | | | | | | | | | |
GOLDMAN SACHS SELECT SATELLITE FUNDS
| |
| 4. FAIR VALUE OF INVESTMENTS (continued) | |
| | | | | | | | | | | | | |
| REAL ESTATE SECURITIES |
| Investment Type | | Level 1 | | Level 2 | | Level 3 |
| |
Assets | | | | | | | | | | | | |
Common Stock and/or Other Equity Investments | | $ | 625,490,407 | | | $ | — | | | $ | — | |
| Short-term Investment | | | 14,075,020 | | | | — | | | | — | |
| |
| |
Total | | $ | 639,565,427 | | | $ | — | | | $ | — | |
| |
| |
| | |
| (a) | | Amount shown represents unrealized gain (loss) at period end. |
| (b) | | To adjust for the time difference between local market close and the calculation of net asset value, the Funds utilize fair value model prices for international equities provided by an independent fair value service resulting in a Level 2 classification. |
| |
| 5. INVESTMENTS IN DERIVATIVES | |
The Funds may make investments in derivative instruments, including, but not limited to options, futures, swaps, swaptions and other derivatives relating to foreign currency transactions. A derivative is an instrument whose value is derived from underlying assets, indices, reference rates or a combination of these factors. Derivative instruments may be privately negotiated contracts (often referred to as over the counter (“OTC”) derivatives) or they may be listed and traded on an exchange. Derivative contracts may involve future commitments to purchase or sell financial instruments or commodities at specified terms on a specified date, or to exchange interest payment streams or currencies based on a notional or contractual amount. Derivative instruments may involve a high degree of financial risk. The use of derivatives also involves the risk of loss if the investment adviser is incorrect in its expectation of the timing or level of fluctuations in securities prices, interest rates or currency prices. Investments in derivative instruments also include the risk of default by the counterparty, the risk that the investment may not be liquid and the risk that a small movement in the price of the underlying security or benchmark may result in a disproportionately large movement, unfavorable or favorable, in the price of the derivative instrument.
During the six months ended June 30, 2011, the Absolute Return Tracker, Commodity Strategy and Dynamic Allocation Funds entered into certain derivative contract types. These instruments were used to meet the Funds’ investment objectives and to obtain and/or manage exposure related to the risks below. The following tables set forth, by certain risk types, the gross value of these derivative contracts for trading activities as of June 30, 2011. The values in the tables below exclude the effects of cash collateral received or posted pursuant to these derivative contracts, and therefore are not representative of the Funds’ net exposure.
| | | | | | | | | | | | | | | | |
| Absolute Return Tracker |
| |
| | | Statements of Assets
| | | | | Statements of Assets
| | | | |
| | | and Liabilities
| | | | | and Liabilities
| | | | |
| Risk | | Location | | Assets | | | Location | | Liabilities | | |
| Currency | | Receivables for forward foreign currency exchange contracts, at value | | $ | 35,149 | | | | Payables for forward foreign currency exchange contracts, at value | | $ | (1,991,949 | ) | | |
| | | | | | | | | | | | | | | | |
| Equity | | Due from broker — variation margin, at value | | | 16,532,311 | (a) | | |
— | | | — | | | |
| | | | | | | | | | | | | | | | |
| Interest Rate | | Due from broker — variation margin, at value | | | 589,853 | (a) | | |
— | | | — | | | |
| | | | | | | | | | | | | | | | |
Total | | | | $ | 17,157,313 | | | | | | $ | (1,991,949 | ) | | |
| | | | | | | | | | | | | | | | |
| | | | | | | | | | | | | | | | |
| | | | | | | | | | | | | | | | |
GOLDMAN SACHS SELECT SATELLITE FUNDS
Notes to Financial Statements (continued)
June 30, 2011 (Unaudited)
| |
| 5. INVESTMENTS IN DERIVATIVES (continued) | |
| | | | | | | | | | | | | | | | |
| Commodity Strategy |
| |
| | | Statements of Assets
| | | | | Statements of Assets
| | | | |
| | | and Liabilities
| | | | | and Liabilities
| | | | |
| Risk | | Location | | Assets | | | Location | | Liabilities | | |
| Commodity | | Receivables for swap contracts, at value | | $ | 11,629,871 | | | | Payables for swap contracts, at value | | $ | (19,059,290 | )(b) | | |
| | | | | | | | | | | | | | | | |
| Interest Rate | | Receivables for swap contracts, at value, Due from broker — variation margin, at value | | | 849,621 | (a) | | | Payables for swap contracts, at value, Due to broker — variation margin, at value | | | (1,423,098 | )(a)(b) | | |
| | | | | | | | | | | | | | | | |
Total | | | | $ | 12,479,492 | | | | | | $ | (20,482,388 | ) | | |
| | | | | | | | | | | | | | | | |
| | | | | | | | | | | | | | | | |
| | | | | | | | | | | | | | | | |
| Dynamic Allocation |
| |
| | | Statements of Assets
| | | | | Statements of Assets
| | | | |
| | | and Liabilities
| | | | | and Liabilities
| | | | |
| Risk | | Location | | Assets | | | Location | | Liabilities | | |
| Credit | | Swap contracts, at value | | $ | 780,727 | | | | Swap contracts, at value | | $ | (79,118 | )(b) | | |
| | | | | | | | | | | | | | | | |
| Equity | | Due from broker — variation margin, at value | | | 2,962,483 | (a) | | |
— | | | — | | | |
| | | | | | | | | | | | | | | | |
| Interest Rate | | Due from broker — variation margin, at value | | | 486,828 | (a) | | | Due to broker — variation margin, at value | | | (15,675 | )(a) | | |
| | | | | | | | | | | | | | | | |
Total | | | | $ | 4,230,038 | | | | | | $ | (94,793 | ) | | |
| | | | | | | | | | | | | | | | |
| | |
| (a) | | Includes unrealized gain (loss) on futures contracts described in the Additional Investment Information sections of the Schedules of Investments. Only current day’s variation margin is reported within the Statements of Assets and Liabilities. |
| (b) | | Aggregate of amounts include $19,724,079 and $79,118 for the Commodity Strategy and Dynamic Allocation Funds, respectively, which represents the payments to be made pursuant to bilateral agreements should counterparties exercise their “right to terminate” provisions based on, among others, the Funds’ performance, their failure to pay on their obligations or failure to pledge collateral. Such amounts do not include incremental charges directly associated with the close-out of the agreements. They also do not reflect the fair value of any assets pledged as collateral which, through the daily margining process, substantially offsets the aforementioned amounts and for which the Funds are entitled to a full return. |
The following tables set forth, by certain risk types, the Funds’ gains (losses) related to these derivatives and their indicative volumes for the six months ended June 30, 2011. These gains (losses) should be considered in the context that these derivative contracts may have been executed to economically hedge certain securities, and accordingly, certain gains (losses) on such
GOLDMAN SACHS SELECT SATELLITE FUNDS
| |
| 5. INVESTMENTS IN DERIVATIVES (continued) | |
derivative contracts may offset certain (losses) gains attributable to securities. These gains (losses) are included in “Net realized gain (loss)” or “Net change in unrealized gain (loss)” on the Statements of Operations:
| | | | | | | | | | | | | | | | |
| Absolute Return Tracker |
| |
| | | | | Net
| | Net Change in
| | | Average
|
| | | | | Realized
| | Unrealized
| | | Number of
|
| Risk | | Statements of Operations Location | | Gain (Loss) | | Gain (Loss) | | | Contracts(a) |
| Currency | | Net realized gain (loss) from foreign currency related transactions/Net change in unrealized gain (loss) on translation of assets and liabilities denominated in foreign currencies | | $ | 8,578,984 | | | $ | (3,364,336 | ) | | | | 9 | |
| | | | | | | | | | | | | | | | |
| Equity | | Net realized gain (loss) from futures transactions/Net change in unrealized gain (loss) on futures | | | 814,888 | | | | 13,183,471 | | | | | 5,739 | |
| | | | | | | | | | | | | | | | |
| Interest rate | | Net realized gain (loss) from futures transactions/Net change in unrealized gain (loss) on futures | | | (5,949,418 | ) | | | (9,938,181 | ) | | | | 3,365 | |
| | | | | | | | | | | | | | | | |
Total | | | | $ | 3,444,454 | | | $ | (119,046 | ) | | | | 9,113 | |
| | | | | | | | | | | | | | | | |
| | | | | | | | | | | | | | | | |
| | | | | | | | | | | | | | | | |
| Commodity Strategy |
| |
| | | | | Net
| | Net Change in
| | | Average
|
| | | | | Realized
| | Unrealized
| | | Number of
|
| Risk | | Statements of Operations Location | | Gain (Loss) | | Gain (Loss) | | | Contracts(a) |
| Commodity | | Net realized gain (loss) from swap contracts/Net change in unrealized gain (loss) on swap contracts | | $ | 114,043,587 | | | $ | (65,376,834 | ) | | | | 13 | |
| | | | | | | | | | | | | | | | |
| Interest rate | | Net realized gain (loss) from futures and swap transactions/Net change in unrealized gain (loss) on futures and swap contracts | | | (2,516,360 | ) | | | (1,005,720 | ) | | | | 782 | |
| | | | | | | | | | | | | | | | |
Total | | | | $ | 111,527,227 | | | $ | (66,382,554 | ) | | | | 795 | |
| | | | | | | | | | | | | | | | |
| | | | | | | | | | | | | | | | |
| | | | | | | | | | | | | | | | |
| Dynamic Allocation |
| |
| | | | | Net
| | Net Change in
| | | Average
|
| | | | | Realized
| | Unrealized
| | | Number of
|
| Risk | | Statements of Operations Location | | Gain (Loss) | | Gain (Loss) | | | Contracts(a) |
| Credit | | Net realized gain (loss) from swap contracts/Net change in unrealized gain (loss) on swap contracts | | $ | (487,242 | ) | | $ | 28,937 | | | | | 3 | |
| | | | | | | | | | | | | | | | |
| Equity | | Net realized gain (loss) from futures transactions/Net change in unrealized gain (loss) on futures | | | 3,682,203 | | | | 2,499,572 | | | | | 1,231 | |
| | | | | | | | | | | | | | | | |
| Interest rate | | Net realized gain (loss) from futures transactions/Net change in unrealized gain (loss) on futures | | | (2,108,620 | ) | | | 1,686,205 | | | | | 786 | |
| | | | | | | | | | | | | | | | |
Total | | | | $ | 1,086,341 | | | $ | 4,214,714 | | | | | 2,020 | |
| | | | | | | | | | | | | | | | |
| | |
| (a) | | Average number of contracts is based on the average of month end balances for the six months ended June 30, 2011. |
GOLDMAN SACHS SELECT SATELLITE FUNDS
Notes to Financial Statements (continued)
June 30, 2011 (Unaudited)
| |
| 6. AGREEMENTS AND AFFILIATED TRANSACTIONS | |
A. Management Agreements — Under the Agreements, GSAM manages the Funds, subject to the general supervision of the trustees.
As compensation for the services rendered pursuant to the Agreements, the assumption of the expenses related thereto and administration of the Funds’ business affairs, including providing facilities, GSAM is entitled to a management fee, accrued daily and paid monthly, equal to an annual percentage rate of each Fund’s average daily net assets.
For the six months ended June 30, 2011, contractual and effective net management fees with GSAM were at the following rates:
| | | | | | | | | | | | | | | | | | | | | | | | | | | | | | | |
| | | Contractual Management Rate | | Effective Net
| | |
| | | First
| | Next
| | Next
| | Next
| | Over
| | Effective
| | Management
| | |
| Fund | | $1 billion | | $1 billion | | $3 billion | | $3 billion | | $8 billion | | Rate | | Rate | | |
| |
| Absolute Return Tracker | | | 1.15 | % | | | 1.04 | % | | | 0.99 | % | | | 0.97 | % | | | 0.95 | % | | | 1.11 | % | | | 1.11 | % | | |
| |
| |
| Commodity Strategy | | | 0.50 | | | | 0.50 | | | | 0.45 | | | | 0.43 | | | | 0.42 | | | | 0.50 | | | | 0.50 | (1) | | |
| |
| |
| Dynamic Allocation | | | 0.90 | | | | 0.81 | | | | 0.77 | | | | 0.75 | | | | 0.74 | | | | 0.90 | | | | 0.90 | | | |
| |
| |
| International Real Estate Securities | | | 1.05 | | | | 1.05 | | | | 0.95 | | | | 0.90 | | | | 0.88 | | | | 1.05 | | | | 1.03 | (2) | | |
| |
| |
| Real Estate Securities | | | 1.00 | | | | 0.90 | | | | 0.86 | | | | 0.84 | | | | 0.82 | | | | 1.00 | | | | 1.00 | | | |
| |
| |
| | |
| (1) | | Reflects combined management fees paid to GSAM under the Agreement and the Subsidiary Agreement (as defined below) after the waivers. |
| (2) | | Effective June 30, 2011, GSAM agreed to waive a portion of its management fee in order to achieve an effective net management rate of 1.02% through at least April 29, 2012. Prior to such date GSAM may not terminate the arrangement without the approval of the trustees. Prior to June 30, 2011, GSAM agreed to waive a portion of its management fee in order to achieve an effective net management rate of 1.03%. |
GSAM also provides management services to the Subsidiary pursuant to a Subsidiary Management Agreement (the “Subsidiary Agreement”) and is entitled to a management fee accrued daily and paid monthly, equal to an annual percentage rate of 0.50% of the Subsidiary’s average daily net assets. In consideration of the Subsidiary’s management fee, and for as long as the Subsidiary Agreement remains in effect, GSAM has contractually agreed to waive irrevocably a portion of the Commodity Strategy Fund’s management fee in an amount equal to the management fee paid to GSAM by the Subsidiary under the Subsidiary Agreement. For the six months ended June 30, 2011, GSAM waived $489,065 of the Fund’s management fee.
B. Distribution and Service Plans — The Trust, on behalf of each Fund, has adopted Distribution and Service Plans (the “Plans”). Under the Plans, Goldman Sachs, which serves as distributor (the “Distributor”), is entitled to a fee, accrued daily and paid monthly for distribution services and personal and account maintenance services, which may then be paid by Goldman Sachs to authorized dealers, at the following annual rates calculated on a Fund’s average daily net assets of each respective share class:
| | | | | | | | | | | | | | | | | |
| | | Distribution and Service Plan Rates |
| | | Class A* | | Class B | | Class C | | Class R* |
| |
| Distribution Plan | | | 0.25 | % | | | 0.75 | % | | | 0.75 | % | | | 0.50 | % |
| |
| |
| Service Plan | | | — | | | | 0.25 | | | | 0.25 | | | | — | |
| |
| |
| | |
| * | | With respect to Class A and Class R Shares, the Distributor at its discretion may use compensation for distribution services paid under the Distribution Plan to compensate service organizations for personal and account maintenance services and expenses as long as such total compensation does not exceed the maximum cap on “service fees” imposed by the Financial Industry Regulatory Authority. |
GOLDMAN SACHS SELECT SATELLITE FUNDS
| |
| 6. AGREEMENTS AND AFFILIATED TRANSACTIONS (continued) | |
C. Distribution Agreement — Goldman Sachs, as Distributor of the shares of the Funds pursuant to a Distribution Agreement, may retain a portion of the Class A front end sales charge and Class B and Class C contingent deferred sales charges. During the six months ended June 30, 2011, Goldman Sachs advised that it retained the following approximate amounts:
| | | | | | | | | | | | | |
| | | Front End
| | Contingent Deferred
|
| | | Sales Charge | | Sales Charge |
| Fund | | Class A | | Class B | | Class C |
| |
| Absolute Return Tracker | | $ | 21,200 | | | | N/A | | | $ | — | |
| |
| |
| Commodity Strategy | | | 69,000 | | | | N/A | | | | — | |
| |
| |
| Dynamic Allocation | | | 47,000 | | | | N/A | | | | — | |
| |
| |
| International Real Estate Securities | | | 1,500 | | | | N/A | | | | — | |
| |
| |
| Real Estate Securities | | | 5,900 | | | | — | | | | — | |
| |
| |
D. Service Plan and Shareholder Administration Plan — The Trust, on behalf of each Fund that offers Service Shares, has adopted a Service Plan and Shareholder Administration Plan. These plans allow for service organizations to provide varying levels of personal and account maintenance and shareholder administration services to their customers who are beneficial owners of such shares. The Service Plan and Shareholder Administration Plan each provide for compensation to the service organizations which is accrued daily and paid monthly at an annual rate as follows: 0.25% (0.50% in aggregate) of the average daily net assets of the Service Shares.
E. Transfer Agency Agreement — Goldman Sachs also serves as the transfer agent of the Funds for a fee pursuant to a Transfer Agency Agreement. The fees charged for such transfer agency services are accrued daily and paid monthly at an annual rate as follows: 0.19% (except for the Commodity Strategy Fund, which charges at an annual rate of 0.13%) of the average daily net assets for Class A, Class B, Class C, Class IR and Class R Shares and 0.04% of the average daily net assets for Institutional and Service Shares.
F. Other Expense Agreements and Affiliated Transactions — GSAM has agreed to limit certain “Other Expense” of the Funds (excluding management fees, distribution and service fees, transfer agent fees and expenses, service fees and shareholder administration fees (as applicable), dividend and interest expenses on short sales, taxes, interest, brokerage fees and litigation, indemnification, shareholder meetings and other extraordinary expenses, exclusive of any custody and transfer agent fee credit reductions) to the extent such expenses exceed, on an annual basis, a percentage rate of the average daily net assets of each Fund. Such Other Expense reimbursements, if any, are accrued daily and paid monthly. In addition, the Funds are not obligated to reimburse GSAM for prior fiscal year expense reimbursements, if any. The Other Expense limitation as an annual percentage rate of average daily net assets for the Absolute Return Tracker, Commodity Strategy, Dynamic Allocation, International Real Estate Securities and Real Estate Securities Funds are 0.014%, 0.044%, 0.054%, 0.064% and 0.004%, respectively. The Subsidiary also pays certain other expenses, including service and custody fees. GSAM has agreed to reduce or limit the Subsidiary’s expenses (excluding management fees) to 0.004% of the Subsidiary’s average daily net assets. These Other Expense reimbursements will remain in place through at least April 29, 2012, and prior to such date GSAM may not terminate the arrangements without the approval of the trustees. In addition, the Funds have entered into certain offset arrangements with the custodian and the transfer agent, which may result in a reduction of the Funds’ expenses.
GOLDMAN SACHS SELECT SATELLITE FUNDS
Notes to Financial Statements (continued)
June 30, 2011 (Unaudited)
| |
| 6. AGREEMENTS AND AFFILIATED TRANSACTIONS (continued) | |
For the six months ended June 30, 2011, these expense reductions, including any fee waivers and Other Expense reimbursements, were as follows (in thousands):
| | | | | | | | | | | | | |
| | | | | Other
| | Total
|
| | | Management
| | Expense
| | Expense
|
| Fund | | Fee Waiver | | Reimbursement | | Reductions |
| |
| Absolute Return Tracker | | $ | — | | | $ | 287 | | | $ | 287 | |
| |
| |
| Commodity Strategy | | | — | | | | 127 | | | | 127 | |
| |
| |
| Dynamic Allocation | | | — | | | | 158 | | | | 158 | |
| |
| |
| International Real Estate Securities | | | 38 | | | | 157 | | | | 195 | |
| |
| |
| Real Estate Securities | | | — | | | | 202 | | | | 202 | |
| |
| |
As of June 30, 2011, the amounts owed to affiliates of the Funds were as follows (in thousands):
| | | | | | | | | | | | | | | | | | | | | |
| | | | | | | | | Over
| | |
| | | | | Distribution
| | | | Reimbursement
| | |
| | | Management
| | and Service
| | Transfer
| | of Other
| | |
| Fund | | Fees | | Fees | | Agent Fees | | Expenses | | Total |
| |
| Absolute Return Tracker | | $ | 1,558 | | | $ | 187 | | | $ | 142 | | | $ | — | | | $ | 1,887 | |
| |
| |
| Commodity Strategy | | | 405 | | | | 52 | | | | 49 | | | | 15 | | | | 521 | |
| |
| |
| Dynamic Allocation | | | 225 | | | | 41 | | | | 29 | | | | — | | | | 295 | |
| |
| |
| International Real Estate Securities | | | 309 | | | | 28 | | | | 28 | | | | — | | | | 365 | |
| |
| |
| Real Estate Securities | | | 510 | | | | 50 | | | | 43 | | | | — | | | | 603 | |
| |
| |
G. Line of Credit Facility — As of June 30, 2011, the Funds participated in a $580,000,000 committed, unsecured revolving line of credit facility (the “facility”) together with other funds of the Trust and registered investment companies having management agreements with GSAM or its affiliates. Pursuant to the terms of the facility, the Funds and other borrowers could increase the credit amount by an additional $340,000,000, for a total of up to $920,000,000. This facility is to be used solely for temporary or emergency purposes. The interest rate on borrowings is based on the federal funds rate. The facility also requires a fee to be paid by the Funds based on the amount of the commitment that has not been utilized. For the six months ended June 30, 2011, the Funds did not have any borrowings under the facility.
H. Other Transactions with Affiliates — For the six months ended June 30, 2011, Goldman Sachs earned approximately $7,600, $400, $8,500 and $2,300 in brokerage commissions from portfolio transactions, including futures transactions executed with Goldman Sachs as the Futures Commission Merchant, on behalf of the Absolute Return Tracker, Commodity Strategy, Dynamic Allocation and Real Estate Securities Funds, respectively.
GOLDMAN SACHS SELECT SATELLITE FUNDS
| |
| 6. AGREEMENTS AND AFFILIATED TRANSACTIONS (continued) | |
As of June 30, 2011, the following Goldman Sachs Fund of Funds Portfolios and the Goldman Sachs Profit Sharing Master Trust were the beneficial owners of 5% or more of total outstanding shares of the following Funds:
| | | | | | | | | | | | | | | | | | | | | |
| | | Goldman Sachs
| | Goldman Sachs
| | Goldman Sachs
| | Goldman Sachs
| | |
| | | Growth and Income
| | Growth Strategy
| | Satellite Strategies
| | Profit Sharing
| | |
| Fund | | Strategy Portfolio | | Portfolio | | Portfolio | | Master Trust | | |
| |
| Commodity Strategy | | | 8 | % | | | 8 | % | | | 8 | % | | | — | % | | | | |
| |
| |
| International Real Estate Securities | | | 7 | | | | 5 | | | | 20 | | | | — | | | | | |
| |
| |
| Real Estate Securities | | | — | | | | — | | | | 11 | | | | 22 | | | | | |
| |
| |
As of June 30, 2011, the Goldman Sachs Group, Inc. was the beneficial owner of approximately 100% of the Class R Shares of the Dynamic Allocation Fund, approximately 69% of the Class IR Shares of the International Real Estate Securities Fund, and approximately 5% of the Class IR Shares of the Real Estate Securities Fund.
| |
| 7. PORTFOLIO SECURITIES TRANSACTIONS | |
The cost of purchases and proceeds from sales and maturities of long-term securities for the six months ended June 30, 2011, were as follows:
| | | | | | | | | | | | | | | | | |
| | | | | | | Sales and
| | Sales and
|
| | | Purchases of
| | Purchases (Excluding
| | Maturities of
| | Maturities (Excluding
|
| | | U.S. Government and
| | U.S. Government and
| | U.S. Government and
| | U.S. Government and
|
| Fund | | Agency Obligations | | Agency Obligations) | | Agency Obligations | | Agency Obligations) |
| |
| Absolute Return Tracker | | $ | — | | | $ | 51,981,368 | | | $ | — | | | $ | 18,314,667 | |
| |
| |
| Commodity Strategy | | | 431,584,664 | | | | 17,800,000 | | | | 716,290,217 | | | | 2,737,836 | |
| |
| |
| Dynamic Allocation | | | 89,491,774 | | | | 100,931,583 | | | | 43,333,146 | | | | 70,265,957 | |
| |
| |
| International Real Estate Securities | | | — | | | | 128,655,498 | | | | — | | | | 142,347,989 | |
| |
| |
| Real Estate Securities | | | — | | | | 175,877,972 | | | | — | | | | 148,307,569 | |
| |
| |
GOLDMAN SACHS SELECT SATELLITE FUNDS
Notes to Financial Statements (continued)
June 30, 2011 (Unaudited)
As of the Funds’ most recent fiscal year end, December 31, 2010, the Funds’ capital loss carryforwards on a tax-basis were as follows:
| | | | | | | | | | | | | | | | | | | | | |
| | | Absolute
| | | | | | International
| | |
| | | Return
| | Commodity
| | Dynamic
| | Real Estate
| | Real Estate
|
| | | Tracker | | Strategy | | Allocation | | Securities | | Securities |
| |
Capital loss carryforward:(1) | | | | | | | | | | | | | | | | | | | | |
| Expiring 2016 | | $ | — | | | $ | (16,221,334 | ) | | $ | — | | | $ | (336,773,705 | ) | | $ | — | |
| Expiring 2017 | | | — | | | | (67,560,179 | ) | | | — | | | | (239,206,981 | ) | | | (190,871,075 | ) |
| Expiring 2018 | | | — | | | | — | | | | — | | | | (18,621,372 | ) | | | — | |
| |
| |
| Total capital loss carryforward | | $ | — | | | $ | (83,781,513 | ) | | $ | — | | | $ | (594,602,058 | ) | | $ | (190,871,075 | ) |
| |
| |
| Timing differences (post-October losses/REIT income deferred/straddle loss deferral) | | $ | (2,266,665 | ) | | $ | (228,828 | ) | | $ | (704,033 | ) | | $ | (202,767 | ) | | $ | 554,833 | |
| |
| |
| | |
| (1) | | Expiration occurs on December 31 of the year indicated. |
As of June 30, 2011, the Funds’ aggregate security unrealized gains and losses based on cost for U.S. federal income tax purposes were as follows:
| | | | | | | | | | | | | | | | | | | | | |
| | | Absolute
| | | | | | International
| | |
| | | Return
| | Commodity
| | Dynamic
| | Real Estate
| | Real Estate
|
| | | Tracker | | Strategy | | Allocation | | Securities | | Securities |
| |
| Tax cost | | $ | 1,722,115,848 | | | $ | 830,977,914 | | | $ | 334,908,161 | | | $ | 367,337,093 | | | $ | 475,538,019 | |
| |
| |
| Gross unrealized gain | | | 23,222,442 | | | | 955,404 | | | | 3,286,597 | | | | 57,988,739 | | | | 172,057,821 | |
| Gross unrealized loss | | | (2,112,810 | ) | | | (683,434 | ) | | | (2,104,979 | ) | | | (55,933,412 | ) | | | (8,030,413 | ) |
| |
| |
| Net unrealized security gain | | $ | 21,109,632 | | | $ | 271,970 | | | $ | 1,181,618 | | | $ | 2,055,327 | | | $ | 164,027,408 | |
| |
| |
The difference between GAAP-basis and tax-basis unrealized gains (losses), as of the most recent fiscal year end, is attributable primarily to wash sales, net mark to market gains (losses) on regulated futures and forward foreign currency exchange contracts, and differences related to the tax treatment of the Goldman Sachs Cayman Commodity Fund Ltd., swap transactions, passive foreign investment companies and real estate investment trust investments.
GSAM has reviewed the Funds’ tax positions for all open tax years (the current and prior three years, as applicable) and has concluded that no provision for income tax is required in the Funds’ financial statements. Such open tax years remain subject to examination and adjustment by tax authorities.
Under the recently enacted Regulated Investment Company Modernization Act of 2010, the Funds will be permitted to carry forward capital losses incurred in taxable years beginning after December 22, 2010 for an unlimited period. However, any losses incurred during those future taxable years will be required to be utilized prior to the losses incurred in pre-enactment taxable years. As a result of this ordering rule, pre-enactment capital loss carryforwards may be more likely to expire unused. Additionally, post-enactment capital losses that are carried forward will retain their character as either short-term or long-term capital losses rather than being considered all short-term as under previous law.
Concentration in ETFs — ETFs are subject to the following risks that do not apply to conventional funds: (i) the market price of the ETF’s shares may trade at a premium or a discount to their NAV; and (ii) an active trading market for an ETF’s shares may not develop or be maintained. As a shareholder of another investment company, the Fund will indirectly bear its proportionate share of
GOLDMAN SACHS SELECT SATELLITE FUNDS
| |
| 9. OTHER RISKS (continued) | |
any management fees and other expenses paid by such other investment companies, in addition to the fees and expenses regularly borne by the Fund.
Foreign Custody Risk — A Fund that invests in foreign securities may hold such securities and foreign currency with foreign banks, agents, and securities depositories appointed by the Fund’s custodian (each a “Foreign Custodian”). In some countries, Foreign Custodians may be subject to little or no regulatory oversight or independent evaluation of their operations. Further, the laws of certain countries may place limitations on a Fund’s ability to recover its assets if a Foreign Custodian enters into bankruptcy. Investments in emerging markets may be subject to greater custody risks than investments in more developed markets. Custody services in emerging market countries are often undeveloped and may be less regulated than in more developed countries, and thus may not afford the same level of investor protection as would apply in developed countries.
Funds’ Shareholder Concentration Risk — Certain funds, accounts, individuals or Goldman Sachs affiliates may from time to time own (beneficially or of record) or control a significant percentage of the Funds’ shares. Redemptions by these entities of their holdings in the Funds may impact the Funds’ liquidity and NAV. These redemptions may also force the Funds to sell securities.
Liquidity Risk — The Funds may make investments that may be illiquid or that may become less liquid in response to market developments or adverse investor perceptions. Liquidity risk may also refer to the risk that a Fund will not be able to pay redemption proceeds within the allowable time period because of unusual market conditions, an unusually high volume of redemption requests, or other reasons. To meet redemption requests, a Fund may be forced to sell investments at an unfavorable time and/or under unfavorable conditions.
Market and Credit Risks — In the normal course of business, the Funds trade financial instruments and enter into financial transactions where risk of potential loss exists due to changes in the market (market risk). Additionally, the Funds may also be exposed to credit risk in the event that an issuer fails to perform or that an institution or entity with which the Funds have unsettled or open transaction defaults.
Investing in foreign markets may involve special risks and considerations not typically associated with investing in the U.S. These risks include revaluation of currencies, high rates of inflation, repatriation restrictions on income and capital, and adverse political and economic developments. Moreover, securities issued in these markets may be less liquid, be subject to government ownership controls, have delayed settlements and their prices may be more volatile than those of comparable securities in the U.S.
Portfolio Concentration Risk — The Real Estate Securities Fund and the International Real Estate Securities Fund invest primarily in securities of issuers (non-U.S. issuers, in the case of International Real Estate Securities Fund) that are primarily engaged in or related to the real estate industry, and each Fund has a policy of concentrating its investments in the real estate industry. Therefore, investments in the Funds are subject to certain risks associated with the real estate industry in general. Such risks include, but are not limited to, declines in property values, increases in property taxes, operating expenses, interest rates or competition, zoning changes, and losses from casualty and condemnation.
Under the Trust’s organizational documents, its trustees, officers, employees and agents are indemnified, to the extent permitted by the Act, against certain liabilities that may arise out of performance of their duties to the Funds. Additionally, in the course of business, the Funds enter into contracts that contain a variety of indemnification clauses. The Funds’ maximum exposure under these arrangements is unknown, as this would involve future claims that may be made against the Funds that have not yet occurred. However, GSAM believes the risk of loss under these arrangements to be remote.
Subsequent events after the balance sheet date have been evaluated through the date the financial statements were issued. GSAM has concluded that there is no impact requiring adjustment or disclosure in the financial statements.
GOLDMAN SACHS SELECT SATELLITE FUNDS
Notes to Financial Statements (continued)
June 30, 2011 (Unaudited)
| |
| 12. SUMMARY OF SHARE TRANSACTIONS | |
Share activity is as follows:
| | | | | | | | | | | | | | | | | |
| | | Absolute Return Tracker Fund |
| | | |
| | | For the Six Months Ended
| | |
| | | June 30, 2011
| | For the Fiscal Year Ended
|
| | | (Unaudited) | | December 31, 2010 |
| | | |
| | | Shares | | Dollars | | Shares | | Dollars |
| | | |
Class A Shares | | | | | | | | | | | | | | | | |
| Shares sold | | | 26,858,817 | | | $ | 250,331,237 | | | | 52,864,296 | | | $ | 476,940,101 | |
| Reinvestment of distributions | | | — | | | | — | | | | 295,963 | | | | 2,716,950 | |
| Shares redeemed | | | (12,497,732 | ) | | | (116,301,835 | ) | | | (35,736,520 | ) | | | (319,060,684 | ) |
| |
| |
| | | | 14,361,085 | | | | 134,029,402 | | | | 17,423,739 | | | | 160,596,367 | |
| |
| |
Class C Shares | | | | | | | | | | | | | | | | |
| Shares sold | | | 1,301,104 | | | | 11,878,224 | | | | 5,549,503 | | | | 49,259,193 | |
| Reinvestment of distributions | | | — | | | | — | | | | 32,815 | | | | 295,666 | |
| Shares redeemed | | | (1,713,654 | ) | | | (15,631,707 | ) | | | (2,193,153 | ) | | | (19,460,275 | ) |
| |
| |
| | | | (412,550 | ) | | | (3,753,483 | ) | | | 3,389,165 | | | | 30,094,584 | |
| |
| |
Institutional Shares | | | | | | | | | | | | | | | | |
| Shares sold | | | 46,255,362 | | | | 435,175,812 | | | | 85,747,363 | | | | 775,746,946 | |
| Reinvestment of distributions | | | — | | | | — | | | | 284,312 | | | | 2,632,745 | |
| Shares redeemed | | | (18,757,985 | ) | | | (176,253,689 | ) | | | (35,431,488 | ) | | | (319,965,729 | ) |
| |
| |
| | | | 27,497,377 | | | | 258,922,123 | | | | 50,600,187 | | | | 458,413,962 | |
| |
| |
Class IR Shares | | | | | | | | | | | | | | | | |
| Shares sold | | | 225,668 | | | | 2,119,390 | | | | 601,049 | | | | 5,403,471 | |
| Reinvestment of distributions | | | — | | | | — | | | | 3,726 | | | | 34,395 | |
| Shares redeemed | | | (197,718 | ) | | | (1,850,589 | ) | | | (226,057 | ) | | | (2,062,534 | ) |
| |
| |
| | | | 27,950 | | | | 268,801 | | | | 378,718 | | | | 3,375,332 | |
| |
| |
Class R Shares | | | | | | | | | | | | | | | | |
| Shares sold | | | 12,198 | | | | 112,852 | | | | 125,081 | | | | 1,124,463 | |
| Reinvestment of distributions | | | — | | | | — | | | | 578 | | | | 5,280 | |
| Shares redeemed | | | (1,667 | ) | | | (15,510 | ) | | | (31,700 | ) | | | (282,384 | ) |
| |
| |
| | | | 10,531 | | | | 97,342 | | | | 93,959 | | | | 847,359 | |
| |
| |
NET INCREASE | | | 41,484,393 | | | $ | 389,564,185 | | | | 71,885,768 | | | $ | 653,327,604 | |
| |
| |
GOLDMAN SACHS SELECT SATELLITE FUNDS
| |
| 12. SUMMARY OF SHARE TRANSACTIONS (continued) | |
Share activity is as follows:
| | | | | | | | | | | | | | | | | |
| | | Commodity Strategy |
| | | |
| | | For the Six Months Ended
| | |
| | | June 30, 2011
| | For the Fiscal Year Ended
|
| | | (Unaudited) | | December 31, 2010 |
| | | |
| | | Shares | | Dollars | | Shares | | Dollars |
| | | |
Class A Shares | | | | | | | | | | | | | | | | |
| Shares sold | | | 13,420,370 | | | $ | 87,418,369 | | | | 15,741,385 | | | $ | 92,165,763 | |
| Reinvestment of distributions | | | 291,330 | | | | 1,931,575 | | | | 2,183,308 | | | | 12,954,494 | |
| Shares redeemed | | | (9,594,464 | ) | | | (63,062,626 | ) | | | (11,882,639 | ) | | | (68,725,299 | ) |
| |
| |
| | | | 4,117,236 | | | | 26,287,318 | | | | 6,042,054 | | | | 36,394,958 | |
| |
| |
Class C Shares | | | | | | | | | | | | | | | | |
| Shares sold | | | 1,346,818 | | | | 8,665,460 | | | | 1,193,935 | | | | 7,056,588 | |
| Reinvestment of distributions | | | 17,292 | | | | 113,963 | | | | 122,711 | | | | 719,091 | |
| Shares redeemed | | | (427,039 | ) | | | (2,713,779 | ) | | | (315,291 | ) | | | (1,791,668 | ) |
| |
| |
| | | | 937,071 | | | | 6,065,644 | | | | 1,001,355 | | | | 5,984,011 | |
| |
| |
Institutional Shares | | | | | | | | | | | | | | | | |
| Shares sold | | | 38,986,802 | | | | 253,354,028 | | | | 49,020,104 | | | | 284,116,756 | |
| Reinvestment of distributions | | | 1,314,610 | | | | 8,715,863 | | | | 9,215,907 | | | | 54,716,366 | |
| Shares redeemed | | | (29,639,902 | ) | | | (194,994,324 | ) | | | (28,755,682 | ) | | | (167,573,577 | ) |
| |
| |
| | | | 10,661,510 | | | | 67,075,567 | | | | 29,480,329 | | | | 171,259,545 | |
| |
| |
Class IR Shares | | | | | | | | | | | | | | | | |
| Shares sold | | | 4,818,629 | | | | 31,705,152 | | | | 1,152,211 | | | | 6,758,447 | |
| Reinvestment of distributions | | | 51,792 | | | | 343,897 | | | | 96,274 | | | | 573,610 | |
| Shares redeemed | | | (1,071,311 | ) | | | (7,058,201 | ) | | | (109,154 | ) | | | (647,896 | ) |
| |
| |
| | | | 3,799,110 | | | | 24,990,848 | | | | 1,139,331 | | | | 6,684,161 | |
| |
| |
Class R Shares | | | | | | | | | | | | | | | | |
| Shares sold | | | 64,979 | | | | 416,104 | | | | 70,220 | | | | 415,854 | |
| Reinvestment of distributions | | | 1,266 | | | | 8,345 | | | | 6,700 | | | | 39,635 | |
| Shares redeemed | | | (7,458 | ) | | | (46,891 | ) | | | (18,034 | ) | | | (110,067 | ) |
| |
| |
| | | | 58,787 | | | | 377,558 | | | | 58,886 | | | | 345,422 | |
| |
| |
NET INCREASE | | | 19,573,714 | | | $ | 124,796,935 | | | | 37,721,955 | | | $ | 220,668,097 | |
| |
| |
GOLDMAN SACHS SELECT SATELLITE FUNDS
Notes to Financial Statements (continued)
June 30, 2011 (Unaudited)
| |
| 12. SUMMARY OF SHARE TRANSACTIONS (continued) | |
Share activity is as follows:
| | | | | | | | | | | | | | | | | |
| | | Dynamic Allocation |
| | | |
| | | For the Six Months Ended
| | |
| | | June 30, 2011
| | For the Fiscal Year Ended
|
| | | (Unaudited) | | December 31, 2010(a) |
| | | |
| | | Shares | | Dollars | | Shares | | Dollars |
| | | |
Class A Shares | | | | | | | | | | | | | | | | |
| Shares sold | | | 7,293,948 | | | $ | 78,690,773 | | | | 4,352,154 | | | $ | 45,166,472 | |
| Reinvestment of distributions | | | — | | | | — | | | | 62,849 | | | | 652,372 | |
| Shares redeemed | | | (1,226,486 | ) | | | (13,174,683 | ) | | | (314,275 | ) | | | (3,287,992 | ) |
| |
| |
| | | | 6,067,462 | | | | 65,516,090 | | | | 4,100,728 | | | | 42,530,852 | |
| |
| |
Class C Shares | | | | | | | | | | | | | | | | |
| Shares sold | | | 1,763,041 | | | | 18,889,014 | | | | 822,961 | | | | 8,534,573 | |
| Reinvestment of distributions | | | — | | | | — | | | | 12,247 | | | | 126,268 | |
| Shares redeemed | | | (114,905 | ) | | | (1,217,465 | ) | | | (16,766 | ) | | | (176,384 | ) |
| |
| |
| | | | 1,648,136 | | | | 17,671,549 | | | | 818,442 | | | | 8,484,457 | |
| |
| |
Institutional Shares | | | | | | | | | | | | | | | | |
| Shares sold | | | 7,470,929 | | | | 80,690,286 | | | | 10,333,683 | | | | 104,381,437 | |
| Reinvestment of distributions | | | — | | | | — | | | | 38,577 | | | | 401,978 | |
| Shares redeemed | | | (1,423,133 | ) | | | (15,389,745 | ) | | | (2,349,827 | ) | | | (23,821,413 | ) |
| |
| |
| | | | 6,047,796 | | | | 65,300,541 | | | | 8,022,433 | | | | 80,962,002 | |
| |
| |
Class IR Shares | | | | | | | | | | | | | | | | |
| Shares sold | | | 962,562 | | | | 10,339,406 | | | | 4,041,433 | | | | 41,754,942 | |
| Reinvestment of distributions | | | — | | | | — | | | | 38,719 | | | | 402,682 | |
| Shares redeemed | | | (624,729 | ) | | | (6,726,492 | ) | | | (1,858,946 | ) | | | (19,730,958 | ) |
| |
| |
| | | | 337,833 | | | | 3,612,914 | | | | 2,221,206 | | | | 22,426,666 | |
| |
| |
Class R Shares | | | | | | | | | | | | | | | | |
| Shares sold | | | — | | | | — | | | | 1,003 | | | | 10,027 | |
| Reinvestment of distributions | | | — | | | | — | | | | 18 | | | | 187 | |
| Shares redeemed | | | — | | | | — | | | | (3 | ) | | | (27 | ) |
| |
| |
| | | | — | | | | — | | | | 1,018 | | | | 10,187 | |
| |
| |
NET INCREASE | | | 14,101,227 | | | $ | 152,101,094 | | | | 15,163,827 | | | $ | 154,414,164 | |
| |
| |
| | |
| (a) | | Commenced operations on January 5, 2010. |
GOLDMAN SACHS SELECT SATELLITE FUNDS
| |
| 12. SUMMARY OF SHARE TRANSACTIONS (continued) | |
Share activity is as follows:
| | | | | | | | | | | | | | | | | |
| | | International Real Estate Securities Fund |
| | | |
| | | For the Six Months Ended
| | |
| | | June 30, 2011
| | For the Fiscal Year Ended
|
| | | (Unaudited) | | December 31, 2010 |
| | | |
| | | Shares | | Dollars | | Shares | | Dollars |
| | | |
Class A Shares | | | | | | | | | | | | | | | | |
| Shares sold | | | 2,791,201 | | | $ | 17,860,373 | | | | 6,914,976 | | | $ | 41,237,811 | |
| Reinvestment of distributions | | | 249,538 | | | | 1,569,594 | | | | 1,314,021 | | | | 7,805,029 | |
| Shares redeemed | | | (5,624,938 | ) | | | (36,344,471 | ) | | | (7,304,642 | ) | | | (43,424,425 | ) |
| |
| |
| | | | (2,584,199 | ) | | | (16,914,504 | ) | | | 924,355 | | | | 5,618,415 | |
| |
| |
Class C Shares | | | | | | | | | | | | | | | | |
| Shares sold | | | 23,930 | | | | 152,908 | | | | 63,289 | | | | 394,975 | |
| Reinvestment of distributions | | | 3,210 | | | | 20,223 | | | | 22,756 | | | | 135,200 | |
| Shares redeemed | | | (95,133 | ) | | | (610,955 | ) | | | (318,136 | ) | | | (1,855,602 | ) |
| |
| |
| | | | (67,993 | ) | | | (437,824 | ) | | | (232,091 | ) | | | (1,325,427 | ) |
| |
| |
Institutional Shares | | | | | | | | | | | | | | | | |
| Shares sold | | | 5,504,924 | | | | 34,597,085 | | | | 11,503,997 | | | | 67,725,173 | |
| Reinvestment of distributions | | | 543,388 | | | | 3,352,701 | | | | 2,455,284 | | | | 14,309,572 | |
| Shares redeemed | | | (5,086,274 | ) | | | (31,945,611 | ) | | | (10,564,767 | ) | | | (59,560,289 | ) |
| |
| |
| | | | 962,038 | | | | 6,004,175 | | | | 3,394,514 | | | | 22,474,456 | |
| |
| |
Class IR Shares | | | | | | | | | | | | | | | | |
| Shares sold | | | — | | | | — | | | | 485 | | | | 3,084 | |
| Reinvestment of distributions | | | 23 | | | | 144 | | | | 94 | | | | 559 | |
| Shares Redeemed | | | (3 | ) | | | (18 | ) | | | (4 | ) | | | (19 | ) |
| |
| |
| | | | 20 | | | | 126 | | | | 575 | | | | 3,624 | |
| |
| |
NET INCREASE (DECREASE) | | | (1,690,134 | ) | | $ | (11,348,027 | ) | | | 4,087,353 | | | $ | 26,771,068 | |
| |
| |
GOLDMAN SACHS SELECT SATELLITE FUNDS
Notes to Financial Statements (continued)
June 30, 2011 (Unaudited)
��
| |
| 12. SUMMARY OF SHARE TRANSACTIONS (continued) | |
Share activity is as follows:
| | | | | | | | | | | | | | | | | |
| | | Real Estate Securities Fund |
| | | |
| | | For the Six Months Ended
| | |
| | | June 30, 2011
| | For the Fiscal Year Ended
|
| | | (Unaudited) | | December 31, 2010 |
| | | |
| | | Shares | | Dollars | | Shares | | Dollars |
| | | |
Class A Shares | | | | | | | | | | | | | | | | |
| Shares sold | | | 1,801,169 | | | $ | 23,656,933 | | | | 4,491,957 | | | $ | 49,595,556 | |
Shares converted from Class B(a) | | | 4,223 | | | | 54,362 | | | | 19,552 | | | | 227,254 | |
| Reinvestment of distributions | | | 124,249 | | | | 1,652,138 | | | | 221,315 | | | | 2,423,679 | |
| Shares redeemed | | | (2,006,045 | ) | | | (26,401,073 | ) | | | (5,676,231 | ) | | | (63,413,349 | ) |
| |
| |
| | | | (76,404 | ) | | | (1,037,640 | ) | | | (943,407 | ) | | | (11,166,860 | ) |
| |
| |
Class B Shares | | | | | | | | | | | | | | | | |
| Shares sold | | | 12,044 | | | | 154,666 | | | | 14,012 | | | | 152,979 | |
Shares converted to Class A(a) | | | (4,239 | ) | | | (54,362 | ) | | | (19,589 | ) | | | (227,254 | ) |
| Reinvestment of distributions | | | 1,120 | | | | 14,826 | | | | 3,661 | | | | 39,947 | |
| Shares redeemed | | | (48,885 | ) | | | (638,114 | ) | | | (169,888 | ) | | | (1,913,948 | ) |
| |
| |
| | | | (39,960 | ) | | | (522,984 | ) | | | (171,804 | ) | | | (1,948,276 | ) |
| |
| |
Class C Shares | | | | | | | | | | | | | | | | |
| Shares sold | | | 82,975 | | | | 1,073,500 | | | | 269,933 | | | | 2,994,130 | |
| Reinvestment of distributions | | | 4,417 | | | | 57,617 | | | | 8,332 | | | | 89,962 | |
| Shares redeemed | | | (109,368 | ) | | | (1,419,529 | ) | | | (221,034 | ) | | | (2,395,174 | ) |
| |
| |
| | | | (21,976 | ) | | | (288,412 | ) | | | 57,231 | | | | 688,918 | |
| |
| |
Institutional Shares | | | | | | | | | | | | | | | | |
| Shares sold | | | 4,310,016 | | | | 57,574,568 | | | | 12,500,689 | | | | 136,785,846 | |
| Reinvestment of distributions | | | 340,496 | | | | 4,586,360 | | | | 733,405 | | | | 8,120,900 | |
| Shares redeemed | | | (2,449,020 | ) | | | (33,018,174 | ) | | | (18,899,686 | ) | | | (216,559,887 | ) |
| |
| |
| | | | 2,201,492 | | | | 29,142,754 | | | | (5,665,592 | ) | | | (71,653,141 | ) |
| |
| |
Service Shares | | | | | | | | | | | | | | | | |
| Shares sold | | | 80,683 | | | | 1,061,156 | | | | 459,681 | | | | 5,071,947 | |
| Reinvestment of distributions | | | 1,327 | | | | 17,753 | | | | 2,972 | | | | 32,709 | |
| Shares redeemed | | | (109,623 | ) | | | (1,462,518 | ) | | | (592,863 | ) | | | (6,530,942 | ) |
| |
| |
| | | | (27,613 | ) | | | (383,609 | ) | | | (130,210 | ) | | | (1,426,286 | ) |
| |
| |
Class IR Shares | | | | | | | | | | | | | | | | |
| Shares sold | | | 7,789 | | | | 104,303 | | | | 6,993 | | | | 79,048 | |
| Reinvestment of distributions | | | 132 | | | | 1,764 | | | | 51 | | | | 580 | |
| Shares redeemed | | | — | | | | — | | | | (540 | ) | | | (6,041 | ) |
| |
| |
| | | | 7,921 | | | | 106,067 | | | | 6,504 | | | | 73,587 | |
| |
| |
GOLDMAN SACHS SELECT SATELLITE FUNDS
| |
| 12. SUMMARY OF SHARE TRANSACTIONS (continued) | |
| | | | | | | | | | | | | | | | | |
| | | Real Estate Securities Fund |
| | | |
| | | For the Six Months Ended
| | |
| | | June 30, 2011
| | For the Fiscal Year Ended
|
| | | (Unaudited) | | December 31, 2010 |
| | | |
| | | Shares | | Dollars | | Shares | | Dollars |
| | | |
Class R Shares | | | | | | | | | | | | | | | | |
| Shares sold | | | 11,764 | | | | 153,369 | | | | 11,014 | | | | 124,103 | |
| Reinvestment of distributions | | | 213 | | | | 2,832 | | | | 242 | | | | 2,659 | |
| Shares redeemed | | | (4,797 | ) | | | (62,483 | ) | | | (3,849 | ) | | | (42,322 | ) |
| |
| |
| | | | 7,180 | | | | 93,718 | | | | 7,407 | | | | 84,440 | |
| |
| |
NET INCREASE (DECREASE) | | | 2,050,640 | | | $ | 27,109,894 | | | | (6,839,871 | ) | | $ | (85,347,618 | ) |
| |
| |
| | |
| (a) | | Class B Shares automatically convert into Class A Shares on or about the fifteenth day of the last month of the calendar quarter that is eight years after the initial purchase date of either the Fund or another Goldman Sachs Fund. |
GOLDMAN SACHS SELECT SATELLITE FUNDS
Fund Expenses — Six Month Period Ended June 30, 2011 (Unaudited)
As a shareholder of Class A, Class B, Class C, Institutional, Service, Class IR or Class R Shares of a Fund you incur two types of costs: (1) transaction costs, including sales charges on purchase payments (with respect to Class A Shares), and contingent deferred sales charges on redemptions (with respect to Class B and Class C Shares): and (2) ongoing costs, including management fees; distribution and service (12b-1) fees (with respect to Class A, Class B, Class C and Class R Shares); and other Fund expenses. This example is intended to help you understand your ongoing costs (in dollars) of investing in Class A, Class B, Class C, Institutional, Service, Class IR and Class R Shares of the Funds and to compare these costs with the ongoing costs of investing in other mutual funds.
The example is based on an investment of $1,000 invested at the beginning of the period and held for the entire period from January 1, 2011 through June 30, 2011.
Actual Expenses — The first line under each share class in the table below provides information about actual account values and actual expenses. You may use the information in this line, together with the amount you invested, to estimate the expenses that you paid over the period. Simply divide your account value by $1,000 (for example, an $8,600 account value divided by $1,000=8.6), then multiply the result by the number in the first line under the heading entitled “Expenses Paid” to estimate the expenses you paid on your account during this period.
Hypothetical Example for Comparison Purposes — The second line under each share class in the table below provides information about hypothetical account values and hypothetical expenses based on the Funds’ actual net expense ratio and an assumed rate of return of 5% per year before expenses, which is not the Funds’ actual return. The hypothetical account values and expenses may not be used to estimate the actual ending account balance or expenses you paid for the period. You may use this information to compare the ongoing costs of investing in the Funds and other funds. To do so, compare this 5% hypothetical example with the 5% hypothetical examples that appear in the shareholder reports of the other funds.
Please note that the expenses shown in the table are meant to highlight your ongoing costs only and do not reflect any transactional costs, such as sales charges, redemption fees, or exchange fees. Therefore, the second line of the table is useful in comparing ongoing costs only, and will not help you determine the relative total costs of owning different funds. In addition, if these transactional costs were included, your costs would have been higher.
| | | | | | | | | | | | | | | | | | | | | | | | | | | | | | | | | | | | | | | | | | | | | | |
| | | | Absolute Return Tracker Fund | | | Commodity Strategy Fund | | | Dynamic Allocation Fund |
| | | | Beginning
| | | Ending
| | | Expenses
| | | Beginning
| | | Ending
| | | Expenses
| | | Beginning
| | | Ending
| | | Expenses
|
| | | | Account
| | | Account
| | | Paid for the
| | | Account
| | | Account
| | | Paid for the
| | | Account
| | | Account
| | | Paid for the
|
| | | | Value
| | | Value
| | | 6 Months Ended
| | | Value
| | | Value
| | | 6 Months Ended
| | | Value
| | | Value
| | | 6 Months Ended
|
| Share Class | | | 1/01/11 | | | 6/30/11 | | | 6/30/11* | | | 1/01/11 | | | 6/30/11 | | | 6/30/11* | | | 1/01/11 | | | 6/30/11 | | | 6/30/11* |
Class A | | | | | | | | | | | | | | | | | | | | | | | | | | | | | | | | | | | | | | | | | | | | | |
| Actual | | | $ | 1,000 | | | | $ | 1,004.30 | | | | $ | 7.75 | | | | $ | 1,000 | | | | $ | 1,053.70 | | | | $ | 5.65 | | | | $ | 1,000 | | | | $ | 1,027.50 | | | | $ | 6.99 | |
| Hypothetical 5% return | | | | 1,000 | | | | | 1,017.06 | + | | | | 7.80 | | | | | 1,000 | | | | | 1,019.29 | + | | | | 5.56 | | | | | 1,000 | | | | | 1,017.90 | + | | | | 6.95 | |
| | | | | | | | | | | | | | | | | | | | | | | | | | | | | | | | | | | | | | | | | | | | | | |
Class C | | | | | | | | | | | | | | | | | | | | | | | | | | | | | | | | | | | | | | | | | | | | | |
| Actual | | | | 1,000 | | | | | 1,000.00 | | | | | 11.46 | | | | | 1,000 | | | | | 1,049.40 | | | | | 11.89 | | | | | 1,000 | | | | | 1,022.90 | | | | | 10.73 | |
| Hypothetical 5% return | | | | 1,000 | | | | | 1,013.34 | + | | | | 11.53 | | | | | 1,000 | | | | | 1,013.19 | + | | | | 11.68 | | | | | 1,000 | | | | | 1,014.18 | + | | | | 10.69 | |
| | | | | | | | | | | | | | | | | | | | | | | | | | | | | | | | | | | | | | | | | | | | | | |
Institutional | | | | | | | | | | | | | | | | | | | | | | | | | | | | | | | | | | | | | | | | | | | | | |
| Actual | | | | 1,000 | | | | | 1,005.40 | | | | | 5.77 | | | | | 1,000 | | | | | 1,054.40 | | | | | 3.46 | | | | | 1,000 | | | | | 1,029.30 | | | | | 4.98 | |
| Hypothetical 5% return | | | | 1,000 | | | | | 1,019.04 | + | | | | 5.81 | | | | | 1,000 | | | | | 1,021.42 | + | | | | 3.41 | | | | | 1,000 | | | | | 1,019.89 | + | | | | 4.96 | |
| | | | | | | | | | | | | | | | | | | | | | | | | | | | | | | | | | | | | | | | | | | | | | |
Class IR | | | | | | | | | | | | | | | | | | | | | | | | | | | | | | | | | | | | | | | | | | | | | |
| Actual | | | | 1,000 | | | | | 1,004.30 | | | | | 6.51 | | | | | 1,000 | | | | | 1,054.20 | | | | | 11.87 | | | | | 1,000 | | | | | 1,028.40 | | | | | 5.73 | |
| Hypothetical 5% return | | | | 1,000 | | | | | 1,018.30 | + | | | | 6.56 | | | | | 1,000 | | | | | 1,013.24 | + | | | | 11.63 | | | | | 1,000 | | | | | 1,019.14 | + | | | | 5.71 | |
| | | | | | | | | | | | | | | | | | | | | | | | | | | | | | | | | | | | | | | | | | | | | | |
Class R | | | | | | | | | | | | | | | | | | | | | | | | | | | | | | | | | | | | | | | | | | | | | |
| Actual | | | | 1,000 | | | | | 1,002.20 | | | | | 8.99 | | | | | 1,000 | | | | | 1,051.80 | | | | | 9.26 | | | | | 1,000 | | | | | 1,025.70 | | | | | 8.24 | |
| Hypothetical 5% return | | | | 1,000 | | | | | 1,015.82 | + | | | | 9.05 | | | | | 1,000 | | | | | 1,015.77 | + | | | | 9.10 | | | | | 1,000 | | | | | 1,016.66 | + | | | | 8.20 | |
| | | | | | | | | | | | | | | | | | | | | | | | | | | | | | | | | | | | | | | | | | | | | | |
82
GOLDMAN SACHS SELECT SATELLITE FUNDS
Fund Expenses — Six Month Period Ended June 30, 2011 (Unaudited) (continued)
| | | | | | | | | | | | | | | | | | | | | | | | | | | | | | | |
| | | | International Real Estate Securities Fund | | | Real Estate Securities Fund |
| | | | Beginning
| | | Ending
| | | Expenses
| | | Beginning
| | | Ending
| | | Expenses
|
| | | | Account
| | | Account
| | | Paid for the
| | | Account
| | | Account
| | | Paid for the
|
| | | | Value
| | | Value
| | | 6 Months Ended
| | | Value
| | | Value
| | | 6 Months Ended
|
| Share Class | | | 1/01/11 | | | 6/30/11 | | | 6/30/11* | | | 1/01/11 | | | 6/30/11 | | | 6/30/11* |
Class A | | | | | | | | | | | | | | | | | | | | | | | | | | | | | | |
| Actual | | | $ | 1,000 | | | | $ | 1,021.00 | | | | $ | 7.67 | | | | $ | 1,000 | | | | $ | 1,102.20 | | | | $ | 7.51 | |
| Hypothetical 5% return | | | | 1,000 | | | | | 1,017.21 | + | | | | 7.65 | | | | | 1,000 | | | | | 1,017.65 | + | | | | 7.20 | |
| | | | | | | | | | | | | | | | | | | | | | | | | | | | | | | |
Class B | | | | | | | | | | | | | | | | | | | | | | | | | | | | | | |
| Actual | | | | N/A | | | | | N/A | | | | | N/A | | | | | 1,000 | | | | | 1,098.00 | | | | | 11.39 | |
| Hypothetical 5% return | | | | N/A | | | | | N/A | | | | | N/A | | | | | 1,000 | | | | | 1,013.93 | + | | | | 10.94 | |
| | | | | | | | | | | | | | | | | | | | | | | | | | | | | | | |
Class C | | | | | | | | | | | | | | | | | | | | | | | | | | | | | | |
| Actual | | | | 1,000 | | | | | 1,015.50 | | | | | 11.39 | | | | | 1,000 | | | | | 1,098.30 | | | | | 11.39 | |
| Hypothetical 5% return | | | | 1,000 | | | | | 1,013.49 | + | | | | 11.38 | | | | | 1,000 | | | | | 1,013.93 | + | | | | 10.94 | |
| | | | | | | | | | | | | | | | | | | | | | | | | | | | | | | |
Institutional | | | | | | | | | | | | | | | | | | | | | | | | | | | | | | |
| Actual | | | | 1,000 | | | | | 1,023.70 | | | | | 5.67 | | | | | 1,000 | | | | | 1,105.50 | | | | | 5.43 | |
| Hypothetical 5% return | | | | 1,000 | | | | | 1,019.19 | + | | | | 5.66 | | | | | 1,000 | | | | | 1,019.64 | + | | | | 5.21 | |
| | | | | | | | | | | | | | | | | | | | | | | | | | | | | | | |
Service | | | | | | | | | | | | | | | | | | | | | | | | | | | | | | |
| Actual | | | | N/A | | | | | N/A | | | | | N/A | | | | | 1,000 | | | | | 1,101.70 | | | | | 8.03 | |
| Hypothetical 5% return | | | | N/A | | | | | N/A | | | | | N/A | | | | | 1,000 | | | | | 1,017.16 | + | | | | 7.70 | |
| | | | | | | | | | | | | | | | | | | | | | | | | | | | | | | |
Class IR | | | | | | | | | | | | | | | | | | | | | | | | | | | | | | |
| Actual | | | | 1,000 | | | | | 1,022.60 | | | | | 6.42 | | | | | 1,000 | | | | | 1,103.40 | | | | | 6.21 | |
| Hypothetical 5% return | | | | 1,000 | | | | | 1,018.45 | + | | | | 6.41 | | | | | 1,000 | | | | | 1,018.89 | + | | | | 5.96 | |
| | | | | | | | | | | | | | | | | | | | | | | | | | | | | | | |
Class R | | | | | | | | | | | | | | | | | | | | | | | | | | | | | | |
| Actual | | | | N/A | | | | | N/A | | | | | N/A | | | | | 1,000 | | | | | 1,101.30 | | | | | 8.81 | |
| Hypothetical 5% return | | | | N/A | | | | | N/A | | | | | N/A | | | | | 1,000 | | | | | 1,016.41 | + | | | | 8.45 | |
| | | | | | | | | | | | | | | | | | | | | | | | | | | | | | | |
| | |
| * | | Expenses are calculated using each Fund’s annualized net expense ratio for each class, which represents the ongoing expenses as a percentage of net assets for the six months ended June 30, 2011. Expenses are calculated by multiplying the annualized net expense ratio by the average account value for the period; then multiplying the result by the number of days in the most recent fiscal half year; and then dividing that result by the number of days in the fiscal year. The annualized net expense ratios for the period were as follows: |
| | | | | | | | | | | | | | | | | | | | | | | | | | | | | |
| Fund | | Class A | | Class B | | Class C | | Institutional | | Service | | Class IR | | Class R |
| |
| |
| Absolute Return Tracker | | | 1.56 | % | | | N/A | | | | 2.31 | % | | | 1.16 | % | | | N/A | | | | 1.31 | % | | | 1.81 | % |
| Commodity Strategy | | | 0.92 | | | | N/A | | | | 1.67 | | | | 0.58 | | | | N/A | | | | 0.67 | | | | 1.17 | |
| Dynamic Allocation | | | 1.39 | | | | N/A | | | | 2.14 | | | | 0.99 | | | | N/A | | | | 1.14 | | | | 1.64 | |
| International Real Estate Securities | | | 1.53 | | | | N/A | | | | 2.28 | | | | 1.13 | | | | N/A | | | | 1.28 | | | | N/A | |
| Real Estate Securities | | | 1.44 | | | | 2.19 | % | | | 2.19 | | | | 1.04 | | | | 1.54 | % | | | 1.19 | | | | 1.69 | |
| |
| |
| | |
| + | | Hypothetical expenses are based on each Fund’s actual annualized net expense ratios and an assumed rate of return of 5% per year before expenses. |
83
GOLDMAN SACHS SELECT SATELLITE FUNDS
Statement Regarding Basis for Approval of Management Agreement (Unaudited)
Background
The Goldman Sachs Absolute Return Tracker, Goldman Sachs Commodity Strategy, Goldman Sachs Dynamic Allocation, Goldman Sachs International Real Estate Securities and Goldman Sachs Real Estate Securities Funds (the “Funds”) are investment portfolios of Goldman Sachs Trust (the “Trust”). The Board of Trustees oversees the management of the Trust and reviews the investment performance and expenses of the Funds at regularly scheduled meetings held during the year. In addition, the Board of Trustees determines annually whether to approve the continuance of the Trust’s investment management agreement (the “Management Agreement”) with Goldman Sachs Asset Management, L.P. (the “Investment Adviser”) on behalf of the Funds.
The Management Agreement was most recently approved for continuation until June 30, 2012 by the Board of Trustees, including those Trustees who are not parties to the Management Agreement or “interested persons” (as defined in the Investment Company Act of 1940, as amended) of any party thereto (the “Independent Trustees”), at a meeting held on June 15-16, 2011 (the “Annual Meeting”).
The review process undertaken by the Trustees spans the course of the year and culminates with the Annual Meeting. To assist the Trustees in their deliberations, the Trustees have established a Contract Review Committee (the “Committee”), comprised of the Independent Trustees. The Committee held three meetings over the course of the year since the Management Agreement was last approved. At those Committee meetings, regularly scheduled Board meetings and/or the Annual Meeting, the Board, or the Independent Trustees, as applicable, considered matters relating to the Management Agreement, including:
| | |
| | (a) | the nature and quality of the advisory, administrative and other services provided to the Funds by the Investment Adviser and its affiliates, including information about: |
| | |
| | (i) | the structure, staff and capabilities of the Investment Adviser and its portfolio management teams; |
| | (ii) | the groups within the Investment Adviser and its affiliates that support the portfolio management teams or provide other types of necessary services, including fund services groups (e.g., accounting and financial reporting, tax, shareholder services and operations), controls and risk management groups (e.g., legal, compliance, valuation oversight, credit risk management, internal audit, market risk analysis, finance and strategy and central funding), sales and distribution support groups and others (e.g., information technology and training); |
| | (iii) | trends in headcount; |
| | (iv) | the Investment Adviser’s financial resources and ability to hire and retain talented personnel and strengthen its operations; and |
| | (v) | the parent company’s support of the Investment Adviser and its mutual fund business, as expressed by the firm’s senior management; |
| | |
| | (b) | information on the investment performance of the Funds, including comparisons to the performance of similar mutual funds (except for Dynamic Allocation Fund, which commenced operations in 2010), as provided by a third party mutual fund data provider engaged as part of the contract review process (the “Outside Data Provider”), benchmark performance indices, comparable institutional composites managed by the Investment Adviser (in the case of Commodity Strategy Fund), and general investment outlooks in the markets in which the Funds invest; |
| | (c) | the terms of the Management Agreement and agreements with affiliated service providers entered into by the Trust on behalf of the Funds; |
| | (d) | expense information for the Funds, including: |
| | |
| | (i) | the relative management fee and expense levels of the Funds as compared to those of comparable funds managed by other advisers, as provided by the Outside Data Provider; |
| | (ii) | each Fund’s expense trends over time; and |
| | (iii) | to the extent the Investment Adviser manages institutional accounts or collective investment vehicles having investment objectives and policies similar to those of the Funds, comparative information on the advisory fees charged and services provided to those accounts by the Investment Adviser; |
| | |
| | (e) | with respect to the extensive investment performance and expense comparison data provided by the Outside Data Provider, its processes in producing that data for the Funds; |
| | (f) | the undertakings of the Investment Adviser to waive certain fees of International Real Estate Securities Fund and reimburse certain expenses of the Funds that exceed specified levels, and a summary of contractual fee reductions made by the Investment Adviser and its affiliates over the past several years with respect to the Funds; |
| | (g) | information relating to the profitability of the Management Agreement and the transfer agency and distribution and service arrangements of each of the Funds and the Trust as a whole to the Investment Adviser and its affiliates; |
| | (h) | whether each Fund’s existing management fee schedule adequately addressed any economies of scale; |
GOLDMAN SACHS SELECT SATELLITE FUNDS
Statement Regarding Basis for Approval of Management Agreement (Unaudited) (continued)
| | |
| | (i) | a summary of the “fall-out” benefits derived by the Investment Adviser and its affiliates from their relationships with the Funds, including the fees received by the Investment Adviser’s affiliates from the Funds for transfer agency, portfolio brokerage, distribution and other services; |
| | (j) | a summary of potential benefits derived by the Funds as a result of their relationship with the Investment Adviser; |
| | (k) | information regarding commissions paid by the Funds, an update on the Investment Adviser’s soft dollars practices, other information regarding portfolio trading and how the Investment Adviser carries out its duty to seek best execution; |
| | (l) | portfolio manager ownership of Fund shares; the manner in which portfolio manager compensation is determined; and the number and types of accounts managed by the portfolio managers; |
| | (m) | the nature and quality of the services provided to the Funds by their unaffiliated service providers, and the Investment Adviser’s general oversight and evaluation (including reports on due diligence) of those service providers as part of the administration services provided under the Management Agreement; and |
| | (n) | the Investment Adviser’s processes and policies addressing various types of potential conflicts of interest; its approach to risk management; the annual review of the effectiveness of the Funds’ compliance program; and compliance reports. |
The Trustees also received an overview of the Funds’ distribution arrangements. They received information regarding the Funds’ assets, share purchase and redemption activity and the payment of Rule 12b-1 distribution and service fees by the Funds and the payment of non-Rule 12b-1 shareholder service and/or administration fees by the Real Estate Securities Fund’s Service Shares. Information was also provided to the Trustees relating to revenue sharing payments made by and services provided by the Investment Adviser and its affiliates to intermediaries that promote the sale, distribution and/or servicing of Fund shares.
The presentations made at the Board and Committee meetings and at the Annual Meeting encompassed the Funds and other mutual fund portfolios for which the Board of Trustees has responsibility. In evaluating the Management Agreement at the Annual Meeting, the Trustees relied upon their knowledge, resulting from their meetings and other interactions throughout the year, of the Investment Adviser, its affiliates, their services and the Funds. In conjunction with these meetings, the Trustees received written materials and oral presentations on the topics covered, and were advised by their independent legal counsel regarding their responsibilities and other regulatory requirements related to the approval and continuation of mutual fund investment management agreements under applicable law. In addition, the Investment Adviser and its affiliates provided the Independent Trustees with a written response to a formal request for information sent on behalf of the Independent Trustees by their independent legal counsel. During the course of their deliberations, the Independent Trustees met in executive sessions with their independent legal counsel, without representatives of the Investment Adviser or its affiliates present. The Independent Trustees also discussed the broad range of other investment choices that are available to Fund investors, including the availability of comparable funds managed by other advisers.
Nature, Extent and Quality of the Services Provided Under the Management Agreement
As part of their review, the Trustees considered the nature, extent and quality of the services provided by the Investment Adviser. In this regard, the Trustees considered both the investment advisory services, and the other, non-advisory services, that are provided to the Funds by the Investment Adviser and its affiliates. The Trustees noted the transition in the leadership and changes in personnel of various portfolio management teams that had occurred in recent periods, the potential benefit to the Funds of recent increases in headcount at the Investment Adviser and the ongoing recruitment efforts aimed at bringing high quality investment talent to the Investment Adviser. The Independent Trustees concluded that the Investment Adviser had committed substantial financial and operational resources to the Funds and expressed confidence that the Investment Adviser would continue to do so in the future. The Trustees also observed that the Investment Adviser had made significant commitments to address regulatory compliance requirements applicable to the Funds and the Investment Adviser.
Investment Performance
The Trustees also considered the investment performance of the Funds and the Investment Adviser. In this regard, they compared the investment performance of each Fund (with the exception of Dynamic Allocation Fund, which commenced operations in 2010) to the performance of other comparable SEC-registered funds and to rankings and ratings compiled by the Outside Data Provider as of December 31, 2010, and updated performance information for each Fund prepared by the Investment Adviser using the peer groups identified by the Outside Data provider. The information on each Fund’s investment performance was provided for the one-, three-, five- and ten-year periods ending on the applicable dates, to the extent that each Fund had been in existence for those periods. The Trustees also reviewed each Fund’s investment performance over time on a year-by-year basis relative to its performance benchmark. In addition, they considered the investment performance trends of the Funds over time, and reviewed the investment performance of each Fund in light of its investment objective and policies, and market conditions. The Trustees also received information comparing the Commodity Strategy Fund’s performance to that of a comparable institutional
GOLDMAN SACHS SELECT SATELLITE FUNDS
Statement Regarding Basis for Approval of Management Agreement (Unaudited) (continued)
composite managed by the Investment Adviser. The Trustees considered whether each Fund had operated within its investment policies and had complied with its investment limitations.
In addition, the Trustees considered materials prepared and presentations made by the Investment Adviser’s senior management and portfolio management personnel, in which Fund performance was assessed. The Trustees also considered the Investment Adviser’s periodic reports with respect to the Funds’ risk profiles, and how the Investment Adviser’s approach to risk monitoring and management influences portfolio management.
The Independent Trustees noted that for the one-year period ended May 31, 2011, the Commodity Strategy Fund had placed in the top half of its peer group and had outperformed its benchmark index. They also noted that during the same period, the Real Estate Securities and International Real Estate Securities Funds had shown improvement by placing in the top half of their respective peer groups, although each had underperformed its benchmark index for the same period. They noted the Absolute Return Tracker Fund had ranked in the third quartile of its peer group but had generated a positive return. The Independent Trustees noted that the Dynamic Allocation Fund had ranked in the fourth quartile of its peer group, but observed that the Fund was relatively new, having launched in 2010, and had shown improving performance relative to its peer group over the recent three month period.
Costs of Services Provided and Competitive Information
The Trustees considered the contractual fee rates payable by each Fund under the Management Agreement. In this regard, the Trustees considered information on the services rendered by the Investment Adviser to the Funds, which included both advisory and administrative services that were directed to the needs and operations of the Funds as registered mutual funds.
In particular, the Trustees reviewed analyses prepared by the Outside Data Provider regarding the expense rankings of the Funds. The analyses provided a comparison of the Funds’ management fees and breakpoints to those of relevant peer groups and category universes; an expense analysis which compared each Fund’s expenses to a peer group and a category universe; and a five-year history (or, in the case of Funds that commenced investment operations within a shorter period, since the year in which it commenced operations), comparing each Fund’s expenses to the peer and category medians. The analyses also compared each Fund’s transfer agency fees, custody and accounting fees, distribution fees, other expenses and fee waivers/reimbursements to those of other funds in the peer group and the peer group median. The Trustees concluded that the comparisons provided by the Outside Data Provider were useful in evaluating the reasonableness of the management fees and total expenses paid by the Funds.
In addition, the Trustees considered the Investment Adviser’s undertakings to waive a portion of its management fee for International Real Estate Securities Fund and to limit each of the Funds’ “other expenses” ratios (excluding certain expenses) to certain specified levels. They also considered, to the extent that the Investment Adviser manages institutional accounts or collective investment vehicles having investment objectives and policies similar to those of the Funds, comparative fee information for services provided by the Investment Adviser to those accounts, and information that indicated that services provided to the Funds differed in various significant respects from the services provided to institutional accounts, which generally operated under less stringent legal and regulatory structures, required fewer services from the Investment Adviser to a smaller number of client contact points, were less time-intensive and paid lower fees. By contrast, the Trustees noted that the Investment Adviser provides substantial administrative services to the Funds under the terms of the Management Agreement.
In addition, the Trustees noted that shareholders are able to redeem their Fund shares at any time if they believe that the Fund fees and expenses are too high or if they are dissatisfied with the performance of the Fund.
Profitability
The Trustees reviewed the Investment Adviser’s revenues and pre-tax profit margins with respect to the Trust and each of the Funds. In this regard the Trustees noted that they had received, among other things, profitability analyses and summaries, revenue and expense schedules by Fund and by function (i.e., investment management, transfer agency and distribution and service) and the Investment Adviser’s expense allocation methodology. They observed that the profitability and expense figures are substantially similar to those used by the Investment Adviser for many internal purposes, including compensation decisions among various business groups, and are thus subject to a vigorous internal debate about how certain revenue and expenses should be allocated. The Trustees also reviewed the report of the internal audit group within the Goldman Sachs organization, which included an assessment of the reasonableness and consistency of the Investment Adviser’s expense allocation methodology and an evaluation of the accuracy of the Investment Adviser’s profitability analysis calculations. Profitability data for the Trust and each Fund were provided for 2010 and 2009 (2010 only for Dynamic Allocation Fund), and the Trustees considered this information in relation to the Investment Adviser’s overall profitability. The Trustees considered the Investment Adviser’s revenues and pre-tax profit margins both in absolute terms and in comparison to information on the reported pre-tax profit margins earned by certain other asset management firms.
GOLDMAN SACHS SELECT SATELLITE FUNDS
Statement Regarding Basis for Approval of Management Agreement (Unaudited) (continued)
Economies of Scale
The Trustees considered the information that had been provided regarding the Investment Adviser’s profitability and the rationale for the Funds’ breakpoint structure. The Trustees also considered the breakpoints in the fee rate payable under the Management Agreement for each of the Funds at the following annual percentage rates of the average daily net assets of the Funds:
| | | | | | | | | | | | | | | | | | | | | |
| | | Absolute
| | | | | | International
| | |
| | | Return
| | Commodity
| | Dynamic
| | Real Estate
| | Real Estate
|
| | | Tracker
| | Strategy
| | Allocation
| | Securities
| | Securities
|
| | | Fund | | Fund | | Fund | | Fund | | Fund |
| |
| First $1 billion | | | 1.15 | % | | | 0.50 | % | | | 0.90 | % | | | 1.05 | % | | | 1.00 | % |
| Next $1 billion | | | 1.04 | | | | 0.50 | | | | 0.81 | | | | 1.05 | | | | 0.90 | |
| Next $3 billion | | | 0.99 | | | | 0.45 | | | | 0.77 | | | | 0.95 | | | | 0.86 | |
| Next $3 billion | | | 0.97 | | | | 0.43 | | | | 0.75 | | | | 0.90 | | | | 0.84 | |
| Over $8 billion | | | 0.95 | | | | 0.42 | | | | 0.74 | | | | 0.88 | | | | 0.82 | |
The Trustees noted that the breakpoints at the $5 and $8 billion asset levels had been proposed by the Investment Adviser and approved by the Trustees in 2008 to further share potential economies of scale, if any, with the Funds and their shareholders as assets under management reach those asset levels. The Trustees considered the amounts of assets in the Funds; the Funds’ recent share purchase and redemption activity; the information provided by the Investment Adviser relating to the costs of the services provided by the Investment Adviser and its affiliates and their realized profits; information comparing fee rates charged by the Investment Adviser with fee rates charged to other funds in the peer group; and the Investment Adviser’s undertakings to limit the International Real Estate Securities Fund’s management fees and the Funds’ “other expenses” ratios (excluding certain expenses) to certain amounts. Upon reviewing these matters at the Annual Meeting, the Trustees concluded that the fee breakpoints represented a means of assuring that benefits of scalability would be passed along to shareholders at the specified asset levels. They also noted that the Investment Adviser was passing along savings to shareholders of the Absolute Return Tracker Fund, which had asset levels above at least the first breakpoint.
Other Benefits to the Investment Adviser and Its Affiliates
The Trustees also considered the other benefits derived by the Investment Adviser and its affiliates from their relationship with the Funds as stated above, including: (a) transfer agency fees received by Goldman, Sachs & Co. (“Goldman Sachs”); (b) brokerage and futures commissions earned by Goldman Sachs for executing securities and futures transactions on behalf of the Funds; (c) research received by the Investment Adviser from broker-dealers in exchange for executing certain transactions on behalf of the International Real Estate Securities and Real Estate Securities Funds; (d) trading efficiencies resulting from aggregation of orders of the Funds with those for other funds or accounts managed by the Investment Adviser; (e) the Investment Adviser’s ability to leverage the infrastructure designed to service the Funds on behalf of its other clients; (f) the Investment Adviser’s ability to cross-market other products and services to Fund shareholders; (g) Goldman Sachs’ retention of certain fees as Fund Distributor; (h) the Investment Adviser’s ability to negotiate better pricing with custodians on behalf of its other clients, as a result of the relationship with the Funds; and (i) the possibility that the working relationship between the Investment Adviser and the Funds’ third party service providers may cause those service providers to be open to doing business with other areas of Goldman Sachs. In the course of considering the foregoing, the Independent Trustees requested and received further information quantifying certain of the fall-out benefits.
Other Benefits to the Funds and Their Shareholders
The Trustees also noted that the Funds receive certain potential benefits as a result of their relationship with the Investment Adviser, including: (a) trading efficiencies resulting from aggregation of orders of the Funds with those of other funds or accounts managed by the Investment Adviser; (b) improved servicing and pricing from vendors because of the volume of business generated by the Investment Adviser and its affiliates; (c) improved servicing from broker-dealers because of the volume of business generated by the Investment Adviser and its affiliates; (d) the Investment Adviser’s ability to negotiate favorable terms with derivatives counterparties as a result of the size and reputation of the Goldman Sachs organization; (e) the advantages gained from the Investment Adviser’s knowledge and experience gained from managing other accounts and products; (f) the Investment Adviser’s ability to hire and retain qualified personnel to provide services to the Funds because of the reputation of the Goldman Sachs organization; (g) the Funds’ access, through the Investment Adviser, to certain firmwide resources (e.g., proprietary databases); and (h) the Funds’ access to certain affiliated distribution channels. The Trustees noted the competitive nature of the mutual fund marketplace, and noted further that many of the Funds’ shareholders invested in the Funds in part because of the
GOLDMAN SACHS SELECT SATELLITE FUNDS
Statement Regarding Basis for Approval of Management Agreement (Unaudited) (continued)
Funds’ relationship with the Investment Adviser and that those shareholders have a general expectation that the relationship will continue.
Conclusion
In connection with their consideration of the Management Agreement, the Trustees gave weight to each of the factors described above, but did not identify any particular factor as controlling their decision. After deliberation and consideration of all of the information provided, including the factors described above, the Trustees concluded, in the exercise of their business judgment, that the management fees paid by each of the Funds were reasonable in light of the services provided to it by the Investment Adviser, the Investment Adviser’s costs and each Fund’s current and reasonably foreseeable asset levels. The Trustees unanimously concluded that the Investment Adviser’s continued management likely would benefit each Fund and its shareholders and that the Management Agreement should be approved and continued with respect to each Fund until June 30, 2012.
FUNDS PROFILE
Goldman Sachs Funds
Goldman Sachs is a premier financial services firm, known since 1869 for creating thoughtful and customized investment solutions in complex global markets.
Today, the Investment Management Divisionof Goldman Sachs serves a diverse set of clients worldwide, including private institutions, public entities and individuals. With portfolio management teams located around the world — and $720.3 billion in assets under management as of June 30, 2011 — our investment professionals bring firsthand knowledge of local markets to every investment decision. Goldman Sachs Asset Management ranks in the top 10 asset management firms worldwide, based on assets under management.1
| |
| OVERVIEW OF GOLDMAN SACHS FUNDS | |

| | | | | |
Money Market2
Financial Square Fundssm
n Financial Square Tax-Exempt Funds
n Financial Square Federal Fund
n Financial Square Government Fund
n Financial Square Money Market Fund
n Financial Square Prime Obligations Fund
n Financial Square Treasury Instruments Fund
n Financial Square Treasury Obligations Fund
Fixed Income
Short Duration and Government
n Enhanced Income Fund
n Ultra-Short Duration Govt. Fund
n Short Duration Government Fund
n Government Income Fund
n Inflation Protected Securities Fund
Multi-Sector
n Core Fixed Income Fund
n Core Plus Fixed Income Fund
n Global Income Fund
n Strategic Income Fund
Municipal and Tax-Free
n High Yield Municipal Fund
n Municipal Income Fund
n Short Duration Tax-Free Fund
Single Sector
n Investment Grade Credit Fund
n U.S. Mortgages Fund
n High Yield Fund
n High Yield Floating Rate Fund | | n Emerging Markets Debt Fund
n Local Emerging Markets Debt Fund
Corporate Credit
n Credit Strategies Fund
Fundamental Equity
n Growth and Income Fund
n Small Cap Value Fund
n Mid Cap Value Fund
n Large Cap Value Fund
n Capital Growth Fund
n Strategic Growth Fund
n Small/Mid Cap Growth Fund
n Flexible Cap Growth Fund3
n Concentrated Growth Fund
n Technology Tollkeeper Fundsm
n Growth Opportunities Fund
n U.S. Equity Fund
Structured Equity
n Balanced Fund
n Structured Small Cap Equity Fund
n Structured U.S. Equity Fund
n Structured Small Cap Growth Fund
n Structured Large Cap Growth Fund
n Structured Large Cap Value Fund
n Structured Small Cap Value Fund
n Structured Tax-Managed Equity Fund
n Structured International Tax-Managed Equity Fund
n U.S. Equity Dividend and Premium Fund
n International Equity Dividend and Premium Fund | | n Structured International Small Cap Fund
n Structured International Equity Fund
n Structured Emerging Markets Equity Fund
Fundamental Equity International
n Strategic International Equity Fund
n Concentrated International Equity Fund
n International Small Cap Fund
n Asia Equity Fund
n Emerging Markets Equity Fund
n BRIC Fund (Brazil, Russia, India, China)
n N-11 Equity Fund
n Brazil Equity Fund
n China Equity Fund
n Korea Equity Fund
n India Equity Fund
Select Satellite4
n Real Estate Securities Fund
n International Real Estate Securities Fund
n Commodity Strategy Fund
n Dynamic Allocation Fund
n Absolute Return Tracker Fund
Total Portfolio Solutions4
n Balanced Strategy Portfolio
n Growth and Income Strategy Portfolio
n Growth Strategy Portfolio
n Equity Growth Strategy Portfolio
n Income Strategies Portfolio
n Satellite Strategies Portfolio
n Retirement Strategies Portfolios
n Enhanced Dividend Global Equity Portfolio
n Tax Advantaged Global Equity Portfolio |
Firmwide assets under management includes assets managed by GSAM and its Investment Advisory Affiliates.
| |
| 1 | Ranking for Goldman Sachs Group, Inc., includes Goldman Sachs Asset Management, Private Wealth Management and Merchant Banking 2010 year-end assets. Ranked 10th in total assets worldwide. Pensions&Investments, June 2011. |
| 2 | An investment in a money market fund is neither insured nor guaranteed by the Federal Deposit Insurance Corporation (“FDIC”) or any other government agency. Although the Funds seek to preserve the value of your investment at $1.00 per share, it is possible to lose money by investing in the Funds. |
| 3 | Effective March 31, 2011, the Goldman Sachs All Cap Growth Fund was renamed the Goldman Sachs Flexible Cap Growth Fund. |
| 4 | Individual Funds within the Total Portfolio Solutions and Select Satellite categories will have various placement on the risk/return spectrum and may have greater or lesser risk than that indicated by the placement of the general Total Portfolio Solutions or Select Satellite category. |
The Goldman Sachs Technology Tollkeeper Fundsm and Financial Square Fundssm are registered service marks of Goldman, Sachs & Co.
| | | |
TRUSTEES
Ashok N. Bakhru, Chairman
Donald C. Burke
John P. Coblentz, Jr.
Diana M. Daniels
Joseph P. LoRusso
James A. McNamara
Jessica Palmer
Alan A. Shuch
Richard P. Strubel | | OFFICERS
James A. McNamara, President
George F. Travers, Principal Financial Officer
Peter V. Bonanno, Secretary
Scott M. McHugh, Treasurer |
| | | |
GOLDMAN, SACHS & CO.
Distributor and Transfer Agent | | GOLDMAN SACHS ASSET MANAGEMENT, L.P.
Investment Adviser |
Visit our Web site at www.goldmansachsfunds.com to obtain the most recent month-end returns.
Goldman Sachs Asset Management, L.P. 200 West Street, New York, New York 10282
The reports concerning the Funds included in this shareholder report may contain certain forward-looking statements about the factors that may affect the performance of the Funds in the future. These statements are based on Fund management’s predictions and expectations concerning certain future events and their expected impact on the Funds, such as performance of the economy as a whole and of specific industry sectors, changes in the levels of interest rates, the impact of developing world events, and other factors that may influence the future performance of the Funds. Management believes these forward-looking statements to be reasonable, although they are inherently uncertain and difficult to predict. Actual events may cause adjustments in portfolio management strategies from those currently expected to be employed.
A description of the policies and procedures that the Funds use to determine how to vote proxies relating to portfolio securities and information regarding how a Fund voted proxies relating to portfolio securities during the most recent 12-month period ended June 30 is available (i) without charge, upon request by calling 1-800-526-7384 (for Retail Shareholders) or 1-800-621-2550 (for Institutional Shareholders); and (ii) on the Securities and Exchange Commission Web site at http://www.sec.gov.
The Funds file their complete schedule of portfolio holdings with the Securities and Exchange Commission (“SEC”) for the first and third quarters of each fiscal year on Form N-Q. The Funds’ Form N-Q will become available on the SEC’s website at http://www.sec.gov within 60 days after the Funds’ first and third fiscal quarters. When available, the Funds’ Forms N-Q may be reviewed and copied at the SEC’s Public Reference Room in Washington, D.C. and information on the operation of the Public Reference Room may also be obtained by calling 1-800-SEC-0330. When available, Form N-Q may be obtained upon request and without charge by calling 1-800-526-7384 (for Retail Shareholders) or 1-800-621-2550 (for Institutional Shareholders).
Holdings and allocations shown may not be representative of current or future investments. Holdings and allocations may not include the Funds’ entire investment portfolio, which may change at any time. Fund holdings should not be relied on in making investment decisions and should not be construed as research or investment advice regarding particular securities.
The portfolio risk management process includes an effort to monitor and manage risk, but does not imply low risk.
This material is not authorized for distribution to prospective investors unless preceded or accompanied by a current Prospectus or summary prospectus, if applicable. Investors should consider a Fund’s objective, risks, and charges and expenses, and read the summary prospectus, if available, and/or the Prospectus carefully before investing or sending money. The summary prospectus, if available, and the Prospectus contain this and other information about a Fund and may be obtained from your authorized dealer or from Goldman, Sachs & Co. by calling (retail – 1-800-526-7384) (institutional – 1-800-621-2550).
© 2011 Goldman Sachs. All rights reserved. 57937.MF.MED.TMPL/8/2011 SELSATSAR11 / 84.9K
| | | |
| | | The information required by this Item is only required in an annual report on this Form N-CSR. |
| | | |
| ITEM 3. | | AUDIT COMMITTEE FINANCIAL EXPERT. |
| | | |
| | | The information required by this Item is only required in an annual report on this Form N-CSR. |
| | | |
| ITEM 4. | | PRINCIPAL ACCOUNTANT FEES AND SERVICES. |
| | | |
| | | The information required by this Item is only required in an annual report on this Form N-CSR. |
| | | |
| ITEM 5. | | AUDIT COMMITTEE OF LISTED REGISTRANTS. |
| | | |
| | | Not applicable. |
| | | |
| ITEM 6. | | SCHEDULE OF INVESTMENTS. |
| | | |
| | | Schedule of Investments is included as part of the Report to Stockholders filed under Item 1. |
| | | |
| ITEM 7. | | DISCLOSURE OF PROXY VOTING POLICIES AND PROCEDURES FOR CLOSED-END MANAGEMENT INVESTMENT COMPANIES. |
| | | |
| | | Not applicable. |
| | | |
| ITEM 8. | | PORTFOLIO MANAGERS OF CLOSED-END MANAGEMENT INVESTMENT COMPANIES. |
| | | |
| | | Not applicable. |
| | | |
| ITEM 9. | | PURCHASES OF EQUITY SECURITIES BY CLOSED-END MANAGEMENT INVESTMENT COMPANY AND AFFILIATED PURCHASERS. |
| | | |
| | | Not applicable. |
| | | |
| ITEM 10. | | SUBMISSION OF MATTERS TO A VOTE OF SECURITY HOLDERS.
There have been no material changes to the procedures by which shareholders may recommend nominees to the registrant’s board of trustees. |
| | | |
| | | |
| ITEM 11. | | CONTROLS AND PROCEDURES. |
| | | |
| | (a) | | The registrant’s principal executive and principal financial officers, or persons performing similar functions have concluded that the registrant’s disclosure controls and procedures (as defined in Rule 30a-3(c) under the Investment Company Act of 1940, as amended (the “1940 Act”)) are effective as of a date within 90 days of the filing of this report that includes the disclosure required by this paragraph, based on the evaluation of these controls and procedures required by Rule 30a-3(b) under the 1940 Act and 15d-15(b) under the Securities Exchange Act of 1934, as amended. |
| | | |
| | (b) | | There were no changes in the registrant’s internal control over financial reporting (as defined in Rule 30a-3(d) under the 1940 Act) that occurred during the registrant’s second fiscal quarter of the period covered by this report that have materially affected, or are reasonably likely to materially affect, the registrant’s internal control over financial reporting. |
| | | |
| | (a)(1) | | The information required by this Item is only required in connection with an annual report on this Form N-CSR. |
| |
| | (a)(2) | | Exhibit 99.CERT | Certifications pursuant to Section 302 of the Sarbanes-Oxley Act of 2002 filed herewith. |
| | | |
| | (b) | | Exhibit 99.906CERT | Certifications pursuant to Section 906 of the Sarbanes-Oxley Act of 2002 filed herewith. |
SIGNATURES
| | | | Pursuant to the requirements of the Securities Exchange Act of 1934 and the Investment Company Act of 1940, the registrant has duly caused this report to be signed on its behalf by the undersigned, thereunto duly authorized. |
| | | | | | | |
| | | | | Goldman Sachs Trust | | |
| | | | | | | |
| By: | | | | /s/ James A. McNamara | | |
| | | | |
| | |
| | | | | James A. McNamara | | |
| | | | | President/Principal Executive Officer | | |
| | | | | Goldman Sachs Trust | | |
| | | | | | | |
| Date: | | | | August 31, 2011 | | |
| | | | Pursuant to the requirements of the Securities Exchange Act of 1934 and the Investment Company Act of 1940, this report has been signed below by the following persons on behalf of the registrant and in the capacities and on the dates indicated. |
| | | | | | | |
| By: | | | | /s/ James A. McNamara | | |
| | | | |
| | |
| | | | | James A. McNamara | | |
| | | | | President/Principal Executive Officer | | |
| | | | | Goldman Sachs Trust | | |
| | | | | | | |
| Date: | | | | August 31, 2011 | | |
| | | | | | | |
| By: | | | | /s/ George F. Travers | | |
| | | | |
| | |
| | | | | George F. Travers | | |
| | | | | Principal Financial Officer | | |
| | | | | Goldman Sachs Trust | | |
| | | | | | | |
| Date: | | | | August 31, 2011 | | |