UNITED STATES
SECURITIES AND EXCHANGE COMMISSION
Washington, D.C. 20549
FORM N-CSR
CERTIFIED SHAREHOLDER REPORT OF REGISTERED
MANAGEMENT INVESTMENT COMPANIES
Investment Company Act file number 811-05349
Goldman Sachs Trust
(Exact name of registrant as specified in charter)71 South Wacker Drive, Chicago, Illinois 60606
(Address of principal executive offices) (Zip code)| | | |
| Peter V. Bonanno, Esq. | | Copies to: |
| Goldman, Sachs & Co. | | Geoffrey R.T. Kenyon, Esq. |
| 200 West Street | | Dechert LLP |
| New York, New York 10282 | | 200 Clarendon Street |
| | | 27th Floor
Boston, MA 02116-5021 |
|
(Name and address of agents for service)
|
Registrant’s telephone number, including area code: (312) 655-4400
Date of fiscal year end: October 31
Date of reporting period: April 30, 2011
| | | |
| ITEM 1. | | REPORTS TO STOCKHOLDERS. |
| | | |
| | | The Semi-Annual Report to Stockholders is filed herewith. |
Goldman Sachs Funds
| | | | |
| | | | |
Semi-Annual Report | | | April 30, 2011 |
| | | | |
| | | | |
| | | | |
| | | | |
| | | | Structured Domestic Equity Funds |
| | | | Balanced |
| | | | Structured Large Cap Growth |
| | | | Structured Large Cap Value |
| | | | Structured Small Cap Equity |
| | | | Structured Small Cap Growth |
| | | | Structured Small Cap Value |
| | | | Structured U.S. Equity |
| | | | |
Goldman Sachs Structured Domestic Equity Funds
| |
| n | BALANCED |
| |
| n | STRUCTURED LARGE CAP GROWTH |
| |
| n | STRUCTURED LARGE CAP VALUE |
| |
| n | STRUCTURED SMALL CAP EQUITY |
| |
| n | STRUCTURED SMALL CAP GROWTH |
| |
| n | STRUCTURED SMALL CAP VALUE |
| |
| n | STRUCTURED U.S. EQUITY |
| | | |
| TABLE OF CONTENTS | | |
| |
| | | |
| Principal Investment Strategies and Risks | | 1 |
| | | |
| Market Review | | 3 |
| | | |
| Investment Process — Balanced Fund | | 6 |
| | | |
| Portfolio Management Discussion and Performance Summaries — Balanced Fund | | 7 |
| | | |
Investment Process — Structured Domestic
Equity Funds | | 15 |
| | | |
| Portfolio Management Discussion and Performance Summaries — Structured Domestic Equity Funds | | 17 |
| | | |
| Schedules of Investments | | 47 |
| | | |
| Financial Statements | | 88 |
| | | |
| Financial Highlights | | 96 |
| | | |
| Notes to Financial Statements | | 110 |
| | | |
| Other Information | | 139 |
| | | | | | | |
NOT FDIC-INSURED | | | May Lose Value | | | No Bank Guarantee |
| | | | | | | |
GOLDMAN SACHS STRUCTURED DOMESTIC EQUITY FUNDS
Principal Investment Strategies and Risks
This is not a complete list of risks that may affect the Funds. For additional information concerning the risks applicable to the Funds, please see the Funds’ Prospectus.
The Goldman Sachs Balanced Fund invests in equity investments considered to have capital appreciation and/or dividend-paying ability and also invests in fixed income securities. The Fund may invest in foreign securities. The Fund’s equity investments will be subject to market risk, which means that the value of the securities in which it invests may go up or down in response to the prospects of individual companies, particular industry sectors and/or general economic conditions. Foreign and emerging market securities may be more volatile than investments in U.S. securities and will be subject to the risks of currency fluctuations and sudden economic or political developments. The Fund may also invest in fixed income securities, which are subject to the risks associated with debt securities generally, including credit, liquidity and interest rate risk. The Fund may make substantial investments in derivative instruments, including options, financial futures, swaps, options on swaps, structured securities and other derivative instruments. Derivative instruments may involve a high degree of financial risk. These risks include the risk that a small movement in the price of the underlying security or benchmark may result in a disproportionately large movement, unfavorable or favorable, in the price of the derivative instrument; the risk of default by a counterparty; and the risk that transactions may not be liquid. The Fund’s balanced objective seeks to reduce the volatility associated with investing in a single market. There is no guarantee however, that market cycles will move in opposition to one another or that a balanced investment program will successfully reduce volatility.
The Goldman Sachs Structured Large Cap Growth Fund invests primarily in a broadly diversified portfolio of equity investments in large-capitalization U.S. issuers, including foreign issuers traded in the United States. The Fund’s equity investments will be subject to market risk, which means that the value of the securities in which it invests may go up or down in response to the prospects of individual companies, particular industry sectors and/or general economic conditions. The Fund may also invest in fixed income securities, which are subject to the risks associated with debt securities generally, including credit, liquidity and interest rate risk.
The Goldman Sachs Structured Large Cap Value Fund invests primarily in a broadly diversified portfolio of equity investments in large-capitalization U.S. issuers, including foreign issuers traded in the United States. The Fund’s equity investments will be subject to market risk, which means that the value of the securities in which it invests may go up or down in response to the prospects of individual companies, particular industry sectors and/or general economic conditions. The Fund may also invest in fixed income securities, which are subject to the risks associated with debt securities generally, including credit, liquidity and interest rate risk.
The Goldman Sachs Structured Small Cap Equity Fund invests primarily in a broadly diversified portfolio of equity investments in small-capitalization U.S. issuers, including foreign issuers traded in the United States. The Fund’s equity investments will be subject to market risk, which means that the value of the securities in which it invests may go up or down in response to the prospects of individual companies, particular industry sectors and/or general economic conditions. Stocks of smaller companies are often more volatile and less liquid and present greater risks than stocks of larger companies. At times, the Fund may be unable to sell certain of its portfolio securities without a substantial drop in price, if at all. The Fund may also invest in fixed income securities, which are subject to the risks associated with debt securities generally, including credit, liquidity and interest rate risk.
GOLDMAN SACHS STRUCTURED DOMESTIC EQUITY FUNDS
The Goldman Sachs Structured Small Cap Growth Fund invests primarily in a broadly diversified portfolio of small-capitalization U.S. equity investments. The Fund’s equity investments are subject to market risk, which means that the value of the securities in which it invests may go up or down in response to the prospects of individual companies, particular industry sectors and/or general economic conditions. Stocks of smaller companies are often more volatile and less liquid and present greater risks than stocks of larger companies. At times, the Fund may be unable to sell certain of its portfolio securities without a substantial drop in price, if at all.
The Goldman Sachs Structured Small Cap Value Fund invests primarily in a broadly diversified portfolio of small-capitalization U.S. equity investments. The Fund’s equity investments are subject to market risk, which means that the value of the securities in which it invests may go up or down in response to the prospects of individual companies, particular industry sectors and/or general economic conditions. Stocks of smaller companies are often more volatile and less liquid and present greater risks than stocks of larger companies. At times, the Fund may be unable to sell certain of its portfolio securities without a substantial drop in price, if at all.
The Goldman Sachs Structured U.S. Equity Fund invests primarily in a broadly diversified portfolio of equity investments in U.S. issuers, including foreign issuers traded in the United States. The Fund’s equity investments will be subject to market risk, which means that the value of the securities in which it invests may go up or down in response to the prospects of individual companies, particular industry sectors and/ or general economic conditions. The Fund may also invest in fixed income securities, which are subject to the risks associated with debt securities generally, including credit, liquidity and interest rate risk.
MARKET REVIEW
Goldman Sachs Structured Domestic Equity Funds
Market Review
U.S. stock and bond markets were resilient in the face of new risks during the six months ended April 30, 2011 (the “Reporting Period”). During the first half of the Reporting Period, strong economic data boosted investor sentiment. Surveys suggested manufacturing activity was expanding rapidly after the summer slowdown, and consumer spending figures improved substantially. Monetary and fiscal stimulus also contributed to the more confident outlook as the Federal Reserve (the “Fed”) began buying U.S. Treasuries through its second quantitative easing program and Congress and the Obama Administration agreed to extend tax cuts into 2011.
The economic outlook and investor confidence faltered during the first calendar quarter of 2011, as political unrest emerged in Tunisia, followed quickly by Egypt and the broader Middle East and North African region. For the first time since 2008, oil prices rose above $100 per barrel on concerns about potential supply disruptions. Meanwhile, the European sovereign debt crisis continued to spread, adding another element of risk to the outlook. In March, Japan was struck by the Tohoku earthquake and tsunami, followed by the crisis at the Fukushima Daiichi nuclear plant. In the U.S., debate intensified over measures to reduce the government deficit, and a government shutdown over the budget for the 2011 fiscal year was narrowly averted in April.
Economic data also began to soften. U.S. economic growth slowed from 3.2% during the fourth quarter of 2010 to 1.8% during the first quarter of 2011. Key indicators remained generally robust, however, and payroll data reflected unexpectedly strong jobs gains in the private sector. The weak spot remained the housing market, as national housing reports reflected a persistent downward trend in prices.
Throughout the Reporting Period, the Fed kept the targeted federal funds rate at a historic low of 0% to 0.25%, where it has stood since December 2008. Although some regional Fed presidents have called for an increase, the Fed continued to reiterate in official policy statements its bias toward an extended period of low interest rates.
Equity Markets
The stock market moved higher during the Reporting Period. Small-cap stocks outperformed large-cap stocks, primarily in the information technology sector. The Russell 2000® Index, which measures the small-cap universe, gained 23.73%, while the S&P® 500 Index, a measure of large-cap stocks, returned 16.36%. Across the capitalization spectrum, value-oriented stocks outperformed growth-oriented stocks, largely as a result of strength in the information technology sector. The Russell 1000® Value Index, representing large-cap value stocks, gained 17.29% for the Reporting Period, outperforming the Russell 1000® Growth Index, representing large-cap growth stocks, which was up 16.96%.
MARKET REVIEW
Fixed Income Markets
Robust investor demand supported the prices of riskier fixed income assets during the Reporting Period, although strong rallies were interrupted by bouts of risk aversion. Renewed confidence in the economic recovery during the final months of 2010 drove longer maturity Treasury yields sharply higher. By early February, the yield on the 10-year Treasury note, which began the Reporting Period at 2.60%, had climbed to 3.74%. The yield curve (or, spectrum of maturities) steepened, with the difference in yields between two- and 30-year Treasuries widening to record levels on speculation that inflation could accelerate. As geopolitical concerns mounted and economic data softened, longer term yields began to fall and by the end of the Reporting Period, the yield on the 10-year Treasury note had dropped to 3.29%.
Looking Ahead
Equity Markets
We continue to believe that cheaper stocks are likely to outpace more expensive ones. Stocks with good momentum are likely, in our view, to outperform those with poor momentum. We plan to focus on seeking profitable companies with positive fundamentals, sustainable earnings and a track record of using capital to enhance shareholder value. As such, we anticipate remaining fully invested, with long-term performance likely to be the result of stock selection rather than sector or capitalization allocations.
We stand behind our investment philosophy that sound economic investment principles, coupled with a disciplined quantitative approach, can provide strong, uncorrelated returns over the long term. Our research agenda is robust, and we continue to enhance our existing models, add new proprietary forecasting signals, and improve our trading execution as we seek to provide the most value to our shareholders.
Fixed Income Markets
We are optimistic about U.S. economic growth potential in 2011 and 2012. However, given the downside risks that arose since the turn of the calendar year, we have trimmed our 2011 U.S. Gross Domestic Product (“GDP”) forecast to 3.2% from 3.5% at the end of 2010, putting us in line with consensus estimates. We also reduced our 2012 U.S. GDP forecast from 3.5% to 3.0%, putting us slightly below the consensus. We expect headline inflation of 1.7% in 2011 and 2.0% in 2012, which is in line with the consensus.
At the end of the Reporting Period, the core drivers of U.S. economic growth—consumer spending and business investment—were improving, and we believe this is likely to continue. Consumer spending was benefiting from a rise in real disposable income, which increased nearly 3% year-over-year in January 2011. The rise in disposable income, driven in part by payroll tax cuts passed in late 2010, was allowing consumers to continue to build their savings while maintaining spending growth of approximately 2% year over year. Meanwhile, business investment was still underpinned by strong corporate profits, which were being recycled into spending on machinery and equipment.
MARKET REVIEW
The job market, a key weak spot in the economic recovery to date, was also showing signs of life at the end of the Reporting Period. The private sector added more jobs than expected in the first quarter, though the unemployment rate remained around 9%. Demand for consumer and business credit, another weak spot in the recovery, also appeared to be growing again, based on the Fed’s survey of senior loan officers. The housing market remained an area of weakness as home prices continued to fall, but we anticipate a pickup in demand as the weather improves in the months ahead.
We expect the Fed to come under heightened pressure in 2011 to raise short-term interest rates. Core inflation (which excludes food and energy prices) appeared, at the end of the Reporting Period, to have bottomed. With more people renting rather than buying a home, the rental price component of core inflation seems likely, we believe, to turn higher. However, we expect inflation to remain relatively low even into 2012 given the amount of slack that is still in the economy. With inflation likely to remain low and growth still facing multiple challenges, we think the Fed will stay on hold throughout 2011.
While we believe domestic sources of strength can support continued economic growth in the U.S., the risk to this view is that the situations in the Middle East, North Africa, Europe and Japan may deteriorate further. In particular, further unrest in the Middle East could derail the U.S. expansion through an oil supply shock. However, we do not anticipate such an occurrence. The situation in Japan was, as of this writing, still developing, and the ultimate impact of events there on the global economy is unknown. We think the key risk for the U.S. is a break in the global supply chain that causes manufacturing or other business activity to slow due to a lack of components produced in Japan. In Europe, the continuing sovereign debt crisis still represented, at the end of the Reporting Period, a potential threat to business and consumer confidence globally.
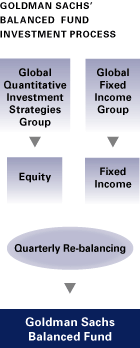
GOLDMAN SACHS BALANCED FUND
What Differentiates Goldman Sachs’
Balanced Fund Investment Process?
The Balanced Fund invests in a diversified investment portfolio through an asset allocation process of strategically selecting different asset classes—such as stocks and bonds. The Fund then adjusts its holdings over time. Goldman Sachs’ approach to asset allocation combines our global presence, market knowledge and risk management expertise.
The Goldman Sachs Balanced Fund provides exposure to the wealth-building opportunities of stocks and the regular income potential of bonds.
Fully invested, well-diversified portfolio that:
| |
| n | Maintains style, sector, risk and capitalization characteristics similar to the benchmark. |
| |
| n | Offers broad access to a clearly defined equity universe. |
| |
| n | Aims to generate equity income that is consistent and repeatable. |
In quantitative investing, we have a systematic and disciplined approach to investing. We have developed our own process-specific daily risk model that evaluates risk for more than 10,000 U.S. stocks daily. Our portfolio construction process uses this model in its attempt to manage and allocate portfolio risk.
In fixed income investing, we believe that a total return investment philosophy provides the most complete picture of performance. We emphasize fundamental credit expertise. Our group scrutinizes factors that could impact a bond’s performance over time — similar to the evaluation of company stocks. Additionally, we identify, monitor and measure a fund’s risk profile.
The Fund’s portfolio comprises the ideas of two experienced Goldman Sachs investment groups:
Global Quantitative Investment Strategies Group: A group of investment professionals with over 17 years of investment experience and a strong commitment to quantitative research.
Global Fixed Income Group: Broad, deep capabilities across global fixed income markets, with a total return investment philosophy.
PORTFOLIO RESULTS
Balanced Fund
Portfolio Management Discussion and Analysis
Below, the Goldman Sachs Quantitative Investment Strategies Team and the Goldman Sachs Fixed Income Investment Management Team discuss the Goldman Sachs Balanced Fund’s (the “Fund”) performance and positioning for the six-month period ended April 30, 2011 (the “Reporting Period”).
| |
| Q | How did the Fund perform during the Reporting Period? |
| |
| A | During the Reporting Period, the Fund’s Class A, B, C, Institutional and IR Shares generated cumulative total returns, without sales charges, of 9.67%, 9.28%, 9.27%, 9.85% and 9.69%, respectively. These returns compare to the 16.36%, 0.02% and 9.66% cumulative total returns of the Fund’s benchmarks, the S&P® 500 Index (with dividends reinvested), the Barclays Capital U.S. Aggregate Bond Index, and the blended index, comprised of 60% S&P 500 Index (with dividends reinvested) and 40% Barclays Capital U.S. Aggregate Bond Index (with dividends reinvested), during the same period. |
| |
| Q | How did the Fund’s asset allocation affect performance? |
| |
| A | In keeping with our investment approach, we split the Fund’s assets between equity and fixed income securities, targeting 60% equities and 40% fixed income. Because of the equity market’s strong performance during the Reporting Period, the Fund benefited from its larger allocation to stocks. At the beginning of the Reporting Period, the Fund was invested 61% in equities and 39% in fixed income. It was invested 59% in equities and 41% in fixed income at the end of the Reporting Period. |
| |
| Q | Did equity sector allocation overall help or hurt the Fund’s performance? |
| |
| A | In investing the equity portion of the Fund’s portfolio, we invest in higher dividend-paying names within industries and sectors, rather than making industry or sector bets. Consequently, its industry and sector weights are similar to those of its equity benchmark, the S&P 500 Index, and they do not usually have a meaningful impact on relative performance. |
| |
| Q | What key factors had the greatest impact on the Fund’s equity portfolio results during the Reporting Period? |
| |
| A | In our stock selection process, we use a unique, proprietary risk model that tracks and manages risk in the portfolio. We also integrate tax considerations into our investment decisions. |
Importantly, we generally favor stocks offering a high dividend yield. We believe the Fund’s bias towards higher dividend-paying stocks was generally helpful during the Reporting Period as many of these stocks performed well. At the end of the Reporting Period, the dividend yield of the equity portion of the Fund was 2.25%, which was higher than the 1.81% dividend yield of the S&P 500 Index.
| |
| Q | Among individual holdings, which stocks contributed most to the Fund’s returns? |
| |
| A | During the Reporting Period, the Fund benefited from overweighted positions in integrated energy company ConocoPhillips, diversified technology manufacturer Honeywell International and health insurance company UnitedHealth Group. |
| |
| Q | What individual stocks detracted from the Fund’s results during the Reporting Period? |
| |
| A | The Fund’s relative performance was hampered by overweighted positions in Armstrong World Industries, a manufacturer of flooring, ceilings and cabinets; Interactive Brokers Group, an online discount brokerage firm; and Xerox, a document management company. |
| |
| Q | Which fixed income market sectors most significantly affected the Fund’s performance? |
| |
| A | In the fixed income portion of the Fund’s portfolio, exposure to non-agency residential mortgage-backed securities (“RMBS”) was the largest contributor to relative returns. We maintained the position because we believed the sector was supported by improving borrower fundamentals, strong market technicals (that is, supply and demand factors) and improved borrower credit trends. Sector positioning in corporate bonds also enhanced performance. |
Individual issue selection also contributed positively to relative results. The Fund benefited from effective issue selection among corporate bonds, especially our continued bias toward investment grade corporate bonds. Investments in Treasury Inflation-Protected Securities (“TIPS”) and agency securities were also advantageous. Detracting modestly were the Fund’s holdings of Brazilian and South African local emerging market bonds.
PORTFOLIO RESULTS
| |
| Q | How did the Fund’s duration and yield curve positioning strategies affect performance during the Reporting Period? |
| |
| A | Within the fixed income portfolio, the Fund’s duration and yield curve positioning strategies detracted from relative performance during the Reporting Period. Duration is a measure of the Fund’s sensitivity to changes in interest rates. Yield curve indicates the spectrum of maturities within a particular sector. The Fund’s longer U.S. duration positioning relative to the Barclays Capital U.S. Aggregate Bond Index dampened its relative results during the fourth quarter of 2010 as longer-term U.S. Treasury yields, which had been in a declining trend, reversed direction. The yield on the 10-year U.S. Treasury note increased 68 basis points (0.68%) during the fourth calendar quarter. During March 2011, the Fund’s underweighted positioning in the five- and seven-year portions of the U.S. Treasury yield curve detracted from performance as global bond yields fell in response to heightened global growth concerns. The political upheaval across the Middle East and North Africa drove oil prices higher, and Japan’s devastating earthquake, tsunami and nuclear disaster raised concern about a disruption in the global supply chain. We partially reduced the Fund’s underweighted positioning in these segments of the U.S. Treasury yield curve in mid-March as the risks to global growth increased. |
| |
| Q | What changes did you make to the Fund’s fixed income weightings during the Reporting Period and how did it affect performance? |
| |
| A | During the Reporting Period, we moved the fixed income portfolio to an underweight in agency securities. We increased the portfolio’s overweight in asset-backed securities (“ABS”), particularly in FFELP (“Federal Family Education Loan Program”) student loans. We also increased the portfolio’s overweight in emerging markets debt and maintained an overweighted position in non-agency adjustable rate mortgages (“ARMS”). Toward the end of the Reporting Period, we slightly increased the portfolio’s overweight to corporate bonds, favoring U.S. financials over their European counterparts. |
| |
| Q | How did the Fund use derivatives or similar instruments during the Reporting Period? |
| |
| A | As we sought to increase the Fund’s total return and to hedge its portfolio against shifts in market conditions, we used instruments that included financial futures contracts, forward foreign currency contracts and swap contracts. In the equity portfolio, we used stock futures to equitize the Fund’s cash holdings. In other words, we put the Fund’s cash holdings to work by using them as collateral for the purchase of stock futures. In the fixed income portfolio, the Fund engaged in forward foreign currency exchange contracts to hedge currency exposure; Treasury futures to hedge interest rate exposure and facilitate specific duration and yield curve strategies; credit default swaps to implement specific credit-related investment strategies and hedge corporate spread duration (or, the price sensitivity of a corporate bond to a 100 basis point change in its spread over LIBOR, or London interbank offered rates, i.e. floating interest rates widely used as reference rates in bank, corporate and government lending agreements); interest rate swaps to hedge interest rate exposure and express an outright term structure view; and swaptions (or, options on interest rate swap contracts) to hedge and express an outright term structure view. Term structure, most often depicted as a yield curve, refers to the term structure of interest rates, which is the relationship between the yield to maturity and the time to maturity for pure discount bonds. The term structure of interest rates is important because monetary policy affects short-term interest rates, but investment depends on long-term interest rates. Theories about the term structure of interest rates thus become theories about the connection between monetary policy and investment. |
| |
| Q | What is the Team’s equity strategy for the months ahead? |
| |
| A | The Goldman Sachs Quantitative Investment Strategies Equity Team manages the equity portion of the Fund’s portfolio. The Team seeks to provide investors with a broad diversified exposure to the U.S. large-cap equity market. It does not make size or sector bets. Rather, it favors stocks with higher dividends within each industry. Its portfolio construction process integrates tax considerations into its investment decisions. The group uses a unique, proprietary risk model in its stock selection process. It believes this risk model can be beneficial as it identifies, tracks and manages risk in the portfolio. |
PORTFOLIO RESULTS
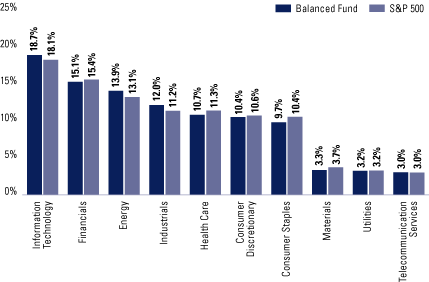
The equity portion of the Fund continues to be broadly diversified. At the end of the Reporting Period, its industry and sector weights were similar to that of the S&P 500 Index. However, the Fund was modestly overweight energy, industrials and information technology relative to the Index. It was modestly underweight the consumer staples, health care, materials and financials sectors. The Fund was relatively neutral in the telecommunication services, utilities and consumer discretionary sectors compared to the Index. We intend to maintain our focus on stocks with high dividend yields. With interest rates so low, we expect investors will continue to find these stocks desirable.
| |
| Q | What is the Fund’s tactical view and strategy for the fixed income markets looking ahead? |
| |
| A | Within the fixed income portfolio as of the end of the Reporting Period, we were targeting a short duration position along the U.S. fixed income yield curve relative to the Barclays Capital U.S. Aggregate Bond Index. Based on our outlook for sustainable U.S. economic growth, we continued to favor riskier fixed income assets over U.S. Treasuries. In our opinion, the improvement in economic fundamentals, coupled with a continuation of low interest rates, is likely to provide a positive backdrop over the long term. In the near term, however, we plan to take a more cautious stance because of the high degree of uncertainty surrounding the outlook for oil prices, Japan’s economy and European bond markets. |
At the end of the Reporting Period, given tight valuations and increasing risk factors, the fixed income portfolio was defensively positioned in agency mortgage-backed securities (“MBS”). It was modestly underweight higher coupon 30-year maturities because we believed MBS valuations reflected overly optimistic views regarding refinancing risks. In addition, we expected a challenging supply and demand environment in 2011 and did not think MBS valuations reflected these future headwinds. We remain positive on the non-agency MBS market, as we believe that prices remain supported by a combination of improving borrower fundamentals and strong technicals. The fixed income portfolio also maintained a neutral to slight overweight bias in commercial mortgage-backed securities (“CMBS”) amid stabilizing fundamentals and improving technicals.
In investment grade credit, we were targeting a modestly overweight position. At the end of the Reporting Period, credit fundamentals were strong and improving in many industries, profit margins were near all-time highs, and companies maintained large cash balances. While we expect to see some borrowing to fund mergers, leveraged buyouts and/or share buybacks, we believe most companies will avoid activities that are materially negative for creditors. In terms of industry positioning, the fixed income portfolio was overweight banks and insurance companies, primarily in the U.S., at the end of Reporting Period. It remained overweight in real estate investment trusts (REITs), energy and pipelines. The fixed income portfolio was underweight consumer-oriented industries. At the same time, we favored bonds lower in the capital structure because we think defensive bonds offer limited return potential. Although regulatory risk remains a concern, we believe changes to the regulatory framework for banks—including the Dodd-Frank legislation in the U.S. and Basel III globally—will be beneficial for financial companies in the long run. Basel III is a global regulatory standard relating to banks’ capital adequacy and liquidity.
At the end of the Reporting Period, the fixed income portfolio maintained a small position in high yield bonds, which are not represented in the Barclays Capital U.S. Aggregate Bond Index. We believe that high yield corporate bonds most exposed to the recovery in consumer confidence and spending are likely to perform well during 2011. In addition to the gaming sector, to which the fixed income portfolio is overweight, we favored certain cyclical sectors, such as packaging and consumer products, which we expect to benefit from further improvements in the U.S. economy. Given the volatility in peripheral European countries, the strongest performing sectors and issuers could be those that benefit from strong economic growth in Germany and the Nordic region (which includes Denmark, Finland, Iceland, Norway and Sweden as well as their associated territories). We believe that more caution is warranted on issuers that depend on economic growth in Greece, Spain, Portugal and Ireland. From an industry perspective, we believe natural gas companies are likely to see natural gas prices weaken on abundant supply resulting from new extraction technologies. We expect homebuilders to be hampered by sluggish new and existing home sales, while utilities seem likely to feel the effects of rising coal costs and low natural gas prices.
PORTFOLIO RESULTS
Emerging markets debt, in our view, can better withstand shocks to the global financial system than in years past, thanks in part to reserve accumulation and improved external debt positions. We believe that greater policy autonomy has also played a key role, as credible monetary policy has helped to moderate inflation and fiscal consolidation has reduced public sector debt burdens. At the end of the Reporting Period, stand-alone valuations in emerging markets debt reflected these fundamental improvements to some extent, but we believe increasing recognition of emerging markets debt as a mature fixed income sector should lead to more strategic investment allocations, consequently boosting valuations.
Given the modest amount of sovereign financing expected in 2011, we expect favorable supply and demand conditions in the months ahead. However, in our opinion, limited issuance must be combined with solid investment flows of both new money and reinvested income if technicals are to remain supportive. At the end of the Reporting Period, we favored Argentine GDP warrants, which pay holders when economic growth exceeds projections, because we believe they have the potential for strong growth over the medium term and could benefit if Argentina elects a more moderate President. We were also positive on the local debt of Brazil and Chile. The fixed income portfolio was generally underweight Latin American external debt at the end of the Reporting Period.
Enhancements Made to Proprietary Quantitative Model During the Reporting Period
We continuously look for ways to improve our investment process. Accordingly, we introduced two enhancements to our proprietary quantitative model, specifically our stock selection model and process, during the Reporting Period. First, we made an improvement to our quantitative portfolio construction methodology that we believe can enable us to tailor trading to reflect the diverse spectrum of signal speeds. In our opinion, the selection of appropriate implementation speeds for each signal can potentially improve portfolio performance. Second, we enhanced the diversification of our factor set by adding new signals across our investment themes. These signals tend to overweight stocks with four general features: strong and stable growth prospects; lower risk of financial distress; inexpensive; and attractive buyout opportunities. We believe these enhancements will add value to our process over different parts of an economic cycle and will also allow us to incorporate tactical elements across and within sectors over time.
FUND BASICS
Balanced Fund
as of April 30, 2011
| | | | | | | | | | | | | | | | | | | |
| | | | | | | Barclay’s Capital
| | S&P 500 60%/
| | |
November 1, 2010–
| | Fund Total Return
| | | | U.S. Aggregate
| | Barclay’s Capital
| | |
| April 30, 2011 | | (based on NAV)1 | | S&P 5002 | | Bond Index3 | | Aggregate (40%) Index | | |
|
| |
| Class A | | | 9.67 | % | | | 16.36 | % | | | 0.02 | % | | | 9.66 | % | | |
| Class B | | | 9.28 | | | | 16.36 | | | | 0.02 | | | | 9.66 | | | |
| Class C | | | 9.27 | | | | 16.36 | | | | 0.02 | | | | 9.66 | | | |
| Institutional | | | 9.85 | | | | 16.36 | | | | 0.02 | | | | 9.66 | | | |
| Class IR | | | 9.69 | | | | 16.36 | | | | 0.02 | | | | 9.66 | | | |
|
| | |
| 1 | | The net asset value (“NAV”) represents the net assets of the class of the Fund (ex-dividend) divided by the total number of shares of the class outstanding. The Fund’s performance reflects the reinvestment of dividends and other distributions. The Fund’s performance does not reflect the deduction of any applicable sales charges. |
| |
| 2 | | The S&P 500 Index is the Standard & Poor’s 500 Composite Index of 500 stocks, an unmanaged index of common stock prices. The figures for the Index do not include any deduction for fees, expenses or taxes. It is not possible to invest directly in an index. |
| |
| 3 | | The Barclay’s Capital U.S. Aggregate Bond Index represents an unmanaged diversified portfolio of fixed income securities, including U.S. Treasuries, investment-grade corporate bonds, and mortgage-backed and asset-backed securities. The Index figures do not reflect any deductions for fees, expenses or taxes. It is not possible to invest directly in an index. |
| |
| STANDARDIZED AVERAGE ANNUAL TOTAL RETURNS4 | |
| | | | | | | | | | | | | | | | | | | | | |
| For the period ended 3/31/11 | | One Year | | 5 Years | | 10 Years | | Since Inception | | Inception Date | | |
|
| |
| Class A | | | 6.14 | % | | | 3.59 | % | | | 4.01 | % | | | 6.44 | % | | 10/12/94 | | |
| Class B | | | 6.34 | | | | 3.57 | | | | 3.96 | | | | 5.18 | | | 5/1/96 | | |
| Class C | | | 10.45 | | | | 3.99 | | | | 3.82 | | | | 3.15 | | | 8/15/97 | | |
| Institutional | | | 12.78 | | | | 5.18 | | | | 5.12 | | | | 4.41 | | | 8/15/97 | | |
| Class IR | | | N/A | | | | N/A | | | | N/A | | | | 15.61 | | | 8/31/10 | | |
|
| | |
| 4 | | The Standardized Average Annual Total Returns are average annual total returns or cumulative total returns (only if performance period is one year or less) as of the most recent calendar quarter-end. They assume reinvestment of all distributions at NAV. These returns reflect a maximum initial sales charge of 5.5% for Class A Shares, the assumed contingent deferred sales charge for Class B Shares (5% maximum declining to 0% after six years) and the assumed contingent deferred sales charge for Class C Shares (1% if redeemed within 12 months of purchase). Class B Shares convert automatically to Class A Shares on or about the fifteenth day of the last month of the calendar quarter that is eight years after purchase. Returns for Class B Shares for the period after conversion reflect the performance of Class A Shares. Because Institutional and Class IR Shares do not involve a sales charge, such a charge is not applied to their Standardized Average Annual Total Returns. The Fund’s Class B Shares are no longer available for purchase by new or existing shareholders (although current Class B shareholders may continue to reinvest income and capital gains distributions into Class B Shares, and Class B shareholders may continue to exchange their shares for Class B Shares of certain other Goldman Sachs Funds). |
| |
| | These returns represent past performance. Past performance does not guarantee future results. The investment return and principal value of an investment will fluctuate and, therefore, an investor’s shares, when redeemed, may be worth more or less than their original cost. Current performance may be lower or higher than the total return figures in the above charts. Please visit www.goldmansachsfunds.com to obtain the most recent month-end returns. Performance reflects fee waivers and/or expense limitations in effect. In their absence, performance would be reduced. Returns do not reflect the deduction of taxes that a shareholder would pay on Fund distributions or the redemption of Fund shares. |
FUND BASICS
| | | | | | | | | | | |
| | | Net Expense Ratio (Current) | | Gross Expense Ratio (Before Waivers) | | |
|
| |
| Class A | | | 1.05 | % | | | 1.40 | % | | |
| Class B | | | 1.80 | | | | 2.15 | | | |
| Class C | | | 1.80 | | | | 2.15 | | | |
| Institutional | | | 0.65 | | | | 1.00 | | | |
| Class IR | | | 0.80 | | | | 1.15 | | | |
|
| | |
| 5 | | The expense ratios of the Fund, both current (net of applicable fee waivers and/or expense limitations) and before waivers (gross of applicable fee waivers and/or expense limitations), are as set forth above according to the most recent publicly available Prospectus for the Fund and may differ from the expense ratios disclosed in the Financial Highlights in this report. Applicable waivers and expense limitations may be modified or terminated in the future, consistent with the terms of any arrangement in place. If this occurs, the expense ratios may change. |
| |
| TOP TEN EQUITY HOLDINGS AS OF 4/30/116 | |
| | | | | | | | | |
| Holding | | % of Net Assets | | Line of Business | | |
|
| |
| Exxon Mobil Corp. | | | 2.4 | % | | Oil, Gas & Consumable Fuels | | |
| Apple, Inc. | | | 1.9 | | | Computers & Peripherals | | |
| The Coca-Cola Co. | | | 1.3 | | | Beverages | | |
| Pfizer, Inc. | | | 1.2 | | | Pharmaceuticals | | |
| ConocoPhillips | | | 1.1 | | | Oil, Gas & Consumable Fuels | | |
| The Procter & Gamble Co. | | | 1.0 | | | Household Products | | |
| Wells Fargo & Co. | | | 1.0 | | | Commercial Banks | | |
| Chevron Corp. | | | 1.0 | | | Oil, Gas & Consumable Fuels | | |
| JPMorgan Chase & Co. | | | 0.9 | | | Diversified Financial Services | | |
| International Business Machines Corp. | | | 0.9 | | | IT Services | | |
|
| | |
| 6 | | The top 10 holdings may not be representative of the Fund’s future investments. |
FUND BASICS
| |
| FUND’S EQUITY SECTOR ALLOCATIONS VS. BENCHMARK7 | |
As of April 30, 2011
| | |
| 7 | | The Fund is actively managed and, as such, its composition may differ over time. The above graph categorizes investments using Global Industry Classification Standard (“GICS”), however, the sector classifications used by the portfolio management team may differ from GICS. Consequently, the Fund’s overall industry sector allocations may differ from the percentages contained in the graph above. The percentage shown for each investment category reflects the value of investments in that category as a percentage of the total value of the Fund’s Equity investments (excluding investments in the securities lending reinvestment vehicle, if any). Investment in the securities lending reinvestment vehicle represented 0.3% of the Fund’s net assets as of April 30, 2011. |
FUND BASICS
| |
| FUND’S FIXED INCOME COMPOSITION8 | |
As of April 30, 2011
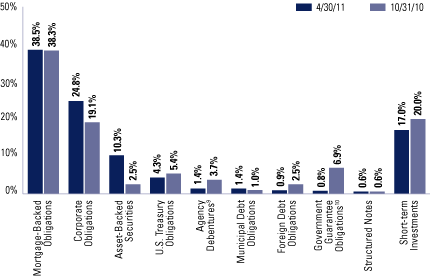
| | |
| 8 | | The percentage shown for each investment category reflects the value of investments in that category as a percentage of the Fund’s Fixed Income investments. Short-term investments represent repurchase agreements. |
| |
| 9 | | “Agency Debentures” include agency securities offered by companies such as Fannie Mae and Freddie Mac, which operate under a government charter. While they are required to report to a government regulator, their assets are not explicitly guaranteed by the government and they otherwise operate like any other publicly traded company. |
| |
| 10 | | “Government Guarantee Obligations” are guaranteed under the Federal Deposit Insurance Corporation’s (“FDIC”) Temporary Liquidity Guarantee Program or a foreign government guarantee program and are backed by the full faith and credit of the United States or the government of a foreign country. The expiration date of the FDIC’s guarantee is the earlier of the maturity date of the debt or June 30, 2012 and the expiration date of a foreign country guarantee is the maturity date of the debt. |
GOLDMAN SACHS STRUCTURED DOMESTIC EQUITY FUNDS
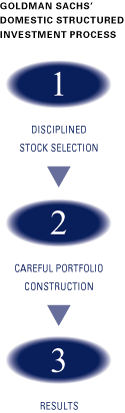
What Differentiates Goldman Sachs’
Domestic Structured Funds Investment Process?
At Goldman Sachs Asset Management, L.P. (“GSAM”), Structured Equity combines traditional fundamental analysis with sophisticated quantitative modeling. Our approach is not unlike that of a more traditional active manager: we look at fundamental investment themes that have been effective historically in forecasting excess returns of stocks. However, where we differ from traditional managers is that we seek to rigorously test every potential research theme or signal to verify whether they have shown consistent predictive ability across a wide variety of stocks in different time periods and under different market conditions.
| |
| n | Comprehensive – We calculate expected excess returns for more than 10,000 stocks on a daily basis. |
| |
| n | Rigorous – We evaluate stocks based on fundamental investment criteria that have outperformed historically. |
| |
| n | Objective – Our stock selection process is free from the emotion that may lead to biased investment decisions. |
| |
| n | Our computer optimization process allocates risk to our best investment ideas and constructs funds that strive to neutralize systematic risks and deliver better returns. |
| |
| n | We use a unique, proprietary risk model that is designed to be more precise, more focused and faster to respond because it seeks to identify, track and manage risk specific to our process, using daily data. |
Fully invested, well-diversified portfolio that seeks to:
| |
| n | Maintain style, sector, risk and capitalization characteristics similar to the benchmark. |
| |
| n | Offer broad access to a clearly defined equity universe. |
| |
| n | Generate excess returns that are positive, consistent and repeatable. |
GOLDMAN SACHS STRUCTURED DOMESTIC EQUITY FUNDS
Enhancements Made to Proprietary Quantitative Model During the Reporting Period
We continuously look for ways to improve our investment process. Accordingly, we introduced two enhancements to our proprietary quantitative model, specifically our stock selection model and process, during the Reporting Period. First, we made an improvement to our quantitative portfolio construction methodology that we believe can enable us to tailor trading to reflect the diverse spectrum of signal speeds. In our opinion, the selection of appropriate implementation speeds for each signal can potentially improve portfolio performance. Second, we enhanced the diversification of our factor set by adding new signals across our investment themes. These signals tend to overweight stocks with four general features: strong and stable growth prospects; lower risk of financial distress; inexpensive; and attractive buyout opportunities. We believe these enhancements will add value to our process over different parts of an economic cycle and will also allow us to incorporate tactical elements across and within sectors over time.
PORTFOLIO RESULTS
Structured Large Cap Growth Fund
Portfolio Management Discussion and Analysis
Below, the Goldman Sachs Quantitative Investment Strategies Team discusses the Structured Large Cap Growth Fund’s (the “Fund”) performance and positioning for the six-month period ended April 30, 2011 (the “Reporting Period”).
| |
| Q | How did the Fund perform during the Reporting Period? |
| |
| A | During the Reporting Period, the Fund’s Class A, B, C, Institutional, Service, IR and R Shares generated cumulative total returns, without sales charges, of 16.33%, 15.95%, 15.98%, 16.55%, 16.24%, 16.49% and 16.15%, respectively. These returns compare to the 16.96% cumulative total return of the Fund’s benchmark, the Russell 1000® Growth Index (with dividends reinvested) (the “Index”), during the same period. |
| |
| Q | What key factors were most responsible for the Fund’s performance during the Reporting Period? |
| |
| A | As expected, and in keeping with our investment approach, our quantitative model and its six investment themes had the greatest impact on relative performance. We use the model’s six investment themes to take a long-term view of market patterns and look for inefficiencies, selecting stocks for the Fund and overweighting or underweighting the ones chosen by the model. Over time and by design, the performance of any one of the model’s investment themes tends to have a low correlation with the model’s other themes, demonstrating the diversification benefit of the Fund’s theme-driven quantitative model. The variance in performance supports our research indicating that the diversification provided by our different investment themes is a significant investment advantage over the long term, even though the Fund may experience underperformance in the short term. Of course, diversification does not protect an investor from market risk nor does it ensure a profit. |
Overall, the Fund underperformed the Index during the Reporting Period with our Momentum and Valuation investment themes detracting most from relative returns. Momentum predicts drift in stock prices caused by under-reaction to company-specific information, while Valuation attempts to capture potential mispricings of securities, typically by comparing a measure of the company’s intrinsic value to its market value. Our Quality and Profitability themes also dampened results. Quality evaluates whether the company’s earnings are coming from more persistent, cash-based sources, as opposed to accruals. Profitability assesses whether a company is earning more than its cost of capital.
Sentiment, which reflects selected investment views and decisions of individuals and financial intermediaries, was our best-performing theme. Our Management theme also added positively to results. Management assesses the characteristics, policies and strategic decisions of company management.
| |
| Q | How did the Fund’s sector allocations affect relative performance? |
| |
| A | In constructing the Fund’s portfolio, we focus on picking stocks rather than on making industry or sector bets. Consequently, the Fund is similar to the Index in terms of its sector allocation and style. Changes in its sector weights generally do not have a meaningful impact on relative performance. |
| |
| Q | Did stock selection help or hurt Fund performance during the Reporting Period? |
| |
| A | We seek to outpace the Index by overweighting stocks we expect to outperform and underweighting those we think may lag. We also build positions based on our thematic views. For example, the Fund aims to hold a basket of stocks with better Momentum characteristics than the benchmark. During the Reporting Period, our stock picks detracted from the Fund’s relative performance. |
PORTFOLIO RESULTS
| |
| Q | Which stock positions contributed the most to the Fund’s relative returns during the Reporting Period? |
| |
| A | Security selection in the consumer discretionary, consumer staples and energy sectors enhanced the Fund’s relative returns. The Fund benefited from overweighted positions in oil refiner Valero Energy, consulting firm Accenture and oil and gas company Chevron. We assumed all three overweighted positions because of our positive views on Profitability. |
| |
| Q | Which individual positions detracted from the Fund’s results during the Reporting Period? |
| |
| A | Stock picks in the information technology, industrials and health care sectors detracted from the Fund’s relative performance. The Fund’s results were hampered by overweighted positions in software maker Microsoft and cruise line company Carnival, positions that we adopted because of our positive views on Momentum. An underweighted position in heavy equipment manufacturer Caterpillar, assumed because of our negative views on Sentiment and Value, was also a drag on relative returns. |
| |
| Q | How did the Fund use derivatives or similar instruments during the Reporting Period? |
| |
| A | As we sought to increase the Fund’s total return and to hedge its portfolio against shifts in market conditions, we used instruments such as financial futures contracts. Specifically, we used stock futures to equitize the Fund’s cash holdings. In other words, we put the Fund’s cash holdings to work by using them as collateral for the purchase of stock futures. |
| |
| Q | What was the Fund’s sector positioning relative to the Index at the end of the Reporting Period? |
| |
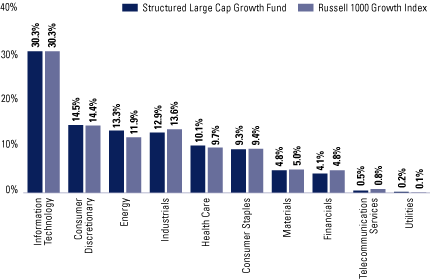
| A | At the end of the Reporting Period, the Fund was overweight the energy and health care sectors relative to the Index. The Fund was underweight industrials, financials, materials and telecommunication services. Compared to the Index, it was relatively neutral to the information technology, consumer discretionary, utilities and consumer staples sectors at the end of the Reporting Period. |
FUND BASICS
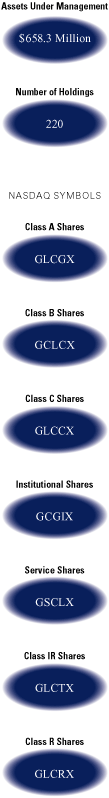
Structured Large Cap Growth Fund
as of April 30, 2011
| | | | | | | | | | | |
| | | Fund Total Return
| | Russell 1000
| | |
| November 1, 2010–April 30, 2011 | | (based on NAV)1 | | Growth Index2 | | |
|
| |
| Class A | | | 16.33 | % | | | 16.96 | % | | |
| Class B | | | 15.95 | | | | 16.96 | | | |
| Class C | | | 15.98 | | | | 16.96 | | | |
| Institutional | | | 16.55 | | | | 16.96 | | | |
| Service | | | 16.24 | | | | 16.96 | | | |
| Class IR | | | 16.49 | | | | 16.96 | | | |
| Class R | | | 16.15 | | | | 16.96 | | | |
|
| | |
| 1 | | The net asset value (“NAV”) represents the net assets of the class of the Fund (ex-dividend) divided by the total number of shares of the class outstanding. The Fund’s performance reflects the reinvestment of dividends and other distributions. The Fund’s performance does not reflect the deduction of any applicable sales charges. |
| |
| 2 | | The Russell 1000 Growth Index is an unmanaged market capitalization weighted index of the 1000 largest U.S. companies with higher price-to-book ratios and higher forecasted growth values. The figures for the Index do not include any deduction for fees, expenses or taxes. It is not possible to invest directly in an index. |
| |
| STANDARDIZED AVERAGE ANNUAL TOTAL RETURNS3 | |
| | | | | | | | | | | | | | | | | | | | | |
| For the period ended 3/31/11 | | One Year | | Five Years | | Ten Years | | Since Inception | | Inception Date | | |
|
| |
| Class A | | | 8.26 | % | | | -1.50 | % | | | 0.71 | % | | | 2.47 | % | | 5/1/97 | | |
| Class B | | | 8.65 | | | | -1.56 | | | | 0.64 | | | | 2.43 | | | 5/1/97 | | |
| Class C | | | 12.80 | | | | -1.15 | | | | 0.51 | | | | 0.92 | | | 8/15/97 | | |
| Institutional | | | 15.04 | | | | 0.04 | | | | 1.70 | | | | 3.29 | | | 5/1/97 | | |
| Service | | | 14.46 | | | | -0.48 | | | | 1.20 | | | | 2.78 | | | 5/1/97 | | |
| Class IR | | | 14.91 | | | | N/A | | | | N/A | | | | -2.25 | | | 11/30/07 | | |
| Class R | | | 14.27 | | | | N/A | | | | N/A | | | | -2.72 | | | 11/30/07 | | |
|
| | |
| 3 | | The Standardized Average Annual Total Returns are average annual total returns as of the most recent calendar quarter-end. They assume reinvestment of all distributions at NAV. These returns reflect a maximum initial sales charge of 5.5% for Class A Shares, the assumed contingent deferred sales charge for Class B Shares (5% maximum declining to 0% after six years) and the assumed contingent deferred sales charge for Class C Shares (1% if redeemed within 12 months of purchase). Class B Shares convert automatically to Class A Shares on or about the fifteenth day of the last month of the calendar quarter that is eight years after purchase. Returns for Class B Shares for the period after conversion reflect the performance of Class A Shares. Because Institutional, Service, Class IR and Class R Shares do not involve a sales charge, such a charge is not applied to their Standardized Average Annual Total Returns. The Fund’s Class B Shares are no longer available for purchase by new or existing shareholders (although current Class B shareholders may continue to reinvest income and capital gains distributions into Class B Shares, and Class B shareholders may continue to exchange their shares for Class B Shares of certain other Goldman Sachs Funds). |
| |
| | These returns represent past performance. Past performance does not guarantee future results. The investment return and principal value of an investment will fluctuate and, therefore, an investor’s shares, when redeemed, may be worth more or less than their original cost. Current performance may be lower or higher than the total return figures in the above charts. Please visit www.goldmansachsfunds.com to obtain the most recent month-end returns. Performance reflects fee waivers and/or expense limitations in effect. In their absence, performance would be reduced. Returns do not reflect the deduction of taxes that a shareholder would pay on Fund distributions or the redemption of Fund shares. |
FUND BASICS
| | | | | | | | | | | |
| | | Net Expense Ratio (Current) | | Gross Expense Ratio (Before Waivers) | | |
|
| |
| Class A | | | 0.95 | % | | | 1.16 | % | | |
| Class B | | | 1.70 | | | | 1.91 | | | |
| Class C | | | 1.70 | | | | 1.91 | | | |
| Institutional | | | 0.55 | | | | 0.76 | | | |
| Service | | | 1.05 | | | | 1.26 | | | |
| Class IR | | | 0.70 | | | | 0.91 | | | |
| Class R | | | 1.20 | | | | 1.41 | | | |
|
| | |
| 4 | | The expense ratios of the Fund, both current (net of applicable fee waivers and/or expense limitations) and before waivers (gross of applicable fee waivers and/or expense limitations), are as set forth above according to the most recent publicly available Prospectus for the Fund and may differ from the expense ratios disclosed in the Financial Highlights in this report. Applicable waivers and expense limitations may be modified or terminated in the future, consistent with the terms of any arrangement in place. If this occurs, the expense ratios may change. |
| |
| TOP TEN HOLDINGS AS OF 4/30/115 | |
| | | | | | | | | |
| Holding | | % of Net Assets | | Line of Business | | |
|
| |
| Exxon Mobil Corp. | | | 4.9 | % | | Oil, Gas & Consumable Fuels | | |
| Microsoft Corp. | | | 4.3 | | | Software | | |
| Intel Corp. | | | 3.4 | | | Semiconductors & Semiconductor Equipment | | |
| Lorillard, Inc. | | | 3.4 | | | Tobacco | | |
| Accenture PLC | | | 3.1 | | | IT Services | | |
| ConocoPhillips | | | 2.3 | | | Oil, Gas & Consumable Fuels | | |
| Google, Inc. Class A | | | 2.1 | | | Internet Software & Services | | |
| The Toro Co. | | | 2.1 | | | Machinery | | |
| Oracle Corp. | | | 2.1 | | | Software | | |
| Eli Lilly & Co. | | | 2.0 | | | Pharmaceuticals | | |
|
| | |
| 5 | | The top 10 holdings may not be representative of the Fund’s future investments. |
FUND BASICS
| |
| FUND VS. BENCHMARK SECTOR ALLOCATIONS6 | |
As of April 30, 2011
| | |
| 6 | | The Fund is actively managed and, as such, its composition may differ over time. The above graph categorizes investments using Global Industry Classification Standard (“GICS”), however, the sector classifications used by the portfolio management team may differ from GICS. Consequently, the Fund’s overall industry sector allocations may differ from the percentages contained in the graph above. The percentage shown for each investment category reflects the value of investments in that category as a percentage of market value (excluding investments in the securities lending reinvestment vehicle, if any). Investment in the securities lending reinvestment vehicle represented 1.2% of the Fund’s net assets as of April 30, 2011. |
PORTFOLIO RESULTS
Structured Large Cap Value Fund
Portfolio Management Discussion and Analysis
Below, the Goldman Sachs Quantitative Investment Strategies Team discusses the Goldman Sachs Large Cap Value Fund’s (the “Fund”) performance and positioning for the six-month period ended April 30, 2011 (the “Reporting Period”).
| |
| Q | How did the Fund perform during the Reporting Period? |
| |
| A | During the Reporting Period, the Fund’s Class A, B, C, Institutional, Service, IR and R Shares generated cumulative total returns, without sales charges, of 18.55%, 18.11%, 18.15%, 18.91%, 18.53%, 18.74% and 18.45%, respectively. These returns compare to the 17.29% cumulative total return of the Fund’s benchmark, the Russell 1000® Value Index (with dividends reinvested) (the “Index”), during the same period. |
| |
| Q | What key factors were most responsible for the Fund’s performance during the Reporting Period? |
| |
| A | As expected, and in keeping with our investment approach, our quantitative model and its six investment themes had the greatest impact on relative performance. We use the model’s six investment themes to take a long-term view of market patterns and look for inefficiencies, selecting stocks for the Fund and overweighting or underweighting the ones chosen by the model. Over time and by design, the performance of any one of the model’s investment themes tends to have a low correlation with the model’s other themes, demonstrating the diversification benefit of the Fund’s theme-driven quantitative model. The variance in performance supports our research indicating that the diversification provided by our different investment themes is a significant investment advantage over the long term, even though the Fund may experience underperformance in the short term. Of course, diversification does not protect an investor from market risk nor does it ensure a profit. |
Overall, the Fund outperformed the Index during the Reporting Period with our Sentiment investment theme contributing the most to relative results. Sentiment reflects selected investment views and decisions of individuals and financial intermediaries. Management and Valuation also enhanced relative performance. Our Management theme assesses the characteristics, policies and strategic decisions of company management, while Valuation attempts to capture potential mispricings of securities, typically by comparing a measure of the company’s intrinsic value to its market value. Profitability also added value, though to a lesser extent. Profitability assesses whether a company is earning more than its cost of capital.
Our Momentum theme, which predicts drift in stock prices caused by under-reaction to company-specific information, was our weakest performing theme. Quality also dampened relative results. The Quality theme evaluates whether the company’s earnings are coming from more persistent, cash-based sources, as opposed to accruals.
| |
| Q | How did the Fund’s sector allocations affect relative performance? |
| |
| A | In constructing the Fund’s portfolio, we focus on picking stocks rather than on making industry or sector bets. Consequently, the Fund is similar to the Index in terms of its sector allocation and style. Changes in its sector weights generally do not have a meaningful impact on relative performance. |
| |
| Q | Did stock selection help or hurt Fund performance during the Reporting Period? |
| |
| A | We seek to outpace the Index by overweighting stocks we expect to outperform and underweighting those we think may lag. We also build positions based on our thematic views. For example, the Fund aims to hold a basket of stocks with better Momentum characteristics than the benchmark. During the Reporting Period, our stock picks added to the Fund’s relative performance. |
PORTFOLIO RESULTS
| |
| Q | Which stock positions contributed the most to the Fund’s relative returns during the Reporting Period? |
| |
| A | Stock picks in the financials, consumer staples and health care sectors contributed to the Fund’s relative returns. The Fund benefited from overweighted positions in oil refiner Valero Energy and petroleum company Tesoro. We chose to overweight Valero Energy because of our positive views on Profitability and Valuation, while the Fund was overweight Tesoro as a result of our positive views on Profitability and Momentum. Having an underweighted position in pharmaceutical company Merck, adopted because of our negative views on Sentiment and Momentum, was also advantageous. |
| |
| Q | Which individual positions detracted from the Fund’s results during the Reporting Period? |
| |
| A | Investments in the industrials, utilities and energy sectors detracted from the Fund’s relative results. The Fund was hampered by overweighted positions in pharmaceutical company Eli Lilly and electric and gas utility Duke Energy. We chose to overweight to Eli Lilly because of our positive views on Profitability, while our positive views on Profitability and Valuation led to the Fund’s overweight in Duke Energy. Also detracting was an underweighted position in oil and gas exploration company Occidental Petroleum, which was assumed as a result of our negative views on Sentiment. |
| |
| Q | How did the Fund use derivatives or similar instruments during the Reporting Period? |
| |
| A | As we sought to increase the Fund’s total return and to hedge its portfolio against shifts in market conditions, we used instruments such as financial futures contracts. Specifically, we used stock futures to equitize the Fund’s cash holdings. In other words, we put the Fund’s cash holdings to work by using them as collateral for the purchase of stock futures. |
| |
| Q | What was the Fund’s sector positioning relative to the Index at the end of the Reporting Period? |
| |
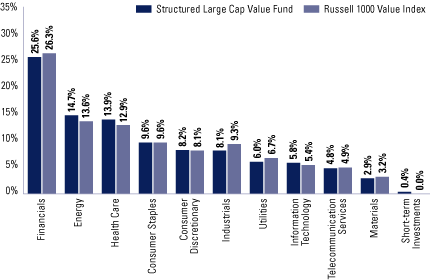
| A | At the end of the Reporting Period, the Fund was overweight the energy, health care and information technology sectors relative to the Index. The Fund was underweight the industrials, utilities, financials, materials and telecommunication services sectors. It was relatively neutral to consumer discretionary and consumer staples compared to the Index at the end of the Reporting Period. |
FUND BASICS
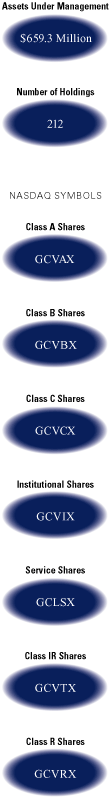
Structured Large Cap Value Fund
as of April 30, 2011
| | | | | | | | | | | |
| | | Fund Total Return
| | | | |
| November 1, 2010–April 30, 2011 | | (based on NAV)1 | | Russell 1000 Value Index2 | | |
|
| |
| Class A | | | 18.55 | % | | | 17.29 | % | | |
| Class B | | | 18.11 | | | | 17.29 | | | |
| Class C | | | 18.15 | | | | 17.29 | | | |
| Institutional | | | 18.91 | | | | 17.29 | | | |
| Service | | | 18.53 | | | | 17.29 | | | |
| Class IR | | | 18.74 | | | | 17.29 | | | |
| Class R | | | 18.45 | | | | 17.29 | | | |
|
| | |
| 1 | | The net asset value (“NAV”) represents the net assets of the class of the Fund (ex-dividend) divided by the total number of shares of the class outstanding. The Fund’s performance reflects the reinvestment of dividends and other distributions. The Fund’s performance does not reflect the deduction of any applicable sales charges. |
| |
| 2 | | The Russell 1000 Value Index is an unmanaged market capitalization weighted index of the 1000 largest U.S. companies with lower price-to-book ratios and lower forecasted growth values. The figures for the Index do not include any deduction for fees, expenses or taxes. It is not possible to invest directly in an index. |
| |
| STANDARDIZED AVERAGE ANNUAL TOTAL RETURNS3 | |
| | | | | | | | | | | | | | | | | | | | | |
| For the period ended 3/31/11 | | One Year | | 5 Years | | 10 Years | | Since Inception | | Inception Date | | |
|
| |
| Class A | | | 8.99 | % | | | -2.67 | % | | | 2.44 | % | | | 2.50 | % | | 12/31/98 | | |
| Class B | | | 9.52 | | | | -2.67 | | | | 2.38 | | | | 2.46 | | | 12/31/98 | | |
| Class C | | | 13.50 | | | | -2.29 | | | | 2.26 | | | | 2.20 | | | 12/31/98 | | |
| Institutional | | | 15.86 | | | | -1.16 | | | | 3.44 | | | | 3.37 | | | 12/31/98 | | |
| Service | | | 15.30 | | | | -1.63 | | | | 2.93 | | | | 2.87 | | | 12/31/98 | | |
| Class IR | | | 15.71 | | | | N/A | | | | N/A | | | | -4.08 | | | 11/30/07 | | |
| Class R | | | 15.14 | | | | N/A | | | | N/A | | | | -4.53 | | | 11/30/07 | | |
|
| | |
| 3 | | The Standardized Average Annual Total Returns are average annual total returns as of the most recent calendar quarter-end. They assume reinvestment of all distributions at NAV. These returns reflect a maximum initial sales charge of 5.5% for Class A Shares, the assumed contingent deferred sales charge for Class B Shares (5% maximum declining to 0% after six years) and the assumed contingent deferred sales charge for Class C Shares (1% if redeemed within 12 months of purchase). Class B Shares convert automatically to Class A Shares on or about the fifteenth day of the last month of the calendar quarter that is eight years after purchase. Returns for Class B Shares for the period after conversion reflect the performance of Class A Shares. Because Institutional, Service, Class IR and Class R Shares do not involve a sales charge, such a charge is not applied to their Standardized Average Annual Total Returns. The Fund’s Class B Shares are no longer available for purchase by new or existing shareholders (although current Class B shareholders may continue to reinvest income and capital gains distributions into Class B Shares, and Class B shareholders may continue to exchange their shares for Class B Shares of certain other Goldman Sachs Funds). |
| |
| | These returns represent past performance. Past performance does not guarantee future results. The investment return and principal value of an investment will fluctuate and, therefore, an investor’s shares, when redeemed, may be worth more or less than their original cost. Current performance may be lower or higher than the total return figures in the above charts. Please visit www.goldmansachsfunds.com to obtain the most recent month-end returns. Performance reflects fee waivers and/or expense limitations in effect. In their absence, performance would be reduced. Returns do not reflect the deduction of taxes that a shareholder would pay on Fund distributions or the redemption of Fund shares. |
FUND BASICS
| | | | | | | | | | | |
| | | Net Expense Ratio (Current) | | Gross Expense Ratio (Before Waivers) | | |
|
| |
| Class A | | | 0.94 | % | | | 1.10 | % | | |
| Class B | | | 1.69 | | | | 1.85 | | | |
| Class C | | | 1.69 | | | | 1.85 | | | |
| Institutional | | | 0.54 | | | | 0.70 | | | |
| Service | | | 1.04 | | | | 1.20 | | | |
| Class IR | | | 0.69 | | | | 0.85 | | | |
| Class R | | | 1.19 | | | | 1.35 | | | |
|
| | |
| 4 | | The expense ratios of the Fund, both current (net of applicable fee waivers and/or expense limitations) and before waivers (gross of applicable fee waivers and/or expense limitations), are as set forth above according to the most recent publicly available Prospectus for the Fund and may differ from the expense ratios disclosed in the Financial Highlights in this report. Applicable waivers and expense limitations may be modified or terminated in the future, consistent with the terms of any arrangement in place. If this occurs, the expense ratios may change. |
| |
| TOP TEN HOLDINGS AS OF 4/30/115 | |
| | | | | | | | | |
| Holding | | % of Net Assets | | Line of Business | | |
|
| |
| Chevron Corp. | | | 4.5 | % | | Oil, Gas & Consumable Fuels | | |
| AT&T, Inc. | | | 3.6 | | | Diversified Telecommunication Services | | |
| Lorillard, Inc. | | | 3.1 | | | Tobacco | | |
| ConocoPhillips | | | 3.0 | | | Oil, Gas & Consumable Fuels | | |
| Pfizer, Inc. | | | 2.9 | | | Pharmaceuticals | | |
| Eli Lilly & Co. | | | 2.8 | | | Pharmaceuticals | | |
| Wells Fargo & Co. | | | 2.5 | | | Commercial Banks | | |
| Simon Property Group, Inc. | | | 2.4 | | | Real Estate Investment Trusts | | |
| The Procter & Gamble Co. | | | 2.3 | | | Household Products | | |
| General Electric Co. | | | 2.2 | | | Industrial Conglomerates | | |
|
| | |
| 5 | | The top 10 holdings may not be representative of the Fund’s future investments. |
FUND BASICS
| |
| FUND VS. BENCHMARK SECTOR ALLOCATIONS6 | |
As of April 30, 2011
| | |
| 6 | | The Fund is actively managed and, as such, its composition may differ over time. The above graph categorizes investments using Global Industry Classification Standard (“GICS”), however, the sector classifications used by the portfolio management team may differ from GICS. Consequently, the Fund’s overall industry sector allocations may differ from the percentages contained in the graph above. The percentage shown for each investment category reflects the value of investments in that category as a percentage of market value (excluding investments in the securities lending reinvestment vehicle, if any). Investment in the securities lending reinvestment vehicle represented 1.1% of the Fund’s net assets as of April 30, 2011. Short-term investments represent repurchase agreements. |
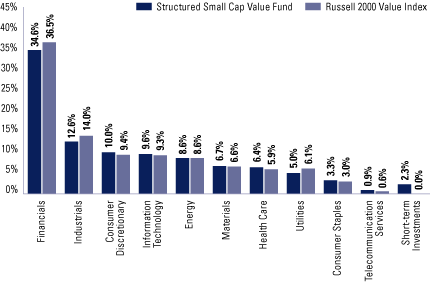
PORTFOLIO RESULTS
Structured Small Cap Equity Fund
Portfolio Management Discussion and Analysis
Below, the Goldman Sachs Quantitative Investment Strategies Team discusses the Goldman Sachs Structured Small Cap Equity Fund’s (the “Fund”) performance and positioning for the six-month period ended April 30, 2011 (the “Reporting Period”).
| |
| Q | How did the Fund perform during the Reporting Period? |
| |
| A | During the Reporting Period, the Fund’s Class A, B, C, Institutional, Service, IR and R Shares generated cumulative total returns, without sales charges, of 23.48%, 22.96%, 22.98%, 23.76%, 23.37%, 23.66% and 23.36%, respectively. These returns compare to the 23.73% cumulative total return of the Fund’s benchmark, the Russell 2000® Index (with dividends reinvested) (the “Index”), during the same period. |
| |
| Q | What key factors were most responsible for the Fund’s performance during the Reporting Period? |
| |
| A | As expected, and in keeping with our investment approach, our quantitative model and its six investment themes had the greatest impact on relative performance. We use the model’s six investment themes to take a long-term view of market patterns and look for inefficiencies, selecting stocks for the Fund and overweighting or underweighting the ones chosen by the model. Over time and by design, the performance of any one of the model’s investment themes tends to have a low correlation with the model’s other themes, demonstrating the diversification benefit of the Fund’s theme-driven quantitative model. The variance in performance supports our research indicating that the diversification provided by our different investment themes is a significant investment advantage over the long term, even though the Fund may experience underperformance in the short term. Of course, diversification does not protect an investor from market risk nor does it ensure a profit. |
Overall, the Fund underperformed the Index during the Reporting Period with our Momentum and Valuation investment themes detracting the most from relative results. Momentum predicts drift in stock prices caused by under-reaction to company-specific information, while Valuation captures potential mispricings of securities, typically by comparing a measure of the company’s intrinsic value to its market value.
Management and Profitability contributed positively to relative returns. The Management theme assesses the characteristics, policies and strategic decisions of company management. Profitability assesses whether a company is earning more than its cost of capital. Quality also added value, although to a lesser extent. Quality evaluates whether the company’s earnings are coming from more persistent, cash-based sources, as opposed to accruals. The impact of our Sentiment theme was relatively neutral. Sentiment reflects selected investment views and decisions of individuals and financial intermediaries.
| |
| Q | How did the Fund’s sector allocations affect relative performance? |
| |
| A | In constructing the Fund’s portfolio, we focus on picking stocks rather than on making industry or sector bets. Consequently, the Fund is similar to the Index in terms of its sector allocation and style. Changes in its sector weights generally do not have a meaningful impact on relative performance. |
| |
| Q | Did stock selection help or hurt Fund performance during the Reporting Period? |
| |
| A | We seek to outpace the Index by overweighting stocks we expect to outperform and underweighting those we think may lag. We also build positions based on our thematic views. For example, the Fund aims to hold a basket of stocks with better Momentum characteristics than the benchmark. During the Reporting Period, stock selection detracted from the Fund’s relative performance. |
| |
| Q | Which positions contributed the most to the Fund’s relative returns during the Reporting Period? |
| |
| A | Investments in the energy, consumer discretionary and health care sectors added to the Fund’s relative performance. The Fund benefited from overweighted positions in petroleum company Tesoro, oil and gas exploration company W&T Offshore and oil refiner Western Refining. We chose to overweight Tesoro and Western Refining as a result of our positive views on Profitability and Momentum. The Fund was overweight W&T Offshore because of our positive views on Momentum and Quality. |
PORTFOLIO RESULTS
| |
| Q | Which individual positions detracted from the Fund’s results during the Reporting Period? |
| |
| A | Stock picks in the industrials, materials and financials sectors dampened the Fund’s performance versus the Index. The Fund was hampered by overweighted positions in Allegiant Travel, a leisure travel company; Lionbridge Technologies, a provider of language, development and testing services for technology applications; and USA Mobility, a supplier of wireless communications and software solutions. We overweighted Allegiant Travel because of our positive views on Profitability and Management. The Fund was overweight Lionbridge Technologies as a result of our positive views on Momentum. We chose to overweight USA Mobility because of our positive views on Quality. |
| |
| Q | How did the Fund use derivatives or similar instruments during the Reporting Period? |
| |
| A | As we sought to increase the Fund’s total return and to hedge its portfolio against shifts in market conditions, we used instruments such as financial futures contracts. Specifically, we used stock futures to equitize the Fund’s cash holdings. In other words, we put the Fund’s cash holdings to work by using them as collateral for the purchase of stock futures. |
| |
| Q | What was the Fund’s sector positioning relative to the Index at the end of the Reporting Period? |
| |
| A | At the end of the Reporting Period, the Fund was overweight the consumer staples, telecommunication services, health care and consumer discretionary sectors relative to the Index. It was underweight utilities, financials and industrials. The Fund was relatively neutral in the energy, information technology and materials sectors compared to the Index at the end of the Reporting Period. |
FUND BASICS
Structured Small Cap Equity Fund
as of April 30, 2011
| | | | | | | | | | | |
| | | Fund Total Return
| | | | |
| November 1, 2010–April 30, 2011 | | (based on NAV)1 | | Russell 2000 Index2 | | |
|
| |
| Class A | | | 23.48 | % | | | 23.73 | % | | |
| Class B | | | 22.96 | | | | 23.73 | | | |
| Class C | | | 22.98 | | | | 23.73 | | | |
| Institutional | | | 23.76 | | | | 23.73 | | | |
| Service | | | 23.37 | | | | 23.73 | | | |
| Class IR | | | 23.66 | | | | 23.73 | | | |
| Class R | | | 23.36 | | | | 23.73 | | | |
|
| | |
| 1 | | The net asset value (“NAV”) represents the net assets of the class of the Fund (ex-dividend) divided by the total number of shares of the class outstanding. The Fund’s performance reflects the reinvestment of dividends and other distributions. The Fund’s performance does not reflect the deduction of any applicable sales charges. |
| |
| 2 | | The Russell 2000 Index is an unmanaged index of common stock prices that measures the performance of the 2000 smallest companies in the Russell 3000 Index. The figures for the Index do not include any deduction for fees, expenses or taxes. It is not possible to invest directly in an index. |
| |
| STANDARDIZED AVERAGE ANNUAL TOTAL RETURNS3 | |
| | | | | | | | | | | | | | | | | | | | | |
| For the period ended 3/31/11 | | One Year | | Five Years | | Ten Years | | Since Inception | | Inception Date | | |
|
| |
| Class A | | | 19.51 | % | | | -1.44 | % | | | 5.73 | % | | | 5.10 | % | | 8/15/97 | | |
| Class B | | | 20.46 | | | | -1.47 | | | | 5.66 | | | | 5.07 | | | 8/15/97 | | |
| Class C | | | 24.60 | | | | -1.07 | | | | 5.54 | | | | 4.78 | | | 8/15/97 | | |
| Institutional | | | 27.02 | | | | 0.08 | | | | 6.75 | | | | 5.95 | | | 8/15/97 | | |
| Service | | | 26.24 | | | | -0.44 | | | | 6.21 | | | | 5.43 | | | 8/15/97 | | |
| Class IR | | | 26.76 | | | | N/A | | | | N/A | | | | 4.65 | | | 11/30/07 | | |
| Class R | | | 26.10 | | | | N/A | | | | N/A | | | | 4.16 | | | 11/30/07 | | |
|
| | |
| 3 | | The Standardized Average Annual Total Returns are average annual total returns as of the most recent calendar quarter-end. They assume reinvestment of all distributions at NAV. These returns reflect a maximum initial sales charge of 5.5% for Class A Shares, the assumed contingent deferred sales charge for Class B Shares (5% maximum declining to 0% after six years) and the assumed contingent deferred sales charge for Class C Shares (1% if redeemed within 12 months of purchase). Class B Shares convert automatically to Class A Shares on or about the fifteenth day of the last month of the calendar quarter that is eight years after purchase. Returns for Class B Shares for the period after conversion reflect the performance of Class A Shares. Because Institutional, Service, Class IR and Class R Shares do not involve a sales charge, such a charge is not applied to their Standardized Average Annual Total Returns. The Fund’s Class B Shares are no longer available for purchase by new or existing shareholders (although current Class B shareholders may continue to reinvest income and capital gains distributions into Class B Shares, and Class B shareholders may continue to exchange their shares for Class B Shares of certain other Goldman Sachs Funds). |
| |
| | These returns represent past performance. Past performance does not guarantee future results. The investment return and principal value of an investment will fluctuate and, therefore, an investor’s shares, when redeemed, may be worth more or less than their original cost. Current performance may be lower or higher than the total return figures in the above charts. Please visit www.goldmansachsfunds.com to obtain the most recent month-end returns. Performance reflects fee waivers and/or expense limitations in effect. In their absence, performance would be reduced. Returns do not reflect the deduction of taxes that a shareholder would pay on Fund distributions or the redemption of Fund shares. |
FUND BASICS
| | | | | | | | | | | |
| | | Net Expense Ratio (Current) | | Gross Expense Ratio (Before Waivers) | | |
|
| |
| Class A | | | 1.25 | % | | | 1.39 | % | | |
| Class B | | | 2.00 | | | | 2.14 | | | |
| Class C | | | 2.00 | | | | 2.14 | | | |
| Institutional | | | 0.85 | | | | 0.99 | | | |
| Service | | | 1.35 | | | | 1.49 | | | |
| Class IR | | | 1.00 | | | | 1.14 | | | |
| Class R | | | 1.50 | | | | 1.64 | | | |
|
| | |
| 4 | | The expense ratios of the Fund, both current (net of applicable fee waivers and/or expense limitations) and before waivers (gross of applicable fee waivers and/or expense limitations), are as set forth above according to the most recent publicly available Prospectus for the Fund and may differ from the expense ratios disclosed in the Financial Highlights in this report. Applicable waivers and expense limitations may be modified or terminated in the future, consistent with the terms of any arrangement in place. If this occurs, the expense ratios may change. |
| |
| TOP TEN HOLDINGS AS OF 4/30/115 | |
| | | | | | | |
| Holding | | % of Net Assets | | Line of Business |
|
| |
| Tesoro Corp. | | | 2.4 | % | | Oil, Gas & Consumable Fuels |
| Rayonier, Inc. | | | 2.3 | | | Real Estate Investment Trusts |
| Lattice Semiconductor Corp. | | | 2.1 | | | Semiconductors & Semiconductor Equipment |
| MicroStrategy, Inc. | | | 1.7 | | | Software |
| USA Mobility, Inc. | | | 1.5 | | | Wireless Telecommunication Services |
| W&T Offshore, Inc. | | | 1.5 | | | Oil, Gas & Consumable Fuels |
| Nationwide Health Properties, Inc. | | | 1.3 | | | Real Estate Investment Trusts |
| Hill-Rom Holdings, Inc. | | | 1.3 | | | Health Care Equipment & Supplies |
| Molina Healthcare, Inc. | | | 1.2 | | | Health Care Providers & Services |
| International Bancshares Corp. | | | 1.2 | | | Commercial Banks |
|
| | |
| 5 | | The top 10 holdings may not be representative of the Fund’s future investments. |
FUND BASICS
| |
| FUND VS. BENCHMARK SECTOR ALLOCATIONS6 | |
As of April 30, 2011
| | |
| 6 | | The Fund is actively managed and, as such, its composition may differ over time. The above graph categorizes investments using Global Industry Classification Standard (“GICS”), however, the sector classifications used by the portfolio management team may differ from GICS. Consequently, the Fund’s overall industry sector allocations may differ from the percentages contained in the graph above. The percentage shown for each investment category reflects the value of investments in that category as a percentage of market value (excluding investments in the securities lending reinvestment vehicle, if any). Investment in the securities lending reinvestment vehicle represented 3.2% of the Fund’s net assets as of April 30, 2011. Short-term investments represent repurchase agreements. |
PORTFOLIO RESULTS
Structured Small Cap Growth Fund
Portfolio Management Discussion and Analysis
Below, the Goldman Sachs Quantitative Investment Strategies Team discusses the Goldman Sachs Structured Small Cap Growth Fund’s (the “Fund”) performance and positioning for the six-month period ended April 30, 2011 (the “Reporting Period”).
| |
| Q | How did the Fund perform during the Reporting Period? |
| |
| A | During the Reporting Period, the Fund’s Class A, B, C, Institutional, IR and R Shares generated cumulative total returns, without sales charges, of 26.88%, 26.41%, 26.44%, 27.18%, 27.07% and 26.73%, respectively. These returns compare to the 27.07% cumulative total return of the Fund’s benchmark, the Russell 2000® Growth Index (with dividends reinvested) (the “Index”), during the same period. |
| |
| Q | What key factors were most responsible for the Fund’s performance during the Reporting Period? |
| |
| A | Security selection generated mixed results during the Reporting Period. However, our quantitative model and its six investment themes overall contributed positively. We use the model’s six investment themes to take a long-term view of market patterns and look for inefficiencies, selecting stocks for the Fund and overweighting or underweighting the ones chosen by the model. Over time and by design, the performance of any one of the model’s investment themes tends to have a low correlation with the model’s other themes, demonstrating the diversification benefit of the Fund’s theme-driven quantitative model. The variance in performance supports our research indicating that the diversification provided by our different investment themes is a significant investment advantage over the long term, even though the Fund may experience underperformance in the short term. Of course, diversification does not protect an investor from market risk nor does it ensure a profit. |
Management was our best-performing investment theme during the Reporting Period. Management assesses the characteristics, policies and strategic decisions of company management. Momentum also added to relative results. The Momentum theme predicts drift in stock prices caused by under-reaction to company-specific information.
Sentiment, Valuation and Quality detracted from relative performance. Sentiment reflects selected investment views and decisions of individuals and financial intermediaries, while Valuation attempts to capture potential mispricings of securities, typically by comparing a measure of the company’s intrinsic value to its market value. Quality evaluates whether the company’s earnings are coming from more persistent, cash-based sources, as opposed to accruals. The impact of our Profitability theme, which assesses whether a company is earning more than its cost of capital, was relatively neutral.
| |
| Q | How did the Fund’s sector allocations affect relative performance? |
| |
| A | In constructing the Fund’s portfolio, we focus on picking stocks rather than on making industry or sector bets. Consequently, the Fund is similar to the Index in terms of its sector allocation and style. Changes in its sector weights generally do not have a meaningful impact on relative performance. |
| |
| Q | Did stock selection help or hurt Fund performance during the Reporting Period? |
| |
| A | We seek to outpace the Index by overweighting stocks we expect to outperform and underweighting those we think may lag. We also build positions based on our thematic views. For example, the Fund aims to hold a basket of stocks with better Momentum characteristics than the benchmark. During the Reporting Period, our security selection provided mixed results. |
| |
| Q | Which investments contributed the most to the Fund’s relative returns during the Reporting Period? |
| |
| A | Security selection in the consumer discretionary, energy and health care sectors contributed to the Fund’s performance versus the Index. The Fund benefited from overweighted positions in oil and gas exploration company W&T Offshore, mobile equipment manufacturer Sauer-Danfoss and petroleum company Tesoro. We chose to overweight W&T Offshore and Sauer-Danfoss because of our positive views on Momentum and Quality. Our positive views on Profitability and Momentum led us to overweight Tesoro. |
PORTFOLIO RESULTS
| |
| Q | Which individual positions detracted from the Fund’s results during the Reporting Period? |
| |
| A | Stock picks in the information technology, materials and financials sectors detracted from the Fund’s relative performance. The Fund was hampered by overweighted positions in leisure travel company Allegiant Travel and pulp and paper product manufacturer Clearwater Paper. We chose to overweight Allegiant Travel because of our positive views on Profitability and Management, while our positive views on Quality and Profitability led us to overweight Clearwater Paper. Also dampening results was having an underweighted position in drugmaker Pharmasset. The Fund was underweight Pharmasset because of our negative views on Profitability and Management. |
| |
| Q | How did the Fund use derivatives or similar instruments during the Reporting Period? |
| |
| A | As we sought to increase the Fund’s total return and to hedge its portfolio against shifts in market conditions, we used instruments such as financial futures contracts. Specifically, we used stock futures to equitize the Fund’s cash holdings. In other words, we put the Fund’s cash holdings to work by using them as collateral for the purchase of stock futures. |
| |
| Q | What was the Fund’s sector positioning relative to the Index at the end of the Reporting Period? |
| |
| A | At the end of the Reporting Period, the Fund was overweight the energy, consumer discretionary, materials and consumer staples sectors relative to the Index. The Fund was underweight the industrials, financials and information technology sectors. It was relatively neutral in health care, telecommunication services and utilities compared to the Index at the end of the Reporting Period. |
FUND BASICS
Structured Small Cap Growth Fund
as of April 30, 2011
| | | | | | | | | | | |
| | | Fund Total Return
| | | | |
| November 1, 2010–April 30, 2011 | | (based on NAV)1 | | Russell 2000 Growth Index2 | | |
|
| |
| Class A | | | 26.88 | % | | | 27.07 | % | | |
| Class B | | | 26.41 | | | | 27.07 | | | |
| Class C | | | 26.44 | | | | 27.07 | | | |
| Institutional | | | 27.18 | | | | 27.07 | | | |
| Class IR | | | 27.07 | | | | 27.07 | | | |
| Class R | | | 26.73 | | | | 27.07 | | | |
|
| | |
| 1 | | The net asset value (“NAV”) represents the net assets of the class of the Fund (ex-dividend) divided by the total number of shares of the class outstanding. The Fund’s performance reflects the reinvestment of dividends and other distributions. The Fund’s performance does not reflect the deduction of any applicable sales charges. |
| |
| 2 | | The Russell 2000 Growth Index measures the performance of the small-cap growth stocks of the U.S. equity universe. The Index figures do not reflect any deduction for fees, expenses or taxes. It is not possible to invest directly in an index. |
| |
| STANDARDIZED AVERAGE ANNUAL TOTAL RETURNS3 | |
| | | | | | | | | | | | | |
| For the period ended 3/31/11 | | One Year | | Since Inception | | Inception Date | | |
|
| |
| Class A | | | 23.44 | % | | | 0.25 | % | | 6/25/07 | | |
| Class B | | | 24.55 | | | | 0.19 | | | 6/25/07 | | |
| Class C | | | 28.58 | | | | 1.00 | | | 6/25/07 | | |
| Institutional | | | 31.07 | | | | 2.18 | | | 6/25/07 | | |
| Class IR | | | 30.95 | | | | 5.21 | | | 11/30/07 | | |
| Class R | | | 30.22 | | | | 4.66 | | | 11/30/07 | | |
|
| | |
| 3 | | The Standardized Average Annual Total Returns are average annual total returns as of the most recent calendar quarter-end. They assume reinvestment of all distributions at NAV. These returns reflect a maximum initial sales charge of 5.5% for Class A Shares, the assumed contingent deferred sales charge for Class B Shares (5% maximum declining to 0% after six years) and the assumed contingent deferred sales charge for Class C Shares (1% if redeemed within 12 months of purchase). Class B Shares convert automatically to Class A Shares on or about the fifteenth day of the last month of the calendar quarter that is eight years after purchase. Returns for Class B Shares for the period after conversion reflect the performance of Class A Shares. Because Institutional, Class IR and R shares do not involve a sales charge, such a charge is not applied to their Standardized Average Annual Total Returns. The Fund’s Class B Shares are no longer available for purchase by new or existing shareholders (although current Class B shareholders may continue to reinvest income and capital gains distributions into Class B Shares, and Class B shareholders may continue to exchange their shares for Class B Shares of certain other Goldman Sachs Funds). |
| |
| | These returns represent past performance. Past performance does not guarantee future results. The Fund’s investment return and principal value will fluctuate so that an investor’s shares, when redeemed, may be worth more or less than their original cost. Current performance may be lower or higher than the performance quoted above. Please visit our Web site at: www.goldmansachsfunds.com to obtain the most recent month-end returns. Performance reflects fee waivers and/or expense limitations in effect. In their absence, performance would be reduced. Returns do not reflect the deduction of taxes that a shareholder would pay on Fund distributions or the redemption of Fund shares. |
FUND BASICS
| | | | | | | | | | | |
| | | Net Expense Ratio (Current) | | Gross Expense Ratio (Before Waivers) | | |
|
| |
| Class A | | | 1.25 | % | | | 2.09 | % | | |
| Class B | | | 2.00 | | | | 2.84 | | | |
| Class C | | | 2.00 | | | | 2.84 | | | |
| Institutional | | | 0.85 | | | | 1.69 | | | |
| Class IR | | | 1.00 | | | | 1.84 | | | |
| Class R | | | 1.50 | | | | 2.34 | | | |
|
| | |
| 4 | | The expense ratios of the Fund, both current (net of applicable fee waivers and/or expense limitations) and before waivers (gross of applicable fee waivers and/or expense limitations), are as set forth above according to the most recent publicly available Prospectus for the Fund and may differ from the expense ratios disclosed in the Financial Highlights in this report. Applicable waivers and expense limitations may be modified or terminated in the future, consistent with the terms of any arrangement in place. If this occurs, the expense ratios may change. |
| |
| TOP TEN HOLDINGS AS OF 4/30/115 | |
| | | | | | | |
| Holding | | % of Net Assets | | Line of Business |
|
| |
| VeriFone Systems, Inc. | | | 1.9 | % | | IT Services |
| W&T Offshore, Inc. | | | 1.9 | | | Oil, Gas & Consumable Fuels |
| Lancaster Colony Corp. | | | 1.7 | | | Food Products |
| Cubist Pharmaceuticals, Inc. | | | 1.6 | | | Biotechnology |
| Masimo Corp. | | | 1.5 | | | Health Care Equipment & Supplies |
| Polaris Industries, Inc. | | | 1.4 | | | Leisure Equipment & Products |
| Kraton Performance Polymers, Inc. | | | 1.4 | | | Chemicals |
| MicroStrategy, Inc. | | | 1.3 | | | Software |
| Lattice Semiconductor Corp. | | | 1.3 | | | Semiconductors & Semiconductor
Equipment |
| Western Refining, Inc. | | | 1.1 | | | Oil, Gas & Consumable Fuels |
|
| | |
| 5 | | The top 10 holdings may not be representative of the Fund’s future investments. |
FUND BASICS
| |
| FUND VS. BENCHMARK SECTOR ALLOCATIONS6 | |
As of April 30, 2011
| | |
| 6 | | The Fund is actively managed and, as such, its composition may differ over time. The above graph categorizes investments using Global Industry Classification Standard (“GICS”), however, the sector classifications used by the portfolio management team may differ from GICS. Underlying industry sector allocations of exchange traded funds held by the Fund are not reflected in the graph above. Consequently, the Fund’s overall industry sector allocations may differ from the percentages contained in the graph above. The percentage shown for each investment category reflects the value of investments in that category as a percentage of market value (excluding investments in the securities lending reinvestment vehicle, if any). Investment in the securities lending reinvestment vehicle represented 2.2% of the Fund’s net assets as of April 30, 2011. Short-term investments represent repurchase agreements. |
PORTFOLIO RESULTS
Structured Small Cap Value Fund
Portfolio Management Discussion and Analysis
Below, the Goldman Sachs Quantitative Investment Strategies Team discusses the Goldman Sachs Structured Small Cap Value Fund’s (the “Fund”) performance and positioning for the six-month period ended April 30, 2011 (the “Reporting Period”).
| |
| Q | How did the Fund perform during the Reporting Period? |
| |
| A | During the Reporting Period, the Fund’s Class A, B, C, Institutional, IR and R Shares generated cumulative total returns, without sales charges, of 21.72%, 21.23%, 21.23%, 21.92%, 21.83% and 21.51%, respectively. These returns compare to the 20.31% cumulative total return of the Fund’s benchmark, the Russell 2000® Value Index (with dividends reinvested) (the “Index”), during the same period. |
| |
| Q | What key factors were most responsible for the Fund’s performance during the Reporting Period? |
| |
| A | As expected, and in keeping with our investment approach, our quantitative model and its six investment themes had the greatest impact on relative performance. We use these themes to take a long-term view of market patterns and look for inefficiencies, selecting stocks for the Fund and overweighting or underweighting the ones chosen by the model. Over time and by design, the performance of any one of the model’s investment themes tends to have a low correlation with the model’s other themes, demonstrating the diversification benefit of the Fund’s theme-driven quantitative model. The variance in performance supports our research indicating that the diversification provided by our different investment themes is a significant investment advantage over the long term, even though the Fund may experience underperformance in the short term. Of course, diversification does not protect an investor from market risk nor does it ensure a profit. |
Overall, the Fund outperformed the Index during the Reporting Period. Sentiment, which reflects selected investment views and decisions of individuals and financial intermediaries, was our best-performing investment theme. Profitability, Management and Quality also contributed positively to relative results. Our Profitability theme assesses whether a company is earning more than its cost of capital, while Management assesses the characteristics, policies and strategic decisions of company management. Quality evaluates whether the company’s earnings are coming from more persistent, cash-based sources, as opposed to accruals.
Momentum and Valuation detracted from relative performance. Our Momentum theme predicts drift in stock prices caused by under-reaction to company-specific information. Valuation attempts to capture potential mispricings of securities, typically by comparing a measure of the company’s intrinsic value to its market value.
| |
| Q | How did the Fund’s sector allocations affect relative performance? |
| |
| A | In constructing the Fund’s portfolio, we focus on picking stocks rather than on making industry or sector bets. Consequently, the Fund is similar to the Index in terms of its sector allocation and style. Changes in its sector weights generally do not have a meaningful impact on relative performance. |
| |
| Q | Did stock selection help or hurt Fund performance during the Reporting Period? |
| |
| A | We seek to outpace the Index by overweighting stocks we expect to outperform and underweighting those we think may lag. We also build positions based on our thematic views. For example, the Fund aims to hold a basket of stocks with better Momentum characteristics than the benchmark. During the Reporting Period, our stock selection enhanced the Fund’s relative performance. |
| |
| Q | Which stock positions contributed the most to the Fund’s relative returns during the Reporting Period? |
| |
| A | Security selection in the energy, information technology and consumer discretionary sectors contributed most to the Fund’s relative results. The Fund benefited from its overweighted positions in oil refiner Western Refining, oil and gas exploration company W&T Offshore and petroleum company Tesoro. We chose to overweight Western Refining and Tesoro because of our positive views of Momentum and Profitability. The Fund was overweight W&T Offshore as a result of our positive views on Momentum and Quality. |
PORTFOLIO RESULTS
| |
| Q | Which individual positions detracted from the Fund’s results during the Reporting Period? |
| |
| A | Investments in the financials, industrials and materials sectors dampened the Fund’s relative results. Specifically, the Fund was overweight Flagstone Reinsurance, Allegiant Travel and Clearwater Paper. The overweight to global reinsurer Flagstone Reinsurance was adopted because of our positive views on Profitability and Valuation. Our positive views on Profitability and Management led us to overweight leisure travel company Allegiant Travel. The Fund was overweight pulp and paper manufacturer Clearwater Paper as a result of our positive views on Quality and Profitability. |
| |
| Q | How did the Fund use derivatives or similar instruments during the Reporting Period? |
| |
| A | As we sought to increase the Fund’s total return and to hedge its portfolio against shifts in market conditions, we used instruments such as financial futures contracts. Specifically, we used stock futures to equitize the Fund’s cash holdings. In other words, we put the Fund’s cash holdings to work by using them as collateral for the purchase of stock futures. |
| |
| Q | What was the Fund’s sector positioning relative to the Index at the end of the Reporting Period? |
| |
| A | At the end of the Reporting Period, the Fund was overweight the consumer discretionary, health care, information technology, consumer staples and telecommunication services sectors relative to the Index. It was underweight industrials, financials and utilities. The Fund was rather neutral to the energy and materials sectors compared to the Index at the end of the Reporting Period. |
FUND BASICS
Structured Small Cap Value Fund
as of April 30, 2011
| | | | | | | | | | | |
| | | Fund Total Return
| | | | |
| November 1, 2010–April 30, 2011 | | (based on NAV)1 | | Russell 2000 Value Index2 | | |
|
| |
| Class A | | | 21.72 | % | | | 20.31 | % | | |
| Class B | | | 21.23 | | | | 20.31 | | | |
| Class C | | | 21.23 | | | | 20.31 | | | |
| Institutional | | | 21.92 | | | | 20.31 | | | |
| Class IR | | | 21.83 | | | | 20.31 | | | |
| Class R | | | 21.51 | | | | 20.31 | | | |
|
| | |
| 1 | | The net asset value (“NAV”) represents the net assets of the class of the Fund (ex-dividend) divided by the total number of shares of the class outstanding. The Fund’s performance reflects the reinvestment of dividends and other distributions. The Fund’s performance does not reflect the deduction of any applicable sales charges. |
| |
| 2 | | The Russell 2000 Value Index is an unmanaged index of common stock prices that measures the performance of those Russell 2000 companies with lower price-to-book ratios and lower forecasted growth values. The Index figures do not reflect any deduction for fees, expenses or taxes. It is not possible to invest directly in an index. |
| |
| STANDARDIZED AVERAGE ANNUAL TOTAL RETURNS3 | |
| | | | | | | | | | | | | |
| For the period ended 3/31/11 | | One Year | | Since Inception | | Inception Date | | |
|
| |
| Class A | | | 16.72 | % | | | -2.13 | % | | 6/25/07 | | |
| Class B | | | 17.54 | | | | -1.82 | | | 6/25/07 | | |
| Class C | | | 21.57 | | | | -1.41 | | | 6/25/07 | | |
| Institutional | | | 24.00 | | | | -0.21 | | | 6/25/07 | | |
| Class IR | | | 23.82 | | | | 4.46 | | | 11/30/07 | | |
| Class R | | | 23.19 | | | | 4.03 | | | 11/30/07 | | |
|
| | |
| 3 | | The Standardized Average Annual Total Returns are average annual total returns as of the most recent calendar quarter-end. They assume reinvestment of all distributions at NAV. These returns reflect a maximum initial sales charge of 5.5% for Class A Shares, the assumed contingent deferred sales charge for Class B Shares (5% maximum declining to 0% after six years) and the assumed contingent deferred sales charge for Class C Shares (1% if redeemed within 12 months of purchase). Class B Shares convert automatically to Class A Shares on or about the fifteenth day of the last month of the calendar quarter that is eight years after purchase. Returns for Class B Shares for the period after conversion reflect the performance of Class A Shares. Because Institutional, Class R and IR shares do not involve a sales charge, such a charge is not applied to their Standardized Average Annual Total Returns. The Fund’s Class B Shares are no longer available for purchase by new or existing shareholders (although current Class B shareholders may continue to reinvest income and capital gains distributions into Class B Shares, and Class B shareholders may continue to exchange their shares for Class B Shares of certain other Goldman Sachs Funds). |
| |
| | The returns represent past performance. Past performance does not guarantee future results. The Fund’s investment return and principal value will fluctuate so that an investor’s shares, when redeemed, may be worth more or less than their original cost. Current performance may be lower or higher than the performance quoted above. Please visit our Web site at: www.goldmansachsfunds.com to obtain the most recent month-end returns. Performance reflects fee waivers and/or expense limitations in effect. In their absence, performance would be reduced. Returns do not reflect the deduction of taxes that a shareholder would pay on Fund distributions or the redemption of Fund shares. |
FUND BASICS
| | | | | | | | | | | |
| | | Net Expense Ratio (Current) | | Gross Expense Ratio (Before Waivers) | | |
|
| |
| Class A | | | 1.25 | % | | | 1.55 | % | | |
| Class B | | | 2.00 | | | | 2.30 | | | |
| Class C | | | 2.00 | | | | 2.30 | | | |
| Institutional | | | 0.85 | | | | 1.15 | | | |
| Class IR | | | 1.00 | | | | 1.30 | | | |
| Class R | | | 1.50 | | | | 1.80 | | | |
|
| | |
| 4 | | The expense ratios of the Fund, both current (net of applicable fee waivers and/or expense limitations) and before waivers (gross of applicable fee waivers and/or expense limitations), are as set forth above according to the most recent publicly available Prospectus for the Fund and may differ from the expense ratios disclosed in the Financial Highlights in this report. Applicable waivers and expense limitations may be modified or terminated in the future, consistent with the terms of any arrangement in place. If this occurs, the expense ratios may change. |
| |
| TOP TEN HOLDINGS AS OF 4/30/115 | |
| | | | | | | | | |
| Holding | | % of Net Assets | | Line of Business | | |
|
| |
| Western Refining, Inc. | | | 2.0 | % | | Oil, Gas & Consumable Fuels | | |
| Southwest Gas Corp. | | | 1.8 | | | Gas Utilities | | |
| Tesoro Corp. | | | 1.6 | | | Oil, Gas & Consumable Fuels | | |
| W&T Offshore, Inc. | | | 1.6 | | | Oil, Gas & Consumable Fuels | | |
| Complete Production Services, Inc. | | | 1.6 | | | Energy Equipment & Services | | |
| American Campus Communities, Inc. | | | 1.4 | | | Real Estate Investment Trusts | | |
| International Bancshares Corp. | | | 1.4 | | | Commercial Banks | | |
| Potlatch Corp. | | | 1.2 | | | Real Estate Investment Trusts | | |
| Portland General Electric Co. | | | 1.1 | | | Electric Utilities | | |
| Equity Lifestyle Properties, Inc. | | | 1.1 | | | Real Estate Investment Trusts | | |
|
| | |
| 5 | | The top 10 holdings may not be representative of the Fund’s future investments. |
FUND BASICS
| |
| FUND VS. BENCHMARK SECTOR ALLOCATIONS6 | |
As of April 30, 2011
| | |
| 6 | | The Fund is actively managed and, as such, its composition may differ over time. The above graph categorizes investments using Global Industry Classification Standard (“GICS”), however, the sector classifications used by the portfolio management team may differ from GICS. Consequently, the Fund’s overall industry sector allocations may differ from the percentages contained in the graph above. The percentage shown for each investment category reflects the value of investments in that category as a percentage of market value (excluding investments in the securities lending reinvestment vehicle, if any). Investment in the securities lending reinvestment vehicle represented 4.5% of the Fund’s net assets as of April 30, 2011. Short-term investments represent repurchase agreements. |
PORTFOLIO RESULTS
Structured U.S. Equity Fund
Portfolio Management Discussion and Analysis
Below, the Goldman Sachs Quantitative Investment Strategies Team discusses the Goldman Sachs Structured U.S. Equity Fund’s (the “Fund”) performance and positioning for the six-month period ended April 30, 2011 (the “Reporting Period”).
| |
| Q | How did the Goldman Sachs Structured U.S. Equity Fund (the “Fund”) perform during the Reporting Period? |
| |
| A | During the Reporting Period, the Fund’s Class A, B, C, Institutional, Service, IR and R Shares generated cumulative total returns, without sales charges, of 16.86%, 16.43%, 16.39%, 17.08%, 16.79%, 17.00% and 16.70%, respectively. These returns compare to the 16.36% cumulative total return of the Fund’s benchmark, the S&P® 500 Index (with dividends reinvested) (the “Index”), during the same period. |
| |
| Q | What key factors were most responsible for the Fund’s performance during the Reporting Period? |
| |
| A | As expected, and in keeping with our investment approach, our quantitative model and its six investment themes had the greatest impact on relative performance. We use these themes to take a long-term view of market patterns and look for inefficiencies, selecting stocks for the Fund and overweighting or underweighting the ones chosen by the model. Over time and by design, the performance of any one of the model’s investment themes tends to have a low correlation with the model’s other themes, demonstrating the diversification benefit of the Fund’s theme-driven quantitative model. The variance in performance supports our research indicating that the diversification provided by our different investment themes is a significant investment advantage over the long term, even though the Fund may experience underperformance in the short term. Of course, diversification does not protect an investor from market risk nor does it ensure a profit. |
Overall, the Fund outperformed the Index during the Reporting Period. The best-performing investment theme was Sentiment, which reflects selected investment views and decisions of individuals and financial intermediaries. Management also contributed positively to relative results. Management assesses the characteristics, policies and strategic decisions of company management.
Momentum detracted from relative returns. Momentum predicts drift in stock prices caused by under-reaction to company-specific information. Quality, Profitability and Valuation also hampered performance, though to a lesser extent. Our Quality theme evaluates whether the company’s earnings are coming from more persistent, cash-based sources, as opposed to accruals. Our Profitability theme assesses whether a company is earning more than its cost of capital, while our Valuation theme attempts to capture potential mispricings of securities, typically by comparing a measure of the company’s intrinsic value to its market value.
| |
| Q | How did the Fund’s sector allocations affect relative performance? |
| |
| A | In constructing the Fund’s portfolio, we focus on picking stocks rather than on making industry or sector bets. Consequently, the Fund is similar to the Index in terms of its sector allocation and style. Changes in its sector weights generally do not have a meaningful impact on relative performance. |
| |
| Q | Did stock selection help or hurt Fund performance during the Reporting Period? |
| |
| A | We seek to outpace the Index by overweighting stocks we expect to outperform and underweighting those we think may lag. We also build positions based on our thematic views. For example, the Fund aims to hold a basket of stocks with better Momentum characteristics than the benchmark. During the Reporting Period, our stock selection added to the Fund’s relative returns. |
PORTFOLIO RESULTS
| |
| Q | Which stock positions contributed the most to the Fund’s relative returns during the Reporting Period? |
| |
| A | Stock picks in the financials, consumer discretionary and consumer staples sectors enhanced the Fund’s relative performance. In particular, the Fund benefited from overweighted positions in oil refiner Valero Energy, integrated energy company ConocoPhillips, and tobacco company Lorillard. Our positive views on Profitability and Valuation led to the overweight in Valero Energy and ConocoPhillips. The Fund was overweight Lorillard because of our positive views on Profitability and Momentum. |
| |
| Q | Which individual positions detracted from the Fund’s results during the Reporting Period? |
| |
| A | Our security selection within the information technology, industrials and materials sectors detracted from the Fund’s results versus the Index. The Fund was hampered by overweighted positions in software maker Microsoft, pharmaceutical company Eli Lilly and gold producer Newmont Mining. We chose to overweight Microsoft as a result of our positive views on Momentum and Profitability. The Fund was overweight in Eli Lilly because of our positive views on Profitability, while our positive views on Momentum led us to overweight Newmont Mining. |
| |
| Q | How did the Fund use derivatives or similar instruments during the Reporting Period? |
| |
| A | As we sought to increase the Fund’s total return and to hedge its portfolio against shifts in market conditions, we used instruments such as financial futures contracts. Specifically, we used stock futures to equitize the Fund’s cash holdings. In other words, we put the Fund’s cash holdings to work by using them as collateral for the purchase of stock futures. |
| |
| Q | What was the Fund’s sector positioning relative to the Index at the end of the Reporting Period? |
| |
| A | At the end of the Reporting Period, the Fund was overweight the energy and health care sectors relative to the Index. The Fund was underweight industrials, financials, information technology, utilities, materials and consumer staples. It was relatively neutral to the Index in consumer discretionary and telecommunication services at the end of the Reporting Period. |
FUND BASICS
Structured U.S. Equity Fund
as of April 30, 2011
| | | | | | | | | | | |
| | | Fund Total Return
| | | | |
| November 1, 2010–April 30, 2011 | | (based on NAV)1 | | S&P 500 Index2 | | |
|
| |
| Class A | | | 16.86 | % | | | 16.36 | % | | |
| Class B | | | 16.43 | | | | 16.36 | | | |
| Class C | | | 16.39 | | | | 16.36 | | | |
| Institutional | | | 17.08 | | | | 16.36 | | | |
| Service | | | 16.79 | | | | 16.36 | | | |
| Class IR | | | 17.00 | | | | 16.36 | | | |
| Class R | | | 16.70 | | | | 16.36 | | | |
|
| | |
| 1 | | The net asset value (“NAV”) represents the net assets of the class of the Fund (ex-dividend) divided by the total number of shares of the class outstanding. The Fund’s performance reflects the reinvestment of dividends and other distributions. The Fund’s performance does not reflect the deduction of any applicable sales charges. |
| |
| 2 | | The S&P 500 Index is the Standard & Poor’s 500 Composite Index of 500 stocks, an unmanaged index of common stock prices. The figures for the Index do not include any deduction for fees, expenses or taxes. It is not possible to invest directly in an index. |
| |
| STANDARDIZED AVERAGE ANNUAL TOTAL RETURNS3 | |
| | | | | | | | | | | | | | | | | | | | | |
| For the period ended 3/31/11 | | One Year | | Five Years | | Ten Years | | Since Inception | | Inception Date | | |
|
| |
| Class A | | | 8.06 | % | | | -1.63 | % | | | 1.89 | % | | | 7.03 | % | | 5/24/91 | | |
| Class B | | | 8.49 | | | | -1.66 | | | | 1.84 | | | | 5.12 | | | 5/1/96 | | |
| Class C | | | 12.53 | | | | -1.25 | | | | 1.71 | | | | 2.63 | | | 8/15/97 | | |
| Institutional | | | 14.80 | | | | -0.12 | | | | 2.87 | | | | 7.14 | | | 6/15/95 | | |
| Service | | | 14.28 | | | | -0.60 | | | | 2.37 | | | | 5.29 | | | 6/07/96 | | |
| Class IR | | | 14.69 | | | | N/A | | | | N/A | | | | -2.92 | | | 11/30/07 | | |
| Class R | | | 14.08 | | | | N/A | | | | N/A | | | | -3.39 | | | 11/30/07 | | |
|
| | |
| 3 | | The Standardized Average Annual Total Returns are average annual total returns as of the most recent calendar quarter-end. They assume reinvestment of all distributions at NAV. These returns reflect a maximum initial sales charge of 5.5% for Class A Shares, the assumed contingent deferred sales charge for Class B Shares (5% maximum declining to 0% after six years) and the assumed contingent deferred sales charge for Class C Shares (1% if redeemed within 12 months of purchase). Class B Shares convert automatically to Class A Shares on or about the fifteenth day of the last month of the calendar quarter that is eight years after purchase. Returns for Class B Shares for the period after conversion reflect the performance of Class A Shares. Because Institutional, Service, Class IR and Class R shares do not involve a sales charge, such a charge is not applied to their Standardized Average Annual Total Returns. The Fund’s Class B Shares are no longer available for purchase by new or existing shareholders (although current Class B shareholders may continue to reinvest income and capital gains distributions into Class B Shares, and Class B shareholders may continue to exchange their shares for Class B Shares of certain other Goldman Sachs Funds). |
| |
| | These returns represent past performance. Past performance does not guarantee future results. The investment return and principal value of an investment will fluctuate and, therefore, an investor’s shares, when redeemed, may be worth more or less than their original cost. Current performance may be lower or higher than the total return figures in the above charts. Please visit www.goldmansachsfunds.com to obtain the most recent month-end returns. Performance reflects fee waivers and/or expense limitations in effect. In their absence, performance would be reduced. Returns do not reflect the deduction of taxes that a shareholder would pay on Fund distributions or the redemption of Fund shares. |
FUND BASICS
| | | | | | | | | | | |
| | | Net Expense Ratio (Current) | | Gross Expense Ratio (Before Waivers) | | |
|
| |
| Class A | | | 0.95 | % | | | 1.18 | % | | |
| Class B | | | 1.70 | | | | 1.93 | | | |
| Class C | | | 1.70 | | | | 1.93 | | | |
| Institutional | | | 0.55 | | | | 0.78 | | | |
| Service | | | 1.05 | | | | 1.28 | | | |
| Class IR | | | 0.70 | | | | 0.93 | | | |
| Class R | | | 1.20 | | | | 1.43 | | | |
|
| | |
| 4 | | The expense ratios of the Fund, both current (net of applicable fee waivers and/or expense limitations) and before waivers (gross of applicable fee waivers and/or expense limitations), are as set forth above according to the most recent publicly available Prospectus for the Fund and may differ from the expense ratios disclosed in the Financial Highlights in this report. Applicable waivers and expense limitations may be modified or terminated in the future, consistent with the terms of any arrangement in place. If this occurs, the expense ratios may change. |
| |
| TOP TEN HOLDINGS AS OF 4/30/115 | |
| | | | | | | | | |
| Holding | | % of Net Assets | | Line of Business | | |
|
| |
| Exxon Mobil Corp. | | | 4.2 | % | | Oil, Gas & Consumable Fuels | | |
| Microsoft Corp. | | | 3.9 | | | Software | | |
| Lorillard, Inc. | | | 3.4 | | | Tobacco | | |
| Eli Lilly & Co. | | | 3.1 | | | Pharmaceuticals | | |
| ConocoPhillips | | | 3.0 | | | Oil, Gas & Consumable Fuels | | |
| Chevron Corp. | | | 2.7 | | | Oil, Gas & Consumable Fuels | | |
| Pfizer, Inc. | | | 2.4 | | | Pharmaceuticals | | |
| Accenture PLC Class A | | | 2.2 | | | IT Services | | |
| AT&T, Inc. | | | 2.2 | | | Diversified Telecommunication Services | | |
| Intel Corp. | | | 2.0 | | | Semiconductors & Semiconductor | | |
| | | | | | | Equipment | | |
|
| | |
| 5 | | The top 10 holdings may not be representative of the Fund’s future investments. |
FUND BASICS
| |
| FUND VS. BENCHMARK SECTOR ALLOCATIONS6 | |
As of April 30, 2011
| | |
| 6 | | The Fund is actively managed and, as such, its composition may differ over time. The above graph categorizes investments using Global Industry Classification Standard (“GICS”), however, the sector classifications used by the portfolio management team may differ from GICS. Consequently, the Fund’s overall industry sector allocations may differ from the percentages contained in the graph above. The percentage shown for each investment category reflects the value of investments in that category as a percentage of market value (excluding investments in the securities lending reinvestment vehicle, if any). Investment in the securities lending reinvestment vehicle represented 0.1% of the Fund’s net assets as of April 30, 2011. Short-term investments represent repurchase agreements. |
GOLDMAN SACHS BALANCED FUND
Schedule of Investments
April 30, 2011 (Unaudited)
| | | | | | | | | |
| Shares | | Description | | Value |
| |
Common Stocks – 57.7% |
Aerospace & Defense – 2.1% |
| | 1,000 | | | General Dynamics Corp. | | $ | 72,820 | |
| | 18,000 | | | Honeywell International, Inc. | | | 1,102,140 | |
| | 3,500 | | | Lockheed Martin Corp. | | | 277,375 | |
| | 800 | | | Raytheon Co. | | | 38,840 | |
| | 6,700 | | | The Boeing Co. | | | 534,526 | |
| | 8,400 | | | United Technologies Corp. | | | 752,472 | |
| | | | | | | | | |
| | | | | | | | 2,778,173 | |
| |
| |
Air Freight & Logistics – 0.5% |
| | 8,600 | | | United Parcel Service, Inc. Class B | | | 644,742 | |
| |
| |
Auto Components – 0.2% |
| | 5,300 | | | Johnson Controls, Inc. | | | 217,300 | |
| |
| |
Automobiles* – 0.4% |
| | 33,000 | | | Ford Motor Co. | | | 510,510 | |
| |
| |
Beverages – 1.3% |
| | 25,500 | | | The Coca-Cola Co. | | | 1,720,230 | |
| |
| |
Biotechnology* – 0.1% |
| | 1,500 | | | Celgene Corp. | | | 88,320 | |
| | 2,500 | | | Gilead Sciences, Inc. | | | 97,100 | |
| | | | | | | | | |
| | | | | | | | 185,420 | |
| |
| |
Building Products – 0.1% |
| | 14,000 | | | Masco Corp. | | | 187,880 | |
| |
| |
Capital Markets – 0.9% |
| | 7,200 | | | Bank of New York Mellon Corp. | | | 208,512 | |
| | 1,000 | | | BlackRock, Inc. | | | 195,940 | |
| | 5,600 | | | Federated Investors, Inc. Class B(a) | | | 144,368 | |
| | 17,400 | | | Morgan Stanley & Co. | | | 455,010 | |
| | 500 | | | State Street Corp. | | | 23,275 | |
| | 2,400 | | | T. Rowe Price Group, Inc. | | | 154,200 | |
| | 1,000 | | | Waddell & Reed Financial, Inc. | | | 41,010 | |
| | | | | | | | | |
| | | | | | | | 1,222,315 | |
| |
| |
Chemicals – 0.5% |
| | 200 | | | Eastman Chemical Co. | | | 21,450 | |
| | 1,939 | | | Monsanto Co. | | | 131,929 | |
| | 300 | | | PPG Industries, Inc. | | | 28,401 | |
| | 11,800 | | | The Dow Chemical Co. | | | 483,682 | |
| | | | | | | | | |
| | | | | | | | 665,462 | |
| |
| |
Commercial Banks – 1.7% |
| | 13,700 | | | BancorpSouth, Inc. | | | 185,635 | |
| | 1,600 | | | Bank of Hawaii Corp. | | | 78,064 | |
| | 3,980 | | | BB&T Corp. | | | 107,142 | |
| | 1,100 | | | PNC Financial Services Group, Inc. | | | 68,574 | |
| | 2,700 | | | SunTrust Banks, Inc. | | | 76,113 | |
| | 6,900 | | | U.S. Bancorp | | | 178,158 | |
| | 17,680 | | | Valley National Bancorp | | | 253,177 | |
| | 44,800 | | | Wells Fargo & Co. | | | 1,304,128 | |
| | | | | | | | | |
| | | | | | | | 2,250,991 | |
| |
| |
Commercial Services & Supplies – 0.7% |
| | 19,900 | | | Pitney Bowes, Inc. | | | 488,744 | |
| | 19,700 | | | R.R. Donnelley & Sons Co. | | | 371,542 | |
| | | | | | | | | |
| | | | | | | | 860,286 | |
| |
| |
Communications Equipment – 1.3% |
| | 27,980 | | | Cisco Systems, Inc. | | | 491,329 | |
| | 2,200 | | | Juniper Networks, Inc.* | | | 84,326 | |
| | 20,200 | | | QUALCOMM, Inc. | | | 1,148,168 | |
| | | | | | | | | |
| | | | | | | | 1,723,823 | |
| |
| |
Computers & Peripherals – 2.2% |
| | 7,200 | | | Apple, Inc.*(b) | | | 2,507,256 | |
| | 2,600 | | | Dell, Inc.* | | | 40,326 | |
| | 7,600 | | | Diebold, Inc. | | | 256,880 | |
| | 6,100 | | | Seagate Technology PLC | | | 107,482 | |
| | | | | | | | | |
| | | | | | | | 2,911,944 | |
| |
| |
Consumer Finance – 0.5% |
| | 8,500 | | | Capital One Financial Corp. | | | 465,205 | |
| | 8,700 | | | Discover Financial Services | | | 216,108 | |
| | | | | | | | | |
| | | | | | | | 681,313 | |
| |
| |
Diversified Consumer Services – 0.0% |
| | 2,000 | | | H&R Block, Inc. | | | 34,580 | |
| |
| |
Diversified Financial Services – 2.3% |
| | 63,400 | | | Bank of America Corp. | | | 778,552 | |
| | 186,313 | | | Citigroup, Inc.* | | | 855,177 | |
| | 600 | | | CME Group, Inc. | | | 177,462 | |
| | 26,400 | | | JPMorgan Chase & Co. | | | 1,204,632 | |
| | | | | | | | | |
| | | | | | | | 3,015,823 | |
| |
| |
Diversified Telecommunication Services – 1.4% |
| | 20,750 | | | AT&T, Inc. | | | 645,740 | |
| | 4,500 | | | CenturyLink, Inc. | | | 183,510 | |
| | 11,700 | | | Frontier Communications Corp. | | | 96,759 | |
| | 21,000 | | | Verizon Communications, Inc. | | | 793,380 | |
| | 5,000 | | | Windstream Corp. | | | 64,050 | |
| | | | | | | | | |
| | | | | | | | 1,783,439 | |
| |
| |
Electric Utilities – 1.2% |
| | 18,100 | | | Duke Energy Corp. | | | 337,565 | |
| | 1,600 | | | Entergy Corp. | | | 111,552 | |
| | 8,900 | | | Exelon Corp. | | | 375,135 | |
| | 1,500 | | | FirstEnergy Corp. | | | 59,940 | |
| | 4,100 | | | NextEra Energy, Inc. | | | 231,937 | |
| | 1,200 | | | PPL Corp. | | | 32,916 | |
| | 7,500 | | | Progress Energy, Inc. | | | 355,875 | |
| | | | | | | | | |
| | | | | | | | 1,504,920 | |
| |
| |
Electrical Equipment – 0.2% |
| | 4,700 | | | Emerson Electric Co. | | | 285,572 | |
| |
| |
The accompanying notes are an integral part of these financial statements. 47
GOLDMAN SACHS BALANCED FUND
Schedule of Investments (continued)
April 30, 2011 (Unaudited)
| | | | | | | | | |
| Shares | | Description | | Value |
| |
Common Stocks – (continued) |
| | | | | | | | | |
Electronic Equipment, Instruments & Components – 0.6% |
| | 6,800 | | | Corning, Inc. | | $ | 142,392 | |
| | 3,600 | | | Jabil Circuit, Inc. | | | 71,424 | |
| | 13,300 | | | Molex, Inc.(a) | | | 359,100 | |
| | 11,000 | | | Molex, Inc. Class A | | | 247,720 | |
| | | | | | | | | |
| | | | | | | | 820,636 | |
| |
| |
Energy Equipment & Services – 1.2% |
| | 2,000 | | | Baker Hughes, Inc. | | | 154,820 | |
| | 1,600 | | | Diamond Offshore Drilling, Inc. | | | 121,392 | |
| | 8,300 | | | Halliburton Co. | | | 418,984 | |
| | 2,200 | | | National-Oilwell Varco, Inc. | | | 168,718 | |
| | 8,000 | | | Schlumberger Ltd. | | | 718,000 | |
| | | | | | | | | |
| | | | | | | | 1,581,914 | |
| |
| |
Food & Staples Retailing – 0.9% |
| | 3,100 | | | CVS Caremark Corp. | | | 112,344 | |
| | 4,200 | | | SUPERVALU, Inc. | | | 47,292 | |
| | 10,581 | | | Wal-Mart Stores, Inc. | | | 581,743 | |
| | 10,300 | | | Walgreen Co. | | | 440,016 | |
| | | | | | | | | |
| | | | | | | | 1,181,395 | |
| |
| |
Food Products – 0.9% |
| | 1,000 | | | Archer-Daniels-Midland Co. | | | 37,020 | |
| | 9,300 | | | ConAgra Foods, Inc. | | | 227,385 | |
| | 10,300 | | | H.J. Heinz Co. | | | 527,669 | |
| | 10,400 | | | Kraft Foods, Inc. | | | 349,232 | |
| | 2,600 | | | Sara Lee Corp. | | | 49,920 | |
| | | | | | | | | |
| | | | | | | | 1,191,226 | |
| |
| |
Gas Utilities – 0.1% |
| | 2,700 | | | ONEOK, Inc. | | | 188,838 | |
| |
| |
Health Care Equipment & Supplies – 0.6% |
| | 3,900 | | | Baxter International, Inc. | | | 221,910 | |
| | 6,500 | | | Boston Scientific Corp.* | | | 48,685 | |
| | 500 | | | Covidien PLC | | | 27,845 | |
| | 200 | | | Intuitive Surgical, Inc.* | | | 69,940 | |
| | 9,500 | | | Medtronic, Inc. | | | 396,625 | |
| | 600 | | | Stryker Corp. | | | 35,400 | |
| | | | | | | | | |
| | | | | | | | 800,405 | |
| |
| |
Health Care Providers & Services – 1.4% |
| | 1,600 | | | Aetna, Inc. | | | 66,208 | |
| | 9,200 | | | Cardinal Health, Inc. | | | 401,948 | |
| | 2,600 | | | CIGNA Corp. | | | 121,758 | |
| | 1,400 | | | Express Scripts, Inc.* | | | 79,436 | |
| | 600 | | | McKesson Corp. | | | 49,806 | |
| | 19,000 | | | UnitedHealth Group, Inc. | | | 935,370 | |
| | 2,100 | | | WellPoint, Inc. | | | 161,259 | |
| | | | | | | | | |
| | | | | | | | 1,815,785 | |
| |
| |
Hotels, Restaurants & Leisure – 0.8% |
| | 4,900 | | | Carnival Corp. | | | 186,543 | |
| | 7,000 | | | McDonald’s Corp. | | | 548,170 | |
| | 900 | | | Starbucks Corp. | | | 32,571 | |
| | 2,200 | | | Wyndham Worldwide Corp. | | | 76,142 | |
| | 1,300 | | | Wynn Resorts Ltd. | | | 191,295 | |
| | | | | | | | | |
| | | | | | | | 1,034,721 | |
| |
| |
Household Durables – 0.4% |
| | 1,100 | | | Garmin Ltd.* | | | 37,653 | |
| | 1,600 | | | KB HOME | | | 18,896 | |
| | 17,800 | | | Leggett & Platt, Inc. | | | 467,962 | |
| | 1,500 | | | M.D.C. Holdings, Inc. | | | 43,785 | |
| | | | | | | | | |
| | | | | | | | 568,296 | |
| |
| |
Household Products – 1.4% |
| | 1,200 | | | Colgate-Palmolive Co. | | | 101,220 | |
| | 7,200 | | | Kimberly-Clark Corp. | | | 475,632 | |
| | 20,200 | | | The Procter & Gamble Co. | | | 1,310,980 | |
| | | | | | | | | |
| | | | | | | | 1,887,832 | |
| |
| |
Independent Power Producers & Energy Traders – 0.2% |
| | 2,500 | | | Constellation Energy Group, Inc. | | | 91,050 | |
| | 3,000 | | | NRG Energy, Inc.* | | | 72,600 | |
| | 6,200 | | | The AES Corp.* | | | 82,088 | |
| | | | | | | | | |
| | | | | | | | 245,738 | |
| |
| |
Industrial Conglomerates – 0.8% |
| | 4,000 | | | 3M Co. | | | 388,840 | |
| | 29,200 | | | General Electric Co. | | | 597,140 | |
| | 700 | | | Tyco International Ltd. | | | 34,118 | |
| | | | | | | | | |
| | | | | | | | 1,020,098 | |
| |
| |
Insurance – 2.2% |
| | 1,100 | | | ACE Ltd. | | | 73,975 | |
| | 1,700 | | | Aflac, Inc. | | | 95,523 | |
| | 2,900 | | | Berkshire Hathaway, Inc. Class B* | | | 241,570 | |
| | 24,000 | | | Cincinnati Financial Corp. | | | 760,320 | |
| | 3,600 | | | Fidelity National Financial, Inc. | | | 55,584 | |
| | 3,800 | | | Lincoln National Corp. | | | 118,674 | |
| | 9,300 | | | MetLife, Inc. | | | 435,147 | |
| | 15,000 | | | Old Republic International Corp. | | | 190,050 | |
| | 2,100 | | | OneBeacon Insurance Group Ltd. | | | 29,505 | |
| | 12,700 | | | Principal Financial Group, Inc. | | | 428,625 | |
| | 1,800 | | | Prudential Financial, Inc. | | | 114,156 | |
| | 11,000 | | | The Progressive Corp. | | | 241,340 | |
| | 2,300 | | | The Travelers Cos., Inc. | | | 145,544 | |
| | | | | | | | | |
| | | | | | | | 2,930,013 | |
| |
| |
Internet & Catalog Retail* – 0.4% |
| | 2,300 | | | Amazon.com, Inc. | | | 451,950 | |
| | 200 | | | Priceline.com, Inc. | | | 109,402 | |
| | | | | | | | | |
| | | | | | | | 561,352 | |
| |
| |
Internet Software & Services* – 0.7% |
| | 1 | | | AOL, Inc. | | | 20 | |
| | 2,400 | | | eBay, Inc. | | | 82,560 | |
| | 1,500 | | | Google, Inc. Class A | | | 816,150 | |
| | | | | | | | | |
| | | | | | | | 898,730 | |
| |
| |
IT Services – 1.9% |
| | 6,500 | | | Automatic Data Processing, Inc. | | | 353,275 | |
| | 6,900 | | | International Business Machines Corp. | | | 1,177,002 | |
| | 100 | | | MasterCard, Inc. Class A | | | 27,589 | |
48 The accompanying notes are an integral part of these financial statements.
GOLDMAN SACHS BALANCED FUND
| | | | | | | | | |
| Shares | | Description | | Value |
| |
Common Stocks – (continued) |
IT Services – (continued) |
| | | | | | | | | |
| | 25,600 | | | Paychex, Inc. | | $ | 837,376 | |
| | 1,500 | | | Visa, Inc. | | | 117,180 | |
| | | | | | | | | |
| | | | | | | | 2,512,422 | |
| |
| |
Leisure Equipment & Products – 0.2% |
| | 7,400 | | | Mattel, Inc. | | | 197,728 | |
| |
| |
Machinery – 1.8% |
| | 7,500 | | | Caterpillar, Inc. | | | 865,575 | |
| | 2,800 | | | Cummins, Inc. | | | 336,504 | |
| | 5,400 | | | Deere & Co. | | | 526,500 | |
| | 11,700 | | | Illinois Tool Works, Inc. | | | 683,397 | |
| | | | | | | | | |
| | | | | | | | 2,411,976 | |
| |
| |
Media – 2.2% |
| | 27,500 | | | Comcast Corp. | | | 721,600 | |
| | 9,600 | | | Comcast Corp. Special Class A | | | 235,680 | |
| | 4,200 | | | News Corp. | | | 74,844 | |
| | 18,100 | | | News Corp. Class B | | | 342,090 | |
| | 12,400 | | | Regal Entertainment Group | | | 170,872 | |
| | 4,500 | | | The McGraw-Hill Cos., Inc. | | | 182,115 | |
| | 16,100 | | | The Walt Disney Co. | | | 693,910 | |
| | 4,400 | | | Thomson Reuters Corp. | | | 178,068 | |
| | 3,800 | | | Time Warner Cable, Inc. | | | 296,894 | |
| | 1 | | | Time Warner, Inc. | | | 38 | |
| | | | | | | | | |
| | | | | | | | 2,896,111 | |
| |
| |
Metals & Mining – 1.2% |
| | 15,800 | | | Freeport-McMoRan Copper & Gold, Inc. | | | 869,474 | |
| | 1,000 | | | Newmont Mining Corp. | | | 58,610 | |
| | 5,900 | | | Nucor Corp. | | | 277,064 | |
| | 2,300 | | | Royal Gold, Inc. | | | 140,254 | |
| | 5,800 | | | Southern Copper Corp. | | | 217,268 | |
| | | | | | | | | |
| | | | | | | | 1,562,670 | |
| |
| |
Multi-Utilities – 0.4% |
| | 1,600 | | | CenterPoint Energy, Inc. | | | 29,760 | |
| | 5,700 | | | Dominion Resources, Inc. | | | 264,594 | |
| | 1,800 | | | PG&E Corp. | | | 82,944 | |
| | 4,200 | | | Public Service Enterprise Group, Inc. | | | 135,114 | |
| | | | | | | | | |
| | | | | | | | 512,412 | |
| |
| |
Multiline Retail – 0.4% |
| | 11,600 | | | J.C. Penney Co., Inc. | | | 446,020 | |
| | 1,200 | | | Macy’s, Inc. | | | 28,692 | |
| | | | | | | | | |
| | | | | | | | 474,712 | |
| |
| |
Office Electronics – 0.4% |
| | 48,300 | | | Xerox Corp. | | | 487,347 | |
| |
| |
Oil, Gas & Consumable Fuels – 6.8% |
| | 2,700 | | | Anadarko Petroleum Corp. | | | 213,138 | |
| | 600 | | | Apache Corp. | | | 80,022 | |
| | 9,600 | | | Chesapeake Energy Corp. | | | 323,232 | |
| | 11,914 | | | Chevron Corp. | | | 1,303,868 | |
| | 18,400 | | | ConocoPhillips | | | 1,452,312 | |
| | 1,300 | | | CONSOL Energy, Inc. | | | 70,317 | |
| | 700 | | | Devon Energy Corp. | | | 63,700 | |
| | 35,903 | | | Exxon Mobil Corp. | | | 3,159,464 | |
| | 7,900 | | | Marathon Oil Corp. | | | 426,916 | |
| | 400 | | | Murphy Oil Corp. | | | 30,992 | |
| | 8,400 | | | Occidental Petroleum Corp. | | | 960,036 | |
| | 13,800 | | | Spectra Energy Corp. | | | 400,752 | |
| | 14,200 | | | The Williams Cos., Inc. | | | 471,014 | |
| | | | | | | | | |
| | | | | | | | 8,955,763 | |
| |
| |
Paper & Forest Products – 0.2% |
| | 7,400 | | | International Paper Co. | | | 228,512 | |
| | 1,500 | | | MeadWestvaco Corp. | | | 50,535 | |
| | | | | | | | | |
| | | | | | | | 279,047 | |
| |
| |
Pharmaceuticals – 4.1% |
| | 5,000 | | | Abbott Laboratories | | | 260,200 | |
| | 26,700 | | | Bristol-Myers Squibb Co. | | | 750,270 | |
| | 27,700 | | | Eli Lilly & Co. | | | 1,025,177 | |
| | 14,300 | | | Johnson & Johnson | | | 939,796 | |
| | 22,200 | | | Merck & Co., Inc. | | | 798,090 | |
| | 73,800 | | | Pfizer, Inc. | | | 1,546,848 | |
| | | | | | | | | |
| | | | | | | | 5,320,381 | |
| |
| |
Real Estate Investment Trusts – 0.9% |
| | 12,500 | | | Host Hotels & Resorts, Inc. | | | 222,375 | |
| | 2,200 | | | Kimco Realty Corp. | | | 42,988 | |
| | 7,700 | | | ProLogis | | | 125,433 | |
| | 3,700 | | | Simon Property Group, Inc. | | | 423,798 | |
| | 3,300 | | | SL Green Realty Corp. | | | 272,349 | |
| | 2,700 | | | The Macerich Co. | | | 142,614 | |
| | 1 | | | Vornado Realty Trust | | | 97 | |
| | | | | | | | | |
| | | | | | | | 1,229,654 | |
| |
| |
Road & Rail – 0.7% |
| | 4,300 | | | CSX Corp. | | | 338,367 | |
| | 5,100 | | | Union Pacific Corp. | | | 527,697 | |
| | | | | | | | | |
| | | | | | | | 866,064 | |
| |
| |
Semiconductors & Semiconductor Equipment – 2.1% |
| | 16,200 | | | Applied Materials, Inc. | | | 254,178 | |
| | 31,100 | | | Intel Corp. | | | 721,209 | |
| | 2,700 | | | Intersil Corp. | | | 39,879 | |
| | 7,200 | | | KLA-Tencor Corp. | | | 316,080 | |
| | 1,700 | | | Linear Technology Corp. | | | 59,160 | |
| | 29,200 | | | Maxim Integrated Products, Inc. | | | 798,328 | |
| | 5,000 | | | Microchip Technology, Inc. | | | 205,200 | |
| | 1,100 | | | National Semiconductor Corp. | | | 26,532 | |
| | 11,000 | | | Texas Instruments, Inc. | | | 390,830 | |
| | | | | | | | | |
| | | | | | | | 2,811,396 | |
| |
| |
Software – 1.5% |
| | 41,140 | | | Microsoft Corp. | | | 1,070,463 | |
| | 24,600 | | | Oracle Corp. | | | 886,830 | |
| | 300 | | | Salesforce.com, Inc.* | | | 41,580 | |
| | | | | | | | | |
| | | | | | | | 1,998,873 | |
| |
| |
The accompanying notes are an integral part of these financial statements. 49
GOLDMAN SACHS BALANCED FUND
Schedule of Investments (continued)
April 30, 2011 (Unaudited)
| | | | | | | | | |
| Shares | | Description | | Value |
| |
Common Stocks – (continued) |
| | | | | | | | | |
Specialty Retail – 1.1% |
| | 900 | | | Abercrombie & Fitch Co. | | $ | 63,720 | |
| | 20,300 | | | Foot Locker, Inc. | | | 436,856 | |
| | 1,300 | | | Limited Brands, Inc. | | | 53,508 | |
| | 15,200 | | | Lowe’s Cos., Inc. | | | 399,000 | |
| | 2,800 | | | The Gap, Inc. | | | 65,072 | |
| | 4,900 | | | The Home Depot, Inc. | | | 181,986 | |
| | 2,900 | | | Tiffany & Co. | | | 201,376 | |
| | | | | | | | | |
| | | | | | | | 1,401,518 | |
| |
| |
Textiles, Apparel & Luxury Goods – 0.0% |
| | 300 | | | NIKE, Inc. Class B | | | 24,696 | |
| |
| |
Thrifts & Mortgage Finance – 0.1% |
| | 12,300 | | | Capitol Federal Financial, Inc. | | | 139,236 | |
| |
| |
Tobacco – 1.1% |
| | 8,200 | | | Philip Morris International, Inc. | | | 569,408 | |
| | 22,100 | | | Reynolds American, Inc. | | | 820,131 | |
| | | | | | | | | |
| | | | | | | | 1,389,539 | |
| |
| |
Trading Companies & Distributors – 0.0% |
| | 1,200 | | | GATX Corp. | | | 50,724 | |
| |
| |
Wireless Telecommunication Services – 0.4% |
| | 3,100 | | | American Tower Corp. Class A* | | | 162,161 | |
| | 2,500 | | | MetroPCS Communications, Inc.* | | | 42,075 | |
| | 300 | | | Millicom International Cellular SA | | | 32,502 | |
| | 2,400 | | | NII Holdings, Inc.* | | | 99,792 | |
| | 30,900 | | | Sprint Nextel Corp.* | | | 160,062 | |
| | | | | | | | | |
| | | | | | | | 496,592 | |
| |
| |
TOTAL COMMON STOCKS |
(Cost $60,196,411) | | $ | 75,930,563 | |
| |
| |
| | | | | | | | | |
| | | | | | | | | | | | | | | |
Principal
| | Interest
| | Maturity
| | |
| Amount | | Rate | | Date | | Value |
| |
Corporate Obligations – 12.1% |
Automotive Parts(c) – 0.1% |
| The Goodyear Tire & Rubber Co. |
| $ | 125,000 | | | | 10.500 | % | | | 05/15/16 | | | $ | 141,562 | |
| |
| |
Banks – 3.7% |
Astoria Financial Corp.(c) |
| | 150,000 | | | | 5.750 | | | | 10/15/12 | | | | 154,536 | |
| Bank of America Corp. |
| | 125,000 | | | | 3.625 | | | | 03/17/16 | | | | 125,635 | |
| | 150,000 | | | | 5.625 | | | | 07/01/20 | | | | 157,305 | |
| | 75,000 | | | | 5.875 | | | | 01/05/21 | | | | 79,941 | |
BB&T Corp.(c) |
| | 125,000 | | | | 3.200 | | | | 03/15/16 | | | | 126,022 | |
BBVA Bancomer SA(d) |
| | 125,000 | | | | 7.250 | | | | 04/22/20 | | | | 128,861 | |
Cie de Financement Foncier(d) |
| | 100,000 | | | | 1.625 | | | | 07/23/12 | | | | 101,007 | |
Citigroup Capital XXI(c)(e) |
| | 132,000 | | | | 8.300 | | | | 12/21/57 | | | | 137,280 | |
| Citigroup, Inc. |
| | 100,000 | | | | 6.375 | | | | 08/12/14 | | | | 111,938 | |
| | 150,000 | | | | 5.000 | | | | 09/15/14 | | | | 157,792 | |
| | 50,000 | | | | 4.750 | | | | 05/19/15 | | | | 53,067 | |
| | 50,000 | | | | 5.375 | | | | 08/09/20 | | | | 52,217 | |
DnB NOR Boligkreditt AS(d) |
| | 300,000 | | | | 2.100 | | | | 10/14/15 | | | | 292,653 | |
| | 400,000 | | | | 2.900 | | | | 03/29/16 | | | | 402,088 | |
| Fifth Third Bancorp |
| | 125,000 | | | | 3.625 | | | | 01/25/16 | | | | 126,350 | |
| HSBC Bank USA NA |
| | 100,000 | | | | 6.000 | | | | 08/09/17 | | | | 110,260 | |
ING Bank NV(d) |
| | 200,000 | | | | 2.500 | | | | 01/14/16 | | | | 194,662 | |
| | 200,000 | | | | 4.000 | | | | 03/15/16 | | | | 203,221 | |
| JPMorgan Chase & Co. |
| | 75,000 | | | | 7.250 | | | | 02/01/18 | | | | 88,334 | |
| | 75,000 | | | | 6.300 | | | | 04/23/19 | | | | 84,518 | |
| JPMorgan Chase Capital XXV |
| | 75,000 | | | | 6.800 | | | | 10/01/37 | | | | 76,206 | |
Lloyds TSB Bank PLC(d) |
| | 100,000 | | | | 6.500 | | | | 09/14/20 | | | | 102,047 | |
Nordea Eiendomskreditt AS(d) |
| | 300,000 | | | | 1.875 | | | | 04/07/14 | | | | 301,801 | |
Resona Preferred Global Securities Ltd.(c)(d)(e) |
| | 150,000 | | | | 7.191 | | | | 07/30/49 | | | | 150,442 | |
| Royal Bank of Scotland PLC |
| | 100,000 | | | | 4.875 | (d) | | | 08/25/14 | | | | 105,746 | |
| | 100,000 | | | | 5.625 | | | | 08/24/20 | | | | 102,383 | |
Sparebanken 1 Boligkreditt(d) |
| | 400,000 | | | | 1.250 | | | | 10/25/13 | | | | 398,322 | |
Stadshypotek AB(d) |
| | 300,000 | | | | 1.450 | | | | 09/30/13 | | | | 300,614 | |
SunTrust Banks, Inc.(c) |
| | 75,000 | | | | 3.600 | | | | 04/15/16 | | | | 75,967 | |
Swedbank Hypotek AB(d) |
| | 200,000 | | | | 0.759 | (e) | | | 03/28/14 | | | | 199,952 | |
| | 200,000 | | | | 2.950 | | | | 03/28/16 | | | | 200,830 | |
| | | | | | | | | | | | | | | |
| | | | | | | | | | | | | | 4,901,997 | |
| |
| |
Brokerage – 0.3% |
| Merrill Lynch & Co., Inc. |
| | 100,000 | | | | 6.400 | | | | 08/28/17 | | | | 110,792 | |
Morgan Stanley & Co.(c) |
| | 200,000 | | | | 6.625 | | | | 04/01/18 | | | | 221,922 | |
| | 100,000 | | | | 5.625 | | | | 09/23/19 | | | | 103,567 | |
| | | | | | | | | | | | | | | |
| | | | | | | | | | | | | | 436,281 | |
| |
| |
Chemicals(c) – 0.2% |
| The Dow Chemical Co. |
| | 175,000 | | | | 7.600 | | | | 05/15/14 | | | | 203,684 | |
| |
| |
Consumer Cyclical Services(c) – 0.1% |
| Iron Mountain, Inc. |
| | 125,000 | | | | 6.625 | | | | 01/01/16 | | | | 124,688 | |
| |
| |
50 The accompanying notes are an integral part of these financial statements.
GOLDMAN SACHS BALANCED FUND
| | | | | | | | | | | | | | | |
Principal
| | Interest
| | Maturity
| | |
| Amount | | Rate | | Date | | Value |
| |
Corporate Obligations – (continued) |
| | | | | | | | | | | | | | | |
Diversified Manufacturing – 0.0% |
| General Electric Co. |
| $ | 50,000 | | | | 5.250 | % | | | 12/06/17 | | | $ | 55,128 | |
| |
| |
Electric(c) – 0.3% |
| Arizona Public Service Co. |
| | 100,000 | | | | 5.800 | | | | 06/30/14 | | | | 110,821 | |
| NRG Energy, Inc. |
| | 125,000 | | | | 7.375 | | | | 02/01/16 | | | | 129,687 | |
PPL WEM Holdings PLC(d) |
| | 50,000 | | | | 5.375 | | | | 05/01/21 | | | | 50,303 | |
| Progress Energy, Inc. |
| | 75,000 | | | | 7.000 | | | | 10/30/31 | | | | 87,512 | |
Puget Sound Energy, Inc.(e) |
| | 50,000 | | | | 6.974 | | | | 06/01/67 | | | | 49,813 | |
| | | | | | | | | | | | | | | |
| | | | | | | | | | | | | | 428,136 | |
| |
| |
Energy – 0.9% |
Anadarko Petroleum Corp.(c) |
| | 100,000 | | | | 6.375 | | | | 09/15/17 | | | | 112,933 | |
| BP Capital Markets PLC |
| | 75,000 | | | | 3.875 | | | | 03/10/15 | | | | 78,613 | |
| | 50,000 | | | | 3.200 | | | | 03/11/16 | | | | 50,406 | |
| | 75,000 | | | | 4.500 | (c) | | | 10/01/20 | | | | 75,706 | |
Dolphin Energy Ltd.(c)(d) |
| | 92,290 | | | �� | 5.888 | | | | 06/15/19 | | | | 99,073 | |
Gaz Capital SA for Gazprom(f) |
| | 130,000 | | | | 9.250 | | | | 04/23/19 | | | | 162,012 | |
Nexen, Inc.(c) |
| | 30,000 | | | | 6.400 | | | | 05/15/37 | | | | 30,807 | |
| | 75,000 | | | | 7.500 | | | | 07/30/39 | | | | 86,572 | |
Petrobras International Finance Co.(c) |
| | 60,000 | | | | 5.375 | | | | 01/27/21 | | | | 60,732 | |
Petroleos Mexicanos(c) |
| | 200,000 | | | | 8.000 | | | | 05/03/19 | | | | 241,000 | |
Transocean, Inc.(c) |
| | 25,000 | | | | 4.950 | | | | 11/15/15 | | | | 26,698 | |
| | 125,000 | | | | 6.500 | | | | 11/15/20 | | | | 140,635 | |
Weatherford International Ltd.(c) |
| | 50,000 | | | | 9.625 | | | | 03/01/19 | | | | 64,656 | |
| | | | | | | | | | | | | | | |
| | | | | | | | | | | | | | 1,229,843 | |
| |
| |
Food & Beverage – 0.3% |
Anheuser-Busch InBev Worldwide, Inc.(c) |
| | 175,000 | | | | 7.750 | | | | 01/15/19 | | | | 219,425 | |
Bunge Ltd. Finance Corp.(c) |
| | 100,000 | | | | 4.100 | | | | 03/15/16 | | | | 102,431 | |
| Kraft Foods, Inc. |
| | 75,000 | | | | 6.500 | | | | 02/09/40 | | | | 83,652 | |
| | | | | | | | | | | | | | | |
| | | | | | | | | | | | | | 405,508 | |
| |
| |
Gaming(c)(d) – 0.2% |
| CityCenter Holdings LLC/CityCenter Finance Corp. |
| | 125,000 | | | | 7.625 | | | | 01/15/16 | | | | 130,312 | |
| Pokagon Gaming Authority |
| | 125,000 | | | | 10.375 | | | | 06/15/14 | | | | 130,000 | |
| | | | | | | | | | | | | | | |
| | | | | | | | | | | | | | 260,312 | |
| |
| |
Health Care – Medical Products(c) – 0.5% |
| Boston Scientific Corp. |
| | 125,000 | | | | 4.500 | | | | 01/15/15 | | | | 131,339 | |
| Community Health Systems, Inc. |
| | 125,000 | | | | 8.875 | | | | 07/15/15 | | | | 127,656 | |
| DJO Finance LLC/DJO Finance Corp. |
| | 125,000 | | | | 10.875 | | | | 11/15/14 | | | | 136,406 | |
| Hospira, Inc. |
| | 50,000 | | | | 5.600 | | | | 09/15/40 | | | | 48,259 | |
| Life Technologies Corp. |
| | 150,000 | | | | 5.000 | | | | 01/15/21 | | | | 152,330 | |
| | | | | | | | | | | | | | | |
| | | | | | | | | | | | | | 595,990 | |
| |
| |
Life Insurance(c) – 0.5% |
| MetLife, Inc. |
| | 150,000 | | | | 4.750 | | | | 02/08/21 | | | | 152,733 | |
Nationwide Financial Services, Inc.(d) |
| | 125,000 | | | | 5.375 | | | | 03/25/21 | | | | 127,258 | |
| Prudential Financial, Inc. |
| | 175,000 | | | | 4.500 | | | | 11/15/20 | | | | 174,373 | |
Reinsurance Group of America, Inc.(e) |
| | 75,000 | | | | 6.750 | | | | 12/15/65 | | | | 74,152 | |
The Northwestern Mutual Life Insurance Co.(d) |
| | 125,000 | | | | 6.063 | | | | 03/30/40 | | | | 133,750 | |
| | | | | | | | | | | | | | | |
| | | | | | | | | | | | | | 662,266 | |
| |
| |
Media – Cable – 0.8% |
Charter Communications Operating LLC/Charter Communications Operating Capital(c)(d) |
| | 250,000 | | | | 8.000 | | | | 04/30/12 | | | | 262,500 | |
| | 50,000 | | | | 10.875 | | | | 09/15/14 | | | | 55,812 | |
| Comcast Holdings Corp. |
| | 125,000 | | | | 10.625 | | | | 07/15/12 | | | | 138,857 | |
COX Communications, Inc.(c)(d) |
| | 98,000 | | | | 8.375 | | | | 03/01/39 | | | | 128,145 | |
CSC Holdings LLC(c) |
| | 125,000 | | | | 8.500 | | | | 06/15/15 | | | | 136,094 | |
DIRECTV Holdings LLC/DIRECTV Financing Co., Inc.(c) |
| | 125,000 | | | | 3.500 | | | | 03/01/16 | | | | 126,912 | |
| | 50,000 | | | | 6.000 | | | | 08/15/40 | | | | 49,651 | |
Virgin Media Finance PLC(c) |
| | 125,000 | | | | 9.500 | | | | 08/15/16 | | | | 143,125 | |
| | | | | | | | | | | | | | | |
| | | | | | | | | | | | | | 1,041,096 | |
| |
| |
Media – Non Cable(c) – 0.3% |
| DISH DBS Corp. |
| | 125,000 | | | | 7.125 | | | | 02/01/16 | | | | 132,938 | |
NBC Universal, Inc.(d) |
| | 75,000 | | | | 4.375 | | | | 04/01/21 | | | | 73,394 | |
News America, Inc.(d) |
| | 125,000 | | | | 6.150 | | | | 02/15/41 | | | | 127,590 | |
| | | | | | | | | | | | | | | |
| | | | | | | | | | | | | | 333,922 | |
| |
| |
Metals & Mining(c) – 0.4% |
| Alcoa, Inc. |
| | 50,000 | | | | 5.400 | | | | 04/15/21 | | | | 50,768 | |
Anglo American Capital PLC(d) |
| | 100,000 | | | | 9.375 | | | | 04/08/19 | | | | 134,528 | |
The accompanying notes are an integral part of these financial statements. 51
GOLDMAN SACHS BALANCED FUND
Schedule of Investments (continued)
April 30, 2011 (Unaudited)
| | | | | | | | | | | | | | | |
Principal
| | Interest
| | Maturity
| | |
| Amount | | Rate | | Date | | Value |
| |
Corporate Obligations – (continued) |
Metals & Mining(c) – (continued) |
| | | | | | | | | | | | | | | |
| Freeport-McMoRan Copper & Gold, Inc. |
| $ | 125,000 | | | | 8.375 | % | | | 04/01/17 | | | $ | 137,656 | |
| Teck Resources Ltd. |
| | 100,000 | | | | 10.750 | | | | 05/15/19 | | | | 127,750 | |
| | | | | | | | | | | | | | | |
| | | | | | | | | | | | | | 450,702 | |
| |
| |
Noncaptive – Financial(c) – 0.4% |
| Capital One Capital III |
| | 50,000 | | | | 7.686 | | | | 08/15/36 | | | | 51,500 | |
| CIT Group, Inc. |
| | 131,179 | | | | 7.000 | | | | 05/01/13 | | | | 133,803 | |
| Discover Financial Services |
| | 50,000 | | | | 10.250 | | | | 07/15/19 | | | | 66,097 | |
GE Capital Trust I(e) |
| | 74,000 | | | | 6.375 | | | | 11/15/67 | | | | 76,775 | |
General Electric Capital Corp.(e) |
| | 50,000 | | | | 6.375 | | | | 11/15/67 | | | | 51,875 | |
| SLM Corp. |
| | 75,000 | | | | 6.250 | | | | 01/25/16 | | | | 79,546 | |
| | | | | | | | | | | | | | | |
| | | | | | | | | | | | | | 459,596 | |
| |
| |
Packaging(c)(d) – 0.0% |
| Plastipak Holdings, Inc. |
| | 25,000 | | | | 8.500 | | | | 12/15/15 | | | | 25,750 | |
| |
| |
Paper(c) – 0.0% |
| Rock-Tenn Co. |
| | 25,000 | | | | 5.625 | | | | 03/15/13 | | | | 25,813 | |
| |
| |
Pipelines – 0.6% |
DCP Midstream LLC(c)(d) |
| | 25,000 | | | | 9.750 | | | | 03/15/19 | | | | 32,457 | |
| El Paso Natural Gas Co. |
| | 75,000 | | | | 7.500 | | | | 11/15/26 | | | | 86,506 | |
El Paso Pipeline Partners Operating Co. LLC(c) |
| | 125,000 | | | | 6.500 | | | | 04/01/20 | | | | 138,906 | |
Energy Transfer Partners LP(c) |
| | 100,000 | | | | 5.950 | | | | 02/01/15 | | | | 110,967 | |
| | 50,000 | | | | 9.000 | | | | 04/15/19 | | | | 63,755 | |
Enterprise Products Operating LLC(c)(e) |
| | 100,000 | | | | 8.375 | | | | 08/01/66 | | | | 109,413 | |
| | 100,000 | | | | 7.034 | | | | 01/15/68 | | | | 105,646 | |
| Tennessee Gas Pipeline Co. |
| | 50,000 | | | | 7.500 | | | | 04/01/17 | | | | 59,880 | |
TransCanada PipeLines Ltd.(c)(e) |
| | 100,000 | | | | 6.350 | | | | 05/15/67 | | | | 100,500 | |
| | | | | | | | | | | | | | | |
| | | | | | | | | | | | | | 808,030 | |
| |
| |
Property/Casualty Insurance(c) – 0.4% |
| Aspen Insurance Holdings Ltd. |
| | 100,000 | | | | 6.000 | | | | 08/15/14 | | | | 107,107 | |
| Endurance Specialty Holdings Ltd. |
| | 50,000 | | | | 6.150 | | | | 10/15/15 | | | | 53,101 | |
QBE Insurance Group Ltd.(d)(e) |
| | 225,000 | | | | 5.647 | | | | 07/01/23 | | | | 214,149 | |
The Chubb Corp.(e) |
| | 100,000 | | | | 6.375 | | | | 03/29/67 | | | | 107,000 | |
| Transatlantic Holdings, Inc. |
| | 75,000 | | | | 8.000 | | | | 11/30/39 | | | | 81,076 | |
| | | | | | | | | | | | | | | |
| | | | | | | | | | | | | | 562,433 | |
| |
| |
Real Estate Investment Trusts – 0.8% |
Brandywine Operating Partnership LP(c) |
| | 100,000 | | | | 4.950 | | | | 04/15/18 | | | | 100,951 | |
| Developers Diversified Realty Corp. |
| | 40,000 | | | | 9.625 | | | | 03/15/16 | | | | 49,151 | |
| | 100,000 | | | | 7.500 | (c) | | | 04/01/17 | | | | 114,750 | |
Duke Realty LP(c) |
| | 75,000 | | | | 6.750 | | | | 03/15/20 | | | | 84,902 | |
HCP, Inc.(c) |
| | 75,000 | | | | 6.000 | | | | 01/30/17 | | | | 82,526 | |
| | 50,000 | | | | 5.375 | | | | 02/01/21 | | | | 52,030 | |
Healthcare Realty Trust, Inc.(c) |
| | 100,000 | | | | 6.500 | | | | 01/17/17 | | | | 112,204 | |
Liberty Property LP(c) |
| | 100,000 | | | | 4.750 | | | | 10/01/20 | | | | 99,797 | |
ProLogis(c)(f) |
| | 75,000 | | | | 1.875 | | | | 11/15/37 | | | | 74,250 | |
Simon Property Group LP(c) |
| | 125,000 | | | | 10.350 | | | | 04/01/19 | | | | 172,772 | |
WEA Finance LLC(c)(d) |
| | 100,000 | | | | 5.400 | | | | 10/01/12 | | | | 105,524 | |
| | | | | | | | | | | | | | | |
| | | | | | | | | | | | | | 1,048,857 | |
| |
| |
Schools(c) – 0.1% |
| Rensselaer Polytechnic Institute |
| | 150,000 | | | | 5.600 | | | | 09/01/20 | | | | 159,040 | |
| |
| |
Services Cyclical – Business Services(c) – 0.1% |
| ACCO Brands Corp. |
| | 125,000 | | | | 10.625 | | | | 03/15/15 | | | | 140,312 | |
| |
| |
Services Cyclical – Rental Equipment(c)(d) – 0.2% |
| Ashtead Capital, Inc. |
| | 100,000 | | | | 9.000 | | | | 08/15/16 | | | | 105,625 | |
| RSC Equipment Rental, Inc./RSC Holdings III LLC |
| | 125,000 | | | | 10.000 | | | | 07/15/17 | | | | 142,812 | |
| | | | | | | | | | | | | | | |
| | | | | | | | | | | | | | 248,437 | |
| |
| |
Technology – Hardware(c)(d) – 0.1% |
| CommScope, Inc. |
| | 75,000 | | | | 8.250 | | | | 01/15/19 | | | | 78,938 | |
| |
| |
Telecommunications – Satellites(c) – 0.1% |
Intelsat Jackson Holdings SA(d) |
| | 125,000 | | | | 7.250 | | | | 04/01/19 | | | | 127,187 | |
| Intelsat Subsidiary Holding Co. SA |
| | 50,000 | | | | 8.875 | | | | 01/15/15 | | | | 51,479 | |
| | | | | | | | | | | | | | | |
| | | | | | | | | | | | | | 178,666 | |
| |
| |
Wirelines Telecommunications(c) – 0.7% |
| AT&T, Inc. |
| | 200,000 | | | | 2.950 | | | | 05/15/16 | | | | 200,977 | |
Deutsche Telekom International Finance BV(d) |
| | 150,000 | | | | 3.125 | | | | 04/11/16 | | | | 151,712 | |
52 The accompanying notes are an integral part of these financial statements.
GOLDMAN SACHS BALANCED FUND
| | | | | | | | | | | | | | | |
Principal
| | Interest
| | Maturity
| | |
| Amount | | Rate | | Date | | Value |
| |
Corporate Obligations – (continued) |
Wirelines Telecommunications(c) – (continued) |
| | | | | | | | | | | | | | | |
| Frontier Communications Corp. |
| $ | 125,000 | | | | 6.250 | % | | | 01/15/13 | | | $ | 131,562 | |
| Qwest Communications International, Inc. |
| | 25,000 | | | | 8.000 | | | | 10/01/15 | | | | 27,375 | |
| Qwest Corp. |
| | 75,000 | | | | 8.375 | | | | 05/01/16 | | | | 88,875 | |
| Telecom Italia Capital |
| | 225,000 | | | | 4.950 | | | | 09/30/14 | | | | 236,467 | |
| Windstream Corp. |
| | 25,000 | | | | 8.625 | | | | 08/01/16 | | | | 26,438 | |
| | | | | | | | | | | | | | | |
| | | | | | | | | | | | | | 863,406 | |
| |
| |
TOTAL CORPORATE OBLIGATIONS |
(Cost $15,291,426) | | $ | 15,870,393 | |
| |
| |
| | | | | | | | | | | | | | | |
| | | | | | | | | | | | | | | |
Mortgage-Backed Obligations – 18.7% |
Collateralized Mortgage Obligations – 3.7% |
Adjustable Rate Non-Agency(e) – 2.1% |
Countrywide Alternative Loan Trust Series 2005-31, Class 2A1 |
| $ | 251,431 | | | | 0.513 | % | | | 08/25/35 | | | $ | 166,322 | |
Countrywide Alternative Loan Trust Series 2005-38, Class A3 |
| | 273,754 | | | | 0.563 | | | | 09/25/35 | | | | 180,707 | |
Countrywide Home Loan Mortgage Pass-Through Trust Series 2004-HYB6, Class A2 |
| | 20,820 | | | | 3.072 | | | | 11/20/34 | | | | 17,221 | |
JPMorgan Alternative Loan Trust Series 2005-A2, Class 1A1 |
| | 298,643 | | | | 0.473 | | | | 01/25/36 | | | | 218,638 | |
JPMorgan Mortgage Trust Series 2007-A1, Class 2A2 |
| | 378,893 | | | | 3.082 | | | | 07/25/35 | | | | 346,900 | |
Merrill Lynch Alternative Note Asset Trust Series 2007-0AR3, Class A1 |
| | 536,233 | | | | 0.403 | | | | 07/25/47 | | | | 329,921 | |
Structured Adjustable Rate Mortgage Loan Trust Series 2004-06, Class 3A2 |
| | 266,617 | | | | 2.566 | | | | 06/25/34 | | | | 248,651 | |
Washington Mutual Mortgage Pass-Through Certificates Series 2005-AR08, Class 2A1A |
| | 285,794 | | | | 0.503 | | | | 07/25/45 | | | | 239,411 | |
Washington Mutual Mortgage Pass-Through Certificates Series 2005-AR11, Class A1A |
| | 457,627 | | | | 0.533 | | | | 08/25/45 | | | | 378,514 | |
Wells Fargo Alternative Loan Trust Series 2007-PA6, Class A1 |
| | 611,317 | | | | 6.101 | | | | 12/28/37 | | | | 473,421 | |
Wells Fargo Mortgage Backed Securities Trust Series 2005-AR16, Class 1A1 |
| | 181,505 | | | | 2.849 | | | | 10/25/35 | | | | 183,702 | |
| | | | | | | | | | | | | | | |
| | | | | | | | | | | | | | 2,783,408 | |
| |
| |
Interest Only(g) – 0.0% |
ABN AMRO Mortgage Corp. Series 2003-8, Class A2 |
| | 12,289 | | | | 5.500 | | | | 06/25/33 | | | | 919 | |
CS First Boston Mortgage Securities Corp. Series 2003-19, Class 1A2 |
| | 29,807 | | | | 5.250 | | | | 07/25/33 | | | | 1,839 | |
CS First Boston Mortgage Securities Corp. Series 2003-AR18, Class 2X(e)(h) |
| | 53,439 | | | | 0.000 | | | | 07/25/33 | | | | — | |
CS First Boston Mortgage Securities Corp. Series 2003-AR20, Class 2X(e)(h) |
| | 67,179 | | | | 0.000 | | | | 08/25/33 | | | | — | |
FNMA REMIC Series 2004-47, Class EI(e)(h) |
| | 126,032 | | | | 0.000 | | | | 06/25/34 | | | | 2,083 | |
FNMA REMIC Series 2004-62, Class DI(e)(h) |
| | 67,060 | | | | 0.000 | | | | 07/25/33 | | | | 814 | |
Master Adjustable Rate Mortgages Trust Series 2003-2, Class 3AX(e) |
| | 66,740 | | | | 0.123 | | | | 08/25/33 | | | | 297 | |
Master Adjustable Rate Mortgages Trust Series 2003-2, Class 4AX(e) |
| | 23,803 | | | | 0.320 | | | | 07/25/33 | | | | 273 | |
| | | | | | | | | | | | | | | |
| | | | | | | | | | | | | | 6,225 | |
| |
| |
Inverse Floaters(e) – 0.1% |
GNMA Series 2001-48, Class SA |
| | 14,666 | | | | 25.786 | | | | 10/16/31 | | | | 21,844 | |
GNMA Series 2001-51, Class SA |
| | 23,070 | | | | 31.565 | | | | 10/16/31 | | | | 36,096 | |
GNMA Series 2001-51, Class SB |
| | 28,950 | | | | 25.786 | | | | 10/16/31 | | | | 43,543 | |
GNMA Series 2002-13, Class SB |
| | 9,623 | | | | 36.559 | | | | 02/16/32 | | | | 16,056 | |
| | | | | | | | | | | | | | | |
| | | | | | | | | | | | | | 117,539 | |
| |
| |
Regular Floater(e) – 1.0% |
Arkle Master Issuer PLC Series 2010-2A, Class 1A1(d) |
| | 300,000 | | | | 1.714 | | | | 05/17/60 | | | | 300,758 | |
FHLMC REMIC Series 3038, Class XA(h) |
| | 8,847 | | | | 0.000 | | | | 09/15/35 | | | | 8,766 | |
Holmes Master Issuer PLC Series 2010-1A, Class A2(d) |
| | 100,000 | | | | 1.678 | | | | 10/15/54 | | | | 100,231 | |
NCUA Guaranteed Notes Series 2011-R3, Class 1A |
| | 194,273 | | | | 0.631 | | | | 03/11/20 | | | | 194,273 | |
Permanent Master Issuer PLC Series 2011-1A, Class 1A3(d) |
| EUR | 300,000 | | | | 2.617 | | | | 07/15/42 | | | | 444,460 | |
Silverstone Master Issuer Series 2010-1A, Class A1(d) |
| $ | 250,000 | | | | 1.674 | | | | 01/21/55 | | | | 250,612 | |
| | | | | | | | | | | | | | | |
| | | | | | | | | | | | | | 1,299,100 | |
| |
| |
Sequential Fixed Rate – 0.5% |
Countrywide Alternative Loan Trust Series 2007-16CB, Class 4A7 |
| | 381,725 | | | | 6.000 | | | | 08/25/37 | | | | 302,638 | |
FHLMC Multifamily Structured Pass Through Certificates Series K011, Class A2(e) |
| | 100,000 | | | | 4.084 | | | | 11/25/20 | | | | 101,274 | |
NCUA Guaranteed Notes Series 2010-C1, Class APT |
| | 197,327 | | | | 2.650 | | | | 10/29/20 | | | | 194,552 | |
| | | | | | | | | | | | | | | |
| | | | | | | | | | | | | | 598,464 | |
| |
| |
TOTAL COLLATERALIZED
MORTGAGE OBLIGATIONS | | $ | 4,804,736 | |
| |
| |
The accompanying notes are an integral part of these financial statements. 53
GOLDMAN SACHS BALANCED FUND
Schedule of Investments (continued)
April 30, 2011 (Unaudited)
| | | | | | | | | | | | | | | |
Principal
| | Interest
| | Maturity
| | |
| Amount | | Rate | | Date | | Value |
| |
Mortgage-Backed Obligations – (continued) |
| | | | | | | | | | | | | | | |
| | | | | | | | | | | | | | | |
| | | | | | | | | | | | | | | |
Commercial Mortgage-Backed Securities – 1.7% |
Sequential Fixed Rate – 1.0% |
GMAC Commercial Mortgage Securities, Inc. Series 2002-C1, Class A2 |
| $ | 847,910 | | | | 6.278 | % | | | 11/15/39 | | | $ | 859,175 | |
Wachovia Bank Commercial Mortgage Trust Series 2006-C29, Class A4 |
| | 400,000 | | | | 5.308 | | | | 11/15/48 | | | | 435,221 | |
| | | | | | | | | | | | | | | |
| | | | | | | | | | | | | | 1,294,396 | |
| |
| |
Sequential Floating Rate(e) – 0.7% |
LB-UBS Commercial Mortgage Trust Series 2005-C7, Class A4 |
| | 500,000 | | | | 5.197 | | | | 11/15/30 | | | | 544,853 | |
Wachovia Bank Commercial Mortgage Trust Series 2006-C25, Class A5 |
| | 400,000 | | | | 5.924 | | | | 05/15/43 | | | | 447,175 | |
| | | | | | | | | | | | | | | |
| | | | | | | | | | | | | | 992,028 | |
| |
| |
TOTAL COMMERCIAL MORTGAGE-BACKED SECURITIES | | $ | 2,286,424 | |
| |
| |
| | | | | | | | | | | | | | | |
Federal Agencies – 13.3% |
Adjustable Rate FHLMC(e) – 0.2% |
| $ | 319,791 | | | | 2.606 | % | | | 08/01/35 | | | $ | 335,858 | |
| |
| |
Adjustable Rate FNMA(e) – 1.0% |
| | 19,367 | | | | 2.580 | | | | 09/01/32 | | | | 20,372 | |
| | 104,498 | | | | 2.433 | | | | 12/01/33 | | | | 109,302 | |
| | 188,334 | | | | 2.465 | | | | 01/01/34 | | | | 197,263 | |
| | 325,675 | | | | 2.500 | | | | 02/01/34 | | | | 341,565 | |
| | 187,078 | | | | 2.459 | | | | 01/01/35 | | | | 195,245 | |
| | 400,000 | | | | 3.740 | | | | 05/01/41 | | | | 408,218 | |
| | | | | | | | | | | | | | | |
| | | | | | | | | | | | | | 1,271,965 | |
| |
| |
Adjustable Rate GNMA(e) – 0.5% |
| | 14,752 | | | | 3.375 | | | | 06/20/23 | | | | 15,191 | |
| | 6,645 | | | | 2.625 | | | | 07/20/23 | | | | 6,838 | |
| | 6,937 | | | | 2.625 | | | | 08/20/23 | | | | 7,140 | |
| | 17,940 | | | | 2.625 | | | | 09/20/23 | | | | 18,467 | |
| | 5,434 | | | | 3.375 | | | | 03/20/24 | | | | 5,609 | |
| | 46,954 | | | | 3.375 | | | | 04/20/24 | | | | 48,435 | |
| | 5,812 | | | | 3.375 | | | | 05/20/24 | | | | 5,990 | |
| | 50,301 | | | | 3.375 | | | | 06/20/24 | | | | 51,977 | |
| | 26,061 | | | | 2.625 | | | | 07/20/24 | | | | 26,985 | |
| | 35,432 | | | | 2.625 | | | | 08/20/24 | | | | 36,632 | |
| | 11,187 | | | | 2.625 | | | | 09/20/24 | | | | 11,531 | |
| | 14,157 | | | | 2.125 | | | | 11/20/24 | | | | 14,718 | |
| | 5,304 | | | | 2.125 | | | | 12/20/24 | | | | 5,515 | |
| | 7,465 | | | | 2.500 | | | | 12/20/24 | | | | 7,872 | |
| | 9,389 | | | | 3.375 | | | | 01/20/25 | | | | 9,783 | |
| | 4,784 | | | | 3.375 | | | | 02/20/25 | | | | 4,985 | |
| | 16,655 | | | | 3.375 | | | | 05/20/25 | | | | 17,305 | |
| | 12,305 | | | | 2.625 | | | | 07/20/25 | | | | 12,841 | |
| | 6,344 | | | | 3.375 | | | | 02/20/26 | | | | 6,573 | |
| | 332 | | | | 2.625 | | | | 07/20/26 | | | | 343 | |
| | 17,321 | | | | 3.375 | | | | 01/20/27 | | | | 18,029 | |
| | 6,304 | | | | 3.375 | | | | 02/20/27 | | | | 6,531 | |
| | 48,437 | | | | 3.375 | | | | 04/20/27 | | | | 50,067 | |
| | 5,558 | | | | 3.375 | | | | 05/20/27 | | | | 5,752 | |
| | 5,025 | | | | 3.375 | | | | 06/20/27 | | | | 5,195 | |
| | 1,930 | | | | 2.125 | | | | 11/20/27 | | | | 1,999 | |
| | 7,958 | | | | 2.125 | | | | 12/20/27 | | | | 8,232 | |
| | 15,214 | | | | 3.375 | | | | 01/20/28 | | | | 15,776 | |
| | 5,076 | | | | 2.250 | | | | 02/20/28 | | | | 5,260 | |
| | 5,684 | | | | 3.375 | | | | 03/20/28 | | | | 5,895 | |
| | 28,262 | | | | 2.625 | | | | 07/20/29 | | | | 29,285 | |
| | 11,722 | | | | 2.625 | | | | 08/20/29 | | | | 12,147 | |
| | 3,397 | | | | 2.625 | | | | 09/20/29 | | | | 3,521 | |
| | 14,993 | | | | 2.125 | | | | 10/20/29 | | | | 15,532 | |
| | 17,962 | | | | 2.125 | | | | 11/20/29 | | | | 18,610 | |
| | 4,538 | | | | 2.125 | | | | 12/20/29 | | | | 4,703 | |
| | 5,529 | | | | 3.250 | | | | 01/20/30 | | | | 5,739 | |
| | 3,034 | | | | 3.250 | | | | 02/20/30 | | | | 3,150 | |
| | 12,775 | | | | 3.250 | | | | 03/20/30 | | | | 13,283 | |
| | 17,181 | | | | 3.375 | | | | 04/20/30 | | | | 17,796 | |
| | 45,358 | | | | 3.375 | | | | 05/20/30 | | | | 47,144 | |
| | 3,995 | | | | 3.375 | | | | 06/20/30 | | | | 4,144 | |
| | 35,749 | | | | 2.625 | | | | 07/20/30 | | | | 37,500 | |
| | 6,470 | | | | 2.625 | | | | 09/20/30 | | | | 6,804 | |
| | 13,106 | | | | 1.875 | | | | 10/20/30 | | | | 13,596 | |
| | | | | | | | | | | | | | | |
| | | | | | | | | | | | | | 670,420 | |
| |
| |
FHLMC – 1.2% |
| | 28,360 | | | | 8.000 | | | | 07/01/15 | | | | 31,107 | |
| | 7,022 | | | | 7.000 | | | | 12/01/15 | | | | 7,407 | |
| | 32,376 | | | | 6.500 | | | | 07/01/16 | | | | 35,325 | |
| | 64,098 | | | | 7.000 | | | | 04/01/31 | | | | 72,186 | |
| | 136,706 | | | | 7.000 | | | | 07/01/32 | | | | 153,517 | |
| | 201,159 | | | | 6.500 | | | | 04/01/34 | | | | 226,760 | |
| | 1,000,000 | | | | 5.000 | | | | TBA-30yr | (i) | | | 1,053,984 | |
| | | | | | | | | | | | | | | |
| | | | | | | | | | | | | | 1,580,286 | |
| |
| |
FNMA – 8.0% |
| | 99,844 | | | | 2.800 | | | | 03/01/18 | | | | 97,947 | |
| | 110,000 | | | | 3.840 | | | | 05/01/18 | | | | 112,303 | |
| | 365,764 | | | | 4.000 | | | | 09/01/18 | | | | 385,627 | |
| | 300,000 | | | | 4.506 | | | | 06/01/19 | | | | 317,131 | |
| | 195,543 | | | | 6.000 | | | | 09/01/19 | | | | 213,939 | |
| | 99,883 | | | | 3.416 | | | | 10/01/20 | | | | 97,499 | |
| | 99,879 | | | | 3.375 | | | | 11/01/20 | | | | 97,112 | |
| | 99,887 | | | | 3.631 | | | | 12/01/20 | | | | 98,729 | |
| | 299,074 | | | | 3.763 | | | | 12/01/20 | | | | 298,637 | |
| | 238,535 | | | | 6.000 | | | | 12/01/20 | | | | 260,975 | |
| | 137,216 | | | | 5.500 | | | | 09/01/23 | | | | 148,979 | |
| | 61,131 | | | | 5.500 | | | | 10/01/23 | | | | 66,487 | |
| | 574,744 | | | | 5.500 | | | | 05/01/25 | | | | 624,353 | |
| | 25,136 | | | | 7.000 | | | | 11/01/30 | | | | 28,426 | |
| | 103,531 | | | | 7.500 | | | | 03/01/31 | | | | 116,872 | |
| | 166,459 | | | | 6.000 | | | | 11/01/35 | | | | 183,609 | |
| | 387,736 | | | | 5.000 | | | | 01/01/39 | | | | 411,409 | |
| | 46,591 | | | | 4.500 | | | | 04/01/39 | | | | 48,187 | |
| | 87,364 | | | | 4.500 | | | | 07/01/39 | | | | 90,466 | |
| | 66,103 | | | | 4.500 | | | | 08/01/39 | | | | 68,450 | |
| | 195,001 | | | | 4.500 | | | | 10/01/39 | | | | 201,803 | |
| | 83,557 | | | | 4.500 | | | | 12/01/39 | | | | 86,472 | |
| | 121,645 | | | | 4.500 | | | | 01/01/40 | | | | 125,889 | |
54 The accompanying notes are an integral part of these financial statements.
GOLDMAN SACHS BALANCED FUND
| | | | | | | | | | | | | | | |
Principal
| | Interest
| | Maturity
| | |
| Amount | | Rate | | Date | | Value |
| |
Mortgage-Backed Obligations – (continued) |
FNMA – (continued) |
| | | | | | | | | | | | | | | |
| $ | 1,000,000 | | | | 4.500 | % | | | TBA-30yr | (i) | | $ | 1,028,906 | |
| | 4,000,000 | | | | 5.000 | | | | TBA-30yr | (i) | | | 4,221,875 | |
| | 1,000,000 | | | | 6.000 | | | | TBA-30yr | (i) | | | 1,093,594 | |
| | | | | | | | | | | | | | | |
| | | | | | | | | | | | | | 10,525,676 | |
| |
| |
GNMA – 2.4% |
| | 29,181 | | | | 5.000 | | | | 05/15/39 | | | | 31,382 | |
| | 55,098 | | | | 5.000 | | | | 06/15/39 | | | | 59,253 | |
| | 995,221 | | | | 3.500 | | | | 12/15/40 | | | | 963,563 | |
| | 2,000,000 | | | | 4.500 | | | | TBA-30yr | (i) | | | 2,088,750 | |
| | | | | | | | | | | | | | | |
| | | | | | | | | | | | | | 3,142,948 | |
| |
| |
TOTAL FEDERAL AGENCIES | | $ | 17,527,153 | |
| |
| |
TOTAL MORTGAGE-BACKED OBLIGATIONS |
(Cost $24,389,647) | | $ | 24,618,313 | |
| |
| |
| | | | | | | | | | | | | | | |
| | | | | | | | | | | | | | | |
Agency Debentures – 0.7% |
| FHLB |
| $ | 700,000 | | | | 5.375 | % | | | 05/15/19 | | | $ | 800,594 | |
Tennessee Valley Authority(b) |
| | 100,000 | | | | 5.375 | | | | 04/01/56 | | | | 107,447 | |
| |
| |
TOTAL AGENCY DEBENTURES |
(Cost $889,242) | | $ | 908,041 | |
| |
| |
| | | | | | | | | | | | | | | |
| | | | | | | | | | | | | | | |
Asset-Backed Securities – 5.0% |
Collateralized Loan Obligations(e) – 3.4% |
Black Diamond CLO Ltd. Series 2005-1A, Class A1A(d) |
| $ | 500,000 | | | | 0.559 | % | | | 06/20/17 | | | $ | 483,338 | |
Callidus Debt Partners Fund Ltd. Series 6A, Class A1T(d) |
| | 476,382 | | | | 0.534 | | | | 10/23/21 | | | | 432,247 | |
Duane Street CLO Series 2007-4A, Class A1T(d) |
| | 728,722 | | | | 0.542 | | | | 11/14/21 | | | | 680,742 | |
Greywolf CLO Ltd. Series 2007-1A, Class A(d) |
| | 490,916 | | | | 0.559 | | | | 02/18/21 | | | | 449,557 | |
Jasper CLO Ltd. Series 2005-1A, Class A(d) |
| | 467,715 | | | | 0.543 | | | | 08/01/17 | | | | 440,916 | |
KKR Financial CLO Ltd. Series 2007-1A, Class A(d) |
| | 841,287 | | | | 0.663 | | | | 05/15/21 | | | | 792,913 | |
Mountain View Funding CLO Series 2007-3A, Class A1(d) |
| | 495,580 | | | | 0.491 | | | | 04/16/21 | | | | 465,386 | |
Westchester CLO Ltd. Series 2007-1X, Class A1A |
| | 890,267 | | | | 0.498 | | | | 08/01/22 | | | | 814,556 | |
| | | | | | | | | | | | | | | |
| | | | | | | | | | | | | | 4,559,655 | |
| |
| |
Home Equity – 0.4% |
CIT Mortgage Loan Trust Series 2007-1, Class 2A1(d)(e) |
| | 80,424 | | | | 1.213 | | | | 10/25/37 | | | | 78,101 | |
CIT Mortgage Loan Trust Series 2007-1, Class 2A2(d)(e) |
| | 120,000 | | | | 1.463 | | | | 10/25/37 | | | | 93,442 | |
CIT Mortgage Loan Trust Series 2007-1, Class 2A3(d)(e) |
| | 210,000 | | | | 1.663 | | | | 10/25/37 | | | | 113,420 | |
Countrywide Home Equity Loan Trust Series 2003-D, Class A(e) |
| | 70,492 | | | | 0.479 | | | | 06/15/29 | | | | 62,966 | |
Countrywide Home Equity Loan Trust Series 2004-N, Class 2A(e) |
| | 141,553 | | | | 0.499 | | | | 02/15/34 | | | | 80,569 | |
GMAC Mortgage Corp. Loan Trust Series 2007-HE3, Class 1A1 |
| | 44,571 | | | | 7.000 | | | | 09/25/37 | | | | 35,417 | |
GMAC Mortgage Corp. Loan Trust Series 2007-HE3, Class 2A1 |
| | 57,152 | | | | 7.000 | | | | 09/25/37 | | | | 41,288 | |
| | | | | | | | | | | | | | | |
| | | | | | | | | | | | | | 505,203 | |
| |
| |
Manufactured Housing – 0.1% |
| Mid-State Trust Series 4, Class A |
| | 101,731 | | | | 8.330 | | | | 04/01/30 | | | | 102,465 | |
| |
| |
Student Loan(e) – 1.1% |
Brazos Higher Education Authority, Inc. Series 2010-1, Class A1 |
| | 98,696 | | | | 1.212 | | | | 05/25/29 | | | | 98,737 | |
Brazos Higher Education Authority, Inc. Series 2011-1, Class A2 |
| | 300,000 | | | | 1.109 | | | | 02/25/30 | | | | 296,008 | |
Knowledgeworks Foundation Student Loan Series 2010-1, Class A |
| | 287,984 | | | | 1.262 | | | | 02/25/42 | | | | 283,977 | |
Nelnet Student Loan Trust Series 2010-3A, Class A(d) |
| | 364,218 | | | | 1.054 | | | | 07/27/48 | | | | 364,577 | |
Nelnet Student Loan Trust Series 2011-1A, Class A(d) |
| | 394,617 | | | | 1.063 | | | | 02/25/43 | | | | 395,864 | |
| | | | | | | | | | | | | | | |
| | | | | | | | | | | | | | 1,439,163 | |
| |
| |
TOTAL ASSET-BACKED SECURITIES |
(Cost $6,700,032) | | $ | 6,606,486 | |
| |
| |
| | | | | | | | | | | | | | | |
| | | | | | | | | | | | | | | |
Foreign Debt Obligations – 0.4% |
Sovereign – 0.3% |
Republic of Argentina(e) |
| EUR | 700,000 | | | | 0.000 | % | | | 12/15/35 | | | $ | 147,745 | |
| Republic of Peru |
| $ | 20,000 | | | | 5.625 | | | | 11/18/50 | | | | 17,500 | |
State of Qatar(d) |
| | 170,000 | | | | 5.250 | | | | 01/20/20 | | | | 179,350 | |
| | | | | | | | | | | | | | | |
| | | | | | | | | | | | | | 344,595 | |
| |
| |
Supranational – 0.1% |
| North American Development Bank |
| | 200,000 | | | | 4.375 | | | | 02/11/20 | | | | 205,548 | |
| |
| |
TOTAL FOREIGN DEBT OBLIGATIONS |
(Cost $501,966) | | $ | 550,143 | |
| |
| |
| | | | | | | | | | | | | | | |
| | | | | | | | | | | | | | | |
Government Guarantee Obligations(d)(j) – 0.4% |
| Achmea Hypotheekbank NV |
| $ | 400,000 | | | | 3.200 | % | | | 11/03/14 | | | $ | 418,275 | |
| Danske Bank AS |
| | 100,000 | | | | 2.500 | | | | 05/10/12 | | | | 101,621 | |
| |
| |
TOTAL GOVERNMENT GUARANTEE OBLIGATIONS |
(Cost $501,021) | | $ | 519,896 | |
| |
| |
The accompanying notes are an integral part of these financial statements. 55
GOLDMAN SACHS BALANCED FUND
Schedule of Investments (continued)
April 30, 2011 (Unaudited)
| | | | | | | | | | | | | | | |
Principal
| | Interest
| | Maturity
| | |
| Amount | | Rate | | Date | | Value |
| |
| | | | | | | | | | | | | | | |
| | | | | | | | | | | | | | | |
Municipal Debt Obligations – 0.7% |
California – 0.4% |
| California State GO Bonds Build America Taxable Series 2009 |
| $ | 75,000 | | | | 7.500 | % | | | 04/01/34 | | | $ | 83,791 | |
| | 125,000 | | | | 7.550 | | | | 04/01/39 | | | | 141,669 | |
| California State GO Bonds Build America Taxable Series 2010 |
| | 80,000 | | | | 7.950 | | | | 03/01/36 | | | | 86,990 | |
| | 175,000 | | | | 7.625 | | | | 03/01/40 | | | | 199,768 | |
| | | | | | | | | | | | | | | |
| | | | | | | | | | | | | | 512,218 | |
| |
| |
Connecticut – 0.0% |
Connecticut State Health & Educational Facilities Authority RB for Yale University Series 2007-Z-1 |
| | 50,000 | | | | 5.000 | | | | 07/01/42 | | | | 50,860 | |
| |
| |
Illinois – 0.1% |
| Illinois State GO Bonds Build America Series 2010 |
| | 75,000 | | | | 7.350 | | | | 07/01/35 | | | | 80,486 | |
| |
| |
New York – 0.1% |
| New York City Municipal Water Finance Authority Water & Sewer System RB Fiscal 2005 Series A |
| | 100,000 | | | | 5.000 | | | | 06/15/39 | | | | 99,695 | |
| |
| |
North Carolina – 0.0% |
| North Carolina Capital Facilities Finance Agency RB for Duke University Project Series 2006 A |
| | 40,000 | | | | 5.000 | | | | 10/01/44 | | | | 40,489 | |
| |
| |
Texas – 0.1% |
| Dallas Area Rapid Transit Sales Tax RB Senior Lien Series 2008 |
| | 100,000 | | | | 5.250 | | | | 12/01/48 | | | | 100,741 | |
| |
| |
TOTAL MUNICIPAL DEBT OBLIGATIONS |
(Cost $818,283) | | $ | 884,489 | |
| |
| |
| | | | | | | | | | | | | | | |
| | | | | | | | | | | | | | | |
Structured Note(e) – 0.3% |
| Notas do Tesouro Nacional Series B (Issuer HSBC Corp.) |
| $ | 589,764 | | | | 6.000 | % | | | 08/15/40 | | | $ | 375,067 | |
(Cost $355,083) | | | | |
| |
| |
| | | | | | | | | | | | | | | |
| | | | | | | | | | | | | | | |
U.S. Treasury Obligations – 2.0% |
| United States Treasury Bonds |
| $ | 100,000 | | | | 4.750 | % | | | 02/15/37 | | | $ | 106,232 | |
| | 100,000 | | | | 4.500 | | | | 05/15/38 | | | | 101,895 | |
| | 800,000 | | | | 4.375 | | | | 05/15/40 | | | | 795,024 | |
| | 400,000 | | | | 4.250 | (b) | | | 11/15/40 | | | | 388,896 | |
| United States Treasury Inflation Protected Securities |
| | 101,152 | | | | 1.125 | | | | 01/15/21 | | | | 104,898 | |
| | 293,470 | | | | 2.375 | | | | 01/15/25 | | | | 337,810 | |
| | 329,121 | | | | 2.375 | | | | 01/15/27 | | | | 376,744 | |
| United States Treasury Notes |
| | 400,000 | | | | 2.000 | | | | 04/30/16 | | | | 400,438 | |
| | 100,000 | | | | 3.625 | | | | 02/15/21 | | | | 102,727 | |
| |
| |
TOTAL U.S. TREASURY OBLIGATIONS |
(Cost $2,711,271) | | $ | 2,714,664 | |
| |
| |
| | | | | | | | | | | | | | | |
| | | | | | | | | | | | | | | |
| | | | | Expiration
| | |
| Units | | Description | | Month | | Value |
| |
Right* – 0.0% |
Pharmaceuticals – 0.0% |
| | 800 | | | | Sanofi-Aventis SA | | | | 12/20 | | | $ | 1,984 | |
(Cost $1,883) | | | | | | | | |
| |
| |
| | | | | | | | | | | | | | | |
| | | | | | | | | | | | | | | |
Principal
| | Interest
| | Maturity
| | |
| Amount | | Rate | | Date | | Value |
| |
Short-term Investment(k) – 8.3% |
Repurchase Agreement – 8.3% |
| Joint Repurchase Agreement Account II |
| $ | 10,900,000 | | | | 0.042 | % | | | 05/02/11 | | | $ | 10,900,000 | |
(Cost $10,900,000) | | | | |
| |
| |
TOTAL INVESTMENTS BEFORE SECURITIES LENDING REINVESTMENT VEHICLE |
(Cost $123,256,265) | | $ | 139,880,039 | |
| |
| |
| | | | | | | | | | | | | | | |
| | | | | | | | | | | |
| Shares | | Rate | | Value |
| |
Securities Lending Reinvestment Vehicle(e)(l) – 0.3% |
| Financial Square Money Market Fund |
| | 406,025 | | | | 0.110 | % | | $ | 406,025 | |
(Cost $406,025) | | | | |
| |
| |
TOTAL INVESTMENTS – 106.6% |
(Cost $123,662,290) | | $ | 140,286,064 | |
| |
| |
LIABILITIES IN EXCESS OF OTHER ASSETS – (6.6)% | | | (8,738,649 | ) |
| |
| |
NET ASSETS – 100.0% | | $ | 131,547,415 | |
| |
| |
The percentage shown for each investment category reflects the value of investments in that category as a percentage of net assets.
| | |
| * | | Non-income producing security. |
| |
| (a) | | All or a portion of security is on loan. |
| |
| (b) | | All or a portion of security is segregated as collateral for initial margin requirement on futures transactions. |
| |
| (c) | | Security with “Call” features with resetting interest rates. Maturity dates disclosed are the final maturity dates. |
| |
| (d) | | Exempt from registration under Rule 144A of the Securities Act of 1933. Under procedures approved by the Board of Trustees, such securities have been determined to be liquid by the investment adviser and may be resold, normally to qualified institutional buyers in transactions exempt from registration. Total market value of Rule 144A securities amounts to $12,104,875, which represents approximately 9.2% of net assets as of April 30, 2011. |
| |
| (e) | | Variable rate security. Interest rate disclosed is that which is in effect at April 30, 2011. |
| |
| (f) | | Security with “Put” features with resetting interest rates. Maturity dates disclosed are the final maturity dates. |
| |
| (g) | | Security with a notional or nominal principal amount. The actual effective yield of this security is different than the stated interest rate. |
56 The accompanying notes are an integral part of these financial statements.
GOLDMAN SACHS BALANCED FUND
| | |
| (h) | | Issued with zero coupon and interest rate is contingent upon LIBOR reaching a predetermined level. |
| |
| (i) | | TBA (To Be Announced) Securities are purchased on a forward commitment basis with an approximate principal amount and no defined maturity date. The actual principal and maturity date will be determined upon settlement when the specific mortgage pools are assigned. Total market value of TBA securities (excluding forward sales contracts, if any) amounts to $9,487,109 which represents approximately 7.2% of net assets as of April 30, 2011. |
| | |
| (j) | | Guaranteed by a foreign government until maturity. |
| |
| (k) | | Joint repurchase agreement was entered into on April 29, 2011. Additional information appears on page 87. |
| |
| (l) | | Represents an affiliated issuer. |
| | | | | |
| |
| |
Currency Abbreviations: |
| BRL | | — | | Brazilian Real |
| EUR | | — | | Euro |
| GBP | | — | | British Pound |
| KRW | | — | | South Korean Won |
| |
Investment Abbreviations: |
| BP | | — | | British Pound Offered Rate |
| EURIBOR | | — | | Euro Interbank Offered Rate |
| FHLB | | — | | Federal Home Loan Bank |
| FHLMC | | — | | Federal Home Loan Mortgage Corp. |
| FNMA | | — | | Federal National Mortgage Association |
| GNMA | | — | | Government National Mortgage Association |
| GO | | — | | General Obligation |
| KWCDC | | — | | South Korean Won Certificate of Deposit |
| LIBOR | | — | | London Interbank Offered Rate |
| OTC | | — | | Over the Counter |
| RB | | — | | Revenue Bond |
| REMIC | | — | | Real Estate Mortgage Investment Conduit |
| |
| |
| |
| ADDITIONAL INVESTMENT INFORMATION | |
FORWARD FOREIGN CURRENCY EXCHANGE CONTRACTS — At April 30, 2011, the Fund had outstanding forward foreign currency exchange contracts to sell foreign currencies:
FORWARD FOREIGN CURRENCY EXCHANGE CONTRACTS WITH UNREALIZED LOSS
| | | | | | | | | | | | | | | | | |
| | | Contracts to
| | Expiration
| | Current
| | Unrealized
|
| Counterparty | | Buy/Sell | | Date | | Value | | Loss |
| |
| JPMorgan Securities, Inc. | | | USD/EUR | | | | 05/12/11 | | | $ | 555,934 | | | $ | (20,252 | ) |
| UBS AG ( London) | | | USD/BRL | | | | 07/14/11 | | | | 329,167 | | | | (11,358 | ) |
|
TOTAL | | | | | | | | | | | | | | $ | (31,610 | ) |
|
FUTURES CONTRACTS — At April 30, 2011, the following futures contracts were open:
| | | | | | | | | | | | | | | |
| | | Number of
| | | | | | |
| | | Contracts
| | Expiration
| | Current
| | Unrealized
|
| Type | | Long (Short) | | Date | | Value | | Gain (Loss) |
| |
| Eurodollars | | | 44 | | | September 2011 | | $ | 10,960,950 | | | $ | 23,714 | |
| Eurodollars | | | 5 | | | March 2012 | | | 1,242,313 | | | | 4,562 | |
| Eurodollars | | | (32 | ) | | September 2012 | | | (7,906,800 | ) | | | (24,456 | ) |
| Eurodollars | | | (13 | ) | | March 2013 | | | (3,192,963 | ) | | | (12,224 | ) |
| S&P Mini 500 Index | | | 17 | | | June 2011 | | | 1,155,745 | | | | 32,228 | |
| Ultra Long U.S. Treasury Bonds | | | 8 | | | June 2011 | | | 1,007,000 | | | | 28,584 | |
| 3 month EURIBOR | | | 2 | | | December 2011 | | | 725,504 | | | | (2,227 | ) |
| 5 Year German Euro-Bobl | | | 5 | | | June 2011 | | | 853,439 | | | | 3,396 | |
| 10 Year German Euro-Bund | | | 16 | | | June 2011 | | | 2,913,008 | | | | 26,554 | |
| 2 Year U.S. Treasury Notes | | | 39 | | | June 2011 | | | 8,545,875 | | | | 38,406 | |
| 5 Year U.S. Treasury Notes | | | 11 | | | June 2011 | | | 1,303,156 | | | | 10,722 | |
| 10 Year U.S. Treasury Notes | | | 12 | | | June 2011 | | | 1,453,687 | | | | 1,761 | |
| 30 Year U.S. Treasury Bonds | | | (1 | ) | | June 2011 | | | (122,375 | ) | | | (1,716 | ) |
| |
| |
TOTAL | | | | | | | | | | | | $ | 129,304 | |
| |
| |
The accompanying notes are an integral part of these financial statements. 57
GOLDMAN SACHS BALANCED FUND
Schedule of Investments (continued)
April 30, 2011 (Unaudited)
| |
| ADDITIONAL INVESTMENT INFORMATION (continued) | |
SWAP CONTRACTS — At April 30, 2011, the Fund had outstanding swap contracts with the following terms:
INTEREST RATE SWAP CONTRACTS
| | | | | | | | | | | | | | | | | | | | | | | |
| | | | | | | Rates Exchanged | | | | | | |
| | | Notional
| | | | Payments
| | Payments
| | | | Upfront Payments
| | |
| | | Amount
| | Termination
| | Received by
| | Made by
| | Market
| | Made (Received)
| | Unrealized
|
| Counterparty | | (000s) | | Date | | the Fund | | the Fund | | Value | | by the Fund | | Gain (Loss) |
| |
| Bank of America Securities LLC | | $ | 1,100 | (a) | | 06/15/16 | | 3 month LIBOR | | 1.750% | | $ | 26,081 | | | $ | 44,789 | | | $ | (18,708 | ) |
| Credit Suisse International (London) | | | 1,000 | (a) | | 06/15/16 | | 1.750% | | 3 month LIBOR | | | (23,710 | ) | | | (41,867 | ) | | | 18,157 | |
| Deutsche Bank Securities, Inc. | | KRW | 550,000 | | | 06/26/11 | | 3.693 | | 3 month KWCDC | | | 394 | | | | — | | | | 394 | |
| | | | 219,234 | | | 07/06/11 | | 3.620 | | 3 month KWCDC | | | 119 | | | | — | | | | 119 | |
| | | | 366,287 | | | 07/07/11 | | 3.626 | | 3 month KWCDC | | | 204 | | | | — | | | | 204 | |
| | | GBP | 600 | (a) | | 06/15/14 | | 1.750 | | 6 month BP | | | (12,693 | ) | | | (14,365 | ) | | | 1,672 | |
| | | $ | 100 | (a) | | 06/15/21 | | 3 month LIBOR | | 2.750 | | | 5,921 | | | | 10,207 | | | | (4,286 | ) |
| JPMorgan Securities, Inc. | | KRW | 200,000 | | | 06/15/11 | | 3.900 | | 3 month KWCDC | | | 244 | | | | — | | | | 244 | |
| | | | 540,000 | | | 06/22/11 | | 3.720 | | 3 month KWCDC | | | 426 | | | | — | | | | 426 | |
| | | | 174,212 | | | 07/08/11 | | 3.660 | | 3 month KWCDC | | | 111 | | | | — | | | | 111 | |
| | | GBP | 900 | (a) | | 06/15/14 | | 1.750 | | 6 month BP | | | (19,039 | ) | | | (26,822 | ) | | | 7,783 | |
| | | $ | 1,100 | (a) | | 06/15/16 | | 1.750 | | 3 month LIBOR | | | (26,081 | ) | | | (34,077 | ) | | | 7,996 | |
| | | | 1,500 | (a) | | 06/15/16 | | 3 month LIBOR | | 1.750 | | | 35,565 | | | | 59,482 | | | | (23,917 | ) |
| Morgan Stanley & Co. | | | 500 | (a) | | 06/15/16 | | 1.750 | | 3 month LIBOR | | | (11,855 | ) | | | (15,875 | ) | | | 4,020 | |
| |
| |
TOTAL | | | | | | | | | | | | $ | (24,313 | ) | | $ | (18,528 | ) | | $ | (5,785 | ) |
| |
| |
| | |
| (a) | | Represents forward starting interest rate swaps whose effective dates of commencement of accruals and cash flows occur subsequent to April 30, 2011. |
WRITTEN OPTIONS CONTRACTS
INTEREST RATE SWAPTION CONTRACTS — At April 30, 2011, the Fund had outstanding written swaptions as follows:
| | | | | | | | | | | | | | | | | | | | | | | | | | | |
| | | | | Notional
| | | | | | | | | | |
| | | | | Amount
| | Expiration
| | Strike
| | Market
| | Premiums
| | Unrealized
|
| Counterparty | | Description | | (000s) | | Date | | Price | | Value | | Received | | Gain (Loss) |
| |
| Deutsche Bank Securities, Inc. | | Put – OTC – 7 year
Interest Rate Swap for the
obligation to pay a fixed
rate versus the 3 month LIBOR
maturing on May 16, 2018 | | $ | 4,000 | | | | 05/12/18 | | | | 3.117 | % | | $ | (79,428 | ) | | $ | (28,600 | ) | | $ | (50,828 | ) |
| | | Call – OTC – 7 year
Interest Rate Swap for the
obligation to pay a fixed
rate versus the 3 month LIBOR
maturing on May 16, 2018 | | | 4,000 | | | | 05/12/18 | | | | 3.117 | | | | (1,351 | ) | | | (28,600 | ) | | | 27,249 | |
| |
| |
TOTAL | | | | $ | 8,000 | | | | | | | | | | | $ | (80,779 | ) | | $ | (57,200 | ) | | $ | (23,579 | ) |
| |
| |
58 The accompanying notes are an integral part of these financial statements.
GOLDMAN SACHS BALANCED FUND
| |
| ADDITIONAL INVESTMENT INFORMATION (continued) | |
For the period ended April 30, 2011, the Fund had the following written swaptions activity:
| | | | | | | | | |
| | | Notional
| | |
| | | Amount
| | Premiums
|
| | | (000s) | | Received |
| |
| Contracts Outstanding October 31, 2010 | | $ | — | | | $ | — | |
| |
| |
| Contracts Written | | | 8,000 | | | | (57,200 | ) |
| |
| |
| Contracts Outstanding April 30, 2011 | | $ | 8,000 | | | $ | (57,200 | ) |
| |
| |
The accompanying notes are an integral part of these financial statements. 59
GOLDMAN SACHS STRUCTURED LARGE CAP GROWTH FUND
Schedule of Investments
April 30, 2011 (Unaudited)
| | | | | | | | | |
| Shares | | Description | | Value |
| |
Common Stocks – 97.9% |
Aerospace & Defense – 2.5% |
| | 140,240 | | | Honeywell International, Inc. | | $ | 8,586,895 | |
| | 81,450 | | | Northrop Grumman Corp. | | | 5,181,035 | |
| | 28,402 | | | Rockwell Collins, Inc. | | | 1,792,166 | |
| | 10,359 | | | United Technologies Corp. | | | 927,959 | |
| | | | | | | | | |
| | | | | | | | 16,488,055 | |
| |
| |
Air Freight & Logistics – 1.9% |
| | 8,804 | | | Expeditors International of Washington, Inc. | | | 477,793 | |
| | 6,765 | | | FedEx Corp. | | | 647,208 | |
| | 152,700 | | | United Parcel Service, Inc. Class B | | | 11,447,919 | |
| | | | | | | | | |
| | | | | | | | 12,572,920 | |
| |
| |
Auto Components – 1.0% |
| | 34,384 | | | Autoliv, Inc. | | | 2,755,190 | |
| | 69,981 | | | TRW Automotive Holdings Corp.* | | | 3,993,116 | |
| | | | | | | | | |
| | | | | | | | 6,748,306 | |
| |
| |
Beverages – 0.8% |
| | 30,481 | | | Dr. Pepper Snapple Group, Inc. | | | 1,194,855 | |
| | 13,039 | | | Hansen Natural Corp.* | | | 862,530 | |
| | 17,879 | | | Molson Coors Brewing Co. Class B | | | 871,601 | |
| | 33,580 | | | PepsiCo., Inc. | | | 2,313,326 | |
| | | | | | | | | |
| | | | | | | | 5,242,312 | |
| |
| |
Biotechnology* – 2.9% |
| | 92,883 | | | Amgen, Inc. | | | 5,280,398 | |
| | 35,357 | | | Biogen Idec, Inc. | | | 3,442,004 | |
| | 4,334 | | | Celgene Corp. | | | 255,186 | |
| | 23,353 | | | Cephalon, Inc.(a) | | | 1,793,510 | |
| | 213,902 | | | Gilead Sciences, Inc. | | | 8,307,954 | |
| | | | | | | | | |
| | | | | | | | 19,079,052 | |
| |
| |
Building Products – 0.0% |
| | 5,032 | | | Lennox International, Inc. | | | 244,605 | |
| |
| |
Capital Markets – 0.8% |
| | 19,450 | | | Franklin Resources, Inc. | | | 2,511,384 | |
| | 18,230 | | | Morgan Stanley & Co. | | | 476,714 | |
| | 67,684 | | | SEI Investments Co. | | | 1,511,384 | |
| | 9,583 | | | T. Rowe Price Group, Inc. | | | 615,708 | |
| | | | | | | | | |
| | | | | | | | 5,115,190 | |
| |
| |
Chemicals – 2.4% |
| | 7,920 | | | Ashland, Inc. | | | 491,674 | |
| | 13,010 | | | Cabot Corp. | | | 583,498 | |
| | 30,308 | | | Eastman Chemical Co. | | | 3,250,533 | |
| | 6,565 | | | Ecolab, Inc. | | | 346,369 | |
| | 175,216 | | | Huntsman Corp. | | | 3,653,254 | |
| | 10,834 | | | PPG Industries, Inc. | | | 1,025,655 | |
| | 4,917 | | | Sigma-Aldrich Corp. | | | 347,042 | |
| | 45,500 | | | The Scotts Miracle-Gro Co. | | | 2,569,385 | |
| | 41,766 | | | The Sherwin-Williams Co. | | | 3,436,924 | |
| | | | | | | | | |
| | | | | | | | 15,704,334 | |
| |
| |
Commercial Services & Supplies* – 0.0% |
| | 6,027 | | | Copart, Inc. | | | 273,445 | |
| |
| |
Communications Equipment – 2.4% |
| | 610,893 | | | Cisco Systems, Inc. | | | 10,727,281 | |
| | 14,142 | | | EchoStar Corp.* | | | 524,385 | |
| | 9,438 | | | F5 Networks, Inc.* | | | 956,636 | |
| | 5,894 | | | Harris Corp. | | | 313,148 | |
| | 33,412 | | | JDS Uniphase Corp.* | | | 696,306 | |
| | 30,687 | | | Juniper Networks, Inc.* | | | 1,176,233 | |
| | 9,756 | | | Polycom, Inc.* | | | 583,701 | |
| | 203,216 | | | Tellabs, Inc. | | | 999,823 | |
| | | | | | | | | |
| | | | | | | | 15,977,513 | |
| |
| |
Computers & Peripherals – 6.5% |
| | 14,705 | | | Apple, Inc.* | | | 5,120,722 | |
| | 605,351 | | | Dell, Inc.* | | | 9,388,994 | |
| | 68,635 | | | EMC Corp.* | | | 1,945,116 | |
| | 222,395 | | | Hewlett-Packard Co. | | | 8,978,086 | |
| | 49,451 | | | Lexmark International, Inc.* | | | 1,594,795 | |
| | 205,545 | | | NetApp, Inc.* | | | 10,684,229 | |
| | 130,187 | | | QLogic Corp.* | | | 2,340,762 | |
| | 8,046 | | | SanDisk Corp.* | | | 395,380 | |
| | 63,392 | | | Western Digital Corp.* | | | 2,523,002 | |
| | | | | | | | | |
| | | | | | | | 42,971,086 | |
| |
| |
Construction & Engineering – 0.0% |
| | 2,908 | | | Fluor Corp. | | | 203,386 | |
| |
| |
Consumer Finance – 0.1% |
| | 13,457 | | | Capital One Financial Corp. | | | 736,502 | |
| |
| |
Diversified Consumer Services* – 0.2% |
| | 25,385 | | | Apollo Group, Inc. | | | 1,016,162 | |
| |
| |
Diversified Financial Services – 0.1% |
| | 2,391 | | | CME Group, Inc. | | | 707,186 | |
| |
| |
Diversified Telecommunication Services – 0.1% |
| | 27,830 | | | AT&T, Inc. | | | 866,070 | |
| |
| |
Electric Utilities – 0.0% |
| | 12,039 | | | Duke Energy Corp. | | | 224,527 | |
| |
| |
Electrical Equipment – 1.5% |
| | 5,793 | | | Cooper Industries PLC | | | 382,048 | |
| | 69,519 | | | Emerson Electric Co. | | | 4,223,974 | |
| | 22,647 | | | General Cable Corp.* | | | 1,098,380 | |
| | 3,331 | | | Regal-Beloit Corp. | | | 252,457 | |
| | 41,795 | | | Rockwell Automation, Inc. | | | 3,641,598 | |
| | 5,164 | | | Thomas & Betts Corp.* | | | 299,357 | |
| | | | | | | | | |
| | | | | | | | 9,897,814 | |
| |
| |
Electronic Equipment, Instruments & Components* – 1.5% |
| | 59,008 | | | Flextronics International Ltd. | | | 411,286 | |
| | 329,909 | | | Ingram Micro, Inc. | | | 6,179,196 | |
| | 155,781 | | | Vishay Intertechnology, Inc. | | | 2,972,301 | |
| | | | | | | | | |
| | | | | | | | 9,562,783 | |
| |
| |
Energy Equipment & Services – 1.3% |
| | 13,123 | | | Core Laboratories NV(a) | | | 1,259,545 | |
| | 32,707 | | | Exterran Holdings, Inc.* | | | 710,069 | |
| | 9,804 | | | FMC Technologies, Inc.* | | | 455,690 | |
| | 9,367 | | | Helmerich & Payne, Inc. | | | 621,407 | |
| |
| |
60 The accompanying notes are an integral part of these financial statements.
GOLDMAN SACHS STRUCTURED LARGE CAP GROWTH FUND
| | | | | | | | | |
| Shares | | Description | | Value |
| |
Common Stocks – (continued) |
Energy Equipment & Services – (continued) |
| | | | | | | | | |
| | 36,171 | | | National-Oilwell Varco, Inc. | | $ | 2,773,954 | |
| | 7,154 | | | Oceaneering International, Inc.* | | | 625,403 | |
| | 8,246 | | | Oil States International, Inc.* | | | 684,500 | |
| | 21,244 | | | Patterson-UTI Energy, Inc. | | | 660,901 | |
| | 4,338 | | | SEACOR Holdings, Inc. | | | 428,725 | |
| | | | | | | | | |
| | | | | | | | 8,220,194 | |
| |
| |
Food & Staples Retailing – 1.5% |
| | 62,709 | | | Costco Wholesale Corp. | | | 5,074,412 | |
| | 16,342 | | | CVS Caremark Corp. | | | 592,234 | |
| | 78,833 | | | Walgreen Co. | | | 3,367,746 | |
| | 10,000 | | | Whole Foods Market, Inc. | | | 627,600 | |
| | | | | | | | | |
| | | | | | | | 9,661,992 | |
| |
| |
Food Products – 1.4% |
| | 108,663 | | | Archer-Daniels-Midland Co. | | | 4,022,704 | |
| | 9,088 | | | Hormel Foods Corp. | | | 267,278 | |
| | 6,588 | | | Kellogg Co. | | | 377,295 | |
| | 15,501 | | | Smithfield Foods, Inc.* | | | 365,204 | |
| | 220,231 | | | Tyson Foods, Inc. | | | 4,382,597 | |
| | | | | | | | | |
| | | | | | | | 9,415,078 | |
| |
| |
Health Care Equipment & Supplies – 2.3% |
| | 16,233 | | | Becton, Dickinson & Co. | | | 1,395,064 | |
| | 467,767 | | | Boston Scientific Corp.* | | | 3,503,575 | |
| | 163,817 | | | CareFusion Corp.* | | | 4,811,305 | |
| | 20,913 | | | DENTSPLY International, Inc. | | | 785,074 | |
| | 4,358 | | | Edwards Lifesciences Corp.* | | | 376,313 | |
| | 16,767 | | | Hill-Rom Holdings, Inc. | | | 754,683 | |
| | 4,758 | | | IDEXX Laboratories, Inc.* | | | 387,444 | |
| | 27,802 | | | Medtronic, Inc. | | | 1,160,734 | |
| | 24,996 | | | Varian Medical Systems, Inc.* | | | 1,754,719 | |
| | 4,689 | | | Zimmer Holdings, Inc.* | | | 305,957 | |
| | | | | | | | | |
| | | | | | | | 15,234,868 | |
| |
| |
Health Care Providers & Services – 1.8% |
| | 147,305 | | | Cardinal Health, Inc. | | | 6,435,756 | |
| | 65,993 | | | Coventry Health Care, Inc.* | | | 2,129,594 | |
| | 7,279 | | | Health Net, Inc.* | | | 242,391 | |
| | 21,976 | | | Humana, Inc.* | | | 1,672,813 | |
| | 8,908 | | | Lincare Holdings, Inc. | | | 279,889 | |
| | 17,772 | | | WellPoint, Inc. | | | 1,364,712 | |
| | | | | | | | | |
| | | | | | | | 12,125,155 | |
| |
| |
Hotels, Restaurants & Leisure – 2.8% |
| | 117,017 | | | Carnival Corp. | | | 4,454,837 | |
| | 9,025 | | | Chipotle Mexican Grill, Inc.* | | | 2,407,780 | |
| | 43,668 | | | McDonald’s Corp. | | | 3,419,641 | |
| | 6,909 | | | Panera Bread Co.* | | | 836,749 | |
| | 148,254 | | | Starbucks Corp. | | | 5,365,312 | |
| | 1,787 | | | Wynn Resorts Ltd. | | | 262,957 | |
| | 25,811 | | | Yum! Brands, Inc. | | | 1,384,502 | |
| | | | | | | | | |
| | | | | | | | 18,131,778 | |
| |
| |
Household Durables – 0.7% |
| | 17,265 | | | Garmin Ltd.(a) | | | 590,981 | |
| | 64,052 | | | Harman International Industries, Inc. | | | 3,108,443 | |
| | 16,445 | | | Mohawk Industries, Inc.* | | | 987,358 | |
| | | | | | | | | |
| | | | | | | | 4,686,782 | |
| |
| |
Household Products – 1.1% |
| | 19,477 | | | Colgate-Palmolive Co. | | | 1,642,885 | |
| | 90,629 | | | The Procter & Gamble Co. | | | 5,881,822 | |
| | | | | | | | | |
| | | | | | | | 7,524,707 | |
| |
| |
Industrial Conglomerates – 0.8% |
| | 3,822 | | | 3M Co. | | | 371,537 | |
| | 84,780 | | | General Electric Co. | | | 1,733,751 | |
| | 68,081 | | | Tyco International Ltd. | | | 3,318,268 | |
| | | | | | | | | |
| | | | | | | | 5,423,556 | |
| |
| |
Insurance – 0.2% |
| | 9,519 | | | StanCorp Financial Group, Inc. | | | 410,269 | |
| | 41,100 | | | Unum Group | | | 1,088,328 | |
| | | | | | | | | |
| | | | | | | | 1,498,597 | |
| |
| |
Internet & Catalog Retail* – 1.5% |
| | 41,182 | | | Amazon.com, Inc.(b) | | | 8,092,263 | |
| | 22,672 | | | Liberty Media Corp. – Interactive | | | 396,307 | |
| | 5,947 | | | Netflix, Inc. | | | 1,383,688 | |
| | | | | | | | | |
| | | | | | | | 9,872,258 | |
| |
| |
Internet Software & Services – 2.7% |
| | 30,247 | | | AOL, Inc.* | | | 616,434 | |
| | 24,919 | | | Google, Inc. Class A* | | | 13,558,428 | |
| | 105,179 | | | VeriSign, Inc. | | | 3,887,416 | |
| | | | | | | | | |
| | | | | | | | 18,062,278 | |
| |
| |
IT Services – 5.3% |
| | 360,490 | | | Accenture PLC | | | 20,594,794 | |
| | 59,359 | | | Amdocs Ltd.* | | | 1,825,289 | |
| | 4,287 | | | Cognizant Technology Solutions Corp.* | | | 355,392 | |
| | 34,572 | | | International Business Machines Corp. | | | 5,897,292 | |
| | 87,791 | | | NeuStar, Inc.* | | | 2,360,700 | |
| | 64,806 | | | Teradata Corp.* | | | 3,623,951 | |
| | | | | | | | | |
| | | | | | | | 34,657,418 | |
| |
| |
Life Sciences Tools & Services* – 0.1% |
| | 15,254 | | | Charles River Laboratories International, Inc. | | | 643,566 | |
| |
| |
Machinery – 4.9% |
| | 38,109 | | | AGCO Corp.* | | | 2,194,316 | |
| | 7,114 | | | Bucyrus International, Inc. | | | 650,575 | |
| | 16,650 | | | CNH Global NV* | | | 804,195 | |
| | 25,203 | | | Cummins, Inc. | | | 3,028,897 | |
| | 40,548 | | | Eaton Corp. | | | 2,170,534 | |
| | 3,233 | | | Gardner Denver, Inc. | | | 279,363 | |
| | 11,242 | | | Harsco Corp. | | | 400,215 | |
| | 8,522 | | | Illinois Tool Works, Inc. | | | 497,770 | |
| | 19,748 | | | Joy Global, Inc. | | | 1,993,561 | |
| | 8,321 | | | Kennametal, Inc. | | | 351,313 | |
| |
| |
The accompanying notes are an integral part of these financial statements. 61
GOLDMAN SACHS STRUCTURED LARGE CAP GROWTH FUND
Schedule of Investments (continued)
April 30, 2011 (Unaudited)
| | | | | | | | | |
| Shares | | Description | | Value |
| |
Common Stocks – (continued) |
Machinery – (continued) |
| | | | | | | | | |
| | 71,215 | | | Oshkosh Corp.* | | $ | 2,254,667 | |
| | 15,383 | | | Parker Hannifin Corp. | | | 1,450,925 | |
| | 199,575 | | | The Toro Co. | | | 13,553,138 | |
| | 41,228 | | | Timken Co. | | | 2,324,847 | |
| | 6,886 | | | WABCO Holdings, Inc.* | | | 508,531 | |
| | | | | | | | | |
| | | | | | | | 32,462,847 | |
| |
| |
Media – 2.7% |
| | 13,167 | | | Cablevision Systems Corp. | | | 463,874 | |
| | 9,815 | | | Comcast Corp. Special Class A | | | 240,958 | |
| | 122,533 | | | DIRECTV* | | | 5,953,879 | |
| | 255,104 | | | DISH Network Corp. Class A* | | | 6,387,804 | |
| | 131,471 | | | News Corp. | | | 2,342,813 | |
| | 65,527 | | | Time Warner, Inc. | | | 2,480,852 | |
| | | | | | | | | |
| | | | | | | | 17,870,180 | |
| |
| |
Metals & Mining – 2.0% |
| | 87,549 | | | Freeport-McMoRan Copper & Gold, Inc. | | | 4,817,821 | |
| | 51,031 | | | Newmont Mining Corp. | | | 2,990,927 | |
| | 11,844 | | | Reliance Steel & Aluminum Co. | | | 670,489 | |
| | 73,530 | | | Southern Copper Corp. | | | 2,754,434 | |
| | 28,460 | | | Titanium Metals Corp.* | | | 570,054 | |
| | 8,531 | | | Walter Energy, Inc. | | | 1,179,155 | |
| | | | | | | | | |
| | | | | | | | 12,982,880 | |
| |
| |
Multi-Utilities – 0.2% |
| | 19,638 | | | Sempra Energy | | | 1,082,054 | |
| |
| |
Multiline Retail – 0.6% |
| | 41,880 | | | Dollar Tree, Inc.* | | | 2,408,100 | |
| | 24,639 | | | Family Dollar Stores, Inc. | | | 1,335,680 | |
| | | | | | | | | |
| | | | | | | | 3,743,780 | |
| |
| |
Oil, Gas & Consumable Fuels – 11.7% |
| | 64,218 | | | Chevron Corp. | | | 7,028,018 | |
| | 34,155 | | | Cimarex Energy Co. | | | 3,777,201 | |
| | 192,898 | | | ConocoPhillips | | | 15,225,439 | |
| | 2,990 | | | Devon Energy Corp. | | | 272,090 | |
| | 365,184 | | | Exxon Mobil Corp. | | | 32,136,192 | |
| | 6,867 | | | Forest Oil Corp.* | | | 246,594 | |
| | 9,750 | | | Hess Corp. | | | 838,110 | |
| | 13,048 | | | Marathon Oil Corp. | | | 705,114 | |
| | 10,960 | | | Murphy Oil Corp. | | | 849,181 | |
| | 8,471 | | | Newfield Exploration Co.* | | | 599,747 | |
| | 44,417 | | | Sunoco, Inc. | | | 1,894,829 | |
| | 112,588 | | | Tesoro Corp.* | | | 3,053,387 | |
| | 377,446 | | | Valero Energy Corp. | | | 10,681,722 | |
| | | | | | | | | |
| | | | | | | | 77,307,624 | |
| |
| |
Paper & Forest Products – 0.3% |
| | 21,099 | | | Domtar Corp. | | | 1,962,629 | |
| |
| |
Personal Products – 0.4% |
| | 28,805 | | | Herbalife Ltd. | | | 2,586,113 | |
| |
| |
Pharmaceuticals – 2.8% |
| | 350,366 | | | Eli Lilly & Co. | | | 12,967,045 | |
| | 14,893 | | | Forest Laboratories, Inc.* | | | 493,852 | |
| |
| |
| | 31,694 | | | Johnson & Johnson | | | 2,082,930 | |
| | 125,649 | | | Pfizer, Inc. | | | 2,633,603 | |
| | | | | | | | | |
| | | | | | | | 18,177,430 | |
| |
| |
Professional Services – 0.3% |
| | 19,997 | | | Manpower, Inc. | | | 1,324,801 | |
| | 17,525 | | | Robert Half International, Inc. | | | 531,533 | |
| | | | | | | | | |
| | | | | | | | 1,856,334 | |
| |
| |
Real Estate Investment Trusts – 2.8% |
| | 10,039 | | | AvalonBay Communities, Inc. | | | 1,271,038 | |
| | 5,657 | | | Nationwide Health Properties, Inc. | | | 247,777 | |
| | 5,631 | | | Plum Creek Timber Co., Inc. | | | 242,640 | |
| | 81,148 | | | Rayonier, Inc. | | | 5,384,981 | |
| | 97,377 | | | Simon Property Group, Inc. | | | 11,153,561 | |
| | | | | | | | | |
| | | | | | | | 18,299,997 | |
| |
| |
Semiconductors & Semiconductor Equipment – 4.0% |
| | 47,853 | | | Fairchild Semiconductor International, Inc.* | | | 1,003,477 | |
| | 962,701 | | | Intel Corp. | | | 22,325,036 | |
| | 9,420 | | | Lam Research Corp.* | | | 455,080 | |
| | 86,268 | | | Marvell Technology Group Ltd.* | | | 1,331,115 | |
| | 13,232 | | | Silicon Laboratories, Inc.* | | | 576,651 | |
| | 22,375 | | | Teradyne, Inc.* | | | 360,238 | |
| | | | | | | | | |
| | | | | | | | 26,051,597 | |
| |
| |
Software – 7.3% |
| | 4,877 | | | ANSYS, Inc.* | | | 269,649 | |
| | 22,666 | | | Autodesk, Inc.* | | | 1,019,517 | |
| | 3,017 | | | Citrix Systems, Inc.* | | | 254,454 | |
| | 1,079,690 | | | Microsoft Corp. | | | 28,093,534 | |
| | 375,087 | | | Oracle Corp. | | | 13,521,886 | |
| | 30,845 | | | Salesforce.com, Inc.* | | | 4,275,117 | |
| | 12,587 | | | Synopsys, Inc.* | | | 344,758 | |
| | | | | | | | | |
| | | | | | | | 47,778,915 | |
| |
| |
Specialty Retail – 3.7% |
| | 21,540 | | | Advance Auto Parts, Inc. | | | 1,410,008 | |
| | 133,353 | | | AutoNation, Inc.*(a) | | | 4,522,000 | |
| | 3,096 | | | AutoZone, Inc.* | | | 874,249 | |
| | 10,754 | | | Dick’s Sporting Goods, Inc.* | | | 440,161 | |
| | 14,188 | | | Foot Locker, Inc. | | | 305,326 | |
| | 135,787 | | | Limited Brands, Inc. | | | 5,588,993 | |
| | 18,665 | | | O’Reilly Automotive, Inc.* | | | 1,102,355 | |
| | 22,234 | | | PetSmart, Inc. | | | 937,608 | |
| | 109,218 | | | Ross Stores, Inc. | | | 8,048,274 | |
| | 20,631 | | | The TJX Cos., Inc. | | | 1,106,234 | |
| | | | | | | | | |
| | | | | | | | 24,335,208 | |
| |
| |
Textiles, Apparel & Luxury Goods – 1.1% |
| | 50,346 | | | Coach, Inc. | | | 3,011,194 | |
| | 11,208 | | | Fossil, Inc.* | | | 1,073,502 | |
| | 40,209 | | | NIKE, Inc. Class B | | | 3,310,005 | |
| | | | | | | | | |
| | | | | | | | 7,394,701 | |
| |
| |
62 The accompanying notes are an integral part of these financial statements.
GOLDMAN SACHS STRUCTURED LARGE CAP GROWTH FUND
| | | | | | | | | |
| Shares | | Description | | Value |
| |
Common Stocks – (continued) |
| | | | | | | | | |
Tobacco – 3.9% |
| | 208,293 | | | Lorillard, Inc. | | $ | 22,183,204 | |
| | 46,256 | | | Philip Morris International, Inc. | | | 3,212,017 | |
| | | | | | | | | |
| | | | | | | | 25,395,221 | |
| |
| |
Trading Companies & Distributors – 0.6% |
| | 4,421 | | | Fastenal Co. | | | 296,605 | |
| | 7,409 | | | MSC Industrial Direct Co., Inc. | | | 530,411 | |
| | 17,727 | | | W.W. Grainger, Inc. | | | 2,687,413 | |
| | 5,795 | | | WESCO International, Inc.* | | | 359,000 | |
| | | | | | | | | |
| | | | | | | | 3,873,429 | |
| |
| |
Wireless Telecommunication Services* – 0.4% |
| | 461,537 | | | Sprint Nextel Corp. | | | 2,390,762 | |
| |
| |
TOTAL COMMON STOCKS |
(Cost $494,474,384) | | $ | 644,341,176 | |
| |
| |
| | | | | | | | | |
| | | | | | | | | | | | | |
| | | | | Expiration
| | |
| Units | | Description | | Month | | Value |
| |
Right* – 0.0% |
Pharmaceuticals – 0.0% |
| | 6,075 | | | Sanofi-Aventis SA | | | 12/20 | | | $ | 15,066 | |
(Cost $14,300) | | | | | | | | |
| |
| |
TOTAL INVESTMENTS BEFORE SECURITIES LENDING REINVESTMENT VEHICLE |
(Cost $494,488,684) | | | | | | $ | 644,356,242 | |
| |
| |
| | | | | | | | | | | | | |
| | | | | | | | | | | |
| Shares | | Rate | | Value |
| |
Securities Lending Reinvestment Vehicle(c)(d) – 1.2% |
| Financial Square Money Market Fund |
| | 7,806,700 | | | | 0.110 | % | | $ | 7,806,700 | |
(Cost $7,806,700) | | | | |
| |
| |
TOTAL INVESTMENTS – 99.1% |
(Cost $502,295,384) | | $ | 652,162,942 | |
| |
| |
OTHER ASSETS IN EXCESS OF LIABILITIES – 0.9% | | | 6,120,781 | |
| |
| |
NET ASSETS – 100.0% | | $ | 658,283,723 | |
| |
| |
The percentage shown for each investment category reflects the value of investments in that category as a percentage of net assets.
| | |
| * | | Non-income producing security. |
| |
| (a) | | All or a portion of security is on loan. |
| |
| (b) | | All or a portion of security is segregated as collateral for initial margin requirements on futures transactions. |
| |
| (c) | | Variable rate security. Interest rate disclosed is that which is in effect at April 30, 2011. |
| |
| (d) | | Represents an affiliated issuer. |
| |
| ADDITIONAL INVESTMENT INFORMATION | |
FUTURES CONTRACTS — At April 30, 2011, the following futures contracts were open:
| | | | | | | | | | | | | | | |
| | | Number of
| | | | | | |
| | | Contracts
| | Expiration
| | Current
| | Unrealized
|
| Type | | Long (Short) | | Date | | Value | | Gain (Loss) |
| |
| S&P Mini 500 Index | | | 192 | | | June 2011 | | $ | 13,053,120 | | | $ | 137,789 | |
| |
| |
The accompanying notes are an integral part of these financial statements. 63
GOLDMAN SACHS STRUCTURED LARGE CAP VALUE FUND
Schedule of Investments
April 30, 2011 (Unaudited)
| | | | | | | | | |
| Shares | | Description | | Value |
| |
Common Stocks – 97.9% |
Aerospace & Defense – 1.1% |
| | 7,807 | | | Honeywell International, Inc. | | $ | 478,023 | |
| | 105,718 | | | Northrop Grumman Corp. | | | 6,724,722 | |
| | | | | | | | | |
| | | | | | | | 7,202,745 | |
| |
| |
Air Freight & Logistics – 1.1% |
| | 9,834 | | | Expeditors International of Washington, Inc. | | | 533,691 | |
| | 41,468 | | | FedEx Corp. | | | 3,967,243 | |
| | 39,310 | | | United Parcel Service, Inc. Class B | | | 2,947,071 | |
| | | | | | | | | |
| | | | | | | | 7,448,005 | |
| |
| |
Auto Components – 0.7% |
| | 22,289 | | | Autoliv, Inc. | | | 1,786,018 | |
| | 14,112 | | | Federal-Mogul Corp.* | | | 373,968 | |
| | 37,921 | | | TRW Automotive Holdings Corp.* | | | 2,163,772 | |
| | | | | | | | | |
| | | | | | | | 4,323,758 | |
| |
| |
Beverages – 0.3% |
| | 26,266 | | | Dr. Pepper Snapple Group, Inc. | | | 1,029,627 | |
| | 5,529 | | | Hansen Natural Corp.* | | | 365,743 | |
| | 12,017 | | | Molson Coors Brewing Co. Class B | | | 585,829 | |
| | | | | | | | | |
| | | | | | | | 1,981,199 | |
| |
| |
Biotechnology* – 2.5% |
| | 138,459 | | | Amgen, Inc. | | | 7,871,394 | |
| | 40,497 | | | Biogen Idec, Inc. | | | 3,942,383 | |
| | 17,774 | | | Cephalon, Inc.(a) | | | 1,365,043 | |
| | 88,868 | | | Gilead Sciences, Inc. | | | 3,451,633 | |
| | | | | | | | | |
| | | | | | | | 16,630,453 | |
| |
| |
Building Products – 0.1% |
| | 13,421 | | | Armstrong World Industries, Inc. | | | 600,590 | |
| | 5,294 | | | Lennox International, Inc. | | | 257,341 | |
| | | | | | | | | |
| | | | | | | | 857,931 | |
| |
| |
Capital Markets – 3.5% |
| | 201,144 | | | Bank of New York Mellon Corp. | | | 5,825,130 | |
| | 59,733 | | | Eaton Vance Corp. | | | 2,017,184 | |
| | 18,472 | | | Federated Investors, Inc. Class B(a) | | | 476,208 | |
| | 30,219 | | | Franklin Resources, Inc. | | | 3,901,877 | |
| | 150,977 | | | Morgan Stanley & Co. | | | 3,948,049 | |
| | 253,027 | | | SEI Investments Co. | | | 5,650,093 | |
| | 23,833 | | | T. Rowe Price Group, Inc. | | | 1,531,270 | |
| | | | | | | | | |
| | | | | | | | 23,349,811 | |
| |
| |
Chemicals – 1.8% |
| | 7,890 | | | Cabot Corp. | | | 353,866 | |
| | 50,024 | | | Eastman Chemical Co. | | | 5,365,074 | |
| | 175,985 | | | Huntsman Corp. | | | 3,669,287 | |
| | 9,679 | | | PPG Industries, Inc. | | | 916,311 | |
| | 3,375 | | | Sigma-Aldrich Corp. | | | 238,208 | |
| | 6,937 | | | The Dow Chemical Co. | | | 284,348 | |
| | 14,453 | | | The Sherwin-Williams Co. | | | 1,189,337 | |
| | | | | | | | | |
| | | | | | | | 12,016,431 | |
| |
| |
Commercial Banks – 4.2% |
| | 4,180 | | | Cullen/Frost Bankers, Inc. | | | 247,623 | |
| | 13,193 | | | M&T Bank Corp. | | | 1,165,866 | |
| | 84,757 | | | PNC Financial Services Group, Inc. | | | 5,283,751 | |
| | 166,966 | | | U.S. Bancorp | | | 4,311,062 | |
| | 569,282 | | | Wells Fargo & Co. | | | 16,571,799 | |
| | | | | | | | | |
| | | | | | | | 27,580,101 | |
| |
| |
Communications Equipment* – 0.1% |
| | 18,711 | | | Motorola Solutions, Inc. | | | 858,461 | |
| |
| |
Computers & Peripherals* – 0.1% |
| | 11,627 | | | NetApp, Inc. | | | 604,371 | |
| |
| |
Consumer Finance – 1.1% |
| | 123,035 | | | Capital One Financial Corp. | | | 6,733,706 | |
| | 19,529 | | | Discover Financial Services | | | 485,100 | |
| | | | | | | | | |
| | | | | | | | 7,218,806 | |
| |
| |
Diversified Consumer Services* – 0.0% |
| | 6,082 | | | Apollo Group, Inc. Class A | | | 243,462 | |
| |
| |
Diversified Financial Services – 5.0% |
| | 707,795 | | | Bank of America Corp. | | | 8,691,723 | |
| | 1,800,349 | | | Citigroup, Inc.* | | | 8,263,602 | |
| | 13,614 | | | CME Group, Inc. | | | 4,026,613 | |
| | 1,744 | | | IntercontinentalExchange, Inc.* | | | 209,890 | |
| | 193,839 | | | JPMorgan Chase & Co. | | | 8,844,873 | |
| | 24,768 | | | Leucadia National Corp. | | | 957,531 | |
| | 41,632 | | | Moody’s Corp. | | | 1,629,476 | |
| | 6,092 | | | NYSE Euronext | | | 243,985 | |
| | | | | | | | | |
| | | | | | | | 32,867,693 | |
| |
| |
Diversified Telecommunication Services – 4.1% |
| | 755,454 | | | AT&T, Inc.(b) | | | 23,509,729 | |
| | 101,454 | | | Verizon Communications, Inc. | | | 3,832,932 | |
| | | | | | | | | |
| | | | | | | | 27,342,661 | |
| |
| |
Electric Utilities – 2.8% |
| | 699,923 | | | Duke Energy Corp. | | | 13,053,564 | |
| | 8,838 | | | Entergy Corp. | | | 616,185 | |
| | 60,727 | | | Exelon Corp. | | | 2,559,643 | |
| | 14,933 | | | Great Plains Energy, Inc. | | | 307,321 | |
| | 47,899 | | | Southern Co. | | | 1,869,977 | |
| | | | | | | | | |
| | | | | | | | 18,406,690 | |
| |
| |
Electrical Equipment – 0.5% |
| | 23,031 | | | General Cable Corp.* | | | 1,117,004 | |
| | 23,126 | | | Rockwell Automation, Inc. | | | 2,014,968 | |
| | | | | | | | | |
| | | | | | | | 3,131,972 | |
| |
| |
Electronic Equipment, Instruments & Components – 1.4% |
| | 163,209 | | | Flextronics International Ltd.* | | | 1,137,567 | |
| | 201,395 | | | Ingram Micro, Inc. Class A* | | | 3,772,128 | |
| | 8,106 | | | National Instruments Corp. | | | 245,936 | |
| | 201,087 | | | Vishay Intertechnology, Inc.* | | | 3,836,740 | |
| | | | | | | | | |
| | | | | | | | 8,992,371 | |
| |
| |
Energy Equipment & Services – 0.8% |
| | 6,457 | | | Core Laboratories NV(a) | | | 619,743 | |
| | 97,790 | | | Exterran Holdings, Inc.* | | | 2,123,021 | |
| | 7,088 | | | FMC Technologies, Inc.* | | | 329,450 | |
| | 3,736 | | | Helmerich & Payne, Inc. | | | 247,846 | |
64 The accompanying notes are an integral part of these financial statements.
GOLDMAN SACHS STRUCTURED LARGE CAP VALUE FUND
| | | | | | | | | |
| Shares | | Description | | Value |
| |
Common Stocks – (continued) |
Energy Equipment & Services – (continued) |
| | | | | | | | | |
| | 9,483 | | | National-Oilwell Varco, Inc. | | $ | 727,251 | |
| | 4,397 | | | Oceaneering International, Inc.* | | | 384,386 | |
| | 5,780 | | | Oil States International, Inc.* | | | 479,798 | |
| | 2,407 | | | SEACOR Holdings, Inc. | | | 237,884 | |
| | | | | | | | | |
| | | | | | | | 5,149,379 | |
| |
| |
Food & Staples Retailing – 0.7% |
| | 6,854 | | | Costco Wholesale Corp. | | | 554,626 | |
| | 40,574 | | | CVS Caremark Corp. | | | 1,470,402 | |
| | 50,261 | | | Safeway, Inc. | | | 1,221,845 | |
| | 9,913 | | | The Kroger Co. | | | 240,985 | |
| | 14,592 | | | Walgreen Co. | | | 623,370 | |
| | 8,592 | | | Whole Foods Market, Inc. | | | 539,234 | |
| | | | | | | | | |
| | | | | | | | 4,650,462 | |
| |
| |
Food Products – 2.5% |
| | 198,092 | | | Archer-Daniels-Midland Co. | | | 7,333,366 | |
| | 9,022 | | | Flowers Foods, Inc. | | | 275,712 | |
| | 10,712 | | | Hormel Foods Corp. | | | 315,040 | |
| | 33,943 | | | Smithfield Foods, Inc.* | | | 799,697 | |
| | 405,438 | | | Tyson Foods, Inc. Class A | | | 8,068,216 | |
| | | | | | | | | |
| | | | | | | | 16,792,031 | |
| |
| |
Gas Utilities – 0.2% |
| | 13,408 | | | Energen Corp. | | | 871,654 | |
| | 3,085 | | | National Fuel Gas Co. | | | 226,131 | |
| | 6,262 | | | ONEOK, Inc. | | | 437,964 | |
| | | | | | | | | |
| | | | | | | | 1,535,749 | |
| |
| |
Health Care Equipment & Supplies – 0.8% |
| | 340,058 | | | Boston Scientific Corp.* | | | 2,547,035 | |
| | 75,235 | | | CareFusion Corp.* | | | 2,209,652 | |
| | 7,528 | | | DENTSPLY International, Inc. | | | 282,601 | |
| | 2,761 | | | IDEXX Laboratories, Inc.* | | | 224,828 | |
| | | | | | | | | |
| | | | | | | | 5,264,116 | |
| |
| |
Health Care Providers & Services – 2.3% |
| | 100,472 | | | Cardinal Health, Inc. | | | 4,389,622 | |
| | 170,009 | | | Coventry Health Care, Inc.* | | | 5,486,190 | |
| | 36,106 | | | Health Net, Inc.* | | | 1,202,330 | |
| | 12,485 | | | Humana, Inc.* | | | 950,358 | |
| | 7,630 | | | Lincare Holdings, Inc. | | | 239,735 | |
| | 5,785 | | | UnitedHealth Group, Inc. | | | 284,795 | |
| | 35,690 | | | WellPoint, Inc. | | | 2,740,635 | |
| | | | | | | | | |
| | | | | | | | 15,293,665 | |
| |
| |
Hotels, Restaurants & Leisure – 0.2% |
| | 5,272 | | | Chipotle Mexican Grill, Inc.* | | | 1,406,517 | |
| | 3,842 | | | Yum! Brands, Inc. | | | 206,085 | |
| | | | | | | | | |
| | | | | | | | 1,612,602 | |
| |
| |
Household Durables – 1.2% |
| | 32,406 | | | Garmin Ltd.(a) | | | 1,109,257 | |
| | 86,646 | | | Harman International Industries, Inc. | | | 4,204,931 | |
| | 45,278 | | | Mohawk Industries, Inc.* | | | 2,718,491 | |
| | | | | | | | | |
| | | | | | | | 8,032,679 | |
| |
| |
Household Products – 2.5% |
| | 15,405 | | | Colgate-Palmolive Co. | | | 1,299,412 | |
| | 232,370 | | | The Procter & Gamble Co. | | | 15,080,813 | |
| | | | | | | | | |
| | | | | | | | 16,380,225 | |
| |
| |
Independent Power Producers & Energy Traders* – 0.1% |
| | 14,604 | | | NRG Energy, Inc. | | | 353,417 | |
| |
| |
Industrial Conglomerates – 2.3% |
| | 708,707 | | | General Electric Co. | | | 14,493,058 | |
| | 20,207 | | | Tyco International Ltd. | | | 984,889 | |
| | | | | | | | | |
| | | | | | | | 15,477,947 | |
| |
| |
Insurance – 5.5% |
| | 3,692 | | | ACE Ltd. | | | 248,287 | |
| | 4,304 | | | Allied World Assurance Co. Holdings Ltd. | | | 279,631 | |
| | 96,013 | | | Aspen Insurance Holdings Ltd. | | | 2,743,092 | |
| | 5,838 | | | Assurant, Inc. | | | 231,769 | |
| | 31,319 | | | Axis Capital Holdings Ltd. | | | 1,107,440 | |
| | 133,371 | | | Berkshire Hathaway, Inc. Class B* | | | 11,109,804 | |
| | 22,690 | | | Everest Re Group Ltd. | | | 2,067,513 | |
| | 51,785 | | | Loews Corp. | | | 2,292,004 | |
| | 50,652 | | | MetLife, Inc. | | | 2,370,007 | |
| | 16,975 | | | Protective Life Corp. | | | 456,797 | |
| | 13,573 | | | StanCorp Financial Group, Inc. | | | 584,996 | |
| | 22,735 | | | Symetra Financial Corp. | | | 315,562 | |
| | 12,638 | | | The Chubb Corp. | | | 823,871 | |
| | 40,985 | | | The Travelers Cos., Inc. | | | 2,593,531 | |
| | 3,522 | | | Torchmark Corp. | | | 235,692 | |
| | 341,259 | | | Unum Group | | | 9,036,538 | |
| | | | | | | | | |
| | | | | | | | 36,496,534 | |
| |
| |
Internet & Catalog Retail* – 0.4% |
| | 157,403 | | | Liberty Media Corp. – Interactive Class A | | | 2,751,404 | |
| |
| |
Internet Software & Services – 0.3% |
| | 36,124 | | | AOL, Inc.* | | | 736,207 | |
| | 24,284 | | | VeriSign, Inc. | | | 897,537 | |
| | | | | | | | | |
| | | | | | | | 1,633,744 | |
| |
| |
IT Services – 0.6% |
| | 49,189 | | | Accenture PLC Class A | | | 2,810,168 | |
| | 15,463 | | | Teradata Corp.* | | | 864,691 | |
| | | | | | | | | |
| | | | | | | | 3,674,859 | |
| |
| |
Life Sciences Tools & Services* – 0.1% |
| | 7,729 | | | Charles River Laboratories International, Inc. | | | 326,087 | |
| |
| |
Machinery – 2.0% |
| | 25,698 | | | AGCO Corp.* | | | 1,479,691 | |
| | 4,306 | | | Bucyrus International, Inc. | | | 393,784 | |
| | 11,442 | | | Harsco Corp. | | | 407,335 | |
| | 7,387 | | | Kennametal, Inc. | | | 311,879 | |
| | 93,341 | | | Oshkosh Corp.* | | | 2,955,176 | |
| | 3,220 | | | Parker Hannifin Corp. | | | 303,710 | |
| | 80,825 | | | The Toro Co. | | | 5,488,826 | |
| | 35,772 | | | Timken Co. | | | 2,017,183 | |
| | | | | | | | | |
| | | | | | | | 13,357,584 | |
| |
| |
The accompanying notes are an integral part of these financial statements. 65
GOLDMAN SACHS STRUCTURED LARGE CAP VALUE FUND
Schedule of Investments (continued)
April 30, 2011 (Unaudited)
| | | | | | | | | |
| Shares | | Description | | Value |
| |
Common Stocks – (continued) |
| | | | | | | | | |
Media – 4.5% |
| | 24,457 | | | Cablevision Systems Corp. Class A | | $ | 861,620 | |
| | 67,178 | | | DIRECTV Class A* | | | 3,264,179 | |
| | 326,761 | | | DISH Network Corp. Class A* | | | 8,182,096 | |
| | 16,512 | | | Liberty Media – Starz Series A* | | | 1,268,947 | |
| | 345,461 | | | News Corp. Class A | | | 6,156,115 | |
| | 33,151 | | | News Corp. Class B | | | 626,554 | |
| | 26,080 | | | The Walt Disney Co. | | | 1,124,048 | |
| | 185,436 | | | Time Warner, Inc. | | | 7,020,607 | |
| | 37,278 | | | Virgin Media, Inc. | | | 1,128,032 | |
| | | | | | | | | |
| | | | | | | | 29,632,198 | |
| |
| |
Metals & Mining – 0.7% |
| | 45,348 | | | Reliance Steel & Aluminum Co. | | | 2,567,150 | |
| | 21,553 | | | Southern Copper Corp. | | | 807,375 | |
| | 48,420 | | | Titanium Metals Corp.* | | | 969,853 | |
| | | | | | | | | |
| | | | | | | | 4,344,378 | |
| |
| |
Multi-Utilities – 2.8% |
| | 41,876 | | | Dominion Resources, Inc. | | | 1,943,884 | |
| | 10,057 | | | DTE Energy Co. | | | 508,180 | |
| | 117,606 | | | Integrys Energy Group, Inc. | | | 6,157,850 | |
| | 27,374 | | | MDU Resources Group, Inc. | | | 653,965 | |
| | 147,022 | | | NiSource, Inc. | | | 2,859,578 | |
| | 112,786 | | | Sempra Energy | | | 6,214,509 | |
| | | | | | | | | |
| | | | | | | | 18,337,966 | |
| |
| |
Multiline Retail* – 0.0% |
| | 4,796 | | | Dollar Tree, Inc. | | | 275,770 | |
| |
| |
Oil, Gas & Consumable Fuels – 13.7% |
| | 11,836 | | | Chesapeake Energy Corp. | | | 398,518 | |
| | 271,227 | | | Chevron Corp. | | | 29,683,083 | |
| | 60,251 | | | Cimarex Energy Co. | | | 6,663,158 | |
| | 251,568 | | | ConocoPhillips | | | 19,856,262 | |
| | 23,002 | | | Devon Energy Corp. | | | 2,093,182 | |
| | 54,452 | | | Exxon Mobil Corp. | | | 4,791,776 | |
| | 20,563 | | | Forest Oil Corp.* | | | 738,417 | |
| | 19,587 | | | Hess Corp. | | | 1,683,699 | |
| | 4,505 | | | Holly Corp. | | | 260,839 | |
| | 21,406 | | | Marathon Oil Corp. | | | 1,156,780 | |
| | 14,561 | | | Murphy Oil Corp. | | | 1,128,186 | |
| | 13,932 | | | Newfield Exploration Co.* | | | 986,386 | |
| | 3,515 | | | Occidental Petroleum Corp. | | | 401,729 | |
| | 7,196 | | | Plains Exploration & Production Co.* | | | 273,736 | |
| | 35,067 | | | Sunoco, Inc. | | | 1,495,958 | |
| | 194,096 | | | Tesoro Corp.* | | | 5,263,884 | |
| | 471,289 | | | Valero Energy Corp. | | | 13,337,479 | |
| | | | | | | | | |
| | | | | | | | 90,213,072 | |
| |
| |
Paper & Forest Products – 0.4% |
| | 28,336 | | | Domtar Corp. | | | 2,635,815 | |
| |
| |
Personal Products – 0.3% |
| | 6,710 | | | Alberto-Culver Co. | | | 250,551 | |
| | 18,075 | | | Herbalife Ltd. | | | 1,622,774 | |
| | | | | | | | | |
| | | | | | | | 1,873,325 | |
| |
| |
Pharmaceuticals – 8.0% |
| | 496,841 | | | Eli Lilly & Co. | | | 18,388,085 | |
| | 90,042 | | | Forest Laboratories, Inc.* | | | 2,985,793 | |
| | 121,508 | | | Johnson & Johnson | | | 7,985,506 | |
| | 105,172 | | | Merck & Co., Inc. | | | 3,780,933 | |
| | 925,048 | | | Pfizer, Inc. | | | 19,389,006 | |
| | | | | | | | | |
| | | | | | | | 52,529,323 | |
| |
| |
Professional Services – 0.5% |
| | 36,872 | | | Manpower, Inc. | | | 2,442,770 | |
| | 17,711 | | | Robert Half International, Inc. | | | 537,175 | |
| | | | | | | | | |
| | | | | | | | 2,979,945 | |
| |
| |
Real Estate Investment Trusts – 5.6% |
| | 49,063 | | | AvalonBay Communities, Inc. | | | 6,211,866 | |
| | 2,885 | | | Federal Realty Investment Trust | | | 252,610 | |
| | 33,262 | | | HCP, Inc. | | | 1,317,840 | |
| | 10,731 | | | Nationwide Health Properties, Inc. | | | 470,018 | |
| | 47,265 | | | Plum Creek Timber Co., Inc. | | | 2,036,649 | |
| | 2,561 | | | Public Storage | | | 300,431 | |
| | 144,005 | | | Rayonier, Inc. | | | 9,556,172 | |
| | 136,203 | | | Simon Property Group, Inc. | | | 15,600,692 | |
| | 9,973 | | | Ventas, Inc. | | | 557,790 | |
| | 36,997 | | | Weyerhaeuser Co. | | | 851,301 | |
| | | | | | | | | |
| | | | | | | | 37,155,369 | |
| |
| |
Road & Rail – 0.2% |
| | 5,498 | | | Norfolk Southern Corp. | | | 410,590 | |
| | 5,957 | | | Union Pacific Corp. | | | 616,371 | |
| | | | | | | | | |
| | | | | | | | 1,026,961 | |
| |
| |
Semiconductors & Semiconductor Equipment – 1.5% |
| | 92,274 | | | Fairchild Semiconductor International, Inc.* | | | 1,934,986 | |
| | 346,790 | | | Intel Corp. | | | 8,042,060 | |
| | | | | | | | | |
| | | | | | | | 9,977,046 | |
| |
| |
Software – 1.8% |
| | 5,559 | | | Autodesk, Inc.* | | | 250,044 | |
| | 414,376 | | | Microsoft Corp. | | | 10,782,063 | |
| | 5,196 | | | Salesforce.com, Inc.* | | | 720,166 | |
| | | | | | | | | |
| | | | | | | | 11,752,273 | |
| |
| |
Specialty Retail – 0.7% |
| | 4,689 | | | Advance Auto Parts, Inc. | | | 306,942 | |
| | 96,692 | | | AutoNation, Inc.*(a) | | | 3,278,826 | |
| | 24,610 | | | Limited Brands, Inc. | | | 1,012,947 | |
| | | | | | | | | |
| | | | | | | | 4,598,715 | |
| |
| |
Textiles, Apparel & Luxury Goods – 0.3% |
| | 4,603 | | | Coach, Inc. | | | 275,306 | |
| | 14,868 | | | Fossil, Inc.* | | | 1,424,057 | |
| | | | | | | | | |
| | | | | | | | 1,699,363 | |
| |
| |
Thrifts & Mortgage Finance – 0.2% |
| | 112,127 | | | Hudson City Bancorp, Inc. | | | 1,068,570 | |
| | 19,115 | | | New York Community Bancorp, Inc. | | | 317,309 | |
| | | | | | | | | |
| | | | | | | | 1,385,879 | |
| |
| |
66 The accompanying notes are an integral part of these financial statements.
GOLDMAN SACHS STRUCTURED LARGE CAP VALUE FUND
| | | | | | | | | |
| Shares | | Description | | Value |
| |
Common Stocks – (continued) |
| | | | | | | | | |
Tobacco – 3.1% |
| | 193,156 | | | Lorillard, Inc. | | $ | 20,571,114 | |
| |
| |
Trading Companies & Distributors – 0.2% |
| | 4,039 | | | MSC Industrial Direct Co., Inc. Class A | | | 289,152 | |
| | 5,348 | | | W.W. Grainger, Inc. | | | 810,757 | |
| | 3,941 | | | WESCO International, Inc.* | | | 244,145 | |
| | | | | | | | | |
| | | | | | | | 1,344,054 | |
| |
| |
Wireless Telecommunication Services* – 0.5% |
| | 675,861 | | | Sprint Nextel Corp. | | | 3,500,960 | |
| |
| |
TOTAL COMMON STOCKS |
(Cost $485,549,379) | | $ | 645,672,931 | |
| |
| |
| | | | | | | | | |
| | | | | | | | | | | | | | | |
Principal
| | Interest
| | Maturity
| | |
| Amount | | Rate | | Date | | Value |
| |
Short-term Investment(c) – 0.4% |
Repurchase Agreement – 0.4% |
| Joint Repurchase Agreement Account II |
| $ | 2,600,000 | | | | 0.042 | % | | | 05/02/11 | | | $ | 2,600,000 | |
(Cost $2,600,000) | | | | | | | | |
| |
| |
TOTAL INVESTMENTS BEFORE SECURITIES LENDING REINVESTMENT VEHICLE |
(Cost $488,149,379) | | | | | | $ | 648,272,931 | |
| |
| |
| | | | | | | | | | | | | | | |
| | | | | | | | | | | |
| Shares | | Rate | | Value |
| |
Securities Lending Reinvestment Vehicle(d)(e) – 1.1% |
| Financial Square Money Market Fund |
| | 6,956,750 | | | | 0.110 | % | | $ | 6,956,750 | |
(Cost $6,956,750) | | | | |
| |
| |
TOTAL INVESTMENTS – 99.4% |
(Cost $495,106,129) | | $ | 655,229,681 | |
| |
| |
OTHER ASSETS IN EXCESS OF LIABILITIES – 0.6% | | | 4,111,719 | |
| |
| |
NET ASSETS – 100.0% | | $ | 659,341,400 | |
| |
| |
The percentage shown for each investment category reflects the value of investments in that category as a percentage of net assets.
| | |
| * | | Non-income producing security. |
| |
| (a) | | All or a portion of security is on loan. |
| |
| (b) | | All or a portion of this security is segregated as collateral for initial margin requirement on futures transactions. |
| |
| (c) | | Joint repurchase agreement was entered into on April 29, 2011. Additional information appears on page 87. |
| |
| (d) | | Variable rate security. Interest rate disclosed is that which is in effect at April 30, 2011. |
| |
| (e) | | Represents an affiliated issuer. |
| |
| ADDITIONAL INVESTMENT INFORMATION | |
FUTURES CONTRACTS — At April 30, 2011, the following futures contracts were open:
| | | | | | | | | | | | | | | |
| | | Number of
| | | | | | |
| | | Contracts
| | Expiration
| | Current
| | Unrealized
|
| Type | | Long (Short) | | Date | | Value | | Gain (Loss) |
| |
| S&P Mini 500 Index | | | 187 | | | June 2011 | | $ | 12,713,195 | | | $ | 179,278 | |
| |
| |
The accompanying notes are an integral part of these financial statements. 67
GOLDMAN SACHS STRUCTURED SMALL CAP EQUITY FUND
Schedule of Investments
April 30, 2011 (Unaudited)
| | | | | | | | | |
| Shares | | Description | | Value |
| |
Common Stocks – 97.8% |
Aerospace & Defense* – 0.5% |
| | 16,185 | | | Ceradyne, Inc. | | $ | 758,429 | |
| | 8,514 | | | DigitalGlobe, Inc. | | | 246,906 | |
| | 19,172 | | | Hexcel Corp. | | | 412,773 | |
| | | | | | | | | |
| | | | | | | | 1,418,108 | |
| |
| |
Air Freight & Logistics* – 0.3% |
| | 131,906 | | | Pacer International, Inc. | | | 790,117 | |
| |
| |
Airlines – 0.1% |
| | 12,953 | | | SkyWest, Inc. | | | 214,113 | |
| |
| |
Auto Components – 0.6% |
| | 13,107 | | | Federal-Mogul Corp.* | | | 347,336 | |
| | 17,093 | | | Standard Motor Products, Inc. | | | 243,575 | |
| | 40,394 | | | Stoneridge, Inc.* | | | 618,028 | |
| | 19,030 | | | Superior Industries International, Inc. | | | 480,888 | |
| | | | | | | | | |
| | | | | | | | 1,689,827 | |
| |
| |
Beverages – 1.1% |
| | 141,545 | | | National Beverage Corp. | | | 1,970,307 | |
| | 12,559 | | | The Boston Beer Co., Inc. Class A* | | | 1,183,811 | |
| | | | | | | | | |
| | | | | | | | 3,154,118 | |
| |
| |
Biotechnology – 4.3% |
| | 20,829 | | | Alexion Pharmaceuticals, Inc.* | | | 2,018,122 | |
| | 25,039 | | | ARIAD Pharmaceuticals, Inc.* | | | 214,083 | |
| | 76,422 | | | Cubist Pharmaceuticals, Inc.* | | | 2,586,885 | |
| | 64,938 | | | Emergent Biosolutions, Inc.* | | | 1,507,211 | |
| | 57,542 | | | Enzon Pharmaceuticals, Inc.* | | | 660,582 | |
| | 68,315 | | | Maxygen, Inc. | | | 352,505 | |
| | 378,256 | | | Nabi Biopharmaceuticals* | | | 2,186,320 | |
| | 347,683 | | | PDL BioPharma, Inc. | | | 2,232,125 | |
| | 143,555 | | | Progenics Pharmaceuticals, Inc.* | | | 1,063,743 | |
| | | | | | | | | |
| | | | | | | | 12,821,576 | |
| |
| |
Building Products – 0.5% |
| | 28,486 | | | American Woodmark Corp. | | | 578,551 | |
| | 32,574 | | | Universal Forest Products, Inc. | | | 1,051,814 | |
| | | | | | | | | |
| | | | | | | | 1,630,365 | |
| |
| |
Capital Markets – 2.4% |
| | 2,970 | | | Capital Southwest Corp. | | | 285,833 | |
| | 40,235 | | | GAMCO Investors, Inc. Class A | | | 2,070,091 | |
| | 71,247 | | | Gladstone Capital Corp.(a) | | | 809,366 | |
| | 135,655 | | | Hercules Technology Growth Capital, Inc. | | | 1,458,291 | |
| | 63,890 | | | MCG Capital Corp. | | | 421,674 | |
| | 147,280 | | | NGP Capital Resources Co. | | | 1,390,323 | |
| | 76,498 | | | Pzena Investment Management, Inc. Class A | | | 556,905 | |
| | 3,557 | | | Virtus Investment Partners, Inc.* | | | 187,845 | |
| | | | | | | | | |
| | | | | | | | 7,180,328 | |
| |
| |
Chemicals – 2.4% |
| | 33,191 | | | A. Schulman, Inc. | | | 840,396 | |
| | 3,671 | | | Airgas, Inc. | | | 254,951 | |
| | 927 | | | Eastman Chemical Co. | | | 99,421 | |
| | 13,913 | | | Georgia Gulf Corp.* | | | 547,894 | |
| | 52,384 | | | Kraton Performance Polymers, Inc.* | | | 2,418,045 | |
| |
| |
| | 53,407 | | | Omnova Solutions, Inc.* | | | 453,959 | |
| | 69,512 | | | Spartech Corp.* | | | 496,316 | |
| | 22,806 | | | Stepan Co. | | | 1,641,348 | |
| | 4,743 | | | Westlake Chemical Corp. | | | 311,378 | |
| | 8,262 | | | Zep, Inc. | | | 156,978 | |
| | | | | | | | | |
| | | | | | | | 7,220,686 | |
| |
| |
Commercial Banks – 4.7% |
| | 21,572 | | | 1st Source Corp. | | | 457,758 | |
| | 302,330 | | | CVB Financial Corp.(a) | | | 2,944,694 | |
| | 11,341 | | | Danvers Bancorp, Inc. | | | 255,740 | |
| | 94,369 | | | First Bancorp | | | 1,317,391 | |
| | 14,083 | | | First Bancorp, Inc.(a) | | | 209,133 | |
| | 24,102 | | | First Interstate BancSystem, Inc. | | | 329,715 | |
| | 73,138 | | | Great Southern Bancorp, Inc. | | | 1,513,957 | |
| | 209,266 | | | International Bancshares Corp. | | | 3,687,267 | |
| | 14,412 | | | Investors Bancorp, Inc.* | | | 216,756 | |
| | 45,662 | | | Popular, Inc.* | | | 143,835 | |
| | 67,602 | | | Renasant Corp. | | | 1,134,362 | |
| | 50,404 | | | Texas Capital Bancshares, Inc.* | | | 1,300,423 | |
| | 150,373 | | | Wilshire Bancorp, Inc.* | | | 601,492 | |
| | | | | | | | | |
| | | | | | | | 14,112,523 | |
| |
| |
Commercial Services & Supplies – 0.7% |
| | 47,295 | | | HNI Corp. | | | 1,301,558 | |
| | 117,464 | | | Kimball International, Inc. Class B | | | 878,631 | |
| | | | | | | | | |
| | | | | | | | 2,180,189 | |
| |
| |
Communications Equipment – 2.2% |
| | 6,986 | | | Bel Fuse, Inc. Class B | | | 140,628 | |
| | 15,399 | | | EchoStar Corp. Class A* | | | 570,995 | |
| | 167,977 | | | Extreme Networks, Inc.* | | | 525,768 | |
| | 30,546 | | | PC-Tel, Inc.* | | | 222,986 | |
| | 160,972 | | | Powerwave Technologies, Inc.* | | | 735,642 | |
| | 176,445 | | | ShoreTel, Inc.* | | | 1,843,850 | |
| | 221,440 | | | Symmetricom, Inc.* | | | 1,350,784 | |
| | 24,010 | | | Tellabs, Inc. | | | 118,129 | |
| | 94,582 | | | Tollgrade Communications, Inc.* | | | 954,333 | |
| | | | | | | | | |
| | | | | | | | 6,463,115 | |
| |
| |
Computers & Peripherals* – 1.6% |
| | 97,127 | | | Electronics for Imaging, Inc. | | | 1,744,401 | |
| | 192,898 | | | Imation Corp. | | | 1,981,063 | |
| | 328,829 | | | Quantum Corp. | | | 1,045,676 | |
| | | | | | | | | |
| | | | | | | | 4,771,140 | |
| |
| |
Consumer Finance – 1.0% |
| | 297,473 | | | Advance America Cash Advance Centers, Inc. | | | 1,749,141 | |
| | 19,350 | | | World Acceptance Corp.* | | | 1,314,833 | |
| | | | | | | | | |
| | | | | | | | 3,063,974 | |
| |
| |
Distributors* – 0.0% |
| | 3,389 | | | Core-Mark Holding Co., Inc. | | | 113,565 | |
| |
| |
Diversified Consumer Services*(a) – 0.5% |
| | 20,943 | | | Pre-Paid Legal Services, Inc. | | | 1,381,191 | |
| |
| |
68 The accompanying notes are an integral part of these financial statements.
GOLDMAN SACHS STRUCTURED SMALL CAP EQUITY FUND
| | | | | | | | | |
| Shares | | Description | | Value |
| |
Common Stocks – (continued) |
| | | | | | | | | |
Diversified Financial Services – 1.6% |
| | 179,974 | | | Compass Diversified Holdings | | $ | 3,016,364 | |
| | 364,716 | | | Primus Guaranty Ltd.*(a) | | | 1,790,756 | |
| | | | | | | | | |
| | | | | | | | 4,807,120 | |
| |
| |
Diversified Telecommunication Services – 0.3% |
| | 33,127 | | | IDT Corp. Class B | | | 960,352 | |
| |
| |
Electric Utilities – 0.3% |
| | 4,250 | | | Northeast Utilities | | | 151,300 | |
| | 27,024 | | | Pepco Holdings, Inc. | | | 520,752 | |
| | 3,951 | | | Portland General Electric Co. | | | 98,617 | |
| | | | | | | | | |
| | | | | | | | 770,669 | |
| |
| |
Electrical Equipment – 1.5% |
| | 10,269 | | | Belden, Inc. | | | 390,530 | |
| | 24,106 | | | Encore Wire Corp. | | | 672,798 | |
| | 20,388 | | | Generac Holdings, Inc.* | | | 424,478 | |
| | 226,865 | | | LSI Industries, Inc. | | | 1,880,711 | |
| | 73,367 | | | Vicor Corp. | | | 1,225,963 | |
| | | | | | | | | |
| | | | | | | | 4,594,480 | |
| |
| |
Electronic Equipment, Instruments & Components – 1.7% |
| | 88,373 | | | Agilysys, Inc.* | | | 461,307 | |
| | 112,658 | | | Brightpoint, Inc.* | | | 1,140,099 | |
| | 12,316 | | | Insight Enterprises, Inc.* | | | 211,343 | |
| | 68,968 | | | Methode Electronics, Inc. | | | 852,445 | |
| | 11,807 | | | National Instruments Corp. | | | 358,224 | |
| | 72,993 | | | RadiSys Corp.* | | | 643,068 | |
| | 82,017 | | | Vishay Intertechnology, Inc.* | | | 1,564,884 | |
| | | | | | | | | |
| | | | | | | | 5,231,370 | |
| |
| |
Energy Equipment & Services* – 1.0% |
| | 50,031 | | | Complete Production Services, Inc. | | | 1,698,052 | |
| | 13,293 | | | Dril-Quip, Inc. | | | 1,017,712 | |
| | 19,033 | | | Exterran Holdings, Inc. | | | 413,207 | |
| | | | | | | | | |
| | | | | | | | 3,128,971 | |
| |
| |
Food Products – 2.0% |
| | 78,462 | | | Dole Food Co., Inc.*(a) | | | 1,083,560 | |
| | 39,600 | | | J&J Snack Foods Corp. | | | 2,012,472 | |
| | 45,802 | | | Lancaster Colony Corp. | | | 2,798,960 | |
| | | | | | | | | |
| | | | | | | | 5,894,992 | |
| |
| |
Gas Utilities – 0.6% |
| | 9,599 | | | Atmos Energy Corp. | | | 334,909 | |
| | 3,558 | | | Energen Corp. | | | 231,306 | |
| | 7,694 | | | ONEOK, Inc. | | | 538,118 | |
| | 15,514 | | | Southwest Gas Corp. | | | 616,992 | |
| | | | | | | | | |
| | | | | | | | 1,721,325 | |
| |
| |
Health Care Equipment & Supplies – 3.0% |
| | 10,183 | | | Align Technology, Inc.* | | | 245,818 | |
| | 12,048 | | | AngioDynamics, Inc.* | | | 196,382 | |
| | 1,897 | | | Atrion Corp. | | | 328,466 | |
| | 85,071 | | | Hill-Rom Holdings, Inc. | | | 3,829,046 | |
| | 72,748 | | | Invacare Corp. | | | 2,393,409 | |
| | 26,103 | | | Masimo Corp. | | | 908,123 | |
| |
| |
| | 108,226 | | | Medical Action Industries, Inc.* | | | 941,566 | |
| | 2,388 | | | Sirona Dental Systems, Inc.* | | | 136,283 | |
| | | | | | | | | |
| | | | | | | | 8,979,093 | |
| |
| |
Health Care Providers & Services – 4.8% |
| | 29,383 | | | AMN Healthcare Services, Inc.* | | | 253,575 | |
| | 84,072 | | | Assisted Living Concepts, Inc. Class A* | | | 3,031,636 | |
| | 104,489 | | | Kindred Healthcare, Inc.* | | | 2,635,213 | |
| | 16,278 | | | Magellan Health Services, Inc.* | | | 846,782 | |
| | 32,443 | | | MedCath Corp.* | | | 438,305 | |
| | 86,094 | | | Molina Healthcare, Inc.* | | | 3,702,042 | |
| | 137,201 | | | PharMerica Corp.* | | | 1,805,565 | |
| | 43,173 | | | Skilled Healthcare Group, Inc. Class A* | | | 523,257 | |
| | 47,224 | | | Universal American Financial Corp. | | | 1,090,874 | |
| | | | | | | | | |
| | | | | | | | 14,327,249 | |
| |
| |
Hotels, Restaurants & Leisure* – 2.8% |
| | 6,790 | | | Biglari Holdings, Inc. | | | 2,968,860 | |
| | 45,179 | | | Domino’s Pizza, Inc. | | | 838,974 | |
| | 148,841 | | | O’Charley’s, Inc. | | | 973,420 | |
| | 116,050 | | | Papa John’s International, Inc. | | | 3,488,463 | |
| | | | | | | | | |
| | | | | | | | 8,269,717 | |
| |
| |
Household Durables – 1.4% |
| | 36,123 | | | Blyth, Inc. | | | 1,702,838 | |
| | 18,822 | | | Hooker Furniture Corp. | | | 234,146 | |
| | 64,019 | | | iRobot Corp.* | | | 2,267,553 | |
| | | | | | | | | |
| | | | | | | | 4,204,537 | |
| |
| |
Household Products* – 0.8% |
| | 239,512 | | | Central Garden & Pet Co. Class A | | | 2,399,910 | |
| |
| |
Insurance – 1.7% |
| | 2,311 | | | Allied World Assurance Co. Holdings Ltd. | | | 150,146 | |
| | 20,569 | | | American Equity Investment Life Holding Co. | | | 264,517 | |
| | 14,192 | | | Aspen Insurance Holdings Ltd. | | | 405,465 | |
| | 87,769 | | | CNA Surety Corp.* | | | 2,325,001 | |
| | 53,972 | | | Flagstone Reinsurance Holdings SA | | | 453,905 | |
| | 9,933 | | | Global Indemnity PLC* | | | 253,689 | |
| | 89,545 | | | Maiden Holdings Ltd. | | | 667,110 | |
| | 25,201 | | | Symetra Financial Corp. | | | 349,790 | |
| | 3,303 | | | W.R. Berkley Corp. | | | 107,711 | |
| | | | | | | | | |
| | | | | | | | 4,977,334 | |
| |
| |
Internet Software & Services – 2.0% |
| | 62,193 | | | Internap Network Services Corp.* | | | 503,141 | |
| | 21,323 | | | LogMeIn, Inc.* | | | 918,382 | |
| | 345,374 | | | Marchex, Inc. Class B | | | 2,438,340 | |
| | 49,961 | | | ModusLink Global Solutions, Inc. | | | 261,796 | |
| | 512,186 | | | RealNetworks, Inc.* | | | 1,895,088 | |
| | | | | | | | | |
| | | | | | | | 6,016,747 | |
| |
| |
IT Services* – 1.9% |
| | 472,507 | | | Ciber, Inc. | | | 2,702,740 | |
| | 29,865 | | | CSG Systems International, Inc. | | | 634,332 | |
| |
| |
The accompanying notes are an integral part of these financial statements. 69
GOLDMAN SACHS STRUCTURED SMALL CAP EQUITY FUND
Schedule of Investments (continued)
April 30, 2011 (Unaudited)
| | | | | | | | | |
| Shares | | Description | | Value |
| |
Common Stocks – (continued) |
IT Services* – (continued) |
| | | | | | | | | |
| | 613,275 | | | Lionbridge Technologies, Inc. | | $ | 2,066,737 | |
| | 7,455 | | | VeriFone Systems, Inc. | | | 408,683 | |
| | | | | | | | | |
| | | | | | | | 5,812,492 | |
| |
| |
Leisure Equipment & Products – 1.0% |
| | 28,351 | | | Polaris Industries, Inc. | | | 2,989,046 | |
| |
| |
Life Sciences Tools & Services* – 0.1% |
| | 77,483 | | | Affymetrix, Inc. | | | 418,408 | |
| |
| |
Machinery – 5.3% |
| | 74,125 | | | Albany International Corp. Class A | | | 1,876,104 | |
| | 21,265 | | | Astec Industries, Inc.* | | | 824,657 | |
| | 67,525 | | | Briggs & Stratton Corp. | | | 1,592,915 | |
| | 980 | | | Bucyrus International, Inc. | | | 89,621 | |
| | 10,092 | | | EnPro Industries, Inc.* | | | 404,487 | |
| | 64,002 | | | Kadant, Inc.* | | | 1,974,462 | |
| | 29,148 | | | Lydall, Inc.* | | | 284,193 | |
| | 37,589 | | | Miller Industries, Inc. | | | 594,658 | |
| | 44,345 | | | Mueller Industries, Inc. | | | 1,734,776 | |
| | 29,965 | | | NACCO Industries, Inc. Class A | | | 3,153,217 | |
| | 7,407 | | | Sauer-Danfoss, Inc.* | | | 437,087 | |
| | 17,363 | | | Tecumseh Products Co. Class A* | | | 177,797 | |
| | 26,751 | | | Tennant Co. | | | 1,097,326 | |
| | 25,232 | | | The Toro Co. | | | 1,713,505 | |
| | | | | | | | | |
| | | | | | | | 15,954,805 | |
| |
| |
Media – 0.8% |
| | 23,231 | | | Ascent Media Corp. Class A* | | | 1,115,785 | |
| | 30,479 | | | Harte-Hanks, Inc. | | | 283,150 | |
| | 161,335 | | | Journal Communications, Inc. Class A* | | | 879,276 | |
| | | | | | | | | |
| | | | | | | | 2,278,211 | |
| |
| |
Metals & Mining – 1.9% |
| | 90,042 | | | Golden Star Resources Ltd.* | | | 292,637 | |
| | 45,215 | | | Hecla Mining Co.* | | | 425,473 | |
| | 43,973 | | | Kaiser Aluminum Corp. | | | 2,203,487 | |
| | 32,812 | | | Materion Corp.* | | | 1,370,229 | |
| | 39,808 | | | Noranda Aluminum Holding Corp.* | | | 676,338 | |
| | 38,395 | | | Titanium Metals Corp.* | | | 769,052 | |
| | | | | | | | | |
| | | | | | | | 5,737,216 | |
| |
| |
Multi-Utilities – 0.3% |
| | 19,099 | | | Integrys Energy Group, Inc. | | | 1,000,024 | |
| |
| |
Multiline Retail – 0.8% |
| | 175,127 | | | Fred’s, Inc. Class A | | | 2,444,773 | |
| |
| |
Oil, Gas & Consumable Fuels – 6.0% |
| | 76,559 | | | Frontier Oil Corp. | | | 2,139,059 | |
| | 2,346 | | | Holly Corp. | | | 135,833 | |
| | 20,054 | | | PetroQuest Energy, Inc.* | | | 175,673 | |
| | 262,368 | | | Tesoro Corp.*(b) | | | 7,115,420 | |
| | 54,668 | | | USEC, Inc.* | | | 250,379 | |
| | 165,960 | | | W&T Offshore, Inc. | | | 4,449,388 | |
| | 210,733 | | | Western Refining, Inc.*(a) | | | 3,574,032 | |
| | | | | | | | | |
| | | | | | | | 17,839,784 | |
| |
| |
Paper & Forest Products* – 1.4% |
| | 32,528 | | | Clearwater Paper Corp. | | | 2,552,797 | |
| | 89,666 | | | KapStone Paper and Packaging Corp. | | | 1,558,395 | |
| | | | | | | | | |
| | | | | | | | 4,111,192 | |
| |
| |
Personal Products* – 0.1% |
| | 35,044 | | | Prestige Brands Holdings, Inc. | | | 404,758 | |
| |
| |
Pharmaceuticals* – 1.1% |
| | 22,755 | | | Akorn, Inc. | | | 150,638 | |
| | 87,688 | | | Questcor Pharmaceuticals, Inc. | | | 1,797,604 | |
| | 32,607 | | | The Medicines Co. | | | 511,930 | |
| | 43,875 | | | ViroPharma, Inc. | | | 846,349 | |
| | | | | | | | | |
| | | | | | | | 3,306,521 | |
| |
| |
Professional Services – 2.6% |
| | 57,440 | | | CDI Corp. | | | 851,261 | |
| | 16,303 | | | Insperity, Inc. | | | 493,818 | |
| | 181,526 | | | Kelly Services, Inc. Class A* | | | 3,468,962 | |
| | 73,639 | | | Kforce, Inc.* | | | 1,152,450 | |
| | 44,679 | | | SFN Group, Inc.* | | | 470,470 | |
| | 113,425 | | | Volt Information Sciences, Inc.* | | | 1,219,318 | |
| | | | | | | | | |
| | | | | | | | 7,656,279 | |
| |
| |
Real Estate Investment Trusts – 7.1% |
| | 16,443 | | | American Campus Communities, Inc. | | | 577,972 | |
| | 29,178 | | | Equity Lifestyle Properties, Inc. | | | 1,745,428 | |
| | 10,873 | | | Federal Realty Investment Trust | | | 952,040 | |
| | 196,172 | | | Franklin Street Properties Corp. | | | 2,773,872 | |
| | 4,561 | | | Health Care REIT, Inc. | | | 245,245 | |
| | 40,581 | | | LTC Properties, Inc. | | | 1,193,893 | |
| | 192,248 | | | MPG Office Trust, Inc.*(a) | | | 640,186 | |
| | 45,359 | | | National Health Investors, Inc. | | | 2,205,808 | |
| | 88,374 | | | Nationwide Health Properties, Inc. | | | 3,870,781 | |
| | 104,923 | | | Rayonier, Inc. | | | 6,962,690 | |
| | | | | | | | | |
| | | | | | | | 21,167,915 | |
| |
| |
Real Estate Management & Development* – 0.1% |
| | 7,137 | | | CB Richard Ellis Group, Inc. Class A | | | 190,629 | |
| |
| |
Road & Rail – 1.5% |
| | 3,081 | | | Dollar Thrifty Automotive Group, Inc.* | | | 212,373 | |
| | 72,098 | | | Marten Transport Ltd. | | | 1,612,111 | |
| | 30,946 | | | Universal Truckload Services, Inc.* | | | 490,185 | |
| | 77,459 | | | Werner Enterprises, Inc. | | | 2,027,102 | |
| | | | | | | | | |
| | | | | | | | 4,341,771 | |
| |
| |
Semiconductors & Semiconductor Equipment – 3.4% |
| | 102,325 | | | DSP Group, Inc.* | | | 826,786 | |
| | 912,012 | | | Lattice Semiconductor Corp.* | | | 6,192,561 | |
| | 78,193 | | | Micrel, Inc. | | | 1,001,652 | |
| | 215,383 | | | Silicon Image, Inc.* | | | 1,791,987 | |
| | 35,287 | | | Zoran Corp.* | | | 369,455 | |
| | | | | | | | | |
| | | | | | | | 10,182,441 | |
| |
| |
Software – 5.9% |
| | 382,496 | | | Accelrys, Inc.* | | | 2,895,495 | |
| | 3,964 | | | Advent Software, Inc.*(b) | | | 107,940 | |
| | 79,761 | | | Blackbaud, Inc. | | | 2,206,189 | |
| |
| |
70 The accompanying notes are an integral part of these financial statements.
GOLDMAN SACHS STRUCTURED SMALL CAP EQUITY FUND
| | | | | | | | | |
| Shares | | Description | | Value |
| |
Common Stocks – (continued) |
Software – (continued) |
| | | | | | | | | |
| | 7,024 | | | CommVault Systems, Inc.* | | $ | 276,675 | |
| | 25,490 | | | Epicor Software Corp.* | | | 318,625 | |
| | 42,672 | | | Kenexa Corp.* | | | 1,255,410 | |
| | 96,208 | | | Magma Design Automation, Inc.* | | | 611,883 | |
| | 95,785 | | | Manhattan Associates, Inc.* | | | 3,462,628 | |
| | 35,460 | | | MicroStrategy, Inc. Class A* | | | 5,010,498 | |
| | 31,176 | | | PROS Holdings, Inc.* | | | 488,840 | |
| | 30,091 | | | Renaissance Learning, Inc. | | | 360,791 | |
| | 11,549 | | | The Ultimate Software Group, Inc.* | | | 646,744 | |
| | | | | | | | | |
| | | | | | | | 17,641,718 | |
| |
| |
Specialty Retail – 4.4% |
| | 19,115 | | | Ann, Inc.* | | | 596,579 | |
| | 55,524 | | | Asbury Automotive Group, Inc.* | | | 960,565 | |
| | 63,891 | | | Brown Shoe Co., Inc. | | | 808,221 | |
| | 17,768 | | | Build-A-Bear Workshop, Inc.* | | | 108,918 | |
| | 28,620 | | | Cabela’s, Inc.* | | | 730,955 | |
| | 41,856 | | | DSW, Inc. Class A*(a) | | | 1,987,323 | |
| | 67,292 | | | Group 1 Automotive, Inc. | | | 2,896,248 | |
| | 21,044 | | | Lithia Motors, Inc. Class A | | | 382,790 | |
| | 28,596 | | | Shoe Carnival, Inc.* | | | 837,005 | |
| | 126,933 | | | Stage Stores, Inc. | | | 2,444,730 | |
| | 17,371 | | | Ulta Salon, Cosmetics & Fragrance, Inc.* | | | 923,963 | |
| | 14,969 | | | Zumiez, Inc.* | | | 420,779 | |
| | | | | | | | | |
| | | | | | | | 13,098,076 | |
| |
| |
Textiles, Apparel & Luxury Goods – 1.0% |
| | 1,523 | | | Fossil, Inc.* | | | 145,873 | |
| | 28,512 | | | Kenneth Cole Productions, Inc. Class A* | | | 384,057 | |
| | 4,863 | | | Lululemon Athletica, Inc.* | | | 486,446 | |
| | 30,402 | | | Oxford Industries, Inc. | | | 1,044,309 | |
| | 35,064 | | | Perry Ellis International, Inc.* | | | 988,103 | |
| | | | | | | | | |
| | | | | | | | 3,048,788 | |
| |
| |
Thrifts & Mortgage Finance – 0.0% |
| | 14,449 | | | Brookline Bancorp, Inc. | | | 133,220 | |
| |
| |
Tobacco* – 0.2% |
| | 123,905 | | | Alliance One International, Inc. | | | 494,381 | |
| |
| |
Trading Companies & Distributors – 1.0% |
| | 43,178 | | | Watsco, Inc. | | | 3,060,888 | |
| |
| |
Wireless Telecommunication Services – 1.5% |
| | 290,116 | | | USA Mobility, Inc. | | | 4,482,292 | |
| |
| |
TOTAL COMMON STOCKS |
(Cost $188,459,773) | | $ | 292,284,429 | |
| |
| |
| | | | | | | | | |
| | | | | | | | | | | | | | | |
Principal
| | Interest
| | Maturity
| | |
| Amount | | Rate | | Date | | Value |
| |
Short-term Investment(c) – 3.2% |
Repurchase Agreement – 3.2% |
| Joint Repurchase Agreement Account II |
| $ | 9,500,000 | | | | 0.042% | | | | 05/02/11 | | | $ | 9,500,000 | |
(Cost $9,500,000) | | | | | | | | |
| |
| |
TOTAL INVESTMENTS BEFORE SECURITIES LENDING REINVESTMENT VEHICLE |
(Cost $197,959,773) | | | | | | $ | 301,784,429 | |
| |
| |
| | | | | | | | | | | | | | | |
| | | | | | | | | | | |
| Shares | | Rate | | Value |
| |
Securities Lending Reinvestment Vehicle(d)(e) – 3.2% |
| Financial Square Money Market Fund |
| | 9,504,425 | | | | 0.110 | % | | $ | 9,504,425 | |
(Cost $9,504,425) | | | | |
| |
| |
TOTAL INVESTMENTS – 104.2% |
(Cost $207,464,198) | | $ | 311,288,854 | |
| |
| |
LIABILITIES IN EXCESS OF OTHER ASSETS – (4.2)% | | | (12,403,880 | ) |
| |
| |
NET ASSETS – 100.0% | | $ | 298,884,974 | |
| |
| |
The percentage shown for each investment category reflects the value of investments in that category as a percentage of net assets.
| | |
| * | | Non-income producing security. |
| |
| (a) | | All or a portion of security is on loan. |
| |
| (b) | | A portion of this security is segregated as collateral for initial margin requirement on futures transactions. |
| |
| (c) | | Joint repurchase agreement was entered into on April 29, 2011. Additional information appears on page 87. |
| |
| (d) | | Represents an affiliated issuer. |
| |
| (e) | | Variable rate security. Interest rate disclosed is that which is in effect at April 30, 2011. |
| | | | | |
| |
| |
Investment Abbreviation: |
| REIT | | — | | Real Estate Investment Trust |
| |
| |
The accompanying notes are an integral part of these financial statements. 71
GOLDMAN SACHS STRUCTURED SMALL CAP EQUITY FUND
Schedule of Investments (continued)
April 30, 2011 (Unaudited)
| |
| ADDITIONAL INVESTMENT INFORMATION | |
FUTURES CONTRACTS — At April 30, 2011, the following futures contracts were open:
| | | | | | | | | | | | | | | |
| | | Number of
| | | | | | |
| | | Contracts
| | Expiration
| | Current
| | Unrealized
|
| Type | | Long (Short) | | Date | | Value | | Gain (Loss) |
| |
| Russell Mini 2000 Index | | | 78 | | | June 2011 | | $ | 6,738,420 | | | $ | 124,934 | |
| |
| |
72 The accompanying notes are an integral part of these financial statements.
GOLDMAN SACHS STRUCTURED SMALL CAP GROWTH FUND
Schedule of Investments
April 30, 2011 (Unaudited)
| | | | | | | | | |
| Shares | | Description | | Value |
| |
Common Stocks – 98.2% |
Aerospace & Defense – 1.1% |
| | 2,062 | | | Aerovironment, Inc.* | | $ | 59,076 | |
| | 4,265 | | | Cubic Corp. | | | 230,651 | |
| | 2,879 | | | DigitalGlobe, Inc.* | | | 83,491 | |
| | 7,718 | | | Hexcel Corp.* | | | 166,169 | |
| | 905 | | | LMI Aerospace, Inc.* | | | 18,145 | |
| | | | | | | | | |
| | | | | | | | 557,532 | |
| |
| |
Air Freight & Logistics* – 0.3% |
| | 26,224 | | | Pacer International, Inc. | | | 157,082 | |
| |
| |
Airlines* – 0.6% |
| | 4,838 | | | Alaska Air Group, Inc. | | | 318,679 | |
| |
| |
Auto Components – 1.3% |
| | 3,068 | | | Amerigon, Inc.* | | | 52,309 | |
| | 4,421 | | | Dana Holding Corp.* | | | 80,330 | |
| | 1,988 | | | Dorman Products, Inc.* | | | 77,532 | |
| | 5,956 | | | Standard Motor Products, Inc. | | | 84,873 | |
| | 7,132 | | | Stoneridge, Inc.* | | | 109,120 | |
| | 10,986 | | | Superior Industries International, Inc. | | | 277,616 | |
| | | | | | | | | |
| | | | | | | | 681,780 | |
| |
| |
Beverages – 0.9% |
| | 5,943 | | | National Beverage Corp. | | | 82,727 | |
| | 4,132 | | | The Boston Beer Co., Inc. Class A* | | | 389,482 | |
| | | | | | | | | |
| | | | | | | | 472,209 | |
| |
| |
Biotechnology – 6.1% |
| | 1,950 | | | Alkermes, Inc.* | | | 28,119 | |
| | 14,192 | | | ARIAD Pharmaceuticals, Inc.* | | | 121,342 | |
| | 1,751 | | | Aveo Pharmaceuticals, Inc.* | | | 27,246 | |
| | 7,376 | | | Cepheid, Inc.* | | | 238,319 | |
| | 3,302 | | | Codexis, Inc.* | | | 34,638 | |
| | 24,200 | | | Cubist Pharmaceuticals, Inc.* | | | 819,170 | |
| | 13,492 | | | Emergent Biosolutions, Inc.* | | | 313,149 | |
| | 2,815 | | | Enzon Pharmaceuticals, Inc.* | | | 32,316 | |
| | 6,931 | | | Genomic Health, Inc.* | | | 189,216 | |
| | 17,655 | | | Maxygen, Inc. | | | 91,100 | |
| | 40,408 | | | Nabi Biopharmaceuticals* | | | 233,558 | |
| | 1,740 | | | Onyx Pharmaceuticals, Inc.* | | | 65,372 | |
| | 47,855 | | | PDL BioPharma, Inc. | | | 307,229 | |
| | 10,385 | | | Progenics Pharmaceuticals, Inc.* | | | 76,953 | |
| | 20,447 | | | SciClone Pharmaceuticals, Inc.* | | | 90,171 | |
| | 26,448 | | | Seattle Genetics, Inc.* | | | 439,301 | |
| | | | | | | | | |
| | | | | | | | 3,107,199 | |
| |
| |
Building Products – 0.3% |
| | 4,811 | | | Simpson Manufacturing Co., Inc. | | | 134,323 | |
| |
| |
Capital Markets – 0.6% |
| | 2,470 | | | Federated Investors, Inc. Class B(a) | | | 63,677 | |
| | 2,947 | | | GAMCO Investors, Inc. Class A | | | 151,623 | |
| | 5,100 | | | Pzena Investment Management, Inc.
Class A | | | 37,128 | |
| | 1,481 | | | Safeguard Scientifics, Inc.* | | | 28,953 | |
| | | | | | | | | |
| | | | | | | | 281,381 | |
| |
| |
Chemicals – 3.4% |
| | 4,033 | | | Ferro Corp.* | | | 60,495 | |
| | 1,266 | | | Georgia Gulf Corp.* | | | 49,855 | |
| | 1,688 | | | Koppers Holdings, Inc. | | | 77,192 | |
| | 15,562 | | | Kraton Performance Polymers, Inc.* | | | 718,342 | |
| | 983 | | | LSB Industries, Inc.* | | | 39,664 | |
| | 6,299 | | | PolyOne Corp.* | | | 91,210 | |
| | 17,025 | | | Senomyx, Inc.* | | | 103,512 | |
| | 7,380 | | | Spartech Corp.* | | | 52,693 | |
| | 4,425 | | | Stepan Co. | | | 318,467 | |
| | 4,634 | | | STR Holdings, Inc.*(a) | | | 76,322 | |
| | 4,104 | | | TPC Group, Inc.* | | | 161,862 | |
| | | | | | | | | |
| | | | | | | | 1,749,614 | |
| |
| |
Commercial Banks* – 0.1% |
| | 653 | | | Signature Bank | | | 38,011 | |
| |
| |
Commercial Services & Supplies – 1.7% |
| | 3,219 | | | Clean Harbors, Inc.* | | | 317,071 | |
| | 14,571 | | | HNI Corp. | | | 400,994 | |
| | 2,279 | | | Kimball International, Inc. Class B | | | 17,047 | |
| | 2,234 | | | Steelcase, Inc. Class A | | | 25,803 | |
| | 1,243 | | | United Stationers, Inc. | | | 89,571 | |
| | | | | | | | | |
| | | | | | | | 850,486 | |
| |
| |
Communications Equipment – 3.7% |
| | 3,871 | | | Acme Packet, Inc.* | | | 319,783 | |
| | 6,529 | | | Arris Group, Inc.* | | | 78,348 | |
| | 7,012 | | | Aruba Networks, Inc.* | | | 251,941 | |
| | 1,333 | | | Blue Coat Systems, Inc.* | | | 38,390 | |
| | 1,553 | | | DG Fastchannel, Inc.* | | | 56,824 | |
| | 974 | | | EMS Technologies, Inc.* | | | 24,603 | |
| | 12,222 | | | Extreme Networks, Inc.* | | | 38,255 | |
| | 2,860 | | | Finisar Corp.* | | | 80,338 | |
| | 13,089 | | | Infinera Corp.* | | | 102,356 | |
| | 1,407 | | | Ixia* | | | 22,990 | |
| | 14,358 | | | Plantronics, Inc. | | | 532,251 | |
| | 6,134 | | | Riverbed Technology, Inc.* | | | 215,549 | |
| | 2,233 | | | SeaChange International, Inc.* | | | 23,916 | |
| | 10,317 | | | ShoreTel, Inc.* | | | 107,813 | |
| | | | | | | | | |
| | | | | | | | 1,893,357 | |
| |
| |
Computers & Peripherals* – 1.3% |
| | 6,333 | | | Hypercom Corp. | | | 75,806 | |
| | 2,669 | | | Imation Corp. | | | 27,411 | |
| | 65,560 | | | Quantum Corp. | | | 208,481 | |
| | 3,604 | | | Super Micro Computer, Inc. | | | 61,484 | |
| | 6,189 | | | Synaptics, Inc.(a) | | | 175,891 | |
| | 12,177 | | | Xyratex Ltd. | | | 124,327 | |
| | | | | | | | | |
| | | | | | | | 673,400 | |
| |
| |
Consumer Finance – 1.4% |
| | 28,663 | | | Advance America Cash Advance Centers, Inc. | | | 168,538 | |
| | 2,284 | | | Cash America International, Inc. | | | 108,376 | |
| | 5,553 | | | First Cash Financial Services, Inc.* | | | 217,900 | |
The accompanying notes are an integral part of these financial statements. 73
GOLDMAN SACHS STRUCTURED SMALL CAP GROWTH FUND
Schedule of Investments (continued)
April 30, 2011 (Unaudited)
| | | | | | | | | |
| Shares | | Description | | Value |
| |
Common Stocks – (continued) |
Consumer Finance – (continued) |
| | | | | | | | | |
| | 558 | | | Green Dot Corp. Class A* | | $ | 24,083 | |
| | 2,568 | | | World Acceptance Corp.* | | | 174,496 | |
| | | | | | | | | |
| | | | | | | | 693,393 | |
| |
| |
Distributors* – 0.3% |
| | 6,567 | | | Audiovox Corp. Class A | | | 48,464 | |
| | 3,854 | | | Core-Mark Holding Co., Inc. | | | 129,148 | |
| | | | | | | | | |
| | | | | | | | 177,612 | |
| |
| |
Diversified Consumer Services* – 1.1% |
| | 1,722 | | | Capella Education Co. | | | 85,411 | |
| | 2,920 | | | Coinstar, Inc. | | | 157,622 | |
| | 4,522 | | | Pre-Paid Legal Services, Inc.(a) | | | 298,226 | |
| | | | | | | | | |
| | | | | | | | 541,259 | |
| |
| |
Diversified Financial Services – 0.2% |
| | 1,508 | | | Compass Diversified Holdings | | | 25,274 | |
| | 3,658 | | | Life Partners Holdings, Inc.(a) | | | 25,642 | |
| | 13,681 | | | Primus Guaranty Ltd.*(a) | | | 67,174 | |
| | | | | | | | | |
| | | | | | | | 118,090 | |
| |
| |
Diversified Telecommunication Services* – 0.3% |
| | 12,567 | | | Cbeyond, Inc. | | | 160,355 | |
| |
| |
Electrical Equipment – 2.4% |
| | 1,877 | | | Belden, Inc. | | | 71,382 | |
| | 4,945 | | | Coleman Cable, Inc.* | | | 49,549 | |
| | 1,856 | | | Franklin Electric Co., Inc. | | | 83,724 | |
| | 2,912 | | | Generac Holdings, Inc.* | | | 60,628 | |
| | 602 | | | General Cable Corp.* | | | 29,197 | |
| | 3,896 | | | II-VI, Inc.* | | | 225,383 | |
| | 2,657 | | | Polypore International, Inc.* | | | 164,123 | |
| | 10,297 | | | Vicor Corp. | | | 172,063 | |
| | 9,739 | | | Woodward Governor Co. | | | 360,830 | |
| | | | | | | | | |
| | | | | | | | 1,216,879 | |
| |
| |
Electronic Equipment, Instruments & Components – 2.7% |
| | 10,334 | | | Benchmark Electronics, Inc.* | | | 174,645 | |
| | 18,843 | | | Brightpoint, Inc.* | | | 190,691 | |
| | 1,690 | | | Cognex Corp. | | | 52,863 | |
| | 1,165 | | | Coherent, Inc.* | | | 72,824 | |
| | 1,849 | | | Electro Scientific Industries, Inc.* | | | 30,416 | |
| | 7,365 | | | Insight Enterprises, Inc.* | | | 126,383 | |
| | 858 | | | IPG Photonics Corp.* | | | 59,597 | |
| | 14,232 | | | Methode Electronics, Inc. | | | 175,908 | |
| | 1,827 | | | National Instruments Corp. | | | 55,431 | |
| | 6,979 | | | RadiSys Corp.* | | | 61,485 | |
| | 18,677 | | | Vishay Intertechnology, Inc.* | | | 356,357 | |
| | 1,780 | | | Vishay Precision Group, Inc.* | | | 29,370 | |
| | | | | | | | | |
| | | | | | | | 1,385,970 | |
| |
| |
Energy Equipment & Services* – 1.2% |
| | 2,713 | | | Complete Production Services, Inc. | | | 92,079 | |
| | 6,726 | | | Dril-Quip, Inc. | | | 514,943 | |
| | | | | | | | | |
| | | | | | | | 607,022 | |
| |
| |
Food & Staples Retailing – 0.2% |
| | 2,354 | | | PriceSmart, Inc. | | | 98,021 | |
| |
| |
Food Products – 1.7% |
| | 3,622 | | | Dole Food Co., Inc.*(a) | | | 50,020 | |
| | 13,724 | | | Lancaster Colony Corp. | | | 838,673 | |
| | | | | | | | | |
| | | | | | | | 888,693 | |
| |
| |
Health Care Equipment & Supplies – 5.9% |
| | 21,057 | | | Align Technology, Inc.* | | | 508,316 | |
| | 2,479 | | | Analogic Corp. | | | 142,964 | |
| | 3,028 | | | ICU Medical, Inc.* | | | 136,593 | |
| | 13,783 | | | Invacare Corp. | | | 453,461 | |
| | 21,833 | | | Masimo Corp. | | | 759,570 | |
| | 4,962 | | | Medical Action Industries, Inc.* | | | 43,169 | |
| | 5,334 | | | Meridian Bioscience, Inc. | | | 131,803 | |
| | 6,726 | | | Sirona Dental Systems, Inc.* | | | 383,853 | |
| | 8,335 | | | STERIS Corp. | | | 300,393 | |
| | 7,469 | | | Vascular Solutions, Inc.* | | | 95,454 | |
| | 823 | | | West Pharmaceutical Services, Inc. | | | 38,879 | |
| | | | | | | | | |
| | | | | | | | 2,994,455 | |
| |
| |
Health Care Providers & Services – 4.4% |
| | 3,989 | | | AMERIGROUP Corp.* | | | 272,449 | |
| | 5,300 | | | AMN Healthcare Services, Inc.* | | | 45,739 | |
| | 4,106 | | | CardioNet, Inc.* | | | 18,723 | |
| | 2,720 | | | CorVel Corp.* | | | 140,896 | |
| | 2,927 | | | Coventry Health Care, Inc.* | | | 94,454 | |
| | 3,615 | | | Five Star Quality Care, Inc.* | | | 30,294 | |
| | 9,394 | | | Health Net, Inc.* | | | 312,820 | |
| | 8,135 | | | Kindred Healthcare, Inc.* | | | 205,165 | |
| | 2,179 | | | Magellan Health Services, Inc.* | | | 113,352 | |
| | 9,861 | | | Molina Healthcare, Inc.* | | | 424,023 | |
| | 12,710 | | | PharMerica Corp.* | | | 167,264 | |
| | 7,996 | | | Skilled Healthcare Group, Inc. Class A* | | | 96,911 | |
| | 5,108 | | | Sunrise Senior Living, Inc.* | | | 53,021 | |
| | 7,794 | | | Universal American Financial Corp. | | | 180,041 | |
| | 1,931 | | | WellCare Health Plans, Inc.* | | | 84,597 | |
| | | | | | | | | |
| | | | | | | | 2,239,749 | |
| |
| |
Health Care Technology* – 0.5% |
| | 6,204 | | | MedAssets, Inc. | | | 99,388 | |
| | 1,905 | | | SXC Health Solutions Corp. | | | 105,080 | |
| | 1,725 | | | Vital Images, Inc. | | | 32,154 | |
| | | | | | | | | |
| | | | | | | | 236,622 | |
| |
| |
Hotels, Restaurants & Leisure – 3.0% |
| | 522 | | | Biglari Holdings, Inc.* | | | 228,239 | |
| | 245 | | | Chipotle Mexican Grill, Inc.* | | | 65,363 | |
| | 24,007 | | | Domino’s Pizza, Inc.* | | | 445,810 | |
| | 2,845 | | | McCormick & Schmick’s Seafood Restaurants, Inc.* | | | 25,975 | |
| | 5,297 | | | O’Charley’s, Inc.* | | | 34,642 | |
| | 2,748 | | | P.F. Chang’s China Bistro, Inc. | | | 110,195 | |
| | 11,330 | | | Papa John’s International, Inc.* | | | 340,580 | |
| | 1,835 | | | Peet’s Coffee & Tea, Inc.* | | | 85,291 | |
| | 10,084 | | | Texas Roadhouse, Inc. | | | 164,067 | |
| | | | | | | | | |
| | | | | | | | 1,500,162 | |
| |
| |
74 The accompanying notes are an integral part of these financial statements.
GOLDMAN SACHS STRUCTURED SMALL CAP GROWTH FUND
| | | | | | | | | |
| Shares | | Description | | Value |
| |
Common Stocks – (continued) |
| | | | | | | | | |
Household Durables – 1.0% |
| | 2,635 | | | Blyth, Inc. | | $ | 124,214 | |
| | 2,079 | | | Harman International Industries, Inc. | | | 100,894 | |
| | 7,978 | | | iRobot Corp.* | | | 282,580 | |
| | | | | | | | | |
| | | | | | | | 507,688 | |
| |
| |
Household Products* – 0.1% |
| | 3,827 | | | Central Garden & Pet Co. Class A | | | 38,347 | |
| |
| |
Insurance – 0.3% |
| | 10,016 | | | CNO Financial Group, Inc.* | | | 80,729 | |
| | 930 | | | Global Indemnity PLC* | | | 23,752 | |
| | 1,679 | | | OneBeacon Insurance Group Ltd. Class A | | | 23,590 | |
| | 2,641 | | | Symetra Financial Corp. | | | 36,657 | |
| | | | | | | | | |
| | | | | | | | 164,728 | |
| |
| |
Internet & Catalog Retail – 0.0% |
| | 1,454 | | | Nutrisystem, Inc. | | | 21,868 | |
| |
| |
Internet Software & Services – 2.6% |
| | 1,010 | | | AOL, Inc.* | | | 20,584 | |
| | 3,626 | | | Liquidity Services, Inc.* | | | 70,525 | |
| | 7,716 | | | LivePerson, Inc.* | | | 103,086 | |
| | 7,699 | | | LogMeIn, Inc.* | | | 331,596 | |
| | 14,917 | | | Marchex, Inc. Class B | | | 105,314 | |
| | 3,658 | | | ModusLink Global Solutions, Inc. | | | 19,168 | |
| | 4,594 | | | Rackspace Hosting, Inc.* | | | 212,197 | |
| | 43,842 | | | RealNetworks, Inc.* | | | 162,215 | |
| | 4,145 | | | Saba Software, Inc.* | | | 42,072 | |
| | 14,053 | | | ValueClick, Inc.* | | | 235,388 | |
| | | | | | | | | |
| | | | | | | | 1,302,145 | |
| |
| |
IT Services* – 3.2% |
| | 5,904 | | | CSG Systems International, Inc. | | | 125,401 | |
| | 40,706 | | | Lionbridge Technologies, Inc. | | | 137,179 | |
| | 1,465 | | | ManTech International Corp. Class A | | | 64,299 | |
| | 1,427 | | | SRA International, Inc. Class A | | | 44,223 | |
| | 13,400 | | | TeleTech Holdings, Inc. | | | 266,258 | |
| | 17,575 | | | VeriFone Systems, Inc. | | | 963,461 | |
| | | | | | | | | |
| | | | | | | | 1,600,821 | |
| |
| |
Leisure Equipment & Products – 1.4% |
| | 6,878 | | | Polaris Industries, Inc. | | | 725,148 | |
| |
| |
Life Sciences Tools & Services* – 0.9% |
| | 36,801 | | | Affymetrix, Inc. | | | 198,726 | |
| | 1,820 | | | Dionex Corp. | | | 215,397 | |
| | 6,109 | | | eResearchTechnology, Inc. | | | 38,853 | |
| | | | | | | | | |
| | | | | | | | 452,976 | |
| |
| |
Machinery – 4.5% |
| | 1,428 | | | Actuant Corp. Class A | | | 39,641 | |
| | 1,451 | | | Alamo Group, Inc. | | | 41,513 | |
| | 3,687 | | | Altra Holdings, Inc.* | | | 93,613 | |
| | 3,325 | | | Astec Industries, Inc.* | | | 128,944 | |
| | 10,768 | | | Briggs & Stratton Corp. | | | 254,017 | |
| | 2,213 | | | Commercial Vehicle Group, Inc.* | | | 38,196 | |
| | 1,593 | | | Kaydon Corp. | | | 61,649 | |
| | 12,473 | | | Lydall, Inc.* | | | 121,612 | |
| | 3,811 | | | Met-Pro Corp. | | | 45,313 | |
| | 5,628 | | | Mueller Industries, Inc. | | | 220,167 | |
| | 8,612 | | | Mueller Water Products, Inc. Class A | | | 37,893 | |
| | 2,229 | | | NACCO Industries, Inc. Class A | | | 234,558 | |
| | 8,057 | | | Sauer-Danfoss, Inc.* | | | 475,444 | |
| | 2,206 | | | Tecumseh Products Co. Class A* | | | 22,589 | |
| | 4,264 | | | Tennant Co. | | | 174,909 | |
| | 326 | | | The Toro Co. | | | 22,139 | |
| | 6,021 | | | TriMas Corp.* | | | 139,747 | |
| | 3,279 | | | Twin Disc, Inc. | | | 111,716 | |
| | | | | | | | | |
| | | | | | | | 2,263,660 | |
| |
| |
Media – 0.5% |
| | 4,125 | | | Arbitron, Inc. | | | 159,555 | |
| | 1,468 | | | Clear Channel Outdoor Holdings, Inc.
Class A* | | | 20,200 | |
| | 13,571 | | | Journal Communications, Inc. Class A* | | | 73,962 | |
| | | | | | | | | |
| | | | | | | | 253,717 | |
| |
| |
Metals & Mining – 1.3% |
| | 50,500 | | | Golden Star Resources Ltd.* | | | 164,125 | |
| | 3,541 | | | Hecla Mining Co.* | | | 33,321 | |
| | 21,392 | | | Noranda Aluminum Holding Corp.* | | | 363,450 | |
| | 4,911 | | | Titanium Metals Corp.* | | | 98,367 | |
| | 170 | | | Walter Energy, Inc. | | | 23,498 | |
| | | | | | | | | |
| | | | | | | | 682,761 | |
| |
| |
Multiline Retail* – 0.1% |
| | 3,154 | | | Retail Ventures, Inc. | | | 64,752 | |
| |
| |
Oil, Gas & Consumable Fuels – 5.3% |
| | 419 | | | Contango Oil & Gas Co.* | | | 25,945 | |
| | 3,579 | | | Energy Partners Ltd.* | | | 65,174 | |
| | 4,208 | | | Frontier Oil Corp. | | | 117,572 | |
| | 4,077 | | | Oasis Petroleum, Inc.* | | | 125,286 | |
| | 5,903 | | | PetroQuest Energy, Inc.* | | | 51,710 | |
| | 1,717 | | | Rosetta Resources, Inc.* | | | 78,862 | |
| | 3,780 | | | Stone Energy Corp.* | | | 133,661 | |
| | 18,928 | | | Tesoro Corp.* | | | 513,327 | |
| | 35,503 | | | W&T Offshore, Inc. | | | 951,835 | |
| | 14,526 | | | Warren Resources, Inc.* | | | 65,803 | |
| | 34,164 | | | Western Refining, Inc.*(a) | | | 579,421 | |
| | | | | | | | | |
| | | | | | | | 2,708,596 | |
| |
| |
Paper & Forest Products* – 0.9% |
| | 5,968 | | | Clearwater Paper Corp. | | | 468,369 | |
| |
| |
Personal Products* – 0.2% |
| | 2,665 | | | USANA Health Sciences, Inc. | | | 99,404 | |
| |
| |
Pharmaceuticals* – 1.5% |
| | 16,993 | | | Akorn, Inc. | | | 112,494 | |
| | 6,402 | | | Obagi Medical Products, Inc. | | | 82,138 | |
| | 11,836 | | | Questcor Pharmaceuticals, Inc. | | | 242,638 | |
| | 6,232 | | | The Medicines Co. | | | 97,842 | |
| | 11,408 | | | ViroPharma, Inc. | | | 220,060 | |
| | | | | | | | | |
| | | | | | | | 755,172 | |
| |
| |
The accompanying notes are an integral part of these financial statements. 75
GOLDMAN SACHS STRUCTURED SMALL CAP GROWTH FUND
Schedule of Investments (continued)
April 30, 2011 (Unaudited)
| | | | | | | | | |
| Shares | | Description | | Value |
| |
Common Stocks – (continued) |
| | | | | | | | | |
Professional Services – 1.6% |
| | 6,984 | | | CDI Corp. | | $ | 103,503 | |
| | 5,801 | | | Insperity, Inc. | | | 175,712 | |
| | 21,322 | | | Kelly Services, Inc. Class A* | | | 407,464 | |
| | 3,660 | | | Kforce, Inc.* | | | 57,279 | |
| | 2,879 | | | Mistras Group, Inc.* | | | 52,743 | |
| | 3,943 | | | SFN Group, Inc.* | | | 41,520 | |
| | | | | | | | | |
| | | | | | | | 838,221 | |
| |
| |
Real Estate Investment Trusts – 1.1% |
| | 3,316 | | | LTC Properties, Inc. | | | 97,557 | |
| | 5,376 | | | National Health Investors, Inc. | | | 261,435 | |
| | 3,555 | | | Potlatch Corp. | | | 137,543 | |
| | 643 | | | Rayonier, Inc. | | | 42,669 | |
| | | | | | | | | |
| | | | | | | | 539,204 | |
| |
| |
Real Estate Management & Development – 0.1% |
| | 336 | | | Jones Lang LaSalle, Inc. | | | 34,400 | |
| |
| |
Road & Rail – 1.0% |
| | 10,366 | | | Celadon Group, Inc.* | | | 153,106 | |
| | 792 | | | Dollar Thrifty Automotive Group, Inc.* | | | 54,593 | |
| | 5,130 | | | Heartland Express, Inc. | | | 88,492 | |
| | 2,336 | | | Roadrunner Transportation Systems, Inc.* | | | 32,914 | |
| | 3,455 | | | Universal Truckload Services, Inc.* | | | 54,727 | |
| | 3,901 | | | Werner Enterprises, Inc. | | | 102,089 | |
| | | | | | | | | |
| | | | | | | | 485,921 | |
| |
| |
Semiconductors & Semiconductor Equipment – 4.7% |
| | 12,855 | | | Advanced Analogic Technologies, Inc.* | | | 54,762 | |
| | 16,723 | | | Applied Micro Circuits Corp.* | | | 175,257 | |
| | 18,480 | | | Integrated Device Technology, Inc.* | | | 150,335 | |
| | 2,794 | | | Kulicke and Soffa Industries, Inc.* | | | 25,314 | |
| | 94,321 | | | Lattice Semiconductor Corp.* | | | 640,440 | |
| | 15,491 | | | LTX-Credence Corp.* | | | 134,307 | |
| | 26,786 | | | Micrel, Inc. | | | 343,129 | |
| | 21,540 | | | PLX Technology, Inc.* | | | 73,882 | |
| | 51,586 | | | RF Micro Devices, Inc.* | | | 343,563 | |
| | 4,809 | | | Standard Microsystems Corp.* | | | 130,564 | |
| | 7,761 | | | Tessera Technologies, Inc.* | | | 153,357 | |
| | 1,471 | | | Veeco Instruments, Inc.*(a) | | | 75,212 | |
| | 6,350 | | | Zoran Corp.* | | | 66,484 | |
| | | | | | | | | |
| | | | | | | | 2,366,606 | |
| |
| |
Software – 9.0% |
| | 11,231 | | | Accelrys, Inc.* | | | 85,019 | |
| | 4,699 | | | Actuate Corp.* | | | 27,395 | |
| | 13,848 | | | Advent Software, Inc.*(b) | | | 377,081 | |
| | 13,613 | | | Blackbaud, Inc. | | | 376,536 | |
| | 4,013 | | | Bottomline Technologies, Inc.* | | | 111,481 | |
| | 11,842 | | | CommVault Systems, Inc.* | | | 466,456 | |
| | 2,563 | | | Deltek, Inc.* | | | 19,222 | |
| | 1,066 | | | ePlus, Inc.* | | | 29,475 | |
| | 7,054 | | | Kenexa Corp.* | | | 207,529 | |
| | 25,956 | | | Magma Design Automation, Inc.* | | | 165,080 | |
| | 9,466 | | | Manhattan Associates, Inc.* | | | 342,196 | |
| | 11,050 | | | Mentor Graphics Corp.* | | | 162,987 | |
| | 4,685 | | | MicroStrategy, Inc. Class A* | | | 661,990 | |
| | 2,562 | | | OPNET Technologies, Inc. | | | 100,328 | |
| | 3,926 | | | PROS Holdings, Inc.* | | | 61,560 | |
| | 3,186 | | | QAD, Inc. Class A* | | | 34,791 | |
| | 15,395 | | | Quest Software, Inc.* | | | 396,575 | |
| | 10,134 | | | Renaissance Learning, Inc. | | | 121,507 | |
| | 3,140 | | | Smith Micro Software, Inc.* | | | 24,241 | |
| | 2,827 | | | Solarwinds, Inc.* | | | 68,498 | |
| | 6,739 | | | Taleo Corp. Class A* | | | 244,424 | |
| | 3,533 | | | TeleNav, Inc.* | | | 47,978 | |
| | 7,597 | | | The Ultimate Software Group, Inc.* | | | 425,432 | |
| | | | | | | | | |
| | | | | | | | 4,557,781 | |
| |
| |
Specialty Retail – 5.3% |
| | 8,764 | | | Ann, Inc.* | | | 273,525 | |
| | 570 | | | AutoNation, Inc.* | | | 19,329 | |
| | 2,540 | | | Body Central Corp.* | | | 61,417 | |
| | 2,879 | | | Brown Shoe Co., Inc. | | | 36,419 | |
| | 1,052 | | | Cabela’s, Inc.* | | | 26,868 | |
| | 8,868 | | | DSW, Inc. Class A* | | | 421,053 | |
| | 3,734 | | | Genesco, Inc.* | | | 150,779 | |
| | 9,140 | | | Group 1 Automotive, Inc. | | | 393,386 | |
| | 7,480 | | | Lithia Motors, Inc. Class A | | | 136,061 | |
| | 6,695 | | | Rue21, Inc.* | | | 201,653 | |
| | 5,997 | | | Select Comfort Corp.* | | | 95,172 | |
| | 8,574 | | | Sonic Automotive, Inc. Class A | | | 120,893 | |
| | 8,987 | | | Ulta Salon, Cosmetics & Fragrance, Inc.* | | | 478,019 | |
| | 5,288 | | | Zale Corp.* | | | 19,460 | |
| | 8,828 | | | Zumiez, Inc.*(a) | | | 248,155 | |
| | | | | | | | | |
| | | | | | | | 2,682,189 | |
| |
| |
Textiles, Apparel & Luxury Goods – 2.8% |
| | 1,273 | | | Lululemon Athletica, Inc.* | | | 127,338 | |
| | 6,708 | | | Oxford Industries, Inc. | | | 230,420 | |
| | 2,259 | | | Perry Ellis International, Inc.* | | | 63,658 | |
| | 9,630 | | | The Timberland Co. Class A* | | | 435,180 | |
| | 5,076 | | | Under Armour, Inc. Class A* | | | 347,503 | |
| | 2,232 | | | Vera Bradley, Inc.* | | | 108,564 | |
| | 1,686 | | | Volcom, Inc. | | | 33,265 | |
| | 2,263 | | | Wolverine World Wide, Inc. | | | 89,796 | |
| | | | | | | | | |
| | | | | | | | 1,435,724 | |
| |
| |
Trading Companies & Distributors – 1.4% |
| | 5,760 | | | Applied Industrial Technologies, Inc. | | | 203,097 | |
| | 7,103 | | | Watsco, Inc. | | | 503,532 | |
| | | | | | | | | |
| | | | | | | | 706,629 | |
| |
| |
Wireless Telecommunication Services – 0.7% |
| | 22,332 | | | USA Mobility, Inc. | | | 345,029 | |
| |
| |
TOTAL COMMON STOCKS |
(Cost $34,639,328) | | $ | 49,875,191 | |
| |
| |
| | | | | | | | | |
| | | | | | | | | |
Exchange Traded Fund(a) – 0.1% |
| | 400 | | | iShares Russell 2000 Growth Index Fund | | | | |
(Cost $32,842) | | $ | 39,508 | |
| |
| |
| | | | | | | | | |
76 The accompanying notes are an integral part of these financial statements.
GOLDMAN SACHS STRUCTURED SMALL CAP GROWTH FUND
| | | | | | | | | | | | | | | |
Principal
| | Interest
| | Maturity
| | |
| Amount | | Rate | | Date | | Value |
| |
Short-term Investment(c) – 1.8% |
Repurchase Agreement – 1.8% |
| Joint Repurchase Agreement Account II |
| $ | 900,000 | | | | 0.042 | % | | | 05/02/11 | | | $ | 900,000 | |
(Cost $900,000) | | | | |
| |
| |
TOTAL INVESTMENTS BEFORE SECURITIES LENDING REINVESTMENT VEHICLE |
(Cost $35,572,170) | | $ | 50,814,699 | |
| |
| |
| | | | | | | | | | | | | | | |
| | | | | | | | | | | |
| Shares | | Rate | | Value |
| |
Securities Lending Reinvestment Vehicle(d)(e) – 2.2% |
| Financial Square Money Market Fund |
| | 1,125,400 | | | | 0.110 | % | | $ | 1,125,400 | |
(Cost $1,125,400) | | | | |
| |
| |
TOTAL INVESTMENTS – 102.3% |
(Cost $36,697,570) | | $ | 51,940,099 | |
| |
| |
LIABILITIES IN EXCESS OF OTHER ASSETS – (2.3)% | | | (1,166,972 | ) |
| |
| |
NET ASSETS – 100.0% | | $ | 50,773,127 | |
| |
| |
The percentage shown for each investment category reflects the value of investments in that category as a percentage of net assets.
| | |
| * | | Non-income producing security. |
| |
| (a) | | All or a portion of security is on loan. |
| |
| (b) | | All or a portion of security is segregated as collateral for initial margin requirement on futures transactions. |
| |
| (c) | | Joint repurchase agreement was entered into on April 29, 2011. Additional information appears on page 87. |
| |
| (d) | | Variable rate security. Interest rate disclosed is that which is in effect at April 30, 2011. |
| |
| (e) | | Represents an affiliated issuer. |
| |
| ADDITIONAL INVESTMENT INFORMATION | |
FUTURES CONTRACTS — At April 30, 2011, the following futures contracts were open:
| | | | | | | | | | | | | | | |
| | | Number of
| | | | | | |
| | | Contracts
| | Expiration
| | Current
| | Unrealized
|
| Type | | Long (Short) | | Date | | Value | | Gain (Loss) |
| |
| Russell Mini 2000 Index | | | 10 | | | June 2011 | | $ | 863,900 | | | $ | 51,695 | |
| |
| |
The accompanying notes are an integral part of these financial statements. 77
GOLDMAN SACHS STRUCTURED SMALL CAP VALUE FUND
Schedule of Investments
April 30, 2011 (Unaudited)
| | | | | | | | | |
| Shares | | Description | | Value |
| |
Common Stocks – 97.7% |
Aerospace & Defense – 1.7% |
| | 753 | | | Alliant Techsystems, Inc. | | $ | 53,199 | |
| | 21,853 | | | Ceradyne, Inc.* | | | 1,024,032 | |
| | 3,950 | | | Cubic Corp. | | | 213,616 | |
| | 4,175 | | | Curtiss-Wright Corp. | | | 138,819 | |
| | 2,669 | | | Ducommun, Inc. | | | 60,720 | |
| | 34,165 | | | Hexcel Corp.* | | | 735,572 | |
| | 11,550 | | | LMI Aerospace, Inc.* | | | 231,577 | |
| | 3,646 | | | Teledyne Technologies, Inc.* | | | 184,087 | |
| | | | | | | | | |
| | | | | | | | 2,641,622 | |
| |
| |
Airlines – 1.5% |
| | 20,387 | | | Alaska Air Group, Inc.* | | | 1,342,892 | |
| | 5,330 | | | Allegiant Travel Co. | | | 239,157 | |
| | 50,339 | | | SkyWest, Inc. | | | 832,103 | |
| | | | | | | | | |
| | | | | | | | 2,414,152 | |
| |
| |
Auto Components – 0.8% |
| | 18,088 | | | Modine Manufacturing Co.* | | | 322,147 | |
| | 22,870 | | | Spartan Motors, Inc. | | | 154,601 | |
| | 28,666 | | | Superior Industries International, Inc. | | | 724,390 | |
| | | | | | | | | |
| | | | | | | | 1,201,138 | |
| |
| |
Beverages – 0.3% |
| | 14,754 | | | National Beverage Corp. | | | 205,376 | |
| | 2,361 | | | The Boston Beer Co., Inc. Class A* | | | 222,548 | |
| | | | | | | | | |
| | | | | | | | 427,924 | |
| |
| |
Biotechnology* – 0.8% |
| | 5,689 | | | Alexion Pharmaceuticals, Inc. | | | 551,207 | |
| | 18,073 | | | Emergent Biosolutions, Inc. | | | 419,474 | |
| | 10,307 | | | Enzon Pharmaceuticals, Inc. | | | 118,325 | |
| | 33,046 | | | Nabi Biopharmaceuticals | | | 191,006 | |
| | | | | | | | | |
| | | | | | | | 1,280,012 | |
| |
| |
Building Products – 0.6% |
| | 7,390 | | | American Woodmark Corp. | | | 150,091 | |
| | 4,493 | | | Quanex Building Products Corp. | | | 94,173 | |
| | 5,484 | | | Simpson Manufacturing Co., Inc. | | | 153,113 | |
| | 17,307 | | | Universal Forest Products, Inc. | | | 558,843 | |
| | | | | | | | | |
| | | | | | | | 956,220 | |
| |
| |
Capital Markets – 3.3% |
| | 13,094 | | | American Capital Ltd.* | | | 134,475 | |
| | 4,083 | | | Arlington Asset Investment Corp.
Class A | | | 124,532 | |
| | 50,487 | | | BlackRock Kelso Capital Corp. | | | 531,123 | |
| | 6,710 | | | Calamos Asset Management, Inc.
Class A | | | 109,172 | |
| | 1,932 | | | Capital Southwest Corp.(a) | | | 185,936 | |
| | 14,483 | | | GAMCO Investors, Inc. Class A | | | 745,150 | |
| | 25,395 | | | Gladstone Capital Corp. | | | 288,487 | |
| | 9,373 | | | Golub Capital BDC, Inc. | | | 150,343 | |
| | 66,063 | | | Hercules Technology Growth Capital, Inc. | | | 710,177 | |
| | 10,303 | | | INTL FCStone, Inc.* | | | 272,823 | |
| | 13,175 | | | MVC Capital, Inc. | | | 182,210 | |
| | 81,617 | | | NGP Capital Resources Co. | | | 770,465 | |
| | 18,325 | | | Safeguard Scientifics, Inc.* | | | 358,254 | |
| | 2,218 | | | Solar Capital Ltd. | | | 56,293 | |
| | 44,217 | | | TICC Capital Corp. | | | 501,421 | |
| | | | | | | | | |
| | | | | | | | 5,120,861 | |
| |
| |
Chemicals – 3.2% |
| | 33,731 | | | A. Schulman, Inc. | | | 854,069 | |
| | 5,556 | | | Georgia Gulf Corp.* | | | 218,795 | |
| | 6,180 | | | Innophos Holdings, Inc. | | | 286,381 | |
| | 29,747 | | | Kraton Performance Polymers, Inc.* | | | 1,373,122 | |
| | 1,219 | | | Minerals Technologies, Inc. | | | 82,892 | |
| | 25,028 | | | OM Group, Inc.* | | | 907,015 | |
| | 48,977 | | | PolyOne Corp. | | | 709,187 | |
| | 29,178 | | | Spartech Corp.* | | | 208,331 | |
| | 2,843 | | | Stepan Co. | | | 204,611 | |
| | 1,701 | | | TPC Group, Inc.* | | | 67,087 | |
| | | | | | | | | |
| | | | | | | | 4,911,490 | |
| |
| |
Commercial Banks – 9.5% |
| | 10,558 | | | 1st Source Corp. | | | 224,041 | |
| | 33,259 | | | Banco Latinoamericano de Comercio Exterior SA Class E | | | 577,376 | |
| | 139,861 | | | CVB Financial Corp.(b) | | | 1,362,246 | |
| | 9,595 | | | Danvers Bancorp, Inc. | | | 216,367 | |
| | 19,102 | | | F.N.B. Corp. | | | 209,167 | |
| | 28,175 | | | First Bancorp | | | 393,323 | |
| | 31,009 | | | First Financial Bancorp | | | 511,028 | |
| | 44,542 | | | First Interstate BancSystem, Inc. | | | 609,335 | |
| | 28,376 | | | FirstMerit Corp. | | | 495,729 | |
| | 11,590 | | | Fulton Financial Corp. | | | 135,371 | |
| | 39,696 | | | Glacier Bancorp, Inc. | | | 596,631 | |
| | 17,468 | | | Great Southern Bancorp, Inc. | | | 361,588 | |
| | 2,293 | | | Home Bancshares, Inc. | | | 54,963 | |
| | 122,727 | | | International Bancshares Corp. | | | 2,162,450 | |
| | 107,020 | | | Investors Bancorp, Inc.* | | | 1,609,581 | |
| | 6,175 | | | Lakeland Financial Corp. | | | 135,294 | |
| | 4,164 | | | Park National Corp. | | | 287,649 | |
| | 55,825 | | | Popular, Inc.* | | | 175,849 | |
| | 6,646 | | | Prosperity Bancshares, Inc. | | | 304,719 | |
| | 33,225 | | | Renasant Corp.(b) | | | 557,515 | |
| | 27,147 | | | Southwest Bancorp, Inc.* | | | 384,944 | |
| | 24,531 | | | Susquehanna Bancshares, Inc. | | | 226,176 | |
| | 18,195 | | | SVB Financial Group* | | | 1,099,706 | |
| | 48,955 | | | Texas Capital Bancshares, Inc.* | | | 1,263,039 | |
| | 3,912 | | | TriCo Bancshares | | | 63,805 | |
| | 3,076 | | | Trustmark Corp. | | | 71,486 | |
| | 10,931 | | | United Bankshares, Inc.(b) | | | 285,955 | |
| | 84,003 | | | Wilshire Bancorp, Inc.*(b) | | | 336,012 | |
| | | | | | | | | |
| | | | | | | | 14,711,345 | |
| |
| |
Commercial Services & Supplies – 0.5% |
| | 795 | | | Clean Harbors, Inc.* | | | 78,308 | |
| | 1,614 | | | Copart, Inc.* | | | 73,227 | |
| | 43,463 | | | Kimball International, Inc. Class B | | | 325,103 | |
| | 4,440 | | | United Stationers, Inc. | | | 319,946 | |
| | | | | | | | | |
| | | | | | | | 796,584 | |
| |
| |
78 The accompanying notes are an integral part of these financial statements.
GOLDMAN SACHS STRUCTURED SMALL CAP VALUE FUND
| | | | | | | | | |
| Shares | | Description | | Value |
| |
Common Stocks – (continued) |
| | | | | | | | | |
Communications Equipment – 0.7% |
| | 4,566 | | | EchoStar Corp. Class A* | | $ | 169,307 | |
| | 95,179 | | | Extreme Networks, Inc.* | | | 297,910 | |
| | 5,978 | | | Plantronics, Inc. | | | 221,605 | |
| | 65,958 | | | Symmetricom, Inc.* | | | 402,344 | |
| | | | | | | | | |
| | | | | | | | 1,091,166 | |
| |
| |
Computers & Peripherals* – 1.3% |
| | 46,971 | | | Electronics for Imaging, Inc. | | | 843,599 | |
| | 67,110 | | | Imation Corp. | | | 689,220 | |
| | 147,927 | | | Quantum Corp. | | | 470,408 | |
| | | | | | | | | |
| | | | | | | | 2,003,227 | |
| |
| |
Consumer Finance – 2.0% |
| | 125,812 | | | Advance America Cash Advance Centers, Inc. | | | 739,775 | |
| | 18,012 | | | Cash America International, Inc. | | | 854,669 | |
| | 5,898 | | | First Cash Financial Services, Inc.* | | | 231,438 | |
| | 18,352 | | | World Acceptance Corp.* | | | 1,247,018 | |
| | | | | | | | | |
| | | | | | | | 3,072,900 | |
| |
| |
Containers & Packaging – 0.2% |
| | 30,595 | | | Boise, Inc. | | | 300,443 | |
| |
| |
Distributors* – 0.1% |
| | 2,678 | | | Core-Mark Holding Co., Inc. | | | 89,740 | |
| |
| |
Diversified Financial Services – 1.2% |
| | 73,816 | | | Compass Diversified Holdings | | | 1,237,156 | |
| | 11,998 | | | Life Partners Holdings, Inc.(b) | | | 84,106 | |
| | 9,048 | | | PHH Corp.* | | | 194,170 | |
| | 85,559 | | | Primus Guaranty Ltd.*(b) | | | 420,095 | |
| | | | | | | | | |
| | | | | | | | 1,935,527 | |
| |
| |
Diversified Telecommunication Services – 0.4% |
| | 19,258 | | | IDT Corp. Class B | | | 558,289 | |
| |
| |
Electric Utilities – 2.4% |
| | 6,367 | | | Pepco Holdings, Inc. | | | 122,692 | |
| | 104,587 | | | PNM Resources, Inc. | | | 1,603,318 | |
| | 70,732 | | | Portland General Electric Co. | | | 1,765,471 | |
| | 4,057 | | | UIL Holdings Corp. | | | 129,094 | |
| | 1,702 | | | Unisource Energy Corp. | | | 63,195 | |
| | | | | | | | | |
| | | | | | | | 3,683,770 | |
| |
| |
Electrical Equipment – 0.7% |
| | 9,209 | | | Encore Wire Corp. | | | 257,023 | |
| | 2,846 | | | Generac Holdings, Inc.* | | | 59,254 | |
| | 1,309 | | | II-VI, Inc.* | | | 75,726 | |
| | 69,049 | | | LSI Industries, Inc. | | | 572,416 | |
| | 11,900 | | | Vicor Corp. | | | 198,849 | |
| | | | | | | | | |
| | | | | | | | 1,163,268 | |
| |
| |
Electronic Equipment, Instruments & Components – 1.7% |
| | 35,155 | | | Agilysys, Inc.* | | | 183,509 | |
| | 13,025 | | | Benchmark Electronics, Inc.* | | | 220,122 | |
| | 16,540 | | | CTS Corp. | | | 181,775 | |
| | 36,047 | | | Insight Enterprises, Inc.* | | | 618,567 | |
| | 47,990 | | | Methode Electronics, Inc. | | | 593,156 | |
| | 8,012 | | | Newport Corp.* | | | 150,065 | |
| | 16,737 | | | RadiSys Corp.* | | | 147,453 | |
| | 27,885 | | | Vishay Intertechnology, Inc.* | | | 532,046 | |
| | | | | | | | | |
| | | | | | | | 2,626,693 | |
| |
| |
Energy Equipment & Services* – 1.9% |
| | 71,816 | | | Complete Production Services, Inc. | | | 2,437,435 | |
| | 5,412 | | | Dawson Geophysical Co. | | | 241,375 | |
| | 14,313 | | | Newpark Resources, Inc. | | | 129,246 | |
| | 14,910 | | | Union Drilling, Inc. | | | 202,180 | |
| | | | | | | | | |
| | | | | | | | 3,010,236 | |
| |
| |
Food & Staples Retailing – 0.2% |
| | 7,139 | | | Ingles Markets, Inc. Class A | | | 135,712 | |
| | 9,301 | | | Susser Holdings Corp.* | | | 128,261 | |
| | | | | | | | | |
| | | | | | | | 263,973 | |
| |
| |
Food Products – 1.6% |
| | 80,513 | | | Dole Food Co., Inc.*(b) | | | 1,111,884 | |
| | 17,937 | | | Fresh Del Monte Produce, Inc. | | | 486,272 | |
| | 21,754 | | | John B. Sanfilippo & Son, Inc.* | | | 239,294 | |
| | 9,472 | | | Lancaster Colony Corp. | | | 578,834 | |
| | | | | | | | | |
| | | | | | | | 2,416,284 | |
| |
| |
Gas Utilities – 2.0% |
| | 2,746 | | | Energen Corp. | | | 178,518 | |
| | 2,496 | | | ONEOK, Inc. | | | 174,570 | |
| | 68,365 | | | Southwest Gas Corp. | | | 2,718,876 | |
| | | | | | | | | |
| | | | | | | | 3,071,964 | |
| |
| |
Health Care Equipment & Supplies – 0.3% |
| | 3,925 | | | Align Technology, Inc.* | | | 94,750 | |
| | 10,376 | | | Invacare Corp. | | | 341,370 | |
| | 12,852 | | | Medical Action Industries, Inc.* | | | 111,812 | |
| | | | | | | | | |
| | | | | | | | 547,932 | |
| |
| |
Health Care Providers & Services – 4.2% |
| | 10,625 | | | AMERIGROUP Corp.* | | | 725,687 | |
| | 8,856 | | | Assisted Living Concepts, Inc. Class A* | | | 319,347 | |
| | 2,375 | | | Health Net, Inc.* | | | 79,088 | |
| | 47,639 | | | Kindred Healthcare, Inc.* | | | 1,201,456 | |
| | 24,981 | | | Magellan Health Services, Inc.* | | | 1,299,512 | |
| | 27,902 | | | Molina Healthcare, Inc.* | | | 1,199,786 | |
| | 28,460 | | | Skilled Healthcare Group, Inc. Class A* | | | 344,935 | |
| | 43,163 | | | Universal American Financial Corp. | | | 997,065 | |
| | 8,239 | | | WellCare Health Plans, Inc.* | | | 360,951 | |
| | | | | | | | | |
| | | | | | | | 6,527,827 | |
| |
| |
Hotels, Restaurants & Leisure* – 1.9% |
| | 2,778 | | | Biglari Holdings, Inc. | | | 1,214,653 | |
| | 50,222 | | | Domino’s Pizza, Inc. | | | 932,622 | |
| | 60,496 | | | O’Charley’s, Inc. | | | 395,644 | |
| | 16,395 | | | Papa John’s International, Inc. | | | 492,834 | |
| | | | | | | | | |
| | | | | | | | 3,035,753 | |
| |
| |
Household Durables – 0.9% |
| | 14,989 | | | Blyth, Inc. | | | 706,582 | |
| | 6,605 | | | CSS Industries, Inc. | | | 127,344 | |
| | 4,374 | | | Harman International Industries, Inc. | | | 212,270 | |
The accompanying notes are an integral part of these financial statements. 79
GOLDMAN SACHS STRUCTURED SMALL CAP VALUE FUND
Schedule of Investments (continued)
April 30, 2011 (Unaudited)
| | | | | | | | | |
| Shares | | Description | | Value |
| |
Common Stocks – (continued) |
Household Durables – (continued) |
| | | | | | | | | |
| | 15,754 | | | Hooker Furniture Corp. | | $ | 195,980 | |
| | 2,994 | | | Mohawk Industries, Inc.* | | | 179,760 | |
| | | | | | | | | |
| | | | | | | | 1,421,936 | |
| |
| |
Household Products* – 0.4% |
| | 61,857 | | | Central Garden & Pet Co. Class A | | | 619,807 | |
| |
| |
Independent Power Producers & Energy Traders* – 0.1% |
| | 14,244 | | | Dynegy, Inc. | | | 90,307 | |
| |
| |
Industrial Conglomerates – 0.3% |
| | 125 | | | Seaboard Corp. | | | 298,375 | |
| | 4,608 | | | Tredegar Corp. | | | 100,823 | |
| | | | | | | | | |
| | | | | | | | 399,198 | |
| |
| |
Insurance – 4.1% |
| | 2,691 | | | Allied World Assurance Co. Holdings Ltd. | | | 174,834 | |
| | 34,961 | | | American Equity Investment Life Holding Co. | | | 449,599 | |
| | 18,137 | | | Aspen Insurance Holdings Ltd. | | | 518,174 | |
| | 33,394 | | | CNA Surety Corp.* | | | 884,607 | |
| | 20,969 | | | CNO Financial Group, Inc.* | | | 169,010 | |
| | 137,179 | | | Flagstone Reinsurance Holdings SA | | | 1,153,675 | |
| | 15,488 | | | Global Indemnity PLC* | | | 395,564 | |
| | 5,252 | | | Kansas City Life Insurance Co. | | | 168,222 | |
| | 70,094 | | | Maiden Holdings Ltd. | | | 522,200 | |
| | 56,233 | | | Montpelier Re Holdings Ltd. | | | 1,017,255 | |
| | 2,980 | | | Platinum Underwriters Holdings Ltd. | | | 112,674 | |
| | 8,928 | | | Presidential Life Corp. | | | 99,458 | |
| | 1,780 | | | StanCorp Financial Group, Inc. | | | 76,718 | |
| | 14,769 | | | Symetra Financial Corp. | | | 204,994 | |
| | 8,249 | | | United Fire & Casualty Co. | | | 163,330 | |
| | 6,658 | | | W.R. Berkley Corp. | | | 217,117 | |
| | | | | | | | | |
| | | | | | | | 6,327,431 | |
| |
| |
Internet & Catalog Retail – 0.1% |
| | 24,857 | | | Gaiam, Inc. | | | 147,899 | |
| |
| |
Internet Software & Services – 0.6% |
| | 72,386 | | | Marchex, Inc. Class B | | | 511,045 | |
| | 131,172 | | | RealNetworks, Inc.* | | | 485,337 | |
| | | | | | | | | |
| | | | | | | | 996,382 | |
| |
| |
IT Services* – 1.5% |
| | 133,641 | | | Ciber, Inc. | | | 764,426 | |
| | 7,874 | | | CSG Systems International, Inc. | | | 167,244 | |
| | 66,490 | | | Lionbridge Technologies, Inc. | | | 224,071 | |
| | 4,967 | | | ManTech International Corp. Class A | | | 218,002 | |
| | 18,267 | | | VeriFone Systems, Inc. | | | 1,001,397 | |
| | | | | | | | | |
| | | | | | | | 2,375,140 | |
| |
| |
Leisure Equipment & Products – 0.2% |
| | 30,199 | | | Callaway Golf Co. | | | 213,809 | |
| | 1,448 | | | Polaris Industries, Inc. | | | 152,663 | |
| | | | | | | | | |
| | | | | | | | 366,472 | |
| |
| |
Life Sciences Tools & Services* – 0.4% |
| | 99,481 | | | Affymetrix, Inc. | | | 537,197 | |
| | 23,292 | | | Albany Molecular Research, Inc.
Class A | | | 113,898 | |
| | | | | | | | | |
| | | | | | | | 651,095 | |
| |
| |
Machinery – 4.4% |
| | 23,411 | | | Albany International Corp. | | | 592,532 | |
| | 5,747 | | | American Railcar Industries, Inc.* | | | 162,813 | |
| | 9,361 | | | Astec Industries, Inc.* | | | 363,020 | |
| | 28,384 | | | Briggs & Stratton Corp. | | | 669,579 | |
| | 18,363 | | | EnPro Industries, Inc.* | | | 735,989 | |
| | 20,596 | | | Kadant, Inc.* | | | 635,387 | |
| | 32,415 | | | Miller Industries, Inc. | | | 512,805 | |
| | 43,436 | | | Mueller Industries, Inc. | | | 1,699,216 | |
| | 9,732 | | | NACCO Industries, Inc. Class A | | | 1,024,098 | |
| | 3,642 | | | Sauer-Danfoss, Inc.* | | | 214,914 | |
| | 22,287 | | | Tecumseh Products Co. Class A* | | | 228,219 | |
| | | | | | | | | |
| | | | | | | | 6,838,572 | |
| |
| |
Media* – 0.6% |
| | 9,071 | | | Ascent Media Corp. Class A | | | 435,680 | |
| | 82,292 | | | Journal Communications, Inc. | | | 448,492 | |
| | | | | | | | | |
| | | | | | | | 884,172 | |
| |
| |
Metals & Mining – 1.7% |
| | 6,655 | | | Haynes International, Inc. | | | 359,636 | |
| | 65,280 | | | Hecla Mining Co.* | | | 614,285 | |
| | 12,724 | | | Kaiser Aluminum Corp. | | | 637,600 | |
| | 16,920 | | | Materion Corp.* | | | 706,579 | |
| | 12,548 | | | Noranda Aluminum Holding Corp.* | | | 213,190 | |
| | 3,983 | | | Olympic Steel, Inc. | | | 116,981 | |
| | 3,546 | | | Titanium Metals Corp.* | | | 71,026 | |
| | | | | | | | | |
| | | | | | | | 2,719,297 | |
| |
| |
Multi-Utilities – 0.6% |
| | 26,083 | | | Black Hills Corp. | | | 906,384 | |
| |
| |
Multiline Retail – 0.6% |
| | 64,292 | | | Fred’s, Inc. Class A | | | 897,516 | |
| |
| |
Oil, Gas & Consumable Fuels – 6.7% |
| | 5,112 | | | Bill Barrett Corp.* | | | 213,324 | |
| | 20,331 | | | Delek US Holdings, Inc. | | | 273,045 | |
| | 4,476 | | | Energy Partners Ltd.* | | | 81,508 | |
| | 19,551 | | | Frontier Oil Corp. | | | 546,255 | |
| | 1,756 | | | Oasis Petroleum, Inc.* | | | 53,962 | |
| | 46,819 | | | PetroQuest Energy, Inc.* | | | 410,134 | |
| | 3,328 | | | REX American Resources Corp.* | | | 57,508 | |
| | 7,367 | | | Stone Energy Corp.* | | | 260,497 | |
| | 93,445 | | | Tesoro Corp.*(a) | | | 2,534,228 | |
| | 68,947 | | | USEC, Inc.* | | | 315,777 | |
| | 93,791 | | | W&T Offshore, Inc. | | | 2,514,537 | |
| | 184,438 | | | Western Refining, Inc.*(b) | | | 3,128,069 | |
| | | | | | | | | |
| | | | | | | | 10,388,844 | |
| |
| |
80 The accompanying notes are an integral part of these financial statements.
GOLDMAN SACHS STRUCTURED SMALL CAP VALUE FUND
| | | | | | | | | |
| Shares | | Description | | Value |
| |
Common Stocks – (continued) |
| | | | | | | | | |
Paper & Forest Products – 1.6% |
| | 21,318 | | | Clearwater Paper Corp.* | | $ | 1,673,037 | |
| | 1,894 | | | Domtar Corp. | | | 176,180 | |
| | 35,575 | | | KapStone Paper and Packaging Corp.* | | | 618,293 | |
| | | | | | | | | |
| | | | | | | | 2,467,510 | |
| |
| |
Personal Products – 0.6% |
| | 9,264 | | | Alberto-Culver Co. | | | 345,918 | |
| | 51,422 | | | Prestige Brands Holdings, Inc.* | | | 593,924 | |
| | | | | | | | | |
| | | | | | | | 939,842 | |
| |
| |
Pharmaceuticals* – 0.6% |
| | 15,760 | | | The Medicines Co. | | | 247,432 | |
| | 37,355 | | | ViroPharma, Inc. | | | 720,578 | |
| | | | | | | | | |
| | | | | | | | 968,010 | |
| |
| |
Professional Services – 1.1% |
| | 30,594 | | | CDI Corp. | | | 453,403 | |
| | 61,355 | | | Kelly Services, Inc. Class A* | | | 1,172,494 | |
| | 8,316 | | | SFN Group, Inc.* | | | 87,568 | |
| | | | | | | | | |
| | | | | | | | 1,713,465 | |
| |
| |
Real Estate Investment Trusts – 13.3% |
| | 7,962 | | | Acadia Realty Trust | | | 166,008 | |
| | 19,980 | | | Agree Realty Corp. | | | 467,332 | |
| | 63,850 | | | American Campus Communities, Inc. | | | 2,244,327 | |
| | 46,875 | | | Ashford Hospitality Trust | | | 584,531 | |
| | 6,657 | | | Chatham Lodging Trust | | | 107,511 | |
| | 15,705 | | | Chesapeake Lodging Trust | | | 282,376 | |
| | 2,379 | | | EastGroup Properties, Inc. | | | 109,577 | |
| | 28,963 | | | Equity Lifestyle Properties, Inc. | | | 1,732,567 | |
| | 7,515 | | | Excel Trust, Inc. | | | 89,428 | |
| | 56,245 | | | Extra Space Storage, Inc. | | | 1,217,704 | |
| | 2,092 | | | Federal Realty Investment Trust | | | 183,175 | |
| | 87,707 | | | Franklin Street Properties Corp. | | | 1,240,177 | |
| | 7,080 | | | Health Care REIT, Inc. | | | 380,692 | |
| | 48,812 | | | Healthcare Realty Trust, Inc. | | | 1,114,866 | |
| | 2,324 | | | Highwoods Properties, Inc. | | | 85,756 | |
| | 38,707 | | | LTC Properties, Inc. | | | 1,138,760 | |
| | 158,406 | | | MPG Office Trust, Inc.* | | | 527,492 | |
| | 23,310 | | | National Health Investors, Inc. | | | 1,133,565 | |
| | 32,815 | | | National Retail Properties, Inc.(b) | | | 864,347 | |
| | 13,405 | | | Nationwide Health Properties, Inc. | | | 587,139 | |
| | 67,822 | | | OMEGA Healthcare Investors, Inc.(b) | | | 1,557,193 | |
| | 3,737 | | | One Liberty Properties, Inc. | | | 57,961 | |
| | 50,068 | | | Potlatch Corp. | | | 1,937,131 | |
| | 20,168 | | | Rayonier, Inc. | | | 1,338,348 | |
| | 3,933 | | | Senior Housing Properties Trust | | | 93,291 | |
| | 29,891 | | | Starwood Property Trust, Inc. | | | 681,216 | |
| | 12,083 | | | Universal Health Realty Income Trust | | | 520,898 | |
| | 8,748 | | | Urstadt Biddle Properties Class A | | | 172,161 | |
| | | | | | | | | |
| | | | | | | | 20,615,529 | |
| |
| |
Road & Rail – 0.9% |
| | 2,809 | | | Heartland Express, Inc. | | | 48,455 | |
| | 13,865 | | | Universal Truckload Services, Inc.* | | | 219,622 | |
| | 41,262 | | | Werner Enterprises, Inc. | | | 1,079,826 | |
| | | | | | | | | |
| | | | | | | | 1,347,903 | |
| |
| |
Semiconductors & Semiconductor Equipment* – 2.1% |
| | 28,303 | | | DSP Group, Inc. | | | 228,688 | |
| | 247,220 | | | Lattice Semiconductor Corp. | | | 1,678,624 | |
| | 6,695 | | | LTX-Credence Corp. | | | 58,046 | |
| | 25,636 | | | Photronics, Inc. | | | 223,802 | |
| | 95,647 | | | Silicon Image, Inc. | | | 795,783 | |
| | 3,194 | | | Standard Microsystems Corp. | | | 86,717 | |
| | 3,211 | | | Tessera Technologies, Inc. | | | 63,449 | |
| | 15,737 | | | Zoran Corp. | | | 164,767 | |
| | | | | | | | | |
| | | | | | | | 3,299,876 | |
| |
| |
Software* – 1.6% |
| | 48,238 | | | Accelrys, Inc. | | | 365,162 | |
| | 6,593 | | | Epicor Software Corp. | | | 82,412 | |
| | 43,661 | | | Magma Design Automation, Inc. | | | 277,684 | |
| | 27,073 | | | Mentor Graphics Corp. | | | 399,327 | |
| | 6,869 | | | MicroStrategy, Inc. Class A | | | 970,590 | |
| | 10,084 | | | QAD, Inc. Class A | | | 110,117 | |
| | 12,129 | | | Quest Software, Inc. | | | 312,443 | |
| | | | | | | | | |
| | | | | | | | 2,517,735 | |
| |
| |
Specialty Retail – 3.9% |
| | 4,311 | | | Ann, Inc.* | | | 134,546 | |
| | 3,912 | | | Asbury Automotive Group, Inc.* | | | 67,678 | |
| | 34,377 | | | Brown Shoe Co., Inc. | | | 434,869 | |
| | 19,148 | | | Build-A-Bear Workshop, Inc.* | | | 117,377 | |
| | 15,856 | | | Cabela’s, Inc.* | | | 404,962 | |
| | 6,079 | | | Genesco, Inc.* | | | 245,470 | |
| | 36,272 | | | Group 1 Automotive, Inc. | | | 1,561,147 | |
| | 38,651 | | | Lithia Motors, Inc. Class A | | | 703,062 | |
| | 22,506 | | | Pacific Sunwear of California, Inc.* | | | 71,794 | |
| | 12,614 | | | Shoe Carnival, Inc.* | | | 369,212 | |
| | 31,957 | | | Sonic Automotive, Inc. Class A | | | 450,594 | |
| | 72,703 | | | Stage Stores, Inc. | | | 1,400,260 | |
| | 2,074 | | | Zumiez, Inc.* | | | 58,300 | |
| | | | | | | | | |
| | | | | | | | 6,019,271 | |
| |
| |
Textiles, Apparel & Luxury Goods – 1.0% |
| | 5,317 | | | Columbia Sportswear Co.(b) | | | 361,503 | |
| | 27,252 | | | Kenneth Cole Productions, Inc. Class A* | | | 367,084 | |
| | 11,299 | | | Movado Group, Inc. | | | 188,580 | |
| | 22,681 | | | Perry Ellis International, Inc.* | | | 639,151 | |
| | | | | | | | | |
| | | | | | | | 1,556,318 | |
| |
| |
Thrifts & Mortgage Finance – 1.2% |
| | 51,474 | | | Astoria Financial Corp. | | | 744,829 | |
| | 57,379 | | | Brookline Bancorp, Inc. | | | 529,034 | |
| | 41,691 | | | Northwest Bancshares, Inc. | | | 524,890 | |
| | 5,892 | | | Provident Financial Services, Inc. | | | 85,552 | |
| | | | | | | | | |
| | | | | | | | 1,884,305 | |
| |
| |
Tobacco – 0.3% |
| | 66,113 | | | Alliance One International, Inc.* | | | 263,791 | |
| | 3,062 | | | Universal Corp. | | | 132,829 | |
| | | | | | | | | |
| | | | | | | | 396,620 | |
| |
| |
The accompanying notes are an integral part of these financial statements. 81
GOLDMAN SACHS STRUCTURED SMALL CAP VALUE FUND
Schedule of Investments (continued)
April 30, 2011 (Unaudited)
| | | | | | | | | |
| Shares | | Description | | Value |
| |
Common Stocks – (continued) |
| | | | | | | | | |
Trading Companies & Distributors – 0.8% |
| | 9,894 | | | H&E Equipment Services, Inc.* | | $ | 196,891 | |
| | 14,852 | | | United Rentals, Inc.* | | | 436,946 | |
| | 9,623 | | | Watsco, Inc. | | | 682,174 | |
| | | | | | | | | |
| | | | | | | | 1,316,011 | |
| |
| |
Wireless Telecommunication Services – 0.5% |
| | 50,890 | | | USA Mobility, Inc. | | | 786,250 | |
| |
| |
TOTAL COMMON STOCKS |
(Cost $106,728,296) | | $ | 151,719,437 | |
| |
| |
| | | | | | | | | |
| | | | | | | | | |
Investment Company – 0.1% |
Capital Markets – 0.1% |
| | 10,178 | | | THL Credit, Inc. | | | | |
(Cost $133,315) | | $ | 145,749 | |
| |
| |
| | | | | | | | | |
| | | | | | | | | | | | | | | |
| | | | | Expiration
| | |
| Units | | Description | | Month | | Value |
| |
Warrant* – 0.0% |
Media – 0.0% |
| | 635 | | | | Granite Broadcasting Corp. | | | | 06/12 | | | $ | — | |
(Cost $12,055) | | | | |
| |
| |
| | | | | | | | | | | | | | | |
| | | | | | | | | | | | | | | |
Principal
| | Interest
| | Maturity
| | |
| Amount | | Rate | | Date | | Value |
| |
Short-term Investment(c) – 2.3% |
Repurchase Agreement – 2.3% |
| Joint Repurchase Agreement Account II |
| $ | 3,600,000 | | | | 0.042 | % | | | 05/02/11 | | | $ | 3,600,000 | |
(Cost $3,600,000) | | | | |
| |
| |
TOTAL INVESTMENTS BEFORE SECURITIES LENDING REINVESTMENT VEHICLE |
(Cost $110,473,666) | | $ | 155,465,186 | |
| |
| |
| | | | | | | | | | | | | | | |
| | | | | | | | | | | |
| Shares | | Rate | | Value |
| |
Securities Lending Reinvestment Vehicle(d)(e) – 4.5% |
| Financial Square Money Market Fund |
| | 6,962,263 | | | | 0.110 | % | | $ | 6,962,263 | |
(Cost $6,962,263) | | | | |
| |
| |
TOTAL INVESTMENTS – 104.6% |
(Cost $117,435,929) | | $ | 162,427,449 | |
| |
| |
LIABILITIES IN EXCESS OF OTHER ASSETS – (4.6)% | | | (7,130,955 | ) |
| |
| |
NET ASSETS – 100.0% | | $ | 155,296,494 | |
| |
| |
The percentage shown for each investment category reflects the value of investments in that category as a percentage of net assets.
| | |
| * | | Non-income producing security. |
| |
| (a) | | All or a portion of security is segregated as collateral for initial margin requirement on futures transactions. |
| |
| (b) | | All or a portion of security is on loan. |
| |
| (c) | | Joint repurchase agreement was entered into on April 29, 2011. Additional information appears on page 87. |
| |
| (d) | | Variable rate security. Interest rate disclosed is that which is in effect at April 30, 2011. |
| |
| (e) | | Represents an affiliated issuer. |
| | | | | |
| |
| |
Investment Abbreviation: |
| REIT | | — | | Real Estate Investment Trust |
| |
| |
| |
| ADDITIONAL INVESTMENT INFORMATION | |
FUTURES CONTRACTS — At April 30, 2011, the following futures contracts were open:
| | | | | | | | | | | | | | | |
| | | Number of
| | | | | | |
| | | Contracts
| | Expiration
| | Current
| | Unrealized
|
| Type | | Long (Short) | | Date | | Value | | Gain (Loss) |
| |
| Russell Mini 2000 Index | | | 38 | | | June 2011 | | $ | 3,282,820 | | | $ | 196,266 | |
| |
| |
82 The accompanying notes are an integral part of these financial statements.
GOLDMAN SACHS STRUCTURED U.S. EQUITY FUND
Schedule of Investments
April 30, 2011 (Unaudited)
| | | | | | | | | |
| Shares | | Description | | Value |
| |
Common Stocks – 96.7% |
Aerospace & Defense – 1.9% |
| | 61,856 | | | Honeywell International, Inc. | | $ | 3,787,443 | |
| | 76,175 | | | Northrop Grumman Corp. | | | 4,845,492 | |
| | 6,463 | | | Rockwell Collins, Inc. | | | 407,815 | |
| | 5,110 | | | United Technologies Corp. | | | 457,754 | |
| | | | | | | | | |
| | | | | | | | 9,498,504 | |
| |
| |
Air Freight & Logistics – 1.7% |
| | 5,859 | | | FedEx Corp. | | | 560,530 | |
| | 106,879 | | | United Parcel Service, Inc. Class B | | | 8,012,719 | |
| | | | | | | | | |
| | | | | | | | 8,573,249 | |
| |
| |
Auto Components – 0.9% |
| | 14,447 | | | Autoliv, Inc. | | | 1,157,638 | |
| | 14,714 | | | Johnson Controls, Inc. | | | 603,274 | |
| | 45,429 | | | TRW Automotive Holdings Corp.* | | | 2,592,179 | |
| | | | | | | | | |
| | | | | | | | 4,353,091 | |
| |
| |
Beverages – 0.3% |
| | 6,758 | | | Dr. Pepper Snapple Group, Inc. | | | 264,914 | |
| | 10,187 | | | Hansen Natural Corp.* | | | 673,870 | |
| | 8,220 | | | Molson Coors Brewing Co. Class B | | | 400,725 | |
| | 5,262 | | | The Coca-Cola Co. | | | 354,974 | |
| | | | | | | | | |
| | | | | | | | 1,694,483 | |
| |
| |
Biotechnology* – 2.6% |
| | 1,527 | | | Alexion Pharmaceuticals, Inc. | | | 147,951 | |
| | 106,149 | | | Amgen, Inc. | | | 6,034,571 | |
| | 22,118 | | | Biogen Idec, Inc. | | | 2,153,187 | |
| | 23,366 | | | Celgene Corp. | | | 1,375,790 | |
| | 3,683 | | | Cephalon, Inc. | | | 282,854 | |
| | 74,269 | | | Gilead Sciences, Inc. | | | 2,884,608 | |
| | | | | | | | | |
| | | | | | | | 12,878,961 | |
| |
| |
Capital Markets – 1.9% |
| | 126,706 | | | Bank of New York Mellon Corp. | | | 3,669,406 | |
| | 16,878 | | | Franklin Resources, Inc. | | | 2,179,287 | |
| | 64,440 | | | Morgan Stanley & Co. | | | 1,685,106 | |
| | 90,828 | | | SEI Investments Co. | | | 2,028,189 | |
| | | | | | | | | |
| | | | | | | | 9,561,988 | |
| |
| |
Chemicals – 1.6% |
| | 13,273 | | | Ashland, Inc. | | | 823,988 | |
| | 24,171 | | | Eastman Chemical Co. | | | 2,592,340 | |
| | 78,056 | | | Huntsman Corp. | | | 1,627,467 | |
| | 10,501 | | | The Dow Chemical Co. | | | 430,436 | |
| | 17,494 | | | The Scotts Miracle-Gro Co. Class A | | | 987,886 | |
| | 19,299 | | | The Sherwin-Williams Co. | | | 1,588,115 | |
| | | | | | | | | |
| | | | | | | | 8,050,232 | |
| |
| |
Commercial Banks – 2.3% |
| | 7,486 | | | PNC Financial Services Group, Inc. | | | 466,677 | |
| | 115,903 | | | U.S. Bancorp | | | 2,992,616 | |
| | 271,855 | | | Wells Fargo & Co. | | | 7,913,699 | |
| | | | | | | | | |
| | | | | | | | 11,372,992 | |
| |
| |
Communications Equipment – 1.4% |
| | 286,675 | | | Cisco Systems, Inc. | | | 5,034,013 | |
| | 30,652 | | | Motorola Solutions, Inc.* | | | 1,406,314 | |
| | 78,337 | | | Tellabs, Inc. | | | 385,418 | |
| | | | | | | | | |
| | | | | | | | 6,825,745 | |
| |
| |
Computers & Peripherals – 3.0% |
| | 352,836 | | | Dell, Inc.* | | | 5,472,486 | |
| | 30,073 | | | Hewlett-Packard Co. | | | 1,214,047 | |
| | 8,218 | | | Lexmark International, Inc. Class A* | | | 265,030 | |
| | 105,524 | | | NetApp, Inc.* | | | 5,485,138 | |
| | 58,593 | | | QLogic Corp.* | | | 1,053,502 | |
| | 35,677 | | | Western Digital Corp.* | | | 1,419,945 | |
| | | | | | | | | |
| | | | | | | | 14,910,148 | |
| |
| |
Construction & Engineering – 0.0% |
| | 2,591 | | | Fluor Corp. | | | 181,215 | |
| |
| |
Consumer Finance – 1.0% |
| | 90,352 | | | Capital One Financial Corp. | | | 4,944,965 | |
| |
| |
Diversified Consumer Services* – 0.1% |
| | 9,478 | | | Apollo Group, Inc. Class A | | | 379,404 | |
| |
| |
Diversified Financial Services – 2.3% |
| | 249,528 | | | Bank of America Corp. | | | 3,064,204 | |
| | 559,949 | | | Citigroup, Inc.* | | | 2,570,166 | |
| | 2,088 | | | CME Group, Inc. | | | 617,568 | |
| | 103,028 | | | JPMorgan Chase & Co. | | | 4,701,167 | |
| | 9,470 | | | Moody’s Corp. | | | 370,656 | |
| | | | | | | | | |
| | | | | | | | 11,323,761 | |
| |
| |
Diversified Telecommunication Services – 2.4% |
| | 343,990 | | | AT&T, Inc.(a) | | | 10,704,969 | |
| | 34,892 | | | Verizon Communications, Inc. | | | 1,318,220 | |
| | | | | | | | | |
| | | | | | | | 12,023,189 | |
| |
| |
Electric Utilities – 1.5% |
| | 307,576 | | | Duke Energy Corp. | | | 5,736,293 | |
| | 38,122 | | | Exelon Corp. | | | 1,606,842 | |
| | 4,048 | | | Southern Co. | | | 158,034 | |
| | | | | | | | | |
| | | | | | | | 7,501,169 | |
| |
| |
Electrical Equipment – 1.1% |
| | 73,431 | | | Emerson Electric Co. | | | 4,461,667 | |
| | 11,261 | | | Rockwell Automation, Inc. | | | 981,171 | |
| | | | | | | | | |
| | | | | | | | 5,442,838 | |
| |
| |
Electronic Equipment, Instruments & Components* – 1.2% |
| | 103,987 | | | Flextronics International Ltd. | | | 724,790 | |
| | 173,423 | | | Ingram Micro, Inc. Class A | | | 3,248,213 | |
| | 112,517 | | | Vishay Intertechnology, Inc. | | | 2,146,824 | |
| | | | | | | | | |
| | | | | | | | 6,119,827 | |
| |
| |
Energy Equipment & Services – 0.5% |
| | 3,936 | | | Cameron International Corp.* | | | 207,506 | |
| | 5,757 | | | Core Laboratories NV | | | 552,557 | |
| | 16,401 | | | Exterran Holdings, Inc.* | | | 356,066 | |
| | 7,584 | | | Halliburton Co. | | | 382,840 | |
| |
| |
The accompanying notes are an integral part of these financial statements. 83
GOLDMAN SACHS STRUCTURED U.S. EQUITY FUND
Schedule of Investments (continued)
April 30, 2011 (Unaudited)
| | | | | | | | | |
| Shares | | Description | | Value |
| |
Common Stocks – (continued) |
Energy Equipment & Services – (continued) |
| | | | | | | | | |
| | 2,403 | | | National-Oilwell Varco, Inc. | | $ | 184,286 | |
| | 9,015 | | | Oil States International, Inc.* | | | 748,335 | |
| | | | | | | | | |
| | | | | | | | 2,431,590 | |
| |
| |
Food & Staples Retailing – 1.4% |
| | 16,263 | | | Costco Wholesale Corp. | | | 1,316,002 | |
| | 11,336 | | | CVS Caremark Corp. | | | 410,817 | |
| | 6,896 | | | The Kroger Co. | | | 167,642 | |
| | 42,480 | | | Wal-Mart Stores, Inc. | | | 2,335,550 | |
| | 52,621 | | | Walgreen Co. | | | 2,247,969 | |
| | 5,133 | | | Whole Foods Market, Inc. | | | 322,147 | |
| | | | | | | | | |
| | | | | | | | 6,800,127 | |
| |
| |
Food Products – 2.1% |
| | 168,012 | | | Archer-Daniels-Midland Co. | | | 6,219,804 | |
| | 6,496 | | | H.J. Heinz Co. | | | 332,790 | |
| | 189,705 | | | Tyson Foods, Inc. Class A | | | 3,775,130 | |
| | | | | | | | | |
| | | | | | | | 10,327,724 | |
| |
| |
Health Care Equipment & Supplies – 0.9% |
| | 250,705 | | | Boston Scientific Corp.* | | | 1,877,781 | |
| | 75,951 | | | CareFusion Corp.* | | | 2,230,681 | |
| | 6,534 | | | DENTSPLY International, Inc. | | | 245,286 | |
| | 2,226 | | | Varian Medical Systems, Inc.* | | | 156,265 | |
| | 3,192 | | | Zimmer Holdings, Inc.* | | | 208,278 | |
| | | | | | | | | |
| | | | | | | | 4,718,291 | |
| |
| |
Health Care Providers & Services – 2.0% |
| | 69,884 | | | Cardinal Health, Inc. | | | 3,053,232 | |
| | 12,454 | | | Coventry Health Care, Inc.* | | | 401,891 | |
| | 25,867 | | | Humana, Inc.* | | | 1,968,996 | |
| | 29,237 | | | UnitedHealth Group, Inc. | | | 1,439,337 | |
| | 43,964 | | | WellPoint, Inc. | | | 3,375,996 | |
| | | | | | | | | |
| | | | | | | | 10,239,452 | |
| |
| |
Hotels, Restaurants & Leisure – 1.6% |
| | 58,486 | | | Carnival Corp. | | | 2,226,562 | |
| | 2,829 | | | Chipotle Mexican Grill, Inc.* | | | 754,749 | |
| | 10,689 | | | McDonald’s Corp. | | | 837,056 | |
| | 104,950 | | | Starbucks Corp. | | | 3,798,140 | |
| | 8,925 | | | Yum! Brands, Inc. | | | 478,737 | |
| | | | | | | | | |
| | | | | | | | 8,095,244 | |
| |
| |
Household Durables – 0.8% |
| | 46,329 | | | Harman International Industries, Inc. | | | 2,248,346 | |
| | 27,491 | | | Mohawk Industries, Inc.* | | | 1,650,560 | |
| | | | | | | | | |
| | | | | | | | 3,898,906 | |
| |
| |
Household Products – 2.2% |
| | 13,782 | | | Colgate-Palmolive Co. | | | 1,162,512 | |
| | 150,512 | | | The Procter & Gamble Co. | | | 9,768,229 | |
| | | | | | | | | |
| | | | | | | | 10,930,741 | |
| |
| |
Industrial Conglomerates – 1.8% |
| | 405,978 | | | General Electric Co. | | | 8,302,250 | |
| | 12,041 | | | Tyco International Ltd. | | | 586,878 | |
| | | | | | | | | |
| | | | | | | | 8,889,128 | |
| |
| |
Insurance – 3.4% |
| | 6,382 | | | Assurant, Inc. | | | 253,365 | |
| | 37,254 | | | Berkshire Hathaway, Inc. Class B* | | | 3,103,258 | |
| | 10,447 | | | Everest Re Group Ltd. | | | 951,931 | |
| | 58,503 | | | Loews Corp. | | | 2,589,343 | |
| | 58,937 | | | MetLife, Inc. | | | 2,757,662 | |
| | 12,860 | | | The Travelers Cos., Inc. | | | 813,781 | |
| | 237,567 | | | Unum Group | | | 6,290,774 | |
| | | | | | | | | |
| | | | | | | | 16,760,114 | |
| |
| |
Internet & Catalog Retail* – 1.4% |
| | 32,043 | | | Amazon.com, Inc. | | | 6,296,450 | |
| | 3,351 | | | Netflix, Inc. | | | 779,677 | |
| | | | | | | | | |
| | | | | | | | 7,076,127 | |
| |
| |
Internet Software & Services – 1.4% |
| | 1 | | | AOL, Inc.* | | | 20 | |
| | 8,266 | | | eBay, Inc.* | | | 284,350 | |
| | 10,444 | | | Google, Inc. Class A* | | | 5,682,581 | |
| | 28,850 | | | VeriSign, Inc. | | | 1,066,296 | |
| | | | | | | | | |
| | | | | | | | 7,033,247 | |
| |
| |
IT Services – 2.6% |
| | 187,840 | | | Accenture PLC Class A | | | 10,731,299 | |
| | 7,304 | | | Amdocs Ltd.* | | | 224,598 | |
| | 36,905 | | | Teradata Corp.* | | | 2,063,728 | |
| | | | | | | | | |
| | | | | | | | 13,019,625 | |
| |
| |
Machinery – 2.9% |
| | 21,069 | | | AGCO Corp.* | | | 1,213,153 | |
| | 2,264 | | | Bucyrus International, Inc. | | | 207,043 | |
| | 8,032 | | | CNH Global NV* | | | 387,946 | |
| | 19,219 | | | Cummins, Inc. | | | 2,309,739 | |
| | 32,153 | | | Eaton Corp. | | | 1,721,150 | |
| | 3,056 | | | Illinois Tool Works, Inc. | | | 178,501 | |
| | 1,757 | | | Joy Global, Inc. | | | 177,369 | |
| | 58,812 | | | Oshkosh Corp.* | | | 1,861,988 | |
| | 9,936 | | | Parker Hannifin Corp. | | | 937,164 | |
| | 62,975 | | | The Toro Co. | | | 4,276,632 | |
| | 20,319 | | | Timken Co. | | | 1,145,788 | |
| | | | | | | | | |
| | | | | | | | 14,416,473 | |
| |
| |
Media – 3.6% |
| | 8,210 | | | Cablevision Systems Corp. Class A | | | 289,238 | |
| | 44,610 | | | Comcast Corp. Class A | | | 1,170,566 | |
| | 141,039 | | | Comcast Corp. Special Class A | | | 3,462,507 | |
| | 19,597 | | | DIRECTV Class A* | | | 952,218 | |
| | 198,539 | | | DISH Network Corp. Class A* | | | 4,971,417 | |
| | 76,879 | | | News Corp. Class A | | | 1,369,984 | |
| | 5,409 | | | The Walt Disney Co. | | | 233,128 | |
| | 143,631 | | | Time Warner, Inc. | | | 5,437,870 | |
| | | | | | | | | |
| | | | | | | | 17,886,928 | |
| |
| |
Metals & Mining – 1.4% |
| | 20,753 | | | Freeport-McMoRan Copper & Gold, Inc. | | | 1,142,038 | |
| | 49,724 | | | Newmont Mining Corp. | | | 2,914,324 | |
| | 30,849 | | | Southern Copper Corp. | | | 1,155,603 | |
| |
| |
84 The accompanying notes are an integral part of these financial statements.
GOLDMAN SACHS STRUCTURED U.S. EQUITY FUND
| | | | | | | | | |
| Shares | | Description | | Value |
| |
Common Stocks – (continued) |
Metals & Mining – (continued) |
| | | | | | | | | |
| | 17,244 | | | Titanium Metals Corp.* | | $ | 345,397 | |
| | 3,994 | | | United States Steel Corp. | | | 190,554 | |
| | 7,692 | | | Walter Energy, Inc. | | | 1,063,188 | |
| | | | | | | | | |
| | | | | | | | 6,811,104 | |
| |
| |
Multi-Utilities – 1.2% |
| | 6,613 | | | Dominion Resources, Inc. | | | 306,976 | |
| | 45,459 | | | Integrys Energy Group, Inc. | | | 2,380,233 | |
| | 13,402 | | | NiSource, Inc. | | | 260,669 | |
| | 52,271 | | | Sempra Energy | | | 2,880,132 | |
| | | | | | | | | |
| | | | | | | | 5,828,010 | |
| |
| |
Oil, Gas & Consumable Fuels – 13.4% |
| | 124,446 | | | Chevron Corp. | | | 13,619,370 | |
| | 9,070 | | | Cimarex Energy Co. | | | 1,003,051 | |
| | 189,479 | | | ConocoPhillips | | | 14,955,578 | |
| | 27,909 | | | Devon Energy Corp. | | | 2,539,719 | |
| | 238,750 | | | Exxon Mobil Corp. | | | 21,010,000 | |
| | 11,441 | | | Hess Corp. | | | 983,468 | |
| | 8,240 | | | Marathon Oil Corp. | | | 445,290 | |
| | 13,158 | | | Murphy Oil Corp. | | | 1,019,482 | |
| | 2,917 | | | Newfield Exploration Co.* | | | 206,524 | |
| | 22,802 | | | Sunoco, Inc. | | | 972,733 | |
| | 69,703 | | | Tesoro Corp.* | | | 1,890,345 | |
| | 280,049 | | | Valero Energy Corp. | | | 7,925,387 | |
| | | | | | | | | |
| | | | | | | | 66,570,947 | |
| |
| |
Paper & Forest Products – 0.1% |
| | 7,069 | | | Domtar Corp. | | | 657,558 | |
| |
| |
Personal Products – 0.1% |
| | 7,099 | | | Herbalife Ltd. | | | 637,348 | |
| |
| |
Pharmaceuticals – 6.1% |
| | 416,870 | | | Eli Lilly & Co. | | | 15,428,359 | |
| | 29,064 | | | Johnson & Johnson | | | 1,910,086 | |
| | 26,421 | | | Merck & Co., Inc. | | | 949,835 | |
| | 572,336 | | | Pfizer, Inc. | | | 11,996,162 | |
| | | | | | | | | |
| | | | | | | | 30,284,442 | |
| |
| |
Professional Services – 0.2% |
| | 11,760 | | | Manpower, Inc. | | | 779,100 | |
| | 4,885 | | | Robert Half International, Inc. | | | 148,162 | |
| | | | | | | | | |
| | | | | | | | 927,262 | |
| |
| |
Real Estate Investment Trusts – 3.6% |
| | 8,504 | | | AvalonBay Communities, Inc. | | | 1,076,691 | |
| | 16,029 | | | Plum Creek Timber Co., Inc. | | | 690,690 | |
| | 2,376 | | | Public Storage | | | 278,729 | |
| | 95,469 | | | Rayonier, Inc. | | | 6,335,323 | |
| | 81,919 | | | Simon Property Group, Inc. | | | 9,383,002 | |
| | | | | | | | | |
| | | | | | | | 17,764,435 | |
| |
| |
Road & Rail – 0.2% |
| | 7,259 | | | Norfolk Southern Corp. | | | 542,102 | |
| | 3,434 | | | Union Pacific Corp. | | | 355,316 | |
| | | | | | | | | |
| | | | | | | | 897,418 | |
| |
| |
Semiconductors & Semiconductor Equipment – 2.5% |
| | 429,955 | | | Intel Corp. | | | 9,970,657 | |
| | 3,643 | | | Lam Research Corp.* | | | 175,993 | |
| | 71,332 | | | Marvell Technology Group Ltd.* | | | 1,100,653 | |
| | 33,431 | | | Texas Instruments, Inc. | | | 1,187,803 | |
| | | | | | | | | |
| | | | | | | | 12,435,106 | |
| |
| |
Software – 5.4% |
| | 749,298 | | | Microsoft Corp. | | | 19,496,734 | |
| | 189,645 | | | Oracle Corp. | | | 6,836,702 | |
| | 3,940 | | | Salesforce.com, Inc.* | | | 546,084 | |
| | | | | | | | | |
| | | | | | | | 26,879,520 | |
| |
| |
Specialty Retail – 1.9% |
| | 20,660 | | | Advance Auto Parts, Inc. | | | 1,352,404 | |
| | 21,604 | | | AutoNation, Inc.*(b) | | | 732,592 | |
| | 7,556 | | | Dick’s Sporting Goods, Inc.* | | | 309,267 | |
| | 99,226 | | | Limited Brands, Inc. | | | 4,084,142 | |
| | 4,422 | | | O’Reilly Automotive, Inc.* | | | 261,163 | |
| | 35,421 | | | Ross Stores, Inc. | | | 2,610,173 | |
| | | | | | | | | |
| | | | | | | | 9,349,741 | |
| |
| |
Textiles, Apparel & Luxury Goods – 0.3% |
| | 14,212 | | | Coach, Inc. | | | 850,020 | |
| | 7,608 | | | Fossil, Inc.* | | | 728,694 | |
| | | | | | | | | |
| | | | | | | | 1,578,714 | |
| |
| |
Thrifts & Mortgage Finance – 0.1% |
| | 26,783 | | | Hudson City Bancorp, Inc. | | | 255,242 | |
| |
| |
Tobacco – 3.7% |
| | 159,822 | | | Lorillard, Inc. | | | 17,021,043 | |
| | 20,198 | | | Philip Morris International, Inc. | | | 1,402,549 | |
| | | | | | | | | |
| | | | | | | | 18,423,592 | |
| |
| |
Trading Companies & Distributors – 0.2% |
| | 4,904 | | | MSC Industrial Direct Co., Inc. Class A | | | 351,077 | |
| | 4,096 | | | W.W. Grainger, Inc. | | | 620,954 | |
| | | | | | | | | |
| | | | | | | | 972,031 | |
| |
| |
Wireless Telecommunication Services* – 0.5% |
| | 513,562 | | | Sprint Nextel Corp. | | | 2,660,251 | |
| |
| |
TOTAL COMMON STOCKS |
(Cost $365,648,210) | | $ | 481,092,199 | |
| |
| |
| | | | | | | | | |
| | | | | | | | | | | | | | | |
Principal
| | Interest
| | Maturity
| | |
| Amount | | Rate | | Date | | Value |
| |
Short-term Investment(c) – 2.6% |
Repurchase Agreement – 2.6% |
| Joint Repurchase Agreement Account II |
| $ | 13,100,000 | | | | 0.042% | | | | 05/02/11 | | | $ | 13,100,000 | |
(Cost $13,100,000) | | | | | | | | |
| |
| |
TOTAL INVESTMENTS BEFORE SECURITIES LENDING REINVESTMENT VEHICLE |
(Cost $378,748,210) | | | | | | $ | 494,192,199 | |
| |
| |
The accompanying notes are an integral part of these financial statements. 85
GOLDMAN SACHS STRUCTURED U.S. EQUITY FUND
Schedule of Investments (continued)
April 30, 2011 (Unaudited)
| | | | | | | | | | | |
| Shares | | Rate | | Value |
| |
Securities Lending Reinvestment Vehicle(d)(e) – 0.1% |
| Financial Square Money Market Fund |
| | 700,000 | | | | 0.110 | % | | $ | 700,000 | |
(Cost $700,000) | | | | |
| |
| |
TOTAL INVESTMENTS – 99.4% |
(Cost $379,448,210) | | $ | 494,892,199 | |
| |
| |
OTHER ASSETS IN EXCESS OF LIABILITIES – 0.6% | | | 2,852,560 | |
| |
| |
NET ASSETS – 100.0% | | $ | 497,744,759 | |
| |
| |
The percentage shown for each investment category reflects the value of investments in that category as a percentage of net assets.
| | |
| * | | Non-income producing security. |
| |
| (a) | | All or a portion of security is segregated as collateral for initial margin requirements on futures transactions. |
| |
| (b) | | All or a portion of security is on loan. |
| |
| (c) | | Joint repurchase agreement was entered into on April 29, 2011. Additional information appears on page 87. |
| |
| (d) | | Variable rate security. Interest rate disclosed is that which is in effect at April 30, 2011. |
| |
| (e) | | Represents an affiliated issuer. |
| |
| ADDITIONAL INVESTMENT INFORMATION | |
FUTURES CONTRACTS — At April 30, 2011, the following futures contracts were open:
| | | | | | | | | | | | | | | |
| | | Number of
| | | | | | |
| | | Contracts
| | Expiration
| | Current
| | Unrealized
|
| Type | | Long (Short) | | Date | | Value | | Gain (Loss) |
| |
| S&P Mini 500 Index | | | 136 | | | June 2011 | | $ | 9,245,960 | | | $ | 574,022 | |
| |
| |
86 The accompanying notes are an integral part of these financial statements.
GOLDMAN SACHS STRUCTURED DOMESTIC EQUITY FUNDS
Schedule of Investments
April 30, 2011 (Unaudited)
| |
| ADDITIONAL INVESTMENT INFORMATION | |
JOINT REPURCHASE AGREEMENT ACCOUNT II — At April 30, 2011, certain Funds had undivided interests in the Joint Repurchase Agreement Account II, with a maturity date of May 2, 2011, as follows:
| | | | | | | | | | | | | |
| | | | | | | Collateral
|
| | | Principal
| | Maturity
| | Value
|
| Fund | | Amount | | Value | | Allocation |
| |
| Balanced | | $ | 10,900,000 | | | $ | 10,900,038 | | | $ | 11,156,741 | |
| |
| |
| Structured Large Cap Value | | | 2,600,000 | | | | 2,600,009 | | | | 2,661,241 | |
| |
| |
| Structured Small Cap Equity | | | 9,500,000 | | | | 9,500,033 | | | | 9,723,765 | |
| |
| |
| Structured Small Cap Growth | | | 900,000 | | | | 900,003 | | | | 921,199 | |
| |
| |
| Structured Small Cap Value | | | 3,600,000 | | | | 3,600,013 | | | | 3,684,795 | |
| |
| |
| Structured U.S. Equity | | | 13,100,000 | | | | 13,100,046 | | | | 13,408,560 | |
| |
| |
REPURCHASE AGREEMENTS — At April 30, 2011, the Principal Amounts of certain Funds’ interest in the Joint Repurchase Agreement Account II were as follows:
| | | | | | | | | | | | | | | | | | | | | | | | | | | | | | | | | |
| | | | | | | | | Structured
| | Structured
| | Structured
| | Structured
| | Structured
|
| | | | | Interest
| | | | Large Cap
| | Small Cap
| | Small Cap
| | Small Cap
| | U.S.
|
| Counterparty | | | | Rate | | Balanced | | Value | | Equity | | Growth | | Value | | Equity |
| |
| Barclays Capital Inc. | | | | | | | 0.030 | % | | $ | 2,996,728 | | | $ | 714,816 | | | $ | 2,611,827 | | | $ | 247,436 | | | $ | 989,745 | | | $ | 3,601,573 | |
| |
| |
| BNP Paribas Securities Co. | | | | | | | 0.030 | | | | 2,247,546 | | | | 536,112 | | | | 1,958,871 | | | | 185,577 | | | | 742,309 | | | | 2,701,179 | |
| |
| |
| BNP Paribas Securities Co. | | | | | | | 0.050 | | | | 794,133 | | | | 189,426 | | | | 692,134 | | | | 65,571 | | | | 262,282 | | | | 954,417 | |
| |
| |
| JPMorgan Securities | | | | | | | 0.050 | | | | 704,231 | | | | 167,982 | | | | 613,779 | | | | 58,148 | | | | 232,590 | | | | 846,370 | |
| |
| |
| UBS Securities LLC | | | | | | | 0.030 | | | | 988,920 | | | | 235,889 | | | | 861,903 | | | | 81,654 | | | | 326,616 | | | | 1,188,519 | |
| |
| |
| UBS Securities LLC | | | | | | | 0.060 | | | | 3,168,442 | | | | 755,775 | | | | 2,761,486 | | | | 261,614 | | | | 1,046,458 | | | | 3,807,942 | |
| |
| |
TOTAL | | | | | | | | | | $ | 10,900,000 | | | $ | 2,600,000 | | | $ | 9,500,000 | | | $ | 900,000 | | | $ | 3,600,000 | | | $ | 13,100,000 | |
| |
| |
At April 30, 2011, the Joint Repurchase Agreement Account II was fully collateralized by:
| | | | | | | | | |
| Issuer | | Interest Rates | | Maturity Dates |
| |
| Federal Home Loan Mortgage Corp. | | | 3.000 to 6.500 | % | | | 02/01/21 to 05/01/41 | |
| |
| |
| Federal National Mortgage Association | | | 3.000 to 7.000 | | | | 03/01/12 to 01/01/48 | |
| |
| |
| Government National Mortgage Association | | | 5.000 | | | | 08/15/38 | |
| |
| |
| U.S. Treasury Notes | | | 0.625 to 1.375 | | | | 05/31/11 to 12/15/13 | |
| |
| |
The accompanying notes are an integral part of these financial statements. 87
GOLDMAN SACHS STRUCTURED DOMESTIC EQUITY FUNDS
Statements of Assets and Liabilities
April 30, 2011 (Unaudited)
| | | | | | | |
| | | Balanced
| | |
| | | Fund | | |
Assets: |
| | | | | | | |
Investments in securities of unaffiliated issuers, at value (identified cost $123,256,265, $494,488,684, $488,149,379, $197,959,773, $35,572,170, $110,473,666 and $378,748,210, respectively)(a) | | $ | 139,880,039 | | | |
| Investments in securities lending reinvestment vehicle — affiliated issuer, at value which equals cost | | | 406,025 | | | |
| Cash | | | 63,175 | | | |
| Foreign currencies, at value (identified cost $33,517 for the Balanced Fund) | | | 38,243 | | | |
| Receivables: | | | | | | |
| Investment securities sold | | | 5,197,187 | | | |
| Investment securities sold on an extended - delivery basis | | | 3,193,750 | | | |
| Dividends and interest, at value | | | 457,279 | | | |
| Fund shares sold | | | 177,559 | | | |
| Swap contracts, at value (includes upfront payments made of $114,478 for the Balanced Fund) | | | 69,065 | | | |
| Reimbursement from investment adviser | | | 15,710 | | | |
| Due from broker — variation margin | | | 15,407 | | | |
| Due from broker — collateral for swap contracts | | | 4,500 | | | |
| Foreign tax reclaims | | | 1,603 | | | |
| Securities lending income | | | — | | | |
| Other assets | | | 1,343 | | | |
| |
| |
Total assets | | | 149,520,885 | | | |
| |
| |
| | | | | | | |
| | | | | | | |
Liabilities: |
| | | | | | | |
| Due to custodian | | | — | | | |
| Payables: | | | | | | |
| Investment securities purchased on an extended - delivery basis | | | 12,597,813 | | | |
| Investment securities purchased | | | 4,225,494 | | | |
| Payable upon return of securities loaned | | | 406,025 | | | |
| Fund shares redeemed | | | 305,182 | | | |
| Amounts owed to affiliates | | | 114,607 | | | |
| Swap contracts, at value (includes upfront payments received of $133,006 for the Balanced Fund) | | | 93,378 | | | |
| Options written, at value (premium received of $57,200 for the Balanced Fund) | | | 80,779 | | | |
| Forward foreign currency exchange contracts, at value | | | 31,610 | | | |
| Accrued expenses and other liabilities | | | 118,582 | | | |
| |
| |
Total liabilities | | | 17,973,470 | | | |
| |
| |
| | | | | | | |
| | | | | | | |
Net Assets: |
| | | | | | | |
| Paid-in capital | | | 126,557,541 | | | |
| Accumulated undistributed (distributions in excess of) net investment income (loss) | | | 51,651 | | | |
| Accumulated net realized loss from investment, futures, swap and foreign currency related transactions | | | (11,758,783 | ) | | |
| Net unrealized gain on investments, futures, options, swaps and translation of assets and liabilities denominated in foreign currencies | | | 16,697,006 | | | |
| |
| |
NET ASSETS | | $ | 131,547,415 | | | |
| | | | | | | |
| Net Assets: | | | | | | |
| Class A | | $ | 109,840,191 | | | |
| Class B | | | 8,007,071 | | | |
| Class C | | | 9,316,299 | | | |
| Institutional | | | 4,187,654 | | | |
| Service | | | — | | | |
| Class IR | | | 196,200 | | | |
| Class R | | | — | | | |
| | | | | | | |
| | | | | | | |
| Total Net Assets | | $ | 131,547,415 | | | |
| | | | | | | |
| Shares Outstanding $0.001 par value (unlimited shares authorized): | | | | | | |
| Class A | | | 5,581,105 | | | |
| Class B | | | 410,024 | | | |
| Class C | | | 478,825 | | | |
| Institutional | | | 209,451 | | | |
| Service | | | — | | | |
| Class IR | | | 9,829 | | | |
| Class R | | | — | | | |
| | | | | | | |
Net asset value, offering and redemption price per share:(b) | | | | | | |
| Class A | | | $19.68 | | | |
| Class B | | | 19.53 | | | |
| Class C | | | 19.46 | | | |
| Institutional | | | 19.99 | | | |
| Service | | | — | | | |
| Class IR | | | 19.96 | | | |
| Class R | | | — | | | |
| | | | | | | |
| | |
| (a) | | Includes loaned securities having a market value of $396,200, $7,613,208, $6,772,463, $9,143,942, $1,089,463, $6,705,684 and $678,200, for the Balanced, Structured Large Cap Growth, Structured Large Cap Value, Structured Small Cap Equity, Structured Small Cap Growth, Structured Small Cap Value and Structured U.S. Equity Funds, respectively. |
| (b) | | Maximum public offering price per share for Class A Shares of the Balanced, Structured Large Cap Growth, Structured Large Cap Value, Structured Small Cap Equity, Structured Small Cap Growth, Structured Small Cap Value and Structured U.S. Equity Funds (NAV per share multiplied by 1.0582) is $20.83, $14.05, $11.80, $14.19, $24.83, $30.86 and $27.26, respectively. At redemption, Class B and Class C Shares may be subject to a contingent deferred sales charge assessed on the amount equal to the lesser of the current net asset value or the original purchase price of the shares. |
88 The accompanying notes are an integral part of these financial statements.
GOLDMAN SACHS STRUCTURED DOMESTIC EQUITY FUNDS
| | | | | | | | | | | | | | | | | | | | | | | | | |
Structured Large Cap
| | Structured Large Cap
| | Structured Small Cap
| | Structured Small Cap
| | Structured Small Cap
| | Structured U.S.
| | |
| Growth Fund | | Value Fund | | Equity Fund | | Growth Fund | | Value Fund | | Equity Fund | | |
| |
| | | | | | | | | | | | | | | | | | | | | | | | | |
$ | 644,356,242 | | | $ | 648,272,931 | | | $ | 301,784,429 | | | $ | 50,814,699 | | | $ | 155,465,186 | | | $ | 494,192,199 | | | |
| | 7,806,700 | | | | 6,956,750 | | | | 9,504,425 | | | | 1,125,400 | | | | 6,962,263 | | | | 700,000 | | | |
| | — | | | | 26,019 | | | | 62,700 | | | | 20,991 | | | | 14,107 | | | | 17,973 | | | |
| | — | | | | — | | | | — | | | | — | | | | — | | | | — | | | |
| | | | | | | | | | | | | | | | | | | | | | | | | |
| | 16,667,909 | | | | 14,384,751 | | | | 88,386 | | | | 627,644 | | | | 957,539 | | | | — | | | |
| | — | | | | — | | | | — | | | | — | | | | — | | | | — | | | |
| | 303,397 | | | | 779,896 | | | | 108,516 | | | | 8,498 | | | | 110,006 | | | | 447,810 | | | |
| | 104,623 | | | | 121,570 | | | | 238,085 | | | | 19,203 | | | | 69,375 | | | | 4,762,372 | | | |
| | — | | | | — | | | | — | | | | — | | | | — | | | | — | | | |
| | 53,428 | | | | 45,215 | | | | 9,255 | | | | 21,287 | | | | 24,560 | | | | 33,864 | | | |
| | 46,079 | | | | 44,873 | | | | 35,100 | | | | 4,500 | | | | 17,100 | | | | 32,638 | | | |
| | — | | | | — | | | | — | | | | — | | | | — | | | | — | | | |
| | 3,782 | | | | 6,824 | | | | — | | | | — | | | | — | | | | 20,832 | | | |
| | 10,224 | | | | 8,118 | | | | 4,247 | | | | 1,406 | | | | 5,162 | | | | 1,104 | | | |
| | 3,793 | | | | 3,632 | | | | 2,919 | | | | 383 | | | | 1,157 | | | | 42,918 | | | |
| |
| |
| | 669,356,177 | | | | 670,650,579 | | | | 311,838,062 | | | | 52,644,011 | | | | 163,626,455 | | | | 500,251,710 | | | |
| |
| |
| | | | | | | | | | | | | | | | | | | | | | | | | |
| | | | | | | | | | | | | | | | | | | | | | | | | |
| |
| | | | | | | | | | | | | | | | | | | | | | | | | |
| | 336,178 | | | | — | | | | — | | | | — | | | | — | | | | — | | | |
| | | | | | | | | | | | | | | | | | | | | | | | | |
| | — | | | | — | | | | — | | | | — | | | | — | | | | — | | | |
| | 1,416,763 | | | | 2,912,950 | | | | 2,743,185 | | | | 556,049 | | | | 797,167 | | | | — | | | |
| | 7,806,700 | | | | 6,956,750 | | | | 9,504,425 | | | | 1,125,400 | | | | 6,962,263 | | | | 700,000 | | | |
| | 983,976 | | | | 904,742 | | | | 294,388 | | | | 51,698 | | | | 272,310 | | | | 1,026,982 | | | |
| | 377,961 | | | | 371,542 | | | | 263,751 | | | | 55,967 | | | | 181,613 | | | | 366,744 | | | |
| | — | | | | — | | | | — | | | | — | | | | — | | | | — | | | |
| | — | | | | — | | | | — | | | | — | | | | — | | | | — | | | |
| | — | | | | — | | | | — | | | | — | | | | — | | | | — | | | |
| | 150,876 | | | | 163,195 | | | | 147,339 | | | | 81,770 | | | | 116,608 | | | | 413,225 | | | |
| |
| |
| | 11,072,454 | | | | 11,309,179 | | | | 12,953,088 | | | | 1,870,884 | | | | 8,329,961 | | | | 2,506,951 | | | |
| |
| |
| | | | | | | | | | | | | | | | | | | | | | | | | |
| | | | | | | | | | | | | | | | | | | | | | | | | |
| |
| | | | | | | | | | | | | | | | | | | | | | | | | |
| | 1,116,353,859 | | | | 1,115,919,153 | | | | 440,559,602 | | | | 51,989,212 | | | | 180,278,262 | | | | 613,567,958 | | | |
| | 2,881,269 | | | | 204,761 | | | | 493,576 | | | | (106,931 | ) | | | (285,708 | ) | | | 1,758,002 | | | |
| | (610,956,752 | ) | | | (617,085,344 | ) | | | (246,117,794 | ) | | | (16,403,378 | ) | | | (69,883,846 | ) | | | (233,599,212 | ) | | |
| | 150,005,347 | | | | 160,302,830 | | | | 103,949,590 | | | | 15,294,224 | | | | 45,187,786 | | | | 116,018,011 | | | |
| |
| |
| $ | 658,283,723 | | | $ | 659,341,400 | | | $ | 298,884,974 | | | $ | 50,773,127 | | | $ | 155,296,494 | | | $ | 497,744,759 | | | |
| | | | | | | | | | | | | | | | | | | | | | | | | |
| | | | | | | | | | | | | | | | | | | | | | | | | |
| $ | 173,046,939 | | | $ | 168,421,683 | | | $ | 95,964,674 | | | $ | 29,167,941 | | | $ | 108,214,202 | | | $ | 302,579,038 | | | |
| | 8,144,565 | | | | 2,529,939 | | | | 1,954,701 | | | | 6,691,875 | | | | 19,956,742 | | | | 17,882,564 | | | |
| | 14,407,851 | | | | 13,442,459 | | | | 16,466,353 | | | | 6,160,770 | | | | 23,366,760 | | | | 37,563,647 | | | |
| | 462,482,259 | | | | 465,996,437 | | | | 176,900,484 | | | | 7,652,159 | | | | 3,502,050 | | | | 138,250,146 | | | |
| | 133,105 | | | | 8,848,113 | | | | 1,889,610 | | | | — | | | | — | | | | 1,419,259 | | | |
| | 9,591 | | | | 22,721 | | | | 5,417,488 | | | | 1,039,280 | | | | 35,208 | | | | 9,353 | | | |
| | 59,413 | | | | 80,048 | | | | 291,664 | | | | 61,102 | | | | 221,532 | | | | 40,752 | | | |
| | | | | | | | | | | | | | | | | | | | | | | | | |
| | | | | | | | | | | | | | | | | | | | | | | | | |
| $ | 658,283,723 | | | $ | 659,341,400 | | | $ | 298,884,974 | | | $ | 50,773,127 | | | $ | 155,296,494 | | | $ | 497,744,759 | | | |
| | | | | | | | | | | | | | | | | | | | | | | | | |
| | | | | | | | | | | | | | | | | | | | | | | | | |
| | 13,034,298 | | | | 15,104,879 | | | | 7,154,506 | | | | 1,243,234 | | | | 3,711,381 | | | | 11,746,610 | | | |
| | 664,323 | | | | 228,135 | | | | 162,185 | | | | 331,223 | | | | 977,040 | | | | 741,284 | | | |
| | 1,177,571 | | | | 1,214,154 | | | | 1,364,069 | | | | 302,500 | | | | 1,012,237 | | | | 1,580,887 | | | |
| | 33,871,513 | | | | 41,805,308 | | | | 12,715,816 | | | | 295,251 | | | | 97,146 | | | | 5,242,520 | | | |
| | 10,119 | | | | 790,104 | | | | 142,174 | | | | — | | | | — | | | | 55,239 | | | |
| | 727 | | | | 2,041 | | | | 406,366 | | | | 44,023 | | | | 1,207 | | | | 366 | | | |
| | 4,517 | | | | 7,191 | | | | 21,880 | | | | 2,631 | | | | 7,631 | | | | 1,595 | | | |
| | | | | | | | | | | | | | | | | | | | | | | | | |
| | | | | | | | | | | | | | | | | | | | | | | | | |
| | $13.28 | | | | $11.15 | | | | $13.41 | | | | $23.46 | | | | $29.16 | | | | $25.76 | | | |
| | 12.26 | | | | 11.09 | | | | 12.05 | | | | 20.20 | | | | 20.43 | | | | 24.12 | | | |
| | 12.24 | | | | 11.07 | | | | 12.07 | | | | 20.37 | | | | 23.08 | | | | 23.76 | | | |
| | 13.65 | | | | 11.15 | | | | 13.91 | | | | 25.92 | | | | 36.05 | | | | 26.37 | | | |
| | 13.15 | | | | 11.20 | | | | 13.29 | | | | — | | | | — | | | | 25.69 | | | |
| | 13.19 | | | | 11.13 | | | | 13.33 | | | | 23.61 | | | | 29.16 | | | | 25.59 | | | |
| | 13.15 | | | | 11.13 | | | | 13.33 | | | | 23.23 | | | | 29.03 | | | | 25.55 | | | |
| | | | | | | | | | | | | | | | | | | | | | | | | |
The accompanying notes are an integral part of these financial statements. 89
GOLDMAN SACHS STRUCTURED DOMESTIC EQUITY FUNDS
Statements of Operations
For the Six Months Ended April 30, 2011 (Unaudited)
| | | | | |
| | | Balanced
|
| | | Fund |
| |
Investment income: |
| | | | | |
| Dividends (net of foreign withholding taxes of $422, $2,038, $1,199, $0, $0, $0 and $777, respectively) | | $ | 1,500,006 | |
| Interest | | | 821,005 | |
| Securities lending income — affiliated issuer | | | 2,204 | |
| |
| |
Total investment income | | | 2,323,215 | |
| |
| |
| | | | | |
| | | | | |
Expenses: |
| | | | | |
| Management fees | | | 421,053 | |
Distribution and Service fees(a) | | | 218,790 | |
Transfer Agent fees(a) | | | 120,372 | |
| Custody and accounting fees | | | 68,227 | |
| Professional fees | | | 47,759 | |
| Printing and mailing costs | | | 32,025 | |
| Registration fees | | | 27,554 | |
| Trustee fees | | | 8,264 | |
| Service Share fees — Shareholder Administration Plan | | | — | |
| Service Share fees — Service Plan | | | — | |
| Other | | | 4,570 | |
| |
| |
Total expenses | | | 948,614 | |
| |
| |
| | | | | |
| Less — expense reductions | | | (211,891 | ) |
| |
| |
Net expenses | | | 736,723 | |
| |
| |
NET INVESTMENT INCOME (LOSS) | | | 1,586,492 | |
| |
| |
| | | | | |
| | | | | |
Realized and unrealized gain (loss) from investment, futures, options, swap and foreign currency related transactions: |
| | | | | |
| Net realized gain (loss) from: | | | | |
| Investment transactions — unaffiliated issuer | | | 2,907,020 | |
| Securities lending reinvestment vehicle transactions — affiliated issuer | | | 406 | |
| Futures transactions | | | (244,773 | ) |
| Swap contracts | | | (42,926 | ) |
| Foreign currency related transactions (includes $82,783 of net realized losses on forward foreign currency exchange contracts for the Balanced Fund) | | | (30,947 | ) |
| Net change in unrealized gain (loss) on: | | | | |
| Investments — unaffiliated issuers | | | 7,676,777 | |
| Securities lending reinvestment vehicle — affiliated issuer | | | (598 | ) |
| Futures | | | 130,936 | |
| Written options | | | (23,579 | ) |
| Swap contracts | | | 12,521 | |
| Translation of assets and liabilities denominated in foreign currencies (includes $4,013 of net unrealized gains on forward foreign currency exchange contracts for the Balanced Fund) | | | 6,997 | |
| |
| |
Net realized and unrealized gain from investment, futures, options, swap and foreign currency related transactions | | | 10,391,834 | |
| |
| |
NET INCREASE IN NET ASSETS RESULTING FROM OPERATIONS | | $ | 11,978,326 | |
| |
| |
| | |
| (a) | | Class specific Distribution and Service, and Transfer Agent fees were as follows: |
| | | | | | | | | | | | | | | | | | | | | | | | | | | | | | | | | | | | | | | | | | | | | |
| | | Distribution and Service Fees | | Transfer Agent Fees |
Fund | | Class A | | Class B | | Class C | | Class R | | Class A | | Class B | | Class C | | Institutional | | Service | | Class IR | | Class R |
| Balanced | | $ | 136,818 | | | $ | 40,321 | | | $ | 41,651 | | | $ | — | | | $ | 103,982 | | | $ | 7,661 | | | $ | 7,914 | | | $ | 722 | | | $ | — | | | $ | 93 | | | $ | — | |
| Structured Large Cap Growth | | | 205,894 | | | | 40,824 | | | | 69,099 | | | | 155 | | | | 156,480 | | | | 7,756 | | | | 13,129 | | | | 89,739 | | | | 20 | | | | 9 | | | | 59 | |
| Structured Large Cap Value | | | 199,152 | | | | 12,201 | | | | 62,731 | | | | 127 | | | | 151,355 | | | | 2,318 | | | | 11,919 | | | | 90,359 | | | | 1,513 | | | | 18 | | | | 49 | |
| Structured Small Cap Equity | | | 139,177 | | | | 9,914 | | | | 75,324 | | | | 566 | | | | 105,775 | | | | 1,883 | | | | 14,312 | | | | 44,048 | | | | 330 | | | | 189 | | | | 215 | |
| Structured Small Cap Growth | | | 32,603 | | | | 33,104 | | | | 28,598 | | | | 135 | | | | 24,778 | | | | 6,290 | | | | 5,434 | | | | 1,323 | | | | — | | | | 582 | | | | 51 | |
| Structured Small Cap Value | | | 128,984 | | | | 101,294 | | | | 113,680 | | | | 454 | | | | 98,028 | | | | 19,246 | | | | 21,599 | | | | 574 | | | | — | | | | 30 | | | | 173 | |
| Structured U.S. Equity | | | 376,222 | | | | 90,410 | | | | 179,874 | | | | 118 | | | | 285,929 | | | | 17,178 | | | | 34,176 | | | | 24,621 | | | | 262 | | | | 8 | | | | 45 | |
90 The accompanying notes are an integral part of these financial statements.
GOLDMAN SACHS STRUCTURED DOMESTIC EQUITY FUNDS
| | | | | | | | | | | | | | | | | | | | | | | | | |
Structured Large Cap
| | Structured Large Cap
| | Structured Small Cap
| | Structured Small Cap
| | Structured Small Cap
| | Structured U.S.
| | |
| Growth Fund | | Value Fund | | Equity Fund | | Growth Fund | | Value Fund | | Equity Fund | | |
| |
| |
| | | | | | | | | | | | | | | | | | | | | | | | | |
| $ | 5,202,960 | | | $ | 6,725,404 | | | $ | 2,901,462 | | | $ | 230,425 | | | $ | 1,407,681 | | | $ | 5,166,891 | | | |
| | 13,284 | | | | 12,986 | | | | 6,075 | | | | 834 | | | | 2,684 | | | | 8,809 | | | |
| | 43,612 | | | | 40,619 | | | | 48,960 | | | | 8,042 | | | | 29,724 | | | | 5,489 | | | |
| |
| |
| | 5,259,856 | | | | 6,779,009 | | | | 2,956,497 | | | | 239,301 | | | | 1,440,089 | | | | 5,181,189 | | | |
| |
| |
| | | | | | | | | | | | | | | | | | | | | | | | | |
| | | | | | | | | | | | | | | | | | | | | | | | | |
| |
| | | | | | | | | | | | | | | | | | | | | | | | | |
| | 2,065,602 | | | | 1,901,208 | | | | 1,490,506 | | | | 194,244 | | | | 634,380 | | | | 1,558,394 | | | |
| | 315,972 | | | | 274,211 | | | | 224,981 | | | | 94,440 | | | | 344,412 | | | | 646,624 | | | |
| | 267,192 | | | | 257,531 | | | | 166,752 | | | | 38,458 | | | | 139,650 | | | | 362,219 | | | |
| | 57,446 | | | | 58,161 | | | | 48,935 | | | | 36,853 | | | | 37,994 | | | | 48,592 | | | |
| | 39,875 | | | | 39,475 | | | | 41,307 | | | | 40,721 | | | | 37,809 | | | | 33,482 | | | |
| | 92,247 | | | | 72,593 | | | | 45,117 | | | | 30,182 | | | | 55,303 | | | | 87,753 | | | |
| | 43,321 | | | | 48,978 | | | | 36,835 | | | | 34,103 | | | | 36,804 | | | | 42,184 | | | |
| | 8,908 | | | | 8,899 | | | | 8,434 | | | | 8,056 | | | | 8,289 | | | | 8,760 | | | |
| | 128 | | | | 9,455 | | | | 2,065 | | | | — | | | | — | | | | 1,636 | | | |
| | 128 | | | | 9,455 | | | | 2,065 | | | | — | | | | — | | | | 1,636 | | | |
| | 11,517 | | | | 10,035 | | | | 7,676 | | | | 3,871 | | | | 4,622 | | | | 10,627 | | | |
| |
| |
| | 2,902,336 | | | | 2,690,001 | | | | 2,074,673 | | | | 480,928 | | | | 1,299,263 | | | | 2,801,907 | | | |
| |
| |
| | | | | | | | | | | | | | | | | | | | | | | | | |
| | (685,550 | ) | | | (553,232 | ) | | | (251,496 | ) | | | (162,047 | ) | | | (207,744 | ) | | | (557,501 | ) | | |
| |
| |
| | 2,216,786 | | | | 2,136,769 | | | | 1,823,177 | | | | 318,881 | | | | 1,091,519 | | | | 2,244,406 | | | |
| |
| |
| | 3,043,070 | | | | 4,642,240 | | | | 1,133,320 | | | | (79,580 | ) | | | 348,570 | | | | 2,936,783 | | | |
| |
| |
| | | | | | | | | | | | | | | | | | | | | | | | | |
| | | | | | | | | | | | | | | | | | | | | | | | | |
| |
| | | | | | | | | | | | | | | | | | | | | | | | | |
| | | | | | | | | | | | | | | | | | | | | | | | | |
| | 27,243,303 | | | | 19,362,114 | | | | 50,947,808 | | | | 2,742,555 | | | | 7,388,863 | | | | 20,182,248 | | | |
| | (1,261 | ) | | | (562 | ) | | | 5,708 | | | | 741 | | | | 612 | | | | (61 | ) | | |
| | 1,358,062 | | | | 1,389,357 | | | | 1,753,620 | | | | 190,980 | | | | 590,302 | | | | 1,276,465 | | | |
| | — | | | | — | | | | — | | | | — | | | | — | | | | — | | | |
| | | | | | | | | | | | | | | | | | | | | | | | | |
| | — | | | | — | | | | — | | | | — | | | | — | | | | — | | | |
| | | | | | | | | | | | | | | | | | | | | | | | | |
| | 63,165,317 | | | | 82,139,408 | | | | 22,221,251 | | | | 7,909,375 | | | | 20,758,283 | | | | 50,784,220 | | | |
| | — | | | | — | | | | (11,051 | ) | | | (941 | ) | | | (1,906 | ) | | | — | | | |
| | 128,120 | | | | 124,413 | | | | (132,464 | ) | | | 2,434 | | | | (778 | ) | | | 88,648 | | | |
| | — | | | | — | | | | — | | | | — | | | | — | | | | — | | | |
| | — | | | | — | | | | — | | | | — | | | | — | | | | — | | | |
| | | | | | | | | | | | | | | | | | | | | | | | | |
| | — | | | | — | | | | — | | | | — | | | | — | | | | — | | | |
| |
| |
| | 91,893,541 | | | | 103,014,730 | | | | 74,784,872 | | | | 10,845,144 | | | | 28,735,376 | | | | 72,331,520 | | | |
| |
| |
| $ | 94,936,611 | | | $ | 107,656,970 | | | $ | 75,918,192 | | | $ | 10,765,564 | | | $ | 29,083,946 | | | $ | 75,268,303 | | | |
| |
| |
The accompanying notes are an integral part of these financial statements. 91
GOLDMAN SACHS STRUCTURED DOMESTIC EQUITY FUNDS
Statements of Changes in Net Assets
| | | | | | | | | |
| | | Balanced Fund |
| | | For the
| | |
| | | Six Months Ended
| | For the Fiscal
|
| | | April 30, 2011
| | Year Ended
|
| | | (Unaudited) | | October 31, 2010 |
| |
From operations: |
| | | | | | | | | |
| Net investment income | | $ | 1,586,492 | | | $ | 3,471,411 | |
| Net realized gain from investment, futures, swap and foreign currency related transactions | | | 2,588,780 | | | | 26,280,825 | |
| Net change in unrealized gain (loss) on investments, futures, options, swaps and translation of assets and liabilities denominated in foreign currencies | | | 7,803,054 | | | | (11,384,842 | ) |
| |
| |
Net increase in net assets resulting from operations | | | 11,978,326 | | | | 18,367,394 | |
| |
| |
| | | | | | | | | |
| | | | | | | | | |
Distributions to shareholders: |
| | | | | | | | | |
| From net investment income | | | | | | | | |
| Class A Shares | | | (1,605,096 | ) | | | (3,616,026 | ) |
| Class B Shares | | | (89,037 | ) | | | (215,148 | ) |
| Class C Shares | | | (90,955 | ) | | | (194,859 | ) |
| Institutional Shares | | | (60,510 | ) | | | (98,311 | ) |
| Service Shares | | | — | | | | — | |
| Class IR Shares | | | (1,008 | ) | | | (8 | )(a) |
| Class R Shares | | | — | | | | — | |
| |
| |
Total distributions to shareholders | | | (1,846,606 | ) | | | (4,124,352 | ) |
| |
| |
| | | | | | | | | |
| | | | | | | | | |
From share transactions: |
| | | | | | | | | |
| Proceeds from sales of shares | | | 14,191,103 | | | | 15,572,448 | |
| Reinvestment of distributions | | | 1,753,141 | | | | 3,906,395 | |
| Cost of shares redeemed | | | (21,814,738 | ) | | | (36,326,263 | ) |
| |
| |
Net increase (decrease) in net assets resulting from share transactions | | | (5,870,494 | ) | | | (16,847,420 | ) |
| |
| |
TOTAL INCREASE (DECREASE) | | | 4,261,226 | | | | (2,604,378 | ) |
| |
| |
| | | | | | | | | |
| | | | | | | | | |
Net assets: |
| | | | | | | | | |
| Beginning of period | | | 127,286,189 | | | | 129,890,567 | |
| |
| |
| End of period | | $ | 131,547,415 | | | $ | 127,286,189 | |
| |
| |
Accumulated undistributed net investment income | | $ | 51,651 | | | $ | 311,765 | |
| |
| |
| | |
| (a) | | Commenced operations on August 31, 2010. |
92 The accompanying notes are an integral part of these financial statements.
GOLDMAN SACHS STRUCTURED DOMESTIC EQUITY FUNDS
| | | | | | | | | | | | | | | |
| Structured Large Cap Growth Fund | | Structured Large Cap Value Fund |
For the
| | | | For the
| | |
Six Months Ended
| | For the Fiscal
| | Six Months Ended
| | For the Fiscal
|
April 30, 2011
| | Year Ended
| | April 30, 2011
| | Year Ended
|
| (Unaudited) | | October 31, 2010 | | (Unaudited) | | October 31, 2010 |
| |
| |
| | | | | | | | | | | | | | | |
| $ | 3,043,070 | | | $ | 7,061,617 | | | $ | 4,642,240 | | | $ | 13,137,132 | |
| | 28,600,104 | | | | 54,664,940 | | | | 20,750,909 | | | | 55,754,660 | |
| | | | | | | | | | | | | | | |
| | 63,293,437 | | | | 39,878,298 | | | | 82,263,821 | | | | 48,318,248 | |
| |
| |
| | 94,936,611 | | | | 101,604,855 | | | | 107,656,970 | | | | 117,210,040 | |
| |
| |
| | | | | | | | | | | | | | | |
| | | | | | | | | | | | | | | |
| |
| | | | | | | | | | | | | | | |
| | | | | | | | | | | | | | | |
| | (1,592,179 | ) | | | (2,000,828 | ) | | | (1,061,372 | ) | | | (2,852,607 | ) |
| | (44,502 | ) | | | (45,907 | ) | | | (7,852 | ) | | | (17,453 | ) |
| | (86,381 | ) | | | (81,474 | ) | | | (40,297 | ) | | | (88,201 | ) |
| | (5,259,752 | ) | | | (8,134,562 | ) | | | (3,627,537 | ) | | | (9,698,780 | ) |
| | (1,001 | ) | | | (1,266 | ) | | | (48,122 | ) | | | (91,679 | ) |
| | (117 | ) | | | (102 | ) | | | (153 | ) | | | (229 | ) |
| | (532 | ) | | | (624 | ) | | | (284 | ) | | | (516 | ) |
| |
| |
| | (6,984,464 | ) | | | (10,264,763 | ) | | | (4,785,617 | ) | | | (12,749,465 | ) |
| |
| |
| | | | | | | | | | | | | | | |
| | | | | | | | | | | | | | | |
| |
| | | | | | | | | | | | | | | |
| | 170,470,853 | | | | 147,389,050 | | | | 168,807,694 | | | | 69,238,516 | |
| | 6,893,160 | | | | 10,186,805 | | | | 4,572,386 | | | | 12,319,400 | |
| | (136,924,354 | ) | | | (472,225,047 | ) | | | (141,003,236 | ) | | | (645,171,934 | ) |
| |
| |
| | 40,439,659 | | | | (314,649,192 | ) | | | 32,376,844 | | | | (563,614,018 | ) |
| |
| |
| | 128,391,806 | | | | (223,309,100 | ) | | | 135,248,197 | | | | (459,153,443 | ) |
| |
| |
| | | | | | | | | | | | | | | |
| | | | | | | | | | | | | | | |
| |
| | | | | | | | | | | | | | | |
| | 529,891,917 | | | | 753,201,017 | | | | 524,093,203 | | | | 983,246,646 | |
| |
| |
| $ | 658,283,723 | | | $ | 529,891,917 | | | $ | 659,341,400 | | | $ | 524,093,203 | |
| |
| |
| $ | 2,881,269 | | | $ | 6,822,663 | | | $ | 204,761 | | | $ | 348,138 | |
| |
| |
The accompanying notes are an integral part of these financial statements. 93
GOLDMAN SACHS STRUCTURED DOMESTIC EQUITY FUNDS
Statements of Changes in Net Assets (continued)
| | | | | | | | | |
| | | Structured Small Cap Equity Fund |
| | | For the
| | |
| | | Six Months Ended
| | For the Fiscal
|
| | | April 30, 2011
| | Year Ended
|
| | | (Unaudited) | | October 31, 2010 |
| |
From operations: |
| | | | | | | | | |
| Net investment income (loss) | | $ | 1,133,320 | | | $ | 2,921,206 | |
| Net realized gain from investment and futures transactions | | | 52,707,136 | | | | 63,491,200 | |
| Net change in unrealized gain on investments and futures transactions | | | 22,077,736 | | | | 50,189,833 | |
| |
| |
Net increase in net assets resulting from operations | | | 75,918,192 | | | | 116,602,239 | |
| |
| |
| | | | | | | | | |
| | | | | | | | | |
Distributions to shareholders: |
| | | | | | | | | |
| From net investment income | | | | | | | | |
| Class A Shares | | | (693,060 | ) | | | (1,046,897 | ) |
| Class B Shares | | | — | | | | (3,362 | ) |
| Class C Shares | | | (7,635 | ) | | | (38,399 | ) |
| Institutional Shares | | | (2,286,438 | ) | | | (4,059,512 | ) |
| Service Shares | | | (6,725 | ) | | | (11,499 | ) |
| Class IR Shares | | | (328 | ) | | | (290 | ) |
| Class R Shares | | | (1,017 | ) | | | (144 | ) |
| |
| |
Total distributions to shareholders | | | (2,995,203 | ) | | | (5,160,103 | ) |
| |
| |
| | | | | | | | | |
| | | | | | | | | |
From share transactions: |
| | | | | | | | | |
| Proceeds from sales of shares | | | 42,725,533 | | | | 59,740,126 | |
| Reinvestment of distributions | | | 2,943,140 | | | | 5,098,529 | |
| Cost of shares redeemed | | | (182,278,249 | ) | | | (309,734,294 | ) |
| |
| |
Net increase (decrease) in net assets resulting from share transactions | | | (136,609,576 | ) | | | (244,895,639 | ) |
| |
| |
TOTAL INCREASE (DECREASE) | | | (63,686,587 | ) | | | (133,453,503 | ) |
| |
| |
| | | | | | | | | |
| | | | | | | | | |
Net assets: |
| | | | | | | | | |
| Beginning of period | | | 362,571,561 | | | | 496,025,064 | |
| |
| |
| End of period | | $ | 298,884,974 | | | $ | 362,571,561 | |
| |
| |
Accumulated undistributed (distributions in excess of) net investment income (loss) | | $ | 493,576 | | | $ | 2,355,459 | |
| |
| |
94 The accompanying notes are an integral part of these financial statements.
GOLDMAN SACHS STRUCTURED DOMESTIC EQUITY FUNDS
| | | | | | | | | | | | | | | | | | | | | | | | | |
| Structured Small Cap Growth Fund | | Structured Small Cap Value Fund | | Structured U.S. Equity Fund | | |
For the
| | | | For the
| | | | For the
| | | | |
Six Months Ended
| | For the Fiscal
| | Six Months Ended
| | For the Fiscal
| | Six Months Ended
| | For the Fiscal
| | |
April 30, 2011
| | Year Ended
| | April 30, 2011
| | Year Ended
| | April 30, 2011
| | Year Ended
| | |
| (Unaudited) | | October 31, 2010 | | (Unaudited) | | October 31, 2010 | | (Unaudited) | | October 31, 2010 | | |
| |
| |
| | | | | | | | | | | | | | | | | | | | | | | | | |
| $ | (79,580 | ) | | $ | (55,919 | ) | | $ | 348,570 | | | $ | 673,958 | | | $ | 2,936,783 | | | $ | 5,923,928 | | | |
| | 2,934,276 | | | | 4,079,387 | | | | 7,979,777 | | | | 16,062,787 | | | | 21,458,652 | | | | 38,548,537 | | | |
| | 7,910,868 | | | | 6,005,104 | | | | 20,755,599 | | | | 18,262,826 | | | | 50,872,868 | | | | 24,745,876 | | | |
| |
| |
| | 10,765,564 | | | | 10,028,572 | | | | 29,083,946 | | | | 34,999,571 | | | | 75,268,303 | | | | 69,218,341 | | | |
| |
| |
| | | | | | | | | | | | | | | | | | | | | | | | | |
| | | | | | | | | | | | | | | | | | | | | | | | | |
| |
| | | | | | | | | | | | | | | | | | | | | | | | | |
| | | | | | | | | | | | | | | | | | | | | | | | | |
| | — | | | | (67,730 | ) | | | (607,909 | ) | | | (739,027 | ) | | | (3,796,772 | ) | | | (4,873,369 | ) | | |
| | — | | | | — | | | | (22,391 | ) | | | (251,655 | ) | | | (94,814 | ) | | | (180,184 | ) | | |
| | — | | | | — | | | | (27,595 | ) | | | (158,920 | ) | | | (219,877 | ) | | | (362,928 | ) | | |
| | — | | | | (27,078 | ) | | | (20,765 | ) | | | (10,895 | ) | | | (1,895,873 | ) | | | (2,758,662 | ) | | |
| | — | | | | — | | | | — | | | | — | | | | (14,843 | ) | | | (20,088 | ) | | |
| | — | | | | (44 | ) | | | (273 | ) | | | (76 | ) | | | (126 | ) | | | (126 | ) | | |
| | — | | | | (185 | ) | | | (543 | ) | | | (765 | ) | | | (494 | ) | | | (810 | ) | | |
| |
| |
| | — | | | | (95,037 | ) | | | (679,476 | ) | | | (1,161,338 | ) | | | (6,022,799 | ) | | | (8,196,167 | ) | | |
| |
| |
| | | | | | | | | | | | | | | | | | | | | | | | | |
| | | | | | | | | | | | | | | | | | | | | | | | | |
| |
| | | | | | | | | | | | | | | | | | | | | | | | | |
| | 5,645,072 | | | | 3,784,019 | | | | 5,101,138 | | | | 10,413,361 | | | | 26,659,808 | | | | 46,333,468 | | | |
| | — | | | | 93,589 | | | | 637,920 | | | | 1,096,489 | | | | 5,665,612 | | | | 7,740,474 | | | |
| | (5,598,988 | ) | | | (9,414,616 | ) | | | (19,164,097 | ) | | | (34,806,251 | ) | | | (75,780,860 | ) | | | (190,747,373 | ) | | |
| |
| |
| | 46,084 | | | | (5,537,008 | ) | | | (13,425,039 | ) | | | (23,296,401 | ) | | | (43,455,440 | ) | | | (136,673,431 | ) | | |
| |
| |
| | 10,811,648 | | | | 4,396,527 | | | | 14,979,431 | | | | 10,541,832 | | | | 25,790,064 | | | | (75,651,257 | ) | | |
| |
| |
| | | | | | | | | | | | | | | | | | | | | | | | | |
| | | | | | | | | | | | | | | | | | | | | | | | | |
| |
| | | | | | | | | | | | | | | | | | | | | | | | | |
| | 39,961,479 | | | | 35,564,952 | | | | 140,317,063 | | | | 129,775,231 | | | | 471,954,695 | | | | 547,605,952 | | | |
| |
| |
| $ | 50,773,127 | | | $ | 39,961,479 | | | $ | 155,296,494 | | | $ | 140,317,063 | | | $ | 497,744,759 | | | $ | 471,954,695 | | | |
| |
| |
| $ | (106,931 | ) | | $ | (27,351 | ) | | $ | (285,708 | ) | | $ | 45,198 | | | $ | 1,758,002 | | | $ | 4,844,018 | | | |
| |
| |
The accompanying notes are an integral part of these financial statements. 95
GOLDMAN SACHS BALANCED FUND
Financial Highlights
Selected Data for a Share Outstanding Throughout Each Period
| | | | | | | | | | | | | | | | | | | | | | | | | | | | | | | |
| | | | | Income (loss) from
| | Distributions
| | |
| | | | | investment operations | | to shareholders | | |
| | | | |
| | | | | |
| | | | | | |
| | | Net asset
| |
| | | | | |
| | | | | | |
| | | value,
| | Net
| | Net realized
| | Total from
| | From net
| | From net
| | | | |
| | | beginning
| | investment
| | and unrealized
| | investment
| | investment
| | realized
| | Total
| | |
| Year - Share Class | | of period | | income(a) | | gain (loss) | | operations | | income | | gains | | distributions | | |
| |
FOR THE SIX MONTHS ENDED APRIL 30, (UNAUDITED) |
| 2011 - A | | $ | 18.21 | | | $ | 0.24 | (c) | | $ | 1.51 | | | $ | 1.75 | | | $ | (0.28 | ) | | $ | — | | | $ | (0.28 | ) | | |
| 2011 - B | | | 18.07 | | | | 0.17 | (c) | | | 1.50 | | | | 1.67 | | | | (0.21 | ) | | | — | | | | (0.21 | ) | | |
| 2011 - C | | | 18.01 | | | | 0.16 | (c) | | | 1.50 | | | | 1.66 | | | | (0.21 | ) | | | — | | | | (0.21 | ) | | |
| 2011 - Institutional | | | 18.50 | | | | 0.27 | (c) | | | 1.53 | | | | 1.80 | | | | (0.31 | ) | | | — | | | | (0.31 | ) | | |
| 2011 - IR | | | 18.48 | | | | 0.19 | (c) | | | 1.59 | | | | 1.78 | | | | (0.30 | ) | | | — | | | | (0.30 | ) | | |
| | | | | | | | | | | | | | | | | | | | | | | | | | | | | | | |
| | | | | | | | | | | | | | | | | | | | | | | | | | | | | | | |
FOR THE FISCAL YEARS ENDED OCTOBER 31, |
| 2010 - A | | | 16.32 | | | | 0.48 | (e) | | | 1.97 | | | | 2.45 | | | | (0.56 | ) | | | — | | | | (0.56 | ) | | |
| 2010 - B | | | 16.19 | | | | 0.35 | (e) | | | 1.96 | | | | 2.31 | | | | (0.43 | ) | | | — | | | | (0.43 | ) | | |
| 2010 - C | | | 16.14 | | | | 0.34 | (e) | | | 1.97 | | | | 2.31 | | | | (0.44 | ) | | | — | | | | (0.44 | ) | | |
| 2010 - Institutional | | | 16.57 | | | | 0.55 | (e) | | | 2.01 | | | | 2.56 | | | | (0.63 | ) | | | — | | | | (0.63 | ) | | |
| 2010 - IR (Commenced August 31, 2010) | | | 17.28 | | | | 0.06 | (e) | | | 1.28 | | | | 1.34 | | | | (0.14 | ) | | | — | | | | (0.14 | ) | | |
| |
|
| 2009 - A | | | 14.64 | | | | 0.46 | | | | 1.71 | | | | 2.17 | | | | (0.49 | ) | | | — | | | | (0.49 | ) | | |
| 2009 - B | | | 14.53 | | | | 0.35 | | | | 1.69 | | | | 2.04 | | | | (0.38 | ) | | | — | | | | (0.38 | ) | | |
| 2009 - C | | | 14.49 | | | | 0.35 | | | | 1.68 | | | | 2.03 | | | | (0.38 | ) | | | — | | | | (0.38 | ) | | |
| 2009 - Institutional | | | 14.86 | | | | 0.53 | | | | 1.73 | | | | 2.26 | | | | (0.55 | ) | | | — | | | | (0.55 | ) | | |
| | | | | | | | | | | | | | | | | | | | | | | | | | | | | | | |
| | | | | | | | | | | | | | | | | | | | | | | | | | | | | | | |
FOR THE PERIOD SEPTEMBER 1, 2008 TO OCTOBER 31, 2008* |
| 2008 - A | | | 17.71 | | | | 0.10 | | | | (2.99 | ) | | | (2.89 | ) | | | (0.18 | ) | | | — | | | | (0.18 | ) | | |
| 2008 - B | | | 17.56 | | | | 0.08 | | | | (2.96 | ) | | | (2.88 | ) | | | (0.15 | ) | | | — | | | | (0.15 | ) | | |
| 2008 - C | | | 17.52 | | | | 0.08 | | | | (2.96 | ) | | | (2.88 | ) | | | (0.15 | ) | | | — | | | | (0.15 | ) | | |
| 2008 - Institutional | | | 17.98 | | | | 0.11 | | | | (3.03 | ) | | | (2.92 | ) | | | (0.20 | ) | �� | | — | | | | (0.20 | ) | | |
| 2008 - Service | | | 17.77 | | | | 0.10 | | | | (3.00 | ) | | | (2.90 | ) | | | (0.18 | ) | | | — | | | | (0.18 | ) | | |
| | | | | | | | | | | | | | | | | | | | | | | | | | | | | | | |
| | | | | | | | | | | | | | | | | | | | | | | | | | | | | | | |
FOR THE FISCAL YEARS ENDED AUGUST 31, |
| 2008 - A | | | 20.66 | | | | 0.64 | | | | (1.86 | ) | | | (1.22 | ) | | | (0.53 | ) | | | (1.20 | ) | | | (1.73 | ) | | |
| 2008 - B | | | 20.50 | | | | 0.50 | | | | (1.86 | ) | | | (1.36 | ) | | | (0.38 | ) | | | (1.20 | ) | | | (1.58 | ) | | |
| 2008 - C | | | 20.46 | | | | 0.50 | | | | (1.86 | ) | | | (1.36 | ) | | | (0.38 | ) | | | (1.20 | ) | | | (1.58 | ) | | |
| 2008 - Institutional | | | 20.95 | | | | 0.73 | | | | (1.89 | ) | | | (1.16 | ) | | | (0.61 | ) | | | (1.20 | ) | | | (1.81 | ) | | |
| 2008 - Service | | | 20.70 | | | | 0.64 | | | | (1.85 | ) | | | (1.21 | ) | | | (0.52 | ) | | | (1.20 | ) | | | (1.72 | ) | | |
| |
|
| 2007 - A | | | 20.68 | | | | 0.56 | | | | 1.52 | | | | 2.08 | | | | (0.60 | ) | | | (1.50 | ) | | | (2.10 | ) | | |
| 2007 - B | | | 20.52 | | | | 0.41 | | | | 1.51 | | | | 1.92 | | | | (0.44 | ) | | | (1.50 | ) | | | (1.94 | ) | | |
| 2007 - C | | | 20.49 | | | | 0.41 | | | | 1.51 | | | | 1.92 | | | | (0.45 | ) | | | (1.50 | ) | | | (1.95 | ) | | |
| 2007 - Institutional | | | 20.94 | | | | 0.66 | | | | 1.53 | | | | 2.19 | | | | (0.68 | ) | | | (1.50 | ) | | | (2.18 | ) | | |
| 2007 - Service | | | 20.66 | | | | 0.56 | | | | 1.53 | | | | 2.09 | | | | (0.55 | ) | | | (1.50 | ) | | | (2.05 | ) | | |
| |
|
| 2006 - A | | | 19.88 | | | | 0.46 | | | | 0.74 | | | | 1.20 | | | | (0.40 | ) | | | — | | | | (0.40 | ) | | |
| 2006 - B | | | 19.73 | | | | 0.30 | | | | 0.74 | | | | 1.04 | | | | (0.25 | ) | | | — | | | | (0.25 | ) | | |
| 2006 - C | | | 19.71 | | | | 0.31 | | | | 0.72 | | | | 1.03 | | | | (0.25 | ) | | | — | | | | (0.25 | ) | | |
| 2006 - Institutional | | | 20.12 | | | | 0.55 | | | | 0.75 | | | | 1.30 | | | | (0.48 | ) | | | — | | | | (0.48 | ) | | |
| 2006 - Service | | | 19.89 | | | | 0.44 | | | | 0.70 | | | | 1.14 | | | | (0.37 | ) | | | — | | | | (0.37 | ) | | |
| |
|
| | |
| * | | The Fund changed its fiscal year end from August 31 to October 31. |
| (a) | | Calculated based on the average shares outstanding methodology. |
| (b) | | Assumes investment at the net asset value at the beginning of the period, reinvestment of all dividends and distributions, a complete redemption of the investment at the net asset value at the end of the period and no sales or redemption charges. Total returns would be reduced if a sales or redemption charge was taken into account. Returns do not reflect the deduction of taxes that a shareholder would pay on Fund distributions or the redemption of Fund shares. Total returns for periods less than one full year are not annualized. |
| (c) | | Reflects income recognized from non-recurring special dividends which amounted to $0.07 per share and 0.73% of average net assets. |
| (d) | | Annualized. |
| (e) | | Reflects income recognized from non-recurring special dividends which amounted to $0.05 per share and 0.28% of average net assets. |
96 The accompanying notes are an integral part of these financial statements.
GOLDMAN SACHS BALANCED FUND
| | | | | | | | | | | | | | | | | | | | | | | | | | | | | | | | | |
| | | | | | | | | | |
| | | | | | |
| | | | | | | | | | |
| | | | | | |
| | | | | | | | | | | Ratio of
| | Portfolio
| | Portfolio
| | |
| | | | | Net assets,
| | Ratio of
| | Ratio of
| | net investment
| | turnover rate
| | turnover rate
| | |
Net asset
| | | | end of
| | net expenses
| | total expenses
| | income
| | (including the
| | (excluding the
| | |
value, end
| | Total
| | period
| | to average
| | to average
| | to average
| | effect of mortgage
| | effect of mortgage
| | |
| of period | | return(b) | | (in 000s) | | net assets | | net assets | | net assets | | dollar rolls) | | dollar rolls) | | |
| |
| |
| $ | 19.68 | | | | 9.67 | % | | $ | 109,840 | | | | 1.05 | %(d) | | | 1.38 | %(d) | | | 2.54 | %(c)(d) | | | 159 | % | | | 122 | % | | |
| | 19.53 | | | | 9.28 | | | | 8,007 | | | | 1.80 | (d) | | | 2.13 | (d) | | | 1.80 | (c)(d) | | | 159 | | | | 122 | | | |
| | 19.46 | | | | 9.27 | | | | 9,316 | | | | 1.80 | (d) | | | 2.13 | (d) | | | 1.73 | (c)(d) | | | 159 | | | | 122 | | | |
| | 19.99 | | | | 9.85 | | | | 4,188 | | | | 0.65 | (d) | | | 0.98 | (d) | | | 2.81 | (c)(d) | | | 159 | | | | 122 | | | |
| | 19.96 | | | | 9.69 | | | | 196 | | | | 0.80 | (d) | | | 1.13 | (d) | | | 2.04 | (c)(d) | | | 159 | | | | 122 | | | |
| | | | | | | | | | | | | | | | | | | | | | | | | | | | | | | | | |
| | | | | | | | | | | | | | | | | | | | | | | | | | | | | | | | | |
| |
| | 18.21 | | | | 15.29 | | | | 108,710 | | | | 1.05 | | | | 1.40 | | | | 2.75 | (e) | | | 238 | | | | 210 | | | |
| | 18.07 | | | | 14.46 | | | | 7,991 | | | | 1.80 | | | | 2.15 | | | | 2.03 | (e) | | | 238 | | | | 210 | | | |
| | 18.01 | | | | 14.48 | | | | 7,665 | | | | 1.80 | | | | 2.15 | | | | 1.99 | (e) | | | 238 | | | | 210 | | | |
| | 18.50 | | | | 15.76 | | | | 2,919 | | | | 0.65 | | | | 1.00 | | | | 3.14 | (e) | | | 238 | | | | 210 | | | |
| | 18.48 | | | | 7.77 | | | | 1 | | | | 0.80 | (d) | | | 1.15 | (d) | | | 2.10 | (d)(e) | | | 238 | | | | 210 | | | |
| |
|
| | 16.32 | | | | 15.32 | | | | 111,326 | | | | 1.05 | | | | 1.38 | | | | 3.20 | | | | 173 | | | | 157 | | | |
| | 16.19 | | | | 14.41 | | | | 8,970 | | | | 1.80 | | | | 2.13 | | | | 2.47 | | | | 173 | | | | 157 | | | |
| | 16.14 | | | | 14.43 | | | | 7,022 | | | | 1.80 | | | | 2.13 | | | | 2.44 | | | | 173 | | | | 157 | | | |
| | 16.57 | | | | 15.76 | | | | 2,572 | | | | 0.65 | | | | 0.98 | | | | 3.58 | | | | 173 | | | | 157 | | | |
| | | | | | | | | | | | | | | | | | | | | | | | | | | | | | | | | |
| | | | | | | | | | | | | | | | | | | | | | | | | | | | | | | | | |
| |
| | 14.64 | | | | (16.41 | ) | | | 116,915 | | | | 1.04 | (d) | | | 1.54 | (d) | | | 3.72 | (d) | | | 58 | | | | 57 | | | |
| | 14.53 | | | | (16.49 | ) | | | 10,306 | | | | 1.79 | (d) | | | 2.29 | (d) | | | 2.97 | (d) | | | 58 | | | | 57 | | | |
| | 14.49 | | | | (16.52 | ) | | | 6,597 | | | | 1.79 | (d) | | | 2.29 | (d) | | | 2.97 | (d) | | | 58 | | | | 57 | | | |
| | 14.86 | | | | (16.35 | ) | | | 2,433 | | | | 0.64 | (d) | | | 1.14 | (d) | | | 4.10 | (d) | | | 58 | | | | 57 | | | |
| | 14.69 | | | | (16.43 | ) | | | 1 | | | | 0.94 | (d) | | | 0.94 | (d) | | | 3.75 | (d) | | | 58 | | | | 57 | | | |
| | | | | | | | | | | | | | | | | | | | | | | | | | | | | | | | | |
| | | | | | | | | | | | | | | | | | | | | | | | | | | | | | | | | |
| |
| | 17.71 | | | | (6.48 | ) | | | 148,623 | | | | 1.03 | | | | 1.29 | | | | 3.37 | | | | 184 | | | | 178 | | | |
| | 17.56 | | | | (7.21 | ) | | | 12,946 | | | | 1.78 | | | | 2.04 | | | | 2.62 | | | | 184 | | | | 178 | | | |
| | 17.52 | | | | (7.19 | ) | | | 7,835 | | | | 1.78 | | | | 2.04 | | | | 2.63 | | | | 184 | | | | 178 | | | |
| | 17.98 | | | | (6.10 | ) | | | 2,951 | | | | 0.63 | | | | 0.89 | | | | 3.78 | | | | 184 | | | | 178 | | | |
| | 17.77 | | | | (6.41 | ) | | | 1 | | | | 1.13 | | | | 1.39 | | | | 3.33 | | | | 184 | | | | 178 | | | |
| |
|
| | 20.66 | | | | 10.53 | | | | 180,905 | | | | 1.06 | | | | 1.31 | | | | 2.72 | | | | 63 | | | | 54 | | | |
| | 20.50 | | | | 9.71 | | | | 16,906 | | | | 1.81 | | | | 2.06 | | | | 1.97 | | | | 63 | | | | 54 | | | |
| | 20.46 | | | | 9.72 | | | | 7,696 | | | | 1.81 | | | | 2.06 | | | | 1.97 | | | | 63 | | | | 54 | | | |
| | 20.95 | | | | 10.99 | | | | 3,187 | | | | 0.66 | | | | 0.91 | | | | 3.14 | | | | 63 | | | | 54 | | | |
| | 20.70 | | | | 10.53 | | | | 2 | | | | 1.16 | | | | 1.41 | | | | 2.60 | | | | 63 | | | | 54 | | | |
| |
|
| | 20.68 | | | | 6.08 | | | | 178,220 | | | | 1.11 | | | | 1.27 | | | | 2.29 | | | | 256 | | | | 220 | | | |
| | 20.52 | | | | 5.32 | | | | 20,462 | | | | 1.86 | | | | 2.02 | | | | 1.51 | | | | 256 | | | | 220 | | | |
| | 20.49 | | | | 5.30 | | | | 6,244 | | | | 1.86 | | | | 2.02 | | | | 1.55 | | | | 256 | | | | 220 | | | |
| | 20.94 | | | | 6.51 | | | | 2,088 | | | | 0.71 | | | | 0.87 | | | | 2.71 | | | | 256 | | | | 220 | | | |
| | 20.66 | | | | 5.80 | | | | 1 | | | | 1.21 | | | | 1.37 | | | | 2.09 | | | | 256 | | | | 220 | | | |
| |
|
The accompanying notes are an integral part of these financial statements. 97
GOLDMAN SACHS STRUCTURED LARGE CAP GROWTH FUND
Financial Highlights
Selected Data for a Share Outstanding Throughout Each Period
| | | | | | | | | | | | | | | | | | | | | | | | | | | | | | | |
| | | | | Income (loss) from
| | Distributions
| | |
| | | | | investment operations | | to shareholders | | |
| | | | |
| | | | | |
| | | | | | |
| | | Net asset
| |
| | | | | |
| | | | | | |
| | | value,
| | Net
| | Net realized
| | Total from
| | From net
| | From net
| | | | |
| | | beginning
| | investment
| | and unrealized
| | investment
| | investment
| | realized
| | Total
| | |
| Year - Share Class | | of period | | income (loss)(a) | | gain (loss) | | operations | | income | | gains | | distributions | | |
| |
FOR THE SIX MONTHS ENDED APRIL 30, (UNAUDITED) |
| 2011 - A | | $ | 11.54 | | | $ | 0.05 | | | $ | 1.82 | | | $ | 1.87 | | | $ | (0.13 | ) | | $ | — | | | $ | (0.13 | ) | | |
| 2011 - B | | | 10.63 | | | | 0.01 | | | | 1.68 | | | | 1.69 | | | | (0.06 | ) | | | — | | | | (0.06 | ) | | |
| 2011 - C | | | 10.62 | | | | — | (d) | | | 1.69 | | | | 1.69 | | | | (0.07 | ) | | | — | | | | (0.07 | ) | | |
| 2011 - Institutional | | | 11.88 | | | | 0.07 | | | | 1.88 | | | | 1.95 | | | | (0.18 | ) | | | — | | | | (0.18 | ) | | |
| 2011 - Service | | | 11.43 | | | | 0.04 | | | | 1.80 | | | | 1.84 | | | | (0.12 | ) | | | — | | | | (0.12 | ) | | |
| 2011 - IR | | | 11.48 | | | | 0.06 | | | | 1.81 | | | | 1.87 | | | | (0.16 | ) | | | — | | | | (0.16 | ) | | |
| 2011 - R | | | 11.42 | | | | 0.03 | | | | 1.80 | | | | 1.83 | | | | (0.10 | ) | | | — | | | | (0.10 | ) | | |
| | | | | | | | | | | | | | | | | | | | | | | | | | | | | | | |
| | | | | | | | | | | | | | | | | | | | | | | | | | | | | | | |
FOR THE FISCAL YEARS ENDED OCTOBER 31, |
| 2010 - A | | | 10.04 | | | | 0.09 | | | | 1.52 | | | | 1.61 | | | | (0.11 | ) | | | — | | | | (0.11 | ) | | |
| 2010 - B | | | 9.26 | | | | 0.01 | | | | 1.40 | | | | 1.41 | | | | (0.04 | ) | | | — | | | | (0.04 | ) | | |
| 2010 - C | | | 9.26 | | | | — | (d) | | | 1.41 | | | | 1.41 | | | | (0.05 | ) | | | — | | | | (0.05 | ) | | |
| 2010 - Institutional | | | 10.33 | | | | 0.13 | | | | 1.58 | | | | 1.71 | | | | (0.16 | ) | | | — | | | | (0.16 | ) | | |
| 2010 - Service | | | 9.95 | | | | 0.08 | | | | 1.51 | | | | 1.59 | | | | (0.11 | ) | | | — | | | | (0.11 | ) | | |
| 2010 - IR | | | 9.99 | | | | 0.11 | | | | 1.52 | | | | 1.63 | | | | (0.14 | ) | | | — | | | | (0.14 | ) | | |
| 2010 - R | | | 9.99 | | | | 0.05 | | | | 1.52 | | | | 1.57 | | | | (0.14 | ) | | | — | | | | (0.14 | ) | | |
|
| 2009 - A | | | 8.94 | | | | 0.10 | | | | 1.08 | | | | 1.18 | | | | (0.08 | ) | | | — | | | | (0.08 | ) | | |
| 2009 - B | | | 8.23 | | | | 0.03 | | | | 1.00 | | | | 1.03 | | | | — | | | | — | | | | — | | | |
| 2009 - C | | | 8.23 | | | | 0.03 | | | | 1.00 | | | | 1.03 | | | | — | | | | — | | | | — | | | |
| 2009 - Institutional | | | 9.23 | | | | 0.14 | | | | 1.10 | | | | 1.24 | | | | (0.14 | ) | | | — | | | | (0.14 | ) | | |
| 2009 - Service | | | 8.87 | | | | 0.09 | | | | 1.07 | | | | 1.16 | | | | (0.08 | ) | | | — | | | | (0.08 | ) | | |
| 2009 - IR | | | 8.92 | | | | 0.11 | | | | 1.08 | | | | 1.19 | | | | (0.12 | ) | | | — | | | | (0.12 | ) | | |
| 2009 - R | | | 8.89 | | | | 0.05 | | | | 1.11 | | | | 1.16 | | | | (0.06 | ) | | | — | | | | (0.06 | ) | | |
| | | | | | | | | | | | | | | | | | | | | | | | | | | | | | | |
| | | | | | | | | | | | | | | | | | | | | | | | | | | | | | | |
FOR THE PERIOD SEPTEMBER 1, 2008 TO OCTOBER 31, 2008* |
| 2008 - A | | | 12.38 | | | | 0.01 | | | | (3.45 | ) | | | (3.44 | ) | | | — | | | | — | | | | — | | | |
| 2008 - B | | | 11.40 | | | | (0.01 | ) | | | (3.16 | ) | | | (3.17 | ) | | | — | | | | — | | | | — | | | |
| 2008 - C | | | 11.41 | | | | (0.01 | ) | | | (3.17 | ) | | | (3.18 | ) | | | — | | | | — | | | | — | | | |
| 2008 - Institutional | | | 12.76 | | | | 0.01 | | | | (3.54 | ) | | | (3.53 | ) | | | — | | | | — | | | | — | | | |
| 2008 - Service | | | 12.28 | | | | — | (d) | | | (3.41 | ) | | | (3.41 | ) | | | — | | | | — | | | | — | | | |
| 2008 - IR | | | 12.35 | | | | 0.01 | | | | (3.44 | ) | | | (3.43 | ) | | | — | | | | — | | | | — | | | |
| 2008 - R | | | 12.31 | | | | — | (d) | | | (3.42 | ) | | | (3.42 | ) | | | — | | | | — | | | | — | | | |
| | | | | | | | | | | | | | | | | | | | | | | | | | | | | | | |
| | | | | | | | | | | | | | | | | | | | | | | | | | | | | | | |
FOR THE FISCAL YEARS ENDED AUGUST 31, |
| 2008 - A | | | 14.36 | | | | 0.06 | | | | (1.91 | ) | | | (1.85 | ) | | | (0.03 | ) | | | (0.10 | ) | | | (0.13 | ) | | |
| 2008 - B | | | 13.31 | | | | (0.04 | ) | | | (1.77 | ) | | | (1.81 | ) | | | — | (d) | | | (0.10 | ) | | | (0.10 | ) | | |
| 2008 - C | | | 13.31 | | | | (0.04 | ) | | | (1.76 | ) | | | (1.80 | ) | | | — | (d) | | | (0.10 | ) | | | (0.10 | ) | | |
| 2008 - Institutional | | | 14.81 | | | | 0.11 | | | | (1.97 | ) | | | (1.86 | ) | | | (0.09 | ) | | | (0.10 | ) | | | (0.19 | ) | | |
| 2008 - Service | | | 14.25 | | | | 0.04 | | | | (1.90 | ) | | | (1.86 | ) | | | (0.01 | ) | | | (0.10 | ) | | | (0.11 | ) | | |
| 2008 - IR (Commenced November 30, 2007) | | | 14.53 | | | | 0.06 | | | | (2.05 | ) | | | (1.99 | ) | | | (0.09 | ) | | | (0.10 | ) | | | (0.19 | ) | | |
| 2008 - R (Commenced November 30, 2007) | | | 14.53 | | | | 0.02 | | | | (2.05 | ) | | | (2.03 | ) | | | (0.09 | ) | | | (0.10 | ) | | | (0.19 | ) | | |
|
| 2007 - A | | | 13.20 | | | | 0.04 | | | | 1.13 | | | | 1.17 | | | | (0.01 | ) | | | — | | | | (0.01 | ) | | |
| 2007 - B | | | 12.33 | | | | (0.06 | ) | | | 1.04 | | | | 0.98 | | | | — | | | | — | | | | — | | | |
| 2007 - C | | | 12.34 | | | | (0.06 | ) | | | 1.03 | | | | 0.97 | | | | — | | | | — | | | | — | | | |
| 2007 - Institutional | | | 13.58 | | | | 0.10 | | | | 1.17 | | | | 1.27 | | | | (0.04 | ) | | | — | | | | (0.04 | ) | | |
| 2007 - Service | | | 13.10 | | | | 0.02 | | | | 1.13 | | | | 1.15 | | | | — | | | | — | | | | — | | | |
|
| 2006 - A | | | 12.55 | | | | 0.04 | | | | 0.61 | | | | 0.65 | | | | — | (d) | | | — | | | | — | | | |
| 2006 - B | | | 11.81 | | | | (0.06 | ) | | | 0.58 | | | | 0.52 | | | | — | | | | — | | | | — | | | |
| 2006 - C | | | 11.81 | | | | (0.06 | ) | | | 0.59 | | | | 0.53 | | | | — | | | | — | | | | — | | | |
| 2006 - Institutional | | | 12.89 | | | | 0.09 | | | | 0.64 | | | | 0.73 | | | | (0.04 | ) | | | — | | | | (0.04 | ) | | |
| 2006 - Service | | | 12.43 | | | | 0.02 | | | | 0.65 | | | | 0.67 | | | | — | | | | — | | | | — | | | |
|
| | |
| * | | The Fund changed its fiscal year end from August 31 to October 31. |
| (a) | | Calculated based on the average shares outstanding methodology. |
| (b) | | Assumes investment at the net asset value at the beginning of the period, reinvestment of all dividends and distributions, a complete redemption of the investment at the net asset value at the end of the period and no sales or redemption charges. Total returns would be reduced if a sales or redemption charge was taken into account. Returns do not reflect the deduction of taxes that a shareholder would pay on Fund distributions or the redemption of Fund shares. Total returns for periods less than one full year are not annualized. |
| (c) | | Annualized. |
| (d) | | Amount is less than $0.005 per share. |
98 The accompanying notes are an integral part of these financial statements.
GOLDMAN SACHS STRUCTURED LARGE CAP GROWTH FUND
| | | | | | | | | | | | | | | | | | | | | | | | | | | | | |
| | | | | | | | | | |
| | | | |
| | | | | | | | | | |
| | | | |
| | | | | | | | | | | Ratio of
| | | | |
| | | | | Net assets,
| | Ratio of
| | Ratio of
| | net investment
| | | | |
Net asset
| | | | end of
| | net expenses
| | total expenses
| | income (loss)
| | Portfolio
| | |
value, end
| | Total
| | period
| | to average
| | to average
| | to average
| | turnover
| | |
| of period | | return(b) | | (in 000s) | | net assets | | net assets | | net assets | | rate | | |
| |
| |
| $ | 13.28 | | | | 16.33 | % | | $ | 173,047 | | | | 0.95 | %(c) | | | 1.17 | %(c) | | | 0.74 | %(c) | | | 30 | % | | |
| | 12.26 | | | | 15.95 | | | | 8,145 | | | | 1.70 | (c) | | | 1.92 | (c) | | | 0.03 | (c) | | | 30 | | | |
| | 12.24 | | | | 15.98 | | | | 14,408 | | | | 1.70 | (c) | | | 1.92 | (c) | | | 0.01 | (c) | | | 30 | | | |
| | 13.65 | | | | 16.55 | | | | 462,482 | | | | 0.55 | (c) | | | 0.77 | (c) | | | 1.08 | (c) | | | 30 | | | |
| | 13.15 | | | | 16.24 | | | | 133 | | | | 1.05 | (c) | | | 1.27 | (c) | | | 0.62 | (c) | | | 30 | | | |
| | 13.19 | | | | 16.49 | | | | 10 | | | | 0.70 | (c) | | | 0.92 | (c) | | | 0.96 | (c) | | | 30 | | | |
| | 13.15 | | | | 16.15 | | | | 59 | | | | 1.20 | (c) | | | 1.42 | (c) | | | 0.51 | (c) | | | 30 | | | |
| | | | | | | | | | | | | | | | | | | | | | | | | | | | | |
| | | | | | | | | | | | | | | | | | | | | | | | | | | | | |
| |
| | 11.54 | | | | 16.17 | | | | 145,079 | | | | 0.95 | | | | 1.16 | | | | 0.79 | | | | 64 | | | |
| | 10.63 | | | | 15.26 | | | | 8,219 | | | | 1.70 | | | | 1.91 | | | | 0.06 | | | | 64 | | | |
| | 10.62 | | | | 15.30 | | | | 13,528 | | | | 1.70 | | | | 1.91 | | | | 0.03 | | | | 64 | | | |
| | 11.88 | | | | 16.68 | | | | 362,907 | | | | 0.55 | | | | 0.76 | | | | 1.21 | | | | 64 | | | |
| | 11.43 | | | | 16.07 | | | | 93 | | | | 1.05 | | | | 1.26 | | | | 0.71 | | | | 64 | | | |
| | 11.48 | | | | 16.50 | | | | 8 | | | | 0.70 | | | | 0.91 | | | | 1.02 | | | | 64 | | | |
| | 11.42 | | | | 15.81 | | | | 59 | | | | 1.20 | | | | 1.41 | | | | 0.47 | | | | 64 | | | |
|
| | 10.04 | | | | 13.42 | | | | 183,762 | | | | 0.95 | | | | 1.16 | | | | 1.13 | | | | 124 | | | |
| | 9.26 | | | | 12.52 | | | | 10,993 | | | | 1.70 | | | | 1.91 | | | | 0.38 | | | | 124 | | | |
| | 9.26 | | | | 12.52 | | | | 14,832 | | | | 1.70 | | | | 1.91 | | | | 0.31 | | | | 124 | | | |
| | 10.33 | | | | 13.75 | | | | 543,449 | | | | 0.55 | | | | 0.76 | | | | 1.53 | | | | 124 | | | |
| | 9.95 | | | | 13.29 | | | | 125 | | | | 1.05 | | | | 1.26 | | | | 1.08 | | | | 124 | | | |
| | 9.99 | | | | 13.65 | | | | 7 | | | | 0.70 | | | | 0.95 | | | | 1.25 | | | | 124 | | | |
| | 9.99 | | | | 13.21 | | | | 34 | | | | 1.20 | | | | 1.41 | | | | 0.55 | | | | 124 | | | |
| | | | | | | | | | | | | | | | | | | | | | | | | | | | | |
| | | | | | | | | | | | | | | | | | | | | | | | | | | | | |
| |
| | 8.94 | | | | (27.79 | ) | | | 285,337 | | | | 0.95 | (c) | | | 1.14 | (c) | | | 0.34 | (c) | | | 19 | | | |
| | 8.23 | | | | (27.81 | ) | | | 16,129 | | | | 1.70 | (c) | | | 1.89 | (c) | | | (0.38 | )(c) | | | 19 | | | |
| | 8.23 | | | | (27.87 | ) | | | 16,324 | | | | 1.70 | (c) | | | 1.89 | (c) | | | (0.41 | )(c) | | | 19 | | | |
| | 9.23 | | | | (27.66 | ) | | | 814,036 | | | | 0.55 | (c) | | | 0.74 | (c) | | | 0.74 | (c) | | | 19 | | | |
| | 8.87 | | | | (27.77 | ) | | | 189 | | | | 1.05 | (c) | | | 1.24 | (c) | | | 0.23 | (c) | | | 19 | | | |
| | 8.92 | | | | (27.77 | ) | | | 6 | | | | 0.70 | (c) | | | 0.89 | (c) | | | 0.63 | (c) | | | 19 | | | |
| | 8.89 | | | | (27.78 | ) | | | 6 | | | | 1.20 | (c) | | | 1.39 | (c) | | | 0.13 | (c) | | | 19 | | | |
| | | | | | | | | | | | | | | | | | | | | | | | | | | | | |
| | | | | | | | | | | | | | | | | | | | | | | | | | | | | |
| |
| | 12.38 | | | | (12.96 | ) | | | 434,970 | | | | 0.95 | | | | 1.10 | | | | 0.40 | | | | 118 | | | |
| | 11.40 | | | | (13.71 | ) | | | 25,718 | | | | 1.70 | | | | 1.85 | | | | (0.34 | ) | | | 118 | | | |
| | 11.41 | | | | (13.63 | ) | | | 23,960 | | | | 1.70 | | | | 1.85 | | | | (0.34 | ) | | | 118 | | | |
| | 12.76 | | | | (12.71 | ) | | | 1,278,322 | | | | 0.55 | | | | 0.70 | | | | 0.82 | | | | 118 | | | |
| | 12.28 | | | | (13.11 | ) | | | 273 | | | | 1.05 | | | | 1.20 | | | | 0.32 | | | | 118 | | | |
| | 12.35 | | | | (13.86 | ) | | | 9 | | | | 0.70 | (c) | | | 0.85 | (c) | | | 0.63 | (c) | | | 118 | | | |
| | 12.31 | | | | (14.18 | ) | | | 9 | | | | 1.20 | (c) | | | 1.35 | (c) | | | 0.21 | (c) | | | 118 | | | |
|
| | 14.36 | | | | 8.85 | | | | 678,286 | | | | 0.95 | | | | 1.09 | | | | 0.30 | | | | 140 | | | |
| | 13.31 | | | | 7.95 | | | | 49,211 | | | | 1.70 | | | | 1.84 | | | | (0.48 | ) | | | 140 | | | |
| | 13.31 | | | | 7.86 | | | | 35,896 | | | | 1.70 | | | | 1.84 | | | | (0.48 | ) | | | 140 | | | |
| | 14.81 | | | | 9.39 | | | | 1,635,283 | | | | 0.55 | | | | 0.69 | | | | 0.69 | | | | 140 | | | |
| | 14.25 | | | | 8.78 | | | | 258 | | | | 1.05 | | | | 1.19 | | | | 0.12 | | | | 140 | | | |
|
| | 13.20 | | | | 5.21 | | | | 310,386 | | | | 1.00 | | | | 1.16 | | | | 0.28 | | | | 111 | | | |
| | 12.33 | | | | 4.40 | | | | 41,947 | | | | 1.76 | | | | 1.91 | | | | (0.52 | ) | | | 111 | | | |
| | 12.34 | | | | 4.49 | | | | 22,811 | | | | 1.76 | | | | 1.91 | | | | (0.52 | ) | | | 111 | | | |
| | 13.58 | | | | 5.66 | | | | 488,448 | | | | 0.60 | | | | 0.76 | | | | 0.69 | | | | 111 | | | |
| | 13.10 | | | | 5.39 | | | | 260 | | | | 1.10 | | | | 1.26 | | | | 0.15 | | | | 111 | | | |
|
The accompanying notes are an integral part of these financial statements. 99
GOLDMAN SACHS STRUCTURED LARGE CAP VALUE FUND
Financial Highlights
Selected Data for a Share Outstanding Throughout Each Period
| | | | | | | | | | | | | | | | | | | | | | | | | | | | | | | |
| | | | | Income (loss) from
| | Distributions
| | |
| | | | | investment operations | | to shareholders | | |
| | | | |
| | | | | |
| | | | | | |
| | | Net asset
| |
| | | | | |
| | | | | | |
| | | value,
| | Net
| | Net realized
| | Total from
| | From net
| | From net
| | | | |
| | | beginning
| | investment
| | and unrealized
| | investment
| | investment
| | realized
| | Total
| | |
| Year - Share Class | | of period | | income(a) | | gain (loss) | | operations | | income | | gains | | distributions | | |
| |
FOR THE SIX MONTHS ENDED APRIL 30, (UNAUDITED) |
| 2011 - A | | $ | 9.47 | | | $ | 0.06 | | | $ | 1.69 | | | $ | 1.75 | | | $ | (0.07 | ) | | $ | — | | | $ | (0.07 | ) | | |
| 2011 - B | | | 9.42 | | | | 0.03 | | | | 1.67 | | | | 1.70 | | | | (0.03 | ) | | | — | | | | (0.03 | ) | | |
| 2011 - C | | | 9.40 | | | | 0.02 | | | | 1.68 | | | | 1.70 | | | | (0.03 | ) | | | — | | | | (0.03 | ) | | |
| 2011 - Institutional | | | 9.46 | | | | 0.08 | | | | 1.70 | | | | 1.78 | | | | (0.09 | ) | | | — | | | | (0.09 | ) | | |
| 2011 - Service | | | 9.51 | | | | 0.06 | | | | 1.70 | | | | 1.76 | | | | (0.07 | ) | | | — | | | | (0.07 | ) | | |
| 2011 - IR | | | 9.45 | | | | 0.07 | | | | 1.69 | | | | 1.76 | | | | (0.08 | ) | | | — | | | | (0.08 | ) | | |
| 2011 - R | | | 9.45 | | | | 0.05 | | | | 1.69 | | | | 1.74 | | | | (0.06 | ) | | | — | | | | (0.06 | ) | | |
| | | | | | | | | | | | | | | | | | | | | | | | | | | | | | | |
| | | | | | | | | | | | | | | | | | | | | | | | | | | | | | | |
FOR THE FISCAL YEARS ENDED OCTOBER 31, |
| 2010 - A | | | 8.42 | | | | 0.13 | | | | 1.05 | | | | 1.18 | | | | (0.13 | ) | | | — | | | | (0.13 | ) | | |
| 2010 - B | | | 8.37 | | | | 0.06 | | | | 1.05 | | | | 1.11 | | | | (0.06 | ) | | | — | | | | (0.06 | ) | | |
| 2010 - C | | | 8.36 | | | | 0.06 | | | | 1.04 | | | | 1.10 | | | | (0.06 | ) | | | — | | | | (0.06 | ) | | |
| 2010 - Institutional | | | 8.41 | | | | 0.17 | | | | 1.05 | | | | 1.22 | | | | (0.17 | ) | | | — | | | | (0.17 | ) | | |
| 2010 - Service | | | 8.45 | | | | 0.12 | | | | 1.06 | | | | 1.18 | | | | (0.12 | ) | | | — | | | | (0.12 | ) | | |
| 2010 - IR | | | 8.41 | | | | 0.15 | | | | 1.04 | | | | 1.19 | | | | (0.15 | ) | | | — | | | | (0.15 | ) | | |
| 2010 - R | | | 8.41 | | | | 0.11 | | | | 1.04 | | | | 1.15 | | | | (0.11 | ) | | | — | | | | (0.11 | ) | | |
|
| 2009 - A | | | 8.60 | | | | 0.17 | | | | (0.16 | ) | | | 0.01 | | | | (0.19 | ) | | | — | | | | (0.19 | ) | | |
| 2009 - B | | | 8.54 | | | | 0.12 | | | | (0.17 | ) | | | (0.05 | ) | | | (0.12 | ) | | | — | | | | (0.12 | ) | | |
| 2009 - C | | | 8.54 | | | | 0.11 | | | | (0.16 | ) | | | (0.05 | ) | | | (0.13 | ) | | | — | | | | (0.13 | ) | | |
| 2009 - Institutional | | | 8.59 | | | | 0.20 | | | | (0.16 | ) | | | 0.04 | | | | (0.22 | ) | | | — | | | | (0.22 | ) | | |
| 2009 - Service | | | 8.63 | | | | 0.16 | | | | (0.16 | ) | | | — | | | | (0.18 | ) | | | — | | | | (0.18 | ) | | |
| 2009 - IR | | | 8.59 | | | | 0.18 | | | | (0.15 | ) | | | 0.03 | | | | (0.21 | ) | | | — | | | | (0.21 | ) | | |
| 2009 - R | | | 8.59 | | | | 0.11 | | | | (0.11 | ) | | | — | | | | (0.18 | ) | | | — | | | | (0.18 | ) | | |
| | | | | | | | | | | | | | | | | | | | | | | | | | | | | | | |
| | | | | | | | | | | | | | | | | | | | | | | | | | | | | | | |
FOR THE PERIOD SEPTEMBER 1, 2008 TO OCTOBER 31, 2008* |
| 2008 - A | | | 11.24 | | | | 0.03 | | | | (2.62 | ) | | | (2.59 | ) | | | (0.05 | ) | | | — | | | | (0.05 | ) | | |
| 2008 - B | | | 11.16 | | | | 0.02 | | | | (2.62 | ) | | | (2.60 | ) | | | (0.02 | ) | | | — | | | | (0.02 | ) | | |
| 2008 - C | | | 11.16 | | | | 0.02 | | | | (2.62 | ) | | | (2.60 | ) | | | (0.02 | ) | | | — | | | | (0.02 | ) | | |
| 2008 - Institutional | | | 11.24 | | | | 0.04 | | | | (2.63 | ) | | | (2.59 | ) | | | (0.06 | ) | | | — | | | | (0.06 | ) | | |
| 2008 - Service | | | 11.28 | | | | 0.03 | | | | (2.64 | ) | | | (2.61 | ) | | | (0.04 | ) | | | — | | | | (0.04 | ) | | |
| 2008 - IR | | | 11.23 | | | | 0.03 | | | | (2.62 | ) | | | (2.59 | ) | | | (0.05 | ) | | | — | | | | (0.05 | ) | | |
| 2008 - R | | | 11.23 | | | | 0.02 | | | | (2.62 | ) | | | (2.60 | ) | | | (0.04 | ) | | | — | | | | (0.04 | ) | | |
| | | | | | | | | | | | | | | | | | | | | | | | | | | | | | | |
| | | | | | | | | | | | | | | | | | | | | | | | | | | | | | | |
FOR THE FISCAL YEARS ENDED AUGUST 31, |
| 2008 - A | | | 14.51 | | | | 0.18 | | | | (2.80 | ) | | | (2.62 | ) | | | (0.19 | ) | | | (0.46 | ) | | | (0.65 | ) | | |
| 2008 - B | | | 14.39 | | | | 0.09 | | | | (2.78 | ) | | | (2.69 | ) | | | (0.08 | ) | | | (0.46 | ) | | | (0.54 | ) | | |
| 2008 - C | | | 14.40 | | | | 0.09 | | | | (2.78 | ) | | | (2.69 | ) | | | (0.09 | ) | | | (0.46 | ) | | | (0.55 | ) | | |
| 2008 - Institutional | | | 14.51 | | | | 0.23 | | | | (2.80 | ) | | | (2.57 | ) | | | (0.24 | ) | | | (0.46 | ) | | | (0.70 | ) | | |
| 2008 - Service | | | 14.56 | | | | 0.17 | | | | (2.82 | ) | | | (2.65 | ) | | | (0.17 | ) | | | (0.46 | ) | | | (0.63 | ) | | |
| 2008 - IR (Commenced November 30, 2007) | | | 13.89 | | | | 0.15 | | | | (2.18 | ) | | | (2.03 | ) | | | (0.17 | ) | | | (0.46 | ) | | | (0.63 | ) | | |
| 2008 - R (Commenced November 30, 2007) | | | 13.89 | | | | 0.11 | | | | (2.17 | ) | | | (2.06 | ) | | | (0.14 | ) | | | (0.46 | ) | | | (0.60 | ) | | |
|
| 2007 - A | | | 13.99 | | | | 0.18 | | | | 1.06 | | | | 1.24 | | | | (0.17 | ) | | | (0.55 | ) | | | (0.72 | ) | | |
| 2007 - B | | | 13.88 | | | | 0.07 | | | | 1.04 | | | | 1.11 | | | | (0.05 | ) | | | (0.55 | ) | | | (0.60 | ) | | |
| 2007 - C | | | 13.90 | | | | 0.07 | | | | 1.04 | | | | 1.11 | | | | (0.06 | ) | | | (0.55 | ) | | | (0.61 | ) | | |
| 2007 - Institutional | | | 14.00 | | | | 0.24 | | | | 1.04 | | | | 1.28 | | | | (0.22 | ) | | | (0.55 | ) | | | (0.77 | ) | | |
| 2007 - Service | | | 14.06 | | | | 0.17 | | | | 1.05 | | | | 1.22 | | | | (0.17 | ) | | | (0.55 | ) | | | (0.72 | ) | | |
|
| 2006 - A | | | 12.69 | | | | 0.17 | | | | 1.51 | | | | 1.68 | | | | (0.14 | ) | | | (0.24 | ) | | | (0.38 | ) | | |
| 2006 - B | | | 12.59 | | | | 0.07 | | | | 1.49 | | | | 1.56 | | | | (0.03 | ) | | | (0.24 | ) | | | (0.27 | ) | | |
| 2006 - C | | | 12.60 | | | | 0.07 | | | | 1.50 | | | | 1.57 | | | | (0.03 | ) | | | (0.24 | ) | | | (0.27 | ) | | |
| 2006 - Institutional | | | 12.69 | | | | 0.23 | | | | 1.50 | | | | 1.73 | | | | (0.18 | ) | | | (0.24 | ) | | | (0.42 | ) | | |
| 2006 - Service | | | 12.73 | | | | 0.17 | | | | 1.50 | | | | 1.67 | | | | (0.10 | ) | | | (0.24 | ) | | | (0.34 | ) | | |
|
| | |
| * | | The Fund changed its fiscal year end from August 31 to October 31. |
| (a) | | Calculated based on the average shares outstanding methodology. |
| (b) | | Assumes investment at the net asset value at the beginning of the period, reinvestment of all dividends and distributions, a complete redemption of the investment at the net asset value at the end of the period and no sales or redemption charges. Total returns would be reduced if a sales or redemption charge was taken into account. Returns do not reflect the deduction of taxes that a shareholder would pay on Fund distributions or the redemption of Fund shares. Total returns for periods less than one full year are not annualized. |
| (c) | | Annualized. |
100 The accompanying notes are an integral part of these financial statements.
GOLDMAN SACHS STRUCTURED LARGE CAP VALUE FUND
| | | | | | | | | | | | | | | | | | | | | | | | | | | | | |
| | | | | | | | | | |
| | | | |
| | | | | | | | | | |
| | | | |
| | | | | | | | | | | Ratio of
| | | | |
| | | | | Net assets,
| | Ratio of
| | Ratio of
| | net investment
| | | | |
Net asset
| | | | end of
| | net expenses
| | total expenses
| | income
| | Portfolio
| | |
value, end
| | Total
| | period
| | to average
| | to average
| | to average
| | turnover
| | |
| of period | | return(b) | | (in 000s) | | net assets | | net assets | | net assets | | rate | | |
| |
| |
| $ | 11.15 | | | | 18.55 | % | | $ | 168,422 | | | | 0.94 | %(c) | | | 1.11 | %(c) | | | 1.23 | %(c) | | | 24 | % | | |
| | 11.09 | | | | 18.11 | | | | 2,530 | | | | 1.69 | (c) | | | 1.86 | (c) | | | 0.50 | (c) | | | 24 | | | |
| | 11.07 | | | | 18.15 | | | | 13,442 | | | | 1.69 | (c) | | | 1.86 | (c) | | | 0.48 | (c) | | | 24 | | | |
| | 11.15 | | | | 18.91 | | | | 465,996 | | | | 0.54 | (c) | | | 0.71 | (c) | | | 1.59 | (c) | | | 24 | | | |
| | 11.20 | | | | 18.53 | | | | 8,848 | | | | 1.04 | (c) | | | 1.21 | (c) | | | 1.10 | (c) | | | 24 | | | |
| | 11.13 | | | | 18.74 | | | | 23 | | | | 0.69 | (c) | | | 0.86 | (c) | | | 1.44 | (c) | | | 24 | | | |
| | 11.13 | | | | 18.45 | | | | 80 | | | | 1.19 | (c) | | | 1.36 | (c) | | | 1.00 | (c) | | | 24 | | | |
| | | | | | | | | | | | | | | | | | | | | | | | | | | | | |
| | | | | | | | | | | | | | | | | | | | | | | | | | | | | |
| |
| | 9.47 | | | | 14.09 | | | | 140,737 | | | | 0.94 | | | | 1.10 | | | | 1.45 | | | | 41 | | | |
| | 9.42 | | | | 13.27 | | | | 2,428 | | | | 1.69 | | | | 1.85 | | | | 0.70 | | | | 41 | | | |
| | 9.40 | | | | 13.22 | | | | 11,940 | | | | 1.69 | | | | 1.85 | | | | 0.68 | | | | 41 | | | |
| | 9.46 | | | | 14.59 | | | | 362,324 | | | | 0.54 | | | | 0.70 | | | | 1.86 | | | | 41 | | | |
| | 9.51 | | | | 14.05 | | | | 6,601 | | | | 1.04 | | | | 1.20 | | | | 1.33 | | | | 41 | | | |
| | 9.45 | | | | 14.31 | | | | 16 | | | | 0.69 | | | | 0.85 | | | | 1.64 | | | | 41 | | | |
| | 9.45 | | | | 13.74 | | | | 47 | | | | 1.19 | | | | 1.35 | | | | 1.15 | | | | 41 | | | |
|
| | 8.42 | | | | 0.37 | | | | 247,183 | | | | 0.95 | | | | 1.10 | | | | 2.28 | | | | 130 | | | |
| | 8.37 | | | | (0.42 | ) | | | 3,290 | | | | 1.70 | | | | 1.85 | | | | 1.58 | | | | 130 | | | |
| | 8.36 | | | | (0.36 | ) | | | 13,110 | | | | 1.70 | | | | 1.85 | | | | 1.47 | | | | 130 | | | |
| | 8.41 | | | | 0.67 | | | | 712,253 | | | | 0.55 | | | | 0.70 | | | | 2.65 | | | | 130 | | | |
| | 8.45 | | | | 0.28 | | | | 7,364 | | | | 1.05 | | | | 1.20 | | | | 2.10 | | | | 130 | | | |
| | 8.41 | | | | 0.65 | | | | 10 | | | | 0.70 | | | | 0.85 | | | | 2.30 | | | | 130 | | | |
| | 8.41 | | | | 0.26 | | | | 36 | | | | 1.20 | | | | 1.35 | | | | 1.45 | | | | 130 | | | |
| | | | | | | | | | | | | | | | | | | | | | | | | | | | | |
| | | | | | | | | | | | | | | | | | | | | | | | | | | | | |
| |
| | 8.60 | | | | (23.14 | ) | | | 310,622 | | | | 0.95 | (c) | | | 1.10 | (c) | | | 1.59 | (c) | | | 24 | | | |
| | 8.54 | | | | (23.21 | ) | | | 5,170 | | | | 1.70 | (c) | | | 1.85 | (c) | | | 0.87 | (c) | | | 24 | | | |
| | 8.54 | | | | (23.29 | ) | | | 14,029 | | | | 1.70 | (c) | | | 1.85 | (c) | | | 0.86 | (c) | | | 24 | | | |
| | 8.59 | | | | (23.05 | ) | | | 851,132 | | | | 0.55 | (c) | | | 0.70 | (c) | | | 2.02 | (c) | | | 24 | | | |
| | 8.63 | | | | (23.16 | ) | | | 7,193 | | | | 1.05 | (c) | | | 1.20 | (c) | | | 1.50 | (c) | | | 24 | | | |
| | 8.59 | | | | (23.10 | ) | | | 7 | | | | 0.70 | (c) | | | 0.85 | (c) | | | 1.81 | (c) | | | 24 | | | |
| | 8.59 | | | | (23.21 | ) | | | 6 | | | | 1.20 | (c) | | | 1.35 | (c) | | | 1.33 | (c) | | | 24 | | | |
| | | | | | | | | | | | | | | | | | | | | | | | | | | | | |
| | | | | | | | | | | | | | | | | | | | | | | | | | | | | |
| |
| | 11.24 | | | | (18.65 | ) | | | 398,881 | | | | 0.95 | | | | 1.05 | | | | 1.41 | | | | 130 | | | |
| | 11.16 | | | | (19.22 | ) | | | 7,306 | | | | 1.70 | | | | 1.80 | | | | 0.67 | | | | 130 | | | |
| | 11.16 | | | | (19.21 | ) | | | 18,614 | | | | 1.70 | | | | 1.80 | | | | 0.67 | | | | 130 | | | |
| | 11.24 | | | | (18.30 | ) | | | 1,027,705 | | | | 0.55 | | | | 0.65 | | | | 1.82 | | | | 130 | | | |
| | 11.28 | | | | (18.73 | ) | | | 8,994 | | | | 1.05 | | | | 1.15 | | | | 1.31 | | | | 130 | | | |
| | 11.23 | | | | (15.18 | ) | | | 8 | | | | 0.70 | (c) | | | 0.80 | (c) | | | 1.70 | (c) | | | 130 | | | |
| | 11.23 | | | | (15.44 | ) | | | 8 | | | | 1.20 | (c) | | | 1.30 | (c) | | | 1.26 | (c) | | | 130 | | | |
|
| | 14.51 | | | | 8.90 | | | | 640,535 | | | | 0.95 | | | | 1.04 | | | | 1.23 | | | | 119 | | | |
| | 14.39 | | | | 8.03 | | | | 16,587 | | | | 1.70 | | | | 1.79 | | | | 0.46 | | | | 119 | | | |
| | 14.40 | | | | 7.99 | | | | 25,946 | | | | 1.70 | | | | 1.79 | | | | 0.47 | | | | 119 | | | |
| | 14.51 | | | | 9.24 | | | | 1,444,839 | | | | 0.55 | | | | 0.64 | | | | 1.64 | | | | 119 | | | |
| | 14.56 | | | | 8.70 | | | | 14,237 | | | | 1.05 | | | | 1.14 | | | | 1.14 | | | | 119 | | | |
|
| | 13.99 | | | | 13.43 | | | | 438,245 | | | | 0.99 | | | | 1.10 | | | | 1.31 | | | | 127 | | | |
| | 13.88 | | | | 12.56 | | | | 19,200 | | | | 1.75 | | | | 1.84 | | | | 0.49 | | | | 127 | | | |
| | 13.90 | | | | 12.66 | | | | 22,768 | | | | 1.75 | | | | 1.84 | | | | 0.51 | | | | 127 | | | |
| | 14.00 | | | | 13.92 | | | | 715,191 | | | | 0.59 | | | | 0.69 | | | | 1.69 | | | | 127 | | | |
| | 14.06 | | | | 13.35 | | | | 1,697 | | | | 1.11 | | | | 1.20 | | | | 1.28 | | | | 127 | | | |
|
The accompanying notes are an integral part of these financial statements. 101
GOLDMAN SACHS STRUCTURED SMALL CAP EQUITY FUND
Financial Highlights
Selected Data for a Share Outstanding Throughout Each Period
| | | | | | | | | | | | | | | | | | | | | | | | | | | | | | | |
| | | | | Income (loss) from
| | Distributions
| | |
| | | | | investment operations | | to shareholders | | |
| | | | |
| | | | | | | |
| | | | |
| | | Net asset
| |
| | | | | | | |
| | | | |
| | | value,
| | Net
| | Net realized
| | Total from
| | From net
| | From net
| | | | |
| | | beginning
| | investment
| | and unrealized
| | investment
| | investment
| | realized
| | Total
| | |
| Year - Share Class | | of period | | income (loss)(a) | | gain (loss) | | operations | | income | | gains | | distributions | | |
| |
FOR THE SIX MONTHS ENDED APRIL 30, (UNAUDITED) |
| 2011 - A | | $ | 10.92 | | | $ | 0.03 | (c) | | $ | 2.53 | | | $ | 2.56 | | | $ | (0.07 | ) | | $ | — | | | $ | (0.07 | ) | | |
| 2011 - B | | | 9.80 | | | | (0.02 | )(c) | | | 2.27 | | | | 2.25 | | | | — | | | | — | | | | — | | | |
| 2011 - C | | | 9.82 | | | | (0.02 | )(c) | | | 2.28 | | | | 2.26 | | | | (0.01 | ) | | | — | | | | (0.01 | ) | | |
| 2011 - Institutional | | | 11.34 | | | | 0.05 | (c) | | | 2.63 | | | | 2.68 | | | | (0.11 | ) | | | — | | | | (0.11 | ) | | |
| 2011 - Service | | | 10.82 | | | | 0.01 | (c) | | | 2.51 | | | | 2.52 | | | | (0.05 | ) | | | — | | | | (0.05 | ) | | |
| 2011 - IR | | | 10.87 | | | | 0.01 | (c) | | | 2.55 | | | | 2.56 | | | | (0.10 | ) | | | — | | | | (0.10 | ) | | |
| 2011 - R | | | 10.86 | | | | — | (c)(e) | | | 2.53 | | | | 2.53 | | | | (0.06 | ) | | | — | | | | (0.06 | ) | | |
| | | | | | | | | | | | | | | | | | | | | | | | | | | | | | | |
| | | | | | | | | | | | | | | | | | | | | | | | | | | | | | | |
FOR THE FISCAL YEARS ENDED OCTOBER 31, |
| 2010 - A | | | 8.45 | | | | 0.04 | (f) | | | 2.50 | | | | 2.54 | | | | (0.07 | ) | | | — | | | | (0.07 | ) | | |
| 2010 - B | | | 7.59 | | | | (0.03 | )(f) | | | 2.25 | | | | 2.22 | | | | (0.01 | ) | | | — | | | | (0.01 | ) | | |
| 2010 - C | | | 7.62 | | | | (0.03 | )(f) | | | 2.26 | | | | 2.23 | | | | (0.03 | ) | | | — | | | | (0.03 | ) | | |
| 2010 - Institutional | | | 8.78 | | | | 0.09 | (f) | | | 2.57 | | | | 2.66 | | | | (0.10 | ) | | | — | | | | (0.10 | ) | | |
| 2010 - Service | | | 8.37 | | | | 0.03 | (f) | | | 2.48 | | | | 2.51 | | | | (0.06 | ) | | | — | | | | (0.06 | ) | | |
| 2010 - IR | | | 8.42 | | | | 0.06 | (f) | | | 2.49 | | | | 2.55 | | | | (0.10 | ) | | | — | | | | (0.10 | ) | | |
| 2010 - R | | | 8.41 | | | | (0.01 | )(f) | | | 2.51 | | | | 2.50 | | | | (0.05 | ) | | | — | | | | (0.05 | ) | | |
|
| 2009 - A | | | 7.98 | | | | 0.04 | | | | 0.48 | | | | 0.52 | | | | (0.05 | ) | | | — | | | | (0.05 | ) | | |
| 2009 - B | | | 7.16 | | | | (0.01 | ) | | | 0.44 | | | | 0.43 | | | | — | | | | — | | | | — | | | |
| 2009 - C | | | 7.19 | | | | (0.01 | ) | | | 0.44 | | | | 0.43 | | | | — | | | | — | | | | — | | | |
| 2009 - Institutional | | | 8.30 | | | | 0.07 | | | | 0.51 | | | | 0.58 | | | | (0.10 | ) | | | — | | | | (0.10 | ) | | |
| 2009 - Service | | | 7.85 | | | | 0.04 | | | | 0.48 | | | | 0.52 | | | | — | | | | — | | | | — | | | |
| 2009 - IR | | | 7.96 | | | | 0.04 | | | | 0.50 | | | | 0.54 | | | | (0.08 | ) | | | — | | | | (0.08 | ) | | |
| 2009 - R | | | 7.93 | | | | (0.01 | ) | | | 0.53 | | | | 0.52 | | | | (0.04 | ) | | | — | | | | (0.04 | ) | | |
| | | | | | | | | | | | | | | | | | | | | | | | | | | | | | | |
| | | | | | | | | | | | | | | | | | | | | | | | | | | | | | | |
FOR THE PERIOD SEPTEMBER 1, 2008 TO OCTOBER 31, 2008* |
| 2008 - A | | | 11.00 | | | | 0.02 | | | | (3.04 | ) | | | (3.02 | ) | | | — | | | | — | | | | — | | | |
| 2008 - B | | | 9.89 | | | | — | (e) | | | (2.73 | ) | | | (2.73 | ) | | | — | | | | — | | | | — | | | |
| 2008 - C | | | 9.94 | | | | — | (e) | | | (2.75 | ) | | | (2.75 | ) | | | — | | | | — | | | | — | | | |
| 2008 - Institutional | | | 11.45 | | | | 0.02 | | | | (3.17 | ) | | | (3.15 | ) | | | — | | | | — | | | | — | | | |
| 2008 - Service | | | 10.84 | | | | 0.01 | | | | (3.00 | ) | | | (2.99 | ) | | | — | | | | — | | | | — | | | |
| 2008 - IR | | | 10.98 | | | | 0.02 | | | | (3.04 | ) | | | (3.02 | ) | | | — | | | | — | | | | — | | | |
| 2008 - R | | | 10.95 | | | | 0.01 | | | | (3.03 | ) | | | (3.02 | ) | | | — | | | | — | | | | — | | | |
| | | | | | | | | | | | | | | | | | | | | | | | | | | | | | | |
| | | | | | | | | | | | | | | | | | | | | | | | | | | | | | | |
FOR THE FISCAL YEARS ENDED AUGUST 31, |
| 2008 - A | | | 12.89 | | | | 0.01 | | | | (1.23 | ) | | | (1.22 | ) | | | (0.01 | ) | | | (0.66 | ) | | | (0.67 | ) | | |
| 2008 - B | | | 11.74 | | | | (0.06 | ) | | | (1.13 | ) | | | (1.19 | ) | | | — | | | | (0.66 | ) | | | (0.66 | ) | | |
| 2008 - C | | | 11.79 | | | | (0.06 | ) | | | (1.13 | ) | | | (1.19 | ) | | | — | | | | (0.66 | ) | | | (0.66 | ) | | |
| 2008 - Institutional | | | 13.37 | | | | 0.06 | | | | (1.27 | ) | | | (1.21 | ) | | | (0.05 | ) | | | (0.66 | ) | | | (0.71 | ) | | |
| 2008 - Service | | | 12.72 | | | | 0.01 | | | | (1.23 | ) | | | (1.22 | ) | | | — | | | | (0.66 | ) | | | (0.66 | ) | | |
| 2008 - IR (Commenced November 30, 2007) | | | 12.16 | | | | 0.03 | | | | (0.50 | ) | | | (0.47 | ) | | | (0.05 | ) | | | (0.66 | ) | | | (0.71 | ) | | |
| 2008 - R (Commenced November 30, 2007) | | | 12.16 | | | | (0.01 | ) | | | (0.49 | ) | | | (0.50 | ) | | | (0.05 | ) | | | (0.66 | ) | | | (0.71 | ) | | |
|
| 2007 - A | | | 13.76 | | | | 0.04 | | | | (0.06 | ) | | | (0.02 | ) | | | (0.01 | ) | | | (0.84 | ) | | | (0.85 | ) | | |
| 2007 - B | | | 12.69 | | | | (0.06 | ) | | | (0.05 | ) | | | (0.11 | ) | | | — | | | | (0.84 | ) | | | (0.84 | ) | | |
| 2007 - C | | | 12.74 | | | | (0.06 | ) | | | (0.05 | ) | | | (0.11 | ) | | | — | | | | (0.84 | ) | | | (0.84 | ) | | |
| 2007 - Institutional | | | 14.23 | | | | 0.10 | | | | (0.06 | ) | | | 0.04 | | | | (0.06 | ) | | | (0.84 | ) | | | (0.90 | ) | | |
| 2007 - Service | | | 13.59 | | | | 0.02 | | | | (0.05 | ) | | | (0.03 | ) | | | — | | | | (0.84 | ) | | | (0.84 | ) | | |
|
| 2006 - A | | | 14.55 | | | | — | (e) | | | 0.35 | | | | 0.35 | | | | — | | | | (1.14 | ) | | | (1.14 | ) | | |
| 2006 - B | | | 13.60 | | | | (0.10 | ) | | | 0.33 | | | | 0.23 | | | | — | | | | (1.14 | ) | | | (1.14 | ) | | |
| 2006 - C | | | 13.64 | | | | (0.10 | ) | | | 0.34 | | | | 0.24 | | | | — | | | | (1.14 | ) | | | (1.14 | ) | | |
| 2006 - Institutional | | | 14.95 | | | | 0.06 | | | | 0.36 | | | | 0.42 | | | | — | | | | (1.14 | ) | | | (1.14 | ) | | |
| 2006 - Service | | | 14.40 | | | | (0.01 | ) | | | 0.34 | | | | 0.33 | | | | — | | | | (1.14 | ) | | | (1.14 | ) | | |
|
| | |
| * | | The Fund changed its fiscal year end from August 31 to October 31. |
| (a) | | Calculated based on the average shares outstanding methodology. |
| (b) | | Assumes investment at the net asset value at the beginning of the period, reinvestment of all dividends and distributions, a complete redemption of the investment at the net asset value at the end of the period and no sales or redemption charges. Total returns would be reduced if a sales or redemption charge was taken into account. Returns do not reflect the deduction of taxes that a shareholder would pay on Fund distributions or the redemption of Fund shares. Total returns for periods less than one full year are not annualized. |
| (c) | | Reflects income recognized from non-recurring special dividends which amounted to $0.03 per share and 0.50% of average net assets. |
| (d) | | Annualized. |
| (e) | | Amount is less than $0.005 per share. |
| (f) | | Reflects income recognized from non-recurring special dividends which amounted to $0.06 per share and 0.56% of average net assets. |
| (g) | | Amount is less than 0.005% of average net assets. |
102 The accompanying notes are an integral part of these financial statements.
GOLDMAN SACHS STRUCTURED SMALL CAP EQUITY FUND
| | | | | | | | | | | | | | | | | | | | | | | | | | | | | |
| | | | | | | | | | |
| | | | |
| | | | | | | | | | |
| | | | |
| | | | | | | | | | | Ratio of
| | | | |
| | | | | Net assets,
| | Ratio of
| | Ratio of
| | net investment
| | | | |
Net asset
| | | | end of
| | net expenses
| | total expenses
| | income (loss)
| | Portfolio
| | |
value, end
| | Total
| | period
| | to average
| | to average
| | to average
| | turnover
| | |
| of period | | return(b) | | (in 000s) | | net assets | | net assets | | net assets | | rate | | |
| |
| |
| $ | 13.41 | | | | 23.48 | % | | $ | 95,965 | | | | 1.25 | %(d) | | | 1.39 | %(d) | | | 0.42 | %(c)(d) | | | 16 | % | | |
| | 12.05 | | | | 22.96 | | | | 1,955 | | | | 2.00 | (d) | | | 2.14 | (d) | | | (0.37 | )(c)(d) | | | 16 | | | |
| | 12.07 | | | | 22.98 | | | | 16,466 | | | | 2.00 | (d) | | | 2.14 | (d) | | | (0.40 | )(c)(d) | | | 16 | | | |
| | 13.91 | | | | 23.76 | | | | 176,900 | | | | 0.85 | (d) | | | 0.99 | (d) | | | 0.85 | (c)(d) | | | 16 | | | |
| | 13.29 | | | | 23.37 | | | | 1,890 | | | | 1.35 | (d) | | | 1.49 | (d) | | | 0.22 | (c)(d) | | | 16 | | | |
| | 13.33 | | | | 23.66 | | | | 5,417 | | | | 1.00 | (d) | | | 1.14 | (d) | | | 0.24 | (c)(d) | | | 16 | | | |
| | 13.33 | | | | 23.36 | | | | 292 | | | | 1.50 | (d) | | | 1.64 | (d) | | | 0.04 | (c)(d) | | | 16 | | | |
| | | | | | | | | | | | | | | | | | | | | | | | | | | | | |
| | | | | | | | | | | | | | | | | | | | | | | | | | | | | |
| |
| | 10.92 | | | | 30.23 | | | | 104,435 | | | | 1.25 | | | | 1.39 | | | | 0.43 | (f) | | | 70 | | | |
| | 9.80 | | | | 29.27 | | | | 2,101 | | | | 2.00 | | | | 2.14 | | | | (0.31 | )(f) | | | 70 | | | |
| | 9.82 | | | | 29.29 | | | | 13,788 | | | | 2.00 | | | | 2.14 | | | | (0.37 | )(f) | | | 70 | | | |
| | 11.34 | | | | 30.76 | | | | 240,597 | | | | 0.85 | | | | 0.99 | | | | 0.88 | (f) | | | 70 | | | |
| | 10.82 | | | | 30.16 | | | | 1,431 | | | | 1.35 | | | | 1.49 | | | | 0.33 | (f) | | | 70 | | | |
| | 10.87 | | | | 30.55 | | | | 35 | | | | 1.00 | | | | 1.14 | | | | 0.63 | (f) | | | 70 | | | |
| | 10.86 | | | | 29.90 | | | | 184 | | | | 1.50 | | | | 1.64 | | | | (0.11 | )(f) | | | 70 | | | |
|
| | 8.45 | | | | 6.70 | | | | 130,439 | | | | 1.25 | | | | 1.40 | | | | 0.61 | | | | 167 | | | |
| | 7.59 | | | | 6.01 | | | | 2,737 | | | | 2.00 | | | | 2.15 | | | | (0.11 | ) | | | 167 | | | |
| | 7.62 | | | | 5.98 | | | | 11,226 | | | | 2.00 | | | | 2.15 | | | | (0.18 | ) | | | 167 | | | |
| | 8.78 | | | | 7.13 | | | | 349,989 | | | | 0.85 | | | | 1.00 | | | | 0.96 | | | | 167 | | | |
| | 8.37 | | | | 6.62 | | | | 1,588 | | | | 1.35 | | | | 1.50 | | | | 0.53 | | | | 167 | | | |
| | 8.42 | | | | 7.09 | | | | 25 | | | | 1.00 | | | | 1.15 | | | | 0.52 | | | | 167 | | | |
| | 8.41 | | | | 6.61 | | | | 21 | | | | 1.50 | | | | 1.65 | | | | (0.10 | ) | | | 167 | | | |
| | | | | | | | | | | | | | | | | | | | | | | | | | | | | |
| | | | | | | | | | | | | | | | | | | | | | | | | | | | | |
| |
| | 7.98 | | | | (27.45 | ) | | | 162,243 | | | | 1.25 | (d) | | | 1.46 | (d) | | | 0.76 | (d) | | | 31 | | | |
| | 7.16 | | | | (27.60 | ) | | | 3,806 | | | | 2.00 | (d) | | | 2.21 | (d) | | | 0.01 | (d) | | | 31 | | | |
| | 7.19 | | | | (27.67 | ) | | | 11,262 | | | | 2.00 | (d) | | | 2.21 | (d) | | | 0.01 | (d) | | | 31 | | | |
| | 8.30 | | | | (27.51 | ) | | | 419,179 | | | | 0.85 | (d) | | | 1.06 | (d) | | | 1.16 | (d) | | | 31 | | | |
| | 7.85 | | | | (27.58 | ) | | | 2,121 | | | | 1.35 | (d) | | | 1.56 | (d) | | | 0.66 | (d) | | | 31 | | | |
| | 7.96 | | | | (27.50 | ) | | | 7 | | | | 1.00 | (d) | | | 1.21 | (d) | | | 0.99 | (d) | | | 31 | | | |
| | 7.93 | | | | (27.58 | ) | | | 7 | | | | 1.50 | (d) | | | 1.71 | (d) | | | 0.54 | (d) | | | 31 | | | |
| | | | | | | | | | | | | | | | | | | | | | | | | | | | | |
| | | | | | | | | | | | | | | | | | | | | | | | | | | | | |
| |
| | 11.00 | | | | (9.73 | ) | | | 211,930 | | | | 1.25 | | | | 1.36 | | | | 0.12 | | | | 160 | | | |
| | 9.89 | | | | (10.39 | ) | | | 5,807 | | | | 2.00 | | | | 2.11 | | | | (0.57 | ) | | | 160 | | | |
| | 9.94 | | | | (10.35 | ) | | | 16,250 | | | | 2.00 | | | | 2.11 | | | | (0.60 | ) | | | 160 | | | |
| | 11.45 | | | | (9.29 | ) | | | 547,109 | | | | 0.85 | | | | 0.96 | | | | 0.54 | | | | 160 | | | |
| | 10.84 | | | | (9.80 | ) | | | 2,904 | | | | 1.35 | | | | 1.46 | | | | 0.12 | | | | 160 | | | |
| | 10.98 | | | | (4.14 | ) | | | 10 | | | | 1.00 | (d) | | | 1.11 | (d) | | | 0.36 | (d) | | | 160 | | | |
| | 10.95 | | | | (4.40 | ) | | | 10 | | | | 1.50 | (d) | | | 1.61 | (d) | | | (0.07 | )(d) | | | 160 | | | |
|
| | 12.89 | | | | (0.76 | ) | | | 208,875 | | | | 1.26 | | | | 1.34 | | | | 0.24 | | | | 154 | | | |
| | 11.74 | | | | (1.52 | ) | | | 10,875 | | | | 2.01 | | | | 2.09 | | | | (0.51 | ) | | | 154 | | | |
| | 11.79 | | | | (1.44 | ) | | | 21,631 | | | | 2.01 | | | | 2.09 | | | | (0.51 | ) | | | 154 | | | |
| | 13.37 | | | | (0.32 | ) | | | 575,499 | | | | 0.86 | | | | 0.94 | | | | 0.64 | | | | 154 | | | |
| | 12.72 | | | | (0.80 | ) | | | 26,406 | | | | 1.36 | | | | 1.44 | | | | 0.14 | | | | 154 | | | |
|
| | 13.76 | | | | 2.42 | | | | 185,508 | | | | 1.27 | | | | 1.37 | | | | — | (g) | | | 151 | | | |
| | 12.69 | | | | 1.66 | | | | 16,197 | | | | 2.02 | | | | 2.11 | | | | (0.75 | ) | | | 151 | | | |
| | 12.74 | | | | 1.65 | | | | 25,899 | | | | 2.02 | | | | 2.11 | | | | (0.75 | ) | | | 151 | | | |
| | 14.23 | | | | 2.77 | | | | 504,101 | | | | 0.87 | | | | 0.97 | | | | 0.40 | | | | 151 | | | |
| | 13.59 | | | | 2.30 | | | | 29,501 | | | | 1.37 | | | | 1.46 | | | | (0.09 | ) | | | 151 | | | |
|
The accompanying notes are an integral part of these financial statements. 103
GOLDMAN SACHS STRUCTURED SMALL CAP GROWTH FUND
Financial Highlights
Selected Data for a Share Outstanding Throughout Each Period
| | | | | | | | | | | | | | | | | | | | | | | | | | | | | | | |
| | | | | Income (loss) from
| | Distributions
| | |
| | | | | investment operations | | to shareholders | | |
| | | | |
| | | | | |
| | | | | | |
| | | Net asset
| |
| | | | | |
| | | | | | |
| | | value,
| | Net
| | Net realized
| | Total from
| | From net
| | From net
| | | | |
| | | beginning
| | investment
| | and unrealized
| | investment
| | investment
| | realized
| | Total
| | |
| Year - Share Class | | of period | | income (loss)(a) | | gain (loss) | | operations | | income | | gains | | distributions | | |
| |
FOR THE SIX MONTHS ENDED APRIL 30, (UNAUDITED) |
| 2011 - A | | $ | 18.49 | | | $ | (0.02 | )(c) | | $ | 4.99 | | | $ | 4.97 | | | $ | — | | | $ | — | | | $ | — | | | |
| 2011 - B | | | 15.98 | | | | (0.08 | )(c) | | | 4.30 | | | | 4.22 | | | | — | | | | — | | | | — | | | |
| 2011 - C | | | 16.11 | | | | (0.09 | )(c) | | | 4.35 | | | | 4.26 | | | | — | | | | — | | | | — | | | |
| 2011 - Institutional | | | 20.38 | | | | 0.02 | (c) | | | 5.52 | | | | 5.54 | | | | — | | | | — | | | | — | | | |
| 2011 - IR | | | 18.58 | | | | (0.04 | )(c) | | | 5.07 | | | | 5.03 | | | | — | | | | — | | | | — | | | |
| 2011 - R | | | 18.33 | | | | (0.05 | )(c) | | | 4.95 | | | | 4.90 | | | | — | | | | — | | | | — | | | |
| | | | | | | | | | | | | | | | | | | | | | | | | | | | | | | |
| | | | | | | | | | | | | | | | | | | | | | | | | | | | | | | |
FOR THE FISCAL YEARS ENDED OCTOBER 31, |
| 2010 - A | | | 14.23 | | | | 0.01 | (e) | | | 4.30 | | | | 4.31 | | | | (0.05 | ) | | | — | | | | (0.05 | ) | | |
| 2010 - B | | | 12.35 | | | | (0.09 | )(e) | | | 3.72 | | | | 3.63 | | | | — | | | | — | | | | — | | | |
| 2010 - C | | | 12.45 | | | | (0.10 | )(e) | | | 3.76 | | | | 3.66 | | | | — | | | | — | | | | — | | | |
| 2010 - Institutional | | | 15.67 | | | | 0.07 | (e) | | | 4.74 | | | | 4.81 | | | | (0.10 | ) | | | — | | | | (0.10 | ) | | |
| 2010 - IR | | | 14.30 | | | | 0.04 | (e) | | | 4.33 | | | | 4.37 | | | | (0.09 | ) | | | — | | | | (0.09 | ) | | |
| 2010 - R | | | 14.15 | | | | (0.03 | )(e) | | | 4.27 | | | | 4.24 | | | | (0.06 | ) | | | — | | | | (0.06 | ) | | |
| |
|
| 2009 - A | | | 12.66 | | | | (0.01 | ) | | | 1.58 | | | | 1.57 | | | | — | | | | — | | | | — | | | |
| 2009 - B | | | 11.07 | | | | (0.08 | ) | | | 1.36 | | | | 1.28 | | | | — | | | | — | | | | — | | | |
| 2009 - C | | | 11.16 | | | | (0.09 | ) | | | 1.38 | | | | 1.29 | | | | — | | | | — | | | | — | | | |
| 2009 - Institutional | | | 13.88 | | | | 0.04 | | | | 1.75 | | | | 1.79 | | | | — | | | | — | | | | — | | | |
| 2009 - IR | | | 12.68 | | | | 0.03 | | | | 1.59 | | | | 1.62 | | | | — | | | | — | | | | — | | | |
| 2009 - R | | | 12.63 | | | | (0.06 | ) | | | 1.58 | | | | 1.52 | | | | — | | | | — | | | | — | | | |
| |
|
| 2008 - A | | | 36.25 | | | | (0.05 | ) | | | (9.43 | ) | | | (9.48 | ) | | | — | | | | (14.11 | ) | | | (14.11 | ) | | |
| 2008 - B | | | 33.77 | | | | (0.17 | ) | | | (8.42 | ) | | | (8.59 | ) | | | — | | | | (14.11 | ) | | | (14.11 | ) | | |
| 2008 - C | | | 33.92 | | | | (0.17 | ) | | | (8.48 | ) | | | (8.65 | ) | | | — | | | | (14.11 | ) | | | (14.11 | ) | | |
| 2008 - Institutional | | | 38.18 | | | | 0.02 | | | | (10.21 | ) | | | (10.19 | ) | | | — | | | | (14.11 | ) | | | (14.11 | ) | | |
| 2008 - IR (Commenced November 30, 2007) | | | 33.22 | | | | (0.01 | ) | | | (6.42 | ) | | | (6.43 | ) | | | — | | | | (14.11 | ) | | | (14.11 | ) | | |
| 2008 - R (Commenced November 30, 2007) | | | 33.22 | | | | (0.08 | ) | | | (6.40 | ) | | | (6.48 | ) | | | — | | | | (14.11 | ) | | | (14.11 | ) | | |
| |
|
| 2007 - A | | | 32.78 | | | | (0.27 | ) | | | 5.59 | | | | 5.32 | | | | — | | | | (1.85 | ) | | | (1.85 | ) | | |
| 2007 - B | | | 30.83 | | | | (0.46 | ) | | | 5.25 | | | | 4.79 | | | | — | | | | (1.85 | ) | | | (1.85 | ) | | |
| 2007 - C | | | 30.96 | | | | (0.46 | ) | | | 5.27 | | | | 4.81 | | | | — | | | | (1.85 | ) | | | (1.85 | ) | | |
| 2007 - Institutional | | | 34.28 | | | | (0.12 | ) | | | 5.87 | | | | 5.75 | | | | — | | | | (1.85 | ) | | | (1.85 | ) | | |
| |
|
| 2006 - A | | | 28.23 | | | | (0.38 | ) | | | 6.64 | | | | 6.26 | | | | — | | | | (1.71 | ) | | | (1.71 | ) | | |
| 2006 - B | | | 26.79 | | | | (0.52 | ) | | | 6.27 | | | | 5.75 | | | | — | | | | (1.71 | ) | | | (1.71 | ) | | |
| 2006 - C | | | 26.89 | | | | (0.52 | ) | | | 6.30 | | | | 5.78 | | | | — | | | | (1.71 | ) | | | (1.71 | ) | | |
| 2006 - Institutional | | | 29.32 | | | | (0.26 | ) | | | 6.93 | | | | 6.67 | | | | — | | | | (1.71 | ) | | | (1.71 | ) | | |
| |
|
| | |
| (a) | | Calculated based on the average shares outstanding methodology. |
| (b) | | Assumes investment at the net asset value at the beginning of the period, reinvestment of all dividends and distributions, a complete redemption of the investment at the net asset value at the end of the period and no sales or redemption charges. Total return would be reduced if a sales or redemption charge was taken into account. Returns do not reflect the deduction of taxes that a shareholder would pay on Fund distributions or the redemption of Fund shares. Total returns for periods less than one full year are not annualized. |
| (c) | | Reflects income recognized from non-recurring special dividends which amounted to $0.10 per share and 0.63% of average net assets. |
| (d) | | Annualized. |
| (e) | | Reflects income recognized from non-recurring special dividends which amounted to $0.04 per share and 0.41% of average net assets. |
104 The accompanying notes are an integral part of these financial statements.
GOLDMAN SACHS STRUCTURED SMALL CAP GROWTH FUND
| | | | | | | | | | | | | | | | | | | | | | | | | | | | | | | | | | | | | |
| | | | | | | | | | |
| | | | | | | | |
| | | | | | | | | | |
| | Ratio of
| | Ratio of
| | | | |
| | | | | Net assets,
| | Ratio of
| | Ratio of
| | Ratio of
| | net investment
| | net investment
| | | | |
Net asset
| | | | end of
| | net expenses
| | net expenses
| | total expenses
| | income (loss)
| | income (loss)
| | Portfolio
| | |
value, end
| | Total
| | period
| | to average
| | (not including fees
| | to average
| | to average
| | (not including fees
| | turnover
| | |
| of period | | return(b) | | (in 000s) | | net assets | | paid indirectly) | | net assets | | net assets | | paid indirectly) | | rate | | |
| |
| |
| $ | 23.46 | | | | 26.88 | % | | $ | 29,168 | | | | 1.25 | %(d) | | | 1.25 | %(d) | | | 1.96 | %(d) | | | (0.21 | )%(c)(d) | | | (0.21 | )%(c)(d) | | | 27 | % | | |
| | 20.20 | | | | 26.41 | | | | 6,692 | | | | 2.00 | (d) | | | 2.00 | (d) | | | 2.71 | (d) | | | (0.92 | )(c)(d) | | | (0.92 | )(c)(d) | | | 27 | | | |
| | 20.37 | | | | 26.44 | | | | 6,161 | | | | 2.00 | (d) | | | 2.00 | (d) | | | 2.71 | (d) | | | (0.94 | )(c)(d) | | | (0.94 | )(c)(d) | | | 27 | | | |
| | 25.92 | | | | 27.18 | | | | 7,652 | | | | 0.85 | (d) | | | 0.85 | (d) | | | 1.56 | (d) | | | 0.19 | (c)(d) | | | 0.19 | (c)(d) | | | 27 | | | |
| | 23.61 | | | | 27.07 | | | | 1,039 | | | | 1.00 | (d) | | | 1.00 | (d) | | | 1.71 | (d) | | | (0.36 | )(c)(d) | | | (0.36 | )(c)(d) | | | 27 | | | |
| | 23.23 | | | | 26.73 | | | | 61 | | | | 1.50 | (d) | | | 1.50 | (d) | | | 2.21 | (d) | | | (0.45 | )(c)(d) | | | (0.45 | )(c)(d) | | | 27 | | | |
| | | | | | | | | | | | | | | | | | | | | | | | | | | | | | | | | | | | | |
| | | | | | | | | | | | | | | | | | | | | | | | | | | | | | | | | | | | | |
| |
| | 18.49 | | | | 30.38 | | | | 22,598 | | | | 1.25 | | | | 1.25 | | | | 2.09 | | | | 0.03 | (e) | | | 0.03 | (e) | | | 100 | | | |
| | 15.98 | | | | 29.39 | | | | 6,395 | | | | 2.00 | | | | 2.00 | | | | 2.84 | | | | (0.65 | )(e) | | | (0.65 | )(e) | | | 100 | | | |
| | 16.11 | | | | 29.40 | | | | 5,263 | | | | 2.00 | | | | 2.00 | | | | 2.84 | | | | (0.70 | )(e) | | | (0.70 | )(e) | | | 100 | | | |
| | 20.38 | | | | 30.87 | | | | 5,649 | | | | 0.85 | | | | 0.85 | | | | 1.69 | | | | 0.39 | (e) | | | 0.39 | (e) | | | 100 | | | |
| | 18.58 | | | | 30.66 | | | | 10 | | | | 1.00 | | | | 1.00 | | | | 1.84 | | | | 0.26 | (e) | | | 0.26 | (e) | | | 100 | | | |
| | 18.33 | | | | 30.07 | | | | 47 | | | | 1.50 | | | | 1.50 | | | | 2.34 | | | | (0.21 | )(e) | | | (0.21 | )(e) | | | 100 | | | |
| |
|
| | 14.23 | | | | 12.40 | | | | 19,090 | | | | 1.25 | | | | 1.25 | | | | 2.44 | | | | (0.06 | ) | | | (0.06 | ) | | | 205 | | | |
| | 12.35 | | | | 11.56 | | | | 7,608 | | | | 2.00 | | | | 2.00 | | | | 3.19 | | | | (0.78 | ) | | | (0.78 | ) | | | 205 | | | |
| | 12.45 | | | | 11.56 | | | | 4,793 | | | | 2.00 | | | | 2.00 | | | | 3.19 | | | | (0.82 | ) | | | (0.82 | ) | | | 205 | | | |
| | 15.67 | | | | 12.90 | | | | 4,026 | | | | 0.85 | | | | 0.85 | | | | 2.04 | | | | 0.31 | | | | 0.31 | | | | 205 | | | |
| | 14.30 | | | | 12.78 | | | | 7 | | | | 1.00 | | | | 1.00 | | | | 2.19 | | | | 0.18 | | | | 0.18 | | | | 205 | | | |
| | 14.15 | | | | 12.03 | | | | 42 | | | | 1.50 | | | | 1.50 | | | | 2.69 | | | | (0.44 | ) | | | (0.44 | ) | | | 205 | | | |
| |
|
| | 12.66 | | | | (39.66 | ) | | | 19,402 | | | | 1.25 | | | | 1.25 | | | | 2.00 | | | | (0.32 | ) | | | (0.32 | ) | | | 182 | | | |
| | 11.07 | | | | (40.12 | ) | | | 10,176 | | | | 2.00 | | | | 2.00 | | | | 2.75 | | | | (1.07 | ) | | | (1.07 | ) | | | 182 | | | |
| | 11.16 | | | | (40.12 | ) | | | 4,918 | | | | 2.00 | | | | 2.00 | | | | 2.75 | | | | (1.07 | ) | | | (1.07 | ) | | | 182 | | | |
| | 13.88 | | | | (39.44 | ) | | | 3,662 | | | | 0.85 | | | | 0.85 | | | | 1.60 | | | | (0.12 | ) | | | (0.12 | ) | | | 182 | | | |
| | 12.68 | | | | (34.14 | ) | | | 7 | | | | 1.00 | (d) | | | 1.00 | (d) | | | 1.75 | (d) | | | (0.06 | )(d) | | | (0.06 | )(d) | | | 182 | | | |
| | 12.63 | | | | (34.40 | ) | | | 7 | | | | 1.50 | (d) | | | 1.50 | (d) | | | 2.25 | (d) | | | (0.40 | )(d) | | | (0.40 | )(d) | | | 182 | | | |
| |
|
| | 36.25 | | | | 17.04 | | | | 45,070 | | | | 1.25 | | | | 1.51 | | | | 2.17 | | | | (0.79 | ) | | | (1.05 | ) | | | 154 | | | |
| | 33.77 | | | | 16.32 | | | | 26,184 | | | | 1.87 | | | | 2.13 | | | | 2.78 | | | | (1.40 | ) | | | (1.67 | ) | | | 154 | | | |
| | 33.92 | | | | 16.32 | | | | 11,911 | | | | 1.87 | | | | 2.13 | | | | 2.78 | | | | (1.40 | ) | | | (1.67 | ) | | | 154 | | | |
| | 38.18 | | | | 17.53 | | | | 15,686 | | | | 0.79 | | | | 1.10 | | | | 1.74 | | | | (0.33 | ) | | | (0.63 | ) | | | 154 | | | |
| |
|
| | 32.78 | | | | 23.15 | | | | 47,721 | | | | 1.60 | | | | 1.65 | | | | 2.18 | | | | (1.25 | ) | | | (1.30 | ) | | | 60 | | | |
| | 30.83 | | | | 22.40 | | | | 30,515 | | | | 2.15 | | | | 2.20 | | | | 2.73 | | | | (1.80 | ) | | | (1.85 | ) | | | 60 | | | |
| | 30.96 | | | | 22.48 | | | | 13,294 | | | | 2.15 | | | | 2.20 | | | | 2.73 | | | | (1.80 | ) | | | (1.85 | ) | | | 60 | | | |
| | 34.28 | | | | 23.71 | | | | 19,037 | | | | 1.15 | | | | 1.20 | | | | 1.73 | | | | (0.80 | ) | | | (0.85 | ) | | | 60 | | | |
| |
|
The accompanying notes are an integral part of these financial statements. 105
GOLDMAN SACHS STRUCTURED SMALL CAP VALUE FUND
Financial Highlights
Selected Data for a Share Outstanding Throughout Each Period
| | | | | | | | | | | | | | | | | | | | | | | | | | | | | | | |
| | | | | Income (loss) from
| | Distributions to
| | |
| | | | | investment operations | | shareholders | | |
| | | | |
| | | | | |
| | | | | | |
| | | Net asset
| |
| | | | | |
| | | | | | |
| | | value,
| | Net
| | Net realized
| | Total from
| | From net
| | From net
| | | | |
| | | beginning
| | investment
| | and unrealized
| | investment
| | investment
| | realized
| | Total
| | |
| Year - Share Class | | of period | | income (loss)(a) | | gain (loss) | | operations | | income | | gains | | distributions | | |
| |
FOR THE SIX MONTHS ENDED APRIL 30, (UNAUDITED) |
| 2011 - A | | $ | 24.10 | | | $ | 0.09 | (c) | | $ | 5.13 | | | $ | 5.22 | | | $ | (0.16 | ) | | $ | — | | | $ | (0.16 | ) | | |
| 2011 - B | | | 16.87 | | | | (0.01 | )(c) | | | 3.59 | | | | 3.58 | | | | (0.02 | ) | | | — | | | | (0.02 | ) | | |
| 2011 - C | | | 19.06 | | | | (0.01 | )(c) | | | 4.06 | | | | 4.05 | | | | (0.03 | ) | | | — | | | | (0.03 | ) | | |
| 2011 - Institutional | | | 29.80 | | | | 0.18 | (c) | | | 6.32 | | | | 6.50 | | | | (0.25 | ) | | | — | | | | (0.25 | ) | | |
| 2011 - IR | | | 24.15 | | | | 0.12 | (c) | | | 5.12 | | | | 5.24 | | | | (0.23 | ) | | | — | | | | (0.23 | ) | | |
| 2011 - R | | | 23.99 | | | | 0.04 | (c) | | | 5.11 | | | | 5.15 | | | | (0.11 | ) | | | — | | | | (0.11 | ) | | |
| | | | | | | | | | | | | | | | | | | | | | | | | | | | | | | |
| | | | | | | | | | | | | | | | | | | | | | | | | | | | | | | |
FOR THE FISCAL YEARS ENDED OCTOBER 31,* |
| 2010 - A | | | 18.78 | | | | 0.16 | (e) | | | 5.34 | | | | 5.50 | | | | (0.18 | ) | | | — | | | | (0.18 | ) | | |
| 2010 - B | | | 13.24 | | | | — | (e)(f) | | | 3.75 | | | | 3.75 | | | | (0.12 | ) | | | — | | | | (0.12 | ) | | |
| 2010 - C | | | 14.94 | | | | — | (e)(f) | | | 4.24 | | | | 4.24 | | | | (0.12 | ) | | | — | | | | (0.12 | ) | | |
| 2010 - Institutional | | | 23.11 | | | | 0.30 | (e) | | | 6.59 | | | | 6.89 | | | | (0.20 | ) | | | — | | | | (0.20 | ) | | |
| 2010 - IR | | | 18.78 | | | | 0.22 | (e) | | | 5.34 | | | | 5.56 | | | | (0.19 | ) | | | — | | | | (0.19 | ) | | |
| 2010 - R | | | 18.74 | | | | 0.10 | (e) | | | 5.33 | | | | 5.43 | | | | (0.18 | ) | | | — | | | | (0.18 | ) | | |
| |
|
| 2009 - A | | | 18.62 | | | | 0.18 | | | | 0.25 | | | | 0.43 | | | | (0.27 | ) | | | — | | | | (0.27 | ) | | |
| 2009 - B | | | 13.16 | | | | 0.05 | | | | 0.19 | | | | 0.24 | | | | (0.16 | ) | | | — | | | | (0.16 | ) | | |
| 2009 - C | | | 14.84 | | | | 0.05 | | | | 0.18 | | | | 0.23 | | | | (0.13 | ) | | | — | | | | (0.13 | ) | | |
| 2009 - Institutional | | | 22.89 | | | | 0.31 | | | | 0.28 | | | | 0.59 | | | | (0.37 | ) | | | — | | | | (0.37 | ) | | |
| 2009 - IR | | | 18.69 | | | | 0.22 | | | | 0.21 | | | | 0.43 | | | | (0.34 | ) | | | — | | | | (0.34 | ) | | |
| 2009 - R | | | 18.62 | | | | 0.12 | | | | 0.23 | | | | 0.35 | | | | (0.23 | ) | | | — | | | | (0.23 | ) | | |
| |
|
| 2008 - A | | | 89.04 | | | | 0.14 | | | | (14.42 | ) | | | (14.28 | ) | | | — | | | | (56.14 | ) | | | (56.14 | ) | | |
| 2008 - B | | | 81.13 | | | | (0.07 | ) | | | (11.76 | ) | | | (11.83 | ) | | | — | | | | (56.14 | ) | | | (56.14 | ) | | |
| 2008 - C | | | 83.58 | | | | — | (f) | | | (12.60 | ) | | | (12.60 | ) | | | — | | | | (56.14 | ) | | | (56.14 | ) | | |
| 2008 - Institutional | | | 95.27 | | | | 0.42 | | | | (16.66 | ) | | | (16.24 | ) | | | — | | | | (56.14 | ) | | | (56.14 | ) | | |
| 2008 - IR (Commenced November 30, 2007) | | | 81.41 | | | | 0.21 | | | | (6.79 | ) | | | (6.58 | ) | | | — | | | | (56.14 | ) | | | (56.14 | ) | | |
| 2008 - R (Commenced November 30, 2007) | | | 81.41 | | | | 0.14 | | | | (6.79 | ) | | | (6.65 | ) | | | — | | | | (56.14 | ) | | | (56.14 | ) | | |
| |
|
| 2007 - A | | | 92.33 | | | | (0.35 | ) | | | 7.42 | | | | 7.07 | | | | (0.21 | ) | | | (10.15 | ) | | | (10.36 | ) | | |
| 2007 - B | | | 85.26 | | | | (0.84 | ) | | | 6.86 | | | | 6.02 | | | | — | | | | (10.15 | ) | | | (10.15 | ) | | |
| 2007 - C | | | 87.57 | | | | (0.84 | ) | | | 7.00 | | | | 6.16 | | | | — | | | | (10.15 | ) | | | (10.15 | ) | | |
| 2007 - Institutional | | | 98.14 | | | | — | (f) | | | 7.98 | | | | 7.98 | | | | (0.70 | ) | | | (10.15 | ) | | | (10.85 | ) | | |
| |
|
| 2006 - A | | | 80.43 | | | | 0.35 | | | | 14.70 | | | | 15.05 | | | | — | | | | (3.15 | ) | | | (3.15 | ) | | |
| 2006 - B | | | 74.90 | | | | (0.14 | ) | | | 13.65 | | | | 13.51 | | | | — | | | | (3.15 | ) | | | (3.15 | ) | | |
| 2006 - C | | | 76.86 | | | | (0.14 | ) | | | 14.00 | | | | 13.86 | | | | — | | | | (3.15 | ) | | | (3.15 | ) | | |
| 2006 - Institutional | | | 84.91 | | | | 0.77 | | | | 15.61 | | | | 16.38 | | | | — | | | | (3.15 | ) | | | (3.15 | ) | | |
| |
|
| | |
| * | | All per share amounts representing data prior to February 9, 2009 have been restated to reflect a 7 for 1 reverse stock split which occurred on that date. |
| (a) | | Calculated based on the average shares outstanding methodology. |
| (b) | | Assumes investment at the net asset value at the beginning of the period, reinvestment of all dividends and distributions, a complete redemption of the investment at the net asset value at the end of the period and no sales or redemption charges. Total returns would be reduced if a sales or redemption charge was taken into account. Returns do not reflect the deduction of taxes that a shareholder would pay on Fund distributions or the redemption of Fund shares. Total returns for periods less than one full year are not annualized. |
| (c) | | Reflects income recognized from non-recurring special dividends which amounted to $0.04 and 0.30% of average net assets. |
| (d) | | Annualized. |
| (e) | | Reflects income recognized from non-recurring special dividends which amounted to $0.06 and 0.33% of average net assets. |
| (f) | | Amount is less than $0.005 per share. |
106 The accompanying notes are an integral part of these financial statements.
GOLDMAN SACHS STRUCTURED SMALL CAP VALUE FUND
| | | | | | | | | | | | | | | | | | | | | | | | | | | | | | | | | | | | | |
| | | | | | | | | | | | | | |
| | | | |
| | | | | | | | | | | | | | |
| | | | |
| | | | | | | | | | | | | Ratio of
| | Ratio of
| | | | |
| | | | | Net assets,
| | Ratio of
| | Ratio of
| | Ratio of
| | net investment
| | net investment
| | | | |
Net asset
| | | | end of
| | net expenses
| | net expenses
| | total expenses
| | income (loss)
| | income (loss)
| | Portfolio
| | |
value, end
| | Total
| | period
| | to average
| | (not including fees
| | to average
| | to average
| | (not including fees
| | turnover
| | |
| of period | | return(b) | | (in 000s) | | net assets | | paid indirectly) | | net assets | | net assets | | paid indirectly) | | rate | | |
| |
| |
| $ | 29.16 | | | | 21.72 | % | | $ | 108,214 | | | | 1.25 | %(d) | | | 1.25 | %(d) | | | 1.53 | %(d) | | | 0.67 | %(c)(d) | | | 0.67 | %(c)(d) | | | 15 | % | | |
| | 20.43 | | | | 21.23 | | | | 19,957 | | | | 2.00 | (d) | | | 2.00 | (d) | | | 2.28 | (d) | | | (0.07 | )(c)(d) | | | (0.07 | )(c)(d) | | | 15 | | | |
| | 23.08 | | | | 21.23 | | | | 23,367 | | | | 2.00 | (d) | | | 2.00 | (d) | | | 2.28 | (d) | | | (0.07 | )(c)(d) | | | (0.07 | )(c)(d) | | | 15 | | | |
| | 36.05 | | | | 21.92 | | | | 3,502 | | | | 0.85 | (d) | | | 0.85 | (d) | | | 1.13 | (d) | | | 1.06 | (c)(d) | | | 1.06 | (c)(d) | | | 15 | | | |
| | 29.16 | | | | 21.83 | | | | 35 | | | | 1.00 | (d) | | | 1.00 | (d) | | | 1.28 | (d) | | | 0.92 | (c)(d) | | | 0.92 | (c)(d) | | | 15 | | | |
| | 29.03 | | | | 21.51 | | | | 222 | | | | 1.50 | (d) | | | 1.50 | (d) | | | 1.78 | (d) | | | 0.28 | (c)(d) | | | 0.28 | (c)(d) | | | 15 | | | |
| | | | | | | | | | | | | | | | | | | | | | | | | | | | | | | | | | | | | |
| | | | | | | | | | | | | | | | | | | | | | | | | | | | | | | | | | | | | |
| |
| | 24.10 | | | | 29.47 | | | | 95,864 | | | | 1.25 | | | | 1.25 | | | | 1.55 | | | | 0.72 | (e) | | | 0.72 | (e) | | | 85 | | | |
| | 16.87 | | | | 28.54 | | | | 20,172 | | | | 2.00 | | | | 2.00 | | | | 2.30 | | | | 0.01 | (e) | | | 0.01 | (e) | | | 85 | | | |
| | 19.06 | | | | 28.54 | | | | 21,671 | | | | 2.00 | | | | 2.00 | | | | 2.30 | | | | (0.02 | )(e) | | | (0.02 | )(e) | | | 85 | | | |
| | 29.80 | | | | 30.03 | | | | 2,462 | | | | 0.85 | | | | 0.85 | | | | 1.15 | | | | 1.10 | (e) | | | 1.10 | (e) | | | 85 | | | |
| | 24.15 | | | | 29.83 | | | | 28 | | | | 1.00 | | | | 1.00 | | | | 1.30 | | | | 0.99 | (e) | | | 0.99 | (e) | | | 85 | | | |
| | 23.99 | | | | 29.17 | | | | 120 | | | | 1.50 | | | | 1.50 | | | | 1.80 | | | | 0.45 | (e) | | | 0.45 | (e) | | | 85 | | | |
| |
|
| | 18.78 | | | | 2.64 | | | | 79,873 | | | | 1.25 | | | | 1.25 | | | | 1.69 | | | | 1.11 | | | | 1.11 | | | | 184 | | | |
| | 13.24 | | | | 2.27 | | | | 27,689 | | | | 2.00 | | | | 2.00 | | | | 2.44 | | | | 0.42 | | | | 0.42 | | | | 184 | | | |
| | 14.94 | | | | 1.61 | | | | 20,883 | | | | 2.00 | | | | 2.00 | | | | 2.44 | | | | 0.38 | | | | 0.38 | | | | 184 | | | |
| | 23.11 | | | | 2.97 | | | | 1,244 | | | | 0.85 | | | | 0.85 | | | | 1.29 | | | | 1.55 | | | | 1.55 | | | | 184 | | | |
| | 18.78 | | | | 2.43 | | | | 7 | | | | 1.00 | | | | 1.00 | | | | 1.44 | | | | 1.34 | | | | 1.34 | | | | 184 | | | |
| | 18.74 | | | | 2.17 | | | | 79 | | | | 1.50 | | | | 1.50 | | | | 1.94 | | | | 0.68 | | | | 0.68 | | | | 184 | | | |
| |
|
| | 18.62 | | | | (33.48 | ) | | | 85,992 | | | | 1.25 | | | | 1.25 | | | | 1.53 | | | | 0.71 | | | | 0.71 | | | | 147 | | | |
| | 13.16 | | | | (34.04 | ) | | | 43,039 | | | | 2.00 | | | | 2.00 | | | | 2.28 | | | | (0.05 | ) | | | (0.05 | ) | | | 147 | | | |
| | 14.84 | | | | (33.89 | ) | | | 26,503 | | | | 2.00 | | | | 2.00 | | | | 2.28 | | | | (0.05 | ) | | | (0.05 | ) | | | 147 | | | |
| | 22.89 | | | | (33.07 | ) | | | 1,599 | | | | 0.85 | | | | 0.85 | | | | 1.13 | | | | 1.05 | | | | 1.05 | | | | 147 | | | |
| | 18.69 | | | | (27.00 | ) | | | 7 | | | | 1.00 | (d) | | | 1.00 | (d) | | | 1.28 | (d) | | | 1.03 | (d) | | | 1.03 | (d) | | | 147 | | | |
| | 18.62 | | | | (27.27 | ) | | | 7 | | | | 1.50 | (d) | | | 1.50 | (d) | | | 1.78 | (d) | | | 0.60 | (d) | | | 0.60 | (d) | | | 147 | | | |
| |
|
| | 89.04 | | | | 8.15 | | | | 213,172 | | | | 1.20 | | | | 1.49 | | | | 1.58 | | | | (0.40 | ) | | | (0.69 | ) | | | 97 | | | |
| | 81.13 | | | | 7.45 | | | | 117,553 | | | | 1.82 | | | | 2.10 | | | | 2.19 | | | | (1.03 | ) | | | (1.31 | ) | | | 97 | | | |
| | 83.58 | | | | 7.41 | | | | 70,151 | | | | 1.82 | | | | 2.10 | | | | 2.19 | | | | (1.01 | ) | | | (1.29 | ) | | | 97 | | | |
| | 95.27 | | | | 8.57 | | | | 16,005 | | | | 0.73 | | | | 1.07 | | | | 1.14 | | | | (0.04 | ) | | | (0.38 | ) | | | 97 | | | |
| |
|
| | 92.33 | | | | 19.38 | | | | 264,595 | | | | 1.59 | | | | 1.60 | | | | 1.60 | | | | 0.38 | | | | 0.37 | | | | 4 | | | |
| | 85.26 | | | | 18.73 | | | | 175,297 | | | | 2.14 | | | | 2.15 | | | | 2.15 | | | | (0.15 | ) | | | (0.16 | ) | | | 4 | | | |
| | 87.57 | | | | 18.71 | | | | 92,123 | | | | 2.14 | | | | 2.15 | | | | 2.15 | | | | (0.16 | ) | | | (0.17 | ) | | | 4 | | | |
| | 98.14 | | | | 19.94 | | | | 25,954 | | | | 1.14 | | | | 1.15 | | | | 1.15 | | | | 0.82 | | | | 0.82 | | | | 4 | | | |
| |
|
The accompanying notes are an integral part of these financial statements. 107
GOLDMAN SACHS STRUCTURED U.S. EQUITY FUND
Financial Highlights
Selected Data for a Share Outstanding Throughout Each Period
| | | | | | | | | | | | | | | | | | | | | | | | | | | | | | | |
| | | | | Income (loss) from
| | Distributions
| | |
| | | | | investment operations | | to shareholders | | |
| | | | |
| | | | | |
| | | | | | |
| | | Net asset
| |
| | | | | |
| | | | | | |
| | | value,
| | Net
| | Net realized
| | Total from
| | From net
| | From net
| | | | |
| | | beginning
| | investment
| | and unrealized
| | investment
| | investment
| | realized
| | Total
| | |
| Year - Share Class | | of period | | income(a) | | gain (loss) | | operations | | income | | gains | | distributions | | |
| |
FOR THE SIX MONTHS ENDED APRIL 30, (UNAUDITED) |
| 2011 - A | | $ | 22.32 | | | $ | 0.14 | (c) | | $ | 3.59 | | | $ | 3.73 | | | $ | (0.29 | ) | | $ | — | | | $ | (0.29 | ) | | |
| 2011 - B | | | 20.82 | | | | 0.05 | (c) | | | 3.36 | | | | 3.41 | | | | (0.11 | ) | | | — | | | | (0.11 | ) | | |
| 2011 - C | | | 20.54 | | | | 0.05 | (c) | | | 3.30 | | | | 3.35 | | | | (0.13 | ) | | | — | | | | (0.13 | ) | | |
| 2011 - Institutional | | | 22.89 | | | | 0.19 | (c) | | | 3.67 | | | | 3.86 | | | | (0.38 | ) | | | — | | | | (0.38 | ) | | |
| 2011 - Service | | | 22.25 | | | | 0.13 | (c) | | | 3.57 | | | | 3.70 | | | | (0.26 | ) | | | — | | | | (0.26 | ) | | |
| 2011 - IR | | | 22.21 | | | | 0.17 | (c) | | | 3.56 | | | | 3.73 | | | | (0.35 | ) | | | — | | | | (0.35 | ) | | |
| 2011 - R | | | 22.11 | | | | 0.11 | (c) | | | 3.55 | | | | 3.66 | | | | (0.22 | ) | | | — | | | | (0.22 | ) | | |
| | | | | | | | | | | | | | | | | | | | | | | | | | | | | | | |
| | | | | | | | | | | | | | | | | | | | | | | | | | | | | | | |
FOR THE FISCAL YEARS ENDED OCTOBER 31, |
| 2010 - A | | | 19.75 | | | | 0.24 | | | | 2.63 | | | | 2.87 | | | | (0.30 | ) | | | — | | | | (0.30 | ) | | |
| 2010 - B | | | 18.43 | | | | 0.08 | | | | 2.44 | | | | 2.52 | | | | (0.13 | ) | | | — | | | | (0.13 | ) | | |
| 2010 - C | | | 18.21 | | | | 0.07 | | | | 2.44 | | | | 2.51 | | | | (0.18 | ) | | | — | | | | (0.18 | ) | | |
| 2010 - Institutional | | | 20.25 | | | | 0.33 | | | | 2.69 | | | | 3.02 | | | | (0.38 | ) | | | — | | | | (0.38 | ) | | |
| 2010 - Service | | | 19.66 | | | | 0.23 | | | | 2.60 | | | | 2.83 | | | | (0.24 | ) | | | — | | | | (0.24 | ) | | |
| 2010 - IR | | | 19.65 | | | | 0.29 | | | | 2.63 | | | | 2.92 | | | | (0.36 | ) | | | — | | | | (0.36 | ) | | |
| 2010 - R | | | 19.63 | | | | 0.18 | | | | 2.61 | | | | 2.79 | | | | (0.31 | ) | | | — | | | | (0.31 | ) | | |
|
| 2009 - A | | | 19.02 | | | | 0.31 | | | | 0.87 | | | | 1.18 | | | | (0.38 | ) | | | (0.07 | ) | | | (0.45 | ) | | |
| 2009 - B | | | 17.63 | | | | 0.18 | | | | 0.82 | | | | 1.00 | | | | (0.13 | ) | | | (0.07 | ) | | | (0.20 | ) | | |
| 2009 - C | | | 17.50 | | | | 0.16 | | | | 0.82 | | | | 0.98 | | | | (0.20 | ) | | | (0.07 | ) | | | (0.27 | ) | | |
| 2009 - Institutional | | | 19.52 | | | | 0.38 | | | | 0.91 | | | | 1.29 | | | | (0.49 | ) | | | (0.07 | ) | | | (0.56 | ) | | |
| 2009 - Service | | | 18.84 | | | | 0.29 | | | | 0.88 | | | | 1.17 | | | | (0.28 | ) | | | (0.07 | ) | | | (0.35 | ) | | |
| 2009 - IR | | | 18.96 | | | | 0.34 | | | | 0.87 | | | | 1.21 | | | | (0.45 | ) | | | (0.07 | ) | | | (0.52 | ) | | |
| 2009 - R | | | 18.89 | | | | 0.16 | | | | 0.98 | | | | 1.14 | | | | (0.33 | ) | | | (0.07 | ) | | | (0.40 | ) | | |
| | | | | | | | | | | | | | | | | | | | | | | | | | | | | | | |
| | | | | | | | | | | | | | | | | | | | | | | | | | | | | | | |
FOR THE PERIOD SEPTEMBER 1, 2008 TO OCTOBER 31, 2008* |
| 2008 - A | | | 24.97 | | | | 0.04 | | | | (5.99 | ) | | | (5.95 | ) | | | — | | | | — | | | | — | | | |
| 2008 - B | | | 23.18 | | | | 0.02 | | | | (5.57 | ) | | | (5.55 | ) | | | — | | | | — | | | | — | | | |
| 2008 - C | | | 23.01 | | | | 0.02 | | | | (5.53 | ) | | | (5.51 | ) | | | — | | | | — | | | | — | | | |
| 2008 - Institutional | | | 25.61 | | | | 0.06 | | | | (6.15 | ) | | | (6.09 | ) | | | — | | | | — | | | | — | | | |
| 2008 - Service | | | 24.74 | | | | 0.04 | | | | (5.94 | ) | | | (5.90 | ) | | | — | | | | — | | | | — | | | |
| 2008 - IR | | | 24.88 | | | | 0.05 | | | | (5.97 | ) | | | (5.92 | ) | | | — | | | | — | | | | — | | | |
| 2008 - R | | | 24.81 | | | | 0.04 | | | | (5.96 | ) | | | (5.92 | ) | | | — | | | | — | | | | — | | | |
| | | | | | | | | | | | | | | | | | | | | | | | | | | | | | | |
| | | | | | | | | | | | | | | | | | | | | | | | | | | | | | | |
FOR THE FISCAL YEARS ENDED AUGUST 31, |
| 2008 - A | | | 33.30 | | | | 0.29 | | | | (4.86 | ) | | | (4.57 | ) | | | (0.34 | ) | | | (3.42 | ) | | | (3.76 | ) | | |
| 2008 - B | | | 31.17 | | | | 0.08 | | | | (4.54 | ) | | | (4.46 | ) | | | (0.11 | ) | | | (3.42 | ) | | | (3.53 | ) | | |
| 2008 - C | | | 31.01 | | | | 0.07 | | | | (4.49 | ) | | | (4.42 | ) | | | (0.16 | ) | | | (3.42 | ) | | | (3.58 | ) | | |
| 2008 - Institutional | | | 34.07 | | | | 0.42 | | | | (4.98 | ) | | | (4.56 | ) | | | (0.48 | ) | | | (3.42 | ) | | | (3.90 | ) | | |
| 2008 - Service | | | 32.98 | | | | 0.26 | | | | (4.80 | ) | | | (4.54 | ) | | | (0.28 | ) | | | (3.42 | ) | | | (3.70 | ) | | |
| 2008 - IR (Commenced November 30, 2007) | | | 33.02 | | | | 0.26 | | | | (4.49 | ) | | | (4.23 | ) | | | (0.49 | ) | | | (3.42 | ) | | | (3.91 | ) | | |
| 2008 - R (Commenced November 30, 2007) | | | 33.02 | | | | 0.17 | | | | (4.48 | ) | | | (4.31 | ) | | | (0.48 | ) | | | (3.42 | ) | | | (3.90 | ) | | |
|
| 2007 - A | | | 31.79 | | | | 0.28 | | | | 2.61 | | | | 2.89 | | | | (0.27 | ) | | | (1.11 | ) | | | (1.38 | ) | | |
| 2007 - B | | | 29.92 | | | | 0.03 | | | | 2.45 | | | | 2.48 | | | | (0.12 | ) | | | (1.11 | ) | | | (1.23 | ) | | |
| 2007 - C | | | 29.78 | | | | 0.02 | | | | 2.45 | | | | 2.47 | | | | (0.13 | ) | | | (1.11 | ) | | | (1.24 | ) | | |
| 2007 - Institutional | | | 32.48 | | | | 0.42 | | | | 2.66 | | | | 3.08 | | | | (0.38 | ) | | | (1.11 | ) | | | (1.49 | ) | | |
| 2007 - Service | | | 31.50 | | | | 0.24 | | | | 2.59 | | | | 2.83 | | | | (0.24 | ) | | | (1.11 | ) | | | (1.35 | ) | | |
|
| 2006 - A | | | 29.13 | | | | 0.24 | | | | 2.53 | | | | 2.77 | | | | (0.11 | ) | | | — | | | | (0.11 | ) | | |
| 2006 - B | | | 27.52 | | | | — | (e) | | | 2.40 | | | | 2.40 | | | | — | | | | — | | | | — | | | |
| 2006 - C | | | 27.39 | | | | 0.01 | | | | 2.38 | | | | 2.39 | | | | — | | | | — | | | | — | | | |
| 2006 - Institutional | | | 29.72 | | | | 0.38 | | | | 2.56 | | | | 2.94 | | | | (0.18 | ) | | | — | | | | (0.18 | ) | | |
| 2006 - Service | | | 28.88 | | | | 0.21 | | | | 2.50 | | | | 2.71 | | | | (0.09 | ) | | | — | | | | (0.09 | ) | | |
|
| | |
| * | | The Fund changed its fiscal year end from August 31 to October 31. |
| (a) | | Calculated based on the average shares outstanding methodology. |
| (b) | | Assumes investment at the net asset value at the beginning of the period, reinvestment of all dividends and distributions, a complete redemption of the investment at the net asset value at the end of the period and no sales or redemption charges. Total returns would be reduced if a sales or redemption charge was taken into account. Returns do not reflect the deduction of taxes that a shareholder would pay on Fund distributions or the redemption of Fund shares. Total returns for periods less than one full year are not annualized. |
| (c) | | Reflects income recognized from non-recurring special dividends which amounted to $0.02 per share and 0.14% of average net assets. |
| (d) | | Annualized. |
| (e) | | Amount is less than $0.005 per share. |
108 The accompanying notes are an integral part of these financial statements.
GOLDMAN SACHS STRUCTURED U.S. EQUITY FUND
| | | | | | | | | | | | | | | | | | | | | | | | | | | | | |
| | | | | | | | | | |
| | | | |
| | | | | | | | | | |
| | | | |
| | | | | | | | | | | Ratio of
| | | | |
| | | | | Net assets,
| | Ratio of
| | Ratio of
| | net investment
| | | | |
Net asset
| | | | end of
| | net expenses
| | total expenses
| | income
| | Portfolio
| | |
value, end
| | Total
| | period
| | to average
| | to average
| | to average
| | turnover
| | |
| of period | | return(b) | | (in 000s) | | net assets | | net assets | | net assets | | rate | | |
| |
| |
| $ | 25.76 | | | | 16.86 | % | | $ | 302,579 | | | | 0.95 | %(d) | | | 1.18 | %(d) | | | 1.22 | %(c)(d) | | | 15 | % | | |
| | 24.12 | | | | 16.43 | | | | 17,883 | | | | 1.70 | (d) | | | 1.93 | (d) | | | 0.48 | (c)(d) | | | 15 | | | |
| | 23.76 | | | | 16.39 | | | | 37,564 | | | | 1.70 | (d) | | | 1.93 | (d) | | | 0.45 | (c)(d) | | | 15 | | | |
| | 26.37 | | | | 17.08 | | | | 138,250 | | | | 0.55 | (d) | | | 0.78 | (d) | | | 1.58 | (c)(d) | | | 15 | | | |
| | 25.69 | | | | 16.79 | | | | 1,419 | | | | 1.05 | (d) | | | 1.28 | (d) | | | 1.09 | (c)(d) | | | 15 | | | |
| | 25.59 | | | | 17.00 | | | | 9 | | | | 0.70 | (d) | | | 0.93 | (d) | | | 1.43 | (c)(d) | | | 15 | | | |
| | 25.55 | | | | 16.70 | | | | 41 | | | | 1.20 | (d) | | | 1.43 | (d) | | | 0.96 | (c)(d) | | | 15 | | | |
| | | | | | | | | | | | | | | | | | | | | | | | | | | | | |
| | | | | | | | | | | | | | | | | | | | | | | | | | | | | |
| |
| | 22.32 | | | | 14.67 | | | | 301,843 | | | | 0.95 | | | | 1.18 | | | | 1.12 | | | | 47 | | | |
| | 20.82 | | | | 13.76 | | | | 18,663 | | | | 1.70 | | | | 1.93 | | | | 0.39 | | | | 47 | | | |
| | 20.54 | | | | 13.84 | | | | 34,942 | | | | 1.70 | | | | 1.93 | | | | 0.37 | | | | 47 | | | |
| | 22.89 | | | | 15.10 | | | | 115,177 | | | | 0.55 | | | | 0.78 | | | | 1.54 | | | | 47 | | | |
| | 22.25 | | | | 14.50 | | | | 1,273 | | | | 1.05 | | | | 1.28 | | | | 1.10 | | | | 47 | | | |
| | 22.21 | | | | 15.00 | | | | 8 | | | | 0.70 | | | | 0.93 | | | | 1.37 | | | | 47 | | | |
| | 22.11 | | | | 14.35 | | | | 48 | | | | 1.20 | | | | 1.43 | | | | 0.88 | | | | 47 | | | |
|
| | 19.75 | | | | 6.57 | | | | 328,575 | | | | 0.95 | | | | 1.19 | | | | 1.75 | | | | 136 | | | |
| | 18.43 | | | | 5.83 | | | | 25,269 | | | | 1.70 | | | | 1.94 | | | | 1.14 | | | | 136 | | | |
| | 18.21 | | | | 5.82 | | | | 37,716 | | | | 1.70 | | | | 1.94 | | | | 0.99 | | | | 136 | | | |
| | 20.25 | | | | 7.04 | | | | 153,872 | | | | 0.55 | | | | 0.79 | | | | 2.14 | | | | 136 | | | |
| | 19.66 | | | | 6.50 | | | | 2,117 | | | | 1.05 | | | | 1.29 | | | | 1.68 | | | | 136 | | | |
| | 19.65 | | | | 6.83 | | | | 7 | | | | 0.70 | | | | 0.94 | | | | 1.93 | | | | 136 | | | |
| | 19.63 | | | | 6.39 | | | | 50 | | | | 1.20 | | | | 1.44 | | | | 0.89 | | | | 136 | | | |
| | | | | | | | | | | | | | | | | | | | | | | | | | | | | |
| | | | | | | | | | | | | | | | | | | | | | | | | | | | | |
| |
| | 19.02 | | | | (23.83 | ) | | | 384,949 | | | | 0.95 | (d) | | | 1.22 | (d) | | | 1.16 | (d) | | | 27 | | | |
| | 17.63 | | | | (23.94 | ) | | | 47,671 | | | | 1.70 | (d) | | | 1.97 | (d) | | | 0.46 | (d) | | | 27 | | | |
| | 17.50 | | | | (23.95 | ) | | | 42,816 | | | | 1.70 | (d) | | | 1.97 | (d) | | | 0.41 | (d) | | | 27 | | | |
| | 19.52 | | | | (23.78 | ) | | | 177,704 | | | | 0.55 | (d) | | | 0.82 | (d) | | | 1.57 | (d) | | | 27 | | | |
| | 18.84 | | | | (23.85 | ) | | | 2,949 | | | | 1.05 | (d) | | | 1.32 | (d) | | | 1.05 | (d) | | | 27 | | | |
| | 18.96 | | | | (23.79 | ) | | | 6 | | | | 0.70 | (d) | | | 0.97 | (d) | | | 1.48 | (d) | | | 27 | | | |
| | 18.89 | | | | (23.86 | ) | | | 6 | | | | 1.20 | (d) | | | 1.47 | (d) | | | 0.99 | (d) | | | 27 | | | |
| | | | | | | | | | | | | | | | | | | | | | | | | | | | | |
| | | | | | | | | | | | | | | | | | | | | | | | | | | | | |
| |
| | 24.97 | | | | (15.39 | ) | | | 530,590 | | | | 0.95 | | | | 1.13 | | | | 1.03 | | | | 96 | | | |
| | 23.18 | | | | (16.04 | ) | | | 77,406 | | | | 1.70 | | | | 1.88 | | | | 0.28 | | | | 96 | | | |
| | 23.01 | | | | (16.01 | ) | | | 58,873 | | | | 1.70 | | | | 1.88 | | | | 0.28 | | | | 96 | | | |
| | 25.61 | | | | (15.09 | ) | | | 253,353 | | | | 0.55 | | | | 0.73 | | | | 1.40 | | | | 96 | | | |
| | 24.74 | | | | (15.43 | ) | | | 3,908 | | | | 1.05 | | | | 1.23 | | | | 0.91 | | | | 96 | | | |
| | 24.88 | | | | (14.61 | ) | | | 9 | | | | 0.70 | (d) | | | 0.88 | (d) | | | 1.30 | (d) | | | 96 | | | |
| | 24.81 | | | | (14.89 | ) | | | 9 | | | | 1.20 | (d) | | | 1.38 | (d) | | | 0.85 | (d) | | | 96 | | | |
|
| | 33.30 | | | | 9.11 | | | | 863,259 | | | | 0.95 | | | | 1.10 | | | | 0.82 | | | | 119 | | | |
| | 31.17 | | | | 8.27 | | | | 154,414 | | | | 1.70 | | | | 1.85 | | | | 0.09 | | | | 119 | | | |
| | 31.01 | | | | 8.27 | | | | 100,803 | | | | 1.70 | | | | 1.85 | | | | 0.07 | | | | 119 | | | |
| | 34.07 | | | | 9.56 | | | | 594,020 | | | | 0.55 | | | | 0.70 | | | | 1.22 | | | | 119 | | | |
| | 32.98 | | | | 9.01 | | | | 15,884 | | | | 1.05 | | | | 1.20 | | | | 0.72 | | | | 119 | | | |
|
| | 31.79 | | | | 9.51 | | | | 611,999 | | | | 0.99 | | | | 1.15 | | | | 0.79 | | | | 129 | | | |
| | 29.92 | | | | 8.72 | | | | 78,110 | | | | 1.75 | | | | 1.90 | | | | 0.01 | | | | 129 | | | |
| | 29.78 | | | | 8.73 | | | | 36,628 | | | | 1.75 | | | | 1.90 | | | | 0.03 | | | | 129 | | | |
| | 32.48 | | | | 9.97 | | | | 644,250 | | | | 0.59 | | | | 0.75 | | | | 1.22 | | | | 129 | | | |
| | 31.50 | | | | 9.39 | | | | 13,019 | | | | 1.09 | | | | 1.25 | | | | 0.70 | | | | 129 | | | |
|
The accompanying notes are an integral part of these financial statements. 109
GOLDMAN SACHS STRUCTURED DOMESTIC EQUITY FUNDS
Notes to Financial Statements
April 30, 2011 (Unaudited)
Goldman Sachs Trust (the “Trust”) is a Delaware statutory trust registered under the Investment Company Act of 1940, as amended (the “Act”), as an open-end management investment company. The following table lists those series of the Trust that are included in this report (collectively, the “Funds” or individually a “Fund”), along with their corresponding share classes and respective diversification status under the Act:
| | | | | |
| | | | | Diversified/
|
| Fund | | Share Classes Offered* | | Non-diversified |
| |
| Balanced | | A, B, C, Institutional and IR | | Diversified |
| |
| |
Structured Large Cap Growth,
Structured Large Cap Value,
Structured Small Cap Equity, and
Structured U.S. Equity | | A, B, C, Institutional, Service, IR and R | | Diversified |
| |
| |
Structured Small Cap Growth and
Structured Small Cap Value | | A, B, C, Institutional, IR and R | | Diversified |
| |
| |
| | |
| * | | Class B Shares are generally no longer available for purchase by current or prospective investors. |
Class A Shares are sold with a front-end sales charge of up to 5.50%. Class B Shares were sold with a contingent deferred sales charge that declines from 5.00% to zero, depending upon the period of time the shares are held. Class C Shares are sold with a contingent deferred sales charge of 1.00%, which is imposed on redemptions made within 12 months of purchase. Institutional, Service, Class IR and Class R Shares are not subject to a sales charge.
Goldman Sachs Asset Management, L.P., (“GSAM”), an affiliate of Goldman, Sachs & Co. (“Goldman Sachs”), serves as investment adviser to each Fund pursuant to a management agreement (the “Agreement”) with the Trust.
| |
| 2. SIGNIFICANT ACCOUNTING POLICIES | |
The following is a summary of the significant accounting policies consistently followed by the Funds. The preparation of financial statements in conformity with accounting principles generally accepted in the United States of America (“GAAP”) requires management to make estimates and assumptions that may affect the amounts and disclosures in the financial statements. Actual results could differ from those estimates and assumptions.
A. Investment Valuation — The investment valuation policy of the Funds is to value investments at market value. Investments in equity securities and investment companies traded on a United States (“U.S.”) securities exchange or the NASDAQ system are valued daily at their last sale price or official closing price on the principal exchange or system on which they are traded. If no sale occurs, such securities and investment companies are valued at the last bid price for long positions and at the last ask price for short positions. Debt securities for which market quotations are readily available are valued on the basis of quotations furnished by an independent pricing service approved by the trustees or provided by securities dealers. The pricing services may use valuation models or matrix pricing, which consider: (i) yield or price with respect to bonds that are considered comparable in characteristics such as rating, interest rate and maturity date or (ii) quotations from securities dealers to determine current value. If accurate quotations are not readily available, or if GSAM believes that such quotations do not accurately reflect fair value, the fair value of the Funds’ investments may be determined based on yield equivalents, a pricing matrix or other sources, under valuation procedures established by the trustees. Unlisted equity securities for which market quotations are available are valued at the last
GOLDMAN SACHS STRUCTURED DOMESTIC EQUITY FUNDS
| |
| 2. SIGNIFICANT ACCOUNTING POLICIES (continued) | |
sale price on the valuation date, or if no sale occurs, at the last bid price. In the absence of market quotations, broker quotes will be utilized or the security will be fair valued. Investments in investment companies (other than those that are exchange traded) are valued at the net asset value per share (“NAV”) of the investment company on the valuation date. Short-term debt obligations that mature in sixty days or less and that do not exhibit signs of credit deterioration are valued at amortized cost, which approximates market value.
GSAM, consistent with its procedures and applicable regulatory guidance, may make an adjustment to the previous closing prices of either domestic or foreign securities in light of significant events to reflect what it believes to be the fair value of the securities at the time of determining the Funds’ NAV. Significant events that could affect a large number of securities in a particular market may include, but are not limited to: situations relating to one or more single issuers in a market sector; significant fluctuations in U.S. or foreign markets; market dislocations; market disruptions or market closings; equipment failures; natural or man-made disasters or acts of God; armed conflicts; government actions or other developments; as well as the same or similar events which may affect specific issuers or the securities markets even though not tied directly to the securities markets. Other significant events that could relate to a single issuer may include, but are not limited to: corporate actions such as reorganizations, mergers and buy-outs; corporate announcements, including those relating to earnings, products and regulatory news; significant litigation; low trading volume; and trading limits or suspensions.
B. Security and Fund Share Transactions, and Investment Income — Security and Fund share transactions are reflected for financial reporting purposes as of the trade date, which may cause the NAV as stated in the accompanying financial statements to be different than the NAV applied to Fund share transactions. Realized gains and losses on sales of portfolio securities are calculated using the identified cost basis. Dividend income is recognized on the ex-dividend date, net of foreign withholding taxes, if any, which are reduced by any amounts reclaimable by the Funds, where applicable. Certain dividends from foreign securities will be recorded when the fund is informed of the dividend, if such information is obtained subsequent to the ex-dividend date. Interest income is recorded on the basis of interest accrued, premium amortized and discount accreted. Realized gains and losses resulting from principal paydowns on mortgage-backed and asset-backed securities are included in interest income. Market discounts, original issue discount and market premiums on debt securities are accreted/amortized to interest income over the life of the security with a corresponding adjustment in the cost basis of that security. In addition, it is the Funds’ policy to accrue for foreign capital gains taxes, if applicable, on certain foreign securities held by the Funds. An estimated foreign capital gains tax is recorded daily on net unrealized gains on these securities and is payable upon the sale of such securities when a gain is realized.
Investment income and unrealized and realized gains or losses are allocated daily to each class of shares of the respective Fund based upon the relative proportion of net assets of each class.
In addition, distributions received from the Funds’ investments in U.S. real estate investment trusts (“REITs”) often include a “return of capital”, which is recorded by the Funds as a reduction of the cost basis of the securities held. The Internal Revenue Code of 1986, as amended (the “Code”) requires a REIT to distribute at least 95% of its taxable income to investors. In many cases, however, because of “non-cash” expenses such as property depreciation, a REIT’s cash flow will exceed its taxable income. The REIT may distribute this excess cash to offer a more competitive yield. This portion of the Funds’ distributions is deemed a return of capital and is generally not taxable to shareholders.
C. Expenses — Expenses incurred by the Funds, which may not specifically relate to the Funds, may be shared with other registered investment companies having management agreements with GSAM or its affiliates, as appropriate. These expenses are allocated to the Funds on a straight-line and/or pro-rata basis depending upon the nature of the expenses and are accrued daily. Non-class specific expenses are allocated daily to each share class of the respective Fund based upon the relative proportion of net assets of each class. Class specific expenses, where applicable, are borne by the respective share classes and include Distribution and Service, Transfer Agent, and Service fees.
GOLDMAN SACHS STRUCTURED DOMESTIC EQUITY FUNDS
Notes to Financial Statements (continued)
April 30, 2011 (Unaudited)
| |
| 2. SIGNIFICANT ACCOUNTING POLICIES (continued) | |
D. Federal Taxes and Distributions to Shareholders — It is each Fund’s policy to comply with the requirements of the Code, applicable to regulated investment companies (mutual funds) and to distribute each year substantially all of its investment company taxable income and capital gains to its shareholders. Accordingly, the Funds are not required to make any provisions for the payment of federal income tax. Distributions to shareholders are recorded on the ex-dividend date. Income and capital gains distributions, if any, are declared and paid according to the following schedule:
| | | | | |
| | | Income Distributions
| | Capital Gains Distributions
|
| Fund | | Declared/Paid | | Declared/Paid |
| |
| Balanced and Structured Large Cap Value | | Quarterly | | Annually |
| |
| |
Structured Large Cap Growth, Structured Small Cap Equity,
Structured Small Cap Growth, Structured Small Cap Value
and Structured U.S. Equity | | Annually | | Annually |
| |
| |
Net capital losses are carried forward to future fiscal years and may be used to the extent allowed by the Code to offset any future capital gains. Utilization of capital loss carryforwards will reduce the requirement of future capital gains distributions.
The characterization of distributions to shareholders for financial reporting purposes is determined in accordance with federal income tax rules, which may differ from GAAP. The source of each Fund’s distributions may be shown in the accompanying financial statements as either from net investment income, net realized gain or capital. Certain components of the Funds’ net assets on the Statements of Assets and Liabilities reflect permanent GAAP/tax differences based on the appropriate tax character.
E. Foreign Currency Translations — The books and records of the Funds are maintained in U.S. dollars. Amounts denominated in foreign currencies are translated into U.S. dollars on the following basis: (i) investment valuations, foreign currency and other assets and liabilities initially expressed in foreign currencies are converted into U.S. dollars based upon 4:00 p.m. Eastern Time exchange rates; and (ii) purchases and sales of foreign investments, income and expenses are converted into U.S. dollars based upon currency exchange rates prevailing on the respective dates of such transactions as of 4:00 p.m. Eastern Time.
Net realized and unrealized gain (loss) on foreign currency transactions represents: (i) foreign exchange gains and losses from the sale and holdings of foreign currencies; (ii) currency gains and losses between trade date and settlement date on investment security transactions and forward foreign currency exchange contracts; and (iii) gains and losses from the difference between amounts of dividends, interest and foreign withholding taxes recorded and the amounts actually received. The effect of changes in foreign currency exchange rates on securities and derivative instruments is included with the net realized and change in unrealized gain (loss) on investments on the Statements of Operations, however, the effect of changes in foreign currency exchange rates on fixed income securities sold during the period is included with the net realized gain (loss) on foreign currency related transactions. Changes in the value of other assets and liabilities as a result of fluctuations in foreign exchange rates are included as an increase or decrease to net change in unrealized gain (loss) on translation of assets and liabilities denominated in foreign currencies.
F. Forward Foreign Currency Exchange Contracts — All forward foreign currency exchange contracts are marked to market daily at the applicable forward rate. Unrealized gains or losses on forward foreign currency exchange contracts are recorded by the Funds on a daily basis and realized gains or losses are recorded on the settlement date of a contract.
Risks may arise upon entering into these contracts from the potential inability of counterparties to meet the terms of their contracts and from unanticipated movements in the value of a foreign currency relative to the U.S. dollar.
GOLDMAN SACHS STRUCTURED DOMESTIC EQUITY FUNDS
| |
| 2. SIGNIFICANT ACCOUNTING POLICIES (continued) | |
The contractual amounts of forward foreign currency exchange contracts do not necessarily represent the amounts potentially subject to risk. The measurement of the risks associated with these instruments is meaningful only when all related and offsetting transactions are considered. The Funds must set aside liquid assets, or engage in other appropriate measures to cover their obligations under these contracts.
G. Futures Contracts — Futures contracts are valued at the last settlement price, or in the absence of a sale, the last bid price, at the end of each day on the board of trade or exchange upon which they are traded. Upon entering into a futures contract, the Funds deposit cash or securities in an account on behalf of the broker in an amount sufficient to meet the initial margin requirement. Subsequent payments are made or received by the Funds equal to the daily change in the contract value and are recorded as variation margin receivable or payable with a corresponding offset in unrealized gains or losses. The Funds recognize a realized gain or loss when a contract is closed or expires.
The use of futures contracts involves, to varying degrees, elements of market and counterparty risk which may exceed the amounts recognized in the Statements of Assets and Liabilities. Futures contracts may be illiquid, and exchanges may limit fluctuations in futures contract prices during a single day. Changes in the value of a futures contract may not directly correlate with changes in the value of the underlying securities. These risks may decrease the effectiveness of the Funds’ strategies and potentially result in a loss. The Funds must set aside liquid assets, or engage in other appropriate measures to cover their obligations under these contracts.
H. Mortgage-Backed and Asset-Backed Securities — The Balanced Fund may invest in mortgage-backed and/or asset-backed securities. Mortgage-backed securities represent direct or indirect participations in, or are collateralized by and payable from, mortgage loans secured by residential and/or commercial real property. These securities may include mortgage pass-through securities, collateralized mortgage obligations, real estate mortgage investment conduit pass-through or participation certificates and stripped mortgage-backed securities. Asset-backed securities include securities whose principal and interest payments are collateralized by pools of assets such as auto loans, credit card receivables, leases, installment contracts and personal property. Asset-backed securities also include home equity line of credit loans and other second-lien mortgages.
The value of certain mortgage-backed and asset-backed securities (including adjustable rate mortgage loans) may be particularly sensitive to changes in prevailing interest rates. The value of these securities may also fluctuate in response to the market’s perception of the creditworthiness of the issuers. Early repayment of principal on mortgage-backed or asset-backed securities may expose a Fund to the risk of earning a lower rate of return upon reinvestment of principal. Asset-backed securities may present credit risks that are not presented by mortgage-backed securities because they generally do not have the benefit of a security interest in collateral that is comparable to mortgage assets. Some asset-backed securities may only have a subordinated claim on collateral. In addition, while mortgage-backed and asset-backed securities may be supported by some form of government or private guarantee and/or insurance, there is no assurance that private guarantors or insurers, if any, will meet their obligations.
Stripped mortgage-backed securities are usually structured with two different classes: one that receives substantially all of the interest payments (the interest-only, or “IO” and/or the high coupon rate with relatively low principal amount, or “IOette”), and the other that receives substantially all of the principal payments (the principal-only, or “PO”) from a pool of mortgage loans. Little to no principal will be received at the maturity of an IO; as a result, periodic adjustments are recorded to reduce the cost of the security through maturity. These adjustments are included in interest income. Payments received for PO’s are treated as a proportionate reduction to the cost basis of the securities and excess amounts are recorded as gains.
I. Mortgage Dollar Rolls — The Balanced Fund may enter into mortgage dollar rolls (“dollar rolls”) in which the Fund sells securities in the current month for delivery and simultaneously contracts with the same counterparty to repurchase similar (same
GOLDMAN SACHS STRUCTURED DOMESTIC EQUITY FUNDS
Notes to Financial Statements (continued)
April 30, 2011 (Unaudited)
| |
| 2. SIGNIFICANT ACCOUNTING POLICIES (continued) | |
type, coupon and maturity) but not identical securities on a specified future date. The Fund treats dollar rolls as two separate transactions: one involving the purchase of a security and a separate transaction involving a sale.
During the settlement period between sale and repurchase, the Fund will not be entitled to accrue interest and principal payments on the securities sold. Dollar roll transactions involve the risk that the market value of the securities sold by the Fund may decline below the repurchase price of those securities. In the event the buyer of the securities in a dollar roll transaction files for bankruptcy or becomes insolvent, the Fund’s use of proceeds from the transaction may be restricted pending a determination by, or with respect to, the other counterparty.
J. Options — When the Funds write call or put options, an amount equal to the premium received is recorded as a liability and is subsequently marked-to-market to reflect the current market value of the option written. Swaptions are options on interest rate swap contracts. Options on a futures contract may be written with premiums to be determined on a future date. The premiums for these options are based upon implied volatility parameters at specified terms. When a written option expires on its stipulated expiration date or the Funds enter into a closing purchase transaction, the Funds realize a gain or loss without regard to any unrealized gain or loss on the underlying future, swap, security or currency transaction, and the liability related to such option is extinguished. When a written call option is exercised, the Funds realize a gain or loss from the sale of the underlying future, swap, security or currency transaction, and the proceeds of the sale are increased by the premium originally received. When a written put option is exercised, the amount of the premium originally received will reduce the cost of the future, swap, security or currency transaction that the Funds purchase upon exercise. There is a risk of loss from a change in value of such options which may exceed the related premiums received. The Funds must set aside liquid assets, or engage in other appropriate measures to cover their obligations under written option contracts.
Upon the purchase of a call option or a put option by the Funds, the premium paid is recorded as an investment and subsequently marked-to-market to reflect the current market value of the option. Certain options may be purchased with premiums to be determined on a future date. The premiums for these options are based upon implied voluntary parameters at specified terms. If an option which the Funds have purchased expires on the stipulated expiration date, the Funds will realize a loss in the amount of the cost of the option. If the Funds enter into a closing sale transaction, the Funds will realize a gain or loss, depending on whether the sale proceeds for the closing sale transaction are greater or less than the cost of the option. If the Funds exercise a purchased put option, the Funds will realize a gain or loss from the sale of the underlying future, swap, security or currency transaction, and the proceeds from such sale will be decreased by the premium originally paid. If the Funds exercise a purchased call option, the cost of the future, swap, security or currency transaction which the Funds purchase upon exercise will be increased by the premium originally paid. Purchased over the counter options are subject to the risk that the counterparty may default on its obligations, which could result in a loss to the Funds.
K. Repurchase Agreements — The Funds may enter into repurchase agreements which involve the purchase of securities subject to the seller’s agreement to repurchase the securities at a mutually agreed upon date and price. During the term of a repurchase agreement, the value of the underlying securities held as collateral on behalf of the Funds, including accrued interest, is required to exceed the value of the repurchase agreement, including accrued interest. If the seller defaults or becomes insolvent, realization of the collateral by the Funds may be delayed or limited and there may be a decline in the value of the collateral during the period while the Funds seek to assert their rights. The underlying securities for all repurchase agreements are held at the Funds’ custodian or designated sub-custodians under tri-party repurchase agreements.
Pursuant to exemptive relief granted by the Securities and Exchange Commission (“SEC”) and terms and conditions contained therein, the Funds, together with other registered investment companies having management agreements with GSAM, or its affiliates, may transfer uninvested cash into joint accounts, the daily aggregate balance of which is invested in one or more repurchase agreements. Under these joint accounts, the Funds’ credit exposure is allocated to the underlying repurchase
GOLDMAN SACHS STRUCTURED DOMESTIC EQUITY FUNDS
| |
| 2. SIGNIFICANT ACCOUNTING POLICIES (continued) | |
agreements counterparties on a pro-rata basis. With the exception of certain transaction fees, the Funds are not subject to any expenses in relation to these investments.
L. Structured Notes — The Balanced Fund may invest in structured notes, the values of which are based on the price movements of a reference security or index. Fluctuations in value are recorded as unrealized gain or loss. Interest income is recorded on the basis of interest accrued, premium amortized and discount accreted. On the termination date, the Fund will receive a payment from the issuer based on the value of the referenced security (notional amount multiplied by price of the referenced security) and record a realized gain or loss. Structured notes are subject to various risks including credit, issuer, liquidity and interest rate risks.
M. Swap Contracts — Swaps are marked to market daily using either pricing vendor quotations, counterparty prices or model prices, and the change in value, if any, is recorded as an unrealized gain or loss. Upfront payments made and/or received by the Funds, are recorded as an asset and/or liability, and realized gains or losses are recognized ratably over the contract’s term/event, with the exception of forward starting interest rate swaps, whose realized gains or losses are recognized ratably from the effective start date. Periodic payments received or made on swap contracts are recorded as realized gains or losses. Gains or losses are realized upon termination of a swap contract and are recorded on the Statements of Operations.
Risks may arise as a result of the failure of the counterparty to the swap contract to comply with the terms of the swap contract. The loss incurred by the failure of a counterparty is generally limited to the net payment to be received by the Funds and/or the termination value at the end of the contract. Therefore, GSAM considers the creditworthiness of each counterparty to a contract in evaluating potential credit risk. Additionally, risks may arise from unanticipated movements in interest rates or in the value of the underlying reference asset or index. Entering into these agreements involves, to varying degrees, market risk, liquidity risk and elements of credit, legal and documentation risk in excess of amounts recognized in the Statements of Assets and Liabilities. The Funds may pay or receive cash as collateral on these contracts which is recorded as an asset and/or liability. The Funds must set aside liquid assets, or engage in other appropriate measures to cover their obligations under these contracts.
The Balanced Fund may invest in the following types of swaps:
An interest rate swap is an agreement that obligates two parties to exchange a series of cash flows at specified intervals, based upon or calculated by reference to changes in specified prices, rates or indices for a specified amount of an underlying asset or notional principal amount. The payment flows are usually netted against each other, with the difference being paid by one party to the other.
A credit default swap is an agreement that involves one party making a stream of payments to another party in exchange for the right to receive protection on a reference security or obligation. A Fund may use credit default swaps to provide a measure of protection against defaults of the reference security or obligation or to take a short position with respect to the likelihood of default. A Fund’s investment in credit default swaps may involve greater risks than if the Fund had invested in the referenced obligation directly. Credit events are contract specific but may include bankruptcy, failure to pay, restructuring and obligation acceleration. If a Fund buys protection through a credit default swap and no credit event occurs, its payments are limited to the periodic payments previously made to the counterparty. Upon the occurrence of a specified credit event, a Fund, as a buyer of credit protection, is entitled to receive an amount equal to the notional amount of the swap and deliver to the seller the defaulted reference obligation in a physically settled trade. A Fund may also receive a net settlement amount in the form of cash or securities equal to the notional amount of the swap reduced by the recovery value of the reference obligation in a cash settled trade.
As a seller of protection, a Fund generally receives a payment stream throughout the term of the swap, provided that there is no credit event. In addition, if the Fund sells protection through a credit default swap, the Fund could suffer a loss because the value of the referenced obligation may be less than the premium payments received. Upon the occurrence of a specified credit
GOLDMAN SACHS STRUCTURED DOMESTIC EQUITY FUNDS
Notes to Financial Statements (continued)
April 30, 2011 (Unaudited)
| |
| 2. SIGNIFICANT ACCOUNTING POLICIES (continued) | |
event, a Fund, as a seller of credit protection, may be required to take possession of the defaulted reference obligation and pay the buyer an amount equal to the notional amount of the swap in a physically settled trade. A Fund may also pay a net settlement amount in the form of cash or securities equal to the notional amount of the swap reduced by the recovery value of the reference obligation in a cash settled trade. Recovery values are at times established through the credit event auction process in which market participants are ensured that a transparent price has been set for the defaulted security or obligation. In addition, a Fund is entitled to a return of any assets, which have been pledged as collateral to the counterparty.
N. Treasury Inflation Protected Securities — The Funds may invest in treasury inflation protected securities (“TIPS”), including structured bonds in which the principal amount is adjusted daily to keep pace with inflation, as measured by the U.S. Consumer Pricing Index for Urban Consumers. The adjustments to principal due to inflation/deflation are reflected as increases/decreases to interest income with a corresponding adjustment to cost. Such adjustments may have a significant impact on the Funds’ distributions and may result in a return of capital to shareholders. The repayment of the original bond principal upon maturity is guaranteed by the full faith and credit of the U.S. Government.
O. When-Issued Securities and Forward Commitments — The Funds may purchase when-issued securities, including TBA (“To Be Announced”) securities that have been authorized, but not yet issued in the market. When-issued securities are purchased in order to secure what is considered to be an advantageous price or yield to the Fund at the time of entering into the transaction. A forward commitment involves entering into a contract to purchase or sell securities, typically on an extended delivery basis, for a fixed price at a future date. The purchase of securities on a when-issued or forward commitment basis involves a risk of loss if the value of the security to be purchased declines before the settlement date. Conversely, the sale of securities on a forward commitment basis involves the risk that the value of the securities sold may increase before the settlement date. Although the Funds will generally purchase securities on a when-issued or forward commitment basis with the intention of acquiring the securities for their portfolios, the Funds may dispose of when-issued securities or forward commitments prior to settlement which may result in a realized gain or loss. When purchasing a security on a when-issued basis or entering into a forward commitment, the Funds must “set aside” liquid assets, or engage in other appropriate measures to “cover” their obligations under these contracts.
| |
| 3. FAIR VALUE OF INVESTMENTS | |
The fair value of a financial instrument is the amount that would be received to sell an asset or paid to transfer a liability in an orderly transaction between market participants at the measurement date (i.e., the exit price). GAAP establishes a fair value hierarchy that prioritizes the inputs to valuation techniques used to measure fair value. The hierarchy gives the highest priority to unadjusted quoted prices in active markets for identical assets or liabilities (Level 1 measurements) and the lowest priority to unobservable inputs (Level 3 measurements). The three levels of the fair value hierarchy are described below:
Level 1 — Unadjusted quoted prices in active markets that are accessible at the measurement date for identical, unrestricted assets or liabilities;
Level 2 — Quoted prices in markets that are not active or financial instruments for which significant inputs are observable (including, but not limited to, quoted prices for similar securities, interest rates, foreign exchange rates, volatility and credit spreads), either directly or indirectly;
Level 3 — Prices or valuations that require significant unobservable inputs (including GSAM’s assumptions in determining fair value measurement).
GOLDMAN SACHS STRUCTURED DOMESTIC EQUITY FUNDS
| |
| 3. FAIR VALUE OF INVESTMENTS (continued) | |
The following is a summary of the Funds’ investments and derivatives categorized in the fair value hierarchy as of April 30, 2011:
| | | | | | | | | | | | | |
BALANCED
| | | | | | |
| Investment Type | | Level 1 | | Level 2 | | Level 3 |
| |
Assets | | | | | | | | | | | | |
Common Stock and/or Other Equity Investments | | $ | 75,930,563 | | | $ | 1,984 | | | $ | — | |
| Fixed Income | | | | | | | | | | | | |
| Corporate Obligations | | | — | | | | 15,870,393 | | | | — | |
| Mortgage-Backed Obligations | | | — | | | | 24,618,313 | | | | — | |
U.S. Treasury Obligations and/or Other U.S. Government Agencies | | | 2,714,664 | | | | 908,041 | | | | — | |
| Asset-Backed Securities | | | — | | | | 6,606,486 | | | | — | |
| Foreign Debt Obligations | | | — | | | | 550,143 | | | | — | |
| Government Guarantee Obligations | | | — | | | | 519,896 | | | | — | |
| Municipal Debt Obligations | | | — | | | | 884,489 | | | | — | |
| Structured Notes | | | — | | | | 375,067 | | | | — | |
| Short-term Investments | | | — | | | | 10,900,000 | | | | — | |
| Securities Lending Reinvestment Vehicle | | | 406,025 | | | | — | | | | — | |
| |
| |
Total | | $ | 79,051,252 | | | $ | 61,234,812 | | | $ | — | |
| |
| |
| Derivative Type | | | | | | |
| |
Assets | | | | | | | | | | | | |
| Futures Contracts* | | $ | 169,927 | | | $ | — | | | $ | — | |
| Interest Rate Swap Contracts | | | — | | | | 69,065 | | | | — | |
| |
| |
Total | | $ | 169,927 | | | $ | 69,065 | | | $ | — | |
| |
| |
Liabilities | | | | | | | | | | | | |
| Forward Foreign Currency Exchange Contracts* | | $ | — | | | $ | (31,610 | ) | | $ | — | |
| Futures Contracts* | | | (40,623 | ) | | | — | | | | — | |
| Interest Rate Swap Contracts | | | — | | | | (93,378 | ) | | | — | |
| Interest Rate Swaption Contracts | | | — | | | | (80,779 | ) | | | — | |
| |
| |
Total | | $ | (40,623 | ) | | $ | (205,767 | ) | | $ | — | |
| |
| |
| | | | | | | | | | | | | |
| | | | | | | | | | | | | |
GOLDMAN SACHS STRUCTURED DOMESTIC EQUITY FUNDS
Notes to Financial Statements (continued)
April 30, 2011 (Unaudited)
| |
| 3. FAIR VALUE OF INVESTMENTS (continued) | |
| | | | | | | | | | | | | |
STRUCTURED LARGE CAP GROWTH
| | | | | | |
| Investment Type | | Level 1 | | Level 2 | | Level 3 |
| |
Assets | | | | | | | | | | | | |
Common Stock and/or Other Equity Investments | | $ | 644,341,176 | | | $ | 15,066 | | | $ | — | |
| Securities Lending Reinvestment Vehicle | | | 7,806,700 | | | | — | | | | — | |
| |
| |
Total | | $ | 652,147,876 | | | $ | 15,066 | | | $ | — | |
| |
| |
| Derivative Type | | Level 1 | | Level 2 | | Level 3 |
| |
Assets | | | | | | | | | | | | |
| Futures Contracts* | | $ | 137,789 | | | $ | — | | | $ | — | |
| |
| |
| | | | | | | | | | | | | |
| | | | | | | | | | | | | |
STRUCTURED LARGE CAP VALUE
| | | | | | |
| Investment Type | | Level 1 | | Level 2 | | Level 3 |
| |
Assets | | | | | | | | | | | | |
Common Stock and/or Other Equity Investments | | $ | 645,672,931 | | | $ | — | | | $ | — | |
| Short-term Investments | | | — | | | | 2,600,000 | | | | — | |
| Securities Lending Reinvestment Vehicle | | | 6,956,750 | | | | — | | | | — | |
| |
| |
Total | | $ | 652,629,681 | | | $ | 2,600,000 | | | $ | — | |
| |
| |
| Derivative Type | | Level 1 | | Level 2 | | Level 3 |
| |
Assets | | | | | | | | | | | | |
| Futures Contracts* | | $ | 179,278 | | | $ | — | | | $ | — | |
| |
| |
| | | | | | | | | | | | | |
| | | | | | | | | | | | | |
STRUCTURED SMALL CAP EQUITY
| | | | | | |
| Investment Type | | Level 1 | | Level 2 | | Level 3 |
| |
Assets | | | | | | | | | | | | |
Common Stock and/or Other Equity Investments | | $ | 292,284,429 | | | $ | — | | | $ | — | |
| Short-term Investments | | | — | | | | 9,500,000 | | | | — | |
| Securities Lending Reinvestment Vehicle | | | 9,504,425 | | | | — | | | | — | |
| |
| |
Total | | $ | 301,788,854 | | | $ | 9,500,000 | | | $ | — | |
| |
| |
| Derivative Type | | Level 1 | | Level 2 | | Level 3 |
| |
Assets | | | | | | | | | | | | |
| Futures Contracts* | | $ | 124,934 | | | $ | — | | | $ | — | |
| |
| |
| | | | | | | | | | | | | |
| | | | | | | | | | | | | |
GOLDMAN SACHS STRUCTURED DOMESTIC EQUITY FUNDS
| |
| 3. FAIR VALUE OF INVESTMENTS (continued) | |
| | | | | | | | | | | | | |
STRUCTURED SMALL CAP GROWTH
| | | | | | |
| Investment Type | | Level 1 | | Level 2 | | Level 3 |
| |
Assets | | | | | | | | | | | | |
Common Stock and/or Other Equity Investments | | $ | 49,914,699 | | | $ | — | | | $ | — | |
| Short-term Investments | | | — | | | | 900,000 | | | | — | |
| Securities Lending Reinvestment Vehicle | | | 1,125,400 | | | | — | | | | — | |
| |
| |
Total | | $ | 51,040,099 | | | $ | 900,000 | | | $ | — | |
| |
| |
| Derivative Type | | Level 1 | | Level 2 | | Level 3 |
| |
Assets | | | | | | | | | | | | |
| Futures Contracts* | | $ | 51,695 | | | $ | — | | | $ | — | |
| |
| |
STRUCTURED SMALL CAP VALUE
| | | | | | |
| Investment Type | | Level 1 | | Level 2 | | Level 3 |
| |
Assets | | | | | | | | | | | | |
Common Stock and/or Other Equity Investments | | $ | 151,719,437 | | | $ | — | | | $ | — | |
| Investment Companies | | | 145,749 | | | | — | | | | — | |
| Short-term Investments | | | — | | | | 3,600,000 | | | | — | |
| Securities Lending Reinvestment Vehicle | | | 6,962,263 | | | | — | | | | — | |
| |
| |
Total | | $ | 158,827,449 | | | $ | 3,600,000 | | | $ | — | |
| |
| |
| Derivative Type | | Level 1 | | Level 2 | | Level 3 |
| |
Assets | | | | | | | | | | | | |
| Futures Contracts* | | $ | 196,266 | | | $ | — | | | $ | — | |
| |
| |
| | | | | | | | | | | | | |
| | | | | | | | | | | | | |
GOLDMAN SACHS STRUCTURED DOMESTIC EQUITY FUNDS
Notes to Financial Statements (continued)
April 30, 2011 (Unaudited)
| |
| 3. FAIR VALUE OF INVESTMENTS (continued) | |
| | | | | | | | | | | | | |
STRUCTURED U.S. EQUITY
| | | | | | |
| Investment Type | | Level 1 | | Level 2 | | Level 3 |
| |
Assets | | | | | | | | | | | | |
Common Stock and/or Other Equity Investments | | $ | 481,092,199 | | | $ | — | | | $ | — | |
| Short-term Investments | | | — | | | | 13,100,000 | | | | — | |
| Securities Lending Reinvestment Vehicle | | | 700,000 | | | | — | | | | — | |
| |
| |
Total | | $ | 481,792,199 | | | $ | 13,100,000 | | | $ | — | |
| |
| |
| Derivative Type | | Level 1 | | Level 2 | | Level 3 |
| |
Assets | | | | | | | | | | | | |
| Futures Contracts* | | $ | 574,022 | | | $ | — | | | $ | — | |
| |
| |
| | |
| * | | Amount shown represents unrealized gain (loss) at period end. |
| |
| 4. INVESTMENTS IN DERIVATIVES | |
The Funds may make investments in derivative instruments, including, but not limited to options, futures, swaps, swaptions and other derivatives relating to foreign currency transactions. A derivative is an instrument whose value is derived from underlying assets, indices, reference rates or a combination of these factors. Derivative instruments may be privately negotiated contracts (often referred to as over the counter (“OTC”) derivatives) or they may be listed and traded on an exchange. Derivative contracts may involve future commitments to purchase or sell financial instruments or commodities at specified terms on a specified date, or to exchange interest payment streams or currencies based on a notional or contractual amount. Derivative instruments may involve a high degree of financial risk. The use of derivatives also involves the risk of loss if the investment adviser is incorrect in its expectation of the timing or level of fluctuations in securities prices, interest rates or currency prices. Investments in derivative instruments also include the risk of default by the counterparty, the risk that the investment may not be liquid and the risk that a small movement in the price of the underlying security or benchmark may result in a disproportionately large movement, unfavorable or favorable, in the price of the derivative instrument.
GOLDMAN SACHS STRUCTURED DOMESTIC EQUITY FUNDS
| |
| 4. INVESTMENTS IN DERIVATIVES (continued) | |
During the six months ended April 30, 2011, the Funds entered into certain derivative contract types. These instruments were used to meet the Funds’ investment objectives and to obtain and/or manage exposure related to the risks below. The following tables set forth, by certain risk types, the gross value of these derivative contracts for trading activities as of April 30, 2011. The values in the tables below exclude the effects of cash collateral received or posted pursuant to these derivative contracts, and therefore are not representative of the Funds’ net exposure.
| | | | | | | | | | | | | | | | |
| Balanced |
| |
| | | Statement of Assets
| | | | | Statement of Assets
| | | | |
| | | and Liabilities
| | | | | and Liabilities
| | | | |
| Risk | | Location | | Assets | | | Location | | Liabilities | | |
| Interest rate | | Receivables for swap contracts, at value; Due from broker — variation margin
| | $ | 206,764 | (a) | | | Payables for swap contracts, at value; Due to broker — variation margin; Options written, at value | |
$ | (214,780 | )(a)(b) | | |
| | | | | | | | | | | | | | | | |
| Equity | | Due to broker — variation margin | | | 32,228 | (a) | | | — | | | — | | | |
| | | | | | | | | | | | | | | | |
| Currency | |
— | | | — | | | | Payables for forward foreign currency exchange contracts, at value | | |
(31,610 | ) | | |
| | | | | | | | | | | | | | | | |
Total | | | | $ | 238,992 | | | | | | $ | (246,390 | ) | | |
| | | | | | | | | | | | | | | | |
| | | | | | | | | | | | | | |
| |
| | | | | Statement of Assets
| | | | | |
| | | | | and Liabilities
| | | | | |
| Risk | | Fund | | Location | | Assets(a) | | | Liabilities |
| Equity | | Structured Large Cap Growth | | Due from broker — variation margin | | $ | 137,789 | | | | $ | — | |
| | | | | | | | | | | | | | |
| Equity | | Structured Large Cap Value | | Due from broker — variation margin | | | 179,278 | | | | | — | |
| | | | | | | | | | | | | | |
| Equity | | Structured Small Cap Equity | | Due from broker — variation margin | | | 124,934 | | | | | — | |
| | | | | | | | | | | | | | |
| Equity | | Structured Small Cap Growth | | Due from broker — variation margin | | | 51,695 | | | | | — | |
| | | | | | | | | | | | | | |
| Equity | | Structured Small Cap Value | | Due from broker — variation margin | | | 196,266 | | | | | — | |
| | | | | | | | | | | | | | |
| Equity | | Structured U.S. Equity | | Due from broker — variation margin | | | 574,022 | | | | | — | |
| | | | | | | | | | | | | | |
| | |
| (a) | | Includes unrealized gain (loss) on futures contracts described in the Additional Investment Information sections of the Schedules of Investments. Only current day’s variation margin is reported within the Statement of Assets and Liabilities. |
| (b) | | Aggregate amount includes $93,378 which represents the payments to be made pursuant to bilateral agreements should counterparties exercise their “right to terminate” provisions based on, among others, the Fund’s performance, its failure to pay on its obligations or failure to pledge collateral. Such amount does not include incremental charges directly associated with the close-out of the agreements. It also does not reflect the fair value of any assets pledged as collateral which, through the daily margining process, substantially offsets the aforementioned amounts and for which the Fund is entitled to a full return. |
GOLDMAN SACHS STRUCTURED DOMESTIC EQUITY FUNDS
Notes to Financial Statements (continued)
April 30, 2011 (Unaudited)
| |
| 4. INVESTMENTS IN DERIVATIVES (continued) | |
The following table sets forth, by certain risk types, the Funds’ gains (losses) related to these derivatives and their indicative volumes for the six months ended April 30, 2011. These gains (losses) should be considered in the context that these derivative contracts may have been executed to economically hedge certain securities, and accordingly, certain gains (losses) on such derivative contracts may offset certain (losses) gains attributable to securities. These gains (losses) are included in “Net realized gain (loss)” or “Net change in unrealized gain (loss)” on the Statements of Operations:
| | | | | | | | | | | | | | | | |
| Balanced |
| |
| | | | | Net
| | Net Change in
| | | Average
|
| | | | | Realized
| | Unrealized
| | | Number of
|
| Risk | | Statement of Operations Location | | Gain (Loss) | | Gain (Loss) | | | Contracts(a) |
| Interest rate | | Net realized gain (loss) from futures transactions and swap contracts/Net change in unrealized gain (loss) on futures, swap contracts and written options | | $ | (448,496 | ) | | $ | 96,336 | | | | | 219 | |
| | | | | | | | | | | | | | | | |
| Credit | | Net realized gain (loss) from swap contracts/Net change in unrealized gain (loss) on swap contracts | | | 10,230 | | | | (5,321 | ) | | | | 1 | |
| | | | | | | | | | | | | | | | |
| Equity | | Net realized gain (loss) from futures transactions/ Net change in unrealized gain (loss) on futures transactions | | | 150,567 | | | | 28,863 | | | | | 14 | |
| | | | | | | | | | | | | | | | |
| Currency | | Net realized gain (loss) from foreign currency related transactions/Net change in unrealized gain (loss) on translation of assets and liabilities denominated in foreign currencies | | | (82,783 | ) | | | 4,013 | | | | | 8 | |
| | | | | | | | | | | | | | | | |
Total | | | | $ | (370,482 | ) | | $ | 123,891 | | | | | 242 | |
| | | | | | | | | | | | | | | | |
The following table represents gains (losses) which are included in “Net realized gain (loss) from future transactions” and “Net change in unrealized gain (loss) on futures” on the Statements of Operations.
| | | | | | | | | | | | | | | | |
| |
| | | | | Net
| | Net Change in
| | | Average
|
| | | | | Realized
| | Unrealized
| | | Number of
|
| Risk | | Fund | | Gain (Loss) | | Gain (Loss) | | | Contracts(a) |
| Equity | | Structured Large Cap Growth | | $ | 1,358,062 | | | $ | 128,120 | | | | | 219 | |
| | | | | | | | | | | | | | | | |
| Equity | | Structured Large Cap Value | | | 1,389,357 | | | | 124,413 | | | | | 216 | |
| | | | | | | | | | | | | | | | |
| Equity | | Structured Small Cap Equity | | | 1,753,620 | | | | (132,464 | ) | | | | 87 | |
| | | | | | | | | | | | | | | | |
| Equity | | Structured Small Cap Growth | | | 190,980 | | | | 2,434 | | | | | 12 | |
| | | | | | | | | | | | | | | | |
| Equity | | Structured Small Cap Value | | | 590,302 | | | | (778 | ) | | | | 38 | |
| | | | | | | | | | | | | | | | |
| Equity | | Structured U.S. Equity | | | 1,276,465 | | | | 88,648 | | | | | 153 | |
| | | | | | | | | | | | | | | | |
| | |
| (a) | | Average number of contracts is based on the average of month end balances for the six months ended April 30, 2011. |
GOLDMAN SACHS STRUCTURED DOMESTIC EQUITY FUNDS
| |
| 5. AGREEMENTS AND AFFILIATED TRANSACTIONS | |
A. Management Agreement — Under the Agreement, GSAM manages the Funds, subject to the general supervision of the trustees.
As compensation for the services rendered pursuant to the Agreement, the assumption of the expenses related thereto and administration of the Funds’ business affairs, including providing facilities, GSAM is entitled to a management fee accrued daily and paid monthly, equal to an annual percentage rate of each Fund’s average daily net assets.
For the six months ended April 30, 2011, contractual and effective net management fees with GSAM were at the following rates:
| | | | | | | | | | | | | | | | | | | | | | | | | | | | | |
| | | Contractual Management Rate | | Effective Net
|
| | | First
| | Next
| | Next
| | Next
| | Over
| | Effective
| | Management
|
| Fund | | $1 billion | | $1 billion | | $3 billion | | $3 billion | | $8 billion | | Rate | | Rate* |
| |
| Balanced | | | 0.65 | % | | | 0.59 | % | | | 0.56 | % | | | 0.55 | % | | | 0.54 | % | | | 0.65 | % | | | 0.55 | % |
| |
| |
| Structured Large Cap Growth | | | 0.65 | | | | 0.59 | | | | 0.56 | | | | 0.55 | | | | 0.54 | | | | 0.65 | | | | 0.51 | |
| |
| |
| Structured Large Cap Value | | | 0.60 | | | | 0.54 | | | | 0.51 | | | | 0.50 | | | | 0.49 | | | | 0.60 | | | | 0.51 | |
| |
| |
| Structured Small Cap Equity | | | 0.85 | | | | 0.85 | | | | 0.77 | | | | 0.73 | | | | 0.72 | | | | 0.85 | | | | 0.81 | |
| |
| |
| Structured Small Cap Growth | | | 0.85 | | | | 0.85 | | | | 0.77 | | | | 0.73 | | | | 0.72 | | | | 0.85 | | | | 0.81 | |
| |
| |
| Structured Small Cap Value | | | 0.85 | | | | 0.85 | | | | 0.77 | | | | 0.73 | | | | 0.72 | | | | 0.85 | | | | 0.81 | |
| |
| |
| Structured U.S. Equity | | | 0.65 | | | | 0.59 | | | | 0.56 | | | | 0.55 | | | | 0.54 | | | | 0.65 | | | | 0.51 | |
| |
| |
| | |
| * | | GSAM agreed to waive a portion of its management fee in order to achieve the effective net management rates shown above through at least February 28, 2012. Prior to such date GSAM may not terminate the arrangement without the approval of the trustees. |
B. Distribution and Service Plans — The Trust, on behalf of each Fund, has adopted Distribution and Service Plans (the “Plans”). Under the Plans, Goldman Sachs, which serves as distributor (the “Distributor”), is entitled to a fee, accrued daily and paid monthly for distribution services and personal and account maintenance services, which may then be paid by Goldman Sachs to authorized dealers, at the following annual rates calculated on a Fund’s average daily net assets of each respective share class:
| | | | | | | | | | | | | | | | | |
| | | Distribution and Service Plan Rates |
| | | Class A* | | Class B | | Class C | | Class R* |
| |
| Distribution Plan | | | 0.25 | % | | | 0.75 | % | | | 0.75 | % | | | 0.50 | % |
| |
| |
| Service Plan | | | — | | | | 0.25 | | | | 0.25 | | | | — | |
| |
| |
| | |
| * | | With respect to Class A and Class R Shares, the Distributor at its discretion may use compensation for distribution services paid under the Distribution Plan to compensate service organizations for personal and account maintenance services and expenses as long as such total compensation does not exceed the maximum cap on “service fees” imposed by the Financial Industry Regulatory Authority. |
GOLDMAN SACHS STRUCTURED DOMESTIC EQUITY FUNDS
Notes to Financial Statements (continued)
April 30, 2011 (Unaudited)
| |
| 5. AGREEMENTS AND AFFILIATED TRANSACTIONS (continued) | |
C. Distribution Agreement — Goldman Sachs, as Distributor of the shares of the Funds pursuant to a Distribution Agreement, may retain a portion of the Class A front end sales charge and Class B and Class C contingent deferred sales charges. During the six months ended April 30, 2011, Goldman Sachs advised that it retained the following approximate amounts:
| | | | | | | | | | | | | |
| | | Front End
| | Contingent Deferred
|
| | | Sales Charge | | Sales Charge |
| Fund | | Class A | | Class B | | Class C |
| |
| Balanced | | $ | 15,300 | | | $ | — | | | $ | 100 | |
| |
| |
| Structured Large Cap Growth | | | 2,900 | | | | — | | | | — | |
| |
| |
| Structured Large Cap Value | | | 5,400 | | | | — | | | | 100 | |
| |
| |
| Structured Small Cap Equity | | | 1,400 | | | | — | | | | 200 | |
| |
| |
| Structured Small Cap Growth | | | 1,200 | | | | — | | | | 100 | |
| |
| |
| Structured Small Cap Value | | | 3,100 | | | | — | | | | 100 | |
| |
| |
| Structured U.S. Equity | | | 6,700 | | | | — | | | | 600 | |
| |
| |
D. Service Plan and Shareholder Administration Plan — The Trust, on behalf of each Fund that offers Service Shares, has adopted a Service Plan and Shareholder Administration Plan. These plans allow service organizations to provide varying levels of personal and account maintenance and shareholder administration services to their customers who are beneficial owners of such shares. The Service Plan and Shareholder Administration Plan each provide for compensation to the service organizations which is accrued daily and paid monthly at an annual rate of 0.25% (0.50% in aggregate) of the average daily net assets of the Service Shares.
E. Transfer Agency Agreement — Goldman Sachs also serves as the transfer agent of the Funds for a fee pursuant to a Transfer Agency Agreement. The fees charged for such transfer agency services are accrued daily and paid monthly at an annual rate as follows: 0.19% of the average daily net assets for Class A, Class B, Class C, Class IR and Class R Shares and 0.04% of the average daily net assets for Institutional and Service Shares.
F. Other Expense Agreements and Affiliated Transactions — GSAM has agreed to limit certain “Other Expense” of the Funds (excluding management fees, distribution and service fees, transfer agent fees and expenses, service fees and shareholder administration fees (as applicable), taxes, interest, brokerage fees and litigation, indemnification, shareholder meetings and other extraordinary expenses, exclusive of any custody and transfer agent fee credit reductions) to the extent such expenses exceed, on an annual basis, a percentage rate of the average daily net assets of each Fund. Such Other Expense reimbursements, if any, are accrued daily and paid monthly. In addition, the Funds are not obligated to reimburse GSAM for prior fiscal year expense reimbursements, if any. The Other Expense limitations as an annual percentage rate of average daily net assets are 0.064% for the Balanced Fund and 0.004% for the remainder of the Funds. These Other Expense reimbursements will remain in place through at least February 28, 2012, and prior to such date GSAM may not terminate the arrangements without the approval of the trustees. In addition, the Funds have entered into certain offset arrangements with the custodian and the transfer agent, which may result in a reduction in the Funds’ expenses.
GOLDMAN SACHS STRUCTURED DOMESTIC EQUITY FUNDS
| |
| 5. AGREEMENTS AND AFFILIATED TRANSACTIONS (continued) | |
For the six months ended April 30, 2011, these expense reductions, including any fee waivers and Other Expense reimbursements, were as follows (in thousands):
| | | | | | | | | | | | | | | | | |
| | | | | | | Other
| | Total
|
| | | Management
| | Custody Fee
| | Expense
| | Expense
|
| Fund | | Fee Waivers | | Credits | | Reimbursements | | Reductions |
| |
| Balanced | | $ | 65 | | | $ | — | * | | $ | 147 | | | $ | 212 | |
| |
| |
| Structured Large Cap Growth | | | 445 | | | | — | * | | | 241 | | | | 686 | |
| |
| |
| Structured Large Cap Value | | | 285 | | | | 43 | | | | 225 | | | | 553 | |
| |
| |
| Structured Small Cap Equity | | | 70 | | | | — | * | | | 181 | | | | 251 | |
| |
| |
| Structured Small Cap Growth | | | 9 | | | | — | * | | | 153 | | | | 162 | |
| |
| |
| Structured Small Cap Value | | | 30 | | | | — | * | | | 178 | | | | 208 | |
| |
| |
| Structured U.S. Equity | | | 336 | | | | — | * | | | 222 | | | | 558 | |
| |
| |
| | |
| * | | Amount is less than $500. |
As of April 30, 2011, the amounts owed to affiliates of the Funds were as follows (in thousands):
| | | | | | | | | | | | | | | | | |
| | | | | Distribution
| | | | |
| | | Management
| | and Service
| | Transfer
| | |
| Fund | | Fees | | Fees | | Agent Fees | | Total |
| |
| Balanced | | $ | 59 | | | $ | 36 | | | $ | 20 | | | $ | 115 | |
| |
| |
| Structured Large Cap Growth | | | 276 | | | | 55 | | | | 47 | | | | 378 | |
| |
| |
| Structured Large Cap Value | | | 277 | | | | 49 | | | | 46 | | | | 372 | |
| |
| |
| Structured Small Cap Equity | | | 202 | | | | 37 | | | | 25 | | | | 264 | |
| |
| |
| Structured Small Cap Growth | | | 33 | | | | 16 | | | | 7 | | | | 56 | |
| |
| |
| Structured Small Cap Value | | | 102 | | | | 57 | | | | 23 | | | | 182 | |
| |
| |
| Structured U.S. Equity | | | 202 | | | | 106 | | | | 59 | | | | 367 | |
| |
| |
G. Line of Credit Facility — As of April 30, 2011, the Funds participated in a $580,000,000 committed, unsecured revolving line of credit facility (the “facility”) together with other funds of the Trust and registered investment companies having management agreements with GSAM or its affiliates. Pursuant to the terms of the facility, the Funds and other borrowers could increase the credit amount by an additional $340,000,000, for a total of up to $920,000,000. This facility is to be used solely for temporary or emergency purposes. The interest rate on borrowings is based on the federal funds rate. The facility also requires a fee to be paid by the Funds based on the amount of the commitment that has not been utilized. For the six months ended April 30, 2011, the Funds did not have any borrowings under the facility.
GOLDMAN SACHS STRUCTURED DOMESTIC EQUITY FUNDS
Notes to Financial Statements (continued)
April 30, 2011 (Unaudited)
| |
| 5. AGREEMENTS AND AFFILIATED TRANSACTIONS (continued) | |
H. Other Transactions with Affiliates — For the six months ended April 30, 2011, Goldman Sachs earned approximately $3,500, $12,900, $12,700, $6,400, $200, $200 and $2,200 in brokerage commissions from portfolio transactions, including futures transactions executed with Goldman Sachs as the Futures Commission Merchant, on behalf of the Balanced, Structured Large Cap Growth, Structured Large Cap Value, Structured Small Cap Equity, Structured Small Cap Growth, Structured Small Cap Value and Structured U.S. Equity Funds, respectively.
As of April 30, 2011, the following Fund of Funds Portfolios and the Profit Sharing Master Trust were the beneficial owners of 5% or more of total outstanding shares of the following Funds:
| | | | | | | | | | | | | | | | | | | | | |
| | | Goldman Sachs
| | Goldman Sachs
| | Goldman Sachs
| | Goldman Sachs
| | Goldman Sachs
|
| | | Balanced Strategy
| | Equity Growth
| | Growth and Income
| | Growth Strategy
| | Profit Sharing
|
| Fund | | Portfolio | | Strategy Portfolio | | Strategy Portfolio | | Portfolio | | Master Trust |
| |
| Structured Large Cap Growth | | | 7 | % | | | 12 | % | | | 23 | % | | | 25 | % | | | — | % |
| |
| |
| Structured Large Cap Value | | | 7 | | | | 12 | | | | 22 | | | | 24 | | | | — | |
| |
| |
| Structured Small Cap Equity | | | 7 | | | | 7 | | | | 19 | | | | 16 | | | | — | |
| |
| |
| Structured U.S. Equity | | | — | | | | — | | | | — | | | | — | | | | 19 | |
| |
| |
As of April 30, 2011, Goldman Sachs Group, Inc. (“GSG”) was the beneficial owner of 5% or more of outstanding Class IR and Class R Shares of the following Funds:
| | | | | | | | | |
| Fund | | Class IR | | Class R |
| |
| Structured Large Cap Growth | | | 100 | % | | | 16 | % |
| |
| |
| Structured Large Cap Value | | | 39 | | | | 11 | |
| |
| |
| Structured Small Cap Growth | | | — | | | | 20 | |
| |
| |
| Structured Small Cap Value | | | 34 | | | | 5 | |
| |
| |
| Structured U.S. Equity | | | 100 | | | | 23 | |
| |
| |
GOLDMAN SACHS STRUCTURED DOMESTIC EQUITY FUNDS
| |
| 6. PORTFOLIO SECURITIES TRANSACTIONS | |
The cost of purchases and proceeds from sales and maturities of long-term securities for the six months ended April 30, 2011, were as follows:
| | | | | | | | | |
| Fund | | Purchases | | Sales and Maturities |
| |
| Balanced* | | $ | 202,182,940 | | | $ | 204,909,728 | |
| |
| |
| Structured Large Cap Growth | | | 222,095,407 | | | | 184,528,084 | |
| |
| |
| Structured Large Cap Value | | | 184,343,595 | | | | 149,911,569 | |
| |
| |
| Structured Small Cap Equity | | | 53,026,562 | | | | 185,276,367 | |
| |
| |
| Structured Small Cap Growth | | | 12,727,551 | | | | 11,879,408 | |
| |
| |
| Structured Small Cap Value | | | 22,490,492 | | | | 32,933,069 | |
| |
| |
| Structured U.S. Equity | | | 72,003,128 | | | | 123,355,751 | |
| |
| |
| | |
| * | | Included in these amounts are the cost of purchases and proceeds from sales and maturities of U.S. Government and agency obligations in the amounts of $156,154,712 and $153,982,720, respectively. |
Pursuant to exemptive relief granted by the SEC and the terms and conditions contained therein, the Funds may lend their securities through a securities lending agent, Goldman Sachs Agency Lending (“GSAL”), a wholly-owned subsidiary of Goldman Sachs, to certain qualified borrowers including Goldman Sachs and affiliates. In accordance with the Funds’ securities lending procedures, the Funds receive cash collateral at least equal to the market value of the securities on loan. The market value of the loaned securities is determined at the close of business of the Funds, at their last sale price or official closing price on the principal exchange or system on which they are traded, and any additional required collateral is delivered to the Funds on the next business day. As with other extensions of credit, the Funds may experience delay in the recovery of their securities or incur a loss should the borrower of the securities breach its agreement with the Funds or become insolvent at a time when the collateral is insufficient to cover the cost of repurchasing securities on loan.
Effective December 29, 2010, the Funds invest the cash collateral received in connection with securities lending transactions in the Goldman Sachs Financial Square Money Market Fund (“Money Market Fund”), a separate series of the Trust. The Money Market Fund, deemed an affiliate of the Trust, is registered under the Act as an open end investment company, is subject to Rule 2a-7 under the Act, and is managed by GSAM, for which GSAM may receive an investment advisory fee of up to 0.205% on an annualized basis of the average daily net assets of the Money Market Fund. Prior to December 29, 2010, the Funds invested the cash collateral received in connection with securities lending transactions in the Enhanced Portfolio II of Boston Global Investment Trust (“Enhanced Portfolio II”), a Delaware statutory trust. The Enhanced Portfolio II, deemed an affiliate of the Trust, was exempt from registration under Section 3(c)(7) of the Act and was managed by GSAM, for which GSAM may have received an investment advisory fee of up to 0.10% on an annualized basis of the average daily net assets of the Enhanced Portfolio II. The Enhanced Portfolio II invested primarily in short-term investments, but was not a “money market fund” subject to the requirements of Rule 2a-7 of the Act.
Both the Funds and GSAL received compensation relating to the lending of the Funds’ securities. The amounts earned by the Funds for the six months ended April 30, 2011, are reported under Investment Income on the Statements of Operations.
GOLDMAN SACHS STRUCTURED DOMESTIC EQUITY FUNDS
Notes to Financial Statements (continued)
April 30, 2011 (Unaudited)
| |
| 7. SECURITIES LENDING (continued) | |
The table below details securities lending activity with affiliates of Goldman Sachs:
| | | | | | | | | | | | | |
| | | For the Six Months Ended April 30, 2011 | | Amounts Payable to
|
| | | Earnings of GSAL
| | Amounts Received
| | Goldman Sachs
|
| | | Relating to
| | by the Funds
| | Upon Return of
|
| | | Securities
| | from Lending to
| | Securities Loaned as of
|
| Fund | | Loaned | | Goldman Sachs | | April 30, 2011 |
| |
| Balanced | | $ | 245 | | | $ | 2 | | | $ | — | |
| |
| |
| Structured Large Cap Growth | | | 4,851 | | | | 2,507 | | | | 1,437,200 | |
| |
| |
| Structured Large Cap Value | | | 4,519 | | | | 10,964 | | | | 3,907,000 | |
| |
| |
| Structured Small Cap Equity | | | 5,449 | | | | 9,514 | | | | 1,202,475 | |
| |
| |
| Structured Small Cap Growth | | | 893 | | | | 1,655 | | | | 236,250 | |
| |
| |
| Structured Small Cap Value | | | 3,307 | | | | 4,612 | | | | 521,100 | |
| |
| |
| Structured U.S. Equity | | | 610 | | | | — | | | | — | |
| |
| |
The following table provides information about the Funds’ investment in the Enhanced Portfolio II for the period from November 1, 2010 to December 28, 2010 (in thousands):
| | | | | | | | | | | | | | | | | |
| | | Number of
| | | | | | |
| | | Shares Held
| | | | | | Number of
|
| | | Beginning
| | Shares
| | Shares
| | Shares Held
|
| Fund | | of Period | | Bought | | Sold | | End of Period |
| |
| Balanced | | | 570 | | | | 632 | | | | (1,202 | ) | | | — | |
| |
| |
| Structured Large Cap Growth | | | 2,692 | | | | 11,418 | | | | (14,110 | ) | | | — | |
| |
| |
| Structured Large Cap Value | | | 2,502 | | | | 6,186 | | | | (8,688 | ) | | | — | |
| |
| |
| Structured Small Cap Equity | | | 20,095 | | | | 20,533 | | | | (40,628 | ) | | | — | |
| |
| |
| Structured Small Cap Growth | | | 941 | | | | 2,138 | | | | (3,079 | ) | | | — | |
| |
| |
| Structured Small Cap Value | | | 6,447 | | | | 8,996 | | | | (15,443 | ) | | | — | |
| |
| |
| Structured U.S. Equity | | | 185 | | | | 2,073 | | | | (2,258 | ) | | | — | |
| |
| |
GOLDMAN SACHS STRUCTURED DOMESTIC EQUITY FUNDS
| |
| 7. SECURITIES LENDING (continued) | |
The following table provides information about the Funds’ investment in the Financial Square Money Market Fund for the period from December 29, 2010 to April 30, 2011 (in thousands):
| | | | | | | | | | | | | | | | | | | | | |
| | | Number of
| | | | | | | | |
| | | Shares Held
| | | | | | Number of
| | |
| | | Beginning
| | Shares
| | Shares
| | Shares Held
| | Value at
|
| Fund | | of Period | | Bought | | Sold | | End of Period | | End of Period |
| |
| Balanced | | | — | | | | 1,324 | | | | (918 | ) | | | 406 | | | $ | 406 | |
| |
| |
| Structured Large Cap Growth | | | — | | | | 15,098 | | | | (7,291 | ) | | | 7,807 | | | | 7,807 | |
| |
| |
| Structured Large Cap Value | | | — | | | | 14,950 | | | | (7,993 | ) | | | 6,957 | | | | 6,957 | |
| |
| |
| Structured Small Cap Equity | | | — | | | | 40,481 | | | | (30,977 | ) | | | 9,504 | | | | 9,504 | |
| |
| |
| Structured Small Cap Growth | | | — | | | | 4,206 | | | | (3,081 | ) | | | 1,125 | | | | 1,125 | |
| |
| |
| Structured Small Cap Value | | | — | | | | 23,624 | | | | (16,662 | ) | | | 6,962 | | | | 6,962 | |
| |
| |
| Structured U.S. Equity | | | — | | | | 1,777 | | | | (1,077 | ) | | | 700 | | | | 700 | |
| |
| |
As of the Funds’ most recent fiscal year end, October 31, 2010, the Funds’ capital loss carryforwards and certain timing differences on a tax basis were as follows:
| | | | | | | | | | | | | | | | | | | | | | | | | | | | | | | |
| | | | | Structured
| | Structured
| | Structured
| | Structured
| | Structured
| | Structured
| | |
| | | | | Large Cap
| | Large Cap
| | Small Cap
| | Small Cap
| | Small Cap
| | U.S.
| | |
| | | Balanced | | Growth | | Value | | Equity | | Growth | | Value | | Equity | | |
| |
Capital loss carryforward:(1) | | | | | | | | | | | | | | | | | | | | | | | | | | | | | | |
| Expiring 2011 | | $ | — | | | $ | (5,803,222 | ) | | $ | — | | | $ | — | | | $ | — | | | $ | — | | | $ | — | | | |
| Expiring 2015 | | | — | | | | (15,811,506 | ) | | | — | | | | — | | | | — | | | | — | | | | — | | | |
| Expiring 2016 | | | — | | | | (273,461,938 | ) | | | (248,799,325 | ) | | | (134,795,126 | ) | | | (9,794,969 | ) | | | (36,807,926 | ) | | | (54,765,344 | ) | | |
| Expiring 2017 | | | (13,796,302 | ) | | | (340,520,322 | ) | | | (382,249,557 | ) | | | (163,876,125 | ) | | | (9,368,246 | ) | | | (40,600,516 | ) | | | (197,412,911 | ) | | |
| |
| |
| Total capital loss carryforward | | $ | (13,796,302 | ) | | $ | (635,596,988 | ) | | $ | (631,048,882 | ) | | $ | (298,671,251 | ) | | $ | (19,163,215 | ) | | $ | (77,408,442 | ) | | $ | (252,178,255 | ) | | |
| |
| |
| Timing differences | | | | | | | | | | | | | | | | | | | | | | | | | | | | | | |
| (Straddle Loss Deferrals) | | $ | (35,622 | ) | | $ | — | | | $ | — | | | $ | — | | | $ | — | | | $ | — | | | $ | — | | | |
| |
| |
| | |
| (1) | | Expiration occurs on October 31 of the year indicated. Utilization of these losses may be limited under the Code. |
GOLDMAN SACHS STRUCTURED DOMESTIC EQUITY FUNDS
Notes to Financial Statements (continued)
April 30, 2011 (Unaudited)
| |
| 8. TAX INFORMATION (continued) | |
As of April 30, 2011, the Funds’ aggregate security unrealized gains and losses based on cost for U.S. federal income tax purposes were as follows:
| | | | | | | | | | | | | | | | | | | | | | | | | | | | | | | |
| | | | | Structured
| | Structured
| | Structured
| | Structured
| | Structured
| | Structured
| | |
| | | | | Large Cap
| | Large Cap
| | Small Cap
| | Small Cap
| | Small Cap
| | U.S.
| | |
| | | Balanced | | Growth | | Value | | Equity | | Growth | | Value | | Equity | | |
| |
| Tax Cost | | $ | 124,269,378 | | | $ | 508,900,567 | | | $ | 504,574,809 | | | $ | 209,449,753 | | | $ | 36,897,343 | | | $ | 117,992,820 | | | $ | 383,143,582 | | | |
| |
| |
| Gross unrealized gain | | | 17,670,943 | | | | 154,819,536 | | | | 163,517,911 | | | | 108,805,628 | | | | 15,854,039 | | | | 47,581,731 | | | | 118,777,782 | | | |
| Gross unrealized loss | | | (1,654,257 | ) | | | (11,557,161 | ) | | | (12,863,039 | ) | | | (6,966,527 | ) | | | (811,283 | ) | | | (3,147,102 | ) | | | (7,029,165 | ) | | |
| |
| |
| Net unrealized security gain | | $ | 16,016,686 | | | $ | 143,262,375 | | | $ | 150,654,872 | | | $ | 101,839,101 | | | $ | 15,042,756 | | | $ | 44,434,629 | | | $ | 111,748,617 | | | |
| |
| |
The difference between GAAP-basis and tax-basis unrealized gains (losses), as of the most recent fiscal year end, is attributable primarily to wash sales, net mark-to-market gains (losses) on regulated futures contracts related and differences in the tax treatment of partnership investments and passive foreign investment company investments.
GSAM has reviewed the Funds’ tax positions for all open tax years (the current and prior three years, as applicable) and has concluded that no provision for income tax is required in the Funds’ financial statements. Such open tax years remain subject to examination and adjustment by tax authorities.
Under the recently enacted Regulated Investment Company Modernization Act of 2010, the Funds will be permitted to carry forward capital losses incurred in taxable years beginning after December 22, 2010 for an unlimited period. However, any losses incurred during those future taxable years will be required to be utilized prior to the losses incurred in pre-enactment taxable years. As a result of this ordering rule, pre-enactment capital loss carryforwards may be more likely to expire unused. Additionally, post-enactment capital losses that are carried forward will retain their character as either short-term or long-term capital losses rather than being considered all short-term as under previous law.
Funds’ Shareholder Concentration Risk — Certain funds, accounts, individuals or Goldman Sachs affiliates may from time to time own (beneficially or of record) or control a significant percentage of the Funds’ shares. Redemptions by these entities of their holdings in the Funds may impact the Funds’ liquidity and NAV. These redemptions may also force the Funds to sell securities.
Liquidity Risk — The Funds may make investments that may be illiquid or that may become less liquid in response to market developments or adverse investor perceptions. Liquidity risk may also refer to the risk that a Fund will not be able to pay redemption proceeds within the allowable time period because of unusual market conditions, an unusually high volume of redemption requests, or other reasons. To meet redemption requests, a Fund may be forced to sell investments at an unfavorable time and/or under unfavorable conditions.
Market and Credit Risks — In the normal course of business, the Funds trade financial instruments and enter into financial transactions where risk of potential loss exists due to changes in the market (market risk). Additionally, the Funds may also be exposed to credit risk in the event that an issuer fails to perform or that an institution or entity with which the Funds have unsettled or open transaction defaults.
Investing in foreign markets may involve special risks and considerations not typically associated with investing in the U.S. These risks include revaluation of currencies, high rates of inflation, repatriation restrictions on income and capital, and adverse
GOLDMAN SACHS STRUCTURED DOMESTIC EQUITY FUNDS
| |
| 9. OTHER RISKS (continued) | |
political and economic developments. Moreover, securities issued in these markets may be less liquid, be subject to government ownership controls, have delayed settlements and their prices may be more volatile than those of comparable securities in the U.S.
Under the Trust’s organizational documents, its trustees, officers, employees and agents are indemnified, to the extent permitted by the Act, against certain liabilities that may arise out of performance of their duties to the Funds. Additionally, in the course of business, the Funds enter into contracts that contain a variety of indemnification clauses. The Funds’ maximum exposure under these arrangements is unknown, as this would involve future claims that may be made against the Funds that have not yet occurred. However, GSAM believes the risk of loss under these arrangements to be remote.
Subsequent events after the balance sheet date have been evaluated through the date the financial statements were issued. GSAM has concluded that there is no impact requiring adjustment or disclosure in the financial statements.
GOLDMAN SACHS STRUCTURED DOMESTIC EQUITY FUNDS
Notes to Financial Statements (continued)
April 30, 2011 (Unaudited)
| |
| 12. SUMMARY OF SHARE TRANSACTIONS | |
Share activity is as follows:
| | | | | | | | | | | | | | | | | |
| | | Balanced Fund |
| | | |
| | | For the Six Months Ended
| | |
| | | April 30, 2011
| | For the Fiscal Year Ended
|
| | | (Unaudited) | | October 31, 2010 |
| | | |
| | | Shares | | Dollars | | Shares | | Dollars |
| | | |
Class A Shares | | | | | | | | | | | | | | | | |
| Shares sold | | | 489,809 | | | $ | 9,208,139 | | | | 723,382 | | | $ | 12,532,682 | |
| Reinvestment of distributions | | | 82,809 | | | | 1,548,656 | | | | 203,113 | | | | 3,471,414 | |
Shares converted from Class B(a) | | | 13,473 | | | | 252,023 | | | | 13,382 | | | | 233,071 | |
| Shares redeemed | | | (973,910 | ) | | | (18,457,674 | ) | | | (1,793,287 | ) | | | (31,033,431 | ) |
| |
| |
| | | | (387,819 | ) | | | (7,448,856 | ) | | | (853,410 | ) | | | (14,796,264 | ) |
| |
| |
Class B Shares | | | | | | | | | | | | | | | | |
| Shares sold | | | 41,499 | | | | 774,143 | | | | 59,398 | | | | 1,014,975 | |
| Reinvestment of distributions | | | 4,258 | | | | 78,898 | | | | 11,433 | | | | 193,607 | |
Shares converted to Class A(a) | | | (13,578 | ) | | | (252,023 | ) | | | (13,494 | ) | | | (233,071 | ) |
| Shares redeemed | | | (64,331 | ) | | | (1,204,317 | ) | | | (169,133 | ) | | | (2,894,716 | ) |
| |
| |
| | | | (32,152 | ) | | | (603,299 | ) | | | (111,796 | ) | | | (1,919,205 | ) |
| |
| |
Class C Shares | | | | | | | | | | | | | | | | |
| Shares sold | | | 104,520 | | | | 1,969,057 | | | | 95,259 | | | | 1,632,504 | |
| Reinvestment of distributions | | | 3,548 | | | | 65,658 | | | | 8,602 | | | | 145,366 | |
| Shares redeemed | | | (54,828 | ) | | | (1,030,972 | ) | | | (113,234 | ) | | | (1,950,875 | ) |
| |
| |
| | | | 53,240 | | | | 1,003,743 | | | | (9,373 | ) | | | (173,005 | ) |
| |
| |
Institutional Shares | | | | | | | | | | | | | | | | |
| Shares sold | | | 105,839 | | | | 2,051,475 | | | | 22,260 | | | | 391,287 | |
| Reinvestment of distributions | | | 3,085 | | | | 58,921 | | | | 5,527 | | | | 96,000 | |
| Shares redeemed | | | (57,276 | ) | | | (1,120,954 | ) | | | (25,261 | ) | | | (447,241 | ) |
| |
| |
| | | | 51,648 | | | | 989,442 | | | | 2,526 | | | | 40,046 | |
| |
| |
Service Shares | | | | | | | | | | | | | | | | |
| Shares sold | | | — | | | | — | | | | — | | | | — | |
| Reinvestment of distributions | | | — | | | | — | | | | — | | | | — | |
| Shares redeemed | | | — | | | | — | | | | — | | | | — | |
| |
| |
| | | | — | | | | — | | | | — | | | | — | |
| |
| |
Class IR Shares(b) | | | | | | | | | | | | | | | | |
| Shares sold | | | 9,761 | | | | 188,289 | | | | 57 | | | | 1,000 | |
| Reinvestment of distributions | | | 52 | | | | 1,008 | | | | 1 | | | | 8 | |
| Shares redeemed | | | (42 | ) | | | (821 | ) | | | — | | | | — | |
| |
| |
| | | | 9,771 | | | | 188,476 | | | | 58 | | | | 1,008 | |
| |
| |
Class R Shares | | | | | | | | | | | | | | | | |
| Shares sold | | | — | | | | — | | | | — | | | | — | |
| Reinvestment of distributions | | | — | | | | — | | | | — | | | | — | |
| Shares redeemed | | | — | | | | — | | | | — | | | | — | |
| |
| |
| | | | — | | | | — | | | | — | | | | — | |
| |
| |
NET DECREASE | | | (305,312 | ) | | $ | (5,870,494 | ) | | | (971,995 | ) | | $ | (16,847,420 | ) |
| |
| |
| | |
| (a) | | Class B Shares automatically convert into Class A Shares on or about the fifteenth day of the last month of the calendar quarter that is eight years after the initial purchase date of either the Fund or another Goldman Sachs Fund. |
| (b) | | Commenced operations on August 31, 2010 for the Balanced Fund. |
GOLDMAN SACHS STRUCTURED DOMESTIC EQUITY FUNDS
| |
| 12. SUMMARY OF SHARE TRANSACTIONS (continued) | |
Share activity is as follows:
| | | | | | | | | | | | | | | | | |
| | | Structured Large Cap Growth Fund |
| | | |
| | | For the Six Months Ended
| | |
| | | April 30, 2011
| | For the Fiscal Year Ended
|
| | | (Unaudited) | | October 31, 2010 |
| | | |
| | | Shares | | Dollars | | Shares | | Dollars |
| | | |
Class A Shares | | | | | | | | | | | | | | | | |
| Shares sold | | | 3,294,081 | | | $ | 40,546,052 | | | | 2,798,011 | | | $ | 30,429,431 | |
| Reinvestment of distributions | | | 128,552 | | | | 1,528,481 | | | | 184,731 | | | | 1,948,917 | |
Shares converted from Class B(a) | | | 39,180 | | | | 474,479 | | | | 174,259 | | | | 1,884,224 | |
| Shares redeemed | | | (3,001,072 | ) | | | (37,704,894 | ) | | | (8,891,472 | ) | | | (96,862,815 | ) |
| |
| |
| | | | 460,741 | | | | 4,844,118 | | | | (5,734,471 | ) | | | (62,600,243 | ) |
| |
| |
Class B Shares | | | | | | | | | | | | | | | | |
| Shares sold | | | 6,811 | | | | 78,849 | | | | 12,811 | | | | 125,930 | |
| Reinvestment of distributions | | | 3,523 | | | | 38,790 | | | | 4,153 | | | | 40,660 | |
Shares converted to Class A(a) | | | (42,353 | ) | | | (474,479 | ) | | | (188,381 | ) | | | (1,884,224 | ) |
| Shares redeemed | | | (76,519 | ) | | | (871,199 | ) | | | (242,911 | ) | | | (2,420,216 | ) |
| |
| |
| | | | (108,538 | ) | | | (1,228,039 | ) | | | (414,328 | ) | | | (4,137,850 | ) |
| |
| |
Class C Shares | | | | | | | | | | | | | | | | |
| Shares sold | | | 30,411 | | | | 348,993 | | | | 60,617 | | | | 605,499 | |
| Reinvestment of distributions | | | 6,411 | | | | 70,455 | | | | 6,742 | | | | 65,939 | |
| Shares redeemed | | | (132,577 | ) | | | (1,511,851 | ) | | | (395,460 | ) | | | (3,964,253 | ) |
| |
| |
| | | | (95,755 | ) | | | (1,092,403 | ) | | | (328,101 | ) | | | (3,292,815 | ) |
| |
| |
Institutional Shares | | | | | | | | | | | | | | | | |
| Shares sold | | | 10,406,124 | | | | 129,467,539 | | | | 10,565,474 | | | | 116,160,501 | |
| Reinvestment of distributions | | | 430,655 | | | | 5,253,989 | | | | 751,352 | | | | 8,129,624 | |
| Shares redeemed | | | (7,507,229 | ) | | | (96,822,957 | ) | | | (33,362,144 | ) | | | (368,880,774 | ) |
| |
| |
| | | | 3,329,550 | | | | 37,898,571 | | | | (22,045,318 | ) | | | (244,590,649 | ) |
| |
| |
Service Shares | | | | | | | | | | | | | | | | |
| Shares sold | | | 2,155 | | | | 27,360 | | | | 1,007 | | | | 10,674 | |
| Reinvestment of distributions | | | 68 | | | | 796 | | | | 90 | | | | 939 | |
| Shares redeemed | | | (233 | ) | | | (2,834 | ) | | | (5,480 | ) | | | (57,989 | ) |
| |
| |
| | | | 1,990 | | | | 25,322 | | | | (4,383 | ) | | | (46,376 | ) |
| |
| |
Class IR Shares | | | | | | | | | | | | | | | | |
| Shares sold | | | 1 | | | | 16 | | | | 3 | | | | 30 | |
| Reinvestment of distributions | | | 9 | | | | 117 | | | | 10 | | | | 102 | |
| Shares redeemed | | | (1 | ) | | | (17 | ) | | | (3 | ) | | | (30 | ) |
| |
| |
| | | | 9 | | | | 116 | | | | 10 | | | | 102 | |
| |
| |
Class R Shares | | | | | | | | | | | | | | | | |
| Shares sold | | | 168 | | | | 2,044 | | | | 5,323 | | | | 56,985 | |
| Reinvestment of distributions | | | 45 | | | | 532 | | | | 60 | | | | 624 | |
| Shares redeemed | | | (837 | ) | | | (10,602 | ) | | | (3,614 | ) | | | (38,970 | ) |
| |
| |
| | | | (624 | ) | | | (8,026 | ) | | | 1,769 | | | | 18,639 | |
| |
| |
NET INCREASE (DECREASE) | | | 3,587,373 | | | $ | 40,439,659 | | | | (28,524,822 | ) | | $ | (314,649,192 | ) |
| |
| |
| | |
| (a) | | Class B Shares automatically convert into Class A Shares on or about the fifteenth day of the last month of the calendar quarter that is eight years after the initial purchase date of either the Fund or another Goldman Sachs Fund. |
GOLDMAN SACHS STRUCTURED DOMESTIC EQUITY FUNDS
Notes to Financial Statements (continued)
April 30, 2011 (Unaudited)
| |
| 12. SUMMARY OF SHARE TRANSACTIONS (continued) | |
Share activity is as follows:
| | | | | | | | | | | | | | | | | |
| | | Structured Large Cap Value Fund |
| | | |
| | | For the Six Months Ended
| | |
| | | April 30, 2011
| | For the Fiscal Year Ended
|
| | | (Unaudited) | | October 31, 2010 |
| | | |
| | | Shares | | Dollars | | Shares | | Dollars |
| | | |
Class A Shares | | | | | | �� | | | | | | | | | | |
| Shares sold | | | 3,827,816 | | | $ | 39,433,756 | | | | 4,041,353 | | | $ | 36,711,026 | |
| Reinvestment of distributions | | | 101,899 | | | | 1,038,750 | | | | 309,442 | | | | 2,800,643 | |
Shares converted from Class B(a) | | | 2,620 | | | | 26,714 | | | | 25,452 | | | | 234,664 | |
| Shares redeemed | | | (3,692,749 | ) | | | (38,755,527 | ) | | | (18,876,203 | ) | | | (176,247,623 | ) |
| |
| |
| | | | 239,586 | | | | 1,743,693 | | | | (14,499,956 | ) | | | (136,501,290 | ) |
| |
| |
Class B Shares | | | | | | | | | | | | | | | | |
| Shares sold | | | 1,567 | | | | 16,505 | | | | 8,576 | | | | 74,691 | |
| Reinvestment of distributions | | | 685 | | | | 6,759 | | | | 1,707 | | | | 15,359 | |
Shares converted to Class A(a) | | | (2,634 | ) | | | (26,714 | ) | | | (25,611 | ) | | | (234,664 | ) |
| Shares redeemed | | | (29,329 | ) | | | (297,384 | ) | | | (119,993 | ) | | | (1,090,882 | ) |
| |
| |
| | | | (29,711 | ) | | | (300,834 | ) | | | (135,321 | ) | | | (1,235,496 | ) |
| |
| |
Class C Shares | | | | | | | | | | | | | | | | |
| Shares sold | | | 148,497 | | | | 1,529,664 | | | | 329,067 | | | | 2,988,355 | |
| Reinvestment of distributions | | | 3,846 | | | | 37,985 | | | | 9,206 | | | | 82,794 | |
| Shares redeemed | | | (208,255 | ) | | | (2,128,398 | ) | | | (636,445 | ) | | | (5,752,314 | ) |
| |
| |
| | | | (55,912 | ) | | | (560,749 | ) | | | (298,172 | ) | | | (2,681,165 | ) |
| |
| |
Institutional Shares | | | | | | | | | | | | | | | | |
| Shares sold | | | 12,560,585 | | | | 126,152,641 | | | | 2,968,508 | | | | 27,009,702 | |
| Reinvestment of distributions | | | 336,751 | | | | 3,446,550 | | | | 1,035,159 | | | | 9,344,308 | |
| Shares redeemed | | | (9,376,629 | ) | | | (99,140,248 | ) | | | (50,371,103 | ) | | | (457,858,563 | ) |
| |
| |
| | | | 3,520,707 | | | | 30,458,943 | | | | (46,367,436 | ) | | | (421,504,553 | ) |
| |
| |
Service Shares | | | | | | | | | | | | | | | | |
| Shares sold | | | 157,088 | | | | 1,642,804 | | | | 268,076 | | | | 2,443,517 | |
| Reinvestment of distributions | | | 4,102 | | | | 41,905 | | | | 8,304 | | | | 75,551 | |
| Shares redeemed | | | (65,268 | ) | | | (677,101 | ) | | | (453,444 | ) | | | (4,220,889 | ) |
| |
| |
| | | | 95,922 | | | | 1,007,608 | | | | (177,064 | ) | | | (1,701,821 | ) |
| |
| |
Class IR Shares(b) | | | | | | | | | | | | | | | | |
| Shares sold | | | 338 | | | | 3,471 | | | | 514 | | | | 4,672 | |
| Reinvestment of distributions | | | 15 | | | | 153 | | | | 25 | | | | 229 | |
| Shares redeemed | | | (2 | ) | | | (24 | ) | | | (1 | ) | | | (19 | ) |
| |
| |
| | | | 351 | | | | 3,600 | | | | 538 | | | | 4,882 | |
| |
| |
Class R Shares | | | | | | | | | | | | | | | | |
| Shares sold | | | 2,656 | | | | 28,853 | | | | 723 | | | | 6,553 | |
| Reinvestment of distributions | | | 28 | | | | 284 | | | | 57 | | | | 516 | |
| Shares redeemed | | | (435 | ) | | | (4,554 | ) | | | (174 | ) | | | (1,644 | ) |
| |
| |
| | | | 2,249 | | | | 24,583 | | | | 606 | | | | 5,425 | |
| |
| |
NET INCREASE (DECREASE) | | | 3,773,192 | | | $ | 32,376,844 | | | | (61,476,805 | ) | | $ | (563,614,018 | ) |
| |
| |
| | |
| (a) | | Class B Shares automatically convert into Class A Shares on or about the fifteenth day of the last month of the calendar quarter that is eight years after the initial purchase date of either the Fund or another Goldman Sachs Fund. |
| (b) | | Commenced operations on August 31, 2010 for the Balanced Fund. |
GOLDMAN SACHS STRUCTURED DOMESTIC EQUITY FUNDS
| |
| 12. SUMMARY OF SHARE TRANSACTIONS (continued) | |
Share activity is as follows:
| | | | | | | | | | | | | | | | | |
| | | Structured Small Cap Equity Fund |
| | | |
| | | For the Six Months Ended
| | |
| | | April 30, 2011
| | For the Fiscal Year Ended
|
| | | (Unaudited) | | October 31, 2010 |
| | | |
| | | Shares | | Dollars | | Shares | | Dollars |
| | | |
Class A Shares | | | | | | | | | | | | | | | | |
| Shares sold | | | 2,043,137 | | | $ | 23,680,289 | | | | 3,453,061 | | | $ | 34,172,335 | |
| Reinvestment of distributions | | | 56,590 | | | | 668,893 | | | | 114,398 | | | | 1,020,427 | |
Shares converted from Class B(a) | | | 3,245 | | | | 39,027 | | | | 41,313 | | | | 410,479 | |
| Shares redeemed | | | (4,510,230 | ) | | | (55,828,213 | ) | | | (9,480,171 | ) | | | (93,739,403 | ) |
| |
| |
| | | | (2,407,258 | ) | | | (31,440,004 | ) | | | (5,871,399 | ) | | | (58,136,162 | ) |
| |
| |
Class B Shares | | | | | | | | | | | | | | | | |
| Shares sold | | | 2,354 | | | | 26,229 | | | | 1,902 | | | | 17,011 | |
| Reinvestment of distributions | | | — | | | | — | | | | 355 | | | | 2,861 | |
Shares converted to Class A(a) | | | (3,606 | ) | | | (39,027 | ) | | | (45,903 | ) | | | (410,479 | ) |
| Shares redeemed | | | (51,025 | ) | | | (547,836 | ) | | | (102,599 | ) | | | (895,756 | ) |
| |
| |
| | | | (52,277 | ) | | | (560,634 | ) | | | (146,245 | ) | | | (1,286,363 | ) |
| |
| |
Class C Shares | | | | | | | | | | | | | | | | |
| Shares sold | | | 197,327 | | | | 2,181,347 | | | | 408,564 | | | | 3,664,707 | |
| Reinvestment of distributions | | | 660 | | | | 7,047 | | | | 4,417 | | | | 35,647 | |
| Shares redeemed | | | (238,408 | ) | | | (2,617,723 | ) | | | (482,013 | ) | | | (4,306,690 | ) |
| |
| |
| | | | (40,421 | ) | | | (429,329 | ) | | | (69,032 | ) | | | (606,336 | ) |
| |
| |
Institutional Shares | | | | | | | | | | | | | | | | |
| Shares sold | | | 879,317 | | | | 11,189,765 | | | | 2,074,011 | | | | 21,380,340 | |
| Reinvestment of distributions | | | 184,734 | | | | 2,261,145 | | | | 436,131 | | | | 4,029,850 | |
| Shares redeemed | | | (9,556,186 | ) | | | (123,041,659 | ) | | | (21,184,599 | ) | | | (209,809,310 | ) |
| |
| |
| | | | (8,492,135 | ) | | | (109,590,749 | ) | | | (18,674,457 | ) | | | (184,399,120 | ) |
| |
| |
Service Shares | | | | | | | | | | | | | | | | |
| Shares sold | | | 24,903 | | | | 303,871 | | | | 31,307 | | | | 309,986 | |
| Reinvestment of distributions | | | 402 | | | | 4,710 | | | | 1,052 | | | | 9,309 | |
| Shares redeemed | | | (15,424 | ) | | | (186,260 | ) | | | (89,682 | ) | | | (925,634 | ) |
| |
| |
| | | | 9,881 | | | | 122,321 | | | | (57,323 | ) | | | (606,339 | ) |
| |
| |
Class IR Shares | | | | | | | | | | | | | | | | |
| Shares sold | | | 403,494 | | | | 5,234,651 | | | | 2,807 | | | | 29,504 | |
| Reinvestment of distributions | | | 28 | | | | 328 | | | | 32 | | | | 291 | |
| Shares redeemed | | | (411 | ) | | | (5,243 | ) | | | (2,497 | ) | | | (26,502 | ) |
| |
| |
| | | | 403,111 | | | | 5,229,736 | | | | 342 | | | | 3,293 | |
| |
| |
Class R Shares | | | | | | | | | | | | | | | | |
| Shares sold | | | 8,998 | | | | 109,381 | | | | 17,381 | | | | 166,243 | |
| Reinvestment of distributions | | | 87 | | | | 1,017 | | | | 16 | | | | 144 | |
| Shares redeemed | | | (4,181 | ) | | | (51,315 | ) | | | (2,941 | ) | | | (30,999 | ) |
| |
| |
| | | | 4,904 | | | | 59,083 | | | | 14,456 | | | | 135,388 | |
| |
| |
NET DECREASE | | | (10,574,195 | ) | | $ | (136,609,576 | ) | | | (24,803,658 | ) | | $ | (244,895,639 | ) |
| |
| |
| | |
| (a) | | Class B Shares automatically convert into Class A Shares on or about the fifteenth day of the last month of the calendar quarter that is eight years after the initial purchase date of either the Fund or another Goldman Sachs Fund. |
GOLDMAN SACHS STRUCTURED DOMESTIC EQUITY FUNDS
Notes to Financial Statements (continued)
April 30, 2011 (Unaudited)
| |
| 12. SUMMARY OF SHARE TRANSACTIONS (continued) | |
Share activity is as follows:
| | | | | | | | | | | | | | | | | |
| | | Structured Small Cap Growth Fund |
| | | |
| | | For the Six Months Ended
| | |
| | | April 30, 2011
| | For the Fiscal Year Ended
|
| | | (Unaudited) | | October 31, 2010 |
| | | |
| | | Shares | | Dollars | | Shares | | Dollars |
| | | |
Class A Shares | | | | | | | | | | | | | | | | |
| Shares sold | | | 163,865 | | | $ | 3,446,416 | | | | 119,638 | | | $ | 1,981,250 | |
| Reinvestment of distributions | | | — | | | | — | | | | 4,387 | | | | 66,625 | |
Shares converted from Class B(a) | | | 33,314 | | | | 694,551 | | | | 104,370 | | | | 1,751,278 | |
| Shares redeemed | | | (176,150 | ) | | | (3,739,593 | ) | | | (347,598 | ) | | | (5,713,818 | ) |
| |
| |
| | | | 21,029 | | | | 401,374 | | | | (119,203 | ) | | | (1,914,665 | ) |
| |
| |
Class B Shares | | | | | | | | | | | | | | | | |
| Shares sold | | | 9,351 | | | | 174,354 | | | | 7,780 | | | | 116,868 | |
| Reinvestment of distributions | | | — | | | | — | | | | — | | | | — | |
Shares converted to Class A(a) | | | (38,626 | ) | | | (694,551 | ) | | | (120,384 | ) | | | (1,751,278 | ) |
| Shares redeemed | | | (39,679 | ) | | | (723,872 | ) | | | (103,206 | ) | | | (1,463,267 | ) |
| |
| |
| | | | (68,954 | ) | | | (1,244,069 | ) | | | (215,810 | ) | | | (3,097,677 | ) |
| |
| |
Class C Shares | | | | | | | | | | | | | | | | |
| Shares sold | | | 20,952 | | | | 382,004 | | | | 45,040 | | | | 651,084 | |
| Reinvestment of distributions | | | — | | | | — | | | | — | | | | — | |
| Shares redeemed | | | (45,138 | ) | | | (826,108 | ) | | | (103,243 | ) | | | (1,505,297 | ) |
| |
| |
| | | | (24,186 | ) | | | (444,104 | ) | | | (58,203 | ) | | | (854,213 | ) |
| |
| |
Institutional Shares | | | | | | | | | | | | | | | | |
| Shares sold | | | 27,657 | | | | 642,024 | | | | 56,483 | | | | 1,011,926 | |
| Reinvestment of distributions | | | — | | | | — | | | | 1,606 | | | | 26,735 | |
| Shares redeemed | | | (9,541 | ) | | | (222,195 | ) | | | (37,853 | ) | | | (701,936 | ) |
| |
| |
| | | | 18,116 | | | | 419,829 | | | | 20,236 | | | | 336,725 | |
| |
| |
Class IR Shares | | | | | | | | | | | | | | | | |
| Shares sold | | | 47,431 | | | | 999,361 | | | | 1 | | | | 25 | |
| Reinvestment of distributions | | | — | | | | — | | | | 3 | | | | 44 | |
| Shares redeemed | | | (3,930 | ) | | | (87,181 | ) | | | (1 | ) | | | (25 | ) |
| |
| |
| | | | 43,501 | | | | 912,180 | | | | 3 | | | | 44 | |
| |
| |
Class R Shares | | | | | | | | | | | | | | | | |
| Shares sold | | | 44 | | | | 913 | | | | 1,426 | | | | 22,866 | |
| Reinvestment of distributions | | | — | | | | — | | | | 12 | | | | 185 | |
| Shares redeemed | | | (2 | ) | | | (39 | ) | | | (1,811 | ) | | | (30,273 | ) |
| |
| |
| | | | 42 | | | | 874 | | | | (373 | ) | | | (7,222 | ) |
| |
| |
NET INCREASE (DECREASE) | | | (10,452 | ) | | $ | 46,084 | | | | (373,350 | ) | | $ | (5,537,008 | ) |
| |
| |
| | |
| (a) | | Class B Shares automatically convert into Class A Shares on or about the fifteenth day of the last month of the calendar quarter that is eight years after the initial purchase date of either the Fund or another Goldman Sachs Fund. |
GOLDMAN SACHS STRUCTURED DOMESTIC EQUITY FUNDS
| |
| 12. SUMMARY OF SHARE TRANSACTIONS (continued) | |
Share activity is as follows:
| | | | | | | | | | | | | | | | | |
| | | Structured Small Cap Value Fund |
| | | |
| | | For the Six Months Ended
| | |
| | | April 30, 2011
| | For the Fiscal Year Ended
|
| | | (Unaudited) | | October 31, 2010 |
| | | |
| | | Shares | | Dollars | | Shares | | Dollars |
| | | |
Class A Shares | | | | | | | | | | | | | | | | |
| Shares sold | | | 129,166 | | | $ | 3,473,521 | | | | 331,385 | | | $ | 7,529,979 | |
| Reinvestment of distributions | | | 22,231 | | | | 581,502 | | | | 35,405 | | | | 704,908 | |
Shares converted from Class B(a) | | | 66,987 | | | | 1,776,619 | | | | 415,782 | | | | 9,307,913 | |
| Shares redeemed | | | (484,142 | ) | | | (13,064,957 | ) | | | (1,058,326 | ) | | | (23,310,286 | ) |
| |
| |
| | | | (265,758 | ) | | | (7,233,315 | ) | | | (275,754 | ) | | | (5,767,486 | ) |
| |
| |
Class B Shares | | | | | | | | | | | | | | | | |
| Shares sold | | | 6,725 | | | | 129,324 | | | | 14,559 | | | | 224,313 | |
| Reinvestment of distributions | | | 1,160 | | | | 21,735 | | | | 17,352 | | | | 243,274 | |
Shares converted to Class A(a) | | | (95,423 | ) | | | (1,776,619 | ) | | | (592,084 | ) | | | (9,307,913 | ) |
| Shares redeemed | | | (131,450 | ) | | | (2,470,381 | ) | | | (335,405 | ) | | | (5,072,723 | ) |
| |
| |
| | | | (218,988 | ) | | | (4,095,941 | ) | | | (895,578 | ) | | | (13,913,049 | ) |
| |
| |
Class C Shares | | | | | | | | | | | | | | | | |
| Shares sold | | | 31,170 | | | | 674,353 | | | | 73,651 | | | | 1,324,365 | |
| Reinvestment of distributions | | | 1,167 | | | | 24,613 | | | | 8,843 | | | | 140,159 | |
| Shares redeemed | | | (156,871 | ) | | | (3,358,067 | ) | | | (343,099 | ) | | | (5,918,410 | ) |
| |
| |
| | | | (124,534 | ) | | | (2,659,101 | ) | | | (260,605 | ) | | | (4,453,886 | ) |
| |
| |
Institutional Shares | | | | | | | | | | | | | | | | |
| Shares sold | | | 21,262 | | | | 720,037 | | | | 44,990 | | | | 1,260,487 | |
| Reinvestment of distributions | | | 287 | | | | 9,254 | | | | 297 | | | | 7,307 | |
| Shares redeemed | | | (7,033 | ) | | | (237,449 | ) | | | (16,494 | ) | | | (464,071 | ) |
| |
| |
| | | | 14,516 | | | | 491,842 | | | | 28,793 | | | | 803,723 | |
| |
| |
Class IR Shares | | | | | | | | | | | | | | | | |
| Shares sold | | | 41 | | | | 1,107 | | | | 754 | | | | 16,323 | |
| Reinvestment of distributions | | | 10 | | | | 273 | | | | 4 | | | | 76 | |
| Shares redeemed | | | — | | | | — | | | | (1 | ) | | | (19 | ) |
| |
| |
| | | | 51 | | | | 1,380 | | | | 757 | | | | 16,380 | |
| |
| |
Class R Shares | | | | | | | | | | | | | | | | |
| Shares sold | | | 3,795 | | | | 102,796 | | | | 2,550 | | | | 57,894 | |
| Reinvestment of distributions | | | 21 | | | | 543 | | | | 39 | | | | 765 | |
| Shares redeemed | | | (1,185 | ) | | | (33,243 | ) | | | (1,797 | ) | | | (40,742 | ) |
| |
| |
| | | | 2,631 | | | | 70,096 | | | | 792 | | | | 17,917 | |
| |
| |
NET DECREASE | | | (592,082 | ) | | $ | (13,425,039 | ) | | | (1,401,595 | ) | | $ | (23,296,401 | ) |
| |
| |
| | |
| (a) | | Class B Shares automatically convert into Class A Shares on or about the fifteenth day of the last month of the calendar quarter that is eight years after the initial purchase date of either the Fund or another Goldman Sachs Fund. |
GOLDMAN SACHS STRUCTURED DOMESTIC EQUITY FUNDS
Notes to Financial Statements (continued)
April 30, 2011 (Unaudited)
| |
| 12. SUMMARY OF SHARE TRANSACTIONS (continued) | |
Share activity is as follows:
| | | | | | | | | | | | | | | | | |
| | | Structured U.S. Equity Fund |
| | | |
| | | For the Six Months Ended
| | |
| | | April 30, 2011
| | For the Fiscal Year Ended
|
| | | (Unaudited) | | October 31, 2010 |
| | | |
| | | Shares | | Dollars | | Shares | | Dollars |
| | | |
Class A Shares | | | | | | | | | | | | | | | | |
| Shares sold | | | 452,776 | | | $ | 10,848,689 | | | | 1,466,589 | | | $ | 30,703,366 | |
| Reinvestment of distributions | | | 154,948 | | | | 3,529,730 | | | | 223,050 | | | | 4,579,227 | |
Shares converted from Class B(a) | | | 54,725 | | | | 1,281,881 | | | | 203,870 | | | | 4,312,940 | |
| Shares redeemed | | | (2,439,302 | ) | | | (58,347,948 | ) | | | (5,003,628 | ) | | | (104,863,682 | ) |
| |
| |
| | | | (1,776,853 | ) | | | (42,687,648 | ) | | | (3,110,119 | ) | | | (65,268,149 | ) |
| |
| |
Class B Shares | | | | | | | | | | | | | | | | |
| Shares sold | | | 9,187 | | | | 207,967 | | | | 15,634 | | | | 311,185 | |
| Reinvestment of distributions | | | 3,926 | | | | 84,033 | | | | 8,450 | | | | 162,910 | |
Shares converted to Class A(a) | | | (58,348 | ) | | | (1,281,881 | ) | | | (217,629 | ) | | | (4,312,940 | ) |
| Shares redeemed | | | (109,703 | ) | | | (2,428,168 | ) | | | (281,390 | ) | | | (5,570,825 | ) |
| |
| |
| | | | (154,938 | ) | | | (3,418,049 | ) | | | (474,935 | ) | | | (9,409,670 | ) |
| |
| |
Class C Shares | | | | | | | | | | | | | | | | |
| Shares sold | | | 73,770 | | | | 1,643,571 | | | | 156,263 | | | | 3,049,334 | |
| Reinvestment of distributions | | | 9,199 | | | | 193,917 | | | | 16,939 | | | | 322,173 | |
| Shares redeemed | | | (203,601 | ) | | | (4,511,091 | ) | | | (542,358 | ) | | | (10,602,005 | ) |
| |
| |
| | | | (120,632 | ) | | | (2,673,603 | ) | | | (369,156 | ) | | | (7,230,498 | ) |
| |
| |
Institutional Shares | | | | | | | | | | | | | | | | |
| Shares sold | | | 550,910 | | | | 13,867,367 | | | | 555,725 | | | | 12,085,256 | |
| Reinvestment of distributions | | | 79,450 | | | | 1,850,388 | | | | 127,193 | | | | 2,668,510 | |
| Shares redeemed | | | (419,904 | ) | | | (10,336,204 | ) | | | (3,250,669 | ) | | | (68,457,269 | ) |
| |
| |
| | | | 210,456 | | | | 5,381,551 | | | | (2,567,751 | ) | | | (53,703,503 | ) |
| |
| |
Service Shares | | | | | | | | | | | | | | | | |
| Shares sold | | | 3,723 | | | | 90,119 | | | | 8,680 | | | | 179,470 | |
| Reinvestment of distributions | | | 305 | | | | 6,924 | | | | 328 | | | | 6,719 | |
| Shares redeemed | | | (6,022 | ) | | | (140,396 | ) | | | (59,461 | ) | | | (1,240,422 | ) |
| |
| |
| | | | (1,994 | ) | | | (43,353 | ) | | | (50,453 | ) | | | (1,054,233 | ) |
| |
| |
Class IR Shares | | | | | | | | | | | | | | | | |
| Shares sold | | | — | | | | 1 | | | | 1 | | | | 24 | |
| Reinvestment of distributions | | | 6 | | | | 126 | | | | 6 | | | | 126 | |
| Shares redeemed | | | — | | | | — | | | | (1 | ) | | | (24 | ) |
| |
| |
| | | | 6 | | | | 127 | | | | 6 | | | | 126 | |
| |
| |
Class R Shares | | | | | | | | | | | | | | | | |
| Shares sold | | | 88 | | | | 2,094 | | | | 231 | | | | 4,833 | |
| Reinvestment of distributions | | | 22 | | | | 494 | | | | 40 | | | | 809 | |
| Shares redeemed | | | (701 | ) | | | (17,053 | ) | | | (658 | ) | | | (13,146 | ) |
| |
| |
| | | | (591 | ) | | | (14,465 | ) | | | (387 | ) | | | (7,504 | ) |
| |
| |
NET DECREASE | | | (1,844,546 | ) | | $ | (43,455,440 | ) | | | (6,572,795 | ) | | $ | (136,673,431 | ) |
| |
| |
| | |
| (a) | | Class B Shares automatically convert into Class A Shares on or about the fifteenth day of the last month of the calendar quarter that is eight years after the initial purchase date of either the Fund or another Goldman Sachs Fund. |
GOLDMAN SACHS STRUCTURED DOMESTIC EQUITY FUNDS
Fund Expenses — Six Month Period Ended April 30, 2011 (Unaudited)
As a shareholder of Class A, Class B, Class C, Institutional, Service, Class IR or Class R Shares of a Fund, you incur two types of costs: (1) transaction costs, including sales charges on purchase payments (with respect to Class A Shares), contingent deferred sales charges on redemptions (with respect to Class B and Class C Shares), and (2) ongoing costs, including management fees; distribution and service (12b-1) fees (with respect to Class A, Class B, Class C and Class R Shares); and other Fund expenses. This Example is intended to help you understand your ongoing costs (in dollars) of investing in Class A, Class B, Class C, Institutional, Service, Class IR or Class R Shares of the Funds and to compare these costs with the ongoing costs of investing in other mutual funds.
The Example is based on an investment of $1,000 invested at the beginning of the period and held for the entire period from November 1, 2010 through April 30, 2011.
Actual Expenses — The first line under each share class in the table below provides information about actual account values and actual expenses. You may use the information in this line, together with the amount you invested, to estimate the expenses that you paid over the period. Simply divide your account value by $1,000 (for example, an $8,600 account value divided by $1,000=8.6), then multiply the result by the number in the first line under the heading entitled “Expenses Paid” to estimate the expenses you paid on your account during this period.
Hypothetical Example for Comparison Purposes — The second line under each share class in the table below provides information about hypothetical account values and hypothetical expenses based on the Funds’ actual net expense ratios and an assumed rate of return of 5% per year before expenses, which is not the Funds’ actual return. The hypothetical account values and expenses may not be used to estimate the actual ending account balance or expenses you paid for the period. You may use this information to compare the ongoing costs of investing in the Funds and other funds. To do so, compare this 5% hypothetical example with the 5% hypothetical examples that appear in the shareholder reports of the other funds.
Please note that the expenses shown in the table are meant to highlight your ongoing costs only and do not reflect any transactional costs, such as sales charges, redemption fees, or exchange fees. Therefore, the second line of the table is useful in comparing ongoing costs only, and will not help you determine the relative total costs of owning different funds. In addition, if these transactional costs were included, your costs would have been higher.
| | | | | | | | | | | | | | | | | | | | | | | | | | | | | | | | | | | | | | | | | | | | | | | | | | | | | | | | | | | | | |
| | | | Balanced Fund | | | Structured Large Cap Growth Fund | | | Structured Large Cap Value Fund | | | Structured Small Cap Equity Fund |
| | | | Beginning
| | | Ending
| | | Expenses
| | | Beginning
| | | Ending
| | | Expenses
| | | Beginning
| | | Ending
| | | Expenses
| | | Beginning
| | | Ending
| | | Expenses
|
| | | | Account
| | | Account
| | | Paid for the
| | | Account
| | | Account
| | | Paid for the
| | | Account
| | | Account
| | | Paid for the
| | | Account
| | | Account
| | | Paid for the
|
| | | | Value
| | | Value
| | | 6 months ended
| | | Value
| | | Value
| | | 6 months ended
| | | Value
| | | Value
| | | 6 months ended
| | | Value
| | | Value
| | | 6 months ended
|
| Share Class | | | 11/1/10 | | | 4/30/11 | | | 4/30/11* | | | 11/1/10 | | | 4/30/11 | | | 4/30/11* | | | 11/1/10 | | | 4/30/11 | | | 4/30/11* | | | 11/1/10 | | | 4/30/11 | | | 4/30/11* |
Class A | | | | | | | | | | | | | | | | | | | | | | | | | | | | | | | | | | | | | | | | | | | | | | | | | | | | | | | | | | | | |
| Actual | | | $ | 1,000.00 | | | | $ | 1,096.70 | | | | $ | 5.46 | | | | $ | 1,000.00 | | | | $ | 1,163.30 | | | | $ | 5.10 | | | | $ | 1,000.00 | | | | $ | 1,185.50 | | | | $ | 5.09 | | | | $ | 1,000.00 | | | | $ | 1,234.80 | | | | $ | 6.93 | |
| Hypothetical 5% return | | | | 1,000.00 | | | | | 1,019.59 | + | | | | 5.26 | | | | | 1,000.00 | | | | | 1,020.08 | + | | | | 4.76 | | | | | 1,000.00 | | | | | 1,020.13 | + | | | | 4.71 | | | | | 1,000.00 | | | | | 1,018.60 | + | | | | 6.26 | |
| | | | | | | | | | | | | | | | | | | | | | | | | | | | | | | | | | | | | | | | | | | | | | | | | | | | | | | | | | | | | |
Class B | | | | | | | | | | | | | | | | | | | | | | | | | | | | | | | | | | | | | | | | | | | | | | | | | | | | | | | | | | | | |
| Actual | | | | 1,000.00 | | | | | 1,092.80 | | | | | 9.34 | | | | | 1,000.00 | | | | | 1,159.50 | | | | | 9.10 | | | | | 1,000.00 | | | | | 1,181.10 | | | | | 9.14 | | | | | 1,000.00 | | | | | 1,229.60 | | | | | 11.06 | |
| Hypothetical 5% return | | | | 1,000.00 | | | | | 1,015.87 | + | | | | 9.00 | | | | | 1,000.00 | | | | | 1,016.36 | + | | | | 8.50 | | | | | 1,000.00 | | | | | 1,016.41 | + | | | | 8.45 | | | | | 1,000.00 | | | | | 1,014.88 | + | | | | 9.99 | |
| | | | | | | | | | | | | | | | | | | | | | | | | | | | | | | | | | | | | | | | | | | | | | | | | | | | | | | | | | | | | |
Class C | | | | | | | | | | | | | | | | | | | | | | | | | | | | | | | | | | | | | | | | | | | | | | | | | | | | | | | | | | | | |
| Actual | | | | 1,000.00 | | | | | 1,092.70 | | | | | 9.34 | | | | | 1,000.00 | | | | | 1,159.80 | | | | | 9.10 | | | | | 1,000.00 | | | | | 1,181.50 | | | | | 9.14 | | | | | 1,000.00 | | | | | 1,229.80 | | | | | 11.06 | |
| Hypothetical 5% return | | | | 1,000.00 | | | | | 1,015.87 | + | | | | 9.00 | | | | | 1,000.00 | | | | | 1,016.36 | + | | | | 8.50 | | | | | 1,000.00 | | | | | 1,016.41 | + | | | | 8.45 | | | | | 1,000.00 | | | | | 1,014.88 | + | | | | 9.99 | |
| | | | | | | | | | | | | | | | | | | | | | | | | | | | | | | | | | | | | | | | | | | | | | | | | | | | | | | | | | | | | |
Institutional | | | | | | | | | | | | | | | | | | | | | | | | | | | | | | | | | | | | | | | | | | | | | | | | | | | | | | | | | | | | |
| Actual | | | | 1,000.00 | | | | | 1,098.50 | | | | | 3.38 | | | | | 1,000.00 | | | | | 1,165.50 | | | | | 2.95 | | | | | 1,000.00 | | | | | 1,189.10 | | | | | 2.93 | | | | | 1,000.00 | | | | | 1,237.60 | | | | | 4.72 | |
| Hypothetical 5% return | | | | 1,000.00 | | | | | 1,021.57 | + | | | | 3.26 | | | | | 1,000.00 | | | | | 1,022.07 | + | | | | 2.76 | | | | | 1,000.00 | | | | | 1,022.12 | + | | | | 2.71 | | | | | 1,000.00 | | | | | 1,020.58 | + | | | | 4.26 | |
| | | | | | | | | | | | | | | | | | | | | | | | | | | | | | | | | | | | | | | | | | | | | | | | | | | | | | | | | | | | | |
Service | | | | | | | | | | | | | | | | | | | | | | | | | | | | | | | | | | | | | | | | | | | | | | | | | | | | | | | | | | | | |
| Actual | | | | N/A | | | | | N/A | | | | | N/A | | | | | 1,000.00 | | | | | 1,162.40 | | | | | 5.63 | | | | | 1,000.00 | | | | | 1,185.30 | | | | | 5.64 | | | | | 1,000.00 | | | | | 1,233.70 | | | | | 7.48 | |
| Hypothetical 5% return | | | | N/A | | | | | N/A | | | | | N/A | | | | | 1,000.00 | | | | | 1,019.59 | + | | | | 5.26 | | | | | 1,000.00 | | | | | 1,019.64 | + | | | | 5.21 | | | | | 1,000.00 | | | | | 1,018.10 | + | | | | 6.76 | |
| | | | | | | | | | | | | | | | | | | | | | | | | | | | | | | | | | | | | | | | | | | | | | | | | | | | | | | | | | | | | |
Class IR | | | | | | | | | | | | | | | | | | | | | | | | | | | | | | | | | | | | | | | | | | | | | | | | | | | | | | | | | | | | |
| Actual | | | | 1,000.00 | | | | | 1,096.90 | | | | | 4.16 | | | | | 1,000.00 | | | | | 1,164.90 | | | | | 3.76 | | | | | 1,000.00 | | | | | 1,187.40 | | | | | 3.74 | | | | | 1,000.00 | | | | | 1,236.60 | | | | | 5.55 | |
| Hypothetical 5% return | | | | 1,000.00 | | | | | 1,020.83 | + | | | | 4.01 | | | | | 1,000.00 | | | | | 1,021.32 | + | | | | 3.51 | | | | | 1,000.00 | | | | | 1,021.37 | + | | | | 3.46 | | | | | 1,000.00 | | | | | 1,019.84 | + | | | | 5.01 | |
| | | | | | | | | | | | | | | | | | | | | | | | | | | | | | | | | | | | | | | | | | | | | | | | | | | | | | | | | | | | | |
Class R | | | | | | | | | | | | | | | | | | | | | | | | | | | | | | | | | | | | | | | | | | | | | | | | | | | | | | | | | | | | |
| Actual | | | | N/A | | | | | N/A | | | | | N/A | | | | | 1,000.00 | | | | | 1,161.50 | | | | | 6.43 | | | | | 1,000.00 | | | | | 1,184.50 | | | | | 6.45 | | | | | 1,000.00 | | | | | 1,233.60 | | | | | 8.31 | |
| Hypothetical 5% return | | | | N/A | | | | | N/A | | | | | N/A | | | | | 1,000.00 | | | | | 1,018.84 | + | | | | 6.01 | | | | | 1,000.00 | | | | | 1,018.89 | + | | | | 5.96 | | | | | 1,000.00 | | | | | 1,017.36 | + | | | | 7.50 | |
| | | | | | | | | | | | | | | | | | | | | | | | | | | | | | | | | | | | | | | | | | | | | | | | | | | | | | | | | | | | | |
139
GOLDMAN SACHS STRUCTURED DOMESTIC EQUITY FUNDS
Fund Expenses — Six Month Period Ended April 30, 2011 (Unaudited) (continued)
| | | | | | | | | | | | | | | | | | | | | | | | | | | | | | | | | | | | | | | | | | | | | | |
| | | | Structured Small Cap Growth Fund | | | Structured Small Cap Value Fund | | | Structured U.S. Equity Fund |
| | | | Beginning
| | | Ending
| | | Expenses
| | | Beginning
| | | Ending
| | | Expenses
| | | Beginning
| | | Ending
| | | Expenses
|
| | | | Account
| | | Account
| | | Paid for the
| | | Account
| | | Account
| | | Paid for the
| | | Account
| | | Account
| | | Paid for the
|
| | | | Value
| | | Value
| | | 6 months ended
| | | Value
| | | Value
| | | 6 months ended
| | | Value
| | | Value
| | | 6 months ended
|
| Share Class | | | 11/1/10 | | | 4/30/11 | | | 4/30/11* | | | 11/1/10 | | | 4/30/11 | | | 4/30/11* | | | 11/1/10 | | | 4/30/11 | | | 4/30/11* |
Class A | | | | | | | | | | | | | | | | | | | | | | | | | | | | | | | | | | | | | | | | | | | | | |
| Actual | | | $ | 1,000.00 | | | | $ | 1,268.80 | | | | $ | 7.03 | | | | $ | 1,000.00 | | | | $ | 1,217.20 | | | | $ | 6.87 | | | | $ | 1000.00 | | | | $ | 1,168.60 | | | | $ | 5.11 | |
| Hypothetical 5% return | | | | 1,000.00 | | | | | 1,018.60 | + | | | | 6.26 | | | | | 1,000.00 | | | | | 1,018.60 | + | | | | 6.26 | | | | | 1,000.00 | | | | | 1,020.08 | + | | | | 4.76 | |
| | | | | | | | | | | | | | | | | | | | | | | | | | | | | | | | | | | | | | | | | | | | | | |
| | | | | | | | | | | | | | | | | | | | | | | | | | | | | | | | | | | | | | | | | | | | | | |
Class B | | | | | | | | | | | | | | | | | | | | | | | | | | | | | | | | | | | | | | | | | | | | | |
| Actual | | | | 1,000.00 | | | | | 1,264.10 | | | | | 11.23 | | | | | 1,000.00 | | | | | 1,212.30 | | | | | 10.97 | | | | | 1,000.00 | | | | | 1,164.30 | | | | | 9.12 | |
| Hypothetical 5% return | | | | 1,000.00 | | | | | 1,014.88 | + | | | | 9.99 | | | | | 1,000.00 | | | | | 1,014.88 | + | | | | 9.99 | | | | | 1,000.00 | | | | | 1,016.36 | + | | | | 8.50 | |
| | | | | | | | | | | | | | | | | | | | | | | | | | | | | | | | | | | | | | | | | | | | | | |
Class C | | | | | | | | | | | | | | | | | | | | | | | | | | | | | | | | | | | | | | | | | | | | | |
| Actual | | | | 1,000.00 | | | | | 1,264.40 | | | | | 11.23 | | | | | 1,000.00 | | | | | 1,212.30 | | | | | 10.97 | | | | | 1,000.00 | | | | | 1,163.90 | | | | | 9.12 | |
| Hypothetical 5% return | | | | 1,000.00 | | | | | 1,014.88 | + | | | | 9.99 | | | | | 1,000.00 | | | | | 1,014.88 | + | | | | 9.99 | | | | | 1,000.00 | | | | | 1,016.36 | + | | | | 8.50 | |
| | | | | | | | | | | | | | | | | | | | | | | | | | | | | | | | | | | | | | | | | | | | | | |
Institutional | | | | | | | | | | | | | | | | | | | | | | | | | | | | | | | | | | | | | | | | | | | | | |
| Actual | | | | 1,000.00 | | | | | 1,271.80 | | | | | 4.79 | | | | | 1,000.00 | | | | | 1,219.20 | | | | | 4.68 | | | | | 1,000.00 | | | | | 1,170.80 | | | | | 2.96 | |
| Hypothetical 5% return | | | | 1,000.00 | | | | | 1,020.58 | + | | | | 4.26 | | | | | 1,000.00 | | | | | 1,020.58 | + | | | | 4.26 | | | | | 1,000.00 | | | | | 1,022.07 | + | | | | 2.76 | |
| | | | | | | | | | | | | | | | | | | | | | | | | | | | | | | | | | | | | | | | | | | | | | |
Service | | | | | | | | | | | | | | | | | | | | | | | | | | | | | | | | | | | | | | | | | | | | | |
| Actual | | | | N/A | | | | | N/A | | | | | N/A | | | | | N/A | | | | | N/A | | | | | N/A | | | | | 1,000.00 | | | | | 1,167.90 | | | | | 5.64 | |
| Hypothetical 5% return | | | | N/A | | | | | N/A | | | | | N/A | | | | | N/A | | | | | N/A | | | | | N/A | | | | | 1,000.00 | | | | | 1,019.59 | + | | | | 5.26 | |
| | | | | | | | | | | | | | | | | | | | | | | | | | | | | | | | | | | | | | | | | | | | | | |
Class IR | | | | | | | | | | | | | | | | | | | | | | | | | | | | | | | | | | | | | | | | | | | | | |
| Actual | | | | 1,000.00 | | | | | 1,270.70 | | | | | 5.63 | | | | | 1,000.00 | | | | | 1,218.30 | | | | | 5.50 | | | | | 1,000.00 | | | | | 1,170.00 | | | | | 3.77 | |
| Hypothetical 5% return | | | | 1,000.00 | | | | | 1,019.84 | + | | | | 5.01 | | | | | 1,000.00 | | | | | 1,019.84 | + | | | | 5.01 | | | | | 1,000.00 | | | | | 1,021.32 | + | | | | 3.51 | |
| | | | | | | | | | | | | | | | | | | | | | | | | | | | | | | | | | | | | | | | | | | | | | |
Class R | | | | | | | | | | | | | | | | | | | | | | | | | | | | | | | | | | | | | | | | | | | | | |
| Actual | | | | 1,000.00 | | | | | 1,267.30 | | | | | 8.43 | | | | | 1,000.00 | | | | | 1,215.10 | | | | | 8.24 | | | | | 1,000.00 | | | | | 1,167.00 | | | | | 6.45 | |
| Hypothetical 5% return | | | | 1,000.00 | | | | | 1,017.36 | + | | | | 7.50 | | | | | 1,000.00 | | | | | 1,017.36 | + | | | | 7.50 | | | | | 1,000.00 | | | | | 1,018.84 | + | | | | 6.01 | |
| | | | | | | | | | | | | | | | | | | | | | | | | | | | | | | | | | | | | | | | | | | | | | |
| | |
| * | | Expenses for each share class are calculated using each Fund’s annualized net expense ratio for each class, which represents the ongoing expenses as a percentage of net assets for the six months ended April 30, 2011. Expenses are calculated by multiplying the annualized net expense ratio by the average account value for the period; then multiplying the result by the number of days in the most recent fiscal half year; and then dividing that result by the number of days in the fiscal year. The annualized net expense ratios for the period were as follows: |
| | | | | | | | | | | | | | | | | | | | | | | | | | | | | |
| Fund | | Class A | | Class B | | Class C | | Institutional | | Service | | Class IR | | Class R |
| |
| Balanced | | | 1.05 | % | | | 1.80 | % | | | 1.80 | % | | | 0.65 | % | | | N/A | | | | 0.80 | % | | | N/A | |
| Structured Large Cap Growth | | | 0.95 | | | | 1.70 | | | | 1.70 | | | | 0.55 | | | | 1.05 | % | | | 0.70 | | | | 1.20 | % |
| Structured Large Cap Value | | | 0.94 | | | | 1.69 | | | | 1.69 | | | | 0.54 | | | | 1.04 | | | | 0.69 | | | | 1.19 | |
| Structured Small Cap Equity | | | 1.25 | | | | 2.00 | | | | 2.00 | | | | 0.85 | | | | 1.35 | | | | 1.00 | | | | 1.50 | |
| Structured Small Cap Growth | | | 1.25 | | | | 2.00 | | | | 2.00 | | | | 0.85 | | | | N/A | | | | 1.00 | | | | 1.50 | |
| Structured Small Cap Value | | | 1.25 | | | | 2.00 | | | | 2.00 | | | | 0.85 | | | | N/A | | | | 1.00 | | | | 1.50 | |
| Structured U.S. Equity | | | 0.95 | | | | 1.70 | | | | 1.70 | | | | 0.55 | | | | 1.05 | | | | 0.70 | | | | 1.20 | |
| |
| |
| | |
| + | | Hypothetical expenses are based on each Fund’s actual annualized net expense ratios and an assumed rate of return of 5% per year before expenses. |
140
FUNDS PROFILE
Goldman Sachs Funds
Goldman Sachs is a premier financial services firm, known since 1869 for creating thoughtful and customized investment solutions in complex global markets.
Today, the Investment Management Divisionof Goldman Sachs serves a diverse set of clients worldwide, including private institutions, public entities and individuals. With portfolio management teams located around the world — and $714.6 billion in assets under management as of March 31, 2011 — our investment professionals bring firsthand knowledge of local markets to every investment decision. Goldman Sachs Asset Management ranks in the top 10 asset management firms worldwide, based on assets under management.1
| |
| OVERVIEW OF GOLDMAN SACHS FUNDS | |

| | | | | |
Money Market2
Financial Square Fundssm
n Financial Square Tax-Exempt Funds
n Financial Square Federal Fund
n Financial Square Government Fund
n Financial Square Money Market Fund
n Financial Square Prime Obligations Fund
n Financial Square Treasury Instruments Fund
n Financial Square Treasury Obligations Fund
Fixed Income
Short Duration and Government
n Enhanced Income Fund
n Ultra-Short Duration Govt. Fund
n Short Duration Government Fund
n Government Income Fund
n Inflation Protected Securities Fund
Multi-Sector
n Core Fixed Income Fund
n Core Plus Fixed Income Fund
n Global Income Fund
n Strategic Income Fund
Municipal and Tax-Free
n High Yield Municipal Fund
n Municipal Income Fund
n Short Duration Tax-Free Fund
Single Sector
n Investment Grade Credit Fund
n U.S. Mortgages Fund
n High Yield Fund
n High Yield Floating Rate Fund | | n Emerging Markets Debt Fund
n Local Emerging Markets Debt Fund
Corporate Credit
n Credit Strategies Fund
Fundamental Equity
n Growth and Income Fund
n Small Cap Value Fund
n Mid Cap Value Fund
n Large Cap Value Fund
n Capital Growth Fund
n Strategic Growth Fund
n Small/Mid Cap Growth Fund
n Flexible Cap Growth Fund3
n Concentrated Growth Fund
n Technology Tollkeeper Fundsm
n Growth Opportunities Fund
n U.S. Equity Fund
Structured Equity
n Balanced Fund
n Structured Small Cap Equity Fund
n Structured U.S. Equity Fund
n Structured Small Cap Growth Fund
n Structured Large Cap Growth Fund
n Structured Large Cap Value Fund
n Structured Small Cap Value Fund
n Structured Tax-Managed Equity Fund
n Structured International Tax-Managed Equity Fund
n U.S. Equity Dividend and Premium Fund
n International Equity Dividend and Premium Fund | | n Structured International Small Cap Fund
n Structured International Equity Fund
n Structured Emerging Markets Equity Fund
Fundamental Equity International
n Strategic International Equity Fund
n Concentrated International Equity Fund
n International Small Cap Fund
n Asia Equity Fund
n Emerging Markets Equity Fund
n BRIC Fund (Brazil, Russia, India, China)
n N-11 Equity Fund
n Brazil Equity Fund
n China Equity Fund
n Korea Equity Fund
Select Satellite4
n Real Estate Securities Fund
n International Real Estate Securities Fund
n Commodity Strategy Fund
n Dynamic Allocation Fund
n Absolute Return Tracker Fund
Total Portfolio Solutions4
n Balanced Strategy Portfolio
n Growth and Income Strategy Portfolio
n Growth Strategy Portfolio
n Equity Growth Strategy Portfolio
n Income Strategies Portfolio
n Satellite Strategies Portfolio
n Retirement Strategies Portfolios
n Enhanced Dividend Global Equity Portfolio
n Tax Advantaged Global Equity Portfolio |
Firmwide assets under management includes assets managed by GSAM and its Investment Advisory Affiliates.
| |
| 1 | Ranking for Goldman Sachs Group, Inc., includes Goldman Sachs Asset Management, Private Wealth Management and Merchant Banking 2009 year-end assets. Ranked 9th in total assets worldwide. Pensions&Investments, June 2010. |
| 2 | An investment in a money market fund is neither insured nor guaranteed by the Federal Deposit Insurance Corporation (“FDIC”) or any other government agency. Although the Funds seek to preserve the value of your investment at $1.00 per share, it is possible to lose money by investing in the Funds. |
| 3 | Effective March 31, 2011, the Goldman Sachs All Cap Growth Fund was renamed the Goldman Sachs Flexible Cap Growth Fund. |
| 4 | Individual Funds within the Total Portfolio Solutions and Select Satellite categories will have various placement on the risk/return spectrum and may have greater or lesser risk than that indicated by the placement of the general Total Portfolio Solutions or Select Satellite category. |
The Goldman Sachs Technology Tollkeeper Fundsm and Financial Square Fundssm are registered service marks of Goldman, Sachs & Co.
| | | |
TRUSTEES
Ashok N. Bakhru, Chairman
Donald C. Burke
John P. Coblentz, Jr.
Diana M. Daniels
Joseph P. LoRusso
James A. McNamara
Jessica Palmer
Alan A. Shuch
Richard P. Strubel | | OFFICERS
James A. McNamara, President
George F. Travers, Principal Financial Officer
Peter V. Bonanno, Secretary
Scott M. McHugh, Treasurer
|
| | | |
GOLDMAN, SACHS & CO.
Distributor and Transfer Agent | | GOLDMAN SACHS ASSET MANAGEMENT, L.P.
Investment Adviser |
Visit our Website at www.goldmansachsfunds.com to obtain the most recent month-end returns.
Goldman Sachs Asset Management, L.P. 200 West Street, New York, New York 10282
The reports concerning the Funds included in this shareholder report may contain certain forward-looking statements about the factors that may affect the performance of the Funds in the future. These statements are based on Fund management’s predictions and expectations concerning certain future events and their expected impact on the Funds, such as performance of the economy as a whole and of specific industry sectors, changes in the levels of interest rates, the impact of developing world events, and other factors that may influence the future performance of the Funds. Management believes these forward-looking statements to be reasonable, although they are inherently uncertain and difficult to predict. Actual events may cause adjustments in portfolio management strategies from those currently expected to be employed.
A description of the policies and procedures that the Funds use to determine how to vote proxies relating to portfolio securities and information regarding how a Fund voted proxies relating to portfolio securities during the most recent 12-month period ended June 30 is available (I) without charge, upon request by calling 1-800-526-7384 (for Retail Shareholders) or 1-800-621-2550 (for Institutional Shareholders); and (II) on the Securities and Exchange Commission Web site at http://www.sec.gov.
The Funds file their complete schedule of portfolio holdings with the Securities and Exchange Commission (“SEC”) for the first and third quarters of each fiscal year on Form N-Q. The Funds’ Forms N-Q will become available on the SEC’s website at http://www.sec.gov within 60 days after the Funds’ first and third fiscal quarters. When available, the Funds’ Forms N-Q may be reviewed and copied at the SEC’s Public Reference Room in Washington, D.C. and information on the operation of the Public Reference Room may also be obtained by calling 1-800-SEC-0330. When available, Form N-Q may be obtained upon request and without charge by calling 1-800-526-7384 (for Retail Shareholders) or 1-800-621-2550 (for Institutional Shareholders).
Holdings and allocations shown are unaudited, and may not be representative of current or future investments. Holdings and allocations may not include the Funds’ entire investment portfolio, which may change at any time. Fund holdings should not be relied on in making investment decisions and should not be construed as research or investment advice regarding particular securities.
Economic and market forecasts presented herein reflect our judgment as of the date of this presentation and are subject to change without notice. These forecasts do not take into account the specific investment objectives, restrictions, tax and financial situation or other needs of any specific client. Actual data will vary and may not be reflected here. These forecasts are subject to high levels of uncertainty that may affect actual performance. Accordingly, these forecasts should be viewed as merely representative of a broad range of possible outcomes. These forecasts are estimated, based on assumptions, and are subject to significant revision and may change materially as economic and market conditions change. Goldman Sachs has no obligation to provide updates or changes to these forecasts. Case studies and examples are for illustrative purposes only.
The Global Industry Classification Standard (GICS) was developed by and is the exclusive property and a service mark of Morgan Stanley Capital International Inc. (MSCI) and Standard & Poor’s, a division of The McGraw-Hill Companies, Inc. (S&P) and is licensed for use by Goldman Sachs. Neither MSCI, S&P nor any other party involved in making or compiling the GICS or any GICS classifications makes any express or implied warranties or representations with respect to such standard or classification (or the results to be obtained by the use thereof), and all such parties hereby expressly disclaim all warranties of originality, accuracy, completeness, merchantability or fitness for a particular purpose with respect to any of such standard or classification. Without limiting any of the foregoing, in no event shall MSCI, S&P, any of their affiliates or any third party involved in making or compiling the GICS or any GICS classifications have any liability for any direct, indirect, special, punitive, consequential or any other damages (including lost profits) even if notified of the possibility of such damages.
The portfolio risk management process includes an effort to monitor and manage risk, but does not imply low risk.
This material is not authorized for distribution to prospective investors unless preceded or accompanied by a current Prospectus or summary prospectus, if applicable. Investors should consider a Fund’s objective, risks, and charges and expenses, and read the summary prospectus, if available, and/or the Prospectus carefully before investing or sending money. The summary prospectus, if available, and the Prospectus contain this and other information about a Fund and may be obtained from your authorized dealer or from Goldman, Sachs & Co. by calling (retail – 1-800-526-7384) (institutional – 1-800-621-2550).
© 2011 Goldman Sachs. All rights reserved. 54372.MF.MED.TMPL/6/2011 STDOMSAR11 / 70.8K
| | | |
| | | The information required by this Item is only required in an annual report on this Form N-CSR. |
| | | |
| ITEM 3. | | AUDIT COMMITTEE FINANCIAL EXPERT. |
| | | |
| | | The information required by this Item is only required in an annual report on this Form N-CSR. |
| | | |
| ITEM 4. | | PRINCIPAL ACCOUNTANT FEES AND SERVICES. |
| | | |
| | | The information required by this Item is only required in an annual report on this Form N-CSR. |
| | | |
| ITEM 5. | | AUDIT COMMITTEE OF LISTED REGISTRANTS. |
| | | |
| | | Not applicable. |
| | | |
| ITEM 6. | | SCHEDULE OF INVESTMENTS. |
| | | |
| | | Schedule of Investments is included as part of the Report to Stockholders filed under Item 1. |
| | | |
| ITEM 7. | | DISCLOSURE OF PROXY VOTING POLICIES AND PROCEDURES FOR CLOSED-END MANAGEMENT INVESTMENT COMPANIES. |
| | | |
| | | Not applicable. |
| | | |
| ITEM 8. | | PORTFOLIO MANAGERS OF CLOSED-END MANAGEMENT INVESTMENT COMPANIES. |
| | | |
| | | Not applicable. |
| | | |
| ITEM 9. | | PURCHASES OF EQUITY SECURITIES BY CLOSED-END MANAGEMENT INVESTMENT COMPANY AND AFFILIATED PURCHASERS. |
| | | |
| | | Not applicable. |
| | | |
| ITEM 10. | | SUBMISSION OF MATTERS TO A VOTE OF SECURITY HOLDERS.
There have been no material changes to the procedures by which shareholders may recommend nominees to the registrant’s board of trustees. |
| | | |
| | | |
| ITEM 11. | | CONTROLS AND PROCEDURES. |
| | | |
| | (a) | | The registrant’s principal executive and principal financial officers, or persons performing similar functions have concluded that the registrant’s disclosure controls and procedures (as defined in Rule 30a-3(c) under the Investment Company Act of 1940, as amended (the “1940 Act”)) are effective as of a date within 90 days of the filing of this report that includes the disclosure required by this paragraph, based on the evaluation of these controls and procedures required by Rule 30a-3(b) under the 1940 Act and 15d-15(b) under the Securities Exchange Act of 1934, as amended. |
| | | |
| | (b) | | There were no changes in the registrant’s internal control over financial reporting (as defined in Rule 30a-3(d) under the 1940 Act) that occurred during the registrant’s second fiscal quarter of the period covered by this report that have materially affected, or are reasonably likely to materially affect, the registrant’s internal control over financial reporting. |
| | | |
| | (a)(1) | | The information required by this Item is only required in connection with an annual report on this Form N-CSR. |
| |
| | (a)(2) | | Exhibit 99.CERT | Certifications pursuant to Section 302 of the Sarbanes-Oxley Act of 2002 filed herewith. |
| | | |
| | (b) | | Exhibit 99.906CERT | Certifications pursuant to Section 906 of the Sarbanes-Oxley Act of 2002 filed herewith. |
SIGNATURES
| | | | Pursuant to the requirements of the Securities Exchange Act of 1934 and the Investment Company Act of 1940, the registrant has duly caused this report to be signed on its behalf by the undersigned, thereunto duly authorized. |
| | | | | | | |
| | | | | Goldman Sachs Trust | | |
| | | | | | | |
| By: | | | | /s/ James A. McNamara | | |
| | | | |
| | |
| | | | | James A. McNamara | | |
| | | | | President/Principal Executive Officer | | |
| | | | | Goldman Sachs Trust | | |
| | | | | | | |
| Date: | | | | June 19, 2011 | | |
| | | | Pursuant to the requirements of the Securities Exchange Act of 1934 and the Investment Company Act of 1940, this report has been signed below by the following persons on behalf of the registrant and in the capacities and on the dates indicated. |
| | | | | | | |
| By: | | | | /s/ James A. McNamara | | |
| | | | |
| | |
| | | | | James A. McNamara | | |
| | | | | President/Principal Executive Officer | | |
| | | | | Goldman Sachs Trust | | |
| | | | | | | |
| Date: | | | | June 19, 2011 | | |
| | | | | | | |
| By: | | | | /s/ George F. Travers | | |
| | | | |
| | |
| | | | | George F. Travers | | |
| | | | | Principal Financial Officer | | |
| | | | | Goldman Sachs Trust | | |
| | | | | | | |
| Date: | | | | June 19, 2011 | | |