UNITED STATES
SECURITIES AND EXCHANGE COMMISSION
Washington, D.C. 20549
FORM N-CSR
CERTIFIED SHAREHOLDER REPORT OF REGISTERED
MANAGEMENT INVESTMENT COMPANIES
Investment Company Act file number 811-05349
Goldman Sachs Trust
(Exact name of registrant as specified in charter)
71 South Wacker Drive,
Chicago, Illinois 60606
(Address of principal executive offices) (Zip code)
| | |
Copies to: |
Peter V. Bonanno, Esq. | | Geoffrey R.T. Kenyon, Esq. |
Goldman, Sachs & Co. | | Dechert LLP |
200 West Street | | 200 Clarendon Street |
New York, New York 10282 | | 27th Floor |
| | Boston, MA 02116-5021 |
(Name and address of agents for service)
Registrant’s telephone number, including area code: (312) 655-4400
Date of fiscal year end: October 31
Date of reporting period: April 30, 2012
| ITEM 1. | REPORTS TO STOCKHOLDERS. |
| | The Semi-Annual Report to Stockholders is filed herewith. |
Goldman Sachs Funds

| | | | |
| | |
| Semi-Annual Report | | | | April 30, 2012 |
| | |
| | | | Structured International Equity Funds |
| | | | Structured Emerging Markets Equity |
| | | | Structured International Equity |
| | | | Structured International Small Cap |

Goldman Sachs Structured International
Equity Funds
| n | | STRUCTURED EMERGING MARKETS EQUITY |
| n | | STRUCTURED INTERNATIONAL EQUITY |
| n | | STRUCTURED INTERNATIONAL SMALL CAP |
| | | | |
TABLE OF CONTENTS | | | | |
| |
Principal Investment Strategies and Risks | | | 1 | |
| |
Investment Process | | | 2 | |
| |
Market Review | | | 3 | |
| |
Portfolio Management Discussions and Performance Summaries | | | 6 | |
| |
Schedules of Investments | | | 21 | |
| |
Financial Statements | | | 46 | |
| |
Financial Highlights | | | 50 | |
| |
Notes to the Financial Statements | | | 56 | |
| |
Other Information | | | 72 | |
| | | | |
| | | |
| NOT FDIC-INSURED | | May Lose Value | | No Bank Guarantee |
GOLDMAN SACHS STRUCTURED INTERNATIONAL EQUITY FUNDS
Principal Investment Strategies and Risks
This is not a complete list of risks that may affect the Funds. For additional information concerning the risks applicable to the Funds, please see the Funds’ Prospectus.
The Goldman Sachs Structured Emerging Markets Equity Fund invests primarily in a diversified portfolio of equity investments in emerging country issuers. The Fund’s investments are subject to market risk, which means that the value of the securities in which it invests may go up or down in response to the prospects of individual companies, particular industry sectors and/or general economic conditions. Foreign and emerging markets securities may be more volatile and less liquid than investments in U.S. securities and will be subject to the risks of currency fluctuations and adverse economic and political developments. The securities markets of emerging countries have less government regulation and are subject to less extensive accounting and financial reporting requirements than the markets of more developed countries. Such securities are also subject to foreign custody risk. At times, the Fund may be unable to sell certain of its investments without a substantial drop in price, if at all. The Investment Adviser’s use of quantitative models to execute investment strategy may fail to produce the intended result. Different investment styles (e.g., “quantitative”) tend to shift in and out of favor, and at times the Fund may underperform other funds that invest in similar asset classes.
The Goldman Sachs Structured International Equity Fund invests primarily in a broadly diversified portfolio of equity investments in companies that are organized outside the United States or whose securities are principally traded outside the United States. The Fund’s equity investments are subject to market risk, which means that the value of the securities in which it invests may go up or down in response to the prospects of individual companies, particular industry sectors and/or general economic conditions. Foreign and emerging market securities may be more volatile and less liquid than investments in U.S. securities and will be subject to the risks of currency fluctuations and adverse economic or political developments. The Investment Adviser’s use of quantitative models to execute investment strategy may fail to produce the intended result. Different investment styles (e.g., “quantitative”) tend to shift in and out of favor, and at times the Fund may underperform other funds that invest in similar asset classes.
The Goldman Sachs Structured International Small Cap Fund invests primarily in a diversified portfolio of equity investments in non-U.S. small-capitalization companies. The Fund is subject to market risk, which means that the value of the securities in which it invests may go up or down in response to the prospects of individual companies, particular industry sectors and/or general economic conditions. Foreign and emerging market securities may be more volatile and less liquid than investments in U.S. securities and will be subject to the risks of currency fluctuations and adverse economic or political developments. The securities of small- and mid-capitalization companies involve greater risks than those associated with larger, more established companies and may be subject to more abrupt or erratic price movements.
1
GOLDMAN SACHS STRUCTURED INTERNATIONAL EQUITY FUNDS
Goldman Sachs’ Structured International Equity Investment Process
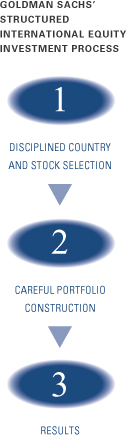

| n | | Comprehensive – We forecast returns on over 8,000 international stocks and 43 equity markets on a daily basis. |
| n | | Rigorous – We evaluate stocks and countries based on fundamental investment criteria that have outperformed historically. |
| n | | Objective – Our stock and country selection process is free from emotion that may lead to biased investment decisions. |

| n | | Our computer optimization process allocates risk to our best investment ideas and constructs funds that strive to neutralize systematic risks and deliver better returns. |
| n | | We use unique, proprietary risk models that are designed to be more precise, more focused and faster to respond because they seek to identify, track and manage risk specific to our process, using daily data. |

Fully invested, well-diversified international portfolio that seeks to:
| n | | Blend top-down market views with bottom-up stock selection. |
| n | | Maintain style, sector, risk and capitalization characteristics similar to the benchmark. |
| n | | Achieve excess returns by taking many small diversified stock positions. Additionally, in the GS Structured Emerging Markets Equity Fund and the GS Structured International Equity Fund we take intentional country bets. |
Enhancements Made to Proprietary Quantitative Model during the Six-Month Period Ended April 30, 2012
We continuously look for ways to improve our investment process. Accordingly, we introduced a number of enhancements to our proprietary quantitative model during the six-month period ended April 30, 2012.
We introduced a new short-term model to our stock selection process during the first quarter of 2012. We plan to use this short-term model, which forecasts potential returns using three-month to 12-month time horizons, to help us make long-term investment decisions and determine when to buy or sell securities. In addition, we implemented enhancements to our country/currency selection process. In seeking to make our models more effective in a variety of market environments, we enhanced the way we expressed our active views by modeling unhedged equity returns directly, rather than modeling our currency and currency-hedged equity views separately. This enhancement should help us match the Funds’ portfolios more closely with our optimal views. During the first calendar quarter, we also introduced country-specific views to increase the flexibility of our process. We believe the incorporation of these country-specific views should enhance performance consistency, especially during periods of unexpected market disruption.
2
MARKET REVIEW
Goldman Sachs Structured International
Equity Funds
Market Review
Global stock markets advanced during the six-month period ended April 30, 2012 (the “Reporting Period”), with a sharp rally during the first two months of 2012 more than offsetting weakness at the beginning and the end of the Reporting Period.
During November and December 2011, international equities and emerging market equities retreated in response to slowing global economic growth and the worsening of Europe’s sovereign debt crisis. Concern about the outlook for global economic growth was exacerbated by a drop in China’s inflation rate, which fell from 6.1% in September to 5.5% in October, and a slowdown in Chinese industrial production. In addition, the euro and many emerging market currencies declined against the U.S. dollar, further weakening equity returns as measured in U.S. dollars. The Greek and Italian governments were replaced by technocrats; credit conditions for banks tightened; and yields on Italian and Spanish government debt hovered near unsustainable levels. Japanese equities generally lagged the broader international equity market despite the announcement that Japan’s economy had grown at an annualized pace of 6% during the third quarter of 2011.
The international equity and emerging equity markets rallied broadly during January and February 2012, as sentiment about the global economy improved and investors started to rotate into riskier assets. Gains extended through March 2012 amidst growing optimism that the U.S. economy was recovering and that Europe might eventually be able to stem its sovereign debt crisis. Despite widespread downgrades of sovereign debt by Standard & Poor’s, European equity markets reflected optimism that a financial crisis could be averted through liquidity provided by the European Central Bank’s longer-term refinancing operation (“LTRO”) and the proposal of a “fiscal compact” for the European Monetary Union.
The emerging equity markets retreated during March, joined by the international equity markets in April, on questions about the strength of the U.S. economic recovery and increased political uncertainty in Europe. Weaker-than-expected economic data from China also renewed concerns about an economic slowdown in Asia. Japanese equities rose as the yen weakened significantly late in the Reporting Period, following the Bank of Japan’s surprise monetary policy easing in the form of increased asset purchases.
3
MARKET REVIEW
Emerging Markets Equity
The MSCI Emerging Markets Index (net, unhedged) (“MSCI Emerging Markets Index”) returned 3.93% during the Reporting Period. Sixteen of the 21 countries in the MSCI Emerging Markets Index were up for the Reporting Period, with Thailand (+25.66%) and the Philippines (+21.77%) recording the largest gains. China (+7.13%) was the largest contributor on the basis of impact, which takes both weightings and total returns into account.
Nine of the 10 sectors in the MSCI Emerging Markets Index were positive for the Reporting Period, with information technology (+15.86%) and consumer staples (+12.50%) gaining the most ground. The information technology sector was also the largest contributor to MSCI Emerging Markets Index returns on the basis of impact.
International Equity
The MSCI EAFE Index (unhedged and net of dividend withholding taxes) (“MSCI EAFE Index”) returned 2.44%* during the Reporting Period. Thirteen of the 22 countries in the MSCI EAFE Index were up for the Reporting Period, with Denmark (+23.13%) and Ireland (+19.35%) posting the largest gains. The U.K. (+6.43%) was the largest contributor on the basis of impact, which takes both weightings and total returns into account.
Seven of the 10 sectors in the MSCI EAFE Index recorded positive results for the Reporting Period, with consumer staples (+7.96%) and consumer discretionary (+7.14%) gaining the most. The consumer staples sector was also the largest contributor to MSCI EAFE Index returns on the basis of impact.
International Small Cap Equity
The MSCI EAFE Small Cap Index (unhedged and net of dividend withholding taxes) (“MSCI EAFE Small Cap Index”) advanced 6.04% during the Reporting Period. Eighteen of the 22 countries in the MSCI EAFE Small Cap Index were up for the Reporting Period, with the U.K. (+14.09%) and Denmark (+13.29%) posting the largest gains. The U.K. was also the largest contributor on the basis of impact, which takes both weightings and total returns into account.
Nine of the 10 sectors in the MSCI EAFE Small Cap Index recorded positive results for the Reporting Period, with information technology (+12.90%) and energy (+12.72%) gaining the most. The industrials (+7.78%) sector was the largest contributor to MSCI EAFE Small Cap Index returns on the basis of impact.
| *All | | index returns are expressed in U.S. dollar terms. |
4
MARKET REVIEW
Looking Ahead
We continue to believe that less expensive stocks are likely to outpace more expensive stocks. In addition, we expect stocks with good momentum to outperform those with poor momentum. We plan to focus on seeking companies about which fundamental research analysts are becoming more positive as well as profitable companies with sustainable earnings and a track record of using their capital to enhance shareholder value. As such, we anticipate remaining fully invested, with long-term performance likely to be the result of stock selection rather than sector or capitalization allocations.
We stand behind our investment philosophy that sound economic investment principles, coupled with a disciplined quantitative approach, can provide strong, uncorrelated returns over the long term. Our research agenda is robust, and we continue to enhance our existing models, add new proprietary forecasting signals, and improve our trading execution as we seek to provide the most value to our shareholders.
5
PORTFOLIO RESULTS
Structured Emerging Markets Equity Fund
Portfolio Management Discussion and Analysis
Below, the Goldman Sachs Quantitative Investment Strategies Team (the “Team”) discusses the Goldman Sachs Structured Emerging Markets Equity Fund’s (the “Fund”) performance and positioning for the six-month period ended April 30, 2012 (the “Reporting Period”).
| Q | | How did the Fund perform during the Reporting Period? |
| A | | During the Reporting Period, the Fund’s Class A, C, Institutional and IR Shares generated cumulative total returns, without sales charges, of 7.28%, 6.88%, 7.45% and 7.38%, respectively. These returns compare to the 3.93% cumulative total return of the Fund’s benchmark, the MSCI Emerging Markets Index (net, unhedged) (the “Index”), during the same period. |
| Q | | What key factors were most responsible for the Fund’s performance during the Reporting Period? |
| A | | We use two distinct strategies—a bottom-up stock selection strategy and a top-down country/currency selection strategy—to manage the Fund. These strategies are uncorrelated, that is, they tend to perform independently of each other over time, which enables us to greater diversify the portfolio. |
| | | During the Reporting Period, our country/currency selection strategy added to the Fund’s relative performance. Our stock selection strategy, which uses stock selection models based on five investment themes, also enhanced relative returns. We use these five investment themes to take a long-term view of market patterns and look for inefficiencies, selecting stocks for the Fund and overweighting or underweighting those stocks chosen by the model. Over time and by design, the performance of any one of our model’s investment themes tends to have a low correlation with the model’s other themes, demonstrating the diversification benefit of our theme-driven quantitative model. The variance in performance supports our research indicating that the diversification provided by our different investment themes is a significant investment advantage over the long term, even though the Fund may experience underperformance in the short term. Of course, diversification does not protect an investor from market risk nor does it ensure a profit. |
| Q | | Which investment themes helped and which hurt within the Team’s stock selection strategy? |
| A | | During the Reporting Period, our bottom-up stock selection strategy and four of its five investment themes added to the Fund’s relative results. |
| | | Sentiment, Momentum and Profitability contributed the most to relative performance. Our Sentiment theme reflects selected investment views and decisions of individuals and financial intermediaries, while Momentum predicts drift in stock prices caused by delayed investor reaction to company-specific information and information about related companies. Profitability assesses whether a company is earning more than its cost of capital. The Quality theme also added value. Quality evaluates whether the company’s earnings are coming from more persistent, cash-based sources, as opposed to accruals. |
| | | Valuation detracted from the Fund’s relative returns during the Reporting Period. Valuation attempts to capture potential mispricings of securities, typically by comparing a measure of the company’s intrinsic value to its market value. |
| Q | | How did the Fund’s sector allocations affect relative results? |
| A | | In constructing the portfolio, we focus on picking stocks rather than on making industry or sector bets. Consequently, the Fund is similar to the Index in terms of its sector allocation and style. Changes in its sector weights generally do not have a meaningful impact on relative returns. |
6
PORTFOLIO RESULTS
| Q | | Which stock positions contributed to the Fund’s relative returns during the Reporting Period? |
| A | | We seek to outpace the Index by overweighting stocks we expect to outperform and underweighting those we think may lag. We also build positions based on our thematic views. For example, the Fund aims to hold a basket of stocks with better Momentum characteristics than the benchmark. |
| | | Security selection in the information technology, financials and consumer discretionary sectors contributed positively during the Reporting Period. The Fund benefited from overweighted positions in Asustek Computer, a Taiwan-based maker of computers and computer components; Samsung Electronics, a South Korea-based electronics manufacturer; and Grupo Aeroportuario del Sueste, an airport operator in Mexico. We chose to overweight Asustek Computer because of our positive views on Momentum. The Fund was overweight Samsung Electronics based on our positive views on Sentiment. Our positive views on Valuation led us to an overweight in Grupo Aeroportuario del Sueste. |
| Q | | Which Fund positions detracted from results during the Reporting Period? |
| A | | Our stock picks in the consumer staples, materials and industrials sectors detracted from relative results during the Reporting Period. The Fund was hampered by overweighted positions in South Korean industrial conglomerate SK Holdings and Brazilian oil and gas company Petroleo Brasileiro. An underweighted position in Tencent Holdings, a Chinese Internet and wireless provider, also dampened returns. Our positive views on Valuation led to the Fund’s overweights in SK Holdings and Petroleo Brasileiro. We adopted the underweight to Tencent Holdings because of our negative views on Profitability. |
| Q | | What impact did the Team’s country/currency selection strategy have on the Fund’s relative performance during the Reporting Period? |
| A | | Our country/currency strategy added to the Fund’s relative returns during the Reporting Period. The Fund benefited from an overweighted position compared to the Index in Thailand. Underweighted positions in Brazil and Korea also contributed positively. The Fund was hampered by an overweighted position in Russia as well as underweighted positions in South Africa and Colombia. |
| | | We made our picks using our proprietary models, which are based on six investment themes specific to our country/ currency strategy—Valuation, Momentum, Risk Premium, Fund Flows, Macro and Visibility. Valuation favors equity and currency markets that appear cheap relative to accounting measures of value and purchasing power. The Momentum theme favors countries and currencies that have had strong recent outperformance. Risk Premium evaluates whether a country is overcompensating investors for various types of risk, while Fund Flows evaluates the strength of capital market inflows. Macro assesses a market’s macroeconomic environment and growth prospects. Finally, Visibility evaluates which markets are drawing the attention of technical traders. |
| Q | | How did the Fund use derivatives and similar instruments during the Reporting Period? |
| A | | The Fund did not use derivatives or similar instruments during the Reporting Period. |
| Q | | What changes did you make to the Fund’s country weightings during the Reporting Period? |
| A | | We increased the Fund’s weightings relative to the Index in China, Thailand and Korea and decreased its weightings in India, Indonesia and Chile. |
| Q | | What were the Fund’s sector and country weightings at the end of the Reporting Period? |
| A | | At the end of the Reporting Period, the Fund was overweight the consumer staples, industrials, information technology and consumer discretionary sectors compared to the Index. The Fund was underweight the materials, utilities, telecommunication services, energy, health care and financials sectors. |
| | | In terms of countries, the Fund was overweight China, Mexico, Russia, Malaysia, Korea, Thailand and the Philippines relative to the Index at the end of the Reporting Period. It was underweight South Africa, India, Taiwan, Chile, Turkey, Colombia, Brazil, Indonesia, Peru, the Czech Republic and Hungary. At the end of the Reporting Period, the Fund was relatively neutral compared to the Index in Poland, Morocco and Egypt. |
7
FUND BASICS
Structured Emerging Markets Equity Fund
as of April 30, 2012
| | | | | | | | | | |
| | PERFORMANCE REVIEW | |
| | | November 1, 2011–April 30, 2012 | | Fund Total Return
(based on NAV)1 | | | MSCI EMF Index2 | |
| | Class A | | | 7.28 | % | | | 3.93 | % |
| | Class C | | | 6.88 | | | | 3.93 | |
| | Institutional | | | 7.45 | | | | 3.93 | |
| | | Class IR | | | 7.38 | | | | 3.93 | |
| | 1 | | The net asset value (NAV) represents the net assets of the class of the Fund (ex-dividend) divided by the total number of shares of the class outstanding. The Fund’s performance assumes the reinvestment of dividends and other distributions. The Fund’s performance does not reflect the deduction of any applicable sales charges. |
| | 2 | | The MSCI Emerging Markets Index (net, unhedged) (the “MSCI EMF Index”) is a free float-adjusted market capitalization index that is designed to measure equity market performance of emerging markets. As of May 30, 2011, the MSCI EMF Index consists of the following 21 emerging market country indices: Brazil, Chile, China, Colombia, Czech Republic, Egypt, Hungary, India, Indonesia, Korea, Malaysia, Mexico, Morocco, Peru, Philippines, Poland, Russia, South Africa, Taiwan, Thailand, and Turkey. Index figures do not reflect any deduction for fees, expenses or taxes. It is not possible to invest directly in an index. |
| | | | | | | | | | | | |
| | STANDARDIZED TOTAL RETURNS3 |
| | | For the period ended 3/31/12 | | One Year | | | Since Inception | | | Inception Date |
| | Class A | | | -12.44 | % | | | -3.50 | % | | 10/5/07 |
| | Class C | | | -9.02 | | | | -2.89 | | | 10/5/07 |
| | Institutional | | | -7.02 | | | | -1.87 | | | 10/5/07 |
| | | Class IR | | | -7.20 | | | | 9.52 | | | 8/31/10 |
| | 3 | | The Standardized Total Returns are average annual total returns as of the most recent calendar quarter-end. They assume reinvestment of all distributions at NAV. These returns reflect a maximum initial sales charge of 5.5% for Class A Shares and the assumed contingent deferred sales charge for Class C Shares (1% if redeemed within 12 months of purchase). Because Institutional and Class IR Shares do not involve a sales charge, such a charge is not applied to their Standardized Total Returns. |
| | | | The returns represent past performance. Past performance does not guarantee future results. The Fund’s investment return and principal value will fluctuate so that an investor’s shares, when redeemed, may be worth more or less than their original cost. Current performance may be lower or higher than the performance quoted above. Please visit our Website at www.goldmansachsfunds.com to obtain the most recent month-end returns. Performance reflects fee waivers and/or expense limitations in effect. In their absence, performance would be reduced. Returns do not reflect the deduction of taxes that a shareholder would pay on Fund distributions or the redemption of Fund shares. |
8
FUND BASICS
| | | | | | | | | | |
| | EXPENSE RATIOS4 | |
| | | | | Net Expense Ratio (Current) | | | Gross Expense Ratio (Before Waivers) | |
| | Class A | | | 1.45 | % | | | 1.71 | % |
| | Class C | | | 2.20 | | | | 2.46 | |
| | Institutional | | | 1.05 | | | | 1.31 | |
| | | Class IR | | | 1.20 | | | | 1.46 | |
| | 4 | | The expense ratios of the Fund, both current (net of applicable fee waivers and/or expense limitations) and before waivers (gross of applicable fee waivers and/or expense limitations) are as set forth above according to the most recent publicly available Prospectus for the Fund and may differ from the expense ratios disclosed in the Financial Highlights in this report. The Fund’s waivers and/or expense limitations will remain in place through at least February 28, 2013, and prior to such date the investment adviser may not terminate the arrangements without the approval of the Fund’s Board of Trustees. If these arrangements are discontinued in the future, the expense ratios may change without shareholder approval. |
| | | | | | | | | | |
| | TOP TEN HOLDINGS AS OF 4/30/125 |
| | | Holding | | % of Total
Net Assets | | | Line of Business | | Country |
| | Samsung Electronics Co. Ltd. | | | 5.6 | % | | Semiconductors &
Semiconductor Equipment | | South Korea |
| | Taiwan Semiconductor Manufacturing Co. Ltd. ADR | | | 2.6 | | | Semiconductors &
Semiconductor Equipment | | Taiwan |
| | Hyundai Motor Co. | | | 2.6 | | | Automobiles & Components | | South Korea |
| | Sberbank of Russia. | | | 2.3 | | | Banks | | Russia |
| | Bank of China Ltd. Class H | | | 2.3 | | | Banks | | China |
| | Petroleo Brasileiro SA Preference Shares | | | 2.3 | | | Energy | | Brazil |
| | Companhia de Bebidas das Americas Preference Shares ADR | | | 2.2 | | | Food, Beverage & Tobacco | | Brazil |
| | China Mobile Ltd. | | | 2.2 | | | Telecommunication Services | | Hong Kong |
| | China Petroleum & Chemical Corp. Class H | | | 2.1 | | | Energy | | China |
| | | China Construction Bank Corp. Class H | | | 2.0 | | | Banks | | China |
| | 5 | | The top 10 holdings may not be representative of the Fund’s future investments. |
9
FUND BASICS
| | |
| FUND VS. BENCHMARK SECTOR ALLOCATIONS6 |
| As of April 30, 2012 | | |
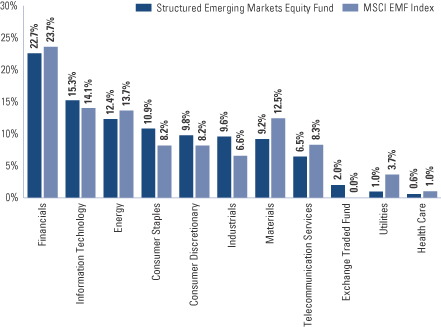
| | 6 | | The Fund is actively managed and, as such, its composition may differ over time. Consequently, the Fund’s overall sector allocations may differ from the percentages contained in the graph above. The above graph categorizes investments using Global Industry Classification Standard (“GICS”), however, the sector classifications used by the portfolio management team may differ from GICS. Underlying sector allocations of Exchange Traded Funds held by the Fund are not reflected in the graph above. The percentage shown for each investment category reflects the value of investments in that category as a percentage of market value (excluding investments in the securities lending reinvestment vehicle, if any). Investment in the securities lending reinvestment vehicle represented 0.3% of the Fund’s net assets at April 30, 2012. The graph depicts the Fund’s investments but may not represent the Fund’s market exposure due to the exclusion of certain derivatives, if any, as listed in the Additional Investment Information section of the Schedule of Investments. |
10
PORTFOLIO RESULTS
Structured International Equity Fund
Portfolio Management Discussion and Analysis
Below, the Goldman Sachs Quantitative Investment Strategies Team (the “Team”) discusses the Goldman Sachs Structured International Equity Fund’s (the “Fund”) performance and positioning for the six-month period ended April 30, 2012 (the “Reporting Period”).
| Q | | How did the Fund perform during the Reporting Period? |
| A | | During the Reporting Period, the Fund’s Class A, B, C, Institutional, Service, IR and R Shares generated cumulative total returns, without sales charges, of 4.37%, 3.90%, 3.88%, 4.57%, 4.21%, 4.34% and 4.23%, respectively. These returns compare to the 2.44% cumulative total return of the Fund’s benchmark, the MSCI EAFE Index (unhedged and net of dividend withholding taxes) (the “Index”), during the same period. |
| Q | | What key factors were most responsible for the Fund’s performance during the Reporting Period? |
| A | | We use two distinct strategies—a bottom-up stock selection strategy and a top-down country/currency selection strategy—to manage the Fund. These strategies are uncorrelated, that is, they tend to perform independently of each other over time, which enables us to greater diversify the portfolio. |
| | | During the Reporting Period, our country/currency selection strategy contributed positively to the Fund’s relative performance. Our bottom-up stock selection strategy, which uses stock selection based on six investment themes, dampened relative returns. We use these six investment themes to take a long-term view of market patterns and look for inefficiencies, selecting stocks for the Fund and overweighting or underweighting those stocks chosen by the model. Over time and by design, the performance of any one of our model’s investment themes tends to have a low correlation with the model’s other themes, demonstrating the diversification benefit of our theme-driven quantitative model. The variance in performance supports our research indicating that the diversification provided by our different investment themes is a significant investment advantage over the long term, even though the Fund may experience underperformance in the short term. Of course, diversification does not protect an investor from market risk nor does it ensure a profit. |
| Q | | Which investment themes helped and which hurt within the Team’s stock selection strategy? |
| A | | Our bottom-up stock selection strategy and its six investment themes hampered relative performance during the Reporting Period. Valuation and Quality were the Fund’s weakest-performing themes. Valuation attempts to capture potential mispricings of securities, typically by comparing a measure of the company’s intrinsic value to its market value. Quality evaluates whether the company’s earnings are coming from more persistent, cash-based sources, as opposed to accruals. |
| | | Profitability and Momentum contributed positively to relative results. Profitability assesses whether a company is earning more than its cost of capital. Momentum seeks to predict drifts in stock prices caused by delayed investor reaction to company-specific information and information about related companies. Sentiment, which reflects selected investment views and decisions of individuals and financial intermediaries, also added value. The impact of our Management theme was relatively neutral during the Reporting Period. Management assesses the characteristics, policies and strategic decisions of company management. |
| Q | | How did the Fund’s sector allocations affect relative performance? |
| A | | In constructing the portfolio, we focus on picking stocks rather than on making industry or sector bets. Consequently, the Fund is similar to the Index in terms of its sector allocation and style. Changes in its sector weights generally do not have a meaningful impact on relative returns. |
11
PORTFOLIO RESULTS
| Q | | Which stock positions contributed to the Fund’s relative returns during the Reporting Period? |
| A | | We seek to outpace the Index by overweighting stocks we expect to outperform and underweighting those we think may lag. We also build positions based on our thematic views. For example, the Fund aims to hold a basket of stocks with better Momentum characteristics than the benchmark. |
| | | Investments in the industrials, financials and consumer staples sectors added to the Fund’s relative performance during the Reporting Period. The Fund benefited from underweighted positions in Siemens, a German-based electronics and electrical engineering conglomerate, and in Royal Dutch Shell, an oil and gas company. An overweighted position in Swiss technology firm Oc Oerlikon also enhanced Fund returns versus the Index. We assumed the underweight to Siemens as a result of our negative views on Momentum and Valuation. Our negative views on Quality led to the Fund’s underweight in Royal Dutch Shell. We chose to overweight Oc Oerlikon because of our positive views on Valuation and Momentum. |
| Q | | Which Fund positions detracted from results during the Reporting Period? |
| A | | Security selection in the utilities, telecommunication services and information technology sectors dampened relative results during the Reporting Period. The Fund was hampered by overweighted positions in Vivendi, a French mass media and telecommunication company, and in Enel, an Italian power company. An underweighted position in Japanese automobile company Toyota Motor also detracted from returns. We adopted the overweights in Vivendi and Enel because of our positive views on Valuation. The Fund was underweight Toyota Motor as a result of our negative views on Management. |
| Q | | What impact did the Team’s country/currency selection strategy have on the Fund’s relative performance during the Reporting Period? |
| A | | Our country/currency selection strategy boosted relative performance during the Reporting Period. The Fund’s underweighted positions compared to the Index in Spain and France added to relative returns. An overweighted position in Italy was also advantageous. Detracting from relative performance were the Fund’s underweighted positions in Denmark and Belgium and its overweighted position in Germany. |
| | | We made our picks using our proprietary models, which are based on five investment factors specific to our country/ currency strategy—Valuation, Momentum, Risk Premium, Fund Flows and Macro. Valuation favors equity and currency markets that appear cheap relative to accounting measures of value and purchasing power. The Momentum factor favors countries and currencies that have had strong recent outperformance. Risk Premium evaluates whether a country is overcompensating investors for various types of risk, while Fund Flows evaluates the strength of capital market inflows. Finally, Macro assesses a market’s macroeconomic environment and growth prospects. |
| Q | | How did the Fund use derivatives and similar instruments during the Reporting Period? |
| A | | During the Reporting Period, we used financial futures contracts to equitize the Fund’s cash holdings. In other words, we put the Fund’s cash holdings to work by using them as collateral for the purchase of financial futures contracts. |
| Q | | What changes did you make to the Fund’s country weightings during the Reporting Period? |
| A | | During the Reporting Period, we increased the Fund’s weightings relative to the Index in Switzerland, Hong Kong and Norway. We decreased its weightings compared to the Index in France, Japan and Italy. |
| Q | | What were the Fund’s sector and country weightings at the end of the Reporting Period? |
| A | | At the end of the Reporting Period, the Fund was overweight consumer staples, consumer discretionary, health care and financials compared to the Index. It was underweight the telecommunication services, information technology, materials and industrials sectors. The Fund was relatively neutral versus the Index in the energy and utilities sectors at the end of the Reporting Period. |
| | | In terms of countries, the Fund was overweight relative to the Index in Hong Kong, the U.K., Switzerland, Norway, Germany, Belgium, Denmark and Singapore at the end of the Reporting Period. It was underweight Australia, France, Japan, Spain, Italy, Sweden, the Netherlands and Ireland. Compared to the Index, the Fund was relatively neutral in Israel, New Zealand, Greece, Finland, Austria and Portugal at the end of the Reporting Period. |
12
FUND BASICS
Structured International Equity Fund
as of April 30, 2012
| | | | | | | | | | |
| | PERFORMANCE REVIEW | |
| | | November 1, 2011–April 30, 2012 | | Fund Total Return
(based on NAV)1 | | | MSCI EAFE (Net) Index2 | |
| | Class A | | | 4.37 | % | | | 2.44 | % |
| | Class B | | | 3.90 | | | | 2.44 | |
| | Class C | | | 3.88 | | | | 2.44 | |
| | Institutional | | | 4.57 | | | | 2.44 | |
| | Service | | | 4.21 | | | | 2.44 | |
| | Class IR | | | 4.34 | | | | 2.44 | |
| | | Class R | | | 4.23 | | | | 2.44 | |
| | 1 | | The net asset value (NAV) represents the net assets of the class of the Fund (ex-dividend) divided by the total number of shares of the class outstanding. The Fund’s performance assumes the reinvestment of dividends and other distributions. The Fund’s performance does not reflect the deduction of any applicable sales charges. |
| | 2 | | The unmanaged Morgan Stanley Capital International (MSCI) Europe, Australasia, Far East (EAFE) (Net) Index (unhedged, with dividends reinvested) (the “Index”) is a market capitalization-weighted composite of securities in 22 developed markets (as of May 30, 2011). The Index figures do not reflect any deduction for fees, expenses or taxes. It is not possible to invest directly in an index. |
| | | | | | | | | | | | | | | | | | | | |
| | STANDARDIZED TOTAL RETURNS3 |
| | | For the period ended 3/31/12 | | One Year | | | Five Years | | | Ten Years | | | Since Inception | | | Inception Date |
| | Class A | | | -14.60 | % | | | -6.47 | % | | | 4.27 | % | | | 2.07 | % | | 8/15/97 |
| | Class B | | | -14.80 | | | | -6.49 | | | | 4.29 | | | | 2.18 | | | 8/15/97 |
| | Class C | | | -11.24 | | | | -6.08 | | | | 4.15 | | | | 1.85 | | | 8/15/97 |
| | Institutional | | | -9.25 | | | | -5.01 | | | | 5.34 | | | | 3.00 | | | 8/15/97 |
| | Service | | | -9.72 | | | | -5.47 | | | | 4.82 | | | | 2.50 | | | 8/15/97 |
| | Class IR | | | -9.40 | | | | N/A | | | | N/A | | | | -7.34 | | | 11/30/07 |
| | | Class R | | | -9.81 | | | | N/A | | | | N/A | | | | -7.74 | | | 11/30/07 |
| | 3 | | The Standardized Total Returns are average annual total returns as of the most recent calendar quarter-end. They assume reinvestment of all distributions at NAV. These returns reflect a maximum initial sales charge of 5.5% for Class A Shares, the assumed contingent deferred sales charge for Class B Shares (5% maximum declining to 0% after six years) and the assumed contingent deferred sales charge for Class C Shares (1% if redeemed within 12 months of purchase). Class B Shares convert automatically to Class A Shares on or about the fifteenth day of the last month of the calendar quarter that is eight years after purchase. Returns for Class B Shares for the period after conversion reflect the performance of Class A Shares. Because Institutional, Service, Class IR and Class R Shares do not involve a sales charge, such a charge is not applied to their Standardized Total Returns. The Fund’s Class B Shares are no longer available for purchase by new or existing shareholders (although current Class B shareholders may continue to reinvest income and capital gains distributions into Class B Shares, and Class B shareholders may continue to exchange their shares for Class B Shares of certain other Goldman Sachs Funds). |
| | | | The returns represent past performance. Past performance does not guarantee future results. The Fund’s investment return and principal value will fluctuate so that an investor’s shares, when redeemed, may be worth more or less than their original cost. Current performance may be lower or higher than the performance quoted above. Please visit our Website at www.goldmansachsfunds.com to obtain the most recent month-end returns. Performance reflects fee waivers and/or expense limitations in effect. In their absence, performance would be reduced. Returns do not reflect the deduction of taxes that a shareholder would pay on Fund distributions or the redemption of Fund shares. |
13
FUND BASICS
| | | | | | | | | | |
| | EXPENSE RATIOS4 | |
| | | | | Net Expense Ratio (Current) | | | Gross Expense Ratio (Before Waivers) | |
| | Class A | | | 1.25 | % | | | 1.31 | % |
| | Class B | | | 2.00 | | | | 2.06 | |
| | Class C | | | 2.00 | | | | 2.06 | |
| | Institutional | | | 0.85 | | | | 0.91 | |
| | Service | | | 1.35 | | | | 1.41 | |
| | Class IR | | | 1.00 | | | | 1.06 | |
| | | Class R | | | 1.50 | | | | 1.56 | |
| | 4 | | The expense ratios of the Fund, both current (net of applicable fee waivers and/or expense limitations) and before waivers (gross of applicable fee waivers and/or expense limitations) are as set forth above according to the most recent publicly available Prospectus for the Fund and may differ from the expense ratios disclosed in the Financial Highlights in this report. The Fund’s waivers and/or expense limitations will remain in place through at least February 28, 2013, and prior to such date the investment adviser may not terminate the arrangements without the approval of the Fund’s Board of Trustees. If these arrangements are discontinued in the future, the expense ratios may change without shareholder approval. |
| | | | | | | | | | |
| | TOP TEN HOLDINGS AS OF 4/30/125 |
| | | Holding | | % of Total
Net Assets | | | Line of Business | | Country |
| | Roche Holding AG | | | 3.9 | % | | Pharmaceuticals, Biotechnology
& Life Sciences | | Switzerland |
| | HSBC Holdings PLC | | | 2.7 | | | Banks | | United Kingdom |
| | British American Tobacco PLC | | | 2.3 | | | Food, Beverage & Tobacco | | United Kingdom |
| | Deutsche Post AG (Registered) | | | 2.0 | | | Transportation | | Germany |
| | Statoil ASA | | | 1.9 | | | Energy | | Norway |
| | Novartis AG (Registered) | | | 1.9 | | | Pharmaceuticals, Biotechnology
& Life Sciences | | Switzerland |
| | Swedish Match AB | | | 1.8 | | | Food, Beverage & Tobacco | | Sweden |
| | Nestle SA (Registered) | | | 1.8 | | | Food, Beverage & Tobacco | | Switzerland |
| | Nissan Motor Co. Ltd | | | 1.7 | | | Automobiles & Components | | Japan |
| | | Royal Dutch Shell PLC Class A | | | 1.7 | | | Energy | | Netherlands |
| | 5 | | The top 10 holdings may not be representative of the Fund’s future investments. |
14
FUND BASICS
| | |
| FUND VS. BENCHMARK SECTOR ALLOCATIONS6 |
| As of April 30, 2012 | | |
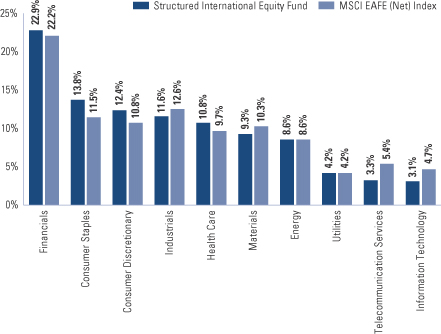
| | 6 | | The Fund is actively managed and, as such, its composition may differ over time. Consequently, the Fund’s overall sector allocations may differ from the percentages contained in the graph above. The graph categorizes investments using Global Industry Classification Standard (“GICS”), however, the sector classifications used by the portfolio management team may differ from GICS. The percentage shown for each investment category reflects the value of investments in that category as a percentage of market value (excluding investments in the securities lending reinvestment vehicle, if any). Investment in the securities lending reinvestment vehicle represented 4.2% of the Fund’s net assets at April 30, 2012. The graph depicts the Fund’s investments but may not represent the Fund’s market exposure due to the exclusion of certain derivatives, if any, as listed in the Additional Investment Information section of the Schedule of Investments. |
15
PORTFOLIO RESULTS
Structured International Small Cap Fund
Portfolio Management Discussion and Analysis
Below, the Goldman Sachs Quantitative Investment Strategies Team (the “Team”) discusses the Goldman Sachs Structured International Small Cap Fund’s (the “Fund”) performance and positioning for the six-month period ended April 30, 2012 (the “Reporting Period”).
| Q | | How did the Fund perform during the Reporting Period? |
| A | | During the Reporting Period, the Fund’s Class A, C, Institutional and IR Shares generated cumulative total returns, without sales charges, of 6.56%, 6.19%, 6.78% and 6.65%, respectively. These returns compare to the 6.04% cumulative total return of the Fund’s benchmark, the MSCI EAFE Small Cap Index (unhedged and net of dividend withholding taxes) (the “Index”), during the same period. |
| Q | | What key factors were most responsible for the Fund’s performance during the Reporting Period? |
| A | | As expected, and in keeping with our investment approach, our quantitative model and its six investment themes had the greatest impact on relative performance. We use these themes to take a long-term view of market patterns and look for inefficiencies, selecting stocks for the Fund and overweighting or underweighting those stocks chosen by the model. Over time and by design, the performance of any one of our model’s investment themes tends to have a low correlation with the model’s other themes, demonstrating the diversification benefit of our theme-driven quantitative model. The variance in performance supports our research indicating that the diversification provided by our different investment themes is a significant investment advantage over the long term, even though the Fund may experience underperformance in the short term. Of course, diversification does not protect an investor from market risk nor does it ensure a profit. |
| | | Overall, our investment themes added to the Fund’s relative returns during the Reporting Period. Momentum was our best-performing theme. Momentum seeks to predict drifts in stock prices caused by delayed investor reaction to company-specific information and information about related companies. Sentiment, Profitability and Quality also enhanced relative performance. Our Sentiment theme reflects selected investment views and decisions of individuals and financial intermediaries. Profitability assesses whether a company is earning more than its cost of capital, while the Quality theme evaluates whether the company’s earnings are coming from more persistent, cash-based sources, as opposed to accruals. |
| | | Valuation and Management detracted from the Fund’s relative results. Valuation attempts to capture potential mispricings of securities, typically by comparing a measure of the company’s intrinsic value to its market value. Management assesses the characteristics, policies and strategic decisions of company management. |
| Q | | How did the Fund’s sector allocations affect relative performance? |
| A | | In constructing the portfolio, we focus on picking stocks rather than on making industry or sector bets. Consequently, the Fund is similar to the Index in terms of its sector allocation and style. Changes in its sector weights generally do not have a meaningful impact on relative performance. |
| Q | | Which stock positions contributed to the Fund’s relative returns during the Reporting Period? |
| A | | We seek to outpace the Index by overweighting stocks we expect to outperform and underweighting those we think may lag. We also build positions based on our thematic views. For example, the Fund aims to hold a basket of stocks with better Momentum characteristics than the benchmark. |
| | | Our stock picks in the consumer discretionary, consumer staples and information technology sectors contributed positively to the Fund’s results versus the Index during the Reporting Period. The Fund benefited from overweighted positions in Kvaerner ASA, a Norway-based engineering and construction services company; Bodycote, a U.K.-based provider of thermal processing services; and Forbo Holding, a German manufacturer of flooring, bonding and movement systems. The overweights in Kvaerner Asa and Forbo Holding were the result of our positive views on Valuation. Our positive views on Momentum led to the Fund’s overweight in Bodycote. |
16
PORTFOLIO RESULTS
| Q | | Which Fund positions detracted from results during the Reporting Period? |
| A | | Investments in the energy, industrials and materials sectors detracted from the Fund’s relative performance during the Reporting Period. The Fund was hindered by its overweighted positions in Heritage Oil, a U.K.-based oil and gas exploration company; Nexans, a French maker of cables and cabling systems; and Petroplus Holding, an independent oil refiner based in the Netherlands. We assumed the overweights in Nexans and Petroplus Holdings because of our positive views on Valuation. The Fund was overweight Heritage Oil based on our positive views on Momentum. |
| Q | | What impact did country selection have on the Fund’s relative performance during the Reporting Period? |
| A | | To construct the portfolio, we focus on security selection rather than on making country bets. As a result, the Fund is similar to the Index in terms of its country allocation; changes in its country weightings are generally the result of our stock picking. That said, the Fund benefited during the Reporting Period from overweighted positions relative to the Index in German and Hong Kong stocks and an underweighted position in Norwegian stocks. The Fund was hampered by its overweighted position in French stocks as well as by underweighted positions in the stocks of Austria and the Netherlands. Security selection in all six countries added to returns. |
| Q | | How did the Fund use derivatives and similar instruments during the Reporting Period? |
| A | | During the Reporting Period, we used financial futures contracts to equitize the Fund’s cash holdings. In other words, we put the Fund’s cash holdings to work by using them as collateral for the purchase of financial futures contracts. |
| Q | | What changes did you make to the Fund’s country weightings during the Reporting Period? |
| A | | The largest shifts we made during the Reporting Period were to increase the Fund’s weightings relative to the Index in Australia, Finland and New Zealand and to decrease the Fund’s weightings in Japan, the U.K. and Portugal. |
| Q | | What were the Fund’s sector and country weightings at the end of the Reporting Period? |
| A | | At the end of the Reporting Period, the Fund was overweight the consumer staples, energy, consumer discretionary, industrials and financials sectors compared to the Index. The Fund was underweight the health care, information technology, materials, telecommunication services and utilities sectors relative to the Index at the end of the Reporting Period. |
| | | In terms of countries, the Fund was overweight Australia, Sweden, Finland, Italy, Germany, the U.K., Denmark and Norway relative to the Index. It was underweight Japan, Switzerland, Greece, the Netherlands, Portugal, Ireland, Spain, France and Belgium. At the end of the Reporting Period, the Fund was relatively neutral compared to the Index in Hong Kong, Austria, Israel, Singapore and New Zealand. |
17
FUND BASICS
Structured International Small Cap Fund
as of April 30, 2012
| | | | | | | | | | |
| | PERFORMANCE REVIEW | |
| | | November 1, 2011–April 30, 2012 | | Fund Total Return (based on NAV)1 | | | MSCI EAFE Small Cap Index2 | |
| | Class A | | | 6.56 | % | | | 6.04 | % |
| | Class C | | | 6.19 | | | | 6.04 | |
| | Institutional | | | 6.78 | | | | 6.04 | |
| | | Class IR | | | 6.65 | | | | 6.04 | |
| | 1 | | The net asset value (NAV) represents the net assets of the class of the Fund (ex-dividend) divided by the total number of shares of the class outstanding. The Fund’s performance assumes the reinvestment of dividends and other distributions. The Fund’s performance does not reflect the deduction of any applicable sales charge. |
| | 2 | | The MSCI EAFE Small Cap (Net) Index (unhedged and net of dividend withholding taxes) is a free float-adjusted market capitalization index that is designed to measure developed market equity performance, excluding the US and Canada. MSCI selects the most liquid securities across developed markets relative to their market capitalization, and targets for index inclusion 40% of the full market capitalization of the eligible small cap universe within each industry group, within each country. Its returns include net reinvested dividends but, unlike Fund returns, do not reflect the payment of sales commissions or other expenses incurred in the purchase or sale of the securities included in the Index. It is not possible to invest directly in an index. |
| | | | | | | | | | |
| | STANDARDIZED TOTAL RETURNS3 |
| | | For the period ended 3/31/12 | | One Year | | | Since Inception | | Inception Date |
| | Class A | | | -10.09 | % | | -2.70% | | 9/28/07 |
| | Class C | | | -6.44 | | | -2.16 | | 9/28/07 |
| | Institutional | | | -4.45 | | | -1.06 | | 9/28/07 |
| | | Class IR | | | -4.58 | | | 15.53 | | 8/31/10 |
| | 3 | | The Standardized Total Returns are average annual total returns as of the most recent calendar quarter-end. They assume reinvestment of all distributions at NAV. These returns reflect a maximum initial sales charge of 5.5% for Class A Shares and the assumed contingent deferred sales charge for Class C Shares (1% if redeemed within 12 months of purchase). Because Institutional and Class IR Shares do not involve a sales charge, such a charge is not applied to their Standardized Total Returns. |
| | | | The returns represent past performance. Past performance does not guarantee future results. The Fund’s investment return and principal value will fluctuate so that an investor’s shares, when redeemed, may be worth more or less than their original cost. Current performance may be lower or higher than the performance quoted above. Please visit our Website at www.goldmansachsfunds.com to obtain the most recent month-end returns. Performance reflects fee waivers and/or expense limitations in effect. In their absence, performance would be reduced. Returns do not reflect the deduction of taxes that a shareholder would pay on Fund distributions or the redemption of Fund shares. |
18
FUND BASICS
| | | | | | | | | | |
| | EXPENSE RATIOS4 | |
| | | | | Net Expense Ratio (Current) | | | Gross Expense Ratio (Before Waivers) | |
| | Class A | | | 1.30 | % | | | 1.47 | % |
| | Class C | | | 2.05 | | | | 2.22 | |
| | Institutional | | | 0.90 | | | | 1.07 | |
| | | Class IR | | | 1.05 | | | | 1.22 | |
| | 4 | | The expense ratios of the Fund, both current (net of applicable fee waivers and/or expense limitations) and before waivers (gross of applicable fee waivers and/or expense limitations) are as set forth above according to the most recent publicly available Prospectus for the Fund and may differ from the expense ratios disclosed in the Financial Highlights in this report. The Fund’s waivers and/or expense limitations will remain in place through at least February 28, 2013, and prior to such date the investment adviser may not terminate the arrangements without the approval of the Fund’s Board of Trustees. If these arrangements are discontinued in the future, the expense ratios may change without shareholder approval. |
| | | | | | | | | | |
| | TOP TEN HOLDINGS AS OF 4/30/125 |
| | | Holding | | % of Total Net Assets | | | Line of Business | | Country |
| | EnQuest PLC | | | 1.1 | % | | Energy | | United Kingdom |
| | Croda International PLC | | | 1.0 | | | Materials | | United Kingdom |
| | Etablissements Maurel et
Prom | | | 0.8 | | | Energy | | France |
| | John Wood Group PLC | | | 0.8 | | | Energy | | United Kingdom |
| | PSP Swiss Property AG
(Registered) | | | 0.7 | | | Real Estate | | Switzerland |
| | Bilfinger Berger SE | | | 0.7 | | | Capital Goods | | Germany |
| | Lancashire Holdings Ltd. | | | 0.7 | | | Insurance | | Bermuda |
| | Kemira OYJ | | | 0.7 | | | Materials | | Finland |
| | KYORIN Holdings, Inc. | | | 0.7 | | | Pharmaceuticals,
Biotechnology & Life Sciences | | Japan |
| | | Nexans SA | | | 0.7 | | | Capital Goods | | France |
| | 5 | | The top 10 holdings may not be representative of the Fund’s future investments. |
19
FUND BASICS
|
| FUND VS. BENCHMARK SECTOR ALLOCATIONS6 |
| As of April 30, 2012 |
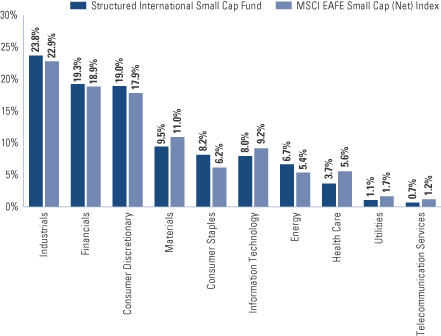
| | 6 | | The Fund is actively managed and, as such, its composition may differ over time. Consequently, the Fund’s overall sector allocations may differ from the percentages contained in the graph above. The graph categorizes investments using Global Industry Classification Standard (“GICS”), however, the sector classifications used by the portfolio management team may differ from GICS. The percentage shown for each investment category reflects the value of investments in that category as a percentage of market value (excluding investments in the securities lending reinvestment vehicle, if any). Investment in the securities lending reinvestment vehicle represented 5.0% of the Fund’s net assets at April 30, 2012. The graph depicts the Fund’s investments but may not represent the Fund’s market exposure due to the exclusion of certain derivatives, if any, as listed in the Additional Investment Information section of the Schedule of Investments. |
20
GOLDMAN SACHS STRUCTURED EMERGING MARKETS EQUITY FUND
Schedule of Investments
April 30, 2012 (Unaudited)
| | | | | | | | |
Shares | | | Description | | Value | |
| | | | | | | | |
| | Common Stocks – 97.4% | |
| Brazil – 12.6% | |
| | 62,300 | | | Banco do Brasil SA (Banks) | | $ | 770,681 | |
| | 193,800 | | | Banco do Estado do Rio Grande do Sul SA Preference B Shares (Banks) | | | 1,679,603 | |
| | 696,900 | | | BM&FBovespa SA (Diversified Financials) | | | 3,919,297 | |
| | 163,700 | | | Companhia de Bebidas das Americas Preference Shares ADR (Food, Beverage & Tobacco) | | | 6,872,126 | |
| | 277,400 | | | Cosan SA Industria e Comercio (Food, Beverage & Tobacco) | | | 4,817,008 | |
| | 18,300 | | | Eletropaulo Metropolitana Eletricidade de Sao Paulo SA Preference Shares (Utilities) | | | 279,951 | |
| | 224,100 | | | Gerdau SA ADR (Materials) | | | 2,104,299 | |
| | 43,100 | | | JBS SA (Food, Beverage & Tobacco)* | | | 169,583 | |
| | 506,900 | | | Klabin SA Preference Shares (Materials) | | | 2,430,588 | |
| | 630,100 | | | Petroleo Brasileiro SA Preference Shares (Energy) | | | 7,037,657 | |
| | 157,800 | | | Telefonica Brasil SA ADR (Telecommunication Services) | | | 4,492,566 | |
| | 223,100 | | | Vale SA Preference A Shares (Materials) | | | 4,851,399 | |
| | | | | | | | |
| | | | | | | 39,424,758 | |
| | |
| China – 16.2% | |
| | 6,243,000 | | | Agricultural Bank of China Ltd. Class H (Banks) | | | 2,952,623 | |
| | 2,200 | | | Baidu, Inc. ADR (Software & Services)* | | | 291,940 | |
| | 17,045,000 | | | Bank of China Ltd. Class H (Banks) | | | 7,097,910 | |
| | 2,393,000 | | | Bank of Communications Co. Ltd. Class H (Banks) | | | 1,841,471 | |
| | 234,000 | | | China BlueChemical Ltd. Class H (Materials) | | | 166,775 | |
| | 8,211,000 | | | China Citic Bank Corp. Ltd. Class H (Banks) | | | 5,202,664 | |
| | 5,079,000 | | | China Communications Construction Co. Ltd. Class H (Capital Goods) | | | 5,060,726 | |
| | 7,889,000 | | | China Construction Bank Corp. Class H (Banks) | | | 6,122,212 | |
| | 410,500 | | | China Merchants Bank Co. Ltd. Class H (Banks) | | | 886,355 | |
| | 794,000 | | | China Minsheng Banking Corp. Ltd. Class H (Banks) | | | 821,621 | |
| | 6,028,000 | | | China Petroleum & Chemical Corp. Class H (Energy) | | | 6,402,404 | |
| | 176,000 | | | China Shenhua Energy Co. Ltd. Class H (Energy) | | | 777,225 | |
| | 620,000 | | | China Southern Airlines Co. Ltd. Class H (Transportation)* | | | 277,842 | |
| | 1,571,000 | | | Country Garden Holdings Co. Ltd. (Real Estate) | | | 677,518 | |
| | |
| | | | | | | | |
Shares | | | Description | | Value | |
| | | | | | | | |
| | Common Stocks – (continued) | |
| China – (continued) | |
| | 1,296,000 | | | Dongfeng Motor Group Co. Ltd. Class H (Automobiles & Components) | | $ | 2,534,802 | |
| | 1,364,000 | | | Evergrande Real Estate Group Ltd. (Real Estate)(a) | | | 783,054 | |
| | 455,500 | | | Great Wall Motor Co. Ltd. Class H (Automobiles & Components) | | | 977,564 | |
| | 642,400 | | | Guangzhou R&F Properties Co. Ltd. Class H (Real Estate) | | | 853,320 | |
| | 566,000 | | | Harbin Electric Co. Ltd. Class H (Capital Goods) | | | 587,672 | |
| | 322,000 | | | Lenovo Group Ltd. (Technology Hardware & Equipment) | | | 307,937 | |
| | 3,022,000 | | | PetroChina Co. Ltd. Class H (Energy) | | | 4,507,909 | |
| | 1,651,000 | | | Soho China Ltd. (Real Estate) | | | 1,279,851 | |
| | | | | | | | |
| | | | | | | 50,411,395 | |
| | |
| Egypt – 0.2% | |
| | 304,160 | | | Telecom Egypt Co. (Telecommunication Services) | | | 652,571 | |
| | |
| Hong Kong – 4.8% | |
| | 448,000 | | | China Everbright Ltd. (Diversified Financials) | | | 707,166 | |
| | 607,500 | | | China Mobile Ltd. (Telecommunication Services) | | | 6,721,091 | |
| | 1,488,000 | | | China Overseas Land & Investment Ltd. (Real Estate) | | | 3,215,592 | |
| | 1,749,000 | | | Citic Pacific Ltd. (Capital Goods) | | | 2,870,286 | |
| | 1,482,000 | | | Guangdong Investment Ltd. (Utilities) | | | 1,087,396 | |
| | 477,000 | | | KWG Property Holding Ltd. (Real Estate) | | | 312,368 | |
| | | | | | | | |
| | | | | | | 14,913,899 | |
| | |
| India – 3.6% | |
| | 58,196 | | | Bajaj Holdings and Investment Ltd. (Diversified Financials) | | | 932,110 | |
| | 725,469 | | | Hexaware Technologies Ltd. (Software & Services) | | | 1,780,332 | |
| | 73,984 | | | India Cements Ltd. (Materials) | | | 118,690 | |
| | 210,447 | | | Indiabulls Financial Services Ltd. (Diversified Financials) | | | 967,262 | |
| | 1,708,050 | | | Indiabulls Infrastructure and Power Ltd. (Utilities)* | | | 339,341 | |
| | 751,094 | | | Indian Bank (Banks) | | | 3,147,716 | |
| | 113,953 | | | Jubilant Life Sciences Ltd. (Pharmaceuticals, Biotechnology & Life Sciences) | | | 391,091 | |
| | 406,469 | | | Oil & Natural Gas Corp. Ltd. (Energy) | | | 2,079,566 | |
| | 419,831 | | | Satyam Computer Services Ltd. (Software & Services)* | | | 613,628 | |
| | |
| | |
| The accompanying notes are an integral part of these financial statements. | | 21 |
GOLDMAN SACHS STRUCTURED EMERGING MARKETS EQUITY FUND
Schedule of Investments (continued)
April 30, 2012 (Unaudited)
| | | | | | | | |
Shares | | | Description | | Value | |
| | | | | | | | |
| | Common Stocks – (continued) | |
| India – (continued) | |
| | 439,961 | | | Sterlite Industries India Ltd. (Materials) | | $ | 886,687 | |
| | | | | | | | |
| | | | | | | 11,256,423 | |
| | |
| Indonesia – 1.9% | |
| | 2,064,000 | | | PT Bank Negara Indonesia (Persero) Tbk (Banks) | | | 900,404 | |
| | 3,130,500 | | | PT Bank Rakyat Indonesia (Persero) Tbk (Banks) | | | 2,253,750 | |
| | 2,741,000 | | | PT Indofood Sukses Makmur Tbk (Food, Beverage & Tobacco) | | | 1,440,335 | |
| | 846,000 | | | PT Kalbe Farma Tbk (Pharmaceuticals, Biotechnology & Life Sciences) | | | 369,353 | |
| | 2,183,500 | | | PT Perusahaan Perkebunan London Sumatra Indonesia Tbk (Food, Beverage & Tobacco) | | | 692,549 | |
| | 80,000 | | | PT Semen Gresik (Persero) Tbk (Materials) | | | 105,438 | |
| | 1,500 | | | PT Unilever Indonesia Tbk (Household & Personal Products) | | | 3,236 | |
| | | | | | | | |
| | | | | | | 5,765,065 | |
| | |
| Luxembourg – 0.1% | |
| | 62,175 | | | Brait SE (Diversified Financials)* | | | 194,894 | |
| | |
| Malaysia – 5.3% | |
| | 944,400 | | | AMMB Holdings Berhad (Diversified Financials) | | | 1,948,082 | |
| | 2,468,400 | | | DRB-Hicom Berhad (Automobiles & Components) | | | 2,071,744 | |
| | 526,100 | | | Genting Berhad (Consumer Services) | | | 1,793,240 | |
| | 2,920,900 | | | Genting Malaysia Berhad (Consumer Services) | | | 3,697,709 | |
| | 26,700 | | | Genting Plantations Berhad (Food, Beverage & Tobacco) | | | 82,754 | |
| | 33,900 | | | Hong Leong Financial Group Berhad (Banks) | | | 133,538 | |
| | 1,405,800 | | | Kulim Malaysia Berhad (Food, Beverage & Tobacco) | | | 1,960,633 | |
| | 19,600 | | | PPB Group Berhad (Food, Beverage & Tobacco) | | | 108,312 | |
| | 241,200 | | | RHB Capital Berhad (Banks) | | | 586,214 | |
| | 2,051,300 | | | Telekom Malaysia Berhad (Telecommunication Services) | | | 3,641,445 | |
| | 229,700 | | | UMW Holdings Berhad (Automobiles & Components) | | | 595,155 | |
| | | | | | | | |
| | | | | | | 16,618,826 | |
| | |
| Mexico – 7.5% | |
| | 84,405 | | | America Movil SAB de CV Series L ADR (Telecommunication Services) | | | 2,249,393 | |
| | 490,435 | | | Cemex SAB de CV ADR (Materials) | | | 3,545,845 | |
| | 27,200 | | | Coca-Cola Femsa SAB de CV ADR (Food, Beverage & Tobacco)* | | | 2,881,840 | |
| | |
| | | | | | | | |
Shares | | | Description | | Value | |
| | | | | | | | |
| | Common Stocks – (continued) | |
| Mexico – (continued) | |
| | 14,130 | | | Fomento Economico Mexicano SAB de CV ADR (Food, Beverage & Tobacco) | | $ | 1,148,204 | |
| | 135,600 | | | Gruma SAB de CV Series B (Food, Beverage & Tobacco)* | | | 375,801 | |
| | 48,040 | | | Grupo Aeroportuario del Pacifico SAB de CV ADR (Transportation) | | | 1,859,628 | |
| | 60,810 | | | Grupo Aeroportuario del Sureste SAB de CV ADR (Transportation) | | | 4,980,947 | |
| | 129,900 | | | Grupo Carso SAB de CV Series A-1 (Capital Goods) | | | 433,799 | |
| | 7,695 | | | Grupo Elektra SA de CV (Retailing) | | | 476,081 | |
| | 432,800 | | | Grupo Mexico SAB de CV Series B (Materials) | | | 1,335,352 | |
| | 345,300 | | | Grupo Modelo SAB de CV Series C (Food, Beverage & Tobacco) | | | 2,438,528 | |
| | 535,100 | | | Inmuebles Carso SAB de CV Series B-1 (Diversified Financials)* | | | 472,415 | |
| | 201,700 | | | Minera Frisco SAB de CV Series A-1 (Materials)* | | | 872,395 | |
| | 143,000 | | | Wal-Mart de Mexico SAB de CV Series V (Food & Staples Retailing) | | | 408,934 | |
| | | | | | | | |
| | | | | | | 23,479,162 | |
| | |
| Philippines – 1.5% | |
| | 495,190 | | | BDO Unibank, Inc. (Banks) | | | 774,308 | |
| | 433,380 | | | Metropolitan Bank & Trust Co. (Banks) | | | 934,263 | |
| | 31,340 | | | Philippine Long Distance Telephone Co. ADR (Telecommunication Services) | | | 1,902,965 | |
| | 607,700 | | | Universal Robina Corp. (Food, Beverage & Tobacco) | | | 933,690 | |
| | | | | | | | |
| | | | | | | 4,545,226 | |
| | |
| Poland – 1.2% | |
| | 87,448 | | | KGHM Polska Miedz SA (Materials) | | | 3,866,673 | |
| | |
| Russia – 8.4% | |
| | 43,156,700 | | | Federal Hydrogenerating Co. (Utilities) | | | 1,532,111 | |
| | 132,250 | | | Gazprom Neft ADR (Energy) | | | 3,275,947 | |
| | 634,439 | | | OAO Gazprom ADR (Energy) | | | 7,348,112 | |
| | 72,970 | | | OAO Lukoil ADR (Energy) | | | 4,489,204 | |
| | 13,319 | | | OAO Tatneft ADR (Energy) | | | 494,393 | |
| | 125,450 | | | OJSC Surgutneftegas ADR (Energy)(a) | | | 1,256,538 | |
| | 760,084 | | | OJSC Surgutneftegas Preference Shares (Energy) | | | 504,489 | |
| | 2,250,000 | | | Sberbank of Russia (Banks) | | | 7,198,816 | |
| | 54,600 | | | Sberbank of Russia Preference Shares (Banks)* | | | 127,423 | |
| | | | | | | | |
| | | | | | | 26,227,033 | |
| | |
| South Africa – 4.8% | |
| | 99,460 | | | ABSA Group Ltd. (Banks) | | | 2,049,739 | |
| | |
| | |
| 22 | | The accompanying notes are an integral part of these financial statements. |
GOLDMAN SACHS STRUCTURED EMERGING MARKETS EQUITY FUND
| | | | | | | | |
Shares | | | Description | | Value | |
| | | | | | | | |
| | Common Stocks – (continued) | |
| South Africa – (continued) | |
| | 549,608 | | | AVI Ltd. (Food, Beverage & Tobacco) | | $ | 3,410,137 | |
| | 33,965 | | | DataTec Ltd. (Technology Hardware & Equipment) | | | 199,425 | |
| | 434,903 | | | FirstRand Ltd. (Diversified Financials) | | | 1,414,405 | |
| | 129,141 | | | Imperial Holdings Ltd. (Retailing) | | | 2,808,041 | |
| | 62,955 | | | JD Group Ltd. (Retailing) | | | 393,835 | |
| | 3,217 | | | Kumba Iron Ore Ltd. (Materials) | | | 227,824 | |
| | 27,115 | | | Lewis Group Ltd. (Retailing) | | | 263,398 | |
| | 82,006 | | | Liberty Holdings Ltd. (Insurance) | | | 930,594 | |
| | 140,795 | | | MMI Holdings Ltd. (Insurance) | | | 317,119 | |
| | 35,778 | | | MTN Group Ltd. (Telecommunication Services) | | | 625,680 | |
| | 101,499 | | | Pick’n Pay Holdings Ltd. (Food & Staples Retailing) | | | 255,270 | |
| | 32,640 | | | Resilient Property Income Fund Ltd. (Real Estate) | | | 165,466 | |
| | 512,160 | | | Super Group Ltd. (Retailing)* | | | 968,534 | |
| | 46,524 | | | The Foschini Group Ltd. (Retailing) | | | 771,236 | |
| | 10,467 | | | Tongaat Hulett Ltd. (Food, Beverage & Tobacco) | | | 141,304 | |
| | | | | | | | |
| | | | | | | 14,942,007 | |
| | |
| South Korea – 16.4% | |
| | 1,098 | | | AmorePacific Group (Household & Personal Products) | | | 275,983 | |
| | 43,475 | | | Daelim Industrial Co. Ltd. (Capital Goods) | | | 4,001,918 | |
| | 13,320 | | | Daewoo Shipbuilding & Marine Engineering Co. Ltd. (Capital Goods) | | | 370,529 | |
| | 10,226 | | | Doosan Heavy Industries & Construction Co. Ltd. (Capital Goods) | | | 479,419 | |
| | 2,573 | | | E-Mart Co. Ltd. (Food & Staples Retailing) | | | 610,562 | |
| | 6,490 | | | Hana Financial Group, Inc. (Banks) | | | 221,252 | |
| | 8,080 | | | Handsome Co. Ltd. (Consumer Durables & Apparel) | | | 271,887 | |
| | 13,630 | | | Hanwha Chemical Corp. (Materials) | | | 266,767 | |
| | 1,269 | | | Honam Petrochemical Corp. (Materials) | | | 303,231 | |
| | 34,560 | | | Hyundai Motor Co. (Automobiles & Components) | | | 8,158,589 | |
| | 4,144 | | | Hyundai Motor Co. Preference Shares (Automobiles & Components) | | | 290,436 | |
| | 168,420 | | | LG Display Co. Ltd. (Technology Hardware & Equipment)* | | | 3,717,937 | |
| | 46,209 | | | LG Electronics, Inc. (Consumer Durables & Apparel) | | | 2,851,047 | |
| | 21,650 | | | LG Fashion Corp. (Consumer Durables & Apparel) | | | 718,610 | |
| | 48,773 | | | LG International Corp. (Capital Goods) | | | 1,988,541 | |
| | 337 | | | Lotte Chilsung Beverage Co. Ltd. (Food, Beverage & Tobacco) | | | 380,022 | |
| | |
| | | | | | | | |
Shares | | | Description | | Value | |
| | | | | | | | |
| | Common Stocks – (continued) | |
| South Korea – (continued) | |
| | 625 | | | Namyang Dairy Products Co. Ltd. (Food, Beverage & Tobacco) | | $ | 359,474 | |
| | 481 | | | OCI Co. Ltd. (Materials) | | | 90,428 | |
| | 912 | | | POSCO (Materials) | | | 302,126 | |
| | 14,362 | | | Samsung Electronics Co. Ltd. (Semiconductors & Semiconductor Equipment) | | | 17,578,533 | |
| | 2,168 | | | Samsung Electronics Co. Ltd. Preference Shares (Semiconductors & Semiconductor Equipment) | | | 1,545,055 | |
| | 16,714 | | | Samyang Holdings Corp. (Food, Beverage & Tobacco) | | | 886,478 | |
| | 2,715 | | | Sindoh Co. Ltd. (Technology Hardware & Equipment) | | | 132,151 | |
| | 41,299 | | | SK Holdings Co. Ltd. (Capital Goods) | | | 4,396,880 | |
| | 125,660 | | | SK Networks Co. Ltd. (Capital Goods) | | | 1,033,195 | |
| | | | | | | | |
| | | | | | | 51,231,050 | |
| | |
| Taiwan – 7.9% | |
| | 539,880 | | | Asustek Computer, Inc. (Technology Hardware & Equipment) | | | 5,423,401 | |
| | 790,000 | | | China Motor Corp. (Automobiles & Components) | | | 649,641 | |
| | 2,831,900 | | | China Petrochemical Development Corp. (Materials) | | | 2,843,429 | |
| | 563,000 | | | Compal Electronics, Inc. (Technology Hardware & Equipment) | | | 644,544 | |
| | 800,000 | | | Forhouse Corp. (Semiconductors & Semiconductor Equipment) | | | 449,133 | |
| | 2,480,000 | | | Systex Corp. (Software & Services) | | | 2,535,070 | |
| | 526,800 | | | Taiwan Semiconductor Manufacturing Co. Ltd. ADR (Semiconductors & Semiconductor Equipment) | | | 8,207,544 | |
| | 7,459,000 | | | United Microelectronics Corp. (Semiconductors & Semiconductor Equipment) | | | 3,901,603 | |
| | | | | | | | |
| | | | | | | 24,654,365 | |
| | |
| Thailand – 5.0% | |
| | 752,700 | | | Airports of Thailand PCL (Transportation) | | | 1,514,360 | |
| | 139,900 | | | Bangchak Petroleum PCL (Energy) | | | 115,682 | |
| | 844,500 | | | Bangkok Bank PCL (Banks) | | | 5,314,704 | |
| | 335,200 | | | Bangkok Dusit Medical Services PCL Class F (Health Care Equipment & Services) | | | 1,001,525 | |
| | 2,013,800 | | | Charoen Pokphand Foods PCL (Food, Beverage & Tobacco) | | | 2,662,353 | |
| | 1,409,900 | | | PTT Global Chemical PCL (Materials) | | | 3,150,341 | |
| | 22,700 | | | PTT PCL (Energy) | | | 258,885 | |
| | |
| | |
| The accompanying notes are an integral part of these financial statements. | | 23 |
GOLDMAN SACHS STRUCTURED EMERGING MARKETS EQUITY FUND
Schedule of Investments (continued)
April 30, 2012 (Unaudited)
| | | | | | | | |
Shares | | | Description | | Value | |
| | | | | | | | |
| | Common Stocks – (continued) | |
| Thailand – (continued) | |
| | 13,200 | | | Siam Makro PCL (Food & Staples Retailing) | | $ | 164,010 | |
| | 310,000 | | | Supalai PCL (Real Estate) | | | 165,009 | |
| | 2,400,900 | | | TPI Polene PCL (Materials) | | | 1,099,706 | |
| | | | | | | | |
| | | | | | | 15,446,575 | |
| | |
| Turkey – 0.0% | |
| | 47,049 | | | Ulker Biskuvi Sanayi AS (Food, Beverage & Tobacco) | | | 142,566 | |
| | |
| | TOTAL COMMON STOCKS | | | | |
| | (Cost $266,461,873) | | $ | 303,772,488 | |
| | |
| | | | | | | | |
| | Exchange Traded Fund – 1.9% | |
| Other – 1.9% | |
| | 143,908 | | | Vanguard MSCI Emerging Markets | | $ | 6,120,407 | |
| | (Cost $6,177,852) | | | | |
| | |
| TOTAL INVESTMENTS BEFORE
SECURITIES LENDING REINVESTMENT
VEHICLE | | | | |
| | (Cost $272,639,725) | | $ | 309,892,895 | |
| | |
| | | | | | | | |
Shares | | Rate | | | Value | |
| | | | | | | | |
| Securities Lending Reinvestment Vehicle(b)(c) – 0.3% | |
Goldman Sachs Financial Square Money Market Fund — FST Shares | |
| 840,000 | | | 0.182 | % | | $ | 840,000 | |
| (Cost $840,000) | | | | | |
| |
| TOTAL INVESTMENTS – 99.6% | |
| (Cost $273,479,725) | | | $ | 310,732,895 | |
| |
OTHER ASSETS IN EXCESS OF LIABILITIES – 0.4% | | | | 1,193,818 | |
| |
| NET ASSETS – 100.0% | | | $ | 311,926,713 | |
| |
| | |
| The percentage shown for each investment category reflects the value of investments in that category as a percentage of net assets. |
* | | Non-income producing security. |
(a) | | All or a portion of security is on loan. |
(b) | | Variable rate security. Interest rate disclosed is that which is in effect at April 30, 2012. |
(c) | | Represents an affiliated issuer. |
| | |
|
Investment Abbreviation: |
ADR | | —American Depositary Receipt |
|
| | |
| 24 | | The accompanying notes are an integral part of these financial statements. |
GOLDMAN SACHS STRUCTURED INTERNATIONAL EQUITY FUND
Schedule of Investments
April 30, 2012 (Unaudited)
| | | | | | | | |
Shares | | | Description | | Value | |
| | | | | | | | |
| | Common Stocks – 98.3% | |
| Australia – 3.4% | |
| | 12,412 | | | ASX Ltd. (Diversified Financials) | | $ | 412,653 | |
| | 60,587 | | | Australia & New Zealand Banking Group Ltd. (Banks) | | | 1,500,938 | |
| | 111,364 | | | AWE Ltd. (Energy) | | | 200,916 | |
| | 504,303 | | | Beach Energy Ltd. (Energy) | | | 730,771 | |
| | 68,017 | | | BHP Billiton Ltd. (Materials) | | | 2,523,924 | |
| | 8,493 | | | Brickworks Ltd. (Materials) | | | 92,033 | |
| | 10,362 | | | Cabcharge Australia Ltd. (Commercial & Professional Services) | | | 68,859 | |
| | 2,819 | | | Campbell Brothers Ltd. (Commercial & Professional Services) | | | 200,031 | |
| | 91,230 | | | Charter Hall Office REIT (REIT) | | | 293,726 | |
| | 93,627 | | | Charter Hall Retail REIT (REIT) | | | 321,875 | |
| | 121,345 | | | Coca-Cola Amatil Ltd. (Food, Beverage & Tobacco) | | | 1,570,612 | |
| | 164,955 | | | Commonwealth Bank of Australia (Banks) | | | 8,898,166 | |
| | 95,506 | | | Crown Ltd. (Consumer Services) | | | 901,837 | |
| | 436,019 | | | Dexus Property Group (REIT) | | | 423,037 | |
| | 337,389 | | | DuluxGroup Ltd. (Materials) | | | 1,084,077 | |
| | 58,989 | | | Echo Entertainment Group Ltd. (Consumer Services) | | | 274,789 | |
| | 144,782 | | | Emeco Holdings Ltd. (Capital Goods) | | | 155,989 | |
| | 20,702 | | | Forge Group Ltd. (Capital Goods) | | | 134,521 | |
| | 238,785 | | | Metcash Ltd. (Food & Staples Retailing) | | | 982,447 | |
| | 5,350 | | | Monadelphous Group Ltd. (Capital Goods) | | | 128,707 | |
| | 51,933 | | | National Australia Bank Ltd. (Banks) | | | 1,357,493 | |
| | 163,537 | | | New Hope Corp. Ltd. (Energy)(a) | | | 830,004 | |
| | 37,149 | | | Newcrest Mining Ltd. (Materials) | | | 1,012,313 | |
| | 135,179 | | | NRW Holdings Ltd. (Capital Goods) | | | 570,709 | |
| | 150,703 | | | OZ Minerals Ltd. (Materials) | | | 1,451,055 | |
| | 31,473 | | | Platinum Asset Management Ltd. (Diversified Financials) | | | 143,348 | |
| | 55,540 | | | Primary Health Care Ltd. (Health Care Equipment & Services) | | | 163,121 | |
| | 31,450 | | | Rio Tinto Ltd. (Materials) | | | 2,151,964 | |
| | 217,421 | | | Stockland (REIT) | | | 698,451 | |
| | 318,603 | | | TABCORP Holdings Ltd. (Consumer Services) | | | 950,356 | |
| | 400,537 | | | Telstra Corp. Ltd. (Telecommunication Services) | | | 1,476,776 | |
| | 65,859 | | | Toll Holdings Ltd. (Transportation) | | | 399,180 | |
| | 253,807 | | | Treasury Wine Estates Ltd. (Food, Beverage & Tobacco) | | | 1,133,993 | |
| | 26,927 | | | Wesfarmers Ltd. (Food & Staples Retailing) | | | 845,558 | |
| | 335,440 | | | Westfield Retail Trust (REIT) | | | 946,588 | |
| | |
| | | | | | | | |
Shares | | | Description | | Value | |
| | | | | | | | |
| | Common Stocks – (continued) | |
| Australia – (continued) | |
| | 103,545 | | | Westpac Banking Corp. (Banks) | | $ | 2,440,164 | |
| | | | | | | | |
| | | | | | | 37,470,981 | |
| | |
| Austria – 0.2% | |
| | 44,749 | | | Oesterreichische Post AG (Transportation)(a) | | | 1,587,284 | |
| | |
| Belgium – 1.8% | |
| | 137,113 | | | Anheuser-Busch InBev NV (Food, Beverage & Tobacco)(a) | | | 9,882,483 | |
| | 12,393 | | | Befimmo SCA Sicafi (REIT) | | | 753,823 | |
| | 6,101 | | | D’ieteren SA NV (Retailing) | | | 269,366 | |
| | 6,705 | | | Elia System Operator SA (Utilities) | | | 286,783 | |
| | 10,817 | | | Financiere de Tubize SA (Diversified Financials) | | | 404,799 | |
| | 16,941 | | | Groupe Bruxelles Lambert SA (Diversified Financials)(a) | | | 1,175,722 | |
| | 23,182 | | | KBC Groep NV (Banks) | | | 449,431 | |
| | 2,450 | | | Kinepolis Group NV (Media) | | | 228,235 | |
| | 10,428 | | | UCB SA (Pharmaceuticals, Biotechnology & Life Sciences)(a) | | | 487,616 | |
| | 110,896 | | | Umicore SA (Materials) | | | 6,022,073 | |
| | | | | | | | |
| | | | | | | 19,960,331 | |
| | |
| Bermuda – 0.2% | |
| | 127,113 | | | Catlin Group Ltd. (Insurance) | | | 870,874 | |
| | 76,815 | | | Lancashire Holdings Ltd. (Insurance) | | | 1,004,062 | |
| | | | | | | | |
| | | | | | | 1,874,936 | |
| | |
| China – 0.6% | |
| | 909,000 | | | China Dongxiang Group Co. (Consumer Durables & Apparel) | | | 122,364 | |
| | 386,000 | | | China Zhongwang Holdings Ltd. (Materials) | | | 158,364 | |
| | 2,358,000 | | | Evergrande Real Estate Group Ltd. (Real Estate)(a) | | | 1,353,696 | |
| | 261,500 | | | Fosun International Ltd. (Materials) | | | 155,114 | |
| | 10,879,000 | | | Semiconductor Manufacturing International Corp. (Semiconductors & Semiconductor Equipment)* | | | 538,897 | |
| | 204,500 | | | Shui On Land Ltd. (Real Estate) | | | 85,377 | |
| | 4,970,500 | | | Soho China Ltd. (Real Estate) | | | 3,853,118 | |
| | | | | | | | |
| | | | | | | 6,266,930 | |
| | |
| Denmark – 2.0% | |
| | 49 | | | A.P. Moller - Maersk A/S Class A (Transportation) | | | 365,482 | |
| | 257 | | | A.P. Moller - Maersk A/S Class B (Transportation) | | | 2,012,295 | |
| | 105,352 | | | Christian Hansen Holding A/S (Materials) | | | 2,923,319 | |
| | 73,321 | | | Novo Nordisk A/S Class B (Pharmaceuticals, Biotechnology & Life Sciences) | | | 10,809,202 | |
| | |
| | |
| The accompanying notes are an integral part of these financial statements. | | 25 |
GOLDMAN SACHS STRUCTURED INTERNATIONAL EQUITY FUND
Schedule of Investments (continued)
April 30, 2012 (Unaudited)
| | | | | | | | |
Shares | | | Description | | Value | |
| | | | | | | | |
| | Common Stocks – (continued) | |
| Denmark – (continued) | |
| | 161,263 | | | Pandora A/S (Consumer Durables & Apparel)(a) | | $ | 1,703,777 | |
| | 429,526 | | | TDC A/S (Telecommunication Services) | | | 3,078,906 | |
| | 6,179 | | | Topdanmark A/S (Insurance)* | | | 1,060,130 | |
| | | | | | | | |
| | | | | | | 21,953,111 | |
| | |
| Finland – 0.7% | |
| | 252,635 | | | Kemira OYJ (Materials)(a) | | | 3,205,940 | |
| | 106,744 | | | Metso OYJ (Capital Goods) | | | 4,584,941 | |
| | | | | | | | |
| | | | | | | 7,790,881 | |
| | |
| France – 3.5% | |
| | 241,934 | | | BNP Paribas SA (Banks) | | | 9,764,315 | |
| | 28,300 | | | Christian Dior SA (Consumer Durables & Apparel) | | | 4,267,401 | |
| | 6,809 | | | Ciments Francais SA (Materials)(a) | | | 436,525 | |
| | 59,841 | | | Etablissements Maurel et Prom (Energy) | | | 996,603 | |
| | 22,537 | | | Hermes International (Consumer Durables & Apparel) | | | 7,965,514 | |
| | 17,481 | | | Legrand SA (Capital Goods) | | | 590,137 | |
| | 150,589 | | | M6 Metropole Television SA (Media) | | | 2,313,740 | |
| | 5,883 | | | PPR (Retailing) | | | 984,518 | |
| | 35,837 | | | Remy Cointreau SA (Food, Beverage & Tobacco) | | | 3,996,566 | |
| | 110,294 | | | Total SA (Energy) | | | 5,294,512 | |
| | 22,389 | | | Zodiac Aerospace (Capital Goods) | | | 2,463,777 | |
| | | | | | | | |
| | | | | | | 39,073,608 | |
| | |
| Germany – 9.9% | |
| | 5,512 | | | Adidas AG (Consumer Durables & Apparel) | | | 459,755 | |
| | 3,472 | | | Aurubis AG (Materials) | | | 193,241 | |
| | 132,213 | | | BASF SE (Materials)(a) | | | 10,885,505 | |
| | 83,766 | | | Bayer AG (Registered) (Pharmaceuticals, Biotechnology & Life Sciences)(a) | | | 5,902,479 | |
| | 43,322 | | | Bilfinger Berger SE (Capital Goods) | | | 3,963,620 | |
| | 40,028 | | | Celesio AG (Health Care Equipment & Services) | | | 690,285 | |
| | 114,971 | | | Daimler AG (Registered) (Automobiles & Components) | | | 6,361,523 | |
| | 172,949 | | | Deutsche Bank AG (Registered) (Diversified Financials) | | | 7,508,251 | |
| | 1,176,274 | | | Deutsche Post AG (Registered) (Transportation) | | | 21,965,662 | |
| | 5,871 | | | Draegerwerk AG & Co. KGaA Preference Shares (Health Care Equipment & Services)(a) | | | 661,331 | |
| | 470,685 | | | E.ON AG (Utilities) | | | 10,657,147 | |
| | 8,661 | | | Freenet AG (Telecommunication Services) | | | 150,630 | |
| | |
| | | | | | | | |
Shares | | | Description | | Value | |
| | | | | | | | |
| | Common Stocks – (continued) | |
| Germany – (continued) | |
| | 6,244 | | | Gerry Weber International AG (Consumer Durables & Apparel) | | $ | 265,214 | |
| | 138,262 | | | Hannover Rueckversicherung AG (Registered) (Insurance)(a) | | | 8,367,251 | |
| | 9,158 | | | Henkel AG & Co. KGaA (Household & Personal Products) | | | 560,749 | |
| | 63,315 | | | Henkel AG & Co. KGaA Preference Shares (Household & Personal Products) | | | 4,711,590 | |
| | 50,871 | | | Lanxess AG (Materials) | | | 4,050,164 | |
| | 11,523 | | | MTU Aero Engines Holding AG (Capital Goods) | | | 970,895 | |
| | 67,499 | | | ProSiebenSat.1 Media AG Preference Shares (Media) | | | 1,715,093 | |
| | 120,829 | | | SAP AG (Software & Services) | | | 8,012,599 | |
| | 4,175 | | | Symrise AG (Materials) | | | 121,000 | |
| | 3,836 | | | Tipp24 SE (Consumer Services)* | | | 217,916 | |
| | 28,548 | | | Volkswagen AG (Automobiles & Components)(a) | | | 4,876,723 | |
| | 32,306 | | | Volkswagen AG Preference Shares (Automobiles & Components) | | | 6,123,875 | |
| | | | | | | | |
| | | | | | | 109,392,498 | |
| | |
| Hong Kong – 7.3% | |
| | 1,842,400 | | | AIA Group Ltd. (Insurance) | | | 6,520,017 | |
| | 2,286,000 | | | BOC Hong Kong Holdings Ltd. (Banks) | | | 7,065,717 | |
| | 243,000 | | | Cathay Pacific Airways Ltd. (Transportation) | | | 411,113 | |
| | 665,000 | | | Champion REIT (REIT) | | | 289,818 | |
| | 322,000 | | | Cheung Kong Holdings Ltd. (Real Estate) | | | 4,258,469 | |
| | 998,500 | | | CLP Holdings Ltd. (Utilities) | | | 8,547,851 | |
| | 664,000 | | | First Pacific Co. Ltd. (Diversified Financials) | | | 719,282 | |
| | 618,000 | | | Foxconn International Holdings Ltd. (Technology Hardware & Equipment)* | | | 292,236 | |
| | 381,000 | | | Galaxy Entertainment Group Ltd. (Consumer Services)* | | | 1,187,743 | |
| | 123,500 | | | Greentown China Holdings Ltd. (Real Estate) | | | 85,657 | |
| | 379,400 | | | Hang Seng Bank Ltd. (Banks) | | | 5,195,646 | |
| | 236,100 | | | Hong Kong Exchanges and Clearing Ltd. (Diversified Financials) | | | 3,754,701 | |
| | 1,442,000 | | | Hutchison Telecommunications Hong Kong Holdings Ltd. (Telecommunication Services) | | | 640,695 | |
| | 485,000 | | | Hutchison Whampoa Ltd. (Capital Goods) | | | 4,646,321 | |
| | 213,000 | | | Johnson Electric Holdings Ltd. (Capital Goods) | | | 133,365 | |
| | 211,500 | | | Kerry Properties Ltd. (Real Estate) | | | 959,666 | |
| | 508,000 | | | Li & Fung Ltd. (Retailing) | | | 1,083,281 | |
| | |
| | |
| 26 | | The accompanying notes are an integral part of these financial statements. |
GOLDMAN SACHS STRUCTURED INTERNATIONAL EQUITY FUND
| | | | | | | | |
Shares | | | Description | | Value | |
| | | | | | | | |
| | Common Stocks – (continued) | |
| Hong Kong – (continued) | |
| | 2,543,600 | | | MGM China Holdings Ltd. (Consumer Services) | | $ | 4,693,327 | |
| | 177,000 | | | New World Development Co. Ltd. (Real Estate) | | | 219,417 | |
| | 239,500 | | | Orient Overseas International Ltd. (Transportation) | | | 1,631,835 | |
| | 174,000 | �� | | Power Assets Holdings Ltd. (Utilities) | | | 1,299,077 | |
| | 329,200 | | | Sands China Ltd. (Consumer Services) | | | 1,288,912 | |
| | 142,000 | | | Shangri-La Asia Ltd. (Consumer Services) | | | 300,518 | |
| | 556,500 | | | Shimao Property Holdings Ltd. (Real Estate) | | | 731,001 | |
| | 1,138,000 | | | Singamas Container Holdings Ltd. (Capital Goods) | | | 339,106 | |
| | 92,000 | | | Sino Land Co. Ltd. (Real Estate) | | | 157,812 | |
| | 886,000 | | | SJM Holdings Ltd. (Consumer Services) | | | 1,935,990 | |
| | 299,168 | | | Sun Hung Kai Properties Ltd. (Real Estate) | | | 3,583,404 | |
| | 657,000 | | | Swire Pacific Ltd. Class A (Real Estate) | | | 7,744,738 | |
| | 102,000 | | | Texwinca Holdings Ltd. (Consumer Durables & Apparel) | | | 124,650 | |
| | 44,800 | | | The Bank of East Asia Ltd. (Banks) | | | 166,692 | |
| | 556,858 | | | The Link REIT (REIT) | | | 2,316,754 | |
| | 1,198,000 | | | Wheelock & Co. Ltd. (Real Estate) | | | 4,036,305 | |
| | 1,102,000 | | | Wynn Macau Ltd. (Consumer Services) | | | 3,522,484 | |
| | 207,000 | | | Yue Yuen Industrial Holdings Ltd. (Consumer Durables & Apparel) | | | 690,559 | |
| | | | | | | | |
| | | | | | | 80,574,159 | |
| | |
| Ireland – 0.3% | |
| | 87,521 | | | Beazley PLC (Insurance) | | | 201,467 | |
| | 84,388 | | | CRH PLC (Materials) | | | 1,710,560 | |
| | 198,095 | | | James Hardie Industries SE CDI (Materials) | | | 1,531,075 | |
| | | | | | | | |
| | | | | | | 3,443,102 | |
| | |
| Israel – 0.7% | |
| | 196,405 | | | Bank Hapoalim BM (Banks) | | | 728,843 | |
| | 148,246 | | | Bezeq Israeli Telecommunication Corp. Ltd. (Telecommunication Services) | | | 247,146 | |
| | 4,882 | | | Elbit Systems Ltd. (Capital Goods) | | | 178,103 | |
| | 47,174 | | | Israel Chemicals Ltd. (Materials) | | | 539,615 | |
| | 29,698 | | | Israel Discount Bank Ltd. Class A (Banks)* | | | 38,514 | |
| | 35,879 | | | Mizrahi Tefahot Bank Ltd. (Banks)* | | | 323,298 | |
| | 7,883 | | | NICE Systems Ltd. ADR (Software & Services)* | | | 302,865 | |
| | |
| | | | | | | | |
Shares | | | Description | | Value | |
| | | | | | | | |
| | Common Stocks – (continued) | |
| Israel – (continued) | |
| | 108,465 | | | Teva Pharmaceutical Industries Ltd. ADR (Pharmaceuticals, Biotechnology & Life Sciences) | | $ | 4,961,189 | |
| | | | | | | | |
| | | | | | | 7,319,573 | |
| | |
| Italy – 0.1% | |
| | 20,649 | | | De’Longhi SpA (Consumer Durables & Apparel)(a) | | | 291,104 | |
| | 272,937 | | | Intesa Sanpaolo SpA (Banks) | | | 413,733 | |
| | 378,912 | | | Intesa Sanpaolo SpA RSP (Banks) | | | 506,424 | |
| | | | | | | | |
| | | | | | | 1,211,261 | |
| | |
| Japan – 18.2% | |
| | 10,100 | | | Aderans Co. Ltd. (Household & Personal Products)* | | | 112,621 | |
| | 10,500 | | | Ai Holdings Corp. (Technology Hardware & Equipment) | | | 66,255 | |
| | 19,000 | | | Aichi Steel Corp. (Materials) | | | 90,581 | |
| | 209,000 | | | Ajinomoto Co., Inc. (Food, Beverage & Tobacco) | | | 2,697,405 | |
| | 18,400 | | | Alpen Co. Ltd. (Retailing) | | | 374,844 | |
| | 1,036,000 | | | Amada Co. Ltd. (Capital Goods) | | | 7,031,654 | |
| | 10,300 | | | Aoyama Trading Co. Ltd. (Retailing) | | | 212,507 | |
| | 9,800 | | | Arc Land Sakamoto Co. Ltd. (Retailing) | | | 153,530 | |
| | 324,000 | | | Asahi Glass Co. Ltd. (Capital Goods) | | | 2,547,470 | |
| | 63,400 | | | Asahi Group Holdings Ltd. (Food, Beverage & Tobacco) | | | 1,427,593 | |
| | 884,000 | | | Asahi Kasei Corp. (Materials) | | | 5,463,775 | |
| | 8,400 | | | Avex Group Holdings, Inc. (Media) | | | 95,376 | |
| | 24,400 | | | Azbil Corp. (Technology Hardware & Equipment) | | | 522,744 | |
| | 36,200 | | | Bridgestone Corp. (Automobiles & Components) | | | 856,556 | |
| | 181,000 | | | Brother Industries Ltd. (Technology Hardware & Equipment) | | | 2,432,052 | |
| | 78,600 | | | Century Tokyo Leasing Corp. (Diversified Financials) | | | 1,572,144 | |
| | 70,300 | | | Chubu Electric Power Co., Inc. (Utilities) | | | 1,151,297 | |
| | 8,600 | | | cocokara fine, Inc. (Food & Staples Retailing) | | | 268,259 | |
| | 11,800 | | | Create SD Holdings Co. Ltd. (Food & Staples Retailing) | | | 327,487 | |
| | 70,000 | | | Daihatsu Motor Co. Ltd. (Automobiles & Components) | | | 1,321,384 | |
| | 21,900 | | | Daiichi Sankyo Co. Ltd. (Pharmaceuticals, Biotechnology & Life Sciences) | | | 376,097 | |
| | 70,500 | | | Dainippon Sumitomo Pharma Co. Ltd. (Pharmaceuticals, Biotechnology & Life Sciences) | | | 706,046 | |
| | |
| | |
| The accompanying notes are an integral part of these financial statements. | | 27 |
GOLDMAN SACHS STRUCTURED INTERNATIONAL EQUITY FUND
Schedule of Investments (continued)
April 30, 2012 (Unaudited)
| | | | | | | | |
Shares | | | Description | | Value | |
| | | | | | | | |
| | Common Stocks – (continued) | |
| Japan – (continued) | |
| | 145,300 | | | Daito Trust Construction Co. Ltd. (Real Estate) | | $ | 13,066,568 | |
| | 106,700 | | | DCM Holdings Co. Ltd. (Retailing) | | | 810,120 | |
| | 10,100 | | | Doutor Nichires Holdings Co. Ltd. (Consumer Services) | | | 137,410 | |
| | 57,000 | | | Ebara Corp. (Capital Goods) | | | 230,606 | |
| | 16,900 | | | Eisai Co. Ltd. (Pharmaceuticals, Biotechnology & Life Sciences) | | | 660,509 | |
| | 2,600 | | | Exedy Corp. (Automobiles & Components) | | | 73,073 | |
| | 6,000 | | | Foster Electric Co. Ltd. (Consumer Durables & Apparel) | | | 89,227 | |
| | 290,700 | | | FUJIFILM Holdings Corp. (Technology Hardware & Equipment) | | | 6,165,864 | |
| | 61,000 | | | Fujitsu Ltd. (Technology Hardware & Equipment) | | | 296,480 | |
| | 45,800 | | | Futaba Industrial Co. Ltd. (Automobiles & Components)* | | | 244,485 | |
| | 103 | | | Geo Holdings Corp. (Retailing) | | | 124,693 | |
| | 8,310 | | | Gulliver International Co. Ltd. (Retailing) | | | 296,798 | |
| | 5,600 | | | Hitachi Transport System Ltd. (Transportation) | | | 102,486 | |
| | 12,600 | | | Hokkaido Electric Power Co., Inc. (Utilities) | | | 177,077 | |
| | 21,400 | | | Hokuriku Electric Power Co. (Utilities) | | | 366,257 | |
| | 74,300 | | | Honda Motor Co. Ltd. (Automobiles & Components) | | | 2,673,997 | |
| | 31,400 | | | Hosiden Corp. (Technology Hardware & Equipment) | | | 208,228 | |
| | 2,700 | | | IBJ Leasing Co. Ltd. (Diversified Financials) | | | 73,292 | |
| | 10,800 | | | Innotech Corp. (Technology Hardware & Equipment) | | | 64,782 | |
| | 212 | | | Inpex Corp. (Energy) | | | 1,399,732 | |
| | 456,000 | | | Ishihara Sangyo Kaisha Ltd. (Materials)* | | | 437,358 | |
| | 186,600 | | | IT Holdings Corp. (Software & Services) | | | 2,389,498 | |
| | 11,400 | | | Jafco Co. Ltd. (Diversified Financials) | | | 269,446 | |
| | 105 | | | Japan Real Estate Investment Corp. (REIT) | | | 930,180 | |
| | 5,000 | | | JGC Corp. (Capital Goods) | | | 143,975 | |
| | 24,600 | | | JTEKT Corp. (Capital Goods) | | | 269,615 | |
| | 216,100 | | | JVC Kenwood Corp. (Consumer Durables & Apparel) | | | 921,176 | |
| | 23,000 | | | Kamigumi Co. Ltd. (Transportation) | | | 184,851 | |
| | 65,400 | | | Kao Corp. (Household & Personal Products) | | | 1,752,415 | |
| | 12,000 | | | Kasai Kogyo Co. Ltd. (Automobiles & Components) | | | 63,335 | |
| | |
| | | | | | | | |
Shares | | | Description | | Value | |
| | | | | | | | |
| | Common Stocks – (continued) | |
| Japan – (continued) | |
| | 197 | | | KDDI Corp. (Telecommunication Services) | | $ | 1,289,620 | |
| | 142,000 | | | Kinki Nippon Tourist Co. Ltd. (Consumer Services)* | | | 219,467 | |
| | 119,000 | | | Kirin Holdings Co. Ltd. (Food, Beverage & Tobacco) | | | 1,515,162 | |
| | 866,000 | | | Kobe Steel Ltd. (Materials) | | | 1,235,083 | |
| | 31,300 | | | Kohnan Shoji Co. Ltd. (Retailing) | | | 453,931 | |
| | 23,600 | | | Konaka Co. Ltd. (Retailing) | | | 249,127 | |
| | 309,500 | | | Konica Minolta Holdings, Inc. (Technology Hardware & Equipment) | | | 2,511,020 | |
| | 3,700 | | | Kose Corp. (Household & Personal Products) | | | 85,510 | |
| | 45,100 | | | Kyushu Electric Power Co., Inc. (Utilities) | | | 598,235 | |
| | 15,800 | | | Macromill, Inc. (Software & Services) | | | 157,471 | |
| | 11,300 | | | Mandom Corp. (Household & Personal Products) | | | 285,906 | |
| | 40,100 | | | Matsumotokiyoshi Holdings Co. Ltd. (Food & Staples Retailing) | | | 889,784 | |
| | 383,000 | | | Mazda Motor Corp. (Automobiles & Components)* | | | 622,387 | |
| | 6,900 | | | Meitec Corp. (Commercial & Professional Services) | | | 141,803 | |
| | 26,800 | | | Mirait Holdings Corp. (Capital Goods) | | | 192,868 | |
| | 75,400 | | | Mitsubishi Corp. (Capital Goods) | | | 1,634,066 | |
| | 574,100 | | | Mitsubishi UFJ Financial Group, Inc. (Banks) | | | 2,756,549 | |
| | 26,610 | | | Mitsubishi UFJ Lease & Finance Co. Ltd. (Diversified Financials) | | | 1,105,591 | |
| | 12,000 | | | Mitsui & Co. Ltd. (Capital Goods) | | | 187,387 | |
| | 321,000 | | | Mitsui Engineering & Shipbuilding Co. Ltd. (Capital Goods) | | | 471,970 | |
| | 6,700 | | | Musashi Seimitsu Industry Co. Ltd. (Automobiles & Components) | | | 156,853 | |
| | 95,400 | | | Namco Bandai Holdings, Inc. (Consumer Durables & Apparel) | | | 1,364,097 | |
| | 53,600 | | | NET One Systems Co. Ltd. (Software & Services) | | | 731,240 | |
| | 34,200 | | | Nichiha Corp. (Capital Goods) | | | 418,120 | |
| | 21,000 | | | Nichirei Corp. (Food, Beverage & Tobacco) | | | 95,219 | |
| | 24,000 | | | Nippon Chemi-Con Corp. (Technology Hardware & Equipment)* | | | 90,482 | |
| | 1,992,000 | | | Nippon Express Co. Ltd. (Transportation) | | | 7,519,811 | |
| | 39,000 | | | Nippon Shokubai Co. Ltd. (Materials) | | | 436,934 | |
| | 122,000 | | | Nippon Soda Co. Ltd. (Materials) | | | 526,741 | |
| | 126,000 | | | Nippon Steel Corp. (Materials) | | | 313,978 | |
| | |
| | |
| 28 | | The accompanying notes are an integral part of these financial statements. |
GOLDMAN SACHS STRUCTURED INTERNATIONAL EQUITY FUND
| | | | | | | | |
Shares | | | Description | | Value | |
| | | | | | | | |
| | Common Stocks – (continued) | |
| Japan – (continued) | |
| | 52,500 | | | Nippon Telegraph & Telephone Corp. (Telecommunication Services) | | $ | 2,375,397 | |
| | 33,000 | | | Nippon Thompson Co. Ltd. (Capital Goods) | | | 182,481 | |
| | 1,816,400 | | | Nissan Motor Co. Ltd. (Automobiles & Components) | | | 18,885,178 | |
| | 890,000 | | | Nisshin Steel Co. Ltd. (Materials) | | | 1,249,148 | |
| | 11 | | | Nomura Real Estate Office Fund, Inc. (REIT) | | | 63,867 | |
| | 5,800 | | | NS Solutions Corp. (Software & Services) | | | 112,704 | |
| | 1,148 | | | NTT DoCoMo, Inc. (Telecommunication Services) | | | 1,960,211 | |
| | 14,300 | | | Olympus Corp. (Health Care Equipment & Services)* | | | 224,521 | |
| | 7,730 | | | ORIX Corp. (Diversified Financials) | | | 739,072 | |
| | 1,678,000 | | | Osaka Gas Co. Ltd. (Utilities) | | | 6,786,014 | |
| | 65,600 | | | Otsuka Holdings Co. Ltd. (Pharmaceuticals, Biotechnology & Life Sciences) | | | 1,977,030 | |
| | 11,850 | | | Paltac Corp. (Retailing) | | | 173,110 | |
| | 10,200 | | | Pigeon Corp. (Household & Personal Products) | | | 406,965 | |
| | 12,800 | | | Pola Orbis Holdings, Inc. (Household & Personal Products) | | | 389,459 | |
| | 52,000 | | | Rohm Co. Ltd. (Semiconductors & Semiconductor Equipment) | | | 2,345,133 | |
| | 218,900 | | | Round One Corp. (Consumer Services) | | | 1,432,116 | |
| | 54,000 | | | Sankyu, Inc. (Transportation) | | | 214,260 | |
| | 213,500 | | | Sapporo Hokuyo Holdings, Inc. (Banks) | | | 745,781 | |
| | 262,000 | | | Sapporo Holdings Ltd. (Food, Beverage & Tobacco) | | | 915,814 | |
| | 46,000 | | | Sasebo Heavy Industries Co. Ltd. (Capital Goods) | | | 69,069 | |
| | 18,000 | | | Seino Holdings Corp. (Transportation) | | | 124,687 | |
| | 21,000 | | | Shikoku Electric Power Co., Inc. (Utilities) | | | 542,426 | |
| | 97,100 | | | Shionogi & Co. Ltd. (Pharmaceuticals, Biotechnology & Life Sciences) | | | 1,266,531 | |
| | 21,800 | | | Ship Healthcare Holdings, Inc. (Health Care Equipment & Services) | | | 515,329 | |
| | 2,561 | | | SKY Perfect JSAT Holdings, Inc. (Media) | | | 1,115,369 | |
| | 66,500 | | | Softbank Corp. (Telecommunication Services) | | | 1,984,790 | |
| | 18,400 | | | Star Micronics Co. Ltd. (Technology Hardware & Equipment) | | | 195,121 | |
| | 732,700 | | | Sumitomo Corp. (Capital Goods) | | | 10,412,543 | |
| | |
| | | | | | | | |
Shares | | | Description | | Value | |
| | | | | | | | |
| | Common Stocks – (continued) | |
| Japan – (continued) | |
| | 481,600 | | | Sumitomo Electric Industries Ltd. (Capital Goods) | | $ | 6,496,423 | |
| | 296,000 | | | Sumitomo Heavy Industries Ltd. (Capital Goods) | | | 1,526,662 | |
| | 73,000 | | | Sumitomo Metal Mining Co. Ltd. (Materials) | | | 957,566 | |
| | 315,700 | | | Sumitomo Mitsui Financial Group, Inc. (Banks) | | | 10,102,015 | |
| | 32,000 | | | Sumitomo Precision Products Co. Ltd. (Capital Goods) | | | 174,359 | |
| | 28,400 | | | T&D Holdings, Inc. (Insurance) | | | 306,141 | |
| | 7,100 | | | Takara Leben Co. Ltd. (Real Estate) | | | 61,587 | |
| | 38,000 | | | Takashimaya Co. Ltd. (Retailing) | | | 288,041 | |
| | 116,000 | | | Takeda Pharmaceutical Co. Ltd. (Pharmaceuticals, Biotechnology & Life Sciences) | | | 5,061,672 | |
| | 23,000 | | | Tanseisha Co. Ltd. (Commercial & Professional Services) | | | 78,393 | |
| | 32,600 | | | Tecmo Koei Holdings Co. Ltd. (Software & Services) | | | 275,191 | |
| | 102,000 | | | The Bank of Yokohama Ltd. (Banks) | | | 493,990 | |
| | 58,000 | | | The Chiba Bank Ltd. (Banks) | | | 352,380 | |
| | 23,900 | | | The Chugoku Electric Power Co., Inc. (Utilities) | | | 410,077 | |
| | 243 | | | The Dai-ichi Life Insurance Co. Ltd. (Insurance) | | | 304,288 | |
| | 29,000 | | | The Daishi Bank Ltd. (Banks) | | | 90,369 | |
| | 78,000 | | | The Eighteenth Bank Ltd. (Banks) | | | 219,765 | |
| | 74,200 | | | The Kansai Electric Power Co., Inc. (Utilities) | | | 1,075,942 | |
| | 8,900 | | | The Musashino Bank Ltd. (Banks) | | | 289,980 | |
| | 275,000 | | | The Nishi-Nippon City Bank Ltd. (Banks) | | | 727,351 | |
| | 2,700 | | | The Yachiyo Bank Ltd. (Banks) | | | 61,260 | |
| | 48,000 | | | The Yokohama Rubber Co. Ltd. (Automobiles & Components) | | | 350,882 | |
| | 62,000 | | | Toagosei Co. Ltd. (Materials) | | | 268,422 | |
| | 22,000 | | | Toei Co. Ltd. (Media) | | | 114,598 | |
| | 34,000 | | | Tohoku Electric Power Co., Inc. (Utilities)* | | | 356,500 | |
| | 41,000 | | | Tokai Rika Co. Ltd. (Automobiles & Components) | | | 763,712 | |
| | 135,700 | | | Tokio Marine Holdings, Inc. (Insurance) | | | 3,471,697 | |
| | 11,800 | | | Tokyo Broadcasting System Holdings, Inc. (Media) | | | 160,001 | |
| | 15,600 | | | Tokyo Electron Ltd. (Semiconductors & Semiconductor Equipment) | | | 864,491 | |
| | 690,000 | | | Tokyu Land Corp. (Real Estate) | | | 3,325,502 | |
| | 14,700 | | | TOMONY Holdings, Inc. (Banks) | | | 67,208 | |
| | 1,203,000 | | | Tosoh Corp. (Materials) | | | 3,325,831 | |
| | 18,500 | | | Touei Housing Corp. (Consumer Durables & Apparel) | | | 185,086 | |
| | |
| | |
| The accompanying notes are an integral part of these financial statements. | | 29 |
GOLDMAN SACHS STRUCTURED INTERNATIONAL EQUITY FUND
Schedule of Investments (continued)
April 30, 2012 (Unaudited)
| | | | | | | | |
Shares | | | Description | | Value | |
| | | | | | | | |
| | Common Stocks – (continued) | |
| Japan – (continued) | |
| | 40,000 | | | Toyo Tire & Rubber Co. Ltd. (Automobiles & Components) | | $ | 109,047 | |
| | 167,600 | | | Toyota Motor Corp. (Automobiles & Components) | | | 6,867,874 | |
| | 68 | | | TV Asahi Corp. (Media) | | | 101,566 | |
| | 4,300 | | | UKC Holdings Corp. (Semiconductors & Semiconductor Equipment) | | | 59,235 | |
| | 27,400 | | | UNY Co. Ltd. (Food & Staples Retailing) | | | 318,412 | |
| | 100,000 | | | Yamatane Corp. (Retailing) | | | 145,234 | |
| | 4,200 | | | Yellow Hat Ltd. (Retailing) | | | 72,852 | |
| | | | | | | | |
| | | | | | | 200,373,350 | |
| | |
| Luxembourg – 0.1% | |
| | 65,824 | | | ArcelorMittal (Materials) | | | 1,143,491 | |
| | 2,552 | | | RTL Group SA (Media) | | | 249,978 | |
| | | | | | | | |
| | | | | | | 1,393,469 | |
| | |
| Mexico – 0.1% | |
| | 37,452 | | | Fresnillo PLC (Materials) | | | 954,247 | |
| | |
| Netherlands – 4.4% | |
| | 40,411 | | | ASML Holding NV (Semiconductors & Semiconductor Equipment) | | | 2,056,234 | |
| | 16,188 | | | Heineken Holding NV (Food, Beverage & Tobacco) | | | 749,707 | |
| | 6,727 | | | Heineken NV (Food, Beverage & Tobacco) | | | 367,891 | |
| | 222,998 | | | ING Groep NV CVA (Diversified Financials)* | | | 1,573,223 | |
| | 813,395 | | | Koninklijke Ahold NV (Food & Staples Retailing) | | | 10,323,960 | |
| | 12,035 | | | Koninklijke DSM NV (Materials) | | | 690,628 | |
| | 517,375 | | | Royal Dutch Shell PLC Class A (Energy) | | | 18,452,603 | |
| | 387,139 | | | Royal Dutch Shell PLC Class B (Energy) | | | 14,167,178 | |
| | | | | | | | |
| | | | | | | 48,381,424 | |
| | |
| New Zealand – 0.1% | |
| | 548,328 | | | Telecom Corp. of New Zealand Ltd. (Telecommunication Services) | | | 1,178,877 | |
| | |
| Norway – 2.9% | |
| | 6,618 | | | Aker ASA Class A (Diversified Financials) | | | 216,432 | |
| | 95,303 | | | Cermaq ASA (Food, Beverage & Tobacco)* | | | 1,302,317 | |
| | 69,696 | | | DNB ASA (Banks)(a) | | | 751,212 | |
| | 518,551 | | | Kvaerner ASA (Energy) | | | 1,533,457 | |
| | 779,905 | | | Statoil ASA (Energy) | | | 20,926,713 | |
| | 1,495,000 | | | STX OSV Holdings Ltd. (Capital Goods) | | | 1,921,763 | |
| | |
| | | | | | | | |
Shares | | | Description | | Value | |
| | | | | | | | |
| | Common Stocks – (continued) | |
| Norway – (continued) | |
| | 298,488 | | | Telenor ASA (Telecommunication Services) | | $ | 5,486,630 | |
| | | | | | | | |
| | | | | | | 32,138,524 | |
| | |
| Portugal – 0.0% | |
| | 28,179 | | | Cimpor Cimentos de Portugal SGPS SA (Materials) | | | 206,141 | |
| | |
| Singapore – 2.4% | |
| | 487,000 | | | CapitaCommercial Trust (REIT) | | | 506,490 | |
| | 281,000 | | | CapitaMall Trust (REIT) | | | 407,973 | |
| | 636,120 | | | DBS Group Holdings Ltd. (Banks) | | | 7,146,392 | |
| | 57,000 | | | Fraser and Neave Ltd. (Capital Goods) | | | 323,486 | |
| | 3,063,000 | | | Golden Agri-Resources Ltd. (Food, Beverage & Tobacco) | | | 1,813,115 | |
| | 798,000 | | | Hutchison Port Holdings Trust Class U (Transportation) | | | 601,078 | |
| | 79,523 | | | Jardine Cycle & Carriage Ltd. (Retailing) | | | 3,020,639 | |
| | 72,000 | | | Keppel Corp. Ltd. (Capital Goods) | | | 640,421 | |
| | 82,000 | | | Oversea-Chinese Banking Corp. Ltd. (Banks) | | | 592,162 | |
| | 347,000 | | | SembCorp Industries Ltd. (Capital Goods) | | | 1,409,481 | |
| | 253,000 | | | Singapore Airlines Ltd. (Transportation) | | | 2,182,293 | |
| | 1,098,780 | | | Singapore Telecommunications Ltd. (Telecommunication Services) | | | 2,763,950 | |
| | 99,000 | | | United Overseas Bank Ltd. (Banks) | | | 1,536,024 | |
| | 1,030,000 | | | UOL Group Ltd. (Real Estate) | | | 3,753,684 | |
| | 140,000 | | | Wing Tai Holdings Ltd. (Real Estate) | | | 133,586 | |
| | | | | | | | |
| | | | | | | 26,830,774 | |
| | |
| Spain – 0.0% | |
| | 70,969 | | | Mapfre SA (Insurance) | | | 205,449 | |
| | |
| Sweden – 2.0% | |
| | 58,560 | | | Haldex AB (Capital Goods) | | | 365,562 | |
| | 21,378 | | | Investor AB Class B (Diversified Financials) | | | 426,262 | |
| | 15,801 | | | Kinnevik Investment AB Class B (Diversified Financials) | | | 321,399 | |
| | 137,204 | | | Nordea Bank AB (Banks) | | | 1,214,312 | |
| | 8,211 | | | Saab AB Class B (Capital Goods) | | | 136,559 | |
| | 483,916 | | | Swedish Match AB (Food, Beverage & Tobacco) | | | 19,712,869 | |
| | | | | | | | |
| | | | | | | 22,176,963 | |
| | |
| Switzerland – 13.4% | |
| | 37,074 | | | Actelion Ltd. (Registered) (Pharmaceuticals, Biotechnology & Life Sciences)* | | | 1,570,008 | |
| | |
| | |
| 30 | | The accompanying notes are an integral part of these financial statements. |
GOLDMAN SACHS STRUCTURED INTERNATIONAL EQUITY FUND
| | | | | | | | |
Shares | | | Description | | Value | |
| | | | | | | | |
| | Common Stocks – (continued) | |
| Switzerland – (continued) | |
| | 97,332 | | | Adecco SA (Registered) (Commercial & Professional Services)* | | $ | 4,748,179 | |
| | 166,869 | | | Compagnie Financiere Richemont SA Class A (Consumer Durables & Apparel) | | | 10,328,971 | |
| | 34,632 | | | Geberit AG (Registered) (Capital Goods)* | | | 7,322,443 | |
| | 316,035 | | | Nestle SA (Registered) (Food, Beverage & Tobacco) | | | 19,369,556 | |
| | 371,118 | | | Novartis AG (Registered) (Pharmaceuticals, Biotechnology & Life Sciences) | | | 20,491,745 | |
| | 235,602 | | | OC Oerlikon Corp. AG (Registered) (Capital Goods)* | | | 2,328,892 | |
| | 2,927 | | | Rieter Holding AG (Registered) (Capital Goods)* | | | 509,700 | |
| | 236,187 | | | Roche Holding AG (Pharmaceuticals, Biotechnology & Life Sciences) | | | 43,173,630 | |
| | 476,081 | | | STMicroelectronics NV (Semiconductors & Semiconductor Equipment) | | | 2,741,201 | |
| | 30,737 | | | Swiss Life Holding AG (Registered) (Insurance)* | | | 3,144,015 | |
| | 29,095 | | | Swiss Prime Site AG (Registered) (Real Estate)* | | | 2,426,544 | |
| | 535 | | | Syngenta AG (Registered) (Materials) | | | 187,612 | |
| | 726,614 | | | UBS AG (Registered) (Diversified Financials)* | | | 9,074,095 | |
| | 6,028 | | | Uster Technologies AG (Capital Goods)* | | | 291,979 | |
| | 266,547 | | | Xstrata PLC (Materials) | | | 5,119,170 | |
| | 61,324 | | | Zurich Insurance Group AG (Insurance)* | | | 15,024,560 | |
| | | | | | | | |
| | | | | | | 147,852,300 | |
| | |
| United Kingdom – 24.0% | |
| | 108,416 | | | Aggreko PLC (Commercial & Professional Services) | | | 3,962,598 | |
| | 122,268 | | | AMEC PLC (Energy) | | | 2,257,917 | |
| | 150,046 | | | Amlin PLC (Insurance) | | | 803,624 | |
| | 132,985 | | | Anglo American PLC (Materials) | | | 5,139,175 | |
| | 558,386 | | | Ashtead Group PLC (Capital Goods) | | | 2,254,808 | |
| | 73,770 | | | Associated British Foods PLC (Food, Beverage & Tobacco) | | | 1,459,897 | |
| | 175,595 | | | AstraZeneca PLC (Pharmaceuticals, Biotechnology & Life Sciences) | | | 7,694,821 | |
| | 419,116 | | | Aviva PLC (Insurance) | | | 2,097,672 | |
| | 12,739 | | | Babcock International Group PLC (Commercial & Professional Services) | | | 171,939 | |
| | 427,289 | | | BAE Systems PLC (Capital Goods) | | | 2,047,669 | |
| | |
| | | | | | | | |
Shares | | | Description | | Value | |
| | | | | | | | |
| | Common Stocks – (continued) | |
| United Kingdom – (continued) | |
| | 2,471,485 | | | Barclays PLC (Banks) | | $ | 8,749,917 | |
| | 85,707 | | | Berendsen PLC (Commercial & Professional Services) | | | 716,716 | |
| | 444,899 | | | BG Group PLC (Energy) | | | 10,497,478 | |
| | 189,339 | | | BHP Billiton PLC (Materials) | | | 6,095,177 | |
| | 202,832 | | | Bodycote PLC (Capital Goods) | | | 1,400,821 | |
| | 16,159 | | | BP PLC (Energy) | | | 116,734 | |
| | 210,736 | | | BP PLC ADR (Energy)(b) | | | 9,148,050 | |
| | 490,288 | | | British American Tobacco PLC (Food, Beverage & Tobacco) | | | 25,146,644 | |
| | 91,370 | | | Britvic PLC (Food, Beverage & Tobacco) | | | 566,896 | |
| | 877,558 | | | BT Group PLC (Telecommunication Services) | | | 3,001,643 | |
| | 1,899,555 | | | Cable & Wireless Communications PLC (Telecommunication Services) | | | 1,016,614 | |
| | 96,902 | | | Chemring Group PLC (Capital Goods) | | | 513,667 | |
| | 35,379 | | | Concentric AB (Capital Goods)(a) | | | 318,593 | |
| | 131,179 | | | Croda International PLC (Materials) | | | 4,751,139 | |
| | 91,102 | | | Dairy Crest Group PLC (Food, Beverage & Tobacco) | | | 445,163 | |
| | 295,620 | | | Debenhams PLC (Retailing) | | | 396,393 | |
| | 281,053 | | | Devro PLC (Food, Beverage & Tobacco) | | | 1,406,551 | |
| | 761,322 | | | Drax Group PLC (Utilities) | | | 6,708,369 | |
| | 270,495 | | | EnQuest PLC (Energy)* | | | 556,469 | |
| | 261,884 | | | Eurasian Natural Resources Corp. PLC (Materials) | | | 2,387,258 | |
| | 263,881 | | | Fenner PLC (Capital Goods) | | | 1,931,154 | |
| | 267,099 | | | GKN PLC (Automobiles & Components) | | | 883,422 | |
| | 205,021 | | | GlaxoSmithKline PLC ADR (Pharmaceuticals, Biotechnology & Life Sciences) | | | 9,478,121 | |
| | 48,283 | | | Greene King PLC (Consumer Services) | | | 400,109 | |
| | 415,321 | | | Halfords Group PLC (Retailing) | | | 1,854,671 | |
| | 515,446 | | | Home Retail Group PLC (Retailing) | | | 891,706 | |
| | 259,934 | | | Homeserve PLC (Commercial & Professional Services) | | | 1,065,300 | |
| | 3,269,944 | | | HSBC Holdings PLC (Banks) | | | 29,518,362 | |
| | 38,754 | | | IG Group Holdings PLC (Diversified Financials) | | | 291,199 | |
| | 130,946 | | | Imperial Tobacco Group PLC (Food, Beverage & Tobacco) | | | 5,236,590 | |
| | 114,285 | | | J Sainsbury PLC (Food & Staples Retailing) | | | 571,303 | |
| | 374,573 | | | John Wood Group PLC (Energy) | | | 4,756,489 | |
| | 268,499 | | | Land Securities Group PLC (REIT) | | | 3,170,789 | |
| | 2,058,303 | | | Legal & General Group PLC (Insurance) | | | 3,930,131 | |
| | 1,282,302 | | | Man Group PLC (Diversified Financials) | | | 2,154,276 | |
| | |
| | |
| The accompanying notes are an integral part of these financial statements. | | 31 |
GOLDMAN SACHS STRUCTURED INTERNATIONAL EQUITY FUND
Schedule of Investments (continued)
April 30, 2012 (Unaudited)
| | | | | | | | |
Shares | | | Description | | Value | |
| | | | | | | | |
| | Common Stocks – (continued) | |
| United Kingdom – (continued) | |
| | 719,638 | | | Marston’s PLC (Consumer Services) | | $ | 1,139,696 | |
| | 46,534 | | | Micro Focus International PLC (Software & Services) | | | 351,367 | |
| | 83,822 | | | Mitie Group PLC (Commercial & Professional Services) | | | 396,899 | |
| | 409,128 | | | Mondi PLC (Materials) | | | 3,804,244 | |
| | 489,029 | | | National Grid PLC (Utilities) | | | 5,280,797 | |
| | 650,230 | | | Pearson PLC (Media) | | | 12,247,599 | |
| | 10,353 | | | Randgold Resources Ltd. (Materials) | | | 918,946 | |
| | 15,151 | | | Renishaw PLC (Technology Hardware & Equipment) | | | 356,429 | |
| | 363,407 | | | Rexam PLC (Materials) | | | 2,536,759 | |
| | 216,629 | | | Rio Tinto PLC (Materials) | | | 12,143,093 | |
| | 190,321 | | | SABMiller PLC (Food, Beverage & Tobacco) | | | 7,998,902 | |
| | 132,137 | | | Shanks Group PLC (Commercial & Professional Services) | | | 198,587 | |
| | 52,106 | | | SSE PLC (Utilities) | | | 1,117,330 | |
| | 57,164 | | | Standard Chartered PLC (Banks) | | | 1,397,411 | |
| | 392,611 | | | Standard Life PLC (Insurance) | | | 1,424,786 | |
| | 437,780 | | | Tate & Lyle PLC (Food, Beverage & Tobacco) | | | 4,907,183 | |
| | 118,456 | | | Tetragon Financial Group Ltd. (Diversified Financials) | | | 928,527 | |
| | 47,174 | | | TUI Travel PLC (Consumer Services) | | | 146,290 | |
| | 83,867 | | | Tullow Oil PLC (Energy) | | | 2,092,357 | |
| | 190,577 | | | Unilever PLC (Food, Beverage & Tobacco) | | | 6,510,487 | |
| | 256,413 | | | Vodafone Group PLC (Telecommunication Services) | | �� | 709,741 | |
| | 298,310 | | | Vodafone Group PLC ADR (Telecommunication Services)(b) | | | 8,301,968 | |
| | 1,180,245 | | | William Hill PLC (Consumer Services) | | | 5,391,172 | |
| | 1,562,555 | | | WM Morrison Supermarkets PLC (Food & Staples Retailing) | | | 7,117,068 | |
| | | | | | | | |
| | | | | | | 265,381,672 | |
| | |
| | TOTAL COMMON STOCKS | | | | |
| | (Cost $1,043,846,633) | | $ | 1,084,991,845 | |
| | |
| | | | | | | | | | | | |
| Units | | | Description | | Expiration
Month | | | Value | |
| | | | | | | | | | | | |
| | Right* – 0.0% | |
| Australia – 0.0% | |
| | 25,985 | | | Beach Energy
Ltd. (Energy) | | | 05/12 | | | $ | — | |
| | (Cost $0) | | | | | |
| | |
| TOTAL INVESTMENTS BEFORE
SECURITIES LENDING
REINVESTMENT VEHICLE |
| | | | |
| | (Cost $1,043,846,633) | | | $ | 1,084,991,845 | |
| | |
| | | | | | |
Shares | | Rate | | Value | |
| | | | | | |
| Securities Lending Reinvestment Vehicle(c)(d) – 4.2% | |
Goldman Sachs Financial Square Money Market Fund – FST Shares | |
| 46,503,780 | | 0.182% | | $ | 46,503,780 | |
| (Cost $46,503,780) | | | | |
| |
| TOTAL INVESTMENTS – 102.5% | |
| (Cost $1,090,350,413) | | $ | 1,131,495,625 | |
| |
LIABILITIES IN EXCESS OF OTHER ASSETS – (2.5)% | | | (27,635,666 | ) |
| |
| NET ASSETS – 100.0% | | $ | 1,103,859,959 | |
| |
| | |
| The percentage shown for each investment category reflects the value of investments in that category as a percentage of net assets. |
* | | Non-income producing security. |
(a) | | All or a portion of security is on loan. |
(b) | | All or a portion of security is segregated as collateral for initial margin requirements on futures transactions. |
(c) | | Variable rate security. Interest rate disclosed is that which is in effect at April 30, 2012. |
(d) | | Represents an affiliated issuer. |
| | |
|
Investment Abbreviations: |
ADR | | —American Depositary Receipt |
CDI | | —CHESS Depositary Interest |
CVA | | —Dutch Certification |
REIT | | —Real Estate Investment Trust |
RSP | | —Risparmio Shares |
|
| | |
| 32 | | The accompanying notes are an integral part of these financial statements. |
GOLDMAN SACHS STRUCTURED INTERNATIONAL EQUITY FUND
| | |
| ADDITIONAL INVESTMENT INFORMATION | | |
FUTURES CONTRACTS — At April 30, 2012, the Fund had the following futures contracts:
| | | | | | | | | | | | | | |
| Type | | Number of
Contracts
Long (Short) | | | Expiration
Date | | Current
Value | | | Unrealized
Gain (Loss) | |
EURO STOXX 50 Index | | | 431 | | | June 2012 | | $ | 12,887,927 | | | $ | (975,926 | ) |
FTSE 100 Index | | | 69 | | | June 2012 | | | 6,399,663 | | | | (58,860 | ) |
Hang Seng Index | | | 4 | | | May 2012 | | | 539,785 | | | | 11,806 | |
MSCI Singapore Index | | | 7 | | | May 2012 | | | 385,552 | | | | 4,136 | |
SPI 200 Index | | | 21 | | | June 2012 | | | 2,405,263 | | | | 38,441 | |
TSE TOPIX Index | | | 58 | | | June 2012 | | | 5,829,785 | | | | (314,841 | ) |
| TOTAL | | | | | | | | | | | | $ | (1,295,244 | ) |
| | |
| The accompanying notes are an integral part of these financial statements. | | 33 |
GOLDMAN SACHS STRUCTURED INTERNATIONAL SMALL CAP FUND
Schedule of Investments
April 30, 2012 (Unaudited)
| | | | | | | | |
Shares | | | Description | | Value | |
| | | | | | | | |
| | Common Stocks – 96.6% | |
| Australia – 9.1% | |
| | 150,402 | | | Adelaide Brighton Ltd. (Materials) | | $ | 475,246 | |
| | 41,959 | | | Ansell Ltd. (Health Care Equipment & Services) | | | 645,962 | |
| | 151,040 | | | Atlas Iron Ltd. (Materials) | | | 435,119 | |
| | 95,186 | | | Australian Infrastructure Fund (Transportation) | | | 220,120 | |
| | 541,132 | | | AWE Ltd. (Energy) | | | 976,275 | |
| | 1,105,650 | | | Beach Energy Ltd. (Energy) | | | 1,602,165 | |
| | 69,588 | | | Billabong International Ltd. (Consumer Durables & Apparel)(a) | | | 189,842 | |
| | 319,243 | | | BlueScope Steel Ltd. (Materials)* | | | 130,221 | |
| | 27,325 | | | BT Investment Management Ltd. (Diversified Financials) | | | 58,274 | |
| | 164,838 | | | Cabcharge Australia Ltd. (Commercial & Professional Services) | | | 1,095,406 | |
| | 128,402 | | | Charter Hall Office REIT (REIT) | | | 413,406 | |
| | 171,711 | | | Charter Hall Retail REIT (REIT) | | | 590,315 | |
| | 335,882 | | | Consolidated Media Holdings Ltd. (Media) | | | 1,151,462 | |
| | 502,942 | | | CSR Ltd. (Capital Goods) | | | 909,553 | |
| | 28,244 | | | Cudeco Ltd. (Materials)* | | | 99,917 | |
| | 92,613 | | | Discovery Metals Ltd. (Materials)* | | | 166,520 | |
| | 440,561 | | | DuluxGroup Ltd. (Materials) | | | 1,415,583 | |
| | 702,945 | | | Emeco Holdings Ltd. (Capital Goods) | | | 757,360 | |
| | 145,297 | | | Envestra Ltd. (Utilities) | | | 118,723 | |
| | 59,366 | | | Fleetwood Corp. Ltd. (Automobiles & Components) | | | 806,845 | |
| | 312,508 | | | FlexiGroup Ltd. (Diversified Financials) | | | 737,172 | |
| | 732,357 | | | Flinders Mines Ltd. (Materials)* | | | 155,364 | |
| | 28,501 | | | Forge Group Ltd. (Capital Goods) | | | 185,198 | |
| | 211,535 | | | Imdex Ltd. (Materials) | | | 550,402 | |
| | 436,757 | | | Investa Office Fund (REIT) | | | 1,239,725 | |
| | 54,265 | | | IOOF Holdings Ltd. (Diversified Financials) | | | 350,183 | |
| | 439,749 | | | Macmahon Holdings Ltd. (Capital Goods) | | | 318,400 | |
| | 23,259 | | | McMillan Shakespeare Ltd. (Commercial & Professional Services) | | | 265,706 | |
| | 49,687 | | | Mineral Deposits Ltd. (Materials)* | | | 309,144 | |
| | 47,307 | | | Monadelphous Group Ltd. (Capital Goods) | | | 1,138,083 | |
| | 549,992 | | | Mount Gibson Iron Ltd. (Materials) | | | 628,171 | |
| | 187,631 | | | Myer Holdings Ltd. (Retailing)(a) | | | 457,414 | |
| | 259,152 | | | NRW Holdings Ltd. (Capital Goods) | | | 1,094,107 | |
| | 302,686 | | | OneSteel Ltd. (Materials) | | | 405,547 | |
| | 74,711 | | | Pacific Brands Ltd. (Retailing) | | | 47,662 | |
| | 16,935 | | | PanAust Ltd. (Materials)* | | | 56,763 | |
| | 9,645 | | | Perpetual Ltd. (Diversified Financials) | | | 254,436 | |
| | 32,812 | | | Platinum Asset Management Ltd. (Diversified Financials) | | | 149,446 | |
| | 30,134 | | | Programmed Maintenance Services Ltd. (Commercial & Professional Services) | | | 80,191 | |
| | 194,187 | | | Regis Resources Ltd. (Materials)* | | | 849,414 | |
| | |
| | | | | | | | |
Shares | | | Description | | Value | |
| | | | | | | | |
| | Common Stocks – (continued) | |
| Australia – (continued) | |
| | 109,824 | | | Resolute Mining Ltd. (Materials)* | | $ | 191,232 | |
| | 244,701 | | | Roc Oil Co. Ltd. (Energy)* | | | 101,238 | |
| | 82,909 | | | Salmat Ltd. (Commercial & Professional Services) | | | 191,123 | |
| | 31,350 | | | Sandfire Resources NL (Materials)* | | | 250,952 | |
| | 114,079 | | | Seek Ltd. (Commercial & Professional Services)(a) | | | 843,683 | |
| | 350,150 | | | Sigma Pharmaceuticals Ltd. (Health Care Equipment & Services) | | | 241,022 | |
| | 43,317 | | | Silver Lake Resources Ltd. (Materials)* | | | 144,580 | |
| | 103,723 | | | Spark Infrastructure Group (Utilities) | | | 156,421 | |
| | 45,829 | | | Spotless Group Ltd. (Commercial & Professional Services) | | | 122,243 | |
| | 237,289 | | | St. Barbara Ltd. (Materials)* | | | 562,415 | |
| | 161,436 | | | STW Communications Group Ltd. (Media) | | | 154,639 | |
| | 329,950 | | | Ten Network Holdings Ltd. (Media) | | | 276,859 | |
| | 19,817 | | | The Reject Shop Ltd. (Retailing) | | | 244,526 | |
| | 313,410 | | | Treasury Wine Estates Ltd. (Food, Beverage & Tobacco) | | | 1,400,296 | |
| | 159,263 | | | Whitehaven Coal Ltd. (Energy) | | | 876,788 | |
| | | | | | | | |
| | | | | | | 27,288,859 | |
| | |
| Austria – 1.2% | |
| | 98,318 | | | Conwert Immobilien Invest SE (Real Estate) | | | 1,172,435 | |
| | 22,842 | | | Oesterreichische Post AG (Transportation)(a) | | | 810,225 | |
| | 3,262 | | | Rosenbauer International AG (Capital Goods) | | | 193,854 | |
| | 5,286 | | | Schoeller-Bleckmann Oilfield Equipment AG (Energy) | | | 471,758 | |
| | 32,415 | | | Strabag SE (Capital Goods) | | | 867,671 | |
| | | | | | | | |
| | | | | | | 3,515,943 | |
| | |
| Belgium – 1.3% | |
| | 5,228 | | | Ackermans & van Haaren NV (Diversified Financials) | | | 448,376 | |
| | 1,345 | | | Barco NV (Technology Hardware & Equipment) | | | 89,290 | |
| | 20,272 | | | Compagnie Maritime Belge SA (Transportation) | | | 471,999 | |
| | 12,627 | | | D’ieteren SA NV (Retailing) | | | 557,496 | |
| | 14,557 | | | Gimv NV (Diversified Financials) | | | 713,063 | |
| | 3,491 | | | Kinepolis Group NV (Media) | | | 325,211 | |
| | 13,093 | | | Recticel SA (Materials) | | | 103,138 | |
| | 33,470 | | | Tessenderlo Chemie NV (Materials) | | | 1,061,071 | |
| | 7,968 | | | ThromboGenics NV (Pharmaceuticals, Biotechnology & Life Sciences)* | | | 250,528 | |
| | | | | | | | |
| | | | | | | 4,020,172 | |
| | |
| Bermuda – 1.3% | |
| | 140,843 | | | Catlin Group Ltd. (Insurance) | | | 964,940 | |
| | 69,910 | | | Gulf Keystone Petroleum Ltd. (Energy)* | | | 270,158 | |
| | |
| | |
| 34 | | The accompanying notes are an integral part of these financial statements. |
GOLDMAN SACHS STRUCTURED INTERNATIONAL SMALL CAP FUND
| | | | | | | | |
Shares | | | Description | | Value | |
| | | | | | | | |
| | Common Stocks – (continued) | |
| Bermuda – (continued) | |
| | 163,285 | | | Lancashire Holdings Ltd. (Insurance) | | $ | 2,134,327 | |
| | 193,938 | | | Northern Offshore Ltd. (Energy) | | | 394,881 | |
| | | | | | | | |
| | | | | | | 3,764,306 | |
| | |
| China – 0.2% | |
| | 44,000 | | | AAC Technologies Holdings, Inc. (Technology Hardware & Equipment) | | | 129,203 | |
| | 193,000 | | | China XLX Fertiliser Ltd. (Materials) | | | 49,651 | |
| | 671,000 | | | Goodbaby International Holdings Ltd. (Consumer Durables & Apparel) | | | 207,074 | |
| | 205,000 | | | Sateri Holdings Ltd. (Materials)* | | | 56,953 | |
| | 441,000 | | | SunVic Chemical Holdings Ltd. (Materials) | | | 120,658 | |
| | | | | | | | |
| | | | | | | 563,539 | |
| | |
| Cyprus – 0.2% | |
| | 424,993 | | | Bank of Cyprus PLC (Banks) | | | 253,322 | |
| | 40,905 | | | ProSafe SE (Energy) | | | 319,578 | |
| | | | | | | | |
| | | | | | | 572,900 | |
| | |
| Denmark – 1.6% | |
| | 2,902 | | | ALK-Abello A/S (Pharmaceuticals, Biotechnology & Life Sciences) | | | 209,392 | |
| | 45,044 | | | East Asiatic Co. Ltd. A/S (Food, Beverage & Tobacco)(a) | | | 1,239,729 | |
| | 41,226 | | | Pandora A/S (Consumer Durables & Apparel)(a) | | | 435,561 | |
| | 9,042 | | | Royal UNIBREW A/S (Food, Beverage & Tobacco)* | | | 645,333 | |
| | 14,252 | | | Schouw & Co. A/S (Capital Goods)(a) | | | 323,410 | |
| | 3,425 | | | SimCorp A/S (Software & Services) | | | 610,941 | |
| | 21,165 | | | Sydbank A/S (Banks)* | | | 368,098 | |
| | 5,230 | | | Topdanmark A/S (Insurance)* | | | 897,310 | |
| | | | | | | | |
| | | | | | | 4,729,774 | |
| | |
| Finland – 1.8% | |
| | 66,494 | | | Amer Sports OYJ Class A (Consumer Durables & Apparel) | | | 946,068 | |
| | 5,371 | | | Cargotec OYJ Class B (Capital Goods) | | | 184,940 | |
| | 18,817 | | | Huhtamaki OYJ (Materials)(a) | | | 298,633 | |
| | 164,042 | | | Kemira OYJ (Materials)(a) | | | 2,081,694 | |
| | 32,618 | | | Outotec OYJ (Capital Goods) | | | 1,756,483 | |
| | 17,669 | | | Sponda OYJ (Real Estate) | | | 70,988 | |
| | | | | | | | |
| | | | | | | 5,338,806 | |
| | |
| France – 4.0% | |
| | 11,853 | | | Akka Technologies SA (Commercial & Professional Services) | | | 382,346 | |
| | 9,171 | | | Alten Ltd. (Software & Services) | | | 266,821 | |
| | 49,402 | | | Assystem (Commercial & Professional Services)(a) | | | 1,045,258 | |
| | 9,937 | | | Boiron SA (Pharmaceuticals, Biotechnology & Life Sciences) | | | 305,869 | |
| | 561 | | | Bonduelle S.C.A. (Food, Beverage & Tobacco) | | | 54,075 | |
| | |
| | | | | | | | |
Shares | | | Description | | Value | |
| | | | | | | | |
| | Common Stocks – (continued) | |
| France – (continued) | |
| | 25,611 | | | Cegid Group (Software & Services) | | $ | 511,841 | |
| | 10,004 | | | Ciments Francais SA (Materials)(a) | | | 641,356 | |
| | 41,213 | | | Club Mediterranee (Consumer Services)* | | | 790,351 | |
| | 971 | | | Esso SA (Energy) | | | 80,435 | |
| | 152,331 | | | Etablissements Maurel et Prom (Energy) | | | 2,536,948 | |
| | 876 | | | Eurofins Scientific (Pharmaceuticals, Biotechnology & Life Sciences) | | | 103,610 | |
| | 91,414 | | | Havas SA (Media)(a) | | | 517,415 | |
| | 1,266 | | | LISI (Capital Goods) | | | 94,750 | |
| | 4,197 | | | M6 Metropole Television SA (Media) | | | 64,485 | |
| | 39,138 | | | Nexans SA (Capital Goods) | | | 1,961,559 | |
| | 14,948 | | | Plastic Omnium SA (Automobiles & Components) | | | 391,011 | |
| | 3,779 | | | Remy Cointreau SA (Food, Beverage & Tobacco) | | | 421,437 | |
| | 687 | | | Sartorius Stedim Biotech (Health Care Equipment & Services) | | | 48,281 | |
| | 7,253 | | | Societe de la Tour Eiffel (REIT) | | | 377,899 | |
| | 5,623 | | | Sword Group (Software & Services) | | | 92,336 | |
| | 593 | | | Tessi SA (Software & Services) | | | 61,599 | |
| | 5,815 | | | Valeo SA (Automobiles & Components) | | | 285,971 | |
| | 9,611 | | | Zodiac Aerospace (Capital Goods) | | | 1,057,634 | |
| | | | | | | | |
| | | | | | | 12,093,287 | |
| | |
| Germany – 5.6% | |
| | 28,375 | | | Bechtle AG (Software & Services) | | | 1,278,109 | |
| | 6,748 | | | Bertrandt AG (Commercial & Professional Services) | | | 511,681 | |
| | 23,785 | | | Bilfinger Berger SE (Capital Goods) | | | 2,176,139 | |
| | 7,808 | | | Biotest AG Preference Shares (Pharmaceuticals, Biotechnology & Life Sciences) | | | 454,881 | |
| | 17,723 | | | Cewe Color Holding AG (Commercial & Professional Services) | | | 781,265 | |
| | 6,764 | | | Delticom AG (Retailing)(a) | | | 657,309 | |
| | 12,805 | | | Deutsche Beteiligungs AG (Diversified Financials) | | | 284,422 | |
| | 4,063 | | | Draegerwerk AG & Co. KGaA (Health Care Equipment & Services) | | | 406,268 | |
| | 9,996 | | | Draegerwerk AG & Co. KGaA Preference Shares (Health Care Equipment & Services)(a) | | | 1,125,987 | |
| | 6,702 | | | Duerr AG (Capital Goods)(a) | | | 423,583 | |
| | 58,863 | | | Freenet AG (Telecommunication Services)(a) | | | 1,023,729 | |
| | 29,657 | | | Gerry Weber International AG (Consumer Durables & Apparel) | | | 1,259,681 | |
| | 5,665 | | | Gesco AG (Capital Goods) | | | 473,922 | |
| | 21,807 | | | Homag Group AG (Capital Goods) | | | 293,932 | |
| | 8,286 | | | Indus Holding AG (Capital Goods) | | | 258,257 | |
| | 14,470 | | | Jenoptik AG (Technology Hardware & Equipment)* | | | 119,178 | |
| | 27,660 | | | Jungheinrich AG Preference Shares (Capital Goods) | | | 952,448 | |
| | |
| | |
| The accompanying notes are an integral part of these financial statements. | | 35 |
GOLDMAN SACHS STRUCTURED INTERNATIONAL SMALL CAP FUND
Schedule of Investments (continued)
April 30, 2012 (Unaudited)
| | | | | | | | |
Shares | | | Description | | Value | |
| | | | | | | | |
| | Common Stocks – (continued) | |
| Germany – (continued) | |
| | 12,643 | | | Leoni AG (Automobiles & Components) | | $ | 649,737 | |
| | 22,406 | | | MTU Aero Engines Holding AG (Capital Goods)(a) | | | 1,887,865 | |
| | 5,749 | | | R. Stahl AG (Capital Goods) | | | 206,263 | |
| | 2,674 | | | Sixt AG (Transportation) | | | 55,551 | |
| | 6,596 | | | Sixt AG Preference Shares (Transportation) | | | 123,365 | |
| | 34,200 | | | Symrise AG (Materials) | | | 991,189 | |
| | 1,909 | | | Tipp24 SE (Consumer Services)* | | | 108,447 | |
| | 5,535 | | | XING AG (Software & Services)* | | | 412,834 | |
| | | | | | | | |
| | | | | | | 16,916,042 | |
| | |
| Greece – 0.3% | |
| | 123,945 | | | Alpha Bank AE (Banks)* | | | 173,920 | |
| | 68,685 | | | Eurobank Properties Real Estate Investment Co. (REIT) | | | 352,763 | |
| | 14,535 | | | Folli Follie Group (Retailing)* | | | 134,800 | |
| | 23,070 | | | Hellenic Exchanges SA (Diversified Financials) | | | 80,026 | |
| | 26,669 | | | JUMBO SA (Retailing)* | | | 129,595 | |
| | 6,903 | | | Metka SA (Capital Goods) | | | 75,875 | |
| | 15,906 | | | Mytilineos Holdings SA (Materials)* | | | 54,325 | |
| | | | | | | | |
| | | | | | | 1,001,304 | |
| | |
| Hong Kong – 2.8% | |
| | 1,634,000 | | | Bonjour Holdings Ltd. (Retailing) | | | 247,612 | |
| | 456,000 | | | Brightoil Petroleum Holdings Ltd. (Energy) | | | 100,378 | |
| | 78,000 | | | Champion REIT (REIT) | | | 33,994 | |
| | 560,000 | | | Chen Hsong Holdings (Capital Goods) | | | 187,101 | |
| | 1,200,000 | | | China Financial International Investments Ltd. (Diversified Financials)* | | | 73,304 | |
| | 111,000 | | | City Telecom HK Ltd. (Telecommunication Services) | | | 65,629 | |
| | 2,320,000 | | | CSI Properties Ltd. (Real Estate) | | | 94,279 | |
| | 70,400 | | | Dah Sing Banking Group Ltd. (Banks) | | | 72,755 | |
| | 575,500 | | | Dickson Concepts International Ltd. (Retailing) | | | 318,163 | |
| | 938,000 | | | Emperor International Holdings (Real Estate) | | | 168,605 | |
| | 244,000 | | | ERA Mining Machinery Ltd. (Capital Goods)* | | | 27,814 | |
| | 178,815 | | | Esprit Holdings Ltd. (Retailing) | | | 365,609 | |
| | 482,000 | | | Giordano International Ltd. (Retailing) | | | 419,072 | |
| | 240,000 | | | Glorious Sun Enterprises Ltd. (Consumer Durables & Apparel) | | | 82,066 | |
| | 137,194 | | | Great Eagle Holdings Ltd. (Real Estate) | | | 402,932 | |
| | 499,700 | | | HKR International Ltd. (Real Estate) | | | 188,687 | |
| | 488,000 | | | Hutchison Telecommunications Hong Kong Holdings Ltd. (Telecommunication Services) | | | 216,823 | |
| | 716,500 | | | Johnson Electric Holdings Ltd. (Capital Goods) | | | 448,620 | |
| | |
| | | | | | | | |
Shares | | | Description | | Value | |
| | | | | | | | |
| | Common Stocks – (continued) | |
| Hong Kong – (continued) | |
| | 55,000 | | | K Wah International Holdings Ltd. (Real Estate) | | $ | 23,135 | |
| | 62,000 | | | Kowloon Development Co. Ltd. (Real Estate) | | | 64,929 | |
| | 2,538,000 | | | Lai Sun Development (Real Estate)* | | | 39,404 | |
| | 91,200 | | | Man Wah Holdings Ltd. (Consumer Durables & Apparel) | | | 47,194 | |
| | 715,000 | | | Melco International Development Ltd. (Consumer Services)* | | | 748,506 | |
| | 52,000 | | | Midland Holdings Ltd. (Real Estate) | | | 26,076 | |
| | 438,000 | | | Next Media Ltd. (Media)* | | | 36,633 | |
| | 184,000 | | | Norstar Founders Group Ltd. (Automobiles & Components)* | | | — | |
| | 664,330 | | | Pacific Andes International Holdings Ltd. (Food, Beverage & Tobacco) | | | 45,330 | |
| | 547,000 | | | Pacific Textile Holdings Ltd. (Consumer Durables & Apparel) | | | 362,852 | |
| | 305,000 | | | Pearl Oriental Oil Ltd. (Diversified Financials) | | | 27,036 | |
| | 1,204,000 | | | Pico Far East Holdings Ltd. (Media) | | | 289,221 | |
| | 1,002,000 | | | Prosperity REIT (REIT) | | | 222,972 | |
| | 158,000 | | | Public Financial Holdings Ltd. (Diversified Financials) | | | 68,024 | |
| | 286,000 | | | Regal Hotels International Holdings Ltd. (Consumer Services) | | | 118,511 | |
| | 448,000 | | | Ruifeng Petroleum Chemical Holdings Ltd. (Energy)* | | | 13,487 | |
| | 394,000 | | | Samling Global Ltd. (Materials) | | | 37,342 | |
| | 224,000 | | | Shun Tak Holdings Ltd. (Capital Goods) | | | 92,429 | |
| | 87,000 | | | Silver base Group Holdings Ltd. (Retailing) | | | 46,599 | |
| | 2,162,000 | | | Singamas Container Holdings Ltd. (Capital Goods) | | | 644,241 | |
| | 57,567 | | | SmarTone Telecommunications Holdings Ltd. (Telecommunication Services) | | | 107,489 | |
| | 109,138 | | | SOCAM Development Ltd. (Capital Goods) | | | 117,537 | |
| | 495,000 | | | Sunlight Real Estate Investment Trust (REIT) | | | 159,335 | |
| | 533,000 | | | Techtronic Industries Co. (Consumer Durables & Apparel) | | | 639,744 | |
| | 310,000 | | | Texwinca Holdings Ltd. (Consumer Durables & Apparel) | | | 378,840 | |
| | 100,000 | | | Tian An China Investments Co. Ltd. (Real Estate) | | | 47,479 | |
| | 708,000 | | | VST Holdings Ltd. (Technology Hardware & Equipment)* | | | 171,087 | |
| | 36,400 | | | VTech Holdings Ltd. (Technology Hardware & Equipment) | | | 407,255 | |
| | | | | | | | |
| | | | | | | 8,496,130 | |
| | |
| Ireland – 1.1% | |
| | 161,506 | | | C&C Group PLC (Food, Beverage & Tobacco) | | | 810,533 | |
| | |
| | |
| 36 | | The accompanying notes are an integral part of these financial statements. |
GOLDMAN SACHS STRUCTURED INTERNATIONAL SMALL CAP FUND
| | | | | | | | |
Shares | | | Description | | Value | |
| | | | | | | | |
| | Common Stocks – (continued) | |
| Ireland – (continued) | |
| | 268,529 | | | Fyffes PLC (Food & Staples Retailing) | | $ | 162,797 | |
| | 90,236 | | | Grafton Group PLC (Capital Goods) | | | 394,293 | |
| | 23,495 | | | Kingspan Group PLC (Capital Goods) | | | 246,082 | |
| | 12,545 | | | Paddy Power PLC (Consumer Services) | | | 819,744 | |
| | 8,247 | | | Smurfit Kappa Group PLC (Materials) | | | 69,478 | |
| | 367,051 | | | Total Produce PLC (Food & Staples Retailing) | | | 218,640 | |
| | 159,671 | | | United Drug PLC (Health Care Equipment & Services) | | | 490,226 | |
| | | | | | | | |
| | | | | | | 3,211,793 | |
| | |
| Israel – 1.0% | |
| | 14,949 | | | Africa-Israel Investments Ltd. (Real Estate)* | | | 56,637 | |
| | 50,947 | | | Alony Hetz Properties & Investments Ltd. (REIT) | | | 244,455 | |
| | 3,537 | | | AL-ROV (Israel) Ltd. (Real Estate)* | | | 86,793 | |
| | 25,674 | | | Amot Investments Ltd. (Real Estate) | | | 66,565 | |
| | 13,527 | | | AudioCodes Ltd. (Technology Hardware & Equipment)* | | | 32,159 | |
| | 1,262 | | | B Communications Ltd. (Telecommunication Services)* | | | 12,094 | |
| | 254 | | | Bayside Land Corp. (Real Estate) | | | 49,618 | |
| | 6,073 | | | Clal Biotechnology Industries Ltd. (Pharmaceuticals, Biotechnology & Life Sciences)* | | | 25,238 | |
| | 18,117 | | | Clal Industries and Investments Ltd. (Capital Goods) | | | 66,471 | |
| | 5,371 | | | Clal Insurance Enterprises Holdings Ltd. (Insurance)* | | | 84,124 | |
| | 11,144 | | | Delek Automotive Systems Ltd. (Retailing) | | | 93,384 | |
| | 6,824 | | | Discount Investment Corp. (Registered) (Capital Goods)* | | | 34,567 | |
| | 2,791 | | | Elron Electronic Industries Ltd. (Diversified Financials)* | | | 13,268 | |
| | 2,225 | | | F.I.B.I. Holdings Ltd. (Banks)* | | | 32,239 | |
| | 1,784 | | | FMS Enterprises Migun Ltd. (Capital Goods) | | | 30,773 | |
| | 15,317 | | | Frutarom Industries Ltd. (Materials) | | | 146,062 | |
| | 9,039 | | | Gazit-Globe Ltd. (Real Estate) | | | 96,434 | |
| | 6,633 | | | Gilat Satellite Networks Ltd. (Technology Hardware & Equipment)* | | | 27,115 | |
| | 3,146 | | | Harel Insurance Investments & Financial Services Ltd. (Insurance) | | | 119,969 | |
| | 12,448 | | | Hot Telecommunication System Ltd. (Media) | | | 125,477 | |
| | 1,133 | | | Ituran Location and Control Ltd. (Technology Hardware & Equipment) | | | 15,491 | |
| | 3,425 | | | J.O.E.L. Jerusalem Oil Exploration (Real Estate)* | | | 66,324 | |
| | 5,770 | | | Jerusalem Economy Ltd. (Real Estate)* | | | 42,123 | |
| | 5,716 | | | Koor Industries Ltd. (Capital Goods)* | | | 83,096 | |
| | 2,507 | | | Melisron Ltd. (Real Estate) | | | 46,588 | |
| | |
| | | | | | | | |
Shares | | | Description | | Value | |
| | | | | | | | |
| | Common Stocks – (continued) | |
| Israel – (continued) | |
| | 6,423 | | | Mellanox Technologies Ltd. (Semiconductors & Semiconductor Equipment)* | | $ | 369,013 | |
| | 4,154 | | | Migdal Insurance & Financial Holding Ltd. (Insurance)* | | | 6,109 | |
| | 4,433 | | | Nitsba Holdings 1995 Ltd. (Real Estate)* | | | 39,004 | |
| | 114,656 | | | Oil Refineries Ltd. (Energy)* | | | 66,664 | |
| | 16,971 | | | Ormat Industries Ltd. (Capital Goods) | | | 84,231 | |
| | 6,138 | | | Osem Investments Ltd. (Food, Beverage & Tobacco) | | | 93,604 | |
| | 565 | | | Paz Oil Co. Ltd. (Energy) | | | 76,947 | |
| | 5,376 | | | Rami Levi Chain Stores Hashikma Marketing 2006 Ltd. (Food & Staples Retailing) | | | 184,095 | |
| | 6,899 | | | Retalix Ltd. (Software & Services)* | | | 145,585 | |
| | 7,207 | | | Shikun & Binui Ltd. (Capital Goods) | | | 12,802 | |
| | 14,386 | | | Shufersal Ltd. (Food & Staples Retailing) | | | 50,538 | |
| | 1,576 | | | The Israel Land Development Co. Ltd. (Media) | | | 11,242 | |
| | 8,556 | | | Tower Semiconductor Ltd. (Semiconductors & Semiconductor Equipment)* | | | 8,294 | |
| | 15,646 | | | Union Bank of Israel Ltd. (Banks)* | | | 55,541 | |
| | | | | | | | |
| | | | | | | 2,900,733 | |
| | |
| Italy – 2.4% | |
| | 71,582 | | | Autostrada Torino-Milano SpA (Transportation)(a) | | | 387,789 | |
| | 6,835 | | | Azimut Holding SpA (Diversified Financials) | | | 67,149 | |
| | 178,713 | | | Banca Popolare dell’Emilia Romagna Scrl (Banks)* | | | 1,098,001 | |
| | 125,490 | | | Banca Popolare di Sondrio Scarl (Banks)(a) | | | 845,524 | |
| | 23,071 | | | Banco di Desio e della Brianza SpA (Banks) | | | 83,331 | |
| | 31,695 | | | Cairo Communication SpA (Media) | | | 133,211 | |
| | 31,695 | | | Credito Emiliano SpA (Banks) | | | 129,760 | |
| | 22,094 | | | Danieli & C. Officine Meccaniche SpA (Capital Goods) | | | 627,113 | |
| | 116,075 | | | Danieli & C. Officine Meccaniche SpA RSP (Capital Goods) | | | 1,720,055 | |
| | 135,039 | | | Davide Campari-Milano SpA (Food, Beverage & Tobacco) | | | 954,738 | |
| | 54,744 | | | De’Longhi SpA (Consumer Durables & Apparel)(a) | | | 771,767 | |
| | 39,584 | | | Indesit Co. SpA (Consumer Durables & Apparel) | | | 230,268 | |
| | 61,468 | | | Mediolanum SpA (Insurance) | | | 252,045 | |
| | | | | | | | |
| | | | | | | 7,300,751 | |
| | |
| Japan – 26.8% | |
| | 9,700 | | | Able & Partners, Inc. (Real Estate) | | | 70,223 | |
| | 483 | | | Access Co. Ltd. (Software & Services)* | | | 206,940 | |
| | |
| | |
| The accompanying notes are an integral part of these financial statements. | | 37 |
GOLDMAN SACHS STRUCTURED INTERNATIONAL SMALL CAP FUND
Schedule of Investments (continued)
April 30, 2012 (Unaudited)
| | | | | | | | |
Shares | | | Description | | Value | |
| | | | | | | | |
| | Common Stocks – (continued) | |
| Japan – (continued) | |
| | 67,000 | | | ADEKA Corp. (Materials) | | $ | 615,544 | |
| | 16,700 | | | Aderans Co. Ltd. (Household & Personal Products)* | | | 186,215 | |
| | 75,000 | | | Aichi Corp. (Capital Goods) | | | 330,841 | |
| | 48,000 | | | Aichi Steel Corp. (Materials) | | | 228,837 | |
| | 22,100 | | | Aisan Industry Co. Ltd. (Automobiles & Components) | | | 234,151 | |
| | 32,600 | | | Alpen Co. Ltd. (Retailing) | | | 664,125 | |
| | 23,200 | | | Alpine Electronics, Inc. (Consumer Durables & Apparel) | | | 304,715 | |
| | 42,500 | | | Alps Electric Co. Ltd. (Technology Hardware & Equipment) | | | 386,554 | |
| | 40,600 | | | Amano Corp. (Capital Goods) | | | 363,236 | |
| | 4,400 | | | AOKI Holdings, Inc. (Retailing) | | | 86,284 | |
| | 39,600 | | | Aoyama Trading Co. Ltd. (Retailing) | | | 817,017 | |
| | 20,000 | | | Arc Land Sakamoto Co. Ltd. (Retailing) | | | 313,327 | |
| | 32,900 | | | Arcs Co. Ltd. (Food & Staples Retailing) | | | 707,212 | |
| | 42,600 | | | Arisawa Manufacturing Co. Ltd. (Technology Hardware & Equipment) | | | 155,991 | |
| | 4,500 | | | Asahi Diamond Industrial Co. Ltd. (Capital Goods) | | | 49,767 | |
| | 15,600 | | | ASKUL Corp. (Retailing) | | | 311,638 | |
| | 493,000 | | | Atsugi Co. Ltd. (Consumer Durables & Apparel) | | | 585,666 | |
| | 15,200 | | | Autobacs Seven Co. Ltd. (Retailing) | | | 729,497 | |
| | 47,600 | | | Avex Group Holdings, Inc. (Media) | | | 540,464 | |
| | 32,900 | | | Azbil Corp. (Technology Hardware & Equipment) | | | 704,847 | |
| | 115,800 | | | Belluna Co. Ltd. (Retailing) | | | 916,308 | |
| | 5,000 | | | BML, Inc. (Health Care Equipment & Services) | | | 125,872 | |
| | 17,700 | | | C. Uyemura & Co. Ltd. (Materials) | | | 708,362 | |
| | 81,000 | | | Calsonic Kansei Corp. (Automobiles & Components) | | | 455,685 | |
| | 30,500 | | | Century Tokyo Leasing Corp. (Diversified Financials) | | | 610,056 | |
| | 3,400 | | | Chiyoda Co. Ltd. (Retailing) | | | 79,236 | |
| | 55,000 | | | Chugai Ro Co. Ltd. (Capital Goods) | | | 180,488 | |
| | 51,200 | | | Coca-Cola Central Japan Co. Ltd. (Food, Beverage & Tobacco) | | | 670,857 | |
| | 6,600 | | | Cocokara fine, Inc. (Food & Staples Retailing) | | | 205,873 | |
| | 3,600 | | | CREATE SD HOLDINGS Co. Ltd. (Food & Staples Retailing) | | | 99,911 | |
| | 51,000 | | | Daifuku Co. Ltd. (Capital Goods) | | | 272,497 | |
| | 21,000 | | | Daiichi Jitsugyo Co. Ltd. (Capital Goods) | | | 107,510 | |
| | 82,100 | | | Daiichikosho Co. Ltd. (Media) | | | 1,657,463 | |
| | 435,000 | | | Daikyo, Inc. (Real Estate) | | | 1,134,559 | |
| | 98,000 | | | Daiwa Industries Ltd. (Capital Goods) | | | 497,050 | |
| | 34,400 | | | DCM Holdings Co. Ltd. (Retailing) | | | 261,182 | |
| | 13,300 | | | Denyo Co. Ltd. (Capital Goods) | | | 171,757 | |
| | 7,400 | | | Doutor Nichires Holdings Co. Ltd. (Consumer Services) | | | 100,676 | |
| | 44,700 | | | DTS Corp. (Software & Services) | | | 606,831 | |
| | |
| | | | | | | | |
Shares | | | Description | | Value | |
| | | | | | | | |
| | Common Stocks – (continued) | |
| Japan – (continued) | |
| | 23,000 | | | Dunlop Sports Co. Ltd. (Consumer Durables & Apparel) | | $ | 298,860 | |
| | 3,300 | | | Dydo Drinco, Inc. (Food, Beverage & Tobacco) | | | 134,197 | |
| | 133,000 | | | Ebara Corp. (Capital Goods) | | | 538,080 | |
| | 63,800 | | | EDION Corp. (Retailing) | | | 399,686 | |
| | 6,500 | | | Eizo Nanao Corp. (Technology Hardware & Equipment) | | | 125,205 | |
| | 70 | | | Frontier Real Estate Investment Corp. (REIT) | | | 592,382 | |
| | 35,100 | | | Fuji Machine Manufacturing Co. Ltd. (Capital Goods) | | | 721,539 | |
| | 59,000 | | | Fujikura Ltd. (Capital Goods) | | | 183,446 | |
| | 13,000 | | | Fukuyama Transporting Co. Ltd. (Transportation) | | | 70,996 | |
| | 112,000 | | | Furukawa-Sky Aluminum Corp. (Materials) | | | 333,197 | |
| | 24,700 | | | Furuno Electric Co. Ltd. (Technology Hardware & Equipment) | | | 122,477 | |
| | 14,200 | | | Fuyo General Lease Co. Ltd. (Diversified Financials) | | | 461,961 | |
| | 384 | | | Geo Holdings Corp. (Retailing) | | | 464,875 | |
| | 127 | | | Global One Real Estate Investment Corp. (REIT)(a) | | | 874,716 | |
| | 30,000 | | | Glory Ltd. (Capital Goods) | | | 645,174 | |
| | 13,210 | | | Goldcrest Co. Ltd. (Real Estate) | | | 226,610 | |
| | 3,400 | | | Growell Holdings Co. Ltd. (Food & Staples Retailing) | | | 109,168 | |
| | 13,420 | | | Gulliver International Co. Ltd. (Retailing) | | | 479,306 | |
| | 5,300 | | | Gurunavi, Inc. (Software & Services) | | | 59,305 | |
| | 52,600 | | | Hakuto Co. Ltd. (Technology Hardware & Equipment) | | | 509,466 | |
| | 34 | | | Hankyu REIT, Inc. (REIT) | | | 166,335 | |
| | 329 | | | Heiwa Real Estate REIT, Inc. (REIT) | | | 198,689 | |
| | 3,100 | | | HI-LEX Corp. (Automobiles & Components) | | | 53,913 | |
| | 42,000 | | | Hitachi Cable Ltd. (Capital Goods)* | | | 98,205 | |
| | 46,100 | | | Hitachi Transport System Ltd. (Transportation) | | | 843,677 | |
| | 4,800 | | | Hogy Medical Co. Ltd. (Health Care Equipment & Services) | | | 221,273 | |
| | 20,500 | | | Hokuetsu Kishu Paper Co. Ltd. (Materials) | | | 131,217 | |
| | 6,800 | | | Hokuto Corp. (Food, Beverage & Tobacco) | | | 146,461 | |
| | 11,800 | | | Hoshizaki Electric Co. Ltd. (Capital Goods) | | | 282,955 | |
| | 8,900 | | | House Foods Corp. (Food, Beverage & Tobacco) | | | 149,894 | |
| | 43,400 | | | IBJ Leasing Co. Ltd. (Diversified Financials) | | | 1,178,106 | |
| | 33,700 | | | Iida Home Max (Real Estate) | | | 278,476 | |
| | 69,200 | | | Inabata & Co. Ltd. (Capital Goods) | | | 454,793 | |
| | 49,000 | | | Iseki & Co. Ltd. (Capital Goods) | | | 116,571 | |
| | |
| | |
| 38 | | The accompanying notes are an integral part of these financial statements. |
GOLDMAN SACHS STRUCTURED INTERNATIONAL SMALL CAP FUND
| | | | | | | | |
Shares | | | Description | | Value | |
| | | | | | | | |
| | Common Stocks – (continued) | |
| Japan – (continued) | |
| | 218,000 | | | Ishihara Sangyo Kaisha Ltd. (Materials)* | | $ | 209,088 | |
| | 29,100 | | | IT Holdings Corp. (Software & Services) | | | 372,639 | |
| | 13,000 | | | Izumi Co. Ltd. (Retailing) | | | 270,827 | |
| | 10,400 | | | Jafco Co. Ltd. (Diversified Financials) | | | 245,811 | |
| | 17,700 | | | Japan Digital Laboratory Co. Ltd. (Technology Hardware & Equipment) | | | 192,659 | |
| | 284 | | | Japan Rental Housing Investments, Inc. (REIT) | | | 131,638 | |
| | 10,100 | | | Japan Securities Finance Co. Ltd. (Diversified Financials) | | | 52,201 | |
| | 19,500 | | | JVC Kenwood Corp. (Consumer Durables & Apparel) | | | 83,123 | |
| | 19,700 | | | kabu.com Securities Co. Ltd. (Diversified Financials) | | | 63,613 | |
| | 23,700 | | | Kaga Electronics Co. Ltd. (Technology Hardware & Equipment) | | | 251,265 | |
| | 41,000 | | | Kaken Pharmaceutical Co. Ltd. (Pharmaceuticals, Biotechnology & Life Sciences) | | | 507,060 | |
| | 49,500 | | | Kasumi Co. Ltd. (Food & Staples Retailing) | | | 358,205 | |
| | 11,100 | | | Kewpie Corp. (Food, Beverage & Tobacco) | | | 166,510 | |
| | 38,000 | | | Kinki Sharyo Co. Ltd. (Capital Goods) | | | 135,365 | |
| | 2,200 | | | Kintetsu World Express, Inc. (Transportation) | | | 78,767 | |
| | 26,000 | | | Kitz Corp. (Capital Goods) | | | 101,819 | |
| | 48,000 | | | Kiyo Holdings, Inc. (Banks) | | | 68,821 | |
| | 6,300 | | | Koa Corp. (Technology Hardware & Equipment) | | | 64,219 | |
| | 22,400 | | | Kohnan Shoji Co. Ltd. (Retailing) | | | 324,858 | |
| | 21,100 | | | Kojima Co. Ltd. (Retailing) | | | 100,488 | |
| | 57,300 | | | Komori Corp. (Capital Goods) | | | 501,189 | |
| | 126,000 | | | Kurabo Industries Ltd. (Consumer Durables & Apparel) | | | 234,816 | |
| | 36,000 | | | Kureha Corp. (Materials) | | | 171,876 | |
| | 28,200 | | | Kuroda Electric Co. Ltd. (Capital Goods) | | | 288,298 | |
| | 51,000 | | | Kyodo Printing Co. Ltd. (Commercial & Professional Services) | | | 140,026 | |
| | 106,000 | | | KYORIN Holdings, Inc. (Pharmaceuticals, Biotechnology & Life Sciences) | | | 2,034,767 | |
| | 48,000 | | | Lion Corp. (Household & Personal Products) | | | 277,296 | |
| | 13,700 | | | Macromill, Inc. (Software & Services) | | | 136,541 | |
| | 30,200 | | | Mandom Corp. (Household & Personal Products) | | | 764,103 | |
| | 43,000 | | | Marudai Food Co. Ltd. (Food, Beverage & Tobacco) | | | 166,195 | |
| | 63,000 | | | Maruzen Showa Unyu Co. Ltd. (Transportation) | | | 207,629 | |
| | 19,900 | | | Matsumotokiyoshi Holdings Co. Ltd. (Food & Staples Retailing) | | | 441,564 | |
| | |
| | | | | | | | |
Shares | | | Description | | Value | |
| | | | | | | | |
| | Common Stocks – (continued) | |
| Japan – (continued) | |
| | 12,100 | | | Matsuya Foods Co. Ltd. (Consumer Services) | | $ | 236,724 | |
| | 7,300 | | | Meitec Corp. (Commercial & Professional Services) | | | 150,024 | |
| | 42 | | | MID REIT, Inc. (REIT) | | | 116,379 | |
| | 1,600 | | | Milbon Co. Ltd. (Household & Personal Products) | | | 47,969 | |
| | 35,500 | | | Ministop Co. Ltd. (Food & Staples Retailing) | | | 626,256 | |
| | 135,000 | | | Mitsubishi Kakoki Kaisha Ltd. (Capital Goods) | | | 262,086 | |
| | 16,700 | | | Mitsubishi Pencil Co. Ltd. (Commercial & Professional Services) | | | 293,544 | |
| | 241,000 | | | Mitsubishi Steel Manufacturing Co. Ltd. (Materials) | | | 761,131 | |
| | 45,000 | | | Mitsui Engineering & Shipbuilding Co. Ltd. (Capital Goods) | | | 66,164 | |
| | 132,000 | | | Mitsui Sugar Co. Ltd. (Food, Beverage & Tobacco) | | | 431,083 | |
| | 115 | | | Mori Trust Sogo REIT, Inc. (REIT) | | | 1,016,848 | |
| | 8,540 | | | Nafco Co. Ltd. (Retailing) | | | 154,199 | |
| | 130,400 | | | Namura Shipbuilding Co. Ltd. (Capital Goods) | | | 516,540 | |
| | 22,100 | | | NEC Fielding Ltd. (Software & Services) | | | 277,423 | |
| | 24,600 | | | NET One Systems Co. Ltd. (Software & Services) | | | 335,606 | |
| | 25,600 | | | Nichiha Corp. (Capital Goods) | | | 312,979 | |
| | 11,000 | | | Nippo Corp. (Capital Goods) | | | 113,176 | |
| | 61 | | | Nippon Accommodations Fund, Inc. (REIT) | | | 402,794 | |
| | 177,000 | | | Nippon Beet Sugar Manufacturing Co. Ltd. (Food, Beverage & Tobacco) | | | 376,720 | |
| | 59,000 | | | Nippon Carbon Co. Ltd. (Capital Goods) | | | 160,460 | |
| | 20,000 | | | Nippon Chemi-Con Corp. (Technology Hardware & Equipment)* | | | 75,402 | |
| | 44,000 | | | Nippon Flour Mills Co. Ltd. (Food, Beverage & Tobacco) | | | 199,081 | |
| | 40,000 | | | Nippon Konpo Unyu Soko Co. Ltd. (Transportation) | | | 519,656 | |
| | 21,000 | | | Nippon Seiki Co. Ltd. (Automobiles & Components) | | | 264,900 | |
| | 40,000 | | | Nippon Shokubai Co. Ltd. (Materials) | | | 448,138 | |
| | 40,300 | | | Nippon Signal Co. Ltd. (Capital Goods) | | | 257,024 | |
| | 134,000 | | | Nippon Soda Co. Ltd. (Materials) | | | 578,552 | |
| | 76,000 | | | Nippon Thompson Co. Ltd. (Capital Goods) | | | 420,259 | |
| | 92,000 | | | Nippon Valqua Industries Ltd. (Materials) | | | 256,654 | |
| | 145,000 | | | Nishimatsu Construction Co. Ltd. (Capital Goods) | | | 311,975 | |
| | 25,000 | | | Nissan Shatai Co. Ltd. (Automobiles & Components) | | | 263,866 | |
| | 27,000 | | | Nissin Corp. (Transportation) | | | 64,992 | |
| | 19,000 | | | Nitto Kogyo Corp. (Capital Goods) | | | 275,996 | |
| | |
| | |
| The accompanying notes are an integral part of these financial statements. | | 39 |
GOLDMAN SACHS STRUCTURED INTERNATIONAL SMALL CAP FUND
Schedule of Investments (continued)
April 30, 2012 (Unaudited)
| | | | | | | | |
Shares | | | Description | | Value | |
| | | | | | | | |
| | Common Stocks – (continued) | |
| Japan – (continued) | |
| | 123,000 | | | NOF Corp. (Materials) | | $ | 619,073 | |
| | 5,700 | | | NS Solutions Corp. (Software & Services) | | | 110,761 | |
| | 4,500 | | | Ohsho Food Service Corp. (Consumer Services) | | | 111,355 | |
| | 12,000 | | | Okasan Securities Group, Inc. (Diversified Financials) | | | 47,451 | |
| | 20,000 | | | Okuwa Co. Ltd. (Food & Staples Retailing) | | | 273,818 | |
| | 13,000 | | | Osaka Steel Co. Ltd. (Materials) | | | 243,126 | |
| | 36,000 | | | Pacific Metals Co. Ltd. (Materials) | | | 174,198 | |
| | 3,300 | | | Paltac Corp. (Retailing) | | | 48,208 | |
| | 15,800 | | | Parco Co. Ltd. (Retailing) | | | 155,284 | |
| | 129 | | | PGM Holdings K K (Consumer Services) | | | 99,948 | |
| | 3,300 | | | Pigeon Corp. (Household & Personal Products) | | | 131,665 | |
| | 6,000 | | | Plenus Co. Ltd. (Consumer Services) | | | 116,484 | |
| | 2,020 | | | Point, Inc. (Retailing) | | | 74,600 | |
| | 22,300 | | | Pola Orbis Holdings, Inc. (Household & Personal Products) | | | 678,511 | |
| | 13,100 | | | Relo Holdings, Inc. (Real Estate) | | | 386,429 | |
| | 9,200 | | | Resorttrust, Inc. (Consumer Services) | | | 152,028 | |
| | 13,600 | | | Ricoh Leasing Co. Ltd. (Diversified Financials) | | | 308,053 | |
| | 23,600 | | | Riso Kagaku Corp. (Technology Hardware & Equipment) | | | 345,170 | |
| | 18,000 | | | Rohto Pharmaceutical Co. Ltd. (Pharmaceuticals, Biotechnology & Life Sciences) | | | 230,559 | |
| | 220,800 | | | Round One Corp. (Consumer Services) | | | 1,444,547 | |
| | 102,000 | | | Ryobi Ltd. (Capital Goods) | | | 366,933 | |
| | 99,000 | | | Sakai Chemical Industry Co. Ltd. (Materials) | | | 344,859 | |
| | 125,000 | | | San-Ai Oil Co. Ltd. (Energy) | | | 608,052 | |
| | 153,000 | | | Sankyu, Inc. (Transportation) | | | 607,071 | |
| | 31,200 | | | Sanshin Electronics Co. Ltd. (Technology Hardware & Equipment) | | | 236,698 | |
| | 20,000 | | | Sanyo Chemical Industries Ltd. (Materials) | | | 129,911 | |
| | 96,000 | | | Sapporo Hokuyo Holdings, Inc. (Banks) | | | 335,339 | |
| | 374,000 | | | Sapporo Holdings Ltd. (Food, Beverage & Tobacco) | | | 1,307,307 | |
| | 163,000 | | | Sasebo Heavy Industries Co. Ltd. (Capital Goods) | | | 244,745 | |
| | 90,000 | | | Seika Corp. (Capital Goods) | | | 260,727 | |
| | 49,000 | | | Seino Holdings Corp. (Transportation) | | | 339,426 | |
| | 72 | | | Sekisui House SI Investment Co. (REIT) | | | 288,477 | |
| | 20,000 | | | Sekisui Jushi Corp. (Capital Goods) | | | 196,491 | |
| | 31,000 | | | Sekisui Plastics Co. Ltd. (Materials) | | | 107,233 | |
| | 60,000 | | | Senko Co. Ltd. (Transportation) | | | 262,978 | |
| | 29,600 | | | Shimachu Co. Ltd. (Retailing) | | | 666,809 | |
| | 51,500 | | | Shinko Shoji Co. Ltd. (Technology Hardware & Equipment) | | | 432,409 | |
| | 89,000 | | | Shinmaywa Industries Ltd. (Capital Goods) | | | 430,575 | |
| | |
| | | | | | | | |
Shares | | | Description | | Value | |
| | | | | | | | |
| | Common Stocks – (continued) | |
| Japan – (continued) | |
| | 80,000 | | | Shinsho Corp. (Capital Goods) | | $ | 180,874 | |
| | 10,200 | | | Ship Healthcare Holdings, Inc. (Health Care Equipment & Services) | | | 241,117 | |
| | 27,000 | | | Shizuoka Gas Co. Ltd. (Utilities) | | | 195,213 | |
| | 21,200 | | | Showa Corp. (Automobiles & Components) | | | 185,048 | |
| | 20,100 | | | Sintokogio Ltd. (Capital Goods) | | | 211,029 | |
| | 2,943 | | | SKY Perfect JSAT Holdings, Inc. (Media) | | | 1,281,738 | |
| | 122,800 | | | Sodick Co. Ltd. (Capital Goods) | | | 619,450 | |
| | 6,600 | | | St. Marc Holdings Co. Ltd. (Consumer Services) | | | 255,464 | |
| | 38,000 | | | Star Micronics Co. Ltd. (Technology Hardware & Equipment) | | | 402,968 | |
| | 22,000 | | | Sumitomo Precision Products Co. Ltd. (Capital Goods) | | | 119,872 | |
| | 6,430 | | | Sumitomo Real Estate Sales Co. Ltd. (Real Estate) | | | 308,434 | |
| | 48,000 | | | Sumitomo Seika Chemicals Co. Ltd. (Materials) | | | 209,053 | |
| | 6,300 | | | Tachi-S Co. Ltd. Class S (Automobiles & Components) | | | 120,440 | |
| | 31,000 | | | Taihei Kogyo Co. Ltd. (Capital Goods) | | | 162,674 | |
| | 37,000 | | | Takiron Co. Ltd. (Materials) | | | 130,274 | |
| | 25,800 | | | Tecmo Koei Holdings Co. Ltd. (Software & Services) | | | 217,789 | |
| | 113,000 | | | The Bank of Nagoya Ltd. (Banks) | | | 363,602 | |
| | 17,600 | | | The Bank of Okinawa Ltd. (Banks) | | | 734,031 | |
| | 11,800 | | | The Chiba Kogyo Bank Ltd. (Banks)* | | | 61,226 | |
| | 28,000 | | | The Hokkoku Bank Ltd. (Banks) | | | 99,300 | |
| | 133,000 | | | The Keiyo Bank Ltd. (Banks) | | | 618,760 | |
| | 7,000 | | | The Musashino Bank Ltd. (Banks) | | | 228,074 | |
| | 21,000 | | | The Nippon Synthetic Chemical Industry Co. Ltd. (Materials) | | | 124,221 | |
| | 43,000 | | | The San-In Godo Bank Ltd. (Banks) | | | 309,167 | |
| | 93,000 | | | The Sumitomo Warehouse Co. Ltd. (Transportation) | | | 444,356 | |
| | 141,000 | | | The Toho Bank Ltd. (Banks) | | | 453,513 | |
| | 13,000 | | | The Tokyo Tomin Bank Ltd. (Banks) | | | 148,398 | |
| | 2,500 | | | The Yachiyo Bank Ltd. (Banks) | | | 56,722 | |
| | 100,000 | | | The Yokohama Rubber Co. Ltd. (Automobiles & Components) | | | 731,003 | |
| | 9,500 | | | TKC Corp. (Software & Services) | | | 205,771 | |
| | 188,000 | | | Toa Corp. (Capital Goods) | | | 340,281 | |
| | 180,000 | | | Toagosei Co. Ltd. (Materials) | | | 779,288 | |
| | 9,600 | | | Tocalo Co. Ltd. (Capital Goods) | | | 172,992 | |
| | 13,200 | | | Tohokushinsha Film Corp. (Media) | | | 115,522 | |
| | 9,200 | | | Tokai Rika Co. Ltd. (Automobiles & Components) | | | 171,369 | |
| | 7,800 | | | Tokai Rubber Industries Ltd. (Automobiles & Components) | | | 92,276 | |
| | 122,000 | | | Tokai Tokyo Financial Holdings, Inc. (Diversified Financials) | | | 434,500 | |
| | 4,500 | | | Tokyo Seimitsu Co. Ltd. (Semiconductors & Semiconductor Equipment) | | | 92,501 | |
| | |
| | |
| 40 | | The accompanying notes are an integral part of these financial statements. |
GOLDMAN SACHS STRUCTURED INTERNATIONAL SMALL CAP FUND
| | | | | | | | |
Shares | | | Description | | Value | |
| | | | | | | | |
| | Common Stocks – (continued) | |
| Japan – (continued) | |
| | 164,000 | | | Tokyo Tatemono Co. Ltd. (Real Estate)* | | $ | 605,579 | |
| | 20,300 | | | Tokyu Livable, Inc. (Real Estate) | | | 224,303 | |
| | 203 | | | Tokyu REIT, Inc. (REIT) | | | 1,046,169 | |
| | 27,200 | | | TOMONY Holdings, Inc. (Banks) | | | 124,358 | |
| | 22,700 | | | Toppan Forms Co. Ltd. (Commercial & Professional Services) | | | 204,153 | |
| | 50,900 | | | Topre Corp. (Automobiles & Components) | | | 479,018 | |
| | 28,000 | | | Torii Pharmaceutical Co. Ltd. (Pharmaceuticals, Biotechnology & Life Sciences) | | | 525,029 | |
| | 118,000 | | | Toshiba TEC Corp. (Technology Hardware & Equipment) | | | 477,592 | |
| | 9,000 | | | Touei Housing Corp. (Consumer Durables & Apparel) | | | 90,042 | |
| | 47,000 | | | Toyo Ink SC Holdings Co. Ltd. (Materials) | | | 188,003 | |
| | 57,000 | | | Toyo Tire & Rubber Co. Ltd. (Automobiles & Components) | | | 155,393 | |
| | 63,000 | | | Tsubakimoto Chain Co. (Capital Goods) | | | 382,773 | |
| | 15,000 | | | Tsukishima Kikai Co. Ltd. (Capital Goods) | | | 127,320 | |
| | 900 | | | Tsuruha Holdings, Inc. (Food & Staples Retailing) | | | 53,921 | |
| | 116 | | | TV Asahi Corp. (Media) | | | 173,259 | |
| | 33,000 | | | Universal Entertainment Corp. (Consumer Durables & Apparel) | | | 759,299 | |
| | 34,600 | | | UNY Co. Ltd. (Food & Staples Retailing) | | | 402,082 | |
| | 24,030 | | | Usen Corp. (Media)* | | | 23,648 | |
| | 19 | | | V Technology Co. Ltd. (Technology Hardware & Equipment) | | | 58,889 | |
| | 3,600 | | | Yellow Hat Ltd. (Retailing) | | | 62,444 | |
| | 21,000 | | | Yodogawa Steel Works Ltd. (Materials) | | | 83,648 | |
| | 9,600 | | | Yokohama Reito Co. Ltd. (Food & Staples Retailing) | | | 74,963 | |
| | 38,500 | | | Yonekyu Corp. (Food, Beverage & Tobacco) | | | 370,110 | |
| | 18,300 | | | Yorozu Corp. (Automobiles & Components) | | | 368,570 | |
| | 19,200 | | | Zensho Holdings Co. Ltd. (Consumer Services) | | | 239,100 | |
| | | | | | | | |
| | | | | | | 80,699,634 | |
| | |
| Luxembourg – 0.1% | |
| | 9,569 | | | Oriflame Cosmetics SA (Household & Personal Products) | | | 343,490 | |
| | |
| Netherlands – 1.5% | |
| | 7,838 | | | Aalberts Industries NV (Capital Goods) | | | 150,423 | |
| | 15,239 | | | Accell Group NV (Consumer Durables & Apparel) | | | 306,858 | |
| | 14,214 | | | ASM International NV (Semiconductors & Semiconductor Equipment) | | | 503,205 | |
| | 27,536 | | | Beter Bed Holding NV (Retailing) | | | 561,344 | |
| | |
| | | | | | | | |
Shares | | | Description | | Value | |
| | | | | | | | |
| | Common Stocks – (continued) | |
| Netherlands – (continued) | |
| | 5,721 | | | Brunel International NV (Commercial & Professional Services) | | $ | 268,140 | |
| | 31,022 | | | Eurocommercial Properties NV CVA (REIT) | | | 1,088,347 | |
| | 7,241 | | | Nutreco NV (Food, Beverage & Tobacco) | | | 526,256 | |
| | 44,043 | | | USG People NV (Commercial & Professional Services) | | | 416,671 | |
| | 16,211 | | | Vastned Retail NV (REIT) | | | 796,785 | |
| | | | | | | | |
| | | | | | | 4,618,029 | |
| | |
| New Zealand – 0.6% | |
| | 158,941 | | | Air New Zealand Ltd. (Transportation) | | | 115,554 | |
| | 194,088 | | | Chorus Ltd. (Telecommunication Services)* | | | 541,998 | |
| | 256,644 | | | New Zealand Oil & Gas Ltd. (Energy) | | | 161,317 | |
| | 74,773 | | | Ryman Healthcare Ltd. (Health Care Equipment & Services) | | | 193,593 | |
| | 165,589 | | | Sky Network Television Ltd. (Media) | | | 738,007 | |
| | 45,288 | | | The Warehouse Group Ltd. (Retailing) | | | 98,591 | |
| | | | | | | | |
| | | | | | | 1,849,060 | |
| | |
| Norway – 2.1% | |
| | 6,473 | | | Aker ASA Class A (Diversified Financials) | | | 211,690 | |
| | 34,993 | | | Atea ASA (Software & Services) | | | 372,797 | |
| | 59,164 | | | Cermaq ASA (Food, Beverage & Tobacco)* | | | 808,477 | |
| | 329,184 | | | Kvaerner ASA (Energy) | | | 973,462 | |
| | 17,167 | | | Leroey Seafood Group ASA (Food, Beverage & Tobacco) | | | 269,971 | |
| | 34,392 | | | Opera Software ASA (Software & Services) | | | 222,245 | |
| | 34,858 | | | Schibsted ASA (Media) | | | 1,330,788 | |
| | 39,948 | | | SpareBank 1 SMN (Banks)(a) | | | 247,129 | |
| | 23,628 | | | Statoil Fuel & Retail ASA (Retailing)(a) | | | 211,727 | |
| | 68,374 | | | Storebrand ASA (Insurance)* | | | 307,374 | |
| | 406,000 | | | STX OSV Holdings Ltd. (Capital Goods) | | | 521,897 | |
| | 31,064 | | | TGS Nopec Geophysical Co. ASA (Energy) | | | 901,869 | |
| | | | | | | | |
| | | | | | | 6,379,426 | |
| | |
| Portugal – 0.2% | |
| | 296,012 | | | Mota-Engil SGPS SA (Capital Goods) | | | 487,547 | |
| | 22,070 | | | REN - Redes Energeticas Nacionais SA (Utilities) | | | 58,360 | |
| | | | | | | | |
| | | | | | | 545,907 | |
| | |
| Singapore – 2.4% | |
| | 285,000 | | | AIMS AMP Capital Industrial REIT (REIT) | | | 278,090 | |
| | 122,000 | | | Ascott Residence Trust (REIT) | | | 110,254 | |
| | 24,000 | | | Boustead Singapore Ltd. (Energy) | | | 16,848 | |
| | 218,000 | | | Cache Logistics Trust (REIT) | | | 182,215 | |
| | 181,000 | | | Cambridge Industrial Trust (REIT) | | | 78,952 | |
| | |
| | |
| The accompanying notes are an integral part of these financial statements. | | 41 |
GOLDMAN SACHS STRUCTURED INTERNATIONAL SMALL CAP FUND
Schedule of Investments (continued)
April 30, 2012 (Unaudited)
| | | | | | | | |
Shares | | | Description | | Value | |
| | | | | | | | |
| | Common Stocks – (continued) | |
| Singapore – (continued) | |
| | 631,000 | | | CapitaCommercial Trust (REIT) | | $ | 656,252 | |
| | 211,000 | | | China Aviation Oil Singapore Corp. Ltd. (Energy) | | | 192,969 | |
| | 153,000 | | | CWT Ltd. (Transportation)* | | | 150,694 | |
| | 88,000 | | | First Resources Ltd. (Food, Beverage & Tobacco) | | | 133,305 | |
| | 12,000 | | | Frasers Centrepoint Trust (REIT) | | | 15,425 | |
| | 350,800 | | | Frasers Commercial Trust (REIT) | | | 260,570 | |
| | 106,000 | | | GuocoLeisure Ltd. (Consumer Services) | | | 50,784 | |
| | 360,000 | | | Hi-P International Ltd. (Technology Hardware & Equipment) | | | 258,834 | |
| | 218,000 | | | Ho Bee Investment Ltd. (Real Estate) | | | 242,506 | |
| | 39,000 | | | Hong Leong Asia Ltd. (Capital Goods) | | | 57,631 | |
| | 317,000 | | | Indofood Agri Resources Ltd. (Food, Beverage & Tobacco)* | | | 363,277 | |
| | 51,000 | | | K-Green Trust (Commercial & Professional Services) | | | 40,565 | |
| | 95,000 | | | KS Energy Ltd. (Capital Goods)* | | | 69,775 | |
| | 672,000 | | | Lippo Malls Indonesia Retail Trust (REIT) | | | 222,408 | |
| | 252,160 | | | Mapletree Logistics Trust (REIT) | | | 199,239 | |
| | 180,383 | | | Miclyn Express Offshore Ltd. (Energy) | | | 388,950 | |
| | 105,000 | | | Overseas Union Enterprise Ltd. (Consumer Services) | | | 198,996 | |
| | 99,000 | | | Parkway Life Real Estate Investment Trust (REIT) | | | 147,796 | |
| | 159,000 | | | Sabana Shari’ah Compliant Industrial Real Estate Investment Trust (REIT) | | | 123,171 | |
| | 118,000 | | | Singapore Post Ltd. (Transportation) | | | 96,735 | |
| | 187,000 | | | SMRT Corp. Ltd. (Transportation) | | | 253,540 | |
| | 61,000 | | | Stamford Land Corp. Ltd. (Consumer Services) | | | 27,024 | |
| | 878,000 | | | Starhill Global REIT (REIT) | | | 464,115 | |
| | 251,000 | | | Suntec Real Estate Investment Trust (REIT) | | | 264,886 | |
| | 19,000 | | | Super Group Ltd. (Food, Beverage & Tobacco) | | | 29,139 | |
| | 597,000 | | | Swiber Holdings Ltd. (Energy)* | | | 280,725 | |
| | 183,600 | | | UOB-Kay Hian Holdings Ltd. (Diversified Financials) | | | 254,024 | |
| | 72,000 | | | Venture Corp. Ltd. (Technology Hardware & Equipment) | | | 498,715 | |
| | 558,000 | | | Wing Tai Holdings Ltd. (Real Estate) | | | 532,437 | |
| | | | | | | | |
| | | | | | | 7,140,846 | |
| | |
| Spain – 1.3% | |
| | 11,809 | | | Baron de Ley SA (Food, Beverage & Tobacco)* | | | 656,526 | |
| | 38,879 | | | Bolsas y Mercados Espanoles SA (Diversified Financials)(a) | | | 916,406 | |
| | 4,613 | | | Corp. Financiera Alba (Diversified Financials) | | | 178,460 | |
| | 11,504 | | | Grupo Catalana Occidente SA (Insurance) | | | 161,806 | |
| | 24,156 | | | Melia Hotels International SA (Consumer Services) | | | 144,448 | |
| | |
| | | | | | | | |
Shares | | | Description | | Value | |
| | | | | | | | |
| | Common Stocks – (continued) | |
| Spain – (continued) | |
| | 8,912 | | | Tecnicas Reunidas SA (Energy) | | $ | 347,972 | |
| | 29,928 | | | Viscofan SA (Food, Beverage & Tobacco) | | | 1,354,677 | |
| | | | | | | | |
| | | | | | | 3,760,295 | |
| | |
| Sweden – 3.3% | |
| | 44,906 | | | Betsson AB (Consumer Services)* | | | 1,473,786 | |
| | 33,089 | | | Bilia AB Class A (Retailing) | | | 636,294 | |
| | 18,527 | | | Castellum AB (Real Estate) | | | 234,595 | |
| | 13,152 | | | Clas Ohlson AB Class B (Retailing) | | | 193,993 | |
| | 8,200 | | | D. Carnegie & Co. AB (Diversified Financials)* | | | — | |
| | 76,016 | | | East Capital Explorer AB (Diversified Financials) | | | 591,050 | |
| | 113,194 | | | Fabege AB (Real Estate) | | | 955,687 | |
| | 4,180 | | | Hakon Invest AB (Food & Staples Retailing) | | | 61,037 | |
| | 94,393 | | | Haldex AB (Capital Goods) | | | 589,250 | |
| | 10,631 | | | Hexpol AB (Capital Goods) | | | 394,150 | |
| | 7,920 | | | Hoganas AB Class B (Materials) | | | 307,246 | |
| | 58,043 | | | Industrial & Financial Systems AB Class B (Software & Services) | | | 993,103 | |
| | 10,008 | | | Loomis AB Class B (Commercial & Professional Services) | | | 135,272 | |
| | 7,240 | | | Lundbergforetagen AB Class B (Diversified Financials) | | | 234,837 | |
| | 5,277 | | | Mekonomen AB (Retailing)* | | | 168,800 | |
| | 6,313 | | | Oresund Investment AB (Diversified Financials)* | | | 92,403 | |
| | 73,283 | | | Saab AB Class B (Capital Goods) | | | 1,218,785 | |
| | 130,208 | | | Trelleborg AB Class B (Capital Goods) | | | 1,493,004 | |
| | 20,570 | | | Wallenstam AB Class B (Real Estate) | | | 205,109 | |
| | 5,810 | | | Wihlborgs Fastigheter AB (Real Estate) | | | 80,706 | |
| | | | | | | | |
| | | | | | | 10,059,107 | |
| | |
| Switzerland – 4.6% | |
| | 1,249 | | | Acino Holding AG (Registered) (Pharmaceuticals, Biotechnology & Life Sciences)* | | | 163,754 | |
| | 209 | | | Banque Cantonale Vaudoise (Registered) (Banks) | | | 118,294 | |
| | 1,182 | | | Bossard Holding AG (Capital Goods) | | | 179,833 | |
| | 7,521 | | | Coltene Holding AG (Registered) (Health Care Equipment & Services)* | | | 249,024 | |
| | 2,022 | | | Dufry AG (Registered) (Retailing)* | | | 274,617 | |
| | 1,294 | | | Flughafen Zuerich AG (Registered) (Transportation) | | | 481,864 | |
| | 937 | | | Forbo Holding AG (Registered) (Consumer Durables & Apparel)* | | | 677,959 | |
| | 2,217 | | | Galenica AG (Registered) (Pharmaceuticals, Biotechnology & Life Sciences) | | | 1,513,011 | |
| | 2,592 | | | Georg Fischer AG (Registered) (Capital Goods)* | | | 1,150,086 | |
| | 5,385 | | | Inficon Holding AG (Registered) (Technology Hardware & Equipment)* | | | 1,219,155 | |
| | |
| | |
| 42 | | The accompanying notes are an integral part of these financial statements. |
GOLDMAN SACHS STRUCTURED INTERNATIONAL SMALL CAP FUND
| | | | | | | | |
Shares | | | Description | | Value | |
| | | | | | | | |
| | Common Stocks – (continued) | |
| Switzerland – (continued) | |
| | 250,971 | | | Informa PLC (Media) | | $ | 1,689,112 | |
| | 121 | | | Intershop Holdings (Real Estate) | | | 43,459 | |
| | 24,279 | | | PSP Swiss Property AG (Registered) (Real Estate)* | | | 2,181,837 | |
| | 5,749 | | | Rieter Holding AG (Registered) (Capital Goods)* | | | 1,001,115 | |
| | 4,972 | | | Schweizerische National-Versicherungs-Gesellschaft (Registered) Class V (Insurance) | | | 193,369 | |
| | 468 | | | Siegfried Holding AG (Registered) (Pharmaceuticals, Biotechnology & Life Sciences)* | | | 53,638 | |
| | 19,675 | | | Swiss Prime Site AG (Registered) (Real Estate)* | | | 1,640,909 | |
| | 291,912 | | | Swisslog Holding AG (Registered) (Capital Goods)* | | | 299,777 | |
| | 6,072 | | | Tecan Group AG (Registered) (Pharmaceuticals, Biotechnology & Life Sciences)* | | | 461,931 | |
| | 3,171 | | | Valiant Holding (Registered) (Banks) | | | 385,457 | |
| | | | | | | | |
| | | | | | | 13,978,201 | |
| | |
| United Kingdom – 19.8% | |
| | 237,598 | | | Aegis Group PLC (Media) | | | 685,535 | |
| | 55,528 | | | Anglo Pacific Group PLC (Energy) | | | 288,505 | |
| | 105,823 | | | BBA Aviation PLC (Transportation) | | | 339,393 | |
| | 148,927 | | | Berendsen PLC (Commercial & Professional Services) | | | 1,245,387 | |
| | 113,996 | | | Big Yellow Group PLC (REIT) | | | 548,454 | |
| | 240,388 | | | Bodycote PLC (Capital Goods) | | | 1,660,194 | |
| | 231,460 | | | Britvic PLC (Food, Beverage & Tobacco) | | | 1,436,070 | |
| | 58,142 | | | Cairn Energy PLC (Energy)* | | | 325,769 | |
| | 34,856 | | | Capital & Counties Properties PLC (Real Estate) | | | 112,597 | |
| | 50,542 | | | Chesnara PLC (Insurance) | | | 144,504 | |
| | 39,562 | | | Cineworld Group PLC (Media) | | | 130,359 | |
| | 143,572 | | | Computacenter PLC (Software & Services) | | | 967,720 | |
| | 24,531 | | | Concentric AB (Capital Goods) | | | 220,905 | |
| | 78,995 | | | Croda International PLC (Materials) | | | 2,861,099 | |
| | 134,474 | | | Dairy Crest Group PLC (Food, Beverage & Tobacco) | | | 657,097 | |
| | 395,920 | | | Debenhams PLC (Retailing) | | | 530,885 | |
| | 27,736 | | | Derwent London PLC (REIT) | | | 784,273 | |
| | 259,675 | | | Devro PLC (Food, Beverage & Tobacco) | | | 1,299,563 | |
| | 179,619 | | | Diploma PLC (Technology Hardware & Equipment) | | | 1,337,352 | |
| | 134,392 | | | Drax Group PLC (Utilities) | | | 1,184,192 | |
| | 351,667 | | | DS Smith PLC (Materials) | | | 957,945 | |
| | 446,774 | | | Elementis PLC (Materials) | | | 1,508,580 | |
| | 1,592,805 | | | EnQuest PLC (Energy)* | | | 3,276,756 | |
| | 54,545 | | | F&C Asset Management PLC (Diversified Financials) | | | 59,618 | |
| | 195,905 | | | Fenner PLC (Capital Goods) | | | 1,433,687 | |
| | |
| | | | | | | | |
Shares | | | Description | | Value | |
| | | | | | | | |
| | Common Stocks – (continued) | |
| United Kingdom – (continued) | |
| | 22,460 | | | Filtrona PLC (Materials) | | $ | 169,358 | |
| | 78,292 | | | Grainger PLC (Real Estate) | | | 126,086 | |
| | 45,823 | | | Great Portland Estates PLC (REIT) | | | 267,835 | |
| | 211,854 | | | Greene King PLC (Consumer Services) | | | 1,755,581 | |
| | 154,132 | | | Gulfsands Petroleum PLC (Energy)* | | | 314,599 | |
| | 336,278 | | | Halfords Group PLC (Retailing) | | | 1,501,694 | |
| | 25,518 | | | Helical Bar PLC (Real Estate) | | | 78,594 | |
| | 89,290 | | | Home Retail Group PLC (Retailing) | | | 154,469 | |
| | 280,853 | | | Homeserve PLC (Commercial & Professional Services) | | | 1,151,033 | |
| | 259,962 | | | IG Group Holdings PLC (Diversified Financials) | | | 1,953,362 | |
| | 417,446 | | | Intermediate Capital Group PLC (Diversified Financials) | | | 1,740,245 | |
| | 134,008 | | | Interserve PLC (Capital Goods) | | | 621,980 | |
| | 59,432 | | | ITE Group PLC (Commercial & Professional Services) | | | 217,954 | |
| | 49,978 | | | JKX Oil & Gas PLC (Energy) | | | 111,319 | |
| | 194,671 | | | John Wood Group PLC (Energy) | | | 2,472,016 | |
| | 427,336 | | | Ladbrokes PLC (Consumer Services) | | | 1,244,515 | |
| | 188,726 | | | Laird PLC (Technology Hardware & Equipment) | | | 662,486 | |
| | 31,982 | | | Lavendon Group PLC (Capital Goods) | | | 62,544 | |
| | 67,745 | | | London & Stamford Property PLC (REIT) | | | 122,034 | |
| | 828,213 | | | Marston’s PLC (Consumer Services) | | | 1,311,647 | |
| | 61,072 | | | Mcbride PLC (Household & Personal Products)* | | | 125,905 | |
| | 1,221,440 | | | Mcbride PLC Preference Shares (Household & Personal Products)* | | | 1,982 | |
| | 254,108 | | | Melrose PLC (Capital Goods) | | | 1,803,145 | |
| | 232,015 | | | Micro Focus International PLC (Software & Services) | | | 1,751,892 | |
| | 15,769 | | | Millennium & Copthorne Hotels PLC (Consumer Services) | | | 124,359 | |
| | 182,590 | | | Mitie Group PLC (Commercial & Professional Services) | | | 864,569 | |
| | 190,600 | | | Mondi PLC (Materials) | | | 1,772,279 | |
| | 72,512 | | | Moneysupermarket.com Group PLC (Software & Services) | | | 156,976 | |
| | 39,170 | | | N Brown Group PLC (Retailing) | | | 145,729 | |
| | 337,454 | | | Pace PLC (Consumer Durables & Apparel) | | | 398,522 | |
| | 163,304 | | | Paragon Group of Companies PLC (Banks) | | | 477,231 | |
| | 71,818 | | | Pennon Group PLC (Utilities) | | | 857,500 | |
| | 129,742 | | | Premier Oil PLC (Energy)* | | | 789,539 | |
| | 27,614 | | | Primary Health Properties PLC (REIT) | | | 149,725 | |
| | 40,070 | | | Provident Financial PLC (Diversified Financials) | | | 751,761 | |
| | 70,928 | | | QinetiQ Group PLC (Capital Goods) | | | 176,163 | |
| | 2,835 | | | Rathbone Brothers PLC (Diversified Financials) | | | 60,874 | |
| | 101,701 | | | Raven Russia Ltd. (Real Estate) | | | 102,744 | |
| | |
| | |
| The accompanying notes are an integral part of these financial statements. | | 43 |
GOLDMAN SACHS STRUCTURED INTERNATIONAL SMALL CAP FUND
Schedule of Investments (continued)
April 30, 2012 (Unaudited)
| | | | | | | | |
Shares | | | Description | | Value | |
| | | | | | | | |
| | Common Stocks – (continued) | |
| United Kingdom – (continued) | |
| | 6,107 | | | Renishaw PLC (Technology Hardware & Equipment) | | $ | 143,668 | |
| | 10,790 | | | Rightmove PLC (Media) | | | 269,964 | |
| | 155,826 | | | RPS Group PLC (Commercial & Professional Services) | | | 599,658 | |
| | 14,296 | | | SDL PLC (Software & Services) | | | 165,358 | |
| | 469,725 | | | Senior PLC (Capital Goods) | | | 1,624,129 | |
| | 14,405 | | | Shaftesbury PLC (REIT) | | | 119,590 | |
| | 119,006 | | | Songbird Estates PLC (Real Estate)* | | | 225,968 | |
| | 31,691 | | | Spectris PLC (Technology Hardware & Equipment) | | | 970,326 | |
| | 552,078 | | | Speedy Hire PLC (Capital Goods) | | | 246,842 | |
| | 141,346 | | | Spirit Pub Co. PLC (Consumer Services)* | | | 127,312 | |
| | 84,151 | | | ST Modwen Properties PLC (Real Estate) | | | 229,241 | |
| | 7,195 | | | Telecom Plus PLC (Utilities) | | | 79,803 | |
| | 98,568 | | | Tetragon Financial Group Ltd. (Diversified Financials) | | | 772,633 | |
| | 415,387 | | | TT electronics PLC (Technology Hardware & Equipment) | | | 1,281,100 | |
| | 5,906 | | | Ultra Electronics Holdings PLC (Capital Goods) | | | 161,461 | |
| | 12,467 | | | Valiant Petroleum PLC (Energy)* | | | 118,361 | |
| | 295,914 | | | William Hill PLC (Consumer Services) | | | 1,351,688 | |
| | 16,074 | | | WS Atkins PLC (Commercial & Professional Services) | | | 189,833 | |
| | 101,725 | | | WSP Group PLC (Commercial & Professional Services) | | | 414,787 | |
| | | | | | | | |
| | | | | | | 59,638,407 | |
| | |
| | TOTAL COMMON STOCKS | |
| | (Cost $262,546,025) | | $ | 290,726,741 | |
| | |
| | | | | | | | |
| | Investment Companies – 0.2% | |
| Australia – 0.2% | |
| | 174,391 | | | Challenger Infrastructure Fund Class A(a) | | $ | 216,198 | |
| | 167,798 | | | Hastings Diversified Utilities Fund | | | 360,051 | |
| | |
| | TOTAL INVESTMENT COMPANIES | |
| | (Cost $461,040) | | $ | 576,249 | |
| | |
| | | | | | | | | | | | |
| Units | | | Description | | Expiration
Month | | | Value | |
| | | | | | | | | | | | |
| | Rights* – 0.0% | |
| Australia – 0.0% | |
| | 127,482 | | | Beach Energy Ltd. (Energy) | | | 05/12 | | | $ | — | |
| | |
| Israel – 0.0% | | | | | |
| | 679 | | | Africa-Israel Investments Ltd. (Real Estate) | | | 05/12 | | | | 152 | |
| | |
| | TOTAL RIGHTS | | | | | |
| | (Cost $0) | | | $ | 152 | |
| | |
| | | | | | | | | | | | |
| | Warrants* – 0.0% | |
| France – 0.0% | | | | | |
| | 13,992 | | | Mersen (Capital Goods) | | | 11/12 | | | $ | — | |
| | 56,200 | | | UBISOFT Entertainment (Software & Services) | | | 10/13 | | | | 2,009 | |
| | | | | | | | | | | | |
| | | | | | | | | | | 2,009 | |
| | �� |
| Netherlands – 0.0% | | | | | |
| | 34,444 | | | Nieuwe Steen Investments NV (REIT) | | | 04/13 | | | | — | |
| | |
| | TOTAL WARRANTS | |
| | (Cost $0) | | | $ | 2,009 | |
| | |
| TOTAL INVESTMENTS BEFORE SECURITIES
LENDING REINVESTMENT VEHICLE |
|
| | (Cost $263,007,065) | | | $ | 291,305,151 | |
| | |
| | | | | | | | |
Shares | | | Rate | | Value | |
| | | | | | | | |
| | Securities Lending Reinvestment Vehicle(b)(c) – 5.0% | |
| Goldman Sachs Financial Square Money Market Fund –
FST Shares |
|
| | 14,980,881 | | | 0.182% | | $ | 14,980,881 | |
| | (Cost $14,980,881) | |
| | |
| | TOTAL INVESTMENTS – 101.8% | |
| | (Cost $277,987,946) | | $ | 306,286,032 | |
| | |
| LIABILITIES IN EXCESS OF
OTHER ASSETS – (1.8)% | | | (5,421,616 | ) |
| | |
| NET ASSETS – 100.0% | | $ | 300,864,416 | |
| | |
|
| The percentage shown for each investment category reflects the value of investments in that category as a percentage of net assets. |
| | |
* | | Non-income producing security. |
(a) | | All or a portion of security is on loan. |
(b) | | Variable rate security. Interest rate disclosed is that which is in effect at April 30, 2012. |
(c) | | Represents an affiliated issuer. |
| | | | |
|
Investment Abbreviations: |
CVA | | —Dutch Certification |
REIT | | —Real Estate Investment Trust |
RSP | | —Risparmio Shares |
|
| | |
| 44 | | The accompanying notes are an integral part of these financial statements. |
GOLDMAN SACHS STRUCTURED INTERNATIONAL SMALL CAP FUND
|
| ADDITIONAL INVESTMENT INFORMATION |
FUTURES CONTRACTS — At April 30, 2012, the Fund had the following futures contracts:
| | | | | | | | | | | | | | |
| Type | | Number of
Contracts
Long (Short) | | | Expiration
Date | | Current
Value | | | Unrealized
Gain (Loss) | |
EURO STOXX 50 Index | | | 106 | | | June 2012 | | $ | 3,169,653 | | | $ | (21,380) | |
FTSE 100 Index | | | 17 | | | June 2012 | | | 1,576,728 | | | | (4,495) | |
Hang Seng Index | | | 1 | | | May 2012 | | | 134,946 | | | | 2,948 | |
MSCI Singapore Index | | | 3 | | | May 2012 | | | 165,236 | | | | 1,773 | |
SPI 200 Index | | | 6 | | | June 2012 | | | 687,218 | | | | 4,362 | |
TSE TOPIX Index | | | 20 | | | June 2012 | | | 2,010,271 | | | | (29,810) | |
| |
| TOTAL | | | | | | | | | | | | $ | (46,602 | ) |
| | |
| The accompanying notes are an integral part of these financial statements. | | 45 |
GOLDMAN SACHS STRUCTURED INTERNATIONAL EQUITY FUNDS
Statements of Assets and Liabilities
April 30, 2012 (Unaudited)
| | | | | | | | | | | | | | |
| | | | |
| | | | | Structured
Emerging Markets
Equity Fund | | | Structured
International
Equity Fund | | | Structured
International
Small Cap Fund | |
| | Assets: | | | | | | | | | | | | |
| | Investments in unaffiliated issuers, at value (cost $272,639,725, $1,043,846,633 and $263,007,065)(a) | | $ | 309,892,895 | | | $ | 1,084,991,845 | | | $ | 291,305,151 | |
| | Investments in affiliated securities lending reinvestment vehicle, at value which equals cost | | | 840,000 | | | | 46,503,780 | | | | 14,980,881 | |
| | Cash | | | 410,261 | | | | 4,020,599 | | | | 5,665,672 | |
| | Foreign currencies, at value (cost $505,927, $22,430,132 and $1,869,835) | | | 509,658 | | | | 22,527,077 | | | | 1,878,389 | |
| | Receivables: | | | | | | | | | | | | |
| | Dividends | | | 868,292 | | | | 7,052,254 | | | | 1,790,208 | |
| | Fund shares sold | | | 285,058 | | | | 40,219 | | | | 233,756 | |
| | Foreign tax reclaims | | | 32,604 | | | | 745,651 | | | | 114,851 | |
| | Securities lending income | | | 6,139 | | | | 190,106 | | | | 17,006 | |
| | Reimbursement from investment adviser | | | 3,243 | | | | 18,726 | | | | 40,989 | |
| | Investments sold | | | 2,363,161 | | | | 8,514,004 | | | | 332,033 | |
| | Futures variation margin(b) | | | — | | | | — | | | | 434,274 | |
| | Due from custodian | | | — | | | | 13,058,966 | | | | 214,322 | |
| | Other assets | | | 1,837 | | | | 305,979 | | | | 1,504 | |
| | Total assets | | | 315,213,148 | | | | 1,187,969,206 | | | | 317,009,036 | |
| | | | | | | | | | | | | | |
| | Liabilities: | | | | | | | | | | | | |
| | Payables: | | | | | | | | | | | | |
| | Payable upon return of securities loaned | | | 840,000 | | | | 46,503,780 | | | | 14,980,881 | |
| | Foreign capital gains taxes | | | 408,075 | | | | — | | | | — | |
| | Fund shares redeemed | | | 279,030 | | | | 15,247,046 | | | | 292,968 | |
| | Amounts owed to affiliates | | | 270,690 | | | | 901,732 | | | | 219,457 | |
| | Investments purchased | | | 1,203,547 | | | | 20,960,151 | | | | 443,652 | |
| | Futures variation margin | | | — | | | | 153,654 | | | | 27,358 | |
| | Accrued expenses | | | 285,093 | | | | 342,884 | | | | 180,304 | |
| | Total liabilities | | | 3,286,435 | | | | 84,109,247 | | | | 16,144,620 | |
| | | | | | | | | | | | | | |
| | Net Assets: | | | | | | | | | | | | |
| | Paid-in capital | | | 308,780,960 | | | | 2,575,882,881 | | | | 301,940,215 | |
| | Undistributed (distributions in excess of) net investment income | | | (23,825 | ) | | | 7,743,374 | | | | 297,556 | |
| | Accumulated net realized loss | | | (33,680,784 | ) | | | (1,519,820,680 | ) | | | (29,681,167 | ) |
| | Net unrealized gain | | | 36,850,362 | | | | 40,054,384 | | | | 28,307,812 | |
| | | NET ASSETS | | $ | 311,926,713 | | | $ | 1,103,859,959 | | | $ | 300,864,416 | |
| | | Net Assets: | | | | | | | | | | | | |
| | | Class A | | $ | 21,118,214 | | | $ | 258,162,290 | | | $ | 25,881,851 | |
| | | Class B | | | — | | | | 3,157,256 | | | | — | |
| | | Class C | | | 263,289 | | | | 3,340,976 | | | | 961,049 | |
| | | Institutional | | | 290,400,046 | | | | 829,333,089 | | | | 273,735,505 | |
| | | Service | | | — | | | | 9,726,239 | | | | — | |
| | | Class IR | | | 145,164 | | | | 42,926 | | | | 286,011 | |
| | | Class R | | | — | | | | 97,183 | | | | — | |
| | | Total Net Assets | | $ | 311,926,713 | | | $ | 1,103,859,959 | | | $ | 300,864,416 | |
| | | Shares outstanding $0.001 par value (unlimited shares authorized): | | | | | | | | | | | | |
| | | Class A | | | 2,466,448 | | | | 28,860,349 | | | | 3,143,077 | |
| | | Class B | | | — | | | | 356,070 | | | | — | |
| | | Class C | | | 30,801 | | | | 377,584 | | | | 118,637 | |
| | | Institutional | | | 33,997,385 | | | | 90,477,622 | | | | 33,278,882 | |
| | | Service | | | — | | | | 1,079,593 | | | | — | |
| | | Class IR | | | 17,000 | | | | 4,855 | | | | 34,818 | |
| | | Class R | | | — | | | | 10,992 | | | | — | |
| | | Net asset value, offering and redemption price per share:(c) | | | | | | | | | | | | |
| | | Class A | | | $8.56 | | | | $8.95 | | | | $8.23 | |
| | | Class B | | | — | | | | 8.87 | | | | — | |
| | | Class C | | | 8.55 | | | | 8.85 | | | | 8.10 | |
| | | Institutional | | | 8.54 | | | | 9.17 | | | | 8.23 | |
| | | Service | | | — | | | | 9.01 | | | | — | |
| | | Class IR | | | 8.54 | | | | 8.84 | | | | 8.21 | |
| | | Class R | | | — | | | | 8.84 | | | | — | |
| | (a) | | Includes loaned securities having a market value of $753,337, $43,147,038 and $14,152,116 for the Structured Emerging Markets Equity, Structured International Equity and Structured International Small Cap Funds, respectively. |
| | (b) | | Includes cash on deposit with counterparty of $434,274 for the Structured International Small Cap Fund relating to initial margin requirements on futures transactions. |
| | (c) | | Maximum public offering price per share for Class A Shares of the Structured Emerging Markets Equity, Structured International Equity and Structured International Small Cap Fund is $9.06, $9.47 and $8.71, respectively. At redemption, Class B and Class C Shares may be subject to a contingent deferred sales charge assessed on the amount equal to the lesser of the current NAV or the original purchase price of the shares. |
| | |
| 46 | | The accompanying notes are an integral part of these financial statements. |
GOLDMAN SACHS STRUCTURED INTERNATIONAL EQUITY FUNDS
Statements of Operations
For the Six Months Ended April 30, 2012 (Unaudited)
| | | | | | | | | | | | | | |
| | | | | Structured
Emerging
Markets
Equity Fund | | | Structured
International
Equity Fund | | | Structured
International
Small Cap
Fund | |
| | Investment income: | |
| | Dividends (net of foreign taxes withheld of $145,424, $1,233,350 and $242,098) | | $ | 2,456,826 | | | $ | 19,859,741 | | | $ | 4,518,624 | |
| | Securities lending income — affiliated issuer | | | 18,591 | | | | 454,784 | | | | 113,034 | |
| | Interest | | | — | | | | 7,358 | | | | 1,974 | |
| | Total investment income | | | 2,475,417 | | | | 20,321,883 | | | | 4,633,632 | |
| | | | | | | | | | | | | | |
| | Expenses: | | | | | | | | | | | | |
| | Management fees | | | 1,445,654 | | | | 4,882,208 | | | | 1,161,111 | |
| | Custody and accounting fees | | | 270,257 | | | | 250,559 | | | | 126,033 | |
| | Transfer Agent fees(a) | | | 71,097 | | | | 445,238 | | | | 75,114 | |
| | Professional fees | | | 65,979 | | | | 75,679 | | | | 97,861 | |
| | Distribution and Service fees(a) | | | 22,879 | | | | 379,319 | | | | 36,950 | |
| | Printing and mailing costs | | | 45,126 | | | | 47,449 | | | | 26,866 | |
| | Registration fees | | | 27,589 | | | | 56,189 | | | | 27,647 | |
| | Trustee fees | | | 7,925 | | | | 8,579 | | | | 7,907 | |
| | Service share fees — Service Plan | | | — | | | | 13,812 | | | | — | |
| | Service share fees — Shareholder Administration Plan | | | — | | | | 13,812 | | | | — | |
| | Other | | | 21,396 | | | | 19,938 | | | | 6,490 | |
| | Total expenses | | | 1,977,902 | | | | 6,192,782 | | | | 1,565,979 | |
| | Less — expense reductions | | | (419,027 | ) | | | (436,024 | ) | | | (276,407 | ) |
| | Net expenses | | | 1,558,875 | | | | 5,756,758 | | | | 1,289,572 | |
| | NET INVESTMENT INCOME | | | 916,542 | | | | 14,565,125 | | | | 3,344,060 | |
| | | | | | | | | | | | | | |
| | Realized and unrealized gain (loss): | | | | | | | | | | | | |
| | Net realized gain (loss) from: | | | | | | | | | | | | |
| | Investments | | | 12,828,594 | | | | (81,146,837 | ) | | | (2,477,363 | ) |
| | Futures contracts | | | — | | | | 8,992 | | | | 537,317 | |
| | Foreign currency transactions | | | (250,173 | ) | | | (1,399,450 | ) | | | (3,422 | ) |
| | Net change in unrealized gain (loss) on: | | | | | | | | | | | | |
| | Investments — (including the effects of the net change in the foreign capital gains tax liability of $449,613, $0 and $0) | | | 5,959,585 | | | | 108,576,811 | | | | 17,075,406 | |
| | Futures contracts | | | — | | | | (1,788,741 | ) | | | (491,857 | ) |
| | Foreign currency translation | | | (48,309 | ) | | | 699,286 | | | | 32,672 | |
| | Net realized and unrealized gain | | | 18,489,697 | | | | 24,950,061 | | | | 14,672,753 | |
| | NET INCREASE IN NET ASSETS RESULTING FROM OPERATIONS | | $ | 19,406,239 | | | $ | 39,515,186 | | | $ | 18,016,813 | |
| | (a) | | Class specific Distribution and Service, and Transfer Agent fees were as follows: |
| | | | | | | | | | | | | | | | | | | | | | | | | | | | | | | | | | | | | | | | | | | | |
| | | Distribution and Service Fees | | | Transfer Agent Fees | |
Fund | | Class A | | | Class B | | | Class C | | | Class R | | | Class A | | | Class B | | | Class C | | | Institutional | | | Service | | | Class IR | | | Class R | |
Structured Emerging Markets Equity | | $ | 21,782 | | | $ | — | | | $ | 1,097 | | | $ | — | | | $ | 16,555 | | | $ | — | | | $ | 208 | | | $ | 54,288 | | | $ | — | | | $ | 46 | | | $ | — | |
Structured International Equity | | | 345,175 | | | | 17,093 | | | | 16,784 | | | | 267 | | | | 262,335 | | | | 3,248 | | | | 3,189 | | | | 174,115 | | | | 2,210 | | | | 40 | | | | 101 | |
Structured International Small Cap | | | 32,549 | | | | — | | | | 4,401 | | | | — | | | | 24,738 | | | | — | | | | 836 | | | | 49,181 | | | | — | | | | 359 | | | | — | |
| | |
| The accompanying notes are an integral part of these financial statements. | | 47 |
GOLDMAN SACHS STRUCTURED INTERNATIONAL EQUITY FUNDS
Statements of Changes in Net Assets
| | | | | | | | | | |
| | | | | Structured Emerging Markets Equity Fund | |
| | | | | For the
Six Months Ended
April 30, 2012
(Unaudited) | | | For the Fiscal
Year Ended
October 31, 2011 | |
| | From operations: | | | | | | | | |
| | Net investment income | | $ | 916,542 | | | $ | 5,986,847 | |
| | Net realized gain (loss) | | | 12,578,421 | | | | 20,744,233 | |
| | Net change in unrealized gain (loss) | | | 5,911,276 | | | | (50,158,805 | ) |
| | Net increase (decrease) in net assets resulting from operations | | | 19,406,239 | | | | (23,427,725 | ) |
| | | | | | | | | | |
| | Distributions to shareholders: | | | | | | | | |
| | From net investment income | | | | | | | | |
| | Class A Shares | | | (190,969 | ) | | | (421,339 | ) |
| | Class B Shares | | | — | | | | — | |
| | Class C Shares | | | — | | | | (946 | ) |
| | Institutional Shares | | | (5,188,307 | ) | | | (4,706,466 | ) |
| | Service Shares | | | — | | | | — | |
| | Class IR Shares | | | (19 | ) | | | (15 | ) |
| | Class R Shares | | | — | | | | — | |
| | Total distributions to shareholders | | | (5,379,295 | ) | | | (5,128,766 | ) |
| | | | | | | | | | |
| | From share transactions: | | | | | | | | |
| | Proceeds from sales of shares | | | 48,631,990 | | | | 135,323,028 | |
| | Reinvestment of distributions | | | 5,376,255 | | | | 5,113,905 | |
| | Cost of shares redeemed | | | (46,432,740 | ) | | | (238,922,516 | ) |
| | Net increase (decrease) in net assets resulting from share transactions | | | 7,575,505 | | | | (98,485,583 | ) |
| | TOTAL INCREASE (DECREASE) | | | 21,602,449 | | | | (127,042,074 | ) |
| | | | | | | | | | |
| | Net assets: | | | | | | | | |
| | Beginning of period | | | 290,324,264 | | | | 417,366,338 | |
| | End of period | | $ | 311,926,713 | | | $ | 290,324,264 | |
| | Undistributed (distributions in excess of) net investment income | | $ | (23,825 | ) | | $ | 4,438,928 | |
| | |
| 48 | | The accompanying notes are an integral part of these financial statements. |
GOLDMAN SACHS STRUCTURED INTERNATIONAL EQUITY FUNDS
| | | | | | | | | | | | | | | | | | | | | | |
| | | Structured International Equity Fund | | | | | Structured International Small Cap Fund | |
| | | For the
Six Months Ended
April 30, 2012
(Unaudited) | | | | | For the Fiscal
Year Ended
October 31, 2011 | | | | | For the
Six Months Ended
April 30, 2012
(Unaudited) | | | | | For the Fiscal
Year Ended
October 31, 2011 | |
| | | | | | | | | | | | | | | | | | | | | | |
| | $ | 14,565,125 | | | | | $ | 62,242,387 | | | | | $ | 3,344,060 | | | | | $ | 6,658,095 | |
| | | (82,537,295 | ) | | | | | 22,698,056 | | | | | | (1,943,468 | ) | | | | | 27,946,189 | |
| | | 107,487,356 | | | | | | (293,652,449 | ) | | | | | 16,616,221 | | | | | | (36,562,728 | ) |
| | | 39,515,186 | | | | | | (208,712,006 | ) | | | | | 18,016,813 | | | | | | (1,958,444 | ) |
| | | | | | | | | | | | | | | | | | | | | | |
| | | | | | | | | | | | | | | | | | | | | | |
| | | | | | | | | | | | | | | | | | | | | | |
| | | (13,871,075 | ) | | | | | (10,415,892 | ) | | | | | (620,606 | ) | | | | | (979,815 | ) |
| | | (138,961 | ) | | | | | (80,045 | ) | | | | | — | | | | | | — | |
| | | (138,496 | ) | | | | | (62,677 | ) | | | | | (16,534 | ) | | | | | (4,949 | ) |
| | | (49,022,202 | ) | | | | | (41,363,992 | ) | | | | | (6,981,053 | ) | | | | | (7,713,278 | ) |
| | | (591,705 | ) | | | | | (426,025 | ) | | | | | — | | | | | | — | |
| | | (2,354 | ) | | | | | (174 | ) | | | | | (8,270 | ) | | | | | (38 | ) |
| | | (5,640 | ) | | | | | (4,837 | ) | | | | | — | | | | | | — | |
| | | (63,770,433 | ) | | | | | (52,353,642 | ) | | | | | (7,626,463 | ) | | | | | (8,698,080 | ) |
| | | | | | | | | | | | | | | | | | | | | | |
| | | | | | | | | | | | | | | | | | | | | | |
| | | 63,297,124 | | | | | | 443,716,127 | | | | | | 41,099,620 | | | | | | 114,946,606 | |
| | | 61,362,112 | | | | | | 49,349,847 | | | | | | 7,278,249 | | | | | | 8,679,577 | |
| | | (344,946,425 | ) | | | | | (1,268,110,378 | ) | | | | | (39,400,829 | ) | | | | | (102,105,515 | ) |
| | | (220,287,189 | ) | | | | | (775,044,404 | ) | | | | | 8,977,040 | | | | | | 21,520,668 | |
| | | (244,542,436 | ) | | | | | (1,036,110,052 | ) | | | | | 19,367,390 | | | | | | 10,864,144 | |
| | | | | | | | | | | | | | | | | | | | | | |
| | | | | | | | | | | | | | | | | | | | | | |
| | | 1,348,402,395 | | | | | | 2,384,512,447 | | | | | | 281,497,026 | | | | | | 270,632,882 | |
| | $ | 1,103,859,959 | | | | | $ | 1,348,402,395 | | | | | $ | 300,864,416 | | | | | $ | 281,497,026 | |
| | $ | 7,743,374 | | | | | $ | 56,948,682 | | | | | $ | 297,556 | | | | | $ | 4,579,959 | |
| | |
| The accompanying notes are an integral part of these financial statements. | | 49 |
GOLDMAN SACHS STRUCTURED EMERGING MARKETS EQUITY FUND
Financial Highlights
Selected Data for a Share Outstanding Throughout Each Period
| | | | | | | | | | | | | | | | | | | | | | | | | | | | | | |
| | | | | | | | Income (loss) from
investment operations | | | Distributions
to shareholders | |
| | | Year - Share Class | | Net asset
value,
beginning
of period | | |
Net
investment
income
(loss)(a) | | | Net realized
and unrealized
gain (loss) | | | Total from
investment
operations | | | From net
investment
income | | | From net
realized
gains | | | Total
distributions | |
| | FOR THE SIX MONTHS ENDED APRIL 30, (UNAUDITED) | |
| | 2012 - A | | $ | 8.08 | | | $ | 0.01 | | | $ | 0.56 | | | $ | 0.57 | | | $ | (0.09 | ) | | $ | — | | | $ | (0.09 | ) |
| | 2012 - C | | | 8.00 | | | | (0.02 | ) | | | 0.57 | | | | 0.55 | | | | — | | | | — | | | | — | |
| | 2012 - Institutional | | | 8.12 | | | | 0.03 | | | | 0.55 | | | | 0.58 | | | | (0.16 | ) | | | — | | | | (0.16 | ) |
| | 2012 - IR | | | 8.11 | | | | 0.07 | | | | 0.51 | | | | 0.58 | | | | (0.15 | ) | | | — | | | | (0.15 | ) |
| | | | | | | | | | | | | | | | | | | | | | | | | | | | | | |
| | FOR THE FISCAL YEARS ENDED OCTOBER 31, | |
| | 2011 - A | | | 8.91 | | | | 0.11 | | | | (0.87 | ) | | | (0.76 | ) | | | (0.07 | ) | | | — | | | | (0.07 | ) |
| | 2011 - C | | | 8.82 | | | | — | (d) | | | (0.81 | ) | | | (0.81 | ) | | | (0.01 | ) | | | — | | | | (0.01 | ) |
| | 2011 - Institutional | | | 8.96 | | | | 0.16 | | | | (0.88 | ) | | | (0.72 | ) | | | (0.12 | ) | | | — | | | | (0.12 | ) |
| | 2011 - IR | | | 8.98 | | | | 0.15 | | | | (0.90 | ) | | | (0.75 | ) | | | (0.12 | ) | | | — | | | | (0.12 | ) |
| | 2010 - A | | | 7.14 | | | | 0.08 | | | | 1.76 | | | | 1.84 | | | | (0.07 | ) | | | — | | | | (0.07 | ) |
| | 2010 - C | | | 7.11 | | | | — | (d) | | | 1.77 | | | | 1.77 | | | | (0.06 | ) | | | — | | | | (0.06 | ) |
| | 2010 - Institutional | | | 7.17 | | | | 0.10 | | | | 1.79 | | | | 1.89 | | | | (0.10 | ) | | | — | | | | (0.10 | ) |
| | 2010 - IR (Commenced August 31, 2010) | | | 7.67 | | | | 0.01 | | | | 1.30 | | | | 1.31 | | | | — | | | | — | | | | — | |
| | 2009 - A | | | 4.45 | | | | 0.12 | (e) | | | 2.61 | | | | 2.73 | | | | (0.04 | ) | | | — | | | | (0.04 | ) |
| | 2009 - C | | | 4.41 | | | | 0.07 | (e) | | | 2.64 | | | | 2.71 | | | | (0.01 | ) | | | — | | | | (0.01 | ) |
| | 2009 - Institutional | | | 4.47 | | | | 0.13 | (e) | | | 2.62 | | | | 2.75 | | | | (0.05 | ) | | | — | | | | (0.05 | ) |
| | 2008 - A | | | 11.04 | | | | 0.15 | (f) | | | (6.64 | ) | | | (6.49 | ) | | | (0.05 | ) | | | (0.05 | ) | | | (0.10 | ) |
| | 2008 - C | | | 11.03 | | | | 0.10 | (f) | | | (6.63 | ) | | | (6.53 | ) | | | (0.04 | ) | | | (0.05 | ) | | | (0.09 | ) |
| | 2008 - Institutional | | | 11.04 | | | | 0.18 | (f) | | | (6.65 | ) | | | (6.47 | ) | | | (0.05 | ) | | | (0.05 | ) | | | (0.10 | ) |
| | | | | | | | | | | | | | | | | | | | | | | | | | | | | | |
| | FOR THE PERIOD ENDED OCTOBER 31, | |
| | 2007 - A (Commenced October 5, 2007) | | | 10.00 | | | | 0.01 | | | | 1.03 | | | | 1.04 | | | | — | | | | — | | | | — | |
| | 2007 - C (Commenced October 5, 2007) | | | 10.00 | | | | — | (d) | | | 1.03 | | | | 1.03 | | | | — | | | | — | | | | — | |
| | 2007 - Institutional (Commenced October 5, 2007) | | | 10.00 | | | | — | (d) | | | 1.04 | | | | 1.04 | | | | — | | | | — | | | | — | |
| | (a) | | Calculated based on the average shares outstanding methodology. |
| | (b) | | Assumes investments at the net asset value at the beginning of the period, reinvestment of all distributions, a complete redemption of the investment at the net asset value at the end of the period and no sales or redemption charges. Total returns would be reduced if a sales or redemption charge was taken into account. Returns do not reflect the deduction of taxes that a shareholder would pay on Fund distributions or the redemption of Fund shares. Total returns for periods less than one full year are not annualized. |
| | (d) | | Amount is less than $0.005 per share. |
| | (e) | | Reflects income recognized from special dividends which amounted to $0.02 per share and 0.34% of average net assets. |
| | (f) | | Reflects income recognized from special dividends which amounted to $0.02 per share and 0.26% of average net assets. |
| | |
| 50 | | The accompanying notes are an integral part of these financial statements. |
GOLDMAN SACHS STRUCTURED EMERGING MARKETS EQUITY FUND
| | | | | | | | | | | | | | | | | | | | | | | | | | | | | | | | | | | | | | | | |
| | | | | | | | | | | | | | | | | | | | | | | | | | | | | | | | | | |
| | | Net asset
value, end
of period | | | | | Total
return(b) | | | | | Net assets,
end of
period
(in 000s) | | | | | Ratio of
net expenses
to average
net assets | | | | | Ratio of
total expenses
to average
net assets | | | | | Ratio of
net investment
income (loss)
to average
net assets | | | | | Portfolio
turnover
rate | |
| | | | |
| | $ | 8.56 | | | | | | 7.28 | % | | | | $ | 21,118 | | | | | | 1.45 | %(c) | | | | | 1.74 | %(c) | | | | | 0.33 | %(c) | | | | | 88 | % |
| | | 8.55 | | | | | | 6.88 | | | | | | 263 | | | | | | 2.20 | (c) | | | | | 2.49 | (c) | | | | | (0.45 | )(c) | | | | | 88 | |
| | | 8.54 | | | | | | 7.45 | | | | | | 290,400 | | | | | | 1.05 | (c) | | | | | 1.34 | (c) | | | | | 0.65 | (c) | | | | | 88 | |
| | | 8.54 | | | | | | 7.38 | | | | | | 145 | | | | | | 1.20 | (c) | | | | | 1.49 | (c) | | | | | 1.58 | (c) | | | | | 88 | |
| | | | | | | | | | | | | | | | | | | | | | | | | | | | | | | | | | | | | | | | |
| | | | |
| | | 8.08 | | | | | | (8.58 | ) | | | | | 17,089 | | | | | | 1.45 | | | | | | 1.71 | | | | | | 1.17 | | | | | | 200 | |
| | | 8.00 | | | | | | (9.23 | ) | | | | | 207 | | | | | | 2.20 | | | | | | 2.46 | | | | | | 0.01 | | | | | | 200 | |
| | | 8.12 | | | | | | (8.19 | ) | | | | | 273,027 | | | | | | 1.05 | | | | | | 1.31 | | | | | | 1.75 | | | | | | 200 | |
| | | 8.11 | | | | | | (8.54 | ) | | | | | 1 | | | | | | 1.20 | | | | | | 1.46 | | | | | | 1.67 | | | | | | 200 | |
| | | 8.91 | | | | | | 25.91 | | | | | | 52,030 | | | | | | 1.45 | | | | | | 1.70 | | | | | | 0.99 | | | | | | 214 | |
| | | 8.82 | | | | | | 25.07 | | | | | | 1,282 | | | | | | 2.20 | | | | | | 2.45 | | | | | | 0.04 | | | | | | 214 | |
| | | 8.96 | | | | | | 26.56 | | | | | | 364,053 | | | | | | 1.05 | | | | | | 1.30 | | | | | | 1.25 | | | | | | 214 | |
| | | 8.98 | | | | | | 17.08 | | | | | | 1 | | | | | | 1.20 | (c) | | | | | 1.45 | (c) | | | | | 0.51 | (c) | | | | | 214 | |
| | | 7.14 | | | | | | 61.83 | | | | | | 2,694 | | | | | | 1.45 | | | | | | 1.76 | | | | | | 2.04 | (e) | | | | | 182 | |
| | | 7.11 | | | | | | 61.28 | | | | | | 1,426 | | | | | | 2.20 | | | | | | 2.51 | | | | | | 1.13 | (e) | | | | | 182 | |
| | | 7.17 | | | | | | 62.25 | | | | | | 311,960 | | | | | | 1.05 | | | | | | 1.36 | | | | | | 2.38 | (e) | | | | | 182 | |
| | | 4.45 | | | | | | (59.22 | ) | | | | | 345 | | | | | | 1.45 | | | | | | 1.89 | | | | | | 1.92 | (f) | | | | | 190 | |
| | | 4.41 | | | | | | (59.48 | ) | | | | | 43 | | | | | | 2.20 | | | | | | 2.64 | | | | | | 1.24 | (f) | | | | | 190 | |
| | | 4.47 | | | | | | (59.01 | ) | | | | | 156,248 | | | | | | 1.05 | | | | | | 1.49 | | | | | | 2.28 | (f) | | | | | 190 | |
| | | | | | | | | | | | | | | | | | | | | | | | | | | | | | | | | | | | | | | | |
| | | | |
| | | 11.04 | | | | | | 10.40 | | | | | | 157 | | | | | | 1.45 | (c) | | | | | 2.79 | (c) | | | | | 0.77 | (c) | | | | | 16 | |
| | | 11.03 | | | | | | 10.30 | | | | | | 11 | | | | | | 2.20 | (c) | | | | | 3.54 | (c) | | | | | (0.60 | )(c) | | | | | 16 | |
| | | 11.04 | | | | | | 10.40 | | | | | | 97,302 | | | | | | 1.05 | (c) | | | | | 2.39 | (c) | | | | | 0.58 | (c) | | | | | 16 | |
| | |
| The accompanying notes are an integral part of these financial statements. | | 51 |
GOLDMAN SACHS STRUCTURED INTERNATIONAL EQUITY FUND
Financial Highlights
Selected Data for a Share Outstanding Throughout Each Period
| | | | | | | | | | | | | | | | | | | | | | | | | | | | | | |
| | | | | | | | Income (loss) from
investment operations | | | Distributions
to shareholders | |
| | | Year - Share Class | |
Net asset
value,
beginning
of period | | | Net
investment
income(a) | | | Net realized
and unrealized
gain (loss) | | | Total from
investment
operations | | | From net
investment
income | | | From net
realized
gains | | | Total
distributions | |
| | FOR THE SIX MONTHS ENDED APRIL 30, (UNAUDITED) | |
| | 2012 - A | | $ | 9.02 | | | $ | 0.09 | | | $ | 0.26 | | | $ | 0.35 | | | $ | (0.42 | ) | | $ | — | | | $ | (0.42 | ) |
| | 2012 - B | | | 8.89 | | | | 0.06 | | | | 0.25 | | | | 0.31 | | | | (0.33 | ) | | | — | | | | (0.33 | ) |
| | 2012 - C | | | 8.89 | | | | 0.06 | | | | 0.25 | | | | 0.31 | | | | (0.35 | ) | | | — | | | | (0.35 | ) |
| | 2012 - Institutional | | | 9.27 | | | | 0.12 | | | | 0.25 | | | | 0.37 | | | | (0.47 | ) | | | — | | | | (0.47 | ) |
| | 2012 - Service | | | 9.08 | | | | 0.09 | | | | 0.25 | | | | 0.34 | | | | (0.41 | ) | | | — | | | | (0.41 | ) |
| | 2012 - IR | | | 8.97 | | | | 0.11 | | | | 0.23 | | | | 0.34 | | | | (0.47 | ) | | | — | | | | (0.47 | ) |
| | 2012 - R | | | 8.93 | | | | 0.08 | | | | 0.25 | | | | 0.33 | | | | (0.42 | ) | | | — | | | | (0.42 | ) |
| | | | | | | | | | | | | | | | | | | | | | | | | | | | | | |
| | FOR THE FISCAL YEARS ENDED OCTOBER 31, | |
| | 2011 - A | | | 10.21 | | | | 0.28 | | | | (1.26 | ) | | | (0.98 | ) | | | (0.21 | ) | | | — | | | | (0.21 | ) |
| | 2011 - B | | | 10.06 | | | | 0.19 | | | | (1.23 | ) | | | (1.04 | ) | | | (0.13 | ) | | | — | | | | (0.13 | ) |
| | 2011 - C | | | 10.06 | | | | 0.19 | | | | (1.23 | ) | | | (1.04 | ) | | | (0.13 | ) | | | — | | | | (0.13 | ) |
| | 2011 - Institutional | | | 10.49 | | | | 0.33 | | | | (1.30 | ) | | | (0.97 | ) | | | (0.25 | ) | | | — | | | | (0.25 | ) |
| | 2011 - Service | | | 10.27 | | | | 0.27 | | | | (1.27 | ) | | | (1.00 | ) | | | (0.19 | ) | | | — | | | | (0.19 | ) |
| | 2011 - IR | | | 10.15 | | | | 0.23 | | | | (1.18 | ) | | | (0.95 | ) | | | (0.23 | ) | | | — | | | | (0.23 | ) |
| | 2011 - R | | | 10.12 | | | | 0.19 | | | | (1.18 | ) | | | (0.99 | ) | | | (0.20 | ) | | | — | | | | (0.20 | ) |
| | 2010 - A | | | 9.61 | | | | 0.18 | | | | 0.63 | | | | 0.81 | | | | (0.21 | ) | | | — | | | | (0.21 | ) |
| | 2010 - B | | | 9.47 | | | | 0.11 | | | | 0.62 | | | | 0.73 | | | | (0.14 | ) | | | — | | | | (0.14 | ) |
| | 2010 - C | | | 9.47 | | | | 0.10 | | | | 0.63 | | | | 0.73 | | | | (0.14 | ) | | | — | | | | (0.14 | ) |
| | 2010 - Institutional | | | 9.86 | | | | 0.22 | | | | 0.66 | | | | 0.88 | | | | (0.25 | ) | | | — | | | | (0.25 | ) |
| | 2010 - Service | | | 9.67 | | | | 0.16 | | | | 0.65 | | | | 0.81 | | | | (0.21 | ) | | | — | | | | (0.21 | ) |
| | 2010 - IR | | | 9.56 | | | | 0.20 | | | | 0.63 | | | | 0.83 | | | | (0.24 | ) | | | — | | | | (0.24 | ) |
| | 2010 - R | | | 9.55 | | | | 0.15 | | | | 0.63 | | | | 0.78 | | | | (0.21 | ) | | | — | | | | (0.21 | ) |
| | 2009 - A | | | 8.06 | | | | 0.17 | | | | 1.77 | | | | 1.94 | | | | (0.39 | ) | | | — | | | | (0.39 | ) |
| | 2009 - B | | | 7.91 | | | | 0.12 | | | | 1.73 | | | | 1.85 | | | | (0.29 | ) | | | — | | | | (0.29 | ) |
| | 2009 - C | | | 7.90 | | | | 0.12 | | | | 1.74 | | | | 1.86 | | | | (0.29 | ) | | | — | | | | (0.29 | ) |
| | 2009 - Institutional | | | 8.29 | | | | 0.21 | | | | 1.81 | | | | 2.02 | | | | (0.45 | ) | | | — | | | | (0.45 | ) |
| | 2009 - Service | | | 8.08 | | | | 0.16 | | | | 1.79 | | | | 1.95 | | | | (0.36 | ) | | | — | | | | (0.36 | ) |
| | 2009 - IR | | | 8.04 | | | | 0.20 | | | | 1.75 | | | | 1.95 | | | | (0.43 | ) | | | — | | | | (0.43 | ) |
| | 2009 - R | | | 8.01 | | | | 0.08 | | | | 1.84 | | | | 1.92 | | | | (0.38 | ) | | | — | | | | (0.38 | ) |
| | | | | | | | | | | | | | | | | | | | | | | | | | | | | | |
| | FOR THE PERIOD SEPTEMBER 1, 2008 TO OCTOBER 31, 2008* | |
| | 2008 - A | | | 11.79 | | | | 0.03 | | | | (3.76 | ) | | | (3.73 | ) | | | — | | | | — | | | | — | |
| | 2008 - B | | | 11.58 | | | | 0.02 | | | | (3.69 | ) | | | (3.67 | ) | | | — | | | | — | | | | — | |
| | 2008 - C | | | 11.56 | | | | 0.02 | | | | (3.68 | ) | | | (3.66 | ) | | | — | | | | — | | | | — | |
| | 2008 - Institutional | | | 12.11 | | | | 0.04 | | | | (3.86 | ) | | | (3.82 | ) | | | — | | | | — | | | | — | |
| | 2008 - Service | | | 11.81 | | | | 0.03 | | | | (3.76 | ) | | | (3.73 | ) | | | — | | | | — | | | | — | |
| | 2008 - IR | | | 11.75 | | | | 0.03 | | | | (3.74 | ) | | | (3.71 | ) | | | — | | | | — | | | | — | |
| | 2008 - R | | | 11.72 | | | | 0.03 | | | | (3.74 | ) | | | (3.71 | ) | | | — | | | | — | | | | — | |
| | | | | | | | | | | | | | | | | | | | | | | | | | | | | | |
| | FOR THE FISCAL YEARS ENDED AUGUST 31, | |
| | 2008 - A | | | 15.90 | | | | 0.52 | | | | (2.77 | ) | | | (2.25 | ) | | | (0.48 | ) | | | (1.38 | ) | | | (1.86 | ) |
| | 2008 - B | | | 15.67 | | | | 0.41 | | | | (2.73 | ) | | | (2.32 | ) | | | (0.39 | ) | | | (1.38 | ) | | | (1.77 | ) |
| | 2008 - C | | | 15.64 | | | | 0.41 | | | | (2.73 | ) | | | (2.32 | ) | | | (0.38 | ) | | | (1.38 | ) | | | (1.76 | ) |
| | 2008 - Institutional | | | 16.28 | | | | 0.59 | | | | (2.84 | ) | | | (2.25 | ) | | | (0.54 | ) | | | (1.38 | ) | | | (1.92 | ) |
| | 2008 - Service | | | 15.93 | | | | 0.49 | | | | (2.76 | ) | | | (2.27 | ) | | | (0.47 | ) | | | (1.38 | ) | | | (1.85 | ) |
| | 2008 - IR (Commenced November 30, 2007) | | | 16.57 | | | | 0.30 | | | | (3.19 | ) | | | (2.89 | ) | | | (0.55 | ) | | | (1.38 | ) | | | (1.93 | ) |
| | 2008 - R (Commenced November 30, 2007) | | | 16.57 | | | | 0.25 | | | | (3.18 | ) | | | (2.93 | ) | | | (0.54 | ) | | | (1.38 | ) | | | (1.92 | ) |
| | 2007 - A | | | 14.29 | | | | 0.30 | | | | 2.33 | | | | 2.63 | | | | (0.17 | ) | | | (0.85 | ) | | | (1.02 | ) |
| | 2007 - B | | | 14.09 | | | | 0.15 | | | | 2.34 | | | | 2.49 | | | | (0.06 | ) | | | (0.85 | ) | | | (0.91 | ) |
| | 2007 - C | | | 14.09 | | | | 0.15 | | | | 2.33 | | | | 2.48 | | | | (0.08 | ) | | | (0.85 | ) | | | (0.93 | ) |
| | 2007 - Institutional | | | 14.59 | | | | 0.38 | | | | 2.38 | | | | 2.76 | | | | (0.22 | ) | | | (0.85 | ) | | | (1.07 | ) |
| | 2007 - Service | | | 14.31 | | | | 0.26 | | | | 2.37 | | | | 2.63 | | | | (0.16 | ) | | | (0.85 | ) | | | (1.01 | ) |
| | * | | The Fund changed its fiscal year end from August 31 to October 31. |
| | (a) | | Calculated based on the average shares outstanding methodology. |
| | (b) | | Assumes investments at the net asset value at the beginning of the period, reinvestment of all distributions, a complete redemption of the investment at the net asset value at the end of the period and no sales or redemption charges. Total returns would be reduced if a sales or redemption charge was taken into account. Returns do not reflect the deduction of taxes that a shareholder would pay on Fund distributions or the redemption of Fund shares. Total returns for periods less than one full year are not annualized. |
| | |
| 52 | | The accompanying notes are an integral part of these financial statements. |
GOLDMAN SACHS STRUCTURED INTERNATIONAL EQUITY FUND
| | | | | | | | | | | | | | | | | | | | | | | | | | | | | | | | | | | | | | | | |
| | | | | | | | | | | | | | | | | | | | | | | | | | | | | | | | | | |
| | | Net asset
value, end
of period | | | | | Total
return(b) | | | | | Net assets,
end of
period
(in 000s) | | | | | Ratio of
net expenses
to average
net assets | | | | | Ratio of
total expenses
to average
net assets | | | | | Ratio of
net investment
income
to average net assets | | | | | Portfolio
turnover
rate | |
| | | | | | | | | | | | | | | | | | | | | | | | | | | | | | | | | | | | | | | | |
| | $ | 8.95 | | | | | | 4.37 | % | | | | $ | 258,162 | | | | | | 1.28 | %(c) | | | | | 1.36 | %(c) | | | | | 2.17 | %(c) | | | | | 103 | % |
| | | 8.87 | | | | | | 3.90 | | | | | | 3,157 | | | | | | 2.03 | (c) | | | | | 2.11 | (c) | | | | | 1.44 | (c) | | | | | 103 | |
| | | 8.85 | | | | | | 3.88 | | | | | | 3,341 | | | | | | 2.03 | (c) | | | | | 2.11 | (c) | | | | | 1.50 | (c) | | | | | 103 | |
| | | 9.17 | | | | | | 4.57 | | | | | | 829,333 | | | | | | 0.88 | (c) | | | | | 0.96 | (c) | | | | | 2.63 | (c) | | | | | 103 | |
| | | 9.01 | | | | | | 4.21 | | | | | | 9,726 | | | | | | 1.38 | (c) | | | | | 1.46 | (c) | | | | | 2.02 | (c) | | | | | 103 | |
| | | 8.84 | | | | | | 4.34 | | | | | | 43 | | | | | | 1.03 | (c) | | | | | 1.11 | (c) | | | | | 2.55 | (c) | | | | | 103 | |
| | | 8.84 | | | | | | 4.23 | | | | | | 97 | | | | | | 1.53 | (c) | | | | | 1.61 | (c) | | | | | 1.98 | (c) | | | | | 103 | |
| | | | | | | | | | | | | | | | | | | | | | | | | | | | | | | | | | | | | | | | |
| | | | | | | | | | | | | | | | | | | | | | | | | | | | | | | | | | | | | | | | |
| | | 9.02 | | | | | | (9.87 | ) | | | | | 314,225 | | | | | | 1.25 | | | | | | 1.31 | | | | | | 2.74 | | | | | | 101 | |
| | | 8.89 | | | | | | (10.52 | ) | | | | | 3,916 | | | | | | 2.00 | | | | | | 2.06 | | | | | | 1.93 | | | | | | 101 | |
| | | 8.89 | | | | | | (10.50 | ) | | | | | 3,660 | | | | | | 2.00 | | | | | | 2.06 | | | | | | 1.94 | | | | | | 101 | |
| | | 9.27 | | | | | | (9.52 | ) | | | | | 1,013,458 | | | | | | 0.85 | | | | | | 0.91 | | | | | | 3.18 | | | | | | 101 | |
| | | 9.08 | | | | | | (9.91 | ) | | | | | 12,982 | | | | | | 1.35 | | | | | | 1.41 | | | | | | 2.60 | | | | | | 101 | |
| | | 8.97 | | | | | | (9.58 | ) | | | | | 45 | | | | | | 1.00 | | | | | | 1.06 | | | | | | 2.53 | | | | | | 101 | |
| | | 8.93 | | | | | | (9.99 | ) | | | | | 116 | | | | | | 1.50 | | | | | | 1.56 | | | | | | 1.87 | | | | | | 101 | |
| | | 10.21 | | | | | | 8.59 | | | | | | 530,086 | | | | | | 1.25 | | | | | | 1.29 | | | | | | 1.89 | | | | | | 111 | |
| | | 10.06 | | | | | | 7.83 | | | | | | 6,563 | | | | | | 2.00 | | | | | | 2.04 | | | | | | 1.13 | | | | | | 111 | |
| | | 10.06 | | | | | | 7.78 | | | | | | 5,023 | | | | | | 2.00 | | | | | | 2.04 | | | | | | 1.12 | | | | | | 111 | |
| | | 10.49 | | | | | | 9.05 | | | | | | 1,819,375 | | | | | | 0.85 | | | | | | 0.89 | | | | | | 2.24 | | | | | | 111 | |
| | | 10.27 | | | | | | 8.49 | | | | | | 23,267 | | | | | | 1.35 | | | | | | 1.39 | | | | | | 1.68 | | | | | | 111 | |
| | | 10.15 | | | | | | 8.77 | | | | | | 8 | | | | | | 1.00 | | | | | | 1.04 | | | | | | 2.13 | | | | | | 111 | |
| | | 10.12 | | | | | | 8.30 | | | | | | 192 | | | | | | 1.50 | | | | | | 1.54 | | | | | | 1.59 | | | | | | 111 | |
| | | 9.61 | | | | | | 25.56 | | | | | | 656,289 | | | | | | 1.25 | | | | | | 1.32 | | | | | | 2.17 | | | | | | 167 | |
| | | 9.47 | | | | | | 24.49 | | | | | | 7,620 | | | | | | 2.00 | | | | | | 2.07 | | | | | | 1.50 | | | | | | 167 | |
| | | 9.47 | | | | | | 24.68 | | | | | | 5,622 | | | | | | 2.00 | | | | | | 2.07 | | | | | | 1.52 | | | | | | 167 | |
| | | 9.86 | | | | | | 26.03 | | | | | | 1,770,267 | | | | | | 0.85 | | | | | | 0.92 | | | | | | 2.55 | | | | | | 167 | |
| | | 9.67 | | | | | | 25.46 | | | | | | 29,882 | | | | | | 1.35 | | | | | | 1.42 | | | | | | 1.96 | | | | | | 167 | |
| | | 9.56 | | | | | | 25.94 | | | | | | 7 | | | | | | 1.00 | | | | | | 1.07 | | | | | | 2.51 | | | | | | 167 | |
| | | 9.55 | | | | | | 25.32 | | | | | | 155 | | | | | | 1.50 | | | | | | 1.57 | | | | | | 0.95 | | | | | | 167 | |
| | | | | | | | | | | | | | | | | | | | | | | | | | | | | | | | | | | | | | | | |
| | | | | | | | | | | | | | | | | | | | | | | | | | | | | | | | | | | | | | | | |
| | | 8.06 | | | | | | (31.64 | ) | | | | | 623,459 | | | | | | 1.20 | (c) | | | | | 1.28 | (c) | | | | | 1.76 | (c) | | | | | 25 | |
| | | 7.91 | | | | | | (31.69 | ) | | | | | 8,149 | | | | | | 1.95 | (c) | | | | | 2.03 | (c) | | | | | 1.00 | (c) | | | | | 25 | |
| | | 7.90 | | | | | | (31.66 | ) | | | | | 6,116 | | | | | | 1.95 | (c) | | | | | 2.03 | (c) | | | | | 1.00 | (c) | | | | | 25 | |
| | | 8.29 | | | | | | (31.54 | ) | | | | | 1,560,672 | | | | | | 0.80 | (c) | | | | | 0.88 | (c) | | | | | 2.20 | (c) | | | | | 25 | |
| | | 8.08 | | | | | | (31.58 | ) | | | | | 22,994 | | | | | | 1.30 | (c) | | | | | 1.38 | (c) | | | | | 1.68 | (c) | | | | | 25 | |
| | | 8.04 | | | | | | (31.57 | ) | | | | | 5 | | | | | | 0.95 | (c) | | | | | 1.03 | (c) | | | | | 1.98 | (c) | | | | | 25 | |
| | | 8.01 | | | | | | (31.66 | ) | | | | | 5 | | | | | | 1.45 | (c) | | | | | 1.53 | (c) | | | | | 1.47 | (c) | | | | | 25 | |
| | | | | | | | | | | | | | | | | | | | | | | | | | | | | | | | | | | | | | | | |
| | | | | | | | | | | | | | | | | | | | | | | | | | | | | | | | | | | | | | | | |
| | | 11.79 | | | | | | (16.33 | ) | | | | | 1,031,252 | | | | | | 1.20 | | | | | | 1.25 | | | | | | 3.70 | | | | | | 161 | |
| | | 11.58 | | | | | | (16.99 | ) | | | | | 13,280 | | | | | | 1.95 | | | | | | 2.00 | | | | | | 2.93 | | | | | | 161 | |
| | | 11.56 | | | | | | (16.99 | ) | | | | | 9,875 | | | | | | 1.95 | | | | | | 2.00 | | | | | | 2.97 | | | | | | 161 | |
| | | 12.11 | | | | | | (15.99 | ) | | | | | 2,676,502 | | | | | | 0.80 | | | | | | 0.85 | | | | | | 4.13 | | | | | | 161 | |
| | | 11.81 | | | | | | (16.50 | ) | | | | | 49,411 | | | | | | 1.30 | | | | | | 1.35 | | | | | | 3.54 | | | | | | 161 | |
| | | 11.75 | | | | | | (19.67 | ) | | | | | 8 | | | | | | 0.95 | (c) | | | | | 1.00 | (c) | | | | | 3.02 | (c) | | | | | 161 | |
| | | 11.72 | | | | | | (19.92 | ) | | | | | 8 | | | | | | 1.45 | (c) | | | | | 1.50 | (c) | | | | | 2.55 | (c) | | | | | 161 | |
| | | 15.90 | | | | | | 19.12 | | | | | | 1,495,073 | | | | | | 1.22 | | | | | | 1.26 | | | | | | 1.96 | | | | | | 56 | |
| | | 15.67 | | | | | | 18.28 | | | | | | 19,124 | | | | | | 1.97 | | | | | | 2.01 | | | | | | 0.98 | | | | | | 56 | |
| | | 15.64 | | | | | | 18.21 | | | | | | 13,961 | | | | | | 1.97 | | | | | | 2.01 | | | | | | 0.98 | | | | | | 56 | |
| | | 16.28 | | | | | | 19.63 | | | | | | 3,255,644 | | | | | | 0.82 | | | | | | 0.86 | | | | | | 2.38 | | | | | | 56 | |
| | | 15.93 | | | | | | 19.11 | | | | | | 55,340 | | | | | | 1.32 | | | | | | 1.36 | | | | | | 1.67 | | | | | | 56 | |
| | |
| The accompanying notes are an integral part of these financial statements. | | 53 |
GOLDMAN SACHS STRUCTURED INTERNATIONAL SMALL CAP FUND
Financial Highlights
Selected Data for a Share Outstanding Throughout Each Period
| | | | | | | | | | | | | | | | | | | | | | |
| | | | | | | | Income (loss) from
investment operations | | | | |
| | | Year - Share Class | | Net asset
value,
beginning
of period | | | Net
investment
income
(loss)(a) | | | Net realized
and unrealized
gain (loss) | | | Total from
investment
operations | | | Distributions
to shareholders
from net
investment
income | |
| | FOR THE SIX MONTHS ENDED APRIL 30, (UNAUDITED) | |
| | 2012 - A | | $ | 7.92 | | | $ | 0.08 | | | $ | 0.41 | | | $ | 0.49 | | | $ | (0.18 | ) |
| | 2012 - C | | | 7.79 | | | | 0.05 | | | | 0.41 | | | | 0.46 | | | | (0.15 | ) |
| | 2012 - Institutional | | | 7.94 | | | | 0.10 | | | | 0.41 | | | | 0.51 | | | | (0.22 | ) |
| | 2012 - IR | | | 7.93 | | | | 0.07 | | | | 0.42 | | | | 0.49 | | | | (0.21 | ) |
| | | | | | | | | | | | | | | | | | | | | | |
| | FOR THE FISCAL YEARS ENDED OCTOBER 31, | |
| | 2011 - A | | | 8.20 | | | | 0.17 | | | | (0.21 | ) | | | (0.04 | ) | | | (0.24 | ) |
| | 2011 - C | | | 8.08 | | | | 0.13 | | | | (0.23 | ) | | | (0.10 | ) | | | (0.19 | ) |
| | 2011 - Institutional | | | 8.21 | | | | 0.20 | | | | (0.20 | ) | | | — | | | | (0.27 | ) |
| | 2011 - IR | | | 8.21 | | | | 0.20 | | | | (0.21 | ) | | | (0.01 | ) | | | (0.27 | ) |
| | 2010 - A | | | 7.03 | | | | 0.12 | (d) | | | 1.21 | | | | 1.33 | | | | (0.16 | ) |
| | 2010 - C | | | 6.95 | | | | 0.09 | (d) | | | 1.17 | | | | 1.26 | | | | (0.13 | ) |
| | 2010 - Institutional | | | 7.04 | | | | 0.16 | (d) | | | 1.19 | | | | 1.35 | | | | (0.18 | ) |
| | 2010 - IR (Commenced August 31, 2010) | | | 7.00 | | | | 0.03 | (d) | | | 1.18 | | | | 1.21 | | | | — | |
| | 2009 - A | | | 4.94 | | | | 0.09 | | | | 2.19 | | | | 2.28 | | | | (0.19 | ) |
| | 2009 - C | | | 4.91 | | | | 0.06 | | | | 2.17 | | | | 2.23 | | | | (0.19 | ) |
| | 2009 - Institutional | | | 4.96 | | | | 0.12 | | | | 2.19 | | | | 2.31 | | | | (0.23 | ) |
| | 2008 - A | | | 10.46 | | | | 0.20 | (e) | | | (5.69 | ) | | | (5.49 | ) | | | (0.03 | ) |
| | 2008 - C | | | 10.46 | | | | 0.13 | (e) | | | (5.68 | ) | | | (5.55 | ) | | | — | (f) |
| | 2008 - Institutional | | | 10.47 | | | | 0.23 | (e) | | | (5.71 | ) | | | (5.48 | ) | | | (0.03 | ) |
| | | | | | | | | | | | | | | | | | | | | | |
| | FOR THE PERIOD ENDED OCTOBER 31, | |
| | 2007 - A (Commenced September 28, 2007) | | | 10.00 | | | | (0.01 | ) | | | 0.47 | | | | 0.46 | | | | — | |
| | 2007 - C (Commenced September 28, 2007) | | | 10.00 | | | | (0.01 | ) | | | 0.47 | | | | 0.46 | | | | — | |
| | 2007 - Institutional (Commenced September 28, 2007) | | | 10.00 | | | | — | (f) | | | 0.47 | | | | 0.47 | | | | — | |
| | (a) | | Calculated based on the average shares outstanding methodology. |
| | (b) | | Assumes investments at the net asset value at the beginning of the period, reinvestment of all distributions, a complete redemption of the investment at the net asset value at the end of the period and no sales or redemption charges. Total returns would be reduced if a sales or redemption charge was taken into account. Returns do not reflect the deduction of taxes that a shareholder would pay on Fund distributions or the redemption of Fund shares. Total returns for periods less than one full year are not annualized. |
| | (d) | | Reflects income recognized from non-recurring special dividends which amounted to $0.01 per share and 0.19% of average net assets. |
| | (e) | | Reflects income recognized from special dividends which amounted to $0.02 per share and 0.20% of average net assets. |
| | (f) | | Amount is less than $0.005 per share. |
| | |
| 54 | | The accompanying notes are an integral part of these financial statements. |
GOLDMAN SACHS STRUCTURED INTERNATIONAL SMALL CAP FUND
| | | | | | | | | | | | | | | | | | | | | | | | | | | | | | | | | | | | | | | | |
| | | | | | | | | | | | | | | | | | | | | | | | | | | | | | | | | | |
| | | Net asset
value, end
of period | | | | | Total
return(b) | | | | | Net assets,
end of
period
(in 000s) | | | | | Ratio of
net expenses
to average
net assets | | | | | Ratio of
total expenses
to average
net assets | | | | | Ratio of
net investment
income (loss)
to average
net assets | | | | | Portfolio
turnover
rate | |
| | | | | | | | | | | | | | | | | | | | | | | | | | | | | | | | | | | | | | | | |
| | $ | 8.23 | | | | | | 6.56 | % | | | | $ | 25,882 | | | | | | 1.30 | %(c) | | | | | 1.50 | %(c) | | | | | 1.97 | %(c) | | | | | 63 | % |
| | | 8.10 | | | | | | 6.19 | | | | | | 961 | | | | | | 2.05 | (c) | | | | | 2.25 | (c) | | | | | 1.39 | (c) | | | | | 63 | |
| | | 8.23 | | | | | | 6.78 | | | | | | 273,736 | | | | | | 0.90 | (c) | | | | | 1.10 | (c) | | | | | 2.50 | (c) | | | | | 63 | |
| | | 8.21 | | | | | | 6.65 | | | | | | 286 | | | | | | 1.05 | (c) | | | | | 1.25 | (c) | | | | | 1.83 | (c) | | | | | 63 | |
| | | | | | | | | | | | | | | | | | | | | | | | | | | | | | | | | | | | | | | | |
| | | | | | | | | | | | | | | | | | | | | | | | | | | | | | | | | | | | | | | | |
| | | 7.92 | | | | | | (0.68 | ) | | | | | 29,729 | | | | | | 1.30 | | | | | | 1.47 | | | | | | 1.95 | | | | | | 79 | |
| | | 7.79 | | | | | | (1.39 | ) | | | | | 856 | | | | | | 2.05 | | | | | | 2.22 | | | | | | 1.56 | | | | | | 79 | |
| | | 7.94 | | | | | | (0.16 | ) | | | | | 249,545 | | | | | | 0.90 | | | | | | 1.07 | | | | | | 2.30 | | | | | | 79 | |
| | | 7.93 | | | | | | (0.33 | ) | | | | | 1,368 | | | | | | 1.05 | | | | | | 1.22 | | | | | | 2.39 | | | | | | 79 | |
| | | 8.20 | | | | | | 19.36 | | | | | | 34,154 | | | | | | 1.30 | | | | | | 1.50 | | | | | | 1.71 | (d) | | | | | 113 | |
| | | 8.08 | | | | | | 18.50 | | | | | | 213 | | | | | | 2.05 | | | | | | 2.25 | | | | | | 1.24 | (d) | | | | | 113 | |
| | | 8.21 | | | | | | 19.67 | | | | | | 236,265 | | | | | | 0.90 | | | | | | 1.10 | | | | | | 2.18 | (d) | | | | | 113 | |
| | | 8.21 | | | | | | 17.29 | | | | | | 1 | | | | | | 1.05 | (c) | | | | | 1.25 | (c) | | | | | 2.49 | (c)(d) | | | | | 113 | |
| | | 7.03 | | | | | | 48.17 | | | | | | 36,310 | | | | | | 1.30 | | | | | | 1.74 | | | | | | 1.62 | | | | | | 209 | |
| | | 6.95 | | | | | | 47.36 | | | | | | 40 | | | | | | 2.05 | | | | | | 2.49 | | | | | | 1.16 | | | | | | 209 | |
| | | 7.04 | | | | | | 48.80 | | | | | | 207,776 | | | | | | 0.90 | | | | | | 1.34 | | | | | | 1.99 | | | | | | 209 | |
| | | 4.94 | | | | | | (52.55 | ) | | | | | 18,763 | | | | | | 1.30 | | | | | | 1.70 | | | | | | 2.39 | (e) | | | | | 117 | |
| | | 4.91 | | | | | | (52.94 | ) | | | | | 21 | | | | | | 2.05 | | | | | | 2.45 | | | | | | 1.70 | (e) | | | | | 117 | |
| | | 4.96 | | | | | | (52.37 | ) | | | | | 67,625 | | | | | | 0.90 | | | | | | 1.30 | | | | | | 2.83 | (e) | | | | | 117 | |
| | | | | | | | | | | | | | | | | | | | | | | | | | | | | | | | | | | | | | | | |
| | | | | | | | | | | | | | | | | | | | | | | | | | | | | | | | | | | | | | | | |
| | | 10.46 | | | | | | 4.60 | | | | | | 43,572 | | | | | | 1.30 | (c) | | | | | 1.90 | (c) | | | | | (0.58 | )(c) | | | | | 4 | |
| | | 10.46 | | | | | | 4.60 | | | | | | 10 | | | | | | 2.05 | (c) | | | | | 2.65 | (c) | | | | | (1.06 | )(c) | | | | | 4 | |
| | | 10.47 | | | | | | 4.70 | | | | | | 143,817 | | | | | | 0.90 | (c) | | | | | 1.50 | (c) | | | | | 0.09 | (c) | | | | | 4 | |
| | |
| The accompanying notes are an integral part of these financial statements. | | 55 |
GOLDMAN SACHS STRUCTURED INTERNATIONAL EQUITY FUNDS
Notes to Financial Statements
April 30, 2012 (Unaudited)
Goldman Sachs Trust (the “Trust”) is a Delaware statutory trust registered under the Investment Company Act of 1940, as amended (the “Act”), as an open-end management investment company. The following table lists those series of the Trust that are included in this report (collectively, the “Funds” or individually a “Fund”), along with their corresponding share classes and respective diversification status under the Act:
| | | | |
| Fund | | Share Classes Offered* | | Diversified/ Non-diversified |
Structured Emerging Markets Equity and Structured International Small Cap | | A, C, Institutional and IR | | Diversified |
Structured International Equity | | A, B, C, Institutional, Service, IR and R | | Diversified |
| * | | Class B Shares are generally no longer available for purchase by current or prospective investors. |
Class A Shares are sold with a front-end sales charge of up to 5.50%. Class B Shares were sold with a contingent deferred sales charge (“CDSC”) that declines from 5.00% to zero, depending upon the period of time the shares are held. Class C Shares are sold with a CDSC of 1.00%, which is imposed on redemptions made within 12 months of purchase. Institutional, Service, Class IR and Class R Shares are not subject to a sales charge.
Goldman Sachs Asset Management, L.P. (“GSAM”), an affiliate of Goldman, Sachs & Co. (“Goldman Sachs”), serves as investment adviser to the Funds pursuant to a management agreement (the “Agreement”) with the Trust.
|
| 2. SIGNIFICANT ACCOUNTING POLICIES |
The preparation of financial statements in conformity with accounting principles generally accepted in the United States of America (“GAAP”) requires management to make estimates and assumptions that may affect the amounts and disclosures in the financial statements. Actual results could differ from those estimates and assumptions.
A. Investment Valuation — The Funds’ valuation policy is to value investments at fair value.
Equity securities and investment companies traded on a United States (“U.S.”) securities exchange or the NASDAQ system, or those located on certain foreign exchanges including, but not limited to the Americas, are valued daily at their last sale price or official closing price on the principal exchange or system on which they are traded. If no sale occurs, such securities and investment companies are valued at the last bid price for long positions and at the last ask price for short positions. Unlisted equity securities for which market quotations are available are valued at the last sale price on the valuation date, or if no sale occurs, at the last bid price. Such securities traded on certain foreign securities exchanges are valued daily at fair value determined by an independent fair value service (if available) under valuation procedures approved by the trustees and consistent with applicable regulatory guidance. The independent fair value service takes into account multiple factors including, but not limited to, movements in U.S. securities markets, certain depositary receipts, futures contracts and foreign currency exchange rates that have occurred subsequent to the close of the foreign securities exchanges. Investments in investment companies (other than those that are exchange traded) are valued at the net asset value per share (“NAV”) of the investment company on the valuation date.
56
GOLDMAN SACHS STRUCTURED INTERNATIONAL EQUITY FUNDS
|
| 2. SIGNIFICANT ACCOUNTING POLICIES (continued) |
Debt securities for which market quotations are readily available are valued on the basis of quotations supplied by dealers or furnished by an independent pricing service approved by the trustees. The pricing services may use valuation models or matrix pricing, which consider: (i) yield or price with respect to bonds that are considered comparable in characteristics such as rating, interest rate and maturity date or (ii) quotations from securities dealers to determine current value. Short-term debt obligations that mature in sixty days or less and that do not exhibit signs of credit deterioration are valued at amortized cost, which approximates fair value.
If quotations are not readily available, or if GSAM believes that such quotations do not accurately reflect fair value, the fair value of the Funds’ investments may be determined under valuation procedures approved by the trustees. GSAM, consistent with its procedures and applicable regulatory guidance, may make an adjustment to the most recent valuation prices of either domestic or foreign securities in light of significant events to reflect what it believes to be the fair value of the securities at the time of determining a Fund’s NAV. Significant events which could affect a large number of securities in a particular market may include, but are not limited to significant fluctuations in U.S. or foreign markets; market dislocations; market disruptions or unscheduled market closings. Significant events, which could also affect a single issuer, may include, but are not limited to corporate actions such as reorganizations, mergers and buy-outs; ratings downgrades and bankruptcies.
B. Investment Income and Investments — Investment income is comprised of interest income and dividend income, and is recorded net of any foreign withholding taxes, less any amounts reclaimable. Interest income is accrued daily and adjusted for amortization of premiums and accretion of discounts. Dividend income is recognized on ex-dividend date or, for certain foreign securities, as soon as such information is obtained subsequent to the ex-dividend date. Investment transactions are reflected on trade date with realized gains and losses on sales calculated using identified cost. Investment transactions are recorded on the following business day for daily NAV calculations. Any foreign capital gains tax is accrued daily based upon net unrealized gains, and is payable upon sale of such investments.
C. Class Allocations and Expenses — Investment income, realized and unrealized gain (loss), and non-class specific expenses of each Fund are allocated daily based upon the proportion of net assets of each class. Class specific expenses, where applicable, are borne by the respective share classes and include Distribution and Service, Transfer Agent and Service and Shareholder Administration fees. Non-class specific expenses directly incurred by a Fund are charged to that Fund, while such expenses incurred by the Trust are allocated across the respective Funds on a straight-line and/or pro-rata basis depending upon the nature of the expenses.
D. Federal Taxes and Distributions to Shareholders — It is each Fund’s policy to comply with the requirements of the Internal Revenue Code of 1986, as amended (the “Code”), applicable to regulated investment companies (mutual funds) and to distribute each year substantially all of its investment company taxable income and capital gains to its shareholders. Accordingly, the Funds are not required to make any provisions for the payment of federal income tax. Distributions to shareholders are recorded on the ex-dividend date. Income and capital gains distributions, if any, are declared and paid annually.
57
GOLDMAN SACHS STRUCTURED INTERNATIONAL EQUITY FUNDS
Notes to Financial Statements (continued)
April 30, 2012 (Unaudited)
|
| 2. SIGNIFICANT ACCOUNTING POLICIES (continued) |
Net capital losses are carried forward to future fiscal years and may be used to the extent allowed by the Code to offset any future capital gains. Utilization of capital loss carryforwards will reduce the requirement of future capital gains distributions.
The characterization of distributions to shareholders for financial reporting purposes is determined in accordance with federal income tax rules, which may differ from GAAP. The source of each Fund’s distributions may be shown in the accompanying financial statements as either from net investment income, net realized gain or capital. Certain components of the Funds’ net assets on the Statements of Assets and Liabilities reflect permanent GAAP/tax differences based on the appropriate tax character.
E. Foreign Currency Translation — The accounting records and reporting currency of the Funds are maintained in U.S. dollars. Investments and other assets and liabilities denominated in foreign currencies are translated into U.S. dollars using the current exchange rates at the close of each business day. The effect of changes in foreign currency exchange rates on investments is included within net realized and unrealized gain (loss) on investments. Changes in the value of other assets and liabilities as a result of fluctuations in foreign exchange rates are included in the Statements of Operations within unrealized gain (loss) on foreign currency translations. Transactions denominated in foreign currencies are translated into U.S. dollars on the date the transaction occurred, the effects of which are included within realized gain (loss) on foreign currency transactions.
F. Futures Contracts — Futures contracts are valued at the last settlement price, or in the absence of a sale, the last bid price for long positions and the last ask price for short positions, at the end of each day on the board of trade or exchange upon which they are traded. Upon entering into a futures contract, the Funds deposit cash or securities in an account on behalf of the broker in an amount sufficient to meet the initial margin requirement. Subsequent payments are made or received by the Funds equal to the daily change in the contract value and are recorded as variation margin receivable or payable with a corresponding offset in unrealized gains or losses. The Funds recognize a realized gain or loss when a contract is closed or expires.
The use of futures contracts involves, to varying degrees, elements of market and counterparty risk which may exceed the amounts recognized in the Statements of Assets and Liabilities. Futures contracts may be illiquid, and exchanges may limit fluctuations in futures contract prices during a single day. Changes in the value of a futures contract may not directly correlate with changes in the value of the underlying securities. These risks may decrease the effectiveness of the Funds’ strategies and potentially result in a loss. The Funds must set aside liquid assets, or engage in other appropriate measures, to cover their obligations under these contracts.
58
GOLDMAN SACHS STRUCTURED INTERNATIONAL EQUITY FUNDS
|
| 3. FAIR VALUE OF INVESTMENTS |
The fair value of a financial instrument is the amount that would be received to sell an asset or paid to transfer a liability in an orderly transaction between market participants at the measurement date (i.e., the exit price). GAAP establishes a fair value hierarchy that prioritizes the inputs to valuation techniques used to measure fair value. The hierarchy gives the highest priority to unadjusted quoted prices in active markets for identical assets or liabilities (Level 1 measurements) and the lowest priority to unobservable inputs (Level 3 measurements). The three levels of the fair value hierarchy are described below:
Level 1 — Unadjusted quoted prices in active markets that are accessible at the measurement date for identical, unrestricted assets or liabilities;
Level 2 — Quoted prices in markets that are not active or financial instruments for which significant inputs are observable (including, but not limited to, quoted prices for similar investments, interest rates, foreign exchange rates, volatility and credit spreads), either directly or indirectly;
Level 3 — Prices or valuations that require significant unobservable inputs (including GSAM’s assumptions in determining fair value measurement).
The levels used for classifying investments are not necessarily an indication of the risk associated with investing in those investments.
The following is a summary of the Funds’ investments and derivatives categorized in the fair value hierarchy as of April 30, 2012:
| | | | | | | | | | | | |
| | | |
STRUCTURED EMERGING MARKETS EQUITY FUND | | | | | | | | | | | | |
| | | |
| Investment Type | | Level 1 | | | Level 2 | | | Level 3 | |
| Assets | | | | | | | | | | | | |
Common Stock and/or Other Equity Investments | | $ | 63,147,579 | | | $ | 246,405,975 | (a) | | $ | 339,341 | |
Securities Lending Reinvestment Vehicle | | | 840,000 | | | | — | | | | — | |
| Total | | $ | 63,987,579 | | | $ | 246,405,975 | | | $ | 339,341 | |
59
GOLDMAN SACHS STRUCTURED INTERNATIONAL EQUITY FUNDS
Notes to Financial Statements (continued)
April 30, 2012 (Unaudited)
|
| 3. FAIR VALUE OF INVESTMENTS (continued) |
The following is a reconciliation of Level 3 investments for the period ended April 30, 2012:
| | | | |
| |
| | | Common Stock
and/or Other Equity
Investments | |
Beginning Balance as of November 1, 2011 | | $ | — | |
Purchases | | $ | 339,341 | |
Ending Balance as of April 30, 2012 | | $ | 339,341 | |
| | | | | | | | | | | | |
| | | |
STRUCTURED INTERNATIONAL EQUITY FUND | | | | | | | | | | | | |
| | | |
| Investment Type | | Level 1 | | | Level 2 | | | Level 3 | |
| Assets | | | | | | | | | | | | |
Common Stock and/or Other Equity Investments | | $ | 32,192,192 | | | $ | 1,052,799,653 | (a) | | $ | — | |
Securities Lending Reinvestment Vehicle | | | 46,503,780 | | | | — | | | | — | |
| Total | | $ | 78,695,972 | | | $ | 1,052,799,653 | | | $ | — | |
| | | |
| Derivative Type | | | | | | | | | |
| Assets(b) | | | | | | | | | | | | |
Futures Contracts | | $ | 54,383 | | | $ | — | | | $ | — | |
| Liabilities(b) | | | | | | | | | | | | |
Futures Contracts | | $ | (1,349,627 | ) | | $ | — | | | $ | — | |
| | | |
STRUCTURED INTERNATIONAL SMALL CAP FUND | | | | | | | | | | | | |
| | | |
| Investment Type | | Level 1 | | | Level 2 | | | Level 3 | |
| Assets | | | | | | | | | | | | |
Common Stock and/or Other Equity Investments | | $ | — | | | $ | 291,305,151 | (a) | | $ | — | |
Securities Lending Reinvestment Vehicle | | | 14,980,881 | | | | — | | | | — | |
| Total | | $ | 14,980,881 | | | $ | 291,305,151 | | | $ | — | |
| | | |
| Derivative Type | | | | | | | | | |
| Assets(b) | | | | | | | | | | | | |
Futures Contracts | | $ | 9,083 | | | $ | — | | | $ | — | |
| Liabilities(b) | | | | | | | | | | | | |
Futures Contracts | | $ | (55,685 | ) | | $ | — | | | $ | — | |
| (a) | | To adjust for the time difference between local market close and the calculation of net asset value, the Funds utilize fair value model prices for international equities provided by an independent fair value service resulting in a Level 2 classification. |
| (b) | | Amount shown represents unrealized gain (loss) at period end. |
60
GOLDMAN SACHS STRUCTURED INTERNATIONAL EQUITY FUNDS
|
| 4. INVESTMENTS IN DERIVATIVES |
The Funds may make investments in derivative instruments, including, but not limited to options, futures, swaps, swaptions and other derivatives relating to foreign currency transactions. A derivative is an instrument whose value is derived from underlying assets, indices, reference rates or a combination of these factors. Derivative instruments may be privately negotiated contracts (often referred to as over the counter (“OTC”) derivatives) or they may be listed and traded on an exchange. Derivative contracts may involve future commitments to purchase or sell financial instruments or commodities at specified terms on a specified date, or to exchange interest payment streams or currencies based on a notional or contractual amount. Derivative instruments may involve a high degree of financial risk. The use of derivatives also involves the risk of loss if the investment adviser is incorrect in its expectation of the timing or level of fluctuations in securities prices, interest rates or currency prices. Investments in derivative instruments also include the risk of default by the counterparty, the risk that the investment may not be liquid and/or the risk that a small movement in the price of the underlying security or benchmark may result in a disproportionately large movement, unfavorable or favorable, in the price of the derivative instrument.
During the six months ended April 30, 2012, the Structured International Equity and Structured International Small Cap Funds entered into futures contracts. These instruments were used to meet the Funds’ investment objectives and to obtain and/or manage exposure related to the risks below. The following table sets forth, by certain risk types, the gross value of these derivative contracts for trading activities as of April 30, 2012. The values in the table below exclude the effects of cash collateral received or posted pursuant to these derivative contracts, and therefore are not representative of the Funds’ net exposure.
| | | | | | | | | | | | | | |
| Fund | | Risk | | Statements of Assets and Liabilities | | Assets(a) | | | Statements of Assets and Liabilities | | Liabilities(a) | |
Structured International Equity | | Equity | | Unrealized gain on futures variation margin | | $ | 54,383 | | | Unrealized loss on futures variation margin | | $ | (1,349,627 | ) |
Structured International Small Cap | | Equity | | Unrealized gain on futures variation margin | | | 9,083 | | | Unrealized loss on futures variation margin | | | (55,685 | ) |
| (a) | | Includes unrealized gain (loss) on futures contracts described in the Additional Investment Information sections of the Schedules of Investments. Only current day’s variation margin is reported within the Statements of Assets and Liabilities. |
The following table sets forth, by certain risk types, the Funds’ gains (losses) related to these derivatives and their indicative volumes for the six months ended April 30, 2012. These gains (losses) should be considered in the context that these derivative contracts may have been executed to economically hedge certain investments, and accordingly, certain gains (losses) on such derivative contracts may offset certain (losses) gains attributable to investments. These gains (losses) are included in “Net realized gain (loss)” or “Net change in unrealized gain (loss)” on the Statements of Operations:
| | | | | | | | | | | | | | |
| Fund | | Risk | | Statements of Operations | | Net
Realized
Gain (Loss) | | | Net Change in
Unrealized
Gain (Loss) | | | Average
Number of
Contracts(a) |
Structured International Equity | | Equity | | Net realized gain (loss) from futures contracts/Net change in unrealized gain (loss) on futures contracts | | $ | 8,992 | | | $ | (1,788,741 | ) | | 431 |
Structured International Small Cap | | Equity | | Net realized gain (loss) from futures contracts/Net change in unrealized gain (loss) on futures contracts | | | 537,317 | | | | (491,857 | ) | | 107 |
| (a) | | Average number of contracts is based on the average of month end balances for the six months ended April 30, 2012. |
61
GOLDMAN SACHS STRUCTURED INTERNATIONAL EQUITY FUNDS
Notes to Financial Statements (continued)
April 30, 2012 (Unaudited)
|
| 5. AGREEMENTS AND AFFILIATED TRANSACTIONS |
A. Management Agreement — Under the Agreement, GSAM manages the Funds, subject to the general supervision of the trustees.
As compensation for the services rendered pursuant to the Agreement, the assumption of the expenses related thereto and administration of the Funds’ business affairs, including providing facilities, GSAM is entitled to a management fee, accrued daily and paid monthly, equal to an annual percentage rate of each Fund’s average daily net assets.
For the six months ended April 30, 2012, contractual management fees with GSAM were at the following rates:
| | | | | | | | | | | | | | | | | | | | | | | | | | |
| | | | | Contractual Management Rate | |
| Fund | | | | First
$1 billion | | | Next
$1 billion | | | Next
$3 billion | | | Next
$3 billion | | | Over $8 billion | | | Effective Rate | |
Structured Emerging Markets Equity | | | | | 1.00 | % | | | 1.00 | % | | | 0.90 | % | | | 0.86 | % | | | 0.84 | % | | | 1.00 | % |
Structured International Equity | | | | | 0.85 | | | | 0.77 | | | | 0.73 | | | | 0.72 | | | | 0.71 | | | | 0.84 | |
Structured International Small Cap | | | | | 0.85 | | | | 0.85 | | | | 0.77 | | | | 0.73 | | | | 0.72 | | | | 0.85 | |
B. Distribution and Service Plans — The Trust, on behalf of each Fund, has adopted Distribution and Service Plans (the “Plans”). Under the Plans, Goldman Sachs, which serves as distributor (the “Distributor”), is entitled to a fee accrued daily and paid monthly for distribution services and personal and account maintenance services, which may then be paid by Goldman Sachs to authorized dealers, at the following annual rates calculated on a Fund’s average daily net assets of each respective share class:
| | | | | | | | | | | | | | | | | | |
| | | | | Distribution and Service Plan Rates | |
| | | | | Class A* | | | Class B | | | Class C | | | Class R* | |
Distribution Plan | | | | | 0.25 | % | | | 0.75 | % | | | 0.75 | % | | | 0.50 | % |
Service Plan | | | | | — | | | | 0.25 | | | | 0.25 | | | | — | |
| * | | With respect to Class A and Class R Shares, the Distributor at its discretion may use compensation for distribution services paid under the Distribution Plan to compensate service organizations for personal and account maintenance services and expenses as long as such total compensation does not exceed the maximum cap on “service fees” imposed by the Financial Industry Regulatory Authority. |
C. Distribution Agreement — Goldman Sachs, as Distributor of the shares of the Funds pursuant to a Distribution Agreement, may retain a portion of the Class A front end sales charge and Class B and Class C CDSC. During the six months ended April 30, 2012, Goldman Sachs advised that it retained front end sales charges of approximately $1,000, $3,300 and $500 for the Structured Emerging Markets Equity, Structured International Equity and Structured International Small Cap Funds, respectively. Goldman Sachs retained no contingent deferred sales charges.
62
GOLDMAN SACHS STRUCTURED INTERNATIONAL EQUITY FUNDS
|
| 5. AGREEMENTS AND AFFILIATED TRANSACTIONS (continued) |
D. Service Plan and Shareholder Administration Plan — The Trust, on behalf of each Fund that offers Service Shares, has adopted a Service Plan and a Shareholder Administration Plan. These plans allow for service organizations to provide varying levels of personal and account maintenance and shareholder administration services to their customers who are beneficial owners of such shares. The Service Plan and Shareholder Administration Plan each provide for compensation to the service organizations which is accrued daily and paid monthly at an annual rate as follows: 0.25% (0.50% in aggregate) of the average daily net assets of the Service Shares.
E. Transfer Agency Agreement — Goldman Sachs also serves as the transfer agent of the Funds for a fee pursuant to a Transfer Agency Agreement. The fees charged for such transfer agency services are accrued daily and paid monthly at an annual rate as follows: 0.19% of the average daily net assets for Class A, Class B, Class C, Class IR and Class R Shares and 0.04% of the average daily net assets for Institutional and Service Shares.
F. Other Expense Agreements and Affiliated Transactions — GSAM has agreed to limit certain “Other Expense” of the Funds (excluding management fees, distribution and service fees, transfer agent fees and expenses, service fees and shareholder administration fees (as applicable), taxes, interest, brokerage fees and litigation, indemnification, shareholder meetings and other extraordinary expenses, exclusive of any custody and transfer agent fee credit reductions) to the extent such expenses exceed, on an annual basis, a percentage rate of the average daily net assets of each Fund. Such Other Expense reimbursements, if any, are accrued daily and paid monthly. In addition, the Funds are not obligated to reimburse GSAM for prior fiscal year expense reimbursements, if any. The Other Expense limitation as an annual percentage rate of average daily net assets for Structured Emerging Markets Equity, Structured International Equity and Structured International Small Cap Funds are 0.014%, 0.004% and 0.014%, respectively. These Other Expense reimbursements will remain in place through February 28, 2013, and prior to such date GSAM may not terminate the arrangements without the approval of the trustees. In addition, the Funds have entered into certain offset arrangements with the custodian and the transfer agent, which may result in a reduction of the Funds’ expenses.
For the six months ended April 30, 2012, these expense reductions, including Other Expense reimbursements, were as follows (in thousands):
| | | | | | | | | | | | | | |
| Fund | | | | Custody Fee
Credits | | | Other
Expense
Reimbursement | | | Total Expense
Reductions | |
Structured Emerging Markets Equity | | | | $ | 1 | | | $ | 418 | | | $ | 419 | |
Structured International Equity | | | | | 1 | | | | 435 | | | | 436 | |
Structured International Small Cap | | | | | 3 | | | | 273 | | | | 276 | |
As of April 30, 2012, the amounts owed to affiliates of the Funds were as follows (in thousands):
| | | | | | | | | | | | | | | | | | |
| Fund | | | | Management
Fees | | | Distribution
and Service
Fees | | | Transfer Agent
Fees | | | Total | |
Structured Emerging Markets Equity | | | | $ | 254 | | | $ | 4 | | | $ | 13 | | | $ | 271 | |
Structured International Equity | | | | | 769 | | | | 63 | | | | 70 | | | | 902 | |
Structured International Small Cap | | | | | 201 | | | | 6 | | | | 12 | | | | 219 | |
63
GOLDMAN SACHS STRUCTURED INTERNATIONAL EQUITY FUNDS
Notes to Financial Statements (continued)
April 30, 2012 (Unaudited)
|
| 5. AGREEMENTS AND AFFILIATED TRANSACTIONS (continued) |
G. Line of Credit Facility — As of April 30, 2012, the Funds participated in a $580,000,000 committed, unsecured revolving line of credit facility (the “facility”) together with other funds of the Trust and registered investment companies having management agreements with GSAM or its affiliates (“Other Borrowers”). Pursuant to the terms of the facility, the Funds and Other Borrowers could increase the credit amount by an additional $340,000,000, for a total of up to $920,000,000. This facility is to be used solely for temporary or emergency purposes. The interest rate on borrowings is based on the federal funds rate. The facility also requires a fee to be paid by the Funds based on the amount of the commitment that has not been utilized. For the six months ended April 30, 2012, the Funds did not have any borrowings under the facility. Effective May 8, 2012, the amount available through the facility increased to $630,000,000.
H. Other Transactions with Affiliates — For the six months ended April 30, 2012, Goldman Sachs earned approximately $16,800 in brokerage commissions from portfolio transactions, including futures transactions executed with Goldman Sachs as the Futures Commission Merchant, on behalf of the Structured International Equity Fund.
As of April 30, 2012, the following Goldman Sachs Fund of Funds Portfolios were the beneficial owners of 5% or more of the total outstanding shares of the following Funds:
| | | | | | | | | | | | | | | | | | | | | | |
| Fund | | | | Goldman Sachs
Equity Growth
Strategy Portfolio | | | Goldman Sachs
Growth Strategy
Portfolio | | | Goldman Sachs
Growth and Income
Strategy Portfolio | | | Goldman Sachs Satellite Strategies
Portfolio | | | Goldman Sachs Tax-Advantaged
Global Equity
Portfolio | |
Structured Emerging Markets Equity | | | | | — | % | | | 7 | % | | | — | % | | | 15 | % | | | 5 | % |
Structured International Equity | | | | | 10 | | | | 20 | | | | 16 | | | | — | | | | — | |
Structured International Small Cap | | | | | — | | | | 10 | | | | 11 | | | | 21 | | | | — | |
As of April 30, 2012, the Goldman Sachs Group, Inc. was the beneficial owner of approximately 1% of the Class IR Shares of the Structured Emerging Markets Equity Fund, and approximately 17% and 7% of the Class IR and Class R Shares of the Structured International Equity Fund, respectively.
|
| 6. PORTFOLIO SECURITIES TRANSACTIONS |
The cost of purchases and proceeds from sales and maturities of long-term securities for the six months ended April 30, 2012, were as follows:
| | | | | | | | | | |
| Fund | | | | Purchases | | | Sales and Maturities | |
Structured Emerging Markets Equity | | | | $ | 256,233,724 | | | $ | 255,535,320 | |
Structured International Equity | | | | | 1,197,552,507 | | | | 1,455,292,332 | |
Structured International Small Cap | | | | | 175,972,268 | | | | 170,306,751 | |
64
GOLDMAN SACHS STRUCTURED INTERNATIONAL EQUITY FUNDS
Pursuant to exemptive relief granted by the Securities and Exchange Commission (“SEC”) and the terms and conditions contained therein, the Funds may lend their securities through a securities lending agent, Goldman Sachs Agency Lending (“GSAL”), a wholly-owned subsidiary of Goldman Sachs, to certain qualified borrowers including Goldman Sachs and affiliates. In accordance with the Funds’ securities lending procedures, the Funds receive cash collateral at least equal to the market value of the securities on loan. The market value of the loaned securities is determined at the close of business of the Funds at their last sale price or official closing price on the principal exchange or system on which they are traded, and any additional required collateral is delivered to the Funds on the next business day. As with other extensions of credit, the Funds may experience a delay in the recovery of their securities or incur a loss should the borrower of the securities breach its agreement with the Funds or become insolvent at a time when the collateral is insufficient to cover the cost of repurchasing securities on loan.
The Funds invest the cash collateral received in connection with securities lending transactions in the Goldman Sachs Financial Square Money Market Fund (“Money Market Fund”), a separate series of the Trust. The Money Market Fund is registered under the Act as an open end investment company, is subject to Rule 2a-7 under the Act and is managed by GSAM, for which GSAM may receive an investment advisory fee of up to 0.205% on an annualized basis of the average daily net assets of the Money Market Fund.
Both the Funds and GSAL received compensation relating to the lending of the Funds’ securities. The amounts earned by the Funds for the six months ended April 30, 2012, are reported under Investment Income on the Statements of Operations. The table below details securities lending activity with affiliates of Goldman Sachs:
| | | | | | | | | | | | | | |
| | | | | For the Six Months Ended April 30, 2012 | | | | |
| Fund | | | | Earnings of GSAL Relating to Securities Loaned | | | Amounts Received by the Funds from Lending to Goldman Sachs | | | Amounts Payable to Goldman Sachs Upon Return of Securities Loaned as of April 30, 2012 | |
Structured Emerging Markets Equity | | | | $ | 2,084 | | | $ | — | | | $ | — | |
Structured International Equity | | | | | 52,975 | | | | 41,037 | | | | 3,946,250 | |
Structured International Small Cap | | | | | 12,687 | | | | 22,638 | | | | 599,150 | |
The following table provides information about the Funds’ investment in the Money Market Fund for the six months ended April 30, 2012 (in thousands):
| | | | | | | | | | | | | | | | | | | | | | |
| Fund | | | | Number of Shares Held Beginning of Period | | | Shares
Bought | | | Shares
Sold | | | Number of Shares Held End of
Period | | | Value at
End
Period | |
Structured Emerging Markets Equity | | | | | — | | | | 20,308 | | | | (19,468 | ) | | | 840 | | | $ | 840 | |
Structured International Equity | | | | | 8,528 | | | | 275,200 | | | | (237,224 | ) | | | 46,504 | | | | 46,504 | |
Structured International Small Cap | | | | | 8,064 | | | | 27,910 | | | | (20,993 | ) | | | 14,981 | | | | 14,981 | |
65
GOLDMAN SACHS STRUCTURED INTERNATIONAL EQUITY FUNDS
Notes to Financial Statements (continued)
April 30, 2012 (Unaudited)
As of the Funds’ most recent fiscal year end, October 31, 2011, the Funds’ capital loss carryovers on a tax-basis were as follows:
| | | | | | | | | | | | |
| | | Structured
Emerging Markets
Equity | | | Structured International Equity | | | Structured
International Small Cap | |
Capital loss carryovers:(1) | | | | | | | | | | | | |
Expiring 2016 | | $ | — | | | $ | (455,911,785 | ) | | $ | (5,458,844 | ) |
Expiring 2017 | | | (38,211,138 | ) | | | (940,883,655 | ) | | | (21,285,839 | ) |
Expiring 2019 | | | — | | | | (5,134,101 | ) | | | — | |
Total capital loss carryovers | | $ | (38,211,138 | ) | | $ | (1,401,929,541 | ) | | $ | (26,744,683 | ) |
| (1) | | Expiration occurs on October 31 of the year indicated. |
As of April 30, 2012, the Funds’ aggregate security unrealized gains and losses based on cost for U.S. federal income tax purposes were as follows:
| | | | | | | | | | | | |
| | | Structured
Emerging Markets
Equity | | | Structured
International
Equity | | | Structured
International
Small Cap | |
Tax cost | | $ | 281,541,566 | | | $ | 1,126,766,572 | | | $ | 281,037,608 | |
Gross unrealized gain | | | 46,568,820 | | | | 70,746,565 | | | | 40,249,140 | |
Gross unrealized loss | | | (17,377,491 | ) | | | (66,017,512 | ) | | | (15,000,716 | ) |
Net unrealized security gain | | $ | 29,191,329 | | | $ | 4,729,053 | | | $ | 25,248,424 | |
The difference between GAAP-basis and tax-basis unrealized gains (losses) is attributable primarily to wash sales, net mark to market gains (losses) on regulated futures contracts and foreign currency contracts and differences related to the tax treatment of passive foreign investment company investments.
GSAM has reviewed the Funds’ tax positions for all open tax years (the current and prior three years, as applicable) and has concluded that no provision for income tax is required in the Funds’ financial statements. Such open tax years remain subject to examination and adjustment by tax authorities.
66
GOLDMAN SACHS STRUCTURED INTERNATIONAL EQUITY FUNDS
The Funds’ risks include, but are not limited to, the following:
Foreign Custody Risk — A Fund that invests in foreign securities may hold such securities and foreign currency with foreign banks, agents, and securities depositories appointed by the Fund’s custodian (each a “Foreign Custodian”). In some countries, Foreign Custodians may be subject to little or no regulatory oversight or independent evaluation of their operations. Further, the laws of certain countries may place limitations on a Fund’s ability to recover its assets if a Foreign Custodian enters into bankruptcy. Investments in emerging markets may be subject to greater custody risks than investments in more developed markets. Custody services in emerging market countries are often undeveloped and may be less regulated than in more developed countries, and thus may not afford the same level of investor protection as would apply in developed countries.
Funds’ Shareholder Concentration Risk — Certain funds, accounts, individuals or Goldman Sachs affiliates may from time to time own (beneficially or of record) or control a significant percentage of the Funds’ shares. Redemptions by these entities of their holdings in the Funds may impact the Funds’ liquidity and NAV. These redemptions may also force the Funds to sell securities.
Liquidity Risk —The Funds may make investments that may be illiquid or that may become less liquid in response to market developments or adverse investor perceptions. Liquidity risk may also refer to the risk that a Fund will not be able to pay redemption proceeds within the allowable time period because of unusual market conditions, an unusually high volume of redemption requests, or other reasons. To meet redemption requests, a Fund may be forced to sell investments at an unfavorable time and/or under unfavorable conditions.
Market and Credit Risks — In the normal course of business, the Funds trade financial instruments and enter into financial transactions where risk of potential loss exists due to changes in the market (market risk). Additionally, the Funds may also be exposed to credit risk in the event that an issuer fails to perform or that an institution or entity with which the Funds have unsettled or open transaction defaults.
Investing in foreign markets may involve special risks and considerations not typically associated with investing in the U.S. These risks include revaluation of currencies, high rates of inflation, repatriation restrictions on income and capital, and adverse political and economic developments. Moreover, securities issued in these markets may be less liquid, be subject to government ownership controls, have delayed settlements and their prices may be more volatile than those of comparable securities in the U.S.
Under the Trust’s organizational documents, its trustees, officers, employees and agents are indemnified, to the extent permitted by the Act, against certain liabilities that may arise out of performance of their duties to the Funds. Additionally, in the course of business, the Funds enter into contracts that contain a variety of indemnification clauses. The Funds’ maximum exposure under these arrangements is unknown, as this would involve future claims that may be made against the Funds that have not yet occurred. However, GSAM believes the risk of loss under these arrangements to be remote.
67
GOLDMAN SACHS STRUCTURED INTERNATIONAL EQUITY FUNDS
Notes to Financial Statements (continued)
April 30, 2012 (Unaudited)
New Accounting Pronouncement — In May 2011, Accounting Standards Update 2011-04 (ASU 2011-04), Amendments to Achieve Common Fair Value Measurement and Disclosure Requirements in U.S. GAAP and IFRSs, was issued and is effective for interim and annual periods beginning after December 15, 2011. ASU 2011-04 amends Financial Accounting Standards Board (FASB) Topic 820, Fair Value Measurement. The amendments are the result of the work by the FASB and the International Accounting Standards Board to develop common requirements for measuring fair value and for disclosing information about fair value measurements in accordance with GAAP. GSAM is currently evaluating the application of ASU 2011-04 and its impact, if any, on the Funds’ financial statements.
In December 2011, Accounting Standards Update 2011-11 (ASU 2011-11), Amendments to Disclosures about Offsetting Assets and Liabilities Requirements in U.S. GAAP and IFRSs, was issued and is effective for interim periods and annual periods
beginning on or after January 1, 2013. The amendments are the result of the work by FASB and the International Accounting Standards Board to develop common requirements for disclosing information about offsetting and related arrangements. GSAM is currently evaluating the application of ASU 2011-11 and its impact, if any, on the Funds’ financial statements.
Other Matters — On February 8, 2012, the Commodity Futures Trading Commission (CFTC) adopted amendments to several of its rules relating to commodity pool operators, including Rule 4.5. The Funds currently rely on Rule 4.5’s exclusion from CFTC regulation for regulated investment companies. GSAM is currently evaluating the amendments and their impact, if any, on the Funds’ financial statements.
Subsequent events after the balance sheet date have been evaluated through the date the financial statements were issued. GSAM has concluded that there is no impact requiring adjustment or disclosure in the financial statements.
68
GOLDMAN SACHS STRUCTURED INTERNATIONAL EQUITY FUNDS
|
| 13. SUMMARY OF SHARE TRANSACTIONS |
Share activity is as follows:
| | | | | | | | | | | | | | | | |
| | | Structured Emerging Markets Equity Fund | |
| | | | |
| | | For the Six Months Ended April 30, 2012 (Unaudited) | | | For the Fiscal Year Ended October 31, 2011 | |
| | | | |
| | | Shares | | | Dollars | | | Shares | | | Dollars | |
| | | | |
| Class A Shares | | | | | | | | | | | | | | | | |
Shares sold | | | 899,758 | | | $ | 7,670,799 | | | | 798,278 | | | $ | 7,208,905 | |
Reinvestment of distributions | | | 25,713 | | | | 190,016 | | | | 46,464 | | | | 420,501 | |
Shares redeemed | | | (573,357 | ) | | | (4,606,206 | ) | | | (4,571,789 | ) | | | (41,124,003 | ) |
| | | | 352,114 | | | | 3,254,609 | | | | (3,727,047 | ) | | | (33,494,597 | ) |
| Class C Shares | | | | | | | | | | | | | | | | |
Shares sold | | | 5,070 | | | | 43,184 | | | | 15,312 | | | | 133,070 | |
Reinvestment of distributions | | | — | | | | — | | | | 36 | | | | 324 | |
Shares redeemed | | | (165 | ) | | | (1,265 | ) | | | (134,742 | ) | | | (1,183,758 | ) |
| | | | 4,905 | | | | 41,919 | | | | (119,394 | ) | | | (1,050,364 | ) |
| Institutional Shares | | | | | | | | | | | | | | | | |
Shares sold | | | 5,029,925 | | | | 40,765,423 | | | | 14,892,939 | | | | 127,981,053 | |
Reinvestment of distributions | | | 704,649 | | | | 5,186,220 | | | | 517,427 | | | | 4,693,065 | |
Shares redeemed | | | (5,363,364 | ) | | | (41,821,351 | ) | | | (22,425,792 | ) | | | (196,614,755 | ) |
| | | | 371,210 | | | | 4,130,292 | | | | (7,015,426 | ) | | | (63,940,637 | ) |
| Class IR Shares | | | | | | | | | | | | | | | | |
Shares sold | | | 17,324 | | | | 152,584 | | | | — | | | | — | |
Reinvestment of distributions | | | 3 | | | | 19 | | | | 2 | | | | 15 | |
Shares redeemed | | | (459 | ) | | | (3,918 | ) | | | — | | | | — | |
| | | | 16,868 | | | | 148,685 | | | | 2 | | | | 15 | |
NET INCREASE (DECREASE) | | | 745,097 | | | $ | 7,575,505 | | | | (10,861,865 | ) | | $ | (98,485,583 | ) |
69
GOLDMAN SACHS STRUCTURED INTERNATIONAL EQUITY FUNDS
Notes to Financial Statements (continued)
April 30, 2012 (Unaudited)
|
| 13. SUMMARY OF SHARE TRANSACTIONS (continued) |
Share activity is as follows:
| | | | | | | | | | | | | | | | |
| | | Structured International Equity Fund | |
| | | | |
| | | For the Six Months Ended April 30, 2012 (Unaudited) | | | For the Fiscal Year Ended October 31, 2011 | |
| | | | |
| | | Shares | | | Dollars | | | Shares | | | Dollars | |
| | | | |
| Class A Shares | | | | | | | | | | | | | | | | |
Shares sold | | | 2,628,170 | | | $ | 22,044,664 | | | | 11,348,906 | | | $ | 118,600,647 | |
Shares converted from Class B(a) | | | 7,360 | | | | 62,072 | | | | 17,113 | | | | 168,197 | |
Reinvestment of distributions | | | 1,704,286 | | | | 13,804,716 | | | | 964,449 | | | | 9,808,446 | |
Shares redeemed | | | (10,305,381 | ) | | | (88,848,044 | ) | | | (29,431,194 | ) | | | (286,605,407 | ) |
| | | | (5,965,565 | ) | | | (52,936,592 | ) | | | (17,100,726 | ) | | | (158,028,117 | ) |
| Class B Shares | | | | | | | | | | | | | | | | |
Shares sold | | | 5,608 | | | | 48,790 | | | | 17,244 | | | | 175,947 | |
Shares converted to Class A(a) | | | (7,406 | ) | | | (62,072 | ) | | | (17,299 | ) | | | (168,197 | ) |
Reinvestment of distributions | | | 16,339 | | | | 131,532 | | | | 7,550 | | | | 76,184 | |
Shares redeemed | | | (99,129 | ) | | | (848,495 | ) | | | (219,476 | ) | | | (2,142,846 | ) |
| | | | (84,588 | ) | | | (730,245 | ) | | | (211,981 | ) | | | (2,058,912 | ) |
| Class C Shares | | | | | | | | | | | | | | | | |
Shares sold | | | 15,916 | | | | 135,702 | | | | 31,151 | | | | 319,060 | |
Reinvestment of distributions | | | 13,667 | | | | 109,747 | | | | 5,055 | | | | 51,002 | |
Shares redeemed | | | (63,819 | ) | | | (543,091 | ) | | | (123,732 | ) | | | (1,237,836 | ) |
| | | | (34,236 | ) | | | (297,642 | ) | | | (87,526 | ) | | | (867,774 | ) |
| Institutional Shares | | | | | | | | | | | | | | | | |
Shares sold | | | 4,443,762 | | | | 40,275,493 | | | | 30,185,328 | | | | 320,568,985 | |
Reinvestment of distributions | | | 5,697,917 | | | | 47,178,757 | | | | 3,764,641 | | | | 39,227,558 | |
Shares redeemed | | | (28,958,966 | ) | | | (250,748,585 | ) | | | (98,134,898 | ) | | | (965,873,711 | ) |
| | | | (18,817,287 | ) | | | (163,294,335 | ) | | | (64,184,929 | ) | | | (606,077,168 | ) |
| Service Shares | | | | | | | | | | | | | | | | |
Shares sold | | | 89,124 | | | | 776,927 | | | | 376,099 | | | | 3,801,122 | |
Reinvestment of distributions | | | 15,853 | | | | 129,366 | | | | 17,739 | | | | 181,647 | |
Shares redeemed | | | (455,460 | ) | | | (3,916,467 | ) | | | (1,229,483 | ) | | | (11,963,533 | ) |
| | | | (350,483 | ) | | | (3,010,174 | ) | | | (835,645 | ) | | | (7,980,764 | ) |
| Class IR Shares | | | | | | | | | | | | | | | | |
Shares sold | | | 256 | | | | 2,290 | | | | 8,327 | | | | 76,873 | |
Reinvestment of distributions | | | 295 | | | | 2,354 | | | | 17 | | | | 174 | |
Shares redeemed | | | (711 | ) | | | (5,892 | ) | | | (4,071 | ) | | | (36,445 | ) |
| | | | (160 | ) | | | (1,248 | ) | | | 4,273 | | | | 40,602 | |
| Class R Shares | | | | | | | | | | | | | | | | |
Shares sold | | | 1,552 | | | | 13,258 | | | | 17,539 | | | | 173,493 | |
Reinvestment of distributions | | | 704 | | | | 5,640 | | | | 480 | | | | 4,836 | |
Shares redeemed | | | (4,270 | ) | | | (35,851 | ) | | | (23,987 | ) | | | (250,600 | ) |
| | | | (2,014 | ) | | | (16,953 | ) | | | (5,968 | ) | | | (72,271 | ) |
NET DECREASE | | | (25,254,333 | ) | | $ | (220,287,189 | ) | | | (82,422,502 | ) | | $ | (775,044,404 | ) |
| (a) | | Class B Shares automatically convert into Class A Shares on or about the fifteenth day of the last month of the calendar quarter that is eight years after the initial purchase date of either the Fund or another Goldman Sachs Fund. |
70
GOLDMAN SACHS STRUCTURED INTERNATIONAL EQUITY FUNDS
|
| 13. SUMMARY OF SHARE TRANSACTIONS (continued) |
Share activity is as follows:
| | | | | | | | | | | | | | | | |
| | | Structured International Small Cap Fund | |
| | | | |
| | | For the Six Months Ended April 30, 2012 (Unaudited) | | | For the Fiscal Year Ended October 31, 2011 | |
| | | | |
| | | Shares | | | Dollars | | | Shares | | | Dollars | |
| | | | |
| Class A Shares | | | | | | | | | | | | | | | | |
Shares sold | | | 283,661 | | | $ | 2,200,018 | | | | 1,513,380 | | | $ | 13,008,314 | |
Reinvestment of distributions | | | 86,080 | | | | 616,336 | | | | 114,710 | | | | 964,710 | |
Shares redeemed | | | (979,628 | ) | | | (7,555,655 | ) | | | (2,042,413 | ) | | | (17,522,649 | ) |
| | | | (609,887 | ) | | | (4,739,301 | ) | | | (414,323 | ) | | | (3,549,625 | ) |
| Class C Shares | | | | | | | | | | | | | | | | |
Shares sold | | | 18,900 | | | | 144,778 | | | | 117,634 | | | | 1,023,252 | |
Reinvestment of distributions | | | 2,039 | | | | 14,392 | | | | 508 | | | | 4,225 | |
Shares redeemed | | | (12,143 | ) | | | (91,995 | ) | | | (34,703 | ) | | | (293,332 | ) |
| | | | 8,796 | | | | 67,175 | | | | 83,439 | | | | 734,145 | |
| Institutional Shares | | | | | | | | | | | | | | | | |
Shares sold | | | 4,911,624 | | | | 38,602,026 | | | | 11,493,128 | | | | 99,513,045 | |
Reinvestment of distributions | | | 929,867 | | | | 6,639,251 | | | | 917,929 | | | | 7,710,604 | |
Shares redeemed | | | (3,977,434 | ) | | | (30,635,303 | ) | | | (9,759,436 | ) | | | (84,289,534 | ) |
| | | | 1,864,057 | | | | 14,605,974 | | | | 2,651,621 | | | | 22,934,115 | |
| Class IR Shares | | | | | | | | | | | | | | | | |
Shares sold | | | 19,152 | | | | 152,798 | | | | 172,325 | | | | 1,401,995 | |
Reinvestment of distributions | | | 1,160 | | | | 8,270 | | | | 4 | | | | 38 | |
Shares redeemed | | | (157,966 | ) | | | (1,117,876 | ) | | | — | | | | — | |
| | | | (137,654 | ) | | | (956,808 | ) | | | 172,329 | | | | 1,402,033 | |
NET INCREASE | | | 1,125,312 | | | $ | 8,977,040 | | | | 2,493,066 | | | $ | 21,520,668 | |
71
GOLDMAN SACHS STRUCTURED INTERNATIONAL EQUITY FUNDS
Fund Expenses — Six Month Period Ended April 30, 2012 (Unaudited)
As a shareholder of Class A, Class B, Class C, Institutional, Service, Class IR or Class R Shares of a Fund you incur two types of costs: (1) transaction costs, including sales charges on purchase payments (with respect to Class A Shares), contingent deferred sales charges on redemptions (with respect to Class B and Class C Shares); and (2) ongoing costs, including management fees; distribution and service (12b-1) fees (with respect to Class A, Class B, Class C and Class R Shares); and other Fund expenses. This example is intended to help you understand your ongoing costs (in dollars) of investing in Class A, Class B, Class C, Institutional, Service, Class IR and Class R Shares of the Funds and to compare these costs with the ongoing costs of investing in other mutual funds.
The example is based on an investment of $1,000 invested at the beginning of the period and held for the entire period from November 1, 2011 through April 30, 2012.
Actual Expenses — The first line under each share class in the table below provides information about actual account values and actual expenses. You may use the information in this line, together with the amount you invested, to estimate the expenses that you paid over the period. Simply divide your account value by $1,000 (for example, an $8,600 account value divided by $1,000=8.6), then multiply the result by the number in the first line under the heading entitled “Expenses Paid” to estimate the expenses you paid on your account during this period.
Hypothetical Example for Comparison Purposes — The second line under each share class in the table below provides information about hypothetical account values and hypothetical expenses based on the Funds’ actual net expense ratio and an assumed rate of return of 5% per year before expenses, which is not the Funds’ actual return. The hypothetical account values and expenses may not be used to estimate the actual ending account balance or expenses you paid for the period. You may use this information to compare the ongoing costs of investing in the Funds and other funds. To do so, compare this 5% hypothetical example with the 5% hypothetical examples that appear in the shareholder reports of the other funds.
Please note that the expenses shown in the table are meant to highlight your ongoing costs only and do not reflect any transactional costs, such as sales charges, redemption fees or exchange fees. Therefore, the second line of the table is useful in comparing ongoing costs only, and will not help you determine the relative total costs of owning different funds. In addition, if these transactional costs were included, your costs would have been higher.
| | | | | | | | | | | | | | | | | | | | | | | | | | | | | | | | | | | | |
| | | Structured Emerging Markets Equity Fund | | | Structured International Equity Fund | | | Structured International Small Cap Fund | |
| Share Class | | Beginning
Account Value
11/01/11 | | | Ending
Account Value
4/30/12 | | | Expenses
Paid for the
6 Months Ended
4/30/12* | | | Beginning
Account Value
11/01/11 | | | Ending
Account Value
4/30/12 | | | Expenses
Paid for the
6 Months Ended
4/30/12* | | | Beginning
Account Value
11/01/11 | | | Ending
Account Value
4/30/12 | | | Expenses
Paid for the
6 Months Ended
4/30/12* | |
| Class A | | | | | | | | | | | | | | | | | | | | | | | | | | | | | | | | | | | | |
Actual | | $ | 1,000 | | | $ | 1,072.80 | | | $ | 7.47 | | | $ | 1,000 | | | $ | 1,043.70 | | | $ | 6.50 | | | $ | 1,000 | | | $ | 1,065.60 | | | $ | 6.68 | |
Hypothetical 5% return | | | 1,000 | | | | 1,017.65 | + | | | 7.27 | | | | 1,000 | | | | 1,018.50 | + | | | 6.42 | | | | 1,000 | | | | 1,018.40 | + | | | 6.52 | |
| Class B | | | | | | | | | | | | | | | | | | | | | | | | | | | | | | | | | | | | |
Actual | | | N/A | | | | N/A | | | | N/A | | | | 1,000 | | | | 1,039.00 | | | | 10.29 | | | | N/A | | | | N/A | | | | N/A | |
Hypothetical 5% return | | | N/A | | | | N/A | | | | N/A | | | | 1,000 | | | | 1,014.77 | + | | | 10.17 | | | | N/A | | | | N/A | | | | N/A | |
| Class C | | | | | | | | | | | | | | | | | | | | | | | | | | | | | | | | | | | | |
Actual | | | 1,000 | | | | 1,068.80 | | | | 11.32 | | | | 1,000 | | | | 1,038.80 | | | | 10.29 | | | | 1,000 | | | | 1,061.90 | | | | 10.51 | |
Hypothetical 5% return | | | 1,000 | | | | 1,013.92 | + | | | 11.02 | | | | 1,000 | | | | 1,014.77 | + | | | 10.17 | | | | 1,000 | | | | 1,014.67 | + | | | 10.27 | |
| Institutional | | | | | | | | | | | | | | | | | | | | | | | | | | | | | | | | | | | | |
Actual | | | 1,000 | | | | 1,074.50 | | | | 5.42 | | | | 1,000 | | | | 1,045.70 | | | | 4.48 | | | | 1,000 | | | | 1,067.80 | | | | 4.63 | |
Hypothetical 5% return | | | 1,000 | | | | 1,019.64 | + | | | 5.27 | | | | 1,000 | | | | 1,020.49 | + | | | 4.42 | | | | 1,000 | | | | 1,020.39 | + | | | 4.52 | |
| Service | | | | | | | | | | | | | | | | | | | | | | | | | | | | | | | | | | | | |
Actual | | | N/A | | | | N/A | | | | N/A | | | | 1,000 | | | | 1,042.10 | | | | 7.01 | | | | N/A | | | | N/A | | | | N/A | |
Hypothetical 5% return | | | N/A | | | | N/A | | | | N/A | | | | 1,000 | | | | 1,018.00 | + | | | 6.92 | | | | N/A | | | | N/A | | | | N/A | |
| Class IR | | | | | | | | | | | | | | | | | | | | | | | | | | | | | | | | | | | | |
Actual | | | 1,000 | | | | 1,073.80 | | | | 6.19 | | | | 1,000 | | | | 1,043.40 | | | | 5.23 | | | | 1,000 | | | | 1,066.50 | | | | 5.39 | |
Hypothetical 5% return | | | 1,000 | | | | 1,018.90 | + | | | 6.02 | | | | 1,000 | | | | 1,019.74 | + | | | 5.17 | | | | 1,000 | | | | 1,019.64 | + | | | 5.27 | |
| Class R | | | | | | | | | | | | | | | | | | | | | | | | | | | | | | | | | | | | |
Actual | | | N/A | | | | N/A | | | | N/A | | | | 1,000 | | | | 1,042.30 | | | | 7.77 | | | | N/A | | | | N/A | | | | N/A | |
Hypothetical 5% return | | | N/A | | | | N/A | | | | N/A | | | | 1,000 | | | | 1,017.26 | + | | | 7.67 | | | | N/A | | | | N/A | | | | N/A | |
| * | | Expenses are calculated using each Fund’s annualized net expense ratio for each class, which represents the ongoing expenses as a percentage of net assets for the six months ended April 30, 2012. Expenses are calculated by multiplying the annualized net expense ratio by the average account value for the period; then multiplying the result by the number of days in the most recent fiscal half year; and then dividing that result by the number of days in the fiscal year. The annualized net expense ratios for the period were as follows: |
| | | | | | | | | | | | | | | | | | | | | | | | | | | | |
| Fund | | Class A | | | Class B | | | Class C | | | Institutional | | | Service | | | Class IR | | | Class R | |
Structured Emerging Markets Equity | | | 1.45 | % | | | N/A | | | | 2.20 | % | | | 1.05 | % | | | N/A | | | | 1.20 | % | | | N/A | |
Structured International Equity | | | 1.28 | | | | 2.03 | % | | | 2.03 | | | | 0.88 | | | | 1.38 | % | | | 1.03 | | | | 1.53 | % |
Structured International Small Cap | | | 1.30 | | | | N/A | | | | 2.05 | | | | 0.90 | | | | N/A | | | | 1.05 | | | | N/A | |
| + | | Hypothetical expenses are based on each Fund's actual annualized net expense ratios and an assumed rate of return of 5% per year before expenses. |
72
FUNDS PROFILE
Goldman Sachs Funds

Goldman Sachs is a premier financial services firm, known since 1869 for creating thoughtful and customized investment solutions in complex global markets.
Today, the Investment Management Division of Goldman Sachs serves a diverse set of clients worldwide, including private institutions, public entities and individuals. With $702.0 billion in assets under management as of March 31, 2012, Goldman Sachs Asset Management (“GSAM”) has portfolio management teams located around the world and our investment professionals bring firsthand knowledge of local markets to every investment decision. GSAM’s assets under management includes assets managed by Goldman Sachs Asset Management, LP and its Investment Advisory Affiliates. Additionally, GSAM ranks in the top 10 asset management firms worldwide, based on assets under management.1
|
| OVERVIEW OF GOLDMAN SACHS FUNDS |

Money Market2
Financial Square FundsSM
| n | | Financial Square Tax-Exempt Funds |
| n | | Financial Square Federal Fund |
| n | | Financial Square Government Fund |
| n | | Financial Square Money Market Fund |
| n | | Financial Square Prime Obligations Fund |
| n | | Financial Square Treasury Instruments Fund |
| n | | Financial Square Treasury Obligations Fund |
Fixed Income
Short Duration and Government
| n | | Ultra-Short Duration Govt. Fund |
| n | | Short Duration Government Fund |
| n | | Short Duration Income Fund |
| n | | Inflation Protected Securities Fund |
Multi-Sector
| n | | Core Plus Fixed Income Fund |
Municipal and Tax-Free
| n | | High Yield Municipal Fund |
| n | | Short Duration Tax-Free Fund |
Single Sector
| n | | Investment Grade Credit Fund |
| n | | High Yield Floating Rate Fund |
| n | | Emerging Markets Debt Fund |
| n | | Local Emerging Markets Debt Fund |
Corporate Credit
Fundamental Equity
| n | | Small/Mid Cap Growth Fund |
| n | | Flexible Cap Growth Fund |
| n | | Concentrated Growth Fund |
| n | | Technology Tollkeeper Fund |
| n | | Growth Opportunities Fund |
| n | | Rising Dividend Growth Fund |
Structured Equity
| n | | Structured Small Cap Equity Fund |
| n | | Structured U.S. Equity Fund |
| n | | Structured Small Cap Growth Fund |
| n | | Structured Large Cap Growth Fund |
| n | | Structured Large Cap Value Fund |
| n | | Structured Small Cap Value Fund |
| n | | Structured Tax-Managed Equity Fund |
| n | | Structured International Tax-Managed Equity Fund |
| n | | U.S. Equity Dividend and Premium Fund |
| n | | International Equity Dividend and Premium Fund |
| n | | Structured International Small Cap Fund |
| n | | Structured International Equity Fund |
| n | | Structured Emerging Markets Equity Fund |
Fundamental Equity International
| n | | Strategic International Equity Fund |
| n | | Concentrated International Equity Fund |
| n | | International Small Cap Fund |
| n | | Emerging Markets Equity Fund |
| n | | BRIC Fund (Brazil, Russia, India, China) |
Select Satellite3
| n | | Real Estate Securities Fund |
| n | | International Real Estate Securities Fund |
| n | | Commodity Strategy Fund |
| n | | Dynamic Allocation Fund |
| n | | Absolute Return Tracker Fund |
| n | | Managed Futures Strategy Fund |
Total Portfolio Solutions3
| n | | Balanced Strategy Portfolio |
| n | | Growth and Income Strategy Portfolio |
| n | | Growth Strategy Portfolio |
| n | | Equity Growth Strategy Portfolio |
| n | | Income Strategies Portfolio |
| n | | Satellite Strategies Portfolio |
| n | | Retirement Strategies Portfolios |
| n | | Enhanced Dividend Global Equity Portfolio |
| n | | Tax Advantaged Global Equity Portfolio |
| 1Ranking | | for Goldman Sachs Group, Inc., includes Goldman Sachs Asset Management, Private Wealth Management and Merchant Banking 2010 year-end assets. Ranked 10th in total assets worldwide. Pensions&Investments, June 2011. |
| 2An | | investment in a money market fund is neither insured nor guaranteed by the Federal Deposit Insurance Corporation (“FDIC”) or any other government agency. Although the Funds seek to preserve the value of your investment at $1.00 per share, it is possible to lose money by investing in the Funds. |
| 3Individual | | Funds within the Total Portfolio Solutions and Select Satellite categories will have various placement on the risk/return spectrum and may have greater or lesser risk than that indicated by the placement of the general Total Portfolio Solutions or Select Satellite category. |
Financial Square FundsSM is a registered service mark of Goldman, Sachs & Co.
| | |
| TRUSTEES | | OFFICERS |
| Ashok N. Bakhru, Chairman | | James A. McNamara, President |
| Donald C. Burke | | George F. Travers, Principal Financial Officer |
| John P. Coblentz, Jr. | | Peter V. Bonanno, Secretary |
| Diana M. Daniels | | Scott M. McHugh, Treasurer |
| Joseph P. LoRusso | | |
| James A. McNamara | | |
| Jessica Palmer | | |
| Alan A. Shuch | | |
| Richard P. Strubel | | |
| |
| GOLDMAN, SACHS & CO. | | GOLDMAN SACHS ASSET MANAGEMENT, L.P. |
| Distributor and Transfer Agent | | Investment Adviser |
Visit our Website at www.goldmansachsfunds.com to obtain the most recent month-end returns.
Goldman Sachs Asset Management, L.P. 200 West Street, New York, New York 10282
The reports concerning the Funds included in this shareholder report may contain certain forward-looking statements about the factors that may affect the performance of the Funds in the future. These statements are based on Fund management’s predictions and expectations concerning certain future events and their expected impact on the Funds, such as performance of the economy as a whole and of specific industry sectors, changes in the levels of interest rates, the impact of developing world events, and other factors that may influence the future performance of the Funds. Management believes these forward-looking statements to be reasonable, although they are inherently uncertain and difficult to predict. Actual events may cause adjustments in portfolio management strategies from those currently expected to be employed.
A description of the policies and procedures that the Funds use to determine how to vote proxies relating to portfolio securities and information regarding how a Fund voted proxies relating to portfolio securities during the most recent 12-month period ended June 30 is available (I) without charge, upon request by calling 1-800-526-7384 (for Retail Shareholders) or 1-800-621-2550 (for Institutional Shareholders); and (II) on the Securities and Exchange Commission Web site at http://www.sec.gov.
The Funds file their complete schedule of portfolio holdings with the Securities and Exchange Commission (“SEC”) for the first and third quarters of each fiscal year on Form N-Q. The Funds’ Forms N-Q will become available on the SEC’s website at http://www.sec.gov within 60 days after the Funds’ first and third fiscal quarters. When available, the Funds’ Forms N-Q may be reviewed and copied at the SEC’s Public Reference Room in Washington, D.C. and information on the operation of the Public Reference Room may also be obtained by calling 1-800-SEC-0330. When available, Form N-Q may be obtained upon request and without charge by calling 1-800-526-7384 (for Retail Shareholders) or 1-800-621-2550 (for Institutional Shareholders).
Holdings and allocations shown are as of April 30, 2012 and may not be representative of future investments. Fund holdings should not be relied on in making investment decisions and should not be construed as research or investment advice regarding particular securities.
The Global Industry Classification Standard (GICS) was developed by and is the exclusive property and a service mark of Morgan Stanley Capital International Inc. (MSCI) and Standard & Poor’s, a division of The McGraw-Hill Companies, Inc. (S&P) and is licensed for use by Goldman Sachs. Neither MSCI, S&P nor any other party involved in making or compiling the GICS or any GICS classifications makes any express or implied warranties or representations with respect to such standard or classification (or the results to be obtained by the use thereof), and all such parties hereby expressly disclaim all warranties of originality, accuracy, completeness, merchantability or fitness for a particular purpose with respect to any of such standard or classification. Without limiting any of the foregoing, in no event shall MSCI, S&P, any of their affiliates or any third party involved in making or compiling the GICS or any GICS classifications have any liability for any direct, indirect, special, punitive, consequential or any other damages (including lost profits) even if notified of the possibility of such damages.
The portfolio risk management process includes an effort to monitor and manage risk, but does not imply low risk.
This material is not authorized for distribution to prospective investors unless preceded or accompanied by a current Prospectus or summary prospectus, if applicable. Investors should consider a Fund’s objective, risks, and charges and expenses, and read the summary prospectus, if available, and/or the Prospectus carefully before investing or sending money. The summary prospectus, if available, and the Prospectus contain this and other information about a Fund and may be obtained from your authorized dealer or from Goldman, Sachs & Co. by calling (retail – 1-800-526-7384) (institutional – 1-800-621-2550).
© 2012 Goldman Sachs. All rights reserved. 75555.MF.MED.TMPL /6/2012 STINTSAR12 / 27K
| | The information required by this Item is only required in an annual report on this Form N-CSR. |
| ITEM 3. | AUDIT COMMITTEE FINANCIAL EXPERT. |
| | The information required by this Item is only required in an annual report on this Form N-CSR. |
| ITEM 4. | PRINCIPAL ACCOUNTANT FEES AND SERVICES. |
| | The information required by this Item is only required in an annual report on this Form N-CSR. |
| ITEM 5. | AUDIT COMMITTEE OF LISTED REGISTRANTS. |
| ITEM 6. | SCHEDULE OF INVESTMENTS. |
| | Schedule of Investments is included as part of the Report to Stockholders filed under Item 1. |
| ITEM 7. | DISCLOSURE OF PROXY VOTING POLICIES AND PROCEDURES FOR CLOSED-END MANAGEMENT INVESTMENT COMPANIES. |
| ITEM 8. | PORTFOLIO MANAGERS OF CLOSED-END MANAGEMENT INVESTMENT COMPANIES. |
| ITEM 9. | PURCHASES OF EQUITY SECURITIES BY CLOSED-END MANAGEMENT INVESTMENT COMPANY AND AFFILIATED PURCHASERS. |
| ITEM 10. | SUBMISSION OF MATTERS TO A VOTE OF SECURITY HOLDERS. |
| | There have been no material changes to the procedures by which shareholders may recommend nominees to the registrant’s board of trustees. |
| ITEM 11. | CONTROLS AND PROCEDURES. |
| | (a) | The registrant’s principal executive and principal financial officers, or persons performing similar functions have concluded that the registrant’s disclosure controls and procedures (as defined in Rule 30a-3(c) under the Investment Company Act of 1940, as amended (the “1940 Act”)) are effective as of a date within 90 days of the filing of this report that includes the disclosure required by this paragraph, based on the evaluation of these controls and procedures required by Rule 30a-3(b) under the 1940 Act and 15d-15(b) under the Securities Exchange Act of 1934, as amended. |
| | (b) | There were no changes in the registrant’s internal control over financial reporting (as defined in Rule 30a-3(d) under the 1940 Act) that occurred during the registrant’s second fiscal quarter of the period covered by this report that have materially affected, or are reasonably likely to materially affect, the registrant’s internal control over financial reporting. |
| | | | |
| (a)(1) | | The information required by this Item is only required in connection with an annual report on this Form N-CSR. |
| | |
| (a)(2) | | Exhibit 99.CERT | | Certifications pursuant to Section 302 of the Sarbanes-Oxley Act of 2002 filed herewith. |
| | |
| (b) | | Exhibit 99.906CERT | | Certifications pursuant to Section 906 of the Sarbanes-Oxley Act of 2002 filed herewith. |
SIGNATURES
Pursuant to the requirements of the Securities Exchange Act of 1934 and the Investment Company Act of 1940, the registrant has duly caused this report to be signed on its behalf by the undersigned, thereunto duly authorized.
| | | | |
| | | | Goldman Sachs Trust |
| | |
| By: | | | | /s/ James A. McNamara |
| | | | James A. McNamara |
| | | | President/Principal Executive Officer |
| | | | Goldman Sachs Trust |
| | |
| Date: | | | | June 26, 2012 |
Pursuant to the requirements of the Securities Exchange Act of 1934 and the Investment Company Act of 1940, this report has been signed below by the following persons on behalf of the registrant and in the capacities and on the dates indicated.
| | | | |
| By: | | | | /s/ James A. McNamara |
| | | | James A. McNamara |
| | | | President/Principal Executive Officer |
| | | | Goldman Sachs Trust |
| | |
| Date: | | | | June 26, 2012 |
| | |
| By: | | | | /s/ George F. Travers |
| | | | George F. Travers |
| | | | Principal Financial Officer |
| | | | Goldman Sachs Trust |
| | |
| Date: | | | | June 25, 2012 |