UNITED STATES
SECURITIES AND EXCHANGE COMMISSION
Washington, D.C. 20549
FORM N-CSR
CERTIFIED SHAREHOLDER REPORT OF REGISTERED
MANAGEMENT INVESTMENT COMPANIES
Investment Company Act file number 811-05349
Goldman Sachs Trust
(Exact name of registrant as specified in charter)
71 South Wacker Drive,
Chicago, Illinois 60606
(Address of principal executive offices) (Zip code)
| | |
Copies to: |
Caroline Kraus | | Geoffrey R.T. Kenyon, Esq. |
Goldman, Sachs & Co. | | Dechert LLP |
200 West Street | | 200 Clarendon Street |
New York, New York 10282 | | 27th Floor |
| | Boston, MA 02116-5021 |
(Name and address of agents for service)
Registrant’s telephone number, including area code: (312) 655-4400
Date of fiscal year end: December 31
Date of reporting period: June 30, 2012
| ITEM 1. | REPORTS TO STOCKHOLDERS. |
| | The Semi-Annual Report to Stockholders is filed herewith. |
Goldman Sachs Funds

| | | | |
| | |
| Semi-Annual Report | | | | June 30, 2012 |
| | |
| | | | Structured Tax-Advantaged Equity Funds |
| | | | U.S. Equity Dividend and Premium |
| | | | International Equity Dividend and Premium |
| | | | Structured Tax-Managed Equity |
| | | | Structured International Tax-Managed Equity |

Goldman Sachs Structured Tax-Advantaged Equity Funds
| n | | U.S. EQUITY DIVIDEND AND PREMIUM |
| n | | INTERNATIONAL EQUITY DIVIDEND AND PREMIUM |
| n | | STRUCTURED TAX-MANAGED EQUITY |
| n | | STRUCTURED INTERNATIONAL TAX-MANAGED EQUITY |
| | | | |
TABLE OF CONTENTS | | | | |
| |
Principal Investment Strategies and Risks | | | 1 | |
| |
Market Review | | | 3 | |
| |
Investment Process — Equity Dividend and Premium Funds | | | 5 | |
| |
Portfolio Management Discussions and Performance Summaries — Equity Dividend and Premium Funds | | | 6 | |
| |
Investment Process — Global Structured Tax-Managed | | | 16 | |
| |
Portfolio Management Discussions and Performance Summaries — Structured Tax-Managed Funds | | | 17 | |
| |
Schedules of Investments | | | 27 | |
| |
Financial Statements | | | 50 | |
| |
Financial Highlights | | | 54 | |
| |
Notes to the Financial Statements | | | 62 | |
| |
Other Information | | | 78 | |
| | | | |
| | | |
| NOT FDIC-INSURED | | May Lose Value | | No Bank Guarantee |
GOLDMAN SACHS STRUCTURED TAX-ADVANTAGED EQUITY FUNDS
Principal Investment Strategies and Risks
This is not a complete list of risks that may affect the Funds. For additional information concerning the risks applicable to the Funds, please see the Funds’ Prospectuses.
The Goldman Sachs U.S. Equity Dividend and Premium Fund invests primarily in dividend-paying equity investments in large-capitalization U.S. equity issuers. The Fund is subject to market risk, which means that the value of the securities in which it invests may go up or down in response to the prospects of individual companies, particular industry sectors and/or general economic conditions. The Fund is also subject to the risks associated with writing (selling) call options, which limits the opportunity to profit from an increase in the market value of stocks in exchange for up-front cash at the time of selling the call option. In a rising market, the Fund could significantly underperform the market, and the Fund’s options strategies may not fully protect it against declines in the value of the market. The Investment Adviser’s use of quantitative models to execute investment strategy may fail to produce the intended result. Different investment styles (e.g., “quantitative”) tend to shift in and out of favor, and at times the Fund may underperform other funds that invest in similar asset classes. The Fund is also subject to the risk that the pre-tax performance of the Fund may be lower than the performance of a similar fund that is not tax-managed. No assurance can be offered that the Fund’s tax-managed strategies will reduce the amount of taxable income and capital gains distributed by the Fund to shareholders.
The Goldman Sachs International Equity Dividend and Premium Fund invests primarily in dividend-paying equity investments in companies that are organized outside the United States or whose securities are principally traded outside the United States. The Fund is subject to market risk, which means that the value of the securities in which it invests may go up or down in response to the prospects of individual companies, particular industry sectors and/or general economic conditions. Foreign and emerging market securities may be more volatile and less liquid than investments in U.S. securities and will be subject to the risks of currency fluctuations and adverse economic or political developments. The Fund is also subject to the risks associated with writing (selling) call options, which limits the opportunity to profit from an increase in the market value of stocks in exchange for up-front cash at the time of selling the call option. In a rising market, the Fund could significantly underperform the market, and the Fund’s options strategies may not fully protect it against declines in the value of the market. The Investment Adviser’s use of quantitative models to execute investment strategy may fail to produce the intended result. Different investment styles (e.g., “quantitative”) tend to shift in and out of favor, and at times the Fund may underperform other funds that invest in similar asset classes. The Fund is also subject to the risk that the pre-tax performance of the Fund may be lower than the performance of a similar fund that is not tax-managed. No assurance can be offered that the Fund’s tax managed strategies will reduce the amount of taxable income and capital gains distributed by the Fund to shareholders.
The Goldman Sachs Structured Tax-Managed Equity Fund invests in equity investments in U.S. issuers, including foreign issuers that are traded in the United States. The Fund is subject to market risk, which means that the value of the securities in which it invests may go up or down in response to the prospects of individual companies, particular industry sectors and/or general economic conditions. The Investment Adviser’s use of quantitative models to execute investment strategy may fail to produce the intended result. Different investment styles (e.g., “quantitative”) tend to shift in and out of favor, and at times the Fund may underperform other funds that invest in similar asset classes. Foreign and emerging markets securities may be more volatile and less liquid than U.S. securities and are subject to the risks of currency fluctuations and adverse economic or political developments. The Fund is also subject to the risk that the pre-tax performance of the Fund may be lower than the performance of a similar fund that is not tax-managed. No assurance can be offered that the Fund’s tax-managed strategies will reduce the amount of taxable income and capital gains distributed by the Fund to shareholders. The Fund is not suitable for IRAs or other tax-exempt or tax-deferred accounts.
1
GOLDMAN SACHS STRUCTURED TAX-ADVANTAGED EQUITY FUNDS
The Goldman Sachs Structured International Tax-Managed Equity Fund invests primarily in international equity securities. The Fund is subject to market risk, which means that the value of the securities in which it invests may go up or down in response to the prospects of individual companies, particular industry sectors and/or general economic conditions. Foreign and emerging market securities may be more volatile than investments in U.S. securities and will be subject to the risks of currency fluctuations and adverse economic or political developments. The Investment Adviser’s use of quantitative models to execute investment strategy may fail to produce the intended result. Different investment styles (e.g., “quantitative”) tend to shift in and out of favor, and at times the Fund may underperform other funds that invest in similar asset classes. The Fund is also subject to the risk that the pre-tax performance of the Fund may be lower than the performance of a similar fund that is not tax-managed. No assurance can be offered that the Fund’s tax-managed strategies will reduce the amount of taxable income and capital gains distributed by the Fund to shareholders. The Fund is not suitable for IRAs or other tax-exempt or tax-deferred accounts.
2
MARKET REVIEW
Goldman Sachs Structured Tax-Advantaged Equity Funds
Market Review
Both U.S. and international equities recorded positive returns during the six months ended June 30, 2012 (the “Reporting Period”). U.S. equity markets gained significant ground, with relatively strong performance versus many other developed markets reflecting optimism on a U.S. economic recovery and simultaneous concerns over Europe’s persistent sovereign debt crisis.
During the first calendar quarter, U.S. equity markets rose on evidence that the labor market, manufacturing and retail sales were improving. News that the Federal Reserve Board (the “Fed”) reduced its outlook for near-term economic growth was offset by its commitment to keep interest rates low until at least late 2014. U.S. banks showed the biggest quarterly increase in lending in four years, while losses from loans fell to their lowest level since early 2008. As a result, financials stocks, which had lagged significantly in 2011, rallied sharply. Elsewhere, strong corporate earnings reports boosted a number of large-cap information technology stocks, and the NASDAQ reached a new 11-year high. The Dow Jones Industrial Average closed above 13,000 for the first time since May 2008.
Despite widespread downgrades of European sovereign debt by Standard & Poor’s, the international equity markets reflected improved sentiment that Europe would avert a financial crisis through liquidity provided by the European Central Bank’s longer-term refinancing operation (“LTRO”) and the proposal of a fiscal compact for the European Monetary Union (“EMU”). Japanese equities rose as the yen weakened significantly early in the Reporting Period following the Bank of Japan’s unexpected monetary policy easing in the form of increased asset purchases.
By April, optimism on Europe had given way to uncertainty and fear of an EMU break-up, a sentiment that would last into June. The changing political landscape unnerved markets. The French did not re-elect their president, who had worked closely with Germany’s chancellor since the start of the sovereign debt crisis, and elected a Socialist. The Dutch coalition government broke up. In addition, deepening concerns over the health of Spanish banks and Greece’s potential exit from the EMU weighed heavily on European equity markets, the euro and the financials sector, particularly large European banks. Despite further easing from the Bank of Japan, the yen continued to rise and pressured Japanese equities.
Also during April, economic data from the U.S. began to lose some momentum and called into question the U.S. recovery. The U.S. labor market, which had been reporting improvements, appeared to lose some momentum, as jobless claims increased for several weeks in a row, and deteriorated further in May. In addition, the initial first quarter U.S. Gross Domestic Product (“GDP”) estimate of 2.2%1 was lower than expected and was subsequently revised down to 1.9%. However, housing market data showed some signs of stabilization, and consumer confidence offered mixed signals.
Outside of U.S. and European economic concerns, disappointing economic reports from faster growing regions of the world renewed fears of a global economic slowdown. Anticipating weaker demand, the benchmark West Texas Intermediate crude oil price slid more than 20% during the second calendar quarter to less than $80 per barrel. The gloomy mood prevailed into June as Spain’s banking system required a bailout and Moody’s Investors Service downgraded 15 international banks. However, markets rallied on the last day of June on the announcement of some coordinated action by European leaders following summit talks.
| 1 | | Source: Commerce Department as of May 31, 2012. |
3
MARKET REVIEW
U.S. Equity Markets
The Russell 3000® Index, which is a measure of the broad equity markets, rose 9.32% during the Reporting Period, compared to the S&P 500® Index, which was up 9.49%. Nine of the 10 sectors in the S&P 500 Index were up, with telecommunication services (+16.64%) and financials (+13.79%) gaining the most ground. The information technology sector (+13.38%) was the largest contributor (measured by weight times total return) to S&P 500 Index returns.
The Russell 1000® Growth Index advanced 10.08% during the Reporting Period, outperforming the Russell 1000® Value Index, which was up 8.68%. The Russell 1000 Growth Index measures the performance of the large-cap growth segment of the U.S. equity universe, while the Russell 1000 Value Index measures the performance of the large-cap value segment of the U.S. equity universe. Growth stocks outperformed value stocks, primarily because of the strong performance of growth-oriented information technology stocks. Large-cap stocks, as represented by the Russell 1000® Index, returned 9.38% during the Reporting Period, outperforming small-cap stocks, with the Russell 2000® Index, a measure of small-cap stocks, returning 8.53%. Large-cap information technology stocks performed better than their small-cap peers.
International Equity Markets
The MSCI EAFE Index gained 2.96% (USD, net) during the Reporting Period. Fifteen of the 22 countries in the MSCI EAFE Index were up, with Belgium (+20.06%) and Singapore (+14.33%) delivering the greatest absolute returns. In terms of its weighting in the MSCI EAFE Index, the U.K. (+3.50%) was the largest contributor.
Five of the 10 sectors in the MSCI EAFE Index recorded positive results for the Reporting Period, with consumer discretionary (+8.11%) and financials (+7.56%) gaining the most ground. The top-weighted financials sector was also the largest contributor (measured by weight times total return).
Looking Ahead
In the coming months, we expect less expensive stocks to outpace more expensive stocks. In addition, we believe stocks with good momentum are likely to outperform those with poor momentum. We plan to focus on seeking profitable companies with positive fundamentals, sustainable earnings and a track record of using capital to enhance shareholder value. We anticipate remaining fully invested, with long-term performance likely to be the result of stock selection rather than sector or capitalization allocations.
We stand behind our investment philosophy that sound economic investment principles, coupled with a disciplined quantitative approach, can provide potentially strong, uncorrelated returns over the long term. Our research agenda is robust, and we continue to enhance our existing models, add new proprietary forecasting signals and improve our trading execution as we seek to provide the most value to our shareholders.
4
INVESTMENT PROCESS
What Differentiates the Goldman Sachs U.S. Equity Dividend and Premium and Goldman Sachs International Equity Dividend and Premium Funds’ Investment Process?
The Goldman Sachs U.S. Equity Dividend and Premium Fund seeks to maximize income and total return. The
Goldman Sachs International Equity Dividend and Premium Fund seeks to maximize total return with an emphasis
on income. Their portfolios consist primarily of large-cap, dividend-paying stocks.1 By investing in these securities,
and through the use of option call writing, the Funds seek to generate an attractive after-tax cash flow.
Goldman Sachs U.S. Equity Dividend and Premium and Goldman Sachs International Equity Dividend and Premium Funds’ Investment Process

A diversified portfolio:
| n | | Create a diversified large-cap equity portfolio that participates in all industries and sectors. |
| n | | Emphasize higher dividend-paying stocks within each industry and sector. |
Written call options:
| n | | The Funds utilize index call writing to seek to enhance their cash flow. |

| n | | We use proprietary quantitative techniques, including optimization tools, a risk model and a transactions cost model, in identifying a portfolio of stocks that we believe may enhance expected dividend yield while limiting deviations when compared to the S&P 500 Index or MSCI EAFE Index, as applicable. |

| n | | A fully invested, style-consistent portfolio. |
| n | | The Funds seek attractive after-tax cash flow from qualified dividends, long-term capital gains and option call writing. |
| n | | The Funds seek to enhance after-tax returns by generating distributions primarily from qualified dividends and long-term capital gains, both of which are subject to current favorable long-term tax rates of 15%.2 |
| 1 | | Dividends are not guaranteed and a company’s future ability to pay dividends may be limited. |
| 2 | | A sunset provision provides that the 15% long-term capital gain rate will increase to 20%, and the taxation of dividends at the long-term capital gain rate will end after 2012. |
5
PORTFOLIO RESULTS
U.S. Equity Dividend and Premium Fund
Portfolio Management Discussion and Analysis
Below, the Goldman Sachs Quantitative Investment Strategies Team discusses the Goldman Sachs U.S. Equity Dividend and Premium Fund’s (the “Fund”) performance and positioning for the six-month period ended June 30, 2012 (the “Reporting Period”).
| Q | | How did the Fund perform during the Reporting Period? |
| A | | During the Reporting Period, the Fund’s Class A, C, Institutional and IR Shares generated cumulative total returns, without sales charges, of 6.59%, 6.14%, 6.79% and 6.74%, respectively. These returns compare to the 9.49% cumulative total return of the Fund’s benchmark, the Standard & Poor’s® 500 Index (with dividends reinvested) (the “S&P 500 Index”), during the same period. The Barclays U.S. Aggregate Bond Index returned 2.37%. Maximizing income is part of the Fund’s investment objective, and therefore we believe that a comparison of the Fund’s performance to that of the Barclays U.S. Aggregate Bond Index is useful to investors. |
| Q | | What key factors were most responsible for the Fund’s performance during the Reporting Period? |
| A | | Security selection detracted from the Fund’s relative performance. The Fund was hampered by stock picks within the financials, telecommunication services, consumer discretionary, industrials, health care, information technology, utilities, energy and materials sectors. Stock selection in the consumer staples sector added to relative results. |
| | The sale of call options on the S&P 500 Index contributed positively overall to the Fund’s total return. (A call option is an option that gives the holder the right to buy a certain quantity of an underlying security at an agreed-upon price at any time up to an agreed-upon date.) |
| Q | | How did the Fund’s call writing affect its performance? |
| A | | Consistent with our investment approach, we wrote index call options on a portion of the stock portfolio’s market value. Upon exercise by the holder, the sale of an index call option obligates us to buy an index at a specified price, also known as the “strike price.” Although the Fund retains the proceeds from the sale of an option, the payment may not exceed the increase in the value of the index as call options are exercised and we pay the purchaser the increase in value. This is what happened during the Reporting Period for certain of the Fund’s options positions. However, overall, the Fund’s call writing contributed positively to performance. |
| | In general, we targeted 4% in annual premiums. We wrote call options covering about 27% of the value of the stock portfolio to achieve this target. |
| | Overall, call option writing tends to reduce volatility. Since its inception, the realized daily volatility of the Fund has been about 22% compared to the realized volatility of the S&P 500 Index of 24%. During the Reporting Period, realized daily volatility of the Fund has been about 12% compared to the realized volatility of the S&P 500 Index of 13%. |
| Q | | What was the Fund’s dividend yield during the Reporting Period? |
| A | | While maintaining industry and sector weights consistent with the S&P 500 Index, we favor stocks with higher dividend yields. The dividend yield of the Fund during the Reporting Period was 3.29% compared to 2.28% for the S&P 500 Index. The Fund’s dividend yield served to enhance its quarterly net income distributions. |
| Q | | Which individual stock holdings detracted significantly from relative performance during the Reporting Period? |
| A | | Relative to the S&P 500 Index, the Fund’s returns were hurt by overweighted positions in Pitney Bowes, a provider of postage meters and mailing services; Frontier Communications, a telecommunications services company; and Windstream, a supplier of advanced network communications. |
6
PORTFOLIO RESULTS
| Q | | Among individual holdings, which stocks contributed most to the Fund’s results? |
| A | | The Fund benefited from overweighted positions in Cincinnati Financial, a provider of property, casualty and life insurance; Kimberly-Clark, a household products maker; and Seagate Technology, a manufacturer of computer hard drives. |
| Q | | How did fixed income investments affect the Fund’s relative performance? |
| A | | The Fund’s investments in fixed income securities are limited to cash equivalents, and therefore fixed income holdings did not have a meaningful impact on performance during the Reporting Period. |
| Q | | How did the Fund use derivatives and similar instruments during the Reporting Period? |
| A | | During the Reporting Period, we used equity index futures to equitize the Fund’s excess cash holdings. In other words, we put the Fund’s excess cash holdings to work by using them as collateral for the purchase of equity index futures. Consistent with our investment approach, we also wrote equity index options on a portion of the portfolio’s market value in an effort to generate premiums and reduce volatility. |
| Q | | What changes or enhancements did you make to your quantitative model during the Reporting Period? |
| A | | No material changes or enhancements were made to our quantitative model during the Reporting Period. |
7
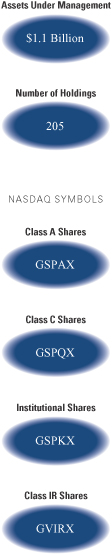
FUND BASICS
U.S. Equity Dividend and Premium Fund
as of June 30, 2012
| | | | | | | | | | | | | | |
| | PERFORMANCE REVIEW | |
| | | January 1, 2012– June 30, 2012 | | Fund Total Return
(based on NAV)1 | | | S&P 500 Index2 | | | Barclays U.S. Aggregate
Bond Index3 | |
| | Class A | | | 6.59 | % | | | 9.49 | % | | | 2.37 | % |
| | Class C | | | 6.14 | | | | 9.49 | | | | 2.37 | |
| | Institutional | | | 6.79 | | | | 9.49 | | | | 2.37 | |
| | | Class IR | | | 6.74 | | | | 9.49 | | | | 2.37 | |
| | 1 | | The net asset value (“NAV”) represents the net assets of the class of the Fund (ex-dividend) divided by the total number of shares of the class outstanding. The Fund’s performance reflects the reinvestment of dividends and other distributions. The Fund’s performance does not reflect the deduction of any applicable sales charges. |
| | 2 | | The S&P 500 Index is an unmanaged composite index of 500 common stock prices. The Index figures do not include any deduction for fees, expenses or taxes. It is not possible to invest directly in an index. |
| | 3 | | The Barclays U.S. Aggregate Bond Index represents an unmanaged diversified portfolio of fixed income securities, including U.S. Treasuries, investment-grade corporate bonds, and mortgage-backed and asset-backed securities. The Index figures do not reflect any deduction for fees, expenses or taxes. It is not possible to invest directly in an index. |
| | | | | | | | | | | | |
| | STANDARDIZED TOTAL RETURNS4 |
| | | For the period ended 6/30/12 | | One Year | | | Five Years | | Since Inception | | Inception Date |
| | Class A | | | -0.13 | % | | -0.16% | | 3.02% | | 8/31/05 |
| | Class C | | | 3.76 | | | 0.17 | | 3.07 | | 8/31/05 |
| | Institutional | | | 6.04 | | | 1.36 | | 4.28 | | 8/31/05 |
| | | Class IR | | | 5.91 | | | N/A | | 16.23 | | 8/31/10 |
| | 4 | | The Standardized Total Returns are average annual total returns as of the most recent calendar quarter-end. They assume reinvestment of all distributions at NAV. These returns reflect a maximum initial sales charge of 5.5% for Class A Shares and the assumed contingent deferred sales charge for Class C Shares (1% if redeemed within 12 months of purchase). Because Institutional and Class IR Shares do not involve a sales charge, such a charge is not applied to their Standardized Total Returns. |
| | | | The returns represent past performance. Past performance does not guarantee future results. The Fund’s investment return and principal value will fluctuate so that an investor’s shares, when redeemed, may be worth more or less than their original cost. Current performance may be lower or higher than the performance quoted above. Please visit our Website at www.goldmansachsfunds.com to obtain the most recent month-end returns. Performance reflects fee waivers and/or expense limitations in effect. In their absence, performance would be reduced. Returns do not reflect the deduction of taxes that a shareholder would pay on Fund distributions or the redemption of Fund shares. |
8
FUND BASICS
| | | | | | | | | | |
| | EXPENSE RATIOS5 | |
| | | | | Net Expense Ratio (Current) | | | Gross Expense Ratio (Before Waivers) | |
| | Class A | | | 1.25 | % | | | 1.26 | % |
| | Class C | | | 2.00 | | | | 2.01 | |
| | Institutional | | | 0.85 | | | | 0.86 | |
| | | Class IR | | | 1.00 | | | | 1.01 | |
| | 5 | | The expense ratios of the Fund, both current (net of applicable fee waivers and/or expense limitations) and before waivers (gross of applicable fee waivers and/or expense limitations) are as set forth above according to the most recent publicly available Prospectus for the Fund and may differ from the expense ratios disclosed in the Financial Highlights in this report. The Fund’s waivers and/or expense limitations will remain in place through at least April 27, 2013, and prior to such date the investment adviser may not terminate the arrangements without the approval of the Fund’s Board of Trustees. If these arrangements are discontinued in the future, the expense ratios may change without shareholder approval. |
| | | | | | | | | | |
| | STANDARDIZED AFTER-TAX PERFORMANCE AS OF 6/30/126 |
| | | Class A Shares | | One Year | | | Five Years | | Since Inception
(8/31/05) |
| | Returns before taxes* | | | -0.13 | % | | -0.16% | | 3.02% |
| | Returns after taxes on distributions** | | | -1.01 | | | -0.77 | | 2.39 |
| | | Returns after taxes on distributions***
and sale of Fund shares | | | 0.54 | | | -0.24 | | 2.50 |
| | 6 | | The after-tax returns are calculated using the historically highest individual federal marginal income tax rates at the time of distributions (currently 15% for qualifying ordinary income dividends and long-term capital gain distributions and 35% for non-qualifying ordinary income dividends) and do not reflect state and local taxes. Actual after-tax returns will be calculated at calendar year-end and depend on an investor’s tax situation and may differ from those shown. In addition, the after-tax returns shown are not relevant to investors who hold Fund shares through tax-deferred arrangements such as 401(k) plans or individual retirement accounts. Under certain circumstances, the addition of the tax benefits from capital losses resulting from redemptions may cause the Returns After Taxes on Distributions and Sale of Fund Shares to be greater than the Returns After Taxes on Distributions or even Returns Before Taxes. Standardized after-tax returns assume reinvestment of all distributions at NAV and reflect a maximum initial sales charge of 5.5% for Class A Shares. |
| | * | | Returns Before Taxes do not reflect taxes on distributions on the Fund’s Class A Shares nor do they show how performance can be impacted by taxes when shares are redeemed. |
| | ** | | Returns After Taxes on Distributions assume that taxes are paid on distributions on the Fund’s Class A Shares (i.e., dividends and capital gains) but do not reflect taxes that may be incurred upon redemption of the Class A Shares at the end of the performance period. |
| *** | | Returns After Taxes on Distributions and Sale of Fund Shares reflect taxes paid on distributions on the Fund’s Class A Shares and taxes applicable when the shares are redeemed. |
9
FUND BASICS
| | | | | | | | |
| | TOP TEN HOLDINGS AS OF 6/30/127 |
| | | Holding | | % of Net Assets | | | Line of Business |
| | Apple Inc. | | | 4.6 | % | | Technology Hardware & Equipment |
| | Exxon Mobil Corp. | | | 2.8 | | | Energy |
| | General Electric Co. | | | 2.6 | | | Capital Goods |
| | Johnson & Johnson | | | 2.5 | | | Pharmaceuticals,
Biotechnology & Life Sciences |
| | Merck & Co Inc. | | | 2.0 | | | Pharmaceuticals,
Biotechnology & Life Sciences |
| | Microsoft Corp | | | 2.0 | | | Software & Services |
| | Intel Corp | | | 1.9 | | | Semiconductors & Semiconductor
Equipment |
| | Chevron Corp | | | 1.8 | | | Energy |
| | Coca-Cola Co | | | 1.7 | | | Food, Beverage & Tobacco |
| | | JPMorgan Chase & Co | | | 1.5 | | | Diversified Financials |
| | 7 | | The top 10 holdings may not be representative of the Fund’s future investments. |
|
| FUND VS. BENCHMARK SECTOR ALLOCATIONS8 |
| As of June 30, 2012 |
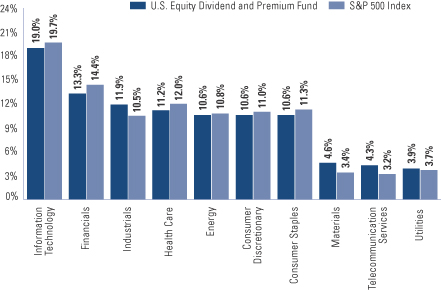
| | 8 | | The Fund is actively managed and, as such, its composition may differ over time. Consequently, the Fund’s overall sector allocations may differ from percentages contained in the graph above. The graph categorizes investments using Global Industry Classification Standard (“GICS”), however, the sector classifications used by the portfolio management team may differ from GICS. The percentage shown for each investment category reflects the value of investments in that category as a percentage of market value. The graph depicts the Fund’s investments but may not represent the Fund’s market exposure due to the exclusion of certain derivatives, if any, as listed in the Additional Investment Information section of the Schedule of Investments. |
10
PORTFOLIO RESULTS
International Equity Dividend and Premium Fund
Portfolio Management Discussion and Analysis
Below, the Goldman Sachs Quantitative Investment Strategies Team discusses the Goldman Sachs International Equity Dividend and Premium Fund’s (the “Fund”) performance and positioning for the six-month period ended June 30, 2012 (the “Reporting Period”).
| Q | | How did the Fund perform during the Reporting Period? |
| A | | During the Reporting Period, the Fund’s Class A, C, Institutional and IR Shares generated cumulative total returns, without sales charges, of 1.05%, 0.53%, 1.11% and 0.97%, respectively. These returns compare to the 2.96% cumulative total return of the Fund’s benchmark, the MSCI EAFE (net) Index (unhedged, with dividends reinvested) (the “MSCI EAFE Index”). The Barclays Global Aggregate Bond Index returned 1.50%. Maximizing income is part of the Fund’s investment objective, and therefore we believe that a comparison of the Fund’s performance to that of the Barclays Global Aggregate Bond Index is useful to investors. |
| Q | | What key factors were most responsible for the Fund’s performance during the Reporting Period? |
| A | | Security selection detracted from the Fund’s relative performance. Stock picks in the financials, consumer staples, consumer discretionary, information technology, industrials, telecommunication services, energy and health care sectors dampened results versus the MSCI EAFE Index. Stock selection in the utilities and materials sectors added to relative performance. |
| | The sale of call options contributed overall to the Fund’s total return. (A call option is an option that gives the holder the right to buy a certain quantity of an underlying security at an agreed-upon price at any time up to an agreed-upon date.) |
| Q | | How did the Fund’s call writing affect its performance? |
| A | | Consistent with our investment approach, we wrote index call options on a portion of the stock portfolio’s market value, primarily on the Japanese, United Kingdom and European indices. Upon exercise by the holder, the sale of an index call option obligates us to buy an index at a specified price, also known as the “strike price.” Although the Fund retains the proceeds from the sale of an option, the payment may not exceed the increase in the value of the index, as call options are exercised and we pay the purchaser the increase in value. This is what happened during the Reporting Period for certain of the Fund’s options positions. However, overall, the Fund’s call writing contributed positively to performance. |
| | In general, we targeted 4% in annual premiums. We wrote call options covering about 27% of the value of the stock portfolio to achieve this target. |
| | Overall, call option writing tends to reduce volatility. Since its inception, the realized daily volatility of the Fund has been about 25% compared to the realized volatility of the MSCI EAFE Index of 26%. During the Reporting Period, realized daily volatility of the Fund has been about 16% compared to the realized volatility of the MSCI EAFE Index of 17%. |
| Q | | What was the Fund’s dividend yield during the Reporting Period? |
| A | | While maintaining industry and sector weights consistent with the MSCI EAFE Index, we favor stocks with higher dividend yields. The dividend yield of the Fund during the Reporting Period was 5.08% compared to 3.97% for the MSCI EAFE Index. The Fund’s dividend yield served to enhance its quarterly net income distributions. |
| Q | | Which individual stock holdings detracted significantly from relative performance during the Reporting Period? |
| A | | Detracting from relative performance were overweighted positions in Man Group, a U.K. provider of alternative investment products; Total, a French oil company; and Mediaset, an Italian television company. |
11
PORTFOLIO RESULTS
| Q | | Among individual holdings, which stocks contributed most to the Fund’s results? |
| A | | The Fund benefited from overweighted positions relative to the MSCI EAFE Index in Mizuho Financial Group, a Japanese financial company, and RWE, a German electric, gas and water utility. An underweighted position in Spanish telecommunications company Telefonica SA also enhanced relative returns. |
| Q | | How did fixed income investments affect the Fund’s relative performance? |
| A | | The Fund’s investments in fixed income securities are limited to cash equivalents, and therefore fixed income holdings did not have a meaningful impact on performance during the Reporting Period. |
| Q | | How did the Fund use derivatives and similar instruments during the Reporting Period? |
| A | | During the Reporting Period, we used equity index futures to equitize the Fund’s excess cash holdings. In other words, we put the Fund’s excess cash holdings to work by using them as collateral for the purchase of equity index futures. Consistent with our investment approach, we also wrote equity index options on a portion of the portfolio’s market value in an effort to generate premiums and reduce volatility. |
| Q | | What changes or enhancements did you make to your quantitative model during the Reporting Period? |
| A | | No material changes or enhancements were made to our quantitative model during the Reporting Period. |
12
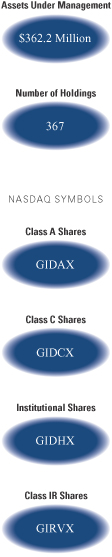
FUND BASICS
International Equity Dividend and Premium Fund
as of June 30, 2012
| | | | | | | | | | | | | | |
| | PERFORMANCE REVIEW | |
| | | January 1, 2012–
June 30, 2012 | | Fund Total Return
(based on NAV)1 | | | MSCI EAFE (Net) Index
(unhedged)2 | | | Barclays Global Aggregate
Bond Index3 | |
| | Class A | | | 1.05 | % | | | 2.96 | % | | | 1.50 | % |
| | Class C | | | 0.53 | | | | 2.96 | | | | 1.50 | |
| | Institutional | | | 1.11 | | | | 2.96 | | | | 1.50 | |
| | | Class IR | | | 0.97 | | | | 2.96 | | | | 1.50 | |
| | 1 | | The net asset value (“NAV”) represents the net assets of the class of the Fund (ex-dividend) divided by the total number of shares of the class outstanding. The Fund’s performance reflects the reinvestment of dividends and other distributions. The Fund’s performance does not reflect the deduction of any applicable sales charges. |
| | 2 | | The MSCI EAFE Index (unhedged and net of dividend withholding taxes) is an unmanaged market capitalization-weighted composite of securities in 22 developed markets. The Index figures do not include any deduction for fees, expenses or taxes. It is not possible to invest directly in an index. |
| | 3 | | The Barclays Global Aggregate Bond Index represents an unmanaged diversified portfolio of fixed income securities, including U.S. Treasuries, investment-grade corporate bonds, and mortgage-backed and asset-backed securities. The Index figures do not reflect any deduction for fees, expenses or taxes. It is not possible to invest directly in an index. |
| | | | | | | | | | | | |
| | STANDARDIZED TOTAL RETURNS4 |
| | | For the period ended 6/30/12 | | One Year | | | Since Inception | | | Inception Date |
| | Class A | | | -20.59 | % | | | -6.52 | % | | 1/31/08 |
| | Class C | | | -17.54 | | | | -6.31 | | | 1/31/08 |
| | Institutional | | | -15.73 | | | | -5.24 | | | 1/31/08 |
| | | Class IR | | | -15.89 | | | | 1.72 | | | 8/31/10 |
| | 4 | | The Standardized Total Returns are average annual total returns as of the most recent calendar quarter-end. They assume reinvestment of all distributions at NAV. These returns reflect a maximum initial sales charge of 5.5% for Class A Shares and the assumed contingent deferred sales charge for Class C Shares (1% if redeemed within 12 months of purchase). Because Institutional and Class IR Shares do not involve a sales charge, such a charge is not applied to their Standardized Total Returns. |
| | | | The returns represent past performance. Past performance does not guarantee future results. The Fund’s investment return and principal value will fluctuate so that an investor’s shares, when redeemed, may be worth more or less than their original cost. Current performance may be lower or higher than the performance quoted above. Please visit our Website at www.goldmansachsfunds.com to obtain the most recent month-end returns. Performance reflects fee waivers and/or expense limitations in effect. In their absence, performance would be reduced. Returns do not reflect the deduction of taxes that a shareholder would pay on Fund distributions or the redemption of Fund shares. |
13
FUND BASICS
| | | | | | | | | | |
| | EXPENSE RATIOS5 | |
| | | | | Net Expense Ratio (Current) | | | Gross Expense Ratio (Before Waivers) | |
| | Class A | | | 1.30 | % | | | 1.38 | % |
| | Class C | | | 2.05 | | | | 2.13 | |
| | Institutional | | | 0.90 | | | | 0.98 | |
| | | Class IR | | | 1.05 | | | | 1.13 | |
| | 5 | | The expense ratios of the Fund, both current (net of applicable fee waivers and/or expense limitations) and before waivers (gross of applicable fee waivers and/or expense limitations) are as set forth above according to the most recent publicly available Prospectus for the Fund and may differ from the expense ratios disclosed in the Financial Highlights in this report. The Fund’s waivers and/or expense limitations will remain in place through at least April 27, 2013, and prior to such date the investment adviser may not terminate the arrangements without the approval of the Fund’s Board of Trustees. If these arrangements are discontinued in the future, the expense ratios may change without shareholder approval. |
| | | | | | | | |
| | STANDARDIZED AFTER-TAX PERFORMANCE AS OF 6/30/126 |
| | | Class A Shares | | One Year | | | Since Inception
(1/31/08) |
| | Returns before taxes* | | | -20.59 | % | | -6.52% |
| | Returns after taxes on distributions** | | | -21.64 | | | -6.96 |
| | | Returns after taxes on distributions***
and sale of Fund shares | | | -12.26 | | | -5.30 |
| | 6 | | The after-tax returns are calculated using the historically highest individual federal marginal income tax rates at the time of distributions (currently 15% for qualifying ordinary income dividends and long-term capital gain distributions and 35% for non-qualifying ordinary income dividends) and do not reflect state and local taxes. Actual after-tax returns will be calculated at calendar year-end and depend on an investor’s tax situation and may differ from those shown. In addition, the after-tax returns shown are not relevant to investors who hold Fund shares through tax-deferred arrangements such as 401(k) plans or individual retirement accounts. Under certain circumstances, the addition of the tax benefits from capital losses resulting from redemptions may cause the Returns After Taxes on Distributions and Sale of Fund Shares to be greater than the Returns After Taxes on Distributions or even Returns Before Taxes. Standardized after-tax returns assume reinvestment of all distributions at NAV and reflect a maximum initial sales charge of 5.5% for Class A Shares. |
| | * | | Returns Before Taxes do not reflect taxes on distributions on the Fund’s Class A Shares nor do they show how performance can be impacted by taxes when shares are redeemed. |
| | ** | | Returns After Taxes on Distributions assume that taxes are paid on distributions on the Fund’s Class A Shares (i.e., dividends and capital gains) but do not reflect taxes that may be incurred upon redemption of the Class A Shares at the end of the performance period. |
| *** | | Returns After Taxes on Distributions and Sale of Fund Shares reflect taxes paid on distributions on the Fund’s Class A Shares and taxes applicable when the shares are redeemed. |
14
FUND BASICS
| | | | | | | | |
| | TOP TEN HOLDINGS AS OF 6/30/127 |
| | | Company | | % of Net Assets | | | Line of Business |
| | Nestle SA | | | 4.0 | % | | Food, Beverage & Tobacco |
| | BP Plc | | | 2.9 | | | Energy |
| | Westpac Banking Corp. | | | 2.4 | | | Banks |
| | Total SA | | | 2.4 | | | Energy |
| | GlaxoSmithKline PLC | | | 2.1 | | | Pharmaceuticals,
Biotechnology & Life Sciences |
| | Blanco Santander SA | | | 1.9 | | | Banks |
| | Vodafone Group PLC | | | 1.9 | | | Telecommunication Services |
| | Roche Holding AG | | | 1.9 | | | Pharmaceuticals,
Biotechnology & Life Sciences |
| | Mizuho Financial Group Inc | | | 1.8 | | | Banks |
| | | Honda Motor Co Ltd | | | 1.7 | | | Automobiles & Components |
| | 7 | | The top 10 holdings may not be representative of the Fund’s future investments. |
|
| FUND VS. BENCHMARK SECTOR ALLOCATIONS8 |
| As of June 30, 2012 |
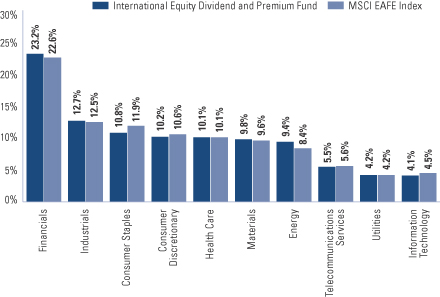
| | 8 | | The Fund is actively managed and, as such, its composition may differ over time. Consequently, the Fund’s overall sector allocations may differ from percentages contained in the graph above. The graph categorizes investments using Global Industry Classification Standard (“GICS”), however, the sector classifications used by the portfolio management team may differ from GICS. The percentage shown for each investment category reflects the value of investments in that category as a percentage of market value. The graph depicts the Fund’s investments but may not represent the Fund’s market exposure due to the exclusion of certain derivatives, if any, as listed in the Additional Investment Information section of the Schedule of Investments. |
15
INVESTMENT PROCESS
What Differentiates the Goldman Sachs Global
Structured Tax-Management Investment Process?
In managing money for many of the world’s wealthiest taxable investors, Goldman Sachs often constructs a diversified investment portfolio around a tax-managed core. With the Goldman Sachs Structured Tax-Managed Equity Fund and Structured International Tax-Managed Equity Fund, investors can access Goldman Sachs’ tax-smart investment expertise while capitalizing on this same strategic approach to portfolio construction.
Goldman Sachs Global Structured Tax-Management Investment Process
The Goldman Sachs Global Structured Tax-Management investment process is a disciplined quantitative approach that has been consistently applied since 1989. With the Goldman Sachs Structured Tax-Managed Equity Fund and the Goldman Sachs Structured International Tax-Managed Equity Fund, the Structured investment process is enhanced with an additional layer that seeks to maximize after-tax returns.
Advantage: Daily analysis of approximately 3,000 U.S. and international equity securities using a proprietary model.
| n | | Sector and size neutral |
Tax optimization is an additional layer that is built into the existing Structured investment process — a distinct advantage. While other managers may simply seek to minimize taxable distributions through a low turnover strategy, this extension of the Structured investment process seeks to maximize after-tax returns — the true objective of every taxable investor.
Advantage: Value added through stock selection — not market timing, industry rotation or style bias.
| n | | A fully invested, style-consistent portfolio |
| n | | Broad access to the entire U.S. and international equity markets |
| n | | A consistent goal of seeking to maximize after-tax risk-adjusted returns |
16
PORTFOLIO RESULTS
Structured Tax-Managed Equity Fund
Portfolio Management Discussion and Analysis
Below, the Goldman Sachs Quantitative Investment Strategies Team discusses the Goldman Sachs Structured Tax-Managed Equity Fund’s (the “Fund”) performance and positioning for the six-month period ended June 30, 2012 (the “Reporting Period”).
| Q | | How did the Fund perform during the Reporting Period? |
| A | | During the Reporting Period, the Fund’s Class A, B, C, Institutional, Service and IR Shares generated cumulative total returns, without sales charges, of 9.05%, 8.72%, 8.67%, 9.33%, 8.99% and 9.22%, respectively. These returns compare to the 9.32% cumulative total return of the Fund’s benchmark, the Russell 3000® Index (with dividends reinvested) (the “Index”), over the same time period. |
| Q | | What key factors were most responsible for the Fund’s performance during the Reporting Period? |
| A | | As expected, and in keeping with our investment approach, our quantitative model and its six investment themes had the greatest impact on relative performance. We use these themes to take a long-term view of market patterns and look for inefficiencies, selecting stocks for the Fund and overweighting or underweighting the ones chosen by the model. Over time and by design, the performance of any one of the model’s investment themes tends to have a low correlation with the model’s other themes, demonstrating the diversification benefit of the Fund’s theme-driven quantitative model. The variance in performance supports our research indicating that the diversification provided by the Fund’s different investment themes is a significant investment advantage over the long term, even though the Fund may experience underperformance in the short term. |
| | The Fund generated mixed results versus the Index during the Reporting Period, with the Valuation, Management and Momentum themes detracting most. The Valuation theme attempts to capture potential mispricings of securities, typically by comparing a measure of the company’s intrinsic value to its market value. Management assesses the characteristics, policies and strategic decisions of company management, while Momentum seeks to predict drifts in stock prices caused by delayed investor reaction to company-specific information and information about related companies. |
| | Our Profitability, Sentiment and Quality themes contributed to the Fund’s relative returns. Profitability assesses whether a company is earning more than its cost of capital. The Sentiment theme reflects selected investment views and decisions of individuals and financial intermediaries. Quality evaluates whether a company’s earnings are coming from more persistent, cash-based sources, as opposed to accruals. |
| Q | | How successful was your stock selection during the Reporting Period? |
| A | | The Fund seeks to provide investors with a tax-efficient means for maintaining broadly diversified exposure to the entire U.S. equity market, ranging from large- to small-cap stocks. During the Reporting Period, stock selection added to the Fund’s relative performance. |
| Q | | Among individual holdings, which stocks contributed most to the Fund’s results? |
| A | | Security selection in the energy, health care and consumer discretionary sectors enhanced the Fund’s relative results during the Reporting Period. The Fund benefited from overweighted positions in agricultural fertilizer maker CF Industries Holdings and in oil refiners Marathon Petroleum and Western Refining. |
| Q | | Which individual stock holdings detracted significantly from relative performance during the Reporting Period? |
| A | | Stock selection in the consumer staples, information technology and financials sectors detracted from relative returns. The Fund was hampered by overweighted positions in mattress and pillow manufacturer Tempur-Pedic International; pharmaceutical firm Eli Lilly; and oil company Conoco Phillips. |
17
PORTFOLIO RESULTS
| Q | | How did the Fund use derivatives and similar instruments during the Reporting Period? |
| A | | During the Reporting Period, we did not use derivatives as part of an active management strategy to add value to the Fund’s results. However, we used equity index futures, on an opportunistic basis, to equitize the Fund’s excess cash holdings. In other words, we put the Fund’s excess cash holdings to work by using them as collateral for the purchase of equity index futures. |
| Q | | What changes or enhancements did you make to your quantitative model during the Reporting Period? |
| A | | During the Reporting Period, we implemented an enhancement to our global stock selection process. More specifically, we incorporated new signals within our Valuation theme, including cash flow signals, book value signals, dividend and buyback signals, forecasted and realized earnings signal and structural valuation signals. These signal weights are customized based on a particular stock’s industry, sector and geographic location. We believe these additional signals will help us more effectively identify the intrinsic value of a company, thereby adding value to our process. |
| Q | | How was the Fund positioned relative to the Index at the end of the Reporting Period? |
| A | | In constructing the Fund’s portfolio, we focus on picking stocks rather than on making industry or sector bets. Consequently, the Fund is similar to the Index in terms of its sector allocation and style. That said, the Fund was modestly overweight relative to the Index in the information technology, consumer staples, energy and consumer discretionary sectors at the end of the Reporting Period. Compared to the Index, it was underweight financials, health care, telecommunication services, industrials, materials and utilities at the end of the Reporting Period. |
18
FUND BASICS
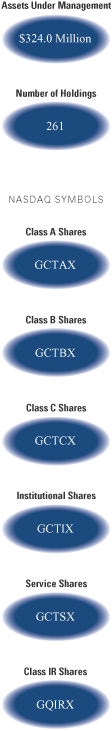
Structured Tax-Managed Equity Fund
as of June 30, 2012
| | | | | | | | | | |
| | PERFORMANCE REVIEW | |
| | | January 1, 2012–June 30, 2012 | | Fund Total Return
(based on NAV)1 | | | Russell 3000 Index2 | |
| | Class A | | | 9.05 | % | | | 9.32 | % |
| | Class B | | | 8.72 | | | | 9.32 | |
| | Class C | | | 8.67 | | | | 9.32 | |
| | Institutional | | | 9.33 | | | | 9.32 | |
| | Service | | | 8.99 | | | | 9.32 | |
| | | Class IR | | | 9.22 | | | | 9.32 | |
| | 1 | | The net asset value (“NAV”) represents the net assets of the class of the Fund (ex-dividend) divided by the total number of shares of the class outstanding. The Fund’s performance assumes the reinvestment of dividends and other distributions. The Fund’s performance does not reflect the deduction of any applicable sales charges. |
| | 2 | | The Russell 3000 Index is an unmanaged index that measures the performance of the 3,000 largest U.S. companies based on total market capitalization, which represents approximately 98% of the investable U.S. equity market. Index figures do not reflect any deduction for fees, expenses or taxes. It is not possible to invest directly in an index. |
| | | | | | | | | | | | | | | | | | | | |
| | STANDARDIZED TOTAL RETURNS3 |
| | | For the period ended 6/30/12 | | One Year | | | Five Years | | | Ten Years | | | Since Inception | | | Inception Date |
| | Class A | | | -2.47 | % | | | -2.89 | % | | | 4.48 | % | | | 0.70 | % | | 4/3/00 |
| | Class B | | | -2.59 | | | | -2.93 | | | | 4.42 | | | | 0.66 | | | 4/3/00 |
| | Class C | | | 1.46 | | | | -2.54 | | | | 4.29 | | | | 0.40 | | | 4/3/00 |
| | Institutional | | | 3.73 | | | | -1.37 | | | | 5.52 | | | | 1.58 | | | 4/3/00 |
| | Service | | | 3.12 | | | | -1.88 | | | | 4.97 | | | | 1.07 | | | 4/3/00 |
| | | Class IR | | | 3.55 | | | | N/A | | | | N/A | | | | 19.14 | | | 8/31/10 |
| | 3 | | The Standardized Total Returns are average annual total returns as of the most recent calendar quarter-end. They assume reinvestment of all distributions at NAV. These returns reflect a maximum initial sales charge of 5.5% for Class A Shares, the assumed contingent deferred sales charge for Class B Shares (5% maximum declining to 0% after six years) and the assumed contingent deferred sales charge for Class C Shares (1% if redeemed within 12 months of purchase). Because Institutional, Service and Class IR Shares do not involve a sales charge, such a charge is not applied to their Standardized Total Returns. The Fund’s Class B Shares are no longer available for purchase by new or existing shareholders (although current Class B shareholders may continue to reinvest income and capital gains distributions into Class B Shares, and Class B shareholders may continue to exchange their shares for Class B Shares of certain other Goldman Sachs Funds). |
| | | | The returns represent past performance. Past performance does not guarantee future results. The Fund’s investment return and principal value will fluctuate so that an investor’s shares, when redeemed, may be worth more or less than their original cost. Current performance may be lower or higher than the performance quoted above. Please visit our Website at www.goldmansachsfunds.com to obtain the most recent month-end returns. Performance reflects fee waivers and/or expense limitations in effect. In their absence, performance would be reduced. Returns do not reflect the deduction of taxes that a shareholder would pay on Fund distributions or the redemption of Fund shares. |
19
FUND BASICS
| | | | | | | | | | |
| | EXPENSE RATIOS4 | |
| | | | | Net Expense Ratio (Current) | | | Gross Expense Ratio (Before Waivers) | |
| | Class A | | | 1.09 | % | | | 1.24 | % |
| | Class B | | | 1.84 | | | | 1.99 | |
| | Class C | | | 1.84 | | | | 1.99 | |
| | Institutional | | | 0.69 | | | | 0.84 | |
| | Service | | | 1.19 | | | | 1.34 | |
| | | Class IR | | | 0.84 | | | | 0.99 | |
| | 4 | | The expense ratios of the Fund, both current (net of applicable fee waivers and/or expense limitations) and before waivers (gross of applicable fee waivers and/or expense limitations) are as set forth above according to the most recent publicly available Prospectus for the Fund and may differ from the expense ratios disclosed in the Financial Highlights in this report. The Fund’s waivers and/or expense limitations will remain in place through at least April 27, 2013, and prior to such date the investment adviser may not terminate the arrangements without the approval of the Fund’s Board of Trustees. If these arrangements are discontinued in the future, the expense ratios may change without shareholder approval. |
| | | | | | | | | | | | | | | | | | |
| | STANDARDIZED AFTER-TAX PERFORMANCE AS OF 6/30/125 | |
| | | Class A Shares | | One Year | | | Five Years | | | Ten Years | | | Since Inception
(4/3/00) | |
| | Returns before taxes* | | | -2.47 | % | | | -2.89 | % | | | 4.48 | % | | | 0.70 | % |
| | Returns after taxes on distributions** | | | -2.60 | | | | -3.02 | | | | 4.39 | | | | 0.62 | |
| | | Returns after taxes on distributions***
and sale of Fund shares | | | -1.46 | | | | -2.45 | | | | 3.90 | | | | 0.58 | |
| | 5 | | The after-tax returns are calculated using the historically highest individual federal marginal income tax rates at the time of distributions (currently 15% for qualifying ordinary income dividends and long-term capital gain distributions and 35% for non-qualifying ordinary income dividends) and do not reflect state and local taxes. Actual after-tax returns will be calculated at calendar year-end and depend on an investor’s tax situation and may differ from those shown. In addition, the after-tax returns shown are not relevant to investors who hold Fund shares through tax-deferred arrangements such as 401(k) plans or individual retirement accounts. Under certain circumstances, the addition of the tax benefits from capital losses resulting from redemptions may cause the Returns After Taxes on Distributions and Sale of Fund Shares to be greater than the Returns After Taxes on Distributions or even Returns Before Taxes. Standardized after-tax returns assume reinvestment of all distributions at NAV and reflect a maximum initial sales charge of 5.5% for Class A Shares. |
| | * | | Returns Before Taxes do not reflect taxes on distributions on the Fund’s Class A Shares nor do they show how performance can be impacted by taxes when shares are redeemed. |
| | ** | | Returns After Taxes on Distributions assume that taxes are paid on distributions on the Fund’s Class A Shares (i.e., dividends and capital gains) but do not reflect taxes that may be incurred upon redemption of the Class A Shares at the end of the performance period. |
| *** | | Returns After Taxes on Distributions and Sale of Fund Shares reflect taxes paid on distributions on the Fund’s Class A Shares and taxes applicable when the shares are redeemed. |
20
FUND BASICS
| | | | | | | | |
| | TOP TEN HOLDINGS AS OF 6/30/126 |
| | | Holding | | % of Net Assets | | | Line of Business |
| | Apple Inc. | | | 3.6 | % | | Technology Hardware & Equipment |
| | Exxon Mobil Corp | | | 3.4 | | | Energy |
| | Chevron Corp. | | | 2.6 | | | Energy |
| | Google Inc | | | 2.2 | | | Software & Services |
| | Microsoft Corp | | | 2.1 | | | Software & Services |
| | Proctor & Gamble Co | | | 2.1 | | | Household & Personal Products |
| | Oracle Corp | | | 2.0 | | | Software & Services |
| | Amgen Inc | | | 1.7 | | | Pharmaceuticals,
Biotechnology & Life Sciences |
| | Marathon Petroleum Corp | | | 1.6 | | | Energy |
| | | DIRECTV | | | 1.4 | | | Media |
| | 6 | | The top 10 holdings may not be representative of the Fund’s future investments. |
| | |
| FUND VS. BENCHMARK SECTOR ALLOCATIONS7 | | |
| As of June 30, 2012 | | |
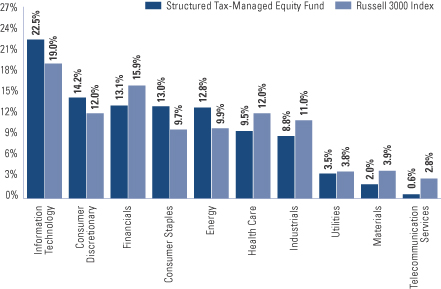
| | 7 | | The Fund is actively managed and, as such, its composition may differ over time. Consequently, the Fund’s overall sector allocations may differ from percentages contained in the graph above. The graph categorizes investments using Global Industry Classification Standard (“GICS”), however, the sector classifications used by the portfolio management team may differ from GICS. The percentage shown for each investment category reflects the value of investments in that category as a percentage of market value (excluding investments in the securities lending reinvestment vehicle, if any). Investments in the securities lending reinvestment vehicle represented 3.7% of the Fund’s net assets as of June 30, 2012. The graph depicts the Fund’s investments but may not represent the Fund’s market exposure due to the exclusion of certain derivatives, if any, as listed in the Additional Investment Information section of the Schedule of Investments. |
21
PORTFOLIO RESULTS
Structured International Tax-Managed Equity Fund
Portfolio Management Discussion and Analysis
Below, the Goldman Sachs Quantitative Investment Strategies Team discusses the Goldman Sachs Structured International Tax-Managed Equity Fund’s (the “Fund”) performance and positioning for the six-month period ended June 30, 2012 (the “Reporting Period”).
| Q | | How did the Fund perform during the Reporting Period? |
| A | | During the Reporting Period, the Fund’s Class A, C, Institutional and IR Shares generated cumulative total returns, without sales charges, of 2.86%, 2.26%, 3.01% and 3.01%, respectively. These returns compare to the 2.96% cumulative total return of the Fund’s benchmark, the MSCI EAFE (net) Index (unhedged, with dividends reinvested) (the “Index”), during the same time period. |
| Q | | What key factors were most responsible for the Fund’s performance during the Reporting Period? |
| A | | As expected, and in keeping with our investment approach, our quantitative model and its six investment themes had the greatest impact on relative performance. We use these themes to take a long-term view of market patterns and look for inefficiencies, selecting stocks for the Fund and overweighting or underweighting the ones chosen by the model. Over time and by design, the performance of any one of the model’s investment themes tends to have a low correlation with the model’s other themes, demonstrating the diversification benefit of the Fund’s theme-driven quantitative model. The variance in performance supports our research indicating that the diversification provided by the Fund’s different investment themes is a significant investment advantage over the long term, even though the Fund may experience underperformance in the short term. |
| | Overall, the Fund generated mixed results versus the Index during the Reporting Period, with the Valuation and Management themes detracting most. Valuation attempts to capture potential mispricings of securities, typically by comparing a measure of the company’s intrinsic value to its market value. Management assesses the characteristics, policies and strategic decisions of company management. |
| | Our Momentum, Profitability and Sentiment themes contributed positively to the Fund’s relative performance. Momentum seeks to predict drifts in stock prices caused by delayed investor reaction to company-specific information and information about related companies. Profitability assesses whether a company is earning more than its cost of capital, while Sentiment reflects selected investment views and decisions of individuals and financial intermediaries. |
| | The impact of our Quality theme was relatively neutral. Quality evaluates whether the company’s earnings are coming from more persistent, cash-based sources, as opposed to accruals. |
| Q | | How successful was your stock selection during the Reporting Period? |
| A | | The Fund seeks to provide investors with a tax-efficient means for maintaining broadly diversified exposure to the entire EAFE equity market. During the Reporting Period, security selection provided mixed results. |
| Q | | Among individual holdings, which stocks contributed most to the Fund’s results? |
| A | | Stock selection in the industrials, consumer discretionary and financials sectors enhanced relative results. The Fund benefited from overweighted positions in tobacco firm Swedish Match; Commonwealth Bank of Australia; and Swiss health care company Roche Holding. |
| Q | | Which individual stock holdings detracted significantly from relative performance during the Reporting Period? |
| A | | Our investments in the energy, materials and information technology sectors detracted from relative results. The Fund was hampered by overweighted positions in Repsol YPF, a Spanish oil and gas exploration company, and in Eurasian Natural Resources, a U.K. diversified natural resources company. An underweighted position in Swiss food maker Nestle also dampened relative performance. |
22
PORTFOLIO RESULTS
| Q | | How did the Fund use derivatives and similar instruments during the Reporting Period? |
| A | | During the Reporting Period, we did not use derivatives as part of an active management strategy to add value to the Fund’s results. However, we used equity index futures, on an opportunistic basis, to equitize the Fund’s excess cash holdings. In other words, we put the Fund’s excess cash holdings to work by using them as collateral for the purchase of equity index futures. |
| Q | | What changes or enhancements did you make to your quantitative model during the Reporting Period? |
| A | | During the Reporting Period, we implemented an enhancement to our global stock selection process. More specifically, we incorporated new signals within our Valuation theme, including cash flow signals, book value signals, dividend and buyback signals, forecasted and realized earnings signal and structural valuation signals. These signal weights are customized based on a particular stock’s industry, sector and geographic location. We believe these additional signals will help us more effectively identify the intrinsic value of a company, thereby adding value to our process. |
| | In addition, we extended our price momentum timing insight to the emerging markets and the U.K. regions. With this enhancement, we aim to capture price momentum in the markets while including a component of timing. Our research indicates that including a timing signal can improve the risk-adjusted returns of the Momentum theme and can significantly mitigate drawdown risk. |
| Q | | How was the Fund positioned relative to the Index at the end of the Reporting Period? |
| A | | In constructing the Fund’s portfolio, we focus on picking stocks rather than on country weightings. Consequently, the Fund is similar to the Index in terms of its sector and country allocations. That said, at the end of the Reporting Period, the Fund was overweight the consumer staples, energy, utilities and consumer discretionary sectors. It was underweight materials, industrials, information technology and telecommunication services. It was rather neutral compared to the Index in the financials and health care sectors. |
| | At the end of the Reporting Period, the Fund was neutrally weighted relative to all 22 countries in the Index — Australia, Austria, Belgium, Denmark, Finland, France, Germany, Greece, Hong Kong, Ireland, Israel, Italy, Japan, the Netherlands, New Zealand, Norway, Portugal, Singapore, Spain, Sweden, Switzerland and the U.K. |
23
FUND BASICS
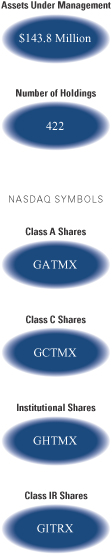
Structured International Tax-Managed Equity Fund
as of June 30, 2012
| | | | | | | | | | |
| | PERFORMANCE REVIEW | |
| | | January 1, 2012–June 30, 2012 | | Fund Total Return
(based on NAV)1 | | | MSCI EAFE (net) Index
(unhedged)2 | |
| | Class A | | | 2.86 | % | | | 2.96 | % |
| | Class C | | | 2.26 | | | | 2.96 | |
| | Institutional | | | 3.01 | | | | 2.96 | |
| | | Class IR | | | 3.01 | | | | 2.96 | |
| | 1 | | The net asset value (“NAV”) represents the net assets of the class of the Fund (ex-dividend) divided by the total number of shares of the class outstanding. The Fund’s performance reflects the reinvestment of dividends and other distributions. The Fund’s performance does not reflect the deduction of any applicable sales charges. |
| | 2 | | The unmanaged MSCI EAFE Index (unhedged and net of dividend withholding taxes) is a market capitalization-weighted composite of securities in 22 developed markets. The Index figures do not include any deduction for fees, expenses or taxes. It is not possible to invest directly in an index. |
| | | | | | | | | | |
| | STANDARDIZED TOTAL RETURNS3 |
| | | For the period ended 6/30/12 | | One Year | | Since Inception | | | Inception Date |
| | Class A | | -19.65% | | | -7.50 | % | | 1/31/08 |
| | Class C | | -16.48 | | | -7.02 | | | 1/31/08 |
| | Institutional | | -14.69 | | | -5.94 | | | 1/31/08 |
| | | Class IR | | -14.67 | | | 3.12 | | | 8/31/10 |
| | 3 | | The Standardized Total Returns are average annual total returns as of the most recent calendar quarter-end. They assume reinvestment of all distributions at NAV. These returns reflect a maximum initial sales charge of 5.5% for Class A Shares and the assumed contingent deferred sales charge for Class C Shares (1% if redeemed within 12 months of purchase). Because Institutional and Class IR Shares do not involve a sales charge, such a charge is not applied to their Standardized Total Returns. |
| | | | The returns represent past performance. Past performance does not guarantee future results. The Fund’s investment return and principal value will fluctuate so that an investor’s shares, when redeemed, may be worth more or less than their original cost. Current performance may be lower or higher than the performance quoted above. Please visit our Website at www.goldmansachsfunds.com to obtain the most recent month-end returns. Performance reflects fee waivers and/or expense limitations in effect. In their absence, performance would be reduced. Returns do not reflect the deduction of taxes that a shareholder would pay on Fund distributions or the redemption of Fund shares. |
24
FUND BASICS
| | | | | | | | | | |
| | EXPENSE RATIOS4 | |
| | | | | Net Expense Ratio (Current) | | | Gross Expense Ratio (Before Waivers) | |
| | Class A | | | 1.26 | % | | | 1.57 | % |
| | Class C | | | 2.01 | | | | 2.32 | |
| | Institutional | | | 0.86 | | | | 1.17 | |
| | | Class IR | | | 1.01 | | | | 1.32 | |
| | 4 | | The expense ratios of the Fund, both current (net of applicable fee waivers and/or expense limitations) and before waivers (gross of applicable fee waivers and/or expense limitations) are as set forth above according to the most recent publicly available Prospectus for the Fund and may differ from the expense ratios disclosed in the Financial Highlights in this report. The Fund’s waivers and/or expense limitations will remain in place through at least April 27, 2013, and prior to such date the investment adviser may not terminate the arrangements without the approval of the Fund’s Board of Trustees. If these arrangements are discontinued in the future, the expense ratios may change without shareholder approval. |
| | | | | | | | | | |
| | STANDARDIZED AFTER-TAX PERFORMANCE AS OF 6/30/125 | |
| | | Class A Shares | | One Year | | | Since Inception
(1/31/08) | |
| | Returns before taxes* | | | -19.65 | % | | | -7.50 | % |
| | Returns after taxes on distributions** | | | -19.80 | | | | -7.70 | |
| | | Returns after taxes on distributions***
and sale of Fund shares | | | -12.14 | | | | -6.17 | |
| | 5 | | The after-tax returns are calculated using the historically highest individual federal marginal income tax rates at the time of distributions (currently 15% for qualifying ordinary income dividends and long-term capital gain distributions and 35% for non-qualifying ordinary income dividends) and do not reflect state and local taxes. Actual after-tax returns will be calculated at calendar year-end and depend on an investor’s tax situation and may differ from those shown. In addition, the after-tax returns shown are not relevant to investors who hold Fund shares through tax-deferred arrangements such as 401(k) plans or individual retirement accounts. Under certain circumstances, the addition of the tax benefits from capital losses resulting from redemptions may cause the Returns After Taxes on Distributions and Sale of Fund Shares to be greater than the Returns After Taxes on Distributions or even Returns Before Taxes. Standardized after-tax returns assume reinvestment of all distributions at NAV and reflect a maximum initial sales charge of 5.5% for Class A Shares. |
| | * | | Returns Before Taxes do not reflect taxes on distributions on the Fund’s Class A Shares nor do they show how performance can be impacted by taxes when shares are redeemed. |
| | ** | | Returns After Taxes on Distributions assume that taxes are paid on distributions on the Fund’s Class A Shares (i.e., dividends and capital gains) but do not reflect taxes that may be incurred upon redemption of the Class A Shares at the end of the performance period. |
| *** | | Returns After Taxes on Distributions and Sale of Fund Shares reflect taxes paid on distributions on the Fund’s Class A Shares and taxes applicable when the shares are redeemed. |
25
FUND BASICS
| | | | | | | | |
| | TOP TEN HOLDINGS AS OF 6/30/126 |
| | | Holding | | % of Total
Net Assets | | | Line of Business |
| | Roche Holding AG | | | 2.9 | % | | Pharmaceuticals,
Biotechnology & Life Sciences |
| | Commonwealth Bank of Australia | | | 2.3 | | | Banks |
| | HSBC Holdings PLC | | | 2.1 | | | Banks |
| | Swedish Match AB | | | 2.0 | | | Food, Beverage & Tobacco |
| | British American Tobacco PLC | | | 2.0 | | | Food, Beverage & Tobacco |
| | Deutsche Post AG | | | 1.7 | | | Transportation |
| | Takeda Pharmaceutical Co Ltd. | | | 1.5 | | | Pharmaceuticals,
Biotechnology & Life Sciences |
| | Sumitomo Mitsui Financial Group Inc | | | 1.4 | | | Banks |
| | Banco Santander SA | | | 1.3 | | | Food, Beverage & Tobacco |
| | | Imperial Tobacco Group PLC | | | 1.3 | | | Insurance |
| | 6 | | The top 10 holdings may not be representative of the Fund’s future investments. |
| | |
| FUND VS. BENCHMARK SECTOR ALLOCATIONS7 | | |
| As of June 30, 2012 | | |
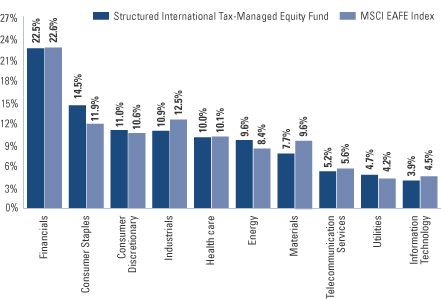
| | 7 | | The Fund is actively managed and, as such, its composition may differ over time. Consequently, the Fund’s overall sector allocations may differ from percentages contained in the graph above. The graph categorizes investments using Global Industry Classification Standard (“GICS”), however, the sector classifications used by the portfolio management team may differ from GICS. The percentage shown for each investment category reflects the value of investments in that category as a percentage of market value (excluding investments in the securities lending reinvestment vehicle, if any). Investments in the securities lending reinvestment vehicle represented 2.4% of the Fund’s net assets as of June 30, 2012. The graph depicts the Fund’s investments but may not represent the Fund’s market exposure due to the exclusion of certain derivatives, if any, as listed in the Additional Investment Information section of the Schedule of Investments. |
26
GOLDMAN SACHS U.S. EQUITY DIVIDEND AND PREMIUM FUND
Schedule of Investments
June 30, 2012 (Unaudited)
| | | | | | | | |
Shares | | | Description | | Value | |
| | | | | | | | |
| | Common Stocks – 96.2% | |
| Automobiles & Components – 0.8% | |
| | 32,800 | | | Autoliv, Inc. | | $ | 1,792,848 | |
| | 286,000 | | | Ford Motor Co. | | | 2,742,740 | |
| | 131,700 | | | Johnson Controls, Inc. | | | 3,649,407 | |
| | | | | | | | |
| | | | | | | 8,184,995 | |
| | |
| Banks – 3.5% | |
| | 35,900 | | | Bank of Hawaii Corp. | | | 1,649,614 | |
| | 33,400 | | | M&T Bank Corp. | | | 2,757,838 | |
| | 751,800 | | | New York Community Bancorp, Inc. | | | 9,420,054 | |
| | 183,600 | | | U.S. Bancorp | | | 5,904,576 | |
| | 501,100 | | | Valley National Bancorp | | | 5,311,660 | |
| | 410,000 | | | Wells Fargo & Co.(a) | | | 13,710,400 | |
| | | | | | | | |
| | | | | | | 38,754,142 | |
| | |
| Capital Goods – 8.6% | |
| | 7,200 | | | Armstrong World Industries, Inc. | | | 353,952 | |
| | 68,700 | | | Caterpillar, Inc. | | | 5,833,317 | |
| | 25,100 | | | Cummins, Inc. | | | 2,432,441 | |
| | 71,800 | | | Deere & Co. | | | 5,806,466 | |
| | 132,500 | | | Eaton Corp. | | | 5,250,975 | |
| | 108,200 | | | Emerson Electric Co. | | | 5,039,956 | |
| | 1,379,150 | | | General Electric Co.(a) | | | 28,741,486 | |
| | 33,700 | | | Harsco Corp. | | | 686,806 | |
| | 76,600 | | | Honeywell International, Inc. | | | 4,277,344 | |
| | 1,800 | | | Hubbell, Inc. Class B | | | 140,292 | |
| | 71,500 | | | Illinois Tool Works, Inc. | | | 3,781,635 | |
| | 146,200 | | | Lockheed Martin Corp. | | | 12,731,096 | |
| | 58,200 | | | Northrop Grumman Corp. | | | 3,712,578 | |
| | 110,100 | | | Raytheon Co. | | | 6,230,559 | |
| | 61,100 | | | The Boeing Co. | | | 4,539,730 | |
| | 18,900 | | | The Manitowoc Co., Inc. | | | 221,130 | |
| | 6,500 | | | Timken Co. | | | 297,635 | |
| | 56,100 | | | United Technologies Corp. | | | 4,237,233 | |
| | | | | | | | |
| | | | | | | 94,314,631 | |
| | |
| Commercial & Professional Services – 1.2% | |
| | 12,600 | | | Manpower, Inc. | | | 461,790 | |
| | 589,900 | | | Pitney Bowes, Inc. | | | 8,830,803 | |
| | 355,000 | | | R.R. Donnelley & Sons Co. | | | 4,178,350 | |
| | | | | | | | |
| | | | | | | 13,470,943 | |
| | |
| Consumer Durables & Apparel – 1.6% | |
| | 75,900 | | | Coach, Inc. | | | 4,438,632 | |
| | 3,400 | | | Deckers Outdoor Corp.* | | | 149,634 | |
| | 12,000 | | | Garmin Ltd. | | | 459,480 | |
| | 263,900 | | | Leggett & Platt, Inc. | | | 5,576,207 | |
| | 7,500 | | | Lululemon Athletica, Inc.* | | | 447,225 | |
| | 21,100 | | | Polaris Industries, Inc. | | | 1,508,228 | |
| | 2,500 | | | PVH Corp. | | | 194,475 | |
| | 5,800 | | | Under Armour, Inc. Class A* | | | 547,984 | |
| | 33,700 | | | VF Corp. | | | 4,497,265 | |
| | | | | | | | |
| | | | | | | 17,819,130 | |
| | |
| | | | | | | | |
| | | | | | | | |
| | Common Stocks – (continued) | |
| Consumer Services – 1.9% | |
| | 111,800 | | | Carnival Corp. | | $ | 3,831,386 | |
| | 254,800 | | | H&R Block, Inc. | | | 4,071,704 | |
| | 32,100 | | | Las Vegas Sands Corp. | | | 1,396,029 | |
| | 90,400 | | | McDonald’s Corp. | | | 8,003,112 | |
| | 63,900 | | | Starbucks Corp. | | | 3,407,148 | |
| | | | | | | | |
| | | | | | | 20,709,379 | |
| | |
| Diversified Financials – 4.8% | |
| | 892,781 | | | Bank of America Corp. | | | 7,302,949 | |
| | 37,000 | | | BlackRock, Inc. | | | 6,283,340 | |
| | 227,430 | | | Citigroup, Inc. | | | 6,233,856 | |
| | 15,300 | | | CME Group, Inc. | | | 4,102,083 | |
| | 30,300 | | | Green Dot Corp. Class A* | | | 670,236 | |
| | 21,800 | | | Greenhill & Co., Inc. | | | 777,170 | |
| | 58,600 | | | Janus Capital Group, Inc. | | | 458,252 | |
| | 468,800 | | | JPMorgan Chase & Co.(a) | | | 16,750,224 | |
| | 12,200 | | | SEI Investments Co. | | | 242,658 | |
| | 77,200 | | | T. Rowe Price Group, Inc. | | | 4,860,512 | |
| | 116,700 | | | The Bank of New York Mellon Corp. | | | 2,561,565 | |
| | 93,600 | | | Waddell & Reed Financial, Inc. Class A | | | 2,834,208 | |
| | | | | | | | |
| | | | | | | 53,077,053 | |
| | |
| Energy – 10.2% | |
| | 87,400 | | | Arch Coal, Inc. | | | 602,186 | |
| | 190,100 | | | Chevron Corp.(a)(b) | | | 20,055,550 | |
| | 237,900 | | | ConocoPhillips | | | 13,293,852 | |
| | 8,300 | | | Continental Resources, Inc.* | | | 552,946 | |
| | 363,800 | | | Exxon Mobil Corp.(a) | | | 31,130,366 | |
| | 207,500 | | | Halliburton Co. | | | 5,890,925 | |
| | 101,500 | | | HollyFrontier Corp. | | | 3,596,145 | |
| | 142,100 | | | Marathon Oil Corp. | | | 3,633,497 | |
| | 155,100 | | | Occidental Petroleum Corp. | | | 13,302,927 | |
| | 11,200 | | | Oceaneering International, Inc. | | | 536,032 | |
| | 25,500 | | | Patterson-UTI Energy, Inc. | | | 371,280 | |
| | 102,050 | | | Phillips 66* | | | 3,392,142 | |
| | 11,900 | | | Plains Exploration & Production Co.* | | | 418,642 | |
| | 46,800 | | | RPC, Inc. | | | 556,452 | |
| | 39,700 | | | SandRidge Energy, Inc.* | | | 265,593 | |
| | 175,600 | | | Schlumberger Ltd. | | | 11,398,196 | |
| | 97,600 | | | Spectra Energy Corp. | | | 2,836,256 | |
| | 14,100 | | | Teekay Corp. | | | 412,848 | |
| | 13,000 | | | Whiting Petroleum Corp.* | | | 534,560 | |
| | | | | | | | |
| | | | | | | 112,780,395 | |
| | |
| Food & Staples Retailing – 1.1% | |
| | 41,800 | | | SUPERVALU, Inc. | | | 216,524 | |
| | 92,600 | | | Walgreen Co. | | | 2,739,108 | |
| | 127,500 | | | Wal-Mart Stores, Inc. | | | 8,889,300 | |
| | | | | | | | |
| | | | | | | 11,844,932 | |
| | |
| | |
| The accompanying notes are an integral part of these financial statements. | | 27 |
GOLDMAN SACHS U.S. EQUITY DIVIDEND AND PREMIUM FUND
Schedule of Investments (continued)
June 30, 2012 (Unaudited)
| | | | | | | | |
Shares | | | Description | | Value | |
| | | | | | | | |
| | Common Stocks – (continued) | |
| Food, Beverage & Tobacco – 6.8% | |
| | 356,800 | | | Altria Group, Inc. | | $ | 12,327,440 | |
| | 127,800 | | | H.J. Heinz Co. | | | 6,949,764 | |
| | 57,600 | | | Kellogg Co. | | | 2,841,408 | |
| | 234,800 | | | Kraft Foods, Inc. Class A | | | 9,067,976 | |
| | 21,400 | | | Lorillard, Inc. | | | 2,823,730 | |
| | 187,000 | | | PepsiCo, Inc. | | | 13,213,420 | |
| | 27,500 | | | Philip Morris International, Inc. | | | 2,399,650 | |
| | 142,100 | | | Reynolds American, Inc. | | | 6,376,027 | |
| | 241,800 | | | The Coca-Cola Co.(a) | | | 18,906,342 | |
| | | | | | | | |
| | | | | | | 74,905,757 | |
| | |
| Health Care Equipment & Services – 1.7% | |
| | 147,200 | | | Baxter International, Inc. | | | 7,823,680 | |
| | 19,800 | | | Brookdale Senior Living, Inc.* | | | 351,252 | |
| | 234,500 | | | Medtronic, Inc. | | | 9,082,185 | |
| | 5,500 | | | SXC Health Solutions Corp.* | | | 545,655 | |
| | 10,500 | | | UnitedHealth Group, Inc. | | | 614,250 | |
| | 6,500 | | | Universal Health Services, Inc. Class B | | | 280,540 | |
| | | | | | | | |
| | | | | | | 18,697,562 | |
| | |
| Household & Personal Products – 2.3% | |
| | 255,100 | | | Avon Products, Inc. | | | 4,135,171 | |
| | 167,800 | | | Kimberly-Clark Corp. | | | 14,056,606 | |
| | 120,700 | | | The Procter & Gamble Co.(a) | | | 7,392,875 | |
| | | | | | | | |
| | | | | | | 25,584,652 | |
| | |
| Insurance – 2.5% | |
| | 71,900 | | | Aflac, Inc. | | | 3,062,221 | |
| | 41,400 | | | Arthur J. Gallagher & Co. | | | 1,451,898 | |
| | 23,000 | | | Berkshire Hathaway, Inc. Class B* | | | 1,916,590 | |
| | 234,700 | | | Cincinnati Financial Corp. | | | 8,935,029 | |
| | 53,400 | | | Mercury General Corp. | | | 2,225,178 | |
| | 141,200 | | | MetLife, Inc. | | | 4,356,020 | |
| | 565,900 | | | Old Republic International Corp. | | | 4,691,311 | |
| | 28,600 | | | Protective Life Corp. | | | 841,126 | |
| | | | | | | | |
| | | | | | | 27,479,373 | |
| | |
| Materials – 4.5% | |
| | 23,300 | | | Allied Nevada Gold Corp.* | | | 661,254 | |
| | 5,000 | | | Cabot Corp. | | | 203,500 | |
| | 172,000 | | | E.I. du Pont de Nemours & Co. | | | 8,698,040 | |
| | 236,400 | | | Freeport-McMoRan Copper & Gold, Inc. | | | 8,054,148 | |
| | 81,400 | | | Huntsman Corp. | | | 1,053,316 | |
| | 106,300 | | | International Paper Co. | | | 3,073,133 | |
| | 16,300 | | | Kronos Worldwide, Inc. | | | 257,377 | |
| | 47,600 | | | LyondellBasell Industries NV Class A | | | 1,916,852 | |
| | 49,000 | | | Monsanto Co. | | | 4,056,220 | |
| | 23,100 | | | Packaging Corp. of America | | | 652,344 | |
| | 22,100 | | | Royal Gold, Inc. | | | 1,732,640 | |
| | 25,400 | | | RPM International, Inc. | | | 690,880 | |
| | 232,157 | | | Southern Copper Corp. | | | 7,315,267 | |
| | 336,900 | | | The Dow Chemical Co. | | | 10,612,350 | |
| | | | | | | | |
| | | | | | | 48,977,321 | |
| | |
| | | | | | | | |
| | Common Stocks – (continued) | |
| Media – 3.2% | |
| | 267,700 | | | Comcast Corp. Class A | | $ | 8,548,394 | |
| | 255,100 | | | Regal Entertainment Group Class A | | | 3,510,176 | |
| | 100,800 | | | The Walt Disney Co. | | | 4,888,800 | |
| | 229,200 | | | Thomson Reuters Corp. | | | 6,520,740 | |
| | 67,200 | | | Time Warner Cable, Inc. | | | 5,517,120 | |
| | 161,500 | | | Time Warner, Inc. | | | 6,217,750 | |
| | | | | | | | |
| | | | | | | 35,202,980 | |
| | |
| Pharmaceuticals, Biotechnology & Life Sciences – 9.1% | |
| | 213,500 | | | Abbott Laboratories | | | 13,764,345 | |
| | 128,800 | | | Agilent Technologies, Inc. | | | 5,054,112 | |
| | 450,500 | | | Bristol-Myers Squibb Co. | | | 16,195,475 | |
| | 406,800 | | | Johnson & Johnson | | �� | 27,483,408 | |
| | 536,350 | | | Merck & Co., Inc. | | | 22,392,612 | |
| | 608,500 | | | Pfizer, Inc.(a)(b) | | | 13,995,500 | |
| | 6,000 | | | Regeneron Pharmaceuticals, Inc.* | | | 685,320 | |
| | | | | | | | |
| | | | | | | 99,570,772 | |
| | |
| Real Estate – 1.9% | |
| | 11,200 | | | BRE Properties, Inc. (REIT) | | | 560,224 | |
| | 9,500 | | | Camden Property Trust (REIT) | | | 642,885 | |
| | 17,600 | | | DDR Corp. (REIT) | | | 257,664 | |
| | 41,200 | | | Duke Realty Corp. (REIT) | | | 603,168 | |
| | 2,200 | | | Essex Property Trust, Inc. (REIT) | | | 338,624 | |
| | 212,001 | | | Host Hotels & Resorts, Inc. (REIT) | | | 3,353,856 | |
| | 102,527 | | | Prologis, Inc. (REIT) | | | 3,406,972 | |
| | 8,100 | | | Rayonier, Inc. (REIT) | | | 363,690 | |
| | 13,200 | | | Senior Housing Properties Trust (REIT) | | | 294,624 | |
| | 48,000 | | | Simon Property Group, Inc. (REIT) | | | 7,471,680 | |
| | 10,600 | | | SL Green Realty Corp. (REIT) | | | 850,544 | |
| | 13,200 | | | Taubman Centers, Inc. (REIT) | | | 1,018,512 | |
| | 7,302 | | | The Macerich Co. (REIT) | | | 431,183 | |
| | 60,500 | | | UDR, Inc. (REIT) | | | 1,563,320 | |
| | | | | | | | |
| | | | | | | 21,156,946 | |
| | |
| Retailing – 2.7% | |
| | 37,300 | | | Amazon.com, Inc.* | | | 8,517,455 | |
| | 5,200 | | | DSW, Inc. Class A | | | 282,880 | |
| | 41,200 | | | Foot Locker, Inc. | | | 1,259,896 | |
| | 52,300 | | | Guess?, Inc. | | | 1,588,351 | |
| | 133,800 | | | Limited Brands, Inc. | | | 5,690,514 | |
| | 121,700 | | | Lowe’s Companies, Inc. | | | 3,461,148 | |
| | 128,900 | | | Macy’s, Inc. | | | 4,427,715 | |
| | 5,600 | | | Priceline.com, Inc.* | | | 3,721,312 | |
| | 174,000 | | | RadioShack Corp. | | | 668,160 | |
| | 6,000 | | | Williams-Sonoma, Inc. | | | 209,820 | |
| | | | | | | | |
| | | | | | | 29,827,251 | |
| | |
| | |
| 28 | | The accompanying notes are an integral part of these financial statements. |
GOLDMAN SACHS U.S. EQUITY DIVIDEND AND PREMIUM FUND
| | | | | | | | |
Shares | | | Description | | Value | |
| | | | | | | | |
| | | | | | | | |
| | Common Stocks – (continued) | |
| Semiconductors & Semiconductor Equipment – 3.0% | |
| | 780,800 | | | Intel Corp.(a)(b) | | $ | 20,808,320 | |
| | 131,800 | | | Intersil Corp. Class A | | | 1,403,670 | |
| | 117,100 | | | Linear Technology Corp. | | | 3,668,743 | |
| | 27,900 | | | Marvell Technology Group Ltd. | | | 314,712 | |
| | 109,500 | | | Maxim Integrated Products, Inc. | | | 2,807,580 | |
| | 132,800 | | | Microchip Technology, Inc. | | | 4,393,024 | |
| | | | | | | | |
| | | | | | | 33,396,049 | |
| | |
| Software & Services – 8.1% | |
| | 62,400 | | | Accenture PLC Class A | | | 3,749,616 | |
| | 156,000 | | | Automatic Data Processing, Inc. | | | 8,682,960 | |
| | 115,200 | | | CA, Inc. | | | 3,120,768 | |
| | 84,100 | | | eBay, Inc.* | | | 3,533,041 | |
| | 19,500 | | | Google, Inc. Class A* | | | 11,311,365 | |
| | 56,600 | | | International Business Machines Corp. | | | 11,069,828 | |
| | 8,100 | | | Mastercard, Inc. Class A | | | 3,483,891 | |
| | 728,450 | | | Microsoft Corp.(a) | | | 22,283,286 | |
| | 273,700 | �� | | Oracle Corp. | | | 8,128,890 | |
| | 240,700 | | | Paychex, Inc. | | | 7,560,387 | |
| | 47,400 | | | TIBCO Software, Inc.* | | | 1,418,208 | |
| | 30,000 | | | Visa, Inc. Class A | | | 3,708,900 | |
| | 15,400 | | | VMware, Inc. Class A* | | | 1,402,016 | |
| | | | | | | | |
| | | | | | | 89,453,156 | |
| | |
| Technology Hardware & Equipment – 7.2% | |
| | 20,000 | | | Acme Packet, Inc.* | | | 373,000 | |
| | 86,000 | | | Apple, Inc.* | | | 50,224,000 | |
| | 486,100 | | | Cisco Systems, Inc. | | | 8,346,337 | |
| | 23,800 | | | Diebold, Inc. | | | 878,458 | |
| | 276,300 | | | Hewlett-Packard Co. | | | 5,556,393 | |
| | 183,400 | | | Molex, Inc. Class A | | | 3,710,182 | |
| | 180,900 | | | QUALCOMM, Inc. | | | 10,072,512 | |
| | 14,500 | | | Riverbed Technology, Inc.* | | | 234,175 | |
| | | | | | | | |
| | | | | | | 79,395,057 | |
| | |
| Telecommunication Services – 4.1% | |
| | 412,228 | | | AT&T, Inc.(a) | | | 14,700,050 | |
| | 315,200 | | | CenturyLink, Inc. | | | 12,447,248 | |
| | 1,260,601 | | | Frontier Communications Corp. | | | 4,828,102 | |
| | 102,700 | | | Verizon Communications, Inc. | | | 4,563,988 | |
| | 891,500 | | | Windstream Corp. | | | 8,611,890 | |
| | | | | | | | |
| | | | | | | 45,151,278 | |
| | |
| | | | | | | | |
| | | | | | | | |
| | Common Stocks – (continued) | |
| Transportation – 1.7% | |
| | 17,400 | | | Copa Holdings SA Class A | | $ | 1,435,152 | |
| | 157,300 | | | CSX Corp. | | | 3,517,228 | |
| | 5,300 | | | Kansas City Southern | | | 368,668 | |
| | 56,900 | | | Union Pacific Corp. | | | 6,788,739 | |
| | 82,900 | | | United Parcel Service, Inc. Class B | | | 6,529,204 | |
| | | | | | | | |
| | | | | | | 18,638,991 | |
| | |
| Utilities – 3.7% | |
| | 165,700 | | | Ameren Corp. | | | 5,557,578 | |
| | 99,500 | | | American Electric Power Co., Inc. | | | 3,970,050 | |
| | 153,500 | | | Dominion Resources, Inc. | | | 8,289,000 | |
| | 198,900 | | | Exelon Corp. | | | 7,482,618 | |
| | 15,900 | | | National Fuel Gas Co. | | | 746,982 | |
| | 343,500 | | | PPL Corp. | | | 9,552,735 | |
| | 151,500 | | | Public Service Enterprise Group, Inc. | | | 4,923,750 | |
| | 21,000 | | | Westar Energy, Inc. | | | 628,950 | |
| | | | | | | | |
| | | | | | | 41,151,663 | |
| | |
| | TOTAL INVESTMENTS – 96.2% | | | | |
| | (Cost $1,054,810,559) | | $ | 1,059,544,408 | |
| | |
| OTHER ASSETS IN EXCESS OF
LIABILITIES – 3.8% | | | 41,884,608 | |
| | |
| | NET ASSETS – 100.0% | | $ | 1,101,429,016 | |
| | |
| | | | | | | | |
| | |
| The percentage shown for each investment category reflects the value of investments in that category as a percentage of net assets. |
* | | Non-income producing security. |
(a) | | All or a portion of this security is held as collateral for call options written. |
(b) | | All or a portion of security is segregated as collateral for initial margin requirements on futures transactions. |
| | |
|
Investment Abbreviation: |
REIT | | —Real Estate Investment Trust |
|
| | |
| The accompanying notes are an integral part of these financial statements. | | 29 |
GOLDMAN SACHS U.S. EQUITY DIVIDEND AND PREMIUM FUND
Schedule of Investments (continued)
June 30, 2012 (Unaudited)
|
| ADDITIONAL INVESTMENT INFORMATION |
FUTURES CONTRACTS — At June 30, 2012, the Fund had the following futures contracts:
| | | | | | | | | | | | | | |
| Type | | Number of Contracts Long (Short) | | | Expiration Date | | Current Value | | | Unrealized Gain (Loss) | |
S&P 500 E-mini Index | | | 600 | | | September 2012 | | $ | 40,692,000 | | | $ | 1,493,377 | |
WRITTEN OPTIONS CONTRACTS — At June 30, 2012, the Fund had the following written options:
| | | | | | | | | | | | | | |
| Call Options | | Exercise Rate | | | Number of
Contracts | | Expiration Month | | | Value | |
S&P 500 Index | | $ | 1,350 | | | 2,685 | | | September 2012 | | | $ | (12,351,000 | ) |
(Premiums Received $11,886,495) | | | | | | | | | | | | | | |
For the six months ended June 30, 2012, the Fund had the following written options activity:
| | | | | | | | |
| | | Number of
Contracts | | | Premiums
Received | |
Contracts Outstanding December 31, 2011 | | | 1,837 | | | | $ 7,640,083 | |
Contracts written | | | 5,674 | | | | 23,564,518 | |
Contracts expired | | | (2,989 | ) | | | (11,678,023) | |
Contracts bought to close | | | (1,837 | ) | | | (7,640,083) | |
Contracts Outstanding June 30, 2012 | | | 2,685 | | | $ | 11,886,495 | |
| | |
| 30 | | The accompanying notes are an integral part of these financial statements. |
GOLDMAN SACHS INTERNATIONAL EQUITY DIVIDEND AND PREMIUM FUND
Schedule of Investments
June 30, 2012 (Unaudited)
| | | | | | | | |
Shares | | | Description | | Value | |
| | | | | | | | |
| | Common Stocks – 98.4% | |
| Australia – 8.6% | |
| | 1,462,824 | | | Alumina Ltd. (Materials) | | $ | 1,199,811 | |
| | 46,038 | | | Amcor Ltd. (Materials) | | | 336,082 | |
| | 25,307 | | | Bendigo and Adelaide Bank Ltd. (Banks) | | | 193,396 | |
| | 144,859 | | | BHP Billiton Ltd. (Materials) | | | 4,718,396 | |
| | 48,271 | | | Boral Ltd. (Materials) | | | 147,116 | |
| | 25,050 | | | Brambles Ltd. (Commercial & Professional Services) | | | 158,875 | |
| | 2,179 | | | Caltex Australia Ltd. (Energy) | | | 30,434 | |
| | 804 | | | Campbell Brothers Ltd. (Commercial & Professional Services) | | | 45,074 | |
| | 1,225 | | | Cochlear Ltd. (Health Care Equipment & Services) | | | 83,193 | |
| | 11,198 | | | Commonwealth Bank of Australia (Banks) | | | 613,255 | |
| | 17,363 | | | Computershare Ltd. (Software & Services) | | | 132,716 | |
| | 15,658 | | | CSL Ltd. (Pharmaceuticals, Biotechnology & Life Sciences) | | | 635,116 | |
| | 476,072 | | | Dexus Property Group (REIT) | | | 455,556 | |
| | 532,382 | | | GPT Group (REIT) | | | 1,800,813 | |
| | 25,529 | | | Iluka Resources Ltd. (Materials) | | | 301,302 | |
| | 121,264 | | | Metcash Ltd. (Food & Staples Retailing) | | | 420,101 | |
| | 36,675 | | | National Australia Bank Ltd. (Banks) | | | 893,315 | |
| | 13,132 | | | Orica Ltd. (Materials) | | | 334,495 | |
| | 26,225 | | | Origin Energy Ltd. (Energy) | | | 330,277 | |
| | 1,418 | | | OZ Minerals Ltd. (Materials) | | | 11,569 | |
| | 154,264 | | | QBE Insurance Group Ltd. (Insurance) | | | 2,132,043 | |
| | 15,089 | | | Sonic Healthcare Ltd. (Health Care Equipment & Services) | | | 197,350 | |
| | 1,283,120 | | | SP AusNet (Utilities) | | | 1,344,721 | |
| | 297,838 | | | TABCORP Holdings Ltd. (Consumer Services) | | | 898,157 | |
| | 7,408 | | | Tatts Group Ltd. (Consumer Services) | | | 19,962 | |
| | 132,799 | | | Telstra Corp. Ltd. (Telecommunication Services) | | | 503,165 | |
| | 225,388 | | | Toll Holdings Ltd. (Transportation) | | | 926,718 | |
| | 66,806 | | | Wesfarmers Ltd. (Food & Staples Retailing) | | | 2,056,398 | |
| | 393,393 | | | Westpac Banking Corp. (Banks) | | | 8,590,223 | |
| | 47,604 | | | Woodside Petroleum Ltd. (Energy) | | | 1,525,520 | |
| | | | | | | | |
| | | | | | | 31,035,149 | |
| | |
| Austria – 0.1% | |
| | 4,440 | | | Raiffeisen Bank International AG (Banks) | | | 145,366 | |
| | 12,954 | | | Voestalpine AG (Materials) | | | 344,050 | |
| | | | | | | | |
| | | | | | | 489,416 | |
| | |
| Belgium – 0.9% | |
| | 5,890 | | | Anheuser-Busch InBev NV (Food, Beverage & Tobacco) | | | 464,375 | |
| | 6,271 | | | Bekaert SA (Capital Goods) | | | 155,411 | |
| | 49,812 | | | Belgacom SA (Telecommunication Services) | | | 1,416,513 | |
| | |
| | | | | | | | |
| | Common Stocks – (continued) | |
| Belgium – (continued) | |
| | 7,851 | | | Delhaize Group SA (Food & Staples Retailing) | | $ | 287,597 | |
| | 2,621 | | | Mobistar SA (Telecommunication Services) | | | 89,764 | |
| | 863 | | | Solvay SA (Materials) | | | 85,205 | |
| | 5,959 | | | UCB SA (Pharmaceuticals, Biotechnology & Life Sciences) | | | 301,021 | |
| | 12,778 | | | Umicore SA (Materials) | | | 590,792 | |
| | | | | | | | |
| | | | | | | 3,390,678 | |
| | |
| Bermuda – 0.4% | |
| | 42,828 | | | Seadrill Ltd. (Energy) | | | 1,527,481 | |
| | |
| China – 0.4% | |
| | 59,000 | | | Foxconn International Holdings Ltd. (Technology Hardware & Equipment)* | | | 21,555 | |
| | 1,541,000 | | | Yangzijiang Shipbuilding Holdings Ltd. Class H (Capital Goods) | | | 1,235,813 | |
| | | | | | | | |
| | | | | | | 1,257,368 | |
| | |
| Denmark – 1.1% | |
| | 12 | | | A.P. Moller - Maersk A/S Class B (Transportation) | | | 78,690 | |
| | 8,184 | | | Carlsberg A/S Class B (Food, Beverage & Tobacco) | | | 645,986 | |
| | 1,778 | | | Coloplast A/S Class B (Health Care Equipment & Services) | | | 319,698 | |
| | 16,789 | | | Novo Nordisk A/S Class B (Pharmaceuticals, Biotechnology & Life Sciences) | | | 2,435,024 | |
| | 66,420 | | | TDC A/S (Telecommunication Services) | | | 461,597 | |
| | 7,149 | | | Vestas Wind Systems A/S (Capital Goods)* | | | 39,635 | |
| | | | | | | | |
| | | | | | | 3,980,630 | |
| | |
| Finland – 0.8% | |
| | 8,495 | | | Metso Oyj (Capital Goods) | | | 292,900 | |
| | 311,085 | | | Nokia Oyj (Technology Hardware & Equipment) | | | 634,612 | |
| | 104,858 | | | Orion Oyj Class B (Pharmaceuticals, Biotechnology & Life Sciences)(a) | | | 1,986,078 | |
| | | | | | | | |
| | | | | | | 2,913,590 | |
| | |
| France – 8.2% | |
| | 28,713 | | | Alstom SA (Capital Goods) | | | 908,437 | |
| | 157,315 | | | AXA SA (Insurance) | | | 2,103,099 | |
| | 18,449 | | | BNP Paribas SA (Banks) | | | 711,296 | |
| | 747 | | | Bouygues SA (Capital Goods) | | | 20,045 | |
| | 16,948 | | | Cap Gemini SA (Software & Services) | | | 623,783 | |
| | 87,006 | | | Carrefour SA (Food & Staples Retailing) | | | 1,606,601 | |
| | 14,241 | | | CNP Assurances (Insurance)* | | | 173,939 | |
| | 36,048 | | | Compagnie de Saint-Gobain SA (Capital Goods) | | | 1,331,945 | |
| | |
| | |
| The accompanying notes are an integral part of these financial statements. | | 31 |
GOLDMAN SACHS INTERNATIONAL EQUITY DIVIDEND AND PREMIUM FUND
Schedule of Investments (continued)
June 30, 2012 (Unaudited)
| | | | | | | | |
Shares | | | Description | | Value | |
| | | | | | | | |
| | Common Stocks – (continued) | |
| France – (continued) | |
| | 217,745 | | | France Telecom SA (Telecommunication Services)(a) | | $ | 2,862,998 | |
| | 17,197 | | | GDF Suez (Utilities) | | | 410,111 | |
| | 2,445 | | | Klepierre (REIT) | | | 80,352 | |
| | 37,680 | | | Lafarge SA (Materials) | | | 1,682,722 | |
| | 2,891 | | | LVMH Moet Hennessy Louis Vuitton SA (Consumer Durables & Apparel) | | | 439,981 | |
| | 283,458 | | | Natixis (Banks) | | | 763,540 | |
| | 33,316 | | | Neopost SA (Technology Hardware & Equipment) | | | 1,777,968 | |
| | 37,631 | | | Peugeot SA (Automobiles & Components)* | | | 371,117 | |
| | 12,219 | | | Sanofi (Pharmaceuticals, Biotechnology & Life Sciences) | | | 924,989 | |
| | 23,946 | | | Schneider Electric SA (Capital Goods) | | | 1,331,008 | |
| | 12,440 | | | Societe Generale SA (Banks)* | | | 291,713 | |
| | 40,306 | | | Societe Television Francaise 1 (Media) | | | 321,839 | |
| | 190,006 | | | Total SA (Energy)(a) | | | 8,551,969 | |
| | 1,089 | | | Unibail-Rodamco SE (REIT) | | | 200,605 | |
| | 2,374 | | | Vallourec SA (Capital Goods) | | | 97,005 | |
| | 118,010 | | | Vivendi SA (Telecommunication Services)(a) | | | 2,192,731 | |
| | | | | | | | |
| | | | | | | 29,779,793 | |
| | |
| Germany – 8.0% | |
| | 72,827 | | | BASF SE (Materials) | | | 5,063,985 | |
| | 13,789 | | | Bayerische Motoren Werke AG Preference Shares (Automobiles & Components) | | | 680,195 | |
| | 143,280 | | | Celesio AG (Health Care Equipment & Services) | | | 2,345,263 | |
| | 113,193 | | | Daimler AG (Registered) (Automobiles & Components) | | | 5,086,829 | |
| | 6,287 | | | Deutsche Boerse AG (Diversified Financials) | | | 339,190 | |
| | 14,929 | | | Deutsche Lufthansa AG (Registered) (Transportation) | | | 172,591 | |
| | 184,773 | | | Deutsche Post AG (Registered) (Transportation) | | | 3,269,277 | |
| | 37,912 | | | Deutsche Telekom AG (Registered) (Telecommunication Services) | | | 415,494 | |
| | 38,756 | | | E.ON AG (Utilities) | | | 837,484 | |
| | 1,911 | | | Hannover Rueckversicherung AG (Registered) (Insurance) | | | 113,835 | |
| | 3,273 | | | MAN SE (Capital Goods) | | | 334,749 | |
| | 12,519 | | | Muenchener Rueckversicherungs-Gesellschaft AG (Registered) (Insurance) | | | 1,766,484 | |
| | 25,921 | | | ProSiebenSat.1 Media AG Preference Shares (Media) | | | 581,077 | |
| | 137,126 | | | RWE AG (Utilities) | | | 5,607,709 | |
| | 14,294 | | | RWE AG Preference Shares (Utilities) | | | 530,776 | |
| | |
| | | | | | | | |
| | Common Stocks – (continued) | |
| Germany – (continued) | |
| | 18,936 | | | Siemens AG (Registered) (Capital Goods) | | $ | 1,591,139 | |
| | 3,432 | | | Wacker Chemie AG (Materials) | | | 236,427 | |
| | | | | | | | |
| | | | | | | 28,972,504 | |
| | |
| Hong Kong – 3.0% | |
| | 251,600 | | | AIA Group Ltd. (Insurance) | | | 869,041 | |
| | 4,200 | | | ASM Pacific Technology Ltd. (Semiconductors & Semiconductor Equipment) | | | 53,686 | |
| | 826,000 | | | BOC Hong Kong Holdings Ltd. (Banks) | | | 2,542,804 | |
| | 28,000 | | | Cathay Pacific Airways Ltd. (Transportation) | | | 45,395 | |
| | 58,000 | | | Cheung Kong Holdings Ltd. (Real Estate) | | | 716,085 | |
| | 4,000 | | | Cheung Kong Infrastructure Holdings Ltd. (Utilities) | | | 24,215 | |
| | 102,500 | | | CLP Holdings Ltd. (Utilities) | | | 871,220 | |
| | 52,000 | | | First Pacific Co. Ltd. (Diversified Financials) | | | 53,937 | |
| | 60,000 | | | Galaxy Entertainment Group Ltd. (Consumer Services)* | | | 150,952 | |
| | 27,000 | | | Hang Lung Group Ltd. (Real Estate) | | | 166,945 | |
| | 53,000 | | | Hang Lung Properties Ltd. (Real Estate) | | | 181,293 | |
| | 49,000 | | | Henderson Land Development Co. Ltd. (Real Estate) | | | 272,412 | |
| | 11,391 | | | HKT Trust / HKT Ltd. (Telecommunication Services) | | | 8,942 | |
| | 119,900 | | | Hong Kong & China Gas Co. Ltd. (Utilities) | | | 254,704 | |
| | 15,800 | | | Hong Kong Exchanges and Clearing Ltd. (Diversified Financials) | | | 227,343 | |
| | 21,500 | | | Hopewell Holdings Ltd. (Capital Goods) | | | 61,550 | |
| | 152,000 | | | Hutchison Port Holdings Trust Class U (Transportation) | | | 108,651 | |
| | 75,000 | | | Hutchison Whampoa Ltd. (Capital Goods) | | | 650,543 | |
| | 15,000 | | | Kerry Properties Ltd. (Real Estate) | | | 64,548 | |
| | 214,000 | | | Li & Fung Ltd. (Retailing) | | | 414,358 | |
| | 29,500 | | | Lifestyle International Holdings Ltd. (Retailing) | | | 65,004 | |
| | 61,500 | | | MTR Corp. Ltd. (Transportation) | | | 211,120 | |
| | 246,919 | | | New World Development Co. Ltd. (Real Estate) | | | 290,958 | |
| | 57,003 | | | Noble Group Ltd. (Capital Goods) | | | 50,934 | |
| | 35,514 | | | NWS Holdings Ltd. (Capital Goods) | | | 51,942 | |
| | 12,500 | | | Orient Overseas International Ltd. (Transportation) | | | 61,307 | |
| | 46,000 | | | Power Assets Holdings Ltd. (Utilities) | | | 345,193 | |
| | 67,200 | | | Sands China Ltd. (Consumer Services) | | | 216,184 | |
| | 104,000 | | | Shangri-La Asia Ltd. (Consumer Services) | | | 199,765 | |
| | |
| | |
| 32 | | The accompanying notes are an integral part of these financial statements. |
GOLDMAN SACHS INTERNATIONAL EQUITY DIVIDEND AND PREMIUM FUND
| | | | | | | | |
Shares | | | Description | | Value | |
| | | | | | | | |
| | Common Stocks – (continued) | |
| Hong Kong – (continued) | |
| | 99,261 | | | Sino Land Co. Ltd. (Real Estate) | | $ | 150,725 | |
| | 20,000 | | | SJM Holdings Ltd. (Consumer Services) | | | 37,475 | |
| | 39,316 | | | Sun Hung Kai Properties Ltd. (Real Estate) | | | 467,426 | |
| | 23,000 | | | Swire Pacific Ltd. Class A (Real Estate) | | | 267,509 | |
| | 28,350 | | | Swire Properties Ltd. (Real Estate) | | | 85,376 | |
| | 48,000 | | | The Wharf Holdings Ltd. (Real Estate) | | | 266,926 | |
| | 27,200 | | | Wynn Macau Ltd. (Consumer Services) | | | 64,184 | |
| | 38,000 | | | Yue Yuen Industrial Holdings Ltd. (Consumer Durables & Apparel) | | | 119,474 | |
| | | | | | | | |
| | | | | | | 10,690,126 | |
| | |
| Ireland – 0.2% | |
| | 36,252 | | | CRH PLC (Materials) | | | 694,521 | |
| | 7,644 | | | James Hardie Industries SE CDI (Materials) | | | 63,024 | |
| | | | | | | | |
| | | | | | | 757,545 | |
| | |
| Israel – 0.6% | |
| | 2,431 | | | Bank Hapoalim BM (Banks) | | | 7,497 | |
| | 77,421 | | | Bank Leumi Le-Israel BM (Banks)* | | | 189,145 | |
| | 184,513 | | | Bezeq Israeli Telecommunication Corp. Ltd. (Telecommunication Services) | | | 196,315 | |
| | 240 | | | Delek Group Ltd. (Capital Goods) | | | 35,734 | |
| | 19,685 | | | Israel Chemicals Ltd. (Materials) | | | 217,802 | |
| | 4,640 | | | Mizrahi Tefahot Bank Ltd. (Banks)* | | | 36,201 | |
| | 16,552 | | | Partner Communications Co. Ltd. (Telecommunication Services) | | | 67,051 | |
| | 35,097 | | | Teva Pharmaceutical Industries Ltd. ADR (Pharmaceuticals, Biotechnology & Life Sciences)(a)(b) | | | 1,384,226 | |
| | | | | | | | |
| | | | | | | 2,133,971 | |
| | |
| Italy – 2.1% | |
| | 53,452 | | | Atlantia SpA (Transportation) | | | 682,237 | |
| | 361,605 | | | Banca Carige SpA (Banks) | | | 314,122 | |
| | 139,829 | | | Enel SpA (Utilities) | | | 451,488 | |
| | 45,071 | | | Eni SpA (Energy) | | | 957,540 | |
| | 83,368 | | | Fiat SpA (Automobiles & Components)* | | | 420,325 | |
| | 517,232 | | | Finmeccanica SpA (Capital Goods)* | | | 2,091,370 | |
| | 297,877 | | | Intesa Sanpaolo SpA (Banks) | | | 344,677 | |
| | 971,500 | | | Mediaset SpA (Media) | | | 1,701,455 | |
| | 538,083 | | | Telecom Italia SpA (Telecommunication Services) | | | 436,045 | |
| | 11,300 | | | UniCredit SpA (Banks)* | | | 42,845 | |
| | | | | | | | |
| | | | | | | 7,442,104 | |
| | |
| Japan – 21.6% | |
| | 24,500 | | | AEON Credit Service Co. Ltd. (Diversified Financials) | | | 454,467 | |
| | 105,000 | | | Amada Co. Ltd. (Capital Goods) | | | 621,267 | |
| | 23,000 | | | Aozora Bank Ltd. (Banks) | | | 54,772 | |
| | 133,000 | | | Asahi Glass Co. Ltd. (Capital Goods) | | | 897,245 | |
| | |
| | | | | | | | |
| | Common Stocks – (continued) | |
| Japan – (continued) | |
| | 179,400 | | | Casio Computer Co. Ltd. (Consumer Durables & Apparel) | | $ | 1,176,333 | |
| | 18,200 | | | Chubu Electric Power Co., Inc. (Utilities) | | | 295,125 | |
| | 5,100 | | | Coca-Cola West Co. Ltd. (Food, Beverage & Tobacco) | | | 88,925 | |
| | 45,000 | | | Dai Nippon Printing Co. Ltd. (Commercial & Professional Services) | | | 352,528 | |
| | 1,500 | | | Daito Trust Construction Co. Ltd. (Real Estate) | | | 142,188 | |
| | 66,000 | | | Daiwa Securities Group, Inc. (Diversified Financials) | | | 248,736 | |
| | 2,400 | | | East Japan Railway Co. (Transportation) | | | 150,699 | |
| | 10,800 | | | Eisai Co. Ltd. (Pharmaceuticals, Biotechnology & Life Sciences) | | | 472,942 | |
| | 600 | | | Fast Retailing Co. Ltd. (Retailing) | | | 120,055 | |
| | 48,000 | | | Fujitsu Ltd. (Technology Hardware & Equipment) | | | 229,714 | |
| | 70,000 | | | Furukawa Electric Co. Ltd. (Capital Goods) | | | 165,569 | |
| | 11,000 | | | GS Yuasa Corp. (Capital Goods) | | | 50,292 | |
| | 4,500 | | | Hokkaido Electric Power Co., Inc. (Utilities) | | | 58,158 | |
| | 175,400 | | | Honda Motor Co. Ltd. (Automobiles & Components) | | | 6,120,679 | |
| | 70,200 | | | ITOCHU Corp. (Capital Goods) | | | 737,848 | |
| | 36,800 | | | Japan Tobacco, Inc. (Food, Beverage & Tobacco) | | | 1,090,224 | |
| | 97 | | | Jupiter Telecommunications Co. Ltd. (Media) | | | 98,899 | |
| | 32,800 | | | JX Holdings, Inc. (Energy) | | | 169,052 | |
| | 134,000 | | | Kaneka Corp. (Materials) | | | 741,085 | |
| | 4,700 | | | Kao Corp. (Household & Personal Products) | | | 129,618 | |
| | 25,000 | | | Kawasaki Heavy Industries Ltd. (Capital Goods) | | | 68,561 | |
| | 62,000 | | | Kawasaki Kisen Kaisha Ltd. (Transportation)* | | | 123,153 | |
| | 47,000 | | | Kirin Holdings Co. Ltd. (Food, Beverage & Tobacco) | | | 553,944 | |
| | 49,700 | | | Komatsu Ltd. (Capital Goods) | | | 1,186,406 | |
| | 43,400 | | | Kyushu Electric Power Co., Inc. (Utilities) | | | 514,867 | |
| | 7,800 | | | Lawson, Inc. (Food & Staples Retailing) | | | 545,465 | |
| | 28,400 | | | Mitsubishi Corp. (Capital Goods) | | | 574,086 | |
| | 37,000 | | | Mitsubishi Electric Corp. (Capital Goods) | | | 309,559 | |
| | 56,000 | | | Mitsubishi Estate Co. Ltd. (Real Estate) | | | 1,004,685 | |
| | 56,000 | | | Mitsubishi Heavy Industries Ltd. (Capital Goods) | | | 227,649 | |
| | 115,600 | | | Mitsubishi UFJ Financial Group, Inc. (Banks) | | | 553,826 | |
| | 128,300 | | | Mitsui & Co. Ltd. (Capital Goods) | | | 1,906,519 | |
| | 36,000 | | | Mitsui Fudosan Co. Ltd. (Real Estate) | | | 698,502 | |
| | |
| | |
| The accompanying notes are an integral part of these financial statements. | | 33 |
GOLDMAN SACHS INTERNATIONAL EQUITY DIVIDEND AND PREMIUM FUND
Schedule of Investments (continued)
June 30, 2012 (Unaudited)
| | | | | | | | |
Shares | | | Description | | Value | |
| | | | | | | | |
| | Common Stocks – (continued) | |
| Japan – (continued) | |
| | 3,867,200 | | | Mizuho Financial Group, Inc. (Banks) | | $ | 6,532,646 | |
| | 18,200 | | | MS&AD Insurance Group Holdings, Inc. (Insurance) | | �� | 318,414 | |
| | 6,600 | | | Murata Manufacturing Co. Ltd. (Technology Hardware & Equipment) | | | 347,164 | |
| | 39,000 | | | NEC Corp. (Technology Hardware & Equipment)* | | | 60,684 | |
| | 4,000 | | | NGK Spark Plug Co. Ltd. (Automobiles & Components) | | | 52,834 | |
| | 7,000 | | | NHK Spring Co. Ltd. (Automobiles & Components) | | | 75,592 | |
| | 1,200 | | | Nintendo Co. Ltd. (Software & Services) | | | 140,137 | |
| | 62 | | | Nippon Building Fund, Inc. (REIT) | | | 599,458 | |
| | 12,000 | | | Nippon Electric Glass Co. Ltd. (Technology Hardware & Equipment) | | | 71,671 | |
| | 742,000 | | | Nippon Express Co. Ltd. (Transportation) | | | 3,064,008 | |
| | 12,200 | | | Nippon Paper Group, Inc. (Materials) | | | 193,679 | |
| | 572,000 | | | Nippon Sheet Glass Co. Ltd. (Capital Goods) | | | 630,209 | |
| | 19,600 | | | Nippon Telegraph & Telephone Corp. (Telecommunication Services) | | | 913,958 | |
| | 368,000 | | | Nippon Yusen Kabushiki Kaisha (Transportation) | | | 973,303 | |
| | 257,700 | | | Nissan Motor Co. Ltd. (Automobiles & Components) | | | 2,447,050 | |
| | 40,500 | | | Nisshin Seifun Group, Inc. (Food, Beverage & Tobacco) | | | 474,144 | |
| | 8,100 | | | Nitto Denko Corp. (Materials) | | | 347,042 | |
| | 31,000 | | | NKSJ Holdings, Inc. (Insurance) | | | 659,923 | |
| | 153,300 | | | Nomura Holdings, Inc. (Diversified Financials) | | | 573,118 | |
| | 21,200 | | | Nomura Research Institute Ltd. (Software & Services) | | | 466,517 | |
| | 388,000 | | | NTN Corp. (Capital Goods) | | | 1,221,391 | |
| | 1,620 | | | NTT DoCoMo, Inc. (Telecommunication Services) | | | 2,695,684 | |
| | 36,400 | | | Oracle Corp. Japan (Software & Services) | | | 1,566,758 | |
| | 676,000 | | | Ricoh Co. Ltd. (Technology Hardware & Equipment) | | | 5,705,150 | |
| | 12,700 | | | Rohm Co. Ltd. (Semiconductors & Semiconductor Equipment) | | | 489,387 | |
| | 31,800 | | | Sankyo Co. Ltd. (Consumer Durables & Apparel) | | | 1,551,814 | |
| | 174,000 | | | Sekisui House Ltd. (Consumer Durables & Apparel) | | | 1,642,915 | |
| | 16,200 | | | Seven & I Holdings Co. Ltd. (Food & Staples Retailing) | | | 488,355 | |
| | 90,600 | | | Shiseido Co. Ltd. (Household & Personal Products) | | | 1,429,631 | |
| | 49,600 | | | Stanley Electric Co. Ltd. (Automobiles & Components) | | | 770,279 | |
| | 645,000 | | | Sumitomo Chemical Co. Ltd. (Materials) | | | 1,982,636 | |
| | |
| | | | | | | | |
| | Common Stocks – (continued) | |
| Japan – (continued) | |
| | 85,800 | | | Sumitomo Corp. (Capital Goods) | | $ | 1,200,497 | |
| | 36,600 | | | Sumitomo Electric Industries Ltd. (Capital Goods) | | | 456,068 | |
| | 47,000 | | | Sumitomo Heavy Industries Ltd. (Capital Goods) | | | 211,639 | |
| | 500,000 | | | Sumitomo Metal Industries Ltd. (Materials) | | | 824,803 | |
| | 61,000 | | | Sumitomo Metal Mining Co. Ltd. (Materials) | | | 687,415 | |
| | 54,100 | | | Sumitomo Mitsui Financial Group, Inc. (Banks) | | | 1,787,190 | |
| | 14,000 | | | Sumitomo Realty & Development Co. Ltd. (Real Estate) | | | 344,349 | |
| | 26,700 | | | T&D Holdings, Inc. (Insurance) | | | 284,432 | |
| | 99,000 | | | Takeda Pharmaceutical Co. Ltd. (Pharmaceuticals, Biotechnology & Life Sciences) | | | 4,494,785 | |
| | 2,600 | | | TDK Corp. (Technology Hardware & Equipment) | | | 105,842 | |
| | 171 | | | The Dai-ichi Life Insurance Co. Ltd. (Insurance) | | | 198,042 | |
| | 10,000 | | | The Japan Steel Works Ltd. (Capital Goods) | | | 55,212 | |
| | 99,500 | | | The Kansai Electric Power Co., Inc. (Utilities) | | | 1,193,256 | |
| | 85,600 | | | Tohoku Electric Power Co., Inc. (Utilities)* | | | 860,089 | |
| | 10,300 | | | Tokio Marine Holdings, Inc. (Insurance) | | | 258,459 | |
| | 1,100 | | | Tokyo Electron Ltd. (Semiconductors & Semiconductor Equipment) | | | 51,584 | |
| | 170,000 | | | TonenGeneral Sekiyu KK (Energy) | | | 1,511,579 | |
| | 51,000 | | | Toppan Printing Co. Ltd. (Commercial & Professional Services) | | | 340,669 | |
| | 57,000 | | | Toshiba Corp. (Technology Hardware & Equipment) | | | 216,962 | |
| | 14,500 | | | Toyoda Gosei Co. Ltd. (Automobiles & Components) | | | 334,268 | |
| | 9,600 | | | Toyota Industries Corp. (Automobiles & Components) | | | 275,241 | |
| | 17,500 | | | Toyota Motor Corp. (Automobiles & Components) | | | 706,339 | |
| | 4,180 | | | USS Co. Ltd. (Retailing) | | | 451,029 | |
| | | | | | | | |
| | | | | | | 78,268,942 | |
| | |
| Luxembourg – 0.3% | |
| | 78,939 | | | ArcelorMittal (Materials) | | | 1,207,728 | |
| | |
| Mexico – 0.3% | |
| | 46,645 | | | Fresnillo PLC (Materials) | | | 1,068,447 | |
| | |
| Netherlands – 4.0% | |
| | 6,205 | | | Akzo Nobel NV (Materials) | | | 292,036 | |
| | 15,916 | | | Corio NV (REIT) | | | 700,740 | |
| | 90,188 | | | Delta Lloyd NV (Insurance) | | | 1,254,209 | |
| | 15,344 | | | Heineken Holding NV (Food, Beverage & Tobacco) | | | 687,272 | |
| | |
| | |
| 34 | | The accompanying notes are an integral part of these financial statements. |
GOLDMAN SACHS INTERNATIONAL EQUITY DIVIDEND AND PREMIUM FUND
| | | | | | | | |
Shares | | | Description | | Value | |
| | | | | | | | |
| | Common Stocks – (continued) | |
| Netherlands – (continued) | |
| | 47,216 | | | Koninklijke DSM NV (Materials) | | $ | 2,327,725 | |
| | 21,613 | | | Koninklijke KPN NV (Telecommunication Services) | | | 206,663 | |
| | 89,871 | | | Koninklijke Philips Electronics NV (Capital Goods) | | | 1,770,974 | |
| | 9,319 | | | Randstad Holding NV (Commercial & Professional Services) | | | 274,789 | |
| | 108,681 | | | Royal Dutch Shell PLC Class A (Energy) | | | 3,668,059 | |
| | 72,473 | | | Royal Dutch Shell PLC Class B (Energy) | | | 2,531,027 | |
| | 27,123 | | | Unilever NV CVA (Food, Beverage & Tobacco) | | | 906,056 | |
| | | | | | | | |
| | | | | | | 14,619,550 | |
| | |
| New Zealand – 0.1% | |
| | 182,371 | | | Telecom Corp. of New Zealand Ltd. (Telecommunication Services) | | | 347,252 | |
| | |
| Norway – 0.7% | |
| | 12,202 | | | DNB ASA (Banks) | | | 121,330 | |
| | 190,532 | | | Gjensidige Forsikring ASA (Insurance) | | | 2,219,911 | |
| | 24,043 | | | Orkla ASA (Capital Goods) | | | 174,479 | |
| | | | | | | | |
| | | | | | | 2,515,720 | |
| | |
| Portugal – 0.1% | |
| | 487,280 | | | Banco Espirito Santo SA (Registered) (Banks)* | | | 333,170 | |
| | 13,222 | | | Portugal Telecom, SGPS, SA (Registered) (Telecommunication Services) | | | 57,908 | |
| | | | | | | | |
| | | | | | | 391,078 | |
| | |
| Singapore – 1.4% | |
| | 105,000 | | | CapitaLand Ltd. (Real Estate) | | | 226,396 | |
| | 13,000 | | | CapitaMall Trust (REIT) | | | 19,691 | |
| | 19,000 | | | City Developments Ltd. (Real Estate) | | | 169,364 | |
| | 67,000 | | | ComfortDelGro Corp. Ltd. (Transportation) | | | 82,046 | |
| | 52,171 | | | DBS Group Holdings Ltd. (Banks) | | | 576,265 | |
| | 20,000 | | | Fraser and Neave Ltd. (Capital Goods) | | | 111,365 | |
| | 166,000 | | | Genting Singapore PLC (Consumer Services) | | | 186,483 | |
| | 135,000 | | | Global Logistic Properties Ltd. (Real Estate)* | | | 224,743 | |
| | 183,000 | | | Golden Agri-Resources Ltd. (Food, Beverage & Tobacco) | | | 97,736 | |
| | 2,000 | | | Jardine Cycle & Carriage Ltd. (Retailing) | | | 73,712 | |
| | 27,000 | | | Keppel Corp. Ltd. (Capital Goods) | | | 221,198 | |
| | 24,000 | | | Keppel Land Ltd. (Real Estate) | | | 61,761 | |
| | 34,000 | | | Olam International Ltd. (Food & Staples Retailing) | | | 49,244 | |
| | 128,144 | | | Oversea-Chinese Banking Corp. Ltd. (Banks) | | | 896,096 | |
| | |
| | | | | | | | |
| | Common Stocks – (continued) | |
| Singapore – (continued) | |
| | 2,000 | | | SembCorp Industries Ltd. (Capital Goods) | | $ | 8,186 | |
| | 13,000 | | | Singapore Airlines Ltd. (Transportation) | | | 107,198 | |
| | 27,000 | | | Singapore Exchange Ltd. (Diversified Financials) | | | 135,644 | |
| | 85,000 | | | Singapore Press Holdings Ltd. (Media) | | | 262,577 | |
| | 26,000 | | | Singapore Technologies Engineering Ltd. (Capital Goods) | | | 64,097 | |
| | 222,000 | | | Singapore Telecommunications Ltd. (Telecommunication Services) | | | 581,365 | |
| | 74,000 | | | StarHub Ltd. (Telecommunication Services) | | | 200,572 | |
| | 38,000 | | | United Overseas Bank Ltd. (Banks) | | | 564,282 | |
| | 32,000 | | | UOL Group Ltd. (Real Estate) | | | 125,438 | |
| | 62,000 | | | Wilmar International Ltd. (Food, Beverage & Tobacco) | | | 178,769 | |
| | | | | | | | |
| | | | | | | 5,224,228 | |
| | |
| Spain – 2.8% | |
| | 10,081 | | | ACS Actividades de Construccion y Servicios SA (Capital Goods) | | | 215,941 | |
| | 257,887 | | | Banco Bilbao Vizcaya Argentaria SA (Banks) | | | 1,841,663 | |
| | 1,062,971 | | | Banco Santander SA (Banks)(a) | | | 7,031,825 | |
| | 87,518 | | | Indra Sistemas SA (Software & Services) | | | 814,798 | |
| | 20,730 | | | Zardoya Otis SA (Capital Goods) | | | 230,451 | |
| | | | | | | | |
| | | | | | | 10,134,678 | |
| | |
| Sweden – 3.0% | |
| | 12,388 | | | Atlas Copco AB Class A (Capital Goods) | | | 266,600 | |
| | 6,690 | | | Atlas Copco AB Class B (Capital Goods) | | | 127,479 | |
| | 140,533 | | | Electrolux AB Class B (Consumer Durables & Apparel) | | | 2,796,667 | |
| | 19,331 | | | Hennes & Mauritz AB Class B (Retailing) | | | 693,866 | |
| | 38,382 | | | Husqvarna AB Class B (Consumer Durables & Apparel) | | | 181,029 | |
| | 66,720 | | | Industrivarden AB Class C (Diversified Financials) | | | 859,618 | |
| | 5,959 | | | Kinnevik Investment AB Class B (Diversified Financials) | | | 119,611 | |
| | 183,112 | | | Ratos AB Class B (Diversified Financials) | | | 1,738,725 | |
| | 27,556 | | | Sandvik AB (Capital Goods) | | | 353,398 | |
| | 60,133 | | | Scania AB Class B (Capital Goods) | | | 1,030,511 | |
| | 226,362 | | | Securitas AB Class B (Commercial & Professional Services) | | | 1,760,104 | |
| | 17,964 | | | SKF AB Class B (Capital Goods) | | | 354,106 | |
| | 3,023 | | | Swedbank AB Class A (Banks) | | | 47,624 | |
| | |
| | |
| The accompanying notes are an integral part of these financial statements. | | 35 |
GOLDMAN SACHS INTERNATIONAL EQUITY DIVIDEND AND PREMIUM FUND
Schedule of Investments (continued)
June 30, 2012 (Unaudited)
| | | | | | | | |
Shares | | | Description | | Value | |
| | | | | | | | |
| | Common Stocks – (continued) | |
| Sweden – (continued) | |
| | 4,356 | | | Swedish Match AB (Food, Beverage & Tobacco) | | $ | 175,571 | |
| | 21,273 | | | Volvo AB Class B (Capital Goods) | | | 243,225 | |
| | | | | | | | |
| | | | | | | 10,748,134 | |
| | |
| Switzerland – 8.9% | |
| | 299 | | | Baloise Holding AG (Registered) (Insurance) | | | 19,754 | |
| | 6,059 | | | Compagnie Financiere Richemont SA Class A (Consumer Durables & Apparel) | | | 332,698 | |
| | 140,752 | | | Credit Suisse Group AG (Registered) (Diversified Financials)* | | | 2,575,346 | |
| | 12,671 | | | Lonza Group AG (Registered) (Pharmaceuticals, Biotechnology & Life Sciences)* | | | 527,179 | |
| | 245,495 | | | Nestle SA (Registered) (Food, Beverage & Tobacco)(a)(b) | | | 14,650,619 | |
| | 90,968 | | | Novartis AG (Registered) (Pharmaceuticals, Biotechnology & Life Sciences) | | | 5,086,141 | |
| | 4,243 | | | Partners Group Holding AG (Diversified Financials) | | | 754,628 | |
| | 39,580 | | | Roche Holding AG (Pharmaceuticals, Biotechnology & Life Sciences) | | | 6,836,772 | |
| | 211,494 | | | STMicroelectronics NV (Semiconductors & Semiconductor Equipment) | | | 1,150,881 | |
| | 468 | | | The Swatch Group AG (Consumer Durables & Apparel) | | | 184,973 | |
| | | | | | | | |
| | | | | | | 32,118,991 | |
| | |
| United Kingdom – 20.8% | |
| | 31,231 | | | AMEC PLC (Energy) | | | 492,339 | |
| | 16,699 | | | Anglo American PLC (Materials) | | | 548,818 | |
| | 23,974 | | | ARM Holdings PLC (Semiconductors & Semiconductor Equipment) | | | 189,937 | |
| | 8,141 | | | AstraZeneca PLC (Pharmaceuticals, Biotechnology & Life Sciences) | | | 363,806 | |
| | 497,613 | | | BAE Systems PLC (Capital Goods) | | | 2,255,994 | |
| | 137,999 | | | Balfour Beatty PLC (Capital Goods) | | | 645,264 | |
| | 814,834 | | | Barclays PLC (Banks) | | | 2,082,106 | |
| | 159,938 | | | BHP Billiton PLC (Materials)(a)(b) | | | 4,545,826 | |
| | 263,560 | | | BP PLC ADR (Energy)(a) | | | 10,684,722 | |
| | 37,170 | | | British American Tobacco PLC (Food, Beverage & Tobacco) | | | 1,889,722 | |
| | 32,212 | | | Burberry Group PLC (Consumer Durables & Apparel) | | | 670,679 | |
| | 74,698 | | | Capita PLC (Commercial & Professional Services) | | | 767,568 | |
| | 14,057 | | | Centrica PLC (Utilities) | | | 70,284 | |
| | 34,431 | | | Eurasian Natural Resources Corp. PLC (Materials) | | | 224,718 | |
| | |
| | | | | | | | |
| | Common Stocks – (continued) | |
| United Kingdom – (continued) | |
| | 164,460 | | | GlaxoSmithKline PLC ADR (Pharmaceuticals, Biotechnology & Life Sciences)(a) | | $ | 7,494,442 | |
| | 20,127 | | | Hammerson PLC (REIT) | | | 139,785 | |
| | 628,335 | | | HSBC Holdings PLC (Banks)(a) | | | 5,536,785 | |
| | 180,356 | | | ICAP PLC (Diversified Financials) | | | 954,667 | |
| | 87,959 | | | Imperial Tobacco Group PLC (Food, Beverage & Tobacco) | | | 3,388,905 | |
| | 1,043,924 | | | J Sainsbury PLC (Food & Staples Retailing) | | | 4,933,739 | |
| | 7,484 | | | Kazakhmys PLC (Materials) | | | 84,853 | |
| | 48,213 | | | Land Securities Group PLC (REIT) | | | 558,590 | |
| | 1,709,079 | | | Man Group PLC (Diversified Financials) | | | 2,045,033 | |
| | 31,220 | | | Marks & Spencer Group PLC (Retailing) | | | 159,211 | |
| | 40,870 | | | National Grid PLC (Utilities) | | | 433,141 | |
| | 2,206 | | | Reckitt Benckiser Group PLC (Household & Personal Products) | | | 116,603 | |
| | 178,014 | | | Reed Elsevier PLC (Media) | | | 1,426,809 | |
| | 181,673 | | | Resolution Ltd. (Insurance) | | | 558,855 | |
| | 74,584 | | | Rexam PLC (Materials) | | | 492,249 | |
| | 69,301 | | | Rio Tinto PLC (Materials)(a) | | | 3,293,436 | |
| | 1,528,094 | | | RSA Insurance Group PLC (Insurance) | | | 2,594,073 | |
| | 26,767 | | | Scottish & Southern Energy PLC (Utilities) | | | 583,936 | |
| | 58,875 | | | Segro PLC (REIT) | | | 200,587 | |
| | 54,210 | | | Standard Chartered PLC (Banks) | | | 1,177,603 | |
| | 121,791 | | | Standard Life PLC (Insurance) | | | 445,929 | |
| | 69,044 | | | The Weir Group PLC (Capital Goods) | | | 1,659,109 | |
| | 683,544 | | | TUI Travel PLC (Consumer Services) | | | 1,817,204 | |
| | 31,202 | | | Unilever PLC (Food, Beverage & Tobacco) | | | 1,047,568 | |
| | 178,856 | | | United Utilities Group PLC (Utilities) | | | 1,894,656 | |
| | 3,233 | | | Vedanta Resources PLC (Materials) | | | 46,340 | |
| | 244,721 | | | Vodafone Group PLC ADR (Telecommunication Services) | | | 6,896,238 | |
| | | | | | | | |
| | | | | | | 75,412,129 | |
| | |
| | TOTAL INVESTMENTS – 98.4% | | | | |
| | (Cost $412,385,915) | | $ | 356,427,232 | |
| | |
| OTHER ASSETS IN EXCESS OF
LIABILITIES – 1.6% | | | 5,805,961 | |
| | |
| | NET ASSETS – 100.0% | | $ | 362,233,193 | |
| | |
| | |
| 36 | | The accompanying notes are an integral part of these financial statements. |
GOLDMAN SACHS INTERNATIONAL EQUITY DIVIDEND AND PREMIUM FUND
| | |
| The percentage shown for each investment category reflects the value of investments in that category as a percentage of net assets. |
* | | Non-income producing security. |
(a) | | All or a portion of this security is held as collateral for call options written. |
(b) | | All or a portion of security is segregated as collateral for initial margin requirements on futures transactions. |
| | |
|
Investment Abbreviations: |
ADR | | —American Depositary Receipt |
CDI | | —CHESS Depositary Interest |
CVA | | —Dutch Certification |
REIT | | —Real Estate Investment Trust |
|
|
| ADDITIONAL INVESTMENT INFORMATION |
FUTURES CONTRACTS — At June 30, 2012, the Fund had the following futures contracts:
| | | | | | | | | | | | | | |
| Type | | Number of
Contracts
Long (Short) | | | Expiration
Date | | Current
Value | | | Unrealized
Gain (Loss) | |
EURO STOXX 50 Index | | | 111 | | | September 2012 | | $ | 3,167,610 | | | $ | 169,379 | |
FTSE 100 Index | | | 16 | | | September 2012 | | | 1,383,975 | | | | 24,762 | |
TSE TOPIX Index | | | 14 | | | September 2012 | | | 1,346,844 | | | | 106,951 | |
| TOTAL | | | | | | | | | | | | $ | 301,092 | |
WRITTEN OPTIONS CONTRACTS — At June 30, 2012, the Fund had the following written options:
| | | | | | | | | | | | | | |
| Call Options | | Exercise
Rate | | | Number of
Contracts | | | Expiration
Month | | Value | |
EURO STOXX 50 Index | | | EUR 2,200 | | | | 1,501 | | | September 2012 | | $ | (2,556,748 | ) |
FTSE 100 Index | | | GBP 5,500 | | | | 321 | | | September 2012 | | | (1,025,577 | ) |
Nikkei-225 Stock Average | | | JPY 8,750 | | | | 250 | | | September 2012 | | | (1,485,582 | ) |
| TOTAL (Premiums Received $3,971,965) | | | | | | | 2,072 | | | | | $ | (5,067,907 | ) |
For the six months ended June 30, 2012, the Fund had the following written options activity:
| | | | | | |
| | | Number of
Contracts | | | Premiums
Received |
Contracts Outstanding December 31, 2011 | | | 1,599 | | | $3,089,731 |
Contracts written | | | 5,975 | | | 7,964,619 |
Contracts expired | | | (3,903 | ) | | (3,992,654) |
Contracts bought to close | | | (1,599 | ) | | (3,089,731) |
Contracts Outstanding June 30, 2012 | | | 2,072 | | | $3,971,965 |
| | |
| The accompanying notes are an integral part of these financial statements. | | 37 |
GOLDMAN SACHS STRUCTURED TAX-MANAGED EQUITY FUND
Schedule of Investments
June 30, 2012 (Unaudited)
| | | | | | | | |
Shares | | | Description | | Value | |
| | | | | | | | |
| | Common Stocks – 97.3% | |
| Automobiles & Components – 0.1% | |
| | 10,920 | | | General Motors Co.* | | $ | 215,342 | |
| | |
| Banks – 2.6% | |
| | 98,264 | | | BB&T Corp. | | | 3,031,444 | |
| | 6,865 | | | Commerce Bancshares, Inc. | | | 260,184 | |
| | 12,266 | | | East West Bancorp, Inc. | | | 287,760 | |
| | 87,622 | | | First Niagara Financial Group, Inc. | | | 670,308 | |
| | 9,931 | | | Investors Bancorp, Inc.* | | | 149,859 | |
| | 34,759 | | | KeyCorp | | | 269,035 | |
| | 12,887 | | | M&T Bank Corp. | | | 1,064,080 | |
| | 24,434 | | | SunTrust Banks, Inc. | | | 592,036 | |
| | 63,937 | | | Wells Fargo & Co. | | | 2,138,053 | |
| | | | | | | | |
| | | | | | | 8,462,759 | |
| | |
| Capital Goods – 4.6% | |
| | 8,871 | | | AGCO Corp.* | | | 405,671 | |
| | 1,876 | | | Alliant Techsystems, Inc. | | | 94,869 | |
| | 2,594 | | | American Science & Engineering, Inc. | | | 146,431 | |
| | 24,472 | | | Cubic Corp. | | | 1,176,614 | |
| | 2,508 | | | Emerson Electric Co. | | | 116,823 | |
| | 18,586 | | | Exelis, Inc. | | | 183,258 | |
| | 61,982 | | | General Electric Co. | | | 1,291,705 | |
| | 6,350 | | | Harsco Corp. | | | 129,413 | |
| | 7,383 | | | Honeywell International, Inc. | | | 412,267 | |
| | 23,391 | | | Illinois Tool Works, Inc. | | | 1,237,164 | |
| | 21,935 | | | Lockheed Martin Corp. | | | 1,910,100 | |
| | 8,373 | | | Moog, Inc. Class A* | | | 346,223 | |
| | 15,799 | | | MSC Industrial Direct Co., Inc. Class A | | | 1,035,624 | |
| | 26,849 | | | Mueller Industries, Inc. | | | 1,143,499 | |
| | 2,966 | | | Sauer-Danfoss, Inc. | | | 103,602 | |
| | 183 | | | Seaboard Corp.* | | | 390,335 | |
| | 16,082 | | | The Boeing Co. | | | 1,194,893 | |
| | 18,029 | | | United Technologies Corp. | | | 1,361,730 | |
| | 30,916 | | | Watsco, Inc. | | | 2,281,601 | |
| | | | | | | | |
| | | | | | | 14,961,822 | |
| | |
| Commercial & Professional Services – 0.1% | |
| | 9,970 | | | Manpower, Inc. | | | 365,401 | |
| | |
| Consumer Durables & Apparel – 0.6% | |
| | 8,978 | | | Arctic Cat, Inc.* | | | 328,236 | |
| | 9,236 | | | Blyth, Inc.(a) | | | 319,196 | |
| | 19,831 | | | Leggett & Platt, Inc. | | | 419,029 | |
| | 18,116 | | | Sturm, Ruger & Co., Inc.(a) | | | 727,357 | |
| | 5,183 | | | Vera Bradley, Inc.*(a) | | | 109,258 | |
| | | | | | | | |
| | | | | | | 1,903,076 | |
| | |
| Consumer Services – 3.2% | |
| | 5,291 | | | Apollo Group, Inc. Class A* | | | 191,481 | |
| | 19,782 | | | Carnival Corp. | | | 677,929 | |
| | 24,098 | | | Coinstar, Inc.*(a) | | | 1,654,569 | |
| | 62,464 | | | Domino’s Pizza, Inc. | | | 1,930,762 | |
| | 2,979 | | | ITT Educational Services, Inc.*(a) | | | 180,974 | |
| | 63,520 | | | Marriott International, Inc. Class A | | | 2,489,984 | |
| | 8,825 | | | Marriott Vacations Worldwide Corp.* | | | 273,399 | |
| | |
| | | | | | | | |
| | Common Stocks – (continued) | |
| Consumer Services – (continued) | |
| | 43,623 | | | Papa John’s International, Inc.* | | $ | 2,075,146 | |
| | 16,284 | | | Starbucks Corp. | | | 868,263 | |
| | | | | | | | |
| | | | | | | 10,342,507 | |
| | |
| Diversified Financials – 5.1% | |
| | 6,552 | | | American Express Co. | | | 381,392 | |
| | 228,130 | | | Bank of America Corp. | | | 1,866,103 | |
| | 7,958 | | | Capital One Financial Corp. | | | 434,984 | |
| | 35,562 | | | Cash America International, Inc. | | | 1,566,151 | |
| | 5,182 | | | Citigroup, Inc. | | | 142,039 | |
| | 45,747 | | | Discover Financial Services | | | 1,581,931 | |
| | 9,055 | | | Eaton Vance Corp. | | | 244,032 | |
| | 24,831 | | | Franklin Resources, Inc. | | | 2,755,993 | |
| | 5,056 | | | Greenhill & Co., Inc. | | | 180,246 | |
| | 101,810 | | | JPMorgan Chase & Co. | | | 3,637,671 | |
| | 40,889 | | | Morgan Stanley | | | 596,571 | |
| | 32,845 | | | PHH Corp.* | | | 574,131 | |
| | 13,589 | | | SEI Investments Co. | | | 270,285 | |
| | 100,161 | | | The Bank of New York Mellon Corp. | | | 2,198,534 | |
| | 1,497 | | | World Acceptance Corp.* | | | 98,503 | |
| | | | | | | | |
| | | | | | | 16,528,566 | |
| | |
| Energy – 12.4% | |
| | 11,478 | | | Alon USA Energy, Inc. | | | 97,104 | |
| | 1,588 | | | Apache Corp. | | | 139,569 | |
| | 79,071 | | | Chevron Corp. | | | 8,341,991 | |
| | 83,733 | | | ConocoPhillips | | | 4,679,000 | |
| | 14,409 | | | Contango Oil & Gas Co.* | | | 853,013 | |
| | 6,572 | | | Delek US Holdings, Inc. | | | 115,601 | |
| | 26,625 | | | Devon Energy Corp. | | | 1,543,984 | |
| | 36,624 | | | Exterran Holdings, Inc.* | | | 466,956 | |
| | 129,101 | | | Exxon Mobil Corp. | | | 11,047,173 | |
| | 51,205 | | | Hess Corp. | | | 2,224,857 | |
| | 49,437 | | | HollyFrontier Corp. | | | 1,751,553 | |
| | 115,123 | | | Marathon Petroleum Corp. | | | 5,171,325 | |
| | 31,214 | | | Murphy Oil Corp. | | | 1,569,752 | |
| | 6,809 | | | Occidental Petroleum Corp. | | | 584,008 | |
| | 8,711 | | | Phillips 66* | | | 289,554 | |
| | 9,388 | | | Southwestern Energy Co.* | | | 299,759 | |
| | 35,709 | | | The Williams Companies, Inc. | | | 1,029,133 | |
| | | | | | | | |
| | | | | | | 40,204,332 | |
| | |
| Food & Staples Retailing – 1.2% | |
| | 44,471 | | | SUPERVALU, Inc.(a) | | | 230,360 | |
| | 5,081 | | | The Pantry, Inc.* | | | 74,691 | |
| | 121,559 | | | Walgreen Co. | | | 3,595,715 | |
| | | | | | | | |
| | | | | | | 3,900,766 | |
| | |
| Food, Beverage & Tobacco – 9.3% | |
| | 18,842 | | | Cal-Maine Foods, Inc. | | | 736,722 | |
| | 106,455 | | | Dean Foods Co.* | | | 1,812,929 | |
| | 25,919 | | | Lancaster Colony Corp. | | | 1,845,692 | |
| | 34,433 | | | Lorillard, Inc. | | | 4,543,434 | |
| | 42,559 | | | Molson Coors Brewing Co. Class B | | | 1,770,880 | |
| | 25,391 | | | PepsiCo, Inc. | | | 1,794,128 | |
| | |
| | |
| 38 | | The accompanying notes are an integral part of these financial statements. |
GOLDMAN SACHS STRUCTURED TAX-MANAGED EQUITY FUND
| | | | | | | | |
Shares | | | Description | | Value | |
| | | | | | | | |
| | Common Stocks – (continued) | |
| Food, Beverage & Tobacco – (continued) | |
| | 9,928 | | | Philip Morris International, Inc. | | $ | 866,317 | |
| | 423,023 | | | Pilgrim’s Pride Corp.*(a) | | | 3,024,614 | |
| | 101,379 | | | Reynolds American, Inc. | | | 4,548,876 | |
| | 79,472 | | | Snyders-Lance, Inc. | | | 2,005,079 | |
| | 31,008 | | | The Boston Beer Co., Inc. Class A*(a) | | | 3,751,968 | |
| | 7,112 | | | The Hershey Co. | | | 512,277 | |
| | 149,761 | | | Tyson Foods, Inc. Class A | | | 2,820,000 | |
| | | | | | | | |
| | | | | | | 30,032,916 | |
| | |
| Health Care Equipment & Services – 3.6% | |
| | 25,332 | | | Amedisys, Inc.* | | | 315,383 | |
| | 14,393 | | | AmerisourceBergen Corp. | | | 566,365 | |
| | 1,970 | | | Becton, Dickinson and Co. | | | 147,257 | |
| | 8,463 | | | Bio-Reference Labs, Inc.* | | | 222,408 | |
| | 114,032 | | | Boston Scientific Corp.* | | | 646,561 | |
| | 9,027 | | | Cardinal Health, Inc. | | | 379,134 | |
| | 1,982 | | | Chemed Corp. | | | 119,792 | |
| | 44,781 | | | DENTSPLY International, Inc. | | | 1,693,170 | |
| | 43,406 | | | Express Scripts Holding Co.* | | | 2,423,357 | |
| | 30,026 | | | Humana, Inc. | | | 2,325,213 | |
| | 10,832 | | | Lincare Holdings, Inc. | | | 368,505 | |
| | 18,264 | | | Magellan Health Services, Inc.* | | | 827,907 | |
| | 27,757 | | | Masimo Corp.* | | | 621,202 | |
| | 4,686 | | | Quest Diagnostics, Inc. | | | 280,691 | |
| | 68,974 | | | Skilled Healthcare Group, Inc. Class A* | | | 433,157 | |
| | 2,964 | | | WellPoint, Inc. | | | 189,074 | |
| | | | | | | | |
| | | | | | | 11,559,176 | |
| | |
| Household & Personal Products – 2.1% | |
| | 6,256 | | | Herbalife Ltd. | | | 302,353 | |
| | 108,548 | | | The Procter & Gamble Co. | | | 6,648,565 | |
| | | | | | | | |
| | | | | | | 6,950,918 | |
| | |
| Insurance – 1.0% | |
| | 4,158 | | | American Financial Group, Inc. | | | 163,118 | |
| | 12,012 | | | MetLife, Inc. | | | 370,570 | |
| | 39,968 | | | Primerica, Inc. | | | 1,068,344 | |
| | 8,704 | | | Reinsurance Group of America, Inc. | | | 463,140 | |
| | 35,771 | | | Symetra Financial Corp. | | | 451,430 | |
| | 10,305 | | | Unum Group | | | 197,135 | |
| | 12,692 | | | Validus Holdings Ltd. | | | 406,525 | |
| | | | | | | | |
| | | | | | | 3,120,262 | |
| | |
| Materials – 2.0% | |
| | 43,837 | | | Buckeye Technologies, Inc. | | | 1,248,916 | |
| | 2,092 | | | Compass Minerals International, Inc. | | | 159,578 | |
| | 24,689 | | | Freeport-McMoRan Copper & Gold, Inc. | | | 841,154 | |
| | 80,124 | | | Kraton Performance Polymers, Inc.* | | | 1,755,517 | |
| | 8,099 | | | Newmont Mining Corp. | | | 392,882 | |
| | 5,678 | | | OM Group, Inc.* | | | 107,882 | |
| | 26,428 | | | Resolute Forest Products*(a) | | | 306,036 | |
| | 3,717 | | | Silgan Holdings, Inc. | | | 158,679 | |
| | 14,199 | | | The Dow Chemical Co. | | | 447,269 | |
| | |
| | | | | | | | |
| | Common Stocks – (continued) | |
| Materials – (continued) | |
| | 12,133 | | | The Scotts Miracle-Gro Co. Class A | | $ | 498,909 | |
| | 43,088 | | | Titanium Metals Corp. | | | 487,325 | |
| | | | | | | | |
| | | | | | | 6,404,147 | |
| | |
| Media – 3.1% | |
| | 10,919 | | | Arbitron, Inc. | | | 382,165 | |
| | 32,131 | | | Cablevision Systems Corp. Class A | | | 427,021 | |
| | 95,891 | | | DIRECTV Class A* | | | 4,681,399 | |
| | 13,342 | | | Regal Entertainment Group Class A(a) | | | 183,586 | |
| | 8,514 | | | Scholastic Corp. | | | 239,754 | |
| | 78,150 | | | Time Warner, Inc. | | | 3,008,775 | |
| | 25,873 | | | Viacom, Inc. Class B | | | 1,216,548 | |
| | | | | | | | |
| | | | | | | 10,139,248 | |
| | |
| Pharmaceuticals, Biotechnology & Life Sciences – 5.7% | |
| | 6,737 | | | Acorda Therapeutics, Inc.* | | | 158,724 | |
| | 73,727 | | | Amgen, Inc. | | | 5,385,020 | |
| | 9,819 | | | Biogen Idec, Inc.* | | | 1,417,667 | |
| | 2,047 | | | Bristol-Myers Squibb Co. | | | 73,590 | |
| | 14,810 | | | Celgene Corp.* | | | 950,210 | |
| | 7,556 | | | Charles River Laboratories International, Inc.* | | | 247,534 | |
| | 7,242 | | | Covance, Inc.* | | | 346,530 | |
| | 44,436 | | | Eli Lilly & Co. | | | 1,906,749 | |
| | 58,092 | | | Gilead Sciences, Inc.* | | | 2,978,958 | |
| | 41,957 | | | Jazz Pharmaceuticals PLC* | | | 1,888,484 | |
| | 9,161 | | | Momenta Pharmaceuticals, Inc.* | | | 123,857 | |
| | 38,239 | | | Pharmacyclics, Inc.* | | | 2,088,232 | |
| | 32,757 | | | Pozen, Inc.* | | | 204,404 | |
| | 1,302 | | | Questcor Pharmaceuticals, Inc.* | | | 69,318 | |
| | 1,260 | | | Regeneron Pharmaceuticals, Inc.* | | | 143,917 | |
| | 7,526 | | | Repros Therapeutics, Inc.* | | | 68,336 | |
| | 7,325 | | | United Therapeutics Corp.* | | | 361,708 | |
| | | | | | | | |
| | | | | | | 18,413,238 | |
| | |
| Real Estate – 4.1% | |
| | 13,954 | | | Altisource Portfolio Solutions SA* | | | 1,021,851 | |
| | 66,208 | | | American Tower Corp. (REIT) | | | 4,628,601 | |
| | 27,310 | | | Annaly Capital Management, Inc. (REIT) | | | 458,262 | |
| | 11,740 | | | AvalonBay Communities, Inc. (REIT) | | | 1,660,975 | |
| | 6,591 | | | Boston Properties, Inc. (REIT) | | | 714,267 | |
| | 10,215 | | | Colony Financial, Inc. (REIT) | | | 176,719 | |
| | 14,104 | | | Equity Lifestyle Properties, Inc. (REIT) | | | 972,753 | |
| | 32,035 | | | Equity Residential (REIT) | | | 1,997,703 | |
| | 3,698 | | | Potlatch Corp. (REIT) | | | 118,114 | |
| | 10,546 | | | Rayonier, Inc. (REIT) | | | 473,515 | |
| | 3,071 | | | Simon Property Group, Inc. (REIT) | | | 478,032 | |
| | 14,847 | | | Zillow, Inc. Class A*(a) | | | 573,624 | |
| | | | | | | | |
| | | | | | | 13,274,416 | |
| | |
| | |
| The accompanying notes are an integral part of these financial statements. | | 39 |
GOLDMAN SACHS STRUCTURED TAX-MANAGED EQUITY FUND
Schedule of Investments (continued)
June 30, 2012 (Unaudited)
| | | | | | | | |
Shares | | | Description | | Value | |
| | | | | | | | |
| | Common Stocks – (continued) | |
| Retailing – 6.8% | |
| | 49,066 | | | Best Buy Co., Inc. | | $ | 1,028,423 | |
| | 19,948 | | | Big Lots, Inc.* | | | 813,679 | |
| | 18,070 | | | Dollar Tree, Inc.* | | | 972,166 | |
| | 37,336 | | | Express, Inc.* | | | 678,395 | |
| | 20,778 | | | Family Dollar Stores, Inc. | | | 1,381,321 | |
| | 142,808 | | | Francesca’s Holdings Corp.* | | | 3,857,244 | |
| | 14,364 | | | Group 1 Automotive, Inc. | | | 655,142 | |
| | 61,274 | | | HOT Topic, Inc. | | | 593,745 | |
| | 5,255 | | | J.C. Penney Co., Inc. | | | 122,494 | |
| | 44,183 | | | Lowe’s Companies, Inc. | | | 1,256,565 | |
| | 1,881 | | | Netflix, Inc.* | | | 128,792 | |
| | 2,471 | | | Priceline.com, Inc.* | | | 1,642,029 | |
| | 103,401 | | | Saks, Inc.*(a) | | | 1,101,221 | |
| | 6,887 | | | Select Comfort Corp.* | | | 144,076 | |
| | 1,622 | | | Target Corp. | | | 94,384 | |
| | 63,975 | | | The Buckle, Inc.(a) | | | 2,531,491 | |
| | 12,560 | | | The Finish Line, Inc. Class A | | | 262,630 | |
| | 57,522 | | | TJX Companies, Inc. | | | 2,469,419 | |
| | 62,361 | | | Zumiez, Inc.* | | | 2,469,496 | |
| | | | | | | | |
| | | | | | | 22,202,712 | |
| | |
| Semiconductors & Semiconductor Equipment – 1.5% | |
| | 14,528 | | | Altera Corp. | | | 491,628 | |
| | 55,188 | | | Applied Materials, Inc. | | | 632,454 | |
| | 64,337 | | | Broadcom Corp. Class A* | | | 2,174,591 | |
| | 55,331 | | | Intel Corp. | | | 1,474,571 | |
| | 11,314 | | | Micrel, Inc. | | | 107,822 | |
| | | | | | | | |
| | | | | | | 4,881,066 | |
| | |
| Software & Services – 12.4% | |
| | 122,103 | | | Activision Blizzard, Inc. | | | 1,464,043 | |
| | 3,852 | | | Blackbaud, Inc. | | | 98,881 | |
| | 6,893 | | | CA, Inc. | | | 186,731 | |
| | 9,641 | | | CommVault Systems, Inc.* | | | 477,904 | |
| | 13,432 | | | Computer Sciences Corp. | | | 333,382 | |
| | 8,623 | | | Cornerstone OnDemand, Inc.* | | | 205,314 | |
| | 24,866 | | | eBay, Inc.* | | | 1,044,621 | |
| | 4,103 | | | Facebook, Inc. Class A* | | | 127,685 | |
| | 12,054 | | | Google, Inc. Class A* | | | 6,992,164 | |
| | 6,372 | | | Imperva, Inc.* | | | 183,641 | |
| | 16,603 | | | International Business Machines Corp. | | | 3,247,215 | |
| | 75,086 | | | Intuit, Inc. | | | 4,456,354 | |
| | 8,899 | | | Lender Processing Services, Inc. | | | 224,967 | |
| | 11,283 | | | Mantech International Corp. Class A | | | 264,812 | |
| | 1,559 | | | Mastercard, Inc. Class A | | | 670,541 | |
| | 223,893 | | | Microsoft Corp.(b) | | | 6,848,887 | |
| | 8,671 | | | MicroStrategy, Inc. Class A* | | | 1,126,016 | |
| | 222,561 | | | Oracle Corp. | | | 6,610,062 | |
| | 18,005 | | | QLIK Technologies, Inc.* | | | 398,270 | |
| | 11,653 | | | RealNetworks, Inc. | | | 100,682 | |
| | 15,325 | | | Sapient Corp. | | | 154,323 | |
| | 133,369 | | | Symantec Corp.* | | | 1,948,521 | |
| | 7,659 | | | TeleTech Holdings, Inc.* | | | 122,544 | |
| | |
| | | | | | | | |
| | Common Stocks – (continued) | |
| Software & Services – (continued) | |
| | 11,322 | | | Visa, Inc. Class A | | $ | 1,399,739 | |
| | 16,604 | | | VMware, Inc. Class A* | | | 1,511,628 | |
| | | | | | | | |
| | | | | | | 40,198,927 | |
| | |
| Technology Hardware & Equipment – 8.1% | |
| | 19,802 | | | Apple, Inc.* | | | 11,564,368 | |
| | 20,860 | | | Cisco Systems, Inc. | | | 358,166 | |
| | 153,171 | | | Dell, Inc.* | | | 1,917,701 | |
| | 31,644 | | | EchoStar Corp. Class A* | | | 836,035 | |
| | 74,168 | | | EMC Corp.* | | | 1,900,926 | |
| | 47,638 | | | Hewlett-Packard Co. | | | 958,000 | |
| | 38,930 | | | Ingram Micro, Inc. Class A* | | | 680,155 | |
| | 69,020 | | | NetApp, Inc.* | | | 2,196,216 | |
| | 33,872 | | | QUALCOMM, Inc. | | | 1,885,993 | |
| | 22,691 | | | Riverbed Technology, Inc.* | | | 366,460 | |
| | 28,594 | | | Seagate Technology PLC | | | 707,130 | |
| | 20,355 | | | Silicon Graphics International Corp.*(a) | | | 130,679 | |
| | 69,278 | | | Western Digital Corp.* | | | 2,111,607 | |
| | 47,623 | | | Xyratex Ltd. | | | 538,616 | |
| | | | | | | | |
| | | | | | | 26,152,052 | |
| | |
| Telecommunication Services – 0.5% | |
| | 14,598 | | | AT&T, Inc.(b) | | | 520,569 | |
| | 23,416 | | | Telephone & Data Systems, Inc. | | | 498,527 | |
| | 16,090 | | | Verizon Communications, Inc. | | | 715,039 | |
| | | | | | | | |
| | | | | | | 1,734,135 | |
| | |
| Transportation – 3.8% | |
| | 75,223 | | | Alaska Air Group, Inc.* | | | 2,700,506 | |
| | 8,315 | | | Allegiant Travel Co.* | | | 579,389 | |
| | 12,840 | | | Arkansas Best Corp. | | | 161,784 | |
| | 7,030 | | | C.H. Robinson Worldwide, Inc. | | | 411,466 | |
| | 15,175 | | | CSX Corp. | | | 339,313 | |
| | 2,506 | | | Expeditors International of Washington, Inc. | | | 97,107 | |
| | 14,941 | | | Hawaiian Holdings, Inc.* | | | 97,266 | |
| | 67,516 | | | Heartland Express, Inc. | | | 966,154 | |
| | 14,240 | | | Norfolk Southern Corp. | | | 1,022,005 | |
| | 12,975 | | | Republic Airways Holdings, Inc.* | | | 72,011 | |
| | 61,416 | | | SkyWest, Inc. | | | 401,046 | |
| | 9,990 | | | Union Pacific Corp. | | | 1,191,907 | |
| | 34,578 | | | United Parcel Service, Inc. Class B | | | 2,723,363 | |
| | 72,413 | | | Werner Enterprises, Inc. | | | 1,729,947 | |
| | | | | | | | |
| | | | | | | 12,493,264 | |
| | |
| Utilities – 3.4% | |
| | 105,130 | | | Ameren Corp. | | | 3,526,060 | |
| | 3,195 | | | Avista Corp. | | | 85,306 | |
| | 70,141 | | | Consolidated Edison, Inc. | | | 4,362,069 | |
| | 3,556 | | | DTE Energy Co. | | | 210,977 | |
| | 29,704 | | | El Paso Electric Co. | | | 984,985 | |
| | 14,359 | | | Entergy Corp. | | | 974,833 | |
| | |
| | |
| 40 | | The accompanying notes are an integral part of these financial statements. |
GOLDMAN SACHS STRUCTURED TAX-MANAGED EQUITY FUND
| | | | | | | | |
Shares | | | Description | | Value | |
| | | | | | | | |
| | Common Stocks – (continued) | |
| Utilities – (continued) | |
| | 1,860 | | | Integrys Energy Group, Inc. | | $ | 105,778 | |
| | 8,993 | | | NorthWestern Corp. | | | 330,043 | |
| | 11,237 | | | Public Service Enterprise Group, Inc. | | | 365,203 | |
| | | | | | | | |
| | | | | | | 10,945,254 | |
| | |
| TOTAL INVESTMENTS BEFORE
SECURITIES LENDING REINVESTMENT
VEHICLE | | | | |
| | (Cost $310,800,244) | | $ | 315,386,302 | |
| | |
| | | | | | |
Shares | | Rate | | Value | |
| | | | | | |
| Securities Lending Reinvestment Vehicle(c)(d) – 3.7% | |
Goldman Sachs Financial Square Money Market Fund – FST Shares | |
| 11,996,350 | | 0.203% | | $ | 11,996,350 | |
| (Cost $11,996,350) | | | | |
| |
| TOTAL INVESTMENTS – 101.0% | | | | |
| (Cost $322,796,594) | | $ | 327,382,652 | |
| |
LIABILITIES IN EXCESS OF OTHER ASSETS – (1.0)% | | | (3,380,798 | ) |
| |
| NET ASSETS – 100.0% | | $ | 324,001,854 | |
| |
| | |
| The percentage shown for each investment category reflects the value of investments in that category as a percentage of net assets. |
* | | Non-income producing security. |
(a) | | All or a portion of security is on loan. |
(b) | | All or a portion of security is segregated as collateral for initial margin requirements on futures transactions. |
(c) | | Variable rate security. Interest rate disclosed is that which is in effect at June 30, 2012. |
(d) | | Represents an affiliated issuer. |
| | |
|
Investment Abbreviation: |
REIT | | —Real Estate Investment Trust |
|
|
| ADDITIONAL INVESTMENT INFORMATION |
FUTURES CONTRACTS — At June 30, 2012, the Fund had the following futures contracts:
| | | | | | | | | | | | | | |
| Type | | Number of
Contracts
Long (Short) | | | Expiration
Date | | Current
Value | | | Unrealized
Gain (Loss) | |
Russell 2000 Mini Index | | | 8 | | | September 2012 | | $ | 636,320 | | | $ | 28,308 | |
S&P 500 E-mini Index | | | 96 | | | September 2012 | | | 6,510,720 | | | | 268,872 | |
| TOTAL | | | | | | | | | | | | $ | 297,180 | |
| | |
| The accompanying notes are an integral part of these financial statements. | | 41 |
GOLDMAN SACHS STRUCTURED INTERNATIONAL TAX-MANAGED EQUITY FUND
Schedule of Investments
June 30, 2012 (Unaudited)
| | | | | | | | |
Shares | | | Description | | Value | |
| | | | | | | | |
| | Common Stocks – 96.9% | |
| Australia – 8.5% | |
| | 34,067 | | | Alumina Ltd. (Materials) | | $ | 27,942 | |
| | 45,568 | | | Australia & New Zealand Banking Group Ltd. (Banks) | | | 1,038,044 | |
| | 147,528 | | | AWE Ltd. (Energy)* | | | 204,821 | |
| | 297,497 | | | Beach Energy Ltd. (Energy) | | | 289,709 | |
| | 16,012 | | | BHP Billiton Ltd. (Materials) | | | 521,548 | |
| | 76,270 | | | Coca-Cola Amatil Ltd. (Food, Beverage & Tobacco) | | | 1,048,134 | |
| | 61,068 | | | Commonwealth Bank of Australia (Banks) | | | 3,344,370 | |
| | 270,471 | | | Commonwealth Property Office Fund (REIT) | | | 281,938 | |
| | 85,100 | | | CSR Ltd. (Capital Goods) | | | 122,778 | |
| | 128,430 | | | Dexus Property Group (REIT) | | | 122,895 | |
| | 64,386 | | | DuluxGroup Ltd. (Materials) | | | 199,902 | |
| | 59,683 | | | Emeco Holdings Ltd. (Capital Goods) | | | 53,916 | |
| | 164,738 | | | Goodman Fielder Ltd. (Food, Beverage & Tobacco) | | | 93,077 | |
| | 158,300 | | | GPT Group (REIT) | | | 535,459 | |
| | 7,206 | | | Iluka Resources Ltd. (Materials) | | | 85,048 | |
| | 44,365 | | | Linc Energy Ltd. (Energy)* | | | 31,955 | |
| | 42,538 | | | New Hope Corp. Ltd. (Energy) | | | 175,723 | |
| | 9,643 | | | Newcrest Mining Ltd. (Materials) | | | 224,403 | |
| | 71,893 | | | NIB Holdings Ltd. (Insurance) | | | 110,006 | |
| | 9,853 | | | NRW Holdings Ltd. (Capital Goods) | | | 30,859 | |
| | 74,219 | | | OZ Minerals Ltd. (Materials) | | | 605,530 | |
| | 21,249 | | | Ramsay Health Care Ltd. (Health Care Equipment & Services) | | | 493,726 | |
| | 11,690 | | | RCR Tomlinson Ltd. (Capital Goods) | | | 21,544 | |
| | 18,020 | | | Rio Tinto Ltd. (Materials) | | | 1,057,898 | |
| | 84,440 | | | Sigma Pharmaceuticals Ltd. (Health Care Equipment & Services) | | | 53,125 | |
| | 22,373 | | | Sonic Healthcare Ltd. (Health Care Equipment & Services) | | | 292,618 | |
| | 49,261 | | | Suncorp Group Ltd. (Insurance) | | | 411,628 | |
| | 12,089 | | | Wesfarmers Ltd. (Food & Staples Retailing) | | | 372,119 | |
| | 5,840 | | | Westpac Banking Corp. (Banks) | | | 127,524 | |
| | 14,008 | | | Whitehaven Coal Ltd. (Energy) | | | 60,222 | |
| | 4,914 | | | Woodside Petroleum Ltd. (Energy) | | | 157,474 | |
| | | | | | | | |
| | | | | | | 12,195,935 | |
| | |
| Austria – 0.1% | |
| | 3,837 | | | Oesterreichische Post AG (Transportation) | | | 128,848 | |
| | 3,680 | | | Telekom Austria AG (Telecommunication Services) | | | 36,171 | |
| | | | | | | | |
| | | | | | | 165,019 | |
| | |
| Belgium – 0.9% | |
| | 4,402 | | | Anheuser-Busch InBev NV (Food, Beverage & Tobacco) | | | 347,059 | |
| | 1,656 | | | Befimmo SCA Sicafi (REIT) | | | 94,089 | |
| | 15,013 | | | Delhaize Group SA (Food & Staples Retailing) | | | 549,954 | |
| | |
| | | | | | | | |
| | | | | | | | |
| | Common Stocks – (continued) | |
| Belgium – (continued) | |
| | 3,899 | | | Financiere de Tubize SA (Diversified Financials) | | $ | 147,487 | |
| | 5,004 | | | Telenet Group Holding NV (Telecommunication Services)* | | | 218,964 | |
| | | | | | | | |
| | | | | | | 1,357,553 | |
| | |
| Bermuda – 0.7% | |
| | 67,212 | | | Aquarius Platinum Ltd. (Materials) | | | 49,331 | |
| | 66,411 | | | Catlin Group Ltd. (Insurance) | | | 443,188 | |
| | 40,839 | | | Lancashire Holdings Ltd. (Insurance) | | | 510,322 | |
| | | | | | | | |
| | | | | | | 1,002,841 | |
| | |
| China – 0.3% | |
| | 285,000 | | | Evergrande Real Estate Group Ltd. (Real Estate) | | | 147,600 | |
| | 174,000 | | | Foxconn International Holdings Ltd. (Technology Hardware & Equipment)* | | | 63,567 | |
| | 260,500 | | | Soho China Ltd. (Real Estate) | | | 199,955 | |
| | | | | | | | |
| | | | | | | 411,122 | |
| | |
| Denmark – 1.1% | |
| | 61 | | | A.P. Moller - Maersk A/S Class B (Transportation) | | | 400,009 | |
| | 1,332 | | | Christian Hansen Holding A/S (Materials) | | | 34,319 | |
| | 14,318 | | | GN Store Nord A/S (Health Care Equipment & Services) | | | 173,088 | |
| | 6,570 | | | Novo Nordisk A/S Class B (Pharmaceuticals, Biotechnology & Life Sciences) | | | 952,892 | |
| | 5,871 | | | Pandora A/S (Consumer Durables & Apparel)(a) | | | 55,124 | |
| | | | | | | | |
| | | | | | | 1,615,432 | |
| | |
| Finland – 0.7% | |
| | 25,433 | | | Kemira Oyj (Materials)(a) | | | 298,201 | |
| | 8,246 | | | Metso Oyj (Capital Goods) | | | 284,315 | |
| | 134,603 | | | Nokia Oyj (Technology Hardware & Equipment)(a) | | | 274,589 | |
| | 2,077 | | | Outotec Oyj (Capital Goods) | | | 94,900 | |
| | | | | | | | |
| | | | | | | 952,005 | |
| | |
| France – 7.8% | |
| | 15,366 | | | Accor SA (Consumer Services) | | | 481,530 | |
| | 4,562 | | | Arkema SA (Materials) | | | 299,123 | |
| | 45,152 | | | AXA SA (Insurance) | | | 603,624 | |
| | 44,910 | | | BNP Paribas SA (Banks) | | | 1,731,493 | |
| | 13,071 | | | Compagnie de Saint-Gobain (Capital Goods) | | | 482,963 | |
| | 649 | | | Compagnie Generale des Etablissements Michelin Class B (Automobiles & Components) | | | 42,462 | |
| | 10,269 | | | Credit Agricole SA (Banks)* | | | 45,311 | |
| | 703 | | | Esso S.A.F. (Energy) | | | 53,203 | |
| | 772 | | | Fonciere Des Regions (REIT) | | | 55,506 | |
| | |
| | |
| 42 | | The accompanying notes are an integral part of these financial statements. |
GOLDMAN SACHS STRUCTURED INTERNATIONAL TAX-MANAGED EQUITY FUND
| | | | | | | | |
Shares | | | Description | | Value | |
| | | | | | | | |
| | | | | | | | |
| | Common Stocks – (continued) | |
| France – (continued) | |
| | 72,582 | | | France Telecom SA (Telecommunication Services)(a) | | $ | 954,337 | |
| | 3,407 | | | Hermes International (Consumer Durables & Apparel) | | | 1,046,776 | |
| | 8,214 | | | Legrand SA (Capital Goods) | | | 278,786 | |
| | 737 | | | LVMH Moet Hennessy Louis Vuitton SA (Consumer Durables & Apparel) | | | 112,164 | |
| | 4,968 | | | Mercialys SA (REIT) | | | 92,447 | |
| | 6,160 | | | Pernod-Ricard SA (Food, Beverage & Tobacco) | | | 658,702 | |
| | 4,026 | | | Publicis Groupe SA (Media)(a) | | | 184,123 | |
| | 3,196 | | | Remy Cointreau SA (Food, Beverage & Tobacco) | | | 351,131 | |
| | 2,667 | | | Schneider Electric SA (Capital Goods) | | | 148,242 | |
| | 31,933 | | | Total SA (Energy) | | | 1,437,271 | |
| | 230 | | | Unibail-Rodamco SE (REIT) | | | 42,368 | |
| | 3,246 | | | Valeo SA (Automobiles & Components) | | | 134,105 | |
| | 27,104 | | | Veolia Environnement SA (Utilities) | | | 343,223 | |
| | 85,567 | | | Vivendi SA (Telecommunication Services) | | | 1,589,911 | |
| | | | | | | | |
| | | | | | | 11,168,801 | |
| | |
| Germany – 7.8% | |
| | 22,452 | | | BASF SE (Materials) | | | 1,561,187 | |
| | 4,397 | | | Bayerische Motoren Werke AG (Automobiles & Components) | | | 318,202 | |
| | 4,361 | | | Bilfinger Berger SE (Commercial & Professional Services) | | | 355,447 | |
| | 1,542 | | | Cewe Color Holding AG (Commercial & Professional Services) | | | 56,452 | |
| | 12,801 | | | Daimler AG (Registered) (Automobiles & Components) | | | 575,270 | |
| | 743 | | | Deutsche Boerse AG (Diversified Financials) | | | 40,086 | |
| | 135,235 | | | Deutsche Post AG (Registered) (Transportation) | | | 2,392,777 | |
| | 56,360 | | | E.ON AG (Utilities) | | | 1,217,891 | |
| | 50,118 | | | Freenet AG (Telecommunication Services) | | | 728,349 | |
| | 8,699 | | | Gerry Weber International AG (Consumer Durables & Apparel) | | | 359,811 | |
| | 1,234 | | | Hannover Rueckversicherung AG (Registered) (Insurance) | | | 73,508 | |
| | 1,331 | | | Henkel AG & Co. KGaA (Household & Personal Products) | | | 73,860 | |
| | 1,838 | | | Henkel AG & Co. KGaA Preference Shares (Household & Personal Products) | | | 122,127 | |
| | 6,087 | | | Lanxess AG (Materials) | | | 385,213 | |
| | 1,243 | | | MTU Aero Engines Holding AG (Capital Goods) | | | 91,484 | |
| | 10,502 | | | ProSiebenSat.1 Media AG Preference Shares (Media) | | | 235,426 | |
| | 13,652 | | | SAP AG (Software & Services) | | | 808,409 | |
| | |
| | | | | | | | |
| | | | | | | | |
| | Common Stocks – (continued) | |
| Germany – (continued) | |
| | 18,613 | | | United Internet AG (Registered) (Software & Services) | | $ | 319,977 | |
| | 2,447 | | | Volkswagen AG (Automobiles & Components) | | | 369,774 | |
| | 7,019 | | | Volkswagen AG Preference Shares (Automobiles & Components) | | | 1,112,006 | |
| | | | | | | | |
| | | | | | | 11,197,256 | |
| | |
| Hong Kong – 2.7% | |
| | 126,800 | | | AIA Group Ltd. (Insurance) | | | 437,975 | |
| | 96,000 | | | BOC Hong Kong Holdings Ltd. (Banks) | | | 295,532 | |
| | 124,000 | | | Champion REIT (REIT) | | | 51,631 | |
| | 45,500 | | | CLP Holdings Ltd. (Utilities) | | | 386,698 | |
| | 44,082 | | | Esprit Holdings Ltd. (Retailing) | | | 57,097 | |
| | 32,000 | | | First Pacific Co. Ltd. (Diversified Financials) | | | 33,192 | |
| | 3,000 | | | Guoco Group Ltd. (Diversified Financials) | | | 23,255 | |
| | 18,200 | | | Hang Seng Bank Ltd. (Banks) | | | 250,213 | |
| | 7,300 | | | Hong Kong Exchanges and Clearing Ltd. (Diversified Financials) | | | 105,038 | |
| | 66,000 | | | Hutchison Port Holdings Trust Class U (Transportation) | | | 47,177 | |
| | 30,000 | | | Hutchison Whampoa Ltd. (Capital Goods) | | | 260,217 | |
| | 4,000 | | | Li & Fung Ltd. (Retailing) | | | 7,745 | |
| | 107,798 | | | Noble Group Ltd. (Capital Goods) | | | 96,321 | |
| | 10,000 | | | Orient Overseas International Ltd. (Transportation) | | | 49,045 | |
| | 32,500 | | | Power Assets Holdings Ltd. (Utilities) | | | 243,886 | |
| | 32,000 | | | Regal Real Estate Investment Trust (REIT) | | | 7,477 | |
| | 6,400 | | | Sands China Ltd. (Consumer Services) | | | 20,589 | |
| | 38,500 | | | Shimao Property Holdings Ltd. (Real Estate) | | | 59,674 | |
| | 111,000 | | | SJM Holdings Ltd. (Consumer Services) | | | 207,989 | |
| | 10,081 | | | Sun Hung Kai Properties Ltd. (Real Estate) | | | 119,852 | |
| | 45,000 | | | Swire Pacific Ltd. Class A (Real Estate) | | | 523,388 | |
| | 38,000 | | | TAI Cheung Holdings (Real Estate) | | | 26,032 | |
| | 65,000 | | | Wheelock & Co. Ltd. (Real Estate) | | | 246,988 | |
| | 108,800 | | | Wynn Macau Ltd. (Consumer Services) | | | 256,736 | |
| | 12,000 | | | Yue Yuen Industrial Holdings Ltd. (Consumer Durables & Apparel) | | | 37,729 | |
| | 55,000 | | | Yuexiu Real Estate Investment (REIT) | | | 26,548 | |
| | | | | | | | |
| | | | | | | 3,878,024 | |
| | |
| Ireland – 0.1% | |
| | 33,032 | | | C&C Group PLC (Food, Beverage & Tobacco) | | | 141,945 | |
| | 3,276 | | | CRH PLC (Materials) | | | 63,204 | |
| | | | | | | | |
| | | | | | | 205,149 | |
| | |
| | |
| The accompanying notes are an integral part of these financial statements. | | 43 |
GOLDMAN SACHS STRUCTURED INTERNATIONAL TAX-MANAGED EQUITY FUND
Schedule of Investments (continued)
June 30, 2012 (Unaudited)
| | | | | | | | |
Shares | | | Description | | Value | |
| | | | | | | | |
| | | | | | | | |
| | Common Stocks – (continued) | |
| Israel – 0.6% | |
| | 3,616 | | | Bank Hapoalim BM (Banks) | | $ | 11,152 | |
| | 29,349 | | | Bezeq Israeli Telecommunication Corp. Ltd. (Telecommunication Services) | | | 31,226 | |
| | 103 | | | Delek Group Ltd. (Capital Goods) | | | 15,336 | |
| | 909 | | | Elbit Systems Ltd. (Capital Goods) | | | 31,300 | |
| | 831 | | | Israel Chemicals Ltd. (Materials) | | | 9,194 | |
| | 10,272 | | | Mizrahi Tefahot Bank Ltd. (Banks)* | | | 80,142 | |
| | 209 | | | NICE Systems Ltd. ADR (Software & Services)* | | | 7,649 | |
| | 13,990 | | | Teva Pharmaceutical Industries Ltd. ADR (Pharmaceuticals, Biotechnology & Life Sciences) | | | 551,766 | |
| | 138 | | | The Israel Corp. Ltd. (Materials) | | | 78,042 | |
| | | | | | | | |
| | | | | | | 815,807 | |
| | |
| Italy – 1.8% | |
| | 48,511 | | | Banca Carige SpA (Banks)(a) | | | 42,141 | |
| | 14,644 | | | Banca Popolare di Sondrio Scarl (Banks) | | | 89,348 | |
| | 9,350 | | | De’Longhi SpA (Consumer Durables & Apparel) | | | 90,024 | |
| | 433,131 | | | Enel SpA (Utilities)(a) | | | 1,398,519 | |
| | 35,900 | | | Eni SpA (Energy) | | | 762,701 | |
| | 2,186 | | | Exor SpA (Diversified Financials) | | | 46,995 | |
| | 2,298 | | | Saipem SpA (Energy) | | | 102,340 | |
| | | | | | | | |
| | | | | | | 2,532,068 | |
| | |
| Japan – 21.1% | |
| | 4,700 | | | A&D Co. Ltd. (Technology Hardware & Equipment) | | | 18,173 | |
| | 3,900 | | | Ai Holdings Corp. (Technology Hardware & Equipment) | | | 21,187 | |
| | 9,000 | | | Aichi Steel Corp. (Materials) | | | 36,328 | |
| | 26,800 | | | Alps Electric Co. Ltd. (Technology Hardware & Equipment) | | | 189,271 | |
| | 21,000 | | | Amada Co. Ltd. (Capital Goods) | | | 124,253 | |
| | 3,100 | | | Arc Land Sakamoto Co. Ltd. (Retailing) | | | 48,742 | |
| | 48,000 | | | Asahi Glass Co. Ltd. (Capital Goods) | | | 323,818 | |
| | 4,100 | | | Azbil Corp. (Technology Hardware & Equipment) | | | 84,032 | |
| | 25,000 | | | Bando Chemical Industries Ltd. (Capital Goods) | | | 94,713 | |
| | 1,600 | | | Belc Co. Ltd. (Food & Staples Retailing) | | | 22,899 | |
| | 48 | | | Central Japan Railway Co. (Transportation) | | | 378,042 | |
| | 4,000 | | | Century Tokyo Leasing Corp. (Diversified Financials) | | | 75,005 | |
| | 17,000 | | | Chino Corp. (Technology Hardware & Equipment) | | | 45,149 | |
| | 10,600 | | | Chubu Electric Power Co., Inc. (Utilities) | | | 171,886 | |
| | 1,700 | | | Coca-Cola West Co. Ltd. (Food, Beverage & Tobacco) | | | 29,642 | |
| | 22,000 | | | Daido Steel Co. Ltd. (Materials) | | | 137,094 | |
| | |
| | | | | | | | |
| | | | | | | | |
| | Common Stocks – (continued) | |
| Japan – (continued) | |
| | 102,000 | | | Daihatsu Motor Co. Ltd. (Automobiles & Components) | | $ | 1,785,732 | |
| | 12,700 | | | Daiichi Sankyo Co. Ltd. (Pharmaceuticals, Biotechnology & Life Sciences) | | | 214,146 | |
| | 10,000 | | | Dainippon Sumitomo Pharma Co. Ltd. (Pharmaceuticals, Biotechnology & Life Sciences) | | | 102,173 | |
| | 2,400 | | | Daito Pharmaceutical Co. Ltd. (Pharmaceuticals, Biotechnology & Life Sciences) | | | 32,545 | |
| | 2,700 | | | Daito Trust Construction Co. Ltd. (Real Estate) | | | 255,939 | |
| | 30,000 | | | Denki Kagaku Kogyo KK (Materials) | | | 104,871 | |
| | 7 | | | Dr. Ci:Labo Co. Ltd. (Household & Personal Products) | | | 23,882 | |
| | 8,600 | | | East Japan Railway Co. (Transportation) | | | 540,004 | |
| | 4,700 | | | EDION Corp. (Retailing) | | | 23,600 | |
| | 3,400 | | | Eisai Co. Ltd. (Pharmaceuticals, Biotechnology & Life Sciences) | | | 148,889 | |
| | 400 | | | Fast Retailing Co. Ltd. (Retailing) | | | 80,037 | |
| | 11,000 | | | FIDEA Holdings Co. Ltd. (Banks) | | | 21,582 | |
| | 47,400 | | | FUJIFILM Holdings Corp. (Technology Hardware & Equipment) | | | 898,050 | |
| | 49,000 | | | Fujitsu Ltd. (Technology Hardware & Equipment) | | | 234,500 | |
| | 2,400 | | | Hokkaido Electric Power Co., Inc. (Utilities) | | | 31,018 | |
| | 5,000 | | | Hokkan Holdings Ltd. (Materials) | | | 15,432 | |
| | 3,500 | | | Hokuriku Electric Power Co. (Utilities) | | | 54,502 | |
| | 42,800 | | | Honda Motor Co. Ltd. (Automobiles & Components) | | | 1,493,529 | |
| | 1,800 | | | Idemitsu Kosan Co. Ltd. (Energy) | | | 161,463 | |
| | 2,800 | | | Information Services International-Dentsu Ltd. (Software & Services) | | | 23,157 | |
| | 59 | | | Inpex Corp. (Energy) | | | 331,374 | |
| | 8,100 | | | ITC Networks Corp. (Technology Hardware & Equipment) | | | 64,762 | |
| | 1,200 | | | ITOCHU-SHOKUHIN Co. Ltd. (Food & Staples Retailing) | | | 44,695 | |
| | 24,200 | | | Japan Tobacco, Inc. (Food, Beverage & Tobacco) | | | 716,941 | |
| | 4,000 | | | JGC Corp. (Capital Goods) | | | 115,965 | |
| | 15,000 | | | Juki Corp. (Capital Goods) | | | 25,251 | |
| | 8,000 | | | Kamei Corp. (Capital Goods) | | | 83,382 | |
| | 1,200 | | | KAWADA TECHNOLOGIES, Inc. (Capital Goods) | | | 17,037 | |
| | 46,000 | | | Kawasaki Kisen Kaisha Ltd. (Transportation)* | | | 91,372 | |
| | 51 | | | KDDI Corp. (Telecommunication Services) | | | 328,996 | |
| | 9,000 | | | Kinki Sharyo Co. Ltd. (Capital Goods) | | | 32,440 | |
| | 62,000 | | | Kirin Holdings Co. Ltd. (Food, Beverage & Tobacco) | | | 730,735 | |
| | 95,000 | | | Kobe Steel Ltd. (Materials) | | | 114,280 | |
| | |
| | |
| 44 | | The accompanying notes are an integral part of these financial statements. |
GOLDMAN SACHS STRUCTURED INTERNATIONAL TAX-MANAGED EQUITY FUND
| | | | | | | | |
Shares | | | Description | | Value | |
| | | | | | | | |
| | | | | | | | |
| | Common Stocks – (continued) | |
| Japan – (continued) | |
| | 8,300 | | | Komatsu Ltd. (Capital Goods) | | $ | 198,132 | |
| | 5,000 | | | Konica Minolta Holdings, Inc. (Technology Hardware & Equipment) | | | 39,390 | |
| | 1,200 | | | KRS Corp. (Transportation) | | | 13,216 | |
| | 3,000 | | | Kyorin Holdings, Inc. (Pharmaceuticals, Biotechnology & Life Sciences) | | | 63,278 | |
| | 2,000 | | | Kyowa Hakko Kirin Co. Ltd. (Pharmaceuticals, Biotechnology & Life Sciences) | | | 20,598 | |
| | 6,500 | | | Kyushu Electric Power Co., Inc. (Utilities) | | | 77,111 | |
| | 6,000 | | | Makino Milling Machine Co. Ltd. (Capital Goods) | | | 36,608 | |
| | 2,800 | | | Mandom Corp. (Household & Personal Products) | | | 71,145 | |
| | 91,000 | | | Marubeni Corp. (Capital Goods) | | | 606,324 | |
| | 6,000 | | | Marudai Food Co. Ltd. (Food, Beverage & Tobacco) | | | 22,962 | |
| | 3,500 | | | Matsumotokiyoshi Holdings Co. Ltd. (Food & Staples Retailing) | | | 77,620 | |
| | 114,000 | | | Mazda Motor Corp. (Automobiles & Components)* | | | 155,240 | |
| | 45,500 | | | Mitsubishi Chemical Holdings Corp. (Materials) | | | 200,577 | |
| | 37,300 | | | Mitsubishi Corp. (Capital Goods) | | | 753,993 | |
| | 269,600 | | | Mitsubishi UFJ Financial Group, Inc. (Banks) | | | 1,291,621 | |
| | 970 | | | Mitsubishi UFJ Lease & Finance Co. Ltd. (Diversified Financials) | | | 40,348 | |
| | 7,000 | | | Mitsuboshi Belting Co. Ltd. (Capital Goods) | | | 33,329 | |
| | 17,000 | | | Mitsui & Co. Ltd. (Capital Goods) | | | 252,618 | |
| | 33,000 | | | Mitsui Engineering & Shipbuilding Co. Ltd. (Capital Goods) | | | 47,560 | |
| | 45,000 | | | Mitsui Mining & Smelting Co. Ltd. (Materials) | | | 98,721 | |
| | 1,200 | | | Musashi Seimitsu Industry Co. Ltd. (Automobiles & Components) | | | 23,037 | |
| | 93,800 | | | Namco Bandai Holdings, Inc. (Consumer Durables & Apparel) | | | 1,286,341 | |
| | 5,000 | | | Nichiban Co. Ltd. (Commercial & Professional Services) | | | 16,076 | |
| | 2,700 | | | Nichi-iko Pharmaceutical Co. Ltd. (Pharmaceuticals, Biotechnology & Life Sciences) | | | 59,568 | |
| | 1,900 | | | Nihon Eslead Corp. (Consumer Durables & Apparel) | | | 16,273 | |
| | 2,500 | | | Nintendo Co. Ltd. (Software & Services) | | | 291,952 | |
| | 14,000 | | | Nippon Chemical Industrial Co. Ltd. (Materials) | | | 21,168 | |
| | 18,000 | | | Nippon Electric Glass Co. Ltd. (Technology Hardware & Equipment) | | | 107,506 | |
| | 8,200 | | | Nippon Telegraph & Telephone Corp. (Telecommunication Services) | | | 382,370 | |
| | |
| | | | | | | | |
| | | | | | | | |
| | Common Stocks – (continued) | |
| Japan – (continued) | |
| | 8,000 | | | Nippon Thompson Co. Ltd. (Capital Goods) | | $ | 38,177 | |
| | 29,000 | | | Nippon Yusen Kabushiki Kaisha (Transportation) | | | 76,701 | |
| | 6,500 | | | Nipro Corp. (Health Care Equipment & Services) | | | 40,849 | |
| | 2,300 | | | Nissin Kogyo Co. Ltd. (Automobiles & Components) | | | 31,599 | |
| | 14,000 | | | NOF Corp. (Materials) | | | 69,940 | |
| | 1,300 | | | Nomura Real Estate Holdings, Inc. (Real Estate) | | | 23,806 | |
| | 49 | | | Nomura Real Estate Office Fund, Inc. (REIT) | | | 276,421 | |
| | 3,100 | | | NS Solutions Corp. (Software & Services) | | | 53,150 | |
| | 23,000 | | | NSK Ltd. (Capital Goods) | | | 149,028 | |
| | 100 | | | NTT Data Corp. (Software & Services) | | | 306,926 | |
| | 180 | | | NTT DoCoMo, Inc. (Telecommunication Services) | | | 299,520 | |
| | 2,300 | | | Olympus Corp. (Health Care Equipment & Services)* | | | 37,271 | |
| | 10,000 | | | Pacific Metals Co. Ltd. (Materials) | | | 41,145 | |
| | 6,200 | | | Riken Keiki Co. Ltd. (Technology Hardware & Equipment) | | | 39,654 | |
| | 124,200 | | | Round One Corp. (Consumer Services) | | | 662,966 | |
| | 11,000 | | | Ryobi Ltd. (Capital Goods) | | | 35,226 | |
| | 18,000 | | | Sanden Corp. (Automobiles & Components) | | | 63,790 | |
| | 4,300 | | | Sankyo Seiko Co. Ltd. (Retailing) | | | 14,170 | |
| | 5,100 | | | SCSK Corp. (Software & Services) | | | 74,114 | |
| | 1,600 | | | Seikagaku Corp. (Pharmaceuticals, Biotechnology & Life Sciences) | | | 15,674 | |
| | 13,500 | | | Seven & I Holdings Co. Ltd. (Food & Staples Retailing) | | | 406,962 | |
| | 3,000 | | | Shikoku Electric Power Co., Inc. (Utilities) | | | 63,772 | |
| | 13,000 | | | Shinmaywa Industries Ltd. (Capital Goods) | | | 64,442 | |
| | 11,800 | | | Shionogi & Co. Ltd. (Pharmaceuticals, Biotechnology & Life Sciences) | | | 160,442 | |
| | 19,400 | | | Shiseido Co. Ltd. (Household & Personal Products) | | | 306,124 | |
| | 3 | | | SKY Perfect JSAT Holdings, Inc. (Media) | | | 1,351 | |
| | 11,000 | | | Softbank Corp. (Telecommunication Services) | | | 409,461 | |
| | 1,300 | | | SRA Holdings (Software & Services) | | | 14,669 | |
| | 74,000 | | | Sumitomo Corp. (Capital Goods) | | | 1,035,394 | |
| | 79,200 | | | Sumitomo Electric Industries Ltd. (Capital Goods) | | | 986,902 | |
| | 48,000 | | | Sumitomo Heavy Industries Ltd. (Capital Goods) | | | 216,142 | |
| | 59,900 | | | Sumitomo Mitsui Financial Group, Inc. (Banks) | | | 1,978,792 | |
| | 140,000 | | | Sumitomo Mitsui Trust Holdings, Inc. (Banks) | | | 418,407 | |
| | |
| | |
| The accompanying notes are an integral part of these financial statements. | | 45 |
GOLDMAN SACHS STRUCTURED INTERNATIONAL TAX-MANAGED EQUITY FUND
Schedule of Investments (continued)
June 30, 2012 (Unaudited)
| | | | | | | | |
Shares | | | Description | | Value | |
| | | | | | | | |
| | | | | | | | |
| | Common Stocks – (continued) | |
| Japan – (continued) | |
| | 8,000 | | | Sumitomo Precision Products Co. Ltd. (Capital Goods) | | $ | 43,857 | |
| | 2,100 | | | T&D Holdings, Inc. (Insurance) | | | 22,371 | |
| | 3,000 | | | Taiyo Nippon Sanso Corp. (Materials) | | | 17,528 | |
| | 2,400 | | | Takara Leben Co. Ltd. (Real Estate) | | | 20,721 | |
| | 46,900 | | | Takeda Pharmaceutical Co. Ltd. (Pharmaceuticals, Biotechnology & Life Sciences) | | | 2,129,348 | |
| | 15,000 | | | Tanseisha Co. Ltd. (Commercial & Professional Services) | | | 44,775 | |
| | 39,000 | | | Teijin Ltd. (Materials) | | | 118,722 | |
| | 3,500 | | | The Chugoku Electric Power Co., Inc. (Utilities) | | | 57,725 | |
| | 112 | | | The Dai-ichi Life Insurance Co. Ltd. (Insurance) | | | 129,711 | |
| | 11,100 | | | The Kansai Electric Power Co., Inc. (Utilities) | | | 133,117 | |
| | 46,000 | | | The Nishi-Nippon City Bank Ltd. (Banks) | | | 111,683 | |
| | 6,000 | | | The Nisshin Oillio Group Ltd. (Food, Beverage & Tobacco) | | | 25,312 | |
| | 5,000 | | | Toagosei Co. Ltd. (Materials) | | | 19,561 | |
| | 5,100 | | | Tohoku Electric Power Co., Inc. (Utilities)* | | | 51,244 | |
| | 6,000 | | | Toko Electric Corp. (Capital Goods) | | | 24,927 | |
| | 6,900 | | | Tokyo Electron Ltd. (Semiconductors & Semiconductor Equipment) | | | 323,575 | |
| | 12,000 | | | Tokyu Land Corp. (Real Estate) | | | 59,565 | |
| | 9,000 | | | Tonami Holdings Co. Ltd. (Transportation) | | | 18,691 | |
| | 3,000 | | | Topre Corp. (Automobiles & Components) | | | 28,975 | |
| | 61,000 | | | Tosoh Corp. (Materials) | | | 166,358 | |
| | 28,500 | | | Toyota Motor Corp. (Automobiles & Components) | | | 1,150,323 | |
| | 3,400 | | | Tv Tokyo Holdings Corp. (Media) | | | 39,444 | |
| | 1,390 | | | Yamada Denki Co. Ltd. (Retailing) | | | 71,166 | |
| | 6,000 | | | YASKAWA Electric Corp. (Technology Hardware & Equipment) | | | 45,712 | |
| | | | | | | | |
| | | | | | | 30,314,595 | |
| | |
| Luxembourg – 0.3% | |
| | 27,186 | | | ArcelorMittal (Materials) | | | 415,932 | |
| | 615 | | | RTL Group SA (Media) | | | 56,815 | |
| | | | | | | | |
| | | | | | | 472,747 | |
| | |
| Mexico – 0.1% | |
| | 3,759 | | | Fresnillo PLC (Materials) | | | 86,103 | |
| | |
| Netherlands – 4.6% | |
| | 9,033 | | | ASML Holding NV (Semiconductors & Semiconductor Equipment) | | | 463,900 | |
| | 1,901 | | | Heineken Holding NV (Food, Beverage & Tobacco) | | | 85,148 | |
| | 24,699 | | | Heineken NV (Food, Beverage & Tobacco) | | | 1,287,971 | |
| | |
| | | | | | | | |
| | | | | | | | |
| | Common Stocks – (continued) | |
| Netherlands – (continued) | |
| | 55,495 | | | ING Groep NV CVA (Diversified Financials)* | | $ | 372,044 | |
| | 97,863 | | | Koninklijke Ahold NV (Food & Staples Retailing) | | | 1,212,259 | |
| | 4,316 | | | Koninklijke KPN NV (Telecommunication Services) | | | 41,269 | |
| | 53,758 | | | Royal Dutch Shell PLC Class A (Energy) | | | 1,814,201 | |
| | 39,313 | | | Royal Dutch Shell PLC Class B (Energy) | | | 1,372,956 | |
| | | | | | | | |
| | | | | | | 6,649,748 | |
| | |
| New Zealand – 0.1% | |
| | 11,620 | | | SKYCITY Entertainment Group Ltd. (Consumer Services) | | | 31,744 | |
| | 53,681 | | | Telecom Corp. of New Zealand Ltd. (Telecommunication Services) | | | 103,719 | |
| | | | | | | | |
| | | | | | | 135,463 | |
| | |
| Norway – 1.5% | |
| | 2,335 | | | Aker ASA Class A (Diversified Financials) | | | 64,758 | |
| | 9,195 | | | Aker Solutions ASA (Energy) | | | 130,471 | |
| | 12,444 | | | DNB ASA (Banks) | | | 123,737 | |
| | 14,146 | | | Gjensidige Forsikring ASA (Insurance) | | | 164,817 | |
| | 48,166 | | | Statoil ASA (Energy) | | | 1,148,688 | |
| | 172,000 | | | STX OSV Holdings Ltd. (Capital Goods) | | | 205,460 | |
| | 22,867 | | | Telenor ASA (Telecommunication Services) | | | 382,297 | |
| | | | | | | | |
| | | | | | | 2,220,228 | |
| | |
| Portugal – 0.2% | |
| | 382,828 | | | Banco Comercial Portugues SA Class R (Banks)* | | | 47,642 | |
| | 46,617 | | | Brisa Auto-Estradas de Portugal SA (Transportation)* | | | 149,511 | |
| | 7,886 | | | Jeronimo Martins, SGPS, SA (Food & Staples Retailing) | | | 133,327 | |
| | | | | | | | |
| | | | | | | 330,480 | |
| | |
| Singapore – 1.6% | |
| | 10,000 | | | AIMS AMP Capital Industrial REIT (REIT) | | | 9,517 | |
| | 78,000 | | | CapitaCommercial Trust (REIT) | | | 78,451 | |
| | 4,000 | | | CDL Hospitality Trusts (REIT) | | | 6,187 | |
| | 20,000 | | | Cityspring Infrastructure Trust (Utilities) | | | 6,336 | |
| | 29,000 | | | ComfortDelGro Corp. Ltd. (Transportation) | | | 35,513 | |
| | 62,596 | | | DBS Group Holdings Ltd. (Banks) | | | 691,416 | |
| | 80,000 | | | Fortune Real Estate Investment Trust (REIT) | | | 48,032 | |
| | 1,000 | | | Fraser and Neave Ltd. (Capital Goods) | | | 5,568 | |
| | 5,000 | | | Genting Singapore PLC (Consumer Services) | | | 5,617 | |
| | |
| | |
| 46 | | The accompanying notes are an integral part of these financial statements. |
GOLDMAN SACHS STRUCTURED INTERNATIONAL TAX-MANAGED EQUITY FUND
| | | | | | | | |
Shares | | | Description | | Value | |
| | | | | | | | |
| | | | | | | | |
| | Common Stocks – (continued) | |
| Singapore – (continued) | |
| | 4,000 | | | Great Eastern Holdings Ltd. (Insurance) | | $ | 40,381 | |
| | 10,000 | | | Ho Bee Investment Ltd. (Real Estate) | | | 9,240 | |
| | 5,000 | | | Jardine Cycle & Carriage Ltd. (Retailing) | | | 184,281 | |
| | 2,000 | | | Keppel Corp. Ltd. (Capital Goods) | | | 16,385 | |
| | 13,000 | | | Oversea-Chinese Banking Corp. Ltd. (Banks) | | | 90,908 | |
| | 5,000 | | | SATS Ltd. (Transportation) | | | 10,633 | |
| | 13,000 | | | SembCorp Industries Ltd. (Capital Goods) | | | 53,210 | |
| | 14,000 | | | Singapore Airlines Ltd. (Transportation) | | | 115,444 | |
| | 5,000 | | | Singapore Technologies Engineering Ltd. (Capital Goods) | | | 12,326 | |
| | 131,000 | | | Singapore Telecommunications Ltd. (Telecommunication Services) | | | 343,058 | |
| | 5,000 | | | United Overseas Bank Ltd. (Banks) | | | 74,248 | |
| | 93,000 | | | UOL Group Ltd. (Real Estate) | | | 364,553 | |
| | 4,000 | | | Venture Corp. Ltd. (Technology Hardware & Equipment) | | | 24,833 | |
| | 31,000 | | | Wilmar International Ltd. (Food, Beverage & Tobacco) | | | 89,385 | |
| | | | | | | | |
| | | | | | | 2,315,522 | |
| | |
| Spain – 2.7% | |
| | 16,007 | | | Banco Bilbao Vizcaya Argentaria SA (Banks) | | | 114,312 | |
| | 277,534 | | | Banco Santander SA (Banks) | | | 1,835,958 | |
| | 58,606 | | | Bankia SA (Banks)*(a) | | | 68,576 | |
| | 19,143 | | | Endesa SA (Utilities) | | | 336,170 | |
| | 8,639 | | | Inditex SA (Retailing) | | | 892,972 | |
| | 35,091 | | | Mapfre SA (Insurance)(a) | | | 71,388 | |
| | 34,697 | | | Repsol YPF SA (Energy) | | | 557,758 | |
| | | | | | | | |
| | | | | | | 3,877,134 | |
| | |
| Sweden – 2.8% | |
| | 3,884 | | | Hennes & Mauritz AB Class B (Retailing) | | | 139,412 | |
| | 3,089 | | | Industrial & Financial Systems AB Class B (Software & Services) | | | 48,339 | |
| | 3,293 | | | Investor AB Class A (Diversified Financials) | | | 60,633 | |
| | 3,398 | | | Kinnevik Investment AB Class B (Diversified Financials) | | | 68,206 | |
| | 9,620 | | | Skandinaviska Enskilda Banken AB Class A (Banks) | | | 62,477 | |
| | 18,258 | | | Swedbank AB Class A (Banks) | | | 287,636 | |
| | 73,013 | | | Swedish Match AB (Food, Beverage & Tobacco) | | | 2,942,830 | |
| | 41,008 | | | Telefonaktiebolaget LM Ericsson Class B (Technology Hardware & Equipment) | | | 375,212 | |
| | 5,038 | | | Trelleborg AB Class B (Capital Goods) | | | 46,485 | |
| | | | | | | | |
| | | | | | | 4,031,230 | |
| | |
| | | | | | | | |
| | | | | | | | |
| | Common Stocks – (continued) | |
| Switzerland – 9.3% | |
| | 17,450 | | | Actelion Ltd. (Registered) (Pharmaceuticals, Biotechnology & Life Sciences)* | | $ | 717,758 | |
| | 24,746 | | | Adecco SA (Registered) (Commercial & Professional Services)* | | | 1,100,450 | |
| | 320 | | | Bucher Industries AG (Registered) (Capital Goods) | | | 51,108 | |
| | 6,395 | | | Compagnie Financiere Richemont SA Class A (Consumer Durables & Apparel) | | | 351,148 | |
| | 77 | | | Galenica AG (Registered) (Pharmaceuticals, Biotechnology & Life Sciences) | | | 48,984 | |
| | 281 | | | Inficon Holding AG (Registered) (Technology Hardware & Equipment)* | | | 57,196 | |
| | 10,031 | | | Julius Baer Group Ltd. (Diversified Financials)* | | | 363,691 | |
| | 25,400 | | | Nestle SA (Registered) (Food, Beverage & Tobacco) | | | 1,515,818 | |
| | 8,845 | | | Novartis AG (Registered) (Pharmaceuticals, Biotechnology & Life Sciences) | | | 494,536 | |
| | 3,418 | | | PSP Swiss Property AG (Registered) (Real Estate)* | | | 301,649 | |
| | 23,747 | | | Roche Holding AG (Pharmaceuticals, Biotechnology & Life Sciences) | | | 4,113,916 | |
| | 1,058 | | | Schindler Holding AG (Capital Goods) | | | 118,291 | |
| | 21,675 | | | STMicroelectronics NV (Semiconductors & Semiconductor Equipment) | | | 117,948 | |
| | 7,034 | | | Swiss Life Holding AG (Registered) (Insurance)* | | | 662,974 | |
| | 29,148 | | | Swiss Re AG (Insurance)* | | | 1,837,543 | |
| | 2,852 | | | Tecan Group AG (Registered) (Pharmaceuticals, Biotechnology & Life Sciences)* | | | 196,814 | |
| | 66,712 | | | UBS AG (Registered) (Diversified Financials)* | | | 780,676 | |
| | 61 | | | Vetropack Holding AG (Materials) | | | 107,135 | |
| | 147 | | | Walter Meier AG (Registered) (Capital Goods) | | | 33,706 | |
| | 29,479 | | | Xstrata PLC (Materials) | | | 370,651 | |
| | | | | | | | |
| | | | | | | 13,341,992 | |
| | |
| United Kingdom – 19.5% | |
| | 25,776 | | | African Barrick Gold PLC (Materials) | | | 156,715 | |
| | 13,236 | | | Aggreko PLC (Commercial & Professional Services) | | | 430,444 | |
| | 20,350 | | | AMEC PLC (Energy) | | | 320,806 | |
| | 15,267 | | | Anglo American PLC (Materials) | | | 501,755 | |
| | 14,582 | | | Antofagasta PLC (Materials) | | | 249,438 | |
| | 19,178 | | | AstraZeneca PLC (Pharmaceuticals, Biotechnology & Life Sciences) | | | 857,020 | |
| | 52,831 | | | Aviva PLC (Insurance) | | | 226,220 | |
| | 45,225 | | | BAE Systems PLC (Capital Goods) | | | 205,033 | |
| | |
| | |
| The accompanying notes are an integral part of these financial statements. | | 47 |
GOLDMAN SACHS STRUCTURED INTERNATIONAL TAX-MANAGED EQUITY FUND
Schedule of Investments (continued)
June 30, 2012 (Unaudited)
| | | | | | | | |
Shares | | | Description | | Value | |
| | | | | | | | |
| | | | | | | | |
| | Common Stocks – (continued) | |
| United Kingdom – (continued) | |
| | 8,071 | | | Berendsen PLC (Commercial & Professional Services) | | $ | 63,286 | |
| | 50,037 | | | BG Group PLC (Energy) | | | 1,024,331 | |
| | 24,182 | | | BHP Billiton PLC (Materials) | | | 687,311 | |
| | 22,552 | | | BP PLC ADR (Energy) | | | 914,258 | |
| | 56,762 | | | British American Tobacco PLC (Food, Beverage & Tobacco) | | | 2,885,778 | |
| | 9,453 | | | British Land Co. PLC (REIT) | | | 75,695 | |
| | 240,063 | | | BT Group PLC Class A (Telecommunication Services) | | | 795,456 | |
| | 9,476 | | | BTG PLC (Pharmaceuticals, Biotechnology & Life Sciences)* | | | 60,597 | |
| | 1,386 | | | Burberry Group PLC (Consumer Durables & Apparel) | | | 28,858 | |
| | 183,976 | | | Cable & Wireless Worldwide PLC (Telecommunication Services) | | | 109,203 | |
| | 42,038 | | | Capital Shopping Centres Group PLC (REIT) | | | 212,370 | |
| | 16,003 | | | Cobham PLC (Capital Goods) | | | 58,301 | |
| | 3,463 | | | Consort Medical PLC (Health Care Equipment & Services) | | �� | 38,262 | |
| | 5,380 | | | Croda International PLC (Materials) | | | 191,152 | |
| | 7,221 | | | Dechra Pharmaceuticals PLC (Pharmaceuticals, Biotechnology & Life Sciences) | | | 54,963 | |
| | 20,514 | | | Diageo PLC (Food, Beverage & Tobacco) | | | 528,748 | |
| | 37,331 | | | Drax Group PLC (Utilities) | | | 328,402 | |
| | 11,324 | | | easyJet PLC (Transportation) | | | 94,377 | |
| | 89,804 | | | Eurasian Natural Resources Corp. PLC (Materials) | | | 586,116 | |
| | 23,168 | | | GKN PLC (Automobiles & Components) | | | 65,685 | |
| | 38,022 | | | GlaxoSmithKline PLC ADR (Pharmaceuticals, Biotechnology & Life Sciences)(b) | | | 1,732,663 | |
| | 9,621 | | | Go-Ahead Group PLC (Transportation) | | | 181,633 | |
| | 27,350 | | | Greene King PLC (Consumer Services) | | | 236,087 | |
| | 235,041 | | | Home Retail Group PLC (Retailing)(a) | | | 312,212 | |
| | 335,567 | | | HSBC Holdings PLC (Banks) | | | 2,956,961 | |
| | 8,871 | | | IG Group Holdings PLC (Diversified Financials) | | | 66,676 | |
| | 47,713 | | | Imperial Tobacco Group PLC (Food, Beverage & Tobacco) | | | 1,838,298 | |
| | 83,200 | | | Intermediate Capital Group PLC (Diversified Financials) | | | 352,618 | |
| | 27,340 | | | John Wood Group PLC (Energy) | | | 294,882 | |
| | 14,950 | | | Micro Focus International PLC (Software & Services) | | | 124,453 | |
| | 6,857 | | | Mucklow A & J Group PLC (REIT) | | | 39,627 | |
| | 166,864 | | | National Grid PLC (Utilities) | | | 1,768,429 | |
| | 44,965 | | | Paragon Group of Companies PLC (Banks) | | | 117,866 | |
| | 2,607 | | | Pearson PLC (Media) | | | 51,727 | |
| | 40,619 | | | Pennon Group PLC (Utilities) | | | 486,213 | |
| | 53,610 | | | Petrofac Ltd. (Energy) | | | 1,170,161 | |
| | |
| | | | | | | | |
| | | | | | | | |
| | Common Stocks – (continued) | |
| United Kingdom – (continued) | |
| | 1,110 | | | Randgold Resources Ltd. (Materials) | | $ | 99,658 | |
| | 4,985 | | | Reckitt Benckiser Group PLC (Household & Personal Products) | | | 263,492 | |
| | 12,705 | | | Resolution Ltd. (Insurance) | | | 39,083 | |
| | 14,026 | | | Rio Tinto PLC (Materials) | | | 666,567 | |
| | 40,613 | | | Standard Chartered PLC (Banks) | | | 882,235 | |
| | 118,444 | | | Tate & Lyle PLC (Food, Beverage & Tobacco) | | | 1,202,908 | |
| | 26,620 | | | Tetragon Financial Group Ltd. (Diversified Financials) | | | 196,803 | |
| | 12,624 | | | Tullow Oil PLC (Energy) | | | 291,773 | |
| | 22,400 | | | Vodafone Group PLC ADR (Telecommunication Services)(b) | | | 631,232 | |
| | 11,452 | | | Whitbread PLC (Consumer Services) | | | 364,128 | |
| | | | | | | | |
| | | | | | | 28,118,965 | |
| | |
| United States – 0.0% | |
| | 11,134 | | | ResMed, Inc. CDI (Health Care Equipment & Services)* | | | 35,243 | |
| | 3,525 | | | Sims Metal Management Ltd. (Materials) | | | 34,911 | |
| | | | | | | | |
| | | | | | | 70,154 | |
| | |
| | TOTAL COMMON STOCKS | |
| | (Cost $150,045,513) | | $ | 139,461,373 | |
| | |
| | | | | | | | |
| | | | | | | | |
| | | | | | | | |
| | Investment Companies – 0.1% | |
| Australia – 0.0% | |
| | 8,391 | | | Challenger Infrastructure Fund Class A | | $ | 11,290 | |
| | |
| Switzerland – 0.1% | |
| | 1,843 | | | HBM BioVentures AG Class A* | | | 93,172 | |
| | |
| | TOTAL INVESTMENT COMPANIES | |
| | (Cost $92,835) | | $ | 104,462 | |
| | |
| | | | | | | | | | | | |
Units | | | Description | | Expiration
Month | | | Value | |
| | | | | | | | | | | | |
| | Right* – 0.0% | |
| Australia – 0.0% | |
| | 11,248 | | | Ten Network Holdings (Media) | | | 07/12 | | | $ | — | |
| | (Cost $0) | |
| | |
| TOTAL INVESTMENTS BEFORE
SECURITIES LENDING REINVESTMENT
VEHICLE |
| | | | |
| | (Cost $150,138,348) | | | $ | 139,565,835 | |
| | |
| | |
| 48 | | The accompanying notes are an integral part of these financial statements. |
GOLDMAN SACHS STRUCTURED INTERNATIONAL TAX-MANAGED EQUITY FUND
| | | | | | |
Shares | | Rate | | Value | |
| Securities Lending Reinvestment Vehicle(c)(d) – 2.4% | |
Goldman Sachs Financial Square Money Market Fund – FST Shares | |
| 3,407,487 | | 0.203% | | $ | 3,407,487 | |
| (Cost $3,407,487) | |
| |
| TOTAL INVESTMENTS – 99.4% | |
| (Cost $153,545,835) | | $ | 142,973,322 | |
| |
OTHER ASSETS IN EXCESS OF LIABILITIES – 0.6% | | | 858,815 | |
| |
| NET ASSETS – 100.0% | | $ | 143,832,137 | |
| |
| | |
| The percentage shown for each investment category reflects the value of investments in that category as a percentage of net assets. |
* | | Non-income producing security. |
(a) | | All or a portion of security is on loan. |
(b) | | All or a portion of security is segregated as collateral for initial margin requirements on futures transactions. |
(c) | | Variable rate security. Interest rate disclosed is that which is in effect at June 30, 2012. |
(d) | | Represents an affiliated issuer. |
| | |
|
Investment Abbreviations: |
ADR | | —American Depositary Receipt |
CDI | | —CHESS Depositary Interest |
CVA | | —Dutch Certification |
REIT | | —Real Estate Investment Trust |
|
|
| ADDITIONAL INVESTMENT INFORMATION |
FUTURES CONTRACTS — At June 30, 2012, the Fund had the following futures contracts:
| | | | | | | | | | | | | | |
| Type | | Number of Contracts Long (Short) | | | Expiration Date | | Current Value | | | Unrealized Gain (Loss) | |
EURO STOXX 50 Index | | | 62 | | | September 2012 | | $ | 1,769,296 | | | $ | 94,608 | |
FTSE 100 Index | | | 9 | | | September 2012 | | | 778,486 | | | | 13,929 | |
SPI 200 Index | | | 3 | | | September 2012 | | | 311,425 | | | | 1,415 | |
TSE TOPIX Index | | | 7 | | | September 2012 | | | 673,422 | | | | 53,475 | |
| TOTAL | | | | | | | | | | | | $ | 163,427 | |
| | |
| The accompanying notes are an integral part of these financial statements. | | 49 |
GOLDMAN SACHS STRUCTURED TAX-ADVANTAGED EQUITY FUNDS
Statements of Assets and Liabilities
June 30, 2012 (Unaudited)
| | | | | | | | | | | | | | | | | | |
| | | | | U.S. Equity
Dividend and
Premium Fund | | | International
Equity Dividend
and Premium Fund | | | Structured
Tax-Managed
Equity Fund | | | Structured
International
Tax-Managed
Equity Fund | |
| | Assets: | | | | | | | | | | | | | | | | |
| | Investments in unaffiliated issuers, at value (cost $1,054,810,559, $412,385,915, $310,800,244 and $150,138,348)(a) | | $ | 1,059,544,408 | | | $ | 356,427,232 | | | $ | 315,386,302 | | | $ | 139,565,835 | |
| | Investments in affiliated securities lending reinvestment vehicle, at value which equals cost | | | — | | | | — | | | | 11,996,350 | | | | 3,407,487 | |
| | Cash | | | 52,515,731 | | | | 519,971 | | | | 8,654,224 | | | | 1,524,899 | |
| | Foreign currencies, at value (cost $0, $11,359,879, $0 and $2,668,503) | | | — | | | | 11,458,833 | | | | — | | | | 2,676,880 | |
| | Receivables: | | | | | | | | | | | | | | | | |
| | Dividends | | | 2,503,254 | | | | 1,292,510 | | | | 280,214 | | | | 278,139 | |
| | Fund shares sold | | | 2,295,207 | | | | 534,587 | | | | 5,096 | | | | 2,042 | |
| | Futures variation margin | | | 1,020,000 | | | | 192,775 | | | | 182,000 | | | | 103,134 | |
| | Investments sold | | | — | | | | — | | | | — | | | | 60,703 | |
| | Foreign tax reclaims | | | — | | | | 584,673 | | | | — | | | | 129,175 | |
| | Securities lending income | | | — | | | | — | | | | 14,417 | | | | 24,580 | |
| | Due from custodian | | | — | | | | — | | | | — | | | | 30,016 | |
| | Reimbursement from investment adviser | | | — | | | | 21,881 | | | | 31,310 | | | | 63,346 | |
| | Other assets | | | 4,110 | | | | 1,602 | | | | 1,487 | | | | 726 | |
| | Total assets | | | 1,117,882,710 | | | | 371,034,064 | | | | 336,551,400 | | | | 147,866,962 | |
| | | | | | | | | | | | | | | | | | |
| | Liabilities: | | | | | | | | | | | | | | | | |
| | Payables: | | | | | | | | | | | | | | | | |
| | Written options, at value (premiums received $11,886,495, $3,971,965, $0 and $0) | | | 12,351,000 | | | | 5,067,907 | | | | — | | | | — | |
| | Payable upon return of securities loaned | | | — | | | | — | | | | 11,996,350 | | | | 3,407,487 | |
| | Fund shares redeemed | | | 3,215,656 | | | | 3,267,136 | | | | 125,646 | | | | 276,992 | |
| | Amounts owed to affiliates | | | 764,865 | | | | 311,847 | | | | 199,654 | | | | 105,198 | |
| | Investments purchased | | | — | | | | 5,552 | | | | — | | | | 68,346 | |
| | Accrued expenses and other liabilities | | | 122,173 | | | | 148,429 | | | | 227,896 | | | | 176,802 | |
| | Total liabilities | | | 16,453,694 | | | | 8,800,871 | | | | 12,549,546 | | | | 4,034,825 | |
| | | | | | | | | | | | | | | | | | |
| | Net Assets: | | | | | | | | | | | | | | | | |
| | Paid-in capital | | | 1,087,739,801 | | | | 430,212,910 | | | | 337,461,889 | | | | 191,475,827 | |
| | Undistributed (distributions in excess of) net investment income | | | (186,351 | ) | | | (375,183 | ) | | | 1,467,509 | | | | 2,486,833 | |
| | Accumulated net realized gain (loss) | | | 8,112,845 | | | | (10,953,626 | ) | | | (19,810,782 | ) | | | (39,798,567 | ) |
| | Net unrealized gain (loss) | | | 5,762,721 | | | | (56,650,908 | ) | | | 4,883,238 | | | | (10,331,956 | ) |
| | | NET ASSETS | | $ | 1,101,429,016 | | | $ | 362,233,193 | | | $ | 324,001,854 | | | $ | 143,832,137 | |
| | | Net Assets: | | | | | | | | | | | | | | | | |
| | | Class A | | $ | 143,584,462 | | | $ | 207,911,248 | | | $ | 46,654,862 | | | $ | 31,055,621 | |
| | | Class B | | | — | | | | — | | | | 757,905 | | | | — | |
| | | Class C | | | 35,032,034 | | | | 1,511,174 | | | | 8,234,773 | | | | 19,170 | |
| | | Institutional | | | 907,876,848 | | | | 151,799,159 | | | | 267,757,062 | | | | 112,741,687 | |
| | | Service | | | — | | | | — | | | | 37,516 | | | | — | |
| | | Class IR | | | 14,935,672 | | | | 1,011,612 | | | | 559,736 | | | | 15,659 | |
| | | Total Net Assets | | $ | 1,101,429,016 | | | $ | 362,233,193 | | | $ | 324,001,854 | | | $ | 143,832,137 | |
| | | Shares outstanding $0.001 par value (unlimited shares authorized): | | | | | | | | | | | | | | | | |
| | | Class A | | | 14,495,069 | | | | 31,813,893 | | | | 4,303,717 | | | | 4,541,196 | |
| | | Class B | | | — | | | | — | | | | 72,378 | | | | — | |
| | | Class C | | | 3,540,416 | | | | 236,072 | | | | 791,847 | | | | 2,822 | |
| | | Institutional | | | 91,833,055 | | | | 23,522,470 | | | | 24,306,945 | | | | 16,487,574 | |
| | | Service | | | — | | | | — | | | | 3,438 | | | | — | |
| | | Class IR | | | 1,509,043 | | | | 156,952 | | | | 50,805 | | | | 2,289 | |
| | | Net asset value, offering and redemption price per share:(b) | | | | | | | | | | | | | | | | |
| | | Class A | | | $9.91 | | | | $6.54 | | | | $10.84 | | | | $6.84 | |
| | | Class B | | | — | | | | — | | | | 10.47 | | | | — | |
| | | Class C | | | 9.89 | | | | 6.40 | | | | 10.40 | | | | 6.79 | |
| | | Institutional | | | 9.89 | | | | 6.45 | | | | 11.02 | | | | 6.84 | |
| | | Service | | | — | | | | — | | | | 10.91 | | | | — | |
| | | Class IR | | | 9.90 | | | | 6.45 | | | | 11.02 | | | | 6.84 | |
| | (a) | | Includes loaned securities having a market value of $12,060,597 and $3,373,284 for the Structured Tax-Managed Equity and Structured International Tax-Managed Equity Funds, respectively. |
| | (b) | | Maximum public offering price per share for Class A Shares of the U.S. Equity Dividend and Premium, International Equity Dividend and Premium, Structured Tax-Managed Equity and Structured International Tax-Managed Equity Funds is $10.49, $6.92, $11.47 and $7.24, respectively. At redemption, Class B and Class C Shares may be subject to a contingent deferred sales charge assessed on the amount equal to the lesser of the current NAV or the original purchase price of the shares. |
| | |
| 50 | | The accompanying notes are an integral part of these financial statements. |
GOLDMAN SACHS STRUCTURED TAX-ADVANTAGED EQUITY FUNDS
Statements of Operations
For the Six Months Ended June 30, 2012 (Unaudited)
| | | | | | | | | | | | | | | | | | |
| | | | | U.S. Equity
Dividend and
Premium Fund | | | International
Equity Dividend
and Premium Fund | | | Structured
Tax-Managed
Equity Fund | | | Structured
International
Tax-Managed
Equity Fund | |
| | Investment income: | | | | | | | | | | | | | | | | |
| | Dividends (net of foreign taxes withheld of $20,433, $764,939, $473 and $247,695) | | $ | 15,877,864 | | | $ | 9,340,627 | | | $ | 2,662,753 | | | $ | 3,175,430 | |
| | Interest | | | — | | | | 5,032 | | | | — | | | | 1,234 | |
| | Securities lending income — affiliated issuer | | | — | | | | — | | | | 39,744 | | | | 113,256 | |
| | Total investment income | | | 15,877,864 | | | | 9,345,659 | | | | 2,702,497 | | | | 3,289,920 | |
| | | | | | | | | | | | | | | | | | |
| | Expenses: | | | | | | | | | | | | | | | | |
| | Management fees | | | 3,696,053 | | | | 1,426,498 | | | | 1,096,889 | | | | 599,503 | |
| | Transfer Agent fees(a) | | | 310,535 | | | | 231,533 | | | | 107,288 | | | | 53,577 | |
| | Distribution and Service fees(a) | | | 278,156 | | | | 271,006 | | | | 108,311 | | | | 42,337 | |
| | Custody and accounting fees | | | 57,016 | | | | 90,166 | | | | 33,985 | | | | 134,601 | |
| | Professional fees | | | 45,833 | | | | 56,973 | | | | 38,871 | | | | 50,122 | |
| | Registration fees | | | 40,864 | | | | 28,103 | | | | 46,556 | | | | 33,613 | |
| | Printing and mailing costs | | | 25,923 | | | | 18,179 | | | | 14,448 | | | | 12,506 | |
| | Trustee fees | | | 8,705 | | | | 8,337 | | | | 8,231 | | | | 8,030 | |
| | Service share fees — Service Plan | | | — | | | | — | | | | 48 | | | | — | |
| | Service share fees — Shareholder Administration Plan | | | — | | | | — | | | | 48 | | | | — | |
| | Other | | | 12,057 | | | | 5,518 | | | | 7,811 | | | | 3,498 | |
| | Total expenses | | | 4,475,142 | | | | 2,136,313 | | | | 1,462,486 | | | | 937,787 | |
| | Less — expense reductions | | | (36,912 | ) | | | (115,427 | ) | | | (226,445 | ) | | | (261,749 | ) |
| | Net expenses | | | 4,438,230 | | | | 2,020,886 | | | | 1,236,041 | | | | 676,038 | |
| | NET INVESTMENT INCOME | | | 11,439,634 | | | | 7,324,773 | | | | 1,466,456 | | | | 2,613,882 | |
| | | | | | | | | | | | | | | | | | |
| | Realized and unrealized gain (loss): | | | | | | | | | | | | | | | | |
| | Net realized gain (loss) from: | | | | | | | | | | | | | | | | |
| | Investments | | | 8,648,089 | | | | (8,133,553 | ) | | | 27,249,385 | | | | 11,076,237 | |
| | Futures contracts | | | 3,021,963 | | | | (1,121,460 | ) | | | 321,367 | | | | 23,163 | |
| | Foreign currency transactions | | | — | | | | (258,333 | ) | | | — | | | | 42,333 | |
| | Written options | | | (9,175,670 | ) | | | (3,589,187 | ) | | | — | | | | — | |
| | Net change in unrealized gain (loss) on: | | | | | | | | | | | | | | | | |
| | Investments | | | 39,556,221 | | | | 5,347,376 | | | | (1,936,210 | ) | | | (9,468,680 | ) |
| | Futures contracts | | | 339,211 | | | | 364,065 | | | | 212,642 | | | | 93,517 | |
| | Foreign currency translation | | | — | | | | 140,351 | | | | — | | | | 24,041 | |
| | Written options | | | 1,815,212 | | | | (593,472 | ) | | | — | | | | — | |
| | Net realized and unrealized gain (loss) | | | 44,205,026 | | | | (7,844,213 | ) | | | 25,847,184 | | | | 1,790,611 | |
| | NET INCREASE (DECREASE) IN NET ASSETS RESULTING FROM OPERATIONS | | $ | 55,644,660 | | | $ | (519,440 | ) | | $ | 27,313,640 | | | $ | 4,404,493 | |
| | (a) | | Class specific Distribution and Service, and Transfer Agent fees were as follows: |
| | | | | | | | | | | | | | | | | | | | | | | | | | | | | | | | | | | | |
| | | Distribution and Service Fees | | | Transfer Agent Fees | |
Fund | | Class A | | | Class B | | | Class C | | | Class A | | | Class B | | | Class C | | | Institutional | | | Service | | | Class IR | |
U.S. Equity Dividend and Premium | | $ | 144,117 | | | $ | – | | | $ | 134,039 | | | $ | 109,530 | | | $ | — | | | $ | 25,468 | | | $ | 167,709 | | | $ | — | | | $ | 7,828 | |
International Equity Dividend and Premium | | | 262,989 | | | | – | | | | 8,017 | | | | 199,874 | | | | — | | | | 1,523 | | | | 27,488 | | | | — | | | | 2,648 | |
Structured Tax-Managed Equity | | | 62,119 | | | | 4,110 | | | | 42,082 | | | | 47,211 | | | | 781 | | | | 7,996 | | | | 50,776 | | | | 7 | | | | 517 | |
Structured International Tax-Managed Equity | | | 42,240 | | | | – | | | | 97 | | | | 32,102 | | | | — | | | | 19 | | | | 21,448 | | | | — | | | | 8 | |
| | |
| The accompanying notes are an integral part of these financial statements. | | 51 |
GOLDMAN SACHS STRUCTURED TAX-ADVANTAGED EQUITY FUNDS
Statements of Changes in Net Assets
| | | | | | | | | | |
| | | | | U.S. Equity Dividend and
Premium Fund | |
| | | | | For the
Six Months Ended
June 30, 2012
(Unaudited) | | | For the
Fiscal Year Ended
December 31, 2011 | |
| | From operations: | | | | | | | | |
| | Net investment income | | $ | 11,439,634 | | | $ | 13,284,144 | |
| | Net realized gain (loss) | | | 2,494,382 | | | | 57,946,168 | |
| | Net change in unrealized gain (loss) | | | 41,710,644 | | | | (39,096,864 | ) |
| | Net increase (decrease) in net assets resulting from operations | | | 55,644,660 | | | | 32,133,448 | |
| | | | | | | | | | |
| | Distributions to shareholders: | | | | | | | | |
| | From net investment income | | | | | | | | |
| | Class A Shares | | | (1,327,119 | ) | | | (984,531 | ) |
| | Class B Shares | | | — | | | | — | |
| | Class C Shares | | | (207,997 | ) | | | (183,459 | ) |
| | Institutional Shares | | | (10,382,366 | ) | | | (13,404,374 | ) |
| | Service Shares | | | — | | | | — | |
| | Class IR Shares | | | (143,874 | ) | | | (10,870 | ) |
| | From net realized gains | | | | | | | | |
| | Class A Shares | | | — | | | | (1,734,528 | ) |
| | Class C Shares | | | — | | | | (429,956 | ) |
| | Institutional Shares | | | — | | | | (16,786,388 | ) |
| | Class IR Shares | | | — | | | | (17,446 | ) |
| | Total distributions to shareholders | | | (12,061,356 | ) | | | (33,551,552 | ) |
| | | | | | | | | | |
| | From share transactions: | | | | | | | | |
| | Proceeds from sales of shares | | | 376,345,573 | | | | 433,976,555 | |
| | Reinvestment of distributions | | | 10,243,358 | | | | 28,446,394 | |
| | Cost of shares redeemed | | | (106,237,653 | ) | | | (139,506,635 | ) |
| | Net increase (decrease) in net assets resulting from share transactions | | | 280,351,278 | | | | 322,916,314 | |
| | TOTAL INCREASE (DECREASE) | | | 323,934,582 | | | | 321,498,210 | |
| | | | | | | | | | |
| | Net assets: | | | | | | | | |
| | Beginning of period | | | 777,494,434 | | | | 455,996,224 | |
| | End of period | | $ | 1,101,429,016 | | | $ | 777,494,434 | |
| | Undistributed (distributions in excess of) net investment income | | $ | (186,351 | ) | | $ | 435,371 | |
| | |
| 52 | | The accompanying notes are an integral part of these financial statements. |
GOLDMAN SACHS STRUCTURED TAX-ADVANTAGED EQUITY FUNDS
| | | | | | | | | | | | | | | | | | | | | | | | | | | | | | | | | | |
| | International Equity Dividend
and Premium Fund | | | | | Structured Tax-Managed
Equity Fund | | | | | Structured International Tax-Managed
Equity Fund | |
| | | For the
Six Months Ended
June 30, 2012
(Unaudited) | | | | | For the
Fiscal Year Ended
December 31, 2011 | | | | | For the
Six Months Ended
June 30, 2012
(Unaudited) | | | | | For the
Fiscal Year Ended
December 31, 2011 | | | | | For the
Six Months Ended
June 30, 2012
(Unaudited) | | | | | For the
Fiscal Year Ended
December 31, 2011 | |
| | | | | | | | | | | | | | | | | | | | | | | | | | | | | | | | | | |
| | $ | 7,324,773 | | | | | $ | 9,391,764 | | | | | $ | 1,466,456 | | | | | $ | 3,734,542 | | | | | $ | 2,613,882 | | | | | $ | 4,370,279 | |
| | | (13,102,533 | ) | | | | | 19,425,290 | | | | | | 27,570,752 | | | | | | 24,826,176 | | | | | | 11,141,733 | | | | | | 21,180,122 | |
| | | 5,258,320 | | | | | | (76,319,786 | ) | | | | | (1,723,568 | ) | | | | | (19,826,325 | ) | | | | | (9,351,122 | ) | | | | | (48,122,324 | ) |
| | | (519,440 | ) | | | | | (47,502,732 | ) | | | | | 27,313,640 | | | | | | 8,734,393 | | | | | | 4,404,493 | | | | | | (22,571,923 | ) |
| | | | | | | | | | | | | | | | | | | | | | | | | | | | | | | | | | |
| | | | | | | | | | | | | | | | | | | | | | | | | | | | | | | | | | |
| | | | | | | | | | | | | | | | | | | | | | | | | | | | | | | | | | |
| | | (4,100,485 | ) | | | | | (5,792,943 | ) | | | | | — | | | | | | (449,162 | ) | | | | | — | | | | | | (1,212,372 | ) |
| | | — | | | | | | — | | | | | | — | | | | | | (1,697 | ) | | | | | — | | | | | | — | |
| | | (24,752 | ) | | | | | (32,511 | ) | | | | | — | | | | | | (23,948 | ) | | | | | — | | | | | | (413 | ) |
| | | (3,162,234 | ) | | | | | (4,224,385 | ) | | | | | — | | | | | | (3,381,300 | ) | | | | | — | | | | | | (3,365,439 | ) |
| | | — | | | | | | — | | | | | | — | | | | | | (311 | ) | | | | | — | | | | | | — | |
| | | (54,012 | ) | | | | | (166 | ) | | | | | — | | | | | | (16 | ) | | | | | — | | | | | | (33 | ) |
| | | | | | | | | | | | | | | | | | | | | | | | | | | | | | | | | | |
| | | — | | | | | | (9,660,352 | ) | | | | | — | | | | | | — | | | | | | — | | | | | | — | |
| | | — | | | | | | (76,476 | ) | | | | | — | | | | | | — | | | | | | — | | | | | | — | |
| | | — | | | | | | (6,254,691 | ) | | | | | — | | | | | | — | | | | | | — | | | | | | — | |
| | | — | | | | | | (1,806 | ) | | | | | — | | | | | | — | | | | | | — | | | | | | — | |
| | | (7,341,483 | ) | | | | | (26,043,330 | ) | | | | | — | | | | | | (3,856,434 | ) | | | | | — | | | | | | (4,578,257 | ) |
| | | | | | | | | | | | | | | | | | | | | | | | | | | | | | | | | | |
| | | | | | | | | | | | | | | | | | | | | | | | | | | | | | | | | | |
| | | 111,195,736 | | | | | | 212,956,436 | | | | | | 51,857,354 | | | | | | 92,300,453 | | | | | | 24,407,339 | | | | | | 65,285,477 | |
| | | 7,063,188 | | | | | | 25,568,327 | | | | | | — | | | | | | 3,818,158 | | | | | | — | | | | | | 4,574,927 | |
| | | (38,068,114 | ) | | | | | (132,417,462 | ) | | | | | (42,692,490 | ) | | | | | (117,208,378 | ) | | | | | (27,002,220 | ) | | | | | (62,170,343 | ) |
| | | 80,190,810 | | | | | | 106,107,301 | | | | | | 9,164,864 | | | | | | (21,089,767 | ) | | | | | (2,594,881 | ) | | | | | 7,690,061 | |
| | | 72,329,887 | | | | | | 32,561,239 | | | | | | 36,478,504 | | | | | | (16,211,808 | ) | | | | | 1,809,612 | | | | | | (19,460,119 | ) |
| | | | | | | | | | | | | | | | | | | | | | | | | | | | | | | | | | |
| | | | | | | | | | | | | | | | | | | | | | | | | | | | | | | | | | |
| | | 289,903,306 | | | | | | 257,342,067 | | | | | | 287,523,350 | | | | | | 303,735,158 | | | | | | 142,022,525 | | | | | | 161,482,644 | |
| | $ | 362,233,193 | | | | | $ | 289,903,306 | | | | | $ | 324,001,854 | | | | | $ | 287,523,350 | | | | | $ | 143,832,137 | | | | | $ | 142,022,525 | |
| | $ | (375,183 | ) | | | | $ | (358,473 | ) | | | | $ | 1,467,509 | | | | | $ | 1,053 | | | | | $ | 2,486,833 | | | | | $ | (127,049 | ) |
| | |
| The accompanying notes are an integral part of these financial statements. | | 53 |
GOLDMAN SACHS U.S. EQUITY DIVIDEND AND PREMIUM FUND
Financial Highlights
Selected Data for a Share Outstanding Throughout Each Period
| | | | | | | | | | | | | | | | | | | | | | | | | | | | | | |
| | | | | | | | Income (loss) from
investment operations | | | Distributions
to shareholders | |
| | | Year - Share Class | |
Net asset
value,
beginning
of period | | | Net
investment
income(a) | | | Net realized
and unrealized
gain (loss) | | | Total from
investment
operations | | | From net
investment
income | | | From net
realized
gains | | | Total
distributions | |
| | FOR THE SIX MONTHS ENDED JUNE 30, (UNAUDITED) | |
| | 2012 - A | | $ | 9.39 | | | $ | 0.10 | | | $ | 0.52 | | | $ | 0.62 | | | $ | (0.10 | ) | | $ | — | | | $ | (0.10 | ) |
| | 2012 - C | | | 9.38 | | | | 0.06 | | | | 0.52 | | | | 0.58 | | | | (0.07 | ) | | | — | | | | (0.07 | ) |
| | 2012 - Institutional | | | 9.37 | | | | 0.12 | | | | 0.52 | | | | 0.64 | | | | (0.12 | ) | | | — | | | | (0.12 | ) |
| | 2012 - IR | | | 9.38 | | | | 0.11 | | | | 0.52 | | | | 0.63 | | | | (0.11 | ) | | | — | | | | (0.11 | ) |
| | | | | | | | | | | | | | | | | | | | | | | | | | | | | | |
| | FOR THE FISCAL YEARS ENDED DECEMBER 31, | |
| | 2011 - A | | | 9.38 | | | | 0.18 | (d) | | | 0.27 | | | | 0.45 | | | | (0.19 | ) | | | (0.25 | ) | | | (0.44 | ) |
| | 2011 - C | | | 9.38 | | | | 0.11 | (d) | | | 0.27 | | | | 0.38 | | | | (0.13 | ) | | | (0.25 | ) | | | (0.38 | ) |
| | 2011 - Institutional | | | 9.36 | | | | 0.22 | (d) | | | 0.27 | | | | 0.49 | | | | (0.23 | ) | | | (0.25 | ) | | | (0.48 | ) |
| | 2011 - IR | | | 9.38 | | | | 0.21 | (d) | | | 0.26 | | | | 0.47 | | | | (0.22 | ) | | | (0.25 | ) | | | (0.47 | ) |
| | 2010 - A | | | 8.29 | | | | 0.16 | (e) | | | 1.08 | | | | 1.24 | | | | (0.15 | ) | | | — | | | | (0.15 | ) |
| | 2010 - C | | | 8.29 | | | | 0.13 | (e) | | | 1.05 | | | | 1.18 | | | | (0.09 | ) | | | — | | | | (0.09 | ) |
| | 2010 - Institutional | | | 8.28 | | | | 0.26 | (e) | | | 1.01 | | | | 1.27 | | | | (0.19 | ) | | | — | | | | (0.19 | ) |
| | 2010 - IR (Commenced August 31, 2010) | | | 8.06 | | | | 0.11 | (e) | | | 1.30 | | | | 1.41 | | | | (0.09 | ) | | | — | | | | (0.09 | ) |
| | 2009 - A | | | 6.86 | | | | 0.13 | | | | 1.43 | | | | 1.56 | | | | (0.13 | ) | | | — | | | | (0.13 | ) |
| | 2009 - C | | | 6.87 | | | | 0.08 | | | | 1.42 | | | | 1.50 | | | | (0.08 | ) | | | — | | | | (0.08 | ) |
| | 2009 - Institutional | | | 6.85 | | | | 0.17 | | | | 1.42 | | | | 1.59 | | | | (0.16 | ) | | | — | | | | (0.16 | ) |
| | 2008 - A | | | 10.34 | | | | 0.19 | | | | (3.46 | ) | | | (3.27 | ) | | | (0.19 | ) | | | (0.02 | ) | | | (0.21 | ) |
| | 2008 - C | | | 10.35 | | | | 0.12 | | | | (3.46 | ) | | | (3.34 | ) | | | (0.12 | ) | | | (0.02 | ) | | | (0.14 | ) |
| | 2008 - Institutional | | | 10.34 | | | | 0.23 | | | | (3.47 | ) | | | (3.24 | ) | | | (0.23 | ) | | | (0.02 | ) | | | (0.25 | ) |
| | 2007 - A | | | 10.97 | | | | 0.29 | (f) | | | 0.05 | | | | 0.34 | | | | (0.29 | ) | | | (0.68 | ) | | | (0.97 | ) |
| | 2007 - C | | | 10.99 | | | | 0.20 | (f) | | | 0.06 | | | | 0.26 | | | | (0.22 | ) | | | (0.68 | ) | | | (0.90 | ) |
| | 2007 - Institutional | | | 10.97 | | | | 0.33 | (f) | | | 0.06 | | | | 0.39 | | | | (0.34 | ) | | | (0.68 | ) | | | (1.02 | ) |
| | (a) | | Calculated based on the average shares outstanding methodology. |
| | (b) | | Assumes investment at the net asset value at the beginning of the period, reinvestment of all distributions, a complete redemption of the investment at the net asset value at the end of the period and no sales or redemption charges. Total returns would be reduced if a sales or redemption charge was taken into account. Returns do not reflect the deduction of taxes that a shareholder would pay on Fund distributions or the redemption of Fund shares. Total returns for periods less than one full year are not annualized. |
| | (d) | | Reflects income recognized from non-recurring special dividends which amounted to $0.01 per share and 0.12% of average net assets. |
| | (e) | | Reflects income recognized from non-recurring special dividends which amounted to $0.05 per share and 0.56% of average net assets. |
| | (f) | | Reflects income recognized from non-recurring special dividends which amounted to $0.05 per share and 0.43% of average net assets. |
| | (g) | | The Fund’s portfolio turnover rate is calculated in accordance with regulatory requirements, without regard to transactions involving short term investments and certain derivatives. If such transactions were included, the Fund’s portfolio turnover rate may be higher. |
| | |
| 54 | | The accompanying notes are an integral part of these financial statements. |
GOLDMAN SACHS U.S. EQUITY DIVIDEND AND PREMIUM FUND
| | | | | | | | | | | | | | | | | | | | | | | | | | | | | | | | | | | | | | | | |
| | | | | | | | | | | | | | | | | | | | | | | | | | | | | | | | | | |
| | | Net asset
value, end
of period | | | | | Total
return(b) | | | | | Net assets,
end of
period
(in 000s) | | | | | Ratio of
net expenses
to average
net assets | | | | | Ratio of
total expenses
to average
net assets | | | | | Ratio of
net investment
income
to average
net assets | | | | | Portfolio
turnover
rate(g) | |
| | | | | | | | | | | | | | | | | | | | | | | | | | | | | | | | | | | | | | | | |
| | $ | 9.91 | | | | | | 6.59 | % | | | | $ | 143,584 | | | | | | 1.22 | %(c) | | | | | 1.23 | %(c) | | | | | 2.03 | %(c) | | | | | 18 | % |
| | | 9.89 | | | | | | 6.14 | | | | | | 35,032 | | | | | | 1.97 | (c) | | | | | 1.98 | (c) | | | | | 1.28 | (c) | | | | | 18 | |
| | | 9.89 | | | | | | 6.79 | | | | | | 907,877 | | | | | | 0.82 | (c) | | | | | 0.83 | (c) | | | | | 2.38 | (c) | | | | | 18 | |
| | | 9.90 | | | | | | 6.74 | | | | | | 14,936 | | | | | | 0.97 | (c) | | | | | 0.98 | (c) | | | | | 2.28 | (c) | | | | | 18 | |
| | | | | | | | | | | | | | | | | | | | | | | | | | | | | | | | | | | | | | | | |
| | | | | | | | | | | | | | | | | | | | | | | | | | | | | | | | | | | | | | | | |
| | | 9.39 | | | | | | 4.90 | | | | | | 70,499 | | | | | | 1.24 | | | | | | 1.25 | | | | | | 1.94 | (d) | | | | | 90 | |
| | | 9.38 | | | | | | 4.03 | | | | | | 17,378 | | | | | | 1.99 | | | | | | 2.00 | | | | | | 1.14 | (d) | | | | | 90 | |
| | | 9.37 | | | | | | 5.31 | | | | | | 688,194 | | | | | | 0.84 | | | | | | 0.85 | | | | | | 2.29 | (d) | | | | | 90 | |
| | | 9.38 | | | | | | 5.05 | | | | | | 1,425 | | | | | | 0.99 | | | | | | 1.00 | | | | | | 2.20 | (d) | | | | | 90 | |
| | | 9.38 | | | | | | 15.07 | | | | | | 37,112 | | | | | | 1.24 | | | | | | 1.26 | | | | | | 1.84 | (e) | | | | | 140 | |
| | | 9.38 | | | | | | 14.32 | | | | | | 10,851 | | | | | | 1.99 | | | | | | 2.01 | | | | | | 1.52 | (e) | | | | | 140 | |
| | | 9.36 | | | | | | 15.53 | | | | | | 408,032 | | | | | | 0.84 | | | | | | 0.86 | | | | | | 2.95 | (e) | | | | | 140 | |
| | | 9.38 | | | | | | 17.53 | | | | | | 1 | | | | | | 0.99 | (c) | | | | | 1.01 | (c) | | | | | 4.04 | (c)(e) | | | | | 140 | |
| | | 8.29 | | | | | | 23.03 | | | | | | 139,340 | | | | | | 1.24 | | | | | | 1.30 | | | | | | 1.85 | | | | | | 125 | |
| | | 8.29 | | | | | | 21.93 | | | | | | 9,540 | | | | | | 1.99 | | | | | | 2.05 | | | | | | 1.10 | | | | | | 125 | |
| | | 8.28 | | | | | | 23.55 | | | | | | 147,446 | | | | | | 0.84 | | | | | | 0.90 | | | | | | 2.30 | | | | | | 125 | |
| | | 6.86 | | | | | | (31.86 | ) | | | | | 115,172 | | | | | | 1.24 | | | | | | 1.29 | | | | | | 2.12 | | | | | | 61 | |
| | | 6.87 | | | | | | (32.36 | ) | | | | | 8,577 | | | | | | 1.99 | | | | | | 2.04 | | | | | | 1.37 | | | | | | 61 | |
| | | 6.85 | | | | | | (31.65 | ) | | | | | 75,190 | | | | | | 0.84 | | | | | | 0.89 | | | | | | 2.62 | | | | | | 61 | |
| | | 10.34 | | | | | | 2.99 | | | | | | 240,787 | | | | | | 1.24 | | | | | | 1.26 | | | | | | 2.57 | (f) | | | | | 53 | |
| | | 10.35 | | | | | | 2.19 | | | | | | 16,209 | | | | | | 1.99 | | | | | | 2.01 | | | | | | 1.78 | (f) | | | | | 53 | |
| | | 10.34 | | | | | | 3.39 | | | | | | 82,388 | | | | | | 0.84 | | | | | | 0.86 | | | | | | 2.90 | (f) | | | | | 53 | |
| | |
| The accompanying notes are an integral part of these financial statements. | | 55 |
GOLDMAN SACHS INTERNATIONAL EQUITY DIVIDEND AND PREMIUM FUND
Financial Highlights
Selected Data for a Share Outstanding Throughout Each Period
| | | | | | | | | | | | | | | | | | | | | | | | | | | | | | | | | | |
| | | | | | | | Income (loss) from
investment operations | | | Distributions
to shareholders | |
| | | Year - Share Class | | Net asset
value,
beginning
of period | | | Net
investment
income | | | Net realized
and unrealized
gain (loss) | | | Total from
investment
operations | | | From net
investment
income | | | From net
realized
gains | | | From
capital | | | Total
distributions | |
| | FOR THE SIX MONTHS ENDED JUNE 30, (UNAUDITED) | |
| | 2012 - A | | $ | 6.60 | | | $ | 0.14 | (b) | | $ | (0.07 | ) | | $ | 0.07 | | | $ | (0.13 | ) | | $ | — | | | $ | — | | | $ | (0.13 | ) |
| | 2012 - C | | | 6.47 | | | | 0.11 | (b) | | | (0.08 | ) | | | 0.03 | | | | (0.10 | ) | | | — | | | | — | | | | (0.10 | ) |
| | 2012 - Institutional | | | 6.52 | | | | 0.15 | (b) | | | (0.08 | ) | | | 0.07 | | | | (0.14 | ) | | | — | | | | — | | | | (0.14 | ) |
| | 2012 - IR | | | 6.52 | | | | 0.19 | (b) | | | (0.13 | ) | | | 0.06 | | | | (0.13 | ) | | | — | | | | — | | | | (0.13 | ) |
| | | | | | | | | | | | | | | | | | | | | | | | | | | | | | | | | | |
| | FOR THE FISCAL YEARS ENDED DECEMBER 31, | |
| | 2011 - A | | | 8.17 | | | | 0.21 | (d) | | | (1.20 | ) | | | (0.99 | ) | | | (0.23 | ) | | | (0.35 | ) | | | — | | | | (0.58 | ) |
| | 2011 - C | | | 8.02 | | | | 0.16 | (d) | | | (1.19 | ) | | | (1.03 | ) | | | (0.17 | ) | | | (0.35 | ) | | | — | | | | (0.52 | ) |
| | 2011 - Institutional | | | 8.07 | | | | 0.24 | (d) | | | (1.18 | ) | | | (0.94 | ) | | | (0.26 | ) | | | (0.35 | ) | | | — | | | | (0.61 | ) |
| | 2011 - IR | | | 8.06 | | | | 0.24 | (d) | | | (1.18 | ) | | | (0.94 | ) | | | (0.25 | ) | | | (0.35 | ) | | | — | | | | (0.60 | ) |
| | 2010 - A | | | 7.86 | | | | 0.16 | (b) | | | 0.41 | | | | 0.57 | | | | (0.14 | ) | | | (0.12 | ) | | | — | | | | (0.26 | ) |
| | 2010 - C | | | 7.73 | | | | 0.10 | (b) | | | 0.41 | | | | 0.51 | | | | (0.10 | ) | | | (0.12 | ) | | | — | | | | (0.22 | ) |
| | 2010 - Institutional | | | 7.76 | | | | 0.18 | (b) | | | 0.42 | | | | 0.60 | | | | (0.17 | ) | | | (0.12 | ) | | | — | | | | (0.29 | ) |
| | 2010 - IR (Commenced August 31, 2010) | | | 7.08 | | | | 0.04 | (b) | | | 1.10 | | | | 1.14 | | | | (0.04 | ) | | | (0.12 | ) | | | — | | | | (0.16 | ) |
| | 2009 - A | | | 6.36 | | | | 0.09 | (b) | | | 1.53 | | | | 1.62 | | | | (0.12 | ) | | | — | | | | — | | | | (0.12 | ) |
| | 2009 - C | | | 6.28 | | | | 0.02 | (b) | | | 1.52 | | | | 1.54 | | | | (0.09 | ) | | | — | | | | — | | | | (0.09 | ) |
| | 2009 - Institutional | | | 6.30 | | | | 0.14 | (b) | | | 1.47 | | | | 1.61 | | | | (0.15 | ) | | | — | | | | — | | | | (0.15 | ) |
| | | | | | | | | | | | | | | | | | | | | | | | | | | | | | | | | | |
| | FOR THE PERIOD ENDED DECEMBER 31, | |
| | 2008 - A (Commenced January 31, 2008) | | | 10.00 | | | | 0.18 | (b) | | | (3.55 | ) | | | (3.37 | ) | | | (0.21 | ) | | | — | | | | (0.06 | ) | | | (0.27 | ) |
| | 2008 - C (Commenced January 31, 2008) | | | 10.00 | | | | 0.15 | (b) | | | (3.66 | ) | | | (3.51 | ) | | | (0.15 | ) | | | — | | | | (0.06 | ) | | | (0.21 | ) |
| | 2008 - Institutional (Commenced January 31, 2008) | | | 10.00 | | | | 0.31 | (b) | | | (3.73 | ) | | | (3.42 | ) | | | (0.22 | ) | | | — | | | | (0.06 | ) | | | (0.28 | ) |
| | (a) | | Assumes investment at the net asset value at the beginning of the period, reinvestment of all distributions, a complete redemption of the investment at the net asset value at the end of the period and no sales or redemption charges. Total returns would be reduced if a sales or redemption charge was taken into account. Returns do not reflect the deduction of taxes that a shareholder would pay on Fund distributions or the redemption of Fund shares. Total returns for periods less than one full year are not annualized. |
| | (b) | | Calculated based on the average shares outstanding methodology. |
| | (d) | | Includes income recognized from a corporate action which amounted to $0.01 per share and 0.13% of average net assets. |
| | (e) | | The Fund’s portfolio turnover rate is calculated in accordance with regulatory requirements, without regard to transactions involving short term investments and certain derivatives. If such transactions were included, the Fund’s portfolio turnover rate may be higher. |
| | |
| 56 | | The accompanying notes are an integral part of these financial statements. |
GOLDMAN SACHS INTERNATIONAL EQUITY DIVIDEND AND PREMIUM FUND
| | | | | | | | | | | | | | | | | | | | | | | | | | | | | | | | | | | | | | | | |
| | | | | | | | | | | | | | | | | | | | | | | | | | | | | | | | | | |
| | | Net asset
value, end
of period | | | | | Total
return(a) | | | | | Net assets,
end of
period
(in 000s) | | | | | Ratio of
net expenses
to average
net assets | | | | | Ratio of
total expenses
to average
net assets | | | | | Ratio of
net investment
income
to average
net assets | | | | | Portfolio
turnover
rate(e) | |
| | | | | | | | | | | | | | | | | | | | | | | | | | | | | | | | | | | | | | | | |
| | $ | 6.54 | | | | | | 1.05 | % | | | | $ | 207,911 | | | | | | 1.30 | %(c) | | | | | 1.37 | %(c) | | | | | 4.01 | %(c) | | | | | 18 | % |
| | | 6.40 | | | | | | 0.53 | | | | | | 1,511 | | | | | | 2.05 | (c) | | | | | 2.12 | (c) | | | | | 3.18 | (c) | | | | | 18 | |
| | | 6.45 | | | | | | 1.11 | | | | | | 151,799 | | | | | | 0.90 | (c) | | | | | 0.97 | (c) | | | | | 4.36 | (c) | | | | | 18 | |
| | | 6.45 | | | | | | 0.97 | | | | | | 1,012 | | | | | | 1.05 | (c) | | | | | 1.12 | (c) | | | | | 5.49 | (c) | | | | | 18 | |
| | | | | | | | | | | | | | | | | | | | | | | | | | | | | | | | | | | | | | | | |
| | | | | | | | | | | | | | | | | | | | | | | | | | | | | | | | | | | | | | | | |
| | | 6.60 | | | | | | (12.44 | ) | | | | | 171,063 | | | | | | 1.30 | | | | | | 1.38 | | | | | | 2.74 | (d) | | | | | 51 | |
| | | 6.47 | | | | | | (13.06 | ) | | | | | 1,502 | | | | | | 2.05 | | | | | | 2.13 | | | | | | 1.87 | (d) | | | | | 51 | |
| | | 6.52 | | | | | | (11.99 | ) | | | | | 116,023 | | | | | | 0.90 | | | | | | 0.98 | | | | | | 3.17 | (d) | | | | | 51 | |
| | | 6.52 | | | | | | (12.01 | ) | | | | | 1,315 | | | | | | 1.05 | | | | | | 1.13 | | | | | | 0.54 | (d) | | | | | 51 | |
| | | 8.17 | | | | | | 7.59 | | | | | | 158,348 | | | | | | 1.30 | | | | | | 1.45 | | | | | | 2.06 | | | | | | 41 | |
| | | 8.02 | | | | | | 6.81 | | | | | | 1,342 | | | | | | 2.05 | | | | | | 2.20 | | | | | | 1.28 | | | | | | 41 | |
| | | 8.07 | | | | | | 8.10 | | | | | | 97,651 | | | | | | 0.90 | | | | | | 1.05 | | | | | | 2.38 | | | | | | 41 | |
| | | 8.06 | | | | | | 16.12 | | | | | | 1 | | | | | | 1.05 | (c) | | | | | 1.20 | (c) | | | | | 1.48 | (c) | | | | | 41 | |
| | | 7.86 | | | | | | 26.17 | | | | | | 67,681 | | | | | | 1.30 | | | | | | 2.09 | | | | | | 1.23 | | | | | | 98 | |
| | | 7.73 | | | | | | 25.12 | | | | | | 894 | | | | | | 2.05 | | | | | | 2.84 | | | | | | 0.28 | | | | | | 98 | |
| | | 7.76 | | | | | | 26.06 | | | | | | 35,883 | | | | | | 0.90 | | | | | | 1.69 | | | | | | 2.07 | | | | | | 98 | |
| | | | | | | | | | | | | | | | | | | | | | | | | | | | | | | | | | | | | | | | |
| | | | | | | | | | | | | | | | | | | | | | | | | | | | | | | | | | | | | | | | |
| | | 6.36 | | | | | | (34.60 | ) | | | | | 9,673 | | | | | | 1.30 | (c) | | | | | 3.50 | (c) | | | | | 2.71 | (c) | | | | | 130 | |
| | | 6.28 | | | | | | (35.82 | ) | | | | | 23 | | | | | | 2.05 | (c) | | | | | 4.25 | (c) | | | | | 2.20 | (c) | | | | | 130 | |
| | | 6.30 | | | | | | (34.98 | ) | | | | | 12,275 | | | | | | 0.90 | (c) | | | | | 3.10 | (c) | | | | | 4.05 | (c) | | | | | 130 | |
| | |
| The accompanying notes are an integral part of these financial statements. | | 57 |
GOLDMAN SACHS STRUCTURED TAX-MANAGED EQUITY FUND
Financial Highlights
Selected Data for a Share Outstanding Throughout Each Period
| | | | | | | | | | | | | | | | | | | | | | | | | | | | | | |
| | | | | | | | Income (loss) from
investment operations | | | Distributions
to shareholders | |
| | | Year - Share Class | |
Net asset
value,
beginning
of period | | | Net
investment
income
(loss)(a) | | | Net realized
and unrealized
gain (loss) | | | Total from
investment
operations | | | From net
investment
income | | | From
capital | | | Total
distributions | |
| | FOR THE SIX MONTHS ENDED JUNE 30, (UNAUDITED) | |
| | 2012 - A | | $ | 9.94 | | | $ | 0.03 | | | $ | 0.87 | | | $ | 0.90 | | | $ | — | | | $ | — | | | $ | — | |
| | 2012 - B | | | 9.64 | | | | (0.01 | ) | | | 0.84 | | | | 0.83 | | | | — | | | | — | | | | — | |
| | 2012 - C | | | 9.57 | | | | (0.01 | ) | | | 0.84 | | | | 0.83 | | | | — | | | | — | | | | — | |
| | 2012 - Institutional | | | 10.08 | | | | 0.06 | | | | 0.88 | | | | 0.94 | | | | — | | | | — | | | | — | |
| | 2012 - Service | | | 10.01 | | | | 0.03 | | | | 0.87 | | | | 0.90 | | | | — | | | | — | | | | — | |
| | 2012 - IR | | | 10.09 | | | | 0.05 | | | | 0.88 | | | | 0.93 | | | | — | | | | — | | | | — | |
| | | | | | | | | | | | | | | | | | | | | | | | | | | | | | |
| | FOR THE FISCAL YEARS ENDED DECEMBER 31, | |
| | 2011 - A | | | 9.73 | | | | 0.09 | (d) | | | 0.20 | | | | 0.29 | | | | (0.08 | ) | | | — | | | | (0.08 | ) |
| | 2011 - B | | | 9.44 | | | | 0.01 | (d) | | | 0.21 | | | | 0.22 | | | | (0.02 | ) | | | — | | | | (0.02 | ) |
| | 2011 - C | | | 9.39 | | | | 0.01 | (d) | | | 0.20 | | | | 0.21 | | | | (0.03 | ) | | | — | | | | (0.03 | ) |
| | 2011 - Institutional | | | 9.89 | | | | 0.13 | (d) | | | 0.21 | | | | 0.34 | | | | (0.15 | ) | | | — | | | | (0.15 | ) |
| | 2011 - Service | | | 9.81 | | | | 0.07 | (d) | | | 0.22 | | | | 0.29 | | | | (0.09 | ) | | | — | | | | (0.09 | ) |
| | 2011 - IR | | | 9.89 | | | | 0.10 | (d) | | | 0.23 | | | | 0.33 | | | | (0.13 | ) | | | — | | | | (0.13 | ) |
| | 2010 - A | | | 8.64 | | | | 0.08 | | | | 1.08 | | | | 1.16 | | | | (0.07 | ) | | | — | | | | (0.07 | ) |
| | 2010 - B | | | 8.38 | | | | 0.01 | | | | 1.05 | | | | 1.06 | | | | — | | | | — | | | | — | |
| | 2010 - C | | | 8.33 | | | | 0.01 | | | | 1.05 | | | | 1.06 | | | | — | | | | — | | | | — | |
| | 2010 - Institutional | | | 8.78 | | | | 0.11 | | | | 1.11 | | | | 1.22 | | | | (0.11 | ) | | | — | | | | (0.11 | ) |
| | 2010 - Service | | | 8.72 | | | | 0.07 | | | | 1.09 | | | | 1.16 | | | | (0.07 | ) | | | — | | | | (0.07 | ) |
| | 2010 - IR (Commenced August 31, 2010) | | | 8.18 | | | | 0.03 | | | | 1.78 | | | | 1.81 | | | | (0.10 | ) | | | — | | | | (0.10 | ) |
| | 2009 - A | | | 7.20 | | | | 0.09 | (e) | | | 1.45 | | | | 1.54 | | | | (0.10 | ) | | | — | | | | (0.10 | ) |
| | 2009 - B | | | 6.97 | | | | 0.04 | (e) | | | 1.39 | | | | 1.43 | | | | (0.02 | ) | | | — | | | | (0.02 | ) |
| | 2009 - C | | | 6.94 | | | | 0.04 | (e) | | | 1.39 | | | | 1.43 | | | | (0.04 | ) | | | — | | | | (0.04 | ) |
| | 2009 - Institutional | | | 7.31 | | | | 0.14 | (e) | | | 1.47 | | | | 1.61 | | | | (0.14 | ) | | | — | | | | (0.14 | ) |
| | 2009 - Service | | | 7.26 | | | | 0.09 | (e) | | | 1.46 | | | | 1.55 | | | | (0.09 | ) | | | — | | | | (0.09 | ) |
| | 2008 - A | | | 11.50 | | | | 0.08 | | | | (4.31 | ) | | | (4.23 | ) | | | (0.07 | ) | | | — | | | | (0.07 | ) |
| | 2008 - B | | | 11.10 | | | | — | (f) | | | (4.13 | ) | | | (4.13 | ) | | | — | | | | — | | | | — | |
| | 2008 - C | | | 11.06 | | | | 0.01 | | | | (4.13 | ) | | | (4.12 | ) | | | — | | | | — | | | | — | |
| | 2008 - Institutional | | | 11.69 | | | | 0.12 | | | | (4.38 | ) | | | (4.26 | ) | | | (0.12 | ) | | | — | | | | (0.12 | ) |
| | 2008 - Service | | | 11.49 | | | | 0.06 | | | | (4.29 | ) | | | (4.23 | ) | | | — | | | | — | | | | — | |
| | 2007 - A | | | 11.72 | | | | 0.08 | | | | (0.20 | ) | | | (0.12 | ) | | | (0.07 | ) | | | (0.03 | ) | | | (0.10 | ) |
| | 2007 - B | | | 11.30 | | | | (0.01 | ) | | | (0.19 | ) | | | (0.20 | ) | | | — | | | | — | | | | — | |
| | 2007 - C | | | 11.27 | | | | (0.01 | ) | | | (0.19 | ) | | | (0.20 | ) | | | (0.01 | ) | | | — | (f) | | | (0.01 | ) |
| | 2007 - Institutional | | | 11.91 | | | | 0.13 | | | | (0.21 | ) | | | (0.08 | ) | | | (0.10 | ) | | | (0.04 | ) | | | (0.14 | ) |
| | 2007 - Service | | | 11.70 | | | | 0.07 | | | | (0.20 | ) | | | (0.13 | ) | | | (0.06 | ) | | | (0.02 | ) | | | (0.08 | ) |
| | (a) | | Calculated based on the average shares outstanding methodology. |
| | (b) | | Assumes investment at the net asset value at the beginning of the period, reinvestment of all distributions, a complete redemption of the investment at the net asset value at the end of the period and no sales or redemption charges. Total returns would be reduced if a sales or redemption charge was taken into account. Returns do not reflect the deduction of taxes that a shareholder would pay on Fund distributions or the redemption of Fund shares. Total returns for periods less than one full year are not annualized. |
| | (d) | | Reflects income recognized from non-recurring special dividends which amounted to $0.02 per share and 0.18% of average net assets. |
| | (e) | | Reflects income recognized from non-recurring special dividends which amounted to $0.01 per share and 0.01% of average net assets. |
| | (f) | | Amount is less than $0.005 per share. |
| | (g) | | The Fund’s portfolio turnover rate is calculated in accordance with regulatory requirements, without regard to transactions involving short term investments and certain derivatives. If such transactions were included, the Fund’s portfolio turnover rate may be higher. |
| | |
| 58 | | The accompanying notes are an integral part of these financial statements. |
GOLDMAN SACHS STRUCTURED TAX-MANAGED EQUITY FUND
| | | | | | | | | | | | | | | | | | | | | | | | | | | | | | | | | | | | | | | | |
| | | | | | | | | | | | | | | | | | | | | | | | | | | | | | | | | | |
| | | Net asset
value, end
of period | | | | | Total
return(b) | | | | | Net assets,
end of
period
(in 000s) | | | | | Ratio of
net expenses
to average
net assets | | | | | Ratio of
total expenses
to average
net assets | | | | | Ratio of
net investment
income (loss)
to average
net assets | | | | | Portfolio
turnover
rate(g) | |
| | | | | | | | | | | | | | | | | | | | | | | | | | | | | | | | | | | | | | | | |
| | $ | 10.84 | | | | | | 9.05 | % | | | | $ | 46,655 | | | | | | 1.09 | %(c) | | | | | 1.24 | %(c) | | | | | 0.63 | %(c) | | | | | 95 | % |
| | | 10.47 | | | | | | 8.72 | | | | | | 758 | | | | | | 1.84 | (c) | | | | | 1.99 | (c) | | | | | (0.12 | )(c) | | | | | 95 | |
| | | 10.40 | | | | | | 8.67 | | | | | | 8,235 | | | | | | 1.84 | (c) | | | | | 1.99 | (c) | | | | | (0.12 | )(c) | | | | | 95 | |
| | | 11.02 | | | | | | 9.33 | | | | | | 267,757 | | | | | | 0.69 | (c) | | | | | 0.84 | (c) | | | | | 1.03 | (c) | | | | | 95 | |
| | | 10.91 | | | | | | 8.99 | | | | | | 38 | | | | | | 1.19 | (c) | | | | | 1.34 | (c) | | | | | 0.53 | (c) | | | | | 95 | |
| | | 11.02 | | | | | | 9.22 | | | | | | 560 | | | | | | 0.84 | (c) | | | | | 0.99 | (c) | | | | | 0.88 | (c) | | | | | 95 | |
| | | | | | | | | | | | | | | | | | | | | | | | | | | | | | | | | | | | | | | | |
| | | | | | | | | | | | | | | | | | | | | | | | | | | | | | | | | | | | | | | | |
| | | 9.94 | | | | | | 3.02 | | | | | | 51,064 | | | | | | 1.09 | | | | | | 1.24 | | | | | | 0.85 | (d) | | | | | 99 | |
| | | 9.64 | | | | | | 2.18 | | | | | | 895 | | | | | | 1.84 | | | | | | 1.99 | | | | | | 0.12 | (d) | | | | | 99 | |
| | | 9.57 | | | | | | 2.22 | | | | | | 7,964 | | | | | | 1.84 | | | | | | 1.99 | | | | | | 0.14 | (d) | | | | | 99 | |
| | | 10.08 | | | | | | 3.43 | | | | | | 227,070 | | | | | | 0.69 | | | | | | 0.84 | | | | | | 1.31 | (d) | | | | | 99 | |
| | | 10.01 | | | | | | 2.92 | | | | | | 36 | | | | | | 1.19 | | | | | | 1.34 | | | | | | 0.72 | (d) | | | | | 99 | |
| | | 10.09 | | | | | | 3.35 | | | | | | 494 | | | | | | 0.84 | | | | | | 0.99 | | | | | | 1.01 | (d) | | | | | 99 | |
| | | 9.73 | | | | | | 13.46 | | | | | | 91,857 | | | | | | 1.09 | | | | | | 1.25 | | | | | | 0.82 | | | | | | 200 | |
| | | 9.44 | | | | | | 12.65 | | | | | | 1,539 | | | | | | 1.84 | | | | | | 2.00 | | | | | | 0.08 | | | | | | 200 | |
| | | 9.39 | | | | | | 12.59 | | | | | | 9,484 | | | | | | 1.84 | | | | | | 2.00 | | | | | | 0.07 | | | | | | 200 | |
| | | 9.89 | | | | | | 14.04 | | | | | | 200,795 | | | | | | 0.69 | | | | | | 0.85 | | | | | | 1.22 | | | | | | 200 | |
| | | 9.81 | | | | | | 13.34 | | | | | | 59 | | | | | | 1.19 | | | | | | 1.35 | | | | | | 0.69 | | | | | | 200 | |
| | | 9.89 | | | | | | 22.18 | | | | | | 1 | | | | | | 0.84 | (c) | | | | | 1.00 | (c) | | | | | 0.97 | (c) | | | | | 200 | |
| | | 8.64 | | | | | | 21.43 | | | | | | 90,909 | | | | | | 1.09 | | | | | | 1.28 | | | | | | 1.37 | (e) | | | | | 352 | |
| | | 8.38 | | | | | | 20.48 | | | | | | 2,259 | | | | | | 1.84 | | | | | | 2.03 | | | | | | 0.62 | (e) | | | | | 352 | |
| | | 8.33 | | | | | | 20.56 | | | | | | 10,887 | | | | | | 1.84 | | | | | | 2.03 | | | | | | 0.63 | (e) | | | | | 352 | |
| | | 8.78 | | | | | | 21.90 | | | | | | 133,016 | | | | | | 0.69 | | | | | | 0.88 | | | | | | 1.88 | (e) | | | | | 352 | |
| | | 8.72 | | | | | | 21.41 | | | | | | 48 | | | | | | 1.19 | | | | | | 1.38 | | | | | | 1.28 | (e) | | | | | 352 | |
| | | 7.20 | | | | | | (36.66 | ) | | | | | 112,426 | | | | | | 1.09 | | | | | | 1.27 | | | | | | 0.81 | | | | | | 153 | |
| | | 6.97 | | | | | | (37.13 | ) | | | | | 5,169 | | | | | | 1.84 | | | | | | 2.02 | | | | | | (0.02 | ) | | | | | 153 | |
| | | 6.94 | | | | | | (37.08 | ) | | | | | 13,977 | | | | | | 1.84 | | | | | | 2.02 | | | | | | 0.06 | | | | | | 153 | |
| | | 7.31 | | | | | | (36.34 | ) | | | | | 67,367 | | | | | | 0.69 | | | | | | 0.87 | | | | | | 1.27 | | | | | | 153 | |
| | | 7.26 | | | | | | (36.74 | ) | | | | | 55 | | | | | | 1.19 | | | | | | 1.37 | | | | | | 0.57 | | | | | | 153 | |
| | | 11.50 | | | | | | (0.92 | ) | | | | | 241,192 | | | | | | 1.10 | | | | | | 1.24 | | | | | | 0.65 | | | | | | 73 | |
| | | 11.10 | | | | | | (1.77 | ) | | | | | 20,010 | | | | | | 1.85 | | | | | | 1.99 | | | | | | (0.11 | ) | | | | | 73 | |
| | | 11.06 | | | | | | (1.75 | ) | | | | | 30,008 | | | | | | 1.85 | | | | | | 1.99 | | | | | | (0.10 | ) | | | | | 73 | |
| | | 11.69 | | | | | | (0.65 | ) | | | | | 63,913 | | | | | | 0.70 | | | | | | 0.84 | | | | | | 1.05 | | | | | | 73 | |
| | | 11.49 | | | | | | (1.10 | ) | | | | | 400 | | | | | | 1.20 | | | | | | 1.34 | | | | | | 0.55 | | | | | | 73 | |
| | |
| The accompanying notes are an integral part of these financial statements. | | 59 |
GOLDMAN SACHS STRUCTURED INTERNATIONAL TAX-MANAGED EQUITY FUND
Financial Highlights
Selected Data for a Share Outstanding Throughout Each Period
| | | | | | | | | | | | | | | | | | | | | | |
| | | | | | | | Income (loss) from
investment operations | | | | |
| | | Year - Share Class | | Net asset
value,
beginning
of period | | | Net
investment
income | | | Net realized
and unrealized
gain (loss) | | | Total from
investment
operations | | | Distributions
to shareholders
from net
investment
income | |
| | FOR THE SIX MONTHS ENDED JUNE 30, (UNAUDITED) | |
| | 2012 - A | | $ | 6.65 | | | $ | 0.11 | (b) | | $ | 0.08 | | | $ | 0.19 | | | $ | — | |
| | 2012 - C | | | 6.64 | | | | 0.09 | (b) | | | 0.06 | | | | 0.15 | | | | — | |
| | 2012 - Institutional | | | 6.64 | | | | 0.13 | (b) | | | 0.07 | | | | 0.20 | | | | — | |
| | 2012 - IR | | | 6.64 | | | | 0.20 | (b) | | | — | (c) | | | 0.20 | | | | — | |
| | | | | | | | | | | | | | | | | | | | | | |
| | FOR THE FISCAL YEARS ENDED DECEMBER 31, | |
| | 2011 - A | | | 7.90 | | | | 0.20 | (b)(e) | | | (1.25 | ) | | | (1.05 | ) | | | (0.20 | ) |
| | 2011 - C | | | 7.88 | | | | 0.13 | (b)(e) | | | (1.23 | ) | | | (1.10 | ) | | | (0.14 | ) |
| | 2011 - Institutional | | | 7.90 | | | | 0.21 | (b)(e) | | | (1.23 | ) | | | (1.02 | ) | | | (0.24 | ) |
| | 2011 - IR | | | 7.90 | | | | 0.20 | (b)(e) | | | (1.24 | ) | | | (1.04 | ) | | | (0.22 | ) |
| | 2010 - A | | | 7.40 | | | | 0.13 | (b) | | | 0.51 | | | | 0.64 | | | | (0.14 | ) |
| | 2010 - C | | | 7.39 | | | | 0.08 | (b) | | | 0.50 | | | | 0.58 | | | | (0.09 | ) |
| | 2010 - Institutional | | | 7.39 | | | | 0.15 | (b) | | | 0.53 | | | | 0.68 | | | | (0.17 | ) |
| | 2010 - IR (Commenced August 31, 2010) | | | 6.82 | | | | 0.03 | (b) | | | 1.21 | | | | 1.24 | | | | (0.16 | ) |
| | 2009 - A | | | 6.07 | | | | 0.13 | (b) | | | 1.32 | | | | 1.45 | | | | (0.12 | ) |
| | 2009 - C | | | 6.06 | | | | 0.09 | (b) | | | 1.31 | | | | 1.40 | | | | (0.07 | ) |
| | 2009 - Institutional | | | 6.06 | | | | 0.15 | (b) | | | 1.33 | | | | 1.48 | | | | (0.15 | ) |
| | | | | | | | | | | | | | | | | | | | | | |
| | FOR THE PERIOD ENDED DECEMBER 31, | |
| | 2008 - A (Commenced January 31, 2008) | | | 10.00 | | | | 0.17 | | | | (3.93 | ) | | | (3.76 | ) | | | (0.17 | ) |
| | 2008 - C (Commenced January 31, 2008) | | | 10.00 | | | | 0.13 | | | | (3.94 | ) | | | (3.81 | ) | | | (0.13 | ) |
| | 2008 - Institutional (Commenced January 31, 2008) | | | 10.00 | | | | 0.19 | | | | (3.94 | ) | | | (3.75 | ) | | | (0.19 | ) |
| | (a) | | Assumes investment at the net asset value at the beginning of the period, reinvestment of all distributions, a complete redemption of the investment at the net asset value at the end of the period and no sales or redemption charges. Total returns would be reduced if a sales or redemption charge was taken into account. Returns do not reflect the deduction of taxes that a shareholder would pay on Fund distributions or the redemption of Fund shares. Total returns for periods less than one full year are not annualized. |
| | (b) | | Calculated based on the average shares outstanding methodology. |
| | (c) | | Amount is less than $0.005 per share. |
| | (e) | | Reflects income recognized from non-recurring special dividends which amounted to $0.01 per share and 0.16% of average net assets. |
| | (f) | | The Fund’s portfolio turnover rate is calculated in accordance with regulatory requirements, without regard to transactions involving short term investments and certain derivatives. If such transactions were included, the Fund’s portfolio turnover rate may be higher. |
| | |
| 60 | | The accompanying notes are an integral part of these financial statements. |
GOLDMAN SACHS STRUCTURED INTERNATIONAL TAX-MANAGED EQUITY FUND
| | | | | | | | | | | | | | | | | | | | | | | | | | | | | | | | | | | | | | | | |
| | | | | | | | | | | | | | | | | | | | | | | | | | | | | | | | | | |
| | | Net asset
value, end
of period | | | | | Total
return(a) | | | | | Net assets,
end of
period
(in 000s) | | | | | Ratio of
net expenses
to average
net assets | | | | | Ratio of
total expenses
to average
net assets | | | | | Ratio of
net investment
income
to average
net assets | | | | | Portfolio
turnover
rate(f) | |
| | | | | | | | | | | | | | | | | | | | | | | | | | | | | | | | | | | | | | | | |
| | $ | 6.84 | | | | | | 2.86 | % | | | | $ | 31,056 | | | | | | 1.26 | %(d) | | | | | 1.63 | %(d) | | | | | 3.29 | %(d) | | | | | 107 | % |
| | | 6.79 | | | | | | 2.26 | | | | | | 19 | | | | | | 2.01 | (d) | | | | | 2.38 | (d) | | | | | 2.66 | (d) | | | | | 107 | |
| | | 6.84 | | | | | | 3.01 | | | | | | 112,742 | | | | | | 0.86 | (d) | | | | | 1.23 | (d) | | | | | 3.84 | (d) | | | | | 107 | |
| | | 6.84 | | | | | | 3.01 | | | | | | 16 | | | | | | 1.01 | (d) | | | | | 1.38 | (d) | | | | | 5.83 | (d) | | | | | 107 | |
| | | | | | | | | | | | | | | | | | | | | | | | | | | | | | | | | | | | | | | | |
| | | | | | | | | | | | | | | | | | | | | | | | | | | | | | | | | | | | | | | | |
| | | 6.65 | | | | | | (13.33 | ) | | | | | 40,837 | | | | | | 1.26 | | | | | | 1.57 | | | | | | 2.60 | (e) | | | | | 88 | |
| | | 6.64 | | | | | | (13.88 | ) | | | | | 19 | | | | | | 2.01 | | | | | | 2.32 | | | | | | 1.72 | (e) | | | | | 88 | |
| | | 6.64 | | | | | | (12.92 | ) | | | | | 101,165 | | | | | | 0.86 | | | | | | 1.17 | | | | | | 2.81 | (e) | | | | | 88 | |
| | | 6.64 | | | | | | (13.11 | ) | | | | | 1 | | | | | | 1.01 | | | | | | 1.32 | | | | | | 2.68 | (e) | | | | | 88 | |
| | | 7.90 | | | | | | 8.64 | | | | | | 75,854 | | | | | | 1.26 | | | | | | 1.56 | | | | | | 1.75 | | | | | | 70 | |
| | | 7.88 | | | | | | 7.89 | | | | | | 24 | | | | | | 2.01 | | | | | | 2.31 | | | | | | 1.05 | | | | | | 70 | |
| | | 7.90 | | | | | | 9.17 | | | | | | 85,604 | | | | | | 0.86 | | | | | | 1.16 | | | | | | 2.12 | | | | | | 70 | |
| | | 7.90 | | | | | | 18.21 | | | | | | 1 | | | | | | 1.01 | (d) | | | | | 1.31 | (d) | | | | | 1.26 | (d) | | | | | 70 | |
| | | 7.40 | | | | | | 23.98 | | | | | | 77,469 | | | | | | 1.26 | | | | | | 1.67 | | | | | | 2.00 | | | | | | 101 | |
| | | 7.39 | | | | | | 23.13 | | | | | | 8 | | | | | | 2.01 | | | | | | 2.42 | | | | | | 1.38 | | | | | | 101 | |
| | | 7.39 | | | | | | 24.47 | | | | | | 53,159 | | | | | | 0.86 | | | | | | 1.27 | | | | | | 2.24 | | | | | | 101 | |
| | | | | | | | | | | | | | | | | | | | | | | | | | | | | | | | | | | | | | | | |
| | | | | | | | | | | | | | | | | | | | | | | | | | | | | | | | | | | | | | | | |
| | | 6.07 | | | | | | (37.56 | ) | | | | | 71,917 | | | | | | 1.26 | (d) | | | | | 1.80 | (d) | | | | | 2.53 | (d) | | | | | 243 | |
| | | 6.06 | | | | | | (38.02 | ) | | | | | 8 | | | | | | 2.01 | (d) | | | | | 2.55 | (d) | | | | | 1.83 | (d) | | | | | 243 | |
| | | 6.06 | | | | | | (37.40 | ) | | | | | 17,652 | | | | | | 0.86 | (d) | | | | | 1.40 | (d) | | | | | 2.05 | (d) | | | | | 243 | |
| | |
| The accompanying notes are an integral part of these financial statements. | | 61 |
GOLDMAN SACHS STRUCTURED TAX-ADVANTAGED EQUITY FUNDS
Notes to Financial Statements
June 30, 2012 (Unaudited)
Goldman Sachs Trust (the “Trust”) is a Delaware statutory trust registered under the Investment Company Act of 1940, as amended (the “Act”), as an open-end management investment company. The following table lists those series of the Trust that are included in this report (collectively, the “Funds” or individually a “Fund”), along with their corresponding share classes and respective diversification status under the Act:
| | | | |
| Fund | | Share Classes Offered* | | Diversified/ Non-diversified |
U.S. Equity Dividend and Premium,
International Equity Dividend and Premium,
Structured International Tax-Managed Equity | | A, C, Institutional and IR | | Diversified |
Structured Tax-Managed Equity | | A, B, C, Institutional, Service and IR | | Diversified |
| * | | Class B Shares are generally no longer available for purchase by current or prospective investors. |
Class A Shares are sold with a front-end sales charge of up to 5.50%. Class B Shares were sold with a contingent deferred sales charge (“CDSC”) that declines from 5.00% to zero, depending upon the period of time the shares are held. Class C Shares are sold with a CDSC of 1.00%, which is imposed on redemptions made within 12 months of purchase. Institutional, Service and Class IR Shares are not subject to a sales charge.
Goldman Sachs Asset Management, L.P. (“GSAM”), an affiliate of Goldman, Sachs & Co. (“Goldman Sachs”), serves as investment adviser to the Funds pursuant to a management agreement (the “Agreement”) with the Trust.
|
| 2. SIGNIFICANT ACCOUNTING POLICIES |
The financial statements have been prepared in accordance with accounting principles generally accepted in the United States of America (“GAAP”) and require management to make estimates and assumptions that may affect the reported amounts and disclosures. Actual results may differ from those estimates and assumptions.
A. Investment Valuation — The Funds’ valuation policy is to value investments at fair value.
B. Investment Income and Investments — Investment income includes interest income and dividend income, net of any foreign withholding taxes, less any amounts reclaimable. Interest income is accrued daily and adjusted for amortization of premiums and accretion of discounts. Dividend income is recognized on ex-dividend date or, for certain foreign securities, as soon as such information is obtained subsequent to the ex-dividend date. Investment transactions are reflected on trade date. Realized gains and losses are calculated using identified cost. Investment transactions are recorded on the following business day for daily net asset value (“NAV”) calculations. Any foreign capital gains tax is accrued daily based upon net unrealized gains, and is payable upon sale of such investments. Distributions received from the Funds’ investments in United States (“U.S.”) real estate investment trusts (“REITs”) may be characterized as ordinary income, net capital gain or a return of capital. A return of capital is recorded by the Funds as a reduction to the cost of the REIT.
For derivative contracts, realized gains and losses are recorded upon settlement of the contract. For securities with paydown provisions, principal payments received are treated as a proportionate reduction to the cost basis of the securities and excess amounts are recorded as gains. For treasury inflation protected securities (“TIPS”), adjustments to principal due to inflation/deflation are reflected as increases/decreases to interest income with a corresponding adjustment to cost. Upfront payments on swaps are recorded as deferred realized gains or losses and are recognized over the contract’s term/event, with the exception of forward starting interest rate swaps whose realized gain or losses are recognized from the effective start date.
C. Class Allocations and Expenses — Investment income, realized and unrealized gain (loss), and non-class specific expenses of each Fund are allocated daily based upon the proportion of net assets of each class. Class specific expenses, where applicable, are borne by the respective share classes and include Distribution and Service, Transfer Agent and Service and Shareholder Administration fees. Non-class specific expenses directly incurred by a Fund are charged to that Fund, while such expenses
62
GOLDMAN SACHS STRUCTURED TAX-ADVANTAGED EQUITY FUNDS
|
| 2. SIGNIFICANT ACCOUNTING POLICIES (continued) |
incurred by the Trust are allocated across the respective Funds on a straight-line and/or pro-rata basis depending upon the nature of the expenses.
D. Federal Taxes and Distributions to Shareholders — It is each Fund’s policy to comply with the requirements of the Internal Revenue Code of 1986, as amended (the “Code”), applicable to regulated investment companies (mutual funds) and to distribute each year substantially all of its investment company taxable income and capital gains to its shareholders. Accordingly, the Funds are not required to make any provisions for the payment of federal income tax. Distributions to shareholders are recorded on the ex-dividend date. Income and capital gains distributions, if any, are declared and paid according to the following schedule:
| | | | | | |
| Fund | | | | Income Distributions Declared/Paid | | Capital Gains Distributions
Declared/Paid |
U.S. Equity Dividend and Premium
International Equity Dividend and Premium | | | | Quarterly | | Annually |
Structured Tax-Managed Equity
Structured International Tax-Managed Equity | | | | Annually | | Annually |
Net capital losses are carried forward to future fiscal years and may be used to the extent allowed by the Code to offset any future capital gains. Utilization of capital loss carryforwards will reduce the requirement of future capital gains distributions.
The characterization of distributions to shareholders for financial reporting purposes is determined in accordance with federal income tax rules, which may differ from GAAP. The source of each Fund’s distributions may be shown in the accompanying financial statements as either from net investment income, net realized gain or capital. Certain components of the Funds’ net assets on the Statements of Assets and Liabilities reflect permanent GAAP/tax differences based on the appropriate tax character.
E. Foreign Currency Translation — The accounting records and reporting currency of the Funds are maintained in U.S. dollars. Assets and liabilities denominated in foreign currencies are translated into U.S. dollars using the current exchange rates at the close of each business day. The effect of changes in foreign currency exchange rates on investments is included within net realized and unrealized gain (loss) on investments. Changes in the value of other assets and liabilities as a result of fluctuations in foreign exchange rates are included in the Statements of Operations within net change in unrealized gain (loss) on foreign currency transactions. Transactions denominated in foreign currencies are translated into U.S. dollars on the date the transaction occurred, the effects of which are included within net realized gain (loss) on foreign currency transactions.
|
| 3. INVESTMENTS AND FAIR VALUE MEASUREMENTS |
The fair value of a financial instrument is the amount that would be received to sell an asset or paid to transfer a liability in an orderly transaction between market participants at the measurement date (i.e., the exit price). GAAP establishes a fair value hierarchy that prioritizes the inputs to valuation techniques used to measure fair value. The hierarchy gives the highest priority to unadjusted quoted prices in active markets for identical assets or liabilities (Level 1 measurements) and the lowest priority to unobservable inputs (Level 3 measurements). The levels used for classifying investments are not necessarily an indication of the risk associated with investing in these investments. The three levels of the fair value hierarchy are described below:
Level 1 — Unadjusted quoted prices in active markets that are accessible at the measurement date for identical, unrestricted assets or liabilities;
Level 2 — Quoted prices in markets that are not active or financial instruments for which significant inputs are observable (including, but not limited to, quoted prices for similar investments, interest rates, foreign exchange rates, volatility and credit spreads), either directly or indirectly;
Level 3 — Prices or valuations that require significant unobservable inputs (including GSAM’s assumptions in determining fair value measurement).
63
GOLDMAN SACHS STRUCTURED TAX-ADVANTAGED EQUITY FUNDS
Notes to Financial Statements (continued)
June 30, 2012 (Unaudited)
|
| 3. INVESTMENTS AND FAIR VALUE MEASUREMENTS (continued) |
A. Level 1 and Level 2 Fair Value Investments — The valuation techniques and significant inputs used in determining the fair values for investments classified as Level 1 and Level 2 are as follows:
Equity Securities — Equity securities and investment companies traded on a U.S. securities exchange or the NASDAQ system, or those located on certain foreign exchanges including, but not limited to the Americas, are valued daily at their last sale price or official closing price on the principal exchange or system on which they are traded. Investments in investment companies (other than those that are exchange traded) are valued at the NAV on the valuation date. If no sale occurs, equity securities and exchange traded investment companies are valued at the last bid price for long positions and at the last ask price for short positions. To the extent these investments are actively traded, they are classified as Level 1 of the fair value hierarchy.
Unlisted equity securities for which market quotations are available are valued at the last sale price on the valuation date, or if no sale occurs, at the last bid price. Securities traded on certain foreign securities exchanges are valued daily at fair value determined by an independent fair value service (if available) under valuation procedures approved by the trustees and consistent with applicable regulatory guidance. The independent fair value service takes into account multiple factors including, but not limited to, movements in the securities markets, certain depositary receipts, futures contracts and foreign currency exchange rates that have occurred subsequent to the close of the foreign securities exchange. Investments applying these valuation adjustments are classified as Level 2 of the fair value hierarchy.
Debt Securities — Debt securities, for which market quotations are readily available, are valued daily on the basis of quotations supplied by dealers or an independent pricing service approved by the trustees. The pricing services may use valuation models or matrix pricing, which consider: (i) yield or price with respect to bonds that are considered comparable in characteristics such as rating, interest rate and maturity date or (ii) quotations from securities dealers to determine current value. Short-term debt obligations that mature in sixty days or less and that do not exhibit signs of credit deterioration are valued at amortized cost, which approximates fair value. With the exception of treasury securities, which are generally classified as Level 1, these investments are generally classified as Level 2 of the fair value hierarchy.
Derivative Contracts — A derivative is an instrument whose value is derived from underlying assets, indices, reference rates or a combination of these factors.
Exchange-traded derivatives, including futures contracts, typically fall within Level 1 of the fair value hierarchy. Over-the-counter (“OTC”) derivatives are valued using market transactions and other market evidence, including market-based inputs to models, calibration to market-clearing transactions, broker or dealer quotations, or other alternative pricing. Where models are used, the selection of a particular model to value an OTC derivative depends upon the contractual terms of, and specific risks inherent in, the instrument, as well as the availability of pricing information in the market. Valuation models require a variety of inputs, including contractual terms, market prices, yield curves, credit curves, measures of volatility, voluntary and involuntary prepayment rates, loss severity rates and correlations of such inputs. For OTC derivatives that trade in liquid markets, model inputs can generally be verified and model selection does not involve significant management judgment. OTC derivatives are classified within Level 2 of the fair value hierarchy when significant inputs are corroborated by market evidence.
i. Futures Contracts — Futures contracts are contracts to buy or sell a standardized quantity of a specified commodity or security and are valued based on exchanged settlement prices or independent market quotes. Futures contracts are valued at the last settlement price, or in the absence of a sale, the last bid price for long positions and at the last ask price for short positions, at the end of each day on the board of trade or exchange upon which they are traded. Upon entering into a futures contract, the Funds deposit cash or securities in an account on behalf of the broker in an amount sufficient to meet the initial margin requirement. Subsequent payments are made or received by the Funds equal to the daily change in the contract value and are recorded as variation margin receivable or payable with a corresponding offset in unrealized gains or losses.
ii. Options — When the Funds write call or put options, an amount equal to the premium received is recorded as a liability and is subsequently marked-to-market to reflect the current value of the option written. Swaptions are options on interest rate swap contracts. Options on a futures contract may be written with premiums to be determined on a future date. The premiums for these options are based upon implied volatility parameters at specified terms.
64
GOLDMAN SACHS STRUCTURED TAX-ADVANTAGED EQUITY FUNDS
|
| 3. INVESTMENTS AND FAIR VALUE MEASUREMENTS (continued) |
Upon the purchase of a call option or a put option by the Funds, the premium paid is recorded as an investment and subsequently marked-to-market to reflect the current value of the option. Certain options may be purchased with premiums to be determined on a future date. The premiums for these options are based upon implied voluntary parameters at specified terms.
B. Level 3 Fair Value Investments — The valuation techniques and significant inputs used in determining the fair values for investments classified as Level 3 are as follows:
To the extent that the aforementioned significant inputs are unobservable, or if quotations are not readily available, or if GSAM believes that such quotations do not accurately reflect fair value, the fair value of the Funds’ investments may be determined under valuation procedures approved by the trustees. GSAM, consistent with its procedures and applicable regulatory guidance, may make an adjustment to the most recent valuation prices of either domestic or foreign securities in light of significant events to reflect what it believes to be the fair value of the securities at the time of determining a Fund’s NAV. Significant events which could affect a large number of securities in a particular market may include, but are not limited to significant fluctuations in U.S. or foreign markets; market dislocations; market disruptions or unscheduled market closings. Significant events, which could also affect a single issuer, may include, but are not limited to corporate actions such as reorganizations, mergers and buy-outs; ratings downgrades; and bankruptcies.
C. Fair Value Hierarchy — The following is a summary of the Funds’ investments and derivatives classified in the fair value hierarchy as of June 30, 2012:
| | | | | | | | | | | | |
| | | |
| U.S. EQUITY DIVIDEND AND PREMIUM | | | | | | | | | | | | |
| | | |
| Investment Type | | Level 1 | | | Level 2 | | | Level 3 | |
| Assets | | | | | | | | | | | | |
Common Stock and/or Other Equity Investments | | $ | 1,059,544,408 | | | $ | — | | | $ | — | |
| | | |
| Derivative Type | | | | | | | | | |
| Assets(a) | | | | | | | | | | | | |
Futures Contracts | | $ | 1,493,377 | | | $ | — | | | $ | — | |
| Liabilities | | | | | | | | | | | | |
Written Options | | $ | (12,351,000 | ) | | $ | — | | | $ | — | |
| | | |
| INTERNATIONAL EQUITY DIVIDEND AND PREMIUM | | | | | | | | | | | | |
| | | |
| Investment Type | | Level 1 | | | Level 2 | | | Level 3 | |
| Assets | | | | | | | | | | | | |
Common Stock and/or Other Equity Investments | | $ | 26,459,628 | | | $ | 329,967,604 | (b) | | $ | — | |
| | | |
| Derivative Type | | | | | | | | | |
| Assets(a) | | | | | | | | | | | | |
Futures Contracts | | $ | 301,092 | | | $ | — | | | $ | — | |
| Liabilities | | | | | | | | | | | | |
Written Options | | $ | (5,067,907 | ) | | $ | — | | | $ | — | |
65
GOLDMAN SACHS STRUCTURED TAX-ADVANTAGED EQUITY FUNDS
Notes to Financial Statements (continued)
June 30, 2012 (Unaudited)
|
| 3. INVESTMENTS AND FAIR VALUE MEASUREMENTS (continued) |
| | | | | | | | | | | | |
| | | |
| STRUCTURED TAX-MANAGED EQUITY | | | | | | | | | | | | |
| | | |
| Investment Type | | Level 1 | | | Level 2 | | | Level 3 | |
| Assets | | | | | | | | | | | | |
Common Stock and/or Other Equity Investments | | $ | 315,386,302 | | | $ | — | | | $ | — | |
Securities Lending Reinvestment Vehicle | | | 11,996,350 | | | | — | | | | — | |
| Total | | $ | 327,382,652 | | | $ | — | | | $ | — | |
| | | |
| Derivative Type | | | | | | | | | |
| Assets(a) | | | | | | | | | | | | |
Futures Contracts | | $ | 297,180 | | | $ | — | | | $ | — | |
| | | |
| STRUCTURED INTERNATIONAL TAX-MANAGED EQUITY | | | | | | | | | | | | |
| | | |
| Investment Type | | Level 1 | | | Level 2 | | | Level 3 | |
| Assets | | | | | | | | | | | | |
Common Stock and/or Other Equity Investments | | $ | 3,837,568 | | | $ | 135,728,267 | (b) | | $ | — | |
Securities Lending Reinvestment Vehicle | | | 3,407,487 | | | | — | | | | — | |
| Total | | $ | 7,245,055 | | | $ | 135,728,267 | | | $ | — | |
| | | |
| Derivative Type | | | | | | | | | |
| Assets(a) | | | | | | | | | | | | |
Futures Contracts | | $ | 163,427 | | | $ | — | | | $ | — | |
| (a) | | Amount shown represents unrealized gain (loss) at period end. |
| (b) | | To adjust for the time difference between local market close and the calculation of net asset value, the Funds utilize fair value model prices for international equities provided by an independent fair value service resulting in a Level 2 classification. |
66
GOLDMAN SACHS STRUCTURED TAX-ADVANTAGED EQUITY FUNDS
|
| 4. INVESTMENTS IN DERIVATIVES |
The following table sets forth, by certain risk types, the gross value of derivative contracts as of June 30, 2012. These instruments were used to meet the Funds’ investment objectives and to obtain and/or manage exposure related to the risks below. The values in the tables below exclude the effects of cash collateral received or posted pursuant to these derivative contracts, and therefore are not representative of the Funds’ net exposure.
| | | | | | | | | | | | | | |
| Fund | | Risk | | Statements of Assets
and Liabilities | | Assets(a) | | | Statements of Assets
and Liabilities | | Liabilities | |
U.S. Equity Dividend and Premium | | Equity | | Unrealized gain on futures variation margin | | $ | 1,493,377 | | | Payable for written options, at value | | $ | (12,351,000) | |
International Equity Dividend and Premium | | Equity | | Unrealized gain on futures variation margin | | | 301,092 | | | Payable for written options, at value | | | (5,067,907) | |
Structured Tax-Managed Equity | | Equity | | Unrealized gain on futures variation margin | | | 297,180 | | | — | | | — | |
Structured International Tax-Managed Equity | | Equity | | Unrealized gain on futures variation margin | | | 163,427 | | | — | | | — | |
| (a) | | Includes cumulative appreciation (depreciation) on futures contracts described in the Additional Investment Information sections of the Schedules of Investments. Only current day's variation margin is reported within the Statements of Assets and Liabilities. |
The following table sets forth, by certain risk types, the Funds’ gains (losses) related to these derivatives and their indicative volumes for the six months ended June 30, 2012. These gains (losses) should be considered in the context that these derivative contracts may have been executed to economically hedge certain investments, and accordingly, certain gains (losses) on such derivative contracts may offset certain (losses) gains attributable to investments. These gains (losses) are included in “Net realized gain (loss)” or “Net change in unrealized gain (loss)” on the Statements of Operations:
| | | | | | | | | | | | | | | | |
| Fund | | Risk | | Statements of Operations | | Net
Realized
Gain (Loss) | | | Net Change in
Unrealized
Gain (Loss) | | | Average
Number of
Contracts(a) | |
U.S. Equity Dividend and Premium | | Equity | | Net realized gain (loss) from futures contracts and written options/Net change in unrealized gain (loss) on futures contracts and written options | | $ | (6,153,707 | ) | | $ | 2,154,423 | | | | 3,119 | |
International Equity Dividend and Premium | | Equity | | Net realized gain (loss) from futures contracts and written options/Net change in unrealized gain (loss) on futures contracts and written options | | | (4,710,647 | ) | | | (229,407 | ) | | | 3,176 | |
Structured Tax-Managed Equity | | Equity | | Net realized gain (loss) from futures contracts/Net change in unrealized gain (loss) on futures contracts | | | 321,367 | | | | 212,642 | | | | 93 | |
Structured International Tax-Managed Equity | | Equity | | Net realized gain (loss) from futures contracts/Net change in unrealized gain (loss) on futures contracts | | | 23,163 | | | | 93,517 | | | | 63 | |
| (a) | | Average number of contracts is based on the average of month end balances for the six months ended June 30, 2012. |
67
GOLDMAN SACHS STRUCTURED TAX-ADVANTAGED EQUITY FUNDS
Notes to Financial Statements (continued)
June 30, 2012 (Unaudited)
|
| 5. AGREEMENTS AND AFFILIATED TRANSACTIONS |
A. Management Agreement — Under the Agreement, GSAM manages the Funds, subject to the general supervision of the trustees.
As compensation for the services rendered pursuant to the Agreement, the assumption of the expenses related thereto and administration of the Funds’ business affairs, including providing facilities, GSAM is entitled to a management fee, accrued daily and paid monthly, equal to an annual percentage rate of each Fund’s average daily net assets.
For the six months ended June 30, 2012, contractual and effective net management fees with GSAM were at the following rates:
| | | | | | | | | | | | | | |
| | | Contractual Management Rate | | Effective Net
Management
Rate |
| Fund | | First
$1 billion | | Next
$1 billion | | Next
$3 billion | | Next
$3 billion | | Over
$8 billion | | Effective
Rate | |
U.S. Equity Dividend and Premium | | 0.75% | | 0.68% | | 0.65% | | 0.64% | | 0.63% | | 0.75% | | 0.75% |
International Equity Dividend and Premium | | 0.81 | | 0.73 | | 0.69 | | 0.68 | | 0.67 | | 0.81 | | 0.81 |
Structured Tax-Managed Equity | | 0.70 | | 0.63 | | 0.60 | | 0.59 | | 0.58 | | 0.70 | | 0.65* |
Structured International Tax-Managed Equity | | 0.85 | | 0.77 | | 0.73 | | 0.72 | | 0.71 | | 0.85 | | 0.81* |
| * | | GSAM agreed to waive a portion of its management fee in order to achieve the effective net management rate shown above through April 27, 2013. Prior to such date GSAM may not terminate the arrangement without the approval of the trustees. |
B. Distribution and Service Plans — The Trust, on behalf of each Fund, has adopted Distribution and Service Plans (the “Plans”). Under the Plans, Goldman Sachs, which serves as distributor (the “Distributor”), is entitled to a fee accrued daily and paid monthly for distribution services and personal and account maintenance services, which may then be paid by Goldman Sachs to authorized dealers, at the following annual rates calculated on a Fund’s average daily net assets of each respective share class:
| | | | | | | | | | | | |
| | | Distribution and Service Plan Rates | |
| | | Class A* | | | Class B | | | Class C | |
Distribution Plan | | | 0.25 | % | | | 0.75 | % | | | 0.75 | % |
Service Plan | | | — | | | | 0.25 | | | | 0.25 | |
| * | | With respect to Class A Shares, the Distributor at its discretion may use compensation for distribution services paid under the Distribution Plan to compensate service organizations for personal and account maintenance services and expenses as long as such total compensation does not exceed the maximum cap on “service fees” imposed by the Financial Industry Regulatory Authority. |
C. Distribution Agreement — Goldman Sachs, as Distributor of the shares of the Funds pursuant to a Distribution Agreement, may retain a portion of the Class A front end sales charge and Class B and Class C CDSC. During the six months ended June 30, 2012, Goldman Sachs advised that it retained front end sales charges of $44,500, $1,400, $900 and $0 for the U.S. Equity Dividend and Premium, International Equity Dividend and Premium, Structured Tax-Managed Equity and Structured International Tax-Managed Equity Funds, respectively. Goldman Sachs retained no contingent deferred sales charges.
D. Service Plan and Shareholder Administration Plan —The Trust, on behalf of each Fund that offers Service Shares, has adopted a Service Plan and a Shareholder Administration Plan. These plans allow for service organizations to provide varying levels of personal and account maintenance and shareholder administration services to their customers who are beneficial owners of such shares. The Service Plan and Shareholder Administration Plan each provide for compensation to the service organizations which is accrued daily and paid monthly at an annual rate as follows: 0.25% (0.50% in aggregate) of the average daily net assets of the Service Shares.
E. Transfer Agency Agreement — Goldman Sachs also serves as the transfer agent of the Funds for a fee pursuant to a Transfer Agency Agreement. The fees charged for such transfer agency services are accrued daily and paid monthly at an annual
68
GOLDMAN SACHS STRUCTURED TAX-ADVANTAGED EQUITY FUNDS
|
| 5. AGREEMENTS AND AFFILIATED TRANSACTIONS (continued) |
rate as follows: 0.19% of the average daily net assets for Class A, Class B, Class C and Class IR Shares and 0.04% of the average daily net assets for Institutional and Service Shares.
F. Other Expense Agreements and Affiliated Transactions — GSAM has agreed to limit certain “Other Expense” of the Funds (excluding management fees, distribution and service fees, transfer agent fees and expenses, service fees and shareholder administration fees (as applicable), taxes, interest, brokerage fees, litigation, indemnification, shareholder meetings and other extraordinary expenses) to the extent such expenses exceed, on an annual basis, a percentage rate of the average daily net assets of each Fund. Such Other Expense reimbursements, if any, are accrued daily and paid monthly. In addition, the Funds are not obligated to reimburse GSAM for prior fiscal year expense reimbursements, if any. The Other Expense limitation as an annual percentage rate of average daily net assets for the U.S. Equity Dividend and Premium, International Equity Dividend and Premium, Structured Tax-Managed Equity and Structured International Tax-Managed Equity Funds are 0.054%, 0.054%, 0.004% and 0.014%, respectively. These Other Expense reimbursements will remain in place through April 27, 2013, and prior to such date GSAM may not terminate the arrangements without the approval of the trustees. In addition, the Funds have entered into certain offset arrangements with the custodian and the transfer agent, which may result in a reduction of the Funds’ expenses.
For the six months ended June 30, 2012, these expense reductions, including any fee waivers and Other Expense reimbursements, were as follows (in thousands):
| | | | | | | | | | | | | | | | | | |
| Fund | | | | Management
Fee Waiver | | | Other
Expense
Reimbursement | | | Custody Fee
Credits | | | Total
Expense
Reductions | |
U.S. Equity Dividend and Premium | | | | $ | — | | | $ | — | | | $ | 37 | | | $ | 37 | |
International Equity Dividend and Premium | | | | | — | | | | 112 | | | | 3 | | | | 115 | |
Structured Tax-Managed Equity | | | | | 78 | | | | 144 | | | | 4 | | | | 226 | |
Structured International Tax-Managed Equity | | | | | 28 | | | | 233 | | | | 1 | | | | 262 | |
As of June 30, 2012, the amounts owed to affiliates of the Funds were as follows (in thousands):
| | | | | | | | | | | | | | | | | | |
| Fund | | | | Management
Fees | | | Distribution
and Service
Fees | | | Transfer
Agent
Fees | | | Total | |
U.S. Equity Dividend and Premium | | | | $ | 652 | | | $ | 55 | | | $ | 58 | | | $ | 765 | |
International Equity Dividend and Premium | | | | | 233 | | | | 42 | | | | 37 | | | | 312 | |
Structured Tax-Managed Equity | | | | | 166 | | | | 17 | | | | 17 | | | | 200 | |
Structured International Tax-Managed Equity | | | | | 91 | | | | 6 | | | | 8 | | | | 105 | |
G. Line of Credit Facility — As of June 30, 2012, the Funds participated in a $630,000,000 committed, unsecured revolving line of credit facility (the “facility”) together with other funds of the Trust and registered investment companies having management agreements with GSAM or its affiliates (“Other Borrowers”). Pursuant to the terms of the facility, the Funds and Other Borrowers could increase the credit amount by an additional $340,000,000, for a total of up to $970,000,000. This facility is to be used solely for temporary or emergency purposes. The interest rate on borrowings is based on the federal funds rate. The facility also requires a fee to be paid by the Funds based on the amount of the commitment that has not been utilized. For the six months ended June 30, 2012, the Funds did not have any borrowings under the facility. Prior to May 8, 2012, the amount available through the facility was $580,000,000.
69
GOLDMAN SACHS STRUCTURED TAX-ADVANTAGED EQUITY FUNDS
Notes to Financial Statements (continued)
June 30, 2012 (Unaudited)
|
| 5. AGREEMENTS AND AFFILIATED TRANSACTIONS (continued) |
H. Other Transactions with Affiliates — For the six months ended June 30, 2012, Goldman Sachs earned approximately $5,700, $12,400, $800 and $3,700 in brokerage commissions from portfolio transactions, including futures transactions executed with Goldman Sachs as the Futures Commission Merchant, on behalf of the U.S. Equity Dividend and Premium, International Equity Dividend and Premium, Structured Tax-Managed Equity and Structured International Tax-Managed Equity Funds, respectively.
As of June 30, 2012, the following Goldman Sachs Fund of Funds Portfolios were the beneficial owners of 5% or more of total outstanding shares of the following Funds:
| | | | | | | | | | |
| Fund | | | | Goldman Sachs Enhanced Dividend
Global Equity
Portfolio | | | Goldman Sachs Tax-Advantaged
Global Equity
Portfolio | |
U.S. Equity Dividend and Premium | | | | | 9 | % | | | — | % |
International Equity Dividend and Premium | | | | | 13 | | | | — | |
Structured Tax-Managed Equity | | | | | — | | | | 79 | |
Structured International Tax-Managed Equity | | | | | — | | | | 73 | |
As of June 30, 2012, the Goldman Sachs Group, Inc. was the beneficial owner of approximately 38% and 7% of the Class C and Class IR Shares of the Structured International Tax-Managed Equity Fund, respectively.
| | |
| 6. PORTFOLIO SECURITIES TRANSACTIONS | | |
The cost of purchases and proceeds from sales and maturities of long-term securities for the six months ended June 30, 2012, were as follows:
| | | | | | | | | | |
| Fund | | | | Purchases | | | Sales | |
U.S. Equity Dividend and Premium | | | | $ | 471,250,567 | | | $ | 170,483,995 | |
International Equity Dividend and Premium | | | | | 129,571,914 | | | | 60,810,928 | |
Structured Tax-Managed Equity | | | | | 298,877,802 | | | | 292,899,250 | |
Structured International Tax-Managed Equity | | | | | 149,661,825 | | | | 149,280,714 | |
Pursuant to exemptive relief granted by the Securities and Exchange Commission (“SEC”) and the terms and conditions contained therein, the Funds may lend their securities through a securities lending agent, Goldman Sachs Agency Lending (“GSAL”), a wholly-owned subsidiary of Goldman Sachs, to certain qualified borrowers including Goldman Sachs and affiliates. In accordance with the Funds’ securities lending procedures, the Funds receive cash collateral at least equal to the market value of the securities on loan. The market value of the loaned securities is determined at the close of business of the Funds at their last sale price or official closing price on the principal exchange or system on which they are traded, and any additional required collateral is delivered to the Funds on the next business day. As with other extensions of credit, the Funds may experience a delay in the recovery of their securities or incur a loss should the borrower of the securities breach its agreement with the Funds or become insolvent at a time when the collateral is insufficient to cover the cost of repurchasing securities on loan.
70
GOLDMAN SACHS STRUCTURED TAX-ADVANTAGED EQUITY FUNDS
|
| 7. SECURITIES LENDING (continued) |
The Funds invest the cash collateral received in connection with securities lending transactions in the Goldman Sachs Financial Square Money Market Fund (“Money Market Fund”), a separate series of the Trust. The Money Market Fund is registered under the Act as an open end investment company, is subject to Rule 2a-7 under the Act and is managed by GSAM, for which GSAM may receive an investment advisory fee of up to 0.205% on an annualized basis of the average daily net assets of the Money Market Fund.
Both the Funds and GSAL received compensation relating to the lending of the Funds’ securities. The amounts earned by the Funds for the six months ended June 30, 2012, are reported under Investment Income on the Statements of Operations. The table below details securities lending activity with affiliates of Goldman Sachs:
| | | | | | | | | | | | | | |
| | | | | For the Six Months Ended June 30, 2012 | | | Amounts Payable to
Goldman Sachs
Upon Return of
Securities Loaned as of
June 30, 2012 | |
| Fund | | | | Earnings of GSAL Relating to Securities Loaned | | | Amounts Received by the Funds from Lending to Goldman Sachs | | |
Structured Tax-Managed Equity | | | | $ | 4,561 | | | $ | 14,993 | | | $ | 3,841,200 | |
Structured International Tax-Managed Equity | | | | | 13,136 | | | | 7,063 | | | | 380,585 | |
The following table provides information about the Funds’ investment in the Money Market Fund for the six months ended June 30, 2012 (in thousands):
| | | | | | | | | | | | | | | | | | | | | | |
| Fund | | | | Number of Shares Held Beginning of Period | | | Shares
Bought | | | Shares
Sold | | | Number of Shares Held End of Period | | | Value at End of Period | |
Structured Tax-Managed Equity | | | | | 2,894 | | | | 26,989 | | | | (17,887 | ) | | | 11,996 | | | $ | 11,996 | |
Structured International Tax-Managed Equity | | | | | 2,582 | | | | 33,125 | | | | (32,300 | ) | | | 3,407 | | | | 3,407 | |
As of the Funds’ most recent fiscal year end, December 31, 2011, the Funds’ capital loss carryovers and certain timing differences, on a tax-basis were as follows:
| | | | | | | | | | | | | | | | |
| | | U.S. Equity
Dividend and
Premium | | | International
Equity Dividend
and Premium | | | Structured
Tax-Managed
Equity | | | Structured
International
Tax-Managed
Equity | |
Capital loss carryovers:(1) | | | | | | | | | | | | | | | | |
Expiring 2016(1) | | $ | — | | | $ | — | | | $ | (47,243,753 | ) | | $ | (18,938,160 | ) |
Expiring 2017(1) | | | — | | | | — | | | | — | | | | (31,387,420 | ) |
Total capital loss carryovers | | $ | — | | | $ | — | | | $ | (47,243,753 | ) | | $ | (50,325,580 | ) |
Timing differences (late year ordinary loss and post October loss deferrals) | | $ | — | | | $ | (705,273 | ) | | $ | — | | | $ | (610,741 | ) |
| (1) | | Expiration occurs on December 31 of the year indicated. |
71
GOLDMAN SACHS STRUCTURED TAX-ADVANTAGED EQUITY FUNDS
Notes to Financial Statements (continued)
June 30, 2012 (Unaudited)
|
| 8. TAX INFORMATION (continued) |
As of June 30, 2012, the Funds’ aggregate security unrealized gains and losses based on cost for U.S. federal income tax purposes were as follows:
| | | | | | | | | | | | | | | | |
| | | U.S. Equity Dividend
and Premium | | | International
Equity Dividend
and Premium | | | Structured
Tax-Managed
Equity | | | Structured
International
Tax-Managed
Equity | |
Tax cost | | $ | 1,056,510,114 | | | $ | 412,519,115 | | | $ | 322,848,784 | | | $ | 153,658,424 | |
Gross unrealized gain | | | 74,130,044 | | | | 8,648,904 | | | | 20,898,479 | | | | 4,998,040 | |
Gross unrealized loss | | | (71,095,750 | ) | | | (64,740,787 | ) | | | (16,364,611 | ) | | | (15,683,142 | ) |
Net unrealized security gain (loss) | | $ | 3,034,294 | | | $ | (56,091,883 | ) | | $ | 4,533,868 | | | $ | (10,685,102 | ) |
The difference between GAAP-basis and tax-basis unrealized gains (losses), as of the most recent fiscal year end, is attributable primarily to wash sales, net mark to market gains (losses) on regulated futures and options contracts and differences related to the tax treatment of passive foreign investment companies.
GSAM has reviewed the Funds’ tax positions for all open tax years (the current and prior three years, as applicable) and has concluded that no provision for income tax is required in the Funds’ financial statements. Such open tax years remain subject to examination and adjustment by tax authorities.
The Funds’ risks include, but are not limited to, the following:
Foreign Custody Risk — A Fund that invests in foreign securities may hold such securities and foreign currency with foreign banks, agents, and securities depositories appointed by the Fund’s custodian (each a “Foreign Custodian”). In some countries, Foreign Custodians may be subject to little or no regulatory oversight or independent evaluation of their operations. Further, the laws of certain countries may place limitations on a Fund’s ability to recover its assets if a Foreign Custodian enters into bankruptcy. Investments in emerging markets may be subject to greater custody risks than investments in more developed markets. Custody services in emerging market countries are often undeveloped and may be less regulated than in more developed countries, and thus may not afford the same level of investor protection as would apply in developed countries.
Funds’ Shareholder Concentration Risk — Certain funds, accounts, individuals or Goldman Sachs affiliates may from time to time own (beneficially or of record) or control a significant percentage of the Funds’ shares. Redemptions by these entities of their holdings in the Funds may impact the Funds’ liquidity and NAV. These redemptions may also force the Funds to sell securities.
Liquidity Risk — The Funds may make investments that may be illiquid or that may become less liquid in response to market developments or adverse investor perceptions. Liquidity risk may also refer to the risk that a Fund will not be able to pay redemption proceeds within the allowable time period because of unusual market conditions, an unusually high volume of redemption requests, or other reasons. To meet redemption requests, a Fund may be forced to sell investments at an unfavorable time and/or under unfavorable conditions.
Market and Credit Risks — In the normal course of business, the Funds trade financial instruments and enter into financial transactions where risk of potential loss exists due to changes in the market (market risk). Additionally, the Funds may also be exposed to credit risk in the event that an issuer fails to perform or that an institution or entity with which the Funds have unsettled or open transaction defaults.
Investing in foreign markets may involve special risks and considerations not typically associated with investing in the U.S. These risks include revaluation of currencies, high rates of inflation, repatriation restrictions on income and capital, and adverse
72
GOLDMAN SACHS STRUCTURED TAX-ADVANTAGED EQUITY FUNDS
|
| 9. OTHER RISKS (continued) |
political and economic developments. Moreover, securities issued in these markets may be less liquid, be subject to government ownership controls, have delayed settlements and their prices may be more volatile than those of comparable securities in the U.S.
Under the Trust’s organizational documents, its trustees, officers, employees and agents are indemnified, to the extent permitted by the Act, against certain liabilities that may arise out of performance of their duties to the Funds. Additionally, in the course of business, the Funds enter into contracts that contain a variety of indemnification clauses. The Funds’ maximum exposure under these arrangements is unknown, as this would involve future claims that may be made against the Funds that have not yet occurred. However, GSAM believes the risk of loss under these arrangements to be remote.
New Accounting Pronouncement — In December 2011, Accounting Standards Update 2011-11 (ASU 2011-11), Amendments to Disclosures about Offsetting Assets and Liabilities Requirements in U.S. GAAP and International Financial Reporting Standards, was issued and is effective for interim periods and annual periods beginning on or after January 1, 2013. The amendments are the result of the work by Financial Accounting Standards Board and the International Accounting Standards Board to develop common requirements for disclosing information about offsetting and related arrangements. GSAM is currently evaluating the application of ASU 2011-11 and its impact, if any, on the Funds’ financial statements.
Other — On February 8, 2012, the Commodity Futures Trading Commission (CFTC) adopted amendments to several of its rules relating to commodity pool operators, including Rule 4.5. The Funds currently rely on Rule 4.5’s exclusion from CFTC regulation for regulated investment companies. GSAM is currently evaluating the amendments and their impact, if any, on the Funds’ financial statements.
Subsequent events after the balance sheet date have been evaluated through the date the financial statements were issued. GSAM has concluded that there is no impact requiring adjustment or disclosure in the financial statements.
73
GOLDMAN SACHS STRUCTURED TAX-ADVANTAGED EQUITY FUNDS
Notes to Financial Statements (continued)
June 30, 2012 (Unaudited)
| | |
| 13. SUMMARY OF SHARE TRANSACTIONS | | |
Share activity is as follows:
| | | | | | | | | | | | | | | | |
| | | U.S. Equity Dividend and Premium Fund | |
| | | | |
| | | For the Six Months Ended
June 30, 2012
(Unaudited) | | | For the Fiscal Year Ended
December 31, 2011 | |
| | | | |
| | | Shares | | | Dollars | | | Shares | | | Dollars | |
| | | | |
| Class A Shares | | | | | | | | | | | | | | | | |
Shares sold | | | 8,598,401 | | | $ | 85,262,773 | | | | 5,034,611 | | | $ | 47,735,466 | |
Reinvestment of distributions | | | 128,655 | | | | 1,272,807 | | | | 271,083 | | | | 2,543,488 | |
Shares redeemed | | | (1,739,389 | ) | | | (17,075,758 | ) | | | (1,754,202 | ) | | | (16,703,785 | ) |
| | | | 6,987,667 | | | | 69,459,822 | | | | 3,551,492 | | | | 33,575,169 | |
| Class C Shares | | | | | | | | | | | | | | | | |
Shares sold | | | 1,897,474 | | | | 18,796,597 | | | | 948,910 | | | | 8,964,580 | |
Reinvestment of distributions | | | 15,345 | | | | 151,600 | | | | 47,542 | | | | 446,168 | |
Shares redeemed | | | (224,304 | ) | | | (2,201,658 | ) | | | (301,720 | ) | | | (2,865,465 | ) |
| | | | 1,688,515 | | | | 16,746,539 | | | | 694,732 | | | | 6,545,283 | |
| Institutional Shares | | | | | | | | | | | | | | | | |
Shares sold | | | 26,278,132 | | | | 258,684,774 | | | | 39,901,744 | | | | 375,663,570 | |
Reinvestment of distributions | | | 877,318 | | | | 8,675,077 | | | | 2,715,856 | | | | 25,428,422 | |
Shares redeemed | | | (8,764,831 | ) | | | (86,702,420 | ) | | | (12,771,237 | ) | | | (119,713,218 | ) |
| | | | 18,390,619 | | | | 180,657,431 | | | | 29,846,363 | | | | 281,378,774 | |
| Class IR Shares | | | | | | | | | | | | | | | | |
Shares sold | | | 1,368,896 | | | | 13,601,429 | | | | 171,919 | | | | 1,612,939 | |
Reinvestment of distributions | | | 14,576 | | | | 143,874 | | | | 3,022 | | | | 28,316 | |
Shares redeemed | | | (26,253 | ) | | | (257,817 | ) | | | (23,242 | ) | | | (224,167 | ) |
| | | | 1,357,219 | | | | 13,487,486 | | | | 151,699 | | | | 1,417,088 | |
NET INCREASE | | | 28,424,020 | | | $ | 280,351,278 | | | | 34,244,286 | | | $ | 322,916,314 | |
74
GOLDMAN SACHS STRUCTURED TAX-ADVANTAGED EQUITY FUNDS
|
| 13. SUMMARY OF SHARE TRANSACTIONS (continued) |
Share activity is as follows:
| | | | | | | | | | | | | | | | |
| | | International Equity Dividend and Premium Fund | |
| | | | |
| | | For the Six Months Ended
June 30, 2012
(Unaudited) | | | For the Fiscal Year Ended
December 31, 2011 | |
| | | | |
| | | Shares | | | Dollars | | | Shares | | | Dollars | |
| | | | |
| Class A Shares | | | | | | | | | | | | | | | | |
Shares sold | | | 8,504,635 | | | $ | 59,636,604 | | | | 17,114,007 | | | $ | 135,091,644 | |
Reinvestment of distributions | | | 622,829 | | | | 4,094,488 | | | | 2,205,555 | | | | 15,375,720 | |
Shares redeemed | | | (3,244,231 | ) | | | (22,000,843 | ) | | | (12,767,792 | ) | | | (93,244,086 | ) |
| | | | 5,883,233 | | | | 41,730,249 | | | | 6,551,770 | | | | 57,223,278 | |
| Class C Shares | | | | | | | | | | | | | | | | |
Shares sold | | | 24,587 | | | | 172,325 | | | | 77,101 | | | | 586,048 | |
Reinvestment of distributions | | | 3,824 | | | | 24,512 | | | | 16,031 | | | | 108,672 | |
Shares redeemed | | | (24,714 | ) | | | (159,497 | ) | | | (28,074 | ) | | | (200,023 | ) |
| | | | 3,697 | | | | 37,340 | | | | 65,058 | | | | 494,697 | |
| Institutional Shares | | | | | | | | | | | | | | | | |
Shares sold | | | 6,879,772 | | | | 46,165,768 | | | | 9,709,686 | | | | 75,989,781 | |
Reinvestment of distributions | | | 448,685 | | | | 2,904,681 | | | | 1,463,387 | | | | 10,081,963 | |
Shares redeemed | | | (1,611,638 | ) | | | (10,732,452 | ) | | | (5,467,904 | ) | | | (38,973,338 | ) |
| | | | 5,716,819 | | | | 38,337,997 | | | | 5,705,169 | | | | 47,098,406 | |
| Class IR Shares | | | | | | | | | | | | | | | | |
Shares sold | | | 742,549 | | | | 5,221,039 | | | | 201,232 | | | | 1,288,963 | |
Reinvestment of distributions | | | 5,820 | | | | 39,507 | | | | 304 | | | | 1,972 | |
Shares redeemed | | | (793,095 | ) | | | (5,175,322 | ) | | | (2 | ) | | | (15 | ) |
| | | | (44,726 | ) | | | 85,224 | | | | 201,534 | | | | 1,290,920 | |
NET INCREASE | | | 11,559,023 | | | $ | 80,190,810 | | | | 12,523,531 | | | $ | 106,107,301 | |
75
GOLDMAN SACHS STRUCTURED TAX-ADVANTAGED EQUITY FUNDS
Notes to Financial Statements (continued)
June 30, 2012 (Unaudited)
| | |
| 13. SUMMARY OF SHARE TRANSACTIONS (continued) |
Share activity is as follows:
| | | | | | | | | | | | | | | | |
| | | Structured Tax-Managed Equity Fund | |
| | | | |
| | | For the Six Months Ended
June 30, 2012
(Unaudited) | | | For the Fiscal Year Ended
December 31, 2011 | |
| | | | |
| | | Shares | | | Dollars | | | Shares | | | Dollars | |
| | | | |
| Class A Shares | | | | | | | | | | | | | | | | |
Shares sold | | | 99,362 | | | $ | 1,084,273 | | | | 2,041,667 | | | $ | 20,656,520 | |
Shares converted from Class B(a) | | | 2,239 | | | | 24,371 | | | | 13,942 | | | | 134,991 | |
Reinvestment of distributions | | | — | | | | — | | | | 42,185 | | | | 422,268 | |
Shares redeemed | | | (936,570 | ) | | | (10,116,244 | ) | | | (6,396,722 | ) | | | (63,088,946 | ) |
| | | | (834,969 | ) | | | (9,007,600 | ) | | | (4,298,928 | ) | | | (41,875,167 | ) |
| Class B Shares | | | | | | | | | | | | | | | | |
Shares sold | | | 129 | | | | 1,349 | | | | 2,179 | | | | 21,438 | |
Shares converted to Class A(a) | | | (2,314 | ) | | | (24,371 | ) | | | (14,379 | ) | | | (134,991 | ) |
Reinvestment of distributions | | | — | | | | — | | | | 118 | | | | 1,149 | |
Shares redeemed | | | (18,283 | ) | | | (188,679 | ) | | | (58,099 | ) | | | (564,734 | ) |
| | | | (20,468 | ) | | | (211,701 | ) | | | (70,181 | ) | | | (677,138 | ) |
| Class C Shares | | | | | | | | | | | | | | | | |
Shares sold | | | 5,331 | | | | 54,360 | | | | 30,513 | | | | 296,816 | |
Reinvestment of distributions | | | — | | | | — | | | | 2,217 | | | | 21,373 | |
Shares redeemed | | | (45,846 | ) | | | (462,379 | ) | | | (210,523 | ) | | | (2,026,377 | ) |
| | | | (40,515 | ) | | | (408,019 | ) | | | (177,793 | ) | | | (1,708,188 | ) |
| Institutional Shares | | | | | | | | | | | | | | | | |
Shares sold | | | 4,652,817 | | | | 50,690,188 | | | | 7,003,605 | | | | 70,818,719 | |
Reinvestment of distributions | | | — | | | | — | | | | 332,319 | | | | 3,373,040 | |
Shares redeemed | | | (2,877,791 | ) | | | (31,916,587 | ) | | | (5,108,403 | ) | | | (51,492,038 | ) |
| | | | 1,775,026 | | | | 18,773,601 | | | | 2,227,521 | | | | 22,699,721 | |
| Service Shares | | | | | | | | | | | | | | | | |
Shares sold | | | 9 | | | | 100 | | | | — | | | | — | |
Reinvestment of distributions | | | — | | | | — | | | | 31 | | | | 312 | |
Shares redeemed | | | (199 | ) | | | (2,101 | ) | | | (2,431 | ) | | | (25,951 | ) |
| | | | (190 | ) | | | (2,001 | ) | | | (2,400 | ) | | | (25,639 | ) |
| Class IR Shares | | | | | | | | | | | | | | | | |
Shares sold | | | 2,380 | | | | 27,084 | | | | 49,908 | | | | 506,960 | |
Reinvestment of distributions | | | — | | | | — | | | | 2 | | | | 16 | |
Shares redeemed | | | (570 | ) | | | (6,500 | ) | | | (1,039 | ) | | | (10,332 | ) |
| | | | 1,810 | | | | 20,584 | | | | 48,871 | | | | 496,644 | |
NET INCREASE (DECREASE) | | | 880,694 | | | $ | 9,164,864 | | | | (2,272,910 | ) | | $ | (21,089,767 | ) |
| (a) | | Class B Shares automatically convert into Class A Shares on or about the fifteenth day of the last month of the calendar quarter that is eight years after the initial purchase date of either the Fund or another Goldman Sachs Fund. |
76
GOLDMAN SACHS STRUCTURED TAX-ADVANTAGED EQUITY FUNDS
|
| 13. SUMMARY OF SHARE TRANSACTIONS (continued) |
Share activity is as follows:
| | | | | | | | | | | | | | | | |
| | | Structured International Tax-Managed Equity Fund | |
| | | | |
| | | For the Six Months Ended
June 30, 2012
(Unaudited) | | | For the Fiscal Year Ended
December 31, 2011 | |
| | | | |
| | | Shares | | | Dollars | | | Shares | | | Dollars | |
| | | | |
| Class A Shares | | | | | | | | | | | | | | | | |
Shares sold | | | 239,476 | | | $ | 1,706,688 | | | | 2,840,464 | | | $ | 22,472,607 | |
Reinvestment of distributions | | | — | | | | — | | | | 182,911 | | | | 1,209,042 | |
Shares redeemed | | | (1,835,457 | ) | | | (12,680,457 | ) | | | (6,490,831 | ) | | | (48,739,971 | ) |
| | | | (1,595,981 | ) | | | (10,973,769 | ) | | | (3,467,456 | ) | | | (25,058,322 | ) |
| Class C Shares | | | | | | | | | | | | | | | | |
Shares sold | | | — | | | | — | | | | 2 | | | | 15 | |
Reinvestment of distributions | | | — | | | | — | | | | 63 | | | | 413 | |
Shares redeemed | | | (91 | ) | | | (606 | ) | | | (159 | ) | | | (1,015 | ) |
| | | | (91 | ) | | | (606 | ) | | | (94 | ) | | | (587 | ) |
| Institutional Shares | | | | | | | | | | | | | | | | |
Shares sold | | | 3,277,070 | | | | 22,684,727 | | | | 5,693,236 | | | | 42,812,843 | |
Reinvestment of distributions | | | — | | | | — | | | | 510,688 | | | | 3,365,439 | |
Shares redeemed | | | (2,022,032 | ) | | | (14,321,157 | ) | | | (1,810,186 | ) | | | (13,429,345 | ) |
| | | | 1,255,038 | | | | 8,363,570 | | | | 4,393,738 | | | | 32,748,937 | |
| Class IR Shares | | | | | | | | | | | | | | | | |
Shares sold | | | 2,134 | | | | 15,924 | | | | 2 | | | | 12 | |
Reinvestment of distributions | | | — | | | | — | | | | 5 | | | | 33 | |
Shares redeemed | | | — | | | | — | | | | (2 | ) | | | (12 | ) |
| | | | 2,134 | | | | 15,924 | | | | 5 | | | | 33 | |
NET INCREASE (DECREASE) | | | (338,900 | ) | | $ | (2,594,881 | ) | | | 926,193 | | | $ | 7,690,061 | |
77
GOLDMAN SACHS STRUCTURED TAX-ADVANTAGED EQUITY FUNDS
Fund Expenses — Six Month Period Ended June 30, 2012 (Unaudited)
As a shareholder of Class A, Class B, Class C, Institutional, Service or Class IR Shares of a Fund you incur types of costs: (1) transaction costs, including sales charges on purchase payments (with respect to Class A Shares), contingent deferred sales charges on redemptions (with respect to Class B and Class C Shares), (if any); and (2) ongoing costs, including management fees; distribution and service (12b-1) fees (with respect to Class A, Class B and Class C Shares); and other Fund expenses. This example is intended to help you understand your ongoing costs (in dollars) of investing in Class A, Class B, Class C, Institutional, Service or Class IR Shares of the Funds and to compare these costs with the ongoing costs of investing in other mutual funds.
The example is based on an investment of $1,000 invested at the beginning of the period and held for the entire period from January 1, 2012 through June 30, 2012.
Actual Expenses — The first line under each share class in the table below provides information about actual account values and actual expenses. You may use the information in this line, together with the amount you invested, to estimate the expenses that you paid over the period. Simply divide your account value by $1,000 (for example, an $8,600 account value divided by $1,000=8.6), then multiply the result by the number in the first line under the heading entitled “Expenses Paid” to estimate the expenses you paid on your account during this period.
Hypothetical Example for Comparison Purposes — The second line under each share class in the table below provides information about hypothetical account values and hypothetical expenses based on the Funds' actual net expense ratio and an assumed rate of return of 5% per year before expenses, which is not the Funds' actual return. The hypothetical account values and expenses may not be used to estimate the actual ending account balance or expenses you paid for the period. You may use this information to compare the ongoing costs of investing in the Funds and other funds. To do so, compare this 5% hypothetical example with the 5% hypothetical examples that appear in the shareholder reports of the other funds.
Please note that the expenses shown in the table are meant to highlight your ongoing costs only and do not reflect any transactional costs, such as sales charges, redemption fees, or exchange fees. Therefore, the second line of the table is useful in comparing ongoing costs only, and will not help you determine the relative total costs of owning different funds. In addition, if these transactional costs were included, your costs would have been higher.
| | | | | | | | | | | | | | | | | | | | | | | | | | | | | | | | | | | | | | | | | | | | | | | | |
| | | U.S. Equity Dividend and Premium Fund | | | International Equity Dividend and Premium Fund | | | Structured Tax-Managed Equity Fund | | | Structured International Tax-Managed Equity Fund | |
| Share Class | | Beginning
Account
Value
01/01/12 | | | Ending
Account
Value
06/30/12 | | | Expenses
Paid for the
6 Months Ended
06/30/12* | | | Beginning
Account
Value
01/01/12 | | | Ending
Account
Value
06/30/12 | | | Expenses
Paid for the
6 Months Ended
06/30/12* | | | Beginning
Account
Value
01/01/12 | | | Ending
Account
Value
06/30/12 | | | Expenses
Paid for the
6 Months Ended
06/30/12* | | | Beginning
Account
Value
01/01/12 | | | Ending
Account
Value
06/30/12 | | | Expenses
Paid for the
6 Months Ended
06/30/12* | |
| Class A | | | | | | | | | | | | | | | | | | | | | | | | | | | | | | | | | | | | | | | | | | | | | | | | |
Actual | | $ | 1,000 | | | $ | 1,065.90 | | | $ | 6.27 | | | $ | 1,000 | | | $ | 1,010.50 | | | $ | 6.50 | | | $ | 1,000 | | | $ | 1,090.50 | | | $ | 5.67 | | | $ | 1,000 | | | $ | 1,028.60 | | | $ | 6.36 | |
Hypothetical 5% return | | | 1,000 | | | | 1,018.80 | + | | | 6.12 | | | | 1,000 | | | | 1,018.40 | + | | | 6.52 | | | | 1,000 | | | | 1,019.44 | + | | | 5.47 | | | | 1,000 | | | | 1,018.60 | + | | | 6.32 | |
| Class B | | | | | | | | | | | | | | | | | | | | | | | | | | | | | | | | | | | | | | | | | | | | | | | | |
Actual | | | N/A | | | | N/A | | | | N/A | | | | N/A | | | | N/A | | | | N/A | | | | 1,000 | | | | 1,087.20 | | | | 9.55 | | | | N/A | | | | N/A | | | | N/A | |
Hypothetical 5% return | | | N/A | | | | N/A | | | | N/A | | | | N/A | | | | N/A | | | | N/A | | | | 1,000 | | | | 1,015.71 | + | | | 9.22 | | | | N/A | | | | N/A | | | | N/A | |
| Class C | | | | | | | | | | | | | | | | | | | | | | | | | | | | | | | | | | | | | | | | | | | | | | | | |
Actual | | | 1,000 | | | | 1,061.40 | | | | 10.10 | | | | 1,000 | | | | 1,005.30 | | | | 10.22 | | | | 1,000 | | | | 1,086.70 | | | | 9.55 | | | | 1,000 | | | | 1,022.60 | | | | 10.11 | |
Hypothetical 5% return | | | 1,000 | | | | 1,015.07 | + | | | 9.87 | | | | 1,000 | | | | 1,014.67 | + | | | 10.27 | | | | 1,000 | | | | 1,015.71 | + | | | 9.22 | | | | 1,000 | | | | 1,014.87 | + | | | 10.07 | |
| Institutional | | | | | | | | | | | | | | | | | | | | | | | | | | | | | | | | | | | | | | | | | | | | | | | | |
Actual | | | 1,000 | | | | 1,067.90 | | | | 4.22 | | | | 1,000 | | | | 1,011.10 | | | | 4.50 | | | | 1,000 | | | | 1,093.30 | | | | 3.59 | | | | 1,000 | | | | 1,030.10 | | | | 4.34 | |
Hypothetical 5% return | | | 1,000 | | | | 1,020.79 | + | | | 4.12 | | | | 1,000 | | | | 1,020.39 | + | | | 4.52 | | | | 1,000 | | | | 1,021.43 | + | | | 3.47 | | | | 1,000 | | | | 1,020.59 | + | | | 4.32 | |
| Service | | | | | | | | | | | | | | | | | | | | | | | | | | | | | | | | | | | | | | | | | | | | | | | | |
Actual | | | N/A | | | | N/A | | | | N/A | | | | N/A | | | | N/A | | | | N/A | | | | 1,000 | | | | 1,089.90 | | | | 6.18 | | | | N/A | | | | N/A | | | | N/A | |
Hypothetical 5% return | | | N/A | | | | N/A | | | | N/A | | | | N/A | | | | N/A | | | | N/A | | | | 1,000 | | | | 1,018.95 | + | | | 5.97 | | | | N/A | | | | N/A | | | | N/A | |
| Class IR | | | | | | | | | | | | | | | | | | | | | | | | | | | | | | | | | | | | | | | | | | | | | | | | |
Actual | | | 1,000 | | | | 1,067.40 | | | | 4.99 | | | | 1,000 | | | | 1,009.70 | | | | 5.25 | | | | 1,000 | | | | 1,092.20 | | | | 4.37 | | | | 1,000 | | | | 1,030.10 | | | | 5.10 | |
Hypothetical 5% return | | | 1,000 | | | | 1,020.04 | + | | | 4.87 | | | | 1,000 | | | | 1,019.64 | + | | | 5.27 | | | | 1,000 | | | | 1,020.69 | + | | | 4.22 | | | | 1,000 | | | | 1,019.84 | + | | | 5.07 | |
| * | | Expenses are calculated using each Fund’s annualized net expense ratio for each class, which represents the ongoing expenses as a percentage of net assets for the six months ended June 30, 2012. Expenses are calculated by multiplying the annualized net expense ratio by the average account value for the period; then multiplying the result by the number of days in the most recent fiscal half year; and then dividing that result by the number of days in the fiscal year. The annualized net expense ratios for the period were as follows: |
| | | | | | | | | | | | | | | | | | | | | | | | |
| Fund | | Class A | | | Class B | | | Class C | | | Institutional | | | Service | | | Class IR | |
U.S. Equity Dividend and Premium | | | 1.22 | % | | | N/A | | | | 1.97 | % | | | 0.82 | % | | | N/A | | | | 0.97 | % |
International Equity Dividend and Premium | | | 1.30 | | | | N/A | | | | 2.05 | | | | 0.90 | | | | N/A | | | | 1.05 | |
Structured Tax-Managed Equity | | | 1.09 | | | | 1.84 | % | | | 1.84 | | | | 0.69 | | | | 1.19 | % | | | 0.84 | |
Structured International Tax-Managed Equity | | | 1.26 | | | | N/A | | | | 2.01 | | | | 0.86 | | | | N/A | | | | 1.01 | |
| + | | Hypothetical expenses are based on each Fund’s actual annualized net expense ratios and an assumed rate of return of 5% per year before expenses. |
78
GOLDMAN SACHS STRUCTURED TAX-ADVANTAGED EQUITY FUNDS
Statement Regarding Basis for Approval of Management Agreement (Unaudited)
Background
The Goldman Sachs U.S. Equity Dividend and Premium, Goldman Sachs International Equity Dividend and Premium, Goldman Sachs Structured Tax-Managed Equity and Goldman Sachs Structured International Tax-Managed Equity Funds (the “Funds”) are investment portfolios of Goldman Sachs Trust (the “Trust”). The Board of Trustees oversees the management of the Trust and reviews the investment performance and expenses of the Funds at regularly scheduled meetings held during the year. In addition, the Board of Trustees determines annually whether to approve the continuance of the Trust’s investment management agreement (the “Management Agreement”) with Goldman Sachs Asset Management, L.P. (the “Investment Adviser”) on behalf of the Funds.
The Management Agreement was most recently approved for continuation until June 30, 2013 by the Board of Trustees, including those Trustees who are not parties to the Management Agreement or “interested persons” (as defined in the Investment Company Act of 1940, as amended) of any party thereto (the “Independent Trustees”), at a meeting held on June 13, 2012 (the “Annual Meeting”).
The review process undertaken by the Trustees spans the course of the year and culminates with the Annual Meeting. To assist the Trustees in their deliberations, the Trustees have established a Contract Review Committee (the “Committee”), comprised of the Independent Trustees. The Committee held three meetings over the course of the year since the Management Agreement was last approved. At those Committee meetings, regularly scheduled Board meetings and/or the Annual Meeting, the Board, or the Independent Trustees, as applicable, considered matters relating to the Management Agreement, including:
| | (a) | | the nature and quality of the advisory, administrative and other services provided to the Funds by the Investment Adviser and its affiliates, including information about: |
| | (i) | | the structure, staff and capabilities of the Investment Adviser and its portfolio management teams; |
| | (ii) | | the groups within the Investment Adviser and its affiliates that support the portfolio management teams or provide other types of necessary services, including fund services groups (e.g., accounting and financial reporting, tax, shareholder services and operations), controls and risk management groups (e.g., legal, compliance, valuation oversight, credit risk management, internal audit, compliance testing, market risk analysis, finance and strategy and central funding), sales and distribution support groups and others (e.g., information technology and training); |
| | (iii) | | trends in headcount; |
| | (iv) | | the Investment Adviser’s financial resources and ability to hire and retain talented personnel and strengthen its operations; and |
| | (v) | | the parent company’s support of the Investment Adviser and its mutual fund business, as expressed by the firm’s senior management; |
| | (b) | | information on the investment performance of the Funds, including comparisons to the performance of similar mutual funds, as provided by a third party mutual fund data provider engaged as part of the contract review process (the “Outside Data Provider”), and benchmark performance indices, and general investment outlooks in the markets in which the Funds invest; |
| | (c) | | the terms of the Management Agreement and agreements with affiliated service providers entered into by the Trust on behalf of the Funds; |
| | (d) | | expense information for the Funds, including: |
| | (i) | | the relative management fee and expense levels of the Funds as compared to those of comparable funds managed by other advisers, as provided by the Outside Data Provider; |
| | (ii) | | each Fund’s expense trends over time; and |
| | (iii) | | to the extent the Investment Adviser manages institutional accounts or collective investment vehicles having investment objectives and policies similar to those of the Funds, comparative information on the advisory fees charged and services provided to those accounts by the Investment Adviser; |
79
GOLDMAN SACHS STRUCTURED TAX-ADVANTAGED EQUITY FUNDS
Statement Regarding Basis for Approval of Management Agreement (Unaudited) (continued)
| | (e) | | with respect to the extensive investment performance and expense comparison data provided by the Outside Data Provider, its processes in producing that data for the Funds; |
| | (f) | | the undertakings of the Investment Adviser to waive certain fees (with respect to the Structured Tax-Managed Equity and Structured International Tax-Managed Equity Funds) and limit certain expenses of each of the Funds that exceed specified levels, and a summary of contractual fee reductions made by the Investment Adviser and its affiliates over the past several years with respect to the Funds; |
| | (g) | | information relating to the profitability of the Management Agreement and the transfer agency and distribution and service arrangements of each of the Funds and the Trust as a whole to the Investment Adviser and its affiliates; |
| | (h) | | whether each Fund’s existing management fee schedule adequately addressed any economies of scale; |
| | (i) | | a summary of the “fall-out” benefits derived by the Investment Adviser and its affiliates from their relationships with the Funds, including the fees received by the Investment Adviser’s affiliates from the Funds for transfer agency, securities lending, portfolio trading, distribution and other services; |
| | (j) | | a summary of potential benefits derived by the Funds as a result of their relationship with the Investment Adviser; |
| | (k) | | information regarding commissions paid by the Funds and broker oversight, other information regarding portfolio trading and how the Investment Adviser carries out its duty to seek best execution; |
| | (l) | | portfolio manager ownership of Fund shares; the manner in which portfolio manager compensation is determined; and the number and types of accounts managed by the portfolio managers; |
| | (m) | | the nature and quality of the services provided to the Funds by their unaffiliated service providers, and the Investment Adviser’s general oversight and evaluation (including reports on due diligence) of those service providers as part of the administration services provided under the Management Agreement; and |
| | (n) | | the Investment Adviser’s processes and policies addressing various types of potential conflicts of interest; its approach to risk management; the annual review of the effectiveness of the Funds’ compliance program; and compliance reports. |
The Trustees also received an overview of the Funds’ distribution arrangements. They received information regarding the Funds’ assets, share purchase and redemption activity and the payment of Rule 12b-1 distribution and service fees by the Funds and the payment of non-Rule 12b-1 shareholder service and/or administration fees by the Structured Tax-Managed Fund’s Service Shares. Information was also provided to the Trustees relating to revenue sharing payments made by and services provided by the Investment Adviser and its affiliates to intermediaries that promote the sale, distribution and/or servicing of Fund shares.
The presentations made at the Board and Committee meetings and at the Annual Meeting encompassed the Funds and other mutual fund portfolios for which the Board of Trustees has responsibility. In evaluating the Management Agreement at the Annual Meeting, the Trustees relied upon their knowledge, resulting from their meetings and other interactions throughout the year, of the Investment Adviser, its affiliates, their services and the Funds. In conjunction with these meetings, the Trustees received written materials and oral presentations on the topics covered, and were advised by their independent legal counsel regarding their responsibilities and other regulatory requirements related to the approval and continuation of mutual fund investment management agreements under applicable law. In addition, the Investment Adviser and its affiliates provided the Independent Trustees with a written response to a formal request for information sent on behalf of the Independent Trustees by their independent legal counsel. During the course of their deliberations, the Independent Trustees met in executive sessions with their independent legal counsel, without representatives of the Investment Adviser or its affiliates present. The Independent Trustees also discussed the broad range of other investment choices that are available to Fund investors, including the availability of comparable funds managed by other advisers.
80
GOLDMAN SACHS STRUCTURED TAX-ADVANTAGED EQUITY FUNDS
Statement Regarding Basis for Approval of Management Agreement (Unaudited) (continued)
Nature, Extent and Quality of the Services Provided Under the Management Agreement
As part of their review, the Trustees considered the nature, extent and quality of the services provided by the Investment Adviser. In this regard, the Trustees considered both the investment advisory services, and the other, non-advisory services, that are provided to the Funds by the Investment Adviser and its affiliates. The Trustees noted the transition in the leadership and changes in personnel of various of the Investment Adviser’s portfolio management teams that had occurred in recent periods, and the potential benefit to the Funds of the ongoing recruitment efforts aimed at bringing high quality investment talent to the Investment Adviser. The Independent Trustees concluded that the Investment Adviser continued to commit substantial financial and operational resources to the Funds and expressed confidence that the Investment Adviser would continue to do so in the future. The Trustees also observed that the Investment Adviser had made significant commitments to address regulatory compliance requirements applicable to the Funds and the Investment Adviser.
Investment Performance
The Trustees also considered the investment performance of the Funds and the Investment Adviser. In this regard, they compared the investment performance of each Fund to its peers using rankings and ratings compiled by the Outside Data Provider as of December 31, 2011, and updated performance information prepared by the Investment Adviser using the peer groups identified by the Outside Data Provider as of March 31, 2012. The information on each Fund’s investment performance was provided for the one-, three-, five- and ten-year periods ending on the applicable dates, to the extent that each Fund had been in existence for those periods. The Trustees also reviewed each Fund’s investment performance over time on a year-by-year basis relative to its performance benchmark. In addition, they considered the investment performance trends of the Funds over time, and reviewed the investment performance of each Fund in light of its investment objective and policies and market conditions.
In addition, the Trustees considered materials prepared and presentations made by the Investment Adviser’s senior management and portfolio management personnel, in which Fund performance was assessed. The Trustees also considered the Investment Adviser’s periodic reports with respect to the Funds’ risk profiles, and how the Investment Adviser’s approach to risk monitoring and management influences portfolio management.
The Independent Trustees noted that the Structured International Tax-Managed Equity and International Equity Divided and Premium Funds had placed in the top half of their respective peer groups during the one-year period and the third quartile of their respective peer groups during the three-year period ended March 31, 2012. The Independent Trustees further observed that the Structured International Tax-Managed Equity and International Equity Dividend and Premium Funds underperformed their respective benchmark indexes during the one- and three-year periods ended March 31, 2012. They noted that the Structured Tax-Managed Equity Fund had placed in the top half of its peer group during the one-, three-, and ten-year periods and in the bottom quartile in the five-year period, outperformed its benchmark index during the one-year period, and underperformed its benchmark index during the three-, five-, and ten-year periods ended March 31, 2012. The Independent Trustees observed that the U.S. Equity Dividend and Premium Fund had placed in the top half of its peer group during the one-, three-, and five-year periods and outperformed its benchmark index during the one- and five-year periods, and underperformed its benchmark index during the three-year period ended March 31, 2012. They noted that the International Equity Dividend and Premium and U.S. Equity Dividend and Premium Funds had certain significant differences from their peer groups (Foreign Large Value and Large Blend, respectively) and benchmark indexes (MSCI EAFE Index (net) and S&P 500 Index, respectively) that caused the peer groups and benchmark indexes to be imperfect bases for performance comparison. The Independent Trustees observed that the Funds generally demonstrated strong performance in the one- and three-year periods. They noted additions to the Funds’ senior portfolio management in 2011, and recognized the team’s recent undertaking to enhance its investment models to strengthen performance.
81
GOLDMAN SACHS STRUCTURED TAX-ADVANTAGED EQUITY FUNDS
Statement Regarding Basis for Approval of Management Agreement (Unaudited) (continued)
Costs of Services Provided and Competitive Information
The Trustees considered the contractual fee rates payable by each Fund under the Management Agreement. In this regard, the Trustees considered information on the services rendered by the Investment Adviser to the Funds, which included both advisory and administrative services that were directed to the needs and operations of the Funds as registered mutual funds.
In particular, the Trustees reviewed analyses prepared by the Outside Data Provider regarding the expense rankings of the Funds. The analyses provided a comparison of the Funds’ management fees and breakpoints to those of relevant peer groups and category universes; an expense analysis which compared each Fund’s overall net and gross expenses to a peer group and a category universe; and a five-year history (four years, in the case of International Equity Dividend and Premium and Structured International Tax-Managed Equity Funds), comparing each Fund’s net expenses to the peer and category medians. The analyses also compared each Fund’s transfer agency, custody and distribution fees, other expenses and fee waivers/reimbursements to those of other funds in the peer group and the peer group and category medians. The Trustees concluded that the comparisons provided by the Outside Data Provider were useful in evaluating the reasonableness of the management fees and total expenses paid by the Funds.
In addition, the Trustees considered the Investment Adviser’s undertakings to waive a portion of its management fee for Structured Tax-Managed Equity and Structured International Tax-Managed Equity Funds and to limit certain expenses of each of the Funds that exceed specified levels. The Trustees also noted that certain changes were being made to existing fee waiver or expense limitation arrangements of the Funds that would have the effect of lowering (in the case of the U.S. Equity Dividend and Premium Fund) or increasing (in the case of each other Fund) total Fund expenses, with such changes taking effect in connection with the Funds’ next annual registration statement update. They also considered, to the extent that the Investment Adviser manages institutional accounts or collective investment vehicles having investment objectives and policies similar to those of the Funds, comparative fee information for services provided by the Investment Adviser to those accounts, and information that indicated that services provided to the Funds differed in various significant respects from the services provided to institutional accounts, which generally operated under less stringent legal and regulatory structures, required fewer services from the Investment Adviser to a smaller number of client contact points, were less time-intensive and paid lower fees. By contrast, the Trustees noted that the Investment Adviser provides substantial administrative services to the Funds under the terms of the Management Agreement.
In addition, the Trustees noted that shareholders are able to redeem their Fund shares at any time if they believe that the Fund fees and expenses are too high or if they are dissatisfied with the performance of the Fund.
Profitability
The Trustees reviewed the Investment Adviser’s revenues and pre-tax profit margins with respect to the Trust and each of the Funds. In this regard the Trustees noted that they had received, among other things, profitability analyses and summaries, revenue and expense schedules by Fund and by function (i.e., investment management, transfer agency and distribution and service) and the Investment Adviser’s expense allocation methodology. They observed that the profitability and expense figures are substantially similar to those used by the Investment Adviser for many internal purposes, including compensation decisions among various business groups, and are thus subject to a vigorous internal debate about how certain revenue and expenses should be allocated. The Trustees also reviewed the report of the internal audit group within the Goldman Sachs organization, which included an assessment of the reasonableness and consistency of the Investment Adviser’s expense allocation methodology and an evaluation of the accuracy of the Investment Adviser’s profitability analysis calculations. Profitability data for the Trust and each Fund were provided for 2011 and 2010, and the Trustees considered this information in relation to the Investment Adviser’s overall profitability. The Trustees considered the Investment Adviser’s revenues and pre-tax profit margins both in absolute terms and in comparison to information on the reported pre-tax profit margins earned by certain other asset management firms.
82
GOLDMAN SACHS STRUCTURED TAX-ADVANTAGED EQUITY FUNDS
Statement Regarding Basis for Approval of Management Agreement (Unaudited) (continued)
Economies of Scale
The Trustees considered the information that had been provided regarding the Investment Adviser’s profitability. The Trustees also considered the breakpoints in the fee rate payable under the Management Agreement for each of the Funds at the following annual percentage rates of the average daily net assets of the Funds:
| | | | | | | | | | | | | | | | |
| | | U.S. Equity
Dividend and
Premium Fund | | | International
Equity Dividend and
Premium Fund | | | Structured
Tax-Managed
Equity Fund | | | Structured
International
Tax-Managed
Equity Fund | |
| First $1 billion | | | 0.75 | % | | | 0.81 | % | | | 0.70 | % | | | 0.85 | % |
| Next $1 billion | | | 0.68 | | | | 0.73 | | | | 0.63 | | | | 0.77 | |
| Next $3 billion | | | 0.65 | | | | 0.69 | | | | 0.60 | | | | 0.73 | |
| Next $3 billion | | | 0.64 | | | | 0.68 | | | | 0.59 | | | | 0.72 | |
| Over $8 billion | | | 0.63 | | | | 0.67 | | | | 0.58 | | | | 0.71 | |
The Trustees noted that the breakpoints were meant to share potential economies of scale, if any, with the Funds and their shareholders as assets under management reach those asset levels. The Trustees considered the amounts of assets in the Funds; the Funds’ recent share purchase and redemption activity; the information provided by the Investment Adviser relating to the costs of the services provided by the Investment Adviser and its affiliates and their realized profits; information comparing fee rates charged by the Investment Adviser with fee rates charged to other funds in the peer groups; and the Investment Adviser’s undertakings to waive certain fees and limit certain expenses of the Funds that exceed specified levels. Upon reviewing these matters at the Annual Meeting, the Trustees concluded that the fee breakpoints represented a means of assuring that benefits of scalability would be passed along to shareholders at the specified asset levels.
Other Benefits to the Investment Adviser and Its Affiliates
The Trustees also considered the other benefits derived by the Investment Adviser and its affiliates from their relationship with the Funds as stated above, including: (a) transfer agency fees received by Goldman, Sachs & Co. (“Goldman Sachs”); (b) brokerage and futures commissions earned by Goldman Sachs for executing securities and futures transactions on behalf of the Funds; (c) trading efficiencies resulting from aggregation of orders of the Funds with those for other funds or accounts managed by the Investment Adviser; (d) fees earned by Goldman Sachs Agency Lending, an affiliate of the Investment Adviser, as securities lending agent (and fees earned by the Investment Adviser for managing the fund in which the Funds’ cash collateral is invested); (e) the Investment Adviser’s ability to leverage the infrastructure designed to service the Funds on behalf of its other clients; (f) the Investment Adviser’s ability to cross-market other products and services to Fund shareholders; (g) Goldman Sachs’ retention of certain fees as Fund Distributor; (h) the Investment Adviser’s ability to negotiate better pricing with custodians on behalf of its other clients, as a result of the relationship with the Funds; and (i) the possibility that the working relationship between the Investment Adviser and the Funds’ third party service providers may cause those service providers to be open to doing business with other areas of Goldman Sachs. In the course of considering the foregoing, the Independent Trustees requested and received further information quantifying certain of these fall-out benefits. In looking at the benefits to Goldman Sachs Agency Lending and the Investment Adviser from the securities lending program, they noted that the Funds also benefited from their participation in the securities lending program.
Other Benefits to the Funds and Their Shareholders
The Trustees also noted that the Funds receive certain potential benefits as a result of their relationship with the Investment Adviser, including: (a) trading efficiencies resulting from aggregation of orders of the Funds with those of other funds or accounts managed by the Investment Adviser; (b) improved servicing and pricing from vendors because of the volume of business generated by the Investment Adviser and its affiliates; (c) improved servicing from broker-dealers because of the volume of business generated by the Investment Adviser and its affiliates; (d) the Investment Adviser’s ability to negotiate favorable terms with derivatives counterparties as a result of the size and reputation of the Goldman Sachs organization; (e) the Investment Adviser’s knowledge and experience gained from managing other accounts and products; (f) the Investment Adviser’s ability to hire and
83
GOLDMAN SACHS STRUCTURED TAX-ADVANTAGED EQUITY FUNDS
Statement Regarding Basis for Approval of Management Agreement (Unaudited) (continued)
retain qualified personnel to provide services to the Funds because of the reputation of the Goldman Sachs organization; (g) the Funds’ access, through the Investment Adviser, to certain firmwide resources (e.g., proprietary risk management systems and databases), subject to certain restrictions; and (h) the Funds’ access to certain affiliated distribution channels. The Trustees noted the competitive nature of the mutual fund marketplace, and noted further that many of the Funds’ shareholders invested in the Funds in part because of the Funds’ relationship with the Investment Adviser and that those shareholders have a general expectation that the relationship will continue.
Conclusion
In connection with their consideration of the Management Agreement, the Trustees gave weight to each of the factors described above, but did not identify any particular factor as controlling their decision. After deliberation and consideration of all of the information provided, including the factors described above, the Trustees concluded, in the exercise of their business judgment, that the management fees paid by each of the Funds were reasonable in light of the services provided to it by the Investment Adviser, the Investment Adviser’s costs and each Fund’s current and reasonably foreseeable asset levels. The Trustees unanimously concluded that the Investment Adviser’s continued management likely would benefit each Fund and its shareholders and that the Management Agreement should be approved and continued with respect to each Fund until June 30, 2013.
84
FUNDS PROFILE
Goldman Sachs Funds

Goldman Sachs is a premier financial services firm, known since 1869 for creating thoughtful and customized investment solutions in complex global markets.
Today, the Investment Management Division of Goldman Sachs serves a diverse set of clients worldwide, including private institutions, public entities and individuals. With approximately $716.1 billion in assets under management as of June 30, 2012, Goldman Sachs Asset Management (“GSAM”) has portfolio management teams located around the world and our investment professionals bring firsthand knowledge of local markets to every investment decision. GSAM’s assets under management includes assets managed by Goldman Sachs Asset Management, LP and its Investment Advisory Affiliates. Additionally, GSAM ranks in the top 10 asset management firms worldwide, based on assets under management.1
|
| OVERVIEW OF GOLDMAN SACHS FUNDS |

Money Market2
Financial Square FundsSM
| n | | Financial Square Tax-Exempt Funds |
| n | | Financial Square Federal Fund |
| n | | Financial Square Government Fund |
| n | | Financial Square Money Market Fund |
| n | | Financial Square Prime Obligations Fund |
| n | | Financial Square Treasury Instruments Fund |
| n | | Financial Square Treasury Obligations Fund |
Fixed Income
Short Duration and Government
| n | | High Quality Floating Rate Fund3 |
| n | | Short Duration Government Fund |
| n | | Short Duration Income Fund |
| n | | Inflation Protected Securities Fund |
Multi-Sector
| n | | Core Plus Fixed Income Fund |
Municipal and Tax-Free
| n | | High Yield Municipal Fund |
| n | | Short Duration Tax-Free Fund |
Single Sector
| n | | Investment Grade Credit Fund |
| n | | High Yield Floating Rate Fund |
| n | | Emerging Markets Debt Fund |
| n | | Local Emerging Markets Debt Fund |
Corporate Credit
Fundamental Equity
| n | | Small/Mid Cap Growth Fund |
| n | | Flexible Cap Growth Fund |
| n | | Concentrated Growth Fund |
| n | | Technology Tollkeeper Fund |
| n | | Growth Opportunities Fund |
| n | | Rising Dividend Growth Fund |
Structured Equity
| n | | Structured Small Cap Equity Fund |
| n | | Structured U.S. Equity Fund |
| n | | Structured Small Cap Growth Fund |
| n | | Structured Large Cap Growth Fund |
| n | | Structured Large Cap Value Fund |
| n | | Structured Small Cap Value Fund |
| n | | Structured Tax-Managed Equity Fund |
| n | | Structured International Tax-Managed Equity Fund |
| n | | U.S. Equity Dividend and Premium Fund |
| n | | International Equity Dividend and Premium Fund |
| n | | Structured International Small Cap Fund |
| n | | Structured International Equity Fund |
| n | | Structured Emerging Markets Equity Fund |
Fundamental Equity International
| n | | Strategic International Equity Fund |
| n | | Concentrated International Equity Fund |
| n | | International Small Cap Fund |
| n | | Emerging Markets Equity Fund |
| n | | BRIC Fund (Brazil, Russia, India, China) |
Select Satellite5
| n | | Real Estate Securities Fund |
| n | | International Real Estate Securities Fund |
| n | | Commodity Strategy Fund |
| n | | Dynamic Allocation Fund |
| n | | Absolute Return Tracker Fund |
| n | | Managed Futures Strategy Fund |
Total Portfolio Solutions5
| n | | Balanced Strategy Portfolio |
| n | | Growth and Income Strategy Portfolio |
| n | | Growth Strategy Portfolio |
| n | | Equity Growth Strategy Portfolio |
| n | | Income Strategies Portfolio |
| n | | Satellite Strategies Portfolio |
| n | | Retirement Strategies Portfolios |
| n | | Enhanced Dividend Global Equity Portfolio |
| n | | Tax Advantaged Global Equity Portfolio |
| 1 | | Ranking for Goldman Sachs Group, Inc., includes Goldman Sachs Asset Management, Private Wealth Management and Merchant Banking 2010 year-end assets. Ranked 10th in total assets worldwide. |
| | | Pensions&Investments, June 2011. |
| 2 | | An investment in a money market fund is neither insured nor guaranteed by the Federal Deposit Insurance Corporation (“FDIC”) or any other government agency. Although the Funds seek to preserve the value of your investment at $1.00 per share, it is possible to lose money by investing in the Funds. |
| 3 | | Effective at the close of business on July 27, 2012, the Goldman Sachs Ultra Short Duration Government Fund was renamed the Goldman Sachs High Quality Floating Rate Fund. |
| 4 | | Effective at the close of business June 29, 2012, the Goldman Sachs Balanced Fund was renamed the Goldman Sachs Income Builder Fund. The Fund’s investment objective and policies were also changed. Performance information prior to this date reflects the Fund’s former investment objective and policies. |
| 5 | | Individual Funds within the Total Portfolio Solutions and Select Satellite categories will have various placement on the risk/return spectrum and may have greater or lesser risk than that indicated by the placement of the general Total Portfolio Solutions or Select Satellite category. |
| | | Financial Square FundsSM is a registered service mark of Goldman, Sachs & Co. |
| | |
TRUSTEES Ashok N. Bakhru, Chairman Donald C. Burke John P. Coblentz, Jr. Diana M. Daniels Joseph P. LoRusso James A. McNamara Jessica Palmer Alan A. Shuch Richard P. Strubel | | OFFICERS James A. McNamara, President George F. Travers, Principal Financial Officer Caroline L. Kraus, Secretary Scott M. McHugh, Treasurer |
| |
GOLDMAN, SACHS & CO. Distributor and Transfer Agent | | GOLDMAN SACHS ASSET MANAGEMENT, L.P. Investment Adviser |
Visit our Web site at www.goldmansachsfunds.com to obtain the most recent month-end returns.
Goldman Sachs Asset Management, L.P. 200 West Street, New York, New York 10282
The reports concerning the Funds included in this shareholder report may contain certain forward-looking statements about the factors that may affect the performance of the Funds in the future. These statements are based on Fund management’s predictions and expectations concerning certain future events and their expected impact on the Funds, such as performance of the economy as a whole and of specific industry sectors, changes in the levels of interest rates, the impact of developing world events, and other factors that may influence the future performance of the Funds. Management believes these forward-looking statements to be reasonable, although they are inherently uncertain and difficult to predict. Actual events may cause adjustments in portfolio management strategies from those currently expected to be employed.
A description of the policies and procedures that the Funds use to determine how to vote proxies relating to portfolio securities and information regarding how a Fund voted proxies relating to portfolio securities during the most recent 12-month period ended June 30 is available (i) without charge, upon request by calling 1-800-526-7384 (for Retail Shareholders) or 1-800-621-2550 (for Institutional Shareholders); and (ii) on the Securities and Exchange Commission (“SEC”) Web site at http://www.sec.gov.
The Funds file their complete schedule of portfolio holdings with the SEC for the first and third quarters of each fiscal year on Form N-Q. The Funds’ Form N-Q will become available on the SEC’s website at http://www.sec.gov within 60 days after the Funds’ first and third fiscal quarters. When available, the Funds’ Forms N-Q may be reviewed and copied at the SEC’s Public Reference Room in Washington, D.C. and information on the operation of the Public Reference Room may also be obtained by calling 1-800-SEC-0330. When available, Form N-Q may be obtained upon request and without charge by calling 1-800-526-7384 (for Retail Shareholders) or 1-800-621-2550 (for Institutional Shareholders).
Goldman, Sachs & Co. (“Goldman Sachs”) does not provide legal, tax or accounting advice. Any statement contained in this communication (including any attachments) concerning U.S. tax matters was not intended or written to be used, and cannot be used, for the purpose of avoiding penalties under the Internal Revenue Code, and was written to support the promotion or marketing of the transaction(s) or matter(s) addressed. Clients of Goldman Sachs should obtain their own independent tax advice based on their particular circumstances. Holdings and allocations shown are as of June 30, 2012 and may not be representative of future investments. Fund holdings should not be relied on in making investment decisions and should not be construed as research or investment advice regarding particular securities.
The Global Industry Classification Standard (GICS) was developed by and is the exclusive property and a service mark of Morgan Stanley Capital International Inc. (MSCI) and Standard & Poor’s, a division of The McGraw-Hill Companies, Inc. (S&P) and is licensed for use by Goldman Sachs. Neither MSCI, S&P nor any other party involved in making or compiling the GICS or any GICS classifications makes any express or implied warranties or representations with respect to such standard or classification (or the results to be obtained by the use thereof), and all such parties hereby expressly disclaim all warranties of originality, accuracy, completeness, merchantability or fitness for a particular purpose with respect to any of such standard or classification. Without limiting any of the foregoing, in no event shall MSCI, S&P, any of their affiliates or any third party involved in making or compiling the GICS or any GICS classifications have any liability for any direct, indirect, special, punitive, consequential or any other damages (including lost profits) even if notified of the possibility of such damages.
The portfolio risk management process includes an effort to monitor and manage risk, but does not imply low risk.
Holdings and allocations shown are as of June 30, 2012 and may not be representative of future investments. Fund holdings should not be relied on in making investment decisions and should not be construed as research or investment advice regarding particular securities.
This material is not authorized for distribution to prospective investors unless preceded or accompanied by a current Prospectus or summary prospectus, if applicable. Investors should consider a Fund’s objective, risks, and charges and expenses, and read the summary prospectus, if available, and/or the Prospectus carefully before investing or sending money. The summary prospectus, if available, and the Prospectus contain this and other information about a Fund and may be obtained from your Authorized Institution or from Goldman, Sachs & Co. by calling (retail–1-800-526-7384) (institutional – 1-800-621-2550).
© 2012 Goldman Sachs. All rights reserved. 79735.MF.MED.TMPL/8/2012 TAXADVSAR12/13.8K
| | The information required by this Item is only required in an annual report on this Form N-CSR. |
| ITEM 3. | AUDIT COMMITTEE FINANCIAL EXPERT. |
| | The information required by this Item is only required in an annual report on this Form N-CSR. |
| ITEM 4. | PRINCIPAL ACCOUNTANT FEES AND SERVICES. |
| | The information required by this Item is only required in an annual report on this Form N-CSR. |
| ITEM 5. | AUDIT COMMITTEE OF LISTED REGISTRANTS. |
| ITEM 6. | SCHEDULE OF INVESTMENTS. |
| | Schedule of Investments is included as part of the Report to Stockholders filed under Item 1. |
| ITEM 7. | DISCLOSURE OF PROXY VOTING POLICIES AND PROCEDURES FOR CLOSED-END MANAGEMENT INVESTMENT COMPANIES. |
| ITEM 8. | PORTFOLIO MANAGERS OF CLOSED-END MANAGEMENT INVESTMENT COMPANIES. |
| ITEM 9. | PURCHASES OF EQUITY SECURITIES BY CLOSED-END MANAGEMENT INVESTMENT COMPANY AND AFFILIATED PURCHASERS. |
| ITEM 10. | SUBMISSION OF MATTERS TO A VOTE OF SECURITY HOLDERS. |
| | There have been no material changes to the procedures by which shareholders may recommend nominees to the registrant’s board of trustees. |
| ITEM 11. | CONTROLS AND PROCEDURES. |
| | (a) | The registrant’s principal executive and principal financial officers, or persons performing similar functions have concluded that the registrant’s disclosure controls and procedures (as defined in Rule 30a-3(c) under the Investment Company Act of 1940, as amended (the “1940 Act”)) are effective as of a date within 90 days of the filing of this report that includes the disclosure required by this paragraph, based on the evaluation of these controls and procedures required by Rule 30a-3(b) under the 1940 Act and 15d-15(b) under the Securities Exchange Act of 1934, as amended. |
| | (b) | There were no changes in the registrant’s internal control over financial reporting (as defined in Rule 30a-3(d) under the 1940 Act) that occurred during the registrant’s second fiscal quarter of the period covered by this report that have materially affected, or are reasonably likely to materially affect, the registrant’s internal control over financial reporting. |
| | | | |
| (a)(1) | | The information required by this Item is only required in connection with an annual report on this Form N-CSR. |
| | |
| (a)(2) | | Exhibit 99.CERT | | Certifications pursuant to Section 302 of the Sarbanes-Oxley Act of 2002 filed herewith. |
| | |
| (b) | | Exhibit 99.906CERT | | Certifications pursuant to Section 906 of the Sarbanes-Oxley Act of 2002 filed herewith. |
SIGNATURES
Pursuant to the requirements of the Securities Exchange Act of 1934 and the Investment Company Act of 1940, the registrant has duly caused this report to be signed on its behalf by the undersigned, thereunto duly authorized.
| | | | |
| | | | Goldman Sachs Trust |
| | |
| By: | | | | /s/ James A. McNamara |
| | | | James A. McNamara |
| | | | President/Principal Executive Officer |
| | | | Goldman Sachs Trust |
| | |
| Date: | | | | August 27, 2012 |
Pursuant to the requirements of the Securities Exchange Act of 1934 and the Investment Company Act of 1940, this report has been signed below by the following persons on behalf of the registrant and in the capacities and on the dates indicated.
| | | | |
| By: | | | | /s/ James A. McNamara |
| | | | James A. McNamara |
| | | | President/Principal Executive Officer |
| | | | Goldman Sachs Trust |
| | |
| Date: | | | | August 27, 2012 |
| | |
| By: | | | | /s/ George F. Travers |
| | | | George F. Travers |
| | | | Principal Financial Officer |
| | | | Goldman Sachs Trust |
| | |
| Date: | | | | August 27, 2012 |