UNITED STATES
SECURITIES AND EXCHANGE COMMISSION
Washington, D.C. 20549
FORM N-CSR
CERTIFIED SHAREHOLDER REPORT OF REGISTERED
MANAGEMENT INVESTMENT COMPANIES
Investment Company Act file number 811-05349
Goldman Sachs Trust
(Exact name of registrant as specified in charter)
71 South Wacker Drive,
Chicago, Illinois 60606
(Address of principal executive offices) (Zip code)
| | |
Copies to: |
Peter V. Bonanno, Esq. | | Geoffrey R.T. Kenyon, Esq. |
Goldman, Sachs & Co. | | Dechert LLP |
200 West Street | | 200 Clarendon Street |
New York, New York 10282 | | 27th Floor |
| | Boston, MA 02116-5021 |
(Name and address of agents for service)
Registrant’s telephone number, including area code: (312) 655-4400
Date of fiscal year end: October 31
Date of reporting period: April 30, 2012
| ITEM 1. | REPORTS TO STOCKHOLDERS. |
| | The Semi-Annual Report to Stockholders is filed herewith. |
Goldman Sachs Funds

| | | | |
| | |
| Semi-Annual Report | | | | April 30, 2012 |
| | |
| | | | Structured Domestic Equity Funds |
| | | | Balanced |
| | | | Structured Large Cap Growth |
| | | | Structured Large Cap Value |
| | | | Structured Small Cap Equity |
| | | | Structured Small Cap Growth |
| | | | Structured Small Cap Value |
| | | | Structured U.S. Equity |

Goldman Sachs Structured Domestic Equity Funds
| n | | STRUCTURED LARGE CAP GROWTH |
| n | | STRUCTURED LARGE CAP VALUE |
| n | | STRUCTURED SMALL CAP EQUITY |
| n | | STRUCTURED SMALL CAP GROWTH |
| n | | STRUCTURED SMALL CAP VALUE |
| | | | |
TABLE OF CONTENTS | | | | |
| |
Principal Investment Strategies and Risks | | | 1 | |
| |
Market Review | | | 3 | |
| |
Investment Process — Balanced Fund | | | 6 | |
| |
Portfolio Management Discussion and Performance Summaries — Balanced Fund | | | 7 | |
| |
Investment Process — Structured Domestic Equity Funds | | | 14 | |
| |
Portfolio Management Discussion and Performance Summaries — Structured Domestic Equity Funds | | | 15 | |
| |
Schedules of Investments | | | 45 | |
| |
Financial Statements | | | 86 | |
| |
Financial Highlights | | | 94 | |
| |
Notes to Financial Statements | | | 108 | |
| |
Other Information | | | 135 | |
| | | | |
| | | |
| NOT FDIC-INSURED | | May Lose Value | | No Bank Guarantee |
GOLDMAN SACHS STRUCTURED DOMESTIC EQUITY FUNDS
Principal Investment Strategies and Risks
This is not a complete list of risks that may affect the Funds. For additional information concerning the risks applicable to the Funds, please see the Funds’ Prospectus.
The Goldman Sachs Balanced Fund invests in equity investments considered to have capital appreciation and/or dividend-paying ability and also invests in fixed income securities. The Fund’s equity investments will be subject to market risk, which means that the value of the securities in which it invests may go up or down in response to the prospects of individual companies, particular industry sectors and/or general economic conditions. Foreign and emerging market securities may be more volatile than investments in U.S. securities and will be subject to the risks of currency fluctuations and adverse economic or political developments. The Fund may also invest in fixed income securities, which are subject to the risks associated with debt securities generally, including credit, liquidity and interest rate risk. The Investment Adviser’s use of quantitative models to execute investment strategy may fail to produce the intended result. Different investment styles (e.g., “quantitative”) tend to shift in and out of favor, and at times the Fund may underperform other funds that invest in similar asset classes. The Fund’s balanced objective seeks to reduce the volatility associated with investing in a single market. There is no guarantee however, that market cycles will move in opposition to one another or that a balanced investment program will successfully reduce volatility.
Effective after the close of business on June 29, 2012, the Fund’s name will change to “Goldman Sachs Income Builder Fund.” Also effective after the close of business on June 29, 2012, the Fund will seek to provide income through investments in fixed income securities (bonds) and high dividend paying equities, preferred equities, and other similar securities (stocks), and will seek to provide capital appreciation primarily through equity securities. In addition to the risks listed above, the Fund’s investments will be subject to risks associated with non-investment grade fixed income securities, derivatives, REITs and master limited partnerships (“MLPs”). High yield, lower rated securities involve greater price volatility and present greater risks, including greater liquidity risk, than higher rated fixed income securities. Derivative instruments may involve a high degree of financial risk. These risks include the risk that a small movement in the price of the underlying security or benchmark may result in a disproportionately large movement, unfavorable or favorable, in the price of the derivative instrument; the risk of default by a counterparty; and liquidity risk. Investing in REITs involves certain unique risks in addition to those risks associated with investing in the real estate industry in general. REITs whose underlying properties are concentrated in a particular industry or geographic region are also subject to risks affecting such industries and regions. The securities of REITs involve greater risks than those associated with larger, more established companies and may be subject to more abrupt or erratic price movements because of interest rate changes, economic conditions and other factors. Investments in MLPs are subject to certain risks, including risks related to limited control and limited rights to vote, potential conflicts of interest, cash flow risks, dilution risks, limited liquidity and risks related to the general partner’s right to force sales at undesirable times or prices.
The Goldman Sachs Structured Large Cap Growth Fund invests primarily in a broadly diversified portfolio of equity investments in large-capitalization U.S. issuers, including foreign issuers traded in the United States. The Fund’s equity investments will be subject to market risk, which means that the value of the securities in which it invests may go up or down in response to the prospects of individual companies, particular industry sectors and/or general economic conditions. The Investment Adviser’s use of quantitative models to execute investment strategy may fail to produce the intended result. Different investment styles (e.g., “quantitative” and “growth”) tend to shift in and out of favor, and at times the Fund may underperform other funds that invest in similar asset classes. The Fund may have a high rate of portfolio turnover, which involves correspondingly greater expenses which must be borne by the Fund, and is also likely to result in short-term capital gains taxable to shareholders.
The Goldman Sachs Structured Large Cap Value Fund invests primarily in a diversified portfolio of equity investments in large-capitalization U.S. issuers, including foreign issuers traded in the United States. The Fund’s equity investments will be subject to market risk, which means that the value of the securities in which it invests may go up or down in response to the prospects of individual companies, particular industry sectors and/or general economic conditions. The Investment Adviser’s use of quantitative models to execute investment strategy may fail to produce the intended result. Different investment styles (e.g., “quantitative” and “value”) tend to shift in and out of favor, and at times the Fund may underperform other funds that invest in similar asset classes. The Fund may have a high rate of portfolio turnover, which involves correspondingly greater expenses which must be borne by the Fund, and is also likely to result in short-term capital gains taxable to shareholders.
1
GOLDMAN SACHS STRUCTURED DOMESTIC EQUITY FUNDS
The Goldman Sachs Structured Small Cap Equity Fund invests primarily in a broadly diversified portfolio of equity investments in small-capitalization U.S. issuers, including foreign issuers traded in the United States. The Fund’s equity investments will be subject to market risk, which means that the value of the securities in which it invests may go up or down in response to the prospects of individual companies, particular industry sectors and/or general economic conditions. The securities of small- and mid-capitalization companies involve greater risks than those associated with larger, more established companies and may be subject to more abrupt or erratic price movements. The Investment Adviser’s use of quantitative models to execute investment strategy may fail to produce the intended result. Different investment styles (e.g., “quantitative”) tend to shift in and out of favor, and at times the Fund may underperform other funds that invest in similar asset classes. The Fund may have a high rate of portfolio turnover, which involves correspondingly greater expenses which must be borne by the Fund, and is also likely to result in short-term capital gains taxable to shareholders.
The Goldman Sachs Structured Small Cap Growth Fund invests primarily in a broadly diversified portfolio of equity investments in small-capitalization U.S. issuers, including foreign issuers that are traded in the U.S. The Fund’s equity investments are subject to market risk, which means that the value of the securities in which it invests may go up or down in response to the prospects of individual companies, particular industry sectors and/or general economic conditions. The securities of small- and mid-capitalization companies involve greater risks than those associated with larger, more established companies and may be subject to more abrupt or erratic price movements. The Investment Adviser’s use of quantitative models to execute investment strategy may fail to produce the intended result. Different investment styles (e.g., “quantitative” and “growth”) tend to shift in and out of favor, and at times the Fund may underperform other funds that invest in similar asset classes. The Fund may have a high rate of portfolio turnover, which involves correspondingly greater expenses which must be borne by the Fund, and is also likely to result in short-term capital gains taxable to shareholders.
The Goldman Sachs Structured Small Cap Value Fund invests primarily in a broadly diversified portfolio of equity investments in small-capitalization U.S. issuers, including foreign issuers that are traded in the U.S. The Fund’s equity investments are subject to market risk, which means that the value of the securities in which it invests may go up or down in response to the prospects of individual companies, particular industry sectors and/or general economic conditions. The securities of small- and mid-capitalization companies involve greater risks than those associated with larger, more established companies and may be subject to more abrupt or erratic price movements. The Investment Adviser’s use of quantitative models to execute investment strategy may fail to produce the intended result. Different investment styles (e.g., “quantitative” and “value”) tend to shift in and out of favor, and at times the Fund may underperform other funds that invest in similar asset classes. The Fund may have a high rate of portfolio turnover, which involves correspondingly greater expenses which must be borne by the Fund, and is also likely to result in short-term capital gains taxable to shareholders.
The Goldman Sachs Structured U.S. Equity Fund invests primarily in a diversified portfolio of equity investments in U.S. issuers, including foreign issuers traded in the United States. The Fund’s equity investments will be subject to market risk, which means that the value of the securities in which it invests may go up or down in response to the prospects of individual companies, particular industry sectors and/ or general economic conditions. The Investment Adviser’s use of quantitative models to execute investment strategy may fail to produce the intended result. Different investment styles (e.g., “quantitative”) tend to shift in and out of favor, and at times the Fund may underperform other funds that invest in similar asset classes. The Fund may have a high rate of portfolio turnover, which involves correspondingly greater expenses which must be borne by the Fund, and is also likely to result in short-term capital gains taxable to shareholders.
2
MARKET REVIEW
Goldman Sachs Structured Domestic Equity Funds
Market Review
The performance of the U.S. stock and bond markets fluctuated during the six-month period ended April 30, 2012 (the “Reporting Period”).
At the beginning of the Reporting Period in November 2011, risk appetite was low, primarily because of concerns about Europe’s financial situation. One of the biggest worries was the health of the European banking system. European banks needed to refinance large amounts of debt, but many investors were focused on reducing exposure to Europe and were reluctant to lend to European banks. As a result, there was the risk of a crisis in Europe’s financial system that could have had significant negative effects on economic growth and asset valuations globally.
Against this backdrop, investors bought U.S. Treasury securities as a safe haven and reduced their exposure to corporate bonds and riskier fixed income securities, which generally trade at a yield premium (or “spread”) over U.S. Treasuries. Meanwhile, the performance of the U.S. equity market was virtually flat in November as some improving economic indicators were offset by other challenges, including the downgrades by Standard & Poor’s of several large banks and the Congressional budget-deficit supercommittee’s failure to come to agreement on spending cuts.
In December, the European Central Bank (“ECB”) announced two long-term refinancing operations (“LTROs”) that would provide unlimited three-year loans to banks in exchange for collateral. The ECB’s announcement, along with other central bank policies designed to ease strains in the global financial system, significantly reduced market concerns about Europe’s banking system and helped to drive a rebound in riskier fixed income asset classes even as U.S. Treasury yields continued to decline. U.S. stocks rallied broadly as risk appetite improved.
Gains extended through March as investors became less worried about Europe and more optimistic about the U.S. economic outlook. Economic data reports were consistently better than expected, highlighted by a string of strong payroll reports. In February, fourth-quarter 2011 U.S. Gross Domestic Product (“GDP”) growth was revised up to 3%, and the Dow Jones Industrial Average closed above 13,000 for the first time since May 2008, while the NASDAQ made a new 11-year high. U.S. banks showed the biggest quarterly increase in lending in four years, while losses from loans fell to the lowest level since early 2008.
In April, the performance of stocks and riskier fixed income asset classes reversed amid questions about the strength of the U.S. economic recovery and increasing political uncertainty in Europe. The U.S. labor market appeared to lose some momentum in April, as jobless claims increased for several weeks in a row, suggesting that some of the stronger job reports from earlier in 2012 might have been boosted by the mild winter. The government’s estimate of first-quarter 2012 U.S. GDP was also lower than expected at 2.2%. However, April’s housing market data showed some signs of stabilization, and consumer confidence modestly increased. In Europe, economic data began to deteriorate sharply, reigniting concerns about debt sustainability in countries with substantial debt and low or negative economic growth.
3
MARKET REVIEW
Equity Markets
Overall, U.S. stocks recorded strong gains during the Reporting Period. Large-cap stocks outperformed small-cap stocks, primarily in the information technology sector. The S&P® 500 Index, a measure of large-cap stocks, returned 12.77%, while the Russell 2000® Index, which measures the small-cap universe, rose 11.02%. All 10 sectors in the S&P 500 index were up, with consumer discretionary (+17.99%) and information technology (+16.23%) posting the strongest results. The information technology sector was also the largest contributor (measured by weight times total return) to S&P 500 Index returns. Across the capitalization spectrum, growth-oriented stocks outperformed value-oriented stocks, primarily due to the strong performance of growth-oriented information technology stocks. The Russell 1000® Growth Index, representing large-cap growth stocks, gained 14.13% during the Reporting Period, outperforming the Russell 1000® Value Index, representing large-cap value stocks, which was up 11.62%.
Fixed Income Markets
For the Reporting Period overall, the fixed income markets generated positive results. In November, as investors flocked to perceived safe havens, U.S. Treasuries significantly outperformed investment grade corporate bonds and riskier asset classes. The Barclays U.S. Corporate Index, representing investment grade corporate bonds, underperformed U.S. Treasuries by 2.88% during November. As the ECB became more aggressive in its monetary policy, demand for U.S. Treasuries declined, and riskier fixed income asset classes performed well between December 2011 and March 2012. As U.S. Treasury prices fell, the yield on a 10-year U.S. Treasury note rose from 1.88% on December 31, 2011 to a high of almost 2.40% during March 2012. The Barclays U.S. Corporate Index outperformed U.S. Treasuries in the first calendar quarter by 3.78%, and the Barclays U.S. Corporate High Yield Index, representing the U.S. high yield bond market, outperformed U.S. Treasuries by 5.91%. In April, as U.S. economic data weakened and the situation in Europe deteriorated, U.S. Treasuries rallied and riskier asset classes declined slightly. The Barclays U.S. Corporate Index underperformed U.S. Treasuries during April by 0.48%, while the Barclays U.S. Corporate High Yield Index underperformed U.S. Treasuries by only 0.05%.
Looking Ahead
Equity Markets
We continue to believe that less expensive stocks are likely to outpace more expensive stocks. In addition, we expect stocks with good momentum to outperform those with poor momentum. We plan to focus on seeking companies about which fundamental research analysts are becoming more positive as well as profitable companies with sustainable earnings and a track record of using their capital to enhance shareholder value. As such, we anticipate remaining fully invested, with long-term performance likely to be the result of stock selection rather than sector or capitalization allocations.
We stand behind our investment philosophy that sound economic investment principles, coupled with a disciplined quantitative approach, can provide strong, uncorrelated returns over the long term. Our research agenda is robust, and we continue to enhance our existing models, add new proprietary forecasting signals, and improve our trading execution as we seek to provide the most value to our shareholders.
4
MARKET REVIEW
Fixed Income Markets
At the beginning of the Reporting Period, we had thought the risks to U.S. economic growth were tilted to the downside, primarily due to the effect that sovereign debt turmoil in Europe was having on U.S. financial conditions. However, U.S. financial conditions eased significantly during the first months of 2012, and thus at the end of the Reporting Period, we believed the risks to our above-consensus forecast of 2.5% growth in the U.S. economy for calendar 2012 were more balanced and perhaps even tilted to the upside.
The primary reason we were more optimistic about U.S. economic growth at the end of the Reporting Period than we were just a few months prior was that easier financial conditions had been accompanied by relatively steady improvement in economic data. Of course, the U.S. economy also appeared to have upward momentum in early 2011 only to falter as oil prices rose and confidence declined amid the sovereign debt situation in Europe and the U.S. debt ceiling debate. However, we think the U.S. was in a better position at the end of April 2012 than it was in early 2011. First, the decline in unemployment suggests to us that the U.S. economic recovery is on firmer footing. Second, the U.S. should be somewhat insulated from higher oil prices due to the drop in domestic natural gas prices. Third, the ECB’s willingness to be aggressive in preventing sovereign debt challenges from spilling over into the banking system should remove some of the contagion threat that worried financial markets in 2011.
Despite the positive supporting factors for our near-term view, we remained at the end of the Reporting Period somewhat cautious on the U.S. outlook over the longer term due mainly to the potential for rising interest rates and tighter fiscal policy. We believe rising interest rates could become a headwind for the U.S. if the economy continues to grow and inflation expectations begin to rise. While we see higher rates primarily as a longer-term risk, stronger economic growth data had already led to a rise in market-implied inflation expectations by the end of the Reporting Period, and interest rates had already risen from their lows. Similarly, we think fiscal policy is unlikely to derail growth or financial markets in the near term. U.S. fiscal policy could subtract more than 2.5 percentage points from economic growth in 2013. We believe policymakers will likely try to reduce the fiscal drag scheduled for next year but are unlikely to focus on this effort until after the presidential election in November. As a result, we do not expect major debates about fiscal policy in the near term, but we see the potential for difficult negotiations in December that could weigh on market confidence.
In our view, the longer-term outlook for the U.S. economy may depend on how much momentum the economy is able to sustain heading into 2013. If the U.S. is able to avoid another slowdown this year, we think the U.S. economy could get an additional boost in 2013 from the housing market, which appears to be close to a bottom. We also see some long-term upward potential in the so-called “manufacturing renaissance” in the U.S., which is being driven by a combination of cheap natural gas, declining U.S. wages, a less-strong U.S. dollar and the relatively flexible corporate and labor market structures in the U.S.
5
GOLDMAN SACHS BALANCED FUND
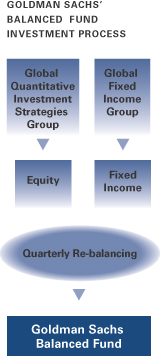
What Differentiates Goldman Sachs’
Balanced Fund Investment Process?
The Balanced Fund invests in a diversified investment portfolio through an asset allocation process of strategically selecting different asset classes — such as stocks and bonds. The Fund then adjusts its holdings over time. Goldman Sachs’ approach to asset allocation combines our global presence, market knowledge and risk management expertise.

The Goldman Sachs Balanced Fund provides exposure to the wealth-building opportunities of stocks and the regular income potential of bonds.

Fully invested, well-diversified portfolio that:
| n | | Maintains style, sector, risk and capitalization characteristics similar to the benchmark. |
| n | | Offers broad access to a clearly defined equity universe. |
| n | | Aims to generate equity income that is consistent and repeatable. |

In quantitative investing, we have a systematic and disciplined approach to investing. We have developed our own process-specific daily risk model that evaluates risk for more than 10,000 U.S. stocks daily. Our portfolio construction process uses this model in its attempt to manage and allocate portfolio risk.
In fixed income investing, we believe that a total return investment philosophy provides the most complete picture of performance. We emphasize fundamental credit expertise. Our group scrutinizes factors that could impact a bond’s performance over time — similar to the evaluation of company stocks. Additionally, we identify, monitor and measure a fund’s risk profile.

The Fund’s portfolio comprises the ideas of two experienced Goldman Sachs investment groups:
Global Quantitative Investment Strategies Group: A group of investment professionals with over 17 years of investment experience and a strong commitment to quantitative research.
Global Fixed Income Group: Broad, deep capabilities across global fixed income markets, with a total return investment philosophy.
6
PORTFOLIO RESULTS
Goldman Sachs Balanced Fund
Portfolio Management Discussion and Analysis
Below, the Goldman Sachs Quantitative Investment Strategies Team (the “Team”) and the Goldman Sachs Fixed Income Investment Management Team discuss the Goldman Sachs Balanced Fund’s (the “Fund”) performance and positioning for the six-month period ended April 30, 2012 (the “Reporting Period”).
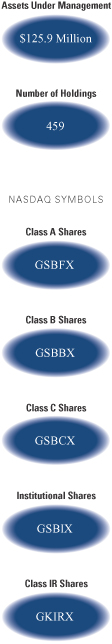
| Q | | How did the Fund perform during the Reporting Period? |
| A | | During the Reporting Period, the Fund’s Class A, B, C, Institutional and IR Shares generated cumulative total returns, without sales charges, of 8.15%, 7.76%, 7.75%, 8.39% and 8.29%, respectively. These returns compare to the 12.77%, 2.44% and 8.75% cumulative total returns of the Fund’s benchmarks, the S&P® 500 Index (with dividends reinvested), the Barclays U.S. Aggregate Bond Index (with dividends reinvested), and the blended index, comprised of 60% S&P 500 Index (with dividends reinvested) and 40% Barclays U.S. Aggregate Bond Index (with dividends reinvested), during the same period. |
| Q | | How did the Fund’s asset allocation affect performance? |
| A | | In keeping with our investment approach, we split the Fund’s assets between equity and fixed income securities, targeting 60% equities and 40% fixed income. As the equity markets posted strong gains during the Reporting Period, the Fund benefited from its allocation to stocks. The Fund’s performance was hampered by its allocation to fixed income, which recorded comparatively weaker returns. At the beginning of the Reporting Period, the Fund was invested 59% in equities and 41% in fixed income. It was invested 61% in equities and 39% in fixed income at the end of the Reporting Period. |
| Q | | Did equity sector allocation overall help or hurt the Fund’s performance? |
| A | | In investing the equity portion of the Fund’s portfolio, we invest in higher dividend-paying names within industries and sectors, rather than making industry or sector bets. Consequently, its industry and sector weights are similar to those of its equity benchmark, the S&P 500 Index, and they do not usually have a meaningful impact on relative performance. |
| Q | | What key factors had the greatest impact on the Fund’s equity portfolio results during the Reporting Period? |
| A | | In our stock selection process, we use a unique, proprietary risk model that tracks and manages risk in the portfolio. We also integrate tax considerations into our investment decisions. |
| | Importantly, we generally favor stocks offering a high dividend yield. We believe the Fund’s bias towards higher dividend-paying stocks was generally helpful during the Reporting Period as many of these stocks performed well. At the end of the Reporting Period, the dividend yield of the equity portion of the Fund was 3.30%, which was higher than the 2.20% dividend yield of the S&P 500 Index. |
| Q | | Among individual holdings, which stocks contributed to the Fund’s returns? |
| A | During the Reporting Period, the Fund benefited from overweighted positions in Seagate Technology, a maker of computer hard drives; J.P. Morgan Chase, a financial services firm; and Dish Network, a satellite television provider. |
| Q | | What individual stocks detracted from the Fund’s results during the Reporting Period? |
| A | | The Fund’s relative performance was hampered by overweighted positions in Frontier Communications, a telecommunications services company, and Pitney Bowes, a provider of postage meters and mailing services. An underweighted position in technology and software maker Apple also detracted from relative returns. |
| Q | | Which fixed income market sectors significantly affected the Fund’s performance? |
| A | | In the fixed income portion of the Fund’s portfolio, exposure to non-agency residential mortgage-backed securities added to relative returns, as demand for these issues improved in the latter part of the Reporting Period. Non-agency residential mortgage-backed securities rallied strongly during the first quarter of 2012, posting some of the strongest gains on record. In addition, the Fund benefited from its exposures to investment grade corporate bonds and emerging markets debt, both of which experienced strong performance during the first four months of 2012. |
7
PORTFOLIO RESULTS
| | Individual issue selection enhanced performance. The Fund benefited from its holdings in the investment grade corporate bond sector, specifically issue selection in industrial and financial bonds. Investments among high yield corporate bonds also boosted relative results. Although the Fund’s position in adjustable-rate mortgage backed securities (“ARMS”) and pass-through mortgage securities added value, these results were partially offset by our selection of commercial mortgage-backed securities (“CMBS”). Our selection of U.S dollar-denominated emerging markets debt contributed positively. (Pass-through mortgage securities consist of a pool of residential mortgage loans, where homeowners’ monthly payments of principal, interest and prepayments pass from the original bank through a government agency or investment bank to investors.) |
| Q | | How did the Fund’s duration and yield curve positioning strategies affect performance during the Reporting Period? |
| A | | Within the fixed income portfolio, the Fund’s duration and yield curve positioning strategies contributed positively to relative returns during the Reporting Period. Duration is a measure of the Fund’s sensitivity to changes in interest rates. Yield curve indicates the spectrum of maturities within a particular sector. The Fund held a longer duration positioning relative to the Barclays U.S. Aggregate Bond Index at the beginning of the Reporting Period because we believed interest rates would decline. This positioning enhanced relative performance as concern about contagion from Greece and other European peripheral nations dampened market sentiment and investors moved out of riskier asset classes and into U.S. Treasuries, pushing down yields. In February, as yields fell on speculation about a third round of quantitative easing (QE3) by the Federal Reserve (the “Fed”), we shifted the Fund to a shorter duration position. In our opinion, investors had placed too much weight on the possibility of QE3. The Fund’s positioning added to relative results when yields increased during March after the Fed reiterated its commitment to low interest rates but did not announce QE3. In April, as softer economic data put downward pressure on yields, the Fund’s shorter duration position detracted from relative performance. |
| Q | | What changes did you make to the Fund’s fixed income weightings during the Reporting Period? |
| A | | During the Reporting Period, we increased the Fund’s overweight in asset-backed securities (“ABS”), particularly in FFELP (“Federal Family Education Loan Program”) student loans. We moved the Fund to underweighted positions in agency mortgage-backed securities and CMBS. In addition, we maintained the Fund’s overweighted position in non-agency residential mortgage-backed securities and investment grade corporate bonds, with a preference for U.S. financials and industrials. We also favored lower quality issues. Over the course of the Reporting Period, we reduced the Fund’s exposure to riskier fixed income asset classes and as a result, the Fund’s position in short-term investments, specifically cash and repurchase agreements (or repos), increased. |
| Q | | How did the Fund use derivatives and similar instruments during the Reporting Period? |
| A | | In the equity portion of the Fund, we used financial futures contracts to equitize the Fund’s cash holdings (that is, to put the Fund’s cash holdings to work). In the fixed income portfolio, the Fund engaged in forward foreign currency exchange contracts to hedge currency exposure and used U.S. Treasury futures to hedge interest rate exposure and to facilitate specific duration and yield curve strategies. It also used credit default swaps to implement specific credit-related investment strategies and hedge corporate spread duration (or the price sensitivity of a corporate bond to a 100 basis point change in its spread over LIBOR, or London interbank offered rates, which are floating interest rates widely used as reference rates in bank, corporate and government lending agreements). The Fund also bought Brazilian inflation-linked notes because we believed Brazil’s real interest rates were high and likely to decline. (The real interest rate is the rate of interest an investor may receive after allowing for inflation.) In addition, the Fund employed interest rate swaps to hedge interest rate exposure and express an outright term structure view. It also used swaptions (or, options on interest rate swap contracts) to hedge and express an outright term structure view. (Term structure, most often depicted as a yield curve, refers to the term structure of interest rates, which is the relationship between the yield to maturity and the time to maturity for pure discount bonds. The term structure of interest rates is important because monetary policy affects short-term interest rates, but investment depends on long-term interest rates. Theories about the term structure of interest rates thus become theories about the connection between monetary policy and investment.) |
8
PORTFOLIO RESULTS
| Q | | What is the Team’s equity strategy for the months ahead? |
| A | | The Goldman Sachs Quantitative Investment Strategies Equity Team manages the equity portion of the Fund’s portfolio. The Team seeks to provide investors with a broad diversified exposure to the U.S. large-cap equity market. It does not make size or sector bets. Rather, it favors stocks with higher dividends within each industry. Its portfolio construction process integrates tax considerations into its investment decisions. The group uses a unique, proprietary risk model in its stock selection process. It believes this risk model can be beneficial as it identifies, tracks and manages risk in the portfolio. |
| | The equity portion of the Fund continues to be broadly diversified. At the end of the Reporting Period, its industry and sector weights were similar to that of the S&P 500 Index. However, the Fund was modestly overweight materials, telecommunication services, industrials, utilities and consumer staples relative to the S&P 500 Index. It was modestly underweight the consumer discretionary, financials, health care, energy and information technology sectors compared to the S&P 500 Index. We intend to maintain our focus on stocks with high dividend yields. Because interest rates are low, we expect investors will continue to find these stocks desirable. |
| Q | | What is the Fund’s tactical view and strategy for the fixed income markets looking ahead? |
| A | | At the end of the Reporting Period, the fixed income portfolio was positioned for rising interest rates. We believe interest rates could rise even if U.S. economic growth slows, as signs of economic weakness would likely prompt another round of quantitative easing by the Fed, which may in turn raise market concern about future inflation. |
| | We had a positive long-term view on non-agency residential mortgage-backed securities at the end of the Reporting Period because we believe this sector is already priced for potentially significant default risk and the U.S. housing sector is more insulated from Europe-related risks in comparison with the corporate sector. In terms of market fundamentals and valuations, we think the backdrop for investment grade corporate bonds is positive: credit risk premiums are high compared to their historical averages, corporate balance sheets are healthy, and we believe the economy has growth potential. |
| | Because we forecast a recession in Europe during 2012 and we think there is downside risk of another sovereign debt flare-up, we plan to underweight those assets we consider most vulnerable to further deterioration in the Eurozone outlook. Given the fluidity of the situation and heightened market sensitivity to short-term policy developments, we expect to continue adjusting our fixed income positions tactically to navigate volatility. |
|
| |
| The Goldman Sachs Balanced Fund (all share classes) filed a supplement April 25, 2012 with the following changes approved by the Board of Trustees of Goldman Sachs Trust: |
| |
n The Balanced Fund will be renamed and repositioned as the Income Builder Fund and will be managed jointly by the Fundamental Equity team and the Fixed Income team. The Fund’s investment objective will change from providing “long-term growth of capital and current income” to “providing income and capital appreciation”. |
| |
n This change will provide investors with a greater yield and a more unified approach to the Fund’s security selection and tactical allocations. The team will expand the universe of securities from primarily higher dividend US stocks and investment grade bonds to also include high yield bonds, global equities, Preferred stocks, REITS and MLPs. The yield target will be 2x that of the S&P. |
| |
n These changes will be effective after the close of business on June 29, 2012. |
| |
9
FUND BASICS
Balanced Fund
as of April 30, 2012
| | | | | | | | | | | | | | | | | | |
| | PERFORMANCE REVIEW | | | | | | | | | |
| | | November 1, 2011– April 30, 2012 | | Fund Total Return (based on NAV)1 | | | S&P 500 60%/ Barclays Aggregate Bond (40%) Index | | | S&P 5002 | | | Barclays U.S. Aggregate Bond Index3 | |
| | Class A | | | 8.15 | % | | | 8.75 | % | | | 12.77 | % | | | 2.44 | % |
| | Class B | | | 7.76 | | | | 8.75 | | | | 12.77 | | | | 2.44 | |
| | Class C | | | 7.75 | | | | 8.75 | | | | 12.77 | | | | 2.44 | |
| | Institutional | | | 8.39 | | | | 8.75 | | | | 12.77 | | | | 2.44 | |
| | | Class IR | | | 8.29 | | | | 8.75 | | | | 12.77 | | | | 2.44 | |
| | 1 | | The net asset value (“NAV”) represents the net assets of the class of the Fund (ex-dividend) divided by the total number of shares of the class outstanding. The Fund’s performance assumes the reinvestment of dividends and other distributions. The Fund’s performance does not reflect the deduction of any applicable sales charges. |
| | 2 | | The S&P 500 Index is the Standard & Poor’s 500 Composite Index of 500 stocks, an unmanaged index of common stock prices. The figures for the Index do not include any deduction for fees, expenses or taxes. It is not possible to invest directly in an index. |
| | 3 | | The Barclays U.S. Aggregate Bond Index represents an unmanaged diversified portfolio of fixed income securities, including U.S. Treasuries, investment-grade corporate bonds, and mortgage-backed and asset-backed securities. The Index figures do not reflect any deductions for fees, expenses or taxes. It is not possible to invest directly in an index. |
| | | | | | | | | | | | | | | | |
| | STANDARDIZED TOTAL RETURNS4 |
| | | For the period ended 3/31/12 | | One Year | | | Five Years | | Ten Years | | Since Inception | | | Inception Date |
| | Class A | | | 1.93 | % | | 3.18% | | 4.58% | | | 6.52 | % | | 10/12/94 |
| | Class B | | | 1.97 | | | 3.14 | | 4.53 | | | 5.35 | | | 5/1/96 |
| | Class C | | | 6.04 | | | 3.57 | | 4.39 | | | 3.41 | | | 8/15/97 |
| | Institutional | | | 8.26 | | | 4.75 | | 5.70 | | | 4.67 | | | 8/15/97 |
| | | Class IR | | | 8.08 | | | N/A | | N/A | | | 15.09 | | | 8/31/10 |
| | 4 | | The Standardized Total Returns are average annual total returns as of the most recent calendar quarter-end. They assume reinvestment of all distributions at NAV. These returns reflect a maximum initial sales charge of 5.5% for Class A Shares, the assumed contingent deferred sales charge for Class B Shares (5% maximum declining to 0% after six years) and the assumed contingent deferred sales charge for Class C Shares (1% if redeemed within 12 months of purchase). Class B Shares convert automatically to Class A Shares on or about the fifteenth day of the last month of the calendar quarter that is eight years after purchase. Returns for Class B Shares for the period after conversion reflect the performance of Class A Shares. Because Institutional and Class IR Shares do not involve a sales charge, such a charge is not applied to their Standardized Total Returns. The Fund’s Class B Shares are no longer available for purchase by new or existing shareholders (although current Class B shareholders may continue to reinvest income and capital gains distributions into Class B Shares, and Class B shareholders may continue to exchange their shares for Class B Shares of certain other Goldman Sachs Funds). |
| | | | The returns represent past performance. Past performance does not guarantee future results. The Fund’s investment return and principal value will fluctuate so that an investor’s shares, when redeemed, may be worth more or less than their original cost. Current performance may be lower or higher than the performance quoted above. Please visit our Website at www.goldmansachsfunds.com to obtain the most recent month-end returns. Performance reflects fee waivers and/or expense limitations in effect. In their absence, performance would be reduced. Returns do not reflect the deduction of taxes that a shareholder would pay on Fund distributions or the redemption of Fund shares. |
10
FUND BASICS
| | | | | | | | | | |
| | EXPENSE RATIOS5 | |
| | | | | Net Expense Ratio (Current) | | | Gross Expense Ratio (Before Waivers) | |
| | Class A | | | 1.05 | % | | | 1.38 | % |
| | Class B | | | 1.80 | | | | 2.13 | |
| | Class C | | | 1.80 | | | | 2.13 | |
| | Institutional | | | 0.65 | | | | 0.98 | |
| | | Class IR | | | 0.80 | | | | 1.13 | |
| | 5 | | The expense ratios of the Fund, both current (net of applicable fee waivers and/or expense limitations) and before waivers (gross of applicable fee waivers and/or expense limitations) are as set forth above according to the most recent publicly available Prospectus for the Fund and may differ from the expense ratios disclosed in the Financial Highlights in this report. The Fund’s waivers and/or expense limitations will remain in place through at least February 28, 2013, and prior to such date the investment adviser may not terminate the arrangements without the approval of the Fund’s Board of Trustees. If these arrangements are discontinued in the future, the expense ratios may change without shareholder approval. |
| | | | | | | | |
| | TOP TEN EQUITY HOLDINGS AS OF 4/30/126 |
| | | Holding | | % of Net
Assets | | | Line of Business |
| | Apple, Inc. | | | 2.4 | % | | Computers & Peripherals |
| | Microsoft Corp. | | | 1.7 | | | Software |
| | Chevron Corp. | | | 1.6 | | | Oil, Gas & Consumable Fuels |
| | Pfizer, Inc. | | | 1.5 | | | Pharmaceuticals |
| | Exxon Mobil Corp. | | | 1.4 | | | Oil, Gas & Consumable Fuels |
| | Intel Corp. | | | 1.3 | | | Semiconductors & Semiconductor Equipment |
| | General Electric Co. | | | 1.3 | | | Industrial Conglomerates |
| | Merck & Co., Inc. | | | 1.2 | | | Pharmaceuticals |
| | The Coca-Cola Co. | | | 1.2 | | | Beverages |
| | | JPMorgan Chase & Co. | | | 1.1 | | | Diversified Financial Services |
| | 6 | | The top 10 holdings may not be representative of the Fund’s future investments. |
11
FUND BASICS
|
| FUND’S EQUITY SECTOR ALLOCATIONS VS. BENCHMARK7 |
| As of April 30, 2012 |
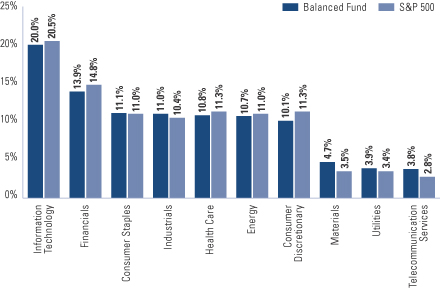
| | 7 | | The Fund is actively managed and, as such, its composition may differ over time. Consequently, the Fund’s overall sector allocations may differ from the percentages contained in the graph above. The graph categorizes investments using Global Industry Classification Standard (“GICS”), however, the sector classifications used by the portfolio management team may differ from GICS. The percentage shown for each investment category reflects the value of investments in that category as a percentage of the Fund’s Equity investments (excluding investments in the securities lending reinvestment vehicle, if any). Investment in the securities lending reinvestment vehicle represented 1.4% of the Fund’s net assets as of April 30, 2012. The graph depicts the Fund’s investments but may not represent the Fund’s market exposure due to the exclusion of certain derivatives, if any, as listed in the Additional Investment Information section of the Schedule of Investments. |
12
FUND BASICS
| | |
| FUND’S FIXED INCOME COMPOSITION8 | | |
| As of April 30, 2012 | | |
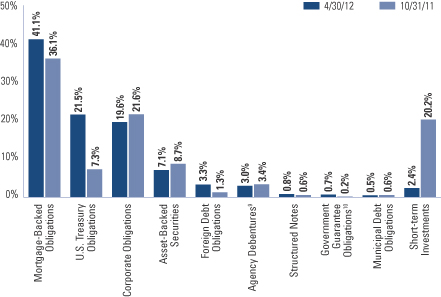
| | 8 | | The percentage shown for each investment category reflects the value of investments in that category as a percentage of the Fund’s Fixed Income investments. Short-term investments represent repurchase agreements. The graph depicts the Fund’s investments but may not represent the Fund’s market exposure due to the exclusion of certain derivatives, if any, as listed in the Additional Investment Information section of the Schedule of Investments. |
| | 9 | | “Agency Debentures” include agency securities offered by companies such as Federal National Mortgage Association (“FNMA”) and Federal Home Loan Mortgage Corp. (“FHLMC”), which operate under a government charter. While they are required to report to a government regulator, their assets are not explicitly guaranteed by the government and they otherwise operate like any other publicly traded company. |
| | 10 | | “Government Guarantee Obligations” are guaranteed under the United States Government Guarantee Program or a foreign government guarantee program and are backed by the full faith and credit of the United States or the government of a foreign country. The expiration date of the United States Government guarantee and a foreign country guarantee is the maturity date of the debt. |
13
GOLDMAN SACHS STRUCTURED DOMESTIC EQUITY FUNDS
What Differentiates Goldman Sachs’
Domestic Structured Funds Investment Process?
At Goldman Sachs Asset Management, L.P. (“GSAM”), Structured Equity combines traditional fundamental analysis with sophisticated quantitative modeling. Our approach is not unlike that of a more traditional active manager: we look at fundamental investment themes that have been effective historically in forecasting excess returns of stocks. However, where we differ from traditional managers is that we seek to rigorously test every potential research theme or signal to verify whether they have shown consistent predictive ability across a wide variety of stocks in different time periods and under different market conditions.

| n | | Comprehensive — We calculate expected excess returns for more than 10,000 stocks on a daily basis. |
| n | | Rigorous — We evaluate stocks based on fundamental investment criteria that have outperformed historically. |
| n | | Objective — Our stock selection process is free from the emotion that may lead to biased investment decisions. |

| n | | Our computer optimization process allocates risk to our best investment ideas and constructs funds that strive to neutralize systematic risks and deliver better returns. |
| n | | We use a unique, proprietary risk model that is designed to be more precise, more focused and faster to respond because it seeks to identify, track and manage risk specific to our process, using daily data. |

Fully invested, well-diversified portfolio that seeks to:
| n | | Maintain style, sector, risk and capitalization characteristics similar to the benchmark. |
| n | | Offer broad access to a clearly defined equity universe. |
| n | | Generate excess returns that are positive, consistent and repeatable. |
Enhancements Made to Proprietary Quantitative Model During the Reporting Period
We continuously look for ways to improve our investment process. Accordingly, we introduced a short-term model to our stock selection process during the first quarter of 2012. (We made no material enhancements during the fourth quarter of 2011.) We plan to use the short-term model, which forecasts potential returns using three-month to 12-month time horizons, to help us make long-term investment decisions and determine when to buy or sell. We believe this enhancement will add value to our process over time.
14
PORTFOLIO RESULTS
Goldman Sachs Structured Large Cap Growth Fund
Portfolio Management Discussion and Analysis
Below, the Goldman Sachs Quantitative Investment Strategies Team (the “Team”) discusses the Goldman Sachs Structured Large Cap Growth Fund’s (the “Fund”) performance and positioning for the six-month period ended April 30, 2012 (the “Reporting Period”).
| Q | | How did the Fund perform during the Reporting Period? |
| A | | During the Reporting Period, the Fund’s Class A, B, C, Institutional, Service, IR and R Shares generated cumulative total returns, without sales charges, of 12.57%, 12.22%, 12.19%, 12.91%, 12.63%, 12.76% and 12.53%, respectively. These returns compare to the 14.13% cumulative total return of the Fund’s benchmark, the Russell 1000® Growth Index (with dividends reinvested) (the “Index”), during the same period. |
| Q | | What key factors were most responsible for the Fund’s performance during the Reporting Period? |
| A | | As expected, and in keeping with our investment approach, our quantitative model and its six investment themes had the greatest impact on relative performance. We use the model’s six investment themes to take a long-term view of market patterns and look for inefficiencies, selecting stocks for the Fund and overweighting or underweighting the ones chosen by the model. Over time and by design, the performance of any one of the model’s investment themes tends to have a low correlation with the model’s other themes, demonstrating the diversification benefit of the Fund’s theme-driven quantitative model. The variance in performance supports our research indicating that the diversification provided by our different investment themes is a significant investment advantage over the long term, even though the Fund may experience underperformance in the short term. Of course, diversification does not protect an investor from market risk nor does it ensure a profit. |
| | | Among our investment themes, Valuation detracted the most from relative performance. Valuation attempts to capture potential mispricings of securities, typically by comparing a measure of the company’s intrinsic value to its market value. Management, Momentum and Quality also dampened returns. The Management theme assesses the characteristics, policies and strategic decisions of company management. Momentum seeks to predict drifts in stock prices caused by delayed investor reaction to company-specific information |
| | and information about related companies. Quality evaluates whether the company’s earnings are coming from more persistent, cash-based sources, as opposed to accruals. |
| | | Profitability and Sentiment contributed to relative results. Profitability assesses whether a company is earning more than its cost of capital, while our Sentiment theme reflects selected investment views and decisions of individuals and financial intermediaries. |
| Q | | How did the Fund’s sector allocations affect relative performance? |
| A | | In constructing the Fund’s portfolio, we focus on picking stocks rather than on making industry or sector bets. Consequently, the Fund is similar to the Index in terms of its sector allocation and style. Changes in its sector weights generally do not have a meaningful impact on relative performance. |
| Q | | Did stock selection help or hurt Fund performance during the Reporting Period? |
| A | | We seek to outpace the Index by overweighting stocks we expect to outperform and underweighting those we think may lag. We also build positions based on our thematic views. For example, the Fund aims to hold a basket of stocks with better Momentum characteristics than the benchmark. During the Reporting Period, our security selection detracted from the Fund’s relative returns. |
| Q | | Which individual positions detracted from the Fund’s results during the Reporting Period? |
| A | | Our stock picking in the information technology, health care and consumer discretionary sectors detracted from relative performance during the Reporting Period. Specifically, the Fund was hampered by overweighted positions in Oracle, an enterprise software and hardware maker; Humana, a provider of health care plans and services; and Conoco Phillips, an oil company. The Fund was overweight Humana and Conoco Phillips because of our positive views on Profitability. We assumed the overweight to Oracle as a result of our positive views on Momentum. |
15
PORTFOLIO RESULTS
| Q | | Which stock positions contributed to the Fund’s relative returns during the Reporting Period? |
| A | | Security selection in the materials, industrials and consumer staples sectors contributed positively to relative returns during the Reporting Period. The Fund benefited from overweighted positions in Toro, a turf maintenance equipment maker; Dish Network, a satellite television provider; and Phillip Morris International, a tobacco company. We adopted the overweight in Toro because of our positive views on Profitability. Our positive views on Momentum led us to overweight Dish Network. The Fund was overweight Phillip Morris International as a result of our positive views on Quality. |
| Q | | How did the Fund use derivatives and similar instruments during the Reporting Period? |
| A | | During the Reporting Period, we used financial futures contracts to equitize the Fund’s cash holdings (that is, to put the Fund’s cash holdings to work). |
| Q | | What was the Fund’s sector positioning relative to the Index at the end of the Reporting Period? |
| A | | At the end of the Reporting Period, the Fund was overweight the information technology, consumer staples, and financials sectors relative to the Index. The Fund was underweight materials, industrials, consumer discretionary, telecommunication services, health care and energy. Compared to the Index, it was relatively neutral to the utilities sector at the end of the Reporting Period. |
16
FUND BASICS
Structured Large Cap Growth Fund
as of April 30, 2012

| | | | | | | | | | |
| | PERFORMANCE REVIEW | |
| | | November 1, 2011– April 30, 2012 | | Fund Total Return
(based on NAV)1 | | | Russell 1000
Growth Index2 | |
| | Class A | | | 12.57 | % | | | 14.13 | % |
| | Class B | | | 12.22 | | | | 14.13 | |
| | Class C | | | 12.19 | | | | 14.13 | |
| | Institutional | | | 12.91 | | | | 14.13 | |
| | Service | | | 12.63 | | | | 14.13 | |
| | Class IR | | | 12.76 | | | | 14.13 | |
| | Class R | | | 12.53 | | | | 14.13 | |
| | 1 | | The net asset value (“NAV”) represents the net assets of the class of the Fund (ex-dividend) divided by the total number of shares of the class outstanding. The Fund’s performance assumes the reinvestment of dividends and other distributions. The Fund’s performance does not reflect the deduction of any applicable sales charges. |
| | 2 | | The Russell 1000 Growth Index is an unmanaged market capitalization weighted index of the 1000 largest U.S. companies with higher price-to-book ratios and higher forecasted growth values. The figures for the Index do not include any deduction for fees, expenses or taxes. It is not possible to invest directly in an index. |
| | | | | | | | | | | | | | |
| | STANDARDIZED TOTAL RETURNS3 |
| | | For the period ended 3/31/12 | | One Year | | | Five Years | | Ten Years | | Since Inception | | Inception Date |
| | Class A | | | 6.14 | % | | 0.22% | | 2.16% | | 3.10% | | 5/1/97 |
| | Class B | | | 6.59 | | | 0.18 | | 2.10 | | 3.07 | | 5/1/97 |
| | Class C | | | 10.48 | | | 0.56 | | 1.97 | | 1.61 | | 8/15/97 |
| | Institutional | | | 12.84 | | | 1.78 | | 3.18 | | 3.90 | | 5/1/97 |
| | Service | | | 12.22 | | | 1.27 | | 2.67 | | 3.39 | | 5/1/97 |
| | Class IR | | | 12.61 | | | N/A | | N/A | | 1.00 | | 11/30/07 |
| | | Class R | | | 12.10 | | | N/A | | N/A | | 0.52 | | 11/30/07 |
| | 3 | | The Standardized Total Returns are average annual total returns as of the most recent calendar quarter-end. They assume reinvestment of all distributions at NAV. These returns reflect a maximum initial sales charge of 5.5% for Class A Shares, the assumed contingent deferred sales charge for Class B Shares (5% maximum declining to 0% after six years) and the assumed contingent deferred sales charge for Class C Shares (1% if redeemed within 12 months of purchase). Class B Shares convert automatically to Class A Shares on or about the fifteenth day of the last month of the calendar quarter that is eight years after purchase. Returns for Class B Shares for the period after conversion reflect the performance of Class A Shares. Because Institutional, Service, Class IR and Class R Shares do not involve a sales charge, such a charge is not applied to their Standardized Total Returns. The Fund’s Class B Shares are no longer available for purchase by new or existing shareholders (although current Class B shareholders may continue to reinvest income and capital gains distributions into Class B Shares, and Class B shareholders may continue to exchange their shares for Class B Shares of certain other Goldman Sachs Funds). |
| | | | The returns represent past performance. Past performance does not guarantee future results. The Fund’s investment return and principal value will fluctuate so that an investor’s shares, when redeemed, may be worth more or less than their original cost. Current performance may be lower or higher than the performance quoted above. Please visit our Website at www.goldmansachsfunds.com to obtain the most recent month-end returns. Performance reflects fee waivers and/or expense limitations in effect. In their absence, performance would be reduced. Returns do not reflect the deduction of taxes that a shareholder would pay on Fund distributions or the redemption of Fund shares. |
17
FUND BASICS
| | | | | | | | | | |
| | EXPENSE RATIOS4 | |
| | | | | Net Expense Ratio (Current) | | | Gross Expense Ratio (Before Waivers) | |
| | Class A | | | 0.95 | % | | | 1.16 | % |
| | Class B | | | 1.70 | | | | 1.91 | |
| | Class C | | | 1.70 | | | | 1.91 | |
| | Institutional | | | 0.55 | | | | 0.76 | |
| | Service | | | 1.05 | | | | 1.26 | |
| | Class IR | | | 0.70 | | | | 0.91 | |
| | | Class R | | | 1.20 | | | | 1.41 | |
| | 4 | | The expense ratios of the Fund, both current (net of applicable fee waivers and/or expense limitations) and before waivers (gross of applicable fee waivers and/or expense limitations) are as set forth above according to the most recent publicly available Prospectus for the Fund and may differ from the expense ratios disclosed in the Financial Highlights in this report. The Fund’s waivers and/or expense limitations will remain in place through at least February 28, 2013, and prior to such date the investment adviser may not terminate the arrangements without the approval of the Fund’s Board of Trustees. If these arrangements are discontinued in the future, the expense ratios may change without shareholder approval. |
| | | | | | | | |
| | TOP TEN HOLDINGS AS OF 4/30/125 |
| | | Holding | | % of Net Assets | | | Line of Business |
| | Apple, Inc. | | | 7.6 | % | | Computers & Peripherals |
| | Microsoft Corp. | | | 4.5 | | | Software |
| | Exxon Mobil Corp. | | | 3.7 | | | Oil, Gas & Consumable Fuels |
| | Philip Morris International, Inc. | | | 2.9 | | | Tobacco |
| | Oracle Corp. | | | 2.8 | | | Software |
| | International Business Machines Corp. | | | 2.8 | | | IT Services |
| | Google, Inc. Class A | | | 2.1 | | | Internet Software & Services |
| | DIRECTV Class A | | | 1.7 | | | Media |
| | American Tower Corp. | | | 1.6 | | | Real Estate Investment Trusts |
| | | Intuit, Inc. | | | 1.5 | | | Software |
| | 5 | | The top 10 holdings may not be representative of the Fund’s future investments. |
18
FUND BASICS
|
| FUND VS. BENCHMARK SECTOR ALLOCATIONS6 |
| As of April 30, 2012 |
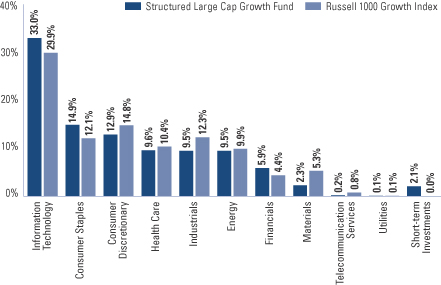
| | 6 | | The Fund is actively managed and, as such, its composition may differ over time. Consequently, the Fund’s overall sector allocations may differ from the percentages contained in the graph above. The graph categorizes investments using Global Industry Classification Standard (“GICS”), however, the sector classifications used by the portfolio management team may differ from GICS. The percentage shown for each investment category reflects the value of investments in that category as a percentage of market value (excluding investments in the securities lending reinvestment vehicle, if any). Investment in the securities lending reinvestment vehicle represented 0.5% of the Fund’s net assets as of April 30, 2012. Short-term investments represent repurchase agreements. The graph depicts the Fund’s investments but may not represent the Fund’s market exposure due to the exclusion of certain derivatives, if any, as listed in the Additional Investment Information section of the Schedule of Investments. |
19
PORTFOLIO RESULTS
Goldman Sachs Structured Large Cap Value Fund
Portfolio Management Discussion and Analysis
Below, the Goldman Sachs Quantitative Investment Strategies Team (the “Team”) discusses the Goldman Sachs Structured Large Cap Value Fund’s (the “Fund”) performance and positioning for the six-month period ended April 30, 2012 (the “Reporting Period”).
| Q | | How did the Fund perform during the Reporting Period? |
| A | | During the Reporting Period, the Fund’s Class A, B, C, Institutional, Service, IR and R Shares generated cumulative total returns, without sales charges, of 10.34%, 10.03%, 10.06%, 10.67%, 10.35%, 10.50% and 10.19%, respectively. These returns compare to the 11.62% cumulative total return of the Fund’s benchmark, the Russell 1000® Value Index (with dividends reinvested) (the “Index”), during the same period. |
| Q | | What key factors were most responsible for the Fund’s performance during the Reporting Period? |
| A | | As expected, and in keeping with our investment approach, our quantitative model and its six investment themes had the greatest impact on relative performance. We use the model’s six investment themes to take a long-term view of market patterns and look for inefficiencies, selecting stocks for the Fund and overweighting or underweighting the ones chosen by the model. Over time and by design, the performance of any one of the model’s investment themes tends to have a low correlation with the model’s other themes, demonstrating the diversification benefit of the Fund’s theme-driven quantitative model. The variance in performance supports our research indicating that the diversification provided by our different investment themes is a significant investment advantage over the long term, even though the Fund may experience underperformance in the short term. Of course, diversification does not protect an investor from market risk nor does it ensure a profit. |
| | Among our investment themes, Momentum hampered relative performance the most. Momentum seeks to predict drifts in stock prices caused by delayed investor reaction to company-specific information and information about related companies. In addition, our Management theme, which assesses the characteristics, policies and strategic decisions of company management, was a drag on relative results. Quality also detracted, though to a lesser extent. Quality evaluates whether the company’s earnings are coming from more persistent, cash-based sources, as opposed to accruals. |
| | Our Profitability theme contributed positively. Profitability assesses whether a company is earning more than its cost of capital. Sentiment, which reflects selected investment views and decisions of individuals and financial intermediaries, also added value. The impact of our Valuation theme was relatively neutral during the Reporting Period. Valuation attempts to capture potential mispricings of securities, typically by comparing a measure of the company’s intrinsic value to its market value. |
| Q | | How did the Fund’s sector allocations affect relative performance? |
| A | | In constructing the Fund’s portfolio, we focus on picking stocks rather than on making industry or sector bets. Consequently, the Fund is similar to the Index in terms of its sector allocation and style. Changes in its sector weights generally do not have a meaningful impact on relative performance. |
| Q | | Did stock selection help or hurt Fund performance during the Reporting Period? |
| A | | We seek to outpace the Index by overweighting stocks we expect to outperform and underweighting those we think may lag. We also build positions based on our thematic views. For example, the Fund aims to hold a basket of stocks with better Momentum characteristics than the benchmark. During the Reporting Period, our stock selection generated mixed results. |
| Q | | Which stock positions contributed to the Fund’s relative returns during the Reporting Period? |
| A | | Investments in the utilities, industrials and consumer discretionary sectors enhanced relative performance during the Reporting Period. The Fund’s overweighted positions in Dish Network, Toro and Western Digital were advantageous. We assumed the overweight in Dish Network, a satellite television provider, because of our positive views on Momentum. Our positive views on Profitability led us to overweight Toro, a turf maintenance equipment maker, and Western Digital, a manufacturer of computer hard drives. |
20
PORTFOLIO RESULTS
| Q | | Which individual positions detracted from the Fund’s results during the Reporting Period? |
| A | | Our security selection in the financials, consumer staples and energy sectors hurt relative returns. The Fund’s overweighted positions in petroleum company Tesoro; health care plans and services provider Humana; and oil refiner Valero Energy detracted from relative performance. The overweighted positions in Tesoro and Valero Energy were the result of our positive views on Valuation. We adopted the overweight to Humana because of our positive views on Profitability. |
| Q | | How did the Fund use derivatives and similar instruments during the Reporting Period? |
| A | | During the Reporting Period, we used financial futures contracts to equitize the Fund’s cash holdings (that is, to put the Fund’s cash holdings to work). |
| Q | | What was the Fund’s sector positioning relative to the Index at the end of the Reporting Period? |
| A | | At the end of the Reporting Period, the Fund was overweight the information technology, consumer staples and consumer discretionary sectors relative to the Index. The Fund was underweight the utilities, industrials, materials, energy, financials and telecommunication services sectors compared to the Index at the end of the Reporting Period. Compared to the Index, the Fund was neutral in health care at the end of the Reporting Period. |
21
FUND BASICS
Structured Large Cap Value Fund
as of April 30, 2012
| | | | | | | | | | |
| | PERFORMANCE REVIEW | |
| | | November 1, 2011–April 30, 2012 | | Fund Total Return
(based on NAV)1 | | | Russell 1000 Value Index2 | |
| | Class A | | | 10.34 | % | | | 11.62 | % |
| | Class B | | | 10.03 | | | | 11.62 | |
| | Class C | | | 10.06 | | | | 11.62 | |
| | Institutional | | | 10.67 | | | | 11.62 | |
| | Service | | | 10.35 | | | | 11.62 | |
| | Class IR | | | 10.50 | | | | 11.62 | |
| | | Class R | | | 10.19 | | | | 11.62 | |
| | 1 | | The net asset value (“NAV”) represents the net assets of the class of the Fund (ex-dividend) divided by the total number of shares of the class outstanding. The Fund’s performance assumes the reinvestment of dividends and other distributions. The Fund’s performance does not reflect the deduction of any applicable sales charges. |
| | 2 | | The Russell 1000 Value Index is an unmanaged market capitalization weighted index of the 1000 largest U.S. companies with lower price-to-book ratios and lower forecasted growth values. The figures for the Index do not include any deduction for fees, expenses or taxes. It is not possible to invest directly in an index. |
| | | | | | | | | | | | | | | | | | | | |
| | STANDARDIZED TOTAL RETURNS3 |
| | | For the period ended 3/31/12 | | One Year | | | Five Years | | | Ten Years | | | Since Inception | | | Inception Date |
| | Class A | | | 0.44 | % | | | -3.70 | % | | | 2.69 | % | | | 2.77 | % | | 12/31/98 |
| | Class B | | | 0.37 | | | | -3.73 | | | | 2.63 | | | | 2.74 | | | 12/31/98 |
| | Class C | | | 4.43 | | | | -3.34 | | | | 2.49 | | | | 2.44 | | | 12/31/98 |
| | Institutional | | | 6.68 | | | | -2.21 | | | | 3.68 | | | | 3.62 | | | 12/31/98 |
| | Service | | | 6.11 | | | | -2.70 | | | | 3.18 | | | | 3.12 | | | 12/31/98 |
| | Class IR | | | 6.55 | | | | N/A | | | | N/A | | | | -1.72 | | | 11/30/07 |
| | | Class R | | | 6.00 | | | | N/A | | | | N/A | | | | -2.19 | | | 11/30/07 |
| | 3 | | The Standardized Total Returns are average annual total returns as of the most recent calendar quarter-end. They assume reinvestment of all distributions at NAV. These returns reflect a maximum initial sales charge of 5.5% for Class A Shares, the assumed contingent deferred sales charge for Class B Shares (5% maximum declining to 0% after six years) and the assumed contingent deferred sales charge for Class C Shares (1% if redeemed within 12 months of purchase). Class B Shares convert automatically to Class A Shares on or about the fifteenth day of the last month of the calendar quarter that is eight years after purchase. Returns for Class B Shares for the period after conversion reflect the performance of Class A Shares. Because Institutional, Service, Class IR and Class R Shares do not involve a sales charge, such a charge is not applied to their Standardized Total Returns. The Fund’s Class B Shares are no longer available for purchase by new or existing shareholders (although current Class B shareholders may continue to reinvest income and capital gains distributions into Class B Shares, and Class B shareholders may continue to exchange their shares for Class B Shares of certain other Goldman Sachs Funds). |
| | | | The returns represent past performance. Past performance does not guarantee future results. The Fund’s investment return and principal value will fluctuate so that an investor’s shares, when redeemed, may be worth more or less than their original cost. Current performance may be lower or higher than the performance quoted above. Please visit our Website at www.goldmansachsfunds.com to obtain the most recent month-end returns. Performance reflects fee waivers and/or expense limitations in effect. In their absence, performance would be reduced. Returns do not reflect the deduction of taxes that a shareholder would pay on Fund distributions or the redemption of Fund shares. |
22
FUND BASICS
| | | | | | | | | | |
| | EXPENSE RATIOS4 | |
| | | | | Net Expense Ratio (Current) | | | Gross Expense Ratio (Before Waivers) | |
| | Class A | | | 0.95 | % | | | 1.13 | % |
| | Class B | | | 1.70 | | | | 1.88 | |
| | Class C | | | 1.70 | | | | 1.88 | |
| | Institutional | | | 0.55 | | | | 0.73 | |
| | Service | | | 1.05 | | | | 1.23 | |
| | Class IR | | | 0.70 | | | | 0.88 | |
| | | Class R | | | 1.20 | | | | 1.38 | |
| | 4 | | The expense ratios of the Fund, both current (net of applicable fee waivers and/or expense limitations) and before waivers (gross of applicable fee waivers and/or expense limitations) are as set forth above according to the most recent publicly available Prospectus for the Fund and may differ from the expense ratios disclosed in the Financial Highlights in this report. The Fund’s waivers and/or expense limitations will remain in place through at least February 28, 2013, and prior to such date the investment adviser may not terminate the arrangements without the approval of the Fund’s Board of Trustees. If these arrangements are discontinued in the future, the expense ratios may change without shareholder approval. |
| | | | | | | | |
| | TOP TEN HOLDINGS AS OF 4/30/125 |
| | | Holding | | % of Net
Assets | | | Line of Business |
| | AT&T, Inc. | | | 3.6 | % | | Diversified Telecommunication Services |
| | Berkshire Hathaway, Inc. Class B | | | 3.4 | | | Insurance |
| | Pfizer, Inc. | | | 3.1 | | | Pharmaceuticals |
| | Chevron Corp. | | | 2.8 | | | Oil, Gas & Consumable Fuels |
| | General Electric Co. | | | 2.7 | | | Industrial Conglomerates |
| | ConocoPhillips | | | 2.7 | | | Oil, Gas & Consumable Fuels |
| | JPMorgan Chase & Co. | | | 2.6 | | | Diversified Financial Services |
| | Wells Fargo & Co. | | | 2.1 | | | Commercial Banks |
| | The Procter & Gamble Co. | | | 2.0 | | | Household Products |
| | | Citigroup, Inc. | | | 2.0 | | | Diversified Financial Services |
| | 5 | | The top 10 holdings may not be representative of the Fund’s future investments. |
23
FUND BASICS
| | |
| FUND VS. BENCHMARK SECTOR ALLOCATIONS6 |
| As of April 30, 2012 | | |
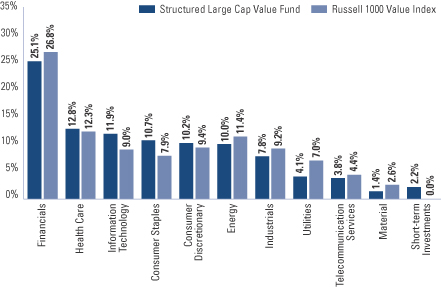
| | 6 | | The Fund is actively managed and, as such, its composition may differ over time. Consequently, the Fund’s overall sector allocation may differ from the percentages contained in the graph above. The graph categorizes investments using Global Industry Classification Standard (“GICS”), however, the sector classifications used by the portfolio management team may differ from GICS. The percentage shown for each investment category reflects the value of investments in that category as a percentage of market value (excluding investments in the securities lending reinvestment vehicle, if any). Investment in the securities lending reinvestment vehicle represented 0.6% of the Fund’s net assets as of April 30, 2012. Short-term investments represent repurchase agreements. The graph depicts the Fund’s investments but may not represent the Fund’s market exposure due to the exclusion of certain derivatives, if any, as listed in the Additional Investment Information section of the Schedule of Investments. |
24
PORTFOLIO RESULTS
Goldman Sachs Structured Small Cap Equity Fund
Portfolio Management Discussion and Analysis
Below, the Goldman Sachs Quantitative Investment Strategies Team (the “Team”) discusses the Goldman Sachs Structured Small Cap Equity Fund’s (the “Fund”) performance and positioning for the six-month period ended April 30, 2012 (the “Reporting Period”).
| Q | | How did the Fund perform during the Reporting Period? |
| A | | During the Reporting Period, the Fund’s Class A, B, C, Institutional, Service, IR and R Shares generated cumulative total returns, without sales charges, of 9.40%, 9.11%, 9.04%, 9.65%, 9.35%, 9.56% and 9.23%, respectively. These returns compare to the 11.02% cumulative total return of the Fund’s benchmark, the Russell 2000® Index (with dividends reinvested) (the “Index”), during the same period. |
| Q | | What key factors were most responsible for the Fund’s performance during the Reporting Period? |
| A | | As expected, and in keeping with our investment approach, our quantitative model and its six investment themes had the greatest impact on relative performance. We use the model’s six investment themes to take a long-term view of market patterns and look for inefficiencies, selecting stocks for the Fund and overweighting or underweighting the ones chosen by the model. Over time and by design, the performance of any one of the model’s investment themes tends to have a low correlation with the model’s other themes, demonstrating the diversification benefit of the Fund’s theme-driven quantitative model. The variance in performance supports our research indicating that the diversification provided by our different investment themes is a significant investment advantage over the long term, even though the Fund may experience underperformance in the short term. Of course, diversification does not protect an investor from market risk nor does it ensure a profit. |
| | | Among our investment themes, Management, Sentiment and Momentum detracted from relative results during the Reporting Period. Management assesses the characteristics, policies and strategic decisions of company management, while Sentiment reflects selected investment views and decisions of individuals and financial intermediaries. Our Momentum theme seeks to predict drifts in stock prices caused by delayed investor reaction to company-specific information and information about related companies. |
| | | Profitability, which assesses whether a company is earning more than its cost of capital, enhanced relative performance. Quality and Valuation also added to returns. The Quality theme evaluates whether the company’s earnings are coming from more persistent, cash-based sources, as opposed to accruals. Valuation captures potential mispricings of securities, typically by comparing a measure of the company’s intrinsic value to its market value. |
| Q | | How did the Fund’s sector allocations affect relative performance? |
| A | | In constructing the Fund’s portfolio, we focus on picking stocks rather than on making industry or sector bets. Consequently, the Fund is similar to the Index in terms of its sector allocation and style. Changes in its sector weights generally do not have a meaningful impact on relative performance. |
| Q | | Did stock selection help or hurt Fund performance during the Reporting Period? |
| A | | We seek to outpace the Index by overweighting stocks we expect to outperform and underweighting those we think may lag. We also build positions based on our thematic views. For example, the Fund aims to hold a basket of stocks with better Momentum characteristics than the benchmark. During the Reporting Period, our stock selection detracted from the Fund’s relative performance. |
| Q | | Which individual positions detracted from the Fund’s results during the Reporting Period? |
| A | | Security selection in the financials, information technology and energy sectors detracted from the Fund’s relative performance during the Reporting Period. The Fund was hampered by its overweighted positions in Marchex, an advertising and small business marketing company; Kelly Services, a recruitment services and workforce solutions provider; and Franklin Street Properties, a real estate investment trust (REIT). We adopted the overweight to Marchex because of our positive views on Profitability, while the overweight to Kelly Services was based on our positive views on Quality. The Fund’s overweighted position in Franklin Street Properties was the result of our positive views on Momentum and Valuation. |
25
PORTFOLIO RESULTS
| Q | | Which stock positions contributed to the Fund’s relative returns during the Reporting Period? |
| A | | Stock picking in the consumer discretionary, materials and health care sectors added to the Fund’s relative results during the Reporting Period. Overweighted positions in Blyth, Progenics Pharmaceuticals and NACCO Industries contributed positively. The Fund was overweight Blyth, a maker of candles and home fragrance products, because of our positive views on Profitability. We chose to overweight biopharmaceutical company Progenics Pharmaceuticals based on our positive views on Management. Our positive views on Momentum led to the Fund’s overweight in NACCO Industries, a holding company focusing on lift trucks, housewares and mining. |
| Q | | How did the Fund use derivatives and similar instruments during the Reporting Period? |
| A | | During the Reporting Period, we used financial futures contracts to equitize the Fund’s cash holdings (that is, to put the Fund’s cash holdings to work). |
| Q | | What was the Fund’s sector positioning relative to the Index at the end of the Reporting Period? |
| A | | At the end of the Reporting Period, the Fund was overweight the information technology, consumer discretionary, consumer staples and industrials sectors relative to the Index. It was underweight the utilities, health care, energy, financials, materials and telecommunication services sectors compared to the Index at the end of the Reporting Period. |
26
FUND BASICS
Structured Small Cap Equity Fund
as of April 30, 2012
| | | | | | | | | | |
| | PERFORMANCE REVIEW | |
| | | November 1, 2011–April 30, 2012 | | Fund Total Return
(based on NAV)1 | | | Russell 2000 Index2 | |
| | Class A | | | 9.40 | % | | | 11.02 | % |
| | Class B | | | 9.11 | | | | 11.02 | |
| | Class C | | | 9.04 | | | | 11.02 | |
| | Institutional | | | 9.65 | | | | 11.02 | |
| | Service | | | 9.35 | | | | 11.02 | |
| | Class IR | | | 9.56 | | | | 11.02 | |
| | | Class R | | | 9.23 | | | | 11.02 | |
| | 1 | | The net asset value (“NAV”) represents the net assets of the class of the Fund (ex-dividend) divided by the total number of shares of the class outstanding. The Fund’s performance assumes the reinvestment of dividends and other distributions. The Fund’s performance does not reflect the deduction of any applicable sales charges. |
| | 2 | | The Russell 2000 Index is an unmanaged index of common stock prices that measures the performance of the 2000 smallest companies in the Russell 3000 Index. The figures for the Index do not include any deduction for fees, expenses or taxes. It is not possible to invest directly in an index. |
| | | | | | | | | | | | | | | | |
| | STANDARDIZED TOTAL RETURNS3 |
| | | For the period ended 3/31/12 | | One Year | | | Five Years | | | Ten Years | | Since Inception | | Inception Date |
| | Class A | | | -1.99 | % | | | -0.91 | % | | 4.38% | | 5.01% | | 8/15/97 |
| | Class B | | | -2.06 | | | | -0.94 | | | 4.33 | | 4.98 | | 8/15/97 |
| | Class C | | | 1.97 | | | | -0.54 | | | 4.19 | | 4.65 | | 8/15/97 |
| | Institutional | | | 4.09 | | | | 0.61 | | | 5.38 | | 5.83 | | 8/15/97 |
| | Service | | | 3.63 | | | | 0.10 | | | 4.86 | | 5.31 | | 8/15/97 |
| | Class IR | | | 3.95 | | | | N/A | | | N/A | | 4.48 | | 11/30/07 |
| | | Class R | | | 3.45 | | | | N/A | | | N/A | | 3.99 | | 11/30/07 |
| | 3 | | The Standardized Total Returns are average annual total returns as of the most recent calendar quarter-end. They assume reinvestment of all distributions at NAV. These returns reflect a maximum initial sales charge of 5.5% for Class A Shares, the assumed contingent deferred sales charge for Class B Shares (5% maximum declining to 0% after six years) and the assumed contingent deferred sales charge for Class C Shares (1% if redeemed within 12 months of purchase). Class B Shares convert automatically to Class A Shares on or about the fifteenth day of the last month of the calendar quarter that is eight years after purchase. Returns for Class B Shares for the period after conversion reflect the performance of Class A Shares. Because Institutional, Service, Class IR and Class R Shares do not involve a sales charge, such a charge is not applied to their Standardized Total Returns. The Fund’s Class B Shares are no longer available for purchase by new or existing shareholders (although current Class B shareholders may continue to reinvest income and capital gains distributions into Class B Shares, and Class B shareholders may continue to exchange their shares for Class B Shares of certain other Goldman Sachs Funds). |
| | | | The returns represent past performance. Past performance does not guarantee future results. The Fund’s investment return and principal value will fluctuate so that an investor’s shares, when redeemed, may be worth more or less than their original cost. Current performance may be lower or higher than the performance quoted above. Please visit our Website at www.goldmansachsfunds.com to obtain the most recent month-end returns. Performance reflects fee waivers and/or expense limitations in effect. In their absence, performance would be reduced. Returns do not reflect the deduction of taxes that a shareholder would pay on Fund distributions or the redemption of Fund shares. |
27
FUND BASICS
| | | | | | | | | | |
| | EXPENSE RATIOS4 | |
| | | | | Net Expense Ratio (Current) | | | Gross Expense Ratio (Before Waivers) | |
| | Class A | | | 1.26 | % | | | 1.43 | % |
| | Class B | | | 2.01 | | | | 2.18 | |
| | Class C | | | 2.01 | | | | 2.18 | |
| | Institutional | | | 0.86 | | | | 1.03 | |
| | Service | | | 1.36 | | | | 1.53 | |
| | Class IR | | | 1.01 | | | | 1.18 | |
| | | Class R | | | 1.51 | | | | 1.68 | |
| | 4 | | The expense ratios of the Fund, both current (net of applicable fee waivers and/or expense limitations) and before waivers (gross of applicable fee waivers and/or expense limitations) are as set forth above according to the most recent publicly available Prospectus for the Fund and may differ from the expense ratios disclosed in the Financial Highlights in this report. The Fund’s waivers and/or expense limitations will remain in place through at least February 28, 2013, and prior to such date the investment adviser may not terminate the arrangements without the approval of the Fund’s Board of Trustees. If these arrangements are discontinued in the future, the expense ratios may change without shareholder approval. |
| | | | | | | | |
| | TOP TEN HOLDINGS AS OF 4/30/125 |
| | | Holding | | % of Net Assets | | | Line of Business |
| | Francesca’s Holdings Corp. | | | 1.4 | % | | Specialty Retail |
| | Manhattan Associates, Inc. | | | 1.3 | | | Software |
| | MicroStrategy, Inc. Class A | | | 1.3 | | | Software |
| | Zumiez, Inc. | | | 1.3 | | | Specialty Retail |
| | Papa John’s International, Inc. | | | 1.3 | | | Hotels, Restaurants & Leisure |
| | Accelrys, Inc. | | | 1.3 | | | Software |
| | International Bancshares Corp. | | | 1.3 | | | Commercial Banks |
| | SemGroup Corp. Class A | | | 1.3 | | | Oil, Gas & Consumable Fuels |
| | Assisted Living Concepts, Inc. Class A | | | 1.3 | | | Health Care Providers & Services |
| | | NACCO Industries, Inc. Class A | | | 1.3 | | | Machinery |
| | 5 | | The top 10 holdings may not be representative of the Fund’s future investments. |
28
FUND BASICS
|
| FUND VS. BENCHMARK SECTOR ALLOCATIONS6 |
| As of April 30, 2012 |
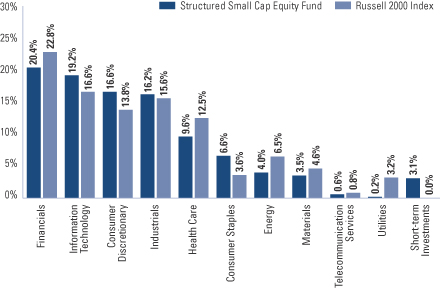
| | 6 | | The Fund is actively managed and, as such, its composition may differ over time. Consequently, the Fund’s overall sector allocations may differ from the percentages contained in the graph above. The graph categorizes investments using Global Industry Classification Standard (“GICS”), however, the sector classifications used by the portfolio management team may differ from GICS. The percentage shown for each investment category reflects the value of investments in that category as a percentage of market value (excluding investments in the securities lending reinvestment vehicle, if any). Investment in the securities lending reinvestment vehicle represented 2.2% of the Fund’s net assets as of April 30, 2012. Short-term investments represent repurchase agreements. The graph depicts the Fund’s investments but may not represent the Fund’s market exposure due to the exclusion of certain derivatives, if any, as listed in the Additional Investment Information section of the Schedule of Investments. |
29
PORTFOLIO RESULTS
Goldman Sachs Structured Small Cap Growth Fund
Portfolio Management Discussion and Analysis
Below, the Goldman Sachs Quantitative Investment Strategies Team (the “Team”) discusses the Goldman Sachs Structured Small Cap Growth Fund’s (the “Fund”) performance and positioning for the six-month period ended April 30, 2012 (the “Reporting Period”).
| Q | | How did the Fund perform during the Reporting Period? |
| A | | During the Reporting Period, the Fund’s Class A, B, C, Institutional, IR and R Shares generated cumulative total returns, without sales charges, of 9.24%, 8.79%, 8.83%, 9.45%, 9.35% and 9.10%, respectively. These returns compare to the 10.58% cumulative total return of the Fund’s benchmark, the Russell 2000® Growth Index (with dividends reinvested) (the “Index”), during the same period. |
| Q | | What key factors were most responsible for the Fund’s performance during the Reporting Period? |
| A | | As expected, and in keeping with our investment approach, our quantitative model and its six investment themes had the greatest impact on relative performance. We use the model’s six investment themes to take a long-term view of market patterns and look for inefficiencies, selecting stocks for the Fund and overweighting or underweighting the ones chosen by the model. Over time and by design, the performance of any one of the model’s investment themes tends to have a low correlation with the model’s other themes, demonstrating the diversification benefit of the Fund’s theme-driven quantitative model. The variance in performance supports our research indicating that the diversification provided by our different investment themes is a significant investment advantage over the long term, even though the Fund may experience underperformance in the short term. Of course, diversification does not protect an investor from market risk nor does it ensure a profit. |
| | Among our investment themes, Management, Sentiment and Valuation detracted from relative results during the Reporting Period. Management assesses the characteristics, policies and strategic decisions of company management, while Sentiment reflects selected investment views and decisions of individuals and financial intermediaries. Valuation attempts to capture potential mispricings of securities, typically by comparing a measure of the company’s intrinsic value to its market value. |
| | Profitability and Quality enhanced relative returns. Profitability assesses whether a company is earning more than its cost of capital, while Quality evaluates whether the company’s earnings are coming from more persistent, cash-based sources, as opposed to accruals. The impact of our Momentum theme was relatively neutral during the Reporting Period. Momentum seeks to predict drifts in stock prices caused by delayed investor reaction to company-specific information and information about related companies. |
| Q | | How did the Fund’s sector allocations affect relative performance? |
| A | | In constructing the Fund’s portfolio, we focus on picking stocks rather than on making industry or sector bets. Consequently, the Fund is similar to the Index in terms of its sector allocation and style. Changes in its sector weights generally do not have a meaningful impact on relative performance. |
| Q | | Did stock selection help or hurt Fund performance during the Reporting Period? |
| A | | We seek to outpace the Index by overweighting stocks we expect to outperform and underweighting those we think may lag. We also build positions based on our thematic views. For example, the Fund aims to hold a basket of stocks with better Momentum characteristics than the benchmark. During the Reporting Period, stock selection detracted from relative performance. |
| Q | | Which individual positions detracted from the Fund’s results during the Reporting Period? |
| A | | Investments in the information technology, health care and energy sectors hampered the Fund’s relative performance during the Reporting Period. Specifically, an underweighted position in Medivation and overweighted positions in Invacare and Tesoro dampened results. The Fund was underweight biopharmaceutical company Medivation because of our negative views on Sentiment. Our positive views on Valuation led us to overweight Invacare, a provider of home medical and long-term care products, and Tesoro, a petroleum company. |
30
PORTFOLIO RESULTS
| Q | | Which stock positions contributed to the Fund’s relative returns during the Reporting Period? |
| A | | Our stock picks in the consumer discretionary, materials and consumer staples sectors added to the Fund’s relative performance during the Reporting Period. The Fund benefited from overweighted positions in Zumiez, a sports clothing retailer, and Blyth, a maker of candles and home fragrance products. An underweighted position in Rambus, a technology licensing company, was also advantageous. We assumed the overweight to Zumiez because of our positive views on Momentum, while the overweight in Blyth was the result of our positive views on Profitability. We adopted the underweight to Rambus based on our negative views on Momentum. |
| Q | | How did the Fund use derivatives and similar instruments during the Reporting Period? |
| A | During the Reporting Period, we used financial futures contracts to equitize the Fund’s cash holdings (that is, to put the Fund’s cash holdings to work). |
| Q | | What was the Fund’s sector positioning relative to the Index at the end of the Reporting Period? |
| A | | At the end of the Reporting Period, the Fund was overweight the consumer discretionary, information technology and consumer staples sectors relative to the Index. It was underweight the energy, health care, materials, telecommunication services, financials and industrials sectors. Compared to the Index, the Fund was relatively neutral in utilities at the end of the Reporting Period. |
31
FUND BASICS
Structured Small Cap Growth Fund
as of April 30, 2012
| | | | | | | | | | |
| | PERFORMANCE REVIEW | | | | | | | | |
| | | November 1, 2011–April 30, 2012 | | Fund Total Return
(based on NAV)1 | | | Russell 2000 Growth Index2 | |
| | Class A | | | 9.24 | % | | | 10.58 | % |
| | Class B | | | 8.79 | | | | 10.58 | |
| | Class C | | | 8.83 | | | | 10.58 | |
| | Institutional | | | 9.45 | | | | 10.58 | |
| | Class IR | | | 9.35 | | | | 10.58 | |
| | | Class R | | | 9.10 | | | | 10.58 | |
| | 1 | | The net asset value (“NAV”) represents the net assets of the class of the Fund (ex-dividend) divided by the total number of shares of the class outstanding. The Fund’s performance assumes the reinvestment of dividends and other distributions. The Fund’s performance does not reflect the deduction of any applicable sales charges. |
| | 2 | | The Russell 2000 Growth Index measures the performance of the small-cap growth stocks of the U.S. equity universe. The Index figures do not reflect any deduction for fees, expenses or taxes. It is not possible to invest directly in an index. |
| | | | | | | | | | |
| | STANDARDIZED TOTAL RETURNS3 |
| | | For the period ended 3/31/12 | | One Year | | | Since Inception | | Inception Date |
| | Class A | | | 0.13 | % | | 1.42% | | 6/25/07 |
| | Class B | | | 0.15 | | | 1.43 | | 6/25/07 |
| | Class C | | | 4.15 | | | 1.86 | | 6/25/07 |
| | Institutional | | | 6.33 | | | 3.04 | | 6/25/07 |
| | Class IR | | | 6.20 | | | 5.44 | | 11/30/07 |
| | | Class R | | | 5.63 | | | 4.88 | | 11/30/07 |
| | 3 | | The Standardized Total Returns are average annual total returns as of the most recent calendar quarter-end. They assume reinvestment of all distributions at NAV. These returns reflect a maximum initial sales charge of 5.5% for Class A Shares, the assumed contingent deferred sales charge for Class B Shares (5% maximum declining to 0% after six years) and the assumed contingent deferred sales charge for Class C Shares (1% if redeemed within 12 months of purchase). Class B Shares convert automatically to Class A Shares on or about the fifteenth day of the last month of the calendar quarter that is eight years after purchase. Returns for Class B Shares for the period after conversion reflect the performance of Class A Shares. Because Institutional, Class IR and Class R Shares do not involve a sales charge, such a charge is not applied to their Standardized Total Returns. The Fund’s Class B Shares are no longer available for purchase by new or existing shareholders (although current Class B shareholders may continue to reinvest income and capital gains distributions into Class B Shares, and Class B shareholders may continue to exchange their shares for Class B Shares of certain other Goldman Sachs Funds). |
| | | | The returns represent past performance. Past performance does not guarantee future results. The Fund’s investment return and principal value will fluctuate so that an investor’s shares, when redeemed, may be worth more or less than their original cost. Current performance may be lower or higher than the performance quoted above. Please visit our Website at www.goldmansachsfunds.com to obtain the most recent month-end returns. Performance reflects fee waivers and/or expense limitations in effect. In their absence, performance would be reduced. Returns do not reflect the deduction of taxes that a shareholder would pay on Fund distributions or the redemption of Fund shares. |
32
FUND BASICS
| | | | | | | | | | |
| | EXPENSE RATIOS4 | |
| | | | | Net Expense Ratio (Current) | | | Gross Expense Ratio (Before Waivers) | |
| | Class A | | | 1.26 | % | | | 1.97 | % |
| | Class B | | | 2.01 | | | | 2.72 | |
| | Class C | | | 2.01 | | | | 2.72 | |
| | Institutional | | | 0.86 | | | | 1.57 | |
| | Class IR | | | 1.01 | | | | 1.72 | |
| | | Class R | | | 1.51 | | | | 2.22 | |
| | 4 | | The expense ratios of the Fund, both current (net of applicable fee waivers and/or expense limitations) and before waivers (gross of applicable fee waivers and/or expense limitations) are as set forth above according to the most recent publicly available Prospectus for the Fund and may differ from the expense ratios disclosed in the Financial Highlights in this report. The Fund’s waivers and/or expense limitations will remain in place through at least February 28, 2013, and prior to such date the investment adviser may not terminate the arrangements without the approval of the Fund’s Board of Trustees. If these arrangements are discontinued in the future, the expense ratios may change without shareholder approval. |
| | | | | | | | |
| | TOP TEN HOLDINGS AS OF 4/30/125 |
| | | Holding | | % of Net Assets | | | Line of Business |
| | Cubist Pharmaceuticals, Inc. | | | 1.5 | % | | Biotechnology |
| | The Boston Beer Co., Inc. Class A | | | 1.5 | | | Beverages |
| | Jazz Pharmaceuticals PLC | | | 1.4 | | | Pharmaceuticals |
| | Zumiez, Inc. | | | 1.4 | | | Specialty Retail |
| | Papa John’s International, Inc. | | | 1.4 | | | Hotels, Restaurants & Leisure |
| | MicroStrategy, Inc. Class A | | | 1.4 | | | Software |
| | Lancaster Colony Corp. | | | 1.4 | | | Food Products |
| | Align Technology, Inc. | | | 1.4 | | | Health Care Equipment & Supplies |
| | The Ultimate Software Group, Inc. | | | 1.3 | | | Software |
| | | Francesca’s Holdings Corp. | | | 1.3 | | | Specialty Retail |
| | 5 | | The top 10 holdings may not be representative of the Fund’s future investments. |
33
FUND BASICS
|
| FUND VS. BENCHMARK SECTOR ALLOCATIONS6 |
| As of April 30, 2012 |
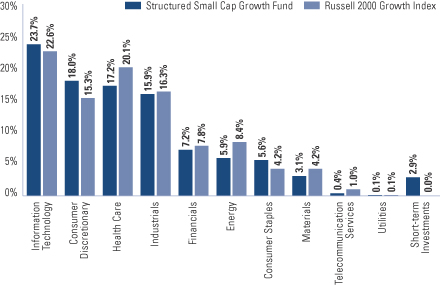
| | 6 | | The Fund is actively managed and, as such, its composition may differ over time. Consequently, the Fund’s overall sector allocation may differ from the percentages contained in the graph above. The graph categorizes investments using Global Industry Classification Standard (“GICS”), however, the sector classifications used by the portfolio management team may differ from GICS. The percentage shown for each investment category reflects the value of investments in that category as a percentage of market value (excluding investments in the securities lending reinvestment vehicle, if any). Investment in the securities lending reinvestment vehicle represented 1.6% of the Fund’s net assets as of April 30, 2012. Short-term investments represent repurchase agreements. The graph depicts the Fund’s investments but may not represent the Fund’s market exposure due to the exclusion of certain derivatives, if any, as listed in the Additional Investment Information section of the Schedule of Investment. |
34
PORTFOLIO RESULTS
Goldman Sachs Structured Small Cap Value Fund
Portfolio Management Discussion and Analysis
Below, the Goldman Sachs Quantitative Investment Strategies Team (the “Team”) discusses the Goldman Sachs Structured Small Cap Value Fund’s (the “Fund”) performance and positioning for the six-month period ended April 30, 2012 (the “Reporting Period”).
| Q | | How did the Fund perform during the Reporting Period? |
| A | | During the Reporting Period, the Fund’s Class A, B, C, Institutional, IR and R Shares generated cumulative total returns, without sales charges, of 8.60%, 8.15%, 8.18%, 8.79%, 8.70% and 8.46%, respectively. These returns compare to the 11.47% cumulative total return of the Fund’s benchmark, the Russell 2000® Value Index (with dividends reinvested) (the “Index”), during the same period. |
| Q | | What key factors were most responsible for the Fund’s performance during the Reporting Period? |
| A | | As expected, and in keeping with our investment approach, our quantitative model and its six investment themes had the greatest impact on relative performance. We use these themes to take a long-term view of market patterns and look for inefficiencies, selecting stocks for the Fund and overweighting or underweighting the ones chosen by the model. Over time and by design, the performance of any one of the model’s investment themes tends to have a low correlation with the model’s other themes, demonstrating the diversification benefit of the Fund’s theme-driven quantitative model. The variance in performance supports our research indicating that the diversification provided by our different investment themes is a significant investment advantage over the long term, even though the Fund may experience underperformance in the short term. Of course, diversification does not protect an investor from market risk nor does it ensure a profit. |
| | Among our investment themes, Management detracted the most from relative performance. Our Management theme assesses the characteristics, policies and strategic decisions of company management. Sentiment and Momentum also dampened relative returns. Sentiment reflects selected investment views and decisions of individuals and financial intermediaries. Momentum seeks to predict drifts in stock prices caused by delayed investor reaction to company-specific information and information about related companies. |
| | Valuation and Profitability added to relative results. Valuation attempts to capture potential mispricings of securities, typically by comparing a measure of the company’s intrinsic value to its market value. Profitability assesses whether a company is earning more than its cost of capital. The impact of our Quality theme was relatively neutral during the Reporting Period. Quality evaluates whether the company’s earnings are coming from more persistent, cash-based sources, as opposed to accruals. |
| Q | | How did the Fund’s sector allocations affect relative performance? |
| A | | In constructing the Fund’s portfolio, we focus on picking stocks rather than on making industry or sector bets. Consequently, the Fund is similar to the Index in terms of its sector allocation and style. Changes in its sector weights generally do not have a meaningful impact on relative performance. |
| Q | | Did stock selection help or hurt Fund performance during the Reporting Period? |
| A | | We seek to outpace the Index by overweighting stocks we expect to outperform and underweighting those we think may lag. We also build positions based on our thematic views. For example, the Fund aims to hold a basket of stocks with better Momentum characteristics than the benchmark. During the Reporting Period, our stock picking detracted from the Fund’s relative performance. |
| Q | | Which individual positions detracted from the Fund’s results during the Reporting Period? |
| A | | Stock selection in the industrials, financials and information technology sectors detracted from the Fund’s relative results during the Reporting Period. The Fund was hampered by overweighted positions in advertising and small business marketing company Marchex; petroleum company Tesoro; and computer component maker Lattice Semiconductor. We assumed the overweight to Marchex because of our positive views on Profitability. The Fund was overweight Tesoro and Lattice Semiconductor because of our positive views on Valuation. |
35
PORTFOLIO RESULTS
| Q | | Which stock positions contributed to the Fund’s relative returns during the Reporting Period? |
| A | | Holdings in the consumer discretionary, utilities and materials sectors enhanced the Fund’s performance versus the Index during the Reporting Period. Specifically, the Fund benefited from its overweighted positions in Blyth, a maker of candles and home fragrance products; Texas Capital Bancshares, a bank holding company; and Group 1 Automotive, an automotive retailer. We chose to overweight Blyth and Group 1 Automotive because of our positive views on Profitability. The overweight to Texas Capital Bancshares was the result of our positive views on Quality. |
| Q | | How did the Fund use derivatives and similar instruments during the Reporting Period? |
| A | | During the Reporting Period, we used financial futures contracts to equitize the Fund’s cash holdings (that is, to put the Fund’s cash holdings to work). |
| Q | | What was the Fund’s sector positioning relative to the Index at the end of the Reporting Period? |
| A | | At the end of the Reporting Period, the Fund was overweight the consumer discretionary, consumer staples and information technology sectors relative to the Index. It was underweight the utilities, industrials, health care, energy, materials, financials and telecommunication services sectors compared to the Index at the end of the Reporting Period. |
36
FUND BASICS
Structured Small Cap Value Fund
as of April 30, 2012
| | | | | | | | | | |
| | PERFORMANCE REVIEW | | | | | | | | |
| | | November 1, 2011–April 30, 2012 | | Fund Total Return
(based on NAV)1 | | | Russell 2000 Value Index2 | |
| | Class A | | | 8.60 | % | | | 11.47 | % |
| | Class B | | | 8.15 | | | | 11.47 | |
| | Class C | | | 8.18 | | | | 11.47 | |
| | Institutional | | | 8.79 | | | | 11.47 | |
| | Class IR | | | 8.70 | | | | 11.47 | |
| | | Class R | | | 8.46 | | | | 11.47 | |
| | 1 | | The net asset value (“NAV”) represents the net assets of the class of the Fund (ex-dividend) divided by the total number of shares of the class outstanding. The Fund’s performance assumes the reinvestment of dividends and other distributions. The Fund’s performance does not reflect the deduction of any applicable sales charges. |
| | 2 | | The Russell 2000 Value Index is an unmanaged index of common stock prices that measures the performance of those Russell 2000 companies with lower price-to-book ratios and lower forecasted growth values. The Index figures do not reflect any deduction for fees, expenses or taxes. It is not possible to invest directly in an index. |
| | | | | | | | | | | | |
| | STANDARDIZED TOTAL RETURNS3 |
| | | For the period ended 3/31/12 | | One Year | | | Since Inception | | | Inception Date |
| | Class A | | | -2.87 | % | | | -1.12% | | | 6/25/07 |
| | Class B | | | -2.99 | | | | -0.89 | | | 6/25/07 |
| | Class C | | | 0.99 | | | | -0.71 | | | 6/25/07 |
| | Institutional | | | 3.19 | | | | 0.49 | | | 6/25/07 |
| | Class IR | | | 3.02 | | | | 4.13 | | | 11/30/07 |
| | | Class R | | | 2.53 | | | | 3.68 | | | 11/30/07 |
| | 3 | | The Standardized Total Returns are average annual total returns as of the most recent calendar quarter-end. They assume reinvestment of all distributions at NAV. These returns reflect a maximum initial sales charge of 5.5% for Class A Shares, the assumed contingent deferred sales charge for Class B Shares (5% maximum declining to 0% after six years) and the assumed contingent deferred sales charge for Class C Shares (1% if redeemed within 12 months of purchase). Class B Shares convert automatically to Class A Shares on or about the fifteenth day of the last month of the calendar quarter that is eight years after purchase. Returns for Class B Shares for the period after conversion reflect the performance of Class A Shares. Because Institutional, Class IR and Class R Shares do not involve a sales charge, such a charge is not applied to their Standardized Total Returns. The Fund’s Class B Shares are no longer available for purchase by new or existing shareholders (although current Class B shareholders may continue to reinvest income and capital gains distributions into Class B Shares, and Class B shareholders may continue to exchange their shares for Class B Shares of certain other Goldman Sachs Funds). |
| | | | The returns represent past performance. Past performance does not guarantee future results. The Fund’s investment return and principal value will fluctuate so that an investor’s shares, when redeemed, may be worth more or less than their original cost. Current performance may be lower or higher than the performance quoted above. Please visit our Website at www.goldmansachsfunds.com to obtain the most recent month-end returns. Performance reflects fee waivers and/or expense limitations in effect. In their absence, performance would be reduced. Returns do not reflect the deduction of taxes that a shareholder would pay on Fund distributions or the redemption of Fund shares. |
37
FUND BASICS
| | | | | | | | | | |
| | EXPENSE RATIOS4 | |
| | | | | Net Expense Ratio (Current) | | | Gross Expense Ratio (Before Waivers) | |
| | Class A | | | 1.26 | % | | | 1.55 | % |
| | Class B | | | 2.01 | | | | 2.30 | |
| | Class C | | | 2.01 | | | | 2.30 | |
| | Institutional | | | 0.86 | | | | 1.15 | |
| | Class IR | | | 1.01 | | | | 1.30 | |
| | | Class R | | | 1.51 | | | | 1.80 | |
| | 4 | | The expense ratios of the Fund, both current (net of applicable fee waivers and/or expense limitations) and before waivers (gross of applicable fee waivers and/or expense limitations) are as set forth above according to the most recent publicly available Prospectus for the Fund and may differ from the expense ratios disclosed in the Financial Highlights in this report. The Fund’s waivers and/or expense limitations will remain in place through at least February 28, 2013, and prior to such date the investment adviser may not terminate the arrangements without the approval of the Fund’s Board of Trustees. If these arrangements are discontinued in the future, the expense ratios may change without shareholder approval. |
| | | | | | | | |
| | TOP TEN HOLDINGS AS OF 4/30/125 |
| | | Holding | | % of Net Assets | | | Line of Business |
| | Group 1 Automotive, Inc. | | | 1.4 | % | | Specialty Retail |
| | Equity Lifestyle Properties, Inc. | | | 1.4 | | | Real Estate Investment Trusts |
| | Southwest Gas Corp. | | | 1.4 | | | Gas Utilities |
| | International Bancshares Corp. | | | 1.3 | | | Commercial Banks |
| | Francesca’s Holdings Corp. | | | 1.3 | | | Specialty Retail |
| | Zumiez, Inc. | | | 1.2 | | | Specialty Retail |
| | Rayonier, Inc. | | | 1.2 | | | Real Estate Investment Trusts |
| | CVB Financial Corp. | | | 1.2 | | | Commercial Banks |
| | Potlatch Corp. | | | 1.2 | | | Real Estate Investment Trusts |
| | | Texas Capital Bancshares, Inc. | | | 1.2 | | | Commercial Banks |
| | 5 | | The top 10 holdings may not be representative of the Fund’s future investments. |
38
FUND BASICS
|
| FUND VS. BENCHMARK SECTOR ALLOCATIONS6 |
| As of April 30, 2012 |
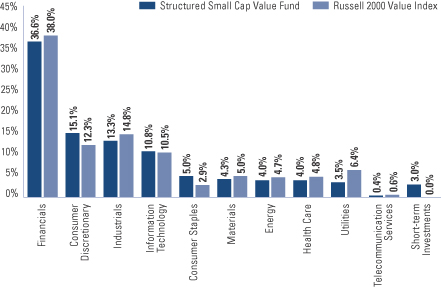
| | 6 | | The Fund is actively managed and, as such, its composition may differ over time. Consequently, the Fund’s overall industry sector allocations may differ from the percentages contained in the graph above. The graph categorizes investments using Global Industry Classification Standard (“GICS”), however, the sector classifications used by the portfolio management team may differ from GICS. The percentage shown for each investment category reflects the value of investments in that category as a percentage of market value (excluding investments in the securities lending reinvestment vehicle, if any). Investment in the securities lending reinvestment vehicle represented 3.0% of the Fund’s net assets as of April 30, 2012. Short-term investments represent repurchase agreements. The graph depicts the Fund’s investments but may not represent the Fund’s market exposure due to the exclusion of certain derivatives, if any, as listed in the Additional Investment Information section of the Schedule of Investment. |
39
PORTFOLIO RESULTS
Goldman Sachs Structured U.S. Equity Fund
Portfolio Management Discussion and Analysis
Below, the Goldman Sachs Quantitative Investment Strategies Team (the “Team”) discusses the Goldman Sachs Structured U.S. Equity Fund’s (the “Fund”) performance and positioning for the six-month period ended April 30, 2012 (the “Reporting Period”).
| Q | | How did the Fund perform during the Reporting Period? |
| A | | During the Reporting Period, the Fund’s Class A, B, C, Institutional, Service, IR and R Shares generated cumulative total returns, without sales charges, of 11.13%, 10.67%, 10.69%, 11.35%, 11.02%, 11.25% and 10.97%, respectively. These returns compare to the 12.77% cumulative total return of the Fund’s benchmark, the S&P® 500 Index (with dividends reinvested) (the “Index”), during the same period. |
| Q | | What key factors were most responsible for the Fund’s performance during the Reporting Period? |
| A | | As expected, and in keeping with our investment approach, our quantitative model and its six investment themes had the greatest impact on relative performance. We use these themes to take a long-term view of market patterns and look for inefficiencies, selecting stocks for the Fund and overweighting or underweighting the ones chosen by the model. Over time and by design, the performance of any one of the model’s investment themes tends to have a low correlation with the model’s other themes, demonstrating the diversification benefit of the Fund’s theme-driven quantitative model. The variance in performance supports our research indicating that the diversification provided by our different investment themes is a significant investment advantage over the long term, even though the Fund may experience underperformance in the short term. Of course, diversification does not protect an investor from market risk nor does it ensure a profit. |
| | Among our investment themes, Management detracted most from relative performance. Our Management theme assesses the characteristics, policies and strategic decisions of company management. Valuation, Momentum and Quality also dampened relative returns. The Valuation theme attempts to capture potential mispricings of securities, typically by comparing a measure of the company’s intrinsic value to its market value. Momentum seeks to predict drifts in stock prices caused by delayed investor reaction to company-specific information and information about related companies. Quality evaluates whether the company’s |
| | earnings are coming from more persistent, cash-based sources, as opposed to accruals. |
| | Profitability, which assesses whether a company is earning more than its cost of capital, was our best-performing theme. Sentiment also enhanced relative results. The Sentiment theme reflects selected investment views and decisions of individuals and financial intermediaries. |
| Q | | How did the Fund’s sector allocations affect relative performance? |
| A | | In constructing the Fund’s portfolio, we focus on picking stocks rather than on making industry or sector bets. Consequently, the Fund is similar to the Index in terms of its sector allocation and style. Changes in its sector weights generally do not have a meaningful impact on relative performance. |
| Q | | Did stock selection help or hurt Fund performance during the Reporting Period? |
| A | | We seek to outpace the Index by overweighting stocks we expect to outperform and underweighting those we think may lag. We also build positions based on our thematic views. For example, the Fund aims to hold a basket of stocks with better Momentum characteristics than the benchmark. During the Reporting Period, security selection detracted from the Fund’s relative returns. |
| Q | | Which individual positions detracted from the Fund’s results during the Reporting Period? |
| A | | Our stock picks in the information technology, financials and consumer staples sectors detracted from relative returns during the Reporting Period. The Fund was hampered by overweighted positions in Oracle, an enterprise software and hardware maker; Humana, a health care plans and services provider; and Tyson Foods, a processor of chicken, beef and pork. We chose to overweight Oracle because of our positive views on Momentum, while our positive views on Profitability resulted in the Fund’s overweights to Humana and Tyson Foods. |
40
FUND BASICS
| Q | | Which stock positions contributed to the Fund’s relative returns during the Reporting Period? |
| A | | Investments in the industrials, utilities and materials sectors added to the Fund’s relative performance during the Reporting Period. The Fund benefited from overweighted positions in Dish Network, a satellite television provider; Toro, a turf maintenance equipment maker; and Western Digital, a manufacturer of computer hard drives. We adopted the overweight to Dish Network as a result of our positive views on Momentum. Our positive views on Profitability led us to overweight Toro and Western Digital. |
| Q | | How did the Fund use derivatives and similar instruments during the Reporting Period? |
| A | | During the Reporting Period, we used financial futures contracts to equitize the Fund’s cash holdings (that is, to put the Fund’s cash holdings to work). |
| Q | | What was the Fund’s sector positioning relative to the Index at the end of the Reporting Period? |
| A | | At the end of the Reporting Period, the Fund was overweight the information technology, consumer staples, financials, health care and energy sectors compared to the Index. It was underweight the materials, utilities, industrials, consumer discretionary and telecommunication services sectors relative to the Index at the end of the Reporting Period. |
41
FUND BASICS
Structured U.S. Equity Fund
as of April 30, 2012
| | | | | | | | | | |
| | PERFORMANCE REVIEW | | | | | | | | |
| | | November 1, 2011–April 30, 2012 | | Fund Total Return
(based on NAV)1 | | | S&P 500 Index2 | |
| | Class A | | | 11.13 | % | | | 12.77 | % |
| | Class B | | | 10.67 | | | | 12.77 | |
| | Class C | | | 10.69 | | | | 12.77 | |
| | Institutional | | | 11.35 | | | | 12.77 | |
| | Service | | | 11.02 | | | | 12.77 | |
| | Class IR | | | 11.25 | | | | 12.77 | |
| | | Class R | | | 10.97 | | | | 12.77 | |
| | 1 | | The net asset value (“NAV”) represents the net assets of the class of the Fund (ex-dividend) divided by the total number of shares of the class outstanding. The Fund’s performance assumes the reinvestment of dividends and other distributions. The Fund’s performance does not reflect the deduction of any applicable sales charges. |
| | 2 | | The S&P 500 Index is the Standard & Poor’s 500 Composite Index of 500 stocks, an unmanaged index of common stock prices. The figures for the Index do not include any deduction for fees, expenses or taxes. It is not possible to invest directly in an index. |
| | | | | | | | | | | | | | | | | | | | |
| | STANDARDIZED TOTAL RETURNS3 |
| | | For the period ended 3/31/12 | | One Year | | | Five Years | | | Ten Years | | | Since Inception | | | Inception Date |
| | Class A | | | 3.75 | % | | | -1.29 | % | | | 2.78 | % | | | 7.16 | % | | 5/24/91 |
| | Class B | | | 3.90 | | | | -1.33 | | | | 2.74 | | | | 5.41 | | | 5/1/96 |
| | Class C | | | 7.93 | | | | -0.92 | | | | 2.60 | | | | 3.05 | | | 8/15/97 |
| | Institutional | | | 10.18 | | | | 0.22 | | | | 3.77 | | | | 7.32 | | | 6/15/95 |
| | Service | | | 9.65 | | | | -0.26 | | | | 3.26 | | | | 5.56 | | | 6/07/96 |
| | Class IR | | | 10.02 | | | | N/A | | | | N/A | | | | -0.07 | | | 11/30/07 |
| | | Class R | | | 9.50 | | | | N/A | | | | N/A | | | | -0.55 | | | 11/30/07 |
| | 3 | | The Standardized Total Returns are average annual total returns as of the most recent calendar quarter-end. They assume reinvestment of all distributions at NAV. These returns reflect a maximum initial sales charge of 5.5% for Class A Shares, the assumed contingent deferred sales charge for Class B Shares (5% maximum declining to 0% after six years) and the assumed contingent deferred sales charge for Class C Shares (1% if redeemed within 12 months of purchase). Class B Shares convert automatically to Class A Shares on or about the fifteenth day of the last month of the calendar quarter that is eight years after purchase. Returns for Class B Shares for the period after conversion reflect the performance of Class A Shares. Because Institutional, Service, Class IR and Class R Shares do not involve a sales charge, such a charge is not applied to their Standardized Total Returns. The Fund’s Class B Shares are no longer available for purchase by new or existing shareholders (although current Class B shareholders may continue to reinvest income and capital gains distributions into Class B Shares, and Class B shareholders may continue to exchange their shares for Class B Shares of certain other Goldman Sachs Funds). |
| | | | The returns represent past performance. Past performance does not guarantee future results. The Fund’s investment return and principal value will fluctuate so that an investor’s shares, when redeemed, may be worth more or less than their original cost. Current performance may be lower or higher than the performance quoted above. Please visit our Website at www.goldmansachsfunds.com to obtain the most recent month-end returns. Performance reflects fee waivers and/or expense limitations in effect. In their absence, performance would be reduced. Returns do not reflect the deduction of taxes that a shareholder would pay on Fund distributions or the redemption of Fund shares. |
42
FUND BASICS
| | | | | | | | | | |
| | EXPENSE RATIOS4 | |
| | | | | Net Expense Ratio (Current) | | | Gross Expense Ratio (Before Waivers) | |
| | Class A | | | 0.95 | % | | | 1.19 | % |
| | Class B | | | 1.70 | | | | 1.94 | |
| | Class C | | | 1.70 | | | | 1.94 | |
| | Institutional | | | 0.55 | | | | 0.79 | |
| | Service | | | 1.05 | | | | 1.29 | |
| | Class IR | | | 0.70 | | | | 0.94 | |
| | | Class R | | | 1.20 | | | | 1.44 | |
| | 4 | | The expense ratios of the Fund, both current (net of applicable fee waivers and/or expense limitations) and before waivers (gross of applicable fee waivers and/or expense limitations) are as set forth above according to the most recent publicly available Prospectus for the Fund and may differ from the expense ratios disclosed in the Financial Highlights in this report. The Fund’s waivers and/or expense limitations will remain in place through at least February 28, 2013, and prior to such date the investment adviser may not terminate the arrangements without the approval of the Fund’s Board of Trustees. If these arrangements are discontinued in the future, the expense ratios may change without shareholder approval. |
| | | | | | | | |
| | TOP TEN HOLDINGS AS OF 4/30/125 |
| | | Holding | | % of Net Assets | | | Line of Business |
| | Apple, Inc. | | | 4.4 | % | | Computers & Peripherals |
| | Exxon Mobile Corp. | | | 3.5 | | | Oil, Gas & Consumable Fuels |
| | Microsoft Corp. | | | 3.2 | | | Software |
| | AT&T, Inc. | | | 2.4 | | | Diversified Telecommunication |
| | | | | | | | Services |
| | Berkshire Hathaway, Inc. Class B | | | 2.4 | | | Insurance |
| | Pfizer, Inc. | | | 2.3 | | | Pharmaceuticals |
| | Oracle Corp. | | | 2.2 | | | Software |
| | The Procter & Gamble Co. | | | 2.1 | | | Household Products |
| | Philip Morris International, Inc. | | | 2.0 | | | Tobacco |
| | | General Electric Co. | | | 2.0 | | | Industrial Conglomerates |
| | 5 | | The top 10 holdings may not be representative of the Fund’s future investments. |
43
FUND BASICS
|
| FUND VS. BENCHMARK SECTOR ALLOCATIONS6 |
| As of April 30, 2012 |
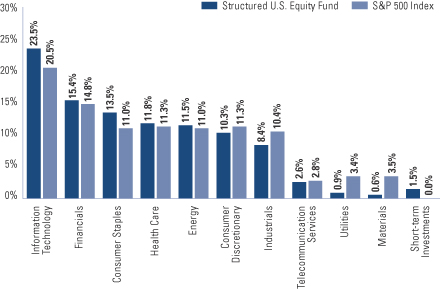
| | 6 | | The Fund is actively managed and, as such, its composition may differ over time. Consequently, the Fund’s overall sector allocations may differ from the percentages contained in the graph above. The graph categorizes investments using Global Industry Classification Standard (“GICS”), however, the sector classifications used by the portfolio management team may differ from GICS. The percentage shown for each investment category reflects the value of investments in that category as a percentage of market value. Short-term investments represent repurchase agreements. The graph depicts the Fund’s investments but may not represent the Fund’s market exposure due to the exclusion of certain derivatives, if any, as listed in the Additional Investment Information section of the Schedule of Investments. |
44
GOLDMAN SACHS BALANCED FUND
Schedule of Investments
April 30, 2012 (Unaudited)
| | | | | | | | |
| Shares | | | Description | | Value | |
| | | | | | | |
| Common Stocks – 58.5% | |
| Aerospace & Defense – 1.9% | |
| | 6,800 | | | Honeywell International, Inc. | | $ | 412,488 | |
| | 9,900 | | | Lockheed Martin Corp. | | | 896,346 | |
| | 16,400 | | | Raytheon Co. | | | 887,896 | |
| | 2,400 | | | The Boeing Co. | | | 184,320 | |
| | | | | | | | |
| | | | | | | 2,381,050 | |
| | |
| Air Freight & Logistics – 0.1% | |
| | 1,100 | | | United Parcel Service, Inc. Class B | | | 85,954 | |
| | |
| Auto Components – 0.3% | |
| | 3,700 | | | Autoliv, Inc. | | | 232,138 | |
| | 4,000 | | | Johnson Controls, Inc. | | | 127,880 | |
| | | | | | | | |
| | | | | | | 360,018 | |
| | |
| Automobiles – 0.2% | |
| | 27,800 | | | Ford Motor Co. | | | 313,584 | |
| | |
| Beverages – 1.7% | |
| | 9,900 | | | PepsiCo, Inc. | | | 653,400 | |
| | 19,300 | | | The Coca-Cola Co. | | | 1,472,976 | |
| | | | | | | | |
| | | | | | | 2,126,376 | |
| | |
| Biotechnology – 0.2% | |
| | 3,300 | | | Amgen, Inc. | | | 234,663 | |
| | 1,300 | | | Gilead Sciences, Inc.* | | | 67,613 | |
| | | | | | | | |
| | | | | | | 302,276 | |
| | |
| Building Products – 0.1% | |
| | 6,600 | | | Masco Corp. | | | 86,988 | |
| | |
| Capital Markets – 1.2% | |
| | 4,100 | | | BlackRock, Inc. | | | 785,478 | |
| | 20,800 | | | Federated Investors, Inc. Class B(a) | | | 459,264 | |
| | 1,300 | | | Greenhill & Co., Inc. | | | 50,505 | |
| | 10,500 | | | Morgan Stanley | | | 181,440 | |
| | 1,400 | | | The Bank of New York Mellon Corp. | | | 33,110 | |
| | | | | | | | |
| | | | | | | 1,509,797 | |
| | |
| Chemicals – 1.4% | |
| | 300 | | | CF Industries Holdings, Inc. | | | 57,918 | |
| | 12,200 | | | E.I. du Pont de Nemours and Co. | | | 652,212 | |
| | 2,800 | | | RPM International, Inc. | | | 74,396 | |
| | 29,200 | | | The Dow Chemical Co. | | | 989,296 | |
| | | | | | | | |
| | | | | | | 1,773,822 | |
| | |
| Commercial Banks – 1.4% | |
| | 1,300 | | | M&T Bank Corp. | | | 112,151 | |
| | 3,200 | | | PNC Financial Services Group, Inc. | | | 212,224 | |
| | 6,000 | | | U.S. Bancorp | | | 193,020 | |
| | 28,164 | | | Valley National Bancorp | | | 354,866 | |
| | 28,200 | | | Wells Fargo & Co. | | | 942,726 | |
| | | | | | | | |
| | | | | | | 1,814,987 | |
| | |
| Commercial Services & Supplies – 1.0% | |
| | 33,000 | | | Pitney Bowes, Inc.(a) | | | 565,290 | |
| | 32,000 | | | R.R. Donnelley & Sons Co.(a) | | | 400,320 | |
| | 9,200 | | | Waste Management, Inc. | | | 314,640 | |
| | | | | | | | |
| | | | | | | 1,280,250 | |
| | |
| | | | | | | | |
| Shares | | | Description | | Value | |
| | | | | | | |
| Common Stocks – (continued) | |
| Communications Equipment – 1.8% | |
| | 48,000 | | | Cisco Systems, Inc. | | $ | 967,200 | |
| | 1,200 | | | F5 Networks, Inc.* | | | 160,716 | |
| | 17,700 | | | QUALCOMM, Inc. | | | 1,129,968 | |
| | | | | | | | |
| | | | | | | 2,257,884 | |
| | |
| Computers & Peripherals – 2.9% | |
| | 5,200 | | | Apple, Inc.*(b) | | | 3,038,048 | |
| | 4,400 | | | Hewlett-Packard Co. | | | 108,944 | |
| | 16,600 | | | Seagate Technology PLC | | | 510,616 | |
| | | | | | | | |
| | | | | | | 3,657,608 | |
| | |
| Distributors – 0.1% | |
| | 1,900 | | | Genuine Parts Co. | | | 123,082 | |
| | |
| Diversified Consumer Services – 0.2% | |
| | 18,000 | | | H&R Block, Inc. | | | 264,600 | |
| | |
| Diversified Financial Services – 1.9% | |
| | 41,900 | | | Bank of America Corp. | | | 339,809 | |
| | 12,331 | | | Citigroup, Inc. | | | 407,416 | |
| | 33,500 | | | JPMorgan Chase & Co. | | | 1,439,830 | |
| | 10,300 | | | NYSE Euronext | | | 265,225 | |
| | | | | | | | |
| | | | | | | 2,452,280 | |
| | |
| Diversified Telecommunication Services – 2.2% | |
| | 37,750 | | | AT&T, Inc. | | | 1,242,353 | |
| | 23,000 | | | CenturyLink, Inc. | | | 886,880 | |
| | 74,900 | | | Frontier Communications Corp.(a) | | | 302,596 | |
| | 32,800 | | | Windstream Corp. | | | 368,672 | |
| | | | | | | | |
| | | | | | | 2,800,501 | |
| | |
| Electric Utilities – 2.0% | |
| | 10,300 | | | American Electric Power Co., Inc. | | | 400,052 | |
| | 1,200 | | | Entergy Corp. | | | 78,672 | |
| | 14,225 | | | Exelon Corp. | | | 554,917 | |
| | 11,600 | | | FirstEnergy Corp. | | | 543,112 | |
| | 1,600 | | | Pepco Holdings, Inc. | | | 30,272 | |
| | 12,100 | | | PPL Corp. | | | 330,935 | |
| | 11,300 | | | The Southern Co. | | | 519,122 | |
| | | | | | | | |
| | | | | | | 2,457,082 | |
| | |
| Electrical Equipment – 0.4% | |
| | 6,900 | | | Emerson Electric Co. | | | 362,526 | |
| | 1,700 | | | Rockwell Automation, Inc. | | | 131,478 | |
| | | | | | | | |
| | | | | | | 494,004 | |
| | |
| Electronic Equipment, Instruments & Components – 0.5% | |
| | 24,800 | | | Molex, Inc. Class A | | | 567,920 | |
| | |
| Energy Equipment & Services – 0.9% | |
| | 2,400 | | | Baker Hughes, Inc. | | | 105,864 | |
| | 8,200 | | | Halliburton Co. | | | 280,604 | |
| | 1,300 | | | National-Oilwell Varco, Inc. | | | 98,488 | |
| | 9,600 | | | Schlumberger Ltd. | | | 711,744 | |
| | | | | | | | |
| | | | | | | 1,196,700 | |
| | |
| Food & Staples Retailing – 1.0% | |
| | 3,400 | | | CVS Caremark Corp. | | | 151,708 | |
| | 12,100 | | | SUPERVALU, Inc.(a) | | | 71,874 | |
| | 12,300 | | | Sysco Corp. | | | 355,470 | |
| | |
| | |
| The accompanying notes are an integral part of these financial statements. | | 45 |
GOLDMAN SACHS BALANCED FUND
Schedule of Investments (continued)
April 30, 2012 (Unaudited)
| | | | | | | | |
| Shares | | | Description | | Value | |
| | | | | | | |
| Common Stocks – (continued) | |
| Food & Staples Retailing – (continued) | |
| | 8,981 | | | Wal-Mart Stores, Inc. | | $ | 529,071 | |
| | 4,600 | | | Walgreen Co. | | | 161,276 | |
| | | | | | | | |
| | | | | | | 1,269,399 | |
| | |
| Food Products – 0.5% | |
| | 2,200 | | | Archer-Daniels-Midland Co. | | | 67,826 | |
| | 15,000 | | | ConAgra Foods, Inc. | | | 387,300 | |
| | 3,300 | | | General Mills, Inc. | | | 128,337 | |
| | 1,300 | | | Kellogg Co. | | | 65,741 | |
| | | | | | | | |
| | | | | | | 649,204 | |
| | |
| Health Care Equipment & Supplies – 0.9% | |
| | 2,700 | | | Baxter International, Inc. | | | 149,607 | |
| | 21,000 | | | Medtronic, Inc. | | | 802,200 | |
| | 6,300 | | | St. Jude Medical, Inc. | | | 243,936 | |
| | | | | | | | |
| | | | | | | 1,195,743 | |
| | |
| Health Care Providers & Services – 0.6% | |
| | 14,000 | | | UnitedHealth Group, Inc. | | | 786,100 | |
| | |
| Hotels, Restaurants & Leisure – 0.7% | |
| | 900 | | | Las Vegas Sands Corp. | | | 49,941 | |
| | 6,100 | | | McDonald’s Corp. | | | 594,445 | |
| | 3,100 | | | Starbucks Corp. | | | 177,878 | |
| | 200 | | | Wynn Resorts Ltd. | | | 26,680 | |
| | | | | | | | |
| | | | | | | 848,944 | |
| | |
| Household Durables – 0.5% | |
| | 23,100 | | | Leggett & Platt, Inc. | | | 502,887 | |
| | 1,100 | | | Whirlpool Corp. | | | 70,422 | |
| | | | | | | | |
| | | | | | | 573,309 | |
| | |
| Household Products – 1.8% | |
| | 1,700 | | | Colgate-Palmolive Co. | | | 168,198 | |
| | 12,200 | | | Kimberly-Clark Corp. | | | 957,334 | |
| | 2,000 | | | The Clorox Co. | | | 140,200 | |
| | 15,300 | | | The Procter & Gamble Co. | | | 973,692 | |
| | | | | | | | |
| | | | | | | 2,239,424 | |
| | |
| Industrial Conglomerates – 1.5% | |
| | 3,000 | | | 3M Co. | | | 268,080 | |
| | 82,900 | | | General Electric Co. | | | 1,623,182 | |
| | | | | | | | |
| | | | | | | 1,891,262 | |
| | |
| Insurance – 1.6% | |
| | 4,800 | | | Aflac, Inc. | | | 216,192 | |
| | 3,500 | | | Arthur J. Gallagher & Co. | | | 131,460 | |
| | 1,200 | | | Berkshire Hathaway, Inc. Class B* | | | 96,540 | |
| | 1,700 | | | Cincinnati Financial Corp. | | | 60,554 | |
| | 11,600 | | | Mercury General Corp. | | | 524,204 | |
| | 5,800 | | | MetLife, Inc. | | | 208,974 | |
| | 23,200 | | | Old Republic International Corp. | | | 230,840 | |
| | 8,100 | | | Prudential Financial, Inc. | | | 490,374 | |
| | | | | | | | |
| | | | | | | 1,959,138 | |
| | |
| Internet & Catalog Retail* – 0.1% | |
| | 100 | | | Priceline.com, Inc. | | | 76,082 | |
| | |
| | | | | | | | |
| Shares | | | Description | | Value | |
| | | | | | | |
| Common Stocks – (continued) | |
| Internet Software & Services* – 0.3% | |
| | 1 | | | AOL, Inc. | | $ | 25 | |
| | 2,200 | | | eBay, Inc. | | | 90,310 | |
| | 500 | | | Google, Inc. Class A | | | 302,615 | |
| | | | | | | | |
| | | | | | | 392,950 | |
| | |
| IT Services – 2.3% | |
| | 13,100 | | | Accenture PLC Class A | | | 850,845 | |
| | 5,200 | | | International Business Machines Corp. | | | 1,076,816 | |
| | 25,500 | | | Paychex, Inc. | | | 789,990 | |
| | 1,000 | | | Visa, Inc. Class A | | | 122,980 | |
| | | | | | | | |
| | | | | | | 2,840,631 | |
| | |
| Leisure Equipment & Products – 0.2% | |
| | 6,700 | | | Hasbro, Inc. | | | 246,158 | |
| | |
| Life Sciences Tools & Services – 0.1% | |
| | 4,400 | | | Agilent Technologies, Inc. | | | 185,592 | |
| | |
| Machinery – 1.2% | |
| | 3,400 | | | Caterpillar, Inc. | | | 349,418 | |
| | 5,800 | | | Deere & Co. | | | 477,688 | |
| | 14,800 | | | Eaton Corp. | | | 713,064 | |
| | | | | | | | |
| | | | | | | 1,540,170 | |
| | |
| Media – 2.1% | |
| | 1,800 | | | Cablevision Systems Corp. Class A | | | 26,676 | |
| | 4,100 | | | CBS Corp. Class B | | | 136,735 | |
| | 25,900 | | | Comcast Corp. Class A | | | 783,097 | |
| | 16,500 | | | DISH Network Corp. Class A | | | 527,505 | |
| | 17,000 | | | Gannett Co., Inc. | | | 234,940 | |
| | 6,200 | | | Regal Entertainment Group Class A | | | 84,382 | |
| | 12,000 | | | The Interpublic Group of Cos., Inc. | | | 141,720 | |
| | 10,700 | | | Thomson Reuters Corp. | | | 319,074 | |
| | 900 | | | Time Warner Cable, Inc. | | | 72,405 | |
| | 6,901 | | | Time Warner, Inc. | | | 258,511 | |
| | 1,300 | | | Viacom, Inc. Class B | | | 60,307 | |
| | | | | | | | |
| | | | | | | 2,645,352 | |
| | |
| Metals & Mining – 1.2% | |
| | 17,400 | | | Freeport-McMoRan Copper & Gold, Inc. | | | 666,420 | |
| | 3,000 | | | Newmont Mining Corp. | | | 142,950 | |
| | 22,477 | | | Southern Copper Corp. | | | 739,044 | |
| | | | | | | | |
| | | | | | | 1,548,414 | |
| | |
| Multi-Utilities – 0.3% | |
| | 1,600 | | | CenterPoint Energy, Inc. | | | 32,336 | |
| | 2,400 | | | Integrys Energy Group, Inc. | | | 131,136 | |
| | 2,400 | | | PG&E Corp. | | | 106,032 | |
| | 4,400 | | | Public Service Enterprise Group, Inc. | | | 137,060 | |
| | 1,700 | | | TECO Energy, Inc. | | | 30,634 | |
| | | | | | | | |
| | | | | | | 437,198 | |
| | |
| Oil, Gas & Consumable Fuels – 5.3% | |
| | 18,514 | | | Chevron Corp. | | | 1,972,852 | |
| | 15,400 | | | ConocoPhillips | | | 1,103,102 | |
| | 20,003 | | | Exxon Mobil Corp. | | | 1,727,059 | |
| | 9,900 | | | Occidental Petroleum Corp. | | | 903,078 | |
| | |
| | |
| 46 | | The accompanying notes are an integral part of these financial statements. |
GOLDMAN SACHS BALANCED FUND
| | | | | | | | |
| Shares | | | Description | | Value | |
| | | | | | | |
| Common Stocks – (continued) | |
| Oil, Gas & Consumable Fuels – (continued) | |
| | 23,100 | | | The Williams Cos., Inc. | | $ | 786,093 | |
| | 8,800 | | | Valero Energy Corp. | | | 217,360 | |
| | | | | | | | |
| | | | | | | 6,709,544 | |
| | |
| Paper & Forest Products – 0.1% | |
| | 3,800 | | | International Paper Co. | | | 126,578 | |
| | |
| Personal Products – 0.2% | |
| | 13,300 | | | Avon Products, Inc. | | | 287,280 | |
| | |
| Pharmaceuticals – 4.4% | |
| | 4,300 | | | Abbott Laboratories | | | 266,858 | |
| | 23,900 | | | Eli Lilly & Co. | | | 989,221 | |
| | 13,600 | | | Johnson & Johnson | | | 885,224 | |
| | 37,900 | | | Merck & Co., Inc. | | | 1,487,196 | |
| | 80,700 | | | Pfizer, Inc. | | | 1,850,451 | |
| | | | | | | | |
| | | | | | | 5,478,950 | |
| | |
| Real Estate Investment Trusts – 1.2% | |
| | 700 | | | American Tower Corp. | | | 45,906 | |
| | 1,100 | | | HCP, Inc. | | | 45,595 | |
| | 14,400 | | | Host Hotels & Resorts, Inc. | | | 239,616 | |
| | 11,949 | | | ProLogis, Inc. | | | 427,535 | |
| | 2,100 | | | Public Storage | | | 300,846 | |
| | 2,700 | | | Simon Property Group, Inc. | | | 420,120 | |
| | 400 | | | Ventas, Inc. | | | 23,516 | |
| | 1 | | | Vornado Realty Trust | | | 86 | |
| | | | | | | | |
| | | | | | | 1,503,220 | |
| | |
| Road & Rail – 0.3% | |
| | 2,500 | | | Norfolk Southern Corp. | | | 182,325 | |
| | 1,500 | | | Union Pacific Corp. | | | 168,660 | |
| | | | | | | | |
| | | | | | | 350,985 | |
| | |
| Semiconductors & Semiconductor Equipment – 1.8% | |
| | 10,400 | | | Applied Materials, Inc. | | | 124,696 | |
| | 58,100 | | | Intel Corp. | | | 1,650,040 | |
| | 13,400 | | | Intersil Corp. Class A | | | 137,618 | |
| | 3,200 | | | Maxim Integrated Products, Inc. | | | 94,656 | |
| | 7,000 | | | Texas Instruments, Inc. | | | 223,580 | |
| | | | | | | | |
| | | | | | | 2,230,590 | |
| | |
| Software – 2.2% | |
| | 7,400 | | | CA, Inc. | | | 195,508 | |
| | 68,140 | | | Microsoft Corp. | | | 2,181,843 | |
| | 12,700 | | | Oracle Corp. | | | 373,253 | |
| | | | | | | | |
| | | | | | | 2,750,604 | |
| | |
| Specialty Retail – 1.3% | |
| | 5,300 | | | American Eagle Outfitters, Inc. | | | 95,453 | |
| | 19,700 | | | Limited Brands, Inc. | | | 979,090 | |
| | 4,300 | | | Staples, Inc. | | | 66,220 | |
| | 8,800 | | | The Home Depot, Inc. | | | 455,752 | |
| | | | | | | | |
| | | | | | | 1,596,515 | |
| | |
| | | | | | | | |
| Shares | | | Description | | Value | |
| | | | | | | |
| Common Stocks – (continued) | |
| Textiles, Apparel & Luxury Goods – 0.3% | |
| | 4,000 | | | Coach, Inc. | | $ | 292,640 | |
| | 600 | | | NIKE, Inc. Class B | | | 67,122 | |
| | 200 | | | VF Corp. | | | 30,410 | |
| | | | | | | | |
| | | | | | | 390,172 | |
| | |
| Thrifts & Mortgage Finance – 0.8% | |
| | 57,200 | | | New York Community Bancorp, Inc. | | | 771,628 | |
| | 17,900 | | | People’s United Financial, Inc. | | | 220,886 | |
| | | | | | | | |
| | | | | | | 992,514 | |
| | |
| Tobacco – 1.3% | |
| | 34,700 | | | Altria Group, Inc. | | | 1,117,687 | |
| | 1,600 | | | Philip Morris International, Inc. | | | 143,216 | |
| | 7,800 | | | Reynolds American, Inc. | | | 318,474 | |
| | | | | | | | |
| | | | | | | 1,579,377 | |
| | |
| | TOTAL COMMON STOCKS | |
| | (Cost $62,584,035) | | $ | 73,628,162 | |
| | |
| | | | | | | | |
| | | | | | | | | | | | | | |
Principal
Amount | | | Interest
Rate | | | Maturity
Date | | | Value | |
| | | | | | | | | | | | | | |
| Corporate Obligations – 8.3% | |
| Banks – 1.9% | |
| Abbey National Treasury Services PLC(c) | |
| GBP | 100,000 | | | | 2.674 | % | | | 02/16/15 | | | $ | 162,322 | |
| Astoria Financial Corp.(d) | |
| $ | 150,000 | | | | 5.750 | | | | 10/15/12 | | | | 153,013 | |
| Bank of America Corp. | |
| | 50,000 | | | | 3.625 | | | | 03/17/16 | | | | 49,663 | |
| | 25,000 | | | | 5.875 | | | | 01/05/21 | | | | 26,314 | |
| | 200,000 | | | | 5.700 | | | | 01/24/22 | | | | 210,408 | |
| Citigroup Capital XXI(c)(d) | |
| | 132,000 | | | | 8.300 | | | | 12/21/57 | | | | 133,980 | |
| Citigroup, Inc. | |
| | 150,000 | | | | 5.000 | | | | 09/15/14 | | | | 155,553 | |
| | 100,000 | | | | 4.450 | | | | 01/10/17 | | | | 104,238 | |
| | 25,000 | | | | 6.125 | | | | 11/21/17 | | | | 27,737 | |
| | 75,000 | | | | 4.500 | | | | 01/14/22 | | | | 76,370 | |
| Fifth Third Bancorp | |
| | 125,000 | | | | 3.625 | | | | 01/25/16 | | | | 131,980 | |
| HSBC Bank USA NA | |
| | 100,000 | | | | 6.000 | | | | 08/09/17 | | | | 108,857 | |
| ING Bank NV(e) | |
| | 200,000 | | | | 2.375 | | | | 06/09/14 | | | | 198,550 | |
| JPMorgan Chase & Co. | |
| | 75,000 | | | | 6.300 | | | | 04/23/19 | | | | 87,818 | |
| JPMorgan Chase Capital XXV | |
| | 75,000 | | | | 6.800 | | | | 10/01/37 | | | | 75,187 | |
| Mizuho Corporate Bank Ltd.(e) | |
| | 200,000 | | | | 2.550 | | | | 03/17/17 | | | | 201,452 | |
| Resona Preferred Global Securities Ltd.(c)(d)(e) | |
| | 150,000 | | | | 7.191 | | | | 07/30/49 | | | | 155,951 | |
| Royal Bank of Scotland PLC(e) | |
| | 100,000 | | | | 4.875 | | | | 08/25/14 | | | | 103,192 | |
| Sparebank 1 Boligkreditt AS(e) | |
| | 200,000 | | | | 2.300 | | | | 06/30/17 | | | | 200,194 | |
| | |
| | |
| The accompanying notes are an integral part of these financial statements. | | 47 |
GOLDMAN SACHS BALANCED FUND
Schedule of Investments (continued)
April 30, 2012 (Unaudited)
| | | | | | | | | | | | | | |
Principal
Amount | | | Interest
Rate | | | Maturity
Date | | | Value | |
| | | | | | | | | | | | | | |
| Corporate Obligations – (continued) | |
| Banks – (continued) | |
| SunTrust Banks, Inc.(d) | |
| $ | 75,000 | | | | 3.600 | % | | | 04/15/16 | | | $ | 77,908 | |
| | | | | | | | | | | | | | |
| | | | | | | | | | | | | 2,440,687 | |
| | |
| Brokerage – 0.2% | |
| Merrill Lynch & Co., Inc. | |
| | 50,000 | | | | 6.400 | | | | 08/28/17 | | | | 53,928 | |
| Morgan Stanley & Co.(d) | |
| | 200,000 | | | | 6.625 | | | | 04/01/18 | | | | 209,551 | |
| | | | | | | | | | | | | | |
| | | | | | | | | | | | | 263,479 | |
| | |
| Chemicals(d) – 0.3% | |
| Ecolab, Inc. | |
| | 125,000 | | | | 3.000 | | | | 12/08/16 | | | | 131,979 | |
| | 100,000 | | | | 4.350 | | | | 12/08/21 | | | | 108,867 | |
| The Dow Chemical Co. | |
| | 175,000 | | | | 7.600 | | | | 05/15/14 | | | | 197,447 | |
| | | | | | | | | | | | | | |
| | | | | | | | | | | | | 438,293 | |
| | |
| Diversified Manufacturing(d)(e) – 0.1% | |
| Xylem, Inc. | |
| | 75,000 | | | | 3.550 | | | | 09/20/16 | | | | 78,848 | |
| | |
| Electric(d) – 0.2% | |
| Arizona Public Service Co. | |
| | 100,000 | | | | 5.800 | | | | 06/30/14 | | | | 109,430 | |
| Ipalco Enterprises, Inc. | |
| | 50,000 | | | | 5.000 | | | | 05/01/18 | | | | 49,750 | |
| PPL WEM Holdings PLC(e) | |
| | 50,000 | | | | 5.375 | | | | 05/01/21 | | | | 54,775 | |
| Puget Sound Energy, Inc.(c) | |
| | 50,000 | | | | 6.974 | | | | 06/01/67 | | | | 50,750 | |
| | | | | | | | | | | | | | |
| | | | | | | | | | | | | 264,705 | |
| | |
| Energy – 1.1% | |
| Anadarko Petroleum Corp.(d) | |
| | 125,000 | | | | 6.375 | | | | 09/15/17 | | | | 148,635 | |
| BP Capital Markets PLC | |
| | 50,000 | | | | 3.200 | | | | 03/11/16 | | | | 53,152 | |
| | 150,000 | | | | 4.500 | (d) | | | 10/01/20 | | | | 167,020 | |
| Dolphin Energy Ltd.(d)(e) | |
| | 84,290 | | | | 5.888 | | | | 06/15/19 | | | | 91,771 | |
| Gaz Capital SA for Gazprom(f) | |
| | 130,000 | | | | 9.250 | | | | 04/23/19 | | | | 161,850 | |
| Newfield Exploration Co.(d) | |
| | 50,000 | | | | 5.750 | | | | 01/30/22 | | | | 53,125 | |
| Nexen, Inc.(d) | |
| | 5,000 | | | | 6.400 | | | | 05/15/37 | | | | 5,530 | |
| | 50,000 | | | | 7.500 | | | | 07/30/39 | | | | 61,419 | |
| Petrobras International Finance Co.(d) | |
| | 80,000 | | | | 5.375 | | | | 01/27/21 | | | | 87,234 | |
| Phillips 66(d)(e) | |
| | 75,000 | | | | 4.300 | | | | 04/01/22 | | | | 78,155 | |
| Plains Exploration & Production Co.(d) | |
| | 50,000 | | | | 6.125 | | | | 06/15/19 | | | | 50,562 | |
| Range Resources Corp.(d) | |
| | 50,000 | | | | 7.500 | | | | 10/01/17 | | | | 52,250 | |
| | |
| | | | | | | | | | | | | | |
Principal
Amount | | | Interest
Rate | | | Maturity
Date | | | Value | |
| | | | | | | | | | | | | | |
| Corporate Obligations – (continued) | |
| Energy – (continued) | |
| Transocean, Inc.(d) | |
| $ | 250,000 | | | | 6.500 | % | | | 11/15/20 | | | $ | 286,715 | |
| Weatherford International Ltd.(d) | |
| | 75,000 | | | | 9.625 | | | | 03/01/19 | | | | 99,384 | |
| | | | | | | | | | | | | | |
| | | | | | | | | | | | | 1,396,802 | |
| | |
| Food & Beverage – 0.6% | |
| Anheuser-Busch InBev Worldwide, Inc.(d) | |
| | 175,000 | | | | 7.750 | | | | 01/15/19 | | | | 230,925 | |
| Kraft Foods, Inc. | |
| | 75,000 | | | | 6.500 | | | | 02/09/40 | | | | 94,061 | |
| Pernod-Ricard SA(d)(e) | |
| | 150,000 | | | | 2.950 | | | | 01/15/17 | | | | 152,512 | |
| SABMiller Holdings, Inc.(d)(e) | |
| | 100,000 | | | | 2.450 | | | | 01/15/17 | | | | 102,411 | |
| | 150,000 | | | | 3.750 | | | | 01/15/22 | | | | 156,002 | |
| | | | | | | | | | | | | | |
| | | | | | | | | | | | | 735,911 | |
| | |
| Health Care – Medical Products(d) – 0.1% | |
| Community Health Systems, Inc. | |
| | 23,000 | | | | 8.875 | | | | 07/15/15 | | | | 23,690 | |
| Life Technologies Corp. | |
| | 125,000 | | | | 5.000 | | | | 01/15/21 | | | | 138,462 | |
| | | | | | | | | | | | | | |
| | | | | | | | | | | | | 162,152 | |
| | |
| Health Care – Services(d) – 0.1% | |
| Cigna Corp. | |
| | 50,000 | | | | 2.750 | | | | 11/15/16 | | | | 51,154 | |
| Express Scripts Holding Co.(e) | |
| | 50,000 | | | | 3.900 | | | | 02/15/22 | | | | 51,575 | |
| | | | | | | | | | | | | | |
| | | | | | | | | | | | | 102,729 | |
| | |
| Life Insurance – 0.5% | |
| American International Group, Inc. | |
| | 25,000 | | | | 5.450 | | | | 05/18/17 | | | | 27,102 | |
| | 25,000 | | | | 6.400 | (d) | | | 12/15/20 | | | | 28,619 | |
| MetLife, Inc.(d) | |
| | 150,000 | | | | 4.750 | | | | 02/08/21 | | | | 165,041 | |
| Nationwide Financial Services, Inc.(d)(e) | |
| | 125,000 | | | | 5.375 | | | | 03/25/21 | | | | 130,101 | |
| Prudential Financial, Inc.(d) | |
| | 175,000 | | | | 4.500 | | | | 11/15/20 | | | | 186,270 | |
| Reinsurance Group of America, Inc.(c)(d) | |
| | 25,000 | | | | 6.750 | | | | 12/15/65 | | | | 23,125 | |
| The Northwestern Mutual Life Insurance Co.(d)(e) | |
| | 100,000 | | | | 6.063 | | | | 03/30/40 | | | | 119,148 | |
| | | | | | | | | | | | | | |
| | | | | | | | | | | | | 679,406 | |
| | |
| Media – Cable – 0.3% | |
| Comcast Holdings Corp. | |
| | 125,000 | | | | 10.625 | | | | 07/15/12 | | | | 127,414 | |
| DIRECTV Holdings LLC/DIRECTV Financing Co., Inc.(d) | |
| | 125,000 | | | | 3.500 | | | | 03/01/16 | | | | 131,824 | |
| Virgin Media Finance PLC(d) | |
| | 52,000 | | | | 9.500 | | | | 08/15/16 | | | | 58,240 | |
| | | | | | | | | | | | | | |
| | | | | | | | | | | | | 317,478 | |
| | |
| | |
| 48 | | The accompanying notes are an integral part of these financial statements. |
GOLDMAN SACHS BALANCED FUND
| | | | | | | | | | | | | | |
Principal
Amount | | | Interest
Rate | | | Maturity
Date | | | Value | |
| | | | | | | | | | | | | | |
| Corporate Obligations – (continued) | |
| Media – Non Cable(d) – 0.2% | |
| NBCUniversal Media LLC | |
| $ | 75,000 | | | | 4.375 | % | | | 04/01/21 | | | $ | 81,688 | |
| News America, Inc. | |
| | 125,000 | | | | 6.150 | | | | 02/15/41 | | | | 142,071 | |
| SGS International, Inc. | |
| | 14,000 | | | | 12.000 | | | | 12/15/13 | | | | 14,052 | |
| | | | | | | | | | | | | | |
| | | | | | | | | | | | | 237,811 | |
| | |
| Metals & Mining(d) – 0.1% | |
| Steel Dynamics, Inc. | |
| | 100,000 | | | | 7.750 | | | | 04/15/16 | | | | 103,750 | |
| | |
| Noncaptive – Financial – 0.2% | |
| Capital One Capital III(d) | |
| | 75,000 | | | | 7.686 | | | | 08/15/36 | | | | 75,750 | |
| Discover Financial Services(d)(e) | |
| | 50,000 | | | | 5.200 | | | | 04/27/22 | | | | 49,782 | |
| GE Capital Trust I(c)(d) | |
| | 74,000 | | | | 6.375 | | | | 11/15/67 | | | | 75,295 | |
| General Electric Capital Corp. | |
| | 25,000 | | | | 5.875 | | | | 01/14/38 | | | | 28,039 | |
| | | | | | | | | | | | | | |
| | | | | | | | | | | | | 228,866 | |
| | |
| Packaging(d)(e) – 0.0% | |
| Plastipak Holdings, Inc. | |
| | 25,000 | | | | 8.500 | | | | 12/15/15 | | | | 25,750 | |
| | |
| Paper(d) – 0.0% | |
| Rock-Tenn Co. | | | | | |
| | 25,000 | | | | 5.625 | | | | 03/15/13 | | | | 25,531 | |
| | |
| Pipelines – 0.5% | |
| El Paso Natural Gas Co. | |
| | 75,000 | | | | 7.500 | | | | 11/15/26 | | | | 90,165 | |
| Energy Transfer Partners LP(d) | |
| | 75,000 | | | | 5.200 | | | | 02/01/22 | | | | 79,816 | |
| Enterprise Products Operating LLC(c)(d) | |
| | 100,000 | | | | 8.375 | | | | 08/01/66 | | | | 108,500 | |
| Tennessee Gas Pipeline Co. | |
| | 50,000 | | | | 7.500 | | | | 04/01/17 | | | | 59,600 | |
| TransCanada PipeLines Ltd.(c)(d) | |
| | 100,000 | | | | 6.350 | | | | 05/15/67 | | | | 103,000 | |
| Western Gas Partners LP(d) | |
| | 125,000 | | | | 5.375 | | | | 06/01/21 | | | | 136,821 | |
| | | | | | | | | | | | | | |
| | | | | | | | | | | | | 577,902 | |
| | |
| Property/Casualty Insurance(d) – 0.4% | |
| Endurance Specialty Holdings Ltd. | |
| | 25,000 | | | | 6.150 | | | | 10/15/15 | | | | 26,817 | |
| Mitsui Sumitomo Insurance Co. Ltd.(c)(e) | |
| | 50,000 | | | | 7.000 | | | | 03/15/72 | | | | 51,372 | |
| QBE Insurance Group Ltd.(c)(e) | |
| | 225,000 | | | | 5.647 | | | | 07/01/23 | | | | 211,219 | |
| The Chubb Corp.(c) | |
| | 100,000 | | | | 6.375 | | | | 03/29/67 | | | | 102,500 | |
| Transatlantic Holdings, Inc. | |
| | 75,000 | | | | 8.000 | | | | 11/30/39 | | | | 86,587 | |
| | | | | | | | | | | | | | |
| | | | | | | | | | | | | 478,495 | |
| | |
| | | | | | | | | | | | | | |
Principal
Amount | | | Interest
Rate | | | Maturity
Date | | | Value | |
| | | | | | | | | | | | | | |
| Corporate Obligations – (continued) | |
| Real Estate Investment Trusts(d) – 0.6% | |
| DDR Corp. | |
| $ | 125,000 | | | | 7.500 | % | | | 04/01/17 | | | $ | 144,092 | |
| ERP Operating LP | |
| | 100,000 | | | | 4.625 | | | | 12/15/21 | | | | 107,290 | |
| HCP, Inc. | |
| | 75,000 | | | | 6.000 | | | | 01/30/17 | | | | 83,434 | |
| | 50,000 | | | | 5.375 | | | | 02/01/21 | | | | 54,322 | |
| Healthcare Realty Trust, Inc. | |
| | 100,000 | | | | 6.500 | | | | 01/17/17 | | | | 110,941 | |
| ProLogis(f) | |
| | 75,000 | | | | 1.875 | | | | 11/15/37 | | | | 74,719 | |
| Simon Property Group LP | |
| | 100,000 | | | | 10.350 | | | | 04/01/19 | | | | 138,646 | |
| | | | | | | | | | | | | | |
| | | | | | | | | | | | | 713,444 | |
| | |
| Schools(d) – 0.1% | |
| Rensselaer Polytechnic Institute | |
| | 150,000 | | | | 5.600 | | | | 09/01/20 | | | | 172,110 | |
| | |
| Services Cyclical – Business Services(d) – 0.1% | |
| ACCO Brands Corp. | |
| | 125,000 | | | | 10.625 | | | | 03/15/15 | | | | 136,250 | |
| | |
| Services Cyclical – Rental Equipment(d)(e) – 0.1% | |
| Ashtead Capital, Inc. | |
| | 100,000 | | | | 9.000 | | | | 08/15/16 | | | | 104,375 | |
| | |
| Technology – Hardware(d) – 0.1% | |
| Hewlett-Packard Co. | |
| | 75,000 | | | | 3.000 | | | | 09/15/16 | | | | 77,131 | |
| | 50,000 | | | | 2.600 | | | | 09/15/17 | | | | 49,993 | |
| | | | | | | | | | | | | | |
| | | | | | | | | | | | | 127,124 | |
�� | | |
| Tobacco – 0.1% | |
| Altria Group, Inc. | |
| | 75,000 | | | | 9.700 | | | | 11/10/18 | | | | 102,903 | |
| | |
| Wirelines Telecommunications(d) – 0.4% | |
| AT&T, Inc. | |
| | 200,000 | | | | 2.950 | | | | 05/15/16 | | | | 212,434 | |
| Frontier Communications Corp. | |
| | 125,000 | | | | 6.250 | | | | 01/15/13 | | | | 127,813 | |
| Verizon Communications, Inc. | |
| | 150,000 | | | | 3.500 | | | | 11/01/21 | | | | 157,345 | |
| | | | | | | | | | | | | | |
| | | | | | | | | | | | | 497,592 | |
| | |
| | TOTAL CORPORATE OBLIGATIONS | |
| | (Cost $9,916,774 ) | | | $ | 10,412,393 | |
| | |
| | | | | | | | | | | | | | |
| | Mortgage-Backed Obligations – 17.4% | |
| Collateralized Mortgage Obligations – 2.2% | |
| Adjustable Rate Non-Agency(c) – 1.1% | |
| | Countrywide Alternative Loan Trust Series 2005-31, Class 2A1 | |
| $ | 224,914 | | | | 0.539 | % | | | 08/25/35 | | | $ | 132,800 | |
| Countrywide Alternative Loan Trust Series 2005-38, Class A3 | |
| | 252,582 | | | | 0.589 | | | | 09/25/35 | | | | 148,358 | |
| | |
| | |
| The accompanying notes are an integral part of these financial statements. | | 49 |
GOLDMAN SACHS BALANCED FUND
Schedule of Investments (continued)
April 30, 2012 (Unaudited)
| | | | | | | | | | | | | | |
Principal
Amount | | | Interest
Rate | | | Maturity
Date | | | Value | |
| | | | | | | | | | | | | | |
| Mortgage-Backed Obligations – (continued) | |
| Adjustable Rate Non-Agency(c) – (continued) | |
| Countrywide Home Loan Mortgage Pass-Through Trust Series
2004-HYB6, Class A2 |
|
| $ | 18,618 | | | | 2.639 | % | | | 11/20/34 | | | $ | 14,966 | |
| JPMorgan Alternative Loan Trust Series 2005-A2, Class 1A1 | |
| | 273,572 | | | | 0.499 | | | | 01/25/36 | | | | 191,127 | |
| Merrill Lynch Alternative Note Asset Trust Series 2007-0AR3,
Class A1 |
|
| | 483,568 | | | | 0.429 | | | | 07/25/47 | | | | 248,961 | |
| Structured Adjustable Rate Mortgage Loan Trust Series 2004-06,
Class 3A2 |
|
| | 245,656 | | | | 2.556 | | | | 06/25/34 | | | | 223,740 | |
| Washington Mutual Mortgage Pass-Through Certificates Series
2005-AR11, Class A1A |
|
| | 417,425 | | | | 0.559 | | | | 08/25/45 | | | | 336,248 | |
| Wells Fargo Mortgage Backed Securities Trust Series
2005-AR16, Class 1A1 |
|
| | 150,210 | | | | 2.741 | | | | 08/25/33 | | | | 148,305 | |
| | | | | | | | | | | | | | |
| | | | | | | | | | | | | 1,444,505 | |
| | |
| Interest Only(g) – 0.0% | |
| ABN AMRO Mortgage Corp. Series 2003-8, Class A2 | |
| | 6,548 | | | | 5.500 | | | | 06/25/33 | | | | 293 | |
| CS First Boston Mortgage Securities Corp. Series 2003-19,
Class 1A2 |
|
| | 18,352 | | | | 5.250 | | | | 07/25/33 | | | | 1,608 | |
| CS First Boston Mortgage Securities Corp. Series 2003-AR18,
Class 2X(c) |
|
| | 45,733 | | | | 0.000 | | | | 07/25/33 | | | | — | |
| CS First Boston Mortgage Securities Corp. Series 2003-AR20,
Class 2X(c) |
|
| | 58,539 | | | | 0.000 | | | | 08/25/33 | | | | — | |
| Master Adjustable Rate Mortgages Trust Series 2003-2,
Class 3AX(c) |
|
| | 63,245 | | | | 0.123 | | | | 08/25/33 | | | | 261 | |
| Master Adjustable Rate Mortgages Trust Series 2003-2,
Class 4AX(c) |
|
| | 23,130 | | | | 0.320 | | | | 07/25/33 | | | | 173 | |
| | | | | | | | | | | | | | |
| | | | | | | | | | | | | 2,335 | |
| | |
| Inverse Floaters(c) – 0.1% | |
| GNMA Series 2001-48, Class SA | |
| | 12,302 | | | | 25.707 | | | | 10/16/31 | | | | 19,718 | |
| GNMA Series 2001-51, Class SA | |
| | 19,013 | | | | 31.459 | | | | 10/16/31 | | | | 32,282 | |
| GNMA Series 2001-51, Class SB | |
| | 23,860 | | | | 25.707 | | | | 10/16/31 | | | | 39,618 | |
| GNMA Series 2002-13, Class SB | |
| | 7,850 | | | | 36.446 | | | | 02/16/32 | | | | 13,616 | |
| | | | | | | | | | | | | | |
| | | | | | | | | | | | | 105,234 | |
| | |
| Regular Floater(c)(e) – 0.1% | |
| Silverstone Master Issuer Series 2012-1A, Class 2A1 | |
| | 150,000 | | | | 2.116 | | | | 01/21/55 | | | | 150,966 | |
| | |
| | | | | | | | | | | | | | |
Principal
Amount | | | Interest
Rate | | | Maturity
Date | | | Value | |
| | | | | | | | | | | | | | |
| Mortgage-Backed Obligations – (continued) | |
| Sequential Fixed Rate – 0.9% | |
| Countrywide Alternative Loan Trust Series 2007-16CB,
Class 4A7 |
|
| $ | 341,485 | | | | 6.000 | % | | | 08/25/37 | | | $ | 259,203 | |
| FHLMC Multifamily Structured Pass-Through Certificates Series
K707, Class A2 |
|
| | 100,000 | | | | 2.220 | | | | 12/25/18 | | | | 101,703 | |
| FHLMC Multifamily Structured Pass-Through Certificates Series
K703, Class A2 |
|
| | 200,000 | | | | 2.699 | | | | 05/25/18 | | | | 209,520 | |
| FHLMC Multifamily Structured Pass-Through Certificates Series
K705, Class A2 |
|
| | 100,000 | | | | 2.303 | | | | 09/25/18 | | | | 102,330 | |
| FHLMC Multifamily Structured Pass-Through Certificates Series
K706, Class A2 |
|
| | 100,000 | | | | 2.323 | | | | 10/25/18 | | | | 102,367 | |
| NCUA Guaranteed Notes Series 2010-C1, Class APT | |
| | 191,114 | | | | 2.650 | | | | 10/29/20 | | | | 199,789 | |
| NCUA Guaranteed Notes Series A4 | |
| | 100,000 | | | | 3.000 | | | | 06/12/19 | | | | 107,461 | |
| | | | | | | | | | | | | | |
| | | | | | | | | | | | | 1,082,373 | |
| | |
| TOTAL COLLATERALIZED
MORTGAGE OBLIGATIONS |
| | $ | 2,785,413 | |
| | |
| Federal Agencies – 15.2% | |
| Adjustable Rate FHLMC(c) – 0.2% | |
| $ | 274,099 | | | | 2.452 | % | | | 08/01/35 | | | $ | 289,764 | |
| | |
| Adjustable Rate FNMA(c) – 0.6% | |
| | 18,706 | | | | 2.415 | | | | 09/01/32 | | | | 19,804 | |
| | 93,103 | | | | 2.536 | | | | 12/01/33 | | | | 99,439 | |
| | 161,246 | | | | 2.691 | | | | 01/01/34 | | | | 172,081 | |
| | 287,627 | | | | 2.859 | | | | 02/01/34 | | | | 307,401 | |
| | 157,599 | | | | 2.460 | | | | 01/01/35 | | | | 168,000 | |
| | | | | | | | | | | | | | |
| | | | | | | | | | | | | 766,725 | |
| | |
| Adjustable Rate GNMA(c) – 0.5% | |
| | 12,806 | | | | 2.375 | | | | 06/20/23 | | | | 13,123 | |
| | 5,862 | | | | 1.625 | | | | 07/20/23 | | | | 6,021 | |
| | 6,200 | | | | 1.625 | | | | 08/20/23 | | | | 6,370 | |
| | 15,886 | | | | 1.625 | | | | 09/20/23 | | | | 16,322 | |
| | 4,751 | | | | 2.375 | | | | 03/20/24 | | | | 4,882 | |
| | 41,533 | | | | 2.375 | | | | 04/20/24 | | | | 42,630 | |
| | 5,098 | | | | 2.375 | | | | 05/20/24 | | | | 5,231 | |
| | 43,230 | | | | 2.375 | | | | 06/20/24 | | | | 44,451 | |
| | 11,217 | | | | 1.625 | | | | 07/20/24 | | | | 11,543 | |
| | 11,595 | | | | 2.000 | | | | 07/20/24 | | | | 12,060 | |
| | 20,536 | | | | 1.625 | | | | 08/20/24 | | | | 21,134 | |
| | 10,690 | | | | 2.000 | | | | 08/20/24 | | | | 11,122 | |
| | 9,890 | | | | 1.625 | | | | 09/20/24 | | | | 10,178 | |
| | 12,450 | | | | 2.000 | | | | 11/20/24 | | | | 12,959 | |
| | 4,804 | | | | 2.000 | | | | 12/20/24 | | | | 5,002 | |
| | 6,757 | | | | 2.500 | | | | 12/20/24 | | | | 7,152 | |
| | 8,163 | | | | 2.375 | | | | 01/20/25 | | | | 8,500 | |
| | 4,249 | | | | 2.375 | | | | 02/20/25 | | | | 4,426 | |
| | 14,948 | | | | 2.375 | | | | 05/20/25 | | | | 15,511 | |
| | 11,088 | | | | 2.000 | | | | 07/20/25 | | | | 11,560 | |
| | |
| | |
| 50 | | The accompanying notes are an integral part of these financial statements. |
GOLDMAN SACHS BALANCED FUND
| | | | | | | | | | | | | | |
Principal
Amount | | | Interest
Rate | | | Maturity
Date | | | Value | |
| | | | | | | | | | | | | | |
| Mortgage-Backed Obligations – (continued) | |
| Adjustable Rate GNMA(c) – (continued) | |
| $ | 5,676 | | | | 2.375 | % | | | 02/20/26 | | | $ | 5,854 | |
| | 298 | | | | 1.625 | | | | 07/20/26 | | | | 307 | |
| | 15,893 | | | | 2.375 | | | | 01/20/27 | | | | 16,524 | |
| | 5,785 | | | | 2.375 | | | | 02/20/27 | | | | 5,974 | |
| | 43,666 | | | | 2.375 | | | | 04/20/27 | | | | 44,975 | |
| | 4,895 | | | | 2.375 | | | | 05/20/27 | | | | 5,042 | |
| | 4,562 | | | | 2.375 | | | | 06/20/27 | | | | 4,700 | |
| | 1,766 | | | | 1.625 | | | | 11/20/27 | | | | 1,827 | |
| | 7,058 | | | | 1.625 | | | | 12/20/27 | | | | 7,300 | |
| | 14,091 | | | | 2.375 | | | | 01/20/28 | | | | 14,572 | |
| | 4,585 | | | | 2.250 | | | | 02/20/28 | | | | 4,741 | |
| | 5,081 | | | | 2.375 | | | | 03/20/28 | | | | 5,256 | |
| | 25,592 | | | | 1.625 | | | | 07/20/29 | | | | 26,534 | |
| | 10,899 | | | | 1.625 | | | | 08/20/29 | | | | 11,302 | |
| | 3,254 | | | | 1.625 | | | | 09/20/29 | | | | 3,374 | |
| | 13,645 | | | | 1.625 | | | | 10/20/29 | | | | 14,148 | |
| | 15,356 | | | | 1.625 | | | | 11/20/29 | | | | 15,923 | |
| | 3,992 | | | | 1.625 | | | | 12/20/29 | | | | 4,140 | |
| | 4,858 | | | | 2.250 | | | | 01/20/30 | | | | 5,028 | |
| | 2,650 | | | | 2.250 | | | | 02/20/30 | | | | 2,748 | |
| | 11,585 | | | | 2.250 | | | | 03/20/30 | | | | 11,993 | |
| | 15,191 | | | | 2.375 | | | | 04/20/30 | | | | 15,700 | |
| | 40,131 | | | | 2.375 | | | | 05/20/30 | | | | 41,651 | |
| | 3,584 | | | | 2.375 | | | | 06/20/30 | | | | 3,709 | |
| | 31,713 | | | | 2.000 | | | | 07/20/30 | | | | 33,382 | |
| | 5,775 | | | | 2.000 | | | | 09/20/30 | | | | 6,066 | |
| | 12,164 | | | | 1.625 | | | | 10/20/30 | | | | 12,628 | |
| | | | | | | | | | | | | | |
| | | | | | | | | | | | | 595,575 | |
| | |
| FHLMC – 2.0% | |
| | 18,366 | | | | 8.000 | | | | 07/01/15 | | | | 19,641 | |
| | 3,494 | | | | 7.000 | | | | 12/01/15 | | | | 3,611 | |
| | 24,234 | | | | 6.500 | | | | 07/01/16 | | | | 26,185 | |
| | 51,660 | | | | 7.000 | | | | 04/01/31 | | | | 59,165 | |
| | 133,696 | | | | 7.000 | | | | 07/01/32 | | | | 152,823 | |
| | 185,023 | | | | 6.500 | | | | 04/01/34 | | | | 210,781 | |
| | 353,891 | | | | 5.500 | | | | 02/01/38 | | | | 385,865 | |
| | 74,280 | | | | 5.500 | | | | 04/01/38 | | | | 80,991 | |
| | 412,061 | | | | 5.500 | | | | 08/01/38 | | | | 448,204 | |
| | 1,000,000 | | | | 4.000 | | | | TBA-30yr | (h) | | | 1,054,922 | |
| | | | | | | | | | | | | | |
| | | | | | | | | | | | | 2,442,188 | |
| | |
| FNMA – 11.9% | |
| | 97,939 | | | | 2.800 | | | | 03/01/18 | | | | 102,907 | |
| | 395,198 | | | | 3.740 | | | | 05/01/18 | | | | 434,471 | |
| | 110,000 | | | | 3.840 | | | | 05/01/18 | | | | 120,642 | |
| | 300,000 | | | | 4.506 | | | | 06/01/19 | | | | 337,776 | |
| | 98,358 | | | | 3.416 | | | | 10/01/20 | | | | 105,483 | |
| | 98,408 | | | | 3.632 | | | | 12/01/20 | | | | 106,769 | |
| | 295,463 | | | | 3.763 | | | | 12/01/20 | | | | 322,588 | |
| | 98,577 | | | | 5.500 | | | | 09/01/23 | | | | 108,179 | |
| | 46,378 | | | | 5.500 | | | | 10/01/23 | | | | 50,965 | |
| | 409,923 | | | | 5.500 | | | | 05/01/25 | | | | 447,700 | |
| | 24,555 | | | | 7.000 | | | | 11/01/30 | | | | 27,488 | |
| | 47,837 | | | | 7.500 | | | | 03/01/31 | | | | 55,195 | |
| | 187,830 | | | | 4.000 | | | | 10/01/31 | | | | 201,209 | |
| | |
| | | | | | | | | | | | | | |
Principal
Amount | | | Interest
Rate | | | Maturity
Date | | | Value | |
| | | | | | | | | | | | | | |
| Mortgage-Backed Obligations – (continued) | |
| FNMA – (continued) | |
| $ | 48,607 | | | | 4.500 | % | | | 09/01/33 | | | $ | 52,019 | |
| | 129,015 | | | | 6.000 | | | | 11/01/35 | | | | 144,256 | |
| | 330,665 | | | | 5.000 | | | | 01/01/39 | | | | 362,465 | |
| | 37,738 | | | | 4.500 | | | | 04/01/39 | | | | 41,068 | |
| | 212,160 | | | | 4.500 | | | | 11/01/39 | | | | 226,931 | |
| | 2,000,001 | | | | 4.500 | | | | 05/01/40 | | | | 2,142,596 | |
| | 208,615 | | | | 4.500 | | | | 09/01/40 | | | | 223,489 | |
| | 111,913 | | | | 5.000 | | | | 02/01/41 | | | | 122,222 | |
| | 2,152,102 | | | | 4.500 | | | | 04/01/41 | | | | 2,309,242 | |
| | 94,532 | | | | 5.000 | | | | 05/01/41 | | | | 102,745 | |
| | 643,939 | | | | 5.000 | | | | 10/01/41 | | | | 702,446 | |
| | 847,900 | | | | 4.500 | | | | 11/01/41 | | | | 909,811 | |
| | 3,000,000 | | | | 3.500 | | | | TBA-30yr | (h) | | | 3,115,312 | |
| | 2,000,000 | | | | 4.000 | | | | TBA-30yr | (h) | | | 2,115,625 | |
| | | | | | | | | | | | | | |
| | | | | | | | | | | | | 14,991,599 | |
| | |
| | TOTAL FEDERAL AGENCIES | | | $ | 19,085,851 | |
| | |
| | TOTAL MORTGAGE-BACKED OBLIGATIONS | |
| | (Cost $21,600,162) | | | $ | 21,871,264 | |
| | |
| | | | | | | | | | | | | | |
| | Agency Debentures – 1.2% | |
| FHLMC | |
| $ | 100,000 | | | | 0.500 | % | | | 10/15/13 | | | $ | 100,249 | |
| EUR | 100,000 | | | | 4.375 | | | | 01/15/14 | | | | 139,131 | |
| $ | 300,000 | | | | 1.000 | | | | 03/08/17 | | | | 299,772 | |
| | 400,000 | | | | 2.375 | | | | 01/13/22 | | | | 402,377 | |
| FNMA(c) | |
| | 500,000 | | | | 0.405 | | | | 05/17/13 | | | | 500,670 | |
| Tennessee Valley Authority(b) | |
| | 100,000 | | | | 5.375 | | | | 04/01/56 | | | | 128,869 | |
| | |
| | TOTAL AGENCY DEBENTURES | | | | | |
| | (Cost $1,530,675) | | | $ | 1,571,068 | |
| | |
| | | | | | | | | | | | | | |
| | Asset-Backed Securities – 3.0% | |
| Collateralized Loan Obligations(c) – 2.2% | |
| Black Diamond CLO Ltd. Series 2005-1A, Class A1A(e) | |
| $ | 293,507 | | | | 0.724 | % | | | 06/20/17 | | | $ | 287,808 | |
| Greywolf CLO Ltd. Series 2007-1A, Class A(e) | |
| | 490,916 | | | | 0.738 | | | | 02/18/21 | | | | 456,927 | |
| Jasper CLO Ltd. Series 2005-1A, Class A(e) | |
| | 467,715 | | | | 0.736 | | | | 08/01/17 | | | | 440,519 | |
| KKR Financial CLO Ltd. Series 2007-1A, Class A(e) | |
| | 841,287 | | | | 0.853 | | | | 05/15/21 | | | | 796,335 | |
| Westchester CLO Ltd. Series 2007-1X, Class A1A | |
| | 826,089 | | | | 0.691 | | | | 08/01/22 | | | | 757,471 | |
| | | | | | | | | | | | | | |
| | | | | | | | | | | | | 2,739,060 | |
| | |
| | |
| The accompanying notes are an integral part of these financial statements. | | 51 |
GOLDMAN SACHS BALANCED FUND
Schedule of Investments (continued)
April 30, 2012 (Unaudited)
| | | | | | | | | | | | | | |
Principal
Amount | | | Interest
Rate | | | Maturity
Date | | | Value | |
| | | | | | | | | | | | | | |
| | Asset-Backed Securities – (continued) | |
| Home Equity – 0.3% | |
| CIT Mortgage Loan Trust Series 2007-1, Class 2A1(c)(e) | |
| $ | 26,358 | | | | 1.239 | % | | | 10/25/37 | | | $ | 26,388 | |
| CIT Mortgage Loan Trust Series 2007-1, Class 2A2(c)(e) | |
| | 120,000 | | | | 1.489 | | | | 10/25/37 | | | | 95,542 | |
| CIT Mortgage Loan Trust Series 2007-1, Class 2A3(c)(e) | |
| | 210,000 | | | | 1.689 | | | | 10/25/37 | | | | 93,300 | |
| Countrywide Home Equity Loan Trust Series 2003-D, Class A(c) | |
| | 50,288 | | | | 0.500 | | | | 06/15/29 | | | | 45,862 | |
| Countrywide Home Equity Loan Trust Series 2004-N, Class 2A(c) | |
| | 125,197 | | | | 0.520 | | | | 02/15/34 | | | | 74,678 | |
| GMAC Mortgage Corp. Loan Trust Series 2007-HE3, Class 1A1 | |
| | 37,650 | | | | 7.000 | | | | 09/25/37 | | | | 29,540 | |
| GMAC Mortgage Corp. Loan Trust Series 2007-HE3, Class 2A1 | |
| | 50,900 | | | | 7.000 | | | | 09/25/37 | | | | 37,233 | |
| | | | | | | | | | | | | | |
| | | | | | | | | | | | | 402,543 | |
| | |
| Manufactured Housing – 0.1% | |
| Mid-State Trust Series 4, Class A | |
| | 82,824 | | | | 8.330 | | | | 04/01/30 | | | | 83,297 | |
| | |
| Student Loan(c) – 0.4% | |
| Brazos Higher Education Authority, Inc. Series 2011-2, Class A2 | |
| | 300,000 | | | | 1.316 | | | | 07/25/29 | | | | 297,528 | |
| Knowledgeworks Foundation Student Loan Series 2010-1,
Class A |
|
| | 264,691 | | | | 1.441 | | | | 02/25/42 | | | | 259,827 | |
| | | | | | | | | | | | | | |
| | | | | | | | | | | | | 557,355 | |
| | |
| | TOTAL ASSET-BACKED SECURITIES | |
| | (Cost $3,918,469) | | | $ | 3,782,255 | |
| | |
| | | | | | | | | | | | | | |
| | Foreign Debt Obligations – 1.4% | |
| Sovereign – 1.2% | |
| Hellenic Republic Government Bond(i) | |
| EUR | 10,000 | | | | 2.000 | % | | | 02/24/32 | | | $ | 2,554 | |
| | 20,000 | | | | 2.000 | | | | 02/24/35 | | | | 5,075 | |
| | 10,000 | | | | 2.000 | | | | 02/24/37 | | | | 2,535 | |
| | 10,000 | | | | 2.000 | | | | 02/24/38 | | | | 2,537 | |
| | 10,000 | | | | 2.000 | | | | 02/24/40 | | | | 2,518 | |
| | 20,000 | | | | 2.000 | | | | 02/24/41 | | | | 5,038 | |
| | 10,000 | | | | 2.000 | | | | 02/24/42 | | | | 2,515 | |
| Mexican Bonos | |
| MXN | 3,100,100 | | | | 7.750 | | | | 11/13/42 | | | | 246,843 | |
| Mexico Cetes(j) | |
| | 2,604,000 | | | | 0.000 | | | | 06/14/12 | | | | 198,904 | |
| | 2,379,300 | | | | 0.000 | | | | 10/18/12 | | | | 178,910 | |
| Republic of Colombia | |
| $ | 100,000 | | | | 6.125 | | | | 01/18/41 | | | | 126,250 | |
| Republic of Indonesia | |
| | 100,000 | | | | 8.500 | | | | 10/12/35 | | | | 145,500 | |
| Republic of South Africa | |
| ZAR | 1,115,000 | | | | 6.750 | | | | 03/31/21 | | | | 135,150 | |
| | 780,000 | | | | 10.500 | | | | 12/21/26 | | | | 120,109 | |
| | |
| | | | | | | | | | | | | | |
Principal
Amount | | | Interest
Rate | | | Maturity
Date | | | Value | |
| | | | | | | | | | | | | | |
| | Foreign Debt Obligations – (continued) | |
| Sovereign – (continued) | |
| Republic of Venezuela | |
| $ | 370,000 | | | | 11.950 | % | | | 08/05/31 | | | $ | 371,850 | |
| | | | | | | | | | | | | | |
| | | | | | | | | | | | | 1,546,288 | |
| | |
| Supranational – 0.2% | |
| North American Development Bank | |
| | 200,000 | | | | 4.375 | | | | 02/11/20 | | | | 223,109 | |
| | |
| | TOTAL FOREIGN DEBT OBLIGATIONS | |
| | (Cost $1,763,058) | | | | | | | | | | | $ | 1,769,397 | |
| | |
| | | | | | | | | | | | | | |
| | Government Guarantee Obligations – 0.3% | |
| Danske Bank AS(e)(k) | |
| $ | 100,000 | | | | 2.500 | % | | | 05/10/12 | | | $ | 100,034 | |
| Israel Government AID Bond(l) | |
| | 200,000 | | | | 5.500 | | | | 09/18/23 | | | | 256,214 | |
| | |
| TOTAL GOVERNMENT GUARANTEE
OBLIGATIONS – 0.3% |
|
| | (Cost $351,003) | | | | | | | | | | | $ | 356,248 | |
| | |
| | | | | | | | | | | | | | |
| | Municipal Debt Obligations – 0.2% | |
| California – 0.2% | |
| California State GO Bonds Build America Taxable Series 2009 | |
| $ | 75,000 | | | | 7.500 | % | | | 04/01/34 | | | $ | 96,041 | |
| California State GO Bonds Build America Taxable Series 2010 | |
| | 80,000 | | | | 7.950 | | | | 03/01/36 | | | | 94,136 | |
| | | | | | | | | | | | | | |
| | | | | | | | | | | | | 190,177 | |
| | |
| | Illinois – 0.0% | | | | | | | | | | | | | |
| Illinois State GO Bonds Build America Series 2010 | |
| | 50,000 | | | | 7.350 | | | | 07/01/35 | | | | 57,107 | |
| | |
| | TOTAL MUNICIPAL DEBT OBLIGATIONS | |
| | (Cost $204,131) | | | | | | | | | | | $ | 247,284 | |
| | |
| | | | | | | | | | | | | | |
| | Structured Note(c) – 0.3% | |
| Notas do Tesouro Nacional Series B (Issuer HSBC Corp.) | |
| BRL | 620,680 | | | | 6.000 | % | | | 08/15/40 | | | $ | 391,441 | |
| | (Cost $372,941) | | | | | | | | | | | | | |
| | |
| | | | | | | | | | | | | | |
| | U.S. Treasury Obligations – 9.1% | |
| United States Treasury Bonds | |
| $ | 500,000 | | | | 4.750 | % | | | 02/15/41 | | | $ | 664,410 | |
| United States Treasury Inflation Protected Securities | |
| | 215,390 | | | | 0.625 | | | | 04/15/13 | | | | 219,663 | |
| | 117,027 | | | | 1.875 | | | | 07/15/15 | | | | 130,358 | |
| United States Treasury Notes | |
| | 100,000 | | | | 0.375 | | | | 07/31/13 | | | | 100,184 | |
| | 1,900,000 | | | | 0.250 | | | | 10/31/13 | | | | 1,900,380 | |
| | 4,600,000 | | | | 0.125 | | | | 12/31/13 | | | | 4,590,524 | |
| | 1,300,000 | | | | 0.625 | (b) | | | 07/15/14 | | | | 1,309,490 | |
| | |
| | |
| 52 | | The accompanying notes are an integral part of these financial statements. |
GOLDMAN SACHS BALANCED FUND
| | | | | | | | | | | | | | |
Principal
Amount | | | Interest
Rate | | | Maturity
Date | | | Value | |
| | | | | | | | | | | | | | |
| | U.S. Treasury Obligations – (continued) | |
| United States Treasury Notes – (continued) | |
| $ | 200,000 | | | | 0.375 | % | | | 11/15/14 | | | $ | 200,196 | |
| | 100,000 | | | | 0.250 | | | | 12/15/14 | | | | 99,756 | |
| | 200,000 | | | | 0.250 | | | | 01/15/15 | | | | 199,454 | |
| | 1,100,000 | | | | 0.250 | | | | 02/15/15 | | | | 1,096,315 | |
| | 300,000 | | | | 0.875 | | | | 04/30/17 | | | | 300,915 | |
| | 600,000 | | | | 1.250 | | | | 04/30/19 | | | | 597,186 | |
| | |
| | TOTAL U.S. TREASURY OBLIGATIONS | |
| | (Cost $11,422,280) | | | $ | 11,408,831 | |
| | |
| | | | | | | | | | | | | | |
| | Short-term Investment(m) – 1.0% | |
| Repurchase Agreement – 1.0% | |
| Joint Repurchase Agreement Account II | |
| $ | 1,300,000 | | | | 0.211 | % | | | 05/01/12 | | | $ | 1,300,000 | |
| | (Cost $1,300,000) | |
| | |
| TOTAL INVESTMENTS BEFORE SECURITIES
LENDING REINVESTMENT VEHICLE |
|
| | (Cost $114,963,528) | | | $ | 126,738,343 | |
| | |
| | | | | | | | |
| Shares | | | Rate | | Value | |
| | Securities Lending Reinvestment Vehicle(c)(n) – 1.4% | |
| Financial Square Money Market Fund | |
| | 1,746,775 | | | 0.182% | | $ | 1,746,775 | |
| | (Cost $1,746,775) | |
| | |
| | TOTAL INVESTMENTS – 102.1% | |
| | (Cost $116,710,303) | | $ | 128,485,118 | |
| | |
| LIABILITIES IN EXCESS OF
OTHER ASSETS – (2.1)% | | | (2,599,051 | ) |
| | |
| | NET ASSETS – 100.0% | | $ | 125,886,067 | |
| | |
| | |
| The percentage shown for each investment category reflects the value of investments in that category as a percentage of net assets. |
* | | Non-income producing security. |
(a) | | All or a portion of security is on loan. |
(b) | | All or a portion of security is segregated as collateral for initial margin requirements on futures transactions. |
(c) | | Variable rate security. Interest rate disclosed is that which is in effect at April 30, 2012. |
(d) | | Security with “Call” features with resetting interest rates. Maturity dates disclosed are the final maturity dates. |
(e) | | Exempt from registration under Rule 144A of the Securities Act of 1933. Under procedures approved by the Board of Trustees, such securities have been determined to be liquid by the investment adviser and may be resold, normally to qualified institutional buyers in transactions exempt from registration. Total market value of Rule 144A securities amounts to $4,764,954, which represents approximately 3.8% of net assets as of April 30, 2012. |
(f) | | Security with “Put” features with resetting interest rates. Maturity dates disclosed are the final maturity dates. |
| | |
(g) | | Security with a notional or nominal principal amount. The actual effective yield of this security is different than the stated interest rate. |
(h) | | TBA (To Be Announced) Securities are purchased on a forward commitment basis with an approximate principal amount and no defined maturity date. The actual principal and maturity date will be determined upon settlement when the specific mortgage pools are assigned. Total market value of TBA securities (excluding forward sales contracts, if any) amounts to $6,285,859 which represents approximately 5.0% of net assets as of April 30, 2012. |
(i) | | Coupon increases periodically based upon a predetermined schedule. Stated interest rate in effect at April 30, 2012. |
(j) | | Issued with zero coupon and interest rate is contingent upon LIBOR reaching a predetermined level. |
(k) | | Guaranteed by a foreign government until maturity. |
(l) | | Guaranteed by the United States Government until maturity. |
(m) | | Joint repurchase agreement was entered into on April 30, 2012. Additional information appears on page 85. |
(n) | | Represents an affiliated issuer. |
| | |
|
Currency Abbreviations: |
BRL | | —Brazilian Real |
EUR | | —Euro |
GBP | | —British Pound |
MXN | | —Mexican Peso |
ZAR | | —South African Rand |
| | |
Investment Abbreviations: |
CLO | | —Collateralized Loan Obligation |
FHLMC | | —Federal Home Loan Mortgage Corp. |
FNMA | | —Federal National Mortgage Association |
GNMA | | —Government National Mortgage Association |
GO | | —General Obligation |
LIBOR | | —London Interbank Offered Rate |
NCUA | | —National Credit Union Administration |
|
| | |
| The accompanying notes are an integral part of these financial statements. | | 53 |
GOLDMAN SACHS BALANCED FUND
Schedule of Investments (continued)
April 30, 2012 (Unaudited)
|
| ADDITIONAL INVESTMENT INFORMATION |
FORWARD FOREIGN CURRENCY EXCHANGE CONTRACTS — At April 30, 2012, the Fund had the following forward foreign currency exchange contracts:
FORWARD FOREIGN CURRENCY EXCHANGE CONTRACTS WITH UNREALIZED GAIN
| | | | | | | | | | | | |
| Counterparty | | Contracts to
Buy/Sell | | Settlement
Date | | Current
Value | | | Unrealized
Gain | |
Barclays Bank PLC | | USD/EUR | | 05/11/12 | | $ | 166,664 | | | $ | 598 | |
Citibank NA | | USD/BRL | | 07/18/12 | | | 364,339 | | | | 14,897 | |
| TOTAL | | | | | | | | | | $ | 15,495 | |
FORWARD FOREIGN CURRENCY EXCHANGE CONTRACTS WITH UNREALIZED LOSS
| | | | | | | | | | | | |
| Counterparty | | Contracts to
Buy/Sell | | Settlement
Date | | Current
Value | | | Unrealized
Loss | |
Royal Bank of Canada | | USD/MXN | | 05/25/12 | | $ | 249,814 | | | $ | (3,796 | ) |
UBS AG (London) | | USD/ZAR | | 06/08/12 | | | 230,710 | | | | (1,943 | ) |
Westpac Banking Corp. | | USD/GBP | | 05/31/12 | | | 163,323 | | | | (980 | ) |
| TOTAL | | | | | | | | | | $ | (6,719 | ) |
FORWARD SALES CONTRACT — At April 30, 2012, the Fund had the following forward sales contract:
| | | | | | | | | | | | | | |
| Description | | Interest
Rate | | Maturity
Date(h) | | Settlement
Date | | Principal
Amount | | | Value | |
FNMA (Proceeds Receivable: $4,222,331) | | 4.500% | | TBA - 30yr | | 05/14/12 | | $ | (4,000,000 | ) | | $ | (4,282,812 | ) |
FUTURES CONTRACTS — At April 30, 2012, the Fund had the following futures contracts:
| | | | | | | | | | | | | | |
| Type | | Number of
Contracts
Long (Short) | | | Expiration
Date | | Current
Value | | | Unrealized
Gain (Loss) | |
Eurodollars | | | (4 | ) | | March 2013 | | $ | (994,700 | ) | | $ | (10,510 | ) |
Eurodollars | | | 12 | | | March 2014 | | | 2,979,150 | | | | 3,754 | |
Eurodollars | | | 14 | | | June 2014 | | | 3,472,350 | | | | 12,632 | |
Eurodollars | | | 35 | | | September 2014 | | | 8,670,813 | | | | 17,529 | |
Eurodollars | | | (12 | ) | | March 2015 | | | (2,963,850 | ) | | | (4,407 | ) |
Eurodollars | | | (35 | ) | | September 2015 | | | (8,615,250 | ) | | | (22,923 | ) |
Eurodollars | | | (14 | ) | | December 2015 | | | (3,440,150 | ) | | | (19,631 | ) |
S&P 500 E-Mini Index | | | 40 | | | June 2012 | | | 2,787,200 | | | | 7,174 | |
Ultra Long U.S. Treasury Bonds | | | 14 | | | June 2012 | | | 2,209,375 | | | | 16,685 | |
10 Year German Euro-Bund | | | 8 | | | June 2012 | | | 1,494,087 | | | | 25,136 | |
5 Year U.S. Treasury Notes | | | 42 | | | June 2012 | | | 5,199,469 | | | | 43,381 | |
10 Year U.S. Treasury Notes | | | 41 | | | June 2012 | | | 5,423,531 | | | | 77,607 | |
30 Year U.S. Treasury Bonds | | | (1 | ) | | June 2012 | | | (142,875 | ) | | | (654 | ) |
| TOTAL | | | | | | | | | | | | $ | 145,773 | |
| | |
| 54 | | The accompanying notes are an integral part of these financial statements. |
GOLDMAN SACHS BALANCED FUND
|
| ADDITIONAL INVESTMENT INFORMATION (continued) |
SWAP CONTRACTS — At April 30, 2012, the Fund had the following swap contracts:
INTEREST RATE SWAP CONTRACTS
| | | | | | | | | | | | | | | | | | |
| | | Rates Exchanged | | Market Value | |
| Counterparty | | Notional
Amount
(000s)(a) | | | Termination
Date | | Payments
Received | | Payments
Made | | Upfront
Payments
Made (Received) | | | Unrealized
Gain (Loss) | |
Deutsche Bank Securities, Inc. | | $ | 1,300 | | | 06/20/19 | | 3 month LIBOR | | 2.000% | | | $(17,383) | | | $ | (17,001 | ) |
JPMorgan Securities, Inc. | | | 500 | | | 06/20/17 | | 3 month LIBOR | | 1.750 | | | (7,199 | ) | | | (7,497 | ) |
| | | 200 | | | 06/20/27 | | 2.750% | | 3 month LIBOR | | | 3,581 | | | | 2,225 | |
| | | | 100 | | | 06/20/42 | | 3 month LIBOR | | 2.750 | | | (909 | ) | | | 2,644 | |
| TOTAL | | | | | | | | | | | | $ | (21,910 | ) | | $ | (19,629 | ) |
| | (a) | | Represents forward starting interest rate swaps whose effective dates of commencement of accruals and cash flows occur subsequent to April 30, 2012. |
CREDIT DEFAULT SWAP CONTRACTS
| | | | | | | | | | | | | | | | | | | | | | | | | | |
| | | | Market Value | |
| Counterparty | | Referenced
Obligation | | Notional
Amount
(000s) | | | Rates
Received
(Paid) | | | Termination
Date | | | Credit
Spread at
April 30,
2012(b) | | | Upfront
Payments
Made (Received) | | | Unrealized
Gain (Loss) | |
Protection Purchased: | |
Bank of America Securities LLC | | CDX North America Investment Grade Index 16 | | $ | 200 | | | | (1.000 | )% | | | 06/20/14 | | | | 0.499 | % | | $ | (1,572 | ) | | $ | (804 | ) |
Barclays Bank PLC | | iTraxx SovX Western Europe Index 6 | | | 70 | | | | (1.000 | ) | | | 12/20/16 | | | | 2.275 | | | | 6,771 | | | | (3,071 | ) |
Credit Suisse International (London) | | iTraxx SovX Western Europe Index 6 | | | 40 | | | | (1.000 | ) | | | 12/20/16 | | | | 2.275 | | | | 3,863 | | | | (1,749 | ) |
Deutsche Bank Securities, Inc. | | iTraxx SovX Western Europe Index 6 | | | 120 | | | | (1.000 | ) | | | 12/20/16 | | | | 2.275 | | | | 12,766 | | | | (6,423 | ) |
JPMorgan Securities, Inc. | | CDX North America
Investment Grade Index 16 | | | 1,700 | | | | (1.000 | ) | | | 06/20/14 | | | | 0.499 | | | | (14,955 | ) | | | (5,234 | ) |
Morgan Stanley & Co. | | CDX North America
Investment Grade Index 16 | | | 400 | | | | (1.000 | ) | | | 06/20/14 | | | | 0.499 | | | | (2,930 | ) | | | (1,821 | ) |
Protection Sold: | |
Bank of America Securities LLC | | CDX North America Investment Grade Index 16 | | | 700 | | | | 1.000 | | | | 06/20/16 | | | | 0.854 | | | | 827 | | | | 4,102 | |
Morgan Stanley & Co. | | CDX North America
Investment Grade Index 16 | | | 800 | | | | 1.000 | | | | 06/20/16 | | | | 0.854 | | | | 903 | | | | 4,730 | |
| TOTAL | | | $ | 5,673 | | | $ | (10,270 | ) |
| | (b) | | Credit spread on the Referenced Obligation, together with the term of the swap contract, are indicators of payment/performance risk. The likelihood of a credit event occurring which would require a fund to make a payment or otherwise be required to perform under the swap contract is generally greater as the credit spread and the term of the swap contract increase. |
| | |
| The accompanying notes are an integral part of these financial statements. | | 55 |
GOLDMAN SACHS BALANCED FUND
Schedule of Investments (continued)
April 30, 2012 (Unaudited)
|
| ADDITIONAL INVESTMENT INFORMATION (continued) |
WRITTEN OPTIONS CONTRACTS — For the six months ended April 30, 2012, the Fund had the following written swaptions activity:
| | | | | | | | | | | | |
| | | Notional
Amount | | | Premiums
Received | |
Contracts Outstanding October 31, 2011 | | $ | — | | | $ | — | |
Contracts Written | | | 45 | | | | 11,149 | |
Contracts Bought to Close | | | (45 | ) | | | (11,149 | ) |
Contracts Expired | | | — | | | | — | |
Contracts Outstanding April 30, 2012 | | $ | — | | | $ | — | |
| | |
| 56 | | The accompanying notes are an integral part of these financial statements. |
GOLDMAN SACHS STRUCTURED LARGE CAP GROWTH FUND
Schedule of Investments
April 30, 2012 (Unaudited)
| | | | | | | | |
Shares | | | Description | | Value | |
| | | | | | | | |
| | Common Stocks – 98.0% | |
| Aerospace & Defense – 2.5% | |
| | 29,559 | | | Alliant Techsystems, Inc. | | $ | 1,575,495 | |
| | 58,518 | | | BE Aerospace, Inc.* | | | 2,752,101 | |
| | 1,975 | | | Goodrich Corp. | | | 247,783 | |
| | 66,061 | | | Northrop Grumman Corp. | | | 4,180,340 | |
| | 58,200 | | | The Boeing Co. | | | 4,469,760 | |
| | 31,162 | | | United Technologies Corp. | | | 2,544,066 | |
| | | | | | | | |
| | | | | | | 15,769,545 | |
| | |
| Air Freight & Logistics – 1.8% | |
| | 75,842 | | | FedEx Corp. | | | 6,692,298 | |
| | 59,613 | | | United Parcel Service, Inc. Class B | | | 4,658,160 | |
| | | | | | | | |
| | | | | | | 11,350,458 | |
| | |
| Automobiles – 0.3% | |
| | 53,426 | | | General Motors Co.* | | | 1,228,798 | |
| | 28,736 | | | Thor Industries, Inc. | | | 972,139 | |
| | | | | | | | |
| | | | | | | 2,200,937 | |
| | |
| Beverages – 3.3% | |
| | 13,634 | | | Beam, Inc. | | | 774,139 | |
| | 11,641 | | | Brown-Forman Corp. Class B | | | 1,005,200 | |
| | 8,687 | | | Coca-Cola Enterprises, Inc. | | | 261,652 | |
| | 75,822 | | | Constellation Brands, Inc. Class A* | | | 1,637,755 | |
| | 29,223 | | | Dr. Pepper Snapple Group, Inc. | | | 1,185,869 | |
| | 69,979 | | | Molson Coors Brewing Co. Class B | | | 2,909,727 | |
| | 42,117 | | | Monster Beverage Corp.* | | | 2,735,920 | |
| | 87,742 | | | PepsiCo., Inc. | | | 5,790,972 | |
| | 67,392 | | | The Coca-Cola Co. | | | 5,143,358 | |
| | | | | | | | |
| | | | | | | 21,444,592 | |
| | |
| Biotechnology – 4.7% | |
| | 32,928 | | | Alexion Pharmaceuticals, Inc.* | | | 2,974,057 | |
| | 102,945 | | | Amgen, Inc. | | | 7,320,419 | |
| | 68,249 | | | Biogen Idec, Inc.* | | | 9,146,048 | |
| | 184,851 | | | Gilead Sciences, Inc.* | | | 9,614,101 | |
| | 25,533 | | | United Therapeutics Corp.* | | | 1,117,069 | |
| | | | | | | | |
| | | | | | | 30,171,694 | |
| | |
| Building Products* – 0.1% | |
| | 26,935 | | | Fortune Brands Home & Security, Inc. | | | 612,502 | |
| | |
| Capital Markets – 0.6% | |
| | 5,417 | | | Greenhill & Co., Inc. | | | 210,450 | |
| | 7,245 | | | Raymond James Financial, Inc. | | | 265,312 | |
| | 77,768 | | | SEI Investments Co. | | | 1,570,136 | |
| | 3,752 | | | T. Rowe Price Group, Inc. | | | 236,808 | |
| | 75,057 | | | The Bank of New York Mellon Corp. | | | 1,775,098 | |
| | | | | | | | |
| | | | | | | 4,057,804 | |
| | |
| Chemicals – 1.9% | |
| | 58,241 | | | Airgas, Inc. | | | 5,337,205 | |
| | 3,857 | | | CF Industries Holdings, Inc. | | | 744,632 | |
| | 61,917 | | | Eastman Chemical Co. | | | 3,341,660 | |
| | |
| | | | | | | | |
Shares | | | Description | | Value | |
| | | | | | | | |
| | Common Stocks – (continued) | |
| Chemicals – (continued) | |
| | 150,223 | | | Huntsman Corp. | | $ | 2,127,158 | |
| | 4,950 | | | Westlake Chemical Corp. | | | 316,553 | |
| | | | | | | | |
| | | | | | | 11,867,208 | |
| | |
| Commercial Banks – 0.0% | |
| | 4,173 | | | PNC Financial Services Group, Inc. | | | 276,753 | |
| | |
| Commercial Services & Supplies* – 0.1% | |
| | 32,620 | | | Copart, Inc. | | | 861,494 | |
| | |
| Communications Equipment – 2.9% | |
| | 382,045 | | | Cisco Systems, Inc. | | | 7,698,207 | |
| | 36,832 | | | Juniper Networks, Inc.* | | | 789,310 | |
| | 142,542 | | | QUALCOMM, Inc. | | | 9,099,881 | |
| | 15,275 | | | Riverbed Technology, Inc.* | | | 301,376 | |
| | 203,216 | | | Tellabs, Inc. | | | 766,124 | |
| | | | | | | | |
| | | | | | | 18,654,898 | |
| | |
| Computers & Peripherals – 10.7% | |
| | 82,852 | | | Apple, Inc.* | | | 48,405,452 | |
| | 360,614 | | | Dell, Inc.* | | | 5,903,251 | |
| | 116,709 | | | NetApp, Inc.* | | | 4,531,810 | |
| | 16,914 | | | QLogic Corp.* | | | 291,767 | |
| | 61,968 | | | Seagate Technology PLC | | | 1,906,136 | |
| | 192,776 | | | Western Digital Corp.* | | | 7,481,637 | |
| | | | | | | | |
| | | | | | | 68,520,053 | |
| | |
| Consumer Finance – 0.4% | |
| | 51,516 | | | Capital One Financial Corp. | | | 2,858,108 | |
| | |
| Diversified Consumer Services(a) – 0.3% | |
| | 26,635 | | | Weight Watchers International, Inc. | | | 2,023,195 | |
| | |
| Diversified Financial Services – 0.9% | |
| | 96,884 | | | Citigroup, Inc. | | | 3,201,047 | |
| | 66,210 | | | JPMorgan Chase & Co. | | | 2,845,706 | |
| | | | | | | | |
| | | | | | | 6,046,753 | |
| | |
| Diversified Telecommunication Services – 0.0% | |
| | 8,432 | | | AT&T, Inc. | | | 277,497 | |
| | |
| Electrical Equipment – 0.4% | |
| | 53,130 | | | Emerson Electric Co. | | | 2,791,450 | |
| | |
| Electronic Equipment, Instruments & Components* – 1.1% | |
| | 294,908 | | | Ingram Micro, Inc. Class A | | | 5,738,910 | |
| | 133,186 | | | Vishay Intertechnology, Inc. | | | 1,494,347 | |
| | | | | | | | |
| | | | | | | 7,233,257 | |
| | |
| Energy Equipment & Services – 0.1% | |
| | 8,887 | | | Schlumberger Ltd. | | | 658,882 | |
| | |
| Food & Staples Retailing – 2.4% | |
| | 171,258 | | | CVS Caremark Corp. | | | 7,641,532 | |
| | 211,284 | | | Walgreen Co. | | | 7,407,617 | |
| | | | | | | | |
| | | | | | | 15,049,149 | |
| | |
| | |
| The accompanying notes are an integral part of these financial statements. | | 57 |
GOLDMAN SACHS STRUCTURED LARGE CAP GROWTH FUND
Schedule of Investments (continued)
April 30, 2012 (Unaudited)
| | | | | | | | |
Shares | | | Description | | Value | |
| | | | | | | | |
| | Common Stocks – (continued) | |
| Food Products – 3.9% | |
| | 250,134 | | | Archer-Daniels-Midland Co. | | $ | 7,711,631 | |
| | 120,187 | | | Bunge Ltd. | | | 7,752,061 | |
| | 8,429 | | | ConAgra Foods, Inc. | | | 217,637 | |
| | 86,870 | | | Dean Foods Co.* | | | 1,066,764 | |
| | 22,400 | | | Hormel Foods Corp. | | | 650,944 | |
| | 54,045 | | | Smithfield Foods, Inc.* | | | 1,132,783 | |
| | 349,898 | | | Tyson Foods, Inc. Class A | | | 6,385,639 | |
| | | | | | | | |
| | | | | | | 24,917,459 | |
| | |
| Health Care Equipment & Supplies – 1.2% | |
| | 467,767 | | | Boston Scientific Corp.* | | | 2,928,221 | |
| | 56,049 | | | CareFusion Corp.* | | | 1,452,229 | |
| | 43,595 | | | DENTSPLY International, Inc. | | | 1,790,011 | |
| | 19,428 | | | Hill-Rom Holdings, Inc. | | | 630,439 | |
| | 14,006 | | | Sirona Dental Systems, Inc.* | | | 707,443 | |
| | | | | | | | |
| | | | | | | 7,508,343 | |
| | |
| Health Care Providers & Services – 2.7% | |
| | 72,550 | | | Cardinal Health, Inc. | | | 3,066,688 | |
| | 111,124 | | | Coventry Health Care, Inc. | | | 3,332,609 | |
| | 88,763 | | | Humana, Inc. | | | 7,161,399 | |
| | 26,935 | | | McKesson Corp. | | | 2,462,128 | |
| | 22,812 | | | WellPoint, Inc. | | | 1,547,110 | |
| | | | | | | | |
| | | | | | | 17,569,934 | |
| | |
| Hotels, Restaurants & Leisure – 2.0% | |
| | 5,429 | | | Choice Hotels International, Inc. | | | 204,239 | |
| | 175,855 | | | Marriott International, Inc. Class A | | | 6,874,172 | |
| | 24,402 | | | Marriott Vacations Worldwide Corp.* | | | 720,591 | |
| | 9,971 | | | McDonald’s Corp. | | | 971,674 | |
| | 28,857 | | | Wynn Resorts Ltd. | | | 3,849,524 | |
| | | | | | | | |
| | | | | | | 12,620,200 | |
| | |
| Household Durables – 1.1% | |
| | 61,195 | | | Leggett & Platt, Inc. | | | 1,332,215 | |
| | 3,099 | | | Mohawk Industries, Inc.* | | | 207,695 | |
| | 95,382 | | | Tempur-Pedic International, Inc.* | | | 5,612,277 | |
| | | | | | | | |
| | | | | | | 7,152,187 | |
| | |
| Household Products – 0.5% | |
| | 51,621 | | | The Procter & Gamble Co. | | | 3,285,160 | |
| | |
| Industrial Conglomerates – 0.1% | |
| | 37,350 | | | General Electric Co. | | | 731,313 | |
| | |
| Insurance* – 1.3% | |
| | 100,985 | | | Berkshire Hathaway, Inc. Class B | | | 8,124,243 | |
| | |
| Internet & Catalog Retail*(b) – 0.9% | |
| | 25,961 | | | Amazon.com, Inc. | | | 6,020,356 | |
| | |
| Internet Software & Services – 2.6% | |
| | 22,528 | | | Google, Inc. Class A* | | | 13,634,622 | |
| | 71,674 | | | VeriSign, Inc. | | | 2,946,518 | |
| | | | | | | | |
| | | | | | | 16,581,140 | |
| | |
| | | | | | | | |
Shares | | | Description | | Value | |
| | | | | | | | |
| | Common Stocks – (continued) | |
| IT Services – 5.0% | |
| | 124,752 | | | Accenture PLC Class A | | $ | 8,102,642 | |
| | 85,007 | | | Amdocs Ltd.* | | | 2,720,224 | |
| | 49,458 | | | Computer Sciences Corp. | | | 1,387,792 | |
| | 85,279 | | | International Business Machines Corp. | | | 17,659,575 | |
| | 26,040 | | | Lender Processing Services, Inc. | | | 691,362 | |
| | 14,370 | | | Visa, Inc. Class A | | | 1,767,223 | |
| | | | | | | | |
| | | | | | | 32,328,818 | |
| | |
| Leisure Equipment & Products – 0.2% | |
| | 13,748 | | | Polaris Industries, Inc. | | | 1,092,141 | |
| | |
| Machinery – 2.4% | |
| | 64,872 | | | AGCO Corp.* | | | 3,021,089 | |
| | 8,197 | | | Donaldson Co., Inc. | | | 284,108 | |
| | 5,037 | | | Graco, Inc. | | | 268,523 | |
| | 65,364 | | | Harsco Corp. | | | 1,457,617 | |
| | 28,864 | | | Stanley Black & Decker, Inc. | | | 2,111,690 | |
| | 113,178 | | | The Toro Co. | | | 8,087,700 | |
| | 9,915 | | | Trinity Industries, Inc. | | | 293,484 | |
| | | | | | | | |
| | | | | | | 15,524,211 | |
| | |
| Media – 3.5% | |
| | 227,008 | | | DIRECTV Class A* | | | 11,184,684 | |
| | 239,414 | | | DISH Network Corp. Class A | | | 7,654,065 | |
| | 94,867 | | | News Corp. Class A | | | 1,859,393 | |
| | 29,221 | | | Pandora Media, Inc.*(a) | | | 251,301 | |
| | 83,283 | | | Regal Entertainment Group Class A | | | 1,133,482 | |
| | 6,115 | | | Time Warner, Inc. | | | 229,068 | |
| | | | | | | | |
| | | | | | | 22,311,993 | |
| | |
| Metals & Mining – 0.2% | |
| | 122,296 | | | Alcoa, Inc. | | | 1,189,940 | |
| | 26,809 | | | Commercial Metals Co. | | | 396,237 | |
| | | | | | | | |
| | | | | | | 1,586,177 | |
| | |
| Multi-Utilities – 0.1% | |
| | 7,091 | | | Integrys Energy Group, Inc. | | | 387,452 | |
| | |
| Multiline Retail – 2.2% | |
| | 33,760 | | | Big Lots, Inc.* | | | 1,236,966 | |
| | 15,617 | | | Dillard’s, Inc. Class A | | | 1,008,234 | |
| | 69,093 | | | Dollar Tree, Inc.* | | | 7,023,994 | |
| | 67,705 | | | Family Dollar Stores, Inc. | | | 4,573,473 | |
| | | | | | | | |
| | | | | | | 13,842,667 | |
| | |
| Oil, Gas & Consumable Fuels – 9.4% | |
| | 7,649 | | | Apache Corp. | | | 733,845 | |
| | 61,735 | | | Chevron Corp. | | | 6,578,482 | |
| | 35,614 | | | Cimarex Energy Co. | | | 2,461,284 | |
| | 105,486 | | | ConocoPhillips | | | 7,555,962 | |
| | 14,310 | | | Devon Energy Corp. | | | 999,553 | |
| | 272,483 | | | Exxon Mobil Corp. | | | 23,526,182 | |
| | 34,952 | | | Hess Corp. | | | 1,822,397 | |
| | 67,158 | | | HollyFrontier Corp. | | | 2,069,810 | |
| | 146,993 | | | Marathon Petroleum Corp. | | | 6,116,379 | |
| | 41,607 | | | Murphy Oil Corp. | | | 2,287,137 | |
| | |
| | |
| 58 | | The accompanying notes are an integral part of these financial statements. |
GOLDMAN SACHS STRUCTURED LARGE CAP GROWTH FUND
| | | | | | | | |
Shares | | | Description | | Value | |
| | | | | | | | |
| | Common Stocks – (continued) | |
| Oil, Gas & Consumable Fuels – (continued) | |
| | 32,350 | | | Occidental Petroleum Corp. | | $ | 2,950,967 | |
| | 9,990 | | | Southwestern Energy Co.* | | | 315,484 | |
| | 92,573 | | | Tesoro Corp.* | | | 2,152,322 | |
| | 23,097 | | | WPX Energy, Inc.* | | | 405,814 | |
| | | | | | | | |
| | | | | | | 59,975,618 | |
| | |
| Paper & Forest Products – 0.2% | |
| | 13,024 | | | Domtar Corp. | | | 1,139,340 | |
| | |
| Personal Products – 0.7% | |
| | 59,874 | | | Herbalife Ltd. | | | 4,210,340 | |
| | |
| Pharmaceuticals – 1.0% | |
| | 126,078 | | | Eli Lilly & Co. | | | 5,218,368 | |
| | 30,952 | | | Merck & Co., Inc. | | | 1,214,557 | |
| | | | | | | | |
| | | | | | | 6,432,925 | |
| | |
| Professional Services – 0.4% | |
| | 46,383 | | | Manpower, Inc. | | | 1,975,916 | |
| | 22,021 | | | Robert Half International, Inc. | | | 656,226 | |
| | | | | | | | |
| | | | | | | 2,632,142 | |
| | |
| Real Estate Investment Trusts – 2.6% | |
| | 159,987 | | | American Tower Corp. | | | 10,491,947 | |
| | 128,042 | | | Rayonier, Inc. | | | 5,806,705 | |
| | 1,483 | | | Simon Property Group, Inc. | | | 230,755 | |
| | | | | | | | |
| | | | | | | 16,529,407 | |
| | |
| Road & Rail – 0.5% | |
| | 83,514 | | | CSX Corp. | | | 1,863,197 | |
| | 2,881 | | | Kansas City Southern | | | 221,895 | |
| | 8,057 | | | Norfolk Southern Corp. | | | 587,597 | |
| | 4,146 | | | Union Pacific Corp. | | | 466,176 | |
| | | | | | | | |
| | | | | | | 3,138,865 | |
| | |
| Semiconductors & Semiconductor Equipment – 0.4% | |
| | 34,728 | | | Applied Materials, Inc. | | | 416,389 | |
| | 70,350 | | | Intel Corp. | | | 1,997,940 | |
| | | | | | | | |
| | | | | | | 2,414,329 | |
| | |
| Software – 10.3% | |
| | 18,766 | | | Activision Blizzard, Inc. | | | 241,518 | |
| | 35,870 | | | Adobe Systems, Inc.* | | | 1,203,797 | |
| | 37,648 | | | Autodesk, Inc.* | | | 1,482,202 | |
| | 12,436 | | | BMC Software, Inc.* | | | 513,109 | |
| | 47,784 | | | CA, Inc. | | | 1,262,453 | |
| | 166,366 | | | Intuit, Inc. | | | 9,644,237 | |
| | 904,334 | | | Microsoft Corp. | | | 28,956,775 | |
| | 617,148 | | | Oracle Corp. | | | 18,137,980 | |
| | 54,335 | | | Symantec Corp.* | | | 897,614 | |
| | 46,758 | | | Synopsys, Inc.* | | | 1,403,208 | |
| | 31,378 | | | TIBCO Software, Inc.* | | | 1,032,336 | |
| | 12,779 | | | VMware, Inc. Class A* | | | 1,427,670 | |
| | | | | | | | |
| | | | | | | 66,202,899 | |
| | |
| | | | | | | | |
Shares | | | Description | | Value | |
| | | | | | | | |
| | Common Stocks – (continued) | |
| Specialty Retail – 1.9% | |
| | 69,840 | | | AutoNation, Inc.*(a) | | $ | 2,415,067 | |
| | 16,892 | | | Best Buy Co., Inc. | | | 372,806 | |
| | 40,058 | | | Dick’s Sporting Goods, Inc. | | | 2,026,935 | |
| | 65,876 | | | Foot Locker, Inc. | | | 2,015,147 | |
| | 20,515 | | | Limited Brands, Inc. | | | 1,019,596 | |
| | 76,545 | | | Lowe’s Cos., Inc. | | | 2,408,871 | |
| | 22,234 | | | PetSmart, Inc. | | | 1,295,353 | |
| | 6,244 | | | TJX Cos., Inc. | | | 260,437 | |
| | 2,785 | | | Ulta Salon, Cosmetics & Fragrance, Inc. | | | 245,581 | |
| | | | | | | | |
| | | | | | | 12,059,793 | |
| | |
| Textiles, Apparel & Luxury Goods* – 0.6% | |
| | 22,910 | | | Fossil, Inc. | | | 2,993,650 | |
| | 5,727 | | | Under Armour, Inc. Class A | | | 560,845 | |
| | | | | | | | |
| | | | | | | 3,554,495 | |
| | |
| Tobacco – 4.2% | |
| | 57,910 | | | Lorillard, Inc. | | | 7,834,644 | |
| | 209,595 | | | Philip Morris International, Inc. | | | 18,760,848 | |
| | | | | | | | |
| | | | | | | 26,595,492 | |
| | |
| Trading Companies & Distributors – 1.2% | |
| | 42,922 | | | MSC Industrial Direct Co., Inc. Class A | | | 3,163,781 | |
| | 15,692 | | | W.W. Grainger, Inc. | | | 3,261,112 | |
| | 15,396 | | | WESCO International, Inc.* | | | 1,022,140 | |
| | | | | | | | |
| | | | | | | 7,447,033 | |
| | |
| Wireless Telecommunication Services* – 0.2% | |
| | 461,537 | | | Sprint Nextel Corp. | | | 1,144,612 | |
| | |
| | TOTAL COMMON STOCKS | | | | |
| | (Cost $519,190,775) | | $ | 627,787,313 | |
| | |
| | | | | | | | | | | | |
Principal
Amount | | | Interest
Rate | | Maturity
Date | | | Value | |
| | Short-term Investment(c) – 2.1% | |
| Repurchase Agreement – 2.1% | | | | | |
| Joint Repurchase Agreement Account II | | | | | |
| $ | 13,600,000 | | | 0.211% | | | 05/01/12 | | | $ | 13,600,000 | |
| | (Cost $13,600,000) | | | | | | | | |
| | |
| TOTAL INVESTMENTS BEFORE SECURITIES
LENDING REINVESTMENT VEHICLE |
|
| | (Cost $532,790,775) | | | | | | $ | 641,387,313 | |
| | |
| | |
| The accompanying notes are an integral part of these financial statements. | | 59 |
GOLDMAN SACHS STRUCTURED LARGE CAP GROWTH FUND
Schedule of Investments (continued)
April 30, 2012 (Unaudited)
| | | | | | |
Shares | | Rate | | Value | |
| Securities Lending Reinvestment Vehicle(d)(e) – 0.5% | |
Financial Square Money Market Fund | |
| 3,116,750 | | 0.182% | | $ | 3,116,750 | |
| (Cost $3,116,750) | | | | |
| |
| TOTAL INVESTMENTS – 100.6% | |
| (Cost $535,907,525) | | $ | 644,504,063 | |
| |
LIABILITIES IN EXCESS OF OTHER ASSETS – (0.6)% | | | (4,053,923 | ) |
| |
| NET ASSETS – 100.0% | | $ | 640,450,140 | |
| |
| | |
| The percentage shown for each investment category reflects the value of investments in that category as a percentage of net assets. |
* | | Non-income producing security. |
(a) | | All or a portion of security is on loan. |
(b) | | All or a portion of security is segregated as collateral for initial margin requirements on futures transactions. |
(c) | | Joint repurchase agreement was entered into on April 30, 2012. Additional information appears on page 85. |
(d) | | Variable rate security. Interest rate disclosed is that which is in effect at April 30, 2012. |
(e) | | Represents an affiliated issuer. |
|
| ADDITIONAL INVESTMENT INFORMATION |
FUTURES CONTRACTS — At April 30, 2012, the Fund had the following futures contracts:
| | | | | | | | | | | | | | |
| Type | | Number of
Contracts
Long (Short) | | | Expiration
Date | | Current
Value | | | Unrealized
Gain (Loss) | |
S&P 500 E-Mini Index | | | 150 | | | June 2012 | | $ | 10,452,000 | | | $ | 140,100 | |
| | |
| 60 | | The accompanying notes are an integral part of these financial statements. |
GOLDMAN SACHS STRUCTURED LARGE CAP VALUE FUND
Schedule of Investments
April 30, 2012 (Unaudited)
| | | | | | | | |
Shares | | | Description | | Value | |
| | | | | | | | |
| | Common Stocks – 100.9% | |
| Aerospace & Defense – 1.3% | | | | |
| | 11,533 | | | Alliant Techsystems, Inc. | | $ | 614,709 | |
| | 26,295 | | | BE Aerospace, Inc.* | | | 1,236,654 | |
| | 72,398 | | | Northrop Grumman Corp. | | | 4,581,345 | |
| | 6,500 | | | The Boeing Co. | | | 499,200 | |
| | | | | | | | |
| | | | | | | 6,931,908 | |
| | |
| Air Freight & Logistics – 0.7% | | | | |
| | 43,280 | | | FedEx Corp. | | | 3,819,027 | |
| | |
| Automobiles – 0.2% | | | | |
| | 9,872 | | | General Motors Co.* | | | 227,056 | |
| | 23,403 | | | Thor Industries, Inc. | | | 791,724 | |
| | | | | | | | |
| | | | | | | 1,018,780 | |
| | |
| Beverages – 0.7% | | | | |
| | 7,522 | | | Beam, Inc. | | | 427,099 | |
| | 7,126 | | | Brown-Forman Corp. Class B | | | 615,330 | |
| | 60,452 | | | Constellation Brands, Inc. Class A* | | | 1,305,763 | |
| | 31,984 | | | Molson Coors Brewing Co. Class B | | | 1,329,895 | |
| | | | | | | | |
| | | | | | | 3,678,087 | |
| | |
| Biotechnology – 3.4% | | | | |
| | 7,208 | | | Alexion Pharmaceuticals, Inc.* | | | 651,027 | |
| | 120,588 | | | Amgen, Inc. | | | 8,575,013 | |
| | 25,219 | | | Biogen Idec, Inc.* | | | 3,379,598 | |
| | 88,055 | | | Gilead Sciences, Inc.* | | | 4,579,740 | |
| | 12,995 | | | United Therapeutics Corp.* | | | 568,531 | |
| | | | | | | | |
| | | | | | | 17,753,909 | |
| | |
| Capital Markets – 3.0% | | | | |
| | 15,835 | | | Greenhill & Co., Inc. | | | 615,190 | |
| | 121,776 | | | Morgan Stanley | | | 2,104,289 | |
| | 25,516 | | | Raymond James Financial, Inc. | | | 934,396 | |
| | 257,196 | | | SEI Investments Co. | | | 5,192,787 | |
| | 10,159 | | | State Street Corp. | | | 469,549 | |
| | 275,399 | | | The Bank of New York Mellon Corp. | | | 6,513,187 | |
| | | | | | | | |
| | | | | | | 15,829,398 | |
| | |
| Chemicals – 0.4% | | | | |
| | 7,769 | | | Airgas, Inc. | | | 711,951 | |
| | 13,316 | | | Eastman Chemical Co. | | | 718,665 | |
| | 61,663 | | | Huntsman Corp. | | | 873,148 | |
| | | | | | | | |
| | | | | | | 2,303,764 | |
| | |
| Commercial Banks – 4.3% | | | | |
| | 41,295 | | | City National Corp. | | | 2,199,372 | |
| | 15,485 | | | Cullen/Frost Bankers, Inc. | | | 912,995 | |
| | 39,079 | | | East West Bancorp, Inc. | | | 889,829 | |
| | 130,624 | | | KeyCorp. | | | 1,050,217 | |
| | 14,284 | | | M&T Bank Corp. | | | 1,232,281 | |
| | 78,266 | | | PNC Financial Services Group, Inc. | | | 5,190,601 | |
| | 327,800 | | | Wells Fargo & Co. | | | 10,958,354 | |
| | | | | | | | |
| | | | | | | 22,433,649 | |
| | |
| | | | | | | | |
Shares | | | Description | | Value | |
| | | | | | | | |
| | Common Stocks – (continued) | |
| Communications Equipment – 1.6% | | | | |
| | 66,138 | | | Brocade Communications Systems, Inc.* | | $ | 366,404 | |
| | 353,837 | | | Cisco Systems, Inc. | | | 7,129,816 | |
| | 27,180 | | | Juniper Networks, Inc.* | | | 582,467 | |
| | | | | | | | |
| | | | | | | 8,078,687 | |
| | |
| Computers & Peripherals – 3.0% | | | | |
| | 123,252 | | | Dell, Inc.* | | | 2,017,635 | |
| | 144,834 | | | Hewlett-Packard Co. | | | 3,586,090 | |
| | 48,746 | | | NetApp, Inc.* | | | 1,892,807 | |
| | 13,465 | | | QLogic Corp.* | | | 232,271 | |
| | 37,439 | | | Seagate Technology PLC | | | 1,151,624 | |
| | 179,680 | | | Western Digital Corp.* | | | 6,973,381 | |
| | | | | | | | |
| | | | | | | 15,853,808 | |
| | |
| Construction & Engineering – 0.1% | | | | |
| | 6,791 | | | URS Corp. | | | 280,536 | |
| | |
| Consumer Finance – 1.5% | | | | |
| | 138,583 | | | Capital One Financial Corp. | | | 7,688,585 | |
| | |
| Diversified Consumer Services – 0.2% | | | | |
| | 10,964 | | | Weight Watchers International, Inc. | | | 832,825 | |
| | |
| Diversified Financial Services – 6.3% | | | | |
| | 834,877 | | | Bank of America Corp. | | | 6,770,853 | |
| | 311,680 | | | Citigroup, Inc. | | | 10,297,907 | |
| | 8,253 | | | CME Group, Inc. | | | 2,193,812 | |
| | 313,394 | | | JPMorgan Chase & Co. | | | 13,469,674 | |
| | | | | | | | |
| | | | | | | 32,732,246 | |
| | |
| Diversified Telecommunication Services(a) – 3.6% | | | | |
| | 575,220 | | | AT&T, Inc. | | | 18,930,490 | |
| | |
| Electric Utilities – 1.3% | | | | |
| | 325,395 | | | Duke Energy Corp. | | | 6,973,215 | |
| | |
| Electronic Equipment, Instruments & Components – 1.2% | |
| | 207,424 | | | Ingram Micro, Inc. Class A* | | | 4,036,471 | |
| | 10,822 | | | National Instruments Corp. | | | 294,358 | |
| | 188,336 | | | Vishay Intertechnology, Inc.* | | | 2,113,130 | |
| | | | | | | | |
| | | | | | | 6,443,959 | |
| | |
| Food & Staples Retailing – 1.6% | | | | |
| | 111,342 | | | CVS Caremark Corp. | | | 4,968,080 | |
| | 50,073 | | | SUPERVALU, Inc.(b) | | | 297,434 | |
| | 82,560 | | | Walgreen Co. | | | 2,894,553 | |
| | | | | | | | |
| | | | | | | 8,160,067 | |
| | |
| Food Products – 4.6% | | | | |
| | 214,873 | | | Archer-Daniels-Midland Co. | | | 6,624,534 | |
| | 101,024 | | | Bunge Ltd. | | | 6,516,048 | |
| | 163,321 | | | Dean Foods Co.* | | | 2,005,582 | |
| | 11,510 | | | Hormel Foods Corp. | | | 334,481 | |
| | 53,547 | | | Smithfield Foods, Inc.* | | | 1,122,345 | |
| | 5,490 | | | The Hershey Co. | | | 367,885 | |
| | 377,983 | | | Tyson Foods, Inc. Class A | | | 6,898,190 | |
| | | | | | | | |
| | | | | | | 23,869,065 | |
| | |
| | |
| The accompanying notes are an integral part of these financial statements. | | 61 |
GOLDMAN SACHS STRUCTURED LARGE CAP VALUE FUND
Schedule of Investments (continued)
April 30, 2012 (Unaudited)
| | | | | | | | |
Shares | | | Description | | Value | |
| | | | | | | | |
| | Common Stocks – (continued) | |
| Health Care Equipment & Supplies* – 0.4% | | | | |
| | 340,058 | | | Boston Scientific Corp. | | $ | 2,128,763 | |
| | |
| Health Care Providers & Services – 2.8% | | | | |
| | 21,675 | | | Cardinal Health, Inc. | | | 916,202 | |
| | 146,789 | | | Coventry Health Care, Inc. | | | 4,402,202 | |
| | 87,480 | | | Humana, Inc. | | | 7,057,887 | |
| | 32,759 | | | WellPoint, Inc. | | | 2,221,715 | |
| | | | | | | | |
| | | | | | | 14,598,006 | |
| | |
| Hotels, Restaurants & Leisure – 1.3% | | | | |
| | 17,857 | | | Carnival Corp. | | | 580,174 | |
| | 145,547 | | | Marriott International, Inc. Class A | | | 5,689,432 | |
| | 12,619 | | | Marriott Vacations Worldwide Corp.* | | | 372,639 | |
| | 1,796 | | | Wynn Resorts Ltd. | | | 239,587 | |
| | | | | | | | |
| | | | | | | 6,881,832 | |
| | |
| Household Durables – 1.2% | | | | |
| | 11,473 | | | Leggett & Platt, Inc. | | | 249,767 | |
| | 33,297 | | | Mohawk Industries, Inc.* | | | 2,231,565 | |
| | 66,777 | | | Tempur-Pedic International, Inc.* | | | 3,929,159 | |
| | | | | | | | |
| | | | | | | 6,410,491 | |
| | |
| Household Products – 2.0% | | | | |
| | 163,387 | | | The Procter & Gamble Co. | | | 10,397,949 | |
| | |
| Industrial Conglomerates – 2.7% | | | | |
| | 726,379 | | | General Electric Co. | | | 14,222,501 | |
| | |
| Insurance – 6.8% | | | | |
| | 11,875 | | | ACE Ltd. | | | 902,144 | |
| | 18,244 | | | Allied World Assurance Co. Holdings Ltd. | | | 1,312,838 | |
| | 31,382 | | | American Financial Group, Inc. | | | 1,221,387 | |
| | 220,308 | | | Berkshire Hathaway, Inc. Class B* | | | 17,723,779 | |
| | 42,778 | | | Lincoln National Corp. | | | 1,059,611 | |
| | 67,820 | | | MetLife, Inc. | | | 2,443,555 | |
| | 19,976 | | | Old Republic International Corp. | | | 198,761 | |
| | 9,550 | | | Protective Life Corp. | | | 279,433 | |
| | 42,568 | | | Reinsurance Group of America, Inc. | | | 2,474,903 | |
| | 10,543 | | | StanCorp Financial Group, Inc. | | | 404,640 | |
| | 297,886 | | | Unum Group | | | 7,071,814 | |
| | 5,362 | | | W.R. Berkley Corp. | | | 201,933 | |
| | | | | | | | |
| | | | | | | 35,294,798 | |
| | |
| Internet Software & Services – 0.3% | | | | |
| | 2,302 | | | Google, Inc. Class A* | | | 1,393,240 | |
| | 5,666 | | | VeriSign, Inc. | | | 232,929 | |
| | | | | | | | |
| | | | | | | 1,626,169 | |
| | |
| IT Services – 0.3% | | | | |
| | 4,522 | | | Accenture PLC Class A | | | 293,704 | |
| | 18,045 | | | Computer Sciences Corp. | | | 506,343 | |
| | 10,731 | | | Lender Processing Services, Inc. | | | 284,908 | |
| | 2,382 | | | Visa, Inc. Class A | | | 292,938 | |
| | | | | | | | |
| | | | | | | 1,377,893 | |
| | |
| | | | | | | | |
Shares | | | Description | | Value | |
| | | | | | | | |
| | Common Stocks – (continued) | |
| Leisure Equipment & Products – 0.1% | | | | |
| | 5,123 | | | Polaris Industries, Inc. | | $ | 406,971 | |
| | |
| Machinery – 1.1% | | | | |
| | 80,825 | | | The Toro Co. | | | 5,775,755 | |
| | |
| Media – 3.7% | | | | |
| | 135,964 | | | DIRECTV Class A* | | | 6,698,946 | |
| | 213,917 | | | DISH Network Corp. Class A | | | 6,838,927 | |
| | 172,820 | | | News Corp. Class A | | | 3,387,272 | |
| | 46,119 | | | Pandora Media, Inc.*(b) | | | 396,623 | |
| | 59,247 | | | Regal Entertainment Group Class A(b) | | | 806,352 | |
| | 32,079 | | | Time Warner, Inc. | | | 1,201,679 | |
| | | | | | | | |
| | | | | | | 19,329,799 | |
| | |
| Metals & Mining – 0.7% | | | | |
| | 26,266 | | | Newmont Mining Corp. | | | 1,251,575 | |
| | 45,348 | | | Reliance Steel & Aluminum Co. | | | 2,534,500 | |
| | | | | | | | |
| | | | | | | 3,786,075 | |
| | |
| Multi-Utilities – 2.9% | | | | |
| | 29,570 | | | Ameren Corp. | | | 969,600 | |
| | 85,105 | | | Consolidated Edison, Inc. | | | 5,059,492 | |
| | 121,507 | | | Integrys Energy Group, Inc. | | | 6,639,143 | |
| | 27,374 | | | MDU Resources Group, Inc. | | | 627,960 | |
| | 48,916 | | | NiSource, Inc. | | | 1,205,779 | |
| | 16,433 | | | PG&E Corp. | | | 726,010 | |
| | | | | | | | |
| | | | | | | 15,227,984 | |
| | |
| Multiline Retail – 2.1% | | | | |
| | 47,210 | | | Big Lots, Inc.* | | | 1,729,774 | |
| | 11,822 | | | Dillard’s, Inc. Class A | | | 763,228 | |
| | 53,628 | | | Dollar Tree, Inc.* | | | 5,451,823 | |
| | 45,264 | | | Family Dollar Stores, Inc. | | | 3,057,583 | |
| | | | | | | | |
| | | | | | | 11,002,408 | |
| | |
| Oil, Gas & Consumable Fuels – 10.3% | | | | |
| | 2,035 | | | Apache Corp. | | | 195,238 | |
| | 136,534 | | | Chevron Corp. | | | 14,549,063 | |
| | 51,031 | | | Cimarex Energy Co. | | | 3,526,752 | |
| | 193,952 | | | ConocoPhillips | | | 13,892,782 | |
| | 29,190 | | | Devon Energy Corp. | | | 2,038,922 | |
| | 31,675 | | | Exxon Mobil Corp. | | | 2,734,820 | |
| | 45,164 | | | Hess Corp. | | | 2,354,851 | |
| | 63,465 | | | HollyFrontier Corp. | | | 1,955,991 | |
| | 133,333 | | | Marathon Petroleum Corp. | | | 5,547,986 | |
| | 35,230 | | | Murphy Oil Corp. | | | 1,936,593 | |
| | 5,193 | | | Occidental Petroleum Corp. | | | 473,705 | |
| | 159,250 | | | Valero Energy Corp. | | | 3,933,475 | |
| | 38,400 | | | WPX Energy, Inc.* | | | 674,688 | |
| | | | | | | | |
| | | | | | | 53,814,866 | |
| | |
| Paper & Forest Products – 0.3% | | | | |
| | 14,960 | | | Domtar Corp. | | | 1,308,701 | |
| | |
| Personal Products – 0.5% | | | | |
| | 36,150 | | | Herbalife Ltd. | | | 2,542,068 | |
| | |
| | |
| 62 | | The accompanying notes are an integral part of these financial statements. |
GOLDMAN SACHS STRUCTURED LARGE CAP VALUE FUND
| | | | | | | | |
Shares | | | Description | | Value | |
| | | | | | | | |
| | Common Stocks – (continued) | |
| Pharmaceuticals – 6.6% | | | | |
| | 133,481 | | | Eli Lilly & Co. | | $ | 5,524,779 | |
| | 20,132 | | | Forest Laboratories, Inc.* | | | 701,198 | |
| | 68,315 | | | Johnson & Johnson | | | 4,446,623 | |
| | 196,973 | | | Merck & Co., Inc. | | | 7,729,220 | |
| | 699,042 | | | Pfizer, Inc. | | | 16,029,033 | |
| | | | | | | | |
| | | | | | | 34,430,853 | |
| | |
| Professional Services – 0.7% | | | | |
| | 70,360 | | | Manpower, Inc. | | | 2,997,336 | |
| | 17,711 | | | Robert Half International, Inc. | | | 527,788 | |
| | | | | | | | |
| | | | | | | 3,525,124 | |
| | |
| Real Estate Investment Trusts – 3.9% | | | | |
| | 104,706 | | | American Tower Corp. | | | 6,866,619 | |
| | 151,885 | | | Rayonier, Inc. | | | 6,887,985 | |
| | 8,262 | | | Senior Housing Properties Trust | | | 182,425 | |
| | 41,241 | | | Simon Property Group, Inc. | | | 6,417,100 | |
| | | | | | | | |
| | | | | | | 20,354,129 | |
| | |
| Road & Rail – 1.1% | | | | |
| | 32,016 | | | Norfolk Southern Corp. | | | 2,334,927 | |
| | 29,467 | | | Union Pacific Corp. | | | 3,313,269 | |
| | | | | | | | |
| | | | | | | 5,648,196 | |
| | |
| Semiconductors & Semiconductor Equipment – 1.5% | | | | |
| | 273,454 | | | Intel Corp. | | | 7,766,094 | |
| | |
| Software – 4.4% | | | | |
| | 18,663 | | | Autodesk, Inc.* | | | 734,762 | |
| | 16,304 | | | CA, Inc. | | | 430,752 | |
| | 104,441 | | | Intuit, Inc. | | | 6,054,445 | |
| | 200,281 | | | Microsoft Corp. | | | 6,412,998 | |
| | 232,034 | | | Oracle Corp. | | | 6,819,479 | |
| | 72,969 | | | Symantec Corp.* | | | 1,205,448 | |
| | 35,757 | | | Synopsys, Inc.* | | | 1,073,067 | |
| | 2,361 | | | VMware, Inc. Class A* | | | 263,771 | |
| | | | | | | | |
| | | | | | | 22,994,722 | |
| | |
| Specialty Retail – 1.6% | | | | |
| | 45,072 | | | AutoNation, Inc.*(b) | | | 1,558,590 | |
| | 50,709 | | | Best Buy Co., Inc. | | | 1,119,147 | |
| | 17,758 | | | Dick’s Sporting Goods, Inc. | | | 898,555 | |
| | 68,181 | | | Foot Locker, Inc. | | | 2,085,657 | |
| | 79,568 | | | Lowe’s Cos., Inc. | | | 2,504,005 | |
| | | | | | | | |
| | | | | | | 8,165,954 | |
| | |
| Textiles, Apparel & Luxury Goods* – 0.2% | | | | |
| | 8,086 | | | Fossil, Inc. | | | 1,056,598 | |
| | |
| Thrifts & Mortgage Finance – 0.1% | | | | |
| | 20,343 | | | BankUnited, Inc. | | | 500,438 | |
| | 13,297 | | | New York Community Bancorp, Inc. | | | 179,376 | |
| | | | | | | | |
| | | | | | | 679,814 | |
| | |
| | | | | | | | |
Shares | | | Description | | Value | |
| | | | | | | | |
| | Common Stocks – (continued) | |
| Tobacco – 1.7% | | | | |
| | 58,919 | | | Lorillard, Inc. | | $ | 7,971,152 | |
| | 18,011 | | | Reynolds American, Inc. | | | 735,389 | |
| | | | | | | | |
| | | | | | | 8,706,541 | |
| | |
| Trading Companies & Distributors – 0.3% | | | | |
| | 15,823 | | | MSC Industrial Direct Co., Inc. Class A | | | 1,166,313 | |
| | 5,838 | | | WESCO International, Inc.* | | | 387,585 | |
| | | | | | | | |
| | | | | | | 1,553,898 | |
| | |
| Wireless Telecommunication Services* – 0.3% | | | | |
| | 675,861 | | | Sprint Nextel Corp. | | | 1,676,135 | |
| | |
| | TOTAL COMMON STOCKS | | | | |
| | (Cost $431,904,359) | | $ | 526,303,092 | |
| | |
| | | | | | | | | | | | | | |
Principal Amount | | | Interest
Rate | | | Maturity
Date | | | Value | |
| | | | | | | | | | | | | | |
| | Short-term Investment(c) – 2.2% | |
| Repurchase Agreement – 2.2% | | | | | |
| Joint Repurchase Agreement Account II | | | | | |
| $ | 11,600,000 | | | | 0.211 | % | | | 05/01/12 | | | $ | 11,600,000 | |
| | (Cost $11,600,000) | | | | | | | | | |
| | |
| TOTAL INVESTMENTS BEFORE SECURITIES
LENDING REINVESTMENT VEHICLE |
|
| | (Cost $443,504,359) | | | $ | 537,903,092 | |
| | |
| | | | | | | | |
| Shares | | Rate | | | Value | |
| Securities Lending Reinvestment Vehicle(d)(e) – 0.6% | |
Financial Square Money Market Fund | |
| 2,926,400 | | | 0.182 | % | | $ | 2,926,400 | |
| (Cost $2,926,400) | | | | | |
| |
| TOTAL INVESTMENT – 103.7% | |
| (Cost $446,430,759) | | | $ | 540,829,492 | |
| |
LIABILITIES IN EXCESS OF OTHER ASSETS – (3.7)% | | | | (19,051,167 | ) |
| |
| NET ASSETS – 100.0% | | | $ | 521,778,325 | |
| |
| | |
| The percentage shown for each investment category reflects the value of investments in that category as a percentage of net assets. |
* | | Non-income producing security. |
(a) | | All or a portion of this security is segregated as collateral for initial margin requirement on futures transactions. |
(b) | | All or a portion of security is on loan. |
(c) | | Joint repurchase agreement was entered into on April 30, 2012. Additional information appears on page 85. |
(d) | | Variable rate security. Interest rate disclosed is that which is in effect at April 30, 2012. |
(e) | | Represents an affiliated issuer. |
| | |
| The accompanying notes are an integral part of these financial statements. | | 63 |
GOLDMAN SACHS STRUCTURED LARGE CAP VALUE FUND
Schedule of Investments (continued)
April 30, 2012 (Unaudited)
|
| ADDITIONAL INVESTMENT INFORMATION |
FUTURES CONTRACTS — At April 30, 2012, the Fund had the following futures contracts:
| | | | | | | | | | | | | | |
| Type | | Number of
Contracts
Long (Short) | | | Expiration
Date | | Current
Value | | | Unrealized
Gain (Loss) | |
S&P 500 E-Mini Index | | | 121 | | | June 2012 | | $ | 8,431,280 | | | $ | (62,059 | ) |
| | |
| 64 | | The accompanying notes are an integral part of these financial statements. |
GOLDMAN SACHS STRUCTURED SMALL CAP EQUITY FUND
Schedule of Investments
April 30, 2012 (Unaudited)
| | | | | | | | |
Shares | | | Description | | Value | |
| | | | | | | | |
| | Common Stocks – 97.7% | |
| Aerospace & Defense – 0.3% | |
| | 1,985 | | | American Science and Engineering, Inc. | | $ | 129,641 | |
| | 13,128 | | | Ceradyne, Inc. | | | 332,401 | |
| | 1,848 | | | Cubic Corp. | | | 85,433 | |
| | 7,977 | | | Orbital Sciences Corp.* | | | 100,191 | |
| | | | | | | | |
| | | | | | | 647,666 | |
| | |
| Air Freight & Logistics* – 0.4% | |
| | 131,906 | | | Pacer International, Inc. | | | 792,755 | |
| | |
| Airlines* – 0.1% | |
| | 3,826 | | | Allegiant Travel Co. | | | 224,816 | |
| | |
| Auto Components – 0.2% | |
| | 22,285 | | | Stoneridge, Inc.* | | | 192,097 | |
| | 8,545 | | | Superior Industries International, Inc. | | | 146,205 | |
| | | | | | | | |
| | | | | | | 338,302 | |
| | |
| Automobiles – 0.2% | |
| | 13,722 | | | Thor Industries, Inc. | | | 464,215 | |
| | |
| Beverages* – 1.8% | |
| | 141,545 | | | National Beverage Corp. | | | 2,103,359 | |
| | 12,953 | | | The Boston Beer Co., Inc. Class A(a) | | | 1,338,304 | |
| | | | | | | | |
| | | | | | | 3,441,663 | |
| | |
| Biotechnology* – 2.9% | |
| | 25,616 | | | Affymax, Inc. | | | 335,826 | |
| | 51,603 | | | Aveo Pharmaceuticals, Inc. | | | 593,434 | |
| | 27,182 | | | Cubist Pharmaceuticals, Inc. | | | 1,149,255 | |
| | 17,783 | | | Emergent Biosolutions, Inc. | | | 250,029 | |
| | 64,748 | | | Enzon Pharmaceuticals, Inc.(a) | | | 403,380 | |
| | 9,647 | | | Momenta Pharmaceuticals, Inc. | | | 153,194 | |
| | 378,256 | | | Nabi Biopharmaceuticals | | | 631,688 | |
| | 143,555 | | | Progenics Pharmaceuticals, Inc. | | | 1,577,669 | |
| | 861 | | | Regeneron Pharmaceuticals, Inc. | | | 116,459 | |
| | 21,995 | | | Spectrum Pharmaceuticals, Inc.(a) | | | 233,807 | |
| | | | | | | | |
| | | | | | | 5,444,741 | |
| | |
| Building Products – 0.9% | |
| | 28,486 | | | American Woodmark Corp. | | | 511,324 | |
| | 32,734 | | | Universal Forest Products, Inc. | | | 1,224,251 | |
| | | | | | | | |
| | | | | | | 1,735,575 | |
| | |
| Capital Markets – 2.6% | |
| | 2,970 | | | Capital Southwest Corp. | | | 284,288 | |
| | 36,035 | | | GAMCO Investors, Inc. Class A | | | 1,623,737 | |
| | 39,524 | | | Gladstone Capital Corp. | | | 316,587 | |
| | 19,523 | | | Greenhill & Co., Inc. | | | 758,469 | |
| | 42,290 | | | Hercules Technology Growth Capital, Inc. | | | 482,529 | |
| | 31,054 | | | Knight Capital Group, Inc. Class A* | | | 408,050 | |
| | 70,569 | | | NGP Capital Resources Co. | | | 429,765 | |
| | |
| | | | | | | | |
Shares | | | Description | | Value | |
| | | | | | | | |
| | Common Stocks – (continued) | |
| Capital Markets – (continued) | |
| | 76,498 | | | Pzena Investment Management, Inc. Class A | | $ | 450,573 | |
| | 5,075 | | | Raymond James Financial, Inc. | | | 185,847 | |
| | | | | | | | |
| | | | | | | 4,939,845 | |
| | |
| Chemicals – 2.4% | |
| | 19,866 | | | A. Schulman, Inc. | | | 488,902 | |
| | 57,117 | | | Kraton Performance Polymers, Inc.* | | | 1,485,042 | |
| | 10,138 | | | LSB Industries, Inc.* | | | 343,881 | |
| | 69,512 | | | Spartech Corp.* | | | 339,219 | |
| | 20,970 | | | Stepan Co. | | | 1,905,334 | |
| | 6,571 | | | Zep, Inc. | | | 93,637 | |
| | | | | | | | |
| | | | | | | 4,656,015 | |
| | |
| Commercial Banks – 5.4% | |
| | 21,572 | | | 1st Source Corp. | | | 489,469 | |
| | 198,642 | | | CVB Financial Corp. | | | 2,298,288 | |
| | 94,369 | | | First Bancorp | | | 945,577 | |
| | 14,083 | | | First Bancorp, Inc. | | | 204,344 | |
| | 24,102 | | | First Interstate BancSystem, Inc. | | | 339,597 | |
| | 53,628 | | | First Niagara Financial Group, Inc. | | | 479,434 | |
| | 73,138 | | | Great Southern Bancorp, Inc. | | | 1,758,238 | |
| | 125,333 | | | International Bancshares Corp. | | | 2,472,820 | |
| | 45,662 | | | Popular, Inc.* | | | 81,278 | |
| | 67,602 | | | Renasant Corp. | | | 1,081,632 | |
| | 8,450 | | | State Bank Financial Corp.* | | | 145,763 | |
| | | | | | | | |
| | | | | | | 10,296,440 | |
| | |
| Commercial Services & Supplies – 0.8% | |
| | 6,928 | | | ABM Industries, Inc. | | | 161,284 | |
| | 22,751 | | | HNI Corp. | | | 548,754 | |
| | 117,464 | | | Kimball International, Inc. Class B | | | 802,279 | |
| | | | | | | | |
| | | | | | | 1,512,317 | |
| | |
| Communications Equipment – 1.7% | |
| | 6,986 | | | Bel Fuse, Inc. Class B | | | 124,281 | |
| | 30,307 | | | Emulex Corp.* | | | 263,065 | |
| | 167,977 | | | Extreme Networks, Inc.* | | | 643,352 | |
| | 22,897 | | | PC-Tel, Inc. | | | 156,387 | |
| | 9,234 | | | Polycom, Inc.* | | | 122,535 | |
| | 167,114 | | | ShoreTel, Inc.* | | | 800,476 | |
| | 213,627 | | | Symmetricom, Inc.* | | | 1,187,766 | |
| | | | | | | | |
| | | | | | | 3,297,862 | |
| | |
| Computers & Peripherals – 2.9% | |
| | 79,154 | | | Electronics for Imaging, Inc.* | | | 1,412,899 | |
| | 13,846 | | | Fusion-io, Inc.* | | | 355,150 | |
| | 137,498 | | | Imation Corp.* | | | 797,488 | |
| | 37,388 | | | QLogic Corp.* | | | 644,943 | |
| | 314,760 | | | Quantum Corp.* | | | 749,129 | |
| | 9,074 | | | Silicon Graphics International Corp.*(a) | | | 85,659 | |
| | 54,207 | | | STEC, Inc.* | | | 449,376 | |
| | 77,845 | | | Xyratex Ltd. | | | 1,130,309 | |
| | | | | | | | |
| | | | | | | 5,624,953 | |
| | |
| | |
| The accompanying notes are an integral part of these financial statements. | | 65 |
GOLDMAN SACHS STRUCTURED SMALL CAP EQUITY FUND
Schedule of Investments (continued)
April 30, 2012 (Unaudited)
| | | | | | | | |
Shares | | | Description | | Value | |
| | | | | | | | |
| | Common Stocks – (continued) | |
| Consumer Finance – 0.5% | |
| | 22,055 | | | Cash America International, Inc. | | $ | 1,031,071 | |
| | |
| Distributors – 0.1% | |
| | 3,389 | | | Core-Mark Holding Co., Inc. | | | 130,815 | |
| | |
| Diversified Consumer Services* – 0.6% | |
| | 19,170 | | | Ascent Capital Group LLC Class A | | | 987,255 | |
| | 3,700 | | | Coinstar, Inc. | | | 232,323 | |
| | | | | | | | |
| | | | | | | 1,219,578 | |
| | |
| Diversified Financial Services – 0.1% | |
| | 6,598 | | | Compass Diversified Holdings | | | 96,859 | |
| | 6,606 | | | PHH Corp.* | | | 102,393 | |
| | | | | | | | |
| | | | | | | 199,252 | |
| | |
| Electric Utilities – 0.2% | |
| | 5,613 | | | El Paso Electric Co. | | | 171,983 | |
| | 5,293 | | | Portland General Electric Co. | | | 136,718 | |
| | | | | | | | |
| | | | | | | 308,701 | |
| | |
| Electrical Equipment – 1.4% | |
| | 5,944 | | | Brady Corp. Class A | | | 184,442 | |
| | 13,812 | | | Encore Wire Corp. | | | 352,068 | |
| | 226,865 | | | LSI Industries, Inc. | | | 1,554,025 | |
| | 73,367 | | | Vicor Corp. | | | 511,368 | |
| | | | | | | | |
| | | | | | | 2,601,903 | |
| | |
| Electronic Equipment, Instruments & Components – 1.8% | |
| | 65,564 | | | Agilysys, Inc.* | | | 574,341 | |
| | 54,765 | | | Brightpoint, Inc.* | | | 335,162 | |
| | 41,710 | | | Ingram Micro, Inc. Class A* | | | 811,677 | |
| | 26,880 | | | Jabil Circuit, Inc. | | | 630,336 | |
| | 51,543 | | | Methode Electronics, Inc. | | | 435,538 | |
| | 72,993 | | | RadiSys Corp.* | | | 463,505 | |
| | 20,766 | | | Vishay Intertechnology, Inc.* | | | 232,994 | |
| | | | | | | | |
| | | | | | | 3,483,553 | |
| | |
| Energy Equipment & Services* – 0.1% | |
| | 15,065 | | | Parker Drilling Co. | | | 77,886 | |
| | 30,510 | | | Willbros Group, Inc. | | | 164,754 | |
| | | | | | | | |
| | | | | | | 242,640 | |
| | |
| Food Products – 3.3% | |
| | 7,606 | | | Dean Foods Co.* | | | 93,402 | |
| | 48,593 | | | Dole Food Co., Inc.*(a) | | | 412,068 | |
| | 39,600 | | | J&J Snack Foods Corp. | | | 2,219,976 | |
| | 37,057 | | | Lancaster Colony Corp. | | | 2,416,487 | |
| | 157,058 | | | Pilgrim’s Pride Corp.* | | | 1,121,394 | |
| | | | | | | | |
| | | | | | | 6,263,327 | |
| | |
| Health Care Equipment & Supplies – 2.2% | |
| | 44,655 | | | Align Technology, Inc.* | | | 1,416,010 | |
| | 6,067 | | | AngioDynamics, Inc.* | | | 75,109 | |
| | 1,897 | | | Atrion Corp. | | | 437,524 | |
| | 65,110 | | | Invacare Corp. | | | 1,031,993 | |
| | 3,005 | | | Masimo Corp.* | | | 66,501 | |
| | |
| | | | | | | | |
Shares | | | Description | | Value | |
| | | | | | | | |
| | Common Stocks – (continued) | |
| Health Care Equipment & Supplies – (continued) | |
| | 108,226 | | | Medical Action Industries, Inc.* | | $ | 597,408 | |
| | 10,833 | | | Sirona Dental Systems, Inc.* | | | 547,175 | |
| | | | | | | | |
| | | | | | | 4,171,720 | |
| | |
| Health Care Providers & Services – 3.4% | |
| | 29,383 | | | AMN Healthcare Services, Inc.* | | | 197,160 | |
| | 137,813 | | | Assisted Living Concepts, Inc. Class A | | | 2,468,231 | |
| | 6,596 | | | Chemed Corp. | | | 398,003 | |
| | 20,768 | | | Kindred Healthcare, Inc.* | | | 200,204 | |
| | 79,132 | | | Molina Healthcare, Inc.* | | | 2,029,736 | |
| | 84,151 | | | PharMerica Corp.* | | | 998,872 | |
| | 30,523 | | | Skilled Healthcare Group, Inc. Class A* | | | 234,111 | |
| | | | | | | | |
| | | | | | | 6,526,317 | |
| | |
| Hotels, Restaurants & Leisure* – 2.8% | |
| | 5,943 | | | Biglari Holdings, Inc. | | | 2,414,819 | |
| | 11,857 | | | Marriott Vacations Worldwide Corp. | | | 350,137 | |
| | 62,044 | | | Papa John’s International, Inc. | | | 2,499,133 | |
| | | | | | | | |
| | | | | | | 5,264,089 | |
| | |
| Household Durables – 2.3% | |
| | 25,813 | | | Blyth, Inc. | | | 2,270,770 | |
| | 14,680 | | | Ethan Allen Interiors, Inc. | | | 340,576 | |
| | 14,918 | | | Hooker Furniture Corp. | | | 176,629 | |
| | 3,281 | | | iRobot Corp.* | | | 77,464 | |
| | 27,474 | | | Tempur-Pedic International, Inc.* | | | 1,616,570 | |
| | | | | | | | |
| | | | | | | 4,482,009 | |
| | |
| Household Products* – 1.2% | |
| | 220,079 | | | Central Garden & Pet Co. Class A | | | 2,352,645 | |
| | |
| Independent Power Producers & Energy Traders – 0.1% | |
| | 12,345 | | | Genie Energy Ltd. Class B | | | 102,710 | |
| | |
| Insurance – 2.4% | |
| | 6,431 | | | American Equity Investment Life Holding Co. | | | 78,844 | |
| | 1,662 | | | American Financial Group, Inc. | | | 64,685 | |
| | 75,199 | | | CNO Financial Group, Inc.* | | | 546,697 | |
| | 30,026 | | | Flagstone Reinsurance Holdings SA | | | 225,195 | |
| | 9,933 | | | Global Indemnity PLC* | | | 178,893 | |
| | 81,320 | | | Maiden Holdings Ltd. | | | 674,956 | |
| | 1,738 | | | Mercury General Corp. | | | 78,540 | |
| | 55,297 | | | Primerica, Inc. | | | 1,450,440 | |
| | 36,825 | | | Symetra Financial Corp. | | | 447,792 | |
| | 8,947 | | | Tower Group, Inc. | | | 193,076 | |
| | 2,515 | | | Validus Holdings Ltd. | | | 81,738 | |
| | 13,362 | | | W.R. Berkley Corp. | | | 503,213 | |
| | | | | | | | |
| | | | | | | 4,524,069 | |
| | |
| Internet Software & Services – 1.5% | |
| | 6,995 | | | Cornerstone OnDemand, Inc.* | | | 145,356 | |
| | 10,491 | | | Internap Network Services Corp.* | | | 73,857 | |
| | |
| | |
| 66 | | The accompanying notes are an integral part of these financial statements. |
GOLDMAN SACHS STRUCTURED SMALL CAP EQUITY FUND
| | | | | | | | |
Shares | | | Description | | Value | |
| | | | | | | | |
| | Common Stocks – (continued) | |
| Internet Software & Services – (continued) | |
| | 7,746 | | | LivePerson, Inc.* | | $ | 123,006 | |
| | 15,723 | | | LogMeIn, Inc.* | | | 566,185 | |
| | 192,572 | | | Marchex, Inc. Class B(a) | | | 670,151 | |
| | 128,046 | | | RealNetworks, Inc. | | | 1,225,400 | |
| | | | | | | | |
| | | | | | | 2,803,955 | |
| | |
| IT Services – 2.7% | |
| | 7,669 | | | Acxiom Corp.* | | | 105,295 | |
| | 472,507 | | | Ciber, Inc.* | | | 1,965,629 | |
| | 27,001 | | | CSG Systems International, Inc.* | | | 388,814 | |
| | 20,079 | | | Lender Processing Services, Inc. | | | 533,098 | |
| | 613,275 | | | Lionbridge Technologies, Inc.* | | | 1,686,506 | |
| | 5,399 | | | ManTech International Corp. Class A | | | 169,637 | |
| | 49,961 | | | ModusLink Global Solutions, Inc.* | | | 247,307 | |
| | | | | | | | |
| | | | | | | 5,096,286 | |
| | |
| Machinery – 4.8% | |
| | 59,517 | | | Albany International Corp. Class A | | | 1,434,360 | |
| | 20,881 | | | Astec Industries, Inc.* | | | 653,366 | |
| | 55,949 | | | Kadant, Inc.* | | | 1,447,401 | |
| | 29,148 | | | Lydall, Inc.* | | | 307,511 | |
| | 35,436 | | | Miller Industries, Inc. | | | 581,150 | |
| | 21,536 | | | NACCO Industries, Inc. Class A | | | 2,443,690 | |
| | 28,436 | | | Oshkosh Corp.* | | | 649,194 | |
| | 2,077 | | | Sauer-Danfoss, Inc. | | | 89,955 | |
| | 23,239 | | | Tecumseh Products Co. Class A* | | | 88,773 | |
| | 21,559 | | | Tennant Co. | | | 955,064 | |
| | 19,400 | | | The Greenbrier Cos., Inc.* | | | 334,650 | |
| | 3,398 | | | Trinity Industries, Inc. | | | 100,581 | |
| | | | | | | | |
| | | | | | | 9,085,695 | |
| | |
| Media – 0.8% | |
| | 9,419 | | | Arbitron, Inc. | | | 358,393 | |
| | 8,803 | | | Digital Generation, Inc.* | | | 81,692 | |
| | 13,855 | | | Entercom Communications Corp. Class A* | | | 85,762 | |
| | 33,622 | | | Harte-Hanks, Inc. | | | 282,425 | |
| | 161,335 | | | Journal Communications, Inc. Class A* | | | 675,994 | |
| | | | | | | | |
| | | | | | | 1,484,266 | |
| | |
| Metals & Mining* – 0.5% | |
| | 90,042 | | | Golden Star Resources Ltd. | | | 137,764 | |
| | 30,852 | | | Materion Corp. | | | 762,353 | |
| | | | | | | | |
| | | | | | | 900,117 | |
| | |
| Multi-Utilities – 0.0% | |
| | 1,193 | | | Integrys Energy Group, Inc. | | | 65,186 | |
| | |
| Multiline Retail – 1.3% | |
| | 166,468 | | | Fred’s, Inc. Class A | | | 2,383,822 | |
| | 10,782 | | | Saks, Inc.* | | | 118,171 | |
| | | | | | | | |
| | | | | | | 2,501,993 | |
| | |
| | | | | | | | |
Shares | | | Description | | Value | |
| | | | | | | | |
| | Common Stocks – (continued) | |
| Oil, Gas & Consumable Fuels – 3.9% | |
| | 37,811 | | | Alon USA Energy, Inc. | | $ | 341,811 | |
| | 4,381 | | | Contango Oil & Gas Co.* | | | 237,713 | |
| | 33,448 | | | Delek US Holdings, Inc. | | | 545,202 | |
| | 3,824 | | | HollyFrontier Corp. | | | 117,856 | |
| | 77,720 | | | SemGroup Corp. Class A* | | | 2,471,496 | |
| | 13,870 | | | Targa Resources Corp. | | | 667,008 | |
| | 73,796 | | | Tesoro Corp.*(b) | | | 1,715,757 | |
| | 66,754 | | | Western Refining, Inc. | | | 1,271,664 | |
| | 5,729 | | | WPX Energy, Inc.* | | | 100,659 | |
| | | | | | | | |
| | | | | | | 7,469,166 | |
| | |
| Paper & Forest Products – 0.6% | |
| | 7,662 | | | Buckeye Technologies, Inc. | | | 248,325 | |
| | 54,479 | | | KapStone Paper and Packaging Corp.* | | | 983,891 | |
| | | | | | | | |
| | | | | | | 1,232,216 | |
| | |
| Pharmaceuticals* – 1.3% | |
| | 47,544 | | | Jazz Pharmaceuticals PLC | | | 2,426,170 | |
| | |
| Professional Services – 3.0% | |
| | 57,440 | | | CDI Corp. | | | 1,018,986 | |
| | 16,303 | | | Insperity, Inc. | | | 444,583 | |
| | 166,110 | | | Kelly Services, Inc. Class A | | | 2,323,879 | |
| | 70,533 | | | Kforce, Inc.* | | | 1,020,612 | |
| | 4,225 | | | Manpower, Inc. | | | 179,985 | |
| | 113,425 | | | Volt Information Sciences, Inc.* | | | 805,317 | |
| | | | | | | | |
| | | | | | | 5,793,362 | |
| | |
| Real Estate Investment Trusts – 8.6% | |
| | 10,989 | | | AG Mortgage Investment Trust, Inc. | | | 217,582 | |
| | 8,174 | | | CBL & Associates Properties, Inc. | | | 152,282 | |
| | 67,814 | | | DuPont Fabros Technology, Inc. | | | 1,841,150 | |
| | 20,336 | | | Equity Lifestyle Properties, Inc. | | | 1,422,300 | |
| | 4,550 | | | Equity One, Inc. | | | 94,549 | |
| | 25,547 | | | Extra Space Storage, Inc. | | | 775,352 | |
| | 191,832 | | | Franklin Street Properties Corp. | | | 1,931,748 | |
| | 6,271 | | | Getty Realty Corp. | | | 99,207 | |
| | 43,461 | | | LTC Properties, Inc. | | | 1,446,382 | |
| | 192,248 | | | MPG Office Trust, Inc.*(a) | | | 405,643 | |
| | 44,669 | | | National Health Investors, Inc. | | | 2,209,775 | |
| | 26,942 | | | Potlatch Corp. | | | 843,285 | |
| | 2,114 | | | PS Business Parks, Inc. | | | 144,281 | |
| | 52,469 | | | Rayonier, Inc. | | | 2,379,469 | |
| | 9,075 | | | Regency Centers Corp. | | | 408,012 | |
| | 5,949 | | | RLJ Lodging Trust | | | 111,722 | |
| | 2,706 | | | Sovran Self Storage, Inc. | | | 142,606 | |
| | 22,253 | | | Taubman Centers, Inc. | | | 1,717,487 | |
| | | | | | | | |
| | | | | | | 16,342,832 | |
| | |
| Real Estate Management & Development – 0.8% | |
| | 22,314 | | | Altisource Portfolio Solutions SA* | | | 1,335,046 | |
| | 3,389 | | | Jones Lang LaSalle, Inc. | | | 270,917 | |
| | | | | | | | |
| | | | | | | 1,605,963 | |
| | |
| | |
| The accompanying notes are an integral part of these financial statements. | | 67 |
GOLDMAN SACHS STRUCTURED SMALL CAP EQUITY FUND
Schedule of Investments (continued)
April 30, 2012 (Unaudited)
| | | | | | | | |
Shares | | | Description | | Value | |
| | | | | | | | |
| | Common Stocks – (continued) | |
| Road & Rail – 2.3% | |
| | 4,618 | | | Genesee & Wyoming, Inc. Class A* | | $ | 248,956 | |
| | 72,098 | | | Marten Transport Ltd. | | | 1,519,105 | |
| | 30,946 | | | Universal Truckload Services, Inc. | | | 482,758 | |
| | 87,984 | | | Werner Enterprises, Inc. | | | 2,078,182 | |
| | | | | | | | |
| | | | | | | 4,329,001 | |
| | |
| Semiconductors & Semiconductor Equipment – 1.4% | |
| | 54,155 | | | DSP Group, Inc.* | | | 354,173 | |
| | 19,707 | | | Kulicke and Soffa Industries, Inc.* | | | 258,162 | |
| | 177,593 | | | Lattice Semiconductor Corp.* | | | 969,658 | |
| | 10,394 | | | LSI Corp.* | | | 83,568 | |
| | 61,253 | | | Micrel, Inc. | | | 667,045 | |
| | 13,329 | | | MKS Instruments, Inc. | | | 368,547 | |
| | | | | | | | |
| | | | | | | 2,701,153 | |
| | |
| Software – 7.3% | |
| | 302,485 | | | Accelrys, Inc.* | | | 2,489,452 | |
| | 62,415 | | | Blackbaud, Inc. | | | 1,933,617 | |
| | 12,784 | | | CommVault Systems, Inc.* | | | 665,663 | |
| | 50,710 | | | Manhattan Associates, Inc.* | | | 2,543,107 | |
| | 18,081 | | | MicroStrategy, Inc. Class A* | | | 2,527,362 | |
| | 3,264 | | | OPNET Technologies, Inc. | | | 75,594 | |
| | 21,386 | | | Pegasystems, Inc. | | | 795,345 | |
| | 33,156 | | | PROS Holdings, Inc.* | | | 652,842 | |
| | 8,035 | | | QLIK Technologies, Inc.* | | | 231,488 | |
| | 23,293 | | | Quest Software, Inc.* | | | 542,028 | |
| | 2,764 | | | SS&C Technologies Holdings, Inc.* | | | 65,700 | |
| | 9,202 | | | Synopsys, Inc.* | | | 276,152 | |
| | 35,348 | | | TIBCO Software, Inc.* | | | 1,162,949 | |
| | | | | | | | |
| | | | | | | 13,961,299 | |
| | |
| Specialty Retail – 7.4% | |
| | 6,857 | | | ANN, Inc.* | | | 189,870 | |
| | 32,789 | | | Asbury Automotive Group, Inc.* | | | 915,469 | |
| | 82,916 | | | Francesca’s Holdings Corp.* | | | 2,599,417 | |
| | 40,100 | | | Group 1 Automotive, Inc. | | | 2,320,988 | |
| | 13,403 | | | Hot Topic, Inc. | | | 131,349 | |
| | 21,044 | | | Lithia Motors, Inc. Class A | | | 564,611 | |
| | 30,119 | | | Lumber Liquidators Holdings, Inc.*(a) | | | 871,343 | |
| | 18,186 | | | Select Comfort Corp.* | | | 525,212 | |
| | 39,866 | | | Shoe Carnival, Inc.* | | | 774,985 | |
| | 122,585 | | | Stage Stores, Inc. | | | 1,871,873 | |
| | 19,146 | | | The Buckle, Inc.(a) | | | 884,162 | |
| | 2,997 | | | The Finish Line, Inc. Class A | | | 66,713 | |
| | 68,191 | | | Zumiez, Inc.* | | | 2,499,882 | |
| | | | | | | | |
| | | | | | | 14,215,874 | |
| | |
| Textiles, Apparel & Luxury Goods – 1.0% | |
| | 28,512 | | | Kenneth Cole Productions, Inc. Class A* | | | 454,196 | |
| | 17,212 | | | Oxford Industries, Inc. | | | 826,004 | |
| | 30,899 | | | Perry Ellis International, Inc.* | | | 578,120 | |
| | 2,162 | | | Vera Bradley, Inc.* | | | 56,169 | |
| | | | | | | | |
| | | | | | | 1,914,489 | |
| | |
| | | | | | | | |
Shares | | | Description | | Value | |
| | | | | | | | |
| | Common Stocks – (continued) | |
| Thrifts & Mortgage Finance – 0.2% | |
| | 17,137 | | | Astoria Financial Corp. | | $ | 166,057 | |
| | 9,465 | | | Brookline Bancorp, Inc. | | | 84,996 | |
| | 6,416 | | | Provident Financial Services, Inc. | | | 94,315 | |
| | | | | | | | |
| | | | | | | 345,368 | |
| | |
| Tobacco – 0.3% | |
| | 123,905 | | | Alliance One International, Inc.* | | | 438,623 | |
| | 3,137 | | | Universal Corp. | | | 143,769 | |
| | | | | | | | |
| | | | | | | 582,392 | |
| | |
| Trading Companies & Distributors – 2.3% | |
| | 30,131 | | | Aircastle Ltd. | | | 366,092 | |
| | 42,798 | | | Beacon Roofing Supply, Inc.* | | | 1,142,279 | |
| | 21,134 | | | H&E Equipment Services, Inc.* | | | 407,886 | |
| | 22,973 | | | Interline Brands, Inc.* | | | 483,352 | |
| | 2,238 | | | MSC Industrial Direct Co., Inc. Class A | | | 164,963 | |
| | 26,231 | | | Watsco, Inc. | | | 1,887,320 | |
| | | | | | | | |
| | | | | | | 4,451,892 | |
| | |
| Wireless Telecommunication Services – 0.6% | |
| | 83,271 | | | USA Mobility, Inc. | | | 1,075,861 | |
| | |
| | TOTAL COMMON STOCKS | | | | |
| | (Cost $149,765,278) | | $ | 186,706,100 | |
| | |
| | | | | | | | | | | | | | |
Principal
Amount | | | Interest
Rate | | | Maturity
Date | | | Value | |
| | | | | | | | | | | | | | |
| | Short-term Investment(c) – 3.1% | |
| Repurchase Agreement – 3.1% | |
| Joint Repurchase Agreement Account II | |
| $ | 6,000,000 | | | | 0.211 | % | | | 05/01/12 | | | $ | 6,000,000 | |
| | (Cost $6,000,000) | | | | | |
| | |
| TOTAL INVESTMENTS BEFORE SECURITIES
LENDING REINVESTMENT VEHICLE |
|
| | (Cost $155,765,278) | | | $ | 192,706,100 | |
| | |
| | | | | | |
Shares | | Rate | | Value | |
| | | | | | |
| Securities Lending Reinvestment Vehicle(d)(e) – 2.2% | |
Financial Square Money Market Fund | |
| 4,287,800 | | 0.182% | | $ | 4,287,800 | |
| (Cost $4,287,800) | |
| |
| TOTAL INVESTMENTS – 103.0% | |
| (Cost $160,053,078) | | $ | 196,993,900 | |
| |
LIABILITIES IN EXCESS OF OTHER ASSETS – (3.0)% | | | (5,804,243 | ) |
| |
| NET ASSETS – 100.0% | | $ | 191,189,657 | |
| |
| | |
| 68 | | The accompanying notes are an integral part of these financial statements. |
GOLDMAN SACHS STRUCTURED SMALL CAP EQUITY FUND
| | |
| The percentage shown for each investment category reflects the value of investments in that category as a percentage of net assets. |
* | | Non-income producing security. |
(a) | | All or a portion of security is on loan. |
(b) | | A portion of this security is segregated as collateral for initial margin requirement on futures transactions. |
(c) | | Joint repurchase agreement was entered into on April 30, 2012. Additional information appears on page 85. |
(d) | | Variable rate security. Interest rate disclosed is that which is in effect at April 30, 2012. |
(e) | | Represents an affiliated issuer. |
|
| ADDITIONAL INVESTMENT INFORMATION |
FUTURES CONTRACTS — At April 30, 2012, the Fund had the following futures contracts:
| | | | | | | | | | | | | | |
| Type | | Number of
Contracts
Long (Short) | | | Expiration
Date | | Current
Value | | | Unrealized
Gain (Loss) | |
Russell 2000 Mini Index | | | 53 | | | June 2012 | | $ | 4,318,970 | | | $ | 107,601 | |
| | |
| The accompanying notes are an integral part of these financial statements. | | 69 |
GOLDMAN SACHS STRUCTURED SMALL CAP GROWTH FUND
Schedule of Investments
April 30, 2012 (Unaudited)
| | | | | | | | |
Shares | | | Description | | Value | |
| | | | | | | | |
| | Common Stocks – 97.9% | |
| Aerospace & Defense – 0.8% | |
| | 696 | | | American Science and Engineering, Inc. | | $ | 45,456 | |
| | 4,265 | | | Cubic Corp. | | | 197,171 | |
| | 905 | | | LMI Aerospace, Inc.* | | | 16,553 | |
| | 4,899 | | | Orbital Sciences Corp.* | | | 61,531 | |
| | 6,137 | | | Taser International, Inc.* | | | 28,230 | |
| | | | | | | | |
| | | | | | | 348,941 | |
| | |
| Air Freight & Logistics* – 0.4% | |
| | 29,813 | | | Pacer International, Inc. | | | 179,176 | |
| | |
| Airlines – 0.5% | |
| | 1,477 | | | Allegiant Travel Co.* | | | 86,789 | |
| | 4,403 | | | JetBlue Airways Corp.* | | | 20,914 | |
| | 13,243 | | | Republic Airways Holdings, Inc.* | | | 67,407 | |
| | 6,978 | | | SkyWest, Inc. | | | 62,732 | |
| | | | | | | | |
| | | | | | | 237,842 | |
| | |
| Auto Components – 0.9% | |
| | 1,988 | | | Dorman Products, Inc.* | | | 94,987 | |
| | 3,201 | | | Standard Motor Products, Inc. | | | 48,239 | |
| | 5,284 | | | Stoneridge, Inc.* | | | 45,548 | |
| | 10,986 | | | Superior Industries International, Inc. | | | 187,970 | |
| | | | | | | | |
| | | | | | | 376,744 | |
| | |
| Automobiles – 0.5% | |
| | 5,524 | | | Thor Industries, Inc. | | | 186,877 | |
| | 2,871 | | | Winnebago Industries, Inc.* | | | 27,992 | |
| | | | | | | | |
| | | | | | | 214,869 | |
| | |
| Beverages* – 1.8% | |
| | 751 | | | Monster Beverage Corp. | | | 48,785 | |
| | 5,943 | | | National Beverage Corp. | | | 88,313 | |
| | 6,223 | | | The Boston Beer Co., Inc. Class A(a) | | | 642,960 | |
| | | | | | | | |
| | | | | | | 780,058 | |
| | |
| Biotechnology – 6.1% | |
| | 2,901 | | | Affymax, Inc.* | | | 38,032 | |
| | 3,786 | | | Alkermes PLC* | | | 65,498 | |
| | 13,884 | | | Aveo Pharmaceuticals, Inc.* | | | 159,666 | |
| | 7,376 | | | Cepheid, Inc.* | | | 283,312 | |
| | 6,816 | | | Codexis, Inc.* | | | 24,674 | |
| | 15,826 | | | Cubist Pharmaceuticals, Inc.* | | | 669,123 | |
| | 11,647 | | | Emergent Biosolutions, Inc.* | | | 163,757 | |
| | 7,647 | | | Enzon Pharmaceuticals, Inc.* | | | 47,641 | |
| | 12,611 | | | Exelixis, Inc.* | | | 60,533 | |
| | 9,064 | | | Genomic Health, Inc.* | | | 259,774 | |
| | 7,841 | | | Momenta Pharmaceuticals, Inc.* | | | 124,515 | |
| | 40,408 | | | Nabi Biopharmaceuticals* | | | 67,481 | |
| | 1,740 | | | Onyx Pharmaceuticals, Inc.* | | | 79,187 | |
| | 29,709 | | | PDL BioPharma, Inc. | | | 186,870 | |
| | 10,385 | | | Progenics Pharmaceuticals, Inc.* | | | 114,131 | |
| | 915 | | | Regeneron Pharmaceuticals, Inc.* | | | 123,763 | |
| | 20,447 | | | SciClone Pharmaceuticals, Inc.* | | | 122,477 | |
| | 7,355 | | | Spectrum Pharmaceuticals, Inc.*(a) | | | 78,184 | |
| | 877 | | | United Therapeutics Corp.* | | | 38,369 | |
| | | | | | | | |
| | | | | | | 2,706,987 | |
| | |
| | | | | | | | |
Shares | | | Description | | Value | |
| | | | | | | | |
| | Common Stocks – (continued) | |
| Building Products – 0.3% | |
| | 1,751 | | | Simpson Manufacturing Co., Inc. | | $ | 54,334 | |
| | 2,683 | | | Universal Forest Products, Inc. | | | 100,344 | |
| | | | | | | | |
| | | | | | | 154,678 | |
| | |
| Capital Markets – 0.7% | |
| | 2,470 | | | Cohen & Steers, Inc. | | | 87,043 | |
| | 2,947 | | | GAMCO Investors, Inc. Class A | | | 132,792 | |
| | 1,572 | | | New Mountain Finance Corp. | | | 21,237 | |
| | 5,100 | | | Pzena Investment Management, Inc. Class A | | | 30,039 | |
| | 1,481 | | | Safeguard Scientifics, Inc.* | | | 24,229 | |
| | | | | | | | |
| | | | | | | 295,340 | |
| | |
| Chemicals – 2.6% | |
| | 1,688 | | | Koppers Holdings, Inc. | | | 65,629 | |
| | 12,340 | | | Kraton Performance Polymers, Inc.* | | | 320,840 | |
| | 3,644 | | | LSB Industries, Inc.* | | | 123,605 | |
| | 6,299 | | | PolyOne Corp. | | | 87,304 | |
| | 17,025 | | | Senomyx, Inc.* | | | 37,285 | |
| | 7,380 | | | Spartech Corp.* | | | 36,014 | |
| | 4,425 | | | Stepan Co. | | | 402,056 | |
| | 2,094 | | | TPC Group, Inc.* | | | 87,906 | |
| | | | | | | | |
| | | | | | | 1,160,639 | |
| | |
| Commercial Banks – 0.8% | |
| | 904 | | | Banner Corp. | | | 19,843 | |
| | 3,596 | | | Cathay General Bancorp | | | 61,923 | |
| | 2,564 | | | PacWest Bancorp | | | 61,074 | |
| | 10,525 | | | PrivateBancorp, Inc. | | | 165,558 | |
| | 2,422 | | | State Bank Financial Corp.* | | | 41,780 | |
| | | | | | | | |
| | | | | | | 350,178 | |
| | |
| Commercial Services & Supplies – 1.4% | |
| | 4,566 | | | ABM Industries, Inc. | | | 106,296 | |
| | 526 | | | Consolidated Graphics, Inc.* | | | 21,035 | |
| | 14,571 | | | HNI Corp. | | | 351,453 | |
| | 716 | | | Portfolio Recovery Associates, Inc.* | | | 49,275 | |
| | 2,234 | | | Steelcase, Inc. Class A | | | 19,302 | |
| | 2,486 | | | United Stationers, Inc. | | | 70,503 | |
| | | | | | | | |
| | | | | | | 617,864 | |
| | |
| Communications Equipment – 1.6% | |
| | 653 | | | Aruba Networks, Inc.* | | | 13,791 | |
| | 2,219 | | | Calix, Inc.* | | | 17,663 | |
| | 10,820 | | | Emulex Corp.* | | | 93,918 | |
| | 12,222 | | | Extreme Networks, Inc.* | | | 46,810 | |
| | 13,089 | | | Infinera Corp.* | | | 93,717 | |
| | 4,915 | | | Plantronics, Inc. | | | 188,343 | |
| | 5,114 | | | Polycom, Inc.* | | | 67,863 | |
| | 4,119 | | | Riverbed Technology, Inc.* | | | 81,268 | |
| | 23,745 | | | ShoreTel, Inc.* | | | 113,739 | |
| | | | | | | | |
| | | | | | | 717,112 | |
| | |
| Computers & Peripherals – 2.7% | |
| | 543 | | | Fusion-io, Inc.* | | | 13,928 | |
| | 2,669 | | | Imation Corp.* | | | 15,480 | |
| | |
| | |
| 70 | | The accompanying notes are an integral part of these financial statements. |
GOLDMAN SACHS STRUCTURED SMALL CAP GROWTH FUND
| | | | | | | | |
Shares | | | Description | | Value | |
| | | | | | | | |
| | Common Stocks – (continued) | |
| Computers & Peripherals – (continued) | |
| | 8,569 | | | QLogic Corp.* | | $ | 147,815 | |
| | 65,560 | | | Quantum Corp.* | | | 156,033 | |
| | 4,407 | | | Silicon Graphics International Corp.* | | | 41,602 | |
| | 23,049 | | | STEC, Inc.* | | | 191,076 | |
| | 5,063 | | | Super Micro Computer, Inc.* | | | 89,362 | |
| | 5,341 | | | Synaptics, Inc.* | | | 164,022 | |
| | 24,928 | | | Xyratex Ltd. | | | 361,955 | |
| | | | | | | | |
| | | | | | | 1,181,273 | |
| | |
| Consumer Finance – 0.6% | |
| | 3,433 | | | Cash America International, Inc. | | | 160,493 | |
| | 1,504 | | | World Acceptance Corp.* | | | 100,031 | |
| | | | | | | | |
| | | | | | | 260,524 | |
| | |
| Distributors – 0.5% | |
| | 3,854 | | | Core-Mark Holding Co., Inc. | | | 148,765 | |
| | 6,567 | | | VOXX International Corp.* | | | 83,335 | |
| | | | | | | | |
| | | | | | | 232,100 | |
| | |
| Diversified Consumer Services – 0.2% | |
| | 988 | | | Coinstar, Inc.* | | | 62,037 | |
| | 1,352 | | | Regis Corp. | | | 24,809 | |
| | | | | | | | |
| | | | | | | 86,846 | |
| | |
| Diversified Financial Services – 0.2% | |
| | 1,476 | | | Compass Diversified Holdings | | | 21,668 | |
| | 3,882 | | | PHH Corp.* | | | 60,171 | |
| | | | | | | | |
| | | | | | | 81,839 | |
| | |
| Diversified Telecommunication Services* – 0.2% | |
| | 15,032 | | | Cbeyond, Inc. | | | 96,656 | |
| | |
| Electrical Equipment – 0.5% | |
| | 2,992 | | | Coleman Cable, Inc.* | | | 25,432 | |
| | 4,665 | | | Generac Holdings, Inc.* | | | 112,333 | |
| | 13,360 | | | Vicor Corp. | | | 93,119 | |
| | | | | | | | |
| | | | | | | 230,884 | |
| | |
| Electronic Equipment, Instruments & Components – 2.4% | |
| | 5,560 | | | Agilysys, Inc.* | | | 48,705 | |
| | 10,334 | | | Benchmark Electronics, Inc.* | | | 164,104 | |
| | 15,783 | | | Brightpoint, Inc.* | | | 96,592 | |
| | 7,365 | | | Insight Enterprises, Inc.* | | | 149,583 | |
| | 2,084 | | | InvenSense, Inc.*(a) | | | 33,511 | |
| | 2,357 | | | Jabil Circuit, Inc. | | | 55,272 | |
| | 11,870 | | | Methode Electronics, Inc. | | | 100,301 | |
| | 1,827 | | | National Instruments Corp. | | | 49,694 | |
| | 6,979 | | | RadiSys Corp.* | | | 44,317 | |
| | 1,314 | | | TTM Technologies, Inc.* | | | 13,574 | |
| | 28,282 | | | Vishay Intertechnology, Inc.* | | | 317,324 | |
| | | | | | | | |
| | | | | | | 1,072,977 | |
| | |
| Energy Equipment & Services* – 0.2% | |
| | 6,011 | | | ION Geophysical Corp. | | | 37,448 | |
| | 8,993 | | | Parker Drilling Co. | | | 46,494 | |
| | | | | | | | |
| | | | | | | 83,942 | |
| | |
| | | | | | | | |
Shares | | | Description | | Value | |
| | | | | | | | |
| | Common Stocks – (continued) | |
| Food & Staples Retailing* – 0.2% | |
| | 3,367 | | | Susser Holdings Corp. | | $ | 89,865 | |
| | |
| Food Products – 2.6% | |
| | 3,513 | | | Dean Foods Co.* | | | 43,140 | |
| | 3,622 | | | Dole Food Co., Inc.* | | | 30,714 | |
| | 3,322 | | | Fresh Del Monte Produce, Inc. | | | 76,971 | |
| | 9,295 | | | Lancaster Colony Corp. | | | 606,127 | |
| | 56,771 | | | Pilgrim’s Pride Corp.* | | | 405,345 | |
| | | | | | | | |
| | | | | | | 1,162,297 | |
| | |
| Health Care Equipment & Supplies – 4.4% | |
| | 19,061 | | | Align Technology, Inc.* | | | 604,424 | |
| | 2,479 | | | Analogic Corp. | | | 169,093 | |
| | 3,028 | | | ICU Medical, Inc.* | | | 158,940 | |
| | 13,783 | | | Invacare Corp. | | | 218,461 | |
| | 19,058 | | | Masimo Corp.* | | | 421,753 | |
| | 4,962 | | | Medical Action Industries, Inc.* | | | 27,390 | |
| | 5,078 | | | Sirona Dental Systems, Inc.* | | | 256,490 | |
| | 5,675 | | | Vascular Solutions, Inc.* | | | 64,411 | |
| | | | | | | | |
| | | | | | | 1,920,962 | |
| | |
| Health Care Providers & Services – 3.7% | |
| | 5,300 | | | AMN Healthcare Services, Inc.* | | | 35,563 | |
| | 3,032 | | | Bio-Reference Laboratories, Inc.* | | | 64,642 | |
| | 3,039 | | | Centene Corp.* | | | 120,314 | |
| | 2,720 | | | CorVel Corp.* | | | 118,293 | |
| | 6,266 | | | Coventry Health Care, Inc. | | | 187,917 | |
| | 8,135 | | | Kindred Healthcare, Inc.* | | | 78,422 | |
| | 1,762 | | | Magellan Health Services, Inc.* | | | 78,021 | |
| | 17,694 | | | Molina Healthcare, Inc.* | | | 453,851 | |
| | 12,710 | | | PharMerica Corp.* | | | 150,868 | |
| | 5,450 | | | Skilled Healthcare Group, Inc. Class A* | | | 41,802 | |
| | 5,274 | | | WellCare Health Plans, Inc.* | | | 322,663 | |
| | | | | | | | |
| | | | | | | 1,652,356 | |
| | |
| Health Care Technology* – 1.0% | |
| | 11,226 | | | MedAssets, Inc. | | | 141,560 | |
| | 10,991 | | | Medidata Solutions, Inc. | | | 284,777 | |
| | | | | | | | |
| | | | | | | 426,337 | |
| | |
| Hotels, Restaurants & Leisure – 3.8% | |
| | 522 | | | Biglari Holdings, Inc.* | | | 212,104 | |
| | 7,425 | | | Boyd Gaming Corp.* | | | 57,098 | |
| | 5,297 | | | Marriott Vacations Worldwide Corp.* | | | 156,421 | |
| | 15,488 | | | Multimedia Games, Inc.* | | | 175,944 | |
| | 1,812 | | | P.F. Chang’s China Bistro, Inc. | | | 71,918 | |
| | 15,151 | | | Papa John’s International, Inc.* | | | 610,282 | |
| | 307 | | | Peet’s Coffee & Tea, Inc.* | | | 23,584 | |
| | 3,376 | | | Red Robin Gourmet Burgers, Inc.* | | | 120,388 | |
| | 13,027 | | | Texas Roadhouse, Inc. | | | 224,716 | |
| | 3,209 | | | Town Sports International Holdings, Inc.* | | | 41,139 | |
| | | | | | | | |
| | | | | | | 1,693,594 | |
| | |
| | |
| The accompanying notes are an integral part of these financial statements. | | 71 |
GOLDMAN SACHS STRUCTURED SMALL CAP GROWTH FUND
Schedule of Investments (continued)
April 30, 2012 (Unaudited)
| | | | | | | | |
Shares | | | Description | | Value | |
| | | | | | | | |
| | Common Stocks – (continued) | |
| Household Durables – 2.1% | |
| | 3,643 | | | Blyth, Inc. | | $ | 320,474 | |
| | 1,929 | | | Ethan Allen Interiors, Inc. | | | 44,753 | |
| | 9,566 | | | Hovnanian Enterprises, Inc. Class A* | | | 19,132 | |
| | 6,872 | | | iRobot Corp.* | | | 162,248 | |
| | 6,339 | | | Tempur-Pedic International, Inc.* | | | 372,987 | |
| | | | | | | | |
| | | | | | | 919,594 | |
| | |
| Household Products* – 0.1% | |
| | 3,827 | | | Central Garden & Pet Co. Class A | | | 40,911 | |
| | |
| Insurance – 0.6% | |
| | 930 | | | Global Indemnity PLC* | | | 16,749 | |
| | 10,172 | | | Primerica, Inc. | | | 266,812 | |
| | | | | | | | |
| | | | | | | 283,561 | |
| | |
| Internet Software & Services – 2.0% | |
| | 5,678 | | | Cornerstone OnDemand, Inc.* | | | 117,989 | |
| | 10,336 | | | LivePerson, Inc.* | | | 164,136 | |
| | 8,616 | | | LogMeIn, Inc.* | | | 310,262 | |
| | 14,917 | | | Marchex, Inc. Class B | | | 51,911 | |
| | 10,960 | | | RealNetworks, Inc. | | | 104,887 | |
| | 4,145 | | | Saba Software, Inc.* | | | 40,289 | |
| | 1,960 | | | VistaPrint NV*(a) | | | 73,089 | |
| | | | | | | | |
| | | | | | | 862,563 | |
| | |
| IT Services – 1.6% | |
| | 4,248 | | | Acxiom Corp.* | | | 58,325 | |
| | 5,186 | | | Convergys Corp.* | | | 69,337 | |
| | 5,904 | | | CSG Systems International, Inc.* | | | 85,018 | |
| | 5,622 | | | Global Cash Access Holdings, Inc.* | | | 47,506 | |
| | 2,047 | | | Lender Processing Services, Inc. | | | 54,348 | |
| | 40,706 | | | Lionbridge Technologies, Inc.* | | | 111,941 | |
| | 2,327 | | | ManTech International Corp. Class A | | | 73,114 | |
| | 3,658 | | | ModusLink Global Solutions, Inc.* | | | 18,107 | |
| | 13,400 | | | TeleTech Holdings, Inc.* | | | 203,010 | |
| | | | | | | | |
| | | | | | | 720,706 | |
| | |
| Leisure Equipment & Products – 0.8% | |
| | 1,958 | | | Arctic Cat, Inc.* | | | 86,622 | |
| | 2,565 | | | Polaris Industries, Inc. | | | 203,764 | |
| | 920 | | | Sturm Ruger & Co., Inc. | | | 52,504 | |
| | | | | | | | |
| | | | | | | 342,890 | |
| | |
| Life Sciences Tools & Services* – 0.5% | |
| | 36,801 | | | Affymetrix, Inc. | | | 162,660 | |
| | 6,109 | | | eResearchTechnology, Inc. | | | 48,261 | |
| | | | | | | | |
| | | | | | | 210,921 | |
| | |
| Machinery – 4.2% | |
| | 1,451 | | | Alamo Group, Inc. | | | 48,870 | |
| | 3,687 | | | Altra Holdings, Inc.* | | | 67,398 | |
| | 1,677 | | | American Railcar Industries, Inc.* | | | 45,245 | |
| | 7,593 | | | Astec Industries, Inc.* | | | 237,585 | |
| | 3,820 | | | Briggs & Stratton Corp. | | | 69,142 | |
| | 1,660 | | | Douglas Dynamics, Inc. | | | 23,456 | |
| | 1,276 | | | FreightCar America, Inc. | | | 27,562 | |
| | |
| | | | | | | | |
Shares | | | Description | | Value | |
| | | | | | | | |
| | Common Stocks – (continued) | |
| Machinery – (continued) | |
| | 12,473 | | | Lydall, Inc.* | | $ | 131,590 | |
| | 3,811 | | | Met-Pro Corp. | | | 37,958 | |
| | 3,066 | | | Mueller Industries, Inc. | | | 140,147 | |
| | 2,229 | | | NACCO Industries, Inc. Class A | | | 252,925 | |
| | 4,487 | | | Sauer-Danfoss, Inc. | | | 194,332 | |
| | 7,538 | | | Tecumseh Products Co. Class A* | | | 28,795 | |
| | 4,264 | | | Tennant Co. | | | 188,895 | |
| | 4,948 | | | The Greenbrier Cos., Inc.* | | | 85,353 | |
| | 8,099 | | | The Manitowoc Co., Inc. | | | 112,171 | |
| | 326 | | | The Toro Co. | | | 23,296 | |
| | 3,801 | | | TriMas Corp.* | | | 83,660 | |
| | 1,058 | | | Woodward, Inc. | | | 44,002 | |
| | | | | | | | |
| | | | | | | 1,842,382 | |
| | |
| Media – 0.9% | |
| | 4,211 | | | Arbitron, Inc. | | | 160,229 | |
| | 2,730 | | | Digital Generation, Inc.* | | | 25,334 | |
| | 11,693 | | | Entercom Communications Corp. Class A* | | | 72,380 | |
| | 2,490 | | | Harte-Hanks, Inc. | | | 20,916 | |
| | 13,571 | | | Journal Communications, Inc. Class A* | | | 56,862 | |
| | 3,474 | | | Pandora Media, Inc.*(a) | | | 29,876 | |
| | 960 | | | Scholastic Corp. | | | 29,328 | |
| | | | | | | | |
| | | | | | | 394,925 | |
| | |
| Metals & Mining – 0.2% | |
| | 2,743 | | | Commercial Metals Co. | | | 40,542 | |
| | 27,893 | | | Golden Star Resources Ltd.* | | | 42,676 | |
| | | | | | | | |
| | | | | | | 83,218 | |
| | |
| Oil, Gas & Consumable Fuels – 5.7% | |
| | 25,142 | | | Alon USA Energy, Inc. | | | 227,284 | |
| | 2,209 | | | Contango Oil & Gas Co.* | | | 119,861 | |
| | 1,907 | | | Crosstex Energy, Inc. | | | 28,414 | |
| | 8,139 | | | CVR Energy, Inc.* | | | 247,100 | |
| | 13,441 | | | Delek US Holdings, Inc. | | | 219,088 | |
| | 3,579 | | | Energy Partners Ltd.* | | | 58,266 | |
| | 3,957 | | | Rosetta Resources, Inc.* | | | 198,919 | |
| | 11,715 | | | SemGroup Corp. Class A* | | | 372,537 | |
| | 3,805 | | | Stone Energy Corp.* | | | 106,730 | |
| | 1,481 | | | Targa Resources Corp. | | | 71,221 | |
| | 10,195 | | | Tesoro Corp.* | | | 237,034 | |
| | 16,095 | | | W&T Offshore, Inc. | | | 318,198 | |
| | 16,705 | | | Western Refining, Inc. | | | 318,230 | |
| | | | | | | | |
| | | | | | | 2,522,882 | |
| | |
| Paper & Forest Products – 0.3% | | | | |
| | 1,329 | | | AbitibiBowater, Inc.* | | | 17,609 | |
| | 2,654 | | | Buckeye Technologies, Inc. | | | 86,016 | |
| | 2,419 | | | KapStone Paper and Packaging Corp.* | | | 43,687 | |
| | | | | | | | |
| | | | | | | 147,312 | |
| | |
| Personal Products – 0.9% | | | | |
| | 1,607 | | | Elizabeth Arden, Inc.* | | | 62,641 | |
| | 768 | | | Herbalife Ltd. | | | 54,006 | |
| | 7,884 | | | Medifast, Inc.*(a) | | | 151,530 | |
| | |
| | |
| 72 | | The accompanying notes are an integral part of these financial statements. |
GOLDMAN SACHS STRUCTURED SMALL CAP GROWTH FUND
| | | | | | | | |
Shares | | | Description | | Value | |
| | | | | | | | |
| | Common Stocks – (continued) | |
| Personal Products – (continued) | | | | |
| | 2,665 | | | USANA Health Sciences, Inc.* | | $ | 111,131 | |
| | | | | | | | |
| | | | | | | 379,308 | |
| | |
| Pharmaceuticals* – 1.7% | | | | |
| | 12,379 | | | Jazz Pharmaceuticals PLC | | | 631,700 | |
| | 6,402
| | | Obagi Medical Products, Inc. | | | 83,994 | |
| | 2,574 | | | ViroPharma, Inc. | | | 55,985 | |
| | | | | | | | |
| | | | | | | 771,679 | |
| | |
| Professional Services – 1.8% | | | | |
| | 6,984 | | | CDI Corp. | | | 123,896 | |
| | 3,806 | | | Heidrick & Struggles International, Inc. | | | 74,217 | |
| | 6,714 | | | Insperity, Inc. | | | 183,091 | |
| | 21,322 | | | Kelly Services, Inc. Class A | | | 298,295 | |
| | 3,660 | | | Kforce, Inc.* | | | 52,960 | |
| | 1,345 | | | Manpower, Inc. | | | 57,297 | |
| | | | | | | | |
| | | | | | | 789,756 | |
| | |
| Real Estate Investment Trusts – 4.0% | | | | |
| | 3,267 | | | AG Mortgage Investment Trust, Inc. | | | 64,687 | |
| | 2,187 | | | CBL & Associates Properties, Inc. | | | 40,744 | |
| | 3,559 | | | Chesapeake Lodging Trust | | | 64,418 | |
| | 5,344 | | | DuPont Fabros Technology, Inc. | | | 145,089 | |
| | 2,191 | | | Equity Lifestyle Properties, Inc. | | | 153,238 | |
| | 5,620 | | | Getty Realty Corp. | | | 88,908 | |
| | 4,499 | | | LTC Properties, Inc. | | | 149,727 | |
| | 5,376 | | | National Health Investors, Inc. | | | 265,951 | |
| | 6,896 | | | Potlatch Corp. | | | 215,845 | |
| | 2,973 | | | PS Business Parks, Inc. | | | 202,907 | |
| | 7,826 | | | Rayonier, Inc. | | | 354,909 | |
| | 233 | | | Taubman Centers, Inc. | | | 17,983 | |
| | | | | | | | |
| | | | | | | 1,764,406 | |
| | |
| Real Estate Management & Development* – 0.4% | |
| | 2,629 | | | Altisource Portfolio Solutions SA | | | 157,293 | |
| | |
| Road & Rail – 1.5% | | | | |
| | 12,875 | | | Celadon Group, Inc. | | | 201,236 | |
| | 2,557 | | | Genesee & Wyoming, Inc. Class A* | | | 137,848 | |
| | 3,455 | | | Universal Truckload Services, Inc. | | | 53,898 | |
| | 11,859 | | | Werner Enterprises, Inc. | | | 280,110 | |
| | | | | | | | |
| | | | | | | 673,092 | |
| | |
| Semiconductors & Semiconductor Equipment – 2.3% | | | | |
| | 18,480 | | | Integrated Device Technology, Inc.* | | | 125,110 | |
| | 50,794 | | | Lattice Semiconductor Corp.* | | | 277,335 | |
| | 26,786 | | | Micrel, Inc. | | | 291,700 | |
| | 21,540 | | | PLX Technology, Inc.* | | | 85,729 | |
| | 21,181 | | | RF Micro Devices, Inc.* | | | 91,714 | |
| | 4,809 | | | Standard Microsystems Corp.* | | | 127,342 | |
| | | | | | | | |
| | | | | | | 998,930 | |
| | |
| Software – 11.4% | | | | |
| | 11,231 | | | Accelrys, Inc.* | | | 92,431 | |
| | 4,699 | | | Actuate Corp.* | | | 33,363 | |
| | 11,397 | | | Advent Software, Inc.*(b) | | | 307,605 | |
| | |
| | | | | | | | |
Shares | | | Description | | Value | |
| | | | | | | | |
| | Common Stocks – (continued) | |
| Software – (continued) | | | | |
| | 2,670 | | | Aspen Technology, Inc.* | | $ | 52,813 | |
| | 13,613 | | | Blackbaud, Inc. | | | 421,731 | |
| | 4,013 | | | Bottomline Technologies, Inc.* | | | 94,426 | |
| | 9,283 | | | CommVault Systems, Inc.* | | | 483,366 | |
| | 2,563 | | | Deltek, Inc.* | | | 26,758 | |
| | 1,066 | | | ePlus, Inc.* | | | 31,617 | |
| | 914 | | | Imperva, Inc.* | | | 31,780 | |
| | 5,787 | | | Kenexa Corp.* | | | 189,061 | |
| | 9,466 | | | Manhattan Associates, Inc.* | | | 474,720 | |
| | 7,036 | | | Mentor Graphics Corp.* | | | 101,670 | |
| | 4,364 | | | MicroStrategy, Inc. Class A* | | | 610,000 | |
| | 1,284 | | | Monotype Imaging Holdings, Inc.* | | | 18,220 | |
| | 4,738 | | | OPNET Technologies, Inc. | | | 109,732 | |
| | 5,771 | | | Pegasystems, Inc. | | | 214,623 | |
| | 2,787 | | | Progress Software Corp.* | | | 64,491 | |
| | 5,541 | | | PROS Holdings, Inc.* | | | 109,102 | |
| | 3,242 | | | QAD, Inc. Class A* | | | 40,039 | |
| | 3,522 | | | QLIK Technologies, Inc.* | | | 101,469 | |
| | 15,395 | | | Quest Software, Inc.* | | | 358,242 | |
| | 2,233 | | | SeaChange International, Inc.* | | | 18,355 | |
| | 2,827 | | | Solarwinds, Inc.* | | | 132,614 | |
| | 2,975 | | | Synopsys, Inc.* | | | 89,280 | |
| | 7,045 | | | TeleNav, Inc.* | | | 47,695 | |
| | 7,597 | | | The Ultimate Software Group, Inc.* | | | 586,184 | |
| | 5,264 | | | TIBCO Software, Inc.* | | | 173,186 | |
| | | | | | | | |
| | | | | | | 5,014,573 | |
| | |
| Specialty Retail – 7.3% | | | | |
| | 2,085 | | | ANN, Inc.* | | | 57,734 | |
| | 3,676 | | | Body Central Corp.* | | | 111,640 | |
| | 2,075 | | | Conn’s, Inc.* | | | 33,926 | |
| | 18,508 | | | Francesca’s Holdings Corp.* | | | 580,226 | |
| | 9,439 | | | Group 1 Automotive, Inc. | | | 546,329 | |
| | 12,258 | | | Hot Topic, Inc. | | | 120,128 | |
| | 7,480 | | | Lithia Motors, Inc. Class A | | | 200,689 | |
| | 10,411 | | | Lumber Liquidators Holdings, Inc.* | | | 301,190 | |
| | 1,272 | | | Rue21, Inc.* | | | 38,605 | |
| | 7,367 | | | Select Comfort Corp.* | | | 212,759 | |
| | 4,982 | | | Sonic Automotive, Inc. Class A | | | 83,797 | |
| | 5,542 | | | The Buckle, Inc.(a) | | | 255,930 | |
| | 15,110 | | | Zale Corp.* | | | 41,401 | |
| | 16,974 | | | Zumiez, Inc.* | | | 622,267 | |
| | | | | | | | |
| | | | | | | 3,206,621 | |
| | |
| Textiles, Apparel & Luxury Goods – 1.2% | | | | |
| | 4,714 | | | Movado Group, Inc. | | | 133,642 | |
| | 6,708 | | | Oxford Industries, Inc. | | | 321,917 | |
| | 2,259 | | | Perry Ellis International, Inc.* | | | 42,266 | |
| | 1,343 | | | Vera Bradley, Inc.* | | | 34,891 | |
| | | | | | | | |
| | | | | | | 532,716 | |
| | |
| Tobacco – 0.1% | | | | |
| | 1,299 | | | Universal Corp. | | | 59,533 | |
| | |
| Trading Companies & Distributors – 4.5% | |
| | 11,872 | | | Aircastle Ltd. | | | 144,245 | |
| | |
| | |
| The accompanying notes are an integral part of these financial statements. | | 73 |
GOLDMAN SACHS STRUCTURED SMALL CAP GROWTH FUND
Schedule of Investments (continued)
April 30, 2012 (Unaudited)
| | | | | | | | |
Shares | | | Description | | Value | |
| | | | | | | | |
| | Common Stocks – (continued) | �� |
| Trading Companies & Distributors – (continued) | |
| | 5,760 | | | Applied Industrial Technologies, Inc. | | $ | 226,368 | |
| | 12,900 | | | Beacon Roofing Supply, Inc.* | | | 344,301 | |
| | 15,304 | | | H&E Equipment Services, Inc.* | | | 295,367 | |
| | 18,145 | | | Interline Brands, Inc.* | | | 381,771 | |
| | 968 | | | Kaman Corp. | | | 33,280 | |
| | 381 | | | MSC Industrial Direct Co., Inc. Class A | | | 28,083 | |
| | 1,160 | | | Rush Enterprises, Inc. Class A* | | | 20,973 | |
| | 7,103 | | | Watsco, Inc. | | | 511,061 | |
| | | | | | | | |
| | | | | | | 1,985,449 | |
| | |
| Water Utilities – 0.1% | | | | |
| | 5,539 | | | Consolidated Water Co., Ltd. | | | 39,715 | |
| | |
| Wireless Telecommunication Services – 0.1% | | | | |
| | 4,720 | | | USA Mobility, Inc. | | | 60,982 | |
| | |
| | TOTAL COMMON STOCKS | | | | |
| | (Cost $35,576,766) | | $ | 43,218,798 | |
| | |
| | | | | | | | | | | | | | |
Principal
Amount | | | Interest
Rate | | | Maturity
Date | | | Value | |
| | | | | | | | | | | | | | |
| | Short-term Investment(c) – 3.0% | | | | | |
| Repurchase Agreement – 3.0% | | | | | |
| Joint Repurchase Agreement Account II | | | | | |
| $ | 1,300,000 | | | | 0.211 | % | | | 05/01/12 | | | $ | 1,300,000 | |
| | (Cost $1,300,000) | | | | | | | | | |
| | |
| TOTAL INVESTMENTS BEFORE SECURITIES
LENDING REINVESTMENT VEHICLE |
|
| | (Cost $36,876,766) | | | | | | | $ | 44,518,798 | |
| | |
| | | | | | |
Shares | | Rate | | Value | |
| | | | | | |
| Securities Lending Reinvestment Vehicle(d)(e) – 1.6% | |
Financial Square Money Market Fund | |
| 710,725 | | 0.182% | | $ | 710,725 | |
| (Cost $710,725) | | | | |
| |
| TOTAL INVESTMENTS – 102.5% | |
| (Cost $37,587,491) | | $ | 45,229,523 | |
| |
LIABILITIES IN EXCESS OF OTHER ASSETS – (2.5)% | | | (1,095,278 | ) |
| |
| NET ASSETS – 100.0% | | $ | 44,134,245 | |
| |
| | |
| The percentage shown for each investment category reflects the value of investments in that category as a percentage of net assets. |
* | | Non-income producing security. |
(a) | | All or a portion of security is on loan. |
(b) | | All or a portion of security is segregated as collateral for initial margin requirement on futures transactions. |
(c) | | Joint repurchase agreement was entered into on April 30, 2012. Additional information appears on page 85. |
(d) | | Variable rate security. Interest rate disclosed is that which is in effect at April 30, 2012. |
(e) | | Represents an affiliated issuer. |
|
| ADDITIONAL INVESTMENT INFORMATION |
FUTURES CONTRACTS — At April 30, 2012, the Fund had the following futures contracts:
| | | | | | | | | | | | | | | | |
| Type | | Number of
Contracts
Long (Short) | | | Expiration
Date | | | Current
Value | | | Unrealized
Gain (Loss) | |
Russell 2000 Mini Index | | | 10 | | | | June 2012 | | | $ | 814,900 | | | $ | 6,464 | |
| | |
| 74 | | The accompanying notes are an integral part of these financial statements. |
GOLDMAN SACHS STRUCTURED SMALL CAP VALUE FUND
Schedule of Investments
April 30, 2012 (Unaudited)
| | | | | | | | |
Shares | | | Description | | Value | |
| | | | | | | | |
| | Common Stocks – 97.5% | |
| Aerospace & Defense – 1.3% | |
| | 6,768 | | | Aerovironment, Inc.* | | $ | 164,598 | |
| | 1,363 | | | American Science and Engineering, Inc. | | | 89,017 | |
| | 23,312 | | | Ceradyne, Inc. | | | 590,260 | |
| | 3,950 | | | Cubic Corp. | | | 182,608 | |
| | 6,710 | | | DigitalGlobe, Inc.* | | | 82,332 | |
| | 8,277 | | | Ducommun, Inc.* | | | 97,669 | |
| | 6,145 | | | Exelis, Inc. | | | 70,852 | |
| | 1,331 | | | Huntington Ingalls Industries, Inc.* | | | 52,508 | |
| | 11,550 | | | LMI Aerospace, Inc.* | | | 211,249 | |
| | 12,830 | | | Orbital Sciences Corp.* | | | 161,145 | |
| | | | | | | | |
| | | | | | | 1,702,238 | |
| | |
| Air Freight & Logistics* – 0.1% | |
| | 25,809 | | | Pacer International, Inc. | | | 155,112 | |
| | |
| Airlines – 0.7% | |
| | 4,818 | | | Allegiant Travel Co.* | | | 283,106 | |
| | 65,752 | | | SkyWest, Inc. | | | 591,110 | |
| | | | | | | | |
| | | | | | | 874,216 | |
| | |
| Auto Components – 0.5% | |
| | 18,088 | | | Modine Manufacturing Co.* | | | 142,895 | |
| | 22,870 | | | Spartan Motors, Inc. | | | 99,485 | |
| | 28,666 | | | Superior Industries International, Inc. | | | 490,475 | |
| | | | | | | | |
| | | | | | | 732,855 | |
| | |
| Automobiles – 0.1% | |
| | 5,791 | | | Thor Industries, Inc. | | | 195,910 | |
| | |
| Beverages* – 1.0% | |
| | 2,190 | | | Monster Beverage Corp. | | | 142,262 | |
| | 14,754 | | | National Beverage Corp. | | | 219,245 | |
| | 9,825 | | | The Boston Beer Co., Inc. Class A(a) | | | 1,015,119 | |
| | | | | | | | |
| | | | | | | 1,376,626 | |
| | |
| Biotechnology* – 0.5% | |
| | 5,503 | | | Aveo Pharmaceuticals, Inc. | | | 63,285 | |
| | 18,073 | | | Emergent Biosolutions, Inc. | | | 254,106 | |
| | 14,855 | | | Enzon Pharmaceuticals, Inc. | | | 92,547 | |
| | 1,590 | | | Genomic Health, Inc. | | | 45,569 | |
| | 5,902 | | | Momenta Pharmaceuticals, Inc. | | | 93,724 | |
| | 33,046 | | | Nabi Biopharmaceuticals | | | 55,187 | |
| | | | | | | | |
| | | | | | | 604,418 | |
| | |
| Building Products – 0.8% | |
| | 7,390 | | | American Woodmark Corp. | | | 132,650 | |
| | 5,484 | | | Simpson Manufacturing Co., Inc. | | | 170,169 | |
| | 19,587 | | | Universal Forest Products, Inc. | | | 732,554 | |
| | | | | | | | |
| | | | | | | 1,035,373 | |
| | |
| Capital Markets – 3.3% | |
| | 32,716 | | | BlackRock Kelso Capital Corp. | | | 315,709 | |
| | 1,932 | | | Capital Southwest Corp.(b) | | | 184,931 | |
| | 14,483 | | | GAMCO Investors, Inc. Class A | | | 652,604 | |
| | 25,395 | | | Gladstone Capital Corp. | | | 203,414 | |
| | 6,973 | | | Golub Capital BDC, Inc. | | | 103,619 | |
| | |
| | | | | | | | |
Shares | | | Description | | Value | |
| | | | | | | | |
| | Common Stocks – (continued) | |
| Capital Markets – (continued) | |
| | 9,550 | | | Greenhill & Co., Inc. | | $ | 371,017 | |
| | 66,063 | | | Hercules Technology Growth Capital, Inc. | | | 753,779 | |
| | 9,391 | | | INTL FCStone, Inc.* | | | 201,906 | |
| | 6,978 | | | Knight Capital Group, Inc. Class A* | | | 91,691 | |
| | 13,175 | | | MVC Capital, Inc. | | | 173,910 | |
| | 81,617 | | | NGP Capital Resources Co. | | | 497,048 | |
| | 2,772 | | | Raymond James Financial, Inc. | | | 101,511 | |
| | 18,325 | | | Safeguard Scientifics, Inc.* | | | 299,797 | |
| | 44,217 | | | TICC Capital Corp. | | | 407,239 | |
| | | | | | | | |
| | | | | | | 4,358,175 | |
| | |
| Chemicals – 2.5% | |
| | 33,731 | | | A. Schulman, Inc. | | | 830,120 | |
| | 2,643 | | | Georgia Gulf Corp.* | | | 93,694 | |
| | 5,375 | | | Innophos Holdings, Inc. | | | 264,289 | |
| | 31,185 | | | Kraton Performance Polymers, Inc.* | | | 810,810 | |
| | 1,219 | | | Minerals Technologies, Inc. | | | 81,795 | |
| | 5,603 | | | OM Group, Inc.* | | | 135,144 | |
| | 40,895 | | | PolyOne Corp. | | | 566,805 | |
| | 29,178 | | | Spartech Corp.* | | | 142,389 | |
| | 2,843 | | | Stepan Co. | | | 258,315 | |
| | 2,037 | | | TPC Group, Inc.* | | | 85,513 | |
| | 4,608 | | | Tredegar Corp. | | | 79,949 | |
| | | | | | | | |
| | | | | | | 3,348,823 | |
| | |
| Commercial Banks – 11.5% | |
| | 10,558 | | | 1st Source Corp. | | | 239,561 | |
| | 33,259 | | | Banco Latinoamericano de Comercio Exterior SA Class E | | | 693,450 | |
| | 6,008 | | | Cathay General Bancorp | | | 103,458 | |
| | 139,861 | | | CVB Financial Corp. | | | 1,618,192 | |
| | 9,687 | | | F.N.B. Corp. | | | 109,947 | |
| | 28,175 | | | First Bancorp | | | 282,314 | |
| | 31,009 | | | First Financial Bancorp | | | 521,261 | |
| | 44,542 | | | First Interstate BancSystem, Inc. | | | 627,597 | |
| | 26,834 | | | First Niagara Financial Group, Inc. | | | 239,896 | |
| | 27,324 | | | FirstMerit Corp. | | | 459,043 | |
| | 39,696 | | | Glacier Bancorp, Inc. | | | 591,470 | |
| | 17,468 | | | Great Southern Bancorp, Inc. | | | 419,931 | |
| | 3,725 | | | Home Bancshares, Inc. | | | 108,547 | |
| | 91,353 | | | International Bancshares Corp. | | | 1,802,395 | |
| | 97,827 | | | Investors Bancorp, Inc.* | | | 1,510,449 | |
| | 6,175 | | | Lakeland Financial Corp. | | | 160,797 | |
| | 7,914 | | | National Penn Bancshares, Inc. | | | 72,967 | |
| | 2,656 | | | PacWest Bancorp | | | 63,266 | |
| | 4,164 | | | Park National Corp.(a) | | | 280,029 | |
| | 55,825 | | | Popular, Inc.* | | | 99,369 | |
| | 20,392 | | | PrivateBancorp, Inc. | | | 320,766 | |
| | 8,486 | | | Prosperity Bancshares, Inc. | | | 395,872 | |
| | 33,225 | | | Renasant Corp. | | | 531,600 | |
| | 21,725 | | | Southwest Bancorp, Inc.* | | | 197,480 | |
| | 8,357 | | | State Bank Financial Corp.* | | | 144,158 | |
| | 24,531 | | | Susquehanna Bancshares, Inc. | | | 254,386 | |
| | 16,960 | | | SVB Financial Group* | | | 1,086,966 | |
| | 41,135 | | | Texas Capital Bancshares, Inc.* | | | 1,551,201 | |
| | |
| | |
| The accompanying notes are an integral part of these financial statements. | | 75 |
GOLDMAN SACHS STRUCTURED SMALL CAP VALUE FUND
Schedule of Investments (continued)
April 30, 2012 (Unaudited)
| | | | | | | | |
Shares | | | Description | | Value | |
| | | | | | | | |
| | Common Stocks – (continued) | |
| Commercial Banks – (continued) | |
| | 3,912 | | | TriCo Bancshares | | $ | 64,313 | |
| | 17,728 | | | Umpqua Holdings Corp. | | | 234,719 | |
| | 84,003 | | | Wilshire Bancorp, Inc.* | | | 450,256 | |
| | 4,982 | | | Wintrust Financial Corp. | | | 180,000 | |
| | | | | | | | |
| | | | | | | 15,415,656 | |
| | |
| Commercial Services & Supplies – 0.5% | |
| | 3,557 | | | HNI Corp. | | | 85,795 | |
| | 43,463 | | | Kimball International, Inc. Class B | | | 296,852 | |
| | 10,029 | | | United Stationers, Inc. | | | 284,423 | |
| | | | | | | | |
| | | | | | | 667,070 | |
| | |
| Communications Equipment* – 0.8% | |
| | 8,656 | | | Calix, Inc. | | | 68,902 | |
| | 21,259 | | | Emulex Corp. | | | 184,528 | |
| | 95,179 | | | Extreme Networks, Inc. | | | 364,536 | |
| | 6,831 | | | Polycom, Inc. | | | 90,647 | |
| | 9,105 | | | ShoreTel, Inc. | | | 43,613 | |
| | 65,958 | | | Symmetricom, Inc. | | | 366,726 | |
| | | | | | | | |
| | | | | | | 1,118,952 | |
| | |
| Computers & Peripherals – 2.0% | |
| | 46,971 | | | Electronics for Imaging, Inc.* | | | 838,432 | |
| | 67,110 | | | Imation Corp.* | | | 389,238 | |
| | 11,882 | | | QLogic Corp.* | | | 204,965 | |
| | 147,927 | | | Quantum Corp.* | | | 352,066 | |
| | 7,659 | | | Silicon Graphics International Corp.*(a) | | | 72,301 | |
| | 25,272 | | | STEC, Inc.* | | | 209,505 | |
| | 44,806 | | | Xyratex Ltd. | | | 650,583 | |
| | | | | | | | |
| | | | | | | 2,717,090 | |
| | |
| Consumer Finance – 0.3% | |
| | 9,145 | | | Cash America International, Inc. | | | 427,529 | |
| | |
| Distributors – 0.1% | |
| | 2,678 | | | Core-Mark Holding Co., Inc. | | | 103,371 | |
| | |
| Diversified Consumer Services – 0.4% | |
| | 9,071 | | | Ascent Capital Group LLC Class A* | | | 467,156 | |
| | 6,067 | | | Universal Technical Institute, Inc. | | | 72,804 | |
| | | | | | | | |
| | | | | | | 539,960 | |
| | |
| Diversified Financial Services – 0.2% | |
| | 10,333 | | | Compass Diversified Holdings | | | 151,688 | |
| | 2,383 | | | PICO Holdings, Inc.* | | | 57,216 | |
| | | | | | | | |
| | | | | | | 208,904 | |
| | |
| Electric Utilities – 1.9% | |
| | 59,945 | | | PNM Resources, Inc. | | | 1,124,568 | |
| | 52,726 | | | Portland General Electric Co. | | | 1,361,913 | |
| | | | | | | | |
| | | | | | | 2,486,481 | |
| | |
| | | | | | | | |
Shares | | | Description | | Value | |
| | | | | | | | |
| | Common Stocks – (continued) | |
| Electrical Equipment – 0.6% | |
| | 9,209 | | | Encore Wire Corp. | | $ | 234,737 | |
| | 69,049 | | | LSI Industries, Inc. | | | 472,986 | |
| | 14,694 | | | Vicor Corp. | | | 102,417 | |
| | | | | | | | |
| | | | | | | 810,140 | |
| | |
| Electronic Equipment, Instruments & Components – 1.8% | |
| | 39,811 | | | Agilysys, Inc.* | | | 348,744 | |
| | 16,540 | | | CTS Corp. | | | 177,474 | |
| | 36,047 | | | Insight Enterprises, Inc.* | | | 732,115 | |
| | 3,034 | | | InvenSense, Inc.*(a) | | | 48,787 | |
| | 47,990 | | | Methode Electronics, Inc. | | | 405,515 | |
| | 8,012 | | | Newport Corp.* | | | 136,765 | |
| | 16,737 | | | RadiSys Corp.* | | | 106,280 | |
| | 38,447 | | | Vishay Intertechnology, Inc.* | | | 431,375 | |
| | | | | | | | |
| | | | | | | 2,387,055 | |
| | |
| Energy Equipment & Services* – 0.4% | |
| | 5,412 | | | Dawson Geophysical Co. | | | 145,312 | |
| | 14,825 | | | Parker Drilling Co. | | | 76,645 | |
| | 14,910 | | | Union Drilling, Inc. | | | 83,049 | |
| | 31,972 | | | Willbros Group, Inc. | | | 172,649 | |
| | | | | | | | |
| | | | | | | 477,655 | |
| | |
| Food & Staples Retailing – 0.3% | |
| | 7,139 | | | Ingles Markets, Inc. Class A | | | 124,147 | |
| | 11,696 | | | Susser Holdings Corp.* | | | 312,166 | |
| | | | | | | | |
| | | | | | | 436,313 | |
| | |
| Food Products – 2.3% | |
| | 7,769 | | | Dean Foods Co.* | | | 95,403 | |
| | 80,513 | | | Dole Food Co., Inc.*(a) | | | 682,750 | |
| | 17,334 | | | Fresh Del Monte Produce, Inc. | | | 401,629 | |
| | 13,718 | | | Lancaster Colony Corp. | | | 894,551 | |
| | 133,258 | | | Pilgrim’s Pride Corp.* | | | 951,462 | |
| | | | | | | | |
| | | | | | | 3,025,795 | |
| | |
| Gas Utilities – 1.4% | |
| | 43,717 | | | Southwest Gas Corp. | | | 1,836,988 | |
| | |
| Health Care Equipment & Supplies – 0.3% | |
| | 3,925 | | | Align Technology, Inc.* | | | 124,462 | |
| | 10,376 | | | Invacare Corp. | | | 164,459 | |
| | 12,852 | | | Medical Action Industries, Inc.* | | | 70,943 | |
| | | | | | | | |
| | | | | | | 359,864 | |
| | |
| Health Care Providers & Services – 2.2% | |
| | 17,712 | | | Assisted Living Concepts, Inc. Class A | | | 317,222 | |
| | 2,217 | | | Bio-Reference Laboratories, Inc.* | | | 47,267 | |
| | 41,420 | | | Kindred Healthcare, Inc.* | | | 399,289 | |
| | 7,708 | | | Magellan Health Services, Inc.* | | | 341,310 | |
| | 51,559 | | | Molina Healthcare, Inc.* | | | 1,322,488 | |
| | 22,355 | | | Skilled Healthcare Group, Inc. Class A* | | | 171,463 | |
| | 43,163 | | | Universal American Corp. | | | 396,236 | |
| | | | | | | | |
| | | | | | | 2,995,275 | |
| | |
| | |
| 76 | | The accompanying notes are an integral part of these financial statements. |
GOLDMAN SACHS STRUCTURED SMALL CAP VALUE FUND
| | | | | | | | |
Shares | | | Description | | Value | |
| | | | | | | | |
| | Common Stocks – (continued) | |
| Hotels, Restaurants & Leisure* – 1.7% | |
| | 2,778 | | | Biglari Holdings, Inc. | | $ | 1,128,785 | |
| | 15,749 | | | Boyd Gaming Corp. | | | 121,110 | |
| | 23,808 | | | Papa John’s International, Inc. | | | 958,986 | |
| | | | | | | | |
| | | | | | | 2,208,881 | |
| | |
| Household Durables – 2.2% | |
| | 16,108 | | | Blyth, Inc.(a) | | | 1,417,021 | |
| | 6,605 | | | CSS Industries, Inc. | | | 126,486 | |
| | 9,240 | | | Ethan Allen Interiors, Inc. | | | 214,368 | |
| | 15,754 | | | Hooker Furniture Corp. | | | 186,527 | |
| | 32,825 | | | Hovnanian Enterprises, Inc. Class A* | | | 65,650 | |
| | 16,149 | | | Tempur-Pedic International, Inc.* | | | 950,207 | |
| | | | | | | | |
| | | | | | | 2,960,259 | |
| | |
| Household Products* – 0.5% | |
| | 61,857 | | | Central Garden & Pet Co. Class A | | | 661,251 | |
| | |
| Independent Power Producers & Energy Traders – 0.1% | |
| | 19,258 | | | Genie Energy Ltd. Class B | | | 160,227 | |
| | |
| Industrial Conglomerates* – 0.2% | |
| | 125 | | | Seaboard Corp. | | | 248,802 | |
| | |
| Insurance – 5.3% | |
| | 7,399 | | | Allied World Assurance Co. Holdings Ltd. | | | 532,432 | |
| | 3,275 | | | Alterra Capital Holdings Ltd. | | | 78,371 | |
| | 34,961 | | | American Equity Investment Life Holding Co. | | | 428,622 | |
| | 103,413 | | | CNO Financial Group, Inc.* | | | 751,813 | |
| | 4,025 | | | First American Financial Corp. | | | 67,419 | |
| | 137,179 | | | Flagstone Reinsurance Holdings SA | | | 1,028,842 | |
| | 15,488 | | | Global Indemnity PLC* | | | 278,939 | |
| | 5,252 | | | Kansas City Life Insurance Co.(a) | | | 170,900 | |
| | 70,094 | | | Maiden Holdings Ltd. | | | 581,780 | |
| | 3,357 | | | Mercury General Corp. | | | 151,703 | |
| | 8,928 | | | Presidential Life Corp. | | | 103,386 | |
| | 37,856 | | | Primerica, Inc. | | | 992,963 | |
| | 14,296 | | | Reinsurance Group of America, Inc. | | | 831,169 | |
| | 24,745 | | | Symetra Financial Corp. | | | 300,899 | |
| | 6,588 | | | Tower Group, Inc. | | | 142,169 | |
| | 8,249 | | | United Fire Group, Inc. | | | 142,048 | |
| | 1,730 | | | Validus Holdings Ltd. | | | 56,225 | |
| | 13,131 | | | W.R. Berkley Corp. | | | 494,513 | |
| | | | | | | | |
| | | | | | | 7,134,193 | |
| | |
| Internet Software & Services – 0.5% | |
| | 1,971 | | | Cornerstone OnDemand, Inc.* | | | 40,958 | |
| | 1,322 | | | LogMeIn, Inc.* | | | 47,605 | |
| | 72,386 | | | Marchex, Inc. Class B(a) | | | 251,903 | |
| | 32,793 | | | RealNetworks, Inc. | | | 313,829 | |
| | | | | | | | |
| | | | | | | 654,295 | |
| | |
| IT Services – 1.6% | |
| | 16,557 | | | Acxiom Corp.* | | | 227,328 | |
| | 133,641 | | | Ciber, Inc.* | | | 555,947 | |
| | 30,060 | | | Convergys Corp.* | | | 401,902 | |
| | |
| | | | | | | | |
Shares | | | Description | | Value | |
| | | | | | | | |
| | Common Stocks – (continued) | |
| IT Services – (continued) | |
| | 7,874 | | | CSG Systems International, Inc.* | | $ | 113,386 | |
| | 6,903 | | | Global Cash Access Holdings, Inc.* | | | 58,330 | |
| | 4,069 | | | Heartland Payment Systems, Inc. | | | 123,982 | |
| | 2,314 | | | Jack Henry & Associates, Inc. | | | 78,583 | |
| | 66,490 | | | Lionbridge Technologies, Inc.* | | | 182,847 | |
| | 7,763 | | | ManTech International Corp. Class A | | | 243,913 | |
| | 3,914 | | | Sapient Corp. | | | 46,851 | |
| | 11,157 | | | TeleTech Holdings, Inc.* | | | 169,029 | |
| | | | | | | | |
| | | | | | | 2,202,098 | |
| | |
| Leisure Equipment & Products – 0.3% | |
| | 4,896 | | | Arctic Cat, Inc.* | | | 216,599 | |
| | 30,199 | | | Callaway Golf Co. | | | 185,120 | |
| | 961 | | | Sturm Ruger & Co., Inc. | | | 54,844 | |
| | | | | | | | |
| | | | | | | 456,563 | |
| | |
| Life Sciences Tools & Services* – 0.4% | |
| | 99,481 | | | Affymetrix, Inc. | | | 439,706 | |
| | 23,292 | | | Albany Molecular Research, Inc. Class A | | | 74,301 | |
| | | | | | | | |
| | | | | | | 514,007 | |
| | |
| Machinery – 4.4% | |
| | 24,612 | | | Albany International Corp. Class A | | | 593,149 | |
| | 6,291 | | | American Railcar Industries, Inc.* | | | 169,731 | |
| | 12,494 | | | Astec Industries, Inc.* | | | 390,937 | |
| | 28,384 | | | Briggs & Stratton Corp. | | | 513,750 | |
| | 9,136 | | | EnPro Industries, Inc.* | | | 378,322 | |
| | 1,905 | | | FreightCar America, Inc. | | | 41,148 | |
| | 20,596 | | | Kadant, Inc.* | | | 532,819 | |
| | 32,415 | | | Miller Industries, Inc. | | | 531,606 | |
| | 22,369 | | | Mueller Industries, Inc. | | | 1,022,487 | |
| | 9,732 | | | NACCO Industries, Inc. Class A | | | 1,104,290 | |
| | 3,636 | | | Oshkosh Corp.* | | | 83,010 | |
| | 1,934 | | | Sauer-Danfoss, Inc. | | | 83,762 | |
| | 35,766 | | | Tecumseh Products Co. Class A* | | | 136,626 | |
| | 14,132 | | | The Greenbrier Cos., Inc.* | | | 243,777 | |
| | 2,130 | | | Trinity Industries, Inc. | | | 63,048 | |
| | | | | | | | |
| | | | | | | 5,888,462 | |
| | |
| Media – 0.5% | |
| | 4,211 | | | Arbitron, Inc. | | | 160,229 | |
| | 13,330 | | | Entercom Communications Corp. Class A* | | | 82,513 | |
| | 82,292 | | | Journal Communications, Inc. Class A* | | | 344,803 | |
| | 1,575 | | | Scholastic Corp. | | | 48,116 | |
| | | | | | | | |
| | | | | | | 635,661 | |
| | |
| Metals & Mining – 0.8% | |
| | 3,776 | | | Commercial Metals Co. | | | 55,809 | |
| | 9,977 | | | Kaiser Aluminum Corp. | | | 524,491 | |
| | 16,920 | | | Materion Corp.* | | | 418,093 | |
| | 3,983 | | | Olympic Steel, Inc. | | | 84,161 | |
| | 798 | | | Royal Gold, Inc. | | | 49,444 | |
| | | | | | | | |
| | | | | | | 1,131,998 | |
| | |
| | |
| The accompanying notes are an integral part of these financial statements. | | 77 |
GOLDMAN SACHS STRUCTURED SMALL CAP VALUE FUND
Schedule of Investments (continued)
April 30, 2012 (Unaudited)
| | | | | | | | |
Shares | | | Description | | Value | |
| | | | | | | | |
| | Common Stocks – (continued) | |
| Multi-Utilities – 0.1% | |
| | 3,108 | | | Black Hills Corp. | | $ | 102,595 | |
| | 1,201 | | | Integrys Energy Group, Inc. | | | 65,623 | |
| | | | | | | | |
| | | | | | | 168,218 | |
| | |
| Multiline Retail – 0.7% | |
| | 64,292 | | | Fred’s, Inc. Class A | | | 920,661 | |
| | |
| Oil, Gas & Consumable Fuels – 3.6% | |
| | 36,298 | | | Alon USA Energy, Inc. | | | 328,134 | |
| | 2,261 | | | Contango Oil & Gas Co.* | | | 122,682 | |
| | 2,718 | | | CVR Energy, Inc.* | | | 82,519 | |
| | 28,472 | | | Delek US Holdings, Inc. | | | 464,094 | |
| | 4,476 | | | Energy Partners Ltd.* | | | 72,869 | |
| | 46,819 | | | PetroQuest Energy, Inc.*(a) | | | 282,787 | |
| | 3,328 | | | REX American Resources Corp.* | | | 92,319 | |
| | 29,768 | | | SemGroup Corp. Class A* | | | 946,622 | |
| | 2,614 | | | Targa Resources Corp. | | | 125,707 | |
| | 33,641 | | | Tesoro Corp.*(b) | | | 782,153 | |
| | 68,947 | | | USEC, Inc.*(a) | | | 58,026 | |
| | 36,383 | | | W&T Offshore, Inc. | | | 719,292 | |
| | 42,268 | | | Western Refining, Inc. | | | 805,205 | |
| | | | | | | | |
| | | | | | | 4,882,409 | |
| | |
| Paper & Forest Products – 1.0% | |
| | 12,675 | | | AbitibiBowater, Inc.*(a) | | | 167,944 | |
| | 3,676 | | | Buckeye Technologies, Inc. | | | 119,139 | |
| | 12,306 | | | Clearwater Paper Corp.* | | | 405,729 | |
| | 35,575 | | | KapStone Paper and Packaging Corp.* | | | 642,484 | |
| | | | | | | | |
| | | | | | | 1,335,296 | |
| | |
| Personal Products – 0.4% | |
| | 1,374 | | | Herbalife Ltd. | | | 96,620 | |
| | 17,690 | | | Medifast, Inc.*(a) | | | 340,002 | |
| | 9,186 | | | Prestige Brands Holdings, Inc.* | | | 156,070 | |
| | | | | | | | |
| | | | | | | 592,692 | |
| | |
| Pharmaceuticals* – 0.6% | |
| | 16,887 | | | Jazz Pharmaceuticals PLC | | | 861,744 | |
| | |
| Professional Services – 1.4% | |
| | 30,594 | | | CDI Corp. | | | 542,738 | |
| | 8,101 | | | Heidrick & Struggles International, Inc. | | | 157,969 | |
| | 61,355 | | | Kelly Services, Inc. Class A | | | 858,356 | |
| | 8,516 | | | Manpower, Inc. | | | 362,782 | |
| | | | | | | | |
| | | | | | | 1,921,845 | |
| | |
| Real Estate Investment Trusts – 13.5% | |
| | 7,962 | | | Acadia Realty Trust | | | 184,559 | |
| | 8,753 | | | AG Mortgage Investment Trust, Inc. | | | 173,309 | |
| | 19,980 | | | Agree Realty Corp. | | | 455,544 | |
| | 18,322 | | | Ashford Hospitality Trust | | | 156,470 | |
| | 8,722 | | | CBL & Associates Properties, Inc. | | | 162,491 | |
| | 4,753 | | | Chatham Lodging Trust | | | 61,789 | |
| | 4,911 | | | DiamondRock Hospitality Co. | | | 52,204 | |
| | 50,197 | | | DuPont Fabros Technology, Inc. | | | 1,362,849 | |
| | 2,379 | | | EastGroup Properties, Inc. | | | 119,664 | |
| | |
| | | | | | | | |
Shares | | | Description | | Value | |
| | | | | | | | |
| | Common Stocks – (continued) | |
| Real Estate Investment Trusts – (continued) | |
| | 26,392 | | | Equity Lifestyle Properties, Inc. | | $ | 1,845,856 | |
| | 9,466 | | | Equity One, Inc. | | | 196,703 | |
| | 48,975 | | | Extra Space Storage, Inc. | | | 1,486,391 | |
| | 87,707 | | | Franklin Street Properties Corp. | | | 883,209 | |
| | 13,657 | | | Getty Realty Corp. | | | 216,054 | |
| | 55,027 | | | Healthcare Realty Trust, Inc. | | | 1,181,980 | |
| | 5,994 | | | LaSalle Hotel Properties | | | 176,284 | |
| | 41,109 | | | LTC Properties, Inc. | | | 1,368,107 | |
| | 1,044 | | | Mid-America Apartment Communities, Inc. | | | 71,065 | |
| | 158,406 | | | MPG Office Trust, Inc.*(a) | | | 334,237 | |
| | 24,146 | | | National Health Investors, Inc. | | | 1,194,503 | |
| | 1,866 | | | National Retail Properties, Inc. | | | 51,091 | |
| | 48,521 | | | OMEGA Healthcare Investors, Inc. | | | 1,038,835 | |
| | 3,737 | | | One Liberty Properties, Inc. | | | 70,667 | |
| | 51,309 | | | Potlatch Corp. | | | 1,605,972 | |
| | 11,438 | | | PS Business Parks, Inc. | | | 780,643 | |
| | 36,089 | | | Rayonier, Inc. | | | 1,636,636 | |
| | 6,269 | | | Regency Centers Corp. | | | 281,854 | |
| | 8,535 | | | Strategic Hotels & Resorts, Inc.* | | | 58,123 | |
| | 4,784 | | | Sunstone Hotel Investors, Inc.* | | | 48,797 | |
| | 2,104 | | | Taubman Centers, Inc. | | | 162,387 | |
| | 12,083 | | | Universal Health Realty Income Trust | | | 488,636 | |
| | 8,748 | | | Urstadt Biddle Properties Class A | | | 168,312 | |
| | | | | | | | |
| | | | | | | 18,075,221 | |
| | |
| Real Estate Management & Development – 0.7% | |
| | 12,960 | | | Altisource Portfolio Solutions SA* | | | 775,397 | |
| | 1,867 | | | Jones Lang LaSalle, Inc. | | | 149,248 | |
| | | | | | | | |
| | | | | | | 924,645 | |
| | |
| Road & Rail – 1.2% | |
| | 13,865 | | | Universal Truckload Services, Inc. | | | 216,294 | |
| | 56,727 | | | Werner Enterprises, Inc. | | | 1,339,892 | |
| | | | | | | | |
| | | | | | | 1,556,186 | |
| | |
| Semiconductors & Semiconductor Equipment* – 1.2% | |
| | 28,303 | | | DSP Group, Inc. | | | 185,101 | |
| | 217,126 | | | Lattice Semiconductor Corp. | | | 1,185,508 | |
| | 25,636 | | | Photronics, Inc. | | | 158,687 | |
| | 2,148 | | | Standard Microsystems Corp. | | | 56,879 | |
| | | | | | | | |
| | | | | | | 1,586,175 | |
| | |
| Software – 2.9% | |
| | 48,238 | | | Accelrys, Inc.* | | | 396,999 | |
| | 1,361 | | | Blackbaud, Inc. | | | 42,164 | |
| | 5,009 | | | CommVault Systems, Inc.* | | | 260,819 | |
| | 18,460 | | | Mentor Graphics Corp.* | | | 266,747 | |
| | 10,178 | | | MicroStrategy, Inc. Class A* | | | 1,422,681 | |
| | 3,463 | | | OPNET Technologies, Inc. | | | 80,203 | |
| | 11,241 | | | Pegasystems, Inc. | | | 418,053 | |
| | 2,473 | | | Progress Software Corp.* | | | 57,225 | |
| | 10,264 | | | QAD, Inc. Class A* | | | 126,760 | |
| | 26,069 | | | Quest Software, Inc.* | | | 606,626 | |
| | 4,698 | | | SS&C Technologies Holdings, Inc.* | | | 111,671 | |
| | |
| | |
| 78 | | The accompanying notes are an integral part of these financial statements. |
GOLDMAN SACHS STRUCTURED SMALL CAP VALUE FUND
| | | | | | | | |
Shares | | | Description | | Value | |
| | | | | | | | |
| | Common Stocks – (continued) | |
| Software – (continued) | |
| | 1,655 | | | Synopsys, Inc.* | | $ | 49,666 | |
| | 2,714 | | | TIBCO Software, Inc.* | | | 89,291 | |
| | | | | | | | |
| | | | | | | 3,928,905 | |
| | |
| Specialty Retail – 7.6% | |
| | 2,686 | | | ANN, Inc.* | | | 74,375 | |
| | 3,912 | | | Asbury Automotive Group, Inc.* | | | 109,223 | |
| | 14,044 | | | Barnes & Noble, Inc.*(a) | | | 291,413 | |
| | 19,148 | | | Build-A-Bear Workshop, Inc.* | | | 86,357 | |
| | 53,598 | | | Francesca’s Holdings Corp.* | | | 1,680,297 | |
| | 33,399 | | | Group 1 Automotive, Inc. | | | 1,933,134 | |
| | 23,980 | | | Hot Topic, Inc. | | | 235,004 | |
| | 38,651 | | | Lithia Motors, Inc. Class A | | | 1,037,006 | |
| | 17,049 | | | Lumber Liquidators Holdings, Inc.*(a) | | | 493,228 | |
| | 3,133 | | | Penske Automotive Group, Inc. | | | 82,837 | |
| | 2,569 | | | Select Comfort Corp.* | | | 74,193 | |
| | 18,921 | | | Shoe Carnival, Inc.* | | | 367,824 | |
| | 31,957 | | | Sonic Automotive, Inc. Class A(a) | | | 537,517 | |
| | 72,703 | | | Stage Stores, Inc. | | | 1,110,175 | |
| | 4,738 | | | The Buckle, Inc. | | | 218,801 | |
| | 2,692 | | | The Finish Line, Inc. Class A | | | 59,924 | |
| | 22,274 | | | Zale Corp.* | | | 61,031 | |
| | 45,165 | | | Zumiez, Inc.* | | | 1,655,749 | |
| | | | | | | | |
| | | | | | | 10,108,088 | |
| | |
| Textiles, Apparel & Luxury Goods – 1.1% | |
| | 3,695 | | | Columbia Sportswear Co. | | | 174,035 | |
| | 27,252 | | | Kenneth Cole Productions, Inc. Class A* | | | 434,124 | |
| | 12,867 | | | Movado Group, Inc. | | | 364,779 | |
| | 22,681 | | | Perry Ellis International, Inc.* | | | 424,362 | |
| | 2,963 | | | Vera Bradley, Inc.* | | | 76,979 | |
| | | | | | | | |
| | | | | | | 1,474,279 | |
| | |
| Thrifts & Mortgage Finance – 2.0% | |
| | 63,382 | | | Astoria Financial Corp. | | | 614,172 | |
| | 13,009 | | | BankUnited, Inc. | | | 320,021 | |
| | 57,379 | | | Brookline Bancorp, Inc. | | | 515,264 | |
| | 41,691 | | | Northwest Bancshares, Inc. | | | 513,633 | |
| | 3,787 | | | Oritani Financial Corp. | | | 56,123 | |
| | 10,748 | | | People’s United Financial, Inc. | | | 132,630 | |
| | 10,707 | | | Provident Financial Services, Inc. | | | 157,393 | |
| | 27,600 | | | Radian Group, Inc.(a) | | | 86,112 | |
| | 13,217 | | | Washington Federal, Inc. | | | 231,826 | |
| | | | | | | | |
| | | | | | | 2,627,174 | |
| | |
| Tobacco – 0.5% | |
| | 66,113 | | | Alliance One International, Inc.* | | | 234,040 | |
| | 9,582 | | | Universal Corp. | | | 439,143 | |
| | | | | | | | |
| | | | | | | 673,183 | |
| | |
| Trading Companies & Distributors – 2.3% | |
| | 8,626 | | | Aircastle Ltd. | | | 104,806 | |
| | 15,274 | | | Beacon Roofing Supply, Inc.* | | | 407,663 | |
| | 37,271 | | | H&E Equipment Services, Inc.* | | | 719,330 | |
| | 20,591 | | | Interline Brands, Inc.* | | | 433,235 | |
| | 3,075 | | | Kaman Corp. | | | 105,718 | |
| | |
| | | | | | | | |
Shares | | | Description | | Value | |
| | | | | | | | |
| | Common Stocks – (continued) | |
| Trading Companies & Distributors – (continued) | |
| | 1,356 | | | MSC Industrial Direct Co., Inc. Class A | | $ | 99,951 | |
| | 5,931 | | | RSC Holdings, Inc.* | | | 140,683 | |
| | 14,068 | | | Watsco, Inc. | | | 1,012,193 | |
| | | | | | | | |
| | | | | | | 3,023,579 | |
| | |
| Wireless Telecommunication Services – 0.4% | |
| | 44,638 | | | USA Mobility, Inc. | | | 576,723 | |
| | |
| | TOTAL COMMON STOCKS | |
| | (Cost $106,351,896) | | $ | 130,491,564 | |
| | |
| | | | | | | | |
| | Investment Company – 0.1% | |
| Capital Markets – 0.1% | |
| | 10,178 | | | THL Credit, Inc. | | $ | 128,243 | |
| | (Cost $133,315) | | | | |
| | |
| | | | | | | | |
| | | | | | | | | | | | |
| Units | | | Description | | Expiration
Month | | | Value | |
| | Warrant* – 0.0% | |
| Media – 0.0% | | | | | |
| | 635 | | | Granite Broadcasting Corp. | | | 06/12 | | | $ | — | |
| | (Cost $12,055) | | | | | | | | |
| | |
| | | | | | | | | | | | |
| | | | | | | | | | |
Principal
Amount | | | Interest
Rate | | Maturity
Date | | Value | |
| | Short-term Investment(c) – 3.0% | |
| Repurchase Agreement – 3.0% | |
| Joint Repurchase Agreement Account II | |
| $ | 4,000,000 | | | 0.211% | | 05/01/12 | | $ | 4,000,000 | |
| | (Cost $4,000,000) | |
| | |
| TOTAL INVESTMENTS BEFORE SECURITIES
LENDING REINVESTMENT VEHICLE |
|
| | (Cost $110,497,266) | | $ | 134,619,807 | |
| | |
| | | | | | | | | | |
| | | | | | |
| Shares | | Rate | | Value | |
| Securities Lending Reinvestment Vehicle(d)(e) – 3.0% | |
Financial Square Money Market Fund | |
| 4,052,750 | | 0.182% | | $ | 4,052,750 | |
| (Cost $4,052,750) | |
| |
| TOTAL INVESTMENTS – 103.6% | |
| (Cost $114,550,016) | | $ | 138,672,557 | |
| |
LIABILITIES IN EXCESS OF OTHER ASSETS – (3.6)% | | | (4,873,362 | ) |
| |
| NET ASSETS – 100.0% | | $ | 133,799,195 | |
| |
| | |
| The accompanying notes are an integral part of these financial statements. | | 79 |
GOLDMAN SACHS STRUCTURED SMALL CAP VALUE FUND
Schedule of Investments (continued)
April 30, 2012 (Unaudited)
| | |
| The percentage shown for each investment category reflects the value of investments in that category as a percentage of net assets. |
* | | Non-income producing security. |
(a) | | All or a portion of security is on loan. |
(b) | | All or a portion of security is segregated as collateral for initial margin requirement on futures transactions. |
(c) | | Joint repurchase agreement was entered into on April 30, 2012. Additional information appears on page 85. |
(d) | | Variable rate security. Interest rate disclosed is that which is in effect at April 30, 2012. |
(e) | | Represents an affiliated issuer. |
| | | | | | | | |
| ADDITIONAL INVESTMENT INFORMATION |
FUTURES CONTRACTS — At April 30, 2012, the Fund had the following futures contracts:
| | | | | | | | | | | | | | |
| Type | | Number of
Contracts
Long (Short) | | | Expiration
Date | | Current
Value | | | Unrealized
Gain (Loss) | |
Russell 2000 Mini Index | | | 37 | | | June 2012 | | $ | 3,015,130 | | | $ | 11,968 | |
| | |
| 80 | | The accompanying notes are an integral part of these financial statements. |
GOLDMAN SACHS STRUCTURED U.S. EQUITY FUND
Schedule of Investments
April 30, 2012 (Unaudited)
| | | | | | | | |
Shares | | |
Description | |
Value | |
| | | | | | | | |
| | Common Stocks – 98.8% | |
| Aerospace & Defense – 1.9% | |
| | 12,190 | | | Alliant Techsystems, Inc. | | $ | 649,727 | |
| | 33,020 | | | BE Aerospace, Inc.* | | | 1,552,931 | |
| | 41,432 | | | Northrop Grumman Corp. | | | 2,621,817 | |
| | 20,600 | | | The Boeing Co. | | | 1,582,080 | |
| | | | | | | | |
| | | | | | | 6,406,555 | |
| | |
| Air Freight & Logistics – 1.4% | |
| | 34,721 | | | FedEx Corp. | | | 3,063,781 | |
| | 21,648 | | | United Parcel Service, Inc. Class B | | | 1,691,575 | |
| | | | | | | | |
| | | | | | | 4,755,356 | |
| | |
| Automobiles – 0.2% | |
| | 7,516 | | | General Motors Co.* | | | 172,868 | |
| | 13,225 | | | Thor Industries, Inc. | | | 447,402 | |
| | | | | | | | |
| | | | | | | 620,270 | |
| | |
| Beverages – 1.9% | |
| | 2,269 | | | Brown-Forman Corp. Class B | | | 195,928 | |
| | 10,314 | | | Coca-Cola Enterprises, Inc. | | | 310,658 | |
| | 18,277 | | | Constellation Brands, Inc. Class A* | | | 394,783 | |
| | 46,865 | | | Molson Coors Brewing Co. Class B | | | 1,948,647 | |
| | 7,882 | | | Monster Beverage Corp.* | | | 512,015 | |
| | 22,219 | | | PepsiCo., Inc. | | | 1,466,454 | |
| | 20,980 | | | The Coca-Cola Co. | | | 1,601,193 | |
| | | | | | | | |
| | | | | | | 6,429,678 | |
| | |
| Biotechnology – 4.6% | |
| | 34,227 | | | Alexion Pharmaceuticals, Inc.* | | | 3,091,383 | |
| | 64,081 | | | Amgen, Inc. | | | 4,556,800 | |
| | 24,478 | | | Biogen Idec, Inc.* | | | 3,280,297 | |
| | 83,943 | | | Gilead Sciences, Inc.* | | | 4,365,875 | |
| | 13,665 | | | United Therapeutics Corp.* | | | 597,844 | |
| | | | | | | | |
| | | | | | | 15,892,199 | |
| | |
| Capital Markets – 2.0% | |
| | 5,932 | | | Franklin Resources, Inc. | | | 744,525 | |
| | 43,630 | | | Morgan Stanley | | | 753,926 | |
| | 7,410 | | | Raymond James Financial, Inc. | | | 271,354 | |
| | 104,292 | | | SEI Investments Co. | | | 2,105,656 | |
| | 123,623 | | | The Bank of New York Mellon Corp. | | | 2,923,684 | |
| | | | | | | | |
| | | | | | | 6,799,145 | |
| | |
| Chemicals – 0.5% | |
| | 12,771 | | | Airgas, Inc. | | | 1,170,334 | |
| | 8,351 | | | Eastman Chemical Co. | | | 450,704 | |
| | | | | | | | |
| | | | | | | 1,621,038 | |
| | |
| Commercial Banks – 1.8% | |
| | 2,471 | | | Bank of Hawaii Corp. | | | 120,808 | |
| | 4,081 | | | City National Corp. | | | 217,354 | |
| | 5,600 | | | Cullen/Frost Bankers, Inc. | | | 330,176 | |
| | 57,754 | | | KeyCorp. | | | 464,342 | |
| | 23,122 | | | PNC Financial Services Group, Inc. | | | 1,533,451 | |
| | 100,626 | | | Wells Fargo & Co. | | | 3,363,927 | |
| | | | | | | | |
| | | | | | | 6,030,058 | |
| | |
| | | | | | | | |
Shares | | |
Description | |
Value | |
| | | | | | | | |
| | Common Stocks – (continued) | |
| Commercial Services & Supplies* – 0.1% | |
| | 18,942 | | | Copart, Inc. | | $ | 500,258 | |
| | |
| Communications Equipment – 2.6% | |
| | 248,774 | | | Cisco Systems, Inc. | | | 5,012,796 | |
| | 25,466 | | | Juniper Networks, Inc.* | | | 545,736 | |
| | 45,478 | | | QUALCOMM, Inc. | | | 2,903,316 | |
| | 78,337 | | | Tellabs, Inc. | | | 295,330 | |
| | | | | | | | |
| | | | | | | 8,757,178 | |
| | |
| Computers & Peripherals – 7.2% | |
| | 25,955 | | | Apple, Inc.*(a) | | | 15,163,949 | |
| | 124,772 | | | Dell, Inc.* | | | 2,042,518 | |
| | 48,871 | | | Hewlett-Packard Co. | | | 1,210,046 | |
| | 41,280 | | | NetApp, Inc.* | | | 1,602,902 | |
| | 18,000 | | | Seagate Technology PLC | | | 553,680 | |
| | 110,202 | | | Western Digital Corp.* | | | 4,276,940 | |
| | | | | | | | |
| | | | | | | 24,850,035 | |
| | |
| Construction & Engineering – 0.0% | |
| | 3,132 | | | URS Corp. | | | 129,383 | |
| | |
| Consumer Finance – 1.4% | |
| | 68,624 | | | Capital One Financial Corp. | | | 3,807,260 | |
| | 25,009 | | | Discover Financial Services | | | 847,805 | |
| | | | | | | | |
| | | | | | | 4,655,065 | |
| | |
| Diversified Financial Services – 3.8% | |
| | 307,722 | | | Bank of America Corp. | | | 2,495,625 | |
| | 136,377 | | | Citigroup, Inc. | | | 4,505,896 | |
| | 5,453 | | | CME Group, Inc. | | | 1,449,517 | |
| | 109,397 | | | JPMorgan Chase & Co. | | | 4,701,883 | |
| | | | | | | | |
| | | | | | | 13,152,921 | |
| | |
| Diversified Telecommunication Services – 2.4% | |
| | 254,113 | | | AT&T, Inc. | | | 8,362,859 | |
| | |
| Electronic Equipment, Instruments & Components* – 1.0% | |
| | 173,423 | | | Ingram Micro, Inc. Class A | | | 3,374,812 | |
| | 19,696 | | | Vishay Intertechnology, Inc. | | | 220,989 | |
| | | | | | | | |
| | | | | | | 3,595,801 | |
| | |
| Food & Staples Retailing – 1.2% | |
| | 89,479 | | | CVS Caremark Corp. | | | 3,992,553 | |
| | 4,874 | | | Walgreen Co. | | | 170,882 | |
| | | | | | | | |
| | | | | | | 4,163,435 | |
| | |
| Food Products – 3.6% | |
| | 112,097 | | | Archer-Daniels-Midland Co. | | | 3,455,950 | |
| | 51,962 | | | Bunge Ltd. | | | 3,351,549 | |
| | 55,892 | | | Dean Foods Co.* | | | 686,354 | |
| | 6,772 | | | Hormel Foods Corp. | | | 196,794 | |
| | 18,757 | | | Smithfield Foods, Inc.* | | | 393,147 | |
| | 1,994 | | | The Hershey Co. | | | 133,618 | |
| | 231,688 | | | Tyson Foods, Inc. Class A | | | 4,228,306 | |
| | | | | | | | |
| | | | | | | 12,445,718 | |
| | |
| | |
| The accompanying notes are an integral part of these financial statements. | | 81 |
GOLDMAN SACHS STRUCTURED U.S. EQUITY FUND
Schedule of Investments (continued)
April 30, 2012 (Unaudited)
| | | | | | | | |
Shares | | |
Description | |
Value | |
| | | | | | | | |
| | Common Stocks – (continued) | |
| Health Care Equipment & Supplies – 0.6% | |
| | 250,705 | | | Boston Scientific Corp.* | | $ | 1,569,413 | |
| | 8,748 | | | DENTSPLY International, Inc. | | | 359,193 | |
| | | | | | | | |
| | | | | | | 1,928,606 | |
| | |
| Health Care Providers & Services – 2.5% | |
| | 40,803 | | | Cardinal Health, Inc. | | | 1,724,743 | |
| | 32,579 | | | Coventry Health Care, Inc. | | | 977,044 | |
| | 53,283 | | | Humana, Inc. | | | 4,298,872 | |
| | 21,673 | | | WellPoint, Inc. | | | 1,469,863 | |
| | | | | | | | |
| | | | | | | 8,470,522 | |
| | |
| Hotels, Restaurants & Leisure – 1.0% | |
| | 52,071 | | | Marriott International, Inc. Class A | | | 2,035,456 | |
| | 5,806 | | | Marriott Vacations Worldwide Corp.* | | | 171,451 | |
| | 7,985 | | | Wynn Resorts Ltd. | | | 1,065,199 | |
| | | | | | | | |
| | | | | | | 3,272,106 | |
| | |
| Household Durables – 1.3% | |
| | 10,299 | | | Leggett & Platt, Inc. | | | 224,209 | |
| | 25,621 | | | Mohawk Industries, Inc.* | | | 1,717,120 | |
| | 43,232 | | | Tempur-Pedic International, Inc.* | | | 2,543,771 | |
| | | | | | | | |
| | | | | | | 4,485,100 | |
| | |
| Household Products – 2.6% | |
| | 18,456 | | | Colgate-Palmolive Co. | | | 1,826,037 | |
| | 110,586 | | | The Procter & Gamble Co. | | | 7,037,693 | |
| | | | | | | | |
| | | | | | | 8,863,730 | |
| | |
| Industrial Conglomerates – 2.0% | |
| | 353,377 | | | General Electric Co. | | | 6,919,122 | |
| | |
| Insurance – 3.9% | |
| | 19,437 | | | American Financial Group, Inc. | | | 756,488 | |
| | 102,521 | | | Berkshire Hathaway, Inc. Class B* | | | 8,247,815 | |
| | 11,105 | | | MetLife, Inc. | | | 400,113 | |
| | 4,188 | | | Protective Life Corp. | | | 122,541 | |
| | 5,805 | | | Reinsurance Group of America, Inc. | | | 337,503 | |
| | 152,056 | | | Unum Group | | | 3,609,809 | |
| | | | | | | | |
| | | | | | | 13,474,269 | |
| | |
| Internet & Catalog Retail* – 0.5% | |
| | 7,668 | | | Amazon.com, Inc. | | | 1,778,209 | |
| | |
| Internet Software & Services – 1.5% | |
| | 8,358 | | | Google, Inc. Class A* | | | 5,058,512 | |
| | 5,690 | | | VeriSign, Inc. | | | 233,916 | |
| | | | | | | | |
| | | | | | | 5,292,428 | |
| | |
| IT Services – 2.5% | |
| | 40,271 | | | Accenture PLC Class A | | | 2,615,602 | |
| | 31,691 | | | Amdocs Ltd.* | | | 1,014,112 | |
| | 34,581 | | | Computer Sciences Corp. | | | 970,343 | |
| | 19,929 | | | International Business Machines Corp. | | | 4,126,897 | |
| | | | | | | | |
| | | | | | | 8,726,954 | |
| | |
| | | | | | | | |
Shares | | |
Description | |
Value | |
| | | | | | | | |
| | Common Stocks – (continued) | |
| Machinery – 1.6% | |
| | 21,339 | | | AGCO Corp.* | | $ | 993,757 | |
| | 59,460 | | | The Toro Co. | | | 4,249,011 | |
| | 6,381 | | | Trinity Industries, Inc. | | | 188,878 | |
| | | | | | | | |
| | | | | | | 5,431,646 | |
| | |
| Media – 3.7% | |
| | 24,683 | | | Cablevision Systems Corp. Class A | | | 365,802 | |
| | 107,150 | | | DIRECTV Class A* | | | 5,279,280 | |
| | 127,508 | | | DISH Network Corp. Class A | | | 4,076,431 | |
| | 38,472 | | | News Corp. Class A | | | 754,051 | |
| | 12,418 | | | Pandora Media, Inc.*(b) | | | 106,795 | |
| | 17,831 | | | Regal Entertainment Group Class A | | | 242,680 | |
| | 46,274 | | | Time Warner, Inc. | | | 1,733,424 | |
| | | | | | | | |
| | | | | | | 12,558,463 | |
| | |
| Metals & Mining – 0.1% | |
| | 7,821 | | | Newmont Mining Corp. | | | 372,671 | |
| | |
| Multi-Utilities – 0.9% | |
| | 11,690 | | | Ameren Corp. | | | 383,315 | |
| | 44,753 | | | Integrys Energy Group, Inc. | | | 2,445,304 | |
| | 3,573 | | | PG&E Corp. | | | 157,855 | |
| | | | | | | | |
| | | | | | | 2,986,474 | |
| | |
| Multiline Retail – 2.3% | |
| | 37,346 | | | Big Lots, Inc.* | | | 1,368,357 | |
| | 37,199 | | | Dollar Tree, Inc.* | | | 3,781,650 | |
| | 38,581 | | | Family Dollar Stores, Inc. | | | 2,606,147 | |
| | | | | | | | |
| | | | | | | 7,756,154 | |
| | |
| Oil, Gas & Consumable Fuels – 11.5% | |
| | 3,512 | | | Apache Corp. | | | 336,941 | |
| | 63,651 | | | Chevron Corp. | | | 6,782,651 | |
| | 4,774 | | | Cimarex Energy Co. | | | 329,931 | |
| | 94,096 | | | ConocoPhillips | | | 6,740,097 | |
| | 24,185 | | | Devon Energy Corp. | | | 1,689,322 | |
| | 139,503 | | | Exxon Mobil Corp. | | | 12,044,689 | |
| | 32,846 | | | Hess Corp. | | | 1,712,590 | |
| | 10,073 | | | HollyFrontier Corp. | | | 310,450 | |
| | 14,667 | | | Murphy Oil Corp. | | | 806,245 | |
| | 35,910 | | | Occidental Petroleum Corp. | | | 3,275,710 | |
| | 41,588 | | | Tesoro Corp.* | | | 966,921 | |
| | 177,722 | | | Valero Energy Corp. | | | 4,389,733 | |
| | 12,608 | | | WPX Energy, Inc.* | | | 221,523 | |
| | | | | | | | |
| | | | | | | 39,606,803 | |
| | |
| Personal Products – 0.3% | |
| | 14,198 | | | Herbalife Ltd. | | | 998,403 | |
| | |
| Pharmaceuticals – 4.2% | |
| | 80,272 | | | Eli Lilly & Co. | | | 3,322,458 | |
| | 10,505 | | | Johnson & Johnson | | | 683,770 | |
| | 71,098 | | | Merck & Co., Inc. | | | 2,789,886 | |
| | 337,256 | | | Pfizer, Inc. | | | 7,733,280 | |
| | | | | | | | |
| | | | | | | 14,529,394 | |
| | |
| | |
| 82 | | The accompanying notes are an integral part of these financial statements. |
GOLDMAN SACHS STRUCTURED U.S. EQUITY FUND
| | | | | | | | |
Shares | | |
Description | |
Value | |
| | | | | | | | |
| | Common Stocks – (continued) | |
| Professional Services – 0.3% | |
| | 25,428 | | | Manpower, Inc. | | $ | 1,083,233 | |
| | |
| Real Estate Investment Trusts – 2.6% | |
| | 72,138 | | | American Tower Corp. | | | 4,730,810 | |
| | 89,850 | | | Rayonier, Inc. | | | 4,074,698 | |
| | | | | | | | |
| | | | | | | 8,805,508 | |
| | |
| Road & Rail – 0.7% | |
| | 21,439 | | | CSX Corp. | | | 478,304 | |
| | 8,653 | | | Norfolk Southern Corp. | | | 631,063 | |
| | 12,059 | | | Union Pacific Corp. | | | 1,355,914 | |
| | | | | | | | |
| | | | | | | 2,465,281 | |
| | |
| Semiconductors & Semiconductor Equipment – 1.1% | |
| | 132,560 | | | Intel Corp. | | | 3,764,704 | |
| | |
| Software – 7.5% | |
| | 4,479 | | | Adobe Systems, Inc.* | | | 150,315 | |
| | 3,935 | | | Autodesk, Inc.* | | | 154,921 | |
| | 5,136 | | | BMC Software, Inc.* | | | 211,911 | |
| | 78,327 | | | Intuit, Inc. | | | 4,540,616 | |
| | 344,234 | | | Microsoft Corp. | | | 11,022,373 | |
| | 256,067 | | | Oracle Corp. | | | 7,525,809 | |
| | 50,342 | | | Symantec Corp.* | | | 831,650 | |
| | 35,013 | | | Synopsys, Inc.* | | | 1,050,740 | |
| | 3,211 | | | VMware, Inc. Class A* | | | 358,733 | |
| | | | | | | | |
| | | | | | | 25,847,068 | |
| | |
| Specialty Retail – 1.3% | |
| | 5,310 | | | Aaron’s, Inc. | | | 144,273 | |
| | 23,193 | | | Best Buy Co., Inc. | | | 511,870 | |
| | 34,059 | | | Dick’s Sporting Goods, Inc. | | | 1,723,385 | |
| | 17,104 | | | Foot Locker, Inc. | | | 523,211 | |
| | 46,388 | | | Lowe’s Cos., Inc. | | | 1,459,830 | |
| | | | | | | | |
| | | | | | | 4,362,569 | |
| | |
| Textiles, Apparel & Luxury Goods* – 0.2% | |
| | 6,294 | | | Fossil, Inc. | | | 822,437 | |
| | |
| Tobacco – 3.9% | |
| | 35,138 | | | Lorillard, Inc. | | | 4,753,820 | |
| | 77,517 | | | Philip Morris International, Inc. | | | 6,938,547 | |
| | 42,959 | | | Reynolds American, Inc. | | | 1,754,016 | |
| | | | | | | | |
| | | | | | | 13,446,383 | |
| | |
| Trading Companies & Distributors – 0.4% | |
| | 17,802 | | | MSC Industrial Direct Co., Inc. Class A | | | 1,312,185 | |
| | |
| Wireless Telecommunication Services* – 0.2% | |
| | 237,207 | | | Sprint Nextel Corp. | | | 588,273 | |
| | |
| | TOTAL COMMON STOCKS | |
| | (Cost $277,626,651) | | $ | 339,115,647 | |
| | |
| | | | | | | | | | |
Principal
Amount | | Interest
Rate | | Maturity
Date | | |
Value | |
| | | | | | | | | | |
| Short-term Investment(c) – 1.6% | |
Repurchase Agreement – 1.6% | |
Joint Repurchase Agreement Account II | |
| $5,300,000 | | 0.211% | | | 05/01/12 | | | $ | 5,300,000 | |
| (Cost $5,300,000) | |
| |
| TOTAL INVESTMENTS BEFORE SECURITIES LENDING REINVESTMENT VEHICLE | |
| (Cost $282,926,651) | | | $ | 344,415,647 | |
| |
| | | | | | | | |
Shares | |
Rate | | |
Value | |
| | | | | | | | |
| Securities Lending Reinvestment Vehicle(d)(e) – 0.0% | |
Financial Square Money Market Fund | |
| 108,225 | | | 0.182 | % | | $ | 108,225 | |
| (Cost $108,225) | |
| |
| TOTAL INVESTMENTS – 100.4% | |
| (Cost $283,034,876) | | | $ | 344,523,872 | |
| |
LIABILITIES IN EXCESS OF
OTHER ASSETS – (0.4)% | | | | (1,348,191 | ) |
| |
| NET ASSETS – 100.0% | | | $ | 343,175,681 | |
| |
| | |
| The percentage shown for each investment category reflects the value of investments in that category as a percentage of net assets. |
* | | Non-income producing security. |
(a) | | All or a portion of security is segregated as collateral for initial margin requirements on futures transactions. |
(b) | | All or a portion of security is on loan. |
(c) | | Joint repurchase agreement was entered into on April 30, 2012. Additional information appears on page 85. |
(d) | | Variable rate security. Interest rate disclosed is that which is in effect at April 30, 2012. |
(e) | | Represents an affiliated issuer. |
| | |
| The accompanying notes are an integral part of these financial statements. | | 83 |
GOLDMAN SACHS STRUCTURED U.S. EQUITY FUND
Schedule of Investments (continued)
April 30, 2012 (Unaudited)
|
| ADDITIONAL INVESTMENT INFORMATION |
FUTURES CONTRACTS — At April 30, 2012, the Fund had the following futures contracts:
| | | | | | | | | | | | | | |
| Type | | Number of
Contracts
Long (Short) | | | Expiration
Date | | Current
Value | | | Unrealized
Gain (Loss) | |
S&P 500 E-Mini Index | | | 65 | | | June 2012 | | $ | 4,529,200 | | | $ | 57,543 | |
| | |
| 84 | | The accompanying notes are an integral part of these financial statements. |
GOLDMAN SACHS STRUCTURED DOMESTIC EQUITY FUNDS
Schedule of Investments
April 30, 2012 (Unaudited)
|
| ADDITIONAL INVESTMENT INFORMATION |
JOINT REPURCHASE AGREEMENT ACCOUNT II — At April 30, 2012, the Funds had undivided interests in the Joint Repurchase Agreement Account II, with a maturity date of May 1, 2012, as follows:
| | | | | | | | | | | | |
| Fund | | Principal Amount | | | Maturity Value | | | Collateral Allocation Value | |
Balanced | | $ | 1,300,000 | | | $ | 1,300,008 | | | $ | 1,327,265 | |
Structured Large Cap Growth | | | 13,600,000 | | | | 13,600,080 | | | | 13,885,230 | |
Structured Large Cap Value | | | 11,600,000 | | | | 11,600,068 | | | | 11,843,284 | |
Structured Small Cap Equity | | | 6,000,000 | | | | 6,000,035 | | | | 6,125,837 | |
Structured Small Cap Growth | | | 1,300,000 | | | | 1,300,008 | | | | 1,327,265 | |
Structured Small Cap Value | | | 4,000,000 | | | | 4,000,023 | | | | 4,083,891 | |
Structured U.S. Equity | | | 5,300,000 | | | | 5,300,031 | | | | 5,411,156 | |
REPURCHASE AGREEMENTS — At April 30, 2012, the Principal Amounts of the Funds’ interest in the Joint Repurchase Agreement Account II were as follows:
| | | | | | | | | | | | | | | | | | | | | | | | | | | | | | | | |
| Counterparty | | Interest
Rate | | | Balanced | | | Structured
Large Cap
Growth | | | Structured
Large Cap
Value | | | Structured
Small Cap
Equity | | | Structured
Small Cap
Growth | | | Structured
Small Cap
Value | | | Structured
U.S. Equity | |
BNP Paribas Securities Co. | | | 0.210 | % | | $ | 504,594 | | | $ | 5,278,834 | | | $ | 4,502,534 | | | $ | 2,328,897 | | | $ | 504,595 | | | $ | 1,552,598 | | | $ | 2,057,193 | |
Credit Suisse Securities LLC | | | 0.170 | | | | 102,978 | | | | 1,077,313 | | | | 918,885 | | | | 475,285 | | | | 102,978 | | | | 316,857 | | | | 419,835 | |
JP Morgan Securities LLC | | | 0.210 | | | | 126,046 | | | | 1,318,631 | | | | 1,124,715 | | | | 581,749 | | | | 126,046 | | | | 387,833 | | | | 513,878 | |
Wells Fargo Securities LLC | | | 0.220 | | | | 566,382 | | | | 5,925,222 | | | | 5,053,866 | | | | 2,614,069 | | | | 566,381 | | | | 1,742,712 | | | | 2,309,094 | |
| TOTAL | | | | | | $ | 1,300,000 | | | $ | 13,600,000 | | | $ | 11,600,000 | | | $ | 6,000,000 | | | $ | 1,300,000 | | | $ | 4,000,000 | | | $ | 5,300,000 | |
At April 30, 2012, the Joint Repurchase Agreement Account II was fully collateralized by:
| | | | | | | | |
| Issuer | | Interest Rates | | | Maturity Dates | |
Federal Home Loan Mortgage Corp. | | | 3.000 to 6.000 | % | | | 02/01/20 to 04/01/42 | |
Federal National Mortgage Association | | | 3.000 to 6.500 | | | | 03/01/16 to 04/01/52 | |
Government National Mortgage Association | | | 3.500 to 7.000 | | | | 09/20/30 to 04/15/42 | |
U.S. Treasury Notes | | | 0.125 to 4.875 | | | | 06/30/12 to 04/30/18 | |
| | |
| The accompanying notes are an integral part of these financial statements. | | 85 |
GOLDMAN SACHS STRUCTURED DOMESTIC EQUITY FUNDS
Statements of Assets and Liabilities
April 30, 2012 (Unaudited)
| | | | | | |
| | | | |
Balanced Fund | |
| | Assets: | | | | |
| | Investments of unaffiliated issuers, at value (cost $114,963,528, $532,790,775, $443,504,359, $155,765,278, $36,876,766, $110,497,266 and $282,926,651)(a) | | $ | 126,738,343 | |
| | Investments in securities lending reinvestment vehicle, affiliated issuers at value which equals cost | | | 1,746,775 | |
| | Cash | | | 218,343 | |
| | Receivables: | | | | |
| | Investments sold on an extended settlement basis | | | 16,546,498 | |
| | Investments sold | | | 877,986 | |
| | Fund shares sold | | | 815,231 | |
| | Dividends and interest | | | 324,582 | |
| | Collateral on certain derivative contracts | | | 110,000 | |
| | Reimbursement from investment adviser | | | 47,281 | |
| | Upfront payments made on swap contracts | | | 28,711 | |
| | Unrealized gain on forward foreign currency exchange contracts | | | 15,495 | |
| | Unrealized gain on swap contracts | | | 13,701 | |
| | Securities lending income | | | 4,968 | |
| | Futures — variation margin | | | 2,310 | |
| | Other assets | | | 819 | |
| | Total assets | | | 147,491,043 | |
| | | | | | |
| | Liabilities: | | | | |
| | Due to custodian — foreign currency | | | 2,430 | |
| | Payables: | | | | |
| | Investments purchased on an extended settlement basis | | | 14,817,773 | |
| | Investments purchased | | | 49,782 | |
| | Forward sale contracts, at value (proceeds receivable $4,222,331 for Balanced Fund) | | | 4,282,812 | |
| | Payable upon return of securities loaned | | | 1,746,775 | |
| | Collateral on certain derivative contracts | | | 200,000 | |
| | Fund shares redeemed | | | 184,788 | |
| | Amounts owed to affiliates | | | 107,756 | |
| | Upfront payments received on swap contracts | | | 44,948 | |
| | Unrealized loss on swap contracts | | | 43,600 | |
| | Unrealized loss on forward foreign currency exchange contracts | | | 6,719 | |
| | Futures — variation margin | | | — | |
| | Accrued expenses and other liabilities | | | 117,593 | |
| | Total liabilities | | | 21,604,976 | |
| | | | | | |
| | Net Assets: | | | | |
| | Paid-in capital | | | 117,136,537 | |
| | Undistributed (distributions in excess of) net investment income (loss) | | | 110,832 | |
| | Accumulated net realized loss | | | (3,200,087 | ) |
| | Net unrealized gain | | | 11,838,785 | |
| | | NET ASSETS | | $ | 125,886,067 | |
| | | Net Assets: | | | | |
| | | Class A | | $ | 96,987,705 | |
| | | Class B | | | 6,366,537 | |
| | | Class C | | | 11,082,927 | |
| | | Institutional | | | 9,789,956 | |
| | | Service | | | — | |
| | | Class IR | | | 1,658,942 | |
| | | Class R | | | — | |
| | | Total Net Assets | | $ | 125,886,067 | |
| | | Shares Outstanding $0.001 par value (unlimited shares authorized): | | | | |
| | | Class A | | | 4,764,928 | |
| | | Class B | | | 315,173 | |
| | | Class C | | | 551,043 | |
| | | Institutional | | | 473,300 | |
| | | Service | | | — | |
| | | Class IR | | | 80,362 | |
| | | Class R | | | — | |
| | | Net asset value, offering and redemption price per share:(b) | | | | |
| | | Class A | | | $20.35 | |
| | | Class B | | | 20.20 | |
| | | Class C | | | 20.11 | |
| | | Institutional | | | 20.68 | |
| | | Service | | | — | |
| | | Class IR | | | 20.64 | |
| | | Class R | | | — | |
| | (a) | | Includes loaned securities having a market value of $1,679,744, $3,028,446, $2,823,264, $4,155,166, $701,609, $4,015,081 and $100,620 for the Balanced, Structured Large Cap Growth, Structured Large Cap Value, Structured Small Cap Equity, Structured Small Cap Growth, Structured Small Cap Value and Structured U.S. Equity Funds, respectively. |
| | (b) | | Maximum public offering price per share for Class A Shares of the Balanced, Structured Large Cap Growth, Structured Large Cap Value, Structured Small Cap Equity, Structured Small Cap Growth, Structured Small Cap Value and Structured U.S. Equity Funds is $21.53, $14.85, $11.81, $13.85, $24.53, $30.14 and $27.96, respectively. At redemption, Class B and Class C Shares may be subject to a contingent deferred sales charge assessed on the amount equal to the lesser of the current NAV or the original purchase price of the shares. |
| | |
| 86 | | The accompanying notes are an integral part of these financial statements. |
GOLDMAN SACHS STRUCTURED DOMESTIC EQUITY FUNDS
| | | | | | | | | | | | | | | | | | | | | | | | | | | | | | | | | | |
| | | Structured
Large Cap
Growth Fund | | | | | Structured
Large Cap
Value Fund | | | | | Structured
Small Cap
Equity Fund | | | | | Structured
Small Cap
Growth Fund | | | | | Structured
Small Cap
Value Fund | | | | | Structured
U.S. Equity
Fund | |
| | | | | | | | | | | | | | | | | | | | | | | | | | | | | | | | | | |
| | $ | 641,387,313 | | | | | $ | 537,903,092 | | | | | $ | 192,706,100 | | | | | $ | 44,518,798 | | | | | $ | 134,619,807 | | | | | $ | 344,415,647 | |
| | | 3,116,750 | | | | | | 2,926,400 | | | | | | 4,287,800 | | | | | | 710,725 | | | | | | 4,052,750 | | | | | | 108,225 | |
| | | 36,019 | | | | | | 31,149 | | | | | | 40,616 | | | | | | 60,161 | | | | | | 67,011 | | | | | | 49,376 | |
| | | | | | | | | | | | | | | | | | | | | | | | | | | | | | | | | | |
| | | — | | | | | | — | | | | | | — | | | | | | — | | | | | | — | | | | | | — | |
| | | — | | | | | | — | | | | | | 1,753,770 | | | | | | 342,224 | | | | | | 1,311,077 | | | | | | — | |
| | | 17,497 | | | | | | 46,485 | | | | | | 56,337 | | | | | | 41,506 | | | | | | 18,007 | | | | | | 54,640 | |
| | | 269,477 | | | | | | 554,569 | | | | | | 89,035 | | | | | | 9,308 | | | | | | 99,420 | | | | | | 321,063 | |
| | | — | | | | | | — | | | | | | — | | | | | | — | | | | | | — | | | | | | — | |
| | | 25,393 | | | | | | — | | | | | | — | | | | | | 24,531 | | | | | | 1,755 | | | | | | 6,433 | |
| | | — | | | | | | — | | | | | | — | | | | | | — | | | | | | — | | | | | | — | |
| | | — | | | | | | — | | | | | | — | | | | | | — | | | | | | — | | | | | | — | |
| | | — | | | | | | — | | | | | | — | | | | | | — | | | | | | — | | | | | | — | |
| | | 2,382 | | | | | | 2,993 | | | | | | 1,962 | | | | | | 1,207 | | | | | | 3,688 | | | | | | 1,145 | |
| | | — | | | | | | — | | | | | | — | | | | | | — | | | | | | — | | | | | | — | |
| | | 3,705 | | | | | | 3,432 | | | | | | 882 | | | | | | 322 | | | | | | 868 | | | | | | 2,183 | |
| | | 644,858,536 | | | | | | 541,468,120 | | | | | | 198,936,502 | | | | | | 45,708,782 | | | | | | 140,174,383 | | | | | | 344,958,712 | |
| | | | | | | | | | | | | | | | | | | | | | | | | | | | | | | | | | |
| | | | | | | | | | | | | | | | | | | | | | | | | | | | | | | | | | |
| | | — | | | | | | — | | | | | | — | | | | | | — | | | | | | — | | | | | | — | |
| | | | | | | | | | | | | | | | | | | | | | | | | | | | | | | | | | |
| | | — | | | | | | — | | | | | | — | | | | | | — | | | | | | — | | | | | | — | |
| | | — | | | | | | — | | | | | | 2,719,847 | | | | | | 676,350 | | | | | | 1,832,741 | | | | | | — | |
| | | — | | | | | | — | | | | | | — | | | | | | — | | | | | | — | | | | | | — | |
| | | 3,116,750 | | | | | | 2,926,400 | | | | | | 4,287,800 | | | | | | 710,725 | | | | | | 4,052,750 | | | | | | 108,225 | |
| | | — | | | | | | — | | | | | | — | | | | | | — | | | | | | — | | | | | | — | |
| | | 750,546 | | | | | | 16,282,421 | | | | | | 388,831 | | | | | | 46,848 | | | | | | 189,643 | | | | | | 984,406 | |
| | | 363,132 | | | | | | 321,156 | | | | | | 173,882 | | | | | | 49,289 | | | | | | 155,047 | | | | | | 287,619 | |
| | | — | | | | | | — | | | | | | — | | | | | | — | | | | | | — | | | | | | — | |
| | | — | | | | | | — | | | | | | — | | | | | | — | | | | | | — | | | | | | — | |
| | | — | | | | | | — | | | | | | — | | | | | | — | | | | | | — | | | | | | — | |
| | | 41,243 | | | | | | 29,645 | | | | | | 47,170 | | | | | | 8,900 | | | | | | 32,930 | | | | | | 15,925 | |
| | | 136,725 | | | | | | 130,173 | | | | | | 129,315 | | | | | | 82,425 | | | | | | 112,077 | | | | | | 386,856 | |
| | | 4,408,396 | | | | | | 19,689,795 | | | | | | 7,746,845 | | | | | | 1,574,537 | | | | | | 6,375,188 | | | | | | 1,783,031 | |
| | | | | | | | | | | | | | | | | | | | | | | | | | | | | | | | | | |
| | | | | | | | | | | | | | | | | | | | | | | | | | | | | | | | | | |
| | | 1,060,710,681 | | | | | | 981,412,867 | | | | | | 344,819,292 | | | | | | 46,294,372 | | | | | | 163,549,749 | | | | | | 461,722,763 | |
| | | 2,532,482 | | | | | | 404,114 | | | | | | 314,859 | | | | | | (81,683 | ) | | | | | (76,735 | ) | | | | | 1,063,606 | |
| | | (531,529,661 | ) | | | | | (554,375,330 | ) | | | | | (190,992,917 | ) | | | | | (9,726,940 | ) | | | | | (53,808,328 | ) | | | | | (181,157,227 | ) |
| | | 108,736,638 | | | | | | 94,336,674 | | | | | | 37,048,423 | | | | | | 7,648,496 | | | | | | 24,134,509 | | | | | | 61,546,539 | |
| | | $ | 640,450,140 | | | | | $ | 521,778,325 | | | | | $ | 191,189,657 | | | | | $ | 44,134,245 | | | | | $ | 133,799,195 | | | | | $ | 343,175,681 | |
| | | | | | | | | | | | | | | | | | | | | | | | | | | | | | | | | | | |
| | | $ | 165,488,518 | | | | | $ | 133,091,723 | | | | | $ | 67,434,254 | | | | | $ | 26,672,581 | | | | | $ | 94,997,082 | | | | | $ | 259,224,467 | |
| | | | 5,244,741 | | | | | | 1,796,060 | | | | | | 1,134,763 | | | | | | 4,196,934 | | | | | | 12,645,712 | | | | | | 11,429,162 | |
| | | | 13,635,037 | | | | | | 11,858,270 | | | | | | 12,846,700 | | | | | | 5,532,152 | | | | | | 19,074,754 | | | | | | 33,398,838 | |
| | | | 454,565,638 | | | | | | 369,413,786 | | | | | | 102,128,322 | | | | | | 7,546,797 | | | | | | 6,280,054 | | | | | | 37,710,592 | |
| | | | 1,127,299 | | | | | | 5,522,345 | | | | | | 1,902,990 | | | | | | — | | | | | | — | | | | | | 1,035,707 | |
| | | | 357,223 | | | | | | 84,696 | | | | | | 5,463,116 | | | | | | 158,557 | | | | | | 320,949 | | | | | | 200,114 | |
| | | | 31,684 | | | | | | 11,445 | | | | | | 279,512 | | | | | | 27,224 | | | | | | 480,644 | | | | | | 176,801 | |
| | | $ | 640,450,140 | | | | | $ | 521,778,325 | | | | | $ | 191,189,657 | | | | | $ | 44,134,245 | | | | | $ | 133,799,195 | | | | | $ | 343,175,681 | |
| | | | | | | | | | | | | | | | | | | | | | | | | | | | | | | | | | | |
| | | | 11,792,402 | | | | | | 11,926,526 | | | | | | 5,151,872 | | | | | | 1,150,714 | | | | | | 3,335,974 | | | | | | 9,813,348 | |
| | | | 404,472 | | | | | | 161,862 | | | | | | 96,440 | | | | | | 211,848 | | | | | | 635,451 | | | | | | 461,699 | |
| | | | 1,055,597 | | | | | | 1,070,717 | | | | | | 1,092,590 | | | | | | 276,962 | | | | | | 848,070 | | | | | | 1,372,728 | |
| | | | 31,489,070 | | | | | | 33,116,682 | | | | | | 7,532,316 | | | | | | 293,546 | | | | | | 178,088 | | | | | | 1,393,519 | |
| | | | 81,295 | | | | | | 492,840 | | | | | | 147,030 | | | | | | — | | | | | | — | | | | | | 39,255 | |
| | | | 25,666 | | | | | | 7,603 | | | | | | 421,318 | | | | | | 6,779 | | | | | | 11,285 | | | | | | 7,636 | |
| | | | 2,269 | | | | | | 1,028 | | | | | | 21,528 | | | | | | 1,189 | | | | | | 16,983 | | | | | | 6,740 | |
| | | | | | | | | | | | | | | | | | | | | | | | | | | | | | | | | | | |
| | | | $14.03 | | | | | | $11.16 | | | | | | $13.09 | | | | | | $23.18 | | | | | | $28.48 | | | | | | $26.42 | |
| | | | 12.97 | | | | | | 11.10 | | | | | | 11.77 | | | | | | 19.81 | | | | | | 19.90 | | | | | | 24.75 | |
| | | | 12.92 | | | | | | 11.08 | | | | | | 11.76 | | | | | | 19.97 | | | | | | 22.49 | | | | | | 24.33 | |
| | | | 14.44 | | | | | | 11.15 | | | | | | 13.56 | | | | | | 25.71 | | | | | | 35.26 | | | | | | 27.06 | |
| | | | 13.87 | | | | | | 11.21 | | | | | | 12.94 | | | | | | — | | | | | | — | | | | | | 26.38 | |
| | | | 13.92 | | | | | | 11.14 | | | | | | 12.97 | | | | | | 23.39 | | | | | | 28.44 | | | | | | 26.21 | |
| | | | 13.97 | | | | | | 11.14 | | | | | | 12.98 | | | | | | 22.89 | | | | | | 28.30 | | | | | | 26.23 | |
| | |
| The accompanying notes are an integral part of these financial statements. | | 87 |
GOLDMAN SACHS STRUCTURED DOMESTIC EQUITY FUNDS
Statements of Operations
For the Six Months Ended April 30, 2012 (Unaudited)
| | | | | | |
| | | | |
Balanced Fund | |
| | Investment income: | | | | |
| | Dividends (net of foreign withholding taxes of $1,833, $3,475, $0, $0, $0, $0 and $2,141) | | $ | 1,248,574 | |
| | Interest | | | 695,185 | |
| | Securities lending income — affiliated issuers | | | 12,566 | |
| | Total investment income | | | 1,956,325 | |
| | |
| | | | | | |
| | Expenses: | | | | |
| | Management fees | | | 387,143 | |
| | Distribution and Service fees(a) | | | 197,918 | |
| | Transfer Agent fees(a) | | | 107,414 | |
| | Custody and accounting fees | | | 75,034 | |
| | Professional fees | | | 52,711 | |
| | Printing and mailing costs | | | 36,824 | |
| | Registration fees | | | 33,145 | |
| | Trustee fees | | | 7,856 | |
| | Service Share fees — Shareholder Administration Plan | | | — | |
| | Service Share fees — Service Plan | | | — | |
| | Other | | | 2,122 | |
| | Total expenses | | | 900,167 | |
| | Less — expense reductions | | | (229,219 | ) |
| | Net expenses | | | 670,948 | |
| | NET INVESTMENT INCOME (LOSS) | | | 1,285,377 | |
| | |
| | | | | | |
| | Realized and unrealized gain (loss): | | | | |
| | Net realized gain (loss) from: | | | | |
| | Investments | | | 3,594,338 | |
| | Futures contracts | | | 610,649 | |
| | Written options | | | (12,578 | ) |
| | Swap contracts | | | (124,427 | ) |
| | Forward foreign currency exchange contracts | | | (15,539 | ) |
| | Foreign currency transactions | | | (6,033 | ) |
| | Net change in unrealized gain (loss) on: | | | | |
| | Investments | | | 4,071,078 | |
| | Futures contracts | | | 35,506 | |
| | Swap contracts | | | (43,171 | ) |
| | Forward foreign currency exchange contracts | | | 26,747 | |
| | Foreign currency translation | | | 2,381 | |
| | Net realized and unrealized gain | | | 8,138,951 | |
| | NET INCREASE IN NET ASSETS RESULTING FROM OPERATIONS | | $ | 9,424,328 | |
| | (a) | | Class specific Distribution and Service, and Transfer Agent fees were as follows: |
| | | | | | | | | | | | | | | | | | | | | | | | | | | | | | | | | | | | | | | | | | | | |
| | | Distribution and Service Fees | | | Transfer Agent Fees | |
Fund | | Class A | | | Class B | | | Class C | | | Class R | | | Class A | | | Class B | | | Class C | | | Institutional | | | Service | | | Class IR | | | Class R | |
Balanced | | $ | 117,016 | | | $ | 31,310 | | | $ | 49,592 | | | $ | — | | | $ | 88,932 | | | $ | 5,949 | | | $ | 9,422 | | | $ | 1,534 | | | $ | — | | | $ | 1,577 | | | $ | — | |
Structured Large Cap Growth | | | 193,763 | | | | 28,083 | | | | 66,000 | | | | 72 | | | | 147,260 | | | | 5,336 | | | | 12,540 | | | | 83,736 | | | | 213 | | | | 112 | | | | 28 | |
Structured Large Cap Value | | | 167,060 | | | | 9,050 | | | | 58,817 | | | | 26 | | | | 126,966 | | | | 1,719 | | | | 11,175 | | | | 76,247 | | | | 1,433 | | | | 72 | | | | 10 | |
Structured Small Cap Equity | | | 86,995 | | | | 6,245 | | | | 64,409 | | | | 630 | | | | 66,116 | | | | 1,187 | | | | 12,238 | | | | 22,083 | | | | 351 | | | | 4,930 | | | | 239 | |
Structured Small Cap Growth | | | 32,316 | | | | 22,548 | | | | 27,165 | | | | 61 | | | | 24,561 | | | | 4,284 | | | | 5,161 | | | | 1,443 | | | | — | | | | 277 | | | | 23 | |
Structured Small Cap Value | | | 115,827 | | | | 68,539 | | | | 95,781 | | | | 895 | | | | 88,029 | | | | 13,022 | | | | 18,199 | | | | 874 | | | | — | | | | 290 | | | | 340 | |
Structured U.S. Equity | | | 332,786 | | | | 60,901 | | | | 164,209 | | | | 289 | | | | 252,917 | | | | 11,571 | | | | 31,200 | | | | 6,837 | | | | 193 | | | | 135 | | | | 110 | |
| | |
| 88 | | The accompanying notes are an integral part of these financial statements. |
GOLDMAN SACHS STRUCTURED DOMESTIC EQUITY FUNDS
| | | | | | | | | | | | | | | | | | | | | | | | | | | | | | | | | | |
| | | Structured
Large Cap
Growth Fund | | | | | Structured
Large Cap
Value Fund | | | | | Structured
Small Cap
Equity Fund | | | | | Structured
Small Cap
Growth Fund | | | | | Structured
Small Cap
Value Fund | | | | | Structured
U.S. Equity
Fund | |
| | | | | | | | | | | | | | | | | | | | | | | | | | | | | | | | | | |
| | $ | 5,479,343 | | | | | $ | 6,764,940 | | | | | $ | 1,371,895 | | | | | $ | 233,436 | | | | | $ | 1,281,828 | | | | | $ | 4,098,186 | |
| | | 9,745 | | | | | | 6,946 | | | | | | 2,935 | | | | | | 655 | | | | | | 2,099 | | | | | | 4,555 | |
| | | 52,652 | | | | | | 18,543 | | | | | | 17,527 | | | | | | 15,197 | | | | | | 30,327 | | | | | | 18,587 | |
| | | 5,541,740 | | | | | | 6,790,429 | | | | | | 1,392,357 | | | | | | 249,288 | | | | | | 1,314,254 | | | | | | 4,121,328 | |
| | | | | | | | | | | |
| | | | | | | | | | | | | | | | | | | | | | | | | | | | | | | | | | |
| | | | | | | | | | | | | | | | | | | | | | | | | | | | | | | | | | |
| | | 1,929,590 | | | | | | 1,607,128 | | | | | | 855,696 | | | | | | 184,140 | | | | | | 554,887 | | | | | | 1,126,640 | |
| | | 287,918 | | | | | | 234,953 | | | | | | 158,279 | | | | | | 82,090 | | | | | | 281,042 | | | | | | 558,185 | |
| | | 249,225 | | | | | | 217,622 | | | | | | 107,144 | | | | | | 35,749 | | | | | | 120,754 | | | | | | 302,963 | |
| | | 55,005 | | | | | | 43,889 | | | | | | 47,344 | | | | | | 37,926 | | | | | | 35,605 | | | | | | 44,910 | |
| | | 40,283 | | | | | | 46,629 | | | | | | 40,721 | | | | | | 41,382 | | | | | | 45,419 | | | | | | 43,116 | |
| | | 46,946 | | | | | | 20,488 | | | | | | 21,944 | | | | | | 18,775 | | | | | | 16,703 | | | | | | 41,039 | |
| | | 55,142 | | | | | | 39,596 | | | | | | 29,570 | | | | | | 38,125 | | | | | | 40,768 | | | | | | 49,766 | |
| | | 8,408 | | | | | | 8,362 | | | | | | 7,921 | | | | | | 7,726 | | | | | | 7,866 | | | | | | 8,084 | |
| | | 1,332 | | | | | | 8,955 | | | | | | 2,197 | | | | | | — | | | | | | — | | | | | | 1,205 | |
| | | 1,332 | | | | | | 8,955 | | | | | | 2,197 | | | | | | — | | | | | | — | | | | | | 1,205 | |
| | | 10,573 | | | | | | 7,513 | | | | | | 8,114 | | | | | | 5,798 | | �� | | | | 3,458 | | | | | | 8,381 | |
| | | 2,685,754 | | | | | | 2,244,090 | | | | | | 1,281,127 | | | | | | 451,711 | | | | | | 1,106,502 | | | | | | 2,185,494 | |
| | | (620,119 | ) | | | | | (406,144 | ) | | | | | (191,875 | ) | | | | | (157,546 | ) | | | | | (173,335 | ) | | | | | (431,049 | ) |
| | | 2,065,635 | | | | | | 1,837,946 | | | | | | 1,089,252 | | | | | | 294,165 | | | | | | 933,167 | | | | | | 1,754,445 | |
| | | 3,476,105 | | | | | | 4,952,483 | | | | | | 303,105 | | | | | | (44,877 | ) | | | | | 381,087 | | | | | | 2,366,883 | |
| | | | | | | | | | | |
| | | | | | | | | | | | | | | | | | | | | | | | | | | | | | | | | | |
| | | | | | | | | | | | | | | | | | | | | | | | | | | | | | | | | | |
| | | | | | | | | | | | | | | | | | | | | | | | | | | | | | | | | | |
| | | 56,920,397 | | | | | | 41,510,028 | | | | | | 22,388,583 | | | | | | 3,306,108 | | | | | | 7,356,169 | | | | | | 31,398,937 | |
| | | 2,070,574 | | | | | | 1,956,511 | | | | | | 1,037,925 | | | | | | 141,531 | | | | | | 410,937 | | | | | | 386,967 | |
| | | — | | | | | | — | | | | | | — | | | | | | — | | | | | | — | | | | | | — | |
| | | — | | | | | | — | | | | | | — | | | | | | — | | | | | | — | | | | | | — | |
| | | — | | | | | | — | | | | | | — | | | | | | — | | | | | | — | | | | | | — | |
| | | — | | | | | | — | | | | | | — | | | | | | — | | | | | | — | | | | | | — | |
| | | | | | | | | | | | | | | | | | | | | | | | | | | | | | | | | | |
| | | 11,151,065 | | | | | | 7,822,717 | | | | | | (1,640,955 | ) | | | | | 468,973 | | | | | | 2,669,451 | | | | | | 1,820,034 | |
| | | (261,893 | ) | | | | | (531,156 | ) | | | | | (88,602 | ) | | | | | (53,969 | ) | | | | | (175,186 | ) | | | | | (226,077 | ) |
| | | — | | | | | | — | | | | | | — | | | | | | — | | | | | | — | | | | | | — | |
| | | — | | | | | | — | | | | | | — | | | | | | — | | | | | | — | | | | | | — | |
| | | — | | | | | | — | | | | | | — | | | | | | — | | | | | | — | | | | | | — | |
| | | 69,880,143 | | | | | | 50,758,100 | | | | | | 21,696,951 | | | | | | 3,862,643 | | | | | | 10,261,371 | | | | | | 33,379,861 | |
| | $ | 73,356,248 | | | | | $ | 55,710,583 | | | | | $ | 22,000,056 | | | | | $ | 3,817,766 | | | | | $ | 10,642,458 | | | | | $ | 35,746,744 | |
| | |
| The accompanying notes are an integral part of these financial statements. | | 89 |
GOLDMAN SACHS STRUCTURED DOMESTIC EQUITY FUNDS
Statements of Changes in Net Assets
| | | | | | | | | | |
| | | | | Balanced Fund | |
| | | | | For the
Six Months Ended
April 30, 2012
(Unaudited) | | | For the Fiscal
Year Ended
October 31, 2011 | |
| | From operations: | |
| | Net investment income | | $ | 1,285,377 | | | $ | 2,651,580 | |
| | Net realized gain | | | 4,046,410 | | | | 6,952,249 | |
| | Net change in unrealized gain (loss) | | | 4,092,541 | | | | (1,147,708 | ) |
| | Net increase in net assets resulting from operations | | | 9,424,328 | | | | 8,456,121 | |
| | | | | | | | | | |
| | Distributions to shareholders: | | | | | | | | |
| | From net investment income | | | | | | | | |
| | Class A Shares | | | (965,936 | ) | | | (2,527,748 | ) |
| | Class B Shares | | | (41,847 | ) | | | (124,008 | ) |
| | Class C Shares | | | (68,450 | ) | | | (144,092 | ) |
| | Institutional Shares | | | (94,559 | ) | | | (121,659 | ) |
| | Service Shares | | | — | | | | — | |
| | Class IR Shares | | | (17,700 | ) | | | (2,731 | ) |
| | Class R Shares | | | — | | | | — | |
| | Total distributions to shareholders | | | (1,188,492 | ) | | | (2,920,238 | ) |
| | | | | | | | | | |
| | From share transactions: | | | | | | | | |
| | Proceeds from sales of shares | | | 19,258,314 | | | | 28,330,246 | |
| | Reinvestment of distributions | | | 1,116,912 | | | | 2,775,474 | |
| | Cost of shares redeemed | | | (19,960,095 | ) | | | (46,692,692 | ) |
| | Net increase (decrease) in net assets resulting from share transactions | | | 415,131 | | | | (15,586,972 | ) |
| | | |
| | TOTAL INCREASE (DECREASE) | | | 8,650,967 | | | | (10,051,089 | ) |
| | | | | | | | | | |
| | Net assets: | | | | | | | | |
| | Beginning of period | | | 117,235,100 | | | | 127,286,189 | |
| | End of period | | $ | 125,886,067 | | | $ | 117,235,100 | |
| | Undistributed net investment income | | $ | 110,832 | | | $ | 13,947 | |
| | |
| 90 | | The accompanying notes are an integral part of these financial statements. |
GOLDMAN SACHS STRUCTURED DOMESTIC EQUITY FUNDS
| | | | | | | | | | | | | | | | | | | | | | |
| | | Structured Large Cap Growth Fund | | | | | Structured Large Cap Value Fund | |
| | | For the
Six Months Ended
April 30, 2012
(Unaudited) | | | | | For the Fiscal
Year Ended
October 31, 2011 | | | | | For the
Six Months Ended
April 30, 2012
(Unaudited) | | | | | For the Fiscal
Year Ended
October 31, 2011 | |
| | | | | | | | | | | | | | | | | | | | | | |
| | $ | 3,476,105 | | | | | $ | 6,471,836 | | | | | $ | 4,952,483 | | | | | $ | 9,244,481 | |
| | | 58,990,971 | | | | | | 49,149,017 | | | | | | 43,466,539 | | | | | | 39,836,896 | |
| | | | 10,889,172 | | | | | | 11,135,556 | | | | | | 7,291,561 | | | | | | 9,006,104 | |
| | | | 73,356,248 | | | | | | 66,756,409 | | | | | | 55,710,583 | | | | | | 58,087,481 | |
| | | | | | | | | | | | | | | | | | | | | | |
| | | | | | | | | | | | | | | | | | | | | | |
| | | | | | | | | | | | | | | | | | | | | | |
| | | (1,569,418 | ) | | | | | (1,592,178 | ) | | | | | (978,311 | ) | | | | | (2,084,314 | ) |
| | | (16,608 | ) | | | | | (44,502 | ) | | | | | (7,649 | ) | | | | | (14,874 | ) |
| | | (60,168 | ) | | | | | (86,381 | ) | | | | | (49,102 | ) | | | | | (84,576 | ) |
| | | (5,594,137 | ) | | | | | (5,259,752 | ) | | | | | (3,459,553 | ) | | | | | (7,249,802 | ) |
| | | (12,560 | ) | | | | | (1,001 | ) | | | | | (53,046 | ) | | | | | (102,081 | ) |
| | | (670 | ) | | | | | (117 | ) | | | | | (647 | ) | | | | | (525 | ) |
| | | | (98 | ) | | | | | (532 | ) | | | | | (61 | ) | | | | | (626 | ) |
| | | | (7,253,659 | ) | | | | | (6,984,463 | ) | | | | | (4,548,369 | ) | | | | | (9,536,798 | ) |
| | | | | | | | | | | | | | | | | | | | | | |
| | | | | | | | | | | | | | | | | | | | | | |
| | | 107,247,642 | | | | | | 269,712,866 | | | | | | 63,748,976 | | | | | | 237,675,485 | |
| | | 7,191,059 | | | | | | 6,893,160 | | | | | | 4,513,296 | | | | | | 9,256,017 | |
| | | | (103,330,684 | ) | | | | | (303,030,355 | ) | | | | | (118,250,010 | ) | | | | | (298,971,539 | ) |
| | | | 11,108,017 | | | | | | (26,424,329 | ) | | | | | (49,987,738 | ) | | | | | (52,040,037 | ) |
| | | | | | | |
| | | | 77,210,606 | | | | | | 33,347,617 | | | | | | 1,174,476 | | | | | | (3,489,354 | ) |
| | | | | | | | | | | | | | | | | | | | | | |
| | | | | | | | | | | | | | | | | | | | | | |
| | | | 563,239,534 | | | | | | 529,891,917 | | | | | | 520,603,849 | | | | | | 524,093,203 | |
| | | $ | 640,450,140 | | | | | $ | 563,239,534 | | | | | $ | 521,778,325 | | | | | $ | 520,603,849 | |
| | | $ | 2,532,482 | | | | | $ | 6,310,036 | | | | | $ | 404,114 | | | | | $ | — | |
| | |
| The accompanying notes are an integral part of these financial statements. | | 91 |
GOLDMAN SACHS STRUCTURED DOMESTIC EQUITY FUNDS
Statements of Changes in Net Assets (continued)
| | | | | | | | | | |
| | | | | Structured Small Cap Equity Fund | |
| | | | | For the
Six Months Ended
April 30, 2012
(Unaudited) | | | For the Fiscal
Year Ended
October 31, 2011 | |
| | From operations: | |
| | Net investment income (loss) | | $ | 303,105 | | | $ | 1,936,345 | |
| | Net realized gain | | | 23,426,508 | | | | 84,844,124 | |
| | Net change in unrealized gain (loss) | | | (1,729,557 | ) | | | (43,093,874 | ) |
| | Net increase in net assets resulting from operations | | | 22,000,056 | | | | 43,686,595 | |
| | | | | | | | | | |
| | Distributions to shareholders: | | | | | | | | |
| | From net investment income | | | | | | | | |
| | Class A Shares | | | (504,874 | ) | | | (693,060 | ) |
| | Class B Shares | | | (298 | ) | | | — | |
| | Class C Shares | | | (29,847 | ) | | | (7,635 | ) |
| | Institutional Shares | | | (1,105,856 | ) | | | (2,286,438 | ) |
| | Service Shares | | | (14,086 | ) | | | (6,725 | ) |
| | Class IR Shares | | | (67,613 | ) | | | (328 | ) |
| | Class R Shares | | | (1,539 | ) | | | (1,017 | ) |
| | Total distributions to shareholders | | | (1,724,113 | ) | | | (2,995,203 | ) |
| | | | | | | | | | |
| | From share transactions: | | | | | | | | |
| | Proceeds from sales of shares | | | 61,107,587 | | | | 55,291,331 | |
| | Reinvestment of distributions | | | 1,674,085 | | | | 2,943,140 | |
| | Cost of shares redeemed | | | (64,677,431 | ) | | | (288,687,951 | ) |
| | Net decrease in net assets resulting from share transactions | | | (1,895,759 | ) | | | (230,453,480 | ) |
| | | |
| | TOTAL INCREASE (DECREASE) | | | 18,380,184 | | | | (189,762,088 | ) |
| | | | | | | | | | |
| | Net assets: | | | | | | | | |
| | Beginning of period | | | 172,809,473 | | | | 362,571,561 | |
| | End of period | | $ | 191,189,657 | | | $ | 172,809,473 | |
| | Undistributed (distributions in excess of) net investment income (loss) | | $ | 314,859 | | | $ | 1,735,867 | |
| | |
| 92 | | The accompanying notes are an integral part of these financial statements. |
GOLDMAN SACHS STRUCTURED DOMESTIC EQUITY FUNDS
| | | | | | | | | | | | | | | | | | | | | | | | | | | | | | | | | | |
| | | Structured Small Cap Growth Fund | | | | | Structured Small Cap Value Fund | | | | | Structured U.S. Equity Fund | |
| | | For the
Six Months Ended
April 30, 2012
(Unaudited) | | | | | For the Fiscal
Year Ended
October 31, 2011 | | | | | For the
Six Months Ended
April 30, 2012
(Unaudited) | | | | | For the Fiscal
Year Ended
October 31, 2011 | | | | | For the
Six Months Ended
April 30, 2012
(Unaudited) | | | | | For the Fiscal
Year Ended
October 31, 2011 | |
| | | | | | | | | | | | | | | | | | | | | | | | | | | | | | | | | | |
| | $ | (44,877 | ) | | | | $ | (173,882 | ) | | | | $ | 381,087 | | | | | $ | 542,506 | | | | | $ | 2,366,883 | | | | | $ | 5,926,992 | |
| | | 3,447,639 | | | | | | 6,160,507 | | | | | | 7,767,106 | | | | | | 16,259,204 | | | | | | 31,785,904 | | | | | | 42,051,886 | |
| | | | 415,004 | | | | | | (149,864 | ) | | | | | 2,494,265 | | | | | | (2,791,943 | ) | | | | | 1,593,957 | | | | | | (5,192,561 | ) |
| | | | 3,817,766 | | | | | | 5,836,761 | | | | | | 10,642,458 | | | | | | 14,009,767 | | | | | | 35,746,744 | | | | | | 42,786,317 | |
| | | | | | | | | | | | | | | | | | | | | | | | | | | | | | | | | | |
| | | | | | | | | | | | | | | | | | | | | | | | | | | | | | | | | | |
| | | | | | | | | | | | | | | | | | | | | | | | | | | | | | | | | | |
| | | — | | | | | | — | | | | | | (461,047 | ) | | | | | (607,909 | ) | | | | | (4,801,561 | ) | | | | | (3,796,772 | ) |
| | | — | | | | | | — | | | | | | — | | | | | | (22,391 | ) | | | | | (129,283 | ) | | | | | (94,814 | ) |
| | | — | | | | | | — | | | | | | — | | | | | | (27,595 | ) | | | | | (393,452 | ) | | | | | (219,877 | ) |
| | | — | | | | | | — | | | | | | (27,544 | ) | | | | | (20,765 | ) | | | | | (687,173 | ) | | | | | (1,895,873 | ) |
| | | — | | | | | | — | | | | | | — | | | | | | — | | | | | | (14,485 | ) | | | | | (14,843 | ) |
| | | — | | | | | | — | | | | | | (1,923 | ) | | | | | (273 | ) | | | | | (1,686 | ) | | | | | (126 | ) |
| | | | — | | | | | | — | | | | | | (1,228 | ) | | | | | (543 | ) | | | | | (426 | ) | | | | | (494 | ) |
| | | | — | | | | | | — | | | | | | (491,742 | ) | | | | | (679,476 | ) | | | | | (6,028,066 | ) | | | | | (6,022,799 | ) |
| | | | | | | | | | | | | | | | | | | | | | | | | | | | | | | | | | |
| | | | | | | | | | | | | | | | | | | | | | | | | | | | | | | | | | |
| | | 3,904,897 | | | | | | 7,827,443 | | | | | | 7,734,678 | | | | | | 10,281,394 | | | | | | 15,394,039 | | | | | | 63,648,652 | |
| | | — | | | | | | — | | | | | | 473,046 | | | | | | 637,920 | | | | | | 5,704,866 | | | | | | 5,665,611 | |
| | | | (5,523,665 | ) | | | | | (11,690,436 | ) | | | | | (13,870,978 | ) | | | | | (35,254,935 | ) | | | | | (66,507,979 | ) | | | | | (219,166,399 | ) |
| | | | (1,618,768 | ) | | | | | (3,862,993 | ) | | | | | (5,663,254 | ) | | | | | (24,335,621 | ) | | | | | (45,409,074 | ) | | | | | (149,852,136 | ) |
| | | | | | | | | | | |
| | | | 2,198,998 | | | | | | 1,973,768 | | | | | | 4,487,462 | | | | | | (11,005,330 | ) | | | | | (15,690,396 | ) | | | | | (113,088,618 | ) |
| | | | | | | | | | | | | | | | | | | | | | | | | | | | | | | | | | |
| | | | | | | | | | | | | | | | | | | | | | | | | | | | | | | | | | |
| | | | 41,935,247 | | | | | | 39,961,479 | | | | | | 129,311,733 | | | | | | 140,317,063 | | | | | | 358,866,077 | | | | | | 471,954,695 | |
| | | $ | 44,134,245 | | | | | $ | 41,935,247 | | | | | $ | 133,799,195 | | | | | $ | 129,311,733 | | | | | $ | 343,175,681 | | | | | $ | 358,866,077 | |
| | | $ | (81,683 | ) | | | | $ | (36,806 | ) | | | | $ | (76,735 | ) | | | | $ | 33,920 | | | | | $ | 1,063,606 | | | | | $ | 4,724,789 | |
| | |
| The accompanying notes are an integral part of these financial statements. | | 93 |
GOLDMAN SACHS BALANCED FUND
Financial Highlights
Selected Data for a Share Outstanding Throughout Each Period
| | | | | | | | | | | | | | | | | | | | | | | | | | | | | | |
| | | | | | | | Income (loss) from
investment operations | | | Distributions
to shareholders | |
| | | Year - Share Class | |
Net asset
value,
beginning
of period | | | Net
investment
income(a) | | | Net realized
and unrealized
gain (loss) | | | Total from
investment
operations | | | From net
investment
income | | | From net
realized
gains | | | Total
distributions | |
| | FOR THE SIX MONTHS ENDED APRIL 30, (UNAUDITED) | | | | | | | | | | | | | |
| | 2012 - A | | $ | 19.01 | | | $ | 0.22 | | | $ | 1.32 | | | $ | 1.54 | | | $ | (0.20 | ) | | $ | — | | | $ | (0.20 | ) |
| | 2012 - B | | | 18.87 | | | | 0.15 | | | | 1.31 | | | | 1.46 | | | | (0.13 | ) | | | — | | | | (0.13 | ) |
| | 2012 - C | | | 18.79 | | | | 0.14 | | | | 1.31 | | | | 1.45 | | | | (0.13 | ) | | | — | | | | (0.13 | ) |
| | 2012 - Institutional | | | 19.31 | | | | 0.25 | | | | 1.36 | | | | 1.61 | | | | (0.24 | ) | | | — | | | | (0.24 | ) |
| | 2012 - IR | | | 19.28 | | | | 0.22 | | | | 1.37 | | | | 1.59 | | | | (0.23 | ) | | | — | | | | (0.23 | ) |
| | | | | | | | | | | | | | | | | | | | | | | | | | | | | | |
| | FOR THE FISCAL YEARS ENDED OCTOBER 31, | |
| | 2011 - A | | | 18.21 | | | | 0.42 | (d) | | | 0.83 | | | | 1.25 | | | | (0.45 | ) | | | — | | | | (0.45 | ) |
| | 2011 - B | | | 18.07 | | | | 0.28 | (d) | | | 0.83 | | | | 1.11 | | | | (0.31 | ) | | | — | | | | (0.31 | ) |
| | 2011 - C | | | 18.01 | | | | 0.26 | (d) | | | 0.84 | | | | 1.10 | | | | (0.32 | ) | | | — | | | | (0.32 | ) |
| | 2011 - Institutional | | | 18.50 | | | | 0.47 | (d) | | | 0.87 | | | | 1.34 | | | | (0.53 | ) | | | — | | | | (0.53 | ) |
| | 2011 - IR | | | 18.48 | | | | 0.40 | (d) | | | 0.90 | | | | 1.30 | | | | (0.50 | ) | | | — | | | | (0.50 | ) |
| | 2010 - A | | | 16.32 | | | | 0.48 | (e) | | | 1.97 | | | | 2.45 | | | | (0.56 | ) | | | — | | | | (0.56 | ) |
| | 2010 - B | | | 16.19 | | | | 0.35 | (e) | | | 1.96 | | | | 2.31 | | | | (0.43 | ) | | | — | | | | (0.43 | ) |
| | 2010 - C | | | 16.14 | | | | 0.34 | (e) | | | 1.97 | | | | 2.31 | | | | (0.44 | ) | | | — | | | | (0.44 | ) |
| | 2010 - Institutional | | | 16.57 | | | | 0.55 | (e) | | | 2.01 | | | | 2.56 | | | | (0.63 | ) | | | — | | | | (0.63 | ) |
| | 2010 - IR (Commenced August 31, 2010) | | | 17.28 | | | | 0.06 | (e) | | | 1.28 | | | | 1.34 | | | | (0.14 | ) | | | — | | | | (0.14 | ) |
| | 2009 - A | | | 14.64 | | | | 0.46 | | | | 1.71 | | | | 2.17 | | | | (0.49 | ) | | | — | | | | (0.49 | ) |
| | 2009 - B | | | 14.53 | | | | 0.35 | | | | 1.69 | | | | 2.04 | | | | (0.38 | ) | | | — | | | | (0.38 | ) |
| | 2009 - C | | | 14.49 | | | | 0.35 | | | | 1.68 | | | | 2.03 | | | | (0.38 | ) | | | — | | | | (0.38 | ) |
| | 2009 - Institutional | | | 14.86 | | | | 0.53 | | | | 1.73 | | | | 2.26 | | | | (0.55 | ) | | | — | | | | (0.55 | ) |
| | | | | | | | | | | | | | | | | | | | | | | | | | | | | | |
| | FOR THE PERIOD SEPTEMBER 1, 2008 TO OCTOBER 31, 2008* | |
| | 2008 - A | | | 17.71 | | | | 0.10 | | | | (2.99 | ) | | | (2.89 | ) | | | (0.18 | ) | | | — | | | | (0.18 | ) |
| | 2008 - B | | | 17.56 | | | | 0.08 | | | | (2.96 | ) | | | (2.88 | ) | | | (0.15 | ) | | | — | | | | (0.15 | ) |
| | 2008 - C | | | 17.52 | | | | 0.08 | | | | (2.96 | ) | | | (2.88 | ) | | | (0.15 | ) | | | — | | | | (0.15 | ) |
| | 2008 - Institutional | | | 17.98 | | | | 0.11 | | | | (3.03 | ) | | | (2.92 | ) | | | (0.20 | ) | | | — | | | | (0.20 | ) |
| | 2008 - Service | | | 17.77 | | | | 0.10 | | | | (3.00 | ) | | | (2.90 | ) | | | (0.18 | ) | | | — | | | | (0.18 | ) |
| | | | | | | | | | | | | | | | | | | | | | | | | | | | | | |
| | FOR THE FISCAL YEARS ENDED AUGUST 31, | |
| | 2008 - A | | | 20.66 | | | | 0.64 | | | | (1.86 | ) | | | (1.22 | ) | | | (0.53 | ) | | | (1.20 | ) | | | (1.73 | ) |
| | 2008 - B | | | 20.50 | | | | 0.50 | | | | (1.86 | ) | | | (1.36 | ) | | | (0.38 | ) | | | (1.20 | ) | | | (1.58 | ) |
| | 2008 - C | | | 20.46 | | | | 0.50 | | | | (1.86 | ) | | | (1.36 | ) | | | (0.38 | ) | | | (1.20 | ) | | | (1.58 | ) |
| | 2008 - Institutional | | | 20.95 | | | | 0.73 | | | | (1.89 | ) | | | (1.16 | ) | | | (0.61 | ) | | | (1.20 | ) | | | (1.81 | ) |
| | 2008 - Service | | | 20.70 | | | | 0.64 | | | | (1.85 | ) | | | (1.21 | ) | | | (0.52 | ) | | | (1.20 | ) | | | (1.72 | ) |
| | 2007 - A | | | 20.68 | | | | 0.56 | | | | 1.52 | | | | 2.08 | | | | (0.60 | ) | | | (1.50 | ) | | | (2.10 | ) |
| | 2007 - B | | | 20.52 | | | | 0.41 | | | | 1.51 | | | | 1.92 | | | | (0.44 | ) | | | (1.50 | ) | | | (1.94 | ) |
| | 2007 - C | | | 20.49 | | | | 0.41 | | | | 1.51 | | | | 1.92 | | | | (0.45 | ) | | | (1.50 | ) | | | (1.95 | ) |
| | 2007 - Institutional | | | 20.94 | | | | 0.66 | | | | 1.53 | | | | 2.19 | | | | (0.68 | ) | | | (1.50 | ) | | | (2.18 | ) |
| | 2007 - Service | | | 20.66 | | | | 0.56 | | | | 1.53 | | | | 2.09 | | | | (0.55 | ) | | | (1.50 | ) | | | (2.05 | ) |
| | * | | The Fund changed its fiscal year end from August 31 to October 31. |
| | (a) | | Calculated based on the average shares outstanding methodology. |
| | (b) | | Assumes investment at the net asset value at the beginning of the period, reinvestment of all dividends and distributions, a complete redemption of the investment at the net asset value at the end of the period and no sales or redemption charges. Total returns would be reduced if a sales or redemption charge was taken into account. Returns do not reflect the deduction of taxes that a shareholder would pay on Fund distributions or the redemption of Fund shares. Total returns for periods less than one full year are not annualized. |
| | (d) | | Reflects income recognized from non-recurring special dividends which amounted to $0.08 per share and 0.40% of average net assets. |
| | (e) | | Reflects income recognized from non-recurring special dividends which amounted to $0.05 per share and 0.28% of average net assets. |
| | |
| 94 | | The accompanying notes are an integral part of these financial statements. |
GOLDMAN SACHS BALANCED FUND
| | | | | | | | | | | | | | | | | | | | | | | | | | | | | | | | | | | | | | | | |
| | | | | | | | | | | | | | | | | | | | | | | | | | | | | | | | | | |
| | | Net asset
value, end
of period | | | | | Total
return(b) | | | | | Net assets,
end of
period
(in 000s) | | | | | Ratio of
net expenses
to average
net assets | | | | | Ratio of
total expenses
to average
net assets | | | | | Ratio of
net investment
income
to average
net assets | | | | | Portfolio
turnover
rate | |
| | | | | | | | | | | | | | | | | | | | | | | | | | | | | | | | | | | | | | | | |
| | | $20.35 | | | | | | 8.15 | % | | | | $ | 96,988 | | | | | | 1.05 | %(c) | | | | | 1.43 | %(c) | | | | | 2.24 | %(c) | | | | | 147 | % |
| | | 20.20 | | | | | | 7.76 | | | | | | 6,367 | | | | | | 1.80 | (c) | | | | | 2.18 | (c) | | | | | 1.50 | (c) | | | | | 147 | |
| | | 20.11 | | | | | | 7.75 | | | | | | 11,083 | | | | | | 1.80 | (c) | | | | | 2.18 | (c) | | | | | 1.47 | (c) | | | | | 147 | |
| | | 20.68 | | | | | | 8.39 | | | | | | 9,790 | | | | | | 0.65 | (c) | | | | | 1.03 | (c) | | | | | 2.57 | (c) | | | | | 147 | |
| | | 20.64 | | | | | | 8.29 | | | | | | 1,659 | | | | | | 0.80 | (c) | | | | | 1.18 | (c) | | | | | 2.18 | (c) | | | | | 147 | |
| | | | | | | | | | | | | | | | | | | | | | | | | | | | | | | | | | | | | | | | |
| | | | | | | | | | | | | | | | | | | | | | | | | | | | | | | | | | | | | | | | |
| | | 19.01 | | | | | | 6.95 | | | | | | 94,819 | | | | | | 1.05 | | | | | | 1.38 | | | | | | 2.20 | (d) | | | | | 357 | |
| | | 18.87 | | | | | | 6.16 | | | | | | 6,332 | | | | | | 1.80 | | | | | | 2.13 | | | | | | 1.47 | (d) | | | | | 357 | |
| | | 18.79 | | | | | | 6.13 | | | | | | 9,297 | | | | | | 1.80 | | | | | | 2.13 | | | | | | 1.38 | (d) | | | | | 357 | |
| | | 19.31 | | | | | | 7.33 | | | | | | 6,610 | | | | | | 0.65 | | | | | | 0.98 | | | | | | 2.44 | (d) | | | | | 357 | |
| | | 19.28 | | | | | | 7.09 | | | | | | 177 | | | | | | 0.80 | | | | | | 1.13 | | | | | | 2.06 | (d) | | | | | 357 | |
| | | 18.21 | | | | | | 15.29 | | | | | | 108,710 | | | | | | 1.05 | | | | | | 1.40 | | | | | | 2.75 | (e) | | | | | 238 | |
| | | 18.07 | | | | | | 14.46 | | | | | | 7,991 | | | | | | 1.80 | | | | | | 2.15 | | | | | | 2.03 | (e) | | | | | 238 | |
| | | 18.01 | | | | | | 14.48 | | | | | | 7,665 | | | | | | 1.80 | | | | | | 2.15 | | | | | | 1.99 | (e) | | | | | 238 | |
| | | 18.50 | | | | | | 15.76 | | | | | | 2,919 | | | | | | 0.65 | | | | | | 1.00 | | | | | | 3.14 | (e) | | | | | 238 | |
| | | 18.48 | | | | | | 7.77 | | | | | | 1 | | | | | | 0.80 | (c) | | | | | 1.15 | (c) | | | | | 2.10 | (c)(e) | | | | | 238 | |
| | | 16.32 | | | | | | 15.32 | | | | | | 111,326 | | | | | | 1.05 | | | | | | 1.38 | | | | | | 3.20 | | | | | | 173 | |
| | | 16.19 | | | | | | 14.41 | | | | | | 8,970 | | | | | | 1.80 | | | | | | 2.13 | | | | | | 2.47 | | | | | | 173 | |
| | | 16.14 | | | | | | 14.43 | | | | | | 7,022 | | | | | | 1.80 | | | | | | 2.13 | | | | | | 2.44 | | | | | | 173 | |
| | | 16.57 | | | | | | 15.76 | | | | | | 2,572 | | | | | | 0.65 | | | | | | 0.98 | | | | | | 3.58 | | | | | | 173 | |
| | | | | | | | | | | | | | | | | | | | | | | | | | | | | | | | | | | | | | | | |
| | | | | | | | | | | | | | | | | | | | | | | | | | | | | | | | | | | | | | | | |
| | | 14.64 | | | | | | (16.41 | ) | | | | | 116,915 | | | | | | 1.04 | (c) | | | | | 1.54 | (c) | | | | | 3.72 | (c) | | | | | 58 | |
| | | 14.53 | | | | | | (16.49 | ) | | | | | 10,306 | | | | | | 1.79 | (c) | | | | | 2.29 | (c) | | | | | 2.97 | (c) | | | | | 58 | |
| | | 14.49 | | | | | | (16.52 | ) | | | | | 6,597 | | | | | | 1.79 | (c) | | | | | 2.29 | (c) | | | | | 2.97 | (c) | | | | | 58 | |
| | | 14.86 | | | | | | (16.35 | ) | | | | | 2,433 | | | | | | 0.64 | (c) | | | | | 1.14 | (c) | | | | | 4.10 | (c) | | | | | 58 | |
| | | 14.69 | | | | | | (16.43 | ) | | | | | 1 | | | | | | 0.94 | (c) | | | | | 0.94 | (c) | | | | | 3.75 | (c) | | | | | 58 | |
| | | | | | | | | | | | | | | | | | | | | | | | | | | | | | | | | | | | | | | | |
| | | | | | | | | | | | | | | | | | | | | | | | | | | | | | | | | | | | | | | | |
| | | 17.71 | | | | | | (6.48 | ) | | | | | 148,623 | | | | | | 1.03 | | | | | | 1.29 | | | | | | 3.37 | | | | | | 184 | |
| | | 17.56 | | | | | | (7.21 | ) | | | | | 12,946 | | | | | | 1.78 | | | | | | 2.04 | | | | | | 2.62 | | | | | | 184 | |
| | | 17.52 | | | | | | (7.19 | ) | | | | | 7,835 | | | | | | 1.78 | | | | | | 2.04 | | | | | | 2.63 | | | | | | 184 | |
| | | 17.98 | | | | | | (6.10 | ) | | | | | 2,951 | | | | | | 0.63 | | | | | | 0.89 | | | | | | 3.78 | | | | | | 184 | |
| | | 17.77 | | | | | | (6.41 | ) | | | | | 1 | | | | | | 1.13 | | | | | | 1.39 | | | | | | 3.33 | | | | | | 184 | |
| | | 20.66 | | | | | | 10.53 | | | | | | 180,905 | | | | | | 1.06 | | | | | | 1.31 | | | | | | 2.72 | | | | | | 63 | |
| | | 20.50 | | | | | | 9.71 | | | | | | 16,906 | | | | | | 1.81 | | | | | | 2.06 | | | | | | 1.97 | | | | | | 63 | |
| | | 20.46 | | | | | | 9.72 | | | | | | 7,696 | | | | | | 1.81 | | | | | | 2.06 | | | | | | 1.97 | | | | | | 63 | |
| | | 20.95 | | | | | | 10.99 | | | | | | 3,187 | | | | | | 0.66 | | | | | | 0.91 | | | | | | 3.14 | | | | | | 63 | |
| | | 20.70 | | | | | | 10.53 | | | | | | 2 | | | | | | 1.16 | | | | | | 1.41 | | | | | | 2.60 | | | | | | 63 | |
| | |
| The accompanying notes are an integral part of these financial statements. | | 95 |
GOLDMAN SACHS STRUCTURED LARGE CAP GROWTH FUND
Financial Highlights
Selected Data for a Share Outstanding Throughout Each Period
| | | | | | | | | | | | | | | | | | | | | | | | | | | | | | |
| | | | | | | | Income (loss) from
investment operations | | | Distributions
to shareholders | |
| | | Year - Share Class | | Net asset value,
beginning of period | | | Net
investment
income (loss)(a) | | | Net realized
and unrealized
gain (loss) | | | Total from
investment
operations | | | From net
investment
income | | | From net
realized
gains | | | Total
distributions | |
| | FOR THE SIX MONTHS ENDED APRIL 30, (UNAUDITED) | |
| | 2012 - A | | $ | 12.60 | | | $ | 0.06 | (c) | | $ | 1.51 | | | $ | 1.57 | | | $ | (0.14 | ) | | $ | — | | | $ | (0.14 | ) |
| | 2012 - B | | | 11.59 | | | | 0.02 | (c) | | | 1.39 | | | | 1.41 | | | | (0.03 | ) | | | — | | | | (0.03 | ) |
| | 2012 - C | | | 11.57 | | | | 0.01 | (c) | | | 1.39 | | | | 1.40 | | | | (0.05 | ) | | | — | | | | (0.05 | ) |
| | 2012 - Institutional | | | 12.98 | | | | 0.09 | (c) | | | 1.56 | | | | 1.65 | | | | (0.19 | ) | | | — | | | | (0.19 | ) |
| | 2012 - Service | | | 12.47 | | | | 0.05 | (c) | | | 1.51 | | | | 1.56 | | | | (0.16 | ) | | | — | | | | (0.16 | ) |
| | 2012 - IR | | | 12.53 | | | | 0.04 | (c) | | | 1.54 | | | | 1.58 | | | | (0.19 | ) | | | — | | | | (0.19 | ) |
| | 2012 - R | | | 12.46 | | | | 0.04 | (c) | | | 1.52 | | | | 1.56 | | | | (0.05 | ) | | | — | | | | (0.05 | ) |
| | | | | | | | | | | | | | | | | | | | | | | | | | | | | | |
| | FOR THE FISCAL YEARS ENDED OCTOBER 31, | |
| | 2011 - A | | | 11.54 | | | | 0.10 | (e) | | | 1.09 | | | | 1.19 | | | | (0.13 | ) | | | — | | | | (0.13 | ) |
| | 2011 - B | | | 10.63 | | | | 0.02 | (e) | | | 1.00 | | | | 1.02 | | | | (0.06 | ) | | | — | | | | (0.06 | ) |
| | 2011 - C | | | 10.62 | | | | 0.01 | (e) | | | 1.01 | | | | 1.02 | | | | (0.07 | ) | | | — | | | | (0.07 | ) |
| | 2011 - Institutional | | | 11.88 | | | | 0.16 | (e) | | | 1.12 | | | | 1.28 | | | | (0.18 | ) | | | — | | | | (0.18 | ) |
| | 2011 - Service | | | 11.43 | | | | 0.06 | (e) | | | 1.10 | | | | 1.16 | | | | (0.12 | ) | | | — | | | | (0.12 | ) |
| | 2011 - IR | | | 11.48 | | | | 0.13 | (e) | | | 1.08 | | | | 1.21 | | | | (0.16 | ) | | | — | | | | (0.16 | ) |
| | 2011 - R | | | 11.42 | | | | 0.08 | (e) | | | 1.06 | | | | 1.14 | | | | (0.10 | ) | | | — | | | | (0.10 | ) |
| | 2010 - A | | | 10.04 | | | | 0.09 | | | | 1.52 | | | | 1.61 | | | | (0.11 | ) | | | — | | | | (0.11 | ) |
| | 2010 - B | | | 9.26 | | | | 0.01 | | | | 1.40 | | | | 1.41 | | | | (0.04 | ) | | | — | | | | (0.04 | ) |
| | 2010 - C | | | 9.26 | | | | — | (f) | | | 1.41 | | | | 1.41 | | | | (0.05 | ) | | | — | | | | (0.05 | ) |
| | 2010 - Institutional | | | 10.33 | | | | 0.13 | | | | 1.58 | | | | 1.71 | | | | (0.16 | ) | | | — | | | | (0.16 | ) |
| | 2010 - Service | | | 9.95 | | | | 0.08 | | | | 1.51 | | | | 1.59 | | | | (0.11 | ) | | | — | | | | (0.11 | ) |
| | 2010 - IR | | | 9.99 | | | | 0.11 | | | | 1.52 | | | | 1.63 | | | | (0.14 | ) | | | — | | | | (0.14 | ) |
| | 2010 - R | | | 9.99 | | | | 0.05 | | | | 1.52 | | | | 1.57 | | | | (0.14 | ) | | | — | | | | (0.14 | ) |
| | 2009 - A | | | 8.94 | | | | 0.10 | | | | 1.08 | | | | 1.18 | | | | (0.08 | ) | | | — | | | | (0.08 | ) |
| | 2009 - B | | | 8.23 | | | | 0.03 | | | | 1.00 | | | | 1.03 | | | | — | | | | — | | | | — | |
| | 2009 - C | | | 8.23 | | | | 0.03 | | | | 1.00 | | | | 1.03 | | | | — | | | | — | | | | — | |
| | 2009 - Institutional | | | 9.23 | | | | 0.14 | | | | 1.10 | | | | 1.24 | | | | (0.14 | ) | | | — | | | | (0.14 | ) |
| | 2009 - Service | | | 8.87 | | | | 0.09 | | | | 1.07 | | | | 1.16 | | | | (0.08 | ) | | | — | | | | (0.08 | ) |
| | 2009 - IR | | | 8.92 | | | | 0.11 | | | | 1.08 | | | | 1.19 | | | | (0.12 | ) | | | — | | | | (0.12 | ) |
| | 2009 - R | | | 8.89 | | | | 0.05 | | | | 1.11 | | | | 1.16 | | | | (0.06 | ) | | | — | | | | (0.06 | ) |
| | | | | | | | | | | | | | | | | | | | | | | | | | | | | | |
| | FOR THE PERIOD SEPTEMBER 1, 2008 TO OCTOBER 31, 2008* | |
| | 2008 - A | | | 12.38 | | | | 0.01 | | | | (3.45 | ) | | | (3.44 | ) | | | — | | | | — | | | | — | |
| | 2008 - B | | | 11.40 | | | | (0.01 | ) | | | (3.16 | ) | | | (3.17 | ) | | | — | | | | — | | | | — | |
| | 2008 - C | | | 11.41 | | | | (0.01 | ) | | | (3.17 | ) | | | (3.18 | ) | | | — | | | | — | | | | — | |
| | 2008 - Institutional | | | 12.76 | | | | 0.01 | | | | (3.54 | ) | | | (3.53 | ) | | | — | | | | — | | | | — | |
| | 2008 - Service | | | 12.28 | | | | — | (f) | | | (3.41 | ) | | | (3.41 | ) | | | — | | | | — | | | | — | |
| | 2008 - IR | | | 12.35 | | | | 0.01 | | | | (3.44 | ) | | | (3.43 | ) | | | — | | | | — | | | | — | |
| | 2008 - R | | | 12.31 | | | | — | (f) | | | (3.42 | ) | | | (3.42 | ) | | | — | | | | — | | | | — | |
| | | | | | | | | | | | | | | | | | | | | | | | | | | | | | |
| | FOR THE FISCAL YEARS ENDED AUGUST 31, | |
| | 2008 - A | | | 14.36 | | | | 0.06 | | | | (1.91 | ) | | | (1.85 | ) | | | (0.03 | ) | | | (0.10 | ) | | | (0.13 | ) |
| | 2008 - B | | | 13.31 | | | | (0.04 | ) | | | (1.77 | ) | | | (1.81 | ) | | | — | (f) | | | (0.10 | ) | | | (0.10 | ) |
| | 2008 - C | | | 13.31 | | | | (0.04 | ) | | | (1.76 | ) | | | (1.80 | ) | | | — | (f) | | | (0.10 | ) | | | (0.10 | ) |
| | 2008 - Institutional | | | 14.81 | | | | 0.11 | | | | (1.97 | ) | | | (1.86 | ) | | | (0.09 | ) | | | (0.10 | ) | | | (0.19 | ) |
| | 2008 - Service | | | 14.25 | | | | 0.04 | | | | (1.90 | ) | | | (1.86 | ) | | | (0.01 | ) | | | (0.10 | ) | | | (0.11 | ) |
| | 2008 - IR (Commenced November 30, 2007) | | | 14.53 | | | | 0.06 | | | | (2.05 | ) | | | (1.99 | ) | | | (0.09 | ) | | | (0.10 | ) | | | (0.19 | ) |
| | 2008 - R (Commenced November 30, 2007) | | | 14.53 | | | | 0.02 | | | | (2.05 | ) | | | (2.03 | ) | | | (0.09 | ) | | | (0.10 | ) | | | (0.19 | ) |
| | 2007 - A | | | 13.20 | | | | 0.04 | | | | 1.13 | | | | 1.17 | | | | (0.01 | ) | | | — | | | | (0.01 | ) |
| | 2007 - B | | | 12.33 | | | | (0.06 | ) | | | 1.04 | | | | 0.98 | | | | — | | | | — | | | | — | |
| | 2007 - C | | | 12.34 | | | | (0.06 | ) | | | 1.03 | | | | 0.97 | | | | — | | | | — | | | | — | |
| | 2007 - Institutional | | | 13.58 | | | | 0.10 | | | | 1.17 | | | | 1.27 | | | | (0.04 | ) | | | — | | | | (0.04 | ) |
| | 2007 - Service | | | 13.10 | | | | 0.02 | | | | 1.13 | | | | 1.15 | | | | — | | | | — | | | | — | |
| | * | | The Fund changed its fiscal year end from August 31 to October 31. |
| | (a) | | Calculated based on the average shares outstanding methodology. |
| | (b) | | Assumes investment at the net asset value at the beginning of the period, reinvestment of all dividends and distributions, a complete redemption of the investment at the net asset value at the end of the period and no sales or redemption charges. Total returns would be reduced if a sales or redemption charge was taken into account. Returns do not reflect the deduction of taxes that a shareholder would pay on Fund distributions or the redemption of Fund shares. Total returns for periods less than one full year are not annualized. |
| | (c) | | Reflects income recognized from non-recurring special dividends which amounted to $0.02 per share and 0.31% of average net assets. |
| | (e) | | Reflects income recognized from non-recurring special dividends which amounted to $0.02 per share and 0.16% of average net assets. |
| | (f) | | Amount is less than $0.005 per share. |
| | |
| 96 | | The accompanying notes are an integral part of these financial statements. |
GOLDMAN SACHS STRUCTURED LARGE CAP GROWTH FUND
| | | | | | | | | | | | | | | | | | | | | | | | | | | | | | | | | | | | | | | | |
| | | | | | | | | | | | | | | | | | | | | | | | | | | | | | | | | | |
| | | Net asset
value, end
of period | | | | | Total
return(b) | | | | | Net assets,
end of
period
(in 000s) | | | | | Ratio of
net expenses
to average
net assets | | | | | Ratio of
total expenses
to average
net assets | | | | | Ratio of
net investment
income (loss)
to average
net assets | | | | | Portfolio
turnover
rate | |
| | | | | | | | | | | | | | | | | | | | | | | | | | | | | | | | | | | | | | | | |
| | $ | 14.03 | | | | | | 12.57 | % | | | | $ | 165,489 | | | | | | 0.95 | %(d) | | | | | 1.16 | %(d) | | | | | 0.93 | %(c)(d) | | | | | 56 | % |
| | | 12.97 | | | | | | 12.22 | | | | | | 5,245 | | | | | | 1.70 | (d) | | | | | 1.91 | (d) | | | | | 0.27 | (c)(d) | | | | | 56 | |
| | | 12.92 | | | | | | 12.19 | | | | | | 13,635 | | | | | | 1.70 | (d) | | | | | 1.91 | (d) | | | | | 0.20 | (c)(d) | | | | | 56 | |
| | | 14.44 | | | | | | 12.91 | | | | | | 454,566 | | | | | | 0.55 | (d) | | | | | 0.76 | (d) | | | | | 1.30 | (c)(d) | | | | | 56 | |
| | | 13.87 | | | | | | 12.63 | | | | | | 1,127 | | | | | | 1.05 | (d) | | | | | 1.26 | (d) | | | | | 0.83 | (c)(d) | | | | | 56 | |
| | | 13.92 | | | | | | 12.76 | | | | | | 357 | | | | | | 0.70 | (d) | | | | | 0.91 | (d) | | | | | 0.58 | (c)(d) | | | | | 56 | |
| | | 13.97 | | | | | | 12.53 | | | | | | 32 | | | | | | 1.20 | (d) | | | | | 1.41 | (d) | | | | | 0.65 | (c)(d) | | | | | 56 | |
| | | | | | | | | | | | | | | | | | | | | | | | | | | | | | | | | | | | | | | | |
| | | | | | | | | | | | | | | | | | | | | | | | | | | | | | | | | | | | | | | | |
| | | 12.60 | | | | | | 10.38 | | | | | | 150,750 | | | | | | 0.95 | | | | | | 1.16 | | | | | | 0.84 | (e) | | | | | 76 | |
| | | 11.59 | | | | | | 9.61 | | | | | | 6,043 | | | | | | 1.70 | | | | | | 1.91 | | | | | | 0.13 | (e) | | | | | 76 | |
| | | 11.57 | | | | | | 9.63 | | | | | | 12,999 | | | | | | 1.70 | | | | | | 1.91 | | | | | | 0.10 | (e) | | | | | 76 | |
| | | 12.98 | | | | | | 10.83 | | | | | | 392,373 | | | | | | 0.55 | | | | | | 0.76 | | | | | | 1.22 | (e) | | | | | 76 | |
| | | 12.47 | | | | | | 10.23 | | | | | | 1,004 | | | | | | 1.05 | | | | | | 1.26 | | | | | | 0.49 | (e) | | | | | 76 | |
| | | 12.53 | | | | | | 10.66 | | | | | | 45 | | | | | | 0.70 | | | | | | 0.91 | | | | | | 1.07 | (e) | | | | | 76 | |
| | | | 12.46 | | | | | | 10.06 | | | | | | 26 | | | | | | 1.20 | | | | | | 1.41 | | | | | | 0.63 | (e) | | | | | 76 | |
| | | 11.54 | | | | | | 16.17 | | | | | | 145,079 | | | | | | 0.95 | | | | | | 1.16 | | | | | | 0.79 | | | | | | 64 | |
| | | 10.63 | | | | | | 15.26 | | | | | | 8,219 | | | | | | 1.70 | | | | | | 1.91 | | | | | | 0.06 | | | | | | 64 | |
| | | 10.62 | | | | | | 15.30 | | | | | | 13,528 | | | | | | 1.70 | | | | | | 1.91 | | | | | | 0.03 | | | | | | 64 | |
| | | 11.88 | | | | | | 16.68 | | | | | | 362,907 | | | | | | 0.55 | | | | | | 0.76 | | | | | | 1.21 | | | | | | 64 | |
| | | 11.43 | | | | | | 16.07 | | | | | | 93 | | | | | | 1.05 | | | | | | 1.26 | | | | | | 0.71 | | | | | | 64 | |
| | | 11.48 | | | | | | 16.50 | | | | | | 8 | | | | | | 0.70 | | | | | | 0.91 | | | | | | 1.02 | | | | | | 64 | |
| | | | 11.42 | | | | | | 15.81 | | | | | | 59 | | | | | | 1.20 | | | | | | 1.41 | | | | | | 0.47 | | | | | | 64 | |
| | | 10.04 | | | | | | 13.42 | | | | | | 183,762 | | | | | | 0.95 | | | | | | 1.16 | | | | | | 1.13 | | | | | | 124 | |
| | | 9.26 | | | | | | 12.52 | | | | | | 10,993 | | | | | | 1.70 | | | | | | 1.91 | | | | | | 0.38 | | | | | | 124 | |
| | | 9.26 | | | | | | 12.52 | | | | | | 14,832 | | | | | | 1.70 | | | | | | 1.91 | | | | | | 0.31 | | | | | | 124 | |
| | | 10.33 | | | | | | 13.75 | | | | | | 543,449 | | | | | | 0.55 | | | | | | 0.76 | | | | | | 1.53 | | | | | | 124 | |
| | | 9.95 | | | | | | 13.29 | | | | | | 125 | | | | | | 1.05 | | | | | | 1.26 | | | | | | 1.08 | | | | | | 124 | |
| | | 9.99 | | | | | | 13.65 | | | | | | 7 | | | | | | 0.70 | | | | | | 0.95 | | | | | | 1.25 | | | | | | 124 | |
| | | 9.99 | | | | | | 13.21 | | | | | | 34 | | | | | | 1.20 | | | | | | 1.41 | | | | | | 0.55 | | | | | | 124 | |
| | | | | | | | | | | | | | | | | | | | | | | | | | | | | | | | | | | | | | | | |
| | | | | | | | | | | | | | | | | | | | | | | | | | | | | | | | | | | | | | | | |
| | | 8.94 | | | | | | (27.79 | ) | | | | | 285,337 | | | | | | 0.95 | (d) | | | | | 1.14 | (d) | | | | | 0.34 | (d) | | | | | 19 | |
| | | 8.23 | | | | | | (27.81 | ) | | | | | 16,129 | | | | | | 1.70 | (d) | | | | | 1.89 | (d) | | | | | (0.38 | )(d) | | | | | 19 | |
| | | 8.23 | | | | | | (27.87 | ) | | | | | 16,324 | | | | | | 1.70 | (d) | | | | | 1.89 | (d) | | | | | (0.41 | )(d) | | | | | 19 | |
| | | 9.23 | | | | | | (27.66 | ) | | | | | 814,036 | | | | | | 0.55 | (d) | | | | | 0.74 | (d) | | | | | 0.74 | (d) | | | | | 19 | |
| | | 8.87 | | | | | | (27.77 | ) | | | | | 189 | | | | | | 1.05 | (d) | | | | | 1.24 | (d) | | | | | 0.23 | (d) | | | | | 19 | |
| | | 8.92 | | | | | | (27.77 | ) | | | | | 6 | | | | | | 0.70 | (d) | | | | | 0.89 | (d) | | | | | 0.63 | (d) | | | | | 19 | |
| | | 8.89 | | | | | | (27.78 | ) | | | | | 6 | | | | | | 1.20 | (d) | | | | | 1.39 | (d) | | | | | 0.13 | (d) | | | | | 19 | |
| | | | | | | | | | | | | | | | | | | | | | | | | | | | | | | | | | | | | | | | |
| | | | | | | | | | | | | | | | | | | | | | | | | | | | | | | | | | | | | | | | |
| | | 12.38 | | | | | | (12.96 | ) | | | | | 434,970 | | | | | | 0.95 | | | | | | 1.10 | | | | | | 0.40 | | | | | | 118 | |
| | | 11.40 | | | | | | (13.71 | ) | | | | | 25,718 | | | | | | 1.70 | | | | | | 1.85 | | | | | | (0.34 | ) | | | | | 118 | |
| | | 11.41 | | | | | | (13.63 | ) | | | | | 23,960 | | | | | | 1.70 | | | | | | 1.85 | | | | | | (0.34 | ) | | | | | 118 | |
| | | 12.76 | | | | | | (12.71 | ) | | | | | 1,278,322 | | | | | | 0.55 | | | | | | 0.70 | | | | | | 0.82 | | | | | | 118 | |
| | | 12.28 | | | | | | (13.11 | ) | | | | | 273 | | | | | | 1.05 | | | | | | 1.20 | | | | | | 0.32 | | | | | | 118 | |
| | | 12.35 | | | | | | (13.86 | ) | | | | | 9 | | | | | | 0.70 | (d) | | | | | 0.85 | (d) | | | | | 0.63 | (d) | | | | | 118 | |
| | | | 12.31 | | | | | | (14.18 | ) | | | | | 9 | | | | | | 1.20 | (d) | | | | | 1.35 | (d) | | | | | 0.21 | (d) | | | | | 118 | |
| | | 14.36 | | | | | | 8.85 | | | | | | 678,286 | | | | | | 0.95 | | | | | | 1.09 | | | | | | 0.30 | | | | | | 140 | |
| | | 13.31 | | | | | | 7.95 | | | | | | 49,211 | | | | | | 1.70 | | | | | | 1.84 | | | | | | (0.48 | ) | | | | | 140 | |
| | | 13.31 | | | | | | 7.86 | | | | | | 35,896 | | | | | | 1.70 | | | | | | 1.84 | | | | | | (0.48 | ) | | | | | 140 | |
| | | 14.81 | | | | | | 9.39 | | | | | | 1,635,283 | | | | | | 0.55 | | | | | | 0.69 | | | | | | 0.69 | | | | | | 140 | |
| | | | 14.25 | | | | | | 8.78 | | | | | | 258 | | | | | | 1.05 | | | | | | 1.19 | | | | | | 0.12 | | | | | | 140 | |
| | |
| The accompanying notes are an integral part of these financial statements. | | 97 |
GOLDMAN SACHS STRUCTURED LARGE CAP VALUE FUND
Financial Highlights
Selected Data for a Share Outstanding Throughout Each Period
| | | | | | | | | | | | | | | | | | | | | | | | | | | | | | |
| | | | | | | | Income (loss) from
investment operations | | | Distributions
to shareholders | |
| | | Year - Share Class | | Net asset
value,
beginning
of period | | | Net
investment
income(a) | | | Net realized
and unrealized
gain (loss) | | | Total from
investment
operations | | | From net
investment
income | | | From net
realized
gains | | | Total
distributions | |
| | FOR THE SIX MONTHS ENDED APRIL 30, (UNAUDITED) | |
| | 2012 - A | | $ | 10.19 | | | $ | 0.08 | (c) | | $ | 0.97 | | | $ | 1.05 | | | $ | (0.08 | ) | | $ | — | | | $ | (0.08 | ) |
| | 2012 - B | | | 10.13 | | | | 0.05 | (c) | | | 0.96 | | | | 1.01 | | | | (0.04 | ) | | | — | | | | (0.04 | ) |
| | 2012 - C | | | 10.11 | | | | 0.04 | (c) | | | 0.97 | | | | 1.01 | | | | (0.04 | ) | | | — | | | | (0.04 | ) |
| | 2012 - Institutional | | | 10.18 | | | | 0.10 | (c) | | | 0.97 | | | | 1.07 | | | | (0.10 | ) | | | — | | | | (0.10 | ) |
| | 2012 - Service | | | 10.23 | | | | 0.08 | (c) | | | 0.97 | | | | 1.05 | | | | (0.07 | ) | | | — | | | | (0.07 | ) |
| | 2012 - IR | | | 10.17 | | | | 0.10 | (c) | | | 0.96 | | | | 1.06 | | | | (0.09 | ) | | | — | | | | (0.09 | ) |
| | 2012 - R | | | 10.17 | | | | 0.07 | (c) | | | 0.96 | | | | 1.03 | | | | (0.06 | ) | | | — | | | | (0.06 | ) |
| | | | | | | | | | | | | | | | | | | | | | | | | | | | | | |
| | FOR THE FISCAL YEARS ENDED OCTOBER 31, | |
| | 2011 - A | | | 9.47 | | | | 0.13 | | | | 0.74 | | | | 0.87 | | | | (0.15 | ) | | | — | | | | (0.15 | ) |
| | 2011 - B | | | 9.42 | | | | 0.06 | | | | 0.72 | | | | 0.78 | | | | (0.07 | ) | | | — | | | | (0.07 | ) |
| | 2011 - C | | | 9.40 | | | | 0.06 | | | | 0.72 | | | | 0.78 | | | | (0.07 | ) | | | — | | | | (0.07 | ) |
| | 2011 - Institutional | | | 9.46 | | | | 0.17 | | | | 0.74 | | | | 0.91 | | | | (0.19 | ) | | | — | | | | (0.19 | ) |
| | 2011 - Service | | | 9.51 | | | | 0.12 | | | | 0.74 | | | | 0.86 | | | | (0.14 | ) | | | — | | | | (0.14 | ) |
| | 2011 - IR | | | 9.45 | | | | 0.15 | | | | 0.74 | | | | 0.89 | | | | (0.17 | ) | | | — | | | | (0.17 | ) |
| | 2011 - R | | | 9.45 | | | | 0.12 | | | | 0.72 | | | | 0.84 | | | | (0.12 | ) | | | — | | | | (0.12 | ) |
| | 2010 - A | | | 8.42 | | | | 0.13 | | | | 1.05 | | | | 1.18 | | | | (0.13 | ) | | | — | | | | (0.13 | ) |
| | 2010 - B | | | 8.37 | | | | 0.06 | | | | 1.05 | | | | 1.11 | | | | (0.06 | ) | | | — | | | | (0.06 | ) |
| | 2010 - C | | | 8.36 | | | | 0.06 | | | | 1.04 | | | | 1.10 | | | | (0.06 | ) | | | — | | | | (0.06 | ) |
| | 2010 - Institutional | | | 8.41 | | | | 0.17 | | | | 1.05 | | | | 1.22 | | | | (0.17 | ) | | | — | | | | (0.17 | ) |
| | 2010 - Service | | | 8.45 | | | | 0.12 | | | | 1.06 | | | | 1.18 | | | | (0.12 | ) | | | — | | | | (0.12 | ) |
| | 2010 - IR | | | 8.41 | | | | 0.15 | | | | 1.04 | | | | 1.19 | | | | (0.15 | ) | | | — | | | | (0.15 | ) |
| | 2010 - R | | | 8.41 | | | | 0.11 | | | | 1.04 | �� | | | 1.15 | | | | (0.11 | ) | | | — | | | | (0.11 | ) |
| | 2009 - A | | | 8.60 | | | | 0.17 | | | | (0.16 | ) | | | 0.01 | | | | (0.19 | ) | | | — | | | | (0.19 | ) |
| | 2009 - B | | | 8.54 | | | | 0.12 | | | | (0.17 | ) | | | (0.05 | ) | | | (0.12 | ) | | | — | | | | (0.12 | ) |
| | 2009 - C | | | 8.54 | | | | 0.11 | | | | (0.16 | ) | | | (0.05 | ) | | | (0.13 | ) | | | — | | | | (0.13 | ) |
| | 2009 - Institutional | | | 8.59 | | | | 0.20 | | | | (0.16 | ) | | | 0.04 | | | | (0.22 | ) | | | — | | | | (0.22 | ) |
| | 2009 - Service | | | 8.63 | | | | 0.16 | | | | (0.16 | ) | | | — | | | | (0.18 | ) | | | — | | | | (0.18 | ) |
| | 2009 - IR | | | 8.59 | | | | 0.18 | | | | (0.15 | ) | | | 0.03 | | | | (0.21 | ) | | | — | | | | (0.21 | ) |
| | 2009 - R | | | 8.59 | | | | 0.11 | | | | (0.11 | ) | | | — | | | | (0.18 | ) | | | — | | | | (0.18 | ) |
| | | | | | | | | | | | | | | | | | | | | | | | | | | | | | |
| | FOR THE PERIOD SEPTEMBER 1, 2008 TO OCTOBER 31, 2008* | |
| | 2008 - A | | | 11.24 | | | | 0.03 | | | | (2.62 | ) | | | (2.59 | ) | | | (0.05 | ) | | | — | | | | (0.05 | ) |
| | 2008 - B | | | 11.16 | | | | 0.02 | | | | (2.62 | ) | | | (2.60 | ) | | | (0.02 | ) | | | — | | | | (0.02 | ) |
| | 2008 - C | | | 11.16 | | | | 0.02 | | | | (2.62 | ) | | | (2.60 | ) | | | (0.02 | ) | | | — | | | | (0.02 | ) |
| | 2008 - Institutional | | | 11.24 | | | | 0.04 | | | | (2.63 | ) | | | (2.59 | ) | | | (0.06 | ) | | | — | | | | (0.06 | ) |
| | 2008 - Service | | | 11.28 | | | | 0.03 | | | | (2.64 | ) | | | (2.61 | ) | | | (0.04 | ) | | | — | | | | (0.04 | ) |
| | 2008 - IR | | | 11.23 | | | | 0.03 | | | | (2.62 | ) | | | (2.59 | ) | | | (0.05 | ) | | | — | | | | (0.05 | ) |
| | 2008 - R | | | 11.23 | | | | 0.02 | | | | (2.62 | ) | | | (2.60 | ) | | | (0.04 | ) | | | — | | | | (0.04 | ) |
| | | | | | | | | | | | | | | | | | | | | | | | | | | | | | |
| | FOR THE FISCAL YEARS ENDED AUGUST 31, | |
| | 2008 - A | | | 14.51 | | | | 0.18 | | | | (2.80 | ) | | | (2.62 | ) | | | (0.19 | ) | | | (0.46 | ) | | | (0.65 | ) |
| | 2008 - B | | | 14.39 | | | | 0.09 | | | | (2.78 | ) | | | (2.69 | ) | | | (0.08 | ) | | | (0.46 | ) | | | (0.54 | ) |
| | 2008 - C | | | 14.40 | | | | 0.09 | | | | (2.78 | ) | | | (2.69 | ) | | | (0.09 | ) | | | (0.46 | ) | | | (0.55 | ) |
| | 2008 - Institutional | | | 14.51 | | | | 0.23 | | | | (2.80 | ) | | | (2.57 | ) | | | (0.24 | ) | | | (0.46 | ) | | | (0.70 | ) |
| | 2008 - Service | | | 14.56 | | | | 0.17 | | | | (2.82 | ) | | | (2.65 | ) | | | (0.17 | ) | | | (0.46 | ) | | | (0.63 | ) |
| | 2008 - IR (Commenced November 30, 2007) | | | 13.89 | | | | 0.15 | | | | (2.18 | ) | | | (2.03 | ) | | | (0.17 | ) | | | (0.46 | ) | | | (0.63 | ) |
| | 2008 - R (Commenced November 30, 2007) | | | 13.89 | | | | 0.11 | | | | (2.17 | ) | | | (2.06 | ) | | | (0.14 | ) | | | (0.46 | ) | | | (0.60 | ) |
| | 2007 - A | | | 13.99 | | | | 0.18 | | | | 1.06 | | | | 1.24 | | | | (0.17 | ) | | | (0.55 | ) | | | (0.72 | ) |
| | 2007 - B | | | 13.88 | | | | 0.07 | | | | 1.04 | | | | 1.11 | | | | (0.05 | ) | | | (0.55 | ) | | | (0.60 | ) |
| | 2007 - C | | | 13.90 | | | | 0.07 | | | | 1.04 | | | | 1.11 | | | | (0.06 | ) | | | (0.55 | ) | | | (0.61 | ) |
| | 2007 - Institutional | | | 14.00 | | | | 0.24 | | | | 1.04 | | | | 1.28 | | | | (0.22 | ) | | | (0.55 | ) | | | (0.77 | ) |
| | 2007 - Service | | | 14.06 | | | | 0.17 | | | | 1.05 | | | | 1.22 | | | | (0.17 | ) | | | (0.55 | ) | | | (0.72 | ) |
| | * | | The Fund changed its fiscal year end from August 31 to October 31. |
| | (a) | | Calculated based on the average shares outstanding methodology. |
| | (b) | | Assumes investment at the net asset value at the beginning of the period, reinvestment of all dividends and distributions, a complete redemption of the investment at the net asset value at the end of the period and no sales or redemption charges. Total returns would be reduced if a sales or redemption charge was taken into account. Returns do not reflect the deduction of taxes that a shareholder would pay on Fund distributions or the redemption of Fund shares. Total returns for periods less than one full year are not annualized. |
| | (c) | | Reflects income recognized from non-recurring special dividends which amounted to $0.02 per share and 0.31% of average net assets. |
| | |
| 98 | | The accompanying notes are an integral part of these financial statements. |
GOLDMAN SACHS STRUCTURED LARGE CAP VALUE FUND
| | | | | | | | | | | | | | | | | | | | | | | | | | | | | | | | | | | | | | | | |
| | | | | | | | | | | | | | | | | | | | | | | | | | | | | | | | | | |
| | | Net asset
value, end
of period | | | | | Total
return(b) | | | | | Net assets,
end of
period
(in 000s) | | | | | Ratio of
net expenses
to average
net assets | | | | | Ratio of
total expenses
to average
net assets | | | | | Ratio of
net investment
income
to average
net assets | | | | | Portfolio
turnover
rate | |
| | | | | | | | | | | | | | | | | | | | | | | | | | | | | | | | | | | | | | | | |
| | $ | 11.16 | | | | | | 10.34 | % | | | | $ | 133,092 | | | | | | 0.95 | %(d) | | | | | 1.10 | %(d) | | | | | 1.61 | %(c)(d) | | | | | 45 | % |
| | | 11.10 | | | | | | 10.03 | | | | | | 1,796 | | | | | | 1.70 | (d) | | | | | 1.85 | (d) | | | | | 0.88 | (c)(d) | | | | | 45 | |
| | | 11.08 | | | | | | 10.06 | | | | | | 11,858 | | | | | | 1.70 | (d) | | | | | 1.85 | (d) | | | | | 0.85 | (c)(d) | | | | | 45 | |
| | | 11.15 | | | | | | 10.67 | | | | | | 369,414 | | | | | | 0.55 | (d) | | | | | 0.70 | (d) | | | | | 1.97 | (c)(d) | | | | | 45 | |
| | | 11.21 | | | | | | 10.35 | | | | | | 5,522 | | | | | | 1.05 | (d) | | | | | 1.20 | (d) | | | | | 1.60 | (c)(d) | | | | | 45 | |
| | | 11.14 | | | | | | 10.50 | | | | | | 85 | | | | | | 0.70 | (d) | | | | | 0.85 | (d) | | | | | 1.81 | (c)(d) | | | | | 45 | |
| | | 11.14 | | | | | | 10.19 | | | | | | 11 | | | | | | 1.20 | (d) | | | | | 1.35 | (d) | | | | | 1.32 | (c)(d) | | | | | 45 | |
| | | | | | | | | | | | | | | | | | | | | | | | | | | | | | | | | | | | | | | | |
| | | | | | | | | | | | | | | | | | | | | | | | | | | | | | | | | | | | | | | | |
| | | 10.19 | | | | | | 9.15 | | | | | | 133,611 | | | | | | 0.95 | | | | | | 1.13 | | | | | | 1.31 | | | | | | 56 | |
| | | 10.13 | | | | | | 8.25 | | | | | | 1,905 | | | | | | 1.70 | | | | | | 1.88 | | | | | | 0.57 | | | | | | 56 | |
| | | 10.11 | | | | | | 8.30 | | | | | | 11,928 | | | | | | 1.70 | | | | | | 1.88 | | | | | | 0.55 | | | | | | 56 | |
| | | 10.18 | | | | | | 9.61 | | | | | | 365,385 | | | | | | 0.55 | | | | | | 0.73 | | | | | | 1.69 | | | | | | 56 | |
| | | 10.23 | | | | | | 9.02 | | | | | | 7,699 | | | | | | 1.05 | | | | | | 1.23 | | | | | | 1.19 | | | | | | 56 | |
| | | 10.17 | | | | | | 9.48 | | | | | | 67 | | | | | | 0.70 | | | | | | 0.88 | | | | | | 1.48 | | | | | | 56 | |
| | | 10.17 | | | | | | 8.96 | | | | | | 10 | | | | | | 1.20 | | | | | | 1.38 | | | | | | 1.13 | | | | | | 56 | |
| | | 9.47 | | | | | | 14.09 | | | | | | 140,737 | | | | | | 0.94 | | | | | | 1.10 | | | | | | 1.45 | | | | | | 41 | |
| | | 9.42 | | | | | | 13.27 | | | | | | 2,428 | | | | | | 1.69 | | | | | | 1.85 | | | | | | 0.70 | | | | | | 41 | |
| | | 9.40 | | | | | | 13.22 | | | | | | 11,940 | | | | | | 1.69 | | | | | | 1.85 | | | | | | 0.68 | | | | | | 41 | |
| | | 9.46 | | | | | | 14.59 | | | | | | 362,324 | | | | | | 0.54 | | | | | | 0.70 | | | | | | 1.86 | | | | | | 41 | |
| | | 9.51 | | | | | | 14.05 | | | | | | 6,601 | | | | | | 1.04 | | | | | | 1.20 | | | | | | 1.33 | | | | | | 41 | |
| | | 9.45 | | | | | | 14.31 | | | | | | 16 | | | | | | 0.69 | | | | | | 0.85 | | | | | | 1.64 | | | | | | 41 | |
| | | 9.45 | | | | | | 13.74 | | | | | | 47 | | | | | | 1.19 | | | | | | 1.35 | | | | | | 1.15 | | | | | | 41 | |
| | | 8.42 | | | | | | 0.37 | | | | | | 247,183 | | | | | | 0.95 | | | | | | 1.10 | | | | | | 2.28 | | | | | | 130 | |
| | | 8.37 | | | | | | (0.42 | ) | | | | | 3,290 | | | | | | 1.70 | | | | | | 1.85 | | | | | | 1.58 | | | | | | 130 | |
| | | 8.36 | | | | | | (0.36 | ) | | | | | 13,110 | | | | | | 1.70 | | | | | | 1.85 | | | | | | 1.47 | | | | | | 130 | |
| | | 8.41 | | | | | | 0.67 | | | | | | 712,253 | | | | | | 0.55 | | | | | | 0.70 | | | | | | 2.65 | | | | | | 130 | |
| | | 8.45 | | | | | | 0.28 | | | | | | 7,364 | | | | | | 1.05 | | | | | | 1.20 | | | | | | 2.10 | | | | | | 130 | |
| | | 8.41 | | | | | | 0.65 | | | | | | 10 | | | | | | 0.70 | | | | | | 0.85 | | | | | | 2.30 | | | | | | 130 | |
| | | 8.41 | | | | | | 0.26 | | | | | | 36 | | | | | | 1.20 | | | | | | 1.35 | | | | | | 1.45 | | | | | | 130 | |
| | | | | | | | | | | | | | | | | | | | | | | | | | | | | | | | | | | | | | | | |
| | | | | | | | | | | | | | | | | | | | | | | | | | | | | | | | | | | | | | | | |
| | | 8.60 | | | | | | (23.14 | ) | | | | | 310,622 | | | | | | 0.95 | (d) | | | | | 1.10 | (d) | | | | | 1.59 | (d) | | | | | 24 | |
| | | 8.54 | | | | | | (23.21 | ) | | | | | 5,170 | | | | | | 1.70 | (d) | | | | | 1.85 | (d) | | | | | 0.87 | (d) | | | | | 24 | |
| | | 8.54 | | | | | | (23.29 | ) | | | | | 14,029 | | | | | | 1.70 | (d) | | | | | 1.85 | (d) | | | | | 0.86 | (d) | | | | | 24 | |
| | | 8.59 | | | | | | (23.05 | ) | | | | | 851,132 | | | | | | 0.55 | (d) | | | | | 0.70 | (d) | | | | | 2.02 | (d) | | | | | 24 | |
| | | 8.63 | | | | | | (23.16 | ) | | | | | 7,193 | | | | | | 1.05 | (d) | | | | | 1.20 | (d) | | | | | 1.50 | (d) | | | | | 24 | |
| | | 8.59 | | | | | | (23.10 | ) | | | | | 7 | | | | | | 0.70 | (d) | | | | | 0.85 | (d) | | | | | 1.81 | (d) | | | | | 24 | |
| | | 8.59 | | | | | | (23.21 | ) | | | | | 6 | | | | | | 1.20 | (d) | | | | | 1.35 | (d) | | | | | 1.33 | (d) | | | | | 24 | |
| | | | | | | | | | | | | | | | | | | | | | | | | | | | | | | | | | | | | | | | |
| | | | | | | | | | | | | | | | | | | | | | | | | | | | | | | | | | | | | | | | |
| | | 11.24 | | | | | | (18.65 | ) | | | | | 398,881 | | | | | | 0.95 | | | | | | 1.05 | | | | | | 1.41 | | | | | | 130 | |
| | | 11.16 | | | | | | (19.22 | ) | | | | | 7,306 | | | | | | 1.70 | | | | | | 1.80 | | | | | | 0.67 | | | | | | 130 | |
| | | 11.16 | | | | | | (19.21 | ) | | | | | 18,614 | | | | | | 1.70 | | | | | | 1.80 | | | | | | 0.67 | | | | | | 130 | |
| | | 11.24 | | | | | | (18.30 | ) | | | | | 1,027,705 | | | | | | 0.55 | | | | | | 0.65 | | | | | | 1.82 | | | | | | 130 | |
| | | 11.28 | | | | | | (18.73 | ) | | | | | 8,994 | | | | | | 1.05 | | | | | | 1.15 | | | | | | 1.31 | | | | | | 130 | |
| | | 11.23 | | | | | | (15.18 | ) | | | | | 8 | | | | | | 0.70 | (d) | | | | | 0.80 | (d) | | | | | 1.70 | (d) | | | | | 130 | |
| | | 11.23 | | | | | | (15.44 | ) | | | | | 8 | | | | | | 1.20 | (d) | | | | | 1.30 | (d) | | | | | 1.26 | (d) | | | | | 130 | |
| | | 14.51 | | | | | | 8.90 | | | | | | 640,535 | | | | | | 0.95 | | | | | | 1.04 | | | | | | 1.23 | | | | | | 119 | |
| | | 14.39 | | | | | | 8.03 | | | | | | 16,587 | | | | | | 1.70 | | | | | | 1.79 | | | | | | 0.46 | | | | | | 119 | |
| | | 14.40 | | | | | | 7.99 | | | | | | 25,946 | | | | | | 1.70 | | | | | | 1.79 | | | | | | 0.47 | | | | | | 119 | |
| | | 14.51 | | | | | | 9.24 | | | | | | 1,444,839 | | | | | | 0.55 | | | | | | 0.64 | | | | | | 1.64 | | | | | | 119 | |
| | | 14.56 | | | | | | 8.70 | | | | | | 14,237 | | | | | | 1.05 | | | | | | 1.14 | | | | | | 1.14 | | | | | | 119 | |
| | |
| The accompanying notes are an integral part of these financial statements. | | 99 |
GOLDMAN SACHS STRUCTURED SMALL CAP EQUITY FUND
Financial Highlights
Selected Data for a Share Outstanding Throughout Each Period
| | | | | | | | | | | | | | | | | | | | | | | | | | | | | | |
| | | | | | | | Income (loss) from
investment operations | | | Distributions
to shareholders | |
| | | Year - Share Class | |
Net asset
value,
beginning
of period | | | Net
investment
income
(loss)(a) | | | Net realized
and unrealized
gain (loss) | | | Total from
investment
operations | | | From net
investment
income | | | From net
realized
gains | | | Total
distributions | |
| | FOR THE SIX MONTHS ENDED APRIL 30, (UNAUDITED) | |
| | 2012 - A | | $ | 12.06 | | | $ | 0.01 | (c) | | $ | 1.12 | | | $ | 1.13 | | | $ | (0.10 | ) | | $ | — | | | $ | (0.10 | ) |
| | 2012 - B | | | 10.79 | | | | (0.03 | )(c) | | | 1.01 | | | | 0.98 | | | | — | (e) | | | — | | | | — | (e) |
| | 2012 - C | | | 10.81 | | | | (0.03 | )(c) | | | 1.01 | | | | 0.98 | | | | (0.03 | ) | | | — | | | | (0.03 | ) |
| | 2012 - Institutional | | | 12.53 | | | | 0.03 | (c) | | | 1.16 | | | | 1.19 | | | | (0.16 | ) | | | — | | | | (0.16 | ) |
| | 2012 - Service | | | 11.94 | | | | — | (c)(e) | | | 1.11 | | | | 1.11 | | | | (0.11 | ) | | | — | | | | (0.11 | ) |
| | 2012 - IR | | | 12.00 | | | | 0.02 | (c) | | | 1.11 | | | | 1.13 | | | | (0.16 | ) | | | — | | | | (0.16 | ) |
| | 2012 - R | | | 11.97 | | | | (0.01 | )(c) | | | 1.11 | | | | 1.10 | | | | (0.09 | ) | | | — | | | | (0.09 | ) |
| | | | | | | | | | | | | | | | | | | | | | | | | | | | | | |
| | FOR THE FISCAL YEARS ENDED OCTOBER 31, | |
| | 2011 - A | | | 10.92 | | | | 0.06 | (f) | | | 1.15 | | | | 1.21 | | | | (0.07 | ) | | | — | | | | (0.07 | ) |
| | 2011 - B | | | 9.80 | | | | (0.03 | )(f) | | | 1.02 | | | | 0.99 | | | | — | | | | — | | | | — | |
| | 2011 - C | | | 9.82 | | | | (0.04 | )(f) | | | 1.04 | | | | 1.00 | | | | (0.01 | ) | | | — | | | | (0.01 | ) |
| | 2011 - Institutional | | | 11.34 | | | | 0.11 | (f) | | | 1.19 | | | | 1.30 | | | | (0.11 | ) | | | — | | | | (0.11 | ) |
| | 2011 - Service | | | 10.82 | | | | 0.04 | (f) | | | 1.13 | | | | 1.17 | | | | (0.05 | ) | | | — | | | | (0.05 | ) |
| | 2011 - IR | | | 10.87 | | | | 0.08 | (f) | | | 1.15 | | | | 1.23 | | | | (0.10 | ) | | | — | | | | (0.10 | ) |
| | 2011 - R | | | 10.86 | | | | 0.02 | (f) | | | 1.15 | | | | 1.17 | | | | (0.06 | ) | | | — | | | | (0.06 | ) |
| | 2010 - A | | | 8.45 | | | | 0.04 | (g) | | | 2.50 | | | | 2.54 | | | | (0.07 | ) | | | — | | | | (0.07 | ) |
| | 2010 - B | | | 7.59 | | | | (0.03 | )(g) | | | 2.25 | | | | 2.22 | | | | (0.01 | ) | | | — | | | | (0.01 | ) |
| | 2010 - C | | | 7.62 | | | | (0.03 | )(g) | | | 2.26 | | | | 2.23 | | | | (0.03 | ) | | | — | | | | (0.03 | ) |
| | 2010 - Institutional | | | 8.78 | | | | 0.09 | (g) | | | 2.57 | | | | 2.66 | | | | (0.10 | ) | | | — | | | | (0.10 | ) |
| | 2010 - Service | | | 8.37 | | | | 0.03 | (g) | | | 2.48 | | | | 2.51 | | | | (0.06 | ) | | | — | | | | (0.06 | ) |
| | 2010 - IR | | | 8.42 | | | | 0.06 | (g) | | | 2.49 | | | | 2.55 | | | | (0.10 | ) | | | — | | | | (0.10 | ) |
| | 2010 - R | | | 8.41 | | | | (0.01 | )(g) | | | 2.51 | | | | 2.50 | | | | (0.05 | ) | | | — | | | | (0.05 | ) |
| | 2009 - A | | | 7.98 | | | | 0.04 | | | | 0.48 | | | | 0.52 | | | | (0.05 | ) | | | — | | | | (0.05 | ) |
| | 2009 - B | | | 7.16 | | | | (0.01 | ) | | | 0.44 | | | | 0.43 | | | | — | | | | — | | | | — | |
| | 2009 - C | | | 7.19 | | | | (0.01 | ) | | | 0.44 | | | | 0.43 | | | | — | | | | — | | | | — | |
| | 2009 - Institutional | | | 8.30 | | | | 0.07 | | | | 0.51 | | | | 0.58 | | | | (0.10 | ) | | | — | | | | (0.10 | ) |
| | 2009 - Service | | | 7.85 | | | | 0.04 | | | | 0.48 | | | | 0.52 | | | | — | | | | — | | | | — | |
| | 2009 - IR | | | 7.96 | | | | 0.04 | | | | 0.50 | | | | 0.54 | | | | (0.08 | ) | | | — | | | | (0.08 | ) |
| | 2009 - R | | | 7.93 | | | | (0.01 | ) | | | 0.53 | | | | 0.52 | | | | (0.04 | ) | | | — | | | | (0.04 | ) |
| | | | | | | | | | | | | | | | | | | | | | | | | | | | | | |
| | FOR THE PERIOD SEPTEMBER 1, 2008 TO OCTOBER 31, 2008* | |
| | 2008 - A | | | 11.00 | | | | 0.02 | | | | (3.04 | ) | | | (3.02 | ) | | | — | | | | — | | | | — | |
| | 2008 - B | | | 9.89 | | | | — | (e) | | | (2.73 | ) | | | (2.73 | ) | | | — | | | | — | | | | — | |
| | 2008 - C | | | 9.94 | | | | — | (e) | | | (2.75 | ) | | | (2.75 | ) | | | — | | | | — | | | | — | |
| | 2008 - Institutional | | | 11.45 | | | | 0.02 | | | | (3.17 | ) | | | (3.15 | ) | | | — | | | | — | | | | — | |
| | 2008 - Service | | | 10.84 | | | | 0.01 | | | | (3.00 | ) | | | (2.99 | ) | | | — | | | | — | | | | — | |
| | 2008 - IR | | | 10.98 | | | | 0.02 | | | | (3.04 | ) | | | (3.02 | ) | | | — | | | | — | | | | — | |
| | 2008 - R | | | 10.95 | | | | 0.01 | | | | (3.03 | ) | | | (3.02 | ) | | | — | | | | — | | | | — | |
| | | | | | | | | | | | | | | | | | | | | | | | | | | | | | |
| | FOR THE FISCAL YEARS ENDED AUGUST 31, | |
| | 2008 - A | | | 12.89 | | | | 0.01 | | | | (1.23 | ) | | | (1.22 | ) | | | (0.01 | ) | | | (0.66 | ) | | | (0.67 | ) |
| | 2008 - B | | | 11.74 | | | | (0.06 | ) | | | (1.13 | ) | | | (1.19 | ) | | | — | | | | (0.66 | ) | | | (0.66 | ) |
| | 2008 - C | | | 11.79 | | | | (0.06 | ) | | | (1.13 | ) | | | (1.19 | ) | | | — | | | | (0.66 | ) | | | (0.66 | ) |
| | 2008 - Institutional | | | 13.37 | | | | 0.06 | | | | (1.27 | ) | | | (1.21 | ) | | | (0.05 | ) | | | (0.66 | ) | | | (0.71 | ) |
| | 2008 - Service | | | 12.72 | | | | 0.01 | | | | (1.23 | ) | | | (1.22 | ) | | | — | | | | (0.66 | ) | | | (0.66 | ) |
| | 2008 - IR (Commenced November 30, 2007) | | | 12.16 | | | | 0.03 | | | | (0.50 | ) | | | (0.47 | ) | | | (0.05 | ) | | | (0.66 | ) | | | (0.71 | ) |
| | 2008 - R (Commenced November 30, 2007) | | | 12.16 | | | | (0.01 | ) | | | (0.49 | ) | | | (0.50 | ) | | | (0.05 | ) | | | (0.66 | ) | | | (0.71 | ) |
| | 2007 - A | | | 13.76 | | | | 0.04 | | | | (0.06 | ) | | | (0.02 | ) | | | (0.01 | ) | | | (0.84 | ) | | | (0.85 | ) |
| | 2007 - B | | | 12.69 | | | | (0.06 | ) | | | (0.05 | ) | | | (0.11 | ) | | | — | | | | (0.84 | ) | | | (0.84 | ) |
| | 2007 - C | | | 12.74 | | | | (0.06 | ) | | | (0.05 | ) | | | (0.11 | ) | | | — | | | | (0.84 | ) | | | (0.84 | ) |
| | 2007 - Institutional | | | 14.23 | | | | 0.10 | | | | (0.06 | ) | | | 0.04 | | | | (0.06 | ) | | | (0.84 | ) | | | (0.90 | ) |
| | 2007 - Service | | | 13.59 | | | | 0.02 | | | | (0.05 | ) | | | (0.03 | ) | | | — | | | | (0.84 | ) | | | (0.84 | ) |
| | * | | The Fund changed its fiscal year end from August 31 to October 31. |
| | (a) | | Calculated based on the average shares outstanding methodology. |
| | (b) | | Assumes investment at the net asset value at the beginning of the period, reinvestment of all dividends and distributions, a complete redemption of the investment at the net asset value at the end of the period and no sales or redemption charges. Total returns would be reduced if a sales or redemption charge was taken into account. Returns do not reflect the deduction of taxes that a shareholder would pay on Fund distributions or the redemption of Fund shares. Total returns for periods less than one full year are not annualized. |
| | (c) | | Reflects income recognized from non-recurring special dividends which amounted to $0.01 per share and 0.19% of average net assets. |
| | (e) | | Amount is less than $0.005 per share. |
| | (f) | | Reflects income recognized from non-recurring special dividends which amounted to $0.07 per share and 0.55% of average net assets. |
| | (g) | | Reflects income recognized from non-recurring special dividends which amounted to $0.06 per share and 0.56% of average net assets. |
| | |
| 100 | | The accompanying notes are an integral part of these financial statements. |
GOLDMAN SACHS STRUCTURED SMALL CAP EQUITY FUND
| | | | | | | | | | | | | | | | | | | | | | | | | | | | | | | | | | | | | | | | |
| | | | | | | | | | | | | | | | | | | | | | | | | | | | | | | | | | |
| | | Net asset
value, end
of period | | | | | Total
return(b) | | | | | Net assets,
end of
period
(in 000s) | | | | | Ratio of
net expenses
to average
net assets | | | | | Ratio of
total expenses
to average
net assets | | | | | Ratio of
net investment
income (loss)
to average
net assets | | | | | Portfolio
turnover
rate | |
| | | | | | | | | | | | | | | | | | | | | | | | | | | | | | | | | | | | | | | | |
| | | $13.09 | | | | | | 9.40 | % | | | | $ | 67,434 | | | | | | 1.25 | %(d) | | | | | 1.44 | %(d) | | | | | 0.14 | %(c)(d) | | | | | 53 | % |
| | | 11.77 | | | | | | 9.11 | | | | | | 1,135 | | | | | | 2.00 | (d) | | | | | 2.19 | (d) | | | | | (0.56 | )(c)(d) | | | | | 53 | |
| | | 11.76 | | | | | | 9.04 | | | | | | 12,847 | | | | | | 2.00 | (d) | | | | | 2.19 | (d) | | | | | (0.59 | )(c)(d) | | | | | 53 | |
| | | 13.56 | | | | | | 9.65 | | | | | | 102,128 | | | | | | 0.85 | (d) | | | | | 1.04 | (d) | | | | | 0.51 | (c)(d) | | | | | 53 | |
| | | 12.94 | | | | | | 9.35 | | | | | | 1,903 | | | | | | 1.35 | (d) | | | | | 1.54 | (d) | | | | | 0.05 | (c)(d) | | | | | 53 | |
| | | 12.97 | | | | | | 9.56 | | | | | | 5,463 | | | | | | 1.00 | (d) | | | | | 1.19 | (d) | | | | | 0.40 | (c)(d) | | | | | 53 | |
| | | 12.98 | | | | | | 9.23 | | | | | | 280 | | | | | | 1.50 | (d) | | | | | 1.69 | (d) | | | | | (0.11 | )(c)(d) | | | | | 53 | |
| | | | | | | | | | | | | | | | | | | | | | | | | | | | | | | | | | | | | | | | |
| | | | | | | | | | | | | | | | | | | | | | | | | | | | | | | | | | | | | | | | |
| | | 12.06 | | | | | | 11.05 | | | | | | 65,299 | | | | | | 1.25 | | | | | | 1.42 | | | | | | 0.45 | (f) | | | | | 34 | |
| | | 10.79 | | | | | | 10.10 | | | | | | 1,399 | | | | | | 2.00 | | | | | | 2.17 | | | | | | (0.31 | )(f) | | | | | 34 | |
| | | 10.81 | | | | | | 10.14 | | | | | | 13,338 | | | | | | 2.00 | | | | | | 2.17 | | | | | | (0.32 | )(f) | | | | | 34 | |
| | | 12.53 | | | | | | 11.49 | | | | | | 86,058 | | | | | | 0.85 | | | | | | 1.02 | | | | | | 0.87 | (f) | | | | | 34 | |
| | | 11.94 | | | | | | 10.84 | | | | | | 1,548 | | | | | | 1.35 | | | | | | 1.52 | | | | | | 0.32 | (f) | | | | | 34 | |
| | | 12.00 | | | | | | 11.32 | | | | | | 4,959 | | | | | | 1.00 | | | | | | 1.17 | | | | | | 0.70 | (f) | | | | | 34 | |
| | | 11.97 | | | | | | 10.78 | | | | | | 207 | | | | | | 1.50 | | | | | | 1.67 | | | | | | 0.14 | (f) | | | | | 34 | |
| | | 10.92 | | | | | | 30.23 | | | | | | 104,435 | | | | | | 1.25 | | | | | | 1.39 | | | | | | 0.43 | (g) | | | | | 70 | |
| | | 9.80 | | | | | | 29.27 | | | | | | 2,101 | | | | | | 2.00 | | | | | | 2.14 | | | | | | (0.31 | )(g) | | | | | 70 | |
| | | 9.82 | | | | | | 29.29 | | | | | | 13,788 | | | | | | 2.00 | | | | | | 2.14 | | | | | | (0.37 | )(g) | | | | | 70 | |
| | | 11.34 | | | | | | 30.76 | | | | | | 240,597 | | | | | | 0.85 | | | | | | 0.99 | | | | | | 0.88 | (g) | | | | | 70 | |
| | | 10.82 | | | | | | 30.16 | | | | | | 1,431 | | | | | | 1.35 | | | | | | 1.49 | | | | | | 0.33 | (g) | | | | | 70 | |
| | | 10.87 | | | | | | 30.55 | | | | | | 35 | | | | | | 1.00 | | | | | | 1.14 | | | | | | 0.63 | (g) | | | | | 70 | |
| | | 10.86 | | | | | | 29.90 | | | | | | 184 | | | | | | 1.50 | | | | | | 1.64 | | | | | | (0.11 | )(g) | | | | | 70 | |
| | | 8.45 | | | | | | 6.70 | | | | | | 130,439 | | | | | | 1.25 | | | | | | 1.40 | | | | | | 0.61 | | | | | | 167 | |
| | | 7.59 | | | | | | 6.01 | | | | | | 2,737 | | | | | | 2.00 | | | | | | 2.15 | | | | | | (0.11 | ) | | | | | 167 | |
| | | 7.62 | | | | | | 5.98 | | | | | | 11,226 | | | | | | 2.00 | | | | | | 2.15 | | | | | | (0.18 | ) | | | | | 167 | |
| | | 8.78 | | | | | | 7.13 | | | | | | 349,989 | | | | | | 0.85 | | | | | | 1.00 | | | | | | 0.96 | | | | | | 167 | |
| | | 8.37 | | | | | | 6.62 | | | | | | 1,588 | | | | | | 1.35 | | | | | | 1.50 | | | | | | 0.53 | | | | | | 167 | |
| | | 8.42 | | | | | | 7.09 | | | | | | 25 | | | | | | 1.00 | | | | | | 1.15 | | | | | | 0.52 | | | | | | 167 | |
| | | 8.41 | | | | | | 6.61 | | | | | | 21 | | | | | | 1.50 | | | | | | 1.65 | | | | | | (0.10 | ) | | | | | 167 | |
| | | | | | | | | | | | | | | | | | | | | | | | | | | | | | | | | | | | | | | | |
| | | | | | | | | | | | | | | | | | | | | | | | | | | | | | | | | | | | | | | | |
| | | 7.98 | | | | | | (27.45 | ) | | | | | 162,243 | | | | | | 1.25 | (d) | | | | | 1.46 | (d) | | | | | 0.76 | (d) | | | | | 31 | |
| | | 7.16 | | | | | | (27.60 | ) | | | | | 3,806 | | | | | | 2.00 | (d) | | | | | 2.21 | (d) | | | | | 0.01 | (d) | | | | | 31 | |
| | | 7.19 | | | | | | (27.67 | ) | | | | | 11,262 | | | | | | 2.00 | (d) | | | | | 2.21 | (d) | | | | | 0.01 | (d) | | | | | 31 | |
| | | 8.30 | | | | | | (27.51 | ) | | | | | 419,179 | | | | | | 0.85 | (d) | | | | | 1.06 | (d) | | | | | 1.16 | (d) | | | | | 31 | |
| | | 7.85 | | | | | | (27.58 | ) | | | | | 2,121 | | | | | | 1.35 | (d) | | | | | 1.56 | (d) | | | | | 0.66 | (d) | | | | | 31 | |
| | | 7.96 | | | | | | (27.50 | ) | | | | | 7 | | | | | | 1.00 | (d) | | | | | 1.21 | (d) | | | | | 0.99 | (d) | | | | | 31 | |
| | | 7.93 | | | | | | (27.58 | ) | | | | | 7 | | | | | | 1.50 | (d) | | | | | 1.71 | (d) | | | | | 0.54 | (d) | | | | | 31 | |
| | | | | | | | | | | | | | | | | | | | | | | | | | | | | | | | | | | | | | | | |
| | | | | | | | | | | | | | | | | | | | | | | | | | | | | | | | | | | | | | | | |
| | | 11.00 | | | | | | (9.73 | ) | | | | | 211,930 | | | | | | 1.25 | | | | | | 1.36 | | | | | | 0.12 | | | | | | 160 | |
| | | 9.89 | | | | | | (10.39 | ) | | | | | 5,807 | | | | | | 2.00 | | | | | | 2.11 | | | | | | (0.57 | ) | | | | | 160 | |
| | | 9.94 | | | | | | (10.35 | ) | | | | | 16,250 | | | | | | 2.00 | | | | | | 2.11 | | | | | | (0.60 | ) | | | | | 160 | |
| | | 11.45 | | | | | | (9.29 | ) | | | | | 547,109 | | | | | | 0.85 | | | | | | 0.96 | | | | | | 0.54 | | | | | | 160 | |
| | | 10.84 | | | | | | (9.80 | ) | | | | | 2,904 | | | | | | 1.35 | | | | | | 1.46 | | | | | | 0.12 | | | | | | 160 | |
| | | 10.98 | | | | | | (4.14 | ) | | | | | 10 | | | | | | 1.00 | (d) | | | | | 1.11 | (d) | | | | | 0.36 | (d) | | | | | 160 | |
| | | 10.95 | | | | | | (4.40 | ) | | | | | 10 | | | | | | 1.50 | (d) | | | | | 1.61 | (d) | | | | | (0.07 | )(d) | | | | | 160 | |
| | | 12.89 | | | | | | (0.76 | ) | | | | | 208,875 | | | | | | 1.26 | | | | | | 1.34 | | | | | | 0.24 | | | | | | 154 | |
| | | 11.74 | | | | | | (1.52 | ) | | | | | 10,875 | | | | | | 2.01 | | | | | | 2.09 | | | | | | (0.51 | ) | | | | | 154 | |
| | | 11.79 | | | | | | (1.44 | ) | | | | | 21,631 | | | | | | 2.01 | | | | | | 2.09 | | | | | | (0.51 | ) | | | | | 154 | |
| | | 13.37 | | | | | | (0.32 | ) | | | | | 575,499 | | | | | | 0.86 | | | | | | 0.94 | | | | | | 0.64 | | | | | | 154 | |
| | | 12.72 | | | | | | (0.80 | ) | | | | | 26,406 | | | | | | 1.36 | | | | | | 1.44 | | | | | | 0.14 | | | | | | 154 | |
| | |
| The accompanying notes are an integral part of these financial statements. | | 101 |
GOLDMAN SACHS STRUCTURED SMALL CAP GROWTH FUND
Financial Highlights
Selected Data for a Share Outstanding Throughout Each Period
| | | | | | | | | | | | | | | | | | | | | | | | | | |
| | | | | | | | Income (loss) from
investment operations | | | Distributions
to shareholders | |
| | | Year - Share Class | | Net asset
value,
beginning
of period | | | Net
investment
income
(loss)(a) | | | Net realized
and unrealized
gain (loss) | | | Total from
investment
operations | | | From net
investment
income | | | From net
realized
gains | |
| | FOR THE SIX MONTH ENDED APRIL 30, (UNAUDITED) | |
| | 2012 - A | | $ | 21.22 | | | $ | (0.01 | )(c) | | $ | 1.97 | | | $ | 1.96 | | | $ | — | | | $ | — | |
| | 2012 - B | | | 18.21 | | | | (0.08 | )(c) | | | 1.68 | | | | 1.60 | | | | — | | | | — | |
| | 2012 - C | | | 18.35 | | | | (0.08 | )(c) | | | 1.70 | | | | 1.62 | | | | — | | | | — | |
| | 2012 - Institutional | | | 23.49 | | | | 0.04 | (c) | | | 2.18 | | | | 2.22 | | | | — | | | | — | |
| | 2012 - IR | | | 21.39 | | | | (0.02 | )(c) | | | 2.02 | | | | 2.00 | | | | — | | | | — | |
| | 2012 - R | | | 20.98 | | | | (0.04 | )(c) | | | 1.95 | | | | 1.91 | | | | — | | | | — | |
| | | | | | | | | | | | | | | | | | | | | | | | | | |
| | FOR THE FISCAL YEARS ENDED OCTOBER 31, | |
| | 2011 - A | | | 18.49 | | | | (0.05 | )(e) | | | 2.78 | | | | 2.73 | | | | — | | | | — | |
| | 2011 - B | | | 15.98 | | | | (0.18 | )(e) | | | 2.41 | | | | 2.23 | | | | — | | | | — | |
| | 2011 - C | | | 16.11 | | | | (0.18 | )(e) | | | 2.42 | | | | 2.24 | | | | — | | | | — | |
| | 2011 - Institutional | | | 20.38 | | | | 0.03 | (e) | | | 3.08 | | | | 3.11 | | | | — | | | | — | |
| | 2011 - IR | | | 18.58 | | | | (0.08 | )(e) | | | 2.89 | | | | 2.81 | | | | — | | | | — | |
| | 2011 - R | | | 18.33 | | | | (0.11 | )(e) | | | 2.76 | | | | 2.65 | | | | — | | | | — | |
| | 2010 - A | | | 14.23 | | | | 0.01 | (f) | | | 4.30 | | | | 4.31 | | | | (0.05 | ) | | | — | |
| | 2010 - B | | | 12.35 | | | | (0.09 | )(f) | | | 3.72 | | | | 3.63 | | | | — | | | | — | |
| | 2010 - C | | | 12.45 | | | | (0.10 | )(f) | | | 3.76 | | | | 3.66 | | | | — | | | | — | |
| | 2010 - Institutional | | | 15.67 | | | | 0.07 | (f) | | | 4.74 | | | | 4.81 | | | | (0.10 | ) | | | — | |
| | 2010 - IR | | | 14.30 | | | | 0.04 | (f) | | | 4.33 | | | | 4.37 | | | | (0.09 | ) | | | — | |
| | 2010 - R | | | 14.15 | | | | (0.03 | )(f) | | | 4.27 | | | | 4.24 | | | | (0.06 | ) | | | — | |
| | 2009 - A | | | 12.66 | | | | (0.01 | ) | | | 1.58 | | | | 1.57 | | | | — | | | | — | |
| | 2009 - B | | | 11.07 | | | | (0.08 | ) | | | 1.36 | | | | 1.28 | | | | — | | | | — | |
| | 2009 - C | | | 11.16 | | | | (0.09 | ) | | | 1.38 | | | | 1.29 | | | | — | | | | — | |
| | 2009 - Institutional | | | 13.88 | | | | 0.04 | | | | 1.75 | | | | 1.79 | | | | — | | | | — | |
| | 2009 - IR | | | 12.68 | | | | 0.03 | | | | 1.59 | | | | 1.62 | | | | — | | | | — | |
| | 2009 - R | | | 12.63 | | | | (0.06 | ) | | | 1.58 | | | | 1.52 | | | | — | | | | — | |
| | 2008 - A | | | 36.25 | | | | (0.05 | ) | | | (9.43 | ) | | | (9.48 | ) | | | — | | | | (14.11 | ) |
| | 2008 - B | | | 33.77 | | | | (0.17 | ) | | | (8.42 | ) | | | (8.59 | ) | | | — | | | | (14.11 | ) |
| | 2008 - C | | | 33.92 | | | | (0.17 | ) | | | (8.48 | ) | | | (8.65 | ) | | | — | | | | (14.11 | ) |
| | 2008 - Institutional | | | 38.18 | | | | 0.02 | | | | (10.21 | ) | | | (10.19 | ) | | | — | | | | (14.11 | ) |
| | 2008 - IR (Commenced November 30, 2007) | | | 33.22 | | | | (0.01 | ) | | | (6.42 | ) | | | (6.43 | ) | | | — | | | | (14.11 | ) |
| | 2008 - R (Commenced November 30, 2007) | | | 33.22 | | | | (0.08 | ) | | | (6.40 | ) | | | (6.48 | ) | | | — | | | | (14.11 | ) |
| | 2007 - A | | | 32.78 | | | | (0.27 | ) | | | 5.59 | | | | 5.32 | | | | — | | | | (1.85 | ) |
| | 2007 - B | | | 30.83 | | | | (0.46 | ) | | | 5.25 | | | | 4.79 | | | | — | | | | (1.85 | ) |
| | 2007 - C | | | 30.96 | | | | (0.46 | ) | | | 5.27 | | | | 4.81 | | | | — | | | | (1.85 | ) |
| | 2007 - Institutional | | | 34.28 | | | | (0.12 | ) | | | 5.87 | | | | 5.75 | | | | — | | | | (1.85 | ) |
| | (a) | | Calculated based on the average shares outstanding methodology. |
| | (b) | | Assumes investment at the net asset value at the beginning of the period, reinvestment of all dividends and distributions, a complete redemption of the investment at the net asset value at the end of the period and no sales or redemption charges. Total return would be reduced if a sales or redemption charge was taken into account. Returns do not reflect the deduction of taxes that a shareholder would pay on Fund distributions or the redemption of Fund shares. Total returns for periods less than one full year are not annualized. The Structured Small Cap Growth Fund first began operations as the AXA Enterprise Small Company Growth Fund (the "Predecessor Fund") of the AXA Enterprise Funds Trust. On June 25, 2007, the Predecessor Fund was reorganized as a new portfolio of the Goldman Sachs Trust. Performance prior to June 25, 2007 is that of the Predecessor Fund. Total return information of the Predecessor Fund is provided in the above table because the Predecessor Fund is considered the accounting survivor of the reorganization. |
| | (c) | | Reflects income recognized from non-recurring special dividends which amounted to $0.03 per share and 0.28% of average net assets. |
| | (e) | | Reflects income recognized from non-recurring special dividends which amounted to $0.07 per share and 0.34% of average net assets. |
| | (f) | | Reflects income recognized from non-recurring special dividends which amounted to $0.10 per share and 0.63% of average net assets. |
| | |
| 102 | | The accompanying notes are an integral part of these financial statements. |
GOLDMAN SACHS STRUCTURED SMALL CAP GROWTH FUND
| | | | | | | | | | | | | | | | | | | | | | | | | | | | | | | | | | | | | | | | | | | | | | | | | | | | |
| | | | | | | | | | | | | | | | | | | | | | | | | | | | | | | | | | | | | | | | | | | | |
| | | Net asset
value, end
of period | | | | | Total
return(b) | | | | | Net assets,
end of
period
(in 000s) | | | | | Ratio of
net expenses
to average
net assets | | | | | Ratio of
net expenses
(not including fees
paid indirectly) | | | | | Ratio of
total expenses
to average
net assets | | | | | Ratio of
net investment
income (loss)
to average
net assets | | | | | Ratio of
net investment
income (loss)
(not including fees
paid indirectly) | | | | | Portfolio
turnover
rate | |
| | | | | | | | | | | | | | | | | | | | | | | | | | | | | | | | | | | | | | | | | | | | | | | �� | | | | | |
| | $ | 23.18 | | | | | | 9.24 | % | | | | $ | 26,673 | | | | | | 1.25 | %(d) | | | | | 1.25 | %(d) | | | | | 1.98 | %(d) | | | | | (0.10 | )%(c)(d) | | | | | (0.10 | )%(c)(d) | | | | | 38 | % |
| | | 19.81 | | | | | | 8.79 | | | | | | 4,197 | | | | | | 2.00 | (d) | | | | | 2.00 | (d) | | | | | 2.73 | (d) | | | | | (0.83 | )(c)(d) | | | | | (0.83 | )(c)(d) | | | | | 38 | |
| | | 19.97 | | | | | | 8.83 | | | | | | 5,532 | | | | | | 2.00 | (d) | | | | | 2.00 | (d) | | | | | 2.73 | (d) | | | | | (0.85 | )(c)(d) | | | | | (0.85 | )(c)(d) | | | | | 38 | |
| | | 25.71 | | | | | | 9.45 | | | | | | 7,547 | | | | | | 0.85 | (d) | | | | | 0.85 | (d) | | | | | 1.58 | (d) | | | | | 0.30 | (c)(d) | | | | | 0.30 | (c)(d) | | | | | 38 | |
| | | 23.39 | | | | | | 9.35 | | | | | | 159 | | | | | | 1.00 | (d) | | | | | 1.00 | (d) | | | | | 1.73 | (d) | | | | | (0.21 | )(c)(d) | | | | | (0.21 | )(c)(d) | | | | | 38 | |
| | | 22.89 | | | | | | 9.10 | | | | | | 27 | | | | | | 1.50 | (d) | | | | | 1.50 | (d) | | | | | 2.23 | (d) | | | | | (0.39 | )(c)(d) | | | | | (0.39 | )(c)(d) | | | | | 38 | |
| | | | | | | | | | | | | | | | | | | | | | | | | | | | | | | | | | | | | | | | | | | | | | | | | | | | |
| | | | | | | | | | | | | | | | | | | | | | | | | | | | | | | | | | | | | | | | | | | | | | | | | | | | |
| | | 21.22 | | | | | | 14.76 | | | | | | 24,979 | | | | | | 1.25 | | | | | | 1.25 | | | | | | 1.96 | | | | | | (0.26 | )(e) | | | | | (0.26 | )(e) | | | | | 52 | |
| | | 18.21 | | | | | | 13.95 | | | | | | 4,760 | | | | | | 2.00 | | | | | | 2.00 | | | | | | 2.71 | | | | | | (0.98 | )(e) | | | | | (0.98 | )(e) | | | | | 52 | |
| | | 18.35 | | | | | | 13.90 | | | | | | 5,180 | | | | | | 2.00 | | | | | | 2.00 | | | | | | 2.71 | | | | | | (1.00 | )(e) | | | | | (1.00 | )(e) | | | | | 52 | |
| | | 23.49 | | | | | | 15.26 | | | | | | 6,959 | | | | | | 0.85 | | | | | | 0.85 | | | | | | 1.56 | | | | | | 0.14 | (e) | | | | | 0.14 | (e) | | | | | 52 | |
| | | 21.39 | | | | | | 15.12 | | | | | | 38 | | | | | | 1.00 | | | | | | 1.00 | | | | | | 1.71 | | | | | | (0.38 | )(e) | | | | | (0.38 | )(e) | | | | | 52 | |
| | | 20.98 | | | | | | 14.46 | | | | | | 19 | | | | | | 1.50 | | | | | | 1.50 | | | | | | 2.21 | | | | | | (0.51 | )(e) | | | | | (0.51 | )(e) | | | | | 52 | |
| | | 18.49 | | | | | | 30.38 | | | | | | 22,598 | | | | | | 1.25 | | | | | | 1.25 | | | | | | 2.09 | | | | | | 0.03 | (f) | | | | | 0.03 | (f) | | | | | 100 | |
| | | 15.98 | | | | | | 29.39 | | | | | | 6,395 | | | | | | 2.00 | | | | | | 2.00 | | | | | | 2.84 | | | | | | (0.65 | )(f) | | | | | (0.65 | )(f) | | | | | 100 | |
| | | 16.11 | | | | | | 29.40 | | | | | | 5,263 | | | | | | 2.00 | | | | | | 2.00 | | | | | | 2.84 | | | | | | (0.70 | )(f) | | | | | (0.70 | )(f) | | | | | 100 | |
| | | 20.38 | | | | | | 30.87 | | | | | | 5,649 | | | | | | 0.85 | | | | | | 0.85 | | | | | | 1.69 | | | | | | 0.39 | (f) | | | | | 0.39 | (f) | | | | | 100 | |
| | | 18.58 | | | | | | 30.66 | | | | | | 10 | | | | | | 1.00 | | | | | | 1.00 | | | | | | 1.84 | | | | | | 0.26 | (f) | | | | | 0.26 | (f) | | | | | 100 | |
| | | 18.33 | | | | | | 30.07 | | | | | | 47 | | | | | | 1.50 | | | | | | 1.50 | | | | | | 2.34 | | | | | | (0.21 | )(f) | | | | | (0.21 | )(f) | | | | | 100 | |
| | | 14.23 | | | | | | 12.40 | | | | | | 19,090 | | | | | | 1.25 | | | | | | 1.25 | | | | | | 2.44 | | | | | | (0.06 | ) | | | | | (0.06 | ) | | | | | 205 | |
| | | 12.35 | | | | | | 11.56 | | | | | | 7,608 | | | | | | 2.00 | | | | | | 2.00 | | | | | | 3.19 | | | | | | (0.78 | ) | | | | | (0.78 | ) | | | | | 205 | |
| | | 12.45 | | | | | | 11.56 | | | | | | 4,793 | | | | | | 2.00 | | | | | | 2.00 | | | | | | 3.19 | | | | | | (0.82 | ) | | | | | (0.82 | ) | | | | | 205 | |
| | | 15.67 | | | | | | 12.90 | | | | | | 4,026 | | | | | | 0.85 | | | | | | 0.85 | | | | | | 2.04 | | | | | | 0.31 | | | | | | 0.31 | | | | | | 205 | |
| | | 14.30 | | | | | | 12.78 | | | | | | 7 | | | | | | 1.00 | | | | | | 1.00 | | | | | | 2.19 | | | | | | 0.18 | | | | | | 0.18 | | | | | | 205 | |
| | | 14.15 | | | | | | 12.03 | | | | | | 42 | | | | | | 1.50 | | | | | | 1.50 | | | | | | 2.69 | | | | | | (0.44 | ) | | | | | (0.44 | ) | | | | | 205 | |
| | | 12.66 | | | | | | (39.66 | ) | | | | | 19,402 | | | | | | 1.25 | | | | | | 1.25 | | | | | | 2.00 | | | | | | (0.32 | ) | | | | | (0.32 | ) | | | | | 182 | |
| | | 11.07 | | | | | | (40.12 | ) | | | | | 10,176 | | | | | | 2.00 | | | | | | 2.00 | | | | | | 2.75 | | | | | | (1.07 | ) | | | | | (1.07 | ) | | | | | 182 | |
| | | 11.16 | | | | | | (40.12 | ) | | | | | 4,918 | | | | | | 2.00 | | | | | | 2.00 | | | | | | 2.75 | | | | | | (1.07 | ) | | | | | (1.07 | ) | | | | | 182 | |
| | | 13.88 | | | | | | (39.44 | ) | | | | | 3,662 | | | | | | 0.85 | | | | | | 0.85 | | | | | | 1.60 | | | | | | (0.12 | ) | | | | | (0.12 | ) | | | | | 182 | |
| | | 12.68 | | | | | | (34.14 | ) | | | | | 7 | | | | | | 1.00 | (d) | | | | | 1.00 | (d) | | | | | 1.75 | (d) | | | | | (0.06 | )(d) | | | | | (0.06 | )(d) | | | | | 182 | |
| | | 12.63 | | | | | | (34.40 | ) | | | | | 7 | | | | | | 1.50 | (d) | | | | | 1.50 | (d) | | | | | 2.25 | (d) | | | | | (0.40 | )(d) | | | | | (0.40 | )(d) | | | | | 182 | |
| | | 36.25 | | | | | | 17.04 | | | | | | 45,070 | | | | | | 1.25 | | | | | | 1.51 | | | | | | 2.17 | | | | | | (0.79 | ) | | | | | (1.05 | ) | | | | | 154 | |
| | | 33.77 | | | | | | 16.32 | | | | | | 26,184 | | | | | | 1.87 | | | | | | 2.13 | | | | | | 2.78 | | | | | | (1.40 | ) | | | | | (1.67 | ) | | | | | 154 | |
| | | 33.92 | | | | | | 16.32 | | | | | | 11,911 | | | | | | 1.87 | | | | | | 2.13 | | | | | | 2.78 | | | | | | (1.40 | ) | | | | | (1.67 | ) | | | | | 154 | |
| | | 38.18 | | | | | | 17.53 | | | | | | 15,686 | | | | | | 0.79 | | | | | | 1.10 | | | | | | 1.74 | | | | | | (0.33 | ) | | | | | (0.63 | ) | | | | | 154 | |
| | |
| The accompanying notes are an integral part of these financial statements. | | 103 |
GOLDMAN SACHS STRUCTURED SMALL CAP VALUE FUND
Financial Highlights
Selected Data for a Share Outstanding Throughout Each Period
| | | | | | | | | | | | | | | | | | | | | | | | | | | | | | |
| | | | | | | | Income (loss) from
investment operations | | | Distributions
to shareholders | |
| | | Year - Share Class | | Net asset
value,
beginning
of period | | | Net
investment
income (loss)(a) | | | Net realized
and unrealized
gain (loss) | | | Total from
investment
operations | | | From net
investment
income | | | From net
realized
gains | | | Total
distributions | |
| | FOR THE SIX MONTHS ENDED APRIL 30, (UNAUDITED) | |
| | 2012 - A | | $ | 26.36 | | | $ | 0.10 | (c) | | $ | 2.16 | | | $ | 2.26 | | | $ | (0.14 | ) | | $ | — | | | $ | (0.14 | ) |
| | 2012 - B | | | 18.40 | | | | — | (c)(e) | | | 1.50 | | | | 1.50 | | | | — | | | | — | | | | — | |
| | 2012 - C | | | 20.79 | | | | — | (c)(e) | | | 1.70 | | | | 1.70 | | | | — | | | | — | | | | — | |
| | 2012 - Institutional | | | 32.66 | | | | 0.20 | (c) | | | 2.65 | | | | 2.85 | | | | (0.25 | ) | | | — | | | | (0.25 | ) |
| | 2012 - IR | | | 26.40 | | | | 0.13 | (c) | | | 2.15 | | | | 2.28 | | | | (0.24 | ) | | | — | | | | (0.24 | ) |
| | 2012 - R | | | 26.21 | | | | 0.06 | (c) | | | 2.15 | | | | 2.21 | | | | (0.12 | ) | | | — | | | | (0.12 | ) |
| | | | | | | | | | | | | | | | | | | | | | | | | | | | | | |
| | FOR THE FISCAL YEARS ENDED OCTOBER 31,* | |
| | 2011 - A | | | 24.10 | | | | 0.15 | (f) | | | 2.27 | | | | 2.42 | | | | (0.16 | ) | | | — | | | | (0.16 | ) |
| | 2011 - B | | | 16.87 | | | | (0.03 | )(f) | | | 1.58 | | | | 1.55 | | | | (0.02 | ) | | | — | | | | (0.02 | ) |
| | 2011 - C | | | 19.06 | | | | (0.04 | )(f) | | | 1.80 | | | | 1.76 | | | | (0.03 | ) | | | — | | | | (0.03 | ) |
| | 2011 - Institutional | | | 29.80 | | | | 0.32 | (f) | | | 2.79 | | | | 3.11 | | | | (0.25 | ) | | | — | | | | (0.25 | ) |
| | 2011 - IR | | | 24.15 | | | | 0.24 | (f) | | | 2.24 | | | | 2.48 | | | | (0.23 | ) | | | — | | | | (0.23 | ) |
| | 2011 - R | | | 23.99 | | | | 0.07 | (f) | | | 2.26 | | | | 2.33 | | | | (0.11 | ) | | | — | | | | (0.11 | ) |
| | 2010 - A | | | 18.78 | | | | 0.16 | (g) | | | 5.34 | | | | 5.50 | | | | (0.18 | ) | | | — | | | | (0.18 | ) |
| | 2010 - B | | | 13.24 | | | | — | (e)(g) | | | 3.75 | | | | 3.75 | | | | (0.12 | ) | | | — | | | | (0.12 | ) |
| | 2010 - C | | | 14.94 | | | | — | (e)(g) | | | 4.24 | | | | 4.24 | | | | (0.12 | ) | | | — | | | | (0.12 | ) |
| | 2010 - Institutional | | | 23.11 | | | | 0.30 | (g) | | | 6.59 | | | | 6.89 | | | | (0.20 | ) | | | — | | | | (0.20 | ) |
| | 2010 - IR | | | 18.78 | | | | 0.22 | (g) | | | 5.34 | | | | 5.56 | | | | (0.19 | ) | | | — | | | | (0.19 | ) |
| | 2010 - R | | | 18.74 | | | | 0.10 | (g) | | | 5.33 | | | | 5.43 | | | | (0.18 | ) | | | — | | | | (0.18 | ) |
| | 2009 - A | | | 18.62 | | | | 0.18 | | | | 0.25 | | | | 0.43 | | | | (0.27 | ) | | | — | | | | (0.27 | ) |
| | 2009 - B | | | 13.16 | | | | 0.05 | | | | 0.19 | | | | 0.24 | | | | (0.16 | ) | | | — | | | | (0.16 | ) |
| | 2009 - C | | | 14.84 | | | | 0.05 | | | | 0.18 | | | | 0.23 | | | | (0.13 | ) | | | — | | | | (0.13 | ) |
| | 2009 - Institutional | | | 22.89 | | | | 0.31 | | | | 0.28 | | | | 0.59 | | | | (0.37 | ) | | | — | | | | (0.37 | ) |
| | 2009 - IR | | | 18.69 | | | | 0.22 | | | | 0.21 | | | | 0.43 | | | | (0.34 | ) | | | — | | | | (0.34 | ) |
| | 2009 - R | | | 18.62 | | | | 0.12 | | | | 0.23 | | | | 0.35 | | | | (0.23 | ) | | | — | | | | (0.23 | ) |
| | 2008 - A | | | 89.04 | | | | 0.14 | | | | (14.42 | ) | | | (14.28 | ) | | | — | | | | (56.14 | ) | | | (56.14 | ) |
| | 2008 - B | | | 81.13 | | | | (0.07 | ) | | | (11.76 | ) | | | (11.83 | ) | | | — | | | | (56.14 | ) | | | (56.14 | ) |
| | 2008 - C | | | 83.58 | | | | — | (e) | | | (12.60 | ) | | | (12.60 | ) | | | — | | | | (56.14 | ) | | | (56.14 | ) |
| | 2008 - Institutional | | | 95.27 | | | | 0.42 | | | | (16.66 | ) | | | (16.24 | ) | | | — | | | | (56.14 | ) | | | (56.14 | ) |
| | 2008 - IR (Commenced November 30, 2007) | | | 81.41 | | | | 0.21 | | | | (6.79 | ) | | | (6.58 | ) | | | — | | | | (56.14 | ) | | | (56.14 | ) |
| | 2008 - R (Commenced November 30, 2007) | | | 81.41 | | | | 0.14 | | | | (6.79 | ) | | | (6.65 | ) | | | — | | | | (56.14 | ) | | | (56.14 | ) |
| | 2007 - A | | | 92.33 | | | | (0.35 | ) | | | 7.42 | | | | 7.07 | | | | (0.21 | ) | | | (10.15 | ) | | | (10.36 | ) |
| | 2007 - B | | | 85.26 | | | | (0.84 | ) | | | 6.86 | | | | 6.02 | | | | — | | | | (10.15 | ) | | | (10.15 | ) |
| | 2007 - C | | | 87.57 | | | | (0.84 | ) | | | 7.00 | | | | 6.16 | | | | — | | | | (10.15 | ) | | | (10.15 | ) |
| | 2007 - Institutional | | | 98.14 | | | | — | (e) | | | 7.98 | | | | 7.98 | | | | (0.70 | ) | | | (10.15 | ) | | | (10.85 | ) |
| | * | | All per share amounts representing data prior to February 9, 2009 have been restated to reflect a 7 for 1 reverse stock split which occurred on that date. |
| | (a) | | Calculated based on the average shares outstanding methodology. |
| | (b) | | Assumes investment at the net asset value at the beginning of the period, reinvestment of all dividends and distributions, a complete redemption of the investment at the net asset value at the end of the period and no sales or redemption charges. Total return would be reduced if a sales or redemption charge was taken into account. Returns do not reflect the deduction of taxes that a shareholder would pay on Fund distributions or the redemption of Fund shares. Total returns for periods less than one full year are not annualized. The Structured Small Cap Value Fund first began operations as the AXA Enterprise Small Company Value Fund (the “Predecessor Fund”) of the AXA Enterprise Funds Trust. On June 25, 2007, the Predecessor Fund was reorganized as a new portfolio of the Goldman Sachs Trust. Performance prior to June 25, 2007 is that of the Predecessor Fund. Total return information of the Predecessor Fund is provided in the above table because the Predecessor Fund is considered the accounting survivor of the reorganization. |
| | (c) | | Reflects income recognized from non-recurring special dividends which amounted to $0.03 per share and 0.20% of average net assets. |
| | (e) | | Amount is less than $0.005 per share. |
| | (f) | | Reflects income recognized from non-recurring special dividends which amounted to $0.07 per share and 0.27% of average net assets. |
| | (g) | | Reflects income recognized from non-recurring special dividends which amounted to $0.06 per share and 0.33% of average net assets. |
| | |
| 104 | | The accompanying notes are an integral part of these financial statements. |
GOLDMAN SACHS STRUCTURED SMALL CAP VALUE FUND
| | | | | | | | | | | | | | | | | | | | | | | | | | | | | | | | | | | | | | | | | | | | | | | | | | | | |
| | | | | | | | | | | | | | | | | | | | | | | | | | | | | | | | | | | | | | | | | | | | |
| | | Net asset
value, end
of period | | | | | Total
return(b) | | | | | Net assets,
end of
period
(in 000s) | | | | | Ratio of
net expenses
to average
net assets | | | | | Ratio of
net expenses
(not including
fees paid
indirectly) | | | | | Ratio of
total expenses
to average
net assets | | | | | Ratio of
net investment
income (loss)
to average
net assets | | | | | Ratio of
net investment
income (loss)
(not including
fees paid
indirectly) | | | | | Portfolio
turnover
rate | |
| | | | | | | | | | | | | | | | | | | | | | | | | | | | | | | | | | | | | | | | | | | | | | | | | | | | |
| | $ | 28.48 | | | | | | 8.60 | % | | | | $ | 94,997 | | | | | | 1.25 | %(d) | | | | | 1.25 | %(d) | | | | | 1.52 | %(d) | | | | | 0.76 | %(c)(d) | | | | | 0.76 | %(c)(d) | | | | | 26 | % |
| | | 19.90 | | | | | | 8.15 | | | | | | 12,646 | | | | | | 2.00 | (d) | | | | | 2.00 | (d) | | | | | 2.27 | (d) | | | | | 0.03 | (c)(d) | | | | | 0.03 | (c)(d) | | | | | 26 | |
| | | 22.49 | | | | | | 8.18 | | | | | | 19,075 | | | | | | 2.00 | (d) | | | | | 2.00 | (d) | | | | | 2.27 | (d) | | | | | 0.01 | (c)(d) | | | | | 0.01 | (c)(d) | | | | | 26 | |
| | | 35.26 | | | | | | 8.79 | | | | | | 6,280 | | | | | | 0.85 | (d) | | | | | 0.85 | (d) | | | | | 1.12 | (d) | | | | | 1.16 | (c)(d) | | | | | 1.16 | (c)(d) | | | | | 26 | |
| | | 28.44 | | | | | | 8.70 | | | | | | 321 | | | | | | 1.00 | (d) | | | | | 1.00 | (d) | | | | | 1.27 | (d) | | | | | 0.92 | (c)(d) | | | | | 0.92 | (c)(d) | | | | | 26 | |
| | | 28.30 | | | | | | 8.46 | | | | | | 481 | | | | | | 1.50 | (d) | | | | | 1.50 | (d) | | | | | 1.77 | (d) | | | | | 0.46 | (c)(d) | | | | | 0.46 | (c)(d) | | | | | 26 | |
| | | | | | | | | | | | | | | | | | | | | | | | | | | | | | | | | | | | | | | | | | | | | | | | | | | | |
| | | | | | | | | | | | | | | | | | | | | | | | | | | | | | | | | | | | | | | | | | | | | | | | | | | | |
| | | 26.36 | | | | | | 10.03 | | | | | | 91,426 | | | | | | 1.25 | | | | | | 1.25 | | | | | | 1.54 | | | | | | 0.58 | (f) | | | | | 0.58 | (f) | | | | | 33 | |
| | | 18.40 | | | | | | 9.19 | | | | | | 14,722 | | | | | | 2.00 | | | | | | 2.00 | | | | | | 2.29 | | | | | | (0.16 | )(f) | | | | | (0.16 | )(f) | | | | | 33 | |
| | | 20.79 | | | | | | 9.21 | | | | | | 19,248 | | | | | | 2.00 | | | | | | 2.00 | | | | | | 2.29 | | | | | | (0.17 | )(f) | | | | | (0.17 | )(f) | | | | | 33 | |
| | | 32.66 | | | | | | 10.46 | | | | | | 3,479 | | | | | | 0.85 | | | | | | 0.85 | | | | | | 1.14 | | | | | | 0.97 | (f) | | | | | 0.97 | (f) | | | | | 33 | |
| | | 26.40 | | | | | | 10.29 | | | | | | 223 | | | | | | 1.00 | | | | | | 1.00 | | | | | | 1.29 | | | | | | 0.96 | (f) | | | | | 0.96 | (f) | | | | | 33 | |
| | | 26.21 | | | | | | 9.71 | | | | | | 214 | | | | | | 1.50 | | | | | | 1.50 | | | | | | 1.79 | | | | | | 0.26 | (f) | | | | | 0.26 | (f) | | | | | 33 | |
| | | 24.10 | | | | | | 29.47 | | | | | | 95,864 | | | | | | 1.25 | | | | | | 1.25 | | | | | | 1.55 | | | | | | 0.72 | (g) | | | | | 0.72 | (g) | | | | | 85 | |
| | | 16.87 | | | | | | 28.54 | | | | | | 20,172 | | | | | | 2.00 | | | | | | 2.00 | | | | | | 2.30 | | | | | | 0.01 | (g) | | | | | 0.01 | (g) | | | | | 85 | |
| | | 19.06 | | | | | | 28.54 | | | | | | 21,671 | | | | | | 2.00 | | | | | | 2.00 | | | | | | 2.30 | | | | | | (0.02 | )(g) | | | | | (0.02 | )(g) | | | | | 85 | |
| | | 29.80 | | | | | | 30.03 | | | | | | 2,462 | | | | | | 0.85 | | | | | | 0.85 | | | | | | 1.15 | | | | | | 1.10 | (g) | | | | | 1.10 | (g) | | | | | 85 | |
| | | 24.15 | | | | | | 29.83 | | | | | | 28 | | | | | | 1.00 | | | | | | 1.00 | | | | | | 1.30 | | | | | | 0.99 | (g) | | | | | 0.99 | (g) | | | | | 85 | |
| | | 23.99 | | | | | | 29.17 | | | | | | 120 | | | | | | 1.50 | | | | | | 1.50 | | | | | | 1.80 | | | | | | 0.45 | (g) | | | | | 0.45 | (g) | | | | | 85 | |
| | | 18.78 | | | | | | 2.64 | | | | | | 79,873 | | | | | | 1.25 | | | | | | 1.25 | | | | | | 1.69 | | | | | | 1.11 | | | | | | 1.11 | | | | | | 184 | |
| | | 13.24 | | | | | | 2.27 | | | | | | 27,689 | | | | | | 2.00 | | | | | | 2.00 | | | | | | 2.44 | | | | | | 0.42 | | | | | | 0.42 | | | | | | 184 | |
| | | 14.94 | | | | | | 1.61 | | | | | | 20,883 | | | | | | 2.00 | | | | | | 2.00 | | | | | | 2.44 | | | | | | 0.38 | | | | | | 0.38 | | | | | | 184 | |
| | | 23.11 | | | | | | 2.97 | | | | | | 1,244 | | | | | | 0.85 | | | | | | 0.85 | | | | | | 1.29 | | | | | | 1.55 | | | | | | 1.55 | | | | | | 184 | |
| | | 18.78 | | | | | | 2.43 | | | | | | 7 | | | | | | 1.00 | | | | | | 1.00 | | | | | | 1.44 | | | | | | 1.34 | | | | | | 1.34 | | | | | | 184 | |
| | | 18.74 | | | | | | 2.17 | | | | | | 79 | | | | | | 1.50 | | | | | | 1.50 | | | | | | 1.94 | | | | | | 0.68 | | | | | | 0.68 | | | | | | 184 | |
| | | 18.62 | | | | | | (33.48 | ) | | | | | 85,992 | | | | | | 1.25 | | | | | | 1.25 | | | | | | 1.53 | | | | | | 0.71 | | | | | | 0.71 | | | | | | 147 | |
| | | 13.16 | | | | | | (34.04 | ) | | | | | 43,039 | | | | | | 2.00 | | | | | | 2.00 | | | | | | 2.28 | | | | | | (0.05 | ) | | | | | (0.05 | ) | | | | | 147 | |
| | | 14.84 | | | | | | (33.89 | ) | | | | | 26,503 | | | | | | 2.00 | | | | | | 2.00 | | | | | | 2.28 | | | | | | (0.05 | ) | | | | | (0.05 | ) | | | | | 147 | |
| | | 22.89 | | | | | | (33.07 | ) | | | | | 1,599 | | | | | | 0.85 | | | | | | 0.85 | | | | | | 1.13 | | | | | | 1.05 | | | | | | 1.05 | | | | | | 147 | |
| | | 18.69 | | | | | | (27.00 | ) | | | | | 7 | | | | | | 1.00 | (d) | | | | | 1.00 | (d) | | | | | 1.28 | (d) | | | | | 1.03 | (d) | | | | | 1.03 | (d) | | | | | 147 | |
| | | 18.62 | | | | | | (27.27 | ) | | | | | 7 | | | | | | 1.50 | (d) | | | | | 1.50 | (d) | | | | | 1.78 | (d) | | | | | 0.60 | (d) | | | | | 0.60 | (d) | | | | | 147 | |
| | | 89.04 | | | | | | 8.15 | | | | | | 213,172 | | | | | | 1.20 | | | | | | 1.49 | | | | | | 1.58 | | | | | | (0.40 | ) | | | | | (0.69 | ) | | | | | 97 | |
| | | 81.13 | | | | | | 7.45 | | | | | | 117,553 | | | | | | 1.82 | | | | | | 2.10 | | | | | | 2.19 | | | | | | (1.03 | ) | | | | | (1.31 | ) | | | | | 97 | |
| | | 83.58 | | | | | | 7.41 | | | | | | 70,151 | | | | | | 1.82 | | | | | | 2.10 | | | | | | 2.19 | | | | | | (1.01 | ) | | | | | (1.29 | ) | | | | | 97 | |
| | | 95.27 | | | | | | 8.57 | | | | | | 16,005 | | | | | | 0.73 | | | | | | 1.07 | | | | | | 1.14 | | | | | | (0.04 | ) | | | | | (0.38 | ) | | | | | 97 | |
| | |
| The accompanying notes are an integral part of these financial statements. | | 105 |
GOLDMAN SACHS STRUCTURED U.S. EQUITY FUND
Financial Highlights
Selected Data for a Share Outstanding Throughout Each Period
| | | | | | | | | | | | | | | | | | | | | | | | | | | | | | |
| | | | | | | | Income (loss) from
investment operations | | | Distributions
to shareholders | |
| | | Year - Share Class | | Net asset
value,
beginning
of period | | | Net
investment
income(a) | | | Net realized
and unrealized
gain (loss) | | | Total from
investment
operations | | | From net
investment
income | | | From net
realized
gains | | | Total
distributions | |
| | FOR THE SIX MONTHS ENDED APRIL 30, (UNAUDITED) | |
| | 2012 - A | | $ | 24.21 | | | $ | 0.18 | (c) | | $ | 2.47 | | | $ | 2.65 | | | $ | (0.44 | ) | | $ | — | | | $ | (0.44 | ) |
| | 2012 - B | | | 22.59 | | | | 0.08 | (c) | | | 2.31 | | | | 2.39 | | | | (0.23 | ) | | | — | | | | (0.23 | ) |
| | 2012 - C | | | 22.25 | | | | 0.08 | (c) | | | 2.27 | | | | 2.35 | | | | (0.27 | ) | | | — | | | | (0.27 | ) |
| | 2012 - Institutional | | | 24.82 | | | | 0.23 | (c) | | | 2.53 | | | | 2.76 | | | | (0.52 | ) | | | — | | | | (0.52 | ) |
| | 2012 - Service | | | 24.14 | | | | 0.16 | (c) | | | 2.46 | | | | 2.62 | | | | (0.38 | ) | | | — | | | | (0.38 | ) |
| | 2012 - IR | | | 24.08 | | | | 0.18 | (c) | | | 2.47 | | | | 2.65 | | | | (0.52 | ) | | | — | | | | (0.52 | ) |
| | 2012 - R | | | 23.98 | | | | 0.09 | (c) | | | 2.51 | | | | 2.60 | | | | (0.35 | ) | | | — | | | | (0.35 | ) |
| | | | | | | | | | | | | | | | | | | | | | | | | | | | | | |
| | FOR THE FISCAL YEARS ENDED OCTOBER 31, | |
| | 2011 - A | | | 22.32 | | | | 0.31 | (e) | | | 1.87 | | | | 2.18 | | | | (0.29 | ) | | | — | | | | (0.29 | ) |
| | 2011 - B | | | 20.82 | | | | 0.12 | (e) | | | 1.76 | | | | 1.88 | | | | (0.11 | ) | | | — | | | | (0.11 | ) |
| | 2011 - C | | | 20.54 | | | | 0.12 | (e) | | | 1.72 | | | | 1.84 | | | | (0.13 | ) | | | — | | | | (0.13 | ) |
| | 2011 - Institutional | | | 22.89 | | | | 0.44 | (e) | | | 1.87 | | | | 2.31 | | | | (0.38 | ) | | | — | | | | (0.38 | ) |
| | 2011 - Service | | | 22.25 | | | | 0.28 | (e) | | | 1.87 | | | | 2.15 | | | | (0.26 | ) | | | — | | | | (0.26 | ) |
| | 2011 - IR | | | 22.21 | | | | 0.36 | (e) | | | 1.86 | | | | 2.22 | | | | (0.35 | ) | | | — | | | | (0.35 | ) |
| | 2011 - R | | | 22.11 | | | | 0.24 | (e) | | | 1.85 | | | | 2.09 | | | | (0.22 | ) | | | — | | | | (0.22 | ) |
| | 2010 - A | | | 19.75 | | | | 0.24 | | | | 2.63 | | | | 2.87 | | | | (0.30 | ) | | | — | | | | (0.30 | ) |
| | 2010 - B | | | 18.43 | | | | 0.08 | | | | 2.44 | | | | 2.52 | | | | (0.13 | ) | | | — | | | | (0.13 | ) |
| | 2010 - C | | | 18.21 | | | | 0.07 | | | | 2.44 | | | | 2.51 | | | | (0.18 | ) | | | — | | | | (0.18 | ) |
| | 2010 - Institutional | | | 20.25 | | | | 0.33 | | | | 2.69 | | | | 3.02 | | | | (0.38 | ) | | | — | | | | (0.38 | ) |
| | 2010 - Service | | | 19.66 | | | | 0.23 | | | | 2.60 | | | | 2.83 | | | | (0.24 | ) | | | — | | | | (0.24 | ) |
| | 2010 - IR | | | 19.65 | | | | 0.29 | | | | 2.63 | | | | 2.92 | | | | (0.36 | ) | | | — | | | | (0.36 | ) |
| | 2010 - R | | | 19.63 | | | | 0.18 | | | | 2.61 | | | | 2.79 | | | | (0.31 | ) | | | — | | | | (0.31 | ) |
| | 2009 - A | | | 19.02 | | | | 0.31 | | | | 0.87 | | | | 1.18 | | | | (0.38 | ) | | | (0.07 | ) | | | (0.45 | ) |
| | 2009 - B | | | 17.63 | | | | 0.18 | | | | 0.82 | | | | 1.00 | | | | (0.13 | ) | | | (0.07 | ) | | | (0.20 | ) |
| | 2009 - C | | | 17.50 | | | | 0.16 | | | | 0.82 | | | | 0.98 | | | | (0.20 | ) | | | (0.07 | ) | | | (0.27 | ) |
| | 2009 - Institutional | | | 19.52 | | | | 0.38 | | | | 0.91 | | | | 1.29 | | | | (0.49 | ) | | | (0.07 | ) | | | (0.56 | ) |
| | 2009 - Service | | | 18.84 | | | | 0.29 | | | | 0.88 | | | | 1.17 | | | | (0.28 | ) | | | (0.07 | ) | | | (0.35 | ) |
| | 2009 - IR | | | 18.96 | | | | 0.34 | | | | 0.87 | | | | 1.21 | | | | (0.45 | ) | | | (0.07 | ) | | | (0.52 | ) |
| | 2009 - R | | | 18.89 | | | | 0.16 | | | | 0.98 | | | | 1.14 | | | | (0.33 | ) | | | (0.07 | ) | | | (0.40 | ) |
| | | | | | | | | | | | | | | | | | | | | | | | | | | | | | |
| | FOR THE PERIOD SEPTEMBER 1, 2008 TO OCTOBER 31, 2008* | |
| | 2008 - A | | | 24.97 | | | | 0.04 | | | | (5.99 | ) | | | (5.95 | ) | | | — | | | | — | | | | — | |
| | 2008 - B | | | 23.18 | | | | 0.02 | | | | (5.57 | ) | | | (5.55 | ) | | | — | | | | — | | | | — | |
| | 2008 - C | | | 23.01 | | | | 0.02 | | | | (5.53 | ) | | | (5.51 | ) | | | — | | | | — | | | | — | |
| | 2008 - Institutional | | | 25.61 | | | | 0.06 | | | | (6.15 | ) | | | (6.09 | ) | | | — | | | | — | | | | — | |
| | 2008 - Service | | | 24.74 | | | | 0.04 | | | | (5.94 | ) | | | (5.90 | ) | | | — | | | | — | | | | — | |
| | 2008 - IR | | | 24.88 | | | | 0.05 | | | | (5.97 | ) | | | (5.92 | ) | | | — | | | | — | | | | — | |
| | 2008 - R | | | 24.81 | | | | 0.04 | | | | (5.96 | ) | | | (5.92 | ) | | | — | | | | — | | | | — | |
| | | | | | | | | | | | | | | | | | | | | | | | | | | | | | |
| | FOR THE FISCAL YEARS ENDED AUGUST 31, | |
| | 2008 - A | | | 33.30 | | | | 0.29 | | | | (4.86 | ) | | | (4.57 | ) | | | (0.34 | ) | | | (3.42 | ) | | | (3.76 | ) |
| | 2008 - B | | | 31.17 | | | | 0.08 | | | | (4.54 | ) | | | (4.46 | ) | | | (0.11 | ) | | | (3.42 | ) | | | (3.53 | ) |
| | 2008 - C | | | 31.01 | | | | 0.07 | | | | (4.49 | ) | | | (4.42 | ) | | | (0.16 | ) | | | (3.42 | ) | | | (3.58 | ) |
| | 2008 - Institutional | | | 34.07 | | | | 0.42 | | | | (4.98 | ) | | | (4.56 | ) | | | (0.48 | ) | | | (3.42 | ) | | | (3.90 | ) |
| | 2008 - Service | | | 32.98 | | | | 0.26 | | | | (4.80 | ) | | | (4.54 | ) | | | (0.28 | ) | | | (3.42 | ) | | | (3.70 | ) |
| | 2008 - IR (Commenced November 30, 2007) | | | 33.02 | | | | 0.26 | | | | (4.49 | ) | | | (4.23 | ) | | | (0.49 | ) | | | (3.42 | ) | | | (3.91 | ) |
| | 2008 - R (Commenced November 30, 2007) | | | 33.02 | | | | 0.17 | | | | (4.48 | ) | | | (4.31 | ) | | | (0.48 | ) | | | (3.42 | ) | | | (3.90 | ) |
| | 2007 - A | | | 31.79 | | | | 0.28 | | | | 2.61 | | | | 2.89 | | | | (0.27 | ) | | | (1.11 | ) | | | (1.38 | ) |
| | 2007 - B | | | 29.92 | | | | 0.03 | | | | 2.45 | | | | 2.48 | | | | (0.12 | ) | | | (1.11 | ) | | | (1.23 | ) |
| | 2007 - C | | | 29.78 | | | | 0.02 | | | | 2.45 | | | | 2.47 | | | | (0.13 | ) | | | (1.11 | ) | | | (1.24 | ) |
| | 2007 - Institutional | | | 32.48 | | | | 0.42 | | | | 2.66 | | | | 3.08 | | | | (0.38 | ) | | | (1.11 | ) | | | (1.49 | ) |
| | 2007 - Service | | | 31.50 | | | | 0.24 | | | | 2.59 | | | | 2.83 | | | | (0.24 | ) | | | (1.11 | ) | | | (1.35 | ) |
| | * | | The Fund changed its fiscal year end from August 31 to October 31. |
| | (a) | | Calculated based on the average shares outstanding methodology. |
| | (b) | | Assumes investment at the net asset value at the beginning of the period, reinvestment of all dividends and distributions, a complete redemption of the investment at the net asset value at the end of the period and no sales or redemption charges. Total returns would be reduced if a sales or redemption charge was taken into account. Returns do not reflect the deduction of taxes that a shareholder would pay on Fund distributions or the redemption of Fund shares. Total returns for periods less than one full year are not annualized. |
| | (c) | | Reflects income recognized from non-recurring special dividends which amounted to $0.04 per share and 0.33% of average net assets. |
| | (e) | | Reflects income recognized from non-recurring special dividends which amounted to $0.03 per share and 0.13% of average net assets. |
| | |
| 106 | | The accompanying notes are an integral part of these financial statements. |
GOLDMAN SACHS STRUCTURED U.S. EQUITY FUND
| | | | | | | | | | | | | | | | | | | | | | | | | | | | | | | | | | | | | | | | |
| | | | | | | | | | | | | | | | | | | | | | | | | | | | | | | | | | |
| | | Net asset
value, end
of period | | | | | Total
return(b) | | | | | Net assets,
end of
period
(in 000s) | | | | | Ratio of
net expenses
to average
net assets | | | | | Ratio of
total expenses
to average
net assets | | | | | Ratio of
net investment
income
to average
net assets | | | | | Portfolio
turnover
rate | |
| | | | | | | | | | | | | | | | | | | | | | | | | | | | | | | | | | | | | | | | |
| | | $26.42 | | | | | | 11.13 | % | | | | $ | 259,224 | | | | | | 0.95 | %(d) | | | | | 1.20 | %(d) | | | | | 1.43 | %(c)(d) | | | | | 43 | % |
| | | 24.75 | | | | | | 10.67 | | | | | | 11,429 | | | | | | 1.70 | (d) | | | | | 1.95 | (d) | | | | | 0.71 | (c)(d) | | | | | 43 | |
| | | 24.33 | | | | | | 10.69 | | | | | | 33,399 | | | | | | 1.70 | (d) | | | | | 1.95 | (d) | �� | | | | 0.65 | (c)(d) | | | | | 43 | |
| | | 27.06 | | | | | | 11.35 | | | | | | 37,711 | | | | | | 0.55 | (d) | | | | | 0.80 | (d) | | | | | 1.79 | (c)(d) | | | | | 43 | |
| | | 26.38 | | | | | | 11.02 | | | | | | 1,036 | | | | | | 1.05 | (d) | | | | | 1.30 | (d) | | | | | 1.28 | (c)(d) | | | | | 43 | |
| | | 26.21 | | | | | | 11.25 | | | | | | 200 | | | | | | 0.70 | (d) | | | | | 0.95 | (d) | | | | | 1.46 | (c)(d) | | | | | 43 | |
| | | 26.23 | | | | | | 10.97 | | | | | | 177 | | | | | | 1.20 | (d) | | | | | 1.45 | (d) | | | | | 0.70 | (c)(d) | | | | | 43 | |
| | | | | | | | | | | | | | | | | | | | | | | | | | | | | | | | | | | | | | | | |
| | | | | | | | | | | | | | | | | | | | | | | | | | | | | | | | | | | | | | | | |
| | | 24.21 | | | | | | 9.83 | | | | | | 278,353 | | | | | | 0.95 | | | | | | 1.19 | | | | | | 1.28 | (e) | | | | | 46 | |
| | | 22.59 | | | | | | 9.05 | | | | | | 13,170 | | | | | | 1.70 | | | | | | 1.94 | | | | | | 0.56 | (e) | | | | | 46 | |
| | | 22.25 | | | | | | 9.00 | | | | | | 32,665 | | | | | | 1.70 | | | | | | 1.94 | | | | | | 0.52 | (e) | | | | | 46 | |
| | | 24.82 | | | | | | 10.20 | | | | | | 33,581 | | | | | | 0.55 | | | | | | 0.79 | | | | | | 1.76 | (e) | | | | | 46 | |
| | | 24.14 | | | | | | 9.74 | | | | | | 962 | | | | | | 1.05 | | | | | | 1.29 | | | | | | 1.19 | (e) | | | | | 46 | |
| | | 24.08 | | | | | | 10.09 | | | | | | 105 | | | | | | 0.70 | | | | | | 0.94 | | | | | | 1.57 | (e) | | | | | 46 | |
| | | 23.98 | | | | | | 9.53 | | | | | | 29 | | | | | | 1.20 | | | | | | 1.44 | | | | | | 1.03 | (e) | | | | | 46 | |
| | | 22.32 | | | | | | 14.67 | | | | | | 301,843 | | | | | | 0.95 | | | | | | 1.18 | | | | | | 1.12 | | | | | | 47 | |
| | | 20.82 | | | | | | 13.76 | | | | | | 18,663 | | | | | | 1.70 | | | | | | 1.93 | | | | | | 0.39 | | | | | | 47 | |
| | | 20.54 | | | | | | 13.84 | | | | | | 34,942 | | | | | | 1.70 | | | | | | 1.93 | | | | | | 0.37 | | | | | | 47 | |
| | | 22.89 | | | | | | 15.10 | | | | | | 115,177 | | | | | | 0.55 | | | | | | 0.78 | | | | | | 1.54 | | | | | | 47 | |
| | | 22.25 | | | | | | 14.50 | | | | | | 1,273 | | | | | | 1.05 | | | | | | 1.28 | | | | | | 1.10 | | | | | | 47 | |
| | | 22.21 | | | | | | 15.00 | | | | | | 8 | | | | | | 0.70 | | | | | | 0.93 | | | | | | 1.37 | | | | | | 47 | |
| | | 22.11 | | | | | | 14.35 | | | | | | 48 | | | | | | 1.20 | | | | | | 1.43 | | | | | | 0.88 | | | | | | 47 | |
| | | 19.75 | | | | | | 6.57 | | | | | | 328,575 | | | | | | 0.95 | | | | | | 1.19 | | | | | | 1.75 | | | | | | 136 | |
| | | 18.43 | | | | | | 5.83 | | | | | | 25,269 | | | | | | 1.70 | | | | | | 1.94 | | | | | | 1.14 | | | | | | 136 | |
| | | 18.21 | | | | | | 5.82 | | | | | | 37,716 | | | | | | 1.70 | | | | | | 1.94 | | | | | | 0.99 | | | | | | 136 | |
| | | 20.25 | | | | | | 7.04 | | | | | | 153,872 | | | | | | 0.55 | | | | | | 0.79 | | | | | | 2.14 | | | | | | 136 | |
| | | 19.66 | | | | | | 6.50 | | | | | | 2,117 | | | | | | 1.05 | | | | | | 1.29 | | | | | | 1.68 | | | | | | 136 | |
| | | 19.65 | | | | | | 6.83 | | | | | | 7 | | | | | | 0.70 | | | | | | 0.94 | | | | | | 1.93 | | | | | | 136 | |
| | | 19.63 | | | | | | 6.39 | | | | | | 50 | | | | | | 1.20 | | | | | | 1.44 | | | | | | 0.89 | | | | | | 136 | |
| | | | | | | | | | | | | | | | | | | | | | | | | | | | | | | | | | | | | | | | |
| | | | | | | | | | | | | | | | | | | | | | | | | | | | | | | | | | | | | | | | |
| | | 19.02 | | | | | | (23.83 | ) | | | | | 384,949 | | | | | | 0.95 | (d) | | | | | 1.22 | (d) | | | | | 1.16 | (d) | | | | | 27 | |
| | | 17.63 | | | | | | (23.94 | ) | | | | | 47,671 | | | | | | 1.70 | (d) | | | | | 1.97 | (d) | | | | | 0.46 | (d) | | | | | 27 | |
| | | 17.50 | | | | | | (23.95 | ) | | | | | 42,816 | | | | | | 1.70 | (d) | | | | | 1.97 | (d) | | | | | 0.41 | (d) | | | | | 27 | |
| | | 19.52 | | | | | | (23.78 | ) | | | | | 177,704 | | | | | | 0.55 | (d) | | | | | 0.82 | (d) | | | | | 1.57 | (d) | | | | | 27 | |
| | | 18.84 | | | | | | (23.85 | ) | | | | | 2,949 | | | | | | 1.05 | (d) | | | | | 1.32 | (d) | | | | | 1.05 | (d) | | | | | 27 | |
| | | 18.96 | | | | | | (23.79 | ) | | | | | 6 | | | | | | 0.70 | (d) | | | | | 0.97 | (d) | | | | | 1.48 | (d) | | | | | 27 | |
| | | 18.89 | | | | | | (23.86 | ) | | | | | 6 | | | | | | 1.20 | (d) | | | | | 1.47 | (d) | | | | | 0.99 | (d) | | | | | 27 | |
| | | | | | | | | | | | | | | | | | | | | | | | | | | | | | | | | | | | | | | | |
| | | | | | | | | | | | | | | | | | | | | | | | | | | | | | | | | | | | | | | | |
| | | 24.97 | | | | | | (15.39 | ) | | | | | 530,590 | | | | | | 0.95 | | | | | | 1.13 | | | | | | 1.03 | | | | | | 96 | |
| | | 23.18 | | | | | | (16.04 | ) | | | | | 77,406 | | | | | | 1.70 | | | | | | 1.88 | | | | | | 0.28 | | | | | | 96 | |
| | | 23.01 | | | | | | (16.01 | ) | | | | | 58,873 | | | | | | 1.70 | | | | | | 1.88 | | | | | | 0.28 | | | | | | 96 | |
| | | 25.61 | | | | | | (15.09 | ) | | | | | 253,353 | | | | | | 0.55 | | | | | | 0.73 | | | | | | 1.40 | | | | | | 96 | |
| | | 24.74 | | | | | | (15.43 | ) | | | | | 3,908 | | | | | | 1.05 | | | | | | 1.23 | | | | | | 0.91 | | | | | | 96 | |
| | | 24.88 | | | | | | (14.61 | ) | | | | | 9 | | | | | | 0.70 | (d) | | | | | 0.88 | (d) | | | | | 1.30 | (d) | | | | | 96 | |
| | | 24.81 | | | | | | (14.89 | ) | | | | | 9 | | | | | | 1.20 | (d) | | | | | 1.38 | (d) | | | | | 0.85 | (d) | | | | | 96 | |
| | | 33.30 | | | | | | 9.11 | | | | | | 863,259 | | | | | | 0.95 | | | | | | 1.10 | | | | | | 0.82 | | | | | | 119 | |
| | | 31.17 | | | | | | 8.27 | | | | | | 154,414 | | | | | | 1.70 | | | | | | 1.85 | | | | | | 0.09 | | | | | | 119 | |
| | | 31.01 | | | | | | 8.27 | | | | | | 100,803 | | | | | | 1.70 | | | | | | 1.85 | | | | | | 0.07 | | | | | | 119 | |
| | | 34.07 | | | | | | 9.56 | | | | | | 594,020 | | | | | | 0.55 | | | | | | 0.70 | | | | | | 1.22 | | | | | | 119 | |
| | | 32.98 | | | | | | 9.01 | | | | | | 15,884 | | | | | | 1.05 | | | | | | 1.20 | | | | | | 0.72 | | | | | | 119 | |
| | |
| The accompanying notes are an integral part of these financial statements. | | 107 |
GOLDMAN SACHS STRUCTURED DOMESTIC EQUITY FUNDS
Notes to Financial Statements
April 30, 2012 (Unaudited)
Goldman Sachs Trust (the “Trust”) is a Delaware statutory trust registered under the Investment Company Act of 1940, as amended (the “Act”), as an open-end management investment company. The following table lists those series of the Trust that are included in this report (collectively, the “Funds” or individually a “Fund”), along with their corresponding share classes and respective diversification status under the Act:
| | | | |
| Fund | | Share Classes Offered* | | Diversified/
Non-diversified |
Balanced | | A, B, C, Institutional and IR | | Diversified |
Structured Large Cap Growth, Structured Large Cap Value, Structured Small Cap Equity and Structured U.S. Equity | | A, B, C, Institutional, Service, IR and R | | Diversified |
Structured Small Cap Growth and Structured Small Cap Value | | A, B, C, Institutional, IR and R | | Diversified |
| * | | Class B Shares are generally no longer available for purchase by current or prospective investors. |
Class A Shares are sold with a front-end sales charge of up to 5.50%. Class B Shares were sold with a contingent deferred sales charge (“CDSC”) that declines from 5.00% to zero, depending upon the period of time the shares are held. Class C Shares are sold with a CDSC of 1.00%, which is imposed on redemptions made within 12 months of purchase. Institutional, Service, Class IR and Class R Shares are not subject to a sales charge.
Goldman Sachs Asset Management, L.P. (“GSAM”), an affiliate of Goldman, Sachs & Co. (“Goldman Sachs”), serves as investment adviser to the Funds pursuant to a management agreement (the “Agreement”) with the Trust.
|
| 2. SIGNIFICANT ACCOUNTING POLICIES |
The preparation of financial statements in conformity with accounting principles generally accepted in the United States of America (“GAAP”) requires management to make estimates and assumptions that may affect the amounts and disclosures in the financial statements. Actual results could differ from those estimates and assumptions.
A. Investment Valuation — The Funds’ valuation policy is to value investments at fair value.
Equity securities and investment companies traded on a United States (“U.S.”) securities exchange or the NASDAQ system are valued daily at their last sale price or official closing price on the principal exchange or system on which they are traded. If no sale occurs, such securities and investment companies are valued at the last bid price for long positions and at the last ask price for short positions. Unlisted equity securities for which market quotations are available are valued at the last sale price on the valuation date, or if no sale occurs, at the last bid price. Investments in investment companies (other than those that are exchange traded) are valued at the net asset value per share (“NAV”) of the investment company on the valuation date.
Debt securities for which market quotations are readily available are valued on the basis of quotations supplied by dealers or furnished by an independent pricing service approved by the trustees. The pricing services may use valuation models or matrix pricing, which consider: (i) yield or price with respect to bonds that are considered comparable in characteristics such as rating, interest rate and maturity date or (ii) quotations from securities dealers to determine current value. Short-term debt obligations that mature in sixty days or less and that do not exhibit signs of credit deterioration are valued at amortized cost, which approximates fair value.
If quotations are not readily available, or if GSAM believes that such quotations do not accurately reflect fair value, the fair value of the Fund’s investments may be determined under valuation procedures approved by the trustees. GSAM, consistent with its procedures and applicable regulatory guidance, may make an adjustment to the most recent valuation prices of either domestic or foreign securities in light of significant events to reflect what it believes to be the fair value of the securities at the time of
108
GOLDMAN SACHS STRUCTURED DOMESTIC EQUITY FUNDS
|
| 2. SIGNIFICANT ACCOUNTING POLICIES (continued) |
determining the Funds’ NAV. Significant events which could affect a large number of securities in a particular market may include, but are not limited to significant fluctuations in U.S. or foreign markets; market dislocations; market disruptions or unscheduled market closings. Significant events, which could also affect a single issuer, may include, but are not limited to corporate actions such as reorganizations, mergers and buy-outs; ratings downgrades and bankruptcies.
B. Investment Income and Investments — Investment income is comprised of interest income and dividend income, and is recorded net of any foreign withholding taxes, less any amounts reclaimable. Interest income is accrued daily and adjusted for amortization of premiums and accretion of discounts. Dividend income is recognized on ex-dividend date or, for certain foreign securities, as soon as such information is obtained subsequent to the ex-dividend date. Investment transactions are reflected on trade date with realized gains and losses on sales calculated using identified cost. Investment transactions are recorded on the following business day for daily NAV calculations. Any foreign capital gains tax is accrued daily based upon net unrealized gains, and is payable upon sale of such investments. Distributions received from the Funds’ investments in U.S. real estate investment trusts (“REITs”) may be characterized as ordinary income, net capital gain or a return of capital. A return of capital is recorded by the Funds as a reduction to the cost of the REIT.
C. Class Allocations and Expenses — Investment income, realized and unrealized gain (loss), and non-class specific expenses of each Fund are allocated daily based upon the proportion of net assets of each class. Class specific expenses, where applicable, are borne by the respective share classes and include Distribution and Service, Transfer Agent and Service and Shareholder Administration fees. Non-class specific expenses directly incurred by a Fund are charged to that Fund, while such expenses incurred by the Trust are allocated across the respective Funds on a straight-line and/or pro-rata basis depending upon the nature of the expenses.
D. Federal Taxes and Distributions to Shareholders — It is each Fund’s policy to comply with the requirements of the Internal Revenue Code of 1986, as amended (the “Code”), applicable to regulated investment companies (mutual funds) and to distribute each year substantially all of its investment company taxable income and capital gains to its shareholders. Accordingly, the Funds are not required to make any provisions for the payment of federal income tax. Distributions to shareholders are recorded on the ex-dividend date. Income and capital gains distributions, if any, are declared and paid according to the following schedule:
| | | | | | |
| Fund | | | | Income Distributions
Declared/Paid | | Capital Gains Distributions
Declared/Paid |
Balanced and Structured Large Cap Value | | | | Quarterly | | Annually |
Structured Large Cap Growth, Structured Small Cap Equity,
Structured Small Cap Growth, Structured Small Cap Value
and Structured U.S. Equity | | | | Annually | | Annually |
Net capital losses are carried forward to future fiscal years and may be used to the extent allowed by the Code to offset any future capital gains. Utilization of capital loss carryforwards will reduce the requirement of future capital gains distributions.
The characterization of distributions to shareholders for financial reporting purposes is determined in accordance with federal income tax rules, which may differ from GAAP. The source of each Fund’s distributions may be shown in the accompanying financial statements as either from net investment income, net realized gain or capital. Certain components of the Funds’ net assets on the Statements of Assets and Liabilities reflect permanent GAAP/tax differences based on the appropriate tax character.
E. Foreign Currency Translation — The accounting records and reporting currency of the Funds are maintained in U.S. dollars. Investments and other assets and liabilities denominated in foreign currencies are translated into U.S. dollars using the current exchange rates at the close of each business day. The effect of changes in foreign currency exchange rates on investments is included within net realized and unrealized gain (loss) on investments. Changes in the value of other assets and liabilities as a result of fluctuations in foreign exchange rates are included in the Statements of Operations within unrealized gain (loss) on
109
GOLDMAN SACHS STRUCTURED DOMESTIC EQUITY FUNDS
Notes to Financial Statements (continued)
April 30, 2012 (Unaudited)
|
| 2. SIGNIFICANT ACCOUNTING POLICIES (continued) |
foreign currency translations. Transactions denominated in foreign currencies are translated into U.S. dollars on the date the transaction occurred, the effects of which are included within realized gain (loss) on foreign currency transactions.
F. Forward Foreign Currency Exchange Contracts — All forward foreign currency exchange contracts are marked to market daily at the applicable forward rate. Unrealized gains or losses on forward foreign currency exchange contracts are recorded by the Funds on a daily basis, and realized gains or losses are recorded on the settlement date of a contract.
Risks may arise upon entering into these contracts from the potential inability of counterparties to meet the terms of their contracts and from unanticipated movements in the value of a foreign currency relative to the U.S. dollar.
The contractual amounts of forward foreign currency exchange contracts do not necessarily represent the amounts potentially subject to risk, and the overall risk at the portfolio level may be mitigated by any applicable related and offsetting transactions. The Funds must set aside liquid assets, or engage in other appropriate measures to cover their obligations under these contracts.
G. Futures Contracts — Futures contracts are valued at the last settlement price, or in the absence of a sale, the last bid price for long positions and at the last ask price for short positions, at the end of each day on the board of trade or exchange upon which they are traded. Upon entering into a futures contract, the Funds deposit cash or securities in an account on behalf of the broker in an amount sufficient to meet the initial margin requirement. Subsequent payments are made or received by the Funds equal to the daily change in the contract value and are recorded as variation margin receivable or payable with a corresponding offset in unrealized gains or losses. The Funds recognize a realized gain or loss when a contract is closed or expires.
The use of futures contracts involves, to varying degrees, elements of market and counterparty risk which may exceed the amounts recognized in the Statements of Assets and Liabilities. Futures contracts may be illiquid, and exchanges may limit fluctuations in futures contract prices during a single day. Changes in the value of a futures contract may not directly correlate with changes in the value of the underlying securities. These risks may decrease the effectiveness of the Funds’ strategies and potentially result in a loss. The Funds must set aside liquid assets, or engage in other appropriate measures to cover their obligations under these contracts.
H. Mortgage-Backed and Asset-Backed Securities — The Balanced Fund may invest in mortgage-backed and/or asset-backed securities. Mortgage-backed securities represent direct or indirect participations in, or are collateralized by and payable from, mortgage loans secured by residential and/or commercial real property. These securities may include mortgage pass-through securities, collateralized mortgage obligations, real estate mortgage investment conduit pass-through or participation certificates and stripped mortgage-backed securities. Asset-backed securities include securities whose principal and interest payments are collateralized by pools of assets such as auto loans, credit card receivables, leases, installment contracts and personal property. Asset-backed securities also include home equity line of credit loans and other second-lien mortgages.
The value of certain mortgage-backed and asset-backed securities (including adjustable rate mortgage loans) may be particularly sensitive to changes in prevailing interest rates. The value of these securities may also fluctuate in response to the market’s perception of the creditworthiness of the issuers. Early repayment of principal on mortgage-backed or asset-backed securities may expose a Fund to the risk of earning a lower rate of return upon reinvestment of principal. Asset-backed securities may present credit risks that are not presented by mortgage-backed securities because they generally do not have the benefit of a security interest in collateral that is comparable to mortgage assets. Some asset-backed securities may only have a subordinated claim on collateral. In addition, while mortgage-backed and asset-backed securities may be supported by some form of government or private guarantee and/or insurance, there is no assurance that private guarantors or insurers, if any, will meet their obligations.
Stripped mortgage-backed securities are usually structured with two different classes: one that receives substantially all of the interest payments (the interest-only, or “IO” and/or the high coupon rate with relatively low principal amount, or “IOette”), and the other that receives substantially all of the principal payments (the principal-only, or “PO”) from a pool of mortgage loans. Little to no principal will be received at the maturity of an IO; as a result, periodic adjustments are recorded to reduce the cost of the security through maturity. These adjustments are included in interest income. Payments received for PO’s are treated as a proportionate reduction to the cost basis of the securities and excess amounts are recorded as gains.
I. Mortgage Dollar Rolls — The Balanced Fund may enter into mortgage dollar rolls (“dollar rolls”) in which the Fund sells securities in the current month for delivery and simultaneously contracts with the same counterparty to repurchase similar (same
110
GOLDMAN SACHS STRUCTURED DOMESTIC EQUITY FUNDS
|
| 2. SIGNIFICANT ACCOUNTING POLICIES (continued) |
type, coupon and maturity) but not identical securities on a specified future date. The Fund treats dollar rolls as two separate transactions: one involving the purchase of a security and a separate transaction involving a sale.
During the settlement period between sale and repurchase, the Fund will not be entitled to accrue interest and principal payments on the securities sold. Dollar roll transactions involve the risk that the market value of the securities sold by the Fund may decline below the repurchase price of those securities. In the event the buyer of the securities in a dollar roll transaction files for bankruptcy or becomes insolvent, the Fund’s use of proceeds from the transaction may be restricted pending a determination by, or with respect to, the other counterparty.
J. Options — When the Funds write call or put options, an amount equal to the premium received is recorded as a liability and is subsequently marked-to-market to reflect the current market value of the option written. Swaptions are options on swap contracts. Options on a futures contract may be written with premiums to be determined on a future date. The premiums for these options are based upon implied volatility parameters at specified terms. When a written option expires on its stipulated expiration date or the Funds enter into a closing purchase transaction, the Funds realize a gain or loss without regard to any unrealized gain or loss on the underlying future, swap, security or currency transaction, and the liability related to such option is extinguished. When a written call option is exercised, the Funds realize a gain or loss from the sale of the underlying future, swap, security or currency transaction, and the proceeds of the sale are increased by the premium originally received. When a written put option is exercised, the amount of the premium originally received will reduce the cost of the future, swap, security or currency transaction that the Funds purchase upon exercise. There is a risk of loss from a change in value of such options which may exceed the related premiums received. The Funds must set aside liquid assets, or engage in other appropriate measures to cover their obligations under written option contracts.
Upon the purchase of a call option or a put option by the Funds, the premium paid is recorded as an investment and subsequently marked-to-market to reflect the current market value of the option. Certain options may be purchased with premiums to be determined on a future date. The premiums for these options are based upon implied voluntary parameters at specified terms. If an option which the Funds have purchased expires on the stipulated expiration date, the Funds will realize a loss in the amount of the cost of the option. If the Funds enter into a closing sale transaction, the Funds will realize a gain or loss, depending on whether the sale proceeds for the closing sale transaction are greater or less than the cost of the option. If the Funds exercise a purchased put option, the Funds will realize a gain or loss from the sale of the underlying future, swap, security or currency transaction, and the proceeds from such sale will be decreased by the premium originally paid. If the Funds exercise a purchased call option, the cost of the future, swap, security or currency transaction which the Funds purchase upon exercise will be increased by the premium originally paid. The Fund’s maximum exposure to purchased options is limited to the premium initially paid. Purchased over the counter options are subject to the risk that the counterparty may default on its obligations, which could result in a loss to the Funds.
K. Repurchase Agreements — The Funds may enter into repurchase agreements which involve the purchase of securities subject to the seller’s agreement to repurchase the securities at a mutually agreed upon date and price. During the term of a repurchase agreement, the value of the underlying securities held as collateral on behalf of the Funds, including accrued interest, is required to exceed the value of the repurchase agreement, including accrued interest. If the seller defaults or becomes insolvent, realization of the collateral by the Funds may be delayed or limited and there may be a decline in the value of the collateral during the period while the Funds seek to assert their rights. The underlying securities for all repurchase agreements are held at the Funds’ custodian or designated sub-custodians under tri-party repurchase agreements.
Pursuant to exemptive relief granted by the Securities and Exchange Commission (“SEC”) and terms and conditions contained therein, the Funds, together with other registered investment companies having management agreements with GSAM, or its affiliates, may transfer uninvested cash into joint accounts, the daily aggregate balance of which is invested in one or more repurchase agreements. Under these joint accounts, the Funds maintain pro rata credit exposure to the underlying repurchase agreements’ counterparties. With the exception of certain transaction fees, the Funds are not subject to any expenses in relation to these investments.
L. Structured Notes — The Funds may invest in structured notes, the values of which are based on the price movements of a reference security or index. Fluctuations in value are recorded as unrealized gain or loss. Interest income is recorded on the basis of
111
GOLDMAN SACHS STRUCTURED DOMESTIC EQUITY FUNDS
Notes to Financial Statements (continued)
April 30, 2012 (Unaudited)
|
| 2. SIGNIFICANT ACCOUNTING POLICIES (continued) |
interest accrued, premium amortized and discount accreted. On the termination date, the Fund will receive a payment from the issuer based on the value of the referenced security (notional amount multiplied by price of the referenced security) and record a realized gain or loss. Structured notes are subject to various risks including credit, issuer, liquidity and interest rate risks.
M. Swap Contracts — Swaps are marked to market daily using either pricing vendor quotations, counterparty prices or model prices, and the change in value, if any, is recorded as an unrealized gain or loss. Upfront payments made and/or received by the Funds, are recorded as an asset and/or liability, and realized gains or losses are recognized ratably over the contract’s term/event, with the exception of forward starting interest rate swaps, whose realized gains or losses are recognized ratably from the effective start date. Periodic payments received or made on swap contracts are recorded as realized gains or losses. Gains or losses are realized upon termination of a swap contract and are recorded on the Statements of Operations.
Risks may arise as a result of the failure of the counterparty to the swap contract to comply with the terms of the swap contract. The loss incurred by the failure of a counterparty is generally limited to the net payment to be received by the Funds and/or the termination value at the end of the contract. Therefore, GSAM considers the creditworthiness of each counterparty to a contract in evaluating potential credit risk. Additionally, risks may arise from unanticipated movements in interest rates or in the value of the underlying reference asset or index. Entering into these agreements involves, to varying degrees, market risk, liquidity risk and elements of credit, legal and documentation risk in excess of amounts recognized in the Statements of Assets and Liabilities. The Funds may pay or receive cash as collateral on these contracts which is recorded as an asset and/or liability. The Funds must set aside liquid assets, or engage in other appropriate measures to cover their obligations under these contracts.
The Balanced Fund may invest in the following types of swaps:
An interest rate swap is an agreement that obligates two parties to exchange a series of cash flows at specified intervals, based upon or calculated by reference to changes in specified prices, rates or indices for a specified amount of an underlying asset or notional principal amount. The payment flows are usually netted against each other, with the difference being paid by one party to the other.
A credit default swap is an agreement that involves one party making a stream of payments to another party in exchange for the right to receive protection on a reference security or obligation. A Fund may use credit default swaps to provide a measure of protection against defaults of the reference security or obligation or to take a short position with respect to the likelihood of default. A Fund’s investment in credit default swaps may involve greater risks than if the Fund had invested in the referenced obligation directly. Credit events are contract specific but may include bankruptcy, failure to pay, restructuring and obligation acceleration. If a Fund buys protection through a credit default swap and no credit event occurs, its payments are limited to the periodic payments previously made to the counterparty. Upon the occurrence of a specified credit event, a Fund, as a buyer of credit protection, is entitled to receive an amount equal to the notional amount of the swap and deliver to the seller the defaulted reference obligation in a physically settled trade. A Fund may also receive a net settlement amount in the form of cash or securities equal to the notional amount of the swap reduced by the recovery value of the reference obligation in a cash settled trade.
As a seller of protection, a Fund generally receives a payment stream throughout the term of the swap, provided that there is no credit event. In addition, if the Fund sells protection through a credit default swap, the Fund could suffer a loss because the value of the referenced obligation may be less than the premium payments received. Upon the occurrence of a specified credit event, a Fund, as a seller of credit protection, may be required to take possession of the defaulted reference obligation and pay the buyer an amount equal to the notional amount of the swap in a physically settled trade. A Fund may also pay a net settlement amount in the form of cash or securities equal to the notional amount of the swap reduced by the recovery value of the reference obligation in a cash settled trade. Recovery values are at times established through the credit event auction process in which market participants are ensured that a transparent price has been set for the defaulted security or obligation. In addition, a Fund is entitled to a return of any assets, which have been pledged as collateral to the counterparty.
The maximum potential amount of future payments (undiscounted) that the Funds as sellers of protection could be required to make under a credit default swap would be an amount equal to the notional amount of the agreement. These potential amounts would be partially offset by any recovery values of the respective referenced obligations or net amounts received from a settlement of a credit default swap for the same reference security or obligation where the Funds bought credit protection.
112
GOLDMAN SACHS STRUCTURED DOMESTIC EQUITY FUNDS
|
| 2. SIGNIFICANT ACCOUNTING POLICIES (continued) |
N. Treasury Inflation Protected Securities — The Funds may invest in treasury inflation protected securities (“TIPS”), including structured bonds in which the principal amount is adjusted daily to keep pace with inflation, as measured by the U.S. Consumer Pricing Index for Urban Consumers. The adjustments to principal due to inflation/deflation are reflected as increases/decreases to interest income with a corresponding adjustment to cost. Such adjustments may have a significant impact on the Funds’ distributions and may result in a return of capital to shareholders. The repayment of the original bond principal upon maturity is guaranteed by the full faith and credit of the U.S. Government.
O. When-Issued Securities and Forward Commitments — The Funds may purchase when-issued securities, including TBA (“To Be Announced”) securities that have been authorized, but not yet issued in the market. When-issued securities are purchased in order to secure what is considered to be an advantageous price or yield to the Fund at the time of entering into the transaction. A forward commitment involves entering into a contract to purchase or sell securities, typically on an extended settlement basis, for a fixed price at a future date. The purchase of securities on a when-issued or forward commitment basis involves a risk of loss if the value of the security to be purchased declines before the settlement date. Conversely, the sale of securities on a forward commitment basis involves the risk that the value of the securities sold may increase before the settlement date. Although the Funds will generally purchase securities on a when-issued or forward commitment basis with the intention of acquiring the securities for their portfolios, the Funds may dispose of when-issued securities or forward commitments prior to settlement which may result in a realized gain or loss. When purchasing a security on a when-issued basis or entering into a forward commitment, the Funds must set aside liquid assets, or engage in other appropriate measures to cover their obligations under these contracts.
| | |
| 3. FAIR VALUE OF INVESTMENTS | | |
The fair value of a financial instrument is the amount that would be received to sell an asset or paid to transfer a liability in an orderly transaction between market participants at the measurement date (i.e., the exit price). GAAP establishes a fair value hierarchy that prioritizes the inputs to valuation techniques used to measure fair value. The hierarchy gives the highest priority to unadjusted quoted prices in active markets for identical assets or liabilities (Level 1 measurements) and the lowest priority to unobservable inputs (Level 3 measurements). The three levels of the fair value hierarchy are described below:
Level 1 — Unadjusted quoted prices in active markets that are accessible at the measurement date for identical, unrestricted assets or liabilities;
Level 2 — Quoted prices in markets that are not active or financial instruments for which significant inputs are observable (including, but not limited to, quoted prices for similar investments, interest rates, foreign exchange rates, volatility and credit spreads), either directly or indirectly;
Level 3 — Prices or valuations that require significant unobservable inputs (including GSAM’s assumptions in determining fair value measurement).
113
GOLDMAN SACHS STRUCTURED DOMESTIC EQUITY FUNDS
Notes to Financial Statements (continued)
April 30, 2012 (Unaudited)
|
| 3. FAIR VALUE OF INVESTMENTS (continued) |
The levels used for classifying investments are not necessarily an indication of the risk associated with investing in those investments.
The following is a summary of the Funds’ investments and derivatives categorized in the fair value hierarchy as of April 30, 2012:
| | | | | | | | | | | | |
|
| BALANCED | |
| | | |
| Investment Type | | Level 1 | | | Level 2 | | | Level 3 | |
| Assets | | | | | | | | | | | | |
Common Stock and/or Other Equity Investments | | $ | 73,628,162 | | | $ | — | | | $ | — | |
Fixed Income | | | | | | | | | | | | |
Corporate Obligations | | | — | | | | 10,412,393 | | | | — | |
Mortgage-Backed Obligations | | | — | | | | 21,871,264 | | | | — | |
U.S. Treasury Obligations and/or Other U.S. Government Agencies | | | 11,408,831 | | | | 1,571,068 | | | | — | |
Asset-Backed Securities | | | — | | | | 3,782,255 | | | | — | |
Foreign Debt Obligations | | | — | | | | 1,769,397 | | | | — | |
Government Guarantee Obligations | | | — | | | | 356,248 | | | | — | |
Municipal Debt Obligations | | | — | | | | 247,284 | | | | — | |
Structured Note | | | — | | | | 391,441 | | | | — | |
Short-term Investments | | | — | | | | 1,300,000 | | | | — | |
Securities Lending Reinvestment Vehicle | | | 1,746,775 | | | | — | | | | — | |
| Total | | $ | 86,783,768 | | | $ | 41,701,350 | | | $ | — | |
| Liabilities | | | | | | | | | | | | |
Fixed Income | | | | | | | | | | | | |
Mortgage-Backed Obligations – Forward Sales Contracts | | $ | — | | | $ | (4,282,812 | ) | | $ | — | |
| | | |
| Derivative Type | | Level 1 | | | Level 2 | | | Level 3 | |
| Assets(a) | | | | | | | | | | | | |
Forward Foreign Currency Exchange Contracts | | $ | — | | | $ | 15,495 | | | $ | — | |
Futures Contracts | | | 203,898 | | | | — | | | | — | |
Interest Rate Swap Contracts | | | — | | | | 4,869 | | | | — | |
Credit Default Swap Contracts | | | — | | | | 8,832 | | | | — | |
| Total | | $ | 203,898 | | | $ | 29,196 | | | $ | — | |
| Liabilities(a) | | | | | | | | | | | | |
Forward Foreign Currency Exchange Contracts | | $ | — | | | $ | (6,719 | ) | | $ | — | |
Futures Contracts | | | (58,125 | ) | | | — | | | | — | |
Interest Rate Swap Contracts | | | — | | | | (24,498 | ) | | | — | |
Credit Default Swap Contracts | | | — | | | | (19,102 | ) | | | — | |
| Total | | $ | (58,125 | ) | | $ | (50,319 | ) | | $ | — | |
114
GOLDMAN SACHS STRUCTURED DOMESTIC EQUITY FUNDS
|
| 3. FAIR VALUE OF INVESTMENTS (continued) |
| | | | | | | | | | | | |
|
| STRUCTURED LARGE CAP GROWTH | |
| | | |
| Investment Type | | Level 1 | | | Level 2 | | | Level 3 | |
| Assets | | | | | | | | | | | | |
Common Stock and/or Other Equity Investments | | $ | 627,787,313 | | | $ | — | | | $ | — | |
Short-term Investments | | | — | | | | 13,600,000 | | | | — | |
Securities Lending Reinvestment Vehicle | | | 3,116,750 | | | | — | | | | — | |
| Total | | $ | 630,904,063 | | | $ | 13,600,000 | | | $ | — | |
| | | |
| Derivative Type | | Level 1 | | | Level 2 | | | Level 3 | |
| Assets(a) | | | | | | | | | | | | |
Futures Contracts | | $ | 140,100 | | | $ | — | | | $ | — | |
| | | |
| STRUCTURED LARGE CAP VALUE | | | | | | | | | | | | |
| | | |
| Investment Type | | Level 1 | | | Level 2 | | | Level 3 | |
| Assets | | | | | | | | | | | | |
Common Stock and/or Other Equity Investments | | $ | 526,303,092 | | | $ | — | | | $ | — | |
Short-term Investments | | | — | | | | 11,600,000 | | | | — | |
Securities Lending Reinvestment Vehicle | | | 2,926,400 | | | | — | | | | — | |
| Total | | $ | 529,229,492 | | | $ | 11,600,000 | | | $ | — | |
| | | |
| Derivative Type | | Level 1 | | | Level 2 | | | Level 3 | |
| Liabilities(a) | | | | | | | | | | | | |
Futures Contracts | | $ | (62,059 | ) | | $ | — | | | $ | — | |
| | | |
| STRUCTURED SMALL CAP EQUITY | | | | | | | | | | | | |
| | | |
| Investment Type | | Level 1 | | | Level 2 | | | Level 3 | |
| Assets | | | | | | | | | | | | |
Common Stock and/or Other Equity Investments | | $ | 186,706,100 | | | $ | — | | | $ | — | |
Short-term Investments | | | — | | | | 6,000,000 | | | | — | |
Securities Lending Reinvestment Vehicle | | | 4,287,800 | | | | — | | | | — | |
| Total | | $ | 190,993,900 | | | $ | 6,000,000 | | | $ | — | |
| | | |
| Derivative Type | | Level 1 | | | Level 2 | | | Level 3 | |
| Assets(a) | | | | | | | | | | | | |
Futures Contracts | | $ | 107,601 | | | $ | — | | | $ | — | |
115
GOLDMAN SACHS STRUCTURED DOMESTIC EQUITY FUNDS
Notes to Financial Statements (continued)
April 30, 2012 (Unaudited)
|
| 3. FAIR VALUE OF INVESTMENTS (continued) |
| | | | | | | | | | | | |
|
| STRUCTURED SMALL CAP GROWTH | |
| | | |
| Investment Type | | Level 1 | | | Level 2 | | | Level 3 | |
| Assets | | | | | | | | | | | | |
Common Stock and/or Other Equity Investments | | $ | 43,218,798 | | | $ | — | | | $ | — | |
Short-term Investments | | | — | | | | 1,300,000 | | | | — | |
Securities Lending Reinvestment Vehicle | | | 710,725 | | | | — | | | | — | |
| Total | | $ | 43,929,523 | | | $ | 1,300,000 | | | $ | — | |
| | | |
| Derivative Type | | Level 1 | | | Level 2 | | | Level 3 | |
| Assets(a) | | | | | | | | | | | | |
Futures Contracts | | $ | 6,464 | | | $ | — | | | $ | — | |
| | | |
| STRUCTURED SMALL CAP VALUE | | | | | | | | | | | | |
| | | |
| Investment Type | | Level 1 | | | Level 2 | | | Level 3 | |
| Assets | | | | | | | | | | | | |
Common Stock and/or Other Equity Investments | | $ | 130,491,564 | | | $ | — | | | $ | — | |
Investment Company | | | 128,243 | | | | — | | | | — | |
Short-term Investments | | | — | | | | 4,000,000 | | | | — | |
Securities Lending Reinvestment Vehicle | | | 4,052,750 | | | | — | | | | — | |
| Total | | $ | 134,672,557 | | | $ | 4,000,000 | | | $ | — | |
| | | |
| Derivative Type | | Level 1 | | | Level 2 | | | Level 3 | |
| Assets(a) | | | | | | | | | | | | |
Futures Contracts | | $ | 11,968 | | | $ | — | | | $ | — | |
| | | |
| STRUCTURED U.S. EQUITY | | | | | | | | | | | | |
| | | |
| Investment Type | | Level 1 | | | Level 2 | | | Level 3 | |
| Assets | | | | | | | | | | | | |
Common Stock and/or Other Equity Investments | | $ | 339,115,647 | | | $ | — | | | $ | — | |
Short-term Investments | | | — | | | | 5,300,000 | | | | — | |
Securities Lending Reinvestment Vehicle | | | 108,225 | | | | — | | | | — | |
| Total | | $ | 339,223,872 | | | $ | 5,300,000 | | | $ | — | |
| | | |
| Derivative Type | | Level 1 | | | Level 2 | | | Level 3 | |
| Assets(a) | | | | | | | | | | | | |
Futures Contracts | | $ | 57,543 | | | $ | — | | | $ | — | |
| (a) | | Amount shown represents unrealized gain (loss) at period end. |
116
GOLDMAN SACHS STRUCTURED DOMESTIC EQUITY FUNDS
|
| 4. INVESTMENTS IN DERIVATIVES |
The Funds may make investments in derivative instruments, including, but not limited to options, futures, swaps, swaptions and other derivatives relating to foreign currency transactions. A derivative is an instrument whose value is derived from underlying assets, indices, reference rates or a combination of these factors. Derivative instruments may be privately negotiated contracts (often referred to as over the counter (“OTC”) derivatives) or they may be listed and traded on an exchange. Derivative contracts may involve future commitments to purchase or sell financial instruments or commodities at specified terms on a specified date, or to exchange interest payment streams or currencies based on a notional or contractual amount. Derivative instruments may involve a high degree of financial risk. The use of derivatives also involves the risk of loss if the investment adviser is incorrect in its expectation of the timing or level of fluctuations in securities prices, interest rates or currency prices. Investments in derivative instruments also include the risk of default by the counterparty, the risk that the investment may not be liquid and/or the risk that a small movement in the price of the underlying security or benchmark may result in a disproportionately large movement, unfavorable or favorable, in the price of the derivative instrument.
During the six months ended April 30, 2012, the Funds entered into certain derivative contract types. These instruments were used to meet the Funds’ investment objectives and to obtain and/or manage exposure related to the risks below. The following tables set forth, by certain risk types, the gross value of these derivative contracts for trading activities as of April 30, 2012. The values in the tables below exclude the effects of cash collateral received or posted pursuant to these derivative contracts, and therefore are not representative of the Funds’ net exposure.
| | | | | | | | | | | | |
| | | |
| Balanced Fund | | | | | | | | | | |
| Risk | | Statement of Assets
and Liabilities | | Assets | | | Statement of Assets
and Liabilities | | Liabilities | |
Interest rate | | Receivable for unrealized gain on swap contracts; Unrealized gain on futures variation margin | | $ | 201,593 | (a) | | Payable for unrealized loss on swap contracts; Unrealized loss on futures variation margin | | $ | (82,623) | (a)(b) |
Credit | | Receivable for unrealized gain on swap contracts | | | 8,832 | | | Payable for unrealized loss on swap contracts | | | (19,102) | (b) |
Equity | | Unrealized gain on futures variation margin | | | 7,174 | (a) | | — | | | — | |
Currency | | Receivable for unrealized gain on forward foreign currency exchange contracts | | | 15,495 | | | Payable for unrealized loss on forward foreign currency exchange contracts | | | (6,719) | |
| Total | | $ | 233,094 | | | | | $ | (108,444) | |
| | | | | | | | | | | | |
| Risk | | Fund | | Statement of Assets
and Liabilities | | Assets(a) | | | Liabilities(a) | |
Equity | | Structured Large Cap Growth | | Unrealized gain on futures variation margin | | $ | 140,100 | | | $ | — | |
Equity | | Structured Large Cap Value | | Unrealized loss on futures variation margin | | | — | | | | (62,059 | ) |
Equity | | Structured Small Cap Equity | | Unrealized gain on futures variation margin | | | 107,601 | | | | — | |
Equity | | Structured Small Cap Growth | | Unrealized gain on futures variation margin | | | 6,464 | | | | — | |
Equity | | Structured Small Cap Value | | Unrealized gain on futures variation margin | | | 11,968 | | | | — | |
Equity | | Structured U.S. Equity | | Unrealized gain on futures variation margin | | | 57,543 | | | | — | |
| (a) | | Includes unrealized gain (loss) on futures contracts described in the Additional Investment Information sections of the Schedules of Investments. Only current day’s variation margin is reported within the Statements of Assets and Liabilities. |
| (b) | | Aggregate of amounts include $43,600 which represents the payments to be made pursuant to bilateral agreements should counterparties exercise their “right to terminate” provisions based on, among others, the Fund’s performance, its failure to pay on its obligations or failure to pledge collateral. Such amount does not include incremental charges directly associated with the close-out of the agreements. It also does not reflect the fair value of any assets pledged as collateral which, through the daily margining process, substantially offsets the aforementioned amounts and for which the Fund is entitled to a full return. |
117
GOLDMAN SACHS STRUCTURED DOMESTIC EQUITY FUNDS
Notes to Financial Statements (continued)
April 30, 2012 (Unaudited)
|
| 4. INVESTMENTS IN DERIVATIVES (continued) |
The following tables set forth, by certain risk types, the Funds’ gains (losses) related to these derivatives and their indicative volumes for the six months ended April 30, 2012. These gains (losses) should be considered in the context that these derivative contracts may have been executed to economically hedge certain investments, and accordingly, certain gains (losses) on such derivative contracts may offset certain (losses) gains attributable to investments. These gains (losses) are included in “Net realized gain (loss)” or “Net change in unrealized gain (loss)” on the Statements of Operations:
| | | | | | | | | | | | | | |
|
| Balanced Fund | |
| Risk | | Statement of Operations | | Net
Realized
Gain (Loss) | | | Net Change in
Unrealized
Gain (Loss) | | | Average
Number of
Contracts(a) | |
| Interest rate | | Net realized gain (loss) from investments, futures contracts, swap contracts and written options/Net change in unrealized gain (loss) on futures contracts and swap contracts | | $ | 300,065 | | | $ | 36,860 | | | | 142 | |
| Credit | | Net realized gain (loss) from swap contracts/Net change in unrealized gain (loss) on swap contracts | | | (62,147 | ) | | | (7,477 | ) | | | 15 | |
| Equity | | Net realized gain (loss) from futures contracts/Net change in unrealized gain (loss) on futures contracts | | | 222,541 | | | | (37,048 | ) | | | 25 | |
| Currency | | Net realized gain (loss) from forward foreign currency exchange contracts/Net change in unrealized gain (loss) on forward foreign currency exchange contracts | | | (15,539 | ) | | | 26,747 | | | | 4 | |
| Total | | | | $ | 444,920 | | | $ | 19,082 | | | | 186 | |
The following table represents gains (losses) which are included in “Net realized gain (loss) from futures contracts” and “Net change in unrealized gain (loss) on futures contracts” on the Statements of Operations.
| | | | | | | | | | | | | | | | | | |
| Risk | | | | Fund | | | | Net Realized
Gain (Loss) | | | | Net Change in
Unrealized
Gain (Loss) | | | Average
Number of
Contracts(a) | |
Equity | | | | Structured Large Cap Growth | | | | $2,070,574 | | | | $ | (261,893 | ) | | | 236 | |
Equity | | | | Structured Large Cap Value | | | | 1,956,511 | | | | | (531,156 | ) | | | 142 | |
Equity | | | | Structured Small Cap Equity | | | | 1,037,925 | | | | | (88,602 | ) | | | 55 | |
Equity | | | | Structured Small Cap Growth | | | | 141,531 | | | | | (53,969 | ) | | | 11 | |
Equity | | | | Structured Small Cap Value | | | | 410,937 | | | | | (175,186 | ) | | | 34 | |
Equity | | | | Structured U.S. Equity | | | | 386,967 | | | | | (226,077 | ) | | | 86 | |
| (a) | | Average number of contracts is based on the average of month end balances for the six months ended April 30, 2012. |
|
| 5. AGREEMENTS AND AFFILIATED TRANSACTIONS |
A. Management Agreement — Under the Agreement, GSAM manages the Funds, subject to the general supervision of the trustees.
As compensation for the services rendered pursuant to the Agreement, the assumption of the expenses related thereto and administration of the Funds’ business affairs, including providing facilities, GSAM is entitled to a management fee accrued daily and paid monthly, equal to an annual percentage rate of each Fund’s average daily net assets.
118
GOLDMAN SACHS STRUCTURED DOMESTIC EQUITY FUNDS
|
| 5. AGREEMENTS AND AFFILIATED TRANSACTIONS (continued) |
For the six months ended April 30, 2012, contractual and effective net management fees with GSAM were at the following rates:
| | | | | | | | | | | | | | | | | | | | | | | | | | | | |
| | | Contractual Management Rate | | | Effective Net
Management
Rate* | |
| Fund | | First
$1 billion | | | Next
$1 billion | | | Next
$3 billion | | | Next
$3 billion | | | Over
$8 billion | | | Effective
Rate | | |
Balanced | | | 0.65 | % | | | 0.59 | % | | | 0.56 | % | | | 0.55 | % | | | 0.54 | % | | | 0.65 | % | | | 0.55 | % |
Structured Large Cap Growth | | | 0.65 | | | | 0.59 | | | | 0.56 | | | | 0.55 | | | | 0.54 | | | | 0.65 | | | | 0.51 | |
Structured Large Cap Value | | | 0.60 | | | | 0.54 | | | | 0.51 | | | | 0.50 | | | | 0.49 | | | | 0.60 | | | | 0.51 | |
Structured Small Cap Equity | | | 0.85 | | | | 0.85 | | | | 0.77 | | | | 0.73 | | | | 0.72 | | | | 0.85 | | | | 0.81 | |
Structured Small Cap Growth | | | 0.85 | | | | 0.85 | | | | 0.77 | | | | 0.73 | | | | 0.72 | | | | 0.85 | | | | 0.81 | |
Structured Small Cap Value | | | 0.85 | | | | 0.85 | | | | 0.77 | | | | 0.73 | | | | 0.72 | | | | 0.85 | | | | 0.81 | |
Structured U.S. Equity | | | 0.65 | | | | 0.59 | | | | 0.56 | | | | 0.55 | | | | 0.54 | | | | 0.65 | | | | 0.51 | |
| * | | GSAM has agreed to waive a portion of its management fee in order to achieve the effective net management rates above through February 28, 2013. Prior to such date GSAM may not terminate the arrangement without the approval of the trustees. |
B. Distribution and Service Plans — The Trust, on behalf of each Fund, has adopted Distribution and Service Plans (the “Plans”). Under the Plans, Goldman Sachs, which serves as distributor (the “Distributor”), is entitled to a fee, accrued daily and paid monthly for distribution services and personal and account maintenance services, which may then be paid by Goldman Sachs to authorized dealers, at the following annual rates calculated on a Fund’s average daily net assets of each respective share class:
| | | | | | | | | | | | | | | | |
| | | Distribution and Service Plan Rates | |
| | | Class A* | | | Class B | | | Class C | | | Class R* | |
Distribution Plan | | | 0.25 | % | | | 0.75 | % | | | 0.75 | % | | | 0.50 | % |
Service Plan | | | — | | | | 0.25 | | | | 0.25 | | | | — | |
| * | | With respect to Class A and Class R Shares, the Distributor at its discretion may use compensation for distribution services paid under the Distribution Plan to compensate service organizations for personal and account maintenance services and expenses as long as such total compensation does not exceed the maximum cap on “service fees” imposed by the Financial Industry Regulatory Authority. |
119
GOLDMAN SACHS STRUCTURED DOMESTIC EQUITY FUNDS
Notes to Financial Statements (continued)
April 30, 2012 (Unaudited)
|
| 5. AGREEMENTS AND AFFILIATED TRANSACTIONS (continued) |
C. Distribution Agreement — Goldman Sachs, as Distributor of the shares of the Funds pursuant to a Distribution Agreement, may retain a portion of the Class A front end sales charge and Class B and Class C CDSC. During the six months ended April 30, 2012, Goldman Sachs advised that it retained the following approximate amounts:
| | | | | | | | | | | | | | |
| | | | | Front End
Sales Charge | | | Contingent Deferred
Sales Charge | |
| Fund | | | | Class A | | | Class B | | | Class C | |
Balanced | | | | $ | 14,600 | | | $ | — | | | $ | — | |
Structured Large Cap Growth | | | | | 2,600 | | | | — | | | | — | |
Structured Large Cap Value | | | | | 1,800 | | | | — | | | | 200 | |
Structured Small Cap Equity | | | | | 3,200 | | | | — | | | | 100 | |
Structured Small Cap Growth | | | | | 2,100 | | | | — | | | | — | |
Structured Small Cap Value | | | | | 2,100 | | | | — | | | | — | |
Structured U.S. Equity | | | | | 4,300 | | | | — | | | | 400 | |
D. Service Plan and Shareholder Administration Plan — The Trust, on behalf of each Fund that offers Service Shares, has adopted a Service Plan and Shareholder Administration Plan. These plans allow service organizations to provide varying levels of personal and account maintenance and shareholder administration services to their customers who are beneficial owners of such shares. The Service Plan and Shareholder Administration Plan each provide for compensation to the service organizations which is accrued daily and paid monthly at an annual rate of 0.25% (0.50% in aggregate) of the average daily net assets of the Service Shares.
E. Transfer Agency Agreement — Goldman Sachs also serves as the transfer agent of the Funds for a fee pursuant to a Transfer Agency Agreement. The fees charged for such transfer agency services are accrued daily and paid monthly at an annual rate as follows: 0.19% of the average daily net assets for Class A, Class B, Class C, Class IR and Class R Shares and 0.04% of the average daily net assets for Institutional and Service Shares.
F. Other Expense Agreements and Affiliated Transactions — GSAM has agreed to limit certain “Other Expense” of the Funds (excluding management fees, distribution and service fees, transfer agent fees and expenses, service fees and shareholder administration fees (as applicable), taxes, interest, brokerage fees and litigation, indemnification, shareholder meetings and other extraordinary expenses, exclusive of any custody and transfer agent fee credit reductions) to the extent such expenses exceed, on an annual basis, a percentage rate of the average daily net assets of each Fund. Such Other Expense reimbursements, if any, are accrued daily and paid monthly. In addition, the Funds are not obligated to reimburse GSAM for prior fiscal year expense reimbursements, if any. The Other Expense limitations as an annual percentage rate of average daily net assets are 0.064% for the Balanced Fund and 0.004% for the remainder of the Funds. These Other Expense reimbursements will remain in place through February 28, 2013, and prior to such date GSAM may not terminate the arrangements without the approval of the trustees. In addition, the Funds have entered into certain offset arrangements with the custodian and the transfer agent, which may result in a reduction in the Funds’ expenses.
120
GOLDMAN SACHS STRUCTURED DOMESTIC EQUITY FUNDS
|
| 5. AGREEMENTS AND AFFILIATED TRANSACTIONS (continued) |
For the six months ended April 30, 2012, these expense reductions, including any fee waivers and Other Expense reimbursements, were as follows (in thousands):
| | | | | | | | | | | | | | | | | | |
| Fund | | | | Management
Fee Waivers | | | Custody Fee
Credits | | | Other
Expense
Reimbursements | | | Total
Expense
Reductions | |
Balanced | | | | $ | 60 | | | $ | — | * | | $ | 169 | | | $ | 229 | |
Structured Large Cap Growth | | | | | 416 | | | | — | * | | | 204 | | | | 620 | |
Structured Large Cap Value | | | | | 241 | | | | 9 | | | | 156 | | | | 406 | |
Structured Small Cap Equity | | | | | 40 | | | | — | * | | | 152 | | | | 192 | |
Structured Small Cap Growth | | | | | 9 | | | | — | * | | | 149 | | | | 158 | |
Structured Small Cap Value | | | | | 26 | | | | — | * | | | 147 | | | | 173 | |
Structured U.S. Equity | | | | | 243 | | | | — | * | | | 188 | | | | 431 | |
| * | | Amount is less than $500. |
As of April 30, 2012, the amounts owed to affiliates of the Funds were as follows (in thousands):
| | | | | | | | | | | | | | | | | | |
| Fund | | | | Management
Fees | | | Distribution and Service
Fees | | | Transfer
Agent
Fees | | | Total | |
Balanced | | | | $ | 56 | | | $ | 34 | | | $ | 18 | | | $ | 108 | |
Structured Large Cap Growth | | | | | 270 | | | | 49 | | | | 44 | | | | 363 | |
Structured Large Cap Value | | | | | 246 | | | | 39 | | | | 36 | | | | 321 | |
Structured Small Cap Equity | | | | | 131 | | | | 26 | | | | 17 | | | | 174 | |
Structured Small Cap Growth | | | | | 30 | | | | 13 | | | | 6 | | | | 49 | |
Structured Small Cap Value | | | | | 89 | | | | 46 | | | | 20 | | | | 155 | |
Structured U.S. Equity | | | | | 146 | | | | 92 | | | | 50 | | | | 288 | |
G. Line of Credit Facility — As of April 30, 2012, the Funds participated in a $580,000,000 committed, unsecured revolving line of credit facility (the “facility”) together with other funds of the Trust and registered investment companies having management agreements with GSAM or its affiliates (“Other Borrowers”). Pursuant to the terms of the facility, the Funds and Other Borrowers could increase the credit amount by an additional $340,000,000, for a total of up to $920,000,000. This facility is to be used solely for temporary or emergency purposes. The interest rate on borrowings is based on the federal funds rate. The facility also requires a fee to be paid by the Funds based on the amount of the commitment that has not been utilized. For the six months ended April 30, 2012, the Funds did not have any borrowings under the facility. Effective May 8, 2012, the amount available through the facility increased to $630,000,000.
H. Other Transactions with Affiliates — For the six months ended April 30, 2012, Goldman Sachs earned approximately $2,900, $7,600, $5,100, $3,700, $100, $300 and $2,900 in brokerage commissions from portfolio transactions, including futures transactions executed with Goldman Sachs as the Futures Commission Merchant, on behalf of the Balanced, Structured Large Cap Growth, Structured Large Cap Value, Structured Small Cap Equity, Structured Small Cap Growth, Structured Small Cap Value and Structured U.S. Equity Funds, respectively.
121
GOLDMAN SACHS STRUCTURED DOMESTIC EQUITY FUNDS
Notes to Financial Statements (continued)
April 30, 2012 (Unaudited)
|
| 5. AGREEMENTS AND AFFILIATED TRANSACTIONS (continued) |
As of April 30, 2012, the following Fund of Funds Portfolios were the beneficial owners of 5% or more of total outstanding shares of the following Funds:
| | | | | | | | | | | | | | | | | | | | | | |
| Fund | | | | Goldman Sachs
Balanced Strategy
Portfolio | | | Goldman Sachs
Enhanced Dividend
Global Equity
Portfolio | | | Goldman Sachs
Equity Growth
Strategy Portfolio | | | Goldman Sachs
Growth and Income
Strategy Portfolio | | | Goldman Sachs
Growth Strategy
Portfolio | |
Structured Large Cap Growth | | | | | 8 | % | | | — | % | | | 12 | % | | | 23 | % | | | 24 | % |
Structured Large Cap Value | | | | | 8 | | | | — | | | | 13 | | | | 22 | | | | 25 | |
Structured Small Cap Equity | | | | | 6 | | | | 10 | | | | 5 | | | | 13 | | | | 13 | |
As of April 30, 2012, Goldman Sachs Group, Inc. (“GSG”) was the beneficial owner of 5% or more of outstanding Class IR and Class R Shares of the following Funds:
| | | | | | | | | | |
| Fund | | | | Class IR | | | Class R | |
Structured Large Cap Growth | | | | | — | % | | | 32 | % |
Structured Large Cap Value | | | | | 11 | | | | 78 | |
Structured Small Cap Growth | | | | | 8 | | | | 44 | |
Structured U.S. Equity | | | | | — | | | | 5 | |
|
| 6. PORTFOLIO SECURITIES TRANSACTIONS |
The cost of purchases and proceeds from sales and maturities of long-term securities for the six months ended April 30, 2012, were as follows:
| | | | | | | | | | |
| Fund | | | | Purchases | | | Sales and Maturities | |
Balanced* | | | | $ | 175,559,703 | | | $ | 176,095,332 | |
Structured Large Cap Growth | | | | | 334,484,271 | | | | 325,952,256 | |
Structured Large Cap Value | | | | | 238,834,907 | | | | 271,499,813 | |
Structured Small Cap Equity | | | | | 104,659,322 | | | | 103,813,514 | |
Structured Small Cap Growth | | | | | 16,397,913 | | | | 16,875,325 | |
Structured Small Cap Value | | | | | 33,927,559 | | | | 37,749,385 | |
Structured U.S. Equity | | | | | 148,546,871 | | | | 193,432,556 | |
| * | | Included in these amounts are the cost of purchases and proceeds from sales and maturities of U.S. Government and agency obligations in the amounts of $130,334,753 and $123,953,776, respectively. |
122
GOLDMAN SACHS STRUCTURED DOMESTIC EQUITY FUNDS
Pursuant to exemptive relief granted by the SEC and the terms and conditions contained therein, the Funds may lend their securities through a securities lending agent, Goldman Sachs Agency Lending (“GSAL”), a wholly-owned subsidiary of Goldman Sachs, to certain qualified borrowers including Goldman Sachs and affiliates. In accordance with the Funds’ securities lending procedures, the Funds receive cash collateral at least equal to the market value of the securities on loan. The market value of the loaned securities is determined at the close of business of the Funds, at their last sale price or official closing price on the principal exchange or system on which they are traded, and any additional required collateral is delivered to the Funds on the next business day. As with other extensions of credit, the Funds may experience delay in the recovery of their securities or incur a loss should the borrower of the securities breach its agreement with the Funds or become insolvent at a time when the collateral is insufficient to cover the cost of repurchasing securities on loan.
The Funds invest the cash collateral received in connection with securities lending transactions in the Goldman Sachs Financial Square Money Market Fund (“Money Market Fund”), a separate series of the Trust. The Money Market Fund, deemed an affiliate of the Trust, is registered under the Act as an open end investment company, is subject to Rule 2a-7 under the Act, and is managed by GSAM, for which GSAM may receive an investment advisory fee of up to 0.205% on an annualized basis of the average daily net assets of the Money Market Fund.
Both the Funds and GSAL received compensation relating to the lending of the Funds’ securities. The amounts earned by the Funds for the six months ended April 30, 2012, are reported under Investment Income on the Statements of Operations.
The table below details securities lending activity with affiliates of Goldman Sachs:
| | | | | | | | | | | | | | |
| | | | | For the Six Months Ended April 30, 2012 | | | Amounts Payable to
Goldman Sachs
Upon Return of
Securities Loaned as of
April 30, 2012 | |
| Fund | | | | Earnings of GSAL Relating to Securities Loaned | | | Amounts Received
by the Funds from Lending to
Goldman Sachs | | |
Balanced | | | | $ | 1,396 | | | $ | 6,278 | | | $ | 890,350 | |
Structured Large Cap Growth | | | | | 5,849 | | | | 35,860 | | | | 1,586,250 | |
Structured Large Cap Value | | | | | 2,060 | | | | 6,065 | | | | — | |
Structured Small Cap Equity | | | | | 1,946 | | | | 3,082 | | | | 187,500 | |
Structured Small Cap Growth | | | | | 1,687 | | | | 7,087 | | | | 103,350 | |
Structured Small Cap Value | | | | | 3,367 | | | | 4,139 | | | | 937,800 | |
Structured U.S. Equity | | | | | 2,065 | | | | 11,754 | | | | — | |
123
GOLDMAN SACHS STRUCTURED DOMESTIC EQUITY FUNDS
Notes to Financial Statements (continued)
April 30, 2012 (Unaudited)
|
| 7. SECURITIES LENDING (continued) |
The following table provides information about the Funds’ investment in the Money Market Fund for the six months ended April 30, 2012 (in thousands):
| | | | | | | | | | | | | | | | | | | | | | |
| Fund | | | | Number of Shares Held Beginning of Period | | | Shares
Bought | | | Shares
Sold | | | Number of
Shares Held
End of Period | | | Value at
End of Period | |
Balanced | | | | | 1,047 | | | | 7,179 | | | | (6,479 | ) | | | 1,747 | | | $ | 1,747 | |
Structured Large Cap Growth | | | | | 5,475 | | | | 28,896 | | | | (31,254 | ) | | | 3,117 | | | | 3,117 | |
Structured Large Cap Value | | | | | 3,116 | | | | 12,939 | | | | (13,129 | ) | | | 2,926 | | | | 2,926 | |
Structured Small Cap Equity | | | | | 9,717 | | | | 17,219 | | | | (22,648 | ) | | | 4,288 | | | | 4,288 | |
Structured Small Cap Growth | | | | | 2,142 | | | | 4,513 | | | | (5,944 | ) | | | 711 | | | | 711 | |
Structured Small Cap Value | | | | | 6,141 | | | | 14,704 | | | | (16,792 | ) | | | 4,053 | | | | 4,053 | |
Structured U.S. Equity | | | | | 1,728 | | | | 4,386 | | | | (6,006 | ) | | | 108 | | | | 108 | |
As of the Funds’ most recent fiscal year end, October 31, 2011, the Funds’ capital loss carryovers and certain timing differences, on a tax basis were as follows:
| | | | | | | | | | | | | | | | | | | | | | | | | | | | |
| | | Balanced | | | Structured Large Cap Growth | | | Structured Large Cap Value | | | Structured Small Cap Equity | | | Structured Small Cap Growth | | | Structured Small Cap Value | | | Structured U.S. Equity | |
Capital loss carryovers:(1) | | | | | | | | | | | | | | | | | | | | | |
Expiring 2016 | | $ | — | | | $ | (242,849,964 | ) | | $ | (207,558,819 | ) | | $ | (49,521,182 | ) | | $ | (3,583,472 | ) | | $ | (20,304,308 | ) | | $ | (13,532,334 | ) |
Expiring 2017 | | | — | | | | (340,520,322 | ) | | | (382,249,557 | ) | | | (163,876,125 | ) | | | (9,368,246 | ) | | | (40,600,516 | ) | | | (197,412,911 | ) |
Expiring 2018 | | | (6,866,217 | ) | | | — | | | | — | | | | — | | | | — | | | | — | | | | — | |
Total capital loss carryovers | | $ | (6,866,217 | ) | | $ | (583,370,286 | ) | | $ | (589,808,376 | ) | | $ | (213,397,307 | ) | | $ | (12,951,718 | ) | | $ | (60,904,824 | ) | | $ | (210,945,245 | ) |
Timing differences (Straddle Loss Deferral) | | $ | (10,766 | ) | | $ | — | | | $ | — | | | $ | — | | | $ | — | | | $ | — | | | $ | — | |
| (1) | | Expiration occurs on October 31 of the year indicated. Utilization of these losses may be limited under the Code. |
As of April 30, 2012, the Funds’ aggregate security unrealized gains and losses based on cost for U.S. federal income tax purposes was as follows:
| | | | | | | | | | | | | | | | | | | | | | | | | | | | |
| | | Balanced | | | Structured Large Cap Growth | | | Structured Large Cap Value | | | Structured Small Cap Equity | | | Structured Small Cap Growth | | | Structured Small Cap Value | | | Structured U.S. Equity | |
Tax Cost | | $ | 117,012,250 | | | $ | 542,655,879 | | | $ | 453,995,155 | | | $ | 160,684,189 | | | $ | 37,786,725 | | | $ | 114,999,679 | | | $ | 284,749,142 | |
Gross unrealized gain | | | 13,044,075 | | | | 112,964,321 | | | | 99,566,096 | | | | 48,105,995 | | | | 9,621,181 | | | | 30,511,480 | | | | 65,176,627 | |
Gross unrealized loss | | | (1,571,207 | ) | | | (11,116,137 | ) | | | (12,731,759 | ) | | | (11,796,284 | ) | | | (2,178,383 | ) | | | (6,838,602 | ) | | | (5,401,897 | ) |
Net unrealized security gain | | $ | 11,472,868 | | | $ | 101,848,184 | | | $ | 86,834,337 | | | $ | 36,309,711 | | | $ | 7,442,798 | | | $ | 23,672,878 | | | $ | 59,774,730 | |
124
GOLDMAN SACHS STRUCTURED DOMESTIC EQUITY FUNDS
|
| 8. TAX INFORMATION (continued) |
The difference between GAAP-basis and tax-basis unrealized gains (losses), as of the most recent fiscal year end, is attributable primarily to wash sales, net mark-to-market gains (losses) on regulated futures contracts, and differences related to the tax treatment of partnership investments and passive investment company investments.
GSAM has reviewed the Funds’ tax positions for all open tax years (the current and prior three years, as applicable) and has concluded that no provision for income tax is required in the Funds’ financial statements. Such open tax years remain subject to examination and adjustment by tax authorities.
The Funds’ risks include, but are not limited to, the following:
Funds’ Shareholder Concentration Risk — Certain funds, accounts, individuals or Goldman Sachs affiliates may from time to time own (beneficially or of record) or control a significant percentage of the Funds’ shares. Redemptions by these entities of their holdings in the Funds may impact the Funds’ liquidity and NAV. These redemptions may also force the Funds to sell securities.
Liquidity Risk — The Funds may make investments that may be illiquid or that may become less liquid in response to market developments or adverse investor perceptions. Liquidity risk may also refer to the risk that a Fund will not be able to pay redemption proceeds within the allowable time period because of unusual market conditions, an unusually high volume of redemption requests, or other reasons. To meet redemption requests, a Fund may be forced to sell investments at an unfavorable time and/or under unfavorable conditions.
Market and Credit Risks — In the normal course of business, the Funds trade financial instruments and enter into financial transactions where risk of potential loss exists due to changes in the market (market risk). Additionally, the Funds may also be exposed to credit risk in the event that an issuer fails to perform or that an institution or entity with which the Funds have unsettled or open transaction defaults.
Investing in foreign markets may involve special risks and considerations not typically associated with investing in the U.S. These risks include revaluation of currencies, high rates of inflation, repatriation restrictions on income and capital, and adverse political and economic developments. Moreover, securities issued in these markets may be less liquid, be subject to government ownership controls, have delayed settlements and their prices may be more volatile than those of comparable securities in the U.S.
125
GOLDMAN SACHS STRUCTURED DOMESTIC EQUITY FUNDS
Notes to Financial Statements (continued)
April 30, 2012 (Unaudited)
Under the Trust’s organizational documents, its trustees, officers, employees and agents are indemnified, to the extent permitted by the Act, against certain liabilities that may arise out of performance of their duties to the Funds. Additionally, in the course of business, the Funds enter into contracts that contain a variety of indemnification clauses. The Funds’ maximum exposure under these arrangements is unknown, as this would involve future claims that may be made against the Funds that have not yet occurred. However, GSAM believes the risk of loss under these arrangements to be remote.
New Accounting Pronouncements — In May 2011, Accounting Standards Update 2011-04 (ASU 2011-04), Amendments to Achieve Common Fair Value Measurement and Disclosure Requirements in U.S. GAAP and IFRSs, was issued and is effective for interim and annual periods beginning after December 15, 2011. ASU 2011-04 amends Financial Accounting Standards Board (FASB) Topic 820, Fair Value Measurement. The amendments are the result of the work by the FASB and the International Accounting Standards Board to develop common requirements for measuring fair value and for disclosing information about fair value measurements in accordance with GAAP. GSAM is currently evaluating the application of ASU 2011-04 and its impact, if any, on the Funds’ financial statements.
In December 2011, Accounting Standards Update 2011-11 (ASU 2011-11), Amendments to Disclosures about Offsetting Assets and Liabilities Requirements in U.S. GAAP and IFRSs, was issued and is effective for interim periods and annual periods beginning on or after January 1, 2013. The amendments are the result of the work by FASB and the International Accounting Standards Board to develop common requirements for disclosing information about offsetting and related arrangements. GSAM is currently evaluating the application of ASU 2011-11 and its impact, if any on the Funds’ financial statements.
Other Matters — On February 8, 2012, the Commodity Futures Trading Commission (CFTC) adopted amendments to several of its rules relating to commodity pool operators, including Rule 4.5. The Funds currently rely on Rule 4.5’s exclusion from CFTC regulation for regulated investment companies. GSAM is currently evaluating the amendments and their impact, if any, on the Funds’ financial statements.
126
GOLDMAN SACHS STRUCTURED DOMESTIC EQUITY FUNDS
Subsequent events after the balance sheet date have been evaluated through the date the financial statements were issued. GSAM has concluded that there is no impact requiring adjustment or disclosure in the financial statements.
127
GOLDMAN SACHS STRUCTURED DOMESTIC EQUITY FUNDS
Notes to Financial Statements (continued)
April 30, 2012 (Unaudited)
|
| 13. SUMMARY OF SHARE TRANSACTIONS |
Share activity is as follows:
| | | | | | | | | | | | | | | | |
| | | Balanced Fund | |
| | | | |
| | | For the Six Months Ended
April 30, 2012
(Unaudited) | | | For the Fiscal Year Ended
October 31, 2011 | |
| | | | |
| | | Shares | | | Dollars | | | Shares | | | Dollars | |
| | | | |
| Class A Shares | | | | | | | | | | | | | | | | |
Shares sold | | | 564,463 | | | $ | 11,060,779 | | | | 977,089 | | | $ | 18,301,461 | |
Reinvestment of distributions | | | 47,541 | | | | 936,766 | | | | 130,893 | | | | 2,444,783 | |
Shares converted from Class B(a) | | | 6,576 | | | | 130,324 | | | | 19,068 | | | | 357,220 | |
Shares redeemed | | | (841,993 | ) | | | (16,423,372 | ) | | | (2,107,633 | ) | | | (39,797,519 | ) |
| | | | (223,413 | ) | | | (4,295,503 | ) | | | (980,583 | ) | | | (18,694,055 | ) |
| Class B Shares | | | | | | | | | | | | | | | | |
Shares sold | | | 42,247 | | | | 821,888 | | | | 66,679 | | | | 1,238,713 | |
Reinvestment of distributions | | | 1,950 | | | | 38,155 | | | | 5,917 | | | | 109,541 | |
Shares converted to Class A(a) | | | (6,627 | ) | | | (130,324 | ) | | | (19,223 | ) | | | (357,220 | ) |
Shares redeemed | | | (58,005 | ) | | | (1,119,997 | ) | | | (159,941 | ) | | | (2,989,824 | ) |
| | | | (20,435 | ) | | | (390,278 | ) | | | (106,568 | ) | | | (1,998,790 | ) |
| Class C Shares | | | | | | | | | | | | | | | | |
Shares sold | | | 114,565 | | | | 2,240,117 | | | | 167,492 | | | | 3,139,752 | |
Reinvestment of distributions | | | 2,746 | | | | 53,651 | | | | 5,721 | | | | 105,680 | |
Shares redeemed | | | (61,119 | ) | | | (1,185,583 | ) | | | (103,947 | ) | | | (1,939,654 | ) |
| | | | 56,192 | | | | 1,108,185 | | | | 69,266 | | | | 1,305,778 | |
| Institutional Shares | | | | | | | | | | | | | | | | |
Shares sold | | | 163,491 | | | | 3,297,340 | | | | 279,068 | | | | 5,450,567 | |
Reinvestment of distributions | | | 3,522 | | | | 70,640 | | | | 5,943 | | | | 112,739 | |
Shares redeemed | | | (35,977 | ) | | | (719,521 | ) | | | (100,550 | ) | | | (1,938,916 | ) |
| | | | 131,036 | | | | 2,648,459 | | | | 184,461 | | | | 3,624,390 | |
| Class IR Shares | | | | | | | | | | | | | | | | |
Shares sold | | | 95,401 | | | | 1,838,190 | | | | 10,349 | | | | 199,753 | |
Reinvestment of distributions | | | 876 | | | | 17,700 | | | | 143 | | | | 2,731 | |
Shares redeemed | | | (25,105 | ) | | | (511,622 | ) | | | (1,360 | ) | | | (26,779 | ) |
| | | | 71,172 | | | | 1,344,268 | | | | 9,132 | | | | 175,705 | |
NET INCREASE (DECREASE) | | | 14,552 | | | $ | 415,131 | | | | (824,292 | ) | | $ | (15,586,972 | ) |
| (a) | | Class B Shares automatically convert into Class A Shares on or about the fifteenth day of the last month of the calendar quarter that is eight years after the initial purchase date of either the Fund or another Goldman Sachs Fund. |
128
GOLDMAN SACHS STRUCTURED DOMESTIC EQUITY FUNDS
|
| 13. SUMMARY OF SHARE TRANSACTIONS (continued) |
Share activity is as follows:
| | | | | | | | | | | | | | | | |
| | | Structured Large Cap Growth Fund | |
| | | | |
| | | For the Six Months Ended
April 30, 2012
(Unaudited) | | | For the Fiscal Year Ended
October 31, 2011 | |
| | | | |
| | | Shares | | | Dollars | | | Shares | | | Dollars | |
| | | | |
| Class A Shares | | | | | | | | | | | | | | | | |
Shares sold | | | 1,895,945 | | | $ | 24,803,366 | | | | 5,171,459 | | | $ | 63,547,790 | |
Reinvestment of distributions | | | 123,037 | | | | 1,535,500 | | | | 128,552 | | | | 1,528,481 | |
Shares converted from Class B(a) | | | 59,052 | | | | 775,023 | | | | 100,200 | | | | 1,225,033 | |
Shares redeemed | | | (2,251,158 | ) | | | (29,668,042 | ) | | | (6,008,242 | ) | | | (74,779,859 | ) |
| | | | (173,124 | ) | | | (2,554,153 | ) | | | (608,031 | ) | | | (8,478,555 | ) |
| Class B Shares | | | | | | | | | | | | | | | | |
Shares sold | | | 2,613 | | | | 30,190 | | | | 20,495 | | | | 236,030 | |
Reinvestment of distributions | | | 1,254 | | | | 14,506 | | | | 3,523 | | | | 38,790 | |
Shares converted to Class A(a) | | | (63,808 | ) | | | (775,023 | ) | | | (108,540 | ) | | | (1,225,033 | ) |
Shares redeemed | | | (56,958 | ) | | | (696,625 | ) | | | (166,968 | ) | | | (1,910,769 | ) |
| | | | (116,899 | ) | | | (1,426,952 | ) | | | (251,490 | ) | | | (2,860,982 | ) |
| Class C Shares | | | | | | | | | | | | | | | | |
Shares sold | | | 48,069 | | | | 586,519 | | | | 61,321 | | | | 698,260 | |
Reinvestment of distributions | | | 4,318 | | | | 49,745 | | | | 6,411 | | | | 70,455 | |
Shares redeemed | | | (120,462 | ) | | | (1,483,148 | ) | | | (217,386 | ) | | | (2,487,922 | ) |
| | | | (68,075 | ) | | | (846,884 | ) | | | (149,654 | ) | | | (1,719,207 | ) |
| Institutional Shares | | | | | | | | | | | | | | | | |
Shares sold | | | 6,105,135 | | | | 81,462,113 | | | | 16,722,074 | | | | 204,119,512 | |
Reinvestment of distributions | | | 436,080 | | | | 5,590,540 | | | | 430,655 | | | | 5,253,989 | |
Shares redeemed | | | (5,271,279 | ) | | | (71,436,016 | ) | | | (17,475,558 | ) | | | (223,640,962 | ) |
| | | | 1,269,936 | | | | 15,616,637 | | | | (322,829 | ) | | | (14,267,461 | ) |
| Service Shares | | | | | | | | | | | | | | | | |
Shares sold | | | 3,275 | | | | 41,831 | | | | 86,260 | | | | 1,069,002 | |
Reinvestment of distributions | | | — | | | | — | | | | 68 | | | | 796 | |
Shares redeemed | | | (2,497 | ) | | | (34,652 | ) | | | (13,940 | ) | | | (165,639 | ) |
| | | | 778 | | | | 7,179 | | | | 72,388 | | | | 904,159 | |
| Class IR Shares | | | | | | | | | | | | | | | | |
Shares sold | | | 22,673 | | | | 318,423 | | | | 2,897 | | | | 34,044 | |
Reinvestment of distributions | | | 54 | | | | 670 | | | | 9 | | | | 117 | |
Shares redeemed | | | (684 | ) | | | (9,081 | ) | | | (1 | ) | | | (17 | ) |
| | | | 22,043 | | | | 310,012 | | | | 2,905 | | | | 34,144 | |
| Class R Shares | | | | | | | | | | | | | | | | |
Shares sold | | | 389 | | | | 5,200 | | | | 693 | | | | 8,228 | |
Reinvestment of distributions | | | 8 | | | | 98 | | | | 45 | | | | 532 | |
Shares redeemed | | | (231 | ) | | | (3,120 | ) | | | (3,776 | ) | | | (45,187 | ) |
| | | | 166 | | | | 2,178 | | | | (3,038 | ) | | | (36,427 | ) |
NET INCREASE (DECREASE) | | | 934,825 | | | $ | 11,108,017 | | | | (1,259,749 | ) | | $ | (26,424,329 | ) |
| (a) | | Class B Shares automatically convert into Class A Shares on or about the fifteenth day of the last month of the calendar quarter that is eight years after the initial purchase date of either the Fund or another Goldman Sachs Fund. |
129
GOLDMAN SACHS STRUCTURED DOMESTIC EQUITY FUNDS
Notes to Financial Statements (continued)
April 30, 2012 (Unaudited)
|
| 13. SUMMARY OF SHARE TRANSACTIONS (continued) |
Share activity is as follows:
| | | | | | | | | | | | | | | | |
| | | Structured Large Cap Value Fund | |
| | | | |
| | | For the Six Months Ended
April 30, 2012
(Unaudited) | | | For the Fiscal Year Ended
October 31, 2011 | |
| | | | |
| | | Shares | | | Dollars | | | Shares | | | Dollars | |
| | | | |
| Class A Shares | | | | | | | | | | | | | | | | |
Shares sold | | | 1,571,031 | | | $ | 16,479,857 | | | | 5,574,688 | | | $ | 56,866,197 | |
Reinvestment of distributions | | | 92,330 | | | | 960,054 | | | | 200,833 | | | | 2,044,055 | |
Shares converted from Class B(a) | | | 2,564 | | | | 26,227 | | | | 11,149 | | | | 114,593 | |
Shares redeemed | | | (2,855,291 | ) | | | (30,443,039 | ) | | | (7,536,071 | ) | | | (77,141,341 | ) |
| | | | (1,189,366 | ) | | | (12,976,901 | ) | | | (1,749,401 | ) | | | (18,116,496 | ) |
| Class B Shares | | | | | | | | | | | | | | | | |
Shares sold | | | 1,657 | | | | 17,802 | | | | 8,033 | | | | 81,320 | |
Reinvestment of distributions | | | 632 | | | | 6,397 | | | | 1,268 | | | | 12,665 | |
Shares converted to Class A(a) | | | (2,575 | ) | | | (26,227 | ) | | | (11,213 | ) | | | (114,593 | ) |
Shares redeemed | | | (25,820 | ) | | | (270,926 | ) | | | (67,966 | ) | | | (684,505 | ) |
| | | | (26,106 | ) | | | (272,954 | ) | | | (69,878 | ) | | | (705,113 | ) |
| Class C Shares | | | | | | | | | | | | | | | | |
Shares sold | | | 121,669 | | | | 1,271,923 | | | | 262,559 | | | | 2,675,408 | |
Reinvestment of distributions | | | 4,665 | | | | 47,165 | | | | 8,045 | | | | 80,471 | |
Shares redeemed | | | (234,935 | ) | | | (2,466,737 | ) | | | (361,352 | ) | | | (3,667,874 | ) |
| | | | (108,601 | ) | | | (1,147,649 | ) | | | (90,748 | ) | | | (911,995 | ) |
| Institutional Shares | | | | | | | | | | | | | | | | |
Shares sold | | | 4,434,552 | | | | 44,725,855 | | | | 17,787,522 | | | | 174,975,317 | |
Reinvestment of distributions | | | 329,243 | | | | 3,449,751 | | | | 690,184 | | | | 7,027,231 | |
Shares redeemed | | | (7,532,509 | ) | | | (80,850,492 | ) | | | (20,876,911 | ) | | | (214,956,156 | ) |
| | | | (2,768,714 | ) | | | (32,674,886 | ) | | | (2,399,205 | ) | | | (32,953,608 | ) |
| Service Shares | | | | | | | | | | | | | | | | |
Shares sold | | | 118,174 | | | | 1,237,780 | | | | 288,598 | | | | 2,991,294 | |
Reinvestment of distributions | | | 4,752 | | | | 49,221 | | | | 8,886 | | | | 90,444 | |
Shares redeemed | | | (382,593 | ) | | | (4,213,672 | ) | | | (239,159 | ) | | | (2,448,951 | ) |
| | | | (259,667 | ) | | | (2,926,671 | ) | | | 58,325 | | | | 632,787 | |
| Class IR Shares | | | | | | | | | | | | | | | | |
Shares sold | | | 1,406 | | | | 15,136 | | | | 5,646 | | | | 54,568 | |
Reinvestment of distributions | | | 62 | | | | 647 | | | | 53 | | | | 525 | |
Shares redeemed | | | (482 | ) | | | (5,144 | ) | | | (772 | ) | | | (7,070 | ) |
| | | | 986 | | | | 10,639 | | | | 4,927 | | | | 48,023 | |
| Class R Shares | | | | | | | | | | | | | | | | |
Shares sold | | | 59 | | | | 623 | | | | 2,901 | | | | 31,381 | |
Reinvestment of distributions | | | 6 | | | | 61 | | | | 61 | | | | 626 | |
Shares redeemed | | | — | | | | — | | | | (6,941 | ) | | | (65,642 | ) |
| | | | 65 | | | | 684 | | | | (3,979 | ) | | | (33,635 | ) |
NET DECREASE | | | (4,351,403 | ) | | $ | (49,987,738 | ) | | | (4,249,959 | ) | | $ | (52,040,037 | ) |
| (a) | | Class B Shares automatically convert into Class A Shares on or about the fifteenth day of the last month of the calendar quarter that is eight years after the initial purchase date of either the Fund or another Goldman Sachs Fund. |
130
GOLDMAN SACHS STRUCTURED DOMESTIC EQUITY FUNDS
|
| 13. SUMMARY OF SHARE TRANSACTIONS (continued) |
Share activity is as follows:
| | | | | | | | | | | | | | | | |
| | | Structured Small Cap Equity Fund | |
| | | | |
| | | For the Six Months Ended
April 30, 2012
(Unaudited) | | | For the Fiscal Year Ended
October 31, 2011 | |
| | | | |
| | | Shares | | | Dollars | | | Shares | | | Dollars | |
| | | | |
| Class A Shares | | | | | | | | | | | | | | | | |
Shares sold | | | 1,113,158 | | | $ | 13,543,482 | | | | 2,420,425 | | | $ | 28,274,643 | |
Reinvestment of distributions | | | 41,276 | | | | 495,313 | | | | 56,590 | | | | 668,893 | |
Shares converted from Class B(a) | | | 14,807 | | | | 182,463 | | | | 14,773 | | | | 176,691 | |
Shares redeemed | | | (1,433,661 | ) | | | (18,307,611 | ) | | | (6,637,260 | ) | | | (81,471,268 | ) |
| | | | (264,420 | ) | | | (4,086,353 | ) | | | (4,145,472 | ) | | | (52,351,041 | ) |
| Class B Shares | | | | | | | | | | | | | | | | |
Shares sold | | | 5,984 | | | | 63,888 | | | | 2,354 | | | | 26,229 | |
Reinvestment of distributions | | | 18 | | | | 201 | | | | — | | | | — | |
Shares converted to Class A(a) | | | (16,447 | ) | | | (182,463 | ) | | | (16,457 | ) | | | (176,691 | ) |
Shares redeemed | | | (22,768 | ) | | | (252,078 | ) | | | (70,706 | ) | | | (755,930 | ) |
| | | | (33,213 | ) | | | (370,452 | ) | | | (84,809 | ) | | | (906,392 | ) |
| Class C Shares | | | | | | | | | | | | | | | | |
Shares sold | | | 88,216 | | | | 992,092 | | | | 326,166 | | | | 3,580,701 | |
Reinvestment of distributions | | | 2,518 | | | | 27,214 | | | | 660 | | | | 7,047 | |
Shares redeemed | | | (232,006 | ) | | | (2,594,677 | ) | | | (497,454 | ) | | | (5,307,932 | ) |
| | | | (141,272 | ) | | | (1,575,371 | ) | | | (170,628 | ) | | | (1,720,184 | ) |
| Institutional Shares | | | | | | | | | | | | | | | | |
Shares sold | | | 3,711,907 | | | | 45,061,859 | | | | 1,350,084 | | | | 17,056,278 | |
Reinvestment of distributions | | | 86,558 | | | | 1,074,181 | | | | 184,734 | | | | 2,261,145 | |
Shares redeemed | | | (3,135,067 | ) | | | (42,358,125 | ) | | | (15,873,851 | ) | | | (200,081,121 | ) |
| | | | 663,398 | | | | 3,777,915 | | | | (14,339,033 | ) | | | (180,763,698 | ) |
| Service Shares | | | | | | | | | | | | | | | | |
Shares sold | | | 73,631 | | | | 937,881 | | | | 42,206 | | | | 515,128 | |
Reinvestment of distributions | | | 676 | | | | 8,024 | | | | 402 | | | | 4,710 | |
Shares redeemed | | | (56,941 | ) | | | (733,213 | ) | | | (45,237 | ) | | | (539,699 | ) |
| | | | 17,366 | | | | 212,692 | | | | (2,629 | ) | | | (19,861 | ) |
| Class IR Shares | | | | | | | | | | | | | | | | |
Shares sold | | | 32,906 | | | | 409,697 | | | | 442,921 | | | | 5,707,325 | |
Reinvestment of distributions | | | 5,696 | | | | 67,613 | | | | 28 | | | | 328 | |
Shares redeemed | | | (30,679 | ) | | | (385,330 | ) | | | (32,809 | ) | | | (402,474 | ) |
| | | | 7,923 | | | | 91,980 | | | | 410,140 | | | | 5,305,179 | |
| Class R Shares | | | | | | | | | | | | | | | | |
Shares sold | | | 7,605 | | | | 98,688 | | | | 10,833 | | | | 131,027 | |
Reinvestment of distributions | | | 129 | | | | 1,539 | | | | 87 | | | | 1,017 | |
Shares redeemed | | | (3,516 | ) | | | (46,397 | ) | | | (10,586 | ) | | | (129,527 | ) |
| | | | 4,218 | | | | 53,830 | | | | 334 | | | | 2,517 | |
NET INCREASE (DECREASE) | | | 254,000 | | | $ | (1,895,759 | ) | | | (18,332,097 | ) | | $ | (230,453,480 | ) |
| (a) | | Class B Shares automatically convert into Class A Shares on or about the fifteenth day of the last month of the calendar quarter that is eight years after the initial purchase date of either the Fund or another Goldman Sachs Fund. |
131
GOLDMAN SACHS STRUCTURED DOMESTIC EQUITY FUNDS
Notes to Financial Statements (continued)
April 30, 2012 (Unaudited)
|
| 13. SUMMARY OF SHARE TRANSACTIONS (continued) |
Share activity is as follows:
| | | | | | | | | | | | | | | | |
| | | Structured Small Cap Growth Fund | |
| | | | |
| | | For the Six Months Ended
April 30, 2012
(Unaudited) | | | For the Fiscal Year Ended
October 31, 2011 | |
| | | | |
| | | Shares | | | Dollars | | | Shares | | | Dollars | |
| | | | |
| Class A Shares | | | | | | | | | | | | | | | | |
Shares sold | | | 84,581 | | | $ | 1,886,082 | | | | 228,626 | | | $ | 4,826,159 | |
Shares converted from Class B(a) | | | 26,799 | | | | 598,276 | | | | 59,313 | | | | 1,236,375 | |
Shares redeemed | | | (137,634 | ) | | | (3,055,037 | ) | | | (333,176 | ) | | | (7,005,445 | ) |
| | | | (26,254 | ) | | | (570,679 | ) | | | (45,237 | ) | | | (942,911 | ) |
| Class B Shares | | | | | | | | | | | | | | | | |
Shares sold | | | 6,123 | | | | 114,210 | | | | 10,682 | | | | 199,185 | |
Shares converted to Class A(a) | | | (31,302 | ) | | | (598,276 | ) | | | (68,874 | ) | | | (1,236,375 | ) |
Shares redeemed | | | (24,426 | ) | | | (463,339 | ) | | | (80,532 | ) | | | (1,469,009 | ) |
| | | | (49,605 | ) | | | (947,405 | ) | | | (138,724 | ) | | | (2,506,199 | ) |
| Class C Shares | | | | | | | | | | | | | | | | |
Shares sold | | | 36,103 | | | | 688,288 | | | | 44,332 | | | | 815,150 | |
Shares redeemed | | | (41,377 | ) | | | (794,567 | ) | | | (88,782 | ) | | | (1,615,191 | ) |
| | | | (5,274 | ) | | | (106,279 | ) | | | (44,450 | ) | | | (800,041 | ) |
| Institutional Shares | | | | | | | | | | | | | | | | |
Shares sold | | | 20,367 | | | | 510,908 | | | | 40,942 | | | | 956,437 | |
Shares redeemed | | | (23,014 | ) | | | (564,943 | ) | | | (21,884 | ) | | | (502,885 | ) |
| | | | (2,647 | ) | | | (54,035 | ) | | | 19,058 | | | | 453,552 | |
| Class IR Shares | | | | | | | | | | | | | | | | |
Shares sold | | | 32,927 | | | | 699,872 | | | | 48,863 | | | | 1,029,008 | |
Shares redeemed | | | (27,924 | ) | | | (645,744 | ) | | | (47,609 | ) | | | (1,058,987 | ) |
| | | | 5,003 | | | | 54,128 | | | | 1,254 | | | | (29,979 | ) |
| Class R Shares | | | | | | | | | | | | | | | | |
Shares sold | | | 263 | | | | 5,537 | | | | 72 | | | | 1,504 | |
Shares redeemed | | | (2 | ) | | | (35 | ) | | | (1,733 | ) | | | (38,919 | ) |
| | | | 261 | | | | 5,502 | | | | (1,661 | ) | | | (37,415 | ) |
NET DECREASE | | | (78,516 | ) | | $ | (1,618,768 | ) | | | (209,760 | ) | | $ | (3,862,993 | ) |
| (a) | | Class B Shares automatically convert into Class A Shares on or about the fifteenth day of the last month of the calendar quarter that is eight years after the initial purchase date of either the Fund or another Goldman Sachs Fund. |
132
GOLDMAN SACHS STRUCTURED DOMESTIC EQUITY FUNDS
|
| 13. SUMMARY OF SHARE TRANSACTIONS (continued) |
Share activity is as follows:
| | | | | | | | | | | | | | | | |
| | | Structured Small Cap Value Fund | |
| | | | |
| | | For the Six Months Ended
April 30, 2012
(Unaudited) | | | For the Fiscal Year Ended
October 31, 2011 | |
| | | | |
| | | Shares | | | Dollars | | | Shares | | | Dollars | |
| | | | |
| Class A Shares | | | | | | | | | | | | | | | | |
Shares sold | | | 134,904 | | | $ | 3,712,476 | | | | 261,255 | | | $ | 6,994,852 | |
Reinvestment of distributions | | | 17,092 | | | | 447,824 | | | | 22,232 | | | | 581,502 | |
Shares converted from Class B(a) | | | 61,859 | | | | 1,698,174 | | | | 129,760 | | | | 3,401,680 | |
Shares redeemed | | | (346,065 | ) | | | (9,504,937 | ) | | | (922,202 | ) | | | (24,576,768 | ) |
| | | | (132,210 | ) | | | (3,646,463 | ) | | | (508,955 | ) | | | (13,598,734 | ) |
| Class B Shares | | | | | | | | | | | | | | | | |
Shares sold | | | 6,706 | | | | 128,698 | | | | 8,465 | | | | 161,701 | |
Reinvestment of distributions | | | — | | | | — | | | | 1,160 | | | | 21,735 | |
Shares converted to Class A(a) | | | (88,352 | ) | | | (1,698,174 | ) | | | (185,179 | ) | | | (3,401,680 | ) |
Shares redeemed | | | (83,150 | ) | | | (1,586,081 | ) | | | (220,227 | ) | | | (4,098,351 | ) |
| | | | (164,796 | ) | | | (3,155,557 | ) | | | (395,781 | ) | | | (7,316,595 | ) |
| Class C Shares | | | | | | | | | | | | | | | | |
Shares sold | | | 16,925 | | | | 368,024 | | | | 58,894 | | | | 1,246,603 | |
Reinvestment of distributions | | | — | | | | — | | | | 1,167 | | | | 24,613 | |
Shares redeemed | | | (94,593 | ) | | | (2,050,413 | ) | | | (271,094 | ) | | | (5,771,021 | ) |
| | | | (77,668 | ) | | | (1,682,389 | ) | | | (211,033 | ) | | | (4,499,805 | ) |
| Institutional Shares | | | | | | | | | | | | | | | | |
Shares sold | | | 87,414 | | | | 3,045,788 | | | | 45,649 | | | | 1,508,203 | |
Reinvestment of distributions | | | 682 | | | | 22,071 | | | | 287 | | | | 9,255 | |
Shares redeemed | | | (16,534 | ) | | | (557,597 | ) | | | (22,040 | ) | | | (715,375 | ) |
| | | | 71,562 | | | | 2,510,262 | | | | 23,896 | | | | 802,083 | |
| Class IR Shares | | | | | | | | | | | | | | | | |
Shares sold | | | 7,527 | | | | 202,732 | | | | 7,735 | | | | 194,177 | |
Reinvestment of distributions | | | 73 | | | | 1,923 | | | | 11 | | | | 272 | |
Shares redeemed | | | (4,769 | ) | | | (136,162 | ) | | | (448 | ) | | | (11,197 | ) |
| | | | 2,831 | | | | 68,493 | | | | 7,298 | | | | 183,252 | |
| Class R Shares | | | | | | | | | | | | | | | | |
Shares sold | | | 10,053 | | | | 276,960 | | | | 6,430 | | | | 175,858 | |
Reinvestment of distributions | | | 47 | | | | 1,228 | | | | 21 | | | | 543 | |
Shares redeemed | | | (1,274 | ) | | | (35,788 | ) | | | (3,294 | ) | | | (82,223 | ) |
| | | | 8,826 | | | | 242,400 | | | | 3,157 | | | | 94,178 | |
NET DECREASE | | | (291,455 | ) | | $ | (5,663,254 | ) | | | (1,081,418 | ) | | $ | (24,335,621 | ) |
| (a) | | Class B Shares automatically convert into Class A Shares on or about the fifteenth day of the last month of the calendar quarter that is eight years after the initial purchase date of either the Fund or another Goldman Sachs Fund. |
133
GOLDMAN SACHS STRUCTURED DOMESTIC EQUITY FUNDS
Notes to Financial Statements (continued)
April 30, 2012 (Unaudited)
|
| 13. SUMMARY OF SHARE TRANSACTIONS (continued) |
Share activity is as follows:
| | | | | | | | | | | | | | | | |
| | | Structured U.S. Equity Fund | |
| | | | |
| | | For the Six Months Ended
April 30, 2012
(Unaudited) | | | For the Fiscal Year Ended
October 31, 2011 | |
| | | | |
| | | Shares | | | Dollars | | | Shares | | | Dollars | |
| | | | |
| Class A Shares | | | | | | | | | | | | | | | | |
Shares sold | | | 343,400 | | | $ | 8,482,278 | | | | 1,727,140 | | | $ | 40,324,090 | |
Reinvestment of distributions | | | 191,540 | | | | 4,577,800 | | | | 154,948 | | | | 3,529,730 | |
Shares converted from Class B(a) | | | 44,264 | | | | 1,111,219 | | | | 103,415 | | | | 2,438,689 | |
Shares redeemed | | | (2,263,617 | ) | | | (56,034,152 | ) | | | (4,011,205 | ) | | | (96,058,718 | ) |
| | | | (1,684,413 | ) | | | (41,862,855 | ) | | | (2,025,702 | ) | | | (49,766,209 | ) |
| Class B Shares | | | | | | | | | | | | | | | | |
Shares sold | | | 3,642 | | | | 82,531 | | | | 12,767 | | | | 290,454 | |
Reinvestment of distributions | | | 5,025 | | | | 112,843 | | | | 3,927 | | | | 84,033 | |
Shares converted to Class A(a) | | | (47,150 | ) | | | (1,111,219 | ) | | | (110,428 | ) | | | (2,438,689 | ) |
Shares redeemed | | | (82,896 | ) | | | (1,930,764 | ) | | | (219,410 | ) | | | (4,876,307 | ) |
| | | | (121,379 | ) | | | (2,846,609 | ) | | | (313,144 | ) | | | (6,940,509 | ) |
| Class C Shares | | | | | | | | | | | | | | | | |
Shares sold | | | 61,207 | | | | 1,408,937 | | | | 162,204 | | | | 3,551,276 | |
Reinvestment of distributions | | | 15,990 | | | | 353,074 | | | | 9,199 | | | | 193,917 | |
Shares redeemed | | | (172,620 | ) | | | (3,988,249 | ) | | | (404,771 | ) | | | (9,002,344 | ) |
| | | | (95,423 | ) | | | (2,226,238 | ) | | | (233,368 | ) | | | (5,257,151 | ) |
| Institutional Shares | | | | | | | | | | | | | | | | |
Shares sold | | | 192,642 | | | | 5,123,241 | | | | 774,981 | | | | 19,248,327 | |
Reinvestment of distributions | | | 26,618 | | | | 650,815 | | | | 79,450 | | | | 1,850,388 | |
Shares redeemed | | | (178,497 | ) | | | (4,452,872 | ) | | | (4,533,739 | ) | | | (108,665,711 | ) |
| | | | 40,763 | | | | 1,321,184 | | | | (3,679,308 | ) | | | (87,566,996 | ) |
| Service Shares | | | | | | | | | | | | | | | | |
Shares sold | | | 1,910 | | | | 46,914 | | | | 5,091 | | | | 122,573 | |
Reinvestment of distributions | | | 344 | | | | 8,222 | | | | 304 | | | | 6,924 | |
Shares redeemed | | | (2,876 | ) | | | (67,965 | ) | | | (22,751 | ) | | | (519,342 | ) |
| | | | (622 | ) | | | (12,829 | ) | | | (17,356 | ) | | | (389,845 | ) |
| Class IR Shares | | | | | | | | | | | | | | | | |
Shares sold | | | 4,552 | | | | 113,456 | | | | 4,742 | | | | 107,269 | |
Reinvestment of distributions | | | 71 | | | | 1,686 | | | | 6 | | | | 125 | |
Shares redeemed | | | (1,361 | ) | | | (31,113 | ) | | | (734 | ) | | | (16,013 | ) |
| | | | 3,262 | | | | 84,029 | | | | 4,014 | | | | 91,381 | |
| Class R Shares | | | | | | | | | | | | | | | | |
Shares sold | | | 5,618 | | | | 136,682 | | | | 196 | | | | 4,663 | |
Reinvestment of distributions | | | 18 | | | | 426 | | | | 22 | | | | 494 | |
Shares redeemed | | | (108 | ) | | | (2,864 | ) | | | (1,192 | ) | | | (27,964 | ) |
| | | | 5,528 | | | | 134,244 | | | | (974 | ) | | | (22,807 | ) |
NET DECREASE | | | (1,852,284 | ) | | $ | (45,409,074 | ) | | | (6,265,838 | ) | | $ | (149,852,136 | ) |
| (a) | | Class B Shares automatically convert into Class A Shares on or about the fifteenth day of the last month of the calendar quarter that is eight years after the initial purchase date of either the Fund or another Goldman Sachs Fund. |
134
GOLDMAN SACHS STRUCTURED DOMESTIC EQUITY FUNDS
Fund Expenses — Six Month Period Ended April 30, 2012 (Unaudited)
As a shareholder of Class A, Class B, Class C, Institutional, Service, Class IR or Class R Shares of a Fund, you incur two types of costs: (1) transaction costs, including sales charges on purchase payments (with respect to Class A Shares), contingent deferred sales charges on redemptions (with respect to Class B and Class C Shares); and (2) ongoing costs, including management fees; distribution and service (12b-1) fees (with respect to Class A, Class B, Class C and Class R Shares); and other Fund expenses. This Example is intended to help you understand your ongoing costs (in dollars) of investing in Class A, Class B, Class C, Institutional, Service, Class IR or Class R Shares of the Funds and to compare these costs with the ongoing costs of investing in other mutual funds.
The Example is based on an investment of $1,000 invested at the beginning of the period and held for the entire period from November 1, 2011 through April 30, 2012.
Actual Expenses — The first line under each share class in the table below provides information about actual account values and actual expenses. You may use the information in this line, together with the amount you invested, to estimate the expenses that you paid over the period. Simply divide your account value by $1,000 (for example, an $8,600 account value divided by $1,000=8.6), then multiply the result by the number in the first line under the heading entitled “Expenses Paid” to estimate the expenses you paid on your account during this period.
Hypothetical Example for Comparison Purposes — The second line under each share class in the table below provides information about hypothetical account values and hypothetical expenses based on the Funds’ actual net expense ratios and an assumed rate of return of 5% per year before expenses, which is not the Funds’ actual return. The hypothetical account values and expenses may not be used to estimate the actual ending account balance or expenses you paid for the period. You may use this information to compare the ongoing costs of investing in the Funds and other funds. To do so, compare this 5% hypothetical example with the 5% hypothetical examples that appear in the shareholder reports of the other funds.
Please note that the expenses shown in the table are meant to highlight your ongoing costs only and do not reflect any transactional costs, such as sales charges, redemption fees, or exchange fees. Therefore, the second line of the table is useful in comparing ongoing costs only, and will not help you determine the relative total costs of owning different funds. In addition, if these transactional costs were included, your costs would have been higher.
| | | | | | | | | | | | | | | | | | | | | | | | | | | | | | | | | | | | | | | | | | | | | | | | |
| | | Balanced Fund | | | Structured Large Cap Growth Fund | | | Structured Large Cap Value Fund | | | Structured Small Cap Equity Fund | |
| Share Class | | Beginning
Account
Value
11/1/11 | | | Ending
Account
Value
4/30/12 | | | Expenses
Paid for the
6 Months Ended
4/30/12* | | | Beginning
Account
Value
11/1/11 | | | Ending
Account
Value
4/30/12 | | | Expenses
Paid for the
6 Months Ended
4/30/12* | | | Beginning
Account
Value
11/1/11 | | | Ending
Account
Value
4/30/12 | | | Expenses
Paid for the
6 Months Ended
4/30/12* | | | Beginning
Account
Value
11/1/11 | | | Ending
Account
Value
4/30/12 | | | Expenses
Paid for the
6 Months Ended
4/30/12* | |
| Class A | | | | | | | | | | | | | | | | | | | | | | | | | | | | | | | | | | | | | | | | | | | | | | | | |
Actual | | $ | 1,000.00 | | | $ | 1,081.50 | | | $ | 5.43 | | | $ | 1,000.00 | | | $ | 1,125.70 | | | $ | 5.02 | | | $ | 1,000.00 | | | $ | 1,103.40 | | | $ | 4.97 | | | $ | 1,000.00 | | | $ | 1,094.00 | | | $ | 6.51 | |
Hypothetical 5% return | | | 1,000.00 | | | | 1,019.64 | + | | | 5.27 | | | | 1,000.00 | | | | 1,020.14 | + | | | 4.77 | | | | 1,000.00 | | | | 1,020.14 | + | | | 4.77 | | | | 1,000.00 | | | | 1,018.65 | + | | | 6.27 | |
| Class B | | | | | | | | | | | | | | | | | | | | | | | | | | | | | | | | | | | | | | | | | | | | | | | | |
Actual | | | 1,000.00 | | | | 1,077.60 | | | | 9.30 | | | | 1,000.00 | | | | 1,122.20 | | | | 8.97 | | | | 1,000.00 | | | | 1,100.30 | | | | 8.88 | | | | 1,000.00 | | | | 1,091.10 | | | | 10.40 | |
Hypothetical 5% return | | | 1,000.00 | | | | 1,015.91 | + | | | 9.02 | | | | 1,000.00 | | | | 1,016.41 | + | | | 8.52 | | | | 1,000.00 | | | | 1,016.41 | + | | | 8.52 | | | | 1,000.00 | | | | 1,014.92 | + | | | 10.02 | |
| Class C | | | | | | | | | | | | | | | | | | | | | | | | | | | | | | | | | | | | | | | | | | | | | | | | |
Actual | | | 1,000.00 | | | | 1,077.50 | | | | 9.30 | | | | 1,000.00 | | | | 1,121.90 | | | | 8.97 | | | | 1,000.00 | | | | 1,100.60 | | | | 8.88 | | | | 1,000.00 | | | | 1,090.40 | | | | 10.39 | |
Hypothetical 5% return | | | 1,000.00 | | | | 1,015.91 | + | | | 9.02 | | | | 1,000.00 | | | | 1,016.41 | + | | | 8.52 | | | | 1,000.00 | | | | 1,016.41 | + | | | 8.52 | | | | 1,000.00 | | | | 1,014.92 | + | | | 10.02 | |
| Institutional | | | | | | | | | | | | | | | | | | | | | | | | | | | | | | | | | | | | | | | | | | | | | | | | |
Actual | | | 1,000.00 | | | | 1,083.90 | | | | 3.37 | | | | 1,000.00 | | | | 1,129.10 | | | | 2.91 | | | | 1,000.00 | | | | 1,106.70 | | | | 2.88 | | | | 1,000.00 | | | | 1,096.50 | | | | 4.43 | |
Hypothetical 5% return | | | 1,000.00 | | | | 1,021.63 | + | | | 3.27 | | | | 1,000.00 | | | | 1,022.13 | + | | | 2.77 | | | | 1,000.00 | | | | 1,022.13 | + | | | 2.77 | | | | 1,000.00 | | | | 1,020.64 | + | | | 4.27 | |
| Service | | | | | | | | | | | | | | | | | | | | | | | | | | | | | | | | | | | | | | | | | | | | | | | | |
Actual | | | N/A | | | | N/A | | | | N/A | | | | 1,000.00 | | | | 1,126.30 | | | | 5.55 | | | | 1,000.00 | | | | 1,103.50 | | | | 5.49 | | | | 1,000.00 | | | | 1,093.50 | | | | 7.03 | |
Hypothetical 5% return | | | N/A | | | | N/A | | | | N/A | | | | 1,000.00 | | | | 1,019.64 | + | | | 5.27 | | | | 1,000.00 | | | | 1,019.64 | + | | | 5.27 | | | | 1,000.00 | | | | 1,018.15 | + | | | 6.77 | |
| Class IR | | | | | | | | | | | | | | | | | | | | | | | | | | | | | | | | | | | | | | | | | | | | | | | | |
Actual | | | 1,000.00 | | | | 1,082.90 | | | | 4.14 | | | | 1,000.00 | | | | 1,127.60 | | | | 3.70 | | | | 1,000.00 | | | | 1,105.00 | | | | 3.66 | | | | 1,000.00 | | | | 1,095.60 | | | | 5.21 | |
Hypothetical 5% return | | | 1,000.00 | | | | 1,020.89 | + | | | 4.02 | | | | 1,000.00 | | | | 1,021.38 | + | | | 3.52 | | | | 1,000.00 | | | | 1,021.38 | + | | | 3.52 | | | | 1,000.00 | | | | 1,019.89 | + | | | 5.02 | |
| Class R | | | | | | | | | | | | | | | | | | | | | | | | | | | | | | | | | | | | | | | | | | | | | | | | |
Actual | | | N/A | | | | N/A | | | | N/A | | | | 1,000.00 | | | | 1,125.30 | | | | 6.34 | | | | 1,000.00 | | | | 1,101.90 | | | | 6.27 | | | | 1,000.00 | | | | 1,092.30 | | | | 7.80 | |
Hypothetical 5% return | | | N/A | | | | N/A | | | | N/A | | | | 1,000.00 | | | | 1.018.90 | + | | | 6.02 | | | | 1,000.00 | | | | 1,018.90 | + | | | 6.02 | | | | 1,000.00 | | | | 1,017.40 | + | | | 7.52 | |
135
GOLDMAN SACHS STRUCTURED DOMESTIC EQUITY FUNDS
Fund Expenses — Six Month Period Ended April 30, 2012 (Unaudited) (continued)
| | | | | | | | | | | | | | | | | | | | | | | | | | | | | | | | | | | | |
| | | Structured Small Cap Growth Fund | | | Structured Small Cap Value Fund | | | Structured U.S. Equity Fund | |
| Share Class | | Beginning
Account
Value
11/1/11 | | | Ending
Account
Value
4/30/12 | | | Expenses
Paid for the
6 Months Ended
4/30/12* | | | Beginning
Account
Value
11/1/11 | | | Ending
Account
Value
4/30/12 | | | Expenses
Paid for the
6 Months Ended
4/30/12* | | | Beginning
Account
Value
11/1/11 | | | Ending
Account
Value
4/30/12 | | | Expenses
Paid for the
6 Months Ended
4/30/12* | |
| Class A | | | | | | | | | | | | | | | | | | | | | | | | | | | | | | | | | | | | |
Actual | | $ | 1,000.00 | | | $ | 1,092.40 | | | $ | 6.50 | | | $ | 1,000.00 | | | $ | 1,086.00 | | | $ | 6.48 | | | $ | 1,000.00 | | | $ | 1,111.30 | | | $ | 4.99 | |
Hypothetical 5% return | | | 1,000.00 | | | | 1,018.65 | + | | | 6.27 | | | | 1,000.00 | | | | 1,018.65 | + | | | 6.27 | | | | 1,000.00 | | | | 1,020.14 | + | | | 4.77 | |
| Class B | | | | | | | | | | | | | | | | | | | | | | | | | | | | | | | | | | | | |
Actual | | | 1,000.00 | | | | 1,087.90 | | | | 10.38 | | | | 1,000.00 | | | | 1,081.50 | | | | 10.35 | | | | 1,000.00 | | | | 1,106.70 | | | | 8.90 | |
Hypothetical 5% return | | | 1,000.00 | | | | 1,014.92 | + | | | 10.02 | | | | 1,000.00 | | | | 1,014.92 | + | | | 10.02 | | | | 1,000.00 | | | | 1,016.41 | + | | | 8.52 | |
| Class C | | | | | | | | | | | | | | | | | | | | | | | | | | | | | | | | | | | | |
Actual | | | 1,000.00 | | | | 1,088.30 | | | | 10.38 | | | | 1,000.00 | | | | 1,081.80 | | | | 10.35 | | | | 1,000.00 | | | | 1,106.90 | | | | 8.91 | |
Hypothetical 5% return | | | 1,000.00 | | | | 1,014.92 | + | | | 10.02 | | | | 1,000.00 | | | | 1,014.92 | + | | | 10.02 | | | | 1,000.00 | | | | 1,016.41 | + | | | 8.52 | |
| Institutional | | | | | | | | | | | | | | | | | | | | | | | | | | | | | | | | | | | | |
Actual | | | 1,000.00 | | | | 1,094.50 | | | | 4.43 | | | | 1,000.00 | | | | 1,087.90 | | | | 4.41 | | | | 1,000.00 | | | | 1,113.50 | | | | 2.89 | |
Hypothetical 5% return | | | 1,000.00 | | | | 1,020.64 | + | | | 4.27 | | | | 1,000.00 | | | | 1,020.64 | + | | | 4.27 | | | | 1,000.00 | | | | 1,022.13 | + | | | 2.77 | |
| Service | | | | | | | | | | | | | | | | | | | | | | | | | | | | | | | | | | | | |
Actual | | | N/A | | | | N/A | | | | N/A | | | | N/A | | | | N/A | | | | N/A | | | | 1,000.00 | | | | 1,110.20 | | | | 5.51 | |
Hypothetical 5% return | | | N/A | | | | N/A | | | | N/A | | | | N/A | | | | N/A | | | | N/A | | | | 1,000.00 | | | | 1,019.64 | + | | | 5.27 | |
| Class IR | | | | | | | | | | | | | | | | | | | | | | | | | | | | | | | | | | | | |
Actual | | | 1,000.00 | | | | 1,093.50 | | | | 5.21 | | | | 1,000.00 | | | | 1,087.00 | | | | 5.19 | | | | 1,000.00 | | | | 1,112.50 | | | | 3.68 | |
Hypothetical 5% return | | | 1,000.00 | | | | 1,019.89 | + | | | 5.02 | | | | 1,000.00 | | | | 1,019.89 | + | | | 5.02 | | | | 1,000.00 | | | | 1,021.38 | + | | | 3.52 | |
| Class R | | | | | | | | | | | | | | | | | | | | | | | | | | | | | | | | | | | | |
Actual | | | 1,000.00 | | | | 1,091.00 | | | | 7.80 | | | | 1,000.00 | | | | 1,084.60 | | | | 7.77 | | | | 1,000.00 | | | | 1,109.70 | | | | 6.29 | |
Hypothetical 5% return | | | 1,000.00 | | | | 1,017.40 | + | | | 7.52 | | | | 1,000.00 | | | | 1,017.40 | + | | | 7.52 | | | | 1,000.00 | | | | 1,018.90 | + | | | 6.02 | |
| * | | Expenses for each share class are calculated using each Fund’s annualized net expense ratio for each class, which represents the ongoing expenses as a percentage of net assets for the six months ended April 30, 2012. Expenses are calculated by multiplying the annualized net expense ratio by the average account value for the period; then multiplying the result by the number of days in the most recent fiscal half year; and then dividing that result by the number of days in the fiscal year. The annualized net expense ratios for the period were as follows: |
| | | | | | | | | | | | | | | | | | | | | | | | | | | | |
| Fund | | Class A | | | Class B | | | Class C | | | Institutional | | | Service | | | Class IR | | | Class R | |
Balanced | | | 1.05 | % | | | 1.80 | % | | | 1.80 | % | | | 0.65 | % | | | N/A | | | | 0.80 | % | | | N/A | |
Structured Large Cap Growth | | | 0.95 | | | | 1.70 | | | | 1.70 | | | | 0.55 | | | | 1.05 | % | | | 0.70 | | | | 1.20 | % |
Structured Large Cap Value | | | 0.95 | | | | 1.70 | | | | 1.70 | | | | 0.55 | | | | 1.05 | | | | 0.70 | | | | 1.20 | |
Structured Small Cap Equity | | | 1.25 | | | | 2.00 | | | | 2.00 | | | | 0.85 | | | | 1.35 | | | | 1.00 | | | | 1.50 | |
Structured Small Cap Growth | | | 1.25 | | | | 2.00 | | | | 2.00 | | | | 0.85 | | | | N/A | | | | 1.00 | | | | 1.50 | |
Structured Small Cap Value | | | 1.25 | | | | 2.00 | | | | 2.00 | | | | 0.85 | | | | N/A | | | | 1.00 | | | | 1.50 | |
Structured U.S. Equity | | | 0.95 | | | | 1.70 | | | | 1.70 | | | | 0.55 | | | | 1.05 | | | | 0.70 | | | | 1.20 | |
| + | | Hypothetical expenses are based on each Fund’s actual annualized net expense ratios and an assumed rate of return of 5% per year before expenses. |
136
FUNDS PROFILE
Goldman Sachs Funds

Goldman Sachs is a premier financial services firm, known since 1869 for creating thoughtful and customized investment solutions in complex global markets.
Today, the Investment Management Division of Goldman Sachs serves a diverse set of clients worldwide, including private institutions, public entities and individuals. With $702.0 billion in assets under management as of March 31, 2012, Goldman Sachs Asset Management (“GSAM”) has portfolio management teams located around the world and our investment professionals bring firsthand knowledge of local markets to every investment decision. GSAM’s assets under management includes assets managed by Goldman Sachs Asset Management, LP and its Investment Advisory Affiliates. Additionally, GSAM ranks in the top 10 asset management firms worldwide, based on assets under management.1
|
| OVERVIEW OF GOLDMAN SACHS FUNDS |

Money Market2
Financial Square FundsSM
| n | | Financial Square Tax-Exempt Funds |
| n | | Financial Square Federal Fund |
| n | | Financial Square Government Fund |
| n | | Financial Square Money Market Fund |
| n | | Financial Square Prime Obligations Fund |
| n | | Financial Square Treasury Instruments Fund |
| n | | Financial Square Treasury Obligations Fund |
Fixed Income
Short Duration and Government
| n | | Ultra-Short Duration Govt. Fund |
| n | | Short Duration Government Fund |
| n | | Short Duration Income Fund |
| n | | Inflation Protected Securities Fund |
Multi-Sector
| n | | Core Plus Fixed Income Fund |
Municipal and Tax-Free
| n | | High Yield Municipal Fund |
| n | | Short Duration Tax-Free Fund |
Single Sector
| n | | Investment Grade Credit Fund |
| n | | High Yield Floating Rate Fund |
| n | | Emerging Markets Debt Fund |
| n | | Local Emerging Markets Debt Fund |
Corporate Credit
Fundamental Equity
| n | | Small/Mid Cap Growth Fund |
| n | | Flexible Cap Growth Fund |
| n | | Concentrated Growth Fund |
| n | | Technology Tollkeeper Fund |
| n | | Growth Opportunities Fund |
| n | | Rising Dividend Growth Fund |
Structured Equity
| n | | Structured Small Cap Equity Fund |
| n | | Structured U.S. Equity Fund |
| n | | Structured Small Cap Growth Fund |
| n | | Structured Large Cap Growth Fund |
| n | | Structured Large Cap Value Fund |
| n | | Structured Small Cap Value Fund |
| n | | Structured Tax-Managed Equity Fund |
| n | | Structured International Tax-Managed Equity Fund |
| n | | U.S. Equity Dividend and Premium Fund |
| n | | International Equity Dividend and Premium Fund |
| n | | Structured International Small Cap Fund |
| n | | Structured International Equity Fund |
| n | | Structured Emerging Markets Equity Fund |
Fundamental Equity International
| n | | Strategic International Equity Fund |
| n | | Concentrated International Equity Fund |
| n | | International Small Cap Fund |
| n | | Emerging Markets Equity Fund |
| n | | BRIC Fund (Brazil, Russia, India, China) |
Select Satellite3
| n | | Real Estate Securities Fund |
| n | | International Real Estate Securities Fund |
| n | | Commodity Strategy Fund |
| n | | Dynamic Allocation Fund |
| n | | Absolute Return Tracker Fund |
| n | | Managed Futures Strategy Fund |
Total Portfolio Solutions3
| n | | Balanced Strategy Portfolio |
| n | | Growth and Income Strategy Portfolio |
| n | | Growth Strategy Portfolio |
| n | | Equity Growth Strategy Portfolio |
| n | | Income Strategies Portfolio |
| n | | Satellite Strategies Portfolio |
| n | | Retirement Strategies Portfolios |
| n | | Enhanced Dividend Global Equity Portfolio |
| n | | Tax Advantaged Global Equity Portfolio |
| 1Ranking | | for Goldman Sachs Group, Inc., includes Goldman Sachs Asset Management, Private Wealth Management and Merchant Banking 2010 year-end assets. Ranked 10th in total assets worldwide. Pensions&Investments, June 2011. |
| 2An | | investment in a money market fund is neither insured nor guaranteed by the Federal Deposit Insurance Corporation (“FDIC”) or any other government agency. Although the Funds seek to preserve the value of your investment at $1.00 per share, it is possible to lose money by investing in the Funds. |
| 3Individual | | Funds within the Total Portfolio Solutions and Select Satellite categories will have various placement on the risk/return spectrum and may have greater or lesser risk than that indicated by the placement of the general Total Portfolio Solutions or Select Satellite category. |
Financial Square FundsSM is a registered service mark of Goldman, Sachs & Co.
| | |
| TRUSTEES | | OFFICERS |
| Ashok N. Bakhru, Chairman | | James A. McNamara, President |
| Donald C. Burke | | George F. Travers, Principal Financial Officer |
| John P. Coblentz, Jr. | | Peter V. Bonanno, Secretary |
| Diana M. Daniels | | Scott M. McHugh, Treasurer |
| Joseph P. LoRusso | | |
| James A. McNamara | | |
| Jessica Palmer | | |
| Alan A. Shuch | | |
| Richard P. Strubel | | |
| |
| GOLDMAN, SACHS & CO. | | GOLDMAN SACHS ASSET MANAGEMENT, L.P. |
| Distributor and Transfer Agent | | Investment Adviser |
Visit our Website at www.goldmansachsfunds.com to obtain the most recent month-end returns.
Goldman Sachs Asset Management, L.P. 200 West Street, New York, New York 10282
The reports concerning the Funds included in this shareholder report may contain certain forward-looking statements about the factors that may affect the performance of the Funds in the future. These statements are based on Fund management’s predictions and expectations concerning certain future events and their expected impact on the Funds, such as performance of the economy as a whole and of specific industry sectors, changes in the levels of interest rates, the impact of developing world events, and other factors that may influence the future performance of the Funds. Management believes these forward-looking statements to be reasonable, although they are inherently uncertain and difficult to predict. Actual events may cause adjustments in portfolio management strategies from those currently expected to be employed.
A description of the policies and procedures that the Funds use to determine how to vote proxies relating to portfolio securities and information regarding how a Fund voted proxies relating to portfolio securities during the most recent 12-month period ended June 30 is available (I) without charge, upon request by calling 1-800-526-7384 (for Retail Shareholders) or 1-800-621-2550 (for Institutional Shareholders); and (II) on the Securities and Exchange Commission Web site at http://www.sec.gov.
The Funds file their complete schedule of portfolio holdings with the Securities and Exchange Commission (“SEC”) for the first and third quarters of each fiscal year on Form N-Q. The Funds’ Forms N-Q will become available on the SEC’s website at http://www.sec.gov within 60 days after the Funds’ first and third fiscal quarters. When available, the Funds’ Forms N-Q may be reviewed and copied at the SEC’s Public Reference Room in Washington, D.C. and information on the operation of the Public Reference Room may also be obtained by calling 1-800-SEC-0330. When available, Form N-Q may be obtained upon request and without charge by calling 1-800-526-7384 (for Retail Shareholders) or 1-800-621-2550 (for Institutional Shareholders).
Holdings and allocations shown are as of April 30, 2012 and may not be representative of future investments. Fund holdings should not be relied on in making investment decisions and should not be construed as research or investment advice regarding particular securities.
Economic and market forecasts presented herein reflect our judgment as of the date of this presentation and are subject to change without notice. These forecasts do not take into account the specific investment objectives, restrictions, tax and financial situation or other needs of any specific client. Actual data will vary and may not be reflected here. These forecasts are subject to high levels of uncertainty that may affect actual performance. Accordingly, these forecasts should be viewed as merely representative of a broad range of possible outcomes. These forecasts are estimated, based on assumptions, and are subject to significant revision and may change materially as economic and market conditions change. Goldman Sachs has no obligation to provide updates or changes to these forecasts. Case studies and examples are for illustrative purposes only.
The Global Industry Classification Standard (GICS) was developed by and is the exclusive property and a service mark of Morgan Stanley Capital International Inc. (MSCI) and Standard & Poor’s, a division of The McGraw-Hill Companies, Inc. (S&P) and is licensed for use by Goldman Sachs. Neither MSCI, S&P nor any other party involved in making or compiling the GICS or any GICS classifications makes any express or implied warranties or representations with respect to such standard or classification (or the results to be obtained by the use thereof), and all such parties hereby expressly disclaim all warranties of originality, accuracy, completeness, merchantability or fitness for a particular purpose with respect to any of such standard or classification. Without limiting any of the foregoing, in no event shall MSCI, S&P, any of their affiliates or any third party involved in making or compiling the GICS or any GICS classifications have any liability for any direct, indirect, special, punitive, consequential or any other damages (including lost profits) even if notified of the possibility of such damages.
The portfolio risk management process includes an effort to monitor and manage risk, but does not imply low risk.
This material is not authorized for distribution to prospective investors unless preceded or accompanied by a current Prospectus or summary prospectus, if applicable. Investors should consider a Fund’s objective, risks, and charges and expenses, and read the summary prospectus, if available, and/or the Prospectus carefully before investing or sending money. The summary prospectus, if available, and the Prospectus contain this and other information about a Fund and may be obtained from your authorized dealer or from Goldman, Sachs & Co. by calling (retail – 1-800-526-7384) (institutional – 1-800-621-2550).
© 2012 Goldman Sachs. All rights reserved. 75690.MF.MED.TMPL/6/2012 STDOMSAR12/60K
| | The information required by this Item is only required in an annual report on this Form N-CSR. |
| ITEM 3. | AUDIT COMMITTEE FINANCIAL EXPERT. |
| | The information required by this Item is only required in an annual report on this Form N-CSR. |
| ITEM 4. | PRINCIPAL ACCOUNTANT FEES AND SERVICES. |
| | The information required by this Item is only required in an annual report on this Form N-CSR. |
| ITEM 5. | AUDIT COMMITTEE OF LISTED REGISTRANTS. |
| ITEM 6. | SCHEDULE OF INVESTMENTS. |
| | Schedule of Investments is included as part of the Report to Stockholders filed under Item 1. |
| ITEM 7. | DISCLOSURE OF PROXY VOTING POLICIES AND PROCEDURES FOR CLOSED-END MANAGEMENT INVESTMENT COMPANIES. |
| ITEM 8. | PORTFOLIO MANAGERS OF CLOSED-END MANAGEMENT INVESTMENT COMPANIES. |
| ITEM 9. | PURCHASES OF EQUITY SECURITIES BY CLOSED-END MANAGEMENT INVESTMENT COMPANY AND AFFILIATED PURCHASERS. |
| ITEM 10. | SUBMISSION OF MATTERS TO A VOTE OF SECURITY HOLDERS. |
| | There have been no material changes to the procedures by which shareholders may recommend nominees to the registrant’s board of trustees. |
| ITEM 11. | CONTROLS AND PROCEDURES. |
| | (a) | The registrant’s principal executive and principal financial officers, or persons performing similar functions have concluded that the registrant’s disclosure controls and procedures (as defined in Rule 30a-3(c) under the Investment Company Act of 1940, as amended (the “1940 Act”)) are effective as of a date within 90 days of the filing of this report that includes the disclosure required by this paragraph, based on the evaluation of these controls and procedures required by Rule 30a-3(b) under the 1940 Act and 15d-15(b) under the Securities Exchange Act of 1934, as amended. |
| | (b) | There were no changes in the registrant’s internal control over financial reporting (as defined in Rule 30a-3(d) under the 1940 Act) that occurred during the registrant’s second fiscal quarter of the period covered by this report that have materially affected, or are reasonably likely to materially affect, the registrant’s internal control over financial reporting. |
| | | | |
| (a)(1) | | The information required by this Item is only required in connection with an annual report on this Form N-CSR. |
| | |
| (a)(2) | | Exhibit 99.CERT | | Certifications pursuant to Section 302 of the Sarbanes-Oxley Act of 2002 filed herewith. |
| | |
| (b) | | Exhibit 99.906CERT | | Certifications pursuant to Section 906 of the Sarbanes-Oxley Act of 2002 filed herewith. |
SIGNATURES
Pursuant to the requirements of the Securities Exchange Act of 1934 and the Investment Company Act of 1940, the registrant has duly caused this report to be signed on its behalf by the undersigned, thereunto duly authorized.
| | | | |
| | | | Goldman Sachs Trust |
| | |
| By: | | | | /s/ James A. McNamara |
| | | | James A. McNamara |
| | | | President/Principal Executive Officer |
| | | | Goldman Sachs Trust |
| | |
| Date: | | | | June 26, 2012 |
Pursuant to the requirements of the Securities Exchange Act of 1934 and the Investment Company Act of 1940, this report has been signed below by the following persons on behalf of the registrant and in the capacities and on the dates indicated.
| | | | |
| By: | | | | /s/ James A. McNamara |
| | | | James A. McNamara |
| | | | President/Principal Executive Officer |
| | | | Goldman Sachs Trust |
| | |
| Date: | | | | June 26, 2012 |
| | |
| By: | | | | /s/ George F. Travers |
| | | | George F. Travers |
| | | | Principal Financial Officer |
| | | | Goldman Sachs Trust |
| | |
| Date: | | | | June 25, 2012 |