UNITED STATES
SECURITIES AND EXCHANGE COMMISSION
Washington, D.C. 20549
FORM N-CSR
CERTIFIED SHAREHOLDER REPORT OF REGISTERED
MANAGEMENT INVESTMENT COMPANIES
Investment Company Act file number 811-05349
Goldman Sachs Trust
(Exact name of registrant as specified in charter)
71 South Wacker Drive,
Chicago, Illinois 60606
(Address of principal executive offices) (Zip code)
| | |
Copies to: |
Peter V. Bonanno, Esq. | | Geoffrey R.T. Kenyon, Esq. |
Goldman, Sachs & Co. | | Dechert LLP |
200 West Street | | 200 Clarendon Street |
New York, New York 10282 | | 27th Floor |
| | Boston, MA 02116-5021 |
(Name and address of agents for service)
Registrant’s telephone number, including area code: (312) 655-4400
Date of fiscal year end: October 31
Date of reporting period: April 30, 2012
| ITEM 1. | REPORTS TO STOCKHOLDERS. |
| | The Semi-Annual Report to Stockholders is filed herewith. |
Goldman Sachs Funds

| | | | |
| | |
| Semi-Annual Report | | | | April 30, 2012 |
| | |
| | | | Fundamental International Equity Funds |
| | | | Concentrated International Equity International Small Cap Strategic International Equity |

Goldman Sachs Fundamental International
Equity Funds
| n | | CONCENTRATED INTERNATIONAL EQUITY |
| n | | INTERNATIONAL SMALL CAP |
| n | | STRATEGIC INTERNATIONAL EQUITY |
| | | | |
TABLE OF CONTENTS | | | | |
| |
Principal Investment Strategies and Risks | | | 1 | |
| |
Investment Process | | | 2 | |
| |
Market Review | | | 3 | |
| |
Portfolio Management Discussions and Performance Summaries | | | 5 | |
| |
Schedule of Investments | | | 23 | |
| |
Financial Statements | | | 30 | |
| |
Financial Highlights | | | 34 | |
| |
Notes to the Financial Statements | | | 40 | |
| |
Other Information | | | 52 | |
| | | | |
| | | |
| NOT FDIC-INSURED | | May Lose Value | | No Bank Guarantee |
GOLDMAN SACHS FUNDAMENTAL EQUITY INTERNATIONAL FUNDS
Principal Investment Strategies and Risks
This is not a complete list of risks that may affect the Funds. For additional information concerning the risks applicable to the Funds, please see the Funds’ Prospectus.
The Goldman Sachs Concentrated International Equity Fund invests primarily in a diversified portfolio of equity investments in companies that are organized outside the United States or whose securities are principally traded outside the United States. The Fund is subject to market risk, which means that the value of the securities in which it invests may go up or down in response to the prospects of individual companies, particular industry sectors and/or general economic conditions. Foreign and emerging market securities may be more volatile and less liquid than investments in U.S. securities and will be subject to the risks of currency fluctuations and adverse economic or political developments. Because the Fund may invest heavily in specific countries or regions, the Fund is subject to greater risk of loss as a result of adverse securities markets, exchange rates and social, political, regulatory or economic events which may occur in those countries or regions.
The Goldman Sachs International Small Cap Fund invests primarily in a diversified portfolio of equity investments in non-U.S. small-capitalization companies. The Fund is subject to market risk, which means that the value of the securities in which it invests may go up or down in response to the prospects of individual companies, particular industry sectors and/or general economic conditions. Foreign and emerging market securities may be more volatile and less liquid than investments in U.S. securities and will be subject to the risks of currency fluctuations and adverse economic or political developments. The securities of small- and mid-capitalization companies involve greater risks than those associated with larger, more established companies and may be subject to more abrupt or erratic price movements.
The Goldman Sachs Strategic International Equity Fund invests primarily in a diversified portfolio of equity investments in companies that are organized outside the United States or whose securities are principally traded outside the United States. The Fund is subject to market risk, which means that the value of the securities in which it invests may go up or down in response to the prospects of individual companies, particular industry sectors and/or general economic conditions. Foreign and emerging market securities may be more volatile and less liquid than investments in U.S. securities and will be subject to the risks of currency fluctuations and adverse economic or political developments.
1
GOLDMAN SACHS FUNDAMENTAL EQUITY INTERNATIONAL FUNDS
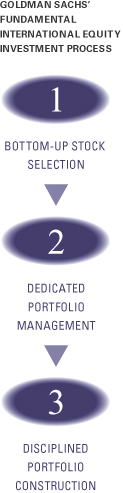
What Differentiates Goldman Sachs’ Fundamental
International Equity Investment Process?
Goldman Sachs’ Fundamental International Equity investment process is based on the belief that strong, consistent results are best achieved through expert stock selection, performed by research teams working together on a global scale. Our deep, diverse and experienced team of research analysts and portfolio managers combines local insights with global, industry-specific expertise to identify its best investment ideas.

| n | | Fundamental research teams based on the ground in London, Melbourne, Hong Kong, Mumbai, Sao Paulo, Seoul, Shanghai, Singapore and Tokyo focus on long-term business and management quality |
| n | | Analysts collaborate regularly to leverage regional and industry-specific research and insights |
| n | | Global perspective is informed by local market expertise |
| n | | A common valuation framework, focusing on long-term earnings power, ensures consistency when valuing and comparing a company to its peers globally |

| n | | Team of experienced Research Analysts is regionally aligned and has sector expertise |
| n | | Team leverages the research of the approximately 55+ regional investment professionals |
| n | | Decision-making process is informed by active participation in the global research process |

| n | | Security selections are aligned with level of investment conviction |
| n | | Risk monitoring considers whether investment and other risks to the Funds are intended and justified |
| n | | Dedicated portfolio construction team assists in ongoing monitoring and adjustment of the Funds |

International equity portfolios that strive to offer:
| | n | | Access to markets across the world | |
| | n | | Disciplined approach to stock selection | |
| | n | | Optimal risk/return profiles | |
2
MARKET REVIEW
Goldman Sachs Fundamental Equity
International Funds
Market Review
Overall, international equities advanced during the six-month period ended April 30, 2012 (the “Reporting Period”). The Morgan Stanley Capital International (MSCI) Europe, Australasia, Far East (EAFE) Index (net, unhedged) (the “MSCI EAFE Index”) posted a return of 2.44%.* The modest gains reflect shifting investor sentiment during the Reporting Period, primarily toward the European sovereign debt crisis and global economic growth prospects.
International equities retreated during the last two months of 2011, as Europe’s sovereign debt crisis worsened. The euro’s depreciation against the U.S. dollar further weakened returns as measured in U.S. dollars. During these two months, the Greek and Italian governments were replaced by technocrats; credit conditions for banks tightened; and yields on Italian and Spanish government debt hovered near unsustainable levels. Japanese equities generally lagged the broader international equity market despite the announcement that its economy grew at an annualized pace of 6% during the third quarter of 2011.
The international equity markets then rallied broadly in January, led by many of the worst performing sectors in 2011. Gains extended through March 2012 amidst growing optimism that the U.S. economy was recovering and that Europe might eventually be able to stem its sovereign debt crisis. Despite widespread downgrades of sovereign debt by Standard & Poor’s, European equity markets reflected improved sentiment that a widespread financial crisis would be averted through liquidity provided by the European Central Bank’s longer-term refinancing operation (“LTRO”) and the proposal of a “fiscal compact” for the European Monetary Union. The international equity market retreated in April amidst questions about the strength of the U.S. economic recovery and increasing political uncertainty in Europe. Japanese equities rose as the yen weakened significantly late in the Reporting Period, following the Bank of Japan’s surprise monetary policy easing in the form of increased asset purchases.
For the Reporting Period overall, the European peripheral countries significantly underperformed the MSCI EAFE Index. Sector performance varied widely. The telecommunication services, utilities and information technology sectors declined during the Reporting Period, while all other sectors gained, led by consumer discretionary, consumer staples and health care.
Looking Ahead
Virtually all agree that international equity performance will continue to be heavily influenced by the European sovereign debt crisis during the months ahead. There is an extraordinarily wide range of possible outcomes, only one of which being the potential break-up of the European Monetary Union, which would, in our view, mean significant risk to international equity investment portfolios. Until a resolution is found, the underlying factors causing the sovereign debt crisis will likely continue to make it difficult for investors to assess risks with confidence, thereby hindering equity market performance. On the other hand, resolution of the sovereign debt crisis would likely lift European and global equities broadly. We do believe that a solution will ultimately emerge, but the process may well take time.
| *All | | index returns are expressed in U.S. dollar terms. |
3
MARKET REVIEW
Our challenge as investors is to seek ways in which we can take advantage of this opportunity of market uncertainty without taking undue risk. For example, we believe a number of high quality cyclical stocks were trading at discounted valuations at the end of the Reporting Period simply because they are based in Europe. At the same time, we found financial stocks, particularly banks, to have too much inherent risk at the end of the Reporting Period despite their potential for significant outperformance on news of a crisis resolution. Additionally, stocks in many traditionally defensive industries were trading at the end of the Reporting Period at valuations we believed did not offer a compelling reward for risk and could actually see declines should a European plan emerge.
In our view, an improving global economy should help support international corporate earnings during the months ahead, as most regions are anticipated to benefit from strong export trends. Even in Europe, more than half of corporate revenues came from outside of Europe and the U.K. during the Reporting Period. We expect a rebound in Japanese corporate earnings and economic growth in calendar 2012 as issues from 2011 — the Tohoku earthquake and tsunami, the floods in Thailand and the record high levels of the yen — recede. In addition, we believe the 12 trillion yen fiscal stimulus package initiated by the Bank of Japan, the second largest such package in Japan’s history, should promote reconstruction demand in Tohoku and boost Japan’s overall economic growth. Furthermore, following the Tohoku earthquake, many Japanese companies began to expand their overseas business more rapidly through local production and through mergers and acquisitions. We believe this international expansion strategy should benefit many Japanese companies, as they seek to build market share in the faster growing Asian markets.
Given this view, we believe individual company performance — that is, picking the right stocks — will continue to be critical to generating returns in a more challenging international equity market environment. Corporate profit margins in many international regions were at historically high levels during the Reporting Period, which was a concern to us in 2011 and remains a risk for 2012. With this in mind, we intend to seek companies that we believe have the ability to sustain, or possibly increase, their profit margins through unique business models, market share gains or other opportunities. As fundamental equity investors, we expect to be looking for companies that may be currently misunderstood or mispriced by the market — such as those judged solely because of their European domicile — but that have what we consider to be unique opportunities to grow their businesses, capture market share and/or sustain profit margins. As always, we maintain our focus on seeking companies that we believe will generate long-term growth in today’s ever-changing market conditions.
4
PORTFOLIO RESULTS
Concentrated International Equity Fund
Portfolio Management Discussion and Analysis
Below, the Goldman Sachs Global Equity Team discusses the Goldman Sachs Concentrated International Equity Fund’s (the “Fund”) performance and positioning for the six-month period ended April 30, 2012 (the “Reporting Period”).
| Q | | How did the Fund perform during Reporting Period? |
| A | | During the Reporting Period, the Fund’s Class A, B, C, Institutional, Service and IR Shares generated cumulative total returns, without sales charges, of 5.17%, 4.82%, 4.78%, 5.45%, 5.18% and 5.29%, respectively. These returns compare to the 2.44% cumulative total return of the Fund’s benchmark, the MSCI EAFE Index (net, unhedged, with dividends reinvested) (the “MSCI Index”), during the same period. |
| Q | | What key factors were responsible for the Fund’s performance during the Reporting Period? |
| A | | The Fund’s outperformance of the MSCI Index during the Reporting Period can be primarily attributed to individual stock selection. In addition, payments received by the Fund relating to a regulatory settlement that the Fund was authorized to participate in also contributed to performance. |
| Q | | What were some of the Fund’s best-performing individual stocks? |
| A | | The greatest contributors to Fund performance relative to the MSCI Index during the Reporting Period were Scania, Nokian Renkaat and UCB. |
| | | The Fund’s holding in Swedish truck manufacturer Scania was the greatest contributor to its relative performance during the Reporting Period. Shares of the company increased particularly strongly in the first quarter of 2012 after the market was buoyed by comments from its Chief Executive Officer, highlighting that he thought demand for trucks had troughed in January and so would hopefully begin to improve. |
| | | Finnish winter tire manufacturer Nokian Renkaat performed particularly well after the company announced strong results with better than expected guidance for 2012. Russian car sales were strong during the Reporting Period, which proved to be a good leading indicator for Nokian Renkaat tire demand. |
| | | The Fund’s position in Belgium-based biopharmaceutical manufacturing company UCB performed well, as the company’s share price gradually increased during the first quarter of 2012. While there were no specific company news items that drove its share price up during the Reporting Period, we believe the share price increase showed that investors have started to look at the growth prospects of UCB. In our view, 2013 should be the trough year for the company, and the company should subsequently see sustainable double-digit growth driven by an attractive product pipeline. |
| Q | | Which stocks detracted significantly from the Fund’s performance during the Reporting Period? |
| A | | The biggest detractors from Fund performance relative to the MSCI Index during the Reporting Period were Nintendo, EDF and Nippon Paper Group. |
| | | Japanese consumer electronics company Nintendo was the biggest detractor from the Fund’s results during the Reporting Period. Shares of Nintendo lagged primarily because of a weaker outlook for its new handheld game platform “3DS.” Company management had commented that Nintendo’s profits should recover during the next year as hardware cost reduction efforts proceed. However, such a recovery looked weaker than expected given the company’s recent sales trends, especially in the U.S. and Europe. |
| | | Shares of French energy company EDF were challenged in the run up to the French elections and in anticipation of the possibility of a Socialist party win. EDF’s share price was also hampered at the start of 2012 after reports that the company would have to invest approximately 10 billion euros in safety improvements following a review by the French nuclear safety regulator. We believe the market overreacted, and the outcome for EDF, regardless of who wins the French elections, will likely not be as bad as implied by its share price at the end of the Reporting Period. Indeed, at the end of the Reporting Period, we continued to like the company and believed that EDF should continue to improve its operational efficiency and produce higher nuclear output. We therefore sought to take advantage of the recent weakness in EDF’s share price to add to the Fund’s position in the company. |
5
PORTFOLIO RESULTS
| | | Japan-based paper manufacturing business Nippon Paper Group disappointed due mainly to a downward revision in its earnings forecast. The share price of its equity method affiliate in China, Lee & Man Paper Manufacturing, sharply declined after Nippon Paper Group increased its stake in the company in August 2011. In turn, such a share price decline forced Nippon Paper Group to post the impairment loss of Lee & Man Paper Manufacturing in its first half results announcement. Given that Nippon Paper Group had been a strong performer earlier in 2011, this negative news gave investors the opportunity to take profits. |
| Q | | Which equity market sectors most significantly affected Fund performance during the Reporting Period? |
| A | | The sectors that contributed most to the Fund’s performance relative to the MSCI Index were financials, telecommunication services and consumer discretionary, due primarily to effective stock selection in each. The Fund’s underweighted allocation to the telecommunication services sector, which lagged the MSCI Index, also contributed positively to the Fund’s performance during the Reporting Period. |
| | | The biggest detractors from the Fund’s relative results during the Reporting Period were information technology, materials and utilities, where stock selection in each of these sectors weighed negatively on performance. It is worth noting that the Fund’s underweighted positioning in the materials sector, which lagged the MSCI Index, actually contributed positively to relative returns, but this was more than offset by the detracting effect of stock selection within the sector. |
| Q | | Which countries most affected the Fund’s performance during the Reporting Period? |
| A | | Typically, the Fund’s individual stock holdings will significantly influence the Fund’s performance within a particular country or region relative to the MSCI Index. This effect may be even more pronounced in a concentrated portfolio or in countries that represent only a modest proportion of the MSCI Index. |
| | | That said, effective stock selection and the Fund’s overall positioning in Spain, Finland and France contributed most positively to its returns relative to the MSCI Index. The countries that detracted most from the Fund’s performance during the Reporting Period were Hong Kong, the Netherlands and the Czech Republic. Stock selection in Hong Kong and the Netherlands and the Fund’s positioning in Hong Kong and the Czech Republic weighed negatively on performance. |
| Q | | How did the Fund use derivatives and similar instruments during the Reporting Period? |
| A | | During the Reporting Period, we did not use derivatives to hedge positions or as part of an active management strategy, but we used index futures on an opportunistic basis, to ensure the Fund remained almost fully exposed to equities following cash inflows or stock sales. |
| Q | | Did the Fund make any significant purchases or sales during the Reporting Period? |
| A | | During the Reporting Period, we purchased Sumitomo Mitsui Financial Group, BP and Deutsche Bank for the Fund, as we believed these are quality companies with attractive valuations. |
| | | We initiated a Fund position in Japanese financial company Sumitomo Mitsui Financial Group during the Reporting Period. The performance of the financial sector was bolstered by the European Central Bank’s December announcement regarding additional enhanced credit support measures implemented to support bank lending and liquidity in the euro area money market. We also liked the stock as we expected solid third quarter results and share buybacks to further buoy the banking industry. |
| | | We decided to establish a Fund position in U.K.-based integrated oil company BP based on its attractive relative valuation, expectations for positive earnings revisions and strong cash flow generation. Furthermore, we thought the risk of further Macondo provisioning requirements was reducing and thus that the company may possibly turn out to be over-provisioned. That is, BP has set aside a certain amount of finances to provide for ultimate fines, penalties and economic compensation related to its role in the Macondo oil well spill, to be determined upon conclusion of a trial that may still last for years to come. Macondo is the well involved in the disastrous Gulf of Mexico oil spill in 2010. |
| | | During the first quarter of 2012, we initiated a Fund position in one of Europe’s largest investment banks, Deutsche Bank. The investment bank is broadly diversified, and we believe the company should benefit from an anticipated recovery in investment banking activities should markets stabilize and confidence return. |
| | | During the Reporting Period, we sold out of the Fund’s positions in Nissan Motor, Mitsubishi UFJ Financial Group and Admiral Group. |
6
PORTFOLIO RESULT
| | | We eliminated the Fund’s positions in Japanese vehicle, forklift and marine product manufacturer Nissan Motor and Japanese financial services company Mitsubishi UFJ Financial Group and used the proceeds to invest in stocks we believed offered higher upside potential and what we considered to be better risk/reward opportunities. |
| | | U.K. auto insurance company Admiral Group’s share price performed well during the first quarter of 2012, recovering from lows experienced toward the end of 2011. We decided to sell out of this name after such strong performance as we saw greater potential upside in other insurance companies. |
| Q | | Were there any notable changes in the Fund’s weightings during the Reporting Period? |
| A | | In this Fund, both sector weightings and country allocations are largely the result of our bottom-up stock selection process rather than any top-down macroeconomic views or industry bets. That said, there were no notable changes in the Fund’s sector or country weightings during the Reporting Period. |
| Q | | How was the Fund positioned relative to the MSCI Index at the end of the Reporting Period? |
| A | | At the end of the Reporting Period, the Fund had more exposure to the United Kingdom, Switzerland and Sweden and less exposure to the Netherlands, Australia and Hong Kong relative to the MSCI Index. At the end of the Reporting Period, the Fund held neutral positions relative to the MSCI Index in several countries, most notably Greece. |
| | | From a sector allocation perspective, the Fund had significant overweight positions relative to the MSCI Index in health care, information technology, industrials and energy at the end of the Reporting Period. On the same date, the Fund had underweighted positions compared to the MSCI Index in consumer discretionary, materials, consumer staples and telecommunication services and rather neutral positions relative to the MSCI Index in utilities and financials. |
| | | As always, we remained focused on individual stock selection, with sector and country positioning being a secondary, closely-monitored effect. |
7
FUND BASICS
Concentrated International Equity Fund
as of April 30, 2012
| | | | | | | | | | |
| | PERFORMANCE REVIEW | |
| | | November 1, 2011–April 30, 2012 | | Fund Total Return
(based on NAV)1 | | | MSCI EAFE (Net)
Index (unhedged)2 | |
| | Class A | | | 5.17 | % | | | 2.44 | % |
| | Class B | | | 4.82 | | | | 2.44 | |
| | Class C | | | 4.78 | | | | 2.44 | |
| | Institutional | | | 5.45 | | | | 2.44 | |
| | Service | | | 5.18 | | | | 2.44 | |
| | | Class IR | | | 5.29 | | | | 2.44 | |
| | 1 | | The net asset value (“NAV”) represents the net assets of the class of the Fund (ex-dividend) divided by the total number of shares of the class outstanding. The Fund’s performance assumes the reinvestment of dividends and other distributions. The Fund’s performance does not reflect the deduction of any applicable sales charges. |
| | 2 | | The MSCI EAFE Index (net, unhedged, with dividends reinvested) is a market capitalization- weighted composite of securities in 22 developed markets. The Index approximates the minimum possible dividend reinvestment. The dividend is reinvested after deduction for withholding tax, applying the rate to non-resident individuals who do not benefit from double taxation treaties. MSCI Barra uses withholding tax rates applicable to Luxembourg holding companies, as Luxembourg applies the highest rates. The Index is unmanaged and the figures for the Index do not include any deduction for fees or expenses. It is not possible to invest directly in an index. |
| | | | | | | | | | | | | | | | | | | | |
| | STANDARDIZED TOTAL RETURNS3 |
| | | For the period ended 3/31/12 | | One Year | | | Five Years | | | Ten Years | | | Since Inception | | | Inception Date |
| | Class A | | | -13.94 | % | | | -6.84 | % | | | 1.92 | % | | | 3.87 | % | | 12/01/92 |
| | Class B | | | -14.13 | | | | -6.85 | | | | 1.92 | | | | 2.15 | | | 5/01/96 |
| | Class C | | | -10.53 | | | | -6.49 | | | | 1.78 | | | | 0.64 | | | 8/15/97 |
| | Institutional | | | -8.59 | | | | -5.41 | | | | 2.96 | | | | 3.43 | | | 2/07/96 |
| | Service | | | -9.05 | | | | -5.89 | | | | 2.44 | | | | 4.19 | | | 3/06/96 |
| | | Class IR | | | -8.72 | | | | N/A | | | | N/A | | | | 5.32 | | | 8/31/10 |
| | 3 | | The Standardized Total Returns are average annual total returns as of the most recent calendar quarter-end. They assume reinvestment of all distributions at NAV. These returns reflect a maximum initial sales charge of 5.5% for Class A Shares, the assumed contingent deferred sales charge for Class B Shares (5% maximum declining to 0% after six years) and the assumed contingent deferred sales charge for Class C Shares (1% if redeemed within 12 months of purchase). Class B Shares convert automatically to Class A Shares on or about the fifteenth day of the last month of the calendar quarter that is eight years after purchase. Returns for Class B Shares for the period after conversion reflect the performance of Class A Shares. Because Institutional, Service and Class IR Shares do not involve a sales charge, such a charge is not applied to their Standardized Total Returns. The Fund’s Class B Shares are no longer available for purchase by new or existing shareholders (although current Class B shareholders may continue to reinvest income and capital gains distributions into Class B Shares, and Class B shareholders may continue to exchange their shares for Class B Shares of certain other Goldman Sachs Funds). |
| | | | The returns represent past performance. Past performance does not guarantee future results. The Fund’s investment return and principal value will fluctuate so that an investor’s shares, when redeemed, may be worth more or less than their original cost. Current performance may be lower or higher than the performance quoted above. Please visit our Website at www.goldmansachsfunds.com to obtain the most recent month-end returns. Performance reflects fee waivers and/or expense limitations in effect. In their absence, performance would be reduced. Returns do not reflect the deduction of taxes that a shareholder would pay on Fund distributions or the redemption of Fund shares. |
8
FUND BASICS
| | | | | | | | | | |
| | EXPENSE RATIOS4 | |
| | | | | Net Expense Ratio (Current) | | | Gross Expense Ratio (Before Waivers) | |
| | Class A | | | 1.51 | % | | | 1.70 | % |
| | Class B | | | 2.26 | | | | 2.45 | |
| | Class C | | | 2.26 | | | | 2.45 | |
| | Institutional | | | 1.11 | | | | 1.30 | |
| | Service | | | 1.61 | | | | 1.80 | |
| | | Class IR | | | 1.26 | | | | 1.45 | |
| | 4 | | The expense ratios of the Fund, both current (net of applicable fee waivers and/or expense limitations) and before waivers (gross of applicable fee waivers and/or expense limitations) are as set forth above according to the most recent publicly available Prospectus for the Fund and may differ from the expense ratios disclosed in the Financial Highlights in this report. The Fund’s waivers and/or expense limitations will remain in place through at least February 28, 2013, and prior to such date the investment adviser may not terminate the arrangements without the approval of the Fund’s Board of Trustees. If these arrangements are discontinued in the future, the expense ratios may change without shareholder approval. |
| | | | | | | | | | |
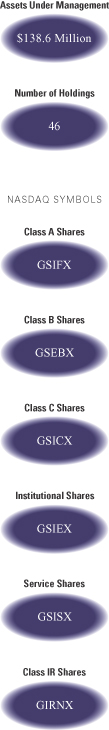
| | TOP TEN HOLDINGS AS OF 4/30/125 |
| | | Holding | | % of Total Net Assets | | | Line of Business | | Country |
| | HSBC Holdings PLC | | | 4.2 | % | | Banks | | United Kingdom |
| | Novartis AG (Registered) | | | 3.7 | | | Pharmaceuticals, Biotechnology & Life Sciences | | Switzerland |
| | Sumitomo Mitsui Financial Group, Inc. | | | 3.4 | | | Banks | | Japan |
| | Vodafone Group PLC | | | 3.2 | | | Telecommunication Services | | United Kingdom |
| | BP PLC | | | 3.2 | | | Energy | | United Kingdom |
| | Rio Tinto PLC | | | 3.0 | | | Materials | | United Kingdom |
| | Telefonaktiebolaget LM Ericsson Class B | | | 2.9 | | | Technology Hardware & Equipment | | Sweden |
| | ENI SpA | | | 2.9 | | | Energy | | Italy |
| | Deutsche Bank AG (Registered) | | | 2.7 | | | Diversified Financials | | Germany |
| | | Aryzta AG | | | 2.7 | | | Food, Beverage & Tobacco | | Switzerland |
| | 5 | | The top 10 holdings may not be representative of the Fund’s future investments. |
9
FUND BASICS
| | |
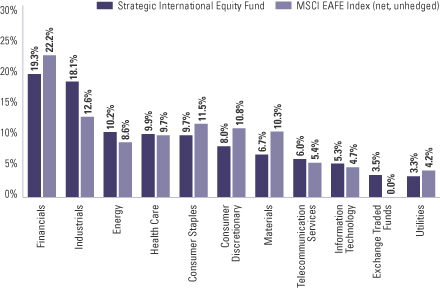
| | FUND VS. BENCHMARK SECTOR ALLOCATIONS6 |
| | | As of April 30, 2012 |
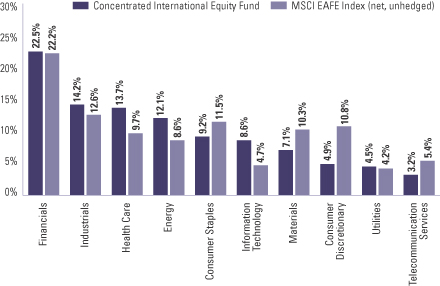
| | 6 | | The Fund is actively managed and, as such, its composition may differ over time. Consequently, the Fund’s overall sector allocations may differ from the percentages contained in the graph above. The graph categorizes investments using Global Industry Classification Standard (“GICS”), however, the sector classifications used by the portfolio management team may differ from GICS. The percentage shown for each investment category reflects the value of investments in that category as a percentage of market value. The graph depicts the Fund’s investments but may not represent the Fund’s market exposure due to the exclusion of certain derivatives, if any, as listed in the Additional Investment Information section of the Schedule of Investments. |
10
PORTFOLIO RESULTS
International Small Cap Fund
Portfolio Management Discussion and Analysis
Below, the Goldman Sachs Global Equity Team discusses the Goldman Sachs International Small Cap Fund’s (the “Fund”) performance and positioning for the six-month period ended April 30, 2012 (the “Reporting Period”).
| Q | | How did the Fund perform during the Reporting Period? |
| A | | During the Reporting Period, the Fund’s Class A, B, C, Institutional, Service and IR Shares generated cumulative total returns, without sales charges, of 7.91%, 7.51%, 7.53%, 8.27%, 7.82% and 8.05%, respectively. These returns compare to the 4.26% cumulative total return of the Fund’s benchmark, the S&P Developed ex-US Small Cap Index (net) (the “S&P Index”), during the same period. |
| Q | | What key factors were responsible for the Fund’s performance during the Reporting Period? |
| A | | The Fund’s outperformance of the S&P Index during the Reporting Period can be primarily attributed to individual stock selection. |
| Q | | What were some of the Fund’s best-performing individual stocks? |
| A | | The greatest contributors to Fund performance relative to the S&P Index during the Reporting Period were Interflex, Aberdeen Asset Management and Sankei Building. |
| | | During the Reporting Period, the greatest contributor to the Fund’s relative performance was South Korean flexible printed circuit boards manufacturer Interflex. Within the information technology sector, shares of Interflex rallied in anticipation of stronger than expected 2012 estimated earnings, driven by global market share gain from its key customers in the smart phone and tablet personal computers fields, namely Samsung Electronics and Apple. Potential customer expansion to Research in Motion or Nokia and an improvement in profitability from a higher utilization rate and product mix improvement further supported Interflex’s share price during the Reporting Period. |
| | | Aberdeen Asset Management is a U.K.-based diversified asset manager with significant exposure to the emerging markets. The company performed particularly well during the first quarter of 2012 given continuing redistribution of assets under management to its higher margin products and due to a valuation that was widely seen as only at a small premium to the asset management sector. |
| | | Within Japan, the Fund’s best individual contributor during the Reporting Period was Sankei Building, a property leasing provider. The company performed well after the announcement of a takeover bid from its primary stakeholder, Fuji Media. Fuji Media announced its intentions to buy the rest of its stake for more than double the closing price on that day. |
| Q | | Which stocks detracted significantly from the Fund’s performance during the Reporting Period? |
| A | | The biggest detractors from Fund performance relative to the S&P Index during the Reporting Period were Iamgold, JCEntertainment and D’Ieteren. |
| | | The Fund’s holding in Canadian gold producer Iamgold was the greatest detractor from the Fund’s relative returns during the Reporting Period. The gold producer performed poorly in January and February 2012 despite positive movement in the underlying price of gold bullion and better performance by the company’s peers. Iamgold’s disappointing performance resulted partially from difficulty selling its Niobium mine and partially due to a slight decline in reserves and resources reported at its fourth quarter 2011 results. Following these events, the stock price fell in line with the declining gold price and other gold equities. Further, Iamgold is exposed to Mali through its interest in the Sadiola gold mine, which did not help sentiment toward the company, as Mali is experiencing several troubles, including a major food crisis and a military coup. |
| | | JCEntertainment, a South Korean online game developer and distributor, detracted from the Fund’s performance relative to the S&P Index during the Reporting Period, as concerns of potential regulatory risk clouded share price performance. Specifically, the company faced the possibility of a Korean law being enacted that would limit the amount of time teenagers can spend on computer games in order to curtail teenager violence in schools. In our view, this potential risk is low, as the proposed regulation is unconstitutional, we believe, and too difficult to implement in reality. Even if the proposed regulation is passed and enacted, we feel it should not have a negative impact on JCEntertainment because most of its revenue is generated from casual game users that do not require long hours to play. Furthermore, we believe |
11
PORTFOLIO RESULTS
| | future revenue may increase as a result of expansion into China and the introduction of a new mobile game called “Rule the Sky.” |
| | | Belgium-based D’Ieteren, an international auto services business with dominant market share in auto glass repair and replacement via its Belron division, was a top detractor from the Fund’s results during the Reporting Period. D’Ieteren has typically been a defensive business exhibiting strong growth and improved market share. However, while market share continued to improve during the Reporting Period, the auto glass repair and replacement market was weaker than expected. Factors such as benign weather conditions and fewer miles driven in the face of higher fuel prices weighed on demand. In turn, management guidance for 2012 disappointed against expectations, and D’Ieteren’s share price declined. Although the valuation of D’Ieteren remained attractive, in our view, this factor alone was not sufficient to outweigh the negative momentum in the company’s Belron division. |
| Q | | Which equity market sectors most significantly affected Fund performance during the Reporting Period? |
| A | | The sectors that contributed most to the Fund’s performance relative to the S&P Index were financials, materials and industrials, due primarily to effective stock selection in each. The Fund’s underweighted allocation to financials, which lagged the S&P Index during the Reporting Period, also contributed positively to performance. |
| | | The biggest detractors from the Fund’s results during the Reporting Period were consumer discretionary, telecommunication services and energy, where stock selection hurt relative performance. |
| Q | | Which countries most affected the Fund’s performance during the Reporting Period? |
| A | | Typically, the Fund’s individual stock holdings will significantly influence the Fund’s performance within a particular country or region relative to the S&P Index. This effect may be even more pronounced in countries that represent only a modest proportion of the S&P Index. |
| | | That said, the Fund’s overall positioning in the United Kingdom, South Korea and Spain contributed most positively to the Fund’s performance during the Reporting Period. The countries that detracted most from the Fund’s performance during the Reporting Period were Sweden, Belgium and Australia. |
| Q | | How did the Fund use derivatives and similar instruments during the Reporting Period? |
| A | | During the Reporting Period, we did not use derivatives to hedge positions or as part of an active management strategy, but we used index futures on an opportunistic basis, to ensure the portfolio remained almost fully exposed to equities following cash inflows or stock sales. |
| Q | | Did the Fund make any significant purchases or sales during the Reporting Period? |
| A | | We purchased several companies for the Fund during the Reporting Period that we viewed as quality companies with compelling long-term prospects trading at attractive valuations. For example, we established a Fund position in indoor golf software provider Golfzon as it has a dominant market position and is changing its business structure from hardware sales via its golf simulators to a fee-based business. During the Reporting Period, the company had a 98% market share in South Korea with approximately 4,000 indoor golf courses and earned revenues on a “per play” basis. At the end of the Reporting Period, we had conviction in the company as we believed it should benefit from domestic consumer income growth, as the number of golfers in South Korea is expected to grow with the country crossing the $20,000 GDP per capita mark. We further expect the company to benefit from expansion into other countries, including Japan and Canada. |
| | | We initiated a Fund position in South Korean food and bioscience company CJ CheilJedang. The bioscience business of the company has become more meaningful for revenues and operating profit due to capacity expansion, price increases, market share gain and agricultural inflation. We believe the company may also benefit as the food business expects a gradual recovery due to lower raw materials costs. Further, the processed food business showed stable growth as single or two-person families are growing to become the majority of South Korean households. This demographic is increasingly dependent on processed food for their convenience. |
12
PORTFOLIO RESULTS
| | | Another new purchase for the Fund during the Reporting Period was Amadeus. Headquartered in Spain, Amadeus provides two information technology-based services to the travel industry: (a) a distribution system for hundreds of airlines across the world to thousands of travel agents and (b) an outsourced technology platform for the core customer-facing functions of an airline. In our view, the company should benefit going forward from strong growth in the latter-mentioned business as it signs on airlines. It already has signed airlines, which we believe should help the division grow by 60% by 2013. Also, as the largest provider of its services, the company should continue, we think, to benefit as airlines outsource their technology needs. |
| | | We sold out of the Fund’s positions in Millicom International Cellular, Himart and Cookson during the Reporting Period. |
| | | After a period of what we considered to be moderate performance, we sold the Fund’s position in Millicom International Cellular, an emerging market telecommunica- tions operator with operations based in South America and in Africa, in order to fund what we believe to be a more attractive idea. |
| | | In the consumer area, Himart, a South Korean online shopping mall, disappointed following news of allegations of embezzlement and tax evasion by its chairperson. We sold the Fund’s position in Himart as a result of this situation and in order to redeploy the capital into what we considered more compelling opportunities. |
| | | U.K.-based Cookson is an international industrial materials company with exposure to the steel and electronics industries, among others. Having come under pressure during the third quarter of 2011 due to macroeconomic fears centered on Europe, Cookson’s share price subsequently rallied sharply as those macroeconomic fears subsided. Investor concerns over the cyclicality of the business were also assuaged in February when the company’s full-year 2011 numbers were released. We sold the Fund’s position in Cookson following an especially strong period for the company’s share price. |
| Q | | Were there any notable changes in the Fund’s weightings during the Reporting Period? |
| A | | In this Fund, both sector weightings and country allocations are largely the result of our bottom-up stock selection process rather than any top-down macroeconomic views or industry bets. That said, there were no notable changes in the Fund’s sector or country weightings during the Reporting Period. |
| Q | | How was the Fund positioned relative to the S&P Index at the end of the Reporting Period? |
| A | | At the end of the Reporting Period, the Fund had more exposure to the United Kingdom, China and Ireland and less exposure to France, Sweden and Hong Kong relative to the S&P Index. At the end of the Reporting Period, the Fund held neutral positions relative to the S&P Index in several countries, most notably Canada. |
| | | From a sector allocation perspective, the Fund had overweighted positions relative to the S&P Index in information technology, materials and consumer discretionary at the end of the Reporting Period. On the same date, the Fund had underweighted positions compared to the S&P Index in financials and industrials, and rather neutral positions relative to the Index in health care, consumer staples, energy and utilities. The Fund had no position at all in telecommunication services. |
| | | As always, we remained focused on individual stock selection, with sector and country positioning being a secondary, closely-monitored effect. |
13
FUND BASICS
International Small Cap Fund
as of April 30, 2012

| | | | | | | | | | |
| | PERFORMANCE REVIEW | |
| | | November 1, 2011–April 30, 2012 | | Fund Total Return
(based on NAV)1 | | | S&P Developed
ex-US Small Cap
Index (Net)2 | |
| | Class A | | | 7.91 | % | | | 4.26 | % |
| | Class B | | | 7.51 | | | | 4.26 | |
| | Class C | | | 7.53 | | | | 4.26 | |
| | Institutional | | | 8.27 | | | | 4.26 | |
| | Service | | | 7.82 | | | | 4.26 | |
| | | Class IR | | | 8.05 | | | | 4.26 | |
| | 1 | | The net asset value (“NAV”) represents the net assets of the class of the Fund (ex-dividend) divided by the total number of shares of the class outstanding. The Fund’s performance assumes the reinvestment of dividends and other distributions. The Fund’s performance does not reflect the deduction of any applicable sales charges. |
| | 2 | | The S&P Developed ex-US Small Cap Index (net) is the small capitalization stock component of the S&P Developed Broad Market Index (BMI). The BMI is a float-weighted index that spans 22 countries (inclusive of the US) and includes the listed shares of all companies with an available market capitalization (float) of at least $100 million at the annual rebalance. At rebalance, companies are deleted from the index if their float falls below $75 million. The Small Cap ex-US is defined as those stocks falling in the bottom 15% of the cumulative available capital in each country. The Index reflects returns net of withholding taxes applied to foreign investors, calculated daily based on tax rates that would be applied to a Luxembourg-based investor. The Index is unmanaged and the figures for the Index do not include any deduction for fees or expenses. It is not possible to invest directly in an index. |
| | | | | | | | | | | | | | | | | | | | |
| | STANDARDIZED TOTAL RETURNS3 |
| | | For the period ended 3/31/12 | | One Year | | | Five Years | | | Ten Years | | | Since Inception | | | Inception Date |
| | Class A | | | -10.01 | % | | | -5.26 | % | | | 6.17 | % | | | 4.67 | % | | 5/01/98 |
| | Class B | | | -10.16 | | | | -5.25 | | | | 6.17 | | | | 4.77 | | | 5/01/98 |
| | Class C | | | -6.43 | | | | -4.88 | | | | 6.03 | | | | 4.44 | | | 5/01/98 |
| | Institutional | | | -4.24 | | | | -3.74 | | | | 7.28 | | | | 5.65 | | | 5/01/98 |
| | Service | | | -4.86 | | | | -4.25 | | | | 6.73 | | | | 5.10 | | | 5/01/98 |
| | | Class IR | | | -4.55 | | | | N/A | | | | N/A | | | | 14.55 | | | 8/31/10 |
| | 3 | | The Standardized Total Returns are average annual total returns as of the most recent calendar quarter-end. They assume reinvestment of all distributions at NAV. These returns reflect a maximum initial sales charge of 5.5% for Class A Shares, the assumed contingent deferred sales charge for Class B Shares (5% maximum declining to 0% after six years) and the assumed contingent deferred sales charge for Class C Shares (1% if redeemed within 12 months of purchase). Class B Shares convert automatically to Class A Shares on or about the fifteenth day of the last month of the calendar quarter that is eight years after purchase. Returns for Class B Shares for the period after conversion reflect the performance of Class A Shares. Because Institutional, Service and Class IR Shares do not involve a sales charge, such a charge is not applied to their Standardized Total Returns. The Fund’s Class B Shares are no longer available for purchase by new or existing shareholders (although current Class B shareholders may continue to reinvest income and capital gains distributions into Class B Shares, and Class B shareholders may continue to exchange their shares for Class B Shares of certain other Goldman Sachs Funds). |
| | | | The returns represent past performance. Past performance does not guarantee future results. The Fund’s investment return and principal value will fluctuate so that an investor’s shares, when redeemed, may be worth more or less than their original cost. Current performance may be lower or higher than the performance quoted above. Please visit our Website at www.goldmansachsfunds.com to obtain the most recent month-end returns. Performance reflects fee waivers and/or expense limitations in effect. In their absence, performance would be reduced. Returns do not reflect the deduction of taxes that a shareholder would pay on Fund distributions or the redemption of Fund shares. |
14
FUND BASICS
| | | | | | | | | | |
| | EXPENSE RATIOS4 | |
| | | | | Net Expense Ratio (Current) | | | Gross Expense Ratio (Before Waivers) | |
| | Class A | | | 1.58 | % | | | 1.94 | % |
| | Class B | | | 2.33 | | | | 2.69 | |
| | Class C | | | 2.33 | | | | 2.69 | |
| | Institutional | | | 1.18 | | | | 1.54 | |
| | Service | | | 1.68 | | | | 2.04 | |
| | | Class IR | | | 1.33 | | | | 1.69 | |
| | 4 | | The expense ratios of the Fund, both current (net of applicable fee waivers and/or expense limitations) and before waivers (gross of applicable fee waivers and/or expense limitations) are as set forth above according to the most recent publicly available Prospectus for the Fund and may differ from the expense ratios disclosed in the Financial Highlights in this report. The Fund’s waivers and/or expense limitations will remain in place through at least February 28, 2013, and prior to such date the investment adviser may not terminate the arrangements without the approval of the Fund’s Board of Trustees. If these arrangements are discontinued in the future, the expense ratios may change without shareholder approval. |
| | | | | | | | | | |
| | TOP TEN HOLDINGS AS OF 4/30/125 |
| | | Holding | | % of Total
Net Assets | | | Line of Business | | Country |
| | Travis Perkins PLC | | | 1.2 | % | | Capital Goods | | United Kingdom |
| | Dufry AG (Registered) | | | 1.2 | | | Retailing | | Switzerland |
| | Lindt & Spruengli AG | | | 1.2 | | | Food, Beverage & Tobacco | | Switzerland |
| | Golfzon Co. Ltd. | | | 1.1 | | | Software & Services | | South Korea |
| | Aberdeen Asset Management PLC | | | 1.1 | | | Diversified Financials | | United Kingdom |
| | Hiscox Ltd. | | | 1.1 | | | Insurance | | Bermuda |
| | MTU Aero Engines Holding AG | | | 1.1 | | | Capital Goods | | Germany |
| | Telecity Group PLC | | | 1.1 | | | Software & Services | | United Kingdom |
| | Pfeiffer Vacuum Technology AG | | | 1.0 | | | Capital Goods | | Germany |
| | | CJ CheilJedang Corp. | | | 1.0 | | | Food, Beverage & Tobacco | | South Korea |
| | 5 | | The top 10 holdings may not be representative of the Fund’s future investments. |
15
FUND BASICS
| | |
| | FUND VS. BENCHMARK SECTOR ALLOCATIONS6 |
| | | As of April 30, 2012 |
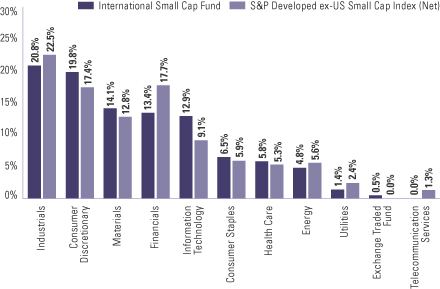
| | 6 | | The Fund is actively managed and, as such, its composition may differ over time. Consequently, the Fund’s overall sector allocations may differ from the percentages contained in the graph above. The graph categorizes investments using Global Industry Classification Standard (“GICS”), however, the sector classifications used by the portfolio management team may differ from GICS. Underlying sector allocations of Exchange Traded Funds held by the Fund are not reflected in the graph above. The percentage shown for each investment category reflects the value of investments in that category as a percentage of market value. The graph depicts the Fund’s investments but may not represent the Fund’s market exposure due to the exclusion of certain derivatives, if any, as listed in the Additional Investment Information section of the Schedule of Investments. |
16
PORTFOLIO RESULTS
Strategic International Equity Fund
Portfolio Management Discussion and Analysis
Below, the Goldman Sachs Global Equity Team discusses the Goldman Sachs Strategic International Equity Fund’s (the “Fund”) performance and positioning for the six-month period ended April 30, 2012 (the “Reporting Period”).
| Q | | How did the Fund perform during the Reporting Period? |
| A | | During the Reporting Period, the Fund’s Class A, B, C, Institutional, IR and R Shares generated cumulative total returns, without sales charges, of 5.65%, 5.37%, 5.23%, 5.88%, 5.81% and 5.57%, respectively. These returns compare to the 2.44% cumulative total return of the Fund’s benchmark, the MSCI EAFE Index (net, unhedged, with dividends reinvested) (the “MSCI Index”), during the same period. |
| Q | | What key factors were responsible for the Fund’s performance during the Reporting Period? |
| A | | The Fund’s outperformance of the MSCI Index during the Reporting Period can be primarily attributed to individual stock selection. |
| Q | | What were some of the Fund’s best-performing individual stocks? |
| A | | The greatest contributors to Fund performance relative to the MSCI Index during the Reporting Period were Nokian Renkaat, Scania and Remy Cointreau. |
| | | Finnish winter tire manufacturer Nokian Renkaat performed particularly well after the company announced strong results with better than expected guidance for 2012. Russian car sales were strong during the Reporting Period, which proved to be a good leading indicator for Nokian Renkaat tire demand. |
| | | The Fund’s holding in Swedish truck manufacturer Scania was a key contributor to its relative performance during the Reporting Period. Shares of the company increased particularly strongly in the first quarter of 2012 after the market was buoyed by comments from its Chief Executive Officer, highlighting that he thought demand for trucks had troughed in January and so would hopefully begin to improve. |
| | | French alcohol manufacturer Remy Cointreau was a top contributor to the Fund’s results during the Reporting Period. The company posted results that surpassed expectations, as strong sales growth was driven by its premium products, most notably VSPO and XO qualities of Remy Martin cognac. At the end of the Reporting Period, we continued to like this company as its products were becoming more popular and affordable in regions such as Asia, Russia and the Middle East. |
| Q | | Which stocks detracted significantly from the Fund’s performance during the Reporting Period? |
| A | | Among the biggest detractors from Fund performance relative to the MSCI Index during the Reporting Period were EDF, Admiral Group and Nintendo. |
| | | Shares of French energy company EDF were challenged in the run up to the French elections and in anticipation of the possibility of a Socialist party win. EDF’s share price was also hampered at the start of 2012 after reports that the company would have to invest approximately 10 billion euros in safety improvements following a review by the French nuclear safety regulator. We believe the market overreacted and the outcome for EDF, regardless of who wins the French elections, will likely not be as bad as implied by its share price at the end of the Reporting Period. Indeed, at the end of the Reporting Period, we continued to like the company and believed that EDF should continue to improve its operational efficiency and produce higher nuclear output. We therefore sought to take advantage of the recent weakness in EDF’s share price to add to the Fund’s position in the company. |
17
PORTFOLIO RESULTS
| | | Admiral Group, a direct sales U.K. auto insurer, was a top detractor from the Fund’s results during the Reporting Period within both the financials sector and the portfolio overall. Though Admiral Group had performed well during the first half of 2011, investors’ perception in October that the stock was defensive hurt it in a strong market and strong financials sector. Admiral Group’s share price also experienced weakness during the second half of 2011 due to investor concerns of upward revisions to loss ratio estimates for the 2009 and 2010 underwriting years highlighted in the company’s half year results report. Further, there was high profile political pressure on the U.K. auto insurance industry broadly regarding lawyer referral fees and industry price increases. Additionally, in November, the company announced that its underwriting results relating to large bodily injury claims had deteriorated compared to the first half of the year. In the early stages of claims development, actuarial estimates of losses can vary significantly from where they ultimately settle, so, in our view, it remains to be seen whether Admiral Group’s recent poor claims experience is true deterioration or merely “noise.” That said, we sold the Fund’s position in Admiral Group by the end of the Reporting Period. |
| | | A position in Japanese consumer electronics company Nintendo detracted from the Fund’s results during the Reporting Period. Shares of Nintendo lagged primarily because of a weaker outlook for its new handheld game platform “3DS.” Company management had commented that Nintendo’s profits should recover during the next year as hardware cost reduction efforts proceed. However, such a recovery looked weaker than expected given the company’s recent sales trends, especially in the U.S. and Europe. |
| Q | | Which equity market sectors most significantly affected Fund performance during the Reporting Period? |
| A | | The sectors that contributed most to the Fund’s performance relative to the MSCI Index were financials, telecommunication services and industrials. Stock selection in all three sectors proved effective during the Reporting Period. The Fund’s underweighted exposure in financials and telecommunication services, each of which underperformed the MSCI Index during the Reporting Period, also contributed positively to relative performance. |
| | | The only detractor at the sector level from the Fund’s relative results during the Reporting Period was information technology. Both stock selection and the Fund’s overweighted allocation to this lagging sector weighed negatively on performance. |
| Q | | Which countries most affected the Fund’s performance during the Reporting Period? |
| A | | Typically, the Fund’s individual stock holdings will significantly influence the Fund’s performance within a particular country or region relative to the MSCI Index. This effect may be even more pronounced in countries that represent only a modest proportion of the MSCI Index. |
| | | That said, effective individual stock selection in Italy and Finland and the Fund’s overweighted positioning in the relatively strong South Korean equity market contributed most positively to the Fund’s returns relative to the MSCI Index. Conversely, the countries that detracted most from the Fund’s performance during the Reporting Period were Hong Kong, Japan and the United Kingdom. Stock selection in all three countries and the Fund’s underweighted positioning in the comparatively strong Hong Kong equity market weighed negatively on relative performance. |
| Q | | How did the Fund use derivatives and similar instruments during the Reporting Period? |
| A | | During the Reporting Period, we did not use derivatives to hedge positions or as part of an active management strategy, but we used index futures on an opportunistic basis, to ensure the portfolio remained almost fully exposed to equities following cash inflows or stock sales. |
| Q | | Did the Fund make any significant purchases or sales during the Reporting Period? |
| A | | During the Reporting Period, we purchased Kubota, Westpac Banking and Deutsche Bank for the Fund, as we believed these are quality companies with attractive valuations. |
| | | We established a Fund position in Kubota, a Japanese agricultural machinery manufacturer, on optimism that U.S. housing starts would improve in 2012 and on expectations of a rebound in tractor demand in Thailand this year. We think U.S. tractor demand at below 120 horsepower, Kubota’s primary area of business, continues to recover gradually from its 2009 bottom, and we expect Kubota to benefit from the market recovery. |
18
PORTFOLIO RESULTS
| | | Westpac Banking, the second largest bank in Australia and New Zealand, was introduced to the Fund during the Reporting Period. We believe this conservatively run bank is purely focused on servicing Australia and New Zealand, unlike its peers, and on retail and commercial banking. Attributes of the company that we find compelling include a strong capital base and a good funding profile. In addition, its loan book has consistently experienced better asset quality versus peers due to its focus on safer mortgages. In our view, a strong cost discipline helps the company earn a consistently high return on equity. Furthermore, we believed at the time of purchase that the company’s valuation was attractive for a bank of this quality in a global context. |
| | | During the first quarter of 2012, we initiated a Fund position in one of Europe’s largest investment banks, Deutsche Bank. The investment bank is broadly diversified, and we believe the company should benefit from an anticipated recovery in investment banking activities should markets stabilize and confidence return. |
| | | During the Reporting Period, we sold out of the Fund’s positions in Admiral Group, Nissan Motor and BASF. |
| | | U.K. auto insurance company Admiral Group’s share price performed well during the first quarter of 2012, recovering from lows experienced toward the end of 2011. We decided to sell out of this name after such strong performance as we saw greater potential upside in other insurance companies. |
| | | We eliminated the Fund’s position in Japanese vehicle, forklift and marine product manufacturer Nissan Motor and used the proceeds to invest in stocks we believed offered higher upside potential and what we considered to be better risk/reward opportunities. |
| | | We decided to sell out of the Fund’s position in German-based chemical company BASF in order to take profits, as the stock had performed well since it bottomed in October 2011. We reallocated the capital into one of the world’s leading suppliers of standard and specialty fertilizers, K&S, a company we believe to have comparatively greater potential upside. |
| Q | | Were there any notable changes in the Fund’s weightings during the Reporting Period? |
| A | | In this Fund, both sector weightings and country allocations are largely the result of our bottom-up stock selection process rather than any top-down macroeconomic views or industry bets. That said, during the Reporting Period, there were no notable changes in the Fund’s sector or country weightings during the Reporting Period. |
| Q | | How was the Fund positioned relative to the MSCI Index at the end of the Reporting Period? |
| A | | At the end of the Reporting Period, the Fund had more exposure to the United Kingdom, Switzerland and South Korea and less exposure to Spain, Hong Kong and Australia relative to the MSCI Index. At the end of the Reporting Period, the Fund held neutral positions relative to the MSCI Index in several countries, most notably France and Finland. |
| | | From a sector allocation perspective, the Fund had overweight positions relative to the MSCI Index in industrials and energy at the end of the Reporting Period. On the same date, the Fund had underweighted positions compared to the MSCI Index in materials, financials, consumer staples and consumer discretionary and rather neutral positions relative to the MSCI Index in telecommunication services, information technology, health care and utilities. |
| | | As always, we remained focused on individual stock selection, with sector and country positioning being a secondary, closely-monitored effect. |
19
FUND BASICS
Strategic International Equity Fund
as of April 30, 2012
| | | | | | | | | | |
| | PERFORMANCE REVIEW | |
| | | November 1, 2011–April 30, 2012 | | Fund Total Return (based on NAV)1 | | | MSCI EAFE (Net)
Index (unhedged)2 | |
| | Class A | | | 5.65 | % | | | 2.44 | % |
| | Class B | | | 5.37 | | | | 2.44 | |
| | Class C | | | 5.23 | | | | 2.44 | |
| | Institutional | | | 5.88 | | | | 2.44 | |
| | Class IR | | | 5.81 | | | | 2.44 | |
| | | Class R | | | 5.57 | | | | 2.44 | |
| | 1 | | The net asset value (“NAV”) represents the net assets of the class of the Fund (ex-dividend) divided by the total number of shares of the class outstanding. The Fund’s performance assumes the reinvestment of dividends and other distributions. The Fund’s performance does not reflect the deduction of any applicable sales charges. |
| | 2 | | The MSCI EAFE Index (net, unhedged, with dividends reinvested) is a market capitalization-weighted composite of securities in 22 developed markets. The Index approximates the minimum possible dividend reinvestment. The dividend is reinvested after deduction for withholding tax, applying the rate to non-resident individuals who do not benefit from double taxation treaties. MSCI Barra uses withholding tax rates applicable to Luxembourg holding companies, as Luxembourg applies the highest rates. The Index is unmanaged and the figures for the Index do not include any deduction for fees or expenses. It is not possible to invest directly in an index. |
| | | | | | | | | | |
| | STANDARDIZED TOTAL RETURNS3 |
| | | For the period ended 3/31/12 | | One Year | | | Since Inception | | Inception Date |
| | Class A | | | -11.73 | % | | -6.76% | | 6/25/07 |
| | Class B | | | -11.96 | | | -6.79 | | 6/25/07 |
| | Class C | | | -8.22 | | | -6.37 | | 6/25/07 |
| | Institutional | | | -6.21 | | | -5.30 | | 6/25/07 |
| | Class IR | | | -6.30 | | | -7.47 | | 11/30/07 |
| | | Class R | | | -6.90 | | | -8.03 | | 11/30/07 |
| | 3 | | The Standardized Total Returns are average annual total returns as of the most recent calendar quarter-end. They assume reinvestment of all distributions at NAV. These returns reflect a maximum initial sales charge of 5.5% for Class A Shares, the assumed contingent deferred sales charge for Class B Shares (5% maximum declining to 0% after six years) and the assumed contingent deferred sales charge for Class C Shares (1% if redeemed within 12 months of purchase). Class B Shares convert automatically to Class A Shares on or about the fifteenth day of the last month of the calendar quarter that is eight years after purchase. Returns for Class B Shares for the period after conversion reflect the performance of Class A Shares. Because Institutional, Class R and Class IR Shares do not involve a sales charge, such a charge is not applied to their Standardized Total Returns. The Fund’s Class B Shares are no longer available for purchase by new or existing shareholders (although current Class B shareholders may continue to reinvest income and capital gains distributions into Class B Shares, and Class B shareholders may continue to exchange their shares for Class B Shares of certain other Goldman Sachs Funds). |
| | | | The returns represent past performance. Past performance does not guarantee future results. The Fund’s investment return and principal value will fluctuate so that an investor’s shares, when redeemed, may be worth more or less than their original cost. Current performance may be lower or higher than the performance quoted above. Please visit our Website at www.goldmansachsfunds.com to obtain the most recent month-end returns. Performance reflects fee waivers and/or expense limitations in effect. In their absence, performance would be reduced. Returns do not reflect the deduction of taxes that a shareholder would pay on Fund distributions or the redemption of Fund shares. |
20
FUND BASICS
| | | | | | | | | | |
| | EXPENSE RATIOS4 | |
| | | | | Net Expense Ratio (Current) | | | Gross Expense Ratio (Before Waivers) | |
| | Class A | | | 1.48 | % | | | 1.81 | % |
| | Class B | | | 2.23 | | | | 2.56 | |
| | Class C | | | 2.23 | | | | 2.56 | |
| | Institutional | | | 1.08 | | | | 1.41 | |
| | Class IR | | | 1.23 | | | | 1.56 | |
| | | Class R | | | 1.73 | | | | 2.06 | |
| | 4 | | The expense ratios of the Fund, both current (net of applicable fee waivers and/or expense limitations) and before waivers (gross of applicable fee waivers and/or expense limitations) are as set forth above according to the most recent publicly available Prospectus for the Fund and may differ from the expense ratios disclosed in the Financial Highlights in this report. The Fund’s waivers and/or expense limitations will remain in place through at least February 28, 2013, and prior to such date the investment adviser may not terminate the arrangements without the approval of the Fund’s Board of Trustees. If these arrangements are discontinued in the future, the expense ratios may change without shareholder approval. |
| | | | | | | | | | |
| | TOP TEN HOLDINGS AS OF 4/30/125 |
| | | Holding | | % of Total
Net Assets | | | Line of Business | | Country |
| | HSBC Holdings PLC | | | 3.5 | % | | Banks | | United Kingdom |
| | Novartis AG (Registered) | | | 3.3 | | | Pharmaceuticals, Biotechnology & Life Sciences | | Switzerland |
| | Reed Elsevier PLC | | | 2.8 | | | Media | | United Kingdom |
| | Vodafone Group PLC | | | 2.7 | | | Telecommunication Services | | United Kingdom |
| | Sumitomo Mitsui | | | 2.5 | | | Banks | | Japan |
| | Financial Group, Inc. | | | | | | | | |
| | BP PLC | | | 2.5 | | | Energy | | United Kingdom |
| | Kubota Corp. | | | 2.1 | | | Capital Goods | | Japan |
| | Mitsui & Co. Ltd. | | | 2.1 | | | Capital Goods | | Japan |
| | Rio Tinto PLC | | | 2.0 | | | Materials | | United Kingdom |
| | | ENI SpA | | | 2.0 | | | Energy | | Italy |
| | 5 | | The top 10 holdings may not be representative of the Fund’s future investments. |
21
FUND BASICS
|
| FUND VS. BENCHMARK SECTOR ALLOCATIONS6 |
| As of April 30, 2012 |
| | 6 | | The Fund is actively managed and, as such, its composition may differ over time. Consequently, the Fund’s overall sector allocations may differ from the percentages contained in the graph above. The graph categorizes investments using Global Industry Classification Standard (“GICS”), however, the sector classifications used by the portfolio management team may differ from GICS. Underlying sector allocations of Exchange Traded Funds held by the Fund are not reflected in the graph above. The percentage shown for each investment category reflects the value of investments in that category as a percentage of market value. The graph depicts the Fund’s investments but may not represent the Fund’s market exposure due to the exclusion of certain derivatives, if any, as listed in the Additional Investment Information section of the Schedule of Investments. |
22
GOLDMAN SACHS CONCENTRATED INTERNATIONAL EQUITY FUND
Schedule of Investments
April 30, 2012 (Unaudited)
| | | | | | | | |
| Shares | | | Description | | Value | |
| | Common Stocks – 98.9% | |
| Australia – 6.6% | |
| | 148,672 | | | Ansell Ltd. (Health Care Equipment & Services) | | $ | 2,288,815 | |
| | 370,579 | | | Computershare Ltd. (Software & Services) | | | 3,232,076 | |
| | 155,800 | | | Westpac Banking Corp. (Banks) | | | 3,671,617 | |
| | | | | | | | |
| | | | | | | 9,192,508 | |
| | |
| Belgium – 2.3% | |
| | 69,410 | | | UCB SA (Pharmaceuticals, Biotechnology & Life Sciences) | | | 3,245,632 | |
| | |
| China – 0.8% | |
| | 1,719,000 | | | China Citic Bank Corp. Ltd. Class H (Banks) | | | 1,089,195 | |
| | |
| Czech Republic – 1.3% | |
| | 45,300 | | | CEZ AS (Utilities) | | | 1,826,612 | |
| | |
| France – 7.4% | |
| | 100,639 | | | EDF SA (Utilities) | | | 2,132,134 | |
| | 90,850 | | | Safran SA (Capital Goods) | | | 3,367,349 | |
| | 92,300 | | | Societe Generale SA (Banks) | | | 2,185,133 | |
| | 52,980 | | | Total SA (Energy) | | | 2,543,232 | |
| | | | | | | | |
| | | | | | | 10,227,848 | |
| | |
| Germany – 8.2% | |
| | 45,450 | | | Bayer AG (Registered) (Pharmaceuticals, Biotechnology & Life Sciences) | | | 3,202,584 | |
| | 87,310 | | | Deutsche Bank AG (Registered) (Diversified Financials) | | | 3,790,397 | |
| | 68,281 | | | GEA Group AG (Capital Goods) | | | 2,255,168 | |
| | 87,649 | | | ThyssenKrupp AG (Materials) | | | 2,078,624 | |
| | | | | | | | |
| | | | | | | 11,326,773 | |
| | |
| Hong Kong – 1.1% | |
| | 428,928 | | | AIA Group Ltd. (Insurance) | | | 1,517,921 | |
| | |
| Italy – 2.9% | |
| | 182,013 | | | ENI SpA (Energy) | | | 4,044,296 | |
| | |
| Japan – 21.5% | |
| | 553,000 | | | Isuzu Motors Ltd. (Automobiles & Components) | | | 3,157,294 | |
| | 146,400 | | | JS Group Corp. (Capital Goods) | | | 2,874,772 | |
| | 349,000 | | | Kubota Corp. (Capital Goods) | | | 3,368,942 | |
| | 283,000 | | | Mitsubishi Electric Corp. (Capital Goods) | | | 2,486,039 | |
| | 154,000 | | | Mitsubishi Estate Co. Ltd. (Real Estate) | | | 2,722,465 | |
| | 14,500 | | | Nintendo Co. Ltd. (Software & Services) | | | 1,957,267 | |
| | 98,500 | | | Otsuka Holdings Co. Ltd. (Pharmaceuticals, Biotechnology & Life Sciences) | | | 2,968,558 | |
| | 108,700 | | | Seven & I Holdings Co. Ltd. (Food & Staples Retailing) | | | 3,290,370 | |
| | 147,200 | | | Sumitomo Mitsui Financial Group, Inc. (Banks) | | | 4,710,221 | |
| | |
| | | | | | | | |
| Shares | | | Description | | Value | |
| | Common Stocks – (continued) | |
| Japan – (continued) | |
| | 471,000 | | | Tokyo Gas Co. Ltd. (Utilities) | | $ | 2,272,859 | |
| | | | | | | | |
| | | | | | | 29,808,787 | |
| | |
| Spain – 1.8% | |
| | 120,590 | | | Amadeus IT Holding SA Class A (Software & Services) | | | 2,468,706 | |
| | |
| Sweden – 5.4% | |
| | 166,892 | | | Scania AB Class B (Capital Goods) | | | 3,410,437 | |
| | 412,177 | | | Telefonaktiebolaget LM Ericsson Class B (Technology Hardware & Equipment)* | | | 4,086,101 | |
| | | | | | | | |
| | | | | | | 7,496,538 | |
| | |
| Switzerland – 11.5% | |
| | 73,417 | | | Aryzta AG (Food, Beverage & Tobacco)* | | | 3,698,200 | |
| | 60,253 | | | Julius Baer Group Ltd. (Diversified Financials)* | | | 2,309,595 | |
| | 92,694 | | | Novartis AG (Registered) (Pharmaceuticals, Biotechnology & Life Sciences) | | | 5,118,215 | |
| | 11,830 | | | Sulzer AG (Registered) (Capital Goods) | | | 1,703,750 | |
| | 243,420 | | | UBS AG (Registered) (Diversified Financials)* | | | 3,039,876 | |
| | | | | | | | |
| | | | | | | 15,869,636 | |
| | |
| United Kingdom – 28.1% | |
| | 63,682 | | | Anglo American PLC (Materials) | | | 2,460,976 | |
| | 113,750 | | | BG Group PLC (Energy) | | | 2,683,953 | |
| | 611,000 | | | BP PLC (Energy) | | | 4,413,926 | |
| | 639,248 | | | HSBC Holdings PLC (Banks) | | | 5,770,605 | |
| | 68,421 | | | Imperial Tobacco Group PLC (Food, Beverage & Tobacco) | | | 2,736,187 | |
| | 50,293 | | | Reckitt Benckiser Group PLC (Household & Personal Products) | | | 2,927,725 | |
| | 422,844 | | | Reed Elsevier PLC (Media) | | | 3,499,059 | |
| | 75,025 | | | Rio Tinto PLC (Materials) | | | 4,205,511 | |
| | 195,802 | | | Smith & Nephew PLC (Health Care Equipment & Services) | | | 1,927,314 | |
| | 117,779 | | | Tullow Oil PLC (Energy) | | | 2,938,410 | |
| | 39,148 | | | Victrex PLC (Materials) | | | 922,521 | |
| | 1,596,833 | | | Vodafone Group PLC (Telecommunication Services) | | | 4,419,972 | |
| | | | | | | | |
| | | | | | | 38,906,159 | |
| | |
| | TOTAL INVESTMENTS – 98.9% | | | | |
| | (Cost $138,471,036) | | $ | 137,020,611 | |
| | |
| OTHER ASSETS IN EXCESS OF
LIABILITIES – 1.1% | | | 1,532,120 | |
| | |
| | NET ASSETS – 100.0% | | $ | 138,552,731 | |
| | |
| | |
| The percentage shown for each investment category reflects the value of investments in that category as a percentage of net assets. |
* | | Non-income producing security. |
| | |
| The accompanying notes are an integral part of these financial statements. | | 23 |
GOLDMAN SACHS INTERNATIONAL SMALL CAP FUND
Schedule of Investments
April 30, 2012 (Unaudited)
| | | | | | | | |
Shares | | | Description | | Value | |
| | | | | | | | |
| | Common Stocks – 94.5% | |
| Australia – 6.5% | |
| | 38,221 | | | Ansell Ltd. (Health Care Equipment & Services) | | $ | 588,415 | |
| | 102,435 | | | Atlas Iron Ltd. (Materials) | | | 295,097 | |
| | 123,055 | | | Boart Longyear Ltd. (Capital Goods) | | | 530,302 | |
| | 52,520 | | | Computershare Ltd. (Software & Services) | | | 458,063 | |
| | 206,748 | | | DUET Group (Utilities) | | | 396,918 | |
| | 62,653 | | | Echo Entertainment Group Ltd. (Consumer Services) | | | 291,857 | |
| | 158,791 | | | Evolution Mining Ltd. (Materials)* | | | 288,978 | |
| | 125,260 | | | GPT Group (REIT) | | | 426,447 | |
| | 13,654 | | | Iluka Resources Ltd. (Materials) | | | 238,514 | |
| | 48,525 | | | Iress Market Technology Ltd. (Software & Services) | | | 339,240 | |
| | 133,444 | | | Myer Holdings Ltd. (Retailing) | | | 325,315 | |
| | 75,027 | | | PanAust Ltd. (Materials)* | | | 251,475 | |
| | | | | | | | |
| | | | | | | 4,430,621 | |
| | |
| Austria – 0.8% | |
| | 10,021 | | | Andritz AG (Capital Goods) | | | 524,949 | |
| | |
| Belgium – 1.4% | |
| | 6,304 | | | Barco NV (Technology Hardware & Equipment) | | | 418,500 | |
| | 11,942 | | | D’ieteren SA NV (Retailing) | | | 527,252 | |
| | | | | | | | |
| | | | | | | 945,752 | |
| | |
| Bermuda – 1.1% | |
| | 111,420 | | | Hiscox Ltd. (Insurance) | | | 720,606 | |
| | |
| Canada – 10.6% | |
| | 24,600 | | | Alamos Gold, Inc. (Materials) | | | 450,238 | |
| | 58,300 | | | Bankers Petroleum Ltd. (Energy)* | | | 201,838 | |
| | 56,200 | | | Bellatrix Exploration Ltd. (Energy)* | | | 238,374 | |
| | 5,700 | | | Canadian Real Estate Investment Trust (REIT) | | | 223,246 | |
| | 13,000 | | | Canadian Western Bank (Banks) | | | 377,557 | |
| | 113,900 | | | Capstone Mining Corp. (Materials)* | | | 340,138 | |
| | 52,900 | | | Copper Mountain Mining Corp. (Materials)* | | | 229,732 | |
| | 12,700 | | | Dorel Industries, Inc. Class B (Consumer Durables & Apparel) | | | 384,272 | |
| | 22,300 | | | Enerflex Ltd. (Energy) | | | 275,632 | |
| | 18,200 | | | Evertz Technologies Ltd. (Technology Hardware & Equipment) | | | 257,934 | |
| | 27,400 | | | Groupe Aeroplan, Inc. (Media) | | | 352,260 | |
| | 16,700 | | | IAMGOLD Corp. (Materials) | | | 207,091 | |
| | 20,841 | | | Legacy Oil + Gas, Inc. (Energy)* | | | 181,859 | |
| | 8,489 | | | MacDonald Dettwiler & Associates Ltd. (Software & Services) | | | 385,500 | |
| | 23,900 | | | Major Drilling Group International (Materials) | | | 358,796 | |
| | 66,200 | | | MBAC Fertilizer Corp. (Materials)* | | | 197,022 | |
| | 19,300 | | | Norbord, Inc. (Materials)* | | | 222,531 | |
| | 23,700 | | | Progressive Waste Solutions Ltd. (Commercial & Professional Services) | | | 514,138 | |
| | |
| | | | | | | | |
Shares | | | Description | | Value | |
| | | | | | | | |
| | Common Stocks – (continued) | |
| Canada – (continued) | |
| | 73,900 | | | Rubicon Minerals Corp. (Materials)* | | $ | 225,175 | |
| | 10,200 | | | ShawCor Ltd. Class A (Energy) | | | 329,898 | |
| | 162,053 | | | Southern Pacific Resource Corp. (Energy)* | | | 257,553 | |
| | 19,600 | | | Toromont Industries Ltd. (Capital Goods) | | | 439,281 | |
| | 17,800 | | | Transglobe Apartment Real Estate Investment Trust (REIT) | | | 256,590 | |
| | 23,700 | | | Westjet Airlines Ltd. Class A (Transportation) | | | 337,560 | |
| | | | | | | | |
| | | | | | | 7,244,215 | |
| | |
| China – 1.7% | |
| | 385,000 | | | Haitian International Holdings Ltd. (Capital Goods) | | | 442,948 | |
| | 32,295 | | | Hollysys Automation Technologies Ltd. (Technology Hardware & Equipment)* | | | 320,690 | |
| | 254,000 | | | Zoomlion Heavy Industry Science and Technology Co. Ltd. Class H (Capital Goods) | | | 376,840 | |
| | | | | | | | |
| | | | | | | 1,140,478 | |
| | |
| Finland – 0.7% | |
| | 10,217 | | | Nokian Renkaat OYJ (Automobiles & Components) | | | 485,017 | |
| | |
| France – 5.1% | |
| | 3,531 | | | Arkema SA (Materials) | | | 313,161 | |
| | 7,058 | | | bioMerieux (Health Care Equipment & Services) | | | 578,408 | |
| | 14,624 | | | Cap Gemini SA (Software & Services) | | | 571,321 | |
| | 16,639 | | | Compagnie Generale de Geophysique-Veritas (Energy)*(a) | | | 477,170 | |
| | 8,214 | | | Ingenico (Technology Hardware & Equipment) | | | 432,061 | |
| | 40,481 | | | M6 Metropole Television SA (Media) | | | 621,975 | |
| | 17,382 | | | Nexity SA (Consumer Durables & Apparel) | | | 494,996 | |
| | | | | | | | |
| | | | | | | 3,489,092 | |
| | |
| Germany – 6.3% | |
| | 3,310 | | | Fresenius SE & Co. KGaA (Health Care Equipment & Services) | | | 330,462 | |
| | 12,283 | | | GEA Group AG (Capital Goods) | | | 405,680 | |
| | 7,330 | | | GfK SE (Media) | | | 389,511 | |
| | 33,523 | | | Infineon Technologies AG (Semiconductors & Semiconductor Equipment) | | | 334,075 | |
| | 9,805 | | | Kabel Deutschland Holding AG (Media)* | | | 618,137 | |
| | 4,420 | | | Lanxess AG (Materials) | | | 351,904 | |
| | 8,533 | | | MTU Aero Engines Holding AG (Capital Goods) | | | 718,966 | |
| | 5,810 | | | Pfeiffer Vacuum Technology AG (Capital Goods) | | | 705,383 | |
| | 1,837 | | | Rational AG (Capital Goods) | | | 469,739 | |
| | | | | | | | |
| | | | | | | 4,323,857 | |
| | |
| | |
| 24 | | The accompanying notes are an integral part of these financial statements. |
GOLDMAN SACHS INTERNATIONAL SMALL CAP FUND
| | | | | | | | |
Shares | | | Description | | Value | |
| | | | | | | | |
| | Common Stocks – (continued) | |
| Hong Kong – 1.2% | |
| | 222,000 | | | Belle International Holdings Ltd. (Retailing) | | $ | 433,175 | |
| | 262,000 | | | China Resources Cement Holdings Ltd. (Materials) | | | 206,906 | |
| | 414,000 | | | Foxconn International Holdings Ltd. (Technology Hardware & Equipment)* | | | 195,770 | |
| | | | | | | | |
| | | | | | | 835,851 | |
| | |
| Ireland – 1.7% | |
| | 610,407 | | | Kenmare Resources PLC (Materials)* | | | 502,263 | |
| | 14,651 | | | Kerry Group PLC Class A (Food, Beverage & Tobacco)(a) | | | 669,093 | |
| | | | | | | | |
| | | | | | | 1,171,356 | |
| | |
| Italy – 1.9% | |
| | 76,892 | | | Davide Campari-Milano SpA (Food, Beverage & Tobacco) | | | 543,633 | |
| | 284,382 | | | Gruppo Editoriale L’Espresso SpA (Media) | | | 384,207 | |
| | 93,910 | | | Unione di Banche Italiane ScpA (Banks) | | | 349,045 | |
| | | | | | | | |
| | | | | | | 1,276,885 | |
| | |
| Japan – 17.7% | |
| | 14,400 | | | Aeon Delight Co. Ltd. (Commercial & Professional Services) | | | 335,253 | |
| | 55,000 | | | Amada Co. Ltd. (Capital Goods) | | | 373,302 | |
| | 12,000 | | | Aoyama Trading Co. Ltd. (Retailing) | | | 247,581 | |
| | 16,800 | | | Capcom Co. Ltd. (Software & Services) | | | 383,627 | |
| | 38,900 | | | Citizen Holdings Co. Ltd. (Technology Hardware & Equipment) | | | 244,301 | |
| | 8,400 | | | Cosel Co. Ltd. (Capital Goods) | | | 119,242 | |
| | 30,700 | | | DCM Holdings Co. Ltd. (Retailing) | | | 233,090 | |
| | 84 | | | Dwango Co. Ltd. (Software & Services) | | | 125,024 | |
| | 19,100 | | | Eiken Chemical Co. Ltd. (Health Care Equipment & Services) | | | 262,754 | |
| | 18,200 | | | Foster Electric Co. Ltd. (Consumer Durables & Apparel) | | | 270,654 | |
| | 4,500 | | | FP Corp. (Materials) | | | 290,608 | |
| | 21,400 | | | Fuji Seal International, Inc. (Materials) | | | 410,373 | |
| | 65,000 | | | Fukuoka Financial Group, Inc. (Banks) | | | 270,432 | |
| | 92,000 | | | Hanwa Co. Ltd. (Capital Goods) | | | 385,962 | |
| | 5,700 | | | HIS Co. Ltd. (Consumer Services) | | | 184,496 | |
| | 29,200 | | | Hitachi Capital Corp. (Diversified Financials) | | | 482,700 | |
| | 36,000 | | | J. Front Retailing Co. Ltd. (Retailing) | | | 184,974 | |
| | 10,600 | | | Kakaku.com, Inc. (Software & Services) | | | 329,622 | |
| | 10,800 | | | Lintec Corp. (Materials) | | | 208,653 | |
| | 4,100 | | | Mabuchi Motor Co. Ltd. (Capital Goods) | | | 171,522 | |
| | 12,600 | | | Maruichi Steel Tube Ltd. (Materials) | | | 277,284 | |
| | 95 | | | Message Co. Ltd. (Health Care Equipment & Services) | | | 337,338 | |
| | 11,500 | | | NET One Systems Co. Ltd. (Software & Services) | | | 156,889 | |
| | 23,700 | | | Nichii Gakkan Co. (Health Care Equipment & Services) | | | 324,646 | |
| | |
| | | | | | | | |
Shares | | | Description | | Value | |
| | | | | | | | |
| | Common Stocks – (continued) | |
| Japan – (continued) | |
| | 23,100 | | | Nihon Dempa Kogyo Co. Ltd. (Technology Hardware & Equipment) | | $ | 318,562 | |
| | 46,000 | | | Nippon Denko Co. Ltd. (Materials) | | | 192,999 | |
| | 67,000 | | | Noritake Co. Ltd. (Capital Goods) | | | 194,882 | |
| | 39,700 | | | Pocket Card Co. Ltd. (Diversified Financials) | | | 179,236 | |
| | 12,900 | | | Pola Orbis Holdings, Inc. (Household & Personal Products) | | | 392,502 | |
| | 75,000 | | | Press Kogyo Co. Ltd. (Automobiles & Components) | | | 445,732 | |
| | 13,300 | | | Resorttrust, Inc. (Consumer Services) | | | 219,780 | |
| | 29,800 | | | Round One Corp. (Consumer Services) | | | 194,962 | |
| | 43,000 | | | Sankyu, Inc. (Transportation) | | | 170,615 | |
| | 10,800 | | | Sega Sammy Holdings, Inc. (Consumer Durables & Apparel) | | | 226,611 | |
| | 48 | | | So-net Entertainment Corp. (Software & Services) | | | 201,296 | |
| | 8,700 | | | Square Enix Holdings Co. Ltd. (Software & Services) | | | 170,284 | |
| | 3,700 | | | Sysmex Corp. (Health Care Equipment & Services) | | | 148,697 | |
| | 9,500 | | | Taikisha Ltd. (Capital Goods) | | | 189,522 | |
| | 67,000 | | | Taiyo Nippon Sanso Corp. (Materials) | | | 462,889 | |
| | 34,000 | | | The Higo Bank Ltd. (Banks) | | | 189,650 | |
| | 61,000 | | | The Oita Bank Ltd. (Banks) | | | 173,557 | |
| | 25,000 | | | The Sumitomo Warehouse Co. Ltd. (Transportation) | | | 119,451 | |
| | 53,000 | | | Tokai Tokyo Financial Holdings, Inc. (Diversified Financials) | | | 188,758 | |
| | 51,000 | | | Toshiba TEC Corp. (Technology Hardware & Equipment) | | | 206,417 | |
| | 12,600 | | | TPR Co. Ltd. (Automobiles & Components) | | | 205,591 | |
| | 24,000 | | | Tsubakimoto Chain Co. (Capital Goods) | | | 145,818 | |
| | 17,600 | | | Warabeya Nichiyo Co. Ltd. (Food, Beverage & Tobacco) | | | 287,940 | |
| | 9,700 | | | Xebio Co. Ltd. (Retailing) | | | 266,996 | |
| | | | | | | | |
| | | | | | | 12,103,074 | |
| | |
| Luxembourg – 0.7% | |
| | 281,513 | | | Regus PLC (Commercial & Professional Services) | | | 488,011 | |
| | |
| Netherlands – 2.6% | |
| | 10,821 | | | Eurocommercial Properties NV CVA (REIT) | | | 379,634 | |
| | 5,010 | | | Fugro NV CVA (Energy) | | | 366,247 | |
| | 21,671 | | | Imtech NV (Capital Goods) | | | 612,815 | |
| | 6,011 | | | Koninklijke Vopak NV (Transportation) | | | 387,683 | |
| | | | | | | | |
| | | | | | | 1,746,379 | |
| | |
| Papua New Guinea – 1.0% | |
| | 19,284 | | | New Britain Palm Oil Ltd. (Food, Beverage & Tobacco)* | | | 272,275 | |
| | 52,312 | | | Oil Search Ltd. (Energy) | | | 397,121 | |
| | | | | | | | |
| | | | | | | 669,396 | |
| | |
| | |
| The accompanying notes are an integral part of these financial statements. | | 25 |
GOLDMAN SACHS INTERNATIONAL SMALL CAP FUND
Schedule of Investments (continued)
April 30, 2012 (Unaudited)
| | | | | | | | |
Shares | | | Description | | Value | |
| | | | | | | | |
| | Common Stocks – (continued) | |
| Singapore – 1.0% | |
| | 53,996 | | | Cape PLC (Commercial & Professional Services) | | $ | 330,799 | |
| | 513,000 | | | Mapletree Commercial Trust (REIT) | | | 376,919 | |
| | | | | | | | |
| | | | | | | 707,718 | |
| | |
| South Korea – 4.9% | |
| | 25,660 | | | Cheil Worldwide, Inc. (Media) | | | 445,254 | |
| | 2,094 | | | CJ CheilJedang Corp. (Food, Beverage & Tobacco) | | | 691,787 | |
| | 27,300 | | | Doosan Infracore Co. Ltd. (Capital Goods)* | | | 506,402 | |
| | 12,365 | | | Golfzon Co. Ltd. (Software & Services) | | | 759,399 | |
| | 3,160 | | | Green Cross Corp. (Pharmaceuticals, Biotechnology & Life Sciences) | | | 373,451 | |
| | 5,670 | | | Huchems Fine Chemical Corp. (Materials) | | | 113,006 | |
| | 6,420 | | | Interflex Co. Ltd. (Technology Hardware & Equipment) | | | 347,546 | |
| | 6,552 | | | Sung Kwang Bend Co. Ltd. (Capital Goods) | | | 133,645 | |
| | | | | | | | |
| | | | | | | 3,370,490 | |
| | |
| Spain – 1.6% | |
| | 33,705 | | | Amadeus IT Holding SA Class A (Software & Services) | | | 690,005 | |
| | 9,618 | | | Tecnicas Reunidas SA (Energy) | | | 375,539 | |
| | | | | | | | |
| | | | | | | 1,065,544 | |
| | |
| Sweden – 1.2% | |
| | 18,200 | | | Boliden AB (Materials) | | | 292,672 | |
| | 38,993 | | | Castellum AB (Real Estate) | | | 493,742 | |
| | | | | | | | |
| | | | | | | 786,414 | |
| | |
| Switzerland – 5.8% | |
| | 5,915 | | | Dufry AG (Registered) (Retailing)* | | | 803,344 | |
| | 1,357 | | | Flughafen Zuerich AG (Registered) (Transportation) | | | 505,324 | |
| | 1,647 | | | Geberit AG (Registered) (Capital Goods)* | | | 348,235 | |
| | 241 | | | Lindt & Spruengli AG (Food, Beverage & Tobacco)* | | | 785,607 | |
| | 4,609 | | | Panalpina Welttransport Holding AG (Registered) (Transportation)* | | | 449,904 | |
| | 2,361 | | | Partners Group Holding AG (Diversified Financials) | | | 449,335 | |
| | 4,404 | | | Sulzer AG (Registered) (Capital Goods) | | | 634,262 | |
| | | | | | | | |
| | | | | | | 3,976,011 | |
| | |
| United Kingdom – 19.0% | |
| | 68,430 | | | Abcam PLC (Pharmaceuticals, Biotechnology & Life Sciences) | | | 411,073 | |
| | 164,096 | | | Aberdeen Asset Management PLC (Diversified Financials) | | | 755,249 | |
| | 99,560 | | | Ashmore Group PLC (Diversified Financials) | | | 618,346 | |
| | 14,887 | | | ASOS PLC (Retailing)* | | | 357,231 | |
| | |
| | | | | | | | |
Shares | | | Description | | Value | |
| | | | | | | | |
| | Common Stocks – (continued) | |
| United Kingdom – (continued) | |
| | 88,480 | | | AZ Electronic Materials SA (Materials) | | $ | 457,328 | |
| | 91,456 | | | Britvic PLC (Food, Beverage & Tobacco) | | | 567,430 | |
| | 34,613 | | | Close Brothers Group PLC (Diversified Financials) | | | 414,345 | |
| | 16,749 | | | Croda International PLC (Materials) | | | 606,628 | |
| | 16,134 | | | Derwent London PLC (REIT) | | | 456,211 | |
| | 150,289 | | | GKN PLC (Automobiles & Components) | | | 497,077 | |
| | 80,470 | | | Greene King PLC (Consumer Services) | | | 666,835 | |
| | 73,763 | | | Halfords Group PLC (Retailing) | | | 329,399 | |
| | 39,554 | | | Hikma Pharmaceuticals PLC (Pharmaceuticals, Biotechnology & Life Sciences) | | | 403,185 | |
| | 23,250 | | | Intercontinental Hotels Group PLC (Consumer Services) | | | 554,370 | |
| | 43,878 | | | Jardine Lloyd Thompson Group PLC (Insurance) | | | 500,724 | |
| | 259,825 | | | Metric Property Investments PLC (REIT) | | | 377,395 | |
| | 41,952 | | | Pennon Group PLC (Utilities) | | | 500,903 | |
| | 59,291 | | | Persimmon PLC (Consumer Durables & Apparel) | | | 604,723 | |
| | 74,309 | | | Rexam PLC (Materials) | | | 518,713 | |
| | 16,797 | | | Rotork PLC (Capital Goods) | | | 601,846 | |
| | 54,744 | | | Telecity Group PLC (Software & Services)* | | | 717,492 | |
| | 47,952 | | | Travis Perkins PLC (Capital Goods) | | | 818,098 | |
| | 25,857 | | | Victrex PLC (Materials) | | | 609,319 | |
| | 24,672 | | | Virgin Media, Inc. (Media) | | | 605,944 | |
| | | | | | | | |
| | | | | | | 12,949,864 | |
| | |
| | TOTAL COMMON STOCKS | | | | |
| | (Cost $63,011,621) | | $ | 64,451,580 | |
| | |
| | | | | | | | |
| | Exchange Traded Fund – 0.5% | |
| Israel – 0.5% | |
| | 7,225 | | | iShares MSCI Israel Capped Index Fund | | $ | 315,444 | |
| | (Cost $331,338) | | | | |
| | |
| | TOTAL INVESTMENTS – 95.0% | | | | |
| | (Cost $63,342,959) | | $ | 64,767,024 | |
| | |
| OTHER ASSETS IN EXCESS OF
LIABILITIES – 5.0% | | | 3,440,883 | |
| | |
| | NET ASSETS – 100.0% | | $ | 68,207,907 | |
| | |
| | |
| The percentage shown for each investment category reflects the value of investments in that category as a percentage of net assets. |
* | | Non-income producing security. |
(a) | | All or a portion of security is segregated as collateral for initial margin requirements on futures transactions. |
| | |
|
Investment Abbreviations: |
CVA | | —Dutch Certification |
REIT | | —Real Estate Investment Trust |
|
| | |
| 26 | | The accompanying notes are an integral part of these financial statements. |
GOLDMAN SACHS INTERNATIONAL SMALL CAP FUND
|
| ADDITIONAL INVESTMENT INFORMATION |
FUTURES CONTRACTS — At April 30, 2012, the Fund had the following futures contracts:
| | | | | | | | | | | | | | |
| Type | | Number of
Contracts
Long (Short) | | | Expiration
Date | | Current
Value | | | Unrealized
Gain (Loss) | |
MSCI Singapore Index | | | 12 | | | May 2012 | | $ | 660,945 | | | $ | 3,231 | |
Dow Jones STOXX Small 200 Index | | | 124 | | | June 2012 | | | 1,367,276 | | | | 10,312 | |
| TOTAL | | | | | | | | | | | | $ | 13,543 | |
| | |
| The accompanying notes are an integral part of these financial statements. | | 27 |
GOLDMAN SACHS STRATEGIC INTERNATIONAL EQUITY FUND
Schedule of Investments
April 30, 2012 (Unaudited)
| | | | | | | | |
Shares | | | Description | | Value | |
| | | | | | | | |
| | Common Stocks – 96.2% | |
| Australia – 3.1% | |
| | 180,075 | | | QR National Ltd. (Transportation) | | $ | 679,523 | |
| | 48,300 | | | Westpac Banking Corp. (Banks) | | | 1,138,249 | |
| | | | | | | | |
| | | | | | | 1,817,772 | |
| | |
| Belgium – 1.4% | |
| | 17,447 | | | UCB SA (Pharmaceuticals, Biotechnology & Life Sciences) | | | 815,827 | |
| | |
| Bermuda – 0.5% | |
| | 44,316 | | | Hiscox Ltd. (Insurance) | | | 286,613 | |
| | |
| Brazil – 0.7% | |
| | 65,255 | | | Magazine Luiza SA (Retailing)* | | | 389,582 | |
| | |
| China – 0.5% | |
| | 457,000 | | | China Citic Bank Corp. Ltd.
Class H (Banks) | | | 289,565 | |
| | |
| Czech Republic – 0.7% | |
| | 10,223 | | | CEZ AS (Utilities) | | | 412,218 | |
| | |
| Finland – 0.8% | |
| | 8,235 | | | Outotec OYJ (Capital Goods) | | | 443,456 | |
| | |
| France – 8.9% | |
| | 4,146 | | | Air Liquide SA (Materials) | | | 533,288 | |
| | 4,161 | | | Air Liquide SA — Prime De Fidelite (Materials)* | | | 535,217 | |
| | 10,971 | | | Compagnie Generale de Geophysique-Veritas (Energy)* | | | 314,624 | |
| | 39,558 | | | EDF SA (Utilities) | | | 838,074 | |
| | 5,406 | | | Remy Cointreau SA (Food, Beverage & Tobacco) | | | 602,881 | |
| | 18,584 | | | Safran SA (Capital Goods) | | | 688,815 | |
| | 32,870 | | | Societe Generale SA (Banks) | | | 778,172 | |
| | 18,821 | | | Total SA (Energy) | | | 903,476 | |
| | | | | | | | |
| | | | | | | 5,194,547 | |
| | |
| Germany – 6.4% | |
| | 14,550 | | | Bayer AG (Registered) (Pharmaceuticals, Biotechnology & Life Sciences) | | | 1,025,250 | |
| | 3,956 | | | Brenntag AG (Capital Goods) | | | 492,833 | |
| | 24,090 | | | Deutsche Bank AG (Registered) (Diversified Financials) | | | 1,045,821 | |
| | 9,677 | | | K+S AG (Registered) (Materials) | | | 483,674 | |
| | 4,294 | | | Kabel Deutschland Holding AG (Media)* | | | 270,707 | |
| | 15,972 | | | ThyssenKrupp AG (Materials) | | | 378,781 | |
| | | | | | | | |
| | | | | | | 3,697,066 | |
| | |
| Hong Kong – 2.0% | |
| | 96,641 | | | AIA Group Ltd. (Insurance) | | | 342,000 | |
| | 250,000 | | | Belle International Holdings Ltd. (Retailing) | | | 487,809 | |
| | 100,000 | | | China Mengniu Dairy Co. Ltd. (Food, Beverage & Tobacco) | | | 307,860 | |
| | | | | | | | |
| | | | | | | 1,137,669 | |
| | |
| | | | | | | | |
Shares | | | Description | | Value | |
| | | | | | | | |
| | Common Stocks – (continued) | |
| Ireland – 2.4% | |
| | 12,965 | | | Kerry Group PLC Class A (Food, Beverage & Tobacco) | | $ | 592,096 | |
| | 25,213 | | | Shire PLC (Pharmaceuticals, Biotechnology & Life Sciences) | | | 821,758 | |
| | | | | | | | |
| | | | | | | 1,413,854 | |
| | |
| Italy – 2.0% | |
| | 51,527 | | | ENI SpA (Energy) | | | 1,144,920 | |
| | |
| Japan – 20.4% | |
| | 4,400 | | | FANUC Corp. (Capital Goods) | | | 742,062 | |
| | 26,200 | | | Hitachi High-Technologies Corp. (Technology Hardware & Equipment) | | | 658,398 | |
| | 128 | | | Japan Tobacco, Inc. (Food, Beverage & Tobacco) | | | 709,080 | |
| | 39,900 | | | JS Group Corp. (Capital Goods) | | | 783,493 | |
| | 129,000 | | | Kubota Corp. (Capital Goods) | | | 1,245,254 | |
| | 103,000 | | | Mitsubishi Electric Corp. (Capital Goods) | | | 904,813 | |
| | 48,000 | | | Mitsubishi Estate Co. Ltd. (Real Estate) | | | 848,561 | |
| | 76,500 | | | Mitsui & Co. Ltd. (Capital Goods) | | | 1,194,594 | |
| | 5,500 | | | Nidec Corp. (Capital Goods) | | | 494,268 | |
| | 4,000 | | | Nintendo Co. Ltd. (Software & Services) | | | 539,936 | |
| | 17,000 | | | Nippon Telegraph & Telephone Corp. (Telecommunication Services) | | | 769,176 | |
| | 27,600 | | | Seven & I Holdings Co. Ltd. (Food & Staples Retailing) | | | 835,457 | |
| | 46,000 | | | Sumitomo Mitsui Financial Group, Inc. (Banks) | | | 1,471,944 | |
| | 143,000 | | | Tokyo Gas Co. Ltd. (Utilities) | | | 690,061 | |
| | | | | | | | |
| | | | | | | 11,887,097 | |
| | |
| Netherlands – 2.7% | |
| | 86 | | | Royal Dutch Shell PLC Class A (Energy) | | | 3,067 | |
| | 7,437 | | | Royal Dutch Shell PLC Class B (Energy) | | | 272,154 | |
| | 26,786 | | | Unilever NV CVA (Food, Beverage & Tobacco) | | | 917,536 | |
| | 12,680 | | | Ziggo NV (Telecommunication Services)* | | | 398,800 | |
| | | | | | | | |
| | | | | | | 1,591,557 | |
| | |
| Russia – 1.0% | |
| | 16,030 | | | Globaltrans Investment PLC GDR (Transportation) | | | 313,973 | |
| | 4,636 | | | OAO Lukoil ADR (Energy) | | | 285,212 | |
| | | | | | | | |
| | | | | | | 599,185 | |
| | |
| South Korea – 2.2% | |
| | 10,230 | | | Kia Motors Corp. (Automobiles & Components) | | | 750,667 | |
| | 421 | | | Samsung Electronics Co. Ltd. (Semiconductors & Semiconductor Equipment) | | | 515,288 | |
| | | | | | | | |
| | | | | | | 1,265,955 | |
| | |
| | |
| 28 | | The accompanying notes are an integral part of these financial statements. |
GOLDMAN SACHS STRATEGIC INTERNATIONAL EQUITY FUND
| | | | | | | | |
Shares | | | Description | | Value | |
| | | | | | | | |
| | Common Stocks – (continued) | |
| Sweden – 3.7% | |
| | 55,856 | | | Scania AB Class B (Capital Goods) | | $ | 1,141,417 | |
| | 104,926 | | | Telefonaktiebolaget LM Ericsson Class B (Technology Hardware & Equipment)* | | | 1,040,180 | |
| | | | | | | | |
| | | | | | | 2,181,597 | |
| | |
| Switzerland – 12.9% | |
| | 11,942 | | | Aryzta AG (Food, Beverage & Tobacco)* | | | 601,549 | |
| | 14,931 | | | Julius Baer Group Ltd. (Diversified Financials)* | | | 572,329 | |
| | 35,311 | | | Novartis AG (Registered) (Pharmaceuticals, Biotechnology & Life Sciences) | | | 1,949,741 | |
| | 2,302 | | | Partners Group Holding AG (Diversified Financials) | | | 438,107 | |
| | 3,928 | | | Roche Holding AG (Pharmaceuticals, Biotechnology & Life Sciences) | | | 717,883 | |
| | 3,981 | | | Schindler Holding AG (Capital Goods) | | | 515,211 | |
| | 3,361 | | | Sulzer AG (Registered) (Capital Goods) | | | 484,049 | |
| | 17,615 | | | Temenos Group AG (Registered) (Software & Services)* | | | 330,205 | |
| | 74,528 | | | UBS AG (Registered) (Diversified Financials)* | | | 930,720 | |
| | 10,921 | | | Wolseley PLC (Capital Goods) | | | 415,780 | |
| | 2,321 | | | Zurich Insurance Group AG (Insurance)* | | | 568,652 | |
| | | | | | | | |
| | | | | | | 7,524,226 | |
| | |
| United Kingdom – 23.9% | |
| | 72,847 | | | Abcam PLC (Pharmaceuticals, Biotechnology & Life Sciences) | | | 437,607 | |
| | 18,214 | | | ASOS PLC (Retailing)* | | | 437,066 | |
| | 31,816 | | | BG Group PLC (Energy) | | | 750,705 | |
| | 201,300 | | | BP PLC (Energy) | | | 1,454,212 | |
| | 225,679 | | | HSBC Holdings PLC (Banks) | | | 2,037,244 | |
| | 26,068 | | | Imperial Tobacco Group PLC (Food, Beverage & Tobacco) | | | 1,042,471 | |
| | 105,124 | | | Inmarsat PLC (Telecommunication Services) | | | 750,135 | |
| | 116,670 | | | Marks & Spencer Group PLC (Retailing) | | | 676,193 | |
| | 194,839 | | | Reed Elsevier PLC (Media) | | | 1,612,304 | |
| | 20,976 | | | Rio Tinto PLC (Materials) | | | 1,175,805 | |
| | 1,093,854 | | | Royal Bank of Scotland Group PLC (Banks)* | | | 431,532 | |
| | 30,960 | | | Tullow Oil PLC (Energy) | | | 772,406 | |
| | 34,187 | | | Victrex PLC (Materials) | | | 805,615 | |
| | 557,708 | | | Vodafone Group PLC (Telecommunication Services) | | | 1,543,714 | |
| | | | | | | | |
| | | | | | | 13,927,009 | |
| | |
| | TOTAL COMMON STOCKS | |
| | (Cost $52,064,931) | | $ | 56,019,715 | |
| | |
| | | | | | | | |
Shares | | | Description | | Value | |
| | | | | | | | |
| | Exchange Traded Fund – 3.5% | |
| Australia – 3.5% | |
| | 86,004 | | | iShares MSCI Australia Index Fund | | $ | 2,050,335 | |
| | (Cost $1,257,855) | |
| | |
| | TOTAL INVESTMENTS – 99.7% | | | | |
| | (Cost $53,322,786) | | $ | 58,070,050 | |
| | |
| OTHER ASSETS IN EXCESS OF
LIABILITIES – 0.3% | | | 175,872 | |
| | |
| | NET ASSETS – 100.0% | | $ | 58,245,922 | |
| | |
| | |
| The percentage shown for each investment category reflects the value of investments in that category as a percentage of net assets. |
* | | Non-income producing security. |
| | |
|
Investment Abbreviations: |
ADR | | —American Depositary Receipt |
CVA | | —Dutch Certification |
GDR | | —Global Depositary Receipt |
|
| | |
| The accompanying notes are an integral part of these financial statements. | | 29 |
GOLDMAN SACHS FUNDAMENTAL INTERNATIONAL EQUITY FUNDS
Statements of Assets and Liabilities
April 30, 2012 (Unaudited)
| | | | | | | | | | | | | | |
| | | | | Concentrated
International
Equity Fund | | | International
Small Cap
Fund | | | Strategic
International
Equity Fund | |
| | Assets: | | | | | | | | | | | | |
| | Investments, at value (cost $138,471,036, $63,342,959 and $53,322,786) | | $ | 137,020,611 | | | $ | 64,767,024 | | | $ | 58,070,050 | |
| | Cash | | | 1,015,689 | | | | 2,630,352 | | | | 58,871 | |
| | Foreign currencies, at value (cost $117,647, $271,580 and $103,949) | | | 120,316 | | | | 265,392 | | | | 104,432 | |
| | Receivables: | | | | | | | | | | | | |
| | Investments sold | | | — | | | | 606,309 | | | | 1,582,067 | |
| | Dividends | | | 754,179 | | | | 238,474 | | | | 278,493 | |
| | Foreign tax reclaims | | | 305,942 | | | | 40,339 | | | | 103,345 | |
| | Fund shares sold | | | 20,463 | | | | 151,184 | | | | 10,929 | |
| | Reimbursement from investment adviser | | | 16,588 | | | | 26,792 | | | | 8,078 | |
| | Due from custodian | | | — | | | | 202,407 | | | | — | |
| | Other assets | | | 82,135 | | | | 44,365 | | | | 332 | |
| | Total assets | | | 139,335,923 | | | | 68,972,638 | | | | 60,216,597 | |
| | | | | | | | | | | | | | |
| | Liabilities: | | | | | | | | | | | | |
| | Payables: | | | | | | | | | | | | |
| | Investments purchased | | | — | | | | 537,609 | | | | 1,734,763 | |
| | Fund shares redeemed | | | 492,171 | | | | 23,217 | | | | 45,424 | |
| | Amounts owed to affiliates | | | 159,015 | | | | 71,674 | | | | 65,357 | |
| | Futures variation margin | | | — | | | | 3,908 | | | | — | |
| | Accrued expenses | | | 132,006 | | | | 128,323 | | | | 125,131 | |
| | Total liabilities | | | 783,192 | | | | 764,731 | | | | 1,970,675 | |
| | | | | | | | | | | | | | |
| | Net Assets: | | | | | | | | | | | | |
| | Paid-in capital | | | 382,082,080 | | | | 103,967,270 | | | | 112,124,418 | |
| | Undistributed net investment income | | | 1,233,743 | | | | 112,536 | | | | 151,365 | |
| | Accumulated net realized loss | | | (243,356,528 | ) | | | (37,303,520 | ) | | | (58,790,510 | ) |
| | Net unrealized gain (loss) | | | (1,406,564 | ) | | | 1,431,621 | | | | 4,760,649 | |
| | | NET ASSETS | | $ | 138,552,731 | | | $ | 68,207,907 | | | $ | 58,245,922 | |
| | | Net Assets: | | | | | | | | | | | | |
| | | Class A | | $ | 98,698,128 | | | $ | 23,161,996 | | | $ | 42,268,265 | |
| | | Class B | | | 978,378 | | | | 509,750 | | | | 3,734,269 | |
| | | Class C | | | 14,693,142 | | | | 2,138,713 | | | | 5,910,243 | |
| | | Institutional | | | 23,878,831 | | | | 41,497,757 | | | | 6,264,934 | |
| | | Service | | | 287,458 | | | | 785,701 | | | | — | |
| | | Class IR | | | 16,794 | | | | 113,990 | | | | 61,330 | |
| | | Class R | | | — | | | | — | | | | 6,881 | |
| | | Total Net Assets | | $ | 138,552,731 | | | $ | 68,207,907 | | | $ | 58,245,922 | |
| | | Shares outstanding $0.001 par value (unlimited shares authorized): | | | | | | | | | | | | |
| | | Class A | | | 6,587,392 | | | | 1,553,817 | | | | 3,912,783 | |
| | | Class B | | | 65,961 | | | | 34,722 | | | | 385,492 | |
| | | Class C | | | 1,042,641 | | | | 148,241 | | | | 602,320 | |
| | | Institutional | | | 1,563,106 | | | | 2,703,002 | | | | 555,302 | |
| | | Service | | | 19,043 | | | | 53,195 | | | | — | |
| | | Class IR | | | 1,102 | | | | 7,426 | | | | 5,659 | |
| | | Class R | | | — | | | | — | | | | 632 | |
| | | Net asset value, offering and redemption price per share:(a) | | | | | | | | | | | | |
| | | Class A | | | $14.98 | | | | $14.91 | | | | $10.80 | |
| | | Class B | | | 14.83 | | | | 14.68 | | | | 9.69 | |
| | | Class C | | | 14.09 | | | | 14.43 | | | | 9.81 | |
| | | Institutional | | | 15.28 | | | | 15.35 | | | | 11.28 | |
| | | Service | | | 15.09 | | | | 14.77 | | | | — | |
| | | Class IR | | | 15.24 | | | | 15.35 | | | | 10.84 | |
| | | Class R | | | — | | | | — | | | | 10.90 | |
| | (a) | | Maximum public offering price per share for Class A Shares of the Concentrated International Equity, International Small Cap and Strategic International Equity Funds is $15.85, $15.78 and $11.43, respectively. At redemption, Class B and Class C Shares may be subject to a contingent deferred sales charge assessed on the amount equal to the lesser of the current NAV or the original purchase price of the shares. |
| | |
| 30 | | The accompanying notes are an integral part of these financial statements. |
GOLDMAN SACHS FUNDAMENTAL INTERNATIONAL EQUITY FUNDS
Statements of Operations
For the Six Months Ended April 30, 2012 (Unaudited)
| | | | | | | | | | | | | | |
| | | | | Concentrated
International
Equity Fund | | | International
Small Cap
Fund | | | Strategic
International
Equity Fund | |
| | Investment income: | | | | | | | | | | | | |
| | Dividends (net of foreign taxes withheld of $137,169, $51,582 and $60,260) | | $ | 2,327,254 | | | $ | 641,519 | | | $ | 911,752 | |
| | Interest | | | 3,057 | | | | 145 | | | | 1,750 | |
| | Total investment income | | | 2,330,311 | | | | 641,664 | | | | 913,502 | |
| | | | | | | | | | | | | | |
| | Expenses: | | | | | | | | | | | | |
| | Management fees | | | 734,563 | | | | 343,591 | | | | 239,566 | |
| | Distribution and Service fees(a) | | | 211,770 | | | | 40,110 | | | | 100,485 | |
| | Transfer Agent fees(a) | | | 120,329 | | | | 30,767 | | | | 48,975 | |
| | Custody and accounting fees | | | 56,465 | | | | 74,991 | | | | 60,182 | |
| | Professional fees | | | 44,498 | | | | 47,910 | | | | 51,809 | |
| | Registration fees | | | 35,644 | | | | 39,709 | | | | 35,366 | |
| | Printing and mailing costs | | | 31,215 | | | | 21,848 | | | | 23,256 | |
| | Trustee fees | | | 7,813 | | | | 7,727 | | | | 7,723 | |
| | Service share fees — Service Plan | | | 365 | | | | 915 | | | | — | |
| | Service share fees — Shareholder Administration Plan | | | 365 | | | | 915 | | | | — | |
| | Other | | | 19,230 | | | | 30,695 | | | | 12,916 | |
| | Total expenses | | | 1,262,257 | | | | 639,178 | | | | 580,278 | |
| | Less — expense reductions | | | (165,855 | ) | | | (210,142 | ) | | | (146,535 | ) |
| | Net expenses | | | 1,096,402 | | | | 429,036 | | | | 433,743 | |
| | NET INVESTMENT INCOME | | | 1,233,909 | | | | 212,628 | | | | 479,759 | |
| | | | | | | | | | | | | | |
| | Realized and unrealized gain (loss): | | | | | | | | | | | | |
| | Net realized gain (loss) from: | | | | | | | | | | | | |
| | Investments | | | (12,691,973 | ) | | | (1,554,592 | ) | | | (1,201,041 | ) |
| | Futures contracts | | | (657,896 | ) | | | 47,551 | | | | (65,685 | ) |
| | Foreign currency transactions | | | (750,798 | ) | | | (13,837 | ) | | | (83,473 | ) |
| | Net change in unrealized gain (loss) on: | | | | | | | | | | | | |
| | Investments | | | 18,319,103 | | | | 6,353,159 | | | | 3,873,986 | |
| | Futures contracts | | | (92,831 | ) | | | (3,098 | ) | | | (85,165 | ) |
| | Foreign currency translation | | | 274,822 | | | | (877 | ) | | | 95,225 | |
| | Net realized and unrealized gain | | | 4,400,427 | | | | 4,828,306 | | | | 2,533,847 | |
| | NET INCREASE IN NET ASSETS RESULTING FROM OPERATIONS | | $ | 5,634,336 | | | $ | 5,040,934 | | | $ | 3,013,606 | |
| | (a) | | Class specific Distribution and Service, and Transfer Agent fees were as follows: |
| | | | | | | | | | | | | | | | | | | | | | | | | | | | | | | | | | | | | | | | | | | | |
| | | Distribution and Service Fees | | | Transfer Agent Fees | |
Fund | | Class A | | | Class B | | | Class C | | | Class R | | | Class A | | | Class B | | | Class C | | | Institutional | | | Service | | | Class IR | | | Class R | |
Concentrated International Equity | | $ | 131,479 | | | $ | 5,359 | | | $ | 74,932 | | | $ | — | | | $ | 99,925 | | | $ | 1,018 | | | $ | 14,237 | | | $ | 5,072 | | | $ | 58 | | | $ | 19 | | | $ | — | |
International Small Cap | | | 27,071 | | | | 2,702 | | | | 10,337 | | | | — | | | | 20,575 | | | | 513 | | | | 1,964 | | | | 7,475 | | | | 147 | | | | 93 | | | | — | |
Strategic International Equity | | | 50,186 | | | | 19,793 | | | | 30,490 | | | | 16 | | | | 38,142 | | | | 3,761 | | | | 5,793 | | | | 1,220 | | | | — | | | | 53 | | | | 6 | |
| | |
| The accompanying notes are an integral part of these financial statements. | | 31 |
GOLDMAN SACHS FUNDAMENTAL INTERNATIONAL EQUITY FUNDS
Statements of Changes in Net Assets
| | | | | | | | | | |
| | | | | Concentrated International Equity Fund | |
| | | | | For the
Six Months Ended
April 30, 2012
(Unaudited) | | | For the Fiscal
Year Ended
October 31, 2011 | |
| | From operations: | | | | | | | | |
| | Net investment income | | $ | 1,233,909 | | | $ | 5,239,266 | |
| | Net realized gain (loss) | | | (14,100,667 | ) | | | (8,551,365 | ) |
| | Net change in unrealized gain (loss) | | | 18,501,094 | | | | (17,063,441 | ) |
| | Net increase (decrease) in net assets resulting from operations | | | 5,634,336 | | | | (20,375,540 | ) |
| | | | | | | | | | |
| | Distributions to shareholders: | | | | | | | | |
| | From net investment income | | | | | | | | |
| | Class A Shares | | | (3,633,195 | ) | | | (2,598,525 | ) |
| | Class B Shares | | | (25,585 | ) | | | (12,499 | ) |
| | Class C Shares | | | (397,748 | ) | | | (212,625 | ) |
| | Institutional Shares | | | (1,037,106 | ) | | | (732,671 | ) |
| | Service Shares | | | (9,638 | ) | | | (4,981 | ) |
| | Class IR Shares | | | (1,281 | ) | | | (23 | ) |
| | Class R Shares | | | — | | | | — | |
| | Total distributions to shareholders | | | (5,104,553 | ) | | | (3,561,324 | ) |
| | | | | | | | | | |
| | From share transactions: | | | | | | | | |
| | Proceeds from sales of shares | | | 6,749,276 | | | | 26,461,691 | |
| | Reinvestment of distributions | | | 4,902,449 | | | | 3,123,196 | |
| | Cost of shares redeemed | | | (39,125,168 | ) | | | (62,408,092 | ) |
| | Net increase (decrease) in net assets resulting from share transactions | | | (27,473,443 | ) | | | (32,823,205 | ) |
| | Increase from regulatory settlements | | | 1,002,638 | | | | — | |
| | Net increase (decrease) in net assets resulting from capital transactions | | | (26,470,805 | ) | | | (32,823,205 | ) |
| | TOTAL INCREASE (DECREASE) | | | (25,941,022 | ) | | | (56,760,069 | ) |
| | | | | | | | | | |
| | Net assets: | | | | | | | | |
| | Beginning of period | | | 164,493,753 | | | | 221,253,822 | |
| | End of period | | $ | 138,552,731 | | | $ | 164,493,753 | |
| | Undistributed net investment income | | $ | 1,233,743 | | | $ | 5,104,387 | |
| | |
| 32 | | The accompanying notes are an integral part of these financial statements. |
GOLDMAN SACHS FUNDAMENTAL INTERNATIONAL EQUITY FUNDS
| | | | | | | | | | | | | | | | | | | | | | |
| | | International Small Cap Fund | | | | | Strategic International Equity Fund | |
| | | For the
Six Months Ended
April 30, 2012
(Unaudited) | | | | | For the Fiscal
Year Ended
October 31, 2011 | | | | | For the
Six Months Ended
April 30, 2012
(Unaudited) | | | | | For the Fiscal
Year Ended
October 31, 2011 | |
| | | | | | | | | | | | | | | | | | | | | | |
| | $ | 212,628 | | | | | $ | 915,679 | | | | | $ | 479,759 | | | | | $ | 1,852,441 | |
| | | (1,520,878 | ) | | | | | 13,655,348 | | | | | | (1,350,199 | ) | | | | | 6,448,236 | |
| | | 6,349,184 | | | | | | (11,649,653 | ) | | | | | 3,884,046 | | | | | | (13,480,768 | ) |
| | | 5,040,934 | | | | | | 2,921,374 | | | | | | 3,013,606 | | | | | | (5,180,091 | ) |
| | | | | | | | | | | | | | | | | | | | | | |
| | | | | | | | | | | | | | | | | | | | | | |
| | | | | | | | | | | | | | | | | | | | | | |
| | | (369,815 | ) | | | | | (435,730 | ) | | | | | (1,361,342 | ) | | | | | (621,039 | ) |
| | | (4,225 | ) | | | | | (8,519 | ) | | | | | (133,041 | ) | | | | | (19,857 | ) |
| | | (20,832 | ) | | | | | (23,645 | ) | | | | | (195,805 | ) | | | | | (30,374 | ) |
| | | (802,770 | ) | | | | | (1,971,757 | ) | | | | | (240,702 | ) | | | | | (285,469 | ) |
| | | (14,688 | ) | | | | | (7,243 | ) | | | | | — | | | | | | — | |
| | | (2,360 | ) | | | | | (23 | ) | | | | | (2,189 | ) | | | | | (69 | ) |
| | | — | | | | | | — | | | | | | (142 | ) | | | | | (183 | ) |
| | | (1,214,690 | ) | | | | | (2,446,917 | ) | | | | | (1,933,221 | ) | | | | | (956,991 | ) |
| | | | | | | | | | | | | | | | | | | | | | |
| | | | | | | | | | | | | | | | | | | | | | |
| | | 7,714,403 | | | | | | 47,141,472 | | | | | | 6,354,449 | | | | | | 12,282,038 | |
| | | 1,125,734 | | | | | | 2,330,163 | | | | | | 1,879,700 | | | | | | 881,245 | |
| | | (6,636,103 | ) | | | | | (103,857,746 | ) | | | | | (10,395,092 | ) | | | | | (45,389,431 | ) |
| | | 2,204,034 | | | | | | (54,386,111 | ) | | | | | (2,160,943 | ) | | | | | (32,226,148 | ) |
| | | 21,131 | | | | | | — | | | | | | — | | | | | | — | |
| | | 2,225,165 | | | | | | (54,386,111 | ) | | | | | (2,160,943 | ) | | | | | (32,226,148 | ) |
| | | 6,051,409 | | | | | | (53,911,654 | ) | | | | | (1,080,558 | ) | | | | | (38,363,230 | ) |
| | | | | | | | | | | | | | | | | | | | | | |
| | | | | | | | | | | | | | | | | | | | | | |
| | | 62,156,498 | | | | | | 116,068,152 | | | | | | 59,326,480 | | | | | | 97,689,710 | |
| | $ | 68,207,907 | | | | | $ | 62,156,498 | | | | | $ | 58,245,922 | | | | | $ | 59,326,480 | |
| | $ | 112,536 | | | | | $ | 1,114,598 | | | | | $ | 151,365 | | | | | $ | 1,604,827 | |
| | |
| The accompanying notes are an integral part of these financial statements. | | 33 |
GOLDMAN SACHS CONCENTRATED INTERNATIONAL EQUITY FUND
Financial Highlights
Selected Data for a Share Outstanding Throughout Each Period
| | | | | | | | | | | | | | | | | | | | | | | | | | |
| | | | | | | | Income (loss) from
investment operations | | | | | | | |
| | | Year - Share Class | | Net asset
value,
beginning
of period | | | Net
investment
income (loss)(a) | | | Net realized
and unrealized
gain (loss) | | | Total from
investment
operations | | | Distributions
to shareholders
from net
investment
income | | | Increase from
regulatory
settlements | |
| | FOR THE SIX MONTHS ENDED APRIL 30, (UNAUDITED) | |
| | 2012 - A | | $ | 14.74 | | | $ | 0.12 | | | $ | 0.49 | | | $ | 0.61 | | | $ | (0.47 | ) | | $ | 0.10 | |
| | 2012 - B | | | 14.48 | | | | 0.06 | | | | 0.50 | | | | 0.56 | | | | (0.31 | ) | | | 0.10 | |
| | 2012 - C | | | 13.82 | | | | 0.07 | | | | 0.45 | | | | 0.52 | | | | (0.35 | ) | | | 0.10 | |
| | 2012 - Institutional | | | 15.07 | | | | 0.15 | | | | 0.50 | | | | 0.65 | | | | (0.54 | ) | | | 0.10 | |
| | 2012 - Service | | | 14.85 | | | | 0.12 | | | | 0.48 | | | | 0.60 | | | | (0.46 | ) | | | 0.10 | |
| | 2012 - IR | | | 15.06 | | | | 0.13 | | | | 0.50 | | | | 0.63 | | | | (0.55 | ) | | | 0.10 | |
| | | | | | | | | | | | | | | | | | | | | | | | | | |
| | FOR THE FISCAL YEARS ENDED OCTOBER 31, | |
| | 2011 - A | | | 16.81 | | | | 0.42 | (e) | | | (2.22 | ) | | | (1.80 | ) | | | (0.27 | ) | | | — | |
| | 2011 - B | | | 16.46 | | | | 0.28 | (e) | | | (2.15 | ) | | | (1.87 | ) | | | (0.11 | ) | | | — | |
| | 2011 - C | | | 15.79 | | | | 0.29 | (e) | | | (2.09 | ) | | | (1.80 | ) | | | (0.17 | ) | | | — | |
| | 2011 - Institutional | | | 17.18 | | | | 0.50 | (e) | | | (2.27 | ) | | | (1.77 | ) | | | (0.34 | ) | | | — | |
| | 2011 - Service | | | 16.92 | | | | 0.42 | (e) | | | (2.24 | ) | | | (1.82 | ) | | | (0.25 | ) | | | — | |
| | 2011 - IR | | | 17.22 | | | | 0.63 | (e) | | | (2.45 | ) | | | (1.82 | ) | | | (0.34 | ) | | | — | |
| | 2010 - A | | | 15.22 | | | | 0.10 | | | | 1.79 | | | | 1.89 | | | | (0.30 | ) | | | — | |
| | 2010 - B | | | 14.90 | | | | (0.01 | ) | | | 1.74 | | | | 1.73 | | | | (0.17 | ) | | | — | |
| | 2010 - C | | | 14.35 | | | | (0.02 | ) | | | 1.69 | | | | 1.67 | | | | (0.23 | ) | | | — | |
| | 2010 - Institutional | | | 15.55 | | | | 0.16 | | | | 1.82 | | | | 1.98 | | | | (0.35 | ) | | | — | |
| | 2010 - Service | | | 15.32 | | | | 0.08 | | | | 1.80 | | | | 1.88 | | | | (0.28 | ) | | | — | |
| | 2010 - IR (Commenced August 31, 2010) | | | 15.13 | | | | 0.02 | | | | 2.07 | | | | 2.09 | | | | — | | | | — | |
| | 2009 - A | | | 13.18 | | | | 0.21 | | | | 2.41 | | | | 2.62 | | | | (0.75 | ) | | | 0.17 | |
| | 2009 - B | | | 12.72 | | | | 0.12 | | | | 2.36 | | | | 2.48 | | | | (0.47 | ) | | | 0.17 | |
| | 2009 - C | | | 12.40 | | | | 0.10 | | | | 2.29 | | | | 2.39 | | | | (0.61 | ) | | | 0.17 | |
| | 2009 - Institutional | | | 13.50 | | | | 0.26 | | | | 2.48 | | | | 2.74 | | | | (0.86 | ) | | | 0.17 | |
| | 2009 - Service | | | 13.28 | | | | 0.19 | | | | 2.43 | | | | 2.62 | | | | (0.75 | ) | | | 0.17 | |
| | | | | | | | | | | | | | | | | | | | | | | | | | |
| | FOR THE PERIOD SEPTEMBER 1, 2008 TO OCTOBER 31, 2008* | |
| | 2008 - A | | | 19.40 | | | | — | (f) | | | (6.22 | ) | | | (6.22 | ) | | | — | | | | — | |
| | 2008 - B | | | 18.75 | | | | (0.02 | ) | | | (6.01 | ) | | | (6.03 | ) | | | — | | | | — | |
| | 2008 - C | | | 18.28 | | | | (0.02 | ) | | | (5.86 | ) | | | (5.88 | ) | | | — | | | | — | |
| | 2008 - Institutional | | | 19.87 | | | | 0.01 | | | | (6.38 | ) | | | (6.37 | ) | | | — | | | | — | |
| | 2008 - Service | | | 19.55 | | | | — | (f) | | | (6.27 | ) | | | (6.27 | ) | | | — | | | | — | |
| | | | | | | | | | | | | | | | | | | | | | | | | | |
| | FOR THE FISCAL YEARS ENDED AUGUST 31, | |
| | 2008 - A | | | 24.04 | | | | 0.44 | (g) | | | (4.89 | ) | | | (4.45 | ) | | | (0.28 | ) | | | 0.09 | |
| | 2008 - B | | | 23.19 | | | | 0.21 | (g) | | | (4.71 | ) | | | (4.50 | ) | | | (0.03 | ) | | | 0.09 | |
| | 2008 - C | | | 22.68 | | | | 0.26 | (g) | | | (4.63 | ) | | | (4.37 | ) | | | (0.12 | ) | | | 0.09 | |
| | 2008 - Institutional | | | 24.61 | | | | 0.58 | (g) | | | (5.03 | ) | | | (4.45 | ) | | | (0.38 | ) | | | 0.09 | |
| | 2008 - Service | | | 24.17 | | | | 0.41 | (g) | | | (4.93 | ) | | | (4.52 | ) | | | (0.19 | ) | | | 0.09 | |
| | 2007 - A | | | 21.05 | | | | 0.24 | | | | 2.91 | | | | 3.15 | | | | (0.16 | ) | | | — | |
| | 2007 - B | | | 20.32 | | | | 0.05 | | | | 2.82 | | | | 2.87 | | | | — | | | | — | |
| | 2007 - C | | | 19.90 | | | | 0.10 | | | | 2.71 | | | | 2.81 | | | | (0.03 | ) | | | — | |
| | 2007 - Institutional | | | 21.53 | | | | 0.34 | | | | 2.97 | | | | 3.31 | | | | (0.23 | ) | | | — | |
| | 2007 - Service | | | 21.19 | | | | 0.20 | | | | 2.95 | | | | 3.15 | | | | (0.17 | ) | | | — | |
| | * | | The Fund changed its fiscal year end from August 31 to October 31. |
| | (a) | | Calculated based on the average shares outstanding methodology. |
| | (b) | | Assumes investments at the net asset value at the beginning of the period, reinvestment of all distributions, a complete redemption of the investment at the net asset value at the end of the period and no sales or redemption charges. Total returns would be reduced if a sales or redemption charge was taken into account. Returns do not reflect the deduction of taxes that a shareholder would pay on Fund distributions or the redemption of Fund shares. Total returns for periods less than one full year are not annualized. |
| | (c) | | Total return reflects the impact of payments for regulatory settlements entitled to be received during the period and recorded as an increase to capital by the Fund. Excluding such payments, the total return would have been: |
| | | | | | | | | | | | | | | | | | | | | | | | |
| | | Class A | | | Class B | | | Class C | | | Institutional | | | Service | | | Class IR | |
For the Six Months Ended April 30, 2012 | | | 4.54 | % | | | 4.18 | % | | | 4.11 | % | | | 4.83 | % | | | 4.55 | % | | | 4.67 | % |
For the Fiscal Year Ended October 31, 2009 | | | 21.64 | | | | 20.44 | | | | 20.79 | | | | 21.99 | | | | 21.50 | | | | N/A | |
For the Fiscal Year Ended August 31, 2008 | | | (18.88 | ) | | | (19.52 | ) | | | (19.48 | ) | | | (18.54 | ) | | | (18.97 | ) | | | N/A | |
| | (e) | | Includes income recognized from a corporate action which amounted to $0.26 per share and 1.55% of average net assets. |
| | (f) | | Amount is less than $0.005 per share. |
| | (g) | | Includes income recognized from a corporate action which amounted to $0.23 per share and 0.98% of average net assets. |
| | |
| 34 | | The accompanying notes are an integral part of these financial statements. |
GOLDMAN SACHS CONCENTRATED INTERNATIONAL EQUITY FUND
| | | | | | | | | | | | | | | | | | | | | | | | |
| | | | | | | | | | | | | | | | | | | |
Net asset
value, end
of period | | Total
return(b) | | | Net assets,
end of
period
(in 000s) | | | Ratio of
net expenses
to average
net assets | | | Ratio of
total expenses
to average
net assets | | | Ratio of
net investment
income (loss) to average net assets | | | Portfolio turnover
rate | |
| | | | | | | | | | | | | | | | | | | | | | | | |
| $14.98 | | | 5.17 | %(c) | | $ | 98,698 | | | | 1.48 | %(d) | | | 1.71 | %(d) | | | 1.70 | %(d) | | | 70 | % |
| 14.83 | | | 4.82 | (c) | | | 978 | | | | 2.23 | (d) | | | 2.46 | (d) | | | 0.92 | (d) | | | 70 | |
| 14.09 | | | 4.78 | (c) | | | 14,693 | | | | 2.23 | (d) | | | 2.46 | (d) | | | 0.97 | (d) | | | 70 | |
| 15.28 | | | 5.45 | (c) | | | 23,879 | | | | 1.08 | (d) | | | 1.31 | (d) | | | 2.08 | (d) | | | 70 | |
| 15.09 | | | 5.18 | (c) | | | 287 | | | | 1.58 | (d) | | | 1.81 | (d) | | | 1.60 | (d) | | | 70 | |
| 15.24 | | | 5.29 | (c) | | | 17 | | | | 1.23 | (d) | | | 1.46 | (d) | | | 1.82 | (d) | | | 70 | |
| | | | | | | | | | | | | | | | | | | | | | | | |
| | | | | | | | | | | | | | | | | | | | | | | | |
| | | | | | | | | | | | | | | | | | | | | | | | |
| 14.74 | | | (10.89 | ) | | | 118,977 | | | | 1.53 | | | | 1.67 | | | | 2.55 | (e) | | | 135 | |
| 14.48 | | | (11.46 | ) | | | 1,225 | | | | 2.28 | | | �� | 2.42 | | | | 1.70 | (e) | | | 135 | |
| 13.82 | | | (11.55 | ) | | | 15,883 | | | | 2.28 | | | | 2.42 | | | | 1.86 | (e) | | | 135 | |
| 15.07 | | | (10.53 | ) | | | 28,105 | | | | 1.13 | | | | 1.27 | | | | 2.94 | (e) | | | 135 | |
| 14.85 | | | (10.96 | ) | | | 300 | | | | 1.63 | | | | 1.77 | | | | 2.51 | (e) | | | 135 | |
15.06 | | | (10.80 | ) | | | 3 | | | | 1.28 | | | | 1.42 | | | | 3.87 | (e) | | | 135 | |
| 16.81 | | | 12.48 | | | | 162,231 | | | | 1.54 | | | | 1.61 | | | | 0.66 | | | | 182 | |
| 16.46 | | | 11.69 | | | | 1,944 | | | | 2.29 | | | | 2.36 | | | | (0.07 | ) | | | 182 | |
| 15.79 | | | 11.72 | | | | 20,031 | | | | 2.29 | | | | 2.36 | | | | (0.11 | ) | | | 182 | |
| 17.18 | | | 12.95 | | | | 36,693 | | | | 1.14 | | | | 1.21 | | | | 1.05 | | | | 182 | |
| 16.92 | | | 12.37 | | | | 354 | | | | 1.64 | | | | 1.71 | | | | 0.54 | | | | 182 | |
17.22 | | | 13.81 | | | | 1 | | | | 1.29 | (d) | | | 1.36 | (d) | | | 0.08 | (d) | | | 182 | |
| 15.22 | | | 22.88 | (c) | | | 165,054 | | | | 1.54 | | | | 1.65 | | | | 1.65 | | | | 129 | |
| 14.90 | | | 21.81 | (c) | | | 2,893 | | | | 2.29 | | | | 2.40 | | | | 0.93 | | | | 129 | |
| 14.35 | | | 21.84 | (c) | | | 18,510 | | | | 2.29 | | | | 2.40 | | | | 0.80 | | | | 129 | |
| 15.55 | | | 23.28 | (c) | | | 30,009 | | | | 1.14 | | | | 1.25 | | | | 1.95 | | | | 129 | |
| 15.32 | | | 22.69 | (c) | | | 493 | | | | 1.64 | | | | 1.75 | | | | 1.51 | | | | 129 | |
| | | | | | | | | | | | | | | | | | | | | | | | |
| | | | | | | | | | | | | | | | | | | | | | | | |
| | | | | | | | | | | | | | | | | | | | | | | | |
| 13.18 | | | (32.11 | ) | | | 187,435 | | | | 1.54 | (d) | | | 1.72 | (d) | | | 0.02 | (d) | | | 21 | |
| 12.72 | | | (32.16 | ) | | | 3,686 | | | | 2.29 | (d) | | | 2.47 | (d) | | | (0.74 | )(d) | | | 21 | |
| 12.40 | | | (32.17 | ) | | | 14,057 | | | | 2.29 | (d) | | | 2.47 | (d) | | | (0.74 | )(d) | | | 21 | |
| 13.50 | | | (32.06 | ) | | | 40,837 | | | | 1.14 | (d) | | | 1.32 | (d) | | | 0.54 | (d) | | | 21 | |
| 13.28 | | | (32.12 | ) | | | 518 | | | | 1.64 | (d) | | | 1.82 | (d) | | | (0.09 | )(d) | | | 21 | |
| | | | | | | | | | | | | | | | | | | | | | | | |
| | | | | | | | | | | | | | | | | | | | | | | | |
| | | | | | | | | | | | | | | | | | | | | | | | |
| 19.40 | | | (18.37 | )(c) | | | 297,558 | | | | 1.54 | | | | 1.55 | | | | (1.92 | )(g) | | | 178 | |
| 18.75 | | | (19.01 | )(c) | | | 6,424 | | | | 2.29 | | | | 2.30 | | | | 0.96 | (g) | | | 178 | |
| 18.28 | | | (18.97 | )(c) | | | 21,480 | | | | 2.29 | | | | 2.30 | | | | 1.18 | (g) | | | 178 | |
| 19.87 | | | (18.03 | )(c) | | | 107,197 | | | | 1.14 | | | | 1.15 | | | | 2.46 | (g) | | | 178 | |
19.55 | | | (18.46 | )(c) | | | 755 | | | | 1.64 | | | | 1.65 | | | | 1.79 | (g) | | | 178 | |
| 24.04 | | | 15.03 | | | | 400,976 | | | | 1.55 | | | | 1.55 | | | | 1.02 | | | | 97 | |
| 23.19 | | | 14.12 | | | | 12,534 | | | | 2.30 | | | | 2.30 | | | | 0.22 | | | | 97 | |
| 22.68 | | | 14.12 | | | | 29,244 | | | | 2.30 | | | | 2.30 | | | | 0.43 | | | | 97 | |
| 24.61 | | | 15.45 | | | | 124,229 | | | | 1.15 | | | | 1.15 | | | | 1.40 | | | | 97 | |
24.17 | | | 14.90 | | | | 1,386 | | | | 1.65 | | | | 1.65 | | | | 0.84 | | | | 97 | |
| | |
| The accompanying notes are an integral part of these financial statements. | | 35 |
GOLDMAN SACHS INTERNATIONAL SMALL CAP FUND
Financial Highlights
Selected Data for a Share Outstanding Throughout Each Period
| | | | | | | | | | | | | | | | | | | | | | |
| | | | | | | | Income (loss) from
investment operations | | | | |
| | | Year - Share Class | | Net asset
value,
beginning
of period | | | Net
investment
income (loss)(a) | | | Net realized
and unrealized
gain (loss) | | | Total from
investment
operations | | | Distributions
to shareholders
from net
investment
income | |
| | FOR THE SIX MONTHS ENDED APRIL 30, (UNAUDITED) | |
| | 2012 - A | | $ | 14.06 | | | $ | 0.03 | | | $ | 1.07 | | | $ | 1.10 | | | $ | (0.25 | ) |
| | 2012 - B | | | 13.74 | | | | (0.02 | ) | | | 1.06 | | | | 1.04 | | | | (0.10 | ) |
| | 2012 - C | | | 13.54 | | | | (0.02 | ) | | | 1.04 | | | | 1.02 | | | | (0.13 | ) |
| | 2012 - Institutional | | | 14.53 | | | | 0.06 | | | | 1.08 | | | | 1.14 | | | | (0.32 | ) |
| | 2012 - Service | | | 13.98 | | | | 0.03 | | | | 1.04 | | | | 1.07 | | | | (0.28 | ) |
| | 2012 - IR | | | 14.50 | | | | 0.05 | | | | 1.09 | | | | 1.14 | | | | (0.29 | ) |
| | | | | | | | | | | | | | | | | | | | | | |
| | FOR THE FISCAL YEARS ENDED OCTOBER 31, | |
| | 2011 - A | | | 14.62 | | | | 0.08 | (d) | | | (0.39 | ) | | | (0.31 | ) | | | (0.25 | ) |
| | 2011 - B | | | 14.29 | | | | (0.04 | )(d) | | | (0.38 | ) | | | (0.42 | ) | | | (0.13 | ) |
| | 2011 - C | | | 14.10 | | | | (0.03 | )(d) | | | (0.38 | ) | | | (0.41 | ) | | | (0.15 | ) |
| | 2011 - Institutional | | | 15.06 | | | | 0.15 | (d) | | | (0.38 | ) | | | (0.23 | ) | | | (0.30 | ) |
| | 2011 - Service | | | 14.53 | | | | 0.06 | (d) | | | (0.38 | ) | | | (0.32 | ) | | | (0.23 | ) |
| | 2011 - IR | | | 15.09 | | | | 0.18 | (d) | | | (0.47 | ) | | | (0.29 | ) | | | (0.30 | ) |
| | 2010 - A | | | 12.27 | | | | 0.04 | (e) | | | 2.74 | | | | 2.78 | | | | (0.43 | ) |
| | 2010 - B | | | 12.01 | | | | (0.06 | )(e) | | | 2.69 | | | | 2.63 | | | | (0.35 | ) |
| | 2010 - C | | | 11.85 | | | | (0.05 | )(e) | | | 2.64 | | | | 2.59 | | | | (0.34 | ) |
| | 2010 - Institutional | | | 12.62 | | | | 0.10 | (e) | | | 2.81 | | | | 2.91 | | | | (0.47 | ) |
| | 2010 - Service | | | 12.20 | | | | 0.03 | (e) | | | 2.72 | | | | 2.75 | | | | (0.42 | ) |
| | 2010 - IR (Commenced August 31, 2010) | | | 12.90 | | | | 0.02 | (e) | | | 2.17 | | | | 2.19 | | | | — | |
| | 2009 - A | | | 9.48 | | | | 0.10 | | | | 3.25 | | | | 3.35 | | | | (0.56 | ) |
| | 2009 - B | | | 9.12 | | | | 0.02 | | | | 3.20 | | | | 3.22 | | | | (0.33 | ) |
| | 2009 - C | | | 9.06 | | | | 0.01 | | | | 3.17 | | | | 3.18 | | | | (0.39 | ) |
| | 2009 - Institutional | | | 9.82 | | | | 0.15 | | | | 3.35 | | | | 3.50 | | | | (0.70 | ) |
| | 2009 - Service | | | 9.42 | | | | 0.09 | | | | 3.24 | | | | 3.33 | | | | (0.55 | ) |
| | | | | | | | | | | | | | | | | | | | | | |
| | FOR THE PERIOD SEPTEMBER 1, 2008 TO OCTOBER 31, 2008* | |
| | 2008 - A | | | 15.26 | | | | 0.02 | | | | (5.80 | ) | | | (5.78 | ) | | | — | |
| | 2008 - B | | | 14.70 | | | | — | (f) | | | (5.58 | ) | | | (5.58 | ) | | | — | |
| | 2008 - C | | | 14.60 | | | | — | (f) | | | (5.54 | ) | | | (5.54 | ) | | | — | |
| | 2008 - Institutional | | | 15.81 | | | | 0.03 | | | | (6.02 | ) | | | (5.99 | ) | | | — | |
| | 2008 - Service | | | 15.18 | | | | 0.02 | | | | (5.78 | ) | | | (5.76 | ) | | | — | |
| | | | | | | | | | | | | | | | | | | | | | |
| | FOR THE FISCAL YEARS ENDED AUGUST 31, | |
| | 2008 - A | | | 21.18 | | | | 0.16 | (g) | | | (5.57 | ) | | | (5.41 | ) | | | (0.51 | ) |
| | 2008 - B | | | 20.41 | | | | 0.03 | (g) | | | (5.39 | ) | | | (5.36 | ) | | | (0.35 | ) |
| | 2008 - C | | | 20.27 | | | | 0.03 | (g) | | | (5.35 | ) | | | (5.32 | ) | | | (0.35 | ) |
| | 2008 - Institutional | | | 21.94 | | | | 0.28 | (g) | | | (5.78 | ) | | | (5.50 | ) | | | (0.63 | ) |
| | 2008 - Service | | | 21.10 | | | | 0.16 | (g) | | | (5.54 | ) | | | (5.38 | ) | | | (0.54 | ) |
| | 2007 - A | | | 18.16 | | | | — | (f) | | | 3.21 | | | | 3.21 | | | | (0.19 | ) |
| | 2007 - B | | | 17.47 | | | | (0.15 | ) | | | 3.09 | | | | 2.94 | | | | — | |
| | 2007 - C | | | 17.40 | | | | (0.15 | ) | | | 3.08 | | | | 2.93 | | | | (0.06 | ) |
| | 2007 - Institutional | | | 18.79 | | | | 0.08 | | | | 3.33 | | | | 3.41 | | | | (0.26 | ) |
| | 2007 - Service | | | 18.13 | | | | (0.01 | ) | | | 3.18 | | | | 3.17 | | | | (0.20 | ) |
| | * | | The Fund changed its fiscal year end from August 31 to October 31. |
| | (a) | | Calculated based on the average shares outstanding methodology. |
| | (b) | | Assumes investments at the net asset value at the beginning of the period, reinvestment of all distributions, a complete redemption of the investment at the net asset value at the end of the period and no sales or redemption charges. Total returns would be reduced if a sales or redemption charge was taken into account. Returns do not reflect the deduction of taxes that a shareholder would pay on Fund distributions or the redemption of Fund shares. Total returns for periods less than one full year are not annualized. |
| | (d) | | Reflects income recognized from non-recurring special dividends which amounted to 0.03 per share and 0.16% of average net assets. |
| | (e) | | Reflects income recognized from non-recurring special dividends which amounted to 0.01 per share and 0.10% of average net assets. |
| | (f) | | Amount is less than $0.005 per share. |
| | (g) | | Reflects income recognized from a corporate action which amounted to $0.08 per share and 0.41% of average net assets. |
| | (h) | | Total return reflects the impact of payments for regulatory settlements. amounting to $0.01 per share, received during the year and recorded as an increase to capital by the Fund. Excluding such payments, the total return would have been (26.18)%, (26.77)%, (26.73)%, (25.89)% and (26.24)%, respectively. |
| | |
| 36 | | The accompanying notes are an integral part of these financial statements. |
GOLDMAN SACHS INTERNATIONAL SMALL CAP FUND
| | | | | | | | | | | | | | | | | | | | | | | | |
| | | | | | | | | | | | | | | | | | | |
Net asset
value, end
of period | | Total
return(b) | | | Net assets,
end of
period
(in 000s) | | | Ratio of
net expenses
to average
net assets | | | Ratio of
total expenses
to average
net assets | | | Ratio of
net investment
income (loss)
to average
net assets | | | Portfolio
turnover
rate | |
| | | | | | | | | | | | | | | | | | | | | | | | |
| $14.91 | | | 7.91 | % | | $ | 23,162 | | | | 1.58 | %(c) | | | 2.25 | %(c) | | | 0.46 | %(c) | | | 50 | % |
| 14.68 | | | 7.51 | | | | 510 | | | | 2.33 | (c) | | | 3.00 | (c) | | | (0.33 | )(c) | | | 50 | |
| 14.43 | | | 7.53 | | | | 2,139 | | | | 2.33 | (c) | | | 3.00 | (c) | | | (0.32 | )(c) | | | 50 | |
| 15.35 | | | 8.27 | | | | 41,498 | | | | 1.18 | (c) | | | 1.85 | (c) | | | 0.88 | (c) | | | 50 | |
| 14.77 | | | 7.82 | | | | 786 | | | | 1.68 | (c) | | | 2.35 | (c) | | | 0.37 | (c) | | | 50 | |
| 15.35 | | | 8.05 | | | | 114 | | | | 1.33 | (c) | | | 2.00 | (c) | | | 0.70 | (c) | | | 50 | |
| | | | | | | | | | | | | | | | | | | | | | | | |
| | | | | | | | | | | | | | | | | | | | | | | | |
| 14.06 | | | (1.97 | ) | | | 22,537 | | | | 1.60 | | | | 1.94 | | | | 0.54 | (d) | | | 117 | |
| 13.74 | | | (2.71 | ) | | | 622 | | | | 2.35 | | | | 2.69 | | | | (0.25 | )(d) | | | 117 | |
| 13.54 | | | (2.68 | ) | | | 2,177 | | | | 2.35 | | | | 2.69 | | | | (0.23 | )(d) | | | 117 | |
| 14.53 | | | (1.59 | ) | | | 36,067 | | | | 1.20 | | | | 1.54 | | | | 0.95 | (d) | | | 117 | |
| 13.98 | | | (2.05 | ) | | | 730 | | | | 1.70 | | | | 2.04 | | | | 0.41 | (d) | | | 117 | |
| 14.50 | | | (1.72 | ) | | | 24 | | | | 1.35 | | | | 1.69 | | | | 1.12 | (d) | | | 117 | |
| 14.62 | | | 23.11 | | | | 23,503 | | | | 1.60 | | | | 1.86 | | | | 0.31 | (e) | | | 155 | |
| 14.29 | | | 22.24 | | | | 919 | | | | 2.35 | | | | 2.61 | | | | (0.45 | )(e) | | | 155 | |
| 14.10 | | | 22.18 | | | | 2,120 | | | | 2.35 | | | | 2.61 | | | | (0.43 | )(e) | | | 155 | |
| 15.06 | | | 23.61 | | | | 89,035 | | | | 1.20 | | | | 1.46 | | | | 0.78 | (e)�� | | | 155 | |
| 14.53 | | | 22.91 | | | | 490 | | | | 1.70 | | | | 1.96 | | | | 0.23 | (e) | | | 155 | |
| 15.09 | | | 16.74 | | | | 1 | | | | 1.35 | (c) | | | 1.61 | (c) | | | 0.73 | (c)(e) | | | 155 | |
| 12.27 | | | 37.78 | | | | 22,952 | | | | 1.60 | | | | 2.08 | | | | 0.93 | | | | 161 | |
| 12.01 | | | 36.79 | | | | 1,015 | | | | 2.35 | | | | 2.83 | | | | 0.18 | | | | 161 | |
| 11.85 | | | 36.79 | | | | 1,924 | | | | 2.35 | | | | 2.83 | | | | 0.12 | | | | 161 | |
| 12.62 | | | 38.50 | | | | 68,199 | | | | 1.20 | | | | 1.68 | | | | 1.45 | | | | 161 | |
| 12.20 | | | 37.85 | | | | 414 | | | | 1.70 | | | | 2.18 | | | | 0.86 | | | | 161 | |
| | | | | | | | | | | | | | | | | | | | | | | | |
| | | | | | | | | | | | | | | | | | | | | | | | |
| 9.48 | | | (37.88 | ) | | | 21,650 | | | | 1.60 | (c) | | | 2.39 | (c) | | | 0.99 | (c) | | | 24 | |
| 9.12 | | | (37.92 | ) | | | 986 | | | | 2.35 | (c) | | | 3.14 | (c) | | | 0.23 | (c) | | | 24 | |
| 9.06 | | | (37.95 | ) | | | 2,239 | | | | 2.35 | (c) | | | 3.14 | (c) | | | 0.22 | (c) | | | 24 | |
| 9.82 | | | (37.85 | ) | | | 28,581 | | | | 1.20 | (c) | | | 1.99 | (c) | | | 1.43 | (c) | | | 24 | |
| 9.42 | | | (37.90 | ) | | | 294 | | | | 1.70 | (c) | | | 2.49 | (c) | | | 0.87 | (c) | | | 24 | |
| | | | | | | | | | | | | | | | | | | | | | | | |
| | | | | | | | | | | | | | | | | | | | | | | | |
| 15.26 | | | (26.10 | )(h) | | | 39,376 | | | | 1.64 | | | | 1.78 | | | | 0.85 | (g) | | | 117 | |
| 14.70 | | | (26.69 | )(h) | | | 1,862 | | | | 2.39 | | | | 2.53 | | | | 0.14 | (g) | | | 117 | |
| 14.60 | | | (26.65 | )(h) | | | 3,950 | | | | 2.39 | | | | 2.53 | | | | 0.18 | (g) | | | 117 | |
| 15.81 | | | (25.81 | )(h) | | | 55,901 | | | | 1.24 | | | | 1.38 | | | | 1.42 | (g) | | | 117 | |
| 15.18 | | | (26.16 | )(h) | | | 454 | | | | 1.74 | | | | 1.88 | | | | 0.84 | (g) | | | 117 | |
| 21.18 | | | 17.73 | | | | 105,435 | | | | 1.65 | | | | 1.77 | | | | (0.01 | ) | | | 88 | |
| 20.41 | | | 16.83 | | | | 4,566 | | | | 2.40 | | | | 2.52 | | | | (0.74 | ) | | | 88 | |
| 20.27 | | | 16.85 | | | | 8,681 | | | | 2.40 | | | | 2.52 | | | | (0.77 | ) | | | 88 | |
| 21.94 | | | 18.23 | | | | 99,069 | | | | 1.25 | | | | 1.37 | | | | 0.39 | | | | 88 | |
| 21.10 | | | 17.56 | | | | 1,215 | | | | 1.75 | | | | 1.87 | | | | (0.06 | ) | | | 88 | |
| | |
| The accompanying notes are an integral part of these financial statements. | | 37 |
GOLDMAN SACHS STRATEGIC INTERNATIONAL EQUITY FUND
Financial Highlights
Selected Data for a Share Outstanding Throughout Each Period
| | | | | | | | | | | | | | | | | | | | | | | | | | | | | | | | | | |
| | | | | | | | Income (loss) from
investment operations | | | Distributions
to shareholders | | | | |
| | | Year - Share Class | | Net asset
value,
beginning
of period | | | Net
investment
income (loss)(a) | | | Net realized
and unrealized
gain (loss) | | | Total from
investment
operations | | | From net
investment
income | | | From net
realized
gains | | | Total
distributions | | | Increase from
regulatory
settlements | |
| | FOR THE SIX MONTHS ENDED APRIL 30, (UNAUDITED) | |
| | 2012 - A | | $ | 10.62 | | | $ | 0.09 | | | $ | 0.46 | | | $ | 0.55 | | | $ | (0.37 | ) | | $ | — | | | $ | (0.37 | ) | | $ | — | |
| | 2012 - B | | | 9.51 | | | | 0.05 | | | | 0.42 | | | | 0.47 | | | | (0.29 | ) | | | — | | | | (0.29 | ) | | | — | |
| | 2012 - C | | | 9.64 | | | | 0.05 | | | | 0.42 | | | | 0.47 | | | | (0.30 | ) | | | — | | | | (0.30 | ) | | | — | |
| | 2012 - Institutional | | | 11.11 | | | | 0.12 | | | | 0.48 | | | | 0.60 | | | | (0.43 | ) | | | — | | | | (0.43 | ) | | | — | |
| | 2012 - IR | | | 10.70 | | | | 0.11 | | | | 0.46 | | | | 0.57 | | | | (0.43 | ) | | | — | | | | (0.43 | ) | | | — | |
| | 2012 - R | | | 10.57 | | | | 0.08 | | | | 0.48 | | | | 0.56 | | | | (0.23 | ) | | | — | | | | (0.23 | ) | | | — | |
| | | | | | | | | | | | | | | | | | | | | | | | | | | | | | | | | | |
| | FOR THE FISCAL YEARS ENDED OCTOBER 31, | |
| | 2011 - A | | | 11.71 | | | | 0.28 | (d) | | | (1.25 | ) | | | (0.97 | ) | | | (0.12 | ) | | | — | | | | (0.12 | ) | | | — | |
| | 2011 - B | | | 10.49 | | | | 0.17 | (d) | | | (1.12 | ) | | | (0.95 | ) | | | (0.03 | ) | | | — | | | | (0.03 | ) | | | — | |
| | 2011 - C | | | 10.63 | | | | 0.17 | (d) | | | (1.12 | ) | | | (0.95 | ) | | | (0.04 | ) | | | — | | | | (0.04 | ) | | | — | |
| | 2011 - Institutional | | | 12.24 | | | | 0.25 | (d) | | | (1.22 | ) | | | (0.97 | ) | | | (0.16 | ) | | | — | | | | (0.16 | ) | | | — | |
| | 2011 - IR | | | 11.70 | | | | 0.17 | (d) | | | (1.06 | ) | | | (0.89 | ) | | | (0.11 | ) | | | — | | | | (0.11 | ) | | | — | |
| | 2011 - R | | | 11.64 | | | | 0.27 | (d) | | | (1.26 | ) | | | (0.99 | ) | | | (0.08 | ) | | | — | | | | (0.08 | ) | | | — | |
| | 2010 - A | | | 10.55 | | | | 0.10 | | | | 1.19 | | | | 1.29 | | | | (0.13 | ) | | | — | | | | (0.13 | ) | | | — | |
| | 2010 - B | | | 9.46 | | | | 0.01 | | | | 1.07 | | | | 1.08 | | | | (0.05 | ) | | | — | | | | (0.05 | ) | | | — | |
| | 2010 - C | | | 9.59 | | | | 0.01 | | | | 1.09 | | | | 1.10 | | | | (0.06 | ) | | | — | | | | (0.06 | ) | | | — | |
| | 2010 - Institutional | | | 11.02 | | | | 0.10 | | | | 1.28 | | | | 1.38 | | | | (0.16 | ) | | | — | | | | (0.16 | ) | | | — | |
| | 2010 - IR | | | 10.54 | | | | 0.12 | | | | 1.19 | | | | 1.31 | | | | (0.15 | ) | | | — | | | | (0.15 | ) | | | — | |
| | 2010 - R | | | 10.52 | | | | 0.07 | | | | 1.19 | | | | 1.26 | | | | (0.14 | ) | | | — | | | | (0.14 | ) | | | — | |
| | 2009 - A | | | 9.01 | | | | 0.14 | | | | 1.77 | | | | 1.91 | | | | (0.38 | ) | | | — | | | | (0.38 | ) | | | 0.01 | |
| | 2009 - B | | | 8.08 | | | | 0.07 | | | | 1.58 | | | | 1.65 | | | | (0.28 | ) | | | — | | | | (0.28 | ) | | | 0.01 | |
| | 2009 - C | | | 8.17 | | | | 0.07 | | | | 1.61 | | | | 1.68 | | | | (0.27 | ) | | | — | | | | (0.27 | ) | | | 0.01 | |
| | 2009 - Institutional | | | 9.42 | | | | 0.19 | | | | 1.84 | | | | 2.03 | | | | (0.44 | ) | | | — | | | | (0.44 | ) | | | 0.01 | |
| | 2009 - IR | | | 9.03 | | | | 0.17 | | | | 1.76 | | | | 1.93 | | | | (0.43 | ) | | | — | | | | (0.43 | ) | | | 0.01 | |
| | 2009 - R | | | 8.99 | | | | 0.08 | | | | 1.80 | | | | 1.88 | | | | (0.36 | ) | | | — | | | | (0.36 | ) | | | 0.01 | |
| | 2008 - A | | | 27.90 | | | | 0.28 | (f) | | | (9.45 | ) | | | (9.17 | ) | | | — | | | | (9.74 | ) | | | (9.74 | ) | | | 0.02 | |
| | 2008 - B | | | 26.18 | | | | 0.15 | (f) | | | (8.53 | ) | | | (8.38 | ) | | | — | | | | (9.74 | ) | | | (9.74 | ) | | | 0.02 | |
| | 2008 - C | | | 26.35 | | | | 0.14 | (f) | | | (8.60 | ) | | | (8.46 | ) | | | — | | | | (9.74 | ) | | | (9.74 | ) | | | 0.02 | |
| | 2008 - Institutional | | | 28.64 | | | | 0.40 | (f) | | | (9.90 | ) | | | (9.50 | ) | | | — | | | | (9.74 | ) | | | (9.74 | ) | | | 0.02 | |
| | 2008 - IR (Commenced November 30, 2007) | | | 26.87 | | | | 0.29 | (f) | | | (8.41 | ) | | | (8.12 | ) | | | — | | | | (9.74 | ) | | | (9.74 | ) | | | 0.02 | |
| | 2008 - R (Commenced November 30, 2007) | | | 26.87 | | | | 0.23 | (f) | | | (8.39 | ) | | | (8.16 | ) | | | — | | | | (9.74 | ) | | | (9.74 | ) | | | 0.02 | |
| | 2007 - A | | | 18.93 | | | | (0.02 | ) | | | 8.99 | | | | 8.97 | | | | — | | | | — | | | | — | | | | — | |
| | 2007 - B | | | 17.88 | | | | (0.15 | ) | | | 8.45 | | | | 8.30 | | | | — | | | | — | | | | — | | | | — | |
| | 2007 - C | | | 17.99 | | | | (0.15 | ) | | | 8.51 | | | | 8.36 | | | | — | | | | — | | | | — | | | | — | |
| | 2007 - Institutional | | | 19.34 | | | | 0.06 | | | | 9.24 | | | | 9.30 | | | | — | | | | — | | | | — | | | | — | |
| | (a) | | Calculated based on the average shares outstanding methodology. |
| | (b) | | Assumes investments at the net asset value at the beginning of the period, reinvestment of all distributions, a complete redemption of the investment at the net asset value at the end of the period and no sales or redemption charges. Total returns would be reduced if a sales or redemption charge was taken into account. Returns do not reflect the deduction of taxes that a shareholder would pay on Fund distributions or the redemption of Fund shares. Total returns for periods less than one full year are not annualized. |
| | (d) | | Includes income recognized from a corporate action which amounted to $0.14 per share and 1.22% of average net assets. |
| | (e) | | Total return reflects the impact of payments for regulatory settlements entitled to be received during the period and recorded as an increase to capital by the Fund. Excluding such payments, the total return would have been: |
| | | | | | | | | | | | | | | | | | | | | | | | |
| | | Class A | | | Class B | | | Class C | | | Institutional | | | Class IR | | | Class R | |
For the Fiscal Year Ended October 31, 2009 | | | 22.37 | % | | | 21.40 | % | | | 21.31 | % | | | 22.76 | % | | | 22.57 | % | | | 22.02 | % |
For the Fiscal Year Ended October 31, 2008 | | | (49.92 | ) | | | (50.39 | ) | | | (50.31 | ) | | | (50.09 | ) | | | (47.93 | ) | | | (48.16 | ) |
| | (f) | | Includes income recognized from a corporate action which amounted to $0.08 per share and 0.56% of average net assets. |
| | |
| 38 | | The accompanying notes are an integral part of these financial statements. |
GOLDMAN SACHS STRATEGIC INTERNATIONAL EQUITY FUND
| | | | | | | | | | | | | | | | | | | | | | | | | | | | | | | | |
| | | | | | | | | | | | | | | | | | | | | | | | | |
Net asset
value, end
of period | | Total
return(b) | | | Net assets,
end of
period
(in 000s) | | | Ratio of
net expenses
to average
net assets | | | Ratio of
net expenses to average net assets
(not including
fees paid
indirectly) | | | Ratio of
total expenses
to average
net assets | | | Ratio of
net investment
income (loss) to average net assets | | | Ratio of
net investment
income (loss) to
average net assets
(not including
fees paid
indirectly) | | | Portfolio turnover
rate | |
| | | | | | | | | | | | | | | | | | | | | | | | | | | | | | | | |
| $10.80 | | | 5.65 | % | | $ | 42,268 | | | | 1.45 | %(c) | | | 1.45 | %(c) | | | 1.97 | %(c) | | | 1.80 | %(c) | | | 1.80 | %(c) | | | 68 | % |
| 9.69 | | | 5.37 | | | | 3,734 | | | | 2.20 | (c) | | | 2.20 | (c) | | | 2.72 | (c) | | | 0.99 | (c) | | | 0.99 | (c) | | | 68 | |
| 9.81 | | | 5.23 | | | | 5,910 | | | | 2.20 | (c) | | | 2.20 | (c) | | | 2.72 | (c) | | | 1.01 | (c) | | | 1.01 | (c) | | | 68 | |
| 11.28 | | | 5.88 | | | | 6,265 | | | | 1.05 | (c) | | | 1.05 | (c) | | | 1.57 | (c) | | | 2.20 | (c) | | | 2.20 | (c) | | | 68 | |
| 10.84 | | | 5.81 | | | | 61 | | | | 1.20 | (c) | | | 1.20 | (c) | | | 1.72 | (c) | | | 2.11 | (c) | | | 2.11 | (c) | | | 68 | |
| 10.90 | | | 5.57 | | | | 7 | | | | 1.70 | (c) | | | 1.70 | (c) | | | 2.22 | (c) | | | 1.56 | (c) | | | 1.56 | (c) | | | 68 | |
| | | | | | | | | | | | | | | | | | | | | | | | | | | | | | | | |
| | | | | | | | | | | | | | | | | | | | | | | | | | | | | | | | |
| | | | | | | | | | | | | | | | | | | | | | | | | | | | | | | | |
| 10.62 | | | (8.40 | ) | | | 41,862 | | | | 1.45 | | | | 1.45 | | | | 1.78 | | | | 2.36 | (d) | | | 2.36 | (d) | | | 139 | |
| 9.51 | | | (9.08 | ) | | | 4,344 | | | | 2.20 | | | | 2.20 | | | | 2.53 | | | | 1.57 | (d) | | | 1.57 | (d) | | | 139 | |
| 9.64 | | | (9.00 | ) | | | 6,643 | | | | 2.20 | | | | 2.20 | | | | 2.53 | | | | 1.63 | (d) | | | 1.63 | (d) | | | 139 | |
| 11.11 | | | (8.04 | ) | | | 6,416 | | | | 1.05 | | | | 1.05 | | | | 1.38 | | | | 2.02 | (d) | | | 2.02 | (d) | | | 139 | |
| 10.70 | | | (7.69 | ) | | | 56 | | | | 1.20 | | | | 1.20 | | | | 1.53 | | | | 1.56 | (d) | | | 1.56 | (d) | | | 139 | |
| 10.57 | | | (8.61 | ) | | | 7 | | | | 1.70 | | | | 1.70 | | | | 2.03 | | | | 2.30 | (d) | | | 2.30 | (d) | | | 139 | |
| 11.71 | | | 12.34 | | | | 60,561 | | | | 1.45 | | | | 1.45 | | | | 1.71 | | | | 0.89 | | | | 0.89 | | | | 121 | |
| 10.49 | | | 11.44 | | | | 6,814 | | | | 2.20 | | | | 2.20 | | | | 2.46 | | | | 0.12 | | | | 0.12 | | | | 121 | |
| 10.63 | | | 11.48 | | | | 8,845 | | | | 2.20 | | | | 2.20 | | | | 2.46 | | | | 0.13 | | | | 0.13 | | | | 121 | |
| 12.24 | | | 12.69 | | | | 21,434 | | | | 1.05 | | | | 1.05 | | | | 1.31 | | | | 0.90 | | | | 0.90 | | | | 121 | |
| 11.70 | | | 12.55 | | | | 7 | | | | 1.20 | | | | 1.20 | | | | 1.46 | | | | 1.13 | | | | 1.13 | | | | 121 | |
| 11.64 | | | 12.06 | | | | 28 | | | | 1.70 | | | | 1.70 | | | | 1.96 | | | | 0.67 | | | | 0.67 | | | | 121 | |
| 10.55 | | | 22.50 | (e) | | | 55,454 | | | | 1.45 | | | | 1.45 | | | | 1.98 | | | | 1.52 | | | | 1.52 | | | | 133 | |
| 9.46 | | | 21.58 | (e) | | | 8,958 | | | | 2.20 | | | | 2.20 | | | | 2.73 | | | | 0.93 | | | | 0.93 | | | | 133 | |
| 9.59 | | | 21.47 | (e) | | | 9,520 | | | | 2.20 | | | | 2.20 | | | | 2.73 | | | | 0.92 | | | | 0.92 | | | | 133 | |
| 11.02 | | | 22.91 | (e) | | | 6,408 | | | | 1.05 | | | | 1.05 | | | | 1.58 | | | | 2.02 | | | | 2.02 | | | | 133 | |
| 10.54 | | | 22.71 | (e) | | | 6 | | | | 1.20 | | | | 1.20 | | | | 1.73 | | | | 1.88 | | | | 1.88 | | | | 133 | |
| 10.52 | | | 22.07 | (e) | | | 33 | | | | 1.70 | | | | 1.70 | | | | 2.23 | | | | 0.81 | | | | 0.81 | | | | 133 | |
| 9.01 | | | (49.64 | )(e) | | | 38,194 | | | | 1.40 | | | | 1.40 | | | | 1.73 | | | | 1.80 | (f) | | | 1.80 | (f) | | | 108 | |
| 8.08 | | | (50.09 | )(e) | | | 10,697 | | | | 2.15 | | | | 2.15 | | | | 2.48 | | | | 1.01 | (f) | | | 1.01 | (f) | | | 108 | |
| 8.17 | | | (50.00 | )(e) | | | 10,577 | | | | 2.15 | | | | 2.15 | | | | 2.48 | | | | 1.00 | (f) | | | 1.00 | (f) | | | 108 | |
| 9.42 | | | (49.45 | )(e) | | | 5,499 | | | | 1.00 | | | | 1.00 | | | | 1.33 | | | | 2.46 | (f) | | | 2.46 | (f) | | | 108 | |
| 9.03 | | | (47.70 | )(e) | | | 5 | | | | 1.15 | (c) | | | 1.15 | (c) | | | 1.48 | (c) | | | 2.18 | (c)(f) | | | 2.18 | (c)(f) | | | 108 | |
| 8.99 | | | (47.93 | )(e) | | | 5 | | | | 1.65 | (c) | | | 1.65 | (c) | | | 1.98 | (c) | | | 1.68 | (c)(f) | | | 1.68 | (c)(f) | | | 108 | |
| 27.90 | | | 49.69 | | | | 101,641 | | | | 1.69 | | | | 1.71 | | | | 1.85 | | | | (0.09 | ) | | | (0.11 | ) | | | 135 | |
| 26.18 | | | 48.67 | | | | 31,881 | | | | 2.31 | | | | 2.33 | | | | 2.48 | | | | (0.69 | ) | | | (0.71 | ) | | | 135 | |
| 26.35 | | | 48.70 | | | | 34,984 | | | | 2.31 | | | | 2.34 | | | | 2.46 | | | | (0.72 | ) | | | (0.74 | ) | | | 135 | |
| 28.64 | | | 50.34 | | | | 27,498 | | | | 1.29 | | | | 1.31 | | | | 1.41 | | | | 0.27 | | | | (0.25 | ) | | | 135 | |
| | |
| The accompanying notes are an integral part of these financial statements. | | 39 |
GOLDMAN SACHS FUNDAMENTAL INTERNATIONAL EQUITY FUNDS
Notes to Financial Statements
April 30, 2012 (Unaudited)
Goldman Sachs Trust (the “Trust”) is a Delaware statutory trust registered under the Investment Company Act of 1940, as amended (the “Act”), as an open-end management investment company. The following table lists those series of the Trust that are included in this report (collectively, the “Funds” or individually a “Fund”), along with their corresponding share classes and respective diversification status under the Act:
| | | | |
| Fund | | Share Classes Offered* | | Diversified/ Non-diversified |
Concentrated International Equity and
International Small Cap | | A, B, C, Institutional, Service and IR | | Diversified |
Strategic International Equity | | A, B, C, Institutional, IR and R | | Diversified |
| * | | Class B Shares are generally no longer available for purchase by current or prospective investors. |
Class A Shares are sold with a front-end sales charge of up to 5.50%. Class B Shares were sold with a contingent deferred sales charge (“CDSC”) that declines from 5.00% to zero, depending upon the period of time the shares are held. Class C Shares are sold with a CDSC of 1.00%, which is imposed on redemptions made within 12 months of purchase. Institutional, Service, Class IR and Class R Shares are not subject to a sales charge.
Goldman Sachs Asset Management International (“GSAMI”), an affiliate of Goldman, Sachs & Co. (“Goldman Sachs”), serves as investment adviser to the Funds pursuant to a management agreement (the “Agreement”) with the Trust.
| | |
| 2. SIGNIFICANT ACCOUNTING POLICIES | | |
The preparation of financial statements in conformity with accounting principles generally accepted in the United States of America (“GAAP”) requires management to make estimates and assumptions that may affect the amounts and disclosures in the financial statements. Actual results could differ from those estimates and assumptions.
A. Investment Valuation — The Funds’ valuation policy is to value investments at fair value.
Equity securities and investment companies traded on a United States (“U.S.”) securities exchange or the NASDAQ system, or those located on certain foreign exchanges including, but not limited to the Americas, are valued daily at their last sale price or official closing price on the principal exchange or system on which they are traded. If no sale occurs, such securities and investment companies are valued at the last bid price for long positions and at the last ask price for short positions. Unlisted equity securities for which market quotations are available are valued at the last sale price on the valuation date, or if no sale occurs, at the last bid price. Such securities traded on certain foreign securities exchanges are valued daily at fair value determined by an independent fair value service (if available) under valuation procedures approved by the trustees and consistent with applicable regulatory guidance. The independent fair value service takes into account multiple factors including, but not limited to, movements in the U.S. securities markets, certain depositary receipts, futures contracts and foreign currency exchange rates that have occurred subsequent to the close of the foreign securities exchanges. Investments in investment companies (other than those that are exchange traded) are valued at the net asset value per share (“NAV”) of the investment company on the valuation date.
Debt securities for which market quotations are readily available are valued on the basis of quotations supplied by dealers or furnished by an independent pricing service approved by the trustees. The pricing services may use valuation models or matrix pricing, which consider: (i) yield or price with respect to bonds that are considered comparable in characteristics such as rating, interest rate and maturity date or (ii) quotations from securities dealers to determine current value. Short-term debt obligations that mature in sixty days or less and that do not exhibit signs of credit deterioration are valued at amortized cost, which approximates fair value.
If quotations are not readily available, or if GSAMI believes that such quotations do not accurately reflect fair value, the fair value of the Funds’ investments may be determined under valuation procedures approved by the trustees. GSAMI, consistent with its procedures and applicable regulatory guidance, may make an adjustment to the most recent valuation prices of either domestic or foreign securities in light of significant events to reflect what it believes to be the fair value of the securities at the time of determining a Fund’s NAV. Significant events which could affect a large number of securities in a particular market may include,
40
GOLDMAN SACHS FUNDAMENTAL INTERNATIONAL EQUITY FUNDS
|
| 2. SIGNIFICANT ACCOUNTING POLICIES (continued) |
but are not limited to significant fluctuations in U.S. or foreign markets; market dislocations; market disruptions or unscheduled market closings. Significant events, which could also affect a single issuer, may include, but are not limited to corporate actions such as reorganizations, mergers and buy-outs; ratings downgrades and bankruptcies.
B. Investment Income and Investments — Investment income is comprised of interest income and dividend income, and is recorded net of any foreign withholding taxes, less any amounts reclaimable. Interest income is accrued daily and adjusted for amortization of premiums and accretion of discounts. Dividend income is recognized on ex-dividend date or, for certain foreign securities, as soon as such information is obtained subsequent to the ex-dividend date. Investment transactions are reflected on trade date with realized gains and losses on sales calculated using identified cost. Investment transactions are recorded on the following business day for daily NAV calculations. Any foreign capital gains tax is accrued daily based upon net unrealized gains, and is payable upon sale of such investments.
C. Class Allocations and Expenses — Investment income, realized and unrealized gain (loss), and non-class specific expenses of each Fund are allocated daily based upon the proportion of net assets of each class. Class specific expenses, where applicable, are borne by the respective share classes and include Distribution and Service, Transfer Agent and Service and Shareholder Administration fees. Non-class specific expenses directly incurred by a Fund are charged to that Fund, while such expenses incurred by the Trust are allocated across the respective Funds on a straight-line and/or pro-rata basis depending upon the nature of the expenses.
D. Federal Taxes and Distributions to Shareholders — It is each Fund’s policy to comply with the requirements of the Internal Revenue Code of 1986, as amended (the “Code”), applicable to regulated investment companies (mutual funds) and to distribute each year substantially all of its investment company taxable income and capital gains to its shareholders. Accordingly, the Funds are not required to make any provisions for the payment of federal income tax. Distributions to shareholders are recorded on the ex-dividend date. Income and capital gains distributions, if any, are declared and paid annually.
Net capital losses are carried forward to future fiscal years and may be used to the extent allowed by the Code to offset any future capital gains. Utilization of capital loss carryforwards will reduce the requirement of future capital gains distributions.
The characterization of distributions to shareholders for financial reporting purposes is determined in accordance with federal income tax rules, which may differ from GAAP. The source of each Fund’s distributions may be shown in the accompanying financial statements as either from net investment income, net realized gain or capital. Certain components of the Funds’ net assets on the Statements of Assets and Liabilities reflect permanent GAAP/tax differences based on the appropriate tax character.
E. Foreign Currency Translation — The accounting records and reporting currency of the Funds are maintained in U.S. dollars. Investments and other assets and liabilities denominated in foreign currencies are translated into U.S. dollars using the current exchange rates at the close of each business day. The effect of changes in foreign currency exchange rates on investments is included within net realized and unrealized gain (loss) on investments. Changes in the value of other assets and liabilities as a result of fluctuations in foreign exchange rates are included in the Statements of Operations within unrealized gain (loss) on foreign currency translations. Transactions denominated in foreign currencies are translated into U.S. dollars on the date the transaction occurred, the effects of which are included within realized gain (loss) on foreign currency transactions.
F. Futures Contracts — Futures contracts are valued at the last settlement price, or in the absence of a sale, the last bid price for long positions and the last ask price for short positions, at the end of each day on the board of trade or exchange upon which they are traded. Upon entering into a futures contract, the Funds deposit cash or securities in an account on behalf of the broker in an amount sufficient to meet the initial margin requirement. Subsequent payments are made or received by the Funds equal to the daily change in the contract value and are recorded as variation margin receivable or payable with a corresponding offset in unrealized gains or losses. The Funds recognize a realized gain or loss when a contract is closed or expires.
The use of futures contracts involves, to varying degrees, elements of market and counterparty risk which may exceed the amounts recognized in the Statements of Assets and Liabilities. Futures contracts may be illiquid, and exchanges may limit fluctuations in futures contract prices during a single day. Changes in the value of a futures contract may not directly correlate with changes in the value of the underlying securities. These risks may decrease the effectiveness of the Funds’ strategies and potentially result in a loss. The Funds must set aside liquid assets, or engage in other appropriate measures, to cover their obligations under these contracts.
41
GOLDMAN SACHS FUNDAMENTAL INTERNATIONAL EQUITY FUNDS
Notes to Financial Statements (continued)
April 30, 2012 (Unaudited)
|
| 3. FAIR VALUE OF INVESTMENTS |
The fair value of a financial instrument is the amount that would be received to sell an asset or paid to transfer a liability in an orderly transaction between market participants at the measurement date (i.e., the exit price). GAAP establishes a fair value hierarchy that prioritizes the inputs to valuation techniques used to measure fair value. The hierarchy gives the highest priority to unadjusted quoted prices in active markets for identical assets or liabilities (Level 1 measurements) and the lowest priority to unobservable inputs (Level 3 measurements). The three levels of the fair value hierarchy are described below:
Level 1 — Unadjusted quoted prices in active markets that are accessible at the measurement date for identical, unrestricted assets or liabilities;
Level 2 — Quoted prices in markets that are not active or financial instruments for which significant inputs are observable (including, but not limited to, quoted prices for similar investments, interest rates, foreign exchange rates, volatility and credit spreads), either directly or indirectly;
Level 3 — Prices or valuations that require significant unobservable inputs (including GSAMI’s assumptions in determining fair value measurement).
The levels used for classifying investments are not necessarily an indication of the risk associated with investing in those investments.
The following is a summary of the Funds’ investments and derivatives categorized in the fair value hierarchy as of April 30, 2012:
| | | | | | | | | | | | |
| | | |
| CONCENTRATED INTERNATIONAL EQUITY | | | | | | | | | | | | |
| | | |
| Investment Type | | Level 1 | | | Level 2 | | | Level 3 | |
| Assets | | | | | | | | | | | | |
Common Stock and/or Other Equity Investments | | $ | — | | | $ | 137,020,611 | (a) | | $ | — | |
| | | |
| INTERNATIONAL SMALL CAP | | | | | | | | | |
| | | |
| Investment Type | | Level 1 | | | Level 2 | | | Level 3 | |
| Assets | | | | | | | | | | | | |
Common Stock and/or Other Equity Investments | | $ | 8,486,293 | | | $ | 56,280,731 | (a) | | $ | — | |
| | | |
| Derivative Type | | | | | | | | | |
| Assets(b) | | | | | | | | | | | | |
Futures Contracts | | $ | 13,543 | | | $ | — | | | $ | — | |
| | | |
| STRATEGIC INTERNATIONAL EQUITY | �� | | | | | | | | |
| | | |
| Investment Type | | Level 1 | | | Level 2 | | | Level 3 | |
| Assets | | | | | | | | | | | | |
Common Stock and/or Other Equity Investments | | $ | 2,439,917 | | | $ | 55,630,133 | (a) | | $ | — | |
| (a) | | To adjust for the time difference between local market close and the calculation of net asset value, the Funds utilize fair value model prices for international equities provided by an independent fair value service resulting in a Level 2 classification. |
| (b) | | Amount shown represents unrealized gain (loss) at period end. |
42
GOLDMAN SACHS FUNDAMENTAL INTERNATIONAL EQUITY FUNDS
|
| 4. INVESTMENTS IN DERIVATIVES |
The Funds may make investments in derivative instruments, including, but not limited to options, futures, swaps, swaptions and other derivatives relating to foreign currency transactions. A derivative is an instrument whose value is derived from underlying assets, indices, reference rates or a combination of these factors. Derivative instruments may be privately negotiated contracts (often referred to as over the counter (“OTC”) derivatives) or they may be listed and traded on an exchange. Derivative contracts may involve future commitments to purchase or sell financial instruments or commodities at specified terms on a specified date, or to exchange interest payment streams or currencies based on a notional or contractual amount. Derivative instruments may involve a high degree of financial risk. The use of derivatives also involves the risk of loss if the investment adviser is incorrect in its expectation of the timing or level of fluctuations in securities prices, interest rates or currency prices. Investments in derivative instruments also include the risk of default by the counterparty, the risk that the investment may not be liquid and/or the risk that a small movement in the price of the underlying security or benchmark may result in a disproportionately large movement, unfavorable or favorable, in the price of the derivative instrument.
During the six months ended April 30, 2012, the Funds entered into futures contracts. These instruments were used to meet the Funds’ investment objectives and to obtain and/or manage exposure related to the risks below. The following table sets forth, by certain risk types, the gross value of these derivative contracts for trading activities as of April 30, 2012. The values in the table below exclude the effects of cash collateral received or posted pursuant to these derivative contracts, and therefore are not representative of the Funds’ net exposure.
| | | | | | | | | | |
| Fund | | Risk | | Statements of Assets
and Liabilities | | | | Assets(a) | |
International Small Cap | | Equity | | Unrealized gain on futures variation margin | | | | $ | 13,543 | |
| (a) | | Includes unrealized gain (loss) on futures contracts described in the Additional Investment Information sections of the Schedules of Investments. Only current day’s variation margin is reported within the Statements of Assets and Liabilities. |
The following table sets forth, by certain risk types, the Funds’ gains (losses) related to these derivatives and their indicative volumes for the six months ended April 30, 2012. These gains (losses) should be considered in the context that these derivative contracts may have been executed to economically hedge certain investments, and accordingly, certain gains (losses) on such derivative contracts may offset certain (losses) gains attributable to investments. These gains (losses) are included in “Net realized gain (loss)” or “Net change in unrealized gain (loss)” on the Statements of Operations:
| | | | | | | | | | | | | | | | |
| Fund | | Risk | | Statements of Operations | | Net
Realized
Gain (Loss) | | | Net Change in
Unrealized
Gain (Loss) | | | Average
Number of
Contracts(a) | |
| Concentrated International Equity | | Equity | | Net realized gain (loss) from futures contracts/Net change in unrealized gain (loss) on futures contracts | | $ | (657,896 | ) | | $ | (92,831 | ) | | | 49 | |
| International Small Cap | | Equity | | Net realized gain (loss) from futures contracts/Net change in unrealized gain (loss) on futures contracts | | | 47,551 | | | | (3,098 | ) | | | 125 | |
| Strategic International Equity | | Equity | | Net realized gain (loss) from futures contracts/Net change in unrealized gain (loss) on futures contracts | | | (65,685 | ) | | | (85,165 | ) | | | 20 | |
| (a) | | Average number of contracts is based on the average of month end balances for the six months ended April 30, 2012. |
43
GOLDMAN SACHS FUNDAMENTAL INTERNATIONAL EQUITY FUNDS
Notes to Financial Statements (continued)
April 30, 2012 (Unaudited)
|
| 5. AGREEMENTS AND AFFILIATED TRANSACTIONS |
A. Management Agreement — Under the Agreement, GSAMI manages the Funds, subject to the general supervision of the trustees.
As compensation for the services rendered pursuant to the Agreement, the assumption of the expenses related thereto and administration of the Funds’ business affairs, including providing facilities, GSAMI is entitled to a management fee, accrued daily and paid monthly, equal to an annual percentage rate of each Fund’s average daily net assets.
For the six months ended April 30, 2012, contractual and effective net management fees with GSAMI were at the following rates:
| | | | | | | | | | | | | | | | | | | | | | | | | | | | | | |
| | | | | Contractual Management Rate | | | | |
| Fund | | | | First $1 billion | | | Next $1 billion | | | Next $3 billion | | | Next $3 billion | | | Over $8 billion | | | Effective
Rate | | | Effective Net
Management
Rate | |
Concentrated International Equity | | | | | 1.00 | % | | | 0.90 | % | | | 0.86 | % | | | 0.84 | % | | | 0.82 | % | | | 1.00 | % | | | 0.94 | %* |
International Small Cap | | | | | 1.10 | | | | 1.10 | | | | 0.99 | | | | 0.94 | | | | 0.92 | | | | 1.10 | | | | 1.08 | * |
Strategic International Equity | | | | | 0.85 | | | | 0.77 | | | | 0.73 | | | | 0.72 | | | | 0.71 | | | | 0.85 | | | | 0.85 | |
| * | | GSAMI agreed to waive a portion of its management fee in order to achieve an effective net management rate shown above for the Concentrated International Equity and International Small Cap Funds, respectively, through February 28, 2013. Prior to such date GSAMI may not terminate the arrangement without the approval of the trustees. |
B. Distribution and Service Plans — The Trust, on behalf of each Fund, has adopted Distribution and Service Plans (the “Plans”). Under the Plans, Goldman Sachs, which serves as distributor (the “Distributor”), is entitled to a fee accrued daily and paid monthly for distribution services and personal and account maintenance services, which may then be paid by Goldman Sachs to authorized dealers, at the following annual rates calculated on a Fund’s average daily net assets of each respective share class:
| | | | | | | | | | | | | | | | |
| | | Distribution and Service Plan Rates | |
| | | Class A* | | | Class B | | | Class C | | | Class R* | |
Distribution Plan | | | 0.25 | % | | | 0.75 | % | | | 0.75 | % | | | 0.50 | % |
Service Plan | | | — | | | | 0.25 | | | | 0.25 | | | | — | |
| * | | With respect to Class A and Class R Shares, the Distributor at its discretion may use compensation for distribution services paid under the Distribution Plan to compensate service organizations for personal and account maintenance services and expenses as long as such total compensation does not exceed the maximum cap on “service fees” imposed by the Financial Industry Regulatory Authority. |
C. Distribution Agreement — Goldman Sachs, as Distributor of the shares of the Funds pursuant to a Distribution Agreement, may retain a portion of the Class A front end sales charge and Class B and Class C CDSC. During the six months ended April 30, 2012, Goldman Sachs advised that it retained the following approximate amounts:
| | | | | | | | | | | | | | |
| | | | | Front End
Sales Charge | | | Contingent Deferred
Sales Charge | |
| Fund | | | | Class A | | | Class B | | | Class C | |
Concentrated International Equity | | | | $ | 900 | | | $ | — | | | $ | 200 | |
International Small Cap | | | | | 400 | | | | — | | | | — | |
Strategic International Equity | | | | | 700 | | | | — | | | | — | |
44
GOLDMAN SACHS FUNDAMENTAL INTERNATIONAL EQUITY FUNDS
|
| 5. AGREEMENTS AND AFFILIATED TRANSACTIONS (continued) |
D. Service Plan and Shareholder Administration Plan — The Trust, on behalf of each Fund that offers Service Shares, has adopted a Service Plan and a Shareholder Administration Plan. These plans allow for service organizations to provide varying levels of personal and account maintenance and shareholder administration services to their customers who are beneficial owners of such shares. The Service Plan and Shareholder Administration Plan each provide for compensation to the service organizations which is accrued daily and paid monthly at an annual rate as follows: 0.25% (0.50% in aggregate) of the average daily net assets of the Service Shares.
E. Transfer Agency Agreement — Goldman Sachs also serves as the transfer agent of the Funds for a fee pursuant to a Transfer Agency Agreement. The fees charged for such transfer agency services are accrued daily and paid monthly at an annual rate as follows: 0.19% of the average daily net assets for Class A, Class B, Class C, Class IR and Class R Shares and 0.04% of the average daily net assets for Institutional and Service Shares.
F. Other Expense Agreements and Affiliated Transactions — GSAMI has agreed to limit certain “Other Expense” of the Funds (excluding management fees, distribution and service fees, transfer agent fees and expenses, service fees and shareholder administration fees (as applicable), taxes, interest, brokerage fees and litigation, indemnification, shareholder meetings and other extraordinary expenses, exclusive of any custody and transfer agent fee credit reductions) to the extent such expenses exceed, on an annual basis, a percentage rate of the average daily net assets of each Fund. Such Other Expense reimbursements, if any, are accrued daily and paid monthly. In addition, the Funds are not obligated to reimburse GSAMI for prior fiscal year expense reimbursements, if any. The Other Expense limitation as an annual percentage rate of average daily net assets for the Concentrated International Equity, International Small Cap and Strategic International Equity Funds are 0.104%, 0.064% and 0.164%, respectively. These Other Expense reimbursements will remain in place through February 28, 2013, and prior to such date GSAMI may not terminate the arrangements without the approval of the trustees. In addition, the Funds have entered into certain offset arrangements with the custodian and the transfer agent, which may result in a reduction of the Funds’ expenses.
For the six months ended April 30, 2012, these expense reductions, including any fee waivers and Other Expense reimbursements, were as follows (in thousands):
| | | | | | | | | | | | | | | | | | |
| Fund | | | | Management
Fee Waiver | | | Custody Fee
Credits | | | Other
Expense
Reimbursement | | | Total
Expense
Reductions | |
Concentrated International Equity | | | | $ | 44 | | | $ | 3 | | | $ | 119 | | | $ | 166 | |
International Small Cap | | | | | 6 | | | | 1 | | | | 203 | | | | 210 | |
Strategic International Equity | | | | | — | | | | 2 | | | | 145 | | | | 147 | |
As of April 30, 2012, the amounts owed to affiliates of the Funds were as follows (in thousands):
| | | | | | | | | | | | | | | | | | |
| Fund | | | | Management
Fees | | | Distribution
and Service
Fees | | | Transfer
Agent
Fees | | | Total | |
Concentrated International Equity | | | | $ | 107 | | | $ | 33 | | | $ | 19 | | | $ | 159 | |
International Small Cap | | | | | 59 | | | | 7 | | | | 6 | | | | 72 | |
Strategic International Equity | | | | | 40 | | | | 17 | | �� | | 8 | | | | 65 | |
G. Line of Credit Facility — As of April 30, 2012, the Funds participated in a $580,000,000 committed, unsecured revolving line of credit facility (the “facility”) together with other funds of the Trust and registered investment companies having management agreements with GSAMI or its affiliates (“Other Borrowers”). Pursuant to the terms of the facility, the Funds and Other Borrowers could increase the credit amount by an additional $340,000,000, for a total of up to $920,000,000. This facility is to be used solely for temporary or emergency purposes. The interest rate on borrowings is based on the federal funds rate. The
45
GOLDMAN SACHS FUNDAMENTAL INTERNATIONAL EQUITY FUNDS
Notes to Financial Statements (continued)
April 30, 2012 (Unaudited)
|
| 5. AGREEMENTS AND AFFILIATED TRANSACTIONS (continued) |
facility also requires a fee to be paid by the Funds based on the amount of the commitment that has not been utilized. For the six months ended April 30, 2012, the Funds did not have any borrowings under the facility. Effective May 8, 2012, the amount available through the facility increased to $630,000,000.
H. Other Transactions with Affiliates — For the six months ended April 30, 2012, Goldman Sachs earned approximately $4,700, $2,900 and $1,300 in brokerage commissions from portfolio transactions, including futures transactions executed with Goldman Sachs as the Futures Commission Merchant, on behalf of the Concentrated International Equity, International Small Cap and Strategic International Equity Funds, respectively.
As of April 30, 2012, the Goldman Sachs Satellite Strategies Portfolio was the beneficial owner of approximately 40% of the total outstanding shares of the International Small Cap Fund.
As of April 30, 2012, the Goldman Sachs Group, Inc. was the beneficial owner of approximately 6% of the Class IR Shares of the Concentrated International Equity Fund, and approximately 12% and 100% of the Class IR and Class R Shares of the Strategic International Equity Fund, respectively.
| | |
| 6. PORTFOLIO SECURITIES TRANSACTIONS | | |
The cost of purchases and proceeds from sales and maturities of long-term securities for the six months ended April 30, 2012, were as follows:
| | | | | | | | | | |
| Fund | | | | Purchases | | | Sales and Maturities | |
Concentrated International Equity | | | | $ | 100,185,873 | | | $ | 112,277,332 | |
International Small Cap | | | | | 30,777,190 | | | | 30,958,054 | |
Strategic International Equity | | | | | 40,735,874 | | | | 37,141,342 | |
As of the Funds’ most recent fiscal year end, October 31, 2011, the Funds’ capital loss carryovers on a tax-basis were as follows:
| | | | | | | | | | | | |
| | | Concentrated
International
Equity | | | International
Small Cap | | | Strategic
International
Equity | |
Capital loss carryovers:(1) | | | | | | | | | | | | |
Expiring 2016 | | $ | (112,531,656 | ) | | $ | (16,365,954 | ) | | $ | (27,734,642 | ) |
Expiring 2017 | | | (106,107,378 | ) | | | (19,170,113 | ) | | | (28,233,535 | ) |
Expiring 2019 | | | (9,250,431 | ) | | | — | | | | — | |
Total capital loss carryovers | | $ | (227,889,465 | ) | | $ | (35,536,067 | ) | | $ | (55,968,177 | ) |
| (1) | | Expiration occurs on October 31 of the year indicated. |
46
GOLDMAN SACHS FUNDAMENTAL INTERNATIONAL EQUITY FUNDS
|
| 7. TAX INFORMATION (continued) |
As of April 30, 2012, the Funds’ aggregate security unrealized gains and losses based on cost for U.S. federal income tax purposes were as follows:
| | | | | | | | | | | | |
| | | Concentrated
International
Equity | | | International
Small Cap | | | Strategic
International
Equity | |
Tax cost | | $ | 139,918,621 | | | $ | 63,689,590 | | | $ | 54,881,442 | |
Gross unrealized gain | | | 6,995,610 | | | | 5,518,304 | | | | 6,107,772 | |
Gross unrealized loss | | | (9,893,620 | ) | | | (4,440,870 | ) | | | (2,919,164 | ) |
Net unrealized security gain (loss) | | $ | (2,898,010 | ) | | $ | 1,077,434 | | | $ | 3,188,608 | |
The difference between GAAP-basis and tax-basis unrealized gains (losses) is attributable primarily to wash sales, net mark to market gains (losses) on regulated futures contracts and differences related to the tax treatment of passive foreign investment company investments.
GSAMI has reviewed the Funds’ tax positions for all open tax years (the current and prior three years, as applicable) and has concluded that no provision for income tax is required in the Funds’ financial statements. Such open tax years remain subject to examination and adjustment by tax authorities.
The Funds’ risks include, but are not limited to, the following:
Foreign Custody Risk — A Fund that invests in foreign securities may hold such securities and foreign currency with foreign banks, agents, and securities depositories appointed by the Fund’s custodian (each a “Foreign Custodian”). In some countries, Foreign Custodians may be subject to little or no regulatory oversight or independent evaluation of their operations. Further, the laws of certain countries may place limitations on a Fund’s ability to recover its assets if a Foreign Custodian enters into bankruptcy. Investments in emerging markets may be subject to greater custody risks than investments in more developed markets. Custody services in emerging market countries are often undeveloped and may be less regulated than in more developed countries, and thus may not afford the same level of investor protection as would apply in developed countries.
Funds’ Shareholder Concentration Risk — Certain funds, accounts, individuals or Goldman Sachs affiliates may from time to time own (beneficially or of record) or control a significant percentage of the Funds’ shares. Redemptions by these entities of their holdings in the Funds may impact the Funds’ liquidity and NAV. These redemptions may also force the Funds to sell securities.
Issuer Concentration Risk — The Concentrated International Equity Fund intends to invest in a relatively small number of issuers. As a result, it may be subject to greater risks than a fund that invests in a greater number of issuers. A change in the value of any single investment held by the Fund may affect the overall value of the Fund more than it would affect a mutual fund that holds more investments. In particular, the Fund may be more susceptible to adverse developments affecting any single issuer in the Fund and may be susceptible to greater losses because of these developments.
Liquidity Risk — The Funds may make investments that may be illiquid or that may become less liquid in response to market developments or adverse investor perceptions. Liquidity risk may also refer to the risk that a Fund will not be able to pay redemption proceeds within the allowable time period because of unusual market conditions, an unusually high volume of redemption requests, or other reasons. To meet redemption requests, a Fund may be forced to sell investments at an unfavorable time and/or under unfavorable conditions.
Market and Credit Risks — In the normal course of business, the Funds trade financial instruments and enter into financial transactions where risk of potential loss exists due to changes in the market (market risk). Additionally, the Funds may also be
47
GOLDMAN SACHS FUNDAMENTAL INTERNATIONAL EQUITY FUNDS
Notes to Financial Statements (continued)
April 30, 2012 (Unaudited)
|
| 8. OTHER RISKS (continued) |
exposed to credit risk in the event that an issuer fails to perform or that an institution or entity with which the Funds have unsettled or open transaction defaults.
Investing in foreign markets may involve special risks and considerations not typically associated with investing in the U.S. These risks include revaluation of currencies, high rates of inflation, repatriation restrictions on income and capital, and adverse political and economic developments. Moreover, securities issued in these markets may be less liquid, be subject to government ownership controls, have delayed settlements and their prices may be more volatile than those of comparable securities in the U.S.
Under the Trust’s organizational documents, its trustees, officers, employees and agents are indemnified, to the extent permitted by the Act, against certain liabilities that may arise out of performance of their duties to the Funds. Additionally, in the course of business, the Funds enter into contracts that contain a variety of indemnification clauses. The Funds’ maximum exposure under these arrangements is unknown, as this would involve future claims that may be made against the Funds that have not yet occurred. However, GSAMI believes the risk of loss under these arrangements to be remote.
New Accounting Pronouncement — In May 2011, Accounting Standards Update 2011-04 (ASU 2011-04), Amendments to Achieve Common Fair Value Measurement and Disclosure Requirements in U.S. GAAP and IFRSs, was issued and is effective for interim and annual periods beginning after December 15, 2011. ASU 2011-04 amends Financial Accounting Standards Board (FASB) Topic 820, Fair Value Measurement. The amendments are the result of the work by the FASB and the International Accounting Standards Board to develop common requirements for measuring fair value and for disclosing information about fair value measurements in accordance with GAAP. GSAMI is currently evaluating the application of ASU 2011-04 and its impact, if any, on the Funds’ financial statements.
In December 2011, Accounting Standards Update 2011-11 (ASU 2011-11), Amendments to Disclosures about Offsetting Assets and Liabilities Requirements in U.S. GAAP and IFRSs, was issued and is effective for interim periods and annual periods beginning on or after January 1, 2013. The amendments are the result of the work by FASB and the International Accounting Standards Board to develop common requirements for disclosing information about offsetting and related arrangements. GSAMI is currently evaluating the application of ASU 2011-11 and its impact, if any, on the Funds’ financial statements.
Other Matters — On February 8, 2012, the Commodity Futures Trading Commission (CFTC) adopted amendments to several of its rules relating to commodity pool operators, including Rule 4.5. The Funds currently rely on Rule 4.5’s exclusion from CFTC regulation for regulated investment companies. GSAMI is currently evaluating the amendments and their impact, if any, on the Funds’ financial statements.
Regulatory Settlements — As of April 30, 2012, the Concentrated International Equity and International Small Cap Funds were entitled to receive payments of $1,002,638 and $21,131, respectively, relating to a regulatory settlement that the Funds were authorized to participate in. This settlement related to market timing of certain mutual funds, including the Funds, by certain third-parties that occurred from 1999 to January 2003. These payments have been included as an increase to Capital Transactions on the Statements of Changes in Net Assets.
Subsequent events after the balance sheet date have been evaluated through the date the financial statements were issued. GSAMI has concluded that there is no impact requiring adjustment or disclosure in the financial statements.
48
GOLDMAN SACHS FUNDAMENTAL INTERNATIONAL EQUITY FUNDS
|
| 12. SUMMARY OF SHARE TRANSACTIONS |
Share activity is as follows:
| | | | | | | | | | | | | | | | |
| | | Concentrated International Equity Fund | |
| | | | |
| | | For the Six Months Ended
April 30, 2012
(Unaudited) | | | For the Fiscal Year Ended
October 31, 2011 | |
| | | | |
| | | Shares | | | Dollars | | | Shares | | | Dollars | |
| | | | |
| Class A Shares | | | | | | | | | | | | | | | | |
Shares sold | | | 205,623 | | | $ | 3,695,032 | | | | 1,010,403 | | | $ | 17,242,818 | |
Shares converted from Class B(a) | | | 4,982 | | | | 71,169 | | | | 5,473 | | | | 89,222 | |
Reinvestment of distributions | | | 266,286 | | | | 3,562,905 | | | | 138,361 | | | | 2,321,693 | |
Shares redeemed | | | (1,960,020 | ) | | | (27,905,925 | ) | | | (2,735,631 | ) | | | (45,533,895 | ) |
| | | | (1,483,129 | ) | | | (20,576,819 | ) | | | (1,581,394 | ) | | | (25,880,162 | ) |
| Class B Shares | | | | | | | | | | | | | | | | |
Shares sold | | | 45 | | | | 8,444 | | | | 4,218 | | | | 74,304 | |
Shares converted to Class A(a) | | | (5,027 | ) | | | (71,169 | ) | | | (5,553 | ) | | | (89,222 | ) |
Reinvestment of distributions | | | 1,852 | | | | 24,589 | | | | 726 | | | | 12,047 | |
Shares redeemed | | | (15,498 | ) | | | (218,849 | ) | | | (32,853 | ) | | | (534,465 | ) |
| | | | (18,628 | ) | | | (256,985 | ) | | | (33,462 | ) | | | (537,336 | ) |
| Class C Shares | | | | | | | | | | | | | | | | |
Shares sold | | | 131,103 | | | | 1,834,665 | | | | 271,787 | | | | 4,311,988 | |
Reinvestment of distributions | | | 29,969 | | | | 378,213 | | | | 12,648 | | | | 200,327 | |
Shares redeemed | | | (267,723 | ) | | | (3,606,546 | ) | | | (403,943 | ) | | | (6,251,648 | ) |
| | | | (106,651 | ) | | | (1,393,668 | ) | | | (119,508 | ) | | | (1,739,333 | ) |
| Institutional Shares | | | | | | | | | | | | | | | | |
Shares sold | | | 140,095 | | | | 2,164,041 | | | | 277,779 | | | | 4,814,087 | |
Reinvestment of distributions | | | 68,565 | | | | 933,856 | | | | 34,400 | | | | 588,267 | |
Shares redeemed | | | (510,042 | ) | | | (7,336,644 | ) | | | (583,381 | ) | | | (10,059,085 | ) |
| | | | (301,382 | ) | | | (4,238,747 | ) | | | (271,202 | ) | | | (4,656,731 | ) |
| Service Shares | | | | | | | | | | | | | | | | |
Shares sold | | | 1,214 | | | | 18,764 | | | | 955 | | | | 15,851 | |
Reinvestment of distributions | | | 119 | | | | 1,605 | | | | 50 | | | | 839 | |
Shares redeemed | | | (2,519 | ) | | | (37,396 | ) | | | (1,678 | ) | | | (28,999 | ) |
| | | | (1,186 | ) | | | (17,027 | ) | | | (673 | ) | | | (12,309 | ) |
| Class IR Shares | | | | | | | | | | | | | | | | |
Shares sold | | | 2,113 | | | | 30,968 | | | | 150 | | | | 2,643 | |
Reinvestment of distributions | | | 94 | | | | 1,281 | | | | 1 | | | | 23 | |
Shares redeemed | | | (1,322 | ) | | | (19,808 | ) | | | — | | | | — | |
| | | | 885 | | | | 12,441 | | | | 151 | | | | 2,666 | |
NET DECREASE | | | (1,910,091 | ) | | $ | (26,470,805 | ) | | | (2,006,088 | ) | | $ | (32,823,205 | ) |
| (a) | | Class B Shares automatically convert into Class A Shares on or about the fifteenth day of the last month of the calendar quarter that is eight years after the initial purchase date of either the Fund or another Goldman Sachs Fund. |
49
GOLDMAN SACHS FUNDAMENTAL INTERNATIONAL EQUITY FUNDS
Notes to Financial Statements (continued)
April 30, 2012 (Unaudited)
|
| 12. SUMMARY OF SHARE TRANSACTIONS (continued) |
Share activity is as follows:
| | | | | | | | | | | | | | | | |
| | | International Small Cap Fund | |
| | | | |
| | | For the Six Months Ended
April 30, 2012 (Unaudited) | | | For the Fiscal Year Ended
October 31, 2011 | |
| | | | |
| | | Shares | | | Dollars | | | Shares | | | Dollars | |
| | | | |
| Class A Shares | | | | | | | | | | | | | | | | |
Shares sold | | | 182,406 | | | $ | 2,489,869 | | | | 768,564 | | | $ | 11,738,997 | |
Shares converted from Class B(a) | | | 512 | | | | 7,208 | | | | 1,889 | | | | 28,581 | |
Reinvestment of distributions | | | 27,182 | | | | 350,377 | | | | 25,507 | | | | 386,439 | |
Shares redeemed | | | (259,343 | ) | | | (3,544,946 | ) | | | (800,865 | ) | | | (11,450,401 | ) |
| | | | (49,243 | ) | | | (697,492 | ) | | | (4,905 | ) | | | 703,616 | |
| Class B Shares | | | | | | | | | | | | | | | | |
Shares sold | | | 82 | | | | 1,372 | | | | 3,571 | | | | 53,874 | |
Shares converted to Class A(a) | | | (519 | ) | | | (7,208 | ) | | | (1,925 | ) | | | (28,581 | ) |
Reinvestment of distributions | | | 310 | | | | 3,950 | | | | 529 | | | | 7,888 | |
Shares redeemed | | | (10,430 | ) | | | (140,184 | ) | | | (21,187 | ) | | | (314,560 | ) |
| | | | (10,557 | ) | | | (142,070 | ) | | | (19,012 | ) | | | (281,379 | ) |
| Class C Shares | | | | | | | | | | | | | | | | |
Shares sold | | | 8,511 | | | | 118,514 | | | | 67,956 | | | | 1,012,517 | |
Reinvestment of distributions | | | 1,139 | | | | 14,270 | | | | 1,289 | | | | 18,933 | |
Shares redeemed | | | (22,147 | ) | | | (299,494 | ) | | | (58,851 | ) | | | (827,350 | ) |
| | | | (12,497 | ) | | | (166,710 | ) | | | 10,394 | | | | 204,100 | |
| Institutional Shares | | | | | | | | | | | | | | | | |
Shares sold | | | 347,495 | | | | 5,018,635 | | | | 2,104,546 | | | | 33,214,090 | |
Reinvestment of distributions | | | 55,817 | | | | 740,136 | | | | 122,570 | | | | 1,909,636 | |
Shares redeemed | | | (183,370 | ) | | | (2,619,438 | ) | | | (5,655,650 | ) | | | (90,486,272 | ) |
| | | | 219,942 | | | | 3,139,333 | | | | (3,428,534 | ) | | | (55,362,546 | ) |
| Service Shares | | | | | | | | | | | | | | | | |
Shares sold | | | — | | | | — | | | | 53,217 | | | | 832,541 | |
Reinvestment of distributions | | | 1,146 | | | | 14,641 | | | | 480 | | | | 7,244 | |
Shares redeemed | | | (167 | ) | | | (2,112 | ) | | | (35,224 | ) | | | (540,736 | ) |
| | | | 979 | | | | 12,529 | | | | 18,473 | | | | 299,049 | |
| Class IR Shares | | | | | | | | | | | | | | | | |
Shares sold | | | 7,566 | | | | 107,144 | | | | 18,231 | | | | 289,453 | |
Reinvestment of distributions | | | 178 | | | | 2,360 | | | | 1 | | | | 23 | |
Shares redeemed | | | (1,973 | ) | | | (29,929 | ) | | | (16,655 | ) | | | (238,427 | ) |
| | | | 5,771 | | | | 79,575 | | | | 1,577 | | | | 51,049 | |
NET INCREASE (DECREASE) | | | 154,395 | | | $ | 2,225,165 | | | | (3,422,007 | ) | | $ | (54,386,111 | ) |
| (a) | | Class B Shares automatically convert into Class A Shares on or about the fifteenth day of the last month of the calendar quarter that is eight years after the initial purchase date of either the Fund or another Goldman Sachs Fund. |
50
GOLDMAN SACHS FUNDAMENTAL INTERNATIONAL EQUITY FUNDS
|
| 12. SUMMARY OF SHARE TRANSACTIONS (continued) |
Share activity is as follows:
| | | | | | | | | | | | | | | | |
| | | Strategic International Equity Fund | |
| | | | |
| | | For the Six Months Ended
April 30, 2012 (Unaudited) | | | For the Fiscal Year Ended
October 31, 2011 | |
| | | | |
| | | Shares | | | Dollars | | | Shares | | | Dollars | |
| | | | |
| Class A Shares | | | | | | | | | | | | | | | | |
Shares sold | | | 583,745 | | | $ | 5,937,702 | | | | 845,476 | | | $ | 10,036,302 | |
Shares converted from Class B(a) | | | 35,769 | | | | 364,964 | | | | 71,726 | | | | 822,322 | |
Reinvestment of distributions | | | 139,238 | | | | 1,338,080 | | | | 46,660 | | | | 551,982 | |
Shares redeemed | | | (788,336 | ) | | | (8,053,835 | ) | | | (2,195,338 | ) | | | (25,528,763 | ) |
| | | | (29,584 | ) | | | (413,089 | ) | | | (1,231,476 | ) | | | (14,118,157 | ) |
| Class B Shares | | | | | | | | | | | | | | | | |
Shares sold | | | 2,763 | | | | 23,922 | | | | 16,740 | | | | 182,407 | |
Shares converted to Class A(a) | | | (39,820 | ) | | | (364,964 | ) | | | (79,714 | ) | | | (822,322 | ) |
Reinvestment of distributions | | | 15,121 | | | | 130,647 | | | | 1,797 | | | | 19,173 | |
Shares redeemed | | | (49,160 | ) | | | (455,207 | ) | | | (131,653 | ) | | | (1,381,144 | ) |
| | | | (71,096 | ) | | | (665,602 | ) | | | (192,830 | ) | | | (2,001,886 | ) |
| Class C Shares | | | | | | | | | | | | | | | | |
Shares sold | | | 24,433 | | | | 228,299 | | | | 86,896 | | | | 937,844 | |
Reinvestment of distributions | | | 19,438 | | | | 170,082 | | | | 2,447 | | | | 26,452 | |
Shares redeemed | | | (130,856 | ) | | | (1,241,232 | ) | | | (231,943 | ) | | | (2,487,746 | ) |
| | | | (86,985 | ) | | | (842,851 | ) | | | (142,600 | ) | | | (1,523,450 | ) |
| Institutional Shares | | | | | | | | | | | | | | | | |
Shares sold | | | 14,722 | | | | 159,326 | | | | 76,728 | | | | 977,830 | |
Reinvestment of distributions | | | 23,808 | | | | 238,560 | | | | 22,965 | | | | 283,386 | |
Shares redeemed | | | (60,650 | ) | | | (642,189 | ) | | | (1,272,833 | ) | | | (15,876,778 | ) |
| | | | (22,120 | ) | | | (244,303 | ) | | | (1,173,140 | ) | | | (14,615,562 | ) |
| Class IR Shares | | | | | | | | | | | | | | | | |
Shares sold | | | 484 | | | | 5,200 | | | | 12,822 | | | | 147,583 | |
Reinvestment of distributions | | | 227 | | | | 2,189 | | | | 6 | | | | 69 | |
Shares redeemed | | | (269 | ) | | | (2,629 | ) | | | (8,228 | ) | | | (95,618 | ) |
| | | | 442 | | | | 4,760 | | | | 4,600 | | | | 52,034 | |
| Class R Shares | | | | | | | | | | | | | | | | |
Shares sold | | | — | | | | — | | | | 6 | | | | 72 | |
Reinvestment of distributions | | | 15 | | | | 142 | | | | 16 | | | | 183 | |
Shares redeemed | | | — | | | | — | | | | (1,815 | ) | | | (19,382 | ) |
| | | | 15 | | | | 142 | | | | (1,793 | ) | | | (19,127 | ) |
NET DECREASE | | | (209,328 | ) | | $ | (2,160,943 | ) | | | (2,737,239 | ) | | $ | (32,226,148 | ) |
| (a) | | Class B Shares automatically convert into Class A Shares on or about the fifteenth day of the last month of the calendar quarter that is eight years after the initial purchase date of either the Fund or another Goldman Sachs Fund. |
51
GOLDMAN SACHS FUNDAMENTAL INTERNATIONAL EQUITY FUNDS
Fund Expenses — Six Month Period Ended April 30, 2012 (Unaudited)
As a shareholder of Class A, Class B, Class C, Institutional, Service, Class IR or Class R Shares of a Fund you incur two types of costs: (1) transaction costs, including sales charges on purchase payments (with respect to Class A Shares) and contingent deferred sales charges on redemptions (with respect to Class B and Class C Shares); and (2) ongoing costs, including management fees; distribution and service (12b-1) fees (with respect to Class A, Class B, Class C and Class R Shares); and other Fund expenses. This example is intended to help you understand your ongoing costs (in dollars) of investing in Class A, Class B, Class C, Institutional, Service, Class IR and Class R Shares of the Funds and to compare these costs with the ongoing costs of investing in other mutual funds.
The example is based on an investment of $1,000 invested at the beginning of the period and held for the entire period from November 1, 2011 through April 30, 2012.
Actual Expenses — The first line under each share class in the table below provides information about actual account values and actual expenses. You may use the information in this line, together with the amount you invested, to estimate the expenses that you paid over the period. Simply divide your account value by $1,000 (for example, an $8,600 account value divided by $1,000=8.6), then multiply the result by the number in the first line under the heading entitled “Expenses Paid” to estimate the expenses you paid on your account during this period.
Hypothetical Example for Comparison Purposes — The second line under each share class in the table below provides information about hypothetical account values and hypothetical expenses based on the Funds’ actual net expense ratio and an assumed rate of return of 5% per year before expenses, which is not the Funds’ actual return. The hypothetical account values and expenses may not be used to estimate the actual ending account balance or expenses you paid for the period. You may use this information to compare the ongoing costs of investing in the Funds and other funds. To do so, compare this 5% hypothetical example with the 5% hypothetical examples that appear in the shareholder reports of the other funds.
Please note that the expenses shown in the table are meant to highlight your ongoing costs only and do not reflect any transactional costs, such as sales charges, redemption fee or exchange fees. Therefore, the second line of the table is useful in comparing ongoing costs only, and will not help you determine the relative total costs of owning different funds. In addition, if these transactional costs were included, your costs would have been higher.
| | | | | | | | | | | | | | | | | | | | | | | | | | | | | | | | | | | | |
| | | Concentrated International Equity Fund | | | International Small Cap Fund | | | Strategic International Equity Fund | |
| Share Class | | Beginning
Account Value
11/01/11 | | | Ending
Account Value
4/30/12 | | | Expenses
Paid for the
6 Months Ended
4/30/12 | | | Beginning
Account Value
11/01/11 | | | Ending
Account Value
4/30/12 | | | Expenses
Paid for the
6 Months Ended
4/30/12 | | | Beginning
Account Value
11/01/11 | | | Ending
Account Value
4/30/12 | | | Expenses
Paid for the
6 Months Ended
4/30/12 | |
| Class A | | | | | | | | | | | | | | | | | | | | | | | | | | | | | | | | | | | | |
Actual | | $ | 1,000 | | | $ | 1,051.70 | | | $ | 7.55 | | | $ | 1,000 | | | $ | 1,079.10 | | | $ | 8.17 | | | $ | 1,000 | | | $ | 1,056.50 | | | $ | 7.41 | |
Hypothetical 5% return | | | 1,000 | | | | 1,017.50 | + | | | 7.42 | | | | 1,000 | | | | 1,017.01 | + | | | 7.92 | | | | 1,000 | | | | 1,017.65 | + | | | 7.27 | |
| Class B | | | | | | | | | | | | | | | | | | | | | | | | | | | | | | | | | | | | |
Actual | | | 1,000 | | | | 1,048.20 | | | | 11.36 | | | | 1,000 | | | | 1,075.10 | | | | 12.02 | | | | 1,000 | | | | 1,053.70 | | | | 11.23 | |
Hypothetical 5% return | | | 1,000 | | | | 1,013.77 | + | | | 11.17 | | | | 1,000 | | | | 1,013.28 | + | | | 11.66 | | | | 1,000 | | | | 1,013.92 | + | | | 11.02 | |
| Class C | | | | | | | | | | | | | | | | | | | | | | | | | | | | | | | | | | | | |
Actual | | | 1,000 | | | | 1,047.80 | | | | 11.35 | | | | 1,000 | | | | 1,075.30 | | | | 12.02 | | | | 1,000 | | | | 1,052.30 | | | | 11.23 | |
Hypothetical 5% return | | | 1,000 | | | | 1,013.77 | + | | | 11.17 | | | | 1,000 | | | | 1,013.28 | + | | | 11.66 | | | | 1,000 | | | | 1,013.92 | + | | | 11.02 | |
| Institutional | | | | | | | | | | | | | | | | | | | | | | | | | | | | | | | | | | | | |
Actual | | | 1,000 | | | | 1,054.50 | | | | 5.52 | | | | 1,000 | | | | 1,082.70 | | | | 6.11 | | | | 1,000 | | | | 1,058.80 | | | | 5.37 | |
Hypothetical 5% return | | | 1,000 | | | | 1,019.49 | + | | | 5.42 | | | | 1,000 | | | | 1,019.00 | + | | | 5.92 | | | | 1,000 | | | | 1,019.64 | + | | | 5.27 | |
| Service | | | | | | | | | | | | | | | | | | | | | | | | | | | | | | | | | | | | |
Actual | | | 1,000 | | | | 1,051.80 | | | | 8.06 | | | | 1,000 | | | | 1,078.20 | | | | 8.68 | | | | N/A | | | | N/A | | | | N/A | |
Hypothetical 5% return | | | 1,000 | | | | 1,017.01 | + | | | 7.92 | | | | 1,000 | | | | 1,016.51 | + | | | 8.42 | | | | N/A | | | | N/A | | | | N/A | |
| Class IR | | | | | | | | | | | | | | | | | | | | | | | | | | | | | | | | | | | | |
Actual | | | 1,000 | | | | 1,052.90 | | | | 6.28 | | | | 1,000 | | | | 1,080.50 | | | | 6.88 | | | | 1,000 | | | | 1,058.10 | | | | 6.14 | |
Hypothetical 5% return | | | 1,000 | | | | 1,018.75 | + | | | 6.17 | | | | 1,000 | | | | 1,018.25 | + | | | 6.67 | | | | 1,000 | | | | 1,018.90 | + | | | 6.02 | |
| Class R | | | | | | | | | | | | | | | | | | | | | | | | | | | | | | | | | | | | |
Actual | | | N/A | | | | N/A | | | | N/A | | | | N/A | | | | N/A | | | | N/A | | | | 1,000 | | | | 1,055.70 | | | | 8.69 | |
Hypothetical 5% return | | | N/A | | | | N/A | | | | N/A | | | | N/A | | | | N/A | | | | N/A | | | | 1,000 | | | | 1,016.41 | + | | | 8.52 | |
| * | | Expenses are calculated using each Fund’s annualized net expense ratio for each class, which represents the ongoing expenses as a percentage of net assets for the six months ended April 30, 2012. Expenses are calculated by multiplying the annualized net expense ratio by the average account value for the period; then multiplying the result by the number of days in the most recent fiscal half year; and then dividing that result by the number of days in the fiscal year. The annualized net expense ratios for the period were as follows: |
| | | | | | | | | | | | | | | | | | | | | | | | | | | | |
| Fund | | Class A | | | Class B | | | Class C | | | Institutional | | | Service | | | Class IR | | | Class R | |
Concentrated International Equity | | | 1.48 | % | | | 2.23 | % | | | 2.23 | % | | | 1.08 | % | | | 1.58 | % | | | 1.23 | % | | | N/A | |
International Small Cap | | | 1.58 | | | | 2.33 | | | | 2.33 | | | | 1.18 | | | | 1.68 | | | | 1.33 | | | | N/A | |
Strategic International Equity | | | 1.45 | | | | 2.20 | | | | 2.20 | | | | 1.05 | | | | N/A | | | | 1.20 | | | | 1.70 | % |
| + | | Hypothetical expenses are based on each Fund's actual annualized net expense ratios and an assumed rate of return of 5% per year before expenses. |
52
FUNDS PROFILE
Goldman Sachs Funds

Goldman Sachs is a premier financial services firm, known since 1869 for creating thoughtful and customized investment solutions in complex global markets.
Today, the Investment Management Division of Goldman Sachs serves a diverse set of clients worldwide, including private institutions, public entities and individuals. With $702.0 billion in assets under management as of March 31, 2012, Goldman Sachs Asset Management (“GSAM”) has portfolio management teams located around the world and our investment professionals bring firsthand knowledge of local markets to every investment decision. GSAM’s assets under management includes assets managed by Goldman Sachs Asset Management, LP and its Investment Advisory Affiliates. Additionally, GSAM ranks in the top 10 asset management firms worldwide, based on assets under management.1
|
| OVERVIEW OF GOLDMAN SACHS FUNDS |

Money Market2
Financial Square FundsSM
| n | | Financial Square Tax-Exempt Funds |
| n | | Financial Square Federal Fund |
| n | | Financial Square Government Fund |
| n | | Financial Square Money Market Fund |
| n | | Financial Square Prime Obligations Fund |
| n | | Financial Square Treasury Instruments Fund |
| n | | Financial Square Treasury Obligations Fund |
Fixed Income
Short Duration and Government
| n | | Ultra-Short Duration Govt. Fund |
| n | | Short Duration Government Fund |
| n | | Short Duration Income Fund |
| n | | Inflation Protected Securities Fund |
Multi-Sector
| n | | Core Plus Fixed Income Fund |
Municipal and Tax-Free
| n | | High Yield Municipal Fund |
| n | | Short Duration Tax-Free Fund |
Single Sector
| n | | Investment Grade Credit Fund |
| n | | High Yield Floating Rate Fund |
| n | | Emerging Markets Debt Fund |
| n | | Local Emerging Markets Debt Fund |
Corporate Credit
Fundamental Equity
| n | | Small/Mid Cap Growth Fund |
| n | | Flexible Cap Growth Fund |
| n | | Concentrated Growth Fund |
| n | | Technology Tollkeeper Fund |
| n | | Growth Opportunities Fund |
| n | | Rising Dividend Growth Fund |
Structured Equity
| n | | Structured Small Cap Equity Fund |
| n | | Structured U.S. Equity Fund |
| n | | Structured Small Cap Growth Fund |
| n | | Structured Large Cap Growth Fund |
| n | | Structured Large Cap Value Fund |
| n | | Structured Small Cap Value Fund |
| n | | Structured Tax-Managed Equity Fund |
| n | | Structured International Tax-Managed Equity Fund |
| n | | U.S. Equity Dividend and Premium Fund |
| n | | International Equity Dividend and Premium Fund |
| n | | Structured International Small Cap Fund |
| n | | Structured International Equity Fund |
| n | | Structured Emerging Markets Equity Fund |
Fundamental Equity International
| n | | Strategic International Equity Fund |
| n | | Concentrated International Equity Fund |
| n | | International Small Cap Fund |
| n | | Emerging Markets Equity Fund |
| n | | BRIC Fund (Brazil, Russia, India, China) |
Select Satellite3
| n | | Real Estate Securities Fund |
| n | | International Real Estate Securities Fund |
| n | | Commodity Strategy Fund |
| n | | Dynamic Allocation Fund |
| n | | Absolute Return Tracker Fund |
| n | | Managed Futures Strategy Fund |
Total Portfolio Solutions3
| n | | Balanced Strategy Portfolio |
| n | | Growth and Income Strategy Portfolio |
| n | | Growth Strategy Portfolio |
| n | | Equity Growth Strategy Portfolio |
| n | | Income Strategies Portfolio |
| n | | Satellite Strategies Portfolio |
| n | | Retirement Strategies Portfolios |
| n | | Enhanced Dividend Global Equity Portfolio |
| n | | Tax Advantaged Global Equity Portfolio |
| 1 | | Ranking for Goldman Sachs Group, Inc., includes Goldman Sachs Asset Management, Private Wealth Management and Merchant Banking 2010 year-end assets. Ranked 10th in total assets worldwide. Pensions&Investments, June 2011. |
| 2 | | An investment in a money market fund is neither insured nor guaranteed by the Federal Deposit Insurance Corporation (“FDIC”) or any other government agency. Although the Funds seek to preserve the value of your investment at $1.00 per share, it is possible to lose money by investing in the Funds. |
| 3 | | Individual Funds within the Total Portfolio Solutions and Select Satellite categories will have various placement on the risk/return spectrum and may have greater or lesser risk than that indicated by the placement of the general Total Portfolio Solutions or Select Satellite category. |
| Financial | | Square FundsSM is a registered service mark of Goldman, Sachs & Co. |
| | |
TRUSTEES Ashok N. Bakhru, Chairman Donald C. Burke John P. Coblentz, Jr. Diana M. Daniels Joseph P. LoRusso James A. McNamara Jessica Palmer Alan A. Shuch Richard P. Strubel | | OFFICERS James A. McNamara, President George F. Travers, Principal Financial Officer Peter V. Bonanno, Secretary Scott M. McHugh, Treasurer |
| |
GOLDMAN, SACHS & CO. Distributor and Transfer Agent | | GOLDMAN SACHS ASSET MANAGEMENT INTERNATIONAL Investment Adviser |
Visit our Website at www.goldmansachsfunds.com to obtain the most recent month-end returns.
Goldman Sachs Asset Management, L.P. 200 West Street, New York, New York 10282
The reports concerning the Funds included in this shareholder report may contain certain forward-looking statements about the factors that may affect the performance of the Funds in the future. These statements are based on Fund management’s predictions and expectations concerning certain future events and their expected impact on the Funds, such as performance of the economy as a whole and of specific industry sectors, changes in the levels of interest rates, the impact of developing world events, and other factors that may influence the future performance of the Funds. Management believes these forward-looking statements to be reasonable, although they are inherently uncertain and difficult to predict. Actual events may cause adjustments in portfolio management strategies from those currently expected to be employed.
A description of the policies and procedures that the Funds use to determine how to vote proxies relating to portfolio securities and information regarding how a Fund voted proxies relating to portfolio securities during the most recent 12-month period ended June 30 is available (I) without charge, upon request by calling 1-800-526-7384 (for Retail Shareholders) or 1-800-621-2550 (for Institutional Shareholders); and (II) on the Securities and Exchange Commission Web site at http://www.sec.gov.
The Funds file their complete schedule of portfolio holdings with the Securities and Exchange Commission (“SEC”) for the first and third quarters of each fiscal year on Form N-Q. The Funds’ Forms N-Q will become available on the SEC’s website at http://www.sec.gov within 60 days after the Funds’ first and third fiscal quarters. When available, the Funds’ Forms N-Q may be reviewed and copied at the SEC’s Public Reference Room in Washington, D.C. and information on the operation of the Public Reference Room may also be obtained by calling 1-800-SEC-0330. When available, Form N-Q may be obtained upon request and without charge by calling 1-800-526-7384 (for Retail Shareholders) or 1-800-621-2550 (for Institutional Shareholders).
Holdings and allocations shown are as of April 30, 2012 and may not be representative of future investments. Fund holdings should not be relied on in making investment decisions and should not be construed as research or investment advice regarding particular securities.
The Global Industry Classification Standard (GICS) was developed by and is the exclusive property and a service mark of Morgan Stanley Capital International Inc. (MSCI) and Standard & Poor’s, a division of The McGraw-Hill Companies, Inc. (S&P) and is licensed for use by Goldman Sachs. Neither MSCI, S&P nor any other party involved in making or compiling the GICS or any GICS classifications makes any express or implied warranties or representations with respect to such standard or classification (or the results to be obtained by the use thereof), and all such parties hereby expressly disclaim all warranties of originality, accuracy, completeness, merchantability or fitness for a particular purpose with respect to any of such standard or classification. Without limiting any of the foregoing, in no event shall MSCI, S&P, any of their affiliates or any third party involved in making or compiling the GICS or any GICS classifications have any liability for any direct, indirect, special, punitive, consequential or any other damages (including lost profits) even if notified of the possibility of such damages.
The portfolio risk management process includes an effort to monitor and manage risk, but does not imply low risk.
This material is not authorized for distribution to prospective investors unless preceded or accompanied by a current Prospectus or summary prospectus, if applicable. Investors should consider a Fund’s objective, risks, and charges and expenses, and read the summary prospectus, if available, and/or the Prospectus carefully before investing or sending money. The summary prospectus, if available, and the Prospectus contain this and other information about a Fund and may be obtained from your authorized dealer or from Goldman, Sachs & Co. by calling (retail – 1-800-526-7384) (institutional – 1-800-621-2550).
© 2012 Goldman Sachs. All rights reserved. 75525.MF.MED.TMPL /6/2012 EQINTSAR12 / 15.2K
| | The information required by this Item is only required in an annual report on this Form N-CSR. |
| ITEM 3. | AUDIT COMMITTEE FINANCIAL EXPERT. |
| | The information required by this Item is only required in an annual report on this Form N-CSR. |
| ITEM 4. | PRINCIPAL ACCOUNTANT FEES AND SERVICES. |
| | The information required by this Item is only required in an annual report on this Form N-CSR. |
| ITEM 5. | AUDIT COMMITTEE OF LISTED REGISTRANTS. |
| ITEM 6. | SCHEDULE OF INVESTMENTS. |
| | Schedule of Investments is included as part of the Report to Stockholders filed under Item 1. |
| ITEM 7. | DISCLOSURE OF PROXY VOTING POLICIES AND PROCEDURES FOR CLOSED-END MANAGEMENT INVESTMENT COMPANIES. |
| ITEM 8. | PORTFOLIO MANAGERS OF CLOSED-END MANAGEMENT INVESTMENT COMPANIES. |
| ITEM 9. | PURCHASES OF EQUITY SECURITIES BY CLOSED-END MANAGEMENT INVESTMENT COMPANY AND AFFILIATED PURCHASERS. |
| ITEM 10. | SUBMISSION OF MATTERS TO A VOTE OF SECURITY HOLDERS. |
| | There have been no material changes to the procedures by which shareholders may recommend nominees to the registrant’s board of trustees. |
| ITEM 11. | CONTROLS AND PROCEDURES. |
| | (a) | The registrant’s principal executive and principal financial officers, or persons performing similar functions have concluded that the registrant’s disclosure controls and procedures (as defined in Rule 30a-3(c) under the Investment Company Act of 1940, as amended (the “1940 Act”)) are effective as of a date within 90 days of the filing of this report that includes the disclosure required by this paragraph, based on the evaluation of these controls and procedures required by Rule 30a-3(b) under the 1940 Act and 15d-15(b) under the Securities Exchange Act of 1934, as amended. |
| | (b) | There were no changes in the registrant’s internal control over financial reporting (as defined in Rule 30a-3(d) under the 1940 Act) that occurred during the registrant’s second fiscal quarter of the period covered by this report that have materially affected, or are reasonably likely to materially affect, the registrant’s internal control over financial reporting. |
| | | | |
| (a)(1) | | The information required by this Item is only required in connection with an annual report on this Form N-CSR. |
| | |
| (a)(2) | | Exhibit 99.CERT | | Certifications pursuant to Section 302 of the Sarbanes-Oxley Act of 2002 filed herewith. |
| | |
| (b) | | Exhibit 99.906CERT | | Certifications pursuant to Section 906 of the Sarbanes-Oxley Act of 2002 filed herewith. |
SIGNATURES
Pursuant to the requirements of the Securities Exchange Act of 1934 and the Investment Company Act of 1940, the registrant has duly caused this report to be signed on its behalf by the undersigned, thereunto duly authorized.
| | | | |
| | | | Goldman Sachs Trust |
| | |
| By: | | | | /s/ James A. McNamara |
| | | | James A. McNamara |
| | | | President/Principal Executive Officer |
| | | | Goldman Sachs Trust |
| | |
| Date: | | | | June 26, 2012 |
Pursuant to the requirements of the Securities Exchange Act of 1934 and the Investment Company Act of 1940, this report has been signed below by the following persons on behalf of the registrant and in the capacities and on the dates indicated.
| | | | |
| By: | | | | /s/ James A. McNamara |
| | | | James A. McNamara |
| | | | President/Principal Executive Officer |
| | | | Goldman Sachs Trust |
| | |
| Date: | | | | June 26, 2012 |
| | |
| By: | | | | /s/ George F. Travers |
| | | | George F. Travers |
| | | | Principal Financial Officer |
| | | | Goldman Sachs Trust |
| | |
| Date: | | | | June 25, 2012 |