UNITED STATES
SECURITIES AND EXCHANGE COMMISSION
Washington, D.C. 20549
FORM N-CSR
CERTIFIED SHAREHOLDER REPORT OF REGISTERED
MANAGEMENT INVESTMENT COMPANIES
Investment Company Act file number 811-05349
Goldman Sachs Trust
(Exact name of registrant as specified in charter)
71 South Wacker Drive,
Chicago, Illinois 60606
(Address of principal executive offices) (Zip code)
| | |
Copies to: |
Peter V. Bonanno, Esq. | | Geoffrey R.T. Kenyon, Esq. |
Goldman, Sachs & Co. | | Dechert LLP |
200 West Street | | 200 Clarendon Street |
New York, New York 10282 | | 27th Floor |
| | Boston, MA 02116-5021 |
(Name and address of agents for service)
Registrant’s telephone number, including area code: (312) 655-4400
Date of fiscal year end: October 31
Date of reporting period: April 30, 2012
| ITEM 1. | REPORTS TO STOCKHOLDERS. |
| | The Semi-Annual Report to Stockholders is filed herewith. |
Goldman Sachs Funds

| | | | |
| | |
| Semi-Annual Report | | | | April 30, 2012 |
| | |
| | | | Fundamental Emerging Markets Equity Funds |
| | | | Asia Equity |
| | | | BRIC |
| | | | Emerging Markets Equity |
| | | | N-11 Equity |

Goldman Sachs Fundamental
Emerging Markets Equity Funds
| n | | EMERGING MARKETS EQUITY |
| | | | |
TABLE OF CONTENTS | | | | |
| |
Principal Investment Strategies and Risks | | | 1 | |
| |
Investment Process | | | 3 | |
| |
Market Review | | | 4 | |
| |
Portfolio Management Discussions and Performance Summaries | | | 6 | |
| |
Schedules of Investments | | | 29 | |
| |
Financial Statements | | | 42 | |
| |
Financial Highlights | | | 46 | |
| |
Notes to Financial Statements | | | 54 | |
| |
Other Information | | | 68 | |
| | | | |
| | | |
| NOT FDIC-INSURED | | May Lose Value | | No Bank Guarantee |
GOLDMAN SACHS FUNDAMENTAL EMERGING MARKETS EQUITY FUNDS
Principal Investment Strategies and Risks
This is not a complete list of risks that may affect the Funds. For additional information concerning the risks applicable to the Funds, please see the Funds’ Prospectuses.
The Goldman Sachs Asia Equity Fund invests primarily in a diversified portfolio of equity investments in Asian issuers. The Fund is subject to market risk, which means that the value of the securities in which it invests may go up or down in response to the prospects of individual companies, particular industry sectors and/or general economic conditions. Foreign and emerging market securities may be more volatile than investments in U.S. securities and will be subject to the risks of currency fluctuations and adverse economic or political developments. Because of its exposure to Asian issuers, the Fund is subject to greater risk of loss as a result of Asian economic, market, political and local risks than a fund that is more geographically diversified. The securities of small- and mid-capitalization companies involve greater risks than those associated with larger, more established companies and may be subject to more abrupt or erratic price movements. At times, the Fund may be unable to sell certain of its investments without a substantial drop in price, if at all.
The Goldman Sachs BRIC Fund invests primarily in a concentrated portfolio of equity investments in Brazil, Russia, India and China (“BRIC countries”) or in issuers that participate in the markets of the BRIC countries. The Fund is subject to market risk, which means that the value of the securities in which it invests may go up or down in response to the prospects of individual companies, particular industry sectors and/or general economic conditions. Foreign and emerging market securities may be more volatile than investments in U.S. securities and will be subject to the risks of currency fluctuations and adverse economic or political developments. Such securities are also subject to foreign custody risk. Because of its exposure to the BRIC countries, the Fund is subject to greater risk of loss as a result of adverse securities markets, exchange rates and social, political, regulatory or economic events that may occur in those countries or regions. At times, the Fund may be unable to sell certain of its investments without a substantial drop in price, if at all. The Fund is “non-diversified” and may invest more of its assets in fewer issuers than “diversified” mutual funds. Accordingly, the Fund may be more susceptible to adverse developments affecting any single issuer held in its portfolio and to greater losses resulting from these developments.
The Goldman Sachs Emerging Markets Equity Fund invests primarily in a diversified portfolio of equity investments in emerging country issuers. The Fund is subject to market risk, which means that the value of the securities in which it invests may go up or down in response to the prospects of individual companies, particular industry sectors and/or general economic conditions. Foreign and emerging market securities may be more volatile than investments in U.S. securities and will be subject to the risks of currency fluctuations and adverse economic or political developments. The securities markets of emerging countries have less government regulation and are subject to less extensive accounting and financial reporting requirements than the markets of more developed countries. Such securities are also subject to foreign custody risk. The securities of small- and mid-capitalization companies involve greater risks than those associated with larger, more established companies and may be subject to more abrupt or erratic price movements. At times, the Fund may be unable to sell certain of its investments without a substantial drop in price, if at all.
1
GOLDMAN SACHS FUNDAMENTAL EMERGING MARKETS EQUITY FUNDS
The Goldman Sachs N-11 Equity Fund invests primarily in a portfolio of equity investments that are tied economically to the “N-11 countries” or in issuers that participate in the markets of the following N-11 countries: Bangladesh, Egypt, Indonesia, Mexico, Nigeria, Pakistan, Philippines, South Korea, Turkey, and Vietnam. While Iran is among the N-11 countries, the Fund will not invest in issuers organized under the laws of Iran, or domiciled in Iran, or in certain other issuers as necessary to comply with U.S. economic sanctions against Iran. The Fund is subject to market risk, which means that the value of the securities in which it invests may go up or down in response to the prospects of individual companies, particular sectors and/or general economic conditions. Foreign and emerging market securities may be more volatile than investments in U.S. securities and will be subject to the risks of currency fluctuations and adverse economic or political developments. Because of its exposure to the N-11 countries, the Fund is subject to greater risk of loss as a result of adverse securities markets, exchange rates and social, political, regulatory or economic events that may occur in those countries. Such securities are also subject to foreign custody risk. The N-11 countries generally have smaller economies or less developed capital markets than traditional emerging markets countries, and, as a result, the risks of investing in these countries are magnified. Derivative instruments may involve a high degree of financial risk. These risks include the risk that a small movement in the price of the underlying security or benchmark may result in a disproportionately large movement, favorable or unfavorable, in the price of the derivative instrument; risk of default by a counterparty; and liquidity risk. The Fund’s investments in participation notes are subject to the same risks associated with the underlying asset or market, as well as counterparty risk. The securities of small- and mid-capitalization companies involve greater risks than those associated with larger, more established companies and may be subject to more abrupt or erratic price movements. At times, the Fund may be unable to sell certain of its investments without a substantial drop in price, if at all. The Fund is “non-diversified” and may invest more of its assets in fewer issuers than “diversified” funds. Accordingly, the Fund may be more susceptible to adverse developments affecting any single issuer held in its portfolio and to greater losses resulting from these developments.
2
GOLDMAN SACHS FUNDAMENTAL EMERGING MARKETS EQUITY FUNDS
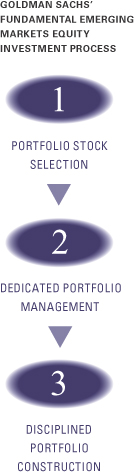
What Differentiates Goldman Sachs’ Fundamental
Emerging Markets Equity Investment Process?
Goldman Sachs’ Fundamental Emerging Markets Equity investment process is based on the belief that strong, consistent results are best achieved through expert stock selection, performed by our dedicated Emerging Markets Team that works together on a global scale. Our deep, diverse and experienced team of research analysts and portfolio managers combines local insights with global, industry-specific expertise to identify its best investment ideas.

| n | | The Emerging Markets Equity research team, based in the United States, United Kingdom, Japan, China, Korea, Singapore, Brazil, India, and Australia focuses on long- term business and management quality |
| n | | Proprietary, bottom-up research is the key driver of our investment process |
| n | | Analysts collaborate regularly to leverage regional and industry-specific research and insights |

| n | | Members of each local investment team are aligned by sector and are responsible for finding ideas with the best risk-adjusted upside in their respective areas of coverage |
| n | | The decision-making process includes active participation in frequent and regular research meetings |
| n | | The Emerging Market Equity team benefits from the country and currency expertise of our Global Emerging Markets Debt and Currency teams |

| n | | Security selections are aligned with levels of investment conviction and risk-adjusted upside |
| n | | Continual risk monitoring identifies various risks at the stock and portfolio level and assesses whether they are intended and justified |
| n | | Dedicated portfolio construction team assists in ongoing monitoring and adjustment of the Funds |

Emerging markets equity portfolios that strive to offer:
| | n | | Access to markets across emerging markets | |
| | n | | Disciplined approach to stock selection | |
| | n | | Optimal risk/return profiles | |
3
MARKET REVIEW
Goldman Sachs Fundamental Emerging Markets Equity Funds
Market Review
Overall, emerging markets equities advanced during the six-month period ended April 30, 2012 (the “Reporting Period”). The Morgan Stanley Capital International (MSCI) Emerging Markets Index (net, unhedged) (the “MSCI EM Index”) posted a return of 3.93%,* as weakness at the end of 2011 and in the last two months of the Reporting Period was more than offset by a sharp rally in the first two months of 2012.
Emerging market equities overall declined in November and December 2011 amidst concerns regarding slowing global economic growth and worsening of Europe’s sovereign debt crisis. Concerns over the outlook for global economic growth were exacerbated by the fact that China’s annual inflation rate fell to 5.5% from 6.1% during October, and its industrial production slowed. In addition, many emerging market currencies declined against the U.S. dollar during these last two months of 2011, further weakening returns as measured in U.S. dollars.
The emerging equity markets then rallied broadly in January and February 2012, as sentiment on the global economy improved, and investors started to rotate into riskier assets. Optimism grew that the U.S. economy was recovering and that Europe might eventually be able to stem its sovereign debt crisis. However, the emerging equity markets retreated in March and April 2012 amidst increased political uncertainty in Europe, questions about the strength of the U.S. economic recovery and weaker than expected economic data from China that renewed concerns around an economic slowdown in Asia.
For the Reporting Period overall, China was one of the better performing large country markets within the MSCI EM Index, as economic data supported the likelihood that its monetary policy would remain loose. The Chinese government officially announced in March that it would target economic growth of 7.5% for 2012, the first time in recent years that the target had been under 8%. In addition, China’s first quarter Gross Domestic Product (“GDP”) showed that its economic growth had moderated to 8.1%, which was below expectations, but other measures of activity growth improved, suggesting that easing policies already in place may be likely to show greater impact going forward. The equity market of Thailand rallied sharply and was the best performing market within the MSCI EM Index during the Reporting Period, as many economists believed its recovery from last year’s flooding was well under way. The equity markets of the Philippines, Egypt and Mexico also generated strong double-digit gains during the Reporting Period.
India was the weakest market in the MSCI EM Index during the Reporting Period. Its government, while dealing with a corruption scandal, was forced to raise interest rates numerous times to control stubbornly high inflation, despite data pointing to slowing in its economy. The large Brazilian equity market also lagged the MSCI EM Index due to concerns over slowing economic growth. Interest rate cuts in Brazil and India in April were still not enough to offset investor concerns over economic growth in both regions. Among the smaller country markets, Poland and the Czech Republic were weak during the Reporting Period, each generating negative returns.
| * | | All index returns are expressed in U.S. dollar terms. |
4
MARKET REVIEW
From a sector perspective, information technology and consumer staples were the strongest absolute performers within the MSCI EM Index during the Reporting Period. Materials was the only sector within the MSCI EM Index to generate a negative absolute return, although energy, industrials and financials, while posting positive returns, also lagged the MSCI EM Index during the Reporting Period.
Looking Ahead
Despite uncertainties toward the end of the Reporting Period about the sustainability of economic momentum, we maintain our positive view ahead for the growth and emerging market economies. We maintain a positive outlook for corporate earnings growth for 2012 overall, though such growth may well be skewed toward the second half of the year. At the end of the Reporting Period, many analysts expected growth and emerging market earnings to grow by 14.6% in 2012, compared to 11.0% in developed markets1, thus offering investors the potential for healthy equity returns. Despite the recent recovery of capital flows into developing markets, the flows into growth and emerging market equities only reached half of the outflows seen during 20112. In our view, valuations at the end of the Reporting Period remained attractive relative both to their long-term average and to developed markets.
Even with our positive outlook for the second half of 2012, we remain aware of some of the risks that the current economic environment poses to growth and emerging market equities. We do not dismiss the possibility of a new escalation of the European sovereign debt crisis, which would have a negative impact on market sentiment. Also, while inflationary pressures across growth and emerging markets overall have eased significantly from their peak in 2011, we are cautious about a potential renewal of inflationary concerns in the near term, possibly driven by a combination of interest rate cuts, monetary easing policies and robust commodity prices.
We maintain a positive view for the growth and emerging markets over the longer term. We believe positive demographic profiles and increasing levels of wealth and income may well be the key structural drivers of robust economic growth in these countries. Currently, the growth and emerging markets’ middle class in aggregate spends nearly $7 trillion a year3, and this figure is set to increase. We believe the theme of domestic consumption is attractively reflected in the equities of the growth and emerging markets, and we have sought to position the Funds’ portfolios to benefit from growing consumer demand.
As always, we maintain our focus on seeking high-quality equity investments trading at compelling valuations and intend to stay true to our long-term discipline as we seek to navigate volatile markets ahead.
| 1 | | Source: Bank of America Merrill Lynch, April 2012. |
| 2 | | Source: Morgan Stanley, April 2012. |
| 3 | | Source: McKinsey, “Capturing the world’s emerging middle class,” July 2010. |
5
PORTFOLIO RESULTS
Goldman Sachs Asia Equity Fund
Portfolio Management Discussion and Analysis
Below, the Goldman Sachs Fundamental Asia ex Japan Equity Portfolio Management Team discusses the Goldman Sachs Asia Equity Fund’s (the “Fund”) performance and positioning for the six-month period ended April 30, 2012 (the “Reporting Period”).
| Q | | How did the Fund perform during the Reporting Period? |
| A | | During the Reporting Period, the Fund’s Class A, B, C and Institutional Shares generated cumulative total returns, without sales charges, of 4.68%, 4.23%, 4.27% and 4.89%, respectively. These returns compare to the 4.90% cumulative total return of the Fund’s benchmark, the MSCI AC (All Country) Asia ex-Japan Index (net, USD, unhedged) (the “Index”), during the same time period. |
| Q | | What key factors were responsible for the Fund’s performance during the Reporting Period? |
| A | | The Fund’s underperformance of the Index during the Reporting Period, albeit modest, can be primarily attributed to individual stock selection. From a country perspective, stock selection was strongest in Taiwan, India and Indonesia. However, more than offsetting these positives was weak stock selection in South Korea, Hong Kong and China. |
| Q | | Which stocks detracted significantly from the Fund’s performance during the Reporting Period? |
| A | | Detracting most from the Fund’s results relative to the Index were positions in materials company POSCO Chemtech, electronics manufacturer Nan Ya Printed Circuit Board and consumer electronics retailer Himart. |
| | POSCO Chemtech, the supplier of refractory material maintenance services to South Korean steel maker POSCO, suffered during the Reporting Period from a lack of momentum given the anticipated restart of its new businesses in 2014. Weakening demand for steel in the region also impacted the company’s results. The slowdown in demand increased investors’ concerns about a potential delay in capacity expansion and reduced shipment growth for POSCO Chemtech. At the end of the Reporting Period, we remained confident in the company’s long-term prospects, given the positive structural outlook for steel demand as well as the company’s expansion into new, more stable margin businesses selling by-products of POSCO’s steel making process. |
| | Nan Ya Printed Circuit Board is a Taiwanese maker of printed circuit boards and integrated circuit substrates. (In electronics, a substrate is a supporting material on which a circuit is formed or fabricated.) The Fund’s position in the company detracted from its results because computer shipments were weak during the Reporting Period. The personal computer supply chain was affected by the flooding in Thailand, which is a major manufacturer of computer hard disks. |
| | Himart, South Korea’s largest online shopping mall, underperformed the Index during the Reporting Period on news of allegations of embezzlement and tax evasion by its chairperson. |
| Q | | What were some of the Fund’s best-performing individual stocks? |
| A | | The Fund benefited most relative to the Index from holdings in Media Nusantara, Shin and Samsung Electronics. |
| | Media Nusantara, the leading free-to-air television network with the largest share of audience in Indonesia, contributed most positively to the Fund’s results. Its stock performed well during the Reporting Period, as the company introduced new programming initiatives aimed at gaining audience, which, in turn, may potentially lead to higher advertising rates for the company. At the end of the Reporting Period, we believed the stock has more upside potential given its strong growth outlook and its significant valuation discount both to other stocks in its industry and to other consumer companies in Indonesia. |
| | Shin, the holding company of Advanced Info Service, offers entry into the telecommunication services sector in Thailand. The company’s shares rallied during the Reporting Period on the back of an improvement in liquidity following the disposal of shares by a major shareholder and on positive news flow regarding its 3G (third generation) license auction. |
6
PORTFOLIO RESULTS
| | Samsung Electronics was another significant stock contributor to the Fund’s results during the Reporting Period. Samsung Electronics had great success with its Galaxy series, and its sales expectations for 2012 were increasing with global fanfare for the series. Despite semiconductor weakness, the top line of Samsung Electronics’ balance sheet was solid thanks to its mobile-related products, including mobile DRAMs (dynamic random access memory, a type of memory that stores each bit of data in a separate capacitor within an integrated circuit), smart phones and tablets. |
| Q | | Which equity market sectors most significantly affected Fund performance during the Reporting Period? |
| A | The biggest detractors from the Fund’s relative results during the Reporting Period were the financials, materials and consumer discretionary sectors, each due primarily to poor stock selection. |
| | The sectors that contributed most to the Fund’s performance relative to the Index were information technology, industrials and energy, each driven primarily by effective stock selection. |
| Q | | How did the Fund use derivatives and similar instruments during the Reporting Period? |
| A | | During the Reporting Period, we did not use derivatives to hedge positions or as part of an active management strategy, but we used index futures, on an opportunistic basis, to ensure the Fund remained almost fully exposed to equities following cash inflows or stock sales. During the Reporting Period, the Fund also gained exposure to select stocks through participatory notes. |
| Q | | Did the Fund make any significant purchases or sales during the Reporting Period? |
| A | | We added to the Fund’s position in Samsung Electronics during the Reporting Period. We have a positive view on the mobile device industry, especially smartphones, and Samsung Electronics has experienced success in the smartphone market via its Galaxy series phones. |
| | We initiated a Fund position in CNOOC, a Chinese producer of crude oil and natural gas, as we believed that being mainly involved in upstream production activities, it would benefit from robust oil prices. (Upstream production activities generally include those operations stages in the oil and gas industry that involve exploration and production.) |
| | We exited the Fund’s position in Samsung Fire & Marine Insurance based on our relative valuation analysis, and we used the proceeds to add to the Fund’s position in South Korean bank KB Financial. |
| | We sold the Fund’s position in Chunghwa Telecom, the dominant Taiwanese company in the telecommunication services market. We believed the Taiwan government’s policy guidance would steer the industry to lower broadband services charges, and as a result, Chunghwa Telecom’s earnings growth potential was impacted. In addition, as a defensive strategy, we used the proceeds from the sale of Chunghwa Telecom to invest in select information technology companies. |
| Q | | Were there any notable changes in the Fund’s weightings during the Reporting Period? |
| A | | Most sector weights are usually established within a relatively narrow range from the Index, as our team prefers to make decisions at the individual stock level, where we believe we can generate more added value. That said, during the Reporting Period, the Fund’s exposure to financials, information technology and industrials increased and its allocations to utilities and telecommunication services decreased. |
| | Similarly, allocations to countries are directly the result of various stock selection decisions. During the Reporting Period, the Fund’s allocation to Hong Kong decreased. |
| Q | | How was the Fund positioned relative to the Index at the end of the Reporting Period? |
| A | | At the end of the Reporting Period, the Fund had overweighted exposures to Taiwan and China compared to the Index. On the same date, the Fund had an underweighted exposure to Hong Kong and was relatively neutrally weighted to the remaining country components of the Index. |
| | From a sector allocation perspective, the Fund had overweighted positions relative to the Index in the information technology and consumer discretionary sectors at the end of the Reporting Period. On the same date, the Fund had underweighted positions compared to the Index in the financials, telecommunication services, materials, consumer staples and utilities sectors and was relatively neutrally weighted compared to the Index in industrials, health care and energy. |
| | As always, we remained focused on individual stock selection, with sector and country positioning being a secondary, closely-monitored effect. |
7
FUND BASICS
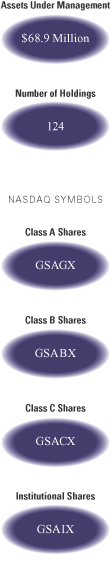
Asia Equity Fund
as of April 30, 2012
| | | | | | | | | | |
| | PERFORMANCE REVIEW | |
| | | November 1, 2011–April 30, 2012 | | Fund Total Return
(based on NAV)1 | | | MSCI AC (All Country)
Asia ex Japan Index2 | |
| | Class A | | | 4.68 | % | | | 4.90 | % |
| | Class B | | | 4.23 | | | | 4.90 | |
| | Class C | | | 4.27 | | | | 4.90 | |
| | | Institutional | | | 4.89 | | | | 4.90 | |
| | 1 | | The net asset value (“NAV”) represents the net assets of the class of the Fund (ex-dividend) divided by the total number of shares of the class outstanding. The Fund’s performance assumes the reinvestment of dividends and other distributions. The Fund’s performance does not reflect the deduction of any applicable sales charges. |
| | 2 | | The MSCI AC (All Country) Asia ex Japan Index (net, USD, unhedged) is a free float-adjusted market capitalization weighted index that is designed to measure the equity market performance of Asia, excluding Japan. The MSCI AC Asia ex Japan Index consists of the following 10 developed and emerging market country indices: China, Hong Kong, India, Indonesia, Korea, Malaysia, Philippines, Singapore, Taiwan, and Thailand. This index is net of dividends re-invested after deduction of withholding taxes, using a tax rate applicable to non-resident institutional investors who do not benefit from double taxation treaties. This series approximates the minimum possible dividend reinvestment. The dividend is reinvested after deduction of withholding tax, applying the rate to nonresident individuals who do not benefit from double taxation treaties. MSCI Barra uses withholding tax rates applicable to Luxembourg holding companies, as Luxembourg applies the highest rates. It is not possible to invest directly in an index. |
| | | | | | | | | | | | | | |
| | STANDARDIZED TOTAL RETURNS3 |
| | | For the period ended 3/31/12 | | One Year | | | Five Years | | Ten Years | | Since Inception | | Inception Date |
| | Class A | | | -14.00 | % | | 0.76% | | 7.05% | | 1.91% | | 7/08/94 |
| | Class B | | | -14.20 | | | 0.71 | | 7.04 | | 0.80 | | 5/01/96 |
| | Class C | | | -10.59 | | | 1.12 | | 6.87 | | 1.07 | | 8/15/97 |
| | | Institutional | | | -8.62 | | | 2.31 | | 8.18 | | 1.86 | | 2/02/96 |
| | 3 | | The Standardized Total Returns are average annual total returns as of the most recent calendar quarter-end. They assume reinvestment of all distributions at NAV. These returns reflect a maximum initial sales charge of 5.5% for Class A Shares, the assumed contingent deferred sales charge for Class B Shares (5% maximum declining to 0% after six years) and the assumed contingent deferred sales charge for Class C Shares (1% if redeemed within 12 months of purchase). Class B Shares convert automatically to Class A Shares on or about the fifteenth day of the last month of the calendar quarter that is eight years after purchase. Returns for Class B Shares for the period after conversion reflect the performance of Class A Shares. Because Institutional Shares do not involve a sales charge, such a charge is not applied to their Standardized Total Returns. The Fund’s Class B Shares are no longer available for purchase by new or existing shareholders (although current Class B shareholders may continue to reinvest income and capital gains distributions into Class B Shares, and Class B shareholders may continue to exchange their shares for Class B Shares of certain other Goldman Sachs Funds). |
| | | | The returns represent past performance. Past performance does not guarantee future results. The Fund’s investment return and principal value will fluctuate so that an investor’s shares, when redeemed, may be worth more or less than their original cost. Current performance may be lower or higher than the performance quoted above. Please visit our Website at www.goldmansachsfunds.com to obtain the most recent month-end returns. Performance reflects fee waivers and/or expense limitations in effect. In their absence, performance would be reduced. Returns do not reflect the deduction of taxes that a shareholder would pay on Fund distributions or the redemption of Fund shares. |
8
FUND BASICS
| | | | | | | | | | |
| | EXPENSE RATIOS4 | |
| | | | | Net Expense Ratio (Current) | | | Gross Expense Ratio (Before Waivers) | |
| | Class A | | | 1.60 | % | | | 2.17 | % |
| | Class B | | | 2.35 | | | | 2.92 | |
| | Class C | | | 2.35 | | | | 2.92 | |
| | | Institutional | | | 1.20 | | | | 1.77 | |
| | 4 | | The expense ratios of the Fund, both current (net of applicable fee waivers and/or expense limitations) and before waivers (gross of applicable fee waivers and/or expense limitations) are as set forth above according to the most recent publicly available Prospectus for the Fund and may differ from the expense ratios disclosed in the Financial Highlights in this report. The Fund’s waivers and/or expense limitations will remain in place through at least February 28, 2013, and prior to such date the investment adviser may not terminate the arrangements without the approval of the Fund’s Board of Trustees. If these arrangements are discontinued in the future, the expense ratios may change without shareholder approval. |
| | | | | | | | | | |
| | TOP TEN HOLDINGS AS OF 4/30/125 |
| | | Holding | | % of Total
Net Assets | | | Line of Business | | Country |
| | Samsung Electronics Co. Ltd. | | | 6.9 | % | | Semiconductors &
Semiconductor Equipment | | South Korea |
| | Taiwan Semiconductor Manufacturing Co. Ltd. | | | 4.0 | | | Semiconductors &
Semiconductor Equipment | | Taiwan |
| | China Construction Bank Corp. Class H | | | 2.6 | | | Banks | | China |
| | Industrial & Commercial Bank of China Ltd. Class H | | | 2.5 | | | Banks | | China |
| | China Mobile Ltd. | | | 2.4 | | | Telecommunication Services | | Hong Kong |
| | Kia Motors Corp. | | | 2.3 | | | Automobiles & Components | | South Korea |
| | CNOOC Ltd. | | | 1.9 | | | Energy | | China |
| | Hon Hai Precision Industry Co. Ltd. | | | 1.9 | | | Technology Hardware &
Equipment | | Taiwan |
| | PetroChina Co. Ltd. Class H | | | 1.7 | | | Energy | | China |
| | | KB Financial Group, Inc. | | | 1.5 | | | Banks | | South Korea |
| | 5 | | The top 10 holdings may not be representative of the Fund’s future investments. |
9
FUND BASICS
|
| FUND VS. BENCHMARKS SECTOR ALLOCATIONS6 |
| As of April 30, 2012 |
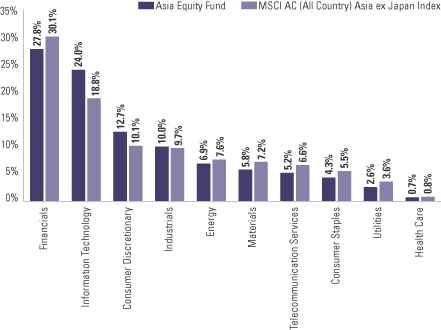
| | 6 | | The Fund is actively managed and, as such, its composition may differ over time. Consequently, the Fund’s overall sector allocations may differ from the percentages contained in the graph above. The graph categorizes investments using Global Industry Classification Standard (“GICS”), however, the sector classifications used by the portfolio management team may differ from GICS. The percentage shown for each investment category reflects the value of investments in that category as a percentage of market value. The graph depicts the Fund’s investments but may not represent the Fund’s market exposure due to the exclusion of certain derivatives, if any, as listed in the Additional Investment Information section of the Schedule of Investments. |
10
PORTFOLIO RESULTS
Goldman Sachs BRIC Fund
Portfolio Management Discussion and Analysis
Below, the Goldman Sachs Fundamental Emerging Markets Equity Portfolio Management Team discusses the Goldman Sachs BRIC Fund’s (the “Fund”) performance and positioning for the six-month period ended April 30, 2012 (the “Reporting Period”).
| Q | | How did the Fund perform during the Reporting Period? |
| A | | During the Reporting Period, the Fund’s Class A, C, Institutional and IR Shares generated cumulative total returns, without sales charges, of -1.07%, -1.43%, -0.90% and -0.97%, respectively. These returns compare to the 0.59% cumulative total return of the Fund’s benchmark, the MSCI BRIC Index (net, unhedged, USD) (the “Index”), during the same period. |
| Q | | What key factors were responsible for the Fund’s performance during the Reporting Period? |
| A | | The Fund underperformed the Index during the Reporting Period. While the Fund did benefit from effective stock selection in India and Russia, such positives were not enough to completely offset the detracting effect of its weak stock selection in Brazil and China. |
| Q | | Which stocks detracted significantly from the Fund’s performance during the Reporting Period? |
| A | | Detracting most from the Fund’s results relative to the Index were positions in three Brazilian companies—real estate company PDG Realty, retailer Magazine Luiza and energy company Petroleo Brasileiro (“Petrobras”). |
| | PDG Realty, the largest real estate company in Brazil, was the greatest detractor from the Fund’s relative performance during the Reporting Period. Its shares declined due to market expectations of weak fourth calendar quarter results. The company’s results were adversely affected by overrunning costs for some of its projects and goodwill adjustments related to prior acquisitions. The company had weak fourth quarter 2011 results, which included a notable cost overrun on some of its projects. We believe that there might be further cost overruns in future quarters as well. Since superior execution and financial control were main theses for the Fund to invest in this company, given that these attributes had set it apart from other companies in the sector, we decided to sell out of the Fund’s position in PDG Realty. |
| | Shares of Magazine Luiza, one of the largest household appliance retail chains in Brazil, declined during the Reporting Period as the company incurred non-operating costs from some of its stores and was instructed by its partner bank to increase provisions at its financial arm. Such instruction came despite a good track record of loan repayment. At the end of the Reporting Period, Magazine Luiza continued to be the Fund’s highest conviction name in the Brazilian consumer discretionary sector. We believe the company should exhibit strong growth in the sector going forward and benefit from the turnaround of its recent acquisitions, with better margins and lower financing costs. |
| | Leading Brazilian energy company Petrobras saw its shares decline during the Reporting Period after it reported weaker than expected results for the fourth quarter of 2011. As the company’s refineries had been running at full capacity, the company had to increase fuel imports to supply the domestic Brazilian market, which led to margin compression during the Reporting Period. |
| Q | | What were some of the Fund’s best-performing individual stocks? |
| A | | The strongest contributors to the Fund’s performance during the Reporting Period were Brazilian packaging company Klabin, Russian homebuilder Etalon Group and Russian rail operator Globaltrans Investment. |
| | Klabin, the leading manufacturer of packaging paper and board in Brazil, was the top contributor to the Fund’s performance during the Reporting Period. Its stock rose after the company reported better than expected third quarter of 2011 results, which showed increasing revenues. The stock was further supported by weakness in the Brazilian real, as a significant share of the company’s revenues is tied to the U.S. dollar. At the end of the Reporting Period, we believed that Klabin offers strong growth potential over the long term attributable to an aggressive cost cutting program and capacity expansion introduced by the new management of the company. We also think that should the Brazilian economy grow as anticipated, the company is likely to shift some of its focus to the domestic market, thus improving its revenue mix. |
11
PORTFOLIO RESULTS
| | Etalon Group, one of Russia’s largest homebuilders focused on real estate development in St. Petersburg, was also a strong contributor to Fund returns during the Reporting Period. Its stock rallied as the company reported stronger than expected first quarter 2012 results. Furthermore, Etalon Group’s outlook for 2012 was positive as the company had pre-sold the majority of its projects. At the end of the Reporting Period, we believed the company’s stock was undervalued and had upside potential given its defensive balance sheet and strong business model. |
| | Shares of Globaltrans Investment, a private freight rail operator in Russia, rallied during the Reporting Period as the company reported strong full year 2011 results. The company had been growing faster than the overall market as its efficiency and timely execution relative to competitors helped it gain market share. At the end of the Reporting Period, we continued to like the company given its strong balance sheet and competitive advantages. In addition, Globaltrans Investment announced plans toward the end of the Reporting Period to make an acquisition, which would allow the company to increase capacity and, potentially, revenue growth as well. |
| Q | | Which equity market sectors most significantly affected Fund performance during the Reporting Period? |
| A | | Relative to the Index, weak stock selection in the consumer staples, consumer discretionary and utilities sectors detracted most from the Fund’s performance during the Reporting Period. Underweighted positions relative to the Index in the comparatively strong consumer staples and utilities sectors and an overweighted exposure to the lagging consumer discretionary sector also hurt. The key drivers of underperformance in the consumer staples sector were the Fund’s positions in Russian retailer X5 Retail Group and India-based paint manufacturer Asian Paints. Within the consumer discretionary sector, the Fund’s overweighted positions in Magazine Luiza and PDG Realty, each mentioned earlier, detracted most from performance during the Reporting Period. In utilities, Fund positions in Indraprastha Gas, one of India’s leading gas distributors, and in China Longyuan Power, a Chinese wind farm operator, particularly detracted from returns. The fact that the Fund did not hold a position in Companhia Energetic de Minas, which performed well, was also a significant detractor within the utilities sector. |
| | Conversely, strong stock selection within the materials and energy sectors contributed most to the Fund’s performance. Notable contributors within materials were Klabin, discussed above, and Brazil’s Gerdau, the largest steel maker in Latin America. The most notable contributors in energy were Chinese integrated oil companies China Petroleum & Chemical (“Sinopec”) and PetroChina and Russian oilfield services company Eurasia Drilling. |
| Q | | How did the Fund use derivatives and similar instruments during the Reporting Period? |
| A | | During the Reporting Period, the Fund gained exposure to select stocks through participatory notes. We used index futures on an opportunistic basis, to ensure the Fund remained almost fully exposed to equities following cash inflows or stock sales. |
| Q | | Did the Fund make any significant purchases or sales during the Reporting Period? |
| A | | We elected to change the Fund’s positioning within the consumer staples sector in Russia. We sold out of the Fund’s position in X5 Retail Group, Russia’s largest retailer as measured by revenue, and initiated a Fund position in Magnit, the second largest retailer in the country. Magnit mainly operates convenience stores. We believe that given Magnit’s strong track record of organic store expansion and sales growth, the company is well positioned to benefit from a positive macroeconomic environment for the consumer sector, especially low inflationary pressures, real wage growth and low unemployment. Furthermore, Magnit reported strong gross margin expansion during the fourth quarter of 2011, and its management has taken some steps to improve its margins on a sustainable basis, which, if achieved, should contribute to the company’s strong position in the market. Magnit also started expanding into cosmetics stores, which may develop into a growth driver for the company given the underpenetrated nature of the industry and the company’s ability to leverage its existing distribution system. We decided to sell out of the Fund’s position in X5 Retail Group, as the retailer is in the process of switching to a different business model, which may have a negative effect on the company’s margin recovery, in our view. Also, X5 Retail Group’s position in the largest cities in Russia has been challenged, as competitors have started gaining market share at the expense of X5 Retail Group. |
12
PORTFOLIO RESULTS
| | In India, we elected to eliminate the Fund’s position in Indraprastha Gas, a company involved in gas supply to the domestic and commercial sectors. We sold out of the Fund’s position on the back of reports about a potential cap on compressed natural gas marketing margins earned by gas utilities, including Indraprastha Gas, which, in turn, led to greater uncertainty about the company’s earnings growth trajectory going forward. We established a Fund position in Bombay Dyeing, one of India’s largest producers of textiles, which owns large amounts of land in the central Mumbai area. We believe the company’s current market capitalization does not reflect the underlying value of its land assets. We decided to initiate this position as Bombay Dyeing started developing and marketing these land assets. |
| Q | | Were there any notable changes in the Fund’s weightings during the Reporting Period? |
| A | | Most sector weights are usually established within a narrow range from the Index, as our team prefers to make decisions at the individual stock level, where we believe we can generate more added value. That said, during the Reporting Period, the Fund’s exposure relative to the Index in consumer staples, information technology, industrials and materials increased and its allocations relative to the Index to health care, utilities and telecommunication services decreased. |
| | Resulting from various stock selection decisions, the Fund’s exposure relative to the Index to Russia, China and India increased modestly and its allocation relative to the Index to Brazil decreased slightly. |
| Q | | How was the Fund positioned relative to the Index at the end of the Reporting Period? |
| A | | At the end of the Reporting Period, the Fund had modestly overweighted exposure to Brazil, China and Russia and a modestly underweighted exposure to India relative to the Index. |
| | From a sector perspective, the Fund had overweighted allocations to consumer discretionary, financials, materials and information technology compared to the Index at the end of the Reporting Period. On the same date, the Fund had underweighted exposure to the utilities, telecommunication services, energy and consumer staples sectors relative to the Index and was rather neutrally weighted relative to the Index in the industrials sector. The Fund had no position at all in the health care sector. |
| | As always, we remained focused on individual stock selection, with sector and country positioning being a secondary, closely-monitored effect. |
13
FUND BASICS
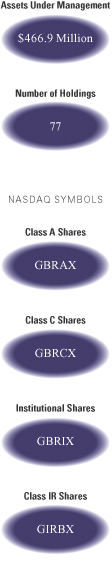
BRIC Fund
as of April 30, 2012
| | | | | | | | | | |
| | PERFORMANCE REVIEW | |
| | | November 1, 2011–April 30, 2012 | | Fund Total Return
(based on NAV)1 | | | MSCI BRIC Index2 | |
| | Class A | | | -1.07 | % | | | 0.59 | % |
| | Class C | | | -1.43 | | | | 0.59 | |
| | Institutional | | | -0.90 | | | | 0.59 | |
| | | Class IR | | | -0.97 | | | | 0.59 | |
| | 1 | | The net asset value (“NAV”) represents the net assets of the class of the Fund (ex-dividend) divided by the total number of shares of the class outstanding. The Fund’s performance assumes the reinvestment of dividends and other distributions. The Fund’s performance does not reflect the deduction of any applicable sales charges. |
| | 2 | | The MSCI BRIC Index (net, unhedged, USD) is a free float-adjusted market capitalization weighted index that is designed to measure the equity market performance of the following four emerging market country indices: Brazil, Russia, India and China. This series approximates the minimum possible dividend reinvestment. The dividend is reinvested after deduction of withholding tax, applying the rate to non-resident individuals who do not benefit from double taxation treaties. MSCI Barra uses withholding tax rates applicable to Luxembourg holding companies, as Luxembourg applies the highest rates. It is not possible to invest directly in an index. |
| | | | | | | | | | | | | | |
| | STANDARDIZED TOTAL RETURNS3 |
| | | For the period ended 3/31/12 | | One Year | | | Five Years | | Since Inception | | | Inception Date |
| | Class A | | | -23.87 | % | | 0.24% | | | 4.75 | % | | 6/30/06 |
| | Class C | | | -20.85 | | | 0.63 | | | 4.99 | | | 6/30/06 |
| | Institutional | | | -19.10 | | | 1.79 | | | 6.21 | | | 6/30/06 |
| | | Class IR | | | -19.24 | | | N/A | | | -2.59 | | | 8/31/10 |
| | 3 | | The Standardized Total Returns are average annual total returns as of the most recent calendar quarter-end. They assume reinvestment of all distributions at NAV. These returns reflect a maximum initial sales charge of 5.5% for Class A Shares and the assumed contingent deferred sales charge for Class C Shares (1% if redeemed within 12 months of purchase). Because Institutional and Class IR Shares do not involve a sales charge, such a charge is not applied to their Standardized Total Returns. |
| | | | The returns represent past performance. Past performance does not guarantee future results. The Fund’s investment return and principal value will fluctuate so that an investor’s shares, when redeemed, may be worth more or less than their original cost. Current performance may be lower or higher than the performance quoted above. Please visit our Website at www.goldmansachsfunds.com to obtain the most recent month-end returns. Performance reflects fee waivers and/or expense limitations in effect. In their absence, performance would be reduced. Returns do not reflect the deduction of taxes that a shareholder would pay on Fund distributions or the redemption of Fund shares. |
14
FUND BASICS
| | | | | | | | | | |
| | EXPENSE RATIOS4 | |
| | | | | Net Expense Ratio (Current) | | | Gross Expense Ratio (Before Waivers) | |
| | Class A | | | 1.78 | % | | | 1.92 | % |
| | Class C | | | 2.53 | | | | 2.67 | |
| | Institutional | | | 1.38 | | | | 1.52 | |
| | | Class IR | | | 1.53 | | | | 1.67 | |
| | 4 | | The expense ratios of the Fund, both current (net of applicable fee waivers and/or expense limitations) and before waivers (gross of applicable fee waivers and/or expense limitations) are as set forth above according to the most recent publicly available Prospectus for the Fund and may differ from the expense ratios disclosed in the Financial Highlights in this report. The Fund’s waivers and/or expense limitations will remain in place through at least February 28, 2013, and prior to such date the investment adviser may not terminate the arrangements without the approval of the Fund’s Board of Trustees. If these arrangements are discontinued in the future, the expense ratios may change without shareholder approval. |
| | | | | | | | | | |
| | TOP TEN HOLDINGS AS OF 4/30/125 |
| | | Holding | | % of Total
Net Assets | | | Line of Business | | Country |
| | Petroleo Brasileiro SA ADR | | | 5.9 | % | | Energy | | Brazil |
| | China Construction Bank Corp. Class H | | | 4.2 | | | Banks | | China |
| | China Mobile Ltd. | | | 3.9 | | | Telecommunication
Services | | Hong Kong |
| | Industrial & Commercial Bank of China Ltd. Class H | | | 3.8 | | | Banks | | China |
| | Vale SA ADR | | | 3.4 | | | Materials | | Brazil |
| | Banco Bradesco SA Preference Shares | | | 3.1 | | | Banks | | Brazil |
| | CNOOC Ltd. | | | 3.1 | | | Energy | | China |
| | Vale SA | | | 2.9 | | | Materials | | Brazil |
| | PetroChina Co. Ltd. Class H | | | 2.8 | | | Energy | | China |
| | | OAO Lukoil ADR | | | 2.7 | | | Energy | | Russia |
| | 5 | | The top 10 holdings may not be representative of the Fund’s future investments. |
15
FUND BASICS
|
| FUND VS. BENCHMARK SECTOR ALLOCATIONS6 |
| As of April 30, 2012 |
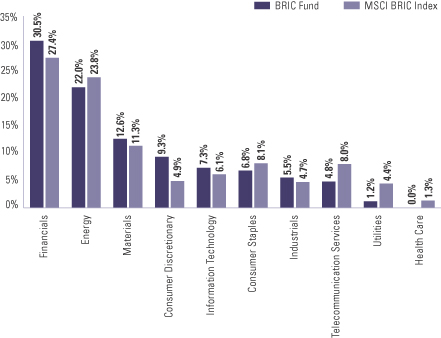
| | 6 | | The Fund is actively managed and, as such, its composition may differ over time. Consequently, the Fund’s overall sector allocations may differ from the percentages contained in the graph above. The graph categorizes investments using Global Industry Classification Standard (“GICS”), however, the sector classifications used by the portfolio management team may differ from GICS. The percentage shown for each investment category reflects the value of investments in that category as a percentage of market value. The graph depicts the Fund’s investments but may not represent the Fund’s market exposure due to the exclusion of certain derivatives, if any, as listed in the Additional Investment Information section of the Schedule of Investments. |
16
PORTFOLIO RESULTS
Goldman Sachs Emerging Markets Equity Fund
Portfolio Management Discussion and Analysis
Below, the Goldman Sachs Fundamental Emerging Markets Equity Portfolio Management Team discusses the Goldman Sachs Emerging Markets Equity Fund’s (the “Fund”) performance and positioning for the six-month period ended April 30, 2012 (the “Reporting Period”).
| Q | | How did the Fund perform during the Reporting Period? |
| A | | During the Reporting Period, the Fund’s Class A, B, C, Institutional, Service and IR Shares generated cumulative total returns, without sales charges, of 2.80%, 2.39%, 2.37%, 2.99%, 2.74% and 2.93%, respectively. These returns compare to the 3.93% cumulative total return of the Fund’s benchmark, the MSCI Emerging Markets Index (net, unhedged, USD) (the “Index”), during the same period. |
| Q | | What key factors were responsible for the Fund’s performance during the Reporting Period? |
| A | | The Fund underperformed relative to the Index during the Reporting Period. While the Fund did benefit from effective stock selection in Indonesia, Taiwan and India, such positives were not enough to offset the detracting effect of its weak stock selection in Brazil, South Korea and China. |
| Q | | Which stocks detracted significantly from the Fund’s performance during the Reporting Period? |
| A | | Detracting most from the Fund’s results relative to the Index were positions in real estate company PDG Realty, retailer Magazine Luiza and materials company POSCO Chemtech. |
| | PDG Realty, the largest real estate company in Brazil, was the greatest detractor from the Fund’s relative performance during the Reporting Period. Its shares declined due to market expectations of weak fourth calendar quarter results. The company’s results were adversely affected by overrunning costs for some of its projects and goodwill adjustments related to prior acquisitions. The company had weak fourth quarter 2011 results, which included a notable cost overrun on some of its projects. We believe that there might be further cost overruns in future quarters as well. Since superior execution and financial control were main theses for the Fund to invest in this company, given that these attributes had set it apart from other companies in the sector, we decided to sell out of the Fund’s position in PDG Realty. |
| | Shares of Magazine Luiza, one of the largest household appliance retail chains in Brazil, declined during the Reporting Period as the company incurred non-operating costs from some of its stores and was instructed by its partner bank to increase provisions at its financial arm. Such instruction came despite a good track record of loan repayment. At the end of the Reporting Period, Magazine Luiza continued to be the Fund’s highest conviction name in the Brazilian consumer discretionary sector. We believe the company should exhibit strong growth in the sector going forward and benefit from the turnaround of its recent acquisitions, with better margins and lower financing costs. |
| | POSCO Chemtech, the supplier of refractory material maintenance services to South Korean steel maker POSCO, suffered during the Reporting Period from a lack of momentum given the anticipated restart of its new businesses in 2014. Weakening demand for steel in the region also impacted the company’s results. The slowdown in demand increased investors’ concerns about a potential delay in capacity expansion and reduced shipment growth for POSCO Chemtech. At the end of the Reporting Period, we remained confident in the company’s long-term prospects, given the positive structural outlook for steel demand as well as its expansion into new more stable margin businesses selling by-products of POSCO’s steel making process. |
| Q | | What were some of the Fund’s best-performing individual stocks? |
| A | | The strongest contributors to the Fund’s performance during the Reporting Period were Media Nusantara, Barloworld and Shin. |
| | Media Nusantara is the leading free-to-air television network with the largest share of audience in Indonesia. Its stock performed well during the Reporting Period, as the company introduced new programming initiatives aimed at gaining audience, which, in turn, may potentially lead to higher advertising rates for the company. At the end of the Reporting Period, we believed the stock has more upside potential given its strong growth outlook and its significant valuation discount both to other stocks in its industry and to other consumer companies in Indonesia. |
17
PORTFOLIO RESULTS
| | Barloworld is a South Africa-based mining equipment distributor with exclusivity in sub-Saharan Africa on equipment manufactured by Caterpillar. The stock performed well after the company posted stronger than expected 12-month results and demonstrated strong operational performance at most of its divisions. Such strong operational performance was driven to a large extent by growing capital expenditures in the mining industry. Also supporting its stock’s performance during the Reporting Period was its management’s expressed positive outlook and belief that the positive momentum the company has experienced will be maintained over the near term. In addition, Barloworld’s first quarter 2012 trading update was positive and indicated continuation of positive momentum in the mining sector. |
| | Shin, the holding company of Advanced Info Service, offers entry into the telecommunication services sector in Thailand. The company’s shares rallied during the Reporting Period on the back of an improvement in liquidity following the disposal of shares by a major shareholder and on positive news flow regarding its 3G (third generation) license auction. |
| Q | | Which equity market sectors most significantly affected Fund performance during the Reporting Period? |
| A | | Relative to the Index, weak stock selection within the financials, consumer discretionary and consumer staples sectors detracted most from the Fund’s performance during the Reporting Period. Underperformance in the financials sector was mainly driven by stock selection among commercial banks, with Brazil’s Banco Bradesco and South Korea’s KB Financial Group particular disappointments. In consumer discretionary, positions in PDG Realty and Magazine Luiza, each discussed above, detracted most from relative returns. A position in X5 Retail Group, the largest food retailer in Russia, was the most significant detractor among the Fund’s consumer staples holdings. |
| | Conversely, strong stock selection within the industrials and health care sectors and an overweighted allocation to information technology contributed most to the Fund’s performance. Two notable contributors within industrials were Barloworld, mentioned above, and Globaltrans, a private freight rail operator in Russia. In health care, our stock selection among health care providers and services was especially strong, with the Fund’s holding in Life Healthcare, a leading private hospital operator in South Africa, a particularly notable contributor. In information technology, the sector overall outpaced the Index, and thus the Fund’s |
| | overweighted allocation boosted results. Within the information technology sector, the Fund’s emphasis on semiconductor and semiconductor equipment companies helped most. |
| Q | | How did the Fund use derivatives and similar instruments during the Reporting Period? |
| A | | During the Reporting Period, the Fund used participatory notes to gain exposure to select stocks. We used index futures on an opportunistic basis, to ensure the Fund remained almost fully exposed to equities following cash inflows or stock sales. |
| Q | | Did the Fund make any significant purchases or sales during the Reporting Period? |
| A | | We elected to change the Fund’s positioning within the consumer staples sector in Russia. We sold out of the Fund’s position in X5 Retail Group, Russia’s largest retailer as measured by revenue, and initiated a Fund position in Magnit, the second largest retailer in the country. Magnit mainly operates convenience stores. We believe that given Magnit’s strong track record of organic store expansion and sales growth, the company is well positioned to benefit from a positive macroeconomic environment for the consumer sector, especially low inflationary pressures, real wage growth and low unemployment. Furthermore, Magnit reported strong gross margin expansion during the fourth quarter of 2011, and its management has taken some steps to improve its margins on a sustainable basis, which, if achieved, we believe should contribute to the company’s strong position in the market. Magnit also started expanding into cosmetics stores, which may develop into a growth driver for the company given the underpenetrated nature of the industry and the company’s ability to leverage its existing distribution system. We decided to sell out of the Fund’s position in X5 Retail Group, as the retailer is in the process of switching to a different business model, which may have a negative effect on the company’s margin recovery, in our view. Also, X5 Retail Group’s position in the largest cities in Russia has been challenged, as competitors have started gaining market share at the expense of X5 Retail Group. |
| | Within China, we elected to change the Fund’s positioning within the energy sector. During the Reporting Period, we trimmed the Fund’s position in China Petroleum & Chemical (“Sinopec”), China’s largest oil and gas refiner, and initiated a Fund position in CNOOC, producer of crude oil and natural gas. We believed the robust oil prices seen during the Reporting Period were likely to have a negative impact on |
18
PORTFOLIO RESULTS
| | Sinopec’s margins in the refinery sector and thus preferred to switch the Fund’s energy exposure to CNOOC. |
| Q | | Were there any notable changes in the Fund’s weightings during the Reporting Period? |
| A | | Most sector weights are usually established within a narrow range from the Index, as our team prefers to make decisions at the individual stock level, where we believe we can generate more added value. That said, during the Reporting Period, the Fund’s exposure relative to the Index to industrials, materials, information technology and consumer staples increased and its allocations relative to the Index to utilities, health care and energy decreased. |
| | Similarly, allocations to countries are directly the result of various stock selection decisions. As such, the Fund’s exposure relative to the Index in South Africa and Poland decreased and its allocations relative to the Index to Chile and Russia increased. |
| Q | | How was the Fund positioned relative to the Index at the end of the Reporting Period? |
| A | | At the end of the Reporting Period, the Fund had overweighted exposures to Russia and Brazil and underweighted exposures to South Africa, Poland, South Korea and Colombia relative to the Index. On the same date, the Fund was relatively neutrally weighted to the Index in the remaining components of the Index. |
| | | From a sector allocation perspective, the Fund had overweighted positions relative to the Index in consumer discretionary, information technology and industrials at the end of the Reporting Period. The Fund had underweighted positions compared to the Index in the energy, materials, telecommunication services and utilities sectors and rather neutral positions relative to the Index in the health care, financials and consumer staples sectors at the end of the Reporting Period. |
| | | As always, we remained focused on individual stock selection, with sector and country positioning being a secondary, closely-monitored effect. |
19
FUND BASICS
Emerging Markets Equity Fund
as of April 30, 2012

| | | | | | | | | | |
| | PERFORMANCE REVIEW | |
| | | November 1, 2011–April 30, 2012 | | Fund Total Return
(based on NAV)1 | | | MSCI Emerging
Markets Index2 | |
| | Class A | | | 2.80 | % | | | 3.93 | % |
| | Class B | | | 2.39 | | | | 3.93 | |
| | Class C | | | 2.37 | | | | 3.93 | |
| | Institutional | | | 2.99 | | | | 3.93 | |
| | Service | | | 2.74 | | | | 3.93 | |
| | | Class IR | | | 2.93 | | | | 3.93 | |
| | 1 | | The net asset value (“NAV”) represents the net assets of the class of the Fund (ex-dividend) divided by the total number of shares of the class outstanding. The Fund’s performance assumes the reinvestment of dividends and other distributions. The Fund’s performance does not reflect the deduction of any applicable sales charges. |
| | 2 | | The MSCI Emerging Markets Index (net, unhedged, USD) is a free float-adjusted market capitalization index that is designed to measure equity market performance of emerging markets. As of May 30, 2011 the MSCI Emerging Markets Index consisted of the following 21 emerging market country indices: Brazil, Chile, China, Colombia, Czech Republic, Egypt, Hungary, India, Indonesia, Korea, Malaysia, Mexico, Morocco, Peru, Philippines, Poland, Russia, South Africa, Taiwan, Thailand, and Turkey. This Index offers an exhaustive representation of the emerging markets by targeting all companies with a market capitalization within the top 85% of their investable equity universe, subject to a global minimum size requirement. It is based on the Global Investable Market Indices methodology. This series approximates the minimum possible dividend reinvestment. The dividend is reinvested after deduction of withholding tax, applying the rate to non-resident individuals who do not benefit from double taxation treaties. MSCI Barra uses withholding tax rates applicable to Luxembourg holding companies, as Luxembourg applies the highest rates. It is not possible to invest directly in an index. |
| | | | | | | | | | | | | | | | | | | | |
| | STANDARDIZED TOTAL RETURNS3 |
| | | For the period ended 3/31/12 | | One Year | | | Five Years | | | Ten Years | | | Since Inception | | | Inception Date |
| | Class A | | | -16.82 | % | | | -0.28 | % | | | 10.77 | % | | | 6.86 | % | | 12/15/97 |
| | Class B | | | -16.94 | | | | -0.30 | | | | 10.79 | | | | 6.99 | | | 12/15/97 |
| | Class C | | | -13.49 | | | | 0.10 | | | | 10.61 | | | | 6.63 | | | 12/15/97 |
| | Institutional | | | -11.59 | | | | 1.27 | | | | 11.91 | | | | 7.86 | | | 12/15/97 |
| | Service | | | -12.01 | | | | 0.77 | | | | 11.35 | | | | 7.18 | | | 12/15/97 |
| | | Class IR | | | -11.77 | | | | N/A | | | | N/A | | | | 4.23 | | | 8/31/10 |
| | 3 | | The Standardized Total Returns are average annual total returns as of the most recent calendar quarter-end. They assume reinvestment of all distributions at NAV. These returns reflect a maximum initial sales charge of 5.5% for Class A Shares, the assumed contingent deferred sales charge for Class B Shares (5% maximum declining to 0% after six years) and the assumed contingent deferred sales charge for Class C Shares (1% if redeemed within 12 months of purchase). Class B Shares convert automatically to Class A Shares on or about the fifteenth day of the last month of the calendar quarter that is eight years after purchase. Returns for Class B Shares for the period after conversion reflect the performance of Class A Shares. Because Institutional, Service and Class IR Shares do not involve a sales charge, such a charge is not applied to their Standardized Total Returns. The Fund’s Class B Shares are no longer available for purchase by new or existing shareholders (although current Class B shareholders may continue to reinvest income and capital gains distributions into Class B Shares, and Class B shareholders may continue to exchange their shares for Class B Shares of certain other Goldman Sachs Funds). |
| | | | The returns represent past performance. Past performance does not guarantee future results. The Fund’s investment return and principal value will fluctuate so that an investor’s shares, when redeemed, may be worth more or less than their original cost. Current performance may be lower or higher than the performance quoted above. Please visit our Website at www.goldmansachsfunds.com to obtain the most recent month-end returns. Performance reflects fee waivers and/or expense limitations in effect. In their absence, performance would be reduced. Returns do not reflect the deduction of taxes that a shareholder would pay on Fund distributions or the redemption of Fund shares. |
20
FUND BASICS
| | | | | | | | | | |
| | EXPENSE RATIOS4 | |
| | | | | Net Expense Ratio (Current) | | | Gross Expense Ratio (Before Waivers) | |
| | Class A | | | 1.82 | % | | | 1.94 | % |
| | Class B | | | 2.57 | | | | 2.69 | |
| | Class C | | | 2.57 | | | | 2.69 | |
| | Institutional | | | 1.42 | | | | 1.54 | |
| | Service | | | 1.92 | | | | 2.04 | |
| | | Class IR | | | 1.57 | | | | 1.69 | |
| | 4 | | The expense ratios of the Fund, both current (net of applicable fee waivers and/or expense limitations) and before waivers (gross of applicable fee waivers and/or expense limitations) are as set forth above according to the most recent publicly available Prospectus for the Fund and may differ from the expense ratios disclosed in the Financial Highlights in this report. The Fund’s waivers and/or expense limitations will remain in place through at least February 28, 2013, and prior to such date the investment adviser may not terminate the arrangements without the approval of the Fund’s Board of Trustees. If these arrangements are discontinued in the future, the expense ratios may change without shareholder approval. |
| | | | | | | | | | |
| | TOP TEN HOLDINGS AS OF 4/30/125 |
| | | Holding | | % of Total
Net Assets | | | Line of Business | | Country |
| | Samsung Electronics Co. Ltd. | | | 3.2 | % | | Semiconductors &
Semiconductor Equipment | | South Korea |
| | Taiwan Semiconductor Manufacturing Co. Ltd. | | | 2.8 | | | Semiconductors &
Semiconductor Equipment | | Taiwan |
| | Petroleo Brasileiro SA ADR | | | 2.7 | | | Energy | | Brazil |
| | China Construction Bank Corp. Class H | | | 1.9 | | | Banks | | China |
| | Industrial & Commercial Bank of China Ltd. Class H | | | 1.8 | | | Banks | | China |
| | China Mobile Ltd. | | | 1.8 | | | Telecommunication Services | | Hong Kong |
| | Vale SA | | | 1.7 | | | Materials | | Brazil |
| | Banco Bradesco SA Preference Shares | | | 1.6 | | | Banks | | Brazil |
| | America Movil SAB de CV Series L ADR | | | 1.5 | | | Telecommunication Services | | Mexico |
| | | Rosneft Oil Co. OJSC GDR | | | 1.5 | | | Energy | | Russia |
| | 5 | | The top 10 holdings may not be representative of the Fund’s future investments. |
21
FUND BASICS
|
| FUND VS. BENCHMARK SECTOR ALLOCATIONS6 |
| As of April 30, 2012 |
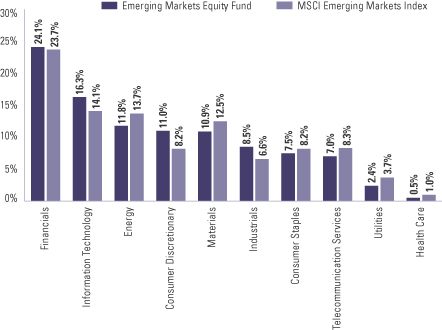
| | 6 | | The Fund is actively managed and, as such, its composition may differ over time. Consequently, the Fund’s overall sector allocations may differ from the percentages contained in the graph above. The graph categorizes investments using Global Industry Classification Standard (“GICS”), however, the sector classifications used by the portfolio management team may differ from GICS. The percentage shown for each investment category reflects the value of investments in that category as a percentage of market value. The graph depicts the Fund’s investments but may not represent the Fund’s market exposure due to the exclusion of certain derivatives, if any, as listed in the Additional Investment Information section of the Schedule of Investments. |
22
PORTFOLIO RESULTS
Goldman Sachs N-11 Equity Fund
Portfolio Management Discussion and Analysis
Below, the Goldman Sachs Fundamental Emerging Markets Equity Portfolio Management Team discusses the Goldman Sachs N-11 Equity Fund’s (the “Fund”) performance and positioning for the six-month period ended April 30, 2012 (the “Reporting Period”).
| Q | | How did the Fund perform during the Reporting Period? |
| A | | During the Reporting Period, the Fund’s Class A, C, Institutional and IR Shares generated cumulative total returns, without sales charges, of 4.80%, 4.41%, 5.10% and 5.01%, respectively. These returns compare to the 7.84% cumulative total return of the Fund’s benchmark, the MSCI GDP Weighted Next 11 ex Iran Index (net, unhedged) (the “Index”), during the same period. |
| Q | | What key factors were responsible for the Fund’s performance during the Reporting Period? |
| A | | The Fund underperformed relative to the Index during the Reporting Period. While the Fund did benefit from effective stock selection in Turkey and Nigeria, such positives were not enough to completely offset the detracting effect of its weak stock selection in South Korea, Mexico and the Philippines. |
| Q | | Which stocks detracted significantly from the Fund’s performance during the Reporting Period? |
| A | | Detracting most from the Fund’s results relative to the Index were positions in Bangladesh bank Islami Bank Bangladesh, Mexican building materials company Cemex and Philippine geothermal energy company Energy Development. |
| | Islami Bank Bangladesh, the leading Islamic bank and the largest private sector bank in Bangladesh, was the worst performing stock in the Fund’s portfolio during the Reporting Period. While the prospects for the company remained relatively well intact, the stock suffered from the overhang of a worsening macroeconomic environment, as Bangladesh’s fiscal and current account deficits worsened, and its central bank raised policy rates and removed a cap on lending rates. Further, the entry of Saudi Arabian-based Islamic Development Bank into the market raised some concerns about the longer-term competitive environment for Islami Bank Bangladesh. At the end of the Reporting Period, we continued to believe that Islami Bank Bangladesh’s near monopoly in Islamic banking in Bangladesh and the large and loyal client base it enjoys can continue to support its |
| | significant funding advantage over its peers and thus the stock’s performance going forward. |
| | Cemex is primarily a global cement company, and the Fund suffered as a result of not owning the name for much of the Reporting Period. Our team did not have the company’s stock in the Fund’s portfolio because approximately 42% of its revenues come from its Europe and Northern Africa operations, a region which we felt would have weak results given the economic conditions there. This thesis did prove correct. However, the stock outperformed as its South/Central America, Caribbean and Mexico operations had better than expected growth during the Reporting Period, and the U.S. market, driven primarily by price improvements for cement, was the second biggest driver of the company’s growth during the Reporting Period. We added the name to the Fund’s portfolio toward the end of the Reporting Period, but remained underweight relative to the Index, as its valuation, in our view, reflected the U.S. cement price improvement but housing and infrastructure data is still sluggish. |
| | The Philippines’ geothermal energy company Energy Development underperformed during the Reporting Period as news of further delays to its Bacman geothermal power plant weighed on its stock price. We subsequently made the decision to sell out of the stock, as this power plant delay raised concerns, in our view, about both the possibility of further execution risks in other parts of the business and the company’s ability to deliver on schedule. |
| Q | | What were some of the Fund’s best-performing individual stocks? |
| A | | The strongest contributors to the Fund’s performance during the Reporting Period were Metropolitan Bank, Puregold Price Club and Koza Altin Isletmeleri. |
| | Metropolitan Bank, a Philippine financial services company, performed strongly during the Reporting Period, driven by an improving macroeconomic backdrop within the country and by the widely-anticipated forthcoming listing of its parent company, which could highlight the value of Metropolitan Bank’s non-financial holdings and present the company with |
23
PORTFOLIO RESULTS
| | an opportunity to unlock this value. At the end of the Reporting Period, we remained positive on the stock, as we saw further potential for earnings acceleration, given that the bank recently completed a clean-up of its assets and should, we believe, be well placed to undertake more aggressive lending growth going forward. |
| | Puregold Price Club, the largest hypermarket retailer in the Philippines, was one of the Fund’s top performers during the Reporting Period and the primary driver of strong performance in the Philippines. (A hypermarket retailer is a retailer that combines a department store and a grocery supermarket in one store.) We had initiated the Fund’s position in this stock through its Initial Public Offering (“IPO”) earlier in 2011, as we believed the stock offered good growth prospects on the back of rapid store expansion and the under-penetration of the retail industry in the country. Indeed, after its IPO, the stock performed well based on store expansion announcements and increased consumer traffic, despite some concerns regarding the potential impact of an economic slowdown. |
| | The performance of Turkish gold mining company Koza Altin Isletmeleri during the Reporting Period was driven by strong earnings, which beat consensus. The company’s stock also benefited from the announcement by Turkey’s Prime Minister Recep Tayyip Erdogan that the government would look to increase incentives to spur investment in industries including mining to help narrow the nation’s current account deficit. |
| Q | | Which equity market sectors most significantly affected Fund performance during the Reporting Period? |
| A | | Relative to the Index, weak stock selection within the information technology, utilities and industrials sectors detracted most from the Fund’s performance during the Reporting Period. Underperformance in the information technology sector was driven largely by the poor performance of NHN, a South Korean Internet software and services company. In utilities, the Fund’s holding in the aforementioned Philippine geothermal energy producer Energy Development significantly underperformed. In industrials, the Fund’s South Korean holdings were the most significant underperformers. In particular, industrial conglomerate LG and end mill, drill and cutting tools manufacturer Y G-1 struggled during the Reporting Period. |
| | Conversely, strong stock selection and effective positioning within financials contributed most to the Fund’s |
| | performance. The Fund was prudently underweight the financials sector, which lagged the Index during the Reporting Period. The most significant individual drivers within the sector were in the commercial banks industry, specifically the Philippines’ Metropolitan Bank, mentioned earlier, and Mexico’s Grupo Financiero Banorte. From a sector perspective, financials was the only equity market sector to contribute positively to the Fund’s relative results during the Reporting Period. |
| Q | | How did the Fund use derivatives and similar instruments during the Reporting Period? |
| A | | During the Reporting Period, the Fund gained exposure to select stocks through participatory notes. We used index futures on an opportunistic basis, to ensure the Fund remained almost fully exposed to equities following cash inflows or stock sales. |
| Q | | Did the Fund make any significant purchases or sales during the Reporting Period? |
| A | | During the Reporting Period, we initiated a Fund position in Nestle Nigeria, the Nigerian subsidiary of the Swiss food and nutrition multi-national company, while reducing the Fund’s exposure to MTN Group, the South African wireless communications provider that is the market leader in the Nigerian wireless network market. Our decision to invest in Nestle Nigeria was grounded on the belief that its growth potential was still underappreciated by the market, given that its product range is highly targeted toward the emerging middle class consumer in Nigeria and is, in many cases — for example, Maggi stock cubes — an increasingly indispensable part of the low to middle income Nigerian’s diet. Furthermore, while Nestle Nigeria’s business model has historically been cash generative, to this point the company has been maxing out capacity utilization at its factories. With a new factory coming online in the last year, we believe the risk of a bottleneck to supply was markedly reduced. Our decision to reduce the Fund’s position in MTN Group was made following the announcement of a lawsuit taken against them by Turkish mobile operator Turkcell in relation to the license MTN Group was awarded in Iran. At the end of the Reporting Period, we continued to believe the Nigerian wireless network market remained attractive — underpinned by rising wealth, rapid adaptation to new technologies and increased utility of mobile technologies on the back of the ability to transfer money from mobile to mobile. However, we trimmed the Fund’s overweighted position in MTN Group given the near-term overhang caused by the legal case. |
24
PORTFOLIO RESULTS
| | In the Philippines, as already mentioned, we decided to eliminate the Fund’s position in geothermal energy company Energy Development based on delays at its Bacman power plant. During the Reporting Period, we also established a new Fund position in Petron, the largest refiner in the Philippines. During the Reporting Period, Petron’s stock was negatively impacted by concerns that rising oil prices may squeeze margins and put pressure on the business. Our view, however, was that these concerns appeared overblown, as Petron could, we believe, pass on the higher crude oil costs to consumers given the fully deregulated local refining industry. Further, at the then-current valuation level, the stock looked attractive to us, especially in light of our view that the market had yet to factor in the potential contribution to earnings from Petron’s newly acquired Malaysian assets and the potential impact of its recent refinery upgrade, which could substantially boost its earnings if completed, as anticipated, by the end of 2013. |
| | During the Reporting Period, we changed the Fund’s positioning within the Turkish retail sector, adding to the Fund’s position in Bizim and exiting out of the Fund’s position in BIM Burlesik Magazalar (“BIM”). Bizim is the second largest cash and carry wholesaler in Turkey and benefits from having a first mover advantage in the fragmented consumer packaged goods market. (First mover advantage is a form of competitive advantage that a company earns by being the first to enter a specific market or industry. Being the first allows a company to acquire superior brand recognition and customer loyalty. The company also often has more time to perfect its product or service.) We believe Bizim is well positioned to gain market share going forward given its low cost, cash generative expansion model. Furthermore, Bizim has already started expanding into the underpenetrated hotel, restaurant and cafeteria segment, which we believe has strong growth potential ahead and thus may become a more substantial part of the company’s earnings given the increasing level of wealth and discretionary income in Turkey. Our decision to sell out of the Fund’s position in BIM, the Turkish hard-discount retailer, was driven by the stock’s strong performance during the Reporting Period, which brought it toward our price target and also meant its valuation on a forward-looking basis seemed increasingly demanding. We also became more concerned about competition within the hard-discount sector, as similar format stores have emerged, attempting to replicate BIM’s success and which have already begun to take up significant market share. |
| Q | | Were there any notable changes in the Fund’s weightings during the Reporting Period? |
| A | Most sector weights are usually established within a narrow range from the Index, as our team prefers to make decisions at the individual stock level, where we believe we can generate more added value. That said, during the Reporting Period, the Fund’s exposure relative to the Index to financials and materials increased, and its allocations relative to the Index to telecommunication services and utilities decreased. |
| | Similarly, allocations to countries are directly the result of various stock selection decisions. As such, the Fund’s allocations relative to the Index to Egypt and Turkey increased, and its exposure relative to the Index in South Africa and South Korea decreased. |
| Q | | How was the Fund positioned relative to the Index at the end of the Reporting Period? |
| A | At the end of the Reporting Period, the Fund had a modest exposure to South Africa. It should be noted that South Africa is not a component of the Index. (The Fund owns a South African-listed company called MTN Group, which has the lead market share in the telecommunications market of Nigeria, which is an N-11 country. We took a position in MTN Group based on prospects for expansion of the telecommunications industry in Nigeria rather than on any investment thesis related to the company’s activities in South Africa. As indicated earlier, we reduced the Fund’s position in MTN Group during the Reporting Period.) On the same date, the Fund had an overweighted allocation relative to the Index to Nigeria, an underweighted exposure relative to the Index to Pakistan and was relatively neutrally weighted to the Index in the remaining country components of the Index. |
| | From a sector allocation perspective, the Fund had overweighted positions relative to the Index in energy and telecommunication services at the end of the Reporting Period. The Fund had underweighted positions compared to the Index in the utilities, materials, industrials and consumer staples sectors and rather neutral positions relative to the Index in the financials, consumer discretionary, health care and information technology sectors at the end the Reporting Period. |
| | We remained focused on individual stock selection, with sector and country positioning being a secondary, closely-monitored effect. |
25
FUND BASICS
N-11 Equity Fund
as of April 30, 2012
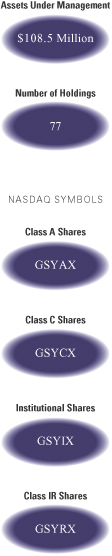
| | | | | | | | | | |
| | PERFORMANCE REVIEW | |
| | | November 1, 2011–April 30, 2012 | | Fund Total Return
(based on NAV)1 | | | MSCI GDP Weighted Next 11
ex Iran Index2 | |
| | Class A | | | 4.80 | % | | | 7.84 | % |
| | Class C | | | 4.41 | | | | 7.84 | |
| | Institutional | | | 5.10 | | | | 7.84 | |
| | | Class IR | | | 5.01 | | | | 7.84 | |
| | 1 | | The net asset value (“NAV”) represents the net assets of the class of the Fund (ex-dividend) divided by the total number of shares of the class outstanding. The Fund’s performance assumes the reinvestment of dividends and other distributions. The Fund’s performance does not reflect the deduction of any applicable sales charges. |
| | 2 | | The Fund’s benchmark index is the MSCI GDP Weighted Next 11 ex Iran Index (net, unhedged). The MSCI GDP Weighted Next 11 ex Iran Index comprises the following 10 emerging and frontier market indices: Bangladesh, Egypt, Indonesia, Mexico, Nigeria, Pakistan, Philippines, South Korea, Turkey and Vietnam. The index is designed to reflect the performance of the Next 11 ex Iran countries based on the size of each country’s economy rather than the size of its equity market, by using country weights based on a country’s gross domestic product (GDP). Each country is divided into large- and mid-cap segments and provides exhaustive coverage of these size segments by targeting a coverage range around 85% of free float-adjusted market capitalization in that market. It is not possible to invest directly in an index. |
| | | | | | | | | | |
| | STANDARDIZED TOTAL RETURNS3 |
| | | For the period ended 3/31/12 | | One Year | | | Since Inception | | Inception Date |
| | Class A | | | -12.68 | % | | -6.00% | | 2/28/11 |
| | Class C | | | -9.30 | | | -1.84 | | 2/28/11 |
| | Institutional | | | -7.26 | | | -0.64 | | 2/28/11 |
| | | Class IR | | | -7.27 | | | -0.73 | | 2/28/11 |
| | 3 | | The Standardized Total Returns are cumulative total returns as of the most recent calendar quarter-end. They assume reinvestment of all distributions at NAV. These returns reflect a maximum initial sales charge of 5.5% for Class A Shares and the assumed contingent deferred sales charge for Class C Shares (1% if redeemed within 12 months of purchase). Because Institutional and Class IR Shares do not involve a sales charge, such a charge is not applied to their Standardized Total Returns. |
| | | | The returns represent past performance. Past performance does not guarantee future results. The Fund’s investment return and principal value will fluctuate so that an investor’s shares, when redeemed, may be worth more or less than their original cost. Current performance may be lower or higher than the performance quoted above. Please visit our Website at www.goldmansachsfunds.com to obtain the most recent month-end returns. Performance reflects fee waivers and/or expense limitations in effect. In their absence, performance would be reduced. Returns do not reflect the deduction of taxes that a shareholder would pay on Fund distributions or the redemption of Fund shares. |
26
FUND BASICS
| | | | | | | | | | |
| | EXPENSE RATIOS4 | |
| | | | | Net Expense Ratio (Current) | | | Gross Expense Ratio (Before Waivers) | |
| | Class A | | | 1.80 | % | | | 3.93 | % |
| | Class C | | | 2.55 | | | | 4.68 | |
| | Institutional | | | 1.40 | | | | 3.53 | |
| | | Class IR | | | 1.55 | | | | 3.68 | |
| | 4 | | The expense ratios of the Fund, both current (net of applicable fee waivers and/or expense limitations) and before waivers (gross of applicable fee waivers and/or expense limitations) are as set forth above according to the most recent publicly available Prospectus for the Fund and may differ from the expense ratios disclosed in the Financial Highlights in this report. The Fund’s waivers and/or expense limitations will remain in place through at least February 28, 2013, and prior to such date the investment adviser may not terminate the arrangements without the approval of the Fund’s Board of Trustees. If these arrangements are discontinued in the future, the expense ratios may change without shareholder approval. |
| | | | | | | | | | |
| | TOP TEN HOLDINGS AS OF 4/30/125 |
| | | Holding | | % of Total
Net Assets | | | Line of Business | | Country |
| | America Movil SAB de CV Series L ADR | | | 9.7 | % | | Telecommunication Services | | Mexico |
| | Samsung Electronics Co. Ltd. | | | 6.3 | | | Semiconductors &
Semiconductor Equipment | | South Korea |
| | Wal-Mart de Mexico SAB de CV Series V | | | 3.5 | | | Food & Staples Retailing | | Mexico |
| | Turkiye Garanti Bankasi AS | | | 3.3 | | | Banks | | Turkey |
| | Kia Motors Corp. | | | 3.1 | | | Automobiles & Components | | South Korea |
| | Nigerian Breweries PLC | | | 2.9 | | | Food, Beverage & Tobacco | | Nigeria |
| | Grupo Financiero Banorte SAB de CV Class O | | | 2.9 | | | Banks | | Mexico |
| | PT Astra International Tbk | | | 2.4 | | | Automobiles & Components | | Indonesia |
| | Metropolitan Bank & Trust | | | 2.3 | | | Banks | | Philippines |
| | | PT Bank Central Asia Tbk | | | 2.3 | | | Banks | | Indonesia |
| | 5 | | The top 10 holdings may not be representative of the Fund’s future investments. |
27
FUND BASICS
|
| FUND VS. BENCHMARK SECTOR ALLOCATIONS6 |
| As of April 30, 2012 |
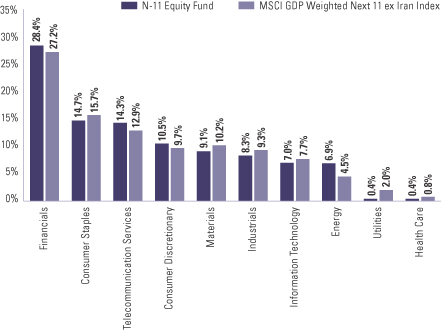
| | 6 | | The Fund is actively managed and, as such, its composition may differ over time. Consequently, the Fund’s overall sector allocations may differ from the percentages contained in the graph above. The graph categorizes investments using Global Industry Classification Standard (“GICS”), however, the sector classifications used by the portfolio management team may differ from GICS. The percentage shown for each investment category reflects the value of investments in that category as a percentage of market value. The graph depicts the Fund’s investments but may not represent the Fund’s market exposure due to the exclusion of certain derivatives, if any, as listed in the Additional Investment Information section of the Schedule of Investments. |
28
GOLDMAN SACHS ASIA EQUITY FUND
Schedule of Investments
April 30, 2012 (Unaudited)
| | | | | | | | |
Shares | | | Description | | Value | |
| | | | | | | |
| Common Stocks – 98.8% | |
| China – 18.8% | |
| | 278,000 | | | China Automation Group Ltd. (Capital Goods) | | $ | 76,302 | |
| | 546,000 | | | China BlueChemical Ltd. Class H (Materials) | | | 389,141 | |
| | 800,000 | | | China Citic Bank Corp. Ltd. Class H (Banks) | | | 506,897 | |
| | 2,268,110 | | | China Construction Bank Corp. Class H (Banks) | | | 1,760,153 | |
| | 168,000 | | | China Life Insurance Co. Ltd. Class H (Insurance) | | | 447,308 | |
| | 132,000 | | | China Minsheng Banking Corp. Ltd. Class H (Banks) | | | 136,592 | |
| | 207,200 | | | China Pacific Insurance Group Co. Ltd. Class H (Insurance) | | | 670,993 | |
| | 148,000 | | | China Petroleum & Chemical Corp. Class H (Energy) | | | 157,192 | |
| | 208,500 | | | China Shenhua Energy Co. Ltd. Class H (Energy) | | | 920,747 | |
| | 356,000 | | | China Telecom Corp. Ltd. Class H (Telecommunication Services) | | | 190,799 | |
| | 617,000 | | | CNOOC Ltd. (Energy) | | | 1,303,813 | |
| | 196,000 | | | Dongfang Electric Corp. Ltd. Class H (Capital Goods) | | | 531,340 | |
| | 393,000 | | | Foxconn International Holdings Ltd. (Technology Hardware & Equipment)* | | | 185,840 | |
| | 21,620 | | | Hollysys Automation Technologies Ltd. (Technology Hardware & Equipment)* | | | 214,687 | |
| | 2,551,635 | | | Industrial & Commercial Bank of China Ltd. Class H (Banks) | | | 1,695,393 | |
| | 178,000 | | | Jiangxi Copper Co. Ltd. Class H (Materials) | | | 428,070 | |
| | 204,000 | | | Minth Group Ltd. (Automobiles & Components) | | | 257,664 | |
| | 794,000 | | | PetroChina Co. Ltd. Class H (Energy) | | | 1,184,407 | |
| | 31,000 | | | Tencent Holdings Ltd. (Software & Services) | | | 969,798 | |
| | 305,200 | | | Zoomlion Heavy Industry Science and Technology Co. Ltd. Class H (Capital Goods) | | | 452,801 | |
| | 194,604 | | | ZTE Corp. Class H (Technology Hardware & Equipment) | | | 469,840 | |
| | | | | | | | |
| | | | | | | 12,949,777 | |
| | |
| Hong Kong – 15.8% | |
| | 56,236 | | | AIA Group Ltd. (Insurance) | | | 199,012 | |
| | 409,000 | | | Belle International Holdings Ltd. (Retailing) | | | 798,056 | |
| | 43,000 | | | Cheung Kong Holdings Ltd. (Real Estate) | | | 568,678 | |
| | 145,000 | | | Cheung Kong Infrastructure Holdings Ltd. (Utilities) | | | 859,315 | |
| | 856,000 | | | China Glass Holdings Ltd. (Materials) | | | 123,562 | |
| | 224,000 | | | China Mengniu Dairy Co. Ltd. (Food, Beverage & Tobacco) | | | 689,606 | |
| | |
| | | | | | | | |
Shares | | | Description | | Value | |
| | | | | | | |
| Common Stocks – (continued) | |
| Hong Kong – (continued) | |
| | 149,500 | | | China Mobile Ltd. (Telecommunication Services) | | $ | 1,653,997 | |
| | 444,000 | | | China Overseas Land & Investment Ltd. (Real Estate) | | | 959,491 | |
| | 524,000 | | | China Resources Cement Holdings Ltd. (Materials) | | | 413,813 | |
| | 106,000 | | | China Unicom Hong Kong Ltd. (Telecommunication Services) | | | 185,392 | |
| | 242,000 | | | Digital China Holdings Ltd. (Technology Hardware & Equipment) | | | 457,084 | |
| | 134,000 | | | Hang Lung Properties Ltd. (Real Estate) | | | 492,654 | |
| | 99,431 | | | Henderson Land Development Co. Ltd. (Real Estate) | | | 564,185 | |
| | 31,000 | | | Hong Kong Exchanges and Clearing Ltd. (Diversified Financials) | | | 492,993 | |
| | 72,000 | | | Hutchison Whampoa Ltd. (Capital Goods) | | | 689,763 | |
| | 182,000 | | | Li & Fung Ltd. (Retailing) | | | 388,105 | |
| | 115,500 | | | Lifestyle International Holdings Ltd. (Retailing) | | | 269,197 | |
| | 1,960,000 | | | Peace Mark Holdings Ltd. (Consumer Durables & Apparel)* | | | — | |
| | 126,800 | | | Sands China Ltd. (Consumer Services) | | | 496,458 | |
| | 22,555 | | | Sun Hung Kai Properties Ltd. (Real Estate) | | | 270,161 | |
| | 70,000 | | | The Link REIT (REIT) | | | 291,228 | |
| | | | | | | | |
| | | | | | | 10,862,750 | |
| | |
| India – 6.3% | |
| | 13,335 | | | Bombay Dyeing & Manufacturing Co. Ltd. (Consumer Durables & Apparel) | | | 131,834 | |
| | 1,554 | | | Bosch Ltd. (Automobiles & Components) | | | 256,106 | |
| | 13,432 | | | CRISIL Ltd. (Diversified Financials) | | | 264,514 | |
| | 24,025 | | | DB Corp. Ltd. (Media) | | | 94,677 | |
| | 14,408 | | | Exide Industries Ltd. (Automobiles & Components) | | | 35,312 | |
| | 3,841 | | | Grasim Industries Ltd. (Materials) | | | 199,652 | |
| | 76,814 | | | HDFC Bank Ltd. (Banks) | | | 790,957 | |
| | 11,600 | | | Hero Motocorp Ltd. (Automobiles & Components) | | | 491,902 | |
| | 24,246 | | | ICICI Bank Ltd. (Banks) | | | 405,916 | |
| | 283,064 | | | Indiabulls Infrastructure and Power Ltd. (Utilities)* | | | 56,237 | |
| | 95,954 | | | Indiabulls Real Estate Ltd. (Real Estate) | | | 114,343 | |
| | 67,432 | | | IndusInd Bank Ltd. (Banks) | | | 424,359 | |
| | 3,769 | | | Oracle Financial Services Software Ltd. (Software & Services)* | | | 187,140 | |
| | 13,592 | | | Tata Consultancy Services Ltd. (Software & Services) | | | 320,558 | |
| | 18,736 | | | Tata Steel Ltd. (Materials) | | | 164,367 | |
| | |
| | |
| The accompanying notes are an integral part of these financial statements. | | 29 |
GOLDMAN SACHS ASIA EQUITY FUND
Schedule of Investments (continued)
April 30, 2012 (Unaudited)
| | | | | | | | |
Shares | | | Description | | Value | |
| | | | | | | |
| Common Stocks – (continued) | |
| India – (continued) | |
| | 33,837 | | | Thermax Ltd. (Capital Goods) | | $ | 285,993 | |
| | 23,773 | | | Titan Industries Ltd. (Consumer Durables & Apparel) | | | 104,910 | |
| | | | | | | | |
| | | | | | | 4,328,777 | |
| | |
| Indonesia – 4.1% | |
| | 826,500 | | | PT Bank Mandiri (Persero) Tbk (Banks) | | | 662,812 | |
| | 1,616,357 | | | PT Bank Negara Indonesia (Persero) Tbk (Banks) | | | 705,123 | |
| | 824,000 | | | PT Indofood Sukses Makmur Tbk (Food, Beverage & Tobacco) | | | 432,994 | |
| | 2,611,000 | | | PT Media Nusantara Citra Tbk (Media) | | | 637,517 | |
| | 434,000 | | | PT Telekomunikasi Indonesia (Persero) Tbk (Telecommunication Services) | | | 400,177 | |
| | | | | | | | |
| | | | | | | 2,838,623 | |
| | |
| Malaysia – 5.5% | |
| | 315,000 | | | CIMB Group Holdings Berhad (Banks) | | | 769,767 | |
| | 253,320 | | | Genting Berhad (Consumer Services) | | | 863,455 | |
| | 244,800 | | | Sime Darby Berhad (Capital Goods) | | | 786,697 | |
| | 395,400 | | | Tenaga Nasional Berhad (Utilities) | | | 839,492 | |
| | 835,500 | | | UEM Land Holdings Berhad (Real Estate)* | | | 553,448 | |
| | | | | | | | |
| | | | | | | 3,812,859 | |
| | |
| Philippines – 0.7% | |
| | 1,951,300 | | | Petron Corp. (Energy) | | | 493,253 | |
| | |
| Singapore – 6.7% | |
| | 159,000 | | | CapitaLand Ltd. (Real Estate) | | | 375,825 | |
| | 89,230 | | | DBS Group Holdings Ltd. (Banks) | | | 1,002,441 | |
| | 484,000 | | | Genting Singapore PLC (Consumer Services)* | | | 674,392 | |
| | 1,229,000 | | | Golden Agri-Resources Ltd. (Food, Beverage & Tobacco) | | | 727,495 | |
| | 151,000 | | | SembCorp Industries Ltd. (Capital Goods) | | | 613,348 | |
| | 135,000 | | | SembCorp Marine Ltd. (Capital Goods) | | | 552,379 | |
| | 276,000 | | | Singapore Telecommunications Ltd. (Telecommunication Services) | | | 694,270 | |
| | | | | | | | |
| | | | | | | 4,640,150 | |
| | |
| South Korea – 21.2% | |
| | 46,850 | | | Cheil Worldwide, Inc. (Media) | | | 812,944 | |
| | 2,331 | | | CJ CheilJedang Corp. (Food, Beverage & Tobacco) | | | 770,084 | |
| | 50,850 | | | Doosan Infracore Co. Ltd. (Capital Goods)* | | | 943,243 | |
| | 3,845 | | | Green Cross Corp. (Pharmaceuticals, Biotechnology & Life Sciences) | | | 454,405 | |
| | 6,530 | | | Hankook Tire Co. Ltd. (Automobiles & Components) | | | 275,473 | |
| | |
| | | | | | | | |
Shares | | | Description | | Value | |
| | | | | | | |
| Common Stocks – (continued) | |
| South Korea – (continued) | |
| | 1,753 | | | Hyundai Heavy Industries Co. Ltd. (Capital Goods) | | $ | 435,621 | |
| | 1,762 | | | Hyundai Mobis (Automobiles & Components) | | | 476,387 | |
| | 30,930 | | | KB Financial Group, Inc. (Banks) | | | 1,046,457 | |
| | 21,150 | | | Kia Motors Corp. (Automobiles & Components) | | | 1,551,966 | |
| | 1,654 | | | LG Chem Ltd. (Materials) | | | 413,438 | |
| | 777 | | | POSCO (Materials) | | | 257,403 | |
| | 1,582 | | | POSCO Chemtech Co. Ltd. (Materials) | | | 176,689 | |
| | 9,180 | | | Samsung C&T Corp. (Capital Goods) | | | 621,024 | |
| | 3,891 | | | Samsung Electronics Co. Ltd. (Semiconductors & Semiconductor Equipment) | | | 4,762,434 | |
| | 8,280 | | | Samsung Securities Co. Ltd. (Diversified Financials)* | | | 364,094 | |
| | 10,460 | | | SK Hynix, Inc. (Semiconductors & Semiconductor Equipment)* | | | 257,812 | |
| | 1,070 | | | S-Oil Corp. (Energy) | | | 91,732 | |
| | 17,199 | | | TK Corp. (Capital Goods)* | | | 463,264 | |
| | 42,420 | | | Woori Finance Holdings Co. Ltd. (Banks) | | | 443,818 | |
| | | | | | | | |
| | | | | | | 14,618,288 | |
| | |
| Taiwan – 16.2% | |
| | 532,170 | | | Advanced Semiconductor Engineering, Inc. (Semiconductors & Semiconductor Equipment) | | | 535,147 | |
| | 75,380 | | | Asustek Computer, Inc. (Technology Hardware & Equipment) | | | 757,235 | |
| | 229,245 | | | Cathay Financial Holding Co. Ltd. (Insurance) | | | 241,003 | |
| | 1,005,037 | | | Chinatrust Financial Holding Co. Ltd. (Banks) | | | 637,075 | |
| | 385,000 | | | Chipbond Technology Corp. (Semiconductors & Semiconductor Equipment) | | | 517,373 | |
| | 172,000 | | | Epistar Corp. (Semiconductors & Semiconductor Equipment) | | | 415,048 | |
| | 383,698 | | | Far Eastern New Century Corp. (Capital Goods) | | | 430,779 | |
| | 263,660 | | | Formosa Plastics Corp. (Materials) | | | 745,736 | |
| | 404,976 | | | Hon Hai Precision Industry Co. Ltd. (Technology Hardware & Equipment) | | | 1,273,316 | |
| | 143,455 | | | Nan Ya Printed Circuit Board Corp. (Technology Hardware & Equipment) | | | 267,140 | |
| | 48,000 | | | PChome Online, Inc. (Software & Services) | | | 270,970 | |
| | 63,000 | | | President Chain Store Corp. (Food & Staples Retailing) | | | 336,708 | |
| | 87,076 | | | Radiant Opto-Electronics Corp. (Semiconductors & Semiconductor Equipment) | | | 363,272 | |
| | 133,000 | | | Taiwan Fertilizer Co. Ltd. (Materials) | | | 316,468 | |
| | |
| | |
| 30 | | The accompanying notes are an integral part of these financial statements. |
GOLDMAN SACHS ASIA EQUITY FUND
| | | | | | | | |
Shares | | | Description | | Value | |
| | | | | | | |
| Common Stocks – (continued) | |
| Taiwan – (continued) | |
| | 939,338 | | | Taiwan Semiconductor Manufacturing Co. Ltd. (Semiconductors & Semiconductor Equipment) | | $ | 2,776,341 | |
| | 129,429 | | | Tripod Technology Corp. (Technology Hardware & Equipment) | | | 378,530 | |
| | 278,000 | | | Wistron Corp. (Technology Hardware & Equipment) | | | 414,733 | |
| | 925,005 | | | Yuanta Financial Holding Co. Ltd. (Diversified Financials)* | | | 440,631 | |
| | | | | | | | |
| | | | | | | 11,117,505 | |
| | |
| Thailand – 2.6% | |
| | 81,500 | | | Bangkok Bank PCL NVDR (Banks) | | | 504,773 | |
| | 109,600 | | | PTT Global Chemical PCL (Materials) | | | 244,895 | |
| | 51,000 | | | PTT PCL (Energy) | | | 581,637 | |
| | 226,700 | | | Shin Corp. PCL NVDR (Telecommunication Services) | | | 420,648 | |
| | | | | | | | |
| | | | | | | 1,751,953 | |
| | |
| United States – 0.9% | |
| | 8,472 | | | Cognizant Technology Solutions Corp. Class A (Software & Services)* | | | 621,167 | |
| | |
| | TOTAL COMMON STOCKS | |
| | (Cost $60,187,205) | | $ | 68,035,102 | |
| | |
| | | | | | | | | | | | |
Notional
Shares | | | Description | | Maturity
Date | | | Value | |
| | | | | | | | | | |
| Participation Notes – 0.5% | |
| India – 0.5% | |
| | 33,121 | | | Exide Industries Ltd. (Issuer UBS AG) (Automobiles & Components) | | | 03/13 | | | $ | 81,175 | |
| | 29,916 | | | IndusInd Bank Ltd. (Issuer Deutsche Bank AG) (Banks) | | | 02/20 | | | | 188,263 | |
| | 4,526 | | | Tata Steel Ltd. (Issuer Morgan Stanley) (Materials)(a) | | | 12/12 | | | | 39,705 | |
| | 5,351 | | | Tata Steel Ltd. GDR (Issuer Deutsche Bank AG) (Materials)(a) | | | 01/17 | | | | 46,943 | |
| | |
| | TOTAL PARTICIPATION NOTES | |
| | (Cost $368,419) | | | $ | 356,086 | |
| | |
| | TOTAL INVESTMENTS – 99.3% | |
| | (Cost $60,555,624) | | | $ | 68,391,188 | |
| | |
| OTHER ASSETS IN EXCESS OF
LIABILITIES – 0.7% |
| | | 490,345 | |
| | |
| | NET ASSETS – 100.0% | | | $ | 68,881,533 | |
| | |
| | |
| The percentage shown for each investment category reflects the value of investments in that category as a percentage of net assets. |
* | | Non-income producing security. |
(a) | | Exempt from registration under Rule 144A of the Securities Act of 1933. Under procedures approved by the Board of Trustees, such securities have been determined to be liquid by the investment adviser and may be resold, normally to qualified institutional buyers in transactions exempt from registration. Total market value of Rule 144A securities amounts to $86,648, which represents approximately 0.1% of net assets as of April 30, 2012. |
| | |
|
Investment Abbreviations: |
GDR | | —Global Depositary Receipt |
NVDR | | —Non-Voting Depositary Receipt |
REIT | | —Real Estate Investment Trust |
|
|
| ADDITIONAL INVESTMENT INFORMATION |
FUTURES CONTRACTS — At April 30, 2012, the Fund had the following futures contracts:
| | | | | | | | | | | | | | |
| Type | | Number of
Contracts
Long (Short) | | | Expiration
Date | | Current
Value | | | Unrealized
Gain (Loss) | |
SGX S&P CNX Nifty Index | | | 37 | | | May 2012 | | $ | 389,721 | | | $ | 3,134 | |
| | |
| The accompanying notes are an integral part of these financial statements. | | 31 |
GOLDMAN SACHS BRIC FUND
Schedule of Investments
April 30, 2012 (Unaudited)
| | | | | | | | |
Shares | | | Description | | Value | |
| | | | | | | | |
| | Common Stocks – 98.2% | |
| Bermuda – 0.8% | |
| | 234,000 | | | BTG Pactual Participations Ltd. (Diversified Financials)* | | $ | 3,755,245 | |
| | |
| Brazil – 30.6% | |
| | 367,353 | | | Anhanguera Educacional Participacoes SA (Consumer Services) | | | 4,883,522 | |
| | 339,516 | | | Autometal SA (Automobiles & Components) | | | 2,719,833 | |
| | 894,605 | | | Banco Bradesco SA Preference Shares (Banks) | | | 14,375,443 | |
| | 1,365,667 | | | BM&FBovespa SA (Diversified Financials) | | | 7,680,377 | |
| | 255,580 | | | Braskem SA Preference A Shares (Materials) | | | 1,796,696 | |
| | 657,633 | | | CCR SA (Transportation) | | | 5,106,087 | |
| | 284,303 | | | Companhia de Bebidas das Americas Preference Shares (Food, Beverage & Tobacco) | | | 11,975,284 | |
| | 186,800 | | | Cosan SA Industria e Comercio (Food, Beverage & Tobacco) | | | 3,243,753 | |
| | 709,553 | | | Direcional Engenharia SA (Real Estate) | | | 3,640,547 | |
| | 685,664 | | | EDP — Energias do Brasil SA (Utilities) | | | 4,794,954 | |
| | 734,708 | | | Itau Unibanco Holding SA Preference Shares (Banks) | | | 11,563,224 | |
| | 1,280,741 | | | Klabin SA Preference Shares (Materials) | | | 6,141,160 | |
| | 966,209 | | | Magazine Luiza SA (Retailing)* | | | 5,768,412 | |
| | 1,167,668 | | | Petroleo Brasileiro SA ADR (Energy) | | | 27,486,905 | |
| | 274,962 | | | Qualicorp SA (Commercial & Professional Services)* | | | 2,394,549 | |
| | 594,342 | | | Vale SA (Materials) | | | 13,282,779 | |
| | 711,022 | | | Vale SA ADR (Materials) | | | 15,784,688 | |
| | | | | | | | |
| | | | | | | 142,638,213 | |
| | |
| China – 28.2% | |
| | 3,757,000 | | | China Automation Group Ltd. (Capital Goods) | | | 1,031,172 | |
| | 3,984,000 | | | China BlueChemical Ltd. Class H (Materials) | | | 2,839,447 | |
| | 9,022,000 | | | China Citic Bank Corp. Ltd. Class H (Banks) | | | 5,716,530 | |
| | 25,375,360 | | | China Construction Bank Corp. Class H (Banks) | | | 19,692,400 | |
| | 4,604,000 | | | China Life Insurance Co. Ltd. Class H (Insurance) | | | 12,258,362 | |
| | 512,000 | | | China Petroleum & Chemical Corp. Class H (Energy) | | | 543,801 | |
| | 2,187,500 | | | China Shenhua Energy Co. Ltd. Class H (Energy) | | | 9,660,112 | |
| | 4,180,000 | | | China Telecom Corp. Ltd. Class H (Telecommunication Services) | | | 2,240,275 | |
| | 6,776,000 | | | CNOOC Ltd. (Energy) | | | 14,318,695 | |
| | |
| | | | | | | | |
Shares | | | Description | | Value | |
| | | | | | | | |
| | Common Stocks – (continued) | |
| China – (continued) | |
| | 1,940,000 | | | Dongfang Electric Corp. Ltd. Class H (Capital Goods) | | $ | 5,259,178 | |
| | 26,689,050 | | | Industrial & Commercial Bank of China Ltd. Class H (Banks) | | | 17,733,113 | |
| | 2,016,000 | | | Jiangxi Copper Co. Ltd. Class H (Materials) | | | 4,848,259 | |
| | 2,250,000 | | | Minth Group Ltd. (Automobiles & Components) | | | 2,841,878 | |
| | 8,616,000 | | | PetroChina Co. Ltd. Class H (Energy) | | | 12,852,463 | |
| | 361,000 | | | Tencent Holdings Ltd. (Software & Services) | | | 11,293,453 | |
| | 3,070,348 | | | Zoomlion Heavy Industry Science and Technology Co. Ltd. Class H (Capital Goods) | | | 4,555,235 | |
| | 1,722,228 | | | ZTE Corp. Class H (Technology Hardware & Equipment) | | | 4,158,046 | |
| | | | | | | | |
| | | | | | | 131,842,419 | |
| | |
| Hong Kong – 12.5% | |
| | 4,479,000 | | | Belle International Holdings Ltd. (Retailing) | | | 8,739,592 | |
| | 2,401,000 | | | China Mengniu Dairy Co. Ltd. (Food, Beverage & Tobacco) | | | 7,391,712 | |
| | 1,629,000 | | | China Mobile Ltd. (Telecommunication Services) | | | 18,022,480 | |
| | 4,838,000 | | | China Overseas Land & Investment Ltd. (Real Estate) | | | 10,454,996 | |
| | 7,182,000 | | | China Resources Cement Holdings Ltd. (Materials) | | | 5,671,770 | |
| | 1,266,000 | | | China Unicom Hong Kong Ltd. (Telecommunication Services) | | | 2,214,205 | |
| | 3,077,000 | | | Digital China Holdings Ltd. (Technology Hardware & Equipment) | | | 5,811,760 | |
| | | | | | | | |
| | | | | | | 58,306,515 | |
| | |
| India – 9.9% | |
| | 153,738 | | | Bombay Dyeing & Manufacturing Co. Ltd. (Consumer Durables & Apparel) | | | 1,519,897 | |
| | 16,344 | | | Bosch Ltd. (Automobiles & Components) | | | 2,693,563 | |
| | 144,271 | | | CRISIL Ltd. (Diversified Financials) | | | 2,841,110 | |
| | 316,715 | | | DB Corp. Ltd. (Media) | | | 1,248,098 | |
| | 533,923 | | | Exide Industries Ltd. (Automobiles & Components) | | | 1,308,563 | |
| | 43,753 | | | Grasim Industries Ltd. (Materials) | | | 2,274,241 | |
| | 779,328 | | | HDFC Bank Ltd. (Banks) | | | 8,024,769 | |
| | 125,851 | | | Hero Motocorp Ltd. (Automobiles & Components) | | | 5,336,754 | |
| | 243,846 | | | ICICI Bank Ltd. (Banks) | | | 4,082,363 | |
| | 3,690,975 | | | Indiabulls Infrastructure and Power Ltd. (Utilities)* | | | 733,292 | |
| | |
| | |
| 32 | | The accompanying notes are an integral part of these financial statements. |
GOLDMAN SACHS BRIC FUND
| | | | | | | | |
Shares | | | Description | | Value | |
| | Common Stocks – (continued) | |
| India – (continued) | |
| | 1,251,178 | | | Indiabulls Real Estate Ltd. (Real Estate) | | $ | 1,490,961 | |
| | 539,314 | | | IndusInd Bank Ltd. (Banks) | | | 3,393,982 | |
| | 43,458 | | | Oracle Financial Services Software Ltd. (Software & Services)* | | | 2,157,794 | |
| | 159,073 | | | Tata Consultancy Services Ltd. (Software & Services) | | | 3,751,625 | |
| | 133,462 | | | Tata Steel Ltd. (Materials) | | | 1,170,837 | |
| | 351,546 | | | Thermax Ltd. (Capital Goods) | | | 2,971,295 | |
| | 273,874 | | | Titan Industries Ltd. (Consumer Durables & Apparel) | | | 1,208,606 | |
| | | | | | | | |
| | | | | | | 46,207,750 | |
| | |
| Netherlands – 0.1% | |
| | 98,475 | | | Nord Gold NV GDR (Materials)* | | | 620,393 | |
| | |
| Russia – 14.6% | |
| | 315,358 | | | DIXY Group OJSC (Food & Staples Retailing)* | | | 4,013,858 | |
| | 595,993 | | | Etalon Group Ltd. GDR (Real Estate)* | | | 3,949,843 | |
| | 177,950 | | | Eurasia Drilling Co. Ltd. GDR (Energy) | | | 5,087,350 | |
| | 216,108 | | | Globaltrans Investment PLC GDR (Transportation)(a) | | | 4,232,814 | |
| | 920,506 | | | OAO Gazprom ADR (Energy) | | | 10,661,358 | |
| | 206,693 | | | OAO Lukoil ADR (Energy) | | | 12,716,007 | |
| | 222,123 | | | OAO Severstal GDR (Materials) | | | 3,021,349 | |
| | 166,150 | | | OJSC Magnit GDR (Food & Staples Retailing) | | | 4,868,869 | |
| | 1,260,278 | | | Rosneft Oil Co. OJSC GDR (Energy)* | | | 9,024,237 | |
| | 3,355,426 | | | Sberbank of Russia (Banks) | | | 10,735,598 | |
| | | | | | | | |
| | | | | | | 68,311,283 | |
| | |
| United States – 1.5% | |
| | 93,330 | | | Cognizant Technology Solutions Corp. Class A (Software & Services)* | | | 6,842,956 | |
| | |
| | TOTAL COMMON STOCKS | | | | |
| | (Cost $438,021,736) | | $ | 458,524,774 | |
| | |
| | | | | | | | | | | | |
Notional
Shares | | | Description | | Maturity
Date | | | Value | |
| | | | | | | | | | | | |
| | Participation Notes – 1.3% | |
| India – 1.3% | |
| | 467,416 | | | Exide Industries Ltd. (Issuer UBS AG) (Automobiles & Components) | | | 03/13 | | | $ | 1,145,565 | |
| | 583,135 | | | IndusInd Bank Ltd. (Issuer Deutsche Bank AG) (Banks) | | | 02/20 | | | | 3,669,696 | |
| | 75,318 | | | Tata Steel Ltd. (Issuer Morgan Stanley) (Materials)(a) | | | 12/12 | | | | 660,743 | |
| | 65,209 | | | Tata Steel Ltd. GDR (Issuer Deutsche Bank AG) (Materials)(a) | | | 01/17 | | | | 572,066 | |
| | |
| | TOTAL PARTICIPATION NOTES | | | | | |
| | (Cost $6,039,999) | | | $ | 6,048,070 | |
| | |
| | | | | | | | | | | | |
| Units | | | Description | | Expiration
Month | | | Value | |
| | Right*– 0.0% | |
| Brazil – 0.0% | |
| | 698 | | | Companhia de Bebidas das Americas (Food, Beverage & Tobacco) | | | 06/12 | | | $ | 5,866 | |
| | (Cost $0) | | | | | |
| | |
| | TOTAL INVESTMENTS – 99.5% | | | | | |
| | (Cost $444,061,735) | | | $ | 464,578,710 | |
| | |
| OTHER ASSETS IN EXCESS OF
LIABILITIES – 0.5% |
| | | 2,295,098 | |
| | |
| | NET ASSETS – 100.0% | | | $ | 466,873,808 | |
| | |
| | |
| The percentage shown for each investment category reflects the value of investments in that category as a percentage of net assets. |
* | | Non-income producing security. |
(a) | | Exempt from registration under Rule 144A of the Securities Act of 1933. Under procedures approved by the Board of Trustees, such securities have been determined to be liquid by the investment adviser and may be resold, normally to qualified institutional buyers in transactions exempt from registration. Total market value of Rule 144A securities amounts to $5,465,623, which represents approximately 1.2% of net assets as of April 30, 2012. |
| | |
|
Investment Abbreviations: |
ADR | | —American Depositary Receipt |
GDR | | —Global Depositary Receipt |
|
| | |
| The accompanying notes are an integral part of these financial statements. | | 33 |
GOLDMAN SACHS BRIC FUND
Schedule of Investments (continued)
April 30, 2012 (Unaudited)
|
| ADDITIONAL INVESTMENT INFORMATION |
FUTURES CONTRACTS — At April 30, 2012, the Fund had the following futures contracts:
| | | | | | | | | | | | | | |
| Type | | Number of
Contracts
Long (Short) | | | Expiration
Date | | Current
Value | | | Unrealized
Gain (Loss) | |
SGX S&P CNX Nifty Index | | | 543 | | | May 2012 | | $ | 5,719,419 | | | $ | 68,778 | |
| | |
| 34 | | The accompanying notes are an integral part of these financial statements. |
GOLDMAN SACHS EMERGING MARKETS EQUITY FUND
Schedule of Investments
April 30, 2012 (Unaudited)
| | | | | | | | |
Shares | | | Description | | Value | |
| | | | | | | | |
| | Common Stocks – 97.2% | |
| Bermuda – 0.4% | |
| | 98,900 | | | BTG Pactual Participations Ltd. (Diversified Financials)* | | $ | 1,587,153 | |
| | |
| Brazil – 15.0% | |
| | 217,027 | | | Anhanguera Educacional Participacoes SA (Consumer Services) | | | 2,885,116 | |
| | 142,586 | | | Autometal SA (Automobiles & Components) | | | 1,142,244 | |
| | 418,276 | | | Banco Bradesco SA Preference Shares (Banks) | | | 6,721,294 | |
| | 703,386 | | | BM&FBovespa SA (Diversified Financials) | | | 3,955,774 | |
| | 111,712 | | | Braskem SA Preference A Shares (Materials) | | | 785,322 | |
| | 355,959 | | | CCR SA (Transportation) | | | 2,763,787 | |
| | 116,338 | | | Companhia de Bebidas das Americas Preference Shares (Food, Beverage & Tobacco) | | | 4,900,337 | |
| | 105,974 | | | Cosan SA Industria e Comercio (Food, Beverage & Tobacco) | | | 1,840,222 | |
| | 319,837 | | | Direcional Engenharia SA (Real Estate) | | | 1,641,007 | |
| | 261,462 | | | EDP — Energias do Brasil SA (Utilities) | | | 1,828,444 | |
| | 219,145 | | | Itau Unibanco Holding SA Preference Shares (Banks) | | | 3,449,020 | |
| | 574,691 | | | Klabin SA Preference Shares (Materials) | | | 2,755,647 | |
| | 562,552 | | | Magazine Luiza SA (Retailing)* | | | 3,358,519 | |
| | 484,623 | | | Petroleo Brasileiro SA ADR (Energy) | | | 11,408,025 | |
| | 129,187 | | | Qualicorp SA (Commercial & Professional Services)* | | | 1,125,045 | |
| | 318,857 | | | Vale SA (Materials) | | | 7,126,044 | |
| | 239,230 | | | Vale SA ADR (Materials) | | | 5,310,906 | |
| | | | | | | | |
| | | | | | | 62,996,753 | |
| | |
| Chile – 1.3% | |
| | 37,900 | | | Compania Cervecerias Unidas SA ADR (Food, Beverage & Tobacco) | | | 2,714,398 | |
| | 129,157 | | | ENTEL Chile SA (Telecommunication Services) | | | 2,569,055 | |
| | | | | | | | |
| | | | | | | 5,283,453 | |
| | |
| China – 13.2% | |
| | 872,000 | | | China Automation Group Ltd. (Capital Goods) | | | 239,335 | |
| | 2,094,000 | | | China BlueChemical Ltd. Class H (Materials)* | | | 1,492,420 | |
| | 3,496,000 | | | China Citic Bank Corp. Ltd. Class H (Banks) | | | 2,215,140 | |
| | 10,092,420 | | | China Construction Bank Corp. Class H (Banks) | | | 7,832,164 | |
| | 1,958,000 | | | China Life Insurance Co. Ltd. Class H (Insurance)* | | | 5,213,265 | |
| | |
| | | | | | | | |
Shares | | | Description | | Value | |
| | | | | | | | |
| | Common Stocks – (continued) | |
| China – (continued) | |
| | 658,000 | | | China Petroleum & Chemical Corp. Class H (Energy) | | $ | 698,869 | |
| | 795,500 | | | China Shenhua Energy Co. Ltd. Class H (Energy)* | | | 3,512,969 | |
| | 2,032,000 | | | China Telecom Corp. Ltd. Class H (Telecommunication Services)* | | | 1,089,052 | |
| | 2,732,000 | | | CNOOC Ltd. (Energy) | | | 5,773,122 | |
| | 862,000 | | | Dongfang Electric Corp. Ltd. Class H (Capital Goods)* | | | 2,336,810 | |
| | 11,506,505 | | | Industrial & Commercial Bank of China Ltd. Class H (Banks) | | | 7,645,313 | |
| | 972,000 | | | Jiangxi Copper Co. Ltd. Class H (Materials) | | | 2,337,553 | |
| | 964,000 | | | Minth Group Ltd. (Automobiles & Components) | | | 1,217,587 | |
| | 3,462,000 | | | PetroChina Co. Ltd. Class H (Energy) | | | 5,164,256 | |
| | 142,000 | | | Tencent Holdings Ltd. (Software & Services) | | | 4,442,300 | |
| | 1,375,740 | | | Zoomlion Heavy Industry Science and Technology Co. Ltd. Class H (Capital Goods) | | | 2,041,078 | |
| | 893,960 | | | ZTE Corp. Class H (Technology Hardware & Equipment)* | | | 2,158,325 | |
| | | | | | | | |
| | | | | | | 55,409,558 | |
| | |
| Czech Republic – 0.8% | |
| | 81,849 | | | CEZ AS (Utilities) | | | 3,300,361 | |
| | |
| Egypt – 0.8% | |
| | 27,140 | | | Orascom Construction Industries GDR (Capital Goods) | | | 1,196,874 | |
| | 935,475 | | | Telecom Egypt Co. (Telecommunication Services) | | | 2,007,049 | |
| | | | | | | | |
| | | | | | | 3,203,923 | |
| | |
| Hong Kong – 5.6% | |
| | 1,796,000 | | | Belle International Holdings Ltd. (Retailing) | | | 3,504,422 | |
| | 931,000 | | | China Mengniu Dairy Co. Ltd. (Food, Beverage & Tobacco) | | | 2,866,174 | |
| | 685,000 | | | China Mobile Ltd. (Telecommunication Services) | | | 7,578,514 | |
| | 1,964,000 | | | China Overseas Land & Investment Ltd. (Real Estate) | | | 4,244,236 | |
| | 2,642,000 | | | China Resources Cement Holdings Ltd. (Materials) | | | 2,086,441 | |
| | 610,000 | | | China Unicom Hong Kong Ltd. (Telecommunication Services) | | | 1,066,876 | |
| | 1,184,000 | | | Digital China Holdings Ltd. (Technology Hardware & Equipment) | | | 2,236,309 | |
| | | | | | | | |
| | | | | | | 23,582,972 | |
| | |
| | |
| The accompanying notes are an integral part of these financial statements. | | 35 |
GOLDMAN SACHS EMERGING MARKETS EQUITY FUND
Schedule of Investments (continued)
April 30, 2012 (Unaudited)
| | | | | | | | |
Shares | | | Description | | Value | |
| | | | | | | | |
| | Common Stocks – (continued) | |
| India – 4.7% | |
| | 70,141 | | | CRISIL Ltd. (Diversified Financials) | | $ | 1,381,277 | |
| | 518,157 | | | Exide Industries Ltd. (Automobiles & Components) | | | 1,269,923 | |
| | 392,649 | | | HDFC Bank Ltd. (Banks) | | | 4,043,121 | |
| | 73,757 | | | Hero Motocorp Ltd. (Automobiles & Components) | | | 3,127,690 | |
| | 594,094 | | | IndusInd Bank Ltd. (Banks) | | | 3,738,721 | |
| | 39,650 | | | Oracle Financial Services Software Ltd. (Software & Services)* | | | 1,968,718 | |
| | 262,986 | | | Thermax Ltd. (Capital Goods) | | | 2,222,779 | |
| | 474,313 | | | Titan Industries Ltd. (Consumer Durables & Apparel) | | | 2,093,143 | |
| | | | | | | | |
| | | | | | | 19,845,372 | |
| | |
| Indonesia – 3.0% | |
| | 11,281,963 | | | PT Bank Negara Indonesia (Persero) Tbk (Banks) | | | 4,921,670 | |
| | 1,535,000 | | | PT Indomobil Sukses Internasional Tbk (Retailing)* | | | 2,955,530 | |
| | 19,816,000 | | | PT Media Nusantara Citra Tbk (Media) | | | 4,838,392 | |
| | | | | | | | |
| | | | | | | 12,715,592 | |
| | |
| Malaysia – 3.6% | |
| | 1,857,000 | | | CIMB Group Holdings Berhad (Banks) | | | 4,537,963 | |
| | 1,038,000 | | | Genting Berhad (Consumer Services) | | | 3,538,079 | |
| | 792,800 | | | Sime Darby Berhad (Capital Goods) | | | 2,547,767 | |
| | 2,164,600 | | | Tenaga Nasional Berhad (Utilities) | | | 4,595,761 | |
| | | | | | | | |
| | | | | | | 15,219,570 | |
| | |
| Mexico – 4.2% | |
| | 241,400 | | | America Movil SAB de CV Series L ADR (Telecommunication Services)(a) | | | 6,433,310 | |
| | 1,334,786 | | | Corp. Moctezuma SAB de CV (Materials) | | | 3,125,374 | |
| | 486,100 | | | Grupo Financiero Banorte SAB de CV Class O (Banks) | | | 2,355,127 | |
| | 529,800 | | | Mexichem SAB de CV (Materials) | | | 1,970,184 | |
| | 1,331,514 | | | Wal-Mart de Mexico SAB de CV Series V (Food & Staples Retailing) | | | 3,807,699 | |
| | | | | | | | |
| | | | | | | 17,691,694 | |
| | |
| Netherlands – 0.1% | |
| | 83,192 | | | Nord Gold NV GDR (Materials)* | | | 524,110 | |
| | |
| Philippines – 0.5% | |
| | 7,834,200 | | | Petron Corp. (Energy) | | | 1,980,343 | |
| | |
| | | | | | | | |
Shares | | | Description | | Value | |
| | | | | | | | |
| | Common Stocks – (continued) | |
| Russia – 7.9% | |
| | 272,205 | | | DIXY Group OJSC (Food & Staples Retailing)* | | $ | 3,464,609 | |
| | 172,800 | | | Eurasia Drilling Co. Ltd. GDR (Energy) | | | 4,940,118 | |
| | 212,801 | | | Globaltrans Investment PLC GDR (Transportation) | | | 4,168,042 | |
| | 94,746 | | | OAO Lukoil ADR (Energy) | | | 5,828,890 | |
| | 103,650 | | | OJSC Magnit GDR (Food & Staples Retailing) | | | 3,037,366 | |
| | 897,879 | | | Rosneft Oil Co. OJSC GDR (Energy)* | | | 6,429,274 | |
| | 415,680 | | | Sberbank of Russia ADR (Banks) | | | 5,384,025 | |
| | | | | | | | |
| | | | | | | 33,252,324 | |
| | |
| South Africa – 6.0% | |
| | 302,214 | | | ABSA Group Ltd. (Banks) | | | 6,228,231 | |
| | 165,240 | | | AngloGold Ashanti Ltd. (Materials) | | | 5,665,890 | |
| | 171,300 | | | Barloworld Ltd. (Capital Goods) | | | 2,160,419 | |
| | 328,218 | | | JSE Ltd. (Diversified Financials) | | | 3,475,829 | |
| | 136,330 | | | Mr. Price Group Ltd. (Retailing) | | | 1,846,326 | |
| | 314,600 | | | MTN Group Ltd. (Telecommunication Services) | | | 5,501,678 | |
| | | | | | | | |
| | | | | | | 24,878,373 | |
| | |
| South Korea – 14.1% | |
| | 189,900 | | | Cheil Worldwide, Inc. (Media) | | | 3,295,156 | |
| | 9,291 | | | CJ CheilJedang Corp. (Food, Beverage & Tobacco) | | | 3,069,435 | |
| | 205,760 | | | Doosan Infracore Co. Ltd. (Capital Goods)* | | | 3,816,747 | |
| | 16,664 | | | Green Cross Corp. (Pharmaceuticals, Biotechnology & Life Sciences) | | | 1,969,365 | |
| | 25,090 | | | Hankook Tire Co. Ltd. (Automobiles & Components) | | | 1,058,439 | |
| | 5,954 | | | Hyundai Heavy Industries Co. Ltd. (Capital Goods) | | | 1,479,570 | |
| | 7,858 | | | Hyundai Mobis (Automobiles & Components) | | | 2,124,543 | |
| | 122,630 | | | KB Financial Group, Inc. (Banks) | | | 4,148,950 | |
| | 85,880 | | | Kia Motors Corp. (Automobiles & Components) | | | 6,301,788 | |
| | 6,953 | | | LG Chem Ltd. (Materials) | | | 1,737,990 | |
| | 3,371 | | | POSCO (Materials) | | | 1,116,740 | |
| | 6,351 | | | POSCO Chemtech Co. Ltd. (Materials) | | | 709,324 | |
| | 40,720 | | | Samsung C&T Corp. (Capital Goods) | | | 2,754,694 | |
| | 10,853 | | | Samsung Electronics Co. Ltd. (Semiconductors & Semiconductor Equipment) | | | 13,283,652 | |
| | 7,765 | | | Samsung Electronics Co. Ltd. Preference Shares (Semiconductors & Semiconductor Equipment) | | | 5,533,835 | |
| | 33,480 | | | Samsung Securities Co. Ltd. (Diversified Financials)* | | | 1,472,207 | |
| | 53,330 | | | SK Hynix, Inc. (Semiconductors & Semiconductor Equipment)* | | | 1,314,447 | |
| | 2,800 | | | S-Oil Corp. (Energy) | | | 240,048 | |
| | |
| | |
| 36 | | The accompanying notes are an integral part of these financial statements. |
GOLDMAN SACHS EMERGING MARKETS EQUITY FUND
| | | | | | | | |
Shares | | | Description | | Value | |
| | | | | | | | |
| | Common Stocks – (continued) | |
| South Korea – (continued) | |
| | 69,215 | | | TK Corp. (Capital Goods)* | | $ | 1,864,344 | |
| | 172,060 | | | Woori Finance Holdings Co. Ltd. (Banks) | | | 1,800,174 | |
| | | | | | | | |
| | | | | | | 59,091,448 | |
| | |
| Taiwan – 10.8% | |
| | 2,310,640 | | | Advanced Semiconductor Engineering, Inc. (Semiconductors & Semiconductor Equipment) | | | 2,323,567 | |
| | 242,460 | | | Asustek Computer, Inc. (Technology Hardware & Equipment) | | | 2,435,648 | |
| | 1,001,360 | | | Cathay Financial Holding Co. Ltd. (Insurance) | | | 1,052,719 | |
| | 3,856,762 | | | Chinatrust Financial Holding Co. Ltd. (Banks) | | | 2,444,732 | |
| | 1,537,000 | | | Chipbond Technology Corp. (Semiconductors & Semiconductor Equipment) | | | 2,065,460 | |
| | 786,000 | | | Epistar Corp. (Semiconductors & Semiconductor Equipment) | | | 1,896,673 | |
| | 1,376,694 | | | Far Eastern New Century Corp. (Capital Goods) | | | 1,545,618 | |
| | 1,052,000 | | | Formosa Plastics Corp. (Materials) | | | 2,975,478 | |
| | 1,667,326 | | | Hon Hai Precision Industry Co. Ltd. (Technology Hardware & Equipment) | | | 5,242,367 | |
| | 647,160 | | | Nan Ya Printed Circuit Board Corp. (Technology Hardware & Equipment) | | | 1,205,133 | |
| | 195,000 | | | PChome Online, Inc. (Software & Services) | | | 1,100,814 | |
| | 245,000 | | | President Chain Store Corp. (Food & Staples Retailing) | | | 1,309,421 | |
| | 338,059 | | | Radiant Opto-Electronics Corp. (Semiconductors & Semiconductor Equipment) | | | 1,410,347 | |
| | 524,000 | | | Taiwan Fertilizer Co. Ltd. (Materials) | | | 1,246,835 | |
| | 3,913,883 | | | Taiwan Semiconductor Manufacturing Co. Ltd. (Semiconductors & Semiconductor Equipment) | | | 11,568,016 | |
| | 559,876 | | | Tripod Technology Corp. (Technology Hardware & Equipment) | | | 1,637,422 | |
| | 1,114,000 | | | Wistron Corp. (Technology Hardware & Equipment) | | | 1,661,915 | |
| | 4,015,173 | | | Yuanta Financial Holding Co. Ltd. (Diversified Financials)* | | | 1,912,651 | |
| | | | | | | | |
| | | | | | | 45,034,816 | |
| | |
| Thailand – 1.8% | |
| | 329,500 | | | Bangkok Bank PCL NVDR (Banks) | | | 2,040,771 | |
| | 482,500 | | | PTT Global Chemical PCL (Materials) | | | 1,078,119 | |
| | |
| | | | | | | | |
Shares | | | Description | | Value | |
| | Common Stocks – (continued) | |
| Thailand – (continued) | |
| | 201,900 | | | PTT PCL (Energy) | | $ | 2,302,597 | |
| | 1,132,800 | | | Shin Corp. PCL NVDR (Telecommunication Services) | | | 2,101,943 | |
| | | | | | | | |
| | | | | | | 7,523,430 | |
| | |
| Turkey – 2.1% | |
| | 243,360 | | | Bizim Toptan Satis Magazalari AS (Food & Staples Retailing) | | | 3,575,552 | |
| | 431,769 | | | TAV Havalimanlari Holding AS (Transportation)* | | | 2,273,892 | |
| | 821,710 | | | Turkiye Garanti Bankasi AS (Banks)* | | | 3,025,160 | |
| | | | | | | | |
| | | | | | | 8,874,604 | |
| | |
| United Kingdom – 0.5% | |
| | 115,663 | | | Antofagasta PLC (Materials) | | | 2,227,309 | |
| | |
| United States – 0.8% | |
| | 42,426 | | | Cognizant Technology Solutions Corp. Class A (Software & Services)* | | | 3,110,674 | |
| | |
| | TOTAL COMMON STOCKS | | | | |
| | (Cost $363,447,833) | | $ | 407,333,832 | |
| | |
| | | | | | | | |
| | Exchange Traded Fund – 0.1% | |
| Mexico – 0.1% | |
| | 2,931 | | | iShares MSCI Mexico Investable Market Index Fund | | $ | 181,194 | |
| | (Cost $180,910) | | | | |
| | |
| | | | | | | | | | | | |
Notional
Shares | | | Description | | Maturity
Date | | | Value | |
| | | | | | | | | | | | |
| | Participation Note – 0.1% | |
| India – 0.1% | |
| | 195,950 | | | Exide Industries Ltd.
(Issuer UBS AG)
(Automobiles &
Components) | | | 03/13 | | | $ | 480,243 | |
| | (Cost $468,967) | | | | | |
| | |
| | | | | | | | | | | | |
| | |
| The accompanying notes are an integral part of these financial statements. | | 37 |
GOLDMAN SACHS EMERGING MARKETS EQUITY FUND
Schedule of Investments (continued)
April 30, 2012 (Unaudited)
| | | | | | | | | | | | |
| Units | | | Description | | Expiration
Month | | | Value | |
| | Right* – 0.0% | |
| Brazil – 0.0% | |
| | 283 | | | Companhia de Bebidas
das Americas (Food,
Beverage & Tobacco) | | | 06/12 | | | $ | 2,379 | |
| | (Cost $0) | | | | | |
| | |
| | TOTAL INVESTMENTS – 97.4% | | | | | |
| | (Cost $364,097,710) | | | $ | 407,997,648 | |
| | |
| OTHER ASSETS IN EXCESS OF
LIABILITIES – 2.6% |
| | | 11,026,046 | |
| | |
| | NET ASSETS – 100.0% | | | $ | 419,023,694 | |
| | |
| | |
| The percentage shown for each investment category reflects the value of investments in that category as a percentage of net assets. |
* | | Non-income producing security. |
(a) | | All or a portion of security is segregated as collateral for initial margin requirements on futures transactions. |
| | |
|
Investment Abbreviations: |
ADR | | —American Depositary Receipt |
GDR | | —Global Depositary Receipt |
NVDR | | —Non-Voting Depositary Receipt |
|
|
| ADDITIONAL INVESTMENT INFORMATION |
FUTURES CONTRACTS — At April 30, 2012, the Fund had the following futures contracts:
| | | | | | | | | | | | | | |
| Type | | Number of
Contracts
Long (Short) | | | Expiration
Date | | Current
Value | | | Unrealized
Gain (Loss) | |
SGX S&P CNX Nifty Index | | | 472 | | | May 2012 | | $ | 4,971,576 | | | $ | 39,986 | |
| | |
| 38 | | The accompanying notes are an integral part of these financial statements. |
GOLDMAN SACHS N-11 EQUITY FUND
Schedule of Investments
April 30, 2012 (Unaudited)
| | | | | | | | |
Shares | | | Description | | Value | |
| | | | | | | |
| Common Stocks – 98.6% | |
| Bangladesh – 1.9% | |
| | 173,600 | | | GrameenPhone Ltd. (Telecommunication Services) | | $ | 455,230 | |
| | 2,227,938 | | | Islami Bank Bangladesh Ltd. (Banks) | | | 1,246,284 | |
| | 453,500 | | | Power Grid Co. of Bangladesh Ltd. (Utilities) | | | 381,079 | |
| | | | | | | | |
| | | | | | | 2,082,593 | |
| | |
| Egypt – 4.3% | |
| | 243,611 | | | Commercial International Bank Egypt SAE (Banks) | | | 1,028,996 | |
| | 85,998 | | | Commercial International Bank Egypt SAE GDR (Banks) | | | 350,012 | |
| | 22,022 | | | Orascom Construction Industries (Capital Goods) | | | 967,737 | |
| | 11,091 | | | Orascom Construction Industries GDR (Capital Goods) | | | 489,113 | |
| | 1,010,239 | | | Talaat Moustafa Group (Real Estate)* | | | 706,291 | |
| | 494,632 | | | Telecom Egypt Co. (Telecommunication Services) | | | 1,061,226 | |
| | | | | | | | |
| | | | | | | 4,603,375 | |
| | |
| Indonesia – 15.5% | |
| | 4,620,500 | | | PT Adaro Energy Tbk (Energy) | | | 931,045 | |
| | 336,500 | | | PT Astra International Tbk (Automobiles & Components) | | | 2,591,309 | |
| | 2,842,500 | | | PT Bank Central Asia Tbk (Banks) | | | 2,468,432 | |
| | 2,477,500 | | | PT Bank Mandiri (Persero) Tbk (Banks) | | | 1,986,832 | |
| | 2,291,000 | | | PT Bank Negara Indonesia (Persero) Tbk (Banks) | | | 999,431 | |
| | 363,000 | | | PT Gudang Garam Tbk (Food, Beverage & Tobacco) | | | 2,331,249 | |
| | 489,500 | | | PT Indocement Tunggal Prakarsa Tbk (Materials) | | | 958,503 | |
| | 1,816,500 | | | PT Indofood Sukses Makmur Tbk (Food, Beverage & Tobacco) | | | 954,530 | |
| | 781,000 | | | PT Semen Gresik (Persero) Tbk (Materials) | | | 1,029,336 | |
| | 348,000 | | | PT Tambang Batubara Bukit Asam (Persero) Tbk (Energy) | | | 696,576 | |
| | 1,993,500 | | | PT Telekomunikasi Indonesia (Persero) Tbk (Telecommunication Services) | | | 1,838,141 | |
| | | | | | | | |
| | | | | | | 16,785,384 | |
| | |
| Mexico – 22.8% | |
| | 388,948 | | | America Movil SAB de CV Series L ADR (Telecommunication Services) | | | 10,365,464 | |
| | 73,701 | | | Cemex SAB de CV ADR (Materials)* | | | 532,858 | |
| | 15,100 | | | Fomento Economico Mexicano SAB de CV ADR (Food, Beverage & Tobacco) | | | 1,227,026 | |
| | 638,215 | | | Grupo Financiero Banorte SAB de CV Class O (Banks) | | | 3,092,116 | |
| | |
| | | | | | | | |
Shares | | | Description | | Value | |
| | | | | | | |
| Common Stocks – (continued) | |
| Mexico – (continued) | |
| | 499,497 | | | Grupo Mexico SAB de CV Series B (Materials) | | $ | 1,541,138 | |
| | 74,518 | | | Grupo Televisa SAB ADR (Media) | | | 1,637,161 | |
| | 527,700 | | | Mexichem SAB de CV (Materials) | | | 1,962,374 | |
| | 594,676 | | | Urbi Desarrollos Urbanos SAB de CV (Consumer Durables & Apparel)* | | | 626,362 | |
| | 1,318,285 | | | Wal-Mart de Mexico SAB de CV Series V (Food & Staples Retailing) | | | 3,769,868 | |
| | | | | | | | |
| | | | | | | 24,754,367 | |
| | |
| Nigeria – 7.3% | |
| | 16,614,410 | | | Guaranty Trust Bank PLC (Banks) | | | 1,687,193 | |
| | 492,107 | | | Nestle Nigeria PLC (Food, Beverage & Tobacco) | | | 1,310,409 | |
| | 4,435,928 | | | Nigerian Breweries PLC (Food, Beverage & Tobacco) | | | 3,103,881 | |
| | 20,431,234 | | | Zenith Bank PLC (Banks) | | | 1,838,616 | |
| | | | | | | | |
| | | | | | | 7,940,099 | |
| | |
| Pakistan – 2.7% | |
| | 592,108 | | | Engro Corp. Ltd. (Materials) | | | 626,711 | |
| | 202,873 | | | Engro Foods Ltd. (Food, Beverage & Tobacco)* | | | 128,890 | |
| | 333,228 | | | MCB Bank Ltd. (Banks) | | | 629,045 | |
| | 463,334 | | | Pakistan Petroleum Ltd. (Energy) | | | 966,574 | |
| | 210,399 | | | Pakistan State Oil Co. Ltd. (Energy) | | | 573,468 | |
| | | | | | | | |
| | | | | | | 2,924,688 | |
| | |
| Philippines – 5.6% | |
| | 5,597,700 | | | Alliance Global Group, Inc. (Capital Goods) | | | 1,631,233 | |
| | 1,167,410 | | | Metropolitan Bank & Trust (Banks) | | | 2,516,655 | |
| | 7,756,000 | | | Petron Corp. (Energy) | | | 1,960,575 | |
| | | | | | | | |
| | | | | | | 6,108,463 | |
| | |
| South Africa – 0.3% | |
| | 15,500 | | | MTN Group Ltd. (Telecommunication Services) | | | 271,062 | |
| | |
| South Korea – 21.6% | |
| | 75,000 | | | Cheil Worldwide, Inc. (Media) | | | 1,301,404 | |
| | 3,652 | | | CJ CheilJedang Corp. (Food, Beverage & Tobacco) | | | 1,206,498 | |
| | 81,900 | | | Doosan Infracore Co. Ltd. (Capital Goods)* | | | 1,519,205 | |
| | 3,483 | | | Green Cross Corp. (Pharmaceuticals, Biotechnology & Life Sciences) | | | 411,624 | |
| | 2,254 | | | Hyundai Heavy Industries Co. Ltd. (Capital Goods) | | | 560,119 | |
| | 1,704 | | | Hyundai Mobis (Automobiles & Components) | | | 460,705 | |
| | 65,510 | | | KB Financial Group, Inc. (Banks) | | | 2,216,405 | |
| | 45,750 | | | Kia Motors Corp. (Automobiles & Components) | | | 3,357,089 | |
| | 2,266 | | | LG Chem Ltd. (Materials) | | | 566,415 | |
| | |
| | |
| The accompanying notes are an integral part of these financial statements. | | 39 |
GOLDMAN SACHS N-11 EQUITY FUND
Schedule of Investments (continued)
April 30, 2012 (Unaudited)
| | | | | | | | |
Shares | | | Description | | Value | |
| | | | | | | |
| Common Stocks – (continued) | |
| South Korea – (continued) | |
| | 13,960 | | | Nexen Tire Corp. (Automobiles & Components) | | $ | 233,219 | |
| | 1,463 | | | POSCO (Materials) | | | 484,660 | |
| | 2,620 | | | POSCO Chemtech Co. Ltd. (Materials) | | | 292,620 | |
| | 15,980 | | | Samsung C&T Corp. (Capital Goods) | | | 1,081,042 | |
| | 5,545 | | | Samsung Electronics Co. Ltd. (Semiconductors & Semiconductor Equipment) | | | 6,786,866 | |
| | 13,570 | | | Samsung Securities Co. Ltd. (Diversified Financials)* | | | 596,710 | |
| | 30,900 | | | SK Hynix, Inc. (Semiconductors & Semiconductor Equipment)* | | | 761,606 | |
| | 2,110 | | | S-Oil Corp. (Energy) | | | 180,893 | |
| | 32,490 | | | Sung Kwang Bend Co. Ltd. (Capital Goods) | | | 662,718 | |
| | 69,580 | | | Woori Finance Holdings Co. Ltd. (Banks) | | | 727,979 | |
| | | | | | | | |
| | | | | | | 23,407,777 | |
| | |
| Turkey – 13.7% | |
| | 176,544 | | | Akbank TAS (Banks) | | | 656,279 | |
| | 248,479 | | | Arcelik AS (Consumer Durables & Apparel) | | | 1,090,342 | |
| | 84,764 | | | Bizim Toptan Satis Magazalari AS (Food & Staples Retailing) | | | 1,245,390 | |
| | 79,284 | | | Koza Altin Isletmeleri AS (Materials) | | | 1,718,034 | |
| | 366,159 | | | TAV Havalimanlari Holding AS (Transportation)* | | | 1,928,360 | |
| | 66,014 | | | Tupras-Turkiye Petrol Rafinerileri AS (Energy) | | | 1,382,294 | |
| | 311,796 | | | Turk Telekomunikasyon AS (Telecommunication Services) | | | 1,366,066 | |
| | 961,467 | | | Turkiye Garanti Bankasi AS (Banks)* | | | 3,539,681 | |
| | 274,933 | | | Turkiye Halk Bankasi AS (Banks) | | | 1,927,273 | |
| | | | | | | | |
| | | | | | | 14,853,719 | |
| | |
| Vietnam – 2.9% | |
| | 772,430 | | | Bank for Foreign Trade of Vietnam JSC (Banks) | | | 1,221,672 | |
| | 240,950 | | | Bao Viet Holdings (Insurance) | | | 800,028 | |
| | 99,390 | | | Masan Group Corp. (Food, Beverage & Tobacco)* | | | 524,002 | |
| | 329,590 | | | PetroVietnam Drilling and Well Services JSC (Energy)* | | | 642,910 | |
| | | | | | | | |
| | | | | | | 3,188,612 | |
| | |
| | TOTAL COMMON STOCKS | |
| | (Cost $101,557,790) | | $ | 106,920,139 | |
| | |
| | | | | | | | | | | | |
Notional
Shares | | | Description | | Maturity
Date | | | Value | |
| | | | | | | | | | | | |
| | Participation Notes – 0.2% | |
| Bangladesh – 0.2% | |
| | 417,825 | | | Islami Bank
Bangladesh Ltd.
(Issuer Deutsche
Bank AG) (Banks) | | | 02/21 | | | $ | 209,012 | |
| | 42,500 | | | Power Grid Co. of
Bangladesh Ltd.
(Issuer Deutsche
Bank AG)
(Utilities)(a) | | | 02/21 | | | | 35,713 | |
| | |
| | TOTAL PARTICIPATION NOTES | |
| | (Cost $257,819) | | | $ | 244,725 | |
| | |
| | TOTAL INVESTMENTS – 98.8% | |
| | (Cost $101,815,609) | | | $ | 107,164,864 | |
| | |
| OTHER ASSETS IN EXCESS OF
LIABILITIES – 1.2% |
| | | 1,296,802 | |
| | |
| | NET ASSETS – 100.0% | | | $ | 108,461,666 | |
| | |
| | |
| The percentage shown for each investment category reflects the value of investments in that category as a percentage of net assets. |
* | | Non-income producing security. |
(a) | | Exempt from registration under Rule 144A of the Securities Act of 1933. Under procedures approved by the Board of Trustees, such securities have been determined to be liquid by the investment adviser and may be resold, normally to qualified institutional buyers in transactions exempt from registration. Total market value of Rule 144A securities amounts to $35,713, which represents approximately 0.0% of net assets as of April 30, 2012. |
| | |
|
Investment Abbreviations: |
ADR | | —American Depositary Receipt |
GDR | | —Global Depositary Receipt |
|
| | |
| 40 | | The accompanying notes are an integral part of these financial statements. |
GOLDMAN SACHS N-11 EQUITY FUND
|
| ADDITIONAL INVESTMENT INFORMATION |
FUTURES CONTRACTS — At April 30, 2012, the Fund had the following futures contracts:
| | | | | | | | | | | | | | |
| Type | | Number of
Contracts
Long (Short) | | | Expiration
Date | | Current
Value | | | Unrealized
Gain (Loss) | |
MEX BOLSA Index | | | 7 | | | June 2012 | | $ | 212,435 | | | $ | 3,209 | |
| | |
| The accompanying notes are an integral part of these financial statements. | | 41 |
GOLDMAN SACHS FUNDAMENTAL EMERGING MARKETS EQUITY FUNDS
Statements of Assets and Liabilities
April 30, 2012 (Unaudited)
| | | | | | | | | | | | | | | | | | |
| | | | | Asia
Equity Fund | | | BRIC
Fund | | | Emerging Markets
Equity Fund | | | N-11
Equity Fund | |
| | Assets: | | | | | | | | | | | | | | | | |
| | Investments, at value (cost $60,555,624, $444,061,735, $364,097,710 and $101,815,609) | | $ | 68,391,188 | | | $ | 464,578,710 | | | $ | 407,997,648 | | | $ | 107,164,864 | |
| | Cash(a) | | | 964,099 | | | | — | | | | 9,388,871 | | | | 802,500 | |
| | Foreign currencies, at value (cost $57,378, $72,430, $1,324,855 and $566,472) | | | 53,334 | | | | 72,986 | | | | 1,328,270 | | | | 566,405 | |
| | Receivables: | | | | | | | | | | | | | | | | |
| | Investments sold | | | 568,841 | | | | 18,028,148 | | | | 4,443,493 | | | | 422,557 | |
| | Dividends | | | 100,795 | | | | 1,476,943 | | | | 627,347 | | | | 219,691 | |
| | Reimbursement from investment adviser | | | 34,937 | | | | — | | | | — | | | | 57,204 | |
| | Futures variation margin(b) | | | 4,366 | | | | 403,449 | | | | 55,696 | | | | 14,433 | |
| | Fund shares sold | | | 3,981 | | | | 325,090 | | | | 701,929 | | | | 554,936 | |
| | Foreign tax reclaims | | | — | | | | — | | | | 30,768 | | | | — | |
| | Due from custodian | | | — | | | | 107,856 | | | | 725,125 | | | | 262,703 | |
| | Other assets | | | 11,556 | | | | 2,891 | | | | 13,391 | | | | 967 | |
| | Total assets | | | 70,133,097 | | | | 484,996,073 | | | | 425,312,538 | | | | 110,066,260 | |
| | | | | | | | | | | | | | | | | | |
| | Liabilities: | | | | | | | | | | | | | | | | |
| | Due to custodian | | | — | | | | 9,123,130 | | | | — | | | | — | |
| | Payables: | | | | | | | | | | | | | | | | |
| | Investments purchased | | | 609,775 | | | | 3,452,989 | | | | 4,458,731 | | | | 1,136,704 | |
| | Fund shares redeemed | | | 333,525 | | | | 4,412,343 | | | | 665,651 | | | | 119,458 | |
| | Amounts owed to affiliates | | | 75,128 | | | | 642,133 | | | | 478,667 | | | | 117,868 | |
| | Foreign capital gains taxes | | | 47,010 | | | | — | | | | 211,763 | | | | 33,137 | |
| | Accrued expenses | | | 186,126 | | | | 491,670 | | | | 474,032 | | | | 197,427 | |
| | Total liabilities | | | 1,251,564 | | | | 18,122,265 | | | | 6,288,844 | | | | 1,604,594 | |
| | | | | | | | | | | | | | | | | | |
| | Net Assets: | | | | | | | | | | | | | | | | |
| | Paid-in capital | | | 85,764,322 | | | | 678,955,548 | | | | 867,606,281 | | | | 108,054,565 | |
| | Undistributed net investment income (loss) | | | (173,314 | ) | | | (897,361 | ) | | | (59,569 | ) | | | 427,594 | |
| | Accumulated net realized loss | | | (24,496,594 | ) | | | (231,698,690 | ) | | | (492,057,170 | ) | | | (5,356,325 | ) |
| | Net unrealized gain | | | 7,787,119 | | | | 20,514,311 | | | | 43,534,152 | | | | 5,335,832 | |
| | | NET ASSETS | | $ | 68,881,533 | | | $ | 466,873,808 | | | $ | 419,023,694 | | | $ | 108,461,666 | |
| | | Net Assets: | | | | | | | | | | | | | | | | |
| | | Class A | | $ | 37,311,111 | | | $ | 175,513,940 | | | $ | 47,294,787 | | | $ | 22,678,847 | |
| | | Class B | | | 1,054,931 | | | | — | | | | 6,056,820 | | | | — | |
| | | Class C | | | 2,938,503 | | | | 98,062,629 | | | | 18,131,801 | | | | 5,505,521 | |
| | | Institutional | | | 27,576,988 | | | | 190,382,924 | | | | 330,657,060 | | | | 76,391,301 | |
| | | Service | | | — | | | | — | | | | 16,583,238 | | | | — | |
| | | Class IR | | | — | | | | 2,914,315 | | | | 299,988 | | | | 3,885,997 | |
| | | Total Net Assets | | $ | 68,881,533 | | | $ | 466,873,808 | | | $ | 419,023,694 | | | $ | 108,461,666 | |
| | | Shares outstanding $0.001 par value (unlimited shares authorized): | | | | | | | | | | | | | | | | |
| | | Class A | | | 2,066,674 | | | | 13,516,931 | | | | 3,139,106 | | | | 2,258,073 | |
| | | Class B | | | 61,118 | | | | — | | | | 441,080 | | | | — | |
| | | Class C | | | 171,971 | | | | 7,895,505 | | | | 1,310,806 | | | | 553,094 | |
| | | Institutional | | | 1,454,882 | | | | 14,355,174 | | | | 20,616,236 | | | | 7,571,308 | |
| | | Service | | | — | | | | — | | | | 1,133,388 | | | | — | |
| | | Class IR | | | — | | | | 218,440 | | | | 18,775 | | | | 385,700 | |
| | | Net asset value, offering and redemption price per share:(c) | | | | | | | | | | | | | | | | |
| | | Class A | | | $18.05 | | | | $12.98 | | | | $15.07 | | | | $10.04 | |
| | | Class B | | | 17.26 | | | | — | | | | 13.73 | | | | — | |
| | | Class C | | | 17.09 | | | | 12.42 | | | | 13.83 | | | | 9.95 | |
| | | Institutional | | | 18.95 | | | | 13.26 | | | | 16.04 | | | | 10.09 | |
| | | Service | | | — | | | | — | | | | 14.63 | | | | — | |
| | | Class IR | | | — | | | | 13.34 | | | | 15.98 | | | | 10.08 | |
| | (a) | | Includes restricted cash relating to collateral on futures transactions of $124,000 for the Asia Equity Fund. |
| | (b) | | Includes cash on deposit with counterparty relating to initial margin requirements on future transactions of $339,375 and $13,159 for the BRIC and N-11 Equity Funds, respectively. |
| | (c) | | Maximum public offering price per share for Class A Shares of the Asia Equity, BRIC, Emerging Markets Equity and N-11 Equity Funds is $19.10, $13.74, $15.95 and $10.62, respectively. At redemption, Class B and Class C Shares may be subject to a contingent deferred sales charge assessed on the amount equal to the lesser of the current NAV or the original purchase price of the shares. |
| | |
| 42 | | The accompanying notes are an integral part of these financial statements. |
GOLDMAN SACHS FUNDAMENTAL EMERGING MARKETS EQUITY FUNDS
Statements of Operations
For the Six Months Ended April 30, 2012 (Unaudited)
| | | | | | | | | | | | | | | | | | |
| | | | | Asia
Equity Fund | | | BRIC
Fund | | | Emerging Markets
Equity Fund | | | N-11
Equity Fund | |
| | Investment income: | | | | | | | | | | | | | | | | |
| | Dividends (net of foreign taxes withheld of $30,253, $31,672, $130,098 and $115,928) | | $ | 343,069 | | | $ | 3,735,484 | | | $ | 3,206,520 | | | $ | 1,051,458 | |
| | | | | | | | | | | | | | | | | | |
| | Expenses: | | | | | | | | | | | | | | | | |
| | Management fees | | | 345,833 | | | | 3,279,758 | | | | 2,486,396 | | | | 524,775 | |
| | Custody and accounting fees | | | 152,351 | | | | 357,128 | | | | 457,066 | | | | 140,625 | |
| | Distribution and Service fees(a) | | | 68,518 | | | | 770,315 | | | | 180,521 | | | | 45,258 | |
| | Transfer Agent fees(a) | | | 45,658 | | | | 330,541 | | | | 137,008 | | | | 35,657 | |
| | Professional fees | | | 41,352 | | | | 47,270 | | | | 51,924 | | | | 51,367 | |
| | Registration fees | | | 31,676 | | | | 45,056 | | | | 42,588 | | | | 41,945 | |
| | Printing and mailing costs | | | 20,656 | | | | 106,510 | | | | 74,780 | | | | 13,838 | |
| | Trustee fees | | | 6,787 | | | | 8,982 | | | | 8,493 | | | | 6,806 | |
| | Offering costs | | | — | | | | — | | | | — | | | | 75,385 | |
| | Service share fees — Service Plan | | | — | | | | — | | | | 18,329 | | | | — | |
| | Service share fees — Shareholder Administration Plan | | | — | | | | — | | | | 18,329 | | | | — | |
| | Other | | | 36,153 | | | | 44,426 | | | | 42,172 | | | | 2,138 | |
| | Total expenses | | | 748,984 | | | | 4,989,986 | | | | 3,517,606 | | | | 937,794 | |
| | Less — expense reductions | | | (233,061 | ) | | | (357,141 | ) | | | (251,697 | ) | | | (311,410 | ) |
| | Net expenses | | | 515,923 | | | | 4,632,845 | | | | 3,265,909 | | | | 626,384 | |
| | NET INVESTMENT INCOME (LOSS) | | | (172,854 | ) | | | (897,361 | ) | | | (59,389 | ) | | | 425,074 | |
| | | | | | | | | | | | | | | | | | |
| | Realized and unrealized gain (loss): | | | | | | | | | | | | | | | | |
| | Net realized gain (loss) from: | | | | | | | | | | | | | | | | |
| | Investments | | | (1,453,500 | ) | | | (17,965,846 | ) | | | (2,051,774 | ) | | | (3,197,212 | ) |
| | Futures contracts | | | 77,553 | | | | (207,623 | ) | | | 269,027 | | | | 18,847 | |
| | Foreign currency transactions | | | (18,710 | ) | | | (266,811 | ) | | | (245,196 | ) | | | 20,292 | |
| | Net change in unrealized gain (loss) on: | | | | | | | | | | | | | | | | |
| | Investments (including the effects of the net change in the foreign capital gains tax liability of $64,298, $0, $234,048 and $2,922) | | | 5,004,473 | | | | 9,567,524 | | | | 12,049,134 | | | | 7,963,064 | |
| | Futures contracts | | | (16,265 | ) | | | 31,693 | | | | (114,414 | ) | | | 7,516 | |
| | Foreign currency translation | | | 16,532 | | | | (56,464 | ) | | | (860 | ) | | | (7,124 | ) |
| | Net realized and unrealized gain (loss) | | | 3,610,083 | | | | (8,897,527 | ) | | | 9,905,917 | | | | 4,805,383 | |
| | NET INCREASE (DECREASE) IN NET ASSETS RESULTING FROM OPERATIONS | | $ | 3,437,229 | | | $ | (9,794,888 | ) | | $ | 9,846,528 | | | $ | 5,230,457 | |
| | (a) | | Class specific Distribution and Service, and Transfer Agent fees were as follows: |
| | | | | | | | | | | | | | | | | | | | | | | | | | | | | | | | | | | | |
| | | Distribution and Service Fees | | | Transfer Agent Fees | |
Fund | | Class A | | | Class B | | | Class C | | | Class A | | | Class B | | | Class C | | | Institutional | | | Service | | | Class IR | |
Asia Equity | | $ | 47,880 | | | $ | 5,381 | | | $ | 15,257 | | | $ | 36,389 | | | $ | 1,023 | | | $ | 2,899 | | | $ | 5,347 | | | $ | — | | | $ | — | |
BRIC | | | 249,539 | | | | — | | | | 520,776 | | | | 189,651 | | | | — | | | | 98,948 | | | | 39,683 | | | | — | | | | 2,259 | |
Emerging Markets Equity | | | 59,720 | | | | 31,610 | | | | 89,191 | | | | 45,388 | | | | 6,006 | | | | 16,946 | | | | 65,513 | | | | 2,933 | | | | 222 | |
N-11 Equity | | | 23,271 | | | | — | | | | 21,987 | | | | 17,687 | | | | — | | | | 4,178 | | | | 10,944 | | | | — | | | | 2,848 | |
| | |
| The accompanying notes are an integral part of these financial statements. | | 43 |
GOLDMAN SACHS FUNDAMENTAL EMERGING MARKETS EQUITY FUNDS
Statements of Changes in Net Assets
| | | | | | | | | | |
| | | | | Asia Equity Fund | |
| | | | | For the
Six Months Ended
April 30, 2012
(Unaudited) | | | For the Fiscal
Year Ended
October 31, 2011 | |
| | From operations: | |
| | Net investment income (loss) | | $ | (172,854 | ) | | $ | 590,647 | |
| | Net realized gain (loss) | | | (1,394,657 | ) | | | 7,814,958 | |
| | Net change in unrealized gain (loss) | | | 5,004,740 | | | | (14,916,922 | ) |
| | Net increase (decrease) in net assets resulting from operations | | | 3,437,229 | | | | (6,511,317 | ) |
| | | | | | | | | | |
| | Distributions to shareholders: | |
| | From net investment income | | | | | | | | |
| | Class A Shares | | | (164,466 | ) | | | (591,305 | ) |
| | Class B Shares | | | — | | | | (8,025 | ) |
| | Class C Shares | | | — | | | | (29,387 | ) |
| | Institutional Shares | | | (229,346 | ) | | | (390,730 | ) |
| | Service Shares | | | — | | | | — | |
| | Class IR Shares | | | — | | | | — | |
| | Total distributions to shareholders | | | (393,812 | ) | | | (1,019,447 | ) |
| | | | | | | | | | |
| | From share transactions: | |
| | Proceeds from sales of shares | | | 4,443,063 | | | | 16,635,096 | |
| | Reinvestment of distributions | | | 382,672 | | | | 893,109 | |
| | Cost of shares redeemed | | | (10,130,035 | ) | | | (17,564,933 | ) |
| | Net decrease in net assets resulting from share transactions | | | (5,304,300 | ) | | | (36,728 | ) |
| | | |
| | TOTAL DECREASE | | | (2,260,883 | ) | | | (7,567,492 | ) |
| | | | | | | | | | |
| | Net assets: | |
| | Beginning of period | | | 71,142,416 | | | | 78,709,908 | |
| | End of period | | $ | 68,881,533 | | | $ | 71,142,416 | |
| | Undistributed (distributions in excess of) net investment income (loss) | | $ | (173,314 | ) | | $ | 393,352 | |
| | (a) | | Commenced operations on February 28, 2011. |
| | (b) | | Net of $7,197 and $2,067 of redemption fees remitted to the BRIC and Emerging Markets Equity Funds, respectively. |
| | |
| 44 | | The accompanying notes are an integral part of these financial statements. |
GOLDMAN SACHS FUNDAMENTAL EMERGING MARKETS EQUITY FUNDS
| | | | | | | | | | | | | | | | | | | | | | | | | | | | | | | | | | |
| | | BRIC Fund | | | | | Emerging Markets Equity Fund | | | | | N-11 Equity Fund | |
| | | For the
Six Months Ended
April 30, 2012
(Unaudited) | | | | | For the Fiscal
Year Ended
October 31, 2011 | | | | | For the
Six Months Ended
April 30, 2012
(Unaudited) | | | | | For the Fiscal
Year Ended
October 31, 2011 | | | | | For the
Six Months Ended
April 30, 2012
(Unaudited) | | | | | For the
Period Ended
October 31, 2011(a) | |
| | | | | | | | | | | | | | | | | | | | | | | | | | | | | | | | | | |
| | $ | (897,361 | ) | | | | $ | 2,507,034 | | | | | $ | (59,389 | ) | | | | $ | 2,747,165 | | | | | $ | 425,074 | | | | | $ | (884 | ) |
| | | (18,440,280 | ) | | | | | 34,064,794 | | | | | | (2,027,943 | ) | | | | | 77,146,926 | | | | | | (3,158,073 | ) | | | | | (2,227,915 | ) |
| | | 9,542,753 | | | | | | (166,624,292 | ) | | | | | 11,933,860 | | | | | | (123,999,919 | ) | | | | | 7,963,456 | | | | | | (2,627,624 | ) |
| | | (9,794,888 | ) | | | | | (130,052,464 | ) | | | | | 9,846,528 | | | | | | (44,105,828 | ) | | | | | 5,230,457 | | | | | | (4,856,423 | ) |
| | | | | | | | | | | | | | | | | | | | | | | | | | | | | | | | | | |
| | | | | | | | | | | | | | | | | | | | | | | | | | | | | | | | | | |
| | | | | | | | | | | | | | | | | | | | | | | | | | | | | | | | | | |
| | | — | | | | | | — | | | | | | — | | | | | | (127,949 | ) | | | | | — | | | | | | — | |
| | | — | | | | | | — | | | | | | — | | | | | | (11,286 | ) | | | | | — | | | | | | — | |
| | | — | | | | | | — | | | | | | — | | | | | | (29,445 | ) | | | | | — | | | | | | — | |
| | | — | | | | | | (486,416 | ) | | | | | (1,112,635 | ) | | | | | (3,267,095 | ) | | | | | — | | | | | | — | |
| | | — | | | | | | — | | | | | | — | | | | | | (46,959 | ) | | | | | — | | | | | | — | |
| | | — | | | | | | (344 | ) | | | | | (1,097 | ) | | | | | (8 | ) | | | | | — | | | | | | — | |
| | | — | | | | | | (486,760 | ) | | | | | (1,113,732 | ) | | | | | (3,482,742 | ) | | | | | — | | | | | | — | |
| | | | | | | | | | | | | | | | | | | | | | | | | | | | | | | | | | |
| | | | | | | | | | | | | | | | | | | | | | | | | | | | | | | | | | |
| | | 78,814,387 | | | | | | 343,253,205 | | | | | | 39,679,648 | | | | | | 146,791,460 | | | | | | 57,931,822 | | | | | | 81,689,306 | |
| | | — | | | | | | 404,278 | | | | | | 1,017,714 | | | | | | 3,022,052 | | | | | | — | | | | | | — | |
| | | (164,116,964 | ) | | | | | (462,997,515 | )(b) | | | | | (73,799,421 | ) | | | | | (247,459,515 | )(b) | | | | | (20,750,829 | ) | | | | | (10,782,667 | ) |
| | | (85,302,577 | ) | | | | | (119,340,032 | ) | | | | | (33,102,059 | ) | | | | | (97,646,003 | ) | | | | | 37,180,993 | | | | | | 70,906,639 | |
| | | | | | | | | | | |
| | | (95,097,465 | ) | | | | | (249,879,256 | ) | | | | | (24,369,263 | ) | | | | | (145,234,573 | ) | | | | | 42,411,450 | | | | | | 66,050,216 | |
| | | | | | | | | | | | | | | | | | | | | | | | | | | | | | | | | | |
| | | | | | | | | | | | | | | | | | | | | | | | | | | | | | | | | | |
| | | 561,971,273 | | | | | | 811,850,529 | | | | | | 443,392,957 | | | | | | 588,627,530 | | | | | | 66,050,216 | | | | | | — | |
| | $ | 466,873,808 | | | | | $ | 561,971,273 | | | | | $ | 419,023,694 | | | | | $ | 443,392,957 | | | | | $ | 108,461,666 | | | | | $ | 66,050,216 | |
| | $ | (897,361 | ) | | | | $ | — | | | | | $ | (59,569 | ) | | | | $ | 1,113,552 | | | | | $ | 427,594 | | | | | $ | 2,520 | |
| | |
| The accompanying notes are an integral part of these financial statements. | | 45 |
GOLDMAN SACHS ASIA EQUITY FUND
Financial Highlights
Selected Data for a Share Outstanding Throughout Each Period
| | | | | | | | | | | | | | | | | | | | | | | | | | | | | | | | |
| | | | | | Income (loss) from
investment operations | | | Distributions
to shareholders | | | | |
| Year - Share Class | | Net asset
value,
beginning
of period | | | Net
investment
income (loss)(a) | | | Net realized
and unrealized
gain (loss) | | | Total from
investment
operations | | | From net
investment
income | | | From net
realized
gains | | | Total
distributions | | | Increase
from
regulatory
settlements | |
| FOR THE SIX MONTHS ENDED APRIL 30, (UNAUDITED) | | | | | |
2012 - A | | $ | 17.33 | | | $ | (0.05 | ) | | $ | 0.84 | | | $ | 0.79 | | | $ | (0.07 | ) | | $ | — | | | $ | (0.07 | ) | | $ | — | |
2012 - B | | | 16.56 | | | | (0.11 | ) | | | 0.81 | | | | 0.70 | | | | — | | | | — | | | | — | | | | — | |
2012 - C | | | 16.39 | | | | (0.11 | ) | | | 0.81 | | | | 0.70 | | | | — | | | | — | | | | — | | | | — | |
2012 - Institutional | | | 18.24 | | | | (0.02 | ) | | | 0.88 | | | | 0.86 | | | | (0.15 | ) | | | — | | | | (0.15 | ) | | | — | |
| FOR THE FISCAL YEARS ENDED OCTOBER 31, | | | | | |
2011 - A | | | 19.14 | | | | 0.12 | | | | (1.69 | ) | | | (1.57 | ) | | | (0.24 | ) | | | — | | | | (0.24 | ) | | | — | |
2011 - B | | | 18.28 | | | | (0.03 | ) | | | (1.60 | ) | | | (1.63 | ) | | | (0.09 | ) | | | — | | | | (0.09 | ) | | | — | |
2011 - C | | | 18.12 | | | | (0.03 | ) | | | (1.59 | ) | | | (1.62 | ) | | | (0.11 | ) | | | — | | | | (0.11 | ) | | | — | |
2011 - Institutional | | | 20.12 | | | | 0.23 | | | | (1.80 | ) | | | (1.57 | ) | | | (0.31 | ) | | | — | | | | (0.31 | ) | | | — | |
2010 - A | | | 15.39 | | | | 0.07 | (d) | | | 3.84 | | | | 3.91 | | | | (0.16 | ) | | | — | | | | (0.16 | ) | | | — | |
2010 - B | | | 14.75 | | | | (0.06 | )(d) | | | 3.68 | | | | 3.62 | | | | (0.09 | ) | | | — | | | | (0.09 | ) | | | — | |
2010 - C | | | 14.64 | | | | (0.05 | )(d) | | | 3.64 | | | | 3.59 | | | | (0.11 | ) | | | — | | | | (0.11 | ) | | | — | |
2010 - Institutional | | | 16.16 | | | | 0.14 | (d) | | | 4.03 | | | | 4.17 | | | | (0.21 | ) | | | — | | | | (0.21 | ) | | | — | |
2009 - A | | | 10.11 | | | | 0.12 | | | | 5.32 | | | | 5.44 | | | | (0.22 | ) | | | (0.02 | ) | | | (0.24 | ) | | | 0.08 | |
2009 - B | | | 9.58 | | | | 0.02 | | | | 5.11 | | | | 5.13 | | | | (0.02 | ) | | | (0.02 | ) | | | (0.04 | ) | | | 0.08 | |
2009 - C | | | 9.51 | | | | 0.02 | | | | 5.07 | | | | 5.09 | | | | (0.02 | ) | | | (0.02 | ) | | | (0.04 | ) | | | 0.08 | |
2009 - Institutional | | | 10.70 | | | | 0.17 | | | | 5.59 | | | | 5.76 | | | | (0.36 | ) | | | (0.02 | ) | | | (0.38 | ) | | | 0.08 | |
| FOR THE PERIOD SEPTEMBER 1, 2008 TO OCTOBER 31, 2008* | | | | | |
2008 - A | | | 16.87 | | | | 0.02 | | | | (6.78 | ) | | | (6.76 | ) | | | — | | | | — | | | | — | | | | — | |
2008 - B | | | 16.00 | | | | — | (f) | | | (6.42 | ) | | | (6.42 | ) | | | — | | | | — | | | | — | | | | — | |
2008 - C | | | 15.88 | | | | — | (f) | | | (6.37 | ) | | | (6.37 | ) | | | — | | | | — | | | | — | | | | — | |
2008 - Institutional | | | 17.84 | | | | 0.03 | | | | (7.17 | ) | | | (7.14 | ) | | | — | | | | — | | | | — | | | | — | |
| FOR THE FISCAL YEARS ENDED AUGUST 31, | | | | | |
2008 - A | | | 22.13 | | | | 0.14 | | | | (4.35 | ) | | | (4.21 | ) | | | (0.15 | ) | | | (0.93 | ) | | | (1.08 | ) | | | 0.03 | |
2008 - B | | | 21.13 | | | | (0.02 | ) | | | (4.14 | ) | | | (4.16 | ) | | | (0.07 | ) | | | (0.93 | ) | | | (1.00 | ) | | | 0.03 | |
2008 - C | | | 21.01 | | | | (0.04 | ) | | | (4.09 | ) | | | (4.13 | ) | | | (0.10 | ) | | | (0.93 | ) | | | (1.03 | ) | | | 0.03 | |
2008 - Institutional | | | 23.31 | | | | 0.22 | | | | (4.58 | ) | | | (4.36 | ) | | | (0.21 | ) | | | (0.93 | ) | | | (1.14 | ) | | | 0.03 | |
2007 - A | | | 15.60 | | | | 0.08 | | | | 6.53 | | | | 6.61 | | | | (0.08 | ) | | | — | | | | (0.08 | ) | | | — | |
2007 - B | | | 14.94 | | | | (0.07 | ) | | | 6.26 | | | | 6.19 | | | | — | | | | — | | | | — | | | | — | |
2007 - C | | | 14.85 | | | | (0.06 | ) | | | 6.22 | | | | 6.16 | | | | — | | | | — | | | | — | | | | — | |
2007 - Institutional | | | 16.42 | | | | 0.17 | | | | 6.86 | | | | 7.03 | | | | (0.14 | ) | | | — | | | | (0.14 | ) | | | — | |
| | * | | The Fund changed its fiscal year end from August 31 to October 31. |
| | (a) | | Calculated based on the average shares outstanding methodology. |
| | (b) | | Assumes investment at the net asset value at the beginning of the period, reinvestment of all distributions, a complete redemption of the investment at the net asset value at the end of the period and no sales or redemption charges. Total returns would be reduced if a sales or redemption charge was taken into account. Returns do not reflect the deduction of taxes that a shareholder would pay on Fund distributions or the redemption of Fund shares. Total returns for periods less than one full year are not annualized. |
| | (d) | | Reflects income recognized from non-recurring special dividends which amounted to $0.02 per share and 0.10% of average net assets. |
| | (e) | | Total return reflects the impact of payments for regulatory settlements entitled to be received during the period and recorded as an increase to capital by the Fund. Excluding such payments, the total return would have been: |
| | | | | | | | | | | | | | | | |
| | | Class A | | | Class B | | | Class C | | | Institutional | |
For the Fiscal Year Ended October 31, 2009 | | | 55.33 | % | | | 54.06 | % | | | 54.16 | % | | | 55.93 | % |
For the Fiscal Year Ended August 31, 2008 | | | (20.59 | ) | | | (21.23 | ) | | | (21.21 | ) | | | (20.27 | ) |
| | (f) | | Amount is less than $0.005 per share. |
| | |
| 46 | | The accompanying notes are an integral part of these financial statements. |
GOLDMAN SACHS ASIA EQUITY FUND
| | | | | | | | | | | | | | | | | | | | | | | | | | |
| | | | | | | | | | | | | | | | | | | | |
Net asset
value, end
of period | | | Total
return(b) | | | Net assets,
end of
period (in 000s) | | | Ratio of
net expenses
to average
net assets | | | Ratio of
total expenses
to average
net assets | | | Ratio of
net investment
income (loss)
to average net assets | | | Portfolio
turnover
rate | |
| | | | | | | | | | | | | | | | | | | | | | | | | | |
| $ | 18.05 | | | | 4.68 | % | | $ | 37,311 | | | | 1.60 | %(c) | | | 2.28 | %(c) | | | (0.61 | )%(c) | | | 40 | % |
| | 17.26 | | | | 4.23 | | | | 1,055 | | | | 2.35 | (c) | | | 3.03 | (c) | | | (1.37 | )(c) | | | 40 | |
| | 17.09 | | | | 4.27 | | | | 2,939 | | | | 2.35 | (c) | | | 3.03 | (c) | | | (1.37 | )(c) | | | 40 | |
| | 18.95 | | | | 4.89 | | | | 27,577 | | | | 1.20 | (c) | | | 1.88 | (c) | | | (0.21 | )(c) | | | 40 | |
| | | | | | | | | | | | | | | | | | | | | | | | | | |
| | 17.33 | | | | (8.33 | ) | | | 39,688 | | | | 1.60 | | | | 2.17 | | | | 0.61 | | | | 107 | |
| | 16.56 | | | | (8.95 | ) | | | 1,164 | | | | 2.35 | | | | 2.92 | | | | (0.18 | ) | | | 107 | |
| | 16.39 | | | | (9.00 | ) | | | 3,219 | | | | 2.35 | | | | 2.92 | | | | (0.18 | ) | | | 107 | |
| | 18.24 | | | | (7.94 | ) | | | 27,071 | | | | 1.20 | | | | 1.77 | | | | 1.15 | | | | 107 | |
| | 19.14 | | | | 25.59 | | | | 47,238 | | | | 1.60 | | | | 2.32 | | | | 0.40 | (d) | | | 85 | |
| | 18.28 | | | | 24.66 | | | | 1,622 | | | | 2.35 | | | | 3.07 | | | | (0.38 | )(d) | | | 85 | |
| | 18.12 | | | | 24.53 | | | | 4,986 | | | | 2.35 | | | | 3.07 | | | | (0.32 | )(d) | | | 85 | |
| | 20.12 | | | | 26.05 | | | | 24,864 | | | | 1.20 | | | | 1.92 | | | | 0.82 | (d) | | | 85 | |
| | 15.39 | | | | 55.89 | (e) | | | 43,833 | | | | 1.60 | | | | 2.36 | | | | 0.97 | | | | 117 | |
| | 14.75 | | | | 54.55 | (e) | | | 1,807 | | | | 2.35 | | | | 3.11 | | | | 0.19 | | | | 117 | |
| | 14.64 | | | | 54.64 | (e) | | | 4,160 | | | | 2.35 | | | | 3.11 | | | | 0.20 | | | | 117 | |
| | 16.16 | | | | 56.48 | (e) | | | 20,575 | | | | 1.20 | | | | 1.96 | | | | 1.35 | | | | 117 | |
| | | | | | | | | | | | | | | | | | | | | | | | | | |
| | 10.11 | | | | (40.07 | ) | | | 37,075 | | | | 1.60 | (c) | | | 2.44 | (c) | | | 0.97 | (c) | | | 7 | |
| | 9.58 | | | | (40.13 | ) | | | 1,218 | | | | 2.35 | (c) | | | 3.19 | (c) | | | 0.23 | (c) | | | 7 | |
| | 9.51 | | | | (40.11 | ) | | | 2,245 | | | | 2.35 | (c) | | | 3.19 | (c) | | | 0.21 | (c) | | | 7 | |
| | 10.70 | | | | (40.02 | ) | | | 18,789 | | | | 1.20 | (c) | | | 2.04 | (c) | | | 1.45 | (c) | | | 7 | |
| | | | | | | | | | | | | | | | | | | | | | | | | | |
| | 16.87 | | | | (20.36 | )(e) | | | 74,240 | | | | 1.60 | | | | 1.77 | | | | 0.63 | | | | 47 | |
| | 16.00 | | | | (21.00 | )(e) | | | 2,432 | | | | 2.35 | | | | 2.52 | | | | (0.10 | ) | | | 47 | |
| | 15.88 | | | | (20.98 | )(e) | | | 4,276 | | | | 2.35 | | | | 2.52 | | | | (0.18 | ) | | | 47 | |
| | 17.84 | | | | (20.04 | )(e) | | | 41,334 | | | | 1.20 | | | | 1.37 | | | | 0.95 | | | | 47 | |
| | 22.13 | | | | 42.55 | | | | 128,224 | | | | 1.61 | | | | 1.81 | | | | 0.42 | | | | 131 | |
| | 21.13 | | | | 41.50 | | | | 3,315 | | | | 2.36 | | | | 2.56 | | | | (0.38 | ) | | | 131 | |
| | 21.01 | | | | 41.48 | | | | 6,314 | | | | 2.36 | | | | 2.56 | | | | (0.32 | ) | | | 131 | |
| | 23.31 | | | | 43.12 | | | | 73,474 | | | | 1.21 | | | | 1.41 | | | | 0.88 | | | | 131 | |
| | |
| The accompanying notes are an integral part of these financial statements. | | 47 |
GOLDMAN SACHS BRIC FUND
Financial Highlights
Selected Data for a Share Outstanding Throughout Each Period
| | | | | | | | | | | | | | | | | | | | | | | | | | | | |
| | | | | | Income (loss) from
investment operations | | | Distributions
to shareholders | |
| Year - Share Class | | Net asset
value,
beginning
of period | | | Net
investment
income (loss)(a) | | | Net realized
and unrealized
gain (loss) | | | Total from
investment
operations | | | From net
investment
income | | | From net
realized
gains | | | Total
distributions | |
| FOR THE SIX MONTHS ENDED APRIL 30, (UNAUDITED) | |
2012 - A | | $ | 13.13 | | | $ | (0.02 | ) | | $ | (0.13 | ) | | $ | (0.15 | ) | | $ | — | | | $ | — | | | $ | — | |
2012 - C | | | 12.60 | | | | (0.07 | ) | | | (0.11 | ) | | | (0.18 | ) | | | — | | | | — | | | | — | |
2012 - Institutional | | | 13.38 | | | | — | (d) | | | (0.12 | ) | | | (0.12 | ) | | | — | | | | — | | | | — | |
2012 - IR | | | 13.47 | | | | 0.01 | | | | (0.14 | ) | | | (0.13 | ) | | | — | | | | — | | | | — | |
| | | | | | | | | | | | | | | | | | | | | | | | | | | | |
| FOR THE FISCAL YEARS ENDED OCTOBER 31, | |
2011 - A | | | 15.78 | | | | 0.03 | | | | (2.68 | ) | | | (2.65 | ) | | | — | | | | — | | | | — | |
2011 - C | | | 15.26 | | | | (0.06 | ) | | | (2.60 | ) | | | (2.66 | ) | | | — | | | | — | | | | — | |
2011 - Institutional | | | 16.04 | | | | 0.18 | | | | (2.81 | ) | | | (2.63 | ) | | | (0.03 | ) | | | — | | | | (0.03 | ) |
2011 - IR | | | 16.19 | | | | 0.03 | | | | (2.72 | ) | | | (2.69 | ) | | | (0.03 | ) | | | — | | | | (0.03 | ) |
2010 - A | | | 13.12 | | | | (0.03 | )(e) | | | 2.69 | | | | 2.66 | | | | — | | | | — | | | | — | |
2010 - C | | | 12.79 | | | | (0.13 | )(e) | | | 2.60 | | | | 2.47 | | | | — | | | | — | | | | — | |
2010 - Institutional | | | 13.29 | | | | 0.05 | (e) | | | 2.70 | | | | 2.75 | | | | — | | | | — | | | | — | |
2010 - IR (Commenced August 31, 2010) | | | 14.12 | | | | (0.02 | )(e) | | | 2.09 | | | | 2.07 | | | | — | | | | — | | | | — | |
2009 - A | | | 7.39 | | | | 0.02 | | | | 5.71 | | | | 5.73 | | | | — | | | | — | | | | — | |
2009 - C | | | 7.26 | | | | (0.05 | ) | | | 5.58 | | | | 5.53 | | | | — | | | | — | | | | — | |
2009 - Institutional | | | 7.46 | | | | 0.05 | | | | 5.78 | | | | 5.83 | | | | — | | | | — | | | | — | |
| | | | | | | | | | | | | | | | | | | | | | | | | | | | |
| FOR THE PERIOD SEPTEMBER 1, 2008 TO OCTOBER 31, 2008* | |
2008 - A | | | 14.21 | | | | 0.02 | | | | (6.84 | ) | | | (6.82 | ) | | | — | | | | — | | | | — | |
2008 - C | | | 13.97 | | | | — | (d) | | | (6.71 | ) | | | (6.71 | ) | | | — | | | | — | | | | — | |
2008 - Institutional | | | 14.32 | | | | 0.03 | | | | (6.89 | ) | | | (6.86 | ) | | | — | | | | — | | | | — | |
| | | | | | | | | | | | | | | | | | | | | | | | | | | | |
| FOR THE FISCAL YEARS ENDED AUGUST 31, | |
2008 - A | | | 16.29 | | | | (0.03 | ) | | | (1.11 | ) | | | (1.14 | ) | | | (0.01 | ) | | | (0.93 | ) | | | (0.94 | ) |
2008 - C | | | 16.14 | | | | (0.15 | ) | | | (1.09 | ) | | | (1.24 | ) | | | — | | | | (0.93 | ) | | | (0.93 | ) |
2008 - Institutional | | | 16.37 | | | | 0.04 | | | | (1.13 | ) | | | (1.09 | ) | | | (0.03 | ) | | | (0.93 | ) | | | (0.96 | ) |
2007 - A | | | 10.45 | | | | (0.07 | ) | | | 5.93 | | | | 5.86 | | | | — | | | | (0.02 | ) | | | (0.02 | ) |
2007 - C | | | 10.43 | | | | (0.18 | ) | | | 5.91 | | | | 5.73 | | | | — | | | | (0.02 | ) | | | (0.02 | ) |
2007 - Institutional | | | 10.46 | | | | (0.01 | ) | | | 5.94 | | | | 5.93 | | | | — | | | | (0.02 | ) | | | (0.02 | ) |
| | * | | The Fund changed its fiscal year end from August 31 to October 31. |
| | (a) | | Calculated based on the average shares outstanding methodology. |
| | (b) | | Assumes investments at the net asset value at the beginning of the period, reinvestment of all distributions, a complete redemption of the investment at the net asset value at the end of the period and no sales or redemption charges. Total returns would be reduced if a sales or redemption charge was taken into account. Returns do not reflect the deduction of taxes that a shareholder would pay on Fund distributions or the redemption of Fund shares. Total returns for periods less than one full year are not annualized. |
| | (d) | | Amount is less than $0.005 per share. |
| | (e) | | Reflects income recognized from non-recurring special dividends which amounted to $0.02 per share and 0.12% of average net assets. |
| | |
| 48 | | The accompanying notes are an integral part of these financial statements. |
GOLDMAN SACHS BRIC FUND
| | | | | | | | | | | | | | | | | | | | | | | | |
| | | | | | | | | | | | | | | | | | | |
Net asset
value, end
of period | | Total
return(b) | | | Net assets,
end of
period
(in 000s) | | | Ratio of
net expenses
to average
net assets | | | Ratio of
total expenses
to average
net assets | | | Ratio of
net investment
income (loss)
to average
net assets | | | Portfolio
turnover
rate | |
| | | | | | | | | | | | | | | | | | | | | | | | |
| $12.98 | | | (1.07 | )% | | $ | 175,514 | | | | 1.84 | %(c) | | | 1.99 | %(c) | | | (0.37 | )%(c) | | | 38 | % |
| 12.42 | | | (1.43 | ) | | | 98,063 | | | | 2.59 | (c) | | | 2.74 | (c) | | | (1.12 | )(c) | | | 38 | |
| 13.26 | | | (0.90 | ) | | | 190,383 | | | | 1.44 | (c) | | | 1.59 | (c) | | | 0.05 | (c) | | | 38 | |
| 13.34 | | | (0.97 | ) | | | 2,914 | | | | 1.59 | (c) | | | 1.74 | (c) | | | 0.08 | (c) | | | 38 | |
| | | | | | | | | | | | | | | | | | | | | | | | |
| | | | | | | | | | | | | | | | | | | | | | | | |
| 13.13 | | | (16.79 | ) | | | 227,178 | | | | 1.86 | | | | 1.92 | | | | 0.16 | | | | 91 | |
| 12.60 | | | (17.43 | ) | | | 114,773 | | | | 2.61 | | | | 2.67 | | | | (0.41 | ) | | | 91 | |
| 13.38 | | | (16.45 | ) | | | 219,820 | | | | 1.46 | | | | 1.52 | | | | 1.15 | | | | 91 | |
| 13.47 | | | (16.66 | ) | | | 200 | | | | 1.60 | | | | 1.66 | | | | 0.18 | | | | 91 | |
| 15.78 | | | 20.27 | | | | 474,512 | | | | 1.89 | | | | 1.92 | | | | (0.22 | )(e) | | | 87 | |
| 15.26 | | | 19.31 | | | | 178,404 | | | | 2.64 | | | | 2.67 | | | | (0.96 | )(e) | | | 87 | |
| 16.04 | | | 20.69 | | | | 158,912 | | | | 1.49 | | | | 1.52 | | | | 0.36 | (e) | | | 87 | |
| 16.19 | | | 14.66 | | | | 23 | | | | 1.64 | (c) | | | 1.67 | (c) | | | (0.83 | )(c)(e) | | | 87 | |
| 13.12 | | | 77.54 | | | | 367,897 | | | | 1.97 | | | | 2.00 | | | | 0.19 | | | | 117 | |
| 12.79 | | | 76.17 | | | | 141,614 | | | | 2.72 | | | | 2.75 | | | | (0.54 | ) | | | 117 | |
| 13.29 | | | 78.15 | | | | 30,269 | | | | 1.57 | | | | 1.60 | | | | 0.46 | | | | 117 | |
| | | | | | | | | | | | | | | | | | | | | | | | |
| | | | | | | | | | | | | | | | | | | | | | | | |
| 7.39 | | | (47.99 | ) | | | 179,052 | | | | 1.97 | (c) | | | 2.10 | (c) | | | 1.03 | (c) | | | 14 | |
| 7.26 | | | (48.03 | ) | | | 77,810 | | | | 2.72 | (c) | | | 2.85 | (c) | | | 0.23 | (c) | | | 14 | |
| 7.46 | | | (47.91 | ) | | | 18,058 | | | | 1.57 | (c) | | | 1.70 | (c) | | | 1.70 | (c) | | | 14 | |
| | | | | | | | | | | | | | | | | | | | | | | | |
| | | | | | | | | | | | | | | | | | | | | | | | |
| 14.21 | | | (8.49 | ) | | | 431,746 | | | | 1.90 | | | | 1.93 | | | | (0.14 | ) | | | 72 | |
| 13.97 | | | (9.18 | ) | | | 169,711 | | | | 2.65 | | | | 2.68 | | | | (0.88 | ) | | | 72 | |
| 14.32 | | | (8.17 | ) | | | 46,769 | | | | 1.50 | | | | 1.53 | | | | 0.21 | | | | 72 | |
| 16.29 | | | 55.99 | | | | 250,209 | | | | 1.98 | | | | 2.08 | | | | (0.52 | ) | | | 56 | |
| 16.14 | | | 54.85 | | | | 91,085 | | | | 2.73 | | | | 2.83 | | | | (1.26 | ) | | | 56 | |
| 16.37 | | | 56.75 | | | | 32,095 | | | | 1.58 | | | | 1.86 | | | | (0.09 | ) | | | 56 | |
| | |
| The accompanying notes are an integral part of these financial statements. | | 49 |
GOLDMAN SACHS EMERGING MARKETS EQUITY FUND
Financial Highlights
Selected Data for a Share Outstanding Throughout Each Period
| | | | | | | | | | | | | | | | | | | | | | | | | | | | |
| | | | | | Income (loss) from
investment operations | | | Distributions
to shareholders | |
| Year - Share Class | | Net asset
value,
beginning
of period | | | Net
investment
income (loss)(a) | | | Net realized
and unrealized
gain (loss) | | | Total from
investment
operations | | | From net
investment
income | | | From net
realized
gains | | | Total
distributions | |
| FOR THE SIX MONTHS ENDED APRIL 30, (UNAUDITED) | |
2012 - A | | $ | 14.66 | | | $ | (0.02 | ) | | $ | 0.43 | | | $ | 0.41 | | | $ | — | | | $ | — | | | $ | — | |
2012 - B | | | 13.41 | | | | (0.07 | ) | | | 0.39 | | | | 0.32 | | | | — | | | | — | | | | — | |
2012 - C | | | 13.51 | | | | (0.07 | ) | | | 0.39 | | | | 0.32 | | | | — | | | | — | | | | — | |
2012 - Institutional | | | 15.63 | | | | 0.01 | | | | 0.45 | | | | 0.46 | | | | (0.05 | ) | | | — | | | | (0.05 | ) |
2012 - Service | | | 14.24 | | | | (0.03 | ) | | | 0.42 | | | | 0.39 | | | | — | | | | — | | | | — | |
2012 - IR | | | 15.59 | | | | 0.01 | | | | 0.44 | | | | 0.45 | | | | (0.06 | ) | | | — | | | | (0.06 | ) |
| | | | | | | | | | | | | | | | | | | | | | | | | | | | |
| FOR THE FISCAL YEARS ENDED OCTOBER 31, | |
2011 - A | | | 16.38 | | | | 0.04 | | | | (1.73 | ) | | | (1.69 | ) | | | (0.03 | ) | | | — | | | | (0.03 | ) |
2011 - B | | | 15.09 | | | | (0.08 | ) | | | (1.58 | ) | | | (1.66 | ) | | | (0.02 | ) | | | — | | | | (0.02 | ) |
2011 - C | | | 15.20 | | | | (0.07 | ) | | | (1.60 | ) | | | (1.67 | ) | | | (0.02 | ) | | | — | | | | (0.02 | ) |
2011 - Institutional | | | 17.48 | | | | 0.11 | | | | (1.84 | ) | | | (1.73 | ) | | | (0.12 | ) | | | — | | | | (0.12 | ) |
2011 - Service | | | 15.95 | | | | 0.02 | | | | (1.68 | ) | | | (1.66 | ) | | | (0.05 | ) | | | — | | | | (0.05 | ) |
2011 - IR | | | 17.56 | | | | 0.02 | | | | (1.87 | ) | | | (1.85 | ) | | | (0.12 | ) | | | — | | | | (0.12 | ) |
2010 - A | | | 13.37 | | | | (0.02 | )(d) | | | 3.03 | | | | 3.01 | | | | — | | | | — | | | | — | |
2010 - B | | | 12.41 | | | | (0.10 | )(d) | | | 2.78 | | | | 2.68 | | | | — | | | | — | | | | — | |
2010 - C | | | 12.50 | | | | (0.10 | )(d) | | | 2.80 | | | | 2.70 | | | | — | | | | — | | | | — | |
2010 - Institutional | | | 14.22 | | | | 0.07 | (d) | | | 3.20 | | | | 3.27 | | | | (0.01 | ) | | | — | | | | (0.01 | ) |
2010 - Service | | | 13.03 | | | | (0.01 | )(d) | | | 2.93 | | | | 2.92 | | | | — | | | | — | | | | — | |
2010 - IR (Commenced August 31, 2010) | | | 15.24 | | | | (0.01 | )(d) | | | 2.33 | | | | 2.32 | | | | — | | | | — | | | | — | |
2009 - A | | | 11.97 | | | | 0.15 | | | | 4.64 | | | | 4.79 | | | | (0.26 | ) | | | (3.13 | ) | | | (3.39 | ) |
2009 - B | | | 11.30 | | | | 0.07 | | | | 4.31 | | | | 4.38 | | | | (0.14 | ) | | | (3.13 | ) | | | (3.27 | ) |
2009 - C | | | 11.31 | | | | 0.07 | | | | 4.34 | | | | 4.41 | | | | (0.09 | ) | | | (3.13 | ) | | | (3.22 | ) |
2009 - Institutional | | | 12.60 | | | | 0.21 | | | | 4.93 | | | | 5.14 | | | | (0.39 | ) | | | (3.13 | ) | | | (3.52 | ) |
2009 - Service | | | 11.80 | | | | 0.15 | | | | 4.51 | | | | 4.66 | | | | (0.30 | ) | | | (3.13 | ) | | | (3.43 | ) |
| | | | | | | | | | | | | | | | | | | | | | | | | | | | |
| FOR THE PERIOD SEPTEMBER 1, 2008 TO OCTOBER 31, 2008* | |
2008 - A | | | 20.13 | | | | 0.05 | | | | (8.21 | ) | | | (8.16 | ) | | | — | | | | — | | | | — | |
2008 - B | | | 19.03 | | | | 0.02 | | | | (7.75 | ) | | | (7.73 | ) | | | — | | | | — | | | | — | |
2008 - C | | | 19.04 | | | | 0.02 | | | | (7.75 | ) | | | (7.73 | ) | | | — | | | | — | | | | — | |
2008 - Institutional | | | 21.18 | | | | 0.06 | | | | (8.64 | ) | | | (8.58 | ) | | | — | | | | — | | | | — | |
2008 - Service | | | 19.85 | | | | 0.04 | | | | (8.09 | ) | | | (8.05 | ) | | | — | | | | — | | | | — | |
| | | | | | | | | | | | | | | | | | | | | | | | | | | | |
| FOR THE FISCAL YEARS ENDED AUGUST 31, | |
2008 - A | | | 26.74 | | | | 0.14 | | | | (2.87 | ) | | | (2.73 | ) | | | (0.04 | ) | | | (3.84 | ) | | | (3.88 | ) |
2008 - B | | | 25.61 | | | | (0.03 | ) | | | (2.71 | ) | | | (2.74 | ) | | | — | | | | (3.84 | ) | | | (3.84 | ) |
2008 - C | | | 25.62 | | | | (0.04 | ) | | | (2.70 | ) | | | (2.74 | ) | | | — | | | | (3.84 | ) | | | (3.84 | ) |
2008 - Institutional | | | 27.91 | | | | 0.25 | | | | (3.04 | ) | | | (2.79 | ) | | | (0.10 | ) | | | (3.84 | ) | | | (3.94 | ) |
2008 - Service | | | 26.48 | | | | 0.16 | | | | (2.88 | ) | | | (2.72 | ) | | | (0.07 | ) | | | (3.84 | ) | | | (3.91 | ) |
2007 - A | | | 19.91 | | | | 0.07 | | | | 6.98 | | | | 7.05 | | | | (0.08 | ) | | | (0.14 | ) | | | (0.22 | ) |
2007 - B | | | 19.14 | | | | (0.11 | ) | | | 6.72 | | | | 6.61 | | | | — | | | | (0.14 | ) | | | (0.14 | ) |
2007 - C | | | 19.16 | | | | (0.12 | ) | | | 6.72 | | | | 6.60 | | | | — | | | | (0.14 | ) | | | (0.14 | ) |
2007 - Institutional | | | 20.75 | | | | 0.18 | | | | 7.27 | | | | 7.45 | | | | (0.15 | ) | | | (0.14 | ) | | | (0.29 | ) |
2007 - Service | | | 19.66 | | | | 0.09 | | | | 6.87 | | | | 6.96 | | | | — | | | | (0.14 | ) | | | (0.14 | ) |
| | * | | The Fund changed its fiscal year end from August 31 to October 31. |
| | (a) | | Calculated based on the average shares outstanding methodology. |
| | (b) | | Assumes investments at the net asset value at the beginning of the period, reinvestment of all distributions, a complete redemption of the investment at the net asset value at the end of the period and no sales or redemption charges. Total returns would be reduced if a sales or redemption charge was taken into account. Returns do not reflect the deduction of taxes that a shareholder would pay on Fund distributions or the redemption of Fund shares. Total returns for periods less than one full year are not annualized. |
| | (d) | | Reflects income recognized from non-recurring special dividends which amounted to 0.02 per share and 0.12% of average net assets. |
| | |
| 50 | | The accompanying notes are an integral part of these financial statements. |
GOLDMAN SACHS EMERGING MARKETS EQUITY FUND
| | | | | | | | | | | | | | | | | | | | | | | | |
| | | | | | | | | | | | | | | | | | | |
Net asset
value, end
of period | | Total
return(b) | | | Net assets,
end of
period
(in 000s) | | | Ratio of
net expenses
to average
net assets | | | Ratio of
total expenses
to average
net assets | | | Ratio of
net investment
income (loss)
to average
net assets | | | Portfolio
turnover
rate | |
| | | | | | | | | | | | | | | | | | | | | | | | |
| $15.07 | | | 2.80 | % | | $ | 47,295 | | | | 1.85 | %(c) | | | 1.97 | %(c) | | | (0.30 | )%(c) | | | 51 | % |
| 13.73 | | | 2.39 | | | | 6,057 | | | | 2.60 | (c) | | | 2.72 | (c) | | | (1.06 | )(c) | | | 51 | |
| 13.83 | | | 2.37 | | | | 18,132 | | | | 2.60 | (c) | | | 2.72 | (c) | | | (1.04 | )(c) | | | 51 | |
| 16.04 | | | 2.99 | | | | 330,657 | | | | 1.45 | (c) | | | 1.57 | (c) | | | 0.10 | (c) | | | 51 | |
| 14.63 | | | 2.74 | | | | 16,583 | | | | 1.95 | (c) | | | 2.07 | (c) | | | (0.39 | )(c) | | | 51 | |
| 15.98 | | | 2.93 | | | | 300 | | | | 1.60 | (c) | | | 1.72 | (c) | | | 0.11 | (c) | | | 51 | |
| | | | | | | | | | | | | | | | | | | | | | | | |
| | | | | | | | | | | | | | | | | | | | | | | | |
| 14.66 | | | (10.33 | ) | | | 51,221 | | | | 1.90 | | | | 1.93 | | | | 0.24 | | | | 121 | |
| 13.41 | | | (11.02 | ) | | | 6,841 | | | | 2.65 | | | | 2.68 | | | | (0.53 | ) | | | 121 | |
| 13.51 | | | (11.01 | ) | | | 18,896 | | | | 2.65 | | | | 2.68 | | | | (0.49 | ) | | | 121 | |
| 15.63 | | | (9.98 | ) | | | 351,982 | | | | 1.50 | | | | 1.53 | | | | 0.61 | | | | 121 | |
| 14.24 | | | (10.43 | ) | | | 14,432 | | | | 2.00 | | | | 2.03 | | | | 0.15 | | | | 121 | |
| 15.59 | | | (10.21 | ) | | | 21 | | | | 1.65 | | | | 1.68 | | | | 0.16 | | | | 121 | |
| 16.38 | | | 22.51 | | | | 68,118 | | | | 1.91 | | | | 1.91 | | | | (0.16 | )(d) | | | 147 | |
| 15.09 | | | 21.60 | | | | 10,335 | | | | 2.66 | | | | 2.66 | | | | (0.75 | )(d) | | | 147 | |
| 15.20 | | | 21.60 | | | | 23,226 | | | | 2.66 | | | | 2.66 | | | | (0.73 | )(d) | | | 147 | |
| 17.48 | | | 23.04 | | | | 472,994 | | | | 1.51 | | | | 1.51 | | | | 0.43 | (d) | | | 147 | |
| 15.95 | | | 22.41 | | | | 13,954 | | | | 2.01 | | | | 2.01 | | | | (0.10 | )(d) | | | 147 | |
| 17.56 | | | 15.22 | | | | 1 | | | | 1.66 | (c) | | | 1.66 | (c) | | | (0.09 | )(c)(d) | | | 147 | |
| 13.37 | | | 58.12 | | | | 256,648 | | | | 1.89 | | | | 1.89 | | | | 1.43 | | | | 179 | |
| 12.41 | | | 56.96 | | | | 10,350 | | | | 2.64 | | | | 2.64 | | | | 0.73 | | | | 179 | |
| 12.50 | | | 57.03 | | | | 17,637 | | | | 2.64 | | | | 2.64 | | | | 0.70 | | | | 179 | |
| 14.22 | | | 58.76 | | | | 347,017 | | | | 1.49 | | | | 1.49 | | | | 1.88 | | | | 179 | |
| 13.03 | | | 57.99 | | | | 10,273 | | | | 1.99 | | | | 1.99 | | | | 1.38 | | | | 179 | |
| | | | | | | | | | | | | | | | | | | | | | | | |
| | | | | | | | | | | | | | | | | | | | | | | | |
| 11.97 | | | (40.54 | ) | | | 263,099 | | | | 1.86 | (c) | | | 1.90 | (c) | | | 1.81 | (c) | | | 20 | |
| 11.30 | | | (40.62 | ) | | | 7,919 | | | | 2.61 | (c) | | | 2.65 | (c) | | | 1.01 | (c) | | | 20 | |
| 11.31 | | | (40.65 | ) | | | 11,612 | | | | 2.61 | (c) | | | 2.65 | (c) | | | 1.04 | (c) | | | 20 | |
| 12.60 | | | (40.51 | ) | | | 522,606 | | | | 1.46 | (c) | | | 1.50 | (c) | | | 2.19 | (c) | | | 20 | |
| 11.80 | | | (40.55 | ) | | | 3,701 | | | | 1.96 | (c) | | | 2.00 | (c) | | | 1.77 | (c) | | | 20 | |
| | | | | | | | | | | | | | | | | | | | | | | | |
| | | | | | | | | | | | | | | | | | | | | | | | |
| 20.13 | | | (13.92 | ) | | | 522,595 | | | | 1.84 | | | | 1.84 | | | | 0.55 | | | | 91 | |
| 19.03 | | | (14.55 | ) | | | 14,677 | | | | 2.59 | | | | 2.59 | | | | (0.16 | ) | | | 91 | |
| 19.04 | | | (14.58 | ) | | | 22,596 | | | | 2.59 | | | | 2.59 | | | | (0.19 | ) | | | 91 | |
| 21.18 | | | (13.57 | ) | | | 986,258 | | | | 1.44 | | | | 1.44 | | | | 0.95 | | | | 91 | |
| 19.85 | | | (14.03 | ) | | | 7,472 | | | | 1.94 | | | | 1.94 | | | | 0.63 | | | | 91 | |
| 26.74 | | | 35.67 | | | | 671,311 | | | | 1.79 | | | | 1.79 | | | | 0.28 | | | | 97 | |
| 25.61 | | | 34.68 | | | | 16,574 | | | | 2.54 | | | | 2.54 | | | | (0.50 | ) | | | 97 | |
| 25.62 | | | 34.64 | | | | 28,345 | | | | 2.54 | | | | 2.54 | | | | (0.55 | ) | | | 97 | |
| 27.91 | | | 36.21 | | | | 1,312,613 | | | | 1.39 | | | | 1.39 | | | | 0.73 | | | | 97 | |
| 26.48 | | | 35.54 | | | | 3,704 | | | | 1.89 | | | | 1.89 | | | | 0.38 | | | | 97 | |
| | |
| The accompanying notes are an integral part of these financial statements. | | 51 |
GOLDMAN SACHS N-11 EQUITY FUND
Financial Highlights
Selected Data for a Share Outstanding Throughout Each Period
| | | | | | | | | | | | | | | | |
| | | | | | Income (loss) from
investment operations | |
| Year - Share Class | | Net asset
value,
beginning
of period | | | Net
investment
income (loss)(a) | | | Net realized
and unrealized
gain (loss) | | | Total from
investment
operations | |
| FOR THE SIX MONTHS ENDED APRIL 30, (UNAUDITED) | |
2012 - A | | $ | 9.57 | | | $ | 0.03 | | | $ | 0.44 | | | $ | 0.47 | |
2012 - C | | | 9.52 | | | | — | (d) | | | 0.43 | | | | 0.43 | |
2012 - Institutional | | | 9.60 | | | | 0.06 | | | | 0.43 | | | | 0.49 | |
2012 - IR | | | 9.59 | | | | 0.05 | | | | 0.44 | | | | 0.49 | |
| | | | | | | | | | | | | | | | |
| FOR THE PERIOD ENDED OCTOBER 31, | |
2011 - A (Commenced February 28, 2011) | | | 10.00 | | | | (0.03 | ) | | | (0.40 | ) | | | (0.43 | ) |
2011 - C (Commenced February 28, 2011) | | | 10.00 | | | | (0.08 | ) | | | (0.40 | ) | | | (0.48 | ) |
2011 - Institutional (Commenced February 28, 2011) | | | 10.00 | | | | 0.02 | | | | (0.42 | ) | | | (0.40 | ) |
2011 - IR (Commenced February 28, 2011) | | | 10.00 | | | | (0.02 | ) | | | (0.39 | ) | | | (0.41 | ) |
| | (a) | | Calculated based on the average shares outstanding methodology. |
| | (b) | | Assumes investments at the net asset value at the beginning of the period, reinvestment of all distributions, a complete redemption of the investment at the net asset value at the end of the period and no sales or redemption charges. Total returns would be reduced if a sales or redemption charge was taken into account. Returns do not reflect the deduction of taxes that a shareholder would pay on Fund distributions or the redemption of Fund shares. Total returns for periods less than one full year are not annualized. |
| | (d) | | Amount is less than $0.005 per share. |
| | |
| 52 | | The accompanying notes are an integral part of these financial statements. |
GOLDMAN SACHS N-11 EQUITY FUND
| | | | | | | | | | | | | | | | | | | | | | | | |
| | | | | | | | | | | | | | | | | | | |
Net asset
value, end
of period | | Total
return(b) | | | Net assets,
end of
period
(in 000s) | | | Ratio of
net expenses
to average
net assets(c) | | | Ratio of
total expenses
to average
net assets(c) | | | Ratio of
net investment
income (loss)
to average
net assets(c) | | | Portfolio
turnover
rate | |
| | | | | | | | | | | | | | | | | | | | | | | | |
$10.04 | | | 4.80 | % | | $ | 22,679 | | | | 1.79 | % | | | 2.47 | % | | | 0.69 | % | | | 41 | % |
9.95 | | | 4.41 | | | | 5,506 | | | | 2.54 | | | | 3.22 | | | | (0.03 | ) | | | 41 | |
10.09 | | | 5.10 | | | | 76,391 | | | | 1.39 | | | | 2.07 | | | | 1.26 | | | | 41 | |
10.08 | | | 5.01 | | | | 3,886 | | | | 1.54 | | | | 2.22 | | | | 1.11 | | | | 41 | |
| | | | | | | | | | | | | | | | | | | | | | | | |
| | | | | | | | | | | | | | | | | | | | | | | | |
9.57 | | | (4.20 | ) | | | 18,335 | | | | 1.82 | | | | 3.92 | | | | (0.40 | ) | | | 73 | |
9.52 | | | (4.70 | ) | | | 3,528 | | | | 2.57 | | | | 4.67 | | | | (1.29 | ) | | | 73 | |
9.60 | | | (4.00 | ) | | | 42,740 | | | | 1.42 | | | | 3.52 | | | | 0.24 | | | | 73 | |
9.59 | | | (4.10 | ) | | | 1,448 | | | | 1.57 | | | | 3.67 | | | | (0.28 | ) | | | 73 | |
| | |
| The accompanying notes are an integral part of these financial statements. | | 53 |
GOLDMAN SACHS FUNDAMENTAL EMERGING MARKETS EQUITY FUNDS
Notes to Financial Statements
April 30, 2012 (Unaudited)
Goldman Sachs Trust (the “Trust”) is a Delaware statutory trust registered under the Investment Company Act of 1940, as amended (the “Act”), as an open-end management investment company. The following table lists those series of the Trust that are included in this report (collectively, the “Funds” or individually a “Fund”), along with their corresponding share classes and respective diversification status under the Act:
| | | | |
| Fund | | Share Classes Offered* | | Diversified/
Non-diversified |
Asia Equity | | A, B, C and Institutional | | Diversified |
BRIC and N-11 Equity | | A, C, Institutional and IR | | Non-diversified |
Emerging Markets Equity | | A, B, C, Institutional, Service and IR | | Diversified |
| * | | Class B Shares are generally no longer available for purchase by current or prospective investors. |
Class A Shares are sold with a front-end sales charge of up to 5.50%. Class B Shares were sold with a contingent deferred sales charge (“CDSC”) that declines from 5.00% to zero, depending upon the period of time the shares are held. Class C Shares are sold with a CDSC of 1.00%, which is imposed on redemptions made within 12 months of purchase. Institutional, Service and Class IR Shares are not subject to a sales charge.
Goldman Sachs Asset Management International (“GSAMI”), an affiliate of Goldman, Sachs & Co. (“Goldman Sachs”), serves as investment adviser to the Funds pursuant to a management agreement (the “Agreement”) with the Trust.
|
| 2. SIGNIFICANT ACCOUNTING POLICIES |
The preparation of financial statements in conformity with accounting principles generally accepted in the United States of America (“GAAP”) requires management to make estimates and assumptions that may affect the amounts and disclosures in the financial statements. Actual results could differ from those estimates and assumptions.
A. Investment Valuation — The Funds’ valuation policy is to value investments at fair value.
Equity securities and investment companies traded on a United States (“U.S.”) securities exchange or the NASDAQ system, or those located on certain foreign exchanges including, but not limited to the Americas, are valued daily at their last sale price or official closing price on the principal exchange or system on which they are traded. If no sale occurs, such securities and investment companies are valued at the last bid price for long positions and at the last ask price for short positions. Unlisted equity securities for which market quotations are available are valued at the last sale price on the valuation date, or if no sale occurs, at the last bid price. Such securities traded on certain foreign securities exchanges are valued daily at fair value determined by an independent fair value service (if available) under valuation procedures approved by the trustees and consistent with applicable regulatory guidance. The independent fair value service takes into account multiple factors including, but not limited to, movements in U.S. securities markets, certain depositary receipts, futures contracts and foreign currency exchange rates that have occurred subsequent to the close of the foreign securities exchanges. Investments in investment companies (other than those that are exchange traded) are valued at the net asset value per share (“NAV”) of the investment company on the valuation date.
Debt securities for which market quotations are readily available are valued on the basis of quotations supplied by dealers or furnished by an independent pricing service approved by the trustees. The pricing services may use valuation models or matrix pricing, which consider: (i) yield or price with respect to bonds that are considered comparable in characteristics such as rating, interest rate and maturity date or (ii) quotations from securities dealers to determine current value. Short-term debt obligations that mature in sixty days or less and that do not exhibit signs of credit deterioration are valued at amortized cost, which approximates fair value.
If quotations are not readily available, or if GSAMI believes that such quotations do not accurately reflect fair value, the fair value of the Funds’ investments may be determined under valuation procedures approved by the trustees. GSAMI, consistent with its procedures and applicable regulatory guidance, may make an adjustment to the most recent valuation prices of either domestic or foreign securities in light of significant events to reflect what it believes to be the fair value of the securities at the time of determining a Fund’s NAV. Significant events which could affect a large number of securities in a particular market may include,
54
GOLDMAN SACHS FUNDAMENTAL EMERGING MARKETS EQUITY FUNDS
|
| 2. SIGNIFICANT ACCOUNTING POLICIES (continued) |
but are not limited to significant fluctuations in U.S. or foreign markets; market dislocations; market disruptions or unscheduled market closings. Significant events, which could also affect a single issuer, may include, but are not limited to corporate actions such as reorganizations, mergers and buy-outs; ratings downgrades and bankruptcies.
B. Investment Income and Investments — Investment income is comprised of interest income and dividend income, and is recorded net of any foreign withholding taxes, less any amounts reclaimable. Interest income is accrued daily and adjusted for amortization of premiums and accretion of discounts. Dividend income is recognized on ex-dividend date or, for certain foreign securities, as soon as such information is obtained subsequent to the ex-dividend date. Investment transactions are reflected on trade date with realized gains and losses on sales calculated using identified cost. Investment transactions are recorded on the following business day for daily NAV calculations. Any foreign capital gains tax is accrued daily based upon net unrealized gains, and is payable upon sale of such investments.
C. Class Allocations and Expenses — Investment income, realized and unrealized gain (loss), and non-class specific expenses of each Fund are allocated daily based upon the proportion of net assets of each class. Class specific expenses, where applicable, are borne by the respective share classes and include Distribution and Service, Transfer Agent and Service and Shareholder Administration fees. Non-class specific expenses directly incurred by a Fund are charged to that Fund, while such expenses incurred by the Trust are allocated across the respective Funds on a straight-line and/or pro-rata basis depending upon the nature of the expenses.
D. Offering Costs — Offering costs paid in connection with the offering of shares of the N-11 Equity Fund were amortized on a straight-line basis over 12 months from the date of commencement of operations.
E. Redemption Fees — Prior to October 1, 2010, all classes of the Funds (with the exception of N-11 Equity Fund) charged a 2% redemption fee on the redemption of shares (including by exchange) held for 30 calendar days or less. For this purpose, the Funds used a first-in first-out method so that shares held longest were treated as being redeemed first and shares held shortest were treated as being redeemed last. Redemption fees were reimbursed to a Fund and were reflected as a reduction in share redemptions. Redemption fees were credited to Paid-in capital and were allocated to each share class of a Fund on a pro-rata basis. Effective October 1, 2010, the redemption fee for each Fund then in existence was eliminated.
F. Federal Taxes and Distributions to Shareholders — It is each Fund’s policy to comply with the requirements of the Internal Revenue Code of 1986, as amended (the “Code”), applicable to regulated investment companies (mutual funds) and to distribute each year substantially all of its investment company taxable income and capital gains to its shareholders. Accordingly, the Funds are not required to make any provisions for the payment of federal income tax. Distributions to shareholders are recorded on the ex-dividend date. Income and capital gains distributions, if any, are declared and paid annually.
Net capital losses are carried forward to future fiscal years and may be used to the extent allowed by the Code to offset any future capital gains. Utilization of capital loss carryforwards will reduce the requirement of future capital gains distributions.
The characterization of distributions to shareholders for financial reporting purposes is determined in accordance with federal income tax rules, which may differ from GAAP. The source of each Fund’s distributions may be shown in the accompanying financial statements as either from net investment income, net realized gain or capital. Certain components of the Funds’ net assets on the Statements of Assets and Liabilities reflect permanent GAAP/tax differences based on the appropriate tax character.
G. Foreign Currency Translation — The accounting records and reporting currency of the Funds are maintained in U.S. dollars. Investments and other assets and liabilities denominated in foreign currencies are translated into U.S. dollars using the current exchange rates at the close of each business day. The effect of changes in foreign currency exchange rates on investments is included within net realized and unrealized gain (loss) on investments. Changes in the value of other assets and liabilities as a result of fluctuations in foreign exchange rates are included in the Statements of Operations within unrealized gain (loss) on foreign currency translations. Transactions denominated in foreign currencies are translated into U.S. dollars on the date the transaction occurred, the effects of which are included within realized gain (loss) on foreign currency transactions.
H. Futures Contracts — Futures contracts are valued at the last settlement price, or in the absence of a sale, the last bid price for long positions and the last ask price for short positions, at the end of each day on the board of trade or exchange upon which they are traded. Upon entering into a futures contract, the Funds deposit cash or securities in an account on behalf of the broker in an
55
GOLDMAN SACHS FUNDAMENTAL EMERGING MARKETS EQUITY FUNDS
Notes to Financial Statements (continued)
April 30, 2012 (Unaudited)
|
| 2. SIGNIFICANT ACCOUNTING POLICIES (continued) |
amount sufficient to meet the initial margin requirement. Subsequent payments are made or received by the Funds equal to the daily change in the contract value and are recorded as variation margin receivable or payable with a corresponding offset in unrealized gains or losses. The Funds recognize a realized gain or loss when a contract is closed or expires.
The use of futures contracts involves, to varying degrees, elements of market and counterparty risk which may exceed the amounts recognized in the Statements of Assets and Liabilities. Futures contracts may be illiquid, and exchanges may limit fluctuations in futures contract prices during a single day. Changes in the value of a futures contract may not directly correlate with changes in the value of the underlying securities. These risks may decrease the effectiveness of the Funds’ strategies and potentially result in a loss. The Funds must set aside liquid assets, or engage in other appropriate measures, to cover their obligations under these contracts.
I. Structured Notes — The Funds may invest in participation notes and equity linked notes, whose values are based on the price movements of a reference security or underlying instrument. Some countries, especially emerging market countries, do not permit foreigners to participate directly in their securities markets or otherwise present difficulties for efficient foreign investment. A Fund may use these notes to establish a position in such markets as a substitute for direct investment. These notes are issued by banks or broker-dealers and are designed to track the return of a particular underlying equity or debt security, or market. On the maturity date of each note, a Fund will receive a payment from a counterparty based on the value of the referenced security (notional amount multiplied by price of the referenced security) and record a realized gain or loss. Interim payments received are recorded as dividend income and are reported under Investment Income on the Statements of Operations.
Investments in participation notes involve the same risks associated with a direct investment in the underlying security, or market that they seek to replicate. In addition, participation notes are generally traded over the counter and are subject to counterparty risk. Counterparty risk is the risk that the broker-dealer or bank that issues participation notes will not fulfill its contractual obligation to complete the transaction with a Fund. These notes constitute general unsecured contractual obligations of the banks or broker-dealers that issue them, and a Fund would be relying on the creditworthiness of such banks or broker-dealers and would have no rights under a participation note against the issuer of the underlying assets. In addition, participation notes may trade at a discount to the value of the underlying securities or markets that they seek to replicate.
| | |
| 3. FAIR VALUE OF INVESTMENTS | | |
The fair value of a financial instrument is the amount that would be received to sell an asset or paid to transfer a liability in an orderly transaction between market participants at the measurement date (i.e., the exit price). GAAP establishes a fair value hierarchy that prioritizes the inputs to valuation techniques used to measure fair value. The hierarchy gives the highest priority to unadjusted quoted prices in active markets for identical assets or liabilities (Level 1 measurements) and the lowest priority to unobservable inputs (Level 3 measurements). The three levels of the fair value hierarchy are described below:
Level 1 — Unadjusted quoted prices in active markets that are accessible at the measurement date for identical, unrestricted assets or liabilities;
Level 2 — Quoted prices in markets that are not active or financial instruments for which significant inputs are observable (including, but not limited to, quoted prices for similar investments, interest rates, foreign exchange rates, volatility and credit spreads), either directly or indirectly;
Level 3 — Prices or valuations that require significant unobservable inputs (including GSAMI’s assumptions in determining fair value measurement).
The levels used for classifying investments are not necessarily an indication of the risk associated with investing in those investments.
56
GOLDMAN SACHS FUNDAMENTAL EMERGING MARKETS EQUITY FUNDS
|
| 3. FAIR VALUE OF INVESTMENTS (continued) |
The following is a summary of the Funds’ investments and derivatives categorized in the fair value hierarchy as of April 30, 2012:
| | | | | | | | | | | | |
| | | |
| ASIA EQUITY | | | | | | | | | | | | |
| | | |
| Investment Type | | Level 1 | | | Level 2 | | | Level 3 | |
| Assets | | | | | | | | | | | | |
Common Stock and/or Other Equity Investments | | $ | 835,854 | | | $ | 67,555,334 | (a) | | $ | — | |
| | | |
| Derivative Type | | | | | | | | | |
| Assets(b) | | | | | | | | | | | | |
Futures Contracts | | $ | 3,134 | | | $ | — | | | $ | — | |
| | | |
| BRIC | | | | | | | | | | | | |
| | | |
| Investment Type | | Level 1 | | | Level 2 | | | Level 3 | |
| Assets | | | | | | | | | | | | |
Common Stock and/or Other Equity Investments | | $ | 107,384,606 | | | $ | 356,460,812 | (a) | | $ | 733,292 | |
| | | |
| Derivative Type | | | | | | | | | |
| Assets(b) | | | | | | | | | | | | |
Futures Contracts | | $ | 68,778 | | | $ | — | | | $ | — | |
The following is a reconciliation of Level 3 investments for the six-months ended April 30, 2012:
| | | | | | |
| | | | | Common Stock
and/or
Other Equity
Investments | |
Beginning Balance as of November 1, 2011 | | | | $ | — | |
Purchases | | | | | 733,292 | |
Ending Balance as of April 30, 2012 | | | | $ | 733,292 | |
| | | | | | | | | | | | |
| | | |
| EMERGING MARKETS EQUITY | | | | | | | | | | | | |
| | | |
| Investment Type | | Level 1 | | | Level 2 | | | Level 3 | |
| Assets | | | | | | | | | | | | |
Common Stock and/or Other Equity Investments | | $ | 72,239,303 | | | $ | 335,758,345 | (a) | | $ | — | |
| | | |
| Derivative Type | | | | | | | | | |
| Assets(b) | | | | | | | | | | | | |
Futures Contracts | | $ | 39,986 | | | $ | — | | | $ | — | |
57
GOLDMAN SACHS FUNDAMENTAL EMERGING MARKETS EQUITY FUNDS
Notes to Financial Statements (continued)
April 30, 2012 (Unaudited)
|
| 3. FAIR VALUE OF INVESTMENTS (continued) |
| | | | | | | | | | | | |
| | | |
| N-11 EQUITY | | | | | | | | | | | | |
| | | |
| Investment Type | | Level 1 | | | Level 2 | | | Level 3 | |
| Assets | | | | | | | | | | | | |
Common Stock and/or Other Equity Investments | | $ | 24,754,367 | | | $ | 82,410,497 | (a) | | $ | — | |
| | | |
| Derivative Type | | | | | | | | | |
| Liabilities(b) | | | | | | | | | | | | |
Futures Contracts | | $ | (3,209 | ) | | $ | — | | | $ | — | |
| (a) | | To adjust for the time difference between local market close and the calculation of net asset value, the Funds utilize fair value model prices for international equities provided by an independent fair value service resulting in a Level 2 classification. |
| (b) | | Amount shown represents unrealized gain (loss) at period end. |
| | |
| 4. INVESTMENTS IN DERIVATIVES | | |
The Funds may make investments in derivative instruments, including, but not limited to options, futures, swaps, swaptions and other derivatives relating to foreign currency transactions. A derivative is an instrument whose value is derived from underlying assets, indices, reference rates or a combination of these factors. Derivative instruments may be privately negotiated contracts (often referred to as over the counter (“OTC”) derivatives) or they may be listed and traded on an exchange. Derivative contracts may involve future commitments to purchase or sell financial instruments or commodities at specified terms on a specified date, or to exchange interest payment streams or currencies based on a notional or contractual amount. Derivative instruments may involve a high degree of financial risk. The use of derivatives also involves the risk of loss if the investment adviser is incorrect in its expectation of the timing or level of fluctuations in securities prices, interest rates or currency prices. Investments in derivative instruments also include the risk of default by the counterparty, the risk that the investment may not be liquid and/or the risk that a small movement in the price of the underlying security or benchmark may result in a disproportionately large movement, unfavorable or favorable, in the price of the derivative instrument.
During the six months ended April 30, 2012, the Funds entered into futures contracts. These instruments were used to meet the Funds’ investment objectives and to obtain and/or manage exposure related to the risks below. The following table sets forth, by certain risk types, the gross value of these derivative contracts for trading activities as of April 30, 2012. The values in the table below exclude the effects of cash collateral received or posted pursuant to these derivative contracts, and therefore are not representative of the Funds’ net exposure.
| | | | | | | | | | |
| Fund | | Risk | | Statements of Assets and Liabilities | | | | Assets(a) | |
Asia Equity | | Equity | | Unrealized gain on futures variation margin | | | | $ | 3,134 | |
BRIC | | Equity | | Unrealized gain on futures variation margin | | | | | 68,778 | |
Emerging Markets Equity | | Equity | | Unrealized gain on futures variation margin | | | | | 39,986 | |
N-11 Equity | | Equity | | Unrealized gain on futures variation margin | | | | | 3,209 | |
| (a) | | Includes unrealized gain (loss) on futures contracts described in the Additional Investment Information sections of the Schedules of Investments. Only current day’s variation margin is reported within the Statements of Assets and Liabilities. |
58
GOLDMAN SACHS FUNDAMENTAL EMERGING MARKETS EQUITY FUNDS
|
| 4. INVESTMENTS IN DERIVATIVES (continued) |
The following table sets forth, by certain risk types, the Funds’ gains (losses) related to these derivatives and their indicative volumes for the six months ended April 30, 2012. These gains (losses) should be considered in the context that these derivative contracts may have been executed to economically hedge certain investments, and accordingly, certain gains (losses) on such derivative contracts may offset certain (losses) gains attributable to investments. These gains (losses) are included in “Net realized gain (loss)” or “Net change in unrealized gain (loss)” on the Statements of Operations:
| | | | | | | | | | | | | | | | |
| Fund | | Risk | | Statements of Operations | | Net
Realized
Gain (Loss) | | | Net Change in
Unrealized
Gain (Loss) | | | Average
Number of
Contracts(a) | |
| Asia Equity | | Equity | | Net realized gain (loss) from futures contracts/Net change in unrealized gain (loss) on futures contracts | | $ | 77,553 | | | $ | (16,265 | ) | | | 41 | |
| BRIC | | Equity | | Net realized gain (loss) from futures contracts/Net change in unrealized gain (loss) on futures contracts | | | (207,623 | ) | | | 31,693 | | | | 450 | |
| Emerging Markets Equity | | Equity | | Net realized gain (loss) from futures contracts/Net change in unrealized gain (loss) on futures contracts | | | 269,027 | | | | (114,414 | ) | | | 241 | |
| N-11 Equity | | Equity | | Net realized gain (loss) from futures contracts/Net change in unrealized gain (loss) on futures contracts | | | 18,847 | | | | 7,516 | | | | 58 | |
| (a) | | Average number of contracts is based on the average of month end balances for the six months ended April 30, 2012. |
| | |
| 5. AGREEMENTS AND AFFILIATED TRANSACTIONS | | |
A. Management Agreement — Under the Agreement, GSAMI manages the Funds, subject to the general supervision of the trustees.
As compensation for the services rendered pursuant to the Agreement, the assumption of the expenses related thereto and administration of the Funds’ business affairs, including providing facilities, GSAMI is entitled to a management fee, accrued daily and paid monthly, equal to an annual percentage rate of each Fund’s average daily net assets.
For the six months ended April 30, 2012, contractual and effective net management fees with GSAMI were at the following rates:
| | | | | | | | | | | | | | | | | | | | | | | | | | | | | | |
| | | | | Contractual Management Rate | | | Effective Net
Management
Rate | |
| Fund | | | | First $1 billion | | | Next $1 billion | | | Next $3 billion | | | Next $3 billion | | | Over $8 billion | | | Effective Rate | | |
Asia Equity | | | | | 1.00 | % | | | 0.90 | % | | | 0.86 | % | | | 0.84 | % | | | 0.82 | % | | | 1.00 | % | | | 1.00 | % |
BRIC | | | | | 1.30 | | | | 1.30 | | | | 1.17 | | | | 1.11 | | | | 1.09 | | | | 1.30 | | | | 1.16 | * |
Emerging Markets Equity | | | | | 1.20 | | | | 1.20 | | | | 1.08 | | | | 1.03 | | | | 1.01 | | | | 1.20 | | | | 1.08 | * |
N-11 Equity | | | | | 1.30 | | | | 1.30 | | | | 1.24 | | | | 1.21 | | | | 1.19 | | | | 1.30 | | | | 1.19 | * |
| * | | GSAMI agreed to waive a portion of its management fee in order to achieve the effective net management rates shown above for the BRIC, Emerging Markets Equity and N-11 Equity Funds, through February 28, 2013. Prior to such date GSAMI may not terminate the arrangements without the approval of the trustees. |
59
GOLDMAN SACHS FUNDAMENTAL EMERGING MARKETS EQUITY FUNDS
Notes to Financial Statements (continued)
April 30, 2012 (Unaudited)
|
| 5. AGREEMENTS AND AFFILIATED TRANSACTIONS (continued) |
B. Distribution and Service Plans — The Trust, on behalf of each Fund, has adopted Distribution and Service Plans (the “Plans”). Under the Plans, Goldman Sachs, which serves as distributor (the “Distributor”), is entitled to a fee accrued daily and paid monthly for distribution services and personal and account maintenance services, which may then be paid by Goldman Sachs to authorized dealers, at the following annual rates calculated on a Fund’s average daily net assets of each respective share class:
| | | | | | | | | | | | |
| | | Distribution and Service Plan Rates | |
| | | Class A* | | | Class B | | | Class C | |
Distribution Plan | | | 0.25 | % | | | 0.75 | % | | | 0.75 | % |
Service Plan | | | — | | | | 0.25 | | | | 0.25 | |
| * | | With respect to Class A Shares, the Distributor at its discretion may use compensation for distribution services paid under the Distribution Plan to compensate service organizations for personal and account maintenance services and expenses as long as such total compensation does not exceed the maximum cap on “service fees” imposed by the Financial Industry Regulatory Authority. |
C. Distribution Agreement — Goldman Sachs, as Distributor of the shares of the Funds pursuant to a Distribution Agreement, may retain a portion of the Class A front end sales charge and Class B and Class C CDSC. During the six months ended April 30, 2012, Goldman Sachs advised that it retained the following approximate amounts:
| | | | | | | | | | | | | | |
| | | | | Front End
Sales Charge | | | Contingent Deferred
Sales Charge | |
| Fund | | | | Class A | | | Class B | | | Class C | |
Asia Equity | | | | $ | 400 | | | $ | — | | | $ | — | |
BRIC | | | | | 18,000 | | | | N/A | | | | 100 | |
Emerging Markets Equity | | | | | 4,900 | | | | — | | | | — | |
N-11 Equity | | | | | 5,500 | | | | N/A | | | | — | |
D. Service Plan and Shareholder Administration Plan — The Trust, on behalf of each Fund that offers Service Shares, has adopted a Service Plan and a Shareholder Administration Plan. These plans allow for service organizations to provide varying levels of personal and account maintenance and shareholder administration services to their customers who are beneficial owners of such shares. The Service Plan and Shareholder Administration Plan each provide for compensation to the service organizations which is accrued daily and paid monthly at an annual rate as follows: 0.25% (0.50% in aggregate) of the average daily net assets of the Service Shares.
E. Transfer Agency Agreement — Goldman Sachs also serves as the transfer agent of the Funds for a fee pursuant to a Transfer Agency Agreement. The fees charged for such transfer agency services are accrued daily and paid monthly at an annual rate as follows: 0.19% of the average daily net assets for Class A, Class B, Class C and Class IR Shares and 0.04% of the average daily net assets for Institutional and Service Shares.
F. Other Expense Agreements and Affiliated Transactions — GSAMI has agreed to limit certain “Other Expense” of the Funds (excluding management fees, distribution and service fees, transfer agent fees and expenses, service fees and shareholder administration fees (as applicable), taxes, interest, brokerage fees and litigation, indemnification, shareholder meetings and other extraordinary expenses, exclusive of any custody and transfer agent fee credit reductions) to the extent such expenses exceed, on an annual basis, a percentage rate of the average daily net assets of each Fund. Such Other Expense reimbursements, if any, are accrued daily and paid monthly. In addition, the Funds are not obligated to reimburse GSAMI for prior fiscal year expense reimbursements, if any. The Other Expense limitation as an annual percentage rate of average daily net assets for the Asia Equity, BRIC, Emerging Markets Equity and N-11 Equity Funds are 0.164%, 0.264%, 0.354% and 0.164%, respectively. These Other Expense reimbursements will remain in place through February 28, 2013 and prior to such date GSAMI may not terminate the arrangements without the approval of the trustees. In addition, the Funds have entered into certain offset arrangements with the custodian and the transfer agent, which may result in a reduction of the Funds’ expenses.
60
GOLDMAN SACHS FUNDAMENTAL EMERGING MARKETS EQUITY FUNDS
|
| 5. AGREEMENTS AND AFFILIATED TRANSACTIONS (continued) |
For the six months ended April 30, 2012, these expense reductions, including any fee waivers and Other Expense reimbursements, were as follows (in thousands):
| | | | | | | | | | | | | | | | | | |
| Fund | | | | Management
Fee Waiver | | | Other Expense
Reimbursement | | | Custody Fee
Credits | | | Total
Expense
Reductions | |
Asia Equity | | | | $ | — | | | $ | 232 | | | $ | 1 | | | $ | 233 | |
BRIC | | | | | 353 | | | | — | | | | 4 | | | | 357 | |
Emerging Markets Equity | | | | | 249 | | | | — | | | | 3 | | | | 252 | |
N-11 Equity | | | | | 44 | | | | 266 | | | | 1 | | | | 311 | |
As of April 30, 2012, the amounts owed to affiliates of the Funds were as follows (in thousands):
| | | | | | | | | | | | | | | | | | |
| Fund | | | | Management
Fees | | | Distribution
and Service
Fees | | | Transfer
Agent
Fees | | | Total | |
Asia Equity | | | | $ | 57 | | | $ | 11 | | | $ | 7 | | | $ | 75 | |
BRIC | | | | | 468 | | | | 121 | | | | 53 | | | | 642 | |
Emerging Markets Equity | | | | | 420 | | | | 36 | | | | 23 | | | | 479 | |
N-11 Equity | | | | | 102 | | | | 9 | | | | 7 | | | | 118 | |
G. Line of Credit Facility — As of April 30, 2012, the Funds participated in a $580,000,000 committed, unsecured revolving line of credit facility (the “facility”) together with other funds of the Trust and registered investment companies having management agreements with GSAMI or its affiliates (“Other Borrowers”). Pursuant to the terms of the facility, the Funds and Other Borrowers could increase the credit amount by an additional $340,000,000, for a total of up to $920,000,000. This facility is to be used solely for temporary or emergency purposes. The interest rate on borrowings is based on the federal funds rate. The facility also requires a fee to be paid by the Funds based on the amount of the commitment that has not been utilized. For the six months ended April 30, 2012, the Funds did not have any borrowings under the facility. Effective May 8, 2012, the amount available through the facility increased to $630,000,000.
H. Other Transactions with Affiliates — For the six months ended April 30, 2012, Goldman Sachs earned approximately $1,400, $5,900 and $900 in brokerage commissions from portfolio transactions, including futures transactions executed with Goldman Sachs as the Futures Commission Merchant, on behalf of the Asia Equity, Emerging Markets Equity and N-11 Equity Funds, respectively.
As of April 30, 2012, the Goldman Sachs Satellite Strategies Portfolio was the beneficial owner of approximately 9% of the total outstanding shares of the Emerging Markets Equity Fund.
|
| 6. PORTFOLIO SECURITIES TRANSACTIONS |
The cost of purchases and proceeds from sales and maturities of long-term securities for the six months ended April 30, 2012, were as follows:
| | | | | | | | | | |
| Fund | | | | Purchases | | | Sales and Maturities | |
Asia Equity | | | | $ | 27,608,517 | | | $ | 32,474,672 | |
BRIC | | | | | 189,063,112 | | | | 266,626,033 | |
Emerging Markets Equity | | | | | 208,236,604 | | | | 244,867,591 | |
N-11 Equity | | | | | 71,035,998 | | | | 32,800,437 | |
61
GOLDMAN SACHS FUNDAMENTAL EMERGING MARKETS EQUITY FUNDS
Notes to Financial Statements (continued)
April 30, 2012 (Unaudited)
As of the Funds’ most recent fiscal year end, October 31, 2011, the Funds’ capital loss carryovers on a tax-basis were as follows:
| | | | | | | | | | | | | | | | | | |
| | | | | Asia Equity | | | BRIC | | | Emerging
Markets Equity | | | N-11 Equity | |
Capital loss carryovers:(1) | | | | | | | | | | | | | | | | | | |
Expiring 2016(2) | | | | $ | — | | | $ | (47,073,350 | ) | | $ | (30,288,056 | ) | | $ | — | |
Expiring 2017(2) | | | | | (22,045,430 | ) | | | (151,677,917 | ) | | | (445,745,035 | ) | | | — | |
Perpetual Short-term | | | | | — | | | | — | | | | — | | | | (1,311,478 | ) |
Total capital loss carryovers | | | | $ | (22,045,430 | ) | | $ | (198,751,267 | ) | | $ | (476,033,091 | ) | | $ | (1,311,478 | ) |
| (1) | | Under new tax rules, capital losses recognized in tax years beginning after December 22, 2010, that do not offset recognized capital gains, may be carried over to future years perpetually, and retain their character as either short-term or long-term that can offset recognized capital gains in such future years. Previously, all capital loss carryovers were treated as short-term and such carryovers generally expired eight years after the initial loss arose. Perpetual capital loss carryovers are required to be utilized prior to expiring capital loss carryovers. |
| (2) | | Expiration occurs on October 31 of the year indicated. |
As of April 30, 2012, the Funds’ aggregate security unrealized gains and losses based on cost for U.S. federal income tax purposes were as follows:
| | | | | | | | | | | | | | | | | | |
| | | | | Asia Equity | | | BRIC | | | Emerging
Markets Equity | | | N-11 Equity | |
Tax cost | | | | $ | 61,612,512 | | | $ | 458,568,878 | | | $ | 378,093,845 | | | $ | 102,702,383 | |
Gross unrealized gain | | | | | 13,792,688 | | | | 56,499,036 | | | | 62,702,684 | | | | 7,985,637 | |
Gross unrealized loss | | | | | (7,014,012 | ) | | | (50,489,204 | ) | | | (32,798,881 | ) | | | (3,523,156 | ) |
Net unrealized security gain | | | | $ | 6,778,676 | | | $ | 6,009,832 | | | $ | 29,903,803 | | | $ | 4,462,481 | |
The difference between GAAP-basis and tax-basis unrealized gains (losses) is attributable primarily to wash sales, net mark to market gains (losses) on foreign currency contracts and differences related to the tax treatment of passive foreign investment company investments.
GSAMI has reviewed the Funds’ tax positions for all open tax years (the current and prior three years, as applicable) and has concluded that no provision for income tax is required in the Funds’ financial statements. Such open tax years remain subject to examination and adjustment by tax authorities.
The Funds’ risks include, but are not limited to, the following:
Foreign Custody Risk — A Fund that invests in foreign securities may hold such securities and foreign currency with foreign banks, agents, and securities depositories appointed by the Fund’s custodian (each a “Foreign Custodian”). In some countries, Foreign Custodians may be subject to little or no regulatory oversight or independent evaluation of their operations. Further, the laws of certain countries may place limitations on a Fund’s ability to recover its assets if a Foreign Custodian enters into bankruptcy. Investments in emerging markets may be subject to greater custody risks than investments in more developed markets. Custody services in emerging market countries are often undeveloped and may be less regulated than in more developed countries, and thus may not afford the same level of investor protection as would apply in developed countries.
Funds’ Shareholder Concentration Risk — Certain funds, accounts, individuals or Goldman Sachs affiliates may from time to time own (beneficially or of record) or control a significant percentage of the Funds’ shares. Redemptions by these entities of their holdings in the Funds may impact the Funds’ liquidity and NAV. These redemptions may also force the Funds to sell securities.
Geographic Risk — Concentration of the investments of a Fund in issuers located in a particular country or region will subject the Fund, to a greater extent than if investments were less concentrated, to the risks of adverse securities markets, exchange rates and social, political, regulatory or economic events which may occur in a given country or region. The Asia Equity Fund invests
62
GOLDMAN SACHS FUNDAMENTAL EMERGING MARKETS EQUITY FUNDS
|
| 8. OTHER RISKS (continued) |
primarily in equity investments in Asian issuers. The BRIC Fund invests primarily in equity investments in the BRIC countries (Brazil, Russia, India and China). The N-11 Equity Fund invests primarily in issuers or instruments that expose the Fund to the prevailing economic circumstances and factors present in the N-11 countries, and the Fund may invest up to 50% of its assets in investments tied economically to and/or issuers that participate in the markets of any one N-11 country.
Liquidity Risk — The Funds may make investments that may be illiquid or that may become less liquid in response to market developments or adverse investor perceptions. Liquidity risk may also refer to the risk that a Fund will not be able to pay redemption proceeds within the allowable time period because of unusual market conditions, an unusually high volume of redemption requests, or other reasons. To meet redemption requests, a Fund may be forced to sell investments at an unfavorable time and/or under unfavorable conditions.
Market and Credit Risks — In the normal course of business, the Funds trade financial instruments and enter into financial transactions where risk of potential loss exists due to changes in the market (market risk). Additionally, the Funds may also be exposed to credit risk in the event that an issuer fails to perform or that an institution or entity with which the Funds have unsettled or open transaction defaults.
Investing in foreign markets may involve special risks and considerations not typically associated with investing in the U.S. These risks include revaluation of currencies, high rates of inflation, repatriation restrictions on income and capital, and adverse political and economic developments. Moreover, securities issued in these markets may be less liquid, be subject to government ownership controls, have delayed settlements and their prices may be more volatile than those of comparable securities in the U.S.
Non-Diversification Risk — The BRIC and N-11 Equity Funds are non-diversified and are permitted to invest more of their assets in fewer issuers than a “diversified” mutual fund. Thus, these Funds may be subject to greater risks than a fund that invests in a greater number of issuers.
Under the Trust’s organizational documents, its trustees, officers, employees and agents are indemnified, to the extent permitted by the Act, against certain liabilities that may arise out of performance of their duties to the Funds. Additionally, in the course of business, the Funds enter into contracts that contain a variety of indemnification clauses. The Funds’ maximum exposure under these arrangements is unknown, as this would involve future claims that may be made against the Funds that have not yet occurred. However, GSAMI believes the risk of loss under these arrangements to be remote.
New Accounting Pronouncement — In May 2011, Accounting Standards Update 2011-04 (ASU 2011-04), Amendments to Achieve Common Fair Value Measurement and Disclosure Requirements in U.S. GAAP and IFRSs, was issued and is effective for interim and annual periods beginning after December 15, 2011. ASU 2011-04 amends Financial Accounting Standards Board (FASB) Topic 820, Fair Value Measurement. The amendments are the result of the work by the FASB and the International Accounting Standards Board to develop common requirements for measuring fair value and for disclosing information about fair value measurements in accordance with GAAP. GSAMI is currently evaluating the application of ASU 2011-04 and its impact, if any, on the Funds’ financial statements.
In December 2011, Accounting Standards Update 2011-11 (ASU 2011-11), Amendments to Disclosures about Offsetting Assets and Liabilities Requirements in U.S. GAAP and IFRSs, was issued and is effective for interim periods and annual periods beginning on or after January 1, 2013. The amendments are the result of the work by FASB and the International Accounting Standards Board to develop common requirements for disclosing information about offsetting and related arrangements. GSAMI is currently evaluating the application of ASU 2011-11 and its impact, if any, on the Funds’ financial statements.
Other Matters — On February 8, 2012, the Commodity Futures Trading Commission (CFTC) adopted amendments to several of its rules relating to commodity pool operators, including Rule 4.5. The Funds currently rely on Rule 4.5’s exclusion from CFTC
63
GOLDMAN SACHS FUNDAMENTAL EMERGING MARKETS EQUITY FUNDS
Notes to Financial Statements (continued)
April 30, 2012 (Unaudited)
|
| 10. OTHER MATTERS (continued) |
regulation for regulated investment companies. GSAMI is currently evaluating the amendments and their impact, if any, on the Funds’ financial statements.
Subsequent events after the balance sheet date have been evaluated through the date the financial statements were issued. GSAMI has concluded that there is no impact requiring adjustment or disclosure in the financial statements.
|
| 12. SUMMARY OF SHARE TRANSACTIONS |
Share activity is as follows:
| | | | | | | | | | | | | | | | |
| | | Asia Equity Fund | |
| | | | |
| | | For the Six Months Ended April 30, 2012 (Unaudited) | | | For the Fiscal Year Ended October 31, 2011 | |
| | | | |
| | | Shares | | | Dollars | | | Shares | | | Dollars | |
| | | | |
| Class A Shares | | | | | | | | | | | | | | | | |
Shares sold | | | 258,035 | | | $ | 4,244,870 | | | | 380,291 | | | $ | 7,356,320 | |
Shares converted from Class B(a) | | | 392 | | | | 6,465 | | | | 1,481 | | | | 28,096 | |
Reinvestment of distributions | | | 9,943 | | | | 160,777 | | | | 26,977 | | | | 521,717 | |
Shares redeemed | | | (491,636 | ) | | | (8,604,125 | ) | | | (587,442 | ) | | | (11,253,412 | ) |
| | | | (223,266 | ) | | | (4,192,013 | ) | | | (178,693 | ) | | | (3,347,279 | ) |
| Class B Shares | | | | | | | | | | | | | | | | |
Shares sold | | | 103 | | | | 1,785 | | | | 4,892 | | | | 94,086 | |
Shares converted to Class A(a) | | | (409 | ) | | | (6,465 | ) | | | (1,543 | ) | | | (28,096 | ) |
Reinvestment of distributions | | | — | | | | — | | | | 324 | | | | 6,038 | |
Shares redeemed | | | (8,869 | ) | | | (143,805 | ) | | | (22,086 | ) | | | (403,028 | ) |
| | | | (9,175 | ) | | | (148,485 | ) | | | (18,413 | ) | | | (331,000 | ) |
| Class C Shares | | | | | | | | | | | | | | | | |
Shares sold | | | 6,859 | | | | 114,098 | | | | 49,827 | | | | 870,031 | |
Reinvestment of distributions | | | — | | | | — | | | | 1,101 | | | | 20,311 | |
Shares redeemed | | | (31,275 | ) | | | (515,337 | ) | | | (129,726 | ) | | | (2,334,432 | ) |
| | | | (24,416 | ) | | | (401,239 | ) | | | (78,798 | ) | | | (1,444,090 | ) |
| Institutional Shares | | | | | | | | | | | | | | | | |
Shares sold | | | 4,752 | | | | 82,310 | | | | 404,273 | | | | 8,314,659 | |
Reinvestment of distributions | | | 13,091 | | | | 221,895 | | | | 17,003 | | | | 345,043 | |
Shares redeemed | | | (46,834 | ) | | | (866,768 | ) | | | (173,151 | ) | | | (3,574,061 | ) |
| | | | (28,991 | ) | | | (562,563 | ) | | | 248,125 | | | | 5,085,641 | |
NET DECREASE | | | (285,848 | ) | | $ | (5,304,300 | ) | | | (27,779 | ) | | $ | (36,728 | ) |
| (a) | | Class B Shares automatically convert into Class A Shares on or about the fifteenth day of the last month of the calendar quarter that is eight years after the initial purchase date of either the Fund or another Goldman Sachs Fund. |
64
GOLDMAN SACHS FUNDAMENTAL EMERGING MARKETS EQUITY FUNDS
|
| 12. SUMMARY OF SHARE TRANSACTIONS (continued) |
Share activity is as follows:
| | | | | | | | | | | | | | | | |
| | | BRIC Fund | |
| | | | |
| | | For the Six Months Ended April 30, 2012 (Unaudited) | | | For the Fiscal Year Ended October 31, 2011 | |
| | | | |
| | | Shares | | | Dollars | | | Shares | | | Dollars | |
| | | | |
| Class A Shares | | | | | | | | | | | | | | | | |
Shares sold | | | 2,114,702 | | | $ | 27,569,820 | | | | 6,234,806 | | | $ | 97,109,075 | |
Shares redeemed | | | (5,902,788 | ) | | | (75,133,656 | ) | | | (19,008,567 | ) | | | (299,941,024 | ) |
| | | | (3,788,086 | ) | | | (47,563,836 | ) | | | (12,773,761 | ) | | | (202,831,949 | ) |
| Class C Shares | | | | | | | | | | | | | | | | |
Shares sold | | | 286,394 | | | | 3,584,156 | | | | 1,412,941 | | | | 21,409,565 | |
Shares redeemed | | | (1,497,036 | ) | | | (18,372,889 | ) | | | (3,994,607 | ) | | | (58,120,369 | ) |
| | | | (1,210,642 | ) | | | (14,788,733 | ) | | | (2,581,666 | ) | | | (36,710,804 | ) |
| Institutional Shares | | | | | | | | | | | | | | | | |
Shares sold | | | 3,344,282 | | | | 44,293,082 | | | | 13,581,430 | | | | 224,215,672 | |
Reinvestment of distributions | | | — | | | | — | | | | 25,325 | | | | 403,934 | |
Shares redeemed | | | (5,416,347 | ) | | | (69,878,295 | ) | | | (7,085,738 | ) | | | (104,646,392 | ) |
| | | | (2,072,065 | ) | | | (25,585,213 | ) | | | 6,521,017 | | | | 119,973,214 | |
| Class IR Shares | | | | | | | | | | | | | | | | |
Shares sold | | | 259,321 | | | | 3,367,329 | | | | 31,907 | | | | 518,893 | |
Reinvestment of distributions | | | — | | | | — | | | | 21 | | | | 344 | |
Shares redeemed | | | (55,760 | ) | | | (732,124 | ) | | | (18,481 | ) | | | (289,730 | ) |
| | | | 203,561 | | | | 2,635,205 | | | | 13,447 | | | | 229,507 | |
NET DECREASE | | | (6,867,232 | ) | | $ | (85,302,577 | ) | | | (8,820,963 | ) | | $ | (119,340,032 | ) |
65
GOLDMAN SACHS FUNDAMENTAL EMERGING MARKETS EQUITY FUNDS
Notes to Financial Statements (continued)
April 30, 2012 (Unaudited)
|
| 12. SUMMARY OF SHARE TRANSACTIONS (continued) |
Share activity is as follows:
| | | | | | | | | | | | | | | | |
| | | Emerging Markets Equity Fund | |
| | | | |
| | | For the Six Months Ended April 30, 2012 (Unaudited) | | | For the Fiscal Year Ended October 31, 2011 | |
| | | | |
| | | Shares | | | Dollars | | | Shares | | | Dollars | |
| | | | |
| Class A Shares | | | | | | | | | | | | | | | | |
Shares sold | | | 345,041 | | | $ | 5,030,250 | | | | 1,065,762 | | | $ | 17,566,074 | |
Shares converted from Class B(a) | | | 2,551 | | | | 38,344 | | | | 8,665 | | | | 142,853 | |
Reinvestment of distributions | | | — | | | | — | | | | 7,205 | | | | 121,096 | |
Shares redeemed | | | (703,112 | ) | | | (10,194,340 | ) | | | (1,745,315 | ) | | | (28,337,316 | ) |
| | | | (355,520 | ) | | | (5,125,746 | ) | | | (663,683 | ) | | | (10,507,293 | ) |
| Class B Shares | | | | | | | | | | | | | | | | |
Shares sold | | | 3,252 | | | | 44,752 | | | | 21,761 | | | | 334,227 | |
Shares converted to Class A(a) | | | (2,795 | ) | | | (38,344 | ) | | | (9,431 | ) | | | (142,853 | ) |
Reinvestment of distributions | | | — | | | | — | | | | 625 | | | | 9,678 | |
Shares redeemed | | | (69,569 | ) | | | (932,010 | ) | | | (187,688 | ) | | | (2,793,854 | ) |
| | | | (69,112 | ) | | | (925,602 | ) | | | (174,733 | ) | | | (2,592,802 | ) |
| Class C Shares | | | | | | | | | | | | | | | | |
Shares sold | | | 143,562 | | | | 1,947,021 | | | | 291,588 | | | | 4,449,961 | |
Reinvestment of distributions | | | — | | | | — | | | | 1,197 | | | | 18,654 | |
Shares redeemed | | | (231,693 | ) | | | (3,050,602 | ) | | | (421,893 | ) | | | (6,329,635 | ) |
| | | | (88,131 | ) | | | (1,103,581 | ) | | | (129,108 | ) | | | (1,861,020 | ) |
| Institutional Shares | | | | | | | | | | | | | | | | |
Shares sold | | | 1,878,931 | | | | 28,933,638 | | | | 6,833,753 | | | | 116,822,286 | |
Reinvestment of distributions | | | 70,112 | | | | 1,016,617 | | | | 158,977 | | | | 2,825,692 | |
Shares redeemed | | | (3,854,139 | ) | | | (57,925,018 | ) | | | (11,535,667 | ) | | | (204,328,847 | ) |
| | | | (1,905,096 | ) | | | (27,974,763 | ) | | | (4,542,937 | ) | | | (84,680,869 | ) |
| Service Shares | | | | | | | | | | | | | | | | |
Shares sold | | | 239,853 | | | | 3,437,741 | | | | 492,167 | | | | 7,597,896 | |
Reinvestment of distributions | | | — | | | | — | | | | 2,880 | | | | 46,932 | |
Shares redeemed | | | (119,849 | ) | | | (1,673,163 | ) | | | (356,241 | ) | | | (5,669,824 | ) |
| | | | 120,004 | | | | 1,764,578 | | | | 138,806 | | | | 1,975,004 | |
| Class IR Shares | | | | | | | | | | | | | | | | |
Shares sold | | | 18,900 | | | | 286,246 | | | | 1,275 | | | | 21,016 | |
Reinvestment of distributions | | | 76 | | | | 1,097 | | | | — | | | | — | |
Shares redeemed | | | (1,540 | ) | | | (24,288 | ) | | | (2 | ) | | | (39 | ) |
| | | | 17,436 | | | | 263,055 | | | | 1,273 | | | | 20,977 | |
NET DECREASE | | | (2,280,419 | ) | | $ | (33,102,059 | ) | | | (5,370,382 | ) | | $ | (97,646,003 | ) |
| (a) | | Class B Shares automatically convert into Class A Shares on or about the fifteenth day of the last month of the calendar quarter that is eight years after the initial purchase date of either the Fund or another Goldman Sachs Fund. |
66
GOLDMAN SACHS FUNDAMENTAL EMERGING MARKETS EQUITY FUNDS
|
| 12. SUMMARY OF SHARE TRANSACTIONS (continued) |
Share activity is as follows:
| | | | | | | | | | | | | | | | |
| | | N-11 Equity Fund | |
| | | | |
| | | For the Six Months Ended April 30, 2012 (Unaudited) | | | For the Period Ended October 31, 2011(a) | |
| | | | |
| | | Shares | | | Dollars | | | Shares | | | Dollars | |
| | | | |
| Class A Shares | | | | | | | | | | | | | | | | |
Shares sold | | | 1,161,854 | | | $ | 11,058,039 | | | | 2,544,133 | | | $ | 26,202,458 | |
Shares redeemed | | | (818,881 | ) | | | (7,585,694 | ) | | | (629,033 | ) | | | (6,210,169 | ) |
| | | | 342,973 | | | | 3,472,345 | | | | 1,915,100 | | | | 19,992,289 | |
| Class C Shares | | | | | | | | | | | | | | | | |
Shares sold | | | 206,009 | | | | 1,938,597 | | | | 421,857 | | | | 4,279,916 | |
Shares redeemed | | | (23,363 | ) | | | (216,725 | ) | | | (51,409 | ) | | | (452,526 | ) |
| | | | 182,646 | | | | 1,721,872 | | | | 370,448 | | | | 3,827,390 | |
| Institutional Shares | | | | | | | | | | | | | | | | |
Shares sold | | | 4,409,396 | | | | 41,989,239 | | | | 4,880,362 | | | | 49,430,764 | |
Shares redeemed | | | (1,290,580 | ) | | | (12,192,442 | ) | | | (427,870 | ) | | | (3,922,159 | ) |
| | | | 3,118,816 | | | | 29,796,797 | | | | 4,452,492 | | | | 45,508,605 | |
| Class IR Shares | | | | | | | | | | | | | | | | |
Shares sold | | | 313,364 | | | | 2,945,947 | | | | 172,311 | | | | 1,776,168 | |
Shares redeemed | | | (78,609 | ) | | | (755,968 | ) | | | (21,366 | ) | | | (197,813 | ) |
| | | | 234,755 | | | | 2,189,979 | | | | 150,945 | | | | 1,578,355 | |
NET INCREASE | | | 3,879,190 | | | $ | 37,180,993 | | | | 6,888,985 | | | $ | 70,906,639 | |
| (a) | | Commenced operations on February 28, 2011. |
67
GOLDMAN SACHS FUNDAMENTAL EMERGING MARKETS EQUITY FUNDS
Fund Expenses — Six Month Period Ended April 30, 2012 (Unaudited)
As a shareholder of Class A, Class B, Class C, Institutional, Service or Class IR Shares of a Fund you incur two types of costs: (1) transaction costs, including sales charges on purchase payments (with respect to Class A Shares) and contingent deferred sales charges on redemptions (with respect to Class B and Class C Shares); and (2) ongoing costs, including management fees; distribution and service (12b-1) fees (with respect to Class A, Class B and Class C Shares); and other Fund expenses. This example is intended to help you understand your ongoing costs (in dollars) of investing in Class A, Class B, Class C, Institutional, Service and Class IR Shares of the Funds and to compare these costs with the ongoing costs of investing in other mutual funds.
The example is based on an investment of $1,000 invested at the beginning of the period and held for the entire period from November 1, 2011 through April 30, 2012.
Actual Expenses — The first line under each share class in the table below provides information about actual account values and actual expenses. You may use the information in this line, together with the amount you invested, to estimate the expenses that you paid over the period. Simply divide your account value by $1,000 (for example, an $8,600 account value divided by $1,000=8.6), then multiply the result by the number in the first line under the heading entitled “Expenses Paid” to estimate the expenses you paid on your account during this period.
Hypothetical Example for Comparison Purposes — The second line under each share class in the table below provides information about hypothetical account values and hypothetical expenses based on the Funds’ actual net expense ratio and an assumed rate of return of 5% per year before expenses, which is not the Funds’ actual return. The hypothetical account values and expenses may not be used to estimate the actual ending account balance or expenses you paid for the period. You may use this information to compare the ongoing costs of investing in the Funds and other funds. To do so, compare this 5% hypothetical example with the 5% hypothetical examples that appear in the shareholder reports of the other funds.
Please note that the expenses shown in the table are meant to highlight your ongoing costs only and do not reflect any transactional costs, such as sales charges, redemption fees, or exchange fees. Therefore, the second line of the table is useful in comparing ongoing costs only, and will not help you determine the relative total costs of owning different funds. In addition, if these transactional costs were included, your costs would have been higher.
| | | | | | | | | | | | | | | | | | | | | | | | | | | | | | | | | | | | | | | | | | | | | | | | |
| | | Asia Equity Fund | | | BRIC Fund | | | Emerging Markets Equity Fund | | | N-11 Equity Fund | |
| Share Class | | Beginning
Account Value
11/01/11 | | | Ending
Account Value
4/30/12 | | | Expenses
Paid for the
6 Months Ended
4/30/12* | | | Beginning
Account Value
11/01/11 | | | Ending
Account Value
4/30/12 | | | Expenses
Paid for the
6 Months Ended
4/30/12* | | | Beginning
Account Value
11/01/11 | | | Ending
Account Value
4/30/12 | | | Expenses
Paid for the
6 Months Ended
4/30/12* | | | Beginning
Account Value
11/01/11 | | | Ending
Account Value
4/30/12 | | | Expenses
Paid for the
6 Months Ended
4/30/12* | |
| Class A | | | | | | | | | | | | | | | | | | | | | | | | | | | | | | | | | | | | | | | | | | | | | | | | |
Actual | | $ | 1,000 | | | $ | 1,046.80 | | | $ | 8.14 | | | $ | 1,000 | | | $ | 989.30 | | | $ | 9.10 | | | $ | 1,000 | | | $ | 1,028.00 | | | $ | 9.33 | | | $ | 1,000 | | | $ | 1,048.00 | | | $ | 9.11 | |
Hypothetical 5% return | | | 1,000 | | | | 1,016.91 | + | | | 8.02 | | | | 1,000 | | | | 1,015.71 | + | | | 9.22 | | | | 1,000 | | | | 1,015.66 | + | | | 9.27 | | | | 1,000 | | | | 1,015.96 | + | | | 8.97 | |
| Class B | | | | | | | | | | | | | | | | | | | | | | | | | | | | | | | | | | | | | | | | | | | | | | | | |
Actual | | | 1,000 | | | | 1,042.30 | | | | 11.93 | | | | N/A | | | | N/A | | | | N/A | | | | 1,000 | | | | 1,023.90 | | | | 13.08 | | | | N/A | | | | N/A | | | | N/A | |
Hypothetical 5% return | | | 1,000 | | | | 1,013.18 | + | | | 11.76 | | | | N/A | | | | N/A | | | | N/A | | | | 1,000 | | | | 1,011.93 | + | | | 13.01 | | | | N/A | | | | N/A | | | | N/A | |
| Class C | | | | | | | | | | | | | | | | | | | | | | | | | | | | | | | | | | | | | | | | | | | | | | | | |
Actual | | | 1,000 | | | | 1,042.70 | | | | 11.94 | | | | 1,000 | | | | 985.70 | | | | 12.79 | | | | 1,000 | | | | 1,023.70 | | | | 13.08 | | | | 1,000 | | | | 1,044.10 | | | | 12.91 | |
Hypothetical 5% return | | | 1,000 | | | | 1,013.18 | + | | | 11.76 | | | | 1,000 | | | | 1,011.98 | + | | | 12.96 | | | | 1,000 | | | | 1,011.93 | + | | | 13.01 | | | | 1,000 | | | | 1,012.23 | + | | | 12.71 | |
| Institutional | | | | | | | | | | | | | | | | | | | | | | | | | | | | | | | | | | | | | | | | | | | | | | | | |
Actual | | | 1,000 | | | | 1,048.90 | | | | 6.11 | | | | 1,000 | | | | 991.00 | | | | 7.13 | | | | 1,000 | | | | 1,029.90 | | | | 7.32 | | | | 1,000 | | | | 1,051.00 | | | | 7.09 | |
Hypothetical 5% return | | | 1,000 | | | | 1,018.90 | + | | | 6.02 | | | | 1,000 | | | | 1,017.70 | + | | | 7.22 | | | | 1,000 | | | | 1,017.65 | + | | | 7.27 | | | | 1,000 | | | | 1,017.95 | + | | | 6.97 | |
| Service | | | | | | | | | | | | | | | | | | | | | | | | | | | | | | | | | | | | | | | | | | | | | | | | |
Actual | | | N/A | | | | N/A | | | | N/A | | | | N/A | | | | N/A | | | | N/A | | | | 1,000 | | | | 1,027.40 | | | | 9.83 | | | | N/A | | | | N/A | | | | N/A | |
Hypothetical 5% return | | | N/A | | | | N/A | | | | N/A | | | | N/A | | | | N/A | | | | N/A | | | | 1,000 | | | | 1,015.17 | + | | | 9.77 | | | | N/A | | | | N/A | | | | N/A | |
| Class IR | | | | | | | | | | | | | | | | | | | | | | | | | | | | | | | | | | | | | | | | | | | | | | | | |
Actual | | | N/A | | | | N/A | | | | N/A | | | | 1,000 | | | | 990.30 | | | | 7.87 | | | | 1,000 | | | | 1,029.30 | | | | 8.07 | | | | 1,000 | | | | 1,050.10 | | | | 7.85 | |
Hypothetical 5% return | | | N/A | | | | N/A | | | | N/A | | | | 1,000 | | | | 1,016.96 | + | | | 7.97 | | | | 1,000 | | | | 1,016.91 | + | | | 8.02 | | | | 1,000 | | | | 1,017.21 | + | | | 7.72 | |
| * | | Expenses are calculated using each Fund’s annualized net expense ratio for each class, which represents the ongoing expenses as a percentage of net assets for the six months ended April 30, 2012. Expenses are calculated by multiplying the annualized net expense ratio by the average account value for the period; then multiplying the result by the number of days in the most recent fiscal half year; and then dividing that result by the number of days in the fiscal year. The annualized net expense ratios for the period were as follows: |
| | | | | | | | | | | | | | | | | | | | | | | | |
| Fund | | Class A | | | Class B | | | Class C | | | Institutional | | | Service | | | Class IR | |
Asia Equity | | | 1.60 | % | | | 2.35 | % | | | 2.35 | % | | | 1.20 | % | | | N/A | | | | N/A | |
BRIC | | | 1.84 | | | | N/A | | | | 2.59 | | | | 1.44 | | | | N/A | | | | 1.59 | % |
Emerging Markets Equity | | | 1.85 | | | | 2.60 | | | | 2.60 | | | | 1.45 | | | | 1.95 | % | | | 1.60 | |
N-11 Equity | | | 1.79 | | | | N/A | | | | 2.54 | | | | 1.39 | | | | N/A | | | | 1.54 | |
| + | | Hypothetical expenses are based on each Fund’s actual annualized net expense ratios and an assumed rate of return of 5% per year before expenses. |
68
FUNDS PROFILE
Goldman Sachs Funds

Goldman Sachs is a premier financial services firm, known since 1869 for creating thoughtful and customized investment solutions in complex global markets.
Today, the Investment Management Division of Goldman Sachs serves a diverse set of clients worldwide, including private institutions, public entities and individuals. With $702.0 billion in assets under management as of March 31, 2012, Goldman Sachs Asset Management (“GSAM”) has portfolio management teams located around the world and our investment professionals bring firsthand knowledge of local markets to every investment decision. GSAM’s assets under management includes assets managed by Goldman Sachs Asset Management, LP and its Investment Advisory Affiliates. Additionally, GSAM ranks in the top 10 asset management firms worldwide, based on assets under management.1
|
| OVERVIEW OF GOLDMAN SACHS FUNDS |

Money Market2
Financial Square FundsSM
| n | | Financial Square Tax-Exempt Funds |
| n | | Financial Square Federal Fund |
| n | | Financial Square Government Fund |
| n | | Financial Square Money Market Fund |
| n | | Financial Square Prime Obligations Fund |
| n | | Financial Square Treasury Instruments Fund |
| n | | Financial Square Treasury Obligations Fund |
Fixed Income
Short Duration and Government
| n | | Ultra-Short Duration Govt. Fund |
| n | | Short Duration Government Fund |
| n | | Short Duration Income Fund |
| n | | Inflation Protected Securities Fund |
Multi-Sector
| n | | Core Plus Fixed Income Fund |
Municipal and Tax-Free
| n | | High Yield Municipal Fund |
| n | | Short Duration Tax-Free Fund |
Single Sector
| n | | Investment Grade Credit Fund |
| n | | High Yield Floating Rate Fund |
| n | | Emerging Markets Debt Fund |
| n | | Local Emerging Markets Debt Fund |
Corporate Credit
Fundamental Equity
| n | | Small/Mid Cap Growth Fund |
| n | | Flexible Cap Growth Fund |
| n | | Concentrated Growth Fund |
| n | | Technology Tollkeeper Fund |
| n | | Growth Opportunities Fund |
| n | | Rising Dividend Growth Fund |
Structured Equity
| n | | Structured Small Cap Equity Fund |
| n | | Structured U.S. Equity Fund |
| n | | Structured Small Cap Growth Fund |
| n | | Structured Large Cap Growth Fund |
| n | | Structured Large Cap Value Fund |
| n | | Structured Small Cap Value Fund |
| n | | Structured Tax-Managed Equity Fund |
| n | | Structured International Tax-Managed Equity Fund |
| n | | U.S. Equity Dividend and Premium Fund |
| n | | International Equity Dividend and Premium Fund |
| n | | Structured International Small Cap Fund |
| n | | Structured International Equity Fund |
| n | | Structured Emerging Markets Equity Fund |
Fundamental Equity International
| n | | Strategic International Equity Fund |
| n | | Concentrated International Equity Fund |
| n | | International Small Cap Fund |
| n | | Emerging Markets Equity Fund |
| n | | BRIC Fund (Brazil, Russia, India, China) |
Select Satellite3
| n | | Real Estate Securities Fund |
| n | | International Real Estate Securities Fund |
| n | | Commodity Strategy Fund |
| n | | Dynamic Allocation Fund |
| n | | Absolute Return Tracker Fund |
| n | | Managed Futures Strategy Fund |
Total Portfolio Solutions3
| n | | Balanced Strategy Portfolio |
| n | | Growth and Income Strategy Portfolio |
| n | | Growth Strategy Portfolio |
| n | | Equity Growth Strategy Portfolio |
| n | | Income Strategies Portfolio |
| n | | Satellite Strategies Portfolio |
| n | | Retirement Strategies Portfolios |
| n | | Enhanced Dividend Global Equity Portfolio |
| n | | Tax Advantaged Global Equity Portfolio |
| 1 | | Ranking for Goldman Sachs Group, Inc., includes Goldman Sachs Asset Management, Private Wealth Management and Merchant Banking 2010 year-end assets. Ranked 10th in total assets worldwide. Pensions&Investments, June 2011. |
| 2 | | An investment in a money market fund is neither insured nor guaranteed by the Federal Deposit Insurance Corporation (“FDIC”) or any other government agency. Although the Funds seek to preserve the value of your investment at $1.00 per share, it is possible to lose money by investing in the Funds. |
| 3 | | Individual Funds within the Total Portfolio Solutions and Select Satellite categories will have various placement on the risk/return spectrum and may have greater or lesser risk than that indicated by the placement of the general Total Portfolio Solutions or Select Satellite category. |
Financial Square FundsSM is a registered service mark of Goldman, Sachs & Co.
| | |
TRUSTEES Ashok N. Bakhru, Chairman Donald C. Burke John P. Coblentz, Jr. Diana M. Daniels Joseph P. LoRusso James A. McNamara Jessica Palmer Alan A. Shuch Richard P. Strubel | | OFFICERS James A. McNamara, President George F. Travers, Principal Financial Officer Peter V. Bonanno, Secretary Scott M. McHugh, Treasurer |
| |
GOLDMAN, SACHS & CO. Distributor and Transfer Agent | | GOLDMAN SACHS ASSET MANAGEMENT INTERNATIONAL Investment Adviser |
Visit our Website at www.goldmansachsfunds.com to obtain the most recent month-end returns.
Goldman Sachs Asset Management, L.P. 200 West Street, New York, New York 10282
The reports concerning the Funds included in this shareholder report may contain certain forward-looking statements about the factors that may affect the performance of the Funds in the future. These statements are based on Fund management’s predictions and expectations concerning certain future events and their expected impact on the Funds, such as performance of the economy as a whole and of specific industry sectors, changes in the levels of interest rates, the impact of developing world events, and other factors that may influence the future performance of the Funds. Management believes these forward-looking statements to be reasonable, although they are inherently uncertain and difficult to predict. Actual events may cause adjustments in portfolio management strategies from those currently expected to be employed.
A description of the policies and procedures that the Funds use to determine how to vote proxies relating to portfolio securities and information regarding how a Fund voted proxies relating to portfolio securities during the most recent 12-month period ended June 30 is available (I) without charge, upon request by calling 1-800-526-7384 (for Retail Shareholders) or 1-800-621-2550 (for Institutional Shareholders); and (II) on the Securities and Exchange Commission Website at http://www.sec.gov.
The Funds file their complete schedule of portfolio holdings with the Securities and Exchange Commission (“SEC”) for the first and third quarters of each fiscal year on Form N-Q. The Funds’ Forms N-Q will become available on the SEC’s website at http://www.sec.gov within 60 days after the Funds’ first and third fiscal quarters. When available, the Funds’ Forms N-Q may be reviewed and copied at the SEC’s Public Reference Room in Washington, D.C. and information on the operation of the Public Reference Room may also be obtained by calling 1-800-SEC-0330. When available, Form N-Q may be obtained upon request and without charge by calling 1-800-526-7384 (for Retail Shareholders) or 1-800-621-2550 (for Institutional Shareholders).
Holdings and allocations shown are as of April 30, 2012 and may not be representative of future investments. Fund holdings should not be relied on in making investment decisions and should not be construed as research or investment advice regarding particular securities.
The Global Industry Classification Standard (GICS) was developed by and is the exclusive property and a service mark of Morgan Stanley Capital International Inc. (MSCI) and Standard & Poor’s, a division of The McGraw-Hill Companies, Inc. (S&P) and is licensed for use by Goldman Sachs. Neither MSCI, S&P nor any other party involved in making or compiling the GICS or any GICS classifications makes any express or implied warranties or representations with respect to such standard or classification (or the results to be obtained by the use thereof), and all such parties hereby expressly disclaim all warranties of originality, accuracy, completeness, merchantability or fitness for a particular purpose with respect to any of such standard or classification. Without limiting any of the foregoing, in no event shall MSCI, S&P, any of their affiliates or any third party involved in making or compiling the GICS or any GICS classifications have any liability for any direct, indirect, special, punitive, consequential or any other damages (including lost profits) even if notified of the possibility of such damages.
The portfolio risk management process includes an effort to monitor and manage risk, but does not imply low risk.
This material is not authorized for distribution to prospective investors unless preceded or accompanied by a current Prospectus or summary prospectus, if applicable. Investors should consider a Fund’s objective, risks, and charges and expenses, and read the summary prospectus, if available, and/or the Prospectus carefully before investing or sending money. The summary prospectus, if available, and the Prospectus contain this and other information about a Fund and may be obtained from your authorized dealer or from Goldman, Sachs & Co. by calling (retail – 1-800-526-7384) (institutional – 1-800-621-2550).
© 2012 Goldman Sachs. All rights reserved. 75554.MF.MED.TMPL/6/2012 EMESAR12/35K
| | The information required by this Item is only required in an annual report on this Form N-CSR. |
| ITEM 3. | AUDIT COMMITTEE FINANCIAL EXPERT. |
| | The information required by this Item is only required in an annual report on this Form N-CSR. |
| ITEM 4. | PRINCIPAL ACCOUNTANT FEES AND SERVICES. |
| | The information required by this Item is only required in an annual report on this Form N-CSR. |
| ITEM 5. | AUDIT COMMITTEE OF LISTED REGISTRANTS. |
| ITEM 6. | SCHEDULE OF INVESTMENTS. |
| | Schedule of Investments is included as part of the Report to Stockholders filed under Item 1. |
| ITEM 7. | DISCLOSURE OF PROXY VOTING POLICIES AND PROCEDURES FOR CLOSED-END MANAGEMENT INVESTMENT COMPANIES. |
| ITEM 8. | PORTFOLIO MANAGERS OF CLOSED-END MANAGEMENT INVESTMENT COMPANIES. |
| ITEM 9. | PURCHASES OF EQUITY SECURITIES BY CLOSED-END MANAGEMENT INVESTMENT COMPANY AND AFFILIATED PURCHASERS. |
| ITEM 10. | SUBMISSION OF MATTERS TO A VOTE OF SECURITY HOLDERS. |
| | There have been no material changes to the procedures by which shareholders may recommend nominees to the registrant’s board of trustees. |
| ITEM 11. | CONTROLS AND PROCEDURES. |
| | (a) | The registrant’s principal executive and principal financial officers, or persons performing similar functions have concluded that the registrant’s disclosure controls and procedures (as defined in Rule 30a-3(c) under the Investment Company Act of 1940, as amended (the “1940 Act”)) are effective as of a date within 90 days of the filing of this report that includes the disclosure required by this paragraph, based on the evaluation of these controls and procedures required by Rule 30a-3(b) under the 1940 Act and 15d-15(b) under the Securities Exchange Act of 1934, as amended. |
| | (b) | There were no changes in the registrant’s internal control over financial reporting (as defined in Rule 30a-3(d) under the 1940 Act) that occurred during the registrant’s second fiscal quarter of the period covered by this report that have materially affected, or are reasonably likely to materially affect, the registrant’s internal control over financial reporting. |
| | | | |
| (a)(1) | | The information required by this Item is only required in connection with an annual report on this Form N-CSR. |
| | |
| (a)(2) | | Exhibit 99.CERT | | Certifications pursuant to Section 302 of the Sarbanes-Oxley Act of 2002 filed herewith. |
| | |
| (b) | | Exhibit 99.906CERT | | Certifications pursuant to Section 906 of the Sarbanes-Oxley Act of 2002 filed herewith. |
SIGNATURES
Pursuant to the requirements of the Securities Exchange Act of 1934 and the Investment Company Act of 1940, the registrant has duly caused this report to be signed on its behalf by the undersigned, thereunto duly authorized.
| | | | |
| | | | Goldman Sachs Trust |
| | |
| By: | | | | /s/ James A. McNamara |
| | | | James A. McNamara |
| | | | President/Principal Executive Officer |
| | | | Goldman Sachs Trust |
| | |
| Date: | | | | June 26, 2012 |
Pursuant to the requirements of the Securities Exchange Act of 1934 and the Investment Company Act of 1940, this report has been signed below by the following persons on behalf of the registrant and in the capacities and on the dates indicated.
| | | | |
| By: | | | | /s/ James A. McNamara |
| | | | James A. McNamara |
| | | | President/Principal Executive Officer |
| | | | Goldman Sachs Trust |
| | |
| Date: | | | | June 26, 2012 |
| | |
| By: | | | | /s/ George F. Travers |
| | | | George F. Travers |
| | | | Principal Financial Officer |
| | | | Goldman Sachs Trust |
| | |
| Date: | | | | June 25, 2012 |