UNITED STATES
SECURITIES AND EXCHANGE COMMISSION
Washington, D.C. 20549
FORM N-CSR
CERTIFIED SHAREHOLDER REPORT OF REGISTERED
MANAGEMENT INVESTMENT COMPANIES
Investment Company Act file number 811-05349
Goldman Sachs Trust
(Exact name of registrant as specified in charter)
71 South Wacker Drive,
Chicago, Illinois 60606
(Address of principal executive offices) (Zip code)
| | |
Copies to: |
Caroline Kraus | | Geoffrey R.T. Kenyon, Esq. |
Goldman, Sachs & Co. | | Dechert LLP |
200 West Street | | 200 Clarendon Street |
New York, New York 10282 | | 27th Floor |
| | Boston, MA 02116-5021 |
(Name and address of agents for service)
Registrant’s telephone number, including area code: (312) 655-4400
Date of fiscal year end: March 31
Date of reporting period: September 30, 2012
| ITEM 1. | REPORTS TO STOCKHOLDERS. |
| | The Semi-Annual Report to Stockholders is filed herewith. |
Goldman Sachs Funds

| | | | |
| | |
| Semi-Annual Report | | | | September 30, 2012 |
| | |
| | | | Short Duration and Government Fixed Income Funds |
| | | | Enhanced Income |
| | | | Government Income |
| | | | High Quality Floating Rate* |
| | | | Inflation Protected Securities |
| | | | Short Duration Government |
| | | | Short Duration Income |
*Effective July 27, 2012, the Goldman Sachs Ultra-Short Duration Government Fund was renamed the Goldman Sachs High Quality Floating Rate Fund.

Goldman Sachs Short Duration and Government Fixed Income Funds
| n | | HIGH QUALITY FLOATING RATE |
| n | | INFLATION PROTECTED SECURITIES |
| n | | SHORT DURATION GOVERNMENT |
| | | | |
TABLE OF CONTENTS | | | | |
| |
Principal Investment Strategies and Risks | | | 1 | |
| |
Investment Process | | | 3 | |
| |
Market Review | | | 4 | |
| |
Portfolio Management Discussions and Performance Summaries | | | 7 | |
| |
Schedules of Investments | | | 34 | |
| |
Financial Statements | | | 70 | |
| |
Financial Highlights | | | 78 | |
| |
Notes to Financial Statements | | | 90 | |
| |
Other Information | | | 115 | |
| | | | |
| | | |
| NOT FDIC-INSURED | | May Lose Value | | No Bank Guarantee |
GOLDMAN SACHS SHORT DURATION AND GOVERNMENT FIXED INCOME FUNDS
Principal Investment Strategies and Risks
This is not a complete list of risks that may affect the Funds. For additional information concerning the risks applicable to the Funds, please see the Funds’ Prospectuses.
The Goldman Sachs Enhanced Income Fund invests primarily in a portfolio of U.S. dollar denominated securities, including non-mortgage U.S. government securities, corporate notes, commercial paper, fixed and floating rate asset-backed securities and foreign securities. The Fund’s investments in fixed income securities are subject to the risks associated with debt securities generally, including credit, liquidity and interest rate risk. Any guarantee on U.S. government securities applies only to the underlying securities of the Fund if held to maturity and not to the value of the Fund’s shares. The Fund may invest in foreign securities, which may be more volatile and less liquid than investments in U.S. securities and will be subject to the risks of adverse economic or political developments. Derivative instruments may involve a high degree of financial risk. These risks include the risk that a small movement in the price of the underlying security or benchmark may result in a disproportionately large movement, unfavorable or favorable, in the price of the derivative instrument; the risk of default by a counterparty; and liquidity risk. At times, the Fund may be unable to sell certain of its investments without a substantial drop in price, if at all.
The Goldman Sachs Government Income Fund invests primarily in U.S. government securities and in repurchase agreements collateralized by such securities. The Fund’s investments in fixed income securities are subject to the risks associated with debt securities generally, including credit, liquidity and interest rate risk. The Fund’s net asset value and yield are not guaranteed by the U.S. government or by its agencies, instrumentalities or sponsored enterprises. Any guarantee on U.S. government securities applies only to the underlying securities of the Fund if held to maturity and not to the value of the Fund’s shares. The Fund’s investments in mortgage-backed securities are also subject to prepayment risk (i.e., the risk that in a declining interest rate environment, issuers may pay principal more quickly than expected, causing the Fund to reinvest proceeds at lower prevailing interest rates). Derivative instruments may involve a high degree of financial risk. These risks include the risk that a small movement in the price of the underlying security or benchmark may result in a disproportionately large movement, unfavorable or favorable, in the price of the derivative instrument; the risk of default by a counterparty; and liquidity risk. At times, the Fund may be unable to sell certain of its investments without a substantial drop in price, if at all.
The Goldman Sachs High Quality Floating Rate Fund invests primarily in high quality floating rate or variable rate obligations, and the Fund considers “high quality” obligations to be (i) those rated AAA or Aaa by a nationally recognized statistical rating organization at the time of purchase (or, if unrated, determined by the Investment Adviser to be of comparable quality), and (ii) U.S. government securities, including mortgage-backed securities, and repurchase agreements collateralized by U.S. government securities. The Fund’s investments in fixed income securities are subject to the risks associated with debt securities generally, including credit, liquidity and interest rate risk. Any guarantee on U.S. government securities applies only to the underlying securities of the Fund if held to maturity and not to the value of the Fund’s shares. The Fund’s investments in mortgage-backed securities are also subject to prepayment risk (i.e., the risk that in a declining interest rate environment, issuers may pay principal more quickly than expected, causing the Fund to reinvest proceeds at lower prevailing interest rates). The Fund’s investments in foreign securities may be more volatile and less liquid than investments in U.S. securities and will be subject to the risks of adverse economic or political developments. Derivative instruments may involve a high degree of financial risk. These risks include the risk that a small movement in the price of the underlying security or benchmark may result in a disproportionately large movement, unfavorable or favorable, in the price of the derivative instrument; the risk of default by a counterparty; and liquidity risk. At times, the Fund may be unable to sell certain of its investments without a substantial drop in price, if at all.
1
GOLDMAN SACHS SHORT DURATION AND GOVERNMENT FIXED INCOME FUNDS
The Goldman Sachs Inflation Protected Securities Fund invests primarily in inflation protected securities (IPS) of varying maturities issued by the U.S. Treasury and other U.S. and non-U.S. Government agencies and corporations. Fixed income securities are subject to the risks associated with debt securities generally, including credit, liquidity and interest rate risk. IPS are fixed income securities whose interest and principal payments are periodically adjusted according to the rate of inflation. The market value of IPS is not guaranteed, and will fluctuate in response to changes in real interest rates. The market for IPS may be less developed or liquid, and more volatile, than certain other securities markets. If deflation were to occur, IPS would likely decline in price. Any guarantee on U.S. government securities applies only to the underlying securities of the Fund if held to maturity and not to the value of the Fund’s shares.
The Goldman Sachs Short Duration Government Fund invests primarily in U.S. government securities and in repurchase agreements collateralized by such securities. The Fund’s investments in fixed income securities are subject to the risks associated with debt securities generally, including credit, liquidity and interest rate risk. The Fund’s net asset value and yield are not guaranteed by the U.S. government or by its agencies, instrumentalities or sponsored enterprises. Any guarantee on U.S. government securities applies only to the underlying securities of the Fund if held to maturity and not to the value of the Fund’s shares. The Fund’s investments in mortgage-backed securities are also subject to prepayment risk (i.e., the risk that in a declining interest rate environment, issuers may pay principal more quickly than expected, causing the Fund to reinvest proceeds at lower prevailing interest rates). Derivative instruments may involve a high degree of financial risk. These risks include the risk that a small movement in the price of the underlying security or benchmark may result in a disproportionately large movement, unfavorable or favorable, in the price of the derivative instrument; the risk of default by a counterparty; and liquidity risk. At times, the Fund may be unable to sell certain of its investments without a substantial drop in price, if at all.
The Goldman Sachs Short Duration Income Fund invests primarily in U.S. or foreign fixed income securities, including U.S. government securities, corporate debt securities, collateralized loan obligations, agency and privately issued mortgage-backed securities, asset-backed securities, high yield non-investment grade securities, bank loans and emerging countries debt. The Fund’s investments in fixed income securities are subject to the risks associated with debt securities generally, including credit, liquidity, interest rate, call and extension risk. Any guarantee on U.S. government securities applies only to the underlying securities of the Fund if held to maturity and not to the value of the Fund’s shares. The Fund’s investments in mortgage-backed securities are also subject to prepayment risk (i.e., the risk that in a declining interest rate environment, issuers may pay principal more quickly than expected, causing the Fund to reinvest proceeds at lower prevailing interest rates). High yield, lower rated securities involve greater price volatility and present greater risks than higher rated fixed income securities. Indirect loan participations may subject the Fund to greater delays, expenses and risks than direct obligations in the case that a borrower fails to pay scheduled principal and interest. The Fund may invest in foreign and emerging markets securities, which may be more volatile and less liquid than investments in U.S. securities and will be subject to the risks of currency fluctuations and adverse economic and political developments. Derivative instruments may involve a high degree of financial risk. These risks include the risk that a small movement in the price of the underlying security or benchmark may result in a disproportionately large movement, unfavorable or favorable, in the price of the derivative instrument; risks of default by a counterparty; and liquidity risk. At times, the Fund may be unable to sell certain of its investments without a substantial drop in price, if at all. The Fund’s use of derivatives may result in leverage, which can make the Fund more volatile. The Fund’s investments in other investment companies subject it to additional expenses. The Fund may be more sensitive to adverse economic, business or political developments if it invests a substantial portion of its assets in bonds of similar projects or in particular types of municipal securities.
2
GOLDMAN SACHS SHORT DURATION AND GOVERNMENT FIXED INCOME FUNDS
What Differentiates Goldman Sachs Asset Management’s Fixed Income Investment Process?
At Goldman Sachs Asset Management, L.P. (“GSAM”), the goal of our fixed income investment process is to provide consistent, strong performance by actively managing our portfolios within a research-intensive, risk-managed framework.
A key element of our fixed income investment philosophy is to evaluate the broadest global opportunity set to capture relative value across sectors and instruments. Our globally integrated investment process involves managing dynamically along the risk/return spectrum, as we continue to develop value-added strategies through:

| n | | Assess relative value among securities and sectors |
| n | | Leverage the vast resources of GSAM in selecting securities for each portfolio |

| n | | Team approach to decision making |
| n | | Manage risk by avoiding significant sector and interest rate bets |
| n | | Careful management of yield curve strategies — while closely managing portfolio duration |

Fixed Income portfolios that:
| | n | | Include domestic and global investment options, income opportunities, and access to areas of specialization such as high yield | |
| | n | | Capitalize on GSAM’s industry-renowned credit research capabilities | |
| | n | | Use a risk-managed framework to seek total return, recognizing the importance of investors’ capital accumulation goals as well as their need for income | |
3
MARKET REVIEW
Goldman Sachs Short Duration and Government Fixed Income Funds
Market Review
Fixed income market performance during the six months ended September 30, 2012 (the “Reporting Period”) was strong but volatile, as corporate bonds and other riskier sectors of the market posted solid gains even as government bond yields fell to new lows.
Riskier fixed income assets, i.e., non-U.S. Treasury sectors, began the Reporting Period under pressure, as U.S. economic data softened in April after a strong start to the year 2012. In particular, March payroll data released in early April showed a significant slowing in job gains. In January and February, payrolls had climbed by more than 200,000 jobs per month, but the March report showed a gain of just more than 100,000 jobs. That report set the tone for April fixed income performance, as U.S. Treasury yields declined, and non-U.S. Treasury sectors underperformed. (Remember, there is usually an inverse relationship between bond prices and yield movements, such that bond prices rise when yields decline and vice versa.)
The performance trend continued in May, as the benchmark 10-year U.S. Treasury yield fell to a new low of 1.56%, and non-U.S. Treasury sectors of the fixed income market continued to perform poorly. Economic data was again a key driver of the weakness in riskier assets, as U.S. payrolls added just 69,000 jobs, less than half the expected gain. Concerns about Europe, and the health of the Spanish banking system in particular, also weighed on investors’ risk appetites. Although Spain announced several measures in May to support its banks, Spanish government bond yields spiked on investor worries about the country’s ability to support its banks given its own debt challenges.
June marked a turning point for non-U.S. Treasury sectors, although U.S. Treasury yields continued to decline. Developments in Europe were again a key driver of risk sentiment, as Greece held a presidential election that raised concerns about the country potentially exiting the Eurozone, and Spain finally appealed to the European Union for assistance for its banking system. Continued weakness in U.S. and global economic data also weighed on sentiment. As a result, U.S. Treasury yields continued to decline, but non-U.S. Treasury sectors gained ground during the month as Greece elected a pro-Eurozone administration and the European Union agreed to provide support to Spain’s banking system. Even as government bond yields hit new record lows, investors began moving back into higher-yielding corporate and emerging market bonds.
Non-U.S. Treasury sectors continued to outperform U.S. Treasuries through the remainder of the Reporting Period, largely as a function of the market searching for yield in an environment of extremely low interest rates. In addition, market expectations for more quantitative easing by the U.S. Federal Reserve (the “Fed”) increased in August in light of minutes from the August 1, 2012 Federal Open Market Committee meeting and Fed Chairman Ben Bernanke’s speech at the Fed’s annual conference in Jackson Hole, Wyoming. Overall economic growth in the U.S. remained sluggish, with housing a key exception as the Standard & Poor’s/Case-Shiller Home Price Index data showed the strongest house price gains since the index’s inception.
In September, the Fed exceeded most expectations for additional quantitative easing, with an announcement of open-ended asset purchases, dubbed QE3, and an extension of the likely period of low short-term interest rates from mid-2014 to at least mid-2015. With the Fed holding short-term interest rates at low levels, demand for higher yielding sectors remained strong. As evidence, the high yield corporate bond sector received record investment inflows on a year-to-date basis during September.
4
MARKET REVIEW
Looking Ahead
Going forward, we believe aggressive central bank action may not provide much of a boost to global economic growth, but we think recent policy measures significantly reduce the downside risks. The Fed has committed to purchase bonds until the U.S. labor market improves substantially, while the European Central Bank has committed to unlimited bond purchases to preserve the euro. These open-ended commitments are a significant departure from previous central bank policies, which focused on specific amounts of bond purchases or liquidity support. We not only doubt these measures will have a significant positive effect on economic growth, but we also worry about the longer-term consequences of further central bank balance sheet expansion. However, in the intermediate term, we think the open-ended nature of the Fed and European Central Bank bond purchases has meaningfully reduced the probability — and the potential severity — of downside economic and market scenarios.
In the U.S., we believe economic growth could see some benefit if there is a reduction in downside scenarios related to Europe and resolution of the uncertainties related to the fiscal cliff and November elections. (The major components of the so-called fiscal cliff include tax increases and spending cuts totaling approximately $576 billion scheduled to take effect on January 1, 2013.) The U.S. corporate sector has continued to stockpile cash and defer hiring and investment as a form of self-insurance against risk and uncertainty. However, the timeline for resolving uncertainties around the fiscal cliff and election is finite in our view. One way or another, within a few months, businesses will have a much better sense of U.S. fiscal policy and the regulatory regime going forward. We think politicians will ultimately defer most of the impact of the fiscal cliff, leaving the U.S. with fiscal restraint1 of about 1.5% of Gross Domestic Product (“GDP”) in 2013, which is close to the level of fiscal restraint seen at the end of the Reporting Period. We believe the combination of a lower than feared fiscal impact, reduced risk of a crisis in Europe and the Fed’s additional support for the U.S. housing recovery should provide modest upside potential for U.S. economic growth in 2013.
China’s economic slowdown, on the other hand, remains a source of greater uncertainty, in our view, as policymakers attempt to transition the Chinese economy from growth driven by exports and investment to growth driven by domestic consumption. China’s leaders have said economic growth will slow, and policymakers are targeting GDP of 7.5% in their latest five-year plan, which is close to the economy’s growth rate over the first half of 2012. Policymakers appear to be taking a conservative approach to stimulating economic growth and are focusing on measures such as subsidies for energy-efficient appliances rather than large infrastructure projects. China has virtually no track record when it comes to stimulating consumption, thereby raising concerns the economic slowdown could be deeper than targeted. That said, we are cautious about overreacting to the short-term trend in Chinese economic growth given policymakers’ long-term focus and 7.5% GDP growth target. Should economic growth slow more significantly, we would expect additional policy responses.
| 1 | | Fiscal restraint in this context refers to the net dollar amount of tax increase and/or government spending decrease, expressed as a percent of the dollar amount of US GDP, for the purpose of indicating the size of the change in taxes and government spending relative to the size of the economy. |
5
MARKET REVIEW
From an investment perspective, we believe the policy and economic growth backdrop anticipated for the coming months favors U.S. non-Treasury sectors. We think strong economic growth is probably the only scenario that could lead central banks to allow a significant rise in real yields, and we believe strong economic growth is a low probability. As a result, we expect yields on government bonds to generally remain in the range seen at the end of the Reporting Period, and we favor a tactical approach to duration management. We also think U.S. corporate credit valuations were attractive relative to fundamentals at the end of the Reporting Period, due largely to risk premiums for European tail risk. (Here, tail risk simply means the risk or probability of rare events.) Should European risk decline and government bond yields remain low as expected, we think U.S. corporate credit should benefit from investor demand for yield as well as from favorable fundamentals. In emerging markets, we do not see the slowdown in China leading to a boom/bust cycle in emerging countries broadly. We believe emerging market countries with good economic growth and strong balance sheets should continue to perform well.
The economic and market forecasts presented herein have been generated by GSAM for informational purposes as of the date of this presentation. They are based on proprietary models and there can be no assurance that the forecasts will be achieved. Please see additional disclosures at the end of this presentation.
6
PORTFOLIO RESULTS
Goldman Sachs Enhanced Income Fund
Investment Objective
The Fund seeks to generate return in excess of traditional money market products while maintaining an emphasis on preservation of capital and liquidity.
Portfolio Management Discussion and Analysis
Below, the Goldman Sachs U.S. Fixed Income Investment Management Team discusses the Goldman Sachs Enhanced Income Fund’s (the “Fund”) performance and positioning for the six-month period ended September 30, 2012 (the “Reporting Period”).
| Q | | How did the Fund perform during the Reporting Period? |
| A | | During the Reporting Period, the Fund’s Class A, B, Institutional, Administration and IR Shares generated cumulative total returns, without sales charges, of 0.59%, 0.26%, 0.76%, 0.63% and 0.71%, respectively. These returns compare to the 0.14% cumulative total return of the Goldman Sachs Enhanced Income Fund Composite Index (the “Enhanced Income Composite”) during the same period. The Enhanced Income Composite is comprised 50% of the Six-Month U.S. Treasury Bill Index and 50% of the One-Year U.S. Treasury Note Index, which generated cumulative total returns of 0.11% and 0.18%, respectively, over the same time period. |
| Q | | What key factors were responsible for the Fund’s performance during the Reporting Period? |
| A | | Both top-down and bottom-up strategies had an impact on the Fund’s performance during the Reporting Period. Within our top-down strategies, our duration and yield curve positioning strategy contributed positively to Fund performance. Duration is a measure of the Fund’s sensitivity to changes in interest rates. Yield curve indicates the spectrum of maturities within a particular sector. Our cross-sector strategy generated mixed results, but also contributed positively to the Fund’s results during the Reporting Period overall. Our cross-sector strategy is one in which we invest Fund assets across a variety of fixed income sectors, including some that may not be included in the Fund’s benchmark. Bottom-up individual issue selection amongst corporate bonds, covered bonds and government/agency securities also boosted results. |
| Q | | Which fixed income market sectors most significantly affected Fund performance? |
| A | | Sector positioning contributed positively to the Fund’s results during the Reporting Period, with allocations to corporate bonds and covered bonds helping most. The positive effect of the Fund’s allocation to covered bonds, which are debt securities backed by cash flows from mortgage loans or public sector loans, was primarily seen late in the Reporting Period, as risk assets, or non-U.S. Treasury sectors, rallied during the third quarter of 2012. Partially offsetting this positive contribution was the detracting effect of an underweighted allocation to U.S. government securities, held during April and May 2012 when interest rates fell significantly on deteriorating economic data, political challenges in Europe and a possibility of a Greek exit from the European Union. An exposure to high quality spread, or non-U.S. Treasury, sectors also detracted from the Fund’s results early in the Reporting Period, as investors were then looking for more safe-haven assets. Developments in Europe in June, supported by additional easing from the European Central Bank and Federal Reserve (the “Fed”), pushed interest rates higher off of their historic lows and sparked a rally in risk assets later in the Reporting Period, and the Fund’s overweighted allocations to corporate bonds, covered bonds, asset-backed securities and agency securities then added value. |
| | Our individual security selection strategies were the primary contributor to the Fund’s relative results during the Reporting Period, especially individual selection of corporate bonds, U.S. government securities and covered bonds. Within the corporate bond sector, a focus on short-dated, high credit quality issuers within the financials industry, added most to relative performance. Among U.S. government securities, a bias toward short-dated securities helped most. |
7
PORTFOLIO RESULTS
| Q | | Did the Fund’s duration and yield curve positioning strategy help or hurt its results during the Reporting Period? |
| A | | Tactical management of the Fund’s duration and yield curve positioning helped its results during the Reporting Period. A steeper yield curve bias benefited the Fund’s performance, particularly in September when aggressive quantitative easing by the Fed pushed the inflation premium at the long-term end of the yield curve higher. However, such positive contribution was partially offset by the detracting effect of having a shorter duration than the benchmark index, especially in the five-year segment of the U.S. Treasury yield curve, during the early months of the Reporting Period. Interest rates declined significantly during April and May 2012, with the 10-year U.S. Treasury yield dropping 66 basis points to 1.56%. (A basis point is 1/100th of a percentage point.) We shifted to a long duration position overall relative to the benchmark index in mid-June and extended the duration modestly further by the end of the Reporting Period. The Fund ended the Reporting Period with a longer duration position than the benchmark index. As mentioned earlier, duration is a measure of the Fund’s sensitivity to changes in interest rates. Yield curve indicates the spectrum of maturities within a particular sector. |
| Q | | How did the Fund use derivatives and similar instruments during the Reporting Period? |
| A | | The Fund used Treasury futures and Eurodollar futures during the Reporting Period for the purpose of managing the duration and term structure of the Fund. (Term structure, most often depicted as a yield curve, refers to the term structure of interest rates, which is the relationship between the yield to maturity and the time to maturity for pure discount bonds.) The Fund employed credit default swaps to manage the credit profile of the Fund. |
| Q | | Were there any notable changes in the Fund’s weightings during the Reporting Period? |
| A | | The Fund’s exposure to U.S. government-guaranteed obligations, investment grade corporate bonds and covered bonds decreased during the Reporting Period. A corresponding increase in allocation was concentrated in U.S. Treasury securities and asset-backed securities. Additionally, as indicated earlier, we shifted the Fund’s duration positioning during the Reporting Period as market conditions changed. At the start of the Reporting Period, the Fund maintained a shorter duration position than the benchmark index. We maintained that position through mid-June. We subsequently shifted to a longer duration position than the benchmark index, extending duration further by the end of September. |
| Q | | How was the Fund positioned relative to its benchmark index at the end of September 2012? |
| A | | While the Fund is benchmarked to U.S. Treasuries, it continued to hold a portion of its assets in non-Treasury sectors not represented in the benchmark index. Indeed, the Fund maintained exposures to high quality spread, or non-Treasury, sectors throughout the Reporting Period, most notably quasi-government securities, including agency-issued debentures, as well as asset-backed securities, covered bonds and investment grade corporate bonds. The Fund maintained an underweighted exposure to government bonds at the end of the Reporting Period. |
8
FUND BASICS
Enhanced Income Fund
as of September 30, 2012
| | | | | | | | | | | | | | | | | | | | | | | | | | |
| | PERFORMANCE REVIEW | |
| | | April 1, 2012–
September 30, 2012 | | Fund Total
Return
(based
on NAV)1 | | | Goldman Sachs
Enhanced
Income Fund
Composite Index2 | | | Six-Month
U.S.
Treasury
Bill Index3 | | | One-Year
U.S.
Treasury
Note Index3 | | | 30-Day
Standardized
Subsidized
Yield4 | | | 30-Day
Standardized
Unsubsidized
Yield4 | |
| | Class A | | | 0.59 | % | | | 0.14 | % | | | 0.11 | % | | | 0.18 | % | | | 0.04 | % | | | 0.04 | % |
| | Class B | | | 0.26 | | | | 0.14 | | | | 0.11 | | | | 0.18 | | | | -0.52 | | | | -0.71 | |
| | Institutional | | | 0.76 | | | | 0.14 | | | | 0.11 | | | | 0.18 | | | | 0.38 | | | | 0.38 | |
| | Administration | | | 0.63 | | | | 0.14 | | | | 0.11 | | | | 0.18 | | | | 0.13 | | | | 0.13 | |
| | | Class IR | | | 0.71 | | | | 0.14 | | | | 0.11 | | | | 0.18 | | | | 0.29 | | | | 0.29 | |
| | 1 | | The net asset value (NAV) represents the net assets of the class of the Fund (ex-dividend) divided by the total number of shares of the class outstanding. The Fund’s performance assumes the reinvestment of dividends and other distributions. The Fund’s performance does not reflect the deduction of any applicable sales charges. |
| | 2 | | The Goldman Sachs Enhanced Income Fund Composite Index is an equal weight blend of the Six-Month U.S. Treasury Bill Index and the One-Year U.S. Treasury Note Index. |
| | 3 | | The Six-Month U.S. Treasury Bill Index and One-Year U.S. Treasury Note Index, as reported by Merrill Lynch, do not reflect any deduction for fees, expenses or taxes. It is not possible to invest directly in an index. |
| | 4 | | The 30-Day Standardized Subsidized Yield of the Fund is calculated by dividing the net investment income per share (as defined by securities industry regulations) earned by the Fund over a 30-day period (ending on the stated month-end date) by the maximum public offering price (“POP”) per share of the Fund on the last day of the period. This number is then annualized. This yield does not necessarily reflect income actually earned and distributed by the Fund and, therefore, may not be correlated with the dividends or other distributions paid to shareholders. The 30-Day Standardized Unsubsidized Yield does not reflect any applicable expense reductions. |
| | | | The returns set forth in the table above represent past performance. Past performance does not guarantee future results. The Fund’s investment return and principal value will fluctuate so that an investor’s shares, when redeemed, may be worth more or less than their original cost. Current performance may be lower or higher than the performance quoted above. Please visit our web site at www.goldmansachsfunds.com to obtain the most recent month-end returns. Performance reflects fee waivers and/or expense limitations in effect. In their absence, performance would be reduced. Returns do not reflect the deduction of taxes that a shareholder would pay on Fund distributions or the redemption of Fund shares. |
9
FUND BASICS
| | | | | | | | | | | | | | | | | | | | |
| | STANDARDIZED TOTAL RETURNS5 |
| | | For the period ended 9/30/12 | | One Year | | | Five Years | | | Ten Years | | | Since Inception | | | Inception Date |
| | Class A | | | -0.29 | % | | | 1.16 | % | | | 1.85 | % | | | 2.50 | % | | 8/2/00 |
| | Class B | | | -4.63 | | | | 0.30 | | | | N/A | | | | 0.63 | | | 6/20/07 |
| | Institutional | | | 1.41 | | | | 1.80 | | | | 2.36 | | | | 2.99 | | | 8/2/00 |
| | Administration | | | 1.27 | | | | 1.58 | | | | 2.13 | | | | 2.77 | | | 8/2/00 |
| | | Class IR | | | 1.32 | | | | N/A | | | | N/A | | | | 0.60 | | | 7/30/10 |
| | 5 | | The Standardized Total Returns are average annual total returns as of the most recent calendar quarter-end. They assume reinvestment of all distributions at NAV. These returns reflect a maximum initial sales charge of 1.5% for Class A Shares and the assumed contingent deferred sales charge for Class B Shares (5% maximum declining to 0% after six years). Class B shares convert automatically to Class A shares on or about the fifteenth day of the last month of the calendar quarter that is eight years after purchase. Because Institutional Shares, Class IR Shares and Administration Shares do not involve a sales charge, such a charge is not applied to their Standardized Total Returns. The Fund’s Class B Shares are no longer available for purchase by new or existing shareholders (although current Class B shareholders may continue to reinvest income and capital gains distributions into Class B Shares, and Class B shareholders may continue to exchange their shares for Class B Shares of certain other Goldman Sachs Funds). |
| | | | The returns set forth in the table above represent past performance. Past performance does not guarantee future results. The Fund’s investment return and principal value will fluctuate so that an investor’s shares, when redeemed, may be worth more or less than their original cost. Current performance may be lower or higher than the performance quoted above. Please visit our web site at www.goldmansachsfunds.com to obtain the most recent month-end returns. Performance reflects fee waivers and/or expense limitations in effect. In their absence, performance would be reduced. Returns do not reflect the deduction of taxes that a shareholder would pay on Fund distributions or the redemption of Fund shares. |
| | | | | | | | | | |
| | EXPENSE RATIOS6 | |
| | | | | Net Expense Ratio (Current) | | | Gross Expense Ratio (Before Waivers) | |
| | Class A | | | 0.69 | % | | | 0.69 | % |
| | Class B | | | 1.44 | | | | 1.44 | |
| | Institutional | | | 0.35 | | | | 0.35 | |
| | Administration | | | 0.60 | | | | 0.60 | |
| | | Class IR | | | 0.44 | | | | 0.44 | |
| | 6 | | The expense ratios of the Fund, both current (net of applicable fee waivers and/or expense limitations) and before waivers (gross of applicable fee waivers and/or expense limitations) are as set forth above according to the most recent publicly available Prospectus for the Fund and may differ from the expense ratios disclosed in the Financial Highlights in this report. The Fund’s waivers and/or expense limitations will remain in place through at least July 27, 2013, and prior to such date the investment adviser may not terminate the arrangements without the approval of the Fund’s Board of Trustees. If these arrangements are discontinued in the future, the expense ratios may change without shareholder approval. |
10
FUND BASICS
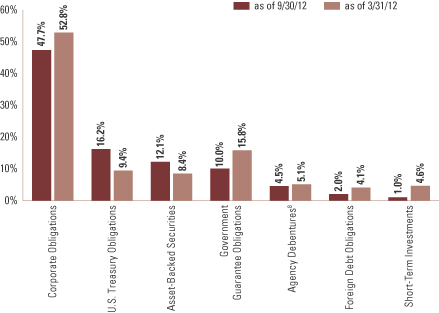
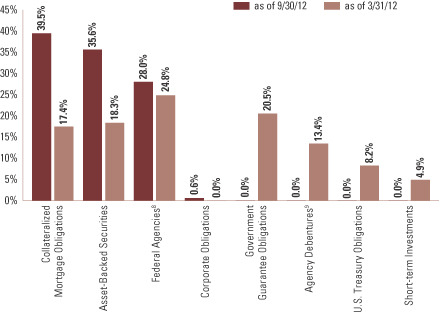
| | 7 | | The percentage shown for each investment category reflects the value of investments in that category as a percentage of net assets. Short-term investments represent commercial paper and repurchase agreements. Figures in the graph may not sum to 100% due to the exclusion of other assets and liabilities. The graph depicts the Fund’s investments but may not represent the Fund’s market exposure due to the exclusion of certain derivatives, if any, as listed in the Additional Investment Information section of the Schedule of Investments. |
| | 8 | | “Agency Debentures” include agency securities offered by companies such as the Federal National Mortgage Association (“FNMA”) and Federal Home Loan Mortgage Corp. (“FHLMC”), which operate under a government charter. While they are required to report to a government regulator, their assets are not explicitly guaranteed by the government and they otherwise operate like any other publicly traded company. |
11
PORTFOLIO RESULTS
Goldman Sachs Government Income Fund
Investment Objective
The Fund seeks a high level of current income, consistent with safety of principal.
Portfolio Management Discussion and Analysis
Below, the Goldman Sachs U.S. Fixed Income Investment Management Team discusses the Goldman Sachs Government Income Fund’s (the “Fund”) performance and positioning for the six-month period ended September 30, 2012 (the “Reporting Period”).
| Q | | How did the Fund perform during the Reporting Period? |
| A | | During the Reporting Period, the Fund’s Class A, B, C, Institutional, Service, IR and R Shares generated cumulative total returns, without sales charges, of 2.83%, 2.45%, 2.44%, 3.07%, 2.74%, 2.96% and 2.77%, respectively. These returns compare to the 2.79% cumulative total return of the Fund’s benchmark, the Barclays Government/ Mortgage Index (the “Barclays Index”), during the same time period. |
| Q | | What key factors were responsible for the Fund’s performance during the Reporting Period? |
| A | | Bottom-up individual issue selection within the collateralized sector contributed most positively to the Fund’s performance during the Reporting Period. Within our top-down strategies, our cross-sector strategy also added value. Our cross-sector strategy is one in which we invest Fund assets across a variety of fixed income sectors, including some that may not be included in the Fund’s benchmark. |
| | The primary detractor from Fund performance was individual issue selection within the government/agency sector. |
| Q | | Which fixed income market sectors most significantly affected Fund performance? |
| A | | During the Reporting Period, individual issue selection within the collateralized sector contributed most positively, particularly selection of agency mortgage-backed security pass-throughs. (Pass-through mortgages consist of a pool of residential mortgage loans, where homeowners’ monthly payments of principal, interest and prepayments pass from the original bank through a government agency or investment bank to investors.) An emphasis on these securities during the months of May, June, July and early August—with a bias toward lower coupon securities—particularly helped. |
| | Exposure to the agency mortgage-backed securities, non-agency mortgage-backed securities and asset-backed securities market sectors, implemented via our cross-sector strategy, also contributed positively to the Fund’s relative results, as riskier assets, or non-U.S. Treasury sectors, continued their rally from the beginning of 2012. |
| | Security selection within the government/agency sector detracted from the Fund’s relative results during the Reporting Period. Specifically, selection of agency securities and U.S. government-guaranteed debt proved disappointing. |
| Q | | Did the Fund’s duration and yield curve positioning strategy help or hurt its results during the Reporting Period? |
| A | | The combination of the Fund’s duration and yield curve positioning had a modest positive impact on its results during the Reporting Period. The Fund’s longer U.S. duration than the Barclays Index proved helpful, as U.S. Treasury yields declined. While riskier assets did rally, the Fed implemented a third round of quantitative easing and extended its intention of maintaining low short-term interest rates through at least mid-2015. Amidst these conditions, investors continued to seek the perceived relative safety of U.S. Treasury securities as global concerns persisted. Duration is a measure of the Fund’s sensitivity to changes in interest rates. Yield curve refers to the spectrum of maturities. |
12
PORTFOLIO RESULTS
| Q | | How did the Fund use derivatives and similar instruments during the Reporting Period? |
| A | | The Fund used Treasury futures and Eurodollar futures to hedge interest rate exposure, i.e., to manage exposure to fluctuations in interest rates, and to facilitate specific duration, yield curve and country strategies. Interest rate swaps were used to hedge interest rate exposure and express an outright term structure view. (Term structure, most often depicted as a yield curve, refers to the term structure of interest rates, which is the relationship between the yield to maturity and the time to maturity for pure discount bonds.) The Fund employed swaptions (or options on interest rate swap contracts) to hedge and express an outright term structure view. |
| Q | | Were there any notable changes in the Fund’s weightings during the Reporting Period? |
| A | | We extended the Fund’s duration, moving from a shorter-than-Barclays Index to a longer-than-Barclays Index duration, which proved beneficial as interest rates declined during the Reporting Period. We maintained the Fund’s overweighted exposure to non-agency mortgage-backed securities, which also was a driver of positive performance during the Reporting Period. The Fund also prudently held its substantial overweighting in agency mortgage-backed securities through much of the Reporting Period, as spreads, or the differential in yields between these securities and U.S. Treasuries, tightened considerably. Agency mortgage-backed securities outperformed U.S. Treasuries by 1.15% during the Reporting Period. We believed the Fed would re-enter the market and begin purchasing agency mortgages. Spreads tightened in anticipation of this Fed move, and we began unwinding the Fund’s position before the Fed actually announced its open-ended mortgage purchases. With the Fed’s announcement, agency mortgages’ spreads tightened even more. At the end of the Reporting Period, we had tactically shifted the Fund’s position, such that the Fund held a neutral to slightly overweight position in agency mortgage-backed securities relative to the Barclays Index, as the Fed had driven valuations, in our view, to be excessively rich. |
| Q | | How was the Fund positioned relative to its benchmark index at the end of September 2012? |
| A | | At the end of September 2012, the Fund had an overweighted allocation relative to the Barclays Index in quasi-government securities, including agency non-government guaranteed securities and government-guaranteed corporate bonds. To a more modest degree, the Fund also had an overweighted allocation relative to the Barclays Index in asset-backed securities. The Fund was significantly underweighted relative to the benchmark index in U.S. government securities. Within the residential mortgage-backed securities sector, the Fund had exposure to agency collateralized mortgage obligations (“CMOs”), which are not a component of the Barclays Index, and was underweighted relative to the Barclays Index in mortgage-backed security pass-throughs. The Fund had a modestly longer duration than that of the Barclays Index at the end of the Reporting Period. The Fund had 23.1% of its net assets invested in short-term investments at the end of the Reporting Period. |
13
FUND BASICS
Government Income Fund
as of September 30, 2012
| | | | | | | | | | | | | | | | | | |
| | PERFORMANCE REVIEW | |
| | | April 1, 2012– September 30, 2012 | | Fund Total Return
(based on NAV)1 | | | Barclays
Government/
Mortgage Index2 | | | 30-Day
Standardized
Subsidized Yield3 | | | 30-Day
Standardized
Unsubsidized Yield3 | |
| | Class A | | | 2.83 | % | | | 2.79 | % | | | 0.32 | % | | | 0.19 | % |
| | Class B | | | 2.45 | | | | 2.79 | | | | -0.41 | | | | -0.55 | |
| | Class C | | | 2.44 | | | | 2.79 | | | | -0.40 | | | | -0.55 | |
| | Institutional | | | 3.07 | | | | 2.79 | | | | 0.67 | | | | 0.53 | |
| | Service | | | 2.74 | | | | 2.79 | | | | 0.18 | | | | 0.04 | |
| | Class IR | | | 2.96 | | | | 2.79 | | | | 0.57 | | | | 0.44 | |
| | | Class R | | | 2.77 | | | | 2.79 | | | | 0.09 | | | | -0.05 | |
| | 1 | | The net asset value (NAV) represents the net assets of the class of the Fund (ex-dividend) divided by the total number of shares of the class outstanding. The Fund’s performance assumes the reinvestment of dividends and other distributions. The Fund’s performance does not reflect the deduction of any applicable sales charges. |
| | 2 | | The Barclays Government/Mortgage Index, an unmanaged index, does not reflect any deduction for fees, expenses or taxes. It is not possible to invest directly in an index. |
| | 3 | | The 30-Day Standardized Subsidized Yield of the Fund is calculated by dividing the net investment income per share (as defined by securities industry regulations) earned by the Fund over a 30-day period (ending on the stated month-end date) by the maximum public offering price (“POP”) per share of the Fund on the last day of the period. This number is then annualized. This yield does not necessarily reflect income actually earned and distributed by the Fund and, therefore, may not be correlated with the dividends or other distributions paid to shareholders. The 30-Day Standardized Unsubsidized Yield does not reflect any applicable expense reductions. |
| | | | The returns set forth in the table above represent past performance. Past performance does not guarantee future results. The Fund’s investment return and principal value will fluctuate so that an investor’s shares, when redeemed, may be worth more or less than their original cost. Current performance may be lower or higher than the performance quoted above. Please visit our web site at www.goldmansachsfunds.com to obtain the most recent month-end returns. Performance reflects fee waivers and/or expense limitations in effect. In their absence, performance would be reduced. Returns do not reflect the deduction of taxes that a shareholder would pay on Fund distributions or the redemption of Fund shares. |
14
FUND BASICS
| | | | | | | | | | | | | | |
| | STANDARDIZED TOTAL RETURNS4 |
| | | For the period ended 9/30/12 | | One Year | | | Five Years | | Ten Years | | Since Inception | | Inception Date |
| | Class A | | | -0.42 | % | | 4.57% | | 3.99% | | 5.55% | | 2/10/93 |
| | Class B | | | -2.45 | | | 4.19 | | 3.75 | | 5.28 | | 5/1/96 |
| | Class C | | | 1.65 | | | 4.59 | | 3.62 | | 4.64 | | 8/15/97 |
| | Institutional | | | 3.79 | | | 5.74 | | 4.78 | | 5.82 | | 8/15/97 |
| | Service | | | 3.20 | | | 5.20 | | 4.25 | | 5.29 | | 8/15/97 |
| | Class IR | | | 3.70 | | | N/A | | N/A | | 5.21 | | 11/30/07 |
| | | Class R | | | 3.19 | | | N/A | | N/A | | 4.74 | | 11/30/07 |
| | 4 | | The Standardized Total Returns are average annual total returns as of the most recent calendar quarter-end. They assume reinvestment of all distributions at NAV. These returns reflect a maximum initial sales charge of 3.75% for Class A Shares, the assumed contingent deferred sales charge for Class B Shares (5% maximum declining to 0% after six years), and the assumed contingent deferred sales charge for Class C Shares (1% if redeemed within 12 months of purchase). Class B Shares convert automatically to Class A Shares on or about the fifteenth day of the last month of the calendar quarter that is eight years after purchase. Returns for Class B Shares for the period after conversion reflect the performance of Class A Shares. Prior to July 29, 2009, the maximum initial sales charge applicable to Class A Shares of the Fund was 4.5%, which is not reflected in the figures shown. Because Institutional Shares, Service Shares, Class IR and R Shares do not involve a sales charge, such a charge is not applied to their Standardized Total Returns. The Fund’s Class B Shares are no longer available for purchase by new or existing shareholders (although current Class B shareholders may continue to reinvest income and capital gains distributions into Class B Shares, and Class B shareholders may continue to exchange their shares for Class B Shares of certain other Goldman Sachs Funds). |
| | | | The returns set forth in the table above represent past performance. Past performance does not guarantee future results. The Fund’s investment return and principal value will fluctuate so that an investor’s shares, when redeemed, may be worth more or less than their original cost. Current performance may be lower or higher than the performance quoted above. Please visit our web site at www.goldmansachsfunds.com to obtain the most recent month-end returns. Performance reflects fee waivers and/or expense limitations in effect. In their absence, performance would be reduced. Returns do not reflect the deduction of taxes that a shareholder would pay on Fund distributions or the redemption of Fund shares. |
| | | | | | | | | | |
| | EXPENSE RATIOS5 | |
| | | | | Net Expense Ratio (Current) | | | Gross Expense Ratio (Before Waivers) | |
| | Class A | | | 0.92 | % | | | 1.00 | % |
| | Class B | | | 1.67 | | | | 1.75 | |
| | Class C | | | 1.67 | | | | 1.75 | |
| | Institutional | | | 0.58 | | | | 0.66 | |
| | Service | | | 1.08 | | | | 1.16 | |
| | Class IR | | | 0.67 | | | | 0.75 | |
| | | Class R | | | 1.17 | | | | 1.25 | |
| | 5 | | The expense ratios of the Fund, both current (net of applicable fee waivers and/or expense limitations) and before waivers (gross of applicable fee waivers and/or expense limitations) are as set forth above according to the most recent publicly available Prospectus for the Fund and may differ from the expense ratios disclosed in the Financial Highlights in this report. The Fund’s waivers and/or expense limitations will remain in place through at least July 27, 2013, and prior to such date the investment adviser may not terminate the arrangements without the approval of the Fund’s Board of Trustees. If these arrangements are discontinued in the future, the expense ratios may change without shareholder approval. |
15
FUND BASICS
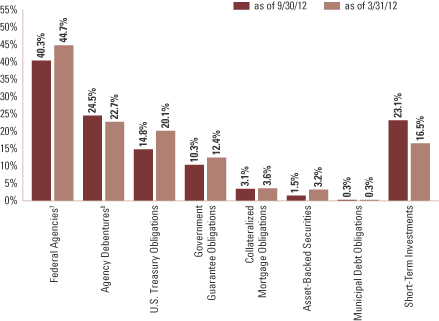
| | 6 | | The percentage shown for each investment category reflects the value of investments in that category as a percentage of net assets. Short-term investments represent repurchase agreements. Figures in the graph may not sum to 100% due to the exclusion of other assets and liabilities. The graph depicts the Fund’s investments but may not represent the Fund’s market exposure due to the exclusion of certain derivatives, if any, as listed in the Additional Investment Information section of the Schedule of Investments. |
| | 7 | | “Federal Agencies” are mortgage-backed securities guaranteed by the Government National Mortgage Association (“GNMA”), Federal National Mortgage Association (“FNMA”) and Federal Home Loan Mortgage Corp. (FHLMC). GNMA instruments are backed by the full faith and credit of the U.S. Government. |
| | 8 | | “Agency Debentures” include agency securities offered by companies such as FNMA and FHLMC, which operate under a government charter. While they are required to report to a government regulator, their assets are not explicitly guaranteed by the government and they otherwise operate like any other publicly traded company. |
16
PORTFOLIO RESULTS
Goldman Sachs High Quality Floating Rate Fund
Investment Objective
The Fund seeks a high level of current income, consistent with low volatility of principal.
Portfolio Management Discussion and Analysis
Below, the Goldman Sachs U.S. Fixed Income Investment Management Team discusses the Goldman Sachs High Quality Floating Rate Fund’s (the “Fund”) performance and positioning for the six-month period ended September 30, 2012 (the “Reporting Period”).
| Q | | How did the Fund perform during the Reporting Period? |
| A | | During the Reporting Period, the Fund’s Class A, Institutional, Service and IR Shares generated cumulative total returns, without sales charges, of 0.22%, 0.50%, 0.25% and 0.45%, respectively. These returns compare to the 0.06% cumulative total return of the Fund’s new benchmark, the BofA ML Three Month U.S. Treasury Bill Index.* To compare, the Fund’s former benchmark, the Goldman Sachs Ultra-Short Duration Government Fund Composite Index (the “Ultra-Short Duration Government Composite Index”), posted a 0.14% cumulative total return during the same period. The Ultra-Short Duration Government Composite Index is comprised 50% of the BofA ML Six-Month U.S. Treasury Bill Index and 50% of the BofA ML One-Year U.S. Treasury Note Index, which generated cumulative total returns of 0.11% and 0.18%, respectively over the same period. |
| Q | | Were there any changes to the Fund during the Reporting Period? |
| A | | To enhance our ability to protect against rising rates and provide a competitive yield, the Goldman Sachs Ultra Short Duration Government Fund was renamed and repositioned as the Goldman Sachs High Quality Floating Rate Fund effective July 27, 2012. As of that date, the Fund invests primarily in high quality floating rate or variable rate obligations, and the Fund considers “high quality” obligations to be (i) those rated AAA or Aaa by a nationally recognized statistical rating organization at the time of purchase (or, if unrated, determined by the Investment Adviser to be of comparable quality), and (ii) U.S. government securities, including mortgage-backed securities, and repurchase agreements collateralized by U.S. government securities. While certain of the Fund’s investment strategies and policies changed and the Fund’s benchmark index changed, there was no change to the Fund’s investment objective or credit profile. |
| Q | | What key factors were responsible for the Fund’s performance during the Reporting Period? |
| A | | Both top-down and bottom-up strategies had an impact on the Fund’s performance during the Reporting Period. Within our top-down strategies, our cross-sector strategy was the primary positive contributor to the Fund’s results during the Reporting Period. Our cross-sector strategy is one in which we invest Fund assets across a variety of fixed income sectors, including some that may not be included in the Fund’s benchmark. Our duration and yield curve positioning strategy detracted from Fund performance. Duration is a measure of the Fund’s sensitivity to changes in interest rates. Yield curve indicates the spectrum of maturities within a particular sector. Bottom-up individual issue selection amongst agency mortgage-backed securities and agency debentures detracted from relative performance, mostly offset by the positive contribution made by individual issue selection amongst asset-backed securities and government securities. |
| Q | | Which fixed income market sectors most significantly affected Fund performance? |
| A | | Sector positioning contributed positively to the Fund’s results during the Reporting Period, with an allocation to agency mortgage-backed securities helping most, as the Federal Reserve (the “Fed”) made an open-ended commitment to buy $40 billion in mortgage-backed securities per month and extended its Operation Twist program until year-end 2012. |
| * | Effective July 27, 2012, the Fund’s performance benchmark was changed from the Goldman Sachs Ultra-Short Duration Government Fund Composite Index to the BofA ML Three Month U.S. Treasury Bill Index, which the Investment Adviser believes is a more appropriate benchmark against which to measure the Fund’s performance, in light of changes to the Fund’s investment strategies. |
17
PORTFOLIO RESULTS
| | The Fund’s exposure to asset-backed securities and corporate bonds added value late in the Reporting Period when risk assets, or non-U.S. Treasury sectors, rallied on further government stimulus. |
| | Individual issue selection amongst agency mortgage-backed securities was the greatest detractor from the Fund’s relative results during the Reporting Period. In particular, the Fund’s exposure to agency collateralized mortgage obligations (“CMOs”) had a significant negative impact. On the positive side, this detractor was largely offset by individual issue selection of mortgage-backed security pass-throughs, asset-backed securities backed by student loans, and short-term and intermediate maturity U.S. Treasuries, which boosted the Fund’s relative results. |
| Q | | Did the Fund’s duration and yield curve positioning strategy help or hurt its results during the Reporting Period? |
| A | | Tactical management of the Fund’s duration and yield curve positioning detracted from its results during the Reporting Period, with the majority of negative return attributable to an underweighted position in long-term maturity U.S. Treasuries held throughout. Long-term U.S. Treasury rates steepened during the Reporting Period, as aggressive quantitative easing by the Fed pushed the inflation premium at the long-term end of the yield curve higher. Also detracting was the Fund’s shorter duration position than the benchmark index in the one-, five-, ten- and 30-year segments of the U.S. Treasury yield curve. Conversely, a longer duration position than the benchmark index in the two-, three- and seven-year segments of the U.S. Treasury yield curve positively impacted the Fund’s performance during the Reporting Period. Overall, we maintained a long duration position relative to the benchmark index within the Fund for the majority of the Reporting Period, having shifted from a shorter duration position than the benchmark index in mid-April. As mentioned earlier, duration is a measure of the Fund’s sensitivity to changes in interest rates. Yield curve indicates the spectrum of maturities within a particular sector. |
| Q | | How did the Fund use derivatives and similar instruments during the Reporting Period? |
| A | | The Fund used Treasury futures, Eurodollar futures and interest rate swaps during the Reporting Period for the purpose of managing the duration and term structure of the Fund. (Term structure, most often depicted as a yield curve, refers to the term structure of interest rates, which is the relationship between the yield to maturity and the time to maturity for pure discount bonds.) The Fund employed swaptions (or options on interest rate swap contracts) for the purpose of taking modest short volatility positions, that is, positions that pay a modest return when market volatility remains relatively stable. |
| Q | | Were there any notable changes in the Fund’s weightings during the Reporting Period? |
| A | | Due to the change in the Fund’s strategy effective July 27, 2012, the portfolio’s allocation to adjustable-rate mortgages (“ARMs”), collateralized mortgage obligations (“CMOs”) and asset-backed securities increased significantly during the Reporting Period. A corresponding decrease in allocation was concentrated in U.S. Treasury securities and quasi-government securities. Additionally, as indicated earlier, we shifted the Fund’s duration positioning during the Reporting Period as market conditions changed. At the start of the Reporting Period, the Fund maintained a shorter duration position than the benchmark index. We maintained that position through mid-April. This position then gave way to a longer duration position than the benchmark index in response to deteriorating economic data and fears over escalation of Europe’s sovereign debt crisis. By the end of the September, the Fund held a longer duration position than the benchmark index. |
| Q | | How was the Fund positioned relative to its benchmark index at the end of September 2012? |
| A | | While the Fund is benchmarked to U.S. Treasuries, it held all of its assets in non-Treasury sectors not represented in the benchmark index at the end of the Reporting Period. Indeed, the Fund maintained exposures to high quality spread, or non-Treasury, sectors throughout the Reporting Period, most notably agency mortgage-backed securities and asset-backed securities. The Fund had no exposure to government bonds and quasi-government securities at the end of the Reporting Period. |
18
FUND BASICS
High Quality Floating Rate Fund
as of September 30, 2012
| | | | | | | | | | | | | | | | | | | | | | |
| | PERFORMANCE REVIEW | |
| | | April 1, 2012–
September 30, 2012 | | Fund Total
Return
(based on NAV)1 | | | BofA ML Three
Month U.S.
Treasury Bill
Index2 | | | Goldman
Sachs Ultra-
Short Duration
Government Fund
Composite Index3 | | | 30-Day
Standardized
Subsidized
Yield4 | | | 30-Day
Standardized
Unsubsidized
Yield4 | |
| | Class A | | | 0.22 | % | | | 0.06 | % | | | 0.14 | % | | | 0.13 | % | | | -0.05 | % |
| | Institutional | | | 0.50 | | | | 0.06 | | | | 0.14 | | | | 0.47 | | | | 0.28 | |
| | Service | | | 0.25 | | | | 0.06 | | | | 0.14 | | | | -0.02 | | | | -0.21 | |
| | | Class IR | | | 0.45 | | | | 0.06 | | | | 0.14 | | | | 0.38 | | | | 0.20 | |
| | 1 | | The net asset value (NAV) represents the net assets of the class of the Fund (ex-dividend) divided by the total number of shares of the class outstanding. The Fund’s performance assumes the reinvestment of dividends and other distributions. The Fund’s performance does not reflect the deduction of any applicable sales charges. |
| | 2 | | The BofA ML Three Month U.S. Treasury Bill Index measures total return on cash, including price and interest income, based on short-term government Treasury Bills of about 90-day maturity, as reported by BofA Merrill Lynch, do not reflect any deduction for fees, expenses or taxes. It is not possible to invest directly in an unmanaged index. |
| | 3 | | The Goldman Sachs Ultra-Short Duration Government Fund Composite Index is an equal blend of the BofA ML Six-Month U.S. Treasury Bill Index and the BofA ML One-Year U.S. Treasury Note Index. |
| | 4 | | The 30-Day Standardized Subsidized Yield of the Fund is calculated by dividing the net investment income per share (as defined by securities industry regulations) earned by the Fund over a 30-day period (ending on the stated month-end date) by the maximum public offering price (“POP”) per share of the Fund on the last day of the period. This number is then annualized. This yield does not necessarily reflect income actually earned and distributed by the Fund and, therefore, may not be correlated with the dividends or other distributions paid to shareholders. The 30-Day Standardized Unsubsidized Yield does not reflect any applicable expense reductions. |
| | | | | | | | | | | | | | |
| | STANDARDIZED TOTAL RETURNS5 |
| | | For the period ended 9/30/12 | | One Year | | | Five Years | | Ten Years | | Since Inception | | Inception Date |
| | Class A | | | -0.85 | % | | 0.35% | | 1.57% | | 3.17% | | 5/15/95 |
| | Institutional | | | 1.07 | | | 1.02 | | 2.08 | | 3.84 | | 7/17/91 |
| | Service | | | 0.57 | | | 0.54 | | 1.60 | | 2.79 | | 3/27/97 |
| | | Class IR | | | 0.98 | | | N/A | | N/A | | 0.82 | | 11/30/07 |
| | 5 | | The Standardized Total Returns are average annual total returns as of the most recent calendar quarter-end. They assume reinvestment of all distributions at NAV. These returns reflect a maximum initial sales charge of 1.5% for Class A Shares. Because Institutional Shares, Service Shares and Class IR Shares do not involve a sales charge, such a charge is not applied to their Standardized Total Returns. |
| | | | The returns set forth in the tables above represent past performance. Past performance does not guarantee future results. The Fund’s investment return and principal value will fluctuate so that an investor’s shares, when redeemed, may be worth more or less than their original cost. Current performance may be lower or higher than the performance quoted above. Please visit our web site at www. goldmansachsfunds.com to obtain the most recent month-end returns. Performance reflects fee waivers and/or expense limitations in effect. In their absence, performance would be reduced. Returns do not reflect the deduction of taxes that a shareholder would pay on Fund distributions or the redemption of Fund shares. |
19
FUND BASICS
| | | | | | | | | | |
| | EXPENSE RATIOS6 | |
| | | | | Net Expense Ratio (Current) | | | Gross Expense Ratio (Before Waivers) | |
| | Class A | | | 0.74 | % | | | 0.90 | % |
| | Institutional | | | 0.40 | | | | 0.56 | |
| | Service | | | 0.90 | | | | 1.06 | |
| | | Class IR | | | 0.49 | | | | 0.65 | |
| | 6 | | The expense ratios of the Fund, both current (net of applicable fee waivers and/or expense limitations) and before waivers (gross of applicable fee waivers and/or expense limitations) are as set forth above according to the most recent publicly available Prospectus for the Fund and may differ from the expense ratios disclosed in the Financial Highlights in this report. The Fund’s waivers and/or expense limitations will remain in place through at least July 27, 2013, and prior to such date the investment adviser may not terminate the arrangements without the approval of the Fund’s Board of Trustees. If these arrangements are discontinued in the future, the expense ratios may change without shareholder approval. |
| | 7 | | The percentage shown for each investment category reflects the value of investments in that category as a percentage of net assets. Short-term investments represent U.S. Treasury Bill and repurchase agreements. Figures in the graph may not sum to 100% due to the exclusion of other assets and liabilities. The graph depicts the Fund’s investments but may not represent the Fund’s market exposure due to the exclusion of certain derivatives, if any, as listed in the Additional Investment Information section of the Schedule of Investments. |
| | 8 | | “Federal Agencies” are mortgage-backed securities guaranteed by the Government National Mortgage Association (“GNMA”), Federal National Mortgage Association (“FNMA”) and Federal Home Loan Mortgage Corp. (FHLMC). GNMA instruments are backed by the full faith and credit of the U.S. Government. |
| | 9 | | “Agency Debentures” include agency securities offered by companies such as FNMA and FHLMC, which operate under a government charter. While they are required to report to a government regulator, their assets are not explicitly guaranteed by the government and they otherwise operate like any other publicly traded company. |
20
PORTFOLIO RESULTS
Goldman Sachs Inflation Protected Securities Fund
Investment Objective
The Fund seeks real return consistent with preservation of capital.
Portfolio Management Discussion and Analysis
Below, the Goldman Sachs U.S. Fixed Income Investment Management Team discusses the Goldman Sachs Inflation Protected Securities Fund’s (the “Fund”) performance and positioning for the six-month period ended September 30, 2012 (the “Reporting Period”).
| Q | | How did the Fund perform during the Reporting Period? |
| A | | During the Reporting Period, the Fund’s Class A, C, Institutional, IR and R Shares generated cumulative total returns, without sales charges, of 5.39%, 4.99%, 5.56%, 5.52% and 5.16%, respectively. These returns compare to the 5.34% cumulative total return of the Fund’s benchmark, the Barclays U.S. TIPS Index (“Barclays Index”) during the same time period. |
| Q | | What key factors were responsible for the Fund’s performance during the Reporting Period? |
| A | | Bottom-up individual issue selection of various maturity Treasury inflation protected securities (“TIPS”) was the key positive contributor to the Fund’s performance during the Reporting Period. Our duration strategy also contributed positively to Fund performance. Duration is a measure of the Fund’s sensitivity to changes in interest rates. None of our strategies materially detracted from relative results during the Reporting Period. |
| Q | | Which fixed income market sectors most significantly affected Fund performance? |
| A | | Individual issue selection of various maturity TIPS contributed most positively to Fund performance during the Reporting Period. Through the Reporting Period, we tactically re-positioned the Fund’s exposure to inflation as market conditions evolved, which added value overall. In addition, our active management around TIPS auctions contributed positively to the Fund’s results during the Reporting Period. We held an overweight bias toward TIPS on the short-term end of the TIPS yield curve versus the long-term end of the TIPS yield curve during the Reporting Period, and these selection strategies boosted the Fund’s results relative to the Barclays Index. |
| Q | | Did the Fund’s duration and yield curve positioning strategy help or hurt its results during the Reporting Period? |
| A | | Active U.S. duration positioning contributed positively, albeit modestly, to the Fund’s performance during the Reporting Period. We generally managed the Fund with a longer U.S. duration position than the Barclays Index, given our concern about the global economic growth slowdown, the potential Greek exit from the Eurozone and uncertainty in the U.S. regarding the November 2012 election and impending fiscal cliff. (The major components of the so-called fiscal cliff include tax increases and spending cuts totaling approximately $576 billion scheduled to take effect on January 1, 2013.) Such positioning added value, as U.S. Treasury yields generally declined during the Reporting Period. |
| Q | | How did the Fund use derivatives and similar instruments during the Reporting Period? |
| A | | The Fund used Treasury futures and Eurodollar futures to hedge interest rate exposure and to facilitate specific duration and yield curve strategies. Interest rate swaps were used to hedge interest rate exposure and express an outright term structure view. (Term structure, most often depicted as a yield curve, refers to the term structure of interest rates, which is the relationship between the yield to maturity and the time to maturity for pure discount bonds.) |
21
PORTFOLIO RESULTS
| Q | | Were there any notable changes in the Fund’s weightings during the Reporting Period? |
| A | | We tactically managed the inflation exposure in the Fund via varying allocations to TIPS throughout the Reporting Period. As already discussed, we maintained the Fund’s duration position longer than that of the Barclays Index throughout the Reporting Period amid the Federal Reserve’s (the “Fed”) commitment to maintain an accommodative monetary policy and given our concerns about the global economic growth slowdown and what we perceived to be elevated levels of financial market risk. |
| Q | | How was the Fund positioned relative to its benchmark index at the end of September 2012? |
| A | | At the end of September 2012, the Fund had more than 98% of its total net assets invested in TIPS, with the remainder in cash or cash equivalents. The Fund had a modestly longer duration than the benchmark index at the end of the Reporting Period. |
22
FUND BASICS
Inflation Protected Securities Fund
as of September 30, 2012
| | | | | | | | | | | | | | | | | | |
| | PERFORMANCE REVIEW | |
| | | April 1, 2012–
September 30, 2012 | | Fund Total Return
(based on NAV)1 | | | Barclays U.S.
TIPS Index2 | | | 30-Day
Standardized
Subsidized Yield3 | | | 30-Day
Standardized
Unsubsidized Yield3 | |
| | Class A | | | 5.39 | % | | | 5.34 | % | | | -2.85 | % | | | -2.97 | % |
| | Class C | | | 4.99 | | | | 5.34 | | | | -3.68 | | | | -3.81 | |
| | Institutional | | | 5.56 | | | | 5.34 | | | | -2.62 | | | | -2.76 | |
| | Class IR | | | 5.52 | | | | 5.34 | | | | -2.71 | | | | -2.84 | |
| | | Class R | | | 5.16 | | | | 5.34 | | | | -3.20 | | | | -3.33 | |
| | 1 | | The net asset value (NAV) represents the net assets of the class of the Fund (ex-dividend) divided by the total number of shares of the class outstanding. The Fund’s performance assumes the reinvestment of dividends and other distributions. The Fund’s performance does not reflect the deduction of any applicable sales charges. |
| | 2 | | The Barclays U.S. TIPS Index represents securities that protect against adverse inflation and provide a minimum level of real return. To be included in this index, bonds must have cash flows linked to an inflation index, be sovereign issues denominated in U.S. currency, and have more than one year to maturity, and, as a portion of the index, total a minimum amount outstanding of 100 million U.S. dollars. It is not possible to invest directly in an index. |
| | 3 | | The 30-Day Standardized Subsidized Yield of the Fund is calculated by dividing the net investment income per share (as defined by securities industry regulations) earned by the Fund over a 30-day period (ending on the stated month-end date) by the maximum public offering price (“POP”) per share of the Fund on the last day of the period. This number is then annualized. This yield does not necessarily reflect income actually earned and distributed by the Fund and, therefore, may not be correlated with the dividends or other distributions paid to shareholders. The Fund invests in US TIPS bonds and similar inflation protected securities, and the 30-Day Standardized Yield of the Fund, as quoted above, includes the positive or negative income effect on those bonds of changes in the rate of inflation. When inflation factors increase, we expect the Fund’s 30-Day Standardized Yield to be higher than if the effects of inflation were excluded, and when the inflation factors decrease, we expect the Fund’s 30-Day Standardized Yield to be lower than if the effects of inflation were excluded. Relatively small changes in the rate of inflation can have significant positive or negative impacts on the 30-Day Standardized Yield of the Fund. To the extent the Yield shown above includes the positive effect of a rise in inflation, it may not be repeated. The 30-Day Standardized Unsubsidized Yield does not reflect any applicable expense reductions. |
| | | | | | | | | | | | |
| | STANDARDIZED TOTAL RETURNS4 |
| | | For the period ended 9/30/12 | | One Year | | | Five Years | | Since Inception | | Inception Date |
| | Class A | | | 4.78 | % | | 6.87% | | 6.98% | | 8/31/07 |
| | Class C | | | 7.03 | | | 6.97 | | 7.07 | | 8/31/07 |
| | Institutional | | | 9.18 | | | 8.14 | | 8.22 | | 8/31/07 |
| | Class IR | | | 9.00 | | | N/A | | 7.17 | | 11/30/07 |
| | | Class R | | | 8.46 | | | N/A | | 6.67 | | 11/30/07 |
| | 4 | | The Standardized Total Returns are average annual total returns as of the most recent calendar quarter-end. They assume reinvestment of all distributions at NAV. These returns reflect a maximum initial sales charge of 3.75% for Class A Shares and the assumed contingent deferred sales charge for Class C Shares (1% if redeemed within 12 months of purchase). Prior to July 29, 2009, the maximum initial sales charge applicable to Class A Shares of the Fund was 4.5%, which is not reflected in the figures shown. Because Institutional Shares, Class IR Shares and R Shares do not involve a sales charge, such a charge is not applied to their Standardized Total Returns. |
| | | | The returns set forth in the tables above represent past performance. Past performance does not guarantee future results. The Fund’s investment return and principal value will fluctuate so that an investor’s shares, when redeemed, may be worth more or less than their original cost. Current performance may be lower or higher than the performance quoted above. Please visit our web site at www.goldmansachsfunds.com to obtain the most recent month-end returns. Performance reflects fee waivers and/or expense limitations in effect. In their absence, performance would be reduced. Returns do not reflect the deduction of taxes that a shareholder would pay on Fund distributions or the redemption of Fund shares. |
23
FUND BASICS
| | | | | | | | | | |
| | EXPENSE RATIOS5 | | | | | | | | |
| | | | | Net Expense Ratio (Current) | | | Gross Expense Ratio (Before Waivers) | |
| | Class A | | | 0.62 | % | | | 0.83 | % |
| | Class C | | | 1.37 | | | | 1.58 | |
| | Institutional | | | 0.28 | | | | 0.49 | |
| | Class IR | | | 0.37 | | | | 0.58 | |
| | | Class R | | | 0.87 | | | | 1.08 | |
| | 5 | | The expense ratios of the Fund, both current (net of applicable fee waivers and/or expense limitations) and before waivers (gross of applicable fee waivers and/or expense limitations) are as set forth above according to the most recent publicly available Prospectus for the Fund and may differ from the expense ratios disclosed in the Financial Highlights in this report. The Fund’s waivers and/or expense limitations will remain in place through at least July 27, 2013, and prior to such date the investment adviser may not terminate the arrangements without the approval of the Fund’s Board of Trustees. If these arrangements are discontinued in the future, the expense ratios may change without shareholder approval. |
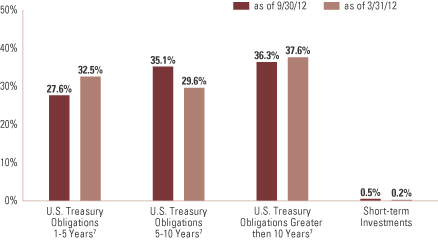
| | 6 | | The percentage shown for each investment category reflects the value of investments in that category as a percentage of net assets. Short-term investments represent repurchase agreements. Figures in the graph may not sum to 100% due to the exclusion of other assets and liabilities. The graph depicts the Fund’s investments but may not represent the Fund’s market exposure due to exclusion of certain derivatives, if any, as listed in the Additional Information section of the Schedule of Investments. |
| | 7 | | “U.S. Treasury Obligations” percentages are grouped by effective maturity. The weighted average maturity was 9.7 and 9.3 years, respectively, at September 30, 2012 and March 31, 2012. |
24
PORTFOLIO RESULTS
Goldman Sachs Short Duration Government Fund
Investment Objective
The Fund seeks a high level of current income and secondarily, in seeking current income, may also consider the potential for capital appreciation.
Portfolio Management Discussion and Analysis
Below, the Goldman Sachs U.S. Fixed Income Investment Management Team discusses the Goldman Sachs Short Duration Government Fund’s (the “Fund”) performance and positioning for the six-month period ended September 30, 2012 (the “Reporting Period”).
| Q | | How did the Fund perform during the Reporting Period? |
| A | | During the Reporting Period, the Fund’s Class A, B, C, Institutional, Service and IR Shares generated cumulative total returns, without sales charges, of 0.51%, 0.30%, 0.33%, 0.59%, 0.43% and 0.64%, respectively. These returns compare to the 0.31% cumulative total return of the Fund’s benchmark, the BofA ML Two-Year U.S. Treasury Note Index, during the same time period. To compare, the Barclays U.S. Government Bond Index (1- 3 Year) returned 0.46% for the Reporting Period. |
| Q | | What key factors were responsible for the Fund’s performance during the Reporting Period? |
| A | | Both top-down and bottom-up strategies had an impact on the Fund’s performance during the Reporting Period. Within our top-down strategies, our cross-sector and duration and yield curve positioning strategies contributed positively to relative performance. Our cross-sector strategy is one in which we invest Fund assets across a variety of fixed income sectors, including some that may not be included in the Fund’s benchmark. Duration is a measure of the Fund’s sensitivity to changes in interest rates. Yield curve indicates the spectrum of maturities within a particular sector. Bottom-up individual issue selection amongst agency mortgage-backed securities and U.S. government securities contributed positively. However, this was largely offset by the detracting effect of individual issue selection amongst agency debentures and U.S. Treasury inflation protected securities (“TIPS”). |
| Q | | Which fixed income market sectors most significantly affected Fund performance? |
| A | | Sector positioning was the primary contributor to the Fund’s results during the Reporting Period, with exposures to agency mortgage-backed securities and agency debentures helping most. Agency mortgage-backed securities outperformed duration-neutral U.S. Treasuries, as the Federal Reserve (the “Fed”) made an open-ended commitment to buy $40 billion in mortgage-backed securities per month and also extended its Operation Twist program until year-end 2012. Further, demand for agency mortgage-backed securities was robust, as investors sought high quality spread, or non-U.S. Treasury, products in an exceptionally low interest rate environment. The European Central Bank’s decision to cut its deposit rate to zero served to intensify the hunt for yield, benefiting the performance of agency debentures. |
| | Effective individual selection of mortgage-backed securities, with a focus on pass-throughs, added value during the Reporting Period. (Pass-through mortgages consist of a pool of residential mortgage loans, where homeowners’ monthly payments of principal, interest and prepayments pass from the original bank through a government agency or investment bank to investors.) In addition, effective individual selection of U.S. government securities helped, as we especially sought short-term and intermediate-term securities. These positive contributors were mostly offset by the detracting effect of individual issue selection among U.S. agency debentures and TIPS. |
25
PORTFOLIO RESULTS
| Q | | Did the Fund’s duration and yield curve positioning strategy help or hurt its results during the Reporting Period? |
| A | | Tactical management of the Fund’s duration and yield curve positioning had a modestly positive impact on its results during the Reporting Period. A shorter duration than the benchmark index during April 2012 detracted from Fund returns, as interest rates declined during that month. Politics dominated European news in April, as the Dutch government collapsed and markets focused on the broader implications of new leadership in both France and Greece. We shifted to a longer duration than the benchmark index in May and modestly extended duration further by the end of the Reporting Period. We also added a U.S. Treasury yield curve steepening bias to the Fund’s positioning following the Fed’s announcement of a third round of quantitative easing and the European Central Bank’s offering of potentially unlimited government bond purchases on a formal request for aid. The Fund ended the Reporting Period with a long duration position relative to the benchmark index. As mentioned earlier, duration is a measure of the Fund’s sensitivity to changes in interest rates. Yield curve indicates the spectrum of maturities within a particular sector. |
| Q | | How did the Fund use derivatives and similar instruments during the Reporting Period? |
| A | | The Fund used Treasury futures, Eurodollar futures and interest rate swaps during the Reporting Period for the purpose of managing the duration and term structure of the Fund. (Term structure, most often depicted as a yield curve, refers to the term structure of interest rates, which is the relationship between the yield to maturity and the time to maturity for pure discount bonds.) The Fund employed swaptions (or options on interest rate swap contracts) for the purpose of taking modest short volatility positions, that is, positions that pay a modest return when market volatility remains relatively stable. |
| Q | | Were there any notable changes in the Fund’s weightings during the Reporting Period? |
| A | | The Fund’s exposure to U.S. government securities decreased during the Reporting Period. A corresponding increase in allocation was concentrated in agency non-government guaranteed securities and agency mortgage-backed securities. Additionally, as indicated earlier, we shifted the Fund’s duration positioning during the Reporting Period as market conditions changed. At the start of the Reporting Period, the Fund maintained a shorter duration position than the benchmark index. We maintained that position through the end of April. We subsequently shifted to a longer duration position than the benchmark index, extending duration further by the end of September. |
| Q | | How was the Fund positioned relative to its benchmark index at the end of September 2012? |
| A | | While the Fund is benchmarked to U.S. Treasuries, it continued to hold a portion of its assets in non-Treasury sectors not represented in the benchmark index. Indeed, the Fund maintained exposures to high quality spread, or non-Treasury, sectors throughout the Reporting Period, most notably quasi-government securities, including agency-issued debentures, as well as agency mortgage-backed securities. The Fund maintained an underweighted exposure to government bonds at the end of the Reporting Period. |
26
FUND BASICS
Short Duration Government Fund
as of September 30, 2012
| | | | | | | | | | | | | | | | | | | | | | |
| | PERFORMANCE REVIEW | |
| | | April 1, 2012– September 30, 2012 | | Fund Total
Return
(based on NAV)1 | | | BofA ML
Two-Year U.S.
Treasury Note
Index2 | | | Barclays U.S.
Government
Bond Index
(1-3 Year)3 | | | 30-Day
Standardized
Subsidized
Yield4 | | | 30-Day
Standardized
Unsubsidized
Yield4 | |
| | Class A | | | 0.51 | % | | | 0.31 | % | | | 0.46 | % | | | 0.11 | % | | | 0.09 | % |
| | Class B | | | 0.30 | | | | 0.31 | | | | 0.46 | | | | -0.34 | | | | -0.65 | |
| | Class C | | | 0.33 | | | | 0.31 | | | | 0.46 | | | | -0.27 | | | | -0.65 | |
| | Institutional | | | 0.59 | | | | 0.31 | | | | 0.46 | | | | 0.44 | | | | 0.43 | |
| | Service | | | 0.43 | | | | 0.31 | | | | 0.46 | | | | -0.05 | | | | -0.07 | |
| | | Class IR | | | 0.64 | | | | 0.31 | | | | 0.46 | | | | 0.36 | | | | 0.34 | |
| | 1 | | The net asset value (NAV) represents the net assets of the class of the Fund (ex-dividend) divided by the total number of shares of the class outstanding. The Fund’s performance assumes the reinvestment of dividends and other distributions. The Fund’s performance does not reflect the deduction of any applicable sales charges. |
| | 2 | | The BofA ML Two-Year U.S. Treasury Note Index, as reported by Bank of America Merrill Lynch, does not reflect any deduction for fees, expenses or taxes. It is not possible to invest directly in an index. |
| | 3 | | The Barclays U.S. Government Bond Index (1-3 Year) includes fixed income securities issued by the U.S. Treasury (not including inflation-protected securities) and U.S. government agencies and instrumentalities, as well as corporate or dollar-denominated foreign debt guaranteed by the U.S. government, all with maturities between 1 and 3 years. It is not possible to invest directly in an index. |
| | 4 | | The 30-Day Standardized Subsidized Yield of the Fund is calculated by dividing the net investment income per share (as defined by securities industry regulations) earned by the Fund over a 30-day period (ending on the stated month-end date) by the maximum public offering price (“POP”) per share of the Fund on the last day of the period. This number is then annualized. This yield does not necessarily reflect income actually earned and distributed by the Fund and, therefore, may not be correlated with the dividends or other distributions paid to shareholders. The 30-Day Standardized Unsubsidized Yield does not reflect any applicable expense reductions. |
| | | | The returns set forth in the table above represent past performance. Past performance does not guarantee future results. The Fund’s investment return and principal value will fluctuate so that an investor’s shares, when redeemed, may be worth more or less than their original cost. Current performance may be lower or higher than the performance quoted above. Please visit our web site at www.goldmansachsfunds.com to obtain the most recent month-end returns. Performance reflects fee waivers and/or expense limitations in effect. In their absence, performance would be reduced. Returns do not reflect the deduction of taxes that a shareholder would pay on Fund distributions or the redemption of Fund shares. |
27
FUND BASICS
| | | | | | | | | | | | | | |
| | STANDARDIZED TOTAL RETURNS5 |
| | | For the period ended 9/30/12 | | One Year | | | Five Years | | Ten Years | | Since Inception | | Inception Date |
| | Class A | | | -0.45 | % | | 3.18% | | 2.93% | | 4.15% | | 5/1/97 |
| | Class B | | | -1.28 | | | 2.97 | | 2.59 | | 3.94 | | 5/1/97 |
| | Class C | | | 0.10 | | | 2.90 | | 2.41 | | 3.43 | | 8/15/97 |
| | Institutional | | | 1.34 | | | 3.84 | | 3.45 | | 5.53 | | 8/15/88 |
| | Service | | | 0.94 | | | 3.33 | | 2.94 | | 4.26 | | 4/10/96 |
| | | Class IR | | | 1.25 | | | N/A | | N/A | | 3.47 | | 11/30/07 |
| | 5 | | The Standardized Total Returns are average annual total returns as of the most recent calendar quarter-end. They assume reinvestment of all distributions at NAV. These returns reflect a maximum initial sales charge of 1.5% for Class A Shares, the assumed contingent deferred sales charge for Class B Shares (2% maximum declining to 0% after three years) and the assumed contingent deferred sales charge for Class C Shares (0.65% if redeemed within 12 months of purchase). Class B Shares convert automatically to Class A Shares on or about the fifteenth day of the last month of the calendar quarter that is eight years after purchase. Returns for Class B Shares for the period after conversion reflect the performance of Class A Shares. Prior to July 29, 2009, the maximum initial sales charge applicable to Class A Shares of the Fund was 2.0%, which is not reflected in the figures shown. Because Institutional Shares, Service Shares and Class IR Shares do not involve a sales charge, such a charge is not applied to their Standardized Total Returns. The Fund’s Class B Shares are no longer available for purchase by new or existing shareholders (although current Class B shareholders may continue to reinvest income and capital gains distributions into Class B Shares, and Class B shareholders may continue to exchange their shares for Class B Shares of certain other Goldman Sachs Funds). |
| | | | The returns set forth in the table above represent past performance. Past performance does not guarantee future results. The Fund’s investment return and principal value will fluctuate so that an investor’s shares, when redeemed, may be worth more or less than their original cost. Current performance may be lower or higher than the performance quoted above. Please visit our web site at www.goldmansachsfunds.com to obtain the most recent month-end returns. Performance reflects fee waivers and/or expense limitations in effect. In their absence, performance would be reduced. Returns do not reflect the deduction of taxes that a shareholder would pay on Fund distributions or the redemption of Fund shares. |
| | | | | | | | |
| | EXPENSE RATIOS6 |
| | | | | Net Expense Ratio (Current) | | | Gross Expense Ratio (Before Waivers) |
| | Class A | | | 0.84 | % | | 0.87% |
| | Class B | | | 1.44 | | | 1.62 |
| | Class C | | | 1.24 | | | 1.62 |
| | Institutional | | | 0.50 | | | 0.53 |
| | Service | | | 1.00 | | | 1.03 |
| | | Class IR | | | 0.59 | | | 0.62 |
| | 6 | | The expense ratios of the Fund, both current (net of applicable fee waivers and/or expense limitations) and before waivers (gross of applicable fee waivers and/or expense limitations) are as set forth above according to the most recent publicly available Prospectus for the Fund and may differ from the expense ratios disclosed in the Financial Highlights in this report. The Fund’s waivers and/or expense limitations will remain in place through at least July 27, 2013, and prior to such date the investment adviser may not terminate the arrangements without the approval of the Fund’s Board of Trustees. If these arrangements are discontinued in the future, the expense ratios may change without shareholder approval. |
28
FUND BASICS

| | 7 | | The percentage shown for each investment category reflects the value of investments in that category as a percentage of net assets. Short-term investments represent repurchase agreements. Figures in the graph may not sum to 100% due to the exclusion of other assets and liabilities. The graph depicts the Fund’s investments but may not represent the Fund’s market exposure due to the exclusion of certain derivatives, if any, as listed in the Additional Investment Information section of the Schedule of Investments. |
| | 8 | | “Agency Debentures” include agency securities offered by companies such as Federal National Mortgage Association (“FNMA”) and Federal Home Loan Mortgage Corp. (“FHLMC”), which operate under a government charter. While they are required to report to a government regulator, their assets are not explicitly guaranteed by the government and they otherwise operate like any other publicly traded company. |
| | 9 | | “Federal Agencies” are mortgage-backed securities guaranteed by the Government National Mortgage Association (“GNMA”), FNMA and FHLMC. GNMA instruments are backed by the full faith and credit of the U.S. Government. |
29
PORTFOLIO RESULTS
Goldman Sachs Short Duration Income Fund
Investment Objective
The Fund seeks total return consisting of income and capital appreciation.
Portfolio Management Discussion and Analysis
Below, the Goldman Sachs Global Liquidity Management Team discusses the Goldman Sachs Short Duration Income Fund’s (the “Fund”) performance and positioning for the six-month period ended September 30, 2012 (the “Reporting Period”).
| Q | | How did the Fund perform during the Reporting Period? |
| A | | During the Reporting Period, the Fund’s Class A, C, Institutional, IR and R Shares generated cumulative total returns, without sales charges, of 2.46%, 2.28%, 2.74%, 2.69% and 2.42%, respectively. These returns compare to the 1.98% cumulative total return of the Goldman Sachs Short Duration Income Fund Composite Index (the “Short Duration Income Composite”) during the same period. The Short Duration Income Composite is comprised 50% of the Barclays U.S. Corporate Bonds Index, 1-5 Years and 50% of the Barclays 1-5 Year U.S. Government Index, which generated cumulative total returns of 2.94% and 1.02%, respectively, over the same time period. To compare, the Barclays 1-5 Year U.S. Government/Credit Index generated a cumulative total return of 1.48% during the Reporting Period. |
| Q | | What key factors were responsible for the Fund’s performance during the Reporting Period? |
| A | | Both top-down and bottom-up strategies had an impact on the Fund’s performance during the Reporting Period. Within our top-down strategies, our cross-sector strategy was the primary positive contributor to the Fund’s results during the Reporting Period. Our cross-sector strategy is one in which we invest Fund assets across a variety of fixed income sectors, including some that may not be included in the Fund’s benchmark. Our duration and yield curve positioning strategy had a modestly negative impact on Fund performance. Duration is a measure of the Fund’s sensitivity to changes in interest rates. Yield curve indicates the spectrum of maturities within a particular sector. Bottom-up individual issue selection amongst corporate bonds, collateralized securities and government bonds contributed positively to the Fund’s results. |
| Q | | Which fixed income market sectors most significantly affected Fund performance? |
| A | | Sector positioning contributed positively to the Fund’s results during the Reporting Period, with an allocation to agency mortgage-backed securities helping most, as the Federal Reserve (the “Fed”) made an open-ended commitment to buy $40 billion in mortgage-backed securities per month and extended its Operation Twist program until year-end 2012. Further, demand for agency mortgage-backed securities was robust, as investors sought high quality spread, or non-U.S. Treasury, products amidst an exceptionally low interest rate environment. |
| | The Fund’s exposure to corporate bonds added to performance, as credit markets rallied, especially during the third calendar quarter, on a combination of improving U.S. economic data and strong technicals, or supply/demand conditions. The Fund’s exposure to emerging market debt also boosted results, mostly driven by the accommodative policies of central banks across many emerging economies. |
| | Individual issue selection of agency collateralized mortgage obligations (“CMOs”) and mortgage-backed security pass-throughs proved effective as did selection amongst high yield corporate bonds. (Pass-through mortgages consist of a pool of residential mortgage loans, where homeowners’ monthly payments of principal, interest and prepayments pass from the original bank through a government agency or investment bank to investors.) |
| | As we continued to deploy cash from the initial launch of the Fund on February 29, 2012, market transaction costs detracted from the Fund’s relative results. |
30
PORTFOLIO RESULTS
| Q | | Did the Fund’s duration and yield curve positioning strategy help or hurt its results during the Reporting Period? |
| A | | Tactical management of the Fund’s duration and yield curve positioning had a modestly negative impact on results during the Reporting Period, with the majority of negative return attributable to an underweighted position in the one-, three- and 20-year segments of the U.S. Treasury yield curve. Long-term U.S. Treasury rates steepened during the Reporting Period, as aggressive quantitative easing by the Fed pushed the inflation premium at the long-term end of the yield curve higher. On the other hand, a longer duration position than the benchmark index in the five- and seven-year segments of the U.S. Treasury yield curve positively impacted the Fund’s performance during the Reporting Period. Furthermore, an overweighted position in intermediate-maturity German bund rates added to the Fund’s performance, as investors sought more safe-haven securities. |
| | Overall, the Fund maintained a shorter duration position than the benchmark index at the start of the Reporting Period. We extended the portfolio’s duration positioning in early May, reverting back to a short to neutral position relative to the benchmark index several times as the Reporting Period progressed. The Fund ended the Reporting Period with a longer duration position than the benchmark index. As mentioned earlier, duration is a measure of the Fund’s sensitivity to changes in interest rates. Yield curve indicates the spectrum of maturities within a particular sector. |
| Q | | How did the Fund use derivatives and similar instruments during the Reporting Period? |
| A | | The Fund used Treasury futures, Eurodollar futures and interest rate swaps during the Reporting Period for the purpose of managing the duration and term structure of the Fund. (Term structure, most often depicted as a yield curve, refers to the term structure of interest rates, which is the relationship between the yield to maturity and the time to maturity for pure discount bonds.) The Fund employed credit default swaps to manage the credit profile of the Fund. The Fund used forward foreign currency transactions to hedge its exposure to foreign currency exposure and increase total return. |
| Q | | Were there any notable changes in the Fund’s weightings during the Reporting Period? |
| A | | The Fund’s allocation to domestic sovereign bonds and investment grade corporate bonds decreased during the Reporting Period, as we continued to build the portfolio since its launch on February 29, 2012. A corresponding increase in allocation was concentrated in high yield corporate bonds and agency mortgage-backed security pass-throughs. Additionally, as mentioned earlier, we shifted the Fund’s duration positioning during the Reporting Period as market conditions changed. At the start of the Reporting Period, the Fund maintained a shorter duration position than the benchmark index. We extended the portfolio’s duration positioning in early May, reverting back to a short to neutral position relative to the benchmark index several times as the Reporting Period progressed. The Fund ended the Reporting Period with a longer duration position than the benchmark index. |
| Q | | How was the Fund positioned relative to its benchmark index at the end of September 2012? |
| A | | While the Fund is benchmarked to an equally-balanced composite of the Barclays U.S. Corporate Bonds Index, 1-5 Years and the Barclays 1-5 Year U.S. Government Bond Index, it held a portion of its assets in non-Treasury sectors not represented in the benchmark index. Indeed, the Fund maintained exposure to high quality spread, or non-Treasury, sectors throughout the Reporting Period, most notably agency mortgage-backed securities, asset-backed securities, high yield corporate bonds and emerging market debt. The Fund had no exposure to government bonds and held only a minimal allocation to quasi-government securities at the end of the Reporting Period. |
31
FUND BASICS
Short Duration Income Fund
as of September 30, 2012

| | | | | | | | | | | | | | | | | | | | | | | | | | |
| | PERFORMANCE REVIEW | | | | | |
| | | April 1, 2012–
September 30, 2012 | | Fund Total
Return
(based on NAV)1 | | | Short Duration
Income Fund
Composite
Index2 | | | Barclays
U.S.
Corporate
Bonds
Index, 1-5
Years3 | | | Barclays
1-5 Year
U.S.
Government
Index4 | | | 30-Day
Standardized
Subsidized
Yield5 | | | 30-Day
Standardized
Unsubsidized
Yield5 | |
| | Class A | | | 2.46 | % | | | 1.98 | % | | | 2.94 | % | | | 1.02 | % | | | 0.83 | % | | | -1.26 | % |
| | Class C | | | 2.28 | | | | 1.98 | | | | 2.94 | | | | 1.02 | | | | 0.64 | | | | -1.07 | |
| | Institutional | | | 2.74 | | | | 1.98 | | | | 2.94 | | | | 1.02 | | | | 1.18 | | | | -0.90 | |
| | Class IR | | | 2.69 | | | | 1.98 | | | | 2.94 | | | | 1.02 | | | | 1.10 | | | | -2.42 | |
| | | Class R | | | 2.42 | | | | 1.98 | | | | 2.94 | | | | 1.02 | | | | 0.57 | | | | -1.47 | |
| | 1 | | The net asset value (NAV) represents the net assets of the class of the Fund (ex-dividend) divided by the total number of shares of the class outstanding. The Fund’s performance assumes the reinvestment of dividends and other distributions. The Fund’s performance does not reflect the deduction of any applicable sales charges. |
| | 2 | | The Short Duration Income Composite Index is comprised of the Barclays U.S. Corporate Bonds Index, 1-5 Years (50%) and the Barclays 1-5 Year U.S. Government Index (50%). |
| | 3 | | The Barclays U.S. Corporate Bonds Index, 1-5 Years provides a broad based measure of the global investment grade corporate sector with final maturities ranging between one and five years. The corporate sectors include industrial, utility and finance, for U.S. and non-U.S. corporations. It is not possible to invest directly in an index. |
| | 4 | | The Barclays 1-5 Year U.S. Government Index provides a broad based measure of securities issued by the U.S. government with final maturities ranging from one to five years. This includes public obligations of the U.S. Treasury, U.S. government agencies, quasi-federal corporations and corporate or foreign debt guaranteed by the U.S. government. It is not possible to invest directly in an index. |
| | 5 | | The 30-Day Standardized Subsidized Yield of the Fund is calculated by dividing the net investment income per share (as defined by securities industry regulations) earned by the Fund over a 30-day period (ending on the stated month-end date) by the maximum public offering price (“POP”) per share of the Fund on the last day of the period. This number is then annualized. This yield does not necessarily reflect income actually earned and distributed by the Fund and, therefore, may not be correlated with the dividends or other distributions paid to shareholders. The 30-Day Standardized Unsubsidized Yield does not reflect any applicable expense reductions. |
| | | | | | | | |
| | STANDARDIZED TOTAL RETURNS6 |
| | | For the period ended 9/30/12 | | Since Inception | | | Inception Date |
| | Class A | | | 0.61 | % | | 2/29/2012 |
| | Class C | | | 1.34 | | | 2/29/2012 |
| | Institutional | | | 2.53 | | | 2/29/2012 |
| | Class IR | | | 2.47 | | | 2/29/2012 |
| | | Class R | | | 2.16 | | | 2/29/2012 |
| | 6 | | The Standardized Total Returns are cumulative total returns as of the most recent calendar quarter-end. They assume reinvestment of all distributions at NAV. These returns reflect a maximum initial sales charge of 1.5% for Class A Shares and the assumed contingent deferred sales charge for Class C Shares (0.65% if redeemed within 12 months of purchase). Because Institutional Shares, Class IR Shares and Class R Shares do not involve a sales charge, such a charge is not applied to their Standardized Total Returns. |
| | The | | returns set forth in the tables above represent past performance. Past performance does not guarantee future results. The Fund’s investment return and principal value will fluctuate so that an investor’s shares, when redeemed, may be worth more or less than their original cost. Current performance may be lower or higher than the performance quoted above. Please visit our web site at www. goldmansachsfunds.com to obtain the most recent month-end returns. Performance reflects fee waivers and/or expense limitations in effect. In their absence, performance would be reduced. Returns do not reflect the deduction of taxes that a shareholder would pay on Fund distributions or the redemption of Fund shares. |
32
FUND BASICS
| | | | | | | | | | |
| | EXPENSE RATIOS7 | |
| | | | | Net Expense Ratio (Current) | | | Gross Expense Ratio (Before Waivers) | |
| | Class A | | | 0.80 | % | | | 6.23 | % |
| | Class C | | | 1.20 | | | | 6.98 | |
| | Institutional | | | 0.46 | | | | 5.89 | |
| | Class IR | | | 0.55 | | | | 5.98 | |
| | | Class R | | | 1.05 | | | | 6.48 | |
| | 7 | | The expense ratios of the Fund, both current (net of applicable fee waivers and/or expense limitations) and before waivers (gross of applicable fee waivers and/or expense limitations) are as set forth above according to the most recent publicly available Prospectus for the Fund and may differ from the expense ratios disclosed in the Financial Highlights in this report. The Fund’s waivers and/or expense limitations will remain in place through at least July 27, 2013, and prior to such date the investment adviser may not terminate the arrangements without the approval of the Fund’s Board of Trustees. If these arrangements are discontinued in the future, the expense ratios may change without shareholder approval. |
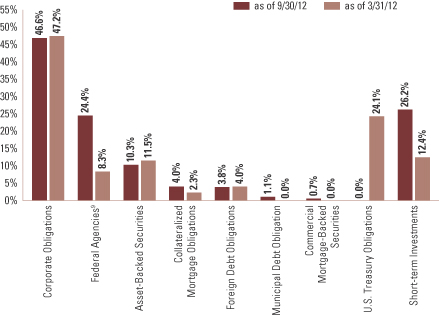
| | 8 | | The percentage shown for each investment category reflects the value of investments in that category as a percentage of net assets. Short-term investments represent U.S. Treasury Bill and repurchase agreements. Figures in the graph may not sum to 100% due to the exclusion of other assets and liabilities. The graph depicts the Fund’s investments but may not represent the Fund’s market exposure due to the exclusion of certain derivatives, if any, as listed in the Additional Investment Information section of the Schedule of Investments. |
| | 9 | | “Federal Agencies” are mortgage-backed securities guaranteed by the Government National Mortgage Association (“GNMA”), Federal National Mortgage Association (“FNMA”) and Federal Home Loan Mortgage Corp. (“FHLMC”). GNMA instruments are backed by the full faith and credit of the U.S. Government. |
33
GOLDMAN SACHS ENHANCED INCOME FUND
Schedule of Investments
September 30, 2012 (Unaudited)
| | | | | | | | | | | | | | |
Principal
Amount | | | Interest
Rate | | | Maturity
Date | | | Value | |
| | | | | | | | | | | | | | |
| | Corporate Obligations – 47.7% | |
| Banks – 24.0% | |
| Abbey National Treasury Services PLC | |
| $ | 1,675,000 | | | | 2.875 | % | | | 04/25/14 | | | $ | 1,697,741 | |
| ANZ National (International) Ltd.(a) | |
| | 1,700,000 | | | | 6.200 | | | | 07/19/13 | | | | 1,767,067 | |
| Australia & New Zealand Banking Group Ltd.(a) | |
| | 4,100,000 | | | | 1.198 | (b) | | | 01/10/14 | | | | 4,122,919 | |
| | 3,100,000 | | | | 1.000 | | | | 10/06/15 | | | | 3,105,270 | |
| Bank of America Corp. | |
| | 925,000 | | | | 5.625 | | | | 10/14/16 | | | | 1,047,454 | |
| Bank of Nova Scotia(a) | |
| | 6,700,000 | | | | 1.050 | | | | 03/20/15 | | | | 6,795,140 | |
| Bank of Scotland PLC(a) | |
| | 1,400,000 | | | | 5.250 | | | | 02/21/17 | | | | 1,589,531 | |
| Bank of Tokyo-Mitsubishi UFJ Ltd.(a) | |
| | 3,600,000 | | | | 2.600 | | | | 01/22/13 | | | | 3,616,297 | |
| BPCE SA(a)(b) | |
| | 1,875,000 | | | | 2.189 | | | | 02/07/14 | | | | 1,888,603 | |
| Caisse centrale Desjardins du Quebec(a) | |
| | 600,000 | | | | 2.550 | | | | 03/24/16 | | | | 637,980 | |
| Canadian Imperial Bank of Commerce(a) | |
| | 2,200,000 | | | | 2.750 | | | | 01/27/16 | | | | 2,354,880 | |
| Capital One Financial Corp. | |
| | 3,825,000 | | | | 2.125 | | | | 07/15/14 | | | | 3,901,767 | |
| Citigroup, Inc. | |
| | 1,575,000 | | | | 6.375 | | | | 08/12/14 | | | | 1,714,354 | |
| Commonwealth Bank of Australia(a)(b) | |
| | 4,625,000 | | | | 1.119 | | | | 03/17/14 | | | | 4,644,665 | |
| DnB Boligkreditt AS(a) | |
| | 300,000 | | | | 2.100 | | | | 10/14/15 | | | | 311,100 | |
| | 18,100,000 | | | | 2.900 | | | | 03/29/16 | | | | 19,263,830 | |
| ING Bank NV(a) | |
| | 1,600,000 | | | | 2.000 | | | | 09/25/15 | | | | 1,602,392 | |
| Intesa Sanpaolo New York | |
| | 2,700,000 | | | | 2.375 | | | | 12/21/12 | | | | 2,667,924 | |
| JPMorgan Chase & Co. | |
| | 3,850,000 | | | | 1.875 | | | | 03/20/15 | | | | 3,926,288 | |
| Mizuho Corporate Bank Ltd.(a) | |
| | 1,475,000 | | | | 2.550 | | | | 03/17/17 | | | | 1,541,372 | |
| Morgan Stanley | |
| | 550,000 | | | | 3.450 | | | | 11/02/15 | | | | 563,607 | |
| Nordea Bank AB(a)(b) | |
| | 6,550,000 | | | | 1.355 | | | | 01/14/14 | | | | 6,583,543 | |
| Nordea Eiendomskreditt AS(a) | |
| | 4,000,000 | | | | 0.880 | (b) | | | 04/07/14 | | | | 3,995,992 | |
| | 1,200,000 | | | | 1.875 | | | | 04/07/14 | | | | 1,221,300 | |
| Northern Rock Asset Management PLC(a) | |
| | 1,000,000 | | | | 5.625 | | | | 06/22/17 | | | | 1,123,700 | |
| Rabobank Nederland(a) | |
| | 4,675,000 | | | | 4.200 | | | | 05/13/14 | | | | 4,917,315 | |
| Sparebank 1 Boligkreditt AS(a) | |
| | 6,500,000 | | | | 1.250 | | | | 10/25/14 | | | | 6,542,900 | |
| | 6,200,000 | | | | 2.625 | | | | 05/26/16 | | | | 6,548,971 | |
| Standard Chartered PLC(a) | |
| | 3,625,000 | | | | 3.850 | | | | 04/27/15 | | | | 3,823,831 | |
| Sumitomo Mitsui Banking Corp.(a)(b) | |
| | 4,550,000 | | | | 1.403 | | | | 07/22/14 | | | | 4,590,409 | |
| | |
| Principal
Amount |
| |
| Interest
Rate |
| |
| Maturity
Date |
| | | Value | |
| | | | | | | | | | | | | | |
| | Corporate Obligations – (continued) | |
| Banks – (continued) | |
| Swedbank Hypotek AB(a)(b) | |
| $ | 1,100,000 | | | | 0.812 | % | | | 03/28/14 | | | $ | 1,098,346 | |
| Toronto-Dominion Bank(a) | |
| | 3,500,000 | | | | 1.625 | | | | 09/14/16 | | | | 3,618,300 | |
| | 1,600,000 | | | | 1.500 | | | | 03/13/17 | | | | 1,645,280 | |
| UBS AG | |
| | 2,625,000 | | | | 3.875 | | | | 01/15/15 | | | | 2,770,203 | |
| Wells Fargo & Co. | |
| | 2,700,000 | | | | 1.250 | | | | 02/13/15 | | | | 2,721,447 | |
| Westpac Banking Corp. | |
| | 3,025,000 | | | | 2.250 | | | | 11/19/12 | | | | 3,032,505 | |
| | | | | | | | | | | | | | |
| | | | | | | | | | | | | 122,994,223 | |
| | |
| Consumer Products(b) – 0.3% | |
| The Procter & Gamble Co. | |
| | 1,550,000 | | | | 0.362 | | | | 02/06/14 | | | | 1,551,189 | |
| | |
| Electric(c) – 2.5% | |
| Commonwealth Edison Co. | |
| | 3,625,000 | | | | 1.625 | | | | 01/15/14 | | | | 3,673,093 | |
| PacifiCorp | |
| | 2,675,000 | | | | 5.450 | | | | 09/15/13 | | | | 2,794,016 | |
| Public Service Co. of Colorado | |
| | 2,325,000 | | | | 7.875 | | | | 10/01/12 | | | | 2,325,000 | |
| Southern Co. | |
| | 875,000 | | | | 4.150 | | | | 05/15/14 | | | | 922,728 | |
| Wisconsin Electric Power Co. | |
| | 2,875,000 | | | | 6.000 | | | | 04/01/14 | | | | 3,091,178 | |
| | | | | | | | | | | | | | |
| | | | | | | | | | | | | 12,806,015 | |
| | |
| Energy – 3.5% | |
| Apache Corp.(c) | |
| | 2,975,000 | | | | 6.000 | | | | 09/15/13 | | | | 3,131,072 | |
| BP Capital Markets PLC | |
| | 2,675,000 | | | | 3.125 | | | | 10/01/15 | | | | 2,851,610 | |
| EnCana Corp.(c) | |
| | 625,000 | | | | 4.750 | | | | 10/15/13 | | | | 648,895 | |
| Shell International Finance BV(c) | |
| | 4,475,000 | | | | 1.875 | | | | 03/25/13 | | | | 4,510,151 | |
| Statoil ASA(c) | |
| | 650,000 | | | | 3.875 | | | | 04/15/14 | | | | 682,661 | |
| | 3,470,000 | | | | 5.125 | (a) | | | 04/30/14 | | | | 3,710,641 | |
| Total Capital Canada Ltd.(c) | |
| | 2,425,000 | | | | 1.625 | | | | 01/28/14 | | | | 2,462,919 | |
| | | | | | | | | | | | | | |
| | | | | | | | | | | | | 17,997,949 | |
| | |
| Food and Beverage – 2.4% | |
| Anheuser-Busch InBev Worldwide, Inc.(c) | |
| | 2,725,000 | | | | 0.800 | | | | 07/15/15 | | | | 2,731,766 | |
| Diageo Finance BV | |
| | 3,700,000 | | | | 5.500 | | | | 04/01/13 | | | | 3,795,031 | |
| Kellogg Co.(c) | |
| | 3,200,000 | | | | 5.125 | | | | 12/03/12 | | | | 3,225,475 | |
| Unilever Capital Corp.(c) | |
| | 2,775,000 | | | | 0.850 | | | | 08/02/17 | | | | 2,744,935 | |
| | | | | | | | | | | | | | |
| | | | | | | | | | | | | 12,497,207 | |
| | |
| | |
| 34 | | The accompanying notes are an integral part of these financial statements. |
GOLDMAN SACHS ENHANCED INCOME FUND
| | | | | | | | | | | | | | |
| Principal
Amount |
| |
| Interest
Rate |
| |
| Maturity
Date |
| | | Value | |
| | | | | | | | | | | | | | |
| | Corporate Obligations – (continued) | |
| Health Care Products(c) – 1.6% | |
| St. Jude Medical, Inc. | |
| $ | 3,575,000 | | | | 2.200 | % | | | 09/15/13 | | | $ | 3,629,760 | |
| Thermo Fisher Scientific, Inc. | |
| | 4,575,000 | | | | 2.150 | | | | 12/28/12 | | | | 4,587,984 | |
| | | | | | | | | | | | | | |
| | | | | | | | | | | | | 8,217,744 | |
| | |
| Health Care Services(c) – 1.0% | |
| Covidien International Finance SA | |
| | 1,625,000 | | | | 1.875 | | | | 06/15/13 | | | | 1,640,888 | |
| | 2,525,000 | | | | 2.800 | | | | 06/15/15 | | | | 2,628,096 | |
| McKesson Corp. | |
| | 950,000 | | | | 3.250 | | | | 03/01/16 | | | | 1,015,640 | |
| | | | | | | | | | | | | | |
| | | | | | | | | | | | | 5,284,624 | |
| | |
| Internet(c) – 0.1% | |
| eBay, Inc. | |
| | 575,000 | | | | 1.350 | | | | 07/15/17 | | | | 578,184 | |
| | |
| Life Insurance – 4.2% | |
| MassMutual Global Funding II(a)(b) | |
| | 4,250,000 | | | | 0.864 | | | | 09/27/13 | | | | 4,270,910 | |
| Metropolitan Life Global Funding I(a) | |
| | 1,725,000 | | | | 5.125 | | | | 04/10/13 | | | | 1,766,564 | |
| | 3,437,000 | | | | 5.125 | | | | 06/10/14 | | | | 3,686,024 | |
| Nationwide Life Global Funding I(a) | |
| | 1,175,000 | | | | 5.450 | | | | 10/02/12 | | | | 1,175,000 | |
| Principal Life Global Funding II(a) | |
| | 3,200,000 | | | | 1.125 | | | | 09/18/15 | | | | 3,206,224 | |
| Prudential Financial, Inc. | |
| | 1,625,000 | | | | 2.750 | | | | 01/14/13 | | | | 1,635,520 | |
| Sun Life Financial Global Funding LP(a)(b) | |
| | 3,750,000 | | | | 0.710 | | | | 10/06/13 | | | | 3,723,375 | |
| TIAA Global Markets, Inc.(a)(c) | |
| | 1,900,000 | | | | 5.125 | | | | 10/10/12 | | | | 1,901,712 | |
| | | | | | | | | | | | | | |
| | | | | | | | | | | | | 21,365,329 | |
| | |
| Media – Non Cable(c) – 0.8% | |
| Reed Elsevier Capital, Inc. | |
| | 450,000 | | | | 7.750 | | | | 01/15/14 | | | | 488,548 | |
| Thomson Reuters Corp. | |
| | 3,209,000 | | | | 5.950 | | | | 07/15/13 | | | | 3,344,336 | |
| | | | | | | | | | | | | | |
| | | | | | | | | | | | | 3,832,884 | |
| | |
| Noncaptive – Financial – 1.7% | |
| American Express Credit Corp. | |
| | 3,650,000 | | | | 2.750 | | | | 09/15/15 | | | | 3,850,900 | |
| General Electric Capital Corp.(b) | |
| | 4,625,000 | | | | 1.310 | | | | 01/07/14 | | | | 4,639,444 | |
| | 250,000 | | | | 0.509 | | | | 03/20/14 | | | | 249,380 | |
| | | | | | | | | | | | | | |
| | | | | | | | | | | | | 8,739,724 | |
| | |
| Pharmaceuticals(c) – 0.3% | |
| GlaxoSmithKline Capital PLC | |
| | 1,350,000 | | | | 0.750 | | | | 05/08/15 | | | | 1,358,069 | |
| | |
| Real Estate Investment Trust(c) – 1.2% | |
| Simon Property Group LP | |
| | 2,475,000 | | | | 4.200 | | | | 02/01/15 | | | | 2,637,371 | |
| | |
| Principal
Amount |
| |
| Interest
Rate |
| |
| Maturity
Date |
| | | Value | |
| | | | | | | | | | | | | | |
| | Corporate Obligations – (continued) | |
| Real Estate Investment Trust(c) – (continued) | |
| WEA Finance LLC(a) | |
| $ | 1,341,000 | | | | 5.400 | % | | | 10/01/12 | | | $ | 1,341,000 | |
| WEA Finance LLC/WT Finance Australia Property Ltd.(a) | |
| | 2,025,000 | | | | 7.500 | | | | 06/02/14 | | | | 2,231,297 | |
| | | | | | | | | | | | | | |
| | | | | | | | | | | | | 6,209,668 | |
| | |
| Technology(c) – 1.4% | |
| Hewlett-Packard Co. | |
| | 3,920,000 | | | | 6.125 | | | | 03/01/14 | | | | 4,182,296 | |
| International Business Machines Corp. | |
| | 2,545,000 | | | | 6.500 | | | | 10/15/13 | | | | 2,705,506 | |
| | | | | | | | | | | | | | |
| | | | | | | | | | | | | 6,887,802 | |
| | |
| Tobacco – 0.7% | |
| Philip Morris International, Inc. | |
| | 3,300,000 | | | | 6.875 | | | | 03/17/14 | | | | 3,603,832 | |
| | |
| Transportation(c) – 0.5% | |
| United Parcel Service, Inc. | |
| | 2,275,000 | | | | 1.125 | | | | 10/01/17 | | | | 2,285,451 | |
| | |
| Wireless Telecommunications – 1.2% | |
| ALLTEL Corp. | |
| | 1,350,000 | | | | 6.500 | | | | 11/01/13 | | | | 1,433,311 | |
| Vodafone Group PLC(c) | |
| | 4,450,000 | | | | 5.000 | | | | 12/16/13 | | | | 4,688,681 | |
| | | | | | | | | | | | | | |
| | | | | | | | | | | | | 6,121,992 | |
| | |
| Wirelines Telecommunications(c) – 0.3% | |
| France Telecom SA | |
| | 1,325,000 | | | | 4.375 | | | | 07/08/14 | | | | 1,399,374 | |
| | |
| | TOTAL CORPORATE OBLIGATIONS | | | | | |
| | (Cost $239,177,797) | | | $ | 243,731,260 | |
| | |
| | | | | | | | | | | | | | |
| | Agency Debentures – 4.5% | |
| FHLB | |
| $ | 4,600,000 | | | | 0.210 | % | | | 01/04/13 | | | $ | 4,600,354 | |
| FNMA | |
| | 14,200,000 | | | | 0.345 | (b) | | | 05/17/13 | | | | 14,207,498 | |
| | 2,400,000 | | | | 4.125 | | | | 04/15/14 | | | | 2,543,321 | |
| | 1,700,000 | | | | 0.375 | | | | 03/16/15 | | | | 1,701,965 | |
| | |
| | TOTAL AGENCY DEBENTURES | | | | | |
| | (Cost $23,024,007) | | | $ | 23,053,138 | |
| | |
| | | | | | | | | | | | | | |
| | Asset-Backed Securities – 12.1% | |
| Autos – 6.7% | |
| Ally Auto Receivables Trust Series 2010-4, Class A3 | |
| $ | 3,058,165 | | | | 0.910 | % | | | 11/17/14 | | | $ | 3,064,578 | |
| CarMax Auto Owner Trust Series 2011-3, Class A2 | |
| | 5,309,677 | | | | 0.700 | | | | 11/17/14 | | | | 5,316,607 | |
| Ford Credit Floorplan Master Owner Trust Series 2012-4,
Class A1 |
|
| | 2,900,000 | | | | 0.740 | | | | 09/15/16 | | | | 2,899,555 | |
| | |
| | |
| The accompanying notes are an integral part of these financial statements. | | 35 |
GOLDMAN SACHS ENHANCED INCOME FUNDS
Schedule of Investments (continued)
September 30, 2012 (Unaudited)
| | | | | | | | | | | | | | |
| Principal
Amount |
| |
| Interest
Rate |
| |
| Maturity
Date |
| | | Value | |
| | | | | | | | | | | | | | |
| | Asset-Backed Securities – (continued) | |
| Autos – (continued) | |
| Ford Credit Floorplan Master Owner Trust Series 2012-4,
Class A2(b) |
|
| $ | 2,800,000 | | | | 0.569 | % | | | 09/15/16 | | | $ | 2,800,059 | |
| Harley-Davidson Motorcycle Trust Series 2012-1, Class A2 | |
| | 5,500,000 | | | | 0.500 | | | | 08/15/15 | | | | 5,503,149 | |
| Honda Auto Receivables Owner Trust Series 2009-3, Class A4 | |
| | 761,471 | | | | 3.300 | | | | 09/15/15 | | | | 764,180 | |
| Huntington Auto Trust Series 2012-1, Class A3 | |
| | 4,000,000 | | | | 0.810 | | | | 09/15/16 | | | | 4,028,301 | |
| Motor PLC Series 2012-A, Class A1B(a)(b) | |
| | 3,250,000 | | | | 0.735 | | | | 02/25/20 | | | | 3,250,038 | |
| Motor PLC Series 2012-A, Class A1C(a) | |
| | 1,000,000 | | | | 1.286 | | | | 02/25/20 | | | | 1,001,535 | |
| Toyota Auto Receivables Owner Trust Series 2011-B, Class A3 | |
| | 2,400,000 | | | | 0.680 | | | | 06/15/15 | | | | 2,408,522 | |
| Volkswagen Auto Loan Enhanced Trust Series 2010-1, Class A4 | |
| | 3,200,000 | | | | 2.140 | | | | 08/22/16 | | | | 3,228,053 | |
| | | | | | | | | | | | | | |
| | | | | | | | | | | | | 34,264,577 | |
| | |
| Home Equity(b) – 0.0% | |
| Amresco Residential Securities Mortgage Loan Trust
Series 1998-2, Class M1F |
|
| | 32,264 | | | | 6.745 | | | | 06/25/28 | | | | 30,267 | |
| Centex Home Equity Series 2004-D, Class MV3 | |
| | 137,626 | | | | 1.217 | | | | 09/25/34 | | | | 11,747 | |
| Morgan Stanley ABS Capital I Series 2004-HE4, Class M3 | |
| | 54,085 | | | | 2.467 | | | | 05/25/34 | | | | 7,497 | |
| | | | | | | | | | | | | | |
| | | | | | | | | | | | | 49,511 | |
| | |
| Manufactured Housing – 0.0% | |
| Lehman ABS Manufactured Housing Contract Series 2001-B,
Class A3 |
|
| | 53,069 | | | | 4.350 | | | | 04/15/40 | | | | 55,398 | |
| | |
| Student Loan – 5.4% | |
| Access Group, Inc. Series 2002-1, Class A2(b) | |
| | 1,219,807 | | | | 0.549 | | | | 09/25/25 | | | | 1,216,266 | |
| Brazos Higher Education Authority, Inc. Series 2005-3,
Class A14(b) |
|
| | 539,471 | | | | 0.479 | | | | 09/25/23 | | | | 538,570 | |
| College Loan Corp. Trust Series 2004-1, Class A3(b) | |
| | 1,467,872 | | | | 0.611 | | | | 04/25/21 | | | | 1,465,579 | |
| College Loan Corp. Trust Series 2004-1, Class A4(b) | |
| | 1,050,000 | | | | 0.641 | | | | 04/25/24 | | | | 984,137 | |
| College Loan Corp. Trust Series 2005-1, Class A2(b) | |
| | 7,000,000 | | | | 0.551 | | | | 07/25/24 | | | | 6,914,218 | |
| College Loan Corp. Trust Series 2005-2, Class A2(b) | |
| | 846,610 | | | | 0.565 | | | | 10/15/21 | | | | 845,852 | |
| Education Funding Capital Trust I Series 2004-1, Class A2(b) | |
| | 963,953 | | | | 0.549 | | | | 12/15/22 | | | | 960,898 | |
| Education Loan Asset-Backed Trust Series 2012-1, Class A1(b) | |
| | 2,300,000 | | | | 0.669 | | | | 06/25/22 | | | | 2,300,000 | |
| Educational Services of America, Inc. Series 2010-1, Class A1(a)(b) | |
| | 1,755,105 | | | | 1.301 | | | | 07/25/23 | | | | 1,769,115 | |
| GCO Slims Trust Series 2006-1A Class Note(a) | |
| | 61,889 | | | | 5.720 | | | | 03/01/22 | | | | 60,342 | |
| | |
| Principal
Amount |
| |
| Interest
Rate |
| |
| Maturity
Date |
| | | Value | |
| | | | | | | | | | | | | | |
| | Asset-Backed Securities – (continued) | |
| Student Loan – (continued) | |
| Northstar Education Finance, Inc. Series 2005-1, Class A1(b) | |
| $ | 370,119 | | | | 0.547 | % | | | 10/28/26 | | | $ | 368,762 | |
| Scholar Funding Trust Series 2012-B, Class A1(a)(b) | |
| | 625,000 | | | | 0.619 | | | | 10/28/25 | | | | 623,345 | |
| SLM Student Loan Trust Series 2007-1, Class A3(b) | |
| | 2,757,437 | | | | 0.481 | | | | 07/25/18 | | | | 2,756,436 | |
| SLM Student Loan Trust Series 2007-2, Class A2(b) | |
| | 2,819,133 | | | | 0.451 | | | | 07/25/17 | | | | 2,811,884 | |
| SLM Student Loan Trust Series 2012-6, Class A1(b) | |
| | 2,200,000 | | | | 0.380 | | | | 02/27/17 | | | | 2,199,788 | |
| Sun Trust Student Loan Trust Series 2006-1A, Class A2(a)(b) | |
| | 1,121,882 | | | | 0.547 | | | | 07/28/20 | | | | 1,121,118 | |
| US Education Loan Trust LLC Series 2006-1, Class A2(a)(b) | |
| | 662,264 | | | | 0.551 | | | | 03/01/25 | | | | 657,800 | |
| | | | | | | | | | | | | | |
| | | | | | | | | | | | | 27,594,110 | |
| | |
| | TOTAL ASSET-BACKED SECURITIES | | | | | |
| | (Cost $62,053,772) | | | $ | 61,963,596 | |
| | |
| | | | | | | | | | | | | | |
| | Foreign Debt Obligations – 2.0% | |
| Sovereign – 1.2% | |
| Kommunalbanken AS(a) | |
| $ | 1,100,000 | | | | 1.000 | % | | | 09/26/17 | | | $ | 1,100,769 | |
| Ontario Province of Canada | |
| | 4,700,000 | | | | 1.875 | | | | 11/19/12 | | | | 4,709,212 | |
| | | | | | | | | | | | | | |
| | | | | | | | | | | | | 5,809,981 | |
| | |
| Supranational(b) – 0.8% | |
| Inter-American Development Bank | |
| | 4,100,000 | | | | 0.884 | | | | 05/20/14 | | | | 4,137,765 | |
| | |
| | TOTAL FOREIGN DEBT OBLIGATIONS | |
| | (Cost $9,935,390) | | | $ | 9,947,746 | |
| | |
| | | | | | | | | | | | | | |
| | Government Guarantee Obligations(d) – 10.0% | |
| Achmea Hypotheekbank NV(a)(b) | |
| $ | 8,200,000 | | | | 0.792 | % | | | 11/03/14 | | | $ | 8,175,769 | |
| BRFkredit A/S(a)(b) | |
| | 10,800,000 | | | | 0.705 | | | | 04/15/13 | | | | 10,800,756 | |
| Kreditanstalt fuer Wiederaufbau(b) | |
| | 15,800,000 | | | | 0.231 | | | | 06/17/13 | | | | 15,800,964 | |
| Landwirtschaftliche Rentenbank | |
| | 2,400,000 | | | | 4.125 | | | | 07/15/13 | | | | 2,471,520 | |
| | 6,500,000 | | | | 4.875 | | | | 01/10/14 | | | | 6,866,834 | |
| Westpac Banking Corp.(a) | |
| | 7,200,000 | | | | 1.900 | | | | 12/14/12 | | | | 7,220,736 | |
| | |
| | TOTAL GOVERNMENT GUARANTEE OBLIGATIONS | |
| | (Cost $51,054,124) | | | $ | 51,336,579 | |
| | |
| | | | | | | | | | | | | | |
| | |
| 36 | | The accompanying notes are an integral part of these financial statements. |
GOLDMAN SACHS ENHANCED INCOME FUND
| | | | | | | | | | | | | | |
| Principal
Amount |
| |
| Interest
Rate |
| |
| Maturity
Date |
| | | Value | |
| | | | | | | | | | | | | | |
| | U.S. Treasury Obligations – 16.2% | |
| United States Treasury Inflation Protected Securities | |
| $ | 479,964 | | | | 1.625 | % | | | 01/15/15 | | | $ | 514,387 | |
| | 1,531,296 | | | | 1.875 | | | | 07/15/15 | | | | 1,685,146 | |
| United States Treasury Notes | |
| | 58,400,000 | | | | 0.250 | (e) | | | 01/31/14 | | | | 58,428,030 | |
| | 5,300,000 | | | | 0.250 | | | | 04/30/14 | | | | 5,301,325 | |
| | 9,100,000 | | | | 0.250 | | | | 05/31/14 | | | | 9,102,548 | |
| | 3,900,000 | | | | 0.500 | | | | 07/31/17 | | | | 3,880,812 | |
| | 3,900,000 | | | | 0.625 | | | | 09/30/17 | | | | 3,898,947 | |
| | |
| | TOTAL U.S. TREASURY OBLIGATIONS | |
| | (Cost $82,757,732) | | | $ | 82,811,195 | |
| | |
| TOTAL INVESTMENTS BEFORE SHORT-TERM
INVESTMENT |
|
| | (Cost $468,002,822) | | | $ | 472,843,514 | |
| | |
| | | | | | | | | | | | | | |
| | Short-term Investment – 1.0% | |
| Certificate of Deposit – 1.0% | |
| Dexia Credit Local | |
| $ | 5,200,000 | | | | 1.700 | % | | | 09/06/13 | | | $ | 5,202,790 | |
| | (Cost $5,200,000) | | | | | |
| | |
| | TOTAL INVESTMENTS – 93.5% | | | | | |
| | (Cost $473,202,822) | | | $ | 478,046,304 | |
| | |
| OTHER ASSETS IN EXCESS OF
LIABILITIES – 6.5% |
| | | 33,501,871 | |
| | |
| | NET ASSETS – 100.0% | | | $ | 511,548,175 | |
| | |
| | |
| The percentage shown for each investment category reflects the value of investments in that category as a percentage of net assets. |
(a) | | Exempt from registration under Rule 144A of the Securities Act of 1933. Under procedures approved by the Board of Trustees, such securities have been determined to be liquid by the investment adviser and may be resold, normally to qualified institutional buyers in transactions exempt from registration. Total market value of Rule 144A securities amounts to $161,745,003, which represents approximately 31.6% of net assets as of 09/30/12. |
(b) | | Variable rate security. Interest rate disclosed is that which is in effect at 09/30/12. |
(c) | | Security with “Call” features with resetting interest rates. Maturity dates disclosed are the final maturity dates. |
(d) | | Guaranteed by a foreign government until maturity. |
(e) | | A portion of this security is segregated as collateral for initial margin requirements on futures transactions. |
| | |
|
Investment Abbreviations: |
FHLB | | —Federal Home Loan Bank |
FNMA | | —Federal National Mortgage Association |
|
|
| ADDITIONAL INVESTMENT INFORMATION |
FUTURES CONTRACTS — At September 30, 2012 the Fund had the following futures contracts:
| | | | | | | | | | | | | | |
| Type | | Number of
Contracts
Long (Short) | | | Expiration
Date | | Current
Value | | | Unrealized
Gain (Loss) | |
Eurodollars | | | 121 | | | December 2012 | | $ | 30,153,200 | | | $ | 20,903 | |
2 Year U.S. Treasury Notes | | | (205 | ) | | December 2012 | | | (45,208,906 | ) | | | (22,331 | ) |
5 Year U.S. Treasury Notes | | | (87 | ) | | December 2012 | | | (10,843,055 | ) | | | (14,186 | ) |
| TOTAL | | | | | | | | | | | | $ | (15,614 | ) |
| | |
| The accompanying notes are an integral part of these financial statements. | | 37 |
GOLDMAN SACHS ENHANCED INCOME FUND
Schedule of Investments (continued)
September 30, 2012 (Unaudited)
|
| ADDITIONAL INVESTMENT INFORMATION (continued) |
SWAP CONTRACTS — At September 30, 2012, the Fund had the following swap contracts:
CREDIT DEFAULT SWAP CONTRACTS
| | | | | | | | | | | | | | | | | | | | | | | | | | |
| | | | | | | | | | | | | | | | | Market Value | |
| Counterparty | | Referenced
Obligation | | Notional
Amount
(000s) | | | Rates Received
(Paid) | | | Termination
Date | | | Credit
Spread at
September 30,
2012(a) | | | Upfront
Payments
Made (Received) | | | Unrealized
Gain (Loss) | |
Protection Sold: | | | | | | | | | | | | | | | | | | | | | | | | | | |
| | | | | | | |
JPMorgan Securities, Inc. | | Pacific Gas and Electric Co., 4.80%, 03/01/14 | | $ | 4,850 | | | | 1.000 | % | | | 06/20/13 | | | | 0.193 | % | | $ | (9,075 | ) | | $ | 39,287 | |
| | (a) | | Credit Spread on the Referenced Obligation, together with the term of the swap contract, are indicators of payment/performance risk. The likelihood of a credit event occurring which would require a fund to make a payment or otherwise be required to perform under the swap contract is generally greater as the credit spread and the term of the swap contract increase. |
| | |
| 38 | | The accompanying notes are an integral part of these financial statements. |
GOLDMAN SACHS GOVERNMENT INCOME FUND
Schedule of Investments
September 30, 2012 (Unaudited)
| | | | | | | | | | | | | | |
Principal Amount | | | Interest
Rate | | | Maturity Date | | | Value | |
| | | | | | | | | | | | | | |
| | Mortgage-Backed Obligations – 43.8% | |
| Collateralized Mortgage Obligations – 3.4% | |
| Adjustable Rate Non-Agency(a) – 0.4% | |
| Bear Stearns Adjustable Rate Mortgage Trust Series 2003-05,
Class 1A1 |
|
| $ | 19,547 | | | | 3.005 | % | | | 08/25/33 | | | $ | 19,348 | |
| Chase Mortgage Finance Corp. Series 2007-A1, Class 3A1 | |
| | 994,962 | | | | 2.940 | | | | 02/25/37 | | | | 957,922 | |
| Countrywide Home Loan Mortgage Pass-Through Trust
Series 2003-37, Class 1A1 |
|
| | 27,801 | | | | 3.253 | | | | 08/25/33 | | | | 24,333 | |
| First Horizon Asset Securities, Inc. Series 2004-AR6, Class 2A1 | |
| | 41,132 | | | | 2.625 | | | | 12/25/34 | | | | 40,664 | |
| JPMorgan Mortgage Trust Series 2005-A4, Class 2A1 | |
| | 325,516 | | | | 3.071 | | | | 07/25/35 | | | | 296,916 | |
| MLCC Mortgage Investors, Inc. Series 2004-E, Class A2B | |
| | 1,035,092 | | | | 1.015 | | | | 11/25/29 | | | | 922,973 | |
| Sequoia Mortgage Trust Series 2004-09, Class A2 | |
| | 546,573 | | | | 1.024 | | | | 10/20/34 | | | | 476,509 | |
| Structured Adjustable Rate Mortgage Loan Trust Series 2004-05,
Class 1A |
|
| | 199,576 | | | | 2.925 | | | | 05/25/34 | | | | 177,954 | |
| Washington Mutual Mortgage Pass-Through Certificates
Series 2004-AR03, Class A2 |
|
| | 138,591 | | | | 2.583 | | | | 06/25/34 | | | | 136,091 | |
| | | | | | | | | | | | | | |
| | | | | | | | | | | | | 3,052,710 | |
| | |
| Interest Only(b) – 0.0% | |
| CS First Boston Mortgage Securities Corp. Series 2003-AR18,
Class 2X(a) |
|
| | 71,141 | | | | 0.000 | | | | 07/25/33 | | | | — | |
| CS First Boston Mortgage Securities Corp. Series 2003-AR20,
Class 2X(a) |
|
| | 91,061 | | | | 0.000 | | | | 08/25/33 | | | | — | |
| FNMA STRIPS Series 151, Class 2 | |
| | 8,590 | | | | 9.500 | | | | 07/25/22 | | | | 1,517 | |
| Master Adjustable Rate Mortgages Trust Series 2003-2,
Class 3AX(a) |
|
| | 35,401 | | | | 0.123 | | | | 08/25/33 | | | | 138 | |
| Master Adjustable Rate Mortgages Trust Series 2003-2,
Class 4AX(a) |
|
| | 15,239 | | | | 0.320 | | | | 07/25/33 | | | | 107 | |
| | | | | | | | | | | | | | |
| | | | | | | | | | | | | 1,762 | |
| | |
| Inverse Floaters(a) – 0.0% | |
| GNMA Series 2001-48, Class SA | |
| | 33,172 | | | | 25.770 | | | | 10/16/31 | | | | 53,705 | |
| GNMA Series 2001-51, Class SA | |
| | 26,017 | | | | 31.543 | | | | 10/16/31 | | | | 44,754 | |
| GNMA Series 2001-51, Class SB | |
| | 32,648 | | | | 25.770 | | | | 10/16/31 | | | | 55,573 | |
| GNMA Series 2002-13, Class SB | |
| | 112,589 | | | | 36.537 | | | | 02/16/32 | | | | 197,511 | |
| | | | | | | | | | | | | | |
| | | | | | | | | | | | | 351,543 | |
| | |
| Principal Only(c) – 0.0% | |
| FNMA REMIC Series G-35, Class N | |
| | 9,283 | | | | 0.000 | | | | 10/25/21 | | | | 9,165 | |
| | |
| Principal
Amount |
| |
| Interest
Rate |
| |
| Maturity
Date |
| | | Value | |
| | | | | | | | | | | | | | |
| | Mortgage-Backed Obligations – (continued) | |
| Regular Floater(a) – 0.4% | |
| FDIC Structured Sale Guaranteed Notes Series 2010-S1,
Class 1A(d) |
|
| $ | 448,044 | | | | 0.782 | % | | | 02/25/48 | | | $ | 448,447 | |
| FHLMC REMIC Series 1760, Class ZB | |
| | 251,370 | | | | 1.140 | | | | 05/15/24 | | | | 263,687 | |
| NCUA Guaranteed Notes Series 2011-A1 | |
| | 2,300,000 | | | | 0.248 | | | | 06/12/13 | | | | 2,300,000 | |
| | | | | | | | | | | | | | |
| | | | | | | | | | | | | 3,012,134 | |
| | |
| Sequential Fixed Rate – 2.2% | |
| FHLMC Multifamily Structured Pass-Through Certificates
Series K020, Class A2 |
|
| | 1,300,000 | | | | 2.373 | | | | 05/25/22 | | | | 1,326,222 | |
| FHLMC Multifamily Structured Pass-Through Certificates
Series K703, Class A2 |
|
| | 3,300,000 | | | | 2.699 | | | | 05/25/18 | | | | 3,562,429 | |
| FHLMC Multifamily Structured Pass-Through Certificates
Series K705, Class A2 |
|
| | 2,500,000 | | | | 2.303 | | | | 09/25/18 | | | | 2,654,351 | |
| FHLMC REMIC Series 2329, Class ZA | |
| | 1,489,598 | | | | 6.500 | | | | 06/15/31 | | | | 1,696,788 | |
| FNMA REMIC Series 2001-53, Class GH | |
| | 129,148 | | | | 8.000 | | | | 09/25/16 | | | | 138,554 | |
| GNMA Series 2002-42, Class KZ | |
| | 4,034,758 | | | | 6.000 | | | | 06/16/32 | | | | 4,591,677 | |
| NCUA Guaranteed Notes Series 2010-R1, Class 2A | |
| | 373,988 | | | | 1.840 | | | | 10/07/20 | | | | 380,066 | |
| NCUA Guaranteed Notes Series A4 | |
| | 3,400,000 | | | | 3.000 | | | | 06/12/19 | | | | 3,672,374 | |
| | | | | | | | | | | | | | |
| | | | | | | | | | | | | 18,022,461 | |
| | |
| Sequential Floating Rate(a) – 0.1% | |
| NCUA Guaranteed Notes Series 2010-R1, Class 1A | |
| | 962,547 | | | | 0.678 | | | | 10/07/20 | | | | 965,818 | |
| | |
| TOTAL COLLATERALIZED
MORTGAGE OBLIGATIONS |
| | $ | 25,415,593 | |
| | |
| | Commercial Mortgage-Backed Securities – 0.4% | |
| Sequential Fixed Rate – 0.4% | |
| FNMA ACES Series 2012-M13, Class A2 | |
| $ | 3,100,000 | | | | 2.377 | % | | | 05/25/22 | | | $ | 3,157,809 | |
| | |
| Federal Agencies – 40.3% | |
| Adjustable Rate FHLMC(a) – 0.5% | |
| $ | 195,616 | | | | 2.349 | % | | | 11/01/32 | | | $ | 209,381 | |
| | 1,894,999 | | | | 2.375 | | | | 09/01/33 | | | | 2,025,280 | |
| | 1,736,107 | | | | 2.375 | | | | 08/01/35 | | | | 1,858,046 | |
| | | | | | | | | | | | | | |
| | | | | | | | | | | | | 4,092,707 | |
| | |
| Adjustable Rate FNMA(a) – 1.0% | |
| | 192,257 | | | | 2.423 | | | | 11/01/32 | | | | 205,675 | |
| | 375,617 | | | | 2.404 | | | | 12/01/32 | | | | 399,968 | |
| | 1,734,942 | | | | 2.166 | | | | 05/01/33 | | | | 1,802,577 | |
| | 50,833 | | | | 2.333 | | | | 06/01/33 | | | | 54,251 | |
| | 1,545,591 | | | | 2.396 | | | | 10/01/33 | | | | 1,659,423 | |
| | |
| | |
| The accompanying notes are an integral part of these financial statements. | | 39 |
GOLDMAN SACHS GOVERNMENT INCOME FUND
Schedule of Investments (continued)
September 30, 2012 (Unaudited)
| | | | | | | | | | | | | | |
Principal Amount | | | Interest
Rate | | | Maturity Date | | | Value | |
| | | | | | | | | | | | | | |
| | Mortgage-Backed Obligations – (continued) | |
| Adjustable Rate FNMA(a) – (continued) | |
| $ | 1,911,696 | | | | 2.320 | % | | | 02/01/35 | | | $ | 2,042,934 | |
| | 1,620,805 | | | | 2.381 | | | | 09/01/35 | | | | 1,731,092 | |
| | | | | | | | | | | | | | |
| | | | | | | | | | | | | 7,895,920 | |
| | |
| Adjustable Rate GNMA(a) – 0.6% | |
| | 107,482 | | | | 1.750 | | | | 06/20/23 | | | | 110,994 | |
| | 49,716 | | | | 1.625 | | | | 07/20/23 | | | | 51,363 | |
| | 52,994 | | | | 1.625 | | | | 08/20/23 | | | | 54,759 | |
| | 135,761 | | | | 1.625 | | | | 09/20/23 | | | | 140,308 | |
| | 39,621 | | | | 1.625 | | | | 03/20/24 | | | | 40,947 | |
| | 347,507 | | | | 1.750 | | | | 04/20/24 | | | | 359,536 | |
| | 42,556 | | | | 1.750 | | | | 05/20/24 | | | | 44,034 | |
| | 285,631 | | | | 1.750 | | | | 06/20/24 | | | | 295,601 | |
| | 75,971 | | | | 2.000 | | | | 06/20/24 | | | | 79,752 | |
| | 96,448 | | | | 1.625 | | | | 07/20/24 | | | | 99,857 | |
| | 100,836 | | | | 2.000 | | | | 07/20/24 | | | | 105,904 | |
| | 172,526 | | | | 1.625 | | | | 08/20/24 | | | | 178,445 | |
| | 90,587 | | | | 2.000 | | | | 08/20/24 | | | | 95,165 | |
| | 84,636 | | | | 1.625 | | | | 09/20/24 | | | | 87,657 | |
| | 103,333 | | | | 2.000 | | | | 11/20/24 | | | | 108,639 | |
| | 39,269 | | | | 2.000 | | | | 12/20/24 | | | | 41,295 | |
| | 56,772 | | | | 2.500 | | | | 12/20/24 | | | | 60,246 | |
| | 68,448 | | | | 2.000 | | | | 01/20/25 | | | | 71,994 | |
| | 36,214 | | | | 2.000 | | | | 02/20/25 | | | | 38,103 | |
| | 122,509 | | | | 2.000 | | | | 05/20/25 | | | | 128,993 | |
| | 96,444 | | | | 2.000 | | | | 07/20/25 | | | | 101,598 | |
| | 48,527 | | | | 1.625 | | | | 02/20/26 | | | | 50,360 | |
| | 2,570 | | | | 1.625 | | | | 07/20/26 | | | | 2,672 | |
| | 62,974 | | | | 1.625 | | | | 01/20/27 | | | | 65,461 | |
| | 69,132 | | | | 2.000 | | | | 01/20/27 | | | | 73,131 | |
| | 49,537 | | | | 1.625 | | | | 02/20/27 | | | | 51,502 | |
| | 367,634 | | | | 1.750 | | | | 04/20/27 | | | | 382,597 | |
| | 39,810 | | | | 1.750 | | | | 05/20/27 | | | | 41,370 | |
| | 39,253 | | | | 1.750 | | | | 06/20/27 | | | | 40,863 | |
| | 14,945 | | | | 1.625 | | | | 11/20/27 | | | | 15,558 | |
| | 344 | | | | 2.000 | | | | 11/20/27 | | | | 365 | |
| | 60,195 | | | | 1.625 | | | | 12/20/27 | | | | 62,674 | |
| | 118,420 | | | | 1.625 | | | | 01/20/28 | | | | 123,312 | |
| | 40,227 | | | | 1.625 | | | | 02/20/28 | | | | 41,895 | |
| | 43,235 | | | | 1.625 | | | | 03/20/28 | | | | 45,034 | |
| | 225,471 | | | | 1.625 | | | | 07/20/29 | | | | 235,585 | |
| | 93,799 | | | | 1.625 | | | | 08/20/29 | | | | 98,017 | |
| | 28,709 | | | | 1.625 | | | | 09/20/29 | | | | 30,005 | |
| | 115,098 | | | | 1.625 | | | | 10/20/29 | | | | 120,118 | |
| | 130,357 | | | | 1.625 | | | | 11/20/29 | | | | 136,142 | |
| | 33,655 | | | | 1.625 | | | | 12/20/29 | | | | 35,152 | |
| | 41,206 | | | | 1.625 | | | | 01/20/30 | | | | 43,046 | |
| | 22,241 | | | | 1.625 | | | | 02/20/30 | | | | 23,239 | |
| | 102,213 | | | | 1.625 | | | | 03/20/30 | | | | 106,792 | |
| | 126,983 | | | | 1.750 | | | | 04/20/30 | | | | 132,796 | |
| | 202,286 | | | | 1.750 | | | | 05/20/30 | | | | 211,555 | |
| | 134,548 | | | | 2.000 | | | | 05/20/30 | | | | 142,781 | |
| | 30,917 | | | | 1.750 | | | | 06/20/30 | | | | 32,337 | |
| | 272,128 | | | | 2.000 | | | | 07/20/30 | | | | 288,779 | |
| | 51,057 | | | | 2.000 | | | | 09/20/30 | | | | 54,181 | |
| | |
| | | | | | | | | | | | | | |
| | Mortgage-Backed Obligations – (continued) | |
| Adjustable Rate GNMA(a) – (continued) | |
| $ | 98,693 | | | | 1.625 | % | | | 10/20/30 | | | $ | 103,215 | |
| | 197,479 | | | | 1.625 | | | | 03/20/32 | | | | 206,921 | |
| | | | | | | | | | | | | | |
| | | | | | | | | | | | | 5,292,645 | |
| | |
| FHLMC – 4.6% | |
| | 48,822 | | | | 6.500 | | | | 12/01/13 | | | | 49,027 | |
| | 1,120 | | | | 6.500 | | | | 02/01/14 | | | | 1,140 | |
| | 714,343 | | | | 7.500 | | | | 11/01/14 | | | | 752,026 | |
| | 1,600 | | | | 7.000 | | | | 02/01/15 | | | | 1,673 | |
| | 28,814 | | | | 8.000 | | | | 07/01/15 | | | | 30,591 | |
| | 21,042 | | | | 7.000 | | | | 09/01/17 | | | | 23,835 | |
| | 8,896 | | | | 7.000 | | | | 10/01/17 | | | | 10,094 | |
| | 74,876 | | | | 5.500 | | | | 05/01/18 | | | | 80,562 | |
| | 798,896 | | | | 5.500 | | | | 06/01/18 | | | | 859,562 | |
| | 34,065 | | | | 4.500 | | | | 09/01/18 | | | | 36,481 | |
| | 10,421 | | | | 10.000 | | | | 10/01/18 | | | | 11,628 | |
| | 206,365 | | | | 5.000 | | | | 06/01/19 | | | | 223,417 | |
| | 44,533 | | | | 10.000 | | | | 07/01/20 | | | | 52,249 | |
| | 60,731 | | | | 10.000 | | | | 10/01/20 | | | | 71,164 | |
| | 97,865 | | | | 6.500 | | | | 07/01/21 | | | | 109,395 | |
| | 7,475 | | | | 6.500 | | | | 08/01/22 | | | | 8,356 | |
| | 111,639 | | | | 9.000 | | | | 10/01/22 | | | | 129,266 | |
| | 456,086 | | | | 4.500 | | | | 10/01/23 | | | | 498,050 | |
| | 2,648,556 | | | | 5.000 | | | | 08/01/24 | | | | 2,875,427 | |
| | 342,614 | | | | 6.500 | | | | 07/01/28 | | | | 367,801 | |
| | 4,947 | | | | 8.000 | | | | 07/01/30 | | | | 5,859 | |
| | 19,814 | | | | 7.500 | | | | 12/01/30 | | | | 22,782 | |
| | 95,181 | | | | 7.000 | | | | 04/01/31 | | | | 109,305 | |
| | 974,249 | | | | 6.000 | | | | 05/01/33 | | | | 1,087,029 | |
| | 746,077 | | | | 6.000 | | | | 10/01/34 | | | | 828,720 | |
| | 102,798 | | | | 5.000 | | | | 12/01/35 | | | | 112,495 | |
| | 309,461 | | | | 5.500 | | | | 01/01/36 | | | | 339,319 | |
| | 832 | | | | 5.500 | | | | 02/01/36 | | | | 911 | |
| | 12,297 | | | | 6.000 | | | | 06/01/36 | | | | 13,647 | |
| | 49,186 | | | | 4.000 | | | | 08/01/36 | | | | 52,796 | |
| | 142,204 | | | | 4.000 | | | | 09/01/36 | | | | 152,642 | |
| | 150,244 | | | | 4.000 | | | | 10/01/36 | | | | 161,272 | |
| | 228,518 | | | | 4.000 | | | | 12/01/36 | | | | 245,290 | |
| | 8,090,962 | | | | 6.000 | | | | 11/01/38 | | | | 9,009,097 | |
| | 380,518 | | | | 4.500 | | | | 09/01/39 | | | | 418,540 | |
| | 9,065 | | | | 4.500 | | | | 11/01/40 | | | | 9,750 | |
| | 63,466 | | | | 4.500 | | | | 03/01/41 | | | | 68,368 | |
| | 1,864,944 | | | | 4.000 | | | | 11/01/41 | | | | 2,024,076 | |
| | 17,000,000 | | | | 3.000 | | | | TBA - 30yr | (e) | | | 17,921,720 | |
| | | | | | | | | | | | | | |
| | | | | | | | | | | | | 38,775,362 | |
| | |
| FNMA – 32.9% | |
| | 8,988 | | | | 7.000 | | | | 03/01/14 | | | | 9,394 | |
| | 23,963 | | | | 7.000 | | | | 03/01/15 | | | | 25,003 | |
| | 7,285 | | | | 8.000 | | | | 01/01/16 | | | | 7,822 | |
| | 148,502 | | | | 8.000 | | | | 11/01/16 | | | | 160,616 | |
| | 192,517 | | | | 5.000 | | | | 08/01/17 | | | | 209,461 | |
| | 2,330,999 | | | | 2.800 | | | | 03/01/18 | | | | 2,509,704 | |
| | 1,964,757 | | | | 3.740 | | | | 05/01/18 | | | | 2,209,087 | |
| | 1,690,000 | | | | 3.840 | | | | 05/01/18 | | | | 1,895,978 | |
| | 83,081 | | | | 4.500 | | | | 05/01/18 | | | | 89,510 | |
| | |
| | |
| 40 | | The accompanying notes are an integral part of these financial statements. |
GOLDMAN SACHS GOVERNMENT INCOME FUND
| | | | | | | | | | | | | | |
Principal Amount | | | Interest
Rate | | | Maturity Date | | | Value | |
| | | | | | | | | | | | | | |
| | Mortgage-Backed Obligations – (continued) | |
| FNMA – (continued) | |
| $ | 177,455 | | | | 4.500 | % | | | 06/01/18 | | | $ | 191,186 | |
| | 37,210 | | | | 4.500 | | | | 07/01/18 | | | | 40,089 | |
| | 52,377 | | | | 4.500 | | | | 08/01/18 | | | | 56,430 | |
| | 456,975 | | | | 5.000 | | | | 09/01/18 | | | | 495,711 | |
| | 2,538,797 | | | | 5.000 | | | | 10/01/18 | | | | 2,753,999 | |
| | 4,400,000 | | | | 4.506 | | | | 06/01/19 | | | | 5,098,077 | |
| | 130,336 | | | | 6.500 | | | | 08/01/19 | | | | 146,537 | |
| | 13,693 | | | | 9.500 | | | | 08/01/20 | | | | 13,748 | |
| | 977,067 | | | | 3.416 | | | | 10/01/20 | | | | 1,084,774 | |
| | 16,585 | | | | 9.500 | | | | 10/01/20 | | | | 16,657 | |
| | 684,442 | | | | 3.632 | | | | 12/01/20 | | | | 761,238 | |
| | 5,192,594 | | | | 3.763 | | | | 12/01/20 | | | | 5,868,475 | |
| | 2,398,012 | | | | 4.375 | | | | 06/01/21 | | | | 2,793,157 | |
| | 809,857 | | | | 5.500 | | | | 02/01/23 | | | | 894,627 | |
| | 1,303,900 | | | | 5.500 | | | | 08/01/23 | | | | 1,440,383 | |
| | 304,811 | | | | 6.000 | | | | 11/01/28 | | | | 339,944 | |
| | 16,211 | | | | 6.500 | | | | 11/01/28 | | | | 18,689 | |
| | 100,000 | | | | 5.000 | | | | 03/01/29 | | | | 109,108 | |
| | 569 | | | | 5.500 | | | | 04/01/29 | | | | 629 | |
| | 46,364 | | | | 7.000 | | | | 11/01/30 | | | | 53,904 | |
| | 122,082 | | | | 7.000 | | | | 07/01/31 | | | | 135,525 | |
| | 1,585,275 | | | | 4.000 | | | | 10/01/31 | | | | 1,715,683 | |
| | 609 | | | | 6.000 | | | | 03/01/32 | | | | 680 | |
| | 10,797,758 | | | | 5.500 | | | | 04/01/33 | | | | 11,986,405 | |
| | 21,962 | | | | 6.000 | | | | 05/01/33 | | | | 24,523 | |
| | 7,308,732 | | | | 5.000 | | | | 06/01/33 | | | | 7,980,989 | |
| | 18,483 | | | | 5.000 | | | | 07/01/33 | | | | 20,381 | |
| | 2,687,135 | | | | 5.500 | | | | 07/01/33 | | | | 2,922,228 | |
| | 115,900 | | | | 5.000 | | | | 08/01/33 | | | | 127,458 | |
| | 107,066 | | | | 5.000 | | | | 09/01/33 | | | | 116,914 | |
| | 16,927 | | | | 5.500 | | | | 09/01/33 | | | | 18,754 | |
| | 8,220 | | | | 5.000 | | | | 12/01/33 | | | | 8,976 | |
| | 9,710 | | | | 6.000 | | | | 12/01/33 | | | | 10,913 | |
| | 22,011 | | | | 5.500 | | | | 02/01/34 | | | | 24,378 | |
| | 3,679 | | | | 5.500 | | | | 04/01/34 | | | | 4,083 | |
| | 18,420 | | | | 5.500 | | | | 05/01/34 | | | | 20,392 | |
| | 528 | | | | 5.500 | | | | 06/01/34 | | | | 584 | |
| | 27,721 | | | | 5.500 | | | | 08/01/34 | | | | 30,766 | |
| | 1,369 | | | | 5.500 | | | | 10/01/34 | | | | 1,519 | |
| | 194,773 | | | | 5.500 | | | | 12/01/34 | | | | 215,224 | |
| | 14,156 | | | | 5.000 | | | | 04/01/35 | | | | 15,415 | |
| | 21,352 | | | | 5.500 | | | | 04/01/35 | | | | 23,551 | |
| | 691,081 | | | | 6.000 | | | | 04/01/35 | | | | 771,669 | |
| | 14,826 | | | | 5.000 | | | | 05/01/35 | | | | 16,369 | |
| | 89,755 | | | | 5.000 | | | | 07/01/35 | | | | 98,156 | |
| | 23,304 | | | | 5.500 | | | | 07/01/35 | | | | 25,708 | |
| | 51,227 | | | | 5.000 | | | | 08/01/35 | | | | 55,937 | |
| | 2,959 | | | | 5.500 | | | | 08/01/35 | | | | 3,272 | |
| | 1,650 | | | | 6.000 | | | | 08/01/35 | | | | 1,830 | |
| | 59,787 | | | | 5.000 | | | | 09/01/35 | | | | 65,102 | |
| | 30,234 | | | | 5.500 | | | | 09/01/35 | | | | 33,338 | |
| | 15,920 | | | | 5.000 | | | | 10/01/35 | | | | 17,335 | |
| | 293,871 | | | | 6.000 | | | | 10/01/35 | | | | 328,373 | |
| | 21,726 | | | | 5.000 | | | | 11/01/35 | | | | 23,658 | |
| | 279,110 | | | | 6.000 | | | | 11/01/35 | | | | 309,696 | |
| | 13,081 | | | | 5.500 | | | | 12/01/35 | | | | 14,490 | |
| | |
| Principal
Amount |
| |
| Interest
Rate |
| |
| Maturity
Date |
| | | Value | |
| | | | | | | | | | | | | | |
| | Mortgage-Backed Obligations – (continued) | |
| FNMA – (continued) | |
| $ | 628,931 | | | | 5.000 | % | | | 02/01/36 | | | $ | 684,851 | |
| | 565 | | | | 5.500 | | | | 02/01/36 | | | | 622 | |
| | 3,099,700 | | | | 5.000 | | | | 03/01/36 | | | | 3,375,304 | |
| | 167,800 | | | | 6.000 | | | | 03/01/36 | | | | 186,839 | |
| | 273,943 | | | | 6.000 | | | | 04/01/36 | | | | 305,030 | |
| | 93,980 | | | | 4.000 | | | | 09/01/36 | | | | 101,113 | |
| | 23,357 | | | | 5.000 | | | | 11/01/36 | | | | 25,407 | |
| | 180,752 | | | | 6.000 | | | | 01/01/37 | | | | 199,153 | |
| | 178,030 | | | | 4.000 | | | | 02/01/37 | | | | 191,542 | |
| | 2,470 | | | | 5.500 | | | | 02/01/37 | | | | 2,718 | |
| | 216,827 | | | | 5.000 | | | | 03/01/37 | | | | 235,688 | |
| | 59,152 | | | | 5.500 | | | | 04/01/37 | | | | 65,138 | |
| | 483,230 | | | | 5.000 | | | | 05/01/37 | | | | 525,263 | |
| | 5,093 | | | | 5.500 | | | | 05/01/37 | | | | 5,593 | |
| | 1,845 | | | | 5.500 | | | | 06/01/37 | | | | 2,026 | |
| | 196 | | | | 5.500 | | | | 08/01/37 | | | | 215 | |
| | 1,184,020 | | | | 7.500 | | | | 11/01/37 | | | | 1,368,182 | |
| | 982 | | | | 5.500 | | | | 12/01/37 | | | | 1,079 | |
| | 2,516,300 | | | | 5.000 | | | | 02/01/38 | | | | 2,745,496 | |
| | 2,197 | | | | 5.500 | | | | 02/01/38 | | | | 2,413 | |
| | 33,489 | | | | 5.500 | | | | 03/01/38 | | | | 36,817 | |
| | 530,114 | | | | 5.000 | | | | 04/01/38 | | | | 576,086 | |
| | 83,554 | | | | 5.500 | | | | 04/01/38 | | | | 91,831 | |
| | 24,680 | | | | 5.500 | | | | 05/01/38 | | | | 27,167 | |
| | 7,378 | | | | 5.500 | | | | 06/01/38 | | | | 8,110 | |
| | 9,901 | | | | 5.500 | | | | 07/01/38 | | | | 10,884 | |
| | 6,682 | | | | 5.500 | | | | 08/01/38 | | | | 7,351 | |
| | 5,733 | | | | 5.500 | | | | 09/01/38 | | | | 6,306 | |
| | 100,000 | | | | 5.000 | | | | 10/01/38 | | | | 108,672 | |
| | 183,564 | | | | 6.000 | | | | 11/01/38 | | | | 202,257 | |
| | 2,822 | | | | 5.500 | | | | 12/01/38 | | | | 3,105 | |
| | 8,626,110 | | | | 5.000 | | | | 01/01/39 | | | | 9,374,170 | |
| | 26,256 | | | | 5.500 | | | | 02/01/39 | | | | 28,972 | |
| | 69,030 | | | | 5.000 | | | | 03/01/39 | | | | 75,336 | |
| | 15,174,972 | | | | 5.000 | | | | 04/01/39 | | | | 16,526,574 | |
| | 34,064 | | | | 4.500 | | | | 05/01/39 | | | | 37,496 | |
| | 1,000,000 | | | | 5.000 | | | | 06/01/39 | | | | 1,086,984 | |
| | 1,059,719 | | | | 4.500 | | | | 07/01/39 | | | | 1,144,292 | |
| | 6,727,328 | | | | 5.000 | | | | 07/01/39 | | | | 7,310,725 | |
| | 19,555 | | | | 4.000 | | | | 08/01/39 | | | | 21,022 | |
| | 117,796 | | | | 4.500 | | | | 08/01/39 | | | | 130,105 | |
| | 1,813,345 | | | | 4.500 | | | | 09/01/39 | | | | 1,958,061 | |
| | 12,046,285 | | | | 4.500 | | | | 11/01/39 | | | | 13,012,231 | |
| | 1,398,133 | | | | 4.500 | | | | 12/01/39 | | | | 1,544,401 | |
| | 693,474 | | | | 5.000 | | | | 07/01/40 | | | | 760,950 | |
| | 2,603,648 | | | | 4.500 | | | | 08/01/40 | | | | 2,817,298 | |
| | 1,992,583 | | | | 4.000 | | | | 09/01/40 | | | | 2,149,543 | |
| | 44,878 | | | | 4.000 | | | | 10/01/40 | | | | 48,288 | |
| | 5,604,523 | | | | 4.000 | | | | 11/01/40 | | | | 6,119,046 | |
| | 150,533 | | | | 4.500 | | | | 11/01/40 | | | | 162,886 | |
| | 1,945,493 | | | | 4.000 | | | | 12/01/40 | | | | 2,093,359 | |
| | 728,395 | | | | 4.500 | | | | 12/01/40 | | | | 788,166 | |
| | 36,640 | | | | 4.000 | | | | 01/01/41 | | | | 39,425 | |
| | 36,031 | | | | 4.000 | | | | 02/01/41 | | | | 38,796 | |
| | 1,163,577 | | | | 5.000 | | | | 02/01/41 | | | | 1,276,794 | |
| | 142,914 | | | | 4.000 | | | | 03/01/41 | | | | 153,882 | |
| | |
| | |
| The accompanying notes are an integral part of these financial statements. | | 41 |
GOLDMAN SACHS GOVERNMENT INCOME FUND
Schedule of Investments (continued)
September 30, 2012 (Unaudited)
| | | | | | | | | | | | | | |
Principal Amount | | | Interest
Rate | | | Maturity Date | | | Value | |
| | | | | | | | | | | | | | |
| | Mortgage-Backed Obligations – (continued) | |
| FNMA – (continued) | |
| $ | 2,636,268 | | | | 4.500 | % | | | 04/01/41 | | | $ | 2,858,071 | |
| | 1,391,282 | | | | 5.000 | | | | 04/01/41 | | | | 1,527,535 | |
| | 948,403 | | | | 5.000 | | | | 05/01/41 | | | | 1,035,028 | |
| | 140,622 | | | | 5.000 | | | | 06/01/41 | | | | 153,466 | |
| | 910,675 | | | | 4.500 | | | | 07/01/41 | | | | 990,552 | |
| | 102,937 | | | | 4.000 | | | | 08/01/41 | | | | 110,837 | |
| | 2,162,302 | | | | 4.500 | | | | 08/01/41 | | | | 2,344,227 | |
| | 54,224 | | | | 4.000 | | | | 09/01/41 | | | | 58,386 | |
| | 2,262,470 | | | | 4.500 | | | | 09/01/41 | | | | 2,460,916 | |
| | 114,426 | | | | 4.500 | | | | 10/01/41 | | | | 124,054 | |
| | 6,606,015 | | | | 5.000 | | | | 10/01/41 | | | | 7,258,461 | |
| | 658,162 | | | | 4.000 | | | | 11/01/41 | | | | 708,672 | |
| | 1,336,046 | | | | 4.000 | | | | 12/01/41 | | | | 1,438,580 | |
| | 71,518 | | | | 4.000 | | | | 01/01/42 | | | | 77,477 | |
| | 20,000,000 | | | | 2.500 | | | | TBA - 15yr | (e) | | | 21,025,000 | |
| | 6,000,000 | | | | 3.000 | | | | TBA - 30yr | (e) | | | 6,333,281 | |
| | 9,000,000 | | | | 3.500 | | | | TBA - 30yr | (e) | | | 9,652,500 | |
| | 55,000,000 | | | | 5.000 | | | | TBA - 30yr | (e) | | | 59,971,483 | |
| | 19,000,000 | | | | 6.000 | | | | TBA - 30yr | (e) | | | 20,981,641 | |
| | | | | | | | | | | | | | |
| | | | | | | | | | | | | 275,375,438 | |
| | |
| GNMA – 0.7% | |
| | 133 | | | | 9.000 | | | | 08/15/16 | | | | 146 | |
| | 700,447 | | | | 3.950 | | | | 07/15/25 | | | | 769,945 | |
| | 167,429 | | | | 7.000 | | | | 12/15/27 | | | | 200,309 | |
| | 20,213 | | | | 6.500 | | | | 08/15/28 | | | | 23,817 | |
| | 298,684 | | | | 6.000 | | | | 01/15/29 | | | | 341,738 | |
| | 261,503 | | | | 7.000 | | | | 10/15/29 | | | | 308,297 | |
| | 2,354,685 | | | | 5.500 | | | | 12/15/32 | | | | 2,634,087 | |
| | 1,374,072 | | | | 5.500 | | | | 06/15/34 | | | | 1,534,722 | |
| | | | | | | | | | | | | | |
| | | | | | | | | | | | | 5,813,061 | |
| | |
| | TOTAL FEDERAL AGENCIES | | | $ | 337,245,133 | |
| | |
| | TOTAL MORTGAGE-BACKED OBLIGATIONS | |
| | (Cost $355,357,081) | | | $ | 365,818,535 | |
| | |
| | | | | | | | | | | | | | |
| | Agency Debentures – 24.5% | |
| | FFCB | | | | | | | | | | | | | |
| $ | 9,000,000 | | | | 4.750 | % | | | 11/06/12 | | | $ | 9,040,131 | |
| | FHLB | | | | | | | | | | | | | |
| | 6,000,000 | | | | 0.210 | | | | 01/04/13 | | | | 6,000,462 | |
| | 10,000,000 | | | | 5.375 | (f) | | | 06/13/14 | | | | 10,866,267 | |
| | 2,900,000 | | | | 5.625 | | | | 06/11/21 | | | | 3,800,729 | |
| | FHLMC | | | | | | | | | | | | | |
| | 13,200,000 | | | | 1.375 | | | | 02/25/14 | | | | 13,408,663 | |
| | 5,200,000 | | | | 0.375 | | | | 02/27/14 | | | | 5,209,600 | |
| | 42,300,000 | | | | 1.000 | | | | 07/30/14 | | | | 42,882,141 | |
| | 32,291,000 | | | | 1.000 | | | | 08/20/14 | | | | 32,709,656 | |
| | 5,100,000 | | | | 5.050 | | | | 01/26/15 | | | | 5,644,743 | |
| | 5,400,000 | | | | 1.000 | | | | 03/08/17 | | | | 5,481,669 | |
| | 300,000 | | | | 1.000 | | | | 06/29/17 | | | | 303,777 | |
| | 2,400,000 | | | | 1.000 | | | | 07/28/17 | | | | 2,429,525 | |
| | 3,100,000 | | | | 1.250 | | | | 08/01/19 | | | | 3,103,497 | |
| | |
| Principal
Amount |
| |
| Interest
Rate |
| |
| Maturity
Date |
| | | Value | |
| | | | | | | | | | | | | | |
| | Agency Debentures – (continued) | |
| FHLMC – (continued) | |
| $ | 6,200,000 | | | | 1.250 | % | | | 10/02/19 | | | $ | 6,190,142 | |
| | 4,900,000 | | | | 2.375 | | | | 01/13/22 | | | | 5,142,315 | |
| | FNMA | | | | | | | | | | | | | |
| | 24,500,000 | | | | 0.600 | | | | 11/14/13 | | | | 24,509,447 | |
| | 2,200,000 | | | | 0.750 | | | | 12/19/14 | | | | 2,221,229 | |
| | 5,800,000 | | | | 0.875 | | | | 08/28/17 | | | | 5,829,209 | |
| | 11,300,000 | | | | 0.875 | | | | 10/26/17 | | | | 11,344,928 | |
| New Valley Generation III | | | | | |
| | 3,165,924 | | | | 4.929 | | | | 01/15/21 | | | | 3,616,006 | |
| Small Business Administration | |
| | 53,597 | | | | 7.500 | | | | 04/01/17 | | | | 57,953 | |
| | 19,850 | | | | 6.800 | | | | 08/01/17 | | | | 21,619 | |
| | 101,831 | | | | 6.300 | | | | 05/01/18 | | | | 111,967 | |
| | 56,229 | | | | 6.300 | | | | 06/01/18 | | | | 61,393 | |
| Tennessee Valley Authority Series B | |
| | 4,200,000 | | | | 4.375 | | | | 06/15/15 | | | | 4,655,662 | |
| | |
| | TOTAL AGENCY DEBENTURES | | | | | |
| | (Cost $200,512,097) | | | $ | 204,642,730 | |
| | |
| | | | | | | | | | | | | | |
| | Asset-Backed Securities(a) – 1.5% | |
| Home Equity – 0.1% | |
| Bear Stearns Adjustable Rate Mortgage Trust Series 2004-1,
Class 21A1 |
|
| $ | 63,636 | | | | 2.722 | % | | | 04/25/34 | | | $ | 60,328 | |
| Citigroup Mortgage Loan Trust, Inc. Series 2004-OPT1, Class A2 | |
| | 319,115 | | | | 0.577 | | | | 10/25/34 | | | | 315,253 | |
| | | | | | | | | | | | | | |
| | | | | | | | | | | | | 375,581 | |
| | |
| Student Loan – 1.4% | |
| Access Group, Inc. Series 2005-2, Class A3 | |
| | 3,350,000 | | | | 0.614 | | | | 11/22/24 | | | | 3,282,961 | |
| Brazos Higher Education Authority, Inc. Series 2005-3,
Class A14 |
|
| | 500,938 | | | | 0.479 | | | | 09/25/23 | | | | 500,101 | |
| College Loan Corp. Trust Series 2004-1, Class A4 | |
| | 1,700,000 | | | | 0.641 | | | | 04/25/24 | | | | 1,593,364 | |
| Education Funding Capital Trust I Series 2004-1, Class A2 | |
| | 771,163 | | | | 0.549 | | | | 12/15/22 | | | | 768,719 | |
| GCO Education Loan Funding Trust Series 2006-1, Class A11L | |
| | 700,000 | | | | 0.657 | | | | 05/25/36 | | | | 606,534 | |
| Northstar Education Finance, Inc. Series 2005-1, Class A1 | |
| | 317,245 | | | | 0.547 | | | | 10/28/26 | | | | 316,082 | |
| SLM Student Loan Trust Series 2008-5, Class A4 | |
| | 3,900,000 | | | | 2.151 | | | | 07/25/23 | | | | 4,109,982 | |
| US Education Loan Trust LLC Series 2006-1, Class A2(d) | |
| | 633,470 | | | | 0.551 | | | | 03/01/25 | | | | 629,200 | |
| | | | | | | | | | | | | | |
| | | | | | | | | | | | | 11,806,943 | |
| | |
| | TOTAL ASSET-BACKED SECURITIES | | | | | |
| | (Cost $12,098,193) | | | $ | 12,182,524 | |
| | |
| | |
| 42 | | The accompanying notes are an integral part of these financial statements. |
GOLDMAN SACHS GOVERNMENT INCOME FUND
| | | | | | | | | | | | | | |
Principal Amount | | | Interest
Rate | | | Maturity Date | | | Value | |
| | | | | | | | | | | | | | |
| | Government Guarantee Obligations – 10.3% | |
| Ally Financial, Inc.(g) | | | | | |
| $ | 9,900,000 | | | | 1.750 | % | | | 10/30/12 | | | $ | 9,912,187 | |
| | 20,000,000 | | | | 2.200 | | | | 12/19/12 | | | | 20,088,120 | |
| Citigroup Funding, Inc.(g) | |
| $ | 20,700,000 | | | | 1.875 | % | | | 10/22/12 | | | $ | 20,719,396 | |
| | 8,000,000 | | | | 1.875 | | | | 11/15/12 | | | | 8,016,272 | |
| General Electric Capital Corp.(g) | |
| | 14,500,000 | | | | 0.376 | (a) | | | 12/21/12 | | | | 14,510,266 | |
| | 4,300,000 | | | | 2.125 | | | | 12/21/12 | | | | 4,318,451 | |
| Israel Government AID Bond(g) | |
| | 1,200,000 | | | | 5.500 | | | | 09/18/23 | | | | 1,586,788 | |
| | 100,000 | | | | 5.500 | | | | 12/04/23 | | | | 132,327 | |
| Private Export Funding Corp.(h) | |
| | 7,000,000 | | | | 3.550 | | | | 04/15/13 | | | | 7,126,763 | |
| | |
| | TOTAL GOVERNMENT GUARANTEE OBLIGATIONS | |
| | (Cost $86,208,903) | | | $ | 86,410,570 | |
| | |
| | | | | | | | | | | | | | |
| | U.S. Treasury Obligations – 14.8% | |
| United States Treasury Bonds | |
| $ | 6,300,000 | | | | 6.625 | % | | | 02/15/27 | | | $ | 9,813,006 | |
| | 590,000 | | | | 5.000 | | | | 05/15/37 | | | | 845,222 | |
| | 5,400,000 | | | | 4.375 | | | | 11/15/39 | | | | 7,141,932 | |
| | 3,100,000 | | | | 4.250 | | | | 11/15/40 | | | | 4,027,458 | |
| | 5,000,000 | | | | 4.375 | | | | 05/15/41 | | | | 6,628,900 | |
| | 3,100,000 | | | | 3.750 | | | | 08/15/41 | | | | 3,708,871 | |
| | 7,800,000 | | | | 3.125 | | | | 02/15/42 | | | | 8,301,541 | |
| | 7,150,000 | | | | 3.000 | | | | 05/15/42 | | | | 7,418,411 | |
| | 2,000,000 | | | | 2.750 | | | | 08/15/42 | | | | 1,967,820 | |
| United States Treasury Inflation Protected Securities | |
| | 719,946 | | | | 1.625 | | | | 01/15/15 | | | | 771,580 | |
| | 2,120,256 | | | | 1.875 | | | | 07/15/15 | | | | 2,333,278 | |
| United States Treasury Notes | |
| | 4,000,000 | | | | 0.750 | | | | 12/15/13 | | | | 4,025,920 | |
| | 4,000,000 | | | | 0.250 | | | | 01/31/14 | | | | 4,001,920 | |
| | 2,300,000 | | | | 0.625 | | | | 05/31/17 | | | | 2,305,865 | |
| | 18,200,000 | | | | 0.625 | | | | 09/30/17 | | | | 18,195,086 | |
| | 6,400,000 | | | | 2.250 | | | | 07/31/18 | | | | 6,928,064 | |
| | 7,400,000 | | | | 1.000 | | | | 08/31/19 | | | | 7,381,278 | |
| | 4,200,000 | | | | 3.625 | | | | 02/15/20 | | | | 4,950,413 | |
| | 6,800,000 | | | | 1.750 | | | | 05/15/22 | | | | 6,896,152 | |
| | 10,600,000 | | | | 1.625 | | | | 08/15/22 | | | | 10,587,598 | |
| United States Treasury Principal-Only STRIPS(c) | |
| | 6,600,000 | | | | 0.000 | | | | 05/15/21 | | | | 5,831,694 | |
| | |
| | TOTAL U.S. TREASURY OBLIGATIONS | | | | | |
| | (Cost $117,217,884) | | | $ | 124,062,009 | |
| | |
| | | | | | | | | | | | | | |
| | Municipal Debt Obligation – 0.3% | |
| New Jersey – 0.3% | |
| New Jersey Economic Development Authority Series A (MBIA) | |
| $ | 2,000,000 | | | | 7.425 | % | | | 02/15/29 | | | $ | 2,527,580 | |
| | (Cost $2,000,000) | | | | | |
| | |
| | | | | | | | | | | | | | |
| Notional
Amount |
| |
| Exercise
Rate |
| |
| Expiration
Date |
| | | Value | |
| | | | | | | | | | | | | | |
| | Options Purchased – 0.1% | |
| Interest Rate Swaptions | |
| Citibank NA Put – OTC – 10 year Interest Rate Swap Strike Price
1.895% |
|
| $ | 6,700,000 | | | | 1.895 | % | | | 02/28/13 | | | $ | 146,975 | |
| Citibank NA Call – OTC – 10 year Interest Rate Swap Strike
Price 1.895% |
|
| | 6,700,000 | | | | 1.895 | | | | 02/28/13 | | | | 106,027 | |
| Deutsche Bank Securities, Inc. Put – OTC – 10 year Interest Rate
Swap Strike Price 2.060% |
|
| | 6,700,000 | | | | 2.060 | | | | 02/19/13 | | | | 215,714 | |
| Deutsche Bank Securities, Inc. Call – OTC – 10 year Interest Rate
Swap Strike Price 2.060% |
|
| | 6,700,000 | | | | 2.060 | | | | 02/19/13 | | | | 65,181 | |
| | |
| | TOTAL OPTIONS PURCHASED | | | | | |
| | (Cost $598,310) | | | $ | 533,897 | |
| | |
| TOTAL INVESTMENTS BEFORE
SHORT-TERM INVESTMENT |
| | | | |
| | (Cost $773,992,468) | | | $ | 796,177,845 | |
| | |
| | | | | | | | | | | | | | |
Principal Amount | | | Interest
Rate | | | Maturity Date | | | Value | |
| | Short-term Investment(i) – 23.1% | |
| Repurchase Agreement – 23.1% | |
| Joint Repurchase Agreement Account II | |
| $ | 193,500,000 | | | | 0.245 | % | | | 10/01/12 | | | $ | 193,500,000 | |
| | (Cost $193,500,000) | |
| | |
| | TOTAL INVESTMENTS – 118.4% | | | | | |
| | (Cost $967,492,468) | | | $ | 989,677,845 | |
| | |
| LIABILITIES IN EXCESS OF
OTHER ASSETS – (18.4)% |
| | | (153,620,946 | ) |
| | |
| | NET ASSETS – 100.0% | | | $ | 836,056,899 | |
| | |
| | | | |
| The percentage shown for each investment category reflects the value of investments in that category as a percentage of net assets. |
(a) | | Variable rate security. Interest rate disclosed is that which is in effect at 09/30/12. |
(b) | | Security with a notional or nominal principal amount. The actual effective yield of this security is different than the stated interest rate. |
(c) | | Issued with a zero coupon. Income is recognized through the accretion of discount. |
(d) | | Exempt from registration under Rule 144A of the Securities Act of 1933. Under procedures approved by the Board of Trustees, such securities have been determined to be liquid by the investment adviser and may be resold, normally to qualified institutional buyers in transactions exempt from registration. Total market value of Rule 144A securities amounts to $1,077,647, which represents approximately 0.1% of net assets as of 09/30/12. |
| | |
| The accompanying notes are an integral part of these financial statements. | | 43 |
GOLDMAN SACHS GOVERNMENT INCOME FUND
Schedule of Investments (continued)
September 30, 2012 (Unaudited)
| | | | |
(e) | | TBA (To Be Announced) Securities are purchased/sold on a forward commitment basis with an approximate principal amount and no defined maturity date. The actual principal and maturity date will be determined upon settlement when the specific mortgage pools are assigned. Total market value of TBA securities (excluding forward sales contracts, if any) amounts to $135,885,625 which represents approximately 16.3% of net assets as of 09/30/12. |
(f) | | A portion of this security is segregated as collateral for initial margin requirements on futures transactions. |
(g) | | Guaranteed under the Federal Deposit Insurance Corporation’s (“FDIC”) Temporary Liquidity Guarantee Program and is backed by the full faith and credit of the United States. The expiration date of the FDIC’s guarantee is the earlier of the maturity date of the debt or December 31, 2012. Total market value of these securities amounts to $79,283,807, which represents approximately 9.5% of net assets as of 09/30/12. |
(h) | | Guaranteed by the Export/Import bank of the United States. Total market value for this security amounts to $7,126,763, which represents approximately 0.8% of net assets as of September 30,2012. |
(i) | | Joint repurchase agreement was entered into on September 28, 2012. Additional information appears on page 69. |
| | |
|
Investment Abbreviations: |
ACES | | —Alternative Credit Enhancement Securities |
FDIC | | —Federal Deposit Insurance Corp. |
FFCB | | —Federal Farm Credit Bank |
FHLB | | —Federal Home Loan Bank |
FHLMC | | —Federal Home Loan Mortgage Corp. |
FNMA | | —Federal National Mortgage Association |
GNMA | | —Government National Mortgage Association |
LIBOR | | —London Interbank Offered Rate |
MBIA | | —Insured by Municipal Bond Investors Insurance |
NCUA | | —National Credit Union Administration |
OTC | | —Over the Counter |
REMIC | | —Real Estate Mortgage Investment Conduit |
STRIPS | | —Separate Trading of Registered Interest and Principal of Securities |
|
|
| ADDITIONAL INVESTMENT INFORMATION |
FORWARD SALES CONTRACTS — At September 30, 2012, the Fund had the following forward sales contracts:
| | | | | | | | | | | | | | | | | | |
| Description | | | | Interest
Rate | | Maturity
Date(e) | | Settlement
Date | | | Principal
Amount | | | Value | |
FNMA (Proceeds Receivable: $12,006,758) | | | | 5.000% | | TBA-30yr | | | 11/10/2012 | | | $ | (11,000,000 | ) | | $ | (12,000,313 | ) |
FUTURES CONTRACTS — At September 30, 2012, the Fund had the following futures contracts:
| | | | | | | | | | | | | | |
| Type | | Number of
Contracts
Long (Short) | | | Expiration
Date | | Current
Value | | | Unrealized
Gain (Loss) | |
Eurodollars | | | 196 | | | September 2014 | | $ | 48,762,350 | | | $ | 351,618 | |
Eurodollars | | | (196 | ) | | September 2015 | | | (48,622,700 | ) | | | (569,809 | ) |
Ultra Long U.S. Treasury Bonds | | | (16 | ) | | December 2012 | | | (2,643,500 | ) | | | (67,895 | ) |
5 Year U.S. Treasury Notes | | | 1,671 | | | December 2012 | | | 208,261,430 | | | | 600,566 | |
10 Year U.S. Treasury Notes | | | 578 | | | December 2012 | | | 77,153,969 | | | | 419,225 | |
30 Year U.S. Treasury Bonds | | | 7 | | | December 2012 | | | 1,045,625 | | | | (4,425 | ) |
| TOTAL | | | | | | | | | | | | $ | 729,280 | |
| | |
| 44 | | The accompanying notes are an integral part of these financial statements. |
GOLDMAN SACHS GOVERNMENT INCOME FUND
|
| ADDITIONAL INVESTMENT INFORMATION – (continued) |
SWAP CONTRACTS — At September 30, 2012, the Fund had the following swap contracts:
INTEREST RATE SWAP CONTRACTS
| | | | | | | | | | | | | | | | | | | | |
| | | | | | | | | Rates Exchanged | | Market Value | |
| Counterparty | | Notional
Amount
(000s)(a) | | | Termination
Date | | | Payments
Received | | Payments
Made | | Upfront Payments
Made (Received) | | | Unrealized
Gain (Loss) | |
Bank of America Securities LLC | | $ | 6,000 | | | | 02/28/17 | | | 3 month LIBOR | | 0.750% | | $ | (6,753 | ) | | $ | (12,676 | ) |
| | | 1,700 | | | | 07/23/24 | | | 2.150% | | 3 month LIBOR | | | — | | | | (16,282 | ) |
Barclays Bank PLC | | | 16,600 | | | | 02/28/17 | | | 3 month LIBOR | | 0.750 | | | (31,225 | ) | | | (22,529 | ) |
Citibank NA | | | 5,800 | | | | 02/28/17 | | | 3 month LIBOR | | 0.750 | | | (5,700 | ) | | | (13,081 | ) |
| | | 14,700 | | | | 12/19/17 | | | 3 month LIBOR | | 1.250 | | | (52,438 | ) | | | (246,744 | ) |
| | | 11,300 | | | | 12/19/19 | | | 3 month LIBOR | | 1.750 | | | (163,854 | ) | | | (209,460 | ) |
Credit Suisse First Boston Corp. | | | 4,600 | | | | 02/28/17 | | | 3 month LIBOR | | 0.750 | | | (4,883 | ) | | | (10,013 | ) |
| | | 11,300 | | | | 12/19/19 | | | 3 month LIBOR | | 1.750 | | | (157,605 | ) | | | (215,710 | ) |
| | | 9,400 | | | | 12/19/42 | | | 3 month LIBOR | | 2.500 | | | (14,694 | ) | | | 283,369 | |
Deutsche Bank Securities, Inc. | | | 12,400 | | | | 02/28/17 | | | 3 month LIBOR | | 0.750 | | | (31,464 | ) | | | (8,690 | ) |
| | | 2,800 | | | | 07/28/24 | | | 2.060 | | 3 month LIBOR | | | — | | | | (50,807 | ) |
JPMorgan Securities, Inc. | | | 3,500 | | | | 02/28/17 | | | 3 month LIBOR | | 0.750 | | | (5,710 | ) | | | (5,624 | ) |
Morgan Stanley Capital Services, Inc. | | | 10,500 | | | | 02/28/17 | | | 3 month LIBOR | | 0.750 | | | (23,359 | ) | | | (10,642 | ) |
| TOTAL | | | | | | | | | | | | | | $ | (497,685 | ) | | $ | (538,889 | ) |
| | (a) | | Represents forward starting interest rate swaps whose effective dates of commencement of accruals and cash flows occur subsequent to September 30, 2012. |
WRITTEN OPTIONS CONTRACTS
INTEREST RATE SWAPTION CONTRACTS — At September 30, 2012, the fund had the following written swaptions:
| | | | | | | | | | | | | | | | | | | | | | |
| Counterparty | | Description | | Notional
Amount
(000s) | | |
Expiration
Date | | | Strike
Price | | |
Market
Value | | |
Premiums
Received | |
Bank of America N.A. | | Put – OTC – 10 year Interest Rate Swap for the obligation to pay a fixed rate of 1.640% versus the 3 month LIBOR maturing on July 23, 2024 | | $ | 6,300 | | | | 07/21/14 | | | | 1.640 | % | | $ | (97,991 | ) | | $ | (140,490 | ) |
Deutsche Bank Securities Inc. | | Put – OTC – 10 year Interest Rate Swap for the obligation to pay a fixed rate of 1.550% versus the 3 month LIBOR maturing on July 28, 2024 | | | 7,700 | | | | 07/24/14 | | | | 1.550 | | | | (100,449 | ) | | | (166,320 | ) |
| TOTAL | | | | $ | 14,000 | | | | | | | | | | | $ | (198,440 | ) | | $ | (306,810 | ) |
For the six months ended September 30, 2012, the Fund had the following written swaptions activity:
| | | | | | | | |
| | | Notional
Amount
(000s) | | | Premiums
Received | |
| | | | | | | | |
Contracts Outstanding March 31, 2012 | | $ | — | | | $ | — | |
Contracts Written | | | 14,000 | | | | 306,810 | |
Contracts Outstanding September 30, 2012 | | $ | 14,000 | | | $ | 306,810 | |
| | | | | | | | |
| | |
| The accompanying notes are an integral part of these financial statements. | | 45 |
GOLDMAN SACHS HIGH QUALITY FLOATING RATE FUND†
Schedule of Investments
September 30, 2012 (Unaudited)
| | | | | | | | | | | | | | |
Principal
Amount | | | Interest
Rate | | | Maturity
Date | | | Value | |
| | | | | | | | | | | | | | |
| | Corporate Obligations(a) – 0.6% | |
| Banks – 0.6% | |
| Sparebank 1 Boligkreditt AS | |
| $ | 1,500,000 | | | | 1.250 | % | | | 10/25/13 | | | $ | 1,509,900 | |
| | (Cost $1,511,283) | | | | | |
| | |
| | | | | | | | | | | | | | |
| | Mortgage-Backed Obligations – 67.5% | |
| Collateralized Mortgage Obligations – 39.5% | |
| Interest Only(b) – 0.0% | |
| FNMA REMIC Series 1990-145, Class B | |
| $ | 733 | | | | 1,004.961 | % | | | 12/25/20 | | | $ | 15,853 | |
| | |
| Planned Amortization Class – 0.1% | |
| FHLMC REMIC Series 2113, Class TE | |
| | 163,548 | | | | 6.000 | | | | 01/15/14 | | | | 167,424 | |
| FNMA REMIC Series 1993-225, Class WC | |
| | 119,196 | | | | 6.500 | | | | 12/25/13 | | | | 122,361 | |
| | | | | | | | | | | | | | |
| | | | | | | | | | | | | 289,785 | |
| | |
| Regular Floater(c) – 38.8% | |
| Collateralized Mortgage Securities Corp. Series N, Class 2 | |
| | 67,482 | | | | 1.027 | | | | 08/25/17 | | | | 67,730 | |
| FDIC Structured Sale Guaranteed Notes Series 2010-S1,
Class 1A(a) |
|
| | 1,344,133 | | | | 0.764 | | | | 02/25/48 | | | | 1,345,342 | |
| FHLMC REMIC Series 1826, Class F | |
| | 71,060 | | | | 0.650 | | | | 09/15/21 | | | | 71,149 | |
| FHLMC REMIC Series 3371, Class FA | |
| | 1,929,274 | | | | 0.821 | | | | 09/15/37 | | | | 1,947,375 | |
| FHLMC REMIC Series 3374, Class FT | |
| | 2,540,277 | | | | 0.521 | | | | 04/15/37 | | | | 2,547,430 | |
| FHLMC REMIC Series 3545, Class FA | |
| | 4,072,027 | | | | 1.071 | | | | 06/15/39 | | | | 4,132,596 | |
| FHLMC REMIC Series 3588, Class CW | |
| | 4,223,588 | | | | 3.510 | | | | 10/15/37 | | | | 4,529,692 | |
| FHLMC REMIC Series 4039, Class FA | |
| | 6,732,106 | | | | 0.721 | | | | 05/15/42 | | | | 6,757,148 | |
| FNMA REMIC Series 1990-145, Class A | |
| | 298,425 | | | | 1.091 | | | | 12/25/20 | | | | 303,213 | |
| FNMA REMIC Series 1997-20, Class F | |
| | 612,416 | | | | 0.630 | | | | 03/25/27 | | | | 603,837 | |
| FNMA REMIC Series 1998-66, Class FC | |
| | 154,501 | | | | 0.721 | | | | 11/17/28 | | | | 155,735 | |
| FNMA REMIC Series 2010-123, Class FL | |
| | 3,864,996 | | | | 0.647 | | | | 11/25/40 | | | | 3,875,978 | |
| FNMA REMIC Series 2011-110, Class FE | |
| | 6,781,049 | | | | 0.617 | | | | 04/25/41 | | | | 6,811,839 | |
| FNMA REMIC Series 2012-56, Class FG | |
| | 5,762,991 | | | | 0.717 | | | | 03/25/39 | | | | 5,807,692 | |
| FNMA REMIC Series 2012-63, Class FE | |
| | 1,356,513 | | | | 0.617 | | | | 06/25/38 | | | | 1,361,708 | |
| FNMA REMIC Series 2012-65, Class FB | |
| | 1,354,354 | | | | 0.737 | | | | 06/25/42 | | | | 1,358,590 | |
| GNMA REMIC Series 2001-25, Class AF | |
| | 7,584,488 | | | | 0.659 | | | | 02/20/41 | | | | 7,618,480 | |
| GNMA REMIC Series 2011-99, Class DF | |
| | 6,505,616 | | | | 0.621 | | | | 07/16/41 | | | | 6,531,952 | |
| | |
| Principal
Amount |
| |
| Interest
Rate |
| |
| Maturity
Date |
| | | Value | |
| | | | | | | | | | | | | | |
| | Mortgage-Backed Obligations – (continued) | |
| Regular Floater(c) – (continued) | |
| GNMA REMIC Series 2012-12, Class HF | |
| $ | 4,539,734 | | | | 0.619 | % | | | 01/20/42 | | | $ | 4,557,478 | |
| NCUA Guaranteed Notes Series 2010-A1, Class A | |
| | 861,789 | | | | 0.569 | | | | 12/07/20 | | | | 862,238 | |
| NCUA Guaranteed Notes Series 2010-R2, Class 1A | |
| | 1,500,185 | | | | 0.598 | | | | 11/06/17 | | | | 1,503,233 | |
| NCUA Guaranteed Notes Series 2011-A1 | |
| | 2,700,000 | | | | 0.248 | | | | 06/12/13 | | | | 2,700,000 | |
| NCUA Guaranteed Notes Series 2011-R1, Class 1A | |
| | 1,137,713 | | | | 0.678 | | | | 01/08/20 | | | | 1,142,158 | |
| NCUA Guaranteed Notes Series 2011-R2, Class 1A | |
| | 3,237,859 | | | | 0.628 | | | | 02/06/20 | | | | 3,247,345 | |
| NCUA Guaranteed Notes Series 2011-R3, Class 1A | |
| | 3,426,228 | | | | 0.628 | | | | 03/11/20 | | | | 3,435,329 | |
| NCUA Guaranteed Notes Series 2011-R4, Class 1A | |
| | 4,958,002 | | | | 0.599 | | | | 03/06/20 | | | | 4,969,816 | |
| NCUA Guaranteed Notes Series 2011-R5, Class 1A | |
| | 4,659,410 | | | | 0.599 | | | | 04/06/20 | | | | 4,669,785 | |
| NCUA Guaranteed Notes Series 2011-R6, Class 1A | |
| | 4,131,789 | | | | 0.599 | | | | 05/07/20 | | | | 4,140,827 | |
| | | | | | | | | | | | | | |
| | | | | | | | | | | | | 87,055,695 | |
| | |
| Sequential Fixed Rate – 0.1% | |
| NCUA Guaranteed Notes Series 2010-R1, Class 2A | |
| | 233,743 | | | | 1.840 | | | | 10/07/20 | | | | 237,541 | |
| | |
| Sequential Floating Rate(c) – 0.5% | |
| NCUA Guaranteed Notes Series 2010-R1, Class 1A | |
| | 962,547 | | | | 0.678 | | | | 10/07/20 | | | | 965,818 | |
| | |
| TOTAL COLLATERALIZED
MORTGAGE OBLIGATIONS |
| | $ | 88,564,692 | |
| | |
| Federal Agencies – 28.0% | |
| Adjustable Rate FHLMC(c) – 8.9% | |
| $ | 40,980 | | | | 2.368 | % | | | 08/01/16 | | | $ | 41,620 | |
| | 66,312 | | | | 3.288 | | | | 08/01/18 | | | | 68,781 | |
| | 41,126 | | | | 2.893 | | | | 11/01/18 | | | | 42,264 | |
| | 232,458 | | | | 2.917 | | | | 11/01/18 | | | | 240,896 | |
| | 16,678 | | | | 2.838 | | | | 02/01/19 | | | | 17,172 | |
| | 42,019 | | | | 2.369 | | | | 03/01/19 | | | | 42,964 | |
| | 29,315 | | | | 3.055 | | | | 03/01/19 | | | | 30,370 | |
| | 39,716 | | | | 2.519 | | | | 06/01/19 | | | | 40,592 | |
| | 30,098 | | | | 2.988 | | | | 07/01/19 | | | | 31,138 | |
| | 699,263 | | | | 3.158 | | | | 11/01/19 | | | | 725,782 | |
| | 520,574 | | | | 6.876 | | | | 11/01/19 | | | | 559,780 | |
| | 44,061 | | | | 3.033 | | | | 01/01/20 | | | | 45,102 | |
| | 61,650 | | | | 2.366 | | | | 05/01/21 | | | | 63,398 | |
| | 36,087 | | | | 2.394 | | | | 10/01/26 | | | | 36,768 | |
| | 636,872 | | | | 3.803 | | | | 08/01/28 | | | | 681,836 | |
| | 314,161 | | | | 2.589 | | | | 05/01/29 | | | | 329,134 | |
| | 39,087 | | | | 4.182 | | | | 06/01/29 | | | | 42,562 | |
| | 59,598 | | | | 2.390 | | | | 04/01/30 | | | | 61,898 | |
| | 59,676 | | | | 4.315 | | | | 06/01/30 | | | | 64,981 | |
| | 160,305 | | | | 2.723 | | | | 12/01/30 | | | | 164,680 | |
| | 47,522 | | | | 2.477 | | | | 02/01/31 | | | | 49,670 | |
| | 13,576 | | | | 2.285 | | | | 06/01/31 | | | | 14,440 | |
| | 3,273,704 | | | | 2.887 | | | | 05/01/34 | | | | 3,523,252 | |
| | |
| | |
| 46 | | The accompanying notes are an integral part of these financial statements. |
GOLDMAN SACHS HIGH QUALITY FLOATING RATE FUND†
| | | | | | | | | | | | | | |
| Principal
Amount |
| |
| Interest
Rate |
| |
| Maturity
Date |
| | | Value | |
| | | | | | | | | | | | | | |
| | Mortgage-Backed Obligations – (continued) | |
| Adjustable Rate FHLMC(c) – (continued) | |
| $ | 390,098 | | | | 3.939 | % | | | 05/01/35 | | | $ | 409,771 | |
| | 3,877,491 | | | | 2.374 | | | | 07/01/35 | | | | 4,151,566 | |
| | 3,729,202 | | | | 2.400 | | | | 04/01/37 | | | | 3,983,706 | |
| | 4,384,743 | | | | 2.372 | | | | 12/01/37 | | | | 4,612,158 | |
| | | | | | | | | | | | | | |
| | | | | | | | | | | | | 20,076,281 | |
| | |
| Adjustable Rate FNMA(c) – 10.4% | |
| | 166,696 | | | | 6.750 | | | | 04/01/17 | | | | 176,619 | |
| | 30,175 | | | | 4.258 | | | | 08/01/17 | | | | 31,507 | |
| | 105,142 | | | | 2.741 | | | | 09/01/17 | | | | 109,716 | |
| | 64,298 | | | | 2.750 | | | | 09/01/17 | | | | 67,500 | |
| | 22,599 | | | | 2.500 | | | | 12/01/17 | | | | 23,056 | |
| | 21,735 | | | | 4.875 | | | | 12/01/17 | | | | 23,331 | |
| | 147,323 | | | | 2.535 | | | | 03/01/18 | | | | 150,478 | |
| | 61,579 | | | | 2.760 | | | | 03/01/18 | | | | 63,460 | |
| | 666,641 | | | | 2.531 | | | | 07/01/18 | | | | 681,171 | |
| | 21,274 | | | | 1.807 | | | | 10/01/18 | | | | 21,482 | |
| | 32,492 | | | | 2.377 | | | | 10/01/18 | | | | 33,235 | |
| | 81,542 | | | | 2.691 | | | | 10/01/18 | | | | 84,814 | |
| | 64,341 | | | | 2.740 | | | | 10/01/18 | | | | 66,512 | |
| | 96,224 | | | | 2.417 | | | | 01/01/19 | | | | 98,408 | |
| | 304,848 | | | | 4.008 | | | | 04/01/19 | | | | 323,508 | |
| | 18,151 | | | | 5.977 | | | | 04/01/19 | | | | 19,159 | |
| | 144,853 | | | | 2.366 | | | | 05/01/19 | | | | 151,201 | |
| | 669,737 | | | | 2.427 | | | | 05/01/19 | | | | 685,982 | |
| | 91,049 | | | | 6.174 | | | | 07/01/19 | | | | 97,849 | |
| | 255,299 | | | | 4.302 | | | | 08/01/19 | | | | 272,758 | |
| | 243,213 | | | | 5.790 | | | | 05/01/20 | | | | 261,378 | |
| | 313,166 | | | | 2.455 | | | | 06/01/20 | | | | 320,770 | |
| | 21,610 | | | | 6.623 | | | | 02/01/22 | | | | 23,237 | |
| | 75,513 | | | | 2.573 | | | | 05/20/22 | | | | 78,254 | |
| | 232,041 | | | | 2.306 | | | | 02/01/23 | | | | 238,155 | |
| | 2,822 | | | | 6.219 | | | | 12/01/23 | | | | 2,895 | |
| | 395,426 | | | | 2.375 | | | | 01/01/24 | | | | 410,601 | |
| | 439,602 | | | | 2.425 | | | | 03/01/24 | | | | 456,794 | |
| | 351,323 | | | | 2.175 | | | | 06/20/24 | | | | 361,414 | |
| | 20,196 | | | | 3.736 | | | | 08/01/24 | | | | 21,027 | |
| | 105,036 | | | | 5.091 | | | | 01/01/25 | | | | 112,881 | |
| | 25,169 | | | | 3.728 | | | | 06/01/27 | | | | 26,356 | |
| | 17,150 | | | | 4.250 | | | | 12/01/27 | | | | 18,675 | |
| | 34,485 | | | | 4.509 | | | | 01/01/28 | | | | 37,551 | |
| | 24,089 | | | | 2.368 | | | | 06/01/29 | | | | 24,978 | |
| | 18,011 | | | | 2.440 | | | | 06/01/29 | | | | 18,629 | |
| | 2,869,302 | | | | 2.400 | | | | 07/01/33 | | | | 3,058,607 | |
| | 848,785 | | | | 2.492 | | | | 11/01/34 | | | | 910,970 | |
| | 18,142 | | | | 3.910 | | | | 05/01/36 | | | | 19,694 | |
| | 7,151,549 | | | | 2.655 | | | | 08/01/37 | | | | 7,675,146 | |
| | 1,697,046 | | | | 2.950 | | | | 09/01/37 | | | | 1,830,683 | |
| | 120,081 | | | | 1.548 | | | | 06/01/40 | | | | 123,143 | |
| | 3,907,724 | | | | 2.344 | | | | 12/01/40 | | | | 4,179,683 | |
| | 10,956 | | | | 1.348 | | | | 02/01/41 | | | | 11,159 | |
| | | | | | | | | | | | | | |
| | | | | | | | | | | | | 23,404,426 | |
| | |
| Principal
Amount |
| |
| Interest
Rate |
| |
| Maturity
Date |
| | | Value | |
| | | | | | | | | | | | | | |
| | Mortgage-Backed Obligations – (continued) | |
| Adjustable Rate GNMA(c) – 4.8% | |
| $ | 1,064,938 | | | | 1.625 | % | | | 02/20/33 | | | $ | 1,108,862 | |
| | 433,038 | | | | 1.750 | | | | 05/20/33 | | | | 450,791 | |
| | 7,124,383 | | | | 1.625 | | | | 08/20/34 | | | | 7,481,522 | |
| | 1,540,318 | | | | 1.625 | | | | 02/20/37 | | | | 1,616,949 | |
| | | | | | | | | | | | | | |
| | | | | | | | | | | | | 10,658,124 | |
| | |
| FHLMC – 1.8% | |
| | 8,773 | | | | 6.500 | | | | 03/01/13 | | | | 8,936 | |
| | 7,805 | | | | 6.500 | | | | 04/01/13 | | | | 7,837 | |
| | 9,152 | | | | 6.500 | | | | 05/01/13 | | | | 9,321 | |
| | 10,266 | | | | 6.500 | | | | 06/01/13 | | | | 10,455 | |
| | 357,786 | | | | 8.000 | | | | 12/01/15 | | | | 381,120 | |
| | 337,927 | | | | 5.500 | | | | 01/01/20 | | | | 366,577 | |
| | 179,057 | | | | 7.000 | | | | 04/01/21 | | | | 207,450 | |
| | 106,557 | | | | 7.000 | | | | 08/01/21 | | | | 123,500 | |
| | 1,039,367 | | | | 7.000 | | | | 03/01/22 | | | | 1,200,468 | |
| | 331,133 | | | | 7.000 | | | | 05/01/22 | | | | 382,470 | |
| | 1,068,286 | | | | 7.000 | | | | 06/01/22 | | | | 1,233,905 | |
| | 9,902 | | | | 4.500 | | | | 05/01/23 | | | | 10,650 | |
| | | | | | | | | | | | | | |
| | | | | | | | | | | | | 3,942,689 | |
| | |
| FNMA – 2.1% | |
| | 89,544 | | | | 5.500 | | | | 01/01/13 | | | | 90,291 | |
| | 174,603 | | | | 8.000 | | | | 01/01/16 | | | | 185,297 | |
| | 409,589 | | | | 7.000 | | | | 03/01/17 | | | | 445,560 | |
| | 75,151 | | | | 7.000 | | | | 05/01/17 | | | | 81,751 | |
| | 2,318,521 | | | | 5.500 | | | | 03/01/18 | | | | 2,510,343 | |
| | 264,900 | | | | 5.500 | | | | 04/01/18 | | | | 286,817 | |
| | 10,829 | | | | 5.000 | | | | 09/01/19 | | | | 11,766 | |
| | 4,185 | | | | 5.000 | | | | 11/01/19 | | | | 4,548 | |
| | 28,300 | | | | 5.000 | | | | 01/01/20 | | | | 30,764 | |
| | 89,869 | | | | 7.000 | | | | 07/01/21 | | | | 102,293 | |
| | 171,356 | | | | 7.000 | | | | 11/01/21 | | | | 195,533 | |
| | 101,101 | | | | 7.000 | | | | 12/01/21 | | | | 115,424 | |
| | 202,189 | | | | 7.000 | | | | 01/01/22 | | | | 230,856 | |
| | 40,274 | | | | 7.000 | | | | 02/01/22 | | | | 45,962 | |
| | 138,802 | | | | 7.000 | | | | 01/01/28 | | | | 161,378 | |
| | 121,853 | | | | 6.500 | | | | 04/01/33 | | | | 140,665 | |
| | | | | | | | | | | | | | |
| | | | | | | | | | | | | 4,639,248 | |
| | |
| GNMA – 0.0% | |
| | 68,159 | | | | 7.000 | | | | 04/15/26 | | | | 81,172 | |
| | |
| | TOTAL FEDERAL AGENCIES | | | $ | 62,801,940 | |
| | |
| | TOTAL MORTGAGE-BACKED OBLIGATIONS | |
| | (Cost $150,059,743) | | | $ | 151,366,632 | |
| | |
| | | | | | | | | | | | | | |
| | Asset-Backed Securities – 35.6% | |
| Auto(c) – 6.6% | |
| Ally Master Owner Trust Series 2010-1, Class A(a) | |
| $ | 6,500,000 | | | | 1.971 | % | | | 01/15/15 | | | $ | 6,527,671 | |
| Ford Credit Floorplan Master Owner Trust Series 2012-1, Class A | |
| | 3,500,000 | | | | 0.691 | | | | 01/15/16 | | | | 3,516,517 | |
| | |
| | |
| The accompanying notes are an integral part of these financial statements. | | 47 |
GOLDMAN SACHS HIGH QUALITY FLOATING RATE FUND†
Schedule of Investments (continued)
September 30, 2012 (Unaudited)
| | | | | | | | | | | | | | |
| Principal
Amount |
| |
| Interest
Rate |
| |
| Maturity
Date |
| | | Value | |
| | | | | | | | | | | | | | |
| | Asset-Backed Securities – (continued) | |
| Auto(c) – (continued) | |
| Ford Credit Floorplan Master Owner Trust Series 2012-4,
Class A2 |
|
| $ | 3,000,000 | | | | 0.569 | % | | | 09/15/16 | | | $ | 3,000,063 | |
| Motor PLC Series 12A, Class A1B(a) | |
| | 1,750,000 | | | | 0.735 | | | | 02/25/20 | | | | 1,750,021 | |
| | | | | | | | | | | | | | |
| | | | | | | | | | | | | 14,794,272 | |
| | |
| Collateralized Loan Obligations(c) – 6.2% | |
| Black Diamond CLO Ltd. Series 2005-1A, Class A1(a) | |
| | 732,829 | | | | 0.649 | | | | 06/20/17 | | | | 724,031 | |
| Crown Point CLO Ltd. Series 2012-1A, Class A1LA(a) | |
| | 700,000 | | | | 1.158 | | | | 11/21/22 | | | | 668,609 | |
| Gleneagles CLO Ltd. Series 2005-1A, Class A1(a) | |
| | 4,068,113 | | | | 0.720 | | | | 11/01/17 | | | | 3,958,539 | |
| Goldentree Loan Opportunities V Ltd. Series 2007-5A, Class A(a) | |
| | 850,000 | | | | 1.150 | | | | 10/18/21 | | | | 835,368 | |
| Greywolf CLO Ltd. Series 2007-1A, Class A(a) | |
| | 490,916 | | | | 0.679 | | | | 02/18/21 | | | | 469,144 | |
| KKR Financial CLO Ltd. Series 2005-1A, Class A1(a) | |
| | 1,311,170 | | | | 0.718 | | | | 04/26/17 | | | | 1,290,924 | |
| KKR Financial CLO Ltd. Series 2007-AA, Class A(a) | |
| | 1,208,190 | | | | 1.205 | | | | 10/15/17 | | | | 1,199,643 | |
| Liberty CLO Ltd. Series 2005-1A, Class A1C(a) | |
| | 3,671,210 | | | | 0.695 | | | | 11/01/17 | | | | 3,523,525 | |
| Lightpoint CLO Ltd. Series 2005-3A, Class A1A(a) | |
| | 420,910 | | | | 0.649 | | | | 09/15/17 | | | | 413,779 | |
| Westchester CLO Ltd. Series 2007-1X, Class A1A | |
| | 814,112 | | | | 0.670 | | | | 08/01/22 | | | | 776,714 | |
| | | | | | | | | | | | | | |
| | | | | | | | | | | | | 13,860,276 | |
| | |
| Credit Card(a)(c) – 1.9% | |
| World Financial Network Credit Card Master Trust
Series 2006-A, Class A |
|
| | 4,200,000 | | | | 0.351 | | | | 02/15/17 | | | | 4,184,526 | |
| | |
| Home Equity(a) – 0.3% | |
| AH Mortgage Advance Trust Series SART-2, Class A1 | |
| | 800,000 | | | | 3.270 | | | | 09/15/43 | | | | 801,781 | |
| | |
| Student Loan(c) – 20.6% | |
| Access Group, Inc. Series 2002-1, Class A2 | |
| | 1,350,501 | | | | 0.549 | | | | 09/25/25 | | | | 1,346,580 | |
| Access Group, Inc. Series 2003-1, Class A2 | |
| | 994,049 | | | | 0.629 | | | | 12/27/16 | | | | 989,256 | |
| Access Group, Inc. Series 2005-2, Class A3 | |
| | 2,800,000 | | | | 0.614 | | | | 11/22/24 | | | | 2,743,968 | |
| Brazos Higher Education Authority, Inc. Series 2005-2,
Class A10 |
|
| | 4,200,000 | | | | 0.489 | | | | 12/26/19 | | | | 4,165,898 | |
| Brazos Higher Education Authority, Inc. Series 2005-2, Class A9 | |
| | 1,572,027 | | | | 0.469 | | | | 12/26/17 | | | | 1,570,122 | |
| Brazos Higher Education Authority, Inc. Series 2005-3,
Class A14 |
|
| | 3,468,030 | | | | 0.479 | | | | 09/25/23 | | | | 3,462,239 | |
| Brazos Higher Education Authority, Inc. Student Loan Revenue
Series 2004 I-A-2 |
|
| | 2,477,590 | | | | 0.529 | | | | 06/27/22 | | | | 2,472,652 | |
| | |
| Principal
Amount |
| |
| Interest
Rate |
| |
| Maturity
Date |
| | | Value | |
| | | | | | | | | | | | | | |
| | Asset-Backed Securities – (continued) | |
| Student Loan(c) – (continued) | |
| Brazos Higher Education Authority, Inc. Student Loan Revenue
Series 2005 I-A-2 |
|
| $ | 1,539,000 | | | | 0.449 | % | | | 12/26/18 | | | $ | 1,535,768 | |
| College Loan Corp. Trust Series 2004-1, Class A3 | |
| | 2,268,530 | | | | 0.611 | | | | 04/25/21 | | | | 2,264,986 | |
| College Loan Corp. Trust Series 2004-1, Class A4 | |
| | 600,000 | | | | 0.641 | | | | 04/25/24 | | | | 562,364 | |
| College Loan Corp. Trust Series 2005-1, Class A2 | |
| | 5,000,000 | | | | 0.551 | | | | 07/25/24 | | | | 4,938,727 | |
| College Loan Corp. Trust Series 2005-2, Class A2 | |
| | 260,495 | | | | 0.565 | | | | 10/15/21 | | | | 260,262 | |
| Education Funding Capital Trust I Series 2004-1, Class A2 | |
| | 1,542,325 | | | | 0.549 | | | | 12/15/22 | | | | 1,537,437 | |
| Education Loan Asset-Backed Trust Series 2012-1, Class A1 | |
| | 1,150,000 | | | | 0.669 | | | | 06/25/22 | | | | 1,150,000 | |
| Educational Services of America, Inc. Series 2012-1, Class A1(a) | |
| | 3,114,216 | | | | 1.367 | | | | 09/25/40 | | | | 3,153,404 | |
| GCO Education Loan Funding Trust Series 2005-2, Class A6L | |
| | 1,500,000 | | | | 0.577 | | | | 05/27/24 | | | | 1,481,578 | |
| Knowledgeworks Foundation Student Loan Series 2010-1,
Class A |
|
| | 468,032 | | | | 1.377 | | | | 02/25/42 | | | | 467,517 | |
| Northstar Education Finance, Inc. Series 2004-1, Class A4 | |
| | 1,484,444 | | | | 0.637 | | | | 04/29/19 | | | | 1,479,493 | |
| Northstar Education Finance, Inc. Series 2005-1, Class A1 | |
| | 1,004,609 | | | | 0.547 | | | | 10/28/26 | | | | 1,000,925 | |
| Pennsylvania State Higher Education Assistance Agency
Series 2009-2 Class A-1 |
|
| | 1,318,111 | | | | 1.051 | | | | 04/25/19 | | | | 1,308,961 | |
| Scholar Funding Trust Series 2012-B, Class A1(a) | |
| | 300,000 | | | | 0.619 | | | | 10/28/25 | | | | 299,206 | |
| SLM Student Loan Trust Series 2006-8, Class A4 | |
| | 489,151 | | | | 0.531 | | | | 10/25/21 | | | | 487,823 | |
| SLM Student Loan Trust Series 2008-5, Class A4 | |
| | 1,250,000 | | | | 2.151 | | | | 07/25/23 | | | | 1,317,302 | |
| SLM Student Loan Trust Series 2012-3, Class A | |
| | 4,573,852 | | | | 0.867 | | | | 12/26/25 | | | | 4,607,528 | |
| South Carolina Student Loan Corp. Series 2005, Class A1 | |
| | 1,623,647 | | | | 0.518 | | | | 12/03/18 | | | | 1,623,371 | |
| | | | | | | | | | | | | | |
| | | | | | | | | | | | | 46,227,367 | |
| | |
| | TOTAL ASSET-BACKED SECURITIES | | | | | |
| | (Cost $79,685,293) | | | $ | 79,868,222 | |
| | |
| | | | | | | | | | | | | | |
Notional
Amount | | | Exercise
Rate | | | Expiration
Date | | | Value | |
| | | | | | | | | | | | | | |
| | Options Purchased – 0.2% | |
| Interest Rate Swaptions | |
| Citibank NA Put – OTC – 10 year Interest Rate Swap
Strike Price 1.895% |
|
| $ | 5,400,000 | | | | 1.895 | % | | | 02/28/13 | | | $ | 118,458 | |
| Citibank NA Call – OTC – 10 year Interest Rate Swap
Strike Price 1.895% |
|
| | 5,400,000 | | | | 1.895 | | | | 02/28/13 | | | | 85,455 | |
| | |
| | |
| 48 | | The accompanying notes are an integral part of these financial statements. |
GOLDMAN SACHS HIGH QUALITY FLOATING RATE FUND†
| | | | | | | | | | | | | | |
| Notional
Amount |
| |
| Exercise
Rate |
| |
| Expiration
Date |
| | | Value | |
| | | | | | | | | | | | | | |
| | Options Purchased – (continued) | |
| Interest Rate Swaptions – (continued) | |
| Deutsche Bank AG Put – OTC – 10 year Interest Rate Swap
Strike Price 2.060% |
|
| $ | 5,300,000 | | | | 2.060 | % | | | 02/19/13 | | | $ | 170,639 | |
| Deutsche Bank AG Call – OTC – 10 year Interest Rate Swap
Strike Price 2.060% |
|
| | 5,300,000 | | | | 2.060 | | | | 02/19/13 | | | | 51,561 | |
| | |
| | TOTAL OPTIONS PURCHASED – 0.2% | |
| | (Cost $477,690) | | | $ | 426,113 | |
| | |
| | TOTAL INVESTMENTS – 103.9% | | | | | |
| | (Cost $231,734,009) | | | $ | 233,170,867 | |
| | |
| LIABILITIES IN EXCESS OF
OTHER ASSETS – (3.9)% |
| | | (8,841,696 | ) |
| | |
| | NET ASSETS – 100.0% | | | $ | 224,329,171 | |
| | |
| | |
| The percentage shown for each investment category reflects the value of investments in that category as a percentage of net assets. |
(a) | | Exempt from registration under Rule 144A of the Securities Act of 1933. Under procedures approved by the Board of Trustees, such securities have been determined to be liquid by the investment adviser and may be resold, normally to qualified institutional buyers in transactions exempt from registration. Total market value of Rule 144A securities amounts to $32,655,413, which represents approximately 14.6% of net assets as of September 30, 2012. |
(b) | | Security with a notional or nominal principal amount. The actual effective yield of this security is different than the stated interest rate. |
(c) | | Variable rate security. Interest rate disclosed is that which is in effect at September 30, 2012. |
| | |
|
Investment Abbreviations: |
CLO | | —Collateralized Loan Obligation |
FDIC | | —Federal Deposit Insurance Corp. |
FHLMC | | —Federal Home Loan Mortgage Corp. |
FNMA | | —Federal National Mortgage Association |
GNMA | | —Government National Mortgage Association |
LIBOR | | —London Interbank Offered Rate |
NCUA | | —National Credit Union Administration |
OTC | | —Over the Counter |
REMIC | | —Real Estate Mortgage Investment Conduit |
SART | | —Servicer Advance Revolving Trust |
|
| | † | | Formerly, Goldman Sachs Ultra-Short Duration Government Fund. Effective July 27, 2012, the Fund changed its name to the Goldman Sachs High Quality Floating Rate Fund |
|
| ADDITIONAL INVESTMENT INFORMATION |
FUTURES CONTRACTS — At September 30, 2012, the Fund had the following futures contracts:
| | | | | | | | | | | | | | |
| Type | | Number of
Contracts
Long (Short) | | | Expiration
Date | | Current
Value | | | Unrealized
Gain (Loss) | |
Eurodollars | | | 1 | | | December 2012 | | $ | 249,200 | | | $ | 1,498 | |
Eurodollars | | | 1 | | | March 2013 | | | 249,187 | | | | 1,985 | |
Eurodollars | | | 1 | | | June 2013 | | | 249,150 | | | | 2,535 | |
Eurodollars | | | 48 | | | September 2014 | | | 11,941,800 | | | | 91,309 | |
Eurodollars | | | (48 | ) | | September 2015 | | | (11,907,600 | ) | | | (148,500 | ) |
Ultra Long U.S. Treasury Bonds | | | (19 | ) | | December 2012 | | | (3,139,156 | ) | | | (89,717 | ) |
5 Year U.S. Treasury Notes | | | 421 | | | December 2012 | | | 52,470,414 | | | | 121,052 | |
10 Year U.S. Treasury Notes | | | 50 | | | December 2012 | | | 6,674,219 | | | | 46,186 | |
30 Year U.S. Treasury Bonds | | | 21 | | | December 2012 | | | 3,136,875 | | | | (14,431 | ) |
| TOTAL | | | | | | | | | | | | $ | 11,917 | |
| | |
| The accompanying notes are an integral part of these financial statements. | | 49 |
GOLDMAN SACHS HIGH QUALITY FLOATING RATE FUND†
Schedule of Investments (continued)
September 30, 2012 (Unaudited)
|
| ADDITIONAL INVESTMENT INFORMATION (continued) |
SWAP CONTRACTS — At September 30, 2012, the Fund had the following swap contracts:
INTEREST RATE SWAP CONTRACTS
| | | | | | | | | | | | | | | | | | | | |
| | | | | | | | | Rates Exchanged | | Market Value | |
| Counterparty | | Notional
Amount
(000s) | | | Termination
Date | | | Payments
Received | | Payments
Made | | Upfront
Payments
Made (Received) | | | Unrealized
Gain (Loss) | |
Bank of America Securities LLC | | $ | 5,100 | (a) | | | 02/28/17 | | | 3 month LIBOR | | 0.750% | | $ | (5,741 | ) | | $ | (10,774 | ) |
| | | 1,400 | (a) | | | 07/23/24 | | | 2.150% | | 3 month LIBOR | | | — | | | | (13,408 | ) |
Barclays Bank PLC | | | 13,900 | (a) | | | 02/28/17 | | | 3 month LIBOR | | 0.750 | | | (26,079 | ) | | | (18,932 | ) |
Citibank NA | | | 4,800 | (a) | | | 02/28/17 | | | 3 month LIBOR | | 0.750 | | | (4,718 | ) | | | (10,826 | ) |
| | | 7,800 | (a) | | | 12/19/17 | | | 3 month LIBOR | | 1.250 | | | (27,824 | ) | | | (130,925 | ) |
| | | 700 | (a) | | | 12/19/19 | | | 1.750 | | 3 month LIBOR | | | 21,172 | | | | 1,953 | |
| | | 16,600 | (a) | | | 12/19/22 | | | 3 month LIBOR | | 2.000 | | | (55,988 | ) | | | (306,199 | ) |
Credit Suisse First Boston Corp. | | | 7,600 | (a) | | | 02/28/17 | | | 3 month LIBOR | | 0.750 | | | (9,332 | ) | | | (15,278 | ) |
| | | 10,800 | (a) | | | 12/19/22 | | | 2.000 | | 3 month LIBOR | | | 167,270 | | | | 68,369 | |
| | | 1,600 | (a) | | | 12/19/42 | | | 3 month LIBOR | | 2.500 | | | (2,501 | ) | | | 48,233 | |
Deutsche Bank Securities, Inc. | | | 6,500 | (a) | | | 02/28/17 | | | 3 month LIBOR | | 0.750 | | | (17,015 | ) | | | (4,033 | ) |
JPMorgan Securities, Inc. | | | 119,000 | | | | 12/31/12 | | | 3 month LIBOR | | 0.943 | | | — | | | | (458,812 | ) |
| | | 3,000 | (a) | | | 02/28/17 | | | 3 month LIBOR | | 0.750 | | | (4,894 | ) | | | (4,820 | ) |
Morgan Stanley Capital Services, Inc. | | | 8,800 | (a) | | | 02/28/17 | | | 3 month LIBOR | | 0.750 | | | (19,583 | ) | | | (8,913 | ) |
| TOTAL | | | | | | | | | | | | | | $ | 14,767 | | | $ | (864,365 | ) |
| | (a) | | Represents forward starting interest rate swaps whose effective dates of commencement of accruals and cash flows occur subsequent to September 30, 2012. |
WRITTEN OPTIONS CONTRACTS
INTEREST RATE SWAPTION CONTRACTS — At September 30, 2012, the fund had the following written swaptions:
| | | | | | | | | | | | | | | | | | |
| Counterparty | | Description | | Notional
Amount
(000s) | | | Expiration
Date | | Strike
Price | | Market
Value | | | Premiums
Received | |
Bank of America N.A. | | Put – OTC – 10 year Interest Rate Swap for the obligation to pay a fixed rate of 1.640% versus the 3 month LIBOR maturing on July 23, 2024 | | $ | 5,100 | | | 07/21/14 | | 1.640% | | $ | (79,326 | ) | | $ | (113,730 | ) |
For the six months ended September 30, 2012, the Fund had the following written swaptions activity:
| | | | | | | | |
| | | Notional
Amount
(000s) | | | Premiums
Received | |
Contracts Outstanding March 31, 2012 | | $ | — | | | $ | — | |
Contracts Written | | | 5,100 | | | | 113,730 | |
Contracts Outstanding September 30, 2012 | | $ | 5,100 | | | $ | 113,730 | |
| | |
| 50 | | The accompanying notes are an integral part of these financial statements. |
GOLDMAN SACHS INFLATION PROTECTED SECURITIES FUND
Schedule of Investments
September 30, 2012 (Unaudited)
| | | | | | | | | | | | | | |
Principal
Amount | | | Interest
Rate | | | Maturity
Date | | | Value | |
| | | | | | | | | | | | | | |
| | U.S. Treasury Obligations – 99.0% | |
| United States Treasury Bonds | |
| $ | 900,000 | | | | 3.125 | % | | | 11/15/41 | | | $ | 959,310 | |
| | United States Treasury Inflation Protected Securities | |
| | 13,856,586 | | | | 2.000 | | | | 07/15/14 | | | | 14,781,098 | |
| | 1,799,865 | | | | 1.625 | | | | 01/15/15 | | | | 1,928,951 | |
| | 42,758,496 | | | | 1.875 | | | | 07/15/15 | | | | 47,054,442 | |
| | 14,294,826 | | | | 2.500 | | | | 07/15/16 | | | | 16,602,154 | |
| | 5,346,322 | | | | 0.125 | | | | 04/15/17 | | | | 5,759,807 | |
| | 20,382,565 | | | | 2.125 | | | | 01/15/19 | | | | 25,016,337 | |
| | 11,267,025 | | | | 1.875 | | | | 07/15/19 | | | | 13,826,780 | |
| | 21,221,716 | | | | 1.250 | | | | 07/15/20 | | | | 25,363,346 | |
| | 38,910,167 | | | | 1.125 | (a) | | | 01/15/21 | | | | 46,053,685 | |
| | 16,530,664 | | | | 2.375 | | | | 01/15/25 | | | | 22,453,270 | |
| | 5,194,665 | | | | 2.000 | | | | 01/15/26 | | | | 6,833,426 | |
| | 29,312,154 | | | | 2.375 | | | | 01/15/27 | | | | 40,514,966 | |
| | 11,899,188 | | | | 3.625 | | | | 04/15/28 | | | | 18,919,709 | |
| | 3,841,740 | | | | 2.500 | | | | 01/15/29 | | | | 5,503,293 | |
| | 1,533,081 | | | | 3.875 | | | | 04/15/29 | | | | 2,549,943 | |
| | 11,770,200 | | | | 2.125 | | | | 02/15/41 | | | | 17,309,609 | |
| United States Treasury Notes | |
| | 1,600,000 | | | | 0.625 | | | | 09/30/17 | | | | 1,599,568 | |
| | 1,200,000 | | | | 1.000 | | | | 09/30/19 | | | | 1,195,404 | |
| | |
| | TOTAL U.S. TREASURY OBLIGATIONS | |
| | (Cost $294,974,583) | | | $ | 314,225,098 | |
| | |
| | | | | | | | | | | | | | |
Notional Amount | | | Exercise
Rate | | | Expiration Date | | | Value | |
| | | | | | | | | | | | | | |
| | Options Purchased – 0.1% | |
| Interest Rate Swaptions | |
| Citibank NA Put – OTC – 10 year Interest Rate Swap Strike
Price 1.895% |
|
| $ | 3,800,000 | | | | 1.895 | % | | | 02/28/13 | | | $ | 83,359 | |
| Citibank NA Call – OTC – 10 year Interest Rate Swap Strike
Price 1.895% |
|
| | 3,800,000 | | | | 1.895 | | | | 02/28/13 | | | | 60,135 | |
| | |
| | TOTAL OPTIONS PURCHASED | |
| | (Cost $167,200) | | | $ | 143,494 | |
| | |
| TOTAL INVESTMENTS BEFORE SHORT-TERM
INVESTMENT |
|
| | (Cost $295,141,783) | | | $ | 314,368,592 | |
| | |
| | | | | | | | | | | | | | |
Principal Amount | | | Interest
Rate | | | Maturity
Date | | | Value | |
| | | | | | | | | | | | | | |
| | Short-term Investment(b) – 0.5% | |
| Repurchase Agreement – 0.5% | |
| Joint Repurchase Agreement Account II | |
| $ | 1,700,000 | | | | 0.245 | % | | | 10/01/12 | | | $ | 1,700,000 | |
| | (Cost $1,700,000) | | | | | |
| | |
| | TOTAL INVESTMENTS – 99.6% | |
| | (Cost $296,841,783) | | | $ | 316,068,592 | |
| | |
| OTHER ASSETS IN EXCESS OF
LIABILITIES – 0.4% |
| | | 1,207,081 | |
| | |
| | NET ASSETS – 100.0% | | | $ | 317,275,673 | |
| | |
| | |
| The percentage shown for each investment category reflects the value of investments in that category as a percentage of net assets. |
(a) | | All or a portion of security is segregated as collateral for initial margin requirement on futures transactions. |
(b) | | Joint repurchase agreement was entered into on September 28, 2012. Additional information appears on page 69. |
| | |
|
Investment Abbreviations: |
LIBOR | | —London Interbank Offered Rate |
OTC | | —Over the Counter |
|
| | |
| The accompanying notes are an integral part of these financial statements. | | 51 |
GOLDMAN SACHS INFLATION PROTECTED SECURITIES FUND
Schedule of Investments (continued)
September 30, 2012 (Unaudited)
|
| ADDITIONAL INVESTMENT INFORMATION |
FUTURES CONTRACTS — At September 30, 2012, the Fund had the following futures contracts:
| | | | | | | | | | | | | | |
| Type | | Number of
Contracts
Long (Short) | | | Expiration
Date | | Current
Value | | | Unrealized
Gain (Loss) | |
Eurodollars | | | 37 | | | September 2014 | | $ | 9,205,138 | | | $ | 69,753 | |
Eurodollars | | | (37 | ) | | September 2015 | | | (9,178,775 | ) | | | (113,067 | ) |
Ultra Long U.S. Treasury Bonds | | | (18 | ) | | December 2012 | | | (2,973,938 | ) | | | (89,006 | ) |
5 Year U.S. Treasury Notes | | | 339 | | | December 2012 | | | 42,250,524 | | | | 96,136 | |
10 Year U.S. Treasury Notes | | | (64 | ) | | December 2012 | | | (8,543,000 | ) | | | (30,293 | ) |
30 Year U.S. Treasury Bonds | | | 5 | | | December 2012 | | | 746,875 | | | | (3,161 | ) |
| TOTAL | | | | | | | | | | | | $ | (69,638 | ) |
SWAP CONTRACTS — At September 30, 2012, the Fund had the following swap contracts:
INTEREST RATE SWAP CONTRACTS
| | | | | | | | | | | | | | | | | | | | |
| | | | | | | | | Rates Exchanged | | Market Value | |
| Counterparty | | Notional
Amount
(000s)(a) | | | Termination
Date | | | Payments
Received | | Payments
Made | | Upfront
Payments
Made (Received) | | | Unrealized
Gain (Loss) | |
Bank of America Securities LLC | | $ | 3,400 | | | | 02/28/17 | | | 0.750% | | 3 month LIBOR | | $ | (3,827 | ) | | $ | (7,183 | ) |
Deutsche Bank Securities, Inc. | | | 3,300 | | | | 02/28/17 | | | 0.750 | | 3 month LIBOR | | | (7,576 | ) | | | (3,110 | ) |
Morgan Stanley Capital Services, Inc. | | | 8,100 | | | | 02/28/17 | | | 0.750 | | 3 month LIBOR | | | (17,241 | ) | | | (8,988 | ) |
| TOTAL | | | | | | | | | | | | | | $ | (28,644 | ) | | $ | (19,281 | ) |
| | (a) | | Represents forward starting interest rate swaps whose effective dates of commencement of accruals and cash flows occur subsequent to September 30, 2012. |
| | |
| 52 | | The accompanying notes are an integral part of these financial statements. |
GOLDMAN SACHS SHORT DURATION GOVERNMENT FUND
Schedule of Investments
September 30, 2012 (Unaudited)
| | | | | | | | | | | | | | |
Principal Amount | | | Interest
Rate | | | Maturity
Date | | | Value | |
| | | | | | | | | | | | | | |
| | Mortgage-Backed Obligations – 65.6% | |
| Collateralized Mortgage Obligations – 16.3% | |
| Inverse Floaters(a) – 0.0% | |
| FNMA REMIC Series 1990-134, Class SC | |
| $ | 24,774 | | | | 21.272 | % | | | 11/25/20 | | | $ | 36,284 | |
| | |
| IOette(b) – 0.0% | |
| FHLMC REMIC Series 1161, Class U | |
| | 499 | | | | 1,172.807 | | | | 11/15/21 | | | | 14,145 | |
| | |
| Planned Amortization Class – 0.0% | |
| FHLMC REMIC Series 1556, Class H | |
| | 59,986 | | | | 6.500 | | | | 08/15/13 | | | | 60,964 | |
| | |
| Regular Floater – 10.5% | |
| FDIC Structured Sale Guaranteed Notes Series 2010-S1,
Class 1A(a)(c) |
|
| | 18,369,817 | | | | 0.764 | | | | 02/25/48 | | | | 18,386,342 | |
| FDIC Structured Sale Guaranteed Notes Series 2010-S1,
Class 2A(c) |
|
| | 12,099,545 | | | | 3.250 | | | | 04/25/38 | | | | 12,476,659 | |
| FNMA REMIC Series 1988-12, Class B(a)(d) | |
| | 70,898 | | | | 0.000 | | | | 02/25/18 | | | | 69,705 | |
| NCUA Guaranteed Notes Series 2010-A1, Class A(a) | |
| | 5,314,363 | | | | 0.578 | | | | 12/07/20 | | | | 5,317,134 | |
| NCUA Guaranteed Notes Series 2010-R2, Class 1A(a) | |
| | 9,563,737 | | | | 0.598 | | | | 11/06/17 | | | | 9,583,164 | |
| NCUA Guaranteed Notes Series 2011-A1(a) | |
| | 17,700,000 | | | | 0.248 | | | | 06/12/13 | | | | 17,700,000 | |
| NCUA Guaranteed Notes Series 2011-R1, Class 1A(a) | |
| | 6,663,749 | | | | 0.678 | | | | 01/08/20 | | | | 6,689,780 | |
| NCUA Guaranteed Notes Series 2011-R2, Class 1A(a) | |
| | 21,693,654 | | | | 0.628 | | | | 02/06/20 | | | | 21,757,210 | |
| NCUA Guaranteed Notes Series 2011-R3, Class 1A(a) | |
| | 23,222,213 | | | | 0.628 | | | | 03/11/20 | | | | 23,283,899 | |
| NCUA Guaranteed Notes Series 2011-R4, Class 1A(a) | |
| | 42,239,605 | | | | 0.608 | | | | 03/06/20 | | | | 42,340,253 | |
| NCUA Guaranteed Notes Series 2011-R5, Class 1A(a) | |
| | 29,045,676 | | | | 0.608 | | | | 04/06/20 | | | | 29,110,349 | |
| NCUA Guaranteed Notes Series 2011-R6, Class 1A(a) | |
| | 25,892,545 | | | | 0.608 | | | | 05/07/20 | | | | 25,949,185 | |
| | | | | | | | | | | | | | |
| | | | | | | | | | | | | 212,663,680 | |
| | |
| Sequential Fixed Rate – 5.4% | |
| FHLMC Multifamily Structured Pass-Through Certificates
Series K703, Class A2 |
|
| | 33,200,000 | | | | 2.699 | | | | 05/25/18 | | | | 35,840,197 | |
| FHLMC Multifamily Structured Pass-Through Certificates
Series K705, Class A2 |
|
| | 7,800,000 | | | | 2.303 | | | | 09/25/18 | | | | 8,281,577 | |
| FHLMC Multifamily Structured Pass-Through Certificates
Series K707, Class A2 |
|
| | 13,700,000 | | | | 2.220 | | | | 12/25/18 | | | | 14,415,326 | |
| FHLMC REMIC Series 108, Class G | |
| | 178,237 | | | | 8.500 | | | | 12/15/20 | | | | 201,625 | |
| FHLMC REMIC Series 1980, Class Z | |
| | 966,063 | | | | 7.000 | | | | 07/15/27 | | | | 1,109,858 | |
| FHLMC REMIC Series 2019, Class Z | |
| | 1,017,630 | | | | 6.500 | | | | 12/15/27 | | | | 1,155,584 | |
| FHLMC REMIC Series 3003, Class CG | |
| | 333,436 | | | | 5.000 | | | | 07/15/23 | | | | 334,249 | |
| | |
| Principal
Amount |
| |
| Interest
Rate |
| |
| Maturity
Date |
| | | Value | |
| | | | | | | | | | | | | | |
| | Mortgage-Backed Obligations – (continued) | |
| Sequential Fixed Rate – (continued) | |
| FHLMC REMIC Series 3466, Class BA | |
| $ | 673,183 | | | | 5.000 | % | | | 08/15/35 | | | $ | 676,052 | |
| FHLMC REMIC Series 3530, Class DB | |
| | 11,283,235 | | | | 4.000 | | | | 05/15/24 | | | | 12,313,056 | |
| FNMA REMIC Series 1989-66, Class J | |
| | 326,226 | | | | 7.000 | | | | 09/25/19 | | | | 360,026 | |
| FNMA REMIC Series 1990-16, Class E | |
| | 192,097 | | | | 9.000 | | | | 03/25/20 | | | | 224,019 | |
| FNMA REMIC Series 2002-91, Class LK | |
| | 262,350 | | | | 4.500 | | | | 06/25/22 | | | | 264,298 | |
| GNMA REMIC Series 1995-3, Class DQ | |
| | 52,305 | | | | 8.050 | | | | 06/16/25 | | | | 60,675 | |
| NCUA Guaranteed Notes Series 2010-C1, Class A2 | |
| | 20,000,000 | | | | 2.900 | | | | 10/29/20 | | | | 21,556,250 | |
| NCUA Guaranteed Notes Series 2010-R1, Class 2A | |
| | 1,402,457 | | | | 1.840 | | | | 10/07/20 | | | | 1,425,247 | |
| NCUA Guaranteed Notes Series A4 | |
| | 11,000,000 | | | | 3.000 | | | | 06/12/19 | | | | 11,881,210 | |
| | | | | | | | | | | | | | |
| | | | | | | | | | | | | 110,099,249 | |
| | |
| Sequential Floating Rate(a) – 0.3% | |
| FHLMC REMICS Series 4097, Class AF | |
| | 922,676 | | | | 0.621 | | | | 07/15/39 | | | | 926,108 | |
| FNMA REMIC Series 1988-12, Class A | |
| | 138,014 | | | | 3.750 | | | | 02/25/18 | | | | 145,847 | |
| NCUA Guaranteed Notes Series 2010-R1, Class 1A | |
| | 5,912,789 | | | | 0.678 | | | | 10/07/20 | | | | 5,932,883 | |
| | | | | | | | | | | | | | |
| | | | | | | | | | | | | 7,004,838 | |
| | |
| TOTAL COLLATERALIZED
MORTGAGE OBLIGATIONS |
| | $ | 329,879,160 | |
| | |
| Commercial Mortgage-Backed Securities – 1.1% | |
| Sequential Fixed Rate – 1.1% | |
| FNMA ACES Series 2009-M2, Class A2 | |
| $ | 21,700,000 | | | | 3.334 | % | | | 01/25/19 | | | $ | 23,263,735 | |
| | |
| Federal Agencies – 48.2% | |
| Adjustable Rate FHLMC(a) – 0.4% | |
| $ | 57,966 | | | | 1.740 | % | | | 05/01/18 | | | $ | 58,605 | |
| | 67,316 | | | | 3.374 | | | | 10/01/25 | | | | 70,145 | |
| | 708,742 | | | | 2.724 | | | | 11/01/34 | | | | 753,463 | |
| | 4,965,511 | | | | 2.375 | | | | 06/01/35 | | | | 5,313,385 | |
| | 570,701 | | | | 3.429 | | | | 05/01/36 | | | | 613,326 | |
| | 96,810 | | | | 2.599 | | | | 10/01/36 | | | | 104,056 | |
| | 159,204 | | | | 2.777 | | | | 11/01/36 | | | | 171,094 | |
| | | | | | | | | | | | | | |
| | | | | | | | | | | | | 7,084,074 | |
| | |
| Adjustable Rate FNMA(a) – 3.2% | |
| | 18,700 | | | | 1.820 | | | | 11/01/17 | | | | 18,869 | |
| | 156,993 | | | | 3.252 | | | | 02/01/18 | | | | 160,453 | |
| | 86,954 | | | | 2.068 | | | | 06/01/18 | | | | 89,130 | |
| | 120,621 | | | | 5.788 | | | | 05/01/20 | | | | 129,630 | |
| | 62,224 | | | | 3.020 | | | | 01/01/23 | | | | 64,656 | |
| | 344,558 | | | | 3.163 | | | | 02/01/27 | | | | 357,513 | |
| | 3,774,473 | | | | 2.871 | | | | 08/01/29 | | | | 3,878,170 | |
| | 57,007 | | | | 2.380 | | | | 07/01/32 | | | | 60,894 | |
| | 41,878 | | | | 2.880 | | | | 07/01/32 | | | | 45,006 | |
| | |
| | |
| The accompanying notes are an integral part of these financial statements. | | 53 |
GOLDMAN SACHS SHORT DURATION GOVERNMENT FUND
Schedule of Investments (continued)
September 30, 2012 (Unaudited)
| | | | | | | | | | | | | | |
Principal Amount | | | Interest
Rate | | | Maturity
Date | | | Value | |
| | | | | | | | | | | | | | |
| | Mortgage-Backed Obligations – (continued) | |
| Adjustable Rate FNMA(a) – (continued) | |
| $ | 234,175 | | | | 2.427 | % | | | 01/01/33 | | | $ | 250,143 | |
| | 2,776,997 | | | | 2.925 | | | | 05/01/33 | | | | 2,984,405 | |
| | 492,392 | | | | 3.000 | | | | 08/01/33 | | | | 524,348 | |
| | 2,182,482 | | | | 4.611 | | | | 08/01/33 | | | | 2,376,518 | |
| | 1,972,180 | | | | 2.413 | | | | 02/01/34 | | | | 2,113,711 | |
| | 592,045 | | | | 2.695 | | | | 05/01/34 | | | | 635,922 | |
| | 1,181,181 | | | | 2.825 | | | | 05/01/34 | | | | 1,269,401 | |
| | 1,091,962 | | | | 2.345 | | | | 06/01/34 | | | | 1,171,097 | |
| | 981,712 | | | | 2.383 | | | | 10/01/34 | | | | 1,053,082 | |
| | 724,387 | | | | 2.462 | | | | 10/01/34 | | | | 778,491 | |
| | 1,853,746 | | | | 2.548 | | | | 02/01/35 | | | | 1,991,152 | |
| | 257,019 | | | | 2.602 | | | | 02/01/35 | | | | 275,369 | |
| | 414,520 | | | | 2.778 | | | | 03/01/35 | | | | 445,082 | |
| | 2,391,826 | | | | 2.805 | | | | 03/01/35 | | | | 2,536,479 | |
| | 2,879,523 | | | | 2.432 | | | | 04/01/35 | | | | 3,048,263 | |
| | 5,287,106 | | | | 2.544 | | | | 04/01/35 | | | | 5,637,610 | |
| | 1,866,680 | | | | 2.845 | | | | 04/01/35 | | | | 2,006,098 | |
| | 846,427 | | | | 2.525 | | | | 05/01/35 | | | | 900,291 | |
| | 524,873 | | | | 2.569 | | | | 05/01/35 | | | | 560,335 | |
| | 3,293,295 | | | | 2.347 | | | | 08/01/35 | | | | 3,541,323 | |
| | 1,787,734 | | | | 2.257 | | | | 10/01/35 | | | | 1,879,214 | |
| | 3,285,728 | | | | 2.856 | | | | 03/01/36 | | | | 3,531,132 | |
| | 771,171 | | | | 2.391 | | | | 04/01/36 | | | | 810,292 | |
| | 2,849,323 | | | | 3.039 | | | | 04/01/36 | | | | 3,037,527 | |
| | 1,630,348 | | | | 2.538 | | | | 06/01/36 | | | | 1,722,878 | |
| | 3,039,271 | | | | 2.881 | | | | 06/01/36 | | | | 3,266,268 | |
| | 2,667,072 | | | | 2.590 | | | | 07/01/36 | | | | 2,822,602 | |
| | 4,369,140 | | | | 2.659 | | | | 09/01/36 | | | | 4,695,462 | |
| | 355,471 | | | | 2.739 | | | | 11/01/36 | | | | 382,021 | |
| | 234,850 | | | | 2.797 | | | | 11/01/36 | | | | 252,390 | |
| | 3,677,376 | | | | 2.863 | | | | 07/01/37 | | | | 3,952,032 | |
| | 157,656 | | | | 2.778 | | | | 12/01/46 | | | | 169,431 | |
| | | | | | | | | | | | | | |
| | | | | | | | | | | | | 65,424,690 | |
| | |
| Adjustable Rate GNMA(a) – 0.6% | |
| | 3,507,493 | | | | 1.750 | | | | 05/20/34 | | | | 3,681,067 | |
| | 1,133,934 | | | | 1.625 | | | | 07/20/34 | | | | 1,190,850 | |
| | 704,692 | | | | 1.625 | | | | 08/20/34 | | | | 740,080 | |
| | 5,027,902 | | | | 1.625 | | | | 09/20/34 | | | | 5,277,361 | |
| | 686,203 | | | | 1.625 | | | | 10/20/34 | | | | 719,639 | |
| | 1,009,715 | | | | 1.625 | | | | 12/20/34 | | | | 1,059,029 | |
| | | | | | | | | | | | | | |
| | | | | | | | | | | | | 12,668,026 | |
| | |
| FHLMC – 0.1% | |
| | 52 | | | | 7.000 | | | | 12/01/12 | | | | 52 | |
| | 2,051 | | | | 6.500 | | | | 01/01/13 | | | | 2,077 | |
| | 3,312 | | | | 6.500 | | | | 04/01/13 | | | | 3,326 | |
| | 15,748 | | | | 6.500 | | | | 05/01/13 | | | | 15,981 | |
| | 5,133 | | | | 6.500 | | | | 06/01/13 | | | | 5,228 | |
| | 4,621 | | | | 6.500 | | | | 10/01/13 | | | | 4,750 | |
| | 29,564 | | | | 8.500 | | | | 10/01/15 | | | | 32,001 | |
| | 123,801 | | | | 8.000 | | | | 12/01/15 | | | | 131,876 | |
| | 8,053 | | | | 7.000 | | | | 03/01/16 | | | | 8,570 | |
| | 1,672,705 | | | | 5.500 | | | | 01/01/20 | | | | 1,814,519 | |
| | 401,540 | | | | 7.000 | | | | 04/01/22 | | | | 463,806 | |
| | 9,902 | | | | 4.500 | | | | 05/01/23 | | | | 10,649 | |
| | |
| Principal
Amount |
| |
| Interest
Rate |
| |
| Maturity
Date |
| | | Value | |
| | | | | | | | | | | | | | |
| | Mortgage-Backed Obligations – (continued) | |
| FHLMC – (continued) | |
| $ | 33,538 | | | | 7.500 | % | | | 01/01/31 | | | $ | 38,561 | |
| | 12,297 | | | | 6.000 | | | | 06/01/36 | | | | 13,647 | |
| | | | | | | | | | | | | | |
| | | | | | | | | | | | | 2,545,043 | |
| | |
| FNMA – 43.8% | |
| | 37,813 | | | | 5.500 | | | | 01/01/13 | | | | 38,128 | |
| | 5,159 | | | | 6.000 | | | | 01/01/14 | | | | 5,697 | |
| | 17,995 | | | | 6.000 | | | | 03/01/14 | | | | 19,872 | |
| | 6,580 | | | | 5.500 | | | | 04/01/14 | | | | 7,216 | |
| | 1,862 | | | | 8.500 | | | | 09/01/15 | | | | 1,868 | |
| | 56,953 | | | | 8.500 | | | | 10/01/15 | | | | 60,930 | |
| | 8,293 | | | | 8.500 | | | | 12/01/15 | | | | 8,880 | |
| | 9,000,000 | | | | 3.660 | | | | 01/01/18 | | | | 10,133,247 | |
| | 5,307 | | | | 5.500 | | | | 01/01/18 | | | | 5,746 | |
| | 7,575,748 | | | | 2.800 | | | | 03/01/18 | | | | 8,156,539 | |
| | 6,860,000 | | | | 3.840 | | | | 05/01/18 | | | | 7,696,098 | |
| | 62,270,947 | | | | 3.738 | | | | 06/01/18 | | | | 70,294,565 | |
| | 275,891 | | | | 5.500 | | | | 07/01/18 | | | | 298,717 | |
| | 177,002 | | | | 5.500 | | | | 08/01/18 | | | | 191,646 | |
| | 332,563 | | | | 5.500 | | | | 09/01/18 | | | | 360,078 | |
| | 15,800,000 | | | | 2.960 | | | | 11/01/18 | | | | 17,219,372 | |
| | 50,152 | | | | 5.500 | | | | 12/01/18 | | | | 54,301 | |
| | 22,700 | | | | 5.500 | | | | 01/01/19 | | | | 24,579 | |
| | 38,317 | | | | 5.500 | | | | 03/01/19 | | | | 41,488 | |
| | 7,953 | | | | 5.500 | | | | 08/01/19 | | | | 8,621 | |
| | 12,362 | | | | 5.000 | | | | 09/01/19 | | | | 13,409 | |
| | 44,938 | | | | 7.000 | | | | 11/01/19 | | | | 50,453 | |
| | 4,885,334 | | | | 3.416 | | | | 10/01/20 | | | | 5,423,868 | |
| | 3,715,545 | | | | 3.632 | | | | 12/01/20 | | | | 4,132,432 | |
| | 5,844,952 | | | | 4.375 | | | | 06/01/21 | | | | 6,808,084 | |
| | 42,173,441 | | | | 4.317 | | | | 07/01/21 | | | | 48,861,132 | |
| | 5,393,886 | | | | 5.500 | | | | 09/01/23 | | | | 5,867,589 | |
| | 1,105,410 | | | | 5.500 | | | | 10/01/23 | | | | 1,205,156 | |
| | 8,532 | | | | 7.000 | | | | 12/01/24 | | | | 9,981 | |
| | 138,328 | | | | 5.000 | | | | 06/01/25 | | | | 151,856 | |
| | 15,938,909 | | | | 4.000 | | | | 08/01/26 | | | | 17,053,209 | |
| | 19,954,989 | | | | 4.000 | | | | 09/01/26 | | | | 21,312,865 | |
| | 1,097,050 | | | | 5.000 | | | | 06/01/27 | | | | 1,204,333 | |
| | 1,676 | | | | 7.000 | | | | 07/01/27 | | | | 1,826 | |
| | 2,398 | | | | 7.000 | | | | 08/01/27 | | | | 2,788 | |
| | 3,461 | | | | 7.000 | | | | 10/01/28 | | | | 4,075 | |
| | 3,014 | | | | 7.000 | | | | 01/01/29 | | | | 3,504 | |
| | 147,166 | | | | 5.000 | | | | 07/01/29 | | | | 161,988 | |
| | 2,654,806 | | | | 4.500 | | | | 09/01/29 | | | | 2,868,577 | |
| | 1,803 | | | | 7.000 | | | | 11/01/29 | | | | 2,097 | |
| | 132,621 | | | | 8.000 | | | | 02/01/31 | | | | 158,378 | |
| | 1,914 | | | | 7.000 | | | | 04/01/31 | | | | 2,267 | |
| | 16,124,892 | | | | 4.500 | | | | 10/01/31 | | | | 17,602,513 | |
| | 12,260 | | | | 7.000 | | | | 05/01/32 | | | | 14,224 | |
| | 11,167 | | | | 7.000 | | | | 06/01/32 | | | | 12,955 | |
| | 5,295 | | | | 7.000 | | | | 08/01/32 | | | | 6,143 | |
| | 1,719,784 | | | | 6.000 | | | | 03/01/33 | | | | 1,927,152 | |
| | 8,609 | | | | 5.000 | | | | 04/01/33 | | | | 9,401 | |
| | 3,102,578 | | | | 6.500 | | | | 04/01/33 | | | | 3,575,745 | |
| | 3,416 | | | | 7.000 | | | | 04/01/34 | | | | 3,973 | |
| | 7,429,122 | | | | 6.000 | | | | 04/01/35 | | | | 8,295,445 | |
| | |
| | |
| 54 | | The accompanying notes are an integral part of these financial statements. |
GOLDMAN SACHS SHORT DURATION GOVERNMENT FUND
| | | | | | | | | | | | | | |
Principal Amount | | | Interest
Rate | | | Maturity
Date | | | Value | |
| | | | | | | | | | | | | | |
| | Mortgage-Backed Obligations – (continued) | |
| FNMA – (continued) | |
| $ | 4,158,233 | | | | 5.000 | % | | | 08/01/35 | | | $ | 4,527,954 | |
| | 14,574 | | | | 5.000 | | | | 09/01/35 | | | | 15,870 | |
| | 1,320 | | | | 6.000 | | | | 11/01/35 | | | | 1,469 | |
| | 990,911 | | | | 5.000 | | | | 12/01/35 | | | | 1,079,017 | |
| | 14,189 | | | | 5.000 | | | | 07/01/36 | | | | 15,435 | |
| | 178,945 | | | | 5.000 | | | | 11/01/36 | | | | 194,654 | |
| | 6,116,637 | | | | 5.000 | | | | 12/01/36 | | | | 6,660,133 | |
| | 139,267 | | | | 5.000 | | | | 02/01/37 | | | | 151,381 | |
| | 1,609,885 | | | | 5.000 | | | | 05/01/37 | | | | 1,749,920 | |
| | 4,521,526 | | | | 5.000 | | | | 06/01/37 | | | | 4,914,826 | |
| | 15,049 | | | | 5.000 | | | | 07/01/37 | | | | 16,358 | |
| | 162,544 | | | | 5.000 | | | | 08/01/37 | | | | 176,683 | |
| | 95,000 | | | | 8.500 | | | | 09/01/37 | | | | 110,093 | |
| | 992,755 | | | | 7.500 | | | | 10/01/37 | | | | 1,145,926 | |
| | 9,098 | | | | 5.000 | | | | 01/01/38 | | | | 9,887 | |
| | 1,459,427 | | | | 5.000 | | | | 02/01/38 | | | | 1,589,190 | |
| | 1,076,794 | | | | 5.000 | | | | 03/01/38 | | | | 1,170,174 | |
| | 4,469,554 | | | | 5.000 | | | | 04/01/38 | | | | 4,857,155 | |
| | 5,273,198 | | | | 5.000 | | | | 05/01/38 | | | | 5,742,211 | |
| | 1,622,022 | | | | 5.000 | | | | 06/01/38 | | | | 1,762,684 | |
| | 1,448,235 | | | | 5.000 | | | | 02/01/39 | | | | 1,580,147 | |
| | 987,237 | | | | 5.000 | | | | 03/01/39 | | | | 1,091,244 | |
| | 982,293 | | | | 5.000 | | | | 04/01/39 | | | | 1,072,014 | |
| | 2,001,928 | | | | 5.000 | | | | 05/01/39 | | | | 2,184,781 | |
| | 4,041,466 | | | | 5.000 | | | | 07/01/39 | | | | 4,391,943 | |
| | 23,654 | | | | 4.500 | | | | 08/01/39 | | | | 25,542 | |
| | 1,019,530 | | | | 5.000 | | | | 10/01/39 | | | | 1,112,652 | |
| | 16,000 | | | | 5.000 | | | | 11/01/39 | | | | 17,462 | |
| | 2,000,000 | | | | 5.000 | | | | 03/01/40 | | | | 2,194,603 | |
| | 1,277,016 | | | | 5.000 | | | | 06/01/40 | | | | 1,401,271 | |
| | 13,406,696 | | | | 4.500 | | | | 08/01/40 | | | | 14,506,819 | |
| | 649,972 | | | | 5.000 | | | | 08/01/40 | | | | 713,215 | |
| | 12,955,723 | | | | 4.500 | | | | 11/01/40 | | | | 14,021,911 | |
| | 484,824 | | | | 5.000 | | | | 02/01/41 | | | | 531,998 | |
| | 5,268,794 | | | | 4.500 | | | | 04/01/41 | | | | 5,712,084 | |
| | 170,248 | | | | 5.000 | | | | 04/01/41 | | | | 187,062 | |
| | 2,248,160 | | | | 4.500 | | | | 05/01/41 | | | | 2,437,309 | |
| | 395,168 | | | | 5.000 | | | | 05/01/41 | | | | 431,262 | |
| | 58,592 | | | | 5.000 | | | | 06/01/41 | | | | 63,944 | |
| | 18,948,403 | | | | 4.500 | | | | 08/01/41 | | | | 20,569,996 | |
| | 457,703 | | | | 4.500 | | | | 10/01/41 | | | | 496,212 | |
| | 2,752,507 | | | | 5.000 | | | | 10/01/41 | | | | 3,024,359 | |
| | 969,656 | | | | 4.000 | | | | 01/01/42 | | | | 1,044,072 | |
| | 183,130 | | | | 5.000 | | | | 02/01/42 | | | | 199,704 | |
| | 203,000,000 | | | | 5.000 | | | | TBA - 30yr | (e) | | | 221,349,292 | |
| | 261,000,000 | | | | 6.000 | | | | TBA - 30yr | (e) | | | 288,221,491 | |
| | | | | | | | | | | | | | |
| | | | | | | | | | | | | 885,848,415 | |
| | |
| Principal
Amount |
| |
| Interest
Rate |
| |
| Maturity
Date |
| | | Value | |
| | | | | | | | | | | | | | |
| | Mortgage-Backed Obligations – (continued) | |
| GNMA – 0.1% | |
| $ | 629,222 | | | | 5.500 | % | | | 07/15/20 | | | $ | 680,735 | |
| | 278,351 | | | | 6.000 | | | | 11/15/38 | | | | 314,395 | |
| | | | | | | | | | | | | | |
| | | | | | | | | | | | | 995,130 | |
| | |
| | TOTAL FEDERAL AGENCIES | | | $ | 974,565,378 | |
| | |
| | TOTAL MORTGAGE-BACKED OBLIGATIONS | |
| | (Cost $1,302,923,873) | | | $ | 1,327,708,273 | |
| | |
| | | | | | | | | | | | | | |
| | Agency Debentures – 50.8% | |
| | FHLB | | | | | | | | | | | | | |
| $ | 12,200,000 | | | | 2.125 | % | | | 06/10/16 | | | $ | 12,886,421 | |
| | FHLMC | | | | | | | | | | | | | |
| | 66,000,000 | | | | 0.181 | (a) | | | 06/03/13 | | | | 66,000,924 | |
| | 41,000,000 | | | | 0.171 | (a) | | | 06/17/13 | | | | 41,028,044 | |
| | 34,220,000 | | | | 5.000 | | | | 01/30/14 | | | | 36,382,013 | |
| | 44,200,000 | | | | 1.375 | | | | 02/25/14 | | | | 44,898,705 | |
| | 51,300,000 | | | | 0.375 | | | | 02/27/14 | | | | 51,394,710 | |
| | 132,800,000 | | | | 1.000 | | | | 07/30/14 | | | | 134,627,620 | |
| | 13,300,000 | | | | 1.000 | | | | 08/20/14 | | | | 13,472,436 | |
| | 9,700,000 | | | | 0.500 | | | | 08/28/15 | | | | 9,742,220 | |
| | 72,100,000 | | | | 3.000 | | | | 07/31/19 | | | | 73,659,912 | |
| | 18,500,000 | | | | 1.250 | | | | 10/02/19 | | | | 18,470,585 | |
| | FNMA | | | | | | | | | | | | | |
| | 125,200,000 | | | | 0.345 | (a) | | | 05/17/13 | | | | 125,266,106 | |
| | 9,535,000 | | | | 1.050 | | | | 10/22/13 | | | | 9,613,718 | |
| | 27,000,000 | | | | 0.600 | | | | 10/25/13 | | | | 27,000,270 | |
| | 103,100,000 | | | | 0.600 | | | | 11/14/13 | | | | 103,139,755 | |
| | 56,400,000 | | | | 4.125 | | | | 04/15/14 | | | | 59,768,056 | |
| | 28,400,000 | | | | 0.000 | (f) | | | 07/05/14 | | | | 28,054,062 | |
| | 6,900,000 | | | | 0.750 | | | | 12/19/14 | | | | 6,966,583 | |
| | 26,100,000 | | | | 0.375 | | | | 03/16/15 | | | | 26,130,161 | |
| | 7,900,000 | | | | 0.500 | | | | 05/27/15 | | | | 7,930,469 | |
| | 8,000,000 | | | | 0.500 | | | | 07/02/15 | | | | 8,035,472 | |
| | 96,700,000 | | | | 2.375 | | | | 04/11/16 | | | | 103,078,158 | |
| | 18,100,000 | | | | 1.125 | | | | 04/27/17 | | | | 18,462,742 | |
| Small Business Administration | |
| | 76,630 | | | | 7.200 | | | | 06/01/17 | | | | 83,985 | |
| | 203,662 | | | | 6.300 | | | | 05/01/18 | | | | 223,935 | |
| | 140,573 | | | | 6.300 | | | | 06/01/18 | | | | 153,483 | |
| | |
| | TOTAL AGENCY DEBENTURES | | | | | |
| | (Cost $1,022,113,520) | | | $ | 1,026,470,545 | |
| | |
| | | | | | | | | | | | | | |
| | U.S. Treasury Obligations – 3.0% | |
| United States Treasury Inflation Protected Securities(g) | |
| $ | 1,919,856 | | | | 1.625 | % | | | 01/15/15 | | | $ | 2,057,548 | |
| | 4,947,264 | | | | 1.875 | | | | 07/15/15 | | | | 5,444,315 | |
| | |
| | |
| The accompanying notes are an integral part of these financial statements. | | 55 |
GOLDMAN SACHS SHORT DURATION GOVERNMENT FUND
Schedule of Investments (continued)
September 30, 2012 (Unaudited)
| | | | | | | | | | | | | | |
Principal Amount | | | Interest
Rate | | | Maturity
Date | | | Value | |
| | | | | | | | | | | | | | |
| | U.S. Treasury Obligations – (continued) | |
| United States Treasury Notes | |
| $ | 30,400,000 | | | | 0.250 | % | | | 05/31/14 | | | $ | 30,408,512 | |
| | 22,500,000 | | | | 1.625 | | | | 08/15/22 | | | | 22,473,676 | |
| | |
| | TOTAL U.S. TREASURY OBLIGATIONS | |
| | (Cost $60,200,409) | | | $ | 60,384,051 | |
| | |
| | | | | | | | | | | | | | |
Notional
Amount | | | Exercise
Rate | | | Expiration
Date | | | Value | |
| | | | | | | | | | | | | | |
| | Options Purchased – 0.1% | |
| Interest Rate Swaptions | |
| Citibank Securities, Inc. Put – OTC – 10 year Interest Rate Swap
Strike Price 1.895% |
|
| $ | 24,000,000 | | | | 1.895 | % | | | 02/28/13 | | | $ | 526,478 | |
| Citibank Securities, Inc. Call – OTC – 10 year Interest Rate Swap
Strike Price 1.895% |
|
| | 24,000,000 | | | | 1.895 | | | | 02/28/13 | | | | 379,800 | |
| Deutsche Bank Securities, Inc. Put – OTC – 10 year Interest Rate
Swap Strike Price 2.060% |
|
| | 24,100,000 | | | | 2.060 | | | | 02/19/13 | | | | 775,926 | |
| Deutsche Bank Securities, Inc. Call – OTC – 10 year Interest Rate
Swap Strike Price 2.060% |
|
| | 24,100,000 | | | | 2.060 | | | | 02/19/13 | | | | 234,457 | |
| | |
| | TOTAL OPTIONS PURCHASED – 0.1% | |
| | (Cost $2,147,730) | | | $ | 1,916,661 | |
| | |
| TOTAL INVESTMENTS BEFORE
SHORT-TERM INVESTMENT |
| | | | |
| | (Cost $2,387,385,532) | | | $ | 2,416,479,530 | |
| | |
| | | | | | | | | | | | | | |
Principal
Amount | | | Interest
Rate | | | Maturity
Date | | | Value | |
| | | | | | | | | | | | | | |
| | Short-term Investment(h) – 5.0% | |
| Repurchase Agreement – 5.0% | |
| Joint Repurchase Agreement Account II | |
| $ | 100,500,000 | | | | 0.245 | % | | | 10/01/12 | | | $ | 100,500,000 | |
| | (Cost $100,500,000) | | | | | |
| | |
| | TOTAL INVESTMENTS – 124.5% | | | | | |
| | (Cost $2,487,885,532) | | | $ | 2,516,979,530 | |
| | |
| LIABILITIES IN EXCESS OF
OTHER ASSETS – (24.5)% |
| | | (494,593,477 | ) |
| | |
| | NET ASSETS – 100.0% | | | $ | 2,022,386,053 | |
| | |
| | |
| The percentage shown for each investment category reflects the value of investments in that category as a percentage of net assets. |
(a) | | Variable rate security. Interest rate disclosed is that which is in effect at 09/30/12. |
(b) | | Security with a notional or nominal principal amount. The actual effective yield of this security is different than the stated interest rate. |
(c) | | Exempt from registration under Rule 144A of the Securities Act of 1933. Under procedures approved by the Board of Trustees, such securities have been determined to be liquid by the investment adviser and may be resold, normally to qualified institutional buyers in transactions exempt from registration. Total market value of Rule 144A securities amounts to $30,863,001, which represents approximately 1.5% of net assets as of 09/30/12. |
(d) | | Issued with zero coupon and interest rate is contingent upon LIBOR reaching a predetermined level. |
(e) | | TBA (To Be Announced) Securities are purchased on a forward commitment basis with an approximate principal amount and no defined maturity date. The actual principal and maturity date will be determined upon settlement when the specific mortgage pools are assigned. Total market value of TBA securities (excluding forward sales contracts, if any) amounts to $509,570,783 which represents approximately 25.2% of net assets as of 09/30/12. |
(f) | | Issued with a zero coupon. Income is recognized through the accretion of discount. |
(g) | | A portion of this security is segregated as collateral for initial margin requirements on futures transactions. |
(h) | | Joint repurchase agreement was entered into on September 28, 2012. Additional information appears on page 69. |
| | |
|
Investment Abbreviations: |
ACES | | —Alternative Credit Enhancement Securities |
FDIC | | —Federal Deposit Insurance Corp. |
FHLB | | —Federal Home Loan Bank |
FHLMC | | —Federal Home Loan Mortgage Corp. |
FNMA | | —Federal National Mortgage Association |
GNMA | | —Government National Mortgage Association |
LIBOR | | —London Interbank Offered Rate |
NCUA | | —National Credit Union Administration |
OTC | | —Over the Counter |
REMIC | | —Real Estate Mortgage Investment Conduit |
|
| | |
| 56 | | The accompanying notes are an integral part of these financial statements. |
GOLDMAN SACHS SHORT DURATION GOVERNMENT FUND
|
| ADDITIONAL INVESTMENT INFORMATION |
FORWARD SALES CONTRACTS — At September 30, 2012, the Fund had the following forward sales contracts:
| | | | | | | | | | | | | | | | | | |
| Description | | Interest
Rate | | | Maturity
Date(e) | | Settlement
Date | | | Principal
Amount | | | Value | |
FNMA | | | 4.500 | % | | TBA-30yr | | | 11/14/12 | | | $ | (65,000,000 | ) | | $ | (70,334,570 | ) |
FNMA | | | 5.000 | | | TBA-30yr | | | 11/10/12 | | | | (13,000,000 | ) | | | (14,182,187 | ) |
| TOTAL (Proceeds Receivable: $84,411,367) | | | | | | | $ | (84,516,757 | ) |
FUTURES CONTRACTS — At September 30, 2012, the Fund had the following futures contracts:
| | | | | | | | | | | | | | |
| Type | | Number of
Contracts
Long (Short) | | | Expiration
Date | | Current
Value | | | Unrealized
Gain (Loss) | |
Eurodollars | | | 249 | | | September 2014 | | $ | 61,948,088 | | | $ | 473,213 | |
Eurodollars | | | (249 | ) | | September 2015 | | | (61,770,675 | ) | | | (769,795 | ) |
Ultra Long U.S. Treasury Bonds | | | 41 | | | December 2012 | | | 6,773,969 | | | | (91,677 | ) |
2 Year U.S. Treasury Notes | | | 6,634 | | | December 2012 | | | 1,463,004,312 | | | | 692,430 | |
5 Year U.S. Treasury Notes | | | 225 | | | December 2012 | | | 28,042,383 | | | | 55,566 | |
10 Year U.S. Treasury Notes | | | (476 | ) | | December 2012 | | | (63,538,563 | ) | | | (191,895 | ) |
30 Year U.S. Treasury Bonds | | | 4 | | | December 2012 | | | 597,500 | | | | (2,529 | ) |
| TOTAL | | | | | | | | | | | | $ | 165,313 | |
SWAP CONTRACTS — At September 30, 2012, the Fund had the following swap contracts:
INTEREST RATE SWAP CONTRACTS
| | | | | | | | | | | | | | | | | | | | | | |
| | | | | | | | | Rates Exchanged | | Market Value | |
| Counterparty | | Notional
Amount
(000s) | | | Termination
Date | | | Payments
Received | | | Payments
Made | | Upfront
Payments
Made (Received) | | | Unrealized
Gain (Loss) | |
Bank of America Securities LLC | | $ | 31,000 | | | | 11/02/16 | | | | 3 month LIBOR | | | 1.780% | | $ | — | | | $ | (1,695,528 | ) |
| | | 22,100 | (a) | | | 02/28/17 | | | | 3 month LIBOR | | | 0.750 | | | (24,876 | ) | | | (46,688 | ) |
| | | 4,200 | (a) | | | 07/23/24 | | | | 2.150% | | | 3 month LIBOR | | | — | | | | (40,226 | ) |
Barclays Bank PLC | | | 70,900 | (a) | | | 02/28/17 | | | | 3 month LIBOR | | | 0.750 | | | (126,480 | ) | | | (103,109 | ) |
| | | 3,100 | (a) | | | 07/21/24 | | | | 2.160 | | | 3 month LIBOR | | | — | | | | (26,509 | ) |
Citibank NA | | | 21,100 | (a) | | | 02/28/17 | | | | 3 month LIBOR | | | 0.750 | | | (20,738 | ) | | | (47,588 | ) |
| | | 188,000 | (a) | | | 12/19/17 | | | | 3 month LIBOR | | | 1.250 | | | (1,037,558 | ) | | | (2,788,712 | ) |
| | | 15,200 | (a) | | | 12/19/22 | | | | 3 month LIBOR | | | 2.000 | | | (233,122 | ) | | | (98,519 | ) |
Credit Suisse International (London) | | | 33,200 | (a) | | | 02/28/17 | | | | 3 month LIBOR | | | 0.750 | | | (40,732 | ) | | | (66,776 | ) |
| | | 79,100 | (a) | | | 12/19/17 | | | | 3 month LIBOR | | | 1.250 | | | (624,099 | ) | | | (985,784 | ) |
| | | 69,200 | (a) | | | 12/19/19 | | | | 3 month LIBOR | | | 1.750 | | | (1,467,524 | ) | | | (818,615 | ) |
| | | 20,500 | (a) | | | 12/19/22 | | | | 3 month LIBOR | | | 2.000 | | | (188,682 | ) | | | (258,597 | ) |
| | | 400 | (a) | | | 12/19/42 | | | | 3 month LIBOR | | | 2.500 | | | (625 | ) | | | 12,058 | |
Deutsche Bank Securities, Inc. | | | 9,300 | (a) | | | 02/28/17 | | | | 0.750 | | | 3 month LIBOR | | | (21,350 | ) | | | (8,764 | ) |
| | | 4,200 | (a) | | | 07/22/24 | | | | 2.130 | | | 3 month LIBOR | | | — | | | | (47,546 | ) |
| | | 6,800 | (a) | | | 07/28/24 | | | | 2.060 | | | 3 month LIBOR | | | — | | | | (123,389 | ) |
JPMorgan Securities, Inc. | | | 185,600 | | | | 12/31/12 | | | | 3 month LIBOR | | | 0.943 | | | — | | | | (715,593 | ) |
| | | 19,700 | (a) | | | 02/28/17 | | | | 3 month LIBOR | | | 0.750 | | | (32,139 | ) | | | (31,654 | ) |
| | | 197,800 | (a) | | | 02/28/17 | | | | 0.750 | | | 3 month LIBOR | | | 771,807 | | | | — | |
| | | 16,300 | (a) | | | 12/19/27 | | | | 3 month LIBOR | | | 2.500 | | | (534,435 | ) | | | 26,079 | |
| | | 17,000 | (a) | | | 12/19/32 | | | | 3 month LIBOR | | | 2.500 | | | (241,102 | ) | | | 145,496 | |
Morgan Stanley Capital Services, Inc. | | | 21,500 | (a) | | | 02/28/17 | | | | 3 month LIBOR | | | 0.750 | | | (49,504 | ) | | | (20,117 | ) |
| TOTAL | | | | | | | | | | | | | | | | $ | (3,871,159 | ) | | $ | (7,740,081 | ) |
| | (a) | | Represents forward starting interest rate swaps whose effective dates of commencement of accruals and cash flows occur subsequent to September 30, 2012. |
| | |
| The accompanying notes are an integral part of these financial statements. | | 57 |
GOLDMAN SACHS SHORT DURATION GOVERNMENT FUND
Schedule of Investments (continued)
September 30, 2012 (Unaudited)
|
| ADDITIONAL INVESTMENT INFORMATION (continued) |
WRITTEN OPTIONS CONTRACTS
INTEREST RATE SWAPTION CONTRACTS — For the six months ended September 30, 2012, the Fund had the following written swaptions:
| | | | | | | | | | | | | | | | | | | | | | |
| Counterparty | | Description | | Notional
Amount
(000s) | | |
Expiration
Date | | | Strike
Price | | |
Market
Value | | |
Premiums
Received | |
Bank of America N.A. | | Put – OTC – 10 year Interest Rate Swap for the obligation to pay a fixed rate of 1.640% versus the 3 month LIBOR maturing on July 23, 2024 | | $ | 15,400 | | | | 07/21/14 | | | | 1.640 | % | | $ | (239,533 | ) | | $ | (343,420 | ) |
Barclays Bank PLC | | Put – OTC – 10 year Interest Rate Swap for the obligation to pay a fixed rate of 1.650% versus the 3 month LIBOR maturing on July 21, 2024 | | | 11,500 | | | | 07/17/14 | | | | 1.650 | | | | (181,838 | ) | | | (258,750 | ) |
| | Put – OTC – 10 year Interest Rate Swap for the obligation to pay a fixed rate of 1.620% versus the 3 month LIBOR maturing on July 22, 2024 | | | 15,400 | | | | 07/18/14 | | | | 1.620 | | | | (231,000 | ) | | | (346,500 | ) |
Deutsche Bank Securities Inc. | | Put – OTC – 10 year Interest Rate Swap for the obligation to pay a fixed rate of 1.550% versus the 3 month LIBOR maturing on July 28, 2024 | | | 18,800 | | | | 07/24/14 | | | | 1.550 | | | | (245,252 | ) | | | (406,080 | ) |
| TOTAL | | | | $ | 61,100 | | | | | | | | | | | $ | (897,623 | ) | | $ | (1,354,750 | ) |
For the six months ended September 30, 2012, the Fund had the following written swaptions activity:
| | | | | | | | |
| | | Notional
Amount
(000s) | | | Premiums
Received | |
Contracts Outstanding March 31, 2012 | | $ | — | | | $ | — | |
Contracts Written | | | 61,000 | | | | 1,354,750 | |
Contracts Outstanding September 30, 2012 | | $ | 61,000 | | | $ | 1,354,750 | |
| | | | | | | | |
| | |
| 58 | | The accompanying notes are an integral part of these financial statements. |
GOLDMAN SACHS SHORT DURATION INCOME FUND
Schedule of Investments
September 30, 2012 (Unaudited)
| | | | | | | | | | | | | | |
Principal Amount | | | Interest
Rate | | | Maturity
Date | | | Value | |
| | | | | | | | | | | | | | |
| | Corporate Obligations – 46.6% | |
| Automotive – 0.4% | |
| Ford Motor Credit Co. LLC | |
| $ | 125,000 | | | | 8.000 | % | | | 12/15/16 | | | $ | 150,625 | |
| | |
| Banks – 14.3% | |
| ANZ Capital Trust II(a)(b) | |
| | 150,000 | | | | 5.360 | | | | 12/31/49 | | | | 152,625 | |
| Australia & New Zealand Banking Group Ltd.(a) | |
| | 300,000 | | | | 1.000 | | | | 10/06/15 | | | | 300,510 | |
| Bank of America Corp. | |
| | 800,000 | | | | 3.625 | | | | 03/17/16 | | | | 846,549 | |
| BNP Paribas Capital Trust VI(b)(c) | |
| EUR | 75,000 | | | | 5.868 | | | | 01/16/49 | | | | 93,555 | |
| Capital One Financial Corp. | |
| $ | 225,000 | | | | 2.125 | | | | 07/15/14 | | | | 229,516 | |
| Citigroup, Inc. | |
| | 695,000 | | | | 4.750 | | | | 05/19/15 | | | | 748,233 | |
| Cooperatieve Centrale Raiffeisen – Boerenleenbank BA(a) | |
| | 100,000 | | | | 3.200 | | | | 03/11/15 | | | | 104,723 | |
| Credit Suisse New York | |
| | 325,000 | | | | 5.500 | | | | 05/01/14 | | | | 347,701 | |
| HSBC Capital Funding LP(a)(b)(c) | |
| | 100,000 | | | | 4.610 | | | | 06/27/49 | | | | 99,300 | |
| ING Bank NV(a) | |
| | 200,000 | | | | 2.000 | | | | 09/25/15 | | | | 200,299 | |
| JPMorgan Chase & Co. | |
| | 500,000 | | | | 3.450 | | | | 03/01/16 | | | | 532,687 | |
| Morgan Stanley | |
| | 675,000 | | | | 3.800 | | | | 04/29/16 | | | | 694,786 | |
| Resona Preferred Global Securities Ltd.(a)(b)(c) | |
| | 100,000 | | | | 7.191 | | | | 07/30/49 | | | | 107,622 | |
| Royal Bank of Scotland Group PLC | |
| | 75,000 | | | | 2.550 | | | | 09/18/15 | | | | 75,943 | |
| Santander Holdings USA, Inc.(b) | |
| | 50,000 | | | | 3.000 | | | | 09/24/15 | | | | 50,222 | |
| Sparebank 1 Boligkreditt AS(a) | |
| | 200,000 | | | | 1.250 | | | | 10/25/14 | | | | 201,320 | |
| Wells Fargo & Co. | |
| | 325,000 | | | | 2.625 | | | | 12/15/16 | | | | 342,832 | |
| | | | | | | | | | | | | | |
| | | | | | | | | | | | | 5,128,423 | |
| | |
| Chemicals(b) – 1.4% | |
| Ecolab, Inc. | |
| | 275,000 | | | | 2.375 | | | | 12/08/14 | | | | 283,820 | |
| Huntsman International LLC | |
| EUR | 100,000 | | | | 5.500 | | | | 06/30/16 | | | | 100,500 | |
| The Dow Chemical Co. | |
| $ | 100,000 | | | | 2.500 | | | | 02/15/16 | | | | 104,012 | |
| | | | | | | | | | | | | | |
| | | | | | | | | | | | | 488,332 | |
| | |
| Consumer Products – Household & Leisure(b) – 0.6% | |
| Spectrum Brands, Inc. | |
| | 200,000 | | | | 9.500 | | | | 06/15/18 | | | | 225,500 | |
| | |
| Electric(b) – 0.3% | |
| Commonwealth Edison Co. | |
| | 100,000 | | | | 1.625 | | | | 01/15/14 | | | | 101,327 | |
| | |
Principal Amount | | | Interest
Rate | | | Maturity
Date | | | Value | |
| | | | | | | | | | | | | | |
| | Corporate Obligations – (continued) | |
| Energy – 4.0% | |
| Anadarko Petroleum Corp.(b) | |
| $ | 150,000 | | | | 6.375 | % | | | 09/15/17 | | | $ | 180,573 | |
| Banco de Bogota SA(b) | |
| | 200,000 | | | | 5.000 | | | | 01/15/17 | | | | 211,038 | |
| BP Capital Markets PLC | |
| | 275,000 | | | | 3.200 | | | | 03/11/16 | | | | 293,883 | |
| Gaz Capital SA for Gazprom | |
| | 100,000 | | | | 9.250 | | | | 04/23/19 | | | | 130,000 | |
| Noble Holding International Ltd.(b) | |
| | 100,000 | | | | 2.500 | | | | 03/15/17 | | | | 102,852 | |
| Petrobras International Finance Co.(b) | |
| | 200,000 | | | | 2.875 | | | | 02/06/15 | | | | 205,342 | |
| Transocean, Inc.(b) | |
| | 200,000 | | | | 5.050 | | | | 12/15/16 | | | | 222,936 | |
| Weatherford International Ltd.(b) | |
| | 100,000 | | | | 5.150 | | | | 03/15/13 | | | | 101,803 | |
| | | | | | | | | | | | | | |
| | | | | | | | | | | | | 1,448,427 | |
| | |
| Energy – Exploration & Production(b) – 0.6% | |
| Range Resources Corp. | |
| | 200,000 | | | | 8.000 | | | | 05/15/19 | | | | 221,000 | |
| | |
| Food & Beverage – 1.8% | |
| Anheuser-Busch InBev Worldwide, Inc.(b) | |
| | 125,000 | | | | 3.625 | | | | 04/15/15 | | | | 133,989 | |
| Diageo Capital PLC(b) | |
| | 25,000 | | | | 1.500 | | | | 05/11/17 | | | | 25,391 | |
| Kraft Foods, Inc. | |
| | 100,000 | | | | 4.125 | | | | 02/09/16 | | | | 109,995 | |
| Pernod-Ricard SA(a)(b) | |
| | 150,000 | | | | 2.950 | | | | 01/15/17 | | | | 155,139 | |
| SABMiller Holdings, Inc.(a)(b) | |
| | 200,000 | | | | 2.450 | | | | 01/15/17 | | | | 209,192 | |
| | | | | | | | | | | | | | |
| | | | | | | | | | | | | 633,706 | |
| | |
| Gaming(b) – 0.8% | |
| MGM Resorts International | |
| | 250,000 | | | | 9.000 | | | | 03/15/20 | | | | 278,750 | |
| | |
| Health Care(b) – 0.2% | |
| Coventry Health Care, Inc. | |
| | 51,000 | | | | 6.300 | | | | 08/15/14 | | | | 55,314 | |
| | |
| Health Care Products(b) – 0.4% | |
| Life Technologies Corp. | |
| | 150,000 | | | | 4.400 | | | | 03/01/15 | | | | 159,144 | |
| | |
| Health Care Services(b) – 1.6% | |
| Express Scripts Holding Co. | |
| | 50,000 | | | | 6.250 | | | | 06/15/14 | | | | 54,436 | |
| | 175,000 | | | | 3.125 | | | | 05/15/16 | | | | 184,794 | |
| Tenet Healthcare Corp. | |
| | 200,000 | | | | 10.000 | | | | 05/01/18 | | | | 230,000 | |
| UnitedHealth Group Inc. | |
| | 100,000 | | | | 1.875 | | | | 11/15/16 | | | | 102,379 | |
| | | | | | | | | | | | | | |
| | | | | | | | | | | | | 571,609 | |
| | |
| | |
| The accompanying notes are an integral part of these financial statements. | | 59 |
GOLDMAN SACHS SHORT DURATION INCOME FUND
Schedule of Investments (continued)
September 30, 2012 (Unaudited)
| | | | | | | | | | | | | | |
Principal Amount | | | Interest
Rate | | | Maturity
Date | | | Value | |
| | | | | | | | | | | | | | |
| | Corporate Obligations – (continued) | |
| Household & Leisure(b) – 0.3% | |
| Prestige Brands, Inc. | |
| $ | 100,000 | | | | 8.250 | % | | | 04/01/18 | | | $ | 110,250 | |
| | |
| Life Insurance – 1.3% | |
| American International Group, Inc.(b) | |
| | 45,000 | | | | 4.875 | | | | 09/15/16 | | | | 49,751 | |
| MetLife, Inc. | |
| | 125,000 | | | | 2.375 | (b) | | | 02/06/14 | | | | 127,649 | |
| | 150,000 | | | | 1.756 | | | | 12/15/17 | | | | 151,486 | |
| Prudential Financial, Inc. | |
| | 125,000 | | | | 5.100 | | | | 09/20/14 | | | | 135,072 | |
| | | | | | | | | | | | | | |
| | | | | | | | | | | | | 463,958 | |
| | |
| Media – Cable(b) – 3.9% | |
| CCO Holdings LLC/CCO Holdings Capital Corp. | |
| | 500,000 | | | | 7.250 | | | | 10/30/17 | | | | 545,000 | |
| COX Communications, Inc. | |
| | 100,000 | | | | 4.625 | | | | 06/01/13 | | | | 102,768 | |
| | 100,000 | | | | 5.500 | | | | 10/01/15 | | | | 113,077 | |
| DIRECTV Holdings LLC/DIRECTV Financing Co., Inc. | |
| | 60,000 | | | | 4.750 | | | | 10/01/14 | | | | 64,519 | |
| | 125,000 | | | | 3.500 | | | | 03/01/16 | | | | 133,164 | |
| DISH DBS Corp. | |
| | 200,000 | | | | 6.625 | | | | 10/01/14 | | | | 216,500 | |
| Virgin Media Finance PLC | |
| | 200,000 | | | | 9.500 | | | | 08/15/16 | | | | 221,000 | |
| | | | | | | | | | | | | | |
| | | | | | | | | | | | | 1,396,028 | |
| | |
| Media – Non Cable – 1.2% | |
| NBCUniversal Media LLC(b) | |
| | 100,000 | | | | 2.100 | | | | 04/01/14 | | | | 102,176 | |
| News America, Inc. | |
| | 200,000 | | | | 5.300 | | | | 12/15/14 | | | | 218,757 | |
| WPP Finance UK(b) | |
| | 100,000 | | | | 8.000 | | | | 09/15/14 | | | | 111,983 | |
| | | | | | | | | | | | | | |
| | | | | | | | | | | | | 432,916 | |
| | |
| Noncaptive – Financial – 0.7% | |
| General Electric Capital Corp. | |
| | 150,000 | | | | 2.150 | | | | 01/09/15 | | | | 154,344 | |
| SLM Corp. | |
| | 100,000 | | | | 5.000 | | | | 10/01/13 | | | | 103,629 | |
| | | | | | | | | | | | | | |
| | | | | | | | | | | | | 257,973 | |
| | |
| Packaging(b) – 0.3% | |
| Ball Corp. | |
| | 100,000 | | | | 7.125 | | | | 09/01/16 | | | | 108,500 | |
| | |
| Pharmaceuticals(b) – 0.9% | |
| GlaxoSmithKline Capital, Inc. | |
| | 100,000 | | | | 4.375 | | | | 04/15/14 | | | | 105,997 | |
| Novartis Capital Corp. | |
| | 100,000 | | | | 2.900 | | | | 04/24/15 | | | | 105,817 | |
| Roche Holdings, Inc.(a) | |
| | 75,000 | | | | 5.000 | | | | 03/01/14 | | | | 79,531 | |
| Watson Pharmaceuticals, Inc. | |
| | 25,000 | | | | 1.875 | | | | 10/01/17 | | | | 25,268 | |
| | | | | | | | | | | | | | |
| | | | | | | | | | | | | 316,613 | |
| | |
| Principal
Amount |
| |
| Interest
Rate |
| |
| Maturity
Date |
| | | Value | |
| | | | | | | | | | | | | | |
| | Corporate Obligations – (continued) | |
| Pipelines(b) – 2.6% | |
| Energy Transfer Partners LP | |
| $ | 100,000 | | | | 5.950 | % | | | 02/01/15 | | | $ | 109,742 | |
| Enterprise Products Operating LLC | |
| | 100,000 | | | | 3.200 | | | | 02/01/16 | | | | 105,404 | |
| | 100,000 | | | | 7.034 | (c) | | | 01/15/68 | | | | 112,250 | |
| ONEOK Partners LP | |
| | 100,000 | | | | 3.250 | | | | 02/01/16 | | | | 105,106 | |
| Southern Union Co.(c) | |
| | 100,000 | | | | 3.462 | | | | 11/01/66 | | | | 80,000 | |
| Targa Resources Partners LP | |
| | 300,000 | | | | 8.250 | | | | 07/01/16 | | | | 312,750 | |
| TransCanada PipeLines Ltd.(c) | |
| | 100,000 | | | | 6.350 | | | | 05/15/67 | | | | 106,500 | |
| | | | | | | | | | | | | | |
| | | | | | | | | | | | | 931,752 | |
| | |
| Real Estate Investment Trust(b) – 2.5% | |
| ERP Operating LP | |
| | 300,000 | | | | 5.250 | | | | 09/15/14 | | | | 324,690 | |
| HCP, Inc. | |
| | 100,000 | | | | 3.750 | | | | 02/01/16 | | | | 106,178 | |
| Health Care REIT, Inc. | |
| | 125,000 | | | | 6.000 | | | | 11/15/13 | | | | 131,464 | |
| Kilroy Realty LP | |
| | 100,000 | | | | 5.000 | | | | 11/03/15 | | | | 108,911 | |
| Simon Property Group LP | |
| | 100,000 | | | | 6.100 | | | | 05/01/16 | | | | 115,501 | |
| WEA Finance LLC(a) | |
| | 100,000 | | | | 5.750 | | | | 09/02/15 | | | | 110,988 | |
| | | | | | | | | | | | | | |
| | | | | | | | | | | | | 897,732 | |
| | |
| Retailers – 0.3% | |
| Wal-Mart Stores, Inc. | |
| | 75,000 | | | | 5.375 | | | | 04/05/17 | | | | 89,144 | |
| | |
| Retailers – Food & Drug(b) – 0.3% | |
| Rite Aid Corp. | |
| | 100,000 | | | | 9.750 | | | | 06/12/16 | | | | 109,500 | |
| | |
| Technology(b) – 1.2% | |
| Fidelity National Information Services, Inc. | |
| | 100,000 | | | | 7.625 | | | | 07/15/17 | | | | 109,500 | |
| Hewlett-Packard Co. | |
| | 150,000 | | | | 3.000 | | | | 09/15/16 | | | | 154,691 | |
| International Business Machines Corp. | |
| | 125,000 | | | | 2.000 | | | | 01/05/16 | | | | 129,080 | |
| Texas Instruments, Inc. | |
| | 50,000 | | | | 2.375 | | | | 05/16/16 | | | | 52,752 | |
| | | | | | | | | | | | | | |
| | | | | | | | | | | | | 446,023 | |
| | |
| Technology – Hardware(b) – 0.2% | |
| Tech Data Corp. | |
| | 75,000 | | | | 3.750 | | | | 09/21/17 | | | | 75,574 | |
| | |
| Tobacco – 0.4% | |
| Philip Morris International, Inc. | |
| | 150,000 | | | | 1.125 | | | | 08/21/17 | | | | 149,605 | |
| | |
| | |
| 60 | | The accompanying notes are an integral part of these financial statements. |
GOLDMAN SACHS SHORT DURATION INCOME FUND
| | | | | | | | | | | | | | |
Principal Amount | | | Interest
Rate | | | Maturity
Date | | | Value | |
| | | | | | | | | | | | | | |
| | Corporate Obligations – (continued) | |
| Transportation(b) – 0.3% | |
| CSX Corp. | |
| $ | 100,000 | | | | 6.250 | % | | | 04/01/15 | | | $ | 113,303 | |
| | |
| Wireless Telecommunications(b) – 0.7% | |
| Deutsche Telekom International Finance BV | |
| | 125,000 | | | | 5.875 | | | | 08/20/13 | | | | 130,575 | |
| Verizon Communications, Inc. | |
| | 125,000 | | | | 3.000 | | | | 04/01/16 | | | | 134,112 | |
| | | | | | | | | | | | | | |
| | | | | | | | | | | | | 264,687 | |
| | |
| Wirelines Telecommunications(b) – 3.1% | |
| AT&T, Inc. | |
| | 100,000 | | | | 2.400 | | | | 08/15/16 | | | | 105,380 | |
| Frontier Communications Corp. | |
| | 300,000 | | | | 7.875 | | | | 04/15/15 | | | | 335,250 | |
| PAETEC Holding Corp. | |
| | 500,000 | | | | 9.875 | | | | 12/01/18 | | | | 572,500 | |
| Telefonica Emisiones SAU | |
| | 100,000 | | | | 4.949 | | | | 01/15/15 | | | | 102,000 | |
| | | | | | | | | | | | | | |
| | | | | | | | | | | | | 1,115,130 | |
| | |
| | TOTAL CORPORATE OBLIGATIONS | |
| | (Cost $16,621,675) | | | $ | 16,740,845 | |
| | |
| | | | | | | | | | | | | | |
| | Mortgage-Backed Obligations – 29.1% | |
| Collateralized Mortgage Obligations – 4.0% | |
| Planned Amortization Class – 0.6% | |
| FNMA REMIC Series 2012-108, Class TE | |
| $ | 200,000 | | | | 3.500 | % | | | 10/25/42 | | | $ | 211,323 | |
| | |
| Sequential Fixed Rate – 1.7% | |
| FHLMC Multifamily Structured Pass-Through Certificates
Series K501, Class A1 |
|
| | 97,790 | | | | 1.337 | | | | 06/25/16 | | | | 99,454 | |
| FHLMC Multifamily Structured Pass-Through Certificates
Series K501, Class A2 |
|
| | 200,000 | | | | 1.655 | | | | 11/25/16 | | | | 206,595 | |
| FHLMC Multifamily Structured Pass-Through Certificates
Series K707, Class A2 |
|
| | 100,000 | | | | 2.220 | | | | 12/25/18 | | | | 105,221 | |
| FHLMC Multifamily Structured Pass-Through Certificates
Series K710, Class A2 |
|
| | 200,000 | | | | 1.883 | | | | 05/25/19 | | | | 205,973 | |
| | | | | | | | | | | | | | |
| | | | | | | | | | | | | 617,243 | |
| | |
| Sequential Floating Rate(c) – 1.7% | |
| Darrowby PLC Series 2012-1, Class A | |
| GBP | 95,703 | | | | 2.399 | | | | 02/20/44 | | | | 159,538 | |
| Granite Mortgages PLC Series 2004-3, Class 2A1 | |
| $ | 189,365 | | | | 0.659 | | | | 09/20/44 | | | | 186,335 | |
| Permanent Master Issuer PLC Series 2011-2X, Class 1A2 | |
| | 250,000 | | | | 2.005 | | | | 07/15/42 | | | | 255,800 | |
| | | | | | | | | | | | | | |
| | | | | | | | | | | | | 601,673 | |
| | |
| TOTAL COLLATERALIZED
MORTGAGE OBLIGATIONS |
| | $ | 1,430,239 | |
| | |
Principal Amount | | | Interest
Rate | | | Maturity
Date | | | Value | |
| | | | | | | | | | | | | | |
| | Mortgage-Backed Obligations – (continued) | |
| Commercial Mortgage-Backed Securities(c) – 0.7% | |
| Sequential Fixed Rate – 0.3% | |
| FNMA ACES Series 12-M9, Class ASQ2 | |
| $ | 100,000 | | | | 1.513 | % | | | 12/25/17 | | | $ | 102,293 | |
| | |
| Sequential Floating Rate – 0.4% | |
| JP Morgan Chase Commercial Mortgage Securities Corp.
Series 2005-CB11, Class A4 |
|
| | 150,000 | | | | 5.335 | | | | 08/12/37 | | | | 165,037 | |
| | |
| Federal Agencies – 24.4% | |
| FNMA – 24.4% | |
| | 123,919 | | | | 5.000 | | | | 12/01/35 | | | | 134,937 | |
| | 147,450 | | | | 5.000 | | | | 05/01/37 | | | | 160,276 | |
| | 107,227 | | | | 5.000 | | | | 02/01/39 | | | | 117,021 | |
| | 1,621,205 | | | | 5.000 | | | | 04/01/39 | | | | 1,769,282 | |
| | 29,678 | | | | 4.000 | | | | 11/01/40 | | | | 31,934 | |
| | 5,000,000 | | | | 5.000 | | | | TBA-30yr | (d) | | | 5,451,953 | |
| | 1,000,000 | | | | 6.000 | | | | TBA-30yr | (d) | | | 1,104,297 | |
| | |
| | TOTAL FEDERAL AGENCIES | | | $ | 8,769,700 | |
| | |
| | TOTAL MORTGAGE-BACKED OBLIGATIONS | |
| | (Cost $10,438,380) | | | $ | 10,467,269 | |
| | |
| | | | | | | | | | | | | | |
| | Asset-Backed Securities – 10.3% | |
| Auto – 2.1% | |
| Motor PLC Series 2012-A, Class A1B(a)(c) | |
| $ | 250,000 | | | | 0.735 | % | | | 02/25/20 | | | $ | 250,003 | |
| Toyota Auto Receivables Owner Trust Series 2011-B, Class A3 | |
| | 250,000 | | | | 0.680 | | | | 06/15/15 | | | | 250,888 | |
| Volkswagen Auto Loan Enhanced Trust Series 2010-1, Class A4 | |
| | 250,000 | | | | 2.140 | | | | 08/22/16 | | | | 252,191 | |
| | | | | | | | | | | | | | |
| | | | | | | | | | | | | 753,082 | |
| | |
| Collateralized Loan Obligations(c) – 3.4% | |
| Black Diamond CLO Ltd. Series 2005-1A, Class A1(a) | |
| | 119,353 | | | | 0.649 | | | | 06/20/17 | | | | 117,920 | |
| Black Diamond CLO Ltd. Series 2006-1A, Class AD(a) | |
| | 250,000 | | | | 0.697 | | | | 04/29/19 | | | | 238,016 | |
| Crown Point CLO Ltd. Series 2012-1A, Class A1LA(a) | |
| | 100,000 | | | | 1.158 | | | | 11/21/22 | | | | 95,516 | |
| Grayson CLO Ltd. Series 2006-1A, Class A1A(a) | |
| | 227,144 | | | | 0.690 | | | | 11/01/21 | | | | 214,243 | |
| KKR Financial CLO Ltd. Series 2007-AA, Class A(a) | |
| | 362,457 | | | | 1.205 | | | | 10/15/17 | | | | 359,893 | |
| Westchester CLO Ltd. Series 2007-1X, Class A1A | |
| | 203,528 | | | | 0.670 | | | | 08/01/22 | | | | 194,178 | |
| | | | | | | | | | | | | | |
| | | | | | | | | | | | | 1,219,766 | |
| | |
| Student Loan(c) – 4.8% | |
| Brazos Higher Education Authority, Inc. Series 2005-3, Class A14 | |
| | 346,803 | | | | 0.479 | | | | 09/25/23 | | | | 346,224 | |
| | |
| | |
| The accompanying notes are an integral part of these financial statements. | | 61 |
GOLDMAN SACHS SHORT DURATION INCOME FUND
Schedule of Investments (continued)
September 30, 2012 (Unaudited)
| | | | | | | | | | | | | | |
Principal Amount | | | Interest
Rate | | | Maturity
Date | | | Value | |
| | | | | | | | | | | | | | |
| | Asset-Backed Securities – (continued) | |
| Student Loan(c) – (continued) | |
| College Loan Corp. Trust Series 2004-1, Class A4 | |
| $ | 100,000 | | | | 0.641 | % | | | 04/25/24 | | | $ | 93,727 | |
| Education Loan Asset-Backed Trust Series 2012-1, Class A1 | |
| | 150,000 | | | | 0.669 | | | | 06/25/22 | | | | 150,000 | |
| Educational Services of America, Inc. Series 2012-1, Class A1(a) | |
| | 222,444 | | | | 1.367 | | | | 09/25/40 | | | | 225,243 | |
| Nelnet Student Loan Corp. Series 2004-2A, Class A4 | |
| | 187,937 | | | | 0.567 | | | | 08/26/19 | | | | 187,660 | |
| SLM Student Loan Trust Series 2006-8, Class A4 | |
| | 244,576 | | | | 0.531 | | | | 10/25/21 | | | | 243,912 | |
| SLM Student Loan Trust Series 2006-9, Class A4 | |
| | 241,170 | | | | 0.521 | | | | 10/25/22 | | | | 240,172 | |
| SLM Student Loan Trust Series 2012-2, Class A | |
| | 224,162 | | | | 0.917 | | | | 01/25/29 | | | | 226,356 | |
| | | | | | | | | | | | | | |
| | | | | | | | | | | | | 1,713,294 | |
| | |
| | TOTAL ASSET-BACKED SECURITIES | |
| | (Cost $3,665,485) | | | $ | 3,686,142 | |
| | |
| | | | | | | | | | | | | | |
| | Foreign Debt Obligations – 3.8% | |
| Sovereign – 3.8% | |
| Kommunalbanken AS(a) | |
| $ | 100,000 | | | | 1.000 | % | | | 09/26/17 | | | $ | 100,070 | |
| Republic of Argentina(e) | |
| | 40,000 | | | | 0.000 | | | | 12/15/35 | | | | 5,260 | |
| EUR | 569,000 | | | | 0.000 | | | | 12/15/35 | | | | 87,743 | |
| Republic of Colombia | |
| $ | 100,000 | | | | 7.375 | | | | 03/18/19 | | | | 132,250 | |
| Republic of Indonesia | |
| | 100,000 | | | | 11.625 | | | | 03/04/19 | | | | 152,875 | |
| Republic of Panama | |
| | 190,000 | | | | 7.250 | | | | 03/15/15 | | | | 217,265 | |
| Republic of Venezuela | |
| | 100,000 | | | | 7.750 | | | | 10/13/19 | | | | 86,750 | |
| Russian Federation(a) | |
| | 200,000 | | | | 3.250 | | | | 04/04/17 | | | | 210,500 | |
| United Mexican States | |
| MXN | 1,113,000 | | | | 0.000 | (e) | | | 10/04/12 | | | | 86,447 | |
| $ | 260,000 | | | | 5.875 | | | | 01/15/14 | | | | 275,600 | |
| | |
| | TOTAL FOREIGN DEBT OBLIGATIONS | |
| | (Cost $1,323,310) | | | $ | 1,354,760 | |
| | |
| | | | | | | | | | | | | | |
| | Municipal Debt Obligations(c) – 1.1% | |
| Florida – 0.5% | |
| Florida Hurricane Catastrophe Fund Finance Corp. RB Floating
Rate Notes Series 2007 A |
|
| $ | 200,000 | | | | 1.001 | % | | | 10/15/12 | | | $ | 200,010 | |
| | |
| Principal
Amount |
| |
| Interest
Rate |
| |
| Maturity
Date |
| | | Value | |
| | | | | | | | | | | | | | |
| | Municipal Debt Obligations – (continued) | |
| Massachusetts – 0.6% | |
| Massachusetts State GO Bonds Series 2010 A | |
| $ | 200,000 | | | | 0.710 | % | | | 02/01/14 | | | $ | 200,478 | |
| | |
| | TOTAL MUNICIPAL DEBT OBLIGATIONS | |
| | (Cost $400,065) | | | $ | 400,488 | |
| | |
| TOTAL INVESTMENTS BEFORE SHORT-TERM
INVESTMENT |
|
| | (Cost $32,448,915) | | | $ | 32,649,504 | |
| | |
| | | | | | | | | | | | | | |
| | Short-term Investments – 26.2% | |
| Certificates of Deposit – 0.8% | |
| Dexia Credit Local | |
| $ | 300,000 | | | | 1.700 | % | | | 09/06/13 | | | $ | 300,161 | |
| | |
| Repurchase Agreement(f) – 25.4% | |
| Joint Repurchase Agreement Account II | |
| | 9,100,000 | | | | 0.245 | | | | 10/01/12 | | | | 9,100,000 | |
| | |
| | TOTAL SHORT-TERM INVESTMENTS – 26.2% | |
| | (Cost $9,400,000) | | | $ | 9,400,161 | |
| | |
| | TOTAL INVESTMENTS – 117.1% | |
| | (Cost $41,848,915) | | | $ | 42,049,665 | |
| | |
| LIABILITIES IN EXCESS OF
OTHER ASSETS – (17.1)% |
| | | (6,149,502 | ) |
| | |
| | NET ASSETS – 100.0% | | | $ | 35,900,163 | |
| | |
| | |
| The percentage shown for each investment category reflects the value of investments in that category as a percentage of net assets. |
(a) | | Exempt from registration under Rule 144A of the Securities Act of 1933. Under procedures approved by the Board of Trustees, such securities have been determined to be liquid by the investment adviser and may be resold, normally to qualified institutional buyers in transactions exempt from registration. Total market value of Rule 144A securities amounts to $3,532,653, which represents approximately 9.8% of net assets as of September 30, 2012. |
(b) | | Security with “Call” features with resetting interest rates. Maturity dates disclosed are the final maturity dates. |
(c) | | Variable rate security. Interest rate disclosed is that which is in effect at September 30, 2012. |
(d) | | TBA (To Be Announced) Securities are purchased on a forward commitment basis with an approximate principal amount and no defined maturity date. The actual principal and maturity date will be determined upon settlement when the specific mortgage pools are assigned. Total market value of TBA securities (excluding forward sales contracts, if any) amounts to $6,556,250, which represents approximately 18.3% of net assets as of September 30, 2012. |
(e) | | Issued with a zero coupon. Income is recognized through the accretion of discount. |
(f) | | Joint repurchase agreement was entered into on September 28, 2012. Additional information appears on page 69. |
| | |
| 62 | | The accompanying notes are an integral part of these financial statements. |
GOLDMAN SACHS SHORT DURATION INCOME FUND
| | |
|
Currency Abbreviations: |
AUD | | —Australian Dollar |
BRL | | —Brazilian Real |
CAD | | —Canadian Dollar |
CHF | | —Swiss Franc |
CLP | | —Chilean Peso |
CZK | | —Czech Koruna |
EUR | | —Euro |
GBP | | —British Pound |
HUF | | —Hungarian Forint |
ILS | | —Israeli Shekel |
INR | | —Indian Rupee |
JPY | | —Japanese Yen |
KRW | | —South Korean Won |
MXN | | —Mexican Peso |
MYR | | —Malaysian Ringgit |
NOK | | —Norwegian Krone |
NZD | | —New Zealand Dollar |
PHP | | —Philippine Peso |
PLN | | —Polish Zloty |
RUB | | —Russian Ruble |
SEK | | —Swedish Krona |
SGD | | —Singapore Dollar |
TRY | | —Turkish Lira |
TWD | | —Taiwan Dollar |
ZAR | | —South African Rand |
| | |
Investment Abbreviations: |
ACES | | —Alternative Credit Enhancement Securities |
CLO | | —Collateralized Loan Obligation |
FHLMC | | —Federal Home Loan Mortgage Corp. |
FNMA | | —Federal National Mortgage Association |
GO | | —General Obligation |
LIBOR | | —London Interbank Offered Rate |
RB | | —Revenue Bond |
REIT | | —Real Estate Investment Trust |
REMIC | | —Real Estate Mortgage Investment Conduit |
|
| | |
| The accompanying notes are an integral part of these financial statements. | | 63 |
GOLDMAN SACHS SHORT DURATION INCOME FUND
Schedule of Investments (continued)
September 30, 2012 (Unaudited)
|
| ADDITIONAL INVESTMENT INFORMATION |
FORWARD SALES CONTRACTS — At September 30, 2012, the Fund had the following forward sales contracts:
| | | | | | | | | | | | | | | | | | |
| Description | | Interest
Rate | | Maturity
Date(d) | | | Settlement
Date | | | Principal
Amount | | | Value | |
| | | | | |
FNMA (Proceeds Receivable: $1,091,523) | | 5.000% | | | TBA-30yr | | | | 11/10/12 | | | $ | (1,000,000 | ) | | $ | (1,090,938 | ) |
FORWARD FOREIGN CURRENCY EXCHANGE CONTRACTS — At September 30, 2012, the Fund had the following forward foreign currency exchange contracts:
FORWARD FOREIGN CURRENCY EXCHANGE CONTRACTS WITH UNREALIZED GAIN
| | | | | | | | | | | | | | |
| Counterparty | | Contracts to
Buy/Sell | | Settlement
Date
| | | Current
Value | | | Unrealized
Gain | |
Barclays Bank PLC | | BRL/USD | | | 10/19/12 | | | $ | 30,091 | | | $ | 91 | |
| | RUB/USD | | | 10/22/12 | | | | 30,033 | | | | 33 | |
| | MYR/USD | | | 10/30/12 | | | | 47,593 | | | | 232 | |
| | CAD/USD | | | 12/19/12 | | | | 67,604 | | | | 183 | |
| | PLN/EUR | | | 12/19/12 | | | | 14,148 | | | | 42 | |
| | USD/CHF | | | 12/19/12 | | | | 81,472 | | | | 528 | |
| | USD/GBP | | | 12/19/12 | | | | 7,265 | | | | 16 | |
| | USD/HUF | | | 12/19/12 | | | | 34,802 | | | | 831 | |
| | USD/JPY | | | 12/19/12 | | | | 35,918 | | | | 82 | |
| | USD/PLN | | | 12/19/12 | | | | 34,938 | | | | 695 | |
| | USD/TWD | | | 10/18/12 | | | | 23,989 | | | | 11 | |
| | USD/ZAR | | | 12/19/12 | | | | 65,954 | | | | 467 | |
BNP Paribas SA | | NZD/USD | | | 12/19/12 | | | | 24,731 | | | | 81 | |
Citibank NA | | RUB/USD | | | 10/22/12 | | | | 15,022 | | | | 22 | |
| | SGD/USD | | | 12/19/12 | | | | 36,057 | | | | 57 | |
| | USD/EUR | | | 12/19/12 | | | | 24,437 | | | | 86 | |
Credit Suisse International (London) | | MXN/USD | | | 12/19/12 | | | | 48,500 | | | | 500 | |
| | RUB/USD | | | 10/09/12 | | | | 24,783 | | | | 783 | |
| | TRY/USD | | | 12/19/12 | | | | 42,907 | | | | 148 | |
| | USD/EUR | | | 10/12/12 | | | | 120,857 | | | | 393 | |
| | USD/EUR | | | 12/19/12 | | | | 29,582 | | | | 33 | |
| | USD/TRY | | | 12/19/12 | | | | 29,944 | | | | 56 | |
Deustche Bank AG (London) | | EUR/HUF | | | 12/19/12 | | | | 14,057 | | | | 91 | |
| | HUF/PLN | | | 12/19/12 | | | | 14,845 | | | | 7 | |
| | INR/USD | | | 10/04/12 | | | | 12,672 | | | | 672 | |
| | INR/USD | | | 10/18/12 | | | | 74,594 | | | | 829 | |
| | JPY/USD | | | 12/19/12 | | | | 15,219 | | | | 219 | |
| | KRW/USD | | | 10/05/12 | | | | 36,580 | | | | 580 | |
| | MYR/USD | | | 10/19/12 | | | | 85,593 | | | | 59 | |
| | MYR/USD | | | 10/30/12 | | | | 10,181 | | | | 5 | |
| | NZD/USD | | | 12/19/12 | | | | 19,903 | | | | 764 | |
| | USD/EUR | | | 12/19/12 | | | | 83,601 | | | | 1,035 | |
| | USD/GBP | | | 12/19/12 | | | | 25,670 | | | | 136 | |
| | USD/JPY | | | 12/19/12 | | | | 167,349 | | | | 720 | |
| | USD/MXN | | | 12/19/12 | | | | 14,937 | | | | 63 | |
HSBC Bank PLC | | GBP/EUR | | | 12/19/12 | | | | 29,582 | | | | 505 | |
| | HUF/EUR | | | 12/19/12 | | | | 11,576 | | | | 186 | |
| | INR/USD | | | 10/18/12 | | | | 126,957 | | | | 2,616 | |
| | KRW/USD | | | 10/05/12 | | | | 37,004 | | | | 453 | |
| | MXN/JPY | | | 12/19/12 | | | | 9,203 | | | | 46 | |
| | NOK/USD | | | 12/19/12 | | | | 43,109 | | | | 109 | |
| | |
| 64 | | The accompanying notes are an integral part of these financial statements. |
GOLDMAN SACHS SHORT DURATION INCOME FUND
|
| ADDITIONAL INVESTMENT INFORMATION (continued) |
FORWARD FOREIGN CURRENCY EXCHANGE CONTRACTS WITH UNREALIZED GAIN (continued)
| | | | | | | | | | | | | | |
| Counterparty | | Contracts to
Buy/Sell | | Settlement
Date
| | | Current
Value | | | Unrealized
Gain | |
HSBC Bank PLC (continued) | | SEK/EUR | | | 12/19/12 | | | $ | 59,164 | | | $ | 1,230 | |
| | USD/MXN | | | 12/19/12 | | | | 14,997 | | | | 3 | |
| | USD/TRY | | | 12/19/12 | | | | 23,882 | | | | 118 | |
JPMorgan Securities, Inc. | | EUR/USD | | | 12/19/12 | | | | 15,434 | | | | 5 | |
| | HUF/EUR | | | 12/19/12 | | | | 11,576 | | | | 170 | |
| | INR/USD | | | 10/10/12 | | | | 72,892 | | | | 4,115 | |
| | INR/USD | | | 11/06/12 | | | | 61,779 | | | | 334 | |
| | TRY/USD | | | 12/19/12 | | | | 38,359 | | | | 83 | |
| | USD/EUR | | | 12/19/12 | | | | 23,151 | | | | 519 | |
| | USD/GBP | | | 11/14/12 | | | | 160,522 | | | | 539 | |
Morgan Stanley & Co. | | USD/EUR | | | 12/19/12 | | | | 29,582 | | | | 214 | |
Royal Bank of Canada | | BRL/USD | | | 10/05/12 | | | | 12,155 | | | | 155 | |
| | USD/AUD | | | 12/19/12 | | | | 292,236 | | | | 2,199 | |
| | USD/CAD | | | 12/19/12 | | | | 74,744 | | | | 256 | |
State Street Bank | | INR/USD | | | 10/04/12 | | | | 49,527 | | | | 2,565 | |
| | INR/USD | | | 10/10/12 | | | | 100,862 | | | | 5,214 | |
| | INR/USD | | | 10/18/12 | | | | 50,661 | | | | 1,661 | |
| | MXN/USD | | | 12/19/12 | | | | 40,450 | | | | 633 | |
| | USD/MXN | | | 12/19/12 | | | | 29,939 | | | | 61 | |
Westpac Banking Corp. | | USD/AUD | | | 12/19/12 | | | | 122,762 | | | | 901 | |
| TOTAL | | | | | | | | | | | | $ | 35,440 | |
FORWARD FOREIGN CURRENCY EXCHANGE CONTRACTS WITH UNREALIZED LOSS
| | | | | | | | | | | | | | |
| Counterparty | | Contracts to
Buy/Sell | | Settlement
Date
| | | Current
Value | | | Unrealized
Loss | |
Barclays Bank PLC | | EUR/SEK | | | 12/19/12 | | | $ | 73,065 | | | $ | (1,039 | ) |
| | EUR/CHF | | | 12/19/12 | | | | 24,541 | | | | (104 | ) |
| | EUR/HUF | | | 12/19/12 | | | | 15,474 | | | | (40 | ) |
| | GBP/USD | | | 12/19/12 | | | | 7,265 | | | | (32 | ) |
| | USD/GBP | | | 12/19/12 | | | | 24,217 | | | | (67 | ) |
| | USD/JPY | | | 12/19/12 | | | | 95,625 | | | | (625 | ) |
| | USD/NZD | | | 12/19/12 | | | | 4,711 | | | | (165 | ) |
| | USD/PLN | | | 12/19/12 | | | | 30,229 | | | | (229 | ) |
| | USD/TWD | | | 10/18/12 | | | | 30,069 | | | | (69 | ) |
| | ZAR/USD | | | 12/19/12 | | | | 14,836 | | | | (164 | ) |
Citibank NA | | DKK/EUR | | | 12/19/12 | | | | 26,922 | | | | (20 | ) |
| | EUR/USD | | | 12/19/12 | | | | 115,756 | | | | (2,388 | ) |
| | JPY/USD | | | 12/19/12 | | | | 14,975 | | | | (25 | ) |
| | PHP/USD | | | 10/15/12 | | | | 23,996 | | | | (4 | ) |
| | RUB/USD | | | 10/17/12 | | | | 183,394 | �� | | | (1,004 | ) |
| | SGD/USD | | | 12/19/12 | | | | 24,176 | | | | (108 | ) |
| | USD/INR | | | 10/18/12 | | | | 15,135 | | | | (135 | ) |
| | USD/KRW | | | 10/05/12 | | | | 48,965 | | | | (965 | ) |
| | USD/RUB | | | 10/09/12 | | | | 12,652 | | | | (238 | ) |
| | USD/AUD | | | 12/19/12 | | | | 146,283 | | | | (257 | ) |
| | USD/JPY | | | 12/19/12 | | | | 40,384 | | | | (449 | ) |
| | USD/SGD | | | 12/19/12 | | | | 114,706 | | | | (1,706 | ) |
Credit Suisse International (London) | | CLP/USD | | | 10/04/12 | | | | 24,458 | | | | (111 | ) |
| | RUB/USD | | | 10/17/12 | | | | 80,378 | | | | (880 | ) |
| | EUR/CHF | | | 12/19/12 | | | | 24,454 | | | | (17 | ) |
| | |
| The accompanying notes are an integral part of these financial statements. | | 65 |
GOLDMAN SACHS SHORT DURATION INCOME FUND
Schedule of Investments (continued)
September 30, 2012 (Unaudited)
|
| ADDITIONAL INVESTMENT INFORMATION (continued) |
FORWARD FOREIGN CURRENCY EXCHANGE CONTRACTS WITH UNREALIZED LOSS (continued)
| | | | | | | | | | | | | | |
| Counterparty | | Contracts to
Buy/Sell | | Settlement
Date
| | | Current
Value | | | Unrealized
Loss | |
Credit Suisse International (London) (continued) | | EUR/USD | | | 12/19/12 | | | $ | 29,582 | | | $ | (487 | ) |
| | USD/CHF | | | 12/19/12 | | | | 68,527 | | | | (811 | ) |
| | USD/CZK | | | 12/19/12 | | | | 84,272 | | | | (908 | ) |
| | USD/JPY | | | 12/19/12 | | | | 30,180 | | | | (180 | ) |
| | USD/KRW | | | 10/05/12 | | | | 24,619 | | | | (619 | ) |
| | USD/TRY | | | 12/19/12 | | | | 60,183 | | | | (183 | ) |
Deutsche Bank AG (London) | | EUR/CHF | | | 12/19/12 | | | | 83,924 | | | | (323 | ) |
| | EUR/USD | | | 12/19/12 | | | | 142,055 | | | | (454 | ) |
| | GBP/USD | | | 12/19/12 | | | | 24,217 | | | | (116 | ) |
| | ILS/USD | | | 12/19/12 | | | | 48,927 | | | | (73 | ) |
| | JPY/USD | | | 12/19/12 | | | | 44,845 | | | | (155 | ) |
| | MYR/USD | | | 10/19/12 | | | | 48,790 | | | | (210 | ) |
| | PHP/USD | | | 10/15/12 | | | | 14,958 | | | | (42 | ) |
| | USD/GBP | | | 12/19/12 | | | | 24,217 | | | | (69 | ) |
| | USD/INR | | | 10/18/12 | | | | 61,128 | | | | (1,430 | ) |
| | USD/MXN | | | 11/26/12 | | | | 84,478 | | | | (351 | ) |
| | USD/TWD | | | 10/18/12 | | | | 30,142 | | | | (142 | ) |
HSBC Bank PLC | | CZK/EUR | | | 12/19/12 | | | | 14,148 | | | | (27 | ) |
| | EUR/SEK | | | 12/19/12 | | | | 54,392 | | | | (373 | ) |
| | EUR/HUF | | | 12/19/12 | | | | 81,834 | | | | (296 | ) |
| | PHP/USD | | | 10/17/12 | | | | 48,517 | | | | (483 | ) |
| | USD/CLP | | | 10/04/12 | | | | 24,458 | | | | (458 | ) |
| | USD/NOK | | | 12/19/12 | | | | 59,128 | | | | (365 | ) |
| | USD/SEK | | | 12/19/12 | | | | 103,424 | | | | (809 | ) |
| | USD/TWD | | | 10/18/12 | | | | 30,099 | | | | (99 | ) |
JPMorgan Securities, Inc. | | BRL/USD | | | 10/19/12 | | | | 12,154 | | | | (19 | ) |
| | MXN/USD | | | 12/19/12 | | | | 141,185 | | | | (1,341 | ) |
| | TRY/USD | | | 12/19/12 | | | | 121,826 | | | | (174 | ) |
| | USD/GBP | | | 10/02/12 | | | | 160,543 | | | | (3,778 | ) |
| | USD/INR | | | 10/04/12 | | | | 62,199 | | | | (535 | ) |
Royal Bank of Canada | | BRL/USD | | | 10/17/12 | | | | 47,941 | | | | (59 | ) |
| | MXN/USD | | | 12/19/12 | | | | 78,097 | | | | (295 | ) |
| | USD/CAD | | | 12/19/12 | | | | 30,013 | | | | (13 | ) |
| | USD/GBP | | | 12/19/12 | | | | 118,034 | | | | (663 | ) |
| | USD/PLN | | | 12/19/12 | | | | 57,198 | | | | (1,749 | ) |
| | ZAR/USD | | | 12/19/12 | | | | 29,488 | | | | (512 | ) |
State Street Bank | | CHF/USD | | | 12/19/12 | | | | 51,339 | | | | (661 | ) |
| | EUR/HUF | | | 12/19/12 | | | | 11,633 | | | | (57 | ) |
| | GBP/USD | | | 12/19/12 | | | | 39,994 | | | | (232 | ) |
| | MXN/USD | | | 12/19/12 | | | | 111,485 | | | | (515 | ) |
| | USD/GBP | | | 12/19/12 | | | | 14,530 | | | | (3 | ) |
| | USD/INR | | | 10/18/12 | | | | 30,841 | | | | (841 | ) |
| | ZAR/USD | | | 12/19/12 | | | | 21,630 | | | | (189 | ) |
Westpac Banking Corp. | | AUD/USD | | | 12/19/12 | | | | 28,845 | | | | (158 | ) |
| | | USD/AUD | | | 12/19/12 | | | | 78,292 | | | | (730 | ) |
| TOTAL | | | | | $ | (32,828 | ) |
| | |
| 66 | | The accompanying notes are an integral part of these financial statements. |
GOLDMAN SACHS SHORT DURATION INCOME FUND
|
| ADDITIONAL INVESTMENT INFORMATION (continued) |
FUTURES CONTRACTS — At September 30, 2012, the Fund had the following futures contracts:
| | | | | | | | | | | | | | |
| Type | | Number of
Contracts
Long (Short) | | | Expiration
Date | | Current
Value | | | Unrealized
Gain (Loss) | |
German Euro-Schatz Futures | | | (3 | ) | | December 2012 | | $ | (426,842 | ) | | $ | (198 | ) |
Ultra Long U.S. Treasury Bonds | | | (1 | ) | | December 2012 | | | (165,219 | ) | | | (4,243 | ) |
5 Year German Euro-Bobl | | | 10 | | | December 2012 | | | 1,615,179 | | | | 6,857 | |
10 Year German Euro-Bund | | | (1 | ) | | December 2012 | | | (182,181 | ) | | | (2,392 | ) |
2 Year U.S. Treasury Notes | | | 15 | | | December 2012 | | | 3,307,969 | | | | 1,055 | |
5 Year U.S. Treasury Notes | | | 134 | | | December 2012 | | | 16,700,797 | | | | 42,787 | |
10 Year U.S. Treasury Notes | | | (2 | ) | | December 2012 | | | (266,969 | ) | | | (855 | ) |
30 Year U.S. Treasury Bonds | | | 2 | | | December 2012 | | | 298,750 | | | | (1,264 | ) |
| TOTAL | | | | | | | | | | | | $ | 41,747 | |
SWAP CONTRACTS — At September 30, 2012, the Fund had the following swap contracts:
INTEREST RATE SWAP CONTRACTS
| | | | | | | | | | | | | | | | | | | | | | |
| | | | | | | | | | | Rates Exchanged | | Market Value | |
| Counterparty | | | | Notional
Amount
(000s) | | | Termination
Date | | | Payments
Received | | Payments
Made | | Upfront
Payments
Made (Received) | | | Unrealized
Gain (Loss) | |
Deutsche Bank Securities, Inc. | | BRL | | | 1,130 | | | | 01/02/14 | | | 7.770% | | 1 month Brazilian
Interbank Deposit Average | | $ | — | | | $ | 456 | |
| | | | | 2,040 | | | | 01/02/14 | | | 7.740 | | 1 month Brazilian
Interbank Deposit Average | | | — | | | | 522 | |
| | | $ | | | 8,300 | (a) | | | 02/28/17 | | | 0.750 | | 3 month LIBOR | | | (19,054 | ) | | | (7,823 | ) |
| TOTAL | | | | | | | | | | | | | | | | $ | (19,054 | ) | | $ | (6,845 | ) |
| | (a) | | Represents forward starting interest rate swaps whose effective dates of commencement of accruals and cash flows occur subsequent to September 30, 2012. |
| | |
| The accompanying notes are an integral part of these financial statements. | | 67 |
GOLDMAN SACHS SHORT DURATION INCOME FUND
Schedule of Investments (continued)
September 30, 2012 (Unaudited)
|
| ADDITIONAL INVESTMENT INFORMATION (continued) |
CREDIT DEFAULT SWAP CONTRACTS
| | | | | | | | | | | | | | | | | | | | | | | | | | |
| | | | | | | | | | | | | | | | | Market Value | |
| Swap Counterparty | | Referenced
Obligation | | Notional
Amount
(000s) | | | Rates (Paid)
Received by
Fund | | | Termination
Date | | | Credit
Spread at
September 30,
2012(a) | | | Upfront
Payments
Made (Received) | | | Unrealized
Gain (Loss) | |
Protection Sold: | | | | | | | | | | | | | | | | | | | | | | | | | | |
| | | | | | | |
Deutsche Bank Securities, Inc. | | CDX North America Investment Grade Index 18 | | $ | 198 | | | | 5.000 | % | | | 06/20/17 | | | | 4.868 | % | | $ | (9,031 | ) | | $ | 10,384 | |
| | (a) | | Credit spread on the Referenced Obligation, together with the term of the swap contract, are indicators of payment/performance risk. The likelihood of a credit event occurring which would require a fund to make a payment or otherwise be required to perform under the swap contract is generally greater as the credit spread and the term of the swap contract increase. |
| | |
| 68 | | The accompanying notes are an integral part of these financial statements. |
GOLDMAN SACHS SHORT DURATION AND GOVERNMENT FIXED INCOME FUNDS
Schedule of Investments
September 30, 2012 (Unaudited)
|
| ADDITIONAL INVESTMENT INFORMATION |
JOINT REPURCHASE AGREEMENT ACCOUNT II — At September 30, 2012, certain Funds had undivided interests in the Joint Repurchase Agreement Account II, with a maturity date of October 1, 2012, as follows:
| | | | | | | | | | | | |
| Fund | | Principal Amount | | | Maturity Value | | | Collateral Allocation Value | |
Government Income | | $ | 193,500,000 | | | $ | 193,503,951 | | | $ | 198,088,909 | |
Inflation Protected Securities | | | 1,700,000 | | | | 1,700,035 | | | | 1,740,316 | |
Short Duration Government | | | 100,500,000 | | | | 100,502,052 | | | | 102,883,387 | |
Short Duration Income | | | 9,100,000 | | | | 9,100,186 | | | | 9,315,809 | |
REPURCHASE AGREEMENTS — At September 30, 2012, the Principal Amounts of certain Funds’ interest in the Joint Repurchase Agreement Account II were as follows:
| | | | | | | | | | | | | | | | | | | | |
| Counterparty | | Interest
Rate | | | Government
Income | | | Inflation
Protected
Securities | | | Short
Duration
Government | | | Short
Duration
Income | |
BNP Paribas Securities Co. | | | 0.250 | % | | $ | 21,715,297 | | | $ | 190,780 | | | $ | 11,278,488 | | | $ | 1,021,236 | |
Credit Suisse Securities LLC | | | 0.200 | | | | 7,795,235 | | | | 68,485 | | | | 4,048,688 | | | | 366,598 | |
Deutsche Bank Securities, Inc. | | | 0.250 | | | | 36,481,699 | | | | 320,511 | | | | 18,947,859 | | | | 1,715,677 | |
JPMorgan Securities LLC | | | 0.250 | | | | 71,827,520 | | | | 631,043 | | | | 37,305,766 | | | | 3,377,935 | |
Wells Fargo Securities LLC | | | 0.240 | | | | 55,680,249 | | | | 489,181 | | | | 28,919,199 | | | | 2,618,554 | |
| TOTAL | | | | | | $ | 193,500,000 | | | $ | 1,700,000 | | | $ | 100,500,000 | | | $ | 9,100,000 | |
At September 30, 2012, the Joint Repurchase Agreement Account II was fully collateralized by:
| | | | | | | | |
| Issuer | | Interest Rates | | | Maturity Dates | |
Federal Home Loan Mortgage Corp. | | | 2.500 to 5.500 | % | | | 08/01/22 to 09/01/42 | |
Federal National Mortgage Association | | | 2.500 to 8.500 | | | | 06/01/14 to 07/01/51 | |
Government National Mortgage Association | | | 2.500 to 4.500 | | | | 04/15/27 to 09/20/42 | |
U.S. Treasury Notes | | | 0.375 to 4.875 | | | | 10/15/12 to 05/15/19 | |
| | |
| The accompanying notes are an integral part of these financial statements. | | 69 |
GOLDMAN SACHS SHORT DURATION AND GOVERNMENT FIXED INCOME FUNDS
Statements of Assets and Liabilities
September 30, 2012 (Unaudited)
| | | | | | |
| | | | |
Enhanced Income Fund | |
| | Assets: | | | | |
| | Investments, at value (cost $473,202,822, $773,992,468, $231,734,009, $295,141,783, $2,387,385,532 and $32,748,915) | | $ | 478,046,304 | |
| | Repurchase agreement, at value which equals cost | | | — | |
| | Cash | | | 14,869,345 | |
| | Foreign currencies, at value (cost $6,256 for Short Duration Income Fund) | | | — | |
| | Receivables: | | | | |
| | Investments sold | | | 21,120,466 | |
| | Investments sold on an extended settlement basis | | | — | |
| | Interest | | | 2,222,523 | |
| | Fund shares sold | | | 477,346 | |
| | Unrealized gain on swap contracts | | | 39,287 | |
| | Unrealized gain on forward foreign currency exchange contracts | | | — | |
| | Futures-variation margin | | | — | |
| | Reimbursement from investment adviser | | | — | |
| | Due from broker — upfront payment | | | — | |
| | Collateral on certain derivative contracts(b) | | | — | |
| | Upfront payments made on swap contracts | | | — | |
| | Deferred offering costs | | | — | |
| | | Other assets | | | 1,276 | |
| | | Total assets | | | 516,776,547 | |
| | | | | | |
| | Liabilities: | | | | |
| | Due to custodian | | | — | |
| | Payables: | | | | |
| | Investments purchased | | | 4,129,169 | |
| | Investments purchased on an extended settlement basis | | | — | |
| | Fund shares redeemed | | | 822,666 | |
| | Amounts owed to affiliates | | | 148,710 | |
| | Income distribution | | | 26,027 | |
| | Futures — variation margin | | | 9,479 | |
| | Collateral on certain derivative contracts | | | — | |
| | Forward sale contracts, at value (proceeds receivable $0, $12,006,758, $0, $0, $84,411,367 and $1,091,523) | | | — | |
| | Written option contracts, at value (premium received $0, $306,810, $113,730, $0, $1,354,750 and $0) | | | — | |
| | Unrealized loss on swap contracts | | | — | |
| | Unrealized loss on forward foreign currency exchange contracts | | | — | |
| | Due to broker — upfront payment | | | — | |
| | Upfront payments received on swap contracts | | | 9,075 | |
| | | Accrued expenses and other liabilities | | | 83,246 | |
| | | Total liabilities | | | 5,228,372 | |
| | | | | | |
| | Net Assets: | | | | |
| | Paid-in capital | | | 527,480,906 | |
| | Undistributed (distributions in excess of) net investment income | | | 716,162 | |
| | Accumulated net realized gain (loss) | | | (21,516,048 | ) |
| | | Net unrealized gain | | | 4,867,155 | |
| | | NET ASSETS | | $ | 511,548,175 | |
| | | Net Assets: | | | | |
| | | Class A | | $ | 83,635,902 | |
| | | Class B | | | 274,863 | |
| | | Class C | | | — | |
| | | Institutional | | | 424,770,386 | |
| | | Administration | | | 1,122,353 | |
| | | Service | | | — | |
| | | Class IR | | | 1,744,671 | |
| | | Class R | | | — | |
| | | Total Net Assets | | $ | 511,548,175 | |
| | | Shares Outstanding $0.001 par value (unlimited shares authorized): | | | | |
| | | Class A | | | 8,798,466 | |
| | | Class B | | | 28,958 | |
| | | Class C | | | — | |
| | | Institutional | | | 44,739,088 | |
| | | Administration | | | 117,812 | |
| | | Service | | | — | |
| | | Class IR | | | 183,809 | |
| | | Class R | | | — | |
| | | Net asset value, offering and redemption price per share(c) | | | | |
| | | Class A | | | $9.51 | |
| | | Class B | | | 9.49 | |
| | | Class C | | | — | |
| | | Institutional | | | 9.49 | |
| | | Administration | | | 9.53 | |
| | | Service | | | — | |
| | | Class IR | | | 9.49 | |
| | | Class R | | | — | |
| | (a) | | Formerly, Goldman Sachs Ultra-Short Duration Government Fund. Effective July 27, 2012, the Fund changed its name to the Goldman Sachs High Quality Floating Rate Fund. |
| | (b) | | Includes segregated cash of $230,000 for High Quality Floating Rate Fund relating to initial margin requirements on futures transactions. |
| | (c) | | Maximum public offering price per share for Class A shares of the Enhanced Income, Government Income, High Quality Floating Rate, Inflation Protected Securities, Short Duration Government and Short Duration Income Funds is $9.65, $16.32, $8.90, $12.11, $10.49 and $10.30, respectively. At redemption, Class B and Class C Shares may be subject to a contingent deferred sales charge, assessed on the amount equal to the lesser of the current net asset value or the original purchase price of the shares. |
| | |
| 70 | | The accompanying notes are an integral part of these financial statements. |
GOLDMAN SACHS SHORT DURATION AND GOVERNMENT FIXED INCOME FUNDS
| | | | | | | | | | | | | | | | | | | | | | | | | | | | |
| | | Government Income Fund | | | | | High Quality Floating Rate Fund(a) | | | | | Inflation Protected
Securities Fund | | | | | Short Duration Government Fund | | | | | Short Duration
Income Fund | |
| | | | | | | | | | | | | | | | | | | | | | | | | | | | |
| | $ | 796,177,845 | | | | | $ | 233,170,867 | | | | | $ | 314,368,592 | | | | | $ | 2,416,479,530 | | | | | $ | 32,949,665 | |
| | | 193,500,000 | | | | | | — | | | | | | 1,700,000 | | | | | | 100,500,000 | | | | | | 9,100,000 | |
| | | 146,181 | | | | | | — | | | | | | 67,679 | | | | | | 253,921 | | | | | | 150,071 | |
| | | — | | | | | | — | | | | | | — | | | | | | — | | | | | | 6,256 | |
| | | | | | | | | | | | | | | | | | | | | | | | | | | | |
| | | 11,265,858 | | | | | | 13,569,306 | | | | | | 3,902,777 | | | | | | 36,891,575 | | | | | | 499,481 | |
| | | 353,664,805 | | | | | | 7,622,500 | | | | | | — | | | | | | 623,814,354 | | | | | | 18,239,648 | |
| | | 2,751,617 | | | | | | 296,944 | | | | | | 1,141,708 | | | | | | 5,747,341 | | | | | | 232,501 | |
| | | 1,837,895 | | | | | | 39,047 | | | | | | 501,412 | | | | | | 39,140,236 | | | | | | 325,000 | |
| | | 283,369 | | | | | | 118,555 | | | | | | — | | | | | | 183,633 | | | | | | 11,362 | |
| | | — | | | | | | — | | | | | | — | | | | | | — | | | | | | 35,440 | |
| | | 45,383 | | | | | | 14,089 | | | | | | 12,278 | | | | | | 564,036 | | | | | | 4,990 | |
| | | 93,122 | | | | | | 20,294 | | | | | | 1,939 | | | | | | — | | | | | | 55,779 | |
| | | 17,460 | | | | | | 12,194 | | | | | | — | | | | | | — | | | | | | — | |
| | | 522,658 | | | | | | 630,000 | | | | | | — | | | | | | 10,629,959 | | | | | | — | |
| | | — | | | | | | 188,442 | | | | | | — | | | | | | 771,807 | | | | | | — | |
| | | — | | | | | | — | | | | | | — | | | | | | — | | | | | | 68,685 | |
| | | 1,953 | | | | | | 4,206 | | | | | | 739 | | | | | | 6,062 | | | | | | — | |
| | | 1,360,308,146 | | | | | | 255,686,444 | | | | | | 321,697,124 | | | | | | 3,234,982,454 | | | | | | 61,678,878 | |
| | | | | | | | | | | | | | | | | | | | | | | | | | | | |
| | | | | | | | | | | | | | | | | | | | | | | | | | | | |
| | | — | | | | | | 3,246,421 | | | | | | — | | | | | | — | | | | | | — | |
| | | | | | | | | | | | | | | | | | | | | | | | | | | | |
| | | 30,452,508 | | | | | | 3,093,537 | | | | | | 2,793,891 | | | | | | 25,834,524 | | | | | | 630,278 | |
| | | 475,957,578 | | | | | | 8,302,702 | | | | | | — | | | | | | 1,057,038,650 | | | | | | 23,896,850 | |
| | | 3,474,016 | | | | | | 14,678,444 | | | | | | 1,359,844 | | | | | | 29,320,474 | | | | | | 1,747 | |
| | | 540,303 | | | | | | 92,536 | | | | | | 113,038 | | | | | | 1,058,983 | | | | | | 15,243 | |
| | | 133,538 | | | | | | 17,882 | | | | | | 26,854 | | | | | | 109,088 | | | | | | 7 | |
| | | — | | | | | | — | | | | | | — | | | | | | — | | | | | | — | |
| | | — | | | | | | 600,000 | | | | | | — | | | | | | 240,000 | | | | | | — | |
| | | 12,000,313 | | | | | | — | | | | | | — | | | | | | 84,516,757 | | | | | | 1,090,938 | |
| | | 198,440 | | | | | | 79,326 | | | | | | — | | | | | | 897,623 | | | | | | — | |
| | | 822,258 | | | | | | 982,920 | | | | | | 19,281 | | | | | | 7,923,714 | | | | | | 7,823 | |
| | | — | | | | | | — | | | | | | — | | | | | | — | | | | | | 32,828 | |
| | | — | | | | | | — | | | | | | — | | | | | | 771,807 | | | | | | — | |
| | | 497,685 | | | | | | 173,675 | | | | | | 28,644 | | | | | | 4,642,967 | | | | | | 28,085 | |
| | | 174,608 | | | | | | 89,830 | | | | | | 79,899 | | | | | | 241,814 | | | | | | 74,916 | |
| | | 524,251,247 | | | | | | 31,357,273 | | | | | | 4,421,451 | | | | | | 1,212,596,401 | | | | | | 25,778,715 | |
| | | | | | | | | | | | | | | | | | | | | | | | | | | | |
| | | | | | | | | | | | | | | | | | | | | | | | | | | | |
| | | 789,915,650 | | | | | | 264,580,472 | | | | | | 295,268,969 | | | | | | 1,992,211,629 | | | | | | 35,446,616 | |
| | | 86,712 | | | | | | 259,642 | | | | | | (1,444,039 | ) | | | | | 5,115,390 | | | | | | (7,727 | ) |
| | | 23,563,954 | | | | | | (41,129,757 | ) | | | | | 4,312,853 | | | | | | 3,188,067 | | | | | | 212,614 | |
| | | 22,490,583 | | | | | | 618,814 | | | | | | 19,137,890 | | | | | | 21,870,967 | | | | | | 248,660 | |
| | | $ | 836,056,899 | | | | | $ | 224,329,171 | | | | | $ | 317,275,673 | | | | | $ | 2,022,386,053 | | | | | $ | 35,900,163 | |
| | | | | | | | | | | | | | | | | | | | | | | | | | | | | |
| | | | $367,607,825 | | | | | $ | 70,622,602 | | | | | $ | 109,494,128 | | | | | $ | 662,460,463 | | | | | $ | 15,522,718 | |
| | | | 10,330,315 | | | | | | — | | | | | | — | | | | | | 389,458 | | | | | | — | |
| | | | 30,532,402 | | | | | | — | | | | | | 21,953,638 | | | | | | 82,246,597 | | | | | | 11,565 | |
| | | | 314,886,303 | | | | | | 151,347,349 | | | | | | 179,544,029 | | | | | | 1,185,271,024 | | | | | | 20,295,793 | |
| | | | — | | | | | | — | | | | | | — | | | | | | — | | | | | | — | |
| | | | 87,932,513 | | | | | | 171,158 | | | | | | — | | | | | | 61,700,962 | | | | | | — | |
| | | | 1,819,699 | | | | | | 2,188,062 | | | | | | 4,447,067 | | | | | | 30,317,549 | | | | | | 59,875 | |
| | | | 22,947,842 | | | | | | — | | | | | | 1,836,811 | | | | | | — | | | | | | 10,212 | |
| | | | $836,056,899 | | | | | $ | 224,329,171 | | | | | $ | 317,275,673 | | | | | $ | 2,022,386,053 | | | | | $ | 35,900,163 | |
| | | | | | | | | | | | | | | | | | | | | | | | | | | | | |
| | | | 23,394,470 | | | | | | 8,049,694 | | | | | | 9,391,975 | | | | | | 64,152,312 | | | | | | 1,528,650 | |
| | | | 657,414 | | | | | | — | | | | | | — | | | | | | 37,856 | | | | | | — | |
| | | | 1,943,145 | | | | | | — | | | | | | 1,876,797 | | | | | | 8,018,151 | | | | | | 1,138 | |
| | | | 20,072,603 | | | | | | 17,247,844 | | | | | | 15,347,110 | | | | | | 115,156,538 | | | | | | 1,996,324 | |
| | | | — | | | | | | — | | | | | | — | | | | | | — | | | | | | — | |
| | | | 5,610,135 | | | | | | 19,409 | | | | | | — | | | | | | 6,002,808 | | | | | | — | |
| | | | 115,882 | | | | | | 249,614 | | | | | | 381,227 | | | | | | 2,934,154 | | | | | | 5,890 | |
| | | | 1,462,110 | | | | | | — | | | | | | 157,197 | | | | | | — | | | | | | 1,005 | |
| | | | | | | | | | | | | | | | | | | | | | | | | | | | | |
| | | | $15.71 | | | | | | $8.77 | | | | | | $11.66 | | | | | | $10.33 | | | | | | $10.15 | |
| | | | 15.71 | | | | | | — | | | | | | — | | | | | | 10.29 | | | | | | — | |
| | | | 15.71 | | | | | | — | | | | | | 11.70 | | | | | | 10.26 | | | | | | 10.16 | |
| | | | 15.69 | | | | | | 8.77 | | | | | | 11.70 | | | | | | 10.29 | | | | | | 10.17 | |
| | | | — | | | | | | — | | | | | | — | | | | | | — | | | | | | — | |
| | | | 15.67 | | | | | | 8.82 | | | | | | — | | | | | | 10.28 | | | | | | — | |
| | | | 15.70 | | | | | | 8.77 | | | | | | 11.67 | | | | | | 10.33 | | | | | | 10.16 | |
| | | | 15.70 | | | | | | — | | | | | | 11.68 | | | | | | — | | | | | | 10.17 | |
| | |
| The accompanying notes are an integral part of these financial statements. | | 71 |
GOLDMAN SACHS SHORT DURATION AND GOVERNMENT FIXED INCOME FUNDS
Statements of Operations
For the Six Months Ended September 30, 2012 (Unaudited)
| | | | | | |
| | | | |
Enhanced
Income Fund | |
| | Investment income: | |
| | Interest | | $ | 3,681,578 | |
| | | | | | |
| | Expenses: | |
| | Management fees | | | 651,504 | |
| | Transfer Agent fees(c) | | | 150,115 | |
| | Distribution and Service fees(c) | | | 126,589 | |
| | Custody and accounting fees | | | 74,286 | |
| | Registration fees | | | 26,665 | |
| | Professional fees | | | 25,875 | |
| | Printing and mailing costs | | | 16,268 | |
| | Trustee fees | | | 8,052 | |
| | Administration share fees | | | 1,748 | |
| | Service Share fees — Shareholder Administration Plan | | | — | |
| | Service Share fees — Service Plan | | | — | |
| | Amortization of offering costs | | | — | |
| | Other | | | 5,688 | |
| | Total expenses | | | 1,086,790 | |
| | Less — expense reductions | | | (85,420 | ) |
| | Net expenses | | | 1,001,370 | |
| | NET INVESTMENT INCOME | | | 2,680,208 | |
| | | | | | |
| | Realized and unrealized gain (loss): | |
| | Net realized gain (loss) from: | | | | |
| | Investments | | | 724,200 | |
| | Futures contracts | | | (2,587,757 | ) |
| | Swap contracts | | | 36,902 | |
| | Forward foreign currency exchange contracts | | | — | |
| | Foreign currency transactions | | | — | |
| | Net change in unrealized gain (loss) on: | | | | |
| | Investments | | | 1,218,798 | |
| | Futures contracts | | | 1,653,661 | |
| | Written options | | | — | |
| | Swap contracts | | | 1,307 | |
| | Forward foreign currency exchange contracts | | | — | |
| | Foreign currency transactions | | | — | |
| | Net realized and unrealized gain (loss) | | | 1,047,111 | |
| | NET INCREASE IN NET ASSETS RESULTING FROM OPERATIONS | | $ | 3,727,319 | |
| | (a) | | Formerly, Goldman Sachs Ultra-Short Duration Government Fund. Effective July 27, 2012, the Fund changed its name to the Goldman Sachs High Quality Floating Rate Fund. |
| | (b) | | Commenced operations on February 29, 2012. |
| | (c) | | Class specific Distribution and Service, and Transfer Agent fees were as follows: |
| | | | | | | | | | | | | | | | | | | | | | | | | | | | | | | | | | | | | | | | | | | | | | | | |
| | | Distribution and Service Fees | | | Transfer Agent Fees | |
Fund | | Class A | | | Class B | | | Class C | | | Class R | | | Class A | | | Class B | | | Class C | | | Institutional | | | Administration | | | Service | | | Class IR | | | Class R | |
Enhanced Income | | $ | 124,555 | | | $ | 2,034 | | | $ | — | | | $ | — | | | $ | 64,769 | | | $ | 264 | | | $ | — | | | $ | 83,572 | | | $ | 280 | | | $ | — | | | $ | 1,230 | | | $ | — | |
Government Income | | | 475,831 | | | | 57,730 | | | | 158,437 | | | | 54,855 | | | | 247,432 | | | | 7,505 | | | | 20,597 | | | | 55,051 | | | | — | | | | 17,493 | | | | 1,369 | | | | 14,262 | |
High Quality Floating Rate(a) | | | 99,987 | | | | — | | | | — | | | | — | | | | 51,993 | | | | — | | | | — | | | | 38,766 | | | | — | | | | 63 | | | | 889 | | | | — | |
Inflation Protected Securities | | | 146,989 | | | | — | | | | 113,633 | | | | 4,158 | | | | 76,434 | | | | — | | | | 14,773 | | | | 33,597 | | | | — | | | | — | | | | 1,964 | | | | 1,081 | |
Short Duration Government | | | 885,126 | | | | 2,272 | | | | 443,073 | | | | — | | | | 460,266 | | | | 296 | | | | 57,599 | | | | 243,688 | | | | — | | | | 13,161 | | | | 19,959 | | | | — | |
Short Duration Income | | | 10,699 | | | | — | | | | 567 | | | | 26 | | | | 5,564 | | | | — | | | | 74 | | | | 2,790 | | | | — | | | | — | | | | 8 | | | | 7 | |
| | |
| 72 | | The accompanying notes are an integral part of these financial statements. |
GOLDMAN SACHS SHORT DURATION AND GOVERNMENT FIXED INCOME FUNDS
| | | | | | | | | | | | | | | | | | | | | | | | | | | | |
| | | Government
Income Fund | | | | | High Quality
Floating Rate
Fund(a) | | | | | Inflation Protected
Securities Fund | | | | | Short Duration
Government Fund | | | | | Short Duration
Income Fund(b) | |
| | | | | | | | | | | | | | | | | | | | | | | | | | | | |
| | $ | 7,379,083 | | | | | $ | 1,822,200 | | | | | $ | 2,494,252 | | | | | $ | 13,771,891 | | | | | $ | 208,039 | |
| | | | | | | | | | | | | | | | | | | | | | | | | | | | |
| | | | | | | | | | | | | | | | | | | | | | | | | | | | |
| | | 2,188,798 | | | | | | 551,003 | | | | | | 516,430 | | | | | | 4,992,300 | | | | | | 45,290 | |
| | | 363,709 | | | | | | 91,711 | | | | | | 127,849 | | | | | | 794,969 | | | | | | 8,443 | |
| | | 746,853 | | | | | | 99,987 | | | | | | 264,780 | | | | | | 1,330,471 | | | | | | 11,292 | |
| | | 117,235 | | | | | | 73,221 | | | | | | 32,612 | | | | | | 133,241 | | | | | | 22,859 | |
| | | 52,218 | | | | | | 35,824 | | | | | | 45,844 | | | | | | 12,755 | | | | | | 16,441 | |
| | | 49,581 | | | | | | 64,576 | | | | | | 44,661 | | | | | | 46,618 | | | | | | 62,255 | |
| | | 101,943 | | | | | | 24,308 | | | | | | 22,499 | | | | | | 75,372 | | | | | | 20,267 | |
| | | 8,279 | | | | | | 7,784 | | | | | | 7,829 | | | | | | 15,583 | | | | | | 7,276 | |
| | | — | | | | | | — | | | | | | — | | | | | | — | | | | | | — | |
| | | 109,331 | | | | | | 391 | | | | | | — | | | | | | 82,258 | | | | | | — | |
| | | 109,331 | | | | | | 391 | | | | | | — | | | | | | 82,258 | | | | | | — | |
| | | — | | | | | | — | | | | | | — | | | | | | — | | | | | | 113,049 | |
| | | 16,904 | | | | | | 8,771 | | | | | | 9,194 | | | | | | 35,193 | | | | | | 4,700 | |
| | | 3,864,182 | | | | | | 957,967 | | | | | | 1,071,698 | | | | | | 7,601,018 | | | | | | 311,872 | |
| | | (370,617 | ) | | | | | (265,110 | ) | | | | | (297,249 | ) | | | | | (978,986 | ) | | | | | (245,529 | ) |
| | | 3,493,565 | | | | | | 692,857 | | | | | | 774,449 | | | | | | 6,622,032 | | | | | | 66,343 | |
| | | 3,885,518 | | | | | | 1,129,343 | | | | | | 1,719,803 | | | | | | 7,149,859 | | | | | | 141,696 | |
| | | | | | | | | | | | | | | | | | | | | | | | | | | | |
| | | | | | | | | | | | | | | | | | | | | | | | | | | | |
| | | | | | | | | | | | | | | | | | | | | | | | | | | | |
| | | 9,697,511 | | | | | | 3,410,602 | | | | | | 6,830,621 | | | | | | 11,248,522 | | | | | | 215,728 | |
| | | 3,857,937 | | | | | | (743,988 | ) | | | | | 343,631 | | | | | | (4,013,004 | ) | | | | | 5,562 | |
| | | (755,830 | ) | | | | | (1,751,264 | ) | | | | | 30,145 | | | | | | (9,793,277 | ) | | | | | 2,862 | |
| | | — | | | | | | — | | | | | | — | | | | | | — | | | | | | (5,654 | ) |
| | | — | | | | | | — | | | | | | — | | | | | | — | | | | | | 2,468 | |
| | | | | | | | | | | | | | | | | | | | | | | | | | | | |
| | | 5,181,927 | | | | | | (1,113,330 | ) | | | | | 7,505,316 | | | | | | 11,764,341 | | | | | | 239,868 | |
| | | 1,610,751 | | | | | | 20,220 | | | | | | (193,398 | ) | | | | | 1,199,448 | | | | | | 23,425 | |
| | | 108,370 | | | | | | 34,404 | | | | | | — | | | | | | 457,127 | | | | | | — | |
| | | (680,572 | ) | | | | | 35,415 | | | | | | (27,143 | ) | | | | | (5,973,177 | ) | | | | | 3,539 | |
| | | — | | | | | | — | | | | | | — | | | | | | — | | | | | | 939 | |
| | | — | | | | | | — | | | | | | — | | | | | | — | | | | | | (573 | ) |
| | | 19,020,094 | | | | | | (107,941 | ) | | | | | 14,489,172 | | | | | | 4,889,980 | | | | | | 488,164 | |
| | $ | 22,905,612 | | | | | $ | 1,021,402 | | | | | $ | 16,208,975 | | | | | $ | 12,039,839 | | | | | $ | 629,860 | |
| | |
| The accompanying notes are an integral part of these financial statements. | | 73 |
GOLDMAN SACHS SHORT DURATION AND GOVERNMENT FIXED INCOME FUNDS
Statements of Changes in Net Assets
| | | | | | | | | | |
| | | | | Enhanced Income Fund | |
| | | | | For the Six Months Ended
September 30, 2012
(Unaudited) | | | For the Fiscal Year Ended
March 31, 2012 | |
| | From operations: | | | | | | | | |
| | Net investment income | | $ | 2,680,208 | | | $ | 8,120,027 | |
| | Net realized gain (loss) | | | (1,826,655 | ) | | | (8,211,874 | ) |
| | Net change in unrealized gain (loss) | | | 2,873,766 | | | | (1,193,835 | ) |
| | Net increase (decrease) in net assets resulting from operations | | | 3,727,319 | | | | (1,285,682 | ) |
| | | | | | | | | | |
| | Distributions to shareholders: | | | | | | | | |
| | From net investment income | | | | | | | | |
| | Class A Shares | | | (380,858 | ) | | | (1,792,169 | ) |
| | Class B Shares | | | (226 | ) | | | (1,525 | ) |
| | Class C Shares | | | — | | | | — | |
| | Institutional Shares | | | (2,261,698 | ) | | | (6,459,840 | ) |
| | Administration Shares | | | (6,117 | ) | | | (25,026 | ) |
| | Service Shares | | | — | | | | — | |
| | Class IR Shares | | | (9,572 | ) | | | (24,400 | ) |
| | Class R Shares | | | — | | | | — | |
| | From net realized gains | | | | | | | | |
| | Class A Shares | | | — | | | | — | |
| | Class B Shares | | | — | | | | — | |
| | Class C Shares | | | — | | | | — | |
| | Institutional Shares | | | — | | | | — | |
| | Service Shares | | | — | | | | — | |
| | Class IR Shares | | | — | | | | — | |
| | Class R Shares | | | — | | | | — | |
| | Total distributions to shareholders | | | (2,658,471 | ) | | | (8,302,960 | ) |
| | | | | | | | | | |
| | From share transactions: | | | | | | | | |
| | Proceeds from sales of shares | | | 231,299,250 | | | | 360,036,258 | |
| | Reinvestment of distributions | | | 2,455,707 | | | | 7,340,591 | |
| | Cost of shares redeemed | | | (233,360,883 | ) | | | (655,224,524 | ) |
| | Net increase (decrease) in net assets resulting from share transactions | | | 394,074 | | | | (287,847,675 | ) |
| | TOTAL INCREASE (DECREASE) | | | 1,462,922 | | | | (297,436,317 | ) |
| | | | | | | | | | |
| | Net assets: | | | | | | | | |
| | Beginning of period | | | 510,085,253 | | | | 807,521,570 | |
| | End of period | | $ | 511,548,175 | | | $ | 510,085,253 | |
| | Undistributed net investment income | | $ | 716,162 | | | $ | 694,425 | |
| | (a) | | Formerly, Goldman Sachs Ultra-Short Duration Government Fund. Effective July 27, 2012, the Fund changed its name to the Goldman Sachs High Quality Floating Rate Fund. |
| | |
| 74 | | The accompanying notes are an integral part of these financial statements. |
GOLDMAN SACHS SHORT DURATION AND GOVERNMENT FIXED INCOME FUNDS
| | | | | | | | | | | | | | | | | | | | | | |
| | | Government Income Fund | | | | | High Quality Floating Rate Fund(a) | |
| | | For the Six Months Ended
September 30, 2012
(Unaudited) | | | | | For the Fiscal Year Ended March 31, 2012 | | | | | For the Six Months Ended September 30, 2012 (Unaudited) | | | | | For the Fiscal Year Ended March 31, 2012 | |
| | | | | | | | | | | | | | | | | | | | | | |
| | $ | 3,885,518 | | | | | $ | 9,810,846 | | | | | $ | 1,129,343 | | | | | $ | 2,853,946 | |
| | | 12,799,618 | | | | | | 39,227,721 | | | | | | 915,350 | | | | | | (3,394,194 | ) |
| | | 6,220,476 | | | | | | 3,705,240 | | | | | | (1,023,291 | ) | | | | | (48,620 | ) |
| | | 22,905,612 | | | | | | 52,743,807 | | | | | | 1,021,402 | | | | | | (588,868 | ) |
| | | | | | | | | | | | | | | | | | | | | | |
| | | | | | | | | | | | | | | | | | | | | | |
| | | | | | | | | | | | | | | | | | | | | | |
| | | (2,303,735 | ) | | | | | (5,120,138 | ) | | | | | (174,059 | ) | | | | | (245,344 | ) |
| | | (26,889 | ) | | | | | (69,255 | ) | | | | | — | | | | | | — | |
| | | (72,346 | ) | | | | | (150,082 | ) | | | | | — | | | | | | — | |
| | | (2,090,075 | ) | | | | | (3,975,947 | ) | | | | | (754,759 | ) | | | | | (1,530,652 | ) |
| | | — | | | | | | — | | | | | | — | | | | | | — | |
| | | (458,179 | ) | | | | | (1,007,114 | ) | | | | | (532 | ) | | | | | (798 | ) |
| | | (14,756 | ) | | | | | (15,696 | ) | | | | | (4,449 | ) | | | | | (3,661 | ) |
| | | (104,109 | ) | | | | | (164,769 | ) | | | | | — | | | | | | — | |
| | | | | | | | | | | | | | | | | | | | | | |
| | | — | | | | | | (8,861,023 | ) | | | | | — | | | | | | — | |
| | | — | | | | | | (307,313 | ) | | | | | — | | | | | | — | |
| | | — | | | | | | (693,760 | ) | | | | | — | | | | | | — | |
| | | — | | | | | | (5,146,024 | ) | | | | | — | | | | | | — | |
| | | — | | | | | | (2,204,050 | ) | | | | | — | | | | | | — | |
| | | — | | | | | | (27,828 | ) | | | | | — | | | | | | — | |
| | | — | | | | | | (401,308 | ) | | | | | — | | | | | | — | |
| | | (5,070,089 | ) | | | | | (28,144,307 | ) | | | | | (933,799 | ) | | | | | (1,780,455 | ) |
| | | | | | | | | | | | | | | | | | | | | | |
| | | | | | | | | | | | | | | | | | | | | | |
| | | 188,701,716 | | | | | | 332,308,933 | | | | | | 34,243,649 | | | | | | 163,330,885 | |
| | | 4,099,625 | | | | | | 22,914,512 | | | | | | 747,377 | | | | | | 1,269,217 | |
| | | (168,371,567 | ) | | | | | (458,448,811 | ) | | | | | (110,643,135 | ) | | | | | (277,140,579 | ) |
| | | 24,429,774 | | | | | | (103,225,366 | ) | | | | | (75,652,109 | ) | | | | | (112,540,477 | ) |
| | | 42,265,297 | | | | | | (78,625,866 | ) | | | | | (75,564,506 | ) | | | | | (114,909,800 | ) |
| | | | | | | | | | | | | | | | | | | | | | |
| | | | | | | | | | | | | | | | | | | | | | |
| | | 793,791,602 | | | | | | 872,417,468 | | | | | | 299,893,677 | | | | | | 414,803,477 | |
| | $ | 836,056,899 | | | | | $ | 793,791,602 | | | | | $ | 224,329,171 | | | | | $ | 299,893,677 | |
| | $ | 86,712 | | | | | $ | 1,271,283 | | | | | $ | 259,642 | | | | | $ | 64,098 | |
| | |
| The accompanying notes are an integral part of these financial statements. | | 75 |
GOLDMAN SACHS SHORT DURATION AND GOVERNMENT FIXED INCOME FUNDS
Statements of Changes in Net Assets (continued)
| | | | | | | | | | |
| | | | | Inflation Protected Securities Fund | |
| | | | | For the Six Months Ended
September 30, 2012
(Unaudited) | | | For the Fiscal Year Ended
March 31, 2012 | |
| | From operations: | | | | | | | | |
| | Net investment income | | $ | 1,719,803 | | | $ | 4,747,552 | |
| | Net realized gain (loss) | | | 7,204,397 | | | | 13,564,864 | |
| | Net change in unrealized gain (loss) | | | 7,284,775 | | | | 9,942,691 | |
| | Net increase (decrease) in net assets resulting from operations | | | 16,208,975 | | | | 28,255,107 | |
| | | | | | | | | | |
| | Distributions to shareholders: | | | | | | | | |
| | From net investment income | | | | | | | | |
| | Class A Shares | | | (1,029,101 | ) | | | (2,478,500 | ) |
| | Class B Shares | | | — | | | | — | |
| | Class C Shares | | | (112,256 | ) | | | (468,608 | ) |
| | Institutional Shares | | | (1,749,281 | ) | | | (3,727,032 | ) |
| | Service Shares | | | — | | | | — | |
| | Class IR Shares | | | (30,554 | ) | | | (12,811 | ) |
| | Class R Shares | | | (12,608 | ) | | | (31,098 | ) |
| | From net realized gains | | | | | | | | |
| | Class A Shares | | | — | | | | (7,853,145 | ) |
| | Class C Shares | | | — | | | | (1,730,710 | ) |
| | Institutional Shares | | | — | | | | (9,396,683 | ) |
| | Service Shares | | | — | | | | — | |
| | Class IR Shares | | | — | | | | (170,273 | ) |
| | Class R Shares | | | — | | | | (85,385 | ) |
| | Total distributions to shareholders | | | (2,933,800 | ) | | | (25,954,245 | ) |
| | | | | | | | | | |
| | From share transactions: | | | | | | | | |
| | Proceeds from sales of shares | | | 58,692,779 | | | | 205,588,498 | |
| | Reinvestment of distributions | | | 2,625,960 | | | | 22,781,478 | |
| | Cost of shares redeemed | | | (65,643,651 | ) | | | (133,424,118 | ) |
| | Net increase (decrease) in net assets resulting from share transactions | | | (4,324,912 | ) | | | 94,945,858 | |
| | TOTAL INCREASE (DECREASE) | | | 8,950,263 | | | | 97,246,720 | |
| | | | | | | | | | |
| | Net assets: | | | | | | | | |
| | Beginning of period | | | 308,325,410 | | | | 211,078,690 | |
| | End of period | | $ | 317,275,673 | | | $ | 308,325,410 | |
| | Undistributed (distributions in excess of) net investment income | | $ | (1,444,039 | ) | | $ | (230,042 | ) |
| | (a) | | Commenced operations on February 29, 2012. |
| | |
| 76 | | The accompanying notes are an integral part of these financial statements. |
GOLDMAN SACHS SHORT DURATION AND GOVERNMENT FIXED INCOME FUNDS
| | | | | | | | | | | | | | | | | | | | | | |
| | | Short Duration Government Fund | | | | | Short Duration Income Fund(a) | |
| | | For the Six Months Ended
September 30, 2012
(Unaudited) | | | | | For the Fiscal Year Ended
March 31, 2012 | | | | | For the Six Months Ended
September 30, 2012
(Unaudited) | | | | | For the Period Ended
March 31, 2012 | |
| | | | | | | | | | | | | | | | | | | | | | |
| | $ | 7,149,859 | | | | | $ | 18,424,514 | | | | | $ | 141,696 | | | | | $ | 10,147 | |
| | | (2,557,759 | ) | | | | | 26,728,359 | | | | | | 220,966 | | | | | | (8,052 | ) |
| | | 7,447,739 | | | | | | (13,627,898 | ) | | | | | 267,198 | | | | | | (18,538 | ) |
| | | 12,039,839 | | | | | | 31,524,975 | | | | | | 629,860 | | | | | | (16,443 | ) |
| | | | | | | | | | | | | | | | | | | | | | |
| | | | | | | | | | | | | | | | | | | | | | |
| | | | | | | | | | | | | | | | | | | | | | |
| | | (1,566,814 | ) | | | | | (3,665,592 | ) | | | | | (48,622 | ) | | | | | (337 | ) |
| | | (36 | ) | | | | | (163 | ) | | | | | — | | | | | | — | |
| | | (33,286 | ) | | | | | (51,682 | ) | | | | | (479 | ) | | | | | (2 | ) |
| | | (4,767,033 | ) | | | | | (10,837,614 | ) | | | | | (100,551 | ) | | | | | (9,789 | ) |
| | | (93,401 | ) | | | | | (216,604 | ) | | | | | — | | | | | | — | |
| | | (106,462 | ) | | | | | (180,431 | ) | | | | | (76 | ) | | | | | (8 | ) |
| | | — | | | | | | — | | | | | | (41 | ) | | | | | (5 | ) |
| | | | | | | | | | | | | | | | | | | | | | |
| | | — | | | | | | (149,257 | ) | | | | | — | | | | | | — | |
| | | — | | | | | | (111 | ) | | | | | — | | | | | | — | |
| | | — | | | | | | (17,475 | ) | | | | | — | | | | | | — | |
| | | — | | | | | | (245,384 | ) | | | | | — | | | | | | — | |
| | | — | | | | | | (12,585 | ) | | | | | — | | | | | | — | |
| | | — | | | | | | (7,450 | ) | | | | | — | | | | | | — | |
| | | (6,567,032 | ) | | | | | (15,384,348 | ) | | | | | (149,769 | ) | | | | | (10,141 | ) |
| | | | | | | | | | | | | | | | | | | | | | |
| | | | | | | | | | | | | | | | | | | | | | |
| | | 355,384,579 | | | | | | 1,284,918,598 | | | | | | 24,358,294 | | | | | | 12,915,887 | |
| | | 5,866,452 | | | | | | 13,009,593 | | | | | | 149,610 | | | | | | 10,134 | |
| | | (619,269,315 | ) | | | | | (1,830,414,905 | ) | | | | | (1,987,198 | ) | | | | | (71 | ) |
| | | (258,018,284 | ) | | | | | (532,486,714 | ) | | | | | 22,520,706 | | | | | | 12,925,950 | |
| | | (252,545,477 | ) | | | | | (516,346,087 | ) | | | | | 23,000,797 | | | | | | 12,899,366 | |
| | | | | | | | | | | | | | | | | | | | | | |
| | | | | | | | | | | | | | | | | | | | | | |
| | | 2,274,931,530 | | | | | | 2,791,277,617 | | | | | | 12,899,366 | | | | | | — | |
| | $ | 2,022,386,053 | | | | | $ | 2,274,931,530 | | | | | $ | 35,900,163 | | | | | $ | 12,899,366 | |
| | $ | 5,115,390 | | | | | $ | 4,532,563 | | | | | $ | (7,727 | ) | | | | $ | 346 | |
| | |
| The accompanying notes are an integral part of these financial statements. | | 77 |
GOLDMAN SACHS ENHANCED INCOME FUND
Financial Highlights
Selected Data for a Share Outstanding Throughout Each Period
| | | | | | | | | | | | | | | | | | | | | | |
| | | | | | | | Income (loss) from
investment operations | | | | |
| | | Year - Share Class | | Net asset
value,
beginning
of period | | | Net
investment
income(a) | | | Net realized
and unrealized
gain (loss) | | | Total from
investment
operations | | | Distributions
to shareholders
from net
investment
income | |
| | FOR THE SIX MONTHS ENDED SEPTEMBER 30, (UNAUDITED) | |
| | 2012 - A | | $ | 9.49 | | | $ | 0.04 | | | $ | 0.02 | | | $ | 0.06 | | | $ | (0.04 | ) |
| | 2012 - B | | | 9.47 | | | | 0.01 | | | | 0.01 | | | | 0.02 | | | | — | (d) |
| | 2012 - Institutional | | | 9.47 | | | | 0.05 | | | | 0.02 | | | | 0.07 | | | | (0.05 | ) |
| | 2012 - Administration | | | 9.51 | | | | 0.04 | | | | 0.02 | | | | 0.06 | | | | (0.04 | ) |
| | 2012 - IR | | | 9.47 | | | | 0.05 | | | | 0.02 | | | | 0.07 | | | | (0.05 | ) |
| | | | | | | | | | | | | | | | | | | | | | |
| | FOR THE FISCAL YEARS ENDED MARCH 31, | |
| | 2012 - A | | | 9.60 | | | | 0.09 | | | | (0.11 | ) | | | (0.02 | ) | | | (0.09 | ) |
| | 2012 - B | | | 9.58 | | | | 0.02 | | | | (0.11 | ) | | | (0.09 | ) | | | (0.02 | ) |
| | 2012 - Institutional | | | 9.59 | | | | 0.12 | | | | (0.11 | ) | | | 0.01 | | | | (0.13 | ) |
| | 2012 - Administration | | | 9.62 | | | | 0.10 | | | | (0.11 | ) | | | (0.01 | ) | | | (0.10 | ) |
| | 2012 - IR | | | 9.58 | | | | 0.11 | | | | (0.10 | ) | | | 0.01 | | | | (0.12 | ) |
| | 2011 - A | | | 9.67 | | | | 0.10 | | | | (0.07 | ) | | | 0.03 | | | | (0.10 | ) |
| | 2011 - B | | | 9.66 | | | | 0.03 | | | | (0.08 | ) | | | (0.05 | ) | | | (0.03 | ) |
| | 2011 - Institutional | | | 9.66 | | | | 0.13 | | | | (0.07 | ) | | | 0.06 | | | | (0.13 | ) |
| | 2011 - Administration | | | 9.69 | | | | 0.11 | | | | (0.07 | ) | | | 0.04 | | | | (0.11 | ) |
| | 2011 - IR (Commenced July 30, 2010) | | | 9.62 | | | | 0.09 | | | | (0.04 | ) | | | 0.05 | | | | (0.09 | ) |
| | 2010 - A | | | 9.51 | | | | 0.12 | | | | 0.19 | | | | 0.31 | | | | (0.15 | ) |
| | 2010 - B | | | 9.50 | | | | 0.07 | | | | 0.17 | | | | 0.24 | | | | (0.08 | ) |
| | 2010 - Institutional | | | 9.50 | | | | 0.16 | | | | 0.18 | | | | 0.34 | | | | (0.18 | ) |
| | 2010 - Administration | | | 9.53 | | | | 0.14 | | | | 0.18 | | | | 0.32 | | | | (0.16 | ) |
| | 2009 - A | | | 9.67 | | | | 0.28 | | | | (0.12 | ) | | | 0.16 | | | | (0.32 | ) |
| | 2009 - B | | | 9.65 | | | | 0.21 | | | | (0.11 | ) | | | 0.10 | | | | (0.25 | ) |
| | 2009 - Institutional | | | 9.66 | | | | 0.31 | | | | (0.11 | ) | | | 0.20 | | | | (0.36 | ) |
| | 2009 - Administration | | | 9.68 | | | | 0.29 | | | | (0.11 | ) | | | 0.18 | | | | (0.33 | ) |
| | | | | | | | | | | | | | | | | | | | | | |
| | FOR THE PERIOD NOVEMBER 1, 2007 TO MARCH 31, 2008* | |
| | 2008 - A | | | 9.72 | | | | 0.16 | | | | (0.04 | ) | | | 0.12 | | | | (0.17 | ) |
| | 2008 - B | | | 9.70 | | | | 0.13 | | | | (0.04 | ) | | | 0.09 | | | | (0.14 | ) |
| | 2008 - Institutional | | | 9.70 | | | | 0.17 | | | | (0.03 | ) | | | 0.14 | | | | (0.18 | ) |
| | 2008 - Administration | | | 9.72 | | | | 0.17 | | | | (0.04 | ) | | | 0.13 | | | | (0.17 | ) |
| | | | | | | | | | | | | | | | | | | | | | |
| | FOR THE FISCAL YEAR ENDED OCTOBER 31, | |
| | 2007 - A | | | 9.73 | | | | 0.43 | | | | — | | | | 0.43 | | | | (0.44 | ) |
| | 2007 - B (Commenced June 20, 2007) | | | 9.74 | | | | 0.13 | | | | (0.02 | ) | | | 0.11 | | | | (0.15 | ) |
| | 2007 - Institutional | | | 9.72 | | | | 0.47 | | | | (0.01 | ) | | | 0.46 | | | | (0.48 | ) |
| | 2007 - Administration | | | 9.71 | | | | 0.44 | | | | 0.02 | | | | 0.46 | | | | (0.45 | ) |
| | * | | The Fund changed its fiscal year end from October 31 to March 31. |
| | (a) | | Calculated based on the average shares outstanding methodology. |
| | (b) | | Assumes investment at the net asset value at the beginning of the period, reinvestment of all dividends and distributions, a complete redemption of the investment at the net asset value at the end of the period and no sales or redemption charges. Total returns would be reduced if a sales or redemption charge was taken into account. Returns do not reflect the deduction of taxes that a shareholder would pay on Fund distributions or the redemption of Fund shares. Total returns for periods less than one full year are not annualized. |
| | (c) | | The Fund’s portfolio turnover rate is calculated in accordance with regulatory requirements, without regard to transactions involving short term investments and certain derivatives. If such transactions were included, the Fund’s portfolio turnover rate may be higher. |
| | (d) | | Amount is less than $0.005 per share. |
| | |
| 78 | | The accompanying notes are an integral part of these financial statements. |
GOLDMAN SACHS ENHANCED INCOME FUND
| | | | | | | | | | | | | | | | | | | | | | | | | | | | | | | | | | | | | | | | |
| | | | | | | | | | | | | | | | | | | | | | | | | | | | | | | | | | |
| | | Net asset
value, end
of period | | | | | Total
return(b) | | | | | Net assets,
end of
period
(in 000s) | | | | | Ratio of
net expenses
to average
net assets | | | | | Ratio of
total expenses
to average
net assets | | | | | Ratio of
net investment
income
to average
net assets | | | | | Portfolio
turnover
rate(c) | |
| | | | | | | | | | | | | | | | | | | | | | | | | | | | | | | | | | | | | | | | |
| | $ | 9.51 | | | | | | 0.59 | % | | | | $ | 83,636 | | | | | | 0.66 | %(e) | | | | | 0.69 | %(e) | | | | | 0.77 | %(e) | | | | | 50 | % |
| | | 9.49 | | | | | | 0.26 | | | | | | 275 | | | | | | 1.31 | (e) | | | | | 1.44 | (e) | | | | | 0.12 | (e) | | | | | 50 | |
| | | 9.49 | | | | | | 0.76 | | | | | | 424,770 | | | | | | 0.32 | (e) | | | | | 0.35 | (e) | | | | | 1.09 | (e) | | | | | 50 | |
| | | 9.53 | | | | | | 0.63 | | | | | | 1,122 | | | | | | 0.57 | (e) | | | | | 0.60 | (e) | | | | | 0.88 | (e) | | | | | 50 | |
| | | 9.49 | | | | | | 0.71 | | | | | | 1,745 | | | | | | 0.41 | (e) | | | | | 0.44 | (e) | | | | | 1.02 | (e) | | | | | 50 | |
| | | | | | | | | | | | | | | | | | | | | | | | | | | | | | | | | | | | | | | | |
| | | | | | | | | | | | | | | | | | | | | | | | | | | | | | | | | | | | | | | | |
| | | 9.49 | | | | | | (0.19 | ) | | | | | 110,136 | | | | | | 0.64 | | | | | | 0.69 | | | | | | 0.94 | | | | | | 86 | |
| | | 9.47 | | | | | | (0.93 | ) | | | | | 476 | | | | | | 1.39 | | | | | | 1.44 | | | | | | 0.19 | | | | | | 86 | |
| | | 9.47 | | | | | | 0.05 | | | | | | 395,751 | | | | | | 0.30 | | | | | | 0.35 | | | | | | 1.28 | | | | | | 86 | |
| | | 9.51 | | | | | | (0.09 | ) | | | | | 1,682 | | | | | | 0.55 | | | | | | 0.60 | | | | | | 1.03 | | | | | | 86 | |
| | | 9.47 | | | | | | 0.06 | | | | | | 2,040 | | | | | | 0.39 | | | | | | 0.44 | | | | | | 1.17 | | | | | | 86 | |
| | | 9.60 | | | | | | 0.29 | | | | | | 225,355 | | | | | | 0.63 | | | | | | 0.68 | | | | | | 1.01 | | | | | | 71 | |
| | | 9.58 | | | | | | (0.56 | ) | | | | | 929 | | | | | | 1.38 | | | | | | 1.43 | | | | | | 0.26 | | | | | | 71 | |
| | | 9.59 | | | | | | 0.63 | | | | | | 578,458 | | | | | | 0.29 | | | | | | 0.34 | | | | | | 1.35 | | | | | | 71 | |
| | | 9.62 | | | | | | 0.38 | | | | | | 2,779 | | | | | | 0.54 | | | | | | 0.59 | | | | | | 1.11 | | | | | | 71 | |
| | | 9.58 | | | | | | 0.53 | | | | | | 1 | | | | | | 0.38 | (e) | | | | | 0.43 | (e) | | | | | 1.39 | (e) | | | | | 71 | |
| | | 9.67 | | | | | | 3.26 | | | | | | 371,906 | | | | | | 0.63 | | | | | | 0.68 | | | | | | 1.25 | | | | | | 66 | |
| | | 9.66 | | | | | | 2.49 | | | | | | 1,393 | | | | | | 1.38 | | | | | | 1.43 | | | | | | 0.75 | | | | | | 66 | |
| | | 9.66 | | | | | | 3.62 | | | | | | 847,623 | | | | | | 0.29 | | | | | | 0.34 | | | | | | 1.64 | | | | | | 66 | |
| | | 9.69 | | | | | | 3.35 | | | | | | 2,814 | | | | | | 0.54 | | | | | | 0.59 | | | | | | 1.45 | | | | | | 66 | |
| | | 9.51 | | | | | | 1.73 | | | | | | 48,001 | | | | | | 0.59 | | | | | | 0.78 | | | | | | 2.94 | | | | | | 180 | |
| | | 9.50 | | | | | | 1.08 | | | | | | 2,218 | | | | | | 1.34 | | | | | | 1.53 | | | | | | 2.21 | | | | | | 180 | |
| | | 9.50 | | | | | | 2.07 | | | | | | 222,638 | | | | | | 0.25 | | | | | | 0.44 | | | | | | 3.30 | | | | | | 180 | |
| | | 9.53 | | | | | | 1.92 | | | | | | 295 | | | | | | 0.50 | | | | | | 0.69 | | | | | | 3.04 | | | | | | 180 | |
| | | | | | | | | | | | | | | | | | | | | | | | | | | | | | | | | | | | | | | | |
| | | | | | | | | | | | | | | | | | | | | | | | | | | | | | | | | | | | | | | | |
| | | 9.67 | | | | | | 1.32 | | | | | | 40,286 | | | | | | 0.58 | (e) | | | | | 0.76 | (e) | | | | | 3.90 | (e) | | | | | 8 | |
| | | 9.65 | | | | | | 0.91 | | | | | | 3,501 | | | | | | 1.33 | (e) | | | | | 1.51 | (e) | | | | | 3.16 | (e) | | | | | 8 | |
| | | 9.66 | | | | | | 1.47 | | | | | | 228,300 | | | | | | 0.24 | (e) | | | | | 0.42 | (e) | | | | | 4.26 | (e) | | | | | 8 | |
| | | 9.68 | | | | | | 1.36 | | | | | | 266 | | | | | | 0.49 | (e) | | | | | 0.67 | (e) | | | | | 4.29 | (e) | | | | | 8 | |
| | | | | | | | | | | | | | | | | | | | | | | | | | | | | | | | | | | | | | | | |
| | | | | | | | | | | | | | | | | | | | | | | | | | | | | | | | | | | | | | | | |
| | | 9.72 | | | | | | 4.43 | | | | | | 40,505 | | | | | | 0.61 | | | | | | 0.79 | | | | | | 4.46 | | | | | | 87 | |
| | | 9.70 | | | | | | 1.16 | | | | | | 5,230 | | | | | | 1.36 | (e) | | | | | 1.54 | (e) | | | | | 3.87 | (e) | | | | | 87 | |
| | | 9.70 | | | | | | 4.82 | | | | | | 236,210 | | | | | | 0.25 | | | | | | 0.43 | | | | | | 4.82 | | | | | | 87 | |
| | | 9.72 | | | | | | 4.88 | | | | | | 254 | | | | | | 0.50 | | | | | | 0.68 | | | | | | 4.40 | | | | | | 87 | |
| | |
| The accompanying notes are an integral part of these financial statements. | | 79 |
GOLDMAN SACHS GOVERNMENT INCOME FUND
Financial Highlights
Selected Data for a Share Outstanding Throughout Each Period
| | | | | | | | | | | | | | | | | | | | | | | | | | | | | | |
| | | | | | | | Income from
investment operations | | | Distributions
to shareholders | |
| | | Year - Share Class | |
Net asset
value,
beginning
of period | | | Net
investment
income(a) | | | Net realized
and unrealized
gain | | | Total from
investment
operations | | | From net
investment
income | | | From net
realized
gains | | | Total
distributions | |
| | FOR THE SIX MONTHS ENDED SEPTEMBER 30, (UNAUDITED) | |
| | 2012 - A | | $ | 15.37 | | | $ | 0.07 | | | $ | 0.36 | | | $ | 0.43 | | | $ | (0.09 | ) | | $ | — | | | $ | (0.09 | ) |
| | 2012 - B | | | 15.37 | | | | 0.01 | | | | 0.37 | | | | 0.38 | | | | (0.04 | ) | | | — | | | | (0.04 | ) |
| | 2012 - C | | | 15.37 | | | | 0.01 | | | | 0.37 | | | | 0.38 | | | | (0.04 | ) | | | — | | | | (0.04 | ) |
| | 2012 - Institutional | | | 15.34 | | | | 0.10 | | | | 0.37 | | | | 0.47 | | | | (0.12 | ) | | | — | | | | (0.12 | ) |
| | 2012 - Service | | | 15.33 | | | | 0.06 | | | | 0.36 | | | | 0.42 | | | | (0.08 | ) | | | — | | | | (0.08 | ) |
| | 2012 - IR | | | 15.36 | | | | 0.09 | | | | 0.36 | | | | 0.45 | | | | (0.11 | ) | | | — | | | | (0.11 | ) |
| | 2012 - R | | | 15.35 | | | | 0.05 | | | | 0.37 | | | | 0.42 | | | | (0.07 | ) | | | — | | | | (0.07 | ) |
| | | | | | | | | | | | | | | | | | | | | | | | | | | | | | |
| | FOR THE FISCAL YEARS ENDED MARCH 31, | |
| | 2012 - A | | | 14.95 | | | | 0.18 | | | | 0.76 | | | | 0.94 | | | | (0.18 | ) | | | (0.34 | ) | | | (0.52 | ) |
| | 2012 - B | | | 14.95 | | | | 0.06 | | | | 0.77 | | | | 0.83 | | | | (0.07 | ) | | | (0.34 | ) | | | (0.41 | ) |
| | 2012 - C | | | 14.95 | | | | 0.06 | | | | 0.77 | | | | 0.83 | | | | (0.07 | ) | | | (0.34 | ) | | | (0.41 | ) |
| | 2012 - Institutional | | | 14.92 | | | | 0.23 | | | | 0.77 | | | | 1.00 | | | | (0.24 | ) | | | (0.34 | ) | | | (0.58 | ) |
| | 2012 - Service | | | 14.91 | | | | 0.15 | | | | 0.77 | | | | 0.92 | | | | (0.16 | ) | | | (0.34 | ) | | | (0.50 | ) |
| | 2012 - IR | | | 14.94 | | | | 0.21 | | | | 0.77 | | | | 0.98 | | | | (0.22 | ) | | | (0.34 | ) | | | (0.56 | ) |
| | 2012 - R | | | 14.93 | | | | 0.13 | | | | 0.78 | | | | 0.91 | | | | (0.15 | ) | | | (0.34 | ) | | | (0.49 | ) |
| | 2011 - A | | | 15.18 | | | | 0.24 | | | | 0.30 | | | | 0.54 | | | | (0.23 | ) | | | (0.54 | ) | | | (0.77 | ) |
| | 2011 - B | | | 15.18 | | | | 0.12 | | | | 0.31 | | | | 0.43 | | | | (0.12 | ) | | | (0.54 | ) | | | (0.66 | ) |
| | 2011 - C | | | 15.18 | | | | 0.12 | | | | 0.31 | | | | 0.43 | | | | (0.12 | ) | | | (0.54 | ) | | | (0.66 | ) |
| | 2011 - Institutional | | | 15.16 | | | | 0.29 | | | | 0.30 | | | | 0.59 | | | | (0.29 | ) | | | (0.54 | ) | | | (0.83 | ) |
| | 2011 - Service | | | 15.15 | | | | 0.21 | | | | 0.30 | | | | 0.51 | | | | (0.21 | ) | | | (0.54 | ) | | | (0.75 | ) |
| | 2011 - IR | | | 15.18 | | | | 0.27 | | | | 0.30 | | | | 0.57 | | | | (0.27 | ) | | | (0.54 | ) | | | (0.81 | ) |
| | 2011 - R | | | 15.17 | | | | 0.19 | | | | 0.31 | | | | 0.50 | | | | (0.20 | ) | | | (0.54 | ) | | | (0.74 | ) |
| | 2010 - A | | | 15.14 | | | | 0.42 | | | | 0.25 | | | | 0.67 | | | | (0.39 | ) | | | (0.24 | ) | | | (0.63 | ) |
| | 2010 - B | | | 15.14 | | | | 0.31 | | | | 0.24 | | | | 0.55 | | | | (0.27 | ) | | | (0.24 | ) | | | (0.51 | ) |
| | 2010 - C | | | 15.14 | | | | 0.30 | | | | 0.25 | | | | 0.55 | | | | (0.27 | ) | | | (0.24 | ) | | | (0.51 | ) |
| | 2010 - Institutional | | | 15.12 | | | | 0.47 | | | | 0.25 | | | | 0.72 | | | | (0.44 | ) | | | (0.24 | ) | | | (0.68 | ) |
| | 2010 - Service | | | 15.11 | | | | 0.39 | | | | 0.25 | | | | 0.64 | | | | (0.36 | ) | | | (0.24 | ) | | | (0.60 | ) |
| | 2010 - IR | | | 15.14 | | | | 0.41 | | | | 0.30 | | | | 0.71 | | | | (0.43 | ) | | | (0.24 | ) | | | (0.67 | ) |
| | 2010 - R | | | 15.14 | | | | 0.33 | | | | 0.30 | | | | 0.63 | | | | (0.36 | ) | | | (0.24 | ) | | | (0.60 | ) |
| | 2009 - A | | | 15.07 | | | | 0.57 | | | | 0.16 | | | | 0.73 | | | | (0.60 | ) | | | (0.06 | ) | | | (0.66 | ) |
| | 2009 - B | | | 15.07 | | | | 0.46 | | | | 0.15 | | | | 0.61 | | | | (0.48 | ) | | | (0.06 | ) | | | (0.54 | ) |
| | 2009 - C | | | 15.07 | | | | 0.46 | | | | 0.15 | | | | 0.61 | | | | (0.48 | ) | | | (0.06 | ) | | | (0.54 | ) |
| | 2009 - Institutional | | | 15.05 | | | | 0.62 | | | | 0.16 | | | | 0.78 | | | | (0.65 | ) | | | (0.06 | ) | | | (0.71 | ) |
| | 2009 - Service | | | 15.04 | | | | 0.54 | | | | 0.16 | | | | 0.70 | | | | (0.57 | ) | | | (0.06 | ) | | | (0.63 | ) |
| | 2009 - IR | | | 15.08 | | | | 0.60 | | | | 0.15 | | | | 0.75 | | | | (0.63 | ) | | | (0.06 | ) | | | (0.69 | ) |
| | 2009 - R | | | 15.08 | | | | 0.52 | | | | 0.17 | | | | 0.69 | | | | (0.57 | ) | | | (0.06 | ) | | | (0.63 | ) |
| | | | | | | | | | | | | | | | | | | | | | | | | | | | | | |
| | FOR THE PERIOD NOVEMBER 1, 2007 TO MARCH 31, 2008* | |
| | 2008 - A | | | 14.79 | | | | 0.26 | | | | 0.28 | | | | 0.54 | | | | (0.26 | ) | | | — | | | | (0.26 | ) |
| | 2008 - B | | | 14.79 | | | | 0.22 | | | | 0.27 | | | | 0.49 | | | | (0.21 | ) | | | — | | | | (0.21 | ) |
| | 2008 - C | | | 14.78 | | | | 0.21 | | | | 0.29 | | | | 0.50 | | | | (0.21 | ) | | | — | | | | (0.21 | ) |
| | 2008 - Institutional | | | 14.77 | | | | 0.28 | | | | 0.28 | | | | 0.56 | | | | (0.28 | ) | | | — | | | | (0.28 | ) |
| | 2008 - Service | | | 14.76 | | | | 0.25 | | | | 0.28 | | | | 0.53 | | | | (0.25 | ) | | | — | | | | (0.25 | ) |
| | 2008 - IR (Commenced November 30, 2007) | | | 15.02 | | | | 0.22 | | | | 0.06 | | | | 0.28 | | | | (0.22 | ) | | | — | | | | (0.22 | ) |
| | 2008 - R (Commenced November 30, 2007) | | | 15.02 | | | | 0.20 | | | | 0.06 | | | | 0.26 | | | | (0.20 | ) | | | — | | | | (0.20 | ) |
| | | | | | | | | | | | | | | | | | | | | | | | | | | | | | |
| | FOR THE FISCAL YEAR ENDED OCTOBER 31, | |
| | 2007 - A | | | 14.64 | | | | 0.60 | | | | 0.13 | | | | 0.73 | | | | (0.58 | ) | | | — | | | | (0.58 | ) |
| | 2007 - B | | | 14.64 | | | | 0.50 | | | | 0.12 | | | | 0.62 | | | | (0.47 | ) | | | — | | | | (0.47 | ) |
| | 2007 - C | | | 14.63 | | | | 0.49 | | | | 0.13 | | | | 0.62 | | | | (0.47 | ) | | | — | | | | (0.47 | ) |
| | 2007 - Institutional | | | 14.63 | | | | 0.65 | | | | 0.13 | | | | 0.78 | | | | (0.64 | ) | | | — | | | | (0.64 | ) |
| | 2007 - Service | | | 14.61 | | | | 0.58 | | | | 0.13 | | | | 0.71 | | | | (0.56 | ) | | | — | | | | (0.56 | ) |
| | * | | The Fund changed its fiscal year end from October 31 to March 31. |
| | (a) | | Calculated based on the average shares outstanding methodology. |
| | (b) | | Assumes investment at the net asset value at the beginning of the period, reinvestment of all dividends and distributions, a complete redemption of the investment at the net asset value at the end of the period and no sales or redemption charges. Total returns would be reduced if a sales or redemption charge was taken into account. Returns do not reflect the deduction of taxes that a shareholder would pay on Fund distributions or the redemption of Fund shares. Total returns for periods less than one full year are not annualized. |
| | (c) | | The Fund’s portfolio turnover rate is calculated in accordance with regulatory requirements, without regard to transactions involving short term investments and certain derivatives. If such transactions were included, the Fund’s portfolio turnover rate may be higher. |
| | |
| 80 | | The accompanying notes are an integral part of these financial statements. |
GOLDMAN SACHS GOVERNMENT INCOME FUND
| | | | | | | | | | | | | | | | | | | | | | | | | | | | | | | | | | | | | | | | |
| | | | | | | | | | | | | | | | | | | | | | | | | | | | | | | | | | |
| | | Net asset
value, end
of period | | | | | Total
return(b) | | | | | Net assets,
end of
period
(in 000s) | | | | | Ratio of
net expenses
to average
net assets | | | | | Ratio of
total expenses
to average
net assets | | | | | Ratio of
net investment
income
to average
net assets | | | | | Portfolio
turnover
rate(c) | |
| | | | | | | | | | | | | | | | | | | | | | | | | | | | | | | | | | | | | | | | |
| | $ | 15.71 | | | | | | 2.83 | % | | | | $ | 367,608 | | | | | | 0.91 | %(d) | | | | | 1.00 | %(d) | | | | | 0.92 | %(d) | | | | | 495 | % |
| | | 15.71 | | | | | | 2.45 | | | | | | 10,330 | | | | | | 1.66 | (d) | | | | | 1.75 | (d) | | | | | 0.17 | (d) | | | | | 495 | |
| | | 15.71 | | | | | | 2.44 | | | | | | 30,532 | | | | | | 1.66 | (d) | | | | | 1.75 | (d) | | | | | 0.16 | (d) | | | | | 495 | |
| | | 15.69 | | | | | | 3.07 | | | | | | 314,886 | | | | | | 0.57 | (d) | | | | | 0.66 | (d) | | | | | 1.23 | (d) | | | | | 495 | |
| | | 15.67 | | | | | | 2.75 | | | | | | 87,933 | | | | | | 1.07 | (d) | | | | | 1.16 | (d) | | | | | 0.76 | (d) | | | | | 495 | |
| | | 15.70 | | | | | | 2.96 | | | | | | 1,820 | | | | | | 0.66 | (d) | | | | | 0.75 | (d) | | | | | 1.14 | (d) | | | | | 495 | |
| | | 15.70 | | | | | | 2.77 | | | | | | 22,948 | | | | | | 1.16 | (d) | | | | | 1.25 | (d) | | | | | 0.66 | (d) | | | | | 495 | |
| | | | | | | | | | | | | | | | | | | | | | | | | | | | | | | | | | | | | | | | |
| | | | | | | | | | | | | | | | | | | | | | | | | | | | | | | | | | | | | | | | |
| | | 15.37 | | | | | | 6.32 | | | | | | 396,439 | | | | | | 0.92 | | | | | | 1.00 | | | | | | 1.14 | | | | | | 763 | |
| | | 15.37 | | | | | | 5.53 | | | | | | 12,109 | | | | | | 1.67 | | | | | | 1.75 | | | | | | 0.39 | | | | | | 763 | |
| | | 15.37 | | | | | | 5.53 | | | | | | 32,148 | | | | | | 1.67 | | | | | | 1.75 | | | | | | 0.38 | | | | | | 763 | |
| | | 15.34 | | | | | | 6.69 | | | | | | 241,382 | | | | | | 0.58 | | | | | | 0.66 | | | | | | 1.48 | | | | | | 763 | |
| | | 15.33 | | | | | | 6.17 | | | | | | 89,677 | | | | | | 1.08 | | | | | | 1.16 | | | | | | 0.97 | | | | | | 763 | |
| | | 15.36 | | | | | | 6.59 | | | | | | 1,669 | | | | | | 0.67 | | | | | | 0.75 | | | | | | 1.35 | | | | | | 763 | |
| | | 15.35 | | | | | | 6.07 | | | | | | 20,368 | | | | | | 1.17 | | | | | | 1.25 | | | | | | 0.87 | | | | | | 763 | |
| | | 14.95 | | | | | | 3.63 | | | | | | 442,915 | | | | | | 0.92 | | | | | | 0.99 | | | | | | 1.53 | | | | | | 545 | |
| | | 14.95 | | | | | | 2.86 | | | | | | 17,358 | | | | | | 1.67 | | | | | | 1.74 | | | | | | 0.79 | | | | | | 545 | |
| | | 14.95 | | | | | | 2.86 | | | | | | 33,279 | | | | | | 1.67 | | | | | | 1.74 | | | | | | 0.78 | | | | | | 545 | |
| | | 14.92 | | | | | | 3.92 | | | | | | 266,217 | | | | | | 0.58 | | | | | | 0.65 | | | | | | 1.86 | | | | | | 545 | |
| | | 14.91 | | | | | | 3.40 | | | | | | 98,072 | | | | | | 1.08 | | | | | | 1.15 | | | | | | 1.36 | | | | | | 545 | |
| | | 14.94 | | | | | | 3.89 | | | | | | 663 | | | | | | 0.67 | | | | | | 0.74 | | | | | | 1.74 | | | | | | 545 | |
| | | 14.93 | | | | | | 3.31 | | | | | | 13,913 | | | | | | 1.17 | | | | | | 1.24 | | | | | | 1.24 | | | | | | 545 | |
| | | 15.18 | | | | | | 4.48 | | | | | | 513,457 | | | | | | 0.92 | | | | | | 1.00 | | | | | | 2.74 | | | | | | 366 | |
| | | 15.18 | | | | | | 3.70 | | | | | | 29,438 | | | | | | 1.67 | | | | | | 1.75 | | | | | | 2.02 | | | | | | 366 | |
| | | 15.18 | | | | | | 3.68 | | | | | | 39,255 | | | | | | 1.67 | | | | | | 1.75 | | | | | | 1.99 | | | | | | 366 | |
| | | 15.16 | | | | | | 4.84 | | | | | | 253,997 | | | | | | 0.58 | | | | | | 0.66 | | | | | | 3.06 | | | | | | 366 | |
| | | 15.15 | | | | | | 4.32 | | | | | | 100,242 | | | | | | 1.08 | | | | | | 1.16 | | | | | | 2.56 | | | | | | 366 | |
| | | 15.18 | | | | | | 4.67 | | | | | | 239 | | | | | | 0.67 | | | | | | 0.75 | | | | | | 2.68 | | | | | | 366 | |
| | | 15.17 | | | | | | 4.22 | | | | | | 5,106 | | | | | | 1.17 | | | | | | 1.25 | | | | | | 2.21 | | | | | | 366 | |
| | | 15.14 | | | | | | 5.00 | | | | | | 574,520 | | | | | | 0.92 | | | | | | 0.98 | | | | | | 3.84 | | | | | | 386 | |
| | | 15.14 | | | | | | 4.22 | | | | | | 45,916 | | | | | | 1.67 | | | | | | 1.73 | | | | | | 3.10 | | | | | | 386 | |
| | | 15.14 | | | | | | 4.19 | | | | | | 42,004 | | | | | | 1.67 | | | | | | 1.73 | | | | | | 3.07 | | | | | | 386 | |
| | | 15.12 | | | | | | 5.37 | | | | | | 245,475 | | | | | | 0.58 | | | | | | 0.64 | | | | | | 4.21 | | | | | | 386 | |
| | | 15.11 | | | | | | 4.85 | | | | | | 90,132 | | | | | | 1.08 | | | | | | 1.14 | | | | | | 3.66 | | | | | | 386 | |
| | | 15.14 | | | | | | 5.19 | | | | | | 11 | | | | | | 0.67 | | | | | | 0.73 | | | | | | 4.06 | | | | | | 386 | |
| | | 15.14 | | | | | | 4.85 | | | | | | 43 | | | | | | 1.17 | | | | | | 1.23 | | | | | | 3.55 | | | | | | 386 | |
| | | | | | | | | | | | | | | | | | | | | | | | | | | | | | | | | | | | | | | | |
| | | | | | | | | | | | | | | | | | | | | | | | | | | | | | | | | | | | | | | | |
| | | 15.07 | | | | | | 3.63 | | | | | | 512,301 | | | | | | 0.90 | (d) | | | | | 0.99 | (d) | | | | | 4.20 | (d) | | | | | 161 | |
| | | 15.07 | | | | | | 3.31 | | | | | | 50,078 | | | | | | 1.65 | (d) | | | | | 1.74 | (d) | | | | | 3.46 | (d) | | | | | 161 | |
| | | 15.07 | | | | | | 3.37 | | | | | | 30,010 | | | | | | 1.65 | (d) | | | | | 1.74 | (d) | | | | | 3.44 | (d) | | | | | 161 | |
| | | 15.05 | | | | | | 3.79 | | | | | | 300,342 | | | | | | 0.56 | (d) | | | | | 0.65 | (d) | | | | | 4.56 | (d) | | | | | 161 | |
| | | 15.04 | | | | | | 3.57 | | | | | | 59,449 | | | | | | 1.06 | (d) | | | | | 1.15 | (d) | | | | | 4.03 | (d) | | | | | 161 | |
| | | 15.08 | | | | | | 1.85 | | | | | | 10 | | | | | | 0.66 | (d) | | | | | 0.78 | (d) | | | | | 4.24 | (d) | | | | | 161 | |
| | | 15.08 | | | | | | 1.65 | | | | | | 10 | | | | | | 1.16 | (d) | | | | | 1.28 | (d) | | | | | 3.86 | (d) | | | | | 161 | |
| | | | | | | | | | | | | | | | | | | | | | | | | | | | | | | | | | | | | | | | |
| | | | | | | | | | | | | | | | | | | | | | | | | | | | | | | | | | | | | | | | |
| | | 14.79 | | | | | | 5.13 | | | | | | 434,917 | | | | | | 0.94 | | | | | | 1.02 | | | | | | 4.11 | | | | | | 141 | |
| | | 14.79 | | | | | | 4.34 | | | | | | 49,393 | | | | | | 1.69 | | | | | | 1.77 | | | | | | 3.44 | | | | | | 141 | |
| | | 14.78 | | | | | | 4.35 | | | | | | 22,078 | | | | | | 1.69 | | | | | | 1.77 | | | | | | 3.37 | | | | | | 141 | |
| | | 14.77 | | | | | | 5.45 | | | | | | 323,764 | | | | | | 0.58 | | | | | | 0.66 | | | | | | 4.49 | | | | | | 141 | |
| | | 14.76 | | | | | | 5.00 | | | | | | 45,154 | | | | | | 1.08 | | | | | | 1.16 | | | | | | 3.99 | | | | | | 141 | |
| | |
| The accompanying notes are an integral part of these financial statements. | | 81 |
GOLDMAN SACHS HIGH QUALITY FLOATING RATE FUND†
Financial Highlights
Selected Data for a Share Outstanding Throughout Each Period
| | | | | | | | | | | | | | | | | | | | | | |
| | | | | | | | Income (loss) from
investment operations | | | | |
| | | Year - Share Class | | Net asset
value,
beginning
of period | | | Net
investment
income(a) | | | Net realized
and unrealized
gain (loss) | | | Total from
investment
operations | | | Distributions to shareholders
from net
investment
income | |
| FOR THE SIX MONTHS ENDED SEPTEMBER 30, (UNAUDITED) | | | | | |
| | 2012 - A | | $ | 8.77 | | | $ | 0.03 | | | $ | (0.01 | ) | | $ | 0.02 | | | $ | (0.02 | ) |
| | 2012 - Institutional | | | 8.77 | | | | 0.04 | | | | (0.01 | ) | | | 0.03 | | | | (0.03 | ) |
| | 2012 - Service | | | 8.81 | | | | 0.02 | | | | — | | | | 0.02 | | | | (0.01 | ) |
| | 2012 - IR | | | 8.76 | | | | 0.03 | | | | 0.01 | | | | 0.04 | | | | (0.03 | ) |
| | | | | | | | | | | | | | | | | | | | | | |
| FOR THE FISCAL YEARS ENDED MARCH 31, | | | | | |
| | 2012 - A | | | 8.81 | | | | 0.05 | | | | (0.07 | ) | | | (0.02 | ) | | | (0.02 | ) |
| | 2012 - Institutional | | | 8.82 | | | | 0.08 | | | | (0.08 | ) | | | — | | | | (0.05 | ) |
| | 2012 - Service | | | 8.86 | | | | 0.04 | | | | (0.08 | ) | | | (0.04 | ) | | | (0.01 | ) |
| | 2012 - IR | | | 8.81 | | | | 0.07 | | | | (0.08 | ) | | | (0.01 | ) | | | (0.04 | ) |
| | 2011 - A | | | 8.86 | | | | 0.06 | | | | (0.06 | ) | | | — | | | | (0.05 | )(e) |
| | 2011 - Institutional | | | 8.86 | | | | 0.09 | | | | (0.05 | ) | | | 0.04 | | | | (0.08 | )(e) |
| | 2011 - Service | | | 8.90 | | | | 0.04 | | | | (0.04 | ) | | | — | | | | (0.04 | )(e) |
| | 2011 - IR | | | 8.85 | | | | 0.08 | | | | (0.05 | ) | | | 0.03 | | | | (0.07 | )(e) |
| | 2010 - A | | | 8.77 | | | | 0.10 | | | | 0.16 | | | | 0.26 | | | | (0.17 | )(e) |
| | 2010 - Institutional | | | 8.77 | | | | 0.13 | | | | 0.16 | | | | 0.29 | | | | (0.20 | )(e) |
| | 2010 - Service | | | 8.81 | | | | 0.11 | | | | 0.13 | | | | 0.24 | | | | (0.15 | )(e) |
| | 2010 - IR | | | 8.76 | | | | 0.10 | | | | 0.18 | | | | 0.28 | | | | (0.19 | )(e) |
| | 2009 - A | | | 9.14 | | | | 0.30 | | | | (0.32 | ) | | | (0.02 | ) | | | (0.35 | ) |
| | 2009 - Institutional | | | 9.14 | | | | 0.34 | | | | (0.33 | ) | | | 0.01 | | | | (0.38 | ) |
| | 2009 - Service | | | 9.18 | | | | 0.29 | | | | (0.33 | ) | | | (0.04 | ) | | | (0.33 | ) |
| | 2009 - IR | | | 9.14 | | | | 0.34 | | | | (0.35 | ) | | | (0.01 | ) | | | (0.37 | ) |
| | | | | | | | | | | | | | | | | | | | | | |
| FOR THE PERIOD NOVEMBER 1, 2007 TO MARCH 31, 2008* | | | | | |
| | 2008 - A | | | 9.28 | | | | 0.15 | | | | (0.12 | ) | | | 0.03 | | | | (0.17 | ) |
| | 2008 - Institutional | | | 9.28 | | | | 0.16 | | | | (0.12 | ) | | | 0.04 | | | | (0.18 | ) |
| | 2008 - Service | | | 9.32 | | | | 0.15 | | | | (0.13 | ) | | | 0.02 | | | | (0.16 | ) |
| | 2008 - IR (Commenced November 30, 2007) | | | 9.26 | | | | 0.12 | | | | (0.10 | ) | | | 0.02 | | | | (0.14 | ) |
| | | | | | | | | | | | | | | | | | | | | | |
| FOR THE FISCAL YEAR ENDED OCTOBER 31, | | | | | |
| | 2007 - A | | | 9.27 | | | | 0.36 | | | | 0.10 | | | | 0.46 | | | | (0.45 | ) |
| | 2007 - Institutional | | | 9.27 | | | | 0.39 | | | | 0.10 | | | | 0.49 | | | | (0.48 | ) |
| | 2007 - Service | | | 9.31 | | | | 0.35 | | | | 0.09 | | | | 0.44 | | | | (0.43 | ) |
| | † | | Formerly, Goldman Sachs Ultra-Short Duration Government Fund. Effective July 27, 2012, the Fund changed its name to the Goldman Sachs High Quality Floating Rate Fund. |
| | * | | The Fund changed its fiscal year end from October 31 to March 31. |
| | (a) | | Calculated based on the average shares outstanding methodology. |
| | (b) | | Assumes investment at the net asset value at the beginning of the period, reinvestment of all dividends and distributions, a complete redemption of the investment at the net asset value at the end of the period and no sales or redemption charges. Total returns would be reduced if a sales or redemption charge was taken into account. Returns do not reflect the deduction of taxes that a shareholder would pay on Fund distributions or the redemption of Fund shares. Total returns for periods less than one full year are not annualized. |
| | (c) | | The Fund’s portfolio turnover rate is calculated in accordance with regulatory requirements, without regard to transactions involving short term investments and certain derivatives. If such transactions were included, the Fund’s portfolio turnover rate may be higher. |
| | (e) | | Includes a return of capital amounting to less than $0.005 per share. |
| | |
| 82 | | The accompanying notes are an integral part of these financial statements. |
GOLDMAN SACHS HIGH QUALITY FLOATING RATE FUND†
| | | | | | | | | | | | | | | | | | | | | | | | | | | | | | | | | | | | | | | | |
| | | | | | | | | | | | | | | | | | | | | | | | | | | | | | | | | | |
| | | Net asset
value, end
of period | | | | | Total
return(b) | | | | | Net assets,
end of
period
(in 000s) | | | | | Ratio of
net expenses
to average
net assets | | | | | Ratio of
total expenses
to average
net assets | | | | | Ratio of
net investment
income
to average
net assets | | | | | Portfolio
turnover
rate(c) | |
| | | | | | | | | | | | | | | | | | | | | | | | | | | | | | | | | | | | | | | | |
| | $ | 8.77 | | | | | | 0.22 | % | | | | $ | 70,623 | | | | | | 0.74 | %(d) | | | | | 0.93 | %(d) | | | | | 0.58 | %(d) | | | | | 205 | % |
| | | 8.77 | | | | | | 0.50 | | | | | | 151,347 | | | | | | 0.40 | (d) | | | | | 0.59 | (d) | | | | | 0.92 | (d) | | | | | 205 | |
| | | 8.82 | | | | | | 0.25 | | | | | | 171 | | | | | | 0.89 | (d) | | | | | 1.09 | (d) | | | | | 0.50 | (d) | | | | | 205 | |
| | | 8.77 | | | | | | 0.45 | | | | | | 2,188 | | | | | | 0.49 | (d) | | | | | 0.68 | (d) | | | | | 0.77 | (d) | | | | | 205 | |
| | | | | | | | | | | | | | | | | | | | | | | | | | | | | | | | | | | | | | | | |
| | | | | | | | | | | | | | | | | | | | | | | | | | | | | | | | | | | | | | | | |
| | | 8.77 | | | | | | (0.21 | ) | | | | | 85,905 | | | | | | 0.75 | | | | | | 0.90 | | | | | | 0.53 | | | | | | 178 | |
| | | 8.77 | | | | | | 0.01 | | | | | | 212,611 | | | | | | 0.41 | | | | | | 0.56 | | | | | | 0.87 | | | | | | 178 | |
| | | 8.81 | | | | | | (0.44 | ) | | | | | 448 | | | | | | 0.86 | | | | | | 1.06 | | | | | | 0.41 | | | | | | 178 | |
| | | 8.76 | | | | | | (0.08 | ) | | | | | 930 | | | | | | 0.50 | | | | | | 0.65 | | | | | | 0.79 | | | | | | 178 | |
| | | 8.81 | | | | | | 0.00 | | | | | | 118,804 | | | | | | 0.82 | | | | | | 0.87 | | | | | | 0.65 | | | | | | 175 | |
| | | 8.82 | | | | | | 0.45 | | | | | | 293,924 | | | | | | 0.48 | | | | | | 0.53 | | | | | | 1.00 | | | | | | 175 | |
| | | 8.86 | | | | | | (0.05 | ) | | | | | 924 | | | | | | 0.98 | | | | | | 1.03 | | | | | | 0.49 | | | | | | 175 | |
| | | 8.81 | | | | | | 0.36 | | | | | | 1,151 | | | | | | 0.57 | | | | | | 0.62 | | | | | | 0.93 | | | | | | 175 | |
| | | 8.86 | | | | | | 2.96 | | | | | | 303,400 | | | | | | 0.83 | | | | | | 0.87 | | | | | | 1.14 | | | | | | 111 | |
| | | 8.86 | | | | | | 3.31 | | | | | | 487,133 | | | | | | 0.49 | | | | | | 0.53 | | | | | | 1.45 | | | | | | 111 | |
| | | 8.90 | | | | | | 2.78 | | | | | | 2,702 | | | | | | 0.99 | | | | | | 1.03 | | | | | | 1.29 | | | | | | 111 | |
| | | 8.85 | | | | | | 3.22 | | | | | | 451 | | | | | | 0.58 | | | | | | 0.62 | | | | | | 1.19 | | | | | | 111 | |
| | | 8.77 | | | | | | (0.26 | ) | | | | | 97,936 | | | | | | 0.83 | | | | | | 0.90 | | | | | | 3.39 | | | | | | 163 | |
| | | 8.77 | | | | | | 0.07 | | | | | | 141,806 | | | | | | 0.49 | | | | | | 0.56 | | | | | | 3.74 | | | | | | 163 | |
| | | 8.81 | | | | | | (0.42 | ) | | | | | 2,919 | | | | | | 0.99 | | | | | | 1.06 | | | | | | 3.22 | | | | | | 163 | |
| | | 8.76 | | | | | | (0.13 | ) | | | | | 10 | | | | | | 0.58 | | | | | | 0.65 | | | | | | 3.81 | | | | | | 163 | |
| | | | | | | | | | | | | | | | | | | | | | | | | | | | | | | | | | | | | | | | |
| | | | | | | | | | | | | | | | | | | | | | | | | | | | | | | | | | | | | | | | |
| | | 9.14 | | | | | | 0.31 | | | | | | 90,398 | | | | | | 0.81 | (d) | | | | | 0.87 | (d) | | | | | 3.94 | (d) | | | | | 28 | |
| | | 9.14 | | | | | | 0.46 | | | | | | 422,242 | | | | | | 0.47 | (d) | | | | | 0.53 | (d) | | | | | 4.26 | (d) | | | | | 28 | |
| | | 9.18 | | | | | | 0.25 | | | | | | 3,620 | | | | | | 0.98 | (d) | | | | | 1.04 | (d) | | | | | 3.81 | (d) | | | | | 28 | |
| | | 9.14 | | | | | | 0.20 | | | | | | 10 | | | | | | 0.57 | (d) | | | | | 0.60 | (d) | | | | | 3.93 | (d) | | | | | 28 | |
| | | | | | | | | | | | | | | | | | | | | | | | | | | | | | | | | | | | | | | | |
| | | | | | | | | | | | | | | | | | | | | | | | | | | | | | | | | | | | | | | | |
| | | 9.28 | | | | | | 5.02 | | | | | | 106,648 | | | | | | 0.85 | | | | | | 0.89 | | | | | | 3.86 | | | | | | 94 | |
| | | 9.28 | | | | | | 5.41 | | | | | | 406,895 | | | | | | 0.49 | | | | | | 0.53 | | | | | | 4.22 | | | | | | 94 | |
| | | 9.32 | | | | | | 4.86 | | | | | | 3,590 | | | | | | 0.99 | | | | | | 1.02 | | | | | | 3.68 | | | | | | 94 | |
| | |
| The accompanying notes are an integral part of these financial statements. | | 83 |
GOLDMAN SACHS INFLATION PROTECTED SECURITIES FUND
Financial Highlights
Selected Data for a Share Outstanding Throughout Each Period
| | | | | | | | | | | | | | | | | | | | | | | | | | | | | | | | | | |
| | | | | | | | Income (loss) from
investment operations | | | Distributions
to shareholders | |
| | | Year - Share Class | | Net asset
value,
beginning
of period | | | Net
investment
income (loss) | | | Net realized
and unrealized
gain (loss) | | | Total from
investment
operations | | | From net
investment
income | | | From net
realized
gains | | | From
capital | | | Total
distributions | |
| | FOR THE SIX MONTHS ENDED SEPTEMBER 30, (UNAUDITED) | |
| | 2012 - A | | $ | 11.16 | | | $ | 0.06 | (c) | | $ | 0.54 | | | $ | 0.60 | | | $ | (0.10 | ) | | $ | — | | | $ | — | | | $ | (0.10 | ) |
| | 2012 - C | | | 11.20 | | | | 0.02 | (c) | | | 0.54 | | | | 0.56 | | | | (0.06 | ) | | | — | | | | — | | | | (0.06 | ) |
| | 2012 - Institutional | | | 11.20 | | | | 0.07 | (c) | | | 0.55 | | | | 0.62 | | | | (0.12 | ) | | | — | | | | — | | | | (0.12 | ) |
| | 2012 - IR | | | 11.17 | | | | 0.02 | (c) | | | 0.60 | | | | 0.62 | | | | (0.12 | ) | | | — | | | | — | | | | (0.12 | ) |
| | 2012 - R | | | 11.19 | | | | 0.03 | (c) | | | 0.55 | | | | 0.58 | | | | (0.09 | ) | | | — | | | | — | | | | (0.09 | ) |
| | | | | | | | | | | | | | | | | | | | | | | | | | | | | | | | | | |
| | FOR THE FISCAL YEARS ENDED MARCH 31, | |
| | 2012 - A | | | 10.95 | | | | 0.19 | (c) | | | 1.11 | | | | 1.30 | | | | (0.30 | ) | | | (0.79 | ) | | | — | | | | (1.09 | ) |
| | 2012 - C | | | 10.99 | | | | 0.13 | (c) | | | 1.09 | | | | 1.22 | | | | (0.22 | ) | | | (0.79 | ) | | | — | | | | (1.01 | ) |
| | 2012 - Institutional | | | 10.99 | | | | 0.23 | (c) | | | 1.11 | | | | 1.34 | | | | (0.34 | ) | | | (0.79 | ) | | | — | | | | (1.13 | ) |
| | 2012 - IR | | | 10.97 | | | | 0.02 | (c) | | | 1.30 | | | | 1.32 | | | | (0.33 | ) | | | (0.79 | ) | | | — | | | | (1.12 | ) |
| | 2012 - R | | | 10.98 | | | | 0.18 | (c) | | | 1.09 | | | | 1.27 | | | | (0.27 | ) | | | (0.79 | ) | | | — | | | | (1.06 | ) |
| | 2011 - A | | | 10.89 | | | | 0.19 | (c) | | | 0.61 | | | | 0.80 | | | | (0.17 | ) | | | (0.57 | ) | | | — | | | | (0.74 | ) |
| | 2011 - C | | | 10.93 | | | | 0.11 | (c) | | | 0.61 | | | | 0.72 | | | | (0.09 | ) | | | (0.57 | ) | | | — | | | | (0.66 | ) |
| | 2011 - Institutional | | | 10.93 | | | | 0.22 | (c) | | | 0.62 | | | | 0.84 | | | | (0.21 | ) | | | (0.57 | ) | | | — | | | | (0.78 | ) |
| | 2011 - IR | | | 10.91 | | | | 0.22 | (c) | | | 0.61 | | | | 0.83 | | | | (0.20 | ) | | | (0.57 | ) | | | — | | | | (0.77 | ) |
| | 2011 - R | | | 10.91 | | | | 0.17 | (c) | | | 0.61 | | | | 0.78 | | | | (0.14 | ) | | | (0.57 | ) | | | — | | | | (0.71 | ) |
| | 2010 - A | | | 10.51 | | | | 0.31 | (c) | | | 0.29 | | | | 0.60 | | | | (0.22 | ) | | | — | | | | — | | | | (0.22 | ) |
| | 2010 - C | | | 10.54 | | | | 0.21 | (c) | | | 0.32 | | | | 0.53 | | | | (0.14 | ) | | | — | | | | — | | | | (0.14 | ) |
| | 2010 - Institutional | | | 10.54 | | | | 0.33 | (c) | | | 0.32 | | | | 0.65 | | | | (0.26 | ) | | | — | | | | — | | | | (0.26 | ) |
| | 2010 - IR | | | 10.53 | | | | 0.23 | (c) | | | 0.40 | | | | 0.63 | | | | (0.25 | ) | | | — | | | | — | | | | (0.25 | ) |
| | 2010 - R | | | 10.53 | | | | 0.20 | (c) | | | 0.37 | | | | 0.57 | | | | (0.19 | ) | | | — | | | | — | | | | (0.19 | ) |
| | 2009 - A | | | 11.07 | | | | 0.04 | | | | (0.35 | ) | | | (0.31 | ) | | | (0.09 | ) | | | (0.02 | ) | | | (0.14 | ) | | | (0.25 | ) |
| | 2009 - C | | | 11.11 | | | | (0.06 | ) | | | (0.34 | ) | | | (0.40 | ) | | | (0.06 | ) | | | (0.02 | ) | | | (0.09 | ) | | | (0.17 | ) |
| | 2009 - Institutional | | | 11.11 | | | | 0.01 | | | | (0.29 | ) | | | (0.28 | ) | | | (0.11 | ) | | | (0.02 | ) | | | (0.16 | ) | | | (0.29 | ) |
| | 2009 - IR | | | 11.09 | | | | 0.15 | | | | (0.43 | ) | | | (0.28 | ) | | | (0.11 | ) | | | (0.02 | ) | | | (0.15 | ) | | | (0.28 | ) |
| | 2009 - R | | | 11.09 | | | | 0.11 | | | | (0.44 | ) | | | (0.33 | ) | | | (0.08 | ) | | | (0.02 | ) | | | (0.13 | ) | | | (0.23 | ) |
| | | | | | | | | | | | | | | | | | | | | | | | | | | | | | | | | | |
| | FOR THE PERIOD ENDED MARCH 31, | |
| | 2008 - A (Commenced August 31, 2007) | | | 10.00 | | | | 0.27 | (c) | | | 0.93 | | | | 1.20 | | | | (0.13 | ) | | | — | | | | — | | | | (0.13 | ) |
| | 2008 - C (Commenced August 31, 2007) | | | 10.00 | | | | 0.29 | (c) | | | 0.91 | | | | 1.20 | | | | (0.09 | ) | | | — | | | | — | | | | (0.09 | ) |
| | 2008 - Institutional (Commenced August 31, 2007) | | | 10.00 | | | | 0.24 | (c) | | | 1.02 | | | | 1.26 | | | | (0.15 | ) | | | — | | | | — | | | | (0.15 | ) |
| | 2008 - IR (Commenced November 30, 2007) | | | 10.56 | | | | 0.17 | (c) | | | 0.46 | | | | 0.63 | | | | (0.10 | ) | | | — | | | | — | | | | (0.10 | ) |
| | 2008 - R (Commenced November 30, 2007) | | | 10.56 | | | | 0.16 | (c) | | | 0.45 | | | | 0.61 | | | | (0.08 | ) | | | — | | | | — | | | | (0.08 | ) |
| | (a) | | Assumes investment at the net asset value at the beginning of the period, reinvestment of all dividends and distributions, a complete redemption of the investment at the net asset value at the end of the period and no sales or redemption charges. Total returns would be reduced if a sales or redemption charge was taken into account. Returns do not reflect the deduction of taxes that a shareholder would pay on Fund distributions or the redemption of Fund shares. Total returns for periods less than one full year are not annualized. |
| | (b) | | The Fund’s portfolio turnover rate is calculated in accordance with regulatory requirements, without regard to transactions involving short term investments and certain derivatives. If such transactions were included, the Fund’s portfolio turnover rate may be higher. |
| | (c) | | Calculated based on the average shares outstanding methodology. |
| | |
| 84 | | The accompanying notes are an integral part of these financial statements. |
GOLDMAN SACHS INFLATION PROTECTED SECURITIES FUND
| | | | | | | | | | | | | | | | | | | | | | | | | | | | | | | | | | | | | | | | |
| | | | | | | | | | | | | | | | | | | | | | | | | | | | | | | | | | |
| | | Net asset
value, end
of period | | | | | Total
return(a) | | | | | Net assets,
end of
period
(in 000s) | | | | | Ratio of
net expenses
to average
net assets | | | | | Ratio of
total expenses
to average
net assets | | | | | Ratio of
net investment
income (loss)
to average
net assets | | | | | Portfolio
turnover
rate(b) | |
| | | | | | | | | | | | | | | | | | | | | | | | | | | | | | | | | | | | | | | | |
| | $ | 11.66 | | | | | | 5.39 | % | | | | $ | 109,494 | | | | | | 0.62 | %(d) | | | | | 0.81 | %(d) | | | | | 1.06 | %(d) | | | | | 118 | % |
| | | 11.70 | | | | | | 4.99 | | | | | | 21,954 | | | | | | 1.37 | (d) | | | | | 1.56 | (d) | | | | | 0.32 | (d) | | | | | 118 | |
| | | 11.70 | | | | | | 5.56 | | | | | | 179,544 | | | | | | 0.28 | (d) | | | | | 0.47 | (d) | | | | | 1.25 | (d) | | | | | 118 | |
| | | 11.67 | | | | | | 5.52 | | | | | | 4,447 | | | | | | 0.37 | (d) | | | | | 0.56 | (d) | | | | | 0.33 | (d) | | | | | 118 | |
| | | 11.68 | | | | | | 5.16 | | | | | | 1,837 | | | | | | 0.87 | (d) | | | | | 1.06 | (d) | | | | | 0.54 | (d) | | | | | 118 | |
| | | | | | | | | | | | | | | | | | | | | | | | | | | | | | | | | | | | | | | | |
| | | | | | | | | | | | | | | | | | | | | | | | | | | | | | | | | | | | | | | | |
| | | 11.16 | | | | | | 11.99 | | | | | | 123,135 | | | | | | 0.63 | | | | | | 0.83 | | | | | | 1.63 | | | | | | 194 | |
| | | 11.20 | | | | | | 11.24 | | | | | | 24,312 | | | | | | 1.28 | | | | | | 1.58 | | | | | | 1.17 | | | | | | 194 | |
| | | 11.20 | | | | | | 12.34 | | | | | | 159,075 | | | | | | 0.29 | | | | | | 0.49 | | | | | | 2.05 | | | | | | 194 | |
| | | 11.17 | | | | | | 12.16 | | | | | | 393 | | | | | | 0.38 | | | | | | 0.58 | | | | | | 0.21 | | | | | | 194 | |
| | | 11.19 | | | | | | 11.70 | | | | | | 1,411 | | | | | | 0.88 | | | | | | 1.08 | | | | | | 1.61 | | | | | | 194 | |
| | | 10.95 | | | | | | 7.53 | | | | | | 79,215 | | | | | | 0.67 | | | | | | 0.83 | | | | | | 1.71 | | | | | | 211 | |
| | | 10.99 | | | | | | 6.72 | | | | | | 22,111 | | | | | | 1.42 | | | | | | 1.58 | | | | | | 0.96 | | | | | | 211 | |
| | | 10.99 | | | | | | 7.88 | | | | | | 108,491 | | | | | | 0.33 | | | | | | 0.49 | | | | | | 1.99 | | | | | | 211 | |
| | | 10.97 | | | | | | 7.80 | | | | | | 116 | | | | | | 0.42 | | | | | | 0.58 | | | | | | 1.93 | | | | | | 211 | |
| | | 10.98 | | | | | | 7.36 | | | | | | 1,145 | | | | | | 0.92 | | | | | | 1.08 | | | | | | 1.50 | | | | | | 211 | |
| | | 10.89 | | | | | | 5.76 | | | | | | 83,263 | | | | | | 0.67 | | | | | | 0.91 | | | | | | 2.88 | | | | | | 82 | |
| | | 10.93 | | | | | | 5.05 | | | | | | 21,962 | | | | | | 1.42 | | | | | | 1.66 | | | | | | 1.91 | | | | | | 82 | |
| | | 10.93 | | | | | | 6.20 | | | | | | 133,980 | | | | | | 0.33 | | | | | | 0.57 | | | | | | 3.05 | | | | | | 82 | |
| | | 10.91 | | | | | | 6.01 | | | | | | 125 | | | | | | 0.42 | | | | | | 0.66 | | | | | | 2.15 | | | | | | 82 | |
| | | 10.91 | | | | | | 5.49 | | | | | | 361 | | | | | | 0.92 | | | | | | 1.16 | | | | | | 1.86 | | | | | | 82 | |
| | | 10.51 | | | | | | (2.68 | ) | | | | | 45,855 | | | | | | 0.67 | | | | | | 1.19 | | | | | | 0.41 | | | | | | 44 | |
| | | 10.54 | | | | | | (3.49 | ) | | | | | 6,890 | | | | | | 1.42 | | | | | | 1.94 | | | | | | (0.57 | ) | | | | | 44 | |
| | | 10.54 | | | | | | (2.33 | ) | | | | | 46,706 | | | | | | 0.33 | | | | | | 0.85 | | | | | | (0.25 | ) | | | | | 44 | |
| | | 10.53 | | | | | | (2.45 | ) | | | | | 10 | | | | | | 0.42 | | | | | | 0.94 | | | | | | 1.44 | | | | | | 44 | |
| | | 10.53 | | | | | | (2.90 | ) | | | | | 11 | | | | | | 0.92 | | | | | | 1.44 | | | | | | 1.01 | | | | | | 44 | |
| | | | | | | | | | | | | | | | | | | | | | | | | | | | | | | | | | | | | | | | |
| | | | | | | | | | | | | | | | | | | | | | | | | | | | | | | | | | | | | | | | |
| | | 11.07 | | | | | | 12.09 | | | | | | 20,155 | | | | | | 0.67 | (d) | | | | | 4.22 | (d) | | | | | 4.37 | (d) | | | | | 1 | |
| | | 11.11 | | | | | | 12.02 | | | | | | 3,031 | | | | | | 1.42 | (d) | | | | | 4.97 | (d) | | | | | 4.61 | (d) | | | | | 1 | |
| | | 11.11 | | | | | | 12.62 | | | | | | 11,765 | | | | | | 0.32 | (d) | | | | | 3.87 | (d) | | | | | 3.95 | (d) | | | | | 1 | |
| | | 11.09 | | | | | | 5.98 | | | | | | 11 | | | | | | 0.42 | (d) | | | | | 4.68 | (d) | | | | | 4.80 | (d) | | | | | 1 | |
| | | 11.09 | | | | | | 5.81 | | | | | | 11 | | | | | | 0.92 | (d) | | | | | 5.18 | (d) | | | | | 4.31 | (d) | | | | | 1 | |
| | |
| The accompanying notes are an integral part of these financial statements. | | 85 |
GOLDMAN SACHS SHORT DURATION GOVERNMENT FUND
Financial Highlights
Selected Data for a Share Outstanding Throughout Each Period
| | | | | | | | | | | | | | | | | | | | | | | | | | | | | | |
| | | | | | | | Income (loss) from
investment operations | | | Distributions
to shareholders | |
| | | Year - Share Class | | Net asset
value,
beginning
of period | | | Net
investment
income(a) | | | Net realized
and unrealized
gain | | | Total from
investment
operations | | | From net
investment
income | | | From net
realized
gains | | | Total
distributions | |
| FOR THE SIX MONTHS ENDED SEPTEMBER 30, (UNAUDITED) | | | | | |
| | 2012 - A | | $ | 10.30 | | | $ | 0.03 | | | $ | 0.02 | | | $ | 0.05 | | | $ | (0.02 | ) | | $ | — | | | $ | (0.02 | ) |
| | 2012 - B | | | 10.26 | | | | — | (e) | | | 0.03 | | | | 0.03 | | | | — | (e) | | | — | | | | — | (e) |
| | 2012 - C | | | 10.23 | | | | 0.01 | | | | 0.02 | | | | 0.03 | | | | — | (e) | | | — | | | | — | (e) |
| | 2012 - Institutional | | | 10.27 | | | | 0.04 | | | | 0.02 | | | | 0.06 | | | | (0.04 | ) | | | — | | | | (0.04 | ) |
| | 2012 - Service | | | 10.25 | | | | 0.02 | | | | 0.02 | | | | 0.04 | | | | (0.01 | ) | | | — | | | | (0.01 | ) |
| | 2012 - IR | | | 10.30 | | | | 0.04 | | | | 0.03 | | | | 0.07 | | | | (0.04 | ) | | | — | | | | (0.04 | ) |
| | | | | | | | | | | | | | | | | | | | | | | | | | | | | | |
| FOR THE FISCAL YEARS ENDED MARCH 31, | | | | | |
| | 2012 - A | | | 10.23 | | | | 0.05 | | | | 0.06 | | | | 0.11 | | | | (0.04 | ) | | | — | (e) | | | (0.04 | ) |
| | 2012 - B | | | 10.20 | | | | 0.02 | | | | 0.04 | | | | 0.06 | | | | — | (e) | | | — | (e) | | | — | (e) |
| | 2012 - C | | | 10.17 | | | | 0.02 | | | | 0.05 | | | | 0.07 | | | | (0.01 | ) | | | — | (e) | | | (0.01 | ) |
| | 2012 - Institutional | | | 10.20 | | | | 0.09 | | | | 0.06 | | | | 0.15 | | | | (0.08 | ) | | | — | (e) | | | (0.08 | ) |
| | 2012 - Service | | | 10.19 | | | | 0.04 | | | | 0.05 | | | | 0.09 | | | | (0.03 | ) | | | — | (e) | | | (0.03 | ) |
| | 2012 - IR | | | 10.24 | | | | 0.08 | | | | 0.05 | | | | 0.13 | | | | (0.07 | ) | | | — | (e) | | | (0.07 | ) |
| | 2011 - A | | | 10.37 | | | | 0.06 | | | | 0.06 | | | | 0.12 | | | | (0.06 | ) | | | (0.20 | ) | | | (0.26 | ) |
| | 2011 - B | | | 10.33 | | | | 0.01 | | | | 0.06 | | | | 0.07 | | | | — | (e) | | | (0.20 | ) | | | (0.20 | ) |
| | 2011 - C | | | 10.30 | | | | 0.01 | | | | 0.07 | | | | 0.08 | | | | (0.01 | ) | | | (0.20 | ) | | | (0.21 | ) |
| | 2011 - Institutional | | | 10.33 | | | | 0.10 | | | | 0.06 | | | | 0.16 | | | | (0.09 | ) | | | (0.20 | ) | | | (0.29 | ) |
| | 2011 - Service | | | 10.32 | | | | 0.05 | | | | 0.06 | | | | 0.11 | | | | (0.04 | ) | | | (0.20 | ) | | | (0.24 | ) |
| | 2011 - IR | | | 10.37 | | | | 0.09 | | | | 0.06 | | | | 0.15 | | | | (0.08 | ) | | | (0.20 | ) | | | (0.28 | ) |
| | 2010 - A | | | 10.36 | | | | 0.16 | | | | 0.19 | | | | 0.35 | | | | (0.17 | ) | | | (0.17 | ) | | | (0.34 | ) |
| | 2010 - B | | | 10.32 | | | | 0.11 | | | | 0.17 | | | | 0.28 | | | | (0.10 | ) | | | (0.17 | ) | | | (0.27 | ) |
| | 2010 - C | | | 10.30 | | | | 0.08 | | | | 0.18 | | | | 0.26 | | | | (0.09 | ) | | | (0.17 | ) | | | (0.26 | ) |
| | 2010 - Institutional | | | 10.33 | | | | 0.19 | | | | 0.18 | | | | 0.37 | | | | (0.20 | ) | | | (0.17 | ) | | | (0.37 | ) |
| | 2010 - Service | | | 10.31 | | | | 0.14 | | | | 0.19 | | | | 0.33 | | | | (0.15 | ) | | | (0.17 | ) | | | (0.32 | ) |
| | 2010 - IR | | | 10.36 | | | | 0.16 | | | | 0.21 | | | | 0.37 | | | | (0.19 | ) | | | (0.17 | ) | | | (0.36 | ) |
| | 2009 - A | | | 10.14 | | | | 0.27 | | | | 0.31 | | | | 0.58 | | | | (0.31 | ) | | | (0.05 | ) | | | (0.36 | ) |
| | 2009 - B | | | 10.10 | | | | 0.22 | | | | 0.30 | | | | 0.52 | | | | (0.25 | ) | | | (0.05 | ) | | | (0.30 | ) |
| | 2009 - C | | | 10.07 | | | | 0.19 | | | | 0.33 | | | | 0.52 | | | | (0.24 | ) | | | (0.05 | ) | | | (0.29 | ) |
| | 2009 - Institutional | | | 10.11 | | | | 0.31 | | | | 0.31 | | | | 0.62 | | | | (0.35 | ) | | | (0.05 | ) | | | (0.40 | ) |
| | 2009 - Service | | | 10.09 | | | | 0.25 | | | | 0.32 | | | | 0.57 | | | | (0.30 | ) | | | (0.05 | ) | | | (0.35 | ) |
| | 2009 - IR | | | 10.14 | | | | 0.30 | | | | 0.31 | | | | 0.61 | | | | (0.34 | ) | | | (0.05 | ) | | | (0.39 | ) |
| | | | | | | | | | | | | | | | | | | | | | | | | | | | | | |
| | FOR THE PERIOD NOVEMBER 1, 2007 TO MARCH 31, 2008* | |
| | 2008 - A | | | 9.79 | | | | 0.17 | | | | 0.34 | | | | 0.51 | | | | (0.16 | ) | | | — | | | | (0.16 | ) |
| | 2008 - B | | | 9.76 | | | | 0.15 | | | | 0.32 | | | | 0.47 | | | | (0.13 | ) | | | — | | | | (0.13 | ) |
| | 2008 - C | | | 9.73 | | | | 0.14 | | | | 0.33 | | | | 0.47 | | | | (0.13 | ) | | | — | | | | (0.13 | ) |
| | 2008 - Institutional | | | 9.77 | | | | 0.18 | | | | 0.33 | | | | 0.51 | | | | (0.17 | ) | | | — | | | | (0.17 | ) |
| | 2008 - Service | | | 9.75 | | | | 0.16 | | | | 0.33 | | | | 0.49 | | | | (0.15 | ) | | | — | | | | (0.15 | ) |
| | 2008 - IR (Commenced November 30, 2007) | | | 9.91 | | | | 0.15 | | | | 0.21 | | | | 0.36 | | | | (0.13 | ) | | | — | | | | (0.13 | ) |
| | | | | | | | | | | | | | | | | | | | | | | | | | | | | | |
| | FOR THE FISCAL YEAR ENDED OCTOBER 31, | |
| | 2007 - A | | | 9.67 | | | | 0.37 | | | | 0.12 | | | | 0.49 | | | | (0.37 | ) | | | — | | | | (0.37 | ) |
| | 2007 - B | | | 9.64 | | | | 0.32 | | | | 0.11 | | | | 0.43 | | | | (0.31 | ) | | | — | | | | (0.31 | ) |
| | 2007 - C | | | 9.61 | | | | 0.30 | | | | 0.11 | | | | 0.41 | | | | (0.29 | ) | | | — | | | | (0.29 | ) |
| | 2007 - Institutional | �� | | 9.64 | | | | 0.41 | | | | 0.12 | | | | 0.53 | | | | (0.40 | ) | | | — | | | | (0.40 | ) |
| | 2007 - Service | | | 9.63 | | | | 0.36 | | | | 0.11 | | | | 0.47 | | | | (0.35 | ) | | | — | | | | (0.35 | ) |
| | * | | The Fund changed its fiscal year end from October 31 to March 31. |
| | (a) | | Calculated based on the average shares outstanding methodology. |
| | (b) | | Assumes investment at the net asset value at the beginning of the period, reinvestment of all dividends and distributions, a complete redemption of the investment at the net asset value at the end of the period and no sales or redemption charges. Total returns would be reduced if a sales or redemption charge was taken into account. Returns do not reflect the deduction of taxes that a shareholder would pay on Fund distributions or the redemption of Fund shares. Total returns for periods less than one full year are not annualized. |
| | (c) | | The Fund’s portfolio turnover rate is calculated in accordance with regulatory requirements, without regard to transactions involving short term investments and certain derivatives. If such transactions were included, the Fund’s portfolio turnover rate may be higher. |
| | (e) | | Amount is less than $0.005 per share. |
| | |
| 86 | | The accompanying notes are an integral part of these financial statements. |
GOLDMAN SACHS SHORT DURATION GOVERNMENT FUND
| | | | | | | | | | | | | | | | | | | | | | | | | | | | | | | | | | | | | | | | |
| | | | | | | | | | | | | | | | | | | | | | | | | | | | | | | | | | |
| | | Net asset
value, end
of period | | | | | Total
return(b) | | | | | Net assets,
end of
period
(in 000s) | | | | | Ratio of
net expenses
to average
net assets | | | | | Ratio of
total expenses
to average
net assets | | | | | Ratio of
net investment
income
to average
net assets | | | | | Portfolio
turnover
rate(c) | |
| | | | | | | | | | | | | | | | | | | | | | | | | | | | | | | | | | | | | | | | |
| | $ | 10.33 | | | | | | 0.51 | % | | | | $ | 662,460 | | | | | | 0.80 | %(d) | | | | | 0.88 | %(d) | | | | | 0.50 | %(d) | | | | | 366 | % |
| | | 10.29 | | | | | | 0.30 | | | | | | 389 | | | | | | 1.24 | (d) | | | | | 1.63 | (d) | | | | | 0.07 | (d) | | | | | 366 | |
| | | 10.26 | | | | | | 0.33 | | | | | | 82,247 | | | | | | 1.18 | (d) | | | | | 1.63 | (d) | | | | | 0.13 | (d) | | | | | 366 | |
| | | 10.29 | | | | | | 0.59 | | | | | | 1,185,271 | | | | | | 0.46 | (d) | | | | | 0.54 | (d) | | | | | 0.84 | (d) | | | | | 366 | |
| | | 10.28 | | | | | | 0.43 | | | | | | 61,701 | | | | | | 0.96 | (d) | | | | | 1.04 | (d) | | | | | 0.34 | (d) | | | | | 366 | |
| | | 10.33 | | | | | | 0.64 | | | | | | 30,318 | | | | | | 0.55 | (d) | | | | | 0.63 | (d) | | | | | 0.75 | (d) | | | | | 366 | |
| | | | | | | | | | | | | | | | | | | | | | | | | | | | | | | | | | | | | | | | |
| | | | | | | | | | | | | | | | | | | | | | | | | | | | | | | | | | | | | | | | |
| | | 10.30 | | | | | | 1.10 | | | | | | 808,034 | | | | | | 0.79 | | | | | | 0.87 | | | | | | 0.53 | | | | | | 359 | |
| | | 10.26 | | | | | | 0.62 | | | | | | 491 | | | | | | 1.18 | | | | | | 1.62 | | | | | | 0.15 | | | | | | 359 | |
| | | 10.23 | | | | | | 0.65 | | | | | | 95,446 | | | | | | 1.15 | | | | | | 1.62 | | | | | | 0.18 | | | | | | 359 | |
| | | 10.27 | | | | | | 1.45 | | | | | | 1,265,479 | | | | | | 0.45 | | | | | | 0.53 | | | | | | 0.87 | | | | | | 359 | |
| | | 10.25 | | | | | | 0.84 | | | | | | 69,463 | | | | | | 0.95 | | | | | | 1.03 | | | | | | 0.39 | | | | | | 359 | |
| | | 10.30 | | | | | | 1.25 | | | | | | 36,019 | | | | | | 0.54 | | | | | | 0.62 | | | | | | 0.77 | | | | | | 359 | |
| | | 10.23 | | | | | | 1.11 | | | | | | 1,013,335 | | | | | | 0.82 | | | | | | 0.87 | | | | | | 0.61 | | | | | | 312 | |
| | | 10.20 | | | | | | 0.69 | | | | | | 1,033 | | | | | | 1.35 | | | | | | 1.62 | | | | | | 0.09 | | | | | | 312 | |
| | | 10.17 | | | | | | 0.74 | | | | | | 126,533 | | | | | | 1.31 | | | | | | 1.62 | | | | | | 0.12 | | | | | | 312 | |
| | | 10.20 | | | | | | 1.56 | | | | | | 1,512,908 | | | | | | 0.48 | | | | | | 0.53 | | | | | | 0.95 | | | | | | 312 | |
| | | 10.19 | | | | | | 1.05 | | | | | | 128,073 | | | | | | 0.98 | | | | | | 1.03 | | | | | | 0.45 | | | | | | 312 | |
| | | 10.24 | | | | | | 1.46 | | | | | | 9,395 | | | | | | 0.57 | | | | | | 0.62 | | | | | | 0.85 | | | | | | 312 | |
| | | 10.37 | | | | | | 3.38 | | | | | | 1,503,139 | | | | | | 0.84 | | | | | | 0.88 | | | | | | 1.53 | | | | | | 175 | |
| | | 10.33 | | | | | | 2.78 | | | | | | 3,797 | | | | | | 1.44 | | | | | | 1.63 | | | | | | 1.05 | | | | | | 175 | |
| | | 10.30 | | | | | | 2.53 | | | | | | 179,424 | | | | | | 1.59 | | | | | | 1.63 | | | | | | 0.80 | | | | | | 175 | |
| | | 10.33 | | | | | | 3.64 | | | | | | 1,921,023 | | | | | | 0.50 | | | | | | 0.54 | | | | | | 1.84 | | | | | | 175 | |
| | | 10.32 | | | | | | 3.23 | | | | | | 190,628 | | | | | | 1.00 | | | | | | 1.04 | | | | | | 1.31 | | | | | | 175 | |
| | | 10.37 | | | | | | 3.64 | | | | | | 3,366 | | | | | | 0.59 | | | | | | 0.63 | | | | | | 1.54 | | | | | | 175 | |
| | | 10.36 | | | | | | 5.90 | | | | | | 933,942 | | | | | | 0.86 | | | | | | 0.91 | | | | | | 2.63 | | | | | | 308 | |
| | | 10.32 | | | | | | 5.29 | | | | | | 5,698 | | | | | | 1.46 | | | | | | 1.66 | | | | | | 2.01 | | | | | | 308 | |
| | | 10.30 | | | | | | 5.25 | | | | | | 122,944 | | | | | | 1.61 | | | | | | 1.66 | | | | | | 1.84 | | | | | | 308 | |
| | | 10.33 | | | | | | 6.28 | | | | | | 850,831 | | | | | | 0.52 | | | | | | 0.57 | | | | | | 3.11 | | | | | | 308 | |
| | | 10.31 | | | | | | 5.76 | | | | | | 85,020 | | | | | | 1.02 | | | | | | 1.07 | | | | | | 2.43 | | | | | | 308 | |
| | | 10.36 | | | | | | 6.16 | | | | | | 62 | | | | | | 0.61 | | | | | | 0.66 | | | | | | 2.99 | | | | | | 308 | |
| | | | | | | | | | | | | | | | | | | | | | | | | | | | | | | | | | | | | | | | |
| | | | | | | | | | | | | | | | | | | | | | | | | | | | | | | | | | | | | | | | |
| | | 10.14 | | | | | | 5.23 | | | | | | 393,830 | | | | | | 0.88 | (d) | | | | | 0.94 | (d) | | | | | 4.11 | (d) | | | | | 61 | |
| | | 10.10 | | | | | | 4.88 | | | | | | 7,975 | | | | | | 1.48 | (d) | | | | | 1.69 | (d) | | | | | 3.52 | (d) | | | | | 61 | |
| | | 10.07 | | | | | | 4.83 | | | | | | 40,967 | | | | | | 1.63 | (d) | | | | | 1.69 | (d) | | | | | 3.36 | (d) | | | | | 61 | |
| | | 10.11 | | | | | | 5.29 | | | | | | 761,654 | | | | | | 0.53 | (d) | | | | | 0.59 | (d) | | | | | 4.44 | (d) | | | | | 61 | |
| | | 10.09 | | | | | | 5.08 | | | | | | 8,429 | | | | | | 1.03 | (d) | | | | | 1.09 | (d) | | | | | 3.96 | (d) | | | | | 61 | |
| | | 10.14 | | | | | | 3.67 | | | | | | 10 | | | | | | 0.63 | (d) | | | | | 0.69 | (d) | | | | | 4.30 | (d) | | | | | 61 | |
| | | | | | | | | | | | | | | | | | | | | | | | | | | | | | | | | | | | | | | | |
| | | | | | | | | | | | | | | | | | | | | | | | | | | | | | | | | | | | | | | | |
| | | 9.79 | | | | | | 5.25 | | | | | | 303,073 | | | | | | 0.90 | | | | | | 0.97 | | | | | | 3.85 | | | | | | 102 | |
| | | 9.76 | | | | | | 4.65 | | | | | | 9,263 | | | | | | 1.50 | | | | | | 1.71 | | | | | | 3.26 | | | | | | 102 | |
| | | 9.73 | | | | | | 4.51 | | | | | | 29,944 | | | | | | 1.65 | | | | | | 1.72 | | | | | | 3.10 | | | | | | 102 | |
| | | 9.77 | | | | | | 5.77 | | | | | | 630,240 | | | | | | 0.54 | | | | | | 0.61 | | | | | | 4.23 | | | | | | 102 | |
| | | 9.75 | | | | | | 5.14 | | | | | | 8,141 | | | | | | 1.04 | | | | | | 1.10 | | | | | | 3.68 | | | | | | 102 | |
| | |
| The accompanying notes are an integral part of these financial statements. | | 87 |
GOLDMAN SACHS SHORT DURATION INCOME FUND
Financial Highlights
Selected Data for a Share Outstanding Throughout Each Period
| | | | | | | | | | | | | | | | | | | | | | |
| | | | | | | | Income (loss) from
investment operations | | | | |
| | | Year - Share Class | | Net asset
value,
beginning
of period | | | Net
investment
income(a) | | | Net realized
and unrealized
gain (loss) | | | Total from
investment
operations | | | Distributions to shareholders
from net
investment
income | |
| | FOR THE SIX MONTHS ENDED SEPTEMBER 30, (UNAUDITED) | |
| | 2012 - A | | $ | 9.96 | | | $ | 0.05 | | | $ | 0.19 | | | $ | 0.24 | | | $ | (0.05 | ) |
| | 2012 - C | | | 9.97 | | | | 0.04 | | | | 0.19 | | | | 0.23 | | | | (0.04 | ) |
| | 2012 - Institutional | | | 9.97 | | | | 0.07 | | | | 0.20 | | | | 0.27 | | | | (0.07 | ) |
| | 2012 - IR | | | 9.97 | | | | 0.06 | | | | 0.20 | | | | 0.26 | | | | (0.07 | ) |
| | 2012 - R | | | 9.97 | | | | 0.04 | | | | 0.20 | | | | 0.24 | | | | (0.04 | ) |
| | | | | | | | | | | | | | | | | | | | | | |
| | FOR THE PERIOD ENDED MARCH 31, | |
| | 2012 - A (Commenced February 29, 2012) | | | 10.00 | | | | 0.01 | | | | (0.04 | ) | | | (0.03 | ) | | | (0.01 | ) |
| | 2012 - C (Commenced February 29, 2012) | | | 10.00 | | | | — | (e) | | | (0.03 | ) | | | (0.03 | ) | | | — | (e) |
| | 2012 - Institutional (Commenced February 29, 2012) | | | 10.00 | | | | 0.01 | | | | (0.03 | ) | | | (0.02 | ) | | | (0.01 | ) |
| | 2012 - IR (Commenced February 29, 2012) | | | 10.00 | | | | 0.01 | | | | (0.03 | ) | | | (0.02 | ) | | | (0.01 | ) |
| | 2012 - R (Commenced February 29, 2012) | | | 10.00 | | | | — | (e) | | | (0.02 | ) | | | (0.02 | ) | | | (0.01 | ) |
| | (a) | | Calculated based on the average shares outstanding methodology. |
| | (b) | | Assumes investment at the net asset value at the beginning of the period, reinvestment of all dividends and distributions, a complete redemption of the investment at the net asset value at the end of the period and no sales or redemption charges. Total returns would be reduced if a sales or redemption charge was taken into account. Returns do not reflect the deduction of taxes that a shareholder would pay on Fund distributions or the redemption of Fund shares. Total returns for periods less than one full year are not annualized. |
| | (d) | | The Fund’s portfolio turnover rate is calculated in accordance with regulatory requirements, without regard to transactions involving short term investments and certain derivatives. If such transactions were included, the Fund’s portfolio turnover rate may be higher. |
| | (e) | | Amount is less than $0.005 per share. |
| | |
| 88 | | The accompanying notes are an integral part of these financial statements. |
GOLDMAN SACHS SHORT DURATION INCOME FUND
| | | | | | | | | | | | | | | | | | | | | | | | | | | | | | | | | | | | | | | | |
| | | | | | | | | | | | | | | | | | | | | | | | | | | | | | | | | | |
| | | Net asset
value, end
of period | | | | | Total
return(b) | | | | | Net assets,
end of
period
(in 000s) | | | | | Ratio of
net expenses
to average
net assets(c) | | | | | Ratio of
total expenses
to average
net assets(c) | | | | | Ratio of
net investment
income
to average
net assets(c) | | | | | Portfolio
turnover
rate(d) | |
| | | | | | | | | | | | | | | | | | | | | | | | | | | | | | | | | | | | | | | | |
| | $ | 10.15 | | | | | | 2.46 | % | | | | $ | 15,523 | | | | | | 0.79 | % | | | | | 2.44 | % | | | | | 1.04 | % | | | | | 657 | % |
| | | 10.16 | | | | | | 2.28 | | | | | | 12 | | | | | | 1.16 | | | | | | 3.19 | | | | | | 0.81 | | | | | | 657 | |
| | | 10.17 | | | | | | 2.74 | | | | | | 20,296 | | | | | | 0.45 | | | | | | 2.10 | | | | | | 1.37 | | | | | | 657 | |
| | | 10.16 | | | | | | 2.69 | | | | | | 60 | | | | | | 0.54 | | | | | | 2.19 | | | | | | 1.24 | | | | | | 657 | |
| | | 10.17 | | | | | | 2.42 | | | | | | 10 | | | | | | 1.04 | | | | | | 2.69 | | | | | | 0.74 | | | | | | 657 | |
| | | | | | | | | | | | | | | | | | | | | | | | | | | | | | | | | | | | | | | | |
| | | | | | | | | | | | | | | | | | | | | | | | | | | | | | | | | | | | | | | | |
| | | 9.96 | | | | | | (0.34 | ) | | | | | 1,747 | | | | | | 0.79 | | | | | | 6.26 | | | | | | 0.79 | | | | | | 29 | |
| | | 9.97 | | | | | | (0.28 | ) | | | | | 10 | | | | | | 1.19 | | | | | | 7.01 | | | | | | 0.38 | | | | | | 29 | |
| | | 9.97 | | | | | | (0.21 | ) | | | | | 11,122 | | | | | | 0.45 | | | | | | 5.92 | | | | | | 1.11 | | | | | | 29 | |
| | | 9.97 | | | | | | (0.22 | ) | | | | | 10 | | | | | | 0.54 | | | | | | 6.01 | | | | | | 0.97 | | | | | | 29 | |
| | | 9.97 | | | | | | (0.25 | ) | | | | | 10 | | | | | | 1.04 | | | | | | 6.51 | | | | | | 0.50 | | | | | | 29 | |
| | |
| The accompanying notes are an integral part of these financial statements. | | 89 |
GOLDMAN SACHS SHORT DURATION AND GOVERNMENT FIXED INCOME FUNDS
Notes to Financial Statements
September 30, 2012 (Unaudited)
Goldman Sachs Trust (the “Trust”) is a Delaware statutory trust registered under the Investment Company Act of 1940, as amended (the “Act”), as an open-end management investment company. The following table lists those series of the Trust that are included in this report (collectively, the “Funds” or individually a “Fund”), along with their corresponding share classes and respective diversification status under the Act:
| | | | |
| Fund | | Share Classes Offered* | | Diversified/
Non-diversified |
Enhanced Income | | A, B, Institutional, Administration and IR | | Diversified |
Government Income | | A, B, C, Institutional, Service, IR and R | | Diversified |
High Quality Floating Rate† | | A, Institutional, Service and IR | | Diversified |
Inflation Protected Securities | | A, C, Institutional, IR and R | | Diversified |
Short Duration Government | | A, B, C, Institutional, Service and IR | | Diversified |
Short Duration Income (Commenced February 29, 2012) | | A, C, Institutional, IR and R | | Diversified |
| * | | Class B Shares are generally no longer available for purchase by current or prospective investors. |
| † | | Formerly, Goldman Sachs Ultra-Short Duration Government Fund. Effective July 27, 2012, the Fund changed its name to the Goldman Sachs High Quality Floating Rate Fund. |
Class A Shares of the Enhanced Income, Government Income, High Quality Floating Rate, Inflation Protected Securities, Short Duration Government and Short Duration Income Funds are sold with a front-end sales charge of up to 1.50%, 3.75%, 1.50%, 3.75%, 1.50% and 1.50%, respectively. Class B Shares were sold with a contingent deferred sales charge (“CDSC”) that declines from 5.00% to zero, (2.00% to zero for Short Duration Government Fund), depending upon the period of time the shares are held. Class C Shares are sold with a CDSC of 1.00% (0.65% for Short Duration Government and Short Duration Income Funds), which is imposed on redemptions made within 12 months of purchase. Institutional, Administration, Service, Class IR and Class R Shares are not subject to a sales charge.
Goldman Sachs Asset Management, L.P. (“GSAM”), an affiliate of Goldman, Sachs & Co. (“Goldman Sachs”), serves as investment adviser to the Funds pursuant to a management agreement (each, an “Agreement”) with the Trust.
|
| 2. SIGNIFICANT ACCOUNTING POLICIES |
The financial statements have been prepared in accordance with accounting principles generally accepted in the United States of America (“GAAP”) and require management to make estimates and assumptions that may affect the reported amounts and disclosures. Actual results may differ from those estimates and assumptions.
A. Investment Valuation — The Funds’ valuation policy is to value investments at fair value.
B. Investment Income and Investments — Investment income includes interest income and dividend income, net of any foreign withholding taxes, less any amounts reclaimable. Interest income is accrued daily and adjusted for amortization of premiums and accretion of discounts. Dividend income is recognized on ex-dividend date or, for certain foreign securities, as soon as such information is obtained subsequent to the ex-dividend date. Investment transactions are reflected on trade date. Realized gains and losses are calculated using identified cost. Investment transactions are recorded on the following business day for daily net asset value (“NAV”) calculations. Any foreign capital gains tax is accrued daily based upon net unrealized gains, and is payable upon sale of such investments.
For derivatives contracts, realized gains and losses are recorded upon settlement of the contract. Upfront payments on swaps are recorded as deferred realized gains or losses and are recognized over the contract’s term/event with the exception of forward starting interest rate swaps whose realized gain or losses are recognized from the effective start date. For securities with paydown provisions, principal payments received are treated as a proportionate reduction to the cost basis of the securities and excess
90
GOLDMAN SACHS SHORT DURATION AND GOVERNMENT FIXED INCOME FUNDS
|
| 2. SIGNIFICANT ACCOUNTING POLICIES (continued) |
amounts are recorded as gains. For treasury inflation protected securities (“TIPS”), adjustments to principal due to inflation/deflation are reflected as increases/decreases to interest income with a corresponding adjustment to cost.
C. Class Allocations and Expenses — Investment income, realized and unrealized gain (loss), and non-class specific expenses of each Fund are allocated daily based upon the proportion of net assets of each class. Class specific expenses, where applicable, are borne by the respective share classes and include Distribution and Service, Transfer Agent and Service and Shareholder Administration fees. Non-class specific expenses directly incurred by a Fund are charged to that Fund, while such expenses incurred by the Trust are allocated across the respective Funds on a straight-line and/or pro-rata basis depending upon the nature of the expenses.
D. Offering Costs — Offering costs paid in connection with the offering of shares of the Short Duration Income Fund are being amortized on a straight-line basis over 12 months from the date of commencement of operations.
E. Federal Taxes and Distributions to Shareholders — It is each Fund’s policy to comply with the requirements of the Internal Revenue Code of 1986, as amended (the “Code”), applicable to regulated investment companies (mutual funds) and to distribute each year substantially all of its investment company taxable income and capital gains to its shareholders. Accordingly, the Funds are not required to make any provisions for the payment of federal income tax. Distributions to shareholders are recorded on the ex-dividend date. Income distributions, if any, are declared daily and paid monthly, and capital gains distributions, if any, are declared and paid annually.
Net capital losses are carried forward to future fiscal years and may be used to the extent allowed by the Code to offset any future capital gains. Utilization of capital loss carryforwards will reduce the requirement of future capital gains distributions.
The characterization of distributions to shareholders for financial reporting purposes is determined in accordance with federal income tax rules, which may differ from GAAP. The source of each Fund’s distributions may be shown in the accompanying financial statements as either from net investment income, net realized gain or capital. Certain components of the Funds’ net assets on the Statements of Assets and Liabilities reflect permanent GAAP/tax differences based on the appropriate tax character.
|
| 3. INVESTMENTS AND FAIR VALUE MEASUREMENTS |
The fair value of a financial instrument is the amount that would be received to sell an asset or paid to transfer a liability in an orderly transaction between market participants at the measurement date (i.e., the exit price). GAAP establishes a fair value hierarchy that prioritizes the inputs to valuation techniques used to measure fair value. The hierarchy gives the highest priority to unadjusted quoted prices in active markets for identical assets or liabilities (Level 1 measurements) and the lowest priority to unobservable inputs (Level 3 measurements). The levels used for classifying investments are not necessarily an indication of the risk associated with investing in these investments. The three levels of the fair value hierarchy are described below:
Level 1 — Unadjusted quoted prices in active markets that are accessible at the measurement date for identical, unrestricted assets or liabilities;
Level 2 — Quoted prices in markets that are not active or financial instruments for which significant inputs are observable (including, but not limited to, quoted prices for similar investments, interest rates, foreign exchange rates, volatility and credit spreads), either directly or indirectly;
Level 3 — Prices or valuations that require significant unobservable inputs (including GSAM’s assumptions in determining fair value measurement).
A. Level 1 and Level 2 Fair Value Investments — The valuation techniques and significant inputs used in determining the fair values for investments classified as Level 1 and Level 2 are as follows:
Debt Securities — Debt securities, for which market quotations are readily available, are valued daily on the basis of quotations supplied by dealers or an independent pricing service approved by the trustees. The pricing services may use valuation models or matrix pricing, which consider: (i) yield or price with respect to bonds that are considered comparable in characteristics such as
91
GOLDMAN SACHS SHORT DURATION AND GOVERNMENT FIXED INCOME FUNDS
Notes to Financial Statements (continued)
September 30, 2012 (Unaudited)
|
| 3. INVESTMENTS AND FAIR VALUE MEASUREMENTS (continued) |
rating, interest rate and maturity date or (ii) quotations from securities dealers to determine current value. Short-term debt obligations that mature in sixty days or less and that do not exhibit signs of credit deterioration are valued at amortized cost, which approximates fair value. With the exception of treasury securities, which are generally classified as Level 1, these investments are generally classified as Level 2 of the fair value hierarchy.
i. Mortgage-Backed and Asset-Backed Securities — Mortgage-backed securities represent direct or indirect participations in, or are collateralized by and payable from, mortgage loans secured by residential and/or commercial real estate property. Asset-backed securities include securities whose principal and interest payments are collateralized by pools of assets. The value of certain mortgage-backed and asset-backed securities (including adjustable rate mortgage loans) may be particularly sensitive to changes in prevailing interest rates. The value of the securities may also fluctuate in response to the market’s perception of the creditworthiness of the issuers.
Asset-backed securities may present credit risks that are not presented by mortgage-backed securities because they generally do not have the benefit of a security interest in collateral that is comparable to mortgage assets. Some asset-backed securities may only have a subordinated claim on collateral.
Stripped mortgage-backed securities are usually structured with two different classes: one that receives substantially all interest payments (interest-only, or “IO” and/or the high coupon rate with relatively low principal amount, or “IOette”), and the other that receives substantially all of the principal payments (principal-only, or “PO”) from a pool of mortgage loans. Little to no principal will be received at the maturity of an IO; as a result, periodic adjustments are recorded to reduce the cost of the security through maturity. These adjustments are included in interest income.
ii. Mortgage Dollar Rolls — Mortgage dollar rolls are transactions whereby the Funds sell mortgage backed securities and simultaneously contract with the same counterparty to repurchase similar securities on a specified future date. During the settlement period, the Funds will not be entitled to accrue interest and principal payments on the securities sold.
iii. Treasury Inflation Protected Securities — TIPS are treasury securities in which the principal amount is adjusted daily to keep pace with inflation, as measured by the U.S. Consumer Pricing Index for Urban Consumers. The repayment of the original bond principal upon maturity is guaranteed by the full faith and credit of the U.S. Government.
iv. When-Issued Securities and Forward Commitments — When-issued securities, including TBA (“To Be Announced”) securities, are securities that are authorized, but not yet issued in the market and purchased in order to secure what is considered to be an advantageous price or yield to the Fund. A forward commitment involves entering into a contract to purchase or sell securities, typically on an extended settlement basis, for a fixed price at a future date. The purchase of securities on a when-issued or forward commitment basis involves a risk of loss if the value of the security to be purchased declines before the settlement date. Conversely, the sale of securities on a forward commitment basis involves the risk that the value of the securities sold may increase before the settlement date. Although the Funds will generally purchase securities on a when-issued or forward commitment basis with the intention of acquiring the securities for their portfolios, the Funds may dispose of when-issued securities or forward commitments prior to settlement which may result in a realized gain or loss.
Equity Securities — Equity securities and investment companies traded on a U.S. securities exchange or the NASDAQ system, or those located on certain foreign exchanges including, but not limited to the Americas, are valued daily at their last sale price or official closing price on the principal exchange or system on which they are traded. If no sale occurs, equity securities and exchange traded investment companies are valued at the last bid price for long positions and at the last ask price for short positions. Investments in investment companies (other than those that are exchange traded) are valued at the NAV on the valuation date. To the extent these investments are actively traded, they are classified as Level 1 of the fair value hierarchy.
Unlisted equity securities for which market quotations are available are valued at the last sale price on the valuation date, or if no sale occurs, at the last bid price. Securities traded on certain foreign securities exchanges are valued daily at fair value determined by an independent fair value service (if available) under valuation procedures approved by the trustees and consistent with applicable regulatory guidance. The independent fair value service takes into account multiple factors including, but not limited to, movements in the securities markets, certain depositary receipts, futures contracts and foreign currency exchange rates
92
GOLDMAN SACHS SHORT DURATION AND GOVERNMENT FIXED INCOME FUNDS
|
| 3. INVESTMENTS AND FAIR VALUE MEASUREMENTS (continued) |
that have occurred subsequent to the close of the foreign securities exchange. Investments applying these valuation adjustments are classified as Level 2 of the fair value hierarchy.
Derivative Contracts — A derivative is an instrument whose value is derived from underlying assets, indices, reference rates or a combination of these factors.
Exchange-traded derivatives, including futures contracts, typically fall within Level 1 of the fair value hierarchy. Over-the-counter (“OTC”) derivatives are valued using market transactions and other market evidence, including market-based inputs to models, calibration to market-clearing transactions, broker or dealer quotations or other alternative pricing. Where models are used, the selection of a particular model to value an OTC derivative depends upon the contractual terms of, and specific risks inherent in, the instrument, as well as the availability of pricing information in the market. Valuation models require a variety of inputs, including contractual terms, market prices, yield curves, credit curves, measures of volatility, voluntary and involuntary prepayment rates, loss severity rates and correlations of such inputs. For OTC derivatives that trade in liquid markets, model inputs can generally be verified and model selection does not involve significant management judgment. OTC derivatives are classified within Level 2 of the fair value hierarchy when significant inputs are corroborated by market evidence.
i. Forward Foreign Currency Exchange Contracts — In a forward foreign currency contract, the Funds agree to receive or deliver a fixed quantity of one currency for another, at a pre-determined price at a future date. All forward foreign currency exchange contracts are marked to market daily at the applicable forward rate.
ii. Futures Contracts — Futures contracts are contracts to buy or sell a standardized quantity of a specified commodity or security and are valued based on exchanged settlement prices or independent market quotes. Futures contracts are valued at the last settlement price, or in the absence of a sale, the last bid price for long positions and at the last ask price for short positions, at the end of each day on the board of trade or exchange upon which they are traded. Upon entering into a futures contract, the Funds deposit cash or securities in an account on behalf of the broker in an amount sufficient to meet the initial margin requirement. Subsequent payments are made or received by the Funds equal to the daily change in the contract value and are recorded as variation margin receivable or payable with a corresponding offset in gains or losses.
iii. Options — When the Funds write call or put options, an amount equal to the premium received is recorded as a liability and is subsequently marked-to-market to reflect the current market value of the option written. Swaptions are options on swap contracts. Options on a futures contract may be written with premiums to be determined on a future date. The premiums for these options are based upon implied volatility parameters at specified terms.
Upon the purchase of a call option or a put option by the Funds, the premium paid is recorded as an investment and subsequently marked-to-market to reflect the current market value of the option. Certain options may be purchased with premiums to be determined on a future date. The premiums for these options are based upon implied voluntary parameters at specified terms.
iv. Swap Contracts — Swaps are marked to market daily using pricing vendor quotations, counterparty prices or model prices, and the change in value, if any, is recorded as an unrealized gain or loss.
An interest rate swap is an agreement that obligates two parties to exchange a series of cash flows at specified intervals, based upon or calculated by reference to changes in specified prices, rates or indices for a specified amount of an underlying asset or notional principal amount. The payment flows are usually netted against each other, with the difference being paid by one party to the other.
A credit default swap is an agreement that involves one party making a stream of payments to another party in exchange for the right to receive protection on a reference security or obligation. A Fund may use credit default swaps to provide a measure of protection against defaults of the reference security or obligation or to take a short position with respect to the likelihood of default. A Fund’s investment in credit default swaps may involve greater risks than if the Fund had invested in the referenced obligation directly. Credit events are contract specific but may include bankruptcy, failure to pay, restructuring and obligation acceleration. If a Fund buys protection through a credit default swap and no credit event occurs, its payments are limited to the periodic payments previously made to the counterparty. Upon the occurrence of a specified credit event, a
93
GOLDMAN SACHS SHORT DURATION AND GOVERNMENT FIXED INCOME FUNDS
Notes to Financial Statements (continued)
September 30, 2012 (Unaudited)
|
| 3. INVESTMENTS AND FAIR VALUE MEASUREMENTS (continued) |
Fund, as a buyer of credit protection, is entitled to receive an amount equal to the notional amount of the swap and deliver to the seller the defaulted reference obligation in a physically settled trade. A Fund may also receive a net settlement amount in the form of cash or securities equal to the notional amount of the swap reduced by the recovery value of the reference obligation in cash settled trade.
As a seller of protection, a Fund generally receives a payment stream throughout the term of the swap, provided that there is no credit event. In addition, if the Fund sells protection through a credit default swap, the Fund could suffer a loss because the value of the referenced obligation may be less than the premium payments received. Upon the occurrence of a specified credit event, a Fund, as a seller of credit protection, may be required to take possession of the defaulted reference obligation and pay the buyer an amount equal to the notional amount of the swap in a physically settled trade. A Fund may also pay a net settlement amount in the form of cash or securities equal to the notional amount of the swap reduced by the recovery value of the reference obligation in cash settled trade. Recovery values are at times established through the credit event auction process in which market participants are ensured that a transparent price has been set for the defaulted security or obligation. In addition, a Fund is entitled to a return of any assets, which have been pledged as collateral to the counterparty.
The maximum potential amount of future payments (undiscounted) that the Funds as sellers of protection could be required to make under a credit default swap would be an amount equal to the notional amount of the agreement. These potential amounts would be partially offset by any recovery values of the respective referenced obligations or net amounts received from a settlement of a credit default swap for the same reference security or obligation where the Funds bought credit protection.
Short Term Investments — Short-term investments having a maturity of 60 days or less are generally valued at amortized cost which approximates fair market value. These investments are classified as Level 2 of the fair value hierarchy.
i. Repurchase Agreements — Repurchase agreements involve the purchase of securities subject to the seller’s agreement to repurchase the securities at a mutually agreed upon date and price. During the term of a repurchase agreement, the value of the underlying securities held as collateral on behalf of the Funds, including accrued interest is required to exceed the value of the repurchase agreement, including accrued interest. The underlying securities for all repurchase agreements are held at the Funds’ custodian or designated sub-custodians under tri-party repurchase agreements.
Pursuant to exemptive relief granted by the Securities and Exchange Commission (“SEC”) and terms and conditions contained therein, the Funds, together with other registered investment companies having management agreements with GSAM or its affiliates, may transfer uninvested cash into joint accounts, the daily aggregate balance of which is invested in one or more repurchase agreements. Under these joint accounts, the Funds maintain pro rata credit exposure to the underlying repurchase agreements’ counterparties. With the exception of certain transaction fees, the Funds are not subject to any expenses in relation to these investments.
B. Level 3 Fair Value Investments — The valuation techniques and significant inputs used in determining the fair values for investments classified as Level 3 are as follows:
To the extent that the aforementioned significant inputs are unobservable, or if quotations are not readily available, or if GSAM believes that such quotations do not accurately reflect fair value, the fair value of the Funds’ investments may be determined under valuation procedures approved by the trustees. GSAM, consistent with its procedures and applicable regulatory guidance, may make an adjustment to the most recent valuation prices of either domestic or foreign securities in light of significant events to reflect what it believes to be the fair value of the securities at the time of determining a Fund’s NAV. Significant events which could affect a large number of securities in a particular market may include, but are not limited to: significant fluctuations in U.S. or foreign markets; market dislocations; market disruptions; or unscheduled market closings. Significant events which could also affect a single issuer, may include, but are not limited to: corporate actions such as reorganizations, mergers and buy-outs; ratings downgrades; and bankruptcies.
94
GOLDMAN SACHS SHORT DURATION AND GOVERNMENT FIXED INCOME FUNDS
|
| 3. INVESTMENTS AND FAIR VALUE MEASUREMENTS (continued) |
C. Fair Value Hierarchy — The following is a summary of the Funds’ investments and derivatives classified in the fair value hierarchy as of September 30, 2012:
| | | | | | | | | | | | |
| | | |
| ENHANCED INCOME | | | | | | | | | | | | |
| | | |
| Investment Type | | Level 1 | | | Level 2 | | | Level 3 | |
| Assets | | | | | | | | | | | | |
Fixed Income | | | | | | | | | | | | |
Corporate Obligations | | $ | — | | | $ | 243,731,260 | | | $ | — | |
U.S. Treasury Obligations and/or Other U.S. Government Agencies | | | 82,811,195 | | | | 23,053,138 | | | | — | |
Asset-Backed Securities | | | — | | | | 61,903,254 | | | | 60,342 | |
Foreign Debt Obligations | | | 4,709,212 | | | | 5,238,534 | | | | — | |
Government Guarantee Obligations | | | — | | | | 51,336,579 | | | | — | |
Short-term Investments | | | — | | | | 5,202,790 | | | | — | |
| Total | | $ | 87,520,407 | | | $ | 390,465,555 | | | $ | 60,342 | |
| | | |
| Derivative Type | | | | | | | | | |
| Assets(a) | | | | | | | | | | | | |
Futures Contracts | | $ | 20,903 | | | $ | — | | | $ | — | |
Credit Default Swap Contracts | | | — | | | | 39,287 | | | | — | |
| Total | | $ | 20,903 | | | $ | 39,287 | | | $ | — | |
| Liabilities(a) | | | | | | | | | | | | |
Futures Contracts | | $ | (36,517 | ) | | $ | — | | | $ | — | |
| | | |
| GOVERNMENT INCOME | | | | | | | | | | | | |
| | | |
| Investment Type | | Level 1 | | | Level 2 | | | Level 3 | |
| Assets | | | | | | | | | | | | |
Fixed Income | | | | | | | | | | | | |
Mortgage-Backed Obligations | | $ | — | | | $ | 365,818,535 | | | $ | — | |
U.S. Treasury Obligations and/or Other U.S. Government Agencies | | | 124,062,009 | | | | 204,642,730 | | | | — | |
Asset-Backed Securities | | | — | | | | 12,182,524 | | | | — | |
Government Guarantee Obligations | | | — | | | | 86,410,570 | | | | — | |
Municipal Debt Obligations | | | — | | | | 2,527,580 | | | | — | |
Short-term Investments | | | — | | | | 193,500,000 | | | | — | |
| Total | | $ | 124,062,009 | | | $ | 865,081,939 | | | $ | — | |
| Liabilities | | | | | | | | | | | | |
Fixed Income | | | | | | | | | | | | |
Mortgage-Backed Obligations — Forward Sales Contracts | | $ | — | | | $ | (12,000,313 | ) | | $ | — | |
95
GOLDMAN SACHS SHORT DURATION AND GOVERNMENT FIXED INCOME FUNDS
Notes to Financial Statements (continued)
September 30, 2012 (Unaudited)
|
| 3. INVESTMENTS AND FAIR VALUE MEASUREMENTS (continued) |
| | | | | | | | | | | | |
|
| GOVERNMENT INCOME (continued) | |
| | | |
| Derivative Type | | Level 1 | | | Level 2 | | | Level 3 | |
| Assets | | | | | | | | | | | | |
Options Purchased | | $ | — | | | $ | 533,897 | | | $ | — | |
Futures Contracts(a) | | | 1,371,409 | | | | — | | | | — | |
Interest Rate Swap Contracts(a) | | | — | | | | 283,369 | | | | — | |
| Total | | $ | 1,371,409 | | | $ | 817,266 | | | $ | — | |
| Liabilities | | | | | | | | | | | | |
Futures Contracts(a) | | $ | (642,129 | ) | | $ | — | | | $ | — | |
Interest Rate Swap Contracts(a) | | | — | | | | (822,258 | ) | | | — | |
Written Options Contracts | | | — | | | | (198,440 | ) | | | — | |
| Total | | $ | (642,129 | ) | | $ | (1,020,698 | ) | | $ | — | |
| | | |
| HIGH QUALITY FLOATING RATE | | | | | | | | | | | | |
| | | |
| Investment Type | | Level 1 | | | Level 2 | | | Level 3 | |
| Assets | | | | | | | | | | | | |
Fixed Income | | | | | | | | | | | | |
Corporate Obligations | | $ | — | | | $ | 1,509,900 | | | $ | — | |
Mortgage-Backed Obligations | | | — | | | | 151,366,632 | | | | — | |
Asset-Backed Securities | | | — | | | | 79,199,613 | | | | 668,609 | |
| Total | | $ | — | | | $ | 232,076,145 | | | $ | 668,609 | |
| | | |
| Derivative Type | | | | | | | | | |
| Assets | | | | | | | | | | | | |
Options Purchased | | $ | — | | | $ | 426,113 | | | $ | — | |
Futures Contracts(a) | | | 264,565 | | | | — | | | | — | |
Interest Rate Swap Contracts(a) | | | — | | | | 118,555 | | | | — | |
| Total | | $ | 264,565 | | | $ | 544,668 | | | $ | — | |
| Liabilities | | | | | | | | | | | | |
Futures Contracts(a) | | $ | (252,648 | ) | | $ | — | | | $ | — | |
Interest Rate Swap Contracts(a) | | | — | | | | (982,920 | ) | | | — | |
Written Options Contracts | | | — | | | | (79,326 | ) | | | — | |
| Total | | $ | (252,648 | ) | | $ | (1,062,246 | ) | | $ | — | |
96
GOLDMAN SACHS SHORT DURATION AND GOVERNMENT FIXED INCOME FUNDS
|
| 3. INVESTMENTS AND FAIR VALUE MEASUREMENTS (continued) |
| | | | | | | | | | | | |
| | | |
| INFLATION PROTECTED SECURITIES | | | | | | | | | | | | |
| | | |
| Investment Type | | Level 1 | | | Level 2 | | | Level 3 | |
| Assets | | | | | | | | | | | | |
Fixed Income | | | | | | | | | | | | |
U.S. Treasury Obligations | | $ | 314,225,098 | | | $ | — | | | $ | — | |
Short-term Investments | | | — | | | | 1,700,000 | | | | — | |
| Total | | $ | 314,225,098 | | | $ | 1,700,000 | | | $ | — | |
| | | |
| Derivative Type | | | | | | | | | |
| Assets | | | | | | | | | | | | |
Options Purchased | | $ | — | | | $ | 143,494 | | | $ | — | |
Futures Contracts(a) | | | 165,889 | | | | — | | | | — | |
| Total | | $ | 165,889 | | | $ | 143,494 | | | $ | — | |
| Liabilities(a) | | | | | | | | | | | | |
Futures Contracts | | $ | (235,527 | ) | | $ | — | | | $ | — | |
Interest Rate Swap Contracts | | | — | | | | (19,281 | ) | | | — | |
| Total | | $ | (235,527 | ) | | $ | (19,281 | ) | | $ | — | |
| | | |
| SHORT DURATION GOVERNMENT | | | | | | | | | | | | |
| | | |
| Investment Type | | Level 1 | | | Level 2 | | | Level 3 | |
| Assets | | | | | | | | | | | | |
Fixed Income | | | | | | | | | | | | |
Mortgage-Backed Obligations | | $ | — | | | $ | 1,327,708,273 | | | $ | — | |
U.S. Treasury Obligations and/or Other U.S. Government Agencies | | | 60,384,051 | | | | 1,026,470,545 | | | | — | |
Short-term Investments | | | — | | | | 100,500,000 | | | | — | |
| Total | | $ | 60,384,051 | | | $ | 2,454,678,818 | | | $ | — | |
| Liabilities | | | | | | | | | | | | |
Fixed Income | | | | | | | | | | | | |
Mortgage-Backed Obligations — Forward Sales Contracts | | $ | — | | | $ | (84,516,757 | ) | | $ | — | |
97
GOLDMAN SACHS SHORT DURATION AND GOVERNMENT FIXED INCOME FUNDS
Notes to Financial Statements (continued)
September 30, 2012 (Unaudited)
|
| 3. INVESTMENTS AND FAIR VALUE MEASUREMENTS (continued) |
| | | | | | | | | | | | |
|
| SHORT DURATION GOVERNMENT (continued) | |
| | | |
| Derivative Type | | Level 1 | | | Level 2 | | | Level 3 | |
| Assets | | | | | | | | | | | | |
Options Purchased | | $ | — | | | $ | 1,916,661 | | | $ | — | |
Futures Contracts(a) | | | 1,221,209 | | | | — | | | | — | |
Interest Rate Swap Contracts(a) | | | — | | | | 183,633 | | | | — | |
| Total | | $ | 1,221,209 | | | $ | 2,100,294 | | | $ | — | |
| Liabilities | | | | | | | | | | | | |
Futures Contracts(a) | | $ | (1,055,896 | ) | | $ | — | | | $ | — | |
Interest Rate Swap Contracts(a) | | | — | | | | (7,923,714 | ) | | | — | |
Written Options Contracts | | | — | | | | (897,623 | ) | | | — | |
| Total | | $ | (1,055,896 | ) | | $ | (8,821,337 | ) | | $ | — | |
| | | |
| SHORT DURATION INCOME | | | | | | | | | | | | |
| | | |
| Investment Type | | Level 1 | | | Level 2 | | | Level 3 | |
| Assets | | | | | | | | | | | | |
Fixed Income | | | | | | | | | | | | |
Corporate Obligations | | $ | — | | | $ | 16,740,845 | | | $ | — | |
Mortgage-Backed Obligations | | | — | | | | 10,467,269 | | | | — | |
Asset-Backed Securities | | | — | | | | 3,590,626 | | | | 95,516 | |
Foreign Debt Obligations | | | — | | | | 1,354,760 | | | | — | |
Municipal Debt Obligations | | | — | | | | 400,488 | | | | — | |
Short-term Investments | | | — | | | | 9,400,161 | | | | — | |
| Total | | $ | — | | | $ | 41,954,149 | | | $ | 95,516 | |
| Liabilities | | | | | | | | | | | | |
Fixed Income | | | | | | | | | | | | |
Mortgage-Backed Obligations — Forward Sales Contracts | | $ | — | | | $ | (1,090,938 | ) | | $ | — | |
98
GOLDMAN SACHS SHORT DURATION AND GOVERNMENT FIXED INCOME FUNDS
|
| 3. INVESTMENTS AND FAIR VALUE MEASUREMENTS (continued) |
| | | | | | | | | | | | |
|
| SHORT DURATION INCOME (continued) | |
| | | |
| Derivative Type | | Level 1 | | | Level 2 | | | Level 3 | |
| Assets(a) | | | | | | | | | | | | |
Forward Foreign Currency Exchange Contracts | | $ | — | | | $ | 35,440 | | | $ | — | |
Futures Contracts | | | 50,699 | | | | — | | | | — | |
Interest Rate Swap Contracts | | | — | | | | 978 | | | | — | |
Credit Default Swap Contracts | | | — | | | | 10,384 | | | | — | |
| Total | | $ | 50,669 | | | $ | 46,802 | | | $ | — | |
| Liabilities(a) | | | | | | | | | | | | |
Forward Foreign Currency Exchange Contracts | | $ | — | | | $ | (32,828 | ) | | $ | — | |
Futures Contracts | | | (8,952 | ) | | | — | | | | — | |
Interest Rate Swap Contracts | | | — | | | | (7,823 | ) | | | — | |
| Total | | $ | (8,952 | ) | | $ | (40,651 | ) | | $ | — | |
| (a) | | Amount shown represents unrealized gain (loss) at period end. |
| | |
| 4. INVESTMENTS IN DERIVATIVES | | |
The following tables set forth, by certain risk types, the gross value of these derivative contracts as of September 30, 2012. These instruments were used to meet the Funds’ investment objectives and to obtain and/or manage exposure related to the risks below. The values in the tables below exclude the effects of cash collateral received or posted pursuant to these derivative contracts, and therefore are not representative of the Funds’ net exposure.
| | | | | | | | | | | | |
| | |
| Enhanced Income | | | | | | | |
| Risk | | Statements of Assets
and Liabilities | | Assets | | | Statements of Assets
and Liabilities | | Liabilities | |
Interest rate | | Unrealized gain on futures variation margin | | $ | 20,903 | (a) | | Unrealized loss on futures variation margin | | $ | (36,517) | (a) |
Credit | | Receivable for unrealized gain on swap contracts | | | 39,287 | | | — | | | — | |
| Total | | $ | 60,190 | | | | | $ | (36,517) | |
| | | |
| Government Income | | | | | | | | | | |
| Risk | | Statements of Assets
and Liabilities | | Assets | | | Statements of Assets
and Liabilities | | Liabilities | |
Interest rate | | Receivable for unrealized gain on swap contracts; Unrealized gain on futures variation margin; Investments, at value | | $ | 2,188,675 | (a) | | Payable for unrealized loss on swap contracts; Unrealized loss on futures variation margin; Options written, at value | | $ | (1,662,827) | (a)(b) |
99
GOLDMAN SACHS SHORT DURATION AND GOVERNMENT FIXED INCOME FUNDS
Notes to Financial Statements (continued)
September 30, 2012 (Unaudited)
|
| 4. INVESTMENTS IN DERIVATIVES (continued) |
| | | | | | | | | | | | |
| | | |
| High Quality Floating Rate | | | | | | | | | | |
| Risk | | Statements of Assets
and Liabilities | | Assets | | | Statements of Assets
and Liabilities | | Liabilities | |
Interest rate | | Receivable for unrealized gain on swap contracts; Unrealized gain on futures variation margin; Investments, at value | | $ | 809,233 | (a) | | Payable for unrealized loss on swap contracts; Unrealized loss on futures variation margin; Options written, at value | | $ | (1,314,894) | (a)(b) |
| | | |
| Inflation Protected Securities | | | | | | | | | | |
| Risk | | Statements of Assets
and Liabilities | | Assets | | | Statements of Assets
and Liabilities | | Liabilities | |
Interest rate | | Unrealized gain on futures variation margin; Investments, at value | | $ | 309,383 | (a) | | Payable for unrealized loss on swap contracts; Unrealized loss on futures variation margin | | $ | (254,808) | (a)(b) |
| | | |
| Short Duration Government | | | | | | | | | | |
| Risk | | Statements of Assets
and Liabilities | | Assets | | | Statements of Assets
and Liabilities | | Liabilities | |
Interest rate | | Receivable for unrealized gain on swap contracts; Unrealized gain on futures variation margin; Investments, at value | | $ | 3,321,503 | (a) | | Payable for unrealized loss on swap contracts; Unrealized loss on futures variation margin; Options written, at value | | $ | (9,877,233) | (a)(b) |
| | | |
| Short Duration Income | | | | | | | | | | |
| Risk | | Statements of Assets
and Liabilities | | Assets | | | Statements of Assets
and Liabilities | | Liabilities | |
Interest rate | | Receivable for unrealized gain on swap contracts; Unrealized gain on futures variation margin; | | $ | 51,677 | (a) | | Payable for unrealized loss on swap contracts; Unrealized loss on futures variation margin | | $ | (16,775) | (a)(b) |
Credit | | Receivable for unrealized gain on swap contracts | | | 10,384 | | | — | | | — | |
Currency | | Receivable for forward foreign currency exchange contracts | | | 35,440 | | | Payable for forward foreign currency exchange contracts | | | (32,828) | |
| Total | | $ | 97,501 | | | | | $ | (49,603) | |
| (a) | | Includes unrealized gain (loss) on futures contracts described in the Additional Investment Information sections of the Schedules of Investments. Only current day’s variation margin is reported within the Statements of Assets and Liabilities. |
| (b) | | Aggregate of amounts include $822,258, $982,920, $19,281, $7,923,714 and $7,823 for Government Income, High Quality Floating Rate, Inflation Protected Securities, Short Duration Government and Short Duration Income Funds, respectively, which represent the payments to be made pursuant to bilateral agreements should counterparties exercise their “right to terminate” provisions based on, among others, the Funds’ performance, their failure to pay on its obligations or failure to pledge collateral. Such amounts do not include incremental charges directly associated with the close-out of the agreements. They also do not reflect the fair value of any assets pledged as collateral which, through the daily margining process, substantially offsets the aforementioned amounts and for which the Funds are entitled to a full return. |
100
GOLDMAN SACHS SHORT DURATION AND GOVERNMENT FIXED INCOME FUNDS
|
| 4. INVESTMENTS IN DERIVATIVES (continued) |
The following tables set forth, by certain risk types, the Funds’ gains (losses) related to these derivatives and their indicative volumes for the six months ended September 30, 2012. These gains (losses) should be considered in the context that these derivative contracts may have been executed to economically hedge certain investments, and accordingly, certain gains (losses) on such derivative contracts may offset certain (losses) gains attributable to investments. These gains (losses) are included in “Net realized gain (loss)” or “Net change in unrealized gain (loss)” on the Statements of Operations:
| | | | | | | | | | | | | | |
| | | |
| Enhanced Income | | | | | | | | | | | | |
| Risk | | Statements of Operations | | Net
Realized
Gain (Loss) | | | Net Change in
Unrealized
Gain (Loss) | | | Average
Number of
Contracts(a) | |
| Interest rate | | Net realized gain (loss) from futures contracts/Net change in unrealized gain (loss) on futures contracts | | $ | (2,587,757 | ) | | $ | 1,653,661 | | | | 987 | |
| Credit | | Net realized gain (loss) from swap contracts/Net change in unrealized gain (loss) on swap contracts | | | 36,902 | | | | 1,307 | | | | 1 | |
| Total | | | | $ | (2,550,855 | ) | | $ | 1,654,968 | | | | 988 | |
| | | |
| Government Income | | | | | | | | | | | | |
| Risk | | Statements of Operations | | Net
Realized
Gain (Loss) | | | Net Change in
Unrealized
Gain (Loss) | | | Average
Number of
Contracts(a) | |
| Interest rate | | Net realized gain (loss) from investments, futures contracts, swap contracts/Net change in unrealized gain (loss) on investments, futures contracts, swap contracts and written options | | $ | 2,952,410 | | | $ | 1,060,992 | | | | 2,639 | |
| | | |
| High Quality Floating Rate | | | | | | | | | | | | |
| Risk | | Statements of Operations | | Net
Realized
Gain (Loss) | | | Net Change in
Unrealized
Gain (Loss) | | | Average
Number of
Contracts(a) | |
| Interest rate | | Net realized gain (loss) from investments, futures contracts, swap contracts and written options/Net change in unrealized gain (loss) on investments, futures contracts, swap contracts and written options | | $ | (2,590,888 | ) | | $ | 92,921 | | | | 630 | |
| | | |
| Inflation Protected Securities | | | | | | | | | | | | |
| Risk | | Statements of Operations | | Net
Realized
Gain (Loss) | | | Net Change in
Unrealized
Gain (Loss) | | | Average
Number of
Contracts(a) | |
| Interest rate | | Net realized gain (loss) from investments, futures contracts, and swap contracts/Net change in unrealized gain (loss) on investments, futures contracts and swap contracts | | $ | 288,902 | | | $ | (195,319 | ) | | | 442 | |
| | | |
| Short Duration Government | | | | | | | | | | | | |
| Risk | | Statements of Operations | | Net
Realized
Gain (Loss) | | | Net Change in
Unrealized
Gain (Loss) | | | Average
Number of
Contracts(a) | |
| Interest rate | | Net realized gain (loss) from investments, futures contracts, swap contracts, written options/Net change in unrealized gain (loss) on investments, futures contracts, swap contracts and written options | | $ | (14,457,142 | ) | | $ | (4,169,858 | ) | | | 8,962 | |
101
GOLDMAN SACHS SHORT DURATION AND GOVERNMENT FIXED INCOME FUNDS
Notes to Financial Statements (continued)
September 30, 2012 (Unaudited)
|
| 4. INVESTMENTS IN DERIVATIVES (continued) |
| | | | | | | | | | | | | | |
| | | |
| Short Duration Income | | | | | | | | | | | | |
| Risk | | Statements of Operations | | Net
Realized
Gain (Loss) | | | Net Change in
Unrealized
Gain (Loss) | | | Average
Number of
Contracts(a) | |
| Interest rate | | Net realized gain (loss) from futures contracts/Net unrealized gain (loss) on futures contracts, swap contracts | | $ | 5,562 | | | $ | 16,580 | | | | 74 | |
| Credit | | Net realized gain (loss) from swap contracts/Net change in unrealized gain (loss) on swap contracts | | | 2,862 | | | | 10,384 | | | | 1 | |
| Currency | | Net realized gain (loss) from foreign currency related transactions/Net unrealized gain (loss) on foreign currency related transactions | | | (5,654 | ) | | | 939 | | | | 251 | |
| Total | | | | $ | 2,770 | | | $ | 27,903 | | | | 326 | |
| (a) | | Average number of contracts is based on the average of month end balances for the six months ended September 30, 2012. |
|
| 5. AGREEMENTS AND AFFILIATED TRANSACTIONS |
A. Management Agreement — Under the Agreement, GSAM manages the Funds, subject to the general supervision of the trustees.
As compensation for the services rendered pursuant to the Agreement, the assumption of the expenses related thereto and administration of the Funds’ business affairs, including providing facilities, GSAM is entitled to a management fee accrued daily and paid monthly, equal to an annual percentage rate of each Fund’s average daily net assets.
For the six months ended September 30, 2012, contractual and effective net management fees with GSAM were at the following rates:
| | | | | | | | | | | | | | | | | | | | | | | | | | | | | | |
| | | | | Contractual Management Fee Rate | | | | |
| Fund | | | | First
$1 billion | | | Next
$1 billion | | | Next
$3 billion | | | Next
$3 billion | | | Over
$8 billion | | | Effective
Rate | | | Effective Net
Management
Fee Rate | |
Enhanced Income | | | | | 0.25 | % | | | 0.23 | % | | | 0.22 | % | | | 0.22 | % | | | 0.22 | % | | | 0.25 | % | | | 0.23 | %1 |
Government Income | | | | | 0.54 | | | | 0.49 | | | | 0.47 | | | | 0.46 | | | | 0.45 | | | | 0.54 | | | | 0.53 | 2 |
High Quality Floating Rate | | | | | 0.40 | | | | 0.36 | | | | 0.34 | | | | 0.33 | | | | 0.32 | | | | 0.40 | | | | 0.31 | 2 |
Inflation Protected Securities | | | | | 0.33 | | | | 0.30 | | | | 0.28 | | | | 0.27 | | | | 0.26 | | | | 0.33 | | | | 0.20 | 2 |
Short Duration Government | | | | | 0.50 | | | | 0.45 | | | | 0.43 | | | | 0.42 | | | | 0.41 | | | | 0.47 | | | | 0.42 | 3 |
Short Duration Income | | | | | 0.40 | | | | 0.36 | | | | 0.34 | | | | 0.33 | | | | 0.32 | | | | 0.40 | | | | 0.40 | |
| 1 | | Effective July 30, 2012, the management fee waiver on the Enhanced Income Fund was discontinued. Prior to such date, the effective net management fee waiver was 0.05%. |
| 2 | | GSAM has agreed to waive a portion of its management fee in order to achieve an effective net management rate of 0.53%, 0.31% and 0.20% for the Government Income, High Quality Floating Rate and Inflation Protected Securities Funds, respectively, as an annual percentage rate of the average daily net assets of the Funds through at least July 27, 2013. Prior to such date GSAM may not terminate the arrangement without the approval of the trustees. |
| 3 | | GSAM has voluntarily agreed to waive a portion of its management fee equal on an annualized basis to 0.05% as an annual percentage rate of the Fund’s average daily net assets. This management fee is temporary and may be modified at any time at the option of GSAM, without shareholder approval. |
102
GOLDMAN SACHS SHORT DURATION AND GOVERNMENT FIXED INCOME FUNDS
|
| 5. AGREEMENTS AND AFFILIATED TRANSACTIONS (continued) |
B. Distribution and Service Plans — The Trust, on behalf of each Fund, has adopted Distribution and Service Plans (the “Plans”). Under the Plans, Goldman Sachs, which serves as distributor (the “Distributor”), is entitled to a fee, accrued daily and paid monthly for distribution services and personal and account maintenance services, which may then be paid by Goldman Sachs to authorized dealers, at the following annual rates calculated on a Fund’s average daily net assets of each respective share class:
| | | | | | | | | | | | | | | | |
| | | Distribution and Service Plan Rates | |
| | | Class A* | | | Class B | | | Class C | | | Class R* | |
Distribution Plan | | | 0.25 | % | | | 0.75 | % | | | 0.75 | % | | | 0.50 | % |
Service Plan | | | — | | | | 0.25 | | | | 0.25 | | | | — | |
| * | | With respect to Class A and Class R Shares, the Distributor at its discretion may use compensation for distribution services paid under the Distribution Plan to compensate service organizations for personal and account maintenance services and expenses as long as such total compensation does not exceed the maximum cap on “service fees” imposed by the Financial Industry Regulatory Authority. |
Goldman Sachs has agreed to waive a portion of the distribution and service fees applicable to the Short Duration Government Fund’s Class B shares in an amount equal to a minimum of 0.15% as an annual percentage rate of the average daily net assets. Goldman Sachs has also agreed to waive a portion of the distribution and service fees applicable to the Short Duration Government Fund’s and Short Duration Income Fund’s Class C Shares in an amount equal to a minimum of 0.35% as an annual percentage rate of the average daily net assets. These arrangements will remain in place through at least July 27, 2013 for Short Duration Government and Short Duration Income Funds. Prior to such date Goldman Sachs may not terminate the arrangement without the approval of the trustees.
For the six months ended September 30, 2012, Goldman Sachs waived a portion of the distribution and service fees equal to 0.10% of the average daily net assets attributable to Class B shares of the Enhanced Income Fund, 0.32% and 0.38% of the average daily net assets attributable to the Class B and Class C shares of the Short Duration Government Fund and 0.38% of the average daily net assets attributable to the Class C shares of the Short Duration Income Fund.
C. Distribution Agreement — Goldman Sachs, as Distributor of the shares of the Funds pursuant to a Distribution Agreement, may retain a portion of the Class A front end sales charge and Class B and Class C CDSC. During the six months ended September 30, 2012, Goldman Sachs advised that it retained the following approximate amounts:
| | | | | | | | | | | | | | |
| | | | | Front End
Sales Charge | | | Contingent Deferred
Sales Charge | |
| Fund | | | | Class A | | | Class B | | | Class C | |
Enhanced Income | | | | $ | 200 | | | $ | — | | | | N/A | |
Government Income | | | | | 4,700 | | | | — | | | $ | — | * |
High Quality Floating Rate | | | | | 200 | | | | N/A | | | | N/A | |
Inflation Protected Securities | | | | | 7,000 | | | | N/A | | | | — | * |
Short Duration Government | | | | | 2,500 | | | | — | | | | — | * |
Short Duration Income | | | | | — | | | | N/A | | | | — | |
| * | | Amount is less than $50. |
103
GOLDMAN SACHS SHORT DURATION AND GOVERNMENT FIXED INCOME FUNDS
Notes to Financial Statements (continued)
September 30, 2012 (Unaudited)
|
| 5. AGREEMENTS AND AFFILIATED TRANSACTIONS (continued) |
D. Service Plan and Shareholder Administration Plan — The Trust, on behalf of each Fund that offers Service Shares, has adopted a Service Plan and a Shareholder Administration Plan. In addition, the Trust, on behalf of the Enhanced Income Fund, has adopted an Administration Plan for Administration Shares. These plans allow service organizations to provide varying levels of personal and account maintenance and shareholder administration services to their customers who are beneficial owners of such shares. The Service Plan and Shareholder Administration Plan each provide for compensation to the service organizations which is accrued daily and paid monthly at an annual rate of 0.25% (0.50% in aggregate) of the average daily net assets of the Service Shares.
For the six months ended September 30, 2012, Goldman Sachs waived a portion of the service fees equal to 0.01% of the average daily net assets attributable to the Service Shares of the High Quality Floating Rate Fund.
E. Transfer Agency Agreement — Goldman Sachs also serves as the transfer agent of the Funds for a fee pursuant to a Transfer Agency Agreement. The fees charged for such transfer agency services are accrued daily and paid monthly at annual rates as follows: 0.13% of the average daily net assets of Class A, Class B, Class C, Class IR and Class R Shares and 0.04% of the average daily net assets of Institutional, Administration and Service Shares.
F. Other Expense Agreements and Affiliated Transactions — GSAM has agreed to limit certain “Other Expense” of the Funds (excluding management fees, distribution and service fees, acquired fund fees and expenses, transfer agent fees and expenses, service fees and shareholder administration fees (as applicable), Administration Share fees (as applicable), taxes, interest, brokerage fees and litigation, indemnification, shareholder meeting and other extraordinary expenses, exclusive of any custody and transfer agent fee credit reductions) to the extent such expenses exceed, on an annual basis, a percentage rate of the average daily net assets of each Fund. Such Other Expense reimbursements, if any, are accrued daily and paid monthly. In addition, the Funds are not obligated to reimburse GSAM for prior fiscal year expense reimbursements, if any. The Other Expense limitations for Enhanced Income, Government Income, High Quality Floating Rate, Inflation Protected Securities, Short Duration Government and Short Duration Income Funds as an annual percentage rate of average daily net assets are 0.064%, 0.004%, 0.054%, 0.044%, 0.004% and 0.014%, respectively. This Other Expense reimbursement will remain in place through at least July 27, 2013. Prior to such date GSAM may not terminate the arrangements without the approval of the trustees. In addition, the Funds have entered into certain offset arrangements with the custodian and the transfer agent, which may result in a reduction of the Funds’ expenses.
For the six months ended September 30, 2012, these expense reductions, including any fee waivers and Other Expense reimbursements, were as follows (in thousands):
| | | | | | | | | | | | | | | | | | | | | | | | | | | | | | |
| | | | | Fee Waivers | | | | | | | | | | |
| Fund | | | | Management
Fees | | | Class B
Distribution and
Service Fees | | | Class C
Distribution and
Service Fees | | | Service
Class
Fees | | | Custody
Fee
Credits | | | Other
Expense
Reimbursements | | | Total
Expense
Reductions | |
Enhanced Income | | | | $ | 85 | | | $ | — | * | | | N/A | | | | N/A | | | $ | — | * | | $ | — | | | $ | 85 | |
Government Income | | | | | 41 | | | | — | | | $ | — | | | $ | — | | | | — | * | | | 330 | | | | 371 | |
High Quality Floating Rate | | | | | 124 | | | | N/A | | | | N/A | | | | — | * | | | 1 | | | | 140 | | | | 265 | |
Inflation Protected Securities | | | | | 203 | | | | N/A | | | | — | | | | N/A | | | | — | * | | | 94 | | | | 297 | |
Short Duration Government | | | | | 528 | | | | — | * | | | 169 | | | | — | | | | 6 | | | | 276 | | | | 979 | |
Short Duration Income | | | | | — | | | | N/A | | | | — | * | | | N/A | | | | — | * | | | 246 | | | | 246 | |
| * | | Amount is less than $500. |
104
GOLDMAN SACHS SHORT DURATION AND GOVERNMENT FIXED INCOME FUNDS
|
| 5. AGREEMENTS AND AFFILIATED TRANSACTIONS (continued) |
As of September 30, 2012, the amounts owed to affiliates of the Funds were as follows (in thousands):
| | | | | | | | | | | | | | | | | | |
| | | | | Management
Fees | | | Distribution
and Service
Fees | | | Transfer
Agent
Fees | | | Total | |
Enhanced Income | | | | $ | 107 | | | $ | 18 | | | $ | 24 | | | $ | 149 | |
Government Income | | | | | 362 | | | | 119 | | | | 59 | | | | 540 | |
High Quality Floating Rate | | | | | 64 | | | | 15 | | | | 14 | | | | 93 | |
Inflation Protected Securities | | | | | 52 | | | | 41 | | | | 20 | | | | 113 | |
Short Duration Government | | | | | 756 | | | | 179 | | | | 124 | | | | 1,059 | |
Short Duration Income | | | | | 10 | | | | 3 | | | | 2 | | | | 15 | |
G. Line of Credit Facility — As of September 30, 2012, the Funds participated in a $630,000,000 committed, unsecured revolving line of credit facility (the “facility”) together with other funds of the Trust and registered investment companies having management agreements with GSAM or its affiliates (“Other Borrowers”). Pursuant to the terms of the facility, the Funds and Other Borrowers could increase the credit amount by an additional $340,000,000, for a total of up to $970,000,000. This facility is to be used solely for temporary or emergency purposes. The interest rate on borrowings is based on the federal funds rate. The facility also requires a fee to be paid by the Funds based on the amount of the commitment that has not been utilized. For the six months ended September 30, 2012, the Funds did not have any borrowings under the facility. Prior to May 8, 2012, the amount available through the facility was $580,000,000.
H. Other Transactions with Affiliates — For the six months ended September 30, 2012, Goldman Sachs earned approximately $9,600, $28,100, $8,000, $5,400, $115,000, and $1,000 in brokerage commissions from portfolio transactions, including futures transactions executed with Goldman Sachs as the Futures Commission Merchant on behalf of Enhanced Income, Government Income, High Quality Floating Rate, Inflation Protected Securities, Short Duration Government and Short Duration Income Funds, respectively.
As of September 30, 2012, the Goldman Sachs Group, Inc. was the beneficial owner of 5% or more of outstanding Class C, Institutional, Service, Class IR and Class R Shares of the following fund:
| | | | | | | | | | | | | | | | | | |
| Fund | | | | Class C | | | Institutional Class | | | Class IR | | | Class R | |
Short Duration Income | | | | | 88 | % | | | 50 | % | | | 17 | % | | | 100 | % |
105
GOLDMAN SACHS SHORT DURATION AND GOVERNMENT FIXED INCOME FUNDS
Notes to Financial Statements (continued)
September 30, 2012 (Unaudited)
|
| 6. PORTFOLIO SECURITIES TRANSACTIONS |
The cost of purchases and proceeds from sales and maturities of long-term securities for the six months ended September 30, 2012, were as follows:
| | | | | | | | | | | | | | | | | | |
| Fund | | | | Purchases of
U.S. Government and
Agency Obligations | | | Purchases (Excluding
U.S. Government and
Agency Obligations) | | | Sales and Maturities of U.S. Government and Agency Obligations | | | Sales and Maturities (Excluding U.S. Government and Agency Obligations) | |
Enhanced Income | | | | $ | 152,090,736 | | | $ | 89,855,312 | | | $ | 120,274,286 | | | $ | 131,881,509 | |
Government Income | | | | | 4,404,226,668 | | | | 6,585,963 | | | | 4,460,627,461 | | | | 40,514,760 | |
High Quality Floating Rate | | | | | 559,443,372 | | | | 43,635,241 | | | | 621,058,927 | | | | 89,285,774 | |
Inflation Protected Securities | | | | | 360,974,325 | | | | — | | | | 368,650,678 | | | | — | |
Short Duration Government | | | | | 9,101,594,611 | | | | 9,080,395 | | | | 8,875,788,509 | | | | 139,732,184 | |
Short Duration Income | | | | | 159,898,781 | | | | 16,476,143 | | | | 156,010,789 | | | | 1,429,896 | |
As of the Funds’ most recent fiscal year end, March 31, 2012, the Funds’ capital loss carryforwards and certain timing differences, on a tax basis were as follows:
| | | | | | | | | | | | | | | | | | | | | | | | |
| | | Enhanced
Income | | | Government
Income | | | High Quality
Floating
Rate | | | Inflation
Protected
Securities | | | Short
Duration
Government | | | Short
Duration
Income | |
Capital loss carryforwards:(1) | | | | | | | | | | | | | | | | | | | | | | | | |
Expiring 2013 | | $ | (352,397 | ) | | $ | — | | | $ | (7,818,636 | ) | | $ | — | | | $ | — | | | $ | — | |
Expiring 2014 | | | (320,682 | ) | | | — | | | | (2,842,873 | ) | | | — | | | | — | | | | — | |
Expiring 2015 | | | (987,433 | ) | | | — | | | | (4,261,952 | ) | | | — | | | | — | | | | — | |
Expiring 2016 | | | (2,472,185 | ) | | | — | | | | — | | | | — | | | | — | | | | — | |
Expiring 2018 | | | (1,658,767 | ) | | | — | | | | (21,924,176 | ) | | | — | | | | — | | | | — | |
Expiring 2019 | | | (9,056,394 | ) | | | — | | | | (2,415,726 | ) | | | — | | | | — | | | | — | |
Perpetual Short-Term | | | (2,846,058 | ) | | | — | | | | — | | | | — | | | | — | | | | — | |
Perpetual Long-Term | | | (3,569,847 | ) | | | — | | | | (2,725,060 | ) | | | — | | | | — | | | | — | |
Total capital loss carryforwards | | $ | (21,263,763 | ) | | $ | — | | | $ | (41,988,423 | ) | | $ | — | | | $ | — | | | $ | — | |
Timing differences (Income Distributions Payable, Post-October and Straddle Loss Deferrals) | | $ | (157,720 | ) | | $ | (3,745,397 | ) | | $ | (110,929 | ) | | $ | (5,412,122 | ) | | $ | (683,923 | ) | | $ | — | |
| (1) | | Except for perpetual capital loss carryforwards, expiration occurs on March 31 of the year indicated. |
106
GOLDMAN SACHS SHORT DURATION AND GOVERNMENT FIXED INCOME FUNDS
|
| 7. TAX INFORMATION (continued) |
As of September 30, 2012, the Funds’ aggregate security unrealized gains and losses based on cost for U.S. federal income tax purposes were as follows:
| | | | | | | | | | | | | | | | | | | | | | | | |
| | | Enhanced
Income | | | Government
Income | | | High Quality Floating Rate | | | Inflation
Protected
Securities | | | Short
Duration
Government | | | Short
Duration
Income | |
Tax Cost | | $ | 473,271,668 | | | $ | 966,440,411 | | | $ | 231,106,479 | | | $ | 297,216,854 | | | $ | 2,481,440,352 | | | $ | 41,849,716 | |
Gross unrealized gain | | | 5,225,703 | | | | 24,162,085 | | | | 2,652,878 | | | | 19,314,251 | | | | 37,094,840 | | | | 246,539 | |
Gross unrealized loss | | | (451,067 | ) | | | (924,651 | ) | | | (588,490 | ) | | | (462,513 | ) | | | (1,555,662 | ) | | | (46,590 | ) |
Net unrealized security gain | | $ | 4,774,636 | | | $ | 23,237,434 | | | $ | 2,064,388 | | | $ | 18,851,738 | | | $ | 35,539,178 | | | $ | 199,949 | |
The difference between GAAP-basis and tax-basis unrealized gains (losses) is attributable primarily to wash sales, net mark-to-market gains (losses) on regulated futures contracts and foreign currency contracts, and differences related to the tax treatment of inflation protected securities, swap transactions, premium amortization and the accretion of market discount.
GSAM has reviewed the Funds’ tax positions for all open tax years (the current and prior three years, as applicable) and has concluded that no provision for income tax is required in the Funds’ financial statements. Such open tax years remain subject to examination and adjustment by tax authorities.
The Funds’ risks include, but are not limited to, the following:
Liquidity Risk — The Funds may make investments that may be illiquid or that may become less liquid in response to market developments or adverse investor perceptions. Liquidity risk may also refer to the risk that a Fund will not be able to pay redemption proceeds within the allowable time period because of unusual market conditions, an unusually high volume of redemption requests, or other reasons. To meet redemption requests, a Fund may be forced to sell investments at an unfavorable time and/or under unfavorable conditions.
Market and Credit Risks — In the normal course of business, the Funds trade financial instruments and enter into financial transactions where risk of potential loss exists due to changes in the market (market risk). Additionally, the Funds may also be exposed to credit risk in the event that an issuer fails to perform or that an institution or entity with which the Funds have unsettled or open transaction defaults.
Shareholder Concentration Risk — Certain funds, accounts, individuals or Goldman Sachs affiliates may from time to time own (beneficially or of record) or control a significant percentage of the Funds’ shares. Redemptions by these entities of their holdings in the Funds may impact the Funds’ liquidity and NAV. These redemptions may also force the Funds to sell securities.
Under the Trust’s organizational documents, its trustees, officers, employees and agents are indemnified, to the extent permitted by the Act, against certain liabilities that may arise out of performance of their duties to the Funds. Additionally, in the course of business, the Funds enter into contracts that contain a variety of indemnification clauses. The Funds’ maximum exposure under these arrangements is unknown, as this would involve future claims that may be made against the Funds that have not yet occurred. However, GSAM believes the risk of loss under these arrangements to be remote.
107
GOLDMAN SACHS SHORT DURATION AND GOVERNMENT FIXED INCOME FUNDS
Notes to Financial Statements (continued)
September 30, 2012 (Unaudited)
Other — On February 8, 2012, the Commodity Futures Trading Commission (CFTC) adopted amendments to several of its rules relating to commodity pool operators, including Rule 4.5. The Funds currently rely on Rule 4.5’s exclusion from CFTC regulation for regulated investment companies. GSAM is currently evaluating the amendments and their impact, if any, on the Funds’ financial statements.
Subsequent events after the balance sheet date have been evaluated through the date the financial statements were issued. GSAM has concluded that there is no impact requiring adjustment or disclosure in the financial statements.
108
GOLDMAN SACHS SHORT DURATION AND GOVERNMENT FIXED INCOME FUNDS
|
| 12. SUMMARY OF SHARE TRANSACTIONS |
Share activity is as follows:
| | | | | | | | | | | | | | | | |
| | | Enhanced Income Fund | |
| | | | |
| | | For the Six Months Ended
September 30, 2012
(Unaudited) | | | For the Fiscal Year Ended
March 31, 2012 | |
| | | | |
| | | Shares | | | Dollars | | | Shares | | | Dollars | |
| | | | |
| Class A Shares | | | | | | | | | | | | | | | | |
Shares sold | | | 1,347,585 | | | $ | 12,783,811 | | | | 8,429,169 | | | $ | 80,441,213 | |
Reinvestment of distributions | | | 37,916 | | | | 359,636 | | | | 175,366 | | | | 1,668,251 | |
Shares converted from Class B(a) | | | 10,223 | | | | 97,125 | | | | 28,534 | | | | 271,009 | |
Shares redeemed | | | (4,207,561 | ) | | | (39,913,141 | ) | | | (20,508,985 | ) | | | (194,751,596 | ) |
| | | | (2,811,837 | ) | | | (26,672,569 | ) | | | (11,875,916 | ) | | | (112,371,123 | ) |
| Class B Shares | | | | | | | | | | | | | | | | |
Shares sold | | | 1 | | | | 7 | | | | 3 | | | | 28 | |
Reinvestment of distributions | | | 20 | | | | 195 | | | | 134 | | | | 1,274 | |
Shares converted to Class A(a) | | | (10,242 | ) | | | (97,125 | ) | | | (28,583 | ) | | | (271,009 | ) |
Shares redeemed | | | (11,121 | ) | | | (105,333 | ) | | | (18,236 | ) | | | (173,216 | ) |
| | | | (21,342 | ) | | | (202,256 | ) | | | (46,682 | ) | | | (442,923 | ) |
| Institutional Shares | | | | | | | | | | | | | | | | |
Shares sold | | | 23,061,219 | | | | 218,392,506 | | | | 28,766,612 | | | | 273,385,851 | |
Reinvestment of distributions | | | 219,986 | | | | 2,084,439 | | | | 593,038 | | | | 5,635,455 | |
Shares redeemed | | | (20,311,419 | ) | | | (192,347,678 | ) | | | (47,934,529 | ) | | | (455,049,701 | ) |
| | | | 2,969,786 | | | | 28,129,267 | | | | (18,574,879 | ) | | | (176,028,395 | ) |
| Administration Shares | | | | | | | | | | | | | | | | |
Shares sold | | | 1,167 | | | | 11,096 | | | | 151,985 | | | | 1,455,717 | |
Reinvestment of distributions | | | 197 | | | | 1,865 | | | | 1,176 | | | | 11,211 | |
Shares redeemed | | | (60,540 | ) | | | (574,894 | ) | | | (265,094 | ) | | | (2,530,998 | ) |
| | | | (59,176 | ) | | | (561,933 | ) | | | (111,933 | ) | | | (1,064,070 | ) |
| Class IR Shares | | | | | | | | | | | | | | | | |
Shares sold | | | 11,809 | | | | 111,830 | | | | 500,051 | | | | 4,753,449 | |
Reinvestment of distributions | | | 1,010 | | | | 9,572 | | | | 2,579 | | | | 24,400 | |
Shares redeemed | | | (44,333 | ) | | | (419,837 | ) | | | (287,412 | ) | | | (2,719,013 | ) |
| | | | (31,514 | ) | | | (298,435 | ) | | | 215,218 | | | | 2,058,836 | |
NET INCREASE (DECREASE) | | | 45,917 | | | $ | 394,074 | | | | (30,394,192 | ) | | $ | (287,847,675 | ) |
| (a) | | Class B Shares automatically convert into Class A Shares on or about the fifteenth day of the last month of the calendar quarter that is eight years after the initial purchase date of either the Fund or another Goldman Sachs Fund. |
109
GOLDMAN SACHS SHORT DURATION AND GOVERNMENT FIXED INCOME FUNDS
Notes to Financial Statements (continued)
September 30, 2012 (Unaudited)
|
| 12. SUMMARY OF SHARE TRANSACTIONS (continued) |
Share activity is as follows:
| | | | | | | | | | | | | | | | |
| | | Government Income Fund | |
| | | | |
| | | For the Six Months Ended
September 30, 2012
(Unaudited) | | | For the Fiscal Year Ended
March 31, 2012 | |
| | | | |
| | | Shares | | | Dollars | | | Shares | | | Dollars | |
| | | | |
| Class A Shares | | | | | | | | | | | | | | | | |
Shares sold | | | 2,547,709 | | | $ | 39,751,860 | | | | 8,615,857 | | | $ | 133,101,236 | |
Reinvestment of distributions | | | 132,123 | | | | 2,063,751 | | | | 799,473 | | | | 12,319,251 | |
Shares converted from Class B(a) | | | 26,992 | | | | 421,515 | | | | 135,799 | | | | 2,090,244 | |
Shares redeemed | | | (5,108,563 | ) | | | (79,636,184 | ) | | | (13,386,289 | ) | | | (206,021,816 | ) |
| | | | (2,401,739 | ) | | | (37,399,058 | ) | | | (3,835,160 | ) | | | (58,511,085 | ) |
| Class B Shares | | | | | | | | | | | | | | | | |
Shares sold | | | 23,590 | | | | 367,401 | | | | 144,496 | | | | 2,237,029 | |
Reinvestment of distributions | | | 1,411 | | | | 21,986 | | | | 20,102 | | | | 309,648 | |
Shares converted to Class A(a) | | | (26,992 | ) | | | (421,515 | ) | | | (135,799 | ) | | | (2,090,244 | ) |
Shares redeemed | | | (128,499 | ) | | | (2,006,623 | ) | | | (402,177 | ) | | | (6,174,441 | ) |
| | | | (130,490 | ) | | | (2,038,751 | ) | | | (373,378 | ) | | | (5,718,008 | ) |
| Class C Shares | | | | | | | | | | | | | | | | |
Shares sold | | | 257,022 | | | | 4,004,989 | | | | 751,404 | | | | 11,613,084 | |
Reinvestment of distributions | | | 3,500 | | | | 54,565 | | | | 40,473 | | | | 623,524 | |
Shares redeemed | | | (409,326 | ) | | | (6,379,779 | ) | | | (926,393 | ) | | | (14,208,849 | ) |
| | | | (148,804 | ) | | | (2,320,225 | ) | | | (134,516 | ) | | | (1,972,241 | ) |
| Institutional Shares | | | | | | | | | | | | | | | | |
Shares sold | | | 7,987,950 | | | | 124,508,272 | | | | 8,898,646 | | | | 136,524,936 | |
Reinvestment of distributions | | | 95,283 | | | | 1,487,219 | | | | 428,891 | | | | 6,599,400 | |
Shares redeemed | | | (3,743,890 | ) | | | (58,319,730 | ) | | | (11,432,867 | ) | | | (176,286,916 | ) |
| | | | 4,339,343 | | | | 67,675,761 | | | | (2,105,330 | ) | | | (33,162,580 | ) |
| Service Shares | | | | | | | | | | | | | | | | |
Shares sold | | | 889,341 | | | | 13,862,048 | | | | 2,533,550 | | | | 39,200,159 | |
Reinvestment of distributions | | | 22,675 | | | | 353,244 | | | | 159,635 | | | | 2,453,781 | |
Shares redeemed | | | (1,151,968 | ) | | | (17,919,313 | ) | | | (3,420,316 | ) | | | (52,593,519 | ) |
| | | | (239,952 | ) | | | (3,704,021 | ) | | | (727,131 | ) | | | (10,939,579 | ) |
| Class IR Shares | | | | | | | | | | | | | | | | |
Shares sold | | | 86,319 | | | | 1,351,745 | | | | 80,709 | | | | 1,251,366 | |
Reinvestment of distributions | | | 944 | | | | 14,755 | | | | 2,823 | | | | 43,524 | |
Shares redeemed | | | (80,048 | ) | | | (1,252,206 | ) | | | (19,231 | ) | | | (298,165 | ) |
| | | | 7,215 | | | | 114,294 | | | | 64,301 | | | | 996,725 | |
| Class R Shares | | | | | | | | | | | | | | | | |
Shares sold | | | 312,006 | | | | 4,855,401 | | | | 544,571 | | | | 8,381,123 | |
Reinvestment of distributions | | | 6,673 | | | | 104,105 | | | | 36,729 | | | | 565,384 | |
Shares redeemed | | | (183,496 | ) | | | (2,857,732 | ) | | | (186,261 | ) | | | (2,865,105 | ) |
| | | | 135,183 | | | | 2,101,774 | | | | 395,039 | | | | 6,081,402 | |
NET INCREASE (DECREASE) | | | 1,560,756 | | | $ | 24,429,774 | | | | (6,716,175 | ) | | $ | (103,225,366 | ) |
| (a) | | Class B Shares automatically convert into Class A Shares on or about the fifteenth day of the last month of the calendar quarter that is eight years after the initial purchase date of either the Fund or another Goldman Sachs Fund. |
110
GOLDMAN SACHS SHORT DURATION AND GOVERNMENT FIXED INCOME FUNDS
|
| 12. SUMMARY OF SHARE TRANSACTIONS (continued) |
Share activity is as follows:
| | | | | | | | | | | | | | | | |
| | | High Quality Floating Rate Fund(a) | |
| | | | |
| | | For the Six Months Ended
September 30, 2012
(Unaudited) | | | For the Fiscal Year Ended
March 31, 2012 | |
| | | | |
| | | Shares | | | Dollars | | | Shares | | | Dollars | |
| | | | |
| Class A Shares | | | | | | | | | | | | | | | | |
Shares sold | | | 1,478,120 | | | $ | 12,927,861 | | | | 7,247,868 | | | $ | 63,621,275 | |
Reinvestment of distributions | | | 18,395 | | | | 161,041 | | | | 25,921 | | | | 227,233 | |
Shares redeemed | | | (3,244,535 | ) | | | (28,411,476 | ) | | | (10,953,976 | ) | | | (96,102,133 | ) |
| | | | (1,748,020 | ) | | | (15,322,574 | ) | | | (3,680,187 | ) | | | (32,253,625 | ) |
| Institutional Shares | | | | | | | | | | | | | | | | |
Shares sold | | | 2,254,769 | | | | 19,729,793 | | | | 11,272,574 | | | | 98,930,807 | |
Reinvestment of distributions | | | 66,377 | | | | 581,367 | | | | 118,287 | | | | 1,037,559 | |
Shares redeemed | | | (9,315,851 | ) | | | (81,619,441 | ) | | | (20,473,420 | ) | | | (179,568,546 | ) |
| | | | (6,994,705 | ) | | | (61,308,281 | ) | | | (9,082,559 | ) | | | (79,600,180 | ) |
| Service Shares | | | | | | | | | | | | | | | | |
Shares sold | | | 224 | | | | 1,973 | | | | 2,261 | | | | 19,939 | |
Reinvestment of distributions | | | 59 | | | | 520 | | | | 87 | | | | 764 | |
Shares redeemed | | | (31,691 | ) | | | (278,418 | ) | | | (55,790 | ) | | | (491,190 | ) |
| | | | (31,408 | ) | | | (275,925 | ) | | | (53,442 | ) | | | (470,487 | ) |
| Class IR Shares | | | | | | | | | | | | | | | | |
Shares sold | | | 181,084 | | | | 1,584,022 | | | | 86,546 | | | | 758,864 | |
Reinvestment of distributions | | | 509 | | | | 4,449 | | | | 418 | | | | 3,661 | |
Shares redeemed | | | (38,188 | ) | | | (333,800 | ) | | | (111,399 | ) | | | (978,710 | ) |
| | | | 143,405 | | | | 1,254,671 | | | | (24,435 | ) | | | (216,185 | ) |
NET DECREASE | | | (8,630,728 | ) | | $ | (75,652,109 | ) | | | (12,840,623 | ) | | $ | (112,540,477 | ) |
| (a) | | Formerly known as Goldman Sachs Ultra-Short Duration Government Fund. Effective July 27, 2012, the Fund changed its name to the Goldman Sachs High Quality Floating Rate Fund. |
111
GOLDMAN SACHS SHORT DURATION AND GOVERNMENT FIXED INCOME FUNDS
Notes to Financial Statements (continued)
September 30, 2012 (Unaudited)
|
| 12. SUMMARY OF SHARE TRANSACTIONS (continued) |
Share activity is as follows:
| | | | | | | | | | | | | | | | |
| | | Inflation Protected Securities Fund | |
| | | | |
| | | For the Six Months Ended
September 30, 2012
(Unaudited) | | | For the Fiscal Year Ended
March 31, 2012 | |
| | | | |
| | | Shares | | | Dollars | | | Shares | | | Dollars | |
| | | | |
| Class A Shares | | | | | | | | | | | | | | | | |
Shares sold | | | 2,090,155 | | | $ | 24,107,776 | | | | 8,459,060 | | | $ | 97,217,003 | |
Reinvestment of distributions | | | 85,622 | | | | 990,286 | | | | 862,847 | | | | 9,661,381 | |
Shares redeemed | | | (3,814,704 | ) | | | (43,736,473 | ) | | | (5,523,827 | ) | | | (63,283,577 | ) |
| | | | (1,638,927 | ) | | | (18,638,411 | ) | | | 3,798,080 | | | | 43,594,807 | |
| Class C Shares | | | | | | | | | | | | | | | | |
Shares sold | | | 156,869 | | | | 1,812,222 | | | | 952,079 | | | | 10,899,837 | |
Reinvestment of distributions | | | 7,205 | | | | 83,696 | | | | 117,346 | | | | 1,316,371 | |
Shares redeemed | | | (457,904 | ) | | | (5,258,875 | ) | | | (911,224 | ) | | | (10,368,501 | ) |
| | | | (293,830 | ) | | | (3,362,957 | ) | | | 158,201 | | | | 1,847,707 | |
| Institutional Shares | | | | | | | | | | | | | | | | |
Shares sold | | | 2,324,509 | | | | 26,950,229 | | | | 8,194,745 | | | | 94,166,957 | |
Reinvestment of distributions | | | 130,007 | | | | 1,508,840 | | | | 1,022,642 | | | | 11,505,098 | |
Shares redeemed | | | (1,308,326 | ) | | | (15,097,311 | ) | | | (4,890,767 | ) | | | (56,744,577 | ) |
| | | | 1,146,190 | | | | 13,361,758 | | | | 4,326,620 | | | | 48,927,478 | |
| Class IR Shares | | | | | | | | | | | | | | | | |
Shares sold | | | 450,800 | | | | 5,172,693 | | | | 223,482 | | | | 2,588,316 | |
Reinvestment of distributions | | | 2,636 | | | | 30,553 | | | | 16,313 | | | | 182,259 | |
Shares redeemed | | | (107,405 | ) | | | (1,247,646 | ) | | | (215,135 | ) | | | (2,433,385 | ) |
| | | | 346,031 | | | | 3,955,600 | | | | 24,660 | | | | 337,190 | |
| Class R Shares | | | | | | | | | | | | | | | | |
Shares sold | | | 56,274 | | | | 649,859 | | | | 62,678 | | | | 716,385 | |
Reinvestment of distributions | | | 1,085 | | | | 12,585 | | | | 10,367 | | | | 116,369 | |
Shares redeemed | | | (26,260 | ) | | | (303,346 | ) | | | (51,306 | ) | | | (594,078 | ) |
| | | | 31,099 | | | | 359,098 | | | | 21,739 | | | | 238,676 | |
NET INCREASE (DECREASE) | | | (409,437 | ) | | $ | (4,324,912 | ) | | | 8,329,300 | | | $ | 94,945,858 | |
112
GOLDMAN SACHS SHORT DURATION AND GOVERNMENT FIXED INCOME FUNDS
|
| 12. SUMMARY OF SHARE TRANSACTIONS (continued) |
Share activity is as follows:
| | | | | | | | | | | | | | | | |
| | | Short Duration Government Fund | |
| | | | |
| | | For the Six Months Ended
September 30, 2012
(Unaudited) | | | For the Fiscal Year Ended
March 31, 2012 | |
| | | | |
| | | Shares | | | Dollars | | | Shares | | | Dollars | |
| | | | |
| Class A Shares | | | | | | | | | | | | | | | | |
Shares sold | | | 11,453,022 | | | $ | 118,022,658 | | | | 36,619,021 | | | $ | 376,296,790 | |
Reinvestment of distributions | | | 141,848 | | | | 1,462,128 | | | | 334,226 | | | | 3,435,497 | |
Shares converted from Class B(a) | | | 362 | | | | 3,739 | | | | 3,645 | | | | 37,452 | |
Shares redeemed | | | (25,904,567 | ) | | | (266,875,252 | ) | | | (57,503,050 | ) | | | (591,029,107 | ) |
| | | | (14,309,335 | ) | | | (147,386,727 | ) | | | (20,546,158 | ) | | | (211,259,368 | ) |
| Class B Shares | | | | | | | | | | | | | | | | |
Shares sold | | | — | | | | — | | | | 2 | | | | 22 | |
Reinvestment of distributions | | | 4 | | | | 36 | | | | 22 | | | | 228 | |
Shares converted to Class A(a) | | | (364 | ) | | | (3,739 | ) | | | (3,659 | ) | | | (37,452 | ) |
Shares redeemed | | | (9,614 | ) | | | (98,732 | ) | | | (49,833 | ) | | | (510,729 | ) |
| | | | (9,974 | ) | | | (102,435 | ) | | | (53,468 | ) | | | (547,931 | ) |
| Class C Shares | | | | | | | | | | | | | | | | |
Shares sold | | | 307,063 | | | | 3,143,399 | | | | 1,817,829 | | | | 18,562,941 | |
Reinvestment of distributions | | | 2,314 | | | | 23,684 | | | | 4,672 | | | | 47,665 | |
Shares redeemed | | | (1,620,838 | ) | | | (16,592,544 | ) | | | (4,938,344 | ) | | | (50,422,502 | ) |
| | | | (1,311,461 | ) | | | (13,425,461 | ) | | | (3,115,843 | ) | | | (31,811,896 | ) |
| Institutional Shares | | | | | | | | | | | | | | | | |
Shares sold | | | 21,955,559 | | | | 225,440,377 | | | | 80,953,973 | | | | 829,714,176 | |
Reinvestment of distributions | | | 408,090 | | | | 4,191,556 | | | | 892,936 | | | | 9,149,548 | |
Shares redeemed | | | (30,485,465 | ) | | | (313,021,629 | ) | | | (106,872,813 | ) | | | (1,094,993,778 | ) |
| | | | (8,121,816 | ) | | | (83,389,696 | ) | | | (25,025,904 | ) | | | (256,130,054 | ) |
| Service Shares | | | | | | | | | | | | | | | | |
Shares sold | | | 278,626 | | | | 2,856,668 | | | | 949,254 | | | | 9,714,157 | |
Reinvestment of distributions | | | 8,098 | | | | 83,068 | | | | 18,909 | | | | 193,402 | |
Shares redeemed | | | (1,059,937 | ) | | | (10,871,537 | ) | | | (6,764,372 | ) | | | (69,168,267 | ) |
| | | | (773,213 | ) | | | (7,931,801 | ) | | | (5,796,209 | ) | | | (59,260,708 | ) |
| Class IR Shares | | | | | | | | | | | | | | | | |
Shares sold | | | 574,278 | | | | 5,921,477 | | | | 4,920,960 | | | | 50,630,507 | |
Reinvestment of distributions | | | 10,278 | | | | 105,980 | | | | 17,817 | | | | 183,253 | |
Shares redeemed | | | (1,145,810 | ) | | | (11,809,621 | ) | | | (2,360,901 | ) | | | (24,290,517 | ) |
| | | | (561,254 | ) | | | (5,782,164 | ) | | | 2,577,876 | | | | 26,523,243 | |
NET DECREASE | | | (25,087,053 | ) | | $ | (258,018,284 | ) | | | (51,959,706 | ) | | $ | (532,486,714 | ) |
| (a) | | Class B Shares automatically convert into Class A Shares on or about the fifteenth day of the last month of the calendar quarter that is eight years after the initial purchase date of either the Fund or another Goldman Sachs Fund. |
113
GOLDMAN SACHS SHORT DURATION AND GOVERNMENT FIXED INCOME FUNDS
Notes to Financial Statements (continued)
September 30, 2012 (Unaudited)
|
| 12. SUMMARY OF SHARE TRANSACTIONS (continued) |
Share activity is as follows:
| | | | | | | | | | | | | | | | |
| | | Short Duration Income Fund(a) | |
| | | | |
| | | For the Six Months Ended
September 30, 2012
(Unaudited) | | | For the Period Ended
March 31, 2012 | |
| | | | |
| | | Shares | | | Dollars | | | Shares | | | Dollars | |
| | | | |
| Class A Shares | | | | | | | | | | | | | | | | |
Shares sold | | | 1,476,609 | | | $ | 14,815,337 | | | | 175,392 | | | $ | 1,745,031 | |
Reinvestment of distributions | | | 4,828 | | | | 48,617 | | | | 34 | | | | 337 | |
Shares redeemed | | | (128,211 | ) | | | (1,283,856 | ) | | | (2 | ) | | | (26 | ) |
| | | | 1,353,226 | | | | 13,580,098 | | | | 175,424 | | | | 1,745,342 | |
| Class C Shares | | | | | | | | | | | | | | | | |
Shares sold | | | 66,295 | | | | 666,757 | | | | 1,001 | | | | 10,011 | |
Reinvestment of distributions | | | 32 | | | | 324 | | | | — | | | | — | |
Shares redeemed | | | (66,189 | ) | | | (667,330 | ) | | | (1 | ) | | | (10 | ) |
| | | | 138 | | | | (249 | ) | | | 1,000 | | | | 10,001 | |
| Institutional Shares | | | | | | | | | | | | | | | | |
Shares sold | | | 874,212 | | | | 8,826,600 | | | | 1,114,759 | | | | 11,140,820 | |
Reinvestment of distributions | | | 9,982 | | | | 100,551 | | | | 982 | | | | 9,789 | |
Shares redeemed | | | (3,609 | ) | | | (36,012 | ) | | | (2 | ) | | | (15 | ) |
| | | | 880,585 | | | | 8,891,139 | | | | 1,115,739 | | | | 11,150,594 | |
| Class IR Shares | | | | | | | | | | | | | | | | |
Shares sold | | | 4,882 | | | | 49,600 | | | | 1,001 | | | | 10,010 | |
Reinvestment of distributions | | | 7 | | | | 77 | | | | 1 | | | | 8 | |
Shares redeemed | | | — | | | | — | | | | (1 | ) | | | (10 | ) |
| | | | 4,889 | | | | 49,677 | | | | 1,001 | | | | 10,008 | |
| Class R Shares | | | | | | | | | | | | | | | | |
Shares sold | | | — | | | | — | | | | 1,001 | | | | 10,015 | |
Reinvestment of distributions | | | 5 | | | | 41 | | | | — | | | | — | |
Shares redeemed | | | — | | | | — | | | | (1 | ) | | | (10 | ) |
| | | | 5 | | | | 41 | | | | 1,000 | | | | 10,005 | |
NET INCREASE | | | 2,238,843 | | | $ | 22,520,706 | | | | 1,294,164 | | | $ | 12,925,950 | |
| (a) | | Commenced operations on February 29, 2012. |
114
GOLDMAN SACHS SHORT DURATION AND GOVERNMENT FIXED INCOME FUNDS
Fund Expenses — Six Month Period Ended September 30, 2012 (Unaudited)
As a shareholder of Class A, Class B, Class C, Institutional, Administration, Service, Class IR or Class R Shares of a Fund, you incur two types of costs: (1) transaction costs, including sales charges on purchase payments (with respect to Class A Shares), contingent deferred sales charges on redemptions (with respect to Class B and Class C Shares); and (2) ongoing costs, including management fees; distribution and service (12b-1) fees (with respect to Class A, Class B, Class C and Class R Shares); and other Fund expenses. This Example is intended to help you understand your ongoing costs (in dollars) of investing in Class A, Class B, Class C, Institutional, Administration, Service, Class IR or Class R Shares of the Funds and to compare these costs with the ongoing costs of investing in other mutual funds.
The Example is based on an investment of $1,000 invested at the beginning of the period and held for the entire period from April 1, 2012 through September 30, 2012.
Actual Expenses — The first line under each share class in the table below provides information about actual account values and actual expenses. You may use the information in this line, together with the amount you invested, to estimate the expenses that you paid over the period. Simply divide your account value by $1,000 (for example, an $8,600 account value divided by $1,000=8.6), then multiply the result by the number in the first line under the heading entitled “Expenses Paid” to estimate the expenses you paid on your account during this period.
Hypothetical Example for Comparison Purposes — The second line under each share class in the table below provides information about hypothetical account values and hypothetical expenses based on the Funds’ actual net expense ratios and an assumed rate of return of 5% per year before expenses, which is not the Funds’ actual return. The hypothetical account values and expenses may not be used to estimate the actual ending account balance or expenses you paid for the period. You may use this information to compare the ongoing costs of investing in the Funds and other funds. To do so, compare this 5% hypothetical example with the 5% hypothetical examples that appear in the shareholder reports of the other funds.
Please note that the expenses shown in the table are meant to highlight your ongoing costs only and do not reflect any transactional costs, such as sales charges, redemption fees, or exchange fees. Therefore, the second line of the table is useful in comparing ongoing costs only, and will not help you determine the relative total costs of owning different funds. In addition, if these transactional costs were included, your costs would have been higher.
| | | | | | | | | | | | | | | | | | | | | | | | | | | | | | | | | | | | |
| | | Enhanced Income Fund | | | Government Income Fund | | | High Quality Floating Rate Fund(a) | |
| Share Class | | Beginning
Account
Value 4/1/12 | | | Ending
Account
Value
9/30/12 | | | Expenses Paid for the 6 months ended
9/30/12* | | | Beginning
Account
Value 4/1/12 | | | Ending
Account
Value
9/30/12 | | | Expenses Paid for the 6 months ended
9/30/12* | | | Beginning
Account
Value 4/1/12 | | | Ending
Account
Value
9/30/12 | | | Expenses Paid for the 6 months ended
9/30/12* | |
| Class A | | | | | | | | | | | | | | | | | | | | | | | | | | | | | | | | | | | | |
Actual | | $ | 1,000.00 | | | $ | 1,005.90 | | | $ | 3.32 | | | $ | 1,000.00 | | | $ | 1,028.30 | | | $ | 4.63 | | | $ | 1,000.00 | | | $ | 1,002.20 | | | $ | 3.71 | |
Hypothetical 5% return | | | 1,000.00 | | | | 1,021.76 | + | | | 3.35 | | | | 1,000.00 | | | | 1,020.51 | + | | | 4.61 | | | | 1,000.00 | | | | 1,021.36 | + | | | 3.75 | |
| Class B | | | | | | | | | | | | | | | | | | | | | | | | | | | | | | | | | | | | |
Actual | | | 1,000.00 | | | | 1,002.60 | | | | 6.58 | | | | 1,000.00 | | | | 1,024.50 | | | | 8.42 | | | | N/A | | | | N/A | | | | N/A | |
Hypothetical 5% return | | | 1,000.00 | | | | 1,018.50 | + | | | 6.63 | | | | 1,000.00 | | | | 1,016.75 | + | | | 8.39 | | | | N/A | | | | N/A | | | | N/A | |
| Class C | | | | | | | | | | | | | | | | | | | | | | | | | | | | | | | | | | | | |
Actual | | | N/A | | | | N/A | | | | N/A | | | | 1,000.00 | | | | 1,024.40 | | | | 8.42 | | | | N/A | | | | N/A | | | | N/A | |
Hypothetical 5% return | | | N/A | | | | N/A | | | | N/A | | | | 1,000.00 | | | | 1,016.75 | + | | | 8.39 | | | | N/A | | | | N/A | | | | N/A | |
| Institutional | | | | | | | | | | | | | | | | | | | | | | | | | | | | | | | | | | | | |
Actual | | | 1,000.00 | | | | 1,007.60 | | | | 1.61 | | | | 1,000.00 | | | | 1,029.60 | | | | 2.90 | | | | 1,000.00 | | | | 1,005.00 | | | | 2.01 | |
Hypothetical 5% return | | | 1,000.00 | | | | 1,023.46 | + | | | 1.62 | | | | 1,000.00 | | | | 1,022.21 | + | | | 2.89 | | | | 1,000.00 | | | | 1,023.06 | + | | | 2.03 | |
| Administration | | | | | | | | | | | | | | | | | | | | | | | | | | | | | | | | | | | | |
Actual | | | 1,000.00 | | | | 1,006.30 | | | | 2.87 | | | | N/A | | | | N/A | | | | N/A | | | | N/A | | | | N/A | | | | N/A | |
Hypothetical 5% return | | | 1,000.00 | | | | 1,022.21 | + | | | 2.89 | | | | N/A | | | | N/A | | | | N/A | | | | N/A | | | | N/A | | | | N/A | |
| Service | | | | | | | | | | | | | | | | | | | | | | | | | | | | | | | | | | | | |
Actual | | | N/A | | | | N/A | | | | N/A | | | | 1,000.00 | | | | 1,027.50 | | | | 5.44 | | | | 1,000.00 | | | | 1,002.50 | | | | 4.52 | |
Hypothetical 5% return | | | N/A | | | | N/A | | | | N/A | | | | 1,000.00 | | | | 1,019.70 | + | | | 5.42 | | | | 1,000.00 | | | | 1,020.56 | + | | | 4.56 | |
| Class IR | | | | | | | | | | | | | | | | | | | | | | | | | | | | | | | | | | | | |
Actual | | | 1,000.00 | | | | 1,007.10 | | | | 2.06 | | | | 1,000.00 | | | | 1,029.60 | | | | 3.36 | | | | 1,000.00 | | | | 1,004.50 | | | | 2.46 | |
Hypothetical 5% return | | | 1,000.00 | | | | 1,023.01 | + | | | 2.08 | | | | 1,000.00 | | | | 1,021.76 | + | | | 3.35 | | | | 1,000.00 | | | | 1,022.61 | + | | | 2.48 | |
| Class R | | | | | | | | | | | | | | | | | | | | | | | | | | | | | | | | | | | | |
Actual | | | N/A | | | | N/A | | | | N/A | | | | 1,000.00 | | | | 1,027.70 | | | | 5.90 | | | | N/A | | | | N/A | | | | N/A | |
Hypothetical 5% return | | | N/A | | | | N/A | | | | N/A | | | | 1,000.00 | | | | 1,019.25 | + | | | 5.87 | | | | N/A | | | | N/A | | | | N/A | |
115
GOLDMAN SACHS SHORT DURATION AND GOVERNMENT FIXED INCOME FUNDS
Fund Expenses — Six Month Period Ended September 30, 2012 (Unaudited) (continued)
| | | | | | | | | | | | | | | | | | | | | | | | | | | | | | | | | | | | |
| | | Inflation Protected Securities Fund | | | Short Duration Government Fund | | | Short Duration Income Fund | |
| Share Class | | Beginning
Account Value 4/1/12 | | | Ending Account Value
9/30/12 | | | Expenses Paid for the 6 months ended
9/30/12* | | | Beginning
Account
Value 4/1/12 | | | Ending
Account
Value
9/30/12 | | | Expenses Paid for the 6 months ended
9/30/12* | | | Beginning
Account
Value 4/1/12 | | | Ending
Account
Value
9/30/12 | | | Expenses Paid for the 6 months ended
9/30/12* | |
| Class A | | | | | | | | | | | | | | | | | | | | | | | | | | | | | | | | | | | | |
Actual | | $ | 1,000.00 | | | $ | 1,053.90 | | | $ | 3.19 | | | $ | 1,000.00 | | | $ | 1,005.10 | | | $ | 4.02 | | | $ | 1,000.00 | | | $ | 1,024.60 | | | $ | 4.01 | |
Hypothetical 5% return | | | 1,000.00 | | | | 1,021.96 | + | | | 3.14 | | | | 1,000.00 | | | | 1,021.06 | + | | | 4.05 | | | | 1,000.00 | | | | 1,021.11 | + | | | 4.00 | |
| Class B | | | | | | | | | | | | | | | | | | | | | | | | | | | | | | | | | | | | |
Actual | | | N/A | | | | N/A | | | | N/A | | | | 1,000.00 | | | | 1,003.00 | | | | 6.23 | | | | N/A | | | | N/A | | | | N/A | |
Hypothetical 5% return | | | N/A | | | | N/A | | | | N/A | | | | 1,000.00 | | | | 1,018.85 | + | | | 6.28 | | | | N/A | | | | N/A | | | | N/A | |
| Class C | | | | | | | | | | | | | | | | | | | | | | | | | | | | | | | | | | | | |
Actual | | | 1,000.00 | | | | 1,049.90 | | | | 7.04 | | | | 1,000.00 | | | | 1,003.30 | | | | 5.93 | | | | 1,000.00 | | | | 1,022.80 | | | | 5.88 | |
Hypothetical 5% return | | | 1,000.00 | | | | 1,018.20 | + | | | 6.93 | | | | 1,000.00 | | | | 1,019.15 | + | | | 5.97 | | | | 1,000.00 | | | | 1,019.25 | + | | | 5.87 | |
| Institutional | | | | | | | | | | | | | | | | | | | | | | | | | | | | | | | | | | | | |
Actual | | | 1,000.00 | | | | 1,055.60 | | | | 1.44 | | | | 1,000.00 | | | | 1,005.90 | | | | 2.31 | | | | 1,000.00 | | | | 1,027.40 | | | | 2.29 | |
Hypothetical 5% return | | | 1,000.00 | | | | 1,023.66 | + | | | 1.42 | | | | 1,000.00 | | | | 1,022.76 | + | | | 2.33 | | | | 1,000.00 | | | | 1,022.81 | + | | | 2.28 | |
| Service | | | | | | | | | | | | | | | | | | | | | | | | | | | | | | | | | | | | |
Actual | | | N/A | | | | N/A | | | | N/A | | | | 1,000.00 | | | | 1,004.30 | | | | 4.82 | | | | N/A | | | | N/A | | | | N/A | |
Hypothetical 5% return | | | N/A | | | | N/A | | | | N/A | | | | 1,000.00 | | | | 1,020.26 | + | | | 4.86 | | | | N/A | | | | N/A | | | | N/A | |
| Class IR | | | | | | | | | | | | | | | | | | | | | | | | | | | | | | | | | | | | |
Actual | | | 1,000.00 | | | | 1,055.20 | | | | 1.91 | | | | 1,000.00 | | | | 1,006.40 | | | | 2.77 | | | | 1,000.00 | | | | 1,026.90 | | | | 2.74 | |
Hypothetical 5% return | | | 1,000.00 | | | | 1,023.21 | + | | | 1.88 | | | | 1,000.00 | | | | 1,022.31 | + | | | 2.79 | | | | 1,000.00 | | | | 1,022.36 | + | | | 2.74 | |
| Class R | | | | | | | | | | | | | | | | | | | | | | | | | | | | | | | | | | | | |
Actual | | | 1,000.00 | | | | 1,051.60 | | | | 4.47 | | | | N/A | | | | N/A | | | | N/A | | | | 1,000.00 | | | | 1,024.20 | | | | 5.28 | |
Hypothetical 5% return | | | 1,000.00 | | | | 1,020.71 | + | | | 4.41 | | | | N/A | | | | N/A | | | | N/A | | | | 1,000.00 | | | | 1,019.85 | + | | | 5.27 | |
| | (a) | | Formerly, Goldman Sachs Ultra-Short Duration Government Fund. Effective July 27, 2012, the Fund changed its name to the Goldman Sachs High Quality Floating Rate Fund. | |
| | * | | Expenses for each share class are calculated using each Fund’s annualized net expense ratio for each class, which represents the ongoing expenses as a percentage of net assets for the six months ended September 30, 2012. Expenses are calculated by multiplying the annualized net expense ratio by the average account value for the period; then multiplying the result by the number of days in the most recent fiscal half year; and then dividing that result by the number of days in the fiscal year. The annualized net expense ratios for the period were as follows: | |
| | | | | | | | | | | | | | | | | | | | | | | | | | | | | | | | |
| Fund | | Class A | | | Class B | | | Class C | | | Institutional | | | Administration | | | Service | | | Class IR | | | Class R | |
Enhanced Income | | | 0.66 | % | | | 1.31 | % | | | N/A | | | | 0.32 | % | | | 0.57 | % | | | N/A | | | | 0.41 | % | | | N/A | |
Government Income | | | 0.91 | | | | 1.66 | | | | 1.66 | % | | | 0.57 | | | | N/A | | | | 1.07 | % | | | 0.66 | | | | 1.16 | % |
High Quality Floating Rate | | | 0.74 | | | | N/A | | | | N/A | | | | 0.40 | | | | N/A | | | | 0.90 | | | | 0.49 | | | | N/A | |
Inflation Protected Securities | | | 0.62 | | | | N/A | | | | 1.37 | | | | 0.28 | | | | N/A | | | | N/A | | | | 0.37 | | | | 0.87 | |
Short Duration Government | | | 0.80 | | | | 1.24 | | | | 1.18 | | | | 0.46 | | | | N/A | | | | 0.96 | | | | 0.55 | | | | N/A | |
Short Duration Income | | | 0.79 | | | | N/A | | | | 1.16 | | | | 0.45 | | | | N/A | | | | N/A | | | | 0.54 | | | | 1.04 | |
| + | | Hypothetical expenses are based on each Fund’s actual annualized net expense ratios and an assumed rate of return of 5% per year before expenses. |
116
GOLDMAN SACHS SHORT DURATION AND GOVERNMENT FIXED INCOME FUNDS
Statement Regarding Basis for Approval of Management Agreements (Unaudited)
Background
The Goldman Sachs Enhanced Income, Goldman Sachs Government Income, Goldman Sachs Inflation Protected Securities, Goldman Sachs Short Duration Government, Goldman Sachs Short Duration Income and Goldman Sachs High Quality Floating Rate (formerly, Goldman Sachs Ultra-Short Duration Government Fund) Funds (the “Funds”) are investment portfolios of Goldman Sachs Trust (the “Trust”). The Board of Trustees oversees the management of the Trust and reviews the investment performance and expenses of the Funds at regularly scheduled meetings held during the year. In addition, the Board of Trustees determines annually whether to approve the continuance of the Trust’s investment management agreements (the “Management Agreements”) with Goldman Sachs Asset Management, L.P. (the “Investment Adviser”) on behalf of the Funds.
The Management Agreements were most recently approved for continuation until June 30, 2013 by the Board of Trustees, including those Trustees who are not parties to the Management Agreements or “interested persons” (as defined in the Investment Company Act of 1940, as amended) of any party thereto (the “Independent Trustees”), at a meeting held on June 13, 2012 (the “Annual Meeting”).
The review process undertaken by the Trustees spans the course of the year and culminates with the Annual Meeting. To assist the Trustees in their deliberations, the Trustees have established a Contract Review Committee (the “Committee”), comprised of the Independent Trustees. The Committee held three meetings over the course of the year since the Management Agreements were last approved. At those Committee meetings, regularly scheduled Board meetings and/or the Annual Meeting, the Board, or the Independent Trustees, as applicable, considered matters relating to the Management Agreements, including:
| | (a) | | the nature and quality of the advisory, administrative and other services provided to the Funds by the Investment Adviser and its affiliates, including information about: |
| | (i) | | the structure, staff and capabilities of the Investment Adviser and its portfolio management teams; |
| | (ii) | | the groups within the Investment Adviser and its affiliates that support the portfolio management teams or provide other types of necessary services, including fund services groups (e.g., accounting and financial reporting, tax, shareholder services and operations), controls and risk management groups (e.g., legal, compliance, valuation oversight, credit risk management, internal audit, compliance testing, market risk analysis, finance and strategy and central funding), sales and distribution support groups and others (e.g., information technology and training); |
| | (iii) | | trends in headcount; |
| | (iv) | | the Investment Adviser’s financial resources and ability to hire and retain talented personnel and strengthen its operations; and |
| | (v) | | the parent company’s support of the Investment Adviser and its mutual fund business, as expressed by the firm’s senior management; |
117
GOLDMAN SACHS SHORT DURATION AND GOVERNMENT FIXED INCOME FUNDS
Statement Regarding Basis for Approval of Management Agreements (Unaudited) (continued)
| | (b) | | information on the investment performance of the Funds, including, with respect to each Fund (except for the Short Duration Income Fund, which commenced operations in 2012), comparisons to the performance of similar mutual funds, as provided by a third party mutual fund data provider engaged as part of the contract review process (the “Outside Data Provider”), benchmark performance indices, and comparable institutional composites managed by the Investment Adviser (in the case of the Enhanced Income, Inflation Protected Securities and Short Duration Government Funds), and general investment outlooks in the markets in which the Funds invest; |
| | (c) | | the terms of the Management Agreements and agreements with affiliated service providers entered into by the Trust on behalf of the Funds; |
| | (d) | | expense information for the Funds, including: |
| | (i) | | the relative management fee and expense levels of the Funds as compared to those of comparable funds managed by other advisers, as provided by the Outside Data Provider; |
| | (ii) | | each Fund’s (with the exception of the Short Duration Income Fund) expense trends over time; and |
| | (iii) | | to the extent the Investment Adviser manages institutional accounts or collective investment vehicles having investment objectives and policies similar to those of the Funds, comparative information on the advisory fees charged and services provided to those accounts by the Investment Adviser; |
| | (e) | | with respect to the extensive investment performance and expense comparison data provided by the Outside Data Provider, its processes in producing that data for the Funds; |
| | (f) | | the undertakings of the Investment Adviser to waive a portion of its management fee (with respect to each Fund other than the Enhanced Income Fund) and limit certain expenses of each of the Funds that exceed specified levels; the undertakings of Goldman, Sachs & Co. (“Goldman Sachs”), the Funds’ affiliated distributor, to waive a portion of the distribution and service fees paid by the Short Duration Government Fund’s Class B and Class C Shares and the Short Duration Income Fund’s Class C Shares; and a summary of contractual fee reductions made by the Investment Adviser and its affiliates over the past several years with respect to the Funds; |
| | (g) | | information relating to the profitability of the Management Agreements and the transfer agency and distribution and service arrangements of each of the Funds (with the exception of the Short Duration Income Fund) and the Trust as a whole to the Investment Adviser and its affiliates; |
| | (h) | | whether each Fund’s existing management fee schedule adequately addressed any economies of scale; |
| | (i) | | a summary of the “fall-out” benefits derived by the Investment Adviser and its affiliates from their relationships with the Funds, including the fees received by the Investment Adviser’s affiliates from the Funds for transfer agency, portfolio trading, distribution and other services; |
| | (j) | | a summary of potential benefits derived by the Funds as a result of their relationship with the Investment Adviser; |
| | (k) | | information regarding portfolio trading and how the Investment Adviser carries out its duty to seek best execution; |
| | (l) | | portfolio manager ownership of Fund shares; the manner in which portfolio manager compensation is determined; and the number and types of accounts managed by the portfolio managers; |
118
GOLDMAN SACHS SHORT DURATION AND GOVERNMENT FIXED INCOME FUNDS
Statement Regarding Basis for Approval of Management Agreements (Unaudited) (continued)
| | (m) | | the nature and quality of the services provided to the Funds by their unaffiliated service providers, and the Investment Adviser’s general oversight and evaluation (including reports on due diligence) of those service providers as part of the administration services provided under the Management Agreements; and |
| | (n) | | the Investment Adviser’s processes and policies addressing various types of potential conflicts of interest; its approach to risk management; the annual review of the effectiveness of the Funds’ compliance program; and compliance reports. |
The Trustees also received an overview of the Funds’ distribution arrangements. They received information regarding the Funds’ assets, share purchase and redemption activity and the payment of Rule 12b-1 distribution and service fees by the Funds and the payment of non-Rule 12b-1 shareholder service and/or administration fees by those Funds offering Service or Administration Shares. Information was also provided to the Trustees relating to revenue sharing payments made by and services provided by the Investment Adviser and its affiliates to intermediaries that promote the sale, distribution and/or servicing of Fund shares.
The presentations made at the Board and Committee meetings and at the Annual Meeting encompassed the Funds and other mutual fund portfolios for which the Board of Trustees has responsibility. In evaluating the Management Agreements at the Annual Meeting, the Trustees relied upon their knowledge, resulting from their meetings and other interactions throughout the year, of the Investment Adviser, its affiliates, their services and the Funds. In conjunction with these meetings, the Trustees received written materials and oral presentations on the topics covered, and were advised by their independent legal counsel regarding their responsibilities and other regulatory requirements related to the approval and continuation of mutual fund investment management agreements under applicable law. In addition, the Investment Adviser and its affiliates provided the Independent Trustees with a written response to a formal request for information sent on behalf of the Independent Trustees by their independent legal counsel. During the course of their deliberations, the Independent Trustees met in executive sessions with their independent legal counsel, without representatives of the Investment Adviser or its affiliates present. The Independent Trustees also discussed the broad range of other investment choices that are available to Fund investors, including the availability of comparable funds managed by other advisers.
Nature, Extent and Quality of the Services Provided Under the Management Agreements
As part of their review, the Trustees considered the nature, extent and quality of the services provided by the Investment Adviser. In this regard, the Trustees considered both the investment advisory services, and the other, non-advisory services, that are provided to the Funds by the Investment Adviser and its affiliates. The Trustees noted the transition in the leadership and changes in personnel of the Investment Adviser’s various portfolio management teams that had occurred in recent periods, and the potential benefit to the Funds of the ongoing recruitment efforts aimed at bringing high quality investment talent to the Investment Adviser. The Independent Trustees concluded that the Investment Adviser continued to commit substantial financial and operational resources to the Funds and expressed confidence that the Investment Adviser would continue to do so in the future. The Trustees also observed that the Investment Adviser had made significant commitments to address regulatory compliance requirements applicable to the Funds and the Investment Adviser.
119
GOLDMAN SACHS SHORT DURATION AND GOVERNMENT FIXED INCOME FUNDS
Statement Regarding Basis for Approval of Management Agreements (Unaudited) (continued)
Investment Performance
The Trustees also considered the investment performance of the Funds and the Investment Adviser. In this regard, they compared the investment performance of each Fund (except for the Short Duration Income Fund, which commenced operations in 2012) to its peers using rankings and ratings compiled by the Outside Data Provider as of December 31, 2011, and updated performance information for each Fund prepared by the Investment Adviser using the peer groups identified by the Outside Data Provider as of March 31, 2012. The information on each Fund’s investment performance was provided for the one-, three-, five- and ten-year periods ending on the applicable dates, to the extent that each Fund had been in existence for those periods. The Trustees also reviewed the investment performance of each Fund (with the exception of the Short Duration Income Fund) over time on a year-by-year basis relative to its performance benchmark. In addition, they considered the investment performance trends of the Funds (except for the Short Duration Income Fund) over time, and reviewed the investment performance of each Fund in light of its investment objective and policies, market conditions and credit and duration parameters. The Trustees also received information comparing the Enhanced Income, Inflation Protected Securities and Short Duration Government Funds’ performance to that of comparable institutional composites managed by the Investment Adviser.
In addition, the Trustees considered materials prepared and presentations made by the Investment Adviser’s senior management and portfolio management personnel, in which Fund performance was assessed. The Trustees also considered the Investment Adviser’s periodic reports with respect to the Funds’ risk profiles, and how the Investment Adviser’s approach to risk monitoring and management influences portfolio management.
The Independent Trustees noted that the Enhanced Income and High Quality Floating Rate Funds had placed in the bottom half of their respective peer groups during the one-, three-, five-, and ten-year periods, outperformed their respective benchmark indexes for the three-year period, and underperformed their respective benchmark indexes for the one-, five-, and ten-year periods ended March 31, 2012. They also noted that the Trustees had recently approved a proposal to rename and modify the investment policies of the High Quality Floating Rate Fund (formerly, the Ultra-Short Duration Government Fund). They noted that the Government Income Fund had placed in the top half of its peer group for the ten-year period, the bottom half of its peer group for the one-, three-, and five-year periods, outperformed its benchmark index for the three-year period, and underperformed its benchmark index for the one-, five-, and ten-year periods ended March 31, 2012. The Independent Trustees noted that the Inflation Protected Securities Fund had placed in the top half of its peer group during the one- and three-year periods and underperformed its benchmark index during the one- and three-year periods ended March 31, 2012. They further noted that the Short Duration Government Fund had placed in the top half of its peer group during the five- and ten-year periods, in the bottom half of its peer group during the one- and three-year periods, outperformed its benchmark index during the three-, five-, and ten-year periods, and underperformed its benchmark index during the one-year period ended March 31, 2012. They noted the addition of certain key hires to the Fixed Income Team in 2011, and that the Fixed Income Team had adjusted its investment process and scenario analysis in 2011 in an effort to provide stronger investment performance.
The Trustees noted that the Short Duration Income Fund had launched on February 29, 2012 and did not yet have a meaningful performance history.
120
GOLDMAN SACHS SHORT DURATION AND GOVERNMENT FIXED INCOME FUNDS
Statement Regarding Basis for Approval of Management Agreements (Unaudited) (continued)
Costs of Services Provided and Competitive Information
The Trustees considered the contractual fee rates payable by each Fund under its respective Management Agreement. In this regard, the Trustees considered information on the services rendered by the Investment Adviser to the Funds, which included both advisory and administrative services that were directed to the needs and operations of the Funds as registered mutual funds.
In particular, the Trustees reviewed analyses prepared by the Outside Data Provider regarding the expense rankings of the Funds (estimates were provided for the Short Duration Income Fund). The analyses provided a comparison of the Funds’ management fees and breakpoints to those of relevant peer groups and category universes; an expense analysis which compared each Fund’s overall net and gross expenses to a peer group and a category universe; and a five-year history (four- and one-year, in the case of the Inflation Protected Securities and Short Duration Income Funds, respectively), comparing each Fund’s net expenses to the peer and category medians. The analyses also compared each Fund’s transfer agency, custody and distribution fees, other expenses and fee waivers/reimbursements to those of other funds in the peer group and the peer group and category medians. The Trustees concluded that the comparisons provided by the Outside Data Provider were useful in evaluating the reasonableness of the management fees and total expenses paid by the Funds.
In addition, the Trustees considered the Investment Adviser’s undertakings to waive a portion of its management fee (with respect to each Fund other than the Enhanced Income Fund) and limit certain expenses of each of the Funds that exceed specified levels, and Goldman Sachs’s undertakings to waive a portion of the distribution and service fees paid by the Short Duration Government Fund’s Class B and Class C Shares and the Short Duration Income Fund’s Class C Shares. The Trustees also noted that a change was being made to the existing fee waiver arrangement for the Enhanced Income Fund that would have the effect of increasing total Fund expenses, with such change taking effect in connection with the Fund’s next annual registration statement update. They also considered, to the extent that the Investment Adviser manages institutional accounts or collective investment vehicles having investment objectives and policies similar to those of the Funds, comparative fee information for services provided by the Investment Adviser to those accounts, and information that indicated that services provided to the Funds differed in various significant respects from the services provided to institutional accounts, which generally operated under less stringent legal and regulatory structures, required fewer services from the Investment Adviser to a smaller number of client contact points, were less time-intensive and paid lower fees. By contrast, the Trustees noted that the Investment Adviser provides substantial administrative services to the Funds under the terms of the Management Agreements.
In addition, the Trustees noted that shareholders are able to redeem their Fund shares at any time if they believe that the Fund fees and expenses are too high or if they are dissatisfied with the performance of the Fund.
121
GOLDMAN SACHS SHORT DURATION AND GOVERNMENT FIXED INCOME FUNDS
Statement Regarding Basis for Approval of Management Agreements (Unaudited) (continued)
Profitability
The Trustees reviewed the Investment Adviser’s revenues and pre-tax profit margins with respect to the Trust and each of the Funds (with the exception of the Short Duration Income Fund, which commenced operations in 2012). In this regard the Trustees noted that they had received, among other things, profitability analyses and summaries, revenue and expense schedules by Fund and by function (i.e., investment management, transfer agency and distribution and service) and the Investment Adviser’s expense allocation methodology. They observed that the profitability and expense figures are substantially similar to those used by the Investment Adviser for many internal purposes, including compensation decisions among various business groups, and are thus subject to a vigorous internal debate about how certain revenue and expenses should be allocated. The Trustees also reviewed the report of the internal audit group within the Goldman Sachs organization, which included an assessment of the reasonableness and consistency of the Investment Adviser’s expense allocation methodology and an evaluation of the accuracy of the Investment Adviser’s profitability analysis calculations. Profitability data for the Trust and each Fund (with the exception of the Short Duration Income Fund) were provided for 2011 and 2010, and the Trustees considered this information in relation to the Investment Adviser’s overall profitability. The Trustees considered the Investment Adviser’s revenues and pre-tax profit margins both in absolute terms and in comparison to information on the reported pre-tax profit margins earned by certain other asset management firms.
Economies of Scale
The Trustees considered the information that had been provided regarding the Investment Adviser’s profitability. The Trustees also considered the breakpoints in the fee rate payable under the Management Agreements for each of the Funds at the following annual percentage rates of the average daily net assets of the Funds:
| | | | | | | | | | | | | | | | | | | | | | | | |
Average Daily
Net Assets | | Enhanced
Income Fund | | | Government
Income Fund | | | High Quality
Floating
Rate Fund | | | Inflation
Protected
Securities
Fund | | | Short
Duration
Government
Fund | | | Short
Duration
Income Fund | |
| First $1 billion | | | 0.25 | % | | | 0.54 | % | | | 0.40 | % | | | 0.33 | % | | | 0.50 | % | | | 0.40 | % |
| Next $1 billion | | | 0.23 | | | | 0.49 | | | | 0.36 | | | | 0.30 | | | | 0.45 | | | | 0.36 | |
| Next $3 billion | | | 0.22 | | | | 0.47 | | | | 0.34 | | | | 0.28 | | | | 0.43 | | | | 0.34 | |
| Next $3 billion | | | 0.22 | | | | 0.46 | | | | 0.33 | | | | 0.27 | | | | 0.42 | | | | 0.33 | |
| Over $8 billion | | | 0.22 | | | | 0.45 | | | | 0.32 | | | | 0.26 | | | | 0.41 | | | | 0.32 | |
122
GOLDMAN SACHS SHORT DURATION AND GOVERNMENT FIXED INCOME FUNDS
Statement Regarding Basis for Approval of Management Agreements (Unaudited) (continued)
The Trustees noted that the breakpoints were meant to share potential economies of scale, if any, with the Funds and their shareholders as assets under management reach those asset levels. The Trustees considered the amounts of assets in the Funds; the Funds’ recent share purchase and redemption activity; the information provided by the Investment Adviser relating to the costs of the services provided by the Investment Adviser and its affiliates and their realized profits; information comparing fee rates charged by the Investment Adviser with fee rates charged to other funds in the peer groups; and the Investment Adviser’s undertakings to waive a portion of its management fee (with respect to each Fund other than the Enhanced Income Fund) and limit certain expenses of each of the Funds that exceed specified levels. Upon reviewing these matters at the Annual Meeting, the Trustees concluded that the fee breakpoints represented a means of assuring that benefits of scalability, if any, would be passed along to shareholders at the specified asset levels. They also noted that the Investment Adviser had passed along savings to shareholders of the Short Duration Government Fund, which had asset levels above at least the first breakpoint during the prior fiscal year.
Other Benefits to the Investment Adviser and Its Affiliates
The Trustees also considered the other benefits derived by the Investment Adviser and its affiliates from their relationship with the Funds as stated above, including: (a) transfer agency fees received by Goldman Sachs; (b) futures commissions earned by Goldman Sachs for executing futures transactions on behalf of the Funds; (c) trading efficiencies resulting from aggregation of orders of the Funds with those for other funds or accounts managed by the Investment Adviser; (d) the Investment Adviser’s ability to leverage the infrastructure designed to service the Funds on behalf of its other clients; (e) the Investment Adviser’s ability to cross-market other products and services to Fund shareholders; (f) Goldman Sachs’ retention of certain fees as Fund Distributor; (g) the Investment Adviser’s ability to negotiate better pricing with custodians on behalf of its other clients, as a result of the relationship with the Funds; and (h) the possibility that the working relationship between the Investment Adviser and the Funds’ third party service providers may cause those service providers to be open to doing business with other areas of Goldman Sachs. In the course of considering the foregoing, the Independent Trustees requested and received further information quantifying certain of these fall-out benefits.
123
GOLDMAN SACHS SHORT DURATION AND GOVERNMENT FIXED INCOME FUNDS
Statement Regarding Basis for Approval of Management Agreements (Unaudited) (continued)
Other Benefits to the Funds and Their Shareholders
The Trustees also noted that the Funds receive certain potential benefits as a result of their relationship with the Investment Adviser, including: (a) trading efficiencies resulting from aggregation of orders of the Funds with those of other funds or accounts managed by the Investment Adviser; (b) improved servicing and pricing from vendors because of the volume of business generated by the Investment Adviser and its affiliates; (c) improved servicing from broker-dealers because of the volume of business generated by the Investment Adviser and its affiliates; (d) the Investment Adviser’s ability to negotiate favorable terms with derivatives counterparties as a result of the size and reputation of the Goldman Sachs organization; (e) the Investment Adviser’s knowledge and experience gained from managing other accounts and products; (f) the Investment Adviser’s ability to hire and retain qualified personnel to provide services to the Funds because of the reputation of the Goldman Sachs organization; (g) the Funds’ access, through the Investment Adviser, to certain firmwide resources (e.g., proprietary risk management systems and databases), subject to certain restrictions; and (h) the Funds’ access to certain affiliated distribution channels. The Trustees noted the competitive nature of the mutual fund marketplace, and noted further that many of the Funds’ shareholders invested in the Funds in part because of the Funds’ relationship with the Investment Adviser and that those shareholders have a general expectation that the relationship will continue.
Conclusion
In connection with their consideration of the Management Agreements, the Trustees gave weight to each of the factors described above, but did not identify any particular factor as controlling their decision. After deliberation and consideration of all of the information provided, including the factors described above, the Trustees concluded, in the exercise of their business judgment, that the management fees paid by each of the Funds were reasonable in light of the services provided to it by the Investment Adviser, the Investment Adviser’s costs and each Fund’s current and reasonably foreseeable asset levels. The Trustees unanimously concluded that the Investment Adviser’s continued management likely would benefit each Fund and its shareholders and that the Management Agreements should be approved and continued with respect to each applicable Fund until June 30, 2013.
124
FUNDS PROFILE
Goldman Sachs Funds

Goldman Sachs is a premier financial services firm, known since 1869 for creating thoughtful and customized investment solutions in complex global markets.
Today, the Investment Management Division of Goldman Sachs serves a diverse set of clients worldwide, including private institutions, public entities and individuals. With approximately $735.5 billion in assets under management as of September 30, 2012, Goldman Sachs Asset Management (“GSAM”) has portfolio management teams located around the world and our investment professionals bring firsthand knowledge of local markets to every investment decision. GSAM’s assets under management includes assets managed by Goldman Sachs Asset Management, LP and its Investment Advisory Affiliates.
|
| OVERVIEW OF GOLDMAN SACHS FUNDS |

Money Market1
Financial Square FundsSM
| n | | Financial Square Tax-Exempt Funds |
| n | | Financial Square Federal Fund |
| n | | Financial Square Government Fund |
| n | | Financial Square Money Market Fund |
| n | | Financial Square Prime Obligations Fund |
| n | | Financial Square Treasury Instruments Fund |
| n | | Financial Square Treasury Obligations Fund |
Fixed Income
Short Duration and Government
| n | | High Quality Floating Rate Fund2 |
| n | | Short Duration Government Fund |
| n | | Short Duration Income Fund |
| n | | Inflation Protected Securities Fund |
Multi-Sector
| n | | Core Plus Fixed Income Fund |
Municipal and Tax-Free
| n | | High Yield Municipal Fund |
| n | | Short Duration Tax-Free Fund |
Single Sector
| n | | Investment Grade Credit Fund |
| n | | High Yield Floating Rate Fund |
| n | | Emerging Markets Debt Fund |
| n | | Local Emerging Markets Debt Fund |
Corporate Credit
Fundamental Equity
| n | | Small/Mid Cap Growth Fund |
| n | | Flexible Cap Growth Fund |
| n | | Concentrated Growth Fund |
| n | | Technology Tollkeeper Fund |
| n | | Growth Opportunities Fund |
| n | | Rising Dividend Growth Fund |
Structured Equity
| n | | Structured Small Cap Equity Fund |
| n | | Structured U.S. Equity Fund |
| n | | Structured Small Cap Growth Fund |
| n | | Structured Large Cap Growth Fund |
| n | | Structured Large Cap Value Fund |
| n | | Structured Small Cap Value Fund |
| n | | Structured Tax-Managed Equity Fund |
| n | | Structured International Tax-Managed Equity Fund |
| n | | U.S. Equity Dividend and Premium Fund |
| n | | International Equity Dividend and Premium Fund |
| n | | Structured International Small Cap Fund |
| n | | Structured International Equity Fund |
| n | | Structured Emerging Markets Equity Fund |
Fundamental Equity International4
| n | | Strategic International Equity Fund |
| n | | Concentrated International Equity Fund |
| n | | International Small Cap Fund |
| n | | Emerging Markets Equity Fund |
| n | | BRIC Fund (Brazil, Russia, India, China) |
Select Satellite5
| n | | Real Estate Securities Fund |
| n | | International Real Estate Securities Fund |
| n | | Commodity Strategy Fund |
| n | | Dynamic Allocation Fund |
| n | | Absolute Return Tracker Fund |
| n | | Managed Futures Strategy Fund |
| n | | Retirement Portfolio Completion Fund |
Total Portfolio Solutions5
| n | | Balanced Strategy Portfolio |
| n | | Growth and Income Strategy Portfolio |
| n | | Growth Strategy Portfolio |
| n | | Equity Growth Strategy Portfolio |
| n | | Income Strategies Portfolio |
| n | | Satellite Strategies Portfolio |
| n | | Retirement Strategies Portfolios6 |
| n | | Enhanced Dividend Global Equity Portfolio |
| n | | Tax Advantaged Global Equity Portfolio |
| 1 | | An investment in a money market fund is neither insured nor guaranteed by the Federal Deposit Insurance Corporation (“FDIC”) or any other government agency. Although the Funds seek to preserve the value of your investment at $1.00 per share, it is possible to lose money by investing in the Funds. |
| 2 | | Effective at the close of business on July 27, 2012, the Goldman Sachs Ultra-Short Duration Government Fund was renamed the Goldman Sachs High Quality Floating Rate Fund. |
| 3 | | Effective at the close of business on June 29, 2012, the Goldman Sachs Balanced Fund was renamed the Goldman Sachs Income Builder Fund. |
| 4 | | Since October 18, 2012, shares of the Goldman Sachs Brazil Equity, India Equity and Korea Equity Funds (each, a “Fund,” and collectively, the “Funds”) have not been available for purchase by investors. Each Fund will be liquidated pursuant to a Board-approved Plan of Liquidation on or about November 30, 2012 (the “Liquidation Date”). At any time prior to the Liquidation Date, shareholders may redeem their shares of the Funds and receive the net asset value thereof in cash or in kind, as provided in the Prospectus. |
| 5 | | Individual Funds within the Total Portfolio Solutions and Select Satellite categories will have various placement on the risk/return spectrum and may have greater or lesser risk than that indicated by the placement of the general Total Portfolio Solutions or Select Satellite category. |
| 6 | | Since July 28, 2012, shares of each of the Goldman Sachs Retirement Strategy Portfolios (the “Portfolios”) have not been available for purchase except to participants within certain Retirement Plans (as defined in the Prospectus). As of the close of business on December 6, 2012, shares of the Portfolios will no longer be available for purchase by any investors. |
Financial Square FundsSM is a registered service mark of Goldman, Sachs & Co.
| | |
TRUSTEES Ashok N. Bakhru, Chairman Donald C. Burke John P. Coblentz, Jr. Diana M. Daniels Joseph P. LoRusso James A. McNamara Jessica Palmer Alan A. Shuch Richard P. Strubel | | OFFICERS James A. McNamara, President George F. Travers, Principal Financial Officer Caroline Kraus, Secretary Scott M. McHugh, Treasurer |
| |
GOLDMAN, SACHS & CO. Distributor and Transfer Agent | | GOLDMAN SACHS ASSET MANAGEMENT, L.P. Investment Adviser |
Visit our Web site at www.goldmansachsfunds.com to obtain the most recent month-end returns.
Goldman Sachs Asset Management, L.P. 200 West Street, New York, New York 10282
The reports concerning the Funds included in this shareholder report may contain certain forward-looking statements about the factors that may affect the performance of the Funds in the future. These statements are based on fund management’s predictions and expectations concerning certain future events and their expected impact on the Funds, such as performance of the economy as a whole and of specific industry sectors, changes in the levels of interest rates, the impact of developing world events, and other factors that may influence the future performance of the Funds. Management believes these forward-looking statements to be reasonable, although they are inherently uncertain and difficult to predict. Actual events may cause adjustments in portfolio management strategies from those currently expected to be employed.
A description of the policies and procedures that the Funds use to determine how to vote proxies relating to portfolio securities and information regarding how a Fund voted proxies relating to portfolio securities during the most recent 12-month period ended June 30 is available (I) without charge, upon request by calling 1-800-526-7384 (for Retail Shareholders) or 1-800-621-2550 (for Institutional Shareholders); and (II) on the Securities and Exchange Commission (“SEC”) web site at http://www.sec.gov.
The Funds file their complete schedule of portfolio holdings with the SEC for the first and third quarters of each fiscal year on Form N-Q. The Funds’ Forms N-Q are available on the SEC’s web site at http://www.sec.gov within 60 days after the Funds’ first and third fiscal quarters. The Funds’ Forms N-Q may be reviewed and copied at the SEC’s Public Reference Room in Washington, D.C. and information on the operation of the Public Reference Room may be obtained by calling 1-800-SEC-0330. Forms N-Q may be obtained upon request and without charge by calling 1-800-526-7384 (for Retail Shareholders) or 1-800-621-2550 (for Institutional Shareholders).
The portfolio risk management process includes an effort to monitor and manage risk, but does not imply low risk.
Economic and market forecasts presented herein reflect our judgment as of the date of this presentation and are subject to change without notice. These forecasts do not take into account the specific investment objectives, restrictions, tax and financial situation or other needs of any specific client. Actual data will vary and may not be reflected here. These forecasts are subject to high levels of uncertainty that may affect actual performance. Accordingly, these forecasts should be viewed as merely representative of a broad range of possible outcomes. These forecasts are estimated, based on assumptions, and are subject to significant revision and may change materially as economic and market conditions change. Goldman Sachs has no obligation to provide updates or changes to these forecasts. Case studies and examples are for illustrative purposes only.
Holdings and allocations shown are as of September 30, 2012 and may not be representative of future investments. Fund holdings should not be relied on in making investment decisions and should not be construed as research or investment advice regarding particular securities.
This material is not authorized for distribution to prospective investors unless preceded or accompanied by a current Prospectus or summary prospectus, if applicable. Investors should consider a Fund’s objective, risks, and charges and expenses, and read the summary prospectus, if available, and/or the Prospectus carefully before investing or sending money. The summary prospectus, if available, and the Prospectus contain this and other information about a Fund and may be obtained from your authorized dealer or from Goldman, Sachs & Co. by calling (retail – 1-800-526-7384) (institutional – 1-800-621-2550).
© 2012 Goldman Sachs. All rights reserved. 86383.MF.MED.TMPL / 11/2012 SDFISAR12 / 46.7K
| | The information required by this Item is only required in an annual report on this Form N-CSR. |
| ITEM 3. | AUDIT COMMITTEE FINANCIAL EXPERT. |
| | The information required by this Item is only required in an annual report on this Form N-CSR. |
| ITEM 4. | PRINCIPAL ACCOUNTANT FEES AND SERVICES. |
| | The information required by this Item is only required in an annual report on this Form N-CSR. |
| ITEM 5. | AUDIT COMMITTEE OF LISTED REGISTRANTS. |
| ITEM 6. | SCHEDULE OF INVESTMENTS. |
| | Schedule of Investments is included as part of the Report to Stockholders filed under Item 1. |
| ITEM 7. | DISCLOSURE OF PROXY VOTING POLICIES AND PROCEDURES FOR CLOSED-END MANAGEMENT INVESTMENT COMPANIES. |
| ITEM 8. | PORTFOLIO MANAGERS OF CLOSED-END MANAGEMENT INVESTMENT COMPANIES. |
| ITEM 9. | PURCHASES OF EQUITY SECURITIES BY CLOSED-END MANAGEMENT INVESTMENT COMPANY AND AFFILIATED PURCHASERS. |
| ITEM 10. | SUBMISSION OF MATTERS TO A VOTE OF SECURITY HOLDERS. |
| | There have been no material changes to the procedures by which shareholders may recommend nominees to the registrant’s board of trustees. |
| ITEM 11. | CONTROLS AND PROCEDURES. |
| | (a) | The registrant’s principal executive and principal financial officers, or persons performing similar functions have concluded that the registrant’s disclosure controls and procedures (as defined in Rule 30a-3(c) under the Investment Company Act of 1940, as amended (the “1940 Act”)) are effective as of a date within 90 days of the filing of this report that includes the disclosure required by this paragraph, based on the evaluation of these controls and procedures required by Rule 30a-3(b) under the 1940 Act and 15d-15(b) under the Securities Exchange Act of 1934, as amended. |
| | (b) | There were no changes in the registrant’s internal control over financial reporting (as defined in Rule 30a-3(d) under the 1940 Act) that occurred during the registrant’s second fiscal quarter of the period covered by this report that have materially affected, or are reasonably likely to materially affect, the registrant’s internal control over financial reporting. |
| | | | |
| (a)(1) | | The information required by this Item is only required in connection with an annual report on this Form N-CSR. |
| | |
| (a)(2) | | Exhibit 99.CERT | | Certifications pursuant to Section 302 of the Sarbanes-Oxley Act of 2002 filed herewith. |
| | |
| (b) | | Exhibit 99.906CERT | | Certifications pursuant to Section 906 of the Sarbanes-Oxley Act of 2002 filed herewith. |
SIGNATURES
Pursuant to the requirements of the Securities Exchange Act of 1934 and the Investment Company Act of 1940, the registrant has duly caused this report to be signed on its behalf by the undersigned, thereunto duly authorized.
| | | | |
| | | | Goldman Sachs Trust |
| | |
| By: | | | | /s/ James A. McNamara |
| | | | James A. McNamara |
| | | | President/Principal Executive Officer |
| | | | Goldman Sachs Trust |
| | |
| Date: | | | | November 19, 2012 |
Pursuant to the requirements of the Securities Exchange Act of 1934 and the Investment Company Act of 1940, this report has been signed below by the following persons on behalf of the registrant and in the capacities and on the dates indicated.
| | | | |
| By: | | | | /s/ James A. McNamara |
| | | | James A. McNamara |
| | | | President/Principal Executive Officer |
| | | | Goldman Sachs Trust |
| | |
| Date: | | | | November 19, 2012 |
| | |
| By: | | | | /s/ George F. Travers |
| | | | George F. Travers |
| | | | Principal Financial Officer |
| | | | Goldman Sachs Trust |
| | |
| Date: | | | | November 16, 2012 |