UNITED STATES
SECURITIES AND EXCHANGE COMMISSION
Washington, D.C. 20549
FORM N-CSR
CERTIFIED SHAREHOLDER REPORT OF REGISTERED
MANAGEMENT INVESTMENT COMPANIES
Investment Company Act file number 811-05349
Goldman Sachs Trust
(Exact name of registrant as specified in charter)
71 South Wacker Drive,
Chicago, Illinois 60606
(Address of principal executive offices) (Zip code)
| | |
Copies to: |
Caroline Kraus | | Geoffrey R.T. Kenyon, Esq. |
Goldman, Sachs & Co. | | Dechert LLP |
200 West Street | | 200 Clarendon Street |
New York, New York 10282 | | 27th Floor |
| | Boston, MA 02116-5021 |
(Name and address of agents for service)
Registrant’s telephone number, including area code: (312) 655-4400
Date of fiscal year end: August 31
Date of reporting period: February 28, 2013
| ITEM 1. | REPORTS TO STOCKHOLDERS. |
| | The Semi-Annual Report to Stockholders is filed herewith. |
Goldman Sachs Funds

| | | | |
| | |
| Semi-Annual Report | | | | February 28, 2013 |
| | |
| | | | Fundamental Equity Growth Funds |
| | | | Capital Growth |
| | | | Concentrated Growth |
| | | | Flexible Cap Growth |
| | | | Focused Growth |
| | | | Growth Opportunities |
| | | | Small/Mid Cap Growth |
| | | | Strategic Growth |
| | | | Technology Tollkeeper |
| | | | U.S. Equity |

Goldman Sachs Fundamental Equity Growth Funds
| | | | |
TABLE OF CONTENTS | | | | |
| |
Principal Investment Strategies and Risks | | | 1 | |
| |
Investment Process | | | 3 | |
| |
Market Review | | | 4 | |
| |
Portfolio Management Discussions and Performance Summaries | | | 6 | |
| |
Schedules of Investments | | | 60 | |
| |
Financial Statements | | | 78 | |
| |
Financial Highlights | | | 88 | |
| |
Notes to Financial Statements | | | 106 | |
| |
Other Information | | | 127 | |
| | | | |
| | | |
| NOT FDIC-INSURED | | May Lose Value | | No Bank Guarantee |
GOLDMAN SACHS FUNDAMENTAL EQUITY GROWTH FUNDS
Principal Investment Strategies and Risks
This is not a complete list of risks that may affect the Funds. For additional information concerning the risks applicable to the Funds, please see the Funds’ Prospectuses.
The Goldman Sachs Capital Growth Fund invests primarily in U.S. equity investments and invests, under normal circumstances, in approximately 30–40 companies. The Fund’s equity investments are subject to market risk, which means that the value of the securities in which it invests may go up or down in response to the prospects of individual companies, particular sectors and/or general economic conditions. Different investment styles (e.g., “growth”) tend to shift in and out of favor, and at times the Fund may underperform other funds that invest in similar asset classes.
The Goldman Sachs Concentrated Growth Fund invests primarily in U.S. equity investments. The Fund’s equity investments are subject to market risk, which means that the value of the securities in which it invests may go up or down in response to the prospects of individual companies, particular sectors and/or general economic conditions. The securities of small- and mid-capitalization companies involve greater risks than those associated with larger, more established companies and may be subject to more abrupt or erratic price movements. Different investment styles (e.g., “growth”) tend to shift in and out of favor, and at times the Fund may underperform other funds that invest in similar asset classes. The Fund is “non-diversified” and may invest more of its assets in fewer issuers than “diversified” funds. Accordingly, the Fund may be more susceptible to adverse developments affecting any single issuer held in its portfolio and to greater losses resulting from these developments.
The Goldman Sachs Flexible Cap Growth Fund invests primarily in U.S. equity investments in small-, mid- and large-capitalization issuers. The Fund’s equity investments are subject to market risk, which means that the value of the securities in which it invests may go up or down in response to the prospects of individual companies, particular sectors and/or general economic conditions. The securities of small- and mid-capitalization companies involve greater risks than those associated with larger, more established companies and may be subject to more abrupt or erratic price movements. Different investment styles (e.g., “growth”) tend to shift in and out of favor, and at times the Fund may underperform other funds that invest in similar asset classes.
The Goldman Sachs Focused Growth Fund invests primarily in U.S. equity investments and invests, under normal circumstances, in approximately 20–25 companies. The Fund’s equity investments are subject to market risk, which means that the value of the securities in which it invests may go up or down in response to the prospects of individual companies, particular sectors and/or general economic conditions. The securities of small- and mid-capitalization companies involve greater risks than those associated with larger, more established companies and may be subject to more abrupt or erratic price movements. Different investment styles (e.g., “growth”) tend to shift in and out of favor, and at times the Fund may underperform other funds that invest in similar asset classes. The Fund is “non-diversified” and may invest more of its assets in fewer issuers than “diversified” funds. Accordingly, the Fund may be more susceptible to adverse developments affecting any single issuer held in its portfolio and to greater losses resulting from these developments.
The Goldman Sachs Growth Opportunities Fund invests primarily in U.S. equity investments with a primary focus on mid-capitalization companies. The Fund’s equity investments are subject to market risk, which means that the value of the securities in which it invests may go up or down in response to the prospects of individual companies, particular sectors and/or general economic conditions. The securities of small- and mid-capitalization companies involve greater risks than those associated with larger, more established companies and may be subject to more abrupt or erratic price movements. Different investment styles (e.g., “growth”) tend to shift in and out of favor, and at times the Fund may underperform other funds that invest in similar asset classes.
1
GOLDMAN SACHS FUNDAMENTAL EQUITY GROWTH FUNDS
The Goldman Sachs Small/Mid Cap Growth Fund invests primarily in U.S. equity investments with a primary focus on small- and mid-capitalization companies. The Fund’s equity investments are subject to market risk, which means that the value of the securities in which it invests may go up or down in response to the prospects of individual companies, particular sectors and/or general economic conditions. The securities of small- and mid-capitalization companies involve greater risks than those associated with larger, more established companies and may be subject to more abrupt or erratic price movements. Different investment styles (e.g., “growth”) tend to shift in and out of favor, and at times the Fund may underperform other funds that invest in similar asset classes.
The Goldman Sachs Strategic Growth Fund invests primarily in U.S. equity investments. The Fund’s equity investments are subject to market risk, which means that the value of the securities in which it invests may go up or down in response to the prospects of individual companies, particular sectors and/or general economic conditions. Different investment styles (e.g., “growth”) tend to shift in and out of favor, and at times the Fund may underperform other funds that invest in similar asset classes.
The Goldman Sachs Technology Tollkeeper Fund invests primarily in equity securities of high quality technology, media or service companies that adopt or use technology to improve their cost structure, revenue opportunities or competitive advantage (“Technology Tollkeeper” companies). Because the Fund concentrates its investments in certain specific industries, the Fund is subject to greater risk of loss as a result of adverse economic, business or other developments affecting those industries than if its investments were more diversified across different industries. Stock prices of internet and internet-related companies in particular may be especially volatile. The securities of small- and mid-capitalization companies involve greater risks than those associated with larger, more established companies and may be subject to more abrupt or erratic price movements. Different investment styles (e.g., “growth”) tend to shift in and out of favor, and at times the Fund may underperform other funds that invest in similar asset classes.
The Goldman Sachs U.S. Equity Fund invests primarily in large-capitalization U.S. equity investments. The Fund’s equity investments are subject to market risk, which means that the value of the securities in which it invests may go up or down in response to the prospects of individual companies, particular sectors and/or general economic conditions. Different investment styles (e.g., “growth” and “value”) tend to shift in and out of favor, and at times the Fund may underperform other funds that invest in similar asset classes.
2
GOLDMAN SACHS FUNDAMENTAL EQUITY GROWTH FUNDS
What Differentiates the Goldman Sachs Growth Team’s Investment Process?
For over 30 years, the Goldman Sachs Growth Team has consistently applied a three-step investment process based on our belief that wealth is created through the long-term ownership of growing businesses.


| n | | Make decisions as long-term business owners rather than as stock traders |
| n | | Perform in-depth, fundamental research |
| n | | Focus on long-term structural and competitive advantages |
Result
Performance driven by the compounding growth of businesses over time — not short-term market movements
Long-term participation in growing businesses — less reliance on macroeconomic predictions, market timing, sector rotation or momentum

Identify high quality growth businesses. Some required investment criteria include:
| n | | Established brand names |
| n | | Recurring revenue streams |
| n | | Long product life cycles |
| n | | Favorable long-term growth prospects |
Result
Investments in businesses that we believe are strategically positioned for consistent, sustainable long-term growth

| n | | Perform rigorous valuation analysis of every potential investment |
| n | | Use valuation tools and analytics to ensure that the high-quality business franchises we have identified also represent sound investments |
Result
Good investment decisions based on solid understanding of what each business is worth
Attractive buying opportunities as the stock prices of quality growth businesses fluctuate over time
Effective April 17, 2013, alongside Steve Barry, the CIO of the Growth Equity team, the portfolio managers for the Growth Equity Funds will be:
| | n | | Capital Growth, Concentrated Growth, Focused Growth and Strategic Growth Funds — Tim Leahy and Steve Becker |
| | n | | Flexible Cap Growth, Growth Opportunities, Small/Mid Cap Growth and Technology Tollkeeper Funds — Jeff Rabinowitz |
3
MARKET REVIEW
Goldman Sachs Fundamental Equity Growth Funds
Market Review
Overall, U.S. equities advanced for the six months ended February 28, 2013 (the “Reporting Period”) with broad sector participation. The Standard & Poor’s 500® Index (the “S&P 500 Index”) ended the Reporting Period with a gain of 8.95%, and the Russell 3000® Index generated a return of 9.97%.
As the Reporting Period began in September 2012, U.S. equities were in the midst of a rally that had begun in the summer of 2012 following assurance of ongoing easing monetary policy from the Federal Reserve Board (the “Fed”) and the European Central Bank. However, the U.S. equity market then pulled back in October 2012 on some cautious corporate earnings guidance and uncertainty surrounding the U.S. presidential election. Also pressuring the U.S. equity market was the worst storm in decades battering the East Coast.
The U.S. equity market subsequently regained momentum in November 2012, as election day largely preserved the status quo in the White House and Congress and economic data continued to show signs of improvement. More specifically, the U.S. reported better than expected third calendar quarter Gross Domestic Product growth of 2%, the 13th consecutive quarter of economic expansion, and the unemployment rate dropped to 7.8%, the lowest rate seen since January 2009. U.S. manufacturing activity increased, and the housing market showed further signs of improvement, as construction of new homes hit a four-year high. In December 2012, further clarification from the Fed, tying its low interest rate policy, in part, to the condition that unemployment drop to 6.5% or lower, helped to offset increasing worries about the then-looming fiscal cliff of tax increases and spending cuts. Following weeks of tense negotiations and technically falling off the fiscal cliff for one day, the U.S. Congress finally reached an agreement averting the full force of tax increases that were scheduled to take effect on January 1, 2013. While spending cuts and other important fiscal issues were not truly addressed but merely postponed, the passage of The American Taxpayer Relief Act (ATRA) of 2012 did resolve some lingering uncertainties.
The U.S. equity market rally picked up steam in the first two months of 2013, with the S&P 500 Index reaching a five-year high and then a new record level and the Dow Jones Industrial Average hitting the 14,000 milestone. Further strengthening in home prices and improving U.S. employment data lifted markets, despite the realization that no deal would be reached in Washington D.C. to avoid the sequester, or automatic spending cuts, scheduled by the federal government to go into effect on March 1, 2013.
For the Reporting Period overall, mid-cap companies performed best with small-cap companies close behind. While generating solid positive returns, large-cap stocks followed at some distance. Value stocks significantly outpaced growth stocks across the capitalization spectrum. (All as measured by Russell Investments indices.) Within the S&P 500 Index, nine of ten sectors made gains during the Reporting Period. The consistent and persistent commitment to accommodative monetary policy from the U.S. Fed and other central banks throughout the Reporting Period drove market leading returns in the financials sector. On optimism about the economy and improved consumer confidence, the industrials, health care and consumer discretionary sectors also posted double-digit gains. The information technology sector was the only one to decline during the Reporting Period, largely due to some weaker than expected corporate earnings reports.
4
MARKET REVIEW
Looking Ahead
With the U.S. equity market trading near all-time highs at the end of the Reporting Period, we continue to use our bottom-up, fundamental research process to drive our investment decisions for the Funds rather than sentiment or headlines. Even after a strong start to 2013, many of the reasons we began the Reporting Period constructive on U.S. equities still held true at the end of the Reporting Period. First, corporate balance sheets remained strong, which we believe provides companies with the ability to generate shareholder value, even in a slow-growth economic environment. Second, the S&P 500 Index was trading below its historical average price to earnings (P/E) ratio, while its dividend yield was greater than the yield on the 10-year U.S. Treasury bond. Third, continued strength in the U.S. housing recovery should, in our view, provide further support to the economy and boost confidence among consumers.
Of course, risks remain. Fiscal policy will likely be a drag on U.S. economic growth as 2013 progresses. Further, with the ultimate direction of fiscal policy still unclear, there is the potential for political headlines, in both the U.S. and overseas, to impact the U.S. equity market. We have long been cautious regarding companies that have a high degree of government dependency, whether it is related to sales, subsidies or regulations.
We believe companies with strong business franchises and competitive advantages may provide some degree of stability against an uncertain backdrop. As always, deep research resources, a forward-looking investment process and truly actively managed portfolios are keys, in our view, to both preserving capital and outperforming the market over the long term.
5
PORTFOLIO RESULTS
Goldman Sachs Capital Growth Fund
Portfolio Composition
The Fund invests primarily in U.S. equity investments. Since the Fund’s inception, the Goldman Sachs Growth Investment Team has focused on several key investment criteria that it believes can drive a company’s growth over the long term. These characteristics are: dominant market share, established brand name, pricing power, recurring revenue stream, free cash flow, high returns on invested capital, predictable growth, sustainable growth, long product life cycle, enduring competitive advantage, favorable demographic trends and excellent management. The Team strives to purchase these companies at reasonable valuations in order to capture the full benefits of their growth.
Portfolio Management Discussion and Analysis
Below, the Goldman Sachs Growth Investment Team discusses the Goldman Sachs Capital Growth Fund’s (the “Fund”) performance and positioning for the six-month period ended February 28, 2013 (the “Reporting Period”).
| Q | | How did the Fund perform during the Reporting Period? |
| A | | During the Reporting Period, the Fund’s Class A, B, C, Institutional, Service, IR and R Shares generated cumulative total returns, without sales charges, of 7.17%, 6.79%, 6.74%, 7.38%, 7.14%, 7.31% and 7.02%, respectively. These returns compare to the 6.23% cumulative total return of the Fund’s benchmark, the Russell 1000® Growth Index (with dividends reinvested) (the “Russell Index”), during the same period. |
| Q | | What key factors were responsible for the Fund’s performance during the Reporting Period? |
| A | | Stock selection overall contributed most to the Fund’s performance relative to the Russell Index during the Reporting Period. |
| Q | | Which equity market sectors most significantly affected Fund performance? |
| A | | Effective stock selection in the information technology, financials and consumer staples sectors helped the Fund’s performance most relative to the Russell Index. Detracting from the Fund’s relative results most was having underweighted positions in industrials and materials, each of which outperformed the Russell Index during the Reporting Period, and weak stock selection in the energy sector. |
| Q | | What were some of the Fund’s best-performing individual stocks? |
| A | | The Fund benefited most relative to the Russell Index from positions in global commercial real estate services firm CBRE Group, biotechnology company Gilead Sciences and software giant Microsoft. |
| | | CBRE Group contributed most to the Fund’s relative performance during the Reporting Period. Its shares rose on the heels of announcing a solid fourth calendar quarter, during which earnings beat analysts’ expectations. In addition, CBRE Group published positive guidance for 2013. At the end of the Reporting Period, we believed the company still had strong growth potential, as it was gaining market share and continued to boost margins through international expansion. Additionally, in our view, the deal struck by CBRE Group to buy a majority of the real estate investment management business of Dutch financial company ING Group should be beneficial, as it provides relatively stable assets under management, recurring revenues and solid margins. |
| | | Gilead Sciences was a top contributor to the Fund’s relative performance during the Reporting Period. In our view, the company is a dominant player in the HIV and hepatitis C treatment areas, and indeed it was positive pipeline development in these areas that drove the company’s strong performance during the Reporting Period. At the end of the Reporting Period, we continued to have high conviction in the company, as we believed it was well positioned within the biotechnology industry, holding significant market share in several niche areas. In our view, Gilead Sciences remained attractively valued at the end of the Reporting Period given its strong pipeline and dominant HIV franchise. |
6
PORTFOLIO RESULTS
| | | Microsoft was a strong contributor to the Fund’s performance during the Reporting Period despite the stock underperforming the Russell Index. As we had been reducing the Fund’s position during the Reporting Period and ultimately exited the position completely, the Fund’s underweighted allocation compared to the Russell Index contributed positively to relative results. During the Reporting Period, Microsoft announced disappointing fiscal first quarter results caused by slower than expected enterprise adoption of the Windows 8 operating system. Investors were also disappointed by the sudden departure of the head of the Windows division. This departure was unexpected, as he was viewed by many as a potential chief executive officer successor. We exited the Fund’s position in Microsoft prior to this announcement, based on our view of slower anticipated growth ahead and limited traction in the mobile computing industry. While Microsoft pays an attractive dividend and should continue to generate large amounts of free cash flow, we believe its flagship Windows product is maturing. We also see the changes being driven by mobile and cloud computing potentially leading to disruptions in the company’s markets. |
| Q | | Which stocks detracted significantly from the Fund’s performance during the Reporting Period? |
| A | | Detracting most from the Fund’s results relative to its benchmark index were positions in personal computer and mobile communications device giant Apple, point-of-sale card payment device manufacturer VeriFone Systems and retail electronic payments network operator Visa. |
| | | A position in Apple detracted most from the Fund’s returns during the Reporting Period. Shares of Apple pulled back as concern persisted around disappointing first calendar quarter iPhone guidance. The iPhone accounts for approximately 60% of the company’s gross profits and remains the key driver of Apple’s growth. At the end of the Reporting Period, we continued to have a positive outlook on the company and saw a number of potential catalysts that could contribute to additional growth. We believe an iPhone that targets the emerging market consumer could reaccelerate growth and help expand the overall market for Apple products. We also believe the market is discounting the optionality in Apple’s stock from new product introductions. (Optionality is the value of additional optional investment opportunities available only after having made an initial investment.) In addition, there is the possibility that Apple could sign a deal with China Mobile, the largest wireless carrier in China with approximately 700 million subscribers. Were this to be realized, this deal could significantly expand the addressable market for Apple’s iPhone. Even as near-term expectations are reduced, we believe the company’s long-term growth potential is still greater than the broader market. We believe Apple has plenty of financial flexibility with its strong balance sheet and healthy free cash flow to return capital to shareholders. Overall, then, we remain positive on Apple and believed, at the end of the Reporting Period, that its stock was trading at a reasonable valuation for a high quality franchise with solid growth potential. |
| | | VeriFone Systems was another significant detractor from the Fund’s relative results during the Reporting Period. Its shares declined sharply following a revenue and earnings miss and a disappointing outlook for the fiscal first quarter of 2013. In our view, the results highlight the challenges the company is facing in migrating from a hardware business to a services business and demonstrate its management’s failure to integrate recent acquisitions. As a result, we exited the Fund’s position in VeriFone Systems by the end of the Reporting Period. |
| | | Visa, a new position for the Fund during the Reporting Period, was a relative detractor from results, given the Fund’s underweight position in this strongly performing stock. In October 2012, the company announced a new chief executive officer, named Charles Scharf, which we viewed as a positive. Visa also reported a solid fiscal first quarter driven by earnings and net revenue growth that exceeded analysts’ expectations. The company also extended its existing partnership with JPMorgan Chase for another ten years. |
7
PORTFOLIO RESULTS
| Q | | How did the Fund use derivatives and similar instruments during the Reporting Period? |
| A | | During the Reporting Period, we did not use derivatives as part of an active management strategy. |
| Q | | Did the Fund make any significant purchases or sales during the Reporting Period? |
| A | | We initiated a Fund position in Activision Blizzard, a leading publisher of gaming software and content, during the Reporting Period. Activision Blizzard owns three of the largest franchises in the electronic gaming industry — Call of Duty and Skylanders on console and World of Warcraft on personal computer. World of Warcraft is offered through a monthly subscription model that provides a large and reliable stream of cash flow, which, in turn, can be used to invest for growth in newer intellectual properties. In our view, these newer properties, including Call of Duty and Skylanders, and upcoming new releases have margin structures that are higher than the corporate average, which should drive Activision Blizzard’s operating margins higher if the company grows over the next few years as anticipated. In addition, we believe the company’s valuations were attractive at the time of purchase. |
| | | We established a Fund position in Allergan, a health care company focused on developing pharmaceuticals, biologics, medical devices and over-counter products. Continued strong growth in key franchises as well as regulatory successes drove the company’s share price appreciation during the Reporting Period. In our view, Allergan has stable growth franchises in ophthalmology and botox for therapeutic and cosmetic applications. Furthermore, we believe the company has a strong pipeline, include DARPins (designed ankyrin repeat proteins) for wet macular degeneration and diabetic macular edema, which could produce significant long-term growth opportunities. |
| | | Conversely, in addition to the sale of Microsoft, already mentioned, we eliminated the Fund’s position in specialty retailer Urban Outfitters during the Reporting Period. Shares of Urban Outfitters rose after the company announced strong results during a mid-quarter update during the fourth calendar quarter. While we still have conviction in the company, its story was becoming more understood by the market and thus the valuation gap narrowed in our view. Therefore, we exited the Fund’s position. |
| Q | | Were there any notable changes in the Fund’s weightings during the Reporting Period? |
| A | | In constructing the Fund’s portfolio, we focus on picking stocks rather than on making industry or sector bets. We seek to outpace the benchmark index by overweighting stocks that we expect to outperform and underweighting those that we think may lag. Consequently, changes in its sector weights are generally the direct result of individual stock selection or of stock appreciation or depreciation. That said, during the Reporting Period, the Fund’s exposure to consumer discretionary, consumer staples, industrials, financials, information technology and telecommunication services increased and its allocations to energy, health care and materials decreased relative to the Russell Index. |
| Q | | How was the Fund positioned relative to its benchmark index at the end of February 2013? |
| A | | At the end of February 2013, the Fund had an overweighted position relative to the Russell Index in the financials sector. On the same date, the Fund had underweighted positions compared to the Russell Index in industrials and materials. The Fund was rather neutrally weighted to the Russell Index in information technology, consumer discretionary, telecommunication services, energy, health care and consumer staples and had no position at all in utilities on February 28, 2013. |
8
FUND BASICS
Capital Growth Fund
as of February 28, 2013
| | | | | | | | | | |
| | PERFORMANCE REVIEW | |
| | | September 1, 2012–February 28, 2013 | | Fund Total Return
(based on NAV)1 | | | Russell 1000
Growth Index2 | |
| | Class A | | | 7.17 | % | | | 6.23 | % |
| | Class B | | | 6.79 | | | | 6.23 | |
| | Class C | | | 6.74 | | | | 6.23 | |
| | Institutional | | | 7.38 | | | | 6.23 | |
| | Service | | | 7.14 | | | | 6.23 | |
| | Class IR | | | 7.31 | | | | 6.23 | |
| | | Class R | | | 7.02 | | | | 6.23 | |
| | 1 | | The net asset value (“NAV”) represents the net assets of the class of the Fund (ex-dividend) divided by the total number of shares of the class outstanding. The Fund’s performance reflects the reinvestment of dividends and other distributions. The Fund’s performance does not reflect the deduction of any applicable sales charges. |
| | 2 | | The Russell 1000 Growth Index (with dividends reinvested) is an unmanaged index that measures the performance of those Russell 1000 companies with higher price-to-book ratios and higher forecasted growth values. The Index figures do not reflect any deduction for fees, expenses or taxes. It is not possible to invest directly in an index. |
| | | | | | | | | | | | | | |
| | STANDARDIZED TOTAL RETURNS3 |
| | | For the period ended 12/31/12 | | One Year | | | Five Years | | Ten Years | | Since Inception | | Inception Date |
| | Class A | | | 12.01 | % | | 0.73% | | 5.39% | | 8.27% | | 4/20/90 |
| | Class B | | | 12.62 | | | 0.71 | | 5.34 | | 5.82 | | 5/01/96 |
| | Class C | | | 16.63 | | | 1.12 | | 5.20 | | 3.54 | | 8/15/97 |
| | Institutional | | | 18.96 | | | 2.29 | | 6.41 | | 4.72 | | 8/15/97 |
| | Service | | | 18.40 | | | 1.78 | | 5.88 | | 8.46 | | 8/15/97 |
| | Class IR | | | 18.82 | | | 2.13 | | N/A | | 2.23 | | 11/30/07 |
| | | Class R | | | 18.26 | | | 1.63 | | N/A | | 1.73 | | 11/30/07 |
| | 3 | | The Standardized Total Returns are average annual total returns as of the most recent calendar quarter-end. They assume reinvestment of all distributions at NAV. These returns reflect a maximum initial sales charge of 5.5% for Class A Shares and the assumed contingent deferred sales charge for Class B Shares (5% maximum declining to 0% after six years) and the assumed contingent deferred sales charge for Class C Shares (1% if redeemed within 12 months of purchase). Class B Shares automatically convert to Class A Shares on or about the fifteenth day of the last month of the calendar year that is eight years after purchase. Returns for Class B Shares for the period after the conversion reflect the performance of Class A Shares. Because Institutional, Service, Class IR and Class R Shares do not involve a sales charge, such a charge is not applied to their Standardized Total Returns. The Fund’s Class B Shares are no longer available for purchase by new or existing shareholders (although current Class B shareholders may continue to reinvest income and capital gains distributions into Class B Shares, and Class B shareholders may continue to exchange their shares for Class B Shares of certain other Goldman Sachs Funds). |
| | | | The returns set forth in the tables above represent past performance. Past performance does not guarantee future results. The Fund’s investment return and principal value will fluctuate so that an investor’s shares, when redeemed, may be worth more or less than their original cost. Current performance may be lower or higher than the performance quoted above. Please visit our web site at www.goldmansachsfunds.com to obtain the most recent month-end returns. Performance reflects applicable fee waivers and/or expense limitations in effect during the periods shown. In their absence, performance would be reduced. Returns do not reflect the deduction of taxes that a shareholder would pay on Fund distributions or the redemption of Fund shares. |
9
FUND BASICS
| | | | | | | | | | |
| | EXPENSE RATIOS4 | | | | | | | | |
| | | | | Net Expense Ratio (Current) | | | Gross Expense Ratio (Before Waivers) | |
| | Class A | | | 1.14 | % | | | 1.48 | % |
| | Class B | | | 1.89 | | | | 2.23 | |
| | Class C | | | 1.89 | | | | 2.23 | |
| | Institutional | | | 0.74 | | | | 1.08 | |
| | Service | | | 1.24 | | | | 1.58 | |
| | Class IR | | | 0.89 | | | | 1.23 | |
| | | Class R | | | 1.39 | | | | 1.73 | |
| | 4 | | The expense ratios of the Fund, both current (net of applicable fee waivers and/or expense limitations) and before waivers (gross of applicable fee waivers and/or expense limitations) are as set forth above according to the most recent publicly available Prospectus for the Fund and may differ from the expense ratios disclosed in the Financial Highlights in this report. The Fund’s waivers and/or expense limitations will remain in place through at least December 29, 2013, and prior to such date the investment adviser may not terminate the arrangements without the approval of the Fund’s Board of Trustees. If these arrangements are discontinued in the future, the expense ratios may change without shareholder approval. |
| | | | | | | | |
| | TOP TEN HOLDINGS AS OF 2/28/135 |
| | | Holding | | % of Net Assets | | | Line of Business |
| | Apple, Inc. | | | 7.3 | % | | Computers & Peripherals |
| | Google, Inc. Class A | | | 4.1 | | | Internet Software & Services |
| | QUALCOMM, Inc. | | | 3.4 | | | Communications Equipment |
| | Schlumberger Ltd. | | | 2.6 | | | Energy Equipment & Services |
| | Honeywell International, Inc. | | | 2.5 | | | Aerospace & Defense |
| | Philip Morris International, Inc. | | | 2.5 | | | Tobacco |
| | American Tower Corp. | | | 2.4 | | | Real Estate Investment Trusts |
| | Amazon.com, Inc. | | | 2.3 | | | Internet & Catalog Retail |
| | NIKE, Inc. Class B | | | 2.3 | | | Textiles, Apparel & Luxury
Goods |
| | | SBA Communications Corp. Class A | | | 2.3 | | | Wireless Telecommunication
Services |
| | 5 | | The top 10 holdings may not be representative of the Fund’s future investments. |
10
FUND BASICS
| | |
| FUND VS. BENCHMARK SECTOR ALLOCATION6 | | |
| As of February 28, 2013 | | |
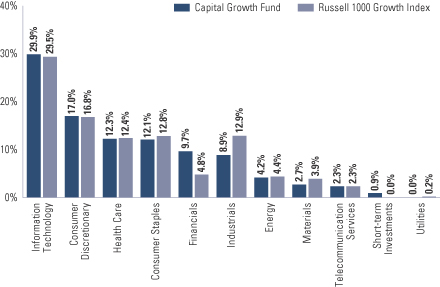
| | 6 | | The Fund is actively managed and, as such, its composition may differ over time. Consequently, the Fund’s overall sector allocations may differ from percentages contained in the graph above. The graph categorizes investments using Global Industry Classification Standard (“GICS”), however, the sector classifications used by the portfolio management team may differ from GICS. The percentage shown for each investment category reflects the value of investments in that category as a percentage of market value. Short-term investments represent repurchase agreements. The graph depicts the Fund’s investments but may not represent the Fund’s market exposure due to the exclusion of certain derivatives, if any, as listed in the Additional Investment Information section of the Schedule of Investments. |
11
PORTFOLIO RESULTS
Goldman Sachs Concentrated Growth Fund
Portfolio Composition
The Fund invests primarily in U.S. equity investments. The Fund typically holds 30–40 high quality growth companies and tends to be more concentrated in individual holdings, industries and sectors than the typical broadly diversified large-cap growth fund. Since the Fund’s inception, the Goldman Sachs Growth Investment Team has focused on several key investment criteria that it believes can drive a company’s growth over the long term. These characteristics are: dominant market share, established brand name, pricing power, recurring revenue stream, free cash flow, high returns on invested capital, predictable growth, sustainable growth, long product life cycle, enduring competitive advantage, favorable demographic trends and excellent management. The Team strives to purchase these companies at reasonable valuations in order to capture the full benefits of their growth.
Portfolio Management Discussion and Analysis
Below, the Goldman Sachs Growth Investment Team discusses the Goldman Sachs Concentrated Growth Fund’s (the “Fund”) performance and positioning for the six-month period ended February 28, 2013 (the “Reporting Period”).
| Q | | How did the Fund perform during the Reporting Period? |
| A | | During the Reporting Period, the Fund’s Class A, B, C, Institutional, IR and R Shares generated cumulative total returns, without sales charges, of 7.66%, 7.32%, 7.33%, 7.91%, 7.80% and 7.62%, respectively. These returns compare to the 6.23% cumulative total return of the Fund’s benchmark, the Russell 1000® Growth Index (with dividends reinvested) (the “Russell Index”), during the same period. |
| Q | | What key factors were responsible for the Fund’s performance during the Reporting Period? |
| A | | Stock selection overall contributed most to the Fund’s performance relative to the Russell Index during the Reporting Period. |
| Q | | Which equity market sectors most significantly affected Fund performance? |
| A | | Effective stock selection in the information technology, financials and consumer staples sectors helped the Fund’s performance most relative to the Russell Index. Detracting from the Fund’s relative results most was weak stock selection in the health care and materials sectors and having underweighted positions in industrials and health care, each of which outperformed the Russell Index during the Reporting Period. |
| Q | | What were some of the Fund’s best-performing individual stocks? |
| A | | The Fund benefited most relative to the Russell Index from positions in global commercial real estate services firm CBRE Group, gaming software and content publisher Activision Blizzard and apparel and footwear company PVH. |
| | | CBRE Group contributed most to the Fund’s relative performance during the Reporting Period. Its shares rose on the heels of announcing a solid fourth calendar quarter, during which earnings beat analysts’ expectations. In addition, CBRE Group published positive guidance for 2013. At the end of the Reporting Period, we believed the company still had strong growth potential, as it was gaining market share and continued to boost margins through international expansion. Additionally, in our view, the deal struck by CBRE Group to buy a majority of the real estate investment management business of Dutch financial company ING Group should be beneficial, as it provides relatively stable assets under management, recurring revenues and solid margins. |
| | | Activision Blizzard, a new position for the Fund during the Reporting Period, was a top contributor to its relative results. Activision Blizzard owns three of the largest franchises in the electronic gaming industry — Call of Duty and Skylanders on console and World of Warcraft on personal computer. World of Warcraft is offered through a monthly subscription model that provides a large and reliable stream of cash flow, which, in turn, can be used to invest for growth in newer intellectual properties. In our view, these newer properties, including Call of Duty and Skylanders, and |
12
PORTFOLIO RESULTS
| | upcoming new releases have margin structures that are higher than the corporate average, which should drive Activision Blizzard’s operating margins higher if the company grows over the next few years as anticipated. In addition, we believe the company’s valuations were attractive at the time of purchase. During the Reporting Period, the company reported solid fourth calendar quarter results, driven by strong performance in key franchises. Its management announced its Skylanders franchise crossed the $1 billion revenue threshold following its launch in 2011, while its Call of Duty franchise grew year-over-year and saw increases in online engagement for Black Ops 2, particularly in December 2012. |
| | | PVH is an apparel company whose portfolio of brands includes Calvin Klein, Tommy Hilfiger, Van Heusen and IZOD, amongst others. Its shares performed well during the Reporting Period after the company announced its strategic acquisition of rival Warnaco Group. Warnaco Group had licensed Calvin Klein’s jeans from PVH, which bought Calvin Klein’s company from the designer in 2003. Analysts, including ours, believe the deal should be substantially accretive to earnings per share upon completion, as it will give the company full control of the Calvin Klein brand and expand PVH’s presence in Europe, Asia and Latin America. PVH’s stock also performed well as both the Tommy Hilfiger and Calvin Klein brands continued to demonstrate high growth both in the U.S. and in international markets. |
| Q | | Which stocks detracted significantly from the Fund’s performance during the Reporting Period? |
| A | | Detracting most from the Fund’s results relative to its benchmark index were positions in personal computer and mobile communications device giant Apple, computer storage and data management company NetApp and generic drug manufacturer Teva Pharmaceutical Industries. |
| | | A position in Apple detracted most from the Fund’s returns during the Reporting Period. Shares of Apple pulled back as concern persisted around disappointing first calendar quarter iPhone guidance. The iPhone accounts for approximately 60% of the company’s gross profits and remains the key driver of Apple’s growth. At the end of the Reporting Period, we continued to have a positive outlook on the company and saw a number of potential catalysts that could contribute to additional growth. We believe an iPhone that targets the emerging market consumer could reaccelerate growth and help expand the overall market for Apple products. We also believe the market is discounting the optionality in Apple’s stock from new product introductions. (Optionality is the value of additional optional investment opportunities available only after having made an initial investment.) In addition, there is the possibility that Apple could sign a deal with China Mobile, the largest wireless carrier in China with approximately 700 million subscribers. Were this to be realized, this deal could significantly expand the addressable market for Apple’s iPhone. Even as near-term expectations are reduced, we believe the company’s long-term growth potential is still greater than the broader market. We believe Apple has plenty of financial flexibility with its strong balance sheet and healthy free cash flow to return capital to shareholders. Overall, then, we remain positive on Apple and believed, at the end of the Reporting Period, that its stock was trading at a reasonable valuation for a high quality franchise with solid growth potential. |
| | | NetApp was another significant detractor from the Fund’s relative results during the Reporting Period despite posting an in-line fiscal third quarter 2012 and giving positive guidance. We believe that fears of weak demand from the U.S. government were an overhang on the stock, as the government represents approximately 15% of NetApp’s revenues. However, at the end of the Reporting Period, we continued to like the business and thought its management was executing well. In our view, the combination of already low expectations and any real improvement in the demand environment should support the company’s growth. |
| | | Teva Pharmaceutical Industries detracted from the Fund’s results relative to the Russell Index during the Reporting Period. The company has a high concentration of profits in a single product, Copaxone. Concerns arose that a new pill from Biogen Idec and the threat of generics to Copaxone would challenge the firm’s profitability. However, we believe Teva Pharmaceutical Industries is competitively well positioned in the industry given its expansive global footprint and its ability to launch products earlier than other generics manufacturers. In our view, Teva Pharmaceutical Industries benefits from economies of scale and also produces about half of the active ingredients used in their products, enabling the company to keep costs low. We further believe the company’s strong free cash flow generation gives it financial flexibility. |
13
PORTFOLIO RESULTS
| Q | | How did the Fund use derivatives and similar instruments during the Reporting Period? |
| A | | During the Reporting Period, we did not use derivatives as part of an active management strategy. |
| Q | | Did the Fund make any significant purchases or sales during the Reporting Period? |
| A | | In addition to the purchase of Activision Blizzard, already mentioned, we initiated a Fund position in Intercontinental Exchange, an operator of regulated futures exchanges, over-the-counter (“OTC”) markets and derivatives clearing houses. We believe the globalization of markets, rising demand for commodities, movement toward clearing and post-trade automation, and need for better risk management amidst an uncertain macro environment should drive Intercontinental Exchange’s growth going forward. |
| | | Conversely, we exited the Fund’s position in social networking website operator Facebook, as we came to believe its path to growth has been extended and is less certain. While the company delivered in-line second calendar quarter earnings on a strong increase in ad revenue, payments revenue growth was challenged and a large amount of insider selling, due to the expiration of the lock-up, caused material weakness in the stock. (Underwriters in Initial Public Offerings (“IPOs”) and insiders of the issuing company agree on lock-ups to prevent insiders from selling their stock within a given time window after the IPO. This time window normally amounts to 180 days. The lock-up agreement attempts to ensure the stability of the issuing company and to align insiders’ incentives with the goals of the company. After the expiration of the lock-up period, insiders are free to sell but potentially have to take into account insider regulation.) The Fund’s position in Facebook detracted from its relative returns during the Reporting Period. In our view, Facebook has achieved tremendous scale in the U.S. and has a large market opportunity as its networking effect creates stickiness, or loyalty, in its user, or customer, base. Though we continue to believe Facebook is well positioned to benefit from targeted advertising on its platform as a result of the information it has on its users as well as the potential to monetize new ad formats and the social networking ad medium over time, we sold the position. |
| | | We sold the Fund’s position in beauty products company Avon Products during the Reporting Period. Avon Products’ stock performed poorly, and thus detracted from the Fund’s results, due to the company’s difficulties executing and managing inventory in key markets. The company’s new chief executive officer, Sheri McCoy, made it clear that the organization she inherited was dysfunctional in a number of ways and communicated a frank assessment of the business as it stands today. She stated that she believes company fundamentals are unlikely to improve during the second half of 2013. While we continue to believe in the growth opportunity of Avon Products’ direct selling model and its research and development capabilities, we also believe improvements will likely require a lot of investment during a time when cost pressures in the business remain fairly significant. We are optimistic about the company’s new management team and its ability to improve past weakness. However, in our view, new products will need to work in order to reinvigorate top-line growth and create operating leverage. Given the variability in outcomes that we perceive and the headwinds the company is facing, we decided to exit the position. |
| Q | | Were there any notable changes in the Fund’s weightings during the Reporting Period? |
| A | | In constructing the Fund’s portfolio, we focus on picking stocks rather than on making industry or sector bets. We seek to outpace the benchmark index by overweighting stocks that we expect to outperform and underweighting those that we think may lag. Consequently, changes in its sector weights are generally the direct result of individual stock selection or of stock appreciation or depreciation. That said, during the Reporting Period, the Fund’s exposure to information technology increased and its allocations to financials, energy, consumer staples, health care and industrials decreased relative to the Russell Index. |
| Q | | How was the Fund positioned relative to its benchmark index at the end of February 2013? |
| A | | At the end of February 2013, the Fund had overweighted positions relative to the Russell Index in the financials, information technology, energy and telecommunication services sectors. On the same date, the Fund had underweighted positions compared to the Russell Index in industrials, health care, consumer staples, consumer discretionary and materials. The Fund had no position at all in the utilities sector on February 28, 2013. |
14
FUND BASICS
Concentrated Growth Fund
as of February 28, 2013
| | | | | | | | | | |
| | PERFORMANCE REVIEW | |
| | | September 1, 2012–February 28, 2013 | | Fund Total Return
(based on NAV)1 | | | Russell 1000
Growth Index2 | |
| | Class A | | | 7.66 | % | | | 6.23 | % |
| | Class B | | | 7.32 | | | | 6.23 | |
| | Class C | | | 7.33 | | | | 6.23 | |
| | Institutional | | | 7.91 | | | | 6.23 | |
| | Class IR | | | 7.80 | | | | 6.23 | |
| | | Class R | | | 7.62 | | | | 6.23 | |
| | 1 | | The net asset value (“NAV”) represents the net assets of the class of the Fund (ex-dividend) divided by the total number of shares of the class outstanding. The Fund’s performance reflects the reinvestment of dividends and other distributions. The Fund’s performance does not reflect the deduction of any applicable sales charges. |
| | 2 | | The Russell 1000 Growth Index (with dividends reinvested) is an unmanaged index that measures the performance of those Russell 1000 companies with higher price-to-book ratios and higher forecasted growth values. The Index figures do not reflect any deduction for fees, expenses or taxes. It is not possible to invest directly in an index. |
| | | | | | | | | | | | | | |
| | STANDARDIZED TOTAL RETURNS3 |
| | | For the period ended 12/31/12 | | One Year | | | Five Years | | Ten Years | | Since Inception | | Inception Date |
| | Class A | | | 12.80 | % | | 0.10% | | 5.11% | | 5.07% | | 9/03/02 |
| | Class B | | | 13.57 | | | 0.08 | | 5.05 | | 5.04 | | 9/03/02 |
| | Class C | | | 17.49 | | | 0.48 | | 4.92 | | 4.85 | | 9/03/02 |
| | Institutional | | | 19.84 | | | 1.64 | | 6.13 | | 6.07 | | 9/03/02 |
| | Class IR | | | 19.68 | | | 1.46 | | N/A | | 1.44 | | 11/30/07 |
| | | Class R | | | 19.08 | | | 0.99 | | N/A | | 0.97 | | 11/30/07 |
| | 3 | | The Standardized Total Returns are average annual total returns as of the most recent calendar quarter-end. They assume reinvestment of all distributions at NAV. These returns reflect a maximum initial sales charge of 5.5% for Class A Shares and the assumed contingent deferred sales charge for Class B Shares (5% maximum declining to 0% after six years) and the assumed contingent deferred sales charge for Class C Shares (1% if redeemed within 12 months of purchase). Class B Shares automatically convert to Class A Shares on or about the fifteenth day of the last month of the calendar year that is eight years after purchase. Returns for Class B Shares for the period after the conversion reflect the performance of Class A Shares. Because Institutional, Service, Class IR and Class R Shares do not involve a sales charge, such a charge is not applied to their Standardized Total Returns. The Fund’s Class B Shares are no longer available for purchase by new or existing shareholders (although current Class B shareholders may continue to reinvest income and capital gains distributions into Class B Shares, and Class B shareholders may continue to exchange their shares for Class B Shares of certain other Goldman Sachs Funds). |
| | | | The returns represent past performance. Past performance does not guarantee future results. The Fund’s investment return and principal value will fluctuate so that an investor’s shares, when redeemed, may be worth more or less than their original cost. Current performance may be lower or higher than the performance quoted above. Please visit our Web site at www.goldmansachsfunds.com to obtain the most recent month-end returns. Performance reflects applicable fee waivers and/or expense limitations in effect during the periods shown. In their absence, performance would be reduced. Returns do not reflect the deduction of taxes that a shareholder would pay on Fund distributions or the redemption of Fund shares. |
15
FUND BASICS
| | | | | | | | | | |
| | EXPENSE RATIOS4 | | | | | | | | |
| | | | | Net Expense Ratio (Current) | | | Gross Expense Ratio (Before Waivers) | |
| | Class A | | | 1.26 | % | | | 1.57 | % |
| | Class B | | | 2.01 | | | | 2.32 | |
| | Class C | | | 2.01 | | | | 2.32 | |
| | Institutional | | | 0.86 | | | | 1.17 | |
| | Class IR | | | 1.01 | | | | 1.32 | |
| | | Class R | | | 1.51 | | | | 1.82 | |
| | 4 | | The expense ratios of the Fund, both current (net of applicable fee waivers and/or expense limitations) and before waivers (gross of applicable fee waivers and/or expense limitations) are as set forth above according to the most recent publicly available Prospectus for the Fund and may differ from the expense ratios disclosed in the Financial Highlights in this report. The Fund’s waivers and/or expense limitations will remain in place through at least December 29, 2013, and prior to such date the investment adviser may not terminate the arrangements without the approval of the Fund’s Board of Trustees. If these arrangements are discontinued in the future, the expense ratios may change without shareholder approval. |
| | | | | | | | |
| | TOP TEN HOLDINGS AS OF 2/28/135 |
| | | Holding | | % of Net Assets | | | Line of Business |
| | Apple, Inc. | | | 7.7 | % | | Computers & Peripherals |
| | Google, Inc. Class A | | | 6.2 | | | Internet Software & Services |
| | QUALCOMM, Inc. | | | 6.2 | | | Communications Equipment |
| | American Tower Corp. | | | 5.3 | | | Real Estate Investment Trusts |
| | Schlumberger Ltd. | | | 5.1 | | | Energy Equipment & Services |
| | CBRE Group, Inc. Class A | | | 3.6 | | | Real Estate Management &
Development |
| | Crown Castle International Corp. | | | 3.6 | | | Wireless Telecommunication Services |
| | NIKE, Inc. Class B | | | 3.6 | | | Textiles, Apparel & Luxury Goods |
| | Costco Wholesale Corp. | | | 3.4 | | | Food & Staples Retailing |
| | | Activision Blizzard, Inc. | | | 3.4 | | | Software |
| | 5 | | The top 10 holdings may not be representative of the Fund’s future investments. |
16
FUND BASICS
| | |
| FUND VS. BENCHMARK SECTOR ALLOCATION6 | | |
| As of February 28, 2013 | | |
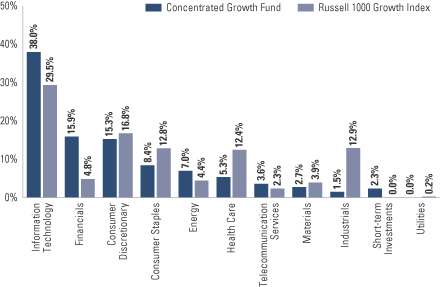
| | 6 | | The Fund is actively managed and, as such, its composition may differ over time. Consequently, the Fund’s overall sector allocations may differ from the percentages contained in the graph above. The graph categorizes investments using Global Industry Classification Standard (“GICS”), however, the sector classifications used by the portfolio management team may differ from GICS. The percentage shown for each investment category reflects the value of investments in that category as a percentage of market value. Short-term investments represent repurchase agreements. The graph depicts the Fund’s investments but may not represent the Fund’s market exposure due to the exclusion of certain derivatives, if any, as listed in the Additional Investment Information section of the Schedule of Investments. |
17
PORTFOLIO RESULTS
Goldman Sachs Flexible Cap Growth Fund
Portfolio Composition
The Fund invests primarily in U.S. equity investments in small-, mid- and large-capitalization issuers. Since the Fund’s inception, the Goldman Sachs Growth Investment Team has focused on several key investment criteria that it believes can drive a company’s growth over the long term. These characteristics are: dominant market share, established brand name, pricing power, recurring revenue stream, free cash flow, high returns on invested capital, predictable growth, sustainable growth, long product life cycle, enduring competitive advantage, favorable demographic trends and excellent management. The Team strives to purchase these companies at reasonable valuations in order to capture the full benefits of their growth.
Portfolio Management Discussion and Analysis
Below, the Goldman Sachs Growth Investment Team discusses the Goldman Sachs Flexible Cap Growth Fund’s (the “Fund”) performance and positioning for the six-month period ended February 28, 2013 (the “Reporting Period”).
| Q | | How did the Fund perform during the Reporting Period? |
| A | | During the Reporting Period, the Fund’s Class A, C, Institutional, IR and R Shares generated cumulative total returns, without sales charges, of 7.11%, 6.80%, 7.41%, 7.36% and 7.01%, respectively. These returns compare to the 6.62% cumulative total return of the Fund’s benchmark, the Russell 3000® Growth Index (with dividends reinvested) (the “Russell Index”), during the same period. |
| Q | | What key factors were responsible for the Fund’s performance during the Reporting Period? |
| A | | Stock selection overall contributed most to the Fund’s performance relative to the Russell Index during the Reporting Period. |
| Q | | Which equity market sectors most significantly affected Fund performance? |
| A | | Effective stock selection in the financials, information technology and consumer staples sectors helped the Fund’s performance most relative to the Russell Index. Detracting from the Fund’s relative results most was weak stock selection in the consumer discretionary and health care sectors and having underweighted positions in industrials and health care, each of which outpaced the Russell Index during the Reporting Period. |
| Q | | What were some of the Fund’s best-performing individual stocks? |
| A | | The Fund benefited most relative to the Russell Index from positions in global commercial real estate services firm CBRE Group, software giant Microsoft and apparel and footwear company PVH. |
| | | CBRE Group contributed most to the Fund’s relative performance during the Reporting Period. Its shares rose on the heels of announcing a solid fourth calendar quarter, during which earnings beat analysts’ expectations. In addition, CBRE Group published positive guidance for 2013. At the end of the Reporting Period, we believed the company still had strong growth potential, as it was gaining market share and continued to boost margins through international expansion. Additionally, in our view, the deal struck by CBRE Group to buy a majority of the real estate investment management business of Dutch financial company ING Group should be beneficial, as it provides relatively stable assets under management, recurring revenues and solid margins. |
| | | Microsoft was a strong contributor to the Fund’s performance during the Reporting Period despite the stock underperforming the Russell Index. As we had been reducing the Fund’s position during the Reporting Period and ultimately exited the position completely, the Fund’s underweighted allocation compared to the Russell Index contributed positively to relative results. During the Reporting Period, Microsoft announced disappointing fiscal first quarter results caused by slower than expected enterprise |
18
PORTFOLIO RESULTS
| | adoption of the Windows 8 operating system. Investors were also disappointed by the sudden departure of the head of the Windows division. This departure was unexpected, as he was viewed by many as a potential chief executive officer successor. We exited the Fund’s position in Microsoft prior to this announcement, based on our view of slower anticipated growth ahead and limited traction in the mobile computing industry. While Microsoft pays an attractive dividend and should continue to generate large amounts of free cash flow, we believe its flagship Windows product is maturing. We also see the changes being driven by mobile and cloud computing potentially leading to disruptions in the company’s markets. |
| | | PVH is an apparel company whose portfolio of brands includes Calvin Klein, Tommy Hilfiger, Van Heusen and IZOD, amongst others. Its shares performed well during the Reporting Period after the company announced its strategic acquisition of rival Warnaco Group. Warnaco Group had licensed Calvin Klein’s jeans from PVH, which bought Calvin Klein’s company from the designer in 2003. Analysts, including ours, believe the deal should be substantially accretive to earnings per share upon completion, as it will give the company full control of the Calvin Klein brand and expand PVH’s presence in Europe, Asia and Latin America. PVH’s stock also performed well as both the Tommy Hilfiger and Calvin Klein brands continued to demonstrate high growth both in the U.S. and in international markets. |
| Q | | Which stocks detracted significantly from the Fund’s performance during the Reporting Period? |
| A | | Detracting most from the Fund’s results relative to its benchmark index were positions in personal computer and mobile communications device giant Apple, point-of-sale card payment device manufacturer VeriFone Systems and information technology integrated systems company Micros Systems. |
| | | A position in Apple detracted most from the Fund’s returns during the Reporting Period. Shares of Apple pulled back as concern persisted around disappointing first calendar quarter iPhone guidance. The iPhone accounts for approximately 60% of the company’s gross profits and remains the key driver of Apple’s growth. At the end of the Reporting Period, we continued to have a positive outlook on the company and saw a number of potential catalysts that could contribute to additional growth. We believe an iPhone that targets the emerging market consumer could reaccelerate growth and help expand the overall market for Apple products. We also believe the market is discounting the optionality in Apple’s stock from new product introductions. (Optionality is the value of additional optional investment opportunities available only after having made an initial investment.) In addition, there is the possibility that Apple could sign a deal with China Mobile, the largest wireless carrier in China with approximately 700 million subscribers. Were this to be realized, this deal could significantly expand the addressable market for Apple’s iPhone. Even as near-term expectations are reduced, we believe the company’s long-term growth potential is still greater than the broader market. We believe Apple has plenty of financial flexibility with its strong balance sheet and healthy free cash flow to return capital to shareholders. Overall, then, we remain positive on Apple and believed, at the end of the Reporting Period, that its stock was trading at a reasonable valuation for a high quality franchise with solid growth potential. |
| | | VeriFone Systems, a new position for the Fund during the Reporting Period, was another significant detractor from the Fund’s relative results. Its shares declined sharply following a revenue and earnings miss and a disappointing outlook for the fiscal first quarter of 2013. In our view, the results highlight the challenges the company is facing in migrating from a hardware business to a services business and demonstrate its management’s failure to integrate recent acquisitions. As a result, we exited the Fund’s position in VeriFone Systems by the end of the Reporting Period. |
| | | Micros Systems is a designer, manufacturer and servicer of enterprise information solutions. Its shares were weak during the Reporting Period as fiscal uncertainty affected the company’s underlying customer base of hospitality providers, retailers and restaurants. Despite the near-term weakness, the company maintained dominant market share with high margins at the end of the Reporting Period and, in our view, was well capitalized. The company also generated recurring revenue through the high-touch servicing it provides to clients. We believe Micros Systems operates a unique franchise that is well positioned for growth as the company appears to be increasing its customer base through new contracts with hotel chains and expanding its business globally. |
19
PORTFOLIO RESULTS
| Q | | How did the Fund use derivatives and similar instruments during the Reporting Period? |
| A | | During the Reporting Period, we did not use derivatives as part of an active management strategy. |
| Q | | Did the Fund make any significant purchases or sales during the Reporting Period? |
| A | | We established a Fund position in Philip Morris International during the Reporting Period. Philip Morris International produces, sells, distributes and markets a wide range of branded cigarettes and tobacco products. In our view, the company has a fundamentally attractive business with price inelasticity for its products and an industry structure that supports persistent pricing power. We believe the company has an attractive geographic profile, with approximately two-thirds of its volume and half of its revenues coming from emerging markets. In our view, Philip Morris International is led by a competent management team that has been successful in producing robust free cash flow and returns on invested capital while aggressively returning cash to shareholders through dividends and buybacks. |
| | | We initiated a Fund position in Activision Blizzard, a leading publisher of gaming software and content, during the Reporting Period. Activision Blizzard owns three of the largest franchises in the electronic gaming industry — Call of Duty and Skylanders on console and World of Warcraft on personal computer. World of Warcraft is offered through a monthly subscription model that provides a large and reliable stream of cash flow, which, in turn, can be used to invest for growth in newer intellectual properties. In our view, these newer properties, including Call of Duty and Skylanders, and upcoming new releases have margin structures that are higher than the corporate average, which should drive Activision Blizzard’s operating margins higher if the company grows over the next few years as anticipated. In addition, we believe the company’s valuations were attractive at the time of purchase. |
| | | Conversely, in addition to the sale of Microsoft, already mentioned, we eliminated the Fund’s position in specialty retailer Urban Outfitters during the Reporting Period. Shares of Urban Outfitters rose after the company announced strong results during a mid-quarter update during the fourth calendar quarter. While we still have conviction in the company, its story was becoming more understood by the market and thus the valuation gap narrowed in our view. Therefore, we exited the Fund’s position. |
| Q | | Were there any notable changes in the Fund’s weightings during the Reporting Period? |
| A | | In constructing the Fund’s portfolio, we focus on picking stocks rather than on making industry or sector bets. We seek to outpace the benchmark index by overweighting stocks that we expect to outperform and underweighting those that we think may lag. Consequently, changes in its sector weights are generally the direct result of individual stock selection or of stock appreciation or depreciation. That said, during the Reporting Period, the Fund’s exposure to consumer staples, health care and industrials increased and its allocations to financials, information technology, energy and consumer discretionary decreased relative to the Russell Index. |
| Q | | How was the Fund positioned relative to its benchmark index at the end of February 2013? |
| A | | At the end of February 2013, the Fund had an overweighted position relative to the Russell Index in the financials sector. On the same date, the Fund had underweighted positions compared to the Russell Index in industrials, consumer staples and health care and was rather neutrally weighted to the Russell Index in information technology, materials, telecommunication services, energy and consumer discretionary. The Fund had no position at all in the utilities sector on February 28, 2013. |
20
FUND BASICS
Flexible Cap Growth Fund
as of February 28, 2013
| | | | | | | | | | |
| | PERFORMANCE REVIEW | |
| | | September 1, 2012–February 28, 2013 | | Fund Total Return
(based on NAV)1 | | | Russell 3000
Growth Index2 | |
| | Class A | | | 7.11 | % | | | 6.62 | % |
| | Class C | | | 6.80 | | | | 6.62 | |
| | Institutional | | | 7.41 | | | | 6.62 | |
| | Class IR | | | 7.36 | | | | 6.62 | |
| | | Class R | | | 7.01 | | | | 6.62 | |
| | 1 | | The net asset value (“NAV”) represents the net assets of the class of the Fund (ex-dividend) divided by the total number of shares of the class outstanding. The Fund’s performance reflects the reinvestment of dividends and other distributions. The Fund’s performance does not reflect the deduction of any applicable sales charges. |
| | 2 | | The unmanaged Russell 3000 Growth Index (with dividends reinvested) measures the performance of the 3,000 largest U.S. companies based on total market capitalization. The Index figures do not reflect any deduction for fees, expenses or taxes. It is not possible to invest directly in an index. |
| | | | | | | | | | |
| | STANDARDIZED TOTAL RETURNS3 |
| | | For the period ended 12/31/12 | | One Year | | | Since Inception | | Inception Date |
| | Class A | | | 12.42 | % | | 4.50% | | 1/31/08 |
| | Class C | | | 16.99 | | | 4.98 | | 1/31/08 |
| | Institutional | | | 19.48 | | | 6.16 | | 1/31/08 |
| | Class IR | | | 19.28 | | | 6.01 | | 1/31/08 |
| | | Class R | | | 18.68 | | | 5.48 | | 1/31/08 |
| | 3 | | The Standardized Total Returns are average annual total returns as of the most recent calendar quarter-end. They assume reinvestment of all distributions at NAV. These returns reflect a maximum initial sales charge of 5.5% for Class A Shares and the assumed contingent deferred sales charge for Class C Shares (1% if redeemed within 12 months of purchase). Because Institutional, Class IR and Class R Shares do not involve a sales charge, such a charge is not applied to their Standardized Total Returns. |
| | | | The returns set forth in the tables above represent past performance. Past performance does not guarantee future results. The Fund’s investment return and principal value will fluctuate so that an investor’s shares, when redeemed, may be worth more or less than their original cost. Current performance may be lower or higher than the performance quoted above. Please visit our web site at www.goldmansachsfunds.com to obtain the most recent month-end returns. Performance reflects applicable fee waivers and/or expense limitations in effect during the periods shown. In their absence, performance would be reduced. Returns do not reflect the deduction of taxes that a shareholder would pay on Fund distributions or the redemption of Fund shares. |
21
FUND BASICS
| | | | | | | | | | |
| | EXPENSE RATIOS4 | | | | | | | | |
| | | | | Net Expense Ratio (Current) | | | Gross Expense Ratio (Before Waivers) | |
| | Class A | | | 1.26 | % | | | 3.14 | % |
| | Class C | | | 2.01 | | | | 3.89 | |
| | Institutional | | | 0.86 | | | | 2.74 | |
| | Class IR | | | 1.01 | | | | 2.89 | |
| | | Class R | | | 1.51 | | | | 3.39 | |
| | 4 | | The expense ratios of the Fund, both current (net of applicable fee waivers and/or expense limitations) and before waivers (gross of applicable fee waivers and/or expense limitations) are as set forth above according to the most recent publicly available Prospectus for the Fund and may differ from the expense ratios disclosed in the Financial Highlights in this report. The Fund’s waivers and/or expense limitations will remain in place through at least December 29, 2013, and prior to such date the investment adviser may not terminate the arrangements without the approval of the Fund’s Board of Trustees. If these arrangements are discontinued in the future, the expense ratios may change without shareholder approval. |
| | | | | | | | |
| | TOP TEN HOLDINGS AS OF 2/28/135 |
| | | Holding | | % of Net Assets | | | Line of Business |
| | Apple, Inc. | | | 6.7 | % | | Computers & Peripherals |
| | Google, Inc. Class A | | | 3.9 | | | Internet Software & Services |
| | QUALCOMM, Inc. | | | 3.3 | | | Communications Equipment |
| | Schlumberger Ltd. | | | 2.7 | | | Energy Equipment & Services |
| | SBA Communications Corp. Class A | | | 2.1 | | | Wireless Telecommunication Services |
| | Costco Wholesale Corp. | | | 2.0 | | | Food & Staples Retailing |
| | American Tower Corp. | | | 1.9 | | | Real Estate Investment Trusts |
| | NIKE, Inc. Class B | | | 1.7 | | | Textiles, Apparel & Luxury Goods |
| | CBRE Group, Inc. Class A | | | 1.6 | | | Real Estate Management &
Development |
| | | Amazon.com, Inc. | | | 1.6 | | | Internet & Catalog Retail |
| | 5 | | The top 10 holdings may not be representative of the Fund’s future investments. |
22
FUND BASICS
| | |
| FUND VS. BENCHMARK SECTOR ALLOCATION6 | | |
| As of February 28, 2013 | | |
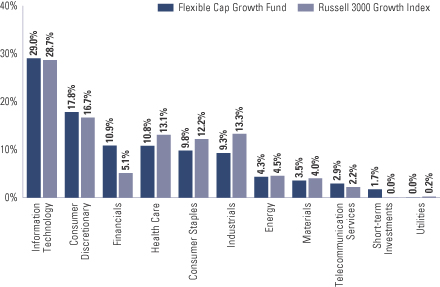
| | 6 | | The Fund is actively managed and, as such, its composition may differ over time. Consequently, the Fund’s overall sector allocations may differ from the percentages contained in the graph above. The graph categorizes investments using Global Industry Classification Standard (“GICS”), however, the sector classifications used by the portfolio management team may differ from GICS. The percentage shown for each investment category reflects the value of investments in that category as a percentage of market value. Short-term investments represent repurchase agreements. The graph depicts the Fund’s investments but may not represent the Fund’s market exposure due to the exclusion of certain derivatives, if any, as listed in the Additional Investment Information section of the Schedule of Investments. |
23
PORTFOLIO RESULTS
Goldman Sachs Focused Growth Fund
Portfolio Composition
The Fund invests primarily in U.S. equity investments. Since the Fund’s inception, the Goldman Sachs Growth Investment Team has focused on several key investment criteria that it believes can drive a company’s growth over the long term. These characteristics are: dominant market share, established brand name, pricing power, recurring revenue stream, free cash flow, high returns on invested capital, predictable growth, sustainable growth, long product life cycle, enduring competitive advantage, favorable demographic trends and excellent management. The Team strives to purchase these companies at reasonable valuations in order to capture the full benefits of their growth.
Portfolio Management Discussion and Analysis
Below, the Goldman Sachs Growth Investment Team discusses the Goldman Sachs Focused Growth Fund’s (the “Fund”) performance and positioning for the six-month period ended February 28, 2013 (the “Reporting Period”).
| Q | | How did the Fund perform during the Reporting Period? |
| A | | During the Reporting Period, the Fund’s Class A, C, Institutional, IR and R Shares generated cumulative total returns, without sales charges, of 9.65%, 9.16%, 9.84%, 9.68% and 9.48%, respectively. These returns compare to the 6.23% cumulative total return of the Fund’s benchmark, the Russell 1000® Growth Index (with dividends reinvested) (the “Russell Index”), during the same period. |
| Q | | What key factors were responsible for the Fund’s performance during the Reporting Period? |
| A | | Stock selection overall contributed most to the Fund’s performance relative to the Russell Index during the Reporting Period. |
| Q | | Which equity market sectors most significantly affected Fund performance? |
| A | | Effective stock selection in the financials, information technology and consumer discretionary sectors helped the Fund’s performance most relative to the Russell Index. Having an overweighted exposure to the financials sector, which outpaced the Russell Index, also boosted the Fund’s relative results. Detracting from the Fund’s relative results most was having no exposure to the industrials and health care sectors, each of which outperformed the Russell Index during the Reporting Period. To a lesser extent, weak stock selection in and having an underweighted allocation to the materials sector also hurt. |
| Q | | What were some of the Fund’s best-performing individual stocks? |
| A | | The Fund benefited most relative to the Russell Index from positions in global commercial real estate services firm CBRE Group, apparel and footwear company PVH and gaming software and content publisher Activision Blizzard. |
| | | CBRE Group contributed most to the Fund’s relative performance during the Reporting Period. Its shares rose on the heels of announcing a solid fourth calendar quarter, during which earnings beat analysts’ expectations. In addition, CBRE Group published positive guidance for 2013. At the end of the Reporting Period, we believed the company still had strong growth potential, as it was gaining market share and continued to boost margins through international expansion. Additionally, in our view, the deal struck by CBRE Group to buy a majority of the real estate investment management business of Dutch financial company ING Group should be beneficial, as it provides relatively stable assets under management, recurring revenues and solid margins. |
| | | PVH is an apparel company whose portfolio of brands includes Calvin Klein, Tommy Hilfiger, Van Heusen and IZOD, amongst others. Its shares performed well during the Reporting Period after the company announced its strategic acquisition of rival Warnaco Group. Warnaco Group had licensed Calvin Klein’s jeans from PVH, which bought Calvin Klein’s company from the designer in 2003. Analysts, including ours, believe the deal should be substantially accretive to earnings per share upon completion, as it will give the company full control of the Calvin Klein brand and |
24
PORTFOLIO RESULTS
| | expand PVH’s presence in Europe, Asia and Latin America. PVH’s stock also performed well as both the Tommy Hilfiger and Calvin Klein brands continued to demonstrate high growth both in the U.S. and in international markets. |
| | | Activision Blizzard, a new position for the Fund during the Reporting Period, was a top contributor to its relative results. Activision Blizzard owns three of the largest franchises in the electronic gaming industry — Call of Duty and Skylanders on console and World of Warcraft on personal computer. World of Warcraft is offered through a monthly subscription model that provides a large and reliable stream of cash flow, which, in turn, can be used to invest for growth in newer intellectual properties. In our view, these newer properties, including Call of Duty and Skylanders, and upcoming new releases have margin structures that are higher than the corporate average, which should drive Activision Blizzard’s operating margins higher if the company grows over the next few years as anticipated. In addition, we believe the company’s valuations were attractive at the time of purchase. During the Reporting Period, the company reported solid fourth calendar quarter results, driven by strong performance in key franchises. Its management announced its Skylanders franchise crossed the $1 billion revenue threshold following its launch in 2011, while its Call of Duty franchise grew year-over-year and saw increase in online engagement for Black Ops 2, particularly in December 2012. |
| Q | | Which stocks detracted significantly from the Fund’s performance during the Reporting Period? |
| A | | The only positions to detract from the Fund’s results relative to its benchmark index during the Reporting Period were those in personal computer and mobile communications device giant Apple and diversified hospitality company Marriott International. |
| | | A position in Apple detracted most from the Fund’s returns during the Reporting Period. Shares of Apple pulled back as concern persisted around disappointing first calendar quarter iPhone guidance. The iPhone accounts for approximately 60% of the company’s gross profits and remains the key driver of Apple’s growth. At the end of the Reporting Period, we continued to have a positive outlook on the company and saw a number of potential catalysts that could contribute to additional growth. We believe an iPhone that targets the emerging market consumer could reaccelerate growth and help expand the overall market for Apple products. We also believe the market is discounting the optionality in Apple’s stock from new product introductions. (Optionality is the value of additional optional investment opportunities available only after having made an initial investment.) In addition, there is the possibility that Apple could sign a deal with China Mobile, the largest wireless carrier in China with approximately 700 million subscribers. Were this to be realized, this deal could significantly expand the addressable market for Apple’s iPhone. Even as near-term expectations are reduced, we believe the company’s long-term growth potential is still greater than the broader market. We believe Apple has plenty of financial flexibility with its strong balance sheet and healthy free cash flow to return capital to shareholders. Overall, then, we remain positive on Apple and believed, at the end of the Reporting Period, that its stock was trading at a reasonable valuation for a high quality franchise with solid growth potential. |
| | | Shares of Marriott International performed weakly during the Reporting Period, detracting from the Fund’s relative results. Lodging is generally tied to Gross Domestic Product (“GDP”), so broad concern around GDP slowing weighed on sentiment regarding the hospitality company. Marriott International’s revenue per available room decelerated throughout the Reporting Period, and there was concern of continued slowdown in this metric if GDP continues to slow. In our view, the company is well positioned relative to its peers, and, at the end of the Reporting Period, we believe the stock was trading at a reasonable valuation. |
| Q | | How did the Fund use derivatives and similar instruments during the Reporting Period? |
| A | | During the Reporting Period, we did not use derivatives as part of an active management strategy. |
25
PORTFOLIO RESULTS
| Q | | Did the Fund make any significant purchases or sales during the Reporting Period? |
| A | | In addition to the purchase of Activision Blizzard, already mentioned, we initiated a Fund position in Intercontinental Exchange, an operator of regulated futures exchanges, over-the-counter (“OTC”) markets and derivatives clearing houses. We believe the globalization of markets, rising demand for commodities, movement toward clearing and post-trade automation, and need for better risk management amidst an uncertain macro environment should drive Intercontinental Exchange’s growth going forward. |
| | | Conversely, we eliminated the Fund’s position in specialty retailer Urban Outfitters during the Reporting Period. Shares of Urban Outfitters rose after the company announced strong results during a mid-quarter update during the fourth calendar quarter. While we still have conviction in the company, its story was becoming more understood by the market and thus the valuation gap narrowed in our view. Therefore, we exited the Fund’s position. |
| | | We sold the Fund’s position in futures and options exchange CME Group. The company performed well in January 2013, as its stock bounced back from December 2012 lows. Average daily volumes improved during January 2013, particularly for interest rate products. At the end of the Reporting Period, we believed the market was starting to realize that CME Group may well benefit from the changing regulatory environment with the centralized clearing mandate requirement to begin in March 2013. However, we decided to sell out of the Fund’s position in favor of a position in Intercontinental Exchange, in which we had higher conviction. |
| Q | | Were there any notable changes in the Fund’s weightings during the Reporting Period? |
| A | | In constructing the Fund’s portfolio, we focus on picking stocks rather than on making industry or sector bets. We seek to outpace the benchmark index by overweighting stocks that we expect to outperform and underweighting those that we think may lag. Consequently, changes in its sector weights are generally the direct result of individual stock selection or of stock appreciation or depreciation. That said, during the Reporting Period, the Fund’s exposure to information technology increased and its allocations to financials, energy, materials, consumer discretionary and consumer staples decreased relative to the Russell Index. |
| Q | | How was the Fund positioned relative to its benchmark index at the end of February 2013? |
| A | | At the end of February 2013, the Fund had overweighted positions relative to the Russell Index in the financials, information technology, energy and telecommunication services sectors. On the same date, the Fund had underweighted positions compared to the Russell Index in consumer staples, consumer discretionary and materials. The Fund had no position at all in the utilities, health care and industrials sectors on February 28, 2013. |
26
FUND BASICS
Focused Growth Fund
as of February 28, 2013
| | | | | | | | | | |
| | PERFORMANCE REVIEW | |
| | | September 1, 2012–February 28, 2013 | | Fund Total Return
(based on NAV)1 | | | Russell 1000
Growth Index2 | |
| | Class A | | | 9.65 | % | | | 6.23 | % |
| | Class C | | | 9.16 | | | | 6.23 | |
| | Institutional | | | 9.84 | | | | 6.23 | |
| | Class IR | | | 9.68 | | | | 6.23 | |
| | | Class R | | | 9.48 | | | | 6.23 | |
| | 1 | | The net asset value (“NAV”) represents the net assets of the class of the Fund (ex-dividend) divided by the total number of shares of the class outstanding. The Fund’s performance reflects the reinvestment of dividends and other distributions. The Fund’s performance does not reflect the deduction of any applicable sales charges. |
| | 2 | | The Russell 1000 Growth Index (with dividends reinvested) is an unmanaged market capitalization weighted index of the 1000 largest U.S. companies with higher price-to-book ratios and higher forecasted growth values. The Index figures do not include any deduction for fees, expenses or taxes. It is not possible to invest directly in an unmanaged index. |
| | | | | | |
| | STANDARDIZED TOTAL RETURNS3 |
| | | For the period ended 12/31/12 | | Since Inception | | Inception Date |
| | Class A | | 11.16% | | 1/31/12 |
| | Class C | | 15.83 | | 1/31/12 |
| | Institutional | | 18.04 | | 1/31/12 |
| | Class IR | | 17.87 | | 1/31/12 |
| | | Class R | | 17.34 | | 1/31/12 |
| | 3 | | The Standardized Total Returns are cumulative total returns as of the most recent calendar quarter-end. They assume reinvestment of all distributions at NAV. These returns reflect a maximum initial sales charge of 5.5% for Class A Shares and the assumed contingent deferred sales charge for Class C Shares (1% if redeemed within 12 months of purchase). Because Institutional, Class IR and Class R Shares do not involve a sales charge, such a charge is not applied to their Standardized Total Returns. |
| | | | The returns set forth in the tables above represent past performance. Past performance does not guarantee future results. The Fund’s investment return and principal value will fluctuate so that an investor’s shares, when redeemed, may be worth more or less than their original cost. Current performance may be lower or higher than the performance quoted above. Please visit our web site at www.goldmansachsfunds.com to obtain the most recent month-end returns. Performance reflects applicable fee waivers and/or expense limitations in effect during the periods shown. In their absence, performance would be reduced. Returns do not reflect the deduction of taxes that a shareholder would pay on Fund distributions or the redemption of Fund shares. |
27
FUND BASICS
| | | | | | | | | | |
| | EXPENSE RATIOS4 | |
| | | | | Net Expense Ratio (Current) | | | Gross Expense Ratio (Before Waivers) | |
| | Class A | | | 1.24 | % | | | 17.07 | % |
| | Class C | | | 1.99 | | | | 17.82 | |
| | Institutional | | | 0.84 | | | | 16.67 | |
| | Class IR | | | 0.99 | | | | 16.82 | |
| | | Class R | | | 1.49 | | | | 17.32 | |
| | 4 | | The expense ratios of the Fund, both current (net of applicable fee waivers and/or expense limitations) and before waivers (gross of applicable fee waivers and/or expense limitations) are as set forth above according to the most recent publicly available Prospectus for the Fund and may differ from the expense ratios disclosed in the Financial Highlights in this report. The Fund’s waivers and/or expense limitations will remain in place through at least December 29, 2013, and prior to such date the investment adviser may not terminate the arrangements without the approval of the Fund’s Board of Trustees. If these arrangements are discontinued in the future, the expense ratios may change without shareholder approval. |
| | | | | | | | |
| | TOP TEN HOLDINGS AS OF 2/28/135 |
| | | Holding | | % of Net Assets | | | Line of Business |
| | Apple, Inc. | | | 8.5 | % | | Computers & Peripherals |
| | Google, Inc. Class A | | | 7.6 | | | Internet Software & Services |
| | QUALCOMM, Inc. | | | 7.5 | | | Communications Equipment |
| | NIKE, Inc. Class B | | | 6.0 | | | Textiles, Apparel & Luxury Goods |
| | American Tower Corp. | | | 5.2 | | | Real Estate Investment Trusts |
| | Schlumberger Ltd. | | | 5.1 | | | Energy Equipment & Services |
| | Activision Blizzard, Inc. | | | 4.8 | | | Software |
| | CBRE Group, Inc. Class A | | | 4.8 | | | Real Estate Management & Development |
| | SBA Communications Corp. Class A | | | 4.7 | | | Wireless Telecommunication Services |
| | | American Express Co. | | | 4.6 | | | Consumer Finance |
| | 5 | | The top 10 holdings may not be representative of the Fund’s future investments. |
28
FUND BASICS
| | |
| FUND VS. BENCHMARK SECTOR ALLOCATION6 | | |
| As of February 28, 2013 | | |
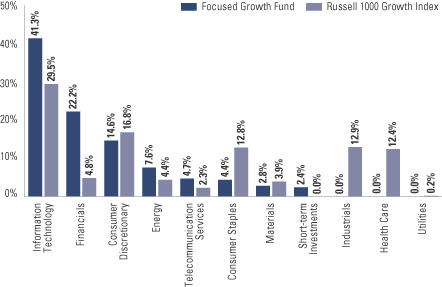
| | 6 | | The Fund is actively managed and, as such, its composition may differ over time. Consequently, the Fund’s overall sector allocations may differ from the percentages contained in the graph above. The graph categorizes investments using the Global Industry Classification Standard (“GICS”), however, the sector classifications used by the portfolio management team may differ from GICS. The percentage shown for each investment category reflects the value of investments in that category as a percentage of market value. Short-term investments represent repurchase agreements. The graph depicts the Fund’s investments but may not represent the Fund’s market exposure due to the exclusion of certain derivatives, if any, as listed in the Additional Investment Information section of the Schedule of Investments. |
29
PORTFOLIO RESULTS
Goldman Sachs Growth Opportunities Fund
Portfolio Composition
The Fund invests primarily in medium-sized growth companies with a market capitalization between $1 and $10 billion. Since the Fund’s inception, the Goldman Sachs Growth Investment Team has focused on several key investment criteria that it believes can drive a company’s growth over the long term. These characteristics are: dominant market share, established brand name, pricing power, recurring revenue stream, free cash flow, high returns on invested capital, predictable growth, sustainable growth, long product life cycle, enduring competitive advantage, favorable demographic trends and excellent management. The Team strives to purchase these companies at reasonable valuations in order to capture the full benefits of their growth.
Portfolio Management Discussion and Analysis
Below, the Goldman Sachs Growth Investment Team discusses the Goldman Sachs Growth Opportunities Fund’s (the “Fund”) performance and positioning for the six-month period ended February 28, 2013 (the “Reporting Period”).
| Q | | How did the Fund perform during the Reporting Period? |
| A | | During the Reporting Period, the Fund’s Class A, B, C, Institutional, Service, IR and R Shares generated cumulative total returns, without sales charges, of 9.77%, 9.38%, 9.38%, 10.02%, 9.69%, 9.94% and 9.67%, respectively. These returns compare to the 11.23% cumulative total return of the Fund’s benchmark, the Russell Midcap® Growth Index (with dividends reinvested) (the “Russell Index”), during the same period. |
| Q | | What key factors were responsible for the Fund’s performance during the Reporting Period? |
| A | | The Fund generated solid absolute gains, but stock selection overall detracted from its performance relative to the Russell Index during the Reporting Period. |
| Q | | Which equity market sectors most significantly affected Fund performance? |
| A | | Detracting most from the Fund’s relative results was weak stock selection in the consumer discretionary, industrials and health care sectors. Having an underweight position in the industrials sector, which outpaced the Russell Index during the Reporting Period, also hurt. Effective stock selection in the information technology, financials, materials and telecommunication services sectors helped the Fund’s performance most relative to the Russell Index. |
| Q | | Which stocks detracted significantly from the Fund’s performance during the Reporting Period? |
| A | | Detracting most from the Fund’s results relative to its benchmark index were positions in footwear and accessories designer Deckers Outdoor, information technology integrated systems company Micros Systems and personal care and food products company Hain Celestial Group. |
| | | Deckers Outdoor was the biggest detractor from the Fund’s results during the Reporting Period. The company’s earnings and guidance were disappointing during 2012, as it continued to battle headwinds from the impact of an unseasonably warm winter in 2011, which pressured the company’s inventory position and profitability. However, at the end of the Reporting Period, we expected the company’s inventory pressure to subside through the course of 2013. The stock had already recovered some of its losses in the early months of 2013, and its results for the fourth quarter of 2012 beat expectations. We continued to believe in the strength of the company’s Ugg brand and expected the company to show improved sales and margin expansion in 2013. |
| | | Micros Systems is a designer, manufacturer and servicer of enterprise information solutions. Its shares were weak during the Reporting Period as fiscal uncertainty affected the company’s underlying customer base of hospitality providers, retailers and restaurants. Despite the near-term weakness, the company maintained dominant market share with high margins at the end of the Reporting Period and, in our view, was well capitalized. The company also generated |
30
PORTFOLIO RESULTS
| | recurring revenue through the high-touch servicing it provides to clients. We believe Micros Systems operates a unique franchise that is well positioned for growth as the company appears to be increasing its customer base through new contracts with hotel chains and expanding its business globally. |
| | | Hain Celestial Group manufactures, markets, distributes and sells natural and organic products. The company re-affirmed weak guidance in mid-October 2012 when it was expected to raise guidance instead. Uncertainty also arose after a change in its management team early in the fourth calendar quarter. Hain Celestial Group also announced the closing of the acquisition of BluePrint, a nationally recognized brand in the raw juice category based in New York City. Hain Celestial Group’s shares traded lower, as investors questioned the difficulty of the integration. We added to the Fund’s position in the company on weakness, as we continued to believe Hain Celestial Group is a diversified way to capitalize on the trends of healthier eating, increased fitness and an aging population. In our view, the company has remained focused on improving margins, and we view its acquisition strategy positively. |
| Q | | What were some of the Fund’s best-performing individual stocks? |
| A | | The Fund benefited most relative to the Russell Index from positions in specialty commercial financial services company FleetCor Technologies, global commercial real estate services firm CBRE Group and apparel and footwear company PVH. |
| | | FleetCor Technologies, an independent global provider of specialized payment products and services, was the top contributor to the Fund’s relative performance during the Reporting Period. FleetCor Technologies’ stock performed well, as the company has successfully integrated accretive acquisitions and consistently beat and raised earnings estimates. While we still like the company and its growth prospects, we trimmed the Fund’s position in FleetCor Technologies’ stock to take profits and reflect its increased valuation. |
| | | CBRE Group contributed to the Fund’s relative performance during the Reporting Period. Its shares rose on the heels of announcing a solid fourth calendar quarter, during which earnings beat analysts’ expectations. In addition, CBRE Group published positive guidance for 2013. At the end of the Reporting Period, we believed the company still had strong growth potential, as it was gaining market share and continued to boost margins through international expansion. Additionally, in our view, the deal struck by CBRE Group to buy a majority of the real estate investment management business of Dutch financial company ING Group should be beneficial, as it provides relatively stable assets under management, recurring revenues and solid margins. |
| | | PVH is an apparel company whose portfolio of brands includes Calvin Klein, Tommy Hilfiger, Van Heusen and IZOD, amongst others. Its shares performed well during the Reporting Period after the company announced its strategic acquisition of rival Warnaco Group. Warnaco Group had licensed Calvin Klein’s jeans from PVH, which bought Calvin Klein’s company from the designer in 2003. Analysts, including ours, believe the deal should be substantially accretive to earnings per share upon completion, as it will give the company full control of the Calvin Klein brand and expand PVH’s presence in Europe, Asia and Latin America. PVH’s stock also performed well as both the Tommy Hilfiger and Calvin Klein brands continued to demonstrate high growth both in the U.S. and in international markets. |
| Q | | How did the Fund use derivatives and similar instruments during the Reporting Period? |
| A | | During the Reporting Period, we did not use derivatives as part of an active management strategy. |
31
PORTFOLIO RESULTS
| Q | | Did the Fund make any significant purchases or sales during the Reporting Period? |
| A | | We initiated a Fund position in Activision Blizzard, a leading publisher of gaming software and content, during the Reporting Period. Activision Blizzard owns three of the largest franchises in the electronic gaming industry — Call of Duty and Skylanders on console and World of Warcraft on personal computer. World of Warcraft is offered through a monthly subscription model that provides a large and reliable stream of cash flow, which, in turn, can be used to invest for growth in newer intellectual properties. In our view, these newer properties, including Call of Duty and Skylanders, and upcoming new releases have margin structures that are higher than the corporate average, which should drive Activision Blizzard’s operating margins higher if the company grows over the next few years as anticipated. In addition, we believe the company’s valuations were attractive at the time of purchase. |
| | | We established a Fund position in discount retailer Dollar General. The company is a leader in the dollar stores retailing segment, a segment that has been a relatively consistent, long-term share gainer within the broader U.S. retailing industry over the past several years. We believe the company should deliver sales growth going forward supported by square footage growth from new stores. Moreover, we believe initiatives including direct sourcing, private brands and reduced inventory shrinkage should lower costs and thereby drive margin expansion. (Inventory shrinkage is material or goods lost through deterioration, obsolescence, pilferage, theft and/or waste.) We have confidence in the company management’s ability to take advantage of existing growth opportunities and to continue to gain market share in a growing industry. |
| | | Conversely, we eliminated the Fund’s position in specialty retailer Urban Outfitters during the Reporting Period. Shares of Urban Outfitters rose after the company announced strong results during a mid-quarter update during the fourth calendar quarter. While we still have conviction in the company, its story was becoming more understood by the market and thus the valuation gap narrowed in our view. Therefore, we exited the Fund’s position. |
| | | We exited the Fund’s position in Family Dollar Stores. While we like the retail market segment, we lost confidence in the turnaround story of Family Dollar Stores, in particular with its key strategic initiatives regarding the sale of tobacco products. We decided to sell out of the Fund’s position and to initiate a position in Dollar General instead, a similar company but one that we believe should provide more consistent growth. |
| Q | | Were there any notable changes in the Fund’s weightings during the Reporting Period? |
| A | | In constructing the Fund’s portfolio, we focus on picking stocks rather than on making industry or sector bets. We seek to outpace the benchmark index by overweighting stocks that we expect to outperform and underweighting those that we think may lag. Consequently, changes in its sector weights are generally the direct result of individual stock selection or of stock appreciation or depreciation. That said, during the Reporting Period, the Fund’s exposure to information technology, financials, consumer staples and health care increased and its allocations to telecommunication services, energy, industrials and consumer discretionary decreased relative to the Russell Index. |
| Q | | How was the Fund positioned relative to its benchmark index at the end of February 2013? |
| A | | At the end of February 2013, the Fund had overweighted positions relative to the Russell Index in the financials, telecommunication services, information technology and health care sectors. On the same date, the Fund had underweighted positions compared to the Russell Index in industrials, consumer discretionary, consumer staples and materials. The Fund was rather neutrally weighted to the Index in energy and had no position at all in utilities on February 28, 2013. |
32
FUND BASICS
Growth Opportunities Fund
as of February 28, 2013
| | | | | | | | | | |
| | PERFORMANCE REVIEW | |
| | | September 1, 2012–February 28, 2013 | | Fund Total Return
(based on NAV)1 | | | Russell Midcap
Growth Index2 | |
| | Class A | | | 9.77 | % | | | 11.23 | % |
| | Class B | | | 9.38 | | | | 11.23 | |
| | Class C | | | 9.38 | | | | 11.23 | |
| | Institutional | | | 10.02 | | | | 11.23 | |
| | Service | | | 9.69 | | | | 11.23 | |
| | Class IR | | | 9.94 | | | | 11.23 | |
| | | Class R | | | 9.67 | | | | 11.23 | |
| | 1 | | The net asset value (“NAV”) represents the net assets of the class of the Fund (ex-dividend) divided by the total number of shares of the class outstanding. The Fund’s performance reflects the reinvestment of dividends and other distributions. The Fund’s performance does not reflect the deduction of any applicable sales charges. |
| | 2 | | The Russell Midcap Growth Index (with dividends reinvested) is an unmanaged market capitalization weighted index that measures the performance of those Russell Midcap companies with higher price-to-book ratios and higher forecasted growth values. The Index figures do not reflect any deduction for fees, expenses or taxes. It is not possible to invest directly in an index. |
| | | | | | | | | | | | | | | | | | |
| | STANDARDIZED TOTAL RETURNS3 |
| | | For the period ended 12/31/12 | | One Year | | | Five Years | | Ten Years | | | Since Inception | | | Inception Date |
| | Class A | | | 12.51 | % | | 3.83% | | | 9.37 | % | | | 9.94 | % | | 5/24/99 |
| | Class B | | | 12.76 | | | 3.80 | | | 9.32 | | | | 9.96 | | | 5/24/99 |
| | Class C | | | 17.10 | | | 4.23 | | | 9.17 | | | | 9.58 | | | 5/24/99 |
| | Institutional | | | 19.52 | | | 5.42 | | | 10.43 | | | | 10.83 | | | 5/24/99 |
| | Service | | | 18.93 | | | 4.91 | | | 9.89 | | | | 10.28 | | | 5/24/99 |
| | Class IR | | | 19.28 | | | 5.27 | | | N/A | | | | 5.58 | | | 11/30/07 |
| | | Class R | | | 18.73 | | | 4.76 | | | N/A | | | | 5.07 | | | 11/30/07 |
| | 3 | | The Standardized Total Returns are average annual total returns as of the most recent calendar quarter-end. They assume reinvestment of all distributions at NAV. These returns reflect a maximum initial sales charge of 5.5% for Class A Shares and the assumed contingent deferred sales charge for Class B Shares (5% maximum declining to 0% after six years) and the assumed contingent deferred sales charge for Class C Shares (1% if redeemed within 12 months of purchase). Class B Shares automatically convert to Class A Shares on or about the fifteenth day of the last month of the calendar year that is eight years after purchase. Returns for Class B Shares for the period after the conversion reflect the performance of Class A Shares. Because Institutional, Service, Class IR and Class R Shares do not involve a sales charge, such a charge is not applied to their Standardized Total Returns. The Fund’s Class B Shares are no longer available for purchase by new or existing shareholders (although current Class B shareholders may continue to reinvest income and capital gains distributions into Class B Shares, and Class B shareholders may continue to exchange their shares for Class B Shares of certain other Goldman Sachs Funds). |
| | | | The returns set forth in the tables above represent past performance. Past performance does not guarantee future results. The Fund’s investment return and principal value will fluctuate so that an investor’s shares, when redeemed, may be worth more or less than their original cost. Current performance may be lower or higher than the performance quoted above. Please visit our web site at www.goldmansachsfunds.com to obtain the most recent month-end returns. Performance reflects applicable fee waivers and/or expense limitations in effect during the periods shown. In their absence, performance would be reduced. Returns do not reflect the deduction of taxes that a shareholder would pay on Fund distributions or the redemption of Fund shares. |
33
FUND BASICS
| | | | | | | | | | |
| | EXPENSE RATIOS4 | | | | | | | | |
| | | | | Net Expense Ratio (Current) | | | Gross Expense Ratio (Before Waivers) | |
| | Class A | | | 1.35 | % | | | 1.41 | % |
| | Class B | | | 2.10 | | | | 2.16 | |
| | Class C | | | 2.10 | | | | 2.16 | |
| | Institutional | | | 0.95 | | | | 1.01 | |
| | Service | | | 1.45 | | | | 1.51 | |
| | Class IR | | | 1.10 | | | | 1.16 | |
| | | Class R | | | 1.60 | | | | 1.66 | |
| | 4 | | The expense ratios of the Fund, both current (net of applicable fee waivers and/or expense limitations) and before waivers (gross of applicable fee waivers and/or expense limitations) are as set forth above according to the most recent publicly available Prospectus for the Fund and may differ from the expense ratios disclosed in the Financial Highlights in this report. The Fund’s waivers and/or expense limitations will remain in place through at least December 29, 2013, and prior to such date the investment adviser may not terminate the arrangements without the approval of the Fund’s Board of Trustees. If these arrangements are discontinued in the future, the expense ratios may change without shareholder approval. |
| | | | | | | | |
| | TOP TEN HOLDINGS AS OF 2/28/135 |
| | | Holding | | % of Net Assets | | | Line of Business |
| | SBA Communications Corp. Class A | | | 3.3 | % | | Wireless Telecommunication Services |
| | PVH Corp. | | | 2.5 | | | Textiles, Apparel & Luxury Goods |
| | CBRE Group, Inc. Class A | | | 2.3 | | | Real Estate Management & Development |
| | Agilent Technologies, Inc. | | | 2.2 | | | Life Sciences Tools & Services |
| | Equinix, Inc. | | | 2.1 | | | Internet Software & Services |
| | Activision Blizzard, Inc. | | | 2.1 | | | Software |
| | Amphenol Corp. Class A | | | 2.0 | | | Electronic Equipment, Instruments &
Components |
| | Dollar General Corp. | | | 2.0 | | | Multiline Retail |
| | IntercontinentalExchange, Inc. | | | 2.0 | | | Diversified Financial Services |
| | | PetSmart, Inc. | | | 1.8 | | | Specialty Retail |
| | 5 | | The top 10 holdings may not be representative of the Fund’s future investments. |
34
FUND BASICS
| | |
| FUND VS. BENCHMARK SECTOR ALLOCATION6 | | |
| As of February 28, 2013 | | |
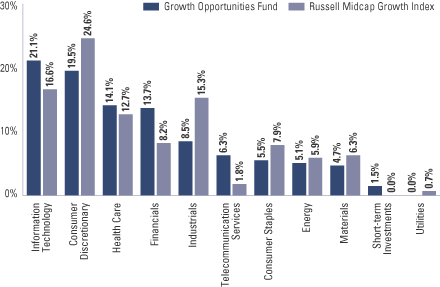
| | 6 | | The Fund is actively managed and, as such, its composition may differ over time. Consequently, the Fund’s overall sector allocations may differ from the percentages contained in the graph above. The graph categorizes investments using the Global Industry Classification Standard (“GICS”), however, the sector classifications used by the portfolio management team may differ from GICS. The percentage shown for each investment category reflects the value of investments in that category as a percentage of market value. Short-term investments represent repurchase agreements. The graph depicts the Fund’s investments but may not represent the Fund’s market exposure due to the exclusion of certain derivatives, if any, as listed in the Additional Investment Information section of the Schedule of Investments. |
35
PORTFOLIO RESULTS
Goldman Sachs Small/Mid Cap Growth Fund
Portfolio Composition
The Fund invests primarily in small and medium-sized growth companies with a market capitalization between $200 million and $10 billion. Since the Fund’s inception, the Goldman Sachs Growth Investment Team has focused on several key investment criteria that it believes can drive a company’s growth over the long term. These characteristics are: dominant market share, established brand name, pricing power, recurring revenue stream, free cash flow, high returns on invested capital, predictable growth, sustainable growth, long product life cycle, enduring competitive advantage, favorable demographic trends and excellent management. The Team strives to purchase these companies at reasonable valuations in order to capture the full benefits of their growth.
Portfolio Management Discussion and Analysis
Below, the Goldman Sachs Growth Investment Team discusses the Goldman Sachs Small/Mid Cap Growth Fund’s (the “Fund”) performance and positioning for the six-month period ended February 28, 2013 (the “Reporting Period”).
| Q | | How did the Fund perform during the Reporting Period? |
| A | | During the Reporting Period, the Fund’s Class A, B, C, Institutional, Service, IR and R Shares generated cumulative total returns, without sales charges, of 12.57%, 12.12%, 12.13%, 12.80%, 12.52%, 12.73% and 12.38%, respectively. These returns compare to the 11.98% cumulative total return of the Fund’s benchmark, the Russell 2500® Growth Index (with dividends reinvested) (the “Russell Index”), during the same period. |
| Q | | What key factors were responsible for the Fund’s performance during the Reporting Period? |
| A | | Stock selection overall contributed most to the Fund’s performance relative to the Russell Index during the Reporting Period. |
| Q | | Which equity market sectors most significantly affected Fund performance? |
| A | | Effective stock selection in the financials, information technology and health care sectors helped the Fund’s performance most relative to the Russell Index. Detracting from the Fund’s relative results was weak stock selection in the consumer discretionary, industrials, energy and consumer staples sectors. Having an underweighted allocation to the industrials sector, which outpaced the Russell Index during the Reporting Period, also hurt. |
| Q | | What were some of the Fund’s best-performing individual stocks? |
| A | | The Fund benefited most relative to the Russell Index from positions in independent investment banking boutique Evercore Partners, specialty commercial financial services company FleetCor Technologies and global commercial real estate services firm CBRE Group. |
| | | A position in Evercore Partners contributed most to the Fund’s relative returns during the Reporting Period. The company’s shares performed well as merger and acquisition activity started to improve and a higher percentage of announced deals closed or were anticipated to close. We believe this is a trend that will continue and that Evercore Partners is well positioned to benefit. In our view, a key competitive advantage is the company’s management team, led by former deputy Treasury Secretary Roger Altman as its chairman and co-founder of BlackRock Ralph Schlosstein as its chief executive officer. |
| | | FleetCor Technologies, an independent global provider of specialized payment products and services, was a top contributor to the Fund’s relative performance during the Reporting Period. FleetCor Technologies’ stock performed well, as the company has successfully integrated accretive acquisitions and consistently beat and raised earnings estimates. While we still like the company and its growth prospects, we trimmed the Fund’s position in FleetCor Technologies’ stock to take profits and reflect its increased valuation. |
36
PORTFOLIO RESULTS
| | | CBRE Group contributed to the Fund’s relative performance during the Reporting Period. Its shares rose on the heels of announcing a solid fourth calendar quarter, during which earnings beat analysts’ expectations. In addition, CBRE Group published positive guidance for 2013. At the end of the Reporting Period, we believed the company still had strong growth potential, as it was gaining market share and continued to boost margins through international expansion. Additionally, in our view, the deal struck by CBRE Group to buy a majority of the real estate investment management business of Dutch financial company ING Group should be beneficial, as it provides relatively stable assets under management, recurring revenues and solid margins. |
| Q | | Which stocks detracted significantly from the Fund’s performance during the Reporting Period? |
| A | | Detracting most from the Fund’s results relative to its benchmark index were positions in footwear and accessories designer Deckers Outdoor, personal care and food products company Hain Celestial Group and specialty pet supplies and services group PetSmart. |
| | | Deckers Outdoor was the biggest detractor from the Fund’s results during the Reporting Period. The company’s earnings and guidance were disappointing during 2012, as it continued to battle headwinds from the impact of an unseasonably warm winter in 2011, which pressured the company’s inventory position and profitability. However, at the end of the Reporting Period, we expected the company’s inventory pressure to subside through the course of 2013. The stock had already recovered some of its losses in the early months of 2013, and its results for the fourth quarter of 2012 beat expectations. We continued to believe in the strength of the company’s Ugg brand and expected the company to show improved sales and margin expansion in 2013. |
| | | Hain Celestial Group manufactures, markets, distributes and sells natural and organic products. The company re-affirmed weak guidance in mid-October 2012 when it was expected to raise guidance instead. Uncertainty also arose after a change in its management team early in the fourth calendar quarter. Hain Celestial Group also announced the closing of the acquisition of BluePrint, a nationally recognized brand in the raw juice category based in New York City. Hain Celestial Group’s shares traded lower, as investors questioned the difficulty of the integration. We added to the Fund’s position in the company on weakness, as we continued to believe Hain Celestial Group is a diversified way to capitalize on the trends of healthier eating, increased fitness and an aging population. In our view, the company has remained focused on improving margins, and we view its acquisition strategy positively. |
| | | A position in PetSmart detracted from the Fund’s relative results during the Reporting Period. In our view, there were two primary issues that impacted PetSmart’s stock — concerns over the turnover in its management, as both its chief executive officer and chief financial officer are leaving the company over the next year, and concerns that the Internet will become a growing threat to its business. However, we added to the Fund’s position in the company on weakness, as we remained confident in its business growth prospects and think the management turnover is a long-planned transition that should not negatively impact the business. While we are wary of the impact of online retail on all traditional retailers, we think PetSmart is relatively well positioned given that it remains largely uneconomical to ship pet food to consumers. Traffic trends at PetSmart stores remained positive during the Reporting Period, which, in our view, is the best indicator consumers continue to prefer to shop for pet supplies in stores rather than online. |
| Q | | How did the Fund use derivatives and similar instruments during the Reporting Period? |
| A | | During the Reporting Period, we did not use derivatives as part of an active management strategy. |
| Q | | Did the Fund make any significant purchases or sales during the Reporting Period? |
| A | | During the Reporting Period, we initiated a Fund position in ExactTarget, a cross-channel interactive marketing company that earns the vast majority of its revenue from email marketing. In our view, ExactTarget has an attractive recurring revenue profile, has grown revenues sequentially every quarter since its inception, and is poised to benefit from growth in international markets and new product categories. As chief marketing officers broadly gain control over an increasing share of information technology budgets, we believe ExactTarget’s differentiated platform positions the company well for years of strong growth and a corresponding increase in the company’s asset value. |
37
PORTFOLIO RESULTS
| | | We established a Fund position in biopharmaceutical company Achillion Pharmaceuticals, which is predominantly focused on producing drugs for patients with hepatitis C. We believe the company currently has two best-in-class drugs for this disease and that there is a potential $15 billion market opportunity. In our view, even if Achillion Pharmaceuticals only takes a small portion of total market share, it justifies a premium to the price of Achillion Pharmaceuticals’ shares at the time of our purchase. |
| | | Conversely, we sold the Fund’s position in Robbins & Myers, a leading supplier of engineered equipment and systems for critical applications in global energy, industrial, chemical and pharmaceutical markets. During the third quarter of 2012, Robbins & Myers announced it was being acquired by oilfield machinery and equipment company National Oilwell Varco. In our view, the acquisition validated our fundamental investment thesis and valuation analysis of Robbins & Myers, which was trading at a discount to our assessment of the company’s intrinsic value. We were encouraged by the stock’s strong performance following the announcement, so we decided to take profits and reallocate capital into opportunities with what we considered to have more attractive risk-reward profiles. |
| | | We exited the Fund’s position in consumer and commercial product producer Newell Rubbermaid. We decided to reallocate capital into opportunities with what we believed to have more favorable risk-reward profiles, as we believe Newell Rubbermaid’s valuations reflected, at the time of our sale, confidence in the business’ turnaround and were trading at the higher end of long-term averages. |
| Q | | Were there any notable changes in the Fund’s weightings during the Reporting Period? |
| A | | In constructing the Fund’s portfolio, we focus on picking stocks rather than on making industry or sector bets. We seek to outpace the benchmark index by overweighting stocks that we expect to outperform and underweighting those that we think may lag. Consequently, changes in its sector weights are generally the direct result of individual stock selection or of stock appreciation or depreciation. That said, during the Reporting Period, the Fund’s exposure to financials, information technology, health care and consumer staples increased and its allocation to materials, telecommunication services, industrials and consumer discretionary decreased relative to the Russell Index. |
| Q | | How was the Fund positioned relative to its benchmark index at the end of February 2013? |
| A | | At the end of February 2013, the Fund had overweighted positions relative to the Russell Index in the telecommunication services, energy and health care sectors. On the same date, the Fund had underweighted positions compared to the Russell Index in industrials and materials. The Fund was rather neutrally weighted to the Russell Index in financials, information technology, consumer staples and consumer discretionary and had no position at all in utilities on February 28, 2013. |
38
FUND BASICS
Small/Mid Cap Growth Fund
as of February 28, 2013
| | | | | | | | | | |
| | PERFORMANCE REVIEW | |
| | | September 1, 2012–February 28, 2013 | | Fund Total Return
(based on NAV)1 | | | Russell 2500
Growth Index2 | |
| | Class A | | | 12.57 | % | | | 11.98 | % |
| | Class B | | | 12.12 | | | | 11.98 | |
| | Class C | | | 12.13 | | | | 11.98 | |
| | Institutional | | | 12.80 | | | | 11.98 | |
| | Service | | | 12.52 | | | | 11.98 | |
| | Class IR | | | 12.73 | | | | 11.98 | |
| | | Class R | | | 12.38 | | | | 11.98 | |
| | 1 | | The net asset value (“NAV”) represents the net assets of the class of the Fund (ex-dividend) divided by the total number of shares of the class outstanding. The Fund’s performance reflects the reinvestment of dividends and other distributions. The Fund’s performance does not reflect the deduction of any applicable sales charges. |
| | 2 | | The Russell 2500 Growth Index (with dividends reinvested) is an unmanaged index that measures the performance of the small- to mid-cap growth segment of the US equity universe. The Russell 2500 Growth Index is constructed to provide a comprehensive and unbiased barometer of the small- to mid-cap growth market. Based on ongoing empirical research of investment manager behavior, the methodology used to determine growth probability approximates the aggregate small- to mid-cap growth manager’s opportunity set. The Index figures do not reflect any deduction for fees, expenses or taxes. It is not possible to invest directly in an index. |
| | | | | | | | | | | | |
| | STANDARDIZED TOTAL RETURNS3 |
| | | For the period ended 12/31/12 | | One Year | | | Five Years | | Since Inception | | Inception Date |
| | Class A | | | 14.15 | % | | 4.66% | | 7.95% | | 6/30/05 |
| | Class B | | | 14.59 | | | 4.67 | | 7.91 | | 6/30/05 |
| | Class C | | | 18.72 | | | 5.03 | | 7.90 | | 6/30/05 |
| | Institutional | | | 21.27 | | | 6.26 | | 9.15 | | 6/30/05 |
| | Service | | | 20.61 | | | 5.73 | | 8.60 | | 6/30/05 |
| | Class IR | | | 21.04 | | | 6.10 | | 6.32 | | 11/30/07 |
| | | Class R | | | 20.44 | | | 5.59 | | 5.80 | | 11/30/07 |
| | 3 | | The Standardized Total Returns are average annual total returns as of the most recent calendar quarter-end. They assume reinvestment of all distributions at NAV. These returns reflect a maximum initial sales charge of 5.5% for Class A Shares and the assumed contingent deferred sales charge for Class B Shares (5% maximum declining to 0% after six years) and the assumed contingent deferred sales charge for Class C Shares (1% if redeemed within 12 months of purchase). Class B Shares automatically convert to Class A Shares on or about the fifteenth day of the last month of the calendar year that is eight years after purchase. Returns for Class B Shares for the period after the conversion reflect the performance of Class A Shares. Because Institutional, Service, Class IR and Class R Shares do not involve a sales charge, such a charge is not applied to their Standardized Total Returns. The Fund’s Class B Shares are no longer available for purchase by new or existing shareholders (although current Class B shareholders may continue to reinvest income and capital gains distributions into Class B Shares, and Class B shareholders may continue to exchange their shares for Class B Shares of certain other Goldman Sachs Funds). |
| | | | The returns set forth in the tables above represent past performance. Past performance does not guarantee future results. The Fund’s investment return and principal value will fluctuate so that an investor’s shares, when redeemed, may be worth more or less than their original cost. Current performance may be lower or higher than the performance quoted above. Please visit our web site at www.goldmansachsfunds.com to obtain the most recent month-end returns. Performance reflects applicable fee waivers and/or expense limitations in effect during the periods shown. In their absence, performance would be reduced. Returns do not reflect the deduction of taxes that a shareholder would pay on Fund distributions or the redemption of Fund shares. |
39
FUND BASICS
| | | | | | | | | | |
| | EXPENSE RATIOS4 | | | | | | | | |
| | | | | Net Expense Ratio (Current) | | | Gross Expense Ratio (Before Waivers) | |
| | Class A | | | 1.35 | % | | | 1.50 | % |
| | Class B | | | 2.10 | | | | 2.25 | |
| | Class C | | | 2.10 | | | | 2.25 | |
| | Institutional | | | 0.95 | | | | 1.10 | |
| | Service | | | 1.45 | | | | 1.60 | |
| | Class IR | | | 1.10 | | | | 1.25 | |
| | | Class R | | | 1.60 | | | | 1.75 | |
| | 4 | | The expense ratios of the Fund, both current (net of applicable fee waivers and/or expense limitations) and before waivers (gross of applicable fee waivers and/or expense limitations) are as set forth above according to the most recent publicly available Prospectus for the Fund and may differ from the expense ratios disclosed in the Financial Highlights in this report. The Fund’s waivers and/or expense limitations will remain in place through at least December 29, 2013, and prior to such date the investment adviser may not terminate the arrangements without the approval of the Fund’s Board of Trustees. If these arrangements are discontinued in the future, the expense ratios may change without shareholder approval. |
| | | | | | | | |
| | TOP TEN HOLDINGS AS OF 2/28/135 |
| | | Holding | | % of Net Assets | | | Line of Business |
| | SBA Communications Corp. Class A | | | 3.5 | % | | Wireless Telecommunication Services |
| | PVH Corp. | | | 2.7 | | | Textiles, Apparel & Luxury Goods |
| | Healthcare Services Group, Inc. | | | 2.0 | | | Commercial Services & Supplies |
| | Dril-Quip, Inc. | | | 1.8 | | | Energy Equipment & Services |
| | MSCI, Inc. Class A | | | 1.8 | | | Diversified Financial Services |
| | Rackspace Hosting, Inc. | | | 1.7 | | | Internet Software & Services |
| | Evercore Partners, Inc. Class A | | | 1.7 | | | Capital Markets |
| | Kennametal, Inc. | | | 1.7 | | | Machinery |
| | CBRE Group, Inc. Class A | | | 1.7 | | | Real Estate Management & Development |
| | | Ritchie Bros. Auctioneers, Inc. | | | 1.6 | | | Commercial Services & Supplies |
| | 5 | | The top 10 holdings may not be representative of the Fund’s future investments. |
40
FUND BASICS
| | |
| FUND VS. BENCHMARK SECTOR ALLOCATION6 | | |
| As of February 28, 2013 | | |
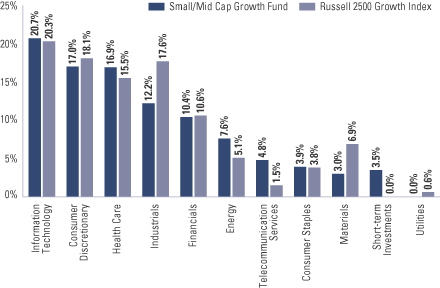
| | 6 | | The Fund is actively managed and, as such, its composition may differ over time. Consequently, the Fund’s overall sector allocations may differ from the percentages contained in the graph above. The graph categorizes investments using the Global Industry Classification Standard (“GICS”), however, the sector classifications used by the portfolio management team may differ from GICS. The percentage shown for each investment category reflects the value of investments in that category as a percentage of market value. Short-term investments represent repurchase agreements. The graph depicts the Fund’s investments but may not represent the Fund’s market exposure due to the exclusion of certain derivatives, if any, as listed in the Additional Investment Information section of the Schedule of Investments. |
41
PORTFOLIO RESULTS
Goldman Sachs Strategic Growth Fund
Portfolio Composition
The Fund invests primarily in U.S. equity investments. The Fund is more selective and focused than many mutual funds and there are typically 50 to 70 holdings in the portfolio. Since the Fund’s inception, the Goldman Sachs Growth Investment Team has focused on several key investment criteria that it believes can drive a company’s growth over the long term. These characteristics are: dominant market share, established brand name, pricing power, recurring revenue stream, free cash flow, high returns on invested capital, predictable growth, sustainable growth, long product life cycle, enduring competitive advantage, favorable demographic trends and excellent management. The Team strives to purchase these companies at reasonable valuations in order to capture the full benefits of their growth.
Portfolio Management Discussion and Analysis
Below, the Goldman Sachs Growth Investment Team discusses the Goldman Sachs Strategic Growth Fund’s (the “Fund”) performance and positioning for the six-month period ended February 28, 2013 (the “Reporting Period”).
| Q | | How did the Fund perform during the Reporting Period? |
| A | | During the Reporting Period, the Fund’s Class A, B, C, Institutional, Service, IR and R Shares generated cumulative total returns, without sales charges, of 7.45%, 7.03%, 6.92%, 7.64%, 7.27%, 7.48% and 7.27%, respectively. These returns compare to the 6.23% cumulative total return of the Fund’s benchmark, the Russell 1000® Growth Index (with dividends reinvested) (the “Russell Index”), during the same period. |
| Q | | What key factors were responsible for the Fund’s performance during the Reporting Period? |
| A | | Stock selection overall contributed most to the Fund’s performance relative to the Russell Index during the Reporting Period. |
| Q | | Which equity market sectors most significantly affected Fund performance? |
| A | | Effective stock selection in the information technology, financials and consumer staples sectors helped the Fund’s performance most relative to the Russell Index. Having an overweighted allocation to financials, which outpaced the Russell Index during the Reporting Period, also helped. Detracting from the Fund’s relative results most was having an underweighted exposure to the industrials sector, which outperformed the Russell Index during the Reporting Period, and weak stock selection in the health care and energy sectors. |
| Q | | What were some of the Fund’s best-performing individual stocks? |
| A | | The Fund benefited most relative to the Russell Index from positions in global commercial real estate services firm CBRE Group, biotechnology company Gilead Sciences and apparel and footwear company PVH. |
| | CBRE Group contributed most to the Fund’s relative performance during the Reporting Period. Its shares rose on the heels of announcing a solid fourth calendar quarter, during which earnings beat analysts’ expectations. In addition, CBRE Group published positive guidance for 2013. At the end of the Reporting Period, we believed the company still had strong growth potential, as it was gaining market share and continued to boost margins through international expansion. Additionally, in our view, the deal struck by CBRE Group to buy a majority of the real estate investment management business of Dutch financial company ING Group should be beneficial, as it provides relatively stable assets under management, recurring revenues and solid margins. |
| | Gilead Sciences was a top contributor to the Fund’s relative performance during the Reporting Period. In our view, the company is a dominant player in the HIV and hepatitis C treatment areas, and indeed it was positive pipeline development in these areas that drove the company’s strong performance during the Reporting Period. At the end of the Reporting Period, we continued to have high conviction in the company, as we believed it was well positioned within the biotechnology industry, holding significant market share in several niche areas. In our view, Gilead Sciences remained |
42
PORTFOLIO RESULTS
| | attractively valued at the end of the Reporting Period given its strong pipeline and dominant HIV franchise. |
| | PVH is an apparel company whose portfolio of brands includes Calvin Klein, Tommy Hilfiger, Van Heusen and IZOD, amongst others. Its shares performed well during the Reporting Period after the company announced its strategic acquisition of rival Warnaco Group. Warnaco Group had licensed Calvin Klein’s jeans from PVH, which bought Calvin Klein’s company from the designer in 2003. Analysts, including ours, believe the deal should be substantially accretive to earnings per share upon completion, as it will give the company full control of the Calvin Klein brand and expand PVH’s presence in Europe, Asia and Latin America. PVH’s stock also performed well as both the Tommy Hilfiger and Calvin Klein brands continued to demonstrate high growth both in the U.S. and in international markets. |
| Q | | Which stocks detracted significantly from the Fund’s performance during the Reporting Period? |
| A | | Detracting most from the Fund’s results relative to its benchmark index were positions in personal computer and mobile communications device giant Apple, medical device company St. Jude Medical and discount retailer Dollar General. |
| | A position in Apple detracted most from the Fund’s returns during the Reporting Period. Shares of Apple pulled back as concern persisted around disappointing first calendar quarter iPhone guidance. The iPhone accounts for approximately 60% of the company’s gross profits and remains the key driver of Apple’s growth. At the end of the Reporting Period, we continued to have a positive outlook on the company and saw a number of potential catalysts that could contribute to additional growth. We believe an iPhone that targets the emerging market consumer could reaccelerate growth and help expand the overall market for Apple products. We also believe the market is discounting the optionality in Apple’s stock from new product introductions. (Optionality is the value of additional optional investment opportunities available only after having made an initial investment.) In addition, there is the possibility that Apple could sign a deal with China Mobile, the largest wireless carrier in China with approximately 700 million subscribers. Were this to be realized, this deal could significantly expand the addressable market for Apple’s iPhone. Even as near-term expectations are reduced, we believe the company’s long-term growth potential is still greater than the broader market. We believe Apple has plenty of financial flexibility with its strong balance sheet and healthy free cash flow to return capital to shareholders. Overall, then, we remain positive on Apple and believed, at the end of the Reporting Period, that its stock was trading at a reasonable valuation for a high quality franchise with solid growth potential. |
| | St. Jude Medical detracted from the Fund’s relative performance, as reports of safety and quality issues continued to weigh on the company and as such reports led to concerns about the possibility of market share loss. In addition, St. Jude Medical experienced pricing pressure combined with weak volume growth. We decided to sell out of the Fund’s position in St. Jude Medical by the end of the Reporting Period in favor of what we considered to be more attractive investment opportunities. |
| | The Fund’s position in Dollar General detracted from its relative results. Despite reporting a decent third calendar quarter, Dollar General’s shares traded down as the company discussed heightened competition and looming consumer weakness as a result of ending payroll tax cuts. Even with these near-term setbacks, we added to the Fund’s position on weakness during the Reporting Period because we believe the company should deliver sales growth going forward supported by square footage growth from new stores. Moreover, we believe initiatives including direct sourcing, private brands and reduced inventory shrinkage should lower costs and thereby drive margin expansion. (Inventory shrinkage is material or goods lost through deterioration, obsolescence, pilferage, theft and/or waste.) We have confidence in the company management’s ability to take advantage of existing growth opportunities and to continue to gain market share in a growing industry. |
43
PORTFOLIO RESULTS
| Q | | How did the Fund use derivatives and similar instruments during the Reporting Period? |
| A | | During the Reporting Period, we did not use derivatives as part of an active management strategy. |
| Q | | Did the Fund make any significant purchases or sales during the Reporting Period? |
| A | | We initiated a Fund position in Activision Blizzard, a leading publisher of gaming software and content, during the Reporting Period. Activision Blizzard owns three of the largest franchises in the electronic gaming industry — Call of Duty and Skylanders on console and World of Warcraft on personal computer. World of Warcraft is offered through a monthly subscription model that provides a large and reliable stream of cash flow, which, in turn, can be used to invest for growth in newer intellectual properties. In our view, these newer properties, including Call of Duty and Skylanders, and upcoming new releases have margin structures that are higher than the corporate average, which should drive Activision Blizzard’s operating margins higher if the company grows over the next few years as anticipated. In addition, we believe the company’s valuations were attractive at the time of purchase. |
| | We established a Fund position in aerospace and defense company Boeing. We believe the important growth drivers for Boeing are likely to come from increasing the production rate and deliveries of its 787 program and the successful development of its new 737 MAX. We believe cash flows may well improve substantially as the new planes are delivered. We are particularly optimistic regarding the outlook for the 787, as headlines appear to be moving away from the production issues that delayed its initial launch. Boeing also maintains a multi-year head start on competitor Airbus’ next generation plane, the A350, an important lead in a duopolistic industry. |
| | Conversely, we sold the Fund’s position in software giant Microsoft. During the Reporting Period, Microsoft announced disappointing fiscal first quarter results caused by slower than expected enterprise adoption of the Windows 8 operating system. Investors were also disappointed by the sudden departure of the head of the Windows division. This departure was unexpected, as he was viewed by many as a potential chief executive officer successor. We exited the Fund’s position in Microsoft prior to this announcement, based on our view of slower anticipated growth ahead and limited traction in the mobile computing industry. While Microsoft pays an attractive dividend and should continue to generate large amounts of free cash flow, we believe its flagship Windows product is maturing. We also see the changes being driven by mobile and cloud computing potentially leading to disruptions in the company’s markets. |
| | We eliminated the Fund’s position in specialty retailer Urban Outfitters during the Reporting Period. Shares of Urban Outfitters rose after the company announced strong results during a mid-quarter update during the fourth calendar quarter. While we still have conviction in the company, its story was becoming more understood by the market and thus the valuation gap narrowed in our view. Therefore, we exited the Fund’s position. |
| Q | | Were there any notable changes in the Fund’s weightings during the Reporting Period? |
| A | | In constructing the Fund’s portfolio, we focus on picking stocks rather than on making industry or sector bets. We seek to outpace the benchmark index by overweighting stocks that we expect to outperform and underweighting those that we think may lag. Consequently, changes in its sector weights are generally the direct result of individual stock selection or of stock appreciation or depreciation. That said, during the Reporting Period, the Fund’s exposure to financials, information technology and industrials increased and its allocations to energy and health care decreased relative to the Russell Index. |
| Q | | How was the Fund positioned relative to its benchmark index at the end of February 2013? |
| A | | At the end of February 2013, the Fund had overweighted positions relative to the Russell Index in the financials and information technology sectors. On the same date, the Fund had underweighted positions compared to the Russell Index in industrials, consumer staples and materials. The Fund was rather neutrally weighted to the Russell Index in consumer discretionary, telecommunication services, energy and health care and had no position at all in utilities on February 28, 2013. |
44
FUND BASICS
Strategic Growth Fund
as of February 28, 2013
| | | | | | | | | | |
| | PERFORMANCE REVIEW | |
| | | September 1, 2012–February 28, 2013 | | Fund Total Return
(based on NAV)1 | | | Russell 1000
Growth Index2 | |
| | Class A | | | 7.45 | % | | | 6.23 | % |
| | Class B | | | 7.03 | | | | 6.23 | |
| | Class C | | | 6.92 | | | | 6.23 | |
| | Institutional | | | 7.64 | | | | 6.23 | |
| | Service | | | 7.27 | | | | 6.23 | |
| | Class IR | | | 7.48 | | | | 6.23 | |
| | | Class R | | | 7.27 | | | | 6.23 | |
| | 1 | | The net asset value (“NAV”) represents the net assets of the class of the Fund (ex-dividend) divided by the total number of shares of the class outstanding. The Fund’s performance reflects the reinvestment of dividends and other distributions. The Fund’s performance does not reflect the deduction of any applicable sales charges. |
| | 2 | | The Russell 1000 Growth Index (with dividends reinvested) is an unmanaged market capitalization weighted index that measures the performance of those Russell 1000 companies with higher price-to-book ratios and higher forecasted growth values. The Index figures do not reflect any deduction for fees, expenses or taxes. It is not possible to invest directly in an index. |
| | | | | | | | | | | | | | | | | | | | |
| | STANDARDIZED TOTAL RETURNS3 |
| | | For the period ended 12/31/12 | | One Year | | | Five Years | | | Ten Years | | | Since Inception | | | Inception Date |
| | Class A | | | 12.91 | % | | | 0.72 | % | | | 5.15 | % | | | 0.82 | % | | 5/24/99 |
| | Class B | | | 13.21 | | | | 0.68 | | | | 5.09 | | | | 0.80 | | | 5/24/99 |
| | Class C | | | 17.52 | | | | 1.10 | | | | 4.95 | | | | 0.50 | | | 5/24/99 |
| | Institutional | | | 19.98 | | | | 2.27 | | | | 6.16 | | | | 1.65 | | | 5/24/99 |
| | Service | | | 19.40 | | | | 1.79 | | | | 5.73 | | | | 1.25 | | | 5/24/99 |
| | Class IR | | | 19.78 | | | | N/A | | | | N/A | | | | 15.00 | | | 01/06/09 |
| | | Class R | | | 19.26 | | | | N/A | | | | N/A | | | | 14.51 | | | 01/06/09 |
| | 3 | | The Standardized Total Returns are average annual total returns as of the most recent calendar quarter-end. They assume reinvestment of all distributions at NAV. These returns reflect a maximum initial sales charge of 5.5% for Class A Shares and the assumed contingent deferred sales charge for Class B Shares (5% maximum declining to 0% after six years) and the assumed contingent deferred sales charge for Class C Shares (1% if redeemed within 12 months of purchase). Class B Shares automatically convert to Class A Shares on or about the fifteenth day of the last month of the calendar year that is eight years after purchase. Returns for Class B Shares for the period after the conversion reflect the performance of Class A Shares. Because Institutional, Service, Class IR and Class R Shares do not involve a sales charge, such a charge is not applied to their Standardized Total Returns. The Fund’s Class B Shares are no longer available for purchase by new or existing shareholders (although current Class B shareholders may continue to reinvest income and capital gains distributions into Class B Shares, and Class B shareholders may continue to exchange their shares for Class B Shares of certain other Goldman Sachs Funds). |
| | | | The returns set forth in the tables above represent past performance. Past performance does not guarantee future results. The Fund’s investment return and principal value will fluctuate so that an investor’s shares, when redeemed, may be worth more or less than their original cost. Current performance may be lower or higher than the performance quoted above. Please visit our web site at www.goldmansachsfunds. com to obtain the most recent month-end returns. Performance reflects applicable fee waivers and/or expense limitations in effect during the periods shown. In their absence, performance would be reduced. Returns do not reflect the deduction of taxes that a shareholder would pay on Fund distributions or the redemption of Fund shares. |
45
FUND BASICS
| | | | | | | | | | |
| | EXPENSE RATIOS4 | |
| | | | | Net Expense Ratio (Current) | | | Gross Expense Ratio (Before Waivers) | |
| | Class A | | | 1.15 | % | | | 1.51 | % |
| | Class B | | | 1.90 | | | | 2.26 | |
| | Class C | | | 1.90 | | | | 2.26 | |
| | Institutional | | | 0.75 | | | | 1.11 | |
| | Service | | | 1.25 | | | | 1.61 | |
| | Class IR | | | 0.90 | | | | 1.26 | |
| | | Class R | | | 1.40 | | | | 1.76 | |
| | 4 | | The expense ratios of the Fund, both current (net of applicable fee waivers and/or expense limitations) and before waivers (gross of applicable fee waivers and/or expense limitations) are as set forth above according to the most recent publicly available Prospectus for the Fund and may differ from the expense ratios disclosed in the Financial Highlights in this report. The Fund’s waivers and/or expense limitations will remain in place through at least December 29, 2013, and prior to such date the investment adviser may not terminate the arrangements without the approval of the Fund’s Board of Trustees. If these arrangements are discontinued in the future, the expense ratios may change without shareholder approval. |
| | | | | | | | |
| | TOP TEN HOLDINGS AS OF 2/28/135 |
| | | Holding | | % of Net Assets | | | Line of Business |
| | Apple, Inc. | | | 7.2 | % | | Computers & Peripherals |
| | Google, Inc. Class A | | | 4.7 | | | Internet Software & Services |
| | QUALCOMM, Inc. | | | 4.5 | | | Communications Equipment |
| | American Tower Corp. | | | 3.7 | | | Real Estate Investment Trusts |
| | Schlumberger Ltd. | | | 3.6 | | | Energy Equipment & Services |
| | Crown Castle International Corp. | | | 3.1 | | | Wireless Telecommunication Services |
| | NIKE, Inc. Class B | | | 2.9 | | | Textiles, Apparel & Luxury Goods |
| | Costco Wholesale Corp. | | | 2.7 | | | Food & Staples Retailing |
| | Amazon.com, Inc. | | | 2.5 | | | Internet & Catalog Retail |
| | | Praxair, Inc. | | | 2.2 | | | Chemicals |
| | 5 | | The top 10 holdings may not be representative of the Fund’s future investments. |
46
FUND BASICS
|
| FUND VS. BENCHMARK SECTOR ALLOCATION6 |
| As of February 28, 2013 |
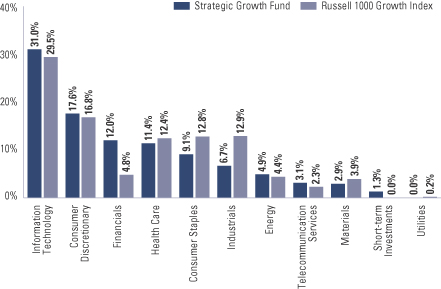
| | 6 | | The Fund is actively managed and, as such, its composition may differ over time. Consequently, the Fund’s overall sector allocations may differ from the percentages contained in the graph above. The graph categorizes investments using Global Industry Classification Standard (“GICS”), however, the sector classifications used by the portfolio management team may differ from GICS. The percentage shown for each investment category reflects the value of investments in that category as a percentage of market value. Short-term investments represent repurchase agreements. The graph depicts the Fund’s investments but may not represent the Fund’s market exposure due to the exclusion of certain derivatives, if any, as listed in the Additional Investment Information section of the Schedule of Investments. |
47
PORTFOLIO RESULTS
Goldman Sachs Technology Tollkeeper Fund
Portfolio Composition
The Fund invests primarily in equity securities of high quality technology, media or service companies that adopt or use technology to improve their cost structure, revenue opportunities or competitive advantage (“Technology Tollkeeper” companies). The Goldman Sachs Growth Investment Team believes Technology Tollkeeper connotes a promising growth business. Like a toll collector for a highway or bridge, Technology Tollkeeper companies may grow revenue by increasing “traffic,” or customers and sales, and raising “tolls,” or prices, and margins. The Team believes that the characteristics of recurring revenue or the ability to generate free cash flow should enable them to consistently grow their business.
Portfolio Management Discussion and Analysis
Below, the Goldman Sachs Growth Investment Team discusses the Goldman Sachs Technology Tollkeeper Fund’s (the “Fund”) performance and positioning for the six-month period ended February 28, 2013 (the “Reporting Period”).
| Q | | How did the Fund perform during the Reporting Period? |
| A | | During the Reporting Period, the Fund’s Class A, B, C, Institutional, Service and IR Shares generated cumulative total returns, without sales charges, of 3.60%, 3.24%, 3.24%, 3.84%, 3.56% and 3.78%, respectively. These returns compare to the 3.04% cumulative total return of the Fund’s benchmark, the NASDAQ Composite Index (the “NASDAQ Index”), during the same period. |
| Q | | What key factors were responsible for the Fund’s performance during the Reporting Period? |
| A | | Stock selection overall contributed most to the Fund’s performance relative to the NASDAQ Index during the Reporting Period. |
| Q | | Which equity market sectors most significantly affected Fund performance? |
| A | | As both the Fund and the NASDAQ Index have the majority of their respective assets allocated to the information technology sector and our Team’s focus is on picking stocks that fit our definition of a Technology Tollkeeper company, broad equity market sector performance generally does not have a meaningful impact on relative performance. That said, effective stock selection in the information technology and telecommunication services sectors helped the Fund’s performance. Detracting from the Fund’s relative results was weak stock selection in and having an underweighted allocation to the consumer discretionary sector, which outpaced the NASDAQ Index during the Reporting Period. Having no positions in health care or industrials, each of which outpaced the NASDAQ Index during the Reporting Period, also hurt. |
| Q | | What were some of the Fund’s best-performing individual stocks? |
| A | | The Fund benefited most relative to the NASDAQ Index from positions in social networking website operator Facebook, gaming software and content publisher Activision Blizzard and data center services company InterXion Holding. |
| | Facebook was a top contributor to the Fund’s relative results during the Reporting Period, as the company demonstrated significant progress in monetizing its mobile-related operations during its third fiscal quarter. Also, selling pressure from the expiration of insider lock-ups failed to materialize, alleviating investor fears and removing one of the primary overhangs on the stock. (Underwriters in Initial Public Offerings (“IPOs”) and insiders of the issuing company agree on lock-ups to prevent insiders from selling their stock within a given time window after the IPO. This time window normally amounts to 180 days. The lock-up agreement attempts to ensure the stability of the issuing company and to align insiders’ incentives with the goals of the company. After the expiration of the lock-up period, insiders are free to sell but potentially have to take into account insider regulation.) In our view, Facebook has achieved tremendous scale in the U.S. and has a large market opportunity as its networking effect creates stickiness, or loyalty, in its user, or customer, base. While we trimmed |
48
PORTFOLIO RESULTS
| | the Fund’s position in Facebook, taking some profits, we maintained the holding, as we continue to believe Facebook is well positioned to benefit from targeted advertising on its platform as a result of the information it has on its users as well as the potential to monetize new ad formats and the social networking ad medium over time. The company is in the very early stages of development, and with attractive long-term growth opportunities and a strong competitive position, we believe patient investors should be rewarded over time, despite the rocky start Facebook has had as a public company. |
| | Activision Blizzard, a new position for the Fund during the Reporting Period, was a top contributor to its relative results. Activision Blizzard owns three of the largest franchises in the electronic gaming industry — Call of Duty and Skylanders on console and World of Warcraft on personal computer. World of Warcraft is offered through a monthly subscription model that provides a large and reliable stream of cash flow, which, in turn, can be used to invest for growth in newer intellectual properties. In our view, these newer properties, including Call of Duty and Skylanders, and upcoming new releases have margin structures that are higher than the corporate average, which should drive Activision Blizzard’s operating margins higher if the company grows over the next few years as anticipated. In addition, we believe the company’s valuations were attractive at the time of purchase. During the Reporting Period, the company reported solid fourth calendar quarter results, driven by strong performance key franchises. Its management announced its Skylanders franchise crossed the $1 billion revenue threshold following its launch in 2011, while its Call of Duty franchise grew year-over-year and saw increase in online engagement for Black Ops 2, particularly in December 2012. |
| | A position in InterXion Holding, a provider of carrier-neutral collocation data center services throughout Europe, contributed to the Fund’s performance during the Reporting Period. The company reported strong fourth calendar quarter results and provided strong guidance for the first quarter of 2013. The company’s data centers act as content and connectivity hubs that facilitate the processing, storage, sharing and distribution of data, content, applications and media among carriers and customers. At the end of the Reporting Period, we believed the company should continue to benefit from a number of key long-term secular growth drivers, including cloud computing, mobile data and video. |
| Q | | Which stocks detracted significantly from the Fund’s performance during the Reporting Period? |
| A | | Detracting most from the Fund’s results relative to its benchmark index were positions in point-of-sale card payment device manufacturer VeriFone Systems, information technology integrated systems company Micros Systems and computer memory device manufacturer EMC. |
| | VeriFone Systems detracted most from the Fund’s relative results during the Reporting Period. Its shares declined sharply following a revenue and earnings miss and a disappointing outlook for the fiscal first quarter of 2013. In our view, the results highlight the challenges the company is facing in migrating from a hardware business to a services business and demonstrate its management’s failure to integrate recent acquisitions. As a result, we exited the Fund’s position in VeriFone Systems by the end of the Reporting Period. |
| | Micros Systems is a designer, manufacturer and servicer of enterprise information solutions. Its shares were weak during the Reporting Period as fiscal uncertainty affected the company’s underlying customer base of hospitality providers, retailers and restaurants. Despite the near-term weakness, the company maintained dominant market share with high margins at the end of the Reporting Period and, in our view, was well capitalized. The company also generated recurring revenue through the high-touch servicing it provides to clients. We believe Micros Systems operates a unique franchise that is well positioned for growth as the company appears to be increasing its customer base through new contracts with hotel chains and expanding its business globally. |
| | Shares of EMC declined during the Reporting Period, primarily due to less than anticipated earnings. Such earnings weakness was attributable to investor concerns that the company lost market share and to a sluggish macro and potentially weak spending environment in 2013. EMC was also negatively impacted in January 2013 by disappointing quarterly results and guidance from VMware, in which EMC holds an approximately 80% stake. We trimmed the Fund’s position in EMC during the Reporting Period but maintained the holding. EMC’s high-end and mid-tier storage products continued to record consistent growth and were gaining market share. Also, we believe that concerns over the |
49
PORTFOLIO RESULTS
| | company’s data storage business stem from the macro environment late in 2012 and that such concerns were overblown. At the end of the Reporting Period, we did not see any company specific issues. While governments’ technology budgets may be tightened in 2013, the company’s management expected strong global information technology spending by corporations to offset any weakness. Long-term, we also believe the outlook is favorable for information storage and virtualization. At the end of the Reporting Period, we believed EMC had a strong balance sheet and was trading below its average price to earnings ratio of recent years. As an industry leader in information storage, we found shares of the company to be attractively valued. |
| Q | | How did the Fund use derivatives and similar instruments during the Reporting Period? |
| A | | During the Reporting Period, we did not use derivatives as part of an active management strategy. |
| Q | | Did the Fund make any significant purchases or sales during the Reporting Period? |
| A | | In addition to the purchase of Activision Blizzard, already mentioned, we initiated a Fund position in ExactTarget, a cross-channel interactive marketing company that earns the vast majority of its revenue from email marketing, during the Reporting Period. In our view, ExactTarget has an attractive recurring revenue profile, has grown revenues sequentially every quarter since its inception, and is poised to benefit from growth in international markets and new product categories. As chief marketing officers broadly gain control over an increasing share of information technology budgets, we believe ExactTarget’s differentiated platform positions the company well for years of strong growth and a corresponding increase in the company’s asset value. |
| | In addition to the sale of VeriFone Systems, mentioned earlier, we exited the Fund’s position in software giant Microsoft. During the Reporting Period, Microsoft announced disappointing fiscal first quarter results caused by slower than expected enterprise adoption of the Windows 8 operating system. Investors were also disappointed by the sudden departure of the head of the Windows division. This departure was unexpected, as he was viewed by many as a potential chief executive officer successor. We exited the Fund’s position in Microsoft prior to this announcement, based on our view of slower anticipated growth ahead and limited traction in the mobile computing industry. While Microsoft pays an attractive dividend and should continue to generate large amounts of free cash flow, we believe its flagship Windows product is maturing. We also see the changes being driven by mobile and cloud computing potentially leading to disruptions in the company’s markets. |
| Q | | Were there any notable changes in the Fund’s weightings during the Reporting Period? |
| A | | In constructing the Fund’s portfolio, we focus on picking stocks rather than on making industry or sector bets. We seek to outpace the benchmark index by overweighting stocks that we expect to outperform and underweighting those that we think may lag. Consequently, changes in its sector weights are generally the direct result of individual stock selection or of stock appreciation or depreciation. That said, during the Reporting Period, the Fund’s exposure to information technology and telecommunication services increased and its allocation to consumer discretionary decreased relative to the NASDAQ Index. |
| Q | | How was the Fund positioned relative to its benchmark index at the end of February 2013? |
| A | | At the end of February 2013, the Fund’s most significant overweighting relative to the NASDAQ Index continued to be in the information technology sector. The Fund also had an overweighted position relative to the NASDAQ Index, albeit more modest, in telecommunication services. On the same date, the Fund had underweighted positions compared to the NASDAQ Index in consumer discretionary and financials. The Fund had no exposure to the consumer staples, energy, health care, materials, industrials and utilities sectors on February 28, 2013. |
50
FUND BASICS
Technology Tollkeeper Fund
as of February 28, 2013
| | | | | | | | | | |
| | PERFORMANCE REVIEW | |
| | | September 1, 2012–February 28, 2013 | | Fund Total Return
(based on NAV)1 | | | NASDAQ
Composite Index2 | |
| | Class A | | | 3.60 | % | | | 3.04 | % |
| | Class B | | | 3.24 | | | | 3.04 | |
| | Class C | | | 3.24 | | | | 3.04 | |
| | Institutional | | | 3.84 | | | | 3.04 | |
| | Service | | | 3.56 | | | | 3.04 | |
| | | Class IR | | | 3.78 | | | | 3.04 | |
| | 1 | | The net asset value (“NAV”) represents the net assets of the class of the Fund (ex-dividend) divided by the total number of shares of the class outstanding. The Fund’s performance reflects the reinvestment of dividends and other distributions. The Fund’s performance does not reflect the deduction of any applicable sales charges. |
| | 2 | | The NASDAQ Composite Index is a broad-based capitalization-weighted index of all NASDAQ National Market and small-cap stocks. The Index figures do not reflect any deduction for fees, expenses or taxes. It is not possible to invest directly in an index. |
| | | | | | | | | | | | | | |
| | STANDARDIZED TOTAL RETURNS3 |
| | | For the period ended 12/31/12 | | One Year | | | Five Years | | Ten Years | | Since Inception | | Inception Date |
| | Class A | | | 13.81 | % | | 2.52% | | 10.51% | | 2.14% | | 10/1/99 |
| | Class B | | | 14.59 | | | 2.55 | | 10.45 | | 2.10 | | 10/1/99 |
| | Class C | | | 18.58 | | | 2.93 | | 10.33 | | 1.81 | | 10/1/99 |
| | Institutional | | | 20.95 | | | 4.11 | | 11.59 | | 2.99 | | 10/1/99 |
| | Service | | | 20.36 | | | 3.62 | | 11.08 | | 2.51 | | 10/1/99 |
| | | Class IR | | | 20.74 | | | N/A | | N/A | | 7.63 | | 9/30/10 |
| | 3 | | The Standardized Total Returns are average annual total returns as of the most recent calendar quarter-end. They assume reinvestment of all distributions at NAV. These returns reflect a maximum initial sales charge of 5.5% for Class A Shares and the assumed contingent deferred sales charge for Class B Shares (5% maximum declining to 0% after six years) and the assumed contingent deferred sales charge for Class C Shares (1% if redeemed within 12 months of purchase). Class B Shares automatically convert to Class A Shares on or about the fifteenth day of the last month of the calendar year that is eight years after purchase. Returns for Class B Shares for the period after the conversion reflect the performance of Class A Shares. Because Institutional, Service and Class IR Shares do not involve a sales charge, such a charge is not applied to their Standardized Total Returns. The Fund’s Class B Shares are no longer available for purchase by new or existing shareholders (although current Class B shareholders may continue to reinvest income and capital gains distributions into Class B Shares, and Class B shareholders may continue to exchange their shares for Class B Shares of certain other Goldman Sachs Funds). |
| | | | The returns set forth in the tables above represent past performance. Past performance does not guarantee future results. The Fund’s investment return and principal value will fluctuate so that an investor’s shares, when redeemed, may be worth more or less than their original cost. Current performance may be lower or higher than the performance quoted above. Please visit our web site at www.goldmansachsfunds.com to obtain the most recent month-end returns. Performance reflects applicable fee waivers and/or expense limitations in effect during the periods shown. In their absence, performance would be reduced. Returns do not reflect the deduction of taxes that a shareholder would pay on Fund distributions or the redemption of Fund shares. |
51
FUND BASICS
| | | | | | | | | | |
| | EXPENSE RATIOS4 | |
| | | | | Net Expense Ratio (Current) | | | Gross Expense Ratio (Before Waivers) | |
| | Class A | | | 1.50 | % | | | 1.55 | % |
| | Class B | | | 2.25 | | | | 2.30 | |
| | Class C | | | 2.25 | | | | 2.30 | |
| | Institutional | | | 1.10 | | | | 1.15 | |
| | Service | | | 1.60 | | | | 1.65 | |
| | | Class IR | | | 1.25 | | | | 1.30 | |
| | 4 | | The expense ratios of the Fund, both current (net of applicable fee waivers and/or expense limitations) and before waivers (gross of applicable fee waivers and/or expense limitations) are as set forth above according to the most recent publicly available Prospectus for the Fund and may differ from the expense ratios disclosed in the Financial Highlights in this report. The Fund’s waivers and/or expense limitations will remain in place through at least December 29, 2013, and prior to such date the investment adviser may not terminate the arrangements without the approval of the Fund’s Board of Trustees. If these arrangements are discontinued in the future, the expense ratios may change without shareholder approval. |
| | | | | | | | |
| | TOP TEN HOLDINGS AS OF 2/28/135 |
| | | Holding | | % of
Net Assets | | | Line of Business |
| | Apple, Inc. | | | 10.8 | % | | Computers & Peripherals |
| | Google, Inc. Class A | | | 6.3 | | | Internet Software & Services |
| | QUALCOMM, Inc. | | | 5.5 | | | Communications Equipment |
| | Activision Blizzard, Inc. | | | 4.2 | | | Software |
| | Rackspace Hosting, Inc. | | | 4.2 | | | Internet Software & Services |
| | Oracle Corp. | | | 3.7 | | | Software |
| | SBA Communications Corp. Class A | | | 3.6 | | | Wireless Telecommunication Services |
| | Salesforce.com, Inc. | | | 3.4 | | | Software |
| | Equinix, Inc. | | | 3.3 | | | Internet Software & Services |
| | | Amazon.com, Inc. | | | 3.2 | | | Internet & Catalog Retail |
| | 5 | | The top 10 holdings may not be representative of the Fund’s future investments. |
52
FUND BASICS
|
| FUND VS. BENCHMARK SECTOR ALLOCATION6 |
| As of February 28, 2013 |
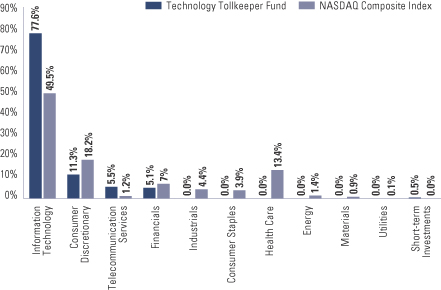
| | 6 | | The Fund is actively managed and, as such, its composition may differ over time. Consequently, the Fund’s overall sector allocations may differ from the percentages contained in the graph above. The graph categorizes investments using the Global Industry Classification Standard (“GICS”), however, the sector classifications used by the portfolio management team may differ from GICS. The percentage shown for each investment category reflects the value of investments in that category as a percentage of market value. Short-term investments represent repurchase agreements. The graph depicts the Fund’s investments but may not represent the Fund’s market exposure due to the exclusion of certain derivatives, if any, as listed in the Additional Investment Information section of the Schedule of Investments. |
53
PORTFOLIO RESULTS
Goldman Sachs U.S. Equity Fund
Portfolio Composition
The Fund invests primarily in large-capitalization U.S. equity investments. Since the Fund’s inception, the Goldman Sachs Growth Investment Team and the Goldman Sachs Value Investment Team have focused on several key investment criteria that they believe can drive a company’s growth over the long term. These characteristics are: dominant market share, established brand name, pricing power, recurring revenue stream, free cash flow, high returns on invested capital, predictable growth, sustainable growth, long product life cycle, enduring competitive advantage, favorable demographic trends and excellent management. The Teams strive to purchase these companies at reasonable valuations in order to capture the full benefits of their growth.
Portfolio Management Discussion and Analysis
Below, the Goldman Sachs Growth Investment Team and the Goldman Sachs Value Investment Team discuss the Goldman Sachs U.S. Equity Fund’s (the “Fund”) performance and positioning for the six-month period ended February 28, 2013 (the “Reporting Period”).
| Q | | How did the Fund perform during the Reporting Period? |
| A | | During the Reporting Period, the Fund’s Class A, C, Institutional, IR and R Shares generated cumulative total returns, without sales charges, of 9.59%, 9.23%, 9.86%, 9.77% and 9.55%, respectively. These returns compare to the 8.95% cumulative total return of the Fund’s benchmark, the Standard & Poor’s 500® Index (the “S&P 500 Index”), during the same period. |
| Q | | What key factors were responsible for the Fund’s performance during the Reporting Period? |
| A | | Stock selection overall contributed most to the Fund’s performance relative to the S&P 500 Index during the Reporting Period. |
| Q | | Which equity market sectors most significantly affected Fund performance? |
| A | | Effective stock selection in the financials, information technology and telecommunication services sectors helped the Fund’s relative results most. The only two sectors to detract from the Fund’s performance relative to the S&P 500 Index were energy and consumer discretionary, both attributable to weak stock selection. |
| Q | | What were some of the Fund’s best-performing individual stocks? |
| A | | The Fund benefited most relative to the S&P 500 Index from positions in diversified banking institutions JPMorgan Chase and Bank of America and in home improvement and buildings products manufacturer and installer Masco. |
| | In the financials sector, the Fund’s holding in JPMorgan Chase contributed positively to performance during the Reporting Period. Its stock improved as concerns surrounding the company’s multi-billion trading loss and other litigation risks subsided and as the company reported better than expected third calendar quarter results. In addition, the company’s management discussed returning value to shareholders and assured investors the company was on track to meet Basel III capital requirements. (Basel III is a global regulatory standard relating to banks’ capital adequacy and liquidity.) By the end of the Reporting Period, we had trimmed the Fund’s position in JPMorgan Chase, taking profits, but maintained the holding, as we continued to have conviction in JPMorgan Chase’s management team and believed the company would benefit from what we considered to be its strong balance sheet, resilient business model and robust capital generating franchises. |
| | A position in Bank of America also contributed strongly to the Fund’s results during the Reporting Period, posting one of the largest gains in the S&P 500 Index during the fourth quarter of 2012. The company made progress on legacy, or long-standing, issues, particularly relating to its mortgage business, and recent settlements reduced litigation risks. Bank of America also increased its capital adequacy ratios over the past few years, which should allow, we believe, the company to invest more capital back into its businesses as the need to build additional reserves decreases. On the expense side, |
54
PORTFOLIO RESULTS
| | Bank of America lowered its funding costs and closed less profitable banking centers. Should its management continue to take steps to reduce expenses as anticipated, we believe additional cost savings could benefit the company’s earnings over the coming years. We believe earnings improvement seen in 2012 may well continue in 2013, and we believe the company should also benefit from its high exposure to the improving housing market. Due to its strong performance, we trimmed the Fund’s position in Bank of America but maintained the holding. |
| | Shares of Masco increased after reporting third quarter 2012 earnings that beat estimates on higher operating margins. At the end of the Reporting Period, we believed Masco still has room to improve results, in part from additional restructuring efforts in its cabinet and installation segments. In our view, Masco was also well positioned to benefit from an improving housing market in the U.S. through increased demand for its products. We believed the combination of cost savings initiatives and higher volumes should lead to margin expansion and greater returns on invested capital. |
| Q | | Which stocks detracted significantly from the Fund’s performance during the Reporting Period? |
| A | | Detracting most from the Fund’s results relative to its benchmark index were positions in independent oil and gas exploration and production company Devon Energy, biotechnology company Vertex Pharmaceuticals and computer memory device manufacturer EMC. |
| | The Fund’s stock selection in the energy sector detracted from performance during the Reporting Period, largely driven by Devon Energy, a North America-focused independent energy company engaged in the exploration, development and production of oil, natural gas and natural gas liquids (“NGLs”). During the Reporting Period, shares of Devon Energy fell along with the broader energy sector due to a decline in oil prices. The company has shifted production and resources toward oil and NGLs over time. As a result, its shares fell further after it reported third calendar quarter production levels that missed expectations due to operating issues. The market was also disappointed by Devon Energy’s forecast for flat overall production in 2013. At the end of the Reporting Period, we recognized our investment thesis may take longer to play out than originally expected, however we believed the value of Devon’s Energy’s large, North American asset base was not fully recognized at its then-current market price. While natural gas output may fall, higher margin oil production should increase, which should lead to a more favorable production mix in our view. Further, Devon Energy’s management is reviewing a number of strategic options, including the creation of a master limited partnership with assets from the company’s midstream business. (The midstream component of the energy industry is usually defined as those companies providing products or services that help link the supply side, i.e. energy producers, and the demand side, i.e. energy end-users, for any type of energy commodity. Such midstream business can include, but are not limited to, those that process, store, market and transport various energy commodities.) We believe the company’s management is taking the right steps to bring out the value within its large asset base. We believe the company maintains a strong balance sheet, which, along with its joint venture partnerships, may help speed up the development of its oil properties. In addition, we believe its cash flow should increase in 2013, as the company projects to spend significantly less on acquiring new acreage. |
| | In October 2012, shares of Vertex Pharmaceuticals declined after a mid-stage study on the firm’s cystic fibrosis drug Kaleydeco did not meet investors’ expectations. Its shares continued to decline in November 2012 after a rival firm announced that a viable alternative to Vertex Pharmaceuticals’ hepatitis C drug Incivek cleared phase three trials. Its company management also announced third calendar quarter earnings that showed slowing Incivek sales and reimbursements for Kaleydeco in the European Union. Despite these setbacks, at the end of the Reporting Period, we continued to believe company has an attractive risk-reward profile with high upside potential. Already a market share leader in the treatment of hepatitis C, we believe Vertex Pharmaceuticals has the potential for margin and multiple expansion through further market penetration and pricing power. Further, in our view, the company maintained its first-mover advantage in cystic fibrosis treatments given its differentiated product pipeline. Holding more than $1 billion in cash, the company is sufficiently capitalized, in our view, to fund the development of its pipeline. |
| | Shares of EMC declined during the Reporting Period, primarily due to less than anticipated earnings. Such earnings weakness was attributable to investor concerns that the company lost market share and to a sluggish macro and potentially weak spending environment in 2013. EMC was also negatively impacted in January 2013 by disappointing quarterly results and guidance from VMware, in which EMC holds an approximately 80% stake. However, EMC’s high-end and mid-tier storage products continued to record consistent growth and were gaining market share. We added |
55
PORTFOLIO RESULTS
| | to the Fund’s position in EMC for this reason and because we believe that concerns over the company’s data storage business stem from the macro environment late in 2012 and that such concerns were overblown. At the end of the Reporting Period, we did not see any company specific issues. While governments’ technology budgets may be tightened in 2013, the company’s management expected strong global information technology spending by corporations to offset any weakness. Long-term, we also believe the outlook is favorable for information storage and virtualization. At the end of the Reporting Period, we believed EMC had a strong balance sheet and was trading below its average price to earnings ratio of recent years. As an industry leader in information storage, we found shares of the company to be attractively valued. |
| Q | | How did the Fund use derivatives and similar instruments during the Reporting Period? |
| A | | During the Reporting Period, we did not use derivatives as part of an active management strategy. |
| Q | | Did the Fund make any significant purchases or sales during the Reporting Period? |
| A | | We initiated a Fund position in Duke Energy during the Reporting Period. The company has a strong dividend yield and, at the time of purchase, was trading at a discount to its peers as uncertainty around regulatory issues heightened and as the company completes its merger with Progress Energy. We believe the near-term concerns are temporary. In our view, earnings growth should be driven ahead by continued investments in environmental and infrastructure projects and modest growth in electricity demand. |
| | We established a Fund position in Activision Blizzard, a leading publisher of gaming software and content, during the Reporting Period. Activision Blizzard owns three of the largest franchises in the electronic gaming industry — Call of Duty and Skylanders on console and World of Warcraft on personal computer. World of Warcraft is offered through a monthly subscription model that provides a large and reliable stream of cash flow, which, in turn, can be used to invest for growth in newer intellectual properties. In our view, these newer properties, including Call of Duty and Skylanders, and upcoming new releases have margin structures that are higher than the corporate average, which should drive Activision Blizzard’s operating margins higher if the company grows over the next few years as anticipated. In addition, we believe the company’s valuations were attractive at the time of purchase. |
| | Conversely, we sold the Fund’s position in software giant Microsoft. During the Reporting Period, Microsoft announced disappointing fiscal first quarter results caused by slower than expected enterprise adoption of the Windows 8 operating system. Investors were also disappointed by the sudden departure of the head of the Windows division. This departure was unexpected, as he was viewed by many as a potential chief executive officer successor. We exited the Fund’s position in Microsoft prior to this announcement, based on our view of slower anticipated growth ahead and limited traction in the mobile computing industry. While Microsoft pays an attractive dividend and should continue to generate large amounts of free cash flow, we believe its flagship Windows product is maturing. We also see the changes being driven by mobile and cloud computing potentially leading to disruptions in the company’s markets. |
| | We exited the Fund’s position in enterprise software firm Oracle. Oracle has dominant market share in database management software, and the company outperformed other information technology names and the broader U.S. equity market during the Reporting Period. As a result, we sold the Fund’s shares in Oracle, taking profits, and re-allocated the proceeds to opportunities that we considered to have greater return potential. |
| Q | | Were there any notable changes in the Fund’s weightings during the Reporting Period? |
| A | | In constructing the Fund’s portfolio, we focus on picking stocks rather than on making industry or sector bets. We seek to outpace the benchmark index by overweighting stocks that we expect to outperform and underweighting those that we think may lag. Consequently, changes in its sector weights are generally the direct result of individual stock selection or of stock appreciation or depreciation. That said, during the Reporting Period, the Fund’s exposure to financials and industrials increased and its allocations to telecommunication services, information technology, utilities and health care decreased compared to the S&P 500 Index. |
| Q | | How was the Fund positioned relative to its benchmark index at the end of February 2012? |
| A | | At the end of February 2013, the Fund had overweighted positions relative to the S&P 500 Index in financials and consumer discretionary. On the same date, the Fund had underweighted positions compared to the S&P 500 Index in materials, health care, consumer staples, industrials and utilities and was rather neutrally weighted to the S&P 500 Index in telecommunication services, information technology and energy. |
56
FUND BASICS
U.S. Equity Fund
as of February 28, 2013

| | | | | | | | | | |
| | PERFORMANCE REVIEW | |
| | | September 1, 2012–February 28, 2013 | | Fund Total Return
(based on NAV)1 | | | S&P 500 Index2 | |
| | Class A | | | 9.59 | % | | | 8.95 | % |
| | Class C | | | 9.23 | | | | 8.95 | |
| | Institutional | | | 9.86 | | | | 8.95 | |
| | Class IR | | | 9.77 | | | | 8.95 | |
| | | Class R | | | 9.55 | | | | 8.95 | |
| | 1 | | The net asset value (“NAV”) represents the net assets of the class of the Fund (ex-dividend) divided by the total number of shares of the class outstanding. The Fund’s performance reflects the reinvestment of dividends and other distributions. The Fund’s performance does not reflect the deduction of any applicable sales charges. |
| | 2 | | The S&P 500 Index is the Standard & Poor’s 500 Composite Index of 500 stocks, an unmanaged index of common stock prices. The Index figures do not reflect any deduction for fees, expenses or taxes. It is not possible to invest directly in an index. |
| | | | | | | | | | |
| | STANDARDIZED TOTAL RETURNS3 |
| | | For the period ended 12/31/12 | | One Year | | | Since Inception | | Inception Date |
| | Class A | | | 11.68 | % | | 6.89% | | 11/30/09 |
| | Class C | | | 16.29 | | | 8.02 | | 11/30/09 |
| | Institutional | | | 18.67 | | | 9.30 | | 11/30/09 |
| | Class IR | | | 18.48 | | | 9.10 | | 11/30/09 |
| | | Class R | | | 17.96 | | | 8.58 | | 11/30/09 |
| | 3 | | The Standardized Total Returns are average annual total returns as of the most recent calendar quarter-end. They assume reinvestment of all distributions at NAV. These returns reflect a maximum initial sales charge of 5.5% for Class A Shares and the assumed contingent deferred sales charge for Class C Shares (1% if redeemed within 12 months of purchase). Because Institutional, Class IR and Class R Shares do not involve a sales charge, such a charge is not applied to their Standardized Total Returns. |
| | | | The returns set forth in the tables above represent past performance. Past performance does not guarantee future results. The Fund’s investment return and principal value will fluctuate so that an investor’s shares, when redeemed, may be worth more or less than their original cost. Current performance may be lower or higher than the performance quoted above. Please visit our web site at www.goldmansachsfunds.com to obtain the most recent month-end returns. Performance reflects applicable fee waivers and/or expense limitations in effect during the periods shown. In their absence, performance would be reduced. Returns do not reflect the deduction of taxes that a shareholder would pay on Fund distributions or the redemption of Fund shares. |
57
FUND BASICS
| | | | | | | | | | |
| | EXPENSE RATIOS4 | |
| | | | | Net Expense Ratio (Current) | | | Gross Expense Ratio (Before Waivers) | |
| | Class A | | | 1.18 | % | | | 3.63 | % |
| | Class C | | | 1.93 | | | | 4.38 | |
| | Institutional | | | 0.78 | | | | 3.23 | |
| | Class IR | | | 0.93 | | | | 3.38 | |
| | | Class R | | | 1.43 | | | | 3.88 | |
| | 4 | | The expense ratios of the Fund, both current (net of applicable fee waivers and/or expense limitations) and before waivers (gross of applicable fee waivers and/or expense limitations) are as set forth above according to the most recent publicly available Prospectus for the Fund and may differ from the expense ratios disclosed in the Financial Highlights in this report. The Fund’s waivers and/or expense limitations will remain in place through at least December 29, 2013, and prior to such date the investment adviser may not terminate the arrangements without the approval of the Fund’s Board of Trustees. If these arrangements are discontinued in the future, the expense ratios may change without shareholder approval. |
| | | | | | | | |
| | TOP TEN HOLDINGS AS OF 2/28/135 |
| | | Holding | | % of Net Assets | | | Line of Business |
| | General Electric Co. | | | 4.2 | % | | Industrial Conglomerates |
| | Apple, Inc. | | | 3.9 | | | Computers & Peripherals |
| | Exxon Mobil Corp. | | | 3.2 | | | Oil, Gas & Consumable Fuels |
| | JPMorgan Chase & Co. | | | 3.2 | | | Diversified Financial Services |
| | Google, Inc. Class A | | | 2.8 | | | Internet Software & Services |
| | The Procter & Gamble Co. | | | 2.8 | | | Household Products |
| | The Boeing Co. | | | 2.8 | | | Aerospace & Defense |
| | NIKE, Inc. Class B | | | 2.4 | | | Textiles, Apparel & Luxury Goods |
| | SBA Communications Corp. Class A | | | 2.4 | | | Wireless Telecommunication Services |
| | | Devon Energy Corp. | | | 2.3 | | | Oil, Gas & Consumable Fuels |
| | 5 | | The top 10 holdings may not be representative of the Fund’s future investments. |
58
FUND BASICS
|
| FUND VS. BENCHMARK SECTOR ALLOCATION6 |
| As of February 28, 2013 |
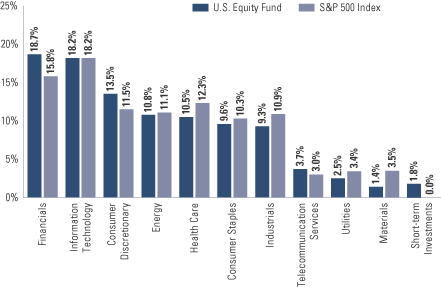
| | 6 | | The Fund is actively managed and, as such, its composition may differ over time. Consequently, the Fund’s overall sector allocations may differ from the percentages contained in the graph above. The graph categorizes investments using Global Industry Classification Standard (“GICS”), however, the sector classifications used by the portfolio management team may differ from GICS. The percentage shown for each investment category reflects the value of investments in that category as a percentage of market value. Short-term investments represent repurchase agreements. The graph depicts the Fund’s investments but may not represent the Fund’s market exposure due to the exclusion of certain derivatives, if any, as listed in the Additional Investment Information section of the Schedule of Investments. |
59
GOLDMAN SACHS CAPITAL GROWTH FUND
Schedule of Investments
February 28, 2013 (Unaudited)
| | | | | | | | |
| Shares | | | Description | |
Value | |
| | | | | | | | |
| | Common Stocks – 99.8% | | | | |
| | Aerospace & Defense – 4.0% | |
| | 295,844 | | | Honeywell International, Inc. | | $ | 20,738,665 | |
| | 169,437 | | | The Boeing Co. | | | 13,029,705 | |
| | | | | | | | |
| | | | | | | 33,768,370 | |
| | |
| | Air Freight & Logistics – 0.8% | |
| | 66,358 | | | FedEx Corp. | | | 6,996,124 | |
| | |
| | Beverages – 3.8% | |
| | 115,967 | | | Beam, Inc. | | | 7,077,466 | |
| | 76,182 | | | Diageo PLC ADR | | | 9,119,747 | |
| | 201,651 | | | PepsiCo., Inc. | | | 15,279,096 | |
| | | | | | | | |
| | | | | | | 31,476,309 | |
| | |
| | Biotechnology* – 4.7% | |
| | 152,737 | | | Celgene Corp. | | | 15,759,404 | |
| | 379,362 | | | Gilead Sciences, Inc. | | | 16,202,551 | |
| | 151,614 | | | Vertex Pharmaceuticals, Inc. | | | 7,098,567 | |
| | | | | | | | |
| | | | | | | 39,060,522 | |
| | |
| | Capital Markets – 0.6% | |
| | 75,824 | | | T. Rowe Price Group, Inc. | | | 5,397,910 | |
| | |
| | Chemicals – 2.7% | |
| | 57,235 | | | Ecolab, Inc. | | | 4,381,339 | |
| | 47,145 | | | Monsanto Co. | | | 4,763,060 | |
| | 122,863 | | | Praxair, Inc. | | | 13,889,662 | |
| | | | | | | | |
| | | | | | | 23,034,061 | |
| | |
| | Communications Equipment – 3.4% | |
| | 430,704 | | | QUALCOMM, Inc. | | | 28,267,103 | |
| | |
| | Computers & Peripherals – 8.3% | |
| | 137,849 | | | Apple, Inc. | | | 60,846,549 | |
| | 259,627 | | | NetApp, Inc.* | | | 8,783,181 | |
| | | | | | | | |
| | | | | | | 69,629,730 | |
| | |
| | Construction & Engineering* – 0.3% | |
| | 101,119 | | | Quanta Services, Inc. | | | 2,871,780 | |
| | |
| | Consumer Finance – 1.7% | |
| | 232,875 | | | American Express Co. | | | 14,473,181 | |
| | |
| | Diversified Financial Services – 3.5% | |
| | 179,158 | | | CME Group, Inc. | | | 10,717,231 | |
| | 79,419 | | | IntercontinentalExchange, Inc.* | | | 12,295,650 | |
| | 202,079 | | | MSCI, Inc. Class A* | | | 6,694,877 | |
| | | | | | | | |
| | | | | | | 29,707,758 | |
| | |
| | Electrical Equipment – 1.9% | |
| | 81,382 | | | Eaton Corp. PLC | | | 5,043,243 | |
| | 47,338 | | | Rockwell Automation, Inc. | | | 4,276,515 | |
| | 55,745 | | | Roper Industries, Inc. | | | 6,946,384 | |
| | | | | | | | |
| | | | | | | 16,266,142 | |
| | |
| | Electronic Equipment, Instruments & Components – 1.1% | |
| | 126,968 | | | Amphenol Corp. Class A | | | 8,996,952 | |
| | |
| | | | | | | | |
| | Common Stocks – (continued) | | | | |
| | Energy Equipment & Services – 3.7% | |
| | 153,002 | | | Halliburton Co. | | $ | 6,351,113 | |
| | 49,075 | | | National Oilwell Varco, Inc. | | | 3,343,480 | |
| | 276,667 | | | Schlumberger Ltd. | | | 21,538,526 | |
| | | | | | | | |
| | | | | | | 31,233,119 | |
| | |
| | Food & Staples Retailing – 2.9% | |
| | 158,080 | | | Costco Wholesale Corp. | | | 16,011,923 | |
| | 111,591 | | | Wal-Mart Stores, Inc. | | | 7,898,411 | |
| | | | | | | | |
| | | | | | | 23,910,334 | |
| | |
| | Health Care Equipment & Supplies – 2.7% | |
| | 320,754 | | | Abbott Laboratories | | | 10,838,278 | |
| | 41,315 | | | C.R. Bard, Inc. | | | 4,083,988 | |
| | 14,843 | | | Intuitive Surgical, Inc.* | | | 7,568,297 | |
| | | | | | | | |
| | | | | | | 22,490,563 | |
| | |
| | Health Care Providers & Services* – 0.7% | |
| | 63,931 | | | Henry Schein, Inc. | | | 5,703,924 | |
| | |
| | Hotels, Restaurants & Leisure – 4.4% | |
| | 38,004 | | | Chipotle Mexican Grill, Inc.* | | | 12,039,287 | |
| | 111,599 | | | Las Vegas Sands Corp. | | | 5,746,232 | |
| | 165,066 | | | Marriott International, Inc. Class A | | | 6,511,854 | |
| | 66,851 | | | McDonald’s Corp. | | | 6,411,011 | |
| | 96,937 | | | Yum! Brands, Inc. | | | 6,347,435 | |
| | | | | | | | |
| | | | | | | 37,055,819 | |
| | |
| | Household Products – 2.1% | |
| | 110,825 | | | Church & Dwight Co., Inc. | | | 6,866,717 | |
| | 19,292 | | | Colgate-Palmolive Co. | | | 2,207,584 | |
| | 115,712 | | | The Procter & Gamble Co. | | | 8,814,940 | |
| | | | | | | | |
| | | | | | | 17,889,241 | |
| | |
| | Industrial Conglomerates – 1.3% | |
| | 174,448 | | | Danaher Corp. | | | 10,745,997 | |
| | |
| | Internet & Catalog Retail* – 3.5% | |
| | 72,944 | | | Amazon.com, Inc. | | | 19,276,911 | |
| | 14,233 | | | Priceline.com, Inc. | | | 9,786,326 | |
| | | | | | | | |
| | | | | | | 29,063,237 | |
| | |
| | Internet Software & Services* – 6.7% | |
| | 64,165 | | | Equinix, Inc. | | | 13,574,106 | |
| | 144,891 | | | Facebook, Inc. Class A | | | 3,948,280 | |
| | 43,273 | | | Google, Inc. Class A | | | 34,670,327 | |
| | 76,345 | | | Rackspace Hosting, Inc. | | | 4,264,632 | |
| | | | | | | | |
| | | | | | | 56,457,345 | |
| | |
| | IT Services – 4.4% | |
| | 122,796 | | | Cognizant Technology Solutions Corp. Class A* | | | 9,427,049 | |
| | 56,843 | | | International Business Machines Corp. | | | 11,415,780 | |
| | 22,592 | | | MasterCard, Inc. Class A | | | 11,698,589 | |
| | 28,170 | | | Visa, Inc. Class A | | | 4,468,889 | |
| | | | | | | | |
| | | | | | | 37,010,307 | |
| | |
| | |
| 60 | | The accompanying notes are an integral part of these financial statements. |
GOLDMAN SACHS CAPITAL GROWTH FUND
| | | | | | | | |
| Shares | | | Description | |
Value | |
| | | | | | | | |
| | Common Stocks – (continued) | | | | |
| | Life Sciences Tools & Services – 1.1% | |
| | 215,244 | | | Agilent Technologies, Inc. | | $ | 8,928,321 | |
| | |
| | Machinery – 0.5% | |
| | 38,266 | | | Cummins, Inc. | | | 4,433,881 | |
| | |
| | Media – 2.9% | |
| | 84,056 | | | Discovery Communications, Inc. Class A* | | | 6,163,826 | |
| | 110,655 | | | Scripps Networks Interactive Class A | | | 6,976,798 | |
| | 185,052 | | | Viacom, Inc. Class B | | | 10,818,140 | |
| | | | | | | | |
| | | | | | | 23,958,764 | |
| | |
| | Multiline Retail* – 1.0% | |
| | 180,967 | | | Dollar General Corp. | | | 8,386,011 | |
| | |
| | Oil, Gas & Consumable Fuels – 0.5% | |
| | 32,870 | | | Pioneer Natural Resources Co. | | | 4,135,375 | |
| | |
| | Personal Products – 1.0% | |
| | 135,637 | | | The Estee Lauder Cos., Inc. Class A | | | 8,694,332 | |
| | |
| | Pharmaceuticals – 3.3% | |
| | 80,393 | | | Allergan, Inc. | | | 8,716,209 | |
| | 262,347 | | | Sanofi ADR | | | 12,385,402 | |
| | 66,661 | | | Shire PLC ADR | | | 6,243,469 | |
| | | | | | | | |
| | | | | | | 27,345,080 | |
| | |
| | Real Estate Investment Trusts – 2.4% | |
| | 256,272 | | | American Tower Corp. | | | 19,886,707 | |
| | |
| | Real Estate Management & Development* – 1.5% | |
| | 507,028 | | | CBRE Group, Inc. Class A | | | 12,254,867 | |
| | |
| | Semiconductors & Semiconductor Equipment – 1.2% | |
| | 277,621 | | | Xilinx, Inc. | | | 10,346,935 | |
| | |
| | Software – 5.0% | |
| | 1,028,144 | | | Activision Blizzard, Inc. | | | 14,702,459 | |
| | 57,249 | | | Citrix Systems, Inc.* | | | 4,058,954 | |
| | 447,921 | | | Oracle Corp. | | | 15,345,774 | |
| | 44,279 | | | Salesforce.com, Inc.* | | | 7,492,892 | |
| | | | | | | | |
| | | | | | | 41,600,079 | |
| | |
| | Specialty Retail – 1.3% | |
| | 114,437 | | | Limited Brands, Inc. | | | 5,209,172 | |
| | 84,180 | | | PetSmart, Inc. | | | 5,480,960 | |
| | | | | | | | |
| | | | | | | 10,690,132 | |
| | |
| | Textiles, Apparel & Luxury Goods – 4.1% | |
| | 41,217 | | | Lululemon Athletica, Inc.* | | | 2,763,600 | |
| | 353,103 | | | NIKE, Inc. Class B | | | 19,229,989 | |
| | 99,970 | | | PVH Corp. | | | 12,181,345 | |
| | | | | | | | |
| | | | | | | 34,174,934 | |
| | |
| | Tobacco – 2.5% | |
| | 225,419 | | | Philip Morris International, Inc. | | | 20,682,193 | |
| | |
| | | | | | | | |
| | Common Stocks – (continued) | | | | |
| | Wireless Telecommunication Services* – 2.3% | |
| | 269,734 | | | SBA Communications Corp. Class A | | $ | 19,183,482 | |
| | |
| | TOTAL COMMON STOCKS | |
| | (Cost $556,315,252) | | $ | 836,206,921 | |
| | |
| | | | | | | | | | | | | | |
Principal
Amount | | | Interest
Rate | | | Maturity
Date | | | Value | |
| | Short-term Investment(a) – 0.9% | |
| | Repurchase Agreement – 0.9% | |
| Joint Repurchase Agreement Account II | |
| $ | 7,500,000 | | | | 0.191 | % | | | 03/01/13 | | | $ | 7,500,000 | |
| | (Cost $7,500,000) | | | | | | | | | |
| | |
| | TOTAL INVESTMENTS – 100.7% | |
| | (Cost $563,815,252) | | | | | | | $ | 843,706,921 | |
| | |
| LIABILITIES IN EXCESS OF
OTHER ASSETS – (0.7)% |
| | | (6,126,869 | ) |
| | |
| | NET ASSETS – 100.0% | | | $ | 837,580,052 | |
| | |
| | |
| The percentage shown for each investment category reflects the value of investments in that category as a percentage of net assets. |
* | | Non-income producing security. |
(a) | | Joint repurchase agreement was entered into on February 28, 2013. Additional information appears on pages 76-77. |
| | |
|
Investment Abbreviation: |
| ADR | | —American Depositary Receipt |
|
| | |
| The accompanying notes are an integral part of these financial statements. | | 61 |
GOLDMAN SACHS CONCENTRATED GROWTH FUND
Schedule of Investments
February 28, 2013 (Unaudited)
| | | | | | | | |
| Shares | | | Description | |
Value | |
| | | | | | | | |
| | Common Stocks – 97.9% | |
| | Aerospace & Defense – 1.5% | |
| | 32,572 | | | Honeywell International, Inc. | | $ | 2,283,297 | |
| | |
| | Beverages – 2.3% | |
| | 46,190 | | | PepsiCo., Inc. | | | 3,499,816 | |
| | |
| | Biotechnology* – 1.6% | |
| | 50,758 | | | Vertex Pharmaceuticals, Inc. | | | 2,376,490 | |
| | |
| | Capital Markets – 1.6% | |
| | 45,066 | | | Northern Trust Corp. | | | 2,396,159 | |
| | |
| | Chemicals – 2.8% | |
| | 36,590 | | | Praxair, Inc. | | | 4,136,499 | |
| | |
| | Communications Equipment – 6.2% | |
| | 141,328 | | | QUALCOMM, Inc. | | | 9,275,357 | |
| | |
| | Computers & Peripherals – 9.7% | |
| | 26,053 | | | Apple, Inc. | | | 11,499,794 | |
| | 92,069 | | | NetApp, Inc.* | | | 3,114,694 | |
| | | | | | | | |
| | | | | | | 14,614,488 | |
| | |
| | Consumer Finance – 3.3% | |
| | 79,123 | | | American Express Co. | | | 4,917,494 | |
| | |
| | Diversified Financial Services* – 2.1% | |
| | 20,130 | | | IntercontinentalExchange, Inc. | | | 3,116,527 | |
| | |
| | Energy Equipment & Services – 7.0% | |
| | 66,142 | | | Halliburton Co. | | | 2,745,555 | |
| | 99,184 | | | Schlumberger Ltd. | | | 7,721,474 | |
| | | | | | | | |
| | | | | | | 10,467,029 | |
| | |
| | Food & Staples Retailing – 3.4% | |
| | 50,480 | | | Costco Wholesale Corp. | | | 5,113,119 | |
| | |
| | Health Care Equipment & Supplies – 1.4% | |
| | 63,255 | | | Abbott Laboratories | | | 2,137,386 | |
| | |
| | Hotels, Restaurants & Leisure – 5.4% | |
| | 10,059 | | | Chipotle Mexican Grill, Inc.* | | | 3,186,591 | |
| | 35,153 | | | Las Vegas Sands Corp. | | | 1,810,028 | |
| | 76,818 | | | Marriott International, Inc. Class A | | | 3,030,470 | |
| | | | | | | | |
| | | | | | | 8,027,089 | |
| | |
| | Household Products – 2.7% | |
| | 52,559 | | | The Procter & Gamble Co. | | | 4,003,945 | |
| | |
| | Internet & Catalog Retail* – 2.9% | |
| | 10,339 | | | Amazon.com, Inc. | | | 2,732,288 | |
| | 2,385 | | | Priceline.com, Inc. | | | 1,639,878 | |
| | | | | | | | |
| | | | | | | 4,372,166 | |
| | |
| | Internet Software & Services* – 10.7% | |
| | 20,729 | | | Equinix, Inc. | | | 4,385,220 | |
| | 11,684 | | | Google, Inc. Class A | | | 9,361,221 | |
| | 40,900 | | | Rackspace Hosting, Inc. | | | 2,284,674 | |
| | | | | | | | |
| | | | | | | 16,031,115 | |
| | |
| | IT Services – 2.2% | |
| | 6,476 | | | MasterCard, Inc. Class A | | | 3,353,402 | |
| | |
| | | | | | | | |
| | Common Stocks – (continued) | |
| | Multiline Retail* – 1.5% | |
| | 47,596 | | | Dollar General Corp. | | $ | 2,205,599 | |
| | |
| | Pharmaceuticals – 2.3% | |
| | 42,317 | | | AbbVie, Inc. | | | 1,562,344 | |
| | 50,975 | | | Teva Pharmaceutical Industries Ltd. ADR | | | 1,906,465 | |
| | | | | | | | |
| | | | | | | 3,468,809 | |
| | |
| | Real Estate Investment Trusts – 5.3% | |
| | 102,160 | | | American Tower Corp. | | | 7,927,616 | |
| | |
| | Real Estate Management & Development* – 3.6% | |
| | 226,219 | | | CBRE Group, Inc. Class A | | | 5,467,713 | |
| | |
| | Semiconductors & Semiconductor Equipment – 2.2% | |
| | 87,106 | | | Xilinx, Inc. | | | 3,246,441 | |
| | |
| | Software – 7.0% | |
| | 352,820 | | | Activision Blizzard, Inc. | | | 5,045,326 | |
| | 87,988 | | | Oracle Corp. | | | 3,014,469 | |
| | 14,622 | | | Salesforce.com, Inc.* | | | 2,474,335 | |
| | | | | | | | |
| | | | | | | 10,534,130 | |
| | |
| | Textiles, Apparel & Luxury Goods – 5.6% | |
| | 98,518 | | | NIKE, Inc. Class B | | | 5,365,290 | |
| | 25,387 | | | PVH Corp. | | | 3,093,406 | |
| | | | | | | | |
| | | | | | | 8,458,696 | |
| | |
| | Wireless Telecommunication Services* – 3.6% | |
| | 78,015 | | | Crown Castle International Corp. | | | 5,445,447 | |
| | |
| | TOTAL COMMON STOCKS | | | | |
| | (Cost $93,942,311) | | $ | 146,875,829 | |
| | |
| | | | | | | | | | | | | | |
Principal
Amount | | | Interest
Rate | | | Maturity
Date | | | Value | |
| | Short-term Investment(a) – 2.2% | |
| | Repurchase Agreement – 2.2% | |
| Joint Repurchase Agreement Account II | |
| $ | 3,400,000 | | | | 0.191 | % | | | 03/01/13 | | | $ | 3,400,000 | |
| | (Cost $3,400,000) | | | | | | | | | |
| | |
| | TOTAL INVESTMENTS – 100.1% | | | | | |
| | (Cost $97,342,311) | | | | | | | $ | 150,275,829 | |
| | |
| LIABILITIES IN EXCESS OF
OTHER ASSETS – (0.1)% |
| | | (196,695 | ) |
| | |
| | NET ASSETS – 100.0% | | | $ | 150,079,134 | |
| | |
| | |
| The percentage shown for each investment category reflects the value of investments in that category as a percentage of net assets. |
* | | Non-income producing security. |
(a) | | Joint repurchase agreement was entered into on February 28, 2013. Additional information appears on pages 76-77. |
| | |
|
Investment Abbreviation: |
ADR | | —American Depositary Receipt |
|
| | |
| 62 | | The accompanying notes are an integral part of these financial statements. |
GOLDMAN SACHS FLEXIBLE CAP GROWTH FUND
Schedule of Investments
February 28, 2013 (Unaudited)
| | | | | | | | |
| Shares | | | Description | |
Value | |
| | | | | | | | |
| | Common Stocks – 97.6% | |
| | Aerospace & Defense – 1.1% | |
| | 1,856 | | | Honeywell International, Inc. | | $ | 130,106 | |
| | |
| | Auto Components* – 0.4% | |
| | 2,946 | | | Gentherm, Inc. | | | 45,368 | |
| | |
| | Beverages – 2.9% | |
| | 1,038 | | | Beam, Inc. | | | 63,349 | |
| | 1,411 | | | Diageo PLC ADR | | | 168,911 | |
| | 1,657 | | | PepsiCo., Inc. | | | 125,551 | |
| | | | | | | | |
| | | | | | | 357,811 | |
| | |
| | Biotechnology* – 4.6% | |
| | 1,195 | | | BioMarin Pharmaceutical, Inc. | | | 69,274 | |
| | 1,095 | | | Celgene Corp. | | | 112,982 | |
| | 1,911 | | | Cepheid, Inc. | | | 69,618 | |
| | 3,050 | | | Gilead Sciences, Inc. | | | 130,266 | |
| | 3,770 | | | Vertex Pharmaceuticals, Inc. | | | 176,511 | |
| | | | | | | | |
| | | | | | | 558,651 | |
| | |
| | Capital Markets – 1.5% | |
| | 3,428 | | | Lazard Ltd. Class A | | | 123,065 | |
| | 1,199 | | | Northern Trust Corp. | | | 63,751 | |
| | | | | | | | |
| | | | | | | 186,816 | |
| | |
| | Chemicals – 3.5% | |
| | 1,035 | | | Airgas, Inc. | | | 103,790 | |
| | 567 | | | Ecolab, Inc. | | | 43,404 | |
| | 1,396 | | | International Flavors & Fragrances, Inc. | | | 101,880 | |
| | 1,567 | | | Praxair, Inc. | | | 177,149 | |
| | | | | | | | |
| | | | | | | 426,223 | |
| | |
| | Commercial Banks – 0.5% | |
| | 1,689 | | | First Republic Bank | | | 61,564 | |
| | |
| | Commercial Services & Supplies – 2.3% | |
| | 4,934 | | | Healthcare Services Group, Inc. | | | 118,909 | |
| | 4,020 | | | Ritchie Bros. Auctioneers, Inc. | | | 91,576 | |
| | 731 | | | Stericycle, Inc.* | | | 70,117 | |
| | | | | | | | |
| | | | | | | 280,602 | |
| | |
| | Communications Equipment – 3.3% | |
| | 6,195 | | | QUALCOMM, Inc. | | | 406,578 | |
| | |
| | Computers & Peripherals – 7.6% | |
| | 1,843 | | | Apple, Inc. | | | 813,500 | |
| | 3,399 | | | NetApp, Inc.* | | | 114,988 | |
| | | | | | | | |
| | | | | | | 928,488 | |
| | |
| | Construction & Engineering* – 0.8% | |
| | 3,440 | | | Quanta Services, Inc. | | | 97,696 | |
| | |
| | Consumer Finance – 2.1% | |
| | 2,598 | | | American Express Co. | | | 161,466 | |
| | 5,188 | | | SLM Corp. | | | 98,416 | |
| | | | | | | | |
| | | | | | | 259,882 | |
| | |
| | Diversified Consumer Services* – 0.8% | |
| | 1,843 | | | Coinstar, Inc. | | | 94,343 | |
| | |
| | | | | | | | |
| | Common Stocks – (continued) | |
| | Diversified Financial Services – 3.1% | |
| | 2,044 | | | CME Group, Inc. | | $ | 122,272 | |
| | 1,081 | | | IntercontinentalExchange, Inc.* | | | 167,360 | |
| | 2,783 | | | MSCI, Inc. Class A* | | | 92,201 | |
| | | | | | | | |
| | | | | | | 381,833 | |
| | |
| | Diversified Telecommunication Services* – 0.8% | |
| | 3,949 | | | TW telecom, Inc. | | | 99,989 | |
| | |
| | Electrical Equipment – 1.3% | |
| | 899 | | | Rockwell Automation, Inc. | | | 81,216 | |
| | 567 | | | Roper Industries, Inc. | | | 70,654 | |
| | | | | | | | |
| | | | | | | 151,870 | |
| | |
| | Electronic Equipment, Instruments & Components – 1.5% | |
| | 2,019 | | | Amphenol Corp. Class A | | | 143,067 | |
| | 3,713 | | | RealD, Inc.* | | | 43,219 | |
| | | | | | | | |
| | | | | | | 186,286 | |
| | |
| | Energy Equipment & Services – 3.8% | |
| | 1,767 | | | Halliburton Co. | | | 73,348 | |
| | 796 | | | National-Oilwell Varco, Inc. | | | 54,232 | |
| | 4,279 | | | Schlumberger Ltd. | | | 333,120 | |
| | | | | | | | |
| | | | | | | 460,700 | |
| | |
| | Food & Staples Retailing – 2.6% | |
| | 2,397 | | | Costco Wholesale Corp. | | | 242,792 | |
| | 3,839 | | | The Chefs’ Warehouse, Inc.* | | | 69,102 | |
| | | | | | | | |
| | | | | | | 311,894 | |
| | |
| | Food Products* – 0.8% | |
| | 1,007 | | | The Hain Celestial Group, Inc. | | | 55,133 | |
| | 786 | | | TreeHouse Foods, Inc. | | | 45,895 | |
| | | | | | | | |
| | | | | | | 101,028 | |
| | |
| | Health Care Equipment & Supplies – 2.3% | |
| | 3,512 | | | Abbott Laboratories | | | 118,671 | |
| | 925 | | | C.R. Bard, Inc. | | | 91,436 | |
| | 2,123 | | | CareFusion Corp.* | | | 69,507 | |
| | | | | | | | |
| | | | | | | 279,614 | |
| | |
| | Health Care Providers & Services* – 1.7% | |
| | 3,077 | | | ExamWorks Group, Inc. | | | 43,570 | |
| | 1,156 | | | Henry Schein, Inc. | | | 103,138 | |
| | 714 | | | MEDNAX, Inc. | | | 61,133 | |
| | | | | | | | |
| | | | | | | 207,841 | |
| | |
| | Hotels, Restaurants & Leisure – 2.8% | |
| | 472 | | | Chipotle Mexican Grill, Inc.* | | | 149,525 | |
| | 2,323 | | | Marriott International, Inc. Class A | | | 91,642 | |
| | 1,452 | | | Yum! Brands, Inc. | | | 95,077 | |
| | | | | | | | |
| | | | | | | 336,244 | |
| | |
| | Household Products – 1.8% | |
| | 1,352 | | | Church & Dwight Co., Inc. | | | 83,770 | |
| | 1,819 | | | The Procter & Gamble Co. | | | 138,571 | |
| | | | | | | | |
| | | | | | | 222,341 | |
| | |
| | |
| The accompanying notes are an integral part of these financial statements. | | 63 |
GOLDMAN SACHS FLEXIBLE CAP GROWTH FUND
Schedule of Investments (continued)
February 28, 2013 (Unaudited)
| | | | | | | | |
| Shares | | | Description | |
Value | |
| | | | | | | | |
| | Common Stocks – (continued) | |
| | Industrial Conglomerates – 0.8% | |
| | 1,652 | | | Danaher Corp. | | $ | 101,763 | |
| | |
| | Internet & Catalog Retail* – 2.7% | |
| | 731 | | | Amazon.com, Inc. | | | 193,181 | |
| | 205 | | | Priceline.com, Inc. | | | 140,954 | |
| | | | | | | | |
| | | | | | | 334,135 | |
| | |
| | Internet Software & Services* – 5.9% | |
| | 663 | | | Equinix, Inc. | | | 140,258 | |
| | 597 | | | Google, Inc. Class A | | | 478,316 | |
| | 1,737 | | | Rackspace Hosting, Inc. | | | 97,029 | |
| | | | | | | | |
| | | | | | | 715,603 | |
| | |
| | IT Services – 3.7% | |
| | 873 | | | Cognizant Technology Solutions Corp. Class A* | | | 67,020 | |
| | 4,479 | | | InterXion Holding NV* | | | 110,766 | |
| | 338 | | | MasterCard, Inc. Class A | | | 175,023 | |
| | 651 | | | Visa, Inc. Class A | | | 103,275 | |
| | | | | | | | |
| | | | | | | 456,084 | |
| | |
| | Life Sciences Tools & Services – 0.9% | |
| | 2,608 | | | Agilent Technologies, Inc. | | | 108,180 | |
| | |
| | Machinery – 2.3% | |
| | 1,182 | | | Graco, Inc. | | | 68,674 | |
| | 1,078 | | | IDEX Corp. | | | 54,902 | |
| | 3,997 | | | Kennametal, Inc. | | | 161,799 | |
| | | | | | | | |
| | | | | | | 285,375 | |
| | |
| | Media – 2.7% | |
| | 1,246 | | | Discovery Communications, Inc. Class A* | | | 91,369 | |
| | 6,290 | | | Pandora Media, Inc.* | | | 76,738 | |
| | 1,181 | | | Scripps Networks Interactive Class A | | | 74,462 | |
| | 1,390 | | | Viacom, Inc. Class B | | | 81,260 | |
| | | | | | | | |
| | | | | | | 323,829 | |
| | |
| | Multiline Retail* – 1.1% | |
| | 2,860 | | | Dollar General Corp. | | | 132,532 | |
| | |
| | Oil, Gas & Consumable Fuels* – 0.5% | |
| | 1,317 | | | Whiting Petroleum Corp. | | | 64,138 | |
| | |
| | Personal Products – 0.5% | |
| | 961 | | | The Estee Lauder Cos., Inc. Class A | | | 61,600 | |
| | |
| | Pharmaceuticals – 1.3% | |
| | 630 | | | Allergan, Inc. | | | 68,305 | |
| | 953 | | | Shire PLC ADR | | | 89,258 | |
| | | | | | | | |
| | | | | | | 157,563 | |
| | |
| | Real Estate Investment Trusts – 1.9% | |
| | 3,015 | | | American Tower Corp. | | | 233,964 | |
| | |
| | Real Estate Management & Development* – 1.6% | |
| | 8,086 | | | CBRE Group, Inc. Class A | | | 195,439 | |
| | |
| | Road & Rail* – 0.6% | |
| | 3,421 | | | Roadrunner Transportation Systems, Inc. | | | 77,930 | |
| | |
| | | | | | | | |
| | Common Stocks – (continued) | |
| | Semiconductors & Semiconductor Equipment – 1.7% | |
| | 923 | | | Hittite Microwave Corp.* | | $ | 59,829 | |
| | 3,865 | | | Xilinx, Inc. | | | 144,048 | |
| | | | | | | | |
| | | | | | | 203,877 | |
| | |
| | Software – 5.1% | |
| | 7,927 | | | Activision Blizzard, Inc. | | | 113,356 | |
| | 807 | | | Citrix Systems, Inc.* | | | 57,216 | |
| | 2,408 | | | MICROS Systems, Inc.* | | | 103,063 | |
| | 5,511 | | | Oracle Corp. | | | 188,807 | |
| | 900 | | | Salesforce.com, Inc.* | | | 152,298 | |
| | | | | | | | |
| | | | | | | 614,740 | |
| | |
| | Specialty Retail – 2.7% | |
| | 1,670 | | | Dick’s Sporting Goods, Inc. | | | 83,500 | |
| | 971 | | | Limited Brands, Inc. | | | 44,200 | |
| | 1,527 | | | PetSmart, Inc. | | | 99,423 | |
| | 1,076 | | | Restoration Hardware Holdings, Inc.* | | | 41,544 | |
| | 878 | | | Tiffany & Co. | | | 58,967 | |
| | | | | | | | |
| | | | | | | 327,634 | |
| | |
| | Textiles, Apparel & Luxury Goods – 4.6% | |
| | 940 | | | Carter’s, Inc.* | | | 53,025 | |
| | 1,572 | | | Deckers Outdoor Corp.* | | | 63,415 | |
| | 803 | | | Lululemon Athletica, Inc.* | | | 53,841 | |
| | 3,881 | | | NIKE, Inc. Class B | | | 211,359 | |
| | 1,417 | | | PVH Corp. | | | 172,662 | |
| | | | | | | | |
| | | | | | | 554,302 | |
| | |
| | Tobacco – 1.0% | |
| | 1,363 | | | Philip Morris International, Inc. | | | 125,055 | |
| | |
| | Wireless Telecommunication Services* – 2.1% | |
| | 3,506 | | | SBA Communications Corp. Class A | | | 249,347 | |
| | |
| | TOTAL COMMON STOCKS | | | | |
| | (Cost $8,489,508) | | $ | 11,896,858 | |
| | |
| | |
| 64 | | The accompanying notes are an integral part of these financial statements. |
GOLDMAN SACHS FLEXIBLE CAP GROWTH FUND
| | | | | | | | | | | | | | |
Principal
Amount | | | Interest
Rate | | | Maturity
Date | | | Value | |
| | Short-term Investment(a) – 1.6% | |
| | Repurchase Agreement – 1.6% | |
| | Joint Repurchase Agreement Account II | |
| $ | 200,000 | | | | 0.191 | % | | | 03/01/13 | | | $ | 200,000 | |
| | (Cost $200,000) | | | | | | | | | |
| | |
| | TOTAL INVESTMENTS – 99.2% | |
| | (Cost $8,689,508) | | | | | | | $ | 12,096,858 | |
| | |
| OTHER ASSETS IN EXCESS OF
LIABILITIES – 0.8% |
| | | 92,600 | |
| | |
| | NET ASSETS – 100.0% | | | $ | 12,189,458 | |
| | |
| | |
| The percentage shown for each investment category reflects the value of investments in that category as a percentage of net assets. |
* | | Non-income producing security. |
(a) | | Joint repurchase agreement was entered into on February 28, 2013. Additional information appears on pages 76-77. |
| | |
|
Investment Abbreviation: |
ADR | | —American Depositary Receipt |
|
| | |
| The accompanying notes are an integral part of these financial statements. | | 65 |
GOLDMAN SACHS FOCUSED GROWTH FUND
Schedule of Investments
February 28, 2013 (Unaudited)
| | | | | | | | |
| Shares | | | Description | |
Value | |
| | | | | | | | |
| | Common Stocks – 97.9% | |
| | Capital Markets – 4.6% | |
| | 10,550 | | | Northern Trust Corp. | | $ | 560,943 | |
| | |
| | Chemicals – 2.8% | |
| | 3,010 | | | Praxair, Inc. | | | 340,281 | |
| | |
| | Communications Equipment – 7.5% | |
| | 14,095 | | | QUALCOMM, Inc. | | | 925,055 | |
| | |
| | Computers & Peripherals – 8.5% | |
| | 2,379 | | | Apple, Inc. | | | 1,050,091 | |
| | |
| | Consumer Finance – 4.6% | |
| | 9,103 | | | American Express Co. | | | 565,751 | |
| | |
| | Diversified Financial Services* – 3.1% | |
| | 2,477 | | | IntercontinentalExchange, Inc. | | | 383,489 | |
| | |
| | Energy Equipment & Services – 7.6% | |
| | 7,423 | | | Halliburton Co. | | | 308,129 | |
| | 7,985 | | | Schlumberger Ltd. | | | 621,632 | |
| | | | | | | | |
| | | | | | | 929,761 | |
| | |
| | Food & Staples Retailing – 4.5% | |
| | 5,398 | | | Costco Wholesale Corp. | | | 546,763 | |
| | |
| | Hotels, Restaurants & Leisure – 4.2% | |
| | 917 | | | Chipotle Mexican Grill, Inc.* | | | 290,496 | |
| | 5,821 | | | Marriott International, Inc. Class A | | | 229,639 | |
| | | | | | | | |
| | | | | | | 520,135 | |
| | |
| | Internet Software & Services* – 14.1% | |
| | 2,617 | | | Equinix, Inc. | | | 553,627 | |
| | 1,165 | | | Google, Inc. Class A | | | 933,398 | |
| | 4,469 | | | Rackspace Hosting, Inc. | | | 249,638 | |
| | | | | | | | |
| | | | | | | 1,736,663 | |
| | |
| | IT Services – 3.2% | |
| | 756 | | | MasterCard, Inc. Class A | | | 391,472 | |
| | |
| | Real Estate Investment Trusts – 5.2% | |
| | 8,238 | | | American Tower Corp. | | | 639,269 | |
| | |
| | Real Estate Management & Development* – 4.8% | |
| | 24,288 | | | CBRE Group, Inc. Class A | | | 587,041 | |
| | |
| | Semiconductors & Semiconductor Equipment – 3.3% | |
| | 10,735 | | | Xilinx, Inc. | | | 400,093 | |
| | |
| | Software – 4.8% | |
| | 41,574 | | | Activision Blizzard, Inc. | | | 594,508 | |
| | |
| | Textiles, Apparel & Luxury Goods – 10.4% | |
| | 13,530 | | | NIKE, Inc. Class B | | | 736,844 | |
| | 4,483 | | | PVH Corp. | | | 546,253 | |
| | | | | | | | |
| | | | | | | 1,283,097 | |
| | |
| | | | | | | | |
| | Common Stocks – (continued) | |
| | Wireless Telecommunication Services* – 4.7% | |
| | 8,130 | | | SBA Communications Corp. Class A | | $ | 578,206 | |
| | |
| | TOTAL COMMON STOCKS | | | | |
| | (Cost $11,159,841) | | $ | 12,032,618 | |
| | |
| | | | | | | | | | | | | | |
Principal
Amount | | | Interest
Rate | | | Maturity
Date | | | Value | |
| | | | | | | | | | | | | | |
| | Short-term Investment(a) – 2.4% | |
| | Repurchase Agreement – 2.4% | |
| Joint Repurchase Agreement Account II | |
| $ | 300,000 | | | | 0.191 | % | | | 03/01/13 | | | $ | 300,000 | |
| | (Cost $300,000) | | | | | |
| | |
| | TOTAL INVESTMENTS – 100.3% | | | | | |
| | (Cost $11,459,841) | | | $ | 12,332,618 | |
| | |
| LIABILITIES IN EXCESS OF
OTHER ASSETS – (0.3)% |
| | | (38,728 | ) |
| | |
| | NET ASSETS – 100.0% | | | $ | 12,293,890 | |
| | |
| | |
| The percentage shown for each investment category reflects the value of investments in that category as a percentage of net assets. |
* | | Non-income producing security. |
(a) | | Joint repurchase agreement was entered into on February 28, 2013. Additional information appears on pages 76-77. |
| | |
| 66 | | The accompanying notes are an integral part of these financial statements. |
GOLDMAN SACHS GROWTH OPPORTUNITIES FUND
Schedule of Investments
February 28, 2013 (Unaudited)
| | | | | | | | |
| Shares | | | Description | |
Value | |
| | | | | | | | |
| | Common Stocks – 98.3% | |
| | Air Freight & Logistics – 0.5% | |
| | 416,413 | | | C.H. Robinson Worldwide, Inc. | | $ | 23,743,869 | |
| | |
| | Beverages – 1.2% | |
| | 870,096 | | | Beam, Inc. | | | 53,101,959 | |
| | |
| | Biotechnology* – 4.9% | |
| | 258,229 | | | Alexion Pharmaceuticals, Inc. | | | 22,398,784 | |
| | 1,288,541 | | | ARIAD Pharmaceuticals, Inc. | | | 27,098,017 | |
| | 640,688 | | | BioMarin Pharmaceutical, Inc. | | | 37,140,683 | |
| | 1,247,868 | | | Cepheid, Inc. | | | 45,459,831 | |
| | 342,247 | | | Medivation, Inc. | | | 16,818,018 | |
| | 1,382,973 | | | Vertex Pharmaceuticals, Inc. | | | 64,750,796 | |
| | | | | | | | |
| | | | | | | 213,666,129 | |
| | |
| | Capital Markets – 4.4% | |
| | 1,756,139 | | | Lazard Ltd. Class A | | | 63,045,390 | |
| | 1,358,035 | | | Northern Trust Corp. | | | 72,206,721 | |
| | 825,692 | | | T. Rowe Price Group, Inc. | | | 58,781,014 | |
| | | | | | | | |
| | | | | | | 194,033,125 | |
| | |
| | Chemicals – 4.7% | |
| | 806,297 | | | Airgas, Inc. | | | 80,855,463 | |
| | 859,602 | | | Ecolab, Inc. | | | 65,802,533 | |
| | 840,375 | | | International Flavors & Fragrances, Inc. | | | 61,330,568 | |
| | | | | | | | |
| | | | | | | 207,988,564 | |
| | |
| | Commercial Banks – 1.7% | |
| | 2,102,138 | | | First Republic Bank | | | 76,622,930 | |
| | |
| | Commercial Services & Supplies – 1.5% | |
| | 2,841,305 | | | Ritchie Bros. Auctioneers, Inc. | | | 64,724,928 | |
| | |
| | Communications Equipment* – 0.5% | |
| | 1,160,728 | | | Juniper Networks, Inc. | | | 24,003,855 | |
| | |
| | Computers & Peripherals* – 1.4% | |
| | 1,757,890 | | | NetApp, Inc. | | | 59,469,419 | |
| | |
| | Construction & Engineering* – 1.0% | |
| | 1,526,554 | | | Quanta Services, Inc. | | | 43,354,134 | |
| | |
| | Consumer Finance – 1.4% | |
| | 3,316,690 | | | SLM Corp. | | | 62,917,609 | |
| | |
| | Diversified Consumer Services* – 1.4% | |
| | 1,234,325 | | | Coinstar, Inc. | | | 63,185,097 | |
| | |
| | Diversified Financial Services* – 3.8% | |
| | 561,531 | | | IntercontinentalExchange, Inc. | | | 86,936,229 | |
| | 2,421,646 | | | MSCI, Inc. Class A | | | 80,229,132 | |
| | | | | | | | |
| | | | | | | 167,165,361 | |
| | |
| | Diversified Telecommunication Services* – 1.3% | |
| | 2,257,994 | | | TW telecom, Inc. | | | 57,172,408 | |
| | |
| | Electrical Equipment – 2.6% | |
| | 494,976 | | | Rockwell Automation, Inc. | | | 44,716,132 | |
| | 419,764 | | | Roper Industries, Inc. | | | 52,306,792 | |
| | |
| | | | | | | | |
| | Common Stocks – (continued) | |
| | Electrical Equipment – (continued) | |
| | 534,600 | | | Sensata Technologies Holding NV* | | $ | 17,369,154 | |
| | | | | | | | |
| | | | | | | 114,392,078 | |
| | |
| | Electronic Equipment, Instruments & Components – 2.8% | |
| | 1,269,312 | | | Amphenol Corp. Class A | | | 89,943,448 | |
| | 2,683,575 | | | RealD, Inc.*(a) | | | 31,236,813 | |
| | | | | | | | |
| | | | | | | 121,180,261 | |
| | |
| | Energy Equipment & Services – 3.2% | |
| | 876,888 | | | Cameron International Corp.* | | | 55,875,303 | |
| | 262,004 | | | Core Laboratories NV | | | 35,933,849 | |
| | 591,106 | | | Dril-Quip, Inc.* | | | 48,606,646 | |
| | | | | | | | |
| | | | | | | 140,415,798 | |
| | |
| | Food Products* – 2.0% | |
| | 990,252 | | | The Hain Celestial Group, Inc. | | | 54,216,297 | |
| | 596,818 | | | TreeHouse Foods, Inc. | | | 34,848,203 | |
| | | | | | | | |
| | | | | | | 89,064,500 | |
| | |
| | Health Care Equipment & Supplies – 2.8% | |
| | 703,323 | | | C.R. Bard, Inc. | | | 69,523,479 | |
| | 1,605,999 | | | CareFusion Corp.* | | | 52,580,407 | |
| | | | | | | | |
| | | | | | | 122,103,886 | |
| | |
| | Health Care Providers & Services* – 2.3% | |
| | 635,697 | | | Henry Schein, Inc. | | | 56,716,887 | |
| | 727,468 | | | HMS Holdings Corp. | | | 21,089,297 | |
| | 251,284 | | | MEDNAX, Inc. | | | 21,514,936 | |
| | | | | | | | |
| | | | | | | 99,321,120 | |
| | |
| | Hotels, Restaurants & Leisure – 3.6% | |
| | 183,425 | | | Chipotle Mexican Grill, Inc.* | | | 58,107,206 | |
| | 1,041,013 | | | Dunkin’ Brands Group, Inc. | | | 38,673,633 | |
| | 1,535,961 | | | Marriott International, Inc. Class A | | | 60,593,661 | |
| | | | | | | | |
| | | | | | | 157,374,500 | |
| | |
| | Household Products – 1.4% | |
| | 994,440 | | | Church & Dwight Co., Inc. | | | 61,615,502 | |
| | |
| | Internet Software & Services* – 3.9% | |
| | 441,247 | | | Equinix, Inc. | | | 93,345,803 | |
| | 1,426,823 | | | Rackspace Hosting, Inc. | | | 79,702,333 | |
| | | | | | | | |
| | | | | | | 173,048,136 | |
| | |
| | IT Services – 2.9% | |
| | 521,963 | | | Cognizant Technology Solutions Corp. Class A* | | | 40,071,100 | |
| | 748,235 | | | FleetCor Technologies, Inc.* | | | 52,234,285 | |
| | 1,954,962 | | | Genpact Ltd. | | | 34,426,881 | |
| | | | | | | | |
| | | | | | | 126,732,266 | |
| | |
| | Life Sciences Tools & Services – 2.9% | |
| | 2,301,528 | | | Agilent Technologies, Inc. | | | 95,467,382 | |
| | 157,019 | | | Mettler-Toledo International, Inc.* | | | 33,413,643 | |
| | | | | | | | |
| | | | | | | 128,881,025 | |
| | |
| | |
| The accompanying notes are an integral part of these financial statements. | | 67 |
GOLDMAN SACHS GROWTH OPPORTUNITIES FUND
Schedule of Investments (continued)
February 28, 2013 (Unaudited)
| | | | | | | | |
| Shares | | | Description | |
Value | |
| | | | | | | | |
| | Common Stocks – (continued) | |
| | Machinery – 2.8% | |
| | 939,783 | | | Graco, Inc. | | $ | 54,601,392 | |
| | 1,727,529 | | | Kennametal, Inc. | | | 69,930,374 | |
| | | | | | | | |
| | | | | | | 124,531,766 | |
| | |
| | Media – 3.2% | |
| | 632,416 | | | Discovery Communications, Inc. Class A* | | | 46,375,065 | |
| | 3,269,254 | | | Pandora Media, Inc.* | | | 39,884,899 | |
| | 831,186 | | | Scripps Networks Interactive Class A | | | 52,406,277 | |
| | | | | | | | |
| | | | | | | 138,666,241 | |
| | |
| | Multiline Retail* – 2.0% | |
| | 1,903,404 | | | Dollar General Corp. | | | 88,203,741 | |
| | |
| | Oil, Gas & Consumable Fuels – 1.9% | |
| | 378,127 | | | Pioneer Natural Resources Co. | | | 47,572,158 | |
| | 739,942 | | | Whiting Petroleum Corp.* | | | 36,035,175 | |
| | | | | | | | |
| | | | | | | 83,607,333 | |
| | |
| | Personal Products – 0.9% | |
| | 609,191 | | | The Estee Lauder Cos., Inc. Class A | | | 39,049,143 | |
| | |
| | Pharmaceuticals – 1.2% | |
| | 500,267 | | | Shire PLC ADR | | | 46,855,007 | |
| | 172,194 | | | Zoetis, Inc.* | | | 5,759,890 | |
| | | | | | | | |
| | | | | | | 52,614,897 | |
| | |
| | Real Estate Management & Development* – 2.3% | |
| | 4,201,996 | | | CBRE Group, Inc. Class A | | | 101,562,243 | |
| | |
| | Semiconductors & Semiconductor Equipment – 4.1% | |
| | 1,963,228 | | | Altera Corp. | | | 69,537,535 | |
| | 1,088,516 | | | Linear Technology Corp. | | | 41,624,852 | |
| | 1,850,014 | | | Xilinx, Inc. | | | 68,950,022 | |
| | | | | | | | |
| | | | | | | 180,112,409 | |
| | |
| | Software – 5.5% | |
| | 6,374,889 | | | Activision Blizzard, Inc. | | | 91,160,913 | |
| | 573,362 | | | Citrix Systems, Inc.* | | | 40,651,366 | |
| | 1,256,295 | | | MICROS Systems, Inc.* | | | 53,769,426 | |
| | 322,928 | | | Salesforce.com, Inc.* | | | 54,645,876 | |
| | | | | | | | |
| | | | | | | 240,227,581 | |
| | |
| | Specialty Retail – 5.0% | |
| | 833,991 | | | Dick’s Sporting Goods, Inc. | | | 41,699,550 | |
| | 1,390,703 | | | Limited Brands, Inc. | | | 63,304,800 | |
| | 1,245,888 | | | PetSmart, Inc. | | | 81,119,768 | |
| | 533,780 | | | Tiffany & Co. | | | 35,848,665 | |
| | | | | | | | |
| | | | | | | 221,972,783 | |
| | |
| | Textiles, Apparel & Luxury Goods – 4.3% | |
| | 1,189,746 | | | Deckers Outdoor Corp.* | | | 47,994,354 | |
| | 474,338 | | | Lululemon Athletica, Inc.* | | | 31,804,363 | |
| | 885,643 | | | PVH Corp. | | | 107,915,599 | |
| | | | | | | | |
| | | | | | | 187,714,316 | |
| | |
| | | | | | | | |
| | Common Stocks – (continued) | |
| | Wireless Telecommunication Services* – 5.0% | |
| | 1,056,775 | | | Crown Castle International Corp. | | $ | 73,762,895 | |
| | 2,062,812 | | | SBA Communications Corp. Class A | | | 146,707,189 | |
| | | | | | | | |
| | | | | | | 220,470,084 | |
| | |
| | TOTAL COMMON STOCKS | |
| | (Cost $3,283,986,465) | | $ | 4,324,010,996 | |
| | |
| | | | | | | | | | | | |
Principal
Amount | | | Interest
Rate | | Maturity
Date | | | Value | |
| | | | | | | | | | | | |
| | Short-term Investment(b) – 1.5% | |
| | Repurchase Agreement – 1.5% | |
| Joint Repurchase Agreement Account II | | | | | |
| $ | 63,700,000 | | | 0.191% | | | 03/01/13 | | | $ | 63,700,000 | |
| | (Cost $63,700,000) | | | | | |
| | |
| | TOTAL INVESTMENTS – 99.8% | |
| | (Cost $3,347,686,465) | | | $ | 4,387,710,996 | |
| | |
| OTHER ASSETS IN EXCESS OF
LIABILITIES – 0.2% |
| | | 10,767,775 | |
| | |
| | NET ASSETS – 100.0% | | | $ | 4,398,478,771 | |
| | |
| | |
| The percentage shown for each investment category reflects the value of investments in that category as a percentage of net assets. |
* | | Non-income producing security. |
(a) | | Represents an affiliated issuer. |
(b) | | Joint repurchase agreement was entered into on February 28, 2013. Additional information appears on pages 76-77. |
| | |
|
Investment Abbreviation: |
ADR | | —American Depositary Receipt |
|
| | |
| 68 | | The accompanying notes are an integral part of these financial statements. |
GOLDMAN SACHS SMALL/MID CAP GROWTH FUND
Schedule of Investments
February 28, 2013 (Unaudited)
| | | | | | | | |
| Shares | | | Description | |
Value | |
| | | | | | | | |
| | Common Stocks – 97.1% | |
| | Aerospace & Defense* – 0.6% | |
| | 289,637 | | | Aerovironment, Inc. | | $ | 6,406,771 | |
| | |
| | Auto Components* – 0.8% | |
| | 570,467 | | | Gentherm, Inc. | | | 8,785,192 | |
| | |
| | Biotechnology* – 7.3% | |
| | 715,439 | | | Achillion Pharmaceuticals, Inc. | | | 5,795,056 | |
| | 388,830 | | | ARIAD Pharmaceuticals, Inc. | | | 8,177,095 | |
| | 239,135 | | | BioMarin Pharmaceutical, Inc. | | | 13,862,656 | |
| | 451,763 | | | Cepheid, Inc. | | | 16,457,726 | |
| | 376,134 | | | Durata Therapeutics, Inc. | | | 3,215,946 | |
| | 324,880 | | | Incyte Corp. | | | 7,212,336 | |
| | 108,772 | | | Medivation, Inc. | | | 5,345,056 | |
| | 608,967 | | | Regulus Therapeutics, Inc. | | | 3,136,180 | |
| | 476,966 | | | Swedish Orphan Biovitrum AB ADR | | | 2,890,175 | |
| | 134,744 | | | Synageva BioPharma Corp. | | | 6,733,158 | |
| | 137,741 | | | Synta Pharmaceuticals Corp. | | | 1,183,195 | |
| | 154,407 | | | Vertex Pharmaceuticals, Inc. | | | 7,229,336 | |
| | | | | | | | |
| | | | | | | 81,237,915 | |
| | |
| | Capital Markets – 2.8% | |
| | 458,462 | | | Evercore Partners, Inc. Class A | | | 18,659,403 | |
| | 342,731 | | | Lazard Ltd. Class A | | | 12,304,043 | |
| | | | | | | | |
| | | | | | | 30,963,446 | |
| | |
| | Chemicals – 3.1% | |
| | 156,930 | | | Airgas, Inc. | | | 15,736,940 | |
| | 157,018 | | | American Vanguard Corp. | | | 4,872,269 | |
| | 181,080 | | | International Flavors & Fragrances, Inc. | | | 13,215,218 | |
| | | | | | | | |
| | | | | | | 33,824,427 | |
| | |
| | Commercial Banks – 3.1% | |
| | 762,424 | | | Eagle Bancorp, Inc.* | | | 16,544,601 | |
| | 289,599 | | | First Republic Bank | | | 10,555,884 | |
| | 241,419 | | | Popular, Inc.* | | | 6,740,418 | |
| | | | | | | | |
| | | | | | | 33,840,903 | |
| | |
| | Commercial Services & Supplies – 4.0% | |
| | 893,757 | | | Healthcare Services Group, Inc. | | | 21,539,544 | |
| | 774,985 | | | Ritchie Bros. Auctioneers, Inc. | | | 17,654,158 | |
| | 47,353 | | | Stericycle, Inc.* | | | 4,542,100 | |
| | | | | | | | |
| | | | | | | 43,735,802 | |
| | |
| | Communications Equipment* – 0.9% | |
| | 1,133,073 | | | Calix, Inc. | | | 9,710,436 | |
| | |
| | Construction & Engineering* – 1.0% | |
| | 381,597 | | | Quanta Services, Inc. | | | 10,837,355 | |
| | |
| | Consumer Finance – 1.1% | |
| | 658,094 | | | SLM Corp. | | | 12,484,043 | |
| | |
| | Diversified Consumer Services* – 1.4% | |
| | 305,038 | | | Coinstar, Inc. | | | 15,614,895 | |
| | |
| | | | | | | | |
| | Common Stocks – (continued) | |
| | Diversified Financial Services* – 1.8% | |
| | 596,582 | | | MSCI, Inc. Class A | | $ | 19,764,762 | |
| | |
| | Diversified Telecommunication Services* – 1.4% | |
| | 613,498 | | | TW telecom, Inc. | | | 15,533,769 | |
| | |
| | Electrical Equipment – 1.4% | |
| | 93,286 | | | Roper Industries, Inc. | | | 11,624,369 | |
| | 134,827 | | | Sensata Technologies Holding NV* | | | 4,380,529 | |
| | | | | | | | |
| | | | | | | 16,004,898 | |
| | |
| | Electronic Equipment, Instruments & Components – 3.3% | |
| | 227,568 | | | Amphenol Corp. Class A | | | 16,125,469 | |
| | 215,115 | | | IPG Photonics Corp. | | | 12,754,168 | |
| | 691,214 | | | RealD, Inc.* | | | 8,045,731 | |
| | | | | | | | |
| | | | | | | 36,925,368 | |
| | |
| | Energy Equipment & Services – 3.3% | |
| | 83,851 | | | Core Laboratories NV | | | 11,500,164 | |
| | 241,574 | | | Dril-Quip, Inc.* | | | 19,864,630 | |
| | 84,324 | | | Lufkin Industries, Inc. | | | 5,462,509 | |
| | | | | | | | |
| | | | | | | 36,827,303 | |
| | |
| | Food & Staples Retailing* – 0.7% | |
| | 418,054 | | | The Chefs’ Warehouse, Inc. | | | 7,524,972 | |
| | |
| | Food Products* – 2.2% | |
| | 279,019 | | | The Hain Celestial Group, Inc. | | | 15,276,290 | |
| | 149,697 | | | TreeHouse Foods, Inc. | | | 8,740,808 | |
| | | | | | | | |
| | | | | | | 24,017,098 | |
| | |
| | Health Care Equipment & Supplies* – 2.1% | |
| | 325,981 | | | CareFusion Corp. | | | 10,672,618 | |
| | 356,180 | | | DexCom, Inc. | | | 5,317,767 | |
| | 89,439 | | | Given Imaging Ltd. | | | 1,417,608 | |
| | 361,141 | | | Tornier NV | | | 6,276,631 | |
| | | | | | | | |
| | | | | | | 23,684,624 | |
| | |
| | Health Care Providers & Services* – 4.7% | |
| | 288,806 | | | Acadia Healthcare Co., Inc. | | | 7,861,299 | |
| | 774,709 | | | ExamWorks Group, Inc. | | | 10,969,879 | |
| | 157,639 | | | Henry Schein, Inc. | | | 14,064,552 | |
| | 270,837 | | | HMS Holdings Corp. | | | 7,851,565 | |
| | 134,199 | | | MEDNAX, Inc. | | | 11,490,118 | |
| | | | | | | | |
| | | | | | | 52,237,413 | |
| | |
| | Health Care Technology* – 0.6% | |
| | 370,185 | | | MedAssets, Inc. | | | 6,837,317 | |
| | |
| | Hotels, Restaurants & Leisure – 1.7% | |
| | 255,105 | | | Dunkin’ Brands Group, Inc. | | | 9,477,151 | |
| | 453,883 | | | Texas Roadhouse, Inc. | | | 8,778,097 | |
| | | | | | | | |
| | | | | | | 18,255,248 | |
| | |
| | Household Products – 1.1% | |
| | 192,645 | | | Church & Dwight Co., Inc. | | | 11,936,284 | |
| | |
| | |
| The accompanying notes are an integral part of these financial statements. | | 69 |
GOLDMAN SACHS SMALL/MID CAP GROWTH FUND
Schedule of Investments (continued)
February 28, 2013 (Unaudited)
| | | | | | | | |
| Shares | | | Description | |
Value | |
| | | | | | | | |
| | Common Stocks – (continued) | |
| | Internet Software & Services* – 4.3% | |
| | 81,914 | | | Equinix, Inc. | | $ | 17,328,907 | |
| | 384,663 | | | ExactTarget, Inc. | | | 8,577,985 | |
| | 363,994 | | | Internap Network Services Corp. | | | 3,159,468 | |
| | 340,354 | | | Rackspace Hosting, Inc. | | | 19,012,174 | |
| | | | | | | | |
| | | | | | | 48,078,534 | |
| | |
| | IT Services – 3.7% | |
| | 230,327 | | | FleetCor Technologies, Inc.* | | | 16,079,128 | |
| | 531,057 | | | Genpact Ltd. | | | 9,351,914 | |
| | 640,479 | | | InterXion Holding NV* | | | 15,839,045 | |
| | | | | | | | |
| | | | | | | 41,270,087 | |
| | |
| | Life Sciences Tools & Services* – 1.5% | |
| | 27,607 | | | Mettler-Toledo International, Inc. | | | 5,874,770 | |
| | 320,476 | | | PAREXEL International Corp. | | | 11,117,312 | |
| | | | | | | | |
| | | | | | | 16,992,082 | |
| | |
| | Machinery – 3.9% | |
| | 241,490 | | | Graco, Inc. | | | 14,030,569 | |
| | 206,094 | | | IDEX Corp. | | | 10,496,367 | |
| | 458,049 | | | Kennametal, Inc. | | | 18,541,824 | |
| | | | | | | | |
| | | | | | | 43,068,760 | |
| | |
| | Media* – 1.4% | |
| | 1,188,216 | | | Pandora Media, Inc. | | | 14,496,235 | |
| | 378,620 | | | RLJ Entertainment, Inc. | | | 1,495,549 | |
| | | | | | | | |
| | | | | | | 15,991,784 | |
| | |
| | Oil, Gas & Consumable Fuels* – 4.3% | |
| | 422,819 | | | Approach Resources, Inc. | | | 10,464,770 | |
| | 751,073 | | | Rex Energy Corp. | | | 10,124,464 | |
| | 242,982 | | | Rosetta Resources, Inc. | | | 11,828,364 | |
| | 314,023 | | | Whiting Petroleum Corp. | | | 15,292,920 | |
| | | | | | | | |
| | | | | | | 47,710,518 | |
| | |
| | Pharmaceuticals* – 0.6% | |
| | 406,870 | | | Sagent Pharmaceuticals, Inc. | | | 6,672,668 | |
| | |
| | Real Estate Management & Development* – 1.7% | |
| | 767,088 | | | CBRE Group, Inc. Class A | | | 18,540,517 | |
| | |
| | Road & Rail* – 1.4% | |
| | 672,489 | | | Roadrunner Transportation Systems, Inc. | | | 15,319,300 | |
| | |
| | Semiconductors & Semiconductor Equipment – 5.8% | |
| | 346,189 | | | Cavium, Inc.* | | | 12,781,298 | |
| | 227,806 | | | Hittite Microwave Corp.* | | | 14,766,385 | |
| | 536,171 | | | Intermolecular, Inc.* | | | 5,184,773 | |
| | 177,849 | | | Linear Technology Corp. | | | 6,800,946 | |
| | 517,489 | | | STR Holdings, Inc.* | | | 1,034,978 | |
| | 159,368 | | | Ultratech, Inc.* | | | 6,530,901 | |
| | 444,246 | | | Xilinx, Inc. | | | 16,557,048 | |
| | | | | | | | |
| | | | | | | 63,656,329 | |
| | |
| | | | | | | | |
| | Common Stocks – (continued) | |
| | Software* – 2.8% | |
| | 314,723 | | | MICROS Systems, Inc. | | $ | 13,470,144 | |
| | 243,302 | | | NetSuite, Inc. | | | 16,980,047 | |
| | | | | | | | |
| | | | | | | 30,450,191 | |
| | |
| | Specialty Retail – 4.3% | |
| | 208,687 | | | Dick’s Sporting Goods, Inc. | | | 10,434,350 | |
| | 252,429 | | | PetSmart, Inc. | | | 16,435,652 | |
| | 123,262 | | | Restoration Hardware Holdings, Inc.* | | | 4,759,146 | |
| | 227,651 | | | Rue21, Inc.* | | | 6,146,577 | |
| | 185,803 | | | Tile Shop Holdings, Inc.* | | | 3,275,707 | |
| | 148,973 | | | Urban Outfitters, Inc.* | | | 6,036,386 | |
| | | | | | | | |
| | | | | | | 47,087,818 | |
| | |
| | Textiles, Apparel & Luxury Goods – 7.5% | |
| | 285,304 | | | Carter’s, Inc.* | | | 16,093,999 | |
| | 286,613 | | | Deckers Outdoor Corp.* | | | 11,561,968 | |
| | 489,989 | | | Fifth & Pacific Co., Inc.* | | | 8,863,901 | |
| | 82,751 | | | Lululemon Athletica, Inc.* | | | 5,548,455 | |
| | 245,978 | | | PVH Corp. | | | 29,972,419 | |
| | 186,112 | | | Under Armour, Inc. Class A* | | | 9,171,599 | |
| | 36,700 | | | Wolverine World Wide, Inc. | | | 1,548,740 | |
| | | | | | | | |
| | | | | | | 82,761,081 | |
| | |
| | Wireless Telecommunication Services* – 3.5% | |
| | 536,798 | | | SBA Communications Corp. Class A | | | 38,177,074 | |
| | |
| | TOTAL COMMON STOCKS | | | | |
| | (Cost $828,749,239) | | $ | 1,072,766,984 | |
| | |
| | | | | | | | | | | | | | |
Principal
Amount | | | Interest
Rate | | | Maturity
Date | | | Value | |
| | | | | | | | | | | | | | |
| | Short-term Investment(a) – 3.5% | |
| | Repurchase Agreement – 3.5% | |
| Joint Repurchase Agreement Account II | |
| $ | 39,000,000 | | | | 0.191 | % | | | 03/01/13 | | | $ | 39,000,000 | |
| | (Cost $39,000,000) | |
| | |
| | TOTAL INVESTMENTS – 100.6% | |
| | (Cost $867,749,239) | | | $ | 1,111,766,984 | |
| | |
| LIABILITIES IN EXCESS OF
OTHER ASSETS – (0.6)% |
| | | (6,202,063 | ) |
| | |
| NET ASSETS –
100.0% |
| | | | | | $ | 1,105,564,921 | |
| | |
| | |
| The percentage shown for each investment category reflects the value of investments in that category as a percentage of net assets. |
* | | Non-income producing security. |
(a) | | Joint repurchase agreement was entered into on February 28, 2013. Additional information appears on pages 76-77. |
| | |
|
Investment Abbreviation: |
ADR | | —American Depositary Receipt |
|
| | |
| 70 | | The accompanying notes are an integral part of these financial statements. |
GOLDMAN SACHS STRATEGIC GROWTH FUND
Schedule of Investments
February 28, 2013 (Unaudited)
| | | | | | | | |
Shares | | | Description | | Value | |
| | | | | | | | |
| | Common Stocks – 99.4% | |
| | Aerospace & Defense – 3.3% | |
| | 104,286 | | | Honeywell International, Inc. | | $ | 7,310,448 | |
| | 57,424 | | | The Boeing Co. | | | 4,415,906 | |
| | | | | | | | |
| | | | | | | 11,726,354 | |
| | |
| | Air Freight & Logistics – 1.1% | |
| | 37,085 | | | FedEx Corp. | | | 3,909,871 | |
| | |
| | Beverages – 3.2% | |
| | 42,129 | | | Diageo PLC ADR | | | 5,043,263 | |
| | 85,960 | | | PepsiCo., Inc. | | | 6,513,189 | |
| | | | | | | | |
| | | | | | | 11,556,452 | |
| | |
| | Biotechnology* – 3.5% | |
| | 37,197 | | | Celgene Corp. | | | 3,837,986 | |
| | 134,759 | | | Gilead Sciences, Inc. | | | 5,755,557 | |
| | 63,245 | | | Vertex Pharmaceuticals, Inc. | | | 2,961,131 | |
| | | | | | | | |
| | | | | | | 12,554,674 | |
| | |
| | Capital Markets – 1.9% | |
| | 78,463 | | | Northern Trust Corp. | | | 4,171,877 | |
| | 36,446 | | | T. Rowe Price Group, Inc. | | | 2,594,591 | |
| | | | | | | | |
| | | | | | | 6,766,468 | |
| | |
| | Chemicals – 2.9% | |
| | 34,157 | | | Ecolab, Inc. | | | 2,614,718 | |
| | 69,127 | | | Praxair, Inc. | | | 7,814,808 | |
| | | | | | | | |
| | | | | | | 10,429,526 | |
| | |
| | Communications Equipment – 4.5% | |
| | 247,455 | | | QUALCOMM, Inc. | | | 16,240,472 | |
| | |
| | Computers & Peripherals – 8.3% | |
| | 58,824 | | | Apple, Inc. | | | 25,964,914 | |
| | 115,856 | | | NetApp, Inc.* | | | 3,919,408 | |
| | | | | | | | |
| | | | | | | 29,884,322 | |
| | |
| | Consumer Finance – 2.2% | |
| | 124,513 | | | American Express Co. | | | 7,738,483 | |
| | |
| | Diversified Financial Services – 2.5% | |
| | 79,068 | | | CME Group, Inc. | | | 4,729,848 | |
| | 27,876 | | | IntercontinentalExchange, Inc.* | | | 4,315,762 | |
| | | | | | | | |
| | | | | | | 9,045,610 | |
| | |
| | Electrical Equipment – 0.7% | |
| | 29,511 | | | Rockwell Automation, Inc. | | | 2,666,024 | |
| | |
| | Electronic Equipment, Instruments & Components – 1.3% | |
| | 64,230 | | | Amphenol Corp. Class A | | | 4,551,338 | |
| | |
| | Energy Equipment & Services – 5.0% | |
| | 79,733 | | | Halliburton Co. | | | 3,309,717 | |
| | 23,007 | | | National Oilwell Varco, Inc. | | | 1,567,467 | |
| | 165,753 | | | Schlumberger Ltd. | | | 12,903,871 | |
| | | | | | | | |
| | | | | | | 17,781,055 | |
| | |
| | Food & Staples Retailing – 2.7% | |
| | 96,660 | | | Costco Wholesale Corp. | | | 9,790,691 | |
| | |
| | | | | | | | |
| | Common Stocks – (continued) | |
| | Health Care Equipment & Supplies – 3.0% | |
| | 174,199 | | | Abbott Laboratories | | $ | 5,886,184 | |
| | 16,841 | | | C.R. Bard, Inc. | | | 1,664,733 | |
| | 6,226 | | | Intuitive Surgical, Inc.* | | | 3,174,575 | |
| | | | | | | | |
| | | | | | | 10,725,492 | |
| | |
| | Hotels, Restaurants & Leisure – 4.6% | |
| | 17,393 | | | Chipotle Mexican Grill, Inc.* | | | 5,509,928 | |
| | 44,238 | | | Las Vegas Sands Corp. | | | 2,277,815 | |
| | 101,937 | | | Marriott International, Inc. Class A | | | 4,021,415 | |
| | 21,168 | | | McDonald’s Corp. | | | 2,030,011 | |
| | 40,782 | | | Yum! Brands, Inc. | | | 2,670,405 | |
| | | | | | | | |
| | | | | | | 16,509,574 | |
| | |
| | Household Products – 1.5% | |
| | 72,029 | | | The Procter & Gamble Co. | | | 5,487,169 | |
| | |
| | Industrial Conglomerates – 1.6% | |
| | 95,054 | | | Danaher Corp. | | | 5,855,326 | |
| | |
| | Internet & Catalog Retail* – 3.6% | |
| | 34,373 | | | Amazon.com, Inc. | | | 9,083,752 | |
| | 5,760 | | | Priceline.com, Inc. | | | 3,960,461 | |
| | | | | | | | |
| | | | | | | 13,044,213 | |
| | |
| | Internet Software & Services* – 8.0% | |
| | 30,349 | | | Equinix, Inc. | | | 6,420,331 | |
| | 65,810 | | | Facebook, Inc. Class A | | | 1,793,323 | |
| | 21,107 | | | Google, Inc. Class A | | | 16,910,928 | |
| | 65,292 | | | Rackspace Hosting, Inc. | | | 3,647,211 | |
| | | | | | | | |
| | | | | | | 28,771,793 | |
| | |
| | IT Services – 1.7% | |
| | 11,928 | | | MasterCard, Inc. Class A | | | 6,176,557 | |
| | |
| | Life Sciences Tools & Services – 1.3% | |
| | 108,588 | | | Agilent Technologies, Inc. | | | 4,504,230 | |
| | |
| | Media – 2.3% | |
| | 35,755 | | | Discovery Communications, Inc. Class A* | | | 2,621,914 | |
| | 97,412 | | | Viacom, Inc. Class B | | | 5,694,706 | |
| | | | | | | | |
| | | | | | | 8,316,620 | |
| | |
| | Multiline Retail* – 1.4% | |
| | 107,455 | | | Dollar General Corp. | | | 4,979,465 | |
| | |
| | Personal Products – 0.5% | |
| | 28,448 | | | The Estee Lauder Cos., Inc. Class A | | | 1,823,517 | |
| | |
| | Pharmaceuticals – 3.8% | |
| | 34,110 | | | Allergan, Inc. | | | 3,698,206 | |
| | 130,600 | | | Sanofi ADR | | | 6,165,626 | |
| | 38,225 | | | Shire PLC ADR | | | 3,580,154 | |
| | | | | | | | |
| | | | | | | 13,443,986 | |
| | |
| | Real Estate Investment Trusts – 3.7% | |
| | 170,615 | | | American Tower Corp. | | | 13,239,724 | |
| | |
| | |
| The accompanying notes are an integral part of these financial statements. | | 71 |
GOLDMAN SACHS STRATEGIC GROWTH FUND
Schedule of Investments (continued)
February 28, 2013 (Unaudited)
| | | | | | | | |
Shares | | | Description | | Value | |
| | | | | | | | |
| | Common Stocks – (continued) | |
| | Real Estate Management & Development* – 1.8% | |
| | 268,821 | | | CBRE Group, Inc. Class A | | $ | 6,497,404 | |
| | |
| | Semiconductors & Semiconductor Equipment – 1.8% | |
| | 171,028 | | | Xilinx, Inc. | | | 6,374,214 | |
| | |
| | Software – 5.6% | |
| | 496,332 | | | Activision Blizzard, Inc. | | | 7,097,548 | |
| | 217,840 | | | Oracle Corp. | | | 7,463,198 | |
| | 32,257 | | | Salesforce.com, Inc.* | | | 5,458,529 | |
| | | | | | | | |
| | | | | | | 20,019,275 | |
| | |
| | Specialty Retail – 0.6% | |
| | 48,955 | | | Limited Brands, Inc. | | | 2,228,432 | |
| | |
| | Textiles, Apparel & Luxury Goods – 5.2% | |
| | 28,474 | | | Lululemon Athletica, Inc.* | | | 1,909,182 | |
| | 188,762 | | | NIKE, Inc. Class B | | | 10,279,979 | |
| | 51,897 | | | PVH Corp. | | | 6,323,649 | |
| | | | | | | | |
| | | | | | | 18,512,810 | |
| | |
| | Tobacco – 1.2% | |
| | 46,551 | | | Philip Morris International, Inc. | | | 4,271,054 | |
| | |
| | Wireless Telecommunication Services* – 3.1% | |
| | 160,606 | | | Crown Castle International Corp. | | | 11,210,299 | |
| | |
| | TOTAL COMMON STOCKS | |
| | (Cost $286,850,927) | | $ | 356,632,494 | |
| | |
| | | | | | | | | | | | |
Principal
Amount | | | Interest
Rate | | Maturity
Date | | | Value | |
| | Short-term Investment(a) – 1.4% | |
| | Repurchase Agreement – 1.4% | |
| Joint Repurchase Agreement Account II | |
| $ | 4,900,000 | | | 0.191% | | | 03/01/13 | | | $ | 4,900,000 | |
| | (Cost $4,900,000) | |
| | |
| | TOTAL INVESTMENTS – 100.8% | |
| | (Cost $291,750,927) | | | $ | 361,532,494 | |
| | |
| LIABILITIES IN EXCESS OF
OTHER ASSETS – (0.8)% |
| | | (2,778,783 | ) |
| | |
| | NET ASSETS – 100.0% | | | $ | 358,753,711 | |
| | |
| | |
| The percentage shown for each investment category reflects the value of investments in that category as a percentage of net assets. |
* | | Non-income producing security. |
(a) | | Joint repurchase agreement was entered into on February 28, 2013. Additional information appears on pages 76-77. |
| | |
|
Investment Abbreviation: |
ADR | | —American Depositary Receipt |
|
| | |
| 72 | | The accompanying notes are an integral part of these financial statements. |
GOLDMAN SACHS TECHNOLOGY TOLLKEEPER FUND
Schedule of Investments
February 28, 2013 (Unaudited)
| | | | | | | | |
Shares | | | Description | | Value | |
| | | | | | | | |
| | Common Stocks – 99.3% | |
| | Communications Equipment – 8.9% | |
| | 459,793 | | | Calix, Inc.* | | $ | 3,940,426 | |
| | 396,588 | | | Juniper Networks, Inc.* | | | 8,201,440 | |
| | 308,032 | | | QUALCOMM, Inc. | | | 20,216,140 | |
| | | | | | | | |
| | | | | | | 32,358,006 | |
| | |
| | Computers & Peripherals – 14.9% | |
| | 89,301 | | | Apple, Inc. | | | 39,417,462 | |
| | 205,481 | | | EMC Corp.* | | | 4,728,118 | |
| | 305,069 | | | NetApp, Inc.* | | | 10,320,484 | |
| | | | | | | | |
| | | | | | | 54,466,064 | |
| | |
| | Diversified Consumer Services* – 2.9% | |
| | 204,799 | | | Coinstar, Inc. | | | 10,483,661 | |
| | |
| | Diversified Financial Services* – 2.2% | |
| | 51,398 | | | IntercontinentalExchange, Inc. | | | 7,957,438 | |
| | |
| | Diversified Telecommunication Services* – 1.9% | |
| | 281,770 | | | TW telecom, Inc. | | | 7,134,416 | |
| | |
| | Electronic Equipment, Instruments & Components – 4.8% | |
| | 128,666 | | | Amphenol Corp. Class A | | | 9,117,273 | |
| | 728,261 | | | RealD, Inc.* | | | 8,476,958 | |
| | | | | | | | |
| | | | | | | 17,594,231 | |
| | |
| | Internet & Catalog Retail* – 5.5% | |
| | 44,590 | | | Amazon.com, Inc. | | | 11,783,800 | |
| | 11,966 | | | Priceline.com, Inc. | | | 8,227,582 | |
| | | | | | | | |
| | | | | | | 20,011,382 | |
| | |
| | Internet Software & Services* – 18.5% | |
| | 56,739 | | | Equinix, Inc. | | | 12,003,135 | |
| | 218,190 | | | ExactTarget, Inc. | | | 4,865,637 | |
| | 245,055 | | | Facebook, Inc. Class A | | | 6,677,749 | |
| | 28,870 | | | Google, Inc. Class A | | | 23,130,644 | |
| | 214,915 | | | Internap Network Services Corp. | | | 1,865,462 | |
| | 273,418 | | | Rackspace Hosting, Inc. | | | 15,273,130 | |
| | 163,236 | | | Yandex NV Class A | | | 3,785,443 | |
| | | | | | | | |
| | | | | | | 67,601,200 | |
| | |
| | IT Services* – 4.7% | |
| | 82,803 | | | Cognizant Technology Solutions Corp. Class A | | | 6,356,786 | |
| | 437,754 | | | InterXion Holding NV | | | 10,825,657 | |
| | | | | | | | |
| | | | | | | 17,182,443 | |
| | |
| | Media* – 2.9% | |
| | 868,404 | | | Pandora Media, Inc. | | | 10,594,529 | |
| | |
| | Real Estate Investment Trusts – 2.9% | |
| | 136,229 | | | American Tower Corp. | | | 10,571,370 | |
| | |
| | Semiconductors & Semiconductor Equipment – 7.7% | |
| | 188,319 | | | Altera Corp. | | | 6,670,259 | |
| | 121,168 | | | Cavium, Inc.* | | | 4,473,523 | |
| | 83,471 | | | Hittite Microwave Corp.* | | | 5,410,590 | |
| | |
| | | | | | | | |
| | Common Stocks – (continued) | |
| | Semiconductors & Semiconductor Equipment – (continued) | |
| | 243,263 | | | Intermolecular, Inc.* | | $ | 2,352,353 | |
| | 244,505 | | | Xilinx, Inc. | | | 9,112,701 | |
| | | | | | | | |
| | | | | | | 28,019,426 | |
| | |
| | Software – 17.9% | |
| | 1,078,205 | | | Activision Blizzard, Inc. | | | 15,418,331 | |
| | 91,660 | | | Citrix Systems, Inc.* | | | 6,498,694 | |
| | 199,225 | | | MICROS Systems, Inc.* | | | 8,526,830 | |
| | 128,428 | | | NetSuite, Inc.* | | | 8,962,990 | |
| | 389,992 | | | Oracle Corp. | | | 13,361,126 | |
| | 73,363 | | | Salesforce.com, Inc.* | | | 12,414,487 | |
| | | | | | | | |
| | | | | | | 65,182,458 | |
| | |
| | Wireless Telecommunication Services* – 3.6% | |
| | 182,479 | | | SBA Communications Corp. Class A | | | 12,977,906 | |
| | |
| | TOTAL COMMON STOCKS | |
| | (Cost $300,800,369) | | $ | 362,134,530 | |
| | |
| | | | | | | | | | | | |
Principal
Amount | | | Interest
Rate | | Maturity
Date | | | Value | |
| | Short-term Investment(a) – 0.5% | |
| | Repurchase Agreement – 0.5% | |
| | |
| $ | 1,900,000 | | | 0.191% | | | 03/01/13 | | | $ | 1,900,000 | |
| | (Cost $1,900,000) | |
| | |
| | TOTAL INVESTMENTS – 99.8% | |
| | (Cost $302,700,369) | | | $ | 364,034,530 | |
| | |
| OTHER ASSETS IN EXCESS OF
LIABILITIES – 0.2% |
| | | 552,771 | |
| | |
| | NET ASSETS – 100.0% | | | $ | 364,587,301 | |
| | |
| | |
| The percentage shown for each investment category reflects the value of investments in that category as a percentage of net assets. |
* | | Non-income producing security. |
(a) | | Joint repurchase agreement was entered into on February 28, 2013. Additional information appears on pages 76-77. |
| | |
| The accompanying notes are an integral part of these financial statements. | | 73 |
GOLDMAN SACHS U.S. EQUITY FUND
Schedule of Investments
February 28, 2013 (Unaudited)
| | | | | | | | |
Shares | | | Description | | Value | |
| | | | | | | | |
| | Common Stocks – 97.5% | |
| | Aerospace & Defense – 2.8% | |
| | 3,989 | | | The Boeing Co. | | $ | 306,754 | |
| | |
| | Air Freight & Logistics – 0.8% | |
| | 857 | | | FedEx Corp. | | | 90,354 | |
| | |
| | Automobiles* – 1.0% | |
| | 4,174 | | | General Motors Co. | | | 113,324 | |
| | |
| | Beverages – 2.6% | |
| | 1,293 | | | Anheuser-Busch InBev NV ADR | | | 121,529 | |
| | 2,246 | | | PepsiCo., Inc. | | | 170,180 | |
| | | | | | | | |
| | | | | | | 291,709 | |
| | |
| | Biotechnology* – 2.8% | |
| | 590 | | | Celgene Corp. | | | 60,876 | |
| | 3,352 | | | Gilead Sciences, Inc. | | | 143,164 | |
| | 2,382 | | | Vertex Pharmaceuticals, Inc. | | | 111,525 | |
| | | | | | | | |
| | | | | | | 315,565 | |
| | |
| | Building Products – 0.7% | |
| | 4,186 | | | Masco Corp. | | | 80,622 | |
| | |
| | Capital Markets – 1.0% | |
| | 4,894 | | | Morgan Stanley, Inc. | | | 110,360 | |
| | |
| | Chemicals – 1.4% | |
| | 1,401 | | | Praxair, Inc. | | | 158,383 | |
| | |
| | Commercial Banks – 1.5% | |
| | 6,202 | | | SunTrust Banks, Inc. | | | 171,113 | |
| | |
| | Commercial Services & Supplies – 1.1% | |
| | 3,187 | | | Waste Management, Inc. | | | 118,939 | |
| | |
| | Communications Equipment – 2.1% | |
| | 3,624 | | | QUALCOMM, Inc. | | | 237,843 | |
| | |
| | Computers & Peripherals – 5.5% | |
| | 969 | | | Apple, Inc. | | | 427,717 | |
| | 6,427 | | | EMC Corp.* | | | 147,885 | |
| | 1,013 | | | NetApp, Inc.* | | | 34,270 | |
| | | | | | | | |
| | | | | | | 609,872 | |
| | |
| | Consumer Finance – 1.7% | |
| | 2,958 | | | American Express Co. | | | 183,840 | |
| | |
| | Diversified Financial Services – 5.1% | |
| | 18,584 | | | Bank of America Corp. | | | 208,698 | |
| | 7,241 | | | JPMorgan Chase & Co. | | | 354,230 | |
| | | | | | | | |
| | | | | | | 562,928 | |
| | |
| | Diversified Telecommunication Services – 1.3% | |
| | 3,931 | | | AT&T, Inc. | | | 141,162 | |
| | |
| | Electric Utilities – 2.5% | |
| | 2,203 | | | Duke Energy Corp. | | | 152,558 | |
| | 4,155 | | | PPL Corp. | | | 128,057 | |
| | | | | | | | |
| | | | | | | 280,615 | |
| | |
| | | | | | | | |
| | Common Stocks – (continued) | |
| | Energy Equipment & Services – 4.3% | |
| | 4,342 | | | Halliburton Co. | | $ | 180,236 | |
| | 2,548 | | | Schlumberger Ltd. | | | 198,362 | |
| | 1,906 | | | Transocean Ltd.* | | | 99,684 | |
| | | | | | | | |
| | | | | | | 478,282 | |
| | |
| | Food & Staples Retailing – 3.1% | |
| | 2,203 | | | Costco Wholesale Corp. | | | 223,142 | |
| | 2,914 | | | Walgreen Co. | | | 119,299 | |
| | | | | | | | |
| | | | | | | 342,441 | |
| | |
| | Food Products – 0.7% | |
| | 2,891 | | | Mondelez International, Inc. Class A | | | 79,936 | |
| | |
| | Health Care Equipment & Supplies – 1.6% | |
| | 5,325 | | | Abbott Laboratories | | | 179,932 | |
| | |
| | Health Care Providers & Services – 1.6% | |
| | 1,176 | | | Aetna, Inc. | | | 55,496 | |
| | 2,187 | | | UnitedHealth Group, Inc. | | | 116,895 | |
| | | | | | | | |
| | | | | | | 172,391 | |
| | |
| | Hotels, Restaurants & Leisure – 2.3% | |
| | 269 | | | Chipotle Mexican Grill, Inc.* | | | 85,216 | |
| | 1,798 | | | Marriott International, Inc. Class A | | | 70,931 | |
| | 1,485 | | | Yum! Brands, Inc. | | | 97,238 | |
| | | | | | | | |
| | | | | | | 253,385 | |
| | |
| | Household Products – 2.8% | |
| | 4,079 | | | The Procter & Gamble Co. | | | 310,738 | |
| | |
| | Industrial Conglomerates – 4.2% | |
| | 20,042 | | | General Electric Co. | | | 465,375 | |
| | |
| | Insurance – 6.1% | |
| | 3,844 | | | American International Group, Inc.* | | | 146,111 | |
| | 935 | | | Everest Re Group Ltd. | | | 116,510 | |
| | 3,360 | | | Prudential Financial, Inc. | | | 186,715 | |
| | 3,990 | | | The Hartford Financial Services Group, Inc. | | | 94,204 | |
| | 1,688 | | | The Travelers Cos., Inc. | | | 135,749 | |
| | | | | | | | |
| | | | | | | 679,289 | |
| | |
| | Internet & Catalog Retail* – 2.5% | |
| | 693 | | | Amazon.com, Inc. | | | 183,139 | |
| | 142 | | | Priceline.com, Inc. | | | 97,636 | |
| | | | | | | | |
| | | | | | | 280,775 | |
| | |
| | Internet Software & Services* – 3.5% | |
| | 370 | | | Equinix, Inc. | | | 78,273 | |
| | 388 | | | Google, Inc. Class A | | | 310,866 | |
| | | | | | | | |
| | | | | | | 389,139 | |
| | |
| | IT Services – 1.3% | |
| | 282 | | | MasterCard, Inc. Class A | | | 146,025 | |
| | |
| | |
| 74 | | The accompanying notes are an integral part of these financial statements. |
GOLDMAN SACHS U.S. EQUITY FUND
| | | | | | | | |
Shares | | | Description | | Value | |
| | | | | | | | |
| | Common Stocks – (continued) | |
| | Media – 1.6% | |
| | 1,798 | | | DIRECTV* | | $ | 86,610 | |
| | 1,474 | | | Viacom, Inc. Class B | | | 86,170 | |
| | | | | | | | |
| | | | | | | 172,780 | |
| | |
| | Multiline Retail* – 1.1% | |
| | 2,594 | | | Dollar General Corp. | | | 120,206 | |
| | |
| | Oil, Gas & Consumable Fuels – 6.4% | |
| | 4,716 | | | Devon Energy Corp. | | | 255,890 | |
| | 3,977 | | | Exxon Mobil Corp. | | | 356,141 | |
| | 3,052 | | | Southwestern Energy Co.* | | | 104,592 | |
| | | | | | | | |
| | | | | | | 716,623 | |
| | |
| | Pharmaceuticals – 4.4% | |
| | 2,501 | | | Johnson & Johnson | | | 190,351 | |
| | 4,257 | | | Merck & Co., Inc. | | | 181,902 | |
| | 4,316 | | | Pfizer, Inc. | | | 118,129 | |
| | | | | | | | |
| | | | | | | 490,382 | |
| | |
| | Real Estate Investment Trusts – 1.9% | |
| | 2,692 | | | American Tower Corp. | | | 208,899 | |
| | |
| | Real Estate Management & Development* – 1.3% | |
| | 5,985 | | | CBRE Group, Inc. Class A | | | 144,657 | |
| | |
| | Semiconductors & Semiconductor Equipment – 2.8% | |
| | 1,585 | | | Altera Corp. | | | 56,141 | |
| | 2,686 | | | Lam Research Corp.* | | | 113,618 | |
| | 3,865 | | | Xilinx, Inc. | | | 144,048 | |
| | | | | | | | |
| | | | | | | 313,807 | |
| | |
| | Software – 2.8% | |
| | 10,255 | | | Activision Blizzard, Inc. | | | 146,646 | |
| | 1,855 | | | Adobe Systems, Inc.* | | | 72,902 | |
| | 518 | | | Salesforce.com, Inc.* | | | 87,656 | |
| | | | | | | | |
| | | | | | | 307,204 | |
| | |
| | Specialty Retail – 1.6% | |
| | 1,024 | | | Bed Bath & Beyond, Inc.* | | | 58,112 | |
| | 3,191 | | | Lowe’s Cos., Inc. | | | 121,737 | |
| | | | | | | | |
| | | | | | | 179,849 | |
| | |
| | Textiles, Apparel & Luxury Goods – 3.3% | |
| | 4,917 | | | NIKE, Inc. Class B | | | 267,780 | |
| | 822 | | | PVH Corp. | | | 100,161 | |
| | | | | | | | |
| | | | | | | 367,941 | |
| | |
| | Wireless Telecommunication Services* – 2.4% | |
| | 3,754 | | | SBA Communications Corp. Class A | | | 266,984 | |
| | |
| | TOTAL COMMON STOCKS | |
| | (Cost $8,828,310) | | $ | 10,840,423 | |
| | |
| | | | | | | | | | | | |
Principal
Amount | | | Interest
Rate | | Maturity
Date | | | Value | |
| | Short-term Investment(a) – 1.8% | |
| | Repurchase Agreement – 1.8% | |
| | |
| $ | 200,000 | | | 0.191% | | | 03/01/13 | | | $ | 200,000 | |
| | (Cost $200,000) | |
| | |
| | TOTAL INVESTMENTS – 99.3% | |
| | (Cost $9,028,310) | | | $ | 11,040,423 | |
| | |
| OTHER ASSETS IN EXCESS OF
LIABILITIES – 0.7% |
| | | 73,823 | |
| | |
| | NET ASSETS – 100.0% | | | $ | 11,114,246 | |
| | |
| | |
| The percentage shown for each investment category reflects the value of investments in that category as a percentage of net assets. |
* | | Non-income producing security. |
(a) | | Joint repurchase agreement was entered into on February 28, 2013. Additional information appears on pages 76-77. |
| | |
|
Investment Abbreviation: |
ADR | | —American Depositary Receipt |
|
| | |
| The accompanying notes are an integral part of these financial statements. | | 75 |
GOLDMAN SACHS FUNDAMENTAL EQUITY GROWTH FUNDS
Schedule of Investments (continued)
February 28, 2013 (Unaudited)
|
| ADDITIONAL INVESTMENT INFORMATION |
JOINT REPURCHASE AGREEMENT ACCOUNT II — At February 28, 2013, the Funds had undivided interests in the Joint Repurchase Agreement Account II, with a maturity date of March 1, 2013, as follows:
| | | | | | | | | | | | |
| Fund | | Principal Amount | | | Maturity Value | | | Collateral Allocation Value | |
Capital Growth | | $ | 7,500,000 | | | $ | 7,500,040 | | | $ | 7,685,883 | |
Concentrated Growth | | | 3,400,000 | | | | 3,400,018 | | | | 3,484,267 | |
Flexible Cap Growth | | | 200,000 | | | | 200,001 | | | | 204,957 | |
Focused Growth | | | 300,000 | | | | 300,002 | | | | 307,435 | |
Growth Opportunities | | | 63,700,000 | | | | 63,700,338 | | | | 65,278,765 | |
Small/Mid Cap Growth | | | 39,000,000 | | | | 39,000,207 | | | | 39,966,591 | |
Strategic Growth | | | 4,900,000 | | | | 4,900,026 | | | | 5,021,443 | |
Technology Tollkeeper | | | 1,900,000 | | | | 1,900,010 | | | | 1,947,090 | |
U.S. Equity | | | 200,000 | | | | 200,001 | | | | 204,957 | |
REPURCHASE AGREEMENTS — At February 28, 2013, the Principal Amounts of the Funds’ interest in the Joint Repurchase Agreement Account II were as follows:
| | | | | | | | | | | | | | | | | | | | | | | | | | | | | | | | | | | | | | | | |
| Counterparty | | Interest Rate | | | Capital Growth | | | Concentrated Growth | | | Flexible
Cap Growth | | | Focused Growth | | | Growth Opportunities | | | Small/Mid Cap Growth | | | Strategic Growth | | | Technology Tollkeeper | | | U.S. Equity | |
BNP Paribas Securities Co. | | | 0.190 | % | | $ | 2,067,782 | | | $ | 937,395 | | | $ | 55,141 | | | $ | 82,711 | | | $ | 17,562,362 | | | $ | 10,752,466 | | | $ | 1,350,951 | | | $ | 523,838 | | | $ | 55,141 | |
Credit Suisse Securities LLC | | | 0.160 | | | | 281,331 | | | | 127,537 | | | | 7,502 | | | | 11,253 | | | | 2,389,437 | | | | 1,462,921 | | | | 183,803 | | | | 71,270 | | | | 7,502 | |
Deutsche Bank Securities, Inc. | | | 0.200 | | | | 1,563,918 | | | | 708,976 | | | | 41,704 | | | | 62,557 | | | | 13,282,880 | | | | 8,132,376 | | | | 1,021,760 | | | | 396,193 | | | | 41,704 | |
J.P. Morgan Securities LLC | | | 0.200 | | | | 576,728 | | | | 261,450 | | | | 15,379 | | | | 23,069 | | | | 4,898,346 | | | | 2,998,987 | | | | 376,796 | | | | 146,105 | | | | 15,379 | |
Wells Fargo Securities LLC | | | 0.190 | | | | 3,010,241 | | | | 1,364,642 | | | | 80,274 | | | | 120,410 | | | | 25,566,975 | | | | 15,653,250 | | | | 1,966,690 | | | | 762,594 | | | | 80,274 | |
| TOTAL | | | | | | $ | 7,500,000 | | | $ | 3,400,000 | | | $ | 200,000 | | | $ | 300,000 | | | $ | 63,700,000 | | | $ | 39,000,000 | | | $ | 4,900,000 | | | $ | 1,900,000 | | | $ | 200,000 | |
| | |
| 76 | | The accompanying notes are an integral part of these financial statements. |
GOLDMAN SACHS FUNDAMENTAL EQUITY GROWTH FUNDS
|
| ADDITIONAL INVESTMENT INFORMATION (continued) |
At February 28, 2013, the Joint Repurchase Agreement Account II was fully collateralized by:
| | | | | | | | |
| Issuer | | Interest Rates | | | Maturity Dates | |
Federal Home Loan Mortgage Corp. | | | 2.000 to 4.500 | % | | | 04/01/26 to 02/01/43 | |
Federal National Mortgage Association | | | 2.000 to 5.000 | | | | 12/01/22 to 01/01/43 | |
Government National Mortgage Association | | | 3.000 to 6.500 | | | | 07/20/26 to 02/20/43 | |
U.S. Treasury Notes | | | 1.750 to 3.125 | | | | 09/30/13 to 10/31/18 | |
| | |
| The accompanying notes are an integral part of these financial statements. | | 77 |
GOLDMAN SACHS FUNDAMENTAL EQUITY GROWTH FUNDS
Statements of Assets and Liabilities
February 28, 2013 (Unaudited)
| | | | | | | | | | |
| | | | |
Capital Growth Fund | | | Concentrated
Growth Fund | |
| | Assets: | |
| | Investments of unaffiliated issuers, at value (cost $563,815,252, $97,342,311, $8,689,508, $11,459,841, $3,280,052,771, $867,749,239, $291,750,927, $302,700,369 and $9,028,310) | | $ | 843,706,921 | | | $ | 150,275,829 | |
| | Investments of affiliated issuers, at value (cost $67,633,694 for Growth Opportunities Fund) | | | — | | | | — | |
| | Cash | | | 24,518 | | | | 6,790 | |
| | Receivables: | | | | | | | | |
| | Investments sold | | | 2,413,903 | | | | 1,193,901 | |
| | Dividends and interest | | | 886,884 | | | | 115,544 | |
| | Fund shares sold | | | 91,759 | | | | 326,120 | |
| | Reimbursement from investment adviser | | | 36,042 | | | | 12,054 | |
| | Other assets | | | 28,197 | | | | 1,185 | |
| | Total assets | | | 847,188,224 | | | | 151,931,423 | |
| | | | | | | | | | |
| | Liabilities: | |
| | Payables: | | | | | | | | |
| | Investments purchased | | | 5,684,358 | | | | 1,611,775 | |
| | Fund shares redeemed | | | 2,993,233 | | | | 39,807 | |
| | Amounts owed to affiliates | | | 767,704 | | | | 127,434 | |
| | Accrued expenses | | | 162,877 | | | | 73,273 | |
| | Total liabilities | | | 9,608,172 | | | | 1,852,289 | |
| | | | | | | | | | |
| | Net Assets: | |
| | Paid-in capital | | | 536,384,881 | | | | 107,503,369 | |
| | Undistributed net investment income (loss) | | | 1,709,746 | | | | 8,764 | |
| | Accumulated net realized gain (loss) | | | 19,593,756 | | | | (10,366,517 | ) |
| | Net unrealized gain | | | 279,891,669 | | | | 52,933,518 | |
| | | NET ASSETS | | $ | 837,580,052 | | | $ | 150,079,134 | |
| | | Net Assets: | | | | | | | | |
| | | Class A | | $ | 655,029,380 | | | $ | 87,151,565 | |
| | | Class B | | | 22,937,394 | | | | 332,499 | |
| | | Class C | | | 73,067,523 | | | | 3,013,018 | |
| | | Institutional | | | 80,849,280 | | | | 59,205,909 | |
| | | Service | | | 1,180,814 | | | | — | |
| | | Class IR | | | 2,552,623 | | | | 364,950 | |
| | | Class R | | | 1,963,038 | | | | 11,193 | |
| | | Total Net Assets | | $ | 837,580,052 | | | $ | 150,079,134 | |
| | | Shares Outstanding $0.001 par value (unlimited shares authorized): | | | | | | | | |
| | | Class A | | | 25,079,696 | | | | 5,429,473 | |
| | | Class B | | | 1,005,156 | | | | 22,451 | |
| | | Class C | | | 3,205,682 | | | | 203,742 | |
| | | Institutional | | | 2,950,794 | | | | 3,572,700 | |
| | | Service | | | 46,026 | | | | — | |
| | | Class IR | | | 97,361 | | | | 22,624 | |
| | | Class R | | | 76,111 | | | | 705 | |
| | | Net asset value, offering and redemption price per share:(a) | | | | | | | | |
| | | Class A | | | $26.12 | | | | $16.05 | |
| | | Class B | | | 22.82 | | | | 14.81 | |
| | | Class C | | | 22.79 | | | | 14.79 | |
| | | Institutional | | | 27.40 | | | | 16.57 | |
| | | Service | | | 25.66 | | | | — | |
| | | Class IR | | | 26.22 | | | | 16.13 | |
| | | Class R | | | 25.79 | | | | 15.88 | |
| | (a) | | Maximum public offering price per share for Class A Shares of the Capital Growth, Concentrated Growth, Flexible Cap Growth, Focused Growth, Growth Opportunities, Small/Mid Cap Growth, Strategic Growth, Technology Tollkeeper and U.S. Equity Funds is $27.64, $16.98, $11.48, $13.09, $25.83, $17.59, $12.10, $14.93 and $14.17, respectively. At redemption, Class B and Class C Shares may be subject to a contingent deferred sales charge, assessed on the amount equal to the lesser of the current NAV or the original purchase price of the shares. |
| | |
| 78 | | The accompanying notes are an integral part of these financial statements. |
GOLDMAN SACHS FUNDAMENTAL EQUITY GROWTH FUNDS
| | | | | | | | | | | | | | | | | | | | | | | | | | | | | | | | | | | | | | | | |
| | | Flexible Cap
Growth Fund | | | | | Focused
Growth Fund | | | | | Growth
Opportunities Fund | | | | | Small/Mid Cap
Growth Fund | | | | | Strategic
Growth Fund | | | | | Technology
Tollkeeper Fund | | | | | U.S. Equity
Fund | |
| |
| | | | | | | | | | | | | | | | | | | | | | | | | | | | | | | | | | | | | | | | |
| | $ | 12,096,858 | | | | | $ | 12,332,618 | | | | | $ | 4,356,474,183 | | | | | $ | 1,111,766,984 | | | | | $ | 361,532,494 | | | | | $ | 364,034,530 | | | | | $ | 11,040,423 | |
| | | — | | | | | | — | | | | | | 31,236,813 | | | | | | — | | | | | | — | | | | | | — | | | | | | — | |
| | | 98,887 | | | | | | 99,190 | | | | | | 11,845 | | | | | | 32,226 | | | | | | 74,021 | | | | | | 95,363 | | | | | | 59,147 | |
| | | | | | | | | | | | | | | | | | | | | | | | | | | | | | | | | | | | | | | | |
| | | 66,917 | | | | | | 72,518 | | | | | | 23,835,303 | | | | | | 8,988,340 | | | | | | 1,969,419 | | | | | | 1,567,942 | | | | | | 97,744 | |
| | | 9,346 | | | | | | 6,095 | | | | | | 2,601,856 | | | | | | 475,590 | | | | | | 314,784 | | | | | | 18,842 | | | | | | 18,326 | |
| | | 76,097 | | | | | | 2,500 | | | | | | 7,057,800 | | | | | | 3,671,063 | | | | | | 533,367 | | | | | | 378,657 | | | | | | — | |
| | | 37,877 | | | | | | 26,367 | | | | | | 2,156 | | | | | | — | | | | | | 32,638 | | | | | | 8,803 | | | | | | 19,829 | |
| | | 147 | | | | | | 125 | | | | | | 57,033 | | | | | | 8,017 | | | | | | 2,769 | | | | | | 3,051 | | | | | | 140 | |
| | | 12,386,129 | | | | | | 12,539,413 | | | | | | 4,421,276,989 | | | | | | 1,124,942,220 | | | | | | 364,459,492 | | | | | | 366,107,188 | | | | | | 11,235,609 | |
| | | | | | | | | | | | | | | | | | | | | | | | | | | | | | | | | | | | | | | | |
| |
| | | | | | | | | | | | | | | | | | | | | | | | | | | | | | | | | | | | | | | | |
| | | 42,288 | | | | | | 175,981 | | | | | | 13,571,007 | | | | | | 16,716,669 | | | | | | 4,701,228 | | | | | | — | | | | | | 43,010 | |
| | | 79,581 | | | | | | — | | | | | | 5,200,479 | | | | | | 1,515,977 | | | | | | 642,641 | | | | | | 972,979 | | | | | | 741 | |
| | | 10,500 | | | | | | 7,622 | | | | | | 3,699,387 | | | | | | 996,667 | | | | | | 264,707 | | | | | | 422,030 | | | | | | 7,681 | |
| | | 64,302 | | | | | | 61,920 | | | | | | 327,345 | | | | | | 147,986 | | | | | | 97,205 | | | | | | 124,878 | | | | | | 69,931 | |
| | | 196,671 | | | | | | 245,523 | | | | | | 22,798,218 | | | | | | 19,377,299 | | | | | | 5,705,781 | | | | | | 1,519,887 | | | | | | 121,363 | |
| | | | | | | | | | | | | | | | | | | | | | | | | | | | | | | | | | | | | | | | |
| |
| | | 8,676,699 | | | | | | 11,324,194 | | | | | | 3,337,132,199 | | | | | | 870,550,631 | | | | | | 275,850,908 | | | | | | 313,710,536 | | | | | | 9,065,113 | |
| | | 9,696 | | | | | | 2,479 | | | | | | 560,701 | | | | | | (5,868,477 | ) | | | | | 434,090 | | | | | | (4,548,036 | ) | | | | | 10,530 | |
| | | 95,713 | | | | | | 94,440 | | | | | | 20,761,340 | | | | | | (3,134,978 | ) | | | | | 12,687,146 | | | | | | (5,909,360 | ) | | | | | 26,490 | |
| | | 3,407,350 | | | | | | 872,777 | | | | | | 1,040,024,531 | | | | | | 244,017,745 | | | | | | 69,781,567 | | | | | | 61,334,161 | | | | | | 2,012,113 | |
| | | $ | 12,189,458 | | | | | $ | 12,293,890 | | | | | $ | 4,398,478,771 | | | | | $ | 1,105,564,921 | | | | | $ | 358,753,711 | | | | | $ | 364,587,301 | | | | | $ | 11,114,246 | |
| | | | | | | | | | | | | | | | | | | | | | | | | | | | | | | | | | | | | | | | | |
| | | | $5,813,092 | | | | | $ | 72,951 | | | | | $ | 1,111,514,590 | | | | | $ | 479,317,361 | | | | | $ | 156,227,003 | | | | | $ | 237,353,825 | | | | | $ | 2,814,224 | |
| | | | — | | | | | | — | | | | | | 10,656,856 | | | | | | 4,614,697 | | | | | | 1,227,772 | | | | | | 7,176,193 | | | | | | — | |
| | | | 849,078 | | | | | | 12,349 | | | | | | 165,835,685 | | | | | | 108,550,628 | | | | | | 9,315,701 | | | | | | 49,734,403 | | | | | | 133,828 | |
| | | | 5,293,038 | | | | | | 12,183,691 | | | | | | 2,895,077,449 | | | | | | 419,524,841 | | | | | | 191,283,367 | | | | | | 57,088,144 | | | | | | 7,976,221 | |
| | | | — | | | | | | — | | | | | | 60,137,336 | | | | | | 7,514,516 | | | | | | 105,828 | | | | | | 11,125,669 | | | | | | — | |
| | | | 167,099 | | | | | | 12,484 | | | | | | 94,024,425 | | | | | | 64,776,166 | | | | | | 589,432 | | | | | | 2,109,067 | | | | | | 146,668 | |
| | | | 67,151 | | | | | | 12,415 | | | | | | 61,232,430 | | | | | | 21,266,712 | | | | | | 4,608 | | | | | | — | | | | | | 43,305 | |
| | | | $12,189,458 | | | | | $ | 12,293,890 | | | | | $ | 4,398,478,771 | | | | | $ | 1,105,564,921 | | | | | $ | 358,753,711 | | | | | $ | 364,587,301 | | | | | $ | 11,114,246 | |
| | | | | | | | | | | | | | | | | | | | | | | | | | | | | | | | | | | | | | | | | |
| | | | 535,566 | | | | | | 5,899 | | | | | | 45,538,492 | | | | | | 28,835,632 | | | | | | 13,671,532 | | | | | | 16,826,185 | | | | | | 210,128 | |
| | | | — | | | | | | — | | | | | | 500,901 | | | | | | 297,484 | | | | | | 118,861 | | | | | | 563,242 | | | | | | — | |
| | | | 81,673 | | | | | | 1,003 | | | | | | 7,879,934 | | | | | | 7,001,256 | | | | | | 900,562 | | | | | | 3,904,102 | | | | | | 10,100 | |
| | | | 474,907 | | | | | | 982,414 | | | | | | 109,879,411 | | | | | | 24,479,017 | | | | | | 16,120,501 | | | | | | 3,833,844 | | | | | | 594,175 | |
| | | | — | | | | | | — | | | | | | 2,514,888 | | | | | | 458,051 | | | | | | 9,272 | | | | | | 796,530 | | | | | | — | |
| | | | 15,126 | | | | | | 1,007 | | | | | | 3,793,281 | | | | | | 3,840,323 | | | | | | 49,618 | | | | | | 142,163 | | | | | | 10,934 | |
| | | | 6,270 | | | | | | 1,003 | | | | | | 2,544,435 | | | | | | 1,297,269 | | | | | | 404 | | | | | | — | | | | | | 3,232 | |
| | | | | | | | | | | | | | | | | | | | | | | | | | | | | | | | | | | | | | | | | |
| | | | $10.85 | | | | | | $12.37 | | | | | | $24.41 | | | | | | $16.62 | | | | | | $11.43 | | | | | | $14.11 | | | | | | $13.39 | |
| | | | — | | | | | | — | | | | | | 21.28 | | | | | | 15.51 | | | | | | 10.33 | | | | | | 12.74 | | | | | | — | |
| | | | 10.40 | | | | | | 12.31 | | | | | | 21.05 | | | | | | 15.50 | | | | | | 10.34 | | | | | | 12.74 | | | | | | 13.25 | |
| | | | 11.15 | | | | | | 12.40 | | | | | | 26.35 | | | | | | 17.14 | | | | | | 11.87 | | | | | | 14.89 | | | | | | 13.42 | |
| | | | — | | | | | | — | | | | | | 23.91 | | | | | | 16.41 | | | | | | 11.41 | | | | | | 13.97 | | | | | | — | |
| | | | 11.05 | | | | | | 12.40 | | | | | | 24.79 | | | | | | 16.87 | | | | | | 11.88 | | | | | | 14.84 | | | | | | 13.41 | |
| | | | 10.71 | | | | | | 12.38 | | | | | | 24.07 | | | | | | 16.39 | | | | | | 11.40 | | | | | | — | | | | | | 13.40 | |
| | |
| The accompanying notes are an integral part of these financial statements. | | 79 |
GOLDMAN SACHS FUNDAMENTAL EQUITY GROWTH FUNDS
Statements of Operations
For the Six Months Ended February 28, 2013 (Unaudited)
| | | | | | | | | | |
| | | | | Capital
Growth Fund | | | Concentrated
Growth Fund | |
| | Investment income: | | | | | | | | |
| | Dividends (net of foreign withholding taxes of $0, $1,860, $68, $0, $130,058, $33,005, $0, $0 and $0) | | $ | 7,119,751 | | | $ | 1,467,310 | |
| | Interest | | | 6,196 | | | | 1,121 | |
| | Total investment income | | | 7,125,947 | | | | 1,468,431 | |
| | | | | | | | | | |
| | Expenses: | | | | | | | | |
| | Management fees | | | 4,150,957 | | | | 731,281 | |
| | Distribution and Service fees(a) | | | 1,293,954 | | | | 126,223 | |
| | Transfer Agent fees(a) | | | 726,272 | | | | 98,069 | |
| | Printing and mailing costs | | | 90,889 | | | | 14,199 | |
| | Registration fees | | | 66,729 | | | | 42,447 | |
| | Custody, accounting and administrative services | | | 54,379 | | | | 25,452 | |
| | Professional fees | | | 44,299 | | | | 38,878 | |
| | Trustee fees | | | 10,646 | | | | 9,669 | |
| | Service Share fees — Shareholder Administration Plan | | | 1,375 | | | | — | |
| | Service Share fees — Service Plan | | | 1,375 | | | | — | |
| | Amortization of offering costs | | | — | | | | — | |
| | Other | | | 9,261 | | | | 2,801 | |
| | Total expenses | | | 6,450,136 | | | | 1,089,019 | |
| | Less — expense reductions | | | (1,504,922 | ) | | | (262,176 | ) |
| | Net expenses | | | 4,945,214 | | | | 826,843 | |
| | NET INVESTMENT INCOME (LOSS) | | | 2,180,733 | | | | 641,588 | |
| | | | | | | | | | |
| | Realized and unrealized gain (loss): | | | | | | | | |
| | Net realized gain (loss) from: | | | | | | | | |
| | Investments — unaffiliated issuers (including commission recapture of $52,988, $9,081, $0, $0, $226,166, $0, $14,892, $11,641 and $0) | | | 36,615,907 | | | | 7,492,914 | |
| | Investments — affiliated issuers | | | — | | | | — | |
| | Net change in unrealized gain (loss) on: | | | | | | | | |
| | Investments — unaffiliated issuers | | | 18,827,605 | | | | 2,787,780 | |
| | Investments — affiliated issuers | | | — | | | | — | |
| | Net realized and unrealized gain | | | 55,443,512 | | | | 10,280,694 | |
| | NET INCREASE IN NET ASSETS RESULTING FROM OPERATIONS | | $ | 57,624,245 | | | $ | 10,922,282 | |
| | (a) | | Class specific Distribution and Service, and Transfer Agent fees were as follows: |
| | | | | | | | | | | | | | | | | | | | | | | | | | | | | | | | | | | | | | | | | | | | |
| | | Distribution and Service Fees | | | Transfer Agent Fees | |
Fund | | Class A | | | Class B | | | Class C | | | Class R | | | Class A | | | Class B | | | Class C | | | Institutional | | | Service | | | Class IR | | | Class R | |
Capital Growth | | $ | 807,960 | | | $ | 121,233 | | | $ | 360,017 | | | $ | 4,744 | | | $ | 614,050 | | | $ | 23,034 | | | $ | 68,403 | | | $ | 16,422 | | | $ | 220 | | | $ | 2,340 | | | $ | 1,803 | |
Concentrated Growth | | | 109,944 | | | | 1,672 | | | | 14,581 | | | | 26 | | | | 83,557 | | | | 318 | | | | 2,770 | | | | 10,900 | | | | — | | | | 514 | | | | 10 | |
Flexible Cap Growth | | | 7,915 | | | | — | | | | 4,278 | | | | 159 | | | | 6,014 | | | | — | | | | 813 | | | | 955 | | | | — | | | | 156 | | | | 61 | |
Focused Growth | | | 71 | | | | — | | | | 58 | | | | 29 | | | | 53 | | | | — | | | | 11 | | | | 1,124 | | | | — | | | | 11 | | | | 11 | |
Growth Opportunities
| | | 1,328,596 | | | | 55,769 | | | | 782,702 | | | | 138,931 | | | | 1,009,733 | | | | 10,596 | | | | 148,713 | | | | 548,160 | | | | 11,923 | | | | 78,075 | | | | 52,794 | |
Small/Mid Cap Growth | | | 521,858 | | | | 22,831 | | | | 463,771 | | | | 49,283 | | | | 396,613 | | | | 4,338 | | | | 88,116 | | | | 65,014 | | | | 1,381 | | | | 49,973 | | | | 18,727 | |
Strategic Growth | | | 205,210 | | | | 6,677 | | | | 41,660 | | | | 11 | | | | 155,960 | | | | 1,268 | | | | 7,915 | | | | 41,436 | | | | 16 | | | | 386 | | | | 4 | |
Technology Tollkeeper | | | 295,305 | | | | 36,964 | | | | 246,457 | | | | — | | | | 224,432 | | | | 7,023 | | | | 46,827 | | | | 9,570 | | | | 2,178 | | | | 2,407 | | | | — | |
U.S. Equity | | | 4,023 | | | | — | | | | 723 | | | | 50 | | | | 3,058 | | | | — | | | | 137 | | | | 1,434 | | | | — | | | | 109 | | | | 19 | |
| | |
| 80 | | The accompanying notes are an integral part of these financial statements. |
GOLDMAN SACHS FUNDAMENTAL EQUITY GROWTH FUNDS
| | | | | | | | | | | | | | | | | | | | | | | | | | | | | | | | | | | | | | | | |
| | | Flexible Cap Growth Fund | | | | | Focused
Growth Fund | | | | | Growth
Opportunities Fund | | | | | Small/Mid Cap
Growth Fund | | | | | Strategic
Growth Fund | | | | | Technology
Tollkeeper Fund | | | | | U.S. Equity
Fund | |
| | | | | | | | | | | | | | | | | | | | | | | | | | | | | | | | | | | | | | | | |
| | $ | 89,095 | | | | | $ | 48,415 | | | | | $ | 22,872,250 | | | | | $ | 4,049,229 | | | | | $ | 3,489,228 | | | | | $ | 896,092 | | | | | $ | 112,360 | |
| | | 118 | | | | | | 94 | | | | | | 46,573 | | | | | | 21,803 | | | | | | 2,089 | | | | | | 3,854 | | | | | | 140 | |
| | | 89,213 | | | | | | 48,509 | | | | | | 22,918,823 | | | | | | 4,071,032 | | | | | | 3,491,317 | | | | | | 899,946 | | | | | | 112,500 | |
| | | | | | | | | | | | | | | | | | | | | | | | | | | | | | | | | | | | | | | | |
| | | | | | | | | | | | | | | | | | | | | | | | | | | | | | | | | | | | | | | | |
| | | 60,938 | | | | | | 28,554 | | | | | | 19,751,124 | | | | | | 4,595,488 | | | | | | 1,907,518 | | | | | | 1,771,017 | | | | | | 37,328 | |
| | | 12,352 | | | | | | 158 | | | | | | 2,305,998 | | | | | | 1,057,743 | | | | | | 253,558 | | | | | | 578,726 | | | | | | 4,796 | |
| | | 7,999 | | | | | | 1,210 | | | | | | 1,859,994 | | | | | | 624,162 | | | | | | 206,985 | | | | | | 292,437 | | | | | | 4,757 | |
| | | 13,199 | | | | | | 13,806 | | | | | | 191,475 | | | | | | 71,130 | | | | | | 32,619 | | | | | | 57,684 | | | | | | 14,127 | |
| | | 49,536 | | | | | | 30,617 | | | | | | 58,312 | | | | | | 32,481 | | | | | | 53,537 | | | | | | 35,863 | | | | | | 47,819 | |
| | | 33,184 | | | | | | 18,015 | | | | | | 115,219 | | | | | | 55,740 | | | | | | 42,077 | | | | | | 32,191 | | | | | | 25,646 | |
| | | 41,035 | | | | | | 6,884 | | | | | | 37,732 | | | | | | 34,777 | | | | | | 39,087 | | | | | | 41,360 | | | | | | 40,852 | |
| | | 7,624 | | | | | | 7,615 | | | | | | 17,856 | | | | | | 12,400 | | | | | | 10,073 | | | | | | 10,068 | | | | | | 7,622 | |
| | | — | | | | | | — | | | | | | 74,516 | | | | | | 8,629 | | | | | | 98 | | | | | | 13,613 | | | | | | — | |
| | | — | | | | | | — | | | | | | 74,516 | | | | | | 8,629 | | | | | | 98 | | | | | | 13,613 | | | | | | — | |
| | | — | | | | | | 114,172 | | | | | | — | | | | | | — | | | | | | — | | | | | | — | | | | | | — | |
| | | 2,381 | | | | | | 29,882 | | | | | | 51,447 | | | | | | 15,432 | | | | | | 6,725 | | | | | | 7,863 | | | | | | 5,645 | |
| | | 228,248 | | | | | | 250,913 | | | | | | 24,538,189 | | | | | | 6,516,611 | | | | | | 2,552,375 | | | | | | 2,854,435 | | | | | | 188,592 | |
| | | (157,709 | ) | | | | | (226,611 | ) | | | | | (1,172,204 | ) | | | | | (689,357 | ) | | | | | (729,703 | ) | | | | | (71,711 | ) | | | | | (139,396 | ) |
| | | 70,539 | | | | | | 24,302 | | | | | | 23,365,985 | | | | | | 5,827,254 | | | | | | 1,822,672 | | | | | | 2,782,724 | | | | | | 49,196 | |
| | | 18,674 | | | | | | 24,207 | | | | | | (447,162 | ) | | | | | (1,756,222 | ) | | | | | 1,668,645 | | | | | | (1,882,778 | ) | | | | | 63,304 | |
| | | | | | | | | | | | | | | | | | | | | | | | | | | | | | | | | | | | | | | | |
| | | | | | | | | | | | | | | | | | | | | | | | | | | | | | | | | | | | | | | | |
| | | | | | | | | | | | | | | | | | | | | | | | | | | | | | | | | | | | | | | | |
| | | | | | | | | | | | | | | | | | | | | | | | | | | | | | | | | | | | | | | | |
| | | 587,867 | | | | | | 115,922 | | | | | | 126,519,801 | | | | | | 15,816,617 | | | | | | 28,625,094 | | | | | | 1,204,369 | | | | | | 295,475 | |
| | | — | | | | | | — | | | | | | (327,414 | ) | | | | | — | | | | | | — | | | | | | — | | | | | | — | |
| | | | | | | | | | | | | | | | | | | | | | | | | | | | | | | | | | | | | | | | |
| | | 234,764 | | | | | | 503,225 | | | | | | 266,548,514 | | | | | | 98,319,559 | | | | | | (2,878,804 | ) | | | | | 12,832,768 | | | | | | 647,792 | |
| | | — | | | | | | — | | | | | | 5,535,977 | | | | | | — | | | | | | — | | | | | | — | | | | | | — | |
| | | 822,631 | | | | | | 619,147 | | | | | | 398,276,878 | | | | | | 114,136,176 | | | | | | 25,746,290 | | | | | | 14,037,137 | | | | | | 943,267 | |
| | $ | 841,305 | | | | | $ | 643,354 | | | | | $ | 397,829,716 | | | | | $ | 112,379,954 | | | | | $ | 27,414,935 | | | | | $ | 12,154,359 | | | | | $ | 1,006,571 | |
| | |
| The accompanying notes are an integral part of these financial statements. | | 81 |
GOLDMAN SACHS FUNDAMENTAL EQUITY GROWTH FUNDS
Statements of Changes in Net Assets
| | | | | | | | | | |
| | | | | Capital Growth Fund | |
| | | | | For the
Six Months Ended
February 28, 2013
(Unaudited) | | | For the Fiscal
Year Ended
August 31, 2012 | |
| | From operations: | | | | | | | | |
| | Net investment income (loss) | | $ | 2,180,733 | | | $ | 590,889 | |
| | Net realized gain | | | 36,615,907 | | | | 96,649,991 | |
| | Net change in unrealized gain | | | 18,827,605 | | | | 63,428,264 | |
| | Net increase in net assets resulting from operations | | | 57,624,245 | | | | 160,669,144 | |
| | | | | | | | | | |
| | Distributions to shareholders: | | | | | | | | |
| | From net investment income | | | | | | | | |
| | Class A Shares | | | (690,477 | ) | | | (1,176,897 | ) |
| | Class B Shares | | | — | | | | — | |
| | Class C Shares | | | — | | | | — | |
| | Institutional Shares | | | (395,128 | ) | | | (843,182 | ) |
| | Service Shares | | | (417 | ) | | | (883 | ) |
| | Class IR Shares | | | (10,114 | ) | | | (9,608 | ) |
| | Class R Shares | | | (3,429 | ) | | | (579 | ) |
| | From net realized gains | | | | | | | | |
| | Class A Shares | | | — | | | | — | |
| | Class C Shares | | | — | | | | — | |
| | Institutional Shares | | | — | | | | — | |
| | Class IR Shares | | | — | | | | — | |
| | Class R Shares | | | — | | | | — | |
| | Total distributions to shareholders | | | (1,099,565 | ) | | | (2,031,149 | ) |
| | | | | | | | | | |
| | From share transactions: | | | | | | | | |
| | Proceeds from sales of shares | | | 23,594,106 | | | | 66,322,103 | |
| | Reinvestment of distributions | | | 1,032,918 | | | | 1,885,834 | |
| | Cost of shares redeemed | | | (94,716,194 | ) | | | (451,308,864 | ) |
| | Net decrease in net assets resulting from share transactions | | | (70,089,170 | ) | | | (383,100,927 | ) |
| | TOTAL DECREASE | | | (13,564,490 | ) | | | (224,462,932 | ) |
| | | | | | | | | | |
| | Net assets: | | | | | | | | |
| | Beginning of period | | | 851,144,542 | | | | 1,075,607,474 | |
| | End of period | | $ | 837,580,052 | | | $ | 851,144,542 | |
| | Undistributed net investment income (loss) | | $ | 1,709,746 | | | $ | 628,578 | |
| | |
| 82 | | The accompanying notes are an integral part of these financial statements. |
GOLDMAN SACHS FUNDAMENTAL EQUITY GROWTH FUNDS
| | | | | | | | | | | | | | | | | | | | | | |
| | | Concentrated Growth Fund | | | | | Flexible Cap Growth Fund | |
| | | For the
Six Months Ended
February 28, 2013
(Unaudited) | | | | | For the Fiscal
Year Ended
August 31, 2012 | | | | | For the
Six Months Ended
February 28, 2013
(Unaudited) | | | | | For the Fiscal
Year Ended
August 31, 2012 | |
| | | | | | | | | | | | | | | | | | | | | | |
| | $ | 641,588 | | | | | $ | 346,598 | | | | | $ | 18,674 | | | | | $ | (21,034 | ) |
| | | 7,492,914 | | | | | | 20,967,098 | | | | | | 587,867 | | | | | | 1,193,798 | |
| | | 2,787,780 | | | | | | 7,552,943 | | | | | | 234,764 | | | | | | 667,097 | |
| | | 10,922,282 | | | | | | 28,866,639 | | | | | | 841,305 | | | | | | 1,839,861 | |
| | | | | | | | | | | | | | | | | | | | | | |
| | | | | | | | | | | | | | | | | | | | | | |
| | | | | | | | | | | | | | | | | | | | | | |
| | | (355,613 | ) | | | | | — | | | | | | — | | | | | | — | |
| | | (218 | ) | | | | | — | | | | | | — | | | | | | — | |
| | | (1,983 | ) | | | | | — | | | | | | — | | | | | | — | |
| | | (419,468 | ) | | | | | (298,715 | ) | | | | | — | | | | | | — | |
| | | — | | | | | | — | | | | | | — | | | | | | — | |
| | | (4,247 | ) | | | | | (1,459 | ) | | | | | — | | | | | | — | |
| | | (24 | ) | | | | | — | | | | | | — | | | | | | — | |
| | | | | | | | | | | | | | | | | | | | | | |
| | | — | | | | | | — | | | | | | (713,810 | ) | | | | | (622,301 | ) |
| | | — | | | | | | — | | | | | | (102,494 | ) | | | | | (57,805 | ) |
| | | — | | | | | | — | | | | | | (539,715 | ) | | | | | (233,496 | ) |
| | | — | | | | | | — | | | | | | (18,987 | ) | | | | | (6,825 | ) |
| | | — | | | | | | — | | | | | | (7,512 | ) | | | | | (9,321 | ) |
| | | (781,553 | ) | | | | | (300,174 | ) | | | | | (1,382,518 | ) | | | | | (929,748 | ) |
| | | | | | | | | | | | | | | | | | | | | | |
| | | | | | | | | | | | | | | | | | | | | | |
| | | 9,104,752 | | | | | | 8,892,961 | | | | | | 1,160,643 | | | | | | 1,930,385 | |
| | | 741,898 | | | | | | 268,022 | | | | | | 1,362,254 | | | | | | 901,192 | |
| | | (22,098,543 | ) | | | | | (124,417,630 | ) | | | | | (3,072,366 | ) | | | | | (11,557,742 | ) |
| | | (12,251,893 | ) | | | | | (115,256,647 | ) | | | | | (549,469 | ) | | | | | (8,726,165 | ) |
| | | (2,111,164 | ) | | | | | (86,690,182 | ) | | | | | (1,090,682 | ) | | | | | (7,816,052 | ) |
| | | | | | | | | | | | | | | | | | | | | | |
| | | | | | | | | | | | | | | | | | | | | | |
| | | 152,190,298 | | | | | | 238,880,480 | | | | | | 13,280,140 | | | | | | 21,096,192 | |
| | $ | 150,079,134 | | | | | $ | 152,190,298 | | | | | $ | 12,189,458 | | | | | $ | 13,280,140 | |
| | $ | 8,764 | | | | | $ | 148,729 | | | | | $ | 9,696 | | | | | $ | (8,978 | ) |
| | |
| The accompanying notes are an integral part of these financial statements. | | 83 |
GOLDMAN SACHS FUNDAMENTAL EQUITY GROWTH FUNDS
Statements of Changes in Net Assets
| | | | | | | | | | |
| | | | | Focused Growth Fund | |
| | | | | For the
Six Months Ended
February 28, 2013
(Unaudited) | | | For the
Period Ended
August 31, 2012(a) | |
| | From operations: | | | | | | | | |
| | Net investment income (loss) | | $ | 24,207 | | | $ | 5,534 | |
| | Net realized gain (loss) | | | 115,922 | | | | (13,299 | ) |
| | Net change in unrealized gain | | | 503,225 | | | | 369,552 | |
| | Net increase in net assets resulting from operations | | | 643,354 | | | | 361,787 | |
| | | | | | | | | | |
| | Distributions to shareholders: | | | | | | | | |
| | From net investment income | | | | | | | | |
| | Class A Shares | | | (261 | ) | | | — | |
| | Class C Shares | | | (11 | ) | | | — | |
| | Institutional Shares | | | (27,074 | ) | | | — | |
| | Class IR Shares | | | (54 | ) | | | — | |
| | Class R Shares | | | (11 | ) | | | — | |
| | From net realized gains | | | | | | | | |
| | Class A Shares | | | (115 | ) | | | — | |
| | Class B Shares | | | — | | | | — | |
| | Class C Shares | | | (21 | ) | | | — | |
| | Institutional Shares | | | (8,003 | ) | | | — | |
| | Service Shares | | | — | | | | — | |
| | Class IR Shares | | | (22 | ) | | | — | |
| | Class R Shares | | | (22 | ) | | | — | |
| | Total distributions to shareholders | | | (35,594 | ) | | | — | |
| | | | | | | | | | |
| | From share transactions: | | | | | | | | |
| | Proceeds from sales of shares | | | 8,190,727 | | | | 3,135,328 | |
| | Reinvestment of distributions | | | 35,594 | | | | — | |
| | Cost of shares redeemed | | | (25,691 | ) | | | (11,615 | ) |
| | Net increase (decrease) in net assets resulting from share transactions | | | 8,200,630 | | | | 3,123,713 | |
| | TOTAL INCREASE (DECREASE) | | | 8,808,390 | | | | 3,485,500 | |
| | | | | | | | | | |
| | Net assets: | | | | | | | | |
| | Beginning of period | | | 3,485,500 | | | | — | |
| | End of period | | $ | 12,293,890 | | | $ | 3,485,500 | |
| | Undistributed net investment income (loss) | | $ | 2,479 | | | $ | 5,683 | |
| | (a) | | Commenced operations on January 31, 2012. |
| | |
| 84 | | The accompanying notes are an integral part of these financial statements. |
GOLDMAN SACHS FUNDAMENTAL EQUITY GROWTH FUNDS
| | | | | | | | | | | | | | | | | | | | | | |
| | Growth Opportunities Fund | | | | | Small/Mid Cap Growth Fund | |
| | | For the
Six Months Ended
February 28, 2013
(Unaudited) | | | | | For the Fiscal
Year Ended
August 31, 2012 | | | | | For the
Six Months Ended
February 28, 2013
(Unaudited) | | | | | For the Fiscal
Year Ended
August 31, 2012 | |
| | | | | | | | | | | | | | | | | | | | | | |
| | $ | (447,162 | ) | | | | $ | (17,949,874 | ) | | | | $ | (1,756,222 | ) | | | | $ | (6,203,176 | ) |
| | | 126,192,387 | | | | | | 243,865,457 | | | | | | 15,816,617 | | | | | | 49,029,178 | |
| | | 272,084,491 | | | | | | 518,961,983 | | | | | | 98,319,559 | | | | | | 95,595,374 | |
| | | 397,829,716 | | | | | | 744,877,566 | | | | | | 112,379,954 | | | | | | 138,421,376 | |
| | | | | | | | | | | | | | | | | | | | | | |
| | | | | | | | | | | | | | | | | | | | | | |
| | | | | | | | | | | | | | | | | | | | | | |
| | | — | | | | | | — | | | | | | — | | | | | | — | |
| | | — | | | | | | — | | | | | | — | | | | | | — | |
| | | — | | | | | | — | | | | | | — | | | | | | — | |
| | | — | | | | | | — | | | | | | — | | | | | | — | |
| | | — | | | | | | — | | | | | | — | | | | | | — | |
| | | | | | | | | | | | | | | | | | | | | | |
| | | (71,926,329 | ) | | | | | (64,632,350 | ) | | | | | (19,824,908 | ) | | | | | (17,429,835 | ) |
| | | (869,553 | ) | | | | | (1,049,756 | ) | | | | | (235,890 | ) | | | | | (250,616 | ) |
| | | (12,084,546 | ) | | | | | (10,894,704 | ) | | | | | (4,682,209 | ) | | | | | (3,847,394 | ) |
| | | (173,115,032 | ) | | | | | (165,671,437 | ) | | | | | (14,180,476 | ) | | | | | (15,419,415 | ) |
| | | (4,124,116 | ) | | | | | (3,596,434 | ) | | | | | (332,236 | ) | | | | | (249,049 | ) |
| | | (5,489,820 | ) | | | | | (3,529,948 | ) | | | | | (2,347,737 | ) | | | | | (1,510,883 | ) |
| | | (3,762,229 | ) | | | | | (2,560,779 | ) | | | | | (941,534 | ) | | | | | (790,187 | ) |
| | | (271,371,625 | ) | | | | | (251,935,408 | ) | | | | | (42,544,990 | ) | | | | | (39,497,379 | ) |
| | | | | | | | | | | | | | | | | | | | | | |
| | | | | | | | | | | | | | | | | | | | | | |
| | | 676,953,899 | | | | | | 1,161,792,215 | | | | | | 280,360,806 | | | | | | 254,027,889 | |
| | | 213,144,077 | | | | | | 177,970,409 | | | | | | 38,750,263 | | | | | | 32,384,155 | |
| | | (757,193,779 | ) | | | | | (1,918,088,425 | ) | | | | | (132,976,287 | ) | | | | | (417,739,214 | ) |
| | | 132,904,197 | | | | | | (578,325,801 | ) | | | | | 186,134,782 | | | | | | (131,327,170 | ) |
| | | 259,362,288 | | | | | | (85,383,643 | ) | | | | | 255,969,746 | | | | | | (32,403,173 | ) |
| | | | | | | | | | | | | | | | | | | | | | |
| | | | | | | | | | | | | | | | | | | | | | |
| | | 4,139,116,483 | | | | | | 4,224,500,126 | | | | | | 849,595,175 | | | | | | 881,998,348 | |
| | $ | 4,398,478,771 | | | | | $ | 4,139,116,483 | | | | | $ | 1,105,564,921 | | | | | $ | 849,595,175 | |
| | $ | 560,701 | | | | | $ | 1,007,863 | | | | | $ | (5,868,477 | ) | | | | $ | (4,112,255 | ) |
| | |
| The accompanying notes are an integral part of these financial statements. | | 85 |
GOLDMAN SACHS FUNDAMENTAL EQUITY GROWTH FUNDS
Statements of Changes in Net Assets
| | | | | | | | | | |
| | | | | Strategic Growth Fund | |
| | | | | For the Six Months Ended
February 28, 2013 (Unaudited) | | | For the Fiscal
Year Ended
August 31, 2012 | |
| | From operations: | |
| | Net investment income (loss) | | $ | 1,668,645 | | | $ | 1,692,336 | |
| | Net realized gain (loss) | | | 28,625,094 | | | | 36,038,433 | |
| | Net change in unrealized gain (loss) | | | (2,878,804 | ) | | | 45,973,656 | |
| | Net increase in net assets resulting from operations | | | 27,414,935 | | | | 83,704,425 | |
| | | | | | | | | | |
| | Distributions to shareholders: | | | | | | | | |
| | From net investment income | | | | | | | | |
| | Class A Shares | | | (768,074 | ) | | | (301,353 | ) |
| | Institutional Shares | | | (1,757,888 | ) | | | (1,575,792 | ) |
| | Service Shares | | | (540 | ) | | | (5 | ) |
| | Class IR Shares | | | (2,531 | ) | | | — | |
| | Class R Shares | | | (13 | ) | | | — | |
| | From net realized gains | | | | | | | | |
| | Class A Shares | | | (12,147,881 | ) | | | — | |
| | Class B Shares | | | (108,492 | ) | | | — | |
| | Class C Shares | | | (659,516 | ) | | | — | |
| | Institutional Shares | | | (14,440,628 | ) | | | — | |
| | Service Shares | | | (5,491 | ) | | | — | |
| | Class IR Shares | | | (24,554 | ) | | | — | |
| | Class R Shares | | | (318 | ) | | | — | |
| | Total distributions to shareholders | | | (29,915,926 | ) | | | (1,877,150 | ) |
| | | | | | | | | | |
| | From share transactions: | | | | | | | | |
| | Proceeds from sales of shares | | | 28,697,962 | | | | 139,830,367 | |
| | Reinvestment of distributions | | | 29,155,483 | | | | 1,800,223 | |
| | Cost of shares redeemed | | | (144,383,879 | ) | | | (246,130,710 | ) |
| | Net increase (decrease) in net assets resulting from share transactions | | | (86,530,434 | ) | | | (104,500,120 | ) |
| | TOTAL INCREASE (DECREASE) | | | (89,031,425 | ) | | | (22,672,845 | ) |
| | | | | | | | | | |
| | Net assets: | | | | | | | | |
| | Beginning of period | | | 447,785,136 | | | | 470,457,981 | |
| | End of period | | $ | 358,753,711 | | | $ | 447,785,136 | |
| | Undistributed net investment income (loss) | | $ | 434,090 | | | $ | 1,294,491 | |
| | |
| 86 | | The accompanying notes are an integral part of these financial statements. |
GOLDMAN SACHS FUNDAMENTAL EQUITY GROWTH FUNDS
| | | | | | | | | | | | | | | | | | | | | | |
| | | Technology Tollkeeper Fund | | | | | U.S. Equity Fund | |
| | | For the Six Months Ended
February 28, 2013
(Unaudited) | | | | | For the Fiscal Year Ended
August 31, 2012 | | | | | For the Six Months Ended
February 28, 2013
(Unaudited) | | | | | For the Fiscal
Year Ended
August 31, 2012 | |
| | | | | | | | | | | | | | | | | | | | | | |
| | $ | (1,882,778 | ) | | | | $ | (4,085,720 | ) | | | | $ | 63,304 | | | | | $ | 92,293 | |
| | | 1,204,369 | | | | | | (6,808,499 | ) | | | | | 295,475 | | | | | | (167,357 | ) |
| | | 12,832,768 | | | | | | 67,954,046 | | | | | | 647,792 | | | | | | 1,490,650 | |
| | | 12,154,359 | | | | | | 57,059,827 | | | | | | 1,006,571 | | | | | | 1,415,586 | |
| | | | | | | | | | | | | | | | | | | | | | |
| | | | | | | | | | | | | | | | | | | | | | |
| | | | | | | | | | | | | | | | | | | | | | |
| | | — | | | | | | — | | | | | | (20,678 | ) | | | | | (10,984 | ) |
| | | — | | | | | | — | | | | | | (76,416 | ) | | | | | (43,957 | ) |
| | | — | | | | | | — | | | | | | — | | | | | | — | |
| | | — | | | | | | — | | | | | | (1,243 | ) | | | | | (317 | ) |
| | | — | | | | | | — | | | | | | (60 | ) | | | | | (5 | ) |
| | | | | | | | | | | | | | | | | | | | | | |
| | | — | | | | | | — | | | | | | — | | | | | | (31,407 | ) |
| | | — | | | | | | — | | | | | | — | | | | | | — | |
| | | — | | | | | | — | | | | | | — | | | | | | (1,397 | ) |
| | | — | | | | | | — | | | | | | — | | | | | | (61,958 | ) |
| | | — | | | | | | — | | | | | | — | | | | | | — | |
| | | — | | | | | | — | | | | | | — | | | | | | (905 | ) |
| | | — | | | | | | — | | | | | | — | | | | | | (110 | ) |
| | | — | | | | | | — | | | | | | (98,397 | ) | | | | | (151,040 | ) |
| | | | | | | | | | | | | | | | | | | | | | |
| | | | | | | | | | | | | | | | | | | | | | |
| | | 46,169,658 | | | | | | 104,187,444 | | | | | | 1,046,033 | | | | | | 2,394,132 | |
| | | — | | | | | | — | | | | | | 83,817 | | | | | | 97,808 | |
| | | (54,592,448 | ) | | | | | (173,142,909 | ) | | | | | (1,636,818 | ) | | | | | (2,489,896 | ) |
| | | (8,422,790 | ) | | | | | (68,955,465 | ) | | | | | (506,968 | ) | | | | | 2,044 | |
| | | 3,731,569 | | | | | | (11,895,638 | ) | | | | | 401,206 | | | | | | 1,266,590 | |
| | | | | | | | | | | | | | | | | | | | | | |
| | | | | | | | | | | | | | | | | | | | | | |
| | | 360,855,732 | | | | | | 372,751,370 | | | | | | 10,713,040 | | | | | | 9,446,450 | |
| | $ | 364,587,301 | | | | | $ | 360,855,732 | | | | | $ | 11,114,246 | | | | | $ | 10,713,040 | |
| | $ | (4,548,036 | ) | | | | $ | (2,665,258 | ) | | | | $ | 10,530 | | | | | $ | 45,623 | |
| | |
| The accompanying notes are an integral part of these financial statements. | | 87 |
GOLDMAN SACHS CAPITAL GROWTH FUND
Financial Highlights
Selected Data for a Share Outstanding Throughout Each Period
| | | | | | | | | | | | | | | | | | | | | | | | | | |
| | | | | | | | Income (loss) from
investment operations | | | Distributions
to shareholders | |
| | | Year - Share Class | | Net asset
value,
beginning
of period | | | Net
investment
income (loss)(a) | | | Net realized
and unrealized
gain (loss) | | | Total from
investment
operations | | | From net
investment
income | | | From net
realized
gains | |
| | FOR THE SIX MONTHS ENDED FEBRUARY 28, (UNAUDITED) | |
| | 2013 - A | | $ | 24.40 | | | $ | 0.07 | (d) | | $ | 1.68 | | | $ | 1.75 | | | $ | (0.03 | ) | | $ | — | |
| | 2013 - B | | | 21.37 | | | | (0.02 | )(d) | | | 1.47 | | | | 1.45 | | | | — | | | | — | |
| | 2013 - C | | | 21.35 | | | | (0.02 | )(d) | | | 1.46 | | | | 1.44 | | | | — | | | | — | |
| | 2013 - Institutional | | | 25.64 | | | | 0.13 | (d) | | | 1.75 | | | | 1.88 | | | | (0.12 | ) | | | — | |
| | 2013 - Service | | | 23.96 | | | | 0.06 | (d) | | | 1.65 | | | | 1.71 | | | | (0.01 | ) | | | — | |
| | 2013 - IR | | | 24.53 | | | | 0.11 | (d) | | | 1.68 | | | | 1.79 | | | | (0.10 | ) | | | — | |
| | 2013 - R | | | 24.14 | | | | 0.04 | (d) | | | 1.65 | | | | 1.69 | | | | (0.04 | ) | | | — | |
| | | | | | | | | | | | | | | | | | | | | | | | | | |
| | FOR THE FISCAL YEARS ENDED AUGUST 31, | |
| | 2012 - A | | | 20.49 | | | | 0.02 | | | | 3.93 | | | | 3.95 | | | | (0.04 | ) | | | — | |
| | 2012 - B | | | 18.06 | | | | (0.13 | ) | | | 3.44 | | | | 3.31 | | | | — | | | | — | |
| | 2012 - C | | | 18.03 | | | | (0.13 | ) | | | 3.45 | | | | 3.32 | | | | — | | | | — | |
| | 2012 - Institutional | | | 21.54 | | | | 0.10 | | | | 4.12 | | | | 4.22 | | | | (0.12 | ) | | | — | |
| | 2012 - Service | | | 20.13 | | | | — | (f) | | | 3.85 | | | | 3.85 | | | | (0.02 | ) | | | — | |
| | 2012 - IR | | | 20.66 | | | | 0.08 | | | | 3.93 | | | | 4.01 | | | | (0.14 | ) | | | — | |
| | 2012 - R | | | 20.31 | | | | (0.03 | ) | | | 3.88 | | | | 3.85 | | | | (0.02 | ) | | | — | |
| | 2011 - A | | | 17.68 | | | | 0.03 | | | | 2.78 | | | | 2.81 | | | | — | | | | — | |
| | 2011 - B | | | 15.70 | | | | (0.11 | ) | | | 2.47 | | | | 2.36 | | | | — | | | | — | |
| | 2011 - C | | | 15.68 | | | | (0.12 | ) | | | 2.47 | | | | 2.35 | | | | — | | | | — | |
| | 2011 - Institutional | | | 18.57 | | | | 0.12 | | | | 2.91 | | | | 3.03 | | | | (0.06 | ) | | | — | |
| | 2011 - Service | | | 17.39 | | | | 0.01 | | | | 2.73 | | | | 2.74 | | | | — | | | | — | |
| | 2011 - IR | | | 17.81 | | | | 0.31 | | | | 2.58 | | | | 2.89 | | | | (0.04 | ) | | | — | |
| | 2011 - R | | | 17.57 | | | | (0.03 | ) | | | 2.77 | | | | 2.74 | | | | — | | | | — | |
| | 2010 - A | | | 16.95 | | | | 0.01 | | | | 0.72 | | | | 0.73 | | | | — | | | | — | |
| | 2010 - B | | | 15.15 | | | | (0.11 | ) | | | 0.66 | | | | 0.55 | | | | — | | | | — | |
| | 2010 - C | | | 15.14 | | | | (0.11 | ) | | | 0.65 | | | | 0.54 | | | | — | | | | — | |
| | 2010 - Institutional | | | 17.72 | | | | 0.10 | | | | 0.75 | | | | 0.85 | | | | — | | | | — | |
| | 2010 - Service | | | 16.68 | | | | (0.01 | ) | | | 0.72 | | | | 0.71 | | | | — | | | | — | |
| | 2010 - IR | | | 17.02 | | | | 0.07 | | | | 0.72 | | | | 0.79 | | | | — | | | | — | |
| | 2010 - R | | | 16.88 | | | | (0.01 | ) | | | 0.70 | | | | 0.69 | | | | — | | | | — | |
| | 2009 - A | | | 22.40 | | | | — | (f) | | | (4.58 | ) | | | (4.58 | ) | | | — | | | | (0.87 | ) |
| | 2009 - B | | | 20.33 | | | | (0.10 | ) | | | (4.21 | ) | | | (4.31 | ) | | | — | | | | (0.87 | ) |
| | 2009 - C | | | 20.31 | | | | (0.10 | ) | | | (4.20 | ) | | | (4.30 | ) | | | — | | | | (0.87 | ) |
| | 2009 - Institutional | | | 23.26 | | | | 0.06 | | | | (4.73 | ) | | | (4.67 | ) | | | — | | | | (0.87 | ) |
| | 2009 - Service | | | 22.09 | | | | (0.02 | ) | | | (4.52 | ) | | | (4.54 | ) | | | — | | | | (0.87 | ) |
| | 2009 - IR | | | 22.44 | | | | 0.03 | | | | (4.58 | ) | | | (4.55 | ) | | | — | | | | (0.87 | ) |
| | 2009 - R | | | 22.37 | | | | (0.03 | ) | | | (4.59 | ) | | | (4.62 | ) | | | — | | | | (0.87 | ) |
| | 2008 - A | | | 23.73 | | | | (0.10 | ) | | | (0.97 | ) | | | (1.07 | ) | | | — | | | | (0.26 | ) |
| | 2008 - B | | | 21.73 | | | | (0.25 | ) | | | (0.89 | ) | | | (1.14 | ) | | | — | | | | (0.26 | ) |
| | 2008 - C | | | 21.70 | | | | (0.25 | ) | | | (0.88 | ) | | | (1.13 | ) | | | — | | | | (0.26 | ) |
| | 2008 - Institutional | | | 24.54 | | | | — | (f) | | | (1.02 | ) | | | (1.02 | ) | | | — | | | | (0.26 | ) |
| | 2008 - Service | | | 23.43 | | | | (0.12 | ) | | | (0.96 | ) | | | (1.08 | ) | | | — | | | | (0.26 | ) |
| | 2008 - IR (Commenced November 30, 2007) | | | 24.22 | | | | (0.03 | ) | | | (1.49 | ) | | | (1.52 | ) | | | — | | | | (0.26 | ) |
| | 2008 - R (Commenced November 30, 2007) | | | 24.22 | | | | (0.10 | ) | | | (1.49 | ) | | | (1.59 | ) | | | — | | | | (0.26 | ) |
| | (a) | | Calculated based on the average shares outstanding methodology. |
| | (b) | | Assumes investment at the net asset value at the beginning of the period, reinvestment of all dividends and distributions, a complete redemption of the investment at the net asset value at the end of the period and no sales or redemption charges. Total returns would be reduced if a sales or redemption charge was taken into account. Returns do not reflect the deduction of taxes that a shareholder would pay on Fund distributions or the redemption of Fund shares. Total returns for periods less than one full year are not annualized. |
| | (c) | | The Fund’s portfolio turnover rate is calculated in accordance with regulatory requirements, without regard to transactions involving short term investments and certain derivatives. If such transactions were included, the Fund’s portfolio turnover rate may be higher. |
| | (d) | | Reflects income recognized from special dividends which amounted to $0.05 per share and 0.44% of average net assets. |
| | (f) | | Amount is less than $0.005 per share. |
| | (g) | | Amount is less than 0.005% of average net assets. |
| | |
| 88 | | The accompanying notes are an integral part of these financial statements. |
GOLDMAN SACHS CAPITAL GROWTH FUND
| | | | | | | | | | | | | | | | | | | | | | | | | | | | | | | | | | | | | | | | |
| | | | | | | | | | | | | | | | | | | | | | | | | | | | | | | | | | |
| | | Net asset
value, end
of period | | | | | Total
return(b) | | | | | Net assets,
end of
period
(in 000s) | | | | | Ratio of
net expenses
to average
net assets | | | | | Ratio of
total expenses
to average
net assets | | | | | Ratio of
net investment
income (loss)
to average
net assets | | | | | Portfolio
turnover
rate(c) | |
| | | | | | | | | | | | | | | | | | | | | | | | | | | | | | | | | | | | | | | | |
| | $ | 26.12 | | | | | | 7.17 | % | | | | $ | 655,029 | | | | | | 1.14 | %(e) | | | | | 1.51 | %(e) | | | | | 0.57 | %(d)(e) | | | | | 19 | % |
| | | 22.82 | | | | | | 6.79 | | | | | | 22,937 | | | | | | 1.89 | (e) | | | | | 2.26 | (e) | | | | | (0.16 | )(d)(e) | | | | | 19 | |
| | | 22.79 | | | | | | 6.74 | | | | | | 73,068 | | | | | | 1.89 | (e) | | | | | 2.26 | (e) | | | | | (0.18 | )(d)(e) | | | | | 19 | |
| | | 27.40 | | | | | | 7.38 | | | | | | 80,849 | | | | | | 0.74 | (e) | | | | | 1.11 | (e) | | | | | 0.98 | (d)(e) | | | | | 19 | |
| | | 25.66 | | | | | | 7.14 | | | | | | 1,181 | | | | | | 1.24 | (e) | | | | | 1.61 | (e) | | | | | 0.47 | (d)(e) | | | | | 19 | |
| | | 26.22 | | | | | | 7.31 | | | | | | 2,553 | | | | | | 0.89 | (e) | | | | | 1.26 | (e) | | | | | 0.85 | (d)(e) | | | | | 19 | |
| | | 25.79 | | | | | | 7.02 | | | | | | 1,963 | | | | | | 1.39 | (e) | | | | | 1.75 | (e) | | | | | 0.34 | (d)(e) | | | | | 19 | |
| | | | | | | | | | | | | | | | | | | | | | | | | | | | | | | | | | | | | | | | |
| | | | | | | | | | | | | | | | | | | | | | | | | | | | | | | | | | | | | | | | |
| | | 24.40 | | | | | | 19.24 | | | | | | 662,127 | | | | | | 1.14 | | | | | | 1.48 | | | | | | 0.09 | | | | | | 55 | |
| | | 21.37 | | | | | | 18.27 | | | | | | 27,428 | | | | | | 1.89 | | | | | | 2.23 | | | | | | (0.66 | ) | | | | | 55 | |
| | | 21.35 | | | | | | 18.36 | | | | | | 73,162 | | | | | | 1.89 | | | | | | 2.23 | | | | | | (0.66 | ) | | | | | 55 | |
| | | 25.64 | | | | | | 19.64 | | | | | | 83,466 | | | | | | 0.74 | | | | | | 1.08 | | | | | | 0.42 | | | | | | 55 | |
| | | 23.96 | | | | | | 19.08 | | | | | | 1,072 | | | | | | 1.24 | | | | | | 1.58 | | | | | | (0.02 | ) | | | | | 55 | |
| | | 24.53 | | | | | | 19.48 | | | | | | 2,415 | | | | | | 0.89 | | | | | | 1.23 | | | | | | 0.36 | | | | | | 55 | |
| | | 24.14 | | | | | | 18.92 | | | | | | 1,475 | | | | | | 1.39 | | | | | | 1.73 | | | | | | (0.12 | ) | | | | | 55 | |
| | | 20.49 | | | | | | 15.89 | | | | | | 662,256 | | | | | | 1.14 | | | | | | 1.47 | | | | | | 0.13 | | | | | | 58 | |
| | | 18.06 | | | | | | 15.03 | | | | | | 38,824 | | | | | | 1.89 | | | | | | 2.22 | | | | | | (0.61 | ) | | | | | 58 | |
| | | 18.03 | | | | | | 14.99 | | | | | | 72,314 | | | | | | 1.89 | | | | | | 2.22 | | | | | | (0.62 | ) | | | | | 58 | |
| | | 21.54 | | | | | | 16.33 | | | | | | 299,223 | | | | | | 0.74 | | | | | | 1.07 | | | | | | 0.53 | | | | | | 58 | |
| | | 20.13 | | | | | | 15.76 | | | | | | 953 | | | | | | 1.24 | | | | | | 1.57 | | | | | | 0.03 | | | | | | 58 | |
| | | 20.66 | | | | | | 16.20 | | | | | | 1,472 | | | | | | 0.89 | | | | | | 1.22 | | | | | | 1.64 | | | | | | 58 | |
| | | 20.31 | | | | | | 15.59 | | | | | | 567 | | | | | | 1.39 | | | | | | 1.72 | | | | | | (0.12 | ) | | | | | 58 | |
| | | 17.68 | | | | | | 4.31 | | | | | | 707,444 | | | | | | 1.14 | | | | | | 1.47 | | | | | | 0.07 | | | | | | 31 | |
| | | 15.70 | | | | | | 3.63 | | | | | | 55,429 | | | | | | 1.89 | | | | | | 2.22 | | | | | | (0.66 | ) | | | | | 31 | |
| | | 15.68 | | | | | | 3.57 | | | | | | 75,203 | | | | | | 1.89 | | | | | | 2.22 | | | | | | (0.67 | ) | | | | | 31 | |
| | | 18.57 | | | | | | 4.80 | | | | | | 344,601 | | | | | | 0.74 | | | | | | 1.07 | | | | | | 0.52 | | | | | | 31 | |
| | | 17.39 | | | | | | 4.26 | | | | | | 988 | | | | | | 1.24 | | | | | | 1.57 | | | | | | (0.03 | ) | | | | | 31 | |
| | | 17.81 | | | | | | 4.64 | | | | | | 8 | | | | | | 0.89 | | | | | | 1.22 | | | | | | 0.36 | | | | | | 31 | |
| | | 17.57 | | | | | | 4.09 | | | | | | 412 | | | | | | 1.39 | | | | | | 1.72 | | | | | | (0.08 | ) | | | | | 31 | |
| | | 16.95 | | | | | | (19.11 | ) | | | | | 966,913 | | | | | | 1.25 | | | | | | 1.48 | | | | | | — | (g) | | | | | 49 | |
| | | 15.15 | | | | | | (19.73 | ) | | | | | 83,648 | | | | | | 2.00 | | | | | | 2.23 | | | | | | (0.75 | ) | | | | | 49 | |
| | | 15.14 | | | | | | (19.69 | ) | | | | | 84,936 | | | | | | 2.00 | | | | | | 2.23 | | | | | | (0.75 | ) | | | | | 49 | |
| | | 17.72 | | | | | | (18.78 | ) | | | | | 212,977 | | | | | | 0.85 | | | | | | 1.08 | | | | | | 0.40 | | | | | | 49 | |
| | | 16.68 | | | | | | (19.17 | ) | | | | | 1,462 | | | | | | 1.35 | | | | | | 1.58 | | | | | | (0.13 | ) | | | | | 49 | |
| | | 17.02 | | | | | | (18.90 | ) | | | | | 8 | | | | | | 1.00 | | | | | | 1.23 | | | | | | 0.23 | | | | | | 49 | |
| | | 16.88 | | | | | | (19.29 | ) | | | | | 106 | | | | | | 1.50 | | | | | | 1.73 | | | | | | (0.19 | ) | | | | | 49 | |
| | | 22.40 | | | | | | (4.57 | ) | | | | | 1,505,237 | | | | | | 1.36 | | | | | | 1.40 | | | | | | (0.42 | ) | | | | | 69 | |
| | | 20.33 | | | | | | (5.37 | ) | | | | | 154,511 | | | | | | 2.11 | | | | | | 2.15 | | | | | | (1.19 | ) | | | | | 69 | |
| | | 20.31 | | | | | | (5.33 | ) | | | | | 126,865 | | | | | | 2.11 | | | | | | 2.15 | | | | | | (1.19 | ) | | | | | 69 | |
| | | 23.26 | | | | | | (4.22 | ) | | | | | 288,404 | | | | | | 0.96 | | | | | | 1.00 | | | | | | (0.01 | ) | | | | | 69 | |
| | | 22.09 | | | | | | (4.72 | ) | | | | | 3,135 | | | | | | 1.46 | | | | | | 1.50 | | | | | | (0.52 | ) | | | | | 69 | |
| | | 22.44 | | | | | | (6.39 | ) | | | | | 9 | | | | | | 1.11 | (e) | | | | | 1.15 | (e) | | | | | (0.19 | )(e) | | | | | 69 | |
| | | 22.37 | | | | | | (6.68 | ) | | | | | 9 | | | | | | 1.61 | (e) | | | | | 1.65 | (e) | | | | | (0.62 | )(e) | | | | | 69 | |
| | |
| The accompanying notes are an integral part of these financial statements. | | 89 |
GOLDMAN SACHS CONCENTRATED GROWTH FUND
Financial Highlights
Selected Data for a Share Outstanding Throughout Each Period
| | | | | | | | | | | | | | | | | | | | | | | | | | |
| | | | | | | | Income (loss) from
investment operations | | | Distributions
to shareholders | |
| | | Year - Share Class | | Net asset
value,
beginning
of period | | | Net
investment
income (loss)(a) | | | Net realized
and unrealized
gain (loss) | | | Total from
investment
operations | | | From net
investment
income | | | From net
realized
gains | |
| | FOR THE SIX MONTHS ENDED FEBRUARY 28, (UNAUDITED) | |
| | 2013 - A | | $ | 14.97 | | | $ | 0.06 | (d) | | $ | 1.08 | | | $ | 1.14 | | | $ | (0.06 | ) | | $ | — | |
| | 2013 - B | | | 13.81 | | | | — | (d)(f) | | | 1.01 | | | | 1.01 | | | | (0.01 | ) | | | — | |
| | 2013 - C | | | 13.79 | | | | — | (d)(f) | | | 1.01 | | | | 1.01 | | | | (0.01 | ) | | | — | |
| | 2013 - Institutional | | | 15.48 | | | | 0.09 | (d) | | | 1.12 | | | | 1.21 | | | | (0.12 | ) | | | — | |
| | 2013 - IR | | | 15.07 | | | | 0.08 | (d) | | | 1.09 | | | | 1.17 | | | | (0.11 | ) | | | — | |
| | 2013 - R | | | 14.80 | | | | 0.04 | (d) | | | 1.07 | | | | 1.11 | | | | (0.03 | ) | | | — | |
| | | | | | | | | | | | | | | | | | | | | | | | | | |
| | FOR THE FISCAL YEARS ENDED AUGUST 31, | |
| | 2012 - A | | | 12.64 | | | | — | (f) | | | 2.33 | | | | 2.33 | | | | — | | | | — | |
| | 2012 - B | | | 11.75 | | | | (0.09 | ) | | | 2.15 | | | | 2.06 | | | | — | | | | — | |
| | 2012 - C | | | 11.73 | | | | (0.09 | ) | | | 2.15 | | | | 2.06 | | | | — | | | | — | |
| | 2012 - Institutional | | | 13.07 | | | | 0.05 | | | | 2.41 | | | | 2.46 | | | | (0.05 | ) | | | — | |
| | 2012 - IR | | | 12.73 | | | | 0.04 | | | | 2.34 | | | | 2.38 | | | | (0.04 | ) | | | — | |
| | 2012 - R | | | 12.52 | | | | (0.03 | ) | | | 2.31 | | | | 2.28 | | | | — | | | | — | |
| | 2011 - A | | | 10.91 | | | | (0.01 | ) | | | 1.74 | | | | 1.73 | | | | — | | | | — | |
| | 2011 - B | | | 10.22 | | | | (0.10 | ) | | | 1.63 | | | | 1.53 | | | | — | | | | — | |
| | 2011 - C | | | 10.20 | | | | (0.10 | ) | | | 1.63 | | | | 1.53 | | | | — | | | | — | |
| | 2011 - Institutional | | | 11.25 | | | | 0.04 | | | | 1.80 | | | | 1.84 | | | | (0.02 | ) | | | — | |
| | 2011 - IR | | | 10.97 | | | | 0.04 | | | | 1.73 | | | | 1.77 | | | | (0.01 | ) | | | — | |
| | 2011 - R | | | 10.83 | | | | (0.04 | ) | | | 1.73 | | | | 1.69 | | | | — | | | | — | |
| | 2010 - A | | | 10.51 | | | | (0.02 | ) | | | 0.42 | | | | 0.40 | | | | — | | | | — | |
| | 2010 - B | | | 9.92 | | | | (0.11 | ) | | | 0.41 | | | | 0.30 | | | | — | | | | — | |
| | 2010 - C | | | 9.90 | | | | (0.11 | ) | | | 0.41 | | | | 0.30 | | | | — | | | | — | |
| | 2010 - Institutional | | | 10.79 | | | | 0.02 | | | | 0.44 | | | | 0.46 | | | | — | | | | — | |
| | 2010 - IR | | | 10.54 | | | | 0.03 | | | | 0.40 | | | | 0.43 | | | | — | | | | — | |
| | 2010 - R | | | 10.46 | | | | (0.05 | ) | | | 0.42 | | | | 0.37 | | | | — | | | | — | |
| | 2009 - A | | | 13.54 | | | | (0.02 | ) | | | (3.01 | ) | | | (3.03 | ) | | | — | | | | — | |
| | 2009 - B | | | 12.88 | | | | (0.09 | ) | | | (2.87 | ) | | | (2.96 | ) | | | — | | | | — | |
| | 2009 - C | | | 12.85 | | | | (0.09 | ) | | | (2.86 | ) | | | (2.95 | ) | | | — | | | | — | |
| | 2009 - Institutional | | | 13.85 | | | | 0.01 | | | | (3.07 | ) | | | (3.06 | ) | | | — | | | | — | |
| | 2009 - IR | | | 13.55 | | | | (0.01 | ) | | | (3.00 | ) | | | (3.01 | ) | | | — | | | | — | |
| | 2009 - R | | | 13.51 | | | | (0.05 | ) | | | (3.00 | ) | | | (3.05 | ) | | | — | | | | — | |
| | 2008 - A | | | 15.01 | | | | (0.10 | ) | | | (0.29 | ) | | | (0.39 | ) | | | — | | | | (1.08 | )(h) |
| | 2008 - B | | | 14.43 | | | | (0.19 | ) | | | (0.28 | ) | | | (0.47 | ) | | | — | | | | (1.08 | )(h) |
| | 2008 - C | | | 14.41 | | | | (0.19 | ) | | | (0.29 | ) | | | (0.48 | ) | | | — | | | | (1.08 | )(h) |
| | 2008 - Institutional | | | 15.27 | | | | (0.04 | ) | | | (0.30 | ) | | | (0.34 | ) | | | — | | | | (1.08 | )(h) |
| | 2008 - IR (Commmenced November 30, 2007) | | | 15.38 | | | | (0.05 | ) | | | (0.70 | ) | | | (0.75 | ) | | | — | | | | (1.08 | )(h) |
| | 2008 - R (Commmenced November 30, 2007) | | | 15.38 | | | | (0.09 | ) | | | (0.70 | ) | | | (0.79 | ) | | | — | | | | (1.08 | )(h) |
| | (a) | | Calculated based on the average shares outstanding methodology. |
| | (b) | | Assumes investment at the net asset value at the beginning of the period, reinvestment of all dividends and distributions, a complete redemption of the investment at the net asset value at the end of the period and no sales or redemption charges. Total returns would be reduced if a sales or redemption charge was taken into account. Returns do not reflect the deduction of taxes that a shareholder would pay on Fund distributions or the redemption of Fund shares. Total returns for periods less than one full year are not annualized. |
| | (c) | | The Fund’s portfolio turnover rate is calculated in accordance with regulatory requirements, without regard to transactions involving short term investments and certain derivatives. If such transactions were included, the Fund’s portfolio turnover rate may be higher. |
| | (d) | | Reflects income recognized from special dividends which amounted to $0.06 per share and 0.73% of average net assets. |
| | (f) | | Amount is less than $0.005 per share. |
| | (g) | | Amount is less than 0.005% of average assets. |
| | (h) | | Includes a distribution from capital of approximately $0.006 per share. |
| | |
| 90 | | The accompanying notes are an integral part of these financial statements. |
GOLDMAN SACHS CONCENTRATED GROWTH FUND
| | | | | | | | | | | | | | | | | | | | | | | | | | | | | | | | | | | | | | | | |
| | | | | | | | | | | | | | | | | | | | | | | | | | | | | | | | | | |
| | | Net asset
value, end
of period | | | | | Total
return(b) | | | | | Net assets,
end of
period (in 000s) | | | | | Ratio of
net expenses
to average
net assets | | | | | Ratio of
total expenses
to average
net assets | | | | | Ratio of
net investment
income (loss)
to average net assets | | | | | Portfolio
turnover
rate(c) | |
| | | | | | | | | | | | | | | | | | | | | | | | | | | | | | | | | | | | | | | | |
| | $ | 16.05 | | | | | | 7.66 | % | | | | $ | 87,152 | | | | | | 1.26 | %(e) | | | | | 1.62 | %(e) | | | | | 0.75 | %(d)(e) | | | | | 17 | % |
| | | 14.81 | | | | | | 7.32 | | | | | | 332 | | | | | | 2.01 | (e) | | | | | 2.37 | (e) | | | | | — | (d)(e)(g) | | | | | 17 | |
| | | 14.79 | | | | | | 7.33 | | | | | | 3,013 | | | | | | 2.01 | (e) | | | | | 2.37 | (e) | | | | | 0.01 | (d)(e) | | | | | 17 | |
| | | 16.57 | | | | | | 7.91 | | | | | | 59,206 | | | | | | 0.86 | (e) | | | | | 1.22 | (e) | | | | | 1.13 | (d)(e) | | | | | 17 | |
| | | 16.13 | | | | | | 7.80 | | | | | | 365 | | | | | | 1.01 | (e) | | | | | 1.38 | (e) | | | | | 1.09 | (d)(e) | | | | | 17 | |
| | | 15.88 | | | | | | 7.62 | | | | | | 11 | | | | | | 1.51 | (e) | | | | | 1.87 | (e) | | | | | 0.50 | (d)(e) | | | | | 17 | |
| | | | | | | | | | | | | | | | | | | | | | | | | | | | | | | | | | | | | | | | |
| | | | | | | | | | | | | | | | | | | | | | | | | | | | | | | | | | | | | | | | |
| | | 14.97 | | | | | | 18.38 | | | | | | 92,207 | | | | | | 1.26 | | | | | | 1.57 | | | | | | 0.01 | | | | | | 33 | |
| | | 13.81 | | | | | | 17.48 | | | | | | 395 | | | | | | 2.01 | | | | | | 2.32 | | | | | | (0.74 | ) | | | | | 33 | |
| | | 13.79 | | | | | | 17.51 | | | | | | 2,877 | | | | | | 2.01 | | | | | | 2.32 | | | | | | (0.72 | ) | | | | | 33 | |
| | | 15.48 | | | | | | 18.80 | | | | | | 56,118 | | | | | | 0.86 | | | | | | 1.17 | | | | | | 0.39 | | | | | | 33 | |
| | | 15.07 | | | | | | 18.69 | | | | | | 584 | | | | | | 1.01 | | | | | | 1.32 | | | | | | 0.28 | | | | | | 33 | |
| | | 14.80 | | | | | | 18.08 | | | | | | 10 | | | | | | 1.51 | | | | | | 1.82 | | | | | | (0.22 | ) | | | | | 33 | |
| | | 12.64 | | | | | | 15.86 | | | | | | 109,826 | | | | | | 1.30 | | | | | | 1.56 | | | | | | (0.08 | ) | | | | | 35 | |
| | | 11.75 | | | | | | 14.97 | | | | | | 496 | | | | | | 2.05 | | | | | | 2.31 | | | | | | (0.83 | ) | | | | | 35 | |
| | | 11.73 | | | | | | 15.00 | | | | | | 2,000 | | | | | | 2.05 | | | | | | 2.31 | | | | | | (0.82 | ) | | | | | 35 | |
| | | 13.07 | | | | | | 16.35 | | | | | | 126,113 | | | | | | 0.90 | | | | | | 1.16 | | | | | | 0.33 | | | | | | 35 | |
| | | 12.73 | | | | | | 16.13 | | | | | | 437 | | | | | | 1.05 | | | | | | 1.31 | | | | | | 0.28 | | | | | | 35 | |
| | | 12.52 | | | | | | 15.60 | | | | | | 9 | | | | | | 1.55 | | | | | | 1.81 | | | | | | (0.29 | ) | | | | | 35 | |
| | | 10.91 | | | | | | 3.81 | | | | | | 108,338 | | | | | | 1.30 | | | | | | 1.56 | | | | | | (0.22 | ) | | | | | 45 | |
| | | 10.22 | | | | | | 3.02 | | | | | | 793 | | | | | | 2.05 | | | | | | 2.31 | | | | | | (0.98 | ) | | | | | 45 | |
| | | 10.20 | | | | | | 3.03 | | | | | | 1,356 | | | | | | 2.05 | | | | | | 2.31 | | | | | | (0.97 | ) | | | | | 45 | |
| | | 11.25 | | | | | | 4.26 | | | | | | 124,258 | | | | | | 0.90 | | | | | | 1.16 | | | | | | 0.18 | | | | | | 45 | |
| | | 10.97 | | | | | | 4.08 | | | | | | 147 | | | | | | 1.05 | | | | | | 1.31 | | | | | | 0.27 | | | | | | 45 | |
| | | 10.83 | | | | | | 3.54 | | | | | | 8 | | | | | | 1.55 | | | | | | 1.81 | | | | | | (0.45 | ) | | | | | 45 | |
| | | 10.51 | | | | | | (22.38 | ) | | | | | 101,233 | | | | | | 1.37 | | | | | | 1.61 | | | | | | (0.27 | ) | | | | | 65 | |
| | | 9.92 | | | | | | (22.98 | ) | | | | | 1,084 | | | | | | 2.12 | | | | | | 2.36 | | | | | | (1.03 | ) | | | | | 65 | |
| | | 9.90 | | | | | | (22.96 | ) | | | | | 1,461 | | | | | | 2.12 | | | | | | 2.36 | | | | | | (1.03 | ) | | | | | 65 | |
| | | 10.79 | | | | | | (22.09 | ) | | | | | 151,504 | | | | | | 0.97 | | | | | | 1.21 | | | | | | 0.13 | | | | | | 65 | |
| | | 10.54 | | | | | | (22.21 | ) | | | | | 7 | | | | | | 1.12 | | | | | | 1.36 | | | | | | (0.07 | ) | | | | | 65 | |
| | | 10.46 | | | | | | (22.58 | ) | | | | | 7 | | | | | | 1.62 | | | | | | 1.86 | | | | | | (0.51 | ) | | | | | 65 | |
| | | 13.54 | | | | | | (3.07 | ) | | | | | 115,431 | | | | | | 1.48 | | | | | | 1.51 | | | | | | (0.70 | ) | | | | | 71 | |
| | | 12.88 | | | | | | (3.79 | ) | | | | | 1,457 | | | | | | 2.23 | | | | | | 2.26 | | | | | | (1.46 | ) | | | | | 71 | |
| | | 12.85 | | | | | | (3.86 | ) | | | | | 2,300 | | | | | | 2.23 | | | | | | 2.26 | | | | | | (1.46 | ) | | | | | 71 | |
| | | 13.85 | | | | | | (2.68 | ) | | | | | 183,809 | | | | | | 1.08 | | | | | | 1.11 | | | | | | (0.30 | ) | | | | | 71 | |
| | | 13.55 | | | | | | (5.34 | ) | | | | | 9 | | | | | | 1.23 | (e) | | | | | 1.26 | (e) | | | | | (0.49 | )(e) | | | | | 71 | |
| | | 13.51 | | | | | | (5.62 | ) | | | | | 9 | | | | | | 1.73 | (e) | | | | | 1.76 | (e) | | | | | (0.93 | )(e) | | | | | 71 | |
| | |
| The accompanying notes are an integral part of these financial statements. | | 91 |
GOLDMAN SACHS FLEXIBLE CAP GROWTH FUND
Financial Highlights
Selected Data for a Share Outstanding Throughout Each Period
| | | | | | | | | | | | | | | | | | | | | | |
| | | | | | | | Income (loss) from
investment operations | | | | |
| | | Year - Share Class | | Net asset
value,
beginning
of period | | | Net
investment
income (loss)(a) | | | Net realized
and unrealized
gain (loss) | | | Total from
investment
operations | | | Distributions
to shareholders
from net
realized
gains | |
| | FOR THE SIX MONTHS ENDED FEBRUARY 28, (UNAUDITED) | |
| | 2013 - A | | $ | 11.48 | | | $ | 0.01 | (d) | | $ | 0.72 | | | $ | 0.73 | | | $ | (1.36 | ) |
| | 2013 - C | | | 11.09 | | | | (0.03 | )(d) | | | 0.70 | | | | 0.67 | | | | (1.36 | ) |
| | 2013 - Institutional | | | 11.73 | | | | 0.03 | (d) | | | 0.75 | | | | 0.78 | | | | (1.36 | ) |
| | 2013 - IR | | | 11.64 | | | | 0.03 | (d) | | | 0.74 | | | | 0.77 | | | | (1.36 | ) |
| | 2013 - R | | | 11.36 | | | | — | (d)(f) | | | 0.71 | | | | 0.71 | | | | (1.36 | ) |
| | | | | | | | | | | | | | | | | | | | | | |
| | FOR THE FISCAL YEARS ENDED AUGUST 31, | |
| | 2012 - A | | | 10.38 | | | | (0.02 | ) | | | 1.71 | | | | 1.69 | | | | (0.59 | ) |
| | 2012 - C | | | 10.12 | | | | (0.10 | ) | | | 1.66 | | | | 1.56 | | | | (0.59 | ) |
| | 2012 - Institutional | | | 10.55 | | | | 0.02 | | | | 1.75 | | | | 1.77 | | | | (0.59 | ) |
| | 2012 - IR | | | 10.49 | | | | 0.01 | | | | 1.73 | | | | 1.74 | | | | (0.59 | ) |
| | 2012 - R | | | 10.30 | | | | (0.05 | ) | | | 1.70 | | | | 1.65 | | | | (0.59 | ) |
| | 2011 - A | | | 9.41 | | | | (0.04 | ) | | | 1.51 | | | | 1.47 | | | | (0.50 | ) |
| | 2011 - C | | | 9.25 | | | | (0.12 | ) | | | 1.49 | | | | 1.37 | | | | (0.50 | ) |
| | 2011 - Institutional | | | 9.53 | | | | — | (f) | | | 1.52 | | | | 1.52 | | | | (0.50 | ) |
| | 2011 - IR | | | 9.49 | | | | — | (f) | | | 1.50 | | | | 1.50 | | | | (0.50 | ) |
| | 2011 - R | | | 9.37 | | | | (0.07 | ) | | | 1.50 | | | | 1.43 | | | | (0.50 | ) |
| | 2010 - A | | | 8.83 | | | | (0.03 | ) | | | 0.61 | | | | 0.58 | | | | — | |
| | 2010 - C | | | 8.75 | | | | (0.11 | ) | | | 0.61 | | | | 0.50 | | | | — | |
| | 2010 - Institutional | | | 8.90 | | | | — | (f) | | | 0.63 | | | | 0.63 | | | | — | |
| | 2010 - IR | | | 8.88 | | | | (0.01 | ) | | | 0.62 | | | | 0.61 | | | | — | |
| | 2010 - R | | | 8.81 | | | | (0.06 | ) | | | 0.62 | | | | 0.56 | | | | — | |
| | 2009 - A | | | 10.64 | | | | (0.02 | ) | | | (1.71 | ) | | | (1.73 | ) | | | (0.08 | ) |
| | 2009 - C | | | 10.60 | | | | (0.08 | ) | | | (1.69 | ) | | | (1.77 | ) | | | (0.08 | ) |
| | 2009 - Institutional | | | 10.67 | | | | 0.01 | | | | (1.70 | ) | | | (1.69 | ) | | | (0.08 | ) |
| | 2009 - IR | | | 10.66 | | | | (0.01 | ) | | | (1.69 | ) | | | (1.70 | ) | | | (0.08 | ) |
| | 2009 - R | | | 10.62 | | | | (0.04 | ) | | | (1.69 | ) | | | (1.73 | ) | | | (0.08 | ) |
| | | | | | | | | | | | | | | | | | | | | | |
| | FOR THE PERIOD ENDED AUGUST 31, | |
| | 2008 - A (Commenced January 31, 2008) | | | 10.00 | | | | (0.03 | ) | | | 0.67 | | | | 0.64 | | | | — | |
| | 2008 - C (Commenced January 31, 2008) | | | 10.00 | | | | (0.08 | ) | | | 0.68 | | | | 0.60 | | | | — | |
| | 2008 - Institutional (Commenced January 31, 2008) | | | 10.00 | | | | (0.01 | ) | | | 0.68 | | | | 0.67 | | | | — | |
| | 2008 - IR (Commenced January 31, 2008) | | | 10.00 | | | | (0.02 | ) | | | 0.68 | | | | 0.66 | | | | — | |
| | 2008 - R (Commenced January 31, 2008) | | | 10.00 | | | | (0.05 | ) | | | 0.67 | | | | 0.62 | | | | — | |
| | (a) | | Calculated based on the average shares outstanding methodology. |
| | (b) | | Assumes investment at the net asset value at the beginning of the period, reinvestment of all dividends and distributions, a complete redemption of the investment at the net asset value at the end of the period and no sales or redemption charges. Total returns would be reduced if a sales or redemption charge was taken into account. Returns do not reflect the deduction of taxes that a shareholder would pay on Fund distributions or the redemption of Fund shares. Total returns for periods less than one full year are not annualized. |
| | (c) | | The Fund’s portfolio turnover rate is calculated in accordance with regulatory requirements, without regard to transactions involving short term investments and certain derivatives. If such transactions were included, the Fund’s portfolio turnover rate may be higher. |
| | (d) | | Reflects income recognized from special dividends which amounted to $0.02 per share and 0.40% of average net assets. |
| | (f) | | Amount is less than $0.005 per share. |
| | |
| 92 | | The accompanying notes are an integral part of these financial statements. |
GOLDMAN SACHS FLEXIBLE CAP GROWTH FUND
| | | | | | | | | | | | | | | | | | | | | | | | | | | | | | | | | | | | | | | | |
| | | | | | | | | | | | | | | | | | | | | | | | | | | | | | | | | | |
| | | Net asset
value, end
of period | | | | | Total
return(b) | | | | | Net assets,
end of
period (in 000s) | | | | | Ratio of
net expenses
to average
net assets | | | | | Ratio of
total expenses
to average
net assets | | | | | Ratio of
net investment
income (loss)
to average net assets | | | | | Portfolio
turnover
rate(c) | |
| | | | | | | | | | | | | | | | | | | | | | | | | | | | | | | | | | | | | | | | |
| | $ | 10.85 | | | | | | 7.11 | % | | | | $ | 5,813 | | | | | | 1.26 | %(e) | | | | | 3.83 | %(e) | | | | | 0.19 | %(d)(e) | | | | | 20 | % |
| | | 10.40 | | | | | | 6.80 | | | | | | 849 | | | | | | 2.02 | (e) | | | | | 4.60 | (e) | | | | | (0.54 | )(d)(e) | | | | | 20 | |
| | | 11.15 | | | | | | 7.41 | | | | | | 5,293 | | | | | | 0.86 | (e) | | | | | 3.49 | (e) | | | | | 0.61 | (d)(e) | | | | | 20 | |
| | | 11.05 | | | | | | 7.36 | | | | | | 167 | | | | | | 1.01 | (e) | | | | | 3.61 | (e) | | | | | 0.47 | (d)(e) | | | | | 20 | |
| | | 10.71 | | | | | | 7.01 | | | | | | 67 | | | | | | 1.51 | (e) | | | | | 4.12 | (e) | | | | | (0.04 | )(d)(e) | | | | | 20 | |
| | | | | | | | | | | | | | | | | | | | | | | | | | | | | | | | | | | | | | | | |
| | | | | | | | | | | | | | | | | | | | | | | | | | | | | | | | | | | | | | | | |
| | | 11.48 | | | | | | 17.11 | | | | | | 7,423 | | | | | | 1.26 | | | | | | 3.14 | | | | | | (0.22 | ) | | | | | 32 | |
| | | 11.09 | | | | | | 16.23 | | | | | | 975 | | | | | | 2.01 | | | | | | 3.89 | | | | | | (0.95 | ) | | | | | 32 | |
| | | 11.73 | | | | | | 17.61 | | | | | | 4,640 | | | | | | 0.86 | | | | | | 2.74 | | | | | | 0.21 | | | | | | 32 | |
| | | 11.64 | | | | | | 17.41 | | | | | | 179 | | | | | | 1.01 | | | | | | 2.89 | | | | | | 0.06 | | | | | | 32 | |
| | | 11.36 | | | | | | 16.84 | | | | | | 63 | | | | | | 1.51 | | | | | | 3.39 | | | | | | (0.43 | ) | | | | | 32 | |
| | | 10.38 | | | | | | 15.42 | | | | | | 15,853 | | | | | | 1.34 | | | | | | 2.59 | | | | | | (0.37 | ) | | | | | 51 | |
| | | 10.12 | | | | | | 14.58 | | | | | | 974 | | | | | | 2.09 | | | | | | 3.34 | | | | | | (1.10 | ) | | | | | 51 | |
| | | 10.55 | | | | | | 15.77 | | | | | | 4,142 | | | | | | 0.94 | | | | | | 2.19 | | | | | | 0.04 | | | | | | 51 | |
| | | 10.49 | | | | | | 15.62 | | | | | | 116 | | | | | | 1.09 | | | | | | 2.34 | | | | | | (0.04 | ) | | | | | 51 | |
| | | 10.30 | | | | | | 15.05 | | | | | | 11 | | | | | | 1.59 | | | | | | 2.84 | | | | | | (0.61 | ) | | | | | 51 | |
| | | 9.41 | | | | | | 6.57 | | | | | | 14,952 | | | | | | 1.35 | | | | | | 2.91 | | | | | | (0.35 | ) | | | | | 61 | |
| | | 9.25 | | | | | | 5.71 | | | | | | 650 | | | | | | 2.10 | | | | | | 3.66 | | | | | | (1.10 | ) | | | | | 61 | |
| | | 9.53 | | | | | | 7.08 | | | | | | 3,145 | | | | | | 0.95 | | | | | | 2.51 | | | | | | 0.04 | | | | | | 61 | |
| | | 9.49 | | | | | | 6.87 | | | | | | 43 | | | | | | 1.10 | | | | | | 2.66 | | | | | | (0.10 | ) | | | | | 61 | |
| | | 9.37 | | | | | | 6.36 | | | | | | 10 | | | | | | 1.60 | | | | | | 3.16 | | | | | | (0.59 | ) | | | | | 61 | |
| | | 8.83 | | | | | | (16.03 | ) | | | | | 11,162 | | | | | | 1.38 | | | | | | 7.98 | | | | | | (0.25 | ) | | | | | 56 | |
| | | 8.75 | | | | | | (16.47 | ) | | | | | 392 | | | | | | 2.13 | | | | | | 8.73 | | | | | | (1.02 | ) | | | | | 56 | |
| | | 8.90 | | | | | | (15.60 | ) | | | | | 4,256 | | | | | | 0.98 | | | | | | 7.58 | | | | | | 0.11 | | | | | | 56 | |
| | | 8.88 | | | | | | (15.71 | ) | | | | | 9 | | | | | | 1.13 | | | | | | 7.73 | | | | | | (0.08 | ) | | | | | 56 | |
| | | 8.81 | | | | | | (16.14 | ) | | | | | 9 | | | | | | 1.63 | | | | | | 8.23 | | | | | | (0.57 | ) | | | | | 56 | |
| | | | | | | | | | | | | | | | | | | | | | | | | | | | | | | | | | | | | | | | |
| | | | | | | | | | | | | | | | | | | | | | | | | | | | | | | | | | | | | | | | |
| | | 10.64 | | | | | | 6.50 | | | | | | 2,262 | | | | | | 1.45 | (e) | | | | | 20.95 | (e) | | | | | (0.54 | )(e) | | | | | 41 | |
| | | 10.60 | | | | | | 6.10 | | | | | | 62 | | | | | | 2.20 | (e) | | | | | 21.70 | (e) | | | | | (1.37 | )(e) | | | | | 41 | |
| | | 10.67 | | | | | | 6.80 | | | | | | 2,322 | | | | | | 1.05 | (e) | | | | | 20.55 | (e) | | | | | (0.22 | )(e) | | | | | 41 | |
| | | 10.66 | | | | | | 6.70 | | | | | | 11 | | | | | | 1.20 | (e) | | | | | 20.70 | (e) | | | | | (0.36 | )(e) | | | | | 41 | |
| | | 10.62 | | | | | | 6.40 | | | | | | 11 | | | | | | 1.70 | (e) | | | | | 21.20 | (e) | | | | | (0.87 | )(e) | | | | | 41 | |
| | |
| The accompanying notes are an integral part of these financial statements. | | 93 |
GOLDMAN SACHS FOCUSED GROWTH FUND
Financial Highlights
Selected Data for a Share Outstanding Throughout Each Period
| | | | | | | | | | | | | | | | | | | | | | | | | | | | | | |
| | | | | | | | Income (loss) from
investment operations | | | Distributions
to shareholders | |
| | | Year - Share Class | |
Net asset
value,
beginning
of period | | | Net
investment
income (loss)(a) | | | Net realized
and unrealized
gain | | | Total from
investment
operations | | | From net
investment
income | | | From net
realized
gains | | | Total
distributions | |
| | FOR THE SIX MONTHS ENDED FEBRUARY 28, (UNAUDITED) | |
| | 2013 - A | | $ | 11.35 | | | $ | 0.04 | (e) | | $ | 1.05 | | | $ | 1.09 | | | $ | (0.05 | ) | | $ | (0.02 | ) | | $ | (0.07 | ) |
| | 2013 - C | | | 11.31 | | | | (0.01 | )(e) | | | 1.04 | | | | 1.03 | | | | (0.01 | ) | | | (0.02 | ) | | | (0.03 | ) |
| | 2013 - Institutional | | | 11.38 | | | | 0.05 | (e) | | | 1.06 | | | | 1.11 | | | | (0.07 | ) | | | (0.02 | ) | | | (0.09 | ) |
| | 2013 - IR | | | 11.38 | | | | 0.05 | (e) | | | 1.05 | | | | 1.10 | | | | (0.06 | ) | | | (0.02 | ) | | | (0.08 | ) |
| | 2013 - R | | | 11.34 | | | | 0.02 | (e) | | | 1.05 | | | | 1.07 | | | | (0.01 | ) | | | (0.02 | ) | | | (0.03 | ) |
| | | | | | | | | | | | | | | | | | | | | | | | | | | | | | |
| | FOR THE PERIOD ENDED AUGUST 31, | |
| | 2012 - A (Commenced January 31, 2012) | | | 10.00 | | | | — | (f) | | | 1.35 | | | | 1.35 | | | | — | | | | — | | | | — | |
| | 2012 - C (Commenced January 31, 2012) | | | 10.00 | | | | (0.05 | ) | | | 1.36 | | | | 1.31 | | | | — | | | | — | | | | — | |
| | 2012 - Institutional (Commenced January 31, 2012) | | | 10.00 | | | | 0.02 | | | | 1.36 | | | | 1.38 | | | | — | | | | — | | | | — | |
| | 2012 - IR (Commenced January 31, 2012) | | | 10.00 | | | | 0.01 | | | | 1.37 | | | | 1.38 | | | | — | | | | — | | | | — | |
| | 2012 - R (Commenced January 31, 2012) | | | 10.00 | | | | (0.02 | ) | | | 1.36 | | | | 1.34 | | | | — | | | | — | | | | — | |
| | (a) | | Calculated based on the average shares outstanding methodology. |
| | (b) | | Assumes investment at the net asset value at the beginning of the period, reinvestment of all dividends and distributions, a complete redemption of the investment at the net asset value at the end of the period and no sales or redemption charges. Total returns would be reduced if a sales or redemption charge was taken into account. Returns do not reflect the deduction of taxes that a shareholder would pay on Fund distributions or the redemption of Fund shares. Total returns for periods less than one full year are not annualized. |
| | (d) | | The Fund’s portfolio turnover rate is calculated in accordance with regulatory requirements, without regard to transactions involving short term investments and certain derivatives. If such transactions were included, the Fund’s portfolio turnover rate may be higher. |
| | (e) | | Reflects income recognized from special dividends which amounted to $0.03 per share and 0.59% of average net assets. |
| | (f) | | Amount is less than $0.005 per share. |
| | |
| 94 | | The accompanying notes are an integral part of these financial statements. |
GOLDMAN SACHS FOCUSED GROWTH FUND
| | | | | | | | | | | | | | | | | | | | | | | | | | | | | | | | | | | | | | | | |
| | | | | | | | | | | | | | | | | | | | | | | | | | | | | | | | | | |
| | | Net asset
value, end
of period | | | | | Total
return(b) | | | | | Net assets,
end of
period
(in 000s) | | | | | Ratio of
net expenses
to average
net assets(c) | | | | | Ratio of
total expenses
to average
net assets(c) | | | | |
Ratio of
net investment
income (loss)
to average
net assets(c) | | | | | Portfolio
turnover
rate(d) | |
| | | | | | | | | | | | | | | | | | | | | | | | | | | | | | | | | | | | | | | | |
| | $ | 12.37 | | | | | | 9.65 | % | | | | $ | 73 | | | | | | 1.24 | % | | | | | 7.15 | % | | | | | 0.67 | %(e) | | | | | 22 | % |
| | | 12.31 | | | | | | 9.16 | | | | | | 12 | | | | | | 1.99 | | | | | | 7.90 | | | | | | (0.14 | )(e) | | | | | 22 | |
| | | 12.40 | | | | | | 9.84 | | | | | | 12,184 | | | | | | 0.84 | | | | | | 6.75 | | | | | | 0.85 | (e) | | | | | 22 | |
| | | 12.40 | | | | | | 9.68 | | | | | | 12 | | | | | | 0.99 | | | | | | 6.90 | | | | | | 0.86 | (e) | | | | | 22 | |
| | | 12.38 | | | | | | 9.48 | | | | | | 12 | | | | | | 1.49 | | | | | | 7.41 | | | | | | 0.35 | (e) | | | | | 22 | |
| | | | | | | | | | | | | | | | | | | | | | | | | | | | | | | | | | | | | | | | |
| | | | | | | | | | | | | | | | | | | | | | | | | | | | | | | | | | | | | | | | |
| | | 11.35 | | | | | | 13.50 | | | | | | 35 | | | | | | 1.24 | | | | | | 17.07 | | | | | | 0.04 | | | | | | 23 | |
| | | 11.31 | | | | | | 13.10 | | | | | | 11 | | | | | | 1.99 | | | | | | 17.82 | | | | | | (0.81 | ) | | | | | 23 | |
| | | 11.38 | | | | | | 13.80 | | | | | | 3,417 | | | | | | 0.84 | | | | | | 16.67 | | | | | | 0.36 | | | | | | 23 | |
| | | 11.38 | | | | | | 13.80 | | | | | | 11 | | | | | | 0.99 | | | | | | 16.82 | | | | | | 0.22 | | | | | | 23 | |
| | | 11.34 | | | | | | 13.40 | | | | | | 11 | | | | | | 1.49 | | | | | | 17.32 | | | | | | (0.30 | ) | | | | | 23 | |
| | |
| The accompanying notes are an integral part of these financial statements. | | 95 |
GOLDMAN SACHS GROWTH OPPORTUNITIES FUND
Financial Highlights
Selected Data for a Share Outstanding Throughout Each Period
| | | | | | | | | | | | | | | | | | | | | | |
| | | | | | | | Income (loss) from
investment operations | | | | |
| | | Year - Share Class | | Net asset
value,
beginning
of period | | | Net
investment
income (loss)(a) | | | Net realized
and unrealized
gain (loss) | | | Total from
investment
operations | | | Distributions
to shareholders
from net
realized
gains | |
| | FOR THE SIX MONTHS ENDED FEBRUARY 28, (UNAUDITED) | |
| | 2013 - A | | $ | 23.88 | | | $ | (0.03 | )(d) | | $ | 2.21 | | | $ | 2.18 | | | $ | (1.65 | ) |
| | 2013 - B | | | 21.10 | | | | (0.10 | )(d) | | | 1.93 | | | | 1.83 | | | | (1.65 | ) |
| | 2013 - C | | | 20.89 | | | | (0.10 | )(d) | | | 1.91 | | | | 1.81 | | | | (1.65 | ) |
| | 2013 - Institutional | | | 25.59 | | | | 0.02 | (d) | | | 2.39 | | | | 2.41 | | | | (1.65 | ) |
| | 2013 - Service | | | 23.44 | | | | (0.04 | )(d) | | | 2.16 | | | | 2.12 | | | | (1.65 | ) |
| | 2013 - IR | | | 24.19 | | | | — | (d)(f) | | | 2.25 | | | | 2.25 | | | | (1.65 | ) |
| | 2013 - R | | | 23.59 | | | | (0.06 | )(d) | | | 2.19 | | | | 2.13 | | | | (1.65 | ) |
| | | | | | | | | | | | | | | | | | | | | | |
| | FOR THE FISCAL YEARS ENDED AUGUST 31, | |
| | 2012 - A | | | 21.36 | | | | (0.15 | ) | | | 4.06 | | | | 3.91 | | | | (1.39 | ) |
| | 2012 - B | | | 19.16 | | | | (0.28 | ) | | | 3.61 | | | | 3.33 | | | | (1.39 | ) |
| | 2012 - C | | | 18.99 | | | | (0.28 | ) | | | 3.57 | | | | 3.29 | | | | (1.39 | ) |
| | 2012 - Institutional | | | 22.71 | | | | (0.06 | ) | | | 4.33 | | | | 4.27 | | | | (1.39 | ) |
| | 2012 - Service | | | 21.01 | | | | (0.17 | ) | | | 3.99 | | | | 3.82 | | | | (1.39 | ) |
| | 2012 - IR | | | 21.57 | | | | (0.09 | ) | | | 4.10 | | | | 4.01 | | | | (1.39 | ) |
| | 2012 - R | | | 21.17 | | | | (0.20 | ) | | | 4.01 | | | | 3.81 | | | | (1.39 | ) |
| | 2011 - A | | | 19.09 | | | | (0.16 | ) | | | 2.65 | | | | 2.49 | | | | (0.22 | ) |
| | 2011 - B | | | 17.27 | | | | (0.30 | ) | | | 2.41 | | | | 2.11 | | | | (0.22 | ) |
| | 2011 - C | | | 17.11 | | | | (0.30 | ) | | | 2.40 | | | | 2.10 | | | | (0.22 | ) |
| | 2011 - Institutional | | | 20.21 | | | | (0.07 | ) | | | 2.79 | | | | 2.72 | | | | (0.22 | ) |
| | 2011 - Service | | | 18.80 | | | | (0.18 | ) | | | 2.61 | | | | 2.43 | | | | (0.22 | ) |
| | 2011 - IR | | | 19.23 | | | | (0.10 | ) | | | 2.66 | | | | 2.56 | | | | (0.22 | ) |
| | 2011 - R | | | 18.97 | | | | (0.22 | ) | | | 2.64 | | | | 2.42 | | | | (0.22 | ) |
| | 2010 - A | | | 16.91 | | | | (0.15 | ) | | | 2.33 | | | | 2.18 | | | | — | |
| | 2010 - B | | | 15.42 | | | | (0.26 | ) | | | 2.11 | | | | 1.85 | | | | — | |
| | 2010 - C | | | 15.28 | | | | (0.26 | ) | | | 2.09 | | | | 1.83 | | | | — | |
| | 2010 - Institutional | | | 17.83 | | | | (0.07 | ) | | | 2.45 | | | | 2.38 | | | | — | |
| | 2010 - Service | | | 16.67 | | | | (0.16 | ) | | | 2.29 | | | | 2.13 | | | | — | |
| | 2010 - IR | | | 16.99 | | | | (0.10 | ) | | | 2.34 | | | | 2.24 | | | | — | |
| | 2010 - R | | | 16.85 | | | | (0.19 | ) | | | 2.31 | | | | 2.12 | | | | — | |
| | 2009 - A | | | 21.68 | | | | (0.08 | ) | | | (3.65 | ) | | | (3.73 | ) | | | (1.04 | ) |
| | 2009 - B | | | 20.06 | | | | (0.18 | ) | | | (3.42 | ) | | | (3.60 | ) | | | (1.04 | ) |
| | 2009 - C | | | 19.89 | | | | (0.17 | ) | | | (3.40 | ) | | | (3.57 | ) | | | (1.04 | ) |
| | 2009 - Institutional | | | 22.67 | | | | (0.03 | ) | | | (3.77 | ) | | | (3.80 | ) | | | (1.04 | ) |
| | 2009 - Service | | | 21.41 | | | | (0.11 | ) | | | (3.59 | ) | | | (3.70 | ) | | | (1.04 | ) |
| | 2009 - IR | | | 21.72 | | | | (0.07 | ) | | | (3.62 | ) | | | (3.69 | ) | | | (1.04 | ) |
| | 2009 - R | | | 21.65 | | | | (0.14 | ) | | | (3.62 | ) | | | (3.76 | ) | | | (1.04 | ) |
| | 2008 - A | | | 25.20 | | | | (0.12 | ) | | | (0.02 | ) | | | (0.14 | ) | | | (3.38 | ) |
| | 2008 - B | | | 23.72 | | | | (0.27 | ) | | | (0.01 | ) | | | (0.28 | ) | | | (3.38 | ) |
| | 2008 - C | | | 23.55 | | | | (0.27 | ) | | | (0.01 | ) | | | (0.28 | ) | | | (3.38 | ) |
| | 2008 - Institutional | | | 26.11 | | | | (0.03 | ) | | | (0.03 | ) | | | (0.06 | ) | | | (3.38 | ) |
| | 2008 - Service | | | 24.95 | | | | (0.14 | ) | | | (0.02 | ) | | | (0.16 | ) | | | (3.38 | ) |
| | 2008 - IR (Commenced November 30, 2007) | | | 25.44 | | | | (0.06 | ) | | | (0.28 | ) | | | (0.34 | ) | | | (3.38 | ) |
| | 2008 - R (Commenced November 30, 2007) | | | 25.44 | | | | (0.13 | ) | | | (0.28 | ) | | | (0.41 | ) | | | (3.38 | ) |
| | (a) | | Calculated based on the average shares outstanding methodology. |
| | (b) | | Assumes investment at the net asset value at the beginning of the period, reinvestment of all dividends and distributions, a complete redemption of the investment at the net asset value at the end of the period and no sales or redemption charges. Total returns would be reduced if a sales or redemption charge was taken into account. Returns do not reflect the deduction of taxes that a shareholder would pay on Fund distributions or the redemption of Fund shares. Total returns for periods less than one full year are not annualized. |
| | (c) | | The Fund’s portfolio turnover rate is calculated in accordance with regulatory requirements, without regard to transactions involving short term investments and certain derivatives. If such transactions were included, the Fund’s portfolio turnover rate may be higher. |
| | (d) | | Reflects income recognized from special dividends which amounted to $0.04 per share and 0.36% of average net assets. |
| | (f) | | Amount is less than $0.005 per share. |
| | (g) | | Portfolio turnover rates exclude portfolio securities received as a result of in-kind redemptions. |
| | |
| 96 | | The accompanying notes are an integral part of these financial statements. |
GOLDMAN SACHS GROWTH OPPORTUNITIES FUND
| | | | | | | | | | | | | | | | | | | | | | | | | | | | | | | | | | | | | | | | |
| | | | | | | | | | | | | | | | | | | | | | | | | | | | | | | | | | |
| | | Net asset
value, end
of period | | | | | Total
return(b) | | | | | Net assets,
end of period
(in 000s) | | | | | Ratio of
net expenses
to average
net assets | | | | | Ratio of
total expenses
to average
net assets | | | | | Ratio of
net investment
income (loss)
to average
net assets | | | | | Portfolio
turnover
rate(c) | |
| | | | | | | | | | | | | | | | | | | | | | | | | | | | | | | | | | | | | | | | |
| | $ | 24.41 | | | | | | 9.77 | % | | $ | | | 1,111,515 | | | | | | 1.35 | %(e) | | | | | 1.41 | %(e) | | | | | (0.25 | )%(d)(e) | | | | | 18 | % |
| | | 21.28 | | | | | | 9.38 | | | | | | 10,657 | | | | | | 2.10 | (e) | | | | | 2.16 | (e) | | | | | (0.96 | )(d)(e) | | | | | 18 | |
| | | 21.05 | | | | | | 9.38 | | | | | | 165,836 | | | | | | 2.10 | (e) | | | | | 2.16 | (e) | | | | | (1.00 | )(d)(e) | | | | | 18 | |
| | | 26.35 | | | | | | 10.02 | | | | | | 2,895,077 | | | | | | 0.95 | (e) | | | | | 1.01 | (e) | | | | | 0.14 | (d)(e) | | | | | 18 | |
| | | 23.91 | | | | | | 9.69 | | | | | | 60,137 | | | | | | 1.45 | (e) | | | | | 1.51 | (e) | | | | | (0.35 | )(d)(e) | | | | | 18 | |
| | | 24.79 | | | | | | 9.94 | | | | | | 94,024 | | | | | | 1.10 | (e) | | | | | 1.16 | (e) | | | | | (0.02 | )(d)(e) | | | | | 18 | |
| | | 24.07 | | | | | | 9.67 | | | | | | 61,232 | | | | | | 1.60 | (e) | | | | | 1.66 | (e) | | | | | (0.51 | )(d)(e) | | | | | 18 | |
| | | | | | | | | | | | | | | | | | | | | | | | | | | | | | | | | | | | | | | | |
| | | | | | | | | | | | | | | | | | | | | | | | | | | | | | | | | | | | | | | | |
| | | 23.88 | | | | | | 19.15 | | | | | | 1,068,187 | | | | | | 1.35 | | | | | | 1.41 | | | | | | (0.67 | ) | | | | | 59 | |
| | | 21.10 | | | | | | 18.29 | | | | | | 12,613 | | | | | | 2.10 | | | | | | 2.16 | | | | | | (1.42 | ) | | | | | 59 | |
| | | 20.89 | | | | | | 18.24 | | | | | | 157,901 | | | | | | 2.10 | | | | | | 2.16 | | | | | | (1.42 | ) | | | | | 59 | |
| | | 25.59 | | | | | | 19.61 | | | | | | 2,710,810 | | | | | | 0.95 | | | | | | 1.01 | | | | | | (0.27 | ) | | | | | 59 | |
| | | 23.44 | | | | | | 19.03 | | | | | | 59,834 | | | | | | 1.45 | | | | | | 1.51 | | | | | | (0.77 | ) | | | | | 59 | |
| | | 24.19 | | | | | | 19.43 | | | | | | 75,702 | | | | | | 1.10 | | | | | | 1.16 | | | | | | (0.42 | ) | | | | | 59 | |
| | | 23.59 | | | | | | 18.83 | | | | | | 54,071 | | | | | | 1.60 | | | | | | 1.66 | | | | | | (0.91 | ) | | | | | 59 | |
| | | 21.36 | | | | | | 12.97 | | | | | | 1,060,320 | | | | | | 1.36 | | | | | | 1.41 | | | | | | (0.70 | ) | | | | | 71 | (g) |
| | | 19.16 | | | | | | 12.13 | | | | | | 16,380 | | | | | | 2.11 | | | | | | 2.16 | | | | | | (1.46 | ) | | | | | 71 | (g) |
| | | 18.99 | | | | | | 12.18 | | | | | | 158,371 | | | | | | 2.11 | | | | | | 2.16 | | | | | | (1.46 | ) | | | | | 71 | (g) |
| | | 22.71 | | | | | | 13.39 | | | | | | 2,843,584 | | | | | | 0.96 | | | | | | 1.01 | | | | | | (0.30 | ) | | | | | 71 | (g) |
| | | 21.01 | | | | | | 12.85 | | | | | | 57,002 | | | | | | 1.46 | | | | | | 1.51 | | | | | | (0.81 | ) | | | | | 71 | (g) |
| | | 21.57 | | | | | | 13.24 | | | | | | 54,912 | | | | | | 1.11 | | | | | | 1.16 | | | | | | (0.43 | ) | | | | | 71 | (g) |
| | | 21.17 | | | | | | 12.68 | | | | | | 33,931 | | | | | | 1.61 | | | | | | 1.66 | | | | | | (0.94 | ) | | | | | 71 | (g) |
| | | 19.09 | | | | | | 12.89 | | | | | | 799,256 | | | | | | 1.37 | | | | | | 1.44 | | | | | | (0.76 | ) | | | | | 57 | (g) |
| | | 17.27 | | | | | | 12.00 | | | | | | 21,174 | | | | | | 2.12 | | | | | | 2.19 | | | | | | (1.51 | ) | | | | | 57 | (g) |
| | | 17.11 | | | | | | 11.98 | | | | | | 129,009 | | | | | | 2.12 | | | | | | 2.19 | | | | | | (1.51 | ) | | | | | 57 | (g) |
| | | 20.21 | | | | | | 13.35 | | | | | | 2,216,786 | | | | | | 0.97 | | | | | | 1.04 | | | | | | (0.35 | ) | | | | | 57 | (g) |
| | | 18.80 | | | | | | 12.78 | | | | | | 60,893 | | | | | | 1.47 | | | | | | 1.54 | | | | | | (0.86 | ) | | | | | 57 | (g) |
| | | 19.23 | | | | | | 13.18 | | | | | | 12,823 | | | | | | 1.12 | | | | | | 1.19 | | | | | | (0.49 | ) | | | | | 57 | (g) |
| | | 18.97 | | | | | | 12.58 | | | | | | 7,954 | | | | | | 1.62 | | | | | | 1.69 | | | | | | (0.97 | ) | | | | | 57 | (g) |
| | | 16.91 | | | | | | (15.03 | ) | | | | | 641,989 | | | | | | 1.45 | | | | | | 1.50 | | | | | | (0.58 | ) | | | | | 78 | |
| | | 15.42 | | | | | | (15.64 | ) | | | | | 27,191 | | | | | | 2.20 | | | | | | 2.25 | | | | | | (1.33 | ) | | | | | 78 | |
| | | 15.28 | | | | | | (15.62 | ) | | | | | 85,240 | | | | | | 2.20 | | | | | | 2.25 | | | | | | (1.33 | ) | | | | | 78 | |
| | | 17.83 | | | | | | (14.66 | ) | | | | | 1,257,148 | | | | | | 1.05 | | | | | | 1.10 | | | | | | (0.19 | ) | | | | | 78 | |
| | | 16.67 | | | | | | (15.08 | ) | | | | | 30,614 | | | | | | 1.55 | | | | | | 1.60 | | | | | | (0.74 | ) | | | | | 78 | |
| | | 16.99 | | | | | | (14.81 | ) | | | | | 1,382 | | | | | | 1.20 | | | | | | 1.25 | | | | | | (0.46 | ) | | | | | 78 | |
| | | 16.85 | | | | | | (15.20 | ) | | | | | 934 | | | | | | 1.70 | | | | | | 1.75 | | | | | | (0.94 | ) | | | | | 78 | |
| | | 21.68 | | | | | | (1.25 | ) | | | | | 851,222 | | | | | | 1.47 | | | | | | 1.47 | | | | | | (0.54 | ) | | | | | 81 | |
| | | 20.06 | | | | | | (1.99 | ) | | | | | 48,770 | | | | | | 2.22 | | | | | | 2.22 | | | | | | (1.28 | ) | | | | | 81 | |
| | | 19.89 | | | | | | (2.00 | ) | | | | | 116,837 | | | | | | 2.22 | | | | | | 2.22 | | | | | | (1.29 | ) | | | | | 81 | |
| | | 22.67 | | | | | | (0.87 | ) | | | | | 938,726 | | | | | | 1.07 | | | | | | 1.07 | | | | | | (0.14 | ) | | | | | 81 | |
| | | 21.41 | | | | | | (1.35 | ) | | | | | 10,601 | | | | | | 1.57 | | | | | | 1.57 | | | | | | (0.64 | ) | | | | | 81 | |
| | | 21.72 | | | | | | (2.01 | ) | | | | | 10 | | | | | | 1.22 | (e) | | | | | 1.22 | (e) | | | | | (0.35 | )(e) | | | | | 81 | |
| | | 21.65 | | | | | | (2.32 | ) | | | | | 10 | | | | | | 1.72 | (e) | | | | | 1.72 | (e) | | | | | (0.81 | )(e) | | | | | 81 | |
| | |
| The accompanying notes are an integral part of these financial statements. | | 97 |
GOLDMAN SACHS SMALL/MID CAP GROWTH FUND
Financial Highlights
Selected Data for a Share Outstanding Throughout Each Period
| | | | | | | | | | | | | | | | | | | | | | |
| | | | | | | | Income (loss) from
investment operations | | | | |
| | | Year - Share Class | | Net asset
value,
beginning
of period | | | Net
investment
loss(a) | | | Net realized
and unrealized
gain (loss) | | | Total from
investment
operations | | | Distributions
to shareholders
from net
realized gains | |
| | FOR THE SIX MONTHS ENDED FEBRUARY 28, (UNAUDITED) | |
| | 2013 - A | | $ | 15.52 | | | $ | (0.04 | )(d) | | $ | 1.91 | | | $ | 1.87 | | | $ | (0.77 | ) |
| | 2013 - B | | | 14.59 | | | | (0.09 | )(d) | | | 1.78 | | | | 1.69 | | | | (0.77 | ) |
| | 2013 - C | | | 14.58 | | | | (0.09 | )(d) | | | 1.78 | | | | 1.69 | | | | (0.77 | ) |
| | 2013 - Institutional | | | 15.95 | | | | — | (d)(f) | | | 1.96 | | | | 1.96 | | | | (0.77 | ) |
| | 2013 - Service | | | 15.34 | | | | (0.04 | )(d) | | | 1.88 | | | | 1.84 | | | | (0.77 | ) |
| | 2013 - IR | | | 15.72 | | | | (0.02 | )(d) | | | 1.94 | | | | 1.92 | | | | (0.77 | ) |
| | 2013 - R | | | 15.34 | | | | (0.05 | )(d) | | | 1.87 | | | | 1.82 | | | | (0.77 | ) |
| | | | | | | | | | | | | | | | | | | | | | |
| | FOR THE FISCAL YEARS ENDED AUGUST 31, | |
| | 2012 - A | | | 13.67 | | | | (0.12 | ) | | | 2.63 | | | | 2.51 | | | | (0.66 | ) |
| | 2012 - B | | | 12.98 | | | | (0.21 | ) | | | 2.48 | | | | 2.27 | | | | (0.66 | ) |
| | 2012 - C | | | 12.98 | | | | (0.21 | ) | | | 2.47 | | | | 2.26 | | | | (0.66 | ) |
| | 2012 - Institutional | | | 13.98 | | | | (0.06 | ) | | | 2.69 | | | | 2.63 | | | | (0.66 | ) |
| | 2012 - Service | | | 13.53 | | | | (0.13 | ) | | | 2.60 | | | | 2.47 | | | | (0.66 | ) |
| | 2012 - IR | | | 13.81 | | | | (0.08 | ) | | | 2.65 | | | | 2.57 | | | | (0.66 | ) |
| | 2012 - R | | | 13.55 | | | | (0.15 | ) | | | 2.60 | | | | 2.45 | | | | (0.66 | ) |
| | 2011 - A | | | 12.08 | | | | (0.15 | ) | | | 2.01 | | | | 1.86 | | | | (0.27 | ) |
| | 2011 - B | | | 11.57 | | | | (0.24 | ) | | | 1.92 | | | | 1.68 | | | | (0.27 | ) |
| | 2011 - C | | | 11.56 | | | | (0.24 | ) | | | 1.93 | | | | 1.69 | | | | (0.27 | ) |
| | 2011 - Institutional | | | 12.30 | | | | (0.09 | ) | | | 2.04 | | | | 1.95 | | | | (0.27 | ) |
| | 2011 - Service | | | 11.97 | | | | (0.16 | ) | | | 1.99 | | | | 1.83 | | | | (0.27 | ) |
| | 2011 - IR | | | 12.17 | | | | (0.10 | ) | | | 2.01 | | | | 1.91 | | | | (0.27 | ) |
| | 2011 - R | | | 12.01 | | | | (0.18 | ) | | | 1.99 | | | | 1.81 | | | | (0.27 | ) |
| | 2010 - A | | | 10.63 | | | | (0.12 | ) | | | 1.57 | | | | 1.45 | | | | — | |
| | 2010 - B | | | 10.25 | | | | (0.20 | ) | | | 1.52 | | | | 1.32 | | | | — | |
| | 2010 - C | | | 10.25 | | | | (0.21 | ) | | | 1.52 | | | | 1.31 | | | | — | |
| | 2010 - Institutional | | | 10.78 | | | | (0.07 | ) | | | 1.59 | | | | 1.52 | | | | — | |
| | 2010 - Service | | | 10.54 | | | | (0.13 | ) | | | 1.56 | | | | 1.43 | | | | — | |
| | 2010 - IR | | | 10.68 | | | | (0.09 | ) | | | 1.58 | | | | 1.49 | | | | — | |
| | 2010 - R | | | 10.59 | | | | (0.15 | ) | | | 1.57 | | | | 1.42 | | | | — | |
| | 2009 - A | | | 12.25 | | | | (0.05 | ) | | | (1.57 | ) | | | (1.62 | ) | | | — | |
| | 2009 - B | | | 11.90 | | | | (0.11 | ) | | | (1.54 | ) | | | (1.65 | ) | | | — | |
| | 2009 - C | | | 11.90 | | | | (0.11 | ) | | | (1.54 | ) | | | (1.65 | ) | | | — | |
| | 2009 - Institutional | | | 12.37 | | | | (0.02 | ) | | | (1.57 | ) | | | (1.59 | ) | | | — | |
| | 2009 - Service | | | 12.16 | | | | (0.06 | ) | | | (1.56 | ) | | | (1.62 | ) | | | — | |
| | 2009 - IR | | | 12.27 | | | | (0.04 | ) | | | (1.55 | ) | | | (1.59 | ) | | | — | |
| | 2009 - R | | | 12.22 | | | | (0.08 | ) | | | (1.55 | ) | | | (1.63 | ) | | | — | |
| | 2008 - A | | | 13.48 | | | | (0.09 | ) | | | (0.20 | ) | | | (0.29 | ) | | | (0.94 | )(g) |
| | 2008 - B | | | 13.22 | | | | (0.18 | ) | | | (0.20 | ) | | | (0.38 | ) | | | (0.94 | )(g) |
| | 2008 - C | | | 13.21 | | | | (0.18 | ) | | | (0.19 | ) | | | (0.37 | ) | | | (0.94 | )(g) |
| | 2008 - Institutional | | | 13.55 | | | | (0.04 | ) | | | (0.20 | ) | | | (0.24 | ) | | | (0.94 | )(g) |
| | 2008 - Service | | | 13.40 | | | | (0.10 | ) | | | (0.20 | ) | | | (0.30 | ) | | | (0.94 | )(g) |
| | 2008 - IR (Commenced November 30, 2007) | | | 13.79 | | | | (0.04 | ) | | | (0.54 | ) | | | (0.58 | ) | | | (0.94 | )(g) |
| | 2008 - R (Commenced November 30, 2007) | | | 13.79 | | | | (0.09 | ) | | | (0.54 | ) | | | (0.63 | ) | | | (0.94 | )(g) |
| | (a) | | Calculated based on the average shares outstanding methodology. |
| | (b) | | Assumes investment at the net asset value at the beginning of the period, reinvestment of all dividends and distributions, a complete redemption of the investment at the net asset value at the end of the period and no sales or redemption charges. Total returns would be reduced if a sales or redemption charge was taken into account. Returns do not reflect the deduction of taxes that a shareholder would pay on Fund distributions or the redemption of Fund shares. Total returns for periods less than one full year are not annualized. |
| | (c) | | The Fund’s portfolio turnover rate is calculated in accordance with regulatory requirements, without regard to transactions involving short term investments and certain derivatives. If such transactions were included, the Fund’s portfolio turnover rate may be higher. |
| | (d) | | Reflects income recognized from special dividends which amounted to $0.03 per share and 0.36% of average net assets. |
| | (f) | | Amount is less than $0.005 per share. |
| | (g) | | Includes a distribution from capital of $0.01 per share. |
| | |
| 98 | | The accompanying notes are an integral part of these financial statements. |
GOLDMAN SACHS SMALL/MID CAP GROWTH FUND
| | | | | | | | | | | | | | | | | | | | | | | | | | | | | | | | | | | | | | | | |
| | | | | | | | | | | | | | | | | | | | | | | | | | | | | | | | | | |
| | | Net asset
value, end
of period | | | | | Total
return(b) | | | | | Net assets,
end of
period
(in 000s) | | | | | Ratio of
net expenses
to average
net assets | | | | | Ratio of
total expenses
to average
net assets | | | | | Ratio of
net investment
loss
to average net
assets | | | | | Portfolio
turnover
rate(c) | |
| | | | | | | | | | | | | | | | | | | | | | | | | | | | | | | | | | | | | | | | |
| | $ | 16.62 | | | | | | 12.57 | % | | $ | | | 479,317 | | | | | | 1.34 | %(e) | | | | | 1.49 | %(e) | | | | | (0.45 | )%(d)(e) | | | | | 16 | % |
| | | 15.51 | | | | | | 12.12 | | | | | | 4,615 | | | | | | 2.09 | (e) | | | | | 2.24 | (e) | | | | | (1.18 | )(d)(e) | | | | | 16 | |
| | | 15.50 | | | | | | 12.13 | | | | | | 108,551 | | | | | | 2.09 | (e) | | | | | 2.24 | (e) | | | | | (1.20 | )(d)(e) | | | | | 16 | |
| | | 17.14 | | | | | | 12.80 | | | | | | 419,525 | | | | | | 0.94 | (e) | | | | | 1.09 | (e) | | | | | (0.06 | )(d)(e) | | | | | 16 | |
| | | 16.41 | | | | | | 12.52 | | | | | | 7,515 | | | | | | 1.44 | (e) | | | | | 1.59 | (e) | | | | | (0.54 | )(d)(e) | | | | | 16 | |
| | | 16.87 | | | | | | 12.73 | | | | | | 64,776 | | | | | | 1.09 | (e) | | | | | 1.24 | (e) | | | | | (0.21 | )(d)(e) | | | | | 16 | |
| | | 16.39 | | | | | | 12.38 | | | | | | 21,267 | | | | | | 1.59 | (e) | | | | | 1.74 | (e) | | | | | (0.69 | )(d)(e) | | | | | 16 | |
| | | | | | | | | | | | | | | | | | | | | | | | | | | | | | | | | | | | | | | | |
| | | | | | | | | | | | | | | | | | | | | | | | | | | | | | | | | | | | | | | | |
| | | 15.52 | | | | | | 18.97 | | | | | | 393,284 | | | | | | 1.35 | | | | | | 1.50 | | | | | | (0.83 | ) | | | | | 51 | |
| | | 14.59 | | | | | | 18.11 | | | | | | 4,783 | | | | | | 2.10 | | | | | | 2.25 | | | | | | (1.58 | ) | | | | | 51 | |
| | | 14.58 | | | | | | 18.03 | | | | | | 87,185 | | | | | | 2.10 | | | | | | 2.25 | | | | | | (1.58 | ) | | | | | 51 | |
| | | 15.95 | | | | | | 19.42 | | | | | | 291,636 | | | | | | 0.95 | | | | | | 1.10 | | | | | | (0.43 | ) | | | | | 51 | |
| | | 15.34 | | | | | | 18.87 | | | | | | 6,774 | | | | | | 1.45 | | | | | | 1.60 | | | | | | (0.92 | ) | | | | | 51 | |
| | | 15.72 | | | | | | 19.22 | | | | | | 46,777 | | | | | | 1.10 | | | | | | 1.25 | | | | | | (0.57 | ) | | | | | 51 | |
| | | 15.34 | | | | | | 18.69 | | | | | | 19,156 | | | | | | 1.60 | | | | | | 1.75 | | | | | | (1.07 | ) | | | | | 51 | |
| | | 13.67 | | | | | | 15.30 | | | | | | 403,960 | | | | | | 1.47 | | | | | | 1.50 | | | | | | (0.99 | ) | | | | | 53 | |
| | | 12.98 | | | | | | 14.41 | | | | | | 5,343 | | | | | | 2.22 | | | | | | 2.25 | | | | | | (1.75 | ) | | | | | 53 | |
| | | 12.98 | | | | | | 14.51 | | | | | | 79,875 | | | | | | 2.22 | | | | | | 2.25 | | | | | | (1.74 | ) | | | | | 53 | |
| | | 13.98 | | | | | | 15.77 | | | | | | 340,712 | | | | | | 1.07 | | | | | | 1.10 | | | | | | (0.59 | ) | | | | | 53 | |
| | | 13.53 | | | | | | 15.19 | | | | | | 5,879 | | | | | | 1.57 | | | | | | 1.60 | | | | | | (1.08 | ) | | | | | 53 | |
| | | 13.81 | | | | | | 15.60 | | | | | | 30,858 | | | | | | 1.22 | | | | | | 1.25 | | | | | | (0.71 | ) | | | | | 53 | |
| | | 13.55 | | | | | | 14.97 | | | | | | 15,370 | | | | | | 1.72 | | | | | | 1.75 | | | | | | (1.24 | ) | | | | | 53 | |
| | | 12.08 | | | | | | 13.64 | | | | | | 267,826 | | | | | | 1.50 | | | | | | 1.54 | | | | | | (0.98 | ) | | | | | 48 | |
| | | 11.57 | | | | | | 12.88 | | | | | | 6,024 | | | | | | 2.25 | | | | | | 2.29 | | | | | | (1.73 | ) | | | | | 48 | |
| | | 11.56 | | | | | | 12.78 | | | | | | 47,685 | | | | | | 2.25 | | | | | | 2.29 | | | | | | (1.73 | ) | | | | | 48 | |
| | | 12.30 | | | | | | 14.10 | | | | | | 222,616 | | | | | | 1.10 | | | | | | 1.14 | | | | | | (0.58 | ) | | | | | 48 | |
| | | 11.97 | | | | | | 13.57 | | | | | | 2,762 | | | | | | 1.60 | | | | | | 1.64 | | | | | | (1.07 | ) | | | | | 48 | |
| | | 12.17 | | | | | | 13.95 | | | | | | 15,059 | | | | | | 1.25 | | | | | | 1.29 | | | | | | (0.72 | ) | | | | | 48 | |
| | | 12.01 | | | | | | 13.41 | | | | | | 10,318 | | | | | | 1.75 | | | | | | 1.79 | | | | | | (1.23 | ) | | | | | 48 | |
| | | 10.63 | | | | | | (13.22 | ) | | | | | 122,262 | | | | | | 1.50 | | | | | | 1.68 | | | | | | (0.59 | ) | | | | | 55 | |
| | | 10.25 | | | | | | (13.87 | ) | | | | | 4,882 | | | | | | 2.25 | | | | | | 2.43 | | | | | | (1.32 | ) | | | | | 55 | |
| | | 10.25 | | | | | | (13.87 | ) | | | | | 18,220 | | | | | | 2.25 | | | | | | 2.43 | | | | | | (1.34 | ) | | | | | 55 | |
| | | 10.78 | | | | | | (12.85 | ) | | | | | 103,383 | | | | | | 1.10 | | | | | | 1.28 | | | | | | (0.17 | ) | | | | | 55 | |
| | | 10.54 | | | | | | (13.32 | ) | | | | | 1,196 | | | | | | 1.60 | | | | | | 1.78 | | | | | | (0.71 | ) | | | | | 55 | |
| | | 10.68 | | | | | | (12.96 | ) | | | | | 131 | | | | | | 1.25 | | | | | | 1.43 | | | | | | (0.44 | ) | | | | | 55 | |
| | | 10.59 | | | | | | (13.34 | ) | | | | | 533 | | | | | | 1.75 | | | | | | 1.93 | | | | | | (0.90 | ) | | | | | 55 | |
| | | 12.25 | | | | | | (2.65 | ) | | | | | 59,269 | | | | | | 1.50 | | | | | | 1.68 | | | | | | (0.73 | ) | | | | | 63 | |
| | | 11.90 | | | | | | (3.42 | ) | | | | | 3,768 | | | | | | 2.25 | | | | | | 2.43 | | | | | | (1.49 | ) | | | | | 63 | |
| | | 11.90 | | | | | | (3.34 | ) | | | | | 10,295 | | | | | | 2.25 | | | | | | 2.43 | | | | | | (1.50 | ) | | | | | 63 | |
| | | 12.37 | | | | | | (2.25 | ) | | | | | 86,275 | | | | | | 1.10 | | | | | | 1.28 | | | | | | (0.35 | ) | | | | | 63 | |
| | | 12.16 | | | | | | (2.75 | ) | | | | | 245 | | | | | | 1.60 | | | | | | 1.78 | | | | | | (0.84 | ) | | | | | 63 | |
| | | 12.27 | | | | | | (4.69 | ) | | | | | 10 | | | | | | 1.25 | (e) | | | | | 1.43 | (e) | | | | | (0.48 | )(e) | | | | | 63 | |
| | | 12.22 | | | | | | (5.08 | ) | | | | | 10 | | | | | | 1.75 | (e) | | | | | 1.93 | (e) | | | | | (0.98 | )(e) | | | | | 63 | |
| | |
| The accompanying notes are an integral part of these financial statements. | | 99 |
GOLDMAN SACHS STRATEGIC GROWTH FUND
Financial Highlights
Selected Data for a Share Outstanding Throughout Each Period
| | | | | | | | | | | | | | | | | | | | | | | | | | | | | | |
| | | | | | | | Income (loss) from
investment operations | | | Distributions
to shareholders | |
| | | Year - Share Class | |
Net asset
value,
beginning
of period | | | Net
investment
income (loss)(a) | | | Net realized
and unrealized
gain (loss) | | | Total from
investment
operations | | | From net
investment
income | | | From net
realized
gains | | | Total
distributions | |
| | FOR THE SIX MONTHS ENDED FEBRUARY 28, (UNAUDITED) | | | | | |
| | 2013 - A | | $ | 11.57 | | | $ | 0.04 | (d) | | $ | 0.74 | | | $ | 0.78 | | | $ | (0.05 | ) | | $ | (0.87 | ) | | $ | (0.92 | ) |
| | 2013 - B | | | 10.53 | | | | — | (d)(f) | | | 0.67 | | | | 0.67 | | | | — | | | | (0.87 | ) | | | (0.87 | ) |
| | 2013 - C | | | 10.54 | | | | — | (d)(f) | | | 0.67 | | | | 0.67 | | | | — | | | | (0.87 | ) | | | (0.87 | ) |
| | 2013 - Institutional | | | 12.00 | | | | 0.06 | (d) | | | 0.78 | | | | 0.84 | | | | (0.10 | ) | | | (0.87 | ) | | | (0.97 | ) |
| | 2013 - Service | | | 11.59 | | | | 0.03 | (d) | | | 0.74 | | | | 0.77 | | | | (0.08 | ) | | | (0.87 | ) | | | (0.95 | ) |
| | 2013 - IR | | | 12.01 | | | | 0.05 | (d) | | | 0.78 | | | | 0.83 | | | | (0.09 | ) | | | (0.87 | ) | | | (0.96 | ) |
| | 2013 - R | | | 11.53 | | | | 0.03 | (d) | | | 0.74 | | | | 0.77 | | | | (0.03 | ) | | | (0.87 | ) | | | (0.90 | ) |
| | | | | | | | | | | | | | | | | | | | | | | | | | | | | | |
| | FOR THE FISCAL YEARS ENDED AUGUST 31, | | | | | |
| | 2012 - A | | | 9.77 | | | | 0.01 | | | | 1.81 | | | | 1.82 | | | | (0.02 | ) | | | — | | | | (0.02 | ) |
| | 2012 - B | | | 8.94 | | | | (0.06 | ) | | | 1.65 | | | | 1.59 | | | | — | | | | — | | | | — | |
| | 2012 - C | | | 8.95 | | | | (0.06 | ) | | | 1.65 | | | | 1.59 | | | | — | | | | — | | | | — | |
| | 2012 - Institutional | | | 10.14 | | | | 0.06 | | | | 1.86 | | | | 1.92 | | | | (0.06 | ) | | | — | | | | (0.06 | ) |
| | 2012 - Service | | | 9.80 | | | | 0.02 | | | | 1.79 | | | | 1.81 | | | | (0.02 | ) | | | — | | | | (0.02 | ) |
| | 2012 - IR | | | 10.10 | | | | 0.04 | | | | 1.87 | | | | 1.91 | | | | — | | | | — | | | | — | |
| | 2012 - R | | | 9.74 | | | | — | (f) | | | 1.79 | | | | 1.79 | | | | — | | | | — | | | | — | |
| | 2011 - A | | | 8.53 | | | | 0.02 | | | | 1.25 | | | | 1.27 | | | | (0.03 | ) | | | — | | | | (0.03 | ) |
| | 2011 - B | | | 7.84 | | | | (0.05 | ) | | | 1.15 | | | | 1.10 | | | | — | | | | — | | | | — | |
| | 2011 - C | | | 7.86 | | | | (0.05 | ) | | | 1.14 | | | | 1.09 | | | | — | | | | — | | | | — | |
| | 2011 - Institutional | | | 8.85 | | | | 0.06 | | | | 1.30 | | | | 1.36 | | | | (0.07 | ) | | | — | | | | (0.07 | ) |
| | 2011 - Service | | | 8.55 | | | | 0.02 | | | | 1.25 | | | | 1.27 | | | | (0.02 | ) | | | — | | | | (0.02 | ) |
| | 2011 - IR | | | 8.84 | | | | 0.04 | | | | 1.29 | | | | 1.33 | | | | (0.07 | ) | | | — | | | | (0.07 | ) |
| | 2011 - R | | | 8.51 | | | | — | (f) | | | 1.24 | | | | 1.24 | | | | (0.01 | ) | | | — | | | | (0.01 | ) |
| | 2010 - A | | | 8.22 | | | | 0.02 | | | | 0.30 | | | | 0.32 | | | | (0.01 | ) | | | — | | | | (0.01 | ) |
| | 2010 - B | | | 7.61 | | | | (0.05 | ) | | | 0.28 | | | | 0.23 | | | | — | | | | — | | | | — | |
| | 2010 - C | | | 7.62 | | | | (0.05 | ) | | | 0.29 | | | | 0.24 | | | | — | | | | — | | | | — | |
| | 2010 - Institutional | | | 8.52 | | | | 0.06 | | | | 0.30 | | | | 0.36 | | | | (0.03 | ) | | | — | | | | (0.03 | ) |
| | 2010 - Service | | | 8.24 | | | | 0.01 | | | | 0.30 | | | | 0.31 | | | | — | | | | — | | | | — | |
| | 2010 - IR | | | 8.51 | | | | 0.04 | | | | 0.32 | | | | 0.36 | | | | (0.03 | ) | | | — | | | | (0.03 | ) |
| | 2010 - R | | | 8.21 | | | | — | (f) | | | 0.30 | | | | 0.30 | | | | — | | | | — | | | | — | |
| | 2009 - A | | | 10.34 | | | | 0.01 | | | | (2.13 | ) | | | (2.12 | ) | | | — | | | | — | | | | — | |
| | 2009 - B | | | 9.65 | | | | (0.04 | ) | | | (2.00 | ) | | | (2.04 | ) | | | — | | | | — | | | | — | |
| | 2009 - C | | | 9.67 | | | | (0.04 | ) | | | (2.01 | ) | | | (2.05 | ) | | | — | | | | — | | | | — | |
| | 2009 - Institutional | | | 10.68 | | | | 0.04 | | | | (2.20 | ) | | | (2.16 | ) | | | — | | | | — | | | | — | |
| | 2009 - Service | | | 10.40 | | | | 0.01 | | | | (2.17 | ) | | | (2.16 | ) | | | — | | | | — | | | | — | |
| | 2009 - IR (Commenced January 6, 2009) | | | 7.07 | | | | 0.02 | | | | 1.42 | | | | 1.44 | | | | — | | | | — | | | | — | |
| | 2009 - R (Commenced January 6, 2009) | | | 6.83 | | | | — | (f) | | | 1.38 | | | | 1.38 | | | | — | | | | — | | | | — | |
| | 2008 - A | | | 10.49 | | | | (0.05 | ) | | | (0.10 | ) | | | (0.15 | ) | | | — | | | | — | | | | — | |
| | 2008 - B | | | 9.86 | | | | (0.12 | ) | | | (0.09 | ) | | | (0.21 | ) | | | — | | | | — | | | | — | |
| | 2008 - C | | | 9.88 | | | | (0.12 | ) | | | (0.09 | ) | | | (0.21 | ) | | | — | | | | — | | | | — | |
| | 2008 - Institutional | | | 10.79 | | | | (0.01 | ) | | | (0.10 | ) | | | (0.11 | ) | | | — | | | | — | | | | — | |
| | 2008 - Service | | | 10.52 | | | | (0.02 | ) | | | (0.10 | ) | | | (0.12 | ) | | | — | | | | — | | | | — | |
| | (a) | | Calculated based on the average shares outstanding methodology. |
| | (b) | | Assumes investment at the net asset value at the beginning of the period, reinvestment of all dividends and distributions, a complete redemption of the investment at the net asset value at the end of the period and no sales or redemption charges. Total returns would be reduced if a sales or redemption charge was taken into account. Returns do not reflect the deduction of taxes that a shareholder would pay on Fund distributions or the redemption of Fund shares. Total returns for periods less than one full year are not annualized. |
| | (c) | | The Fund’s portfolio turnover rate is calculated in accordance with regulatory requirements, without regard to transactions involving short term investments and certain derivatives. If such transactions were included, the Fund’s portfolio turnover rate may be higher. |
| | (d) | | Reflects income recognized from special dividends which amounted to $0.03 per share and 0.56% of average net assets. |
| | (f) | | Amount is less than $0.005 per share. |
| | (g) | | Amount is less than 0.005% of average net assets. |
| | |
| 100 | | The accompanying notes are an integral part of these financial statements. |
GOLDMAN SACHS STRATEGIC GROWTH FUND
| | | | | | | | | | | | | | | | | | | | | | | | | | | | | | | | | | | | | | | | |
| | | Net asset
value, end
of period | | | | | Total
return(b) | | | | | Net assets,
end of
period
(in 000s) | | | | | Ratio of
net expenses
to average
net assets | | | | | Ratio of
total expenses
to average
net assets | | | | |
Ratio of
net investment
income (loss)
to average
net assets | | | | | Portfolio
turnover
rate(c) | |
| | | | | | | | | | | | | | | | | | | | | | | | | | | | | | | | | | | | | | | | |
| | $ | 11.43 | | | | | | 7.45 | % | | | | $ | 156,227 | | | | | | 1.16 | %(e) | | | | | 1.54 | %(e) | | | | | 0.68 | %(d)(e) | | | | | 19 | % |
| | | 10.33 | | | | | | 7.03 | | | | | | 1,228 | | | | | | 1.91 | (e) | | | | | 2.29 | (e) | | | | | (0.08 | )(d)(e) | | | | | 19 | |
| | | 10.34 | | | | | | 6.92 | | | | | | 9,316 | | | | | | 1.91 | (e) | | | | | 2.29 | (e) | | | | | (0.09 | )(d)(e) | | | | | 19 | |
| | | 11.87 | | | | | | 7.64 | | | | | | 191,283 | | | | | | 0.76 | (e) | | | | | 1.14 | (e) | | | | | 1.08 | (d)(e) | | | | | 19 | |
| | | 11.41 | | | | | | 7.27 | | | | | | 106 | | | | | | 1.26 | (e) | | | | | 1.64 | (e) | | | | | 0.48 | (d)(e) | | | | | 19 | |
| | | 11.88 | | | | | | 7.48 | | | | | | 589 | | | | | | 0.91 | (e) | | | | | 1.29 | (e) | | | | | 0.82 | (d)(e) | | | | | 19 | |
| | | 11.40 | | | | | | 7.27 | | | | | | 5 | | | | | | 1.33 | (e) | | | | | 1.71 | (e) | | | | | 0.50 | (d)(e) | | | | | 19 | |
| | | | | | | | | | | | | | | | | | | | | | | | | | | | | | | | | | | | | | | | |
| | | | | | | | | | | | | | | | | | | | | | | | | | | | | | | | | | | | | | | | |
| | | 11.57 | | | | | | 18.45 | | | | | | 181,257 | | | | | | 1.15 | | | | | | 1.51 | | | | | | 0.14 | | | | | | 54 | |
| | | 10.53 | | | | | | 17.62 | | | | | | 1,482 | | | | | | 1.90 | | | | | | 2.26 | | | | | | (0.60 | ) | | | | | 54 | |
| | | 10.54 | | | | | | 17.71 | | | | | | 8,279 | | | | | | 1.90 | | | | | | 2.26 | | | | | | (0.61 | ) | | | | | 54 | |
| | | 12.00 | | | | | | 18.97 | | | | | | 256,389 | | | | | | 0.75 | | | | | | 1.11 | | | | | | 0.54 | | | | | | 54 | |
| | | 11.59 | | | | | | 18.50 | | | | | | 52 | | | | | | 1.25 | | | | | | 1.61 | | | | | | 0.18 | | | | | | 54 | |
| | | 12.01 | | | | | | 18.85 | | | | | | 321 | | | | | | 0.90 | | | | | | 1.26 | | | | | | 0.38 | | | | | | 54 | |
| | | 11.53 | | | | | | 18.32 | | | | | | 4 | | | | | | 1.40 | | | | | | 1.76 | | | | | | (0.05 | ) | | | | | 54 | |
| | | 9.77 | | | | | | 14.89 | | | | | | 199,185 | | | | | | 1.15 | | | | | | 1.51 | | | | | | 0.19 | | | | | | 40 | |
| | | 8.94 | | | | | | 14.03 | | | | | | 1,834 | | | | | | 1.90 | | | | | | 2.26 | | | | | | (0.56 | ) | | | | | 40 | |
| | | 8.95 | | | | | | 13.87 | | | | | | 8,828 | | | | | | 1.90 | | | | | | 2.26 | | | | | | (0.56 | ) | | | | | 40 | |
| | | 10.14 | | | | | | 15.33 | | | | | | 260,481 | | | | | | 0.75 | | | | | | 1.11 | | | | | | 0.58 | | | | | | 40 | |
| | | 9.80 | | | | | | 14.90 | | | | | | 2 | | | | | | 1.25 | | | | | | 1.61 | | | | | | 0.21 | | | | | | 40 | |
| | | 10.10 | | | | | | 14.99 | | | | | | 125 | | | | | | 0.90 | | | | | | 1.26 | | | | | | 0.42 | | | | | | 40 | |
| | | 9.74 | | | | | | 14.52 | | | | | | 4 | | | | | | 1.40 | | | | | | 1.76 | | | | | | — | (g) | | | | | 40 | |
| | | 8.53 | | | | | | 3.83 | | | | | | 192,744 | | | | | | 1.15 | | | | | | 1.53 | | | | | | 0.22 | | | | | | 60 | |
| | | 7.84 | | | | | | 3.02 | | | | | | 2,716 | | | | | | 1.90 | | | | | | 2.28 | | | | | | (0.55 | ) | | | | | 60 | |
| | | 7.86 | | | | | | 3.15 | | | | | | 9,224 | | | | | | 1.90 | | | | | | 2.28 | | | | | | (0.55 | ) | | | | | 60 | |
| | | 8.85 | | | | | | 4.26 | | | | | | 264,902 | | | | | | 0.75 | | | | | | 1.13 | | | | | | 0.60 | | | | | | 60 | |
| | | 8.55 | | | | | | 3.76 | | | | | | 1 | | | | | | 1.25 | | | | | | 1.63 | | | | | | 0.11 | | | | | | 60 | |
| | | 8.84 | | | | | | 4.25 | | | | | | 10 | | | | | | 0.90 | | | | | | 1.28 | | | | | | 0.39 | | | | | | 60 | |
| | | 8.51 | | | | | | 3.65 | | | | | | 3 | | | | | | 1.40 | | | | | | 1.78 | | | | | | 0.01 | | | | | | 60 | |
| | | 8.22 | | | | | | (20.50 | ) | | | | | 141,371 | | | | | | 1.28 | | | | | | 1.62 | | | | | | 0.12 | | | | | | 62 | |
| | | 7.61 | | | | | | (21.14 | ) | | | | | 3,729 | | | | | | 2.03 | | | | | | 2.37 | | | | | | (0.63 | ) | | | | | 62 | |
| | | 7.62 | | | | | | (21.20 | ) | | | | | 8,447 | | | | | | 2.03 | | | | | | 2.37 | | | | | | (0.63 | ) | | | | | 62 | |
| | | 8.52 | | | | | | (20.22 | ) | | | | | 114,641 | | | | | | 0.88 | | | | | | 1.22 | | | | | | 0.52 | | | | | | 62 | |
| | | 8.24 | | | | | | (20.77 | ) | | | | | 1 | | | | | | 1.38 | | | | | | 1.72 | | | | | | 0.10 | | | | | | 62 | |
| | | 8.51 | | | | | | 20.37 | | | | | | 3 | | | | | | 1.03 | (e) | | | | | 1.37 | (e) | | | | | 0.32 | (e) | | | | | 62 | |
| | | 8.21 | | | | | | 20.20 | | | | | | 3 | | | | | | 1.53 | (e) | | | | | 1.87 | (e) | | | | | 0.05 | (e) | | | | | 62 | |
| | | 10.34 | | | | | | (1.43 | ) | | | | | 177,810 | | | | | | 1.44 | | | | | | 1.52 | | | | | | (0.44 | ) | | | | | 59 | |
| | | 9.65 | | | | | | (2.12 | ) | | | | | 6,015 | | | | | | 2.19 | | | | | | 2.27 | | | | | | (1.19 | ) | | | | | 59 | |
| | | 9.67 | | | | | | (2.12 | ) | | | | | 11,374 | | | | | | 2.19 | | | | | | 2.27 | | | | | | (1.19 | ) | | | | | 59 | |
| | | 10.68 | | | | | | (1.02 | ) | | | | | 154,711 | | | | | | 1.04 | | | | | | 1.12 | | | | | | (0.05 | ) | | | | | 59 | |
| | | 10.40 | | | | | | (1.14 | ) | | | | | 3 | | | | | | 1.54 | | | | | | 1.62 | | | | | | (0.20 | ) | | | | | 59 | |
| | |
| The accompanying notes are an integral part of these financial statements. | | 101 |
GOLDMAN SACHS TECHNOLOGY TOLLKEEPER FUND
Financial Highlights
Selected Data for a Share Outstanding Throughout Each Period
| | | | | | | | | | | | | | | | | | |
| | | | | | | | Income (loss) from
investment operations | |
| | | Year - Share Class | |
Net asset
value,
beginning
of period | | | Net
investment
loss(a) | | | Net realized
and unrealized
gain (loss) | | | Total from
investment
operations | |
| | FOR THE SIX MONTHS ENDED FEBRUARY 28, (UNAUDITED) | |
| | 2013 - A | | $ | 13.62 | | | $ | (0.07 | ) | | $ | 0.56 | | | $ | 0.49 | |
| | 2013 - B | | | 12.34 | | | | (0.11 | ) | | | 0.51 | | | | 0.40 | |
| | 2013 - C | | | 12.34 | | | | (0.11 | ) | | | 0.51 | | | | 0.40 | |
| | 2013 - Institutional | | | 14.34 | | | | (0.04 | ) | | | 0.59 | | | | 0.55 | |
| | 2013 - Service | | | 13.49 | | | | (0.07 | ) | | | 0.55 | | | | 0.48 | |
| | 2013 - IR | | | 14.30 | | | | (0.05 | ) | | | 0.59 | | | | 0.54 | |
| | | | | | | | | | | | | | | | | | |
| | FOR THE FISCAL YEARS ENDED AUGUST 31, | |
| | 2012 - A | | | 11.51 | | | | (0.13 | ) | | | 2.24 | | | | 2.11 | |
| | 2012 - B | | | 10.52 | | | | (0.21 | ) | | | 2.03 | | | | 1.82 | |
| | 2012 - C | | | 10.51 | | | | (0.21 | ) | | | 2.04 | | | | 1.83 | |
| | 2012 - Institutional | | | 12.08 | | | | (0.09 | ) | | | 2.35 | | | | 2.26 | |
| | 2012 - Service | | | 11.41 | | | | (0.14 | ) | | | 2.22 | | | | 2.08 | |
| | 2012 - IR | | | 12.06 | | | | (0.11 | ) | | | 2.35 | | | | 2.24 | |
| | 2011 - A | | | 10.43 | | | | (0.14 | ) | | | 1.22 | | | | 1.08 | |
| | 2011 - B | | | 9.60 | | | | (0.21 | ) | | | 1.13 | | | | 0.92 | |
| | 2011 - C | | | 9.59 | | | | (0.21 | ) | | | 1.13 | | | | 0.92 | |
| | 2011 - Institutional | | | 10.90 | | | | (0.09 | ) | | | 1.27 | | | | 1.18 | |
| | 2011 - Service | | | 10.34 | | | | (0.15 | ) | | | 1.22 | | | | 1.07 | |
| | 2011 - IR (Commenced September 30, 2010) | | | 12.30 | | | | (0.07 | ) | | | (0.17 | ) | | | (0.24 | ) |
| | 2010 - A | | | 9.14 | | | | (0.11 | ) | | | 1.40 | | | | 1.29 | |
| | 2010 - B | | | 8.48 | | | | (0.17 | ) | | | 1.29 | | | | 1.12 | |
| | 2010 - C | | | 8.47 | | | | (0.17 | ) | | | 1.29 | | | | 1.12 | |
| | 2010 - Institutional | | | 9.52 | | | | (0.07 | ) | | | 1.45 | | | | 1.38 | |
| | 2010 - Service | | | 9.08 | | | | (0.12 | ) | | | 1.38 | | | | 1.26 | |
| | 2009 - A | | | 10.19 | | | | (0.06 | ) | | | (0.99 | ) | | | (1.05 | ) |
| | 2009 - B | | | 9.52 | | | | (0.10 | ) | | | (0.94 | ) | | | (1.04 | ) |
| | 2009 - C | | | 9.52 | | | | (0.11 | ) | | | (0.94 | ) | | | (1.05 | ) |
| | 2009 - Institutional | | | 10.56 | | | | (0.03 | ) | | | (1.01 | ) | | | (1.04 | ) |
| | 2009 - Service | | | 10.12 | | | | (0.07 | ) | | | (0.97 | ) | | | (1.04 | ) |
| | | | | | | | | | | | | | | | | | |
| | FOR THE PERIOD JANUARY 1, 2008 TO AUGUST 31, 2008* | |
| | 2008 - A | | | 11.52 | | | �� | (0.06 | ) | | | (1.27 | ) | | | (1.33 | ) |
| | 2008 - B | | | 10.82 | | | | (0.10 | ) | | | (1.20 | ) | | | (1.30 | ) |
| | 2008 - C | | | 10.81 | | | | (0.10 | ) | | | (1.19 | ) | | | (1.29 | ) |
| | 2008 - Institutional | | | 11.91 | | | | (0.03 | ) | | | (1.32 | ) | | | (1.35 | ) |
| | 2008 - Service | | | 11.45 | | | | (0.06 | ) | | | (1.27 | ) | | | (1.33 | ) |
| | * | | The Fund changed its fiscal year end from December 31 to August 31. |
| | (a) | | Calculated based on the average shares outstanding methodology. |
| | (b) | | Assumes investment at the net asset value at the beginning of the period, reinvestment of all dividends and distributions, a complete redemption of the investment at the net asset value at the end of the period and no sales or redemption charges. Total returns would be reduced if a sales or redemption charge was taken into account. Returns do not reflect the deduction of taxes that a shareholder would pay on Fund distributions or the redemption of Fund shares. Total returns for periods less than one full year are not annualized. |
| | (c) | | The Fund’s portfolio turnover rate is calculated in accordance with regulatory requirements, without regard to transactions involving short term investments and certain derivatives. If such transactions were included, the Fund’s portfolio turnover rate may be higher. |
| | |
| 102 | | The accompanying notes are an integral part of these financial statements. |
GOLDMAN SACHS TECHNOLOGY TOLLKEEPER FUND
| | | | | | | | | | | | | | | | | | | | | | | | | | | | | | | | | | | | | | | | |
| | | | | | | | | | | | | |
| | | Net asset
value, end
of period | | | | | Total
return(b) | | | | | Net assets,
end of
period
(in 000s) | | | | | Ratio of
net expenses
to average
net assets | | | | | Ratio of
total expenses
to average
net assets | | | | | Ratio of
net investment
loss
to average
net assets | | | | | Portfolio
turnover
rate(c) | |
| | | | | | | | | | | | | | | | | | | | | | | | | | | | | | | | | | | | | | | | |
| | $ | 14.11 | | | | | | 3.60 | % | | | | $ | 237,354 | | | | | | 1.50 | %(d) | | | | | 1.54 | %(d) | | | | | (1.00 | )%(d) | | | | | 13 | % |
| | | 12.74 | | | | | | 3.24 | | | | | | 7,176 | | | | | | 2.25 | (d) | | | | | 2.29 | (d) | | | | | (1.74 | )(d) | | | | | 13 | |
| | | 12.74 | | | | | | 3.24 | | | | | | 49,734 | | | | | | 2.25 | (d) | | | | | 2.29 | (d) | | | | | (1.74 | )(d) | | | | | 13 | |
| | | 14.89 | | | | | | 3.84 | | | | | | 57,088 | | | | | | 1.10 | (d) | | | | | 1.14 | (d) | | | | | (0.60 | )(d) | | | | | 13 | |
| | | 13.97 | | | | | | 3.56 | | | | | | 11,126 | | | | | | 1.60 | (d) | | | | | 1.64 | (d) | | | | | (1.10 | )(d) | | | | | 13 | |
| | | 14.84 | | | | | | 3.78 | | | | | | 2,109 | | | | | | 1.25 | (d) | | | | | 1.29 | (d) | | | | | (0.75 | )(d) | | | | | 13 | |
| | | | | | | | | | | | | | | | | | | | | | | | | | | | | | | | | | | | | | | | |
| | | | | | | | | | | | | | | | | | | | | | | | | | | | | | | | | | | | | | | | |
| | | 13.62 | | | | | | 18.28 | | | | | | 239,355 | | | | | | 1.50 | | | | | | 1.55 | | | | | | (1.06 | ) | | | | | 43 | |
| | | 12.34 | | | | | | 17.25 | | | | | | 8,034 | | | | | | 2.25 | | | | | | 2.30 | | | | | | (1.82 | ) | | | | | 43 | |
| | | 12.34 | | | | | | 17.36 | | | | | | 50,682 | | | | | | 2.25 | | | | | | 2.30 | | | | | | (1.81 | ) | | | | | 43 | |
| | | 14.34 | | | | | | 18.65 | | | | | | 49,238 | | | | | | 1.10 | | | | | | 1.15 | | | | | | (0.66 | ) | | | | | 43 | |
| | | 13.49 | | | | | | 18.18 | | | | | | 10,977 | | | | | | 1.60 | | | | | | 1.65 | | | | | | (1.15 | ) | | | | | 43 | |
| | | 14.30 | | | | | | 18.52 | | | | | | 2,569 | | | | | | 1.25 | | | | | | 1.30 | | | | | | (0.81 | ) | | | | | 43 | |
| | | 11.51 | | | | | | 10.35 | | | | | | 244,288 | | | | | | 1.50 | | | | | | 1.52 | | | | | | (1.07 | ) | | | | | 64 | |
| | | 10.52 | | | | | | 9.58 | | | | | | 10,408 | | | | | | 2.25 | | | | | | 2.27 | | | | | | (1.82 | ) | | | | | 64 | |
| | | 10.51 | | | | | | 9.59 | | | | | | 50,424 | | | | | | 2.25 | | | | | | 2.27 | | | | | | (1.82 | ) | | | | | 64 | |
| | | 12.08 | | | | | | 10.83 | | | | | | 54,356 | | | | | | 1.10 | | | | | | 1.12 | | | | | | (0.66 | ) | | | | | 64 | |
| | | 11.41 | | | | | | 10.35 | | | | | | 10,826 | | | | | | 1.60 | | | | | | 1.62 | | | | | | (1.18 | ) | | | | | 64 | |
| | | 12.06 | | | | | | (1.95 | ) | | | | | 2,449 | | | | | | 1.25 | (d) | | | | | 1.27 | (d) | | | | | (0.59 | )(d) | | | | | 64 | |
| | | 10.43 | | | | | | 14.11 | | | | | | 225,873 | | | | | | 1.50 | | | | | | 1.63 | | | | | | (1.03 | ) | | | | | 97 | |
| | | 9.60 | | | | | | 13.21 | | | | | | 13,547 | | | | | | 2.25 | | | | | | 2.38 | | | | | | (1.78 | ) | | | | | 97 | |
| | | 9.59 | | | | | | 13.22 | | | | | | 47,001 | | | | | | 2.25 | | | | | | 2.38 | | | | | | (1.78 | ) | | | | | 97 | |
| | | 10.90 | | | | | | 14.50 | | | | | | 32,538 | | | | | | 1.10 | | | | | | 1.23 | | | | | | (0.63 | ) | | | | | 97 | |
| | | 10.34 | | | | | | 13.88 | | | | | | 11,324 | | | | | | 1.60 | | | | | | 1.73 | | | | | | (1.12 | ) | | | | | 97 | |
| | | 9.14 | | | | | | (10.22 | ) | | | | | 196,405 | | | | | | 1.50 | | | | | | 1.67 | | | | | | (0.76 | ) | | | | | 52 | |
| | | 8.48 | | | | | | (10.92 | ) | | | | | 17,643 | | | | | | 2.25 | | | | | | 2.42 | | | | | | (1.49 | ) | | | | | 52 | |
| | | 8.47 | | | | | | (10.94 | ) | | | | | 44,420 | | | | | | 2.25 | | | | | | 2.42 | | | | | | (1.51 | ) | | | | | 52 | |
| | | 9.52 | | | | | | (9.85 | ) | | | | | 21,790 | | | | | | 1.10 | | | | | | 1.27 | | | | | | (0.37 | ) | | | | | 52 | |
| | | 9.08 | | | | | | (10.28 | ) | | | | | 6,111 | | | | | | 1.60 | | | | | | 1.77 | | | | | | (0.88 | ) | | | | | 52 | |
| | | | | | | | | | | | | | | | | | | | | | | | | | | | | | | | | | | | | | | | |
| | | | | | | | | | | | | | | | | | | | | | | | | | | | | | | | | | | | | | | | |
| | | 10.19 | | | | | | (11.63 | ) | | | | | 184,063 | | | | | | 1.44 | (d) | | | | | 1.51 | (d) | | | | | (0.86 | )(d) | | | | | 29 | |
| | | 9.52 | | | | | | (12.01 | ) | | | | | 33,787 | | | | | | 2.19 | (d) | | | | | 2.26 | (d) | | | | | (1.60 | )(d) | | | | | 29 | |
| | | 9.52 | | | | | | (12.03 | ) | | | | | 49,880 | | | | | | 2.19 | (d) | | | | | 2.26 | (d) | | | | | (1.60 | )(d) | | | | | 29 | |
| | | 10.56 | | | | | | (11.34 | ) | | | | | 17,717 | | | | | | 1.04 | (d) | | | | | 1.11 | (d) | | | | | (0.45 | )(d) | | | | | 29 | |
| | | 10.12 | | | | | | (11.62 | ) | | | | | 3,185 | | | | | | 1.54 | (d) | | | | | 1.61 | (d) | | | | | (0.89 | )(d) | | | | | 29 | |
| | |
| The accompanying notes are an integral part of these financial statements. | | 103 |
GOLDMAN SACHS U.S. EQUITY FUND
Financial Highlights
Selected Data for a Share Outstanding Throughout Each Period
| | | | | | | | | | | | | | | | | | | | | | | | | | | | | | |
| | | | | | | | Income (loss) from
investment operations | | | Distributions
to shareholders | |
| | | Year - Share Class | |
Net asset
value,
beginning
of period | | | Net
investment
income (loss)(a) | | | Net realized
and unrealized
gain (loss) | | | Total from
investment
operations | | | From net
investment
income | | | From net
realized
gains | | | Total
distributions | |
| | FOR THE SIX MONTHS ENDED FEBRUARY 28, (UNAUDITED) | |
| | 2013 - A | | $ | 12.30 | | | $ | 0.06 | (d) | | $ | 1.11 | | | $ | 1.17 | | | $ | (0.08 | ) | | $ | — | | | $ | (0.08 | ) |
| | 2013 - C | | | 12.13 | | | | 0.01 | (d) | | | 1.11 | | | | 1.12 | | | | — | | | | — | | | | — | |
| | 2013 - Institutional | | | 12.35 | | | | 0.08 | (d) | | | 1.13 | | | | 1.21 | | | | (0.14 | ) | | | — | | | | (0.14 | ) |
| | 2013 - IR | | | 12.34 | | | | 0.08 | (d) | | | 1.12 | | | | 1.20 | | | | (0.13 | ) | | | — | | | | (0.13 | ) |
| | 2013 - R | | | 12.29 | | | | 0.04 | (d) | | | 1.13 | | | | 1.17 | | | | (0.06 | ) | | | — | | | | (0.06 | ) |
| | | | | | | | | | | | | | | | | | | | | | | | | | | | | | |
| | FOR THE FISCAL YEARS ENDED AUGUST 31, | |
| | 2012 - A | | | 10.71 | | | | 0.08 | | | | 1.66 | | | | 1.74 | | | | (0.04 | ) | | | (0.11 | ) | | | (0.15 | ) |
| | 2012 - C | | | 10.61 | | | | (0.01 | ) | | | 1.64 | | | | 1.63 | | | | — | | | | (0.11 | ) | | | (0.11 | ) |
| | 2012 - Institutional | | | 10.76 | | | | 0.13 | | | | 1.65 | | | | 1.78 | | | | (0.08 | ) | | | (0.11 | ) | | | (0.19 | ) |
| | 2012 - IR | | | 10.73 | | | | 0.11 | | | | 1.65 | | | | 1.76 | | | | (0.04 | ) | | | (0.11 | ) | | | (0.15 | ) |
| | 2012 - R | | | 10.70 | | | | 0.05 | | | | 1.65 | | | | 1.70 | | | | — | (f) | | | (0.11 | ) | | | (0.11 | ) |
| | 2011 - A | | | 9.55 | | | | 0.03 | | | | 1.21 | | | | 1.24 | | | | (0.05 | ) | | | (0.03 | ) | | | (0.08 | ) |
| | 2011 - C | | | 9.49 | | | | (0.05 | ) | | | 1.21 | | | | 1.16 | | | | (0.01 | ) | | | (0.03 | ) | | | (0.04 | ) |
| | 2011 - Institutional | | | 9.57 | | �� | | 0.08 | | | | 1.22 | | | | 1.30 | | | | (0.08 | ) | | | (0.03 | ) | | | (0.11 | ) |
| | 2011 - IR | | | 9.56 | | | | 0.06 | | | | 1.22 | | | | 1.28 | | | | (0.08 | ) | | | (0.03 | ) | | | (0.11 | ) |
| | 2011 - R | | | 9.53 | | | | 0.01 | | | | 1.20 | | | | 1.21 | | | | (0.01 | ) | | | (0.03 | ) | | | (0.04 | ) |
| | | | | | | | | | | | | | | | | | | | | | | | | | | | | | |
| | FOR THE PERIOD ENDED AUGUST 31, | |
| | 2010 - A (Commenced November 30, 2009) | | | 10.00 | | | | 0.03 | | | | (0.47 | ) | | | (0.44 | ) | | | (0.01 | ) | | | — | | | | (0.01 | ) |
| | 2010 - C (Commenced November 30, 2009) | | | 10.00 | | | | (0.02 | ) | | | (0.49 | ) | | | (0.51 | ) | | | — | (f) | | | — | | | | — | (d) |
| | 2010 - Institutional (Commenced November 30, 2009) | | | 10.00 | | | | 0.06 | | | | (0.48 | ) | | | (0.42 | ) | | | (0.01 | ) | | | — | | | | (0.01 | ) |
| | 2010 - IR (Commenced November 30, 2009) | | | 10.00 | | | | 0.05 | | | | (0.48 | ) | | | (0.43 | ) | | | (0.01 | ) | | | — | | | | (0.01 | ) |
| | 2010 - R (Commenced November 30, 2009) | | | 10.00 | | | | 0.01 | | | | (0.47 | ) | | | (0.46 | ) | | | (0.01 | ) | | | — | | | | (0.01 | ) |
| | (a) | | Calculated based on the average shares outstanding methodology. |
| | (b) | | Assumes investment at the net asset value at the beginning of the period, reinvestment of all dividends and distributions, a complete redemption of the investment at the net asset value at the end of the period and no sales or redemption charges. Total returns would be reduced if a sales or redemption charge was taken into account. Returns do not reflect the deduction of taxes that a shareholder would pay on Fund distributions or the redemption of Fund shares. Total returns for periods less than one full year are not annualized. |
| | (c) | | The Fund’s portfolio turnover rate is calculated in accordance with regulatory requirements, without regard to transactions involving short term investments and certain derivatives. If such transactions were included, the Fund’s portfolio turnover rate may be higher. |
| | (d) | | Reflects income recognized from special dividends which amounted to $0.02 per share and 0.29% of average net assets. |
| | (f) | | Amount is less than $0.005 per share. |
| | |
| 104 | | The accompanying notes are an integral part of these financial statements. |
GOLDMAN SACHS U.S. EQUITY FUND
| | | | | | | | | | | | | | | | | | | | | | | | | | | | | | | | | | | | | | | | |
| | | | | | | | | | | | | |
| | | Net asset
value, end
of period | | | | | Total return(b) | | | | | Net assets,
end of
period
(in 000s) | | | | | Ratio of net expenses to average net assets | | | | | Ratio of
total expenses
to average
net assets | | | | |
Ratio of net investment income (loss) to average net assets | | | | | Portfolio
turnover
rate(c) | |
| | | | | | | | | | | | | | | | | | | | | | | | | | | | | | | | | | | | | | | | |
| | $ | 13.39 | | | | | | 9.59 | % | | | | $ | 2,814 | | | | | | 1.18 | %(e) | | | | | 3.80 | %(e) | | | | | 0.91 | %(d)(e) | | | | | 27 | % |
| | | 13.25 | | | | | | 9.23 | | | | | | 134 | | | | | | 1.93 | (e) | | | �� | | 4.60 | (e) | | | | | 0.15 | (d)(e) | | | | | 27 | |
| | | 13.42 | | | | | | 9.86 | | | | | | 7,976 | | | | | | 0.78 | (e) | | | | | 3.40 | (e) | | | | | 1.33 | (d)(e) | | | | | 27 | |
| | | 13.41 | | | | | | 9.77 | | | | | | 147 | | | | | | 0.93 | (e) | | | | | 3.59 | (e) | | | | | 1.22 | (d)(e) | | | | | 27 | |
| | | 13.40 | | | | | | 9.55 | | | | | | 43 | | | | | | 1.44 | (e) | | | | | 3.92 | (e) | | | | | 0.57 | (d)(e) | | | | | 27 | |
| | | | | | | | | | | | | | | | | | | | | | | | | | | | | | | | | | | | | | | | |
| | | | | | | | | | | | | | | | | | | | | | | | | | | | | | | | | | | | | | | | |
| | | 12.30 | | | | | | 16.37 | | | | | | 3,331 | | | | | | 1.18 | | | | | | 3.63 | | | | | | 0.69 | | | | | | 76 | |
| | | 12.13 | | | | | | 15.45 | | | | | | 158 | | | | | | 1.93 | | | | | | 4.38 | | | | | | (0.05 | ) | | | | | 76 | |
| | | 12.35 | | | | | | 16.71 | | | | | | 7,142 | | | | | | 0.78 | | | | | | 3.23 | | | | | | 1.11 | | | | | | 76 | |
| | | 12.34 | | | | | | 16.52 | | | | | | 70 | | | | | | 0.93 | | | | | | 3.38 | | | | | | 0.97 | | | | | | 76 | |
| | | 12.29 | | | | | | 16.02 | | | | | | 12 | | | | | | 1.43 | | | | | | 3.88 | | | | | | 0.45 | | | | | | 76 | |
| | | 10.71 | | | | | | 12.94 | | | | | | 3,110 | | | | | | 1.18 | | | | | | 4.88 | | | | | | 0.29 | | | | | | 51 | |
| | | 10.61 | | | | | | 12.19 | | | | | | 139 | | | | | | 1.93 | | | | | | 5.63 | | | | | | (0.42 | ) | | | | | 51 | |
| | | 10.76 | | | | | | 13.54 | | | | | | 5,945 | | | | | | 0.78 | | | | | | 4.48 | | | | | | 0.72 | | | | | | 51 | |
| | | 10.73 | | | | | | 13.32 | | | | | | 241 | | | | | | 0.93 | | | | | | 4.63 | | | | | | 0.56 | | | | | | 51 | |
| | | 10.70 | | | | | | 12.70 | | | | | | 11 | | | | | | 1.43 | | | | | | 5.13 | | | | | | 0.08 | | | | | | 51 | |
| | | | | | | | | | | | | | | | | | | | | | | | | | | | | | | | | | | | | | | | |
| | | | | | | | | | | | | | | | | | | | | | | | | | | | | | | | | | | | | | | | |
| | | 9.55 | | | | | | (4.44 | ) | | | | | 777 | | | | | | 1.18 | (e) | | | | | 11.67 | (e) | | | | | 0.37 | (e) | | | | | 63 | |
| | | 9.49 | | | | | | (5.10 | ) | | | | | 14 | | | | | | 1.93 | (e) | | | | | 12.42 | (e) | | | | | (0.29 | )(e) | | | | | 63 | |
| | | 9.57 | | | | | | (4.20 | ) | | | | | 4,351 | | | | | | 0.78 | (e) | | | | | 11.27 | (e) | | | | | 0.74 | (e) | | | | | 63 | |
| | | 9.56 | | | | | | (4.31 | ) | | | | | 20 | | | | | | 0.93 | (e) | | | | | 11.42 | (e) | | | | | 0.62 | (e) | | | | | 63 | |
| | | 9.53 | | | | | | (4.65 | ) | | | | | 10 | | | | | | 1.43 | (e) | | | | | 11.92 | (e) | | | | | 0.10 | (e) | | | | | 63 | |
| | |
| The accompanying notes are an integral part of these financial statements. | | 105 |
GOLDMAN SACHS FUNDAMENTAL EQUITY GROWTH FUNDS
Notes to Financial Statements
February 28, 2013 (Unaudited)
Goldman Sachs Trust (the “Trust”) is a Delaware statutory trust registered under the Investment Company Act of 1940, as amended (the “Act”), as an open-end management investment company. The following table lists those series of the Trust that are included in this report (collectively, the “Funds” or individually a “Fund”), along with their corresponding share classes and respective diversification status under the Act:
| | | | |
| Fund | | Share Classes Offered* | | Diversified/ Non-diversified |
Capital Growth, Growth Opportunities, Small/Mid Cap Growth and Strategic Growth | | A, B, C, Institutional, Service, IR and R | | Diversified |
Concentrated Growth | | A, B, C, Institutional, IR and R | | Non-diversified |
Flexible Cap Growth and U.S. Equity | | A, C, Institutional, IR and R | | Diversified |
Focused Growth | | A, C, Institutional, IR and R | | Non-diversified |
Technology Tollkeeper | | A, B, C, Institutional, Service and IR | | Diversified |
| * | | Class B Shares are generally no longer available for purchase by current or prospective investors. |
Class A Shares are sold with a front-end sales charge of up to 5.50%. Class B Shares were sold with a contingent deferred sales charge (“CDSC”) that declines from 5.00% to zero, depending upon the period of time the shares are held. Class C Shares are sold with a CDSC of 1.00%, which is imposed on redemptions made within 12 months of purchase. Institutional, Service, Class IR and Class R Shares are not subject to a sales charge.
Goldman Sachs Asset Management, L.P. (“GSAM”), an affiliate of Goldman, Sachs & Co. (“Goldman Sachs”), serves as investment adviser to the Funds pursuant to a management agreement (the “Agreement”) with the Trust.
106
GOLDMAN SACHS FUNDAMENTAL EQUITY GROWTH FUNDS
|
| 2. SIGNIFICANT ACCOUNTING POLICIES |
The financial statements have been prepared in accordance with accounting principles generally accepted in the United States of America (“GAAP”) and require management to make estimates and assumptions that may affect the reported amounts and disclosures. Actual results may differ from those estimates and assumptions.
A. Investment Valuation — The Funds’ valuation policy is to value investments at fair value.
B. Investment Income and Investments — Investment income includes interest income and dividend income, net of any foreign withholding taxes, less any amounts reclaimable. Interest income is accrued daily and adjusted for amortization of premiums and accretion of discounts. Dividend income is recognized on ex-dividend date or, for certain foreign securities, as soon as such information is obtained subsequent to the ex-dividend date. Investment transactions are reflected on trade date. Realized gains and losses are calculated using identified cost. Investment transactions are recorded on the following business day for daily net asset value (“NAV”) calculations. Any foreign capital gains tax is accrued daily based upon net unrealized gains, and is payable upon sale of such investments.
C. Class Allocations and Expenses — Investment income, realized and unrealized gain (loss), and non-class specific expenses of each Fund are allocated daily based upon the proportion of net assets of each class. Class specific expenses, where applicable, are borne by the respective share classes and include Distribution and Service, Transfer Agent and Service and Shareholder Administration fees. Non-class specific expenses directly incurred by a Fund are charged to that Fund, while such expenses incurred by the Trust are allocated across the respective Funds on a straight-line and/or pro-rata basis depending upon the nature of the expenses.
D. Offering Costs — Offering costs paid in connection with the offering of shares of the Focused Growth Fund have been amortized on a straight-line basis over 12 months from the date of commencement of operations.
E. Federal Taxes and Distributions to Shareholders — It is each Fund’s policy to comply with the requirements of the Internal Revenue Code of 1986, as amended ( the “Code”) applicable to regulated investment companies (mutual funds) and to distribute each year substantially all of its investment company taxable income and capital gains to its shareholders. Accordingly, the Funds are not required to make any provisions for the payment of federal income tax.
Distributions to shareholders are recorded on the ex-dividend date. Income and capital gains distributions, if any, are declared and paid annually. Net capital losses are carried forward to future fiscal years and may be used to the extent allowed by the Code to offset any future capital gains. Utilization of capital loss carryforwards will reduce the requirement of future capital gains distributions.
Under the Regulated Investment Company Modernization Act of 2010, the Funds are permitted to carry forward capital losses incurred in taxable years beginning after December 22, 2010 for an unlimited period. However, any losses incurred during those future taxable years will be required to be utilized prior to the losses incurred in pre-enactment taxable years. As a result of this ordering rule, pre-enactment capital loss carryforwards may be more likely to expire unused. Additionally, post-enactment capital losses that are carried forward will retain their character as either short-term or long-term capital losses rather than being considered all short-term as under previous law.
The characterization of distributions to shareholders for financial reporting purposes is determined in accordance with federal income tax rules, which may differ from GAAP. The source of each Fund’s distributions may be shown in the accompanying financial statements as either from net investment income, net realized gain or capital. Certain components of the Funds’ net assets on the Statements of Assets and Liabilities reflect permanent GAAP/tax differences based on the appropriate tax character.
F. Commission Recapture — GSAM, on behalf of certain Funds, may direct portfolio trades, subject to seeking best execution, to various brokers who have agreed to rebate a portion of the commissions generated. Such rebates are made directly to a Fund as cash payments and are included in the net realized gain (loss) from investments on the Statements of Operations.
107
GOLDMAN SACHS FUNDAMENTAL EQUITY GROWTH FUNDS
Notes to Financial Statements (continued)
February 28, 2013 (Unaudited)
|
| 3. INVESTMENTS AND FAIR VALUE MEASUREMENTS |
The fair value of a financial instrument is the amount that would be received to sell an asset or paid to transfer a liability in an orderly transaction between market participants at the measurement date (i.e., the exit price). GAAP establishes a fair value hierarchy that prioritizes the inputs to valuation techniques used to measure fair value. The hierarchy gives the highest priority to unadjusted quoted prices in active markets for identical assets or liabilities (Level 1 measurements) and the lowest priority to unobservable inputs (Level 3 measurements). The levels used for classifying investments are not necessarily an indication of the risk associated with investing in these investments. The three levels of the fair value hierarchy are described below:
Level 1 — Unadjusted quoted prices in active markets that are accessible at the measurement date for identical, unrestricted assets or liabilities;
Level 2 — Quoted prices in markets that are not active or financial instruments for which significant inputs are observable (including, but not limited to, quoted prices for similar investments, interest rates, foreign exchange rates, volatility and credit spreads), either directly or indirectly;
Level 3 — Prices or valuations that require significant unobservable inputs (including GSAM’s assumptions in determining fair value measurement).
The Trustees have adopted Valuation Procedures that govern the valuation of the portfolio investments held by the Funds, including investments for which market quotations are not readily available. The Trustees have delegated to GSAM day-to-day responsibility for implementing and maintaining internal controls and procedures related to the valuation of the Funds’ portfolio investments. To assess the continuing appropriateness of pricing sources and methodologies, GSAM regularly performs price verification procedures and issues challenges as necessary to third party pricing vendors or brokers, and any differences are reviewed in accordance with the Valuation Procedures.
A. Level 1 and Level 2 Fair Value Investments — The valuation techniques and significant inputs used in determining the fair values for investments classified as Level 1 and Level 2 are as follows:
Equity Securities — Equity securities and investment companies traded on a United States (“U.S.”) securities exchange or the NASDAQ system, or those located on certain foreign exchanges including, but not limited to the Americas, are valued daily at their last sale price or official closing price on the principal exchange or system on which they are traded. If no sale occurs, equity securities and exchange traded investment companies are valued at the last bid price for long positions and at the last ask price for short positions. Investments in investment companies (other than those that are exchange traded) are valued at the daily NAV on the valuation date. To the extent these investments are actively traded, they are classified as Level 1 of the fair value hierarchy.
Unlisted equity securities for which market quotations are available are valued at the last sale price on the valuation date, or if no sale occurs, at the last bid price. Securities traded on certain foreign securities exchanges are valued daily at fair value determined by an independent fair value service (if available) under Valuation Procedures approved by the Trustees and consistent with applicable regulatory guidance. The independent fair value service takes into account multiple factors including, but not limited to, movements in the securities markets, certain depositary receipts, futures contracts and foreign currency exchange rates that have occurred subsequent to the close of the foreign securities exchange. Investments applying these valuation adjustments are classified as Level 2 of the fair value hierarchy.
108
GOLDMAN SACHS FUNDAMENTAL EQUITY GROWTH FUNDS
|
| 3. INVESTMENTS AND FAIR VALUE MEASUREMENTS (continued) |
Debt Securities — Debt securities for which market quotations are readily available are valued daily on the basis of quotations supplied by dealers or an independent pricing service approved by the Trustees. The pricing services may use valuation models or matrix pricing, which consider: (i) yield or price with respect to bonds that are considered comparable in characteristics such as rating, interest rate and maturity date or (ii) quotations from securities dealers to determine current value. Short-term debt obligations that mature in sixty days or less and that do not exhibit signs of credit deterioration are valued at amortized cost, which approximates fair value. With the exception of treasury securities, which are generally classified as Level 1, these investments are generally classified as Level 2 of the fair value hierarchy.
Short Term Investments — Short-term investments having a maturity of 60 days or less are generally valued at amortized cost which approximates fair market value. These investments are classified as Level 2 of the fair value hierarchy.
Repurchase Agreements — Repurchase agreements involve the purchase of securities subject to the seller’s agreement to repurchase the securities at a mutually agreed upon date and price. During the term of a repurchase agreement, the value of the underlying securities held as collateral on behalf of the Funds, including accrued interest, is required to exceed the value of the repurchase agreement, including accrued interest. The underlying securities for all repurchase agreements are held at the Funds’ custodian or designated sub-custodians under tri-party repurchase agreements.
Pursuant to exemptive relief granted by the Securities and Exchange Commission and terms and conditions contained therein, the Funds, together with other funds of the Trust and registered investment companies having management agreements with GSAM, or its affiliates, may transfer uninvested cash into joint accounts, the daily aggregate balance of which is invested in one or more repurchase agreements. Under these joint accounts, the Funds maintain pro-rata credit exposure to the underlying repurchase agreements’ counterparties. With the exception of certain transaction fees, the Funds are not subject to any expenses in relation to these investments.
B. Level 3 Fair Value Investments — To the extent that the aforementioned significant inputs are unobservable, or if quotations are not readily available, or if GSAM believes that such quotations do not accurately reflect fair value, the fair value of the Funds’ investments may be determined under Valuation Procedures approved by the Trustees. GSAM, consistent with its procedures and applicable regulatory guidance, may make an adjustment to the most recent valuation prices of either domestic or foreign securities in light of significant events to reflect what it believes to be the fair value of the securities at the time of determining a Fund’s NAV. Significant events which could affect a large number of securities in a particular market may include, but are not limited to: significant fluctuations in U.S. or foreign markets; market dislocations; market disruptions; or unscheduled market closings. Significant events which could also affect a single issuer, may include, but are not limited to: corporate actions such as reorganizations, mergers and buy-outs, ratings downgrades; and bankruptcies.
109
GOLDMAN SACHS FUNDAMENTAL EQUITY GROWTH FUNDS
Notes to Financial Statements (continued)
February 28, 2013 (Unaudited)
|
| 3. INVESTMENTS AND FAIR VALUE MEASUREMENTS (continued) |
C. Fair Value Hierarchy — The following is a summary of the Funds’ investments classified in the fair value hierarchy as of February 28, 2013:
| | | | | | | | | | | | |
| | | |
| CAPITAL GROWTH | | | | | | | | | | | | |
| | | |
| Investment Type | | Level 1 | | | Level 2 | | | Level 3 | |
| Assets | | | | | | | | | | | | |
Common Stock and/or Other Equity Investments | | $ | 836,206,921 | | | $ | — | | | $ | — | |
Short-term Investments | | | — | | | | 7,500,000 | | | | — | |
| Total | | $ | 836,206,921 | | | $ | 7,500,000 | | | $ | — | |
| | | |
| CONCENTRATED GROWTH | | | | | | | | | | | | |
| | | |
| Investment Type | | Level 1 | | | Level 2 | | | Level 3 | |
| Assets | | | | | | | | | | | | |
Common Stock and/or Other Equity Investments | | $ | 146,875,829 | | | $ | — | | | $ | — | |
Short-term Investments | | | — | | | | 3,400,000 | | | | — | |
| Total | | $ | 146,875,829 | | | $ | 3,400,000 | | | $ | — | |
| | | |
| FLEXIBLE CAP GROWTH | | | | | | | | | | | | |
| | | |
| Investment Type | | Level 1 | | | Level 2 | | | Level 3 | |
| Assets | | | | | | | | | | | | |
Common Stock and/or Other Equity Investments | | $ | 11,896,858 | | | $ | — | | | $ | — | |
Short-term Investments | | | — | | | | 200,000 | | | | — | |
| Total | | $ | 11,896,858 | | | $ | 200,000 | | | $ | — | |
| | | |
| FOCUSED GROWTH | | | | | | | | | | | | |
| | | |
| Investment Type | | Level 1 | | | Level 2 | | | Level 3 | |
| Assets | | | | | | | | | | | | |
Common Stock and/or Other Equity Investments | | $ | 12,032,618 | | | $ | — | | | $ | — | |
Short-term Investments | | | — | | | | 300,000 | | | | — | |
| Total | | $ | 12,032,618 | | | $ | 300,000 | | | $ | — | |
110
GOLDMAN SACHS FUNDAMENTAL EQUITY GROWTH FUNDS
|
| 3. INVESTMENTS AND FAIR VALUE MEASUREMENTS (continued) |
| | | | | | | | | | | | |
| | | |
| GROWTH OPPORTUNITIES | | | | | | | | | | | | |
| | | |
| Investment Type | | Level 1 | | | Level 2 | | | Level 3 | |
| Assets | | | | | | | | | | | | |
Common Stock and/or Other Equity Investments | | $ | 4,324,010,996 | | | $ | — | | | $ | — | |
Short-term Investments | | | — | | | | 63,700,000 | | | | — | |
| Total | | $ | 4,324,010,996 | | | $ | 63,700,000 | | | $ | — | |
| | | |
| SMALL/MID CAP GROWTH | | | | | | | | | | | | |
| | | |
| Investment Type | | Level 1 | | | Level 2 | | | Level 3 | |
| Assets | | | | | | | | | | | | |
Common Stock and/or Other Equity Investments | | $ | 1,069,876,809 | | | $ | 2,890,175 | | | $ | — | |
Short-term Investments | | | — | | | | 39,000,000 | | | | — | |
| Total | | $ | 1,069,876,809 | | | $ | 41,890,175 | | | $ | — | |
| | | |
| STRATEGIC GROWTH | | | | | | | | | | | | |
| | | |
| Investment Type | | Level 1 | | | Level 2 | | | Level 3 | |
| Assets | | | | | | | | | | | | |
Common Stock and/or Other Equity Investments | | $ | 356,632,494 | | | $ | — | | | $ | — | |
Short-term Investments | | | — | | | | 4,900,000 | | | | — | |
| Total | | $ | 356,632,494 | | | $ | 4,900,000 | | | $ | — | |
| | | |
| TECHNOLOGY TOLLKEEPER | | | | | | | | | | | | |
| | | |
| Investment Type | | Level 1 | | | Level 2 | | | Level 3 | |
| Assets | | | | | | | | | | | | |
Common Stock and/or Other Equity Investments | | $ | 362,134,530 | | | $ | — | | | $ | — | |
Short-term Investments | | | — | | | | 1,900,000 | | | | — | |
| Total | | $ | 362,134,530 | | | $ | 1,900,000 | | | $ | — | |
| | | |
| U.S. EQUITY | | | | | | | | | | | | |
| | | |
| Investment Type | | Level 1 | | | Level 2 | | | Level 3 | |
| Assets | | | | | | | | | | | | |
Common Stock and/or Other Equity Investments | | $ | 10,840,423 | | | $ | — | | | $ | — | |
Short-term Investments | | | — | | | | 200,000 | | | | — | |
| Total | | $ | 10,840,423 | | | $ | 200,000 | | | $ | — | |
For further information regarding security characteristics, see the Schedules of Investments.
111
GOLDMAN SACHS FUNDAMENTAL EQUITY GROWTH FUNDS
Notes to Financial Statements (continued)
February 28, 2013 (Unaudited)
|
| 4. AGREEMENTS AND AFFILIATED TRANSACTIONS |
A. Management Agreement — Under the Agreement, GSAM manages the Funds, subject to the general supervision of the Trustees.
As compensation for the services rendered pursuant to the Agreement, the assumption of the expenses related thereto and administration of the Funds’ business affairs, including providing facilities, GSAM is entitled to a management fee, accrued daily and paid monthly, equal to an annual percentage rate of each Fund’s average daily net assets.
For the six months ended February 28, 2013, contractual and effective net management fees with GSAM were at the following rates:
| | | | | | | | | | | | | | | | | | | | | | | | | | | | | | |
| | | | | Contractual Management Rate | | | Effective Net
Management
Rate | |
| Fund | | | | First $1 billion | | | Next
$1 billion | | | Next
$3 billion | | | Next
$3 billion | | | Over
$8 billion | | | Effective Rate | | |
Capital Growth | | | | | 1.00 | % | | | 0.90 | % | | | 0.80 | % | | | 0.80 | % | | | 0.80 | % | | | 1.00 | % | | | 0.70 | %# |
Concentrated Growth | | | | | 1.00 | | | | 0.90 | | | | 0.86 | | | | 0.84 | | | | 0.82 | | | | 1.00 | | | | 0.81 | # |
Flexible Cap Growth | | | | | 1.00 | | | | 0.90 | | | | 0.86 | | | | 0.84 | | | | 0.82 | | | | 1.00 | | | | 0.81 | # |
Focused Growth | | | | | 1.00 | | | | 0.90 | | | | 0.86 | | | | 0.84 | | | | 0.82 | | | | 1.00 | | | | 0.79 | # |
Growth Opportunities | | | | | 1.00 | | | | 1.00 | | | | 0.90 | | | | 0.86 | | | | 0.84 | | | | 0.95 | | | | 0.90 | # |
Small/Mid Cap Growth | | | | | 1.00 | | | | 1.00 | | | | 0.90 | | | | 0.86 | | | | 0.84 | | | | 1.00 | | | | 0.85 | # |
Strategic Growth | | | | | 1.00 | | | | 0.90 | | | | 0.86 | | | | 0.84 | | | | 0.82 | | | | 1.00 | | | | 0.71 | # |
Technology Tollkeeper | | | | | 1.00 | | | | 0.90 | | | | 0.86 | | | | 0.84 | | | | 0.82 | | | | 1.00 | | | | 1.00 | |
U.S. Equity | | | | | 0.70 | | | | 0.63 | | | | 0.60 | | | | 0.59 | | | | 0.58 | | | | 0.70 | | | | 0.70 | |
| # | | GSAM agreed to waive a portion of its management fees, in order to achieve the effective net management fee rates shown above through at least December 29, 2013. Prior to such date GSAM may not terminate the arrangements without the approval of the Trustees. Where the application of the above contractual management fee breakpoint schedule would result in a lower management fee rate, the breakpoint schedule will be applied to the Fund’s assets. |
112
GOLDMAN SACHS FUNDAMENTAL EQUITY GROWTH FUNDS
|
| 4. AGREEMENTS AND AFFILIATED TRANSACTIONS (continued) |
B. Distribution and Service Plans — The Trust, on behalf of each Fund, has adopted Distribution and Service Plans (the “Plans”). Under the Plans, Goldman Sachs, which serves as distributor (the “Distributor”), is entitled to a fee, accrued daily and paid monthly, for distribution services and personal and account maintenance services, which may then be paid by Goldman Sachs to authorized dealers, at the following annual rates calculated on a Fund’s average daily net assets of each respective share class:
| | | | | | | | | | | | | | | | |
| | | Distribution and Service Plan Rates | |
| | | Class A* | | | Class B | | | Class C | | | Class R* | |
Distribution Plan | | | 0.25 | % | | | 0.75 | % | | | 0.75 | % | | | 0.50 | % |
Service Plan | | | — | | | | 0.25 | | | | 0.25 | | | | — | |
| * | | With respect to Class A and Class R Shares, the Distributor at its discretion may use compensation for distribution services paid under the Distribution Plan to compensate service organizations for personal and account maintenance services and expenses as long as such total compensation does not exceed the maximum cap on “service fees” imposed by the Financial Industry Regulatory Authority. |
C. Distribution Agreement — Goldman Sachs, as Distributor of the shares of the Funds pursuant to a Distribution Agreement, may retain a portion of the Class A front end sales charge and Class B and Class C Shares’ CDSC. During the six months ended February 28, 2013, Goldman Sachs advised that it retained the following approximate amounts:
| | | | | | | | | | | | | | |
| | | | | Front End
Sales Charge | | | Contingent Deferred
Sales Charge | |
| Fund | | | | Class A | | | Class B | | | Class C | |
Capital Growth | | | | $ | 11,900 | | | $ | — | | | $ | 400 | |
Concentrated Growth | | | | | 700 | | | | — | | | | — | |
Flexible Cap Growth | | | | | 600 | | | | N/A | | | | — | |
Focused Growth | | | | | 100 | | | | N/A | | | | — | |
Growth Opportunities | | | | | 36,700 | | | | — | | | | 300 | |
Small/Mid Cap Growth | | | | | 37,500 | | | | — | | | | — | * |
Strategic Growth | | | | | 1,800 | | | | — | | | | — | |
Technology Tollkeeper | | | | | 15,600 | | | | — | | | | 200 | |
U.S. Equity | | | | | 500 | | | | N/A | | | | — | |
113
GOLDMAN SACHS FUNDAMENTAL EQUITY GROWTH FUNDS
Notes to Financial Statements (continued)
February 28, 2013 (Unaudited)
|
| 4. AGREEMENTS AND AFFILIATED TRANSACTIONS (continued) |
D. Service Plan and Shareholder Administration Plan — The Trust, on behalf of each Fund that offers Service Shares, has adopted a Service Plan and a Shareholder Administration Plan. These plans allow for service organizations to provide varying levels of personal and account maintenance and shareholder administration services to their customers who are beneficial owners of such shares. The Service Plan and Shareholder Administration Plan each provide for compensation to the service organizations which is accrued daily and paid monthly at an annual rate of 0.25% (0.50% in aggregate) of the average daily net assets of the Service Shares.
E. Transfer Agency Agreement — Goldman Sachs also serves as the transfer agent of the Funds for a fee pursuant to a Transfer Agency Agreement. The fees charged for such transfer agency services are accrued daily and paid monthly at annual rates as follows: 0.19% of the average daily net assets of Class A, Class B, Class C, Class IR and Class R Shares; and 0.04% of the average daily net assets of Institutional and Service Shares.
F. Other Expense Agreements and Affiliated Transactions — GSAM has agreed to limit certain “Other Expense” of the Funds (excluding management fees, distribution and service fees, acquired fund fees and expenses, transfer agent fees and expenses, service fees and shareholder administration fees (as applicable), taxes, interest, brokerage fees, litigation, indemnification, shareholder meeting and other extraordinary expenses) to the extent such expenses exceed, on an annual basis, a percentage rate of the average daily net assets of each Fund. Such Other Expense reimbursements, if any, are accrued daily and paid monthly. In addition, the Funds are not obligated to reimburse GSAM for prior fiscal year expense reimbursements, if any. The Other Expense limitations as an annual percentage rate of average daily net assets for Capital Growth, Concentrated Growth, Flexible Cap Growth, Focused Growth, Growth Opportunities, Small/Mid Cap Growth, Strategic Growth, Technology Tollkeeper and U.S. Equity Funds are 0.004%, 0.014%, 0.014%, 0.014%, 0.014%, 0.064%, 0.004%, 0.064% and 0.044%, respectively. These Other Expense reimbursements will remain in place through at least December 29, 2013, and prior to such date GSAM may not terminate the arrangements without the approval of the Trustees. In addition, the Funds have entered into certain offset arrangements with the custodian and the transfer agent, which may result in a reduction of the Funds’ expenses and are received irrespective of the application of the “Other Expense” limitations described above.
For the six months ended February 28, 2013, these expense reductions, including any fee waivers and Other Expense reimbursements were as follows:
| | | | | | | | | | | | | | | | | | |
| Fund | | | | Management Fee Waiver | | | Custody Fee Credits | | | Other Expense Reimbursements | | | Total
Expense Reductions | |
Capital Growth | | | | $ | 1,245,287 | | | $ | 36 | | | $ | 259,599 | | | $ | 1,504,922 | |
Concentrated Growth | | | | | 138,943 | | | | 25 | | | | 123,208 | | | | 262,176 | |
Flexible Cap Growth | | | | | 11,578 | | | | 25 | | | | 146,106 | | | | 157,709 | |
Focused Growth | | | | | 5,996 | | | | 24 | | | | 220,591 | | | | 226,611 | |
Growth Opportunities | | | | | 991,780 | | | | 196 | | | | 180,228 | | | | 1,172,204 | |
Small/Mid Cap Growth | | | | | 689,323 | | | | 34 | | | | — | | | | 689,357 | |
Strategic Growth | | | | | 553,180 | | | | 35 | | | | 176,488 | | | | 729,703 | |
Technology Tollkeeper | | | | | — | | | | 26 | | | | 71,685 | | | | 71,711 | |
U.S. Equity | | | | | — | | | | 31 | | | | 139,365 | | | | 139,396 | |
114
GOLDMAN SACHS FUNDAMENTAL EQUITY GROWTH FUNDS
|
| 4. AGREEMENTS AND AFFILIATED TRANSACTIONS (continued ) |
As of February 28, 2013, the amounts owed to affiliates of the Funds were as follows:
| | | | | | | | | | | | | | | | | | |
| Fund | | | | Management
Fees | | | Distribution
and Service
Fees | | | Transfer
Agent
Fees | | | Total | |
Capital Growth | | | | $ | 452,565 | | | $ | 201,712 | | | $ | 113,427 | | | $ | 767,704 | |
Concentrated Growth | | | | | 92,958 | | | | 19,366 | | | | 15,110 | | | | 127,434 | |
Flexible Cap Growth | | | | | 7,547 | | | | 1,784 | | | | 1,169 | | | | 10,500 | |
Focused Growth | | | | | 7,215 | | | | 28 | | | | 379 | | | | 7,622 | |
Growth Opportunities | | | | | 3,027,692 | | | | 371,436 | | | | 300,259 | | | | 3,699,387 | |
Small/Mid Cap Growth | | | | | 703,338 | | | | 183,484 | | | | 109,845 | | | | 996,667 | |
Strategic Growth | | | | | 195,995 | | | | 38,257 | | | | 30,455 | | | | 264,707 | |
Technology Tollkeeper | | | | | 284,393 | | | | 91,331 | | | | 46,306 | | | | 422,030 | |
U.S. Equity | | | | | 6,183 | | | | 739 | | | | 759 | | | | 7,681 | |
G. Line of Credit Facility — As of February 28, 2013, the Funds participated in a $630,000,000 committed, unsecured revolving line of credit facility (the “facility”) together with other funds of the Trust and registered investment companies having management agreements with GSAM or its affiliates (“Other Borrowers”). Pursuant to the terms of the facility, the Funds and Other Borrowers could increase the credit amount by an additional $340,000,000, for a total of up to $970,000,000. This facility is to be used solely for temporary or emergency purposes, which may include the funding of redemptions. The interest rate on borrowings is based on the federal funds rate. The facility also requires a fee to be paid by the Funds based on the amount of the commitment that has not been utilized. For the six months ended February 28, 2013, the Funds did not have any borrowings under the facility.
115
GOLDMAN SACHS FUNDAMENTAL EQUITY GROWTH FUNDS
Notes to Financial Statements (continued)
February 28, 2013 (Unaudited)
|
| 4. AGREEMENTS AND AFFILIATED TRANSACTIONS (continued) |
H. Other Transactions with Affiliates — For the six months ended February 28, 2013, Goldman Sachs earned approximately $2,300 in brokerage commissions from portfolio transactions on behalf of the Small/Mid Cap Growth Fund.
An investment by a Fund representing greater than 5% of the voting securities of an issuer makes that issuer an affiliated person (as defined by the Act) of such Fund. The following table provides information about the investment by the Growth Opportunities Fund in shares of issuers of which the Fund is an affiliate for the six months ended February 28, 2013:
| | | | | | | | | | | | | | | | | | | | | | | | |
| Name of Affiliated Issuer | | | | Number of Shares Held Beginning of Period | | Shares Bought | | | Shares Sold | | | Number of
Shares Held
End of Period | | | Value at End of Period | | | Dividend Income | |
| RealD, Inc. | | | | 2,733,653 | | | — | | | | (50,078 | ) | | | 2,683,575 | | | $ | 31,236,813 | | | $ | — | |
As of February 28, 2013, the Goldman Sachs Group, Inc. was the beneficial owner of 5% or more of outstanding Class A, Class C, Institutional, Class IR and Class R Shares of the following Funds:
| | | | | | | | | | | | | | | | | | | | | | |
| Fund | | | | Class A | | | Class C | | | Institutional | | | Class IR | | | Class R | |
Concentrated Growth | | | | | — | % | | | — | % | | | — | % | | | — | % | | | 99 | % |
Flexible Cap Growth | | | | | — | | | | — | | | | — | | | | 8 | | | | 20 | |
Focused Growth | | | | | 17 | | | | 100 | | | | 20 | | | | 100 | | | | 100 | |
Strategic Growth | | | | | — | | | | — | | | | — | | | | — | | | | 98 | |
U.S. Equity | | | | | — | | | | 10 | | | | 35 | | | | 9 | | | | 32 | |
116
GOLDMAN SACHS FUNDAMENTAL EQUITY GROWTH FUNDS
|
| 5. PORTFOLIO SECURITIES TRANSACTIONS |
The cost of purchases and proceeds from sales and maturities of long-term securities for the six months ended February 28, 2013, were as follows:
| | | | | | | | | | |
| Fund | | | | Purchases | | | Sales and Maturities | |
Capital Growth | | | | $ | 157,806,857 | | | $ | 223,140,594 | |
Concentrated Growth | | | | | 24,774,503 | | | | 40,324,425 | |
Flexible Cap Growth | | | | | 2,479,320 | | | | 4,709,847 | |
Focused Growth | | | | | 9,370,210 | | | | 1,345,705 | |
Growth Opportunities | | | | | 752,950,138 | | | | 935,500,479 | |
Small/Mid Cap Growth | | | | | 261,555,030 | | | | 143,411,971 | |
Strategic Growth | | | | | 72,881,047 | | | | 189,206,852 | |
Technology Tollkeeper | | | | | 46,889,899 | | | | 54,877,546 | |
U.S. Equity | | | | | 2,900,839 | | | | 3,626,857 | |
117
GOLDMAN SACHS FUNDAMENTAL EQUITY GROWTH FUNDS
Notes to Financial Statements (continued)
February 28, 2013 (Unaudited)
As of the Funds’ most recent fiscal year end, August 31, 2012, the Funds’ capital loss carryforwards and certain timing differences on a tax basis were as follows:
| | | | | | | | | | | | | | | | |
| | | Capital Growth | | | Concentrated
Growth | | | Technology Tollkeeper | | | U.S. Equity | |
Capital loss carryforwards:(1) | | | | | | | | | | | | | | | | |
Expiring 2018 | | $ | (3,077,823 | ) | | $ | (13,845,990 | ) | | $ | — | | | $ | — | |
Perpetual Short-term | | | — | | | | — | | | | (6,614,247 | ) | | | (30,604 | ) |
Total capital loss carryforwards | | $ | (3,077,823 | ) | | $ | (13,845,990 | ) | | $ | (6,614,247 | ) | | $ | (30,604 | ) |
| (1) | | With the exception of perpetual capital loss carryforwards, expiration occurs on August 31 of the year indicated. |
As of February 28, 2013, the Funds’ aggregate security unrealized gains and losses based on cost for U.S. federal income tax purposes were as follows:
| | | | | | | | | | | | | | | | | | | | | | | | | | | | | | | | | | | | |
| | | Capital Growth | | | Concentrated
Growth | | | Flexible Cap
Growth | | | Focused
Growth | | | Growth
Opportunities | | | Small/Mid
Cap Growth | | | Strategic
Growth | | | Technology
Tollkeeper | | | U.S. Equity | |
Tax Cost | | $ | 569,142,502 | | | $ | 99,148,402 | | | $ | 8,857,033 | | | $ | 11,467,517 | | | $ | 3,370,184,258 | | | $ | 873,379,884 | | | $ | 294,383,677 | | | $ | 302,946,096 | | | $ | 9,122,846 | |
Gross unrealized gain | | | 283,391,570 | | | | 53,547,970 | | | | 3,566,311 | | | | 990,055 | | | | 1,135,696,608 | | | | 271,588,042 | | | | 72,469,174 | | | | 76,429,630 | | | | 2,080,388 | |
Gross unrealized loss | | | (8,827,151 | ) | | | (2,420,543 | ) | | | (326,486 | ) | | | (124,954 | ) | | | (118,169,870 | ) | | | (33,200,942 | ) | | | (5,320,357 | ) | | | (15,341,196 | ) | | | (162,811 | ) |
Net unrealized gain | | $ | 274,564,419 | | | $ | 51,127,427 | | | $ | 3,239,825 | | | $ | 865,101 | | | $ | 1,017,526,738 | | | $ | 238,387,100 | | | $ | 67,148,817 | | | $ | 61,088,434 | | | $ | 1,917,577 | |
The difference between GAAP-basis and tax-basis unrealized gains (losses) is attributable primarily to wash sales, differences in tax treatment of partnerships and underlying fund investments.
In order to present certain components of the Funds’ capital accounts on a tax basis, certain reclassifications have been recorded to the Funds’ accounts. These reclassifications have no impact on the net asset value of the Funds and result primarily from certain non-deductible expenses and differences in the tax treatment of expired capital loss carryforwards, net operating losses, redemptions utilized as distributions and underlying fund investments.
GSAM has reviewed the Funds’ tax positions for all open tax years (the current and prior three years, as applicable) and has concluded that no provision for income tax is required in the Funds’ financial statements. Such open tax years remain subject to examination and adjustment by tax authorities.
The Funds’ risks include, but are not limited to, the following:
Liquidity Risk — The Funds may make investments that are illiquid or that may become less liquid in response to market developments or adverse investor perceptions. Illiquid investments may be more difficult to value. Liquidity risk may also refer to the risk that a Fund will not be able to pay redemption proceeds within the allowable time period because of unusual market conditions, an unusually high volume of redemption requests, or other reasons. To meet redemption requests, a Fund may be forced to sell investments at an unfavorable time and/or under unfavorable conditions.
Market and Credit Risks — In the normal course of business, the Funds trade financial instruments and enter into financial transactions where risk of potential loss exists due to changes in the market (market risk). Additionally, the Funds may also be exposed to credit risk in the event that an issuer fails to perform or that an institution or entity with which the Funds have unsettled or open transactions defaults.
118
GOLDMAN SACHS FUNDAMENTAL EQUITY GROWTH FUNDS
| | |
| 7. OTHER RISKS (continued) | | |
Non-Diversification Risk — Each of the Concentrated Growth Fund and Focused Growth Fund is non-diversified, meaning that it is permitted to invest a larger percentage of its assets in fewer issuers than diversified mutual funds. Thus, each Fund may be more susceptible to adverse developments affecting any single issuer held in its portfolio, and may be more susceptible to greater losses because of these developments.
Portfolio Concentration Risk — The Technology Tollkeeper Fund invests primarily in equity investments in high-quality technology, media, or service companies that adopt or use technology to improve their cost structure, revenue opportunities or competitive advantage (“Technology Tollkeeper” companies). Because of its focus on technology, media and service companies, the Technology Tollkeeper Fund is subject to greater risk of loss as a result of adverse economic, business or other developments than if its investments were diversified across different industry sectors. The Technology Tollkeeper Fund may also invest in a relatively few number of issuers. Thus, the Technology Tollkeeper Fund may be more susceptible to adverse developments affecting any single issuer held in its portfolio and may be more susceptible to greater losses because of these developments.
Shareholder Concentration Risk — Certain funds, accounts, individuals or Goldman Sachs affiliates may from time to time own (beneficially or of record) or control a significant percentage of the Funds’ shares. Redemptions by these entities of their holdings in the Funds, may impact the Funds’ liquidity and NAV. These redemptions may also force the Funds to sell securities.
Under the Trust’s organizational documents, its Trustees, officers, employees and agents are indemnified, to the extent permitted by the Act, against certain liabilities that may arise out of performance of their duties to the Funds. Additionally, in the course of business, the Funds enter into contracts that contain a variety of indemnification clauses. The Funds’ maximum exposure under these arrangements is unknown, as this would involve future claims that may be made against the Funds that have not yet occurred. However, GSAM believes the risk of loss under these arrangements to be remote.
New Accounting Pronouncement — In December 2011, the Financial Accounting Standards Board issued an Accounting Standards Update (“ASU”) to enhance disclosures about financial instruments and derivative instruments that are subject to offsetting (“netting”) on the Statement of Assets and Liabilities. This information will enable users of the Fund’s financial statements to evaluate the effect or potential effect of netting arrangements on the Funds’ financial position. The ASU is effective for financial statements with fiscal years beginning on or after January 1, 2013, and interim periods within those fiscal years. At this time, GSAM is evaluating the implications of these changes on the financial statements.
Subsequent events after the Statement of Assets and Liabilities date have been evaluated through the date the financial statements were issued. GSAM has concluded that there is no impact requiring adjustment or disclosure in the financial statements.
119
GOLDMAN SACHS FUNDAMENTAL EQUITY GROWTH FUNDS
Notes to Financial Statements (continued)
February 28, 2013 (Unaudited)
|
| 11. SUMMARY OF SHARE TRANSACTIONS |
Share activity is as follows:
| | | | | | | | | | | | | | | | |
| | | Capital Growth Fund | |
| | | | |
| | | For the Six Months Ended
February 28, 2013
(Unaudited) | | | For the Fiscal Year Ended August 31, 2012 | |
| | | | |
| | | Shares | | | Dollars | | | Shares | | | Dollars | |
| | | | |
| Class A Shares | | | | | | | | | | | | | | | | |
Shares sold | | | 463,898 | | | $ | 11,562,763 | | | | 1,084,024 | | | $ | 24,154,826 | |
Reinvestment of distributions | | | 26,769 | | | | 652,349 | | | | 52,303 | | | | 1,108,305 | |
Shares converted from Class B(a) | | | 110,693 | | | | 2,779,619 | | | | 353,535 | | | | 7,719,849 | |
Shares redeemed | | | (2,661,851 | ) | | | (66,449,967 | ) | | | (6,664,249 | ) | | | (147,831,503 | ) |
| | | | (2,060,491 | ) | | | (51,455,236 | ) | | | (5,174,387 | ) | | | (114,848,523 | ) |
| Class B Shares | | | | | | | | | | | | | | | | |
Shares sold | | | 12,862 | | | | 284,102 | | | | 31,691 | | | | 631,477 | |
Reinvestment of distributions | | | — | | | | — | | | | — | | | | — | |
Shares converted to Class A(a) | | | (126,443 | ) | | | (2,779,619 | ) | | | (401,921 | ) | | | (7,719,849 | ) |
Shares redeemed | | | (164,597 | ) | | | (3,601,307 | ) | | | (496,555 | ) | | | (9,601,763 | ) |
| | | | (278,178 | ) | | | (6,096,824 | ) | | | (866,785 | ) | | | (16,690,135 | ) |
| Class C Shares | | | | | | | | | | | | | | | | |
Shares sold | | | 129,971 | | | | 2,837,370 | | | | 229,000 | | | | 4,496,638 | |
Reinvestment of distributions | | | — | | | | — | | | | — | | | | — | |
Shares redeemed | | | (351,608 | ) | | | (7,677,920 | ) | | | (811,583 | ) | | | (15,909,096 | ) |
| | | | (221,637 | ) | | | (4,840,550 | ) | | | (582,583 | ) | | | (11,412,458 | ) |
| Institutional Shares | | | | | | | | | | | | | | | | |
Shares sold | | | 296,339 | | | | 7,780,414 | | | | 1,387,625 | | | | 34,003,014 | |
Reinvestment of distributions | | | 14,360 | | | | 366,743 | | | | 34,518 | | | | 766,649 | |
Shares redeemed | | | (615,370 | ) | | | (16,204,149 | ) | | | (12,060,256 | ) | | | (276,289,478 | ) |
| | | | (304,671 | ) | | | (8,056,992 | ) | | | (10,638,113 | ) | | | (241,519,815 | ) |
| Service Shares | | | | | | | | | | | | | | | | |
Shares sold | | | 2,278 | | | | 55,486 | | | | 8,337 | | | | 177,814 | |
Reinvestment of distributions | | | 15 | | | | 371 | | | | 33 | | | | 693 | |
Shares redeemed | | | (1,009 | ) | | | (25,236 | ) | | | (10,961 | ) | | | (242,183 | ) |
| | | | 1,284 | | | | 30,621 | | | | (2,591 | ) | | | (63,676 | ) |
| Class IR Shares | | | | | | | | | | | | | | | | |
Shares sold | | | 15,857 | | | | 390,465 | | | | 83,789 | | | | 1,983,053 | |
Reinvestment of distributions | | | 410 | | | | 10,026 | | | | 452 | | | | 9,608 | |
Shares redeemed | | | (17,347 | ) | | | (438,066 | ) | | | (57,040 | ) | | | (1,326,123 | ) |
| | | | (1,080 | ) | | | (37,575 | ) | | | 27,201 | | | | 666,538 | |
| Class R Shares | | | | | | | | | | | | | | | | |
Shares sold | | | 27,462 | | | | 683,506 | | | | 37,981 | | | | 875,281 | |
Reinvestment of distributions | | | 142 | | | | 3,429 | | | | 28 | | | | 579 | |
Shares redeemed | | | (12,597 | ) | | | (319,549 | ) | | | (4,804 | ) | | | (108,718 | ) |
| | | | 15,007 | | | | 367,386 | | | | 33,205 | | | | 767,142 | |
NET DECREASE | | | (2,849,766 | ) | | $ | (70,089,170 | ) | | | (17,204,053 | ) | | $ | (383,100,927 | ) |
| (a) | | Class B Shares automatically convert into Class A Shares on or about the fifteenth day of the last month of the calendar quarter that is eight years after the initial purchase date of either the Fund or another Goldman Sachs Fund. |
120
GOLDMAN SACHS FUNDAMENTAL EQUITY GROWTH FUNDS
| | | | | | | | | | | | | | | | | | | | | | | | | | | | | | |
| Concentrated Growth Fund | | | Flexible Cap Growth Fund | |
For the Six Months Ended
February 28, 2013
(Unaudited) | | | For the Fiscal Year Ended August 31, 2012 | | | For the Six Months Ended
February 28, 2013
(Unaudited) | | | For the Fiscal Year Ended August 31, 2012 | |
| Shares | | | Dollars | | | Shares | | | Dollars | | | Shares | | | Dollars | | | Shares | | | Dollars | |
| | | | | | | | | | | | | | | | | | | | | | | | | | | | | | |
| | 95,622 | | | $ | 1,452,832 | | | | 298,275 | | | $ | 4,099,586 | | | | 27,600 | | | $ | 308,682 | | | | 133,292 | | | $ | 1,436,893 | |
| | 23,697 | | | | 352,580 | | | | — | | | | — | | | | 69,116 | | | | 702,914 | | | | 59,683 | | | | 598,033 | |
| | 745 | | | | 11,645 | | | | 1,550 | | | | 22,618 | | | | — | | | | — | | | | — | | | | — | |
| | (851,211 | ) | | | (13,043,075 | ) | | | (2,828,879 | ) | | | (38,324,423 | ) | | | (207,816 | ) | | | (2,335,678 | ) | | | (1,074,061 | ) | | | (10,753,016 | ) |
| | (731,147 | ) | | | (11,226,018 | ) | | | (2,529,054 | ) | | | (34,202,219 | ) | | | (111,100 | ) | | | (1,324,082 | ) | | | (881,086 | ) | | | (8,718,090 | ) |
| | | | | | | | | | | | | | | | | | | | | | | | | | | | | | |
| | 1 | | | | 14 | | | | 1,174 | | | | 15,089 | | | | — | | | | — | | | | — | | | | — | |
| | 9 | | | | 118 | | | | — | | | | — | | | | — | | | | — | | | | — | | | | — | |
| | (807 | ) | | | (11,645 | ) | | | (1,673 | ) | | | (22,618 | ) | | | — | | | | — | | | | — | | | | — | |
| | (5,325 | ) | | | (75,554 | ) | | | (13,134 | ) | | | (168,228 | ) | | | — | | | | — | | | | — | | | | — | |
| | (6,122 | ) | | | (87,067 | ) | | | (13,633 | ) | | | (175,757 | ) | | | — | | | | — | | | | — | | | | — | |
| | | | | | | | | | | | | | | | | | | | | | | | | | | | | | |
| | 16,819 | | | | 239,034 | | | | 88,927 | | | | 1,039,296 | | | | 19,157 | | | | 208,221 | | | | 16,505 | | | | 167,714 | |
| | 111 | | | | 1,519 | | | | — | | | | — | | | | 9,747 | | | | 95,129 | | | | 5,501 | | | | 53,517 | |
| | (21,753 | ) | | | (305,486 | ) | | | (50,798 | ) | | | (634,034 | ) | | | (35,145 | ) | | | (377,700 | ) | | | (30,415 | ) | | | (311,608 | ) |
| | (4,823 | ) | | | (64,933 | ) | | | 38,129 | | | | 405,262 | | | | (6,241 | ) | | | (74,350 | ) | | | (8,409 | ) | | | (90,377 | ) |
| | | | | | | | | | | | | | | | | | | | | | | | | | | | | | |
| | 460,194 | | | | 7,366,709 | | | | 262,002 | | | | 3,655,390 | | | | 56,606 | | | | 627,889 | | | | 11,239 | | | | 122,770 | |
| | 24,979 | | | | 383,410 | | | | 19,908 | | | | 266,563 | | | | 51,636 | | | | 538,564 | | | | 22,869 | | | | 233,496 | |
| | (536,978 | ) | | | (8,369,446 | ) | | | (6,307,896 | ) | | | (85,264,561 | ) | | | (28,931 | ) | | | (319,951 | ) | | | (31,173 | ) | | | (351,212 | ) |
| | (51,805 | ) | | | (619,327 | ) | | | (6,025,986 | ) | | | (81,342,608 | ) | | | 79,311 | | | | 846,502 | | | | 2,935 | | | | 5,054 | |
| | | | | | | | | | | | | | | | | | | | | | | | | | | | | | |
| | — | | | | — | | | | — | | | | — | | | | — | | | | — | | | | — | | | | — | |
| | — | | | | — | | | | — | | | | — | | | | — | | | | — | | | | — | | | | — | |
| | — | | | | — | | | | — | | | | — | | | | — | | | | — | | | | — | | | | — | |
| | — | | | | — | | | | — | | | | — | | | | — | | | | — | | | | — | | | | — | |
| | | | | | | | | | | | | | | | | | | | | | | | | | | | | | |
| | 3,048 | | | | 46,088 | | | | 6,314 | | | | 83,600 | | | | 1,369 | | | | 15,371 | | | | 6,064 | | | | 65,540 | |
| | 284 | | | | 4,247 | | | | 112 | | | | 1,459 | | | | 1,793 | | | | 18,561 | | | | 673 | | | | 6,825 | |
| | (19,482 | ) | | | (304,982 | ) | | | (2,004 | ) | | | (26,384 | ) | | | (3,386 | ) | | | (39,016 | ) | | | (2,418 | ) | | | (26,257 | ) |
| | (16,150 | ) | | | (254,647 | ) | | | 4,422 | | | | 58,675 | | | | (224 | ) | | | (5,084 | ) | | | 4,319 | | | | 46,108 | |
| | | | | | | | | | | | | | | | | | | | | | | | | | | | | | |
| | 5 | | | | 75 | | | | — | | | | — | | | | 44 | | | | 480 | | | | 14,675 | | | | 137,468 | |
| | 1 | | | | 24 | | | | — | | | | — | | | | 706 | | | | 7,086 | | | | 938 | | | | 9,321 | |
| | — | | | | — | | | | — | | | | — | | | | (2 | ) | | | (21 | ) | | | (11,152 | ) | | | (115,649 | ) |
| | 6 | | | | 99 | | | | — | | | | — | | | | 748 | | | | 7,545 | | | | 4,461 | | | | 31,140 | |
| | (810,041 | ) | | $ | (12,251,893 | ) | | | (8,526,122 | ) | | $ | (115,256,647 | ) | | | (37,506 | ) | | $ | (549,469 | ) | | | (877,780 | ) | | $ | (8,726,165 | ) |
121
GOLDMAN SACHS FUNDAMENTAL EQUITY GROWTH FUNDS
Notes to Financial Statements (continued)
February 28, 2013 (Unaudited)
|
| 11. SUMMARY OF SHARE TRANSACTIONS (continued) |
Share activity is as follows:
| | | | | | | | | | | | | | | | |
| | | Focused Growth Fund | |
| | | | |
| | | For the Six Months Ended
February 28, 2013
(Unaudited) | | | For the Period Ended
August 31, 2012(a) | |
| | | | |
| | | Shares | | | Dollars | | | Shares | | | Dollars | |
| | | | |
| Class A Shares | | | | | | | | | | | | | | | | |
Shares sold | | | 4,878 | | | $ | 57,449 | | | | 4,077 | | | $ | 42,857 | |
Reinvestment of distributions | | | 33 | | | | 376 | | | | — | | | | — | |
Shares converted from Class B(b) | | | — | | | | — | | | | — | | | | — | |
Shares redeemed | | | (2,065 | ) | | | (24,767 | ) | | | (1,024 | ) | | | (11,584 | ) |
| | | | 2,846 | | | | 33,058 | | | | 3,053 | | | | 31,273 | |
| Class B Shares | | | | | | | | | | | | | | | | |
Shares sold | | | — | | | | — | | | | — | | | | — | |
Reinvestment of distributions | | | — | | | | — | | | | — | | | | — | |
Shares converted to Class A(b) | | | — | | | | — | | | | — | | | | — | |
Shares redeemed | | | — | | | | — | | | | — | | | | — | |
| | | | — | | | | — | | | | — | | | | — | |
| Class C Shares | | | | | | | | | | | | | | | | |
Shares sold | | | — | | | | — | | | | 1,000 | | | | 10,000 | |
Reinvestment of distributions | | | 3 | | | | 32 | | | | — | | | | — | |
Shares redeemed | | | — | | | | — | | | | — | | | | — | |
| | | | 3 | | | | 32 | | | | 1,000 | | | | 10,000 | |
| Institutional Shares | | | | | | | | | | | | | | | | |
Shares sold | | | 679,258 | | | | 8,133,278 | | | | 300,173 | | | | 3,062,463 | |
Reinvestment of distributions | | | 3,066 | | | | 35,077 | | | | — | | | | — | |
Shares redeemed | | | (81 | ) | | | (924 | ) | | | (2 | ) | | | (21 | ) |
| | | | 682,243 | | | | 8,167,431 | | | | 300,171 | | | | 3,062,442 | |
| Service Shares | | | | | | | | | | | | | | | | |
Shares sold | | | — | | | | — | | | | — | | | | — | |
Reinvestment of distributions | | | — | | | | — | | | | — | | | | — | |
Shares redeemed | | | — | | | | — | | | | — | | | | — | |
| | | | — | | | | — | | | | — | | | | — | |
| Class IR Shares | | | | | | | | | | | | | | | | |
Shares sold | | | — | | | | — | | | | 1,000 | | | | 9,998 | |
Reinvestment of distributions | | | 7 | | | | 76 | | | | — | | | | — | |
Shares redeemed | | | — | | | | — | | | | — | | | | — | |
| | | | 7 | | | | 76 | | | | 1,000 | | | | 9,998 | |
| Class R Shares | | | | | | | | | | | | | | | | |
Shares sold | | | — | | | | — | | | | 1,001 | | | | 10,010 | |
Reinvestment of distributions | | | 3 | | | | 33 | | | | — | | | | — | |
Shares redeemed | | | — | | | | — | | | | (1 | ) | | | (10 | ) |
| | | | 3 | | | | 33 | | | | 1,000 | | | | 10,000 | |
NET INCREASE (DECREASE) | | | 685,102 | | | $ | 8,200,630 | | | | 306,224 | | | $ | 3,123,713 | |
| (a) | | Commenced operations on January 31, 2012. |
| (b) | | Class B Shares automatically convert into Class A Shares on or about the fifteenth day of the last month of the calendar quarter that is eight years after the initial purchase date of either the Fund or another Goldman Sachs Fund. |
122
GOLDMAN SACHS FUNDAMENTAL EQUITY GROWTH FUNDS
| | | | | | | | | | | | | | | | | | | | | | | | | | | | | | |
| Growth Opportunities Fund | | | Small/Mid Cap Growth Fund | |
For the Six Months Ended
February 28, 2013
(Unaudited) | | | For the Fiscal Year Ended August 31, 2012 | | | For the Six Months Ended
February 28, 2013
(Unaudited) | | | For the Fiscal Year Ended August 31, 2012 | |
| Shares | | | Dollars | | | Shares | | | Dollars | | | Shares | | | Dollars | | | Shares | | | Dollars | |
| | | | | | | | | | | | | | | | | | | | | | | | | | | | | | |
| | 6,625,961 | | | $ | 157,472,102 | | | | 12,479,928 | | | $ | 276,499,645 | | | | 6,583,166 | | | $ | 104,892,894 | | | | 7,242,299 | | | $ | 105,157,992 | |
| | 2,964,499 | | | | 66,165,624 | | | | 2,839,166 | | | | 59,650,884 | | | | 1,264,232 | | | | 19,013,728 | | | | 1,220,980 | | | | 16,666,374 | |
| | 12,978 | | | | 307,819 | | | | 30,359 | | | | 658,382 | | | | 4,401 | | | | 68,325 | | | | 14,646 | | | | 207,722 | |
| | (8,801,836 | ) | | | (207,572,224 | ) | | | (20,251,134 | ) | | | (445,364,324 | ) | | | (4,349,430 | ) | | | (68,541,146 | ) | | | (12,689,251 | ) | | | (178,758,545 | ) |
| | 801,602 | | | | 16,373,321 | | | | (4,901,681 | ) | | | (108,555,413 | ) | | | 3,502,369 | | | | 55,433,801 | | | | (4,211,326 | ) | | | (56,726,457 | ) |
| | | | | | | | | | | | | | | | | | | | | | | | | | | | | | |
| | 13,672 | | | | 280,606 | | | | 23,933 | | | | 480,623 | | | | 15,070 | | | | 223,001 | | | | 30,709 | | | | 412,653 | |
| | 40,326 | | | | 785,947 | | | | 50,305 | | | | 938,689 | | | | 13,116 | | | | 184,412 | | | | 15,992 | | | | 206,298 | |
| | (14,786 | ) | | | (307,819 | ) | | | (34,128 | ) | | | (658,382 | ) | | | (4,700 | ) | | | (68,325 | ) | | | (15,516 | ) | | | (207,722 | ) |
| | (136,105 | ) | | | (2,831,757 | ) | | | (297,173 | ) | | | (5,834,768 | ) | | | (53,803 | ) | | | (790,242 | ) | | | (114,983 | ) | | | (1,551,849 | ) |
| | (96,893 | ) | | | (2,073,023 | ) | | | (257,063 | ) | | | (5,073,838 | ) | | | (30,317 | ) | | | (451,154 | ) | | | (83,798 | ) | | | (1,140,620 | ) |
| | | | | | | | | | | | | | | | | | | | | | | | | | | | | | |
| | 799,610 | | | | 16,294,207 | | | | 1,236,535 | | | | 24,115,016 | | | | 1,308,641 | | | | 19,600,594 | | | | 1,380,478 | | | | 18,852,885 | |
| | 457,705 | | | | 8,824,234 | | | | 422,485 | | | | 7,807,516 | | | | 276,804 | | | | 3,887,979 | | | | 235,881 | | | | 3,040,509 | |
| | (936,713 | ) | | | (19,312,730 | ) | | | (2,440,814 | ) | | | (47,349,929 | ) | | | (562,307 | ) | | | (8,316,955 | ) | | | (1,793,758 | ) | | | (24,152,011 | ) |
| | 320,602 | | | | 5,805,711 | | | | (781,794 | ) | | | (15,427,397 | ) | | | 1,023,138 | | | | 15,171,618 | | | | (177,399 | ) | | | (2,258,617 | ) |
| | | | | | | | | | | | | | | | | | | | | | | | | | | | | | |
| | 18,269,222 | | | | 465,250,820 | | | | 33,459,444 | | | | 791,179,267 | | | | 7,658,649 | | | | 125,586,872 | | | | 6,684,343 | | | | 97,137,207 | |
| | 5,195,727 | | | | 125,061,145 | | | | 4,498,137 | | | | 100,983,169 | | | | 793,208 | | | | 12,285,172 | | | | 722,281 | | | | 10,097,488 | |
| | (19,498,548 | ) | | | (497,787,156 | ) | | | (57,238,667 | ) | | | (1,365,933,364 | ) | | | (2,254,989 | ) | | | (36,576,078 | ) | | | (13,499,985 | ) | | | (191,048,721 | ) |
| | 3,966,401 | | | | 92,524,809 | | | | (19,281,086 | ) | | | (473,770,928 | ) | | | 6,196,868 | | | | 101,295,966 | | | | (6,093,361 | ) | | | (83,814,026 | ) |
| | | | | | | | | | | | | | | | | | | | | | | | | | | | | | |
| | 329,848 | | | | 7,656,572 | | | | 603,262 | | | | 13,213,280 | | | | 115,488 | | | | 1,802,813 | | | | 189,054 | | | | 2,711,034 | |
| | 140,298 | | | | 3,068,322 | | | | 121,131 | | | | 2,500,144 | | | | 6,203 | | | | 92,110 | | | | 5,394 | | | | 72,774 | |
| | (508,208 | ) | | | (11,825,843 | ) | | | (884,568 | ) | | | (19,276,595 | ) | | | (105,272 | ) | | | (1,633,209 | ) | | | (187,351 | ) | | | (2,599,588 | ) |
| | (38,062 | ) | | | (1,100,949 | ) | | | (160,175 | ) | | | (3,563,171 | ) | | | 16,419 | | | | 261,714 | | | | 7,097 | | | | 184,220 | |
| | | | | | | | | | | | | | | | | | | | | | | | | | | | | | |
| | 820,318 | | | | 19,798,337 | | | | 1,414,402 | | | | 32,013,233 | | | | 1,536,637 | | | | 24,431,192 | | | | 1,586,072 | | | | 23,092,898 | |
| | 241,798 | | | | 5,476,736 | | | | 166,081 | | | | 3,529,228 | | | | 153,792 | | | | 2,345,328 | | | | 109,459 | | | | 1,510,525 | |
| | (397,873 | ) | | | (9,538,526 | ) | | | (996,769 | ) | | | (22,440,530 | ) | | | (825,006 | ) | | | (13,024,537 | ) | | | (955,561 | ) | | | (13,736,580 | ) |
| | 664,243 | | | | 15,736,547 | | | | 583,714 | | | | 13,101,931 | | | | 865,423 | | | | 13,751,983 | | | | 739,970 | | | | 10,866,843 | |
| | | | | | | | | | | | | | | | | | | | | | | | | | | | | | |
| | 436,261 | | | | 10,201,255 | | | | 1,103,996 | | | | 24,291,151 | | | | 245,208 | | | | 3,823,440 | | | | 467,680 | | | | 6,663,220 | |
| | 170,855 | | | �� | 3,762,069 | | | | 123,114 | | | | 2,560,779 | | | | 63,446 | | | | 941,534 | | | | 58,489 | | | | 790,187 | |
| | (354,520 | ) | | | (8,325,543 | ) | | | (537,873 | ) | | | (11,888,915 | ) | | | (260,167 | ) | | | (4,094,120 | ) | | | (411,670 | ) | | | (5,891,920 | ) |
| | 252,596 | | | | 5,637,781 | | | | 689,237 | | | | 14,963,015 | | | | 48,487 | | | | 670,854 | | | | 114,499 | | | | 1,561,487 | |
| | 5,870,489 | | | $ | 132,904,197 | | | | (24,108,848 | ) | | $ | (578,325,801 | ) | | | 11,622,387 | | | $ | 186,134,782 | | | | (9,704,318 | ) | | $ | (131,327,170 | ) |
123
GOLDMAN SACHS FUNDAMENTAL EQUITY GROWTH FUNDS
Notes to Financial Statements (continued)
February 28, 2013 (Unaudited)
|
| 11. SUMMARY OF SHARE TRANSACTIONS (continued) |
Share activity is as follows:
| | | | | | | | | | | | | | | | |
| | | Strategic Growth Fund | |
| | | | |
| | | For the Six Months Ended
February 28, 2013
(Unaudited) | | | For the Fiscal Year Ended August 31, 2012 | |
| | | | |
| | | Shares | | | Dollars | | | Shares | | | Dollars | |
| | | | |
| Class A Shares | | | | | | | | | | | | | | | | |
Shares sold | | | 711,682 | | | $ | 8,042,089 | | | | 4,642,961 | | | $ | 46,368,395 | |
Reinvestment of distributions | | | 1,197,404 | | | | 12,752,339 | | | | 29,590 | | | | 295,906 | |
Shares converted from Class B(a) | | | 1,377 | | | | 15,375 | | | | 8,375 | | | | 81,778 | |
Shares redeemed | | | (3,911,500 | ) | | | (44,536,076 | ) | | | (9,398,894 | ) | | | (97,114,411 | ) |
| | | | (2,001,037 | ) | | | (23,726,273 | ) | | | (4,717,968 | ) | | | (50,368,332 | ) |
| Class B Shares | | | | | | | | | | | | | | | | |
Shares sold | | | 3,123 | | | | 31,690 | | | | 10,625 | | | | 105,936 | |
Reinvestment of distributions | | | 9,625 | | | | 92,882 | | | | — | | | | — | |
Shares converted to Class A(a) | | | (1,518 | ) | | | (15,375 | ) | | | (9,153 | ) | | | (81,778 | ) |
Shares redeemed | | | (33,171 | ) | | | (344,695 | ) | | | (65,774 | ) | | | (603,941 | ) |
| | | | (21,941 | ) | | | (235,498 | ) | | | (64,302 | ) | | | (579,783 | ) |
| Class C Shares | | | | | | | | | | | | | | | | |
Shares sold | | | 154,704 | | | | 1,578,401 | | | | 49,492 | | | | 493,305 | |
Reinvestment of distributions | | | 52,954 | | | | 502,138 | | | | — | | | | — | |
Shares redeemed | | | (92,645 | ) | | | (965,671 | ) | | | (249,916 | ) | | | (2,412,589 | ) |
| | | | 115,013 | | | | 1,114,868 | | | | (200,424 | ) | | | (1,919,284 | ) |
| Institutional Shares | | | | | | | | | | | | | | | | |
Shares sold | | | 1,606,511 | | | | 18,742,364 | | | | 9,078,777 | | | | 92,535,724 | |
Reinvestment of distributions | | | 1,427,641 | | | | 15,775,437 | | | | 145,345 | | | | 1,504,317 | |
Shares redeemed | | | (8,274,862 | ) | | | (98,515,216 | ) | | | (13,554,630 | ) | | | (145,862,912 | ) |
| | | | (5,240,710 | ) | | | (63,997,415 | ) | | | (4,330,508 | ) | | | (51,822,871 | ) |
| Service Shares | | | | | | | | | | | | | | | | |
Shares sold | | | 6,185 | | | | 67,915 | | | | 4,351 | | | | 47,378 | |
Reinvestment of distributions | | | 495 | | | | 5,271 | | | | — | | | | — | |
Shares redeemed | | | (1,930 | ) | | | (21,614 | ) | | | (2 | ) | | | (18 | ) |
| | | | 4,750 | | | | 51,572 | | | | 4,349 | | | | 47,360 | |
| Class IR Shares | | | | | | | | | | | | | | | | |
Shares sold | | | 20,460 | | | | 235,428 | | | | 26,562 | | | | 279,629 | |
Reinvestment of distributions | | | 2,447 | | | | 27,085 | | | | — | | | | — | |
Shares redeemed | | | (52 | ) | | | (607 | ) | | | (12,184 | ) | | | (136,839 | ) |
| | | | 22,855 | | | | 261,906 | | | | 14,378 | | | | 142,790 | |
| Class R Shares | | | | | | | | | | | | | | | | |
Shares sold | | | 6 | | | | 75 | | | | — | | | | — | |
Reinvestment of distributions | | | 31 | | | | 331 | | | | — | | | | — | |
| | | | 37 | | | | 406 | | | | — | | | | — | |
NET INCREASE (DECREASE) | | | (7,121,033 | ) | | $ | (86,530,434 | ) | | | (9,294,475 | ) | | $ | (104,500,120 | ) |
| (a) | | Class B Shares automatically convert into Class A Shares on or about the fifteenth day of the last month of the calendar quarter that is eight years after the initial purchase date of either the Fund or another Goldman Sachs Fund. |
124
GOLDMAN SACHS FUNDAMENTAL EQUITY GROWTH FUNDS
| | | | | | | | | | | | | | |
| Technology Tollkeeper Fund | |
For the Six Months Ended
February 28, 2013
(Unaudited) | | | For the Fiscal Year Ended August 31, 2012 | |
| Shares | | | Dollars | | | Shares | | | Dollars | |
| | | | | | | | | | | | | | |
| | 1,707,591 | | | $ | 23,596,697 | | | | 4,457,690 | | | $ | 56,545,968 | |
| | — | | | | — | | | | — | | | | — | |
| | 28,125 | | | | 391,512 | | | | 100,055 | | | | 1,233,162 | |
| | (2,489,373 | ) | | | (34,241,792 | ) | | | (8,195,427 | ) | | | (99,752,966 | ) |
| | (753,657 | ) | | | (10,253,583 | ) | | | (3,637,682 | ) | | | (41,973,836 | ) |
| | | | | | | | | | | | | | |
| | 15,694 | | | | 192,995 | | | | 23,354 | | | | 273,568 | |
| | — | | | | — | | | | — | | | | — | |
| | (31,049 | ) | | | (391,512 | ) | | | (109,787 | ) | | | (1,233,162 | ) |
| | (72,232 | ) | | | (892,683 | ) | | | (251,907 | ) | | | (2,866,147 | ) |
| | (87,587 | ) | | | (1,091,200 | ) | | | (338,340 | ) | | | (3,825,741 | ) |
| | | | | | | | | | | | | | |
| | 296,732 | | | | 3,708,277 | | | | 508,668 | | | | 5,813,555 | |
| | — | | | | — | | | | — | | | | — | |
| | (499,337 | ) | | | (6,212,910 | ) | | | (1,197,561 | ) | | | (13,657,384 | ) |
| | (202,605 | ) | | | (2,504,633 | ) | | | (688,893 | ) | | | (7,843,829 | ) |
| | | | | | | | | | | | | | |
| | 1,065,553 | | | | 15,792,585 | | | | 1,875,402 | | | | 24,313,242 | |
| | — | | | | — | | | | — | | | | — | |
| | (664,320 | ) | | | (9,616,882 | ) | | | (2,941,535 | ) | | | (37,120,645 | ) |
| | 401,233 | | | | 6,175,703 | | | | (1,066,133 | ) | | | (12,807,403 | ) |
| | | | | | | | | | | | | | |
| | 160,230 | | | | 2,187,987 | | | | 1,450,494 | | | | 16,969,227 | |
| | — | | | | — | | | | — | | | | — | |
| | (177,550 | ) | | | (2,412,185 | ) | | | (1,585,284 | ) | | | (19,177,207 | ) |
| | (17,320 | ) | | | (224,198 | ) | | | (134,790 | ) | | | (2,207,980 | ) |
| | | | | | | | | | | | | | |
| | 46,772 | | | | 691,117 | | | | 20,030 | | | | 271,884 | |
| | — | | | | — | | | | — | | | | — | |
| | (84,273 | ) | | | (1,215,996 | ) | | | (43,385 | ) | | | (568,560 | ) |
| | (37,501 | ) | | | (524,879 | ) | | | (23,355 | ) | | | (296,676 | ) |
| | | | | | | | | | | | | | |
| | — | | | | — | | | | — | | | | — | |
| | — | | | | — | | | | — | | | | — | |
| | — | | | | — | | | | — | | | | — | |
| | (697,437 | ) | | $ | (8,422,790 | ) | | | (5,889,193 | ) | | $ | (68,955,465 | ) |
125
GOLDMAN SACHS FUNDAMENTAL EQUITY GROWTH FUNDS
Notes to Financial Statements (continued)
February 28, 2013 (Unaudited)
|
| 11. SUMMARY OF SHARE TRANSACTIONS (continued) |
| | | | | | | | | | | | | | | | |
| | | U.S. Equity Fund | |
| | | | |
| | | For the Six Months Ended
February 28, 2013
(Unaudited) | | | For the Fiscal Year Ended August 31, 2012 | |
| | | | |
| | | Shares | | | Dollars | | | Shares | | | Dollars | |
| | | | |
| Class A Shares | | | | | | | | | | | | | | | | |
Shares sold | | | 21,350 | | | $ | 274,716 | | | | 47,129 | | | $ | 523,773 | |
Reinvestment of distributions | | | 1,659 | | | | 20,678 | | | | 3,236 | | | | 35,118 | |
Shares redeemed | | | (83,741 | ) | | | (1,081,955 | ) | | | (69,803 | ) | | | (786,446 | ) |
| | | | (60,732 | ) | | | (786,561 | ) | | | (19,438 | ) | | | (227,555 | ) |
| Class C Shares | | | | | | | | | | | | | | | | |
Shares sold | | | 1,633 | | | | 21,774 | | | | 5,114 | | | | 58,024 | |
Reinvestment of distributions | | | — | | | | — | | | | 130 | | | | 1,397 | |
Shares redeemed | | | (4,544 | ) | | | (57,534 | ) | | | (5,320 | ) | | | (62,172 | ) |
| | | | (2,911 | ) | | | (35,760 | ) | | | (76 | ) | | | (2,751 | ) |
| Institutional Shares | | | | | | | | | | | | | | | | |
Shares sold | | | 48,232 | | | | 627,272 | | | | 150,543 | | | | 1,751,835 | |
Reinvestment of distributions | | | 4,955 | | | | 61,836 | | | | 5,516 | | | | 59,956 | |
Shares redeemed | | | (37,131 | ) | | | (470,209 | ) | | | (130,594 | ) | | | (1,400,473 | ) |
| | | | 16,056 | | | | 218,899 | | | | 25,465 | | | | 411,318 | |
| Class IR Shares | | | | | | | | | | | | | | | | |
Shares sold | | | 7,309 | | | | 93,500 | | | | 5,209 | | | | 60,500 | |
Reinvestment of distributions | | | 100 | | | | 1,243 | | | | 112 | | | | 1,222 | |
Shares redeemed | | | (2,182 | ) | | | (27,120 | ) | | | (22,101 | ) | | | (240,805 | ) |
| | | | 5,227 | | | | 67,623 | | | | (16,780 | ) | | | (179,083 | ) |
| Class R Shares | | | | | | | | | | | | | | | | |
Shares sold | | | 2,212 | | | | 28,771 | | | | — | | | | — | |
Reinvestment of distributions | | | 5 | | | | 60 | | | | 11 | | | | 115 | |
| | | | 2,217 | | | | 28,831 | | | | 11 | | | | 115 | |
NET INCREASE (DECREASE) | | | (40,143 | ) | | $ | (506,968 | ) | | | (10,818 | ) | | $ | 2,044 | |
126
GOLDMAN SACHS FUNDAMENTAL EQUITY GROWTH FUNDS
Fund Expenses — Six Month Period Ended February 28, 2013 (Unaudited)
As a shareholder of Class A, Class B, Class C, Institutional, Service, Class IR or Class R Shares of a Fund, you incur two types of costs: (1) transaction costs, including sales charges on purchase payments (with respect to Class A Shares), contingent deferred sales charges on redemptions (with respect to Class B and Class C Shares), and (2) ongoing costs, including management fees; distribution and service (12b-1) fees (with respect to Class A, Class B, Class C and Class R Shares); and other Fund expenses. This Example is intended to help you understand your ongoing costs (in dollars) of investing in Class A, Class B, Class C, Institutional, Service, Class IR or Class R Shares of the Funds and to compare these costs with the ongoing costs of investing in other mutual funds.
The Example is based on an investment of $1,000 invested at the beginning of the period and held for the entire period from September 1, 2012 through February 28, 2013.
Actual Expenses — The first line under each share class in the table below provides information about actual account values and actual expenses. You may use the information in this line, together with the amount you invested, to estimate the expenses that you paid over the period. Simply divide your account value by $1,000 (for example, an $8,600 account value divided by $1,000=8.6), then multiply the result by the number in the first line under the heading entitled “Expenses Paid” to estimate the expenses you paid on your account during this period.
Hypothetical Example for Comparison Purposes — The second line under each share class in the table below provides information about hypothetical account values and hypothetical expenses based on the Funds’ actual net expense ratios and an assumed rate of return of 5% per year before expenses, which is not the Funds’ actual return. The hypothetical account values and expenses may not be used to estimate the actual ending account balance or expenses you paid for the period. You may use this information to compare the ongoing costs of investing in the Funds and other funds. To do so, compare this 5% hypothetical example with the 5% hypothetical examples that appear in the shareholder reports of the other funds.
Please note that the expenses shown in the table are meant to highlight your ongoing costs only and do not reflect any transactional costs, such as sales charges, redemption fees, or exchange fees. Therefore, the second line of the table is useful in comparing ongoing costs only, and will not help you determine the relative total costs of owning different funds. In addition, if these transactional costs were included, your costs would have been higher.
| | | | | | | | | | | | | | | | | | | | | | | | | | | | | | | | | | | | | | | | | | | | | | | | | | | | | | | | | | | | |
| | | Capital Growth Fund | | | Concentrated Growth Fund | | | Flexible Cap Growth Fund | | | Focused Growth Fund | | | Growth Opportunities Fund | |
| Share Class | | Beginning
Account
Value
9/1/12 | | | Ending
Account
Value
2/28/13 | | | Expenses
Paid for the
6 months
ended
2/28/13* | | | Beginning
Account
Value
9/1/12 | | | Ending
Account
Value
2/28/13 | | | Expenses
Paid for the
6 months
ended
2/28/13* | | | Beginning
Account
Value
9/1/12 | | | Ending
Account
Value
2/28/13 | | | Expenses
Paid for the
6 months
ended
2/28/13* | | | Beginning
Account
Value
9/1/12 | | | Ending
Account
Value
2/28/13 | | | Expenses
Paid for the
6 months
ended
2/28/13* | | | Beginning
Account
Value
9/1/12 | | | Ending
Account
Value
2/28/13 | | | Expenses
Paid for the
6 months
ended
2/28/13* | |
| Class A | | | | | | | | | | | | | | | | | | | | | | | | | | | | | | | | | | | | | | | | | | | | | | | | | | | | | | | | | | | | |
Actual | | $ | 1,000.00 | | | $ | 1,071.70 | | | $ | 5.86 | | | $ | 1,000.00 | | | $ | 1,076.60 | | | $ | 6.49 | | | $ | 1,000.00 | | | $ | 1,071.10 | | | $ | 6.47 | | | $ | 1,000.00 | | | $ | 1,096.50 | | | $ | 6.45 | | | $ | 1,000.00 | | | $ | 1,097.70 | | | $ | 7.02 | |
Hypothetical 5% return | | | 1,000.00 | | | | 1,019.14 | + | | | 5.71 | | | | 1,000.00 | | | | 1,018.55 | + | | | 6.31 | | | | 1,000.00 | | | | 1,018.55 | + | | | 6.31 | | | | 1,000.00 | | | | 1,018.65 | + | | | 6.21 | | | | 1,000.00 | | | | 1,018.10 | + | | | 6.76 | |
| Class B | | | | | | | | | | | | | | | | | | | | | | | | | | | | | | | | | | | | | | | | | | | | | | | | | | | | | | | | | | | | |
Actual | | | 1,000.00 | | | | 1,067.90 | | | | 9.69 | | | | 1,000.00 | | | | 1,073.20 | | | | 10.33 | | | | N/A | | | | N/A | | | | N/A | | | | N/A | | | | N/A | | | | N/A | | | | 1,000.00 | | | | 1,093.80 | | | | 10.90 | |
Hypothetical 5% return | | | 1,000.00 | | | | 1,015.42 | + | | | 9.44 | | | | 1,000.00 | | | | 1,014.83 | + | | | 10.04 | | | | N/A | | | | N/A | | | | N/A | | | | N/A | | | | N/A | | | | N/A | | | | 1,000.00 | | | | 1,014.38 | + | | | 10.49 | |
| Class C | | | | | | | | | | | | | | | | | | | | | | | | | | | | | | | | | | | | | | | | | | | | | | | | | | | | | | | | | | | | |
Actual | | | 1,000.00 | | | | 1,067.40 | | | | 9.69 | | | | 1,000.00 | | | | 1,073.30 | | | | 10.33 | | | | 1,000.00 | | | | 1,068.00 | | | | 10.36 | | | | 1,000.00 | | | | 1,091.60 | | | | 10.32 | | | | 1,000.00 | | | | 1,093.80 | | | | 10.90 | |
Hypothetical 5% return | | | 1,000.00 | | | | 1,015.42 | + | | | 9.44 | | | | 1,000.00 | | | | 1,014.83 | + | | | 10.04 | | | | 1,000.00 | | | | 1,014.78 | + | | | 10.09 | | | | 1,000.00 | | | | 1,014.93 | + | | | 9.94 | | | | 1,000.00 | | | | 1,014.38 | + | | | 10.49 | |
| Institutional | | | | | | | | | | | | | | | | | | | | | | | | | | | | | | | | | | | | | | | | | | | | | | | | | | | | | | | | | | | | |
Actual | | | 1,000.00 | | | | 1,073.80 | | | | 3.80 | | | | 1,000.00 | | | | 1,079.10 | | | | 4.43 | | | | 1,000.00 | | | | 1,074.10 | | | | 4.42 | | | | 1,000.00 | | | | 1,098.40 | | | | 4.37 | | | | 1,000.00 | | | | 1,100.20 | | | | 4.95 | |
Hypothetical 5% return | | | 1,000.00 | | | | 1,021.13 | + | | | 3.71 | | | | 1,000.00 | | | | 1,020.53 | + | | | 4.31 | | | | 1,000.00 | | | | 1,020.53 | + | | | 4.31 | | | | 1,000.00 | | | | 1,020.63 | + | | | 4.21 | | | | 1,000.00 | | | | 1,020.08 | + | | | 4.76 | |
| Service | | | | | | | | | | | | | | | | | | | | | | | | | | | | | | | | | | | | | | | | | | | | | | | | | | | | | | | | | | | | |
Actual | | | 1,000.00 | | | | 1,071.40 | | | | 6.37 | | | | N/A | | | | N/A | | | | N/A | | | | N/A | | | | N/A | | | | N/A | | | | N/A | | | | N/A | | | | N/A | | | | 1,000.00 | | | | 1,096.90 | | | | 7.54 | |
Hypothetical 5% return | | | 1,000.00 | | | | 1,018.65 | + | | | 6.21 | | | | N/A | | | | N/A | | | | N/A | | | | N/A | | | | N/A | | | | N/A | | | | N/A | | | | N/A | | | | N/A | | | | 1,000.00 | | | | 1,017.60 | + | | | 7.25 | |
| Class IR | | | | | | | | | | | | | | | | | | | | | | | | | | | | | | | | | | | | | | | | | | | | | | | | | | | | | | | | | | | | |
Actual | | | 1,000.00 | | | | 1,073.10 | | | | 4.57 | | | | 1,000.00 | | | | 1,078.00 | | | | 5.20 | | | | 1,000.00 | | | | 1,073.60 | | | | 5.19 | | | | 1,000.00 | | | | 1,096.80 | | | | 5.15 | | | | 1,000.00 | | | | 1,099.40 | | | | 5.73 | |
Hypothetical 5% return | | | 1,000.00 | | | | 1,020.38 | + | | | 4.46 | | | | 1,000.00 | | | | 1,019.79 | + | | | 5.06 | | | | 1,000.00 | | | | 1,019.79 | + | | | 5.06 | | | | 1,000.00 | | | | 1,019.89 | + | | | 4.96 | | | | 1,000.00 | | | | 1,019.34 | + | | | 5.51 | |
| Class R | | | | | | | | | | | | | | | | | | | | | | | | | | | | | | | | | | | | | | | | | | | | | | | | | | | | | | | | | | | | |
Actual | | | 1,000.00 | | | | 1,070.20 | | | | 7.13 | | | | 1,000.00 | | | | 1,076.20 | | | | 7.77 | | | | 1,000.00 | | | | 1,070.10 | | | | 7.75 | | | | 1,000.00 | | | | 1,094.80 | | | | 7.74 | | | | 1,000.00 | | | | 1,096.70 | | | | 8.32 | |
Hypothetical 5% return | | | 1,000.00 | | | | 1,017.90 | + | | | 6.95 | | | | 1,000.00 | | | | 1,017.31 | + | | | 7.55 | | | | 1,000.00 | | | | 1,017.31 | + | | | 7.55 | | | | 1,000.00 | | | | 1,017.41 | + | | | 7.45 | | | | 1,000.00 | | | | 1,016.86 | + | | | 8.00 | |
127
GOLDMAN SACHS FUNDAMENTAL EQUITY GROWTH FUNDS
Fund Expenses — Six Month Period Ended February 28, 2013 (Unaudited) (continued)
| | | | | | | | | | | | | | | | | | | | | | | | | | | | | | | | | | | | | | | | | | | | | | | | |
| | | Small/Mid Cap Growth Fund | | | Strategic Growth Fund | | | Technology Tollkeeper Fund | | | U.S. Equity Fund | |
| Share Class | | Beginning
Account
Value
9/1/12 | | | Ending
Account
Value
2/28/13 | | | Expenses
Paid for the
6 months ended
2/28/13* | | | Beginning
Account
Value
9/1/12 | | | Ending
Account
Value
2/28/13 | | | Expenses
Paid for the
6 months ended
2/28/13* | | | Beginning
Account
Value
9/1/12 | | | Ending
Account
Value
2/28/13 | | | Expenses
Paid for the
6 months ended
2/28/13* | | | Beginning
Account
Value
9/1/12 | | | Ending
Account
Value
2/28/13 | | | Expenses
Paid for the
6 months ended
2/28/13* | |
| Class A | | | | | | | | | | | | | | | | | | | | | | | | | | | | | | | | | | | | | | | | | | | | | | | | |
Actual | | $ | 1,000.00 | | | $ | 1,125.70 | | | $ | 7.06 | | | $ | 1,000.00 | | | $ | 1,074.50 | | | $ | 5.97 | | | $ | 1,000.00 | | | $ | 1,036.00 | | | $ | 7.57 | | | $ | 1,000.00 | | | $ | 1,095.90 | | | $ | 6.13 | |
Hypothetical 5% return | | | 1,000.00 | | | | 1,018.15 | + | | | 6.71 | | | | 1,000.00 | | | | 1,019.04 | + | | | 5.81 | | | | 1,000.00 | | | | 1,017.36 | + | | | 7.50 | | | | 1,000.00 | | | | 1,018.94 | + | | | 5.91 | |
| Class B | | | | | | | | | | | | | | | | | | | | | | | | | | | | | | | | | | | | | | | | | | | | | | | | |
Actual | | | 1,000.00 | | | | 1,121.20 | | | | 10.99 | | | | 1,000.00 | | | | 1,070.30 | | | | 9.80 | | | | 1,000.00 | | | | 1,032.40 | | | | 11.34 | | | | N/A | | | | N/A | | | | N/A | |
Hypothetical 5% return | | | 1,000.00 | | | | 1,014.43 | + | | | 10.44 | | | | 1,000.00 | | | | 1,015.32 | + | | | 9.54 | | | | 1,000.00 | | | | 1,013.64 | + | | | 11.23 | | | | N/A | | | | N/A | | | | N/A | |
| Class C | | | | | | | | | | | | | | | | | | | | | | | | | | | | | | | | | | | | | | | | | | | | | | | | |
Actual | | | 1,000.00 | | | | 1,121.30 | | | | 10.99 | | | | 1,000.00 | | | | 1,069.20 | | | | 9.80 | | | | 1,000.00 | | | | 1,032.40 | | | | 11.34 | | | | 1,000.00 | | | | 1,092.30 | | | | 10.01 | |
Hypothetical 5% return | | | 1,000.00 | | | | 1,014.43 | + | | | 10.44 | | | | 1,000.00 | | | | 1,015.32 | + | | | 9.54 | | | | 1,000.00 | | | | 1,013.64 | + | | | 11.23 | | | | 1,000.00 | | | | 1,015.22 | + | | | 9.64 | |
| Institutional | | | | | | | | | | | | | | | | | | | | | | | | | | | | | | | | | | | | | | | | | | | | | | | | |
Actual | | | 1,000.00 | | | | 1,128.00 | | | | 4.96 | | | | 1,000.00 | | | | 1,076.40 | | | | 3.91 | | | | 1,000.00 | | | | 1,038.40 | | | | 5.56 | | | | 1,000.00 | | | | 1,098.60 | | | | 4.06 | |
Hypothetical 5% return | | | 1,000.00 | | | | 1,020.13 | + | | | 4.71 | | | | 1,000.00 | | | | 1,021.03 | + | | | 3.81 | | | | 1,000.00 | | | | 1,019.34 | + | | | 5.51 | | | | 1,000.00 | | | | 1,020.93 | + | | | 3.91 | |
| Service | | | | | | | | | | | | | | | | | | | | | | | | | | | | | | | | | | | | | | | | | | | | | | | | |
Actual | | | 1,000.00 | | | | 1,125.20 | | | | 7.59 | | | | 1,000.00 | | | | 1,072.70 | | | | 6.48 | | | | 1,000.00 | | | | 1,035.60 | | | | 8.08 | | | | N/A | | | | N/A | | | | N/A | |
Hypothetical 5% return | | | 1,000.00 | | | | 1,017.65 | + | | | 7.20 | | | | 1,000.00 | | | | 1,018.55 | + | | | 6.31 | | | | 1,000.00 | | | | 1,016.86 | + | | | 8.00 | | | | N/A | | | | N/A | | | | N/A | |
| Class IR | | | | | | | | | | | | | | | | | | | | | | | | | | | | | | | | | | | | | | | | | | | | | | | | |
Actual | | | 1,000.00 | | | | 1,127.30 | | | | 5.75 | | | | 1,000.00 | | | | 1,074.80 | | | | 4.68 | | | | 1,000.00 | | | | 1,037.80 | | | | 6.32 | | | | 1,000.00 | | | | 1,097.70 | | | | 4.84 | |
Hypothetical 5% return | | | 1,000.00 | | | | 1,019.39 | + | | | 5.46 | | | | 1,000.00 | | | | 1,020.28 | + | | | 4.56 | | | | 1,000.00 | | | | 1,018.60 | + | | | 6.26 | | | | 1,000.00 | | | | 1,020.18 | + | | | 4.66 | |
| Class R | | | | | | | | | | | | | | | | | | | | | | | | | | | | | | | | | | | | | | | | | | | | | | | | |
Actual | | | 1,000.00 | | | | 1,123.80 | | | | 8.37 | | | | 1,000.00 | | | | 1,072.70 | | | | 6.84 | | | | N/A | | | | N/A | | | | N/A | | | | 1,000.00 | | | | 1,095.50 | | | | 7.48 | |
Hypothetical 5% return | | | 1,000.00 | | | | 1,016.91 | + | | | 7.95 | | | | 1,000.00 | | | | 1,018.20 | + | | | 6.66 | | | | N/A | | | | N/A | | | | N/A | | | | 1,000.00 | | | | 1,017.65 | + | | | 7.20 | |
| * | | Expenses for each share class are calculated using each Fund’s annualized net expense ratio for each class, which represents the ongoing expenses as a percentage of net assets for the six months ended February 28, 2013. Expenses are calculated by multiplying the annualized net expense ratio by the average account value for the period; then multiplying the result by the number of days in the most recent fiscal half year; and then dividing that result by the number of days in the fiscal year. The annualized net expense ratios for the period were as follows: |
| | | | | | | | | | | | | | | | | | | | | | | | | | | | |
| Fund | | Class A | | | Class B | | | Class C | | | Institutional | | | Service | | | Class IR | | | Class R | |
Capital Growth | | | 1.14 | % | | | 1.89 | % | | | 1.89 | % | | | 0.74 | % | | | 1.24 | % | | | 0.89 | % | | | 1.39 | % |
Concentrated Growth | | | 1.26 | | | | 2.01 | | | | 2.01 | | | | 0.86 | | | | N/A | | | | 1.01 | | | | 1.51 | |
Flexible Cap Growth | | | 1.26 | | | | N/A | | | | 2.02 | | | | 0.86 | | | | N/A | | | | 1.01 | | | | 1.51 | |
Focused Growth | | | 1.24 | | | | N/A | | | | 1.99 | | | | 0.84 | | | | N/A | | | | 0.99 | | | | 1.49 | |
Growth Opportunities | | | 1.35 | | | | 2.10 | | | | 2.10 | | | | 0.95 | | | | 1.45 | | | | 1.10 | | | | 1.60 | |
Small/Mid Cap Growth | | | 1.34 | | | | 2.09 | | | | 2.09 | | | | 0.94 | | | | 1.44 | | | | 1.09 | | | | 1.59 | |
Strategic Growth | | | 1.16 | | | | 1.91 | | | | 1.91 | | | | 0.76 | | | | 1.26 | | | | 0.91 | | | | 1.33 | |
Technology Tollkeeper | | | 1.50 | | | | 2.25 | | | | 2.25 | | | | 1.10 | | | | 1.60 | | | | 1.25 | | | | N/A | |
U.S. Equity | | | 1.18 | | | | N/A | | | | 1.93 | | | | 0.78 | | | | N/A | | | | 0.93 | | | | 1.44 | |
| + | | Hypothetical expenses are based on each Fund’s actual annualized net expense ratios and an assumed rate of return of 5% per year before expenses. |
128
FUNDS PROFILE
Goldman Sachs Funds

Goldman Sachs is a premier financial services firm, known since 1869 for creating thoughtful and customized investment solutions in complex global markets.
Today, the Investment Management Division of Goldman Sachs serves a diverse set of clients worldwide, including private institutions, public entities and individuals. With approximately $742.4 billion in assets under management as of December 31, 2012, Goldman Sachs Asset Management (“GSAM”) has portfolio management teams located around the world and our investment professionals bring firsthand knowledge of local markets to every investment decision. GSAM’s assets under management includes assets managed by Goldman Sachs Asset Management, LP and its Investment Advisory Affiliates.
|
| OVERVIEW OF GOLDMAN SACHS FUNDS |

Money Market1
Financial Square FundsSM
| n | | Financial Square Tax-Exempt Funds |
| n | | Financial Square Federal Fund |
| n | | Financial Square Government Fund |
| n | | Financial Square Money Market Fund |
| n | | Financial Square Prime Obligations Fund |
| n | | Financial Square Treasury Instruments Fund |
| n | | Financial Square Treasury Obligations Fund |
Fixed Income
Short Duration and Government
| n | | High Quality Floating Rate Fund2 |
| n | | Short Duration Government Fund |
| n | | Short Duration Income Fund |
| n | | Inflation Protected Securities Fund |
Multi-Sector
| n | | Core Plus Fixed Income Fund |
Municipal and Tax-Free
| n | | High Yield Municipal Fund |
| n | | Short Duration Tax-Free Fund |
Single Sector
| n | | Investment Grade Credit Fund |
| n | | High Yield Floating Rate Fund |
| n | | Emerging Markets Debt Fund |
| n | | Local Emerging Markets Debt Fund |
Corporate Credit
Fundamental Equity
| n | | Small/Mid Cap Growth Fund |
| n | | Flexible Cap Growth Fund |
| n | | Concentrated Growth Fund |
| n | | Technology Tollkeeper Fund |
| n | | Growth Opportunities Fund |
| n | | Rising Dividend Growth Fund |
Structured Equity
| n | | Structured Small Cap Equity Fund |
| n | | Structured U.S. Equity Fund |
| n | | Structured Small Cap Growth Fund |
| n | | Structured Large Cap Growth Fund |
| n | | Structured Large Cap Value Fund |
| n | | Structured Small Cap Value Fund |
| n | | Structured Tax-Managed Equity Fund Structured International |
| n | | Tax-Managed Equity Fund |
| n | | U.S. Equity Dividend and Premium Fund |
| n | | International Equity Dividend and Premium Fund |
| n | | Structured International Small Cap Fund |
| n | | Structured International Equity Fund Structured Emerging Markets Equity Fund |
Fundamental Equity International
| n | | Strategic International Equity Fund |
| n | | Concentrated International Equity Fund |
| n | | International Small Cap Fund |
| n | | Emerging Markets Equity Fund |
| n | | BRIC Fund (Brazil, Russia, India, China) |
| n | | N-11 Equity Fund China Equity Fund |
Select Satellite4
| n | | Real Estate Securities Fund |
| n | | International Real Estate |
| n | | Commodity Strategy Fund |
| n | | Dynamic Allocation Fund |
| n | | Absolute Return Tracker Fund |
| n | | Managed Futures Strategy Fund |
| n | | Retirement Portfolio Completion Fund Income Strategies Portfolio |
Total Portfolio Solutions4
| n | | Balanced Strategy Portfolio |
| n | | Growth and Income Strategy Portfolio |
| n | | Growth Strategy Portfolio |
| n | | Equity Growth Strategy Portfolio |
| n | | Satellite Strategies Portfolio |
| n | | Enhanced Dividend Global Equity Portfolio |
| n | | Tax Advantaged Global Equity Portfolio |
| 1 | | An investment in a money market fund is neither insured nor guaranteed by the Federal Deposit Insurance Corporation (“FDIC”) or any other government agency. Although the Funds seek to preserve the value of your investment at $1.00 per share, it is possible to lose money by investing in the Funds. |
| 2 | | Effective at the close of business on July 27, 2012, the Goldman Sachs Ultra-Short Duration Government Fund was renamed the Goldman Sachs High Quality Floating Rate Fund. |
| 3 | | Effective at the close of business on June 29, 2012, the Goldman Sachs Balanced Fund was renamed the Goldman Sachs Income Builder Fund. |
| 4 | | Individual Funds within the Total Portfolio Solutions and Select Satellite categories will have various placement on the risk/return spectrum and may have greater or lesser risk than that indicated by the placement of the general Total Portfolio Solutions or Select Satellite category. |
Financial Square FundsSM is a registered service mark of Goldman, Sachs & Co.
| | |
TRUSTEES Ashok N. Bakhru, Chairman Donald C. Burke John P. Coblentz, Jr. Diana M. Daniels Joseph P. LoRusso James A. McNamara Jessica Palmer Alan A. Shuch Richard P. Strubel | | OFFICERS James A. McNamara, President George F. Travers, Principal Financial Officer Caroline Kraus, Secretary Scott M. McHugh, Treasurer |
| |
GOLDMAN, SACHS & CO. Distributor and Transfer Agent | | GOLDMAN SACHS ASSET MANAGEMENT, L.P. Investment Adviser |
Visit our Web site at www.goldmansachsfunds.com to obtain the most recent month-end returns.
Goldman Sachs Asset Management, L.P. 200 West Street, New York, New York 10282
The reports concerning the Funds included in this shareholder report may contain certain forward-looking statements about the factors that may affect the performance of the Funds in the future. These statements are based on Fund management’s predictions and expectations concerning certain future events and their expected impact on the Funds, such as performance of the economy as a whole and of specific industry sectors, changes in the levels of interest rates, the impact of developing world events, and other factors that may influence the future performance of the Funds. Management believes these forward-looking statements to be reasonable, although they are inherently uncertain and difficult to predict. Actual events may cause adjustments in portfolio management strategies from those currently expected to be employed.
A description of the policies and procedures that the Funds use to determine how to vote proxies relating to portfolio securities and information regarding how a Fund voted proxies relating to portfolio securities during the most recent 12-month period ended June 30 is available (I) without charge, upon request by calling 1-800-526-7384 (for Retail Shareholders) or 1-800-621-2550 (for Institutional Shareholders); and (II) on the Securities and Exchange Commission Web site at http://www.sec.gov.
The Funds file their complete schedule of portfolio holdings with the Securities and Exchange Commission (“SEC”) for the first and third quarters of each fiscal year on Form N-Q. The Funds’ Forms N-Q are available on the SEC’s Web site at http://www.sec.gov within 60 days after the Funds’ first and third fiscal quarters. The Funds’ Forms N-Q may be reviewed and copied at the SEC’s Public Reference Room in Washington, D.C. and information on the operation of the Public Reference Room may also be obtained by calling 1-800-SEC-0330. Form N-Q may be obtained upon request and without charge by calling 1-800-526-7384 (for Retail Shareholders) or 1-800-621-2550 (for Institutional Shareholders).
The Global Industry Classification Standard (GICS) was developed by and is the exclusive property and a service mark of Morgan Stanley Capital International Inc. (MSCI) and Standard & Poor’s, a division of The McGraw-Hill Companies, Inc. (S&P) and is licensed for use by Goldman Sachs. Neither MSCI, S&P nor any other party involved in making or compiling the GICS or any GICS classifications makes any express or implied warranties or representations with respect to such standard or classification (or the results to be obtained by the use thereof), and all such parties hereby expressly disclaim all warranties of originality, accuracy, completeness, merchantability or fitness for a particular purpose with respect to any of such standard or classification. Without limiting any of the foregoing, in no event shall MSCI, S&P, any of their affiliates or any third party involved in making or compiling the GICS or any GICS classifications have any liability for any direct, indirect, special, punitive, consequential or any other damages (including lost profits) even if notified of the possibility of such damages.
Holdings and allocations shown are as of February 28, 2013 and may not be representative of future investments. Fund holdings should not be relied on in making investment decisions and should not be construed as research or investment advice regarding particular securities.
Economic and market forecasts presented herein reflect our judgment as of the date of this presentation and are subject to change without notice. These forecasts do not take into account the specific investment objectives, restrictions, tax and financial situation or other needs of any specific client. Actual data will vary and may not be reflected here. These forecasts are subject to high levels of uncertainty that may affect actual performance. Accordingly, these forecasts should be viewed as merely representative of a broad range of possible outcomes. These forecasts are estimated, based on assumptions, and are subject to significant revision and may change materially as economic and market conditions change. Goldman Sachs has no obligation to provide updates or changes to these forecasts. Case studies and examples are for illustrative purposes only.
This material is not authorized for distribution to prospective investors unless preceded or accompanied by a current Prospectus or summary prospectus, if applicable. Investors should consider a Fund’s objective, risks, and charges and expenses, and read the summary prospectus, if available, and/or the Prospectus carefully before investing or sending money. The summary prospectus, if available, and the Prospectus contain this and other information about a Fund and may be obtained from your authorized dealer or from Goldman, Sachs & Co. by calling (retail – 1-800-526-7384) (institutional – 1-800-621-2550).
© 2013 Goldman Sachs. All rights reserved. 97189.MF.MED.TMPL / 4 / 2013 EQGRWSAR13 / 193K
| | The information required by this Item is only required in an annual report on this Form N-CSR. |
| ITEM 3. | AUDIT COMMITTEE FINANCIAL EXPERT. |
| | The information required by this Item is only required in an annual report on this Form N-CSR. |
| ITEM 4. | PRINCIPAL ACCOUNTANT FEES AND SERVICES. |
| | The information required by this Item is only required in an annual report on this Form N-CSR. |
| ITEM 5. | AUDIT COMMITTEE OF LISTED REGISTRANTS. |
| ITEM 6. | SCHEDULE OF INVESTMENTS. |
| | Schedule of Investments is included as part of the Report to Stockholders filed under Item 1. |
| ITEM 7. | DISCLOSURE OF PROXY VOTING POLICIES AND PROCEDURES FOR CLOSED-END MANAGEMENT INVESTMENT COMPANIES. |
| ITEM 8. | PORTFOLIO MANAGERS OF CLOSED-END MANAGEMENT INVESTMENT COMPANIES. |
| ITEM 9. | PURCHASES OF EQUITY SECURITIES BY CLOSED-END MANAGEMENT INVESTMENT COMPANY AND AFFILIATED PURCHASERS. |
| ITEM 10. | SUBMISSION OF MATTERS TO A VOTE OF SECURITY HOLDERS. |
| | There have been no material changes to the procedures by which shareholders may recommend nominees to the registrant’s board of trustees. |
| ITEM 11. | CONTROLS AND PROCEDURES. |
| | (a) | The registrant’s principal executive and principal financial officers, or persons performing similar functions have concluded that the registrant’s disclosure controls and procedures (as defined in Rule 30a-3(c) under the Investment Company Act of 1940, as amended (the “1940 Act”)) are effective as of a date within 90 days of the filing of this report that includes the disclosure required by this paragraph, based on the evaluation of these controls and procedures required by Rule 30a-3(b) under the 1940 Act and 15d-15(b) under the Securities Exchange Act of 1934, as amended. |
| | (b) | There were no changes in the registrant’s internal control over financial reporting (as defined in Rule 30a-3(d) under the 1940 Act) that occurred during the registrant’s second fiscal quarter of the period covered by this report that have materially affected, or are reasonably likely to materially affect, the registrant’s internal control over financial reporting. |
| | | | |
| (a)(1) | | The information required by this Item is only required in connection with an annual report on this Form N-CSR. |
| | |
| (a)(2) | | Exhibit 99.CERT | | Certifications pursuant to Section 302 of the Sarbanes-Oxley Act of 2002 filed herewith. |
| | |
| (b) | | Exhibit 99.906CERT | | Certifications pursuant to Section 906 of the Sarbanes-Oxley Act of 2002 filed herewith. |
SIGNATURES
Pursuant to the requirements of the Securities Exchange Act of 1934 and the Investment Company Act of 1940, the registrant has duly caused this report to be signed on its behalf by the undersigned, thereunto duly authorized.
| | | | |
| | | | Goldman Sachs Trust |
| | |
| By: | | | | /s/ James A. McNamara |
| | | | James A. McNamara |
| | | | President/Principal Executive Officer |
| | | | Goldman Sachs Trust |
| | |
| Date: | | | | April 18, 2013 |
Pursuant to the requirements of the Securities Exchange Act of 1934 and the Investment Company Act of 1940, this report has been signed below by the following persons on behalf of the registrant and in the capacities and on the dates indicated.
| | | | |
| By: | | | | /s/ James A. McNamara |
| | | | James A. McNamara |
| | | | President/Principal Executive Officer |
| | | | Goldman Sachs Trust |
| | |
| Date: | | | | April 18, 2013 |
| | |
| By: | | | | /s/ George F. Travers |
| | | | George F. Travers |
| | | | Principal Financial Officer |
| | | | Goldman Sachs Trust |
| | |
| Date: | | | | April 18, 2013 |