UNITED STATES
SECURITIES AND EXCHANGE COMMISSION
Washington, D.C. 20549
FORM N-CSR
CERTIFIED SHAREHOLDER REPORT OF REGISTERED
MANAGEMENT INVESTMENT COMPANIES
Investment Company Act file number 811-05349
Goldman Sachs Trust
(Exact name of registrant as specified in charter)
71 South Wacker Drive,
Chicago, Illinois 60606
(Address of principal executive offices) (Zip code)
| | |
Copies to: |
Caroline Kraus | | Geoffrey R.T. Kenyon, Esq. |
Goldman, Sachs & Co. | | Dechert LLP |
200 West Street | | 200 Clarendon Street |
New York, New York 10282 | | 27th Floor |
| | Boston, MA 02116-5021 |
(Name and address of agents for service)
Registrant’s telephone number, including area code: (312) 655-4400
Date of fiscal year end: October 31
Date of reporting period: April 30, 2013
| ITEM 1. | REPORTS TO STOCKHOLDERS. |
| | The Semi-Annual Report to Stockholders is filed herewith. |
Goldman Sachs Funds

| | | | |
| | |
| Semi-Annual Report | | | | April 30, 2013 |
| | |
| | | | International Equity Insights Funds* |
| | | | Emerging Markets Equity Insights |
| | | | International Equity Insights |
| | | | International Small Cap Insights |
*Effective May 3, 2013, the Goldman Sachs Structured Emerging Markets Equity, Structured International Equity and Structured International Small Cap Funds were renamed the Goldman Sachs Emerging Markets Equity Insights, International Equity Insights and International Small Cap Insights Funds, respectively.

Goldman Sachs International Equity Insights Funds
| | | | |
n EMERGING MARKETS EQUITY INSIGHTS n INTERNATIONAL EQUITY INSIGHTS n INTERNATIONAL SMALL CAP INSIGHTS | | | | Emerging Markets Equity Insights, International Equity Insights, and International Small Cap Insights were formerly known as Structured Emerging Markets Equity, Structured International Equity, and Structured International Small Cap, respectively. They are referenced throughout this report by their aforementioned revised names. |
| | | | |
TABLE OF CONTENTS | | | | |
| |
Principal Investment Strategies and Risks | | | 1 | |
| |
Investment Process | | | 2 | |
| |
Market Review | | | 4 | |
| |
Portfolio Management Discussions and Performance Summaries | | | 7 | |
| |
Schedules of Investments | | | 22 | |
| |
Financial Statements | | | 46 | |
| |
Financial Highlights | | | 50 | |
| |
Notes to the Financial Statements | | | 56 | |
| |
Other Information | | | 72 | |
| | | | |
| | | |
| NOT FDIC-INSURED | | May Lose Value | | No Bank Guarantee |
GOLDMAN SACHS INTERNATIONAL EQUITY INSIGHTS FUNDS
Principal Investment Strategies and Risks
This is not a complete list of risks that may affect the Funds. For additional information concerning the risks applicable to the Funds, please see the Funds’ Prospectus.
The Goldman Sachs Emerging Markets Equity Insights Fund invests primarily in a diversified portfolio of equity investments in emerging country issuers. The Fund’s investments are subject to market risk, which means that the value of the securities in which it invests may go up or down in response to the prospects of individual companies, particular sectors and/or general economic conditions. Foreign and emerging markets investments may be more volatile and less liquid than investments in U.S. securities and are subject to the risks of currency fluctuations and adverse economic and political developments. The securities markets of emerging countries have less government regulation and are subject to less extensive accounting and financial reporting requirements than the markets of more developed countries. At times, the Fund may be unable to sell certain of its illiquid investments without a substantial drop in price, if at all. The Investment Adviser’s use of quantitative models to execute the Fund’s investment strategy may fail to produce the intended result. Different investment styles (e.g., “quantitative”) tend to shift in and out of favor, and at times the Fund may underperform other funds that invest in similar asset classes.
The Goldman Sachs International Equity Insights Fund invests primarily in a broadly diversified portfolio of equity investments in companies that are organized outside the United States or whose securities are principally traded outside the United States. The Fund’s investments are subject to market risk, which means that the value of the securities in which it invests may go up or down in response to the prospects of individual companies, particular sectors and/or general economic conditions. Foreign and emerging markets investments may be more volatile and less liquid than investments in U.S. securities and are subject to the risks of currency fluctuations and adverse economic or political developments. The Investment Adviser’s use of quantitative models to execute the Fund’s investment strategy may fail to produce the intended result. Different investment styles (e.g., “quantitative”) tend to shift in and out of favor, and at times the Fund may underperform other funds that invest in similar asset classes.
The Goldman Sachs International Small Cap Insights Fund invests primarily in a broadly diversified portfolio of equity investments in small capitalization non-U.S. issuers. The Fund’s investments are subject to market risk, which means that the value of the securities in which it invests may go up or down in response to the prospects of individual companies, particular sectors and/or general economic conditions. Foreign and emerging markets investments may be more volatile and less liquid than investments in U.S. securities and are subject to the risks of currency fluctuations and adverse economic or political developments. The securities of mid- and small-capitalization companies involve greater risks than those associated with larger, more established companies and may be subject to more abrupt or erratic price movements. The Investment Adviser’s use of quantitative models to execute the Fund’s investment strategy may fail to produce the intended result. Different investment styles (e.g., “quantitative”) tend to shift in and out of favor, and at times the Fund may underperform other funds that invest in similar asset classes.
1
GOLDMAN SACHS INTERNATIONAL EQUITY INSIGHTS FUNDS
Goldman Sachs’ International Equity Insights Investment Process
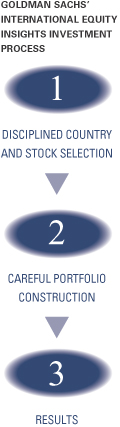

| n | | Comprehensive — We forecast returns on over 8,000 international stocks and 43 equity markets on a daily basis. |
| n | | Rigorous — We evaluate stocks, countries and currencies based on fundamental investment criteria that have outperformed historically. |
| n | | Objective — Our stock and equity market selection process is free from emotion that may lead to biased investment decisions. |

| n | | Our computer optimization process allocates risk to our best investment ideas and constructs funds that strive to neutralize systematic risks and deliver better returns. |
| n | | We use unique, proprietary risk models that are designed to be more precise, more focused and faster to respond because they seek to identify, track and manage risk specific to our process, using daily data. |

Fully invested, well-diversified international portfolio that seeks to:
| n | | Blend top-down market views with bottom-up stock selection. |
| n | | Maintain style, sector, risk and capitalization characteristics similar to the benchmark. |
| n | | Achieve excess returns by taking many small diversified stock positions. Additionally, in the GS Emerging Markets Equity Insights Fund and the GS International Equity Insights Fund we take intentional country bets. |
|
| |
| Enhancements Made to Proprietary Quantitative Model during the Six-Month Period Ended April 30, 2013 |
| |
| We continuously look for ways to improve our investment process. Accordingly, we introduced a number of enhancements to our proprietary quantitative model during the six-month period ended April 30, 2013. |
| During the fourth quarter of 2012, we implemented an enhancement to our stock selection process across several geographic regions, incorporating several measures to the signals within our Quality theme. These include measures of capital investment, funding source, earnings quality, competitive positioning and financial solvency. We believe these measures enhance the signals within our Quality theme by capturing how much of a company’s investment quality can be attributed to management decisions as well as to firm economics. |
| |
| In addition, we extended our Momentum theme in Continental Europe, the U.K. and Japan using enhanced cross-company linkages. In Continental Europe and the U.K., we link economically-related companies, which may or may not belong to the same industry. In Japan, we leverage its unique corporate infrastructure (“keiretsu”), where cross share holding is common, to create a cross company linkage signal. (A kieretsu is |
2
GOLDMAN SACHS INTERNATIONAL EQUITY INSIGHTS FUNDS
|
| |
| a set of companies with interlocking business relationships and shareholdings.) We believe these signals help identify Momentum trends earlier in their history. |
| |
| Also during the fourth quarter of 2012, we enhanced our Momentum theme in the emerging markets, creating a currency signal to allow us to take advantage of mispricing due to currency risk. Additionally, we added a new Management theme based on financing decisions. |
| |
| We made no enhancements to our proprietary quantitative model within the international or emerging markets regions during the first quarter of 2013. |
3
MARKET REVIEW
Goldman Sachs International Equity
Insights Funds
Market Review
Emerging markets equities and developed international equities advanced during the six-month period ended April 30, 2013 (the “Reporting Period”).
Emerging Markets Equities
Emerging markets equities generated solid positive absolute returns during the Reporting Period, but underperformed developed international equities, as concerns over slowing economic growth in several regions weighed on many of the larger growth and emerging markets. In turn, a number of countries’ central banks began to cut interest rates in an effort to boost economic growth.
Improving economic data for China lifted the Chinese equity markets and others in the region toward the end of 2012, but those same markets pulled back in 2013 on fears of new regulation and tightening measures in China. China’s equity market lagged the MSCI Emerging Markets Index (net, unhedged) (“MSCI Emerging Markets Index”) for the Reporting Period overall, but Asia was still the best performing region during the Reporting Period, with many markets significantly outperforming the MSCI Emerging Markets Index. The Philippine equity market, which received its first investment grade rating for its debt from Fitch, Inc. posted the strongest returns during the Reporting Period. Thailand, Indonesia and Taiwan also notably outperformed. Outside of Asia, the only country components of the MSCI Emerging Markets Index to post double-digit gains were Turkey and Mexico. Weakness in the South Korean equity market reflected disappointment that the Bank of Korea did not cut interest rates amidst lackluster economic growth projections and worries about the effects of the weak yen on South Korea’s exports. North Korea’s provocations drew additional concern. The Russian equity market was also particularly weak during the Reporting Period, reflecting economic growth concerns, which, in turn, weakened the ruble. The Economic Development Ministry significantly reduced its forecast for Russian GDP growth for 2013 to 2.4%. Generating negative returns during the Reporting Period were some smaller equity markets, including those of Egypt, Czech Republic, Colombia and South Africa.
For the Reporting Period overall, the MSCI Emerging Markets Index returned 5.29%.* Fifteen of the 21 countries in the MSCI Emerging Markets Index were up for the Reporting Period, with the Philippines (+32.35%) and Thailand (+21.85%) recording the largest gains. Taiwan (+12.47%) was the largest contributor on the basis of impact, which takes both weightings and total returns into account.
Eight of the 10 sectors in the MSCI Emerging Markets Index were positive for the Reporting Period, with financials (+12.28%) and consumer staples (+11.46%) gaining the most ground. The financials sector was the largest contributor to MSCI Emerging Markets Index returns on the basis of impact.
4
MARKET REVIEW
International Equities
The commitment to low interest rates and easy monetary policy from central banks in the U.S., Europe and Japan drove developed international equity performance during the Reporting Period, contributing to particularly strong returns amongst financials stocks.
Japanese equities surged during the Reporting Period and led returns within the MSCI Europe, Australasia, Far East (EAFE) Index (net, unhedged) (the “MSCI EAFE Index”). Japan’s Liberal Democratic Party returned to power late in 2012 after campaigning on a platform of establishing an inflation target and weakening the yen. Once elected, Japan’s new prime minister, Shinzo Abe, followed through on setting an inflation target, while the new head of the Bank of Japan, Haruhiku Kuroda, announced a decision to double Japan’s monetary base. The yen subsequently weakened to its lowest level against the U.S. dollar in four years. The sharp rally in Japanese equity markets reflected optimism that the aggressive policies from its government and central bank would end deflation and stimulate Japan’s economy. In addition, the Japanese equity market responded positively to the weaker yen, which benefits Japan’s export-oriented economy.
European equities advanced solidly, generally reflecting optimism regarding Europe’s ability to work through its debt issues, despite some volatility during the Reporting Period driven by a banking crisis in Cyprus and by Italy’s political stalemate. In April 2013, the International Monetary Fund (“IMF”) lowered slightly its forecast for the Eurozone to a 0.3% contraction in economic growth for calendar year 2013. Other lackluster economic data points for Europe during April 2013 fueled speculation that the European Central Bank (“ECB”) would cut interest rates in early May 2013. Such speculation boosted equity markets broadly and financials stocks in particular. Additionally, a previously well-regarded academic paper linking lower debt-to-GDP ratios and economic growth was repudiated, leading equity markets to reflect the possibility of less austerity in Europe’s future.
For the Reporting Period overall, the MSCI EAFE Index returned 16.90%.* All 22 countries in the MSCI EAFE Index were up for the Reporting Period, with Japan (+31.40%) and Greece (+25.79%) recording the largest gains. Japan was also the largest contributor on the basis of impact, which takes both weightings and total returns into account.
All 10 sectors in the MSCI EAFE Index posted positive returns for the Reporting Period, with consumer discretionary (+24.49%) and financials (+23.49%) gaining the most. The financials sector was also the largest contributor to MSCI EAFE Index returns on the basis of impact.
In the international small cap arena, the MSCI EAFE Small Cap Index (unhedged and net of dividend withholding taxes) (“MSCI EAFE Small Cap Index”) advanced 18.08%* during the Reporting Period. All 22 countries in the MSCI EAFE Small Cap Index were up for the Reporting Period, with Ireland (+39.57%) and Portugal (31.77%) posting the largest gains. Japan (+28.01%)��was the largest contributor on the basis of impact, which takes both weightings and total returns into account.
Nine of the 10 sectors in the MSCI EAFE Small Cap Index recorded positive results for the Reporting Period, with telecommunication services (+27.90%) and consumer discretionary (+25.69%) gaining the most. The consumer discretionary sector was also the largest contributor to MSCI EAFE Small Cap Index returns on the basis of impact.
5
MARKET REVIEW
Looking Ahead
We continue to believe that less expensive stocks are likely to outpace more expensive stocks. In addition, we expect stocks with good momentum to outperform those with poor momentum. We plan to focus on seeking companies about which fundamental research analysts are becoming more positive as well as profitable companies with sustainable earnings and a track record of using their capital to enhance shareholder value. As such, we anticipate remaining fully invested, with long-term performance likely to be the result of stock selection rather than sector or capitalization allocations.
| *All | | index returns are expressed in U.S. dollar terms. |
6
PORTFOLIO RESULTS
Goldman Sachs Emerging Markets Equity
Insights Fund
Portfolio Management Discussion and Analysis
Effective after the close of business on May 3, 2013, the Goldman Sachs Structured Emerging Markets Equity Fund was renamed the Goldman Sachs Emerging Markets Equity Insights Fund (the “Fund”). Below, the Goldman Sachs Quantitative Investment Strategies Team discusses the Fund’s performance and positioning for the six-month period ended April 30, 2013 (the “Reporting Period”).
| Q | | How did the Fund perform during the Reporting Period? |
| A | | During the Reporting Period, the Fund’s Class A, C, Institutional and IR Shares generated cumulative total returns, without sales charges, of 9.93%, 9.31%, 9.99% and 9.97%, respectively. These returns compare to the 5.29% cumulative total return of the Fund’s benchmark, the MSCI Emerging Markets Standard Index (net, unhedged) (the “Index”), during the same period. |
| Q | | What key factors were most responsible for the Fund’s performance during the Reporting Period? |
| A | | We use two distinct strategies — a bottom-up stock selection strategy and a top-down country/currency selection strategy — to manage the Fund. These strategies are uncorrelated, that is, they tend to perform independently of each other over time, which enables us to greater diversify the portfolio. During the Reporting Period, our country/currency selection strategy boosted the Fund’s relative returns. Our stock selection strategy, which uses fundamental research and stock selection models based on six investment themes, also added to relative performance. |
| Q | | Which investment themes helped and which hurt within the Team’s stock selection strategy? |
| A | | Our bottom-up stock selection strategy performed well largely because of our investment themes. We use a quantitative model and six investment themes to take a long-term view of market patterns and look for inefficiencies, selecting stocks for the Fund and overweighting or underweighting those stocks chosen by the model. Over time and by design, the performance of any one of our model’s investment themes tends to have a low correlation with the model’s other themes, demonstrating the diversification benefit of our theme-driven quantitative model. The variance in performance supports our research indicating that the diversification provided by our different investment themes is a significant investment advantage over the long term, even though the Fund may experience underperformance in the short term. Of course, diversification does not protect an investor from market risk nor does it ensure a profit. |
| | | Momentum was the Fund’s best-performing theme during the Reporting Period. Momentum seeks to predict drifts in stock prices caused by delayed investor reaction to company- specific information and information about related companies. Sentiment, Valuation and Quality also enhanced relative performance. Our Sentiment theme reflects selected investment views and decisions of individuals and financial intermediaries, while Valuation attempts to capture potential mispricings of securities, typically by comparing a measure of the company’s intrinsic value to its market value. The Quality theme assesses both firm and management quality. |
| | | Our Management theme detracted from relative results. Management assesses the characteristics, policies and strategic decisions of company management. The impact of our Profitability theme, which assesses whether a company is earning more than its cost of capital, was relatively neutral during the Reporting Period. |
| Q | | How did the Fund’s sector and industry allocations affect relative results? |
| A | | In constructing the portfolio, we focus on picking stocks rather than on making sector or industry bets. Consequently, the Fund is similar to the Index in terms of its sector and industry allocations and its style. Changes in its sector or industry weights generally do not have a meaningful impact on relative returns. |
| Q | | Did stock selection help or hurt Fund performance during the Reporting Period? |
| A | | We seek to outpace the Index by overweighting stocks we expect to outperform and underweighting those we think may lag. At the same time, we strive to maintain a risk profile similar to the Index. The Fund’s investments are selected using fundamental research and a variety of quantitative techniques based on our investment themes. For example, the Fund aims to hold a basket of stocks with better Momentum characteristics than the benchmark. During the Reporting Period, our security selection added to the Fund’s relative returns. |
7
PORTFOLIO RESULTS
| Q | | Which stock positions contributed most to the Fund’s relative returns during the Reporting Period? |
| A | | Investments in the industrials, materials and financials sectors contributed positively to the Fund’s relative performance during the Reporting Period. The Fund benefited from overweighted positions in Turk Hava Yollari, a Turkish airline; Turkiye Vakiflar Bankasi, the fifth-largest bank in Turkey; and Great Wall Motors, a Chinese automobile manufacturer. The Fund was overweight Turk Hava Yollari because of our positive views on Valuation and Momentum. Our positive view on Sentiment led us to overweight Turkiye Vakiflar Bankasi. We adopted the overweight in Great Wall Motors because of our positive view on Management. |
| Q | | Which Fund positions detracted most from results during the Reporting Period? |
| A | | Our stock picks in the information technology, consumer staples and utilities sectors detracted from relative performance during the Reporting Period. The Fund was hindered by overweighted positions in Hyundai Mobis, a Korean auto parts company, and Vodacom Group Limited, an African mobile communications company. The Fund’s underweight in Russian oil company Rosneft Oil also dampened relative returns. We chose to overweight Hyundai Mobis because of our positive views on Momentum and Valuation. The Fund was overweight Vodacom Group because of our positive view on Momentum. We assumed the underweight to Rosneft Oil based on our negative view on Management. |
| Q | | What impact did the Team’s country/currency selection strategy have on the Fund’s relative performance during the Reporting Period? |
| A | | Our country/currency strategy added to the Fund’s relative performance during the Reporting Period. The Fund benefited from its overweighted positions relative to the Index in Turkey and the Philippines. Its underweight in South Africa was also advantageous. The Fund was hampered by its underweighted positions in Thailand and Taiwan. An overweight relative to the Index in the Czech Republic also detracted from relative results during the Reporting Period. |
| | | We made our picks using our proprietary models, which, during the Reporting Period, were based on three investment themes specific to our country/currency strategy — Valuation, Risk Premium, and Macro. Valuation favors equity and currency markets that appear cheap relative to fundamentals and purchasing power. Risk Premium evaluates whether a country is overcompensating investors for various types of risk. Macro assesses a market’s macroeconomic environment and growth prospects. |
| Q | | How did the Fund use derivatives and similar instruments during the Reporting Period? |
| A | | During the Reporting Period, we used financial futures contracts to equitize the Fund’s cash holdings. In other words, we put the Fund’s cash holdings to work by using them as collateral for the purchase of financial futures contracts. |
| Q | | What changes did you make to the Fund’s country weightings during the Reporting Period? |
| A | | We increased the Fund’s weightings relative to the Index in China, South Africa and Hungary and decreased its weightings compared to the Index in South Korea, Mexico and Poland. |
| Q | | What were the Fund’s sector and country weightings at the end of the Reporting Period? |
| A | | At the end of the Reporting Period, the Fund was overweight relative to the Index in the financials, consumer discretionary and industrials sectors. It was underweight the materials, information technology, telecommunication services, energy, consumer staples and utilities sectors. Compared to the Index, the Fund was relatively neutral in the health care sector at the end of the Reporting Period. |
| | | In terms of countries, the Fund was overweight Russia, Turkey, Brazil, Hungary, Taiwan, China, Peru and India relative to the Index at the end of the Reporting Period. It was underweight South Korea, Mexico, Chile, Indonesia, Poland, Thailand, the Philippines, Malaysia, Colombia, South Africa, Egypt and the Czech Republic. At the end of the Reporting Period, the Fund was relatively neutral compared to the Index in Morocco. |
8
FUND BASICS
Emerging Markets Equity Insights Fund
as of April 30, 2013
| | | | | | | | | | |
| | | November 1, 2012–April 30, 2013 | | Fund Total Return
(based on NAV)1 | | | MSCI EMF Index2 | |
| | Class A | | | 9.93 | % | | | 5.29 | % |
| | Class C | | | 9.31 | | | | 5.29 | |
| | Institutional | | | 9.99 | | | | 5.29 | |
| | | Class IR | | | 9.97 | | | | 5.29 | |
| | 1 | | The net asset value (NAV) represents the net assets of the class of the Fund (ex-dividend) divided by the total number of shares of the class outstanding. The Fund’s performance assumes the reinvestment of dividends and other distributions. The Fund’s performance does not reflect the deduction of any applicable sales charges. |
| | 2 | | The MSCI Emerging Markets Standard Index (net, unhedged) (the “MSCI EMF Index”) is a free float-adjusted market capitalization index that is designed to measure equity market performance of emerging markets. As of December 31, 2012, the MSCI EMF Index consists of the following 21 emerging market country indices: Brazil, Chile, China, Colombia, Czech Republic, Egypt, Hungary, India, Indonesia, Korea, Malaysia, Mexico, Morocco, Peru, Philippines, Poland, Russia, South Africa, Taiwan, Thailand, and Turkey. Index figures do not reflect any deduction for fees, expenses or taxes. It is not possible to invest directly in an index. |
| | | | | | | | | | | | | | |
| | STANDARDIZED TOTAL RETURNS3 |
| | | For the period ended 3/31/13 | | One Year | | | Five Years | | Since Inception | | | Inception Date |
| | Class A | | | -0.19 | % | | 0.64% | | | -1.90 | % | | 10/5/07 |
| | Class C | | | 3.85 | | | 1.14 | | | -1.53 | | | 10/5/07 |
| | Institutional | | | 6.02 | | | 2.20 | | | -0.48 | | | 10/5/07 |
| | | Class IR | | | 5.76 | | | N/A | | | 8.05 | | | 8/31/10 |
| | 3 | | The Standardized Total Returns are average annual total returns as of the most recent calendar quarter-end. They assume reinvestment of all distributions at NAV. These returns reflect a maximum initial sales charge of 5.5% for Class A Shares and the assumed contingent deferred sales charge for Class C Shares (1% if redeemed within 12 months of purchase). Because Institutional and Class IR Shares do not involve a sales charge, such a charge is not applied to their Standardized Total Returns. |
| | | | The returns set forth in the tables above represent past performance. Past performance does not guarantee future results. The Fund’s investment return and principal value will fluctuate so that an investor’s shares, when redeemed, may be worth more or less than their original cost. Current performance may be lower or higher than the performance quoted above. Please visit our web site at www.goldmansachsfunds.com to obtain the most recent month-end returns. Performance reflects applicable fee waivers and/or expense limitations in effect during the periods shown. In their absence, performance would be reduced. Returns do not reflect the deduction of taxes that a shareholder would pay on Fund distributions or the redemption of Fund shares. |
9
FUND BASICS
| | | | | | | | | | |
| | EXPENSE RATIOS4 | | | | | | | | |
| | | | | Net Expense Ratio (Current) | | | Gross Expense Ratio (Before Waivers) | |
| | Class A | | | 1.58 | % | | | 1.69 | % |
| | Class C | | | 2.33 | | | | 2.46 | |
| | Institutional | | | 1.18 | | | | 1.30 | |
| | | Class IR | | | 1.33 | | | | 1.41 | |
| | 4 | | The expense ratios of the Fund, both current (net of applicable fee waivers and/or expense limitations) and before waivers (gross of applicable fee waivers and/or expense limitations) are as set forth above according to the most recent publicly available Prospectus for the Fund and may differ from the expense ratios disclosed in the Financial Highlights in this report. The Fund’s waivers and/or expense limitations will remain in place through at least February 28, 2014, and prior to such date the Investment Adviser may not terminate the arrangements without the approval of the Fund’s Board of Trustees. If these arrangements are discontinued in the future, the expense ratios may change without shareholder approval. |
| | | | | | | | | | |
| | TOP TEN HOLDINGS AS OF 4/30/135 |
| | | Holding | | % of Total
Net Assets | | | Line of Business | | Country |
| | Samsung Electronics Co. Ltd. | | | 4.6 | % | | Semiconductors &
Semiconductor Equipment | | South Korea |
| | Taiwan Semiconductor Manufacturing Co. Ltd. ADR | | | 3.7 | | | Semiconductors &
Semiconductor Equipment | | Taiwan |
| | China Construction Bank Corp. Class H | | | 3.0 | | | Banks | | China |
| | China Mobile Ltd. | | | 2.6 | | | Telecommunication Services | | Hong Kong |
| | OAO Lukoil ADR | | | 2.5 | | | Energy | | Russia |
| | Vanguard FTSE Emerging Markets | | | 2.5 | | | Exchange Traded Fund | | Other |
| | Bank of China Ltd. Class H | | | 2.4 | | | Banks | | China |
| | Companhia de Bebidas das Americas Preference Shares ADR | | | 1.9 | | | Food, Beverage & Tobacco | | Brazil |
| | OTP Bank PLC | | | 1.9 | | | Banks | | Hungary |
| | | Sberbank of Russia | | | 1.9 | | | Banks | | Russia |
| | 5 | | The top 10 holdings may not be representative of the Fund’s future investments. |
10
FUND BASICS
|
| FUND VS. BENCHMARK SECTOR ALLOCATIONS6 |
| As of April 30, 2013 |
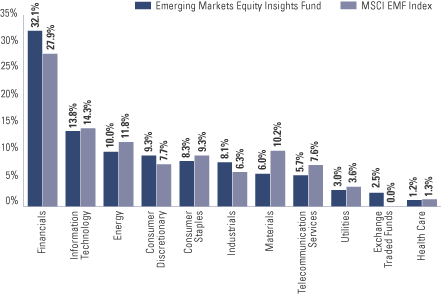
| | 6 | | The Fund is actively managed and, as such, its composition may differ over time. Consequently, the Fund’s overall industry sector allocations may differ from percentages contained in the graph above. The graph categorizes investments using Global Industry Classification Standard (“GICS”), however, the sector classifications used by the portfolio management team may differ from GICS. Underlying sector allocations of exchange traded funds held by the Fund are not reflected in the graph above. The percentage shown for each investment category reflects the value of investments in that category as a percentage of market value (excluding investments in the securities lending reinvestment vehicle, if any). Investments in the securities lending reinvestment vehicle represented 1.0% of the Fund’s net assets at April 30, 2013. The graph depicts the Fund’s investments but may not represent the Fund’s market exposure due to the exclusion of certain derivatives, if any, as listed in the Additional Investment Information section of the Schedule of Investments. |
11
PORTFOLIO RESULTS
Goldman Sachs International Equity Insights Fund
Portfolio Management Discussion and Analysis
Effective after the close of business on May 3, 2013, the Goldman Sachs Structured International Equity Fund was renamed the Goldman Sachs International Equity Insights Fund (the “Fund”). Below, the Goldman Sachs Quantitative Investment Strategies Team discusses the Fund’s performance and positioning for the six-month period ended April 30, 2013 (the “Reporting Period”).
| Q | | How did the Fund perform during the Reporting Period? |
| A | | During the Reporting Period, the Fund’s Class A, B, C, Institutional, Service, IR and R Shares generated cumulative total returns, without sales charges, of 15.85%, 15.27%, 15.37%, 15.93%, 15.75%, 15.94% and 15.66%, respectively. These returns compare to the 16.90% cumulative total return of the Fund’s benchmark, the MSCI® EAFE® Index (unhedged and net of dividend withholding taxes) (the “Index”), during the same period. |
| Q | | What key factors were most responsible for the Fund’s performance during the Reporting Period? |
| A | | We use two distinct strategies — a bottom-up stock selection strategy and a top-down country/currency selection strategy — to manage the Fund. These strategies are uncorrelated, that is, they tend to perform independently of each other over time, which enables us to greater diversify the portfolio. Our country/currency selection strategy detracted from the Fund’s relative performance during the Reporting Period. Our bottom-up stock selection strategy, which uses fundamental research and stock selection models based on six investment themes, added to the Fund’s relative results. |
| Q | | Which investment themes helped and which hurt within the Team’s stock selection strategy? |
| A | | Our bottom-up stock selection strategy performed well largely because of our investment themes. We use a quantitative model and six investment themes to take a long-term view of market patterns and look for inefficiencies, selecting stocks for the Fund and overweighting or underweighting those stocks chosen by the model. Over time and by design, the performance of any one of our model’s investment themes tends to have a low correlation with the model’s other themes, demonstrating the diversification benefit of our theme-driven quantitative model. The variance in performance supports our research indicating that the diversification provided by our different investment themes is a significant investment advantage over the long term, |
| | | even though the Fund may experience underperformance in the short term. Of course, diversification does not protect an investor from market risk nor does it ensure a profit. |
| | | Our Momentum theme, which seeks to predict drifts in stock prices caused by delayed investor reaction to company-specific information and information about related companies, added most to relative returns. Valuation and Sentiment also enhanced relative performance. Valuation attempts to capture potential mispricings of securities, typically by comparing a measure of the company’s intrinsic value to its market value. Sentiment reflects selected investment views and decisions of individuals and financial intermediaries. |
| | | None of our investment themes detracted from the fund’s relative performance during the Reporting Period. Our Quality, Profitability and Management themes had a relatively neutral impact on relative results. Quality assesses both firm management and management quality. Profitability assesses whether a company is earning more than its cost of capital, while Management assesses the characteristics, policies and strategic decisions of company management. |
| Q | | How did the Fund’s sector and industry allocations affect relative results? |
| A | | In constructing the portfolio, we focus on picking stocks rather than on making sector or industry bets. Consequently, the Fund is similar to the Index in terms of its sector and industry allocations and its style. Changes in its sector or industry weights generally do not have a meaningful impact on relative returns. |
| Q | | Did stock selection help or hurt Fund performance during the Reporting Period? |
| A | | We seek to outpace the Index by overweighting stocks we expect to outperform and underweighting those we think may lag. At the same time, we strive to maintain a risk profile similar to the Index. |
| | | The Fund’s investments are selected using fundamental research and a variety of quantitative techniques based on our investment themes. For example, the Fund aims to hold a |
12
PORTFOLIO RESULTS
| | basket of stocks with better Momentum characteristics than the benchmark. During the Reporting Period, our security selection added to the Fund’s relative returns. |
| Q | | Which stock positions contributed most to the Fund’s relative returns during the Reporting Period? |
| A | | Investments in the financials, health care and materials sectors contributed positively to the Fund’s relative performance during the Reporting Period. The Fund benefited from overweighted positions in London-headquartered airline company easyJet, British financial services firm Barclays and Japan-based real estate company Tokyu Land. We adopted the overweight to easyJet and Tokyu Land because of our positive views on Momentum and Sentiment. The overweight in Barclays was the result of our positive views on Momentum and Valuation. |
| Q | | Which Fund positions detracted most from results during the Reporting Period? |
| A | | Security selection in the consumer discretionary, energy and information technology sectors detracted from relative returns during the Reporting Period. The Fund was hampered by overweighted positions in Petrofac, a U.K.-based provider of facilities services to the oil, gas and energy production and processing industries; Deutsche Bank, a German global banking and financial services firm; and Compagnie Generale des Etablissements Michelin, a France-based tire manufacturer. We chose to overweight Petrofac and Compagnie Generale des Etablissements Michelin because of our positive views on Profitability and Momentum. The overweight to Deutsche Bank was established because of our positive views on Valuation and Momentum. |
| Q | | How did the Fund use derivatives and similar instruments during the Reporting Period? |
| A | | During the Reporting Period, we used financial futures contracts to equitize the Fund’s cash holdings. In other words, we put the Fund’s cash holdings to work by using them as collateral for the purchase of financial futures contracts. |
| Q | | What impact did the Team’s country/currency selection strategy have on the Fund’s relative performance during the Reporting Period? |
| A | | Our country/currency selection strategy hurt the Fund’s relative performance during the Reporting Period. The Fund’s underweighted positions in Italy and Japan and its overweighted position in the U.K. detracted from returns. On the positive side, the Fund benefited from underweighted positions in Hong Kong and Spain and an overweighted position in Belgium. |
| | | We made our picks using our proprietary models, which, during the Reporting Period, were based on five investment factors specific to our country/ currency strategy — Valuation, Momentum, Risk Premium, Fund Flows and Macro. Valuation favors equity and currency markets that appear cheap relative to fundamentals and purchasing power. The Momentum factor favors countries and currencies that have had strong recent outperformance. Risk Premium evaluates whether a country is overcompensating investors for various types of risk, while Fund Flows evaluates the strength of capital market inflows. Finally, Macro assesses a market’s macroeconomic environment and growth prospects. |
| Q | | What changes did you make to the Fund’s country weightings during the Reporting Period? |
| A | | During the Reporting Period, we moved the Fund from an underweight relative to the Index in Japan to an overweighted position. We increased the Fund’s overweight in Norway and decreased its underweight in Australia. We also shifted the Fund from overweighted positions compared to the Index in Germany, Hong Kong and Sweden to underweighted positions. |
| Q | | What were the Fund’s sector and country weightings at the end of the Reporting Period? |
| A | | At the end of the Reporting Period, the Fund was overweight the consumer discretionary, health care, consumer staples, financials, industrials and energy sectors relative to the Index. The Fund was underweight the materials, utilities, telecommunication services and information technology sectors at the end of the Reporting Period. |
| | | In terms of countries, the Fund was overweight relative to the Index in the U.K., France, Japan, Norway, Belgium and the Netherlands. It was underweight in Australia, Hong Kong, Switzerland, Sweden, Germany, Spain, Finland, Italy, Singapore and Ireland. Compared to the Index, the Fund was relatively neutral in Denmark, Israel, New Zealand, Greece, Austria and Portugal at the end of the Reporting Period. |
13
FUND BASICS
International Equity Insights Fund
as of April 30, 2013
| | | | | | | | | | |
| | PERFORMANCE REVIEW | | | | | | | | |
| | | November 1, 2012–April 30, 2013 | | Fund Total Return (based on NAV)1 | | | MSCI EAFE (Net) Index2 | |
| | Class A | | | 15.85 | % | | | 16.90 | % |
| | Class B | | | 15.27 | | | | 16.90 | |
| | Class C | | | 15.37 | | | | 16.90 | |
| | Institutional | | | 15.93 | | | | 16.90 | |
| | Service | | | 15.75 | | | | 16.90 | |
| | Class IR | | | 15.94 | | | | 16.90 | |
| | | Class R | | | 15.66 | | | | 16.90 | |
| | 1The | | net asset value (NAV) represents the net assets of the class of the Fund (ex-dividend) divided by the total number of shares of the class outstanding. The Fund’s performance assumes the reinvestment of dividends and other distributions. The Fund’s performance does not reflect the deduction of any applicable sales charges. |
| | 2The | | unmanaged MSCI Europe, Australasia, Far East (EAFE) (Net) Index (unhedged, with dividends reinvested) (the “Index”) is a market capitalization-weighted composite of securities in 22 developed markets (as of December 31, 2012). The Index figures do not reflect any deduction for fees, expenses or taxes. It is not possible to invest directly in an index. |
| | | | | | | | | | | | | | | | | | | | |
| | STANDARDIZED TOTAL RETURNS3 |
| | | For the period ended 3/31/13 | | One Year | | | Five Years | | | Ten Years | | | Since Inception | | | Inception Date |
| | Class A | | | 3.54 | % | | | -3.59 | % | | | 8.08 | % | | | 2.54 | % | | 8/15/97 |
| | Class B | | | 3.51 | | | | -3.63 | | | | 8.06 | | | | 2.64 | | | 8/15/97 |
| | Class C | | | 7.70 | | | | -3.21 | | | | 7.93 | | | | 2.27 | | | 8/15/97 |
| | Institutional | | | 9.98 | | | | -2.10 | | | | 9.16 | | | | 3.44 | | | 8/15/97 |
| | Service | | | 9.44 | | | | -2.58 | | | | 8.63 | | | | 2.94 | | | 8/15/97 |
| | Class IR | | | 9.86 | | | | -2.24 | | | | N/A | | | | -4.34 | | | 11/30/07 |
| | | Class R | | | 9.23 | | | | -2.70 | | | | N/A | | | | -4.78 | | | 11/30/07 |
| | 3The | | Standardized Total Returns are average annual total returns as of the most recent calendar quarter-end. They assume reinvestment of all distributions at NAV. These returns reflect a maximum initial sales charge of 5.5% for Class A Shares, the assumed contingent deferred sales charge for Class B Shares (5% maximum declining to 0% after six years) and the assumed contingent deferred sales charge for Class C Shares (1% if redeemed within 12 months of purchase). Class B Shares convert automatically to Class A Shares on or about the fifteenth day of the last month of the calendar quarter that is eight years after purchase. Returns for Class B Shares for the period after conversion reflect the performance of Class A Shares. Because Institutional, Service, Class IR and Class R Shares do not involve a sales charge, such a charge is not applied to their Standardized Total Returns. The Fund’s Class B Shares are no longer available for purchase by new or existing shareholders (although current Class B shareholders may continue to reinvest income and capital gains distributions into Class B Shares, and Class B shareholders may continue to exchange their shares for Class B Shares of certain other Goldman Sachs Funds). |
| | The | | returns set forth in the tables above represent past performance. Past performance does not guarantee future results. The Fund’s investment return and principal value will fluctuate so that an investor’s shares, when redeemed, may be worth more or less than their original cost. Current performance may be lower or higher than the performance quoted above. Please visit our web site at www.goldmansachsfunds.com to obtain the most recent month-end returns. Performance reflects applicable fee waivers and/or expense limitations in effect during the periods shown. In their absence, performance would be reduced. Returns do not reflect the deduction of taxes that a shareholder would pay on Fund distributions or the redemption of Fund shares. |
14
FUND BASICS
| | | | | | | | | | |
| | EXPENSE RATIOS4 | |
| | | | | Net Expense Ratio (Current) | | | Gross Expense Ratio (Before Waivers) | |
| | Class A | | | 1.28 | % | | | 1.37 | % |
| | Class B | | | 2.04 | | | | 2.12 | |
| | Class C | | | 2.04 | | | | 2.12 | |
| | Institutional | | | 0.88 | | | | 0.97 | |
| | Service | | | 1.38 | | | | 1.47 | |
| | Class IR | | | 1.04 | | | | 1.11 | |
| | | Class R | | | 1.53 | | | | 1.62 | |
| | 4The | | expense ratios of the Fund, both current (net of applicable fee waivers and/or expense limitations) and before waivers (gross of applicable fee waivers and/or expense limitations) are as set forth above according to the most recent publicly available Prospectus for the Fund and may differ from the expense ratios disclosed in the Financial Highlights in this report. The Fund’s waivers and/or expense limitations will remain in place through at least February 28, 2014, and prior to such date the Investment Adviser may not terminate the arrangements without the approval of the Fund’s Board of Trustees. If these arrangements are discontinued in the future, the expense ratios may change without shareholder approval. |
| | | | | | | | | | |
| | TOP TEN HOLDINGS AS OF 4/30/135 |
| | | Holding | | % of Total
Net Assets | | | Line of Business | | Country |
| | HSBC Holdings PLC | | | 3.1 | % | | Banks | | United Kingdom |
| | BASF SE | | | 2.3 | | | Materials | | Germany |
| | Swiss Re AG | | | 2.3 | | | Insurance | | Switzerland |
| | Royal Dutch Shell PLC Class A | | | 2.2 | | | Energy | | Netherlands |
| | Compagnie Generale des Etablissements Michelin Class B | | | 2.1 | | | Automobiles & Components | | France |
| | Daihatsu Motor Co. Ltd. | | | 2.0 | | | Automobiles & Components | | Japan |
| | Royal Dutch Shell PLC Class B | | | 1.8 | | | Energy | | Netherlands |
| | Sanofi | | | 1.7 | | | Pharmaceuticals, Biotechnology
& Life Sciences | | France |
| | British American Tobacco PLC | | | 1.6 | | | Food, Beverage & Tobacco | | United Kingdom |
| | | Bayer AG (Registered) | | | 1.6 | | | Pharmaceuticals, Biotechnology
& Life Sciences | | Germany |
| | 5The | | top 10 holdings may not be representative of the Fund’s future investments. |
15
FUND BASICS
|
| FUND VS. BENCHMARK SECTOR ALLOCATIONS6 |
| As of April 30, 2013 |
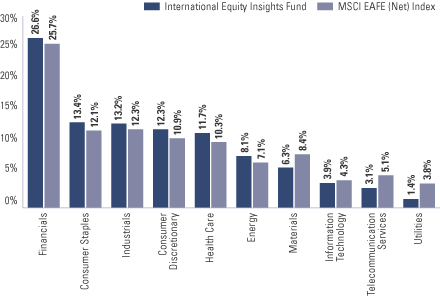
| | 6The | | Fund is actively managed and, as such, its composition may differ over time. Consequently, the Fund’s overall industry sector allocations may differ from percentages contained in the graph above. The graph categorizes investments using Global Industry Classification Standard (“GICS”), however, the sector classifications used by the portfolio management team may differ from GICS. The percentage shown for each investment category reflects the value of investments in that category as a percentage of market value (excluding investments in the securities lending reinvestment vehicle, if any). Investments in the securities lending reinvestment vehicle represented 9.7% of the Fund’s net assets at April 30, 2013. The graph depicts the Fund’s investments but may not represent the Fund’s market exposure due to the exclusion of certain derivatives, if any, as listed in the Additional Investment Information section of the Schedule of Investments. |
16
PORTFOLIO RESULTS
Goldman Sachs International Small Cap
Insights Fund
Portfolio Management Discussion and Analysis
Effective after the close of business on May 3, 2013, the Goldman Sachs Structured International Small Cap Fund was renamed the Goldman Sachs International Small Cap Insights Fund (the “Fund”). Below, the Goldman Sachs Quantitative Investment Strategies Team discusses the Fund’s performance and positioning for the six-month period ended April 30, 2013 (the “Reporting Period”).
| Q | | How did the Fund perform during the Reporting Period? |
| A | | During the Reporting Period, the Fund’s Class A, C, Institutional and IR Shares generated cumulative total returns, without sales charges, of 18.84%, 18.39%, 19.07% and 18.99%, respectively. These returns compare to the 18.08% cumulative total return of the Fund’s benchmark, the MSCI® EAFE® Small Cap Index (unhedged and net of dividend withholding taxes) (the “Index”), during the same period. |
| Q | | What key factors were most responsible for the Fund’s performance during the Reporting Period? |
| A | | As expected, and in keeping with our investment approach, our quantitative model and its six investment themes had the greatest impact on relative performance. We use these themes to take a long-term view of market patterns and look for inefficiencies, selecting stocks for the Fund and overweighting or underweighting those stocks chosen by the model. Over time and by design, the performance of any one of our model’s investment themes tends to have a low correlation with the model’s other themes, demonstrating the diversification benefit of our theme-driven quantitative model. The variance in performance supports our research indicating that the diversification provided by our different investment themes is a significant investment advantage over the long term, even though the Fund may experience underperformance in the short term. Of course, diversification does not protect an investor from market risk nor does it ensure a profit. |
| | | The Fund outperformed the Index during the Reporting Period largely because of our investment themes. Momentum was our best-performing theme. Momentum seeks to predict drifts in stock prices caused by delayed investor reaction to company-specific information and information about related companies. Valuation and Sentiment also contributed positively. The Valuation theme attempts to |
| | | capture potential mispricings of securities, typically by comparing a measure of the company’s intrinsic value to its market value. Sentiment reflects selected investment views and decisions of individuals and financial intermediaries. Quality and Profitability also added value, though to a lesser extent. Quality assesses both firm and management quality. Profitability assesses whether a company is earning more than its cost of capital. |
| | | The impact of our Management theme, which assesses the characteristics, policies and strategic decisions of company management, was relatively neutral during the Reporting Period. |
| Q | | How did the Fund’s sector and industry allocations affect relative results? |
| A | | In constructing the portfolio, we focus on picking stocks rather than on making sector or industry bets. Consequently, the Fund is similar to the Index in terms of its sector and industry allocations and its style. Changes in its sector or industry weights generally do not have a meaningful impact on relative returns. |
| Q | | Did stock selection help or hurt Fund performance during the Reporting Period? |
| A | | We seek to outpace the Index by overweighting stocks we expect to outperform and underweighting those we think may lag. At the same time, we strive to maintain a risk profile similar to the Index. The Fund’s investments are selected using fundamental research and a variety of quantitative techniques based on our investment themes. For example, the Fund aims to hold a basket of stocks with better Momentum characteristics than the benchmark. During the Reporting Period, our stock picks enhanced the Fund’s relative returns. |
17
PORTFOLIO RESULTS
| Q | | Which stock positions contributed most to the Fund’s relative returns during the Reporting Period? |
| A | | Security selection in the materials, industrials and health care sectors added to the Fund’s relative performance during the Reporting Period. The Fund benefited from overweighted positions in London-headquartered airline company easyJet; Japanese real estate company Tokyo Tatemono; and Japan-based holding company primarily engaged in securities businesses Tokai Tokyo Financial Holdings. We chose to overweight all three names because of our positive views on Momentum and Sentiment. |
| Q | | Which Fund positions detracted most from results during the Reporting Period? |
| A | | Investments in the consumer discretionary, information technology and utilities sectors detracted from the Fund’s relative results during the Reporting Period. The Fund was hurt by its overweighted positions in Debenhams, a U.K. retailer; Danieli & Co. Officine Meccaniche, an Italy-based company that engages in the design and construction of iron and steel plants; and Cabcharge Australia, a provider of taxi-related services. We adopted the overweight in Debenhams as a result of our positive views on Management and Momentum. The Fund was overweight Danieli & Co. Officine Meccaniche because of our positive views on Sentiment and Value. It was overweight Cabcharge Australia because of our positive views on Management and Quality. |
| Q | | What impact did country selection have on the Fund’s relative performance during the Reporting Period? |
| A | | To construct the portfolio, we focus on security selection rather than on making country bets. As a result, the Fund is similar to the Index in terms of its country allocation; changes in its country weightings are generally the result of our stock picking. That said, the Fund benefited during the Reporting Period from overweights in U.K. and Danish stocks relative to the Index as well as from an underweight in Japanese stocks. The Fund was hampered by its underweighted positions compared to the Index in the stocks of Ireland, the Netherlands and Switzerland. Security selection in all six countries added to returns. |
| Q | | How did the Fund use derivatives and similar instruments during the Reporting Period? |
| A | | During the Reporting Period, we used financial futures contracts to equitize the Fund’s cash holdings. In other words, we put the Fund’s cash holdings to work by using them as collateral for the purchase of financial futures contracts. |
| Q | | What changes did you make to the Fund’s country weightings during the Reporting Period? |
| A | | The largest shifts we made during the Reporting Period were to increase the Fund’s weightings compared to the Index in France, Switzerland and Norway and to decrease the Fund’s relative weightings in Sweden, Austria and Finland. |
| Q | | What were the Fund’s sector and country weightings at the end of the Reporting Period? |
| A | | At the end of the Reporting Period, the Fund was overweight the financials, consumer discretionary, health care and energy sectors relative to the Index. It was underweight the materials, information technology, consumer staples, utilities and telecommunication services sectors. Compared to the Index, the Fund was relatively neutral in the industrials sector at the end of the Reporting Period. |
| | | In terms of countries, the Fund was overweight Italy, Denmark, France, Sweden, Norway and Australia relative to the Index. It was underweight Ireland, Switzerland, Greece, Finland, the Netherlands, Austria, New Zealand, Spain and Germany. At the end of the Reporting Period, the Fund was relatively neutral compared to the Index in the U.K., Hong Kong, Israel, Singapore, Portugal, Belgium and Japan. |
18
FUND BASICS
International Small Cap Insights Fund
as of April 30, 2013
| | | | | | | | | | |
| | PERFORMANCE REVIEW | |
| | | November 1, 2012–April 30, 2013 | | Fund Total Return
(based on NAV)1 | | | MSCI EAFE
Small Cap Index2 | |
| | Class A | | | 18.84 | % | | | 18.08 | % |
| | Class C | | | 18.39 | | | | 18.08 | |
| | Institutional | | | 19.07 | | | | 18.08 | |
| | | Class IR | | | 18.99 | | | | 18.08 | |
| | 1 | | The net asset value (NAV) represents the net assets of the class of the Fund (ex-dividend) divided by the total number of shares of the class outstanding. The Fund’s performance assumes the reinvestment of dividends and other distributions. The Fund’s performance does not reflect the deduction of any applicable sales charge. |
| | 2 | | The MSCI EAFE Small Cap (Net) Index (unhedged and net of dividend withholding taxes) is a free float-adjusted market capitalization index that is designed to measure developed market equity performance, excluding the US and Canada. MSCI selects the most liquid securities across developed markets relative to their market capitalization, and targets for index inclusion 40% of the full market capitalization of the eligible small cap universe within each industry group, within each country. Its returns include net reinvested dividends but, unlike Fund returns, do not reflect the payment of sales commissions or other expenses incurred in the purchase or sale of the securities included in the Index. It is not possible to invest directly in an index. |
| | | | | | | | | | | | | | |
| | STANDARDIZED TOTAL RETURNS3 |
| | | For the period ended 3/31/13 | | One Year | | | Five Years | | Since Inception | | | Inception Date |
| | Class A | | | 8.15 | % | | 3.07% | | | 0.20 | % | | 9/28/07 |
| | Class C | | | 12.55 | | | 3.50 | | | 0.52 | | | 9/28/07 |
| | Institutional | | | 14.76 | | | 4.63 | | | 1.64 | | | 9/28/07 |
| | | Class IR | | | 14.66 | | | N/A | | | 15.20 | | | 8/31/10 |
| | 3 | | The Standardized Total Returns are average annual total returns as of the most recent calendar quarter-end. They assume reinvestment of all distributions at NAV. These returns reflect a maximum initial sales charge of 5.5% for Class A Shares and the assumed contingent deferred sales charge for Class C Shares (1% if redeemed within 12 months of purchase). Because Institutional and Class IR Shares do not involve a sales charge, such a charge is not applied to their Standardized Total Returns. |
| | | | The returns set forth in the tables above represent past performance. Past performance does not guarantee future results. The Fund’s investment return and principal value will fluctuate so that an investor’s shares, when redeemed, may be worth more or less than their original cost. Current performance may be lower or higher than the performance quoted above. Please visit our web site at www.goldmansachsfunds.com to obtain the most recent month-end returns. Performance reflects applicable fee waivers and/or expense limitations in effect during the periods shown. In their absence, performance would be reduced. Returns do not reflect the deduction of taxes that a shareholder would pay on Fund distributions or the redemption of Fund shares. |
19
FUND BASICS
| | | | | | | | | | |
| | EXPENSE RATIOS4 | |
| | | | | Net Expense Ratio (Current) | | | Gross Expense Ratio (Before Waivers) | |
| | Class A | | | 1.30 | % | | | 1.51 | % |
| | Class C | | | 2.05 | | | | 2.26 | |
| | Institutional | | | 0.90 | | | | 1.11 | |
| | | Class IR | | | 1.05 | | | | 1.26 | |
| | 4 | | The expense ratios of the Fund, both current (net of applicable fee waivers and/or expense limitations) and before waivers (gross of applicable fee waivers and/or expense limitations) are as set forth above according to the most recent publicly available Prospectus for the Fund and may differ from the expense ratios disclosed in the Financial Highlights in this report. The Fund’s waivers and/or expense limitations will remain in place through at least February 28, 2014, and prior to such date the Investment Adviser may not terminate the arrangements without the approval of the Fund’s Board of Trustees. If these arrangements are discontinued in the future, the expense ratios may change without shareholder approval. |
| | | | | | | | | | |
| | TOP TEN HOLDINGS AS OF 4/30/135 |
| | | Holding | | % of Total Net Assets | | | Line of Business | | Country |
| | Fred Olsen Energy ASA | | | 1.1 | % | | Energy | | Norway |
| | Topdanmark A/S | | | 1.0 | | | Insurance | | Denmark |
| | Daiichikosho Co. Ltd. | | | 1.0 | | | Media | | Japan |
| | easyJet PLC | | | 0.9 | | | Transportation | | United Kingdom |
| | William Hill PLC | | | 0.8 | | | Consumer Services | | United Kingdom |
| | Mondi PLC | | | 0.8 | | | Materials | | United Kingdom |
| | Kawasaki Kisen Kaisha Ltd. | | | 0.7 | | | Transportation | | Japan |
| | Tokyo Tatemono Co. Ltd. | | | 0.7 | | | Real Estate | | Japan |
| | Australian Infrastructure Fund | | | 0.7 | | | Transportation | | Australia |
| | | GN Store Nord A/S | | | 0.7 | | | Health Care Equipment
& Services | | Denmark |
| | 5 | | The top 10 holdings may not be representative of the Fund’s future investments. |
20
FUND BASICS
|
| FUND VS. BENCHMARK SECTOR ALLOCATIONS6 |
| As of April 30, 2013 |
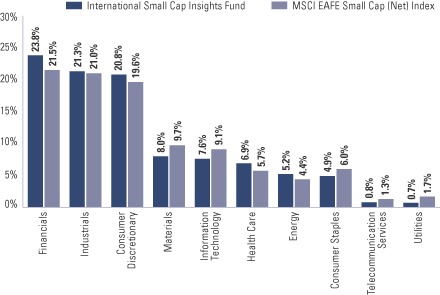
| | 6 | | The Fund is actively managed and, as such, its composition may differ over time. Consequently, the Fund’s overall sector allocations may differ from percentages contained in the graph above. The graph categorizes investments using Global Industry Classification Standard (“GICS”), however, the sector classifications used by the portfolio management team may differ from GICS. The percentage shown for each investment category reflects the value of investments in that category as a percentage of market value (excluding investments in the securities lending reinvestment vehicle, if any). Investment in the securities lending reinvestment vehicle represented 6.1% of the Fund’s net assets at April 30, 2013. The graph depicts the Fund’s investments but may not represent the Fund’s market exposure due to the exclusion of certain derivatives, if any, as listed in the Additional Investment Information section of the Schedule of Investments. |
21
GOLDMAN SACHS EMERGING MARKETS EQUITY INSIGHTS FUND
Schedule of Investments
April 30, 2013 (Unaudited)
| | | | | | | | |
Shares | | | Description | | Value | |
| | | | | | | | |
| | Common Stocks – 92.0% | |
| | Brazil – 9.9% | | | | |
| | 491,200 | | | Arteris SA (Transportation) | | $ | 5,474,827 | |
| | 219,100 | | | Banco Bradesco SA (Banks) | | | 3,793,389 | |
| | 305,500 | | | Banco Bradesco SA ADR (Banks) | | | 5,068,245 | |
| | 405,600 | | | Banco do Brasil SA (Banks) | | | 5,094,454 | |
| | 981,600 | | | CCR SA (Transportation) | | | 9,704,385 | |
| | 650,400 | | | CIA de Saneamento Basico do Estado de Sao Paulo ADR (Utilities)(a) | | | 9,300,720 | |
| | 18,900 | | | Companhia de Bebidas das Americas (Food, Beverage & Tobacco) | | | 772,720 | |
| | 985,490 | | | Duratex SA (Materials) | | | 7,452,437 | |
| | 224,300 | | | Grupo BTG Pactual (Diversified Financials) | | | 3,725,347 | |
| | 24,300 | | | M. Dias Branco SA (Food, Beverage & Tobacco) | | | 1,080,945 | |
| | 198,800 | | | Minerva SA (Food, Beverage & Tobacco)* | | | 1,132,735 | |
| | 228,100 | | | Multiplus SA (Commercial & Professional Services) | | | 3,743,998 | |
| | 211,200 | | | Petroleo Brasileiro SA ADR (Energy) | | | 4,044,480 | |
| | 417,500 | | | Porto Seguro SA (Insurance) | | | 5,239,748 | |
| | | | | | | | |
| | | | | | | 65,628,430 | |
| | |
| | Chile – 0.2% | | | | |
| | 111,881 | | | Administradora de Fondos de Pensiones Provida SA (Diversified Financials) | | | 774,460 | |
| | 180,476 | | | AFP Habitat SA (Diversified Financials) | | | 359,458 | |
| | 5,243 | | | Banco de Credito e Inversiones (Banks) | | | 376,289 | |
| | | | | | | | |
| | | | | | | 1,510,207 | |
| | |
| | China – 12.1% | | | | |
| | 1,458,000 | | | Agile Property Holdings Ltd. (Real Estate) | | | 1,890,209 | |
| | 8,458,000 | | | Air China Ltd. Class H (Transportation) | | | 6,856,513 | |
| | 33,351,000 | | | Bank of China Ltd. Class H (Banks) | | | 15,626,090 | |
| | 336,000 | | | Beijing Capital International Airport Co. Ltd. Class H (Transportation) | | | 233,426 | |
| | 3,381,000 | | | China Communications Construction Co. Ltd. Class H (Capital Goods) | | | 3,245,045 | |
| | 23,811,000 | | | China Construction Bank Corp. Class H (Banks) | | | 19,984,824 | |
| | 3,289,500 | | | China Merchants Bank Co. Ltd. Class H (Banks) | | | 7,026,742 | |
| | 3,138,000 | | | China Minsheng Banking Corp. Ltd. Class H (Banks) | | | 4,036,984 | |
| | 1,372,000 | | | China Railway Construction Corp. Ltd. Class H (Capital Goods) | | | 1,387,032 | |
| | 1,354,000 | | | China Southern Airlines Co. Ltd. Class H (Transportation) | | | 714,173 | |
| | 3,648,000 | | | CNOOC Ltd. (Energy) | | | 6,832,960 | |
| | |
| | Common Stocks – (continued) | |
| | China – (continued) | |
| | 835,000 | | | Great Wall Motor Co. Ltd. Class H (Automobiles & Components) | | $ | 3,628,056 | |
| | 2,604,400 | | | Guangzhou R&F Properties Co. Ltd. Class H (Real Estate) | | | 4,726,026 | |
| | 594,000 | | | Huaneng Power International, Inc. Class H (Utilities) | | | 688,246 | |
| | 2,266,000 | | | Lenovo Group Ltd. (Technology Hardware & Equipment) | | | 2,072,893 | |
| | 1,920,000 | | | Sino-Ocean Land Holdings Ltd. Class H (Real Estate) | | | 1,267,471 | |
| | | | | | | | |
| | | | | | | 80,216,690 | |
| | |
| | Colombia – 0.5% | |
| | 63,349 | | | Ecopetrol SA ADR (Energy)(a) | | | 3,013,512 | |
| | |
| | Hong Kong – 7.1% | |
| | 1,587,000 | | | China Mobile Ltd. (Telecommunication Services) | | | 17,454,803 | |
| | 2,796,000 | | | China Overseas Land & Investment Ltd. (Real Estate) | | | 8,536,920 | |
| | 1,568,000 | | | China Resources Power Holdings Co. Ltd. (Utilities) | | | 5,134,123 | |
| | 250,000 | | | COSCO Pacific Ltd. (Transportation) | | | 332,126 | |
| | 1,154,000 | | | Kunlun Energy Co. Ltd. (Energy) | | | 2,261,577 | |
| | 3,356,500 | | | KWG Property Holding Ltd. (Real Estate) | | | 2,320,833 | |
| | 354,000 | | | Lee & Man Paper Manufacturing Ltd. (Materials) | | | 264,052 | |
| | 2,150,000 | | | Shenzhen Investment Ltd. (Real Estate) | | | 903,547 | |
| | 2,340,500 | | | Shimao Property Holdings Ltd. (Real Estate) | | | 5,051,197 | |
| | 956,000 | | | Sino Biopharmaceutical (Pharmaceuticals, Biotechnology & Life Sciences) | | | 659,664 | |
| | 13,204,000 | | | Yuexiu Property Co. Ltd. (Real Estate) | | | 3,914,354 | |
| | | | | | | | |
| | | | | | | 46,833,196 | |
| | |
| | Hungary – 1.9% | |
| | 614,820 | | | OTP Bank PLC (Banks) | | | 12,836,393 | |
| | |
| | India – 7.9% | |
| | 25,970 | | | Asian Paints Ltd. (Materials) | | | 2,259,795 | |
| | 36,792 | | | Bajaj Auto Ltd. (Automobiles & Components) | | | 1,285,934 | |
| | 58,196 | | | Bajaj Holdings and Investment Ltd. (Diversified Financials) | | | 962,314 | |
| | 475,909 | | | Gitanjali Gems Ltd. (Consumer Durables & Apparel) | | | 5,458,709 | |
| | 190,878 | | | Glenmark Pharmaceuticals Ltd. (Pharmaceuticals, Biotechnology & Life Sciences) | | | 1,727,212 | |
| | 263,665 | | | HCL Technologies Ltd. (Software & Services) | | | 3,527,336 | |
| | |
| | |
| 22 | | The accompanying notes are an integral part of these financial statements. |
GOLDMAN SACHS EMERGING MARKETS EQUITY INSIGHTS FUND
| | | | | | | | |
Shares | | | Description | | Value | |
| | Common Stocks – (continued) | |
| | India – (continued) | |
| | 847,601 | | | Indiabulls Financial Services Ltd. (Diversified Financials) | | $ | 4,276,157 | |
| | 634,185 | | | Indian Bank (Banks) | | | 2,010,926 | |
| | 112,054 | | | ITC Ltd. (Food, Beverage & Tobacco) | | | 684,703 | |
| | 178,490 | | | Mahindra & Mahindra Ltd. (Automobiles & Components) | | | 3,066,560 | |
| | 96,662 | | | Oil & Natural Gas Corp. Ltd. (Energy) | | | 587,249 | |
| | 788,454 | | | Reliance Industries Ltd. (Energy) | | | 11,550,500 | |
| | 223,377 | | | Rural Electrification Corp. Ltd. (Diversified Financials) | | | 931,694 | |
| | 419,831 | | | Satyam Computer Services Ltd. (Software & Services)* | | | 861,429 | |
| | 3,179 | | | Shree Cement Ltd. (Materials) | | | 266,032 | |
| | 40,800 | | | Tata Consultancy Services Ltd. (Software & Services) | | | 1,044,286 | |
| | 80,637 | | | Tech Mahindra Ltd. (Software & Services) | | | 1,432,950 | |
| | 35,343 | | | United Spirits Ltd. (Food, Beverage & Tobacco) | | | 1,450,424 | |
| | 76,620 | | | Wockhardt Ltd. (Pharmaceuticals, Biotechnology & Life Sciences)* | | | 2,711,175 | |
| | 1,401,039 | | | Zee Entertainment Enterprises Ltd. (Media) | | | 6,092,271 | |
| | | | | | | | |
| | | | | | | 52,187,656 | |
| | |
| | Indonesia – 1.5% | |
| | 2,064,000 | | | PT Bank Negara Indonesia (Persero) Tbk (Banks) | | | 1,147,875 | |
| | 1,310,500 | | | PT Bank Rakyat Indonesia (Persero) Tbk (Banks) | | | 1,269,252 | |
| | 1,305,000 | | | PT Indocement Tunggal Prakarsa Tbk (Materials) | | | 3,550,960 | |
| | 314,500 | | | PT Indofood CBP Sukses Makmur Tbk (Food, Beverage & Tobacco) | | | 370,644 | |
| | 1,672,000 | | | PT Indofood Sukses Makmur Tbk (Food, Beverage & Tobacco) | | | 1,265,535 | |
| | 2,911,000 | | | PT Perusahaan Gas Negara Persero Tbk (Utilities) | | | 1,872,433 | |
| | 190,000 | | | PT Semen Indonesia (Persero) Tbk (Materials) | | | 360,093 | |
| | | | | | | | |
| | | | | | | 9,836,792 | |
| | |
| | Luxembourg – 0.1% | |
| | 239,490 | | | Brait SE (Diversified Financials)* | | | 978,403 | |
| | |
| | Malaysia – 2.7% | |
| | 4,667,000 | | | AMMB Holdings Berhad (Diversified Financials) | | | 10,277,371 | |
| | 2,313,000 | | | Genting Malaysia Berhad (Consumer Services) | | | 2,861,137 | |
| | 640,200 | | | IHH Healthcare Bhd (Health Care Equipment & Services)* | | | 789,750 | |
| | 957,100 | | | KLCC Property Holdings Berhad (Real Estate) | | | 2,280,682 | |
| | |
| | Common Stocks – (continued) | |
| | Malaysia – (continued) | |
| | 409,500 | | | Kulim Malaysia Berhad (Food, Beverage & Tobacco) | | $ | 481,844 | |
| | 733,000 | | | Top Glove Corp. Berhad (Health Care Equipment & Services) | | | 1,522,616 | |
| | | | | | | | |
| | | | | | | 18,213,400 | |
| | |
| | Mexico – 3.5% | |
| | 47,300 | | | Arca Continental SAB de CV (Food, Beverage & Tobacco) | | | 390,093 | |
| | 5,520 | | | Coca-Cola Femsa SAB de CV ADR (Food, Beverage & Tobacco) | | | 890,762 | |
| | 74,900 | | | Controladora Comercial Mexicana SA de CV (Food & Staples Retailing) | | | 289,180 | |
| | 20,470 | | | Grupo Aeroportuario del Pacifico SAB de CV ADR (Transportation) | | | 1,184,804 | |
| | 72,010 | | | Grupo Aeroportuario del Sureste SAB de CV ADR (Transportation) | | | 8,937,161 | |
| | 129,900 | | | Grupo Carso SAB de CV Series A-1 (Capital Goods) | | | 741,488 | |
| | 30,300 | | | Grupo Financiero Banorte SAB de CV Class O (Banks) | | | 228,480 | |
| | 121,100 | | | Grupo Modelo SAB de CV Series C (Food, Beverage & Tobacco) | | | 1,101,861 | |
| | 319,400 | | | Grupo Televisa SAB ADR (Media) | | | 8,087,208 | |
| | 351,200 | | | Kimberly-Clark de Mexico SAB de CV Class A (Household & Personal Products) | | | 1,218,265 | |
| | | | | | | | |
| | | | | | | 23,069,302 | |
| | |
| | Peru – 1.4% | |
| | 62,000 | | | Credicorp Ltd. (Banks) | | | 9,336,580 | |
| | |
| | Philippines – 0.2% | |
| | 429,840 | | | Universal Robina Corp. (Food, Beverage & Tobacco) | | | 1,240,678 | |
| | |
| | Poland – 0.5% | |
| | 39,650 | | | KGHM Polska Miedz SA (Materials) | | | 1,865,566 | |
| | 207,028 | | | PGE SA (Utilities) | | | 1,075,919 | |
| | 155,597 | | | Synthos SA (Materials) | | | 232,091 | |
| | | | | | | | |
| | | | | | | 3,173,576 | |
| | |
| | Russia – 8.6% | |
| | 25,776 | | | Mail.ru Group Ltd. GDR (Software & Services) | | | 695,952 | |
| | 103,729 | | | OAO Gazprom Neft ADR (Energy)(a) | | | 2,119,273 | |
| | 263,443 | | | OAO Lukoil ADR (Energy) | | | 16,750,753 | |
| | 1,656,800 | | | OAO Rosneft GDR (Energy) | | | 11,363,222 | |
| | 42,242 | | | OJSC Magnit GDR (Food & Staples Retailing) | | | 2,158,581 | |
| | 263,640 | | | OJSC MMC Norilsk Nickel ADR (Materials) | | | 4,069,463 | |
| | 300,000 | | | OJSC Mobile Telesystems ADR (Telecommunication Services) | | | 6,210,000 | |
| | |
| | |
| The accompanying notes are an integral part of these financial statements. | | 23 |
GOLDMAN SACHS EMERGING MARKETS EQUITY INSIGHTS FUND
Schedule of Investments (continued)
April 30, 2013 (Unaudited)
| | | | | | | | |
Shares | | | Description | | Value | |
| | Common Stocks – (continued) | |
| | Russia – (continued) | |
| | 89,378 | | | Phosagro OAO GDR (Materials) | | $ | 1,265,480 | |
| | 3,921,910 | | | Sberbank of Russia (Banks) | | | 12,514,886 | |
| | | | | | | | |
| | | | | | | 57,147,610 | |
| | |
| | South Africa – 6.2% | |
| | 346,517 | | | AVI Ltd. (Food, Beverage & Tobacco) | | | 2,085,242 | |
| | 242,903 | | | Liberty Holdings Ltd. (Insurance) | | | 3,237,783 | |
| | 514,486 | | | Mondi Ltd. (Materials) | | | 6,920,933 | |
| | 243,969 | | | MTN Group Ltd. (Telecommunication Services) | | | 4,402,663 | |
| | 21,123 | | | Naspers Ltd. (Media) | | | 1,415,508 | |
| | 195,524 | | | Netcare Ltd. (Health Care Equipment & Services) | | | 444,496 | |
| | 270,061 | | | Pick’n Pay Holdings Ltd. (Food & Staples Retailing) | | | 534,193 | |
| | 2,080,835 | | | Sanlam Ltd. (Insurance) | | | 10,676,389 | |
| | 640,877 | | | Super Group Ltd. (Retailing)* | | | 1,721,908 | |
| | 831,576 | | | Vodacom Group Ltd. (Telecommunication Services) | | | 9,753,203 | |
| | | | | | | | |
| | | | | | | 41,192,318 | |
| | |
| | South Korea – 8.5% | |
| | 1,359 | | | AmorePacific Group (Household & Personal Products) | | | 516,004 | |
| | 26,210 | | | Grand Korea Leisure Co. Ltd. (Consumer Services) | | | 814,984 | |
| | 2,685 | | | Hanmi Pharm Co. Ltd. (Pharmaceuticals, Biotechnology & Life Sciences)* | | | 396,678 | |
| | 9,670 | | | Hanwha Corp. (Materials) | | | 274,109 | |
| | 36,990 | | | Hanwha Life Insurance Co. Ltd. (Insurance)* | | | 225,219 | |
| | 19,540 | | | Hyundai Marine & Fire Insurance Co. Ltd. (Insurance) | | | 550,500 | |
| | 52,403 | | | Hyundai Mobis (Automobiles & Components) | | | 11,914,829 | |
| | 24,316 | | | Hyundai Motor Co. (Automobiles & Components) | | | 4,415,377 | |
| | 1,957 | | | Hyundai Wia Corp. (Automobiles & Components) | | | 252,895 | |
| | 73,700 | | | Iljin Display Co. Ltd. (Semiconductors & Semiconductor Equipment) | | | 1,464,250 | |
| | 17,300 | | | Korea Gas Corp. (Utilities) | | | 1,110,823 | |
| | 197,460 | | | Macquarie Korea Infrastructure Fund (Diversified Financials) | | | 1,251,623 | |
| | 8,754 | | | Modetour Network, Inc. (Consumer Services) | | | 209,792 | |
| | 13,021 | | | Paradise Co. Ltd. (Consumer Services) | | | 270,458 | |
| | 22,041 | | | Samsung Electronics Co. Ltd. (Semiconductors & Semiconductor Equipment) | | | 30,483,153 | |
| | |
| | Common Stocks – (continued) | |
| | South Korea – (continued) | |
| | 5,651 | | | Samsung Life Insurance Co. Ltd. (Insurance) | | $ | 557,013 | |
| | 16,714 | | | Samyang Holdings Corp. (Food, Beverage & Tobacco) | | | 1,421,245 | |
| | 43,550 | | | Woori Finance Holdings Co. Ltd. (Banks) | | | 471,563 | |
| | | | | | | | |
| | | | | | | 56,600,515 | |
| | |
| | Taiwan – 12.5% | |
| | 1,233,000 | | | Asia Cement Corp. (Materials) | | | 1,565,570 | |
| | 913,880 | | | Asustek Computer, Inc. (Technology Hardware & Equipment) | | | 10,644,283 | |
| | 703,000 | | | Cathay Financial Holding Co. Ltd. (Insurance) | | | 947,237 | |
| | 463,000 | | | Cheng Shin Rubber Industry Co. Ltd. (Automobiles & Components) | | | 1,570,376 | |
| | 14,000 | | | Chicony Electronics Co. Ltd. (Technology Hardware & Equipment) | | | 41,188 | |
| | 976,000 | | | Chipbond Technology Corp. (Semiconductors & Semiconductor Equipment) | | | 2,488,087 | |
| | 553,000 | | | Chong Hong Construction Co. (Real Estate) | | | 1,913,437 | |
| | 166,000 | | | Farglory Land Development Co. Ltd. (Real Estate) | | | 317,220 | |
| | 1,060,000 | | | Fubon Financial Holding Co. Ltd. (Diversified Financials) | | | 1,516,579 | |
| | 421,000 | | | Grape King Industrial Co. (Household & Personal Products) | | | 1,513,895 | |
| | 1,070,000 | | | Huang Hsiang Construction Co. (Real Estate) | | | 2,850,339 | |
| | 228,000 | | | Makalot Industrial Co. Ltd. (Consumer Durables & Apparel) | | | 966,255 | |
| | 2,296,505 | | | Mega Financial Holding Co. Ltd. (Banks) | | | 1,772,805 | |
| | 324,000 | | | Novatek Microelectronics Corp. Ltd. (Semiconductors & Semiconductor Equipment) | | | 1,584,066 | |
| | 4,703,000 | | | Pou Chen Corp. (Consumer Durables & Apparel) | | | 5,551,389 | |
| | 881,000 | | | Radiant Opto-Electronics Corp. (Semiconductors & Semiconductor Equipment) | | | 3,586,120 | |
| | 628,000 | | | Sigurd Microelectronics Corp. (Semiconductors & Semiconductor Equipment) | | | 656,147 | |
| | 14,433,000 | | | Taishin Financial Holding Co. Ltd. (Banks) | | | 6,271,158 | |
| | 1,287,000 | | | Taiwan Semiconductor Manufacturing Co. Ltd. ADR (Semiconductors & Semiconductor Equipment) | | | 24,555,960 | |
| | |
| | |
| 24 | | The accompanying notes are an integral part of these financial statements. |
GOLDMAN SACHS EMERGING MARKETS EQUITY INSIGHTS FUND
| | | | | | | | |
Shares | | | Description | | Value | |
| | Common Stocks – (continued) | |
| | Taiwan – (continued) | |
| | 4,494,190 | | | Uni-President Enterprises Corp. (Food, Beverage & Tobacco) | | $ | 8,855,797 | |
| | 3,331,000 | | | Vanguard International Semiconductor Corp. (Semiconductors & Semiconductor Equipment) | | | 3,638,500 | |
| | | | | | | | |
| | | | | | | 82,806,408 | |
| | |
| | Thailand – 1.8% | |
| | 43,100 | | | Airports of Thailand PCL (Transportation) | | | 212,250 | |
| | 6,293,500 | | | CP ALL PCL (Food & Staples Retailing) | | | 9,442,585 | |
| | 139,300 | | | Ratchaburi Electricity Generating Holding PCL (Utilities) | | | 281,490 | |
| | 899,000 | | | Supalai PCL (Real Estate) | | | 629,027 | |
| | 361,100 | | | Thai Oil PCL (Energy) | | | 814,020 | |
| | 426,600 | | | Tisco Financial Group PCL (Banks) | | | 873,290 | |
| | | | | | | | |
| | | | | | | 12,252,662 | |
| | |
| | Turkey – 4.9% | |
| | 17,044 | | | Coca-Cola Icecek AS (Food, Beverage & Tobacco) | | | 475,986 | |
| | 233,823 | | | Dogus Otomotiv Servis ve Ticaret AS (Retailing) | | | 1,490,587 | |
| | 2,536,348 | | | Turk Hava Yollari (Transportation)* | | | 10,567,712 | |
| | 3,212,786 | | | Turkiye Is Bankasi Class C (Banks) | | | 12,427,033 | |
| | 911,277 | | | Turkiye Sinai Kalkinma Bankasi AS (Banks) | | | 1,313,389 | |
| | 1,149,500 | | | Turkiye Vakiflar Bankasi T.A.O Class D (Banks) | | | 4,113,315 | |
| | 249,251 | | | Ulker Biskuvi Sanayi AS (Food, Beverage & Tobacco) | | | 2,134,153 | |
| | 25,750 | | | Yazicilar Holding AS Class A (Capital Goods) | | | 307,710 | |
| | | | | | | | |
| | | | | | | 32,829,885 | |
| | |
| | TOTAL COMMON STOCKS | |
| | (Cost $551,455,875) | | $ | 610,904,213 | |
| | |
| | | | | | | | |
| | Preferred Stocks – 5.1% | |
| | Brazil – 4.4% | |
| | 306,900 | | | Companhia de Bebidas das Americas Preference Shares ADR (Food, Beverage & Tobacco) | | | 12,895,938 | |
| | 204,600 | | | Itausa – Investimentos Itau SA Preference Shares (Banks) | | | 1,020,571 | |
| | 1,388,900 | | | Klabin SA Preference Shares (Materials) | | | 9,454,864 | |
| | 596,200 | | | Petroleo Brasileiro SA Preference Shares (Energy) | | | 5,986,584 | |
| | | | | | | | |
| | | | | | | 29,357,957 | |
| | |
| | Preferred Stocks – (continued) | |
| | Chile – 0.1% | |
| | 69,284 | | | Coca-Cola Embonor SA Preference Shares Class B (Food, Beverage & Tobacco) | | $ | 216,260 | |
| | 41,149 | | | Embotelladora Andina SA Preference Shares Class B (Food, Beverage & Tobacco) | | | 279,598 | |
| | | | | | | | |
| | | | | | | 495,858 | |
| | |
| | Russia – 0.1% | |
| | 1,072,584 | | | OJSC Surgutneftegas Preference Shares (Energy) | | | 758,237 | |
| | 87,900 | | | Sberbank of Russia Preference Shares (Banks) | | | 204,558 | |
| | | | | | | | |
| | | | | | | 962,795 | |
| | |
| | South Korea – 0.5% | |
| | 8,163 | | | Hyundai Motor Co. Preference Shares (Automobiles & Components) | | | 616,185 | |
| | 3,014 | | | Samsung Electronics Co. Ltd. Preference Shares (Semiconductors & Semiconductor Equipment) | | | 2,388,373 | |
| | | | | | | | |
| | | | | | | 3,004,558 | |
| | |
| | TOTAL PREFERRED STOCKS | |
| | (Cost $30,935,752) | | $ | 33,821,168 | |
| | |
| | | | | | | | |
| | Exchange Traded Fund – 2.4% | |
| | Other – 2.4% | |
| | 372,903 | | | Vanguard FTSE Emerging Markets | | $ | 16,318,235 | |
| | (Cost $16,108,918) | | | | |
| | |
| | | | | | | | | | |
| Units | | Description | | Expiration
Month | | | Value | |
| Right – 0.0% | |
| Thailand – 0.0% | |
| 42,660 | | Tisco Financial
Group PCL (Banks)* | | | 06/13 | | | $ | 52,445 | |
| (Cost $0) | |
| |
TOTAL INVESTMENTS BEFORE SECURITIES LENDING REINVESTMENT VEHICLE | |
| (Cost $598,500,545) | | | $ | 661,096,061 | |
| |
| | |
| The accompanying notes are an integral part of these financial statements. | | 25 |
GOLDMAN SACHS EMERGING MARKETS EQUITY INSIGHTS FUND
| | | | | | | | |
Shares | | | Rate | | Value | |
| | Securities Lending Reinvestment Vehicle(b)(c) – 1.0% | |
| Goldman Sachs Financial Square Money Market Fund –
FST Shares |
|
| | 6,410,410 | | | 0.109% | | $ | 6,410,410 | |
| | (Cost $6,410,410) | |
| | |
| | TOTAL INVESTMENTS – 100.5% | |
| | (Cost $604,910,955) | | $ | 667,506,471 | |
| | |
| LIABILITIES IN EXCESS OF
OTHER ASSETS – (0.5)% | | | (3,483,987 | ) |
| | |
| | NET ASSETS – 100.0% | | $ | 664,022,484 | |
| | |
| | |
| The percentage shown for each investment category reflects the value of investments in that category as a percentage of net assets. |
* | | Non-income producing security. |
(a) | | All or a portion of security is on loan. |
(b) | | Variable rate security. Interest rate disclosed is that which is in effect at April 30, 2013. |
(c) | | Represents an affiliated issuer. |
| | |
|
Investment Abbreviations: |
ADR | | —American Depositary Receipt |
GDR | | —Global Depositary Receipt |
|
| | |
| 26 | | The accompanying notes are an integral part of these financial statements. |
GOLDMAN SACHS INTERNATIONAL EQUITY INSIGHTS FUND
Schedule of Investments
April 30, 2013 (Unaudited)
| | | | | | | | |
Shares | | | Description | | Value | |
| | | | | | | | |
| | Common Stocks – 96.7% | |
| | Australia – 5.3% | |
| | 755,310 | | | Arrium Ltd. (Materials) | | $ | 667,850 | |
| | 7,040 | | | Australia & New Zealand Banking Group Ltd. (Banks) | | | 232,652 | |
| | 1,267,390 | | | Australian Infrastructure Fund (Transportation) | | | 4,138,795 | |
| | 325,464 | | | AWE Ltd. (Energy)* | | | 435,872 | |
| | 65,717 | | | BHP Billiton Ltd. (Materials) | | | 2,209,337 | |
| | 286,394 | | | BlueScope Steel Ltd. (Materials)* | | | 1,474,708 | |
| | 119,827 | | | Commonwealth Bank of Australia (Banks) | | | 9,133,322 | |
| | 71,856 | | | David Jones Ltd. (Retailing) | | | 222,109 | |
| | 142,664 | | | DuluxGroup Ltd. (Materials) | | | 694,452 | |
| | 768,728 | | | Fortescue Metals Group Ltd. (Materials) | | | 2,808,087 | |
| | 590,109 | | | Insurance Australia Group Ltd. (Insurance) | | | 3,562,836 | |
| | 87,973 | | | Macquarie Group Ltd. (Diversified Financials) | | | 3,578,894 | |
| | 132,498 | | | NIB Holdings Ltd. (Insurance) | | | 323,263 | |
| | 84,944 | | | Primary Health Care Ltd. (Health Care Equipment & Services) | | | 464,247 | |
| | 111,665 | | | Ramsay Health Care Ltd. (Health Care Equipment & Services) | | | 3,707,979 | |
| | 53,930 | | | RCR Tomlinson Ltd. (Capital Goods) | | | 126,425 | |
| | 125,428 | | | Skilled Group Ltd. (Commercial & Professional Services) | | | 370,933 | |
| | 65,717 | | | Tatts Group Ltd. (Consumer Services) | | | 222,860 | |
| | 1,247,317 | | | Westfield Retail Trust (REIT) | | | 4,264,950 | |
| | 266,154 | | | Westpac Banking Corp. (Banks) | | | 9,336,688 | |
| | 37,916 | | | Woodside Petroleum Ltd. (Energy) | | | 1,479,244 | |
| | 199,681 | | | Woolworths Ltd. (Food & Staples Retailing) | | | 7,541,800 | |
| | | | | | | | |
| | | | | | | 56,997,303 | |
| | |
| | Austria – 0.2% | |
| | 53,879 | | | Raiffeisen Bank International AG (Banks)(a) | | | 1,901,932 | |
| | |
| | Belgium – 1.5% | |
| | 109,845 | | | Anheuser-Busch InBev NV (Food, Beverage & Tobacco)(a) | | | 10,552,872 | |
| | 16,451 | | | Delhaize Group SA (Food & Staples Retailing) | | | 1,029,395 | |
| | 10,592 | | | Groupe Bruxelles Lambert SA (Diversified Financials)(a) | | | 819,806 | |
| | 96,682 | | | KBC Groep NV (Banks) | | | 3,784,224 | |
| | | | | | | | |
| | | | | | | 16,186,297 | |
| | |
| | Bermuda – 0.3% | |
| | 207,277 | | | Catlin Group Ltd. (Insurance) | | | 1,694,402 | |
| | 119,267 | | | Hiscox Ltd. (Insurance) | | | 1,039,594 | |
| | 72,292 | | | Hiscox Ltd. Class B (Insurance)* | | | 56,148 | |
| | | | | | | | |
| | | | | | | 2,790,144 | |
| | |
| | | | | | | | |
| | Common Stocks – (continued) | |
| | China – 0.0% | |
| | 471,000 | | | China Minzhong Food Corp. Ltd. (Food, Beverage & Tobacco)* | | $ | 383,854 | |
| | |
| | Denmark – 1.3% | |
| | 55,011 | | | Novo Nordisk A/S Class B (Pharmaceuticals, Biotechnology & Life Sciences) | | | 9,683,302 | |
| | 51,489 | | | Pandora A/S (Consumer Durables & Apparel)(a) | | | 1,575,429 | |
| | 91,803 | | | Topdanmark A/S (Insurance)* | | | 2,356,642 | |
| | | | | | | | |
| | | | | | | 13,615,373 | |
| | |
| | Finland – 0.2% | |
| | 73,718 | | | Orion OYJ Class B (Pharmaceuticals, Biotechnology & Life Sciences) | | | 2,118,491 | |
| | |
| | France – 11.8% | |
| | 195,988 | | | AXA SA (Insurance) | | | 3,670,193 | |
| | 237,310 | | | BNP Paribas SA (Banks) | | | 13,231,909 | |
| | 268,411 | | | Compagnie Generale des Etablissements Michelin Class B (Automobiles & Components) | | | 22,697,349 | |
| | 199,108 | | | Danone SA (Food, Beverage & Tobacco)(a) | | | 15,185,599 | |
| | 4,807 | | | Euler Hermes SA (Insurance) | | | 459,656 | |
| | 42,344 | | | Fonciere Des Regions (REIT)(a) | | | 3,378,530 | |
| | 41,812 | | | JCDecaux SA (Media) | | | 1,150,373 | |
| | 353,192 | | | Legrand SA (Capital Goods) | | | 16,482,965 | |
| | 6,476 | | | Plastic Omnium SA (Automobiles & Components) | | | 316,459 | |
| | 16,792 | | | PPR (Retailing) | | | 3,698,789 | |
| | 165,791 | | | Sanofi (Pharmaceuticals, Biotechnology & Life Sciences) | | | 17,924,591 | |
| | 20,568 | | | SCOR SE (Insurance)(a) | | | 624,232 | |
| | 264,531 | | | Total SA (Energy) | | | 13,315,714 | |
| | 285,071 | | | Vinci SA (Capital Goods) | | | 13,742,374 | |
| | | | | | | | |
| | | | | | | 125,878,733 | |
| | |
| | Germany – 6.4% | |
| | 263,872 | | | BASF SE (Materials)(a) | | | 24,701,732 | |
| | 160,873 | | | Bayer AG (Registered) (Pharmaceuticals, Biotechnology & Life Sciences)(a) | | | 16,818,708 | |
| | 257,035 | | | Commerzbank AG (Banks)* | | | 3,469,153 | |
| | 45,417 | | | Continental AG (Automobiles & Components)* | | | 5,402,254 | |
| | 50,426 | | | Freenet AG (Telecommunication Services) | | | 1,257,258 | |
| | 16,781 | | | Gildemeister AG (Capital Goods)(a) | | | 379,469 | |
| | 6,422 | | | Hannover Rueckversicherung SE (Registered) (Insurance)(a) | | | 543,340 | |
| | 5,874 | | | Henkel AG & Co. KGaA (Household & Personal Products) | | | 460,425 | |
| | 45,440 | | | Merck KGaA (Pharmaceuticals, Biotechnology & Life Sciences)(a) | | | 6,922,629 | |
| | |
| | |
| The accompanying notes are an integral part of these financial statements. | | 27 |
GOLDMAN SACHS INTERNATIONAL EQUITY INSIGHTS FUND
Schedule of Investments (continued)
April 30, 2013 (Unaudited)
| | | | | | | | |
Shares | | | Description | | Value | |
| | | | | | | | |
| | Common Stocks – (continued) | |
| | Germany – (continued) | |
| | 95,025 | | | SAP AG (Software & Services) | | $ | 7,575,578 | |
| | 28,789 | | | SMA Solar Technology AG (Semiconductors & Semiconductor Equipment)(a) | | | 715,370 | |
| | | | | | | | |
| | | | | | | 68,245,916 | |
| | |
| | Hong Kong – 0.8% | |
| | 286,800 | | | AIA Group Ltd. (Insurance) | | | 1,275,818 | |
| | 139,000 | | | CLP Holdings Ltd. (Utilities) | | | 1,226,037 | |
| | 32,000 | | | First Pacific Co. Ltd. (Diversified Financials) | | | 44,319 | |
| | 26,500 | | | Hang Seng Bank Ltd. (Banks) | | | 443,887 | |
| | 63,000 | | | Hutchison Whampoa Ltd. (Capital Goods) | | | 685,391 | |
| | 9,500 | | | Jardine Strategic Holdings Ltd. (Capital Goods) | | | 370,969 | |
| | 509,200 | | | MGM China Holdings Ltd. (Consumer Services) | | | 1,202,011 | |
| | 231,000 | | | Noble Group Ltd. (Capital Goods) | | | 211,894 | |
| | 65,000 | | | Swire Pacific Ltd. Class B (Real Estate) | | | 156,826 | |
| | 48,858 | | | The Link REIT (REIT) | | | 276,966 | |
| | 462,000 | | | Wheelock & Co. Ltd. (Real Estate) | | | 2,574,509 | |
| | | | | | | | |
| | | | | | | 8,468,627 | |
| | |
| | Ireland – 0.2% | |
| | 489,992 | | | Beazley PLC (Insurance) | | | 1,711,743 | |
| | |
| | Israel – 0.5% | |
| | 126,341 | | | Bank Hapoalim B.M. (Banks)* | | | 587,708 | |
| | 73,787 | | | Bank Leumi Le-Israel BM (Banks)* | | | 262,270 | |
| | 62,938 | | | Bezeq Israeli Telecommunication Corp. Ltd. (Telecommunication Services) | | | 91,418 | |
| | 924 | | | Delek Group Ltd. (Energy) | | | 243,615 | |
| | 44,003 | | | Israel Chemicals Ltd. (Materials) | | | 524,362 | |
| | 3,649 | | | Mellanox Technologies Ltd. (Semiconductors & Semiconductor Equipment)* | | | 191,161 | |
| | 27,593 | | | Mizrahi Tefahot Bank Ltd. (Banks)* | | | 282,290 | |
| | 305 | | | NICE Systems Ltd. ADR (Software & Services)* | | | 10,818 | |
| | 79,462 | | | Teva Pharmaceutical Industries Ltd. ADR (Pharmaceuticals, Biotechnology & Life Sciences) | | | 3,042,600 | |
| | 109 | | | The Israel Corp. Ltd. (Materials)* | | | 70,190 | |
| | | | | | | | |
| | | | | | | 5,306,432 | |
| | |
| | Italy – 1.6% | |
| | 13,235 | | | Eni SpA (Energy) | | | 315,872 | |
| | 290,472 | | | Impregilo SpA (Capital Goods)(a) | | | 1,527,039 | |
| | 4,521,289 | | | Intesa Sanpaolo SpA (Banks) | | | 8,211,192 | |
| | 1,520,696 | | | Intesa Sanpaolo SpA RSP (Banks) | | | 2,386,492 | |
| | 358,007 | | | Iride SpA (Utilities) | | | 365,663 | |
| | |
| | | | | | | | |
| | Common Stocks – (continued) | |
| | Italy – (continued) | |
| | 128,053 | | | Lottomatica Group SpA (Consumer Services) | | $ | 3,266,788 | |
| | 44,059 | | | Yoox SpA (Retailing)* | | | 827,208 | |
| | | | | | | | |
| | | | | | | 16,900,254 | |
| | |
| | Japan – 24.6% | |
| | 1,762 | | | Accordia Golf Co. Ltd. (Consumer Services) | | | 2,000,856 | |
| | 22,900 | | | Aisin Seiki Co. Ltd. (Automobiles & Components) | | | 826,617 | |
| | 542,000 | | | Aozora Bank Ltd. (Banks) | | | 1,698,140 | |
| | 498,000 | | | Asahi Glass Co. Ltd. (Capital Goods) | | | 3,912,894 | |
| | 37,600 | | | Asahi Group Holdings Ltd. (Food, Beverage & Tobacco) | | | 935,021 | |
| | 36,800 | | | Astellas Pharma, Inc. (Pharmaceuticals, Biotechnology & Life Sciences) | | | 2,144,891 | |
| | 24,300 | | | Azbil Corp. (Technology Hardware & Equipment) | | | 524,712 | |
| | 855 | | | Bic Camera, Inc. (Retailing)(a) | | | 374,604 | |
| | 3,500 | | | Canon, Inc. (Technology Hardware & Equipment) | | | 125,876 | |
| | 24,300 | | | Capcom Co. Ltd. (Software & Services) | | | 399,150 | |
| | 36,000 | | | Central Japan Railway Co. (Transportation) | | | 4,341,720 | |
| | 97,100 | | | Chubu Electric Power Co., Inc. (Utilities) | | | 1,257,061 | |
| | 17,800 | | | Cocokara fine, Inc. (Food & Staples Retailing) | | | 672,969 | |
| | 97,000 | | | Dai Nippon Printing Co. Ltd. (Commercial & Professional Services) | | | 949,790 | |
| | 1,062,000 | | | Daihatsu Motor Co. Ltd. (Automobiles & Components) | | | 21,066,641 | |
| | 277,500 | | | Daiichi Sankyo Co. Ltd. (Pharmaceuticals, Biotechnology & Life Sciences) | | | 5,429,765 | |
| | 50,700 | | | Daito Trust Construction Co. Ltd. (Real Estate) | | | 4,915,925 | |
| | 523,000 | | | Daiwa Securities Group, Inc. (Diversified Financials) | | | 4,640,397 | |
| | 8,800 | | | Dena Co. Ltd. (Software & Services) | | | 250,678 | |
| | 877,000 | | | DIC Corp. (Materials) | | | 1,963,194 | |
| | 20,300 | | | East Japan Railway Co. (Transportation) | | | 1,713,660 | |
| | 114,900 | | | EDION Corp. (Retailing) | | | 538,131 | |
| | 17,200 | | | Eisai Co. Ltd. (Pharmaceuticals, Biotechnology & Life Sciences) | | | 784,908 | |
| | 78,900 | | | FamilyMart Co. Ltd. (Food & Staples Retailing) | | | 3,605,772 | |
| | 95,000 | | | Fuji Heavy Industries Ltd. (Automobiles & Components) | | | 1,793,171 | |
| | 181 | | | Fuji Media Holdings, Inc. (Media) | | | 393,409 | |
| | |
| | |
| 28 | | The accompanying notes are an integral part of these financial statements. |
GOLDMAN SACHS INTERNATIONAL EQUITY INSIGHTS FUND
| | | | | | | | |
Shares | | | Description | | Value | |
| | | | | | | | |
| | Common Stocks – (continued) | |
| | Japan – (continued) | |
| | 10,500 | | | FUJIFILM Holdings Corp. (Technology Hardware & Equipment) | | $ | 215,707 | |
| | 1,293,000 | | | Fujitsu Ltd. (Technology Hardware & Equipment) | | | 5,430,702 | |
| | 73,000 | | | Fukuyama Transporting Co. Ltd. (Transportation) | | | 407,641 | |
| | 6,000 | | | HIS Co. Ltd. (Consumer Services) | | | 258,786 | |
| | 4,900 | | | Hisamitsu Pharmaceutical Co., Inc. (Pharmaceuticals, Biotechnology & Life Sciences) | | | 288,114 | |
| | 221,000 | | | Hitachi Ltd. (Technology Hardware & Equipment) | | | 1,412,377 | |
| | 20,600 | | | Hokkaido Electric Power Co., Inc. (Utilities)* | | | 261,388 | |
| | 51,200 | | | Hokuriku Electric Power Co. (Utilities) | | | 755,115 | |
| | 7,900 | | | Idemitsu Kosan Co. Ltd. (Energy) | | | 668,340 | |
| | 614 | | | Inpex Corp. (Energy) | | | 2,971,336 | |
| | 882,000 | | | Isuzu Motors Ltd. (Automobiles & Components) | | | 5,877,942 | |
| | 186,600 | | | IT Holdings Corp. (Software & Services) | | | 2,801,194 | |
| | 100,500 | | | Japan Airlines Co. Ltd. (Transportation) | | | 5,103,488 | |
| | 379 | | | Japan Prime Realty Investment Corp. (REIT) | | | 1,392,727 | |
| | 12 | | | Japan Real Estate Investment Corp. (REIT) | | | 161,201 | |
| | 64,900 | | | Japan Tobacco, Inc. (Food, Beverage & Tobacco) | | | 2,453,300 | |
| | 289,800 | | | JTEKT Corp. (Capital Goods) | | | 2,954,904 | |
| | 23,000 | | | Kaneka Corp. (Materials) | | | 138,555 | |
| | 2,859,000 | | | Kawasaki Kisen Kaisha Ltd. (Transportation) | | | 6,290,761 | |
| | 69,000 | | | KDDI Corp. (Telecommunication Services) | | | 3,318,026 | |
| | 623,500 | | | Konica Minolta, Inc. (Technology Hardware & Equipment) | | | 4,404,944 | |
| | 62,800 | | | Kyokuto Securities Co. Ltd. (Diversified Financials) | | | 1,180,523 | |
| | 34,000 | | | Kyowa Hakko Kirin Co. Ltd. (Pharmaceuticals, Biotechnology & Life Sciences) | | | 417,332 | |
| | 6,800 | | | LIXIL Group Corp. (Capital Goods) | | | 152,873 | |
| | 779,000 | | | Marubeni Corp. (Capital Goods) | | | 5,591,854 | |
| | 22,200 | | | Matsumotokiyoshi Holdings Co. Ltd. (Food & Staples Retailing) | | | 635,477 | |
| | 13,200 | | | MEIJI Holdings Co. Ltd. (Food, Beverage & Tobacco) | | | 595,901 | |
| | 9,700 | | | Ministop Co. Ltd. (Food & Staples Retailing) | | | 167,252 | |
| | 2,600 | | | Miraca Holdings, Inc. (Health Care Equipment & Services) | | | 129,654 | |
| | 41,000 | | | Mito Securities Co. Ltd. (Diversified Financials) | | | 251,829 | |
| | |
| | | | | | | | |
| | Common Stocks – (continued) | |
| | Japan – (continued) | |
| | 566,500 | | | Mitsubishi Chemical Holdings Corp. (Materials) | | $ | 2,762,891 | |
| | 27,900 | | | Mitsubishi Tanabe Pharma Corp. (Pharmaceuticals, Biotechnology & Life Sciences) | | | 424,396 | |
| | 1,544,100 | | | Mitsubishi UFJ Financial Group, Inc. (Banks) | | | 10,476,479 | |
| | 106,500 | | | Mitsubishi UFJ Lease & Finance Co. Ltd. (Diversified Financials) | | | 601,576 | |
| | 40,200 | | | Mitsui & Co. Ltd. (Capital Goods) | | | 553,822 | |
| | 2,628,200 | | | Mizuho Financial Group, Inc. (Banks) | | | 5,783,243 | |
| | 25,700 | | | Moshi Moshi Hotline, Inc. (Commercial & Professional Services) | | | 380,630 | |
| | 9,700 | | | Namco Bandai Holdings, Inc. (Consumer Durables & Apparel) | | | 176,796 | |
| | 82,300 | | | NET One Systems Co. Ltd. (Software & Services) | | | 721,923 | |
| | 10,000 | | | Nihon Parkerizing Co. Ltd. (Materials) | | | 203,692 | |
| | 4,200 | | | Nintendo Co. Ltd. (Software & Services) | | | 463,565 | |
| | 88,000 | | | Nippon Shokubai Co. Ltd. (Materials) | | | 865,823 | |
| | 81,700 | | | Nippon Suisan Kaisha Ltd. (Food, Beverage & Tobacco) | | | 158,550 | |
| | 57,900 | | | Nippon Telegraph & Telephone Corp. (Telecommunication Services) | | | 2,879,376 | |
| | 377,000 | | | Nomura Holdings, Inc. (Diversified Financials) | | | 3,081,109 | |
| | 171,700 | | | Nomura Real Estate Holdings, Inc. (Real Estate) | | | 4,615,955 | |
| | 64 | | | Nomura Real Estate Office Fund, Inc. (REIT) | | | 408,927 | |
| | 182 | | | NOVARESE, Inc. (Consumer Services) | | | 138,453 | |
| | 51 | | | NTT Data Corp. (Software & Services) | | | 161,470 | |
| | 1,135 | | | NTT DoCoMo, Inc. (Telecommunication Services) | | | 1,879,444 | |
| | 93,000 | | | OKK Corp. (Capital Goods) | | | 184,490 | |
| | 3,400 | | | Oriental Land Co. Ltd. (Consumer Services) | | | 549,680 | |
| | 511,200 | | | ORIX Corp. (Diversified Financials) | | | 7,844,011 | |
| | 1,600 | | | Otsuka Corp. (Software & Services) | | | 165,863 | |
| | 197,900 | | | Otsuka Holdings Co. Ltd. (Pharmaceuticals, Biotechnology & Life Sciences) | | | 7,136,729 | |
| | 13,100 | | | Parco Co. Ltd. (Retailing) | | | 171,733 | |
| | 108,000 | | | Rengo Co. Ltd. (Materials) | | | 522,876 | |
| | 25,600 | | | Rohm Co. Ltd. (Semiconductors & Semiconductor Equipment) | | | 905,001 | |
| | 103,300 | | | Round One Corp. (Consumer Services) | | | 865,851 | |
| | |
| | |
| The accompanying notes are an integral part of these financial statements. | | 29 |
GOLDMAN SACHS INTERNATIONAL EQUITY INSIGHTS FUND
Schedule of Investments (continued)
April 30, 2013 (Unaudited)
| | | | | | | | |
Shares | | | Description | | Value | |
| | | | | | | | |
| | Common Stocks – (continued) | |
| | Japan – (continued) | |
| | 14,300 | | | Sankyo Co. Ltd. (Consumer Durables & Apparel) | | $ | 651,758 | |
| | 4,800 | | | SCSK Corp. (Software & Services) | | | 106,963 | |
| | 28,000 | | | Sekisui Chemical Co. Ltd. (Consumer Durables & Apparel) | | | 352,591 | |
| | 12,000 | | | Sekisui House Ltd. (Consumer Durables & Apparel) | | | 179,872 | |
| | 71,200 | | | Seven & I Holdings Co. Ltd. (Food & Staples Retailing) | | | 2,738,791 | |
| | 23,100 | | | Shikoku Electric Power Co., Inc. (Utilities)* | | | 418,730 | |
| | 18,100 | | | Shinko Electric Industries Co. Ltd. (Semiconductors & Semiconductor Equipment) | | | 184,567 | |
| | 97,500 | | | Shionogi & Co. Ltd. (Pharmaceuticals, Biotechnology & Life Sciences) | | | 2,398,203 | |
| | 46,900 | | | Showa Corp. (Automobiles & Components) | | | 680,875 | |
| | 82,700 | | | Softbank Corp. (Telecommunication Services) | | | 4,101,419 | |
| | 50,000 | | | Sumikin Bussan Corp. (Capital Goods) | | | 163,378 | |
| | 598,200 | | | Sumitomo Corp. (Capital Goods) | | | 7,488,887 | |
| | 904,000 | | | Sumitomo Heavy Industries Ltd. (Capital Goods) | | | 4,025,281 | |
| | 22,000 | | | Sumitomo Metal Mining Co. Ltd. (Materials) | | | 307,985 | |
| | 198,500 | | | Sumitomo Mitsui Financial Group, Inc. (Banks) | | | 9,382,570 | |
| | 1,085,000 | | | Sumitomo Mitsui Trust Holdings, Inc. (Banks) | | | 5,452,677 | |
| | 121,300 | | | T&D Holdings, Inc. (Insurance) | | | 1,412,932 | |
| | 43,000 | | | Taikisha Ltd. (Capital Goods) | | | 974,460 | |
| | 88,400 | | | Takeda Pharmaceutical Co. Ltd. (Pharmaceuticals, Biotechnology & Life Sciences) | | | 4,853,316 | |
| | 56,200 | | | TDK Corp. (Technology Hardware & Equipment) | | | 2,055,049 | |
| | 67,400 | | | The Chugoku Electric Power Co., Inc. (Utilities) | | | 967,419 | |
| | 33,700 | | | The Kansai Electric Power Co., Inc. (Utilities)* | | | 411,724 | |
| | 25,300 | | | Tokai Rika Co. Ltd. (Automobiles & Components) | | | 512,637 | |
| | 40,000 | | | Tokai Tokyo Financial Holdings, Inc. (Diversified Financials) | | | 363,761 | |
| | 402,000 | | | Toko, Inc. (Technology Hardware & Equipment)*(a) | | | 1,190,967 | |
| | 76,600 | | | Tokyo Ohka Kogyo Co. Ltd. (Materials) | | | 1,660,444 | |
| | 175,000 | | | Tokyo Tatemono Co. Ltd. (Real Estate) | | | 1,621,907 | |
| | 194,000 | | | Tokyu Land Corp. (Real Estate) | | | 2,385,244 | |
| | 31,000 | | | Toshiba TEC Corp. (Technology Hardware & Equipment) | | | 183,180 | |
| | |
| | | | | | | | |
| | Common Stocks – (continued) | |
| | Japan – (continued) | |
| | 3,900 | | | Towa Pharmaceutical Co. Ltd. (Pharmaceuticals, Biotechnology & Life Sciences) | | $ | 193,477 | |
| | 217,300 | | | Toyota Motor Corp. (Automobiles & Components) | | | 12,611,626 | |
| | 28,300 | | | TSI Holdings Co. Ltd. (Consumer Durables & Apparel) | | | 208,862 | |
| | 50,900 | | | Tsumura & Co. (Pharmaceuticals, Biotechnology & Life Sciences) | | | 1,663,193 | |
| | 1,400 | | | Tsuruha Holdings, Inc. (Food & Staples Retailing) | | | 136,425 | |
| | 4,600 | | | Unipres Corp. (Automobiles & Components) | | | 102,382 | |
| | 21,200 | | | UNY Group Holdings Co., Ltd. (Food & Staples Retailing) | | | 150,881 | |
| | 16,500 | | | Ushio, Inc. (Capital Goods) | | | 168,121 | |
| | 217,900 | | | West Japan Railway Co. (Transportation) | | | 10,542,509 | |
| | | | | | | | |
| | | | | | | 262,038,612 | |
| | |
| | Luxembourg – 0.2% | |
| | 75,570 | | | SES SA FDR (Media) | | | 2,356,946 | |
| | |
| | Netherlands – 6.7% | |
| | 86,411 | | | Heineken Holding NV (Food, Beverage & Tobacco)(a) | | | 5,206,882 | |
| | 22,551 | | | Heineken NV (Food, Beverage & Tobacco)(a) | | | 1,596,041 | |
| | 627,393 | | | Koninklijke Ahold NV (Food & Staples Retailing) | | | 9,911,057 | |
| | 133,795 | | | Koninklijke Philips Electronics NV (Capital Goods)(a) | | | 3,703,185 | |
| | 49,805 | | | Randstad Holding NV (Commercial & Professional Services) | | | 2,076,090 | |
| | 687,467 | | | Royal Dutch Shell PLC Class A (Energy) | | | 23,383,191 | |
| | 558,944 | | | Royal Dutch Shell PLC Class B (Energy) | | | 19,606,325 | |
| | 136,854 | | | Unilever NV CVA (Food, Beverage & Tobacco) | | | 5,831,531 | |
| | | | | | | | |
| | | | | | | 71,314,302 | |
| | |
| | New Zealand – 0.1% | |
| | 174,185 | | | Fletcher Building Ltd. (Materials) | | | 1,321,448 | |
| | |
| | Norway – 3.0% | |
| | 648,266 | | | DNB ASA (Banks)*(a) | | | 10,615,692 | |
| | 271,741 | | | Gjensidige Forsikring ASA (Insurance)(a) | | | 4,382,348 | |
| | 219,665 | | | Orkla ASA (Food, Beverage & Tobacco) | | | 1,980,789 | |
| | 432,121 | | | Statoil ASA (Energy) | | | 10,578,915 | |
| | 180,883 | | | Telenor ASA (Telecommunication Services) | | | 4,076,188 | |
| | | | | | | | |
| | | | | | | 31,633,932 | |
| | |
| | |
| 30 | | The accompanying notes are an integral part of these financial statements. |
GOLDMAN SACHS INTERNATIONAL EQUITY INSIGHTS FUND
| | | | | | | | |
Shares | | | Description | | Value | |
| | | | | | | | |
| | Common Stocks – (continued) | |
| | Singapore – 1.3% | |
| | 38,000 | | | CapitaCommercial Trust (REIT) | | $ | 52,911 | |
| | 436,000 | | | Cityspring Infrastructure Trust (Utilities) | | | 175,289 | |
| | 226,120 | | | DBS Group Holdings Ltd. (Banks) | | | 3,084,564 | |
| | 400,000 | | | Frasers Commercial Trust (REIT) | | | 506,792 | |
| | 32,000 | | | Hong Leong Asia Ltd. (Capital Goods) | | | 42,317 | |
| | 183,000 | | | Hutchison Port Holdings Trust Class U (Transportation) | | | 152,157 | |
| | 29,523 | | | Jardine Cycle & Carriage Ltd. (Retailing) | | | 1,170,130 | |
| | 260,000 | | | K1 Ventures Ltd. (Diversified Financials) | | | 33,986 | |
| | 99,000 | | | Keppel Corp. Ltd. (Capital Goods) | | | 863,552 | |
| | 31,800 | | | Keppel REIT (REIT) | | | 39,027 | |
| | 349,000 | | | Lippo Malls Indonesia Retail Trust (REIT) | | | 148,983 | |
| | 81,000 | | | Mapletree Logistics Trust (REIT) | | | 86,160 | |
| | 98,000 | | | Singapore Airlines Ltd. (Transportation) | | | 884,950 | |
| | 524,780 | | | Singapore Telecommunications Ltd. (Telecommunication Services) | | | 1,676,307 | |
| | 22,000 | | | United Engineers Ltd. (Capital Goods) | | | 56,164 | |
| | 126,000 | | | United Overseas Bank Ltd. (Banks) | | | 2,189,539 | |
| | 340,000 | | | UOL Group Ltd. (Real Estate) | | | 1,974,083 | |
| | 77,000 | | | Wilmar International Ltd. (Food, Beverage & Tobacco) | | | 209,017 | |
| | 257,000 | | | Wing Tai Holdings Ltd. (Real Estate) | | | 455,274 | |
| | | | | | | | |
| | | | | | | 13,801,202 | |
| | |
| | Spain – 1.7% | |
| | 151,069 | | | Amadeus IT Holding SA Class A (Software & Services) | | | 4,457,530 | |
| | 45,982 | | | Enagas SA (Utilities) | | | 1,224,551 | |
| | 379,328 | | | Ferrovial SA (Capital Goods) | | | 6,275,015 | |
| | 42,574 | | | Inditex SA (Retailing) | | | 5,713,663 | |
| | | | | | | | |
| | | | | | | 17,670,759 | |
| | |
| | Sweden – 1.2% | | | | |
| | 28,945 | | | Hexpol AB (Materials) | | | 1,632,080 | |
| | 48,139 | | | Investor AB Class B (Diversified Financials) | | | 1,427,651 | |
| | 8,620 | | | Modern Times Group AB Class B (Media) | | | 369,971 | |
| | 235,342 | | | Nordea Bank AB (Banks) | | | 2,831,877 | |
| | 208,204 | | | Swedbank AB Class A (Banks) | | | 5,126,745 | |
| | 111,877 | | | Telefonaktiebolaget LM Ericsson Class B (Technology Hardware & Equipment) | | | 1,391,344 | |
| | | | | | | | |
| | | | | | | 12,779,668 | |
| | |
| | Switzerland – 6.8% | |
| | 84,442 | | | Actelion Ltd. (Registered) (Pharmaceuticals, Biotechnology & Life Sciences)* | | | 5,170,245 | |
| | |
| | | | | | | | |
| | Common Stocks – (continued) | |
| | Switzerland – (continued) | |
| | 584 | | | Forbo Holding AG (Registered) (Consumer Durables & Apparel)* | | $ | 377,072 | |
| | 44,999 | | | Geberit AG (Registered) (Capital Goods)* | | | 10,996,959 | |
| | 95 | | | Lindt & Spruengli AG (Food, Beverage & Tobacco) | | | 367,994 | |
| | 193,662 | | | Nestle SA (Registered) (Food, Beverage & Tobacco) | | | 13,810,523 | |
| | 91,769 | | | Novartis AG (Registered) (Pharmaceuticals, Biotechnology & Life Sciences) | | | 6,793,437 | |
| | 243,525 | | | OC Oerlikon Corp. AG (Registered) (Capital Goods)* | | | 2,818,897 | |
| | 3,002 | | | Partners Group Holding AG (Diversified Financials) | | | 770,208 | |
| | 26,786 | | | Roche Holding AG (Pharmaceuticals, Biotechnology & Life Sciences) | | | 6,705,624 | |
| | 301,281 | | | Swiss Re AG (Insurance)* | | | 23,976,421 | |
| | 2,354 | | | Swisscom AG (Registered) (Telecommunication Services) | | | 1,108,780 | |
| | | | | | | | |
| | | | | | | 72,896,160 | |
| | |
| | United Kingdom – 21.0% | |
| | 996,064 | | | Aberdeen Asset Management PLC (Diversified Financials) | | | 6,952,834 | |
| | 216,661 | | | AMEC PLC (Energy) | | | 3,415,428 | |
| | 241,502 | | | ARM Holdings PLC (Semiconductors & Semiconductor Equipment) | | | 3,756,301 | |
| | 144,930 | | | Ashmore Group PLC (Diversified Financials) | | | 900,120 | |
| | 144,072 | | | AstraZeneca PLC (Pharmaceuticals, Biotechnology & Life Sciences) | | | 7,480,364 | |
| | 1,105,752 | | | Barclays PLC (Banks) | | | 4,934,395 | |
| | 308,742 | | | Barratt Developments PLC (Consumer Durables & Apparel)* | | | 1,494,564 | |
| | 67,211 | | | Berendsen PLC (Commercial & Professional Services) | | | 807,679 | |
| | 29,963 | | | BG Group PLC (Energy) | | | 505,816 | |
| | 500,526 | | | BHP Billiton PLC (Materials) | | | 14,081,193 | |
| | 16,159 | | | BP PLC (Energy) | | | 117,091 | |
| | 91,579 | | | BP PLC ADR (Energy) | | | 3,992,844 | |
| | 306,883 | | | British American Tobacco PLC (Food, Beverage & Tobacco) | | | 17,012,139 | |
| | 268,943 | | | British Sky Broadcasting Group PLC (Media) | | | 3,524,685 | |
| | 919,206 | | | Cable & Wireless Communications PLC (Telecommunication Services) | | | 605,152 | |
| | 781,517 | | | Centrica PLC (Utilities) | | | 4,507,598 | |
| | 27,016 | | | Croda International PLC (Materials) | | | 1,041,454 | |
| | 39,369 | | | CSR PLC (Semiconductors & Semiconductor Equipment) | | | 301,883 | |
| | 281,053 | | | Devro PLC (Food, Beverage & Tobacco) | | | 1,443,602 | |
| | |
| | |
| The accompanying notes are an integral part of these financial statements. | | 31 |
GOLDMAN SACHS INTERNATIONAL EQUITY INSIGHTS FUND
Schedule of Investments (continued)
April 30, 2013 (Unaudited)
| | | | | | | | |
Shares | | | Description | | Value | |
| | | | | | | | |
| | Common Stocks – (continued) | |
| | United Kingdom – (continued) | |
| | 424,869 | | | Diageo PLC (Food, Beverage & Tobacco) | | $ | 12,974,478 | |
| | 408,454 | | | easyJet PLC (Transportation) | | | 7,102,809 | |
| | 106,744 | | | Elementis PLC (Materials) | | | 438,223 | |
| | 803,542 | | | Firstgroup PLC (Transportation) | | | 2,638,768 | |
| | 152,911 | | | GlaxoSmithKline PLC ADR (Pharmaceuticals, Biotechnology & Life Sciences) | | | 7,896,324 | |
| | 40,748 | | | Great Portland Estates PLC (REIT) | | | 337,086 | |
| | 350,468 | | | Hammerson PLC (REIT) | | | 2,831,940 | |
| | 3,008,996 | | | HSBC Holdings PLC (Banks) | | | 32,954,494 | |
| | 243,503 | | | IG Group Holdings PLC (Diversified Financials) | | | 2,039,524 | |
| | 103,735 | | | IMI PLC (Capital Goods) | | | 1,999,612 | |
| | 123,327 | | | Inmarsat PLC (Telecommunication Services) | | | 1,386,235 | |
| | 33,758 | | | InterContinental Hotels Group PLC (Consumer Services) | | | 997,418 | |
| | 187,242 | | | Intermediate Capital Group PLC (Diversified Financials) | | | 1,230,930 | |
| | 29,100 | | | Keller Group PLC (Capital Goods) | | | 388,392 | |
| | 915,526 | | | Ladbrokes PLC (Consumer Services) | | | 2,695,807 | |
| | 3,918,255 | | | Lloyds Banking Group PLC (Banks)* | | | 3,328,530 | |
| | 62,968 | | | London Stock Exchange Group PLC (Diversified Financials) | | | 1,313,926 | |
| | 222,937 | | | Mondi PLC (Materials) | | | 2,962,720 | |
| | 240,963 | | | National Grid PLC (Utilities) | | | 3,071,606 | |
| | 52,732 | | | Next PLC (Retailing) | | | 3,574,514 | |
| | 31,165 | | | Petrofac Ltd. (Energy) | | | 655,027 | |
| | 211,717 | | | Rexam PLC (Materials) | | | 1,699,973 | |
| | 20,292 | | | Rotork PLC (Capital Goods) | | | 918,036 | |
| | 132,043 | | | SIG PLC (Capital Goods) | | | 332,809 | |
| | 212,442 | | | Standard Chartered PLC (Banks) | | | 5,346,616 | |
| | 231,717 | | | TalkTalk Telecom Group PLC (Telecommunication Services) | | | 902,364 | |
| | 395,478 | | | Tate & Lyle PLC (Food, Beverage & Tobacco) | | | 5,190,049 | |
| | 124,955 | | | Tetragon Financial Group Ltd. (Diversified Financials)(a) | | | 1,368,257 | |
| | 781,174 | | | TUI Travel PLC (Consumer Services) | | | 3,819,371 | |
| | 113,922 | | | Tullow Oil PLC (Energy) | | | 1,775,785 | |
| | 320,342 | | | Unilever PLC (Food, Beverage & Tobacco) | | | 13,879,373 | |
| | 29,646 | | | Victrex PLC (Materials) | | | 739,633 | |
| | 256,413 | | | Vodafone Group PLC (Telecommunication Services) | | | 782,392 | |
| | 282,037 | | | Vodafone Group PLC ADR (Telecommunication Services)(b) | | | 8,627,512 | |
| | 53,999 | | | WH Smith PLC (Retailing)(a) | | | 621,489 | |
| | 20,342 | | | Whitbread PLC (Consumer Services) | | | 808,660 | |
| | | | | | | | |
| | Common Stocks – (continued) | |
| | United Kingdom – (continued) | |
| | 1,156,965 | | | William Hill PLC (Consumer Services) | | $ | 7,666,515 | |
| | | | | | | | |
| | | | | | | 224,172,339 | |
| | |
| | TOTAL COMMON STOCKS | |
| | (Cost $931,486,427) | | $ | 1,030,490,467 | |
| | |
| | | | | | | | |
| | Preferred Stocks – 0.2% | |
| | Germany – 0.2% | |
| | 15,915 | | | Henkel AG & Co. KGaA Preference Shares (Household & Personal Products) | | $ | 1,502,486 | |
| | 35,802 | | | ProSiebenSat.1 Media AG Preference Shares (Media) | | | 1,366,482 | |
| | |
| | TOTAL PREFERRED STOCKS | |
| | (Cost $2,541,831) | | $ | 2,868,968 | |
| | |
| TOTAL INVESTMENTS BEFORE SECURITIES LENDING
REINVESTMENT VEHICLE |
|
| | (Cost $934,028,258) | | $ | 1,033,359,435 | |
| | |
| | | | | | | | |
| Shares | | | Rate | | Value | |
| | Securities Lending Reinvestment Vehicle(c)(d) – 9.7% | |
| Goldman Sachs Financial Square Money Market Fund –
FST Shares |
|
| | 102,847,510 | | | 0.109% | | $ | 102,847,510 | |
| | (Cost $102,847,510) | | | | |
| | |
| | TOTAL INVESTMENTS – 106.6% | |
| | (Cost $1,036,875,768) | | $ | 1,136,206,945 | |
| | |
| LIABILITIES IN EXCESS OF
OTHER ASSETS – (6.6)% | | | (70,623,460 | ) |
| | |
| | NET ASSETS – 100.0% | | $ | 1,065,583,485 | |
| | |
| | |
| The percentage shown for each investment category reflects the value of investments in that category as a percentage of net assets. |
* | | Non-income producing security. |
(a) | | All or a portion of security is on loan. |
(b) | | All or a portion of security is segregated as collateral for initial margin requirements on futures transactions. |
(c) | | Variable rate security. Interest rate disclosed is that which is in effect at April 30, 2013. |
(d) | | Represents an affiliated issuer. |
| | |
|
Investment Abbreviations: |
ADR | | —American Depositary Receipt |
CVA | | —Dutch Certification |
FDR | | —Fiduciary Depositary Receipt |
REIT | | —Real Estate Investment Trust |
RSP | | —Risparmio Shares |
|
| | |
| 32 | | The accompanying notes are an integral part of these financial statements. |
GOLDMAN SACHS INTERNATIONAL EQUITY INSIGHTS FUND
Schedule of Investments (continued)
April 30, 2013 (Unaudited)
|
| ADDITIONAL INVESTMENT INFORMATION |
FUTURES CONTRACTS — At April 30, 2013, the Fund had the following futures contracts:
| | | | | | | | | | | | | | |
| Type | | Number of
Contracts
Long (Short) | | | Expiration
Date | | Current Value | | | Unrealized
Gain (Loss) | |
EURO STOXX 50 Index | | | 293 | | | June 2013 | | $ | 10,298,773 | | | $ | 41,565 | |
FTSE 100 Index | | | 48 | | | June 2013 | | | 4,759,589 | | | | 23,067 | |
Hang Seng Index | | | 3 | | | May 2013 | | | 436,925 | | | | 2,735 | |
MSCI Singapore Index | | | 4 | | | May 2013 | | | 246,943 | | | | 2,769 | |
SPI 200 Index | | | 13 | | | June 2013 | | | 1,741,241 | | | | 65,917 | |
TSE TOPIX Index | | | 38 | | | June 2013 | | | 4,549,008 | | | | 483,493 | |
| TOTAL | | | | | | | | | | | | $ | 619,546 | |
| | |
| The accompanying notes are an integral part of these financial statements. | | 33 |
GOLDMAN SACHS INTERNATIONAL SMALL CAP INSIGHTS FUND
Schedule of Investments
April 30, 2013 (Unaudited)
| | | | | | | | |
| Shares | | | Description | | Value | |
| | | | | | | | |
| | Common Stocks – 92.1% | |
| | Australia – 7.9% | |
| | 70,156 | | | Adelaide Brighton Ltd. (Materials) | | $ | 247,554 | |
| | 48,282 | | | Amcom Telecommunications Ltd. (Telecommunication Services) | | | 101,194 | |
| | 377,163 | | | Ardent Leisure Group (Real Estate) | | | 602,026 | |
| | 1,386,424 | | | Arrium Ltd. (Materials) | | | 1,225,885 | |
| | 204,960 | | | Aurora Oil & Gas Ltd. (Energy)* | | | 649,630 | |
| | 719,668 | | | Australian Infrastructure Fund (Transportation) | | | 2,350,151 | |
| | 175,673 | | | Automotive Holdings Group Ltd. (Retailing) | | | 741,618 | |
| | 849,485 | | | AWE Ltd. (Energy)* | | | 1,137,658 | |
| | 25,550 | | | BC Iron Ltd. (Materials) | | | 91,320 | |
| | 449,256 | | | Beach Energy Ltd. (Energy) | | | 634,607 | |
| | 279,099 | | | BlueScope Steel Ltd. (Materials)* | | | 1,437,144 | |
| | 137,945 | | | Bradken Ltd. (Capital Goods) | | | 736,271 | |
| | 28,736 | | | BWP Trust (REIT) | | | 72,071 | |
| | 113,276 | | | Cabcharge Australia Ltd. (Commercial & Professional Services) | | | 561,428 | |
| | 100,036 | | | Challenger Ltd. (Diversified Financials) | | | 436,164 | |
| | 276,613 | | | Charter Hall Group (REIT) | | | 1,220,730 | |
| | 38,032 | | | Clough Ltd. (Capital Goods) | | | 46,525 | |
| | 695,149 | | | Commonwealth Property Office Fund (REIT) | | | 835,349 | |
| | 371,286 | | | David Jones Ltd. (Retailing) | | | 1,147,657 | |
| | 139,367 | | | DuluxGroup Ltd. (Materials) | | | 678,403 | |
| | 84,410 | | | Envestra Ltd. (Utilities) | | | 91,796 | |
| | 37,780 | | | Forge Group Ltd. (Capital Goods) | | | 226,673 | |
| | 66,219 | | | iiNET Ltd. (Telecommunication Services) | | | 423,638 | |
| | 57,560 | | | Imdex Ltd. (Materials) | | | 58,958 | |
| | 98,733 | | | Investa Office Fund (REIT) | | | 335,776 | |
| | 77,822 | | | IOOF Holdings Ltd. (Diversified Financials) | | | 711,791 | |
| | 47,220 | | | JB Hi-Fi Ltd. (Retailing)(a) | | | 783,974 | |
| | 20,659 | | | Karoon Gas Australia Ltd. (Energy)* | | | 89,558 | |
| | 29,598 | | | Linc Energy Ltd. (Energy)* | | | 59,043 | |
| | 51,936 | | | M2 Telecommunications Group Ltd. (Telecommunication Services) | | | 303,483 | |
| | 6,819 | | | McMillan Shakespeare Ltd. (Commercial & Professional Services) | | | 107,907 | |
| | 8,732 | | | Monadelphous Group Ltd. (Capital Goods) | | | 189,742 | |
| | 39,804 | | | Myer Holdings Ltd. (Retailing) | | | 132,570 | |
| | 240,898 | | | NRW Holdings Ltd. (Capital Goods) | | | 325,163 | |
| | 7,019 | | | Perpetual Ltd. (Diversified Financials) | | | 299,950 | |
| | 40,603 | | | Premier Investments Ltd. (Retailing) | | | 364,138 | |
| | 267,665 | | | Primary Health Care Ltd. (Health Care Equipment & Services) | | | 1,462,876 | |
| | 35,598 | | | Regis Resources Ltd. (Materials)* | | | 140,567 | |
| | 244,701 | | | Roc Oil Co. Ltd. (Energy)* | | | 115,689 | |
| | 106,494 | | | Shopping Centres Australasia Property Group (REIT)* | | | 178,852 | |
| | 596,373 | | | Skilled Group Ltd. (Commercial & Professional Services) | | | 1,763,678 | |
| | |
| | | | | | | | |
| | Common Stocks – (continued) | |
| | Australia – (continued) | |
| | 30,887 | | | Southern Cross Media Group Ltd. (Media) | | $ | 49,821 | |
| | 782,315 | | | Spark Infrastructure Group (Utilities) | | | 1,452,007 | |
| | 161,436 | | | STW Communications Group Ltd. (Media) | | | 242,838 | |
| | 46,685 | | | Super Retail Group Ltd. (Retailing) | | | 637,534 | |
| | 59,512 | | | Tassal Group Ltd. (Food, Beverage & Tobacco) | | | 132,647 | |
| | 40,671 | | | Thorn Group Ltd. (Retailing) | | | 85,216 | |
| | 406,631 | | | UXC Ltd. (Software & Services) | | | 499,382 | |
| | | | | | | | |
| | | | | | | 26,218,652 | |
| | |
| | Austria – 0.2% | |
| | 1,882 | | | Flughafen Wien AG (Transportation)* | | | 116,591 | |
| | 9,639 | | | Oesterreichische Post AG (Transportation)(a) | | | 427,433 | |
| | 33,384 | | | S IMMO AG (Real Estate) | | | 208,834 | |
| | | | | | | | |
| | | | | | | 752,858 | |
| | |
| | Belgium – 1.1% | |
| | 84,353 | | | Ablynx NV (Pharmaceuticals, Biotechnology & Life Sciences)* | | | 710,968 | |
| | 3,179 | | | Ackermans & van Haaren NV (Diversified Financials) | | | 270,474 | |
| | 2,722 | | | Barco NV (Technology Hardware & Equipment) | | | 242,381 | |
| | 18,001 | | | Compagnie Maritime Belge SA (Transportation) | | | 354,567 | |
| | 32,726 | | | Galapagos NV (Pharmaceuticals, Biotechnology & Life Sciences)* | | | 855,392 | |
| | 2,353 | | | Gimv NV (Diversified Financials) | | | 121,101 | |
| | 6,856 | | | Kinepolis Group NV (Media) | | | 893,843 | |
| | 13,224 | | | Melexis NV (Semiconductors & Semiconductor Equipment) | | | 268,719 | |
| | | | | | | | |
| | | | | | | 3,717,445 | |
| | |
| | Bermuda – 0.8% | |
| | 247,295 | | | Catlin Group Ltd. (Insurance) | | | 2,021,532 | |
| | 81,492 | | | Hiscox Ltd. (Insurance) | | | 710,328 | |
| | 9,689 | | | Hiscox Ltd. Class B (Insurance)* | | | 7,525 | |
| | | | | | | | |
| | | | | | | 2,739,385 | |
| | |
| | China – 0.3% | |
| | 13,500 | | | AAC Technologies Holdings, Inc. (Technology Hardware & Equipment) | | | 66,081 | |
| | 380,000 | | | China Minzhong Food Corp. Ltd. (Food, Beverage & Tobacco)* | | | 309,691 | |
| | 1,272,000 | | | Foxconn International Holdings Ltd. (Technology Hardware & Equipment)* | | | 491,841 | |
| | 205,000 | | | Sateri Holdings Ltd. (Materials) | | | 48,301 | |
| | 93,000 | | | SITC International Holdings Co. Ltd. (Transportation) | | | 34,202 | |
| | | | | | | | |
| | | | | | | 950,116 | |
| | |
| | |
| 34 | | The accompanying notes are an integral part of these financial statements. |
GOLDMAN SACHS INTERNATIONAL SMALL CAP INSIGHTS FUND
| | | | | | | | |
| Shares | | | Description | | Value | |
| | | | | | | | |
| | Common Stocks – (continued) | |
| | Denmark – 2.8% | |
| | 6,482 | | | Bavarian Nordic A/S (Pharmaceuticals, Biotechnology & Life Sciences)* | | $ | 78,540 | |
| | 128,472 | | | GN Store Nord A/S (Health Care Equipment & Services) | | | 2,349,663 | |
| | 50,482 | | | Pandora A/S (Consumer Durables & Apparel)(a) | | | 1,544,617 | |
| | 2,351 | | | Rockwool International A/S Class B (Capital Goods)(a) | | | 311,126 | |
| | 13,309 | | | Royal UNIBREW A/S (Food, Beverage & Tobacco)(a) | | | 1,205,461 | |
| | 14,252 | | | Schouw & Co. A/S (Capital Goods) | | | 471,976 | |
| | 130,612 | | | Topdanmark A/S (Insurance)* | | | 3,352,895 | |
| | | | | | | | |
| | | | | | | 9,314,278 | |
| | |
| | Finland – 0.7% | |
| | 30,972 | | | Cramo OYJ (Capital Goods) | | | 408,863 | |
| | 20,957 | | | Huhtamaki OYJ (Materials)(a) | | | 392,849 | |
| | 79,987 | | | Ramirent OYJ (Capital Goods) | | | 793,480 | |
| | 60,580 | | | Sponda OYJ (Real Estate) | | | 323,314 | |
| | 17,842 | | | Tieto OYJ (Software & Services) | | | 382,667 | |
| | | | | | | | |
| | | | | | | 2,301,173 | |
| | |
| | France – 4.4% | |
| | 191,800 | | | Air France-KLM (Transportation)*(a) | | | 1,942,792 | |
| | 5,100 | | | Altamir Amboise (Diversified Financials)* | | | 60,005 | |
| | 47,404 | | | Assystem (Commercial & Professional Services) | | | 1,007,599 | |
| | 12,036 | | | Boiron SA (Pharmaceuticals, Biotechnology & Life Sciences) | | | 682,060 | |
| | 20,806 | | | Cegid Group (Software & Services) | | | 423,337 | |
| | 8,101 | | | Ciments Francais SA (Materials) | | | 442,641 | |
| | 14,186 | | | Club Mediterranee SA (Consumer Services)* | | | 241,105 | |
| | 1,648 | | | Eiffage SA (Capital Goods) | | | 73,086 | |
| | 19,706 | | | Etablissements Maurel et Prom (Energy) | | | 335,848 | |
| | 15,171 | | | Euler Hermes SA (Insurance) | | | 1,450,683 | |
| | 31,803 | | | Ipsen SA (Pharmaceuticals, Biotechnology & Life Sciences) | | | 1,138,127 | |
| | 58,864 | | | M6 Metropole Television SA (Media) | | | 986,305 | |
| | 81,147 | | | Maurel & Prom Nigeria SA (Energy)* | | | 377,551 | |
| | 33,222 | | | Medica SA (Health Care Equipment & Services) | | | 615,268 | |
| | 39,128 | | | Mercialys SA (REIT) | | | 872,970 | |
| | 8,294 | | | Parrot SA (Technology Hardware & Equipment)* | | | 212,624 | |
| | 25,464 | | | Plastic Omnium SA (Automobiles & Components)(a) | | | 1,244,335 | |
| | 5,977 | | | Rallye SA (Food & Staples Retailing) | | | 236,657 | |
| | 2,801 | | | Sa des Ciments Vicat (Materials) | | | 165,995 | |
| | 17,722 | | | Saft Groupe SA (Capital Goods) | | | 436,096 | |
| | 12,283 | | | Societe de la Tour Eiffel (REIT) | | | 812,040 | |
| | 36,684 | | | Societe Television Francaise 1 (Media) | | | 387,588 | |
| | |
| | | | | | | | |
| | Common Stocks – (continued) | |
| | France – (continued) | |
| | 45,265 | | | Technicolor SA (Registered) (Media)* | | $ | 188,662 | |
| | 9,412 | | | Teleperformance (Commercial & Professional Services) | | | 413,926 | |
| | | | | | | | |
| | | | | | | 14,747,300 | |
| | |
| | Germany – 4.6% | |
| | 4,094 | | | Aurelius AG (Diversified Financials) | | | 318,456 | |
| | 128,982 | | | Borussia Dortmund GmbH & Co. KGaA (Media) | | | 556,765 | |
| | 13,983 | | | CENTROTEC Sustainable AG (Capital Goods) | | | 290,001 | |
| | 16,402 | | | CropEnergies AG (Energy) | | | 126,364 | |
| | 4,204 | | | Delticom AG (Retailing) | | | 206,782 | |
| | 34,450 | | | Deutsche Beteiligungs AG (Diversified Financials) | | | 837,230 | |
| | 30,238 | | | Freenet AG (Telecommunication Services) | | | 753,916 | |
| | 8,581 | | | Fuchs Petrolub AG (Materials) | | | 653,907 | |
| | 41,065 | | | Gerresheimer AG (Pharmaceuticals, Biotechnology & Life Sciences) | | | 2,346,382 | |
| | 38,099 | | | Gildemeister AG (Capital Goods)(a) | | | 861,532 | |
| | 16,504 | | | Grammer AG (Automobiles & Components) | | | 524,762 | |
| | 21,807 | | | Homag Group AG (Capital Goods)* | | | 410,678 | |
| | 1,457 | | | Nemetschek AG (Software & Services) | | | 88,148 | |
| | 25,490 | | | NORMA Group AG (Capital Goods) | | | 900,365 | |
| | 7,448 | | | Pfeiffer Vacuum Technology AG (Capital Goods) | | | 906,344 | |
| | 5,749 | | | R Stahl AG (Capital Goods) | | | 268,776 | |
| | 27,801 | | | Rheinmetall AG (Capital Goods) | | | 1,320,140 | |
| | 13,528 | | | Sixt AG (Transportation) | | | 293,744 | |
| | 21,467 | | | Software AG (Software & Services)(a) | | | 752,322 | |
| | 43,968 | | | Symrise AG (Materials) | | | 1,879,359 | |
| | 35,190 | | | Takkt AG (Retailing) | | | 587,172 | |
| | 9,306 | | | Tipp24 SE (Consumer Services)* | | | 540,347 | |
| | | | | | | | |
| | | | | | | 15,423,492 | |
| | |
| | Hong Kong – 2.6% | |
| | 1,410,000 | | | Bonjour Holdings Ltd. (Retailing) | | | 229,296 | |
| | 456,000 | | | Brightoil Petroleum Holdings Ltd. (Energy)* | | | 87,074 | |
| | 39,000 | | | Champion REIT (REIT) | | | 20,549 | |
| | 254,000 | | | Chen Hsong Holdings (Capital Goods) | | | 85,559 | |
| | 58,000 | | | Chow Sang Sang Holdings International Ltd. (Retailing) | | | 157,308 | |
| | 29,600 | | | Dah Sing Banking Group Ltd. (Banks) | | | 43,619 | |
| | 99,200 | | | Dah Sing Financial Holdings Ltd. (Banks) | | | 521,600 | |
| | 451,500 | | | Dickson Concepts International Ltd. (Retailing) | | | 240,507 | |
| | 475,000 | | | Dorsett Hospitality International Ltd. (Consumer Services) | | | 131,239 | |
| | |
| | |
| The accompanying notes are an integral part of these financial statements. | | 35 |
GOLDMAN SACHS INTERNATIONAL SMALL CAP INSIGHTS FUND
Schedule of Investments (continued)
April 30, 2013 (Unaudited)
| | | | | | | | |
| Shares | | | Description | | Value | |
| | | | | | | | |
| | Common Stocks – (continued) | |
| | Hong Kong – (continued) | |
| | 996,000 | | | Emperor International Holdings (Real Estate) | | $ | 279,347 | |
| | 460,000 | | | Emperor Watch & Jewellery Ltd. (Retailing) | | | 46,951 | |
| | 236,715 | | | Esprit Holdings Ltd. (Retailing) | | | 332,903 | |
| | 212,000 | | | Giordano International Ltd. (Retailing) | | | 212,231 | |
| | 88,000 | | | Glorious Sun Enterprises Ltd. (Consumer Durables & Apparel) | | | 26,195 | |
| | 90,932 | | | Great Eagle Holdings Ltd. (Real Estate) | | | 386,046 | |
| | 538,100 | | | HKR International Ltd. (Real Estate) | | | 269,390 | |
| | 400,000 | | | Hutchison Telecommunications Hong Kong Holdings Ltd. (Telecommunication Services) | | | 213,552 | |
| | 116,000 | | | IT Ltd. (Retailing) | | | 42,515 | |
| | 154,500 | | | Johnson Electric Holdings Ltd. (Capital Goods) | | | 105,261 | |
| | 107,000 | | | Luk Fook Holdings International Ltd. (Retailing) | | | 304,354 | |
| | 366,000 | | | Man Wah Holdings Ltd. (Consumer Durables & Apparel) | | | 356,498 | |
| | 104,000 | | | Melco International Development Ltd. (Consumer Services) | | | 202,970 | |
| | 540,000 | | | Newocean Energy Holdings Ltd. (Energy) | | | 337,316 | |
| | 184,000 | | | Norstar Founders Group Ltd. (Automobiles & Components)* | | | — | |
| | 375,000 | | | Pacific Textile Holdings Ltd. (Consumer Durables & Apparel) | | | 463,340 | |
| | 768,000 | | | Pico Far East Holdings Ltd. (Media) | | | 279,268 | |
| | 611,000 | | | Prosperity REIT (REIT) | | | 217,243 | |
| | 210,000 | | | Regal Hotels International Holdings Ltd. (Consumer Services) | | | 98,357 | |
| | 178,000 | | | Regal Real Estate Investment Trust (REIT) | | | 58,841 | |
| | 234,000 | | | Shun Tak Holdings Ltd. (Capital Goods) | | | 123,235 | |
| | 1,008,000 | | | Singamas Container Holdings Ltd. (Capital Goods) | | | 247,614 | |
| | 12,054 | | | SmarTone Telecommunications Holdings Ltd. (Telecommunication Services) | | | 21,503 | |
| | 109,138 | | | SOCAM Development Ltd. (Capital Goods) | | | 157,274 | |
| | 405,000 | | | Sunlight Real Estate Investment Trust (REIT) | | | 177,512 | |
| | 366,000 | | | Techtronic Industries Co. (Consumer Durables & Apparel) | | | 877,087 | |
| | 19,900 | | | Television Broadcasts Ltd. (Media) | | | 150,076 | |
| | 284,000 | | | Texwinca Holdings Ltd. (Consumer Durables & Apparel) | | | 332,011 | |
| | 50,000 | | | The United Laboratories International Holdings Ltd. (Pharmaceuticals, Biotechnology & Life Sciences)* | | | 18,774 | |
| | 100,000 | | | Tian An China Investments Co. Ltd. (Real Estate) | | | 70,488 | |
| | |
| | | | | | | | |
| | Common Stocks – (continued) | |
| | Hong Kong – (continued) | |
| | 260,000 | | | Truly International Holdings (Technology Hardware & Equipment) | | $ | 138,955 | |
| | 778,000 | | | VST Holdings Ltd. (Technology Hardware & Equipment) | | | 208,813 | |
| | 19,400 | | | VTech Holdings Ltd. (Technology Hardware & Equipment) | | | 247,555 | |
| | | | | | | | |
| | | | | | | 8,520,226 | |
| | |
| | Ireland – 0.4% | |
| | 127,241 | | | Beazley PLC (Insurance) | | | 444,505 | |
| | 3,841 | | | FBD Holdings PLC (Insurance) | | | 62,480 | |
| | 31,943 | | | Grafton Group PLC (Capital Goods) | | | 222,617 | |
| | 69,829 | | | Greencore Group PLC (Food, Beverage & Tobacco) | | | 115,583 | |
| | 367,051 | | | Total Produce PLC (Food & Staples Retailing) | | | 335,932 | |
| | | | | | | | |
| | | | | | | 1,181,117 | |
| | |
| | Israel – 0.9% | |
| | 14,949 | | | Africa-Israel Investments Ltd. (Real Estate)* | | | 36,282 | |
| | 1,743 | | | Airport City Ltd. (Real Estate)* | | | 10,692 | |
| | 61,782 | | | Alony Hetz Properties & Investments Ltd. (REIT) | | | 404,924 | |
| | 2,359 | | | AL-ROV (Israel) Ltd. (Real Estate)* | | | 65,749 | |
| | 33,206 | | | Amot Investments Ltd. (Real Estate) | | | 93,375 | |
| | 254 | | | Bayside Land Corp. (Real Estate) | | | 56,318 | |
| | 16,372 | | | Clal Industries Ltd. (Capital Goods) | | | 65,060 | |
| | 2,646 | | | Clal Insurance Enterprises Holdings Ltd. (Insurance) | | | 43,856 | |
| | 1,840 | | | Delek Automotive Systems Ltd. (Retailing) | | | 19,748 | |
| | 3,764 | | | Elbit Systems Ltd. (Capital Goods) | | | 157,115 | |
| | 6,639 | | | First International Bank Of Israel Ltd. (Banks)* | | | 96,794 | |
| | 7,228 | | | Frutarom Industries Ltd. (Materials) | | | 106,797 | |
| | 11,179 | | | Gazit-Globe Ltd. (Real Estate) | | | 148,802 | |
| | 624 | | | Harel Insurance Investments & Financial Services Ltd. (Insurance) | | | 31,078 | |
| | 143,927 | | | Israel Discount Bank Ltd. Class A (Banks)* | | | 241,970 | |
| | 2,329 | | | Ituran Location and Control Ltd. (Technology Hardware & Equipment) | | | 37,453 | |
| | 3,425 | | | J.O.E.L Jerusalem Oil Exploration (Real Estate)* | | | 89,451 | |
| | 3,234 | | | Jerusalem Economy Ltd. (Real Estate)* | | | 22,679 | |
| | 7,289 | | | Koor Industries Ltd. (Capital Goods)* | | | 103,044 | |
| | 9,692 | | | Matrix IT Ltd. (Software & Services) | | | 48,997 | |
| | 2,507 | | | Melisron Ltd. (Real Estate) | | | 51,964 | |
| | 1,590 | | | Naphtha Israel Petroleum Corp. Ltd. (Energy)* | | | 8,072 | |
| | 4,433 | | | Nitsba Holdings 1995 Ltd. (Real Estate)* | | | 51,456 | |
| | 35,547 | | | Oil Refineries Ltd. (Energy)* | | | 18,613 | |
| | 42,629 | | | Ormat Industries Ltd. (Capital Goods)* | | | 253,320 | |
| | |
| | |
| 36 | | The accompanying notes are an integral part of these financial statements. |
GOLDMAN SACHS INTERNATIONAL SMALL CAP INSIGHTS FUND
| | | | | | | | |
| Shares | | | Description | | Value | |
| | | | | | | | |
| | Common Stocks – (continued) | |
| | Israel – (continued) | |
| | 24,554 | | | Partner Communications Co. Ltd. (Telecommunication Services) | | $ | 169,972 | |
| | 896 | | | Paz Oil Co. Ltd. (Energy)* | | | 139,813 | |
| | 342 | | | Property & Building Corp. (Real Estate)* | | | 20,212 | |
| | 5,114 | | | Rami Levi Chain Stores Hashikma Marketing 2006 Ltd. (Food & Staples Retailing) | | | 236,232 | |
| | 5,135 | | | Shikun & Binui Ltd. (Capital Goods) | | | 10,755 | |
| | 7,048 | | | Shufersal Ltd. (Food & Staples Retailing) | | | 25,666 | |
| | 11,391 | | | Strauss Group Ltd. (Food, Beverage & Tobacco) | | | 167,810 | |
| | 15,646 | | | Union Bank of Israel Ltd. (Banks)* | | | 59,361 | |
| | | | | | | | |
| | | | | | | 3,093,430 | |
| | |
| | Italy – 4.7% | |
| | 126,019 | | | ASTM SpA (Transportation)* | | | 1,502,871 | |
| | 53,578 | | | Azimut Holding SpA (Diversified Financials) | | | 997,148 | |
| | 839,049 | | | Banca Carige SpA (Banks)(a) | | | 610,726 | |
| | 51,738 | | | Banca Generali SpA (Diversified Financials) | | | 1,067,777 | |
| | 20,704 | | | Banca IFIS SpA (Diversified Financials) | | | 216,798 | |
| | 17,329 | | | Banca Popolare dell’Emilia Romagna Scrl (Banks) | | | 146,964 | |
| | 332,240 | | | Banca Popolare di Sondrio Scarl (Banks)* | | | 1,928,417 | |
| | 84,378 | | | Cairo Communication SpA (Media) | | | 328,963 | |
| | 142,144 | | | Credito Emiliano SpA (Banks) | | | 813,505 | |
| | 135,401 | | | Danieli & C. Officine Meccaniche SpA RSP (Capital Goods) | | | 2,269,156 | |
| | 190,251 | | | Geox SpA (Consumer Durables & Apparel)(a) | | | 577,278 | |
| | 43,677 | | | Indesit Co. SpA (Consumer Durables & Apparel) | | | 343,609 | |
| | 62,280 | | | Lottomatica Group SpA (Consumer Services) | | | 1,588,839 | |
| | 270,189 | | | Mediaset SpA (Media) | | | 699,613 | |
| | 23,470 | | | Recordati SpA (Pharmaceuticals, Biotechnology & Life Sciences) | | | 241,926 | |
| | 6,548 | | | Salvatore Ferragamo Italia SpA (Consumer Durables & Apparel) | | | 195,657 | |
| | 190,265 | | | Societa Iniziative Autostradali e Servizi SpA (Transportation) | | | 1,721,412 | |
| | 13,025 | | | Yoox SpA (Retailing)* | | | 244,544 | |
| | | | | | | | |
| | | | | | | 15,495,203 | |
| | |
| | Japan – 26.6% | |
| | 1,900 | | | Accordia Golf Co. Ltd. (Consumer Services) | | | 2,157,563 | |
| | 22,100 | | | Aisan Industry Co. Ltd. (Automobiles & Components) | | | 212,276 | |
| | 11,000 | | | Alpen Co. Ltd. (Retailing) | | | 229,644 | |
| | 16,400 | | | Amano Corp. (Technology Hardware & Equipment) | | | 175,836 | |
| | |
| | | | | | | | |
| | Common Stocks – (continued) | |
| | Japan – (continued) | |
| | 19,000 | | | Aoyama Trading Co. Ltd. (Retailing) | | $ | 568,565 | |
| | 24,700 | | | Arcs Co. Ltd. (Food & Staples Retailing) | | | 490,052 | |
| | 6,300 | | | Ariake Japan Co. Ltd. (Food, Beverage & Tobacco) | | | 144,768 | |
| | 29,500 | | | Arnest One Corp. (Consumer Durables & Apparel) | | | 676,962 | |
| | 27,900 | | | Asahi Holdings, Inc. (Materials) | | | 564,816 | |
| | 26,600 | | | ASKUL Corp. (Retailing) | | | 473,265 | |
| | 23,100 | | | Autobacs Seven Co. Ltd. (Retailing) | | | 389,270 | |
| | 5,100 | | | Azbil Corp. (Technology Hardware & Equipment) | | | 110,125 | |
| | 491 | | | Bic Camera, Inc. (Retailing)(a) | | | 215,124 | |
| | 9,200 | | | BML, Inc. (Health Care Equipment & Services) | | | 237,597 | |
| | 10,600 | | | C. Uyemura & Co. Ltd. (Materials) | | | 433,116 | |
| | 18,400 | | | Capcom Co. Ltd. (Software & Services) | | | 302,237 | |
| | 18,100 | | | Century Tokyo Leasing Corp. (Diversified Financials) | | | 534,252 | |
| | 4,900 | | | Chiyoda Integre Co. Ltd. (Capital Goods) | | | 71,767 | |
| | 5,300 | | | Chori Co. Ltd. (Retailing) | | | 59,821 | |
| | 31,000 | | | Chugoku Marine Paints Ltd. (Materials) | | | 156,498 | |
| | 13,300 | | | Coca-Cola Central Japan Co. Ltd. (Food, Beverage & Tobacco)(a) | | | 200,495 | |
| | 11,600 | | | Cocokara fine, Inc. (Food & Staples Retailing) | | | 438,564 | |
| | 568 | | | CyberAgent, Inc. (Media) | | | 1,115,212 | |
| | 7,500 | | | Dai-ichi Seiko Co. Ltd. (Technology Hardware & Equipment) | | | 110,022 | |
| | 109,300 | | | Daiichikosho Co. Ltd. (Media) | | | 3,250,353 | |
| | 13,000 | | | Dainichiseika Color & Chemicals Manufacturing Co. Ltd. (Materials) | | | 60,748 | |
| | 47,000 | | | Daiwa Industries Ltd. (Capital Goods) | | | 294,746 | |
| | 18 | | | Daiwa Office Investment Corp. (REIT) | | | 85,765 | |
| | 21,000 | | | Denki Kogyo Co. Ltd. (Technology Hardware & Equipment) | | | 97,457 | |
| | 12,200 | | | Denyo Co. Ltd. (Capital Goods) | | | 176,755 | |
| | 258,000 | | | DIC Corp. (Materials) | | | 577,542 | |
| | 10,400 | | | Doutor Nichires Holdings Co. Ltd. (Consumer Services) | | | 148,378 | |
| | 18,000 | | | Dowa Holdings Co. Ltd. (Materials) | | | 129,016 | |
| | 3,400 | | | DTS Corp. (Software & Services) | | | 56,844 | |
| | 24,500 | | | Dunlop Sports Co. Ltd. (Consumer Durables & Apparel) | | | 304,019 | |
| | 15,900 | | | Dydo Drinco, Inc. (Food, Beverage & Tobacco) | | | 710,957 | |
| | 51,500 | | | EDION Corp. (Retailing) | | | 241,199 | |
| | 11,500 | | | Eizo Corp. (Technology Hardware & Equipment) | | | 199,139 | |
| | 94,000 | | | Fuji Machine Manufacturing Co. Ltd. (Capital Goods) | | | 816,448 | |
| | 300,000 | | | Fujibo Holdings, Inc. (Consumer Durables & Apparel) | | | 842,569 | |
| | 4,000 | | | Fujicco Co. Ltd. (Food, Beverage & Tobacco) | | | 46,033 | |
| | |
| | |
| The accompanying notes are an integral part of these financial statements. | | 37 |
GOLDMAN SACHS INTERNATIONAL SMALL CAP INSIGHTS FUND
Schedule of Investments (continued)
April 30, 2013 (Unaudited)
| | | | | | | | |
| Shares | | | Description | | Value | |
| | | | | | | | |
| | Common Stocks – (continued) | |
| | Japan – (continued) | |
| | 50,000 | | | Fujikura Ltd. (Capital Goods) | | $ | 187,369 | |
| | 11,500 | | | FUJISOFT, Inc. (Software & Services) | | | 307,620 | |
| | 86,000 | | | Fukuyama Transporting Co. Ltd. (Transportation) | | | 480,234 | |
| | 181 | | | Geo Holdings Corp. (Retailing) | | | 216,365 | |
| | 79 | | | Global One Real Estate Investment Corp. (REIT) | | | 534,224 | |
| | 22,400 | | | Glory Ltd. (Capital Goods) | | | 615,539 | |
| | 1,800 | | | Goldcrest Co. Ltd. (Real Estate) | | | 59,210 | |
| | 19,000 | | | G-Tekt Corp. (Automobiles & Components) | | | 598,174 | |
| | 121,200 | | | Gulliver International Co. Ltd. (Retailing) | | | 974,012 | |
| | 4,500 | | | Hajime Construction Co. Ltd. (Consumer Durables & Apparel) | | | 293,986 | |
| | 22,800 | | | Heiwa Real Estate Co. Ltd. (Real Estate) | | | 580,931 | |
| | 426 | | | Heiwa Real Estate REIT, Inc. (REIT) | | | 351,254 | |
| | 27,700 | | | HIS Co. Ltd. (Consumer Services) | | | 1,194,728 | |
| | 15,000 | | | Hisaka Works Ltd. (Capital Goods) | | | 139,466 | |
| | 89,100 | | | Hitachi Capital Corp. (Diversified Financials) | | | 2,221,371 | |
| | 8,700 | | | Hogy Medical Co. Ltd. (Health Care Equipment & Services) | | | 535,493 | |
| | 7,300 | | | Hoshizaki Electric Co. Ltd. (Capital Goods) | | | 243,133 | |
| | 36,000 | | | IBJ Leasing Co. Ltd. (Diversified Financials) | | | 1,265,600 | |
| | 13,700 | | | Ichiyoshi Securities Co. Ltd. (Diversified Financials) | | | 199,231 | |
| | 10,000 | | | Iida Home Max (Real Estate) | | | 191,815 | |
| | 75,800 | | | Inabata & Co. Ltd. (Capital Goods) | | | 594,351 | |
| | 20,600 | | | Ines Corp. (Software & Services) | | | 155,675 | |
| | 59,100 | | | IT Holdings Corp. (Software & Services) | | | 887,195 | |
| | 31,500 | | | Ito En Ltd. (Food, Beverage & Tobacco) | | | 759,029 | |
| | 17,000 | | | Itoham Foods, Inc. (Food, Beverage & Tobacco) | | | 78,169 | |
| | 11,300 | | | Itoki Corp. (Commercial & Professional Services) | | | 70,805 | |
| | 9,000 | | | Izumiya Co. Ltd. (Food & Staples Retailing) | | | 45,034 | |
| | 54,000 | | | Jaccs Co. Ltd. (Diversified Financials) | | | 372,708 | |
| | 3,100 | | | Jafco Co. Ltd. (Diversified Financials) | | | 150,139 | |
| | 27,000 | | | Japan Aviation Electronics Industry Ltd. (Technology Hardware & Equipment) | | | 233,984 | |
| | 16,400 | | | Japan Digital Laboratory Co. Ltd. (Technology Hardware & Equipment) | | | 202,259 | |
| | 51 | | | Japan Logistics Fund, Inc. (REIT) | | | 553,238 | |
| | 30,600 | | | Japan Securities Finance Co. Ltd. (Diversified Financials) | | | 301,245 | |
| | 9,500 | | | JSP Corp. (Materials) | | | 138,900 | |
| | 23,700 | | | Kaga Electronics Co. Ltd. (Technology Hardware & Equipment) | | | 194,245 | |
| | 42,200 | | | Kamei Corp. (Capital Goods) | | | 427,394 | |
| | 38,600 | | | Kasumi Co. Ltd. (Food & Staples Retailing) | | | 277,235 | |
| | |
| | | | | | | | |
| | Common Stocks – (continued) | |
| | Japan – (continued) | |
| | 1,118,000 | | | Kawasaki Kisen Kaisha Ltd. (Transportation) | | $ | 2,459,976 | |
| | 139 | | | Kenedix Realty Investment Corp. (REIT) | | | 652,075 | |
| | 40,000 | | | Kinki Sharyo Co. Ltd. (Capital Goods) | | | 128,676 | |
| | 10,000 | | | Kinugawa Rubber Industrial Co. Ltd. (Automobiles & Components) | | | 52,385 | |
| | 15,900 | | | Kissei Pharmaceutical Co. Ltd. (Pharmaceuticals, Biotechnology & Life Sciences) | | | 344,969 | |
| | 6,200 | | | Kokuyo Co. Ltd. (Commercial & Professional Services) | | | 50,020 | |
| | 126,000 | | | Kurabo Industries Ltd. (Consumer Durables & Apparel) | | | 236,825 | |
| | 52,100 | | | Kuroda Electric Co. Ltd. (Capital Goods)(a) | | | 692,547 | |
| | 82,300 | | | KYORIN Holdings, Inc. (Pharmaceuticals, Biotechnology & Life Sciences) | | | 2,199,036 | |
| | 4,500 | | | Kyoritsu Maintenance Co. Ltd. (Consumer Services) | | | 136,100 | |
| | 55,000 | | | Kyosan Electric Manufacturing Co. Ltd. (Capital Goods) | | | 182,563 | |
| | 17,700 | | | Lintec Corp. (Materials) | | | 322,279 | |
| | 98,000 | | | Marudai Food Co. Ltd. (Food, Beverage & Tobacco) | | | 325,312 | |
| | 44,000 | | | Maruzen Showa Unyu Co. Ltd. (Transportation) | | | 158,164 | |
| | 22,900 | | | Matsumotokiyoshi Holdings Co. Ltd. (Food & Staples Retailing) | | | 655,514 | |
| | 5,000 | | | Max Co. Ltd. (Capital Goods) | | | 57,050 | |
| | 25,100 | | | Megachips Corp. (Semiconductors & Semiconductor Equipment) | | | 380,722 | |
| | 17,700 | | | Meitec Corp. (Commercial & Professional Services) | | | 456,128 | |
| | 836 | | | MID REIT, Inc. (REIT) | | | 2,231,450 | |
| | 9,900 | | | Ministop Co. Ltd. (Food & Staples Retailing) | | | 170,700 | |
| | 3,200 | | | Mitsubishi Pencil Co. Ltd. (Commercial & Professional Services) | | | 67,765 | |
| | 101,000 | | | Mitsubishi Steel Manufacturing Co. Ltd. (Materials) | | | 216,734 | |
| | 16,700 | | | Mitsui High-Tec, Inc. (Semiconductors & Semiconductor Equipment) | | | 120,027 | |
| | 41,000 | | | Mitsui Sugar Co. Ltd. (Food, Beverage & Tobacco) | | | 128,777 | |
| | 35,200 | | | Mitsumi Electric Co. Ltd. (Technology Hardware & Equipment)* | | | 201,674 | |
| | 9,000 | | | Mochida Pharmaceutical Co. Ltd. (Pharmaceuticals, Biotechnology & Life Sciences) | | | 119,669 | |
| | 4,800 | | | Modec, Inc. (Energy) | | | 138,431 | |
| | 127 | | | Monex Group, Inc. (Diversified Financials) | | | 57,302 | |
| | |
| | |
| 38 | | The accompanying notes are an integral part of these financial statements. |
GOLDMAN SACHS INTERNATIONAL SMALL CAP INSIGHTS FUND
| | | | | | | | |
| Shares | | | Description | | Value | |
| | | | | | | | |
| | Common Stocks – (continued) | |
| | Japan – (continued) | |
| | 20 | | | Mori Hills REIT Investment Corp. (REIT) | | $ | 139,294 | |
| | 124,000 | | | Morinaga Milk Industry Co. Ltd. (Food, Beverage & Tobacco) | | | 365,317 | |
| | 24,700 | | | Moshi Moshi Hotline, Inc. (Commercial & Professional Services) | | | 365,819 | |
| | 113,800 | | | Namura Shipbuilding Co. Ltd. (Capital Goods) | | | 613,736 | |
| | 10,300 | | | NEC Fielding Ltd. (Software & Services) | | | 136,299 | |
| | 14,600 | | | NEC Networks & System Integration Corp. (Software & Services) | | | 320,129 | |
| | 112,500 | | | NET One Systems Co. Ltd. (Software & Services) | | | 986,832 | |
| | 12,200 | | | Nichi-iko Pharmaceutical Co. Ltd. (Pharmaceuticals, Biotechnology & Life Sciences) | | | 295,238 | |
| | 102,000 | | | Nichirei Corp. (Food, Beverage & Tobacco) | | | 600,050 | |
| | 133 | | | NIFTY Corp. (Software & Services) | | | 208,627 | |
| | 48,000 | | | Nippon Beet Sugar Manufacturing Co. Ltd. (Food, Beverage & Tobacco) | | | 90,267 | |
| | 11,000 | | | Nippon Flour Mills Co. Ltd. (Food, Beverage & Tobacco) | | | 51,143 | |
| | 43,000 | | | Nippon Kayaku Co. Ltd. (Materials) | | | 619,963 | |
| | 27,700 | | | Nippon Konpo Unyu Soko Co. Ltd. (Transportation) | | | 427,704 | |
| | 114,600 | | | Nippon Light Metal Holdings Co. Ltd. (Materials) | | | 134,982 | |
| | 35,000 | | | Nippon Seiki Co. Ltd. (Automobiles & Components) | | | 461,986 | |
| | 59,000 | | | Nippon Shokubai Co. Ltd. (Materials) | | | 580,495 | |
| | 41,000 | | | Nippon Soda Co. Ltd. (Materials) | | | 190,968 | |
| | 108,300 | | | Nippon Suisan Kaisha Ltd. (Food, Beverage & Tobacco) | | | 210,171 | |
| | 18,000 | | | Nippon Thompson Co. Ltd. (Capital Goods) | | | 89,867 | |
| | 180,000 | | | Nishimatsu Construction Co. Ltd. (Capital Goods) | | | 345,011 | |
| | 42,000 | | | Nisshinbo Holdings, Inc. (Capital Goods) | | | 305,114 | |
| | 27,000 | | | Nissin Corp. (Transportation) | | | 79,302 | |
| | 17,000 | | | Nissin Electric Co. Ltd. (Capital Goods) | | | 84,594 | |
| | 3,200 | | | Nitto Kogyo Corp. (Capital Goods) | | | 47,679 | |
| | 39,000 | | | NOF Corp. (Materials) | | | 210,094 | |
| | 20,400 | | | Noritz Corp. (Capital Goods) | | | 432,853 | |
| | 8,000 | | | Okuwa Co. Ltd. (Food & Staples Retailing) | | | 87,152 | |
| | 41,000 | | | Organo Corp. (Capital Goods) | | | 233,012 | |
| | 6,600 | | | Osaka Steel Co. Ltd. (Materials) | | | 120,904 | |
| | 11,000 | | | Osaki Electric Co. Ltd. (Technology Hardware & Equipment) | | | 58,184 | |
| | 21,200 | | | Otsuka Kagu Ltd. (Retailing) | | | 235,863 | |
| | 6,800 | | | Paltac Corp. (Retailing) | | | 88,396 | |
| | 27,600 | | | Parco Co. Ltd. (Retailing) | | | 361,819 | |
| | |
| | | | | | | | |
| | Common Stocks – (continued) | |
| | Japan – (continued) | |
| | 234 | | | Pasona Group, Inc. (Commercial & Professional Services) | | $ | 187,023 | |
| | 80 | | | PGM Holdings K K (Consumer Services) | | | 85,835 | |
| | 30,100 | | | Pola Orbis Holdings, Inc. (Household & Personal Products) | | | 1,065,936 | |
| | 6,400 | | | Proto Corp. (Media) | | | 106,007 | |
| | 244,000 | | | Rengo Co. Ltd. (Materials) | | | 1,181,312 | |
| | 18,500 | | | Resorttrust, Inc. (Consumer Services) | | | 630,389 | |
| | 4,400 | | | Ricoh Leasing Co. Ltd. (Diversified Financials) | | | 135,361 | |
| | 12,000 | | | Riken Corp. (Automobiles & Components) | | | 48,421 | |
| | 22,300 | | | Riso Kagaku Corp. (Technology Hardware & Equipment) | | | 426,399 | |
| | 13,000 | | | Rohto Pharmaceutical Co. Ltd. (Pharmaceuticals, Biotechnology & Life Sciences) | | | 182,101 | |
| | 124,500 | | | Round One Corp. (Consumer Services) | | | 1,043,547 | |
| | 126,000 | | | Ryobi Ltd. (Capital Goods) | | | 295,618 | |
| | 5,000 | | | S Foods, Inc. (Food & Staples Retailing) | | | 50,351 | |
| | 42,000 | | | San-Ai Oil Co. Ltd. (Energy) | | | 192,841 | |
| | 36,000 | | | Sankyu, Inc. (Transportation) | | | 160,905 | |
| | 7,200 | | | Sanoh Industrial Co. Ltd. (Automobiles & Components) | | | 51,714 | |
| | 8,100 | | | Sanshin Electronics Co. Ltd. (Technology Hardware & Equipment) | | | 51,076 | |
| | 17,000 | | | Sanyo Chemical Industries Ltd. (Materials) | | | 100,371 | |
| | 20,000 | | | Sanyo Shokai Ltd. (Consumer Durables & Apparel) | | | 60,735 | |
| | 35,000 | | | Seika Corp. (Capital Goods) | | | 89,218 | |
| | 22,600 | | | Seikagaku Corp. (Pharmaceuticals, Biotechnology & Life Sciences) | | | 308,458 | |
| | 9,300 | | | Seiren Co. Ltd. (Consumer Durables & Apparel) | | | 62,033 | |
| | 395 | | | Sekisui House SI Investment Co. (REIT)(a) | | | 2,020,247 | |
| | 31,000 | | | Sekisui Plastics Co. Ltd. (Materials) | | | 81,765 | |
| | 64,000 | | | Senko Co. Ltd. (Transportation) | | | 347,001 | |
| | 44,100 | | | Shinko Electric Industries Co. Ltd. (Semiconductors & Semiconductor Equipment) | | | 449,690 | |
| | 3,400 | | | Shinko Shoji Co. Ltd. (Technology Hardware & Equipment) | | | 33,056 | |
| | 80,000 | | | Shinsho Corp. (Capital Goods) | | | 159,258 | |
| | 19,100 | | | Showa Corp. (Automobiles & Components) | | | 277,286 | |
| | 20,100 | | | Sintokogio Ltd. (Capital Goods) | | | 182,028 | |
| | 526 | | | SKY Perfect JSAT Holdings, Inc. (Media) | | | 264,642 | |
| | 114,100 | | | Skymark Airlines, Inc. (Transportation)* | | | 422,934 | |
| | 99,600 | | | Sodick Co. Ltd. (Capital Goods) | | | 600,186 | |
| | 23,000 | | | Sumikin Bussan Corp. (Capital Goods) | | | 75,154 | |
| | |
| | |
| The accompanying notes are an integral part of these financial statements. | | 39 |
GOLDMAN SACHS INTERNATIONAL SMALL CAP INSIGHTS FUND
Schedule of Investments (continued)
April 30, 2013 (Unaudited)
| | | | | | | | |
| Shares | | | Description | | Value | |
| | | | | | | | |
| | Common Stocks – (continued) | |
| | Japan – (continued) | |
| | 25,500 | | | Sumitomo Forestry Co. Ltd. (Consumer Durables & Apparel) | | $ | 303,948 | |
| | 10,000 | | | Sumitomo Precision Products Co. Ltd. (Capital Goods) | | | 43,249 | |
| | 4,340 | | | Sumitomo Real Estate Sales Co. Ltd. (Real Estate) | | | 302,003 | |
| | 48,000 | | | Sumitomo Seika Chemicals Co. Ltd. (Materials) | | | 182,885 | |
| | 8,300 | | | Tachi-S Co. Ltd. (Automobiles & Components) | | | 153,268 | |
| | 49,400 | | | Taikisha Ltd. (Capital Goods) | | | 1,119,495 | |
| | 21,000 | | | Takasago Thermal Engineering Co. Ltd. (Capital Goods) | | | 165,687 | |
| | 59,000 | | | The Bank of Nagoya Ltd. (Banks) | | | 279,953 | |
| | 53,000 | | | The Hyakugo Bank Ltd. (Banks) | | | 265,329 | |
| | 17,000 | | | The Hyakujushi Bank Ltd. (Banks) | | | 67,249 | |
| | 92,000 | | | The Keiyo Bank Ltd. (Banks) | | | 565,917 | |
| | 60,000 | | | The Mie Bank Ltd. (Banks) | | | 144,326 | |
| | 189,000 | | | The Ogaki Kyoritsu Bank Ltd. (Banks) | | | 702,843 | |
| | 7,000 | | | The Okinawa Electric Power Co., Inc. (Utilities) | | | 258,469 | |
| | 141,000 | | | The Toho Bank Ltd. (Banks) | | | 441,998 | |
| | 1,800 | | | The Yachiyo Bank Ltd. (Banks) | | | 67,159 | |
| | 28,000 | | | The Yokohama Rubber Co. Ltd. (Automobiles & Components) | | | 367,683 | |
| | 230,000 | | | Toa Corp. (Capital Goods)* | | | 354,246 | |
| | 58,000 | | | Toagosei Co. Ltd. (Materials) | | | 250,017 | |
| | 22,900 | | | Tocalo Co. Ltd. (Capital Goods) | | | 335,349 | |
| | 13,600 | | | Toho Holdings Co. Ltd. (Health Care Equipment & Services) | | | 311,981 | |
| | 13,200 | | | Tohokushinsha Film Corp. (Media) | | | 130,733 | |
| | 215,800 | | | Tokai Tokyo Financial Holdings, Inc. (Diversified Financials) | | | 1,962,492 | |
| | 3,430 | | | Token Corp. (Consumer Durables & Apparel) | | | 221,110 | |
| | 68,000 | | | Toko, Inc. (Technology Hardware & Equipment)*(a) | | | 201,457 | |
| | 17,600 | | | Tokyo Ohka Kogyo Co. Ltd. (Materials) | | | 381,512 | |
| | 258,000 | | | Tokyo Tatemono Co. Ltd. (Real Estate) | | | 2,391,154 | |
| | 5,500 | | | Tokyu Livable, Inc. (Real Estate) | | | 134,851 | |
| | 15 | | | Tokyu REIT, Inc. (REIT) | | | 95,608 | |
| | 60,900 | | | TOMONY Holdings, Inc. (Banks) | | | 250,475 | |
| | 44 | | | Top REIT, Inc. (REIT) | | | 235,931 | |
| | 5,600 | | | Toppan Forms Co. Ltd. (Commercial & Professional Services) | | | 52,570 | |
| | 50,900 | | | Topre Corp. (Automobiles & Components) | | | 474,764 | |
| | 22,700 | | | Torii Pharmaceutical Co. Ltd. (Pharmaceuticals, Biotechnology & Life Sciences) | | | 533,343 | |
| | 8,800 | | | Torishima Pump Manufacturing Co. Ltd. (Capital Goods) | | | 71,603 | |
| | 34,000 | | | Toshiba TEC Corp. (Technology Hardware & Equipment) | | | 200,907 | |
| | |
| | | | | | | | |
| | Common Stocks – (continued) | |
| | Japan – (continued) | |
| | 22,000 | | | Towa Pharmaceutical Co. Ltd. (Pharmaceuticals, Biotechnology & Life Sciences) | | $ | 1,091,411 | |
| | 38,000 | | | Toyo Tire & Rubber Co. Ltd. (Automobiles & Components) | | | 204,487 | |
| | 10,400 | | | Transcosmos, Inc. (Software & Services) | | | 145,264 | |
| | 18,800 | | | TSI Holdings Co. Ltd. (Consumer Durables & Apparel) | | | 138,750 | |
| | 63,000 | | | Tsubakimoto Chain Co. (Capital Goods) | | | 337,591 | |
| | 25,000 | | | Tsukishima Kikai Co. Ltd. (Capital Goods) | | | 235,394 | |
| | 1,300 | | | Tsuruha Holdings, Inc. (Food & Staples Retailing) | | | 126,680 | |
| | 4,500 | | | TV Asahi Corp. (Media) | | | 93,992 | |
| | 6,500 | | | Tv Tokyo Holdings Corp. (Media) | | | 89,438 | |
| | 6,600 | | | UKC Holdings Corp. (Semiconductors & Semiconductor Equipment) | | | 154,445 | |
| | 5,900 | | | ULVAC, Inc. (Semiconductors & Semiconductor Equipment)* | | | 46,150 | |
| | 99,000 | | | Uniden Corp. (Technology Hardware & Equipment) | | | 236,590 | |
| | 4,900 | | | Unipres Corp. (Automobiles & Components) | | | 109,059 | |
| | 3,200 | | | Universal Entertainment Corp. (Consumer Durables & Apparel) | | | 80,294 | |
| | 74,400 | | | UNY Group Holdings Co., Ltd. (Food & Staples Retailing) | | | 529,508 | |
| | 24,030 | | | Usen Corp. (Media)* | | | 38,744 | |
| | 6,000 | | | Valor Co. Ltd. (Food & Staples Retailing) | | | 113,539 | |
| | 122,000 | | | Wakita & Co. Ltd. (Capital Goods) | | | 1,525,831 | |
| | 4,700 | | | Warabeya Nichiyo Co. Ltd. (Food, Beverage & Tobacco) | | | 79,890 | |
| | 4,300 | | | Weathernews, Inc. (Commercial & Professional Services) | | | 105,399 | |
| | 6,700 | | | Yellow Hat Ltd. (Retailing) | | | 134,250 | |
| | 9,600 | | | Yorozu Corp. (Automobiles & Components) | | | 160,450 | |
| | | | | | | | |
| | | | | | | 88,486,527 | |
| | |
| | Luxembourg – 0.7% | |
| | 69,562 | | | GAGFAH SA (Real Estate)* | | | 898,694 | |
| | 35,647 | | | Oriflame Cosmetics SA (Household & Personal Products)(a) | | | 1,292,257 | |
| | | | | | | | |
| | | | | | | 2,190,951 | |
| | |
| | Netherlands – 0.8% | | | | |
| | 2,950 | | | Amsterdam Commodities NV (Food & Staples Retailing)* | | | 65,485 | |
| | 6,714 | | | BE Semiconductor Industries NV (Semiconductors & Semiconductor Equipment) | | | 62,778 | |
| | 27,536 | | | Beter Bed Holding NV (Retailing) | | | 516,445 | |
| | 71,786 | | | BinckBank NV (Diversified Financials)(a) | | | 550,116 | |
| | |
| | |
| 40 | | The accompanying notes are an integral part of these financial statements. |
GOLDMAN SACHS INTERNATIONAL SMALL CAP INSIGHTS FUND
| | | | | | | | |
| Shares | | | Description | | Value | |
| | | | | | | | |
| | Common Stocks – (continued) | |
| | Netherlands – (continued) | |
| | 27,887 | | | CSM (Food, Beverage & Tobacco) | | $ | 624,238 | |
| | 6,236 | | | Eurocommercial Properties NV (REIT) | | | 254,501 | |
| | 349,050 | | | SNS REAAL NV (Diversified Financials)*(a) | | | — | |
| | 14,570 | | | Vastned Retail NV (REIT)(a) | | | 650,881 | |
| | | | | | | | |
| | | | | | | 2,724,444 | |
| | |
| | New Zealand – 0.5% | |
| | 256,644 | | | New Zealand Oil & Gas Ltd. (Energy) | | | 180,598 | |
| | 259,047 | | | Ryman Healthcare Ltd. (Health Care Equipment & Services) | | | 1,355,297 | |
| | | | | | | | |
| | | | | | | 1,535,895 | |
| | |
| | Norway – 2.5% | |
| | 4,586 | | | Aker ASA Class A (Diversified Financials)(a) | | | 141,819 | |
| | 13,626 | | | Cermaq ASA (Food, Beverage & Tobacco)* | | | 203,509 | |
| | 79,255 | | | Fred Olsen Energy ASA (Energy) | | | 3,457,532 | |
| | 6,700 | | | Leroey Seafood Group ASA (Food, Beverage & Tobacco) | | | 210,531 | |
| | 59,764 | | | Marine Harvest ASA (Food, Beverage & Tobacco)* | | | 62,185 | |
| | 102,497 | | | Petroleum Geo-Services ASA (Energy) | | | 1,505,929 | |
| | 1,198,415 | | | Renewable Energy Corp. ASA (Semiconductors & Semiconductor Equipment)* | | | 333,138 | |
| | 109,006 | | | SpareBank 1 SMN (Banks) | | | 928,141 | |
| | 36,865 | | | TGS Nopec Geophysical Co. ASA (Energy) | | | 1,325,560 | |
| | | | | | | | |
| | | | | | | 8,168,344 | |
| | |
| | Peru – 0.1% | |
| | 44,018 | | | Copeinca ASA (Food, Beverage & Tobacco)(a) | | | 461,821 | |
| | |
| | Portugal – 0.3% | |
| | 25,031 | | | Mota-Engil SGPS SA (Capital Goods) | | | 69,226 | |
| | 193,711 | | | Portucel SA (Materials)* | | | 701,541 | |
| | 18,498 | | | Semapa-Sociedade de Investimento e Gestao (Materials) | | | 174,911 | |
| | | | | | | | |
| | | | | | | 945,678 | |
| | |
| | Singapore – 2.6% | |
| | 478,481 | | | AIMS AMP Capital Industrial REIT (REIT) | | | 707,381 | |
| | 108,000 | | | Amtek Engineering Ltd. (Capital Goods) | | | 45,262 | |
| | 24,000 | | | Boustead Singapore Ltd. (Energy) | | | 26,520 | |
| | 82,629 | | | Cambridge Industrial Trust (REIT) | | | 57,459 | |
| | 211,000 | | | China Aviation Oil Singapore Corp. Ltd. (Energy) | | | 176,546 | |
| | 448,000 | | | Chip Eng Seng Corp. Ltd. (Capital Goods) | | | 296,894 | |
| | |
| | | | | | | | |
| | Common Stocks – (continued) | |
| | Singapore – (continued) | |
| | 78,000 | | | CWT Ltd. (Transportation) | | $ | 107,469 | |
| | 12,000 | | | Frasers Centrepoint Trust (REIT) | | | 21,940 | |
| | 650,800 | | | Frasers Commercial Trust (REIT) | | | 824,550 | |
| | 282,000 | | | GuocoLeisure Ltd. (Consumer Services) | | | 200,660 | |
| | 301,000 | | | Hi-P International Ltd. Class P (Technology Hardware & Equipment)* | | | 171,474 | |
| | 188,000 | | | Ho Bee Investment Ltd. (Real Estate) | | | 328,726 | |
| | 49,000 | | | Hong Leong Asia Ltd. (Capital Goods) | | | 64,799 | |
| | 221,000 | | | Hyflux Ltd. (Utilities) | | | 246,283 | |
| | 176,000 | | | Indofood Agri Resources Ltd. (Food, Beverage & Tobacco) | | | 152,532 | |
| | 255,000 | | | K1 Ventures Ltd. (Diversified Financials) | | | 33,332 | |
| | 164,000 | | | Keppel REIT (REIT) | | | 201,272 | |
| | 74,000 | | | K-Green Trust (Commercial & Professional Services) | | | 62,557 | |
| | 1,452,000 | | | Lippo Malls Indonesia Retail Trust (REIT) | | | 619,838 | |
| | 68,000 | | | Mapletree Logistics Trust (REIT) | | | 72,332 | |
| | 61,000 | | | OSIM International Ltd. (Retailing) | | | 99,057 | |
| | 67,000 | | | Overseas Union Enterprise Ltd. (Consumer Services) | | | 169,563 | |
| | 61,000 | | | Parkway Life Real Estate Investment Trust (REIT) | | | 132,432 | |
| | 88,000 | | | Perennial China Retail Trust (Real Estate) | | | 45,737 | |
| | 299,000 | | | Sabana Shari’ah Compliant Industrial Real Estate Investment Trust (REIT) | | | 331,542 | |
| | 162,000 | | | SATS Ltd. (Transportation) | | | 414,184 | |
| | 155,000 | | | SMRT Corp. Ltd. (Transportation) | | | 186,266 | |
| | 254,000 | | | Stamford Land Corp. Ltd. (Consumer Services) | | | 122,752 | |
| | 786,000 | | | Starhill Global REIT (REIT) | | | 615,458 | |
| | 171,000 | | | Suntec Real Estate Investment Trust (REIT) | | | 270,378 | |
| | 57,000 | | | Super Group Ltd. (Food, Beverage & Tobacco) | | | 181,871 | |
| | 176,000 | | | Tat Hong Holdings Ltd. (Capital Goods) | | | 213,131 | |
| | 218,000 | | | Tiger Airways Holdings Ltd. (Transportation)* | | | 117,016 | |
| | 145,000 | | | Tuan Sing Holdings Ltd. (Capital Goods)* | | | 42,410 | |
| | 69,000 | | | United Engineers Ltd. (Capital Goods) | | | 176,151 | |
| | 78,000 | | | Venture Corp. Ltd. (Technology Hardware & Equipment) | | | 526,856 | |
| | 390,000 | | | Wing Tai Holdings Ltd. (Real Estate) | | | 690,882 | |
| | | | | | | | |
| | | | | | | 8,753,512 | |
| | |
| | Spain – 1.2% | |
| | 37,633 | | | Almirall SA (Pharmaceuticals, Biotechnology & Life Sciences) | | | 497,500 | |
| | |
| | |
| The accompanying notes are an integral part of these financial statements. | | 41 |
GOLDMAN SACHS INTERNATIONAL SMALL CAP INSIGHTS FUND
Schedule of Investments (continued)
April 30, 2013 (Unaudited)
| | | | | | | | |
| Shares | | | Description | | Value | |
| | | | | | | | |
| | Common Stocks – (continued) | |
| | Spain – (continued) | |
| | 31,583 | | | Bolsas y Mercados Espanoles SA (Diversified Financials)(a) | | $ | 857,238 | |
| | 154,261 | | | Ence Energia y Celulosa SA (Materials) | | | 406,918 | |
| | 36,324 | | | Grupo Catalana Occidente SA (Insurance) | | | 823,139 | |
| | 112,491 | | | Mediaset Espana Comunicacion SA (Media)*(a) | | | 881,711 | |
| | 59,424 | | | Vueling Airlines SA (Transportation)* | | | 697,003 | |
| | | | | | | | |
| | | | | | | 4,163,509 | |
| | |
| | Sweden – 3.6% | |
| | 3,241 | | | AF AB Class B (Commercial & Professional Services) | | | 89,248 | |
| | 10,466 | | | Avanza Bank Holding AB (Diversified Financials) | | | 232,149 | |
| | 24,761 | | | Axfood AB (Food & Staples Retailing) | | | 1,091,043 | |
| | 44,906 | | | Betsson AB (Consumer Services)* | | | 1,315,332 | |
| | 50,643 | | | Bilia AB Class A (Retailing) | | | 879,890 | |
| | 19,967 | | | BillerudKorsnas AB (Materials) | | | 198,188 | |
| | 15,225 | | | BioGaia AB Class B (Pharmaceuticals, Biotechnology & Life Sciences) | | | 532,457 | |
| | 51,989 | | | Bure Equity AB (Diversified Financials) | | | 183,970 | |
| | 8,200 | | | D. Carnegie & Co. AB (Diversified Financials)* | | | — | |
| | 71,398 | | | East Capital Explorer AB (Diversified Financials)* | | | 518,754 | |
| | 2,873 | | | Hakon Invest AB (Food & Staples Retailing)* | | | 77,568 | |
| | 22,020 | | | Hexpol AB (Materials) | | | 1,241,610 | |
| | 45,778 | | | Industrial & Financial Systems AB Class B (Software & Services) | | | 872,325 | |
| | 14,204 | | | JM AB (Consumer Durables & Apparel)(a) | | | 319,893 | |
| | 8,327 | | | Lundbergforetagen AB Class B (Diversified Financials) | | | 325,500 | |
| | 8,803 | | | Medivir AB (Pharmaceuticals, Biotechnology & Life Sciences)* | | | 93,041 | |
| | 33,848 | | | Modern Times Group AB Class B (Media) | | | 1,452,757 | |
| | 5,958 | | | Nolato AB Class B (Technology Hardware & Equipment)(a) | | | 100,885 | |
| | 60,001 | | | Nordnet AB Class B (Diversified Financials)(a) | | | 167,958 | |
| | 25,750 | | | Saab AB Class B (Capital Goods) | | | 565,183 | |
| | 176,460 | | | SAS AB (Transportation)*(a) | | | 386,548 | |
| | 63,502 | | | Swedish Orphan Biovitrum AB (Pharmaceuticals, Biotechnology & Life Sciences)* | | | 406,386 | |
| | 57,837 | | | Wihlborgs Fastigheter AB (Real Estate) | | | 957,846 | |
| | | | | | | | |
| | | | | | | 12,008,531 | |
| | |
| | Switzerland – 2.5% | |
| | 8,613 | | | Basilea Pharmaceutica (Registered) (Pharmaceuticals, Biotechnology & Life Sciences)* | | | 476,435 | |
| | |
| | | | | | | | |
| | Common Stocks – (continued) | |
| | Switzerland – (continued) | |
| | 1,340 | | | Forbo Holding AG (Registered) (Consumer Durables & Apparel)* | | $ | 865,200 | |
| | 2,274 | | | Helvetia Holding AG (Registered) (Insurance) | | | 954,023 | |
| | 5,946 | | | Inficon Holding AG (Registered) (Technology Hardware & Equipment)* | | | 1,849,494 | |
| | 376 | | | Intershop Holdings (Real Estate) | | | 129,404 | |
| | 10,383 | | | Kudelski SA (Technology Hardware & Equipment)* | | | 130,898 | |
| | 320 | | | LEM Holding SA (Registered) (Technology Hardware & Equipment) | | | 194,219 | |
| | 114,911 | | | OC Oerlikon Corp. AG (Registered) (Capital Goods)* | | | 1,330,140 | |
| | 14,549 | | | Schweizerische National-Versicherungs-Gesellschaft (Registered) Class V (Insurance) | | | 695,036 | |
| | 2,826 | | | Siegfried Holding AG (Registered) (Pharmaceuticals, Biotechnology & Life Sciences)* | | | 372,741 | |
| | 170 | | | Vetropack Holding AG (Materials) | | | 344,637 | |
| | 19,677 | | | Zehnder Group AG (Capital Goods)(a) | | | 870,572 | |
| | | | | | | | |
| | | | | | | 8,212,799 | |
| | |
| | United Kingdom – 19.3% | |
| | 44,535 | | | Ashmore Group PLC (Diversified Financials) | | | 276,594 | |
| | 302,491 | | | Barratt Developments PLC (Consumer Durables & Apparel)* | | | 1,464,304 | |
| | 43,796 | | | BBA Aviation PLC (Transportation) | | | 170,997 | |
| | 148,927 | | | Berendsen PLC (Commercial & Professional Services) | | | 1,789,665 | |
| | 36,754 | | | Berkeley Group Holdings PLC (Consumer Durables & Apparel) | | | 1,191,723 | |
| | 92,920 | | | Betfair Group PLC (Consumer Services)(a) | | | 1,251,066 | |
| | 97,598 | | | Big Yellow Group PLC (REIT) | | | 611,722 | |
| | 138,134 | | | Bodycote PLC (Capital Goods) | | | 1,112,946 | |
| | 141,321 | | | BTG PLC (Pharmaceuticals, Biotechnology & Life Sciences)* | | | 758,884 | |
| | 437,894 | | | Cable & Wireless Communications PLC (Telecommunication Services) | | | 288,284 | |
| | 86,632 | | | Cairn Energy PLC (Energy)* | | | 389,018 | |
| | 116,357 | | | Cineworld Group PLC (Media) | | | 523,251 | |
| | 7,060 | | | Close Brothers Group PLC (Diversified Financials) | | | 113,980 | |
| | 83,382 | | | Computacenter PLC (Software & Services) | | | 582,124 | |
| | 39,947 | | | Concentric AB (Capital Goods) | | | 408,106 | |
| | 193,585 | | | CSR PLC (Semiconductors & Semiconductor Equipment) | | | 1,484,420 | |
| | 1,091,211 | | | Debenhams PLC (Retailing) | | | 1,411,510 | |
| | 218,458 | | | Diploma PLC (Technology Hardware & Equipment) | | | 1,935,945 | |
| | 23,066 | | | Drax Group PLC (Utilities) | | | 220,140 | |
| | 179,803 | | | easyJet PLC (Transportation) | | | 3,126,684 | |
| | |
| | |
| 42 | | The accompanying notes are an integral part of these financial statements. |
GOLDMAN SACHS INTERNATIONAL SMALL CAP INSIGHTS FUND
| | | | | | | | |
| Shares | | | Description | | Value | |
| | | | | | | | |
| | Common Stocks – (continued) | |
| | United Kingdom – (continued) | |
| | 474,447 | | | Elementis PLC (Materials) | | $ | 1,947,778 | |
| | 785,040 | | | EnQuest PLC (Energy)* | | | 1,572,807 | |
| | 163,451 | | | F&C Asset Management PLC (Diversified Financials) | | | 248,819 | |
| | 180,082 | | | Firstgroup PLC (Transportation) | | | 591,375 | |
| | 35,360 | | | Galliford Try PLC (Capital Goods) | | | 542,094 | |
| | 6,152 | | | Go-Ahead Group PLC (Transportation) | | | 148,095 | |
| | 37,294 | | | Great Portland Estates PLC (REIT) | | | 308,513 | |
| | 909,383 | | | Hansteen Holdings PLC (REIT) | | | 1,207,497 | |
| | 292,618 | | | Home Retail Group PLC (Retailing) | | | 708,662 | |
| | 105,347 | | | Homeserve PLC (Commercial & Professional Services) | | | 342,950 | |
| | 137,728 | | | IG Group Holdings PLC (Diversified Financials) | | | 1,153,577 | |
| | 313,197 | | | Intermediate Capital Group PLC (Diversified Financials) | | | 2,058,960 | |
| | 86,443 | | | International Personal Finance PLC (Diversified Financials) | | | 685,540 | |
| | 236,963 | | | Interserve PLC (Capital Goods) | | | 1,744,419 | |
| | 83,865 | | | John Wood Group PLC (Energy) | | | 1,012,228 | |
| | 110,836 | | | Jupiter Fund Management PLC (Diversified Financials) | | | 570,603 | |
| | 54,249 | | | Keller Group PLC (Capital Goods) | | | 724,051 | |
| | 699,907 | | | Ladbrokes PLC (Consumer Services) | | | 2,060,907 | |
| | 125,565 | | | Laird PLC (Technology Hardware & Equipment) | | | 423,779 | |
| | 163,285 | | | Lancashire Holdings Ltd. (Insurance) | | | 2,149,865 | |
| | 158,909 | | | Micro Focus International PLC (Software & Services) | | | 1,654,196 | |
| | 195,917 | | | Mondi PLC (Materials) | | | 2,603,638 | |
| | 154,837 | | | N Brown Group PLC (Retailing) | | | 1,072,121 | |
| | 98,451 | | | Northgate PLC (Transportation) | | | 518,429 | |
| | 79,675 | | | Pace PLC (Technology Hardware & Equipment) | | | 307,304 | |
| | 345,643 | | | Paragon Group of Companies PLC (Banks) | | | 1,679,149 | |
| | 422,510 | | | Pendragon PLC (Retailing)* | | | 152,591 | |
| | 29,735 | | | Premier Oil PLC (Energy)* | | | 172,575 | |
| | 613,919 | | | QinetiQ Group PLC (Capital Goods) | | | 1,807,406 | |
| | 7,369 | | | Renishaw PLC (Technology Hardware & Equipment) | | | 188,740 | |
| | 38,834 | | | Rightmove PLC (Media) | | | 1,158,505 | |
| | 12,493 | | | Rotork PLC (Capital Goods) | | | 565,199 | |
| | 29,185 | | | Savills PLC (Real Estate) | | | 263,847 | |
| | 428,480 | | | SIG PLC (Capital Goods) | | | 1,079,968 | |
| | 275,219 | | | Soco International PLC (Energy)* | | | 1,622,694 | |
| | 711,055 | | | Speedy Hire PLC (Capital Goods) | | | 535,691 | |
| | 50,422 | | | Stagecoach Group PLC (Transportation) | | | 241,000 | |
| | 83,690 | | | TalkTalk Telecom Group PLC (Telecommunication Services) | | | 325,910 | |
| | 68,636 | | | Taylor Wimpey PLC (Consumer Durables & Apparel) | | | 99,312 | |
| | 57,948 | | | Tetragon Financial Group Ltd. (Diversified Financials) | | | 634,531 | |
| | |
| | | | | | | | |
| | Common Stocks – (continued) | |
| | United Kingdom – (continued) | |
| | 315,443 | | | TT electronics PLC (Technology Hardware & Equipment) | | $ | 817,131 | |
| | 109,040 | | | Tullett Prebon PLC (Diversified Financials) | | | 414,959 | |
| | 77,541 | | | Victrex PLC (Materials) | | | 1,934,556 | |
| | 161,863 | | | WH Smith PLC (Retailing)(a) | | | 1,862,926 | |
| | 396,722 | | | William Hill PLC (Consumer Services) | | | 2,628,839 | |
| | 23,024 | | | Workspace Group PLC (REIT) | | | 134,208 | |
| | 27,251 | | | WS Atkins PLC (Commercial & Professional Services) | | | 382,182 | |
| | 66,830 | | | Xchanging PLC (Software & Services) | | | 139,106 | |
| | | | | | | | |
| | | | | | | 64,310,595 | |
| | |
| | TOTAL COMMON STOCKS | | | | |
| | (Cost $257,897,689) | | $ | 306,417,281 | |
| | |
| | | | | | | | |
| | Preferred Stocks – 0.4% | |
| | Germany – 0.4% | |
| | 8,876 | | | Fuchs Petrolub AG Preference Shares (Materials) | | $ | 749,180 | |
| | 10,293 | | | Jungheinrich AG Preference Shares (Capital Goods) | | | 425,016 | |
| | 1,021 | | | Sto AG Preference Shares (Materials) | | | 157,319 | |
| | |
| | TOTAL PREFERRED STOCKS | | | | |
| | (Cost $1,312,488) | | $ | 1,331,515 | |
| | |
| | | | | | | | | | |
| Units | | Description | | Expiration
Month | | | Value | |
| | | | | | | | | | |
| Right – 0.0% | |
| Israel – 0.0% | |
| 325 | | Africa Israel Investments Ltd.
(Real Estate)* | | | 05/13 | | | $ | 1,089 | |
| (Cost $0) | | | | | | | | |
| |
| | | | | | | | | | |
| Warrant – 0.0% | |
| France – 0.0% | |
| 56,200 | | UBISOFT Entertainment
(Software & Services)* | | | 10/13 | | | $ | 11,028 | |
| (Cost $0) | | | | | | | | |
| |
| TOTAL INVESTMENTS BEFORE SECURITIES LENDING REINVESTMENT VEHICLE | |
| (Cost $259,210,177) | | | $ | 307,760,913 | |
| |
| | |
| The accompanying notes are an integral part of these financial statements. | | 43 |
GOLDMAN SACHS INTERNATIONAL SMALL CAP INSIGHTS FUND
Schedule of Investments (continued)
April 30, 2013 (Unaudited)
| | | | | | |
Shares | | Rate | | Value | |
| | | | | | |
| Securities Lending Reinvestment Vehicle(b)(c) – 6.1% | |
Goldman Sachs Financial Square Money Market Fund – FST Shares | |
| 20,151,325 | | 0.109% | | $ | 20,151,325 | |
| (Cost $20,151,325) | |
| |
| TOTAL INVESTMENTS – 98.6% | |
| (Cost $279,361,502) | | $ | 327,912,238 | |
| |
OTHER ASSETS IN EXCESS OF
LIABILITIES – 1.4% | | | 4,744,203 | |
| |
| NET ASSETS – 100.0% | | $ | 332,656,441 | |
| |
| | |
| The percentage shown for each investment category reflects the value of investments in that category as a percentage of net assets. |
* | | Non-income producing security. |
(a) | | All or a portion of security is on loan. |
(b) | | Variable rate security. Interest rate disclosed is that which is in effect at April 30, 2013. |
(c) | | Represents an affiliated issuer. |
| | |
|
Investment Abbreviations: |
REIT | | —Real Estate Investment Trust |
RSP | | —Risparmio Shares |
|
| | |
| 44 | | The accompanying notes are an integral part of these financial statements. |
GOLDMAN SACHS INTERNATIONAL SMALL CAP INSIGHTS FUND
|
| ADDITIONAL INVESTMENT INFORMATION |
FUTURES CONTRACTS — At April 30, 2013, the Fund had the following futures contracts:
| | | | | | | | | | | | | | |
| Type | | Number of
Contracts
Long (Short) | | | Expiration
Date | | Current
Value | | | Unrealized
Gain (Loss) | |
EURO STOXX 50 Index | | | 261 | | | June 2013 | | $ | 9,173,992 | | | $ | 185,482 | |
FTSE 100 Index | | | 47 | | | June 2013 | | | 4,660,430 | | | | 41,819 | |
Hang Seng Index | | | 3 | | | May 2013 | | | 436,925 | | | | 931 | |
MSCI Singapore Index | | | 8 | | | May 2013 | | | 493,886 | | | | 1,645 | |
SPI 200 Index | | | 16 | | | June 2013 | | | 2,143,066 | | | | 26,285 | |
TSE TOPIX Index | | | 48 | | | June 2013 | | | 5,746,115 | | | | 275,088 | |
| TOTAL | | | | | | | | | | | | $ | 531,250 | |
| | |
| The accompanying notes are an integral part of these financial statements. | | 45 |
GOLDMAN SACHS INTERNATIONAL EQUITY INSIGHTS FUNDS
Statements of Assets and Liabilities
April 30, 2013 (Unaudited)
| | | | | | | | | | | | | | |
| | | | | Emerging Markets
Equity Insights
Fund | | | International Equity Insights
Fund | | | International Small Cap Insights
Fund | |
| | Assets: | | | | | | | | | | | | |
| | Investments in unaffiliated issuers, at value (cost $598,500,545, $934,028,258 and $259,210,177)(a) | | $ | 661,096,061 | | | $ | 1,033,359,435 | | | $ | 307,760,913 | |
| | Investments in affiliated securities lending reinvestment vehicle, at value which equals cost | | | 6,410,410 | | | | 102,847,510 | | | | 20,151,325 | |
| | Cash | | | 10,787,221 | | | | 432,002 | | | | 26,302,599 | |
| | Foreign currencies, at value (cost $2,101,200, $22,146,040 and $1,313,158) | | | 2,100,142 | | | | 22,223,928 | | | | 1,332,318 | |
| | Receivables: | | | | | | | | | | | | |
| | Investments sold | | | 19,417,492 | | | | 79,347,833 | | | | 8,477,614 | |
| | Fund shares sold | | | 17,156,805 | | | | 162,867 | | | | 15,286,313 | |
| | Dividends | | | 1,155,520 | | | | 5,451,747 | | | | 1,528,875 | |
| | Securities lending income | | | 3,613 | | | | 210,447 | | | | 50,230 | |
| | Collateral on certain derivative contracts(b) | | | — | | | | — | | | | 1,259,561 | |
| | Foreign tax reclaims | | | — | | | | 854,458 | | | | 152,365 | |
| | Other assets | | | 150,571 | | | | 305,152 | | | | 1,626 | |
| | Total assets | | | 718,277,835 | | | | 1,245,195,379 | | | | 382,303,739 | |
| | | | | | | | | | | | | | |
| | Liabilities: | | | | | | | | | | | | |
| | Payables: | | | | | | | | | | | | |
| | Investments purchased | | | 46,562,524 | | | | 74,449,696 | | | | 28,092,481 | |
| | Payable upon return of securities loaned | | | 6,410,410 | | | | 102,847,510 | | | | 20,151,325 | |
| | Amounts owed to affiliates | | | 548,010 | | | | 838,298 | | | | 223,290 | |
| | Fund shares redeemed | | | 511,280 | | | | 1,078,841 | | | | 141,480 | |
| | Foreign capital gains taxes | | | 129,579 | | | | — | | | | — | |
| | Futures variation margin | | | — | | | | 257,652 | | | | 909,666 | |
| | Accrued expenses | | | 93,548 | | | | 139,897 | | | | 129,056 | |
| | Total liabilities | | | 54,255,351 | | | | 179,611,894 | | | | 49,647,298 | |
| | | | | | | | | | | | | | |
| | Net Assets: | | | | | | | | | | | | |
| | Paid-in capital | | | 609,689,692 | | | | 2,445,538,693 | | | | 299,584,942 | |
| | Undistributed (distributions in excess of) net investment income | | | (1,614,982 | ) | | | 3,678,375 | | | | (2,808,369 | ) |
| | Accumulated net realized loss | | | (6,593,435 | ) | | | (1,483,665,761 | ) | | | (13,201,498 | ) |
| | Net unrealized gain | | | 62,541,209 | | | | 100,032,178 | | | | 49,081,366 | |
| | | NET ASSETS | | $ | 664,022,484 | | | $ | 1,065,583,485 | | | $ | 332,656,441 | |
| | | Net Assets: | | | | | | | | | | | | |
| | | Class A | | $ | 23,821,819 | | | $ | 101,101,736 | | | $ | 27,106,824 | |
| | | Class B | | | — | | | | 2,370,554 | | | | — | |
| | | Class C | | | 195,551 | | | | 2,977,588 | | | | 1,190,120 | |
| | | Institutional | | | 639,618,571 | | | | 951,644,014 | | | | 303,739,952 | |
| | | Service | | | — | | | | 7,219,348 | | | | — | |
| | | Class IR | | | 386,543 | | | | 187,601 | | | | 619,545 | |
| | | Class R | | | — | | | | 82,644 | | | | — | |
| | | Total Net Assets | | $ | 664,022,484 | | | $ | 1,065,583,485 | | | $ | 332,656,441 | |
| | | Shares outstanding $0.001 par value (unlimited shares authorized): | | | | | | | | | | | | |
| | | Class A | | | 2,615,300 | | | | 10,038,698 | | | | 2,886,277 | |
| | | Class B | | | — | | | | 237,303 | | | | — | |
| | | Class C | | | 21,498 | | | | 298,879 | | | | 128,964 | |
| | | Institutional | | | 70,331,649 | | | | 92,189,213 | | | | 32,416,553 | |
| | | Service | | | — | | | | 711,775 | | | | — | |
| | | Class IR | | | 42,528 | | | | 18,882 | | | | 66,235 | |
| | | Class R | | | — | | | | 8,301 | | | | — | |
| | | Net asset value, offering and redemption price per share:(c) | | | | | | | | | | | | |
| | | Class A | | | $9.11 | | | | $10.07 | | | | $9.39 | |
| | | Class B | | | — | | | | 9.99 | | | | — | |
| | | Class C | | | 9.10 | | | | 9.96 | | | | 9.23 | |
| | | Institutional | | | 9.09 | | | | 10.32 | | | | 9.37 | |
| | | Service | | | — | | | | 10.14 | | | | — | |
| | | Class IR | | | 9.09 | | | | 9.94 | | | | 9.35 | |
| | | Class R | | | — | | | | 9.96 | | | | — | |
| | (a) | | Includes loaned securities having a market value of $6,347,537, $98,440,559 and $19,249,167 for the Emerging Markets Equity Insights, International Equity Insights and International Small Cap Insights Funds, respectively. |
| | (b) | | Represents segregated cash on deposit with counterparty for the International Small Cap Insights Fund relating to initial margin requirements on futures transactions. |
| | (c) | | Maximum public offering price per share for Class A shares of the Emerging Markets Equity Insights, International Equity Insights and International Small Cap Insights Funds is $9.64, $10.66 and $9.94, respectively. At redemption, Class B and Class C Shares may be subject to a contingent deferred sales charge assessed on the amount equal to the lesser of the current NAV or the original purchase price of the shares. |
| | |
| 46 | | The accompanying notes are an integral part of these financial statements. |
GOLDMAN SACHS INTERNATIONAL EQUITY INSIGHTS FUNDS
Statements of Operations
For the Six Months Ended April 30, 2013 (Unaudited)
| | | | | | | | | | | | | | |
| | | | | Emerging Markets
Equity Insights
Fund | | | International
Equity Insights
Fund | | | International
Small Cap Insights
Fund | |
| | Investment income: | | | | | | | | | | | | |
| | Dividends (net of foreign taxes withheld of $431,923, $1,003,310 and $183,452) | | $ | 4,784,036 | | | $ | 16,628,398 | | | $ | 4,070,956 | |
| | Securities lending income — affiliated issuer | | | 28,559 | | | | 420,684 | | | | 138,893 | |
| | Total investment income | | | 4,812,595 | | | | 17,049,082 | | | | 4,209,849 | |
| | | | | | | | | | | | | | |
| | Expenses: | | | | | | | | | | | | |
| | Management fees | | | 2,894,848 | | | | 3,856,685 | | | | 1,100,268 | |
| | Custody, accounting and administrative services | | | 304,225 | | | | 184,114 | | | | 140,139 | |
| | Transfer Agent fees(a) | | | 148,551 | | | | 322,830 | | | | 67,894 | |
| | Distribution and Service fees(a) | | | 55,061 | | | | 255,445 | | | | 29,797 | |
| | Professional fees | | | 50,843 | | | | 52,060 | | | | 39,257 | |
| | Registration fees | | | 30,569 | | | | 46,451 | | | | 27,177 | |
| | Printing and mailing costs | | | 24,387 | | | | 8,982 | | | | 11,839 | |
| | Trustee fees | | | 8,478 | | | | 8,861 | | | | 8,072 | |
| | Service share fees — Service Plan | | | — | | | | 9,603 | | | | — | |
| | Service share fees — Shareholder Administration Plan | | | — | | | | 9,603 | | | | — | |
| | Other | | | 7,947 | | | | 11,040 | | | | 7,533 | |
| | Total expenses | | | 3,524,909 | | | | 4,765,674 | | | | 1,431,976 | |
| | Less — expense reductions | | | (255,341 | ) | | | (298,236 | ) | | | (219,064 | ) |
| | Net expenses | | | 3,269,568 | | | | 4,467,438 | | | | 1,212,912 | |
| | NET INVESTMENT INCOME | | | 1,543,027 | | | | 12,581,644 | | | | 2,996,937 | |
| | | | | | | | | | | | | | |
| | Realized and unrealized gain (loss): | | | | | | | | | | | | |
| | Net realized gain (loss) from: | | | | | | | | | | | | |
| | Investments | | | 24,876,866 | | | | 60,120,561 | | | | 16,292,891 | |
| | Futures contracts | | | — | | | | 2,805,300 | | | | 1,202,239 | |
| | Foreign currency transactions | | | (327,840 | ) | | | (723,031 | ) | | | (189,075 | ) |
| | Net change in unrealized gain (loss) on: | | | | | | | | | | | | |
| | Investments (including the effects of the net change in the foreign capital gains tax liability of $1,268,792, $0 and $0) | | | 27,006,864 | | | | 61,603,262 | | | | 25,005,964 | |
| | Futures contracts | | | — | | | | 343,715 | | | | 493,171 | |
| | Foreign currency translation | | | (666,093 | ) | | | 4,768 | | | | (372 | ) |
| | Net realized and unrealized gain | | | 50,889,797 | | | | 124,154,575 | | | | 42,804,818 | |
| | NET INCREASE IN NET ASSETS RESULTING FROM OPERATIONS | | $ | 52,432,824 | | | $ | 136,736,219 | | | $ | 45,801,755 | |
| | (a) | | Class specific Distribution and Service, and Transfer Agent fees were as follows: |
| | | | | | | | | | | | | | | | | | | | | | | | | | | | | | | | | | | | | | | | | | | | |
| | | Distribution and Service Fees | | | Transfer Agent Fees | |
Fund | | Class A | | | Class B | | | Class C | | | Class R | | | Class A | | | Class B | | | Class C | | | Institutional | | | Service | | | Class IR | | | Class R | |
Emerging Markets Equity Insights | | $ | 54,071 | | | | N/A | | | $ | 990 | | | | N/A | | | $ | 41,094 | | | | N/A | | | $ | 188 | | | $ | 107,060 | | | | N/A | | | $ | 209 | | | | N/A | |
International Equity Insights | | | 228,410 | | | $ | 12,326 | | | | 14,521 | | | $ | 188 | | | | 173,593 | | | $ | 2,342 | | | | 2,759 | | | | 142,396 | | | $ | 1,537 | | | | 132 | | | $ | 71 | |
International Small Cap Insights | | | 25,146 | | | | N/A | | | | 4,651 | | | | N/A | | | | 19,111 | | | | N/A | | | | 884 | | | | 47,480 | | | | N/A | | | | 419 | | | | N/A | |
| | |
| The accompanying notes are an integral part of these financial statements. | | 47 |
GOLDMAN SACHS INTERNATIONAL EQUITY INSIGHTS FUNDS
Statements of Changes in Net Assets
| | | | | | | | | | |
| | | | | Emerging Markets Equity Insights Fund | |
| | | | | For the
Six Months Ended
April 30, 2013
(Unaudited) | | | For the Fiscal
Year Ended
October 31, 2012 | |
| | From operations: | | | | | | | | |
| | Net investment income | | $ | 1,543,027 | | | $ | 6,726,714 | |
| | Net realized gain (loss) | | | 24,549,026 | | | | 14,281,721 | |
| | Net change in unrealized gain | | | 26,340,771 | | | | 5,261,352 | |
| | Net increase in net assets resulting from operations | | | 52,432,824 | | | | 26,269,787 | |
| | | | | | | | | | |
| | Distributions to shareholders: | | | | | | | | |
| | From net investment income | | | | | | | | |
| | Class A Shares | | | (646,730 | ) | | | (190,969 | ) |
| | Class B Shares | | | — | | | | — | |
| | Class C Shares | | | (1,269 | ) | | | — | |
| | Institutional Shares | | | (7,459,492 | ) | | | (5,188,307 | ) |
| | Service Shares | | | — | | | | — | |
| | Class IR Shares | | | (1,842 | ) | | | (19 | ) |
| | Class R Shares | | | — | | | | — | |
| | Total distributions to shareholders | | | (8,109,333 | ) | | | (5,379,295 | ) |
| | | | | | | | | | |
| | From share transactions: | | | | | | | | |
| | Proceeds from sales of shares | | | 240,876,361 | | | | 287,062,372 | |
| | Reinvestment of distributions | | | 8,086,923 | | | | 5,376,256 | |
| | Cost of shares redeemed | | | (144,550,591 | ) | | | (88,367,084 | ) |
| | Net increase (decrease) in net assets resulting from share transactions | | | 104,412,693 | | | | 204,071,544 | |
| | TOTAL INCREASE (DECREASE) | | | 148,736,184 | | | | 224,962,036 | |
| | | | | | | | | | |
| | Net assets: | | | | | | | | |
| | Beginning of period | | | 515,286,300 | | | | 290,324,264 | |
| | End of period | | $ | 664,022,484 | | | $ | 515,286,300 | |
| | Undistributed (distributions in excess of) net investment income | | $ | (1,614,982 | ) | | $ | 4,951,324 | |
| | |
| 48 | | The accompanying notes are an integral part of these financial statements. |
GOLDMAN SACHS INTERNATIONAL EQUITY INSIGHTS FUNDS
| | | | | | | | | | | | | | | | | | | | | | |
| | | International Equity Insights Fund | | | | | International Small Cap Insights Fund | |
| | | For the Six Months Ended
April 30, 2013
(Unaudited) | | | | | For the Fiscal
Year Ended
October 31, 2012 | | | | | For the Six Months Ended
April 30, 2013
(Unaudited) | | | | | For the Fiscal
Year Ended
October 31, 2012 | |
| | | | | | | | | | | | | | | | | | | | | | |
| | $ | 12,581,644 | | | | | $ | 25,755,743 | | | | | $ | 2,996,937 | | | | | $ | 6,879,714 | |
| | | 62,202,830 | | | | | | (107,575,164 | ) | | | | | 17,306,055 | | | | | | (909,501 | ) |
| | | 61,951,745 | | | | | | 105,513,405 | | | | | | 25,498,763 | | | | | | 11,891,012 | |
| | | 136,736,219 | | | | | | 23,693,984 | | | | | | 45,801,755 | | | | | | 17,861,225 | |
| | | | | | | | | | | | | | | | | | | | | | |
| | | | | | | | | | | | | | | | | | | | | | |
| | | | | | | | | | | | | | | | | | | | | | |
| | | (6,802,694 | ) | | | | | (13,871,075 | ) | | | | | (812,215 | ) | | | | | (620,606 | ) |
| | | (64,323 | ) | | | | | (138,961 | ) | | | | | — | | | | | | — | |
| | | (73,960 | ) | | | | | (138,496 | ) | | | | | (34,519 | ) | | | | | (16,534 | ) |
| | | (21,631,287 | ) | | | | | (49,022,202 | ) | | | | | (10,634,235 | ) | | | | | (6,981,053 | ) |
| | | (268,276 | ) | | | | | (591,705 | ) | | | | | — | | | | | | — | |
| | | (4,577 | ) | | | | | (2,354 | ) | | | | | (17,900 | ) | | | | | (8,270 | ) |
| �� | | (2,186 | ) | | | | | (5,640 | ) | | | | | — | | | | | | — | |
| | | (28,847,303 | ) | | | | | (63,770,433 | ) | | | | | (11,498,869 | ) | | | | | (7,626,463 | ) |
| | | | | | | | | | | | | | | | | | | | | | |
| | | | | | | | | | | | | | | | | | | | | | |
| | | 350,595,479 | | | | | | 196,869,212 | | | | | | 96,115,008 | | | | | | 60,454,193 | |
| | | 28,534,242 | | | | | | 61,362,112 | | | | | | 10,415,151 | | | | | | 7,278,249 | |
| | | (242,788,149 | ) | | | | | (745,204,273 | ) | | | | | (72,466,937 | ) | | | | | (95,173,897 | ) |
| | | 136,341,572 | | | | | | (486,972,949 | ) | | | | | 34,063,222 | | | | | | (27,441,455 | ) |
| | | 244,230,488 | | | | | | (527,049,398 | ) | | | | | 68,366,108 | | | | | | (17,206,693 | ) |
| | | | | | | | | | | | | | | | | | | | | | |
| | | | | | | | | | | | | | | | | | | | | | |
| | | 821,352,997 | | | | | | 1,348,402,395 | | | | | | 264,290,333 | | | | | | 281,497,026 | |
| | $ | 1,065,583,485 | | | | | $ | 821,352,997 | | | | | $ | 332,656,441 | | | | | $ | 264,290,333 | |
| | $ | 3,678,375 | | | | | $ | 19,944,034 | | | | | $ | (2,808,369 | ) | | | | $ | 5,693,563 | |
| | |
| The accompanying notes are an integral part of these financial statements. | | 49 |
GOLDMAN SACHS EMERGING MARKETS EQUITY INSIGHTS FUND
Financial Highlights
Selected Data for a Share Outstanding Throughout Each Period
| | | | | | | | | | | | | | | | | | | | | | | | | | | | | | |
| | | | | | | | Income (loss) from
investment operations | | | Distributions
to shareholders | |
| | | Year - Share Class | | Net asset
value,
beginning
of period | | | Net
investment
income (loss)(a) | | | Net realized
and unrealized
gain (loss) | | | Total from
investment
operations | | | From net
investment
income | | | From net
realized
gains | | | Total
distributions | |
| | FOR THE SIX MONTHS ENDED APRIL 30, (UNAUDITED) | |
| | 2013 - A | | $ | 8.40 | | | $ | — | (d) | | $ | 0.83 | | | $ | 0.83 | | | $ | (0.12 | ) | | $ | — | | | $ | (0.12 | ) |
| | 2013 - C | | | 8.36 | | | | (0.03 | ) | | | 0.82 | | | | 0.79 | | | | (0.05 | ) | | | — | | | | (0.05 | ) |
| | 2013 - Institutional | | | 8.40 | | | | 0.03 | | | | 0.80 | | | | 0.83 | | | | (0.14 | ) | | | — | | | | (0.14 | ) |
| | 2013 - IR | | | 8.39 | | | | 0.03 | | | | 0.80 | | | | 0.83 | | | | (0.13 | ) | | | — | | | | (0.13 | ) |
| | | | | | | | | | | | | | | | | | | | | | | | | | | | | | |
| | FOR THE FISCAL YEARS ENDED OCTOBER 31, | |
| | 2012 - A | | | 8.08 | | | | 0.13 | | | | 0.28 | | | | 0.41 | | | | (0.09 | ) | | | — | | | | (0.09 | ) |
| | 2012 - C | | | 8.00 | | | | 0.08 | | | | 0.28 | | | | 0.36 | | | | — | | | | — | | | | — | |
| | 2012 - Institutional | | | 8.12 | | | | 0.16 | | | | 0.28 | | | | 0.44 | | | | (0.16 | ) | | | — | | | | (0.16 | ) |
| | 2012 - IR | | | 8.11 | | | | 0.25 | | | | 0.18 | | | | 0.43 | | | | (0.15 | ) | | | — | | | | (0.15 | ) |
| | 2011 - A | | | 8.91 | | | | 0.11 | | | | (0.87 | ) | | | (0.76 | ) | | | (0.07 | ) | | | — | | | | (0.07 | ) |
| | 2011 - C | | | 8.82 | | | | — | (d) | | | (0.81 | ) | | | (0.81 | ) | | | (0.01 | ) | | | — | | | | (0.01 | ) |
| | 2011 - Institutional | | | 8.96 | | | | 0.16 | | | | (0.88 | ) | | | (0.72 | ) | | | (0.12 | ) | | | — | | | | (0.12 | ) |
| | 2011 - IR | | | 8.98 | | | | 0.15 | | | | (0.90 | ) | | | (0.75 | ) | | | (0.12 | ) | | | — | | | | (0.12 | ) |
| | 2010 - A | | | 7.14 | | | | 0.08 | | | | 1.76 | | | | 1.84 | | | | (0.07 | ) | | | — | | | | (0.07 | ) |
| | 2010 - C | | | 7.11 | | | | — | (d) | | | 1.77 | | | | 1.77 | | | | (0.06 | ) | | | — | | | | (0.06 | ) |
| | 2010 - Institutional | | | 7.17 | | | | 0.10 | | | | 1.79 | | | | 1.89 | | | | (0.10 | ) | | | — | | | | (0.10 | ) |
| | 2010 - IR (Commenced August 31, 2010) | | | 7.67 | | | | 0.01 | | | | 1.30 | | | | 1.31 | | | | — | | | | — | | | | — | |
| | 2009 - A | | | 4.45 | | | | 0.12 | (f) | | | 2.61 | | | | 2.73 | | | | (0.04 | ) | | | — | | | | (0.04 | ) |
| | 2009 - C | | | 4.41 | | | | 0.07 | (f) | | | 2.64 | | | | 2.71 | | | | (0.01 | ) | | | — | | | | (0.01 | ) |
| | 2009 - Institutional | | | 4.47 | | | | 0.13 | (f) | | | 2.62 | | | | 2.75 | | | | (0.05 | ) | | | — | | | | (0.05 | ) |
| | 2008 - A | | | 11.04 | | | | 0.15 | (g) | | | (6.64 | ) | | | (6.49 | ) | | | (0.05 | ) | | | (0.05 | ) | | | (0.10 | ) |
| | 2008 - C | | | 11.03 | | | | 0.10 | (g) | | | (6.63 | ) | | | (6.53 | ) | | | (0.04 | ) | | | (0.05 | ) | | | (0.09 | ) |
| | 2008 - Institutional | | | 11.04 | | | | 0.18 | (g) | | | (6.65 | ) | | | (6.47 | ) | | | (0.05 | ) | | | (0.05 | ) | | | (0.10 | ) |
| | (a) | | Calculated based on the average shares outstanding methodology. |
| | (b) | | Assumes investment at the net asset value at the beginning of the period, reinvestment of all distributions, a complete redemption of the investment at the net asset value at the end of the period and no sales or redemption charges. Total returns would be reduced if a sales or redemption charge was taken into account. Returns do not reflect the deduction of taxes that a shareholder would pay on Fund distributions or the redemption of Fund shares. Total returns for periods less than one full year are not annualized. |
| | (c) | | The Fund's portfolio turnover rate is calculated in accordance with regulatory requirements, without regard to transactions involving short term investments and certain derivatives. If such transactions were included, the Fund's portfolio turnover rate may be higher. |
| | (d) | | Amount is less than $0.005 per share. |
| | (f) | | Reflects income recognized from special dividends which amounted to $0.02 per share and 0.34% of average net assets. |
| | (g) | | Reflects income recognized from special dividends which amounted to $0.02 per share and 0.26% of average net assets. |
| | |
| 50 | | The accompanying notes are an integral part of these financial statements. |
GOLDMAN SACHS EMERGING MARKETS EQUITY INSIGHTS FUND
| | | | | | | | | | | | | | | | | | | | | | | | | | | | | | | | | | | | | | | | |
| | | | | | | | | | | | | | | | | | | | | | | | | | | | | | | | | | |
| | | | | | | | | | | | | | | | | | | | | | | | | | | | | | | | | | |
| | | Net asset
value, end
of period | | | | | Total
return(b) | | | | | Net assets,
end of
period
(in 000s) | | | | | Ratio of
net expenses
to average
net assets | | | | | Ratio of
total expenses
to average
net assets | | | | | Ratio of
net investment
income (loss)
to average
net assets | | | | | Portfolio
turnover
rate(c) | |
| | | | | | | | | | | | | | | | | | | | | | | | | | | | | | | | | | | | | | | | |
| | $ | 9.11 | | | | | | 9.93 | % | | | | $ | 23,822 | | | | | | 1.48 | %(e) | | | | | 1.59 | %(e) | | | | | (0.04 | )%(e) | | | | | 102 | % |
| | | 9.10 | | | | | | 9.31 | | | | | | 196 | | | | | | 2.24 | (e) | | | | | 2.34 | (e) | | | | | (0.70 | )(e) | | | | | 102 | |
| | | 9.09 | | | | | | 9.99 | | | | | | 639,619 | | | | | | 1.10 | (e) | | | | | 1.19 | (e) | | | | | 0.58 | (e) | | | | | 102 | |
| | | 9.09 | | | | | | 9.97 | | | | | | 387 | | | | | | 1.27 | (e) | | | | | 1.33 | (e) | | | | | 0.63 | (e) | | | | | 102 | |
| | | | | | | | | | | | | | | | | | | | | | | | | | | | | | | | | | | | | | | | |
| | | | | | | | | | | | | | | | | | | | | | | | | | | | | | | | | | | | | | | | |
| | | 8.40 | | | | | | 5.26 | | | | | | 50,760 | | | | | | 1.45 | | | | | | 1.69 | | | | | | 1.58 | | | | | | 180 | |
| | | 8.36 | | | | | | 4.49 | | | | | | 228 | | | | | | 2.20 | | | | | | 2.46 | | | | | | 0.97 | | | | | | 180 | |
| | | 8.40 | | | | | | 5.68 | | | | | | 464,180 | | | | | | 1.05 | | | | | | 1.30 | | | | | | 1.98 | | | | | | 180 | |
| | | 8.39 | | | | | | 5.48 | | | | | | 118 | | | | | | 1.20 | | | | | | 1.41 | | | | | | 3.06 | | | | | | 180 | |
| | | 8.08 | | | | | | (8.58 | ) | | | | | 17,089 | | | | | | 1.45 | | | | | | 1.71 | | | | | | 1.17 | | | | | | 200 | |
| | | 8.00 | | | | | | (9.23 | ) | | | | | 207 | | | | | | 2.20 | | | | | | 2.46 | | | | | | 0.01 | | | | | | 200 | |
| | | 8.12 | | | | | | (8.19 | ) | | | | | 273,027 | | | | | | 1.05 | | | | | | 1.31 | | | | | | 1.75 | | | | | | 200 | |
| | | 8.11 | | | | | | (8.54 | ) | | | | | 1 | | | | | | 1.20 | | | | | | 1.46 | | | | | | 1.67 | | | | | | 200 | |
| | | 8.91 | | | | | | 25.91 | | | | | | 52,030 | | | | | | 1.45 | | | | | | 1.70 | | | | | | 0.99 | | | | | | 214 | |
| | | 8.82 | | | | | | 25.07 | | | | | | 1,282 | | | | | | 2.20 | | | | | | 2.45 | | | | | | 0.04 | | | | | | 214 | |
| | | 8.96 | | | | | | 26.56 | | | | | | 364,053 | | | | | | 1.05 | | | | | | 1.30 | | | | | | 1.25 | | | | | | 214 | |
| | | 8.98 | | | | | | 17.08 | | | | | | 1 | | | | | | 1.20 | (e) | | | | | 1.45 | (e) | | | | | 0.51 | (e) | | | | | 214 | |
| | | 7.14 | | | | | | 61.83 | | | | | | 2,694 | | | | | | 1.45 | | | | | | 1.76 | | | | | | 2.04 | (f) | | | | | 182 | |
| | | 7.11 | | | | | | 61.28 | | | | | | 1,426 | | | | | | 2.20 | | | | | | 2.51 | | | | | | 1.13 | (f) | | | | | 182 | |
| | | 7.17 | | | | | | 62.25 | | | | | | 311,960 | | | | | | 1.05 | | | | | | 1.36 | | | | | | 2.38 | (f) | | | | | 182 | |
| | | 4.45 | | | | | | (59.22 | ) | | | | | 345 | | | | | | 1.45 | | | | | | 1.89 | | | | | | 1.92 | (g) | | | | | 190 | |
| | | 4.41 | | | | | | (59.48 | ) | | | | | 43 | | | | | | 2.20 | | | | | | 2.64 | | | | | | 1.24 | (g) | | | | | 190 | |
| | | 4.47 | | | | | | (59.01 | ) | | | | | 156,248 | | | | | | 1.05 | | | | | | 1.49 | | | | | | 2.28 | (g) | | | | | 190 | |
| | |
| The accompanying notes are an integral part of these financial statements. | | 51 |
GOLDMAN SACHS INTERNATIONAL EQUITY INSIGHTS FUND
Financial Highlights
Selected Data for a Share Outstanding Throughout Each Period
| | | | | | | | | | | | | | | | | | | | | | | | | | | | | | |
| | | | | | | | Income (loss) from
investment operations | | | Distributions
to shareholders | |
| | | Year - Share Class | | Net asset
value,
beginning
of period | | | Net
investment
income(a) | | | Net realized
and unrealized
gain (loss) | | | Total from
investment
operations | | | From net
investment
income | | | From net
realized
gains | | | Total
distributions | |
| | FOR THE SIX MONTHS ENDED APRIL 30, (UNAUDITED) | |
| | 2013 - A | | $ | 9.00 | | | $ | 0.08 | (d) | | $ | 1.30 | | | $ | 1.38 | | | $ | (0.31 | ) | | $ | — | | | $ | (0.31 | ) |
| | 2013 - B | | | 8.89 | | | | 0.07 | (d) | | | 1.26 | | | | 1.33 | | | | (0.23 | ) | | | — | | | | (0.23 | ) |
| | 2013 - C | | | 8.87 | | | | 0.07 | (d) | | | 1.26 | | | | 1.33 | | | | (0.24 | ) | | | — | | | | (0.24 | ) |
| | 2013 - Institutional | | | 9.25 | | | | 0.15 | (d) | | | 1.27 | | | | 1.42 | | | | (0.35 | ) | | | — | | | | (0.35 | ) |
| | 2013 - Service | | | 9.06 | | | | 0.09 | (d) | | | 1.29 | | | | 1.38 | | | | (0.30 | ) | | | — | | | | (0.30 | ) |
| | 2013 - IR | | | 8.91 | | | | 0.14 | (d) | | | 1.24 | | | | 1.38 | | | | (0.35 | ) | | | — | | | | (0.35 | ) |
| | 2013 - R | | | 8.88 | | | | 0.10 | (d) | | | 1.26 | | | | 1.36 | | | | (0.28 | ) | | | — | | | | (0.28 | ) |
| | | | | | | | | | | | | | | | | | | | | | | | | | | | | | |
| | FOR THE FISCAL YEARS ENDED OCTOBER 31, | |
| | 2012 - A | | | 9.02 | | | | 0.19 | | | | 0.21 | | | | 0.40 | | | | (0.42 | ) | | | — | | | | (0.21 | ) |
| | 2012 - B | | | 8.89 | | | | 0.13 | | | | 0.20 | | | | 0.33 | | | | (0.33 | ) | | | — | | | | (0.13 | ) |
| | 2012 - C | | | 8.89 | | | | 0.13 | | | | 0.20 | | | | 0.33 | | | | (0.35 | ) | | | — | | | | (0.13 | ) |
| | 2012 - Institutional | | | 9.27 | | | | 0.24 | | | | 0.21 | | | | 0.45 | | | | (0.47 | ) | | | — | | | | (0.25 | ) |
| | 2012 - Service | | | 9.08 | | | | 0.18 | | | | 0.21 | | | | 0.39 | | | | (0.41 | ) | | | — | | | | (0.19 | ) |
| | 2012 - IR | | | 8.97 | | | | 0.20 | | | | 0.21 | | | | 0.41 | | | | (0.47 | ) | | | — | | | | (0.23 | ) |
| | 2012 - R | | | 8.93 | | | | 0.17 | | | | 0.20 | | | | 0.37 | | | | (0.42 | ) | | | — | | | | (0.20 | ) |
| | 2011 - A | | | 10.21 | | | | 0.28 | | | | (1.26 | ) | | | (0.98 | ) | | | (0.21 | ) | | | — | | | | (0.21 | ) |
| | 2011 - B | | | 10.06 | | | | 0.19 | | | | (1.23 | ) | | | (1.04 | ) | | | (0.13 | ) | | | — | | | | (0.14 | ) |
| | 2011 - C | | | 10.06 | | | | 0.19 | | | | (1.23 | ) | | | (1.04 | ) | | | (0.13 | ) | | | — | | | | (0.14 | ) |
| | 2011 - Institutional | | | 10.49 | | | | 0.33 | | | | (1.30 | ) | | | (0.97 | ) | | | (0.25 | ) | | | — | | | | (0.25 | ) |
| | 2011 - Service | | | 10.27 | | | | 0.27 | | | | (1.27 | ) | | | (1.00 | ) | | | (0.19 | ) | | | — | | | | (0.21 | ) |
| | 2011 - IR | | | 10.15 | | | | 0.23 | | | | (1.18 | ) | | | (0.95 | ) | | | (0.23 | ) | | | — | | | | (0.24 | ) |
| | 2011 - R | | | 10.12 | | | | 0.19 | | | | (1.18 | ) | | | (0.99 | ) | | | (0.20 | ) | | | — | | | | (0.21 | ) |
| | 2010 - A | | | 9.61 | | | | 0.18 | | | | 0.63 | | | | 0.81 | | | | (0.21 | ) | | | — | | | | (0.39 | ) |
| | 2010 - B | | | 9.47 | | | | 0.11 | | | | 0.62 | | | | 0.73 | | | | (0.14 | ) | | | — | | | | (0.29 | ) |
| | 2010 - C | | | 9.47 | | | | 0.10 | | | | 0.63 | | | | 0.73 | | | | (0.14 | ) | | | — | | | | (0.29 | ) |
| | 2010 - Institutional | | | 9.86 | | | | 0.22 | | | | 0.66 | | | | 0.88 | | | | (0.25 | ) | | | — | | | | (0.45 | ) |
| | 2010 - Service | | | 9.67 | | | | 0.16 | | | | 0.65 | | | | 0.81 | | | | (0.21 | ) | | | — | | | | (0.36 | ) |
| | 2010 - IR | | | 9.56 | | | | 0.20 | | | | 0.63 | | | | 0.83 | | | | (0.24 | ) | | | — | | | | (0.43 | ) |
| | 2010 - R | | | 9.55 | | | | 0.15 | | | | 0.63 | | | | 0.78 | | | | (0.21 | ) | | | — | | | | (0.38 | ) |
| | 2009 - A | | | 8.06 | | | | 0.17 | | | | 1.77 | | | | 1.94 | | | | (0.39 | ) | | | — | | | | (0.39 | ) |
| | 2009 - B | | | 7.91 | | | | 0.12 | | | | 1.73 | | | | 1.85 | | | | (0.29 | ) | | | — | | | | (0.29 | ) |
| | 2009 - C | | | 7.90 | | | | 0.12 | | | | 1.74 | | | | 1.86 | | | | (0.29 | ) | | | — | | | | (0.29 | ) |
| | 2009 - Institutional | | | 8.29 | | | | 0.21 | | | | 1.81 | | | | 2.02 | | | | (0.45 | ) | | | — | | | | (0.45 | ) |
| | 2009 - Service | | | 8.08 | | | | 0.16 | | | | 1.79 | | | | 1.95 | | | | (0.36 | ) | | | — | | | | (0.36 | ) |
| | 2009 - IR | | | 8.04 | | | | 0.20 | | | | 1.75 | | | | 1.95 | | | | (0.43 | ) | | | — | | | | (0.43 | ) |
| | 2009 - R | | | 8.01 | | | | 0.08 | | | | 1.84 | | | | 1.92 | | | | (0.38 | ) | | | — | | | | (0.38 | ) |
| | | | | | | | | | | | | | | | | | | | | | | | | | | | | | |
| | FOR THE PERIOD SEPTEMBER 1, 2008 TO OCTOBER 31, 2008* | |
| | 2008 - A | | | 11.79 | | | | 0.03 | | | | (3.76 | ) | | | (3.73 | ) | | | — | | | | — | | | | — | |
| | 2008 - B | | | 11.58 | | | | 0.02 | | | | (3.69 | ) | | | (3.67 | ) | | | — | | | | — | | | | — | |
| | 2008 - C | | | 11.56 | | | | 0.02 | | | | (3.68 | ) | | | (3.66 | ) | | | — | | | | — | | | | — | |
| | 2008 - Institutional | | | 12.11 | | | | 0.04 | | | | (3.86 | ) | | | (3.82 | ) | | | — | | | | — | | | | — | |
| | 2008 - Service | | | 11.81 | | | | 0.03 | | | | (3.76 | ) | | | (3.73 | ) | | | — | | | | — | | | | — | |
| | 2008 - IR (Commenced November 30, 2007) | | | 11.75 | | | | 0.03 | | | | (3.74 | ) | | | (3.71 | ) | | | — | | | | — | | | | — | |
| | 2008 - R (Commenced November 30, 2007) | | | 11.72 | | | | 0.03 | | | | (3.74 | ) | | | (3.71 | ) | | | — | | | | — | | | | — | |
| | | | | | | | | | | | | | | | | | | | | | | | | | | | | | |
| | FOR THE FISCAL YEAR ENDED AUGUST 31, | |
| | 2008 - A | | | 15.90 | | | | 0.52 | | | | (2.77 | ) | | | (2.25 | ) | | | (0.48 | ) | | | (1.38 | ) | | | (1.86 | ) |
| | 2008 - B | | | 15.67 | | | | 0.41 | | | | (2.73 | ) | | | (2.32 | ) | | | (0.39 | ) | | | (1.38 | ) | | | (1.77 | ) |
| | 2008 - C | | | 15.64 | | | | 0.41 | | | | (2.73 | ) | | | (2.32 | ) | | | (0.38 | ) | | | (1.38 | ) | | | (1.76 | ) |
| | 2008 - Institutional | | | 16.28 | | | | 0.59 | | | | (2.84 | ) | | | (2.25 | ) | | | (0.54 | ) | | | (1.38 | ) | | | (1.92 | ) |
| | 2008 - Service | | | 15.93 | | | | 0.49 | | | | (2.76 | ) | | | (2.27 | ) | | | (0.47 | ) | | | (1.38 | ) | | | (1.85 | ) |
| | 2008 - IR (Commenced November 30, 2007) | | | 16.57 | | | | 0.30 | | | | (3.19 | ) | | | (2.89 | ) | | | (0.55 | ) | | | (1.38 | ) | | | (1.93 | ) |
| | 2008 - R (Commenced November 30, 2007) | | | 16.57 | | | | 0.25 | | | | (3.18 | ) | | | (2.93 | ) | | | (0.54 | ) | | | (1.38 | ) | | | (1.92 | ) |
| | * | | The Fund changed its fiscal year end from August 31 to October 31. |
| | (a) | | Calculated based on the average shares outstanding methodology. |
| | (b) | | Assumes investment at the net asset value at the beginning of the period, reinvestment of all distributions, a complete redemption of the investment at the net asset value at the end of the period and no sales or redemption charges. Total returns would be reduced if a sales or redemption charge was taken into account. Returns do not reflect the deduction of taxes that a shareholder would pay on Fund distributions or the redemption of Fund shares. Total returns for periods less than one full year are not annualized. |
| | (c) | | The Fund’s portfolio turnover rate is calculated in accordance with regulatory requirements, without regard to transactions involving short term investments and certain derivatives. If such transactions were included, the Fund’s portfolio turnover rate may be higher. |
| | (d) | | Reflects income recognized from special dividends which amounted to $0.03 per share and 0.57% of average net assets. |
| | |
| 52 | | The accompanying notes are an integral part of these financial statements. |
GOLDMAN SACHS INTERNATIONAL EQUITY INSIGHTS FUND
| | | | | | | | | | | | | | | | | | | | | | | | | | | | | | | | | | | | | | | | |
| | | | | | | | | | | | | | | | | | | | | | | | | | | | | | | | | | |
| | | Net asset
value, end
of period | | | | | Total
return(b) | | | | | Net assets,
end of
period
(in 000s) | | | | | Ratio of
net expenses
to average
net assets | | | | | Ratio of
total expenses
to average
net assets | | | | | Ratio of
net investment
income
to average
net assets | | | | | Portfolio
turnover
rate(c) | |
| | | | | | | | | | | | | | | | | | | | | | | | | | | | | | | | | | | | | | | | |
| | $ | 10.07 | | | | | | 15.85 | % | | | | $ | 101,102 | | | | | | 1.29 | %(e) | | | | | 1.37 | %(e) | | | | | 1.67 | %(d)(e) | | | | | 99 | % |
| | | 9.99 | | | | | | 15.27 | | | | | | 2,371 | | | | | | 2.04 | (e) | | | | | 2.11 | (e) | | | | | 1.46 | (d)(e) | | | | | 99 | |
| | | 9.96 | | | | | | 15.37 | | | | | | 2,978 | | | | | | 2.04 | (e) | | | | | 2.11 | (e) | | | | | 1.52 | (d)(e) | | | | | 99 | |
| | | 10.32 | | | | | | 15.93 | | | | | | 951,644 | | | | | | 0.89 | (e) | | | | | 0.95 | (e) | | | | | 3.06 | (d)(e) | | | | | 99 | |
| | | 10.14 | | | | | | 15.75 | | | | | | 7,219 | | | | | | 1.39 | (e) | | | | | 1.46 | (e) | | | | | 2.02 | (d)(e) | | | | | 99 | |
| | | 9.94 | | | | | | 15.94 | | | | | | 188 | | | | | | 1.04 | (e) | | | | | 1.10 | (e) | | | | | 3.03 | (d)(e) | | | | | 99 | |
| | | 9.96 | | | | | | 15.66 | | | | | | 83 | | | | | | 1.54 | (e) | | | | | 1.61 | (e) | | | | | 2.14 | (d)(e) | | | | | 99 | |
| | | | | | | | | | | | | | | | | | | | | | | | | | | | | | | | | | | | | | | | |
| | | | | | | | | | | | | | | | | | | | | | | | | | | | | | | | | | | | | | | | |
| | | 9.00 | | | | | | 4.94 | | | | | | 210,612 | | | | | | 1.28 | | | | | | 1.37 | | | | | | 2.21 | | | | | | 203 | |
| | | 8.89 | | | | | | 4.13 | | | | | | 2,587 | | | | | | 2.04 | | | | | | 2.12 | | | | | | 1.47 | | | | | | 203 | |
| | | 8.87 | | | | | | 4.10 | | | | | | 3,087 | | | | | | 2.04 | | | | | | 2.12 | | | | | | 1.48 | | | | | | 203 | |
| | | 9.25 | | | | | | 5.47 | | | | | | 596,986 | | | | | | 0.88 | | | | | | 0.97 | | | | | | 2.69 | | | | | | 203 | |
| | | 9.06 | | | | | | 4.77 | | | | | | 7,945 | | | | | | 1.38 | | | | | | 1.47 | | | | | | 2.09 | | | | | | 203 | |
| | | 8.91 | | | | | | 5.16 | | | | | | 65 | | | | | | 1.04 | | | | | | 1.11 | | | | | | 2.33 | | | | | | 203 | |
| | | 8.88 | | | | | | 4.69 | | | | | | 71 | | | | | | 1.53 | | | | | | 1.62 | | | | | | 1.98 | | | | | | 203 | |
| | | 9.02 | | | | | | (9.87 | ) | | | | | 314,225 | | | | | | 1.25 | | | | | | 1.31 | | | | | | 2.74 | | | | | | 101 | |
| | | 8.89 | | | | | | (10.52 | ) | | | | | 3,916 | | | | | | 2.00 | | | | | | 2.06 | | | | | | 1.93 | | | | | | 101 | |
| | | 8.89 | | | | | | (10.50 | ) | | | | | 3,660 | | | | | | 2.00 | | | | | | 2.06 | | | | | | 1.94 | | | | | | 101 | |
| | | 9.27 | | | | | | (9.52 | ) | | | | | 1,013,458 | | | | | | 0.85 | | | | | | 0.91 | | | | | | 3.18 | | | | | | 101 | |
| | | 9.08 | | | | | | (9.91 | ) | | | | | 12,982 | | | | | | 1.35 | | | | | | 1.41 | | | | | | 2.60 | | | | | | 101 | |
| | | 8.97 | | | | | | (9.58 | ) | | | | | 45 | | | | | | 1.00 | | | | | | 1.06 | | | | | | 2.53 | | | | | | 101 | |
| | | 8.93 | | | | | | (9.99 | ) | | | | | 116 | | | | | | 1.50 | | | | | | 1.56 | | | | | | 1.87 | | | | | | 101 | |
| | | 10.21 | | | | | | 8.59 | | | | | | 530,086 | | | | | | 1.25 | | | | | | 1.29 | | | | | | 1.89 | | | | | | 111 | |
| | | 10.06 | | | | | | 7.83 | | | | | | 6,563 | | | | | | 2.00 | | | | | | 2.04 | | | | | | 1.13 | | | | | | 111 | |
| | | 10.06 | | | | | | 7.78 | | | | | | 5,023 | | | | | | 2.00 | | | | | | 2.04 | | | | | | 1.12 | | | | | | 111 | |
| | | 10.49 | | | | | | 9.05 | | | | | | 1,819,375 | | | | | | 0.85 | | | | | | 0.89 | | | | | | 2.24 | | | | | | 111 | |
| | | 10.27 | | | | | | 8.49 | | | | | | 23,267 | | | | | | 1.35 | | | | | | 1.39 | | | | | | 1.68 | | | | | | 111 | |
| | | 10.15 | | | | | | 8.77 | | | | | | 8 | | | | | | 1.00 | | | | | | 1.04 | | | | | | 2.13 | | | | | | 111 | |
| | | 10.12 | | | | | | 8.30 | | | | | | 192 | | | | | | 1.50 | | | | | | 1.54 | | | | | | 1.59 | | | | | | 111 | |
| | | 9.61 | | | | | | 25.56 | | | | | | 656,289 | | | | | | 1.25 | | | | | | 1.32 | | | | | | 2.17 | | | | | | 167 | |
| | | 9.47 | | | | | | 24.49 | | | | | | 7,620 | | | | | | 2.00 | | | | | | 2.07 | | | | | | 1.50 | | | | | | 167 | |
| | | 9.47 | | | | | | 24.68 | | | | | | 5,622 | | | | | | 2.00 | | | | | | 2.07 | | | | | | 1.52 | | | | | | 167 | |
| | | 9.86 | | | | | | 26.03 | | | | | | 1,770,267 | | | | | | 0.85 | | | | | | 0.92 | | | | | | 2.55 | | | | | | 167 | |
| | | 9.67 | | | | | | 25.46 | | | | | | 29,882 | | | | | | 1.35 | | | | | | 1.42 | | | | | | 1.96 | | | | | | 167 | |
| | | 9.56 | | | | | | 25.94 | | | | | | 7 | | | | | | 1.00 | | | | | | 1.07 | | | | | | 2.51 | | | | | | 167 | |
| | | 9.55 | | | | | | 25.32 | | | | | | 155 | | | | | | 1.50 | | | | | | 1.57 | | | | | | 0.95 | | | | | | 167 | |
| | | | | | | | | | | | | | | | | | | | | | | | | | | | | | | | | | | | | | | | |
| | | | | | | | | | | | | | | | | | | | | | | | | | | | | | | | | | | | | | | | |
| | | 8.06 | | | | | | (31.64 | ) | | | | | 623,459 | | | | | | 1.20 | (e) | | | | | 1.28 | (e) | | | | | 1.76 | (e) | | | | | 25 | |
| | | 7.91 | | | | | | (31.69 | ) | | | | | 8,149 | | | | | | 1.95 | (e) | | | | | 2.03 | (e) | | | | | 1.00 | (e) | | | | | 25 | |
| | | 7.90 | | | | | | (31.66 | ) | | | | | 6,116 | | | | | | 1.95 | (e) | | | | | 2.03 | (e) | | | | | 1.00 | (e) | | | | | 25 | |
| | | 8.29 | | | | | | (31.54 | ) | | | | | 1,560,672 | | | | | | 0.80 | (e) | | | | | 0.88 | (e) | | | | | 2.20 | (e) | | | | | 25 | |
| | | 8.08 | | | | | | (31.58 | ) | | | | | 22,994 | | | | | | 1.30 | (e) | | | | | 1.38 | (e) | | | | | 1.68 | (e) | | | | | 25 | |
| | | 8.04 | | | | | | (31.57 | ) | | | | | 5 | | | | | | 0.95 | (e) | | | | | 1.03 | (e) | | | | | 1.98 | (e) | | | | | 25 | |
| | | 8.01 | | | | | | (31.66 | ) | | | | | 5 | | | | | | 1.45 | (e) | | | | | 1.53 | (e) | | | | | 1.47 | (e) | | | | | 25 | |
| | | | | | | | | | | | | | | | | | | | | | | | | | | | | | | | | | | | | | | | |
| | | | | | | | | | | | | | | | | | | | | | | | | | | | | | | | | | | | | | | | |
| | | 11.79 | | | | | | (16.33 | ) | | | | | 1,031,252 | | | | | | 1.20 | | | | | | 1.25 | | | | | | 3.70 | | | | | | 161 | |
| | | 11.58 | | | | | | (16.99 | ) | | | | | 13,280 | | | | | | 1.95 | | | | | | 2.00 | | | | | | 2.93 | | | | | | 161 | |
| | | 11.56 | | | | | | (16.99 | ) | | | | | 9,875 | | | | | | 1.95 | | | | | | 2.00 | | | | | | 2.97 | | | | | | 161 | |
| | | 12.11 | | | | | | (15.99 | ) | | | | | 2,676,502 | | | | | | 0.80 | | | | | | 0.85 | | | | | | 4.13 | | | | | | 161 | |
| | | 11.81 | | | | | | (16.50 | ) | | | | | 49,411 | | | | | | 1.30 | | | | | | 1.35 | | | | | | 3.54 | | | | | | 161 | |
| | | 11.75 | | | | | | (19.67 | ) | | | | | 8 | | | | | | 0.95 | (e) | | | | | 1.00 | (e) | | | | | 3.02 | (e) | | | | | 161 | |
| | | 11.72 | | | | | | (19.92 | ) | | | | | 8 | | | | | | 1.45 | (e) | | | | | 1.50 | (e) | | | | | 2.55 | (e) | | | | | 161 | |
| | |
| The accompanying notes are an integral part of these financial statements. | | 53 |
GOLDMAN SACHS INTERNATIONAL SMALL CAP INSIGHTS FUND
Financial Highlights
Selected Data for a Share Outstanding Throughout Each Period
| | | | | | | | | | | | | | | | | | | | | | |
| | | | | | | | Income (loss) from
investment operations | | | | |
| | | Year - Share Class | | Net asset
value,
beginning
of period | | | Net
investment
income(a) | | | Net realized
and unrealized
gain (loss) | | | Total from
investment
operations | | | Distributions
to shareholders
from net
investment
income | |
| | FOR THE SIX MONTHS ENDED APRIL 30, (UNAUDITED) | |
| | 2013 - A | | $ | 8.29 | | | $ | 0.09 | (d) | | $ | 1.40 | | | $ | 1.49 | | | $ | (0.39 | ) |
| | 2013 - C | | | 8.13 | | | | 0.05 | (d) | | | 1.39 | | | | 1.44 | | | | (0.34 | ) |
| | 2013 - Institutional | | | 8.30 | | | | 0.10 | (d) | | | 1.41 | | | | 1.51 | | | | (0.44 | ) |
| | 2013 - IR | | | 8.28 | | | | 0.10 | (d) | | | 1.40 | | | | 1.50 | | | | (0.43 | ) |
| | | | | | | | | | | | | | | | | | | | | | |
| | FOR THE FISCAL YEARS ENDED OCTOBER 31, | |
| | 2012 - A | | | 7.92 | | | | 0.17 | | | | 0.38 | | | | 0.55 | | | | (0.18 | ) |
| | 2012 - C | | | 7.79 | | | | 0.11 | | | | 0.38 | | | | 0.49 | | | | (0.15 | ) |
| | 2012 - Institutional | | | 7.94 | | | | 0.20 | | | | 0.38 | | | | 0.58 | | | | (0.22 | ) |
| | 2012 - IR | | | 7.93 | | | | 0.16 | | | | 0.40 | | | | 0.56 | | | | (0.21 | ) |
| | 2011 - A | | | 8.20 | | | | 0.17 | | | | (0.21 | ) | | | (0.04 | ) | | | (0.24 | ) |
| | 2011 - C | | | 8.08 | | | | 0.13 | | | | (0.23 | ) | | | (0.10 | ) | | | (0.19 | ) |
| | 2011 - Institutional | | | 8.21 | | | | 0.20 | | | | (0.20 | ) | | | — | | | | (0.27 | ) |
| | 2011 - IR | | | 8.21 | | | | 0.20 | | | | (0.21 | ) | | | (0.01 | ) | | | (0.27 | ) |
| | 2010 - A | | | 7.03 | | | | 0.12 | (f) | | | 1.21 | | | | 1.33 | | | | (0.16 | ) |
| | 2010 - C | | | 6.95 | | | | 0.09 | (f) | | | 1.17 | | | | 1.26 | | | | (0.13 | ) |
| | 2010 - Institutional | | | 7.04 | | | | 0.16 | (f) | | | 1.19 | | | | 1.35 | | | | (0.18 | ) |
| | 2010 - IR (Commenced August 31, 2010) | | | 7.00 | | | | 0.03 | (f) | | | 1.18 | | | | 1.21 | | | | — | |
| | 2009 - A | | | 4.94 | | | | 0.09 | | | | 2.19 | | | | 2.28 | | | | (0.19 | ) |
| | 2009 - C | | | 4.91 | | | | 0.06 | | | | 2.17 | | | | 2.23 | | | | (0.19 | ) |
| | 2009 - Institutional | | | 4.96 | | | | 0.12 | | | | 2.19 | | | | 2.31 | | | | (0.23 | ) |
| | 2008 - A | | | 10.46 | | | | 0.20 | (g) | | | (5.69 | ) | | | (5.49 | ) | | | (0.03 | ) |
| | 2008 - C | | | 10.46 | | | | 0.13 | (g) | | | (5.68 | ) | | | (5.55 | ) | | | — | (h) |
| | 2008 - Institutional | | | 10.47 | | | | 0.23 | (g) | | | (5.71 | ) | | | (5.48 | ) | | | (0.03 | ) |
| | (a) | | Calculated based on the average shares outstanding methodology. |
| | (b) | | Assumes investment at the net asset value at the beginning of the period, reinvestment of all distributions, a complete redemption of the investment at the net asset value at the end of the period and no sales or redemption charges. Total returns would be reduced if a sales or redemption charge was taken into account. Returns do not reflect the deduction of taxes that a shareholder would pay on Fund distributions or the redemption of Fund shares. Total returns for periods less than one full year are not annualized. |
| | (c) | | The Fund's portfolio turnover rate is calculated in accordance with regulatory requirements, without regard to transactions involving short term investments and certain derivatives. If such transactions were included, the Fund's portfolio turnover rate may be higher. |
| | (d) | | Reflects income recognized from special dividends which amounted to $0.02 per share and 0.42% of average net assets. |
| | (f) | | Reflects income recognized from special dividends which amounted to $0.01 per share and 0.19% of average net assets. |
| | (g) | | Reflects income recognized from special dividends which amounted to $0.02 per share and 0.20% of average net assets. |
| | (h) | | Amount is less than $0.005 per share. |
| | |
| 54 | | The accompanying notes are an integral part of these financial statements. |
GOLDMAN SACHS INTERNATIONAL SMALL CAP INSIGHTS FUND
| | | | | | | | | | | | | | | | | | | | | | | | | | | | | | | | | | | | | | | | |
| | | | | | | | | | | | | | | | | | | | | | | | | | | | | | | | | | |
| | | Net asset
value, end
of period | | | | | Total
return(b) | | | | | Net assets,
end of
period
(in 000s) | | | | | Ratio of
net expenses
to average
net assets | | | | | Ratio of
total expenses
to average
net assets | | | | | Ratio of
net investment
income
to average
net assets | | | | | Portfolio
turnover
rate(c) | |
| | | | | | | | | | | | | | | | | | | | | | | | | | | | | | | | | | | | | | | | |
| | $ | 9.39 | | | | | | 18.84 | % | | | | $ | 27,107 | | | | | | 1.30 | %(e) | | | | | 1.47 | %(e) | | | | | 2.03 | %(d)(e) | | | | | 85 | % |
| | | 9.23 | | | | | | 18.39 | | | | | | 1,190 | | | | | | 2.05 | (e) | | | | | 2.22 | (e) | | | | | 1.19 | (d)(e) | | | | | 85 | |
| | | 9.37 | | | | | | 19.07 | | | | | | 303,740 | | | | | | 0.90 | (e) | | | | | 1.07 | (e) | | | | | 2.34 | (d)(e) | | | | | 85 | |
| | | 9.35 | | | | | | 18.99 | | | | | | 620 | | | | | | 1.05 | (e) | | | | | 1.21 | (e) | | | | | 2.32 | (d)(e) | | | | | 85 | |
| | | | | | | | | | | | | | | | | | | | | | | | | | | | | | | | | | | | | | | | |
| | | | | | | | | | | | | | | | | | | | | | | | | | | | | | | | | | | | | | | | |
| | | 8.29 | | | | | | 7.32 | | | | | | 18,914 | | | | | | 1.30 | | | | | | 1.51 | | | | | | 2.13 | | | | | | 150 | |
| | | 8.13 | | | | | | 6.56 | | | | | | 896 | | | | | | 2.05 | | | | | | 2.26 | | | | | | 1.44 | | | | | | 150 | |
| | | 8.30 | | | | | | 7.80 | | | | | | 244,135 | | | | | | 0.90 | | | | | | 1.11 | | | | | | 2.59 | | | | | | 150 | |
| | | 8.28 | | | | | | 7.54 | | | | | | 345 | | | | | | 1.05 | | | | | | 1.26 | | | | | | 2.06 | | | | | | 150 | |
| | | 7.92 | | | | | | (0.68 | ) | | | | | 29,729 | | | | | | 1.30 | | | | | | 1.47 | | | | | | 1.95 | | | | | | 79 | |
| | | 7.79 | | | | | | (1.39 | ) | | | | | 856 | | | | | | 2.05 | | | | | | 2.22 | | | | | | 1.56 | | | | | | 79 | |
| | | 7.94 | | | | | | (0.16 | ) | | | | | 249,545 | | | | | | 0.90 | | | | | | 1.07 | | | | | | 2.30 | | | | | | 79 | |
| | | 7.93 | | | | | | (0.33 | ) | | | | | 1,368 | | | | | | 1.05 | | | | | | 1.22 | | | | | | 2.39 | | | | | | 79 | |
| | | 8.20 | | | | | | 19.36 | | | | | | 34,154 | | | | | | 1.30 | | | | | | 1.50 | | | | | | 1.71 | (f) | | | | | 113 | |
| | | 8.08 | | | | | | 18.50 | | | | | | 213 | | | | | | 2.05 | | | | | | 2.25 | | | | | | 1.24 | (f) | | | | | 113 | |
| | | 8.21 | | | | | | 19.67 | | | | | | 236,265 | | | | | | 0.90 | | | | | | 1.10 | | | | | | 2.18 | (f) | | | | | 113 | |
| | | 8.21 | | | | | | 17.29 | | | | | | 1 | | | | | | 1.05 | (e) | | | | | 1.25 | (e) | | | | | 2.49 | (e)(f) | | | | | 113 | |
| | | 7.03 | | | | | | 48.17 | | | | | | 36,310 | | | | | | 1.30 | | | | | | 1.74 | | | | | | 1.62 | | | | | | 209 | |
| | | 6.95 | | | | | | 47.36 | | | | | | 40 | | | | | | 2.05 | | | | | | 2.49 | | | | | | 1.16 | | | | | | 209 | |
| | | 7.04 | | | | | | 48.80 | | | | | | 207,776 | | | | | | 0.90 | | | | | | 1.34 | | | | | | 1.99 | | | | | | 209 | |
| | | 4.94 | | | | | | (52.55 | ) | | | | | 18,763 | | | | | | 1.30 | | | | | | 1.70 | | | | | | 2.39 | (g) | | | | | 117 | |
| | | 4.91 | | | | | | (52.94 | ) | | | | | 21 | | | | | | 2.05 | | | | | | 2.45 | | | | | | 1.70 | (g) | | | | | 117 | |
| | | 4.96 | | | | | | (52.37 | ) | | | | | 67,625 | | | | | | 0.90 | | | | | | 1.30 | | | | | | 2.83 | (g) | | | | | 117 | |
| | |
| The accompanying notes are an integral part of these financial statements. | | 55 |
GOLDMAN SACHS INTERNATIONAL EQUITY INSIGHTS FUNDS
Notes to Financial Statements
April 30, 2013 (Unaudited)
Goldman Sachs Trust (the “Trust”) is a Delaware statutory trust registered under the Investment Company Act of 1940, as amended (the “Act”), as an open-end management investment company. The following table lists those series of the Trust that are included in this report (collectively, the “Funds” or individually a “Fund”), along with their corresponding share classes and respective diversification status under the Act:
| | | | |
Fund† | | Share Classes Offered* | | Diversified/ Non-diversified |
| Emerging Markets Equity Insights and International Small Cap Insights | | A, C, Institutional and IR | | Diversified |
International Equity Insights | | A, B, C, Institutional, Service, IR and R | | Diversified |
| † | | Formerly, Goldman Sachs Structured Emerging Markets Equity, Goldman Sachs Structured International Small Cap and Goldman Sachs Structured International Equity. Effective at the close of business May 3, 2013, the Funds changed their names to the Goldman Sachs Emerging Markets Equity Insights, Goldman Sachs International Small Cap Insights and Goldman Sachs International Equity Insights, respectively. |
| * | | Class B Shares are generally no longer available for purchase by current or prospective investors. |
Class A Shares are sold with a front-end sales charge of up to 5.50%. Class B Shares were sold with a contingent deferred sales charge (“CDSC”) that declines from 5.00% to zero, depending upon the period of time the shares are held. Class C Shares are sold with a CDSC of 1.00%, which is imposed on redemptions made within 12 months of purchase. Institutional, Service, Class IR and Class R Shares are not subject to a sales charge.
Goldman Sachs Asset Management, L.P. (“GSAM”), an affiliate of Goldman, Sachs & Co. (“Goldman Sachs”), serves as investment adviser to the Funds pursuant to a management agreement (the “Agreement”) with the Trust.
| | |
| 2. SIGNIFICANT ACCOUNTING POLICIES | | |
The financial statements have been prepared in accordance with accounting principles generally accepted in the United States of America (“GAAP”) and require management to make estimates and assumptions that may affect the reported amounts and disclosures. Actual results may differ from those estimates and assumptions.
A. Investment Valuation — The Funds’ valuation policy is to value investments at fair value.
B. Investment Income and Investments — Investment income includes interest income and dividend income, net of any foreign withholding taxes, less any amounts reclaimable. Interest income is accrued daily and adjusted for amortization of premiums and accretion of discounts. Dividend income is recognized on ex-dividend date or, for certain foreign securities, as soon as such information is obtained subsequent to the ex-dividend date. Investment transactions are reflected on trade date. Realized gains and losses are calculated using identified cost. Investment transactions are recorded on the following business day for daily net asset value (“NAV”) calculations. Any foreign capital gains tax is accrued daily based upon net unrealized gains, and is payable upon sale of such investments.
56
GOLDMAN SACHS INTERNATIONAL EQUITY INSIGHTS FUNDS
|
| 2. SIGNIFICANT ACCOUNTING POLICIES (continued) |
For derivative contracts, realized gains and losses are recorded upon settlement of the contract. Upfront payments are made or received upon entering into a swap agreement and are reflected as a receivable from or payable to the counterparty in the Statement of Assets and Liabilities. Upfront payments are recognized over the contract’s term/event as realized gains or losses, with the exception of forward starting interest rate swaps whose realized gains or losses are recognized from the effective start date. For securities with paydown provisions, principal payments received are treated as a proportionate reduction to the cost basis of the securities and excess or shortfall amounts are recorded as gains or losses. For treasury inflation protected securities (“TIPS”), adjustments to principal due to inflation/deflation are reflected as increases/decreases to interest income with a corresponding adjustment to cost.
C. Class Allocations and Expenses — Investment income, realized and unrealized gain (loss), and non-class specific expenses of each Fund are allocated daily based upon the proportion of net assets of each class. Class specific expenses, where applicable, are borne by the respective share classes and include Distribution and Service, Transfer Agent and Service and Shareholder Administration fees. Non-class specific expenses directly incurred by a Fund are charged to that Fund, while such expenses incurred by the Trust are allocated across the respective Funds on a straight-line and/or pro-rata basis depending upon the nature of the expenses.
D. Federal Taxes and Distributions to Shareholders — It is each Fund’s policy to comply with the requirements of the Internal Revenue Code of 1986, as amended (the “Code”), applicable to regulated investment companies (mutual funds) and to distribute each year substantially all of its investment company taxable income and capital gains to its shareholders. Accordingly, the Funds are not required to make any provisions for the payment of federal income tax. Distributions to shareholders are recorded on the ex-dividend date. Income and capital gains distributions, if any, are declared and paid annually.
Net capital losses are carried forward to future fiscal years and may be used to the extent allowed by the Code to offset any future capital gains. Utilization of capital loss carryforwards will reduce the requirement of future capital gains distributions.
Under the Regulated Investment Company Modernization Act of 2010, the Funds are permitted to carry forward capital losses incurred in taxable years beginning after December 22, 2010 for an unlimited period. However, any losses incurred during those future taxable years will be required to be utilized prior to the losses incurred in pre-enactment taxable years. As a result of this ordering rule, pre-enactment capital loss carryforwards may be more likely to expire unused. Additionally, post-enactment capital losses that are carried forward will retain their character as either short-term or long-term capital losses rather than being considered all short-term as under previous law.
The characterization of distributions to shareholders for financial reporting purposes is determined in accordance with federal income tax rules, which may differ from GAAP. The source of each Fund’s distributions may be shown in the accompanying financial statements as either from net investment income, net realized gain or capital. Certain components of the Funds’ net assets on the Statements of Assets and Liabilities reflect permanent GAAP/tax differences based on the appropriate tax character.
57
GOLDMAN SACHS INTERNATIONAL EQUITY INSIGHTS FUNDS
Notes to Financial Statements (continued)
April 30, 2013 (Unaudited)
|
| 3. INVESTMENTS AND FAIR VALUE MEASUREMENTS |
E. Foreign Currency Translation — The accounting records and reporting currency of the Funds are maintained in United States (“U.S.”) dollars. Assets and liabilities denominated in foreign currencies are translated into U.S. dollars using the current exchange rates at the close of each business day. The effect of changes in foreign currency exchange rates on investments is included within net realized and unrealized gain (loss) on investments. Changes in the value of other assets and liabilities as a result of fluctuations in foreign exchange rates are included in the Statements of Operations within net change in unrealized gain (loss) on foreign currency transactions. Transactions denominated in foreign currencies are translated into U.S. dollars on the date the transaction occurred, the effects of which are included within net realized gain (loss) on foreign currency transactions.
The fair value of a financial instrument is the amount that would be received to sell an asset or paid to transfer a liability in an orderly transaction between market participants at the measurement date (i.e., the exit price). GAAP establishes a fair value hierarchy that prioritizes the inputs to valuation techniques used to measure fair value. The hierarchy gives the highest priority to unadjusted quoted prices in active markets for identical assets or liabilities (Level 1 measurements) and the lowest priority to unobservable inputs (Level 3 measurements). The levels used for classifying investments are not necessarily an indication of the risk associated with investing in these investments. The three levels of the fair value hierarchy are described below:
Level 1 — Unadjusted quoted prices in active markets that are accessible at the measurement date for identical, unrestricted assets or liabilities;
Level 2 — Quoted prices in markets that are not active or financial instruments for which significant inputs are observable (including, but not limited to, quoted prices for similar investments, interest rates, foreign exchange rates, volatility and credit spreads), either directly or indirectly;
Level 3 — Prices or valuations that require significant unobservable inputs (including GSAM’s assumptions in determining fair value measurement).
The Trustees have adopted Valuation Procedures that govern the valuation of the portfolio investments held by the Funds, including investments for which market quotations are not readily available. The Trustees have delegated to GSAM day-to-day responsibility for implementing and maintaining internal controls and procedures related to the valuation of the Funds’ portfolio investments. To assess the continuing appropriateness of pricing sources and methodologies, GSAM regularly performs price verification procedures and issues challenges as necessary to third party pricing vendors or brokers, and any differences are reviewed in accordance with the Valuation Procedures.
A. Level 1 and Level 2 Fair Value Investments — The valuation techniques and significant inputs used in determining the fair values for investments classified as Level 1 and Level 2 are as follows:
Equity Securities — Equity securities and investment companies traded on a U.S. securities exchange or the NASDAQ system, or those located on certain foreign exchanges, including but not limited to the Americas, are valued daily at their last sale price or official closing price on the principal exchange or system on which they are traded. If no sale occurs, equity securities and exchange traded investment companies are valued at the last bid price for long positions and at the last ask price for short positions. Investments in investment companies (other than those that are exchange traded) are valued at the NAV on the valuation date. To the extent these investments are actively traded, they are classified as Level 1 of the fair value hierarchy.
Unlisted equity securities for which market quotations are available are valued at the last sale price on the valuation date, or if no sale occurs, at the last bid price. Securities traded on certain foreign securities exchanges are valued daily at fair value determined by an independent fair value service (if available) under Valuation Procedures approved by the Trustees and consistent with applicable regulatory guidance. The independent fair value service takes into account multiple factors including, but not limited to, movements in the securities markets, certain depositary receipts, futures contracts and foreign currency exchange rates that have occurred subsequent to the close of the foreign securities exchange. These investments are generally classified as Level 2 of the fair value hierarchy.
58
GOLDMAN SACHS INTERNATIONAL EQUITY INSIGHTS FUNDS
|
| 3. INVESTMENTS AND FAIR VALUE MEASUREMENTS (continued) |
Debt Securities — Debt securities for which market quotations are readily available are valued daily on the basis of quotations supplied by dealers or an independent pricing service approved by the Trustees. The pricing services may use valuation models or matrix pricing, which consider: (i) yield or price with respect to bonds that are considered comparable in characteristics such as rating, interest rate and maturity date or (ii) quotations from securities dealers to determine current value. Short-term debt obligations that mature in sixty days or less and that do not exhibit signs of credit deterioration are valued at amortized cost, which approximates fair value. With the exception of treasury securities, which are generally classified as Level 1, these investments are generally classified as Level 2 of the fair value hierarchy.
Derivative Contracts — A derivative is an instrument whose value is derived from underlying assets, indices, reference rates or a combination of these factors.
Exchange-traded derivatives, including futures contracts, typically fall within Level 1 of the fair value hierarchy. Over-the-counter (“OTC”) derivatives are valued using market transactions and other market evidence, including market-based inputs to models, calibration to market-clearing transactions, broker or dealer quotations, or other alternative pricing sources. Where models are used, the selection of a particular model to value an OTC derivative depends upon the contractual terms of, and specific risks inherent in, the instrument, as well as the availability of pricing information in the market. Valuation models require a variety of inputs, including contractual terms, market prices, yield curves, credit curves, measures of volatility, voluntary and involuntary prepayment rates, loss severity rates and correlations of such inputs. For OTC derivatives that trade in liquid markets, model inputs can generally be verified and model selection does not involve significant management judgment. OTC derivatives are classified within Level 2 of the fair value hierarchy when significant inputs are corroborated by market evidence.
i. Futures Contracts — Futures contracts are contracts to buy or sell a standardized quantity of a specified commodity or security and are valued based on exchanged settlement prices or independent market quotes. Futures contracts are valued at the last settlement price, or in the absence of a sale, the last bid price for long positions and at the last ask price for short positions, at the end of each day on the board of trade or exchange upon which they are traded. Upon entering into a futures contract, a Fund deposits cash or securities in an account on behalf of the broker in an amount sufficient to meet the initial margin requirement. Subsequent payments are made or received by the Fund equal to the daily change in the contract value and are recorded as variation margin receivable or payable with a corresponding offset to unrealized gains or losses.
Level 3 Fair Value Investments — To the extent that the aforementioned significant inputs are unobservable, or if quotations are not readily available, or if GSAM believes that such quotations do not accurately reflect fair value, the fair value of the Funds’ investments may be determined under Valuation Procedures approved by the Trustees. GSAM, consistent with its procedures and applicable regulatory guidance, may make an adjustment to the most recent valuation prices of either domestic or foreign securities in light of significant events to reflect what it believes to be the fair value of the securities at the time of determining a Fund’s NAV. Significant events which could affect a large number of securities in a particular market may include, but are not limited to: significant fluctuations in U.S. or foreign markets; market dislocations; market disruptions; or unscheduled market closings. Significant events which could also affect a single issuer may include, but are not limited to: corporate actions such as reorganizations, mergers and buy-outs; ratings downgrades; and bankruptcies.
59
GOLDMAN SACHS INTERNATIONAL EQUITY INSIGHTS FUNDS
Notes to Financial Statements (continued)
April 30, 2013 (Unaudited)
|
| 3. INVESTMENTS AND FAIR VALUE MEASUREMENTS (continued) |
B. Fair Value Hierarchy — The following is a summary of the Funds’ investments and derivatives classified in the fair value hierarchy as of April 30, 2013:
| | | | | | | | | | | | |
| | | |
| EMERGING MARKETS EQUITY INSIGHTS FUND | | | | | | | | | | | | |
| | | |
| Investment Type | | Level 1 | | | Level 2 | | | Level 3 | |
| Assets | | | | | | | | | | | | |
Common Stock and/or Other Equity Investments | | | | | | | | | | | | |
North and South America | | $ | 113,943,762 | | | $ | 18,468,084 | | | $ | — | |
Other | | | 47,084,195 | | | | 481,600,020 | (a) | | | — | |
Securities Lending Reinvestment Vehicle | | | 6,410,410 | | | | — | | | | — | |
| Total | | $ | 167,438,367 | | | $ | 500,068,104 | | | $ | — | |
| | | |
| INTERNATIONAL EQUITY INSIGHTS FUND | | | | | | | | | | | | |
| | | |
| Investment Type | | Level 1 | | | Level 2 | | | Level 3 | |
| Assets | | | | | | | | | | | | |
Common Stock and/or Other Equity Investments | | | | | | | | | | | | |
North and South America | | $ | — | | | $ | 2,790,144 | | | $ | — | |
Other | | | 23,570,099 | | | | 1,006,999,192 | (a) | | | — | |
Securities Lending Reinvestment Vehicle | | | 102,847,510 | | | | — | | | | — | |
| Total | | $ | 126,417,609 | | | $ | 1,009,789,336 | | | $ | — | |
| | | |
| Derivative Type | | | | | | | | | |
| Assets(b) | | | | | | | | | | | | |
Futures Contracts | | $ | 619,546 | | | $ | — | | | $ | — | |
| | | |
| INTERNATIONAL SMALL CAP INSIGHTS FUND | | | | | | | | | | | | |
| | | |
| Investment Type | | Level 1 | | | Level 2 | | | Level 3 | |
| Assets | | | | | | | | | | | | |
Common Stock and/or Other Equity Investments | | | | | | | | | | | | |
North and South America | | $ | — | | | $ | 3,201,206 | | | $ | — | |
Other | | | — | | | | 304,559,707 | (a) | | | — | |
Securities Lending Reinvestment Vehicle | | | 20,151,325 | | | | — | | | | — | |
| Total | | $ | 20,151,325 | | | $ | 307,760,913 | | | $ | — | |
| | | |
| Derivative Type | | | | | | | | | |
| Assets(b) | | | | | | | | | | | | |
Futures Contracts | | $ | 531,250 | | | $ | — | | | $ | — | |
| (a) | | To adjust for the time difference between local market close and the calculation of net asset value, the Funds utilize fair value model prices for international equities provided by an independent fair value service resulting in a Level 2 classification. |
| (b) | | Amount shown represents unrealized gain at fiscal year end. |
For further information regarding security characteristics, see the Schedules of Investments.
60
GOLDMAN SACHS INTERNATIONAL EQUITY INSIGHTS FUNDS
|
| 4. INVESTMENTS IN DERIVATIVES |
The following table sets forth, by certain risk types, the gross value of derivative contracts as of April 30, 2013. These instruments were used to meet the Funds’ investment objectives and to obtain and/or manage exposure related to the risks below. The values in the table below exclude the effects of cash collateral received or posted pursuant to these derivative contracts, and therefore are not representative of the Funds’ net exposure:
| | | | | | | | |
| Fund | | Risk | | Statements of Assets and Liabilities | | Assets(a) | |
International Equity Insights | | Equity | | Receivable for unrealized gain on futures variation margin | | | $619,546 | |
International Small Cap Insights | | Equity | | Receivable for unrealized gain on futures variation margin | | | 531,250 | |
| (a) | | Includes unrealized gain on futures contracts described in the Additional Investment Information sections of the Schedules of Investments. Only current day’s variation margin is reported within the Statements of Assets and Liabilities. |
The following table sets forth, by certain risk types, the Funds’ gains (losses) related to these derivatives and their indicative volumes for the six months ended April 30, 2013. These gains (losses) should be considered in the context that these derivative contracts may have been executed to economically hedge certain investments, and accordingly, certain gains (losses) on such derivative contracts may offset certain (losses) gains attributable to investments. These gains (losses) are included in “Net realized gain (loss)” or “Net change in unrealized gain (loss)” on the Statements of Operations:
| | | | | | | | | | | | | | | | |
| Fund | | Risk | | Statements of Operations | | Net Realized
Gain (Loss) | | | Net Change in
Unrealized
Gain (Loss) | | | Average
Number of
Contracts(a) | |
International Equity Insights | | Equity | | Net realized gain (loss) from futures contracts/Net change in unrealized gain (loss) on futures contracts | | | $2,805,300 | | | | $343,715 | | | | 620 | |
International Small Cap Insights | | Equity | | Net realized gain (loss) from futures contracts/Net change in unrealized gain (loss) on futures contracts | | | 1,202,239 | | | | 493,171 | | | | 182 | |
| (a) | | Average number of contracts is based on the average of month end balances for the six months ended April 30, 2013. |
61
GOLDMAN SACHS INTERNATIONAL EQUITY INSIGHTS FUNDS
Notes to Financial Statements (continued)
April 30, 2013 (Unaudited)
|
| 5. AGREEMENTS AND AFFILIATED TRANSACTIONS |
A. Management Agreement — Under the Agreement, GSAM manages the Funds, subject to the general supervision of the Trustees.
As compensation for the services rendered pursuant to the Agreement, the assumption of the expenses related thereto and administration of the Funds’ business affairs, including providing facilities, GSAM is entitled to a management fee, accrued daily and paid monthly, equal to an annual percentage rate of each Fund’s average daily net assets.
For the six months ended April 30, 2013, contractual and effective net management fees with GSAM were at the following rates:
| | | | | | | | | | | | | | | | | | | | | | | | | | |
| | | | | Contractual Management Fee Rate | |
| Fund | | | | First $1 billion | | | Next $1 billion | | | Next $3 billion | | | Next $3 billion | | | Over $8 billion | | | Effective Fee Rate | |
Emerging Markets Equity Insights | | | | | 1.00 | % | | | 1.00 | % | | | 0.90 | % | | | 0.86 | % | | | 0.84 | % | | | 1.00 | % |
International Equity Insights | | | | | 0.85 | | | | 0.77 | | | | 0.73 | | | | 0.72 | | | | 0.71 | | | | 0.85 | |
International Small Cap Insights | | | | | 0.85 | | | | 0.85 | | | | 0.77 | | | | 0.73 | | | | 0.72 | | | | 0.85 | |
B. Distribution and Service Plans — The Trust, on behalf of each Fund, has adopted Distribution and Service Plans (the “Plans”). Under the Plans, Goldman Sachs, which serves as distributor (the “Distributor”), is entitled to a fee accrued daily and paid monthly, for distribution services and personal and account maintenance services, which may then be paid by Goldman Sachs to authorized dealers, at the following annual rates calculated on a Fund’s average daily net assets of each respective share class:
| | | | | | | | | | | | | | | | |
| | | Distribution and Service Plan Rates | |
| | | Class A* | | | Class B | | | Class C | | | Class R* | |
Distribution Plan | | | 0.25 | % | | | 0.75 | % | | | 0.75 | % | | | 0.50 | % |
Service Plan | | | — | | | | 0.25 | | | | 0.25 | | | | — | |
| * | | With respect to Class A and Class R Shares, the Distributor at its discretion may use compensation for distribution services paid under the Distribution Plan to compensate service organizations for personal and account maintenance services and expenses as long as such total compensation does not exceed the maximum cap on “service fees” imposed by the Financial Industry Regulatory Authority. |
C. Distribution Agreement — Goldman Sachs, as Distributor of the shares of the Funds pursuant to a Distribution Agreement, may retain a portion of the Class A front end sales charge and Class B and Class C Shares’ CDSC. During the six months ended April, 30, 2013, Goldman Sachs advised that it retained front end sales charges of $980, $2,484, $3,974 for the Emerging Markets Equity Insights, International Equity Insights and International Small Cap Insights Funds, respectively. Goldman Sachs retained no contingent deferred sales charges.
62
GOLDMAN SACHS INTERNATIONAL EQUITY INSIGHTS FUNDS
|
| 5. AGREEMENTS AND AFFILIATED TRANSACTIONS (continued) |
D. Service Plan and Shareholder Administration Plan — The Trust, on behalf of each Fund that offers Service Shares, has adopted a Service Plan and a Shareholder Administration Plan. These plans allow for service organizations to provide varying levels of personal and account maintenance and shareholder administration services to their customers who are beneficial owners of such shares. The Service Plan and Shareholder Administration Plan each provide for compensation to the service organizations which is accrued daily and paid monthly at an annual rate of 0.25% (0.50% in aggregate) of the average daily net assets of the Service Shares.
E. Transfer Agency Agreement — Goldman Sachs also serves as the transfer agent of the Funds for a fee pursuant to a Transfer Agency Agreement. The fees charged for such transfer agency services are accrued daily and paid monthly at annual rates as follows: 0.19% of the average daily net assets of Class A, Class B, Class C, Class IR and Class R Shares and 0.04% of the average daily net assets of Institutional and Service Shares.
F. Other Expense Agreements and Affiliated Transactions — GSAM has agreed to limit certain “Other Expense” of the Funds (excluding transfer agent fees and expenses, service fees and shareholder administration fees (as applicable), taxes, interest, brokerage fees, litigation, indemnification, shareholder meeting and other extraordinary expenses) to the extent such expenses exceed, on an annual basis, a percentage rate of the average daily net assets of each Fund. Such Other Expense reimbursements, if any, are accrued daily and paid monthly. In addition, the Funds are not obligated to reimburse GSAM for prior fiscal year expense reimbursements, if any. The Other Expense limitations as an annual percentage rate of average daily net assets for Emerging Markets Equity Insights, International Equity Insights and International Small Cap Insights Funds are 0.144%, 0.004% and 0.014%, respectively. Prior to February 28, 2013, the Other Expense limitation for the Emerging Markets Equity Insights Fund was 0.014%. These Other Expense reimbursements will remain in place through at least February 28, 2014, and prior to such date GSAM may not terminate the arrangements without the approval of the Trustees. In addition, the Funds have entered into certain offset arrangements with the custodian and the transfer agent, which may result in a reduction of the Funds’ expenses and are received irrespective of the application of the “Other Expense” limitations described above.
For the six months ended April 30, 2013, these expense reductions, including any fee waivers and Other Expense reimbursements, were as follows:
| | | | | | | | | | | | | | |
| Fund | | | | Custody Fee
Credits | | | Other Expense
Reimbursement | | | Total
Expense
Reductions | |
Emerging Markets Equity Insights | | | | $ | 2,279 | | | $ | 253,062 | | | $ | 255,341 | |
International Equity Insights | | | | | 4,923 | | | | 293,313 | | | | 298,236 | |
International Small Cap Insights | | | | | 3,184 | | | | 215,880 | | | | 219,064 | |
63
GOLDMAN SACHS INTERNATIONAL EQUITY INSIGHTS FUNDS
Notes to Financial Statements (continued)
April 30, 2013 (Unaudited)
|
| 5. AGREEMENTS AND AFFILIATED TRANSACTIONS (continued) |
As of April 30, 2013, the amounts owed to affiliates of the Funds were as follows:
| | | | | | | | | | | | | | | | | | |
| Fund | | | | Management
Fees | | | Distribution
and Service
Fees | | | Transfer
Agent
Fees | | | Total | |
Emerging Markets Equity Insights | | | | $ | 518,657 | | | $ | 5,393 | | | $ | 23,960 | | | $ | 548,010 | |
International Equity Insights | | | | | 762,067 | | | | 28,643 | | | | 47,588 | | | | 838,298 | |
International Small Cap Insights | | | | | 204,993 | | | | 5,635 | | | | 12,662 | | | | 223,290 | |
G. Line of Credit Facility — As of April 30, 2013, the Funds participated in a $630,000,000 committed, unsecured revolving line of credit facility (the “facility”) together with other funds of the Trust and registered investment companies having management agreements with GSAM or its affiliates (“Other Borrowers”). Pursuant to the terms of the facility, the Funds and Other Borrowers could increase the credit amount by an additional $340,000,000, for a total of up to $970,000,000. This facility is to be used solely for temporary or emergency purposes, which may include the funding of redemptions. The interest rate on borrowings is based on the federal funds rate. The facility also requires a fee to be paid by the Funds based on the amount of the commitment that has not been utilized. For the six months ended April 30, 2013, the Funds did not have any borrowings under the facility. Effective May 8, 2013, the committed amount available through the facility increased to $780,000,000.
H. Other Transactions with Affiliates — For the six months ended April 30, 2013, Goldman Sachs earned approximately $24,094 in brokerage commissions from portfolio transactions, including futures transactions executed with Goldman Sachs as the Futures Commission Merchant, on behalf of the International Equity Insights Fund.
As of April 30, 2013, the following Goldman Sachs Fund of Funds Portfolios were the beneficial owners of 5% or more of total outstanding shares of the following Funds:
| | | | | | | | | | | | | | | | | | | | | | | | | | |
| Fund | | | | Goldman Sachs
Balanced Strategy
Portfolio | | | Goldman Sachs
Equity Growth
Strategy Portfolio | | | Goldman Sachs Growth Strategy Portfolio | | | Goldman Sachs Growth and Income Strategy Portfolio | | | Goldman Sachs Satellite Strategies
Portfolio | | | Goldman Sachs Tax-Advantaged Global Equity Portfolio | |
Emerging Markets Equity Insights | | | | | 5 | % | | | 6 | % | | | 14 | % | | | 14 | % | | | 9 | % | | | 11 | % |
International Equity Insights | | | | | 8 | | | | 14 | | | | 26 | | | | 22 | | | | — | | | | — | |
International Small Cap Insights | | | | | — | | | | — | | | | 7 | | | | 6 | | | | 22 | | | | 6 | |
As of April 30, 2013, the Goldman Sachs Group, Inc. was the beneficial owner of approximately 10% of the Class R Shares of the International Equity Insights Fund.
64
GOLDMAN SACHS INTERNATIONAL EQUITY INSIGHTS FUNDS
|
| 6. PORTFOLIO SECURITIES TRANSACTIONS |
The cost of purchases and proceeds from sales and maturities of long-term securities for the six months ended April 30, 2013, were as follows:
| | | | | | | | | | |
| Fund | | | | Purchases | | | Sales and Maturities | |
Emerging Markets Equity Insights | | | | $ | 706,401,844 | | | $ | 606,275,740 | |
International Equity Insights | | | | | 994,683,406 | | | | 889,468,422 | |
International Small Cap Insights | | | | | 230,913,659 | | | | 219,298,658 | |
Pursuant to exemptive relief granted by the Securities and Exchange Commission (“SEC”) and the terms and conditions contained therein, the Funds may lend their securities through a securities lending agent, Goldman Sachs Agency Lending (“GSAL”), a wholly-owned subsidiary of Goldman Sachs, to certain qualified borrowers including Goldman Sachs and affiliates. In accordance with the Funds’ securities lending procedures, the Funds receive cash collateral at least equal to the market value of the securities on loan. The market value of the loaned securities is determined at the close of business of the Funds, at their last sale price or official closing price on the principal exchange or system on which they are traded, and any additional required collateral is delivered to the Funds on the next business day. As with other extensions of credit, the Funds may experience delay in the recovery of their securities or incur a loss should the borrower of the securities breach its agreement with the Funds or become insolvent at a time when the collateral is insufficient to cover the cost of repurchasing securities on loan. Dividend income received from securities on loan may not be subject to withholding taxes and therefore withholding taxes paid may differ from the amounts listed in the Statement of Operations.
The Funds invest the cash collateral received in connection with securities lending transactions in the Goldman Sachs Financial Square Money Market Fund (“Money Market Fund”), a separate series of the Trust. The Money Market Fund, deemed an affiliate of the Trust, is registered under the Act as an open end investment company, is subject to Rule 2a-7 under the Act and is managed by GSAM, for which GSAM may receive an investment advisory fee of up to 0.205% on an annualized basis of the average daily net assets of the Money Market Fund.
Both the Funds and GSAL received compensation relating to the lending of the Funds’ securities. The amounts earned by the Funds for the six months ended April 30, 2013, are reported under Investment Income on the Statements of Operations.
The table below details securities lending activity with affiliates of Goldman Sachs:
| | | | | | | | | | | | | | |
| | | | | For the Six Months Ended April 30, 2013 | | | Amounts Payable to
Goldman Sachs Upon
Return of
Securities Loaned as of
April 30, 2013 | |
| Fund | | | | Earnings of GSAL
Relating to
Securities
Loaned | | | Amounts Received
by the Funds
from Lending to
Goldman Sachs | | |
Emerging Markets Equity Insights | | | | $ | 3,137 | | | $ | 178 | | | $ | 1,305,250 | |
International Equity Insights | | | | | 49,233 | | | | 72,633 | | | | 7,529,376 | |
International Small Cap Insights | | | | | 15,679 | | | | 132,390 | | | | 7,329,210 | |
65
GOLDMAN SACHS INTERNATIONAL EQUITY INSIGHTS FUNDS
Notes to Financial Statements (continued)
April 30, 2013 (Unaudited)
|
| 7. SECURITIES LENDING (continued) |
The following table provides information about the Funds’ investment in the Money Market Fund for the six months ended April 30, 2013:
| | | | | | | | | | | | | | | | | | | | | | |
| Fund | | | | Number of
Shares Held
Beginning
of Period | | | Shares Bought | | | Shares Sold | | | Number of
Shares Held
End of Period | | | Value at
End of Period | |
Emerging Markets Equity Insights | | | | | 4,880,850 | | | | 84,233,255 | | | | (82,703,695 | ) | | | 6,410,410 | | | $ | 6,410,410 | |
International Equity Insights | | | | | 3,010,747 | | | | 203,768,838 | | | | (103,932,075 | ) | | | 102,847,510 | | | | 102,847,510 | |
International Small Cap Insights | | | | | 5,200,492 | | | | 40,141,735 | | | | (25,190,902 | ) | | | 20,151,325 | | | | 20,151,325 | |
As of the Funds’ most recent fiscal year ended, October 31,2012, the Funds’ capital loss carryforwards on a tax-basis were as follows:
| | | | | | | | | | | | |
| | | Emerging Markets
Equity Insights | | | International Equity Insights | | | International Small Cap Insights | |
Capital loss carryforwards: | | | | | | | | | | | | |
Expiring 2016(1) | | $ | — | | | $ | (455,911,785 | ) | | $ | (5,458,844 | ) |
Expiring 2017(1) | | | (27,536,144 | ) | | | (940,883,655 | ) | | | (21,285,839 | ) |
Expiring 2019(1) | | | — | | | | (2,867,280 | ) | | | — | |
Perpetual Long-term | | | — | | | | (47,404,352 | ) | | | — | |
Perpetual Short-term | | | — | | | | (86,071,791 | ) | | | (2,591,053 | ) |
Total capital loss carryforwards | | $ | (27,536,144 | ) | | $ | (1,533,138,863 | ) | | $ | (29,335,736 | ) |
| (1) | | Expiration occurs on October 31 of the year indicated. |
As of April 30, 2013, the Funds’ aggregate security unrealized gains and losses based on cost for U.S. federal income tax purposes were as follows:
| | | | | | | | | | | | |
| | | Emerging Markets
Equity Insights | | | International Equity Insights | | | International Small Cap Insights | |
Tax cost | | $ | 608,700,505 | | | $ | 1,051,092,697 | | | $ | 284,475,145 | |
Gross unrealized gain | | | 74,778,551 | | | | 110,406,471 | | | | 53,271,843 | |
Gross unrealized loss | | | (15,972,585 | ) | | | (25,292,223 | ) | | | (9,834,750 | ) |
Net unrealized security gain | | $ | 58,805,966 | | | $ | 85,114,248 | | | $ | 43,437,093 | |
The difference between GAAP-basis and tax-basis unrealized gains (losses) is attributable primarily to wash sales, net mark to market gains (losses) on regulated futures contracts and differences related to the tax treatment of passive foreign investment company investments.
GSAM has reviewed the Funds’ tax positions for all open tax years (the current and prior three years, as applicable) and has concluded that no provision for income tax is required in the Funds’ financial statements. Such open tax years remain subject to examination and adjustment by tax authorities.
66
GOLDMAN SACHS INTERNATIONAL EQUITY INSIGHTS FUNDS
The Funds’ risks include, but are not limited to, the following:
Foreign Custody Risk — A Fund that invests in foreign securities may hold such securities and foreign currency with foreign banks, agents, and securities depositories appointed by the Fund’s custodian (each a “Foreign Custodian”). In some countries, Foreign Custodians may be subject to little or no regulatory oversight or independent evaluation of their operations. Further, the laws of certain countries may place limitations on a Fund’s ability to recover its assets if a Foreign Custodian enters into bankruptcy. Investments in emerging markets may be subject to greater custody risks than investments in more developed markets. Custody services in emerging market countries are often undeveloped and may be less regulated than in more developed countries, and thus may not afford the same level of investor protection as would apply in developed countries.
Shareholder Concentration Risk — Certain funds, accounts, individuals or Goldman Sachs affiliates may from time to time own (beneficially or of record) or control a significant percentage of the Funds’ shares. Redemptions by these entities of their holdings in the Funds may impact the Funds’ liquidity and NAV. These redemptions may also force the Funds to sell securities.
Investments in Other Investment Companies — As a shareholder of another investment company, including an exchange traded fund (“ETF”), a Fund will directly bear its proportionate share of any management fees and other expenses paid by such other investment companies, in addition to the fees and expenses regularly borne by the Fund. ETFs are subject to risks that do not apply to conventional mutual funds, including but not limited to the following: (i) the market price of the ETF’s shares may trade at a premium or a discount to their NAV; and (ii) an active trading market for an ETF’s shares may not develop or be maintained.
Liquidity Risk — The Funds may make investments that are illiquid or that may become less liquid in response to market developments or adverse investor perceptions. Illiquid investments may be more difficult to value. Liquidity risk may also refer to the risk that a Fund will not be able to pay redemption proceeds within the allowable time period because of unusual market conditions, an unusually high volume of redemption requests, or other reasons. To meet redemption requests, a Fund may be forced to sell investments at an unfavorable time and/or under unfavorable conditions.
Market and Credit Risks — In the normal course of business, the Funds trade financial instruments and enter into financial transactions where risk of potential loss exists due to changes in the market (market risk). Additionally, the Funds may also be exposed to credit risk in the event that an issuer fails to perform or that an institution or entity with which the Funds have unsettled or open transaction defaults.
Investing in foreign markets may involve special risks and considerations not typically associated with investing in the U.S. These risks include revaluation of currencies, high rates of inflation, repatriation restrictions on income and capital, and adverse political and economic developments. Moreover, securities issued in these markets may be less liquid, be subject to government ownership controls, have delayed settlements and their prices may be more volatile than those of comparable securities in the U.S.
67
GOLDMAN SACHS INTERNATIONAL EQUITY INSIGHTS FUNDS
Notes to Financial Statements (continued)
April 30, 2013 (Unaudited)
Under the Trust’s organizational documents, its Trustees, officers, employees and agents are indemnified, to the extent permitted by the Act and State law, against certain liabilities that may arise out of performance of their duties to the Funds. Additionally, in the course of business, the Funds enter into contracts that contain a variety of indemnification clauses. The Funds’ maximum exposure under these arrangements is unknown, as this would involve future claims that may be made against the Funds that have not yet occurred. However, GSAM believes the risk of loss under these arrangements to be remote.
New Accounting Pronouncement — In December 2011, the Financial Accounting Standards Board issued an Accounting Standards Update No. 2011-11: Disclosures about Offsetting Assets and Liabilities (“ASU”) to enhance disclosures about financial instruments and derivative instruments that are subject to offsetting (“netting”) on the Statements of Assets and Liabilities. This information will enable users of the Funds’ financial statements to evaluate the effect or potential effect of netting arrangements on the Funds’ financial position. The ASU is effective for financial statements with fiscal years beginning on or after January 1, 2013, and interim periods within those fiscal years. At this time, GSAM is evaluating the implications of these changes on the financial statements.
Subsequent events after the Statement of Assets and Liabilities date have been evaluated through the date the financial statements were issued. GSAM has concluded that there is no impact requiring adjustment or disclosure in the financial statements.
68
GOLDMAN SACHS INTERNATIONAL EQUITY INSIGHTS FUNDS
|
| 13. SUMMARY OF SHARE TRANSACTIONS |
Share activity is as follows:
| | | | | | | | | | | | | | | | |
| | | Emerging Markets Equity Insights Fund | |
| | | For the Six Months Ended
April 30, 2013
(Unaudited) | | | For the Fiscal Year Ended
October 31, 2012 | |
| | | Shares | | | Dollars | | | Shares | | | Dollars | |
| | | | |
| Class A Shares | | | | | | | | | | | | | | | | |
Shares sold | | | 1,268,698 | | | $ | 11,656,485 | | | | 5,791,877 | | | $ | 46,864,404 | |
Reinvestment of distributions | | | 73,688 | | | | 645,508 | | | | 25,713 | | | | 190,016 | |
Shares redeemed | | | (4,767,330 | ) | | | (42,525,925 | ) | | | (1,891,680 | ) | | | (15,474,285 | ) |
| | | | (3,424,944 | ) | | | (30,223,932 | ) | | | 3,925,910 | | | | 31,580,135 | |
| Class C Shares | | | | | | | | | | | | | | | | |
Shares sold | | | 9,906 | | | | 89,886 | | | | 5,166 | | | | 43,987 | |
Reinvestment of distributions | | | 127 | | | | 1,115 | | | | — | | | | — | |
Shares redeemed | | | (15,873 | ) | | | (140,495 | ) | | | (3,724 | ) | | | (28,557 | ) |
| | | | (5,840 | ) | | | (49,494 | ) | | | 1,442 | | | | 15,430 | |
| Institutional Shares | | | | | | | | | | | | | | | | |
Shares sold | | | 25,695,182 | | | | 228,822,703 | | | | 30,079,722 | | | | 240,000,396 | |
Reinvestment of distributions | | | 852,057 | | | | 7,438,458 | | | | 704,649 | | | | 5,186,221 | |
Shares redeemed | | | (11,488,069 | ) | | | (101,833,773 | ) | | | (9,138,067 | ) | | | (72,835,942 | ) |
| | | | 15,059,170 | | | | 134,427,388 | | | | 21,646,304 | | | | 172,350,675 | |
| Class IR Shares | | | | | | | | | | | | | | | | |
Shares sold | | | 33,986 | | | | 307,287 | | | | 17,443 | | | | 153,585 | |
Reinvestment of distributions | | | 211 | | | | 1,842 | | | | 3 | | | | 19 | |
Shares redeemed | | | (5,679 | ) | | | (50,398 | ) | | | (3,568 | ) | | | (28,300 | ) |
| | | | 28,518 | | | | 258,731 | | | | 13,878 | | | | 125,304 | |
NET INCREASE | | | 11,656,904 | | | $ | 104,412,693 | | | | 25,587,534 | | | $ | 204,071,544 | |
69
GOLDMAN SACHS INTERNATIONAL EQUITY INSIGHTS FUNDS
Notes to Financial Statements (continued)
April 30, 2013 (Unaudited)
|
| 13. SUMMARY OF SHARE TRANSACTIONS (continued) |
Share activity is as follows:
| | | | | | | | | | | | | | | | |
| | | International Equity Insights Fund | |
| | | For the Six Months Ended
April 30, 2013
(Unaudited) | | | For the Fiscal Year Ended
October 31, 2012 | |
| | | Shares | | | Dollars | | | Shares | | | Dollars | |
| | | | |
| Class A Shares | | | | | | | | | | | | | | | | |
Shares sold | | | 2,567,744 | | | $ | 23,910,720 | | | | 5,507,894 | | | $ | 47,755,253 | |
Shares converted from Class B(a) | | | 3,699 | | | | 34,929 | | | | 12,209 | | | | 103,223 | |
Reinvestment of distributions | | | 751,842 | | | | 6,751,544 | | | | 1,704,286 | | | | 13,804,716 | |
Shares redeemed | | | (16,679,083 | ) | | | (158,365,951 | ) | | | (18,655,807 | ) | | | (160,393,596 | ) |
| | | | (13,355,798 | ) | | | (127,668,758 | ) | | | (11,431,418 | ) | | | (98,730,404 | ) |
| Class B Shares | | | | | | | | | | | | | | | | |
Shares sold | | | 2,531 | | | | 23,329 | | | | 6,723 | | | | 58,459 | |
Shares converted to Class A(a) | | | (3,723 | ) | | | (34,929 | ) | | | (12,306 | ) | | | (103,223 | ) |
Reinvestment of distributions | | | 6,687 | | | | 59,782 | | | | 16,339 | | | | 131,532 | |
Shares redeemed | | | (59,209 | ) | | | (551,482 | ) | | | (160,397 | ) | | | (1,373,323 | ) |
| | | | (53,714 | ) | | | (503,300 | ) | | | (149,641 | ) | | | (1,286,555 | ) |
| Class C Shares | | | | | | | | | | | | | | | | |
Shares sold | | | 15,861 | | | | 149,929 | | | | 34,689 | | | | 294,411 | |
Reinvestment of distributions | | | 7,377 | | | | 65,731 | | | | 13,667 | | | | 109,747 | |
Shares redeemed | | | (72,303 | ) | | | (668,777 | ) | | | (112,232 | ) | | | (951,786 | ) |
| | | | (49,065 | ) | | | (453,117 | ) | | | (63,876 | ) | | | (547,628 | ) |
| Institutional Shares | | | | | | | | | | | | | | | | |
Shares sold | | | 33,646,165 | | | | 325,115,083 | | | | 16,161,479 | | | | 147,464,668 | |
Reinvestment of distributions | | | 2,346,076 | | | | 21,583,896 | | | | 5,697,917 | | | | 47,178,757 | |
Shares redeemed | | | (8,376,716 | ) | | | (80,257,628 | ) | | | (66,580,617 | ) | | | (576,273,721 | ) |
| | | | 27,615,525 | | | | 266,441,351 | | | | (44,721,221 | ) | | | (381,630,296 | ) |
| Service Shares | | | | | | | | | | | | | | | | |
Shares sold | | | 136,001 | | | | 1,288,557 | | | | 142,848 | | | | 1,243,577 | |
Reinvestment of distributions | | | 7,351 | | | | 66,526 | | | | 15,854 | | | | 129,366 | |
Shares redeemed | | | (308,250 | ) | | | (2,938,237 | ) | | | (712,105 | ) | | | (6,129,358 | ) |
| | | | (164,898 | ) | | | (1,583,154 | ) | | | (553,403 | ) | | | (4,756,415 | ) |
| Class IR Shares | | | | | | | | | | | | | | | | |
Shares sold | | | 11,404 | | | | 104,031 | | | | 3,616 | | | | 32,291 | |
Reinvestment of distributions | | | 517 | | | | 4,577 | | | | 294 | | | | 2,354 | |
Shares redeemed | | | (342 | ) | | | (3,167 | ) | | | (1,622 | ) | | | (13,522 | ) |
| | | | 11,579 | | | | 105,441 | | | | 2,288 | | | | 21,123 | |
| Class R Shares | | | | | | | | | | | | | | | | |
Shares sold | | | 421 | | | | 3,830 | | | | 17,539 | | | | 173,493 | |
Reinvestment of distributions | | | 246 | | | | 2,186 | | | | 480 | | | | 4,836 | |
Shares redeemed | | | (320 | ) | | | (2,907 | ) | | | (23,987 | ) | | | (250,600 | ) |
| | | | 347 | | | | 3,109 | | | | (5,968 | ) | | | (72,271 | ) |
NET INCREASE (DECREASE) | | | 14,003,976 | | | $ | 136,341,572 | | | | (56,923,239 | ) | | $ | (487,002,446 | ) |
| (a) | | Class B Shares automatically convert into Class A Shares on or about the fifteenth day of the last month of the calendar quarter that is eight years after the initial purchase date of either the Fund or another Goldman Sachs Fund. |
70
GOLDMAN SACHS INTERNATIONAL EQUITY INSIGHTS FUNDS
|
| 13. SUMMARY OF SHARE TRANSACTIONS (continued) |
Share activity is as follows:
| | | | | | | | | | | | | | | | |
| | | International Small Cap Insights Fund | |
| | | For the Six Months Ended
April 30, 2013
(Unaudited) | | | For the Fiscal Year Ended
October 31, 2012 | |
| | | Shares | | | Dollars | | | Shares | | | Dollars | |
| | | | |
| Class A Shares | | | | | | | | | | | | | | | | |
Shares sold | | | 1,914,310 | | | $ | 16,808,419 | | | | 1,513,380 | | | $ | 13,008,314 | |
Reinvestment of distributions | | | 100,341 | | | | 802,726 | | | | 114,710 | | | | 964,710 | |
Shares redeemed | | | (1,409,857 | ) | | | (12,166,631 | ) | | | (2,042,413 | ) | | | (17,522,649 | ) |
| | | | 604,794 | | | | 5,444,514 | | | | (414,323 | ) | | | (3,549,625 | ) |
| Class C Shares | | | | | | | | | | | | | | | | |
Shares sold | | | 29,163 | | | | 254,220 | | | | 117,634 | | | | 1,023,252 | |
Reinvestment of distributions | | | 4,103 | | | | 32,332 | | | | 508 | | | | 4,225 | |
Shares redeemed | | | (14,604 | ) | | | (119,512 | ) | | | (34,703 | ) | | | (293,332 | ) |
| | | | 18,662 | | | | 167,040 | | | | 83,439 | | | | 734,145 | |
| Institutional Shares | | | | | | | | | | | | | | | | |
Shares sold | | | 8,899,606 | | | | 78,733,869 | | | | 11,493,128 | | | | 99,513,045 | |
Reinvestment of distributions | | | 1,199,773 | | | | 9,562,193 | | | | 917,929 | | | | 7,710,604 | |
Shares redeemed | | | (7,097,674 | ) | | | (60,055,967 | ) | | | (9,759,436 | ) | | | (84,289,534 | ) |
| | | | 3,001,705 | | | | 28,240,095 | | | | 2,651,621 | | | | 22,934,115 | |
| Class IR Shares | | | | | | | | | | | | | | | | |
Shares sold | | | 37,213 | | | | 318,500 | | | | 172,325 | | | | 1,401,995 | |
Reinvestment of distributions | | | 2,249 | | | | 17,900 | | | | 4 | | | | 38 | |
Shares redeemed | | | (14,886 | ) | | | (124,827 | ) | | | — | | | | — | |
| | | | 24,576 | | | | 211,573 | | | | 172,329 | | | | 1,402,033 | |
NET INCREASE | | | 3,649,737 | | | $ | 34,063,222 | | | | 2,493,066 | | | $ | 21,520,668 | |
71
GOLDMAN SACHS INTERNATIONAL EQUITY INSIGHTS FUNDS
Fund Expenses — Six Month Period Ended April 30, 2013 (Unaudited)
As a shareholder of Class A, Class B, Class C, Institutional, Service, Class IR or Class R Shares of a Fund you incur two types of costs: (1) transaction costs, including sales charges on purchase payments (with respect to Class A Shares) and contingent deferred sales charges on redemptions (with respect to Class B and Class C Shares); and (2) ongoing costs, including management fees; distribution and service (12b-1) fees (with respect to Class A, Class B, Class C and Class R Shares); and other Fund expenses. This example is intended to help you understand your ongoing costs (in dollars) of investing in Class A, Class B, Class C, Institutional, Service, Class IR and Class R Shares of the Funds and to compare these costs with the ongoing costs of investing in other mutual funds.
The example is based on an investment of $1,000 invested at the beginning of the period and held for the entire period from November 1, 2012 through April 30, 2013.
Actual Expenses — The first line under each share class in the table below provides information about actual account values and actual expenses. You may use the information in this line, together with the amount you invested, to estimate the expenses that you paid over the period. Simply divide your account value by $1,000 (for example, an $8,600 account value divided by $1,000=8.6), then multiply the result by the number in the first line under the heading entitled “Expenses Paid” to estimate the expenses you paid on your account during this period.
Hypothetical Example for Comparison Purposes — The second line under each share class in the table below provides information about hypothetical account values and hypothetical expenses based on the Funds’ actual net expense ratio and an assumed rate of return of 5% per year before expenses, which is not the Funds’ actual return. The hypothetical account values and expenses may not be used to estimate the actual ending account balance or expenses you paid for the period. You may use this information to compare the ongoing costs of investing in the Funds and other funds. To do so, compare this 5% hypothetical example with the 5% hypothetical examples that appear in the shareholder reports of the other funds.
Please note that the expenses shown in the table are meant to highlight your ongoing costs only and do not reflect any transactional costs, such as sales charges, redemption fees or exchange fees. Therefore, the second line of the table is useful in comparing ongoing costs only, and will not help you determine the relative total costs of owning different funds. In addition, if these transactional costs were included, your costs would have been higher.
| | | | | | | | | | | | | | | | | | | | | | | | | | | | | | | | | | | | |
| | | Emerging Markets Equity Insights Fund | | | International Equity Insights Fund | | | International Small Cap Insights Fund | |
| Share Class | | Beginning
Account
Value
11/01/12 | | | Ending
Account
Value
04/30/13 | | | Expenses
Paid for the
6 Months Ended
04/30/13* | | | Beginning
Account
Value
11/01/12 | | | Ending
Account
Value
04/30/13 | | | Expenses
Paid for the
6 Months Ended
04/30/13* | | | Beginning
Account
Value
11/01/12 | | | Ending
Account
Value
04/30/13 | | | Expenses
Paid for the
6 Months Ended
04/30/13* | |
| Class A | | | | | | | | | | | | | | | | | | | | | | | | | | | | | | | | | | | | |
Actual | | $ | 1,000 | | | $ | 1,099.30 | | | $ | 7.70 | | | $ | 1,000 | | | $ | 1,158.50 | | | $ | 6.90 | | | $ | 1,000 | | | $ | 1,188.40 | | | $ | 7.05 | |
Hypothetical 5% return | | | 1,000 | | | | 1,017.46 | + | | | 7.40 | | | | 1,000 | | | | 1,018.40 | + | | | 6.46 | | | | 1,000 | | | | 1,018.35 | + | | | 6.51 | |
| Class B | | | | | | | | | | | | | | | | | | | | | | | | | | | | | | | | | | | | |
Actual | | | N/A | | | | N/A | | | | N/A | | | | 1,000 | | | | 1,152.70 | | | | 10.89 | | | | N/A | | | | N/A | | | | N/A | |
Hypothetical 5% return | | | N/A | | | | N/A | | | | N/A | | | | 1,000 | | | | 1,014.68 | + | | | 10.19 | | | | N/A | | | | N/A | | | | N/A | |
| Class C | | | | | | | | | | | | | | | | | | | | | | | | | | | | | | | | | | | | |
Actual | | | 1,000 | | | | 1,093.10 | | | | 11.63 | | | | 1,000 | | | | 1,153.70 | | | | 10.89 | | | | 1,000 | | | | 1,183.90 | | | | 11.10 | |
Hypothetical 5% return | | | 1,000 | | | | 1,013.69 | + | | | 11.18 | | | | 1,000 | | | | 1,014.68 | + | | | 10.19 | | | | 1,000 | | | | 1,014.63 | + | | | 10.24 | |
| Institutional | | | | | | | | | | | | | | | | | | | | | | | | | | | | | | | | | | | | |
Actual | | | 1,000 | | | | 1,099.90 | | | | 5.73 | | | | 1,000 | | | | 1,159.30 | | | | 4.76 | | | | 1,000 | | | | 1,190.70 | | | | 4.89 | |
Hypothetical 5% return | | | 1,000 | | | | 1,019.34 | + | | | 5.51 | | | | 1,000 | | | | 1,020.38 | + | | | 4.46 | | | | 1,000 | | | | 1,020.33 | + | | | 4.51 | |
| Service | | | | | | | | | | | | | | | | | | | | | | | | | | | | | | | | | | | | |
Actual | | | N/A | | | | N/A | | | | N/A | | | | 1,000 | | | | 1,157.50 | | | | 7.44 | | | | N/A | | | | N/A | | | | N/A | |
Hypothetical 5% return | | | N/A | | | | N/A | | | | N/A | | | | 1,000 | | | | 1,017.90 | + | | | 6.95 | | | | N/A | | | | N/A | | | | N/A | |
| Class IR | | | | | | | | | | | | | | | | | | | | | | | | | | | | | | | | | | | | |
Actual | | | 1,000 | | | | 1,099.70 | | | | 6.61 | | | | 1,000 | | | | 1,159.40 | | | | 5.57 | | | | 1,000 | | | | 1,189.90 | | | | 5.70 | |
Hypothetical 5% return | | | 1,000 | | | | 1,018.50 | + | | | 6.36 | | | | 1,000 | | | | 1,019.64 | + | | | 5.21 | | | | 1,000 | | | | 1,019.59 | + | | | 5.26 | |
| Class R | | | | | | | | | | | | | | | | | | | | | | | | | | | | | | | | | | | | |
Actual | | | N/A | | | | N/A | | | | N/A | | | | 1,000 | | | | 1,156.60 | | | | 8.23 | | | | N/A | | | | N/A | | | | N/A | |
Hypothetical 5% return | | | N/A | | | | N/A | | | | N/A | | | | 1,000 | | | | 1,017.16 | + | | | 7.70 | | | | N/A | | | | N/A | | | | N/A | |
| * | | Expenses are calculated using each Fund’s annualized net expense ratio for each class, which represents the ongoing expenses as a percentage of net assets for the six months ended April 30, 2013. Expenses are calculated by multiplying the annualized net expense ratio by the average account value for the period; then multiplying the result by the number of days in the most recent fiscal half year; and then dividing that result by the number of days in the fiscal year. The annualized net expense ratios for the period were as follows: |
| | | | | | | | | | | | | | | | | | | | | | | | | | | | |
| Fund | | Class A | | | Class B | | | Class C | | | Institutional | | | Service | | | Class IR | | | Class R | |
Emerging Markets Equity Insights | | | 1.48 | % | | | N/A | | | | 2.24 | % | | | 1.10 | % | | | N/A | | | | 1.27 | % | | | N/A | |
International Equity Insights | | | 1.29 | | | | 2.04 | % | | | 2.04 | | | | 0.89 | | | | 1.39 | % | | | 1.04 | | | | 1.54 | % |
International Small Cap Insights | | | 1.30 | | | | N/A | | | | 2.05 | | | | 0.90 | | | | N/A | | | | 1.05 | | | | N/A | |
| + | | Hypothetical expenses are based on each Fund's actual annualized net expense ratios and an assumed rate of return of 5% per year before expenses. |
72
FUNDS PROFILE
Goldman Sachs Funds

Goldman Sachs is a premier financial services firm, known since 1869 for creating thoughtful and customized investment solutions in complex global markets.
Today, the Investment Management Division of Goldman Sachs serves a diverse set of clients worldwide, including private institutions, public entities and individuals. With approximately $748.1 billion in assets under management as of March 31, 2013, Goldman Sachs Asset Management (“GSAM”) has portfolio management teams located around the world and our investment professionals bring firsthand knowledge of local markets to every investment decision. GSAM’s assets under management includes assets managed by Goldman Sachs Asset Management, L.P. and its Investment Advisory Affiliates.
|
| OVERVIEW OF GOLDMAN SACHS FUNDS |

Money Market1
Financial Square FundsSM
| n | | Financial Square Tax-Exempt Funds |
| n | | Financial Square Federal Fund |
| n | | Financial Square Government Fund |
| n | | Financial Square Money Market Fund |
| n | | Financial Square Prime Obligations Fund |
| n | | Financial Square Treasury Instruments Fund |
| n | | Financial Square Treasury Obligations Fund |
Fixed Income
Short Duration and Government
| n | | High Quality Floating Rate Fund2 |
| n | | Short Duration Government Fund |
| n | | Short Duration Income Fund |
| n | | Inflation Protected Securities Fund |
Multi-Sector
| n | | Core Plus Fixed Income Fund |
Municipal and Tax-Free
| n | | High Yield Municipal Fund |
| n | | Short Duration Tax-Free Fund |
Single Sector
| n | | Investment Grade Credit Fund |
| n | | High Yield Floating Rate Fund |
| n | | Emerging Markets Debt Fund |
| n | | Local Emerging Markets Debt Fund |
Corporate Credit
Fundamental Equity
| n | | Small/Mid Cap Growth Fund |
| n | | Flexible Cap Growth Fund |
| n | | Concentrated Growth Fund |
| n | | Technology Tollkeeper Fund |
| n | | Growth Opportunities Fund |
| n | | Rising Dividend Growth Fund |
Structured Equity
| n | | Structured Tax-Managed Equity Fund |
| n | | Structured International Tax-Managed Equity Fund |
| n | | U.S. Equity Dividend and Premium Fund |
| n | | International Equity Dividend and Premium Fund |
Equity Insights4
| n | | Small Cap Equity Insights Fund |
| n | | U.S. Equity Insights Fund |
| n | | Small Cap Growth Insights Fund |
| n | | Large Cap Growth Insights Fund |
| n | | Large Cap Value Insights Fund |
| n | | Small Cap Value Insights Fund |
| n | | International Small Cap Insights Fund |
| n | | International Equity Insights Fund |
| n | | Emerging Markets Equity Insights Fund |
Fundamental Equity International
| n | | Strategic International Equity Fund |
| n | | Concentrated International Equity Fund |
| n | | International Small Cap Fund |
| n | | Emerging Markets Equity Fund |
| n | | BRIC Fund (Brazil, Russia, India, China) |
Select Satellite5
| n | | Real Estate Securities Fund |
| n | | International Real Estate Securities Fund |
| n | | Commodity Strategy Fund |
| n | | Dynamic Allocation Fund |
| n | | Absolute Return Tracker Fund |
| n | | Managed Futures Strategy Fund |
| n | | MLP Energy Infrastructure Fund |
| n | | Multi-Manager Alternatives Fund |
| n | | Retirement Portfolio Completion Fund |
| n | | Income Strategies Portfolio |
Total Portfolio Solutions5
| n | | Balanced Strategy Portfolio |
| n | | Growth and Income Strategy Portfolio |
| n | | Growth Strategy Portfolio |
| n | | Equity Growth Strategy Portfolio |
| n | | Satellite Strategies Portfolio |
| n | | Enhanced Dividend Global Equity Portfolio |
| n | | Tax Advantaged Global Equity Portfolio |
| 1 | | An investment in a money market fund is neither insured nor guaranteed by the Federal Deposit Insurance Corporation (“FDIC”) or any other government agency. Although the Funds seek to preserve the value of your investment at $1.00 per share, it is possible to lose money by investing in the Funds. |
| 2 | | Effective at the close of business on July 27, 2012, the Goldman Sachs Ultra-Short Duration Government Fund was renamed the Goldman Sachs High Quality Floating Rate Fund. |
| 3 | | Effective at the close of business on June 29, 2012, the Goldman Sachs Balanced Fund was renamed the Goldman Sachs Income Builder Fund. |
| 4 | | Effective at the close of business May 3, 2013, the Goldman Sachs Structured Large Cap Growth, Structured Large Cap Value, Structured Small Cap Equity, Structured Small Cap Growth, Structured Small Cap Value, Structured U.S. Equity, Structured Emerging Markets Equity, Structured International Equity and Structured International Small Cap Funds were renamed the Goldman Sachs Large Cap Growth Insights, Large Cap Value Insights, Small Cap Equity Insights, Small Cap Growth Insights, Small Cap Value Insights, U.S. Equity Insights, Emerging Markets Equity Insights, International Equity Insights and International Small Cap Insights Funds respectively. |
| 5 | | Individual Funds within the Total Portfolio Solutions and Select Satellite categories will have various placement on the risk/return spectrum and may have greater or lesser risk than that indicated by the placement of the general Total Portfolio Solutions or Select Satellite category. |
Financial Square FundsSM is a registered service mark of Goldman, Sachs & Co.
| | |
TRUSTEES Ashok N. Bakhru, Chairman Donald C. Burke John P. Coblentz, Jr. Diana M. Daniels Joseph P. LoRusso James A. McNamara Jessica Palmer Alan A. Shuch Richard P. Strubel | | OFFICERS James A. McNamara, President George F. Travers, Principal Financial Officer Caroline Kraus, Secretary Scott M. McHugh, Treasurer |
| |
GOLDMAN, SACHS & CO. Distributor and Transfer Agent | | GOLDMAN SACHS ASSET MANAGEMENT, L.P. Investment Adviser |
Visit our web site at www.goldmansachsfunds.com to obtain the most recent month-end returns.
Goldman Sachs Asset Management, L.P. 200 West Street, New York, New York 10282
The reports concerning the Funds included in this shareholder report may contain certain forward-looking statements about the factors that may affect the performance of the Funds in the future. These statements are based on Fund management’s predictions and expectations concerning certain future events and their expected impact on the Funds, such as performance of the economy as a whole and of specific industry sectors, changes in the levels of interest rates, the impact of developing world events, and other factors that may influence the future performance of the Funds. Management believes these forward-looking statements to be reasonable, although they are inherently uncertain and difficult to predict. Actual events may cause adjustments in portfolio management strategies from those currently expected to be employed.
A description of the policies and procedures that the Funds use to determine how to vote proxies relating to portfolio securities and information regarding how a Fund voted proxies relating to portfolio securities during the most recent 12-month period ended June 30 is available (I) without charge, upon request by calling 1-800-526-7384 (for Retail Shareholders) or 1-800-621-2550 (for Institutional Shareholders); and (II) on the Securities and Exchange Commission (“SEC”) web site at http://www.sec.gov.
The Funds file their complete schedule of portfolio holdings with the SEC for the first and third quarters of each fiscal year on Form N-Q. The Funds’ Forms N-Q are available on the SEC’s web site at http://www.sec.gov within 60 days after the Funds’ first and third fiscal quarters. The Funds’ Forms N-Q may be reviewed and copied at the SEC’s Public Reference Room in Washington, D.C. and information on the operation of the Public Reference Room may also be obtained by calling 1-800-SEC-0330. Form N-Q may be obtained upon request and without charge by calling 1-800-526-7384 (for Retail Shareholders) or 1-800-621-2550 (for Institutional Shareholders).
Holdings and allocations shown are as of April 30, 2013 and may not be representative of future investments. Fund holdings should not be relied on in making investment decisions and should not be construed as research or investment advice regarding particular securities. Current and future holdings are subject to risk.
The Global Industry Classification Standard (GICS) was developed by and is the exclusive property and a service mark of Morgan Stanley Capital International Inc. (MSCI) and Standard & Poor’s, a division of The McGraw-Hill Companies, Inc. (S&P) and is licensed for use by Goldman Sachs. Neither MSCI, S&P nor any other party involved in making or compiling the GICS or any GICS classifications makes any express or implied warranties or representations with respect to such standard or classification (or the results to be obtained by the use thereof), and all such parties hereby expressly disclaim all warranties of originality, accuracy, completeness, merchantability or fitness for a particular purpose with respect to any of such standard or classification. Without limiting any of the foregoing, in no event shall MSCI, S&P, any of their affiliates or any third party involved in making or compiling the GICS or any GICS classifications have any liability for any direct, indirect, special, punitive, consequential or any other damages (including lost profits) even if notified of the possibility of such damages.
The portfolio risk management process includes an effort to monitor and manage risk, but does not imply low risk.
This material is not authorized for distribution to prospective investors unless preceded or accompanied by a current Prospectus or summary prospectus, if applicable. Investors should consider a Fund’s objective, risks, and charges and expenses, and read the summary prospectus, if available, and/or the Prospectus carefully before investing or sending money. The summary prospectus, if available, and the Prospectus contain this and other information about a Fund and may be obtained from your authorized dealer or from Goldman, Sachs & Co. by calling (retail – 1-800-526-7384) (institutional – 1-800-621-2550).
© 2013 Goldman Sachs. All rights reserved. 102248.MF.MED.TMPL/6/2013/STINTSAR13/12K
| | The information required by this Item is only required in an annual report on this Form N-CSR. |
| ITEM 3. | AUDIT COMMITTEE FINANCIAL EXPERT. |
| | The information required by this Item is only required in an annual report on this Form N-CSR. |
| ITEM 4. | PRINCIPAL ACCOUNTANT FEES AND SERVICES. |
| | The information required by this Item is only required in an annual report on this Form N-CSR. |
| ITEM 5. | AUDIT COMMITTEE OF LISTED REGISTRANTS. |
| ITEM 6. | SCHEDULE OF INVESTMENTS. |
| | Schedule of Investments is included as part of the Report to Stockholders filed under Item 1. |
| ITEM 7. | DISCLOSURE OF PROXY VOTING POLICIES AND PROCEDURES FOR CLOSED-END MANAGEMENT INVESTMENT COMPANIES. |
| ITEM 8. | PORTFOLIO MANAGERS OF CLOSED-END MANAGEMENT INVESTMENT COMPANIES. |
| ITEM 9. | PURCHASES OF EQUITY SECURITIES BY CLOSED-END MANAGEMENT INVESTMENT COMPANY AND AFFILIATED PURCHASERS. |
| ITEM 10. | SUBMISSION OF MATTERS TO A VOTE OF SECURITY HOLDERS. |
| | There have been no material changes to the procedures by which shareholders may recommend nominees to the registrant’s board of trustees. |
| ITEM 11. | CONTROLS AND PROCEDURES. |
| | (a) | The registrant’s principal executive and principal financial officers, or persons performing similar functions have concluded that the registrant’s disclosure controls and procedures (as defined in Rule 30a-3(c) under the Investment Company Act of 1940, as amended (the “1940 Act”)) are effective as of a date within 90 days of the filing of this report that includes the disclosure required by this paragraph, based on the evaluation of these controls and procedures required by Rule 30a-3(b) under the 1940 Act and 15d-15(b) under the Securities Exchange Act of 1934, as amended. |
| | (b) | There were no changes in the registrant’s internal control over financial reporting (as defined in Rule 30a-3(d) under the 1940 Act) that occurred during the registrant’s second fiscal quarter of the period covered by this report that have materially affected, or are reasonably likely to materially affect, the registrant’s internal control over financial reporting. |
| | | | |
| (a)(1) | | The information required by this Item is only required in connection with an annual report on this Form N-CSR. |
| | |
| (a)(2) | | Exhibit 99.CERT | | Certifications pursuant to Section 302 of the Sarbanes-Oxley Act of 2002 filed herewith. |
| | |
| (b) | | Exhibit 99.906CERT | | Certifications pursuant to Section 906 of the Sarbanes-Oxley Act of 2002 filed herewith. |
SIGNATURES
Pursuant to the requirements of the Securities Exchange Act of 1934 and the Investment Company Act of 1940, the registrant has duly caused this report to be signed on its behalf by the undersigned, thereunto duly authorized.
| | | | |
| | | | Goldman Sachs Trust |
| | |
| By: | | | | /s/ James A. McNamara |
| | | | James A. McNamara |
| | | | President/Principal Executive Officer |
| | | | Goldman Sachs Trust |
| | |
| Date: | | | | June 20, 2013 |
Pursuant to the requirements of the Securities Exchange Act of 1934 and the Investment Company Act of 1940, this report has been signed below by the following persons on behalf of the registrant and in the capacities and on the dates indicated.
| | | | |
| By: | | | | /s/ James A. McNamara |
| | | | James A. McNamara |
| | | | President/Principal Executive Officer |
| | | | Goldman Sachs Trust |
| | |
| Date: | | | | June 20, 2013 |
| | |
| By: | | | | /s/ George F. Travers |
| | | | George F. Travers |
| | | | Principal Financial Officer |
| | | | Goldman Sachs Trust |
| | |
| Date: | | | | June 20, 2013 |