UNITED STATES
SECURITIES AND EXCHANGE COMMISSION
Washington, D.C. 20549
FORM N-CSR
CERTIFIED SHAREHOLDER REPORT OF REGISTERED
MANAGEMENT INVESTMENT COMPANIES
Investment Company Act file number 811-05349
Goldman Sachs Trust
(Exact name of registrant as specified in charter)
71 South Wacker Drive,
Chicago, Illinois 60606
(Address of principal executive offices) (Zip code)
| | |
Copies to: |
Caroline Kraus | | Geoffrey R.T. Kenyon, Esq. |
Goldman, Sachs & Co. | | Dechert LLP |
200 West Street | | 200 Clarendon Street |
New York, New York 10282 | | 27th Floor |
| | Boston, MA 02116-5021 |
(Name and address of agents for service)
Registrant’s telephone number, including area code: (312) 655-4400
Date of fiscal year end: August 31
Date of reporting period: February 28, 2013
| ITEM 1. | REPORTS TO STOCKHOLDERS. |
| | The Semi-Annual Report to Stockholders is filed herewith. |
Goldman Sachs Funds

| | | | |
| | |
| Semi-Annual Report | | | | February 28, 2013 |
| | |
| | | | Global Tax-Aware Equity Portfolios |
| | | | Enhanced Dividend Global Equity Portfolio |
| | | | Tax-Advantaged Global Equity Portfolio |
| | | | |
| | | | |
| | | | |

Goldman Sachs Global Tax-Aware Equity Portfolios
| n | | ENHANCED DIVIDEND GLOBAL EQUITY PORTFOLIO |
| n | | TAX-ADVANTAGED GLOBAL EQUITY PORTFOLIO |
| | | | |
TABLE OF CONTENTS | | | | |
| |
Principal Investment Strategies and Risks | | | 1 | |
| |
Market Review | | | 2 | |
| |
Portfolio Management Discussion and Performance Summaries | | | 7 | |
| |
Schedules of Investments | | | 17 | |
| |
Financial Statements | | | 19 | |
| |
Financial Highlights | | | 22 | |
| |
Notes to Financial Statements | | | 26 | |
| |
Other Information | | | 40 | |
| | | | |
| | | |
| NOT FDIC-INSURED | | May Lose Value | | No Bank Guarantee |
GOLDMAN SACHS GLOBAL TAX-AWARE EQUITY PORTFOLIOS
Principal Investment Strategies and Risks
This is not a complete list of risks that may affect the Portfolios. For additional information concerning the risks applicable to the Portfolios, please see the Portfolios’ Prospectus.
The Goldman Sachs Enhanced Dividend Global Equity Portfolio invests primarily in affiliated domestic and international equity and fixed income funds (“Underlying Funds”). The Portfolio will also invest directly in other securities, including exchange-traded funds. The Portfolio is intended for investors who want current income. The Portfolio expects to invest primarily in underlying equity funds and equity securities with a blend of domestic large cap, small cap and international exposure, and expects to invest a relatively significant percentage of this equity allocation in the Goldman Sachs U.S. Equity Dividend and Premium and Goldman Sachs International Equity Dividend and Premium Funds, which employ call writing strategies and have an emphasis on dividend paying stocks. In addition, the Portfolio will have a small strategic allocation in U.S. investment grade bonds, which may consist of an investment in the Goldman Sachs Core Fixed Income Fund, the Goldman Sachs High Yield Fund or other fixed income securities. The Portfolio may also engage in short selling. Short sales involve the risk of an unlimited increase in the market value of the security sold short, which could result in a theoretically unlimited loss.
The Portfolio is subject to the risk factors of the Underlying Funds in direct proportion to its investments in those Underlying Funds, and the ability of the Portfolio to meet its investment objective is directly related to the ability of the Underlying Funds to meet their investment objectives, as well as the allocation among those Underlying Funds by the Investment Adviser. An Underlying Fund is subject to the risks associated with its investments, including (as applicable) those associated with equity, fixed income, foreign and derivative investments generally. From time to time, the Underlying Funds in which the Portfolio invests, and the size of the investments in the Underlying Funds, may change. Because the Portfolio is subject to the Underlying Fund expenses as well as its own expenses, the cost of investing in the Portfolio may be higher than investing in a mutual fund that only invests directly in stocks and bonds.
The Goldman Sachs Tax-Advantaged Global Equity Portfolio invests primarily in affiliated domestic and international equity and fixed income funds (“Underlying Funds”). The Portfolio will also invest directly in other securities, including exchange-traded funds. The Portfolio is intended for investors who wish to minimize short-term gains and defer long-term gains. The Portfolio expects to invest primarily in underlying equity funds and equity securities with a blend of domestic large cap, small cap and international exposure, and expects to invest a relatively significant percentage of this equity allocation in the Goldman Sachs Structured Tax- Managed Equity and Goldman Sachs Structured International Tax-Managed Equity Funds. In addition, the Portfolio will have a small strategic allocation in U.S. investment grade bonds, which may consist of an investment in the Goldman Sachs Core Fixed Income Fund, the Goldman Sachs High Yield Fund or other fixed income securities. The Portfolio may also engage in short selling. Short sales involve the risk of an unlimited increase in the market value of the security sold short, which could result in a theoretically unlimited loss. No assurance can be offered that the Portfolio’s tax-managed strategies will reduce the amount of taxable income and capital gains distributed by the Portfolio to shareholders.
The Portfolio is subject to the risk factors of the Underlying Funds in direct proportion to its investments in those Underlying Funds, and the ability of the Portfolio to meet its investment objective is directly related to the ability of the Underlying Funds to meet their investment objectives, as well as the allocation among those Underlying Funds by the Investment Adviser. An Underlying Fund is subject to the risks associated with its investments, including (as applicable) those associated with equity, fixed income, foreign and derivative investments generally. From time to time, the Underlying Funds in which the Portfolio invests, and the size of the investments in the Underlying Funds, may change. Because the Portfolio is subject to the Underlying Fund expenses as well as its own expenses, the cost of investing in the Portfolio may be higher than investing in a mutual fund that only invests directly in stocks and bonds.
1
MARKET REVIEW
Goldman Sachs Global Tax-Aware Equity Portfolios
|
| |
| Investment Strategy |
| |
| The Portfolios invest in a strategic mix of Underlying Funds and other securities with the goal of achieving long-term growth of capital (both Portfolios) and current income (Enhanced Dividend Global Equity Portfolio only). Under normal conditions, at least 80% of the Portfolios’ net assets plus any borrowings for investment purposes will be allocated among the Underlying Equity Funds and equity securities with a blend of domestic large-cap, small-cap and international exposure, to seek capital appreciation. The Portfolios may also invest directly in other securities and instruments, including unaffiliated exchange-traded funds. Under normal circumstances, each of the Portfolios also has a small strategic allocation to U.S. investment grade bonds and can use these investments for implementing tactical tilts. |
Market Review
Accommodative monetary policies by global central banks supported the performance of the equity and fixed income markets during the six months ended February 28, 2013 (“the Reporting Period”).
U.S. Equity Markets
As the Reporting Period began in September 2012, U.S. equities were in the midst of a rally that had begun during the summer of 2012 following assurances of ongoing easy monetary policy from the Federal Reserve Board (the “Fed”) and the European Central Bank (“ECB”). However, the U.S. equity market then pulled back in October 2012 on some cautious corporate earnings guidance and uncertainty surrounding the U.S. presidential election. Also pressuring the U.S. equity market was the worst storm in decades battering the East Coast.
The U.S. equity market subsequently regained momentum in November 2012, as election day largely preserved the status quo in the White House and Congress and economic data continued to show signs of improvement. More specifically, the U.S. reported better than expected third calendar quarter Gross Domestic Product (“GDP”) growth of 2%, the 13th consecutive quarter of economic expansion, and the unemployment rate dropped to 7.8%, the lowest rate seen since January 2009. U.S. manufacturing activity increased, and the housing market showed further signs of improvement, as construction of new homes hit a four-year high. In December 2012, further clarification from the Fed, tying its low interest rate policy, in part, to the condition that unemployment drop to 6.5% or lower, helped to offset increasing worries about the then-looming fiscal cliff of tax increases and spending cuts. Following weeks of tense negotiations and technically falling off the fiscal cliff for one day, the U.S. Congress finally reached an agreement averting the full force of tax increases that were scheduled to take effect on January 1, 2013. While spending cuts and other important fiscal issues were not truly addressed but merely postponed, the passage of The American Taxpayer Relief Act (ATRA) of 2012 did resolve some lingering uncertainties.
2
MARKET REVIEW
The U.S. equity market rally picked up steam in the first two months of 2013, with the S&P 500® Index reaching a five-year high and then a new record level and the Dow Jones Industrial Average hitting the 14,000 milestone. Further strengthening in home prices and improving U.S. employment data lifted markets, despite the realization that no deal would be reached in Washington D.C. to avoid the sequester, or automatic spending cuts, scheduled to go into effect on March 1, 2013.
For the Reporting Period overall, the S&P 500® Index (with dividends reinvested) gained 8.95%, and the Russell 3000® Index recorded a return of 9.97%. From a capitalization perspective, U.S. mid-cap stocks performed best with small-cap stocks close behind. While generating solid positive returns, U.S. large-cap stocks followed at some distance. Value stocks significantly outperformed growth stocks across the capitalization spectrum. (All as measured by Russell Investments indices.) The consistent and persistent commitment to accommodative monetary policy from the Fed and other central banks throughout the Reporting Period drove market leading returns in the financials sector. On optimism about the economy and improved consumer confidence, the industrials, health care and consumer discretionary sectors also posted double-digit gains. The information technology sector was the only one to decline during the Reporting Period, largely due to some weaker than expected corporate earnings reports.
International Equity Markets
When the Reporting Period began, the bull market in international equities that had begun during the summer of 2012 continued, fueled by a number of positive developments around the world. Positive sentiment about Spain’s plan to restructure its banks, as well as an agreement among European Union (“EU”) finance ministers to reschedule some of Greece’s debt and release aid to that country, lifted European equity markets through the end of 2012. Market sentiment continued to improve and by early 2013, bond yields in the EU peripheral countries were down significantly from their highs during the summer of 2012, with the yield on the Greek 10-year government bond dropping below 10% for the first time in more than two years. In addition, competitiveness and trade imbalances appeared to be improving in the peripheral countries and economic activity within the EU appeared to be increasing, though from low levels.
In February 2013, the lack of a clear winner in Italy’s general elections renewed concerns about that nation’s ability to improve its economy and about the fate of the EU as a whole. The U.K.’s loss of its AAA debt rating and reports of fourth quarter 2012 economic contractions in Germany and France weighed on European equity markets and the euro. In addition, a Eurozone flash purchasing manager’s index (“PMI”) reading at the end of the February 2013 dimmed hopes from earlier in the year that the EU was squarely back on the path to economic growth.
3
MARKET REVIEW
The Japanese equity market rose sharply during the Reporting Period on optimism that its newly elected prime minister would focus on weakening the yen and establishing an inflation target. Haruhiko Kuroda, a critic of the Bank of Japan’s (“BoJ”) failure to end deflation and a supporter of balance sheet expansion to meet inflation targets, was nominated to head the BoJ. By early 2013, following the Japanese government’s announcement of a ¥103 trillion stimulus package, the yen weakened to its lowest level against the U.S. dollar in two and a half years. A weak yen is perceived as good for Japan’s export-oriented economy, and in fact, Japanese exports increased in January 2013 for the first time in eight months as the weak yen made Japanese goods more competitive in the global marketplace. However, a weakening yen reduced equity returns expressed in U.S. dollars.
The international equity markets, as represented by the MSCI EAFE Index (net), returned 14.41% during the Reporting Period. All regions contributed to the strong performance. Asia-ex-Japan, as measured by the MSCI All Country Asia ex Japan Index (net, USD, unhedged, with dividends reinvested), was the best performing region in U.S. dollars during the Reporting Period, led by strong returns in Australia. From a sector perspective within the MSCI Europe, Australasia, Far East (EAFE) Index, financials was by far the best performer and the biggest contributor to overall performance. Cyclical sectors such as materials and consumer discretionary also performed well, while more defensive sectors such as telecommunication services and utilities underperformed the broader market.
Fixed Income Markets
Spread sectors (that is, non-U.S. Treasury sectors) rallied during the Reporting Period overall. U.S. government bonds weakened, with the benchmark 10-year U.S. Treasury yield rising 33 basis points (a basis point is 1/100th of a percent) from 1.56% to 1.89%.
Monetary policy stimulus was the driving factor in the spread sector rally. During September 2012, the Fed announced open-ended purchases of agency mortgage-backed securities in a third round of quantitative easing (“QE3”), and the ECB pledged to purchase potentially unlimited amounts of distressed government bonds in secondary markets with its Outright Monetary Transactions (“OMT”) program. These easing measures helped assuage investors’ concerns about the slow-moving U.S. economy and the potential for a financial crisis in the Eurozone and also gave fresh impetus to the hunt for yield in an exceptionally low interest rate environment.
Spread sectors weathered the political uncertainty leading into the November 6, 2012 U.S. elections, which returned Barack Obama to the Presidency and slightly increased the Democratic majority in the Senate. However, the rally faltered after the election, due in part to the unwinding of trades that would have benefited from a Mitt Romney victory. With the elections over, fixed income investors focused their attention on negotiations between lawmakers to avert the fiscal cliff — automatic tax increases and spending cuts scheduled to take effect at year-end 2012. Concern about the fiscal cliff benefited U.S. Treasuries. The 10-year U.S. Treasury yield, for example, dropped nine basis points to 1.62% during November 2012.
4
MARKET REVIEW
Despite a lack of clarity on U.S. fiscal policy, spread sectors recovered in December 2012. The monetary policy outlook remained accommodative — the Fed confirmed that sales of short-maturity U.S. Treasuries would cease at year-end 2012 with the expiration of Operation Twist but that its purchases of longer-maturity securities would continue at a pace of $45 billion a month. At the same time, the Fed abandoned its previous calendar guidance on short-term interest rates in favor of an outcome-based approach focusing on inflation and unemployment levels. Investors’ risk appetite also benefited from improved economic data. U.S. home prices continued to rise in December 2012, and non-farm payrolls numbers were better than expected, with the unemployment rate dropping to 7.7%. Among spread sectors, high yield corporate credit was the strongest performer in December 2012, overtaking a rally in investment grade corporate bonds that had occurred during September and October 2012.
In January 2013, investor risk appetite benefited further from a last-minute deal on the fiscal cliff. U.S. lawmakers agreed to extend the Bush-era tax cuts for all but the highest income earners. U.S. Treasury yields rose in January 2013 for a second month in a row, with the 10-year U.S. Treasury yield climbing 22 basis points to 1.98%.
During February 2013, risk appetite cooled, and the prices of U.S. Treasury securities rebounded, mainly because of concerns about U.S. fiscal policy gridlock and global market volatility as potentially driven by Italy’s upcoming elections. U.S. lawmakers appeared unwilling to reach a compromise on spending cuts and revenue raising measures, which had been held over from the fiscal cliff debate, and more rancorous talks loomed on a potential debt ceiling increase during the second quarter of 2013.
For the Reporting Period overall, higher yielding sectors generally outperformed U.S. Treasuries. In the U.S. fixed income market, high yield corporate bonds, as represented by the Barclays U.S. High Yield Bond Index (2% Cap), recorded a gain of 6.67%. U.S. mortgage-backed securities posted a small decline, with the Barclays U.S. Securitized Index returning -0.01% during the Reporting Period. The global fixed income market, as represented by the Barclays Global Aggregate Bond Index (U.S. dollar hedged), returned 1.35% during the Reporting Period. Emerging markets debt, as measured by the JP Morgan EMBI Global Diversified Index, returned 2.76%. Local emerging markets debt, as represented by the J.P. Morgan GBI-EM Global Diversified Index (U.S. dollar hedged), returned 7.28%.
Looking Ahead
Within the U.S. economy, we see a divergence between private sector growth and public sector drag. At the end of the Reporting Period, the private sector was growing organically at around 3.5% to 4%, and there had been significant gains in equity prices and house prices. We believe that going forward business investment is likely to provide as strong a contribution to 2013 growth as housing did during 2012, though concern about tax increases and spending cuts appear to have delayed the pickup. At the end of the Reporting Period, the impact from fiscal tightening had been less than feared, but there are likely more spending cuts to come. In our opinion, the increase in payroll taxes will trim 1.5% from consumption, and the net impact of sequestration cuts on GDP will be between -0.3% and -0.5%. Possible offsets to the fiscal drag include the possibility that consumers will draw down on savings to compensate for the impact of a higher payroll tax (a view supported by retail sales figures in January and February 2013) and the increased contribution to economic growth from general construction spending due to the housing market recovery.
5
MARKET REVIEW
Investor sentiment about China, which tends to fluctuate sharply, was positive at the end of the Reporting Period, largely because growth concerns had eased and the leadership handover within the nation was a smooth one. We see the potential for another negative swing in sentiment, as food prices drive Chinese inflation higher, raising the prospect of more tightening by China’s central bank. We believe China’s economic growth should reach 8% in 2013 but its momentum appears to no longer be strengthening, and we see the pace of its economic growth slipping to 7.6% in 2014.
The policy-driven depreciation of the yen appears to be having a positive economic impact in Japan. Exports have recovered somewhat, though headwinds of the territorial dispute with China over the Diaoyu/Senkaku islands remain. We expect Japan’s current account (that is, its net income) to stabilize and perhaps improve in the months ahead.
Our economic outlook for the Eurozone remains negative, as we believe growth in the region will remain close to zero for the foreseeable future. We think that Italy will probably need to restructure its debt, and that France faces a likely recession. The main risks to the Eurozone, in our view, include Germany’s elections, Italy’s politics and financial sector reform. On the positive side, debt/budget trajectories are moving in the right direction, and Eurozone current accounts and competitiveness are improving.
The economic and market forecasts presented herein are for informational purposes as of the date of this presentation. There can be no assurance that the forecasts will be achieved. Please see additional disclosures at the end of this presentation.
6
PORTFOLIO RESULTS
Goldman Sachs Enhanced Dividend
Global Equity Portfolio
Portfolio Management Discussion and Analysis
Below, the Goldman Sachs Quantitative Investment Strategies Team discusses the Goldman Sachs Enhanced Dividend Global Equity Portfolio’s (the “Portfolio”) performance and positioning for the six-month period ended February 28, 2013 (the “Reporting Period”).
| Q | | How did the Portfolio perform during the Reporting Period? |
| A | | During the Reporting Period, the Portfolio’s Class A and Institutional Shares generated cumulative total returns, without sales charges, of 8.35% and 8.65%, respectively. |
| | These returns compare to the 10.24% cumulative total return of the Enhanced Dividend Global Equity (“EDGE”) Composite Index (“EDGE Composite Index”) over the same time period. The EDGE Composite Index is comprised of the Barclays U.S. Aggregate Bond Index (10%), the MSCI All Country World Index (ACWI), ex North America® (30%) and the Russell 3000® Index (60%). |
| | The components of the Portfolio’s blended benchmark generated cumulative total returns of 0.15%, 14.24% and 9.97% for the Barclays U.S. Aggregate Bond Index, the MSCI ACWI, ex North America® and the Russell 3000® Index, respectively, during the same period. |
| Q | | What key factors affected the Portfolio’s performance during the Reporting Period? |
| A | | Although tactical asset allocation decisions added to relative returns, the Portfolio underperformed the EDGE Composite Index during the Reporting Period. In keeping with its investment process, the Portfolio had a significant percentage of its equity allocation invested in two Underlying Funds, the Goldman Sachs U.S. Equity Dividend and Premium Fund and the Goldman Sachs International Equity Dividend and Premium Fund, which each employ call writing strategies and have an emphasis on dividend paying stocks. As stock markets appreciated during the Reporting Period, the index call writing strategy of both these Underlying Funds detracted from the Portfolio’s performance. |
| | Stock selection within the Underlying Funds detracted from the Portfolio’s returns. In addition to the two Underlying Funds mentioned above, two others of the five Underlying Funds we use to implement our strategic allocation decisions underperformed their respective benchmark indices. One of the five Underlying Funds we use to implement our strategic allocation decisions outperformed its benchmark index during the Reporting Period. |
| Q | | How did Global Tactical Asset Allocation decisions affect the Portfolio’s performance during the Reporting Period? |
| A | | The implementation of our tactical views contributed positively to performance. The Portfolio was underweight U.S. investment grade bonds. It was overweight U.S. high yield corporate bonds. The Fed’s decision to keep short-term interest rates near zero until certain unemployment and/or inflation data points are reached suggested to us that investors’ search for yield would continue — to the benefit of high yield corporate bonds, which at the end of the Reporting Period had yields to maturity (or, redemption yields) of approximately 6.6%. High yield corporate spreads (or, yield differentials to U.S. Treasuries) were near the historic median, a level that we believe implies a default rate of nearly 4%. In our opinion, the actual default rate would have to be more than 8% — even if we assume a conservative recovery rate by bondholders of 35% — to fully erode these spread levels. |
| | The Portfolio was overweight the U.S. banking sector through an exchange traded fund (“ETF”), which appreciated in value during the Reporting Period. We believed U.S. bank stocks had attractive valuations relative to their historical performance and relative to the broad U.S. equity market. Furthermore, bank credit costs have been falling, early-stage delinquencies continued to improve and banks have been fortifying their balance sheets. |
| | Because we saw several sources of downside risk to the stocks in the S&P® 500 Index, the Portfolio had an allocation to April 2013 S&P® 500 Index put options. (S&P® 500 Index put options have an underlying value that is equal to the full value on the day of purchase of the S&P® 500 Index.) Although truly adverse downside risks appear to have been mitigated by global central bank action, such as the Fed’s QE3 and the ECB’s OMT programs, we anticipated several other sources of potential downside risk to come into focus in the months ahead, including Italy’s elections in March 2013, the initiation of sequester-related spending cuts in the U.S., and the risk of a U.S. government shutdown if temporary spending authority was not extended. In addition, during January 2013, when we initiated the Portfolio’s S&P® 500 |
7
PORTFOLIO RESULTS
| | Index put options position, U.S. equity market volatility had collapsed, with the VIX (a measure of the implied volatility of S&P® 500 Index options) dropping to near 13. As a result, the cost of purchasing the April 2013 S&P® 500 Index put options was low by historical standards. |
| | The Portfolio was overweight the Japanese and European equity markets during the Reporting Period. The Portfolio was overweight Japanese equities because we believed their valuations were attractive. Japanese stocks had been trading at a discount to their own historical performance and relative to U.S. and international stocks. Also, we believed that Japanese corporate earnings would outgrow the corporate earnings in other major regions, thanks to government policy changes, supportive domestic economic growth, Japan’s exposure to emerging markets growth and high profit margins. The Portfolio was overweight European equities because of what we considered to be attractive valuations. During the Reporting Period, the Euro Stoxx 50® Index (which covers 50 blue chip stocks from 12 Eurozone countries) was trading near its 2003 and 2009 lows, and European stock valuations stood well within the lower quartile of their historical levels on both an absolute basis and relative to U.S. stocks. Additionally, the European equity market offered a dividend yield of approximately 5%, which we believed added a margin of downside protection for the Portfolio. Although the Eurozone still faces many challenges, financial stress seemed to be abating as result of policy changes within the European Union and a reduction in the pace of European bank deleveraging. In addition, nearly half the sales of Euro Stoxx 50® Index companies are overseas. The Portfolio’s weightings in the European and Japanese equity markets were implemented through investment in stock futures. (A stock future, which is traded on an exchange, is a contract that obligates a buyer to purchase stock at a predetermined future date and price.) |
| | Through an allocation to the Goldman Sachs Emerging Markets Debt Fund, we adopted an overweight position in emerging markets debt. We believe the global financial crisis has increased the relative structural attractiveness of emerging markets bonds. The debt burden of the emerging markets is widely projected to be much lower than that of G-10 (Group of Ten) economies in the next decade. (The Group of Ten economies, though so-called, are actually eleven, namely Belgium, Canada, France, Germany, Italy, Japan, the Netherlands, Sweden, Switzerland, the U.K. and the U.S.) However, in our view, emerging markets debt spreads relative to U.S. Treasuries remained attractive. We believe demand for emerging markets local debt should increase because emerging markets countries are for the first time showing the ability to manage their monetary and fiscal policies, which should help them navigate the global business cycle better than many had expected. |
| Q | | How did the Portfolio’s Underlying Funds perform relative to their respective benchmark indices during the Reporting Period? |
| A | | Four of the five Underlying Funds we use to express our strategic views within the Portfolio underperformed their respective benchmark indices during the Reporting Period. Two of the Underlying Funds that underperformed in relative terms — the Goldman Sachs U.S. Equity Dividend and Premium Fund and the Goldman Sachs International Equity Dividend Fund — were those in which the Portfolio invested a significant percentage of its equity allocation. The Goldman Sachs U.S. Equity Dividend and Premium Fund underperformed its benchmark, the S&P 500® Index (with dividends reinvested), by approximately 3.44%. The Goldman Sachs International Equity Dividend and Premium Fund underperformed its benchmark, the MSCI EAFE Index, by approximately 2.45% during the Reporting Period. The Goldman Sachs Structured Small Cap Equity Fund and the Goldman Sachs Structured International Small Cap Equity Fund also underperformed their respective benchmark indices. The Goldman Sachs Structured Emerging Markets Equity Fund outperformed its benchmark index during the Reporting Period. |
| Q | | How did call writing affect performance? |
| A | | As mentioned above, the Portfolio’s two largest allocations were to the Goldman Sachs U.S. Equity Dividend and Premium Fund and the Goldman Sachs International Equity Dividend and Premium Fund, which earn premiums through an equity index call writing strategy. When equity markets are down, flat or only modestly positive, these Underlying Funds tend to outperform their respective benchmark indices because of the premiums they earn from call writing. When equity markets rally strongly, these two Underlying Funds are likely to trail their respective benchmark indices. Although the Underlying Funds keep the premiums they earn from call writing, they can underperform when the call options are exercised. |
8
| | The economic and market forecasts presented herein are for informational purposes as of the date of this presentation. There can be no assurance that the forecasts will be achieved. Please see additional disclosures at the end of this presentation. |
PORTFOLIO RESULTS
| | The U.S. and international equity markets appreciated during the Reporting Period and the call writing strategy of both Underlying Funds detracted from performance as call options were exercised. |
| Q | | How did the Portfolio use derivatives and similar instruments during the Reporting Period? |
| A | | The Portfolio used equity index futures, equity swap contracts and equity index options. Equity index futures were used to implement our views on the Japanese and European stock markets. Equity swap contracts were used to implement the Portfolio’s tactical tilt in Financial Times Stock Exchange 100 share index (the “FTSE 100”) dividend futures, a position we eliminated during the Reporting Period. Equity index options were used to implement the Portfolio’s position in S&P® 500 Index put options. We used forward foreign currency exchange contracts to take a long position in the Chinese renminbi, a position we eliminated during the Reporting Period. In addition, some of the Portfolio’s Underlying Funds used derivatives during the Reporting Period to apply their active investment views with greater versatility and to afford greater risk management precision. As market conditions warranted during the Reporting Period, some of these Underlying Funds engaged in forward foreign currency exchange contracts, financial futures contracts, options and swap contracts to enhance portfolio return and for hedging purposes. |
| Q | | What changes did you make during the Reporting Period within both the equity and fixed income portions of the Portfolio? |
| A | In September 2012, we increased the Portfolio’s overweight in European equities through an investment in Euro Stoxx 50® Index futures. At the same time, we reduced the Portfolio’s allocations to investment grade fixed income through the Goldman Sachs Core Fixed Income Fund and to U.S. equities through the Goldman Sachs U.S. Equity Dividend and Premium Fund and the Goldman Sachs Structured Small Cap Equity Fund. |
| | At the beginning of the Reporting Period, the Portfolio had a position in FTSE 100 dividend futures, implemented through equity swap contracts. The dividend futures market allows investors to take a view on the amount of dividends that a specific company or index of companies will pay over the course of a calendar year. We eliminated the position in October 2012. |
| | During November 2012, we decreased the Portfolio’s exposure to high yield corporate bonds by reducing its allocation to the Goldman Sachs High Yield Fund. We reallocated the proceeds to investment grade fixed income through the Goldman Sachs Core Fixed Income Fund. Also in November 2012, we allowed the Portfolio’s allocation to the Chinese renminbi to mature. We had initiated the position in October 2011. In December 2012, we allowed the Portfolio’s position in December 2012 S&P® 500 Index put options, which we had initiated in August 2012, to expire. |
| | During January 2013, we decreased the Portfolio’s overweighted exposure to Japanese equities and invested the proceeds into investment grade fixed income through the Goldman Sachs Core Fixed Income Fund. Later that month, we purchased April 2013 S&P® 500 Index put options at a strike price of 1500. (For put options, the strike price is the price at which shares can be sold.) We funded the position by reducing the Portfolio’s allocation to investment grade fixed income through the Goldman Sachs Core Fixed Income Fund. |
| Q | | What was the Portfolio’s tactical view and strategy at the end of the Reporting Period? |
| A | | As of February 28, 2013, the Portfolio — through its holdings in equity index futures — was overweight the Japanese and European stock markets. It was overweight large-cap U.S. bank stocks through an investment in an ETF. The Portfolio held a position in S&P® 500 Index put options. In fixed income, through allocations to the Underlying Funds, the Portfolio held an overweighted position in high yield securities and an underweighted position in investment grade securities. It was overweight emerging markets debt relative to the EDGE Composite Index. |
9
FUND BASICS
Enhanced Dividend Global Equity Portfolio
as of February 28, 2013
| | | | | | | | | | |
| | PERFORMANCE REVIEW | |
| | | September 1, 2012–February 28, 2013 | | Portfolio Total Return
(based on NAV)1 | | | EDGE Composite
Index2 | |
| | Class A | | | 8.35 | % | | | 10.24 | % |
| | | Institutional | | | 8.65 | | | | 10.24 | |
| | 1 | | The net asset value (“NAV”) represents the net assets of the class of the Portfolio (ex-dividend) divided by the total number of shares of the class outstanding. The Portfolio’s performance reflects the reinvestment of dividends and other distributions. The Portfolio’s performance does not reflect the deduction of any applicable sales charges. |
| | 2 | | The EDGE Composite Index is comprised of the Barclays U.S. Aggregate Bond Index (10%), the MSCI ACWI Index, ex North America® (30%) and the Russell 3000® Index (60%). The Index figures do not reflect any deduction of fees, expenses or taxes. It is not possible to invest directly in an unmanaged index. |
| | | | | | | | | | | | |
| | STANDARDIZED TOTAL RETURNS3 |
| | | For the period ended 12/31/12 | | | | One Year | | | Since Inception | | Inception Date |
| | Class A | | | | | 7.21 | % | | 1.50% | | 4/30/08 |
| | | Institutional | | | | | 13.99 | | | 3.16 | | 4/30/08 |
| | 3 | | The Standardized Total Returns are average annual total returns as of the most recent calendar quarter-end. They assume reinvestment of all distributions at NAV. These returns reflect a maximum initial sales charge of 5.5% for Class A Shares. Because Institutional Shares do not involve a sales charge, such a charge is not applied to their Standardized Total Returns. |
| | | | The returns represent past performance. Past performance does not guarantee future results. The Portfolio’s investment return and principal value will fluctuate so that an investor’s shares, when redeemed, may be worth more or less than their original cost. Current performance may be lower or higher than the performance quoted above. Please visit our website at www.goldmansachsfunds.com to obtain the most recent month-end returns. Performance reflects applicable fee waivers and/or expense limitations in effect during the periods shown. In their absence, performance would be reduced. Returns do not reflect the deduction of taxes that a shareholder would pay on Portfolio distributions or the redemption of Portfolio shares. |
| | | | | | | | | | |
| | EXPENSE RATIOS4 | |
| | | | | Net Expense Ratio (Current) | | | Gross Expense Ratio (Before Waivers) | |
| | Class A | | | 1.46 | % | | | 1.56 | % |
| | | Institutional | | | 1.06 | | | | 1.16 | |
| | 4 | | The expense ratios of the Portfolio, both current (net of applicable fee waivers and/or expense limitations) and before waivers (gross of applicable fee waivers and/or expense limitations), are as set forth above according to the most recent publicly available Prospectus for the Portfolio and will differ from the expense ratios disclosed in the Financial Highlights in this report due to the inclusion of underlying Fund fees and expenses, which are not included in the operating expenses of the Portfolio reflected in the Financial Highlights. The Portfolio’s waivers and/or expense limitations, if any, will remain in place through at least December 29, 2013, and prior to such date the Investment Adviser may not terminate the arrangements without the approval of the Portfolio’s Board of Trustees. If these arrangements are discontinued in the future, the expense ratios may change without shareholder approval. |
10
FUND BASICS
| | | | | | | | | | |
| | STANDARDIZED AFTER-TAX PERFORMANCE AS OF 12/31/125 | |
| | | Class A Shares | | One Year | | | Since Inception (4/30/08) | |
| | Returns before taxes* | | | 7.21 | % | | �� | 1.50 | % |
| | Returns after taxes on distributions** | | | 6.50 | | | | 1.01 | |
| | | Returns after taxes on distributions*** and sale of Portfolio shares | | | 5.43 | | | | 1.19 | |
| | 5 | | The after-tax returns are calculated using the historically highest individual federal marginal income tax rates at the time of distributions (currently 15% for qualifying ordinary income dividends and long-term capital gain distributions and 35% for non-qualifying ordinary income dividends) and do not reflect state and local taxes. Actual after-tax returns will be calculated at calendar year-end and depend on an investor’s tax situation and may differ from those shown. In addition, the after-tax returns shown are not relevant to investors who hold Portfolio shares through tax-deferred arrangements such as 401(k) plans or individual retirement accounts. Under certain circumstances, the addition of the tax benefits from capital losses resulting from redemptions may cause the Returns After Taxes on Distributions and Sale of Portfolio Shares to be greater than the Returns After Taxes on Distributions or even Returns Before Taxes. Standardized after-tax returns assume reinvestment of all distributions at NAV and reflect a maximum initial sales charge of 5.5% for Class A Shares. |
| | *Returns | | Before Taxes do not reflect taxes on distributions on the Portfolio’s Class A Shares nor do they show how performance can be impacted by taxes when shares are redeemed. |
| | **Returns | | After Taxes on Distributions assume that taxes are paid on distributions on the Portfolio’s Class A Shares (i.e., dividends and capital gains) but do not reflect taxes that may be incurred upon redemption of the Class A Shares at the end of the performance period. |
| ***Returns | | After Taxes on Distributions and Sale of Portfolio Shares reflect taxes paid on distributions on the Portfolio’s Class A Shares and taxes applicable when the shares are redeemed. |
|
| OVERALL UNDERLYING FUND WEIGHTINGS6 |
| Percentage of Net Assets |
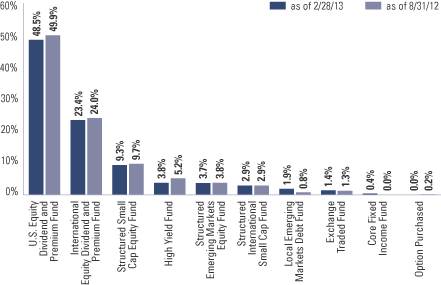
| | 6 | | The Portfolio is actively managed and, as such, its composition may differ over time. The percentage shown for each Underlying Fund reflects the value of that underlying fund as a percentage of net assets of the Portfolio. Figures in the graph above may not sum to 100% due to rounding and/or the exclusion of other assets and liabilities. Underlying sector allocations of ETFs held by the Portfolio are not reflected in the graph above. The above graph depicts the Portfolio’s investments but may not represent the Portfolio’s market exposure due to the exclusion of certain derivatives, if any, as listed in the Additional Investment Information section of the Schedule of Investments. |
11
PORTFOLIO RESULTS
Goldman Sachs Tax-Advantaged
Global Equity Portfolio
Portfolio Management Discussion and Analysis
Below, the Goldman Sachs Quantitative Investment Strategies Team discuss the Goldman Sachs Tax-Advantaged Global Equity Portfolio’s (the “Portfolio”) performance and positioning for the six-month period ended February 28, 2013 (the “Reporting Period”).
| Q | | How did the Portfolio perform during the Reporting Period? |
| A | | During the Reporting Period, the Portfolio’s Class A and Institutional Shares generated cumulative total returns, without sales charges, of 10.70% and 10.86%, respectively. These returns compare to the 10.24% cumulative total return of the Tax-Advantaged Global (“TAG”) Composite Index (“TAG Composite Index”) over the same time period. The TAG Composite Index is comprised of the Barclays U.S. Aggregate Bond Index (10%), the MSCI All Country World Index (ACWI), ex North America® (30%) and the Russell 3000® Index (60%). |
| | The components of the Portfolio’s blended benchmark generated cumulative total returns of 0.15%, 14.24% and 9.97% for the Barclays U.S. Aggregate Bond Index, the MSCI ACWI, ex North America® and the Russell 3000® Index, respectively, during the same period. |
| Q | | What key factors affected the Portfolio’s performance during the Reporting Period? |
| A | | The Portfolio outperformed the TAG Composite Index during the Reporting Period, primarily as a result of our tactical asset allocation decisions. Security selection within the Underlying Funds detracted modestly. Two of the Portfolio’s four Underlying Funds, which we use to implement our strategic allocation decisions, underperformed their respective benchmark indices. |
| Q | | How did Global Tactical Asset Allocation decisions affect the Portfolio’s performance during the Reporting Period? |
| A | | The implementation of our tactical views contributed positively to performance. The Portfolio was underweight U.S. investment grade bonds. It was overweight U.S. high yield corporate bonds. The Fed’s decision to keep short-term interest rates near zero until certain unemployment and/or inflation data points are reached suggested to us that investors’ search for yield would continue — to the benefit of high yield corporate bonds, which at the end of the Reporting Period had yields to maturity (or, redemption yields) of approximately 6.6%. High yield corporate spreads (or, yield differentials to U.S. Treasuries) were near the historic median, a level that implies a default rate of nearly 4%. In our opinion, the actual default rate would have to be more than 8% — even if we assume a conservative recovery rate by bondholders of 35% — to fully erode these spread levels. |
| | The Portfolio was overweight the U.S. banking sector through an exchange traded fund (“ETF”), which appreciated in value during the Reporting Period. We believed U.S. bank stocks had attractive valuations relative to their historical performance and relative to the broad U.S. equity market. Furthermore, bank credit costs have been falling, early-stage delinquencies continued to improve and banks have been fortifying their balance sheets. |
| | Because we saw several sources of downside risk to the stocks in the S&P® 500 Index, the Portfolio had an allocation to April 2013 S&P® 500 Index put options. (S&P® 500 Index put options have an underlying value that is equal to the full value on the day of purchase of the S&P® 500 Index.) Although truly adverse downside risks appear to have been mitigated by global central bank action, such as the Fed’s QE3 and the ECB’s OMT programs, we anticipated several other sources of potential downside risk to come into focus in the months ahead, including Italy’s elections in March 2013, the initiation of sequester-related spending cuts in the U.S. and the risk of a U.S. government shutdown if temporary spending authority is not extended. In addition, during January 2013 when we initiated the Portfolio’s S&P® 500 Index put options position, U.S. equity market volatility had collapsed, with the VIX (a measure of the implied volatility of S&P® 500 index options) dropping to near 13. As a result, the cost of purchasing the April 2013 S&P® 500 Index put options was low by historical standards. |
12
PORTFOLIO RESULTS
| | The Portfolio was overweight the Japanese and European equity markets. The Portfolio was overweight Japanese equities because we believed their valuations were attractive. Japanese stocks had been trading at a discount to their own historical performance and relative to U.S. and international stocks. Also, we believed that Japanese corporate earnings would outgrow the corporate earnings in other major regions, thanks to government policy changes, supportive domestic economic growth, Japan’s exposure to emerging markets growth and high profit margins. The Portfolio was overweight European equities because of what we considered to be attractive valuations. During the Reporting Period, the Euro Stoxx 50® Index (which covers 50 blue chip stocks from 12 Eurozone countries) was trading near its 2003 and 2009 lows, and European stock valuations stood well within the lower quartile of their historical levels on both an absolute basis and relative to U.S. stocks. Additionally, the European equity market offered a dividend yield of approximately 5%, which we believed added a margin of downside protection for the Portfolio. Although the Eurozone still faces many challenges, financial stress seemed to be abating as result of policy changes within the European Union and a reduction in the pace of European bank deleveraging. In addition, nearly half the sales of Euro Stoxx 50® Index companies are overseas. The Portfolio’s weightings in the European and Japanese equity markets were implemented through investment in stock futures. (A stock future, which is traded on an exchange, is a contract that obligates a buyer to purchase stock at a predetermined future date and price.) |
| | Through an allocation to the Goldman Sachs Emerging Markets Debt Fund, we adopted an overweight position in emerging markets debt. We believe the global financial crisis has increased the relative structural attractiveness of emerging markets bonds. The debt burden of the emerging markets is widely projected to be much lower than that of G-10 (Group of Ten) economies in the next decade. (The Group of Ten economies, though so-called, are actually eleven, namely Belgium, Canada, France, Germany, Italy, Japan, the Netherlands, Sweden, Switzerland, the U.K. and the U.S.) However, in our view, emerging markets debt spreads relative to U.S. Treasuries remained attractive. We believe demand for emerging markets local debt should increase because emerging markets countries are for the first time showing the ability to manage their monetary and fiscal policies, which should help them navigate the global business cycle better than most expected. |
| Q | | How did the Portfolio’s Underlying Funds perform relative to their respective benchmark indices during the Reporting Period? |
| A | | Two of the four Underlying Funds we use to implement our strategic allocation decisions within the Portfolio underperformed their respective benchmark indices. These Underlying Funds were the Goldman Sachs Structured International Small Cap Equity Fund and the Goldman Sachs Structured Tax-Managed Fund. The Goldman Sachs Structured Emerging Markets Equity Fund and the Goldman Sachs Structured International Tax-Managed Equity Fund outperformed their respective benchmark indices. Of the Underlying Funds in which the Portfolio held its greatest weightings, the Goldman Sachs Structured Tax-Managed Equity Fund underperformed its benchmark, the Russell 3000® Index, by approximately 0.88%, and the Goldman Sachs Structured International Tax-Managed Equity Fund outperformed its benchmark, the MSCI EAFE Index, by approximately 0.01% during the Reporting Period. |
| Q | | How did the Portfolio use derivatives and similar instruments during the Reporting Period? |
| A | | The Portfolio used equity index futures, equity swap contracts and equity index options. Equity index futures were used to implement our views on the Japanese and European stock markets. Equity swap contracts were used to implement the Portfolio’s tactical tilt in the FTSE 100 dividend futures, a position we eliminated during the Reporting Period. Equity index options were used to implement the Portfolio’s position in S&P® 500 Index put options. We used forward foreign currency exchange contracts to take a long position in the Chinese renminbi, a position we eliminated during the Reporting Period. In addition, some of the Portfolio’s Underlying Funds used derivatives during the Reporting Period to apply their active investment views with greater versatility and to afford greater risk management precision. As market conditions warranted during the Reporting Period, some of these Underlying Funds engaged in forward foreign currency exchange contracts, financial futures contracts, options and swap contracts to enhance portfolio return and for hedging purposes. |
| | | The economic and market forecasts presented herein are for informational purposes as of the date of this presentation. There can be no assurance that the forecasts will be achieved. Please see additional disclosures at the end of this presentation. |
13
PORTFOLIO RESULTS
| Q | | What changes did you make during the Reporting Period within both the equity and fixed income portions of the Portfolio? |
| A | | In September 2012, we increased the Portfolio’s overweight in European equities through an investment in Euro Stoxx 50® Index futures. At the same time, we reduced the Portfolio’s allocations to investment grade fixed income through the Goldman Sachs Core Fixed Income Fund and to U.S. equities through the Goldman Sachs Structured Tax-Managed Equity Fund. |
| | At the beginning of the Reporting Period, the Portfolio had a position in FTSE 100 dividend futures, implemented through equity swap contracts. The dividend futures market allows investors to take a view on the amount of dividends that a specific company or index of companies will pay over the course of a calendar year. We eliminated the position in October 2012. |
| | During November 2012, we decreased the Portfolio’s exposure to high yield corporate bonds by reducing its allocation to the Goldman Sachs High Yield Fund. We reallocated the proceeds to investment grade fixed income through the Goldman Sachs Core Fixed Income Fund. Also in November 2012, we allowed the Portfolio’s allocation to the Chinese renminbi to mature. We had initiated the position in October 2011. In December 2012, we allowed the Portfolio’s position in December 2012 S&P® 500 Index put options, which we had initiated in August 2012, to expire. |
| | During January 2013, we decreased the Portfolio’s overweighted exposure to Japanese equities and invested the proceeds into investment grade fixed income through the Goldman Sachs Core Fixed Income Fund. Later that month, we purchased April 2013 S&P® 500 Index put options at a strike price of 1500. (For put options, the strike price is the price at which shares can be sold.) We funded the position by reducing the Portfolio’s allocation to investment grade fixed income through the Goldman Sachs Core Fixed Income Fund. |
| Q | | What was the Portfolio’s tactical view and strategy at the end of the Reporting Period? |
| A | | As of February 28, 2013, the Portfolio — through its holdings in equity index futures — was overweight the Japanese and European stock markets. It was overweight large-cap U.S. bank stocks through an investment in an ETF. The Portfolio held a position in S&P® 500 Index put options. In fixed income, through allocations to the Underlying Funds, the Portfolio held an overweighted position in high yield securities and an underweighted position in investment grade securities. It was overweight emerging markets debt relative to the TAG Composite Index. |
14
FUND BASICS
Tax-Advantaged Global Equity Portfolio
as of February 28, 2013
| | | | | | | | | | |
| | PERFORMANCE REVIEW | |
| | | September 1, 2012–February 28, 2013 | | Portfolio Total Return
(based on NAV)1 | | | TAG Composite
Index2 | |
| | Class A | | | 10.70 | % | | | 10.24 | % |
| | | Institutional | | | 10.86 | | | | 10.24 | |
| | 1 | | The net asset value (“NAV”) represents the net assets of the class of the Portfolio (ex-dividend) divided by the total number of shares of the class outstanding. The Portfolio’s performance reflects the reinvestment of dividends and other distributions. The Portfolio’s performance does not reflect the deduction of any applicable sales charges. |
| | 2 | | The TAG Composite Index is comprised of the Barclay’s U.S. Aggregate Bond Index (10%), the MSCI ACWI Index, ex North America® (30%) and the Russell 3000® Index (60%). The Index figures do not reflect any deduction of fees, expenses or taxes. It is not possible to invest directly in an unmanaged index. |
| | | | | | | | | | | | | | |
| | STANDARDIZED TOTAL RETURNS3 | | | | | |
| | | For the period ended 12/31/12 | | One Year | | | Since Inception | | | Inception Date | |
| | Class A | | | 10.90 | % | | | 0.85 | % | | | 4/30/08 | |
| | | Institutional | | | 17.83 | | | | 2.50 | | | | 4/30/08 | |
| | 3 | | The Standardized Total Returns are average annual total returns as of the most recent calendar quarter-end. They assume reinvestment of all distributions at NAV. These returns reflect a maximum initial sales charge of 5.5% for Class A Shares. Because Institutional Shares do not involve a sales charge, such a charge is not applied to their Standardized Total Returns. |
| | The | | returns represent past performance. Past performance does not guarantee future results. The Portfolio’s investment return and principal value will fluctuate so that an investor’s shares, when redeemed, may be worth more or less than their original cost. Current performance may be lower or higher than the performance quoted above. Please visit our Website at www.goldmansachsfunds.com to obtain the most recent month-end returns. Performance reflects applicable fee waivers and/or expense limitations in effect during the periods shown. In their absence, performance would be reduced. Returns do not reflect the deduction of taxes that a shareholder would pay on Portfolio distributions or the redemption of Portfolio shares. |
| | | | | | | | | | |
| | EXPENSE RATIOS4 | |
| | | | | Net Expense Ratio (Current) | | | Gross Expense Ratio (Before Waivers) | |
| | Class A | | | 1.38 | % | | | 1.43 | % |
| | | Institutional | | | 0.98 | | | | 1.03 | |
| | 4 | | The expense ratios of the Portfolio, both current (net of applicable fee waivers and/or expense limitations) and before waivers (gross of applicable fee waivers and/or expense limitations) are as set forth above according to the most recent publicly available Prospectus for the Portfolio and will differ from the expense ratios disclosed in the Financial Highlights in this report due to the inclusion of underlying Fund fees and expenses, which are not included in the operating expenses of the Portfolio reflected in the Financial Highlights. The Portfolio’s waivers and/or expense limitations will remain in place through at least December 29, 2013, and prior to such date the Investment Adviser may not terminate the arrangements without the approval of the Portfolio’s Board of Trustees. If these arrangements are discontinued in the future, the expense ratios may change without shareholder approval. |
15
FUND BASICS
| | | | | | | | | | |
| | STANDARDIZED AFTER-TAX PERFORMANCE AS OF 12/31/125 | |
| | | Class A Shares | | One Year | | | Since Inception
(4/30/08) | |
| | Returns before taxes* | | | 10.90 | % | | | 0.85 | % |
| | Returns after taxes on distributions** | | | 10.47 | | | | 0.53 | |
| | | Returns after taxes on distributions*** and sale of Portfolio shares | | | 7.42 | | | | 0.63 | |
| | 5 | | The after-tax returns are calculated using the historically highest individual federal marginal income tax rates at the time of distributions (currently 15% for qualifying ordinary income dividends and long-term capital gain distributions and 35% for non-qualifying ordinary income dividends) and do not reflect state and local taxes. Actual after-tax returns will be calculated at calendar year-end and depend on an investor’s tax situation and may differ from those shown. In addition, the after-tax returns shown are not relevant to investors who hold Portfolio shares through tax-deferred arrangements such as 401(k) plans or individual retirement accounts. Under certain circumstances, the addition of the tax benefits from capital losses resulting from redemptions may cause the Returns After Taxes on Distributions and Sale of Portfolio Shares to be greater than the Returns After Taxes on Distributions or even Returns Before Taxes. Standardized after-tax returns assume reinvestment of all distributions at NAV and reflect a maximum initial sales charge of 5.5% for Class A Shares. |
| | * | | Returns Before Taxes do not reflect taxes on distributions on the Portfolio’s Class A Shares nor do they show how performance can be impacted by taxes when shares are redeemed. |
| | ** | | Returns After Taxes on Distributions assume that taxes are paid on distributions on the Portfolio’s Class A Shares (i.e., dividends and capital gains) but do not reflect taxes that may be incurred upon redemption of the Class A Shares at the end of the performance period. |
| *** | | Returns After Taxes on Distributions and Sale of Portfolio Shares reflect taxes paid on distributions on the Portfolio’s Class A Shares and taxes applicable when the shares are redeemed. |
|
| OVERALL UNDERLYING FUND WEIGHTINGS6 |
| Percentage of Net Assets |
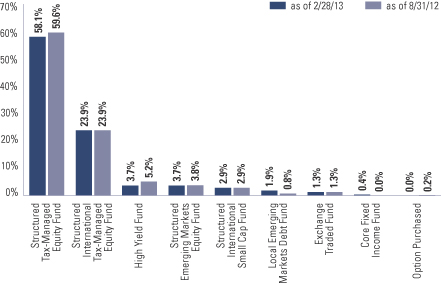
| | 6 | | The Portfolio is actively managed and, as such, its composition may differ over time. The percentage shown for each Underlying Fund reflects the value of that underlying fund as a percentage of net assets of the Portfolio. Figures in the graph above may not sum to 100% due to rounding and/or the exclusion of other assets and liabilities. Underlying sector allocations of ETFs held by the Portfolio are not reflected in the graph above. The above graph depicts the Portfolio’s investments but may not represent the Portfolio’s market exposure due to the exclusion of certain derivatives, if any, as listed in the Additional Investment Information section of the Schedule of Investments. |
16
GOLDMAN SACHS ENHANCED DIVIDEND GLOBAL EQUITY PORTFOLIO
Schedule of Investments
February 28, 2013 (Unaudited)
| | | | | | | | |
Shares | | | Description | | Value | |
| | Underlying Funds (Institutional Shares)(a) – 93.9% | |
| | Equity – 87.8% | |
| | 11,547,081 | | | Goldman Sachs U.S. Equity Dividend and Premium Fund | | $ | 116,048,168 | |
| | 7,632,596 | | | Goldman Sachs International Equity Dividend and Premium Fund | | | 55,946,927 | |
| | 1,535,167 | | | Goldman Sachs Structured Small Cap Equity Fund | | | 22,398,089 | |
| | 973,994 | | | Goldman Sachs Structured Emerging Markets Equity Fund | | | 8,834,127 | |
| | 803,220 | | | Goldman Sachs Structured International Small Cap Fund | | | 7,020,143 | |
| | | | | | | | |
| | | | | | | 210,247,454 | |
| | |
| | Fixed Income – 6.1% | |
| | 1,208,130 | | | Goldman Sachs High Yield Fund | | | 8,903,920 | |
| | 464,435 | | | Goldman Sachs Local Emerging Markets Debt Fund | | | 4,565,394 | |
| | 93,405 | | | Goldman Sachs Core Fixed Income Fund | | | 995,700 | |
| | | | | | | | |
| | | | | | | 14,465,014 | |
| | |
| TOTAL UNDERLYING FUNDS
(INSTITUTIONAL SHARES) – 93.9% |
|
| | (Cost $190,518,110) | | $ | 224,712,468 | |
| | |
| | | | | | | | |
Shares | | | Description | | Value | |
| | | | | | | | |
| | Exchange Traded Fund – 1.4% | |
| | 130,534 | | | SPDR S&P Bank Fund | | $ | 3,393,884 | |
| | (Cost $2,837,947) | |
| | |
| | | | | | | | |
| Contracts | | Strike Price | | Expiration Date | | Value | |
| | | | | | | | |
| Option Purchased – 0.0% | |
S&P 500 Index Put Option | | | | | | |
| 29 | | $1,500 | | 04/20/13 | | $ | 73,950 | |
| (Cost $102,457) | | | | | | |
| |
| TOTAL INVESTMENTS – 95.3% | | | | |
| (Cost $193,458,514) | | $ | 228,180,302 | |
| |
OTHER ASSETS IN EXCESS OF
LIABILITIES – 4.7% | | | 11,276,644 | |
| |
| NET ASSETS – 100.0% | | | | $ | 239,456,946 | |
| |
| | |
| The percentage shown for each investment and investment category reflects the value of the respective investment or category as a percentage of net assets. |
(a) | | Represents Affiliated Funds. |
| | |
|
Investment Abbreviation: |
SPDR | | —Standard and Poor’s Depositary Receipts |
|
|
| ADDITIONAL INVESTMENT INFORMATION |
FUTURES CONTRACTS — At February 28, 2013, the Portfolio had the following futures contracts:
| | | | | | | | | | | | | | |
| Type | | Number of
Contracts
Long (Short) | | | Expiration
Date | | Current
Value | | | Unrealized
Gain (Loss) | |
EURO STOXX 50 Index | | | 182 | | | March 2013 | | $ | 6,261,026 | | | $ | (13,662 | ) |
Nikkei 225 Index | | | 40 | | | March 2013 | | | 2,305,000 | | | | 381,870 | |
| TOTAL | | | | | | | | | | | | $ | 368,208 | |
| | |
| The accompanying notes are an integral part of these financial statements. | | 17 |
GOLDMAN SACHS TAX-ADVANTAGED GLOBAL EQUITY PORTFOLIO
Schedule of Investments
February 28, 2013 (Unaudited)
| | | | | | | | |
Shares | | | Description | | Value | |
| | Underlying Funds (Institutional Shares)(a) – 94.6% | |
| | Equity – 88.6% | |
| | 27,469,337 | | | Goldman Sachs Structured Tax-Managed Equity Fund | | $ | 338,147,541 | |
| | 17,754,645 | | | Goldman Sachs Structured International Tax-Managed Equity Fund | | | 139,018,868 | |
| | 2,386,092 | | | Goldman Sachs Structured Emerging Markets Equity Fund | | | 21,641,856 | |
| | 1,921,122 | | | Goldman Sachs Structured International Small Cap Fund | | | 16,790,609 | |
| | | | | | | | |
| | | | | | | 515,598,874 | |
| | |
| | Fixed Income – 6.0% | |
| | 2,925,528 | | | Goldman Sachs High Yield Fund | | | 21,561,140 | |
| | 1,130,957 | | | Goldman Sachs Local Emerging Markets Debt Fund | | | 11,117,304 | |
| | 234,714 | | | Goldman Sachs Core Fixed Income Fund | | | 2,502,055 | |
| | | | | | | | |
| | | | | | | 35,180,499 | |
| | |
| TOTAL UNDERLYING FUNDS
(INSTITUTIONAL SHARES) – 94.6% |
|
| | (Cost $422,489,568) | | $ | 550,779,373 | |
| | |
| | | | | | | | |
Shares | | | Description | | Value | |
| | | | | | | | |
| | Exchange Traded Fund – 1.3% | |
| | 290,793 | | | SPDR S&P Bank Fund | | $ | 7,560,618 | |
| | (Cost $6,389,485) | |
| | |
| | | | | | | | | | |
| Contracts | | Strike Price | | Expiration
Date | | | Value | |
| | | | | | | | | | |
| Option Purchased – 0.0% | |
S&P 500 Index Put Option | |
| 70 | | $1,500 | | | 04/20/13 | | | $ | 178,500 | |
| (Cost $247,310) | |
| |
| TOTAL INVESTMENTS – 95.9% | | | | | |
| (Cost $429,126,363) | | | | | | $ | 558,518,491 | |
| |
OTHER ASSETS IN EXCESS OF
LIABILITIES – 4.1% | | | | | | | 23,643,596 | |
| |
| NET ASSETS – 100.0% | | | | | | $ | 582,162,087 | |
| |
| | |
| The percentage shown for each investment and investment category reflects the value of the respective investment or category as a percentage of net assets. |
(a) | | Represents Affiliated Funds. |
| | |
|
Investment Abbreviation: |
SPDR | | —Standard and Poor’s Depositary Receipts |
|
|
| ADDITIONAL INVESTMENT INFORMATION |
FUTURES CONTRACTS — At February 28, 2013, the Portfolio had the following futures contracts:
| | | | | | | | | | | | | | |
| Type | | Number of
Contracts
Long (Short) | | | Expiration
Date | | Current
Value | | | Unrealized
Gain (Loss) | |
EURO STOXX 50 Index | | | 413 | | | March 2013 | | $ | 14,207,713 | | | $ | (31,002 | ) |
Nikkei 225 Index | | | 91 | | | March 2013 | | | 5,243,875 | | | | 868,754 | |
| TOTAL | | | | | | | | | | | | $ | 837,752 | |
| | |
| 18 | | The accompanying notes are an integral part of these financial statements. |
GOLDMAN SACHS GLOBAL TAX-AWARE EQUITY PORTFOLIOS
Statements of Assets and Liabilities
February 28, 2013 (Unaudited)
| | | | | | | | | | |
| | | | | Enhanced Dividend
Global Equity
Portfolio | | | Tax-Advantaged
Global Equity
Portfolio | |
| | Assets: | |
| | Investments in Affiliated Underlying Funds, at value (cost $190,518,110 and $422,489,568) | | $ | 224,712,468 | | | $ | 550,779,373 | |
| | Investments, at value (cost $2,940,404 and $6,636,795) | | | 3,467,834 | | | | 7,739,118 | |
| | Cash | | | 8,603,064 | | | | 19,415,896 | |
| | Receivables: | | | | | | | | |
| | Portfolio shares sold | | | 3,790,875 | | | | 3,763,068 | |
| | Collateral on certain derivative contracts(a) | | | 765,000 | | | | 1,555,000 | |
| | Investments sold | | | 239,149 | | | | 261,040 | |
| | Dividends | | | 67,976 | | | | 163,530 | |
| | Futures variation margin | | | 66,589 | | | | 151,181 | |
| | Reimbursement from investment adviser | | | 14,439 | | | | 23,029 | |
| | Other assets | | | 1,944 | | | | 4,529 | |
| | Total assets | | | 241,729,338 | | | | 583,855,764 | |
| | | | | | | | | | |
| | Liabilities: | |
| | Payables: | | | | | | | | |
| | Portfolio shares redeemed | | | 2,065,138 | | | | 1,294,427 | |
| | Amounts owed to affiliates | | | 75,268 | | | | 162,121 | |
| | Investments purchased | | | 67,976 | | | | 163,530 | |
| | Accrued expenses | | | 64,010 | | | | 73,599 | |
| | Total liabilities | | | 2,272,392 | | | | 1,693,677 | |
| | | | | | | | | | |
| | Net Assets: | |
| | Paid-in capital | | | 212,217,108 | | | | 468,710,154 | |
| | Distributions in excess of net investment income | | | (1,299,582 | ) | | | (157,599 | ) |
| | Accumulated net realized loss | | | (6,559,151 | ) | | | (16,640,001 | ) |
| | Net unrealized gain | | | 35,098,571 | | | | 130,249,533 | |
| | | NET ASSETS | | $ | 239,456,946 | | | $ | 582,162,087 | |
| | | Net Assets: | | | | | | | | |
| | | Class A | | $ | 130,076,511 | | | $ | 253,216,474 | |
| | | Institutional | | | 109,380,435 | | | | 328,945,613 | |
| | | Total Net Assets | | $ | 239,456,946 | | | $ | 582,162,087 | |
| | | Shares outstanding $0.001 par value (unlimited shares authorized): | | | | | | | | |
| | | Class A | | | 12,708,141 | | | | 23,882,871 | |
| | | Institutional | | | 10,643,550 | | | | 30,878,655 | |
| | | Net asset value, offering and redemption price per share:(b) | | | | | | | | |
| | | Class A | | | $10.24 | | | | $10.60 | |
| | | Institutional | | | 10.28 | | | | 10.65 | |
| | (a) | | Represents segregated cash relating to collateral on futures transactions. |
| | (b) | | Maximum public offering price per share for Class A Shares of the Enhanced Dividend Global Equity and Tax-Advantaged Global Equity Portfolios is $10.84 and $11.22, respectively. |
| | |
| The accompanying notes are an integral part of these financial statements. | | 19 |
GOLDMAN SACHS GLOBAL TAX-AWARE EQUITY PORTFOLIOS
Statements of Operations
For the Six Months Ended February 28, 2013 (Unaudited)
| | | | | | | | | | |
| | | | | Enhanced Dividend
Global Equity
Portfolio | | | Tax-Advantaged
Global Equity
Portfolio | |
| | Investment income: | |
| | Dividends from Affiliated Underlying Funds | | $ | 3,045,806 | | | $ | 9,670,939 | |
| | Dividends from Unaffiliated Funds | | | 39,378 | | | | 86,457 | |
| | Total investment income | | | 3,085,184 | | | | 9,757,396 | |
| | | | | | | | | | |
| | Expenses: | |
| | Distribution and Service fees — Class A Shares | | | 161,936 | | | | 313,566 | |
| | Management fees | | | 161,122 | | | | 372,123 | |
| | Transfer Agent fees(a) | | | 140,128 | | | | 287,374 | |
| | Professional fees | | | 34,037 | | | | 33,541 | |
| | Custody, accounting and administrative services | | | 25,055 | | | | 31,361 | |
| | Printing and mailing costs | | | 19,595 | | | | 24,646 | |
| | Registration fees | | | 11,345 | | | | 15,082 | |
| | Trustee fees | | | 7,697 | | | | 9,700 | |
| | Other | | | 4,668 | | | | 6,232 | |
| | Total expenses | | | 565,583 | | | | 1,093,625 | |
| | Less — expense reductions | | | (90,904 | ) | | | (94,118 | ) |
| | Net expenses | | | 474,679 | | | | 999,507 | |
| | NET INVESTMENT INCOME | | | 2,610,505 | | | | 8,757,889 | |
| | | | | | | | | | |
| | Realized and unrealized gain (loss): | |
| | Net realized gain (loss) from: | | | | | | | | |
| | Investments in Affiliated Underlying Funds | | | (871,785 | ) | | | 250,766 | |
| | Investments | | | (312,158 | ) | | | (688,896 | ) |
| | Futures contracts | | | 1,764,134 | | | | 3,932,442 | |
| | Swap contracts | | | 37,873 | | | | 84,367 | |
| | Forward foreign currency exchange contracts | | | 25,198 | | | | 57,746 | |
| | Foreign currency transactions | | | 20,958 | | | | 46,929 | |
| | Capital gain distributions from Affiliated Underlying Funds | | | 5,743,216 | | | | 355,328 | |
| | Net change in unrealized gain (loss) on: | | | | | | | | |
| | Investments in Affiliated Underlying Funds | | | 8,354,270 | | | | 38,175,850 | |
| | Investments | | | 390,837 | | | | 855,582 | |
| | Futures contracts | | | (371,837 | ) | | | (796,984 | ) |
| | Swap contracts | | | (22,727 | ) | | | (50,628 | ) |
| | Forward foreign currency exchange contracts | | | (3,699 | ) | | | (8,478 | ) |
| | Foreign currency translation | | | 11,559 | | | | 26,400 | |
| | Net realized and unrealized gain | | | 14,765,839 | | | | 42,240,424 | |
| | NET INCREASE IN NET ASSETS RESULTING FROM OPERATIONS | | $ | 17,376,344 | | | $ | 50,998,313 | |
| | (a) | | Class specific Transfer Agent fees were as follows: |
| | | | | | | | | | |
| | | | | Transfer Agent Fees | |
| | | Portfolio | | Class A | | | Institutional | |
| | Enhanced Dividend Global Equity | | | $123,072 | | | | $17,056 | |
| | Tax-Advantaged Global Equity | | | 238,312 | | | | 49,062 | |
| | |
| 20 | | The accompanying notes are an integral part of these financial statements. |
GOLDMAN SACHS GLOBAL TAX-AWARE EQUITY PORTFOLIOS
Statements of Changes in Net Assets
| | | | | | | | | | | | | | | | | | |
| | | | | Enhanced Dividend Global
Equity Portfolio | | | Tax-Advantaged Global
Equity Portfolio | |
| | | | | For the
Six Months Ended
February 28, 2013
(Unaudited) | | | For the Fiscal
Year Ended
August 31, 2012 | | | For the
Six Months Ended
February 28, 2013
(Unaudited) | | | For the Fiscal
Year Ended
August 31, 2012 | |
| | From operations: | | | | | | | | | |
| | Net investment income | | $ | 2,610,505 | | | $ | 3,918,889 | | | $ | 8,757,889 | | | $ | 6,955,754 | |
| | Net realized gain (loss) | | | 6,407,436 | | | | (1,230,848 | ) | | | 4,038,682 | | | | (5,294,626 | ) |
| | Net change in unrealized gain | | | 8,358,403 | | | | 12,319,913 | | | | 38,201,742 | | | | 39,023,173 | |
| | Net increase in net assets resulting from operations | | | 17,376,344 | | | | 15,007,954 | | | | 50,998,313 | | | | 40,684,301 | |
| | | | | | | | | | | | | | | | | | |
| | Distributions to shareholders: | | | | | | | | | |
| | From net investment income | | | | | | | | | | | | | | | | |
| | Class A Shares | | | (2,274,221 | ) | | | (3,145,048 | ) | | | (4,171,091 | ) | | | (3,193,242 | ) |
| | Institutional Shares | | | (1,638,242 | ) | | | (2,151,392 | ) | | | (5,177,323 | ) | | | (2,955,554 | ) |
| | From net realized gains | | | | | | | | | | | | | | | | |
| | Class A Shares | | | (1,476,537 | ) | | | (70,490 | ) | | | (793,567 | ) | | | (167,113 | ) |
| | Institutional Shares | | | (941,687 | ) | | | (45,892 | ) | | | (745,537 | ) | | | (119,000 | ) |
| | Total distributions to shareholders | | | (6,330,687 | ) | | | (5,412,822 | ) | | | (10,887,518 | ) | | | (6,434,909 | ) |
| | | | | | | | | | | | | | | | | | |
| | From share transactions: | | | | | | | | | |
| | Proceeds from sales of shares | | | 35,160,058 | | | | 66,990,762 | | | | 128,715,345 | | | | 117,049,494 | |
| | Reinvestment of distributions | | | 5,994,376 | | | | 4,924,873 | | | | 9,635,536 | | | | 5,815,636 | |
| | Cost of shares redeemed | | | (15,769,008 | ) | | | (46,838,528 | ) | | | (47,294,628 | ) | | | (75,969,330 | ) |
| | Net increase in net assets resulting from share transactions | | | 25,385,426 | | | | 25,077,107 | | | | 91,056,253 | | | | 46,895,800 | |
| | TOTAL INCREASE | | | 36,431,083 | | | | 34,672,239 | | | | 131,167,048 | | | | 81,145,192 | |
| | | | | | | | | | | | | | | | | | |
| | Net assets: | | | | | | | | | |
| | Beginning of period | | | 203,025,863 | | | | 168,353,624 | | | | 450,995,039 | | | | 369,849,847 | |
| | End of period | | $ | 239,456,946 | | | $ | 203,025,863 | | | $ | 582,162,087 | | | $ | 450,995,039 | |
| | Undistributed (distributions in excess of) net investment income | | $ | (1,299,582 | ) | | $ | 2,376 | | | $ | (157,599 | ) | | $ | 432,926 | |
| | |
| The accompanying notes are an integral part of these financial statements. | | 21 |
GOLDMAN SACHS ENHANCED DIVIDEND GLOBAL EQUITY PORTFOLIO
Financial Highlights
Selected Data for a Share Outstanding Throughout Each Period
| | | | | | | | | | | | | | | | | | | | | | | | | | | | | | | | | | |
| | | | | | | | Income (loss) from
investment operations | | | Distributions
to shareholders | |
| | | Year - Share Class | |
Net asset
value,
beginning
of period | | | Net
investment
income(a)(b) | | | Net realized
and unrealized
gain (loss) | | | Total from
investment
operations | | | From net
investment
income | | | From net
realized
gains | | | From
capital | | | Total
distributions | |
| | FOR THE SIX MONTHS ENDED FEBRUARY 28, (UNAUDITED) | |
| | 2013 - A | | $ | 9.73 | | | $ | 0.11 | | | $ | 0.68 | | | $ | 0.79 | | | $ | (0.17 | ) | | $ | (0.11 | ) | | $ | — | | | $ | (0.28 | ) |
| | 2013 - Institutional | | | 9.76 | | | | 0.13 | | | | 0.69 | | | | 0.82 | | | | (0.19 | ) | | | (0.11 | ) | | | — | | | | (0.30 | ) |
| | | | | | | | | | | | | | | | | | | | | | | | | | | | | | | | | | |
| | FOR THE FISCAL YEARS ENDED AUGUST 31, | |
| | 2012 - A | | | 9.23 | | | | 0.19 | | | | 0.58 | | | | 0.77 | | | | (0.26 | ) | | | (0.01 | ) | | | — | | | | (0.27 | ) |
| | 2012 - Institutional | | | 9.27 | | | | 0.23 | | | | 0.57 | | | | 0.80 | | | | (0.30 | ) | | | (0.01 | ) | | | — | | | | (0.31 | ) |
| | 2011 - A | | | 8.27 | | | | 0.18 | | | | 1.03 | | | | 1.21 | | | | (0.20 | ) | | | (0.05 | ) | | | — | | | | (0.25 | ) |
| | 2011 - Institutional | | | 8.30 | | | | 0.22 | | | | 1.04 | | | | 1.26 | | | | (0.24 | ) | | | (0.05 | ) | | | — | | | | (0.29 | ) |
| | 2010 - A | | | 7.98 | | | | 0.15 | | | | 0.32 | | | | 0.47 | | | | (0.16 | ) | | | (0.02 | ) | | | — | | | | (0.18 | ) |
| | 2010 - Institutional | | | 8.00 | | | | 0.19 | | | | 0.32 | | | | 0.51 | | | | (0.19 | ) | | | (0.02 | ) | | | — | | | | (0.21 | ) |
| | 2009 - A | | | 9.12 | | | | 0.11 | | | | (1.09 | ) | | | (0.98 | ) | | | (0.16 | ) | | | — | | | | — | | | | (0.16 | ) |
| | 2009 - Institutional | | | 9.13 | | | | 0.17 | | | | (1.12 | ) | | | (0.95 | ) | | | (0.18 | ) | | | — | | | | — | | | | (0.18 | ) |
| | | | | | | | | | | | | | | | | | | | | | | | | | | | | | | | | | |
| | FOR THE PERIOD ENDED AUGUST 31, | |
| | 2008 - A (Commenced April 30, 2008) | | | 10.00 | | | | 0.03 | | | | (0.80 | ) | | | (0.77 | ) | | | (0.08 | ) | | | — | | | | (0.03 | ) | | | (0.11 | ) |
| | 2008 - Institutional (Commenced April 30, 2008) | | | 10.00 | | | | 0.07 | | | | (0.83 | ) | | | (0.76 | ) | | | (0.08 | ) | | | — | | | | (0.03 | ) | | | (0.11 | ) |
| | (a) | | Calculated based on the average shares outstanding methodology. |
| | (b) | | Recognition of net investment income by the Portfolio is affected by the timing of declaration of dividends by the Underlying Funds in which the Portfolio invests. |
| | (c) | | Assumes investment at the net asset value at the beginning of the period, reinvestment of all distributions, a complete redemption of the investment at the net asset value at the end of the period and no sales or redemption charges. Total returns would be reduced if a sales or redemption charge was taken into account. Returns do not reflect the deduction of taxes that a shareholder would pay on Portfolio distributions or the redemption of Portfolio shares. Total returns for periods less than one full year are not annualized. |
| | (d) | | Expense ratios exclude the expenses of the Underlying Funds in which the Portfolio invests. |
| | (e) | | The portfolio turnover rate is calculated in accordance with regulatory requirements, without regard to transactions involving short term investments and certain derivatives. If such transactions were included, the portfolio turnover rate may be higher. |
| | |
| 22 | | The accompanying notes are an integral part of these financial statements. |
GOLDMAN SACHS ENHANCED DIVIDEND GLOBAL EQUITY PORTFOLIO
| | | | | | | | | | | | | | | | | | | | | | | | | | | | | | | | | | | | | | | | |
| | | | | | | | | | | | | | | | | | | | | | | | | | | | | | | | | | |
| | | Net asset
value, end
of period | | | | | Total
return(c) | | | | | Net assets,
end of
period
(in 000s) | | | | | Ratio of
net expenses
to average
net assets(d) | | | | | Ratio of
total expenses
to average
net assets(d) | | | | | Ratio of
net investment
income
to average
net assets(b) | | | | | Portfolio
turnover
rate(e) | |
| | | | |
| | $ | 10.24 | | | | | | 8.35 | % | | | | $ | 130,077 | | | | | | 0.60 | %(f) | | | | | 0.68 | %(f) | | | | | 2.32 | %(f) | | | | | 11 | % |
| | | 10.28 | | | | | | 8.65 | | | | | | 109,380 | | | | | | 0.20 | (f) | | | | | 0.28 | (f) | | | | | 2.58 | (f) | | | | | 11 | |
| | | | | | | | | | | | | | | | | | | | | | | | | | | | | | | | | | | | | | | | |
| | | | |
| | | 9.73 | | | | | | 8.51 | | | | | | 127,290 | | | | | | 0.60 | | | | | | 0.70 | | | | | | 2.02 | | | | | | 32 | |
| | | 9.76 | | | | | | 8.79 | | | | | | 75,735 | | | | | | 0.20 | | | | | | 0.30 | | | | | | 2.42 | | | | | | 32 | |
| | | 9.23 | | | | | | 14.52 | | | | | | 102,498 | | | | | | 0.60 | | | | | | 0.73 | | | | | | 1.91 | | | | | | 25 | |
| | | 9.27 | | | | | | 15.01 | | | | | | 65,856 | | | | | | 0.20 | | | | | | 0.33 | | | | | | 2.28 | | | | | | 25 | |
| | | 8.27 | | | | | | 5.80 | | | | | | 54,481 | | | | | | 0.60 | | | | | | 0.78 | | | | | | 1.74 | | | | | | 42 | |
| | | 8.30 | | | | | | 6.31 | | | | | | 30,802 | | | | | | 0.20 | | | | | | 0.38 | | | | | | 2.18 | | | | | | 42 | |
| | | 7.98 | | | | | | (10.53 | ) | | | | | 32,912 | | | | | | 0.60 | | | | | | 1.56 | | | | | | 1.67 | | | | | | 75 | |
| | | 8.00 | | | | | | (10.11 | ) | | | | | 22,764 | | | | | | 0.20 | | | | | | 1.16 | | | | | | 2.45 | | | | | | 75 | |
| | | | | | | | | | | | | | | | | | | | | | | | | | | | | | | | | | | | | | | | |
| | | | |
| | | 9.12 | | | | | | (7.70 | ) | | | | | 4,043 | | | | | | 0.60 | (f) | | | | | 4.05 | (f) | | | | | 1.00 | (f) | | | | | 9 | |
| | | 9.13 | | | | | | (7.58 | ) | | | | | 20,332 | | | | | | 0.20 | (f) | | | | | 3.65 | (f) | | | | | 2.13 | (f) | | | | | 9 | |
| | |
| The accompanying notes are an integral part of these financial statements. | | 23 |
GOLDMAN SACHS TAX-ADVANTAGED GLOBAL EQUITY PORTFOLIO
Financial Highlights
Selected Data for a Share Outstanding Throughout Each Period
| | | | | | | | | | | | | | | | | | | | | | | | | | | | | | |
| | | | | | | | Income (loss)
from investment operations | | | Distributions
to shareholders | |
| | | Year - Share Class | |
Net asset
value,
beginning
of period | | | Net
investment
income(a)(b) | | | Net realized
and unrealized
gain (loss) | | | Total from
investment
operations | | | From net
investment
income | | | From net
realized
gains | | | Total
distributions | |
| | FOR THE SIX MONTHS ENDED FEBRUARY 28, (UNAUDITED) | |
| | 2013 - A | | $ | 9.78 | | | $ | 0.17 | | | $ | 0.85 | | | $ | 1.02 | | | $ | (0.17 | ) | | $ | (0.03 | ) | | $ | (0.20 | ) |
| | 2013 - Institutional | | | 9.84 | | | | 0.18 | | | | 0.87 | | | | 1.05 | | | | (0.21 | ) | | | (0.03 | ) | | | (0.24 | ) |
| | | | | | | | | | | | | | | | | | | | | | | | | | | | | | |
| | FOR THE FISCAL YEARS ENDED AUGUST 31, | |
| | 2012 - A | | | 8.98 | | | | 0.15 | | | | 0.79 | | | | 0.94 | | | | (0.13 | ) | | | (0.01 | ) | | | (0.14 | ) |
| | 2012 - Institutional | | | 9.04 | | | | 0.17 | | | | 0.81 | | | | 0.98 | | | | (0.17 | ) | | | (0.01 | ) | | | (0.18 | ) |
| | 2011 - A | | | 7.84 | | | | 0.10 | | | | 1.19 | | | | 1.29 | | | | (0.12 | ) | | | (0.03 | ) | | | (0.15 | ) |
| | 2011 - Institutional | | | 7.89 | | | | 0.14 | | | | 1.19 | | | | 1.33 | | | | (0.15 | ) | | | (0.03 | ) | | | (0.18 | ) |
| | 2010 - A | | | 7.78 | | | | 0.11 | | | | 0.10 | | | | 0.21 | | | | (0.13 | ) | | | (0.02 | ) | | | (0.15 | ) |
| | 2010 - Institutional | | | 7.82 | | | | 0.14 | | | | 0.10 | | | | 0.24 | | | | (0.15 | ) | | | (0.02 | ) | | | (0.17 | ) |
| | 2009 - A | | | 9.25 | | | | 0.08 | | | | (1.44 | ) | | | (1.36 | ) | | | (0.11 | ) | | | — | | | | (0.11 | ) |
| | 2009 - Institutional | | | 9.27 | | | | 0.13 | | | | (1.47 | ) | | | (1.34 | ) | | | (0.11 | ) | | | — | | | | (0.11 | ) |
| | | | | | | | | | | | | | | | | | | | | | | | | | | | | | |
| | FOR THE PERIOD ENDED AUGUST 31, | |
| | 2008 - A (Commenced April 30, 2008) | | | 10.00 | | | | — | (g) | | | (0.75 | ) | | | (0.75 | ) | | | — | | | | — | | | | — | |
| | 2008 - Institutional (Commenced April 30, 2008) | | | 10.00 | | | | 0.01 | | | | (0.74 | ) | | | (0.73 | ) | | | — | | | | — | | | | — | |
| | (a) | | Calculated based on the average shares outstanding methodology. |
| | (b) | | Recognition of net investment income by the Portfolio is affected by the timing of declaration of dividends by the Underlying Funds in which the Portfolio invests. |
| | (c) | | Assumes investment at the net asset value at the beginning of the period, reinvestment of all distributions, a complete redemption of the investment at the net asset value at the end of the period and no sales or redemption charges. Total returns would be reduced if a sales or redemption charge was taken into account. Returns do not reflect the deduction of taxes that a shareholder would pay on Portfolio distributions or the redemption of Portfolio shares. Total returns for periods less than one full year are not annualized. |
| | (d) | | Expense ratios exclude the expenses of the Underlying Funds in which the Portfolio invests. |
| | (e) | | The portfolio turnover rate is calculated in accordance with regulatory requirements, without regard to transactions involving short term investments and certain derivatives. If such transactions were included, the portfolio turnover rate may be higher. |
| | (g) | | Amount is less than $0.005 per share. |
| | |
| 24 | | The accompanying notes are an integral part of these financial statements. |
GOLDMAN SACHS TAX-ADVANTAGED GLOBAL EQUITY PORTFOLIO
| | | | | | | | | | | | | | | | | | | | | | | | | | | | | | | | | | | | | | | | |
| | | | | | | | | | | | | | | | | | | | | | | | | | | | | | | | | | |
| | | Net asset
value, end
of period | | | | | Total
return(c) | | | | | Net assets,
end of
period
(in 000s) | | | | | Ratio of
net expenses
to average
net assets(d) | | | | | Ratio of
total expenses
to average
net assets(d) | | | | | Ratio of
net investment
income (loss)
to average
net assets(b) | | | | | Portfolio
turnover
rate(e) | |
| | | | |
| | $ | 10.60 | | | | | | 10.70 | % | | | | $ | 253,216 | | | | | | 0.60 | %(f) | | | | | 0.64 | %(f) | | | | | 3.43 | %(f) | | | | | 11 | % |
| | | 10.65 | | | | | | 10.86 | | | | | | 328,946 | | | | | | 0.20 | (f) | | | | | 0.24 | (f) | | | | | 3.61 | (f) | | | | | 11 | |
| | | | | | | | | | | | | | | | | | | | | | | | | | | | | | | | | | | | | | | | |
| | | | |
| | | 9.78 | | | | | | 10.52 | | | | | | 243,892 | | | | | | 0.60 | | | | | | 0.65 | | | | | | 1.62 | | | | | | 24 | |
| | | 9.84 | | | | | | 11.02 | | | | | | 207,103 | | | | | | 0.20 | | | | | | 0.25 | | | | | | 1.88 | | | | | | 24 | |
| | | 8.98 | | | | | | 16.41 | | | | | | 222,002 | | | | | | 0.60 | | | | | | 0.66 | | | | | | 1.05 | | | | | | 23 | |
| | | 9.04 | | | | | | 16.89 | | | | | | 147,848 | | | | | | 0.20 | | | | | | 0.26 | | | | | | 1.46 | | | | | | 23 | |
| | | 7.84 | | | | | | 2.56 | | | | | | 191,008 | | | | | | 0.60 | | | | | | 0.69 | | | | | | 1.30 | | | | | | 23 | |
| | | 7.89 | | | | | | 2.94 | | | | | | 57,539 | | | | | | 0.20 | | | | | | 0.29 | | | | | | 1.73 | | | | | | 23 | |
| | | 7.78 | | | | | | (14.61 | ) | | | | | 120,898 | | | | | | 0.60 | | | | | | 1.11 | | | | | | 1.12 | | | | | | 52 | |
| | | 7.82 | | | | | | (14.16 | ) | | | | | 28,022 | | | | | | 0.20 | | | | | | 0.71 | | | | | | 1.85 | | | | | | 52 | |
| | | | | | | | | | | | | | | | | | | | | | | | | | | | | | | | | | | | | | | | |
| | | | |
| | | 9.25 | | | | | | (7.40 | ) | | | | | 20,710 | | | | | | 0.60 | (f) | | | | | 3.25 | (f) | | | | | (0.05 | )(f) | | | | | 15 | |
| | | 9.27 | | | | | | (7.30 | ) | | | | | 8,536 | | | | | | 0.20 | (f) | | | | | 2.85 | (f) | | | | | 0.33 | (f) | | | | | 15 | |
| | |
| The accompanying notes are an integral part of these financial statements. | | 25 |
GOLDMAN SACHS GLOBAL TAX-AWARE EQUITY PORTFOLIOS
Notes to Financial Statements
February 28, 2013 (Unaudited)
Goldman Sachs Trust (the “Trust”) is a Delaware statutory trust registered under the Investment Company Act of 1940, as amended (the “Act”), as an open-end management investment company. The following table lists those series of the Trust that are included in this report (collectively, the “Portfolios” or individually a “Portfolio”), along with their corresponding share classes and respective diversification status under the Act:
| | | | |
| Portfolio | | Share Classes Offered | | Diversified/ Non-diversified |
| Enhanced Dividend Global Equity and Tax-Advantaged Global Equity | | A and Institutional | | Diversified |
Class A Shares are sold with a front-end sales charge of up to 5.50%. Institutional Shares are not subject to a sales charge.
Goldman Sachs Asset Management, L.P. (“GSAM”), an affiliate of Goldman, Sachs & Co. (“Goldman Sachs”), serves as investment adviser to the Portfolios pursuant to a management agreement (the “Agreement”) with the Trust.
The Portfolios are expected to invest primarily in a combination of domestic and international equity and fixed income underlying funds (“Underlying Funds”) which are registered under the Act, for which GSAM or Goldman Sachs Asset Management International (“GSAMI”), also an affiliate of Goldman Sachs, act as investment advisers. Additionally, these Portfolios may invest a portion of their assets directly in other securities and instruments, including unaffiliated funds (“Unaffiliated Funds”).
|
| 2. SIGNIFICANT ACCOUNTING POLICIES |
The financial statements have been prepared in accordance with accounting principles generally accepted in the United States of America (“GAAP”) and require management to make estimates and assumptions that may affect the reported amounts and disclosures. Actual results may differ from those estimates and assumptions.
A. Investment Valuation — The Portfolios’ valuation policy, as well as the Underlying Funds’, is to value investments at fair value.
B. Investment Income and Investments — Investment income includes interest income and dividend income, net of any foreign withholding taxes, less any amounts reclaimable. Interest income is accrued daily and adjusted for amortization of premiums and accretion of discounts. Dividend income is recognized on ex-dividend date or, for certain foreign securities, as soon as such information is obtained subsequent to the ex-dividend date. Capital gain distributions received from Underlying Funds are recognized on ex-dividend date. Investment transactions are reflected on trade date. Realized gains and losses are calculated using identified cost. Investment transactions are recorded on the following business day for daily net asset value (“NAV”) calculations. Any foreign capital gains tax is accrued daily based upon net unrealized gains, and is payable upon sale of such investments.
For derivative contracts, realized gains and losses are recorded upon settlement of the contract. Upfront payments on swaps are recognized over the contract’s term/event as realized gains or losses, with the exception of forward starting interest rate swaps whose realized gains or losses are recognized from the effective start date.
C. Class Allocations and Expenses — Investment income, realized and unrealized gain (loss), and non-class specific expenses of each Portfolio are allocated daily based upon the proportion of net assets of each class. Class specific expenses, where applicable, are borne by the respective share classes and include Distribution and Service, Transfer Agent and Service and Shareholder Administration fees. Non-class specific expenses directly incurred by a Portfolio are charged to that Portfolio, while such expenses incurred by the Trust are allocated across the respective Portfolios on a straight-line and/or pro-rata basis depending upon the nature of the expenses.
26
GOLDMAN SACHS GLOBAL TAX-AWARE EQUITY PORTFOLIOS
|
| 2. SIGNIFICANT ACCOUNTING POLICIES (continued) |
Expenses included in the accompanying financial statements reflect the expenses of each Portfolio and do not include any expenses associated with the Underlying Funds. Because the Underlying Funds have varied expense and fee levels and the Portfolios may own different proportions of the Underlying Funds at different times, the amount of fees and expenses incurred indirectly by each Portfolio will vary.
D. Federal Taxes and Distributions to Shareholders — It is each Portfolio’s policy to comply with the requirements of the Internal Revenue Code of 1986, as amended (the “Code”), applicable to regulated investment companies (mutual funds) and to distribute each year substantially all of its investment company taxable income and capital gains to its shareholders. Accordingly, the Portfolios are not required to make any provisions for the payment of federal income tax. Distributions to shareholders are recorded on the ex-dividend date. Income and capital gains distributions, if any, are declared and paid according to the following schedule:
| | | | | | |
| Portfolio | | | | Income Distributions
Declared/Paid | | Capital Gains Distributions
Declared/Paid |
Enhanced Dividend Global Equity | | | | Quarterly | | Annually |
Tax-Advantaged Global Equity | | | | Annually | | Annually |
Net capital losses are carried forward to future fiscal years and may be used to the extent allowed by the Code to offset any future capital gains. Utilization of capital loss carryforwards will reduce the requirement of future capital gains distributions.
Under the Regulated Investment Company Modernization Act of 2010, the Portfolios are permitted to carry forward capital losses incurred in taxable years beginning after December 22, 2010 for an unlimited period. However, any losses incurred during those future taxable years will be required to be utilized prior to the losses incurred in pre-enactment taxable years. As a result of this ordering rule, pre-enactment capital loss carryforwards may be more likely to expire unused. Additionally, post-enactment capital losses that are carried forward will retain their character as either short-term or long term capital losses rather than being considered all short-term as under previous law.
The characterization of distributions to shareholders for financial reporting purposes is determined in accordance with federal income tax rules, which may differ from GAAP. The source of each Portfolio’s distributions may be shown in the accompanying financial statements as either from net investment income, net realized gain or capital. Certain components of the Portfolios’ net assets on the Statements of Assets and Liabilities reflect permanent GAAP/tax differences based on the appropriate tax character.
E. Foreign Currency Translation — The accounting records and reporting currency of the Portfolios are maintained in United States (“U.S.”) dollars. Assets and liabilities denominated in foreign currencies are translated into U.S. dollars using the current exchange rates at the close of each business day. The effect of changes in foreign currency exchange rates on investments is included within net realized and unrealized gain (loss) on investments. Changes in the value of other assets and liabilities as a result of fluctuations in foreign exchange rates are included in the Statements of Operations within net change in unrealized gain (loss) on foreign currency transactions. Transactions denominated in foreign currencies are translated into U.S. dollars on the date the transaction occurred, the effects of which are included within net realized gain (loss) on foreign currency transactions.
|
| 3. INVESTMENTS AND FAIR VALUE MEASUREMENTS |
The fair value of a financial instrument is the amount that would be received to sell an asset or paid to transfer a liability in an orderly transaction between market participants at the measurement date (i.e., the exit price). GAAP establishes a fair value hierarchy that prioritizes the inputs to valuation techniques used to measure fair value. The hierarchy gives the highest priority to
27
GOLDMAN SACHS GLOBAL TAX-AWARE EQUITY PORTFOLIOS
Notes to Financial Statements (continued)
February 28, 2013 (Unaudited)
|
| 3. INVESTMENTS AND FAIR VALUE MEASUREMENTS (continued) |
unadjusted quoted prices in active markets for identical assets or liabilities (Level 1 measurements) and the lowest priority to unobservable inputs (Level 3 measurements). The levels used for classifying investments are not necessarily an indication of the risk associated with investing in these investments. The three levels of the fair value hierarchy are described below:
Level 1 — Unadjusted quoted prices in active markets that are accessible at the measurement date for identical, unrestricted assets or liabilities;
Level 2 — Quoted prices in markets that are not active or financial instruments for which significant inputs are observable (including, but not limited to, quoted prices for similar investments, interest rates, foreign exchange rates, volatility and credit spreads), either directly or indirectly;
Level 3 — Prices or valuations that require significant unobservable inputs (including GSAM’s assumptions in determining fair value measurement).
The Trustees have adopted Valuation Procedures that govern the valuation of the portfolio investments held by the Portfolios including investments for which market quotations are not readily available. The Trustees have delegated to GSAM day-to-day responsibility for implementing and maintaining internal controls and procedures related to the valuation of the Portfolio’s portfolio investments. To assess the continuing appropriateness of pricing sources and methodologies, GSAM regularly performs price verification procedures and issues challenges as necessary to third party pricing vendors or brokers, and any differences are reviewed in accordance with the Valuation Procedures.
A. Level 1 and Level 2 Fair Value Investments — The valuation techniques and significant inputs used in determining the fair values for investments classified as Level 1 and Level 2 are as follows:
Underlying Funds — Investments in the Underlying Funds are valued at the NAV of the Institutional Share class of each Underlying Fund on the day of valuation. Because each Portfolio invests primarily in other mutual funds that fluctuate in value, the Portfolios’ shares will correspondingly fluctuate in value.
The Underlying Funds may invest in debt securities which, if market quotations are readily available are valued daily on the basis of quotations supplied by dealers or an independent pricing service approved by the Trustees. The pricing services may use valuation models or matrix pricing, which consider: (i) yield or price with respect to bonds that are considered comparable in characteristics such as rating, interest rate and maturity date or (ii) quotations from securities dealers to determine current value. Short-term debt obligations that mature in sixty days or less and that do not exhibit signs of credit deterioration are valued at amortized cost, which approximates fair value. With the exception of treasury securities, which are generally classified as Level 1, these investments are generally classified as Level 2 of the fair value hierarchy.
The Portfolio and the Underlying Funds may invest in equity securities and investment companies. Investments in equity securities and investment companies traded on a U.S. securities exchange or the NASDAQ system, or those located on certain foreign exchanges, including but not limited to the Americas, are valued daily at their last sale price or official closing price on the principal exchange or system on which they are traded. If no sale occurs, equity securities and exchange traded investment companies are valued at the last bid price for long positions and at the last ask price for short positions. Investments in investment companies (other than those that are exchange traded) are valued at the NAV on the valuation date. To the extent these investments are actively traded, they are classified as Level 1 of the fair value hierarchy.
Unlisted equity securities for which market quotations are available are valued at the last sale price on the valuation date, or if no sale occurs, at the last bid price. Securities traded on certain foreign securities exchanges are valued daily at fair value determined by an independent fair value service (if available) under Valuation Procedures approved by the Trustees and consistent with applicable regulatory guidance. The independent fair value service takes into account multiple factors including, but not
28
GOLDMAN SACHS GLOBAL TAX-AWARE EQUITY PORTFOLIOS
|
| 3. INVESTMENTS AND FAIR VALUE MEASUREMENTS (continued) |
limited to, movements in the securities markets, certain depositary receipts, futures contracts and foreign currency exchange rates that have occurred subsequent to the close of the foreign securities exchange. Investments applying these valuation adjustments are classified as Level 2 of the fair value hierarchy.
Derivative Contracts — A derivative is an instrument whose value is derived from underlying assets, indices, reference rates or a combination of these factors.
Exchange-traded derivatives, including futures contracts, typically fall within Level 1 of the fair value hierarchy. Over-the-counter (“OTC”) derivatives are valued using market transactions and other market evidence, including market-based inputs to models, calibration to market-clearing transactions, broker or dealer quotations, or other alternative pricing sources. Where models are used, the selection of a particular model to value an OTC derivative depends upon the contractual terms of, and specific risks inherent in, the instrument, as well as the availability of pricing information in the market. Valuation models require a variety of inputs, including contractual terms, market prices, yield curves, credit curves, measures of volatility, voluntary and involuntary prepayment rates, loss severity rates and correlations of such inputs. For OTC derivatives that trade in liquid markets, model inputs can generally be verified and model selection does not involve significant management judgment. OTC derivatives are classified within Level 2 of the fair value hierarchy when significant inputs are corroborated by market evidence.
i. Forward Foreign Currency Exchange Contracts — In a forward foreign currency contract, a Portfolio agrees to receive or deliver a fixed quantity of one currency for another, at a pre-determined price at a future date. All forward foreign currency exchange contracts are marked-to-market daily at the applicable forward rate.
ii. Futures Contracts — Futures contracts are contracts to buy or sell a standardized quantity of a specified commodity or security and are valued based on exchanged settlement prices or independent market quotes. Futures contracts are valued at the last settlement price, or in the absence of a sale, the last bid price for long positions and at the last ask price for short positions, at the end of each day on the board of trade or exchange upon which they are traded. Upon entering into a futures contract, the Portfolios deposit cash or securities in an account on behalf of the broker in an amount sufficient to meet the initial margin requirement. Subsequent payments are made or received by the Portfolios equal to the daily change in the contract value and are recorded as variation margin receivable or payable with a corresponding offset to unrealized gains or losses.
iii. Options — When the Portfolios write call or put options, an amount equal to the premium received is recorded as a liability and is subsequently marked-to-market to reflect the current value of the option written. Swaptions are options on interest rate swap contracts. Options on a futures contract may be written with premiums to be determined on a future date. The premiums for these options are based upon implied volatility parameters at specified terms.
Upon the purchase of a call option or a put option by the Portfolios, the premium paid is recorded as an investment and subsequently marked-to-market to reflect the current value of the option. Certain options may be purchased with premiums to be determined on a future date. The premiums for these options are based upon implied volatility parameters at specified terms.
iv. Swap Contracts — Swaps are marked to market daily using pricing vendor quotations, counterparty prices or model prices, and the change in value, if any, is recorded as an unrealized gain or loss.
A total return swap is an agreement that gives a Portfolio the right to receive the appreciation in the value of a specified security, index or other instrument in return for a fee paid to the counterparty, which will typically be an agreed upon interest rate. If the underlying asset declines in value over the term of the swap, the Portfolio may also be required to pay the dollar value of that decline to the counterparty.
29
GOLDMAN SACHS GLOBAL TAX-AWARE EQUITY PORTFOLIOS
Notes to Financial Statements (continued)
February 28, 2013 (Unaudited)
|
| 3. INVESTMENTS AND FAIR VALUE MEASUREMENTS (continued) |
B. Level 3 Fair Value Investments — To the extent that the aforementioned significant inputs are unobservable, or if quotations are not readily available, or if GSAM believes that such quotations do not accurately reflect fair value, the fair value of the Portfolios’ investments may be determined under Valuation Procedures approved by the Trustees. GSAM, consistent with its procedures and applicable regulatory guidance, may make an adjustment to the most recent valuation prices of either domestic or foreign securities in light of significant events to reflect what it believes to be the fair value of the securities at the time of determining a Portfolio’s NAV. Significant events which could affect a large number of securities in a particular market may include, but are not limited to: significant fluctuations in U.S. or foreign markets; market dislocations; market disruptions; or unscheduled market closings. Significant events which could also affect a single issuer may include, but are not limited to: corporate actions such as reorganizations, mergers and buy-outs; ratings downgrades; and bankruptcies.
30
GOLDMAN SACHS GLOBAL TAX-AWARE EQUITY PORTFOLIOS
|
| 3. INVESTMENTS AND FAIR VALUE MEASUREMENTS (continued) |
C. Fair Value Hierarchy — The following is a summary of the Portfolios’ investments and derivatives classified in the fair value hierarchy as of February 28, 2013:
| | | | | | | | | | | | |
| | | |
| ENHANCED DIVIDEND GLOBAL EQUITY | | | | | | | | | | | | |
| | | |
| Investment Type | | Level 1 | | | Level 2 | | | Level 3 | |
| Assets | | | | | | | | | | | | |
Equity Underlying Funds | | $ | 210,247,454 | | | $ | — | | | $ | — | |
Fixed Income Underlying Funds | | | 14,465,014 | | | | — | | | | — | |
Exchange Traded Fund | | | 3,393,884 | | | | — | | | | — | |
| Total | | $ | 228,106,352 | | | $ | — | | | $ | — | |
| | | |
| Derivative Type | | | | | | | | | |
| Assets | | | | | | | | | | | | |
Futures Contracts(a) | | $ | 381,870 | | | $ | — | | | $ | — | |
Option Purchased | | | 73,950 | | | | — | | | | — | |
| Total | | $ | 455,820 | | | $ | — | | | $ | — | |
| Liabilities(a) | | | | | | | | | | | | |
Futures Contracts | | $ | (13,662 | ) | | $ | — | | | $ | — | |
| | | |
| TAX-ADVANTAGED GLOBAL EQUITY | | | | | | | | | | | | |
| | | |
| Investment Type | | Level 1 | | | Level 2 | | | Level 3 | |
| Assets | | | | | | | | | | | | |
Equity Underlying Funds | | $ | 515,598,874 | | | $ | — | | | $ | — | |
Fixed Income Underlying Funds | | | 35,180,499 | | | | — | | | | — | |
Exchange Traded Fund | | | 7,560,618 | | | | — | | | | — | |
| Total | | $ | 558,339,991 | | | $ | — | | | $ | — | |
| | | |
| Derivative Type | | | | | | | | | |
| Assets | | | | | | | | | | | | |
Futures Contracts(a) | | $ | 868,754 | | | $ | — | | | $ | — | |
Option Purchased | | | 178,500 | | | | — | | | | — | |
| Total | | $ | 1,047,254 | | | $ | — | | | $ | — | |
| Liabilities(a) | | | | | | | | | | | | |
Futures Contracts | | $ | (31,002 | ) | | $ | — | | | $ | — | |
| (a) | | Amount shown represents unrealized gain (loss) at period end. |
For further information regarding security characteristics, see the Schedules of Investments.
31
GOLDMAN SACHS GLOBAL TAX-AWARE EQUITY PORTFOLIOS
Notes to Financial Statements (continued)
February 28, 2013 (Unaudited)
|
| 4. INVESTMENTS IN DERIVATIVES |
The following tables set forth, by certain risk types, the gross value of derivative contracts as of February 28, 2013. These instruments were used to meet the Portfolios’ investment objectives and to obtain and/or manage exposure related to the risks below. The values in the tables below exclude the effects of cash collateral received or posted pursuant to these derivative contracts, and therefore are not representative of the Portfolios’ net exposure:
| | | | | | | | | | | | |
|
| Enhanced Dividend Global Equity | |
| Risk | | Statements of Assets
and Liabilities | | Assets(a) | | | Statements of Assets
and Liabilities | | Liabilities(a) | |
Equity | | Unrealized gain on futures variation margin; Investments, at value | | $ | 455,820 | | | Unrealized loss on futures variation margin | | $ | (13,662) | |
|
| Tax-Advantaged Global Equity | |
| Risk | | Statements of Assets
and Liabilities | | Assets(a) | | | Statements of Assets
and Liabilities | | Liabilities(a) | |
Equity | | Unrealized gain on futures variation margin; Investments, at value | | $ | 1,047,254 | | | Unrealized loss on futures variation margin | | $ | (31,002) | |
| (a) | | Includes unrealized gain (loss) on futures contracts described in the Additional Investment Information sections of the Schedules of Investments. Only current day’s variation margin is reported within the Statements of Assets and Liabilities. |
The following tables set forth, by certain risk types, the Portfolios’ gains (losses) related to these derivatives and their indicative volumes for the six months ended February 28, 2013. These gains (losses) should be considered in the context that these derivative contracts may have been executed to economically hedge certain investments, and accordingly, certain gains (losses) on such derivative contracts may offset certain (losses) gains attributable to investments. These gains (losses) are included in “Net realized gain (loss)” or “Net change in unrealized gain (loss)” on the Statements of Operations:
| | | | | | | | | | | | | | |
|
| Enhanced Dividend Global Equity | |
| Risk | | Statements of Operations | | Net
Realized
Gain (Loss) | | | Net Change in
Unrealized
Gain (Loss) | | | Average
Number of
Contracts(a) | |
| Currency | | Net realized gain (loss) from forward foreign currency exchange contracts/Net change in unrealized gain (loss) on forward foreign currency exchange contracts | | $ | 25,198 | | | $ | (3,699 | ) | | | 1 | |
| Equity | | Net realized gain (loss) from investments, futures and swap contracts/Net change in unrealized gain (loss) on investments, futures and swap contracts | | | 1,489,849 | | | | (435,831 | ) | | | 336 | |
| Total | | | | $ | 1,515,047 | | | $ | (439,530 | ) | | | 337 | |
|
| Tax-Advantaged Global Equity | |
| Risk | | Statements of Operations | | Net
Realized
Gain (Loss) | | | Net Change in
Unrealized
Gain (Loss) | | | Average
Number of
Contracts(a) | |
| Currency | | Net realized gain (loss) from forward foreign currency exchange contracts/Net change in unrealized gain (loss) on forward foreign currency exchange contracts | | $ | 57,746 | | | $ | (8,478 | ) | | | 1 | |
| Equity | | Net realized gain (loss) from investments, futures and swap contracts/Net change in unrealized gain (loss) on investments, futures and swap contracts | | | 3,327,913 | | | | (944,582 | ) | | | 759 | |
| Total | | | | $ | 3,385,659 | | | $ | (953,060 | ) | | | 760 | |
| (a) | | Average number of contracts is based on the average of month end balances for the period ended February 28, 2013. |
32
GOLDMAN SACHS GLOBAL TAX-AWARE EQUITY PORTFOLIOS
|
| 5. AGREEMENTS AND AFFILIATED TRANSACTIONS |
A. Management Agreement — Under the Agreement, GSAM manages the Portfolios, subject to the general supervision of the Trustees.
As compensation for the services rendered pursuant to the Agreement, the assumption of the expenses related thereto and administration of the Portfolios’ business affairs, including providing facilities, GSAM is entitled to a management fee, accrued daily and paid monthly, equal to an annual percentage rate of 0.15% of each Portfolio’s average daily net assets.
B. Distribution and Service Plans — The Trust, on behalf of each Portfolio’s Class A Shares, has adopted Distribution and Service Plans (the “Plans”). Under the Plans, Goldman Sachs, which serves as distributor (the “Distributor”), is entitled to a fee accrued daily and paid monthly, for distribution services and personal and account maintenance services, which may then be paid by Goldman Sachs to authorized dealers, equal to, on an annual basis, 0.25% of each Portfolio’s average daily net assets attributable to Class A Shares.
C. Distribution Agreement — Goldman Sachs, as Distributor of the shares of the Portfolios pursuant to a Distribution Agreement, may retain a portion of the Class A front end sales charge. During the six months ended February 28, 2013, Goldman Sachs advised that it did not retain any Class A front-end sales charges.
D. Transfer Agency Agreement — Goldman Sachs also serves as the transfer agent of the Portfolios for a fee pursuant to a Transfer Agency Agreement. The fees charged for such transfer agency services are accrued daily and paid monthly at annual rates as follows: 0.19% of the average daily net assets of Class A Shares and 0.04% of the average daily net assets of Institutional Shares.
E. Other Expense Agreements and Affiliated Transactions — GSAM has agreed to limit certain “Other Expense” of the Portfolios (excluding management fees, distribution and service fees, acquired fund fees and expenses, transfer agent fees and expenses, service fees and shareholder administration fees (as applicable), Administration Share fees (as applicable), taxes, interest, brokerage fees, litigation, indemnification, shareholder meeting and other extraordinary expenses) to the extent such expenses exceed, on an annual basis, a percentage rate of the average daily net assets of each Portfolio. Such Other Expense reimbursements, if any, are accrued daily and paid monthly. In addition, the Portfolios are not obligated to reimburse GSAM for prior fiscal year expense reimbursements, if any. The Other Expense limitation as an annual percentage rate of average daily net assets for the Portfolios is 0.014%. These Other Expense reimbursements will remain in place through at least December 29, 2013, and prior to such date GSAM may not terminate the arrangements without the approval of the Trustees. In addition, the Portfolios have entered into certain offset arrangements with the custodian and the transfer agent, which may result in a reduction of the Portfolios’ expenses and are received irrespective of the application of the “Other Expense” limitations described above.
For the six months ended February 28, 2013, these expense reductions, including Other Expense reimbursements, were approximately $90,900 and $94,100 for the Enhanced Dividend Global Equity and Tax-Advantaged Global Equity Portfolios, respectively.
As of February 28, 2013, the amounts owed to affiliates of the Portfolios were as follows (in thousands):
| | | | | | | | | | | | | | | | | | |
| Portfolio | | | | Management
Fees | | | Distribution
and Service
Fees | | | Transfer
Agent
Fees | | | Total | |
Enhanced Dividend Global Equity | | | | | $27 | | | | $25 | | | | $23 | | | | $75 | |
Tax-Advantaged Global Equity | | | | | 66 | | | | 49 | | | | 47 | | | | 162 | |
F. Line of Credit Facility — As of February 28, 2013, the Portfolios participated in a $630,000,000 committed, unsecured revolving line of credit facility (the “facility”) together with other funds of the Trust and registered investment companies having management agreements with GSAM or its affiliates (“Other Borrowers”). Pursuant to the terms of the facility, the Portfolios and Other Borrowers could increase the credit amount by an additional $340,000,000, for a total of up to $970,000,000. This facility is to be used solely for temporary or emergency purposes, which may include the funding of redemptions. The interest rate on borrowings is based on the federal funds rate. The facility also requires a fee to be paid by the Portfolios based on the amount of
33
GOLDMAN SACHS GLOBAL TAX-AWARE EQUITY PORTFOLIOS
Notes to Financial Statements (continued)
February 28, 2013 (Unaudited)
|
| 5. AGREEMENTS AND AFFILIATED TRANSACTIONS (continued) |
the commitment that has not been utilized. For the six months ended February 28, 2013, the Portfolios did not have any borrowings under the facility.
G. Other Transactions with Affiliates — For the six months ended February 28, 2013, Goldman Sachs earned approximately $2,600 and $5,900 in brokerage commissions from portfolio transactions, including futures transactions executed with Goldman Sachs as the Futures Commission Merchant, on behalf of the Enhanced Dividend Global Equity and Tax-Advantaged Global Equity Portfolios, respectively.
The Portfolios invest primarily in the Institutional Shares of the Underlying Funds. These Underlying Funds are considered to be affiliated with the Portfolios. The tables below show the transactions in and earnings from investments in these affiliated Funds for the six months ended February 28, 2013 (in thousands):
| | | | | | | | | | | | | | | | | | | | | | | | | | | | | | | | |
|
| Enhanced Dividend Global Equity | |
| Underlying Funds | | Market
Value
08/31/2012 | | | Purchases
at Cost* | | | Proceeds
from
Sales | | | Net
Realized
Gain
(Loss) | | | Change in
Unrealized
Appreciation
(Depreciation) | | | Market
Value
02/28/2013 | | | Dividend
Income | | | Capital
Gain
Distributions | |
Goldman Sachs Core Fixed Income Fund | | $ | 5 | | | $ | 3,228 | | | $ | (2,219 | ) | | $ | (16 | ) | | $ | (2 | ) | | $ | 996 | | | $ | 8 | | | | — | |
Goldman Sachs High Yield Fund | | | 10,573 | | | | 2,787 | | | | (4,615 | ) | | | 124 | | | | 35 | | | | 8,904 | | | | 318 | | | $ | 147 | |
Goldman Sachs International Equity Dividend
and Premium Fund | | | 48,800 | | | | 8,049 | | | | (5,739 | ) | | | (852 | ) | | | 5,689 | | | | 55,947 | | | | 451 | | | | 418 | |
Goldman Sachs Local Emerging Markets
Debt Fund | | | 1,711 | | | | 2,881 | | | | (102 | ) | | | (1 | ) | | | 76 | | | | 4,565 | | | | 60 | | | | 9 | |
Goldman Sachs Structured Emerging Markets
Equity Fund | | | 7,648 | | | | 1,158 | | | | (974 | ) | | | (1 | ) | | | 1,003 | | | | 8,834 | | | | 139 | | | | — | |
Goldman Sachs Structured International
Small Cap Fund | | | 5,869 | | | | 1,080 | | | | (580 | ) | | | (5 | ) | | | 656 | | | | 7,020 | | | | 315 | | | | — | |
Goldman Sachs Structured Small Cap
Equity Fund | | | 19,616 | | | | 3,329 | | | | (2,313 | ) | | | 23 | | | | 1,743 | | | | 22,398 | | | | 139 | | | | — | |
Goldman Sachs U.S. Equity Dividend and
Premium Fund | | | 101,335 | | | | 22,651 | | | | (6,949 | ) | | | (144 | ) | | | (845 | ) | | | 116,048 | | | | 1,616 | | | | 5,169 | |
| Total | | $ | 195,557 | | | $ | 45,163 | | | $ | (23,491 | ) | | $ | (872 | ) | | $ | 8,355 | | | $ | 224,712 | | | $ | 3,046 | | | $ | 5,743 | |
| | | | | | | | | | | | | | | | | | | | | | | | | | | | | | | | |
|
| Tax-Advantaged Global Equity | |
| Underlying Funds | | Market
Value
08/31/2012 | | | Purchases
at Cost* | | | Proceeds
from
Sales | | | Net
Realized
Gain
(Loss) | | | Change in
Unrealized
Appreciation
(Depreciation) | | | Market
Value
02/28/2013 | | | Dividend
Income | | | Capital
Gain
Distributions | |
Goldman Sachs Core Fixed Income Fund | | $ | 12 | | | $ | 7,792 | | | $ | (5,258 | ) | | $ | (38 | ) | | $ | (6 | ) | | $ | 2,502 | | | $ | 18 | | | | — | |
Goldman Sachs High Yield Fund | | | 23,484 | | | | 8,142 | | | | (10,419 | ) | | | 249 | | | | 105 | | | | 21,561 | | | | 727 | | | $ | 334 | |
Goldman Sachs Local Emerging Markets
Debt Fund | | | 3,716 | | | | 7,466 | | | | (226 | ) | | | (— | )** | | | 161 | | | | 11,117 | | | | 138 | | | | 21 | |
Goldman Sachs Structured Emerging Markets
Equity Fund | | | 17,054 | | | | 4,184 | | | | (1,855 | ) | | | 12 | | | | 2,247 | | | | 21,642 | | | | 314 | | | | — | |
Goldman Sachs Structured International
Small Cap Fund | | | 13,001 | | | | 3,649 | | | | (1,340 | ) | | | (2 | ) | | | 1,483 | | | | 16,791 | | | | 741 | | | | — | |
Goldman Sachs Structured International
Tax-Managed Equity Fund | | | 107,695 | | | | 29,591 | | | | (10,547 | ) | | | (102 | ) | | | 12,382 | | | | 139,019 | | | | 3,460 | | | | — | |
Goldman Sachs Structured Tax-Managed
Equity Fund | | | 269,093 | | | | 71,935 | | | | (25,052 | ) | | | 133 | | | | 22,038 | | | | 338,147 | | | | 4,273 | | | | — | |
| Total | | $ | 434,055 | | | $ | 132,759 | | | $ | (54,697 | ) | | $ | 252 | | | $ | 38,410 | | | $ | 550,779 | | | $ | 9,671 | | | $ | 355 | |
| * | | Includes reinvestment of distributions. |
| ** | | Amount is less than $500. |
34
GOLDMAN SACHS GLOBAL TAX-AWARE EQUITY PORTFOLIOS
|
| 5. AGREEMENTS AND AFFILIATED TRANSACTIONS (continued) |
As of February 28, 2013, the following Portfolios were the beneficial owners of 5% or more of total outstanding shares of the following Funds:
| | | | | | | | | | |
| Underlying Funds | | | | Enhanced Dividend
Global Equity | | | Tax Advantaged
Global Equity | |
Goldman Sachs International Equity Dividend and Premium | | | | | 14 | % | | | — | % |
Goldman Sachs Structured International Small Cap | | | | | — | | | | 6 | |
Goldman Sachs Structured International Tax-Managed Equity | | | | | — | | | | 84 | |
Goldman Sachs Structured Small Cap Equity | | | | | 10 | | | | — | |
Goldman Sachs Structured Tax-Managed Equity | | | | | — | | | | 85 | |
Goldman Sachs U.S. Equity Dividend and Premium | | | | | 10 | | | | — | |
|
| 6. PORTFOLIO SECURITIES TRANSACTIONS |
The cost of purchases and proceeds from sales and maturities of long-term securities for the six months ended February 28, 2013 were as follows:
| | | | | | | | | | |
| Portfolio | | | | Purchases | | | Sales | |
Enhanced Dividend Global Equity | | | | $ | 45,463,679 | | | $ | 23,491,759 | |
Tax-Advantaged Global Equity | | | | | 133,894,021 | | | | 54,698,094 | |
As of the Funds’ most recent fiscal year end, August 31, 2012, the Funds’ capital loss carryforwards and certain timing differences on a tax-basis were as follows:
| | | | | | | | |
| | | Enhanced Dividend
Global Equity | | | Tax-Advantaged
Global Equity | |
Capital loss carryforwards: | | | | | | | | |
Perpetual short-term | | $ | — | | | $ | (160,645 | ) |
As of February 28, 2013, the Portfolios’ aggregate security unrealized gains and losses based on cost for U.S. federal income tax purposes were as follows:
| | | | | | | | |
| | | Enhanced Dividend
Global Equity | | | Tax-Advantaged
Global Equity | |
Tax cost | | $ | 205,449,437 | | | $ | 447,572,686 | |
Gross unrealized gain | | | 34,752,323 | | | | 129,465,951 | |
Gross unrealized loss | | | (12,021,458 | ) | | | (18,520,146 | ) |
Net unrealized security gain | | $ | 22,730,865 | | | $ | 110,945,805 | |
The difference between GAAP-basis and tax-basis unrealized gains (losses) is attributable primarily to wash sales and net mark to market gains (losses) on regulated futures, options and forward foreign currency exchange contracts.
35
GOLDMAN SACHS GLOBAL TAX-AWARE EQUITY PORTFOLIOS
Notes to Financial Statements (continued)
February 28, 2013 (Unaudited)
|
| 7. TAX INFORMATION (continued) |
GSAM has reviewed the Portfolios’ tax positions for all open tax years (the current and prior three years, as applicable) and has concluded that no provision for income tax is required in the Portfolios’ financial statements. Such open tax years remain subject to examination and adjustment by tax authorities.
The Portfolios’ risks include, but are not limited to, the following:
Investments in the Underlying Funds — The Portfolios invest primarily in a combination of Underlying Funds, and are subject to the risk factors associated with the investments of those Underlying Funds in direct proportion to the amount of assets allocated to each. As of February 28, 2013, the Enhanced Dividend Global Equity Portfolio invested 48.5% and 23.4% of its net assets in the Goldman Sachs U.S. Equity Dividend and Premium Fund (the “U.S. Equity Dividend and Premium Fund”) and the Goldman Sachs International Equity Dividend and Premium Fund (the “International Equity Dividend and Premium Fund”), respectively. Because of the high concentration of its assets in these Underlying Funds, the Enhanced Dividend Global Equity Portfolio has greater exposure to the risks associated with these Underlying Funds than it does to the risks associated with the other Underlying Funds in which it invests. The U.S. Equity Dividend and Premium Fund invests primarily in dividend paying equity investments in large-capitalization U.S. equity issuers, with public stock market capitalizations within the range of the market capitalization of the S&P 500 at the time of investment. This Underlying Fund expects that, under normal circumstances, it will write call options on the S&P 500 Index or related exchange-traded funds in an amount that is between 25% and 75% of the value of its portfolio. The International Equity Dividend and Premium Fund invests primarily in dividend-paying equity investments in companies that are organized outside the United States or whose securities are principally traded outside the United States with public stock market capitalizations within the range of capitalization of the Morgan Stanley Capital International (MSCI) Europe, Australia, Far East (EAFE) Index (“MSCI EAFE Index”) at the time of investment. This Underlying Fund expects that, under normal circumstances, it will write call options on the MSCI EAFE Index, other national or regional stock market indices or related exchange-traded funds in an amount that is between 25% and 75% of the value of its portfolio.
As of February 28, 2013, the Tax-Advantaged Global Equity Portfolio invested 58.1% and 23.9% of its net assets in the Goldman Sachs Structured Tax-Managed Equity Fund (the “Structured Tax-Managed Equity Fund”) and the Goldman Sachs Structured International Tax-Managed Equity Fund (the “Structured International Tax-Managed Equity Fund”), respectively. Because of the high concentration of its assets in these Underlying Funds, the Tax-Advantaged Global Equity Portfolio has greater exposure to the risks associated with these Underlying Funds than it does to the risks associated with the other Underlying Funds in which it invests. The Structured Tax-Managed Equity Fund invests in a broadly diversified portfolio of equity investments in U.S. issuers, including foreign issuers that are traded in the United States. This Underlying Fund will seek to maintain risk, style, capitalization and industry characteristics similar to the Russell 3000 Index. The Structured International Tax-Managed Equity Fund invests primarily in international equity securities. This Underlying Fund will seek to maintain risk, style, capitalization and industry characteristics similar to the MSCI EAFE Index. The investment adviser may seek tax-efficiency by offsetting gains and losses, limiting portfolio turnover or selling high tax basis securities for both Underlying Funds.
The Portfolios do not invest in the Underlying Funds for the purpose of exercising management or control; however, investments by the Portfolios within their principal investment strategies may represent a significant portion of an Underlying Fund’s net assets.
Liquidity Risk — The Underlying Funds may make investments that are illiquid or that may become less liquid in response to market developments or adverse investor perceptions. Illiquid investments may be more difficult to value. Liquidity risk may also refer to the risk that a Portfolio will not be able to pay redemption proceeds within the allowable time period because of unusual market conditions, an unusually high volume of redemption requests, or other reasons. To meet redemption requests, a Portfolio may be forced to sell investments at an unfavorable time and/or under unfavorable conditions.
Market and Credit Risks — In the normal course of business, the Portfolios and the Underlying Funds trade financial instruments and enter into financial transactions where risk of potential loss exists due to changes in the market (market risk).
36
GOLDMAN SACHS GLOBAL TAX-AWARE EQUITY PORTFOLIOS
|
| 8. OTHER RISKS (continued) |
Additionally, the Portfolios and the Underlying Funds may also be exposed to credit risk in the event that an issuer fails to perform or that an institution or entity with which the Portfolios and the Underlying Funds have unsettled or open transactions defaults.
Investing in foreign markets may involve special risks and considerations not typically associated with investing in the U.S. These risks include revaluation of currencies, high rates of inflation, repatriation restrictions on income and capital, and adverse political and economic developments. Moreover, securities issued in these markets may be less liquid, be subject to government ownership controls, have delayed settlements and their prices may be more volatile than those of comparable securities in the U.S.
Under the Trust’s organizational documents, its Trustees, officers, employees and agents are indemnified, to the extent permitted by the Act, against certain liabilities that may arise out of performance of their duties to the Portfolios. Additionally, in the course of business, the Portfolios enter into contracts that contain a variety of indemnification clauses. The Portfolios’ maximum exposure under these arrangements is unknown, as this would involve future claims that may be made against the Portfolios that have not yet occurred. However, GSAM believes the risk of loss under these arrangements to be remote.
New Accounting Pronouncement — In December 2011, the Financial Accounting Standards Board issued an Accounting Standards Update (“ASU”) to enhance disclosures about financial instruments and derivative instruments that are subject to offsetting (“netting”) on the Statement of Assets and Liabilities. This information will enable users of the Portfolios’ financial statements to evaluate the effect or potential effect of netting arrangements on the Portfolios’ financial position. The ASU is effective for financial statements with fiscal years beginning on or after January 1, 2013, and interim periods within those fiscal years. At this time, GSAM is evaluating the implications of these changes on the financial statements.
Subsequent events after the Statement of Assets and Liabilities date have been evaluated through the date the financial statements were issued. GSAM has concluded that there is no impact requiring adjustment or disclosure in the financial statements.
37
GOLDMAN SACHS GLOBAL TAX-AWARE EQUITY PORTFOLIOS
Notes to Financial Statements (continued)
February 28, 2013 (Unaudited)
|
| 12. SUMMARY OF SHARE TRANSACTIONS |
Share activity is as follows:
| | | | | | | | | | | | | | | | |
| | | Enhanced Dividend Global Equity Portfolio | |
| | | | |
| | | For the Six Months Ended
February 28, 2013
(Unaudited) | | | For the Fiscal Year Ended
August 31, 2012 | |
| | | | |
| | | Shares | | | Dollars | | | Shares | | | Dollars | |
| | | | |
| Class A Shares | | | | | | | | | | | | | | | | |
Shares sold | | | 561,917 | | | $ | 5,569,491 | | | | 5,522,941 | | | $ | 51,013,512 | |
Reinvestment of distributions | | | 382,163 | | | | 3,750,758 | | | | 350,174 | | | | 3,215,538 | |
Shares redeemed | | | (1,324,227 | ) | | | (13,143,804 | ) | | | (3,887,500 | ) | | | (35,442,181 | ) |
| | | | (380,147 | ) | | | (3,823,555 | ) | | | 1,985,615 | | | | 18,786,869 | |
| Institutional Shares | | | | | | | | | | | | | | | | |
Shares sold | | | 2,919,152 | | | | 29,590,567 | | | | 1,686,825 | | | | 15,977,250 | |
Reinvestment of distributions | | | 227,756 | | | | 2,243,618 | | | | 185,877 | | | | 1,709,335 | |
Shares redeemed | | | (260,373 | ) | | | (2,625,204 | ) | | | (1,221,613 | ) | | | (11,396,347 | ) |
| | | | 2,886,535 | | | | 29,208,981 | | | | 651,089 | | | | 6,290,238 | |
NET INCREASE | | | 2,506,388 | | | $ | 25,385,426 | | | | 2,636,704 | | | $ | 25,077,107 | |
38
GOLDMAN SACHS GLOBAL TAX-AWARE EQUITY PORTFOLIOS
|
| 12. SUMMARY OF SHARE TRANSACTIONS (continued) |
Share activity is as follows:
| | | | | | | | | | | | | | | | |
| | | Tax-Advantaged Global Equity Portfolio | |
| | | | |
| | | For the Six Months Ended
February 28, 2013
(Unaudited) | | | For the Fiscal Year Ended
August 31, 2012 | |
| | | | |
| | | Shares | | | Dollars | | | Shares | | | Dollars | |
| | | | |
| Class A Shares | | | | | | | | | | | | | | | | |
Shares sold | | | 1,276,455 | | | $ | 12,798,093 | | | | 6,894,969 | | | $ | 63,944,467 | |
Reinvestment of distributions | | | 497,466 | | | | 4,964,658 | | | | 382,556 | | | | 3,360,355 | |
Shares redeemed | | | (2,838,042 | ) | | | (28,972,425 | ) | | | (7,043,808 | ) | | | (64,067,163 | ) |
| | | | (1,064,121 | ) | | | (11,209,674 | ) | | | 233,717 | | | | 3,237,659 | |
| Institutional Shares | | | | | | | | | | | | | | | | |
Shares sold | | | 11,152,543 | | | | 115,917,252 | | | | 5,679,749 | | | | 53,105,027 | |
Reinvestment of distributions | | | 465,876 | | | | 4,670,878 | | | | 278,499 | | | | 2,455,281 | |
Shares redeemed | | | (1,783,663 | ) | | | (18,322,203 | ) | | | (1,263,048 | ) | | | (11,902,167 | ) |
| | | | 9,834,756 | | | | 102,265,927 | | | | 4,695,200 | | | | 43,658,141 | |
NET INCREASE | | | 8,770,635 | | | $ | 91,056,253 | | | | 4,928,917 | | | $ | 46,895,800 | |
39
GOLDMAN SACHS GLOBAL TAX-AWARE EQUITY PORTFOLIOS
| | |
Portfolio Expenses — Six Month Period Ended February 28, 2013 (Unaudited) | | |
As a shareholder of Class A or Institutional Shares of a Portfolio, you incur two types of costs: (1) transaction costs, including sales charges on purchase payments (with respect to Class A Shares), and (2) ongoing costs, including management fees; distribution and service (12b-1) fees (with respect to Class A Shares); and other Portfolio expenses. This example is intended to help you understand your ongoing costs (in dollars) of investing in Class A and Institutional Shares of the Portfolios and to compare these costs with the ongoing costs of investing in other mutual funds.
The example is based on an investment of $1,000 invested at the beginning of the period and held for the entire period from September 1, 2012 through February 28, 2013.
Actual Expenses — The first line under each share class in the table below provides information about actual account values and actual expenses. You may use the information in this line, together with the amount you invested, to estimate the expenses that you paid over the period. Simply divide your account value by $1,000 (for example, an $8,600 account value divided by $1,000=8.6), then multiply the result by the number in the first line under the heading entitled “Expenses Paid” to estimate the expenses you paid on your account during this period.
Hypothetical Example for Comparison Purposes — The second line under each share class in the table below provides information about hypothetical account values and hypothetical expenses based on the Portfolios' actual net expense ratios and an assumed rate of return of 5% per year before expenses, which is not the Portfolios' actual return. The hypothetical account values and expenses may not be used to estimate the actual ending account balance or expenses you paid for the period. You may use this information to compare the ongoing costs of investing in the Portfolios and other funds. To do so, compare this 5% hypothetical example with the 5% hypothetical examples that appear in the shareholder reports of the other funds.
Please note that the expenses shown in the table are meant to highlight your ongoing costs only and do not reflect any transactional costs, such as sales charges, redemption fees, or exchange fees and do not include expenses of Underlying Funds in which the Portfolios invest. Therefore, the second line of the table is useful in comparing ongoing costs only, and will not help you determine the relative total costs of owning different funds. In addition, if these transactional costs were included, your costs would have been higher.
| | | | | | | | | | | | | | | | | | | | | | | | |
| | | Enhanced Dividend Global Equity Portfolio | | | Tax-Advantaged Global Equity Portfolio | |
| Share Class | | Beginning
Account Value
9/01/12 | | | Ending
Account Value
2/28/13 | | | Expenses
Paid for the
6 Months
Ended
2/28/13* | | | Beginning
Account Value
9/01/12 | | | Ending
Account Value
2/28/13 | | | Expenses
Paid for the
6 Months
Ended
2/28/13* | |
| Class A | | | | | | | | | | | | | | | | | | | | | | | | |
Actual | | $ | 1,000 | | | $ | 1,083.50 | | | $ | 3.10 | | | $ | 1,000 | | | $ | 1,107.00 | | | $ | 3.13 | |
Hypothetical 5% return | | | 1,000 | | | | 1,021.82 | + | | | 3.01 | | | | 1,000 | | | | 1,021.82 | + | | | 3.01 | |
| Institutional | | | | | | | | | | | | | | | | | | | | | | | | |
Actual | | | 1,000 | | | | 1,086.50 | | | | 1.03 | | | | 1,000 | | | | 1,108.60 | | | | 1.05 | |
Hypothetical 5% return | | | 1,000 | | | | 1,023.80 | + | | | 1.00 | | | | 1,000 | | | | 1,023.80 | + | | | 1.00 | |
| | * | | Expenses are calculated using each Portfolio’s annualized net expense ratio for each class, which represents the ongoing expenses as a percentage of net assets for the six months ended February 28, 2013. Expenses are calculated by multiplying the annualized net expense ratio by the average account value for the period; then multiplying the result by the number of days in the most recent fiscal half year; and then dividing that result by the number of days in the fiscal year. The annualized net expense ratios for the period were as follows: | |
| | | | | | | | |
| Portfolio | | Class A | | | Institutional | |
Enhanced Dividend Global Equity | | | 0.60 | % | | | 0.20 | % |
Tax-Advantaged Global Equity | | | 0.60 | | | | 0.20 | |
| | + | | Hypothetical expenses are based on each Portfolio’s actual annualized net expense ratios and an assumed rate of return of 5% per year before expenses. | |
40
FUNDS PROFILE
Goldman Sachs Funds

Goldman Sachs is a premier financial services firm, known since 1869 for creating thoughtful and customized investment solutions in complex global markets.
Today, the Investment Management Division of Goldman Sachs serves a diverse set of clients worldwide, including private institutions, public entities and individuals. With approximately $742.4 billion in assets under management as of December 31, 2012, Goldman Sachs Asset Management (“GSAM”) has portfolio management teams located around the world and our investment professionals bring firsthand knowledge of local markets to every investment decision. GSAM’s assets under management includes assets managed by Goldman Sachs Asset Management, LP and its Investment Advisory Affiliates.
|
| OVERVIEW OF GOLDMAN SACHS FUNDS |

Money Market1
Financial Square FundsSM
| n | | Financial Square Tax-Exempt Funds |
| n | | Financial Square Federal Fund |
| n | | Financial Square Government Fund |
| n | | Financial Square Money Market Fund |
| n | | Financial Square Prime Obligations Fund |
| n | | Financial Square Treasury Instruments Fund |
| n | | Financial Square Treasury Obligations Fund |
Fixed Income
Short Duration and Government
| n | | High Quality Floating Rate Fund2 |
| n | | Short Duration Government Fund |
| n | | Short Duration Income Fund |
| n | | Inflation Protected Securities Fund |
Multi-Sector
| n | | Core Plus Fixed Income Fund |
Municipal and Tax-Free
| n | | High Yield Municipal Fund |
| n | | Short Duration Tax-Free Fund |
Single Sector
| n | | Investment Grade Credit Fund |
| n | | High Yield Floating Rate Fund |
| n | | Emerging Markets Debt Fund |
| n | | Local Emerging Markets Debt Fund |
Corporate Credit
Fundamental Equity
| n | | Small/Mid Cap Growth Fund |
| n | | Flexible Cap Growth Fund |
| n | | Concentrated Growth Fund |
| n | | Technology Tollkeeper Fund |
| n | | Growth Opportunities Fund |
| n | | Rising Dividend Growth Fund |
Structured Equity
| n | | Structured Small Cap Equity Fund |
| n | | Structured U.S. Equity Fund |
| n | | Structured Small Cap Growth Fund |
| n | | Structured Large Cap Growth Fund |
| n | | Structured Large Cap Value Fund |
| n | | Structured Small Cap Value Fund |
| n | | Structured Tax-Managed Equity Fund |
| n | | Structured International Tax-Managed Equity Fund |
| n | | U.S. Equity Dividend and Premium Fund |
| n | | International Equity Dividend and Premium Fund |
| n | | Structured International Small Cap Fund |
| n | | Structured International Equity Fund |
| n | | Structured Emerging Markets Equity Fund |
Fundamental Equity International
| n | | Strategic International Equity Fund |
| n | | Concentrated International Equity Fund |
| n | | International Small Cap Fund |
| n | | Emerging Markets Equity Fund |
| n | | BRIC Fund (Brazil, Russia, India, China) |
Select Satellite4
| n | | Real Estate Securities Fund |
| n | | International Real Estate Securities Fund |
| n | | Commodity Strategy Fund |
| n | | Dynamic Allocation Fund |
| n | | Absolute Return Tracker Fund |
| n | | Managed Futures Strategy Fund |
| n | | Retirement Portfolio Completion Fund |
| n | | Income Strategies Portfolio |
Total Portfolio Solutions4
| n | | Balanced Strategy Portfolio |
| n | | Growth and Income Strategy Portfolio |
| n | | Growth Strategy Portfolio |
| n | | Equity Growth Strategy Portfolio |
| n | | Satellite Strategies Portfolio |
| n | | Enhanced Dividend Global Equity Portfolio |
| n | | Tax Advantaged Global Equity Portfolio |
| 1 | | An investment in a money market fund is neither insured nor guaranteed by the Federal Deposit Insurance Corporation (“FDIC”) or any other government agency. Although the Funds seek to preserve the value of your investment at $1.00 per share, it is possible to lose money by investing in the Funds. |
| 2 | | Effective at the close of business on July 27, 2012, the Goldman Sachs Ultra-Short Duration Government Fund was renamed the Goldman Sachs High Quality Floating Rate Fund. |
| 3 | | Effective at the close of business on June 29, 2012, the Goldman Sachs Balanced Fund was renamed the Goldman Sachs Income Builder Fund. |
| 4 | | Individual Funds within the Total Portfolio Solutions and Select Satellite categories will have various placement on the risk/return spectrum and may have greater or lesser risk than that indicated by the placement of the general Total Portfolio Solutions or Select Satellite category. |
Financial Square FundsSM is a registered service mark of Goldman, Sachs & Co.
| | |
TRUSTEES Ashok N. Bakhru, Chairman Donald C. Burke John P. Coblentz, Jr. Diana M. Daniels Joseph P. LoRusso James A. McNamara Jessica Palmer Alan A. Shuch Richard P. Strubel | | OFFICERS James A. McNamara, President George F. Travers, Principal Financial Officer Caroline Kraus, Secretary Scott M. McHugh, Treasurer |
| |
GOLDMAN, SACHS & CO. Distributor and Transfer Agent | | GOLDMAN SACHS ASSET MANAGEMENT, L.P. Investment Adviser |
Visit our Web site at www.goldmansachsfunds.com to obtain the most recent month-end returns.
Goldman Sachs Asset Management, L.P., 200 West Street, New York, New York 10282
The reports concerning the Portfolios included in this shareholder report may contain certain forward-looking statements about the factors that may affect the performance of the Portfolios in the future. These statements are based on Portfolio management’s predictions and expectations concerning certain future events and their expected impact on the Portfolios, such as performance of the economy as a whole and of specific industry sectors, changes in the levels of interest rates, the impact of developing world events, and other factors that may influence the future performance of the Portfolios. Management believes these forward-looking statements to be reasonable, although they are inherently uncertain and difficult to predict. Actual events may cause adjustments in portfolio management strategies from those currently expected to be employed.
A description of the policies and procedures that the Portfolios use to determine how to vote proxies relating to portfolio securities and information regarding how a Portfolio voted proxies relating to portfolio securities during the most recent 12-month period ended June 30 is available (i) without charge, upon request by calling 1-800-526-7384 (for Retail Shareholders) or 1-800-621-2550 (for Institutional Shareholders); and (ii) on the Securities and Exchange Commission Web site at http://www.sec.gov.
The Funds file their complete schedule of portfolio holdings with the Securities and Exchange Commission (“SEC”) for the first and third quarters of each fiscal year on Form N-Q. The Funds’ Forms N-Q are available on the SEC’s Web site at http://www.sec.gov within 60 days after the Funds’ first and third fiscal quarters. The Funds’ Forms N-Q may be reviewed and copied at the SEC’s Public Reference Room in Washington, D.C. and information on the operation of the Public Reference Room may also be obtained by calling 1-800-SEC-0330. Form N-Q may be obtained upon request and without charge by calling 1-800-526-7384 (for Retail Shareholders) or 1-800-621-2550 (for Institutional Shareholders).
Economic and market forecasts presented herein reflect our judgment as of the date of this presentation and are subject to change without notice. These forecasts do not take into account the specific investment objectives, restrictions, tax and financial situation or other needs of any specific client. Actual data will vary and may not be reflected here. These forecasts are subject to high levels of uncertainty that may affect actual performance. Accordingly, these forecasts should be viewed as merely representative of a broad range of possible outcomes. These forecasts are estimated, based on assumptions, and are subject to significant revision and may change materially as economic and market conditions change. Goldman Sachs has no obligation to provide updates or changes to these forecasts. Case studies and examples are for illustrative purposes only.
Goldman, Sachs & Co. (“Goldman Sachs”) does not provide legal, tax or accounting advice. Any statement contained in this communication (including any attachments) concerning U.S. tax matters was not intended or written to be used, and cannot be used, for the purpose of avoiding penalties under the Internal Revenue Code, and was written to support the promotion or marketing of the transaction(s) or matter(s) addressed. Clients of Goldman Sachs should obtain their own independent tax advice based on their particular circumstances.
Holdings and allocations shown are as of February 28, 2013 and may not be representative of future investments. Fund holdings should not be relied on in making investment decisions and should not be construed as research or investment advice regarding particular securities.
This material is not authorized for distribution to prospective investors unless preceded or accompanied by a current Prospectus or summary prospectus, if applicable. Investors should consider a Fund’s objective, risks, and charges and expenses, and read the summary prospectus, if available, and/or the Prospectus carefully before investing or sending money. The summary prospectus, if available, and the Prospectus contain this and other information about a Fund and may be obtained from your authorized dealer or from Goldman, Sachs & Co. by calling (retail – 1-800-526-7384) (institutional – 1-800-621-2550).
Goldman, Sachs & Co. is the distributor of the Goldman Sachs Funds.
© 2013 Goldman Sachs. All rights reserved. 97188.MF.MED.TMPL/4/2013 TAGEDSAR13/1.3K
| | The information required by this Item is only required in an annual report on this Form N-CSR. |
| ITEM 3. | AUDIT COMMITTEE FINANCIAL EXPERT. |
| | The information required by this Item is only required in an annual report on this Form N-CSR. |
| ITEM 4. | PRINCIPAL ACCOUNTANT FEES AND SERVICES. |
| | The information required by this Item is only required in an annual report on this Form N-CSR. |
| ITEM 5. | AUDIT COMMITTEE OF LISTED REGISTRANTS. |
| ITEM 6. | SCHEDULE OF INVESTMENTS. |
| | Schedule of Investments is included as part of the Report to Stockholders filed under Item 1. |
| ITEM 7. | DISCLOSURE OF PROXY VOTING POLICIES AND PROCEDURES FOR CLOSED-END MANAGEMENT INVESTMENT COMPANIES. |
| ITEM 8. | PORTFOLIO MANAGERS OF CLOSED-END MANAGEMENT INVESTMENT COMPANIES. |
| ITEM 9. | PURCHASES OF EQUITY SECURITIES BY CLOSED-END MANAGEMENT INVESTMENT COMPANY AND AFFILIATED PURCHASERS. |
| ITEM 10. | SUBMISSION OF MATTERS TO A VOTE OF SECURITY HOLDERS. |
| | There have been no material changes to the procedures by which shareholders may recommend nominees to the registrant’s board of trustees. |
| ITEM 11. | CONTROLS AND PROCEDURES. |
| | (a) | The registrant’s principal executive and principal financial officers, or persons performing similar functions have concluded that the registrant’s disclosure controls and procedures (as defined in Rule 30a-3(c) under the Investment Company Act of 1940, as amended (the “1940 Act”)) are effective as of a date within 90 days of the filing of this report that includes the disclosure required by this paragraph, based on the evaluation of these controls and procedures required by Rule 30a-3(b) under the 1940 Act and 15d-15(b) under the Securities Exchange Act of 1934, as amended. |
| | (b) | There were no changes in the registrant’s internal control over financial reporting (as defined in Rule 30a-3(d) under the 1940 Act) that occurred during the registrant’s second fiscal quarter of the period covered by this report that have materially affected, or are reasonably likely to materially affect, the registrant’s internal control over financial reporting. |
| | | | |
| (a)(1) | | The information required by this Item is only required in connection with an annual report on this Form N-CSR. |
| | |
| (a)(2) | | Exhibit 99.CERT | | Certifications pursuant to Section 302 of the Sarbanes-Oxley Act of 2002 filed herewith. |
| | |
| (b) | | Exhibit 99.906CERT | | Certifications pursuant to Section 906 of the Sarbanes-Oxley Act of 2002 filed herewith. |
SIGNATURES
Pursuant to the requirements of the Securities Exchange Act of 1934 and the Investment Company Act of 1940, the registrant has duly caused this report to be signed on its behalf by the undersigned, thereunto duly authorized.
| | | | |
| | | | Goldman Sachs Trust |
| | |
| By: | | | | /s/ James A. McNamara |
| | | | James A. McNamara |
| | | | President/Principal Executive Officer |
| | | | Goldman Sachs Trust |
| | |
| Date: | | | | April 18, 2013 |
Pursuant to the requirements of the Securities Exchange Act of 1934 and the Investment Company Act of 1940, this report has been signed below by the following persons on behalf of the registrant and in the capacities and on the dates indicated.
| | | | |
| By: | | | | /s/ James A. McNamara |
| | | | James A. McNamara |
| | | | President/Principal Executive Officer |
| | | | Goldman Sachs Trust |
| | |
| Date: | | | | April 18, 2013 |
| | |
| By: | | | | /s/ George F. Travers |
| | | | George F. Travers |
| | | | Principal Financial Officer |
| | | | Goldman Sachs Trust |
| | |
| Date: | | | | April 18, 2013 |