UNITED STATES
SECURITIES AND EXCHANGE COMMISSION
Washington, D.C. 20549
FORM N-CSR
CERTIFIED SHAREHOLDER REPORT OF REGISTERED
MANAGEMENT INVESTMENT COMPANIES
Investment Company Act file number 811-05349
Goldman Sachs Trust
(Exact name of registrant as specified in charter)
71 South Wacker Drive,
Chicago, Illinois 60606
(Address of principal executive offices) (Zip code)
| | |
Copies to: |
Caroline Kraus | | Geoffrey R.T. Kenyon, Esq. |
Goldman, Sachs & Co. | | Dechert LLP |
200 West Street | | 200 Clarendon Street |
New York, New York 10282 | | 27th Floor |
| | Boston, MA 02116-5021 |
(Name and address of agents for service)
Registrant’s telephone number, including area code: (312) 655-4400
Date of fiscal year end: October 31
Date of reporting period: April 30, 2013
| ITEM 1. | REPORTS TO STOCKHOLDERS. |
| | The Semi-Annual Report to Stockholders is filed herewith. |
Goldman Sachs Funds

| | | | |
| | |
| Semi-Annual Report | | | | April 30, 2013 |
| | |
| | | | Domestic Equity Insights Funds* |
| | | | Large Cap Growth Insights |
| | | | Large Cap Value Insights |
| | | | Small Cap Equity Insights |
| | | | Small Cap Growth Insights |
| | | | Small Cap Value Insights |
| | | | U.S. Equity Insights |
*Effective May 3, 2013, the Goldman Sachs Structured Large Cap Growth, Structured Large Cap Value, Structured Small Cap Equity, Structured Small Cap Growth, Structured Small Cap Value and Structured U.S. Equity Funds were renamed the Goldman Sachs Large Cap Growth Insights, Large Cap Value Insights, Small Cap Equity Insights, Small Cap Growth Insights, Small Cap Value Insights and U.S. Equity Insights Funds, respectively.

Goldman Sachs Domestic Equity Insights Funds
| | | | |
n LARGE CAP GROWTH INSIGHTS n LARGE CAP VALUE INSIGHTS n SMALL CAP EQUITY INSIGHTS n SMALL CAP GROWTH INSIGHTS n SMALL CAP VALUE INSIGHTS n U.S. EQUITY INSIGHTS | | | | Large Cap Growth Insights, Large Cap Value Insights, Small Cap Equity Insights, Small Cap Growth Insights, Small Cap Value Insights, and U.S. Equity Insights were formerly known as Structured Large Cap Growth, Structured Large Cap Value, Structured Small Cap Equity, Structured Small Cap Growth, Structured Small Cap Value, and Structured U.S. Equity, respectively. They are referenced throughout this report by their aforementioned revised names. |
| | | | |
TABLE OF CONTENTS | | | | |
| |
Principal Investment Strategies and Risks | | | 1 | |
| |
Market Review | | | 3 | |
| |
Investment Process | | | 5 | |
| |
Portfolio Management Discussion and Performance Summaries | | | 7 | |
| |
Schedules of Investments | | | 37 | |
| |
Financial Statements | | | 66 | |
| |
Financial Highlights | | | 74 | |
| |
Notes to Financial Statements | | | 86 | |
| |
Other Information | | | 106 | |
| | | | |
| | | |
| NOT FDIC-INSURED | | May Lose Value | | No Bank Guarantee |
GOLDMAN SACHS DOMESTIC EQUITY INSIGHTS FUNDS
Principal Investment Strategies and Risks
This is not a complete list of risks that may affect the Funds. For additional information concerning the risks applicable to the Funds, please see the Funds’ Prospectus.
The Goldman Sachs Large Cap Growth Insights Fund invests primarily in a broadly diversified portfolio of equity investments in large-capitalization U.S. issuers, including foreign issuers traded in the United States. The Fund’s equity investments will be subject to market risk, which means that the value of the securities in which it invests may go up or down in response to the prospects of individual companies, particular sectors and/or general economic conditions. The Investment Adviser’s use of quantitative models to execute the Fund’s investment strategy may fail to produce the intended result. Different investment styles (e.g., “quantitative” and “growth”) tend to shift in and out of favor, and at times the Fund may underperform other funds that invest in similar asset classes. The Fund may have a high rate of portfolio turnover, which involves correspondingly greater expenses which must be borne by the Fund, and is also likely to result in short-term capital gains taxable to shareholders.
The Goldman Sachs Large Cap Value Insights Fund invests primarily in a diversified portfolio of equity investments in large-capitalization U.S. issuers, including foreign issuers traded in the United States. The Fund’s equity investments will be subject to market risk, which means that the value of the securities in which it invests may go up or down in response to the prospects of individual companies, particular sectors and/or general economic conditions. The Investment Adviser’s use of quantitative models to execute the Fund’s investment strategy may fail to produce the intended result. Different investment styles (e.g., “quantitative” and “value”) tend to shift in and out of favor, and at times the Fund may underperform other funds that invest in similar asset classes. The Fund may have a high rate of portfolio turnover, which involves correspondingly greater expenses which must be borne by the Fund, and is also likely to result in short-term capital gains taxable to shareholders.
The Goldman Sachs Small Cap Equity Insights Fund invests primarily in a broadly diversified portfolio of equity investments in small-capitalization U.S. issuers, including foreign issuers traded in the United States. The Fund’s equity investments will be subject to market risk, which means that the value of the securities in which it invests may go up or down in response to the prospects of individual companies, particular sectors and/or general economic conditions. The securities of mid- and small-capitalization companies involve greater risks than those associated with larger, more established companies and may be subject to more abrupt or erratic price movements. The Investment Adviser’s use of quantitative models to execute the Fund’s investment strategy may fail to produce the intended result. Different investment styles (e.g., “quantitative”) tend to shift in and out of favor, and at times the Fund may underperform other funds that invest in similar asset classes. The Fund may have a high rate of portfolio turnover, which involves correspondingly greater expenses which must be borne by the Fund, and is also likely to result in short-term capital gains taxable to shareholders.
The Goldman Sachs Small Cap Growth Insights Fund invests primarily in a broadly diversified portfolio of equity investments in small-capitalization U.S. issuers, including foreign issuers that are traded in the U.S. The Fund’s equity investments are subject to market risk, which means that the value of the securities in which it invests may go up or down in response to the prospects of individual companies, particular sectors and/or general economic conditions. The securities of mid- and small-capitalization companies involve greater risks than those associated with larger, more established companies and may be subject to more abrupt or erratic price movements. The Investment Adviser’s use of quantitative models to execute the Fund’s investment strategy may fail to produce the intended result. Different investment styles (e.g., “quantitative” and “growth”) tend to shift in and out of favor, and at times the Fund may underperform other funds that invest in similar asset classes. The Fund may have a high rate of portfolio turnover, which involves correspondingly greater expenses which must be borne by the Fund, and is also likely to result in short-term capital gains taxable to shareholders.
1
GOLDMAN SACHS DOMESTIC EQUITY INSIGHTS FUNDS
The Goldman Sachs Small Cap Value Insights Fund invests primarily in a broadly diversified portfolio of equity investments in small-capitalization U.S. issuers, including foreign issuers that are traded in the U.S. The Fund’s equity investments are subject to market risk, which means that the value of the securities in which it invests may go up or down in response to the prospects of individual companies, particular sectors and/or general economic conditions. The securities of mid- and small-capitalization companies involve greater risks than those associated with larger, more established companies and may be subject to more abrupt or erratic price movements. The Investment Adviser’s use of quantitative models to execute the Fund’s investment strategy may fail to produce the intended result. Different investment styles (e.g., “quantitative” and “value”) tend to shift in and out of favor, and at times the Fund may underperform other funds that invest in similar asset classes. The Fund may have a high rate of portfolio turnover, which involves correspondingly greater expenses which must be borne by the Fund, and is also likely to result in short-term capital gains taxable to shareholders.
The Goldman Sachs U.S. Equity Insights Fund invests primarily in a diversified portfolio of equity investments in U.S. issuers, including foreign issuers traded in the United States. The Fund’s equity investments will be subject to market risk, which means that the value of the securities in which it invests may go up or down in response to the prospects of individual companies, particular sectors and/ or general economic conditions. The Investment Adviser’s use of quantitative models to execute the Fund’s investment strategy may fail to produce the intended result. Different investment styles (e.g., “quantitative”) tend to shift in and out of favor, and at times the Fund may underperform other funds that invest in similar asset classes. The Fund may have a high rate of portfolio turnover, which involves correspondingly greater expenses which must be borne by the Fund, and is also likely to result in short-term capital gains taxable to shareholders.
2
MARKET REVIEW
Goldman Sachs Domestic Equity Insights Funds
Market Review
U.S. equities posted strong gains during the six-month period ended April 30, 2013 (the “Reporting Period”). Commitments by global central banks to low interest rates and continued easy monetary policies drove the robust performance of U.S. equities, especially financials stocks, during the Reporting Period.
As the Reporting Period began, U.S. equities made only modest gains in November and December 2012 after President Obama’s re-election and as the fiscal cliff loomed, despite encouraging signs of momentum in the housing market and stabilization in the labor market. During December 2012, the Federal Reserve (the “Fed”) updated its low interest policy to include the condition that the unemployment rate must drop to 6.5% or less before the Fed would increase interest rates.
In January 2013, market sentiment was boosted by a last-minute deal on the fiscal cliff, as U.S. lawmakers agreed to extend the Bush-era tax cuts for all but the highest income earners. U.S. equities rallied, despite a wide variation in corporate earnings reports and weaker than expected U.S. economic growth. Continued improvement in the housing market was a highlight, as the Standard & Poor’s/Case-Shiller Home Price Indices increased at the fastest pace since mid-2006 — at annualized rates of 8.1% in January 2013 and 9.3% in February 2013. The labor picture also improved with the unemployment rate dropping to 7.7% during February 2013.
U.S. equities continued to rally in March 2013, even as Congress chose to not act on the automatic federal spending cuts known as the sequester, allowing them to start taking effect. U.S. equities rallied further in April 2013, as investors seemed to look past weaker global economic data. The Conference Board estimate for consumer confidence in April 2013 significantly exceeded expectations, suggesting consumers might be feeling the effects of improved housing and labor market conditions.
During the Reporting Period overall, U.S. stocks recorded double-digit gains. The S&P 500® Index, a measure of large-cap stocks, returned 14.42%, while the Russell 2000® Index, which measures the small-cap universe, rose 16.58%. All 10 sectors in the S&P 500® Index were up, with consumer discretionary (+19.83%) and health care (+19.63%) generating the strongest returns. The financials sector (+19.05%) was the largest contributor (measured by weight times total return) to S&P 500® Index returns. Small-cap stocks outperformed large-cap stocks, though large-cap stocks held up reasonably well in the information technology sector. Across the capitalization spectrum, value-oriented stocks outperformed growth-oriented stocks, primarily due to the weak performance of growth-oriented information technology stocks. The Russell 1000® Value Index, representing large-cap value stocks, rose 16.31%, outperforming the Russell 1000® Growth Index, representing large-cap growth stocks, which was up 13.71% during the Reporting Period.
3
MARKET REVIEW
Looking Ahead
We continue to believe that less expensive stocks are likely to outpace more expensive stocks. In addition, we expect stocks with good momentum to outperform those with poor momentum. We plan to focus on seeking companies about which fundamental research analysts are becoming more positive as well as profitable companies with sustainable earnings and a track record of using their capital to enhance shareholder value. As such, we anticipate remaining fully invested, and expect long-term performance to be the result of stock selection rather than sector or capitalization allocations.
4
GOLDMAN SACHS DOMESTIC EQUITY INSIGHTS FUNDS
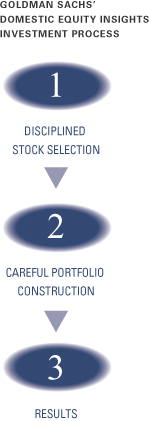
What Differentiates Goldman Sachs’
Domestic Equity Insights Funds Investment Process?
At Goldman Sachs Asset Management, L.P. (“GSAM”), Equity Insights combines traditional fundamental analysis with sophisticated quantitative modeling. Our approach is not unlike that of a more traditional active manager: we look at fundamental investment themes that have been effective historically in forecasting excess returns of stocks. However, where we differ from traditional managers is that we seek to rigorously test every potential research theme or signal to verify whether they have shown consistent predictive ability across a wide variety of stocks in different time periods and under different market conditions.

| n | | Comprehensive — We calculate expected excess returns for more than 10,000 stocks on a daily basis. |
| n | | Rigorous — We evaluate stocks based on fundamental investment criteria that have outperformed historically. |
| n | | Objective — Our stock selection process is free from the emotion that may lead to biased investment decisions. |

| n | | Our computer optimization process allocates risk to our high conviction investment ideas and constructs funds that strive to neutralize systematic risks and deliver better returns. |
| n | | We use a unique, proprietary risk model that is designed to be more precise, more focused and faster to respond because it seeks to identify, track and manage risk specific to our process, using daily data. |

Fully invested, well-diversified portfolio that seeks to:
| n | | Maintain style, sector, risk and capitalization characteristics similar to the benchmark. |
| n | | Offer broad access to a clearly defined equity universe. |
| n | | Generate excess returns that are positive, consistent and repeatable. |
5
GOLDMAN SACHS DOMESTIC EQUITY INSIGHTS FUNDS
Enhancements Made to Proprietary Quantitative Model during the 6-month Period Ended April 30, 2013
We continuously look for ways to improve our investment process. Accordingly, we introduced a number of enhancements to our proprietary quantitative model during the six-month period ended April 30, 2013.
We made no enhancements to our proprietary quantitative model within the U.S. region during the fourth quarter of 2012.
In the first quarter of 2013, we implemented enhancements to three of our investment themes: Momentum, Quality and Sentiment. We applied a new price momentum timing insight in our U.S. model that had previously been introduced in other regions. With this enhancement, we aim to capture price momentum in the markets while including a component of timing. Our research indicates that including a timing signal can improve the risk-adjusted returns of the Momentum theme and can significantly mitigate drawdown risk. In addition, we implemented an enhancement to our stock selection process, incorporating several measures to the signals within our Quality theme. These include measures of capital investment, funding source, earnings quality, competitive positioning and financial solvency. Finally, we expanded the Sentiment theme by incorporating elements of behavioral economics and prospect theory that should help us identify structural misvaluations within equities.
Changes Made to the Team’s Management
Effective March 8, 2013, Dennis Walsh was named a Portfolio Manager for the Domestic Equity Insights Funds.
6
PORTFOLIO RESULTS
Goldman Sachs Large Cap Growth Insights Fund
Portfolio Management Discussion and Analysis
Effective after the close of business on May 3, 2013, the Goldman Sachs Structured Large Cap Growth Fund was renamed the Goldman Sachs Large Cap Growth Insights Fund (the “Fund”). Below, the Goldman Sachs Quantitative Investment Strategies Team discusses the Fund’s performance and positioning for the six-month period ended April 30, 2013 (the “Reporting Period”).
| Q | | How did the Fund perform during the Reporting Period? |
| A | | During the Reporting Period, the Fund’s Class A, B, C, Institutional, Service, IR and R Shares generated cumulative total returns, without sales charges, of 14.36%, 13.97%, 13.96%, 14.61%, 14.32%, 14.52% and 14.21%, respectively. These returns compare to the 13.71% cumulative total return of the Fund’s benchmark, the Russell 1000® Growth Index (with dividends reinvested) (the “Index”), during the same period. |
| Q | | What key factors were most responsible for the Fund’s performance during the Reporting Period? |
| A | | The Fund outperformed the Index during the Reporting Period largely because of our investment themes. Security selection also enhanced relative returns during the Reporting Period. |
| Q | | What impact did the Fund’s investment themes have on performance during the Reporting Period? |
| A | | In keeping with our investment approach, we use our quantitative model and its six investment themes to take a long-term view of market patterns and look for inefficiencies, selecting stocks for the Fund and overweighting or underweighting the ones chosen by the model. Over time and by design, the performance of any one of the model’s investment themes tends to have a low correlation with the model’s other themes, demonstrating the diversification benefit of the Fund’s theme-driven quantitative model. The variance in performance supports our research indicating that the diversification provided by our different investment themes is a significant investment advantage over the long term, even though the Fund may experience underperformance in the short term. Of course, diversification does not protect an investor from market risk nor does it ensure a profit. |
| | Momentum contributed most positively to relative returns during the Reporting Period. Momentum seeks to predict drifts in stock prices caused by delayed investor reaction to company-specific information and information about related companies. Our Valuation theme also added value. Valuation attempts to capture potential mispricings of securities, typically by comparing a measure of the company’s intrinsic value to its market value. |
| | Management, Sentiment, Profitability and Quality detracted from relative results. Management assesses the characteristics, policies and strategic decisions of company management, while Sentiment reflects selected investment views and decisions of individuals and financial intermediaries. The Profitability theme assesses whether a company is earning more than its cost of capital. The Quality theme assesses both firm and management quality. |
| Q | | How did the Fund’s sector and industry allocations affect relative performance? |
| A | | In constructing the Fund’s portfolio, we focus on picking stocks rather than on making sector or industry bets. Consequently, the Fund is similar to the Index in terms of its sector and industry allocations and its style. Changes in its sector or industry weights generally do not have a meaningful impact on relative performance. |
| Q | | Did stock selection help or hurt Fund performance during the Reporting Period? |
| A | | We seek to outpace the Index by overweighting stocks we expect to outperform and underweighting those we think may lag. At the same time, we strive to maintain a risk profile similar to the Index. The Fund’s investments are selected using fundamental research and a variety of quantitative techniques based on our investment themes. For example, the Fund aims to hold a basket of stocks with better Momentum characteristics than the benchmark. During the Reporting Period, our security selection added to the Fund’s relative performance. |
7
PORTFOLIO RESULTS
| Q | | Which stock positions contributed most to the Fund’s relative returns during the Reporting Period? |
| A | | Security selection in the health care, industrials and information technology sectors enhanced relative returns during the Reporting Period. The Fund benefited from overweighted positions in oil and natural gas exploration company Marathon Petroleum; pharmaceutical maker Biogen Idec; and video game retailer GameStop. Our positive views on Momentum and Sentiment led to the Fund’s overweight in Marathon Petroleum. We adopted the overweight in Biogen Idec because of our positive views on Valuation and Profitability. The overweight to GameStop was the result our positive views on Valuation and Quality. |
| Q | | Which individual positions detracted most from the Fund’s results during the Reporting Period? |
| A | | Investments in the consumer discretionary, consumer staples and utilities sectors detracted from relative performance during the Reporting Period. The Fund was hurt by overweighted positions in Herbalife, a nutrition and weight management company; Yum! Brands, an operator of fast food restaurants; and Cablevision Systems, a cable television and high-speed data provider. We chose to overweight Herbalife and Yum! Brands because of our positive views on Momentum and Profitability. The Fund was overweight Cablevision Systems as a result of our positive views on Momentum and Quality. |
| Q | | How did the Fund use derivatives and similar instruments during the Reporting Period? |
| A | | During the Reporting Period, we used financial futures contracts to equitize the Fund’s cash holdings (that is, to put the Fund’s cash holdings to work). |
| Q | | What was the Fund’s sector positioning relative to the Index at the end of the Reporting Period? |
| A | | At the end of the Reporting Period, the Fund was overweight the health care, financials, energy and materials sectors relative to the Index. The Fund was underweight consumer staples, industrials, information technology, consumer discretionary, telecommunication services and utilities compared to the Index at the end of the Reporting Period. |
8
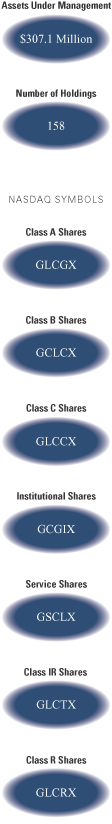
FUND BASICS
Large Cap Growth Insights Fund
as of April 30, 2013
| | | | | | | | | | |
| | PERFORMANCE REVIEW | |
| | | November 1, 2012–April 30, 2013 | | Fund Total Return
(based on NAV)1 | | | Russell 1000
Growth Index2 | |
| | Class A | | | 14.36 | % | | | 13.71 | % |
| | Class B | | | 13.97 | | | | 13.71 | |
| | Class C | | | 13.96 | | | | 13.71 | |
| | Institutional | | | 14.61 | | �� | | 13.71 | |
| | Service | | | 14.32 | | | | 13.71 | |
| | Class IR | | | 14.52 | | | | 13.71 | |
| | | Class R | | | 14.21 | | | | 13.71 | |
| | 1 | | The net asset value (“NAV”) represents the net assets of the class of the Fund (ex-dividend) divided by the total number of shares of the class outstanding. The Fund’s performance assumes the reinvestment of dividends and other distributions. The Fund’s performance does not reflect the deduction of any applicable sales charges. |
| | 2 | | The Russell 1000® Growth Index (with dividends reinvested) is an unmanaged market capitalization weighted index of the 1000 largest U.S. companies with higher price-to-book ratios and higher forecasted growth values. The figures for the Index do not include any deduction for fees, expenses or taxes. It is not possible to invest directly in an index. |
| | | | | | | | | | | | | | |
| | STANDARDIZED TOTAL RETURNS3 |
| | | For the period ended 3/31/13 | | One Year | | | Five Years | | Ten Years | | Since Inception | | Inception Date |
| | Class A | | | 4.00 | % | | 4.29% | | 6.22% | | 3.52% | | 5/1/97 |
| | Class B | | | 4.19 | | | 4.37 | | 6.16 | | 3.49 | | 5/1/97 |
| | Class C | | | 8.26 | | | 4.70 | | 6.02 | | 2.08 | | 8/15/97 |
| | Institutional | | | 10.43 | | | 5.90 | | 7.27 | | 4.30 | | 5/1/97 |
| | Service | | | 9.96 | | | 5.39 | | 6.75 | | 3.79 | | 5/1/97 |
| | Class IR | | | 10.32 | | | 5.74 | | N/A | | 2.68 | | 11/30/07 |
| | | Class R | | | 9.79 | | | 5.23 | | N/A | | 2.20 | | 11/30/07 |
| | 3 | | The Standardized Total Returns are average annual total returns as of the most recent calendar quarter-end. They assume reinvestment of all distributions at NAV. These returns reflect a maximum initial sales charge of 5.5% for Class A Shares, the assumed contingent deferred sales charge for Class B Shares (5% maximum declining to 0% after six years) and the assumed contingent deferred sales charge for Class C Shares (1% if redeemed within 12 months of purchase). Class B Shares convert automatically to Class A Shares on or about the fifteenth day of the last month of the calendar quarter that is eight years after purchase. Returns for Class B Shares for the period after conversion reflect the performance of Class A Shares. Because Institutional, Service, Class IR and Class R Shares do not involve a sales charge, such a charge is not applied to their Standardized Total Returns. The Fund’s Class B Shares are no longer available for purchase by new or existing shareholders (although current Class B shareholders may continue to reinvest income and capital gains distributions into Class B Shares, and Class B shareholders may continue to exchange their shares for Class B Shares of certain other Goldman Sachs Funds). |
| | | | The returns set forth in the tables above represent past performance. Past performance does not guarantee future results. The Fund’s investment return and principal value will fluctuate so that an investor’s shares, when redeemed, may be worth more or less than their original cost. Current performance may be lower or higher than the performance quoted above. Please visit our web site at www.goldmansachsfunds.com to obtain the most recent month-end returns. Performance reflects applicable fee waivers and/or expense limitations in effect during the periods shown. In their absence, performance would be reduced. Returns do not reflect the deduction of taxes that a shareholder would pay on Fund distributions or the redemption of Fund shares. |
9
FUND BASICS
| | | | | | | | | | |
| | EXPENSE RATIOS4 | |
| | | | | Net Expense Ratio (Current) | | | Gross Expense Ratio (Before Waivers) | |
| | Class A | | | 0.95 | % | | | 1.16 | % |
| | Class B | | | 1.71 | | | | 1.91 | |
| | Class C | | | 1.70 | | | | 1.91 | |
| | Institutional | | | 0.55 | | | | 0.76 | |
| | Service | | | 1.05 | | | | 1.26 | |
| | Class IR | | | 0.70 | | | | 0.90 | |
| | | Class R | | | 1.20 | | | | 1.39 | |
| | 4 | | The expense ratios of the Fund, both current (net of applicable fee waivers and/or expense limitations) and before waivers (gross of applicable fee waivers and/or expense limitations) are as set forth above according to the most recent publicly available Prospectus for the Fund and may differ from the expense ratios disclosed in the Financial Highlights in this report. The Fund’s waivers and/or expense limitations will remain in place through at least February 28, 2014, and prior to such date the Investment Adviser may not terminate the arrangements without the approval of the Fund’s Board of Trustees. If these arrangements are discontinued in the future, the expense ratios may change without shareholder approval. |
| | | | | | | | |
| | TOP TEN HOLDINGS AS OF 4/30/135 |
| | | Holding | | % of Net Assets | | | Line of Business |
| | Apple, Inc. | | | 6.0 | % | | Computers & Peripherals |
| | International Business Machines Corp. | | | 3.7 | | | IT Services |
| | Google, Inc. Class A | | | 3.7 | | | Internet Software & Services |
| | Microsoft Corp. | | | 3.4 | | | Software |
| | The Boeing Co. | | | 1.8 | | | Aerospace & Defense |
| | Biogen Idec, Inc. | | | 1.7 | | | Biotechnology |
| | Abbott Laboratories | | | 1.7 | | | Health Care Equipment & Supplies |
| | eBay, Inc. | | | 1.7 | | | Internet Software & Services |
| | Celgene Corp. | | | 1.6 | | | Biotechnology |
| | | American Tower Corp. | | | 1.4 | | | Real Estate Investment Trusts |
| | 5 | | The top 10 holdings may not be representative of the Fund’s future investments. |
10
FUND BASICS
|
| FUND VS. BENCHMARK SECTOR ALLOCATIONS6 |
| As of April 30, 2013 |
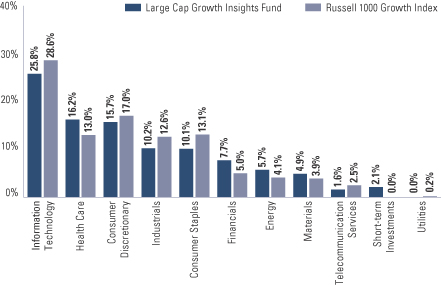
| | 6 | | The Fund is actively managed and, as such, its composition may differ over time. Consequently, the Fund’s overall sector allocation may differ from the percentages contained in the graph. The graph categorizes investments using Global Industry Classification Standard (“GICS”), however, the sector classifications used by the portfolio management team may differ from GICS. The percentage shown for each investment category reflects the value of investments in that category as a percentage of market value (excluding investments in the securities lending reinvestment vehicle, if any). Investment in the securities lending reinvestment vehicle represented 2.0% of the Fund’s net assets at April 30, 2013. Short-term investments represent repurchase agreements. The graph depicts the Fund’s investments but may not represent the Fund’s market exposure due to the exclusion of certain derivatives, if any, as listed in the Additional Investment Information section of the Schedule of Investment. |
11
PORTFOLIO RESULTS
Goldman Sachs Large Cap Value Insights Fund
Portfolio Management Discussion and Analysis
Effective after the close of business on May 3, 2013, the Goldman Sachs Structured Large Cap Value Fund was renamed the Goldman Sachs Large Cap Value Insights Fund (the “Fund”). Below, the Goldman Sachs Quantitative Investment Strategies Team discusses the Fund’s performance and positioning for the six-month period ended April 30, 2013 (the “Reporting Period”).
| Q | | How did the Fund perform during the Reporting Period? |
| A | | During the Reporting Period, the Fund’s Class A, B, C, Institutional, Service, IR and R Shares generated cumulative total returns, without sales charges, of 15.34%, 14.94%, 14.89%, 15.60%, 15.23%, 15.45% and 15.18%, respectively. These returns compare to the 16.31% cumulative total return of the Fund’s benchmark, the Russell 1000® Value Index (with dividends reinvested) (the “Index”), during the same period. |
| Q | | What key factors were most responsible for the Fund’s performance during the Reporting Period? |
| A | | The Fund underperformed the Index during the Reporting Period largely because of our investment themes. Security selection enhanced relative performance. |
| Q | | What impact did the Fund’s investment themes have on performance during the Reporting Period? |
| A | | In keeping with our investment approach, we use our quantitative model and its six investment themes to take a long-term view of market patterns and look for inefficiencies, selecting stocks for the Fund and overweighting or underweighting the ones chosen by the model. Over time and by design, the performance of any one of the model’s investment themes tends to have a low correlation with the model’s other themes, demonstrating the diversification benefit of the Fund’s theme-driven quantitative model. The variance in performance supports our research indicating that the diversification provided by our different investment themes is a significant investment advantage over the long term, even though the Fund may experience underperformance in the short term. Of course, diversification does not protect an investor from market risk nor does it ensure a profit. |
| | | During the Reporting Period, four of our investment themes — Sentiment, Management, Quality and Profitability — detracted from relative performance. Sentiment reflects selected investment views and decisions of individuals and financial intermediaries, while Management assesses the characteristics, policies and strategic decisions of company management. The Quality theme assesses both firm and management quality. Profitability assesses whether a company is earning more than its cost of capital. |
| | | Our best performing theme was Momentum, which seeks to predict drifts in stock prices caused by delayed investor reaction to company-specific information and information about related companies. Valuation also contributed positively, though to a lesser extent. Our Valuation theme attempts to capture potential mispricings of securities, typically by comparing a measure of the company’s intrinsic value to its market value. |
| Q | | How did the Fund’s sector and industry allocations affect relative performance? |
| A | | In constructing the Fund’s portfolio, we focus on picking stocks rather than on making sector or industry bets. Consequently, the Fund is similar to the Index in terms of its sector and industry allocations and its style. Changes in its sector or industry weights generally do not have a meaningful impact on relative performance. |
| Q | | Did stock selection help or hurt Fund performance during the Reporting Period? |
| A | | We seek to outpace the Index by overweighting stocks we believe should outperform and underweighting those we think may lag. At the same time, we strive to maintain a risk profile similar to the Index. The Fund’s investments are selected using fundamental research and a variety of quantitative techniques based on our investment themes. For example, the Fund aims to hold a basket of stocks with better Momentum characteristics than the benchmark. During the Reporting Period, security selection added to relative returns. |
12
PORTFOLIO RESULTS
| Q | | Which stock positions contributed most to the Fund’s relative returns during the Reporting Period? |
| A | | Investments in the energy, financials and health care sectors boosted relative performance during the Reporting Period. The Fund benefited from overweighted positions in oil and natural gas exploration company Marathon Petroleum; video game retailer GameStop; and pharmaceutical maker Biogen Idec. We chose to overweight Marathon Petroleum because of our positive views on Momentum and Sentiment. The Fund was overweight GameStop as a result of our positive views on Valuation and Quality. We assumed the overweight in Biogen Idec because of our positive views on Valuation. |
| Q | | Which individual positions detracted most from the Fund’s results during the Reporting Period? |
| A | | Stock selection in the consumer discretionary, information technology and consumer staples sectors detracted from relative results. The Fund was hampered by its overweighted positions in Herbalife, a nutrition and weight management company; Entergy, an integrated energy company engaged primarily in electric power production and distribution; and Consolidated Edison, an electric, gas and steam utility. We established the overweight in Herbalife because of our positive views on Momentum and Profitability. The overweights in Entergy and Consolidated Edison were the result of our positive views on Valuation and Momentum. |
| Q | | How did the Fund use derivatives and similar instruments during the Reporting Period? |
| A | | During the Reporting Period, we used financial futures contracts to equitize the Fund’s cash holdings (that is, to put the Fund’s cash holdings to work). |
| Q | | What was the Fund’s sector positioning relative to the Index at the end of the Reporting Period? |
| A | | At the end of the Reporting Period, the Fund was overweight the health care, consumer discretionary, energy, materials and industrials sectors relative to the Index. Compared to the Index, the Fund was underweight the consumer staples, information technology, utilities, financials and telecommunication services sectors at the end of the Reporting Period. |
13
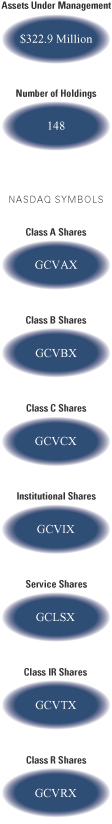
FUND BASICS
Large Cap Value Insights Fund
as of April 30, 2013
| | | | | | | | | | |
| | PERFORMANCE REVIEW | |
| | | November 1, 2012–April 30, 2013 | | Fund Total Return
(based on NAV)1 | | | Russell 1000 Value Index2 | |
| | Class A | | | 15.34 | % | | | 16.31 | % |
| | Class B | | | 14.94 | | | | 16.31 | |
| | Class C | | | 14.89 | | | | 16.31 | |
| | Institutional | | | 15.60 | | | | 16.31 | |
| | Service | | | 15.23 | | | | 16.31 | |
| | Class IR | | | 15.45 | | | | 16.31 | |
| | | Class R | | | 15.18 | | | | 16.31 | |
| | 1 | | The net asset value (“NAV”) represents the net assets of the class of the Fund (ex-dividend) divided by the total number of shares of the class outstanding. The Fund’s performance assumes the reinvestment of dividends and other distributions. The Fund’s performance does not reflect the deduction of any applicable sales charges. |
| | 2 | | The Russell 1000® Value Index (with dividends reinvested) is an unmanaged market capitalization weighted index of the 1000 largest U.S. companies with lower price-to-book ratios and lower forecasted growth values. The figures for the Index do not include any deduction for fees, expenses or taxes. It is not possible to invest directly in an index. |
| | | | | | | | | | | | | | |
| | STANDARDIZED TOTAL RETURNS3 |
| | | For the period ended 3/31/13 | | One Year | | | Five Years | | Ten Years | | Since Inception | | Inception Date |
| | Class A | | | 9.05 | % | | 2.37% | | 7.03% | | 3.61% | | 12/31/98 |
| | Class B | | | 9.47 | | | 2.38 | | 6.97 | | 3.58 | | 12/31/98 |
| | Class C | | | 13.55 | | | 2.77 | | 6.83 | | 3.25 | | 12/31/98 |
| | Institutional | | | 15.87 | | | 3.96 | | 8.06 | | 4.43 | | 12/31/98 |
| | Service | | | 15.21 | | | 3.43 | | 7.52 | | 3.92 | | 12/31/98 |
| | Class IR | | | 15.64 | | | 3.80 | | N/A | | 1.32 | | 11/30/07 |
| | | Class R | | | 15.08 | | | 3.28 | | N/A | | 0.83 | | 11/30/07 |
| | 3 | | The Standardized Total Returns are average annual total returns as of the most recent calendar quarter-end. They assume reinvestment of all distributions at NAV. These returns reflect a maximum initial sales charge of 5.5% for Class A Shares, the assumed contingent deferred sales charge for Class B Shares (5% maximum declining to 0% after six years) and the assumed contingent deferred sales charge for Class C Shares (1% if redeemed within 12 months of purchase). Class B Shares convert automatically to Class A Shares on or about the fifteenth day of the last month of the calendar quarter that is eight years after purchase. Returns for Class B Shares for the period after conversion reflect the performance of Class A Shares. Because Institutional, Service, Class IR and Class R Shares do not involve a sales charge, such a charge is not applied to their Standardized Total Returns. The Fund’s Class B Shares are no longer available for purchase by new or existing shareholders (although current Class B shareholders may continue to reinvest income and capital gains distributions into Class B Shares, and Class B shareholders may continue to exchange their shares for Class B Shares of certain other Goldman Sachs Funds). |
| | | | The returns set forth in the tables above represent past performance. Past performance does not guarantee future results. The Fund’s investment return and principal value will fluctuate so that an investor’s shares, when redeemed, may be worth more or less than their original cost. Current performance may be lower or higher than the performance quoted above. Please visit our web site at www.goldmansachsfunds.com to obtain the most recent month-end returns. Performance reflects applicable fee waivers and/or expense limitations in effect during the periods shown. In their absence, performance would be reduced. Returns do not reflect the deduction of taxes that a shareholder would pay on Fund distributions or the redemption of Fund shares. |
14
FUND BASICS
| | | | | | | | | | |
| | EXPENSE RATIOS4 | |
| | | | | Net Expense Ratio (Current) | | | Gross Expense Ratio (Before Waivers) | |
| | Class A | | | 0.95 | % | | | 1.11 | % |
| | Class B | | | 1.70 | | | | 1.86 | |
| | Class C | | | 1.70 | | | | 1.86 | |
| | Institutional | | | 0.55 | | | | 0.71 | |
| | Service | | | 1.05 | | | | 1.21 | |
| | Class IR | | | 0.70 | | | | 0.86 | |
| | | Class R | | | 1.20 | | | | 1.36 | |
| | 4 | | The expense ratios of the Fund, both current (net of applicable fee waivers and/or expense limitations) and before waivers (gross of applicable fee waivers and/or expense limitations) are as set forth above according to the most recent publicly available Prospectus for the Fund and may differ from the expense ratios disclosed in the Financial Highlights in this report. The Fund’s waivers and/or expense limitations will remain in place through at least February 28, 2014, and prior to such date the Investment Adviser may not terminate the arrangements without the approval of the Fund’s Board of Trustees. If these arrangements are discontinued in the future, the expense ratios may change without shareholder approval. |
| | | | | | | | |
| | TOP TEN HOLDINGS AS OF 4/30/135 |
| | | Holding | | % of Net Assets | | | Line of Business |
| | Exxon Mobil Corp. | | | 5.9 | % | | Oil, Gas & Consumable Fuels |
| | Pfizer, Inc. | | | 3.5 | | | Pharmaceuticals |
| | General Electric Co. | | | 3.3 | | | Industrial Conglomerates |
| | Chevron Corp. | | | 3.2 | | | Oil, Gas & Consumable Fuels |
| | AT&T, Inc. | | | 2.8 | | | Diversified Telecommunication Services |
| | Merck & Co., Inc. | | | 2.7 | | | Pharmaceuticals |
| | Wells Fargo & Co. | | | 2.2 | | | Commercial Banks |
| | Citigroup, Inc. | | | 1.8 | | | Diversified Financial Services |
| | ConocoPhillips | | | 1.8 | | | Oil, Gas & Consumable Fuels |
| | | Capital One Financial Corp. | | | 1.4 | | | Consumer Finance |
| | 5 | | The top 10 holdings may not be representative of the Fund’s future investments. |
15
FUND BASICS
|
| FUND VS. BENCHMARK SECTOR ALLOCATIONS6 |
| As of April 30, 2013 |
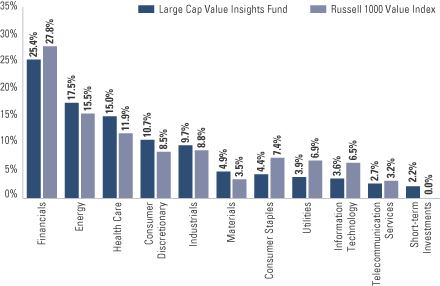
| | 6 | | The Fund is actively managed and, as such, its composition may differ over time. Consequently, the Fund’s overall sector allocation may differ from the percentages contained in the graph above. The graph categorizes investments using Global Industry Classification Standard (“GICS”), however, the sector classifications used by the portfolio management team may differ from GICS. The percentage shown for each investment category reflects the value of investments in that category as a percentage of market value (excluding investments in the securities lending reinvestment vehicle, if any). Investment in the securities lending reinvestment vehicle represented 2.8% of the Fund’s net assets as of April 30, 2013. Short-term investments represent repurchase agreements. The graph depicts the Fund’s investments but may not represent the Fund’s market exposure due to the exclusion of certain derivatives, if any, as listed in the Additional Investment Information section of the Schedule of Investments. |
16
PORTFOLIO RESULTS
Goldman Sachs Small Cap Equity Insights Fund
Portfolio Management Discussion and Analysis
Effective after the close of business on May 3, 2013, the Goldman Sachs Structured Small Cap Equity Fund was renamed the Goldman Sachs Small Cap Equity Insights Fund (the “Fund”). Below, the Goldman Sachs Quantitative Investment Strategies Team discusses the Fund’s performance and positioning for the six-month period ended April 30, 2013 (the “Reporting Period”).
| Q | | How did the Fund perform during the Reporting Period? |
| A | | During the Reporting Period, the Fund’s Class A, B, C, Institutional, Service, IR and R Shares generated cumulative total returns, without sales charges, of 13.90%, 13.47%, 13.57%, 14.15%, 13.84%, 14.00% and 13.81%, respectively. These returns compare to the 16.58% cumulative total return of the Fund’s benchmark, the Russell 2000® Index (with dividends reinvested) (the “Index”), during the same period. |
| Q | | What key factors were most responsible for the Fund’s performance during the Reporting Period? |
| A | | The Fund underperformed the Index during the Reporting Period largely because of our investment themes. Security selection added to relative results. |
| Q | | What impact did the Fund’s investment themes have on performance during the Reporting Period? |
| A | | In keeping with our investment approach, we use our quantitative model and its six investment themes to take a long-term view of market patterns and look for inefficiencies, selecting stocks for the Fund and overweighting or underweighting the ones chosen by the model. Over time and by design, the performance of any one of the model’s investment themes tends to have a low correlation with the model’s other themes, demonstrating the diversification benefit of the Fund’s theme-driven quantitative model. The variance in performance supports our research indicating that the diversification provided by our different investment themes is a significant investment advantage over the long term, even though the Fund may experience underperformance in the short term. Of course, diversification does not protect an investor from market risk nor does it ensure a profit. |
| | During the Reporting Period, three of our six investment themes detracted from relative performance. Our weakest performing theme was Management, which assesses the characteristics, policies and strategic decisions of company management. Sentiment and Quality also dampened relative returns. Sentiment reflects selected investment views and decisions of individuals and financial intermediaries, while The Quality theme assesses both firm and management quality. |
| | Momentum was our best performing theme. Momentum seeks to predict drifts in stock prices caused by delayed investor reaction to company-specific information and information about related companies. Valuation also added to results. The Valuation theme attempts to capture potential mispricings of securities, typically by comparing a measure of the company’s intrinsic value to its market value. |
| | The impact of our Profitability theme was relatively neutral during the Reporting Period. Profitability assesses whether a company is earning more than its cost of capital. |
| Q | | How did the Fund’s sector and industry allocations affect relative performance? |
| A | | In constructing the Fund’s portfolio, we focus on picking stocks rather than on making sector or industry bets. Consequently, the Fund is similar to the Index in terms of its sector and industry allocations and its style. Changes in its sector or industry weights generally do not have a meaningful impact on relative performance. |
| Q | | Did stock selection help or hurt Fund performance during the Reporting Period? |
| A | | We seek to outpace the Index by overweighting stocks we expect to outperform and underweighting those we think may lag. At the same time, we strive to maintain a risk profile similar to the Index. The Fund’s investments are selected using fundamental research and a variety of quantitative techniques based on our investment themes. For example, the Fund aims to hold a basket of stocks with better Momentum characteristics than the benchmark. During the Reporting Period, our security selection contributed positively to the Fund’s relative performance. |
17
PORTFOLIO RESULTS
| Q | | Which stock positions contributed most to the Fund’s relative returns during the Reporting Period? |
| A | | Stock picks in the materials, energy and industrials sectors added to the Fund’s relative results during the Reporting Period. The Fund benefited from overweighted positions in biotechnology companies Acorda Therapeutics and Santarus as well as from an overweighted position in chemicals and building products company Axiall. We chose to overweight Acorda Therapeutics because of our positive views on Momentum and Valuation. The Fund was overweight Santarus based on our positive views on Quality and Profitability. We assumed the overweight in Axiall as a result of our positive views on Quality and Sentiment. |
| Q | | Which individual positions detracted most from the Fund’s results during the Reporting Period? |
| A | | Security selection in the consumer discretionary, financials and information technology sectors detracted from relative returns during the Reporting Period. The Fund was hampered by overweighted positions in Affymax, a biotechnology company; Altisource Portfolio Solutions, a provider of real estate and mortgage portfolio management; and Herbalife, a nutrition and weight management company. We adopted the overweight in Affymax because of our positive views on Quality and Momentum. The overweighted positions in Altisource Portfolio Solutions and Herbalife were the result of our positive views on Profitability and Momentum. |
| Q | | How did the Fund use derivatives and similar instruments during the Reporting Period? |
| A | | During the Reporting Period, we used financial futures contracts to equitize the Fund’s cash holdings (that is, to put the Fund’s cash holdings to work). |
| Q | | What was the Fund’s sector positioning relative to the Index at the end of the Reporting Period? |
| A | | At the end of the Reporting Period, the Fund was overweight the industrials, health care and materials sectors relative to the Index. It was underweight the information technology, financials, consumer discretionary, consumer staples, energy and utilities sectors. Compared to the Index, the Fund was relatively neutral in telecommunication services at the end of the Reporting Period. |
18
FUND BASICS
Small Cap Equity Insights Fund
as of April 30, 2013
| | | | | | | | | | |
| | PERFORMANCE REVIEW | |
| | | November 1, 2012–April 30, 2013 | | Fund Total Return
(based on NAV)1 | | | Russell 2000 Index2 | |
| | Class A | | | 13.90 | % | | | 16.58 | % |
| | Class B | | | 13.47 | | | | 16.58 | |
| | Class C | | | 13.57 | | | | 16.58 | |
| | Institutional | | | 14.15 | | | | 16.58 | |
| | Service | | | 13.84 | | | | 16.58 | |
| | Class IR | | | 14.00 | | | | 16.58 | |
| | | Class R | | | 13.81 | | | | 16.58 | |
| | 1 | | The net asset value (“NAV”) represents the net assets of the class of the Fund (ex-dividend) divided by the total number of shares of the class outstanding. The Fund’s performance assumes the reinvestment of dividends and other distributions. The Fund’s performance does not reflect the deduction of any applicable sales charges. |
| | 2 | | The Russell 2000® Index is an unmanaged index of common stock prices that measures the performance of the 2000 smallest companies in the Russell 3000 Index. The figures for the Index do not include any deduction for fees, expenses or taxes. It is not possible to invest directly in an index. |
| | | | | | | | | | | | | | |
| | STANDARDIZED TOTAL RETURNS3 |
| | | For the period ended 3/31/13 | | One Year | | | Five Years | | Ten Years | | Since Inception | | Inception Date |
| | Class A | | | 4.44 | % | | 7.00% | | 8.44% | | 5.35% | | 8/15/97 |
| | Class B | | | 4.73 | | | 7.13 | | 8.38 | | 5.33 | | 8/15/97 |
| | Class C | | | 8.65 | | | 7.40 | | 8.22 | | 4.96 | | 8/15/97 |
| | Institutional | | | 10.97 | | | 8.65 | | 9.47 | | 6.15 | | 8/15/97 |
| | Service | | | 10.43 | | | 8.10 | | 8.92 | | 5.63 | | 8/15/97 |
| | Class IR | | | 10.78 | | | 8.49 | | N/A | | 5.63 | | 11/30/07 |
| | | Class R | | | 10.32 | | | 7.98 | | N/A | | 5.15 | | 11/30/07 |
| | 3 | | The Standardized Total Returns are average annual total returns as of the most recent calendar quarter-end. They assume reinvestment of all distributions at NAV. These returns reflect a maximum initial sales charge of 5.5% for Class A Shares, the assumed contingent deferred sales charge for Class B Shares (5% maximum declining to 0% after six years) and the assumed contingent deferred sales charge for Class C Shares (1% if redeemed within 12 months of purchase). Class B Shares convert automatically to Class A Shares on or about the fifteenth day of the last month of the calendar quarter that is eight years after purchase. Returns for Class B Shares for the period after conversion reflect the performance of Class A Shares. Because Institutional, Service, Class IR and Class R Shares do not involve a sales charge, such a charge is not applied to their Standardized Total Returns. The Fund’s Class B Shares are no longer available for purchase by new or existing shareholders (although current Class B shareholders may continue to reinvest income and capital gains distributions into Class B Shares, and Class B shareholders may continue to exchange their shares for Class B Shares of certain other Goldman Sachs Funds). |
| | | | The returns set forth in the tables above represent past performance. Past performance does not guarantee future results. The Fund’s investment return and principal value will fluctuate so that an investor’s shares, when redeemed, may be worth more or less than their original cost. Current performance may be lower or higher than the performance quoted above. Please visit our web site at www.goldmansachsfunds.com to obtain the most recent month-end returns. Performance reflects applicable fee waivers and/or expense limitations in effect during the periods shown. In their absence, performance would be reduced. Returns do not reflect the deduction of taxes that a shareholder would pay on Fund distributions or the redemption of Fund shares. |
19
FUND BASICS
| | | | | | | | | | |
| | EXPENSE RATIOS4 | |
| | | | | Net Expense Ratio (Current) | | | Gross Expense Ratio (Before Waivers) | |
| | Class A | | | 1.26 | % | | | 1.46 | % |
| | Class B | | | 2.02 | | | | 2.22 | |
| | Class C | | | 2.01 | | | | 2.21 | |
| | Institutional | | | 0.86 | | | | 1.06 | |
| | Service | | | 1.36 | | | | 1.56 | |
| | Class IR | | | 1.01 | | | | 1.21 | |
| | | Class R | | | 1.51 | | | | 1.71 | |
| | 4 | | The expense ratios of the Fund, both current (net of applicable fee waivers and/or expense limitations) and before waivers (gross of applicable fee waivers and/or expense limitations) are as set forth above according to the most recent publicly available Prospectus for the Fund and may differ from the expense ratios disclosed in the Financial Highlights in this report. The Fund’s waivers and/or expense limitations will remain in place through at least February 28, 2014, and prior to such date the Investment Adviser may not terminate the arrangements without the approval of the Fund’s Board of Trustees. If these arrangements are discontinued in the future, the expense ratios may change without shareholder approval. |
| | | | | | | | |
| | TOP TEN HOLDINGS AS OF 4/30/135 |
| | | Holding | | % of Net Assets | | | Line of Business |
| | Pharmacyclics, Inc. | | | 1.0 | % | | Biotechnology |
| | Lumber Liquidators Holdings, Inc. | | | 0.9 | | | Specialty Retail |
| | Ocwen Financial Corp. | | | 0.9 | | | Thrifts & Mortgage Finance |
| | US Airways Group, Inc. | | | 0.8 | | | Airlines |
| | Alaska Air Group, Inc. | | | 0.8 | | | Airlines |
| | Isis Pharmaceuticals, Inc. | | | 0.8 | | | Biotechnology |
| | Aspen Technology, Inc. | | | 0.8 | | | Software |
| | Potlatch Corp. | | | 0.8 | | | Real Estate Investment Trusts |
| | Watsco, Inc. | | | 0.8 | | | Trading Companies & Distributors |
| | | Seattle Genetics, Inc. | | | 0.8 | | | Biotechnology |
| | 5 | | The top 10 holdings may not be representative of the Fund’s future investments. |
20
FUND BASICS
|
| FUND VS. BENCHMARK SECTOR ALLOCATIONS6 |
| As of April 30, 2013 |
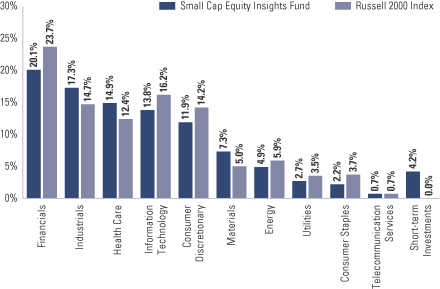
| | 6 | | The Fund is actively managed and, as such, its composition may differ over time. Consequently, the Fund’s overall sector allocations may differ from the percentages contained in the graph above. The graph categorizes investments using the Global Industry Classification Standard (“GICS”), however, the sector classifications used by the portfolio management team may differ from GICS. The percentage shown for each investment category reflects the value of investments in that category as a percentage of market value (excluding investments in the securities lending reinvestment vehicle, if any). Investment in the securities lending investment vehicle represented 10.6% of the Fund’s net assets at April 30, 2013. Short-term investments represent repurchase agreements. The graph depicts the Fund’s investments but may not represent the Fund’s market exposure due to the exclusion of certain derivatives, if any, as listed in the Additional Investment Information section of the Schedule of Investments. |
21
PORTFOLIO RESULTS
Goldman Sachs Small Cap Growth Insights Fund
Portfolio Management Discussion and Analysis
Effective after the close of business on May 3, 2013, the Goldman Sachs Structured Small Cap Growth Fund was renamed the Goldman Sachs Small Cap Growth Insights Fund (the “Fund”). Below, the Goldman Sachs Quantitative Investment Strategies Team discusses the Fund’s performance and positioning for the six-month period ended April 30, 2013 (the “Reporting Period”).
| Q | | How did the Fund perform during the Reporting Period? |
| A | | During the Reporting Period, the Fund’s Class A, B, C, Institutional, IR and R Shares generated cumulative total returns, without sales charges, of 15.12%, 14.62%, 14.65%, 15.32%, 15.20% and 14.94%, respectively. These returns compare to the 16.60% cumulative total return of the Fund’s benchmark, the Russell 2000® Growth Index (with dividends reinvested) (the “Index”), during the same period. |
| Q | | What key factors were most responsible for the Fund’s performance during the Reporting Period? |
| A | | The Fund underperformed the Index during the Reporting Period largely because of our investment themes. Security selection added to relative results. |
| Q | | What impact did the Fund’s investment themes have on performance during the Reporting Period? |
| A | | In keeping with our investment approach, we use our quantitative model and its six investment themes to take a long-term view of market patterns and look for inefficiencies, selecting stocks for the Fund and overweighting or underweighting the ones chosen by the model. Over time and by design, the performance of any one of the model’s investment themes tends to have a low correlation with the model’s other themes, demonstrating the diversification benefit of the Fund’s theme-driven quantitative model. The variance in performance supports our research indicating that the diversification provided by our different investment themes is a significant investment advantage over the long term, even though the Fund may experience underperformance in the short term. Of course, diversification does not protect an investor from market risk nor does it ensure a profit. |
| | | During the Reporting Period, four of our investment themes — Management, Sentiment, Quality and Profitability — hurt relative performance. Management assesses the characteristics, policies and strategic decisions of company management, while Sentiment reflects selected investment views and decisions of individuals and financial intermediaries. Our Quality theme assesses both firm and management quality. The Profitability theme assesses whether a company is earning more than its cost of capital. |
| | | Our best performing theme was Momentum, which seeks to predict drifts in stock prices caused by delayed investor reaction to company-specific information and information about related companies. Our Valuation theme also contributed positively. Valuation attempts to capture potential mispricings of securities, typically by comparing a measure of the company’s intrinsic value to its market value. |
| Q | | How did the Fund’s sector and industry allocations affect relative performance? |
| A | | In constructing the Fund’s portfolio, we focus on picking stocks rather than on making sector or industry bets. Consequently, the Fund is similar to the Index in terms of its sector and industry allocations and style. Changes in its sector or industry weights generally do not have a meaningful impact on relative performance. |
| Q | | Did stock selection help or hurt Fund performance during the Reporting Period? |
| A | | We seek to outpace the Index by overweighting stocks we expect to outperform and underweighting those we think may lag. At the same time, we strive to maintain a risk profile similar to the Index. The Fund’s investments are selected using fundamental research and a variety of quantitative techniques based on our investment themes. For example, the Fund aims to hold a basket of stocks with better Momentum characteristics than the benchmark. During the Reporting Period, our security selection enhanced the Fund’s relative performance. |
| Q | | Which stock positions contributed most to the Fund’s relative returns during the Reporting Period? |
| A | | Investments in the industrials, materials and energy sectors added to the Fund’s relative returns during the Reporting Period. The Fund benefited from an underweighted position |
22
PORTFOLIO RESULTS
| | in semiconductor supplier Cirrus Logic and overweighted positions in biotechnology companies Pharmacyclics and Santarus. We assumed the underweight in Cirrus Logic because of our negative views on Momentum and Quality. Our positive view on Quality led us to overweight Pharmacyclics and Santarus. |
| Q | | Which individual positions detracted most from the Fund’s results during the Reporting Period? |
| A | | Stock selection in the consumer discretionary, financials and health care sectors detracted from relative performance during the Reporting Period. The Fund was hindered by overweighted positions in Affymax, a biotechnology company; Altisource Portfolio Solutions, a provider of real estate and mortgage portfolio management; and Select Comfort, a maker of mattresses and bedding accessories. We chose to overweight Affymax because of our positive views on Quality and Momentum. The Fund was overweight Altisource Portfolio Solutions as a result of our positive view on Profitability. Our positive view on Momentum led us to overweight Select Comfort. |
| Q | | How did the Fund use derivatives and similar instruments during the Reporting Period? |
| A | | During the Reporting Period, we used financial futures contracts to equitize the Fund’s cash holdings (that is, to put the Fund’s cash holdings to work). |
| Q | | What was the Fund’s sector positioning relative to the Index at the end of the Reporting Period? |
| A | | At the end of the Reporting Period, the Fund was overweight the health care, industrials and materials sectors relative to the Index. It was underweight the information technology, consumer discretionary, energy and consumer staples sectors. Compared to the Index, the Fund was relatively neutral in the financials, utilities and telecommunication services sectors at the end of the Reporting Period. |
23
FUND BASICS
Small Cap Growth Insights Fund
as of April 30, 2013
| | | | | | | | | | |
| | PERFORMANCE REVIEW | |
| | | November 1, 2012–April 30, 2013 | | Fund Total Return
(based on NAV)1 | | | Russell 2000 Growth Index2 | |
| | Class A | | | 15.12 | % | | | 16.60 | % |
| | Class B | | | 14.62 | | | | 16.60 | |
| | Class C | | | 14.65 | | | | 16.60 | |
| | Institutional | | | 15.32 | | | | 16.60 | |
| | Class IR | | | 15.20 | | | | 16.60 | |
| | | Class R | | | 14.94 | | | | 16.60 | |
| | 1 | | The net asset value (“NAV”) represents the net assets of the class of the Fund (ex-dividend) divided by the total number of shares of the class outstanding. The Fund’s performance assumes the reinvestment of dividends and other distributions. The Fund’s performance does not reflect the deduction of any applicable sales charges. |
| | 2 | | The Russell 2000® Growth Index measures the performance of the small-cap growth stocks of the U.S. equity universe. The Index figures do not reflect any deduction for fees, expenses or taxes. It is not possible to invest directly in an index. |
| | | | | | | | | | | | | | |
| | STANDARDIZED TOTAL RETURNS3 |
| | | For the period ended 3/31/13 | | One Year | | | Five Years | | | Since Inception | | Inception Date |
| | Class A | | | 7.04 | % | | | 9.20 | % | | 3.38% | | 6/25/07 |
| | Class B | | | 7.40 | | | | 9.34 | | | 3.43 | | 6/25/07 |
| | Class C | | | 11.40 | | | | 9.62 | | | 3.61 | | 6/25/07 |
| | Institutional | | | 13.74 | | | | 10.88 | | | 4.81 | | 6/25/07 |
| | Class IR | | | 13.51 | | | | 10.72 | | | 6.90 | | 11/30/07 |
| | | Class R | | | 12.97 | | | | 10.14 | | | 6.35 | | 11/30/07 |
| | 3 | | The Standardized Total Returns are average annual total returns as of the most recent calendar quarter-end. They assume reinvestment of all distributions at NAV. These returns reflect a maximum initial sales charge of 5.5% for Class A Shares, the assumed contingent deferred sales charge for Class B Shares (5% maximum declining to 0% after six years) and the assumed contingent deferred sales charge for Class C Shares (1% if redeemed within 12 months of purchase). Class B Shares convert automatically to Class A Shares on or about the fifteenth day of the last month of the calendar quarter that is eight years after purchase. Returns for Class B Shares for the period after conversion reflect the performance of Class A Shares. Because Institutional, Class IR and Class R Shares do not involve a sales charge, such a charge is not applied to their Standardized Total Returns. The Fund’s Class B Shares are no longer available for purchase by new or existing shareholders (although current Class B shareholders may continue to reinvest income and capital gains distributions into Class B Shares, and Class B shareholders may continue to exchange their shares for Class B Shares of certain other Goldman Sachs Funds). |
| | | | The returns set forth in the tables above represent past performance. Past performance does not guarantee future results. The Fund’s investment return and principal value will fluctuate so that an investor’s shares, when redeemed, may be worth more or less than their original cost. Current performance may be lower or higher than the performance quoted above. Please visit our web site at www.goldmansachsfunds.com to obtain the most recent month-end returns. Performance reflects applicable fee waivers and/or expense limitations in effect during the periods shown. In their absence, performance would be reduced. Returns do not reflect the deduction of taxes that a shareholder would pay on Fund distributions or the redemption of Fund shares. |
24
FUND BASICS
| | | | | | | | | | |
| | EXPENSE RATIOS4 | |
| | | | | Net Expense Ratio (Current) | | | Gross Expense Ratio (Before Waivers) | |
| | Class A | | | 1.28 | % | | | 1.96 | % |
| | Class B | | | 2.04 | | | | 2.71 | |
| | Class C | | | 2.03 | | | | 2.71 | |
| | Institutional | | | 0.88 | | | | 1.55 | |
| | Class IR | | | 1.03 | | | | 1.70 | |
| | | Class R | | | 1.53 | | | | 2.20 | |
| | 4 | | The expense ratios of the Fund, both current (net of applicable fee waivers and/or expense limitations) and before waivers (gross of applicable fee waivers and/or expense limitations) are as set forth above according to the most recent publicly available Prospectus for the Fund and may differ from the expense ratios disclosed in the Financial Highlights in this report. The Fund’s waivers and/or expense limitations will remain in place through at least February 28, 2014, and prior to such date the Investment Adviser may not terminate the arrangements without the approval of the Fund’s Board of Trustees. If these arrangements are discontinued in the future, the expense ratios may change without shareholder approval. |
| | | | | | | | |
| | TOP TEN HOLDINGS AS OF 4/30/135 |
| | | Holding | | % of Net Assets | | | Line of Business |
| | Pharmacyclics, Inc. | | | 1.3 | % | | Biotechnology |
| | Alkermes PLC | | | 1.2 | | | Biotechnology |
| | Alaska Air Group, Inc. | | | 1.1 | | | Airlines |
| | US Airways Group, Inc. | | | 1.1 | | | Airlines |
| | Seattle Genetics, Inc. | | | 1.0 | | | Biotechnology |
| | Watsco, Inc. | | | 1.0 | | | Trading Companies & Distributors |
| | PAREXEL International Corp. | | | 1.0 | | | Life Sciences Tools & Services |
| | Aspen Technology, Inc. | | | 1.0 | | | Software |
| | Lumber Liquidators Holdings, Inc. | | | 1.0 | | | Specialty Retail |
| | | Domino’s Pizza, Inc. | | | 1.0 | | | Hotels, Restaurants & Leisure |
| | 5 | | The top 10 holdings may not be representative of the Fund’s future investments. |
25
FUND BASICS
| | |
| FUND VS. BENCHMARK SECTOR ALLOCATIONS6 | | |
| As of April 30, 2013 | | |
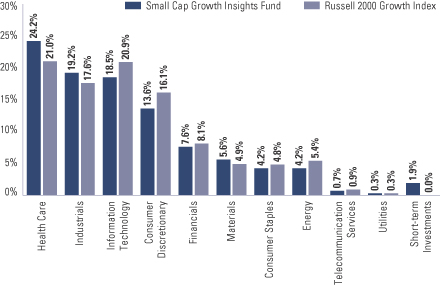
| | 6 | | The Fund is actively managed and, as such, its composition may differ over time. Consequently, the Fund’s overall sector allocations may differ from the percentages contained in the graph above. The graph categorizes investments using the Global Industry Classification Standard (“GICS”), however, the sector classifications used by the portfolio management team may differ from GICS. The percentage shown for each investment category reflects the value of investments in that category as a percentage of market value (excluding investments in the securities lending reinvestment vehicle, if any). Investment in the securities lending reinvestment vehicle represented 8.0% of the Fund’s net assets as of April 30, 2013. Short-term investments represent repurchase agreements. The graph depicts the Fund’s investments but may not represent the Fund’s market exposure due to the exclusion of certain derivatives, if any, as listed in the Additional Investment Information section of the Schedule of Investments. |
26
PORTFOLIO RESULTS
Goldman Sachs Small Cap Value Insights Fund
Portfolio Management Discussion and Analysis
Effective after the close of business on May 3, 2013, the Goldman Sachs Structured Small Cap Value Fund was renamed the Goldman Sachs Small Cap Value Insights Fund (the “Fund”). Below, the Goldman Sachs Quantitative Investment Strategies Team discusses the Fund’s performance and positioning for the six-month period ended April 30, 2013 (the “Reporting Period”).
| Q | | How did the Fund perform during the Reporting Period? |
| A | | During the Reporting Period, the Fund’s Class A, B, C, Institutional, IR and R Shares generated cumulative total returns, without sales charges, of 11.80%, 11.44%, 11.42%, 12.06%, 12.00% and 11.68%, respectively. These returns compare to the 16.58% cumulative total return of the Fund’s benchmark, the Russell 2000® Value Index (with dividends reinvested) (the “Index”), during the same period. |
| Q | | What key factors were most responsible for the Fund’s performance during the Reporting Period? |
| A | | The Fund underperformed the Index during the Reporting Period largely because of our investment themes. Security selection enhanced relative results. |
| Q | | What impact did the Fund’s investment themes have on performance during the Reporting Period? |
| A | | In keeping with our investment approach, we use our quantitative model and its six investment themes to take a long-term view of market patterns and look for inefficiencies, selecting stocks for the Fund and overweighting or underweighting the ones chosen by the model. Over time and by design, the performance of any one of the model’s investment themes tends to have a low correlation with the model’s other themes, demonstrating the diversification benefit of the Fund’s theme-driven quantitative model. The variance in performance supports our research indicating that the diversification provided by our different investment themes is a significant investment advantage over the long term, even though the Fund may experience underperformance in the short term. Of course, diversification does not protect an investor from market risk nor does it ensure a profit. |
| | During the Reporting Period, three of our six investment themes — Sentiment, Management and Quality — detracted from relative performance. Sentiment reflects selected investment views and decisions of individuals and financial intermediaries, while Management assesses the characteristics, policies and strategic decisions of company management. The Quality theme assesses both firm and management quality. |
| | Momentum was our best performing investment theme. Our Momentum theme seeks to predict drifts in stock prices caused by delayed investor reaction to company-specific information and information about related companies. Valuation also added value. The Valuation theme attempts to capture potential mispricings of securities, typically by comparing a measure of the company’s intrinsic value to its market value. |
| | The impact of our Profitability theme was relatively neutral during the Reporting Period. Profitability assesses whether a company is earning more than its cost of capital. |
| Q | | How did the Fund’s sector and industry allocations affect relative performance? |
| A | | In constructing the Fund’s portfolio, we focus on picking stocks rather than on making sector or industry bets. Consequently, the Fund is similar to the Index in terms of its sector and industry allocations and style. Changes in its sector or industry weights generally do not have a meaningful impact on relative performance. |
| Q | | Did stock selection help or hurt Fund performance during the Reporting Period? |
| A | | We seek to outpace the Index by overweighting stocks we expect to outperform and underweighting those we think may lag. At the same time, we strive to maintain a risk profile similar to the Index. The Fund’s investments are selected using fundamental research and a variety of quantitative techniques based on our investment themes. For example, the Fund aims to hold a basket of stocks with better Momentum characteristics than the benchmark. During the Reporting Period, security selection contributed positively to the Fund’s relative returns. |
27
PORTFOLIO RESULTS
| Q | | Which stock positions contributed most to the Fund’s relative returns during the Reporting Period? |
| A | | Investments in the materials, industrials and utilities sectors added to the Fund’s relative performance during the Reporting Period. The Fund benefited from its overweighted positions in First Solar, a manufacturer of solar panels; Axiall, a chemicals and building products company; and Zillow, an online real estate database company. We assumed the overweights in First Solar and Axiall as a result of our positive view on Quality. The Fund was overweight Zillow because of our positive view on Profitability. |
| Q | | Which individual positions detracted most from the Fund’s results during the Reporting Period? |
| A | | Investments in the financials, consumer discretionary and health care sectors dampened relative results during the Reporting Period. The Fund was hampered by overweighted positions in Affymax, a biotechnology firm; Herbalife, a nutrition and weight management company; and Altisource Portfolio Solutions, a provider of real estate and mortgage portfolio management. We chose to overweight Affymax because of our positive view on Quality. The overweight in Herbalife was the result of our positive view on Momentum, while we adopted the overweight in Altisource Portfolio Solutions because of our positive view on Profitability. |
| Q | | How did the Fund use derivatives and similar instruments during the Reporting Period? |
| A | | During the Reporting Period, we used financial futures contracts to equitize the Fund’s cash holdings (that is, to put the Fund’s cash holdings to work). |
| Q | | What was the Fund’s sector positioning relative to the Index at the end of the Reporting Period? |
| A | | At the end of the Reporting Period, the Fund was overweight the health care, industrials and materials sectors relative to the Index. It was underweight the information technology, financials, utilities, consumer discretionary, energy and telecommunication services sectors. Compared to the Index, the Fund was relatively neutral in the consumer staples sector at the end of the Reporting Period. |
28
FUND BASICS
Small Cap Value Insights Fund
as of April 30, 2013
| | | | | | | | | | |
| | PERFORMANCE REVIEW | |
| | | November 1, 2012–April 30, 2013 | | Fund Total Return
(based on NAV)1 | | | Russell 2000 Value Index2 | |
| | Class A | | | 11.80 | % | | | 16.58 | % |
| | Class B | | | 11.44 | | | | 16.58 | |
| | Class C | | | 11.42 | | | | 16.58 | |
| | Institutional | | | 12.06 | | | | 16.58 | |
| | Class IR | | | 12.00 | | | | 16.58 | |
| | | Class R | | | 11.68 | | | | 16.58 | |
| | 1 | | The net asset value (“NAV”) represents the net assets of the class of the Fund (ex-dividend) divided by the total number of shares of the class outstanding. The Fund’s performance assumes the reinvestment of dividends and other distributions. The Fund’s performance does not reflect the deduction of any applicable sales charges. |
| | 2 | | The Russell 2000® Value Index is an unmanaged index of common stock prices that measures the performance of those Russell 2000 companies with lower price-to-book ratios and lower forecasted growth values. The Index figures do not reflect any deduction for fees, expenses or taxes. It is not possible to invest directly in an index. |
| | | | | | | | | | | | |
| | STANDARDIZED TOTAL RETURNS3 |
| | | For the period ended 3/31/13 | | One Year | | | Five Years | | Since Inception | | Inception Date |
| | Class A | | | 4.42 | % | | 6.61% | | 0.80% | | 6/25/07 |
| | Class B | | | 4.66 | | | 7.03 | | 0.99 | | 6/25/07 |
| | Class C | | | 8.64 | | | 7.00 | | 1.01 | | 6/25/07 |
| | Institutional | | | 10.95 | | | 8.30 | | 2.23 | | 6/25/07 |
| | Class IR | | | 10.78 | | | 8.04 | | 5.34 | | 11/30/07 |
| | | Class R | | | 10.23 | | | 7.53 | | 4.88 | | 11/30/07 |
| | 3 | | The Standardized Total Returns are average annual total returns as of the most recent calendar quarter-end. They assume reinvestment of all distributions at NAV. These returns reflect a maximum initial sales charge of 5.5% for Class A Shares, the assumed contingent deferred sales charge for Class B Shares (5% maximum declining to 0% after six years) and the assumed contingent deferred sales charge for Class C Shares (1% if redeemed within 12 months of purchase). Class B Shares convert automatically to Class A Shares on or about the fifteenth day of the last month of the calendar quarter that is eight years after purchase. Returns for Class B Shares for the period after conversion reflect the performance of Class A Shares. Because Institutional, Class R and Class IR Shares do not involve a sales charge, such a charge is not applied to their Standardized Total Returns. The Fund’s Class B Shares are no longer available for purchase by new or existing shareholders (although current Class B shareholders may continue to reinvest income and capital gains distributions into Class B Shares, and Class B shareholders may continue to exchange their shares for Class B Shares of certain other Goldman Sachs Funds). |
| | | | The returns set forth in the tables above represent past performance. Past performance does not guarantee future results. The Fund’s investment return and principal value will fluctuate so that an investor’s shares, when redeemed, may be worth more or less than their original cost. Current performance may be lower or higher than the performance quoted above. Please visit our web site at www.goldmansachsfunds.com to obtain the most recent month-end returns. Performance reflects applicable fee waivers and/or expense limitations in effect during the periods shown. In their absence, performance would be reduced. Returns do not reflect the deduction of taxes that a shareholder would pay on Fund distributions or the redemption of Fund shares. |
29
FUND BASICS
| | | | | | | | | | |
| | EXPENSE RATIOS4 | |
| | | | | Net Expense Ratio (Current) | | | Gross Expense Ratio (Before Waivers) | |
| | Class A | | | 1.25 | % | | | 1.52 | % |
| | Class B | | | 2.01 | | | | 2.27 | |
| | Class C | | | 2.00 | | | | 2.27 | |
| | Institutional | | | 0.85 | | | | 1.11 | |
| | Class IR | | | 1.00 | | | | 1.26 | |
| | | Class R | | | 1.50 | | | | 1.75 | |
| | 4 | | The expense ratios of the Fund, both current (net of applicable fee waivers and/or expense limitations) and before waivers (gross of applicable fee waivers and/or expense limitations) are as set forth above according to the most recent publicly available Prospectus for the Fund and may differ from the expense ratios disclosed in the Financial Highlights in this report. The Fund’s waivers and/or expense limitations will remain in place through at least February 28, 2014, and prior to such date the Investment Adviser may not terminate the arrangements without the approval of the Fund’s Board of Trustees. If these arrangements are discontinued in the future, the expense ratios may change without shareholder approval. |
| | | | | | | | |
| | TOP TEN HOLDINGS AS OF 4/30/135 |
| | | Holding | | % of Net Assets | | | Line of Business |
| | Ocwen Financial Corp. | | | 1.2 | % | | Thrifts & Mortgage Finance |
| | First Solar, Inc. | | | 1.1 | | | Semiconductors & Semiconductor Equipment |
| | Portland General Electric Co. | | | 1.0 | | | Electric Utilities |
| | Louisiana-Pacific Corp. | | | 0.9 | | | Paper & Forest Products |
| | Healthcare Realty Trust, Inc. | | | 0.9 | | | Real Estate Investment Trusts |
| | The Geo Group, Inc. | | | 0.9 | | | Real Estate Investment Trusts |
| | FirstMerit Corp. | | | 0.8 | | | Commercial Banks |
| | EnerSys, Inc. | | | 0.8 | | | Electrical Equipment |
| | Southwest Gas Corp. | | | 0.8 | | | Gas Utilities |
| | | Brady Corp. Class A | | | 0.8 | | | Electrical Equipment |
| | 5 | | The top 10 holdings may not be representative of the Fund’s future investments. |
30
FUND BASICS
|
| FUND VS. BENCHMARK SECTOR ALLOCATIONS6 |
| As of April 30, 3013 |
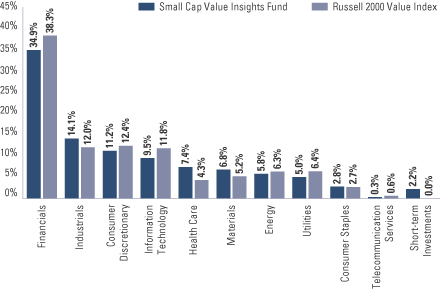
| | 6 | | The Fund is actively managed and, as such, its composition may differ over time. Consequently, the Fund’s overall sector allocations may differ from the percentages contained in the graph above. The graph categorizes investments using the Global Industry Classification Standard (“GICS”), however, the sector classifications used by the portfolio management team may differ from GICS. The percentage shown for each investment category reflects the value of investments in that category as a percentage of market value (excluding investments in the securities lending reinvestment vehicle, if any). Investment in the securities lending reinvestment vehicle represented 7.4% of the Fund’s net assets as of April 30, 2013. Short-term investments represent repurchase agreements. The graph depicts the Fund’s investments but may not represent the Fund’s market exposure due to the exclusion of certain derivatives, if any, as listed in the Additional Investment Information section of the Schedule of Investments. |
31
PORTFOLIO RESULTS
Goldman Sachs U.S. Equity Insights Fund
Portfolio Management Discussion and Analysis
Effective after the close of business on May 3, 2013, the Goldman Sachs Structured U.S. Equity Fund was renamed the Goldman Sachs U.S. Equity Insights Fund (the “Fund”). Below, the Goldman Sachs Quantitative Investment Strategies Team discusses the Fund’s performance and positioning for the six-month period ended April 30, 2013 (the “Reporting Period”.
| Q | | How did the Fund perform during the Reporting Period? |
| A | | During the Reporting Period, the Fund’s Class A, B, C, Institutional, Service, IR and R Shares generated cumulative total returns, without sales charges, of 15.60%, 15.15%, 15.17%, 15.82%, 15.51%, 15.72% and 15.45%, respectively. These returns compare to the 14.42% cumulative total return of the Fund’s benchmark, the S&P 500® Index (with dividends reinvested) (the “Index”), during the same period. |
| Q | | What key factors were most responsible for the Fund’s performance during the Reporting Period? |
| A | | The Fund outperformed the Index during the Reporting Period largely because of our investment themes. Security selection also contributed positively. |
| Q | | What impact did the Fund’s investment themes have on performance during the Reporting Period? |
| A | | In keeping with our investment approach, we use our quantitative model and its six investment themes to take a long-term view of market patterns and look for inefficiencies, selecting stocks for the Fund and overweighting or underweighting the ones chosen by the model. Over time and by design, the performance of any one of the model’s investment themes tends to have a low correlation with the model’s other themes, demonstrating the diversification benefit of the Fund’s theme-driven quantitative model. The variance in performance supports our research indicating that the diversification provided by our different investment themes is a significant investment advantage over the long term, even though the Fund may experience underperformance in the short term. Of course, diversification does not protect an investor from market risk nor does it ensure a profit. |
| | Momentum contributed most positively to relative returns during the Reporting Period. Momentum seeks to predict drifts in stock prices caused by delayed investor reaction to company-specific information and information about related companies. Valuation also enhanced relative returns. Valuation attempts to capture potential mispricings of securities, typically by comparing a measure of the company’s intrinsic value to its market value. |
| | Management, Quality, Sentiment and Profitability dampened relative results. Management assesses the characteristics, policies and strategic decisions of company management. The Quality theme assesses both firm and management quality. Sentiment reflects selected investment views and decisions of individuals and financial intermediaries, while Profitability assesses whether a company is earning more than its cost of capital. |
| Q | | How did the Fund’s sector and industry allocations affect relative performance? |
| A | | In constructing the Fund’s portfolio, we focus on picking stocks rather than on making sector or industry bets. Consequently, the Fund is similar to the Index in terms of its sector and industry allocations and style. Changes in its sector or industry weights generally do not have a meaningful impact on relative performance. |
| Q | | Did stock selection help or hurt Fund performance during the Reporting Period? |
| A | | We seek to outpace the Index by overweighting stocks we expect to outperform and underweighting those we think may lag. At the same time, we strive to maintain a risk profile similar to the Index. The Fund’s investments are selected using fundamental research and a variety of quantitative techniques based on our investment themes. For example, the Fund aims to hold a basket of stocks with better Momentum characteristics than the benchmark. During the Reporting Period, our security selection added to the Fund’s relative performance. |
32
PORTFOLIO RESULTS
| Q | | Which stock positions contributed most to the Fund’s relative returns during the Reporting Period? |
| A | | During the Reporting Period, our stock selection in the health care, energy and financials sectors boosted the Fund’s relative performance. The Fund benefited from overweighted positions in oil and natural gas exploration company Marathon Petroleum; biotechnology company Celgene; and pharmaceutical maker Biogen Idec. We chose to overweight Marathon Petroleum because of our positive views on Momentum and Sentiment. The Fund was overweight Celgene as a result of our positive views on Momentum and Valuation. We assumed the overweight in Biogen Idec because of our positive views on Valuation and Profitability. |
| Q | | Which individual positions detracted most from the Fund’s results during the Reporting Period? |
| A | | Investments in the consumer discretionary, consumer staples and utilities sectors detracted from relative returns during the Reporting Period. The Fund was hurt by overweighted positions in nutrition and weight management company Herbalife and oil giant Exxon Mobil. An underweight in software maker Microsoft also dampened relative performance. We adopted the overweights to Herbalife and Exxon Mobil because of our positive views on Momentum and Profitability. The Fund was underweight Microsoft as a result of our negative views on Management and Momentum. |
| Q | | How did the Fund use derivatives and similar instruments during the Reporting Period? |
| A | | During the Reporting Period, we used financial futures contracts to equitize the Fund’s cash holdings (that is, to put the Fund’s cash holdings to work). |
| Q | | What was the Fund’s sector positioning relative to the Index at the end of the Reporting Period? |
| A | | At the end of the Reporting Period, the Fund was overweight the health care, energy, consumer discretionary and materials sectors relative to the Index. It was underweight the consumer staples, information technology, utilities, financials and telecommunication services sectors. Compared to the Index, the Fund was relatively neutral in the industrials sector at the end of the Reporting Period. |
33
FUND BASICS
U.S. Equity Insights Fund
as of April 30, 2013
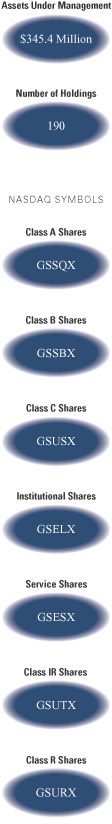
| | | | | | | | | | |
| | PERFORMANCE REVIEW | |
| | | November 1, 2012–April 30, 2013 | | Fund Total Return
(based on NAV)1 | | | S&P 500 Index2 | |
| | Class A | | | 15.60 | % | | | 14.42 | % |
| | Class B | | | 15.15 | | | | 14.42 | |
| | Class C | | | 15.17 | | | | 14.42 | |
| | Institutional | | | 15.82 | | | | 14.42 | |
| | Service | | | 15.51 | | | | 14.42 | |
| | Class IR | | | 15.72 | | | | 14.42 | |
| | | Class R | | | 15.45 | | | | 14.42 | |
| | 1 | | The net asset value (“NAV”) represents the net assets of the class of the Fund (ex-dividend) divided by the total number of shares of the class outstanding. The Fund’s performance assumes the reinvestment of dividends and other distributions. The Fund’s performance does not reflect the deduction of any applicable sales charges. |
| | 2 | | The S&P 500® Index (with dividends reinvested) is the Standard & Poor’s 500 Composite Index of 500 stocks, an unmanaged index of common stock prices. The figures for the Index do not include any deduction for fees, expenses or taxes. It is not possible to invest directly in an index. |
| | | | | | | | | | | | | | |
| | STANDARDIZED TOTAL RETURNS3 |
| | | For the period ended 3/31/13 | | One Year | | | Five Years | | Ten Years | | Since Inception | | Inception Date |
| | Class A | | | 7.21 | % | | 3.80% | | 6.88% | | 7.44% | | 5/24/91 |
| | Class B | | | 7.65 | | | 3.85 | | 6.82 | | 5.87 | | 5/1/96 |
| | Class C | | | 11.65 | | | 4.20 | | 6.69 | | 3.64 | | 8/15/97 |
| | Institutional | | | 13.92 | | | 5.39 | | 7.91 | | 7.68 | | 6/15/95 |
| | Service | | | 13.38 | | | 4.88 | | 7.38 | | 6.01 | | 6/07/96 |
| | Class IR | | | 13.78 | | | 5.24 | | N/A | | 2.39 | | 11/30/07 |
| | | Class R | | | 13.21 | | | 4.73 | | N/A | | 1.89 | | 11/30/07 |
| | 3 | | The Standardized Total Returns are average annual total returns as of the most recent calendar quarter-end. They assume reinvestment of all distributions at NAV. These returns reflect a maximum initial sales charge of 5.5% for Class A Shares, the assumed contingent deferred sales charge for Class B Shares (5% maximum declining to 0% after six years) and the assumed contingent deferred sales charge for Class C Shares (1% if redeemed within 12 months of purchase). Class B Shares convert automatically to Class A Shares on or about the fifteenth day of the last month of the calendar quarter that is eight years after purchase. Returns for Class B Shares for the period after conversion reflect the performance of Class A Shares. Because Institutional, Service, Class IR and Class R Shares do not involve a sales charge, such a charge is not applied to their Standardized Total Returns. The Fund’s Class B Shares are no longer available for purchase by new or existing shareholders (although current Class B shareholders may continue to reinvest income and capital gains distributions into Class B Shares, and Class B shareholders may continue to exchange their shares for Class B Shares of certain other Goldman Sachs Funds). |
| | | | The returns set forth in the tables above represent past performance. Past performance does not guarantee future results. The Fund’s investment return and principal value will fluctuate so that an investor’s shares, when redeemed, may be worth more or less than their original cost. Current performance may be lower or higher than the performance quoted above. Please visit our web site at www.goldmansachsfunds.com to obtain the most recent month-end returns. Performance reflects applicable fee waivers and/or expense limitations in effect during the periods shown. In their absence, performance would be reduced. Returns do not reflect the deduction of taxes that a shareholder would pay on Fund distributions or the redemption of Fund shares. |
34
FUND BASICS
| | | | | | | | | | |
| | EXPENSE RATIOS4 | |
| | | | | Net Expense Ratio (Current) | | | Gross Expense Ratio (Before Waivers) | |
| | Class A | | | 0.95 | % | | | 1.20 | % |
| | Class B | | | 1.71 | | | | 1.95 | |
| | Class C | | | 1.70 | | | | 1.95 | |
| | Institutional | | | 0.55 | | | | 0.80 | |
| | Service | | | 1.05 | | | | 1.30 | |
| | Class IR | | | 0.70 | | | | 0.95 | |
| | | Class R | | | 1.20 | | | | 1.44 | |
| | 4 | | The expense ratios of the Fund, both current (net of applicable fee waivers and/or expense limitations) and before waivers (gross of applicable fee waivers and/or expense limitations) are as set forth above according to the most recent publicly available Prospectus for the Fund and may differ from the expense ratios disclosed in the Financial Highlights in this report. The Fund’s waivers and/or expense limitations will remain in place through at least February 28, 2014, and prior to such date the Investment Adviser may not terminate the arrangements without the approval of the Fund’s Board of Trustees. If these arrangements are discontinued in the future, the expense ratios may change without shareholder approval. |
| | | | | | | | |
| | TOP TEN HOLDINGS AS OF 4/30/135 |
| | | Holding | | % of Net Assets | | | Line of Business |
| | Exxon Mobil Corp. | | | 3.8 | % | | Oil, Gas & Consumable Fuels |
| | Apple, Inc. | | | 3.1 | | | Computers & Peripherals |
| | General Electric Co. | | | 2.6 | | | Industrial Conglomerates |
| | Google, Inc. Class A | | | 2.6 | | | Internet Software & Services |
| | International Business Machines Corp. | | | 2.5 | | | IT Services |
| | AT&T, Inc. | | | 2.4 | | | Diversified Telecommunication
Services |
| | Pfizer, Inc. | | | 2.3 | | | Pharmaceuticals |
| | Merck & Co., Inc. | | | 2.0 | | | Pharmaceuticals |
| | Johnson & Johnson | | | 1.9 | | | Pharmaceuticals |
| | | Chevron Corp. | | | 1.7 | | | Oil, Gas & Consumable Fuels |
| | 5 | | The top 10 holdings may not be representative of the Fund’s future investments. |
35
FUND BASICS
|
| FUND VS. BENCHMARK SECTOR ALLOCATIONS6 |
| As of April 30, 3013 |
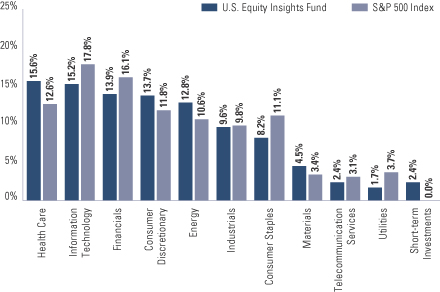
| | 6 | | The Fund is actively managed and, as such, its composition may differ over time. Consequently, the Fund’s overall sector allocation may differ from the percentages contained in the graph above. The graph categorizes investments using Global Industry Classification Standard (“GICS”), however, the sector classifications used by the portfolio management team may differ from GICS. The percentage shown for each investment category reflects the value of investments in that category as a percentage of market value (excluding investments in the securities lending reinvestment vehicle, if any). Investment in the securities lending reinvestment vehicle represented 1.8% of the Fund’s net assets at April 30, 2013. Short-term investments represent repurchase agreements. The graph depicts the Fund’s investments but may not represent the Fund’s market exposure due to the exclusion of certain derivatives, if any, as listed in the Additional Investment Information section of the Schedule of Investments. |
36
GOLDMAN SACHS LARGE CAP GROWTH INSIGHTS FUND
Schedule of Investments
April 30, 2013 (Unaudited)
| | | | | | | | |
Shares | | | Description | | Value | |
| | | | | | | | |
| | Common Stocks – 97.9% | |
| | Aerospace & Defense – 3.6% | |
| | 14,212 | | | Alliant Techsystems, Inc. | | $ | 1,056,804 | |
| | 38,236 | | | Lockheed Martin Corp. | | | 3,788,805 | |
| | 5,215 | | | Raytheon Co. | | | 320,097 | |
| | 11,487 | | | Textron, Inc. | | | 295,790 | |
| | 59,876 | | | The Boeing Co. | | | 5,473,265 | |
| | 1,108 | | | TransDigm Group, Inc. | | | 162,655 | |
| | | | | | | | |
| | | | | | | 11,097,416 | |
| | |
| | Air Freight & Logistics – 0.1% | |
| | 2,388 | | | FedEx Corp. | | | 224,496 | |
| | |
| | Airlines* – 0.9% | |
| | 157,352 | | | Delta Air Lines, Inc. | | | 2,697,013 | |
| | |
| | Auto Components* – 0.1% | |
| | 3,092 | | | BorgWarner, Inc. | | | 241,702 | |
| | |
| | Beverages – 2.4% | |
| | 11,415 | | | Coca-Cola Enterprises, Inc. | | | 418,132 | |
| | 9,602 | | | Monster Beverage Corp.* | | | 541,553 | |
| | 31,711 | | | PepsiCo., Inc. | | | 2,615,206 | |
| | 88,488 | | | The Coca-Cola Co. | | | 3,745,697 | |
| | | | | | | | |
| | | | | | | 7,320,588 | |
| | |
| | Biotechnology – 7.0% | |
| | 29,125 | | | Alexion Pharmaceuticals, Inc.* | | | 2,854,250 | |
| | 27,098 | | | Amgen, Inc. | | | 2,823,883 | |
| | 24,027 | | | Biogen Idec, Inc.* | | | 5,260,231 | |
| | 49,284 | | | BioMarin Pharmaceutical, Inc.* | | | 3,233,030 | |
| | 42,888 | | | Celgene Corp.* | | | 5,063,786 | |
| | 46,093 | | | Gilead Sciences, Inc.* | | | 2,334,150 | |
| | | | | | | | |
| | | | | | | 21,569,330 | |
| | |
| | Building Products – 0.2% | |
| | 5,054 | | | Lennox International, Inc. | | | 313,348 | |
| | 9,851 | | | Masco Corp. | | | 191,503 | |
| | | | | | | | |
| | | | | | | 504,851 | |
| | |
| | Capital Markets – 1.5% | |
| | 4,774 | | | Ameriprise Financial, Inc. | | | 355,806 | |
| | 20,909 | | | Federated Investors, Inc. Class B(a) | | | 480,071 | |
| | 70,195 | | | SEI Investments Co. | | | 2,011,789 | |
| | 83,018 | | | TD Ameritrade Holding Corp. | | | 1,652,888 | |
| | | | | | | | |
| | | | | | | 4,500,554 | |
| | |
| | Chemicals – 4.3% | |
| | 4,862 | | | Celanese Corp. Series A | | | 240,231 | |
| | 23,182 | | | LyondellBasell Industries NV Class A | | | 1,407,147 | |
| | 1,110 | | | NewMarket Corp. | | | 298,257 | |
| | 21,091 | | | PPG Industries, Inc. | | | 3,103,330 | |
| | 20,146 | | | The Sherwin-Williams Co. | | | 3,688,934 | |
| | 51,680 | | | The Valspar Corp. | | | 3,298,218 | |
| | 14,654 | | | W.R. Grace & Co.* | | | 1,129,970 | |
| | | | | | | | |
| | | | | | | 13,166,087 | |
| | |
| | Commercial Banks – 0.1% | |
| | 8,763 | | | SunTrust Banks, Inc. | | | 256,318 | |
| | |
| | | | | | | |
| | Common Stocks – (continued) | |
| | Communications Equipment – 2.0% | |
| | 19,030 | | | Brocade Communications Systems, Inc.* | | $ | 110,754 | |
| | 28,104 | | | Harris Corp. | | | 1,298,405 | |
| | 4,326 | | | Motorola Solutions, Inc. | | | 247,447 | |
| | 23,184 | | | Polycom, Inc.* | | | 243,432 | |
| | 68,114 | | | QUALCOMM, Inc. | | | 4,197,185 | |
| | | | | | | | |
| | | | | | | 6,097,223 | |
| | |
| | Computers & Peripherals – 6.1% | |
| | 41,358 | | | Apple, Inc.(b) | | | 18,311,255 | |
| | 20,184 | | | EMC Corp.* | | | 452,727 | |
| | | | | | | | |
| | | | | | | 18,763,982 | |
| | |
| | Consumer Finance – 0.7% | |
| | 36,247 | | | Capital One Financial Corp. | | | 2,094,352 | |
| | |
| | Containers & Packaging – 0.4% | |
| | 27,547 | | | Packaging Corp. of America | | | 1,310,135 | |
| | |
| | Diversified Financial Services – 0.1% | |
| | 6,027 | | | CBOE Holdings, Inc. | | | 226,193 | |
| | |
| | Diversified Telecommunication Services – 1.6% | |
| | 34,348 | | | AT&T, Inc. | | | 1,286,676 | |
| | 40,281 | | | tw telecom, Inc.* | | | 1,090,810 | |
| | 47,041 | | | Verizon Communications, Inc. | | | 2,535,980 | |
| | 17,359 | | | Windstream Corp.(a) | | | 147,899 | |
| | | | | | | | |
| | | | | | | 5,061,365 | |
| | |
| | Energy Equipment & Services – 0.1% | |
| | 3,849 | | | Schlumberger Ltd. | | | 286,481 | |
| | |
| | Food & Staples Retailing – 2.2% | |
| | 17,396 | | | Costco Wholesale Corp. | | | 1,886,248 | |
| | 17,314 | | | CVS Caremark Corp. | | | 1,007,329 | |
| | 2,590 | | | The Fresh Market, Inc.* | | | 106,009 | |
| | 108,298 | | | The Kroger Co. | | | 3,723,285 | |
| | 2,086 | | | Wal-Mart Stores, Inc. | | | 162,124 | |
| | | | | | | | |
| | | | | | | 6,884,995 | |
| | |
| | Food Products – 3.4% | |
| | 16,814 | | | Hormel Foods Corp. | | | 693,914 | |
| | 23,371 | | | Ingredion, Inc. | | | 1,682,946 | |
| | 11,541 | | | Kraft Foods Group, Inc. | | | 594,246 | |
| | 29,901 | | | Mead Johnson Nutrition Co. | | | 2,424,672 | |
| | 4,499 | | | Mondelez International, Inc. Class A | | | 141,493 | |
| | 39,548 | | | The Hershey Co. | | | 3,526,100 | |
| | 58,172 | | | Tyson Foods, Inc. Class A | | | 1,432,776 | |
| | | | | | | | |
| | | | | | | 10,496,147 | |
| | |
| | Health Care Equipment & Supplies – 2.7% | |
| | 141,447 | | | Abbott Laboratories | | | 5,222,223 | |
| | 145,092 | | | Boston Scientific Corp.* | | | 1,086,739 | |
| | 7,010 | | | Edwards Lifesciences Corp.* | | | 447,168 | |
| | 37,178 | | | St. Jude Medical, Inc. | | | 1,532,477 | |
| | | | | | | | |
| | | | | | | 8,288,607 | |
| | |
| | Health Care Providers & Services – 0.3% | |
| | 12,482 | | | Humana, Inc. | | | 925,041 | |
| | |
| | |
| The accompanying notes are an integral part of these financial statements. | | 37 |
GOLDMAN SACHS LARGE CAP GROWTH INSIGHTS FUND
Schedule of Investments (continued)
April 30, 2013 (Unaudited)
| | | | | | | | |
Shares | | | Description | | Value | |
| | | | | | | |
| | Common Stocks – (continued) | |
| | Hotels, Restaurants & Leisure – 1.0% | |
| | 9,016 | | | Bally Technologies, Inc.* | | $ | 480,373 | |
| | 25,077 | | | Carnival Corp. | | | 865,407 | |
| | 30,138 | | | Starbucks Corp. | | | 1,833,596 | |
| | | | | | | | |
| | | | | | | 3,179,376 | |
| | |
| | Household Durables – 0.8% | |
| | 41,650 | | | Garmin Ltd.(a) | | | 1,461,082 | |
| | 6,981 | | | Mohawk Industries, Inc.* | | | 774,053 | |
| | 254 | | | NVR, Inc.* | | | 261,620 | |
| | | | | | | | |
| | | | | | | 2,496,755 | |
| | |
| | Household Products – 0.6% | |
| | 13,183 | | | Colgate-Palmolive Co. | | | 1,574,182 | |
| | 2,470 | | | The Clorox Co. | | | 213,038 | |
| | | | | | | | |
| | | | | | | 1,787,220 | |
| | |
| | Industrial Conglomerates – 1.5% | |
| | 35,535 | | | 3M Co. | | | 3,720,870 | |
| | 2,872 | | | Danaher Corp. | | | 175,020 | |
| | 36,835 | | | General Electric Co. | | | 821,052 | |
| | | | | | | | |
| | | | | | | 4,716,942 | |
| | |
| | Insurance – 1.5% | |
| | 25,965 | | | Aflac, Inc. | | | 1,413,535 | |
| | 51,951 | | | Prudential Financial, Inc. | | | 3,138,879 | |
| | | | | | | | |
| | | | | | | 4,552,414 | |
| | |
| | Internet & Catalog Retail – 3.2% | |
| | 4,115 | | | Amazon.com, Inc.* | | | 1,044,428 | |
| | 49,318 | | | Expedia, Inc. | | | 2,753,917 | |
| | 134,561 | | | Liberty Interactive Corp. Class A* | | | 2,864,804 | |
| | 4,506 | | | Priceline.com, Inc.* | | | 3,136,131 | |
| | | | | | | | |
| | | | | | | 9,799,280 | |
| | |
| | Internet Software & Services* – 6.2% | |
| | 49,606 | | | AOL, Inc. | | | 1,916,776 | |
| | 98,584 | | | eBay, Inc. | | | 5,164,816 | |
| | 10,792 | | | Facebook, Inc. Class A | | | 299,586 | |
| | 13,871 | | | Google, Inc. Class A | | | 11,437,610 | |
| | 6,242 | | | Rackspace Hosting, Inc. | | | 300,864 | |
| | | | | | | | |
| | | | | | | 19,119,652 | |
| | |
| | IT Services – 6.2% | |
| | 24,675 | | | CoreLogic, Inc.* | | | 673,134 | |
| | 6,746 | | | Gartner, Inc.* | | | 390,256 | |
| | 56,791 | | | International Business Machines Corp. | | | 11,502,449 | |
| | 50,294 | | | Lender Processing Services, Inc. | | | 1,395,156 | |
| | 7,895 | | | MasterCard, Inc. Class A | | | 4,365,382 | |
| | 8,672 | | | Teradata Corp.* | | | 442,879 | |
| | 21,289 | | | Western Union Co. | | | 315,290 | |
| | | | | | | | |
| | | | | | | 19,084,546 | |
| | |
| | Leisure Equipment & Products(a) – 0.6% | |
| | 36,370 | | | Hasbro, Inc. | | | 1,722,847 | |
| | |
| | Common Stocks – (continued) | |
| | Life Sciences Tools & Services* – 0.3% | |
| | 19,549 | | | Charles River Laboratories International, Inc. | | $ | 850,186 | |
| | |
| | Machinery – 3.3% | |
| | 17,143 | | | Donaldson Co., Inc. | | | 623,662 | |
| | 9,915 | | | IDEX Corp. | | | 515,877 | |
| | 62,107 | | | Illinois Tool Works, Inc. | | | 4,009,628 | |
| | 46,662 | | | The Toro Co. | | | 2,100,257 | |
| | 41,598 | | | WABCO Holdings, Inc.* | | | 3,004,624 | |
| | | | | | | | |
| | | | | | | 10,254,048 | |
| | |
| | Media – 3.4% | |
| | 66,942 | | | Cinemark Holdings, Inc. | | | 2,067,838 | |
| | 5,280 | | | Liberty Global, Inc. Class A* | | | 382,114 | |
| | 9,272 | | | Liberty Global, Inc. Series C* | | | 627,251 | |
| | 94,890 | | | News Corp. Class A | | | 2,938,743 | |
| | 9,914 | | | Regal Entertainment Group Class A(a) | | | 177,857 | |
| | 65,016 | | | Viacom, Inc. Class B | | | 4,160,374 | |
| | | | | | | | |
| | | | | | | 10,354,177 | |
| | |
| | Metals & Mining – 0.2% | |
| | 74,733 | | | Alcoa, Inc. | | | 635,231 | |
| | 1,473 | | | Reliance Steel & Aluminum Co. | | | 95,848 | |
| | | | | | | | |
| | | | | | | 731,079 | |
| | |
| | Multiline Retail – 0.2% | |
| | 13,679 | | | Big Lots, Inc.* | | | 498,189 | |
| | 2,978 | | | Family Dollar Stores, Inc. | | | 182,760 | |
| | | | | | | | |
| | | | | | | 680,949 | |
| | |
| | Office Electronics* – 0.1% | |
| | 7,563 | | | Zebra Technologies Corp. Class A | | | 352,814 | |
| | |
| | Oil, Gas & Consumable Fuels – 5.6% | |
| | 25,525 | | | Cabot Oil & Gas Corp. | | | 1,736,976 | |
| | 6,895 | | | EOG Resources, Inc. | | | 835,398 | |
| | 33,538 | | | Exxon Mobil Corp. | | | 2,984,547 | |
| | 8,234 | | | Hess Corp. | | | 594,330 | |
| | 52,312 | | | HollyFrontier Corp. | | | 2,586,828 | |
| | 36,440 | | | Marathon Petroleum Corp. | | | 2,855,439 | |
| | 51,140 | | | Tesoro Corp. | | | 2,730,876 | |
| | 72,118 | | | Valero Energy Corp. | | | 2,907,798 | |
| | | | | | | | |
| | | | | | | 17,232,192 | |
| | |
| | Personal Products – 0.6% | |
| | 32,955 | | | Nu Skin Enterprises, Inc. Class A(a) | | | 1,671,807 | |
| | 2,874 | | | The Estee Lauder Cos., Inc. Class A | | | 199,312 | |
| | | | | | | | |
| | | | | | | 1,871,119 | |
| | |
| | Pharmaceuticals – 5.9% | |
| | 69,080 | | | AbbVie, Inc. | | | 3,181,134 | |
| | 38,362 | | | Allergan, Inc. | | | 4,356,005 | |
| | 23,141 | | | Johnson & Johnson | | | 1,972,307 | |
| | 63,208 | | | Merck & Co., Inc. | | | 2,970,776 | |
| | 13,126 | | | Mylan, Inc.* | | | 382,098 | |
| | |
| | |
| 38 | | The accompanying notes are an integral part of these financial statements. |
GOLDMAN SACHS LARGE CAP GROWTH INSIGHTS FUND
| | | | | | | | |
Shares | | | Description | | Value | |
| | | | | | | |
| | Common Stocks – (continued) | |
| | Pharmaceuticals – (continued) | |
| | 97,099 | | | Pfizer, Inc. | | $ | 2,822,668 | |
| | 166,774 | | | Warner Chilcott PLC Class A | | | 2,398,210 | |
| | | | | | | | |
| | | | | | | 18,083,198 | |
| | |
| | Professional Services – 0.3% | |
| | 14,366 | | | Manpowergroup, Inc. | | | 763,697 | |
| | |
| | Real Estate Investment Trusts – 3.9% | |
| | 52,882 | | | American Tower Corp. | | | 4,441,559 | |
| | 44,744 | | | Corrections Corp. of America | | | 1,619,733 | |
| | 41,304 | | | Equity Residential | | | 2,398,110 | |
| | 10,789 | | | Rayonier, Inc. | | | 641,082 | |
| | 9,990 | | | Regency Centers Corp. | | | 562,038 | |
| | 26,210 | | | Taubman Centers, Inc. | | | 2,241,217 | |
| | | | | | | | |
| | | | | | | 11,903,739 | |
| | |
| | Road & Rail – 0.0% | |
| | 3,444 | | | Con-way, Inc. | | | 116,407 | |
| | |
| | Semiconductors & Semiconductor Equipment* – 0.1% | |
| | 64,146 | | | LSI Corp. | | | 419,515 | |
| | |
| | Software – 5.0% | |
| | 86,414 | | | Cadence Design Systems, Inc.* | | | 1,192,513 | |
| | 5,688 | | | FactSet Research Systems, Inc. | | | 535,070 | |
| | 317,246 | | | Microsoft Corp. | | | 10,500,843 | |
| | 91,510 | | | Oracle Corp. | | | 2,999,698 | |
| | 3,847 | | | VMware, Inc. Class A* | | | 271,213 | |
| | | | | | | | |
| | | | | | | 15,499,337 | |
| | |
| | Specialty Retail – 6.3% | |
| | 2,023 | | | Advance Auto Parts, Inc. | | | 169,689 | |
| | 95,787 | | | American Eagle Outfitters, Inc. | | | 1,863,057 | |
| | 4,397 | | | AutoZone, Inc.* | | | 1,798,769 | |
| | 71,920 | | | GameStop Corp. Class A(a) | | | 2,510,008 | |
| | 51,574 | | | L Brands, Inc. | | | 2,599,845 | |
| | 86,146 | | | Lowe’s Cos., Inc. | | | 3,309,729 | |
| | 34,336 | | | O’Reilly Automotive, Inc.* | | | 3,684,940 | |
| | 6,842 | | | The Gap, Inc. | | | 259,928 | |
| | 21,683 | | | The Home Depot, Inc. | | | 1,590,448 | |
| | 40,144 | | | Urban Outfitters, Inc.* | | | 1,663,567 | |
| | | | | | | | |
| | | | | | | 19,449,980 | |
| | |
| | Textiles, Apparel & Luxury Goods – 0.1% | |
| | 1,259 | | | Ralph Lauren Corp. | | | 228,609 | |
| | |
| | Tobacco – 0.9% | |
| | 3,192 | | | Lorillard, Inc. | | | 136,905 | |
| | 26,853 | | | Philip Morris International, Inc. | | | 2,566,878 | |
| | | | | | | | |
| | | | | | | 2,703,783 | |
| | |
| | Trading Companies & Distributors – 0.3% | |
| | 10,283 | | | MSC Industrial Direct Co., Inc. Class A | | | 810,300 | |
| | |
| | TOTAL COMMON STOCKS | |
| | (Cost $272,172,484) | | $ | 300,777,037 | |
| | |
| | | | | | | | | | | | |
Principal Amount | | | Interest Rate | | Maturity Date | | | Value | |
| | Short-term Investment(c) – 2.1% | |
| | Repurchase Agreement – 2.1% | |
| Joint Repurchase Agreement Account II | |
| $ | 6,300,000 | | | 0.169% | | | 05/01/13 | | | $ | 6,300,000 | |
| | (Cost $6,300,000) | |
| | |
| TOTAL INVESTMENTS BEFORE
SECURITIES LENDING
REINVESTMENT VEHICLE |
| | | | |
| | (Cost $278,472,484) | | | | | | $ | 307,077,037 | |
| | |
| | | | | | |
| Shares | | Rate | | Value | |
| Securities Lending Reinvestment Vehicle(d)(e) – 2.0% | |
Financial Square Money Market Fund – FST Shares | |
| 6,133,180 | | 0.109% | | $ | 6,133,180 | |
| (Cost $6,133,180) | | | | |
| |
| TOTAL INVESTMENTS – 102.0% | |
| (Cost $284,605,664) | | $ | 313,210,217 | |
| |
| LIABILITIES IN EXCESS OF OTHER ASSETS – (2.0)% | | | (6,130,797 | ) |
| |
| NET ASSETS – 100.0% | | $ | 307,079,420 | |
| |
| | |
| The percentage shown for each investment category reflects the value of investments in that category as a percentage of net assets. |
* | | Non-income producing security. |
(a) | | All or a portion of security is on loan. |
(b) | | All or a portion of security is segregated as collateral for initial margin requirements on futures transactions. |
(c) | | Joint repurchase agreement was entered into on April 30, 2013. Additional information appears on page 65. |
(d) | | Variable rate security. Interest rate disclosed is that which is in effect at April 30, 2013. |
(e) | | Represents an affiliated issuer. |
| | |
| The accompanying notes are an integral part of these financial statements. | | 39 |
GOLDMAN SACHS LARGE CAP GROWTH INSIGHTS FUND
Schedule of Investments (continued)
April 30, 2013 (Unaudited)
|
| ADDITIONAL INVESTMENT INFORMATION |
FUTURES CONTRACTS — At April 30, 2013, the Fund had the following futures contracts:
| | | | | | | | | | | | |
| Type | | Number of
Contracts
Long (Short) | | Expiration
Date | | Current Value | | | Unrealized
Gain (Loss) | |
S&P 500 E-Mini Index | | 69 | | June 2013 | | $ | 5,493,090 | | | $ | 131,578 | |
| | |
| 40 | | The accompanying notes are an integral part of these financial statements. |
GOLDMAN SACHS LARGE CAP VALUE INSIGHTS FUND
Schedule of Investments
April 30, 2013 (Unaudited)
| | | | | | | | |
| Shares | | | Description | | Value | |
| | | | | | | | |
| | Common Stocks – 97.7% | |
| | Aerospace & Defense – 1.8% | |
| | 38,369 | | | Alliant Techsystems, Inc. | | $ | 2,853,119 | |
| | 7,299 | | | Lockheed Martin Corp. | | | 723,258 | |
| | 18,311 | | | Raytheon Co. | | | 1,123,929 | |
| | 31,210 | | | Textron, Inc. | | | 803,658 | |
| | 5,054 | | | The Boeing Co. | | | 461,986 | |
| | | | | | | | |
| | | | | | | 5,965,950 | |
| | |
| | Airlines* – 0.7% | |
| | 127,588 | | | Delta Air Lines, Inc. | | | 2,186,858 | |
| | |
| | Biotechnology – 3.1% | |
| | 10,857 | | | Alexion Pharmaceuticals, Inc.* | | | 1,063,986 | |
| | 3,066 | | | Amgen, Inc. | | | 319,508 | |
| | 15,422 | | | Biogen Idec, Inc.* | | | 3,376,338 | |
| | 31,773 | | | BioMarin Pharmaceutical, Inc.* | | | 2,084,309 | |
| | 27,096 | | | Celgene Corp.* | | | 3,199,225 | |
| | | | | | | | |
| | | | | | | 10,043,366 | |
| | |
| | Building Products – 0.1% | |
| | 14,642 | | | Masco Corp. | | | 284,640 | |
| | |
| | Capital Markets – 5.2% | |
| | 123,067 | | | American Capital Ltd.* | | | 1,862,004 | |
| | 52,115 | | | Ameriprise Financial, Inc. | | | 3,884,131 | |
| | 71,010 | | | Federated Investors, Inc. Class B(a) | | | 1,630,389 | |
| | 62,330 | | | Janus Capital Group, Inc. | | | 555,984 | |
| | 11,935 | | | LPL Financial Holdings, Inc. | | | 412,474 | |
| | 76,004 | | | Morgan Stanley, Inc. | | | 1,683,488 | |
| | 112,593 | | | SEI Investments Co. | | | 3,226,915 | |
| | 172,466 | | | TD Ameritrade Holding Corp. | | | 3,433,798 | |
| | | | | | | | |
| | | | | | | 16,689,183 | |
| | |
| | Chemicals – 2.2% | |
| | 45,520 | | | LyondellBasell Industries NV Class A | | | 2,763,064 | |
| | 996 | | | NewMarket Corp. | | | 267,625 | |
| | 9,885 | | | The Sherwin-Williams Co. | | | 1,810,043 | |
| | 30,143 | | | The Valspar Corp. | | | 1,923,726 | |
| | 6,556 | | | W.R. Grace & Co.* | | | 505,533 | |
| | | | | | | | |
| | | | | | | 7,269,991 | |
| | |
| | Commercial Banks – 3.9% | |
| | 131,289 | | | SunTrust Banks, Inc. | | | 3,840,203 | |
| | 50,188 | | | U.S. Bancorp | | | 1,670,257 | |
| | 183,267 | | | Wells Fargo & Co. | | | 6,960,481 | |
| | | | | | | | |
| | | | | | | 12,470,941 | |
| | |
| | Commercial Services & Supplies – 0.2% | |
| | 11,635 | | | Avery Dennison Corp. | | | 482,271 | |
| | 7,080 | | | Tyco International Ltd. | | | 227,409 | |
| | | | | | | | |
| | | | | | | 709,680 | |
| | |
| | Communications Equipment* – 0.2% | |
| | 46,558 | | | Brocade Communications Systems, Inc. | | | 270,968 | |
| | 32,823 | | | Polycom, Inc. | | | 344,641 | |
| | | | | | | | |
| | | | | | | 615,609 | |
| | |
| | | | | | | | |
| | Common Stocks – (continued) | |
| | Computers & Peripherals – 0.0% | |
| | 291 | | | Apple, Inc. | | $ | 128,840 | |
| | |
| | Consumer Finance – 1.4% | |
| | 78,170 | | | Capital One Financial Corp. | | | 4,516,663 | |
| | |
| | Containers & Packaging – 0.3% | |
| | 11,854 | | | Bemis Co., Inc. | | | 466,455 | |
| | 10,769 | | | Packaging Corp. of America | | | 512,174 | |
| | | | | | | | |
| | | | | | | 978,629 | |
| | |
| | Diversified Consumer Services – 0.2% | |
| | 37,376 | | | Service Corp. | | | 630,907 | |
| | |
| | Diversified Financial Services – 4.5% | |
| | 40,901 | | | CBOE Holdings, Inc. | | | 1,535,014 | |
| | 122,468 | | | Citigroup, Inc. | | | 5,714,357 | |
| | 7,136 | | | CME Group, Inc. | | | 434,297 | |
| | 41,246 | | | Interactive Brokers Group, Inc. Class A | | | 621,165 | |
| | 1,142 | | | IntercontinentalExchange, Inc.* | | | 186,066 | |
| | 66,448 | | | JPMorgan Chase & Co. | | | 3,256,616 | |
| | 4,904 | | | Leucadia National Corp. | | | 151,485 | |
| | 7,291 | | | Moody’s Corp. | | | 443,657 | |
| | 72,958 | | | The NASDAQ OMX Group, Inc. | | | 2,150,802 | |
| | | | | | | | |
| | | | | | | 14,493,459 | |
| | |
| | Diversified Telecommunication Services(b) – 2.8% | |
| | 237,183 | | | AT&T, Inc. | | | 8,884,875 | |
| | |
| | Electric Utilities – 2.0% | |
| | 14,024 | | | Edison International | | | 754,491 | |
| | 20,654 | | | Great Plains Energy, Inc. | | | 498,381 | |
| | 84,141 | | | NV Energy, Inc. | | | 1,819,970 | |
| | 54,383 | | | Pinnacle West Capital Corp. | | | 3,311,925 | |
| | | | | | | | |
| | | | | | | 6,384,767 | |
| | |
| | Electronic Equipment, Instruments & Components – 0.3% | |
| | 17,472 | | | AVX Corp. | | | 197,608 | |
| | 27,278 | | | Molex, Inc. | | | 752,055 | |
| | | | | | | | |
| | | | | | | 949,663 | |
| | |
| | Food & Staples Retailing – 0.6% | |
| | 2,824 | | | Costco Wholesale Corp. | | | 306,206 | |
| | 25,643 | | | CVS Caremark Corp. | | | 1,491,910 | |
| | | | | | | | |
| | | | | | | 1,798,116 | |
| | |
| | Food Products – 2.6% | |
| | 27,772 | | | Kraft Foods Group, Inc. | | | 1,429,980 | |
| | 7,382 | | | Mead Johnson Nutrition Co. | | | 598,607 | |
| | 81,116 | | | Mondelez International, Inc. Class A | | | 2,551,098 | |
| | 35,382 | | | The Hershey Co. | | | 3,154,659 | |
| | 32,360 | | | Tyson Foods, Inc. Class A | | | 797,027 | |
| | | | | | | | |
| | | | | | | 8,531,371 | |
| | |
| | |
| The accompanying notes are an integral part of these financial statements. | | 41 |
GOLDMAN SACHS LARGE CAP VALUE INSIGHTS FUND
Schedule of Investments (continued)
April 30, 2013 (Unaudited)
| | | | | | | | |
| Shares | | | Description | | Value | |
| | | | | | | | |
| | Common Stocks – (continued) | |
| | Health Care Equipment & Supplies – 2.4% | |
| | 90,897 | | | Abbott Laboratories | | $ | 3,355,917 | |
| | 391,128 | | | Boston Scientific Corp.* | | | 2,929,549 | |
| | 32,689 | | | St. Jude Medical, Inc. | | | 1,347,441 | |
| | | | | | | | |
| | | | | | | 7,632,907 | |
| | |
| | Health Care Providers & Services – 0.7% | |
| | 29,538 | | | Humana, Inc. | | | 2,189,061 | |
| | |
| | Hotels, Restaurants & Leisure – 0.7% | |
| | 17,918 | | | Bally Technologies, Inc.* | | | 954,671 | |
| | 34,461 | | | Carnival Corp. | | | 1,189,249 | |
| | | | | | | | |
| | | | | | | 2,143,920 | |
| | |
| | Household Durables – 1.6% | |
| | 36,861 | | | Garmin Ltd.(a) | | | 1,293,084 | |
| | 24,574 | | | Mohawk Industries, Inc.* | | | 2,724,765 | |
| | 548 | | | NVR, Inc.* | | | 564,440 | |
| | 18,644 | | | PulteGroup, Inc.* | | | 391,337 | |
| | 1,924 | | | Whirlpool Corp. | | | 219,875 | |
| | | | | | | | |
| | | | | | | 5,193,501 | |
| | |
| | Household Products – 1.2% | |
| | 51,111 | | | The Procter & Gamble Co. | | | 3,923,791 | |
| | |
| | Independent Power Producers & Energy Traders – 0.5% | |
| | 123,595 | | | The AES Corp. | | | 1,713,027 | |
| | |
| | Industrial Conglomerates – 3.6% | |
| | 8,008 | | | 3M Co. | | | 838,518 | |
| | 483,443 | | | General Electric Co. | | | 10,775,944 | |
| | | | | | | | |
| | | | | | | 11,614,462 | |
| | |
| | Insurance – 4.5% | |
| | 80,112 | | | Aflac, Inc.(b) | | | 4,361,297 | |
| | 5,689 | | | Everest Re Group Ltd. | | | 767,958 | |
| | 50,750 | | | MetLife, Inc. | | | 1,978,743 | |
| | 72,869 | | | Prudential Financial, Inc. | | | 4,402,745 | |
| | 28,119 | | | Reinsurance Group of America, Inc. | | | 1,758,844 | |
| | 13,205 | | | RenaissanceRe Holdings Ltd. | | | 1,239,817 | |
| | | | | | | | |
| | | | | | | 14,509,404 | |
| | |
| | Internet & Catalog Retail – 1.9% | |
| | 50,489 | | | Expedia, Inc. | | | 2,819,306 | |
| | 150,056 | | | Liberty Interactive Corp. Class A* | | | 3,194,692 | |
| | | | | | | | |
| | | | | | | 6,013,998 | |
| | |
| | Internet Software & Services* – 1.8% | |
| | 17,961 | | | AOL, Inc. | | | 694,013 | |
| | 34,578 | | | eBay, Inc. | | | 1,811,541 | |
| | 3,940 | | | Google, Inc. Class A | | | 3,248,806 | |
| | | | | | | | |
| | | | | | | 5,754,360 | |
| | |
| | IT Services – 0.7% | |
| | 13,122 | | | Booz Allen Hamilton Holding Corp. | | | 199,323 | |
| | 43,484 | | | CoreLogic, Inc.* | | | 1,186,244 | |
| | 4,796 | | | International Business Machines Corp. | | | 971,382 | |
| | | | | | | | |
| | | | | | | 2,356,949 | |
| | |
| | | | | | | | |
| | Common Stocks – (continued) | |
| | Leisure Equipment & Products(a) – 0.3% | |
| | 21,429 | | | Hasbro, Inc. | | $ | 1,015,092 | |
| | |
| | Life Sciences Tools & Services* – 0.1% | |
| | 10,730 | | | Charles River Laboratories International, Inc. | | | 466,648 | |
| | |
| | Machinery – 2.1% | |
| | 6,635 | | | Donaldson Co., Inc. | | | 241,381 | |
| | 2,564 | | | IDEX Corp. | | | 133,405 | |
| | 50,786 | | | Illinois Tool Works, Inc. | | | 3,278,744 | |
| | 2,914 | | | The Toro Co. | | | 131,159 | |
| | 43,706 | | | WABCO Holdings, Inc.* | | | 3,156,885 | |
| | | | | | | | |
| | | | | | | 6,941,574 | |
| | |
| | Media – 1.7% | |
| | 24,955 | | | Cinemark Holdings, Inc. | | | 770,860 | |
| | 17,240 | | | Liberty Global, Inc.
Series C* (a) | | | 1,166,286 | |
| | 27,787 | | | News Corp. Class A | | | 860,563 | |
| | 41,081 | | | Viacom, Inc. Class B | | | 2,628,773 | |
| | | | | | | | |
| | | | | | | 5,426,482 | |
| | |
| | Metals & Mining – 2.3% | |
| | 415,031 | | | Alcoa, Inc. | | | 3,527,763 | |
| | 110,367 | | | Commercial Metals Co. | | | 1,613,565 | |
| | 10,809 | | | Newmont Mining Corp. | | | 350,212 | |
| | 16,646 | | | Reliance Steel & Aluminum Co. | | | 1,083,155 | |
| | 49,752 | | | United States Steel Corp.(a) | | | 885,586 | |
| | | | | | | | |
| | | | | | | 7,460,281 | |
| | |
| | Multi-Utilities – 1.1% | |
| | 55,400 | | | Consolidated Edison, Inc. | | | 3,526,210 | |
| | |
| | Office Electronics – 0.3% | |
| | 103,127 | | | Xerox Corp. | | | 884,830 | |
| | |
| | Oil, Gas & Consumable Fuels – 17.4% | |
| | 8,216 | | | Cabot Oil & Gas Corp. | | | 559,099 | |
| | 84,137 | | | Chevron Corp. | | | 10,265,555 | |
| | 94,485 | | | ConocoPhillips | | | 5,711,618 | |
| | 215,372 | | | Exxon Mobil Corp. | | | 19,165,954 | |
| | 45,927 | | | Hess Corp. | | | 3,315,011 | |
| | 69,524 | | | HollyFrontier Corp. | | | 3,437,962 | |
| | 50,854 | | | Marathon Petroleum Corp. | | | 3,984,920 | |
| | 34,089 | | | Peabody Energy Corp. | | | 683,825 | |
| | 26,599 | | | Phillips 66 | | | 1,621,209 | |
| | 63,447 | | | Tesoro Corp. | | | 3,388,070 | |
| | 14,140 | | | Ultra Petroleum Corp.* | | | 302,596 | |
| | 96,354 | | | Valero Energy Corp. | | | 3,884,993 | |
| | | | | | | | |
| | | | | | | 56,320,812 | |
| | |
| | Pharmaceuticals – 8.7% | |
| | 12,466 | | | AbbVie, Inc. | | | 574,059 | |
| | 28,844 | | | Allergan, Inc. | | | 3,275,236 | |
| | 33,132 | | | Johnson & Johnson | | | 2,823,841 | |
| | 183,614 | | | Merck & Co., Inc. | | | 8,629,858 | |
| | |
| | |
| 42 | | The accompanying notes are an integral part of these financial statements. |
GOLDMAN SACHS LARGE CAP VALUE INSIGHTS FUND
| | | | | | | | |
| Shares | | | Description | | Value | |
| | | | | | | | |
| | Common Stocks – (continued) | |
| | Pharmaceuticals – (continued) | |
| | 389,861 | | | Pfizer, Inc. | | $ | 11,333,259 | |
| | 106,858 | | | Warner Chilcott PLC Class A | | | 1,536,618 | |
| | | | | | | | |
| | | | | | | 28,172,871 | |
| | |
| | Professional Services – 1.0% | |
| | 59,460 | | | Manpowergroup, Inc. | | | 3,160,894 | |
| | |
| | Real Estate Investment Trusts – 5.3% | |
| | 39,449 | | | American Tower Corp. | | | 3,313,321 | |
| | 88,602 | | | Corrections Corp. of America | | | 3,207,392 | |
| | 67,028 | | | Equity Residential | | | 3,891,646 | |
| | 30,973 | | | Rayonier, Inc. | | | 1,840,416 | |
| | 26,402 | | | Regency Centers Corp. | | | 1,485,377 | |
| | 39,185 | | | Taubman Centers, Inc. | | | 3,350,709 | |
| | | | | | | | |
| | | | | | | 17,088,861 | |
| | |
| | Real Estate Management & Development – 0.7% | |
| | 21,594 | | | Jones Lang LaSalle, Inc. | | | 2,138,238 | |
| | |
| | Road & Rail – 0.1% | |
| | 9,378 | | | Con-way, Inc. | | | 316,976 | |
| | |
| | Semiconductors & Semiconductor Equipment – 0.2% | |
| | 5,257 | | | First Solar, Inc.* | | | 244,766 | |
| | 10,353 | | | Marvell Technology Group Ltd. | | | 111,398 | |
| | 10,180 | | | NXP Semiconductor NV* | | | 280,459 | |
| | | | | | | | |
| | | | | | | 636,623 | |
| | |
| | Software* – 0.1% | |
| | 16,046 | | | Cadence Design Systems, Inc. | | | 221,435 | |
| | |
| | Specialty Retail – 4.3% | |
| | 3,473 | | | Abercrombie & Fitch Co. Class A | | | 172,122 | |
| | 64,550 | | | American Eagle Outfitters, Inc. | | | 1,255,498 | |
| | 2,466 | | | AutoZone, Inc.* | | | 1,008,816 | |
| | 98,407 | | | GameStop Corp. Class A(a) | | | 3,434,404 | |
| | 7,954 | | | L Brands, Inc. | | | 400,961 | |
| | 98,396 | | | Lowe’s Cos, Inc. | | | 3,780,374 | |
| | 30,957 | | | O’Reilly Automotive, Inc.* | | | 3,322,305 | |
| | 16,017 | | | Urban Outfitters, Inc.* | | | 663,745 | |
| | | | | | | | |
| | | | | | | 14,038,225 | |
| | |
| | Water Utilities – 0.3% | |
| | 23,270 | | | American Water Works Co., Inc. | | | 974,548 | |
| | |
| | TOTAL COMMON STOCKS | |
| | (Cost $283,669,468) | | $ | 315,369,488 | |
| | |
| | | | | | | | | | | | | | |
Principal Amount | | | Interest
Rate | | | Maturity Date | | | Value | |
| | | | | | | | | | | | | | |
| | Short-term Investment(c) – 2.2% | | | | | |
| | Repurchase Agreement – 2.2% | | | | | |
| | Joint Repurchase Agreement Account II | | | | | |
| $ | 7,200,000 | | | | 0.169 | % | | | 05/01/13 | | | $ | 7,200,000 | |
| | (Cost $7,200,000) | | | | | | | | | |
| | |
| TOTAL INVESTMENTS BEFORE
SECURITIES LENDING
REINVESTMENT VEHICLE |
| | | | |
| | (Cost $290,869,468) | | | | | | | $ | 322,569,488 | |
| | |
| | | | | | | | |
| Shares | | | Rate | | Value | |
| | | | | | | | |
| | Securities Lending Reinvestment Vehicle(d)(e) – 2.8% | |
| | Financial Square Money Market Fund – FST Shares | |
| | 9,092,164 | | | 0.109% | | $ | 9,092,164 | |
| | (Cost $9,092,164) | | | | |
| | |
| | TOTAL INVESTMENTS – 102.7% | |
| | (Cost $299,961,632) | | $ | 331,661,652 | |
| | |
| LIABILITIES IN EXCESS OF
OTHER ASSETS – (2.7)% | | | (8,809,431 | ) |
| | |
| | NET ASSETS – 100.0% | | $ | 322,852,221 | |
| | |
| | |
| The percentage shown for each investment category reflects the value of investments in that category as a percentage of net assets. |
* | | Non-income producing security. |
(a) | | All or a portion of security is on loan. |
(b) | | All or a portion of security is segregated as collateral for initial margin requirements on futures transactions. |
(c) | | Joint repurchase agreement was entered into on April 30, 2013. Additional information appears on page 65. |
(d) | | Variable rate security. Interest rate disclosed is that which is in effect at April 30, 2013. |
(e) | | Represents an affiliated issuer. |
| | |
| The accompanying notes are an integral part of these financial statements. | | 43 |
|
| ADDITIONAL INVESTMENT INFORMATION |
FUTURES CONTRACTS — At April 30, 2013, the Fund had the following futures contracts:
| | | | | | | | | | | | |
| Type | | Number of
Contracts
Long (Short) | | Expiration
Date | | Current Value | | | Unrealized
Gain (Loss) | |
S&P 500 E-Mini Index | | 79 | | June 2013 | | $ | 6,289,190 | | | $ | 145,371 | |
GOLDMAN SACHS SMALL CAP EQUITY INSIGHTS FUND
Schedule of Investments
April 30, 2013 (Unaudited)
| | | | | | | | |
| Shares | | | Description | | Value | |
| | | | | | | | |
| | Common Stocks – 95.2% | |
| | Aerospace & Defense – 1.0% | |
| | 14,812 | | | Alliant Techsystems, Inc. | | $ | 1,101,420 | |
| | 5,931 | | | American Science and Engineering, Inc. | | | 382,431 | |
| | 16,118 | | | Hexcel Corp.* | | | 491,599 | |
| | 2,894 | | | Spirit AeroSystems Holdings, Inc. Class A* | | | 57,851 | |
| | 16,775 | | | Taser International, Inc.* | | | 147,788 | |
| | | | | | | | |
| | | | | | | 2,181,089 | |
| | |
| | Air Freight & Logistics* – 0.2% | |
| | 64,048 | | | Pacer International, Inc. | | | 364,433 | |
| | |
| | Airlines – 3.7% | |
| | 28,946 | | | Alaska Air Group, Inc.* | | | 1,784,232 | |
| | 14,518 | | | Allegiant Travel Co. | | | 1,305,168 | |
| | 179,054 | | | JetBlue Airways Corp.* | | | 1,233,682 | |
| | 56,086 | | | Republic Airways Holdings, Inc.* | | | 627,602 | |
| | 42,778 | | | SkyWest, Inc. | | | 612,153 | |
| | 23,831 | | | Spirit Airlines, Inc.* | | | 636,288 | |
| | 105,811 | | | US Airways Group, Inc.*(a) | | | 1,788,206 | |
| | | | | | | | |
| | | | | | | 7,987,331 | |
| | |
| | Auto Components – 1.4% | |
| | 22,818 | | | Cooper Tire & Rubber Co. | | | 567,940 | |
| | 9,030 | | | Modine Manufacturing Co.* | | | 82,534 | |
| | 16,135 | | | Standard Motor Products, Inc. | | | 494,376 | |
| | 22,285 | | | Stoneridge, Inc.* | | | 168,698 | |
| | 7,252 | | | Superior Industries International, Inc. | | | 133,147 | |
| | 35,458 | | | Tenneco, Inc.* | | | 1,371,161 | |
| | 4,137 | | | Visteon Corp.* | | | 243,214 | |
| | | | | | | | |
| | | | | | | 3,061,070 | |
| | |
| | Biotechnology – 8.0% | |
| | 39,054 | | | Acorda Therapeutics, Inc.* | | | 1,545,367 | |
| | 27,092 | | | Aegerion Pharmaceuticals, Inc.* | | | 1,138,948 | |
| | 91,361 | | | Affymax, Inc.*(a) | | | 82,234 | |
| | 24,341 | | | Alkermes PLC* | | | 745,078 | |
| | 50,419 | | | Arena Pharmaceuticals, Inc.*(a) | | | 415,453 | |
| | 9,722 | | | BioMarin Pharmaceutical, Inc.* | | | 637,763 | |
| | 2,130 | | | Cepheid, Inc.* | | | 81,217 | |
| | 6,181 | | | Coronado Biosciences, Inc.* | | | 69,536 | |
| | 32,332 | | | Cubist Pharmaceuticals, Inc.* | | | 1,484,685 | |
| | 27,442 | | | Emergent Biosolutions, Inc.* | | | 420,960 | |
| | 52,394 | | | Enzon Pharmaceuticals, Inc. | | | 172,900 | |
| | 26,606 | | | Genomic Health, Inc.* | | | 807,758 | |
| | 20,098 | | | ImmunoGen, Inc.* | | | 321,970 | |
| | 9,465 | | | Infinity Pharmaceuticals, Inc.* | | | 407,847 | |
| | 78,529 | | | Isis Pharmaceuticals, Inc.*(a) | | | 1,758,264 | |
| | 15,702 | | | MannKind Corp.* | | | 62,023 | |
| | 72,520 | | | Momenta Pharmaceuticals, Inc.* | | | 893,446 | |
| | 3,329 | | | Myriad Genetics, Inc.* | | | 92,713 | |
| | 197,375 | | | PDL BioPharma, Inc.(a) | | | 1,527,683 | |
| | 25,487 | | | Pharmacyclics, Inc.* | | | 2,077,190 | |
| | 43,885 | | | Seattle Genetics, Inc.*(a) | | | 1,621,551 | |
| | 16,630 | | | Synageva BioPharma Corp.* | | | 859,605 | |
| | | | | | | | |
| | | | | | | 17,224,191 | |
| | |
| | | | | | | | |
| | Common Stocks – (continued) | |
| | Building Products – 2.1% | |
| | 10,864 | | | American Woodmark Corp.* | | $ | 365,573 | |
| | 14,893 | | | Lennox International, Inc. | | | 923,366 | |
| | 10,795 | | | Masco Corp. | | | 209,855 | |
| | 25,663 | | | Trex Co., Inc.* | | | 1,249,275 | |
| | 33,762 | | | Universal Forest Products, Inc. | | | 1,303,213 | |
| | 16,710 | | | USG Corp.* | | | 434,293 | |
| | | | | | | | |
| | | | | | | 4,485,575 | |
| | |
| | Capital Markets – 4.5% | |
| | 158,258 | | | Apollo Investment Corp. | | | 1,394,253 | |
| | 5,197 | | | Arlington Asset Investment Corp. Class A | | | 140,787 | |
| | 31,481 | | | BlackRock Kelso Capital Corp. | | | 313,236 | |
| | 5,367 | | | Calamos Asset Management, Inc. Class A | | | 60,916 | |
| | 2,970 | | | Capital Southwest Corp.(a) | | | 349,539 | |
| | 20,437 | | | Cohen & Steers, Inc.(a) | | | 807,466 | |
| | 47,442 | | | Federated Investors, Inc. Class B(a) | | | 1,089,268 | |
| | 21,262 | | | FXCM, Inc. Class A | | | 288,100 | |
| | 26,554 | | | GAMCO Investors, Inc. Class A | | | 1,394,085 | |
| | 28,737 | | | Gladstone Capital Corp. | | | 266,392 | |
| | 29,909 | | | Greenhill & Co., Inc. | | | 1,381,497 | |
| | 19,154 | | | Investment Technology Group, Inc.* | | | 208,587 | |
| | 18,151 | | | Janus Capital Group, Inc. | | | 161,907 | |
| | 7,834 | | | LPL Financial Holdings, Inc. | | | 270,743 | |
| | 34,196 | | | NGP Capital Resources Co. | | | 227,745 | |
| | 12,005 | | | Piper Jaffray Cos., Inc.* | | | 405,289 | |
| | 6,793 | | | SEI Investments Co. | | | 194,687 | |
| | 6,211 | | | Waddell & Reed Financial, Inc. Class A | | | 266,266 | |
| | 4,828 | | | Walter Investment Management Corp.* | | | 162,028 | |
| | 23,184 | | | WisdomTree Investments, Inc.* | | | 268,934 | |
| | | | | | | | |
| | | | | | | 9,651,725 | |
| | |
| | Chemicals – 3.8% | |
| | 29,584 | | | A. Schulman, Inc. | | | 768,297 | |
| | 18,631 | | | Axiall Corp. | | | 977,196 | |
| | 24,526 | | | Chemtura Corp.* | | | 521,423 | |
| | 4,720 | | | Koppers Holdings, Inc. | | | 207,255 | |
| | 55,916 | | | Kraton Performance Polymers, Inc.* | | | 1,269,852 | |
| | 18,827 | | | Minerals Technologies, Inc. | | | 764,941 | |
| | 26,253 | | | OM Group, Inc.* | | | 642,411 | |
| | 24,250 | | | Stepan Co. | | | 1,380,795 | |
| | 16,354 | | | The Valspar Corp. | | | 1,043,712 | |
| | 7,636 | | | W.R. Grace & Co.* | | | 588,812 | |
| | 6,571 | | | Zep, Inc. | | | 99,879 | |
| | | | | | | | |
| | | | | | | 8,264,573 | |
| | |
| | Commercial Banks – 4.7% | |
| | 21,572 | | | 1st Source Corp. | | | 507,589 | |
| | 3,516 | | | Banco Latinoamericano de Comercio Exterior SA Class E | | | 79,778 | |
| | 9,619 | | | BBCN Bancorp, Inc. | | | 123,893 | |
| | 1,801 | | | BOK Financial Corp. | | | 112,544 | |
| | 3,556 | | | Cathay General Bancorp | | | 70,089 | |
| | 47,618 | | | CVB Financial Corp. | | | 517,608 | |
| | 39,062 | | | F.N.B. Corp. | | | 444,916 | |
| | |
| | |
| 44 | | The accompanying notes are an integral part of these financial statements. |
GOLDMAN SACHS SMALL CAP EQUITY INSIGHTS FUND
| | | | | | | | |
| Shares | | | Description | | Value | |
| | | | | | | | |
| | Common Stocks – (continued) | |
| | Commercial Banks – (continued) | |
| | 14,083 | | | First Bancorp, Inc. | | $ | 240,678 | |
| | 24,102 | | | First Interstate BancSystem, Inc. | | | 489,753 | |
| | 12,609 | | | First Niagara Financial Group, Inc. | | | 119,912 | |
| | 65,190 | | | FirstMerit Corp. | | | 1,116,705 | |
| | 15,084 | | | Great Southern Bancorp, Inc. | | | 397,765 | |
| | 29,906 | | | International Bancshares Corp. | | | 580,176 | |
| | 8,359 | | | Investors Bancorp, Inc. | | | 165,508 | |
| | 6,225 | | | OFG Bancorp | | | 100,036 | |
| | 11,769 | | | PacWest Bancorp | | | 326,354 | |
| | 6,762 | | | Popular, Inc.* | | | 192,649 | |
| | 42,625 | | | PrivateBancorp, Inc. | | | 817,548 | |
| | 62,788 | | | Renasant Corp. | | | 1,432,822 | |
| | 4,343 | | | Southwest Bancorp, Inc.* | | | 57,414 | |
| | 8,450 | | | State Bank Financial Corp. | | | 124,300 | |
| | 86,947 | | | Susquehanna Bancshares, Inc. | | | 1,014,671 | |
| | 15,232 | | | TCF Financial Corp. | | | 221,626 | |
| | 38,727 | | | Umpqua Holdings Corp. | | | 464,724 | |
| | 13,293 | | | Wintrust Financial Corp. | | | 476,687 | |
| | | | | | | | |
| | | | | | | 10,195,745 | |
| | |
| | Commercial Services & Supplies – 1.9% | |
| | 22,166 | | | ABM Industries, Inc. | | | 499,843 | |
| | 1,774 | | | Consolidated Graphics, Inc.* | | | 63,279 | |
| | 30,015 | | | HNI Corp. | | | 1,033,416 | |
| | 41,172 | | | Kimball International, Inc. Class B | | | 378,371 | |
| | 9,764 | | | Mine Safety Appliances Co. | | | 468,672 | |
| | 19,953 | | | Quad Graphics, Inc.(a) | | | 417,018 | |
| | 90,553 | | | Steelcase, Inc. Class A | | | 1,150,023 | |
| | | | | | | | |
| | | | | | | 4,010,622 | |
| | |
| | Communications Equipment – 2.5% | |
| | 82,087 | | | ARRIS Group, Inc.* | | | 1,355,256 | |
| | 22,429 | | | Aruba Networks, Inc.* | | | 504,428 | |
| | 5,075 | | | Bel Fuse, Inc. Class B | | | 74,704 | |
| | 7,407 | | | Calix, Inc.* | | | 63,182 | |
| | 67,550 | | | Ciena Corp.* | | | 1,010,548 | |
| | 55,786 | | | Extreme Networks, Inc.* | | | 185,767 | |
| | 31,159 | | | InterDigital, Inc. | | | 1,383,771 | |
| | 22,897 | | | PC-Tel, Inc. | | | 152,723 | |
| | 20,673 | | | Polycom, Inc.* | | | 217,067 | |
| | 72,587 | | | Symmetricom, Inc.* | | | 377,453 | |
| | 4,562 | | | Ubiquiti Networks, Inc. | | | 70,483 | |
| | | | | | | | |
| | | | | | | 5,395,382 | |
| | |
| | Computers & Peripherals* – 0.1% | |
| | 39,306 | | | Imation Corp. | | | 144,646 | |
| | |
| | Construction & Engineering – 0.0% | |
| | 4,353 | | | Pike Electric Corp. | | | 68,037 | |
| | |
| | Construction Materials* – 0.1% | |
| | 23,587 | | | Headwaters, Inc. | | | 256,155 | |
| | |
| | Consumer Finance – 0.4% | |
| | 16,641 | | | Cash America International, Inc. | | | 726,047 | |
| | 1,889 | | | World Acceptance Corp.* | | | 167,856 | |
| | | | | | | | |
| | | | | | | 893,903 | |
| | |
| | | | | | | | |
| | Common Stocks – (continued) | |
| | Containers & Packaging – 0.9% | |
| | 19,103 | | | Bemis Co., Inc. | | $ | 751,703 | |
| | 13,551 | | | Graphic Packaging Holding Co.* | | | 101,903 | |
| | 23,307 | | | Packaging Corp. of America | | | 1,108,481 | |
| | | | | | | | |
| | | | | | | 1,962,087 | |
| | |
| | Diversified Consumer Services* – 0.7% | |
| | 19,170 | | | Ascent Capital Group LLC Class A | | | 1,274,613 | |
| | 4,854 | | | Coinstar, Inc.(a) | | | 256,340 | |
| | | | | | | | |
| | | | | | | 1,530,953 | |
| | |
| | Diversified Financial Services – 0.9% | |
| | 19,473 | | | CBOE Holdings, Inc. | | | 730,822 | |
| | 3,279 | | | MarketAxess Holdings, Inc. | | | 138,767 | |
| | 47,416 | | | PHH Corp.* | | | 999,529 | |
| | 3,016 | | | The NASDAQ OMX Group, Inc. | | | 88,912 | |
| | | | | | | | |
| | | | | | | 1,958,030 | |
| | |
| | Diversified Telecommunication Services – 0.5% | |
| | 7,724 | | | Cogent Communications Group, Inc. | | | 221,215 | |
| | 6,517 | | | magicJack VocalTec Ltd.*(a) | | | 107,726 | |
| | 29,148 | | | tw telecom, Inc.* | | | 789,328 | |
| | 20,133 | | | Vonage Holdings Corp.* | | | 61,406 | |
| | | | | | | | |
| | | | | | | 1,179,675 | |
| | |
| | Electric Utilities – 1.0% | |
| | 9,871 | | | El Paso Electric Co. | | | 369,768 | |
| | 3,532 | | | Great Plains Energy, Inc. | | | 85,227 | |
| | 3,282 | | | IDACORP, Inc. | | | 161,507 | |
| | 2,247 | | | Otter Tail Corp. | | | 70,107 | |
| | 9,808 | | | PNM Resources, Inc. | | | 235,490 | |
| | 26,573 | | | Portland General Electric Co. | | | 856,979 | |
| | 9,192 | | | UIL Holdings Corp. | | | 382,755 | |
| | | | | | | | |
| | | | | | | 2,161,833 | |
| | |
| | Electrical Equipment – 1.1% | |
| | 24,061 | | | Brady Corp. Class A | | | 815,187 | |
| | 13,812 | | | Encore Wire Corp. | | | 452,343 | |
| | 14,575 | | | EnerSys, Inc.* | | | 668,118 | |
| | 1,840 | | | Generac Holdings, Inc. | | | 66,111 | |
| | 49,902 | | | LSI Industries, Inc. | | | 351,310 | |
| | | | | | | | |
| | | | | | | 2,353,069 | |
| | |
| | Electronic Equipment, Instruments & Components – 0.2% | |
| | 5,138 | | | AVX Corp. | | | 58,111 | |
| | 3,133 | | | Cognex Corp. | | | 124,380 | |
| | 2,844 | | | SYNNEX Corp.* | | | 98,402 | |
| | 5,878 | | | Vishay Intertechnology, Inc.* | | | 82,527 | |
| | | | | | | | |
| | | | | | | 363,420 | |
| | |
| | Energy Equipment & Services – 0.5% | |
| | 1,056 | | | Bristow Group, Inc. | | | 66,739 | |
| | 28,288 | | | Exterran Holdings, Inc.* | | | 747,369 | |
| | 17,021 | | | Parker Drilling Co.* | | | 70,127 | |
| | 30,510 | | | Willbros Group, Inc.* | | | 289,845 | |
| | | | | | | | |
| | | | | | | 1,174,080 | |
| | |
| | |
| The accompanying notes are an integral part of these financial statements. | | 45 |
GOLDMAN SACHS SMALL CAP EQUITY INSIGHTS FUND
Schedule of Investments (continued)
April 30, 2013 (Unaudited)
| | | | | | | | |
| Shares | | | Description | | Value | |
| | | | | | | | |
| | Common Stocks – (continued) | |
| | Food & Staples Retailing* – 0.0% | |
| | 6,507 | | | The Pantry, Inc. | | $ | 95,067 | |
| | |
| | Food Products – 1.5% | |
| | 2,637 | | | J&J Snack Foods Corp. | | | 197,828 | |
| | 16,521 | | | Lancaster Colony Corp. | | | 1,304,003 | |
| | 6,510 | | | Omega Protein Corp.* | | | 60,608 | |
| | 24,518 | | | Pilgrim’s Pride Corp.* | | | 240,031 | |
| | 5,531 | | | Post Holdings, Inc.* | | | 242,202 | |
| | 15,140 | | | Sanderson Farms, Inc. | | | 927,476 | |
| | 59 | | | Seaboard Corp. | | | 162,013 | |
| | | | | | | | |
| | | | | | | 3,134,161 | |
| | |
| | Gas Utilities – 0.9% | |
| | 6,911 | | | Northwest Natural Gas Co. | | | 307,332 | |
| | 30,319 | | | Southwest Gas Corp. | | | 1,536,264 | |
| | | | | | | | |
| | | | | | | 1,843,596 | |
| | |
| | Health Care Equipment & Supplies – 1.2% | |
| | 1,787 | | | Atrion Corp. | | | 358,097 | |
| | 17,177 | | | Cyberonics, Inc.* | | | 745,825 | |
| | 10,491 | | | Cynosure, Inc. Class A* | | | 271,297 | |
| | 3,562 | | | Haemonetics Corp.* | | | 137,137 | |
| | 6,769 | | | Hill-Rom Holdings, Inc. | | | 230,620 | |
| | 29,107 | | | Invacare Corp. | | | 391,489 | |
| | 2,994 | | | Meridian Bioscience, Inc. | | | 60,748 | |
| | 2,475 | | | SurModics, Inc.* | | | 65,464 | |
| | 15,476 | | | Volcano Corp.* | | | 314,008 | |
| | 2,513 | | | Wright Medical Group, Inc.* | | | 58,905 | |
| | | | | | | | |
| | | | | | | 2,633,590 | |
| | |
| | Health Care Providers & Services – 2.0% | |
| | 15,492 | | | Amedisys, Inc.* | | | 155,540 | |
| | 29,383 | | | AMN Healthcare Services, Inc.* | | | 403,429 | |
| | 15,683 | | | Assisted Living Concepts, Inc. Class A | | | 186,941 | |
| | 3,717 | | | Bio-Reference Laboratories, Inc.*(a) | | | 94,783 | |
| | 10,361 | | | Five Star Quality Care, Inc.* | | | 49,008 | |
| | 3,143 | | | HealthSouth Corp.* | | | 86,433 | |
| | 20,768 | | | Kindred Healthcare, Inc.* | | | 217,856 | |
| | 1,535 | | | LifePoint Hospitals, Inc.* | | | 73,680 | |
| | 13,777 | | | Magellan Health Services, Inc.* | | | 704,831 | |
| | 36,022 | | | Molina Healthcare, Inc.* | | | 1,195,930 | |
| | 27,919 | | | PharMerica Corp.* | | | 359,876 | |
| | 70,932 | | | Select Medical Holdings Corp. | | | 585,189 | |
| | 30,523 | | | Skilled Healthcare Group, Inc. Class A* | | | 214,882 | |
| | | | | | | | |
| | | | | | | 4,328,378 | |
| | |
| | Hotels, Restaurants & Leisure – 3.2% | |
| | 24,004 | | | Ameristar Casinos, Inc. | | | 633,466 | |
| | 6,578 | | | Bally Technologies, Inc.* | | | 350,476 | |
| | 3,684 | | | Biglari Holdings, Inc.* | | | 1,426,739 | |
| | 37,371 | | | Boyd Gaming Corp.*(a) | | | 448,452 | |
| | 24,013 | | | Domino’s Pizza, Inc. | | | 1,325,518 | |
| | 11,135 | | | Interval Leisure Group, Inc. | | | 212,233 | |
| | 16,747 | | | Marriott Vacations Worldwide Corp.* | | | 761,654 | |
| | 4,481 | | | Multimedia Games Holding Co., Inc.* | | | 110,501 | |
| | |
| | | | | | | | |
| | Common Stocks – (continued) | |
| | Hotels, Restaurants & Leisure – (continued) | |
| | 24,093 | | | Papa John’s International, Inc.*(b) | | $ | 1,517,859 | |
| | 6,985 | | | Texas Roadhouse, Inc. | | | 164,147 | |
| | | | | | | | |
| | | | | | | 6,951,045 | |
| | |
| | Household Durables – 1.7% | |
| | 3,795 | | | American Greetings Corp. Class A | | | 69,980 | |
| | 15,111 | | | Blyth, Inc.(a) | | | 249,029 | |
| | 2,449 | | | CSS Industries, Inc. | | | 70,188 | |
| | 2,953 | | | Ethan Allen Interiors, Inc. | | | 86,464 | |
| | 14,918 | | | Hooker Furniture Corp. | | | 257,932 | |
| | 237,113 | | | Hovnanian Enterprises, Inc. Class A*(a) | | | 1,292,266 | |
| | 1,266 | | | Jarden Corp.* | | | 56,983 | |
| | 7,614 | | | Mohawk Industries, Inc.* | | | 844,240 | |
| | 6,874 | | | NACCO Industries, Inc. Class A | | | 398,830 | |
| | 12,991 | | | PulteGroup, Inc.* | | | 272,681 | |
| | | | | | | | |
| | | | | | | 3,598,593 | |
| | |
| | Household Products* – 0.2% | |
| | 40,484 | | | Central Garden & Pet Co. Class A | | | 356,259 | |
| | |
| | Independent Power Producers & Energy Traders – 0.1% | |
| | 12,345 | | | Genie Energy Ltd. Class B | | | 133,079 | |
| | |
| | Insurance – 1.2% | |
| | 31,788 | | | AmTrust Financial Services, Inc.(a) | | | 1,006,408 | |
| | 28,468 | | | First American Financial Corp. | | | 762,088 | |
| | 9,933 | | | Global Indemnity PLC* | | | 221,407 | |
| | 2,599 | | | Homeowners Choice, Inc. | | | 68,978 | |
| | 2,908 | | | Horace Mann Educators Corp. | | | 65,575 | |
| | 8,865 | | | Maiden Holdings Ltd. | | | 91,576 | |
| | 1,791 | | | Platinum Underwriters Holdings Ltd. | | | 101,639 | |
| | 7,460 | | | Stewart Information Services Corp. | | | 201,942 | |
| | | | | | | | |
| | | | | | | 2,519,613 | |
| | |
| | Internet & Catalog Retail – 0.1% | |
| | 2,894 | | | Blue Nile, Inc.* | | | 94,431 | |
| | 4,928 | | | PetMed Express, Inc. | | | 61,600 | |
| | | | | | | | |
| | | | | | | 156,031 | |
| | |
| | Internet Software & Services – 2.0% | |
| | 4,881 | | | Digital River, Inc.* | | | 70,677 | |
| | 15,562 | | | LivePerson, Inc.* | | | 199,505 | |
| | 81,193 | | | Marchex, Inc. Class B | | | 335,327 | |
| | 27,930 | | | Monster Worldwide, Inc.* | | | 122,333 | |
| | 12,203 | | | OpenTable, Inc.* | | | 675,924 | |
| | 2,317 | | | Travelzoo, Inc.* | | | 59,153 | |
| | 14,686 | | | ValueClick, Inc.* | | | 453,210 | |
| | 15,001 | | | VistaPrint NV*(a) | | | 612,041 | |
| | 14,583 | | | WebMD Health Corp.* | | | 352,179 | |
| | 24,320 | | | Zillow, Inc. Class A*(a) | | | 1,430,746 | |
| | | | | | | | |
| | | | | | | 4,311,095 | |
| | |
| | IT Services – 2.9% | |
| | 41,196 | | | Acxiom Corp.* | | | 819,388 | |
| | 6,685 | | | Booz Allen Hamilton Holding Corp. | | | 101,545 | |
| | 77,501 | | | Ciber, Inc.* | | | 330,154 | |
| | 7,893 | | | Convergys Corp. | | | 134,339 | |
| | |
| | |
| 46 | | The accompanying notes are an integral part of these financial statements. |
GOLDMAN SACHS SMALL CAP EQUITY INSIGHTS FUND
| | | | | | | | |
| Shares | | | Description | | Value | |
| | | | | | | | |
| | Common Stocks – (continued) | |
| | IT Services – (continued) | |
| | 34,667 | | | CoreLogic, Inc.* | | $ | 945,716 | |
| | 27,001 | | | CSG Systems International, Inc.* | | | 583,492 | |
| | 27,916 | | | Euronet Worldwide, Inc.* | | | 852,276 | |
| | 3,071 | | | Gartner, Inc.* | | | 177,657 | |
| | 11,388 | | | Global Cash Access Holdings, Inc.* | | | 81,196 | |
| | 8,020 | | | Heartland Payment Systems, Inc. | | | 263,778 | |
| | 41,248 | | | Lender Processing Services, Inc. | | | 1,144,220 | |
| | 97,326 | | | Lionbridge Technologies, Inc.* | | | 332,855 | |
| | 7,781 | | | ManTech International Corp. Class A | | | 207,675 | |
| | 854 | | | MAXIMUS, Inc. | | | 68,055 | |
| | 49,961 | | | ModusLink Global Solutions, Inc.* | | | 139,891 | |
| | | | | | | | |
| | | | | | | 6,182,237 | |
| | |
| | Leisure Equipment & Products – 0.6% | |
| | 22,962 | | | Brunswick Corp. | | | 726,977 | |
| | 52,196 | | | Smith & Wesson Holding Corp.*(a) | | | 458,281 | |
| | | | | | | | |
| | | | | | | 1,185,258 | |
| | |
| | Life Sciences Tools & Services – 1.2% | |
| | 13,196 | | | Cambrex Corp.* | | | 164,818 | |
| | 14,014 | | | Charles River Laboratories International, Inc.* | | | 609,469 | |
| | 6,332 | | | Luminex Corp.* | | | 105,301 | |
| | 38,125 | | | PAREXEL International Corp.* | | | 1,561,219 | |
| | 1,995 | | | Techne Corp. | | | 127,959 | |
| | | | | | | | |
| | | | | | | 2,568,766 | |
| | |
| | Machinery – 2.4% | |
| | 5,743 | | | Albany International Corp. Class A | | | 166,834 | |
| | 6,464 | | | Astec Industries, Inc. | | | 212,213 | |
| | 12,119 | | | Briggs & Stratton Corp. | | | 272,556 | |
| | 7,212 | | | Donaldson Co., Inc. | | | 262,373 | |
| | 1,642 | | | EnPro Industries, Inc.* | | | 80,918 | |
| | 25,621 | | | Hyster-Yale Materials Handling, Inc. | | | 1,337,160 | |
| | 2,754 | | | John Bean Technologies Corp. | | | 57,118 | |
| | 14,569 | | | Kadant, Inc. | | | 403,124 | |
| | 17,458 | | | Lydall, Inc.* | | | 250,348 | |
| | 21,347 | | | Miller Industries, Inc. | | | 322,553 | |
| | 1,288 | | | Mueller Industries, Inc. | | | 66,693 | |
| | 23,239 | | | Tecumseh Products Co. Class A* | | | 206,827 | |
| | 12,107 | | | Tennant Co. | | | 578,957 | |
| | 10,941 | | | WABCO Holdings, Inc.* | | | 790,268 | |
| | 3,213 | | | Watts Water Technologies, Inc. Class A | | | 151,204 | |
| | | | | | | | |
| | | | | | | 5,159,146 | |
| | |
| | Media – 0.7% | |
| | 14,176 | | | Arbitron, Inc. | | | 661,877 | |
| | 13,855 | | | Entercom Communications Corp. Class A*(a) | | | 109,593 | |
| | 33,622 | | | Harte-Hanks, Inc. | | | 266,623 | |
| | 52,171 | | | Journal Communications, Inc. Class A* | | | 355,285 | |
| | 5,316 | | | LIN TV Corp. Class A* | | | 65,440 | |
| | 2,534 | | | Valassis Communications, Inc. | | | 64,946 | |
| | | | | | | | |
| | | | | | | 1,523,764 | |
| | |
| | | | | | | | |
| | Common Stocks – (continued) | |
| | Metals & Mining – 0.8% | |
| | 4,001 | | | Coeur d’Alene Mines Corp.* | | $ | 60,975 | |
| | 11,860 | | | Globe Specialty Metals, Inc. | | | 154,891 | |
| | 25,390 | | | Materion Corp. | | | 672,581 | |
| | 20,194 | | | Schnitzer Steel Industries, Inc. Class A | | | 495,359 | |
| | 13,559 | | | SunCoke Energy, Inc.* | | | 205,148 | |
| | 5,727 | | | Worthington Industries, Inc. | | | 184,295 | |
| | | | | | | | |
| | | | | | | 1,773,249 | |
| | |
| | Multi-Utilities – 0.8% | |
| | 4,230 | | | Avista Corp. | | | 118,651 | |
| | 30,213 | | | Black Hills Corp. | | | 1,416,688 | |
| | 931 | | | CH Energy Group, Inc. | | | 60,487 | |
| | 2,684 | | | NorthWestern Corp. | | | 115,466 | |
| | | | | | | | |
| | | | | | | 1,711,292 | |
| | |
| | Multiline Retail – 0.0% | |
| | 6,561 | | | Fred’s, Inc. Class A | | | 93,363 | |
| | |
| | Oil, Gas & Consumable Fuels – 4.4% | |
| | 73,132 | | | Alon USA Energy, Inc. | | | 1,213,991 | |
| | 22,925 | | | CVR Energy, Inc. | | | 1,129,515 | |
| | 32,705 | | | Delek US Holdings, Inc. | | | 1,180,324 | |
| | 5,993 | | | Green Plains Renewable Energy, Inc.* | | | 74,972 | |
| | 22,381 | | | HollyFrontier Corp. | | | 1,106,740 | |
| | 27,108 | | | SemGroup Corp. Class A* | | | 1,405,550 | |
| | 43,152 | | | Ship Finance International Ltd. | | | 711,145 | |
| | 20,094 | | | Tesoro Corp. | | | 1,073,020 | |
| | 47,500 | | | Western Refining, Inc. | | | 1,468,225 | |
| | | | | | | | |
| | | | | | | 9,363,482 | |
| | |
| | Paper & Forest Products – 1.5% | |
| | 84,694 | | | Louisiana-Pacific Corp.* | | | 1,534,655 | |
| | 2,732 | | | PH Glatfelter Co. | | | 65,568 | |
| | 63,355 | | | Resolute Forest Products* | | | 926,884 | |
| | 18,201 | | | Schweitzer-Mauduit International, Inc. | | | 733,318 | |
| | | | | | | | |
| | | | | | | 3,260,425 | |
| | |
| | Personal Products(a) – 0.5% | |
| | 9,247 | | | Nu Skin Enterprises, Inc. Class A | | | 469,100 | |
| | 11,296 | | | USANA Health Sciences, Inc.* | | | 637,321 | |
| | | | | | | | |
| | | | | | | 1,106,421 | |
| | |
| | Pharmaceuticals – 2.4% | |
| | 29,002 | | | Auxilium Pharmaceuticals, Inc.* | | | 433,000 | |
| | 7,810 | | | Endo Health Solutions, Inc.* | | | 286,158 | |
| | 50,342 | | | Questcor Pharmaceuticals, Inc.(a) | | | 1,547,513 | |
| | 77,170 | | | Santarus, Inc.* | | | 1,417,613 | |
| | 4,101 | | | ViroPharma, Inc.* | | | 111,752 | |
| | 95,363 | | | Warner Chilcott PLC Class A | | | 1,371,320 | |
| | | | | | | | |
| | | | | | | 5,167,356 | |
| | |
| | Professional Services – 2.2% | |
| | 1,563 | | | Barrett Business Services, Inc. | | | 82,745 | |
| | 21,180 | | | CDI Corp. | | | 331,891 | |
| | 22,685 | | | Insperity, Inc. | | | 626,787 | |
| | 77,226 | | | Kelly Services, Inc. Class A | | | 1,314,387 | |
| | |
| | |
| The accompanying notes are an integral part of these financial statements. | | 47 |
GOLDMAN SACHS SMALL CAP EQUITY INSIGHTS FUND
Schedule of Investments (continued)
April 30, 2013 (Unaudited)
| | | | | | | | |
| Shares | | | Description | | Value | |
| | | | | | | | |
| | Common Stocks – (continued) | |
| | Professional Services – (continued) | |
| | 74,153 | | | Kforce, Inc. | | $ | 1,121,193 | |
| | 13,753 | | | Manpowergroup, Inc. | | | 731,109 | |
| | 62,248 | | | Volt Information Sciences, Inc.* | | | 504,209 | |
| | | | | | | | |
| | | | | | | 4,712,321 | |
| | |
| | Real Estate Investment Trusts – 6.4% | |
| | 7,581 | | | Acadia Realty Trust | | | 216,438 | |
| | 8,311 | | | Corporate Office Properties Trust | | | 240,936 | |
| | 29,216 | | | Corrections Corp. of America | | | 1,057,619 | |
| | 63,462 | | | Cousins Properties, Inc. | | | 693,005 | |
| | 18,209 | | | DuPont Fabros Technology, Inc. | | | 457,774 | |
| | 5,075 | | | EastGroup Properties, Inc. | | | 320,080 | |
| | 23,828 | | | Extra Space Storage, Inc. | | | 1,038,424 | |
| | 29,909 | | | Franklin Street Properties Corp. | | | 456,710 | |
| | 3,972 | | | Getty Realty Corp. | | | 85,041 | |
| | 48,173 | | | Healthcare Realty Trust, Inc. | | | 1,446,154 | |
| | 11,016 | | | LTC Properties, Inc. | | | 512,244 | |
| | 24,331 | | | National Health Investors, Inc. | | | 1,611,685 | |
| | 8,742 | | | NorthStar Realty Finance Corp. | | | 87,158 | |
| | 8,414 | | | Pennsylvania Real Estate Investment Trust | | | 174,422 | |
| | 35,489 | | | Potlatch Corp. | | | 1,680,404 | |
| | 2,603 | | | Regency Centers Corp. | | | 146,445 | |
| | 28,412 | | | Ryman Hospitality Properties, Inc.(a) | | | 1,263,198 | |
| | 2,963 | | | Sovran Self Storage, Inc. | | | 203,262 | |
| | 7,041 | | | Sunstone Hotel Investors, Inc.* | | | 87,379 | |
| | 12,865 | | | Taubman Centers, Inc. | | | 1,100,086 | |
| | 13,563 | | | The Geo Group, Inc. | | | 507,934 | |
| | 14,606 | | | Washington Real Estate Investment Trust | | | 417,147 | |
| | | | | | | | |
| | | | | | | 13,803,545 | |
| | |
| | Real Estate Management & Development – 0.9% | |
| | 6,531 | | | Altisource Residential Corp. Class B* | | | 124,089 | |
| | 11,514 | | | Jones Lang LaSalle, Inc. | | | 1,140,116 | |
| | 2,006 | | | Realogy Holdings Corp.* | | | 96,288 | |
| | 31,788 | | | The St. Joe Co.*(a) | | | 622,091 | |
| | | | | | | | |
| | | | | | | 1,982,584 | |
| | |
| | Road & Rail – 1.1% | |
| | 11,085 | | | Avis Budget Group, Inc.* | | | 319,691 | |
| | 2,128 | | | Con-way, Inc. | | | 71,926 | |
| | 33,893 | | | Heartland Express, Inc. | | | 459,928 | |
| | 18,593 | | | Marten Transport Ltd. | | | 378,740 | |
| | 4,038 | | | Saia, Inc.* | | | 165,235 | |
| | 10,946 | | | Swift Transportation Co.* | | | 153,463 | |
| | 12,848 | | | Universal Truckload Services, Inc.* | | | 324,284 | |
| | 16,943 | | | Werner Enterprises, Inc. | | | 389,011 | |
| | | | | | | | |
| | | | | | | 2,262,278 | |
| | |
| | Semiconductors & Semiconductor Equipment – 2.9% | |
| | 35,523 | | | Advanced Energy Industries, Inc.*(b) | | | 603,181 | |
| | 1,725 | | | Cabot Microelectronics Corp.* | | | 57,805 | |
| | 8,467 | | | Cree, Inc.* | | | 478,978 | |
| | 47,272 | | | Cypress Semiconductor Corp.* | | | 476,974 | |
| | 40,402 | | | DSP Group, Inc.* | | | 326,044 | |
| | |
| | | | | | | | |
| | Common Stocks – (continued) | |
| | Semiconductors & Semiconductor Equipment – (continued) | |
| | 32,301 | | | First Solar, Inc.*(a) | | $ | 1,503,935 | |
| | 56,073 | | | Micrel, Inc. | | | 564,094 | |
| | 10,437 | | | MKS Instruments, Inc. | | | 280,442 | |
| | 42,719 | | | Spansion, Inc. Class A* | | | 554,920 | |
| | 53,620 | | | SunPower Corp.* | | | 728,696 | |
| | 16,535 | | | Veeco Instruments, Inc.*(a) | | | 629,487 | |
| | | | | | | | |
| | | | | | | 6,204,556 | |
| | |
| | Software – 3.2% | |
| | 143,270 | | | Accelrys, Inc.* | | | 1,411,210 | |
| | 56,903 | | | Aspen Technology, Inc.* | | | 1,734,404 | |
| | 4,629 | | | Cadence Design Systems, Inc.* | | | 63,880 | |
| | 10,158 | | | EPIQ Systems, Inc. | | | 141,907 | |
| | 6,886 | | | Manhattan Associates, Inc.* | | | 483,466 | |
| | 72,723 | | | Mentor Graphics Corp. | | | 1,327,922 | |
| | 1,133 | | | MicroStrategy, Inc. Class A* | | | 102,185 | |
| | 6,465 | | | Monotype Imaging Holdings, Inc. | | | 149,923 | |
| | 4,299 | | | Pegasystems, Inc. | | | 108,808 | |
| | 33,156 | | | PROS Holdings, Inc.* | | | 859,404 | |
| | 6,458 | | | RealPage, Inc.*(a) | | | 131,743 | |
| | 9,305 | | | Verint System, Inc.* | | | 307,437 | |
| | | | | | | | |
| | | | | | | 6,822,289 | |
| | |
| | Specialty Retail – 2.5% | |
| | 3,683 | | | American Eagle Outfitters, Inc. | | | 71,634 | |
| | 10,833 | | | Brown Shoe Co., Inc. | | | 183,186 | |
| | 37,517 | | | GameStop Corp. Class A(a) | | | 1,309,343 | |
| | 4,016 | | | Haverty Furniture Cos., Inc. | | | 95,500 | |
| | 5,643 | | | Hibbett Sports, Inc.* | | | 309,519 | |
| | 23,739 | | | Lumber Liquidators Holdings, Inc.* | | | 1,945,648 | |
| | 54,935 | | | OfficeMax, Inc. | | | 632,302 | |
| | 5,866 | | | Penske Automotive Group, Inc. | | | 181,377 | |
| | 9,803 | | | Stage Stores, Inc. | | | 271,445 | |
| | 6,630 | | | Vitamin Shoppe, Inc.* | | | 325,865 | |
| | | | | | | | |
| | | | | | | 5,325,819 | |
| | |
| | Textiles, Apparel & Luxury Goods – 0.9% | |
| | 10,375 | | | Columbia Sportswear Co.(a) | | | 607,975 | |
| | 9,295 | | | Crocs, Inc.* | | | 148,906 | |
| | 7,982 | | | Hanesbrands, Inc.* | | | 400,377 | |
| | 9,662 | | | Movado Group, Inc. | | | 292,179 | |
| | 19,164 | | | Perry Ellis International, Inc. | | | 336,712 | |
| | 2,663 | | | Skechers U.S.A., Inc. Class A* | | | 55,337 | |
| | 3,436 | | | Unifi, Inc.* | | | 67,002 | |
| | | | | | | | |
| | | | | | | 1,908,488 | |
| | |
| | Thrifts & Mortgage Finance – 0.9% | |
| | 9,465 | | | Brookline Bancorp, Inc. | | | 79,506 | |
| | 52,807 | | | Ocwen Financial Corp.* | | | 1,931,680 | |
| | | | | | | | |
| | | | | | | 2,011,186 | |
| | |
| | Tobacco* – 0.0% | |
| | 19,290 | | | Alliance One International, Inc. | | | 72,338 | |
| | |
| | |
| 48 | | The accompanying notes are an integral part of these financial statements. |
GOLDMAN SACHS SMALL CAP EQUITY INSIGHTS FUND
| | | | | | | | |
| Shares | | | Description | | Value | |
| | | | | | | | |
| | Common Stocks – (continued) | |
| | Trading Companies & Distributors – 1.5% | |
| | 2,897 | | | Beacon Roofing Supply, Inc.* | | $ | 110,463 | |
| | 12,373 | | | H&E Equipment Services, Inc. | | | 251,914 | |
| | 31,860 | | | TAL International Group, Inc. | | | 1,319,004 | |
| | 19,593 | | | Watsco, Inc. | | | 1,653,257 | |
| | | | | | | | |
| | | | | | | 3,334,638 | |
| | |
| | Wireless Telecommunication Services – 0.2% | |
| | 23,924 | | | USA Mobility, Inc. | | | 324,649 | |
| | |
| | TOTAL COMMON STOCKS | |
| | (Cost $180,014,573) | | $ | 204,787,581 | |
| | |
| | | | | | | | | | | | | | |
Principal Amount | | | Interest
Rate | | | Maturity
Date | | | Value | |
| | | | | | | | | | | | | | |
| | Short-term Investment(c) – 4.2% | | | | | |
| | Repurchase Agreement – 4.2% | | | | | |
| Joint Repurchase Agreement Account II | | | | | |
| $ | 9,000,000 | | | | 0.169 | % | | | 05/01/13 | | | $ | 9,000,000 | |
| | (Cost $9,000,000) | | | | | | | | | |
| | |
| TOTAL INVESTMENTS BEFORE
SECURITIES LENDING
REINVESTMENT VEHICLE |
| | | | |
| | (Cost $189,014,573) | | | | | | | $ | 213,787,581 | |
| | |
| | | | | | | | |
| Shares | | | Description | | Value | |
| | | | | | | | |
| | Securities Lending Reinvestment Vehicle(d)(e) – 10.6% | |
| Financial Square Money Market Fund | |
| | 22,757,070 | | | 0.109% | | $ | 22,757,070 | |
| | (Cost $22,757,070) | | | | |
| | |
| | TOTAL INVESTMENTS – 110.0% | | | | |
| | (Cost $211,771,643) | | $ | 236,544,651 | |
| | |
| LIABILITIES IN EXCESS OF
OTHER ASSETS – (10.0)% | | | (21,499,257 | ) |
| | |
| | NET ASSETS – 100.0% | | $ | 215,045,394 | |
| | |
| | |
| The percentage shown for each investment category reflects the value of investments in that category as a percentage of net assets. |
* | | Non-income producing security. |
(a) | | All or a portion of security is on loan. |
(b) | | A portion of this security is segregated as collateral for initial margin requirement on futures transactions. |
(c) | | Joint repurchase agreement was entered into on April 30, 2013. Additional information appears on page 65. |
(d) | | Variable rate security. Interest rate disclosed is that which is in effect at April 30, 2013. |
(e) | | Represents an affiliated issuer. |
|
| ADDITIONAL INVESTMENT INFORMATION |
FUTURES CONTRACTS — At April 30, 2013, the Fund had the following futures contracts:
| | | | | | | | | | | | |
| Type | | Number of
Contracts
Long (Short) | | Expiration
Date | | Current Value | | | Unrealized
Gain (Loss) | |
Russell 2000 Mini Index | | 94 | | June 2013 | | $ | 8,883,940 | | | $ | 128,469 | |
| | |
| The accompanying notes are an integral part of these financial statements. | | 49 |
GOLDMAN SACHS SMALL CAP GROWTH INSIGHTS FUND
Schedule of Investments
April 30, 2013 (Unaudited)
| | | | | | | | |
Shares | | | Description | | Value | |
| | | | | | | | |
| | Common Stocks – 96.8% | |
| | Aerospace & Defense – 2.0% | |
| | 3,320 | | | Alliant Techsystems, Inc. | | $ | 246,875 | |
| | 963 | | | American Science and Engineering, Inc. | | | 62,094 | |
| | 7,095 | | | DigitalGlobe, Inc.* | | | 207,103 | |
| | 10,848 | | | Hexcel Corp.* | | | 330,864 | |
| | 12,281 | | | Taser International, Inc.* | | | 108,196 | |
| | | | | | | | |
| | | | | | | 955,132 | |
| | |
| | Air Freight & Logistics* – 0.1% | |
| | 11,616 | | | Pacer International, Inc. | | | 66,095 | |
| | |
| | Airlines – 3.7% | |
| | 8,780 | | | Alaska Air Group, Inc.* | | | 541,199 | |
| | 3,715 | | | Allegiant Travel Co. | | | 333,978 | |
| | 8,973 | | | Republic Airways Holdings, Inc.* | | | 100,408 | |
| | 8,222 | | | SkyWest, Inc. | | | 117,657 | |
| | 7,651 | | | Spirit Airlines, Inc.* | | | 204,282 | |
| | 30,356 | | | US Airways Group, Inc.*(a) | | | 513,016 | |
| | | | | | | | |
| | | | | | | 1,810,540 | |
| | |
| | Auto Components – 1.6% | |
| | 14,007 | | | Cooper Tire & Rubber Co. | | | 348,634 | |
| | 5,284 | | | Stoneridge, Inc.* | | | 40,000 | |
| | 3,903 | | | Superior Industries International, Inc. | | | 71,659 | |
| | 8,797 | | | Tenneco, Inc.* | | | 340,180 | |
| | | | | | | | |
| | | | | | | 800,473 | |
| | |
| | Beverages – 0.1% | |
| | 4,603 | | | National Beverage Corp. | | | 67,802 | |
| | |
| | Biotechnology – 12.2% | |
| | 10,406 | | | Acorda Therapeutics, Inc.* | | | 411,765 | |
| | 5,410 | | | Aegerion Pharmaceuticals, Inc.* | | | 227,436 | |
| | 19,132 | | | Alkermes PLC* | | | 585,631 | |
| | 2,174 | | | Alnylam Pharmaceuticals, Inc.* | | | 52,067 | |
| | 21,308 | | | Arena Pharmaceuticals, Inc.*(a) | | | 175,578 | |
| | 3,805 | | | BioMarin Pharmaceutical, Inc.* | | | 249,608 | |
| | 1,196 | | | Cepheid, Inc.* | | | 45,603 | |
| | 13,231 | | | Codexis, Inc.* | | | 29,637 | |
| | 7,431 | | | Coronado Biosciences, Inc.* | | | 83,599 | |
| | 9,818 | | | Cubist Pharmaceuticals, Inc.* | | | 450,843 | |
| | 5,730 | | | Emergent Biosolutions, Inc.* | | | 87,898 | |
| | 11,425 | | | Genomic Health, Inc.* | | | 346,863 | |
| | 5,566 | | | Infinity Pharmaceuticals, Inc.* | | | 239,839 | |
| | 21,437 | | | Isis Pharmaceuticals, Inc.*(a) | | | 479,974 | |
| | 3,416 | | | Ligand Pharmaceuticals, Inc. Class B* | | | 93,325 | |
| | 41,077 | | | MannKind Corp.*(a) | | | 162,254 | |
| | 14,912 | | | Merrimack Pharmaceuticals, Inc.* | | | 73,367 | |
| | 17,775 | | | Momenta Pharmaceuticals, Inc.* | | | 218,988 | |
| | 10,597 | | | NPS Pharmaceuticals, Inc.* | | | 142,318 | |
| | 49,486 | | | PDL BioPharma, Inc.(a) | | | 383,022 | |
| | 7,954 | | | Pharmacyclics, Inc.* | | | 648,251 | |
| | 3,455 | | | Sangamo Biosciences, Inc.* | | | 35,172 | |
| | 13,603 | | | Seattle Genetics, Inc.* | | | 502,631 | |
| | 7,417 | | | Spectrum Pharmaceuticals, Inc.(a) | | | 54,960 | |
| | |
| | | | | | | | |
| | Common Stocks – (continued) | |
| | Biotechnology – (continued) | |
| | 1,279 | | | Synageva BioPharma Corp.* | | $ | 66,112 | |
| | 1,284 | | | United Therapeutics Corp.* | | | 85,746 | |
| | | | | | | | |
| | | | | | | 5,932,487 | |
| | |
| | Building Products – 1.5% | |
| | 1,006 | | | American Woodmark Corp.* | | | 33,852 | |
| | 662 | | | Lennox International, Inc. | | | 41,044 | |
| | 7,339 | | | Trex Co., Inc.* | | | 357,263 | |
| | 2,683 | | | Universal Forest Products, Inc. | | | 103,564 | |
| | 7,759 | | | USG Corp.* | | | 201,656 | |
| | | | | | | | |
| | | | | | | 737,379 | |
| | |
| | Capital Markets – 1.6% | |
| | 4,842 | | | Cohen & Steers, Inc. | | | 191,307 | |
| | 2,947 | | | GAMCO Investors, Inc. Class A | | | 154,718 | |
| | 7,927 | | | Greenhill & Co., Inc. | | | 366,148 | |
| | 1,149 | | | Waddell & Reed Financial, Inc. Class A | | | 49,258 | |
| | | | | | | | |
| | | | | | | 761,431 | |
| | |
| | Chemicals – 3.0% | |
| | 9,257 | | | Axiall Corp. | | | 485,529 | |
| | 2,395 | | | Chemtura Corp.* | | | 50,918 | |
| | 2,613 | | | Koppers Holdings, Inc. | | | 114,737 | |
| | 2,694 | | | Kraton Performance Polymers, Inc.* | | | 61,181 | |
| | 2,987 | | | Minerals Technologies, Inc. | | | 121,362 | |
| | 1,911 | | | OM Group, Inc.* | | | 46,762 | |
| | 3,136 | | | Omnova Solutions, Inc.* | | | 20,917 | |
| | 1,458 | | | PolyOne Corp. | | | 32,849 | |
| | 17,025 | | | Senomyx, Inc.* | | | 34,901 | |
| | 6,030 | | | Stepan Co. | | | 343,348 | |
| | 2,106 | | | The Valspar Corp. | | | 134,405 | |
| | | | | | | | |
| | | | | | | 1,446,909 | |
| | |
| | Commercial Banks – 0.1% | |
| | 2,422 | | | State Bank Financial Corp. | | | 35,628 | |
| | |
| | Commercial Services & Supplies – 2.7% | |
| | 10,749 | | | Healthcare Services Group, Inc. | | | 239,595 | |
| | 12,108 | | | HNI Corp. | | | 416,879 | |
| | 4,618 | | | Intersections, Inc. | | | 44,148 | |
| | 6,119 | | | Kimball International, Inc. Class B | | | 56,234 | |
| | 4,991 | | | Mine Safety Appliances Co. | | | 239,568 | |
| | 18,957 | | | Steelcase, Inc. Class A | | | 240,754 | |
| | 2,486 | | | United Stationers, Inc. | | | 80,720 | |
| | | | | | | | |
| | | | | | | 1,317,898 | |
| | |
| | Communications Equipment – 3.6% | |
| | 15,070 | | | ARRIS Group, Inc.* | | | 248,806 | |
| | 16,106 | | | Aruba Networks, Inc.* | | | 362,224 | |
| | 3,803 | | | Calix, Inc.* | | | 32,440 | |
| | 25,101 | | | Ciena Corp.* | | | 375,511 | |
| | 8,250 | | | Extreme Networks, Inc.* | | | 27,472 | |
| | 8,729 | | | InterDigital, Inc. | | | 387,655 | |
| | 5,497 | | | Plantronics, Inc. | | | 240,879 | |
| | 1,335 | | | ViaSat, Inc.* | | | 64,707 | |
| | | | | | | | |
| | | | | | | 1,739,694 | |
| | |
| | |
| 50 | | The accompanying notes are an integral part of these financial statements. |
GOLDMAN SACHS SMALL CAP GROWTH INSIGHTS FUND
| | | | | | | | |
Shares | | | Description | | Value | |
| | | | | | | | |
| | Common Stocks – (continued) | |
| | Computers & Peripherals*(a) – 0.6% | |
| | 7,787 | | | 3D Systems, Corp. | | $ | 297,775 | |
| | |
| | Construction Materials* – 0.1% | |
| | 6,302 | | | Headwaters, Inc. | | | 68,440 | |
| | |
| | Consumer Finance – 0.5% | |
| | 3,259 | | | Cash America International, Inc. | | | 142,190 | |
| | 1,524 | | | DFC Global Corp.* | | | 20,574 | |
| | 768 | | | World Acceptance Corp.*(a) | | | 68,245 | |
| | | | | | | | |
| | | | | | | 231,009 | |
| | |
| | Containers & Packaging – 0.8% | |
| | 3,848 | | | Bemis Co., Inc. | | | 151,419 | |
| | 5,307 | | | Packaging Corp. of America | | | 252,401 | |
| | | | | | | | |
| | | | | | | 403,820 | |
| | |
| | Distributors – 0.1% | |
| | 609 | | | Core-Mark Holding Co., Inc. | | | 31,692 | |
| | |
| | Diversified Consumer Services*(a) – 0.5% | |
| | 4,340 | | | Coinstar, Inc. | | | 229,195 | |
| | |
| | Diversified Financial Services – 0.4% | |
| | 2,412 | | | Interactive Brokers Group, Inc. Class A | | | 36,325 | |
| | 2,909 | | | MarketAxess Holdings, Inc. | | | 123,109 | |
| | 2,059 | | | NewStar Financial, Inc.* | | | 24,605 | |
| | | | | | | | |
| | | | | | | 184,039 | |
| | |
| | Diversified Telecommunication Services – 0.6% | |
| | 5,343 | | | Cbeyond, Inc.* | | | 46,912 | |
| | 3,691 | | | Cogent Communications Group, Inc. | | | 105,710 | |
| | 2,159 | | | Fairpoint Communications, Inc.*(a) | | | 17,574 | |
| | 3,718 | | | magicJack VocalTec Ltd.*(a) | | | 61,458 | |
| | 2,673 | | | tw telecom, Inc.* | | | 72,385 | |
| | | | | | | | |
| | | | | | | 304,039 | |
| | |
| | Electric Utilities – 0.2% | |
| | 2,833 | | | Otter Tail Corp. | | | 88,390 | |
| | |
| | Electrical Equipment – 0.7% | |
| | 1,182 | | | Acuity Brands, Inc. | | | 86,239 | |
| | 2,992 | | | Coleman Cable, Inc. | | | 44,880 | |
| | 1,565 | | | EnerSys, Inc.* | | | 71,740 | |
| | 3,623 | | | Generac Holdings, Inc. | | | 130,174 | |
| | | | | | | | |
| | | | | | | 333,033 | |
| | |
| | Electronic Equipment, Instruments & Components – 1.0% | |
| | 1,680 | | | Anixter International, Inc. | | | 120,523 | |
| | 2,735 | | | AVX Corp. | | | 30,933 | |
| | 4,949 | | | Cognex Corp. | | | 196,475 | |
| | 1,697 | | | Electro Scientific Industries, Inc. | | | 18,294 | |
| | 1,393 | | | Littelfuse, Inc. | | | 97,259 | |
| | 1,399 | | | Plexus Corp.* | | | 37,731 | |
| | | | | | | | |
| | | | | | | 501,215 | |
| | |
| | Energy Equipment & Services* – 0.2% | |
| | 7,928 | | | Willbros Group, Inc. | | | 75,316 | |
| | |
| | | | | | | | |
| | Common Stocks – (continued) | |
| | Food & Staples Retailing* – 0.7% | |
| | 5,586 | | | Susser Holdings Corp. | | $ | 297,008 | |
| | 3,790 | | | The Pantry, Inc. | | | 55,372 | |
| | | | | | | | |
| | | | | | | 352,380 | |
| | |
| | Food Products – 2.7% | |
| | 674 | | | Cal-Maine Foods, Inc. | | | 28,766 | |
| | 4,415 | | | Lancaster Colony Corp. | | | 348,476 | |
| | 31,641 | | | Pilgrim’s Pride Corp.* | | | 309,766 | |
| | 1,970 | | | Post Holdings, Inc.* | | | 86,266 | |
| | 3,973 | | | Sanderson Farms, Inc. | | | 243,386 | |
| | 42 | | | Seaboard Corp. | | | 115,331 | |
| | 6,301 | | | Snyder’s-Lance, Inc. | | | 158,659 | |
| | | | | | | | |
| | | | | | | 1,290,650 | |
| | |
| | Health Care Equipment & Supplies – 3.7% | |
| | 1,983 | | | ABIOMED, Inc.*(a) | | | 36,626 | |
| | 9,045 | | | Align Technology, Inc.* | | | 299,570 | |
| | 1,945 | | | Conceptus, Inc.* | | | 60,315 | |
| | 7,486 | | | Cyberonics, Inc.* | | | 325,042 | |
| | 2,098 | | | Cynosure, Inc. Class A* | | | 54,254 | |
| | 3,028 | | | ICU Medical, Inc.* | | | 182,437 | |
| | 5,389 | | | Invacare Corp. | | | 72,482 | |
| | 8,960 | | | Masimo Corp. | | | 179,738 | |
| | 1,545 | | | Meridian Bioscience, Inc. | | | 31,348 | |
| | 1,218 | | | SurModics, Inc.* | | | 32,216 | |
| | 3,949 | | | Vascular Solutions, Inc.* | | | 62,829 | |
| | 16,390 | | | Volcano Corp.* | | | 332,553 | |
| | 1,679 | | | West Pharmaceutical Services, Inc. | | | 107,221 | |
| | | | | | | | |
| | | | | | | 1,776,631 | |
| | |
| | Health Care Providers & Services* – 2.3% | |
| | 1,905 | | | Amedisys, Inc. | | | 19,126 | |
| | 5,300 | | | AMN Healthcare Services, Inc. | | | 72,769 | |
| | 2,588 | | | Bio-Reference Laboratories, Inc.(a) | | | 65,994 | |
| | 4,946 | | | BioScrip, Inc. | | | 68,552 | |
| | 2,720 | | | CorVel Corp. | | | 129,118 | |
| | 2,904 | | | Gentiva Health Services, Inc. | | | 30,463 | |
| | 9,319 | | | HealthSouth Corp. | | | 256,272 | |
| | 9,821 | | | Kindred Healthcare, Inc. | | | 103,022 | |
| | 2,431 | | | Magellan Health Services, Inc. | | | 124,370 | |
| | 3,990 | | | Molina Healthcare, Inc. | | | 132,468 | |
| | 5,073 | | | PharMerica Corp. | | | 65,391 | |
| | 9,441 | | | Skilled Healthcare Group, Inc. Class A | | | 66,465 | |
| | | | | | | | |
| | | | | | | 1,134,010 | |
| | |
| | Hotels, Restaurants & Leisure – 3.8% | |
| | 6,682 | | | Ameristar Casinos, Inc. | | | 176,338 | |
| | 522 | | | Biglari Holdings, Inc.* | | | 202,160 | |
| | 985 | | | Bob Evans Farms, Inc. | | | 42,690 | |
| | 11,195 | | | Boyd Gaming Corp.* | | | 134,340 | |
| | 8,913 | | | Domino’s Pizza, Inc. | | | 491,998 | |
| | 1,787 | | | Interval Leisure Group, Inc. | | | 34,060 | |
| | 6,218 | | | Papa John’s International, Inc.* | | | 391,734 | |
| | 2,453 | | | SHFL Entertainment, Inc.* | | | 38,757 | |
| | 4,657 | | | Sonic Corp.* | | | 58,352 | |
| | |
| | |
| The accompanying notes are an integral part of these financial statements. | | 51 |
GOLDMAN SACHS SMALL CAP GROWTH INSIGHTS FUND
Schedule of Investments (continued)
April 30, 2013 (Unaudited)
| | | | | | | | |
Shares | | | Description | | Value | |
| | | | | | | | |
| | Common Stocks – (continued) | |
| | Hotels, Restaurants & Leisure – (continued) | |
| | 9,931 | | | Texas Roadhouse, Inc. | | $ | 233,379 | |
| | 3,209 | | | Town Sports International Holdings, Inc. | | | 32,315 | |
| | | | | | | | |
| | | | | | | 1,836,123 | |
| | |
| | Household Durables – 1.2% | |
| | 3,400 | | | Blyth, Inc.(a) | | | 56,032 | |
| | 1,453 | | | Ethan Allen Interiors, Inc. | | | 42,544 | |
| | 38,551 | | | Hovnanian Enterprises, Inc. Class A*(a) | | | 210,103 | |
| | 1,321 | | | Libbey, Inc.* | | | 25,588 | |
| | 1,460 | | | Mohawk Industries, Inc.* | | | 161,885 | |
| | 1,312 | | | NACCO Industries, Inc. Class A | | | 76,122 | |
| | | | | | | | |
| | | | | | | 572,274 | |
| | |
| | Insurance – 0.9% | |
| | 7,341 | | | AmTrust Financial Services, Inc.(a) | | | 232,416 | |
| | 1,990 | | | Employers Holdings, Inc. | | | 45,073 | |
| | 2,671 | | | First American Financial Corp. | | | 71,503 | |
| | 930 | | | Global Indemnity PLC* | | | 20,730 | |
| | 1,062 | | | Reinsurance Group of America, Inc. | | | 66,428 | |
| | | | | | | | |
| | | | | | | 436,150 | |
| | |
| | Internet & Catalog Retail – 0.2% | |
| | 766 | | | Blue Nile, Inc.* | | | 24,994 | |
| | 741 | | | HSN, Inc. | | | 38,962 | |
| | 1,862 | | | PetMed Express, Inc. | | | 23,275 | |
| | | | | | | | |
| | | | | | | 87,231 | |
| | |
| | Internet Software & Services – 3.3% | |
| | 2,799 | | | Dice Holdings, Inc.* | | | 23,624 | |
| | 3,829 | | | j2 Global, Inc. | | | 155,840 | |
| | 8,982 | | | LivePerson, Inc.* | | | 115,149 | |
| | 11,427 | | | Marchex, Inc. Class B | | | 47,193 | |
| | 2,953 | | | NIC, Inc. | | | 49,729 | |
| | 3,823 | | | OpenTable, Inc.* | | | 211,756 | |
| | 7,623 | | | Responsys, Inc.* | | | 59,231 | |
| | 3,331 | | | Travelzoo, Inc.* | | | 85,040 | |
| | 11,426 | | | ValueClick, Inc.* | | | 352,606 | |
| | 5,872 | | | VistaPrint NV*(a) | | | 239,578 | |
| | 4,181 | | | Zillow, Inc. Class A*(a) | | | 245,968 | |
| | | | | | | | |
| | | | | | | 1,585,714 | |
| | |
| | IT Services – 2.6% | |
| | 3,557 | | | Cardtronics, Inc.* | | | 99,632 | |
| | 4,619 | | | CoreLogic, Inc.* | | | 126,006 | |
| | 5,904 | | | CSG Systems International, Inc.* | | | 127,585 | |
| | 5,622 | | | Global Cash Access Holdings, Inc.* | | | 40,085 | |
| | 2,938 | | | Heartland Payment Systems, Inc. | | | 96,631 | |
| | 5,094 | | | Lender Processing Services, Inc. | | | 141,308 | |
| | 15,384 | | | Lionbridge Technologies, Inc.* | | | 52,613 | |
| | 3,063 | | | MAXIMUS, Inc. | | | 244,090 | |
| | 5,034 | | | Sapient Corp.* | | | 58,797 | |
| | 13,400 | | | TeleTech Holdings, Inc.* | | | 285,286 | |
| | | | | | | | |
| | | | | | | 1,272,033 | |
| | |
| | | | | | | | |
| | Common Stocks – (continued) | |
| | Leisure Equipment & Products – 1.2% | |
| | 13,488 | | | Brunswick Corp. | | $ | 427,030 | |
| | 15,564 | | | Smith & Wesson Holding Corp.*(a) | | | 136,652 | |
| | | | | | | | |
| | | | | | | 563,682 | |
| | |
| | Life Sciences Tools & Services* – 1.6% | |
| | 5,304 | | | Affymetrix, Inc. | | | 19,306 | |
| | 6,743 | | | Cambrex Corp. | | | 84,220 | |
| | 1,733 | | | Charles River Laboratories International, Inc. | | | 75,368 | |
| | 1,836 | | | Luminex Corp. | | | 30,533 | |
| | 423 | | | Mettler-Toledo International, Inc. | | | 88,390 | |
| | 12,126 | | | PAREXEL International Corp. | | | 496,560 | |
| | | | | | | | |
| | | | | | | 794,377 | |
| | |
| | Machinery – 2.0% | |
| | 1,634 | | | Altra Holdings, Inc. | | | 43,546 | |
| | 780 | | | EnPro Industries, Inc.* | | | 38,438 | |
| | 1,276 | | | FreightCar America, Inc. | | | 26,643 | |
| | 2,229 | | | Hyster-Yale Materials Handling, Inc. | | | 116,332 | |
| | 510 | | | Lindsay Corp. | | | 39,178 | |
| | 2,890 | | | Lydall, Inc.* | | | 41,443 | |
| | 3,811 | | | Met-Pro Corp. | | | 51,067 | |
| | 4,786 | | | Mueller Industries, Inc. | | | 247,819 | |
| | 6,350 | | | Tecumseh Products Co. Class A* | | | 56,515 | |
| | 3,924 | | | Tennant Co. | | | 187,646 | |
| | 1,770 | | | WABCO Holdings, Inc.* | | | 127,847 | |
| | | | | | | | |
| | | | | | | 976,474 | |
| | |
| | Media – 0.7% | |
| | 4,490 | | | Arbitron, Inc. | | | 209,638 | |
| | 5,985 | | | Entercom Communications Corp. Class A* | | | 47,341 | |
| | 2,490 | | | Harte-Hanks, Inc. | | | 19,746 | |
| | 3,181 | | | Journal Communications, Inc. Class A* | | | 21,663 | |
| | 2,688 | | | Lions Gate Entertainment Corp.* | | | 66,689 | |
| | | | | | | | |
| | | | | | | 365,077 | |
| | |
| | Metals & Mining – 0.6% | |
| | 9,395 | | | Globe Specialty Metals, Inc. | | | 122,699 | |
| | 11,148 | | | SunCoke Energy, Inc.* | | | 168,669 | |
| | | | | | | | |
| | | | | | | 291,368 | |
| | |
| | Multi-Utilities – 0.1% | |
| | 568 | | | Black Hills Corp. | | | 26,634 | |
| | |
| | Oil, Gas & Consumable Fuels – 4.0% | |
| | 16,948 | | | Alon USA Energy, Inc.(b) | | | 281,337 | |
| | 1,476 | | | Contango Oil & Gas Co. | | | 55,527 | |
| | 5,507 | | | CVR Energy, Inc. | | | 271,330 | |
| | 6,772 | | | Delek US Holdings, Inc. | | | 244,401 | |
| | 4,948 | | | HollyFrontier Corp. | | | 244,679 | |
| | 4,720 | | | Tesoro Corp. | | | 252,048 | |
| | 19,306 | | | W&T Offshore, Inc. | | | 225,494 | |
| | 11,428 | | | Western Refining, Inc. | | | 353,239 | |
| | | | | | | | |
| | | | | | | 1,928,055 | |
| | |
| | |
| 52 | | The accompanying notes are an integral part of these financial statements. |
GOLDMAN SACHS SMALL CAP GROWTH INSIGHTS FUND
| | | | | | | | |
Shares | | | Description | | Value | |
| | | | | | | | |
| | Common Stocks – (continued) | |
| | Paper & Forest Products – 0.9% | |
| | 14,462 | | | Louisiana-Pacific Corp.* | | $ | 262,051 | |
| | 4,765 | | | Schweitzer-Mauduit International, Inc. | | | 191,982 | |
| | | | | | | | |
| | | | | | | 454,033 | |
| | |
| | Personal Products*(a) – 0.6% | |
| | 5,404 | | | USANA Health Sciences, Inc. | | | 304,894 | |
| | |
| | Pharmaceuticals – 4.0% | |
| | 17,616 | | | Auxilium Pharmaceuticals, Inc.* | | | 263,007 | |
| | 4,453 | | | BioDelivery Sciences International, Inc.* | | | 25,293 | |
| | 7,354 | | | Endocyte, Inc.* | | | 102,147 | |
| | 3,824 | | | Jazz Pharmaceuticals PLC* | | | 223,130 | |
| | 13,701 | | | Questcor Pharmaceuticals, Inc.(a) | | | 421,169 | |
| | 2,951 | | | Repros Therapeutics, Inc.*(a) | | | 60,023 | |
| | 19,967 | | | Santarus, Inc.* | | | 366,794 | |
| | 12,815 | | | SciClone Pharmaceuticals, Inc.* | | | 60,615 | |
| | 5,104 | | | The Medicines Co.* | | | 172,311 | |
| | 15,048 | | | Warner Chilcott PLC Class A | | | 216,390 | |
| | 3,294 | | | XenoPort, Inc.* | | | 20,456 | |
| | | | | | | | |
| | | | | | | 1,931,335 | |
| | |
| | Professional Services – 1.7% | |
| | 4,327 | | | CDI Corp. | | | 67,804 | |
| | 2,914 | | | Heidrick & Struggles International, Inc. | | | 38,523 | |
| | 8,049 | | | Insperity, Inc. | | | 222,394 | |
| | 16,511 | | | Kelly Services, Inc. Class A | | | 281,017 | |
| | 5,716 | | | Kforce, Inc. | | | 86,426 | |
| | 2,584 | | | Manpowergroup, Inc. | | | 137,366 | |
| | | | | | | | |
| | | | | | | 833,530 | |
| | |
| | Real Estate Investment Trusts – 3.4% | |
| | 1,881 | | | Corrections Corp. of America | | | 68,092 | |
| | 11,151 | | | Cousins Properties, Inc. | | | 121,769 | |
| | 5,482 | | | EastGroup Properties, Inc. | | | 345,750 | |
| | 853 | | | LTC Properties, Inc. | | | 39,664 | |
| | 8,462 | | | Potlatch Corp. | | | 400,676 | |
| | 6,956 | | | Ryman Hospitality Properties, Inc. | | | 309,264 | |
| | 2,228 | | | Taubman Centers, Inc. | | | 190,516 | |
| | 1,219 | | | Universal Health Realty Income Trust | | | 65,497 | |
| | 4,127 | | | Washington Real Estate Investment Trust | | | 117,867 | |
| | | | | | | | |
| | | | | | | 1,659,095 | |
| | |
| | Road & Rail – 1.6% | |
| | 5,890 | | | Avis Budget Group, Inc.* | | | 169,868 | |
| | 3,876 | | | Celadon Group, Inc. | | | 65,078 | |
| | 11,540 | | | Heartland Express, Inc. | | | 156,598 | |
| | 10,450 | | | Swift Transportation Co.* | | | 146,509 | |
| | 2,476 | | | Universal Truckload Services, Inc.* | | | 62,494 | |
| | 6,727 | | | Werner Enterprises, Inc. | | | 154,452 | |
| | | | | | | | |
| | | | | | | 754,999 | |
| | |
| | Semiconductors & Semiconductor Equipment – 2.3% | |
| | 4,327 | | | Advanced Energy Industries, Inc.* | | | 73,472 | |
| | 1,494 | | | ATMI, Inc.* | | | 32,494 | |
| | 3,796 | | | Cabot Microelectronics Corp.* | | | 127,204 | |
| | 698 | | | Cree, Inc.* | | | 39,486 | |
| | |
| | | | | | | | |
| | Common Stocks – (continued) | |
| | Semiconductors & Semiconductor Equipment – (continued) | |
| | 4,798 | | | Cypress Semiconductor Corp.* | | $ | 48,412 | |
| | 2,508 | | | First Solar, Inc.* | | | 116,772 | |
| | 20,954 | | | Micrel, Inc. | | | 210,797 | |
| | 12,906 | | | PLX Technology, Inc.* | | | 60,271 | |
| | 14,526 | | | RF Micro Devices, Inc.* | | | 81,491 | |
| | 11,837 | | | SunPower Corp.* | | | 160,865 | |
| | 3,079 | | | Veeco Instruments, Inc.* | | | 117,218 | |
| | 3,771 | | | Volterra Semiconductor Corp.* | | | 49,061 | |
| | | | | | | | |
| | | | | | | 1,117,543 | |
| | |
| | Software – 4.8% | |
| | 11,231 | | | Accelrys, Inc.* | | | 110,625 | |
| | 4,107 | | | Advent Software, Inc.* | | | 119,267 | |
| | 16,201 | | | Aspen Technology, Inc.* | | | 493,806 | |
| | 2,558 | | | Fair Isaac Corp. | | | 119,152 | |
| | 3,107 | | | Manhattan Associates, Inc.* | | | 218,142 | |
| | 21,115 | | | Mentor Graphics Corp. | | | 385,560 | |
| | 863 | | | MicroStrategy, Inc. Class A* | | | 77,834 | |
| | 2,691 | | | Monotype Imaging Holdings, Inc. | | | 62,404 | |
| | 1,344 | | | NetScout Systems, Inc.* | | | 30,657 | |
| | 2,068 | | | Pegasystems, Inc. | | | 52,341 | |
| | 5,541 | | | PROS Holdings, Inc.* | | | 143,623 | |
| | 3,309 | | | QAD, Inc. Class A | | | 39,973 | |
| | 2,661 | | | RealPage, Inc.* | | | 54,284 | |
| | 3,506 | | | Take-Two Interactive Software, Inc.* | | | 53,502 | |
| | 7,045 | | | TeleNav, Inc.* | | | 36,916 | |
| | 10,679 | | | Verint System, Inc.* | | | 352,834 | |
| | | | | | | | |
| | | | | | | 2,350,920 | |
| | |
| | Specialty Retail – 3.5% | |
| | 6,743 | | | ANN, Inc.* | | | 199,188 | |
| | 1,071 | | | Destination Maternity Corp. | | | 25,436 | |
| | 9,078 | | | GameStop Corp. Class A(a) | | | 316,822 | |
| | 3,845 | | | Hibbett Sports, Inc.* | | | 210,898 | |
| | 6,018 | | | Lumber Liquidators Holdings, Inc.* | | | 493,235 | |
| | 3,360 | | | OfficeMax, Inc. | | | 38,674 | |
| | 4,206 | | | Penske Automotive Group, Inc. | | | 130,050 | |
| | 2,043 | | | The Buckle, Inc.(a) | | | 99,188 | |
| | 3,749 | | | Vitamin Shoppe, Inc.* | | | 184,263 | |
| | | | | | | | |
| | | | | | | 1,697,754 | |
| | |
| | Textiles, Apparel & Luxury Goods – 0.7% | |
| | 2,988 | | | Crocs, Inc.* | | | 47,868 | |
| | 8,437 | | | Movado Group, Inc. | | | 255,135 | |
| | 2,259 | | | Perry Ellis International, Inc. | | | 39,690 | |
| | | | | | | | |
| | | | | | | 342,693 | |
| | |
| | Thrifts & Mortgage Finance* – 0.7% | |
| | 8,719 | | | Ocwen Financial Corp. | | | 318,941 | |
| | |
| | Trading Companies & Distributors – 2.9% | |
| | 3,379 | | | Applied Industrial Technologies, Inc. | | | 142,763 | |
| | 9,370 | | | Beacon Roofing Supply, Inc.* | | | 357,278 | |
| | 11,958 | | | H&E Equipment Services, Inc. | | | 243,465 | |
| | |
| | |
| The accompanying notes are an integral part of these financial statements. | | 53 |
GOLDMAN SACHS SMALL CAP GROWTH INSIGHTS FUND
Schedule of Investments (continued)
April 30, 2013 (Unaudited)
| | | | | | | | |
Shares | | | Description | | Value | |
| | | | | | | | |
| | Common Stocks – (continued) | |
| | Trading Companies & Distributors – (continued) | |
| | 3,756 | | | TAL International Group, Inc. | | $ | 155,498 | |
| | 5,885 | | | Watsco, Inc. | | | 496,576 | |
| | | | | | | | |
| | | | | | | 1,395,580 | |
| | |
| | Water Utilities – 0.1% | |
| | 5,132 | | | Consolidated Water Co., Ltd. | | | 51,166 | |
| | |
| | Wireless Telecommunication Services – 0.1% | |
| | 3,896 | | | USA Mobility, Inc. | | | 52,869 | |
| | |
| | TOTAL COMMON STOCKS | |
| | (Cost $40,369,949) | | $ | 46,973,646 | |
| | |
| | | | | | | | | | | | | | |
Principal Amount | | | Interest
Rate | | | Maturity
Date | | | Value | |
| | Short-term Investment(c) – 1.9% | |
| | Repurchase Agreement – 1.9% | |
| Joint Repurchase Agreement Account II | |
| $ | 900,000 | | | | 0.169 | % | | | 05/01/13 | | | $ | 900,000 | |
| | (Cost $900,000) | |
| | |
| TOTAL INVESTMENTS BEFORE
SECURITIES LENDING
REINVESTMENT VEHICLE |
| | | | |
| | (Cost $41,269,949) | | | $ | 47,873,646 | |
| | |
| | | | | | |
Shares | | Rate | | Value | |
| Securities Lending Reinvestment Vehicle(d)(e) – 8.0% | |
Financial Square Money Market Fund – FST Shares | |
| 3,887,872 | | 0.109% | | $ | 3,887,872 | |
| (Cost $3,887,872) | |
| |
| TOTAL INVESTMENTS – 106.7% | |
| (Cost $45,157,821) | | $ | 51,761,518 | |
| |
| LIABILITIES IN EXCESS OF OTHER ASSETS – (6.7)% | | | (3,260,316 | ) |
| |
| NET ASSETS – 100.0% | | $ | 48,501,202 | |
| |
| | |
| The percentage shown for each investment category reflects the value of investments in that category as a percentage of net assets. |
* | | Non-income producing security. |
(a) | | All or a portion of security is on loan. |
(b) | | All or a portion of security is segregated as collateral for initial margin requirement on futures transactions. |
(c) | | Joint repurchase agreement was entered into on April 30, 2013. Additional information appears on page 65. |
(d) | | Variable rate security. Interest rate disclosed is that which is in effect at April 30, 2013. |
(e) | | Represents an affiliated issuer. |
|
| ADDITIONAL INVESTMENT INFORMATION |
FUTURES CONTRACTS — At April 30, 2013, the Fund had the following futures contracts:
| | | | | | | | | | | | |
| Type | | Number of
Contracts
Long (Short) | | Expiration
Date | | Current Value | | | Unrealized
Gain (Loss) | |
Russell 2000 Mini Index | | 11 | | June 2013 | | $ | 1,039,610 | | | $ | 34,387 | |
| | |
| 54 | | The accompanying notes are an integral part of these financial statements. |
GOLDMAN SACHS SMALL CAP VALUE INSIGHTS FUND
Schedule of Investments
April 30, 2013 (Unaudited)
| | | | | | | | |
Shares | | | Description | | Value | |
| | | | | | | | |
| | Common Stocks – 97.6% | |
| | Aerospace & Defense – 1.8% | |
| | 3,351 | | | AAR Corp. | | $ | 59,849 | |
| | 9,539 | | | Alliant Techsystems, Inc. | | | 709,320 | |
| | 2,688 | | | American Science and Engineering, Inc. | | | 173,322 | |
| | 22,669 | | | DigitalGlobe, Inc.* | | | 661,708 | |
| | 8,277 | | | Ducommun, Inc.* | | | 202,704 | |
| | 7,931 | | | LMI Aerospace, Inc.* | | | 169,644 | |
| | 1,883 | | | Moog, Inc. Class A* | | | 87,013 | |
| | 22,191 | | | Orbital Sciences Corp.* | | | 399,882 | |
| | | | | | | | |
| | | | | | | 2,463,442 | |
| | |
| | Air Freight & Logistics* – 0.1% | |
| | 25,809 | | | Pacer International, Inc. | | | 146,853 | |
| | |
| | Airlines – 2.3% | |
| | 11,660 | | | Alaska Air Group, Inc.* | | | 718,722 | |
| | 142,107 | | | JetBlue Airways Corp.* | | | 979,117 | |
| | 24,456 | | | Republic Airways Holdings, Inc.* | | | 273,663 | |
| | 66,726 | | | SkyWest, Inc. | | | 954,849 | |
| | 17,241 | | | US Airways Group, Inc*(a) | | | 291,373 | |
| | | | | | | | |
| | | | | | | 3,217,724 | |
| | |
| | Auto Components – 1.3% | |
| | 21,579 | | | Cooper Tire & Rubber Co. | | | 537,101 | |
| | 26,940 | | | Dana Holding Corp. | | | 464,715 | |
| | 18,088 | | | Modine Manufacturing Co.* | | | 165,324 | |
| | 22,870 | | | Spartan Motors, Inc. | | | 121,669 | |
| | 8,562 | | | Standard Motor Products, Inc. | | | 262,340 | |
| | 15,795 | | | Superior Industries International, Inc. | | | 289,996 | |
| | | | | | | | |
| | | | | | | 1,841,145 | |
| | |
| | Biotechnology – 3.9% | |
| | 12,698 | | | Acorda Therapeutics, Inc.* | | | 502,460 | |
| | 3,687 | | | BioMarin Pharmaceutical, Inc.* | | | 241,867 | |
| | 4,090 | | | Cubist Pharmaceuticals, Inc.* | | | 187,813 | |
| | 18,895 | | | Curis, Inc.* | | | 70,856 | |
| | 19,444 | | | Emergent Biosolutions, Inc.* | | | 298,271 | |
| | 20,157 | | | Enzon Pharmaceuticals, Inc. | | | 66,518 | |
| | 6,713 | | | Genomic Health, Inc.* | | | 203,807 | |
| | 3,474 | | | ImmunoGen, Inc.* | | | 55,653 | |
| | 29,117 | | | Isis Pharmaceuticals, Inc.*(a) | | | 651,930 | |
| | 34,055 | | | Momenta Pharmaceuticals, Inc.* | | | 419,558 | |
| | 11,451 | | | NewLink Genetics Corp.*(a) | | | 159,627 | |
| | 4,612 | | | NPS Pharmaceuticals, Inc.* | | | 61,939 | |
| | 119,054 | | | PDL BioPharma, Inc.(a) | | | 921,478 | |
| | 11,079 | | | Pharmacyclics, Inc.* | | | 902,938 | |
| | 10,943 | | | Seattle Genetics, Inc.* | | | 404,344 | |
| | 48,867 | | | XOMA Corp.*(a) | | | 171,035 | |
| | | | | | | | |
| | | | | | | 5,320,094 | |
| | |
| | Building Products – 0.9% | |
| | 7,390 | | | American Woodmark Corp.* | | | 248,673 | |
| | 5,164 | | | Trex Co., Inc.* | | | 251,384 | |
| | 19,677 | | | Universal Forest Products, Inc. | | | 759,532 | |
| | | | | | | | |
| | | | | | | 1,259,589 | |
| | |
| | | | | | | | |
| | Common Stocks – (continued) | |
| | Capital Markets – 4.8% | |
| | 122,036 | | | Apollo Investment Corp. | | $ | 1,075,137 | |
| | 6,768 | | | Arlington Asset Investment Corp. Class A | | | 183,345 | |
| | 50,189 | | | BlackRock Kelso Capital Corp. | | | 499,381 | |
| | 4,424 | | | Calamos Asset Management, Inc. Class A | | | 50,212 | |
| | 1,932 | | | Capital Southwest Corp. | | | 227,377 | |
| | 5,881 | | | FXCM, Inc. Class A | | | 79,688 | |
| | 14,483 | | | GAMCO Investors, Inc. Class A | | | 760,358 | |
| | 19,680 | | | Gladstone Capital Corp. | | | 182,434 | |
| | 5,565 | | | Golub Capital BDC, Inc.(a) | | | 98,111 | |
| | 16,789 | | | Greenhill & Co., Inc. | | | 775,484 | |
| | 14,316 | | | Investment Technology Group, Inc.* | | | 155,901 | |
| | 41,261 | | | Janus Capital Group, Inc. | | | 368,048 | |
| | 13,175 | | | MVC Capital, Inc. | | | 171,143 | |
| | 33,396 | | | NGP Capital Resources Co. | | | 222,417 | |
| | 9,531 | | | Piper Jaffray Cos., Inc.* | | | 321,767 | |
| | 16,810 | | | Safeguard Scientifics, Inc.* | | | 271,313 | |
| | 31,653 | | | TICC Capital Corp. | | | 321,911 | |
| | 6,596 | | | Waddell & Reed Financial, Inc. Class A | | | 282,771 | |
| | 17,495 | | | Walter Investment Management Corp.* | | | 587,132 | |
| | | | | | | | |
| | | | | | | 6,633,930 | |
| | |
| | Chemicals – 3.6% | |
| | 33,928 | | | A. Schulman, Inc. | | | 881,110 | |
| | 17,216 | | | Axiall Corp. | | | 902,979 | |
| | 16,579 | | | Chemtura Corp.* | | | 352,470 | |
| | 9,798 | | | Ferro Corp.* | | | 68,978 | |
| | 38,923 | | | Kraton Performance Polymers, Inc.* | | | 883,942 | |
| | 15,464 | | | Minerals Technologies, Inc. | | | 628,302 | |
| | 27,864 | | | OM Group, Inc.* | | | 681,832 | |
| | 9,793 | | | PolyOne Corp. | | | 220,636 | |
| | 5,686 | | | Stepan Co. | | | 323,761 | |
| | | | | | | | |
| | | | | | | 4,944,010 | |
| | |
| | Commercial Banks – 10.3% | |
| | 11,854 | | | 1st Source Corp. | | | 278,925 | |
| | 5,841 | | | Associated Banc-Corp | | | 83,351 | |
| | 5,298 | | | Banco Latinoamericano de Comercio Exterior SA Class E | | | 120,212 | |
| | 27,020 | | | BancorpSouth, Inc. | | | 432,320 | |
| | 2,636 | | | Banner Corp. | | | 86,118 | |
| | 11,994 | | | BBCN Bancorp, Inc. | | | 154,483 | |
| | 1,790 | | | BOK Financial Corp. | | | 111,857 | |
| | 2,709 | | | Cardinal Financial Corp. | | | 41,312 | |
| | 16,655 | | | Cathay General Bancorp | | | 328,270 | |
| | 15,665 | | | Columbia Banking System, Inc. | | | 336,327 | |
| | 6,548 | | | Community Bank System, Inc. | | | 187,535 | |
| | 24,653 | | | CVB Financial Corp. | | | 267,978 | |
| | 84,754 | | | F.N.B. Corp. | | | 965,348 | |
| | 6,734 | | | First Commonwealth Financial Corp. | | | 48,148 | |
| | 36,043 | | | First Financial Bancorp | | | 553,981 | |
| | 44,542 | | | First Interstate BancSystem, Inc. | | | 905,093 | |
| | 67,557 | | | FirstMerit Corp. | | | 1,157,251 | |
| | 35,306 | | | Glacier Bancorp, Inc. | | | 651,396 | |
| | 10,607 | | | Great Southern Bancorp, Inc. | | | 279,707 | |
| | 5,058 | | | Hancock Holding Co. | | | 137,932 | |
| | |
| | |
| The accompanying notes are an integral part of these financial statements. | | 55 |
GOLDMAN SACHS SMALL CAP VALUE INSIGHTS FUND
Schedule of Investments (continued)
April 30, 2013 (Unaudited)
| | | | | | | | |
Shares | | | Description | | Value | |
| | | | | | | | |
| | Common Stocks – (continued) | |
| | Commercial Banks – (continued) | |
| | 4,499 | | | Home Bancshares, Inc. | | $ | 178,700 | |
| | 3,631 | | | IBERIABANK Corp. | | | 165,646 | |
| | 28,620 | | | International Bancshares Corp. | | | 555,228 | |
| | 7,764 | | | Investors Bancorp, Inc. | | | 153,727 | |
| | 6,175 | | | Lakeland Financial Corp. | | | 165,490 | |
| | 12,965 | | | National Penn Bancshares, Inc. | | | 126,927 | |
| | 7,948 | | | OFG Bancorp | | | 127,724 | |
| | 16,209 | | | PacWest Bancorp | | | 449,475 | |
| | 4,628 | | | Park National Corp. | | | 316,463 | |
| | 46,404 | | | PrivateBancorp, Inc. | | | 890,029 | |
| | 33,225 | | | Renasant Corp. | | | 758,194 | |
| | 3,526 | | | Southside Bancshares, Inc. | | | 75,384 | |
| | 14,687 | | | Southwest Bancorp, Inc.* | | | 194,162 | |
| | 11,460 | | | State Bank Financial Corp. | | | 168,577 | |
| | 3,137 | | | Sterling Financial Corp. | | | 68,387 | |
| | 79,506 | | | Susquehanna Bancshares, Inc. | | | 927,835 | |
| | 3,912 | | | TriCo Bancshares | | | 68,343 | |
| | 4,482 | | | UMB Financial Corp. | | | 225,624 | |
| | 49,495 | | | Umpqua Holdings Corp. | | | 593,940 | |
| | 5,006 | | | United Bankshares, Inc.(a) | | | 126,702 | |
| | 8,130 | | | Western Alliance Bancorp* | | | 119,592 | |
| | 13,031 | | | Wilshire Bancorp, Inc.* | | | 83,268 | |
| | 12,603 | | | Wintrust Financial Corp. | | | 451,944 | |
| | | | | | | | |
| | | | | | | 14,118,905 | |
| | |
| | Commercial Services & Supplies – 1.5% | |
| | 13,278 | | | ABM Industries, Inc. | | | 299,419 | |
| | 6,826 | | | Consolidated Graphics, Inc.* | | | 243,483 | |
| | 7,964 | | | HNI Corp. | | | 274,201 | |
| | 29,421 | | | Kimball International, Inc. Class B | | | 270,379 | |
| | 4,571 | | | Quad Graphics, Inc. | | | 95,534 | |
| | 64,214 | | | Steelcase, Inc. Class A | | | 815,518 | |
| | 2,743 | | | United Stationers, Inc. | | | 89,065 | |
| | | | | | | | |
| | | | | | | 2,087,599 | |
| | |
| | Communications Equipment – 1.6% | |
| | 60,798 | | | ARRIS Group, Inc.* | | | 1,003,775 | |
| | 9,828 | | | Calix, Inc.* | | | 83,833 | |
| | 26,414 | | | Ciena Corp.* | | | 395,153 | |
| | 61,306 | | | Extreme Networks, Inc.* | | | 204,149 | |
| | 7,975 | | | InterDigital, Inc. | | | 354,170 | |
| | 33,104 | | | Symmetricom, Inc.* | | | 172,141 | |
| | | | | | | | |
| | | | | | | 2,213,221 | |
| | |
| | Computers & Peripherals* – 0.2% | |
| | 41,246 | | | Imation Corp. | | | 151,786 | |
| | 45,568 | | | Quantum Corp. | | | 65,162 | |
| | | | | | | | |
| | | | | | | 216,948 | |
| | |
| | Consumer Finance – 0.3% | |
| | 10,769 | | | Cash America International, Inc. | | | 469,851 | |
| | |
| | | | | | | | |
| | Common Stocks – (continued) | |
| | Containers & Packaging – 0.4% | |
| | 5,550 | | | Boise, Inc. | | $ | 44,345 | |
| | 13,674 | | | Graphic Packaging Holding Co.* | | | 102,828 | |
| | 8,986 | | | Packaging Corp. | | | 427,374 | |
| | | | | | | | |
| | | | | | | 574,547 | |
| | |
| | Distributors – 0.1% | |
| | 2,678 | | | Core-Mark Holding Co., Inc. | | | 139,363 | |
| | |
| | Diversified Consumer Services* – 0.4% | |
| | 9,071 | | | Ascent Capital Group LLC Class A | | | 603,131 | |
| | |
| | Diversified Financial Services* – 0.8% | |
| | 52,374 | | | PHH Corp. | | | 1,104,044 | |
| | |
| | Diversified Telecommunication Services*(a) – 0.1% | |
| | 8,579 | | | magicJack VocalTec Ltd. | | | 141,811 | |
| | |
| | Electric Utilities – 2.2% | |
| | 5,467 | | | El Paso Electric Co. | | | 204,794 | |
| | 1,990 | | | Otter Tail Corp. | | | 62,088 | |
| | 23,022 | | | PNM Resources, Inc. | | | 552,758 | |
| | 43,091 | | | Portland General Electric Co. | | | 1,389,685 | |
| | 18,336 | | | UIL Holdings Corp. | | | 763,511 | |
| | 1,126 | | | UNS Energy Corp. | | | 57,381 | |
| | | | | | | | |
| | | | | | | 3,030,217 | |
| | |
| | Electrical Equipment – 2.1% | |
| | 32,927 | | | Brady Corp. Class A | | | 1,115,567 | |
| | 9,209 | | | Encore Wire Corp. | | | 301,595 | |
| | 25,139 | | | EnerSys, Inc.* | | | 1,152,372 | |
| | 1,265 | | | Generac Holdings, Inc. | | | 45,451 | |
| | 33,708 | | | LSI Industries, Inc. | | | 237,304 | |
| | | | | | | | |
| | | | | | | 2,852,289 | |
| | |
| | Electronic Equipment, Instruments & Components – 0.7% | |
| | 7,525 | | | CTS Corp. | | | 80,141 | |
| | 6,809 | | | Daktronics, Inc. | | | 68,022 | |
| | 31,094 | | | Insight Enterprises, Inc.* | | | 563,423 | |
| | 9,622 | | | Methode Electronics, Inc. | | | 138,365 | |
| | 8,012 | | | Newport Corp.* | | | 121,382 | |
| | | | | | | | |
| | | | | | | 971,333 | |
| | |
| | Energy Equipment & Services – 0.9% | |
| | 1,779 | | | Bristow Group, Inc. | | | 112,433 | |
| | 5,412 | | | Dawson Geophysical Co.* | | | 166,365 | |
| | 23,632 | | | Exterran Holdings, Inc.* | | | 624,357 | |
| | 31,559 | | | Parker Drilling Co.* | | | 130,023 | |
| | 26,718 | | | Willbros Group, Inc.* | | | 253,821 | |
| | | | | | | | |
| | | | | | | 1,286,999 | |
| | |
| | Food & Staples Retailing – 0.7% | |
| | 7,139 | | | Ingles Markets, Inc. Class A | | | 152,204 | |
| | 9,655 | | | Susser Holdings Corp.* | | | 513,356 | |
| | 15,665 | | | The Pantry, Inc.* | | | 228,866 | |
| | | | | | | | |
| | | | | | | 894,426 | |
| | |
| | |
| 56 | | The accompanying notes are an integral part of these financial statements. |
GOLDMAN SACHS SMALL CAP VALUE INSIGHTS FUND
| | | | | | | | |
Shares | | | Description | | Value | |
| | | | | | | | |
| | Common Stocks – (continued) | |
| | Food Products – 1.1% | |
| | 2,027 | | | Lancaster Colony Corp. | | $ | 159,991 | |
| | 44,734 | | | Pilgrim’s Pride Corp.* | | | 437,946 | |
| | 3,361 | | | Post Holdings, Inc.* | | | 147,178 | |
| | 5,334 | | | Sanderson Farms, Inc. | | | 326,761 | |
| | 176 | | | Seaboard Corp. | | | 483,293 | |
| | | | | | | | |
| | | | | | | 1,555,169 | |
| | |
| | Gas Utilities – 1.4% | |
| | 9,029 | | | Northwest Natural Gas Co. | | | 401,520 | |
| | 22,532 | | | Southwest Gas Corp. | | | 1,141,696 | |
| | 2,494 | | | The Laclede Group, Inc. | | | 116,495 | |
| | 4,202 | �� | | WGL Holdings, Inc. | | | 194,216 | |
| | | | | | | | |
| | | | | | | 1,853,927 | |
| | |
| | Health Care Equipment & Supplies – 0.4% | |
| | 1,877 | | | Cyberonics, Inc.* | | | 81,499 | |
| | 4,270 | | | Cynosure, Inc. Class A* | | | 110,422 | |
| | 1,500 | | | Greatbatch, Inc.* | | | 41,910 | |
| | 9,483 | | | Invacare Corp. | | | 127,546 | |
| | 2,632 | | | SurModics, Inc.* | | | 69,617 | |
| | 5,086 | | | Wright Medical Group, Inc.* | | | 119,216 | |
| | | | | | | | |
| | | | | | | 550,210 | |
| | |
| | Health Care Providers & Services – 1.8% | |
| | 12,754 | | | Amedisys, Inc.* | | | 128,050 | |
| | 6,690 | | | BioScrip, Inc.* | | | 92,723 | |
| | 1,419 | | | Community Health Systems, Inc. | | | 64,664 | |
| | 10,760 | | | Five Star Quality Care, Inc.* | | | 50,895 | |
| | 41,420 | | | Kindred Healthcare, Inc.* | | | 434,496 | |
| | 5,695 | | | Magellan Health Services, Inc.* | | | 291,356 | |
| | 16,419 | | | Molina Healthcare, Inc.* | | | 545,111 | |
| | 14,108 | | | PharMerica Corp.* | | | 181,852 | |
| | 45,604 | | | Select Medical Holdings Corp. | | | 376,233 | |
| | 25,199 | | | Skilled Healthcare Group, Inc. Class A* | | | 177,401 | |
| | 7,922 | | | Universal American Corp. | | | 67,733 | |
| | | | | | | | |
| | | | | | | 2,410,514 | |
| | |
| | Hotels, Restaurants & Leisure – 2.3% | |
| | 11,414 | | | Ameristar Casinos, Inc. | | | 301,216 | |
| | 2,514 | | | Biglari Holdings, Inc.* | | | 973,622 | |
| | 39,699 | | | Boyd Gaming Corp.*(a) | | | 476,388 | |
| | 13,127 | | | Krispy Kreme Doughnuts, Inc.* | | | 179,315 | |
| | 7,934 | | | Marriott Vacations Worldwide Corp.* | | | 360,838 | |
| | 14,221 | | | Papa John’s International, Inc.* | | | 895,923 | |
| | | | | | | | |
| | | | | | | 3,187,302 | |
| | |
| | Household Durables – 2.1% | |
| | 10,989 | | | American Greetings Corp. Class A | | | 202,637 | |
| | 9,662 | | | Beazer Homes USA, Inc. *(a) | | | 156,138 | |
| | 7,951 | | | Blyth, Inc.(a) | | | 131,032 | |
| | 6,605 | | | CSS Industries, Inc. | | | 189,299 | |
| | 4,210 | | | Ethan Allen Interiors, Inc. | | | 123,269 | |
| | 11,446 | | | Hooker Furniture Corp. | | | 197,901 | |
| | 175,084 | | | Hovnanian Enterprises, Inc. Class A*(a) | | | 954,208 | |
| | 2,696 | | | La-Z-Boy, Inc. | | | 48,690 | |
| | 7,748 | | | M/I Homes, Inc.* | | | 190,601 | |
| | |
| | | | | | | | |
| | Common Stocks – (continued) | |
| | Household Durables – (continued) | |
| | 1,187 | | | Mohawk Industries, Inc.* | | $ | 131,615 | |
| | 4,919 | | | NACCO Industries, Inc. Class A | | | 285,400 | |
| | 15,526 | | | PulteGroup, Inc.* | | | 325,891 | |
| | | | | | | | |
| | | | | | | 2,936,681 | |
| | |
| | Household Products* – 0.2% | |
| | 29,296 | | | Central Garden & Pet Co. Class A | | | 257,805 | |
| | |
| | Independent Power Producers & Energy Traders – 0.2% | |
| | 19,258 | | | Genie Energy Ltd. Class B | | | 207,601 | |
| | 4,357 | | | Ormat Technologies, Inc. | | | 94,721 | |
| | | | | | | | |
| | | | | | | 302,322 | |
| | |
| | Insurance – 3.7% | |
| | 34,961 | | | American Equity Investment Life Holding Co. | | | 532,806 | |
| | 19,621 | | | AmTrust Financial Services, Inc.(a) | | | 621,201 | |
| | 92,037 | | | CNO Financial Group, Inc. | | | 1,041,859 | |
| | 26,296 | | | First American Financial Corp. | | | 703,944 | |
| | 15,488 | | | Global Indemnity PLC* | | | 345,227 | |
| | 2,934 | | | Horace Mann Educators Corp. | | | 66,162 | |
| | 5,252 | | | Kansas City Life Insurance Co.(a) | | | 189,597 | |
| | 10,573 | | | Maiden Holdings Ltd. | | | 109,219 | |
| | 4,366 | | | Platinum Underwriters Holdings Ltd. | | | 247,770 | |
| | 14,471 | | | Stewart Information Services Corp. | | | 391,730 | |
| | 45,441 | | | Symetra Financial Corp. | | | 619,361 | |
| | 8,249 | | | United Fire Group, Inc. | | | 230,642 | |
| | | | | | | | |
| | | | | | | 5,099,518 | |
| | |
| | Internet Software & Services – 1.4% | |
| | 5,815 | | | Digital River, Inc.* | | | 84,201 | |
| | 45,455 | | | Marchex, Inc. Class B | | | 187,729 | |
| | 5,877 | | | OpenTable, Inc.* | | | 325,527 | |
| | 3,729 | | | Travelzoo, Inc.* | | | 95,201 | |
| | 5,991 | | | ValueClick, Inc.* | | | 184,882 | |
| | 9,639 | | | WebMD Health Corp.* | | | 232,782 | |
| | 14,885 | | | Zillow, Inc. Class A*(a) | | | 875,685 | |
| | | | | | | | |
| | | | | | | 1,986,007 | |
| | |
| | IT Services – 1.6% | |
| | 32,689 | | | Acxiom Corp.* | | | 650,184 | |
| | 57,204 | | | Ciber, Inc.* | | | 243,689 | |
| | 7,874 | | | CSG Systems International, Inc.* | | | 170,157 | |
| | 10,551 | | | Euronet Worldwide, Inc.* | | | 322,122 | |
| | 12,819 | | | Global Cash Access Holdings, Inc.* | | | 91,399 | |
| | 38,359 | | | Lionbridge Technologies, Inc.* | | | 131,188 | |
| | 10,313 | | | ManTech International Corp. Class A | | | 275,254 | |
| | 3,918 | | | Sykes Enterprises, Inc.* | | | 60,298 | |
| | 11,157 | | | TeleTech Holdings, Inc.* | | | 237,533 | |
| | 3,421 | | | Unisys Corp.* | | | 65,444 | |
| | | | | | | | |
| | | | | | | 2,247,268 | |
| | |
| | Leisure Equipment & Products*(a) – 0.1% | |
| | 13,810 | | | Smith & Wesson Holding Corp. | | | 121,252 | |
| | |
| | |
| The accompanying notes are an integral part of these financial statements. | | 57 |
GOLDMAN SACHS SMALL CAP VALUE INSIGHTS FUND
Schedule of Investments (continued)
April 30, 2013 (Unaudited)
| | | | | | | | |
Shares | | | Description | | Value | |
| | | | | | | | |
| | Common Stocks – (continued) | |
| | Life Sciences Tools & Services* – 0.4% | |
| | 50,565 | | | Affymetrix, Inc. | | $ | 184,056 | |
| | 18,784 | | | Cambrex Corp. | | | 234,612 | |
| | 1,738 | | | Charles River Laboratories International, Inc. | | | 75,586 | |
| | | | | | | | |
| | | | | | | 494,254 | |
| | |
| | Machinery – 2.9% | |
| | 16,033 | | | Albany International Corp. Class A | | | 465,759 | |
| | 7,154 | | | Astec Industries, Inc. | | | 234,866 | |
| | 6,239 | | | Briggs & Stratton Corp. | | | 140,315 | |
| | 3,696 | | | EnPro Industries, Inc.* | | | 182,139 | |
| | 3,072 | | | FreightCar America, Inc. | | | 64,143 | |
| | 17,703 | | | Hyster-Yale Materials Handling, Inc. | | | 923,920 | |
| | 10,425 | | | Kadant, Inc. | | | 288,460 | |
| | 3,080 | | | Lydall, Inc.* | | | 44,167 | |
| | 15,184 | | | Miller Industries, Inc. | | | 229,430 | |
| | 15,707 | | | Mueller Industries, Inc. | | | 813,308 | |
| | 19,233 | | | Tecumseh Products Co. Class A* | | | 171,174 | |
| | 5,361 | | | WABCO Holdings, Inc.* | | | 387,225 | |
| | | | | | | | |
| | | | | | | 3,944,906 | |
| | |
| | Media – 0.4% | |
| | 13,330 | | | Entercom Communications Corp. Class A* | | | 105,440 | |
| | 38,508 | | | Journal Communications, Inc. Class A* | | | 262,240 | |
| | 2,478 | | | Scholastic Corp. | | | 68,021 | |
| | 4,416 | | | Valassis Communications, Inc.(a) | | | 113,182 | |
| | | | | | | | |
| | | | | | | 548,883 | |
| | |
| | Metals & Mining – 0.9% | |
| | 6,921 | | | Coeur d’Alene Mines Corp.* | | | 105,476 | |
| | 16,920 | | | Materion Corp. | | | 448,211 | |
| | 13,435 | | | Schnitzer Steel Industries, Inc. Class A | | | 329,561 | |
| | 8,672 | | | SunCoke Energy, Inc.* | | | 131,207 | |
| | 6,989 | | | Worthington Industries, Inc. | | | 224,906 | |
| | | | | | | | |
| | | | | | | 1,239,361 | |
| | |
| | Multi-Utilities – 1.3% | |
| | 9,507 | | | Avista Corp. | | | 266,671 | |
| | 21,392 | | | Black Hills Corp. | | | 1,003,071 | |
| | 1,696 | | | CH Energy Group, Inc. | | | 110,189 | |
| | 7,704 | | | NorthWestern Corp. | | | 331,426 | |
| | | | | | | | |
| | | | | | | 1,711,357 | |
| | |
| | Multiline Retail – 0.1% | |
| | 7,768 | | | Fred’s, Inc. Class A | | | 110,539 | |
| | |
| | Oil, Gas & Consumable Fuels – 4.8% | |
| | 47,876 | | | Alon USA Energy, Inc. | | | 794,742 | |
| | 15,524 | | | CVR Energy, Inc. | | | 764,867 | |
| | 22,676 | | | Delek US Holdings, Inc. | | | 818,377 | |
| | 4,686 | | | Green Plains Renewable Energy, Inc.* | | | 58,622 | |
| | 13,558 | | | HollyFrontier Corp. | | | 670,443 | |
| | 14,219 | | | Penn Virginia Corp. | | | 57,303 | |
| | 11,929 | | | PetroQuest Energy, Inc.* | | | 51,056 | |
| | 24,862 | | | Quicksilver Resources, Inc.*(a) | | | 62,652 | |
| | 21,244 | | | SemGroup Corp. Class A* | | | 1,101,501 | |
| | |
| | | | | | | | |
| | Common Stocks – (continued) | |
| | Oil, Gas & Consumable Fuels – (continued) | |
| | 22,731 | | | Ship Finance International Ltd. | | $ | 374,607 | |
| | 13,442 | | | Tesoro Corp. | | | 717,803 | |
| | 20,076 | | | W&T Offshore, Inc. | | | 234,488 | |
| | 29,797 | | | Western Refining, Inc.(b) | | | 921,025 | |
| | | | | | | | |
| | | | | | | 6,627,486 | |
| | |
| | Paper & Forest Products – 1.9% | |
| | 2,843 | | | Clearwater Paper Corp.* | | | 130,835 | |
| | 69,694 | | | Louisiana-Pacific Corp.* | | | 1,262,855 | |
| | 4,454 | | | PH Glatfelter Co. | | | 106,896 | |
| | 64,031 | | | Resolute Forest Products* | | | 936,774 | |
| | 5,443 | | | Schweitzer-Mauduit International, Inc. | | | 219,298 | |
| | | | | | | | |
| | | | | | | 2,656,658 | |
| | |
| | Personal Products*(a) – 0.4% | |
| | 10,459 | | | USANA Health Sciences, Inc. | | | 590,097 | |
| | |
| | Pharmaceuticals – 1.0% | |
| | 58,121 | | | Horizon Pharma, Inc.* | | | 139,490 | |
| | 23,241 | | | Questcor Pharmaceuticals, Inc.(a) | | | 714,428 | |
| | 27,096 | | | Warner Chilcott PLC Class A | | | 389,641 | |
| | 28,381 | | | XenoPort, Inc.* | | | 176,246 | |
| | | | | | | | |
| | | | | | | 1,419,805 | |
| | |
| | Professional Services – 1.0% | |
| | 14,377 | | | CDI Corp. | | | 225,288 | |
| | 8,101 | | | Heidrick & Struggles International, Inc. | | | 107,095 | |
| | 53,341 | | | Kelly Services, Inc. Class A | | | 907,864 | |
| | 6,454 | | | Kforce, Inc. | | | 97,584 | |
| | 1,181 | | | Manpowergroup, Inc. | | | 62,782 | |
| | | | | | | | |
| | | | | | | 1,400,613 | |
| | |
| | Real Estate Investment Trusts – 12.1% | |
| | 26,092 | | | AG Mortgage Investment Trust, Inc. | | | 675,000 | |
| | 9,378 | | | Agree Realty Corp. | | | 281,997 | |
| | 18,322 | | | Ashford Hospitality Trust | | | 235,987 | |
| | 4,753 | | | Chatham Lodging Trust | | | 87,027 | |
| | 9,305 | | | Corrections Corp. of America | | | 336,841 | |
| | 50,062 | | | Cousins Properties, Inc. | | | 546,677 | |
| | 5,579 | | | CubeSmart | | | 98,023 | |
| | 40,359 | | | DuPont Fabros Technology, Inc. | | | 1,014,625 | |
| | 4,461 | | | EastGroup Properties, Inc. | | | 281,355 | |
| | 20,842 | | | Extra Space Storage, Inc. | | | 908,294 | |
| | 25,679 | | | Franklin Street Properties Corp. | | | 392,118 | |
| | 16,205 | | | Getty Realty Corp. | | | 346,949 | |
| | 5,444 | | | Glimcher Realty Trust | | | 68,268 | |
| | 40,704 | | | Healthcare Realty Trust, Inc. | | | 1,221,934 | |
| | 5,714 | | | Inland Real Estate Corp. | | | 64,683 | |
| | 16,340 | | | LaSalle Hotel Properties | | | 423,696 | |
| | 5,437 | | | Lexington Realty Trust | | | 69,648 | |
| | 8,119 | | | LTC Properties, Inc. | | | 377,534 | |
| | 13,324 | | | National Health Investors, Inc. | | | 882,582 | |
| | 31,591 | | | NorthStar Realty Finance Corp. | | | 314,962 | |
| | 3,737 | | | One Liberty Properties, Inc. | | | 85,727 | |
| | 4,525 | | | Parkway Properties, Inc. | | | 82,491 | |
| | 24,134 | | | Pennsylvania Real Estate Investment Trust | | | 500,298 | |
| | |
| | |
| 58 | | The accompanying notes are an integral part of these financial statements. |
GOLDMAN SACHS SMALL CAP VALUE INSIGHTS FUND
| | | | | | | | |
Shares | | | Description | | Value | |
| | | | | | | | |
| | Common Stocks – (continued) | |
| | Real Estate Investment Trusts – (continued) | |
| | 21,766 | | | Potlatch Corp. | | $ | 1,030,620 | |
| | 10,589 | | | PS Business Parks, Inc. | | | 845,002 | |
| | 14,846 | | | Rayonier, Inc. | | | 882,149 | |
| | 8,513 | | | RLJ Lodging Trust | | | 196,140 | |
| | 17,451 | | | Ryman Hospitality Properties, Inc. | | | 775,872 | |
| | 482 | | | Silver Bay Realty Trust Corp. | | | 9,202 | |
| | 5,283 | | | Sovran Self Storage, Inc. | | | 362,414 | |
| | 18,376 | | | Strategic Hotels & Resorts, Inc.* | | | 148,294 | |
| | 29,616 | | | Sunstone Hotel Investors, Inc.* | | | 367,535 | |
| | 2,273 | | | Taubman Centers, Inc. | | | 194,364 | |
| | 32,314 | | | The Geo Group, Inc. | | | 1,210,159 | |
| | 12,083 | | | Universal Health Realty Income Trust | | | 649,220 | |
| | 8,748 | | | Urstadt Biddle Properties Class A | | | 194,818 | |
| | 16,227 | | | Washington Real Estate Investment Trust | | | 463,443 | |
| | 4,620 | | | Winthrop Realty Trust | | | 58,720 | |
| | | | | | | | |
| | | | | | | 16,684,668 | |
| | |
| | Real Estate Management & Development* – 0.3% | |
| | 4,338 | | | Altisource Residential Corp. Class B | | | 82,422 | |
| | 2,136 | | | Realogy Holdings Corp. | | | 102,528 | |
| | 11,057 | | | The St. Joe Co. | | | 216,386 | |
| | | | | | | | |
| | | | | | | 401,336 | |
| | |
| | Road & Rail – 0.6% | |
| | 293 | | | AMERCO | | | 47,085 | |
| | 14,102 | | | Heartland Express, Inc. | | | 191,364 | |
| | 3,856 | | | Saia, Inc.* | | | 157,788 | |
| | 8,673 | | | Universal Truckload Services, Inc.* | | | 218,906 | |
| | 6,748 | | | Werner Enterprises, Inc. | | | 154,934 | |
| | | | | | | | |
| | | | | | | 770,077 | |
| | |
| | Semiconductors & Semiconductor Equipment – 2.6% | |
| | 26,977 | | | Advanced Energy Industries, Inc.* | | | 458,069 | |
| | 26,053 | | | DSP Group, Inc.* | | | 210,248 | |
| | 31,043 | | | First Solar, Inc.*(a) | | | 1,445,362 | |
| | 4,211 | | | MKS Instruments, Inc. | | | 113,150 | |
| | 9,680 | | | Photronics, Inc.* | | | 76,375 | |
| | 11,606 | | | Spansion, Inc. Class A* | | | 150,762 | |
| | 36,309 | | | SunPower Corp.*(a) | | | 493,439 | |
| | 14,972 | | | Veeco Instruments, Inc.* | | | 569,984 | |
| | | | | | | | |
| | | | | | | 3,517,389 | |
| | |
| | Software – 1.4% | |
| | 48,238 | | | Accelrys, Inc.* | | | 475,144 | |
| | 29,168 | | | Aspen Technology, Inc.* | | | 889,041 | |
| | 23,257 | | | Mentor Graphics Corp. | | | 424,673 | |
| | 10,255 | | | QAD, Inc. Class A | | | 123,880 | |
| | | | | | | | |
| | | | | | | 1,912,738 | |
| | |
| | Specialty Retail – 3.3% | |
| | 17,995 | | | Brown Shoe Co., Inc. | | | 304,296 | |
| | 5,652 | | | Destination Maternity Corp. | | | 134,235 | |
| | 26,000 | | | GameStop Corp. Class A(a) | | | 907,400 | |
| | 13,504 | | | Group 1 Automotive, Inc. | | | 816,722 | |
| | 1,980 | | | Haverty Furniture Cos., Inc. | | | 47,084 | |
| | 1,162 | | | Lithia Motors, Inc. Class A | | | 57,542 | |
| | |
| | | | | | | | |
| | Common Stocks – (continued) | |
| | Specialty Retail – (continued) | |
| | 7,900 | | | Lumber Liquidators Holdings, Inc.* | | $ | 647,484 | |
| | 70,049 | | | OfficeMax, Inc. | | | 806,264 | |
| | 17,328 | | | Penske Automotive Group, Inc. | | | 535,782 | |
| | 9,251 | | | Stage Stores, Inc. | | | 256,160 | |
| | | | | | | | |
| | | | | | | 4,512,969 | |
| | |
| | Textiles, Apparel & Luxury Goods – 1.0% | |
| | 5,352 | | | Columbia Sportswear Co.(a) | | | 313,627 | |
| | 2,638 | | | Culp, Inc. | | | 42,841 | |
| | 17,605 | | | Movado Group, Inc. | | | 532,375 | |
| | 13,711 | | | Perry Ellis International, Inc. | | | 240,902 | |
| | 10,779 | | | Skechers U.S.A., Inc. Class A* | | | 223,988 | |
| | | | | | | | |
| | | | | | | 1,353,733 | |
| | |
| | Thrifts & Mortgage Finance – 2.4% | |
| | 69,827 | | | Astoria Financial Corp. | | | 669,641 | |
| | 57,379 | | | Brookline Bancorp, Inc. | | | 481,983 | |
| | 41,691 | | | Northwest Bancshares, Inc. | | | 510,715 | |
| | 44,040 | | | Ocwen Financial Corp.* | | | 1,610,983 | |
| | 3,787 | | | Oritani Financial Corp. | | | 58,585 | |
| | | | | | | | |
| | | | | | | 3,331,907 | |
| | |
| | Tobacco – 0.4% | |
| | 19,775 | | | Alliance One International, Inc.* | | | 74,156 | |
| | 8,367 | | | Universal Corp.(a) | | | 481,521 | |
| | | | | | | | |
| | | | | | | 555,677 | |
| | |
| | Trading Companies & Distributors – 0.9% | |
| | 2,372 | | | Applied Industrial Technologies, Inc. | | | 100,217 | |
| | 28,380 | | | H&E Equipment Services, Inc. | | | 577,817 | |
| | 9,022 | | | TAL International Group, Inc. | | | 373,511 | |
| | 2,249 | | | Watsco, Inc. | | | 189,770 | |
| | | | | | | | |
| | | | | | | 1,241,315 | |
| | |
| | Wireless Telecommunication Services – 0.2% | |
| | 16,569 | | | USA Mobility, Inc. | | | 224,841 | |
| | |
| | TOTAL COMMON STOCKS | |
| | (Cost $117,146,247) | | $ | 134,290,055 | |
| | |
| | | | | | | | |
| | Investment Company – 0.1% | |
| | Capital Markets – 0.1% | |
| | 10,178 | | | THL Credit, Inc. | | $ | 156,537 | |
| | (Cost $133,315) | | | | |
| | |
| | |
| The accompanying notes are an integral part of these financial statements. | | 59 |
GOLDMAN SACHS SMALL CAP VALUE INSIGHTS FUND
Schedule of Investments (continued)
April 30, 2013 (Unaudited)
| | | | | | | | | | | | | | |
Principal Amount | | | Interest Rate | | | Maturity Date | | | Value | |
| | Short-term Investment(c) – 2.2% | |
| | Repurchase Agreement – 2.2% | |
| Joint Repurchase Agreement Account II | |
| $ | 3,100,000 | | | | 0.169 | % | | | 05/01/13 | | | $ | 3,100,000 | |
| | (Cost $3,100,000) | | | | | |
| | |
| TOTAL INVESTMENTS BEFORE
SECURITIES LENDING
REINVESTMENT VEHICLE |
| | | | |
| | (Cost $120,379,562) | | | $ | 137,546,592 | |
| | |
| | | | | | | | |
| Shares | | | Rate | | Value | |
| | Securities Lending Reinvestment Vehicle(d)(e) – 7.4% | |
| Financial Square Money Market Fund – FST Shares | |
| | 10,214,136 | | | 0.109% | | $ | 10,214,136 | |
| | (Cost $10,214,136) | |
| | |
| | TOTAL INVESTMENTS – 107.3% | |
| | (Cost $130,593,698) | | $ | 147,760,728 | |
| | |
| LIABILITIES IN EXCESS OF
OTHER ASSETS – (7.3)% | | | (10,101,509 | ) |
| | |
| | NET ASSETS – 100.0% | | $ | 137,659,219 | |
| | |
| | |
| The percentage shown for each investment category reflects the value of investments in that category as a percentage of net assets. |
* | | Non-income producing security. |
(a) | | All or a portion of security is on loan. |
(b) | | All or a portion of security is segregated as collateral for initial margin requirement on futures transactions. |
(c) | | Joint repurchase agreement was entered into on April 30, 2013. Additional information appears on page 65. |
(d) | | Variable rate security. Interest rate disclosed is that which is in effect at April 30, 2013. |
(e) | | Represents an affiliated issuer. |
|
| ADDITIONAL INVESTMENT INFORMATION |
FUTURES CONTRACTS — At April 30, 2013, the Fund had the following futures contracts:
| | | | | | | | | | | | |
| Type | | Number of
Contracts
Long (Short) | | Expiration
Date | | Current
Value | | | Unrealized
Gain (Loss) | |
Russell 2000 Mini Index | | 33 | | June 2013 | | $ | 3,118,830 | | | $ | 47,379 | |
| | |
| 60 | | The accompanying notes are an integral part of these financial statements. |
GOLDMAN SACHS U.S. EQUITY INSIGHTS FUND
Schedule of Investments
April 30, 2013 (Unaudited)
| | | | | | | | |
Shares | | | Description | | Value | |
| | | | | | | | |
| | Common Stocks – 97.7% | |
| | Aerospace & Defense – 2.3% | |
| | 35,840 | | | Alliant Techsystems, Inc. | | $ | 2,665,062 | |
| | 13,557 | | | Lockheed Martin Corp. | | | 1,343,363 | |
| | 13,799 | | | Raytheon Co. | | | 846,983 | |
| | 2,202 | | | Rockwell Collins, Inc. | | | 138,550 | |
| | 33,072 | | | The Boeing Co. | | | 3,023,111 | |
| | | | | | | | |
| | | | | | | 8,017,069 | |
| | |
| | Air Freight & Logistics – 0.1% | |
| | 1,976 | | | FedEx Corp. | | | 185,764 | |
| | |
| | Airlines* – 0.2% | |
| | 25,480 | | | Delta Air Lines, Inc. | | | 436,727 | |
| | 6,143 | | | United Continental Holdings, Inc. | | | 198,419 | |
| | | | | | | | |
| | | | | | | 635,146 | |
| | |
| | Auto Components* – 0.1% | |
| | 4,301 | | | BorgWarner, Inc. | | | 336,209 | |
| | 10,232 | | | The Goodyear Tire & Rubber Co. | | | 127,849 | |
| | | | | | | | |
| | | | | | | 464,058 | |
| | |
| | Biotechnology – 4.9% | |
| | 20,335 | | | Alexion Pharmaceuticals, Inc.* | | | 1,992,830 | |
| | 48,538 | | | Amgen, Inc. | | | 5,058,145 | |
| | 22,363 | | | Biogen Idec, Inc.* | | | 4,895,932 | |
| | 10,183 | | | BioMarin Pharmaceutical, Inc.* | | | 668,005 | |
| | 37,788 | | | Celgene Corp.* | | | 4,461,629 | |
| | | | | | | | |
| | | | | | | 17,076,541 | |
| | |
| | Capital Markets – 2.8% | |
| | 29,790 | | | Ameriprise Financial, Inc. | | | 2,220,249 | |
| | 1,788 | | | BlackRock, Inc. | | | 476,502 | |
| | 6,863 | | | Federated Investors, Inc. Class B(a) | | | 157,574 | |
| | 11,605 | | | Janus Capital Group, Inc. | | | 103,516 | |
| | 89,572 | | | Morgan Stanley, Inc. | | | 1,984,020 | |
| | 86,401 | | | SEI Investments Co. | | | 2,476,253 | |
| | 9,627 | | | State Street Corp. | | | 562,891 | |
| | 93,017 | | | TD Ameritrade Holding Corp. | | | 1,851,968 | |
| | | | | | | | |
| | | | | | | 9,832,973 | |
| | |
| | Chemicals – 3.2% | |
| | 9,207 | | | Celanese Corp. Series A | | | 454,918 | |
| | 10,380 | | | Kronos Worldwide, Inc.(a) | | | 183,518 | |
| | 46,568 | | | LyondellBasell Industries NV Class A | | | 2,826,678 | |
| | 550 | | | NewMarket Corp. | | | 147,785 | |
| | 20,936 | | | PPG Industries, Inc. | | | 3,080,523 | |
| | 14,299 | | | The Sherwin-Williams Co. | | | 2,618,290 | |
| | 20,154 | | | The Valspar Corp. | | | 1,286,228 | |
| | 3,960 | | | W.R. Grace & Co.* | | | 305,356 | |
| | | | | | | | |
| | | | | | | 10,903,296 | |
| | |
| | Commercial Banks – 1.2% | |
| | 33,367 | | | KeyCorp. | | | 332,669 | |
| | 2,446 | | | M&T Bank Corp. | | | 245,089 | |
| | 17,872 | | | PNC Financial Services Group, Inc. | | | 1,213,152 | |
| | |
| | | | | | | | |
| | Common Stocks – (continued) | |
| | Commercial Banks – (continued) | |
| | 16,465 | | | SunTrust Banks, Inc. | | $ | 481,601 | |
| | 52,243 | | | Wells Fargo & Co. | | | 1,984,189 | |
| | | | | | | | |
| | | | | | | 4,256,700 | |
| | |
| | Commercial Services & Supplies – 0.4% | |
| | 42,163 | | | Tyco International Ltd. | | | 1,354,276 | |
| | |
| | Communications Equipment – 0.8% | |
| | 20,789 | | | Polycom, Inc.* | | | 218,285 | |
| | 42,426 | | | QUALCOMM, Inc. | | | 2,614,290 | |
| | | | | | | | |
| | | | | | | 2,832,575 | |
| | |
| | Computers & Peripherals – 3.8% | |
| | 24,495 | | | Apple, Inc.(b) | | | 10,845,161 | |
| | 61,727 | | | EMC Corp.* | | | 1,384,537 | |
| | 47,123 | | | Hewlett-Packard Co. | | | 970,734 | |
| | | | | | | | |
| | | | | | | 13,200,432 | |
| | |
| | Consumer Finance – 1.0% | |
| | 58,795 | | | Capital One Financial Corp. | | | 3,397,175 | |
| | |
| | Diversified Consumer Services – 0.1% | |
| | 10,107 | | | Service Corp. | | | 170,606 | |
| | |
| | Diversified Financial Services – 2.3% | |
| | 14,057 | | | CBOE Holdings, Inc. | | | 527,559 | |
| | 79,709 | | | Citigroup, Inc. | | | 3,719,222 | |
| | 4,866 | | | CME Group, Inc. | | | 296,145 | |
| | 10,204 | | | Interactive Brokers Group, Inc. Class A | | | 153,672 | |
| | 5,242 | | | IntercontinentalExchange, Inc.* | | | 854,079 | |
| | 17,972 | | | JPMorgan Chase & Co. | | | 880,808 | |
| | 4,283 | | | Leucadia National Corp. | | | 132,302 | |
| | 45,132 | | | The NASDAQ OMX Group, Inc. | | | 1,330,491 | |
| | | | | | | | |
| | | | | | | 7,894,278 | |
| | |
| | Diversified Telecommunication Services – 2.4% | |
| | 221,956 | | | AT&T, Inc. | | | 8,314,472 | |
| | |
| | Electric Utilities – 1.2% | |
| | 16,282 | | | American Electric Power Co., Inc. | | | 837,383 | |
| | 6,239 | | | Edison International | | | 335,658 | |
| | 10,697 | | | Great Plains Energy, Inc. | | | 258,119 | |
| | 23,465 | | | NV Energy, Inc. | | | 507,548 | |
| | 34,700 | | | Pinnacle West Capital Corp. | | | 2,113,230 | |
| | | | | | | | |
| | | | | | | 4,051,938 | |
| | |
| | Electronic Equipment, Instruments & Components – 0.9% | |
| | 6,436 | | | Avnet, Inc.* | | | 210,779 | |
| | 208,812 | | | Corning, Inc. | | | 3,027,774 | |
| | | | | | | | |
| | | | | | | 3,238,553 | |
| | |
| | Food & Staples Retailing – 2.1% | |
| | 9,664 | | | Costco Wholesale Corp. | | | 1,047,868 | |
| | 45,447 | | | CVS Caremark Corp. | | | 2,644,106 | |
| | 20,756 | | | Safeway, Inc. | | | 467,425 | |
| | 37,490 | | | The Kroger Co. | | | 1,288,906 | |
| | 24,443 | | | Wal-Mart Stores, Inc. | | | 1,899,710 | |
| | | | | | | | |
| | | | | | | 7,348,015 | |
| | |
| | |
| The accompanying notes are an integral part of these financial statements. | | 61 |
GOLDMAN SACHS U.S. EQUITY INSIGHTS FUND
Schedule of Investments (continued)
April 30, 2013 (Unaudited)
| | | | | | | | |
Shares | | | Description | | Value | |
| | | | | | | | |
| | Common Stocks – (continued) | |
| | Food Products – 3.4% | |
| | 3,949 | | | Ingredion, Inc. | | $ | 284,368 | |
| | 35,300 | | | Kraft Foods Group, Inc. | | | 1,817,597 | |
| | 33,174 | | | Mead Johnson Nutrition Co. | | | 2,690,080 | |
| | 43,014 | | | Mondelez International, Inc. Class A | | | 1,352,790 | |
| | 41,006 | | | The Hershey Co. | | | 3,656,095 | |
| | 77,275 | | | Tyson Foods, Inc. Class A | | | 1,903,283 | |
| | | | | | | | |
| | | | | | | 11,704,213 | |
| | |
| | Health Care Equipment & Supplies – 1.6% | |
| | 70,336 | | | Abbott Laboratories | | | 2,596,805 | |
| | 5,597 | | | Baxter International, Inc. | | | 391,062 | |
| | 177,387 | | | Boston Scientific Corp.* | | | 1,328,629 | |
| | 27,713 | | | St. Jude Medical, Inc. | | | 1,142,330 | |
| | | | | | | | |
| | | | | | | 5,458,826 | |
| | |
| | Hotels, Restaurants & Leisure – 1.5% | |
| | 10,078 | | | Bally Technologies, Inc.* | | | 536,956 | |
| | 34,441 | | | Carnival Corp. | | | 1,188,559 | |
| | 7,311 | | | Starbucks Corp. | | | 444,801 | |
| | 39,095 | | | Wyndham Worldwide Corp. | | | 2,348,827 | |
| | 11,130 | | | Yum! Brands, Inc. | | | 758,176 | |
| | | | | | | | |
| | | | | | | 5,277,319 | |
| | |
| | Household Durables – 0.5% | |
| | 3,667 | | | Garmin Ltd.(a) | | | 128,638 | |
| | 10,444 | | | Mohawk Industries, Inc.* | | | 1,158,031 | |
| | 496 | | | NVR, Inc.* | | | 510,880 | |
| | | | | | | | |
| | | | | | | 1,797,549 | |
| | |
| | Household Products – 1.1% | |
| | 2,893 | | | Colgate-Palmolive Co. | | | 345,453 | |
| | 45,590 | | | The Procter & Gamble Co. | | | 3,499,944 | |
| | | | | | | | |
| | | | | | | 3,845,397 | |
| | |
| | Independent Power Producers & Energy Traders – 0.0% | |
| | 10,507 | | | The AES Corp. | | | 145,627 | |
| | |
| | Industrial Conglomerates – 3.7% | |
| | 31,505 | | | 3M Co. | | | 3,298,888 | |
| | 4,388 | | | Danaher Corp. | | | 267,405 | |
| | 408,499 | | | General Electric Co. | | | 9,105,443 | |
| | | | | | | | |
| | | | | | | 12,671,736 | |
| | |
| | Insurance – 2.8% | |
| | 60,504 | | | Aflac, Inc. | | | 3,293,838 | |
| | 51,555 | | | MetLife, Inc. | | | 2,010,129 | |
| | 71,854 | | | Prudential Financial, Inc. | | | 4,341,419 | |
| | 3,042 | | | Reinsurance Group of America, Inc. | | | 190,277 | |
| | | | | | | | |
| | | | | | | 9,835,663 | |
| | |
| | Internet & Catalog Retail – 3.2% | |
| | 5,404 | | | Amazon.com, Inc.* | | | 1,371,589 | |
| | 36,165 | | | Expedia, Inc. | | | 2,019,454 | |
| | 64,718 | | | Groupon, Inc.*(a) | | | 394,780 | |
| | |
| | | | | | | | |
| | Common Stocks – (continued) | |
| | Internet & Catalog Retail – (continued) | |
| | 156,714 | | | Liberty Interactive Corp. Class A* | | $ | 3,336,441 | |
| | 5,881 | | | Priceline.com, Inc.* | | | 4,093,117 | |
| | | | | | | | |
| | | | | | | 11,215,381 | |
| | |
| | Internet Software & Services* – 4.3% | |
| | 24,316 | | | AOL, Inc. | | | 939,570 | |
| | 88,991 | | | eBay, Inc. | | | 4,662,239 | |
| | 10,725 | | | Google, Inc. Class A | | | 8,843,513 | |
| | 8,353 | | | VeriSign, Inc. | | | 384,823 | |
| | | | | | | | |
| | | | | | | 14,830,145 | |
| | |
| | IT Services – 4.0% | |
| | 10,773 | | | CoreLogic, Inc.* | | | 293,887 | |
| | 41,818 | | | International Business Machines Corp. | | | 8,469,818 | |
| | 30,140 | | | Lender Processing Services, Inc. | | | 836,084 | |
| | 6,926 | | | MasterCard, Inc. Class A | | | 3,829,593 | |
| | 5,294 | | | Teradata Corp.* | | | 270,365 | |
| | | | | | | | |
| | | | | | | 13,699,747 | |
| | |
| | Leisure Equipment & Products(a) – 0.2% | |
| | 12,627 | | | Hasbro, Inc. | | | 598,141 | |
| | |
| | Life Sciences Tools & Services* – 0.2% | |
| | 12,716 | | | Charles River Laboratories International, Inc. | | | 553,019 | |
| | |
| | Machinery – 2.6% | |
| | 9,209 | | | AGCO Corp. | | | 490,379 | |
| | 15,100 | | | Donaldson Co., Inc. | | | 549,338 | |
| | 2,998 | | | IDEX Corp. | | | 155,986 | |
| | 64,762 | | | Illinois Tool Works, Inc. | | | 4,181,035 | |
| | 36,659 | | | The Toro Co. | | | 1,650,021 | |
| | 25,216 | | | WABCO Holdings, Inc.* | | | 1,821,352 | |
| | | | | | | | |
| | | | | | | 8,848,111 | |
| | |
| | Media – 3.8% | |
| | 1,698 | | | AMC Networks, Inc. Class A* | | | 106,991 | |
| | 5,650 | | | Cinemark Holdings, Inc. | | | 174,529 | |
| | 40,105 | | | Comcast Corp. Class A | | | 1,601,596 | |
| | 35,374 | | | Liberty Global, Inc. Series C*(a) | | | 2,393,051 | |
| | 156,869 | | | News Corp. Class A | | | 4,858,233 | |
| | 62,095 | | | Viacom, Inc. Class B | | | 3,973,459 | |
| | | | | | | | |
| | | | | | | 13,107,859 | |
| | |
| | Metals & Mining – 1.3% | |
| | 214,050 | | | Alcoa, Inc. | | | 1,819,425 | |
| | 58,364 | | | Commercial Metals Co. | | | 853,281 | |
| | 3,505 | | | Newmont Mining Corp. | | | 113,562 | |
| | 11,126 | | | Reliance Steel & Aluminum Co. | | | 723,969 | |
| | 52,755 | | | United States Steel Corp.(a) | | | 939,039 | |
| | | | | | | | |
| | | | | | | 4,449,276 | |
| | |
| | Multi-Utilities – 0.5% | |
| | 19,573 | | | Consolidated Edison, Inc. | | | 1,245,821 | |
| | 1,834 | | | Sempra Energy | | | 151,947 | |
| | |
| | |
| 62 | | The accompanying notes are an integral part of these financial statements. |
GOLDMAN SACHS U.S. EQUITY INSIGHTS FUND
| | | | | | | | |
Shares | | | Description | | Value | |
| | | | | | | | |
| | Common Stocks – (continued) | |
| | Multi-Utilities – (continued) | |
| | 3,994 | | | Vectren Corp. | | $ | 150,015 | |
| | 4,110 | | | Wisconsin Energy Corp. | | | 184,703 | |
| | | | | | | | |
| | | | | | | 1,732,486 | |
| | |
| | Multiline Retail* – 0.1% | |
| | 11,095 | | | Big Lots, Inc. | | | 404,080 | |
| | |
| | Office Electronics – 0.1% | |
| | 27,280 | | | Xerox Corp. | | | 234,062 | |
| | 2,630 | | | Zebra Technologies Corp. Class A* | | | 122,690 | |
| | | | | | | | |
| | | | | | | 356,752 | |
| | |
| | Oil, Gas & Consumable Fuels – 12.8% | |
| | 14,486 | | | Cabot Oil & Gas Corp. | | | 985,772 | |
| | 48,541 | | | Chevron Corp. | | | 5,922,487 | |
| | 79,086 | | | ConocoPhillips | | | 4,780,749 | |
| | 3,467 | | | EOG Resources, Inc. | | | 420,062 | |
| | 147,743 | | | Exxon Mobil Corp. | | | 13,147,650 | |
| | 45,714 | | | Hess Corp. | | | 3,299,636 | |
| | 67,619 | | | HollyFrontier Corp. | | | 3,343,759 | |
| | 50,938 | | | Marathon Petroleum Corp. | | | 3,991,502 | |
| | 19,904 | | | Peabody Energy Corp. | | | 399,274 | |
| | 17,763 | | | Phillips 66 | | | 1,082,655 | |
| | 46,880 | | | Tesoro Corp. | | | 2,503,392 | |
| | 10,949 | | | Ultra Petroleum Corp.* | | | 234,309 | |
| | 99,493 | | | Valero Energy Corp. | | | 4,011,558 | |
| | | | | | | | |
| | | | | | | 44,122,805 | |
| | |
| | Paper & Forest Products – 0.0% | |
| | 1,959 | | | Domtar Corp. | | | 136,170 | |
| | |
| | Personal Products – 0.3% | |
| | 6,220 | | | Herbalife Ltd.(a) | | | 246,996 | |
| | 17,717 | | | Nu Skin Enterprises, Inc. Class A | | | 898,784 | |
| | | | | | | | |
| | | | | | | 1,145,780 | |
| | |
| | Pharmaceuticals – 9.0% | |
| | 78,375 | | | AbbVie, Inc. | | | 3,609,169 | |
| | 37,170 | | | Allergan, Inc. | | | 4,220,653 | |
| | 19,823 | | | Bristol-Myers Squibb Co. | | | 787,370 | |
| | 9,551 | | | Eli Lilly & Co. | | | 528,934 | |
| | 75,109 | | | Johnson & Johnson | | | 6,401,540 | |
| | 144,704 | | | Merck & Co., Inc. | | | 6,801,088 | |
| | 7,678 | | | Mylan, Inc.* | | | 223,507 | |
| | 270,967 | | | Pfizer, Inc. | | | 7,877,011 | |
| | 35,351 | | | Warner Chilcott PLC Class A | | | 508,347 | |
| | | | | | | | |
| | | | | | | 30,957,619 | |
| | |
| | Professional Services – 0.3% | |
| | 19,471 | | | Manpowergroup, Inc. | | | 1,035,078 | |
| | |
| | | | | | | | |
| | Common Stocks – (continued) | |
| | Real Estate Investment Trusts – 3.6% | |
| | 51,272 | | | American Tower Corp. | | $ | 4,306,335 | |
| | 60,317 | | | Corrections Corp. of America | | | 2,183,475 | |
| | 40,294 | | | Equity Residential | | | 2,339,470 | |
| | 3,129 | | | Health Care REIT, Inc. | | | 234,581 | |
| | 41,574 | | | Rayonier, Inc. | | | 2,470,327 | |
| | 2,958 | | | Regency Centers Corp. | | | 166,417 | |
| | 10,260 | | | Taubman Centers, Inc. | | | 877,333 | |
| | | | | | | | |
| | | | | | | 12,577,938 | |
| | |
| | Real Estate Management & Development – 0.1% | |
| | 1,756 | | | Jones Lang LaSalle, Inc. | | | 173,879 | |
| | |
| | Road & Rail – 0.1% | |
| | 1,467 | | | Union Pacific Corp. | | | 217,057 | |
| | |
| | Semiconductors & Semiconductor Equipment – 0.5% | |
| | 17,182 | | | Broadcom Corp. Class A | | | 618,552 | |
| | 3,656 | | | Cree, Inc.* | | | 206,820 | |
| | 23,350 | | | Cypress Semiconductor Corp.* | | | 235,602 | |
| | 8,174 | | | First Solar, Inc.*(a) | | | 380,581 | |
| | 6,368 | | | NXP Semiconductor NV* | | | 175,438 | |
| | | | | | | | |
| | | | | | | 1,616,993 | |
| | |
| | Software – 0.8% | |
| | 79,071 | | | Microsoft Corp. | | | 2,617,250 | |
| | |
| | Specialty Retail – 4.1% | |
| | 2,786 | | | Advance Auto Parts, Inc. | | | 233,690 | |
| | 42,259 | | | American Eagle Outfitters, Inc. | | | 821,937 | |
| | 1,984 | | | AutoZone, Inc.* | | | 811,634 | |
| | 7,345 | | | Best Buy Co., Inc. | | | 190,896 | |
| | 67,154 | | | GameStop Corp. Class A(a) | | | 2,343,675 | |
| | 13,270 | | | L Brands, Inc. | | | 668,941 | |
| | 92,426 | | | Lowe’s Cos., Inc. | | | 3,551,007 | |
| | 35,674 | | | O’Reilly Automotive, Inc.* | | | 3,828,534 | |
| | 15,294 | | | Staples, Inc. | | | 202,493 | |
| | 9,040 | | | The Home Depot, Inc. | | | 663,084 | |
| | 24,142 | | | Urban Outfitters, Inc.* | | | 1,000,444 | |
| | | | | | | | |
| | | | | | | 14,316,335 | |
| | |
| | Textiles, Apparel & Luxury Goods – 0.0% | |
| | 1,044 | | | PVH Corp. | | | 120,488 | |
| | |
| | Tobacco – 1.3% | |
| | 45,194 | | | Philip Morris International, Inc. | | | 4,320,094 | |
| | |
| | Trading Companies & Distributors – 0.1% | |
| | 4,547 | | | MSC Industrial Direct Co., Inc. Class A | | | 358,304 | |
| | |
| | TOTAL COMMON STOCKS | | | | |
| | (Cost $298,048,967) | | $ | 337,420,984 | |
| | |
| | |
| The accompanying notes are an integral part of these financial statements. | | 63 |
GOLDMAN SACHS U.S. EQUITY INSIGHTS FUND
Schedule of Investments (continued)
April 30, 2013 (Unaudited)
| | | | | | | | | | | | | | |
Principal
Amount | | | Interest
Rate | | | Maturity
Date | | | Value | |
| | Short-term Investment(c) – 2.4% | |
| | Repurchase Agreement – 2.4% | |
| Joint Repurchase Agreement Account II | |
| $ | 8,200,000 | | | | 0.169 | % | | | 05/01/13 | | | $ | 8,200,000 | |
| | (Cost $8,200,000) | |
| | |
| TOTAL INVESTMENTS BEFORE
SECURITIES LENDING
REINVESTMENT VEHICLE |
| | | | |
| | (Cost $306,248,967) | | | $ | 345,620,984 | |
| | |
| | | | | | |
| Shares | | Rate | | Value | |
| Securities Lending Reinvestment Vehicle(d)(e) – 1.8% | |
Financial Square Money Market Fund – FST Shares | |
| 6,229,975 | | 0.109% | | $ | 6,229,975 | |
| (Cost $6,229,975) | |
| |
| TOTAL INVESTMENTS – 101.9% | |
| (Cost $312,478,942) | | $ | 351,850,959 | |
| |
| LIABILITIES IN EXCESS OF OTHER ASSETS – (1.9)% | | | (6,455,199 | ) |
| |
| NET ASSETS – 100.0% | | $ | 345,395,760 | |
| |
| | |
|
| The percentage shown for each investment category reflects the value of investments in that category as a percentage of net assets. |
* | | Non-income producing security. |
(a) | | All or a portion of security is on loan. |
(b) | | All or a portion of security is segregated as collateral for initial margin requirements on futures transactions. |
(c) | | Joint repurchase agreement was entered into on April 30, 2013. Additional information appears on page 65. |
(d) | | Variable rate security. Interest rate disclosed is that which is in effect at April 30, 2013. |
(e) | | Represents an affiliated issuer. |
| | |
|
Investment Abbreviation: |
REIT | | —Real Estate Investment Trust |
|
|
| ADDITIONAL INVESTMENT INFORMATION |
FUTURES CONTRACTS — At April 30, 2013, the Fund had the following futures contracts:
| | | | | | | | | | | | |
| Type | | Number of
Contracts
Long (Short) | | Expiration
Date | | Current
Value | | | Unrealized
Gain (Loss) | |
S&P 500 E-Mini Index | | 72 | | June 2013 | | $ | 5,731,920 | | | $ | 169,404 | |
| | |
| 64 | | The accompanying notes are an integral part of these financial statements. |
GOLDMAN SACHS DOMESTIC EQUITY INSIGHTS FUNDS
Schedule of Investments
April 30, 2013 (Unaudited)
|
| ADDITIONAL INVESTMENT INFORMATION |
JOINT REPURCHASE AGREEMENT ACCOUNT II — At April 30, 2013, the Funds had undivided interests in the Joint Repurchase Agreement Account II, with a maturity date of May 1, 2013, as follows:
| | | | | | | | | | | | |
| Fund | | Principal
Amount | | | Maturity
Value | | | Collateral
Allocation
Value | |
Large Cap Growth Insights | | $ | 6,300,000 | | | $ | 6,300,030 | | | $ | 6,449,040 | |
Large Cap Value Insights | | | 7,200,000 | | | | 7,200,034 | | | | 7,370,331 | |
Small Cap Equity Insights | | | 9,000,000 | | | | 9,000,042 | | | | 9,212,914 | |
Small Cap Growth Insights | | | 900,000 | | | | 900,004 | | | | 921,291 | |
Small Cap Value Insights | | | 3,100,000 | | | | 3,100,015 | | | | 3,173,337 | |
U.S. Equity Insights | | | 8,200,000 | | | | 8,200,038 | | | | 8,393,988 | |
REPURCHASE AGREEMENTS — At April 30, 2013, the Principal Amounts of the Funds’ interest in the Joint Repurchase Agreement Account II were as follows:
| | | | | | | | | | | | | | | | | | | | | | | | | | | | |
| Counterparty | | Interest
Rate | | | Large Cap
Growth Insights | | | Large Cap
Value Insights | | | Small Cap
Equity Insights | | | Small Cap
Growth Insights | | | Small Cap
Value Insights | | | U.S.
Equity Insights | |
BNP Paribas Securities Co. | | | 0.170 | % | | $ | 2,303,942 | | | $ | 2,633,076 | | | $ | 3,291,345 | | | $ | 329,135 | | | $ | 1,133,685 | | | $ | 2,998,781 | |
Deutsche Bank Securities, Inc. | | | 0.170 | | | | 1,535,961 | | | | 1,755,384 | | | | 2,194,230 | | | | 219,423 | | | | 755,791 | | | | 1,999,187 | |
Wells Fargo Securities LLC | | | 0.150 | | | | 156,156 | | | | 178,464 | | | | 223,080 | | | | 22,308 | | | | 76,839 | | | | 203,251 | |
Wells Fargo Securities LLC | | | 0.170 | | | | 2,303,941 | | | | 2,633,076 | | | | 3,291,345 | | | | 329,134 | | | | 1,133,685 | | | | 2,998,781 | |
| TOTAL | | | | | | $ | 6,300,000 | | | $ | 7,200,000 | | | $ | 9,000,000 | | | $ | 900,000 | | | $ | 3,100,000 | | | $ | 8,200,000 | |
At April 30, 2013, the Joint Repurchase Agreement Account II was fully collateralized by:
| | | | | | | | |
| Issuer | | Interest Rates | | | Maturity Dates | |
Federal Home Loan Mortgage Corp. | | | 2.500% to 7.000 | % | | | 01/01/24 to 04/01/43 | |
Federal National Mortgage Association | | | 2.000 to 7.000 | | | | 01/01/17 to 05/01/48 | |
Government National Mortgage Association | | | 3.500 to 4.000 | | | | 03/20/25 to 11/20/41 | |
U.S. Treasury Bill | | | 0.000 | | | | 07/05/13 | |
U.S. Treasury Note | | | 3.125 | | | | 08/31/13 | |
| | |
| The accompanying notes are an integral part of these financial statements. | | 65 |
GOLDMAN SACHS DOMESTIC EQUITY INSIGHTS FUNDS
Statements of Assets and Liabilities
April 30, 2013 (Unaudited)
| | | | | | |
| | | | | Large Cap Growth Insights Fund | |
| Assets: | | | | | | |
| | Investments of unaffiliated issuers, at value (cost $278,472,484, $290,869,468, $189,014,573, $41,269,949, $120,379,562 and $306,248,967)(a) | | $ | 307,077,037 | |
| | Investments in securities lending reinvestment vehicle, affiliated issuers at value which equals cost | | | 6,133,180 | |
| | Cash | | | 81,444 | |
| | Receivables: | | | | |
| | Dividends and interest | | | 516,995 | |
| | Fund shares sold | | | 44,198 | |
| | Reimbursement from investment adviser | | | 34,862 | |
| | Futures — variation margin | | | 13,800 | |
| | Securities lending income | | | 3,919 | |
| | Investments sold | | | — | |
| | Other assets | | | 1,507 | |
| | Total assets | | | 313,906,942 | |
| | | | | | |
| | Liabilities: | | | | |
| | Payables: | | | | |
| | Payable upon return of securities loaned | | | 6,133,180 | |
| | Fund shares redeemed | | | 423,747 | |
| | Amounts owed to affiliates | | | 177,072 | |
| | Accrued expenses and other liabilities | | | 93,523 | |
| | Total liabilities | | | 6,827,522 | |
| | | | | | |
| | Net Assets: | | | | |
| | Paid-in capital | | | 683,058,594 | |
| | Undistributed net investment income | | | 2,601,355 | |
| | Accumulated net realized loss | | | (407,316,660 | ) |
| | Net unrealized gain | | | 28,736,131 | |
| | | NET ASSETS | | $ | 307,079,420 | |
| | | Net Assets: | | | | |
| | | Class A | | $ | 71,151,113 | |
| | | Class B | | | 3,798,067 | |
| | | Class C | | | 13,072,527 | |
| | | Institutional | | | 217,445,608 | |
| | | Service | | | 1,085,799 | |
| | | Class IR | | | 427,905 | |
| | | Class R | | | 98,401 | |
| | | Total Net Assets | | $ | 307,079,420 | |
| | | Shares Outstanding $0.001 par value (unlimited shares authorized): | | | | |
| | | Class A | | | 4,476,487 | |
| | | Class B | | | 258,855 | |
| | | Class C | | | 895,744 | |
| | | Institutional | | | 13,314,670 | |
| | | Service | | | 69,220 | |
| | | Class IR | | | 27,216 | |
| | | Class R | | | 6,254 | |
| | | Net asset value, offering and redemption price per share:(b) | | | | |
| | | Class A | | | $15.89 | |
| | | Class B | | | 14.67 | |
| | | Class C | | | 14.59 | |
| | | Institutional | | | 16.33 | |
| | | Service | | | 15.69 | |
| | | Class IR | | | 15.72 | |
| | | Class R | | | 15.73 | |
| | (a) | | Includes loaned securities having a market value of $5,995,800, $8,892,688, $22,291,070, $3,824,022, $10,028,733 and $6,110,577 for the Large Cap Growth Insights, Large Cap Value Insights, Small Cap Equity Insights, Small Cap Growth Insights, Small Cap Value Insights and U.S. Equity Insights Funds, respectively. |
| | (b) | | Maximum public offering price per share for Class A Shares of the Large Cap Growth Insights, Large Cap Value Insights, Small Cap Equity Insights, Small Cap Growth Insights, Small Cap Value Insights and U.S. Equity Insights Funds is $16.81, $13.89, $15.56, $28.29, $33.63 and $32.30, respectively. At redemption, Class B and Class C Shares may be subject to a contingent deferred sales charge assessed on the amount equal to the lesser of the current NAV or the original purchase price of the shares. |
| | |
| 66 | | The accompanying notes are an integral part of these financial statements. |
GOLDMAN SACHS DOMESTIC EQUITY INSIGHTS FUNDS
| | | | | | | | | | | | | | | | | | | | | | | | | | | | |
| | | Large Cap Value Insights Fund | | | | | Small Cap Equity Insights Fund | | | | | Small Cap Growth
Insights Fund | | | | | Small Cap Value Insights Fund | | | | | U.S. Equity Insights Fund | |
| | | | | | | | | | | | | | | | | | | | | | | | | | | | |
| | $ | 322,569,488 | | | | | $ | 213,787,581 | | | | | $ | 47,873,646 | | | | | $ | 137,546,592 | | | | | $ | 345,620,984 | |
| | | 9,092,164 | | | | | | 22,757,070 | | | | | | 3,887,872 | | | | | | 10,214,136 | | | | | | 6,229,975 | |
| | | 84,400 | | | | | | 233,385 | | | | | | 96,900 | | | | | | 61,346 | | | | | | 53,071 | |
| | | | | | | | | | | | | | | | | | | | | | | | | | | | |
| | | 812,576 | | | | | | 249,082 | | | | | | 14,822 | | | | | | 127,365 | | | | | | 606,267 | |
| | | 89,888 | | | | | | 334,537 | | | | | | 137,435 | | | | | | 33,046 | | | | | | 194,597 | |
| | | 34,970 | | | | | | 48,196 | | | | | | 31,137 | | | | | | 33,279 | | | | | | 39,871 | |
| | | 15,800 | | | | | | 53,580 | | | | | | 6,270 | | | | | | 18,810 | | | | | | 14,400 | |
| | | 6,803 | | | | | | 54,725 | | | | | | 19,042 | | | | | | 27,335 | | | | | | 6,712 | |
| | | — | | | | | | 989,733 | | | | | | 447,941 | | | | | | 190,769 | | | | | | — | |
| | | 1,688 | | | | | | 1,179 | | | | | | 219 | | | | | | 573 | | | | | | 2,853 | |
| | | 332,707,777 | | | | | | 238,509,068 | | | | | | 52,515,284 | | | | | | 148,253,251 | | | | | | 352,768,730 | |
| | | | | | | | | | | | | | | | | | | | | | | | | | | | |
| | | | | | | | | | | | | | | | | | | | | | | | | | | | |
| | | | | | | | | | | | | | | | | | | | | | | | | | | | |
| | | 9,092,164 | | | | | | 22,757,070 | | | | | | 3,887,872 | | | | | | 10,214,136 | | | | | | 6,229,975 | |
| | | 479,045 | | | | | | 410,328 | | | | | | 11,838 | | | | | | 156,821 | | | | | | 531,797 | |
| | | 176,501 | | | | | | 175,102 | | | | | | 51,355 | | | | | | 151,723 | | | | | | 271,443 | |
| | | 107,846 | | | | | | 121,174 | | | | | | 63,017 | | | | | | 71,352 | | | | | | 339,755 | |
| | | 9,855,556 | | | | | | 23,463,674 | | | | | | 4,014,082 | | | | | | 10,594,032 | | | | | | 7,372,970 | |
| | | | | | | | | | | | | | | | | | | | | | | | | | | | |
| | | | | | | | | | | | | | | | | | | | | | | | | | | | |
| | | 719,017,915 | | | | | | 343,960,916 | | | | | | 44,349,438 | | | | | | 152,546,096 | | | | | | 417,194,698 | |
| | | 837,265 | | | | | | 1,852,777 | | | | | | 49,577 | | | | | | 325,178 | | | | | | 1,479,023 | |
| | | (428,848,350 | ) | | | | | (155,669,776 | ) | | | | | (2,535,897 | ) | | | | | (32,426,464 | ) | | | | | (112,819,382 | ) |
| | | 31,845,391 | | | | | | 24,901,477 | | | | | | 6,638,084 | | | | | | 17,214,409 | | | | | | 39,541,421 | |
| | | $ | 322,852,221 | | | | | $ | 215,045,394 | | | | | $ | 48,501,202 | | | | | $ | 137,659,219 | | | | | $ | 345,395,760 | |
| | | | | | | | | | | | | | | | | | | | | | | | | | | | | |
| | | $ | 55,441,790 | | | | | $ | 39,394,532 | | | | | $ | 27,638,454 | | | | | $ | 94,014,552 | | | | | $ | 243,451,407 | |
| | | | 1,376,669 | | | | | | 573,246 | | | | | | 3,110,563 | | | | | | 9,503,658 | | | | | | 8,102,327 | |
| | | | 12,067,398 | | | | | | 13,593,282 | | | | | | 5,692,525 | | | | | | 18,451,876 | | | | | | 32,112,051 | |
| | | | 249,098,136 | | | | | | 146,700,316 | | | | | | 11,724,924 | | | | | | 13,634,538 | | | | | | 59,821,460 | |
| | | | 4,582,014 | | | | | | 2,362,994 | | | | | | — | | | | | | — | | | | | | 1,041,646 | |
| | | | 246,627 | | | | | | 6,640,318 | | | | | | 225,592 | | | | | | 1,172,609 | | | | | | 490,942 | |
| | | | 39,587 | | | | | | 5,780,706 | | | | | | 109,144 | | | | | | 881,986 | | | | | | 375,927 | |
| | | | $322,852,221 | | | | | $ | 215,045,394 | | | | | $ | 48,501,202 | | | | | $ | 137,659,219 | | | | | $ | 345,395,760 | |
| | | | | | | | | | | | | | | | | | | | | | | | | | | | | |
| | | | 4,224,033 | | | | | | 2,679,362 | | | | | | 1,033,962 | | | | | | 2,958,010 | | | | | | 7,977,496 | |
| | | | 105,507 | | | | | | 43,610 | | | | | | 136,458 | | | | | | 430,076 | | | | | | 283,058 | |
| | | | 926,758 | | | | | | 1,034,847 | | | | | | 247,673 | | | | | | 737,836 | | | | | | 1,144,049 | |
| | | | 18,990,678 | | | | | | 9,642,557 | | | | | | 395,171 | | | | | | 345,474 | | | | | | 1,913,140 | |
| | | | 347,744 | | | | | | 162,810 | | | | | | — | | | | | | — | | | | | | 34,187 | |
| | | | 18,831 | | | | | | 456,576 | | | | | | 8,366 | | | | | | 36,994 | | | | | | 16,229 | |
| | | | 3,024 | | | | | | 397,248 | | | | | | 4,150 | | | | | | 27,986 | | | | | | 12,431 | |
| | | | | | | | | | | | | | | | | | | | | | | | | | | | | |
| | | | $13.13 | | | | | | $14.70 | | | | | | $26.73 | | | | | | $31.78 | | | | | | $30.52 | |
| | | | 13.05 | | | | | | 13.14 | | | | | | 22.80 | | | | | | 22.10 | | | | | | 28.62 | |
| | | | 13.02 | | | | | | 13.14 | | | | | | 22.98 | | | | | | 25.01 | | | | | | 28.07 | |
| | | | 13.12 | | | | | | 15.21 | | | | | | 29.67 | | | | | | 39.47 | | | | | | 31.27 | |
| | | | 13.18 | | | | | | 14.51 | | | | | | — | | | | | | — | | | | | | 30.47 | |
| | | | 13.10 | | | | | | 14.54 | | | | | | 26.97 | | | | | | 31.70 | | | | | | 30.25 | |
| | | | 13.09 | | | | | | 14.55 | | | | | | 26.30 | | | | | | 31.52 | | | | | | 30.24 | |
| | |
| The accompanying notes are an integral part of these financial statements. | | 67 |
GOLDMAN SACHS DOMESTIC EQUITY INSIGHTS FUNDS
Statements of Operations
For the Six Months Ended April 30, 2013 (Unaudited)
| | | | | | |
| | | | | Large Cap Growth
Insights Fund | |
| | Investment income: | | | | |
| | Dividends (net of foreign withholding taxes of $46,089, $65,760, $37, $0, $48 and $44,225) | | $ | 5,056,410 | |
| | Interest | | | 4,358 | |
| | Securities lending income — affiliated issuer | | | 80,734 | |
| | Total investment income | | | 5,141,502 | |
| | | | | | |
| | Expenses: | | | | |
| | Management fees | | | 1,202,829 | |
| | Distribution and Service fees(a) | | | 198,058 | |
| | Transfer Agent fees(a) | | | 156,012 | |
| | Registration fees | | | 48,825 | |
| | Custody, accounting and administrative services | | | 43,370 | |
| | Professional fees | | | 42,226 | |
| | Printing and mailing costs | | | 26,158 | |
| | Trustee fees | | | 8,636 | |
| | Service Share fees — Shareholder Administration Plan | | | 1,237 | |
| | Service Share fees — Service Plan | | | 1,237 | |
| | Other | | | 7,320 | |
| | Total expenses | | | 1,735,908 | |
| | Less — expense reductions | | | (428,222 | ) |
| | Net expenses | | | 1,307,686 | |
| | NET INVESTMENT INCOME | | | 3,833,816 | |
| | | | | | |
| | Realized and unrealized gain (loss): | | | | |
| | Net realized gain from: | | | | |
| | Investments | | | 64,640,268 | |
| | Futures contracts | | | 825,901 | |
| | Net change in unrealized gain (loss) on: | | | | |
| | Investments | | | (20,426,428 | ) |
| | Futures contracts | | | 256,960 | |
| | Net realized and unrealized gain | | | 45,296,701 | |
| | NET INCREASE IN NET ASSETS RESULTING FROM OPERATIONS | | $ | 49,130,517 | |
| | (a) | | Class specific Distribution and Service, and Transfer Agent fees were as follows: |
| | | | | | | | | | | | | | | | | | | | | | | | | | | | | | | | | | | | | | | | | | | | |
| | | Distribution and Service Fees | | | Transfer Agent Fees | |
Fund | | Class A | | | Class B | | | Class C | | | Class R | | | Class A | | | Class B | | | Class C | | | Institutional | | | Service | | | Class IR | | | Class R | |
Large Cap Growth Insights | | $ | 115,112 | | | $ | 19,752 | | | $ | 62,855 | | | $ | 339 | | | $ | 87,485 | | | $ | 3,753 | | | $ | 11,942 | | | $ | 51,958 | | | $ | 198 | | | $ | 547 | | | $ | 129 | |
Large Cap Value Insights | | | 100,918 | | | | 7,170 | | | | 55,899 | | | | 90 | | | | 76,698 | | | | 1,362 | | | | 10,621 | | | | 58,159 | | | | 921 | | | | 166 | | | | 34 | |
Small Cap Equity Insights | | | 58,098 | | | | 3,392 | | | | 64,766 | | | | 1,576 | | | | 44,154 | | | | 644 | | | | 12,306 | | | | 28,338 | | | | 442 | | | | 5,581 | | | | 599 | |
Small Cap Growth Insights | | | 32,253 | | | | 16,146 | | | | 26,945 | | | | 162 | | | | 24,512 | | | | 3,068 | | | | 5,120 | | | | 1,933 | | | | — | | | | 177 | | | | 61 | |
Small Cap Value Insights | | | 112,712 | | | | 49,259 | | | | 89,606 | | | | 1,974 | | | | 85,661 | | | | 9,359 | | | | 17,025 | | | | 2,564 | | | | — | | | | 1,116 | | | | 750 | |
U.S. Equity Insights | | | 300,609 | | | | 41,671 | | | | 155,944 | | | | 861 | | | | 228,463 | | | | 7,918 | | | | 29,629 | | | | 8,007 | | | | 202 | | | | 244 | | | | 327 | |
| | |
| 68 | | The accompanying notes are an integral part of these financial statements. |
GOLDMAN SACHS DOMESTIC EQUITY INSIGHTS FUNDS
| | | | | | | | | | | | | | | | | | | | | | | | | | | | |
| | | Large Cap Value
Insights Fund | | | | | Small Cap Equity
Insights Fund | | | | | Small Cap Growth
Insights Fund | | | | | Small Cap Value
Insights Fund | | | | | U.S. Equity
Insights Fund | |
| | | | | | | | | | | | | | | | | | | | | | | | | | | | |
| | $ | 6,551,552 | | | | | $ | 3,254,234 | | | | | $ | 539,991 | | | | | $ | 2,033,852 | | | | | $ | 4,684,666 | |
| | | 4,492 | | | | | | 5,168 | | | | | | 1,083 | | | | | | 3,419 | | | | | | 6,336 | |
| | | 95,411 | | | | | | 299,123 | | | | | | 86,001 | | | | | | 175,631 | | | | | | 55,675 | |
| | | 6,651,455 | | | | | | 3,558,525 | | | | | | 627,075 | | | | | | 2,212,902 | | | | | | 4,746,677 | |
| | | | | | | | | | | | | | | | | | | | | | | | | | | | |
| | | | | | | | | | | | | | | | | | | | | | | | | | | | |
| | | 1,166,881 | | | | | | 894,686 | | | | | | 188,439 | | | | | | 564,086 | | | | | | 1,045,380 | |
| | | 164,077 | | | | | | 127,832 | | | | | | 75,506 | | | | | | 253,551 | | | | | | 499,085 | |
| | | 147,961 | | | | | | 92,064 | | | | | | 34,871 | | | | | | 116,475 | | | | | | 274,790 | |
| | | 49,645 | | | | | | 44,984 | | | | | | 35,112 | | | | | | 35,360 | | | | | | 45,666 | |
| | | 46,381 | | | | | | 50,741 | | | | | | 36,110 | | | | | | 41,663 | | | | | | 39,574 | |
| | | 42,226 | | | | | | 45,070 | | | | | | 38,161 | | | | | | 37,881 | | | | | | 42,226 | |
| | | 21,652 | | | | | | 19,783 | | | | | | 16,603 | | | | | | 19,882 | | | | | | 40,808 | |
| | | 8,691 | | | | | | 8,534 | | | | | | 8,329 | | | | | | 8,437 | | | | | | 8,614 | |
| | | 5,759 | | | | | | 2,765 | | | | | | — | | | | | | — | | | | | | 1,259 | |
| | | 5,759 | | | | | | 2,765 | | | | | | — | | | | | | — | | | | | | 1,259 | |
| | | 7,708 | | | | | | 7,765 | | | | | | 3,079 | | | | | | 6,267 | | | | | | 6,009 | |
| | | 1,666,740 | | | | | | 1,296,989 | | | | | | 436,210 | | | | | | 1,083,602 | | | | | | 2,004,670 | |
| | | (343,572 | ) | | | | | (211,065 | ) | | | | | (142,982 | ) | | | | | (173,402 | ) | | | | | (401,645 | ) |
| | | 1,323,168 | | | | | | 1,085,924 | | | | | | 293,228 | | | | | | 910,200 | | | | | | 1,603,025 | |
| | | 5,328,287 | | | | | | 2,472,601 | | | | | | 333,847 | | | | | | 1,302,702 | | | | | | 3,143,652 | |
| | | | | | | | | | | | | | | | | | | | | | | | | | | | |
| | | | | | | | | | | | | | | | | | | | | | | | | | | | |
| | | | | | | | | | | | | | | | | | | | | | | | | | | | |
| | | 72,952,520 | | | | | | 19,085,623 | | | | | | 3,123,688 | | | | | | 9,029,611 | | | | | | 43,859,206 | |
| | | 868,871 | | | | | | 783,825 | | | | | | 115,153 | | | | | | 536,435 | | | | | | 602,604 | |
| | | | | | | | | | | | | | | | | | | | | | | | | | | | |
| | | (23,649,425 | ) | | | | | 5,831,204 | | | | | | 2,564,953 | | | | | | 3,936,024 | | | | | | (868,849 | ) |
| | | 297,667 | | | | | | 221,896 | | | | | | 64,788 | | | | | | 156,768 | | | | | | 255,531 | |
| | | 50,469,633 | | | | | | 25,922,548 | | | | | | 5,868,582 | | | | | | 13,658,838 | | | | | | 43,848,492 | |
| | $ | 55,797,920 | | | | | $ | 28,395,149 | | | | | $ | 6,202,429 | | | | | $ | 14,961,540 | | | | | $ | 46,992,144 | |
| | |
| The accompanying notes are an integral part of these financial statements. | | 69 |
GOLDMAN SACHS DOMESTIC EQUITY INSIGHTS FUNDS
Statements of Changes in Net Assets
| | | | | | | | | | |
| | | | | Large Cap Growth Insights Fund | |
| | | | | For the
Six Months Ended
April 30, 2013
(Unaudited) | | | For the Fiscal
Year Ended
October 31, 2012 | |
| | From operations: | | | | | | | | |
| | Net investment income | | $ | 3,833,816 | | | $ | 6,255,650 | |
| | Net realized gain | | | 65,466,169 | | | | 117,420,200 | |
| | Net change in unrealized gain (loss) | | | (20,169,468 | ) | | | (48,941,867 | ) |
| | Net increase in net assets resulting from operations | | | 49,130,517 | | | | 74,733,983 | |
| | | | | | | | | | |
| | Distributions to shareholders: | | | | | | | | |
| | From net investment income | | | | | | | | |
| | Class A Shares | | | (1,171,997 | ) | | | (1,569,418 | ) |
| | Class B Shares | | | (18,591 | ) | | | (16,608 | ) |
| | Class C Shares | | | (74,138 | ) | | | (60,168 | ) |
| | Institutional Shares | | | (4,947,299 | ) | | | (5,594,137 | ) |
| | Service Shares | | | (10,846 | ) | | | (12,560 | ) |
| | Class IR Shares | | | (11,083 | ) | | | (670 | ) |
| | Class R Shares | | | (1,778 | ) | | | (98 | ) |
| | Total distributions to shareholders | | | (6,235,732 | ) | | | (7,253,659 | ) |
| | | | | | | | | | |
| | From share transactions: | | | | | | | | |
| | Proceeds from sales of shares | | | 15,141,782 | | | | 114,579,918 | |
| | Reinvestment of distributions | | | 6,179,118 | | | | 7,191,059 | |
| | Cost of shares redeemed | | | (205,928,508 | ) | | | (303,698,592 | ) |
| | Net increase (decrease) in net assets resulting from share transactions | | | (184,607,608 | ) | | | (181,927,615 | ) |
| | TOTAL INCREASE (DECREASE) | | | (141,712,823 | ) | | | (114,447,291 | ) |
| | | | | | | | | | |
| | Net assets: | | | | | | | | |
| | Beginning of period | | | 448,792,243 | | | | 563,239,534 | |
| | End of period | | $ | 307,079,420 | | | $ | 448,792,243 | |
| | Undistributed net investment income | | $ | 2,601,355 | | | $ | 5,003,271 | |
| | |
| 70 | | The accompanying notes are an integral part of these financial statements. |
GOLDMAN SACHS DOMESTIC EQUITY INSIGHTS FUNDS
| | | | | | | | | | | | | | | | | | | | | | |
| | Large Cap Value Insights Fund | | | | | Small Cap Equity Insights Fund | |
| | | For the
Six Months Ended
April 30, 2013
(Unaudited) | | | | | For the Fiscal
Year Ended
October 31, 2012 | | | | | For the
Six Months Ended
April 30, 2013
(Unaudited) | | | | | For the Fiscal
Year Ended
October 31, 2012 | |
| | | | | | | | | | | | | | | | | | | | | | |
| | $ | 5,328,287 | | | | | $ | 9,018,860 | | | | | $ | 2,472,601 | | | | | $ | 622,827 | |
| | | 73,821,391 | | | | | | 95,105,346 | | | | | | 19,869,448 | | | | | | 38,461,697 | |
| | | (23,351,758 | ) | | | | | (31,847,964 | ) | | | | | 6,053,100 | | | | | | (19,929,603 | ) |
| | | 55,797,920 | | | | | | 72,276,242 | | | | | | 28,395,149 | | | | | | 19,154,921 | |
| | | | | | | | | | | | | | | | | | | | | | |
| | | | | | | | | | | | | | | | | | | | | | |
| | | | | | | | | | | | | | | | | | | | | | |
| | | (840,793 | ) | | | | | (1,871,938 | ) | | | | | (88,986 | ) | | | | | (504,874 | ) |
| | | (8,626 | ) | | | | | (14,033 | ) | | | | | — | | | | | | (298 | ) |
| | | (62,774 | ) | | | | | (93,749 | ) | | | | | — | | | | | | (29,847 | ) |
| | | (3,633,035 | ) | | | | | (6,754,521 | ) | | | | | (872,718 | ) | | | | | (1,105,856 | ) |
| | | (44,090 | ) | | | | | (91,864 | ) | | | | | (5,571 | ) | | | | | (14,086 | ) |
| | | (1,817 | ) | | | | | (1,769 | ) | | | | | (31,951 | ) | | | | | (67,613 | ) |
| | | (286 | ) | | | | | (273 | ) | | | | | (733 | ) | | | | | (1,539 | ) |
| | | (4,591,421 | ) | | | | | (8,828,147 | ) | | | | | (999,959 | ) | | | | | (1,724,113 | ) |
| | | | | | | | | | | | | | | | | | | | | | |
| | | | | | | | | | | | | | | | | | | | | | |
| | | 16,938,446 | | | | | | 94,200,289 | | | | | | 50,594,368 | | | | | | 132,896,306 | |
| | | 4,554,899 | | | | | | 8,763,865 | | | | | | 969,011 | | | | | | 1,674,085 | |
| | | (212,861,548 | ) | | | | | (224,002,173 | ) | | | | | (58,477,197 | ) | | | | | (130,246,650 | ) |
| | | (191,368,203 | ) | | | | | (121,038,019 | ) | | | | | (6,913,818 | ) | | | | | 4,323,741 | |
| | | (140,161,704 | ) | | | | | (57,589,924 | ) | | | | | 20,481,372 | | | | | | 21,754,549 | |
| | | | | | | | | | | | | | | | | | | | | | |
| | | | | | | | | | | | | | | | | | | | | | |
| | | 463,013,925 | | | | | | 520,603,849 | | | | | | 194,564,022 | | | | | | 172,809,473 | |
| | $ | 322,852,221 | | | | | $ | 463,013,925 | | | | | $ | 215,045,394 | | | | | $ | 194,564,022 | |
| | $ | 837,265 | | | | | $ | 100,399 | | | | | $ | 1,852,777 | | | | | $ | 380,135 | |
| | |
| The accompanying notes are an integral part of these financial statements. | | 71 |
GOLDMAN SACHS DOMESTIC EQUITY INSIGHTS FUNDS
Statements of Changes in Net Assets (continued)
| | | | | | | | | | |
| | | | | Small Cap Growth Insights Fund | |
| | | | | For the Six Months Ended April 30, 2013 (Unaudited) | | | For the Fiscal Year Ended October 31, 2012 | |
| | From operations: | | | | | | | | |
| | Net investment income | | $ | 333,847 | | | $ | 27,386 | |
| | Net realized gain | | | 3,238,841 | | | | 7,426,241 | |
| | Net change in unrealized gain (loss) | | | 2,629,741 | | | | (3,225,149 | ) |
| | Net increase in net assets resulting from operations | | | 6,202,429 | | | | 4,228,478 | |
| | | | | | | | | | |
| | Distributions to shareholders: | | | | | | | | |
| | From net investment income | | | | | | | | |
| | Class A Shares | | | (186,704 | ) | | | — | |
| | Class B Shares | | | (7,362 | ) | | | — | |
| | Class C Shares | | | (11,799 | ) | | | — | |
| | Institutional Shares | | | (94,299 | ) | | | — | |
| | Service Shares | | | — | | | | — | |
| | Class IR Shares | | | (1,734 | ) | | | — | |
| | Class R Shares | | | (455 | ) | | | — | |
| | Total distributions to shareholders | | | (302,353 | ) | | | — | |
| | | | | | | | | | |
| | From share transactions: | | | | | | | | |
| | Proceeds from sales of shares | | | 6,021,993 | | | | 6,189,106 | |
| | Reinvestment of distributions | | | 297,004 | | | | — | |
| | Cost of shares redeemed | | | (5,950,825 | ) | | | (10,119,877 | ) |
| | Net increase (decrease) in net assets resulting from share transactions | | | 368,172 | | | | (3,930,771 | ) |
| | TOTAL INCREASE (DECREASE) | | | 6,268,248 | | | | 297,707 | |
| | | | | | | | | | |
| | Net assets: | | | | | | | | |
| | Beginning of period | | | 42,232,954 | | | | 41,935,247 | |
| | End of period | | $ | 48,501,202 | | | $ | 42,232,954 | |
| | Undistributed net investment income | | $ | 49,577 | | | $ | 18,083 | |
| | |
| 72 | | The accompanying notes are an integral part of these financial statements. |
GOLDMAN SACHS DOMESTIC EQUITY INSIGHTS FUNDS
| | | | | | | | | | | | | | | | | | | | | | |
| | | Small Cap Value Insights Fund | | | | | U.S. Equity Insights Fund | |
| | | For the Six Months Ended April 30, 2013 (Unaudited) | | | | | For the Fiscal Year Ended October 31, 2012 | | | | | For the Six Months Ended April 30, 2013 (Unaudited) | | | | | For the Fiscal Year Ended October 31, 2012 | |
| | | | | | | | | | | | | | | | | | | | | | |
| | $ | 1,302,702 | | | | | $ | 837,203 | | | | | $ | 3,143,652 | | | | | $ | 4,214,040 | |
| | | 9,566,046 | | | | | | 19,476,024 | | | | | | 44,461,810 | | | | | | 55,566,265 | |
| | | 4,092,792 | | | | | | (8,518,627 | ) | | | | | (613,318 | ) | | | | | (19,797,843 | ) |
| | | 14,961,540 | | | | | | 11,794,600 | | | | | | 46,992,144 | | | | | | 39,982,462 | |
| | | | | | | | | | | | | | | | | | | | | | |
| | | | | | | | | | | | | | | | | | | | | | |
| | | | | | | | | | | | | | | | | | | | | | |
| | | (987,412 | ) | | | | | (461,047 | ) | | | | | (3,522,397 | ) | | | | | (4,801,561 | ) |
| | | (88,104 | ) | | | | | — | | | | | | (56,722 | ) | | | | | (129,283 | ) |
| | | (133,538 | ) | | | | | — | | | | | | (272,799 | ) | | | | | (393,452 | ) |
| | | (153,124 | ) | | | | | (27,544 | ) | | | | | (611,061 | ) | | | | | (687,173 | ) |
| | | — | | | | | | — | | | | | | (14,875 | ) | | | | | (14,485 | ) |
| | | (16,812 | ) | | | | | (1,923 | ) | | | | | (3,807 | ) | | | | | (1,686 | ) |
| | | (8,149 | ) | | | | | (1,228 | ) | | | | | (4,903 | ) | | | | | (426 | ) |
| | | (1,387,139 | ) | | | | | (491,742 | ) | | | | | (4,486,564 | ) | | | | | (6,028,066 | ) |
| | | | | | | | | | | | | | | | | | | | | | |
| | | | | | | | | | | | | | | | | | | | | | |
| | | 10,685,249 | | | | | | 20,282,395 | | | | | | 35,896,629 | | | | | | 22,541,188 | |
| | | 1,349,648 | | | | | | 473,047 | | | | | | 4,282,891 | | | | | | 5,704,866 | |
| | | (16,562,388 | ) | | | | | (32,757,724 | ) | | | | | (52,054,585 | ) | | | | | (106,301,282 | ) |
| | | (4,527,491 | ) | | | | | (12,002,282 | ) | | | | | (11,875,065 | ) | | | | | (78,055,228 | ) |
| | | 9,046,910 | | | | | | (699,424 | ) | | | | | 30,630,515 | | | | | | (44,100,832 | ) |
| | | | | | | | | | | | | | | | | | | | | | |
| | | | | | | | | | | | | | | | | | | | | | |
| | | 128,612,309 | | | | | | 129,311,733 | | | | | | 314,765,245 | | | | | | 358,866,077 | |
| | $ | 137,659,219 | | | | | $ | 128,612,309 | | | | | $ | 345,395,760 | | | | | $ | 314,765,245 | |
| | $ | 325,178 | | | | | $ | 409,615 | | | | | $ | 1,479,023 | | | | | $ | 2,821,935 | |
| | |
| The accompanying notes are an integral part of these financial statements. | | 73 |
GOLDMAN SACHS LARGE CAP GROWTH INSIGHTS FUND
Financial Highlights
Selected Data for a Share Outstanding Throughout Each Period
| | | | | | | | | | | | | | | | | | | | | | | | | | | | | | |
| | | | | | | | Income (loss) from
investment operations | | | Distributions
to shareholders | |
| | | Year - Share Class | |
Net asset
value,
beginning
of period | | | Net
investment
income
(loss)(a) | | | Net realized
and unrealized
gain (loss) | | | Total from
investment
operations | | | From net
investment
income | | | From net
realized
gains | | | Total
distributions | |
| | FOR THE SIX MONTHS ENDED APRIL 30, (UNAUDITED) | |
| | 2013 - A | | $ | 14.05 | | | $ | 0.13 | (d) | | $ | 1.87 | | | $ | 2.00 | | | $ | (0.16 | ) | | $ | — | | | $ | (0.16 | ) |
| | 2013 - B | | | 12.93 | | | | 0.07 | (d) | | | 1.73 | | | | 1.80 | | | | (0.06 | ) | | | — | | | | (0.06 | ) |
| | 2013 - C | | | 12.88 | | | | 0.06 | (d) | | | 1.73 | | | | 1.79 | | | | (0.08 | ) | | | — | | | | (0.08 | ) |
| | 2013 - Institutional | | | 14.48 | | | | 0.17 | (d) | | | 1.91 | | | | 2.08 | | | | (0.23 | ) | | | — | | | | (0.23 | ) |
| | 2013 - Service | | | 13.88 | | | | 0.11 | (d) | | | 1.86 | | | | 1.97 | | | | (0.16 | ) | | | — | | | | (0.16 | ) |
| | 2013 - IR | | | 13.95 | | | | 0.14 | (d) | | | 1.85 | | | | 1.99 | | | | (0.22 | ) | | | — | | | | (0.22 | ) |
| | 2013 - R | | | 13.97 | | | | 0.10 | (d) | | | 1.86 | | | | 1.96 | | | | (0.20 | ) | | | — | | | | (0.20 | ) |
| | | | | | | | | | | | | | | | | | | | | | | | | | | | | | |
| | FOR THE FISCAL YEARS ENDED OCTOBER 31, | |
| | 2012 - A | | | 12.60 | | | | 0.12 | (f) | | | 1.47 | | | | 1.59 | | | | (0.14 | ) | | | — | | | | (0.14 | ) |
| | 2012 - B | | | 11.59 | | | | 0.02 | (f) | | | 1.35 | | | | 1.37 | | | | (0.03 | ) | | | — | | | | (0.03 | ) |
| | 2012 - C | | | 11.57 | | | | 0.01 | (f) | | | 1.35 | | | | 1.36 | | | | (0.05 | ) | | | — | | | | (0.05 | ) |
| | 2012 - Institutional | | | 12.98 | | | | 0.17 | (f) | | | 1.52 | | | | 1.69 | | | | (0.19 | ) | | | — | | | | (0.19 | ) |
| | 2012 - Service | | | 12.47 | | | | 0.10 | (f) | | | 1.47 | | | | 1.57 | | | | (0.16 | ) | | | — | | | | (0.16 | ) |
| | 2012 - IR | | | 12.53 | | | | 0.13 | (f) | | | 1.48 | | | | 1.61 | | | | (0.19 | ) | | | — | | | | (0.19 | ) |
| | 2012 - R | | | 12.46 | | | | 0.06 | (f) | | | 1.50 | | | | 1.56 | | | | (0.05 | ) | | | — | | | | (0.05 | ) |
| | 2011 - A | | | 11.54 | | | | 0.10 | (g) | | | 1.09 | | | | 1.19 | | | | (0.13 | ) | | | — | | | | (0.13 | ) |
| | 2011 - B | | | 10.63 | | | | 0.02 | (g) | | | 1.00 | | | | 1.02 | | | | (0.06 | ) | | | — | | | | (0.06 | ) |
| | 2011 - C | | | 10.62 | | | | 0.01 | (g) | | | 1.01 | | | | 1.02 | | | | (0.07 | ) | | | — | | | | (0.07 | ) |
| | 2011 - Institutional | | | 11.88 | | | | 0.16 | (g) | | | 1.12 | | | | 1.28 | | | | (0.18 | ) | | | — | | | | (0.18 | ) |
| | 2011 - Service | | | 11.43 | | | | 0.06 | (g) | | | 1.10 | | | | 1.16 | | | | (0.12 | ) | | | — | | | | (0.12 | ) |
| | 2011 - IR | | | 11.48 | | | | 0.13 | (g) | | | 1.08 | | | | 1.21 | | | | (0.16 | ) | | | — | | | | (0.16 | ) |
| | 2011 - R | | | 11.42 | | | | 0.08 | (g) | | | 1.06 | | | | 1.14 | | | | (0.10 | ) | | | — | | | | (0.10 | ) |
| | 2010 - A | | | 10.04 | | | | 0.09 | | | | 1.52 | | | | 1.61 | | | | (0.11 | ) | | | — | | | | (0.11 | ) |
| | 2010 - B | | | 9.26 | | | | 0.01 | | | | 1.40 | | | | 1.41 | | | | (0.04 | ) | | | — | | | | (0.04 | ) |
| | 2010 - C | | | 9.26 | | | | — | (h) | | | 1.41 | | | | 1.41 | | | | (0.05 | ) | | | — | | | | (0.05 | ) |
| | 2010 - Institutional | | | 10.33 | | | | 0.13 | | | | 1.58 | | | | 1.71 | | | | (0.16 | ) | | | — | | | | (0.16 | ) |
| | 2010 - Service | | | 9.95 | | | | 0.08 | | | | 1.51 | | | | 1.59 | | | | (0.11 | ) | | | — | | | | (0.11 | ) |
| | 2010 - IR | | | 9.99 | | | | 0.11 | | | | 1.52 | | | | 1.63 | | | | (0.14 | ) | | | — | | | | (0.14 | ) |
| | 2010 - R | | | 9.99 | | | | 0.05 | | | | 1.52 | | | | 1.57 | | | | (0.14 | ) | | | — | | | | (0.14 | ) |
| | 2009 - A | | | 8.94 | | | | 0.10 | | | | 1.08 | | | | 1.18 | | | | (0.08 | ) | | | — | | | | (0.08 | ) |
| | 2009 - B | | | 8.23 | | | | 0.03 | | | | 1.00 | | | | 1.03 | | | | — | | | | — | | | | — | |
| | 2009 - C | | | 8.23 | | | | 0.03 | | | | 1.00 | | | | 1.03 | | | | — | | | | — | | | | — | |
| | 2009 - Institutional | | | 9.23 | | | | 0.14 | | | | 1.10 | | | | 1.24 | | | | (0.14 | ) | | | — | | | | (0.14 | ) |
| | 2009 - Service | | | 8.87 | | | | 0.09 | | | | 1.07 | | | | 1.16 | | | | (0.08 | ) | | | — | | | | (0.08 | ) |
| | 2009 - IR | | | 8.92 | | | | 0.11 | | | | 1.08 | | | | 1.19 | | | | (0.12 | ) | | | — | | | | (0.12 | ) |
| | 2009 - R | | | 8.89 | | | | 0.05 | | | | 1.11 | | | | 1.16 | | | | (0.06 | ) | | | — | | | | (0.06 | ) |
| | | | | | | | | | | | | | | | | | | | | | | | | | | | | | |
| | FOR THE PERIOD SEPTEMBER 1, 2008 TO OCTOBER 31, 2008* | |
| | 2008 - A | | | 12.38 | | | | 0.01 | | | | (3.45 | ) | | | (3.44 | ) | | | — | | | | — | | | | — | |
| | 2008 - B | | | 11.40 | | | | (0.01 | ) | | | (3.16 | ) | | | (3.17 | ) | | | — | | | | — | | | | — | |
| | 2008 - C | | | 11.41 | | | | (0.01 | ) | | | (3.17 | ) | | | (3.18 | ) | | | — | | | | — | | | | — | |
| | 2008 - Institutional | | | 12.76 | | | | 0.01 | | | | (3.54 | ) | | | (3.53 | ) | | | — | | | | — | | | | — | |
| | 2008 - Service | | | 12.28 | | | | — | (h) | | | (3.41 | ) | | | (3.41 | ) | | | — | | | | — | | | | — | |
| | 2008 - IR | | | 12.35 | | | | 0.01 | | | | (3.44 | ) | | | (3.43 | ) | | | — | | | | — | | | | — | |
| | 2008 - R | | | 12.31 | | | | — | (h) | | | (3.42 | ) | | | (3.42 | ) | | | — | | | | — | | | | — | |
| | | | | | | | | | | | | | | | | | | | | | | | | | | | | | |
| | FOR THE FISCAL YEAR ENDED AUGUST 31, | |
| | 2008 - A | | | 14.36 | | | | 0.06 | | | | (1.91 | ) | | | (1.85 | ) | | | (0.03 | ) | | | (0.10 | ) | | | (0.13 | ) |
| | 2008 - B | | | 13.31 | | | | (0.04 | ) | | | (1.77 | ) | | | (1.81 | ) | | | — | (h) | | | (0.10 | ) | | | (0.10 | ) |
| | 2008 - C | | | 13.31 | | | | (0.04 | ) | | | (1.76 | ) | | | (1.80 | ) | | | — | (h) | | | (0.10 | ) | | | (0.10 | ) |
| | 2008 - Institutional | | | 14.81 | | | | 0.11 | | | | (1.97 | ) | | | (1.86 | ) | | | (0.09 | ) | | | (0.10 | ) | | | (0.19 | ) |
| | 2008 - Service | | | 14.25 | | | | 0.04 | | | | (1.90 | ) | | | (1.86 | ) | | | (0.01 | ) | | | (0.10 | ) | | | (0.11 | ) |
| | 2008 - IR (Commenced November 30, 2007) | | | 14.53 | | | | 0.06 | | | | (2.05 | ) | | | (1.99 | ) | | | (0.09 | ) | | | (0.10 | ) | | | (0.19 | ) |
| | 2008 - R (Commenced November 30, 2007) | | | 14.53 | | | | 0.02 | | | | (2.05 | ) | | | (2.03 | ) | | | (0.09 | ) | | | (0.10 | ) | | | (0.19 | ) |
| | * | | The Fund changed its fiscal year end from August 31 to October 31. |
| | (a) | | Calculated based on the average shares outstanding methodology. |
| | (b) | | Assumes investment at the net asset value at the beginning of the period, reinvestment of all dividends and distributions, a complete redemption of the investment at the net asset value at the end of the period and no sales or redemption charges. Total returns would be reduced if a sales or redemption charge was taken into account. Returns do not reflect the deduction of taxes that a shareholder would pay on Fund distributions or the redemption of Fund shares. Total returns for periods less than one full year are not annualized. |
| | (c) | | The Fund’s portfolio turnover rate is calculated in accordance with regulatory requirements, without regard to transactions involving short term investments and certain derivatives. If such transactions were included, the Fund’s portfolio turnover rate may be higher. |
| | (d) | | Reflects income recognized from special dividends which amounted to $0.03 per share and 0.46% of average net assets. |
| | (f) | | Reflects income recognized from special dividends which amounted to $0.03 per share and 0.22% of average net assets. |
| | (g) | | Reflects income recognized from special dividends which amounted to $0.02 per share and 0.16% of average net assets. |
| | (h) | | Amount is less than $0.005 per share. |
| | |
| 74 | | The accompanying notes are an integral part of these financial statements. |
GOLDMAN SACHS LARGE CAP GROWTH INSIGHTS FUND
| | | | | | | | | | | | | | | | | | | | | | | | | | | | | | | | | | | | | | | | |
| | | | | | | | | | | | | | | | | | | | | | | | | | | | | | | | | | |
| | | Net asset
value, end
of period | | | | | Total
return(b) | | | | | Net assets,
end of
period
(in 000s) | | | | | Ratio of
net expenses
to average
net assets | | | | | Ratio of
total expenses
to average
net assets | | | | | Ratio of
net investment
income (loss)
to average
net assets | | | | | Portfolio
turnover
rate(c) | |
| | | | | | | | | | | | | | | | | | | | | | | | | | | | | | | | | | | | | | | | |
| | $ | 15.89 | | | | | | 14.36 | % | | | | $ | 71,151 | | | | | | 0.95 | %(e) | | | | | 1.18 | %(e) | | | | | 1.85 | %(d)(e) | | | | | 102 | % |
| | | 14.67 | | | | | | 13.97 | | | | | | 3,798 | | | | | | 1.70 | (e) | | | | | 1.93 | (e) | | | | | 0.99 | (d)(e) | | | | | 102 | |
| | | 14.59 | | | | | | 13.96 | | | | | | 13,073 | | | | | | 1.70 | (e) | | | | | 1.93 | (e) | | | | | 0.94 | (d)(e) | | | | | 102 | |
| | | 16.33 | | | | | | 14.61 | | | | | | 217,446 | | | | | | 0.55 | (e) | | | | | 0.78 | (e) | | | | | 2.22 | (d)(e) | | | | | 102 | |
| | | 15.69 | | | | | | 14.32 | | | | | | 1,086 | | | | | | 1.05 | (e) | | | | | 1.29 | (e) | | | | | 1.58 | (d)(e) | | | | | 102 | |
| | | 15.72 | | | | | | 14.52 | | | | | | 428 | | | | | | 0.70 | (e) | | | | | 0.93 | (e) | | | | | 1.99 | (d)(e) | | | | | 102 | |
| | | 15.73 | | | | | | 14.21 | | | | | | 98 | | | | | | 1.20 | (e) | | | | | 1.43 | (e) | | | | | 1.43 | (d)(e) | | | | | 102 | |
| | | | | | | | | | | | | | | | | | | | | | | | | | | | | | | | | | | | | | | | |
| | | | | | | | | | | | | | | | | | | | | | | | | | | | | | | | | | | | | | | | |
| | | 14.05 | | | | | | 12.69 | | | | | | 118,956 | | | | | | 0.95 | | | | | | 1.16 | | | | | | 0.83 | (f) | | | | | 146 | |
| | | 12.93 | | | | | | 11.84 | | | | | | 4,240 | | | | | | 1.71 | | | | | | 1.91 | | | | | | 0.13 | (f) | | | | | 146 | |
| | | 12.88 | | | | | | 11.81 | | | | | | 12,555 | | | | | | 1.70 | | | | | | 1.91 | | | | | | 0.08 | (f) | | | | | 146 | |
| | | 14.48 | | | | | | 13.18 | | | | | | 311,286 | | | | | | 0.55 | | | | | | 0.76 | | | | | | 1.23 | (f) | | | | | 146 | |
| | | 13.88 | | | | | | 12.67 | | | | | | 963 | | | | | | 1.05 | | | | | | 1.26 | | | | | | 0.73 | (f) | | | | | 146 | |
| | | 13.95 | | | | | | 12.96 | | | | | | 667 | | | | | | 0.70 | | | | | | 0.90 | | | | | | 0.95 | (f) | | | | | 146 | |
| | | 13.97 | | | | | | 12.50 | | | | | | 127 | | | | | | 1.20 | | | | | | 1.39 | | | | | | 0.39 | (f) | | | | | 146 | |
| | | 12.60 | | | | | | 10.38 | | | | | | 150,750 | | | | | | 0.95 | | | | | | 1.16 | | | | | | 0.84 | (g) | | | | | 76 | |
| | | 11.59 | | | | | | 9.61 | | | | | | 6,043 | | | | | | 1.70 | | | | | | 1.91 | | | | | | 0.13 | (g) | | | | | 76 | |
| | | 11.57 | | | | | | 9.63 | | | | | | 12,999 | | | | | | 1.70 | | | | | | 1.91 | | | | | | 0.10 | (g) | | | | | 76 | |
| | | 12.98 | | | | | | 10.83 | | | | | | 392,373 | | | | | | 0.55 | | | | | | 0.76 | | | | | | 1.22 | (g) | | | | | 76 | |
| | | 12.47 | | | | | | 10.23 | | | | | | 1,004 | | | | | | 1.05 | | | | | | 1.26 | | | | | | 0.49 | (g) | | | | | 76 | |
| | | 12.53 | | | | | | 10.66 | | | | | | 45 | | | | | | 0.70 | | | | | | 0.91 | | | | | | 1.07 | (g) | | | | | 76 | |
| | | 12.46 | | | | | | 10.06 | | | | | | 26 | | | | | | 1.20 | | | | | | 1.41 | | | | | | 0.63 | (g) | | | | | 76 | |
| | | 11.54 | | | | | | 16.17 | | | | | | 145,079 | | | | | | 0.95 | | | | | | 1.16 | | | | | | 0.79 | | | | | | 64 | |
| | | 10.63 | | | | | | 15.26 | | | | | | 8,219 | | | | | | 1.70 | | | | | | 1.91 | | | | | | 0.06 | | | | | | 64 | |
| | | 10.62 | | | | | | 15.30 | | | | | | 13,528 | | | | | | 1.70 | | | | | | 1.91 | | | | | | 0.03 | | | | | | 64 | |
| | | 11.88 | | | | | | 16.68 | | | | | | 362,907 | | | | | | 0.55 | | | | | | 0.76 | | | | | | 1.21 | | | | | | 64 | |
| | | 11.43 | | | | | | 16.07 | | | | | | 93 | | | | | | 1.05 | | | | | | 1.26 | | | | | | 0.71 | | | | | | 64 | |
| | | 11.48 | | | | | | 16.50 | | | | | | 8 | | | | | | 0.70 | | | | | | 0.91 | | | | | | 1.02 | | | | | | 64 | |
| | | 11.42 | | | | | | 15.81 | | | | | | 59 | | | | | | 1.20 | | | | | | 1.41 | | | | | | 0.47 | | | | | | 64 | |
| | | 10.04 | | | | | | 13.42 | | | | | | 183,762 | | | | | | 0.95 | | | | | | 1.16 | | | | | | 1.13 | | | | | | 124 | |
| | | 9.26 | | | | | | 12.52 | | | | | | 10,993 | | | | | | 1.70 | | | | | | 1.91 | | | | | | 0.38 | | | | | | 124 | |
| | | 9.26 | | | | | | 12.52 | | | | | | 14,832 | | | | | | 1.70 | | | | | | 1.91 | | | | | | 0.31 | | | | | | 124 | |
| | | 10.33 | | | | | | 13.75 | | | | | | 543,449 | | | | | | 0.55 | | | | | | 0.76 | | | | | | 1.53 | | | | | | 124 | |
| | | 9.95 | | | | | | 13.29 | | | | | | 125 | | | | | | 1.05 | | | | | | 1.26 | | | | | | 1.08 | | | | | | 124 | |
| | | 9.99 | | | | | | 13.65 | | | | | | 7 | | | | | | 0.70 | | | | | | 0.95 | | | | | | 1.25 | | | | | | 124 | |
| | | 9.99 | | | | | | 13.21 | | | | | | 34 | | | | | | 1.20 | | | | | | 1.41 | | | | | | 0.55 | | | | | | 124 | |
| | | | | | | | | | | | | | | | | | | | | | | | | | | | | | | | | | | | | | | | |
| | | | | | | | | | | | | | | | | | | | | | | | | | | | | | | | | | | | | | | | |
| | | 8.94 | | | | | | (27.79 | ) | | | | | 285,337 | | | | | | 0.95 | (e) | | | | | 1.14 | (e) | | | | | 0.34 | (e) | | | | | 19 | |
| | | 8.23 | | | | | | (27.81 | ) | | | | | 16,129 | | | | | | 1.70 | (e) | | | | | 1.89 | (e) | | | | | (0.38 | )(e) | | | | | 19 | |
| | | 8.23 | | | | | | (27.87 | ) | | | | | 16,324 | | | | | | 1.70 | (e) | | | | | 1.89 | (e) | | | | | (0.41 | )(e) | | | | | 19 | |
| | | 9.23 | | | | | | (27.66 | ) | | | | | 814,036 | | | | | | 0.55 | (e) | | | | | 0.74 | (e) | | | | | 0.74 | (e) | | | | | 19 | |
| | | 8.87 | | | | | | (27.77 | ) | | | | | 189 | | | | | | 1.05 | (e) | | | | | 1.24 | (e) | | | | | 0.23 | (e) | | | | | 19 | |
| | | 8.92 | | | | | | (27.77 | ) | | | | | 6 | | | | | | 0.70 | (e) | | | | | 0.89 | (e) | | | | | 0.63 | (e) | | | | | 19 | |
| | | 8.89 | | | | | | (27.78 | ) | | | | | 6 | | | | | | 1.20 | (e) | | | | | 1.39 | (e) | | | | | 0.13 | (e) | | | | | 19 | |
| | | | | | | | | | | | | | | | | | | | | | | | | | | | | | | | | | | | | | | | |
| | | | | | | | | | | | | | | | | | | | | | | | | | | | | | | | | | | | | | | | |
| | | 12.38 | | | | | | (12.96 | ) | | | | | 434,970 | | | | | | 0.95 | | | | | | 1.10 | | | | | | 0.40 | | | | | | 118 | |
| | | 11.40 | | | | | | (13.71 | ) | | | | | 25,718 | | | | | | 1.70 | | | | | | 1.85 | | | | | | (0.34 | ) | | | | | 118 | |
| | | 11.41 | | | | | | (13.63 | ) | | | | | 23,960 | | | | | | 1.70 | | | | | | 1.85 | | | | | | (0.34 | ) | | | | | 118 | |
| | | 12.76 | | | | | | (12.71 | ) | | | | | 1,278,322 | | | | | | 0.55 | | | | | | 0.70 | | | | | | 0.82 | | | | | | 118 | |
| | | 12.28 | | | | | | (13.11 | ) | | | | | 273 | | | | | | 1.05 | | | | | | 1.20 | | | | | | 0.32 | | | | | | 118 | |
| | | 12.35 | | | | | | (13.86 | ) | | | | | 9 | | | | | | 0.70 | (e) | | | | | 0.85 | (e) | | | | | 0.63 | (e) | | | | | 118 | |
| | | 12.31 | | | | | | (14.18 | ) | | | | | 9 | | | | | | 1.20 | (e) | | | | | 1.35 | (e) | | | | | 0.21 | (e) | | | | | 118 | |
| | |
| The accompanying notes are an integral part of these financial statements. | | 75 |
GOLDMAN SACHS LARGE CAP VALUE INSIGHTS FUND
Financial Highlights
Selected Data for a Share Outstanding Throughout Each Period
| | | | | | | | | | | | | | | | | | | | | | | | | | | | | | |
| | | | | | | | Income (loss) from
investment operations | | | Distributions
to shareholders | |
| | | Year - Share Class | |
Net asset
value,
beginning
of period | | | Net
investment
income(a) | | | Net realized
and unrealized
gain (loss) | | | Total from
investment
operations | | | From net
investment
income | | | From net
realized
gains | | | Total
distributions | |
| | FOR THE SIX MONTHS ENDED APRIL 30, (UNAUDITED) | |
| | 2013 - A | | $ | 11.49 | | | $ | 0.15 | (d) | | $ | 1.60 | | | $ | 1.75 | | | $ | (0.11 | ) | | $ | — | | | $ | (0.11 | ) |
| | 2013 - B | | | 11.42 | | | | 0.10 | (d) | | | 1.60 | | | | 1.70 | | | | (0.07 | ) | | | — | | | | (0.07 | ) |
| | 2013 - C | | | 11.40 | | | | 0.09 | (d) | | | 1.60 | | | | 1.69 | | | | (0.07 | ) | | | — | | | | (0.07 | ) |
| | 2013 - Institutional | | | 11.48 | | | | 0.17 | (d) | | | 1.60 | | | | 1.77 | | | | (0.13 | ) | | | — | | | | (0.13 | ) |
| | 2013 - Service | | | 11.54 | | | | 0.14 | (d) | | | 1.60 | | | | 1.74 | | | | (0.10 | ) | | | — | | | | (0.10 | ) |
| | 2013 - IR | | | 11.47 | | | | 0.15 | (d) | | | 1.61 | | | | 1.76 | | | | (0.13 | ) | | | — | | | | (0.13 | ) |
| | 2013 - R | | | 11.46 | | | | 0.12 | (d) | | | 1.61 | | | | 1.73 | | | | (0.10 | ) | | | — | | | | (0.10 | ) |
| | | | | | | | | | | | | | | | | | | | | | | | | | | | | | |
| | FOR THE FISCAL YEARS ENDED OCTOBER 31, | |
| | 2012 - A | | | 10.19 | | | | 0.17 | | | | 1.29 | (f) | | | 1.46 | | | | (0.16 | ) | | | — | | | | (0.16 | ) |
| | 2012 - B | | | 10.13 | | | | 0.09 | | | | 1.29 | (f) | | | 1.38 | | | | (0.09 | ) | | | — | | | | (0.09 | ) |
| | 2012 - C | | | 10.11 | | | | 0.09 | | | | 1.29 | (f) | | | 1.38 | | | | (0.09 | ) | | | — | | | | (0.09 | ) |
| | 2012 - Institutional | | | 10.18 | | | | 0.21 | | | | 1.30 | (f) | | | 1.51 | | | | (0.21 | ) | | | — | | | | (0.21 | ) |
| | 2012 - Service | | | 10.23 | | | | 0.17 | | | | 1.29 | (f) | | | 1.46 | | | | (0.15 | ) | | | — | | | | (0.15 | ) |
| | 2012 - IR | | | 10.17 | | | | 0.19 | | | | 1.30 | (f) | | | 1.49 | | | | (0.19 | ) | | | — | | | | (0.19 | ) |
| | 2012 - R | | | 10.17 | | | | 0.13 | | | | 1.30 | (f) | | | 1.43 | | | | (0.14 | ) | | | — | | | | (0.14 | ) |
| | 2011 - A | | | 9.47 | | | | 0.13 | | | | 0.74 | | | | 0.87 | | | | (0.15 | ) | | | — | | | | (0.15 | ) |
| | 2011 - B | | | 9.42 | | | | 0.06 | | | | 0.72 | | | | 0.78 | | | | (0.07 | ) | | | — | | | | (0.07 | ) |
| | 2011 - C | | | 9.40 | | | | 0.06 | | | | 0.72 | | | | 0.78 | | | | (0.07 | ) | | | — | | | | (0.07 | ) |
| | 2011 - Institutional | | | 9.46 | | | | 0.17 | | | | 0.74 | | | | 0.91 | | | | (0.19 | ) | | | — | | | | (0.19 | ) |
| | 2011 - Service | | | 9.51 | | | | 0.12 | | | | 0.74 | | | | 0.86 | | | | (0.14 | ) | | | — | | | | (0.14 | ) |
| | 2011 - IR | | | 9.45 | | | | 0.15 | | | | 0.74 | | | | 0.89 | | | | (0.17 | ) | | | — | | | | (0.17 | ) |
| | 2011 - R | | | 9.45 | | | | 0.12 | | | | 0.72 | | | | 0.84 | | | | (0.12 | ) | | | — | | | | (0.12 | ) |
| | 2010 - A | | | 8.42 | | | | 0.13 | | | | 1.05 | | | | 1.18 | | | | (0.13 | ) | | | — | | | | (0.13 | ) |
| | 2010 - B | | | 8.37 | | | | 0.06 | | | | 1.05 | | | | 1.11 | | | | (0.06 | ) | | | — | | | | (0.06 | ) |
| | 2010 - C | | | 8.36 | | | | 0.06 | | | | 1.04 | | | | 1.10 | | | | (0.06 | ) | | | — | | | | (0.06 | ) |
| | 2010 - Institutional | | | 8.41 | | | | 0.17 | | | | 1.05 | | | | 1.22 | | | | (0.17 | ) | | | — | | | | (0.17 | ) |
| | 2010 - Service | | | 8.45 | | | | 0.12 | | | | 1.06 | | | | 1.18 | | | | (0.12 | ) | | | — | | | | (0.12 | ) |
| | 2010 - IR | | | 8.41 | | | | 0.15 | | | | 1.04 | | | | 1.19 | | | | (0.15 | ) | | | — | | | | (0.15 | ) |
| | 2010 - R | | | 8.41 | | | | 0.11 | | | | 1.04 | | | | 1.15 | | | | (0.11 | ) | | | — | | | | (0.11 | ) |
| | 2009 - A | | | 8.60 | | | | 0.17 | | | | (0.16 | ) | | | 0.01 | | | | (0.19 | ) | | | — | | | | (0.19 | ) |
| | 2009 - B | | | 8.54 | | | | 0.12 | | | | (0.17 | ) | | | (0.05 | ) | | | (0.12 | ) | | | — | | | | (0.12 | ) |
| | 2009 - C | | | 8.54 | | | | 0.11 | | | | (0.16 | ) | | | (0.05 | ) | | | (0.13 | ) | | | — | | | | (0.13 | ) |
| | 2009 - Institutional | | | 8.59 | | | | 0.20 | | | | (0.16 | ) | | | 0.04 | | | | (0.22 | ) | | | — | | | | (0.22 | ) |
| | 2009 - Service | | | 8.63 | | | | 0.16 | | | | (0.16 | ) | | | — | | | | (0.18 | ) | | | — | | | | (0.18 | ) |
| | 2009 - IR | | | 8.59 | | | | 0.18 | | | | (0.15 | ) | | | 0.03 | | | | (0.21 | ) | | | — | | | | (0.21 | ) |
| | 2009 - R | | | 8.59 | | | | 0.11 | | | | (0.11 | ) | | | — | | | | (0.18 | ) | | | — | | | | (0.18 | ) |
| | | | | | | | | | | | | | | | | | | | | | | | | | | | | | |
| | FOR THE PERIOD SEPTEMBER 1, 2008 TO OCTOBER 31, 2008* | |
| | 2008 - A | | | 11.24 | | | | 0.03 | | | | (2.62 | ) | | | (2.59 | ) | | | (0.05 | ) | | | — | | | | (0.05 | ) |
| | 2008 - B | | | 11.16 | | | | 0.02 | | | | (2.62 | ) | | | (2.60 | ) | | | (0.02 | ) | | | — | | | | (0.02 | ) |
| | 2008 - C | | | 11.16 | | | | 0.02 | | | | (2.62 | ) | | | (2.60 | ) | | | (0.02 | ) | | | — | | | | (0.02 | ) |
| | 2008 - Institutional | | | 11.24 | | | | 0.04 | | | | (2.63 | ) | | | (2.59 | ) | | | (0.06 | ) | | | — | | | | (0.06 | ) |
| | 2008 - Service | | | 11.28 | | | | 0.03 | | | | (2.64 | ) | | | (2.61 | ) | | | (0.04 | ) | | | — | | | | (0.04 | ) |
| | 2008 - IR | | | 11.23 | | | | 0.03 | | | | (2.62 | ) | | | (2.59 | ) | | | (0.05 | ) | | | — | | | | (0.05 | ) |
| | 2008 - R | | | 11.23 | | | | 0.02 | | | | (2.62 | ) | | | (2.60 | ) | | | (0.04 | ) | | | — | | | | (0.04 | ) |
| | | | | | | | | | | | | | | | | | | | | | | | | | | | | | |
| | FOR THE FISCAL YEAR ENDED AUGUST 31, | |
| | 2008 - A | | | 14.51 | | | | 0.18 | | | | (2.80 | ) | | | (2.62 | ) | | | (0.19 | ) | | | (0.46 | ) | | | (0.65 | ) |
| | 2008 - B | | | 14.39 | | | | 0.09 | | | | (2.78 | ) | | | (2.69 | ) | | | (0.08 | ) | | | (0.46 | ) | | | (0.54 | ) |
| | 2008 - C | | | 14.40 | | | | 0.09 | | | | (2.78 | ) | | | (2.69 | ) | | | (0.09 | ) | | | (0.46 | ) | | | (0.55 | ) |
| | 2008 - Institutional | | | 14.51 | | | | 0.23 | | | | (2.80 | ) | | | (2.57 | ) | | | (0.24 | ) | | | (0.46 | ) | | | (0.70 | ) |
| | 2008 - Service | | | 14.56 | | | | 0.17 | | | | (2.82 | ) | | | (2.65 | ) | | | (0.17 | ) | | | (0.46 | ) | | | (0.63 | ) |
| | 2008 - IR (Commenced November 30, 2007) | | | 13.89 | | | | 0.15 | | | | (2.18 | ) | | | (2.03 | ) | | | (0.17 | ) | | | (0.46 | ) | | | (0.63 | ) |
| | 2008 - R (Commenced November 30, 2007) | | | 13.89 | | | | 0.11 | | | | (2.17 | ) | | | (2.06 | ) | | | (0.14 | ) | | | (0.46 | ) | | | (0.60 | ) |
| | * | | The Fund changed its fiscal year end from August 31 to October 31. |
| | (a) | | Calculated based on the average shares outstanding methodology. |
| | (b) | | Assumes investment at the net asset value at the beginning of the period, reinvestment of all dividends and distributions, a complete redemption of the investment at the net asset value at the end of the period and no sales or redemption charges. Total returns would be reduced if a sales or redemption charge was taken into account. Returns do not reflect the deduction of taxes that a shareholder would pay on Fund distributions or the redemption of Fund shares. Total returns for periods less than one full year are not annualized. |
| | (c) | | The Fund’s portfolio turnover rate is calculated in accordance with regulatory requirements, without regard to transactions involving short term investments and certain derivatives. If such transactions were included, the Fund’s portfolio turnover rate may be higher. |
| | (d) | | Reflects income recognized from special dividends which amounted to $0.03 per share and 0.58% of average net assets. |
| | (f) | | Reflects payment from affiliate relating to certain investment transactions which amounted to $0.01 per share. Excluding such payment, the total return would have been 14.34%, 13.51%, 13.55%, 14.81%, 14.28%, 14.67% and 13.98%, respectively. |
| | |
| 76 | | The accompanying notes are an integral part of these financial statements. |
GOLDMAN SACHS LARGE CAP VALUE INSIGHTS FUND
| | | | | | | | | | | | | | | | | | | | | | | | | | | | | | | | | | | | | | | | |
| | | | | | | | | | | | | | | | | | | | | | | | | | | | | | | | | | |
| | | Net asset
value, end
of period | | | | | Total
return(b) | | | | | Net assets,
end of
period
(in 000s) | | | | | Ratio of
net expenses
to average
net assets | | | | | Ratio of
total expenses
to average
net assets | | | | | Ratio of
net investment
income
to average
net assets | | | | | Portfolio
turnover
rate(c) | |
| | | | | | | | | | | | | | | | | | | | | | | | | | | | | | | | | | | | | | | | |
| | $ | 13.13 | | | | | | 15.34 | % | | | | $ | 55,442 | | | | | | 0.95 | %(e) | | | | | 1.13 | %(e) | | | | | 2.54 | %(d)(e) | | | | | 101 | % |
| | | 13.05 | | | | | | 14.94 | | | | | | 1,377 | | | | | | 1.70 | (e) | | | | | 1.88 | (e) | | | | | 1.64 | (d)(e) | | | | | 101 | |
| | | 13.02 | | | | | | 14.89 | | | | | | 12,067 | | | | | | 1.70 | (e) | | | | | 1.88 | (e) | | | | | 1.58 | (d)(e) | | | | | 101 | |
| | | 13.12 | | | | | | 15.60 | | | | | | 249,098 | | | | | | 0.55 | (e) | | | | | 0.73 | (e) | | | | | 2.85 | (d)(e) | | | | | 101 | |
| | | 13.18 | | | | | | 15.23 | | | | | | 4,582 | | | | | | 1.05 | (e) | | | | | 1.23 | (e) | | | | | 2.33 | (d)(e) | | | | | 101 | |
| | | 13.10 | | | | | | 15.45 | | | | | | 247 | | | | | | 0.70 | (e) | | | | | 0.89 | (e) | | | | | 2.39 | (d)(e) | | | | | 101 | |
| | | 13.09 | | | | | | 15.18 | | | | | | 40 | | | | | | 1.20 | (e) | | | | | 1.38 | (e) | | | | | 2.04 | (d)(e) | | | | | 101 | |
| | | | | | | | | | | | | | | | | | | | | | | | | | | | | | | | | | | | | | | | |
| | | | | | | | | | | | | | | | | | | | | | | | | | | | | | | | | | | | | | | | |
| | | 11.49 | | | | | | 14.44 | (f) | | | | | 107,535 | | | | | | 0.95 | | | | | | 1.11 | | | | | | 1.53 | | | | | | 135 | |
| | | 11.42 | | | | | | 13.61 | (f) | | | | | 1,532 | | | | | | 1.70 | | | | | | 1.86 | | | | | | 0.79 | | | | | | 135 | |
| | | 11.40 | | | | | | 13.65 | (f) | | | | | 11,018 | | | | | | 1.70 | | | | | | 1.86 | | | | | | 0.77 | | | | | | 135 | |
| | | 11.48 | | | | | | 14.91 | (f) | | | | | 337,650 | | | | | | 0.55 | | | | | | 0.71 | | | | | | 1.91 | | | | | | 135 | |
| | | 11.54 | | | | | | 14.38 | (f) | | | | | 5,117 | | | | | | 1.05 | | | | | | 1.21 | | | | | | 1.48 | | | | | | 135 | |
| | | 11.47 | | | | | | 14.77 | (f) | | | | | 128 | | | | | | 0.70 | | | | | | 0.86 | | | | | | 1.74 | | | | | | 135 | |
| | | 11.46 | | | | | | 14.08 | (f) | | | | | 33 | | | | | | 1.20 | | | | | | 1.36 | | | | | | 1.18 | | | | | | 135 | |
| | | 10.19 | | | | | | 9.15 | | | | | | 133,611 | | | | | | 0.95 | | | | | | 1.13 | | | | | | 1.31 | | | | | | 56 | |
| | | 10.13 | | | | | | 8.25 | | | | | | 1,905 | | | | | | 1.70 | | | | | | 1.88 | | | | | | 0.57 | | | | | | 56 | |
| | | 10.11 | | | | | | 8.30 | | | | | | 11,928 | | | | | | 1.70 | | | | | | 1.88 | | | | | | 0.55 | | | | | | 56 | |
| | | 10.18 | | | | | | 9.61 | | | | | | 365,385 | | | | | | 0.55 | | | | | | 0.73 | | | | | | 1.69 | | | | | | 56 | |
| | | 10.23 | | | | | | 9.02 | | | | | | 7,699 | | | | | | 1.05 | | | | | | 1.23 | | | | | | 1.19 | | | | | | 56 | |
| | | 10.17 | | | | | | 9.48 | | | | | | 67 | | | | | | 0.70 | | | | | | 0.88 | | | | | | 1.48 | | | | | | 56 | |
| | | 10.17 | | | | | | 8.96 | | | | | | 10 | | | | | | 1.20 | | | | | | 1.38 | | | | | | 1.13 | | | | | | 56 | |
| | | 9.47 | | | | | | 14.09 | | | | | | 140,737 | | | | | | 0.94 | | | | | | 1.10 | | | | | | 1.45 | | | | | | 41 | |
| | | 9.42 | | | | | | 13.27 | | | | | | 2,428 | | | | | | 1.69 | | | | | | 1.85 | | | | | | 0.70 | | | | | | 41 | |
| | | 9.40 | | | | | | 13.22 | | | | | | 11,940 | | | | | | 1.69 | | | | | | 1.85 | | | | | | 0.68 | | | | | | 41 | |
| | | 9.46 | | | | | | 14.59 | | | | | | 362,324 | | | | | | 0.54 | | | | | | 0.70 | | | | | | 1.86 | | | | | | 41 | |
| | | 9.51 | | | | | | 14.05 | | | | | | 6,601 | | | | | | 1.04 | | | | | | 1.20 | | | | | | 1.33 | | | | | | 41 | |
| | | 9.45 | | | | | | 14.31 | | | | | | 16 | | | | | | 0.69 | | | | | | 0.85 | | | | | | 1.64 | | | | | | 41 | |
| | | 9.45 | | | | | | 13.74 | | | | | | 47 | | | | | | 1.19 | | | | | | 1.35 | | | | | | 1.15 | | | | | | 41 | |
| | | 8.42 | | | | | | 0.37 | | | | | | 247,183 | | | | | | 0.95 | | | | | | 1.10 | | | | | | 2.28 | | | | | | 130 | |
| | | 8.37 | | | | | | (0.42 | ) | | | | | 3,290 | | | | | | 1.70 | | | | | | 1.85 | | | | | | 1.58 | | | | | | 130 | |
| | | 8.36 | | | | | | (0.36 | ) | | | | | 13,110 | | | | | | 1.70 | | | | | | 1.85 | | | | | | 1.47 | | | | | | 130 | |
| | | 8.41 | | | | | | 0.67 | | | | | | 712,253 | | | | | | 0.55 | | | | | | 0.70 | | | | | | 2.65 | | | | | | 130 | |
| | | 8.45 | | | | | | 0.28 | | | | | | 7,364 | | | | | | 1.05 | | | | | | 1.20 | | | | | | 2.10 | | | | | | 130 | |
| | | 8.41 | | | | | | 0.65 | | | | | | 10 | | | | | | 0.70 | | | | | | 0.85 | | | | | | 2.30 | | | | | | 130 | |
| | | 8.41 | | | | | | 0.26 | | | | | | 36 | | | | | | 1.20 | | | | | | 1.35 | | | | | | 1.45 | | | | | | 130 | |
| | | | | | | | | | | | | | | | | | | | | | | | | | | | | | | | | | | | | | | | |
| | | | | | | | | | | | | | | | | | | | | | | | | | | | | | | | | | | | | | | | |
| | | 8.60 | | | | | | (23.14 | ) | | | | | 310,622 | | | | | | 0.95 | (e) | | | | | 1.10 | (e) | | | | | 1.59 | (e) | | | | | 24 | |
| | | 8.54 | | | | | | (23.21 | ) | | | | | 5,170 | | | | | | 1.70 | (e) | | | | | 1.85 | (e) | | | | | 0.87 | (e) | | | | | 24 | |
| | | 8.54 | | | | | | (23.29 | ) | | | | | 14,029 | | | | | | 1.70 | (e) | | | | | 1.85 | (e) | | | | | 0.86 | (e) | | | | | 24 | |
| | | 8.59 | | | | | | (23.05 | ) | | | | | 851,132 | | | | | | 0.55 | (e) | | | | | 0.70 | (e) | | | | | 2.02 | (e) | | | | | 24 | |
| | | 8.63 | | | | | | (23.16 | ) | | | | | 7,193 | | | | | | 1.05 | (e) | | | | | 1.20 | (e) | | | | | 1.50 | (e) | | | | | 24 | |
| | | 8.59 | | | | | | (23.10 | ) | | | | | 7 | | | | | | 0.70 | (e) | | | | | 0.85 | (e) | | | | | 1.81 | (e) | | | | | 24 | |
| | | 8.59 | | | | | | (23.21 | ) | | | | | 6 | | | | | | 1.20 | (e) | | | | | 1.35 | (e) | | | | | 1.33 | (e) | | | | | 24 | |
| | | | | | | | | | | | | | | | | | | | | | | | | | | | | | | | | | | | | | | | |
| | | | | | | | | | | | | | | | | | | | | | | | | | | | | | | | | | | | | | | | |
| | | 11.24 | | | | | | (18.65 | ) | | | | | 398,881 | | | | | | 0.95 | | | | | | 1.05 | | | | | | 1.41 | | | | | | 130 | |
| | | 11.16 | | | | | | (19.22 | ) | | | | | 7,306 | | | | | | 1.70 | | | | | | 1.80 | | | | | | 0.67 | | | | | | 130 | |
| | | 11.16 | | | | | | (19.21 | ) | | | | | 18,614 | | | | | | 1.70 | | | | | | 1.80 | | | | | | 0.67 | | | | | | 130 | |
| | | 11.24 | | | | | | (18.30 | ) | | | | | 1,027,705 | | | | | | 0.55 | | | | | | 0.65 | | | | | | 1.82 | | | | | | 130 | |
| | | 11.28 | | | | | | (18.73 | ) | | | | | 8,994 | | | | | | 1.05 | | | | | | 1.15 | | | | | | 1.31 | | | | | | 130 | |
| | | 11.23 | | | | | | (15.18 | ) | | | | | 8 | | | | | | 0.70 | (e) | | | | | 0.80 | (e) | | | | | 1.70 | (e) | | | | | 130 | |
| | | 11.23 | | | | | | (15.44 | ) | | | | | 8 | | | | | | 1.20 | (e) | | | | | 1.30 | (e) | | | | | 1.26 | (e) | | | | | 130 | |
| | |
| The accompanying notes are an integral part of these financial statements. | | 77 |
GOLDMAN SACHS SMALL CAP EQUITY INSIGHTS FUND
Financial Highlights
Selected Data for a Share Outstanding Throughout Each Period
| | | | | | | | | | | | | | | | | | | | | | | | | | | | | | |
| | | | | | | | Income (loss) from
investment operations | | | Distributions
to shareholders | |
| | | Year - Share Class | | Net asset
value,
beginning
of period | | | Net
investment
income (loss)(a) | | | Net realized
and unrealized
gain (loss) | | | Total from
investment
operations | | | From net
investment
income | | | From
net realized
gains | | | Total
distributions | |
| | FOR THE SIX MONTHS ENDED APRIL 30, (UNAUDITED) | |
| | 2013 - A | | $ | 12.93 | | | $ | 0.16 | (d) | | $ | 1.63 | | | $ | 1.79 | | | $ | (0.02 | ) | | $ | — | | | $ | (0.02 | ) |
| | 2013 - B | | | 11.58 | | | | 0.11 | (d) | | | 1.45 | | | | 1.56 | | | | — | | | | — | | | | — | |
| | 2013 - C | | | 11.57 | | | | 0.09 | (d) | | | 1.48 | | | | 1.57 | | | | — | | | | — | | | | — | |
| | 2013 - Institutional | | | 13.42 | | | | 0.17 | (d) | | | 1.72 | | | | 1.89 | | | | (0.10 | ) | | | — | | | | (0.10 | ) |
| | 2013 - Service | | | 12.78 | | | | 0.14 | (d) | | | 1.62 | | | | 1.76 | | | | (0.03 | ) | | | — | | | | (0.03 | ) |
| | 2013 - IR | | | 12.83 | | | | 0.16 | (d) | | | 1.63 | | | | 1.79 | | | | (0.08 | ) | | | — | | | | (0.08 | ) |
| | 2013 - R | | | 12.81 | | | | 0.05 | (d) | | | 1.72 | | | | 1.77 | | | | (0.03 | ) | | | — | | | | (0.03 | ) |
| | | | | | | | | | | | | | | | | | | | | | | | | | | | | | |
| | FOR THE FISCAL YEARS ENDED OCTOBER 31, | |
| | 2012 - A | | | 12.06 | | | | 0.01 | (f) | | | 0.96 | (g) | | | 0.97 | | | | (0.10 | ) | | | — | | | | (0.10 | ) |
| | 2012 - B | | | 10.79 | | | | (0.07 | )(f) | | | 0.86 | (g) | | | 0.79 | | | | — | (h) | | | — | | | | — | (h) |
| | 2012 - C | | | 10.81 | | | | (0.07 | )(f) | | | 0.86 | (g) | | | 0.79 | | | | (0.03 | ) | | | — | | | | (0.03 | ) |
| | 2012 - Institutional | | | 12.53 | | | | 0.07 | (f) | | | 0.98 | (g) | | | 1.05 | | | | (0.16 | ) | | | — | | | | (0.16 | ) |
| | 2012 - Service | | | 11.94 | | | | 0.01 | (f) | | | 0.94 | (g) | | | 0.95 | | | | (0.11 | ) | | | — | | | | (0.11 | ) |
| | 2012 - IR | | | 12.00 | | | | 0.05 | (f) | | | 0.94 | (g) | | | 0.99 | | | | (0.16 | ) | | | — | | | | (0.16 | ) |
| | 2012 - R | | | 11.97 | | | | (0.01 | )(f) | | | 0.94 | (g) | | | 0.93 | | | | (0.09 | ) | | | — | | | | (0.09 | ) |
| | 2011 - A | | | 10.92 | | | | 0.06 | (i) | | | 1.15 | | | | 1.21 | | | | (0.07 | ) | | | — | | | | (0.07 | ) |
| | 2011 - B | | | 9.80 | | | | (0.03 | )(i) | | | 1.02 | | | | 0.99 | | | | — | | | | — | �� | | | — | |
| | 2011 - C | | | 9.82 | | | | (0.04 | )(i) | | | 1.04 | | | | 1.00 | | | | (0.01 | ) | | | — | | | | (0.01 | ) |
| | 2011 - Institutional | | | 11.34 | | | | 0.11 | (i) | | | 1.19 | | | | 1.30 | | | | (0.11 | ) | | | — | | | | (0.11 | ) |
| | 2011 - Service | | | 10.82 | | | | 0.04 | (i) | | | 1.13 | | | | 1.17 | | | | (0.05 | ) | | | — | | | | (0.05 | ) |
| | 2011 - IR | | | 10.87 | | | | 0.08 | (i) | | | 1.15 | | | | 1.23 | | | | (0.10 | ) | | | — | | | | (0.10 | ) |
| | 2011 - R | | | 10.86 | | | | 0.02 | (i) | | | 1.15 | | | | 1.17 | | | | (0.06 | ) | | | — | | | | (0.06 | ) |
| | 2010 - A | | | 8.45 | | | | 0.04 | (j) | | | 2.50 | | | | 2.54 | | | | (0.07 | ) | | | — | | | | (0.07 | ) |
| | 2010 - B | | | 7.59 | | | | (0.03 | )(j) | | | 2.25 | | | | 2.22 | | | | (0.01 | ) | | | — | | | | (0.01 | ) |
| | 2010 - C | | | 7.62 | | | | (0.03 | )(j) | | | 2.26 | | | | 2.23 | | | | (0.03 | ) | | | — | | | | (0.03 | ) |
| | 2010 - Institutional | | | 8.78 | | | | 0.09 | (j) | | | 2.57 | | | | 2.66 | | | | (0.10 | ) | | | — | | | | (0.10 | ) |
| | 2010 - Service | | | 8.37 | | | | 0.03 | (j) | | | 2.48 | | | | 2.51 | | | | (0.06 | ) | | | — | | | | (0.06 | ) |
| | 2010 - IR | | | 8.42 | | | | 0.06 | (j) | | | 2.49 | | | | 2.55 | | | | (0.10 | ) | | | — | | | | (0.10 | ) |
| | 2010 - R | | | 8.41 | | | | (0.01 | )(j) | | | 2.51 | | | | 2.50 | | | | (0.05 | ) | | | — | | | | (0.05 | ) |
| | 2009 - A | | | 7.98 | | | | 0.04 | | | | 0.48 | | | | 0.52 | | | | (0.05 | ) | | | — | | | | (0.05 | ) |
| | 2009 - B | | | 7.16 | | | | (0.01 | ) | | | 0.44 | | | | 0.43 | | | | — | | | | — | | | | — | |
| | 2009 - C | | | 7.19 | | | | (0.01 | ) | | | 0.44 | | | | 0.43 | | | | — | | | | — | | | | — | |
| | 2009 - Institutional | | | 8.30 | | | | 0.07 | | | | 0.51 | | | | 0.58 | | | | (0.10 | ) | | | — | | | | (0.10 | ) |
| | 2009 - Service | | | 7.85 | | | | 0.04 | | | | 0.48 | | | | 0.52 | | | | — | | | | — | | | | — | |
| | 2009 - IR | | | 7.96 | | | | 0.04 | | | | 0.50 | | | | 0.54 | | | | (0.08 | ) | | | — | | | | (0.08 | ) |
| | 2009 - R | | | 7.93 | | | | (0.01 | ) | | | 0.53 | | | | 0.52 | | | | (0.04 | ) | | | — | | | | (0.04 | ) |
| | | | | | | | | | | | | | | | | | | | | | | | | | | | | | |
| | FOR THE PERIOD SEPTEMBER 1, 2008 TO OCTOBER 31, 2008* | |
| | 2008 - A | | | 11.00 | | | | 0.02 | | | | (3.04 | ) | | | (3.02 | ) | | | — | | | | — | | | | — | |
| | 2008 - B | | | 9.89 | | | | — | (h) | | | (2.73 | ) | | | (2.73 | ) | | | — | | | | — | | | | — | |
| | 2008 - C | | | 9.94 | | | | — | (h) | | | (2.75 | ) | | | (2.75 | ) | | | — | | | | — | | | | — | |
| | 2008 - Institutional | | | 11.45 | | | | 0.02 | | | | (3.17 | ) | | | (3.15 | ) | | | — | | | | — | | | | — | |
| | 2008 - Service | | | 10.84 | | | | 0.01 | | | | (3.00 | ) | | | (2.99 | ) | | | — | | | | — | | | | — | |
| | 2008 - IR | | | 10.98 | | | | 0.02 | | | | (3.04 | ) | | | (3.02 | ) | | | — | | | | — | | | | — | |
| | 2008 - R | | | 10.95 | | | | 0.01 | | | | (3.03 | ) | | | (3.02 | ) | | | — | | | | — | | | | — | |
| | | | | | | | | | | | | | | | | | | | | | | | | | | | | | |
| | FOR THE FISCAL YEAR ENDED AUGUST 31, | |
| | 2008 - A | | | 12.89 | | | | 0.01 | | | | (1.23 | ) | | | (1.22 | ) | | | (0.01 | ) | | | (0.66 | ) | | | (0.67 | ) |
| | 2008 - B | | | 11.74 | | | | (0.06 | ) | | | (1.13 | ) | | | (1.19 | ) | | | — | | | | (0.66 | ) | | | (0.66 | ) |
| | 2008 - C | | | 11.79 | | | | (0.06 | ) | | | (1.13 | ) | | | (1.19 | ) | | | — | | | | (0.66 | ) | | | (0.66 | ) |
| | 2008 - Institutional | | | 13.37 | | | | 0.06 | | | | (1.27 | ) | | | (1.21 | ) | | | (0.05 | ) | | | (0.66 | ) | | | (0.71 | ) |
| | 2008 - Service | | | 12.72 | | | | 0.01 | | | | (1.23 | ) | | | (1.22 | ) | | | — | | | | (0.66 | ) | | | (0.66 | ) |
| | 2008 - IR (Commenced November 30, 2007) | | | 12.16 | | | | 0.03 | | | | (0.50 | ) | | | (0.47 | ) | | | (0.05 | ) | | | (0.66 | ) | | | (0.71 | ) |
| | 2008 - R (Commenced November 30, 2007) | | | 12.16 | | | | (0.01 | ) | | | (0.49 | ) | | | (0.50 | ) | | | (0.05 | ) | | | (0.66 | ) | | | (0.71 | ) |
| | * | | The Fund changed its fiscal year end from August 31 to October 31. |
| | (a) | | Calculated based on the average shares outstanding methodology. |
| | (b) | | Assumes investment at the net asset value at the beginning of the period, reinvestment of all dividends and distributions, a complete redemption of the investment at the net asset value at the end of the period and no sales or redemption charges. Total returns would be reduced if a sales or redemption charge was taken into account. Returns do not reflect the deduction of taxes that a shareholder would pay on Fund distributions or the redemption of Fund shares. Total returns for periods less than one full year are not annualized. |
| | (c) | | The Fund’s portfolio turnover rate is calculated in accordance with regulatory requirements, without regard to transactions involving short term investments and certain derivatives. If such transactions were included, the Fund’s portfolio turnover rate may be higher. |
| | (d) | | Reflects income recognized from special dividends which amounted to $0.10 per share and 1.43% of average net assets. |
| | (f) | | Reflects income recognized from special dividends which amounted to $0.02 per share and 0.17% of average net assets. |
| | (g) | | Reflects payment from affiliate relating to certain investment transactions which amounted to $0.04 per share. Excluding such payment, the total return would have been 7.71%, 6.95%, 6.89%, 8.17%, 7.63%, 8.02%, and 7.44%, respectively. |
| | (h) | | Amount is less than $0.005 per share. |
| | (i) | | Reflects income recognized from special dividends which amounted to $0.07 per share and 0.55% of average net assets. |
| | (j) | | Reflects income recognized from special dividends which amounted to $0.06 per share and 0.56% of average net assets. |
| | |
| 78 | | The accompanying notes are an integral part of these financial statements. |
GOLDMAN SACHS SMALL CAP EQUITY INSIGHTS FUND
| | | | | | | | | | | | | | | | | | | | | | | | | | | | | | | | | | | | | | | | |
| | | | | | | | | | | | | | | | | | | | | | | | | | | | | | | | | | |
| | | Net asset
value, end
of period | | | | | Total
return(b) | | | | | Net assets,
end of
period
(in 000s) | | | | | Ratio of
net expenses
to average
net assets | | | | | Ratio of
total expenses
to average
net assets | | | | | Ratio of
net investment
income (loss)
to average
net assets | | | | | Portfolio
turnover
rate(c) | |
| | | | | | | | | | | | | | | | | | | | | | | | | | | | | | | | | | | | | | | | |
| | $ | 14.70 | | | | | | 13.90 | % | | | | $ | 39,395 | | | | | | 1.26 | %(e) | | | | | 1.45 | %(e) | | | | | 2.31 | %(d)(e) | | | | | 80 | % |
| | | 13.14 | | | | | | 13.47 | | | | | | 573 | | | | | | 2.00 | (e) | | | | | 2.20 | (e) | | | | | 1.77 | (d)(e) | | | | | 80 | |
| | | 13.14 | | | | | | 13.57 | | | | | | 13,593 | | | | | | 2.00 | (e) | | | | | 2.21 | (e) | | | | | 1.46 | (d)(e) | | | | | 80 | |
| | | 15.21 | | | | | | 14.15 | | | | | | 146,700 | | | | | | 0.86 | (e) | | | | | 1.06 | (e) | | | | | 2.45 | (d)(e) | | | | | 80 | |
| | | 14.51 | | | | | | 13.84 | | | | | | 2,363 | | | | | | 1.36 | (e) | | | | | 1.56 | (e) | | | | | 2.08 | (d)(e) | | | | | 80 | |
| | | 14.54 | | | | | | 14.00 | | | | | | 6,640 | | | | | | 1.01 | (e) | | | | | 1.21 | (e) | | | | | 2.40 | (d)(e) | | | | | 80 | |
| | | 14.55 | | | | | | 13.81 | | | | | | 5,781 | | | | | | 1.51 | (e) | | | | | 1.87 | (e) | | | | | 0.77 | (d)(e) | | | | | 80 | |
| | | | | | | | | | | | | | | | | | | | | | | | | | | | | | | | | | | | | | | | |
| | | | | | | | | | | | | | | | | | | | | | | | | | | | | | | | | | | | | | | | |
| | | 12.93 | | | | | | 8.04 | (g) | | | | | 49,863 | | | | | | 1.25 | | | | | | 1.46 | | | | | | 0.15 | (f) | | | | | 125 | |
| | | 11.58 | | | | | | 7.32 | (g) | | | | | 780 | | | | | | 2.01 | | | | | | 2.22 | | | | | | (0.57 | )(f) | | | | | 125 | |
| | | 11.57 | | | | | | 7.26 | (g) | | | | | 12,487 | | | | | | 2.00 | | | | | | 2.21 | | | | | | (0.57 | )(f) | | | | | 125 | |
| | | 13.42 | | | | | | 8.49 | (g) | | | | | 123,556 | | | | | | 0.85 | | | | | | 1.06 | | | | | | 0.55 | (f) | | | | | 125 | |
| | | 12.78 | | | | | | 7.97 | (g) | | | | | 2,133 | | | | | | 1.35 | | | | | | 1.56 | | | | | | 0.10 | (f) | | | | | 125 | |
| | | 12.83 | | | | | | 8.36 | (g) | | | | | 5,389 | | | | | | 1.00 | | | | | | 1.21 | | | | | | 0.43 | (f) | | | | | 125 | |
| | | 12.81 | | | | | | 7.78 | (g) | | | | | 357 | | | | | | 1.50 | | | | | | 1.71 | | | | | | (0.06 | )(f) | | | | | 125 | |
| | | 12.06 | | | | | | 11.05 | | | | | | 65,299 | | | | | | 1.25 | | | | | | 1.42 | | | | | | 0.45 | (i) | | | | | 34 | |
| | | 10.79 | | | | | | 10.10 | | | | | | 1,399 | | | | | | 2.00 | | | | | | 2.17 | | | | | | (0.31 | )(i) | | | | | 34 | |
| | | 10.81 | | | | | | 10.14 | | | | | | 13,338 | | | | | | 2.00 | | | | | | 2.17 | | | | | | (0.32 | )(i) | | | | | 34 | |
| | | 12.53 | | | | | | 11.49 | | | | | | 86,058 | | | | | | 0.85 | | | | | | 1.02 | | | | | | 0.87 | (i) | | | | | 34 | |
| | | 11.94 | | | | | | 10.84 | | | | | | 1,548 | | | | | | 1.35 | | | | | | 1.52 | | | | | | 0.32 | (i) | | | | | 34 | |
| | | 12.00 | | | | | | 11.32 | | | | | | 4,959 | | | | | | 1.00 | | | | | | 1.17 | | | | | | 0.70 | (i) | | | | | 34 | |
| | | 11.97 | | | | | | 10.78 | | | | | | 207 | | | | | | 1.50 | | | | | | 1.67 | | | | | | 0.14 | (i) | | | | | 34 | |
| | | 10.92 | | | | | | 30.23 | | | | | | 104,435 | | | | | | 1.25 | | | | | | 1.39 | | | | | | 0.43 | (j) | | | | | 70 | |
| | | 9.80 | | | | | | 29.27 | | | | | | 2,101 | | | | | | 2.00 | | | | | | 2.14 | | | | | | (0.31 | )(j) | | | | | 70 | |
| | | 9.82 | | | | | | 29.29 | | | | | | 13,788 | | | | | | 2.00 | | | | | | 2.14 | | | | | | (0.37 | )(j) | | | | | 70 | |
| | | 11.34 | | | | | | 30.76 | | | | | | 240,597 | | | | | | 0.85 | | | | | | 0.99 | | | | | | 0.88 | (j) | | | | | 70 | |
| | | 10.82 | | | | | | 30.16 | | | | | | 1,431 | | | | | | 1.35 | | | | | | 1.49 | | | | | | 0.33 | (j) | | | | | 70 | |
| | | 10.87 | | | | | | 30.55 | | | | | | 35 | | | | | | 1.00 | | | | | | 1.14 | | | | | | 0.63 | (j) | | | | | 70 | |
| | | 10.86 | | | | | | 29.90 | | | | | | 184 | | | | | | 1.50 | | | | | | 1.64 | | | | | | (0.11 | )(j) | | | | | 70 | |
| | | 8.45 | | | | | | 6.70 | | | | | | 130,439 | | | | | | 1.25 | | | | | | 1.40 | | | | | | 0.61 | | | | | | 167 | |
| | | 7.59 | | | | | | 6.01 | | | | | | 2,737 | | | | | | 2.00 | | | | | | 2.15 | | | | | | (0.11 | ) | | | | | 167 | |
| | | 7.62 | | | | | | 5.98 | | | | | | 11,226 | | | | | | 2.00 | | | | | | 2.15 | | | | | | (0.18 | ) | | | | | 167 | |
| | | 8.78 | | | | | | 7.13 | | | | | | 349,989 | | | | | | 0.85 | | | | | | 1.00 | | | | | | 0.96 | | | | | | 167 | |
| | | 8.37 | | | | | | 6.62 | | | | | | 1,588 | | | | | | 1.35 | | | | | | 1.50 | | | | | | 0.53 | | | | | | 167 | |
| | | 8.42 | | | | | | 7.09 | | | | | | 25 | | | | | | 1.00 | | | | | | 1.15 | | | | | | 0.52 | | | | | | 167 | |
| | | 8.41 | | | | | | 6.61 | | | | | | 21 | | | | | | 1.50 | | | | | | 1.65 | | | | | | (0.10 | ) | | | | | 167 | |
| | | | | | | | | | | | | | | | | | | | | | | | | | | | | | | | | | | | | | | | |
| | | | | | | | | | | | | | | | | | | | | | | | | | | | | | | | | | | | | | | | |
| | | 7.98 | | | | | | (27.45 | ) | | | | | 162,243 | | | | | | 1.25 | (e) | | | | | 1.46 | (e) | | | | | 0.76 | (e) | | | | | 31 | |
| | | 7.16 | | | | | | (27.60 | ) | | | | | 3,806 | | | | | | 2.00 | (e) | | | | | 2.21 | (e) | | | | | 0.01 | (e) | | | | | 31 | |
| | | 7.19 | | | | | | (27.67 | ) | | | | | 11,262 | | | | | | 2.00 | (e) | | | | | 2.21 | (e) | | | | | 0.01 | (e) | | | | | 31 | |
| | | 8.30 | | | | | | (27.51 | ) | | | | | 419,179 | | | | | | 0.85 | (e) | | | | | 1.06 | (e) | | | | | 1.16 | (e) | | | | | 31 | |
| | | 7.85 | | | | | | (27.58 | ) | | | | | 2,121 | | | | | | 1.35 | (e) | | | | | 1.56 | (e) | | | | | 0.66 | (e) | | | | | 31 | |
| | | 7.96 | | | | | | (27.50 | ) | | | | | 7 | | | | | | 1.00 | (e) | | | | | 1.21 | (e) | | | | | 0.99 | (e) | | | | | 31 | |
| | | 7.93 | | | | | | (27.58 | ) | | | | | 7 | | | | | | 1.50 | (e) | | | | | 1.71 | (e) | | | | | 0.54 | (e) | | | | | 31 | |
| | | | | | | | | | | | | | | | | | | | | | | | | | | | | | | | | | | | | | | | |
| | | | | | | | | | | | | | | | | | | | | | | | | | | | | | | | | | | | | | | | |
| | | 11.00 | | | | | | (9.73 | ) | | | | | 211,930 | | | | | | 1.25 | | | | | | 1.36 | | | | | | 0.12 | | | | | | 160 | |
| | | 9.89 | | | | | | (10.39 | ) | | | | | 5,807 | | | | | | 2.00 | | | | | | 2.11 | | | | | | (0.57 | ) | | | | | 160 | |
| | | 9.94 | | | | | | (10.35 | ) | | | | | 16,250 | | | | | | 2.00 | | | | | | 2.11 | | | | | | (0.60 | ) | | | | | 160 | |
| | | 11.45 | | | | | | (9.29 | ) | | | | | 547,109 | | | | | | 0.85 | | | | | | 0.96 | | | | | | 0.54 | | | | | | 160 | |
| | | 10.84 | | | | | | (9.80 | ) | | | | | 2,904 | | | | | | 1.35 | | | | | | 1.46 | | | | | | 0.12 | | | | | | 160 | |
| | | 10.98 | | | | | | (4.14 | ) | | | | | 10 | | | | | | 1.00 | (e) | | | | | 1.11 | (e) | | | | | 0.36 | (e) | | | | | 160 | |
| | | 10.95 | | | | | | (4.40 | ) | | | | | 10 | | | | | | 1.50 | (e) | | | | | 1.61 | (e) | | | | | (0.07 | )(e) | | | | | 160 | |
| | |
| The accompanying notes are an integral part of these financial statements. | | 79 |
GOLDMAN SACHS SMALL CAP GROWTH INSIGHTS FUND
Financial Highlights
Selected Data for a Share Outstanding Throughout Each Period
| | | | | | | | | | | | | | | | | | | | | | | | | | |
| | | | | | | | Income (loss) from
investment operations | | | Distributions
to shareholders | |
| | | Year - Share Class | |
Net asset
value,
beginning
of period | | | Net
investment
income (loss)(a) | | | Net realized
and unrealized
gain (loss) | | | Total from
investment
operations | | | From net
investment
income | | | From net
realized
gains | |
| FOR THE SIX MONTHS ENDED APRIL 30, (UNAUDITED) | | | | | |
| | 2013 - A | | $ | 23.40 | | | $ | 0.19 | (d) | | $ | 3.32 | | | $ | 3.51 | | | $ | (0.18 | ) | | $ | — | |
| | 2013 - B | | | 19.93 | | | | 0.10 | (d) | | | 2.82 | | | | 2.92 | | | | (0.05 | ) | | | — | |
| | 2013 - C | | | 20.09 | | | | 0.09 | (d) | | | 2.85 | | | | 2.94 | | | | (0.05 | ) | | | — | |
| | 2013 - Institutional | | | 26.01 | | | | 0.26 | (d) | | | 3.68 | | | | 3.94 | | | | (0.28 | ) | | | — | |
| | 2013 - IR | | | 23.64 | | | | 0.22 | (d) | | | 3.35 | | | | 3.57 | | | | (0.24 | ) | | | — | |
| | 2013 - R | | | 23.08 | | | | 0.14 | (d) | | | 3.28 | | | | 3.42 | | | | (0.20 | ) | | | — | |
| | | | | | | | | | | | | | | | | | | | | | | | | | |
| | FOR THE FISCAL YEARS ENDED OCTOBER 31, | |
| | 2012 - A | | | 21.22 | | | | 0.04 | (f) | | | 2.14 | (g) | | | 2.18 | | | | — | | | | — | |
| | 2012 - B | | | 18.21 | | | | (0.12 | )(f) | | | 1.84 | (g) | | | 1.72 | | | | — | | | | — | |
| | 2012 - C | | | 18.35 | | | | (0.11 | )(f) | | | 1.85 | (g) | | | 1.74 | | | | — | | | | — | |
| | 2012 - Institutional | | | 23.49 | | | | 0.15 | (f) | | | 2.37 | (g) | | | 2.52 | | | | — | | | | — | |
| | 2012 - IR | | | 21.39 | | | | 0.03 | (f) | | | 2.22 | (g) | | | 2.25 | | | | — | | | | — | |
| | 2012 - R | | | 20.98 | | | | (0.01 | )(f) | | | 2.11 | (g) | | | 2.10 | | | | — | | | | — | |
| | 2011 - A | | | 18.49 | | | | (0.05 | )(h) | | | 2.78 | | | | 2.73 | | | | — | | | | — | |
| | 2011 - B | | | 15.98 | | | | (0.18 | )(h) | | | 2.41 | | | | 2.23 | | | | — | | | | — | |
| | 2011 - C | | | 16.11 | | | | (0.18 | )(h) | | | 2.42 | | | | 2.24 | | | | — | | | | — | |
| | 2011 - Institutional | | | 20.38 | | | | 0.03 | (h) | | | 3.08 | | | | 3.11 | | | | — | | | | — | |
| | 2011 - IR | | | 18.58 | | | | (0.08 | )(h) | | | 2.89 | | | | 2.81 | | | | — | | | | — | |
| | 2011 - R | | | 18.33 | | | | (0.11 | )(h) | | | 2.76 | | | | 2.65 | | | | — | | | | — | |
| | 2010 - A | | | 14.23 | | | | 0.01 | (i) | | | 4.30 | | | | 4.31 | | | | (0.05 | ) | | | — | |
| | 2010 - B | | | 12.35 | | | | (0.09 | )(i) | | | 3.72 | | | | 3.63 | | | | — | | | | — | |
| | 2010 - C | | | 12.45 | | | | (0.10 | )(i) | | | 3.76 | | | | 3.66 | | | | — | | | | — | |
| | 2010 - Institutional | | | 15.67 | | | | 0.07 | (i) | | | 4.74 | | | | 4.81 | | | | (0.10 | ) | | | — | |
| | 2010 - IR | | | 14.30 | | | | 0.04 | (i) | | | 4.33 | | | | 4.37 | | | | (0.09 | ) | | | — | |
| | 2010 - R | | | 14.15 | | | | (0.03 | )(i) | | | 4.27 | | | | 4.24 | | | | (0.06 | ) | | | — | |
| | 2009 - A | | | 12.66 | | | | (0.01 | ) | | | 1.58 | | | | 1.57 | | | | — | | | | — | |
| | 2009 - B | | | 11.07 | | | | (0.08 | ) | | | 1.36 | | | | 1.28 | | | | — | | | | — | |
| | 2009 - C | | | 11.16 | | | | (0.09 | ) | | | 1.38 | | | | 1.29 | | | | — | | | | — | |
| | 2009 - Institutional | | | 13.88 | | | | 0.04 | | | | 1.75 | | | | 1.79 | | | | — | | | | — | |
| | 2009 - IR | | | 12.68 | | | | 0.03 | | | | 1.59 | | | | 1.62 | | | | — | | | | — | |
| | 2009 - R | | | 12.63 | | | | (0.06 | ) | | | 1.58 | | | | 1.52 | | | | — | | | | — | |
| | 2008 - A | | | 36.25 | | | | (0.05 | ) | | | (9.43 | ) | | | (9.48 | ) | | | — | | | | (14.11 | ) |
| | 2008 - B | | | 33.77 | | | | (0.17 | ) | | | (8.42 | ) | | | (8.59 | ) | | | — | | | | (14.11 | ) |
| | 2008 - C | | | 33.92 | | | | (0.17 | ) | | | (8.48 | ) | | | (8.65 | ) | | | — | | | | (14.11 | ) |
| | 2008 - Institutional | | | 38.18 | | | | 0.02 | | | | (10.21 | ) | | | (10.19 | ) | | | — | | | | (14.11 | ) |
| | 2008 - IR (Commenced November 30, 2007) | | | 33.22 | | | | (0.01 | ) | | | (6.42 | ) | | | (6.43 | ) | | | — | | | | (14.11 | ) |
| | 2008 - R (Commenced November 30, 2007) | | | 33.22 | | | | (0.08 | ) | | | (6.40 | ) | | | (6.48 | ) | | | — | | | | (14.11 | ) |
| | (a) | | Calculated based on the average shares outstanding methodology. |
| | (b) | | Assumes investment at the net asset value at the beginning of the period, reinvestment of all dividends and distributions, a complete redemption of the investment at the net asset value at the end of the period and no sales or redemption charges. Total returns would be reduced if a sales or redemption charge was taken into account. Returns do not reflect the deduction of taxes that a shareholder would pay on Fund distributions or the redemption of Fund shares. Total returns for periods less than one full year are not annualized. |
| | (c) | | The Fund’s portfolio turnover rate is calculated in accordance with regulatory requirements, without regard to transactions involving short term investments and certain derivatives. If such transactions were included, the Fund’s portfolio turnover rate may be higher. |
| | (d) | | Reflects income recognized from special dividends which amounted to $0.16 per share and 1.28% of average net assets. |
| | (f) | | Reflects income recognized from special dividends which amounted to $0.11 per share and 0.51% of average net assets. |
| | (g) | | Reflects payment from affiliate relating to certain investment transactions which amounted to $0.11 per share. Excluding such payment, the total return would have been 9.73%, 8.82%, 8.86%, 10.23%, 9.98% and 9.46%, respectively. |
| | (h) | | Reflects income recognized from special dividends which amounted to $0.07 per share and 0.34% of average net assets. |
| | (i) | | Reflects income recognized from special dividends which amounted to $0.10 per share and 0.63% of average net assets |
| | |
| 80 | | The accompanying notes are an integral part of these financial statements. |
GOLDMAN SACHS SMALL CAP GROWTH INSIGHTS FUND
| | | | | | | | | | | | | | | | | | | | | | | | | | | | | | | | | | | | | | | | |
| | | | | | | | | | | | | | | | | | | | | | | | | | | | | | | | | | |
| | | Net asset
value, end
of period | | | | | Total
return(b) | | | | | Net assets,
end of
period
(in 000s) | | | | | Ratio of
net expenses
to average
net assets | | | | | Ratio of
total expenses
to average
net assets | | | | | Ratio of
net investment
income (loss)
to average
net assets | | | | | Portfolio
turnover
rate(c) | |
| | | | | | | | | | | | | | | | | | | | | | | | | | | | | | | | | | | | | | | | |
| | $ | 26.73 | | | | | | 15.12 | % | | | | $ | 27,638 | | | | | | 1.26 | %(e) | | | | | 1.91 | %(e) | | | | | 1.57 | %(d)(e) | | | | | 74 | % |
| | | 22.80 | | | | | | 14.62 | | | | | | 3,111 | | | | | | 2.01 | (e) | | | | | 2.65 | (e) | | | | | 0.97 | (d)(e) | | | | | 74 | |
| | | 22.98 | | | | | | 14.65 | | | | | | 5,693 | | | | | | 2.01 | (e) | | | | | 2.65 | (e) | | | | | 0.82 | (d)(e) | | | | | 74 | |
| | | 29.67 | | | | | | 15.32 | | | | | | 11,725 | | | | | | 0.86 | (e) | | | | | 1.51 | (e) | | | | | 1.89 | (d)(e) | | | | | 74 | |
| | | 26.97 | | | | | | 15.20 | | | | | | 226 | | | | | | 1.01 | (e) | | | | | 1.66 | (e) | | | | | 1.79 | (d)(e) | | | | | 74 | |
| | | 26.30 | | | | | | 14.94 | | | | | | 109 | | | | | | 1.51 | (e) | | | | | 2.17 | (e) | | | | | 1.12 | (d)(e) | | | | | 74 | |
| | | | | | | | | | | | | | | | | | | | | | | | | | | | | | | | | | | | | | | | |
| | | | | | | | | | | | | | | | | | | | | | | | | | | | | | | | | | | | | | | | |
| | | 23.40 | | | | | | 10.24 | (g) | | | | | 25,662 | | | | | | 1.25 | | | | | | 1.96 | | | | | | 0.16 | (f) | | | | | 116 | |
| | | 19.93 | | | | | | 9.42 | (g) | | | | | 3,385 | | | | | | 2.01 | | | | | | 2.71 | | | | | | (0.63 | )(f) | | | | | 116 | |
| | | 20.09 | | | | | | 9.46 | (g) | | | | | 5,247 | | | | | | 2.00 | | | | | | 2.71 | | | | | | (0.59 | )(f) | | | | | 116 | |
| | | 26.01 | | | | | | 10.70 | (g) | | | | | 7,733 | | | | | | 0.85 | | | | | | 1.55 | | | | | | 0.57 | (f) | | | | | 116 | |
| | | 23.64 | | | | | | 10.49 | (g) | | | | | 176 | | | | | | 1.00 | | | | | | 1.70 | | | | | | 0.12 | (f) | | | | | 116 | |
| | | 23.08 | | | | | | 9.98 | (g) | | | | | 30 | | | | | | 1.50 | | | | | | 2.20 | | | | | | (0.08 | )(f) | | | | | 116 | |
| | | 21.22 | | | | | | 14.76 | | | | | | 24,979 | | | | | | 1.25 | | | | | | 1.96 | | | | | | (0.26 | )(h) | | | | | 52 | |
| | | 18.21 | | | | | | 13.95 | | | | | | 4,760 | | | | | | 2.00 | | | | | | 2.71 | | | | | | (0.98 | )(h) | | | | | 52 | |
| | | 18.35 | | | | | | 13.90 | | | | | | 5,180 | | | | | | 2.00 | | | | | | 2.71 | | | | | | (1.00 | )(h) | | | | | 52 | |
| | | 23.49 | | | | | | 15.26 | | | | | | 6,959 | | | | | | 0.85 | | | | | | 1.56 | | | | | | 0.14 | (h) | | | | | 52 | |
| | | 21.39 | | | | | | 15.12 | | | | | | 38 | | | | | | 1.00 | | | | | | 1.71 | | | | | | (0.38 | )(h) | | | | | 52 | |
| | | 20.98 | | | | | | 14.46 | | | | | | 19 | | | | | | 1.50 | | | | | | 2.21 | | | | | | (0.51 | )(h) | | | | | 52 | |
| | | 18.49 | | | | | | 30.38 | | | | | | 22,598 | | | | | | 1.25 | | | | | | 2.09 | | | | | | 0.03 | (i) | | | | | 100 | |
| | | 15.98 | | | | | | 29.39 | | | | | | 6,395 | | | | | | 2.00 | | | | | | 2.84 | | | | | | (0.65 | )(i) | | | | | 100 | |
| | | 16.11 | | | | | | 29.40 | | | | | | 5,263 | | | | | | 2.00 | | | | | | 2.84 | | | | | | (0.70 | )(i) | | | | | 100 | |
| | | 20.38 | | | | | | 30.87 | | | | | | 5,649 | | | | | | 0.85 | | | | | | 1.69 | | | | | | 0.39 | (i) | | | | | 100 | |
| | | 18.58 | | | | | | 30.66 | | | | | | 10 | | | | | | 1.00 | | | | | | 1.84 | | | | | | 0.26 | (i) | | | | | 100 | |
| | | 18.33 | | | | | | 30.07 | | | | | | 47 | | | | | | 1.50 | | | | | | 2.34 | | | | | | (0.21 | )(i) | | | | | 100 | |
| | | 14.23 | | | | | | 12.40 | | | | | | 19,090 | | | | | | 1.25 | | | | | | 2.44 | | | | | | (0.06 | ) | | | | | 205 | |
| | | 12.35 | | | | | | 11.56 | | | | | | 7,608 | | | | | | 2.00 | | | | | | 3.19 | | | | | | (0.78 | ) | | | | | 205 | |
| | | 12.45 | | | | | | 11.56 | | | | | | 4,793 | | | | | | 2.00 | | | | | | 3.19 | | | | | | (0.82 | ) | | | | | 205 | |
| | | 15.67 | | | | | | 12.90 | | | | | | 4,026 | | | | | | 0.85 | | | | | | 2.04 | | | | | | 0.31 | | | | | | 205 | |
| | | 14.30 | | | | | | 12.78 | | | | | | 7 | | | | | | 1.00 | | | | | | 2.19 | | | | | | 0.18 | | | | | | 205 | |
| | | 14.15 | | | | | | 12.03 | | | | | | 42 | | | | | | 1.50 | | | | | | 2.69 | | | | | | (0.44 | ) | | | | | 205 | |
| | | 12.66 | | | | | | (39.66 | ) | | | | | 19,402 | | | | | | 1.25 | | | | | | 2.00 | | | | | | (0.32 | ) | | | | | 182 | |
| | | 11.07 | | | | | | (40.12 | ) | | | | | 10,176 | | | | | | 2.00 | | | | | | 2.75 | | | | | | (1.07 | ) | | | | | 182 | |
| | | 11.16 | | | | | | (40.12 | ) | | | | | 4,918 | | | | | | 2.00 | | | | | | 2.75 | | | | | | (1.07 | ) | | | | | 182 | |
| | | 13.88 | | | | | | (39.44 | ) | | | | | 3,662 | | | | | | 0.85 | | | | | | 1.60 | | | | | | (0.12 | ) | | | | | 182 | |
| | | 12.68 | | | | | | (34.14 | ) | | | | | 7 | | | | | | 1.00 | (e) | | | | | 1.75 | (e) | | | | | (0.06 | )(e) | | | | | 182 | |
| | | 12.63 | | | | | | (34.40 | ) | | | | | 7 | | | | | | 1.50 | (e) | | | | | 2.25 | (e) | | | | | (0.40 | )(e) | | | | | 182 | |
| | |
| The accompanying notes are an integral part of these financial statements. | | 81 |
GOLDMAN SACHS SMALL CAP VALUE INSIGHTS FUND
Financial Highlights
Selected Data for a Share Outstanding Throughout Each Period
| | | | | | | | | | | | | | | | | | | | | | | | | | |
| | | | | | | | Income (loss) from
investment operations | | | Distributions
to shareholders | |
| | | Year - Share Class | | Net asset
value,
beginning
of period | | | Net
investment
income (loss)(a) | | | Net realized
and unrealized
gain (loss) | | | Total from
investment
operations | | | From net
investment
income | | | From net
realized
gains | |
| | FOR THE SIX MONTHS ENDED APRIL 30, (UNAUDITED)* | |
| | 2013 - A | | $ | 28.75 | | | $ | 0.31 | (d) | | $ | 3.04 | | | $ | 3.35 | | | $ | (0.32 | ) | | $ | — | |
| | 2013 - B | | | 20.01 | | | | 0.14 | (d) | | | 2.13 | | | | 2.27 | | | | (0.18 | ) | | | — | |
| | 2013 - C | | | 22.62 | | | | 0.16 | (d) | | | 2.40 | | | | 2.56 | | | | (0.17 | ) | | | — | |
| | 2013 - Institutional | | | 35.67 | | | | 0.45 | (d) | | | 3.79 | | | | 4.24 | | | | (0.44 | ) | | | — | |
| | 2013 - IR | | | 28.75 | | | | 0.33 | (d) | | | 3.05 | | | | 3.38 | | | | (0.43 | ) | | | — | |
| | 2013 - R | | | 28.54 | | | | 0.26 | (d) | | | 3.04 | | | | 3.30 | | | | (0.32 | ) | | | — | |
| | | | | | | | | | | | | | | | | | | | | | | | | | |
| | FOR THE FISCAL YEARS ENDED OCTOBER 31, | |
| | 2012 - A | | | 26.36 | | | | 0.22 | (f) | | | 2.31 | (g) | | | 2.53 | | | | (0.14 | ) | | | — | |
| | 2012 - B | | | 18.40 | | | | (0.01 | )(f) | | | 1.62 | (g) | | | 1.61 | | | | — | | | | — | |
| | 2012 - C | | | 20.79 | | | | — | (f)(h) | | | 1.83 | (g) | | | 1.83 | | | | — | | | | — | |
| | 2012 - Institutional | | | 32.66 | | | | 0.47 | (f) | | | 2.79 | (g) | | | 3.26 | | | | (0.25 | ) | | | — | |
| | 2012 - IR | | | 26.40 | | | | 0.31 | (f) | | | 2.28 | (g) | | | 2.59 | | | | (0.24 | ) | | | — | |
| | 2012 - R | | | 26.21 | | | | 0.15 | (f) | | | 2.30 | (g) | | | 2.45 | | | | (0.12 | ) | | | — | |
| | 2011 - A | | | 24.10 | | | | 0.15 | (i) | | | 2.27 | | | | 2.42 | | | | (0.16 | ) | | | — | |
| | 2011 - B | | | 16.87 | | | | (0.03 | )(i) | | | 1.58 | | | | 1.55 | | | | (0.02 | ) | | | — | |
| | 2011 - C | | | 19.06 | | | | (0.04 | )(i) | | | 1.80 | | | | 1.76 | | | | (0.03 | ) | | | — | |
| | 2011 - Institutional | | | 29.80 | | | | 0.32 | (i) | | | 2.79 | | | | 3.11 | | | | (0.25 | ) | | | — | |
| | 2011 - IR | | | 24.15 | | | | 0.24 | (i) | | | 2.24 | | | | 2.48 | | | | (0.23 | ) | | | — | |
| | 2011 - R | | | 23.99 | | | | 0.07 | (i) | | | 2.26 | | | | 2.33 | | | | (0.11 | ) | | | — | |
| | 2010 - A | | | 18.78 | | | | 0.16 | (j) | | | 5.34 | | | | 5.50 | | | | (0.18 | ) | | | — | |
| | 2010 - B | | | 13.24 | | | | — | (h)(j) | | | 3.75 | | | | 3.75 | | | | (0.12 | ) | | | — | |
| | 2010 - C | | | 14.94 | | | | — | (h)(j) | | | 4.24 | | | | 4.24 | | | | (0.12 | ) | | | — | |
| | 2010 - Institutional | | | 23.11 | | | | 0.30 | (j) | | | 6.59 | | | | 6.89 | | | | (0.20 | ) | | | — | |
| | 2010 - IR | | | 18.78 | | | | 0.22 | (j) | | | 5.34 | | | | 5.56 | | | | (0.19 | ) | | | — | |
| | 2010 - R | | | 18.74 | | | | 0.10 | (j) | | | 5.33 | | | | 5.43 | | | | (0.18 | ) | | | — | |
| | 2009 - A | | | 18.62 | | | | 0.18 | | | | 0.25 | | | | 0.43 | | | | (0.27 | ) | | | — | |
| | 2009 - B | | | 13.16 | | | | 0.05 | | | | 0.19 | | | | 0.24 | | | | (0.16 | ) | | | — | |
| | 2009 - C | | | 14.84 | | | | 0.05 | | | | 0.18 | | | | 0.23 | | | | (0.13 | ) | | | — | |
| | 2009 - Institutional | | | 22.89 | | | | 0.31 | | | | 0.28 | | | | 0.59 | | | | (0.37 | ) | | | — | |
| | 2009 - IR | | | 18.69 | | | | 0.22 | | | | 0.21 | | | | 0.43 | | | | (0.34 | ) | | | — | |
| | 2009 - R | | | 18.62 | | | | 0.12 | | | | 0.23 | | | | 0.35 | | | | (0.23 | ) | | | — | |
| | 2008 - A | | | 89.04 | | | | 0.14 | | | | (14.42 | ) | | | (14.28 | ) | | | — | | | | (56.14 | ) |
| | 2008 - B | | | 81.13 | | | | (0.07 | ) | | | (11.76 | ) | | | (11.83 | ) | | | — | | | | (56.14 | ) |
| | 2008 - C | | | 83.58 | | | | — | (h) | | | (12.60 | ) | | | (12.60 | ) | | | — | | | | (56.14 | ) |
| | 2008 - Institutional | | | 95.27 | | | | 0.42 | | | | (16.66 | ) | | | (16.24 | ) | | | — | | | | (56.14 | ) |
| | 2008 - IR (Commenced November 30, 2007) | | | 81.41 | | | | 0.21 | | | | (6.79 | ) | | | (6.58 | ) | | | — | | | | (56.14 | ) |
| | 2008 - R (Commenced November 30, 2007) | | | 81.41 | | | | 0.14 | | | | (6.79 | ) | | | (6.65 | ) | | | — | | | | (56.14 | ) |
| | * | | All per share amounts representing data prior to February 9, 2009 have been restated to reflect a 7 for 1 reverse stock split which occurred on that date. |
| | (a) | | Calculated based on the average shares outstanding methodology. |
| | (b) | | Assumes investment at the net asset value at the beginning of the period, reinvestment of all dividends and distributions, a complete redemption of the investment at the net asset value at the end of the period and no sales or redemption charges. Total returns would be reduced if a sales or redemption charge was taken into account. Returns do not reflect the deduction of taxes that a shareholder would pay on Fund distributions or the redemption of Fund shares. Total returns for periods less than one full year are not annualized. |
| | (c) | | The Fund’s portfolio turnover rate is calculated in accordance with regulatory requirements, without regard to transactions involving short term investments and certain derivatives. If such transactions were included, the Fund’s portfolio turnover rate may be higher. |
| | (d) | | Reflects income recognized from special dividends which amounted to $0.14 per share and 0.96% of average net assets. |
| | (f) | | Reflects income recognized from special dividends which amounted to $0.09 per share and 0.33% of average net assets. |
| | (g) | | Reflects payment from affiliate relating to certain investment transactions which amounted to $0.07 per share. Excluding such payment, the total return would have been 9.34%, 8.35%, 8.44%, 9.81%, 9.55% and 9.09%, respectively. |
| | (h) | | Amount is less than $0.005 per share. |
| | (i) | | Reflects income recognized from special dividends which amounted to $0.07 per share and 0.27% of average net assets. |
| | (j) | | Reflects income recognized from special dividends which amounted to $0.06 per share and 0.33% of average net assets. |
| | |
| 82 | | The accompanying notes are an integral part of these financial statements. |
GOLDMAN SACHS SMALL CAP VALUE INSIGHTS FUND
| | | | | | | | | | | | | | | | | | | | | | | | | | | | | | | | | | | | | | | | |
| | | | | | | | | | | | | | | | | | | | | | | | | | | | | | | | | | |
| | | Net asset
value, end
of period | | | | | Total
return(b) | | | | | Net assets,
end of
period
(in 000s) | | | | | Ratio of
net expenses
to average
net assets | | | | | Ratio of
total expenses
to average
net assets | | | | | Ratio of
net investment
income (loss)
to average
net assets | | | | | Portfolio
turnover
rate(c) | |
| | | | | | | | | | | | | | | | | | | | | | | | | | | | | | | | | | | | | | | | |
| | $ | 31.78 | | | | | | 11.80 | % | | | | $ | 94,015 | | | | | | 1.25 | %(e) | | | | | 1.51 | %(e) | | | | | 2.08 | %(d)(e) | | | | | 63 | % |
| | | 22.10 | | | | | | 11.44 | | | | | | 9,504 | | | | | | 2.00 | (e) | | | | | 2.26 | (e) | | | | | 1.39 | (d)(e) | | | | | 63 | |
| | | 25.01 | | | | | | 11.42 | | | | | | 18,452 | | | | | | 2.00 | (e) | | | | | 2.26 | (e) | | | | | 1.34 | (d)(e) | | | | | 63 | |
| | | 39.47 | | | | | | 12.06 | | | | | | 13,635 | | | | | | 0.85 | (e) | | | | | 1.11 | (e) | | | | | 2.45 | (d)(e) | | | | | 63 | |
| | | 31.70 | | | | | | 12.00 | | | | | | 1,173 | | | | | | 1.00 | (e) | | | | | 1.26 | (e) | | | | | 2.24 | (d)(e) | | | | | 63 | |
| | | 31.52 | | | | | | 11.68 | | | | | | 882 | | | | | | 1.50 | (e) | | | | | 1.76 | (e) | | | | | 1.77 | (d)(e) | | | | | 63 | |
| | | | | | | | | | | | | | | | | | | | | | | | | | | | | | | | | | | | | | | | |
| | | | | | | | | | | | | | | | | | | | | | | | | | | | | | | | | | | | | | | | |
| | | 28.75 | | | | | | 9.60 | (g) | | | | | 87,084 | | | | | | 1.25 | | | | | | 1.52 | | | | | | 0.79 | (f) | | | | | 85 | |
| | | 20.01 | | | | | | 8.73 | (g) | | | | | 10,256 | | | | | | 2.01 | | | | | | 2.27 | | | | | | 0.03 | (f) | | | | | 85 | |
| | | 22.62 | | | | | | 8.78 | (g) | | | | | 17,808 | | | | | | 2.00 | | | | | | 2.27 | | | | | | 0.04 | (f) | | | | | 85 | |
| | | 35.67 | | | | | | 10.02 | (g) | | | | | 12,310 | | | | | | 0.85 | | | | | | 1.11 | | | | | | 1.30 | (f) | | | | | 85 | |
| | | 28.75 | | | | | | 9.82 | (g) | | | | | 455 | | | | | | 1.00 | | | | | | 1.26 | | | | | | 1.11 | (f) | | | | | 85 | |
| | | 28.54 | | | | | | 9.35 | (g) | | | | | 699 | | | | | | 1.50 | | | | | | 1.75 | | | | | | 0.52 | (f) | | | | | 85 | |
| | | 26.36 | | | | | | 10.03 | | | | | | 91,426 | | | | | | 1.25 | | | | | | 1.54 | | | | | | 0.58 | (i) | | | | | 33 | |
| | | 18.40 | | | | | | 9.19 | | | | | | 14,722 | | | | | | 2.00 | | | | | | 2.29 | | | | | | (0.16 | )(i) | | | | | 33 | |
| | | 20.79 | | | | | | 9.21 | | | | | | 19,248 | | | | | | 2.00 | | | | | | 2.29 | | | | | | (0.17 | )(i) | | | | | 33 | |
| | | 32.66 | | | | | | 10.46 | | | | | | 3,479 | | | | | | 0.85 | | | | | | 1.14 | | | | | | 0.97 | (i) | | | | | 33 | |
| | | 26.40 | | | | | | 10.29 | | | | | | 223 | | | | | | 1.00 | | | | | | 1.29 | | | | | | 0.96 | (i) | | | | | 33 | |
| | | 26.21 | | | | | | 9.71 | | | | | | 214 | | | | | | 1.50 | | | | | | 1.79 | | | | | | 0.26 | (i) | | | | | 33 | |
| | | 24.10 | | | | | | 29.47 | | | | | | 95,864 | | | | | | 1.25 | | | | | | 1.55 | | | | | | 0.72 | (j) | | | | | 85 | |
| | | 16.87 | | | | | | 28.54 | | | | | | 20,172 | | | | | | 2.00 | | | | | | 2.30 | | | | | | 0.01 | (j) | | | | | 85 | |
| | | 19.06 | | | | | | 28.54 | | | | | | 21,671 | | | | | | 2.00 | | | | | | 2.30 | | | | | | (0.02 | )(j) | | | | | 85 | |
| | | 29.80 | | | | | | 30.03 | | | | | | 2,462 | | | | | | 0.85 | | | | | | 1.15 | | | | | | 1.10 | (j) | | | | | 85 | |
| | | 24.15 | | | | | | 29.83 | | | | | | 28 | | | | | | 1.00 | | | | | | 1.30 | | | | | | 0.99 | (j) | | | | | 85 | |
| | | 23.99 | | | | | | 29.17 | | | | | | 120 | | | | | | 1.50 | | | | | | 1.80 | | | | | | 0.45 | (j) | | | | | 85 | |
| | | 18.78 | | | | | | 2.64 | | | | | | 79,873 | | | | | | 1.25 | | | | | | 1.69 | | | | | | 1.11 | | | | | | 184 | |
| | | 13.24 | | | | | | 2.27 | | | | | | 27,689 | | | | | | 2.00 | | | | | | 2.44 | | | | | | 0.42 | | | | | | 184 | |
| | | 14.94 | | | | | | 1.61 | | | | | | 20,883 | | | | | | 2.00 | | | | | | 2.44 | | | | | | 0.38 | | | | | | 184 | |
| | | 23.11 | | | | | | 2.97 | | | | | | 1,244 | | | | | | 0.85 | | | | | | 1.29 | | | | | | 1.55 | | | | | | 184 | |
| | | 18.78 | | | | | | 2.43 | | | | | | 7 | | | | | | 1.00 | | | | | | 1.44 | | | | | | 1.34 | | | | | | 184 | |
| | | 18.74 | | | | | | 2.17 | | | | | | 79 | | | | | | 1.50 | | | | | | 1.94 | | | | | | 0.68 | | | | | | 184 | |
| | | 18.62 | | | | | | (33.48 | ) | | | | | 85,992 | | | | | | 1.25 | | | | | | 1.53 | | | | | | 0.71 | | | | | | 147 | |
| | | 13.16 | | | | | | (34.04 | ) | | | | | 43,039 | | | | | | 2.00 | | | | | | 2.28 | | | | | | (0.05 | ) | | | | | 147 | |
| | | 14.84 | | | | | | (33.89 | ) | | | | | 26,503 | | | | | | 2.00 | | | | | | 2.28 | | | | | | (0.05 | ) | | | | | 147 | |
| | | 22.89 | | | | | | (33.07 | ) | | | | | 1,599 | | | | | | 0.85 | | | | | | 1.13 | | | | | | 1.05 | | | | | | 147 | |
| | | 18.69 | | | | | | (27.00 | ) | | | | | 7 | | | | | | 1.00 | (e) | | | | | 1.28 | (e) | | | | | 1.03 | (e) | | | | | 147 | |
| | | 18.62 | | | | | | (27.27 | ) | | | | | 7 | | | | | | 1.50 | (e) | | | | | 1.78 | (e) | | | | | 0.60 | (e) | | | | | 147 | |
| | |
| The accompanying notes are an integral part of these financial statements. | | 83 |
GOLDMAN SACHS U.S. EQUITY INSIGHTS FUND
Financial Highlights
Selected Data for a Share Outstanding Throughout Each Period
| | | | | | | | | | | | | | | | | | | | | | | | | | | | | | |
| | | | | | | | Income (loss) from
investment operations | | | Distributions
to shareholders | |
| | | Year - Share Class | |
Net asset
value,
beginning
of period | | | Net
investment
income(a) | | | Net realized
and unrealized
gain (loss) | | | Total from
investment
operations | | | From net
investment
income | | | From net
realized
gains | | | Total
distributions | |
| | FOR THE SIX MONTHS ENDED APRIL 30, (UNAUDITED) | |
| | 2013 - A | | $ | 26.80 | | | $ | 0.28 | (d) | | $ | 3.84 | | | $ | 4.12 | | | $ | (0.40 | ) | | $ | — | | | $ | (0.40 | ) |
| | 2013 - B | | | 25.02 | | | | 0.17 | (d) | | | 3.60 | | | | 3.77 | | | | (0.17 | ) | | | — | | | | (0.17 | ) |
| | 2013 - C | | | 24.59 | | | | 0.16 | (d) | | | 3.54 | | | | 3.70 | | | | (0.22 | ) | | | — | | | | (0.22 | ) |
| | 2013 - Institutional | | | 27.51 | | | | 0.33 | (d) | | | 3.94 | | | | 4.27 | | | | (0.51 | ) | | | — | | | | (0.51 | ) |
| | 2013 - Service | | | 26.76 | | | | 0.27 | (d) | | | 3.82 | | | | 4.09 | | | | (0.38 | ) | | | — | | | | (0.38 | ) |
| | 2013 - IR | | | 26.62 | | | | 0.30 | (d) | | | 3.81 | | | | 4.11 | | | | (0.48 | ) | | | — | | | | (0.48 | ) |
| | 2013 - R | | | 26.58 | | | | 0.24 | (d) | | | 3.81 | | | | 4.05 | | | | (0.39 | ) | | | — | | | | (0.39 | ) |
| | | | | | | | | | | | | | | | | | | | | | | | | | | | | | |
| | FOR THE FISCAL YEARS ENDED OCTOBER 31, | |
| | 2012 - A | | | 24.21 | | | | 0.33 | (f) | | | 2.70 | (g) | | | 3.03 | | | | (0.44 | ) | | | — | | | | (0.44 | ) |
| | 2012 - B | | | 22.59 | | | | 0.14 | (f) | | | 2.52 | (g) | | | 2.66 | | | | (0.23 | ) | | | — | | | | (0.23 | ) |
| | 2012 - C | | | 22.25 | | | | 0.13 | (f) | | | 2.48 | (g) | | | 2.61 | | | | (0.27 | ) | | | — | | | | (0.27 | ) |
| | 2012 - Institutional | | | 24.82 | | | | 0.44 | (f) | | | 2.77 | (g) | | | 3.21 | | | | (0.52 | ) | | | — | | | | (0.52 | ) |
| | 2012 - Service | | | 24.14 | | | | 0.30 | (f) | | | 2.70 | (g) | | | 3.00 | | | | (0.38 | ) | | | — | | | | (0.38 | ) |
| | 2012 - IR | | | 24.08 | | | | 0.37 | (f) | | | 2.69 | (g) | | | 3.06 | | | | (0.52 | ) | | | — | | | | (0.52 | ) |
| | 2012 - R | | | 23.98 | | | | 0.22 | (f) | | | 2.73 | (g) | | | 2.95 | | | | (0.35 | ) | | | — | | | | (0.35 | ) |
| | 2011 - A | | | 22.32 | | | | 0.31 | (h) | | | 1.87 | | | | 2.18 | | | | (0.29 | ) | | | — | | | | (0.29 | ) |
| | 2011 - B | | | 20.82 | | | | 0.12 | (h) | | | 1.76 | | | | 1.88 | | | | (0.11 | ) | | | — | | | | (0.11 | ) |
| | 2011 - C | | | 20.54 | | | | 0.12 | (h) | | | 1.72 | | | | 1.84 | | | | (0.13 | ) | | | — | | | | (0.13 | ) |
| | 2011 - Institutional | | | 22.89 | | | | 0.44 | (h) | | | 1.87 | | | | 2.31 | | | | (0.38 | ) | | | — | | | | (0.38 | ) |
| | 2011 - Service | | | 22.25 | | | | 0.28 | (h) | | | 1.87 | | | | 2.15 | | | | (0.26 | ) | | | — | | | | (0.26 | ) |
| | 2011 - IR | | | 22.21 | | | | 0.36 | (h) | | | 1.86 | | | | 2.22 | | | | (0.35 | ) | | | — | | | | (0.35 | ) |
| | 2011 - R | | | 22.11 | | | | 0.24 | (h) | | | 1.85 | | | | 2.09 | | | | (0.22 | ) | | | — | | | | (0.22 | ) |
| | 2010 - A | | | 19.75 | | | | 0.24 | | | | 2.63 | | | | 2.87 | | | | (0.30 | ) | | | — | | | | (0.30 | ) |
| | 2010 - B | | | 18.43 | | | | 0.08 | | | | 2.44 | | | | 2.52 | | | | (0.13 | ) | | | — | | | | (0.13 | ) |
| | 2010 - C | | | 18.21 | | | | 0.07 | | | | 2.44 | | | | 2.51 | | | | (0.18 | ) | | | — | | | | (0.18 | ) |
| | 2010 - Institutional | | | 20.25 | | | | 0.33 | | | | 2.69 | | | | 3.02 | | | | (0.38 | ) | | | — | | | | (0.38 | ) |
| | 2010 - Service | | | 19.66 | | | | 0.23 | | | | 2.60 | | | | 2.83 | | | | (0.24 | ) | | | — | | | | (0.24 | ) |
| | 2010 - IR | | | 19.65 | | | | 0.29 | | | | 2.63 | | | | 2.92 | | | | (0.36 | ) | | | — | | | | (0.36 | ) |
| | 2010 - R | | | 19.63 | | | | 0.18 | | | | 2.61 | | | | 2.79 | | | | (0.31 | ) | | | — | | | | (0.31 | ) |
| | 2009 - A | | | 19.02 | | | | 0.31 | | | | 0.87 | | | | 1.18 | | | | (0.38 | ) | | | (0.07 | ) | | | (0.45 | ) |
| | 2009 - B | | | 17.63 | | | | 0.18 | | | | 0.82 | | | | 1.00 | | | | (0.13 | ) | | | (0.07 | ) | | | (0.20 | ) |
| | 2009 - C | | | 17.50 | | | | 0.16 | | | | 0.82 | | | | 0.98 | | | | (0.20 | ) | | | (0.07 | ) | | | (0.27 | ) |
| | 2009 - Institutional | | | 19.52 | | | | 0.38 | | | | 0.91 | | | | 1.29 | | | | (0.49 | ) | | | (0.07 | ) | | | (0.56 | ) |
| | 2009 - Service | | | 18.84 | | | | 0.29 | | | | 0.88 | | | | 1.17 | | | | (0.28 | ) | | | (0.07 | ) | | | (0.35 | ) |
| | 2009 - IR | | | 18.96 | | | | 0.34 | | | | 0.87 | | | | 1.21 | | | | (0.45 | ) | | | (0.07 | ) | | | (0.52 | ) |
| | 2009 - R | | | 18.89 | | | | 0.16 | | | | 0.98 | | | | 1.14 | | | | (0.33 | ) | | | (0.07 | ) | | | (0.40 | ) |
| | | | | | | | | | | | | | | | | | | | | | | | | | | | | | |
| | FOR THE PERIOD SEPTEMBER 1, 2008 TO OCTOBER 31, 2008* | |
| | 2008 - A | | | 24.97 | | | | 0.04 | | | | (5.99 | ) | | | (5.95 | ) | | | — | | | | — | | | | — | |
| | 2008 - B | | | 23.18 | | | | 0.02 | | | | (5.57 | ) | | | (5.55 | ) | | | — | | | | — | | | | — | |
| | 2008 - C | | | 23.01 | | | | 0.02 | | | | (5.53 | ) | | | (5.51 | ) | | | — | | | | — | | | | — | |
| | 2008 - Institutional | | | 25.61 | | | | 0.06 | | | | (6.15 | ) | | | (6.09 | ) | | | — | | | | — | | | | — | |
| | 2008 - Service | | | 24.74 | | | | 0.04 | | | | (5.94 | ) | | | (5.90 | ) | | | — | | | | — | | | | — | |
| | 2008 - IR | | | 24.88 | | | | 0.05 | | | | (5.97 | ) | | | (5.92 | ) | | | — | | | | — | | | | — | |
| | 2008 - R | | | 24.81 | | | | 0.04 | | | | (5.96 | ) | | | (5.92 | ) | | | — | | | | — | | | | — | |
| | | | | | | | | | | | | | | | | | | | | | | | | | | | | | |
| | FOR THE FISCAL YEAR ENDED AUGUST 31, | |
| | 2008 - A | | | 33.30 | | | | 0.29 | | | | (4.86 | ) | | | (4.57 | ) | | | (0.34 | ) | | | (3.42 | ) | | | (3.76 | ) |
| | 2008 - B | | | 31.17 | | | | 0.08 | | | | (4.54 | ) | | | (4.46 | ) | | | (0.11 | ) | | | (3.42 | ) | | | (3.53 | ) |
| | 2008 - C | | | 31.01 | | | | 0.07 | | | | (4.49 | ) | | | (4.42 | ) | | | (0.16 | ) | | | (3.42 | ) | | | (3.58 | ) |
| | 2008 - Institutional | | | 34.07 | | | | 0.42 | | | | (4.98 | ) | | | (4.56 | ) | | | (0.48 | ) | | | (3.42 | ) | | | (3.90 | ) |
| | 2008 - Service | | | 32.98 | | | | 0.26 | | | | (4.80 | ) | | | (4.54 | ) | | | (0.28 | ) | | | (3.42 | ) | | | (3.70 | ) |
| | 2008 - IR (Commenced November 30, 2007) | | | 33.02 | | | | 0.26 | | | | (4.49 | ) | | | (4.23 | ) | | | (0.49 | ) | | | (3.42 | ) | | | (3.91 | ) |
| | 2008 - R (Commenced November 30, 2007) | | | 33.02 | | | | 0.17 | | | | (4.48 | ) | | | (4.31 | ) | | | (0.48 | ) | | | (3.42 | ) | | | (3.90 | ) |
| | * | | The Fund changed its fiscal year end from August 31 to October 31. |
| | (a) | | Calculated based on the average shares outstanding methodology. |
| | (b) | | Assumes investment at the net asset value at the beginning of the period, reinvestment of all dividends and distributions, a complete redemption of the investment at the net asset value at the end of the period and no sales or redemption charges. Total returns would be reduced if a sales or redemption charge was taken into account. Returns do not reflect the deduction of taxes that a shareholder would pay on Fund distributions or the redemption of Fund shares. Total returns for periods less than one full year are not annualized. |
| | (c) | | The Fund’s portfolio turnover rate is calculated in accordance with regulatory requirements, without regard to transactions involving short term investments and certain derivatives. If such transactions were included, the Fund’s portfolio turnover rate may be higher. |
| | (d) | | Reflects income recognized from special dividends which amounted to $0.07 per share and 0.47% of average net assets. |
| | (f) | | Reflects income recognized from special dividends which amounted to $0.06 per share and 0.23% of average net assets. |
| | (g) | | Reflects payment from affiliate relating to certain investment transactions which amounted to $0.02 per share. Excluding such payment, the total return would have been 12.61%, 11.75%, 13.08%, 12.50%, 12.87%, and 12.33%, respectively. |
| | (h) | | Reflects income recognized from special dividends which amounted to $0.03 per share and 0.13% of average net assets. |
| | |
| 84 | | The accompanying notes are an integral part of these financial statements. |
GOLDMAN SACHS U.S. EQUITY INSIGHTS FUND
| | | | | | | | | | | | | | | | | | | | | | | | | | | | | | | | | | | | | | | | |
| | | Net asset
value, end
of period | | | | | Total
return(b) | | | | | Net assets,
end of
period
(in 000s) | | | | | Ratio of
net expenses
to average
net assets | | | | | Ratio of
total expenses
to average
net assets | | | | | Ratio of
net investment
income
to average
net assets | | | | | Portfolio
turnover
rate(c) | |
| | | | | | | | | | | | | | | | | | | | | | | | | | | | | | | | | | | | | | | | |
| | $ | 30.52 | | | | | | 15.60 | % | | | | $ | 243,451 | | | | | | 0.95 | %(e) | | | | | 1.20 | %(e) | | | | | 2.01 | %(d)(e) | | | | | 89 | % |
| | | 28.62 | | | | | | 15.15 | | | | | | 8,102 | | | | | | 1.70 | (e) | | | | | 1.95 | (e) | | | | | 1.31 | (d)(e) | | | | | 89 | |
| | | 28.07 | | | | | | 15.17 | | | | | | 32,112 | | | | | | 1.70 | (e) | | | | | 1.95 | (e) | | | | | 1.26 | (d)(e) | | | | | 89 | |
| | | 31.27 | | | | | | 15.82 | | | | | | 59,821 | | | | | | 0.55 | (e) | | | | | 0.81 | (e) | | | | | 2.27 | (d)(e) | | | | | 89 | |
| | | 30.47 | | | | | | 15.51 | | | | | | 1,042 | | | | | | 1.05 | (e) | | | | | 1.30 | (e) | | | | | 1.94 | (d)(e) | | | | | 89 | |
| | | 30.25 | | | | | | 15.72 | | | | | | 491 | | | | | | 0.70 | (e) | | | | | 0.96 | (e) | | | | | 2.12 | (d)(e) | | | | | 89 | |
| | | 30.24 | | | | | | 15.45 | | | | | | 376 | | | | | | 1.20 | (e) | | | | | 1.45 | (e) | | | | | 1.75 | (d)(e) | | | | | 89 | |
| | | | | | | | | | | | | | | | | | | | | | | | | | | | | | | | | | | | | | | | |
| | | | | | | | | | | | | | | | | | | | | | | | | | | | | | | | | | | | | | | | |
| | | 26.80 | | | | | | 12.69 | (g) | | | | | 239,796 | | | | | | 0.95 | | | | | | 1.20 | | | | | | 1.31 | (f) | | | | | 121 | |
| | | 25.02 | | | | | | 11.84 | (g) | | | | | 8,807 | | | | | | 1.71 | | | | | | 1.95 | | | | | | 0.60 | (f) | | | | | 121 | |
| | | 24.59 | | | | | | 11.84 | (g) | | | | | 30,979 | | | | | | 1.70 | | | | | | 1.95 | | | | | | 0.55 | (f) | | | | | 121 | |
| | | 27.51 | | | | | | 13.16 | (g) | | | | | 33,613 | | | | | | 0.55 | | | | | | 0.80 | | | | | | 1.69 | (f) | | | | | 121 | |
| | | 26.76 | | | | | | 12.58 | (g) | | | | | 1,036 | | | | | | 1.05 | | | | | | 1.30 | | | | | | 1.18 | (f) | | | | | 121 | |
| | | 26.62 | | | | | | 12.96 | (g) | | | | | 198 | | | | | | 0.70 | | | | | | 0.95 | | | | | | 1.45 | (f) | | | | | 121 | |
| | | 26.58 | | | | | | 12.42 | (g) | | | | | 336 | | | | | | 1.20 | | | | | | 1.44 | | | | | | 0.85 | (f) | | | | | 121 | |
| | | 24.21 | | | | | | 9.83 | | | | | | 278,353 | | | | | | 0.95 | | | | | | 1.19 | | | | | | 1.28 | (h) | | | | | 46 | |
| | | 22.59 | | | | | | 9.05 | | | | | | 13,170 | | | | | | 1.70 | | | | | | 1.94 | | | | | | 0.56 | (h) | | | | | 46 | |
| | | 22.25 | | | | | | 9.00 | | | | | | 32,665 | | | | | | 1.70 | | | | | | 1.94 | | | | | | 0.52 | (h) | | | | | 46 | |
| | | 24.82 | | | | | | 10.20 | | | | | | 33,581 | | | | | | 0.55 | | | | | | 0.79 | | | | | | 1.76 | (h) | | | | | 46 | |
| | | 24.14 | | | | | | 9.74 | | | | | | 962 | | | | | | 1.05 | | | | | | 1.29 | | | | | | 1.19 | (h) | | | | | 46 | |
| | | 24.08 | | | | | | 10.09 | | | | | | 105 | | | | | | 0.70 | | | | | | 0.94 | | | | | | 1.57 | (h) | | | | | 46 | |
| | | 23.98 | | | | | | 9.53 | | | | | | 29 | | | | | | 1.20 | | | | | | 1.44 | | | | | | 1.03 | (h) | | | | | 46 | |
| | | 22.32 | | | | | | 14.67 | | | | | | 301,843 | | | | | | 0.95 | | | | | | 1.18 | | | | | | 1.12 | | | | | | 47 | |
| | | 20.82 | | | | | | 13.76 | | | | | | 18,663 | | | | | | 1.70 | | | | | | 1.93 | | | | | | 0.39 | | | | | | 47 | |
| | | 20.54 | | | | | | 13.84 | | | | | | 34,942 | | | | | | 1.70 | | | | | | 1.93 | | | | | | 0.37 | | | | | | 47 | |
| | | 22.89 | | | | | | 15.10 | | | | | | 115,177 | | | | | | 0.55 | | | | | | 0.78 | | | | | | 1.54 | | | | | | 47 | |
| | | 22.25 | | | | | | 14.50 | | | | | | 1,273 | | | | | | 1.05 | | | | | | 1.28 | | | | | | 1.10 | | | | | | 47 | |
| | | 22.21 | | | | | | 15.00 | | | | | | 8 | | | | | | 0.70 | | | | | | 0.93 | | | | | | 1.37 | | | | | | 47 | |
| | | 22.11 | | | | | | 14.35 | | | | | | 48 | | | | | | 1.20 | | | | | | 1.43 | | | | | | 0.88 | | | | | | 47 | |
| | | 19.75 | | | | | | 6.57 | | | | | | 328,575 | | | | | | 0.95 | | | | | | 1.19 | | | | | | 1.75 | | | | | | 136 | |
| | | 18.43 | | | | | | 5.83 | | | | | | 25,269 | | | | | | 1.70 | | | | | | 1.94 | | | | | | 1.14 | | | | | | 136 | |
| | | 18.21 | | | | | | 5.82 | | | | | | 37,716 | | | | | | 1.70 | | | | | | 1.94 | | | | | | 0.99 | | | | | | 136 | |
| | | 20.25 | �� | | | | | 7.04 | | | | | | 153,872 | | | | | | 0.55 | | | | | | 0.79 | | | | | | 2.14 | | | | | | 136 | |
| | | 19.66 | | | | | | 6.50 | | | | | | 2,117 | | | | | | 1.05 | | | | | | 1.29 | | | | | | 1.68 | | | | | | 136 | |
| | | 19.65 | | | | | | 6.83 | | | | | | 7 | | | | | | 0.70 | | | | | | 0.94 | | | | | | 1.93 | | | | | | 136 | |
| | | 19.63 | | | | | | 6.39 | | | | | | 50 | | | | | | 1.20 | | | | | | 1.44 | | | | | | 0.89 | | | | | | 136 | |
| | | | | | | | | | | | | | | | | | | | | | | | | | | | | | | | | | | | | | | | |
| | | | | | | | | | | | | | | | | | | | | | | | | | | | | | | | | | | | | | | | |
| | | 19.02 | | | | | | (23.83 | ) | | | | | 384,949 | | | | | | 0.95 | (e) | | | | | 1.22 | (e) | | | | | 1.16 | (e) | | | | | 27 | |
| | | 17.63 | | | | | | (23.94 | ) | | | | | 47,671 | | | | | | 1.70 | (e) | | | | | 1.97 | (e) | | | | | 0.46 | (e) | | | | | 27 | |
| | | 17.50 | | | | | | (23.95 | ) | | | | | 42,816 | | | | | | 1.70 | (e) | | | | | 1.97 | (e) | | | | | 0.41 | (e) | | | | | 27 | |
| | | 19.52 | | | | | | (23.78 | ) | | | | | 177,704 | | | | | | 0.55 | (e) | | | | | 0.82 | (e) | | | | | 1.57 | (e) | | | | | 27 | |
| | | 18.84 | | | | | | (23.85 | ) | | | | | 2,949 | | | | | | 1.05 | (e) | | | | | 1.32 | (e) | | | | | 1.05 | (e) | | | | | 27 | |
| | | 18.96 | | | | | | (23.79 | ) | | | | | 6 | | | | | | 0.70 | (e) | | | | | 0.97 | (e) | | | | | 1.48 | (e) | | | | | 27 | |
| | | 18.89 | | | | | | (23.86 | ) | | | | | 6 | | | | | | 1.20 | (e) | | | | | 1.47 | (e) | | | | | 0.99 | (e) | | | | | 27 | |
| | | | | | | | | | | | | | | | | | | | | | | | | | | | | | | | | | | | | | | | |
| | | | | | | | | | | | | | | | | | | | | | | | | | | | | | | | | | | | | | | | |
| | | 24.97 | | | | | | (15.39 | ) | | | | | 530,590 | | | | | | 0.95 | | | | | | 1.13 | | | | | | 1.03 | | | | | | 96 | |
| | | 23.18 | | | | | | (16.04 | ) | | | | | 77,406 | | | | | | 1.70 | | | | | | 1.88 | | | | | | 0.28 | | | | | | 96 | |
| | | 23.01 | | | | | | (16.01 | ) | | | | | 58,873 | | | | | | 1.70 | | | | | | 1.88 | | | | | | 0.28 | | | | | | 96 | |
| | | 25.61 | | | | | | (15.09 | ) | | | | | 253,353 | | | | | | 0.55 | | | | | | 0.73 | | | | | | 1.40 | | | | | | 96 | |
| | | 24.74 | | | | | | (15.43 | ) | | | | | 3,908 | | | | | | 1.05 | | | | | | 1.23 | | | | | | 0.91 | | | | | | 96 | |
| | | 24.88 | | | | | | (14.61 | ) | | | | | 9 | | | | | | 0.70 | (e) | | | | | 0.88 | (e) | | | | | 1.30 | (e) | | | | | 96 | |
| | | 24.81 | | | | | | (14.89 | ) | | | | | 9 | | | | | | 1.20 | (e) | | | | | 1.38 | (e) | | | | | 0.85 | (e) | | | | | 96 | |
| | |
| The accompanying notes are an integral part of these financial statements. | | 85 |
GOLDMAN SACHS DOMESTIC EQUITY INSIGHTS FUNDS
Notes to Financial Statements
April 30, 2013 (Unaudited)
Goldman Sachs Trust (the “Trust”) is a Delaware statutory trust registered under the Investment Company Act of 1940, as amended (the “Act”), as an open-end management investment company. The following table lists those series of the Trust that are included in this report (collectively, the “Funds” or individually a “Fund”), along with their corresponding share classes and respective diversification status under the Act:
| | | | |
| Fund† | | Share Classes Offered* | | Diversified/
Non-diversified |
Large Cap Growth Insights, Large Cap Value Insights, Small Cap Equity Insights and U.S. Equity Insights | | A, B, C, Institutional, Service, IR and R | | Diversified |
Small Cap Growth Insights and Small Cap Value Insights | | A, B, C, Institutional, IR and R | | Diversified |
| † | | Formerly, Goldman Sachs Structured Large Cap Growth, Goldman Sachs Structured Large Cap Value, Goldman Sachs Structured Small Cap Equity, Goldman Sachs Structured U.S. Equity, Goldman Sachs Structured Small Cap Growth and Goldman Sachs Structured Small Cap Value Funds. Effective at the close of business May 3, 2013, the Funds changed their names to the Goldman Sachs Large Cap Growth Insights, Goldman Sachs Large Cap Value Insights, Goldman Sachs Small Cap Equity Insights, Goldman Sachs U.S. Equity Insights, Goldman Sachs Small Cap Growth Insights and Goldman Sachs Small Cap Value Insights Funds, respectively. |
| * | | Class B Shares are generally no longer available for purchase by current or prospective investors. |
Class A Shares are sold with a front-end sales charge of up to 5.50%. Class B Shares were sold with a contingent deferred sales charge (“CDSC”) that declines from 5.00% to zero, depending upon the period of time the shares are held. Class C Shares are sold with a CDSC of 1.00%, which is imposed on redemptions made within 12 months of purchase. Institutional, Service, Class IR and Class R Shares are not subject to a sales charge.
Goldman Sachs Asset Management, L.P. (“GSAM”), an affiliate of Goldman, Sachs & Co. (“Goldman Sachs”), serves as investment adviser to the Funds pursuant to management agreements (each, an “Agreement”) with the Trust.
|
| 2. SIGNIFICANT ACCOUNTING POLICIES |
The financial statements have been prepared in accordance with accounting principles generally accepted in the United States of America (“GAAP”) and require management to make estimates and assumptions that may affect the reported amounts and disclosures. Actual results may differ from those estimates and assumptions.
A. Investment Valuation — The Funds’ valuation policy is to value investments at fair value.
B. Investment Income and Investments — Investment income includes interest income and dividend income, net of any foreign withholding taxes, less any amounts reclaimable. Interest income is accrued daily and adjusted for amortization of premiums and accretion of discounts. Dividend income is recognized on ex-dividend date or, for certain foreign securities, as soon as such information is obtained subsequent to the ex-dividend date. Investment transactions are reflected on trade date. Realized gains and losses are calculated using identified cost. Investment transactions are recorded on the following business day for daily net asset value (“NAV”) calculations. Any foreign capital gains tax is accrued daily based upon net unrealized gains, and is payable upon sale of such investments. Distributions received from the Funds’ investments in United States (“U.S.”) real estate investment trusts (“REITs”) may be characterized as ordinary income, net capital gain or a return of capital. A return of capital is recorded by the Funds as a reduction to the cost basis of the REIT.
For derivative contracts, realized gains and losses are recorded upon settlement of the contract.
86
GOLDMAN SACHS DOMESTIC EQUITY INSIGHTS FUNDS
|
| 2. SIGNIFICANT ACCOUNTING POLICIES (continued) |
C. Class Allocations and Expenses — Investment income, realized and unrealized gain (loss), and non-class specific expenses of each Fund are allocated daily based upon the proportion of net assets of each class. Class specific expenses, where applicable, are borne by the respective share classes and include Distribution and Service, Transfer Agent and Service and Shareholder Administration fees. Non-class specific expenses directly incurred by a Fund are charged to that Fund, while such expenses incurred by the Trust are allocated across the respective Funds on a straight-line and/or pro-rata basis depending upon the nature of the expenses.
D. Federal Taxes and Distributions to Shareholders — It is each Fund’s policy to comply with the requirements of the Internal Revenue Code of 1986, as amended (the “Code”), applicable to regulated investment companies (mutual funds) and to distribute each year substantially all of its investment company taxable income and capital gains to its shareholders. Accordingly, the Funds are not required to make any provisions for the payment of federal income tax.
Distributions to shareholders are recorded on the ex-dividend date. Income and capital gains distributions, if any, are declared and paid according to the following schedule:
| | | | | | |
| Fund | | | | Income Distributions Declared/Paid | | Capital Gains Distributions Declared/Paid |
Large Cap Value Insights | | | | Quarterly | | Annually |
Large Cap Growth Insights, Small Cap Equity Insights, Small Cap Growth Insights, Small Cap Value Insights and U.S. Equity Insights | | | | Annually | | Annually |
Net capital losses are carried forward to future fiscal years and may be used to the extent allowed by the Code to offset any future capital gains. Utilization of capital loss carryforwards will reduce the requirement of future capital gains distributions.
Under the Regulated Investment Company Modernization Act of 2010, the Funds are permitted to carry forward capital losses incurred in taxable years beginning after December 22, 2010 for an unlimited period. However, any losses incurred during those future taxable years will be required to be utilized prior to the losses incurred in pre-enactment taxable years. As a result of this ordering rule, pre-enactment capital loss carryforwards may be more likely to expire unused. Additionally, post-enactment capital losses that are carried forward will retain their character as either short-term or long term capital losses rather than being considered all short-term as under previous law.
The characterization of distributions to shareholders for financial reporting purposes is determined in accordance with federal income tax rules, which may differ from GAAP. The source of each Fund’s distributions may be shown in the accompanying financial statements as either from net investment income, net realized gain or capital. Certain components of the Funds’ net assets on the Statements of Assets and Liabilities reflect permanent GAAP/tax differences based on the appropriate tax character.
|
| 3. INVESTMENTS AND FAIR VALUE MEASUREMENTS |
The fair value of a financial instrument is the amount that would be received to sell an asset or paid to transfer a liability in an orderly transaction between market participants at the measurement date (i.e., the exit price). GAAP establishes a fair value hierarchy that prioritizes the inputs to valuation techniques used to measure fair value. The hierarchy gives the highest priority to unadjusted quoted prices in active markets for identical assets or liabilities (Level 1 measurements) and the lowest priority to
87
GOLDMAN SACHS DOMESTIC EQUITY INSIGHTS FUNDS
Notes to Financial Statements (continued)
April 30, 2013 (Unaudited)
|
| 3. INVESTMENTS AND FAIR VALUE MEASUREMENTS (continued) |
unobservable inputs (Level 3 measurements). The levels used for classifying investments are not necessarily an indication of the risk associated with investing in these investments. The three levels of the fair value hierarchy are described below:
Level 1 — Unadjusted quoted prices in active markets that are accessible at the measurement date for identical, unrestricted assets or liabilities;
Level 2 — Quoted prices in markets that are not active or financial instruments for which significant inputs are observable (including, but not limited to, quoted prices for similar investments, interest rates, foreign exchange rates, volatility and credit spreads), either directly or indirectly;
Level 3 — Prices or valuations that require significant unobservable inputs (including GSAM’s assumptions in determining fair value measurement).
The Trustees have adopted Valuation Procedures that govern the valuation of the portfolio investments held by the Funds, including investments for which market quotations are not readily available. The Trustees have delegated to GSAM day-to-day responsibility for implementing and maintaining internal controls and procedures related to the valuation of the Fund’s portfolio investments. To assess the continuing appropriateness of pricing sources and methodologies, GSAM regularly performs price verification procedures and issues challenges as necessary to third party pricing vendors or brokers, and any differences are reviewed in accordance with the Valuation Procedures.
A. Level 1 and Level 2 Fair Value Investments — The valuation techniques and significant inputs used in determining the fair values for investments classified as Level 1 and Level 2 are as follows:
Equity Securities — Equity securities and investment companies traded on a U.S. securities exchange or the NASDAQ system, or those located on certain foreign exchanges, including but not limited to the Americas, are valued daily at their last sale price or official closing price on the principal exchange or system on which they are traded. If no sale occurs, equity securities and exchange traded investment companies are valued at the last bid price for long positions and at the last ask price for short positions. Investments in investment companies (other than those that are exchange traded) are valued at the NAV on the valuation date. To the extent these investments are actively traded, they are classified as Level 1 of the fair value hierarchy.
Unlisted equity securities for which market quotations are available are valued at the last sale price on the valuation date, or if no sale occurs, at the last bid price. Securities traded on certain foreign securities exchanges are valued daily at fair value determined by an independent fair value service (if available) under Valuation Procedures approved by the Trustees and consistent with applicable regulatory guidance. The independent fair value service takes into account multiple factors including, but not limited to, movements in the securities markets, certain depositary receipts, futures contracts and foreign currency exchange rates that have occurred subsequent to the close of the foreign securities exchange. These investments are generally classified as Level 2 of the fair value hierarchy.
Derivative Contracts — A derivative is an instrument whose value is derived from underlying assets, indices, reference rates or a combination of these factors.
Exchange-traded derivatives, including futures contracts, typically fall within Level 1 of the fair value hierarchy. Over-the-counter (“OTC”) derivatives are valued using market transactions and other market evidence, including market-based inputs to models, calibration to market-clearing transactions, broker or dealer quotations, or other alternative pricing sources. Where models are used, the selection of a particular model to value an OTC derivative depends upon the contractual terms of, and specific risks inherent in, the instrument, as well as the availability of pricing information in the market. Valuation models require a variety of inputs, including contractual terms, market prices, yield curves, credit curves, measures of volatility, voluntary and involuntary prepayment rates, loss severity rates and correlations of such inputs. For OTC derivatives that trade in liquid markets, model inputs can generally be verified and model selection does not involve significant management judgment. OTC derivatives are classified within Level 2 of the fair value hierarchy when significant inputs are corroborated by market evidence.
88
GOLDMAN SACHS DOMESTIC EQUITY INSIGHTS FUNDS
|
| 3. INVESTMENTS AND FAIR VALUE MEASUREMENTS (continued) |
i. Futures Contracts — Futures contracts are contracts to buy or sell a standardized quantity of a specified commodity or security and are valued based on exchanged settlement prices or independent market quotes. Futures contracts are valued at the last settlement price, or in the absence of a sale, the last bid price for long positions and at the last ask price for short positions, at the end of each day on the board of trade or exchange upon which they are traded. Upon entering into a futures contract, a Fund deposits cash or securities in an account on behalf of the broker in an amount sufficient to meet the initial margin requirement. Subsequent payments are made or received by the Fund equal to the daily change in the contract value and are recorded as variation margin receivable or payable with a corresponding offset to unrealized gains or losses.
Short Term Investments — Short-term investments having a maturity of 60 days or less are generally valued at amortized cost which approximates fair market value. These investments are classified as Level 2 of the fair value hierarchy.
i. Repurchase Agreements — Repurchase agreements involve the purchase of securities subject to the seller’s agreement to repurchase the securities at a mutually agreed upon date and price. During the term of a repurchase agreement, the value of the underlying securities held as collateral on behalf of a Fund, including accrued interest, is required to exceed the value of the repurchase agreement, including accrued interest. The underlying securities for all repurchase agreements are held at the Funds’ custodian or designated sub-custodians under tri-party repurchase agreements.
Pursuant to exemptive relief granted by the Securities and Exchange Commission and terms and conditions contained therein, the Funds, together with other funds of the Trust and registered investment companies having management agreements with GSAM, or its affiliates, may transfer uninvested cash into joint accounts, the daily aggregate balance of which is invested in one or more repurchase agreements. Under these joint accounts, the Funds maintain pro-rata credit exposure to the underlying repurchase agreements’ counterparties. With the exception of certain transaction fees, the Funds are not subject to any expenses in relation to these investments.
B. Level 3 Fair Value Investments — To the extent that the aforementioned significant inputs are unobservable, or if quotations are not readily available, or if GSAM believes that such quotations do not accurately reflect fair value, the fair value of the Funds’ investments may be determined under Valuation Procedures approved by the Trustees. GSAM, consistent with its procedures and applicable regulatory guidance, may make an adjustment to the most recent valuation prices of either domestic or foreign securities in light of significant events to reflect what it believes to be the fair value of the securities at the time of determining a Fund’s NAV. Significant events which could affect a large number of securities in a particular market may include, but are not limited to: significant fluctuations in U.S. or foreign markets; market dislocations; market disruptions; or unscheduled market closings. Significant events which could also affect a single issuer may include, but are not limited to: corporate actions such as reorganizations, mergers and buy outs; ratings downgrades; and bankruptcies.
89
GOLDMAN SACHS DOMESTIC EQUITY INSIGHTS FUNDS
Notes to Financial Statements (continued)
April 30, 2013 (Unaudited)
|
| 3. INVESTMENTS AND FAIR VALUE MEASUREMENTS (continued) |
C. Fair Value Hierarchy — The following is a summary of the Funds’ investments and derivatives classified in the fair value hierarchy as of April 30, 2013:
| | | | | | | | | | | | |
| | | |
| LARGE CAP GROWTH INSIGHTS | | | | | | | | | | | | |
| | | |
| Investment Type | | Level 1 | | | Level 2 | | | Level 3 | |
| Assets | | | | | | | | | | | | |
Common Stock and/or Other Equity Investments | | $ | 300,777,037 | | | $ | — | | | $ | — | |
Short-term Investments | | | — | | | | 6,300,000 | | | | — | |
Securities Lending Reinvestment Vehicle | | | 6,133,180 | | | | — | | | | — | |
| Total | | $ | 306,910,217 | | | $ | 6,300,000 | | | $ | — | |
| | | |
| Derivative Type | | Level 1 | | | Level 2 | | | Level 3 | |
| Assets(a) | | | | | | | | | | | | |
Futures Contracts | | $ | 131,578 | | | $ | — | | | $ | — | |
| | | |
| LARGE CAP VALUE INSIGHTS | | | | | | | | | | | | |
| | | |
| Investment Type | | Level 1 | | | Level 2 | | | Level 3 | |
| Assets | | | | | | | | | | | | |
Common Stock and/or Other Equity Investments | | $ | 315,369,488 | | | $ | — | | | $ | — | |
Short-term Investments | | | — | | | | 7,200,000 | | | | — | |
Securities Lending Reinvestment Vehicle | | | 9,092,164 | | | | — | | | | — | |
| Total | | $ | 324,461,652 | | | $ | 7,200,000 | | | $ | — | |
| | | |
| Derivative Type | | Level 1 | | | Level 2 | | | Level 3 | |
| Assets(a) | | | | | | | | | | | | |
Futures Contracts | | $ | 145,371 | | | $ | — | | | $ | — | |
90
GOLDMAN SACHS DOMESTIC EQUITY INSIGHTS FUNDS
|
| 3. INVESTMENTS AND FAIR VALUE MEASUREMENTS (continued) |
| | | | | | | | | | | | |
| | | |
| SMALL CAP EQUITY INSIGHTS | | | | | | | | | | | | |
| | | |
| Investment Type | | Level 1 | | | Level 2 | | | Level 3 | |
| Assets | | | | | | | | | | | | |
Common Stock and/or Other Equity Investments | | $ | 204,787,581 | | | $ | — | | | $ | — | |
Short-term Investments | | | — | | | | 9,000,000 | | | | — | |
Securities Lending Reinvestment Vehicle | | | 22,757,070 | | | | — | | | | — | |
| Total | | $ | 227,544,651 | | | $ | 9,000,000 | | | $ | — | |
| | | |
| Derivative Type | | Level 1 | | | Level 2 | | | Level 3 | |
| Assets(a) | | | | | | | | | | | | |
Futures Contracts | | $ | 128,469 | | | $ | — | | | $ | — | |
| | | |
| SMALL CAP GROWTH INSIGHTS | | | | | | | | | | | | |
| | | |
| Investment Type | | Level 1 | | | Level 2 | | | Level 3 | |
| Assets | | | | | | | | | | | | |
Common Stock and/or Other Equity Investments | | $ | 46,973,646 | | | $ | — | | | $ | — | |
Short-term Investments | | | — | | | | 900,000 | | | | — | |
Securities Lending Reinvestment Vehicle | | | 3,887,872 | | | | — | | | | — | |
| Total | | $ | 50,861,518 | | | $ | 900,000 | | | $ | — | |
| | | |
| Derivative Type | | Level 1 | | | Level 2 | | | Level 3 | |
| Assets(a) | | | | | | | | | | | | |
Futures Contracts | | $ | 34,387 | | | $ | — | | | $ | — | |
| | | |
| SMALL CAP VALUE INSIGHTS | | | | | | | | | | | | |
| | | |
| Investment Type | | Level 1 | | | Level 2 | | | Level 3 | |
| Assets | | | | | | | | | | | | |
Common Stock and/or Other Equity Investments | | $ | 134,290,055 | | | $ | — | | | $ | — | |
Investment Company | | | 156,537 | | | | — | | | | — | |
Short-term Investments | | | — | | | | 3,100,000 | | | | — | |
Securities Lending Reinvestment Vehicle | | | 10,214,136 | | | | — | | | | — | |
| Total | | $ | 144,660,728 | | | $ | 3,100,000 | | | $ | — | |
| | | |
| Derivative Type | | Level 1 | | | Level 2 | | | Level 3 | |
| Assets(a) | | | | | | | | | | | | |
Futures Contracts | | $ | 47,379 | | | $ | — | | | $ | — | |
91
GOLDMAN SACHS DOMESTIC EQUITY INSIGHTS FUNDS
Notes to Financial Statements (continued)
April 30, 2013 (Unaudited)
|
| 3. INVESTMENTS AND FAIR VALUE MEASUREMENTS (continued) |
| | | | | | | | | | | | |
| | | |
| U.S. EQUITY INSIGHTS | | | | | | | | | | | | |
| | | |
| Investment Type | | Level 1 | | | Level 2 | | | Level 3 | |
| Assets | | | | | | | | | | | | |
Common Stock and/or Other Equity Investments | | $ | 337,420,984 | | | $ | — | | | $ | — | |
Short-term Investments | | | — | | | | 8,200,000 | | | | — | |
Securities Lending Reinvestment Vehicle | | | 6,229,975 | | | | — | | | | — | |
| Total | | $ | 343,650,959 | | | $ | 8,200,000 | | | $ | — | |
| | | |
| Derivative Type | | Level 1 | | | Level 2 | | | Level 3 | |
| Assets(a) | | | | | | | | | | | | |
Futures Contracts | | $ | 169,404 | | | $ | — | | | $ | — | |
| (a) | | Amount shown represents unrealized gain (loss) at period end. |
For further information regarding security characteristics, see the Schedule of Investments.
|
| 4. INVESTMENTS IN DERIVATIVES |
The following table sets forth, by certain risk types, the gross value of derivative contracts as of April 30, 2013. These instruments were used to meet the Funds’ investment objectives and to obtain and/or manage exposure related to the risks below. These values in the tables below exclude the effects of cash collateral received or posted pursuant to these derivative contracts, and therefore are not representative of the Funds’ net exposure.
| | | | | | | | | | |
| Risk | | | | Fund | | Statements of Assets and Liabilities | | Assets(a) | |
Equity | | | | Large Cap Growth Insights | | Unrealized gain on futures variation margin | | | $131,578 | |
Equity | | | | Large Cap Value Insights | | Unrealized gain on futures variation margin | | | 145,371 | |
Equity | | | | Small Cap Equity Insights | | Unrealized gain on futures variation margin | | | 128,469 | |
Equity | | | | Small Cap Growth Insights | | Unrealized gain on futures variation margin | | | 34,387 | |
Equity | | | | Small Cap Value Insights | | Unrealized gain on futures variation margin | | | 47,379 | |
Equity | | | | U.S. Equity Insights | | Unrealized gain on futures variation margin | | | 169,404 | |
| (a) | | Includes unrealized gain (loss) on futures contracts described in the Additional Investment Information sections of the Schedule of Investments. Only current day’s variation margin is reported within the Statements of Assets and Liabilities. |
92
GOLDMAN SACHS DOMESTIC EQUITY INSIGHTS FUNDS
|
| 4. INVESTMENTS IN DERIVATIVES (continued) |
The following table sets forth, by certain risk types, the Funds’ gains (losses) related to these derivatives and their indicative volumes for the six months ended April 30, 2013. These gains (losses) should be considered in the context that these derivative contracts may have been executed to economically hedge certain investments, and accordingly, certain gains (losses) on such derivative contracts may offset certain (losses) gains attributable to investments. These gains (losses) are included in “Net realized gain (loss)” or “Net change in unrealized gain (loss)” on the Statements of Operations:
| | | | | | | | | | | | | | | | | | | | |
| Risk | | | | Fund | | | | Net
Realized
Gain (Loss) | | | | | Net Change in
Unrealized
Gain (Loss) | | | Average
Number of
Contracts(a) | |
Equity | | | | Large Cap Growth Insights | | | | $ | 825,901 | | | | | $ | 256,960 | | | | 88 | |
Equity | | | | Large Cap Value Insights | | | | | 868,871 | | | | | | 297,667 | | | | 96 | |
Equity | | | | Small Cap Equity Insights | | | | | 783,825 | | | | | | 221,896 | | | | 62 | |
Equity | | | | Small Cap Growth Insights | | | | | 115,153 | | | | | | 64,788 | | | | 10 | |
Equity | | | | Small Cap Value Insights | | | | | 536,435 | | | | | | 156,768 | | | | 34 | |
Equity | | | | U.S. Equity Insights | | | | | 602,604 | | | | | | 255,531 | | | | 88 | |
| (a) | | Average number of contracts is based on the average of month end balances for the six months ended April 30, 2013. |
|
| 5. AGREEMENTS AND AFFILIATED TRANSACTIONS |
A. Management Agreement — Under the Agreement, GSAM manages the Funds, subject to the general supervision of the Trustees.
As compensation for the services rendered pursuant to the Agreement, the assumption of the expenses related thereto and administration of the Funds’ business affairs, including providing facilities, GSAM is entitled to a management fee, accrued daily and paid monthly, equal to an annual percentage rate of each Fund’s average daily net assets.
93
GOLDMAN SACHS DOMESTIC EQUITY INSIGHTS FUNDS
Notes to Financial Statements (continued)
April 30, 2013 (Unaudited)
|
| 5. AGREEMENTS AND AFFILIATED TRANSACTIONS (continued) |
For the six months ended April 30, 2013, contractual and effective net management fees with GSAM were at the following rates:
| | | | | | | | | | | | | | | | | | | | | | | | | | | | | | |
| | | | | Contractual Management Rate | | | Effective Net
Management
Rate* | |
| Fund | | | | First
$1 billion | | | Next
$1 billion | | | Next
$3 billion | | | Next
$3 billion | | | Over
$8 billion | | | Effective
Rate | | |
Large Cap Growth Insights | | | | | 0.65 | % | | | 0.59 | % | | | 0.56 | % | | | 0.55 | % | | | 0.54 | % | | | 0.65 | % | | | 0.51 | % |
Large Cap Value Insights | | | | | 0.60 | | | | 0.54 | | | | 0.51 | | | | 0.50 | | | | 0.49 | | | | 0.60 | | | | 0.51 | |
Small Cap Equity Insights | | | | | 0.85 | | | | 0.85 | | | | 0.77 | | | | 0.73 | | | | 0.72 | | | | 0.85 | | | | 0.81 | |
Small Cap Growth Insights | | | | | 0.85 | | | | 0.85 | | | | 0.77 | | | | 0.73 | | | | 0.72 | | | | 0.85 | | | | 0.82 | |
Small Cap Value Insights | | | | | 0.85 | | | | 0.85 | | | | 0.77 | | | | 0.73 | | | | 0.72 | | | | 0.85 | | | | 0.81 | |
U.S. Equity Insights | | | | | 0.65 | | | | 0.59 | | | | 0.56 | | | | 0.55 | | | | 0.54 | | | | 0.65 | | | | 0.51 | |
| * | | GSAM has agreed to waive a portion of its management fee in order to achieve net management rates, as defined in the funds’ most recent prospectuses. These waivers will be effective through at least February 28, 2014, and prior to such date GSAM may not terminate the arrangement without approval of the Trustees. The Effective Net Management Rates above are calculated based on management rates before and after the waivers had been adjusted, if applicable. |
B. Distribution and Service Plans — The Trust, on behalf of each Fund, has adopted Distribution and Service Plans (the “Plans”). Under the Plans, Goldman Sachs, which serves as distributor (the “Distributor”), is entitled to a fee, accrued daily and paid monthly, for distribution services and personal and account maintenance services, which may then be paid by Goldman Sachs to authorized dealers, at the following annual rates calculated on a Fund’s average daily net assets of each respective share class:
| | | | | | | | | | | | | | | | |
| | | Distribution and Service Plan Rates | |
| | | Class A* | | | Class B | | | Class C | | | Class R* | |
Distribution Plan | | | 0.25 | % | | | 0.75 | % | | | 0.75 | % | | | 0.50 | % |
Service Plan | | | — | | | | 0.25 | | | | 0.25 | | | | — | |
| * | | With respect to Class A and Class R Shares, the Distributor at its discretion may use compensation for distribution services paid under the Distribution Plan to compensate service organizations for personal and account maintenance services and expenses as long as such total compensation does not exceed the maximum cap on “service fees” imposed by the Financial Industry Regulatory Authority. |
94
GOLDMAN SACHS DOMESTIC EQUITY INSIGHTS FUNDS
|
| 5. AGREEMENTS AND AFFILIATED TRANSACTIONS (continued) |
C. Distribution Agreement — Goldman Sachs, as Distributor of the shares of the Funds pursuant to a Distribution Agreement, may retain a portion of the Class A front end sales charge and Class B and Class C Shares’ CDSC. During the six months ended April 30, 2013, Goldman Sachs advised that it retained the following amounts:
| | | | | | | | | | |
| | | | | Front End
Sales Charge | | | Contingent Deferred
Sales Charge* | |
| Fund | | | | Class A | | | Class C | |
Large Cap Growth Insights | | | | $ | 1,630 | | | $ | — | |
Large Cap Value Insights | | | | | 690 | | | | 217 | |
Small Cap Equity Insights | | | | | 834 | | | | 142 | |
Small Cap Growth Insights | | | | | 679 | | | | — | |
Small Cap Value Insights | | | | | 1,532 | | | | — | |
U.S. Equity Insights | | | | | 4,698 | | | | 435 | |
| * | | Goldman Sachs did not retain Contingent Deferred Sales Charges for Class B shares. |
D. Service Plan and Shareholder Administration Plan — The Trust, on behalf of each Fund that offers Service Shares, has adopted a Service Plan and a Shareholder Administration Plan. These plans allow for service organizations to provide varying levels of personal and account maintenance and shareholder administration services to their customers who are beneficial owners of such shares. The Service Plan and Shareholder Administration Plan each provide for compensation to the service organizations which is accrued daily and paid monthly at an annual rate of 0.25% (0.50% in aggregate) of the average daily net assets of the Service Shares.
E. Transfer Agency Agreement — Goldman Sachs also serves as the transfer agent of the Funds for a fee pursuant to a Transfer Agency Agreement. The fees charged for such transfer agency services are accrued daily and paid monthly at annual rates as follows: 0.19% of the average daily net assets of Class A, Class B, Class C, Class IR and Class R Shares; and 0.04% of the average daily net assets of Institutional and Service Shares.
F. Other Expense Agreements and Affiliated Transactions — GSAM has agreed to limit certain “Other Expense” of the Funds (excluding transfer agent fees and expenses, service fees and shareholder administration fees (as applicable), taxes, interest, brokerage fees, litigation, indemnification, shareholder meetings and other extraordinary expenses) to the extent such expenses exceed, on an annual basis, a percentage rate of the average daily net assets of each Fund. Such Other Expense reimbursements, if any, are accrued daily and paid monthly. In addition, the Funds are not obligated to reimburse GSAM for prior fiscal year expense reimbursements, if any. The Other Expense limitations as an annual percentage rate of average daily net assets are 0.004%. These Other Expense reimbursements will remain in place through at least February 28, 2014, and prior to such date GSAM may not terminate the arrangements without the approval of the Trustees. In addition, the Funds have entered into certain offset arrangements with the custodian and the transfer agent, which may result in a reduction of the Funds’ expenses and are received irrespective of the application of the “Other Expense” limitations described above.
95
GOLDMAN SACHS DOMESTIC EQUITY INSIGHTS FUNDS
Notes to Financial Statements (continued)
April 30, 2013 (Unaudited)
|
| 5. AGREEMENTS AND AFFILIATED TRANSACTIONS (continued) |
For the six months ended April 30, 2013, these expense reductions, including any fee waivers and Other Expense reimbursements, were as follows:
| | | | | | | | | | | | | | | | | | |
Fund | | | | Management
Fee Waivers | | | Custody Fee
Credits | | | Other
Expense
Reimbursements | | | Total
Expense
Reductions | |
Large Cap Growth Insights | | | | $ | 259,071 | | | $ | 18 | | | $ | 169,133 | | | $ | 428,222 | |
Large Cap Value Insights | | | | | 175,032 | | | | 17 | | | | 168,523 | | | | 343,572 | |
Small Cap Equity Insights | | | | | 38,369 | | | | 28 | | | | 172,668 | | | | 211,065 | |
Small Cap Growth Insights | | | | | 6,457 | | | | 19 | | | | 136,506 | | | | 142,982 | |
Small Cap Value Insights | | | | | 26,545 | | | | 22 | | | | 146,835 | | | | 173,402 | |
U.S. Equity Insights | | | | | 225,159 | | | | 21 | | | | 176,465 | | | | 401,645 | |
As of April 30, 2013, the amounts owed to affiliates of the Funds were as follows:
| | | | | | | | | | | | | | | | | | |
| Fund | | | | Management
Fees | | | Distribution
and Service
Fees | | | Transfer
Agent
Fees | | | Total | |
Large Cap Growth Insights | | | | $ | 127,398 | | | $ | 28,626 | | | $ | 21,048 | | | $ | 177,072 | |
Large Cap Value Insights | | | | | 134,605 | | | | 22,594 | | | | 19,302 | | | | 176,501 | |
Small Cap Equity Insights | | | | | 140,287 | | | | 20,327 | | | | 14,488 | | | | 175,102 | |
Small Cap Growth Insights | | | | | 32,660 | | | | 12,699 | | | | 5,996 | | | | 51,355 | |
Small Cap Value Insights | | | | | 90,241 | | | | 41,970 | | | | 19,512 | | | | 151,723 | |
U.S. Equity Insights | | | | | 143,208 | | | | 82,317 | | | | 45,918 | | | | 271,443 | |
G. Line of Credit Facility — As of April 30, 2013, the Funds participated in a $630,000,000 committed, unsecured revolving line of credit facility (the “facility”) together with other funds of the Trust and registered investment companies having management agreements with GSAM or its affiliates (“Other Borrowers”). Pursuant to the terms of the facility, the Funds and Other Borrowers could increase the credit amount by an additional $340,000,000, for a total of up to $970,000,000. This facility is to be used solely for temporary or emergency purposes, which may include the funding of redemptions. The interest rate on borrowings is based on the federal funds rate. The facility also requires a fee to be paid by the Funds based on the amount of the commitment that has not been utilized. For the six months ended April 30, 2013, the Funds did not have any borrowings under the facility. Effective May 8, 2013, the committed amount available through the facility increased to $780,000,000.
96
GOLDMAN SACHS DOMESTIC EQUITY INSIGHTS FUNDS
|
| 5. AGREEMENTS AND AFFILIATED TRANSACTIONS (continued) |
H. Other Transactions with Affiliates — For the six months ended April 30, 2013, Goldman Sachs earned approximately $7,900, $8,000, $2,800, $300, $800 and $1,500 in brokerage commissions from portfolio transactions, including futures transactions executed with Goldman Sachs as the Futures Commission Merchant on behalf of Large Cap Growth Insights, Large Cap Value Insights, Small Cap Equity Insights, Small Cap Growth Insights, Small Cap Value Insights and U.S. Equity Insights Funds, respectively.
As of April 30, 2013, the following Fund of Funds Portfolios were the beneficial owners of 5% or more of total outstanding shares of the following Funds:
| | | | | | | | | | | | | | | | | | | | | | |
| Fund | | | | Goldman Sachs
Balanced Strategy
Portfolio | | | Goldman Sachs
Enhanced Dividend
Global Equity Portfolio | | | Goldman Sachs
Equity Growth
Strategy Portfolio | | | Goldman Sachs
Growth and Income
Strategy Portfolio | | | Goldman Sachs
Growth Strategy
Portfolio | |
Large Cap Growth Insights | | | | | 5 | % | | | — | % | | | 15 | % | | | 20 | % | | | 25 | % |
Large Cap Value Insights | | | | | 8 | | | | — | | | | 16 | | | | 24 | | | | 27 | |
Small Cap Equity Insights | | | | | 7 | | | | 8 | | | | 7 | | | | 17 | | | | 16 | |
As of April 30, 2013, Goldman Sachs Group, Inc. (“GSG”) was the beneficial owner of 5% or more of outstanding Class IR and Class R Shares of the following Funds:
| | | | | | | | | | |
| Fund | | | | Class IR | | | Class R | |
Large Cap Growth Insights | | | | | — | % | | | 12 | % |
Large Cap Value Insights | | | | | — | | | | 27 | |
Small Cap Growth Insights | | | | | 6 | | | | 13 | |
| | |
| 6. PORTFOLIO SECURITIES TRANSACTIONS | | |
The cost of purchases and proceeds from sales and maturities of long-term securities for the six months ended April 30, 2013, were as follows:
| | | | | | | | | | |
| Fund | | | | Purchases | | | Sales | |
Large Cap Growth Insights | | | | $ | 369,678,413 | | | $ | 554,338,101 | |
Large Cap Value Insights | | | | | 382,854,567 | | | | 571,594,991 | |
Small Cap Equity Insights | | | | | 163,921,094 | | | | 170,888,830 | |
Small Cap Growth Insights | | | | | 33,630,444 | | | | 32,337,248 | |
Small Cap Value Insights | | | | | 81,718,800 | | | | 84,665,091 | |
U.S. Equity Insights | | | | | 282,169,994 | | | | 297,205,628 | |
97
GOLDMAN SACHS DOMESTIC EQUITY INSIGHTS FUNDS
Notes to Financial Statements (continued)
April 30, 2013 (Unaudited)
Pursuant to exemptive relief granted by the SEC and the terms and conditions contained therein, the Funds may lend its securities through a securities lending agent, Goldman Sachs Agency Lending (“GSAL”), a wholly-owned subsidiary of Goldman Sachs, to certain qualified borrowers including Goldman Sachs and affiliates. In accordance with the Funds’ securities lending procedures, the Funds receive cash collateral at least equal to the market value of the securities on loan. The market value of the loaned securities is determined at the close of business of the Funds, at their last sale price or official closing price on the principal exchange or system on which they are traded, and any additional required collateral is delivered to the Funds on the next business day. As with other extensions of credit, the Funds may experience delay in the recovery of its securities or incur a loss should the borrower of the securities breach its agreement with the Funds or become insolvent at a time when the collateral is insufficient to cover the cost of repurchasing securities on loan. Dividend income received from securities on loan may not be subject to withholding taxes and therefore withholding taxes paid may differ from the amounts listed in the Statement of Operations.
The Funds invest the cash collateral received in connection with securities lending transactions in the Goldman Sachs Financial Square Money Market Fund (“Money Market Fund”), a separate series of the Trust. The Money Market Fund, deemed an affiliate of the Trust, is registered under the Act as an open end investment company, is subject to Rule 2a-7 under the Act, and is managed by GSAM, for which GSAM may receive an investment advisory fee of up to 0.205% on an annualized basis of the average daily net assets of the Money Market Fund.
Both the Funds and GSAL received compensation relating to the lending of the Funds’ securities. The amounts earned by the Funds for the six months ended April 30, 2013, are reported under Investment Income on the Statements of Operations.
The table below details securities lending activity with affiliates of Goldman Sachs:
| | | | | | | | | | | | | | |
| | | | | For the Six Months Ended April 30, 2013 | | | Amounts Payable to
Goldman Sachs
Upon Return of
Securities Loaned as of
April 30, 2013 | |
| Fund | | | | Earnings of GSAL
Relating to
Securities
Loaned | | | Amounts Received
by the Funds from Lending to
Goldman Sachs | | |
Large Cap Growth Insights | | | | $ | 8,970 | | | $ | 22,218 | | | $ | 352,500 | |
Large Cap Value Insights | | | | | 10,600 | | | | 9,611 | | | | 3,488,439 | |
Small Cap Equity Insights | | | | | 33,229 | | | | 52,933 | | | | 7,964,970 | |
Small Cap Growth Insights | | | | | 9,552 | | | | 22,133 | | | | 1,611,984 | |
Small Cap Value Insights | | | | | 19,509 | | | | 45,680 | | | | 2,013,311 | |
U.S. Equity Insights | | | | | 6,185 | | | | 13,675 | | | | 139,125 | |
98
GOLDMAN SACHS DOMESTIC EQUITY INSIGHTS FUNDS
|
| 7. SECURITIES LENDING (continued) |
The following table provides information about the Funds’ investment in the Money Market Fund for the six months ended April 30, 2013:
| | | | | | | | | | | | | | | | | | | | | | |
| Fund | | | | Number of
Shares Held
Beginning of Period | | | Shares
Bought | | | Shares Sold | | | Number of
Shares Held
End of Period | | | Value at End of Period | |
Large Cap Growth Insights | | | | | 4,178,675 | | | | 34,634,259 | | | | (32,679,754 | ) | | | 6,133,180 | | | $ | 6,133,180 | |
Large Cap Value Insights | | | | | 1,648,200 | | | | 42,033,347 | | | | (34,589,383 | ) | | | 9,092,164 | | | | 9,092,164 | |
Small Cap Equity Insights | | | | | 14,613,327 | | | | 72,282,395 | | | | (64,138,652 | ) | | | 22,757,070 | | | | 22,757,070 | |
Small Cap Growth Insights | | | | | 3,491,625 | | | | 14,371,460 | | | | (13,975,213 | ) | | | 3,887,872 | | | | 3,887,872 | |
Small Cap Value Insights | | | | | 10,098,450 | | | | 41,376,836 | | | | (41,261,150 | ) | | | 10,214,136 | | | | 10,214,136 | |
U.S. Equity Insights | | | | | 1,346,950 | | | | 34,077,041 | | | | (29,194,016 | ) | | | 6,229,975 | | | | 6,229,975 | |
As of the Funds’ most recent fiscal year end, October 31, 2012, the Funds’ capital loss carryovers and certain timing differences, on a tax basis were as follows:
| | | | | | | | | | | | | | | | | | | | | | | | |
| | | Large Cap Growth Insights | | | Large Cap Value Insights | | | Small Cap Equity Insights | | | Small Cap
Growth Insights | | | Small Cap
Value Insights | | | U.S. Equity Insights | |
Undistributed ordinary Income — net | | $ | 5,003,273 | | | $ | 100,400 | | | $ | — | | | $ | 18,082 | | | $ | 290,692 | | | $ | 2,821,935 | |
Capital loss carryforwards:(1) | | | | | | | | | | | | | | | | | | | | | | | | |
Expiring 2016 | | | (130,741,618 | ) | | | (115,976,490 | ) | | | (10,818,137 | ) | | | — | | | | (865,995 | ) | | | — | |
Expiring 2017 | | | (340,520,322 | ) | | | (382,249,557 | ) | | | (163,876,125 | ) | | | (5,667,247 | ) | | | (40,600,516 | ) | | | (156,909,082 | ) |
Total capital loss carryforwards | | $ | (471,261,940 | ) | | $ | (498,226,047 | ) | | $ | (174,694,262 | ) | | $ | (5,667,247 | ) | | $ | (41,466,511 | ) | | $ | (156,909,082 | ) |
| (1) | | Expiration occurs on October 31 of the year indicated. |
As of April 30, 2013, the Funds’ aggregate security unrealized gains and losses based on cost for U.S. federal income tax purposes was as follows:
| | | | | | | | | | | | | | | | | | | | | | | | |
| | | Large Cap
Growth Insights | | | Large Cap
Value Insights | | | Small Cap
Equity Insights | | | Small Cap
Growth
Insights | | | Small Cap Value Insights | | | U.S. Equity Insights | |
Tax Cost | | $ | 286,251,937 | | | $ | 305,459,759 | | | $ | 212,329,897 | | | $ | 45,295,712 | | | $ | 131,110,163 | | | $ | 313,009,385 | |
Gross unrealized gain | | | 30,722,879 | | | | 34,269,644 | | | | 32,015,566 | | | | 8,003,607 | | | | 21,838,572 | | | | 41,444,699 | |
Gross unrealized loss | | | (3,764,599 | ) | | | (8,067,751 | ) | | | (7,800,812 | ) | | | (1,537,801 | ) | | | (5,188,007 | ) | | | (2,603,125 | ) |
Net unrealized security gain | | $ | 26,958,280 | | | $ | 26,201,893 | | | $ | 24,214,754 | | | $ | 6,465,806 | | | $ | 16,650,565 | | | $ | 38,841,574 | |
99
GOLDMAN SACHS DOMESTIC EQUITY INSIGHTS FUNDS
Notes to Financial Statements (continued)
April 30, 2013 (Unaudited)
|
| 8. TAX INFORMATION (continued) |
The difference between GAAP-basis and tax-basis unrealized gains (losses) is attributable primarily to wash sales, net mark to market gains (losses) on regulated futures contracts, and differences related to the tax treatment of underlying fund investments.
GSAM has reviewed the Funds’ tax positions for all open tax years (the current and prior three years, as applicable) and has concluded that no provision for income tax is required in the Funds’ financial statements. Such open tax years remain subject to examination and adjustment by tax authorities.
The Funds’ risks include, but are not limited to, the following:
Shareholder Concentration Risk — Certain funds, accounts, individuals or Goldman Sachs affiliates may from time to time own (beneficially or of record) or control a significant percentage of the Funds’ shares. Redemptions by these entities of their holdings in the Funds may impact the Funds’ liquidity and NAV. These redemptions may also force the Funds to sell securities.
Liquidity Risk — The Funds may make investments that are illiquid or that may become less liquid in response to market developments or adverse investor perceptions. Illiquid investments may be more difficult to value. Liquidity risk may also refer to the risk that a Fund will not be able to pay redemption proceeds within the allowable time period because of unusual market conditions, an unusually high volume of redemption requests, or other reasons. To meet redemption requests, a Fund may be forced to sell investments at an unfavorable time and/or under unfavorable conditions.
Market and Credit Risks — In the normal course of business, the Funds trade financial instruments and enter into financial transactions where risk of potential loss exists due to changes in the market (market risk). Additionally, the Funds may also be exposed to credit risk in the event that an issuer fails to perform or that an institution or entity with which the Funds have unsettled or open transactions defaults.
Investing in foreign markets may involve special risks and considerations not typically associated with investing in the U.S. These risks include revaluation of currencies, high rates of inflation, repatriation restrictions on income and capital, and adverse political and economic developments. Moreover, securities issued in these markets may be less liquid, be subject to government ownership controls, have delayed settlements and their prices may be more volatile than those of comparable securities in the U.S.
Under the Trust’s organizational documents, its Trustees, officers, employees and agents are indemnified, to the extent permitted by the Act and State law, against certain liabilities that may arise out of performance of their duties to the Funds. Additionally, in the course of business, the Funds enter into contracts that contain a variety of indemnification clauses. The Funds’ maximum exposure under these arrangements is unknown, as this would involve future claims that may be made against the Funds that have not yet occurred. However, GSAM believes the risk of loss under these arrangements to be remote.
100
GOLDMAN SACHS DOMESTIC EQUITY INSIGHTS FUNDS
New Accounting Pronouncement — In December 2011, the Financial Accounting Standards Board issued an Accounting Standards Update No. 2011-11: Disclosures about offsetting Assets and Liabilities (“ASU”) to enhance disclosures about financial instruments and derivative instruments that are subject to offsetting (“netting”) on the Statements of Assets and Liabilities. This information will enable users of the Funds’ financial statements to evaluate the effect or potential effect of netting arrangements on the Funds’ financial position. The ASU is effective for financial statements with fiscal years beginning on or after January 1, 2013, and interim periods within those fiscal years. At this time, GSAM is evaluating the implications of these changes on the financial statements.
Subsequent events after the Statement of Assets and Liabilities date have been evaluated through the date the financial statements were issued. GSAM has concluded that there is no impact requiring adjustment or disclosure in the financial statements.
101
GOLDMAN SACHS DOMESTIC EQUITY INSIGHTS FUNDS
Notes to Financial Statements (continued)
April 30, 2013 (Unaudited)
|
| 13. SUMMARY OF SHARE TRANSACTIONS |
Share activity is as follows:
| | | | | | | | | | | | | | | | |
| | | Large Cap Growth Insights Fund | |
| | | | |
| | | For the Six Months Ended
April 30, 2013 (Unaudited) | | | For the Fiscal Year Ended
October 31, 2012 | |
| | | | |
| | | Shares | | | Dollars | | | Shares | | | Dollars | |
| | | | |
| Class A Shares | | | | | | | | | | | | | | | | |
Shares sold | | | 151,147 | | | $ | 2,221,957 | | | | 2,154,372 | | | $ | 28,393,655 | |
Reinvestment of distributions | | | 81,875 | | | | 1,139,681 | | | | 123,037 | | | | 1,535,500 | |
Shares converted from Class B(a) | | | 26,858 | | | | 396,974 | | | | 88,488 | | | | 1,181,991 | |
Shares redeemed | | | (4,250,087 | ) | | | (62,230,407 | ) | | | (5,864,729 | ) | | | (80,463,127 | ) |
| | | | (3,990,207 | ) | | | (58,471,795 | ) | | | (3,498,832 | ) | | | (49,351,981 | ) |
| Class B Shares | | | | | | | | | | | | | | | | |
Shares sold | | | 1,945 | | | | 27,030 | | | | 4,635 | | | | 56,379 | |
Reinvestment of distributions | | | 1,265 | | | | 16,309 | | | | 1,254 | | | | 14,506 | |
Shares converted to Class A(a) | | | (29,047 | ) | | | (396,974 | ) | | | (95,728 | ) | | | (1,181,991 | ) |
Shares redeemed | | | (43,127 | ) | | | (586,092 | ) | | | (103,713 | ) | | | (1,300,868 | ) |
| | | | (68,964 | ) | | | (939,727 | ) | | | (193,552 | ) | | | (2,411,974 | ) |
| Class C Shares | | | | | | | | | | | | | | | | |
Shares sold | | | 34,953 | | | | 473,207 | | | | 64,011 | | | | 789,707 | |
Reinvestment of distributions | | | 5,240 | | | | 67,169 | | | | 4,318 | | | | 49,745 | |
Shares redeemed | | | (118,924 | ) | | | (1,606,114 | ) | | | (217,526 | ) | | | (2,727,863 | ) |
| | | | (78,731 | ) | | | (1,065,738 | ) | | | (149,197 | ) | | | (1,888,411 | ) |
| Institutional Shares | | | | | | | | | | | | | | | | |
Shares sold | | | 839,329 | | | | 12,303,534 | | | | 6,317,283 | | | | 84,523,472 | |
Reinvestment of distributions | | | 346,155 | | | | 4,943,098 | | | | 436,080 | | | | 5,590,540 | |
Shares redeemed | | | (9,365,886 | ) | | | (141,023,441 | ) | | | (15,477,425 | ) | | | (218,937,584 | ) |
| | | | (8,180,402 | ) | | | (123,776,809 | ) | | | (8,724,062 | ) | | | (128,823,572 | ) |
| Service Shares | | | | | | | | | | | | | | | | |
Shares sold | | | 2,268 | | | | 32,397 | | | | 5,119 | | | | 67,131 | |
Reinvestment of distributions | | | — | | | | — | | | | — | | | | — | |
Shares redeemed | | | (2,442 | ) | | | (33,780 | ) | | | (16,242 | ) | | | (228,984 | ) |
| | | | (174 | ) | | | (1,383 | ) | | | (11,123 | ) | | | (161,853 | ) |
| Class IR Shares | | | | | | | | | | | | | | | | |
Shares sold | | | 4,501 | | | | 65,634 | | | | 46,622 | | | | 643,240 | |
Reinvestment of distributions | | | 806 | | | | 11,083 | | | | 54 | | | | 670 | |
Shares redeemed | | | (25,890 | ) | | | (384,555 | ) | | | (2,500 | ) | | | (33,988 | ) |
| | | | (20,583 | ) | | | (307,838 | ) | | | 44,176 | | | | 609,922 | |
| Class R Shares | | | | | | | | | | | | | | | | |
Shares sold | | | 1,225 | | | | 18,023 | | | | 7,411 | | | | 106,334 | |
Reinvestment of distributions | | | 129 | | | | 1,778 | | | | 8 | | | | 98 | |
Shares redeemed | | | (4,163 | ) | | | (64,119 | ) | | | (459 | ) | | | (6,178 | ) |
| | | | (2,809 | ) | | | (44,318 | ) | | | 6,960 | | | | 100,254 | |
NET INCREASE (DECREASE) | | | (12,341,870 | ) | | $ | (184,607,608 | ) | | | (12,525,630 | ) | | $ | (181,927,615 | ) |
| (a) | | Class B Shares automatically convert into Class A Shares on or about the fifteenth day of the last month of the calendar quarter that is eight years after the initial purchase date of either the Fund or another Goldman Sachs Fund. |
102
GOLDMAN SACHS DOMESTIC EQUITY INSIGHTS FUNDS
| | | | | | | | | | | | | | | | | | | | | | | | | | | | | | |
| Large Cap Value Insights Fund | | | Small Cap Equity Insights Fund | |
For the Six Months Ended April 30, 2013 (Unaudited) | | | For the Fiscal Year Ended October 31, 2012 | | | For the Six Months Ended April 30, 2013 (Unaudited) | | | For the Fiscal Year Ended October 31, 2012 | |
| Shares | | | Dollars | | | Shares | | | Dollars | | | Shares | | | Dollars | | | Shares | | | Dollars | |
| | | | | | | | | | | | | | | | | | | | | | | | | | | | | | |
| | 243,867 | | | $ | 2,997,345 | | | | 2,202,488 | | | $ | 23,680,613 | | | | 420,720 | | | $ | 5,820,346 | | | | 3,421,016 | | | $ | 43,260,091 | |
| | 70,546 | | | | 813,210 | | | | 170,736 | | | | 1,835,029 | | | | 6,723 | | | | 87,001 | | | | 41,277 | | | | 495,313 | |
| | 2,852 | | | | 35,789 | | | | 3,540 | | | | 37,083 | | | | 2,068 | | | | 28,613 | | | | 18,017 | | | | 224,211 | |
| | (5,453,703 | ) | | | (66,275,189 | ) | | | (6,132,185 | ) | | | (67,022,480 | ) | | | (1,606,478 | ) | | | (22,486,533 | ) | | | (5,040,273 | ) | | | (64,767,202 | ) |
| | (5,136,438 | ) | | | (62,428,845 | ) | | | (3,755,421 | ) | | | (41,469,755 | ) | | | (1,176,967 | ) | | | (16,550,573 | ) | | | (1,559,963 | ) | | | (20,787,587 | ) |
| | | | | | | | | | | | | | | | | | | | | | | | | | | | | | |
| | 4,453 | | | | 55,778 | | | | 2,541 | | | | 27,904 | | | | — | | | | — | | | | 5,984 | | | | 63,991 | |
| | 628 | | | | 7,106 | | | | 1,104 | | | | 11,679 | | | | — | | | | — | | | | 18 | | | | 201 | |
| | (2,869 | ) | | | (35,789 | ) | | | (3,559 | ) | | | (37,083 | ) | | | (2,308 | ) | | | (28,613 | ) | | | (20,025 | ) | | | (224,211 | ) |
| | (30,847 | ) | | | (374,863 | ) | | | (53,912 | ) | | | (584,701 | ) | | | (21,415 | ) | | | (267,363 | ) | | | (48,297 | ) | | | (543,632 | ) |
| | (28,635 | ) | | | (347,768 | ) | | | (53,826 | ) | | | (582,201 | ) | | | (23,723 | ) | | | (295,976 | ) | | | (62,320 | ) | | | (703,651 | ) |
| | | | | | | | | | | | | | | | | | | | | | | | | | | | | | |
| | 98,767 | | | | 1,200,330 | | | | 189,563 | | | | 2,018,367 | | | | 84,272 | | | | 1,038,501 | | | | 196,166 | | | | 2,223,629 | |
| | 5,357 | | | | 60,529 | | | | 8,520 | | | | 90,181 | | | | — | | | | — | | | | 2,517 | | | | 27,214 | |
| | (143,732 | ) | | | (1,721,291 | ) | | | (411,035 | ) | | | (4,383,466 | ) | | | (128,378 | ) | | | (1,589,865 | ) | | | (353,592 | ) | | | (3,985,314 | ) |
| | (39,608 | ) | | | (460,432 | ) | | | (212,952 | ) | | | (2,274,918 | ) | | | (44,106 | ) | | | (551,364 | ) | | | (154,909 | ) | | | (1,734,471 | ) |
| | | | | | | | | | | | | | | | | | | | | | | | | | | | | | |
| | 1,024,111 | | | | 12,064,351 | | | | 6,344,587 | | | | 66,688,711 | | | | 2,645,383 | | | | 37,126,536 | | | | 6,643,648 | | | | 84,934,855 | |
| | 312,040 | | | | 3,629,905 | | | | 624,213 | | | | 6,739,504 | | | | 63,265 | | | | 845,860 | | | | 86,557 | | | | 1,074,181 | |
| | (11,746,869 | ) | | | (142,773,362 | ) | | | (13,452,800 | ) | | | (146,724,216 | ) | | | (2,271,465 | ) | | | (33,238,183 | ) | | | (4,393,749 | ) | | | (59,131,812 | ) |
| | (10,410,718 | ) | | | (127,079,106 | ) | | | (6,484,000 | ) | | | (73,296,001 | ) | | | 437,183 | | | | 4,734,213 | | | | 2,336,456 | | | | 26,877,224 | |
| | | | | | | | | | | | | | | | | | | | | | | | | | | | | | |
| | 42,278 | | | | 522,794 | | | | 160,009 | | | | 1,702,642 | | | | 25,045 | | | | 346,575 | | | | 116,306 | | | | 1,481,980 | |
| | 3,621 | | | | 42,046 | | | | 7,972 | | | | 85,430 | | | | 272 | | | | 3,466 | | | | 676 | | | | 8,024 | |
| | (141,778 | ) | | | (1,712,934 | ) | | | (476,865 | ) | | | (5,272,923 | ) | | | (29,370 | ) | | | (401,762 | ) | | | (79,783 | ) | | | (1,027,535 | ) |
| | (95,879 | ) | | | (1,148,094 | ) | | | (308,884 | ) | | | (3,484,851 | ) | | | (4,053 | ) | | | (51,721 | ) | | | 37,199 | | | | 462,469 | |
| | | | | | | | | | | | | | | | | | | | | | | | | | | | | | |
| | 7,704 | | | | 95,192 | | | | 5,466 | | | | 59,043 | | | | 63,484 | | | | 889,856 | | | | 58,773 | | | | 737,232 | |
| | 154 | | | | 1,817 | | | | 162 | | | | 1,769 | | | | 2,498 | | | | 31,951 | | | | 5,696 | | | | 67,613 | |
| | (192 | ) | | | (2,432 | ) | | | (1,080 | ) | | | (11,584 | ) | | | (29,551 | ) | | | (405,075 | ) | | | (57,719 | ) | | | (729,754 | ) |
| | 7,666 | | | | 94,577 | | | | 4,548 | | | | 49,228 | | | | 36,431 | | | | 516,732 | | | | 6,750 | | | | 75,091 | |
| | | | | | | | | | | | | | | | | | | | | | | | | | | | | | |
| | 216 | | | | 2,656 | | | | 2,175 | | | | 23,009 | | | | 375,505 | | | | 5,372,554 | | | | 15,169 | | | | 194,528 | |
| | 25 | | | | 286 | | | | 25 | | | | 273 | | | | 57 | | | | 733 | | | | 129 | | | | 1,539 | |
| | (118 | ) | | | (1,477 | ) | | | (262 | ) | | | (2,803 | ) | | | (6,185 | ) | | | (88,416 | ) | | | (4,737 | ) | | | (61,401 | ) |
| | 123 | | | | 1,465 | | | | 1,938 | | | | 20,479 | | | | 369,377 | | | | 5,284,871 | | | | 10,561 | | | | 134,666 | |
| | (15,703,489 | ) | | $ | (191,368,203 | ) | | | (10,808,597 | ) | | $ | (121,038,019 | ) | | | (405,858 | ) | | $ | (6,913,818 | ) | | | 613,774 | | | $ | 4,323,741 | |
103
GOLDMAN SACHS DOMESTIC EQUITY INSIGHTS FUNDS
Notes to Financial Statements (continued)
April 30, 2013 (Unaudited)
|
| 13. SUMMARY OF SHARE TRANSACTIONS (continued) |
Share activity is as follows:
| | | | | | | | | | | | | | | | |
| | | Small Cap Growth Insights Fund | |
| | | | |
| | | For the Six Months Ended April 30, 2013
(Unaudited) | | | For the Fiscal Year Ended
October 31, 2012 | |
| | | | |
| | | Shares | | | Dollars | | | Shares | | | Dollars | |
| | | | |
| Class A Shares | | | | | | | | | | | | | | | | |
Shares sold | | | 83,210 | | | $ | 2,124,341 | | | | 150,164 | | | $ | 3,374,569 | |
Reinvestment of distributions | | | 7,887 | | | | 183,392 | | | | — | | | | — | |
Shares converted from Class B(a) | | | 15,183 | | | | 385,689 | | | | 45,644 | | | | 1,035,608 | |
Shares redeemed | | | (168,814 | ) | | | (4,117,380 | ) | | | (276,280 | ) | | | (6,267,685 | ) |
| | | | (62,534 | ) | | | (1,423,958 | ) | | | (80,472 | ) | | | (1,857,508 | ) |
| Class B Shares | | | | | | | | | | | | | | | | |
Shares sold | | | 710 | | | | 15,187 | | | | 9,851 | | | | 188,314 | |
Reinvestment of distributions | | | 365 | | | | 7,291 | | | | — | | | | — | |
Shares converted to Class A(a) | | | (17,770 | ) | | | (385,689 | ) | | | (53,388 | ) | | | (1,035,608 | ) |
Shares redeemed | | | (16,693 | ) | | | (354,282 | ) | | | (48,070 | ) | | | (928,940 | ) |
| | | | (33,388 | ) | | | (717,493 | ) | | | (91,607 | ) | | | (1,776,234 | ) |
| Class C Shares | | | | | | | | | | | | | | | | |
Shares sold | | | 33,432 | | | | 727,220 | | | | 51,359 | | | | 990,994 | |
Reinvestment of distributions | | | 543 | | | | 10,923 | | | | — | | | | — | |
Shares redeemed | | | (47,475 | ) | | | (1,008,414 | ) | | | (72,422 | ) | | | (1,409,005 | ) |
| | | | (13,500 | ) | | | (270,271 | ) | | | (21,063 | ) | | | (418,011 | ) |
| Institutional Shares | | | | | | | | | | | | | | | | |
Shares sold | | | 110,397 | | | | 3,031,321 | | | | 31,554 | | | | 800,082 | |
Reinvestment of distributions | | | 3,620 | | | | 93,209 | | | | — | | | | — | |
Shares redeemed | | | (16,163 | ) | | | (438,321 | ) | | | (30,430 | ) | | | (756,172 | ) |
| | | | 97,854 | | | | 2,686,209 | | | | 1,124 | | | | 43,910 | |
| Service Shares | | | | | | | | | | | | | | | | |
Shares sold | | | — | | | | — | | | | — | | | | — | |
Reinvestment of distributions | | | — | | | | — | | | | — | | | | — | |
Shares redeemed | | | — | | | | — | | | | — | | | | — | |
| | | | — | | | | — | | | | — | | | | — | |
| Class IR Shares | | | | | | | | | | | | | | | | |
Shares sold | | | 1,166 | | | | 31,020 | | | | 38,575 | | | | 827,372 | |
Reinvestment of distributions | | | 74 | | | | 1,734 | | | | — | | | | — | |
Shares redeemed | | | (309 | ) | | | (7,570 | ) | | | (32,916 | ) | | | (758,032 | ) |
| | | | 931 | | | | 25,184 | | | | 5,659 | | | | 69,340 | |
| Class R Shares | | | | | | | | | | | | | | | | |
Shares sold | | | 3,897 | | | | 92,904 | | | | 362 | | | | 7,775 | |
Reinvestment of distributions | | | 20 | | | | 455 | | | | — | | | | — | |
Shares redeemed | | | (1,055 | ) | | | (24,858 | ) | | | (2 | ) | | | (43 | ) |
| | | | 2,862 | | | | 68,501 | | | | 360 | | | | 7,732 | |
NET INCREASE (DECREASE) | | | (7,775 | ) | | $ | 368,172 | | | | (185,999 | ) | | $ | (3,930,771 | ) |
| (a) | | Class B Shares automatically convert into Class A Shares on or about the fifteenth day of the last month of the calendar quarter that is eight years after the initial purchase date of either the Fund or another Goldman Sachs Fund. |
104
GOLDMAN SACHS DOMESTIC EQUITY INSIGHTS FUNDS
| | | | | | | | | | | | | | | | | | | | | | | | | | | | | | |
| Small Cap Value Insights Fund | | | U.S. Equity Insights Fund | |
For the Six Months Ended April 30, 2013 (Unaudited) | | | For the Fiscal Year Ended
October 31, 2012 | | | For the Six Months Ended April 30, 2013 (Unaudited) | | | For the Fiscal Year Ended
October 31, 2012 | |
| Shares | | | Dollars | | | Shares | | | Dollars | | | Shares | | | Dollars | | | Shares | | | Dollars | |
| | | | | | | | | | | | | | | | | | | | | | | | | | | | | | |
| | 214,617 | | | $ | 6,353,373 | | | | 234,841 | | | $ | 6,551,642 | | | | 338,817 | | | $ | 9,703,370 | | | | 516,276 | | | $ | 12,982,428 | |
| | 34,214 | | | | 967,845 | | | | 17,093 | | | | 447,825 | | | | 127,319 | | | | 3,368,658 | | | | 191,540 | | | | 4,577,800 | |
| | 30,279 | | | | 924,423 | | | | 102,593 | | | | 2,861,234 | | | | 30,063 | | | | 862,541 | | | | 70,854 | | | | 1,815,567 | |
| | (350,552 | ) | | | (10,541,003 | ) | | | (793,259 | ) | | | (22,403,570 | ) | | | (1,466,176 | ) | | | (42,027,158 | ) | | | (3,328,958 | ) | | | (83,967,729 | ) |
| | (71,442 | ) | | | (2,295,362 | ) | | | (438,732 | ) | | | (12,542,869 | ) | | | (969,977 | ) | | | (28,092,589 | ) | | | (2,550,288 | ) | | | (64,591,934 | ) |
| | | | | | | | | | | | | | | | | | | | | | | | | | | | | | |
| | 5,119 | | | | 108,200 | | | | 13,002 | | | | 252,705 | | | | 2,675 | | | | 70,426 | | | | 6,870 | | | | 161,501 | |
| | 4,372 | | | | 86,327 | | | | — | | | | — | | | | 1,914 | | | | 47,666 | | | | 5,024 | | | | 112,843 | |
| | (43,454 | ) | | | (924,423 | ) | | | (146,760 | ) | | | (2,861,234 | ) | | | (32,000 | ) | | | (862,541 | ) | | | (75,583 | ) | | | (1,815,567 | ) |
| | (48,430 | ) | | | (1,025,803 | ) | | | (154,020 | ) | | | (2,978,139 | ) | | | (41,500 | ) | | | (1,088,973 | ) | | | (167,420 | ) | | | (3,972,045 | ) |
| | (82,393 | ) | | | (1,755,699 | ) | | | (287,778 | ) | | | (5,586,668 | ) | | | (68,911 | ) | | | (1,833,422 | ) | | | (231,109 | ) | | | (5,513,268 | ) |
| | | | | | | | | | | | | | | | | | | | | | | | | | | | | | |
| | 22,177 | | | | 518,312 | | | | 54,318 | | | | 1,200,983 | | | | 43,648 | | | | 1,136,895 | | | | 108,987 | | | | 2,555,577 | |
| | 5,469 | | | | 122,191 | | | | — | | | | — | | | | 10,068 | | | | 245,757 | | | | 15,991 | | | | 353,074 | |
| | (77,100 | ) | | | (1,817,527 | ) | | | (192,766 | ) | | | (4,249,365 | ) | | | (169,355 | ) | | | (4,437,090 | ) | | | (333,441 | ) | | | (7,842,518 | ) |
| | (49,454 | ) | | | (1,177,024 | ) | | | (138,448 | ) | | | (3,048,382 | ) | | | (115,639 | ) | | | (3,054,438 | ) | | | (208,463 | ) | | | (4,933,867 | ) |
| | | | | | | | | | | | | | | | | | | | | | | | | | | | | | |
| | 67,093 | | | | 2,505,783 | | | | 321,012 | | | | 11,364,487 | | | | 812,347 | | | | 24,539,798 | | | | 237,774 | | | | 6,323,070 | |
| | 4,236 | | | | 148,474 | | | | 681 | | | | 22,071 | | | | 22,320 | | | | 604,198 | | | | 26,618 | | | | 650,815 | |
| | (70,950 | ) | | | (2,636,419 | ) | | | (83,124 | ) | | | (2,870,446 | ) | | | (143,307 | ) | | | (4,164,540 | ) | | | (395,368 | ) | | | (10,323,460 | ) |
| | 379 | | | | 17,838 | | | | 238,569 | | | | 8,516,112 | | | | 691,360 | | | | 20,979,456 | | | | (130,976 | ) | | | (3,349,575 | ) |
| | | | | | | | | | | | | | | | | | | | | | | | | | | | | | |
| | — | | | | — | | | | — | | | | — | | | | 508 | | | | 14,194 | | | | 3,829 | | | | 95,432 | |
| | — | | | | — | | | | — | | | | — | | | | 299 | | | | 7,903 | | | | 344 | | | | 8,222 | |
| | — | | | | — | | | | — | | | | — | | | | (5,354 | ) | | | (149,206 | ) | | | (5,316 | ) | | | (132,172 | ) |
| | — | | | | — | | | | — | | | | — | | | | (4,547 | ) | | | (127,109 | ) | | | (1,143 | ) | | | (28,518 | ) |
| | | | | | | | | | | | | | | | | | | | | | | | | | | | | | |
| | 34,324 | | | | 989,937 | | | | 14,403 | | | | 398,988 | | | | 14,518 | | | | 418,427 | | | | 4,747 | | | | 118,621 | |
| | 591 | | | | 16,662 | | | | 74 | | | | 1,923 | | | | 145 | | | | 3,806 | | | | 71 | | | | 1,686 | |
| | (13,755 | ) | | | (424,501 | ) | | | (7,097 | ) | | | (203,630 | ) | | | (5,890 | ) | | | (163,695 | ) | | | (1,736 | ) | | | (40,658 | ) |
| | 21,160 | | | | 582,098 | | | | 7,380 | | | | 197,281 | | | | 8,773 | | | | 258,538 | | | | 3,082 | | | | 79,649 | |
| | | | | | | | | | | | | | | | | | | | | | | | | | | | | | |
| | 7,063 | | | | 209,644 | | | | 18,168 | | | | 513,590 | | | | 484 | | | | 13,519 | | | | 12,321 | | | | 304,559 | |
| | 290 | | | | 8,149 | | | | 47 | | | | 1,228 | | | | 187 | | | | 4,903 | | | | 18 | | | | 426 | |
| | (3,863 | ) | | | (117,135 | ) | | | (1,876 | ) | | | (52,574 | ) | | | (893 | ) | | | (23,923 | ) | | | (898 | ) | | | (22,700 | ) |
| | 3,490 | | | | 100,658 | | | | 16,339 | | | | 462,244 | | | | (222 | ) | | | (5,501 | ) | | | 11,441 | | | | 282,285 | |
| | (178,260 | ) | | $ | (4,527,491 | ) | | | (602,670 | ) | | $ | (12,002,282 | ) | | | (459,163 | ) | | $ | (11,875,065 | ) | | | (3,107,456 | ) | | $ | (78,055,228 | ) |
105
GOLDMAN SACHS DOMESTIC EQUITY INSIGHTS FUNDS
Fund Expenses — Six Month Period Ended April 30, 2013 (Unaudited)
As a shareholder of Class A, Class B, Class C, Institutional, Service, Class IR or Class R Shares of a Fund, you incur two types of costs: (1) transaction costs, including sales charges on purchase payments (with respect to Class A Shares), contingent deferred sales charges on redemptions (with respect to Class B and Class C Shares), and (2) ongoing costs, including management fees; distribution and service (12b-1) fees (with respect to Class A, Class B, Class C and Class R Shares); and other Fund expenses. This Example is intended to help you understand your ongoing costs (in dollars) of investing in Class A, Class B, Class C, Institutional, Service, Class IR or Class R Shares of the Funds and to compare these costs with the ongoing costs of investing in other mutual funds.
The Example is based on an investment of $1,000 invested at the beginning of the period and held for the entire period from November 1, 2012 through April 30, 2013.
Actual Expenses — The first line under each share class in the table below provides information about actual account values and actual expenses. You may use the information in this line, together with the amount you invested, to estimate the expenses that you paid over the period. Simply divide your account value by $1,000 (for example, an $8,600 account value divided by $1,000=8.6), then multiply the result by the number in the first line under the heading entitled “Expenses Paid” to estimate the expenses you paid on your account during this period.
Hypothetical Example for Comparison Purposes — The second line under each share class in the table below provides information about hypothetical account values and hypothetical expenses based on the Funds’ actual net expense ratios and an assumed rate of return of 5% per year before expenses, which is not the Funds’ actual return. The hypothetical account values and expenses may not be used to estimate the actual ending account balance or expenses you paid for the period. You may use this information to compare the ongoing costs of investing in the Funds and other funds. To do so, compare this 5% hypothetical example with the 5% hypothetical examples that appear in the shareholder reports of the other funds.
Please note that the expenses shown in the table are meant to highlight your ongoing costs only and do not reflect any transactional costs, such as sales charges, redemption fees, or exchange fees. Therefore, the second line of the table is useful in comparing ongoing costs only, and will not help you determine the relative total costs of owning different funds. In addition, if these transactional costs were included, your costs would have been higher.
| | | | | | | | | | | | | | | | | | | | | | | | | | | | | | | | | | | | |
| | | Large Cap Growth Insights Fund | | | Large Cap Value Insights Fund | | | Small Cap Equity Insights Fund | |
| Share Class | | Beginning
Account
Value
11/1/12 | | | Ending
Account
Value
4/30/13 | | | Expenses Paid for the
6 Months Ended
4/30/13* | | | Beginning
Account
Value
11/1/12 | | | Ending
Account
Value
4/30/13 | | | Expenses Paid for the
6 Months Ended
4/30/13* | | | Beginning
Account
Value
11/1/12 | | | Ending
Account
Value
4/30/13 | | | Expenses Paid for the
6 Months Ended
4/30/13* | |
| Class A | | | | | | | | | | | | | | | | | | | | | | | | | | | | | | | | | | | | |
Actual | | $ | 1,000.00 | | | $ | 1,143.60 | | | $ | 5.05 | | | $ | 1,000.00 | | | $ | 1,153.40 | | | $ | 5.07 | | | $ | 1,000.00 | | | $ | 1,139.00 | | | $ | 6.68 | |
Hypothetical 5% return | | | 1,000.00 | | | | 1,020.08 | + | | | 4.76 | | | | 1,000.00 | | | | 1,020.08 | + | | | 4.76 | | | | 1,000.00 | | | | 1,018.55 | + | | | 6.31 | |
| Class B | | | | | | | | | | | | | | | | | | | | | | | | | | | | | | | | | | | | |
Actual | | | 1,000.00 | | | | 1,139.70 | | | | 9.02 | | | | 1,000.00 | | | | 1,149.40 | | | | 9.06 | | | | 1,000.00 | | | | 1,134.70 | | | | 10.59 | |
Hypothetical 5% return | | | 1,000.00 | | | | 1,016.36 | + | | | 8.50 | | | | 1,000.00 | | | | 1,016.36 | + | | | 8.50 | | | | 1,000.00 | | | | 1,014.88 | + | | | 9.99 | |
| Class C | | | | | | | | | | | | | | | | | | | | | | | | | | | | | | | | | | | | |
Actual | | | 1,000.00 | | | | 1,139.60 | | | | 9.02 | | | | 1,000.00 | | | | 1,148.90 | | | | 9.06 | | | | 1,000.00 | | | | 1,135.70 | | | | 10.59 | |
Hypothetical 5% return | | | 1,000.00 | | | | 1,016.36 | + | | | 8.50 | | | | 1,000.00 | | | | 1,016.36 | + | | | 8.50 | | | | 1,000.00 | | | | 1,014.88 | + | | | 9.99 | |
| Institutional | | | | | | | | | | | | | | | | | | | | | | | | | | | | | | | | | | | | |
Actual | | | 1,000.00 | | | | 1,146.10 | | | | 2.93 | | | | 1,000.00 | | | | 1,156.00 | | | | 2.94 | | | | 1,000.00 | | | | 1,141.50 | | | | 4.57 | |
Hypothetical 5% return | | | 1,000.00 | | | | 1,022.07 | + | | | 2.76 | | | | 1,000.00 | | | | 1,022.07 | + | | | 2.76 | | | | 1,000.00 | | | | 1,020.53 | + | | | 4.31 | |
| Service | | | | | | | | | | | | | | | | | | | | | | | | | | | | | | | | | | | | |
Actual | | | 1,000.00 | | | | 1,143.20 | | | | 5.58 | | | | 1,000.00 | | | | 1,152.30 | | | | 5.60 | | | | 1,000.00 | | | | 1,138.40 | | | | 7.21 | |
Hypothetical 5% return | | | 1,000.00 | | | | 1,019.59 | + | | | 5.26 | | | | 1,000.00 | | | | 1,019.59 | + | | | 5.26 | | | | 1,000.00 | | | | 1,018.05 | + | | | 6.80 | |
| Class IR | | | | | | | | | | | | | | | | | | | | | | | | | | | | | | | | | | | | |
Actual | | | 1,000.00 | | | | 1,145.20 | | | | 3.72 | | | | 1,000.00 | | | | 1,154.50 | | | | 3.74 | | | | 1,000.00 | | | | 1,140.00 | | | | 5.36 | |
Hypothetical 5% return | | | 1,000.00 | | | | 1,021.32 | + | | | 3.51 | | | | 1,000.00 | | | | 1,021.32 | + | | | 3.51 | | | | 1,000.00 | | | | 1,019.79 | + | | | 5.06 | |
| Class R | | | | | | | | | | | | | | | | | | | | | | | | | | | | | | | | | | | | |
Actual | | | 1,000.00 | | | | 1,142.10 | | | | 6.37 | | | | 1,000.00 | | | | 1,151.80 | | | | 6.40 | | | | 1,000.00 | | | | 1,138.10 | | | | 8.00 | |
Hypothetical 5% return | | | 1,000.00 | | | | 1,018.84 | + | | | 6.01 | | | | 1,000.00 | | | | 1,018.84 | + | | | 6.01 | | | | 1,000.00 | | | | 1,017.31 | + | | | 7.55 | |
106
GOLDMAN SACHS DOMESTIC EQUITY INSIGHTS FUNDS
Fund Expenses — Six Month Period Ended April 30, 2013 (Unaudited) (continued)
| | | | | | | | | | | | | | | | | | | | | | | | | | | | | | | | | | | | |
| | | Small Cap Growth Insights Fund | | | Small Cap Value Insights Fund | | | U.S. Equity Insights Fund | |
| Share Class | | Beginning
Account
Value
11/1/12 | | | Ending
Account
Value
4/30/13 | | | Expenses Paid for the
6 Months Ended
4/30/13* | | | Beginning
Account
Value
11/1/12 | | | Ending
Account
Value
4/30/13 | | | Expenses Paid for the
6 Months Ended
4/30/13* | | | Beginning
Account
Value
11/1/12 | | | Ending
Account
Value
4/30/13 | | | Expenses Paid for the
6 Months Ended
4/30/13* | |
| Class A | | | | | | | | | | | | | | | | | | | | | | | | | | | | | | | | | | | | |
Actual | | $ | 1,000.00 | | | $ | 1,151.20 | | | $ | 6.72 | | | $ | 1,000.00 | | | $ | 1,118.00 | | | $ | 6.56 | | | $ | 1,000.00 | | | $ | 1,156.00 | | | $ | 5.08 | |
Hypothetical 5% return | | | 1,000.00 | | | | 1,018.55 | + | | | 6.31 | | | | 1,000.00 | | | | 1,018.60 | + | | | 6.26 | | | | 1,000.00 | | | | 1,020.08 | + | | | 4.76 | |
| Class B | | | | | | | | | | | | | | | | | | | | | | | | | | | | | | | | | | | | |
Actual | | | 1,000.00 | | | | 1,146.20 | | | | 10.70 | | | | 1,000.00 | | | | 1,114.40 | | | | 10.49 | | | | 1,000.00 | | | | 1,151.50 | | | | 9.07 | |
Hypothetical 5% return | | | 1,000.00 | | | | 1,014.83 | + | | | 10.04 | | | | 1,000.00 | | | | 1,014.88 | + | | | 9.99 | | | | 1,000.00 | | | | 1,016.36 | + | | | 8.50 | |
| Class C | | | | | | | | | | | | | | | | | | | | | | | | | | | | | | | | | | | | |
Actual | | | 1,000.00 | | | | 1,146.50 | | | | 10.70 | | | | 1,000.00 | | | | 1,114.20 | | | | 10.48 | | | | 1,000.00 | | | | 1,151.70 | | | | 9.07 | |
Hypothetical 5% return | | | 1,000.00 | | | | 1,014.83 | + | | | 10.04 | | | | 1,000.00 | | | | 1,014.88 | + | | | 9.99 | | | | 1,000.00 | | | | 1,016.36 | + | | | 8.50 | |
| Institutional | | | | | | | | | | | | | | | | | | | | | | | | | | | | | | | | | | | | |
Actual | | | 1,000.00 | | | | 1,153.20 | | | | 4.59 | | | | 1,000.00 | | | | 1,120.60 | | | | 4.47 | | | | 1,000.00 | | | | 1,158.20 | | | | 2.94 | |
Hypothetical 5% return | | | 1,000.00 | | | | 1,020.53 | + | | | 4.31 | | | | 1,000.00 | | | | 1,020.58 | + | | | 4.26 | | | | 1,000.00 | | | | 1,022.07 | + | | | 2.76 | |
| Service | | | | | | | | | | | | | | | | | | | | | | | | | | | | | | | | | | | | |
Actual | | | N/A | | | | N/A | | | | N/A | | | | N/A | | | | N/A | | | | N/A | | | | 1,000.00 | | | | 1,155.10 | | | | 5.61 | |
Hypothetical 5% return | | | N/A | | | | N/A | | | | N/A | | | | N/A | | | | N/A | | | | N/A | | | | 1,000.00 | | | | 1,019.59 | + | | | 5.26 | |
| Class IR | | | | | | | | | | | | | | | | | | | | | | | | | | | | | | | | | | | | |
Actual | | | 1,000.00 | | | | 1,152.00 | | | | 5.39 | | | | 1,000.00 | | | | 1,120.00 | | | | 5.26 | | | | 1,000.00 | | | | 1,157.20 | | | | 3.74 | |
Hypothetical 5% return | | | 1,000.00 | | | | 1,019.79 | + | | | 5.06 | | | | 1,000.00 | | | | 1,019.84 | + | | | 5.01 | | | | 1,000.00 | | | | 1,021.32 | + | | | 3.51 | |
| Class R | | | | | | | | | | | | | | | | | | | | | | | | | | | | | | | | | | | | |
Actual | | | 1,000.00 | | | | 1,149.40 | | | | 8.05 | | | | 1,000.00 | | | | 1,116.80 | | | | 7.87 | | | | 1,000.00 | | | | 1,154.50 | | | | 6.41 | |
Hypothetical 5% return | | | 1,000.00 | | | | 1,017.31 | + | | | 7.55 | | | | 1,000.00 | | | | 1,017.36 | + | | | 7.50 | | | | 1,000.00 | | | | 1,018.84 | + | | | 6.01 | |
| * | | Expenses for each share class are calculated using each Fund’s annualized net expense ratio for each class, which represents the ongoing expenses as a percentage of net assets for the six months ended April 30, 2013. Expenses are calculated by multiplying the annualized net expense ratio by the average account value for the period; then multiplying the result by the number of days in the most recent fiscal half year; and then dividing that result by the number of days in the fiscal year. The annualized net expense ratios for the period were as follows: |
107
GOLDMAN SACHS DOMESTIC EQUITY INSIGHTS FUNDS
Fund Expenses — Six Month Period Ended April 30, 2013 (Unaudited) (continued)
| | | | | | | | | | | | | | | | | | | | | | | | | | | | |
| Fund | | Class A | | | Class B | | | Class C | | | Institutional | | | Service | | | Class IR | | | Class R | |
Large Cap Growth Insights | | | 0.95 | % | | | 1.70 | % | | | 1.70 | % | | | 0.55 | % | | | 1.05 | % | | | 0.70 | % | | | 1.20 | % |
Large Cap Value Insights | | | 0.95 | | | | 1.70 | | | | 1.70 | | | | 0.55 | | | | 1.05 | | | | 0.70 | | | | 1.20 | |
Small Cap Equity Insights | | | 1.26 | | | | 2.00 | | | | 2.00 | | | | 0.86 | | | | 1.36 | | | | 1.01 | | | | 1.51 | |
Small Cap Growth Insights | | | 1.26 | | | | 2.01 | | | | 2.01 | | | | 0.86 | | | | N/A | | | | 1.01 | | | | 1.51 | |
Small Cap Value Insights | | | 1.25 | | | | 2.00 | | | | 2.00 | | | | 0.85 | | | | N/A | | | | 1.00 | | | | 1.50 | |
U.S. Equity Insights | | | 0.95 | | | | 1.70 | | | | 1.70 | | | | 0.55 | | | | 1.05 | | | | 0.70 | | | | 1.20 | |
| + | | Hypothetical expenses are based on each Fund’s actual annualized net expense ratios and an assumed rate of return of 5% per year before expenses. |
108
FUNDS PROFILE
Goldman Sachs Funds

Goldman Sachs is a premier financial services firm, known since 1869 for creating thoughtful and customized investment solutions in complex global markets.
Today, the Investment Management Division of Goldman Sachs serves a diverse set of clients worldwide, including private institutions, public entities and individuals. With approximately $748.1 billion in assets under management as of March 31, 2013, Goldman Sachs Asset Management (“GSAM”) has portfolio management teams located around the world and our investment professionals bring firsthand knowledge of local markets to every investment decision. GSAM’s assets under management includes assets managed by Goldman Sachs Asset Management, L.P. and its Investment Advisory Affiliates.
|
| OVERVIEW OF GOLDMAN SACHS FUNDS |

Money Market1
Financial Square FundsSM
| n | | Financial Square Tax-Exempt Funds |
| n | | Financial Square Federal Fund |
| n | | Financial Square Government Fund |
| n | | Financial Square Money Market Fund |
| n | | Financial Square Prime Obligations Fund |
| n | | Financial Square Treasury Instruments Fund |
| n | | Financial Square Treasury Obligations Fund |
Fixed Income
Short Duration and Government
| n | | High Quality Floating Rate Fund2 |
| n | | Short Duration Government Fund |
| n | | Short Duration Income Fund |
| n | | Inflation Protected Securities Fund |
Multi-Sector
| n | | Core Plus Fixed Income Fund |
Municipal and Tax-Free
| n | | High Yield Municipal Fund |
| n | | Short Duration Tax-Free Fund |
Single Sector
| n | | Investment Grade Credit Fund |
| n | | High Yield Floating Rate Fund |
| n | | Emerging Markets Debt Fund |
| n | | Local Emerging Markets Debt Fund |
Corporate Credit
Fundamental Equity
| n | | Small/Mid Cap Growth Fund |
| n | | Flexible Cap Growth Fund |
| n | | Concentrated Growth Fund |
| n | | Technology Tollkeeper Fund |
| n | | Growth Opportunities Fund |
| n | | Rising Dividend Growth Fund |
Structured Equity
| n | | Structured Tax-Managed Equity Fund |
| n | | Structured International Tax-Managed Equity Fund |
| n | | U.S. Equity Dividend and Premium Fund |
| n | | International Equity Dividend and Premium Fund |
Equity Insights4
| n | | Small Cap Equity Insights Fund |
| n | | U.S. Equity Insights Fund |
| n | | Small Cap Growth Insights Fund |
| n | | Large Cap Growth Insights Fund |
| n | | Large Cap Value Insights Fund |
| n | | Small Cap Value Insights Fund |
| n | | International Small Cap Insights Fund |
| n | | International Equity Insights Fund |
| n | | Emerging Markets Equity Insights Fund |
Fundamental Equity International
| n | | Strategic International Equity Fund |
| n | | Concentrated International Equity Fund |
| n | | International Small Cap Fund |
| n | | Emerging Markets Equity Fund |
| n | | BRIC Fund (Brazil, Russia, India, China) |
Select Satellite5
| n | | Real Estate Securities Fund |
| n | | International Real Estate Securities Fund |
| n | | Commodity Strategy Fund |
| n | | Dynamic Allocation Fund |
| n | | Absolute Return Tracker Fund |
| n | | Managed Futures Strategy Fund |
| n | | MLP Energy Infrastructure Fund |
| n | | Multi-Manager Alternatives Fund |
| n | | Retirement Portfolio Completion Fund |
| n | | Income Strategies Portfolio |
Total Portfolio Solutions5
| n | | Balanced Strategy Portfolio |
| n | | Growth and Income Strategy Portfolio |
| n | | Growth Strategy Portfolio |
| n | | Equity Growth Strategy Portfolio |
| n | | Satellite Strategies Portfolio |
| n | | Enhanced Dividend Global Equity Portfolio |
| n | | Tax Advantaged Global Equity Portfolio |
| 1 | | An investment in a money market fund is neither insured nor guaranteed by the Federal Deposit Insurance Corporation (“FDIC”) or any other government agency. Although the Funds seek to preserve the value of your investment at $1.00 per share, it is possible to lose money by investing in the Funds. |
| 2 | | Effective at the close of business on July 27, 2012, the Goldman Sachs Ultra-Short Duration Government Fund was renamed the Goldman Sachs High Quality Floating Rate Fund. |
| 3 | | Effective at the close of business on June 29, 2012, the Goldman Sachs Balanced Fund was renamed the Goldman Sachs Income Builder Fund. |
| 4 | | Effective at the close of business May 3, 2013, the Goldman Sachs Structured Large Cap Growth, Structured Large Cap Value, Structured Small Cap Equity, Structured Small Cap Growth, Structured Small Cap Value, Structured U.S. Equity, Structured Emerging Markets Equity, Structured International Equity and Structured International Small Cap Funds were renamed the Goldman Sachs Large Cap Growth Insights, Large Cap Value Insights, Small Cap Equity Insights, Small Cap Growth Insights, Small Cap Value Insights, U.S. Equity Insights, Emerging Markets Equity Insights, International Equity Insights and International Small Cap Insights Funds respectively. |
| 5 | | Individual Funds within the Total Portfolio Solutions and Select Satellite categories will have various placement on the risk/return spectrum and may have greater or lesser risk than that indicated by the placement of the general Total Portfolio Solutions or Select Satellite category. |
Financial Square FundsSM is a registered service mark of Goldman, Sachs & Co.
| | |
TRUSTEES Ashok N. Bakhru, Chairman Donald C. Burke John P. Coblentz, Jr. Diana M. Daniels Joseph P. LoRusso James A. McNamara Jessica Palmer Alan A. Shuch Richard P. Strubel | | OFFICERS James A. McNamara, President George F. Travers, Principal Financial Officer Caroline Kraus, Secretary Scott M. McHugh, Treasurer |
| |
GOLDMAN, SACHS & CO. Distributor and Transfer Agent | | GOLDMAN SACHS ASSET MANAGEMENT, L.P. Investment Adviser |
Visit our web site at www.goldmansachsfunds.com to obtain the most recent month-end returns.
Goldman Sachs Asset Management, L.P., 200 West Street, New York, New York 10282
The reports concerning the Funds included in this shareholder report may contain certain forward-looking statements about the factors that may affect the performance of the Funds in the future. These statements are based on Fund management’s predictions and expectations concerning certain future events and their expected impact on the Funds, such as performance of the economy as a whole and of specific industry sectors, changes in the levels of interest rates, the impact of developing world events, and other factors that may influence the future performance of the Funds. Management believes these forward-looking statements to be reasonable, although they are inherently uncertain and difficult to predict. Actual events may cause adjustments in portfolio management strategies from those currently expected to be employed.
A description of the policies and procedures that the Funds use to determine how to vote proxies relating to portfolio securities and information regarding how a Fund voted proxies relating to portfolio securities during the most recent 12-month period ended June 30 is available (I) without charge, upon request by calling 1-800-526-7384 (for Retail Shareholders) or 1-800-621-2550 (for Institutional Shareholders); and (II) on the Securities and Exchange Commission (“SEC”) web site at http://www.sec.gov.
The Funds file their complete schedule of portfolio holdings with the SEC for the first and third quarters of each fiscal year on Form N-Q. The Funds’ Forms N-Q are available on the SEC’s web site at http://www.sec.gov within 60 days after the Funds’ first and third fiscal quarters. The Funds’ Forms N-Q may be reviewed and copied at the SEC’s Public Reference Room in Washington, D.C., and information on the operation of the Public Reference Room may also be obtained by calling 1-800-SEC-0330. Forms N-Q may be obtained upon request and without charge by calling 1-800-526-7384 (for Retail Shareholders) or 1-800-621-2550 (for Institutional Shareholders).
Holdings and allocations shown are as of April 30, 2013 and may not be representative of future investments. Fund holdings should not be relied on in making investment decisions and should not be construed as research or investment advice regarding particular securities. Current and future holdings are subject to risk.
Economic and market forecasts presented herein reflect our judgment as of the date of this presentation and are subject to change without notice. These forecasts do not take into account the specific investment objectives, restrictions, tax and financial situation or other needs of any specific client. Actual data will vary and may not be reflected here. These forecasts are subject to high levels of uncertainty that may affect actual performance. Accordingly, these forecasts should be viewed as merely representative of a broad range of possible outcomes. These forecasts are estimated, based on assumptions, and are subject to significant revision and may change materially as economic and market conditions change. Goldman Sachs has no obligation to provide updates or changes to these forecasts. Case studies and examples are for illustrative purposes only.
The Global Industry Classification Standard (GICS) was developed by and is the exclusive property and a service mark of Morgan Stanley Capital International Inc. (MSCI) and Standard & Poor’s, a division of The McGraw-Hill Companies, Inc. (S&P) and is licensed for use by Goldman Sachs. Neither MSCI, S&P nor any other party involved in making or compiling the GICS or any GICS classifications makes any express or implied warranties or representations with respect to such standard or classification (or the results to be obtained by the use thereof), and all such parties hereby expressly disclaim all warranties of originality, accuracy, completeness, merchantability or fitness for a particular purpose with respect to any of such standard or classification. Without limiting any of the foregoing, in no event shall MSCI, S&P, any of their affiliates or any third party involved in making or compiling the GICS or any GICS classifications have any liability for any direct, indirect, special, punitive, consequential or any other damages (including lost profits) even if notified of the possibility of such damages.
The portfolio risk management process includes an effort to monitor and manage risk, but does not imply low risk.
This material is not authorized for distribution to prospective investors unless preceded or accompanied by a current Prospectus or summary prospectus, if applicable. Investors should consider a Fund’s objective, risks, and charges and expenses, and read the summary prospectus, if available, and/or the Prospectus carefully before investing or sending money. The summary prospectus, if available, and the Prospectus contain this and other information about a Fund and may be obtained from your authorized dealer or from Goldman, Sachs & Co. by calling (retail – 1-800-526-7384) (institutional – 1-800-621-2550).
© 2013 Goldman Sachs. All rights reserved. 102247.MF.MED.TMPL/6/2013 STDOMSAR13 / 45k
| | The information required by this Item is only required in an annual report on this Form N-CSR. |
| ITEM 3. | AUDIT COMMITTEE FINANCIAL EXPERT. |
| | The information required by this Item is only required in an annual report on this Form N-CSR. |
| ITEM 4. | PRINCIPAL ACCOUNTANT FEES AND SERVICES. |
| | The information required by this Item is only required in an annual report on this Form N-CSR. |
| ITEM 5. | AUDIT COMMITTEE OF LISTED REGISTRANTS. |
| ITEM 6. | SCHEDULE OF INVESTMENTS. |
| | Schedule of Investments is included as part of the Report to Stockholders filed under Item 1. |
| ITEM 7. | DISCLOSURE OF PROXY VOTING POLICIES AND PROCEDURES FOR CLOSED-END MANAGEMENT INVESTMENT COMPANIES. |
| ITEM 8. | PORTFOLIO MANAGERS OF CLOSED-END MANAGEMENT INVESTMENT COMPANIES. |
| ITEM 9. | PURCHASES OF EQUITY SECURITIES BY CLOSED-END MANAGEMENT INVESTMENT COMPANY AND AFFILIATED PURCHASERS. |
| ITEM 10. | SUBMISSION OF MATTERS TO A VOTE OF SECURITY HOLDERS. |
| | There have been no material changes to the procedures by which shareholders may recommend nominees to the registrant’s board of trustees. |
| ITEM 11. | CONTROLS AND PROCEDURES. |
| | (a) | The registrant’s principal executive and principal financial officers, or persons performing similar functions have concluded that the registrant’s disclosure controls and procedures (as defined in Rule 30a-3(c) under the Investment Company Act of 1940, as amended (the “1940 Act”)) are effective as of a date within 90 days of the filing of this report that includes the disclosure required by this paragraph, based on the evaluation of these controls and procedures required by Rule 30a-3(b) under the 1940 Act and 15d-15(b) under the Securities Exchange Act of 1934, as amended. |
| | (b) | There were no changes in the registrant’s internal control over financial reporting (as defined in Rule 30a-3(d) under the 1940 Act) that occurred during the registrant’s second fiscal quarter of the period covered by this report that have materially affected, or are reasonably likely to materially affect, the registrant’s internal control over financial reporting. |
| | | | |
| (a)(1) | | The information required by this Item is only required in connection with an annual report on this Form N-CSR. |
| | |
| (a)(2) | | Exhibit 99.CERT | | Certifications pursuant to Section 302 of the Sarbanes-Oxley Act of 2002 filed herewith. |
| | |
| (b) | | Exhibit 99.906CERT | | Certifications pursuant to Section 906 of the Sarbanes-Oxley Act of 2002 filed herewith. |
SIGNATURES
Pursuant to the requirements of the Securities Exchange Act of 1934 and the Investment Company Act of 1940, the registrant has duly caused this report to be signed on its behalf by the undersigned, thereunto duly authorized.
| | | | |
| | | | Goldman Sachs Trust |
| | |
| By: | | | | /s/ James A. McNamara |
| | | | James A. McNamara |
| | | | President/Principal Executive Officer |
| | | | Goldman Sachs Trust |
| | |
| Date: | | | | June 20, 2013 |
Pursuant to the requirements of the Securities Exchange Act of 1934 and the Investment Company Act of 1940, this report has been signed below by the following persons on behalf of the registrant and in the capacities and on the dates indicated.
| | | | |
| By: | | | | /s/ James A. McNamara |
| | | | James A. McNamara |
| | | | President/Principal Executive Officer |
| | | | Goldman Sachs Trust |
| | |
| Date: | | | | June 20, 2013 |
| | |
| By: | | | | /s/ George F. Travers |
| | | | George F. Travers |
| | | | Principal Financial Officer |
| | | | Goldman Sachs Trust |
| | |
| Date: | | | | June 20, 2013 |