UNITED STATES
SECURITIES AND EXCHANGE COMMISSION
Washington, D.C. 20549
FORM N-CSR
CERTIFIED SHAREHOLDER REPORT OF REGISTERED
MANAGEMENT INVESTMENT COMPANIES
Investment Company Act file number 811-05349
Goldman Sachs Trust
(Exact name of registrant as specified in charter)
71 South Wacker Drive,
Chicago, Illinois 60606
(Address of principal executive offices) (Zip code)
| | |
Copies to: |
Caroline Kraus | | Geoffrey R.T. Kenyon, Esq. |
Goldman, Sachs & Co. | | Dechert LLP |
200 West Street | | 200 Clarendon Street |
New York, New York 10282 | | 27th Floor |
| | Boston, MA 02116-5021 |
(Name and address of agents for service)
Registrant’s telephone number, including area code: (312) 655-4400
Date of fiscal year end: August 31
Date of reporting period: February 28, 2013
| ITEM 1. | REPORTS TO STOCKHOLDERS. |
| | The Semi-Annual Report to Stockholders is filed herewith. |
Goldman Sachs Funds

| | | | |
| | |
| Semi-Annual Report | | | | February 28, 2013 |
| | |
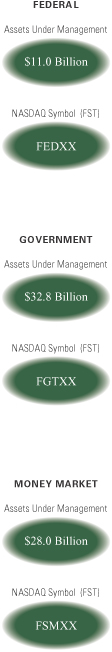
| | | | Financial Square Funds |
| | | | Federal |
| | | | Government |
| | | | Money Market |
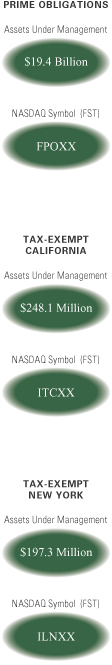
| | | | Prime Obligations |
| | | | Tax-Exempt California |
| | | | Tax-Exempt New York |
| | | | Tax-Free Money Market |
| | | | Treasury Instruments |
| | | | Treasury Obligations |

Goldman Sachs Financial Square Funds
| n | | TAX-EXEMPT CALIFORNIA FUND |
| n | | TAX-EXEMPT NEW YORK FUND |
| n | | TAX-FREE MONEY MARKET FUND |
| n | | TREASURY INSTRUMENTS FUND |
| n | | TREASURY OBLIGATIONS FUND |
| | | | |
TABLE OF CONTENTS | | | | |
| |
Principal Investment Strategies and Risks | | | 1 | |
| |
Market Review | | | 2 | |
| |
Portfolio Results | | | 5 | |
| |
Fund Basics | | | 8 | |
| |
Yield Summary | | | 10 | |
| |
Sector Allocations | | | 11 | |
| |
Schedules of Investments | | | 13 | |
| |
Financial Statements | | | 56 | |
| |
Financial Highlights | | | 64 | |
| |
Notes to Financial Statements | | | 82 | |
| |
Other Information | | | 102 | |
| | | | |
| | | |
| NOT FDIC-INSURED | | May Lose Value | | No Bank Guarantee |
GOLDMAN SACHS FUNDS — FINANCIAL SQUARE FUNDS
Principal Investment Strategies and Risks
This is not a complete list of risks that may affect the Funds. For additional information concerning the risks applicable to the Funds, please see the Funds’ Prospectuses.
Taxable Funds The Prime Obligations, Money Market, Treasury Obligations, Treasury Instruments, Federal and Government Funds seek to maximize current income to the extent consistent with the preservation of capital and the maintenance of liquidity by investing exclusively in high quality money market instruments. The Prime Obligations and Money Market Funds pursue their investment objectives by investing in U.S. Government Securities (as defined in the Funds’ Prospectuses), obligations of U.S. banks, commercial paper and other short-term obligations of U.S. companies, states, municipalities and other entities and repurchase agreements. The Money Market Fund may also invest in U.S. dollar-denominated obligations of foreign banks, foreign companies and foreign governments. The Treasury Obligations Fund pursues its investment objective by investing only in securities issued or guaranteed by the U.S. Treasury and repurchase agreements relating to such securities. The Government Fund pursues its investment objective by investing, directly or indirectly, only in U.S. Government Securities and repurchase agreements relating to such securities. The Treasury Instruments and Federal Funds pursue their investment objectives by limiting their investments only to U.S. Treasury Obligations (as defined in the Funds’ Prospectuses) and U.S. Government Securities, respectively, the interest from which is generally exempt from state income taxation. You should consult your tax adviser to determine whether distributions from the Treasury Instruments and Federal Funds (and any other Fund that may hold such obligations) derived from interest on such obligations are exempt from state income taxation in your own state. In order to obtain a rating from a rating organization, the Prime Obligations, Money Market, Treasury Instruments, Treasury Obligations, Government and Federal Funds may be subject to additional investment restrictions.
Tax-Exempt Funds The Tax-Free Money Market Fund seeks to maximize current income to the extent consistent with the preservation of capital and the maintenance of liquidity by investing exclusively in high quality money market instruments. The Tax-Exempt California and Tax-Exempt New York Funds seek to provide shareholders, to the extent consistent with preservation of capital and prescribed portfolio standards, with a high level of income exempt from federal income tax by investing primarily in municipal obligations. In addition, the Tax-Exempt California and Tax-Exempt New York Funds seek to provide shareholders with income exempt from California personal income tax and New York State and New York City personal income taxes, respectively, by investing in obligations the interest on which is exempt from those taxes. The Tax-Free Money Market, Tax-Exempt California and Tax-Exempt New York Funds pursue their investment objectives by investing in securities issued by or on behalf of states, territories, and possessions of the United States and their political subdivisions, agencies, authorities and instrumentalities, and the District of Columbia, the interest from which, if any, is in the opinion of bond counsel excluded from gross income for federal income tax purposes, and generally not an item of tax preference under the federal alternative minimum tax. In order to obtain a rating from a rating organization, the Tax-Free Money Market Fund may be subject to additional investment restrictions.
An investment in a Fund is neither insured nor guaranteed by the Federal Deposit Insurance Corporation or any other government agency. Although the Funds seek to preserve the value of your investment at $1.00 per share, it is possible to lose money by investing in the Funds.
1
MARKET REVIEW
Goldman Sachs Financial Square Funds
Economic and Market Review
U.S. economic growth gradually improved during the six-month period ended February 28, 2013 (the “Reporting Period”). Yields on taxable and tax-exempt money market funds remained low throughout the Reporting Period.
In September 2012, when the Reporting Period began, accommodative monetary policy by global central banks was a major theme, with the U.S. Federal Reserve Board (the “Fed”), European Central Bank, Bank of Japan, People’s Bank of China and Reserve Bank of Australia each carrying out a form of additional monetary easing. The Fed delivered beyond most expectations by extending the likely period of near-zero interest rates to at least mid-2015 and breaking new ground with an open-ended commitment to asset purchases. It also announced that its planned $40 billion a month of agency mortgage-backed securities purchases would continue until the outlook for the labor market improved substantially, depending on incoming data. Under the Operation Twist program, which was launched in September 2011, the Fed had gradually extended the duration of its portfolio by selling short-term U.S. Treasury holdings and buying longer-term U.S. Treasury securities. Because Operation Twist increased the market supply of short-term U.S. Treasuries, it helped to curb declines in short-term yields.
In October 2012, the Fed indicated that U.S. economic activity had expanded modestly in late August and September, with consumer spending flat to slightly higher, manufacturing conditions mixed and the housing market improving. In November 2012, President Obama’s re-election lowered the risk of market speculation about a shift in Fed policy to a less accommodative stance. There were two implications for the broad fixed income market if Fed policy remains accommodative. First, interest rate volatility was likely to remain low. The Fed’s policies had already reduced the volatility of interest rates across the U.S. Treasury yield curve. Second, ultra low interest rates were expected to continue to drive demand for spread (or non-Treasury) fixed income sectors. Fed policies drove yields lower on high-quality assets, and some investors moved out along the risk spectrum in pursuit of yield, driving demand for fixed income sectors that traded at higher yields than U.S. Treasuries.
The Fed’s December 2012 statement confirmed that Operation Twist would expire at year-end 2012 and that its sales of short-term U.S. Treasuries would cease. However, the Fed made an open-ended commitment to buy $45 billion in long-term U.S. Treasury securities per month, in addition to its continuing purchases of $40 billion of agency mortgage-backed securities. The Fed’s other news caused a slightly bigger stir, as the Fed abandoned its calendar-based approach to interest rate guidance in favor of using economic data thresholds. Instead of reiterating its pledge to keep interest rates near exceptional lows through at least mid-2015, the Fed said it expected to keep its accommodative policies in place at least until unemployment reaches 6.5% or lower and/or inflation rises above 2.5%.
December 2012 non-farm payrolls increased 155,000, and November’s gains were revised higher to 161,000. The unemployment rate held steady at 7.8%, following a small upward revision to November’s number. The Institute for Supply Management’s (“ISM”) manufacturing index ticked up slightly in December from 49.5 to 50.7, indicating a slight shift into expansionary territory.
After much brinksmanship and a technical breach of a year-end deadline, the U.S. Congress was able to come to an agreement to avoid the majority of the fiscal contraction that would have taken place as part of the fiscal cliff. On January 2, 2013, legislation extending the Bush-era tax cuts for household incomes under $450,000 was signed into law. The deal allowed tax rates to rise on incomes higher than $400,000 ($450,000 for married couples), limited deductions and extended
2
MARKET REVIEW
emergency unemployment benefits. Entitlement reform was not part of the agreement, and further negotiation on the $110 billion in spending cuts under the sequester, or automatic spending cuts scheduled for calendar year 2013 was postponed until March 2013.
Unlimited Federal Deposit Insurance Corporation (“FDIC”) insurance on the FDIC’s Transaction Account Guarantee (“TAG”) accounts expired on December 31, 2012, as Senate Majority Leader Harry Reid’s bill, which called for a two-year extension, fell short of the 60 votes needed to pass the Senate. The TAG program, which provided unlimited insurance for non-interest bearing accounts, was implemented in the 2008 financial crisis and was extended in 2010. The threshold for full insurance reverted to $250,000, and outflows of excess deposits to money markets were widely expected. However, according to most research, the TAG expiration was not the main driver of the increase in money market assets during the fourth quarter of 2012. Rather, it appeared to be a combination of gain harvesting (that is, investors were realizing gains) in advance of anticipated higher tax rates and large one-time special dividend payments from many companies together with the TAG expiration.
Fourth quarter 2012 U.S. Gross Domestic Product (“GDP”) came in below expectations at -0.1%, due mainly to weak inventory investment and defense spending. However, in December 2012, the U.S. leading indicators index increased — the most it had in three months. Also, in January 2013, the ISM manufacturing index rose to a one-year high of 53.1, pointing to accelerating manufacturing activity. January’s employment data, with 157,000 new jobs, were in line with expectations, though the unemployment rate ticked up to 7.9%. Job gains for the two prior months were revised upward by a combined 127,000.
In early February 2013, President Obama signed a bill to suspend the U.S. debt limit for three months. Because the U.S. Treasury can use extraordinary measures when the debt ceiling is reached, the bill effectively extends the debt ceiling deadline to mid-summer 2013. In the meantime, battles loom with respect to the sequester and the expiration of a continuing resolution that is financing many government operations.
Finally, it is important to note that there were a number of significant developments on the money market reform front after Securities and Exchange Commission (“SEC”) Chair Mary Schapiro was unable to persuade a majority of the Commission to vote in favor of making the proposal available for public comment at the end of August 2012. SEC commissioner Daniel Gallagher, who voted against issuing Ms. Schapiro’s reform plan for public comment, expressed his potential support for further reforms.
In turn, in November 2012 the Financial Stability Oversight Council (“FSOC”) proposed three alternative reform scenarios for the Industry:
· floating net asset value (“NAV”) per share
· stable NAV per share, provided that a fund maintains a “buffer” of up to 1% of fund assets, plus a 3% “minimum balance at risk” of a shareholder’s account be made available for redemption on a delayed basis
· stable NAV per share, provided that a fund maintains a “buffer” of 3% of fund assets, plus agrees to take potential steps to reduce portfolio risks (including further diversification and liquidity requirements)
The immediate next steps were a 60-day comment period on the FSOC recommendations, followed by a potential final recommendation to the SEC in late January 2013. According to the U.S. Department of the Treasury, the FSOC announced on January 15, 2013 that it had extended the comment period for proposed recommendations for money market mutual fund reform until February 15, 2013 to allow the public more time to review, consider and comment on the
3
MARKET REVIEW
proposed recommendations. This also allowed the public to consider the information in the SEC staff report issued on November 30, 2012.
Looking Ahead
We are relatively optimistic about the outlook for global economic growth broadly and for U.S. economic growth in particular. For the last few years, U.S. economic growth has been stuck near 2% but we think it could gain momentum in 2013, largely because of two factors. First, the ongoing housing recovery appears to us to be durable and improving home prices are beginning to feed into overall economic activity. Second, business investment could improve should political risk decline.
If economic growth strengthens in 2013, we think the financial markets may begin to focus on inflation risks. In our opinion, the markets have been relatively complacent about the inflation outlook, probably because of the large amount of global economic slack and the fact that central bank policy has yet to generate a meaningful increase in inflation.
After the Fed announced it would tie its interest rate policy to economic outcomes, the futures markets priced in a slightly higher possibility of a rate hike in late-2014 to early 2015. However, we do not see major implications for the Fed’s policy bias, in part because we do not believe the Fed’s economic thresholds will be decisively breached in the next couple of years. We will continue to monitor policy developments, but in our view, rate hikes are still too far in the future to pose much of a challenge for short duration investors or to become a central factor in our cash management strategy.
Finally, the momentum for additional money market reforms continues to grow. The FSOC has put its weight behind proposals shelved last year when the SEC was unable to reach consensus. With the appointment of new Chair Mary Jo White, we believe the SEC to re-engage actively with the industry on reforms in the coming months. In sum, we anticipate a very active year for policy. In our view, 2013 may well be the year for adoption of new measures and 2014 is likely to be the year for implementation.
4
PORTFOLIO RESULTS
Goldman Sachs Financial Square Funds
Portfolio Management Discussion and Analysis
Below, the Goldman Sachs Money Market Portfolio Management Team discusses the Goldman Sachs Financial Square Funds’ (the “Funds”) performance and positioning for the six-month period ended February 28, 2013 (the “Reporting Period”).
| Q | | What key factors were responsible for the performance of the Funds during the Reporting Period? |
| A | | The Funds’ yields remained low during the Reporting Period due primarily to the market factors discussed in the Economic and Market Review. With the targeted federal funds rate near zero throughout the Reporting Period, money market yields were anchored near the same level with little difference between maturities. Because the yield curve, or spectrum of maturities, was extremely flat, we saw little value in extending further out the curve. Instead, we focused within the Funds on remaining liquid and short in duration so as to be more nimble should yields begin to increase and risk premia be priced in accordingly. That said, we seek to manage the Funds consistently regardless of interest rate conditions. Our investment approach has always been tri-fold — to seek preservation of capital, daily liquidity and maximization of yield potential. We manage interest, liquidity and credit risk daily. Whether interest rates are historically low, high or in-between, we intend to continue to use our actively managed approach to provide the best possible return within the framework of our Funds’ guidelines and objectives. |
| Q | | How were the taxable Funds invested? |
| A | | Collectively, the taxable Funds had investments in commercial paper, asset-backed commercial paper, U.S. Treasury securities, government agency securities, repurchase agreements (“repos”), government guaranteed paper and certificates of deposit during the Reporting Period. There was strong demand by taxable investors for variable rate municipal debt during the Reporting Period. Because of tight supply conditions, the taxable Funds’ holdings of these securities declined. |
| | | For most of the Reporting Period, we used a laddered strategy in managing the taxable Funds’ duration, wherein we invested primarily in securities with three-month and six- month maturities and let the longer maturities roll down (that is, move closer to their maturity dates). |
| Q | | How were the tax-exempt Funds invested? |
| A | | Collectively, the tax-exempt Funds had investments during the Reporting Period in variable rate demand notes (“VRDNs”), tax-exempt commercial paper, tax anticipation notes, general obligation bonds, revenue bonds and municipal put bonds. |
| | | Because repo yields were elevated and institutional investors had year-end 2012 balance sheet constraints, we were able to increase the tax-exempt Funds’ holdings of bonds with nine- month to one-year maturities yielding in the mid-20 basis point range. (A basis point is 1/100th of a percent.) |
| | | Additionally, between the beginning of 2013 and the end of the Reporting Period, the tax exempt yield curve flattened in response to strong demand for short-term maturities. The weight of the Fed’s buying under its third quantitative easing program (“QE3”) and large investment flows into tax-exempt money market funds during the fourth quarter of 2012 increased demand for shorter maturities, vastly outstripping supply. As a result, we decided to let the tax-exempt Funds’ portfolios of bonds roll down the yield curve as we awaited tactical opportunities to extend. |
| Q | | How did you manage the taxable Funds’ weighted average maturity during the Reporting Period? |
| A | | Overall, during the Reporting Period, we maintained the taxable Funds’ weighted average maturity between 30 days and 60 days. The weighted average maturity of a money market fund is a measure of its price sensitivity to changes in interest rates. |
5
PORTFOLIO RESULTS
| | | At the beginning of the Reporting Period in September 2012, we used a barbell strategy in managing the taxable Funds’ duration, wherein we invested in one-year U.S. Treasury and government securities. During this time, the taxable Funds’ weighted average maturity was between 45 days and 60 days. Heading into the first quarter of 2013, we anticipated downward pressure on the short end of the yield curve and on general collateral rates in the repo markets as a result of supply constraints and increased demand. On the supply side, the Fed was no longer releasing collateral to the market through its sales of short-term maturities, while through its QE3 purchases, it was building up reserves of longer-term maturities. We also saw stronger demand because of the expiration of the Federal Deposit Insurance Corporation’s (“FDIC”) Transaction Account Guarantee (“TAG”) accounts, as well as potential for a flight-to-quality trade because of the debt ceiling negotiations. |
| | | In November 2012, we shifted to a laddered strategy in managing the taxable Funds’ duration, wherein we invested primarily in securities with three-month and six-month maturities and let the longer maturities roll down the curve. The taxable Funds’ weighted average maturity remained between 45 days and 60 days. In January 2013, volatility increased in the repo market. The combination of QE3-related settlements for mortgage-backed securities and U.S. Treasury securities, in conjunction with the expiration of short-term U.S. Treasury securities sales under the Fed’s Operation Twist program, resulted in large swings in the amount of cash and collateral in the market. In this environment, we maintained the taxable Funds’ weighted average maturity in range of between 40 days and 60 days. The secular themes of continued reserve creation by the Fed and a scarcity of high quality assets remained in place in February 2013, and we kept the taxable Funds positioned accordingly, maintaining their weighted average maturity between 30 days and 55 days. We continued to look for tactical opportunities to trade around firmer collateral conditions, potentially to build larger cash balances and also to extend the taxable Funds’ weighted average maturity. |
| Q | | How did you manage the tax-exempt Funds’ weighted average maturity during the Reporting Period? |
| A | | Overall, during the Reporting Period, we maintained the tax-exempt Funds’ weighted average maturity between 25 days and 50 days. |
| | | Early in the Reporting Period, we purchased some one-year notes yielding 0.22% as the August 2012 payroll jobs report increased the likelihood the Fed would soon engage in long-term asset purchases. We maintained the tax-exempt Funds’ weighted average maturity between 25 days and 35 days. At the end of September 2012, we extended the tax-exempt Funds’ weighted average maturity to between 35 days and 45 days and toward the end of October 2012, to between 40 days and 50 days. As we extended the tax-exempt Funds’ weighted average maturity, we reduced their holdings of variable rate obligations, such as VRDNs. |
| | | During the fourth quarter of 2012, tax-exempt money market funds overall gained more than $25 billion in assets. In addition, according to Bloomberg, the average par amount of VRDNs held by dealers in inventory dropped from $7.59 billion during the first nine months of 2012 to $5.72 billion during the fourth quarter. VRDN inventory remained near these depressed levels for the first month and a half of 2013 as tax-exempt mutual funds overall continued to be flush with cash as a result of beginning-of-the-year bond maturities and coupon payments. Thereafter, the four-year trend of asset losses resumed. Assets held in tax-exempt money market funds overall declined 21% in 2009, 19% in 2010, 13% in 2011 and 9% during the first nine months of 2012. Between November 2012 and the end of the Reporting Period, we maintained the tax-exempt Funds’ weighted average maturity between 40 days and 50 days. |
| | | Over the course of the Reporting Period, the Securities Industry and Financial Association (“SIFMA”) 7-day VRDN Index traded as high as 0.21%, but declined as tax-exempt money market funds picked up assets and closed the Reporting Period at 0.11%. Over the course of the Reporting Period, the SIFMA 7-day VRDN Index averaged 0.15%. One-year, high-grade fixed rate municipal securities — as represented by the Thomson Reuters Municipal Market Data (“MMD”) AAA Index — traded at 0.20%. |
6
PORTFOLIO RESULTS
| Q | | How did you manage the taxable and tax-exempt Funds’ weighted average life during the Reporting Period? |
| A | | During the Reporting Period, we managed the weighted average life of all the taxable and tax-exempt Funds below 120 days. The weighted average life of a money market fund is a measure of a money market fund’s price sensitivity to changes in liquidity and/or credit risk. |
| Q | | Did you make any changes to the Funds’ portfolios during the Reporting Period? |
| A | | As mentioned earlier, we made adjustments to the Funds’ weighted average maturity based on then-current market conditions, our near-term view and anticipated and actual Fed monetary policy statements. |
| Q | | What is the Funds’ tactical view and strategy for the months ahead? |
| A | | We do not believe there is value in sacrificing liquidity or quality in exchange for opportunities that only modestly increase yield potential, and so we expect to keep the Funds conservatively positioned as we continue to focus on preservation of capital and daily liquidity. As always, we will continue to use our actively managed approach to seek the best possible return within the framework of the Funds’ investment guidelines and objectives. In addition, we will continue to manage interest, liquidity and credit risk daily. We will also continue to closely monitor economic data, Fed policy and any shifts in the money market yield curve, as we strive to strategically navigate the interest rate environment. |
7
FUND BASICS
Financial Square Funds
as of February 28, 2013
| | | | | | | | | | |
| | PERFORMANCE REVIEW1 | |
| | | September 1, 2012–February 28, 2013 | | Fund Total Return (based on NAV)2
FST Shares | | | iMoneynet Institutional
Average3 | |
| | Federal | | | 0.00 | % | | | 0.02 | %(4) |
| | Government | | | 0.02 | | | | 0.02 | (4) |
| | Money Market | | | 0.07 | | | | 0.06 | (5) |
| | Prime Obligations | | | 0.05 | | | | 0.06 | (5) |
| | Tax-Exempt California | | | 0.02 | | | | 0.02 | (6) |
| | Tax-Exempt New York | | | 0.01 | | | | 0.02 | (6) |
| | Tax-Free Money Market | | | 0.02 | | | | 0.02 | (7) |
| | Treasury Instruments | | | 0.00 | | | | 0.00 | (8) |
| | | Treasury Obligations | | | 0.00 | | | | 0.01 | (9) |
| | | | The returns represent past performance. Past performance does not guarantee future results. The Funds’ investment returns will fluctuate. Current performance may be lower or higher than the performance quoted above. Please visit our Web site at www.goldmansachsfunds.com to obtain the most recent month-end returns. Performance reflects applicable fee waivers and/or expense limitations in effect during the periods shown. In their absence, performance would be reduced. Returns do not reflect the deduction of taxes that a shareholder would pay on Fund distributions or the redemption of Fund shares. |
| | 1 | | Each of the Government, Treasury Obligations, Money Market, Treasury Instruments, Federal and Tax-Free Money Market Funds offers nine separate classes of shares (FST, Select, Preferred, Capital, Administration, Service, Cash Management, Premier and Resource), each of the Tax-Exempt California and Tax-Exempt New York Funds offers four separate classes of shares (FST, Administration, Service and Cash Management), and the Prime Obligations Fund offers eleven separate classes of shares (FST, Select, Preferred, Capital, Administration, Service, Cash Management, Premier, Resource, Class B and Class C), each of which is subject to different fees and expenses that affect performance and entitles shareholders to different services. The FST Shares do not have distribution (12b-1), administration or shareholder service fees. The Select, Preferred, Capital, Administration, Service, Cash Management, Premier, Resource, Class B and Class C Shares offer financial institutions the opportunity to receive fees for providing certain distribution (12b-1), administrative support and/or shareholder services (as applicable). As an annualized percentage of average daily net assets, these share classes pay combined distribution (12b-1), administration and/or shareholder service fees (as applicable) at the following contractual rates: the Select Shares pay 0.03%, Preferred Shares pay 0.10%, Capital Shares pay 0.15%, Administration Shares (for Tax- Exempt California and Tax-Exempt New York Funds) pay 0.15%, Administration Shares (for all other Funds) pay 0.25%, Service Shares (for Tax-Exempt California and Tax-Exempt New York Funds) pay 0.40%, Service Shares (for all other Funds) pay 0.50%, Cash Management Shares (for Tax-Exempt California and Tax-Exempt New York Funds) pay 1.00%, Cash Management Shares (for all other Funds) pay 0.80%, Premier Shares pay 0.35%, Resource Shares pay 0.65%, and Class B and Class C Shares each pay 1.00%. |
| | | | If these fees were reflected in the above performance, performance would have been reduced. |
| | | | An investment in any of the Financial Square Funds is neither insured nor guaranteed by the Federal Deposit Insurance Corporation or any other government agency. Although the Funds seek to preserve the value of your investment at $1.00 per share, it is possible to lose money by investing in the Funds. |
| | 2 | | The net asset value (NAV) represents the net assets of the class of the Fund (ex-dividend) divided by the total number of shares of the class outstanding. A Fund’s performance reflects the reinvestment of dividends and other distributions. A Fund’s performance does not reflect the deduction of any applicable sales charges. |
| | 3 | | Source: iMoneyNet, Inc. February 2013 |
| | 4 | | Government & Agencies Institutional – Category includes the most broadly based of the government institutional funds. These funds may invest in U.S. treasuries, U.S. agencies, repurchase agreements, or government-backed floating rate notes. |
| | 5 | | First Tier Institutional – Category includes only non-government institutional funds that also are not holding any second tier securities. Portfolio holdings of First Tier funds include U.S. Treasury, U.S. other, repurchase agreements, time deposits, domestic bank obligations, foreign bank obligations, first tier commercial paper, floating rate notes, and asset-backed commercial paper. |
| | 6 | | Tax-Free State-Specific – Category includes all retail and institutional State-Specific money funds. Portfolio holdings of tax-free funds include rated and unrated demand notes, rated and unrated general market notes, commercial paper, put bonds — 6 months & less, put bonds — over 6 months, AMT paper, and other tax-free holdings. |
| | 7 | | Tax-Free National – Category includes all retail and institutional national tax-free and municipal money funds. Portfolio holdings of tax-free funds include rated and unrated demand notes, rated and unrated general market notes, commercial paper, put bonds – 6 months & less, put bonds – over 6 months, AMT paper, and other tax-free holdings. |
| | 8 | | Treasury Institutional – Category includes only institutional government funds that hold 100 percent in U.S. Treasuries. |
| | 9 | | Treasury & Repo Institutional – Category includes only institutional government funds that hold U.S. Treasuries and repurchase agreements backed by the U.S. Treasury. |
8
FUND BASICS
| | | | | | | | | | | | | | | | | | | | | | | | |
| | STANDARDIZED AVERAGE ANNUAL TOTAL RETURNS1,10 |
| | | For the period ended 12/31/12 | | SEC 7-Day
Current
Yield11 | | | One Year | | | Five
Years | | | Ten Years | | | Since
Inception | | | Inception Date |
| | Federal | | | 0.01 | % | | | 0.01 | % | | | 0.55 | % | | | 1.76 | % | | | 2.82 | % | | 2/28/97 |
| | Government | | | 0.02 | | | | 0.05 | | | | 0.59 | | | | 1.82 | | | | 3.25 | | | 4/6/93 |
| | Money Market | | | 0.11 | | | | 0.17 | | | | 0.71 | | | | 1.91 | | | | 3.34 | | | 5/18/94 |
| | Prime Obligations | | | 0.07 | | | | 0.12 | | | | 0.66 | | | | 1.89 | | | | 3.63 | | | 3/8/90 |
| | Tax-Exempt California | | | 0.01 | | | | 0.02 | | | | 0.34 | | | | 1.12 | | | | 2.32 | | | 10/4/88 |
| | Tax-Exempt New York | | | 0.01 | | | | 0.01 | | | | 0.36 | | | | 1.14 | | | | 2.04 | | | 2/15/91 |
| | Tax-Free Money Market | | | 0.01 | | | | 0.03 | | | | 0.50 | | | | 1.35 | | | | 2.17 | | | 7/19/94 |
| | Treasury Instruments | | | 0.00 | | | | 0.00 | | | | 0.34 | | | | 1.55 | | | | 2.56 | | | 3/3/97 |
| | | Treasury Obligations | | | 0.01 | | | | 0.01 | | | | 0.37 | | | | 1.64 | | | | 3.42 | | | 4/25/90 |
| | 10 | | Standardized Average Annual Total Returns are average annual total returns of FST Shares as of the most recent calendar quarter-end. They assume reinvestment of all distributions at net asset value. |
| | | | Because FST Shares do not involve a sales charge, such a charge is not applied to their Standardized Average Annual Total Returns. |
| | | | The returns represent past performance. Past performance does not guarantee future results. The Funds’ investment return will fluctuate. Current performance may be lower or higher than the performance quoted above. Please visit our Web site at www.goldmansachsfunds.com to obtain the most recent month-end returns. Performance reflects applicable fee waivers and/or expense limitations in effect during the periods shown. In their absence, performance would be reduced. Returns do not reflect the deduction of taxes that a shareholder would pay on Fund distributions or the redemption of Fund shares. |
| | 11 | | The SEC 7-Day Current Yield figures are as of 12/31/12 and are calculated in accordance with securities industry regulations and do not include net capital gains. SEC 7-Day Current Yield may differ slightly from the actual distribution rate of a given Fund because of the exclusion of distributed capital gains, which are non-recurring. The SEC 7-Day Current Yield more closely reflects a Fund’s current earnings than do the Standardized Average Annual Total Return figures. |
9
YIELD SUMMARY

| | | | | | | | | | | | | | | | | | | | | | | | | | |
| | SUMMARY OF THE FST SHARES1 AS OF 2/28/13 | |
| | | Funds | | 7-Day
Dist.
Yield12 | | | SEC 7-Day
Current
Yield13 | | | SEC 7-Day
Effective
Yield13 | | | 30-Day
Average
Yield14 | | | Weighted
Avg.
Maturity
(days)15 | | | Weighted
Avg. Life
(days)16 | |
| | Federal | | | 0.01 | % | | | 0.01 | % | | | 0.01 | % | | | 0.01 | % | | | 57 | | | | 112 | |
| | Government | | | 0.02 | | | | 0.02 | | | | 0.02 | | | | 0.02 | | | | 50 | | | | 112 | |
| | Money Market | | | 0.12 | | | | 0.11 | | | | 0.11 | | | | 0.11 | | | | 37 | | | | 61 | |
| | Prime Obligations | | | 0.09 | | | | 0.07 | | | | 0.07 | | | | 0.08 | | | | 38 | | | | 75 | |
| | Tax-Exempt California | | | 0.01 | | | | 0.01 | | | | 0.01 | | | | 0.01 | | | | 37 | | | | 38 | |
| | Tax-Exempt New York | | | 0.01 | | | | 0.01 | | | | 0.01 | | | | 0.01 | | | | 25 | | | | 25 | |
| | Tax-Free Money Market | | | 0.01 | | | | 0.01 | | | | 0.01 | | | | 0.01 | | | | 47 | | | | 47 | |
| | Treasury Instruments | | | 0.00 | | | | 0.00 | | | | 0.00 | | | | 0.00 | | | | 52 | | | | 52 | |
| | | Treasury Obligations | | | 0.01 | | | | 0.01 | | | | 0.01 | | | | 0.01 | | | | 48 | | | | 49 | |
| | | | The Yields represent past performance. Past performance does not guarantee future results. Current performance may be lower or higher than the performance quoted above. |
| | | | Yields reflect fee waivers and expense limitations in effect and will fluctuate as market conditions change. Please visit our Web site at www.goldmansachs.com to obtain the most recent month-end performance. |
| | 12 | | The 7-Day Distribution yield is the average total return over the previous seven days. It is the Fund’s total income net of expenses, divided by the total number of outstanding shares. This yield can include capital gain/loss distribution, if any. This is not a SEC Yield. |
| | 13 | | The SEC 7-Day Current Yield and SEC 7-Day Effective Yield of a Fund are calculated in accordance with securities industry regulations and do not include net capital gains. SEC 7-Day Current Yield may differ slightly from the actual distribution rate of a given Fund because of the exclusion of distributed capital gains, which are non-recurring. The SEC 7-Day Effective Yield assumes reinvestment of dividends for one year. |
| | 14 | | The 30-Day Average Yield is a net annualized yield of 30 days back from the current date listed. This yield includes capital gain/loss distribution. |
| | 15 | | A Fund’s weighted average maturity (WAM) is an average of the effective maturities of all securities held in the portfolio, weighted by each security’s percentage of net assets. This must not exceed 60 days as calculated under SEC Rule 2a-7. |
| | 16 | | A Fund’s weighted average life (WAL) is an average of the final maturities of all securities held in the portfolio, weighted by each security’s percentage of net assets. This must not exceed 120 days as calculated under SEC Rule 2a-7. |
10
SECTOR ALLOCATIONS
| | | | | | | | | | | | | | | | | | | | | | | | | | |
| | TAXABLE FUNDS17 | |
| | | as of February 28, 2013 | | | | | | | | | | | | | | | | | | |
| | | Security Type
(Percentage of Net Assets) | | Federal | | | Government | | | Money
Market | | | Prime
Obligations | | | Treasury
Instruments | | | Treasury
Obligations | |
| | Certificates of
Deposit - Eurodollar | | | — | | | | — | | | | 2.6 | % | | | — | | | | — | | | | — | |
| | Certificates of
Deposit - Yankeedollar | | | — | | | | — | | | | 11.8 | | | | — | | | | — | | | | — | |
| | Commercial Paper & Corporate Obligations | | | — | | | | — | | | | 15.8 | | | | 21.8 | % | | | — | | | | — | |
| | Repurchase
Agreements | | | — | | | | 61.3 | % | | | 39.4 | | | | 45.0 | | | | — | | | | 75.2 | % |
| | Time Deposits | | | — | | | | — | | | | 6.6 | | | | 2.0 | | | | — | | | | — | |
| | U.S. Government
Agency Obligations | | | 80.2 | % | | | 35.8 | | | | 11.8 | | | | 17.2 | | | | — | | | | — | |
| | U.S. Treasury
Obligations | | | 28.6 | | | | 3.6 | | | | 0.5 | | | | 1.5 | | | | 99.8 | % | | | 24.7 | |
| | Variable Rate
Municipal Debt
Obligations | | | — | | | | — | | | | 1.7 | | | | 5.7 | | | | — | | | | — | |
| | | Variable Rate
Obligations | | | — | | | | — | | | | 11.2 | | | | 8.7 | | | | — | | | | — | |
| | | as of August 31, 2012 | | | | | | | | | | | | | | | | | | |
| | | Security Type
(Percentage of Net Assets) | | Federal | | | Government | | | Money
Market | | | Prime
Obligations | | | Treasury
Instruments | | | Treasury
Obligations | |
| | Certificates of
Deposit - Eurodollar | | | — | | | | — | | | | 1.0 | % | | | — | | | | — | | | | — | |
| | Certificates of
Deposit - Yankeedollar | | | — | | | | — | | | | 6.1 | | | | — | | | | — | | | | — | |
| | Commercial Paper & Corporate Obligations | | | — | | | | — | | | | 16.3 | | | | 16.2 | % | | | — | | | | — | |
| | Fixed Rate Municipal
Debt Obligation | | | — | | | | — | | | | 0.2 | | | | — | | | | — | | | | — | |
| | Repurchase
Agreements | | | — | | | | 71.1 | % | | | 29.4 | | | | 29.1 | | | | — | | | | 79.9 | % |
| | Time Deposits | | | — | | | | — | | | | 3.8 | | | | 3.3 | | | | — | | | | — | |
| | U.S. Government
Agency Obligations | | | 72.1 | % | | | 28.0 | | | | 17.3 | | | | 24.0 | | | | — | | | | — | |
| | U.S. Treasury
Obligations | | | 28.4 | | | | 1.4 | | | | 3.8 | | | | 6.4 | | | | 100.0 | % | | | 20.0 | |
| | Variable Rate
Municipal Debt
Obligations | | | — | | | | — | | | | 8.4 | | | | 14.6 | | | | — | | | | — | |
| | | Variable Rate
Obligations | | | — | | | | — | | | | 14.9 | | | | 6.4 | | | | — | | | | — | |
| | 17 | | Each Fund is actively managed and, as such, its portfolio composition may differ over time. The percentage shown for each investment category reflects the value (based on amortized cost) of investments in that category as a percentage of net assets. Figures in the above table may not sum to 100% due to the exclusion of other assets and liabilities. |
11
SECTOR ALLOCATIONS
| | | | | | | | | | | | | | |
| | TAX-EXEMPT FUNDS18 | |
| | | as of February 28, 2013 | | | | | | | | | |
| | | Security Type
(Percentage of Net Assets) | | Tax-Exempt
California | | | Tax-Exempt
New York | | | Tax-Free
Money Market | |
| | Bond Anticipation Notes | | | — | | | | — | | | | 1.1 | % |
| | Commercial Paper | | | 6.3 | % | | | 5.0 | % | | | 12.0 | |
| | General Obligation Bonds | | | 1.2 | | | | 5.0 | | | | 4.0 | |
| | Pre-Refunded Bonds | | | 0.4 | | | | — | | | | 0.7 | |
| | Put Bonds | | | 1.3 | | | | 1.1 | | | | 1.2 | |
| | Revenue Anticipation Notes | | | 1.3 | | | | — | | | | 2.2 | |
| | Revenue Bonds | | | 4.4 | | | | 6.5 | | | | 2.0 | |
| | Tax and Revenue Anticipation Notes | | | 7.0 | | | | — | | | | 7.6 | |
| | Tax Anticipation Notes | | | — | | | | — | | | | 2.2 | |
| | | Variable Rate Obligations | | | 79.3 | | | | 82.3 | | | | 66.5 | |
| | | as of August 31, 2012 | | | | | | | | | |
| | | Security Type
(Percentage of Net Assets) | | Tax-Exempt
California | | | Tax-Exempt
New York | | | Tax-Free
Money Market | |
| | Bond Anticipation Notes | | | — | | | | — | | | | 0.6 | % |
| | Commercial Paper | | | 5.7 | % | | | 2.0 | % | | | 11.0 | |
| | General Obligation Bonds | | | — | | | | — | | | | 2.3 | |
| | Pre-Refunded Bonds | | | — | | | | — | | | | 0.1 | |
| | Put Bonds | | | 1.7 | | | | — | | | | — | |
| | Revenue Anticipation Notes | | | 1.2 | | | | — | | | | 1.6 | |
| | Revenue Bonds | | | 1.6 | | | | 5.9 | | | | 0.5 | |
| | Tax and Revenue Anticipation Notes | | | 2.7 | | | | — | | | | 3.3 | |
| | Tax Anticipation Notes | | | — | | | | — | | | | 0.3 | |
| | | Variable Rate Obligations | | | 87.0 | | | | 92.0 | | | | 80.1 | |
| | 18 | | Each Fund is actively managed and, as such, its portfolio composition may differ over time. The percentage shown for each investment category reflects the value (based on amortized cost) of investments in that category as a percentage of net assets. Figures in the above table may not sum to 100% due to the exclusion of other assets and liabilities. |
12
FINANCIAL SQUARE FEDERAL FUND
Schedule of Investments
February 28, 2013 (Unaudited)
| | | | | | | | | | | | | | |
Principal
Amount | | | Interest
Rate | | | Maturity
Date | | | Amortized
Cost | |
| | | | | | | | | | | | | | |
| | U.S. Government Agency Obligations – 80.2% | |
| Federal Farm Credit Bank | |
| $ | 42,200,000 | | | | 0.190 | % | | | 03/01/13 | | | $ | 42,200,000 | |
| | 10,000,000 | | | | 0.172 | (a) | | | 03/18/13 | | | | 9,999,956 | |
| | 40,000,000 | | | | 0.081 | (a) | | | 03/20/13 | | | | 39,998,424 | |
| | 100,000,000 | | | | 0.149 | (a) | | | 04/09/13 | | | | 99,997,886 | |
| | 79,500,000 | | | | 0.172 | (a) | | | 04/17/13 | | | | 79,498,660 | |
| | 19,480,000 | | | | 0.253 | (a) | | | 04/26/13 | | | | 19,481,821 | |
| | 100,000,000 | | | | 0.179 | (a) | | | 07/08/13 | | | | 99,996,407 | |
| | 250,000,000 | | | | 0.112 | (a) | | | 09/13/13 | | | | 249,979,080 | |
| | 15,000,000 | | | | 0.202 | (a) | | | 12/16/13 | | | | 15,003,697 | |
| | 1,100,000 | | | | 5.330 | | | | 12/18/13 | | | | 1,145,333 | |
| | 1,800,000 | | | | 3.750 | | | | 02/05/14 | | | | 1,859,443 | |
| | 35,000,000 | | | | 0.177 | (a) | | | 07/01/14 | | | | 34,995,453 | |
| | 100,000,000 | | | | 0.280 | (a) | | | 07/09/14 | | | | 100,027,504 | |
| | 18,100,000 | | | | 0.172 | (a) | | | 07/25/14 | | | | 18,092,789 | |
| | 124,000,000 | | | | 0.280 | (a) | | | 07/30/14 | | | | 124,035,555 | |
| | 20,000,000 | | | | 0.172 | (a) | | | 08/01/14 | | | | 19,994,313 | |
| | 8,000,000 | | | | 0.213 | (a) | | | 08/27/14 | | | | 8,002,466 | |
| | 70,000,000 | | | | 0.180 | (a) | | | 09/04/14 | | | | 69,981,261 | |
| | 10,000,000 | | | | 0.212 | (a) | | | 10/24/14 | | | | 10,001,694 | |
| Federal Home Loan Bank | |
| | 428,800,000 | | | | 0.050 | | | | 03/01/13 | | | | 428,800,000 | |
| | 300,000,000 | | | | 0.100 | | | | 03/01/13 | | | | 300,000,000 | |
| | 100,000,000 | | | | 0.110 | | | | 03/01/13 | | | | 100,000,000 | |
| | 19,190,000 | | | | 0.125 | | | | 03/01/13 | | | | 19,190,000 | |
| | 26,600,000 | | | | 0.290 | | | | 03/01/13 | | | | 26,600,000 | |
| | 1,400,000 | | | | 0.300 | | | | 03/04/13 | | | | 1,400,000 | |
| | 21,500,000 | | | | 0.090 | | | | 03/06/13 | | | | 21,499,731 | |
| | 48,000,000 | | | | 0.200 | | | | 03/06/13 | | | | 47,999,782 | |
| | 66,598,000 | | | | 0.060 | | | | 03/08/13 | | | | 66,597,223 | |
| | 397,000,000 | | | | 0.100 | | | | 03/13/13 | | | | 396,986,767 | |
| | 37,000,000 | | | | 0.100 | | | | 03/15/13 | | | | 36,998,561 | |
| | 461,000,000 | | | | 0.120 | | | | 03/15/13 | | | | 460,978,487 | |
| | 25,265,000 | | | | 1.625 | | | | 03/20/13 | | | | 25,283,285 | |
| | 483,999,000 | | | | 0.120 | | | | 03/22/13 | | | | 483,965,120 | |
| | 250,000,000 | | | | 0.124 | | | | 03/22/13 | | | | 249,981,917 | |
| | 37,944,000 | �� | | | 0.105 | | | | 03/27/13 | | | | 37,941,123 | |
| | 976,500,000 | | | | 0.100 | (b) | | | 04/01/13 | | | | 976,415,912 | |
| | 168,329,000 | | | | 0.120 | | | | 04/10/13 | | | | 168,306,556 | |
| | 5,000,000 | | | | 0.145 | (a) | | | 04/12/13 | | | | 5,000,258 | |
| | 173,500,000 | | | | 0.160 | | | | 04/18/13 | | | | 173,502,297 | |
| | 32,600,000 | | | | 0.210 | | | | 05/17/13 | | | | 32,597,048 | |
| | 33,500,000 | | | | 0.200 | | | | 05/22/13 | | | | 33,496,019 | |
| | 225,000,000 | | | | 0.132 | (a) | | | 05/23/13 | | | | 224,985,060 | |
| | 19,800,000 | | | | 0.230 | | | | 05/23/13 | | | | 19,798,952 | |
| | 1,685,000 | | | | 0.230 | | | | 05/24/13 | | | | 1,684,890 | |
| | 113,800,000 | | | | 0.154 | (a) | | | 05/28/13 | | | | 113,797,139 | |
| | 51,000,000 | | | | 0.230 | | | | 05/29/13 | | | | 50,997,106 | |
| | 355,000,000 | | | | 0.160 | | | | 06/05/13 | | | | 354,989,530 | |
| | 20,000,000 | | | | 0.200 | | | | 06/07/13 | | | | 20,003,135 | |
| | 13,500,000 | | | | 0.230 | | | | 06/07/13 | | | | 13,499,157 | |
| | 20,100,000 | | | | 0.350 | | | | 06/10/13 | | | | 20,105,333 | |
| | 2,500,000 | | | | 1.750 | | | | 06/10/13 | | | | 2,511,204 | |
| | 33,500,000 | | | | 0.230 | | | | 06/12/13 | | | | 33,497,800 | |
| | 1,060,000 | | | | 1.625 | | | | 06/14/13 | | | | 1,064,174 | |
| | 2,370,000 | | | | 3.750 | | | | 06/14/13 | | | | 2,393,794 | |
| | 206,000,000 | | | | 0.125 | | | | 06/18/13 | | | | 205,989,785 | |
| | |
| | | | | | | | | | | | | | |
| | U.S. Government Agency Obligations – (continued) | |
| Federal Home Loan Bank – (continued) | |
| $ | 350,000,000 | | | | 0.142 | %(a) | | | 06/18/13 | | | $ | 349,994,511 | |
| | 33,500,000 | | | | 0.230 | | | | 06/18/13 | | | | 33,497,642 | |
| | 9,275,000 | | | | 0.400 | | | | 06/19/13 | | | | 9,279,066 | |
| | 46,400,000 | | | | 0.250 | | | | 06/20/13 | | | | 46,398,967 | |
| | 39,900,000 | | | | 0.420 | | | | 06/21/13 | | | | 39,920,292 | |
| | 102,315,000 | | | | 1.875 | | | | 06/21/13 | | | | 102,842,968 | |
| | 28,000,000 | | | | 0.240 | | | | 06/27/13 | | | | 27,996,922 | |
| | 29,500,000 | | | | 0.125 | | | | 06/28/13 | | | | 29,486,711 | |
| | 56,700,000 | | | | 0.240 | | | | 06/28/13 | | | | 56,697,141 | |
| | 23,350,000 | | | | 0.330 | | | | 07/01/13 | | | | 23,355,244 | |
| | 6,000,000 | | | | 0.250 | | | | 07/02/13 | | | | 5,999,729 | |
| | 100,000,000 | | | | 0.139 | (a) | | | 07/08/13 | | | | 99,982,099 | |
| | 125,000,000 | | | | 0.140 | | | | 07/08/13 | | | | 124,992,941 | |
| | 6,475,000 | | | | 0.350 | | | | 07/11/13 | | | | 6,477,260 | |
| | 144,100,000 | | | | 0.120 | | | | 07/18/13 | | | | 144,094,072 | |
| | 50,000,000 | | | | 0.120 | | | | 08/13/13 | | | | 49,996,985 | |
| | 210,000,000 | | | | 0.164 | (a) | | | 08/28/13 | | | | 209,989,562 | |
| | 32,810,000 | | | | 0.500 | | | | 08/28/13 | | | | 32,853,190 | |
| | 300,000,000 | | | | 0.150 | (b) | | | 09/11/13 | | | | 299,979,684 | |
| | 3,070,000 | | | | 1.000 | | | | 09/13/13 | | | | 3,082,863 | |
| | 7,690,000 | | | | 2.625 | | | | 09/13/13 | | | | 7,787,548 | |
| | 13,065,000 | | | | 4.500 | | | | 09/16/13 | | | | 13,366,990 | |
| | 13,400,000 | | | | 0.210 | | | | 10/10/13 | | | | 13,399,564 | |
| | 4,400,000 | | | | 0.300 | | | | 10/18/13 | | | | 4,402,288 | |
| | 2,000,000 | | | | 0.375 | | | | 10/18/13 | | | | 2,001,988 | |
| | 39,445,000 | | | | 3.625 | | | | 10/18/13 | | | | 40,292,568 | |
| | 75,000,000 | | | | 0.170 | | | | 12/24/13 | | | | 74,989,548 | |
| | 81,040,000 | | | | 0.180 | | | | 01/02/14 | | | | 81,041,767 | |
| | 7,000,000 | | | | 0.180 | | | | 01/03/14 | | | | 6,998,661 | |
| | 20,000,000 | | | | 0.330 | | | | 01/17/14 | | | | 20,022,340 | |
| | 15,000,000 | | | | 0.300 | | | | 01/23/14 | | | | 15,013,035 | |
| | 56,725,000 | | | | 0.375 | | | | 01/29/14 | | | | 56,822,344 | |
| | 350,000,000 | | | | 0.144 | (a) | | | 02/28/14 | | | | 349,965,438 | |
| | 90,000,000 | | | | 0.172 | (a) | | | 06/24/14 | | | | 89,963,867 | |
| | 15,000,000 | | | | 0.173 | (a) | | | 06/26/14 | | | | 14,996,473 | |
| | 96,000,000 | | | | 0.183 | (a) | | | 06/27/14 | | | | 95,980,549 | |
| | 66,000,000 | | | | 0.181 | (a) | | | 08/15/14 | | | | 65,980,388 | |
| | |
| TOTAL U.S. GOVERNMENT
AGENCY OBLIGATIONS |
| | $ | 8,853,092,092 | |
| | |
| | | | | | | | | | | | | | |
| | U.S. Treasury Obligations – 28.6% | |
| United States Treasury Bills | |
| $ | 815,000,000 | | | | 0.065 | % | | | 03/07/13 | | | $ | 814,991,171 | |
| | 210,000,000 | | | | 0.080 | | | | 03/14/13 | | | | 209,993,933 | |
| | 200,000,000 | | | | 0.105 | | | | 03/21/13 | | | | 199,988,333 | |
| | 450,000,000 | | | | 0.115 | | | | 03/21/13 | | | | 449,971,250 | |
| | 300,000,000 | | | | 0.110 | | | | 03/28/13 | | | | 299,975,250 | |
| United States Treasury Notes | |
| | 436,000,000 | | | | 1.375 | | | | 03/15/13 | | | | 436,213,009 | |
| | 45,000,000 | | | | 3.625 | | | | 05/15/13 | | | | 45,328,424 | |
| | 5,000,000 | | | | 0.375 | | | | 06/30/13 | | | | 5,002,170 | |
| | 180,000,000 | | | | 3.375 | | | | 06/30/13 | | | | 181,865,135 | |
| | 153,000,000 | | | | 1.000 | | | | 07/15/13 | | | | 153,431,814 | |
| | 21,800,000 | | | | 0.125 | | | | 09/30/13 | | | | 21,789,634 | |
| | |
| | |
| The accompanying notes are an integral part of these financial statements. | | 13 |
FINANCIAL SQUARE FEDERAL FUND
Schedule of Investments (continued)
February 28, 2013 (Unaudited)
| | | | | | | | | | | | | | |
Principal
Amount | | | Interest
Rate | | | Maturity
Date | | | Amortized
Cost | |
| | | | | | | | | | | | | | |
| | U.S. Treasury Obligations – (continued) | |
| United States Treasury Notes – (continued) | |
| $ | 19,100,000 | | | | 3.125 | % | | | 09/30/13 | | | $ | 19,424,834 | |
| | 79,400,000 | | | | 0.500 | | | | 10/15/13 | | | | 79,544,795 | |
| | 150,000,000 | | | | 0.250 | | | | 10/31/13 | | | | 150,107,495 | |
| | 35,000,000 | | | | 0.500 | | | | 11/15/13 | | | | 35,070,637 | |
| | 47,000,000 | | | | 4.000 | | | | 02/15/14 | | | | 48,723,634 | |
| | |
| TOTAL U.S. TREASURY
OBLIGATIONS |
| | $ | 3,151,421,518 | |
| | |
| | TOTAL INVESTMENTS – 108.8% | | | $ | 12,004,513,610 | |
| | |
| LIABILITIES IN EXCESS OF
OTHER ASSETS – (8.8)% |
| | | (973,193,620 | ) |
| | |
| | NET ASSETS – 100.0% | | | $ | 11,031,319,990 | |
| | |
| | |
| The percentage shown for each investment category reflects the value of investments in that category as a percentage of net assets. |
(a) | | Variable or floating rate security. Interest rate disclosed is that which is in effect at February 28, 2013. |
(b) | | All or a portion represents a forward commitment. |
Interest rates represent either the stated coupon rate, annualized yield on date of purchase for discounted securities, or, for floating rate securities, the current reset rate, which is based upon current interest rate indices.
Maturity dates represent either the final legal maturity date on the security, the demand date for puttable securities, or the prerefunded date for those types of securities.
| | |
| 14 | | The accompanying notes are an integral part of these financial statements. |
FINANCIAL SQUARE GOVERNMENT FUND
Schedule of Investments
February 28, 2013 (Unaudited)
| | | | | | | | | | | | | | |
Amount Principal | | | Interest Rate | | | Maturity
Date | | | Amortized Cost | |
| | | | | | | | | | | | | | |
| | U.S. Government Agency Obligations – 35.8% | |
| Federal Farm Credit Bank | |
| $ | 35,000,000 | | | | 0.172 | %(a) | | | 03/18/13 | | | $ | 34,999,846 | |
| | 100,000,000 | | | | 0.149 | (a) | | | 04/09/13 | | | | 99,997,886 | |
| | 35,000,000 | | | | 0.172 | (a) | | | 04/17/13 | | | | 34,999,889 | |
| | 40,000,000 | | | | 0.177 | (a) | | | 07/01/14 | | | | 39,994,803 | |
| | 38,100,000 | | | | 0.172 | (a) | | | 07/25/14 | | | | 38,086,617 | |
| | 26,000,000 | | | | 0.280 | (a) | | | 07/30/14 | | | | 26,007,455 | |
| | 24,000,000 | | | | 0.172 | (a) | | | 08/01/14 | | | | 23,993,175 | |
| | 180,000,000 | | | | 0.180 | (a) | | | 09/04/14 | | | | 179,951,813 | |
| Federal Home Loan Bank | |
| | 40,240,000 | | | | 0.125 | | | | 03/01/13 | | | | 40,240,000 | |
| | 64,890,000 | | | | 0.290 | | | | 03/01/13 | | | | 64,890,000 | |
| | 3,300,000 | | | | 0.300 | | | | 03/04/13 | | | | 3,300,000 | |
| | 22,000,000 | | | | 0.125 | | | | 03/05/13 | | | | 21,999,740 | |
| | 100,000,000 | | | | 0.200 | | | | 03/06/13 | | | | 99,999,547 | |
| | 53,100,000 | | | | 1.625 | | | | 03/20/13 | | | | 53,138,430 | |
| | 250,000,000 | | | | 0.240 | | | | 04/16/13 | | | | 249,995,814 | |
| | 272,160,000 | | | | 0.200 | | | | 04/30/13 | | | | 272,138,400 | |
| | 100,000,000 | | | | 0.300 | | | | 05/07/13 | | | | 100,008,549 | |
| | 80,860,000 | | | | 0.210 | | | | 05/17/13 | | | | 80,852,679 | |
| | 83,100,000 | | | | 0.200 | | | | 05/22/13 | | | | 83,090,124 | |
| | 49,100,000 | | | | 0.230 | | | | 05/23/13 | | | | 49,097,402 | |
| | 4,100,000 | | | | 0.230 | | | | 05/24/13 | | | | 4,099,733 | |
| | 125,000,000 | | | | 0.230 | | | | 05/29/13 | | | | 124,992,908 | |
| | 33,200,000 | | | | 0.230 | | | | 06/07/13 | | | | 33,197,926 | |
| | 49,900,000 | | | | 0.350 | | | | 06/10/13 | | | | 49,913,239 | |
| | 83,100,000 | | | | 0.230 | | | | 06/12/13 | | | | 83,094,544 | |
| | 22,380,000 | | | | 1.625 | | | | 06/14/13 | | | | 22,467,381 | |
| | 83,100,000 | | | | 0.230 | | | | 06/18/13 | | | | 83,094,151 | |
| | 121,500,000 | | | | 0.250 | | | | 06/20/13 | | | | 121,497,294 | |
| | 96,200,000 | | | | 0.420 | | | | 06/21/13 | | | | 96,248,925 | |
| | 47,055,000 | | | | 1.875 | | | | 06/21/13 | | | | 47,287,939 | |
| | 75,925,000 | | | | 0.240 | | | | 06/27/13 | | | | 75,916,654 | |
| | 77,600,000 | | | | 0.125 | | | | 06/28/13 | | | | 77,565,044 | |
| | 146,900,000 | | | | 0.240 | | | | 06/28/13 | | | | 146,892,596 | |
| | 90,000,000 | | | | 0.250 | | | | 07/02/13 | | | | 89,992,009 | |
| | 92,460,000 | | | | 0.250 | | | | 07/05/13 | | | | 92,455,704 | |
| | 19,000,000 | | | | 0.139 | (a) | | | 07/08/13 | | | | 18,996,599 | |
| | 65,540,000 | | | | 0.350 | | | | 07/09/13 | | | | 65,560,154 | |
| | 22,720,000 | | | | 0.350 | | | | 07/11/13 | | | | 22,727,697 | |
| | 40,000,000 | | | | 0.141 | (a) | | | 07/15/13 | | | | 39,992,451 | |
| | 35,005,000 | | | | 0.280 | | | | 08/13/13 | | | | 35,007,547 | |
| | 40,020,000 | | | | 0.250 | | | | 09/06/13 | | | | 40,022,923 | |
| | 13,100,000 | | | | 4.000 | | | | 09/06/13 | | | | 13,355,898 | |
| | 263,750,000 | | | | 0.150 | (b) | | | 09/11/13 | | | | 263,732,139 | |
| | 14,160,000 | | | | 5.250 | | | | 09/13/13 | | | | 14,538,539 | |
| | 9,330,000 | | | | 4.500 | | | | 09/16/13 | | | | 9,547,357 | |
| | 18,800,000 | | | | 0.125 | | | | 09/24/13 | | | | 18,790,104 | |
| | 12,000,000 | | | | 0.125 | | | | 09/25/13 | | | | 11,993,298 | |
| | 700,000,000 | | | | 0.173 | (a) | | | 09/27/13 | | | | 700,000,000 | |
| | 2,000,000 | | | | 2.000 | | | | 09/30/13 | | | | 2,020,767 | |
| | 68,600,000 | | | | 0.210 | | | | 10/01/13 | | | | 68,594,808 | |
| | 37,500,000 | | | | 0.210 | | | | 10/10/13 | | | | 37,498,780 | |
| | 12,240,000 | | | | 0.300 | | | | 10/18/13 | | | | 12,246,364 | |
| | 16,255,000 | | | | 0.375 | | | | 10/18/13 | | | | 16,270,268 | |
| | 84,625,000 | | | | 3.625 | | | | 10/18/13 | | | | 86,442,124 | |
| | 20,535,000 | | | | 0.290 | | | | 11/14/13 | | | | 20,543,899 | |
| | |
| | | | | | | | | | | | | | |
| | U.S. Government Agency Obligations – (continued) | |
| Federal Home Loan Bank – (continued) | |
| $ | 26,100,000 | | | | 0.300 | % | | | 11/22/13 | | | $ | 26,113,586 | |
| | 135,855,000 | | | | 0.375 | | | | 11/27/13 | | | | 135,998,208 | |
| | 24,100,000 | | | | 0.320 | | | | 11/29/13 | | | | 24,115,693 | |
| | 39,000,000 | | | | 0.125 | | | | 12/10/13 | | | | 38,974,841 | |
| | 83,000,000 | | | | 0.500 | | | | 12/13/13 | | | | 83,193,749 | |
| | 22,760,000 | | | | 0.320 | | | | 12/18/13 | | | | 22,781,341 | |
| | 30,840,000 | | | | 0.180 | | | | 01/02/14 | | | | 30,839,341 | |
| | 26,000,000 | | | | 0.180 | | | | 01/03/14 | | | | 25,995,028 | |
| | 623,125,000 | | | | 0.180 | | | | 01/07/14 | | | | 623,042,988 | |
| | 185,000,000 | | | | 0.330 | | | | 01/17/14 | | | | 185,206,643 | |
| | 21,765,000 | | | | 0.270 | | | | 01/23/14 | | | | 21,778,065 | |
| | 36,060,000 | | | | 0.300 | | | | 01/23/14 | | | | 36,091,336 | |
| | 33,665,000 | | | | 0.375 | | | | 01/29/14 | | | | 33,724,337 | |
| | 340,000,000 | | | | 0.144 | (a) | | | 02/28/14 | | | | 339,966,425 | |
| | 700,000,000 | | | | 0.172 | (a) | | | 06/24/14 | | | | 699,718,964 | |
| | 31,000,000 | | | | 0.173 | (a) | | | 06/26/14 | | | | 30,992,711 | |
| | 767,500,000 | | | | 0.183 | (a) | | | 06/27/14 | | | | 767,344,495 | |
| | 188,000,000 | | | | 0.181 | (a) | | | 08/15/14 | | | | 187,944,135 | |
| Federal Home Loan Mortgage Corporation | |
| | 240,000,000 | | | | 0.162 | (a) | | | 03/21/13 | | | | 239,996,033 | |
| | 31,153,000 | | | | 0.750 | | | | 03/28/13 | | | | 31,164,903 | |
| | 7,070,000 | | | | 4.000 | | | | 06/12/13 | | | | 7,144,308 | |
| | 39,050,000 | | | | 0.152 | (a) | | | 06/17/13 | | | | 39,046,237 | |
| | 20,746,000 | | | | 4.125 | | | | 09/27/13 | | | | 21,210,987 | |
| | 60,375,000 | | | | 0.375 | | | | 10/15/13 | | | | 60,431,630 | |
| | 7,674,000 | | | | 0.500 | | | | 10/15/13 | | | | 7,687,040 | |
| | 45,804,000 | | | | 0.875 | | | | 10/28/13 | | | | 46,000,701 | |
| | 149,525,000 | | | | 0.375 | | | | 10/30/13 | | | | 149,680,098 | |
| | 300,000,000 | | | | 0.170 | (a) | | | 11/04/13 | | | | 299,938,241 | |
| | 5,405,000 | | | | 0.375 | | | | 11/27/13 | | | | 5,410,684 | |
| | 215,000,000 | | | | 0.625 | | | | 12/23/13 | | | | 215,784,539 | |
| | 28,227,000 | | | | 0.450 | | | | 01/09/14 | | | | 28,286,790 | |
| | 123,793,000 | | | | 4.500 | | | | 01/15/14 | | | | 128,452,134 | |
| Federal National Mortgage Association | |
| | 204,808,000 | | | | 4.375 | | | | 03/15/13 | | | | 205,133,518 | |
| | 350,000,000 | | | | 0.200 | (a) | | | 05/17/13 | | | | 349,977,225 | |
| | 9,465,000 | | | | 1.500 | | | | 06/26/13 | | | | 9,502,708 | |
| | 9,490,000 | | | | 4.375 | | | | 07/17/13 | | | | 9,636,405 | |
| | 134,388,000 | | | | 0.500 | | | | 08/09/13 | | | | 134,527,589 | |
| | 9,292,000 | | | | 1.125 | | | | 09/17/13 | | | | 9,337,952 | |
| | 17,120,000 | | | | 1.000 | | | | 09/23/13 | | | | 17,192,363 | |
| | 2,250,000 | | | | 1.125 | | | | 09/30/13 | | | | 2,261,891 | |
| | 150,000,000 | | | | 0.160 | (a) | | | 10/03/13 | | | | 149,964,014 | |
| | 222,467,000 | | | | 4.625 | | | | 10/15/13 | | | | 228,566,396 | |
| | 4,250,000 | | | | 1.050 | | | | 10/22/13 | | | | 4,272,599 | |
| | 397,000,000 | | | | 0.160 | | | | 10/25/13 | | | | 396,580,062 | |
| | 300,000,000 | | | | 0.171 | (a) | | | 11/14/13 | | | | 299,936,057 | |
| | 5,000,000 | | | | 0.800 | | | | 11/18/13 | | | | 5,020,437 | |
| | 6,231,000 | | | | 0.750 | | | | 12/18/13 | | | | 6,258,770 | |
| | 25,000,000 | | | | 2.750 | | | | 03/13/14 | | | | 25,660,974 | |
| | 42,557,000 | | | | 0.181 | (a) | | | 06/20/14 | | | | 42,553,862 | |
| | 400,000,000 | | | | 0.179 | (a) | | | 09/11/14 | | | | 399,876,064 | |
| | 600,000,000 | | | | 0.173 | (a) | | | 02/27/15 | | | | 599,699,081 | |
| | |
| TOTAL U.S. GOVERNMENT
AGENCY OBLIGATIONS |
| | $ | 11,733,394,110 | |
| | |
| | |
| The accompanying notes are an integral part of these financial statements. | | 15 |
FINANCIAL SQUARE GOVERNMENT FUND
Schedule of Investments (continued)
February 28, 2013 (Unaudited)
| | | | | | | | | | | | | | |
Amount Principal | | | Interest Rate | | | Maturity
Date | | | Amortized Cost | |
| | | | | | | | | | | | | | |
| | U.S. Treasury Obligations – 3.6% | |
| United States Treasury Notes | |
| $ | 200,000,000 | | | | 1.375 | % | | | 03/15/13 | | | $ | 200,089,382 | |
| | 12,000,000 | | | | 0.375 | | | | 06/30/13 | | | | 12,005,208 | |
| | 138,000,000 | | | | 3.375 | | | | 06/30/13 | | | | 139,429,874 | |
| | 76,000,000 | | | | 1.000 | | | | 07/15/13 | | | | 76,211,063 | |
| | 211,200,000 | | | | 0.125 | | | | 09/30/13 | | | | 211,104,513 | |
| | 203,400,000 | | | | 3.125 | | | | 09/30/13 | | | | 206,857,611 | |
| | 74,000,000 | | | | 0.500 | | | | 11/15/13 | | | | 74,149,346 | |
| | 135,000,000 | | | | 4.250 | | | | 11/15/13 | | | | 138,854,828 | |
| | 115,000,000 | | | | 2.000 | | | | 11/30/13 | | | | 116,530,071 | |
| | |
| TOTAL U.S. TREASURY
OBLIGATIONS |
| | $ | 1,175,231,896 | |
| | |
| TOTAL INVESTMENTS BEFORE
REPURCHASE AGREEMENTS |
| | $ | 12,908,626,006 | |
| | |
| | | | | | | | | | | | | | |
| | Repurchase Agreements(c) – 61.3% | |
| Bank of America, N.A. | |
| $ | 600,000,000 | | | | 0.170 | % | | | 03/01/13 | | | $ | 600,000,000 | |
| Maturity Value: $600,002,833 | |
| Collateralized by Federal Home Loan Mortgage Corp., 5.500%,
due 03/01/40, Federal National Mortgage Association, 5.000%
to 5.500%, due 06/01/33 to 10/01/33 and Government National
Mortgage Association, 4.000% to 5.500%, due 12/20/39 to
04/15/40. The aggregate market value of the collateral,
including accrued interest, was $617,999,999. |
|
| | |
| Bank of Nova Scotia (The) | |
| | 250,000,000 | | | | 0.210 | (a)(d) | | | 03/07/13 | | | | 250,000,000 | |
| Maturity Value: $250,262,499 | |
| Settlement Date: 09/13/12 | |
| Collateralized by Federal Home Loan Mortgage Corp., 3.000% to
5.000%, due 08/01/26 to 12/01/42 and Federal National
Mortgage Association, 2.500% to 5.000%, due 02/01/28 to
12/01/42. The aggregate market value of the collateral,
including accrued interest, was $258,498,737. |
|
| | 500,000,000 | | | | 0.220 | (a)(d) | | | 03/07/13 | | | | 500,000,000 | |
| Maturity Value: $500,549,999 | |
| Settlement Date: 10/12/12 | |
| Collateralized by Federal Home Loan Mortgage Corp., 3.000% to
5.500%, due 09/01/25 to 12/01/42 and Federal National
Mortgage Association, 2.500% to 5.500%, due 03/01/26 to
12/01/42. The aggregate market value of the collateral,
including accrued interest, was $517,416,580. |
|
| | 350,000,000 | | | | 0.230 | (a)(d) | | | 03/07/13 | | | | 350,000,000 | |
| Maturity Value: $350,402,501 | |
| Settlement Date: 11/16/12 | |
| Collateralized by Federal Home Loan Mortgage Corp., 3.000% to
5.000%, due 12/01/26 to 12/01/42 and Federal National
Mortgage Association, 2.500% to 5.500%, due 05/01/26 to
12/01/42. The aggregate market value of the collateral,
including accrued interest, was $362,064,934. |
|
| | |
| | | | | | | | | | | | | | |
| | Repurchase Agreements(c) – (continued) | |
| Bank of Nova Scotia (The) – (continued) | |
| $ | 500,000,000 | | | | 0.200 | %(a)(d) | | | 03/07/13 | | | $ | 500,000,000 | |
| Maturity Value: $501,013,897 | |
| Settlement Date: 02/27/13 | |
| Collateralized by Federal Home Loan Mortgage Corp., 3.000% to
3.500%, due 04/01/42 to 02/01/43, Federal National Mortgage
Association, 3.000% to 6.000%, due 05/01/26 to 02/01/43 and
Government National Mortgage Association, 5.000%, due
02/15/39. The aggregate market value of the collateral,
including accrued interest, was $515,005,723. |
|
| | |
| BNP Paribas Securities Corp. | |
| | 1,250,000,000 | | | | 0.130 | (a)(d) | | | 03/01/13 | | | | 1,250,000,000 | |
| Maturity Value: $1,250,126,389 | |
| Settlement Date: 02/01/13 | |
| Collateralized by Government National Mortgage Association,
2.500% to 5.000%, due 04/20/27 to 02/20/43. The aggregate
market value of the collateral, including accrued interest, was
$1,275,000,000. |
|
| | 550,000,000 | | | | 0.210 | (a) | | | 03/08/13 | | | | 550,000,000 | |
| Maturity Value: $550,885,495 | |
| Settlement Date: 06/05/12 | |
| Collateralized by Federal Home Loan Mortgage Corp., 3.000%,
due 01/01/43, Federal National Mortgage Association, 3.500%,
due 08/01/42 to 11/01/42 and Government National Mortgage
Association, 3.500%, due 12/20/42. The aggregate market
value of the collateral, including accrued interest, was
$561,000,000. |
|
| | 250,000,000 | | | | 0.220 | (a)(d) | | | 03/11/13 | | | | 250,000,000 | |
| Maturity Value: $250,276,527 | |
| Settlement Date: 09/11/12 | |
| Collateralized by Federal Home Loan Mortgage Corp., 2.500% to
3.500%, due 12/01/27 to 08/01/42 and Federal National
Mortgage Association, 2.500% to 6.000%, due 07/01/27 to
02/01/43. The aggregate market value of the collateral,
including accrued interest, was $255,000,003. |
|
| | 525,000,000 | | | | 0.230 | (a)(d) | | | 03/07/13 | | | | 525,000,000 | |
| Maturity Value: $525,610,459 | |
| Settlement Date: 09/10/12 | |
| Collateralized by Federal Home Loan Mortgage Corp., 3.000%,
due 02/01/43, Federal National Mortgage Association, 3.500%,
due 11/01/42 and Government National Mortgage Association,
3.000% to 4.000%, due 01/20/42 to 02/20/43. The aggregate
market value of the collateral, including accrued interest, was
$535,500,001. |
|
| | 500,000,000 | | | | 0.210 | (a) | | | 03/15/13 | | | | 500,000,000 | |
| Maturity Value: $500,825,412 | |
| Settlement Date: 06/05/12 | |
| Collateralized by Federal Home Loan Mortgage Corp., 3.000% to
4.000%, due 11/01/31 to 03/01/43, Federal National Mortgage
Association, 4.000%, due 03/01/42 and Government National
Mortgage Association, 4.000% to 6.000%, due 05/15/40 to
02/20/42. The aggregate market value of the collateral,
including accrued interest, was $510,000,001. |
|
| | |
| | |
| 16 | | The accompanying notes are an integral part of these financial statements. |
FINANCIAL SQUARE GOVERNMENT FUND
| | | | | | | | | | | | | | |
Amount Principal | | | Interest Rate | | | Maturity
Date | | | Amortized Cost | |
| | | | | | | | | | | | | | |
| | Repurchase Agreements(c) – (continued) | |
| BNP Paribas Securities Corp. – (continued) | |
| $ | 250,000,000 | | | | 0.240 | %(a)(d) | | | 03/07/13 | | | $ | 250,000,000 | |
| Maturity Value: $250,300,002 | |
| Settlement Date: 10/17/12 | |
| Collateralized by Federal Home Loan Mortgage Corp., 2.500% to
4.000%, due 08/01/42 to 12/01/42, Federal National Mortgage
Association, 3.000% to 6.000%, due 01/01/39 to 02/01/43 and
Government National Mortgage Association, 3.500%, due
10/20/42. The aggregate market value of the collateral,
including accrued interest, was $255,000,001. |
|
| | 350,000,000 | | | | 0.150 | (a)(d) | | | 03/07/13 | | | | 350,000,000 | |
| Maturity Value: $350,263,960 | |
| Settlement Date: 02/01/13 | |
| Collateralized by Federal Home Loan Mortgage Corp., 3.500% to
5.500%, due 10/01/26 to 08/01/42 and Federal National
Mortgage Association, 4.000% to 5.500%, due 12/01/31 to
07/01/39. The aggregate market value of the collateral,
including accrued interest, was $357,000,001. |
|
| | |
| Citibank, N.A. | |
| | 1,500,000,000 | | | | 0.150 | | | | 03/06/13 | | | | 1,500,000,000 | |
| Maturity Value: $1,500,043,750 | |
| Settlement Date: 02/27/13 | |
| Collateralized by Federal Home Loan Mortgage Corp., 2.500% to
8.500%, due 03/01/13 to 01/01/43 and Federal National
Mortgage Association, 2.500% to 11.000%, due 03/01/13 to
09/01/50. The aggregate market value of the collateral,
including accrued interest, was $1,530,000,016. |
|
| | |
| Citigroup Global Markets Inc. | |
| | 1,336,100,000 | | | | 0.200 | | | | 03/01/13 | | | | 1,336,100,000 | |
| Maturity Value: $1,336,107,423 | |
| Collateralized by Federal Home Loan Mortgage Corp., 2.500% to
6.000%, due 07/01/19 to 01/01/43 and Federal National
Mortgage Association, 2.000% to 6.500%, due 02/01/21 to
02/01/43. The aggregate market value of the collateral,
including accrued interest, was $1,362,822,002. |
|
| | |
| Credit Agricole Corporate and Investment Bank | |
| | 1,500,000,000 | | | | 0.200 | (a)(d) | | | 03/07/13 | | | | 1,500,000,000 | |
| Maturity Value: $1,501,016,675 | |
| Settlement Date: 02/15/13 | |
| Collateralized by Federal Home Loan Mortgage Corp., 4.000% to
4.500%, due 02/01/40 to 05/01/42 and Federal National
Mortgage Association, 2.500% to 5.500%, due 03/01/26 to
01/01/43. The aggregate market value of the collateral,
including accrued interest, was $1,545,000,002. |
|
| | |
| Credit Suisse Securities (USA) LLC | |
| | 1,100,000,000 | | | | 0.250 | | | | 04/03/13 | | | | 1,100,000,000 | |
| Maturity Value: $1,100,924,306 | |
| Settlement Date: 12/03/12 | |
| Collateralized by Federal National Mortgage Association, 2.500% to
7.500%, due 12/01/15 to 03/01/43. The aggregate market value of
the collateral, including accrued interest, was $1,122,000,895. |
|
| | 250,000,000 | | | | 0.230 | | | | 05/01/13 | | | | 250,000,000 | |
| Maturity Value: $250,186,875 | |
| Settlement Date: 01/04/13 | |
| Collateralized by Federal National Mortgage Association, 2.500% to
7.500%, due 11/01/22 to 02/01/43. The aggregate market value of
the collateral, including accrued interest, was $255,004,227. |
|
| | |
| | | | | | | | | | | | | | |
| | Repurchase Agreements(c) – (continued) | |
| Credit Suisse Securities (USA) LLC – (continued) | |
| $ | 500,000,000 | | | | 0.200 | % | | | 05/31/13 | | | $ | 500,000,000 | |
| Maturity Value: $500,294,444 | |
| Settlement Date: 02/14/13 | |
| Collateralized by Federal National Mortgage Association, 2.500%
to 7.500%, due 04/01/18 to 02/01/43. The aggregate market
value of the collateral, including accrued interest, was
$510,003,757. |
|
| | |
| Deutsche Bank Securities, Inc | |
| | 1,000,000,000 | | | | 0.250 | | | | 03/15/13 | | | | 1,000,000,000 | |
| Maturity Value: $1,000,840,278 | |
| Settlement Date: 11/14/12 | |
| Collateralized by Federal Home Loan Mortgage Corp., 3.000% to
6.500%, due 01/01/26 to 01/01/43, Federal National Mortgage
Association, 2.500% to 7.000%, due 01/01/25 to 02/01/43 and
Government National Mortgage Association, 3.000% to
7.000%, due 08/15/18 to 07/15/41. The aggregate market value
of the collateral, including accrued interest, was
$1,029,999,999. |
|
| | 100,000,000 | | | | 0.240 | | | | 03/18/13 | | | | 100,000,000 | |
| Maturity Value: $100,079,333 | |
| Settlement Date: 11/19/12 | |
| Collateralized by Federal Home Loan Mortgage Corp., 3.500%,
due 02/01/43 and Federal National Mortgage Association,
3.000% to 4.500%, due 10/01/25 to 02/01/43. The aggregate
market value of the collateral, including accrued interest, was
$103,269,504. |
|
| | |
| ING Financial Markets LLC | |
| | 50,000,000 | | | | 0.160 | | | | 03/01/13 | | | | 50,000,000 | |
| Maturity Value: $50,000,222 | |
| Collateralized by Federal Home Loan Mortgage Corp., 0.500% to
2.375%, due 04/17/15 to 01/13/22. The aggregate market value
of the collateral, including accrued interest, was $51,005,001. |
|
| | 350,000,000 | | | | 0.270 | (a)(d) | | | 03/07/13 | | | | 350,000,000 | |
| Maturity Value: $350,469,875 | |
| Settlement Date: 10/15/12 | |
| Collateralized by Federal Home Loan Mortgage Corp., 3.000% to
7.500%, due 06/01/26 to 01/01/43, Federal National Mortgage
Association, 3.000% to 6.000%, due 08/01/26 to 11/01/50 and
U.S. Treasury Interest-Only Stripped Security, 0.000%, due
05/15/27. The aggregate market value of the collateral,
including accrued interest, was $357,000,061. |
|
| | 500,000,000 | | | | 0.270 | (a)(d) | | | 03/07/13 | | | | 500,000,000 | |
| Maturity Value: $500,675,000 | |
| Settlement Date: 11/15/12 | |
| Collateralized by Federal Home Loan Mortgage Corp., 3.000% to
6.000%, due 12/01/24 to 01/01/43 and Federal National
Mortgage Association, 3.000% to 6.000%, due 08/01/27 to
01/01/43. The aggregate market value of the collateral,
including accrued interest, was $510,000,050. |
|
| | 1,100,000,000 | | | | 0.190 | (a)(d) | | | 03/07/13 | | | | 1,100,000,000 | |
| Maturity Value: $1,101,608,146 | |
| Collateralized by Federal National Mortgage Association, 2.500%
to 7.000%, due 02/01/23 to 08/01/48. The aggregate market
value of the collateral, including accrued interest, was
$1,122,003,823. |
|
| | |
| | |
| The accompanying notes are an integral part of these financial statements. | | 17 |
FINANCIAL SQUARE GOVERNMENT FUND
Schedule of Investments (continued)
February 28, 2013 (Unaudited)
| | | | | | | | | | | | | | |
Amount Principal | | | Interest Rate | | | Maturity
Date | | | Amortized Cost | |
| | | | | | | | | | | | | | |
| | Repurchase Agreements(c) – (continued) | |
| Joint Repurchase Agreement Account I | |
| $ | 1,698,300,000 | | | | 0.166 | % | | | 03/01/13 | | | $ | 1,698,300,000 | |
| Maturity Value: $1,698,307,837 | |
| | |
| Joint Repurchase Agreement Account III | |
| | 340,000,000 | | | | 0.184 | | | | 03/01/13 | | | | 340,000,000 | |
| Maturity Value: $340,001,737 | |
| | |
| JPMorgan Securities LLC | |
| | 500,000,000 | | | | 0.200 | (a)(d) | | | 03/07/13 | | | | 500,000,000 | |
| Maturity Value: $500,252,780 | |
| Settlement Date: 12/10/12 | |
| Collateralized by Federal National Mortgage Association, 2.000%
to 11.500%, due 11/01/13 to 01/01/53. The aggregate market
value of the collateral, including accrued interest, was
$510,003,351. |
|
| | |
| RBC Capital Markets LLC | |
| | 700,000,000 | | | | 0.190 | | | | 03/01/13 | | | | 700,000,000 | |
| Maturity Value: $700,003,694 | |
| Collateralized by Federal Home Loan Mortgage Corp., 3.500%,
due 09/01/42 and Federal National Mortgage Association,
4.000%, due 01/01/42 to 06/01/42. The aggregate market value
of the collateral, including accrued interest, was $714,000,001. |
|
| | 250,000,000 | | | | 0.190 | (a)(d)(e) | | | 03/07/13 | | | | 250,000,000 | |
| Maturity Value: $250,116,112 | |
| Settlement Date: 01/04/13 | |
| Collateralized by Federal National Mortgage Association, 3.000%
to 5.000%, due 02/01/28 to 02/01/43. The aggregate market
value of the collateral, including accrued interest, was
$255,864,647. |
|
| | |
| Societe Generale | |
| | 500,000,000 | | | | 0.170 | | | | 03/01/13 | | | | 500,000,000 | |
| Maturity Value: $500,002,361 | |
| Collateralized by Federal Farm Credit Bank, 0.230% to 0.550%,
due 07/30/13 to 07/09/15, Federal Home Loan Bank, 0.280% to
1.000%, due 08/13/13 to 10/23/17, Federal Home Loan
Mortgage Corp., 0.500% to 4.750%, due 11/27/15 to 01/13/22
and Federal National Mortgage Association, 0.550% to
1.000%, due 12/18/13 to 02/08/18. The aggregate market value
of the collateral, including accrued interest, was $510,000,128. |
|
| | 500,000,000 | | | | 0.170 | | | | 03/01/13 | | | | 500,000,000 | |
| Maturity Value: $500,002,361 | |
| Collateralized by Government National Mortgage Association,
2.500% to 6.000%, due 10/15/32 to 01/20/43. The aggregate
market value of the collateral, including accrued interest, was
$515,000,000. |
|
| | |
| TD Securities (USA) LLC | |
| | 200,000,000 | | | | 0.170 | | | | 03/01/13 | | | | 200,000,000 | |
| Maturity Value: $200,000,944 | |
| Collateralized by Federal Farm Credit Bank, 0.180% to 5.200%,
due 04/15/13 to 01/17/20, Federal Home Loan Bank, 0.120% to
5.500%, due 03/08/13 to 12/09/22 and Federal Home Loan
Mortgage Corp., 0.000% to 6.750%, due 06/17/13 to 09/15/29.
The aggregate market value of the collateral, including accrued
interest, was $204,000,005. |
|
| | |
| | | | | | | | | | | | | | |
| | Repurchase Agreements(c) – (continued) | |
| UBS Securities LLC | |
| $ | 50,000,000 | | | | 0.150 | % | | | 03/01/13 | | | $ | 50,000,000 | |
| Maturity Value: $50,000,208 | |
| Collateralized by U.S. Treasury Inflation-Indexed Bond, 0.750%,
due 02/15/42 and U.S. Treasury Note, 0.625%, due 11/30/17.
The aggregate market value of the collateral, including accrued
interest, was $51,000,012. |
|
| | |
| Wells Fargo Securities LLC | |
| | 200,000,000 | | | | 0.200 | | | | 03/01/13 | | | | 200,000,000 | |
| Maturity Value: $200,001,111 | |
| Collateralized by Federal Farm Credit Bank, 0.270%, due
02/24/15 and U.S. Treasury Note, 0.250% to 2.625%, due
10/31/13 to 02/15/15. The aggregate market value of the
collateral, including accrued interest, was $204,000,030. |
|
| | |
| | TOTAL REPURCHASE AGREEMENTS | | | $ | 20,099,400,000 | |
| | |
| | TOTAL INVESTMENTS – 100.7% | | | $ | 33,008,026,006 | |
| | |
| LIABILITIES IN EXCESS OF
OTHER ASSETS – (0.7)% |
| | | (239,604,540 | ) |
| | |
| | NET ASSETS – 100.0% | | | $ | 32,768,421,466 | |
| | |
| | |
| The percentage shown for each investment category reflects the value of investments in that category as a percentage of net assets. |
(a) | | Variable or floating rate security. Interest rate disclosed is that which is in effect at February 28, 2013. |
(b) | | All or a portion represents a forward commitment. |
(c) | | Unless noted, all repurchase agreements were entered into on February 28, 2013. Additional information on Joint Repurchase Agreement Account I & III appears on pages 53-55. |
(d) | | The instrument is subject to a demand feature. |
(e) | | Security has been determined to be illiquid by the Investment Adviser. At February 28, 2013, these securities amounted to $250,000,000 or approximately 0.8% of net assets. |
Interest rates represent either the stated coupon rate, annualized yield on date of purchase for discounted securities, or, for floating rate securities, the current reset rate, which is based upon current interest rate indices.
Maturity dates represent either the final legal maturity date on the security, the demand date for puttable securities, or the prerefunded date for those types of securities.
| | |
| 18 | | The accompanying notes are an integral part of these financial statements. |
FINANCIAL SQUARE MONEY MARKET FUND
Schedule of Investments
February 28, 2013 (Unaudited)
| | | | | | | | | | | | | | |
Principal Amount | | | Interest
Rate | | | Maturity
Date | | | Amortized Cost | |
| | | | | | | | | | | | | | |
| | Commercial Paper and Corporate Obligations – 15.8% | |
| ABN Amro Funding (USA) LLC | |
| $ | 125,000,000 | | | | 0.401 | % | | | 03/01/13 | | | $ | 125,000,000 | |
| | 75,000,000 | | | | 0.300 | | | | 06/03/13 | | | | 74,941,250 | |
| | 140,000,000 | | | | 0.300 | | | | 06/04/13 | | | | 139,889,167 | |
| | 40,000,000 | | | | 0.300 | | | | 06/19/13 | | | | 39,963,333 | |
| Aspen Funding Corp. | |
| | 20,000,000 | | | | 0.270 | | | | 05/06/13 | | | | 19,990,100 | |
| | 125,000,000 | | | | 0.260 | | | | 05/09/13 | | | | 124,937,708 | |
| Atlantic Asset Securitization LLC | |
| | 19,000,000 | | | | 0.220 | | | | 03/18/13 | | | | 18,998,026 | |
| | 95,000,000 | | | | 0.220 | | | | 03/19/13 | | | | 94,989,550 | |
| | 42,000,000 | | | | 0.240 | | | | 03/25/13 | | | | 41,993,280 | |
| | 100,000,000 | | | | 0.250 | | | | 03/25/13 | | | | 99,983,333 | |
| | 150,000,000 | | | | 0.430 | (a) | | | 04/04/13 | | | | 150,000,000 | |
| Atlantis One Funding Corp. | |
| | 150,000,000 | | | | 0.200 | | | | 03/01/13 | | | | 150,000,000 | |
| | 30,000,000 | | | | 0.210 | | | | 03/18/13 | | | | 29,997,025 | |
| | 350,000,000 | | | | 0.472 | | | | 06/17/13 | | | | 349,506,500 | |
| | 250,000,000 | | | | 0.401 | | | | 07/25/13 | | | | 249,594,444 | |
| Bank of China Ltd. | |
| | 45,000,000 | | | | 0.571 | | | | 03/18/13 | | | | 44,987,888 | |
| | 100,000,000 | | | | 0.411 | | | | 08/21/13 | | | | 99,802,972 | |
| Chariot Funding LLC | |
| | 75,000,000 | | | | 0.270 | | | | 08/21/13 | | | | 74,902,688 | |
| Gemini Securitization Corp. LLC | |
| | 19,500,000 | | | | 0.250 | | | | 05/01/13 | | | | 19,491,740 | |
| | 220,000,000 | | | | 0.250 | | | | 05/06/13 | | | | 219,899,167 | |
| | 45,000,000 | | | | 0.260 | | | | 05/20/13 | | | | 44,974,000 | |
| | 110,000,000 | | | | 0.260 | | | | 05/29/13 | | | | 109,929,294 | |
| Hannover Funding Co. LLC | |
| | 50,000,000 | | | | 0.250 | | | | 03/13/13 | | | | 49,995,833 | |
| | 75,000,000 | | | | 0.260 | | | | 03/18/13 | | | | 74,990,792 | |
| | 50,000,000 | | | | 0.270 | | | | 04/16/13 | | | | 49,982,750 | |
| | 75,000,000 | | | | 0.270 | | | | 04/29/13 | | | | 74,966,813 | |
| Jupiter Securitization Co. LLC | |
| | 25,000,000 | | | | 0.321 | | | | 05/09/13 | | | | 24,984,667 | |
| | 75,000,000 | | | | 0.321 | | | | 06/11/13 | | | | 74,932,000 | |
| | 100,000,000 | | | | 0.321 | | | | 06/12/13 | | | | 99,908,444 | |
| | 25,000,000 | | | | 0.321 | | | | 06/25/13 | | | | 24,974,222 | |
| | 50,000,000 | | | | 0.270 | | | | 08/08/13 | | | | 49,940,000 | |
| | 75,000,000 | | | | 0.270 | | | | 08/20/13 | | | | 74,903,250 | |
| Kells Funding LLC | |
| | 111,000,000 | | | | 0.300 | | | | 07/01/13 | | | | 110,887,150 | |
| | 60,000,000 | | | | 0.321 | | | | 08/13/13 | | | | 59,912,000 | |
| | 150,000,000 | | | | 0.260 | | | | 08/27/13 | | | | 149,806,083 | |
| | 100,000,000 | | | | 0.260 | (b) | | | 08/28/13 | | | | 99,870,000 | |
| LMA Americas LLC | |
| | 100,000,000 | | | | 0.230 | | | | 03/07/13 | | | | 99,996,167 | |
| | 100,000,000 | | | | 0.220 | | | | 03/18/13 | | | | 99,989,611 | |
| | 60,000,000 | | | | 0.240 | | | | 04/02/13 | | | | 59,987,200 | |
| Newport Funding Corp. | |
| | 105,086,000 | | | | 0.270 | | | | 05/21/13 | | | | 105,022,160 | |
| | 50,040,000 | | | | 0.260 | | | | 05/29/13 | | | | 50,007,836 | |
| Regency Markets No. 1 LLC | |
| | 100,000,000 | | | | 0.190 | | | | 03/20/13 | | | | 99,989,972 | |
| | |
| | | | | | | | | | | | | | |
| | Commercial Paper and Corporate Obligations – (continued) | |
| Royal Park Investments Funding Corp. | |
| $ | 40,000,000 | | | | 0.451 | % | | | 04/09/13 | | | $ | 39,980,500 | |
| | 60,000,000 | | | | 0.350 | | | | 04/16/13 | | | | 59,973,167 | |
| | 75,000,000 | | | | 1.005 | | | | 04/17/13 | | | | 74,902,083 | |
| | 50,000,000 | | | | 0.350 | | | | 04/24/13 | | | | 49,973,750 | |
| | 71,000,000 | | | | 0.350 | | | | 04/29/13 | | | | 70,959,274 | |
| | 74,000,000 | | | | 0.270 | | | | 05/22/13 | | | | 73,954,490 | |
| | 29,900,000 | | | | 0.270 | | | | 05/30/13 | | | | 29,879,818 | |
| Versailles Commercial Paper LLC | |
| | 150,000,000 | | | | 0.220 | | | | 03/26/13 | | | | 149,977,083 | |
| | |
| TOTAL COMMERCIAL PAPER AND
CORPORATE OBLIGATIONS |
| | $ | 4,408,418,580 | |
| | |
| | | | | | | | | | | | | | |
| | Certificates of Deposit-Eurodollar – 2.6% | |
| Bank of Tokyo-Mitsubishi UFJ Ltd. | |
| $ | 100,000,000 | | | | 0.240 | % | | | 03/18/13 | | | $ | 99,988,671 | |
| | 75,000,000 | | | | 0.240 | | | | 03/22/13 | | | | 74,989,504 | |
| | 90,000,000 | | | | 0.240 | | | | 04/02/13 | | | | 89,980,808 | |
| Landesbank Hessen-Thueringen Girozentrale | |
| | 300,000,000 | | | | 0.310 | | | | 04/08/13 | | | | 300,001,582 | |
| Mizuho Corporate Bank Ltd. | |
| | 70,000,000 | | | | 0.270 | | | | 05/01/13 | | | | 69,967,996 | |
| Sumitomo Mitsui Trust Bank Ltd. | |
| | 100,000,000 | | | | 0.295 | | | | 04/11/13 | | | | 99,966,428 | |
| | |
| TOTAL CERTIFICATES OF
DEPOSIT-EURODOLLAR |
| | $ | 734,894,989 | |
| | |
| | | | | | | | | | | | | | |
| | Certificates of Deposit-Yankeedollar – 11.8% | |
| Bank of China Ltd. | |
| $ | 75,000,000 | | | | 0.420 | % | | | 03/01/13 | | | $ | 75,000,000 | |
| | 75,000,000 | | | | 0.630 | | | | 03/19/13 | | | | 75,000,000 | |
| | 75,000,000 | | | | 0.620 | | | | 05/28/13 | | | | 75,000,000 | |
| BNP Paribas Securities Corp. | |
| | 420,000,000 | | | | 0.310 | | | | 03/15/13 | | | | 420,000,000 | |
| Industrial & Commercial Bank of China Ltd. | |
| | 50,000,000 | | | | 0.340 | | | | 06/03/13 | | | | 50,000,638 | |
| | 100,000,000 | | | | 0.350 | | | | 06/03/13 | | | | 100,001,304 | |
| Mitsubishi UFJ Trust & Banking Corp. | |
| | 375,000,000 | | | | 0.260 | | | | 06/03/13 | | | | 375,000,000 | |
| Mizuho Corporate Bank Ltd. | |
| | 200,000,000 | | | | 0.280 | | | | 04/01/13 | | | | 200,000,000 | |
| | 195,000,000 | | | | 0.260 | | | | 04/08/13 | | | | 195,000,000 | |
| Norinchukin Bank | |
| | 85,000,000 | | | | 0.490 | | | | 03/01/13 | | | | 85,000,000 | |
| | 450,000,000 | | | | 0.290 | | | | 03/07/13 | | | | 450,000,000 | |
| Societe Generale | |
| | 343,000,000 | | | | 0.230 | | | | 03/07/13 | | | | 343,000,000 | |
| Standard Chartered Bank | |
| | 172,000,000 | | | | 0.300 | | | | 05/03/13 | | | | 172,000,000 | |
| | 172,000,000 | | | | 0.300 | | | | 05/10/13 | | | | 172,000,000 | |
| | |
| | |
| The accompanying notes are an integral part of these financial statements. | | 19 |
FINANCIAL SQUARE MONEY MARKET FUND
Schedule of Investments (continued)
February 28, 2013 (Unaudited)
| | | | | | | | | | | | | | |
Principal Amount | | | Interest
Rate | | | Maturity
Date | | | Amortized Cost | |
| | | | | | | | | | | | | | |
| | Certificates of Deposit-Yankeedollar – (continued) | |
| Sumitomo Mitsui Trust Bank Ltd. | |
| $ | 150,000,000 | | | | 0.250 | % | | | 04/10/13 | | | $ | 150,000,000 | |
| | 300,000,000 | | | | 0.260 | | | | 04/12/13 | | | | 300,000,000 | |
| | 50,000,000 | | | | 0.380 | | | | 04/22/13 | | | | 50,005,038 | |
| | |
| TOTAL CERTIFICATES OF
DEPOSIT-YANKEEDOLLAR |
| | $ | 3,287,006,980 | |
| | |
| | | | | | | | | | | | | | |
| | Time Deposits – 6.6% | |
| Credit Industriel et Commercial | |
| $ | 850,000,000 | | | | 0.180 | % | | | 03/01/13 | | | $ | 850,000,000 | |
| National Bank of Kuwait | |
| | 300,000,000 | | | | 0.190 | | | | 03/01/13 | | | | 300,000,000 | |
| Standard Chartered Bank | |
| | 700,000,000 | | | | 0.180 | | | | 03/01/13 | | | | 700,000,000 | |
| | |
| | TOTAL TIME DEPOSITS | | | $ | 1,850,000,000 | |
| | |
| | | | | | | | | | | | | | |
| | U.S. Government Agency Obligations – 11.8% | |
| Federal Home Loan Bank | |
| $ | 29,770,000 | | | | 0.125 | % | | | 03/01/13 | | | $ | 29,770,000 | |
| | 48,200,000 | | | | 0.290 | | | | 03/01/13 | | | | 48,200,000 | |
| | 2,400,000 | | | | 0.300 | | | | 03/04/13 | | | | 2,400,000 | |
| | 39,250,000 | | | | 1.625 | | | | 03/20/13 | | | | 39,278,406 | |
| | 58,600,000 | | | | 0.210 | | | | 05/17/13 | | | | 58,594,695 | |
| | 60,300,000 | | | | 0.200 | | | | 05/22/13 | | | | 60,292,834 | |
| | 35,600,000 | | | | 0.230 | | | | 05/23/13 | | | | 35,598,116 | |
| | 2,990,000 | | | | 0.230 | | | | 05/24/13 | | | | 2,989,805 | |
| | 74,000,000 | | | | 0.240 | | | | 05/24/13 | | | | 73,997,748 | |
| | 90,000,000 | | | | 0.230 | | | | 05/29/13 | | | | 89,994,894 | |
| | 81,000,000 | | | | 0.240 | | | | 06/06/13 | | | | 80,997,137 | |
| | 24,100,000 | | | | 0.230 | | | | 06/07/13 | | | | 24,098,494 | |
| | 36,200,000 | | | | 0.350 | | | | 06/10/13 | | | | 36,209,604 | |
| | 60,300,000 | | | | 0.230 | | | | 06/12/13 | | | | 60,296,041 | |
| | 15,460,000 | | | | 1.625 | | | | 06/14/13 | | | | 15,520,362 | |
| | 60,350,000 | | | | 0.230 | | | | 06/18/13 | | | | 60,345,753 | |
| | 65,400,000 | | | | 0.420 | | | | 06/21/13 | | | | 65,433,261 | |
| | 23,500,000 | | | | 1.875 | | | | 06/21/13 | | | | 23,616,427 | |
| | 47,500,000 | | | | 0.240 | | | | 06/27/13 | | | | 47,494,779 | |
| | 52,900,000 | | | | 0.125 | | | | 06/28/13 | | | | 52,876,170 | |
| | 37,000,000 | | | | 0.240 | | | | 06/28/13 | | | | 36,998,397 | |
| | 9,700,000 | | | | 0.250 | | | | 07/02/13 | | | | 9,699,562 | |
| | 63,860,000 | | | | 0.250 | | | | 07/05/13 | | | | 63,857,033 | |
| | 15,000,000 | | | | 0.139 | (a) | | | 07/08/13 | | | | 14,997,315 | |
| | 45,270,000 | | | | 0.350 | | | | 07/09/13 | | | | 45,283,921 | |
| | 30,000,000 | | | | 0.141 | (a) | | | 07/15/13 | | | | 29,994,338 | |
| | 197,900,000 | | | | 0.220 | | | | 08/08/13 | | | | 197,861,987 | |
| | 8,350,000 | | | | 0.125 | | | | 09/25/13 | | | | 8,345,337 | |
| | 69,200,000 | | | | 0.210 | | | | 10/01/13 | | | | 69,194,762 | |
| | 14,400,000 | | | | 3.625 | | | | 10/18/13 | | | | 14,709,321 | |
| | 97,000,000 | | | | 0.210 | | | | 10/24/13 | | | | 96,998,237 | |
| | 116,000,000 | | | | 0.181 | (a) | | | 08/15/14 | | | | 115,965,530 | |
| | |
| | | | | | | | | | | | | | |
| | U.S. Government Agency Obligations – (continued) | |
| Federal Home Loan Mortgage Corporation | |
| $ | 468,000,000 | | | | 0.150 | %(a) | | | 05/03/13 | | | $ | 467,967,293 | |
| | 196,750,000 | | | | 0.148 | (a) | | | 05/06/13 | | | | 196,735,675 | |
| | 211,000,000 | | | | 0.150 | (a) | | | 06/03/13 | | | | 210,978,034 | |
| | 4,880,000 | | | | 4.000 | | | | 06/12/13 | | | | 4,931,290 | |
| | 200,000,000 | | | | 0.152 | (a) | | | 06/17/13 | | | | 199,967,110 | |
| | 14,300,000 | | | | 0.375 | | | | 10/15/13 | | | | 14,313,126 | |
| | 5,900,000 | | | | 0.500 | | | | 10/15/13 | | | | 5,910,025 | |
| | 1,500,000 | | | | 0.875 | | | | 10/28/13 | | | | 1,506,407 | |
| Federal National Mortgage Association | |
| | 17,600,000 | | | | 4.375 | | | | 03/15/13 | | | | 17,627,922 | |
| | 61,290,000 | | | | 0.500 | | | | 08/09/13 | | | | 61,351,707 | |
| | 2,800,000 | | | | 1.000 | | | | 09/23/13 | | | | 2,812,257 | |
| | 5,100,000 | | | | 1.125 | | | | 10/08/13 | | | | 5,127,820 | |
| | 23,100,000 | | | | 4.625 | | | | 10/15/13 | | | | 23,733,794 | |
| | 347,750,000 | | | | 0.160 | | | | 10/25/13 | | | | 347,382,158 | |
| Overseas Private Investment Corp. (USA) | |
| | 43,500,000 | | | | 0.160 | (a) | | | 03/07/13 | | | | 43,500,000 | |
| | 86,000,000 | | | | 0.170 | (a) | | | 03/07/13 | | | | 86,000,000 | |
| | |
| TOTAL U.S. GOVERNMENT
AGENCY OBLIGATIONS |
| | $ | 3,301,754,884 | |
| | |
| | | | | | | | | | | | | | |
| | U.S. Treasury Obligations – 0.5% | |
| United States Treasury Notes | |
| $ | 63,000,000 | | | | 1.000 | % | | | 07/15/13 | | | $ | 63,174,960 | |
| | 42,500,000 | | | | 0.125 | | | | 09/30/13 | | | | 42,479,792 | |
| | 37,500,000 | | | | 3.125 | | | | 09/30/13 | | | | 38,137,763 | |
| | |
| TOTAL U.S. TREASURY
OBLIGATIONS |
| | $ | 143,792,515 | |
| | |
| | | | | | | | | | | | | | |
| | Variable Rate Municipal Debt Obligations(a) – 1.7% | |
| Alaska Housing Finance Corp. VRDN RB Taxable General Series 2012 B | |
| $ | 25,000,000 | | | | 0.150 | % | | | 03/07/13 | | | $ | 25,000,000 | |
| BlackRock Municipal Bond Trust VRDN Putters Series 2012-T0014
(JPMorgan Chase Bank N.A., LIQ)(c) |
|
| | 19,375,000 | | | | 0.180 | | | | 03/01/13 | | | | 19,375,000 | |
| BlackRock MuniVest Fund, Inc. VRDN RB Putters Series 2012-T0005
(JPMorgan Chase Bank N.A., LIQ)(c) |
|
| | 33,000,000 | | | | 0.180 | | | | 03/01/13 | | | | 33,000,000 | |
| BlackRock MuniVest Fund, Inc. VRDN RB Putters Series 2012-T0007
(JPMorgan Chase Bank N.A., LIQ) |
|
| | 29,110,000 | | | | 0.180 | | | | 03/01/13 | | | | 29,110,000 | |
| City of Durham, North Carolina GO VRDN for Taxable Housing Series 2000
(Bank of America N.A., SPA) |
|
| | 3,810,000 | | | | 0.290 | | | | 03/07/13 | | | | 3,810,000 | |
| City of Portland, Maine GO VRDN for Taxable Pension Series 2001
(JPMorgan Chase Bank N.A., SPA) |
|
| | 40,000,000 | | | | 0.240 | | | | 03/07/13 | | | | 40,000,000 | |
| Connecticut State Housing Finance Authority VRDN RB Taxable Housing
Mortgage Finance Program Series 2011 D (GO of Authority)
(Barclays Bank PLC, SPA) |
|
| | 72,485,000 | | | | 0.170 | | | | 03/07/13 | | | | 72,485,000 | |
| | |
| | |
| 20 | | The accompanying notes are an integral part of these financial statements. |
FINANCIAL SQUARE MONEY MARKET FUND
| | | | | | | | | | | | | | |
Principal Amount | | | Interest
Rate | | | Maturity
Date | | | Amortized Cost | |
| | | | | | | | | | | | | | |
| | Variable Rate Municipal Debt Obligations(a) – (continued) | |
| Connecticut State Housing Finance Authority VRDN RB Taxable Housing
Mortgage Finance Program Series 2011 Subseries A-2
(Bank of America N.A., SPA) |
|
| $ | 19,680,000 | | | | 0.220 | % | | | 03/07/13 | | | $ | 19,680,000 | |
| Department of Budget and Finance of the State of Hawaii VRDN RB P-Floats-
MT-829 Series 2012 (AMBAC) (Bank of America N.A., LIQ)
(GTY AGMT-Bank of America N.A.)(c) |
|
| | 21,780,000 | | | | 0.340 | | | | 03/07/13 | | | | 21,780,000 | |
| Nuveen Municipal Market Opportunity Fund, Inc. VRDN Tax-Exempt Preferred
Series 2010-1 (Deutsche Bank A.G., LIQ)(c) |
|
| | 25,000,000 | | | | 0.250 | | | | 03/07/13 | | | | 25,000,000 | |
| Oglethorpe, Georgia Power Corp. VRDN RB Putters Series 2012 SGT05
(NATL-RE) (FGIC) (Societe Generale, LIQ)(c) |
|
| | 32,000,000 | | | | 0.240 | | | | 03/01/13 | | | | 32,000,000 | |
| Port of Corpus Christi Authority of Nueces County VRDN RB for Flint Hills
Resources Series 2002 A (GTY AGMT-Flint Hills Resources) |
|
| | 33,100,000 | | | | 0.120 | | | | 03/07/13 | | | | 33,100,000 | |
| Port of Oakland, California VRDN RB SPEARS Series 2012-DBE-1136X
(GTY AGMT-Deutsche Bank A.G.) (Deutsche Bank A.G., LIQ)(c) |
|
| | 30,000,000 | | | | 0.180 | | | | 03/07/13 | | | | 30,000,000 | |
| Private Colleges & Universities Authority, Georgia VRDN RB for Emory
University Project Series 1999 B (GO of University) |
|
| | 9,975,000 | | | | 0.180 | | | | 03/07/13 | | | | 9,975,000 | |
| San Francisco City & County Airports Commission VRDN RB for San Francisco
International Airport Refunding Second Series 2010 A-2
(JPMorgan Chase Bank N.A., LOC) |
|
| | 30,000,000 | | | | 0.110 | | | | 03/07/13 | | | | 30,000,000 | |
| State of Texas GO VRDN Refunding for College Student Loan Series 2003
(Landesbank Hessen-Thueringen Girozentrale, SPA) |
|
| | 23,000,000 | | | | 0.140 | | | | 03/07/13 | | | | 23,000,000 | |
| State of Texas GO VRDN Refunding for Taxable Veterans’ Land Series 2002
(Landesbank Hessen-Thueringen Girozentrale, SPA) |
|
| | 25,460,000 | | | | 0.170 | | | | 03/07/13 | | | | 25,460,000 | |
| | |
| TOTAL VARIABLE RATE MUNICIPAL
DEBT OBLIGATIONS |
| | $ | 472,775,000 | |
| | |
| | | | | | | | | | | | | | |
| | Variable Rate Obligations(a) – 11.2% | |
| Australia & New Zealand Banking Group Ltd. | |
| $ | 260,000,000 | | | | 0.303 | %(c) | | | 03/18/14 | | | $ | 260,000,000 | |
| Bank of Nova Scotia (The) | |
| | 350,000,000 | | | | 0.338 | | | | 03/24/14 | | | | 350,000,000 | |
| Commonwealth Bank of Australia | |
| | 72,000,000 | | | | 0.338 | (c) | | | 11/18/13 | | | | 72,000,000 | |
| | 50,000,000 | | | | 0.361 | (c) | | | 11/27/13 | | | | 49,999,701 | |
| Cooperatieve Centrale Raiffeisen-Boerenleenbank BA | |
| | 350,000,000 | | | | 0.397 | | | | 05/29/13 | | | | 350,000,000 | |
| Credit Suisse Securities (USA) LLC | |
| | 550,000,000 | | | | 0.282 | | | | 05/29/13 | | | | 550,000,000 | |
| Deutsche Bank AG | |
| | 398,000,000 | | | | 0.858 | | | | 03/15/13 | | | | 398,000,000 | |
| JPMorgan Chase Bank N.A. | |
| | 195,000,000 | | | | 0.373 | | | | 06/18/13 | | | | 195,000,000 | |
| | 280,000,000 | | | | 0.402 | | | | 06/21/13 | | | | 280,000,000 | |
| Providence Health & Services (U.S. Bank N.A.) | |
| | 47,000,000 | | | | 0.200 | | | | 03/07/13 | | | | 47,000,000 | |
| | |
| | | | | | | | | | | | | | |
| | Variable Rate Obligations(a) – (continued) | |
| Svenska Handelsbanken AB | |
| $ | 195,000,000 | | | | 0.385 | % | | | 03/04/14 | | | $ | 195,000,000 | |
| Wells Fargo Bank N.A. | |
| | 150,000,000 | | | | 0.359 | | | | 03/20/14 | | | | 150,000,000 | |
| Westpac Banking Corp. | |
| | 246,000,000 | | | | 0.390 | (c) | | | 02/28/14 | | | | 246,000,000 | |
| | |
| TOTAL VARIABLE RATE
OBLIGATIONS |
| | $ | 3,142,999,701 | |
| | |
| TOTAL INVESTMENTS BEFORE
REPURCHASE AGREEMENTS |
| | $ | 17,341,642,649 | |
| | |
| | | | | | | | | | | | | | |
| | Repurchase Agreements(d) – 39.4% | |
| ABN Amro Securities (USA) LLC | |
| $ | 99,000,000 | | | | 0.390 | %(a) | | | 03/06/13 | | | $ | 99,000,000 | |
| Maturity Value: $99,007,507 | |
| Settlement Date: 02/27/13 | |
| Collateralized by various equity securities. The aggregate market
value of the collateral, including accrued interest, was
$108,239,370. |
|
| | |
| BNP Paribas Securities Corp. | |
| | 250,000,000 | | | | 0.210 | | | | 03/01/13 | | | | 250,000,000 | |
| Maturity Value: $250,001,458 | |
| Collateralized by U.S. Treasury Note, 0.625% to 1.500%, due
09/30/17 to 05/31/19. The aggregate market value of the
collateral, including accrued interest, was $255,000,011. |
|
| | 100,000,000 | | | | 0.230 | | | | 03/01/13 | | | | 100,000,000 | |
| Maturity Value: $100,000,639 | |
| Collateralized by Government National Mortgage Association,
2.490% to 6.500%, due 02/20/21 to 02/20/43. The aggregate
market value of the collateral, including accrued interest, was
$102,000,000. |
|
| | 25,000,000 | | | | 0.560 | | | | 03/01/13 | | | | 25,000,000 | |
| Maturity Value: $25,000,389 | |
| Collateralized by Federal National Mortgage Association,
0.000%, due 10/09/19, various asset-backed obligations,
8.351% to 9.411%, due 05/17/13 to 02/25/14 and various
corporate security issuers, 0.908% to 11.875%, due 04/08/13 to
12/31/99. The aggregate market value of the collateral,
including accrued interest, was $27,522,814. |
|
| | 350,000,000 | | | | 0.510 | (a) | | | 03/06/13 | | | | 350,000,000 | |
| Maturity Value: $350,034,708 | |
| Settlement Date: 02/27/13 | |
| Collateralized by an equity security and various corporate security
issuers, 0.000% to 9.000%, due 04/15/13 to 04/01/63. The
aggregate market value of the collateral, including accrued
interest, was $385,000,661. |
|
| | 100,000,000 | | | | 0.230 | (a)(e) | | | 03/07/13 | | | | 100,000,000 | |
| Maturity Value: $100,116,278 | |
| Settlement Date: 09/10/12 | |
| Collateralized by Federal Home Loan Mortgage Corp., 2.500% to
4.500%, due 04/01/26 to 12/01/41, Federal National Mortgage
Association, 3.000% to 7.000%, due 12/01/17 to 11/01/42 and
Government National Mortgage Association, 3.500% to
4.500%, due 03/20/41 to 04/20/41. The aggregate market value
of the collateral, including accrued interest, was $102,000,000. |
|
| | |
| | |
| The accompanying notes are an integral part of these financial statements. | | 21 |
FINANCIAL SQUARE MONEY MARKET FUND
Schedule of Investments (continued)
February 28, 2013 (Unaudited)
| | | | | | | | | | | | | | |
Principal Amount | | | Interest
Rate | | | Maturity
Date | | | Amortized Cost | |
| | | | | | | | | | | | | | |
| | Repurchase Agreements(d) – (continued) | |
| BNP Paribas Securities Corp. (continued) | |
| $ | 100,000,000 | | | | 0.510 | %(a) | | | 03/07/13 | | | $ | 100,000,000 | |
| Maturity Value: $100,009,917 | |
| Collateralized by various corporate security issuers, 0.250% to
8.875%, due 06/30/13 to 10/15/39. The aggregate market value
of the collateral, including accrued interest, was $110,000,612. |
|
| | |
| Credit Agricole Corporate and Investment Bank | |
| | 325,000,000 | | | | 0.190 | (a)(e) | | | 03/01/13 | | | | 325,000,000 | |
| Maturity Value: $325,077,188 | |
| Settlement Date: 01/15/13 | |
| Collateralized by Federal National Mortgage Association, 2.500%
to 5.500%, due 03/01/27 to 08/01/48. The aggregate market
value of the collateral, including accrued interest, was
$334,750,000. |
|
| | 325,000,000 | | | | 0.190 | (a)(b)(e) | | | 03/07/13 | | | | 325,000,000 | |
| Maturity Value: $325,210,979 | |
| | |
| Credit Suisse Securities (USA) LLC | |
| | 400,000,000 | | | | 0.260 | (f) | | | 03/04/13 | | | | 400,000,000 | |
| Maturity Value: $400,320,667 | |
| Settlement Date: 11/13/12 | |
| Collateralized by Federal Home Loan Mortgage Corp., 2.500% to
8.500%, due 05/01/18 to 02/01/43. The aggregate market value
of the collateral, including accrued interest, was $408,003,754. |
|
| | 200,000,000 | | | | 0.652 | (a)(f) | | | 04/03/13 | | | | 200,000,000 | |
| Maturity Value: $201,375,813 | |
| Settlement Date: 03/26/12 | |
| Collateralized by various mortgage-backed obligations, 0.341% to
6.274%, due 11/15/17 to 04/15/47. The aggregate market value
of the collateral, including accrued interest, was $240,004,711. |
|
| | 250,000,000 | | | | 0.240 | | | | 04/08/13 | | | | 250,000,000 | |
| Maturity Value: $250,205,000 | |
| Settlement Date: 12/06/12 | |
| Collateralized by Federal Home Loan Mortgage Corp., 2.500% to
6.000%, due 07/01/18 to 02/01/43. The aggregate market value
of the collateral, including accrued interest, was $255,003,857. |
|
| | 275,000,000 | | | | 0.220 | | | | 04/16/13 | | | | 275,000,000 | |
| Maturity Value: $275,201,667 | |
| Settlement Date: 12/17/12 | |
| Collateralized by Federal Home Loan Mortgage Corp., 2.500% to
8.000%, due 06/01/16 to 02/01/43. The aggregate market value
of the collateral, including accrued interest, was $280,501,721. |
|
| | 220,000,000 | | | | 0.200 | | | | 05/31/13 | | | | 220,000,000 | |
| Maturity Value: $220,129,556 | |
| Settlement Date: 02/14/13 | |
| Collateralized by Federal Home Loan Mortgage Corp., 3.000% to
5.500%, due 07/01/24 to 04/01/48. The aggregate market value
of the collateral, including accrued interest, was $224,405,123. |
|
| | |
| Deutsche Bank Securities, Inc. | |
| | 296,000,000 | | | | 0.280 | | | | 03/01/13 | | | | 296,000,000 | |
| Maturity Value: $296,002,302 | |
| Collateralized by various corporate security issuers, 1.500% to
7.500%, due 03/29/13 to 06/01/42, various equity securities and
various Exchange-Traded Funds. The aggregate market value
of the collateral, including accrued interest, was $321,991,510. |
|
| | |
| | | | | | | | | | | | | | |
| | Repurchase Agreements(d) – (continued) | |
| Deutsche Bank Securities, Inc. (continued) | |
| $ | 97,000,000 | | | | 0.510 | % | | | 03/01/13 | | | $ | 97,000,000 | |
| Maturity Value: $97,001,374 | |
| Collateralized by various corporate security issuers, 1.500% to
5.000%, due 03/29/13 to 06/01/42 and an Exchange-Traded
Fund. The aggregate market value of the collateral, including
accrued interest, was $107,438,974. |
|
| | 212,000,000 | | | | 0.240 | (f) | | | 03/18/13 | | | | 212,000,000 | |
| Maturity Value: $212,168,187 | |
| Settlement Date: 11/19/12 | |
| Collateralized by Federal Home Loan Mortgage Corp., 3.500% to
8.000%, due 12/01/19 to 05/01/42, Federal National Mortgage
Association, 2.500% to 11.000%, due 04/01/13 to 01/01/43 and
Government National Mortgage Association, 4.000% to
5.000%, due 06/15/39 to 10/20/42. The aggregate market value
of the collateral, including accrued interest, was $218,442,274. |
|
| | 275,000,000 | | | | 0.250 | (f) | | | 04/03/13 | | | | 275,000,000 | |
| Maturity Value: $275,231,076 | |
| Settlement Date: 12/03/12 | |
| Collateralized by Federal Home Loan Mortgage Corp., 4.000%,
due 01/01/26 to 07/01/42, Federal National Mortgage
Association, 3.000% to 7.000%, due 07/01/24 to 10/01/42 and
Government National Mortgage Association, 3.000% to
7.000%, due 04/15/18 to 01/20/43. The aggregate market value
of the collateral, including accrued interest, was $283,881,963. |
|
| | |
| ING Financial Markets LLC | |
| | 270,000,000 | | | | 0.280 | | | | 03/01/13 | | | | 270,000,000 | |
| Maturity Value: $270,002,100 | |
| Collateralized by various corporate security issuers, 0.675% to
9.875%, due 04/05/13 to 11/15/67. The aggregate market value
of the collateral, including accrued interest, was $283,505,436. |
|
| | 100,000,000 | | | | 0.190 | (a)(e) | | | 03/07/13 | | | | 100,000,000 | |
| Maturity Value: $100,146,195 | |
| Collateralized by Federal Home Loan Mortgage Corp., 2.000% to
3.500%, due 04/15/32 to 12/15/41. The aggregate market value
of the collateral, including accrued interest, was $104,001,833. |
|
| | 100,000,000 | | | | 0.270 | (a)(e) | | | 03/07/13 | | | | 100,000,000 | |
| Maturity Value: $100,134,250 | |
| Settlement Date: 10/15/12 | |
| Collateralized by a corporate security issuer, 6.650%, due
06/15/67, Federal Home Loan Mortgage Corp., 2.000% to
5.500%, due 06/01/26 to 01/01/43 and Federal National
Mortgage Association, 0.000% to 6.000%, due 11/25/23 to
05/25/45. The aggregate market value of the collateral,
including accrued interest, was $103,533,541. |
|
| | 250,000,000 | | | | 0.280 | (a)(e) | | | 03/07/13 | | | | 250,000,000 | |
| Maturity Value: $250,350,001 | |
| Settlement Date: 11/15/12 | |
| Collateralized by Federal Home Loan Mortgage Corp., 1.201% to
6.000%, due 09/01/26 to 01/01/43 and Federal National
Mortgage Association, 2.374% to 5.500%, due 08/01/27 to
01/01/43. The aggregate market value of the collateral,
including accrued interest, was $258,384,261. |
|
| | |
| Joint Repurchase Agreement Account I | |
| | 150,000,000 | | | | 0.166 | | | | 03/01/13 | | | | 150,000,000 | |
| Maturity Value: $150,000,692 | |
| | |
| | |
| 22 | | The accompanying notes are an integral part of these financial statements. |
FINANCIAL SQUARE MONEY MARKET FUND
| | | | | | | | | | | | | | |
Principal Amount | | | Interest
Rate | | | Maturity
Date | | | Amortized Cost | |
| | | | | | | | | | | | | | |
| | Repurchase Agreements(d) – (continued) | |
| Joint Repurchase Agreement Account III | |
| $ | 1,894,100,000 | | | | 0.184 | % | | | 03/01/13 | | | $ | 1,894,100,000 | |
| Maturity Value: $1,894,109,676 | |
| | |
| JPMorgan Chase Securities LLC | |
| | 75,000,000 | | | | 0.580 | (f) | | | 04/17/13 | | | | 75,000,000 | |
| Maturity Value: $75,108,750 | |
| Settlement Date: 01/17/13 | |
| Collateralized by various mortgage-backed obligations, 0.000% to
8087.816%, due 09/15/29 to 09/25/46. The aggregate market
value of the collateral, including accrued interest, was
$86,250,014. |
|
| | 200,000,000 | | | | 0.600 | (f) | | | 05/22/13 | | | | 200,000,000 | |
| Maturity Value: $200,400,000 | |
| Settlement Date: 01/22/13 | |
| Collateralized by various mortgage-backed obligations, 0.000% to
52.819%, due 08/15/29 to 08/12/48. The aggregate market
value of the collateral, including accrued interest, was
$230,001,632. |
|
| | |
| Merrill Lynch Government Securities, Inc | |
| | 250,000,000 | | | | 0.280 | | | | 03/01/13 | | | | 250,000,000 | |
| Maturity Value: $250,001,944 | |
| Collateralized by various corporate security issuers, 0.750% to
5.750%, due 03/15/13 to 12/15/36, various equity securities and
an Exchange-Traded Fund. The aggregate market value of the
collateral, including accrued interest, was $274,522,980. |
|
| | 500,000,000 | | | | 0.340 | | | | 03/06/13 | | | | 500,000,000 | |
| Maturity Value: $500,033,056 | |
| Settlement Date: 02/27/13 | |
| Collateralized by various corporate security issuers, 1.000% to
5.500%, due 08/01/13 to 04/15/29, various equity securities and
various Exchange-Traded Funds. The aggregate market value
of the collateral, including accrued interest, was $540,694,157. |
|
| | |
| RBC Capital Markets LLC | |
| | 200,000,000 | | | | 0.190 | | | | 03/01/13 | | | | 200,000,000 | |
| Maturity Value: $200,001,056 | |
| Collateralized by Government National Mortgage Association,
3.000%, due 10/20/42. The market value of the collateral,
including accrued interest, was $204,000,001. |
|
| | |
| RBS Securities, Inc. | |
| | 245,000,000 | | | | 0.460 | | | | 03/01/13 | | | | 245,000,000 | |
| Maturity Value: $245,003,131 | |
| Collateralized by Federal National Mortgage Association, 2.330%
to 2.360%, due 12/14/22 to 01/23/23. The aggregate market
value of the collateral, including accrued interest, was
$249,904,695. |
|
| | |
| Societe Generale | |
| | 1,000,000,000 | | | | 0.190 | | | | 03/01/13 | | | | 1,000,000,000 | |
| Maturity Value: $1,000,005,278 | |
| Collateralized by Federal Home Loan Mortgage Corp., 3.000% to
3.500%, due 07/01/26 to 03/01/43 and Federal National
Mortgage Association, 0.750% to 6.500%, due 02/01/16 to
02/01/43. The aggregate market value of the collateral,
including accrued interest, was $1,029,592,201. |
|
| | |
| | | | | | | | | | | | | | |
| | Repurchase Agreements(d) – (continued) | |
| Societe Generale (continued) | |
| $ | 150,000,000 | | | | 0.550 | %(a) | | | 03/06/13 | | | $ | 150,000,000 | |
| Maturity Value: $150,016,042 | |
| Settlement Date: 02/27/13 | |
| Collateralized by various equity securities. The aggregate market
value of the collateral, including accrued interest, was
$164,152,901. |
|
| | |
| UBS Securities LLC | |
| | 25,000,000 | | | | 0.150 | | | | 03/01/13 | | | | 25,000,000 | |
| Maturity Value: $25,000,104 | |
| Collateralized by U.S. Treasury Note, 2.125%, due 12/31/15. The
market value of the collateral, including accrued interest, was
$25,500,013. |
|
| | 175,000,000 | | | | 0.180 | | | | 03/01/13 | | | | 175,000,000 | |
| Maturity Value: $175,000,875 | |
| Collateralized by Federal Home Loan Mortgage Corp., 2.500% to
4.000%, due 07/01/26 to 09/01/27 and Federal National
Mortgage Association, 3.000% to 4.000%, due 02/01/26 to
03/01/42. The aggregate market value of the collateral,
including accrued interest, was $178,500,000. |
|
| | 250,000,000 | | | | 0.480 | (a)(e) | | | 03/07/13 | | | | 250,000,000 | |
| Maturity Value: $250,316,666 | |
| Collateralized by various corporate security issuers, 1.375% to
7.500%, due 06/30/13 to 04/01/42. The aggregate market value
of the collateral, including accrued interest, was $275,001,544. |
|
| | 250,000,000 | | | | 0.600 | (a)(e) | | | 03/07/13 | | | | 250,000,000 | |
| Maturity Value: $250,375,001 | |
| Settlement Date: 12/11/12 | |
| Collateralized by various corporate security issuers, 0.000% to
13.000%, due 05/01/13 to 10/15/42 and various equity
securities. The aggregate market value of the collateral,
including accrued interest, was $275,000,365. |
|
| | |
| Wells Fargo Securities, LLC | |
| | 150,000,000 | | | | 0.190 | | | | 03/01/13 | | | | 150,000,000 | |
| Maturity Value: $150,000,792 | |
| Collateralized by Federal Home Loan Mortgage Corp., 2.500% to
6.999%, due 09/15/27 to 04/15/42, Federal National Mortgage
Association, 3.000% to 6.298%, due 11/25/17 to 05/25/42 and
Government National Mortgage Association, 0.000% to
79.788%, due 08/20/27 to 11/16/52. The aggregate market
value of the collateral, including accrued interest, was
$154,500,002. |
|
| | 100,000,000 | | | | 0.200 | | | | 03/01/13 | | | | 100,000,000 | |
| Maturity Value: $100,000,556 | |
| Collateralized by Federal Home Loan Mortgage Corp., 5.699%,
due 03/15/42, Federal National Mortgage Association, 3.500%
to 6.348%, due 06/25/39 to 03/25/42 and Government National
Mortgage Association, 1.250% to 6.409%, due 01/20/25 to
12/20/42. The aggregate market value of the collateral,
including accrued interest, was $103,000,001. |
|
| | |
| | |
| The accompanying notes are an integral part of these financial statements. | | 23 |
FINANCIAL SQUARE MONEY MARKET FUND
Schedule of Investments (continued)
February 28, 2013 (Unaudited)
| | | | | | | | | | | | | | |
Principal Amount | | | Interest
Rate | | | Maturity
Date | | | Amortized Cost | |
| | | | | | | | | | | | | | |
| | Repurchase Agreements(d) – (continued) | |
| Wells Fargo Securities, LLC (continued) | |
| $ | 200,000,000 | | | | 0.310 | % | | | 03/01/13 | | | $ | 200,000,000 | |
| Maturity Value: $200,001,722 | |
| Collateralized by various asset-backed obligations, 0.462% to
5.790%, due 09/05/16 to 02/25/47, various corporate security
issuers, 1.700% to 11.625%, due 05/01/13 to 02/15/43, various
mortgage-backed obligations, 0.592% to 5.322%, due 10/15/22
to 05/10/63 and a municipal debt obligation, 0.200%, due
05/01/18. The aggregate market value of the collateral,
including accrued interest, was $209,433,020. |
|
| | 300,000,000 | | | | 0.350 | | | | 03/01/13 | | | | 300,000,000 | |
| Maturity Value: $300,020,417 | |
| Settlement Date: 02/22/13 | |
| Collateralized by a municipal debt obligation, 8.024%, due
05/01/46, various asset-backed obligations, 0.000% to 7.100%,
due 08/22/16 to 03/25/49, various corporate security issuers,
0.000% to 10.000%, due 03/15/13 to 12/29/49 and various
mortgage-backed obligations, 0.582% to 6.006%, due 04/10/34
to 12/10/49. The aggregate market value of the collateral,
including accrued interest, was $314,901,825. |
|
| | 300,000,000 | | | | 0.360 | | | | 03/01/13 | | | | 300,000,000 | |
| Maturity Value: $300,003,000 | |
| Collateralized by an asset-backed obligation, 4.704%, due
06/26/17, various corporate security issuers, 0.000% to 7.625%,
due 03/19/13 to 12/15/42 and various mortgage-backed
obligations, 4.597% to 6.006%, due 11/25/35 to 12/10/49. The
aggregate market value of the collateral, including accrued
interest, was $312,904,064. |
|
| | |
| | TOTAL REPURCHASE AGREEMENTS | | | $ | 11,033,100,000 | |
| | |
| | TOTAL INVESTMENTS – 101.4% | | | $ | 28,374,742,649 | |
| | |
| LIABILITIES IN EXCESS OF
OTHER ASSETS – (1.4)% |
| | | (401,224,044 | ) |
| | |
| | NET ASSETS – 100.0% | | | $ | 27,973,518,605 | |
| | |
| | |
| The percentage shown for each investment category reflects the value of investments in that category as a percentage of net assets. |
(a) | | Variable or floating rate security. Interest rate disclosed is that which is in effect at February 28, 2013. |
(b) | | All or a portion represents a forward commitment. Forward settling repurchase agreements will be collateralized at settlement. |
(c) | | Security not registered under the Securities Act of 1933, as amended. Such securities have been determined to be liquid by the Investment Adviser. At February 28, 2013, these securities amounted to $789,154,701 or approximately 2.8% of net assets. |
(d) | | Unless noted, all repurchase agreements were entered into on February 28, 2013. Additional information on Joint Repurchase Agreement Account I & III appears on pages 53-55. |
(e) | | The instrument is subject to a demand feature. |
(f) | | Security has been determined to be illiquid by the Investment Adviser. At February 28, 2013, these securities amounted to $1,362,000,000 or approximately 4.9% of net assets. |
Interest rates represent either the stated coupon rate, annualized yield on date of purchase for discounted securities, or, for floating rate securities, the current reset rate, which is based upon current interest rate indices.
Maturity dates represent either the final legal maturity date on the security, the demand date for puttable securities, or the prerefunded date for those types of securities.
| | |
|
Investment Abbreviations: |
AMBAC | | — Insured by American Municipal Bond Assurance Corp. |
FGIC | | — Insured by Financial Guaranty Insurance Co. |
GO | | — General Obligation |
GTY AGMT | | — Guaranty Agreement |
LIQ | | — Liquidity Agreement |
LOC | | — Letter of Credit |
NATL-RE | | — National Reinsurance Corp. |
RB | | — Revenue Bond |
SPA | | — Stand-by Purchase Agreement |
SPEARS | | — Short Puttable Exempt Adjustable Receipts |
VRDN | | — Variable Rate Demand Notes |
|
| | |
| 24 | | The accompanying notes are an integral part of these financial statements. |
FINANCIAL SQUARE PRIME OBLIGATIONS FUND
Schedule of Investments
February 28, 2013 (Unaudited)
| | | | | | | | | | | | | | |
Principal
Amount | | | Interest
Rate | | | Maturity
Date | | | Amortized
Cost | |
| | | | | | | | | | | | | | |
| | Commercial Paper and Corporate Obligations – 21.8% | |
| Aspen Funding Corp. | |
| $ | 150,000,000 | | | | 0.260 | % | | | 05/09/13 | | | $ | 149,925,250 | |
| | 50,000,000 | | | | 0.260 | | | | 05/29/13 | | | | 49,967,861 | |
| Atlantic Asset Securitization LLC | |
| | 85,000,000 | | | | 0.220 | | | | 03/19/13 | | | | 84,990,650 | |
| | 100,000,000 | | | | 0.250 | | | | 03/25/13 | | | | 99,983,333 | |
| | 150,000,000 | | | | 0.430 | (a) | | | 04/04/13 | | | | 150,000,000 | |
| Atlantis One Funding Corp. | |
| | 300,000,000 | | | | 0.200 | | | | 03/01/13 | | | | 300,000,000 | |
| | 30,000,000 | | | | 0.210 | | | | 03/18/13 | | | | 29,997,025 | |
| | 300,000,000 | | | | 0.472 | | | | 06/17/13 | | | | 299,577,000 | |
| | 195,500,000 | | | | 0.401 | | | | 07/25/13 | | | | 195,182,855 | |
| Chariot Funding LLC | |
| | 50,000,000 | | | | 0.321 | | | | 06/03/13 | | | | 49,958,222 | |
| | 50,000,000 | | | | 0.321 | | | | 06/06/13 | | | | 49,956,889 | |
| | 25,000,000 | | | | 0.321 | | | | 06/10/13 | | | | 24,977,556 | |
| | 45,000,000 | | | | 0.321 | | | | 06/11/13 | | | | 44,959,200 | |
| | 50,000,000 | | | | 0.321 | | | | 06/12/13 | | | | 49,954,222 | |
| | 50,000,000 | | | | 0.321 | | | | 06/13/13 | | | | 49,953,778 | |
| | 50,000,000 | | | | 0.270 | | | | 08/08/13 | | | | 49,940,000 | |
| Gemini Securitization Corp. LLC | |
| | 325,000,000 | | | | 0.270 | | | | 04/08/13 | | | | 324,907,375 | |
| | 250,000,000 | | | | 0.250 | | | | 05/06/13 | | | | 249,885,417 | |
| Hannover Funding Co. LLC | |
| | 100,000,000 | | | | 0.270 | | | | 04/16/13 | | | | 99,965,500 | |
| | 100,000,000 | | | | 0.280 | | | | 04/22/13 | | | | 99,959,555 | |
| Jupiter Securitization Co. LLC | |
| | 50,000,000 | | | | 0.200 | | | | 04/22/13 | | | | 49,985,556 | |
| | 25,000,000 | | | | 0.321 | | | | 05/09/13 | | | | 24,984,667 | |
| | 150,000,000 | | | | 0.321 | | | | 06/05/13 | | | | 149,872,000 | |
| | 50,000,000 | | | | 0.321 | | | | 06/06/13 | | | | 49,956,889 | |
| | 100,000,000 | | | | 0.321 | | | | 06/13/13 | | | | 99,907,555 | |
| | 100,000,000 | | | | 0.300 | | | | 07/08/13 | | | | 99,892,500 | |
| | 50,000,000 | | | | 0.270 | | | | 08/28/13 | | | | 49,932,500 | |
| Kells Funding LLC | |
| | 60,000,000 | | | | 0.321 | | | | 08/13/13 | | | | 59,912,000 | |
| | 100,000,000 | | | | 0.260 | (b) | | | 08/28/13 | | | | 99,870,000 | |
| LMA Americas LLC | |
| | 100,000,000 | | | | 0.230 | | | | 03/07/13 | | | | 99,996,167 | |
| | 100,000,000 | | | | 0.220 | | | | 03/18/13 | | | | 99,989,611 | |
| Newport Funding Corp. | |
| | 125,096,000 | | | | 0.260 | | | | 05/14/13 | | | | 125,029,143 | |
| | 50,000,000 | | | | 0.260 | | | | 05/29/13 | | | | 49,967,861 | |
| Regency Markets No. 1 LLC | |
| | 72,654,000 | | | | 0.190 | | | | 03/13/13 | | | | 72,649,399 | |
| | 100,000,000 | | | | 0.190 | | | | 03/20/13 | | | | 99,989,972 | |
| Royal Park Investments Funding Corp. | |
| | 35,000,000 | | | | 0.451 | | | | 04/09/13 | | | | 34,982,938 | |
| | 121,000,000 | | | | 0.400 | | | | 04/10/13 | | | | 120,946,222 | |
| | 77,338,000 | | | | 1.005 | | | | 04/17/13 | | | | 77,237,031 | |
| | 50,000,000 | | | | 0.350 | | | | 04/24/13 | | | | 49,973,750 | |
| | 122,000,000 | | | | 0.320 | | | | 05/03/13 | | | | 121,931,680 | |
| Versailles Commercial Paper LLC | |
| | 155,000,000 | | | | 0.220 | | | | 03/19/13 | | | | 154,982,950 | |
| | |
| TOTAL COMMERCIAL PAPER AND
CORPORATE OBLIGATIONS |
| | $ | 4,246,032,079 | |
| | |
| | | | | | | | | | | | | | |
| | Time Deposit – 2.0% | |
| Citibank, N.A. | |
| $ | 387,000,000 | | | | 0.160 | % | | | 03/01/13 | | | $ | 387,000,000 | |
| | |
| | | | | | | | | | | | | | |
| | U.S. Government Agency Obligations – 17.2% | |
| Federal Home Loan Bank | |
| $ | 35,800,000 | | | | 0.125 | % | | | 03/01/13 | | | $ | 35,800,000 | |
| | 44,200,000 | | | | 0.290 | | | | 03/01/13 | | | | 44,200,000 | |
| | 47,200,000 | | | | 1.625 | | | | 03/20/13 | | | | 47,234,160 | |
| | 120,000,000 | | | | 0.230 | | | | 05/29/13 | | | | 119,993,191 | |
| | 74,500,000 | | | | 0.240 | | | | 06/06/13 | | | | 74,497,367 | |
| | 12,300,000 | | | | 1.625 | | | | 06/14/13 | | | | 12,348,024 | |
| | 63,500,000 | | | | 0.420 | | | | 06/21/13 | | | | 63,532,295 | |
| | 22,900,000 | | | | 1.875 | | | | 06/21/13 | | | | 23,013,454 | |
| | 85,300,000 | | | | 0.240 | | | | 06/28/13 | | | | 85,295,657 | |
| | 50,850,000 | | | | 0.250 | | | | 07/05/13 | | | | 50,847,638 | |
| | 15,000,000 | | | | 0.139 | (a) | | | 07/08/13 | | | | 14,997,315 | |
| | 36,040,000 | | | | 0.350 | | | | 07/09/13 | | | | 36,051,082 | |
| | 29,000,000 | | | | 0.141 | (a) | | | 07/15/13 | | | | 28,994,527 | |
| | 34,500,000 | | | | 0.250 | | | | 07/19/13 | | | | 34,499,603 | |
| | 85,000,000 | | | | 0.280 | | | | 08/13/13 | | | | 85,006,185 | |
| | 11,000,000 | | | | 0.250 | | | | 09/06/13 | | | | 11,001,812 | |
| | 7,530,000 | | | | 4.000 | | | | 09/06/13 | | | | 7,677,093 | |
| | 1,500,000 | | | | 2.625 | | | | 09/13/13 | | | | 1,519,344 | |
| | 5,370,000 | | | | 4.500 | | | | 09/16/13 | | | | 5,495,102 | |
| | 10,820,000 | | | | 0.125 | | | | 09/24/13 | | | | 10,814,305 | |
| | 6,750,000 | | | | 0.125 | | | | 09/25/13 | | | | 6,746,230 | |
| | 300,000,000 | | | | 0.173 | (a) | | | 09/27/13 | | | | 300,000,000 | |
| | 29,400,000 | | | | 0.210 | | | | 10/01/13 | | | | 29,397,775 | |
| | 22,200,000 | | | | 0.210 | | | | 10/10/13 | | | | 22,199,278 | |
| | 87,300,000 | | | | 0.200 | | | | 10/18/13 | | | | 87,292,909 | |
| | 7,250,000 | | | | 0.300 | | | | 10/18/13 | | | | 7,253,770 | |
| | 3,300,000 | | | | 0.375 | | | | 10/18/13 | | | | 3,303,280 | |
| | 10,600,000 | | | | 3.625 | | | | 10/18/13 | | | | 10,827,695 | |
| | 205,000,000 | | | | 0.172 | (a) | | | 06/24/14 | | | | 204,917,697 | |
| | 99,500,000 | | | | 0.181 | (a) | | | 08/15/14 | | | | 99,470,433 | |
| Federal Home Loan Mortgage Corporation | |
| | 500,000,000 | | | | 0.150 | (a) | | | 05/03/13 | | | | 499,965,079 | |
| | 102,000,000 | | | | 0.150 | (a) | | | 06/03/13 | | | | 101,989,381 | |
| | 3,885,000 | | | | 4.000 | | | | 06/12/13 | | | | 3,925,832 | |
| | 60,328,000 | | | | 4.500 | | | | 07/15/13 | | | | 61,280,919 | |
| | 19,500,000 | | | | 0.375 | | | | 10/15/13 | | | | 19,518,403 | |
| | 4,000,000 | | | | 0.500 | | | | 10/15/13 | | | | 4,006,797 | |
| | 14,100,000 | | | | 0.875 | | | | 10/28/13 | | | | 14,160,882 | |
| | 34,355,000 | | | | 0.375 | | | | 10/30/13 | | | | 34,391,514 | |
| Federal National Mortgage Association | |
| | 21,200,000 | | | | 4.375 | | | | 03/15/13 | | | | 21,233,633 | |
| | 199,000,000 | | | | 0.200 | (a) | | | 05/17/13 | | | | 198,987,051 | |
| | 32,878,000 | | | | 0.500 | | | | 08/09/13 | | | | 32,910,616 | |
| | 2,810,000 | | | | 1.125 | | | | 09/17/13 | | | | 2,823,936 | |
| | 1,200,000 | | | | 1.000 | | | | 09/23/13 | | | | 1,205,253 | |
| | 1,300,000 | | | | 1.125 | | | | 09/30/13 | | | | 1,306,870 | |
| | 250,000,000 | | | | 0.160 | (a) | | | 10/03/13 | | | | 249,940,024 | |
| | 4,100,000 | | | | 1.125 | | | | 10/08/13 | | | | 4,122,365 | |
| | 26,994,000 | | | | 4.625 | | | | 10/15/13 | | | | 27,735,333 | |
| | 192,300,000 | | | | 0.160 | | | | 10/25/13 | | | | 192,096,589 | |
| | 200,000,000 | | | | 0.171 | (a) | | | 11/14/13 | | | | 199,957,371 | |
| | |
| | |
| The accompanying notes are an integral part of these financial statements. | | 25 |
FINANCIAL SQUARE PRIME OBLIGATIONS FUND
Schedule of Investments (continued)
February 28, 2013 (Unaudited)
| | | | | | | | | | | | | | |
Principal
Amount | | | Interest
Rate | | | Maturity
Date | | | Amortized
Cost | |
| | | | | | | | | | | | | | |
| | U.S. Government Agency Obligations – (continued) | |
| Overseas Private Investment Corp. (USA) | |
| $ | 41,000,000 | | | | 0.160 | %(a) | | | 03/07/13 | | | $ | 41,000,000 | |
| | 72,000,000 | | | | 0.170 | (a) | | | 03/07/13 | | | | 72,000,000 | |
| | |
| TOTAL U.S. GOVERNMENT
AGENCY OBLIGATIONS |
| | $ | 3,348,785,069 | |
| | |
| | | | | | | | | | | | | | |
| | U.S. Treasury Obligations – 1.5% | |
| United States Treasury Notes | |
| $ | 180,000,000 | | | | 3.375 | % | | | 06/30/13 | | | $ | 181,856,677 | |
| | 42,000,000 | | | | 1.000 | | | | 07/15/13 | | | | 42,116,640 | |
| | 34,400,000 | | | | 0.125 | | | | 09/30/13 | | | | 34,383,644 | |
| | 30,200,000 | | | | 3.125 | | | | 09/30/13 | | | | 30,713,612 | |
| | |
| TOTAL U.S. TREASURY
OBLIGATIONS |
| | $ | 289,070,573 | |
| | |
| | | | | | | | | | | | | | |
| | Variable Rate Municipal Debt Obligations(a) – 5.7% | |
| Akron, Ohio Student Housing Association LLC VRDN RB for Central Campus
Project Series 2012 SGT04 (AGM) (Societe Generale, LIQ)(c) |
|
| $ | 16,930,000 | | | | 0.190 | % | | | 03/01/13 | | | $ | 16,930,000 | |
| Alaska Housing Finance Corp. VRDN RB for Home Mortgage Series 2002 A
RMKT (GO of Corp.) (JPMorgan Chase Bank, SPA) |
|
| | 16,745,000 | | | | 0.160 | | | | 03/01/13 | | | | 16,745,000 | |
| Alaska Housing Finance Corp. VRDN RB Taxable General Series 2012 B | |
| | 24,500,000 | | | | 0.150 | | | | 03/07/13 | | | | 24,500,000 | |
| BlackRock Municipal Income Trust VRDN RB Putters Series 2012-T0008
(JPMorgan Chase Bank N.A., LIQ)(c) |
|
| | 35,500,000 | | | | 0.180 | | | | 03/01/13 | | | | 35,500,000 | |
| BlackRock MuniHoldings Investment Quality Fund VRDN Tax-Exempt Preferred
Series 2011 W-7-2746 (Bank of America N.A., LIQ)(c) |
|
| | 42,200,000 | | | | 0.324 | | | | 03/07/13 | | | | 42,200,000 | |
| BlackRock MuniVest Fund, Inc. VRDN RB Putters Series 2012-T0007
(JPMorgan Chase Bank N.A., LIQ) |
|
| | 30,000,000 | | | | 0.180 | | | | 03/01/13 | | | | 30,000,000 | |
| BlackRock MuniYield Fund, Inc. VRDN Tax-Exempt Preferred Series 2011
W-7-2514 (Bank of America N.A., LIQ)(c) |
|
| | 37,700,000 | | | | 0.324 | | | | 03/07/13 | | | | 37,700,000 | |
| City of Portland, Maine GO VRDN for Taxable Pension Series 2001
(JPMorgan Chase Bank N.A., SPA) |
|
| | 42,100,000 | | | | 0.240 | | | | 03/07/13 | | | | 42,100,000 | |
| Colorado Springs Utilities VRDN RB for Subordinated Lien Series 2000 A (MBIA)
(Bayerische Landesbank, SPA) |
|
| | 93,700,000 | | | | 0.170 | | | | 03/07/13 | | | | 93,700,000 | |
| Connecticut Housing Finance Authority VRDN RB Series 2012 D Subseries D-3
(Bank of Tokyo Mitsubishi UFJ, SPA) |
|
| | 38,300,000 | | | | 0.140 | | | | 03/07/13 | | | | 38,300,000 | |
| Connecticut State Housing Finance Authority VRDN RB Taxable Housing
Mortgage Finance Program Series 2008 E (GO of Authority)
(Bank of America N.A., SPA) |
|
| | 75,000,000 | | | | 0.150 | | | | 03/07/13 | | | | 75,000,000 | |
| Connecticut State Housing Finance Authority VRDN RB Taxable Housing
Mortgage Finance Program Series 2011 Subseries A-2
(Bank of America N.A., SPA) |
|
| | 20,400,000 | | | | 0.220 | | | | 03/07/13 | | | | 20,400,000 | |
| | |
| | | | | | | | | | | | | | |
| | Variable Rate Municipal Debt Obligations(a) – (continued) | |
| Cook County GO VRDN Series 2002 B (Bank of NY Mellon, SPA) | |
| $ | 44,900,000 | | | | 0.110 | % | | | 03/07/13 | | | $ | 44,900,000 | |
| County of Oakland, Michigan GO TANS Series 2012 | |
| | 25,000,000 | | | | 0.352 | | | | 04/01/13 | | | | 25,000,000 | |
| Denver City & County VRDN RB SPEARS Series 2012-DBE-1129X
(GTY AGMT- Deutsche Bank A.G.) (Deutsche Bank A.G., LIQ)(c) |
|
| | 20,000,000 | | | | 0.180 | | | | 03/07/13 | | | | 20,000,000 | |
| Glendale VRDN COPS for Police Building Project Series 2000
(Morgan Guaranty Trust, SPA) |
|
| | 22,200,000 | | | | 0.140 | | | | 03/07/13 | | | | 22,200,000 | |
| Hawaii Department of Budget & Finance VRDN RB P-Floats Series 2012-MT-828
(AMBAC) (Bank of America N.A., LIQ)(c) |
|
| | 26,900,000 | | | | 0.340 | | | | 03/07/13 | | | | 26,900,000 | |
| Kentucky Municipal Power Agency VRDN RB Floaters Series 2010 B002
(Assured GTY) (Morgan Stanley Bank, LIQ)(c) |
|
| | 20,000,000 | | | | 0.450 | | | | 03/07/13 | | | | 20,000,000 | |
| Maryland Industrial Development Financing Authority Port Facilities VRDN RB
Refunding for Occidental Petroleum Corp. Series 2010 |
|
| | 30,200,000 | | | | 0.130 | | | | 03/07/13 | | | | 30,200,000 | |
| Massachusetts Bay Transportation Authority VRDN RB for General
Transportation System Series 2000 A2 RMKT
(GO of Authority) (Bank of America N.A., SPA) |
|
| | 53,335,000 | | | | 0.190 | | | | 03/07/13 | | | | 53,335,000 | |
| Metropolitan Washington D.C. Airports Authority VRDN RB Putters
Series 2007-1691 (FGIC) (Deutsche Bank A.G., LIQ) |
|
| | 12,280,000 | | | | 0.170 | | | | 03/07/13 | | | | 12,280,000 | |
| Nassau County, New York Interim Finance Authority VRDN RB Series 2008 D-2
(JPMorgan Chase Bank N.A., SPA) |
|
| | 26,215,000 | | | | 0.120 | | | | 03/07/13 | | | | 26,215,000 | |
| New Hampshire Turnpike System VRDN RB SPEARS Series 2012-DBE-1137X
(GTY AGMT-Deutsche Bank A.G.) (Deutsche Bank A.G., LIQ)(c) |
|
| | 14,400,000 | | | | 0.180 | | | | 03/07/13 | | | | 14,400,000 | |
| New York City GO VRDN Series 2002 Subseries C-2
(Bayerische Landesbank, LOC) |
|
| | 63,005,000 | | | | 0.140 | | | | 03/07/13 | | | | 63,005,000 | |
| New York City Transitional Finance Authority VRDN RB for Future Tax Secured
Series 1999 Subseries B-3 (JPMorgan Chase Bank N.A., SPA) |
|
| | 390,000 | | | | 0.110 | | | | 03/07/13 | | | | 390,000 | |
| New York State Dormitory Authority VRDN RB for Mental Health Services
Facilities SPEARS Series 2011 DB-1022X (AGM State Appropriations)
(Deutsche Bank A.G., LIQ)(c) |
|
| | 7,835,000 | | | | 0.150 | | | | 03/07/13 | | | | 7,835,000 | |
| New York State Local Government Assistance Corp. VRDN RB Refunding
Subordinate Lien Series 2003-4V RMKT (GO of Corp.)
(Bank of America N.A., SPA) |
|
| | 31,960,000 | | | | 0.170 | | | | 03/07/13 | | | | 31,960,000 | |
| Nuveen Municipal Market Opportunity Fund, Inc. VRDN Tax-Exempt Preferred
Series 2010-1 (Deutsche Bank A.G., LIQ)(c) |
|
| | 27,000,000 | | | | 0.250 | | | | 03/07/13 | | | | 27,000,000 | |
| Oglethorpe, Georgia Power Corp. VRDN RB Putters Series 2012 SGT05
(NATL-RE) (FGIC) (Societe Generale, LIQ)(c) |
|
| | 26,200,000 | | | | 0.240 | | | | 03/01/13 | | | | 26,200,000 | |
| Omaha Parking Facilities Corp. VRDN RB Putters Series 2013 SGT06
(Societe Generale, LIQ)(c) |
|
| | 18,500,000 | | | | 0.240 | | | | 03/01/13 | | | | 18,500,000 | |
| | |
| | |
| 26 | | The accompanying notes are an integral part of these financial statements. |
FINANCIAL SQUARE PRIME OBLIGATIONS FUND
| | | | | | | | | | | | | | |
Principal
Amount | | | Interest
Rate | | | Maturity
Date | | | Amortized
Cost | |
| | | | | | | | | | | | | | |
| | Variable Rate Municipal Debt Obligations(a) – (continued) | |
| Port Authority of New York & New Jersey VRDN RB ROCS RR-II R-11589
Series 2008 (FGIC GO of Authority) (Citibank N.A., LIQ)(c) |
|
| $ | 18,165,000 | | | | 0.160 | % | | | 03/07/13 | | | $ | 18,165,000 | |
| Port Authority of New York & New Jersey VRDN RB Series 2008-DB-636
(CIFG GO of Authority) (Deutsche Bank A.G., LIQ) |
|
| | 8,700,000 | | | | 0.180 | | | | 03/07/13 | | | | 8,700,000 | |
| Port Authority of New York & New Jersey VRDN RB SPEARS Series 2011
DB-1023X (Go of Authority) (Deutsche Bank A.G., LIQ)(c) |
|
| | 7,085,000 | | | | 0.150 | | | | 03/07/13 | | | | 7,085,000 | |
| Port Authority of New York & New Jersey VRDN RB SPEARS Series 2011
DB-1024X (Go of Authority) (Deutsche Bank A.G., LIQ)(c) |
|
| | 10,660,000 | | | | 0.150 | | | | 03/07/13 | | | | 10,660,000 | |
| Port of Corpus Christi Authority of Nueces County VRDN RB for Flint Hills
Resources Series 2002 A (GTY AGMT-Flint Hill Resources) |
|
| | 6,900,000 | | | | 0.120 | | | | 03/07/13 | | | | 6,900,000 | |
| Port of Oakland, California VRDN RB SPEARS Series 2012-DBE-1136X
(GTY AGMT-Deutsche Bank A.G.) (Deutsche Bank A.G., LIQ)(c) |
|
| | 23,195,000 | | | | 0.180 | | | | 03/07/13 | | | | 23,195,000 | |
| Port of Port Arthur Navigation District Environmental Facilities VRDN RB for
Motiva Enterprises LLC Series 2010 Subseries D |
|
| | 29,300,000 | | | | 0.110 | | | | 03/01/13 | | | | 29,300,000 | |
| Texas State GO VRDN Refunding for Taxable Veterans Land Series 2006 C
(JPMorgan Chase Bank N.A., SPA) |
|
| | 15,525,000 | | | | 0.170 | | | | 03/07/13 | | | | 15,525,000 | |
| Texas State GO VRDN Refunding Series 2010 D RMKT
(Bank of Tokyo Mitsubishi UFJ, SPA) |
|
| | 12,630,000 | | | | 0.170 | | | | 03/07/13 | | | | 12,630,000 | |
| Texas State GO VRDN Refunding Taxable Series 2010 E
(Sumitomo Mitsui Banking Corp., LIQ) |
|
| | 23,000,000 | | | | 0.190 | | | | 03/07/13 | | | | 23,000,000 | |
| Texas State VRDN RB Refunding for Taxable Veterans Land Series 2005 RMKT
(JPMorgan Chase Bank N.A., SPA) |
|
| | 12,450,000 | | | | 0.170 | | | | 03/07/13 | | | | 12,450,000 | |
| | |
| TOTAL VARIABLE RATE MUNICIPAL
DEBT OBLIGATIONS |
| | $ | 1,111,005,000 | |
| | |
| | | | | | | | | | | | | | |
| | Variable Rate Obligations(a) – 8.7% | |
| JPMorgan Chase Bank N.A. | |
| $ | 255,000,000 | | | | 0.373 | % | | | 06/18/13 | | | $ | 255,000,000 | |
| | 300,000,000 | | | | 0.402 | | | | 06/21/13 | | | | 300,000,000 | |
| Metropolitan Life Global Funding I | |
| | 250,000,000 | | | | 0.475 | (c) | | | 08/09/13 | | | | 250,000,000 | |
| Providence Health & Services (U.S. Bank N.A.) | |
| | 47,000,000 | | | | 0.200 | | | | 03/07/13 | | | | 47,000,000 | |
| State Street Bank And Trust Co. | |
| | 500,000,000 | | | | 0.358 | | | | 03/18/14 | | | | 500,000,000 | |
| Wells Fargo Bank N.A. | |
| | 125,000,000 | | | | 0.359 | | | | 03/20/14 | | | | 125,000,000 | |
| | 205,000,000 | | | | 0.380 | | | | 03/21/14 | | | | 205,000,000 | |
| | |
| TOTAL VARIABLE RATE
OBLIGATIONS |
| | $ | 1,682,000,000 | |
| | |
| TOTAL INVESTMENTS BEFORE
REPURCHASE AGREEMENTS |
| | $ | 11,063,892,721 | |
| | |
| | | | | | | | | | | | | | |
| | | | | | | | | | | | | | |
| | Repurchase Agreements(d) – 45.0% | |
| ABN Amro Securities (USA) LLC | |
| $ | 1,000,000,000 | | | | 0.200 | % | | | 03/01/13 | | | $ | 1,000,000,000 | |
| Maturity Value: $1,000,005,556 | |
| Collateralized by Federal National Mortgage Association, 3.500%
to 4.500%, due 09/01/27 to 11/01/41 and U.S. Treasury Notes,
0.625% to 4.250%, due 11/15/14 to 08/31/17. The aggregate
market value of the collateral, including accrued interest, was
$1,023,184,941. |
|
| | |
| BNP Paribas Securities Corp. | |
| | 125,000,000 | | | | 0.230 | (a)(e) | | | 03/07/13 | | | | 125,000,000 | |
| Maturity Value: $125,145,348 | |
| Settlement Date: 09/10/12 | |
| Collateralized by Federal National Mortgage Association, 2.500%
to 6.000%, due 12/01/25 to 02/01/43 and Government National
Mortgage Association, 3.000% to 4.500%, due 12/15/19 to
02/15/43. The aggregate market value of the collateral,
including accrued interest, was $127,500,001. |
|
| | |
| Credit Agricole Corporate and Investment Bank | |
| | 270,000,000 | | | | 0.190 | (a)(e) | | | 03/01/13 | | | | 270,000,000 | |
| Maturity Value: $270,064,125 | |
| Settlement Date: 01/15/13 | |
| Collateralized by Federal National Mortgage Association, 3.500%
to 4.000%, due 06/01/42 to 11/01/42. The aggregate market
value of the collateral, including accrued interest, was
$278,100,000. |
|
| | 270,000,000 | | | | 0.190 | (a)(b)(e) | | | 03/07/13 | | | | 270,000,000 | |
| Maturity Value: $270,175,275 | |
| | |
| Credit Suisse Securities (USA) LLC | |
| | 300,000,000 | | | | 0.260 | | | | 03/04/13 | | | | 300,000,000 | |
| Maturity Value: $300,240,500 | |
| Settlement Date: 11/13/12 | |
| Collateralized by Federal Home Loan Mortgage Corp., 2.500% to
6.500%, due 11/01/22 to 02/01/43. The aggregate market value
of the collateral, including accrued interest, was $306,003,228. |
|
| | 200,000,000 | | | | 0.240 | | | | 04/08/13 | | | | 200,000,000 | |
| Maturity Value: $200,164,000 | |
| Settlement Date: 12/06/12 | |
| Collateralized by Federal Home Loan Mortgage Corp., 2.500% to
5.500%, due 06/01/24 to 02/01/43. The aggregate market value
of the collateral, including accrued interest, was $204,003,231. |
|
| | 225,000,000 | | | | 0.220 | | | | 04/16/13 | | | | 225,000,000 | |
| Maturity Value: $225,165,000 | |
| Settlement Date: 12/17/12 | |
| Collateralized by Federal Home Loan Mortgage Corp., 2.500% to
6.000%, due 11/01/20 to 03/01/43. The aggregate market value
of the collateral, including accrued interest, was $229,504,158. |
|
| | 180,000,000 | | | | 0.200 | | | | 05/31/13 | | | | 180,000,000 | |
| Maturity Value: $180,106,000 | |
| Settlement Date: 02/14/13 | |
| Collateralized by Federal Home Loan Mortgage Corp., 2.500% to
4.500%, due 10/01/25 to 11/01/42. The aggregate market value
of the collateral, including accrued interest, was $183,600,155. |
|
| | |
| | |
| The accompanying notes are an integral part of these financial statements. | | 27 |
FINANCIAL SQUARE PRIME OBLIGATIONS FUND
Schedule of Investments (continued)
February 28, 2013 (Unaudited)
| | | | | | | | | | | | | | |
Principal
Amount | | | Interest
Rate | | | Maturity
Date | | | Amortized
Cost | |
| | | | | | | | | | | | | | |
| | Repurchase Agreements(d) – (continued) | |
| Deutsche Bank Securities, Inc. | |
| $ | 50,000,000 | | | | 0.250 | % | | | 03/15/13 | | | $ | 50,000,000 | |
| Maturity Value: $50,042,014 | |
| Settlement Date: 11/14/12 | |
| Collateralized by Federal Home Loan Mortgage Corp., 3.500% to
4.500%, due 11/01/26 to 01/01/42, Federal National Mortgage
Association, 2.500% to 4.500%, due 10/01/27 to 12/01/42 and
Government National Mortgage Association, 3.000% to
7.000%, due 09/15/36 to 10/20/42. The aggregate market value
of the collateral, including accrued interest, was $51,656,339. |
|
| | 180,000,000 | | | | 0.240 | | | | 03/18/13 | | | | 180,000,000 | |
| Maturity Value: $180,142,800 | |
| Settlement Date: 11/19/12 | |
| Collateralized by Federal Home Loan Mortgage Corp., 4.500%,
due 08/01/41, Federal National Mortgage Association, 3.000%
to 7.000%, due 10/01/25 to 02/01/43 and Government National
Mortgage Association, 4.000%, due 01/20/43. The aggregate
market value of the collateral, including accrued interest, was
$185,454,676. |
|
| | 230,000,000 | | | | 0.250 | | | | 04/03/13 | | | | 230,000,000 | |
| Maturity Value: $230,193,264 | |
| Settlement Date: 12/03/12 | |
| Collateralized by Federal Home Loan Mortgage Corp., 3.500% to
6.500%, due 02/01/32 to 08/01/41, Federal National Mortgage
Association, 3.500% to 7.000%, due 10/01/25 to 11/01/42 and
Government National Mortgage Association, 3.000% to
4.000%, due 04/20/27 to 01/20/43. The aggregate market value
of the collateral, including accrued interest, was $237,017,944. |
|
| | 250,000,000 | | | | 0.200 | | | | 05/09/13 | | | | 250,000,000 | |
| Maturity Value: $250,168,056 | |
| Settlement Date: 01/08/13 | |
| Collateralized by Federal Home Loan Mortgage Corp., 4.000%,
due 07/01/42 and Federal National Mortgage Association,
3.000% to 5.500%, due 06/01/26 to 02/01/43. The aggregate
market value of the collateral, including accrued interest, was
$257,983,489. |
|
| | |
| HSBC Securities (USA), Inc. | |
| | 700,000,000 | | | | 0.190 | | | | 03/01/13 | | | | 700,000,000 | |
| Maturity Value: $700,003,694 | |
| Collateralized by Federal National Mortgage Association, 3.500%
to 6.000%, due 12/01/26 to 02/01/43. The aggregate market
value of the collateral, including accrued interest, was
$714,001,396. |
|
| | |
| ING Financial Markets LLC | |
| | 150,000,000 | | | | 0.190 | (a)(e) | | | 03/07/13 | | | | 150,000,000 | |
| Maturity Value: $150,219,293 | |
| Collateralized by Federal Home Loan Mortgage Corp., 0.551% to
20.396%, due 02/15/18 to 01/15/43, Federal Home Loan
Mortgage Stripped Securities, 6.500% to 7.000%, due 02/01/28
to 07/01/28 and Federal National Mortgage Association
Stripped Securities, 6.500% to 7.500%, due 04/01/23 to
04/01/29. The aggregate market value of the collateral,
including accrued interest, was $156,000,856. |
|
| | |
| | | | | | | | | | | | | | |
| | Repurchase Agreements(d) – (continued) | |
| ING Financial Markets LLC (continued) | |
| $ | 100,000,000 | | | | 0.270 | %(a)(e) | | | 03/07/13 | | | $ | 100,000,000 | |
| Maturity Value: $100,134,250 | |
| Settlement Date: 10/15/12 | |
| Collateralized by Federal Home Loan Mortgage Corp., 0.601% to
6.000%, due 09/01/26 to 01/01/43 and Federal National
Mortgage Association, 2.330% to 5.500%, due 07/01/27 to
01/01/43. The aggregate market value of the collateral,
including accrued interest, was $103,363,486. |
|
| | |
| Joint Repurchase Agreement Account I | |
| | 365,500,000 | | | | 0.166 | | | | 03/01/13 | | | | 365,500,000 | |
| Maturity Value: $365,501,687 | |
| | |
| Joint Repurchase Agreement Account III | |
| | 1,557,400,000 | | | | 0.184 | | | | 03/01/13 | | | | 1,557,400,000 | |
| Maturity Value: $1,557,407,956 | |
| | |
| JPMorgan Chase Securities LLC | |
| | 400,000,000 | | | | 0.200 | (a)(e) | | | 03/01/13 | | | | 400,000,000 | |
| Maturity Value: $400,202,224 | |
| Settlement Date: 12/10/12 | |
| Collateralized by Federal National Mortgage Association, 2.500% to
12.000%, due 02/01/14 to 03/01/52. The aggregate market value
of the collateral, including accrued interest, was $408,001,616. |
|
| | 125,000,000 | | | | 0.580 | (f) | | | 04/17/13 | | | | 125,000,000 | |
| Maturity Value: $125,181,250 | |
| Settlement Date: 01/17/13 | |
| Collateralized by various mortgage-backed obligations, 0.000% to
6.033%, due 06/15/22 to 02/25/47. The aggregate market value
of the collateral, including accrued interest, was $143,751,038. |
|
| | 150,000,000 | | | | 0.600 | (f) | | | 05/22/13 | | | | 150,000,000 | |
| Maturity Value: $150,300,000 | |
| Settlement Date: 01/22/13 | |
| Collateralized by various mortgage-backed obligations, 0.352% to
7.000%, due 08/25/33 to 05/25/47. The aggregate market value
of the collateral, including accrued interest, was $172,500,042. |
|
| | |
| Merrill Lynch Government Securities, Inc. | |
| | 498,000,000 | | | | 0.340 | | | | 03/06/13 | | | | 498,000,000 | |
| Maturity Value: $498,032,923 | |
| Settlement Date: 02/27/13 | |
| Collateralized by various corporate security issuers, 0.500% to
8.250%, due 03/15/13 to 05/15/41 and various Exchange-
Traded Funds. The aggregate market value of the collateral,
including accrued interest, was $543,857,675. |
|
| | |
| Morgan Stanley & Co. LLC | |
| | 150,000,000 | | | | 0.200 | | | | 03/01/13 | | | | 150,000,000 | |
| Maturity Value: $150,000,833 | |
| Collateralized by Federal National Mortgage Association, 2.500% to
5.000%, due 03/01/27 to 05/01/41. The aggregate market value of
the collateral, including accrued interest, was $153,000,001. |
|
| | |
| RBC Capital Markets LLC | |
| | 500,000,000 | | | | 0.190 | | | | 03/01/13 | | | | 500,000,000 | |
| Maturity Value: $500,002,639 | |
| Collateralized by Federal Home Loan Mortgage Corp., 3.500%, due
09/01/42 and Federal National Mortgage Association, 2.500% to
3.500%, due 08/01/42 to 01/01/43. The aggregate market value of
the collateral, including accrued interest, was $510,000,000. |
|
| | |
| | |
| 28 | | The accompanying notes are an integral part of these financial statements. |
FINANCIAL SQUARE PRIME OBLIGATIONS FUND
| | | | | | | | | | | | | | |
Principal
Amount | | | Interest
Rate | | | Maturity
Date | | | Amortized
Cost | |
| | | | | | | | | | | | | | |
| | Repurchase Agreements(d) – (continued) | |
| TD Securities (USA) LLC | |
| $ | 200,000,000 | | | | 0.190 | % | | | 03/01/13 | | | $ | 200,000,000 | |
| Maturity Value: $200,001,056 | |
| Collateralized by Federal Home Loan Mortgage Corp., 3.000%,
due 02/01/43 and U.S. Treasury Inflation-Indexed Bond,
2.125%, due 02/15/40. The aggregate market value of the
collateral, including accrued interest, was $205,540,337. |
|
| | |
| UBS Securities LLC | |
| | 25,000,000 | | | | 0.150 | | | | 03/01/13 | | | | 25,000,000 | |
| Maturity Value: $25,000,104 | |
| Collateralized by U.S. Treasury Note, 2.125%, due 12/31/15. The
market value of the collateral, including accrued interest, was
$25,500,013. |
|
| | |
| Wells Fargo Securities LLC | |
| | 200,000,000 | | | | 0.310 | | | | 03/01/13 | | | | 200,000,000 | |
| Maturity Value: $200,001,722 | |
| Collateralized by various asset-backed obligations, 0.000% to
14.550%, due 01/15/15 to 11/25/60, various corporate security
issuers, 1.450% to 10.000%, due 12/13/13 to 04/15/37, and
various mortgage-backed obligations, 2.954% to 5.746%, due
11/05/34 to 05/10/63. The aggregate market value of the
collateral, including accrued interest, was $209,788,548. |
|
| | 100,000,000 | | | | 0.350 | | | | 03/01/13 | | | | 100,000,000 | |
| Maturity Value: $100,006,806 | |
| Settlement Date: 02/22/13 | |
| Collateralized by various asset-backed obligations, 0.780% to
1.350%, due 12/15/15 to 04/21/17, a municipal debt obligation,
0.560%, due 01/01/24, various corporate security issuers,
0.850% to 9.000%, due 10/01/13 to 11/01/42, a government
guaranteed note, 0.000%, due 08/15/23 and various mortgage-
backed obligations, 0.906% to 5.750%, due 09/25/22 to
07/25/37. The aggregate market value of the collateral,
including accrued interest, was $104,420,751. |
|
| | 250,000,000 | | | | 0.450 | (f) | | | 05/14/13 | | | | 250,000,000 | |
| Maturity Value: $250,281,250 | |
| Settlement Date: 02/13/13 | |
| Collateralized by various asset-backed obligations, 0.000% to
7.560%, due 07/01/13 to 03/25/49, various corporate security
issuers, 2.250% to 12.000%, due 04/01/13 to 12/31/99, various
government guaranteed notes, 0.000%, due 11/15/13 to
08/15/24 and various mortgage-backed obligations, 0.332% to
7.825%, due 03/25/18 to 11/23/50. The aggregate market value
of the collateral, including accrued interest, was $262,382,861. |
|
| | |
| | TOTAL REPURCHASE AGREEMENTS | | | $ | 8,750,900,000 | |
| | |
| | TOTAL INVESTMENTS – 101.9% | | | $ | 19,814,792,721 | |
| | |
| LIABILITIES IN EXCESS OF OTHER
ASSETS – (1.9)% |
| | | (366,988,932 | ) |
| | |
| | NET ASSETS – 100.0% | | | $ | 19,447,803,789 | |
| | |
| | |
The percentage shown for each investment category reflects the value of investments in that category as a percentage of net assets. |
(a) | | Variable or floating rate security. Interest rate disclosed is that which is in effect at February 28, 2013. |
(b) | | All or a portion represents a forward commitment. Forward settling repurchase agreements will be collateralized at settlement. |
(c) | | Security not registered under the Securities Act of 1933, as amended. Such securities have been determined to be liquid by the Investment Adviser. At February 28, 2013, these securities amounted to $602,270,000 or approximately 3.1% of net assets. |
(d) | | Unless noted, all repurchase agreements were entered into on February 28, 2013. Additional information on Joint Repurchase Agreement Account I and III appears on pages 53-55. |
(e) | | The instrument is subject to a demand feature. |
(f) | | Security has been determined to be illiquid by the Investment Adviser. At February 28, 2013, these securities amounted to $525,000,000 or approximately 2.7% of net assets. |
Interest rates represent either the stated coupon rate, annualized yield on date of purchase for discounted securities, or, for floating rate securities, the current reset rate, which is based upon current interest rate indices.
Maturity dates represent either the final legal maturity date on the security, the demand date for puttable securities, or the prerefunded date for those types of securities.
| | |
|
Investment Abbreviations: |
AGM | | —Insured by Assured Guaranty Municipal Corp. |
AMBAC | | —Insured by American Municipal Bond Assurance Corp. |
COPS | | —Certificates of Participation |
FGIC | | —Insured by Financial Guaranty Insurance Co. |
GO | | —General Obligation |
GTY AGMT | | —Guaranty Agreement |
LIQ | | —Liquidity Agreement |
LOC | | —Letter of Credit |
MBIA | | —Insured by Municipal Bond Investors Assurance |
NATL-RE | | —National Reinsurance Corp. |
RB | | —Revenue Bond |
RMKT | | —Remarketed |
ROCS | | —Reset Option Certificates |
RR | | —Revenue Refunding |
SPA | | —Stand-by Purchase Agreement |
SPEARS | | —Short Puttable Exempt Adjustable Receipts |
TANS | | —Tax Anticipation Notes |
VRDN | | —Variable Rate Demand Notes |
|
| | |
| The accompanying notes are an integral part of these financial statements. | | 29 |
FINANCIAL SQUARE TAX-EXEMPT CALIFORNIA FUND
Schedule of Investments
February 28, 2013 (Unaudited)
| | | | | | | | | | | | | | |
Principal
Amount | | | Interest
Rate | | | Maturity
Date | | | Amortized
Cost | |
| | | | | | | | | | | | | | |
| | Municipal Debt Obligations – 101.2% | |
| | California – 98.4% | |
| Abag Finance Authority For Nonprofit Corporations VRDN RB for Sharp
Healthcare Series 2009-C (Citibank N.A., LOC) |
|
| $ | 300,000 | | | | 0.130 | % | | | 03/07/13 | | | $ | 300,000 | |
| Bay Area Toll Authority California Toll Bridge VRDN RB for San Francisco Bay
Area CR-PT-4708 Series 2011(Bank of America N.A., LIQ)(a) |
|
| | 1,000,000 | | | | 0.110 | | | | 03/07/13 | | | | 1,000,000 | |
| Bay Area Toll Authority California Toll Bridge VRDN RB for San Francisco Bay
Area SPEARS Series 2011-DB-1043 (Deutsche Bank A.G., LIQ)(a) |
|
| | 2,600,000 | | | | 0.130 | | | | 03/07/13 | | | | 2,600,000 | |
| California Educational Facilities Authority VRDN RB for California Institute of
Technology Floater Certificates Series 2009-42C (GO of Institution) (Wells
Fargo & Co., LIQ)(a) |
|
| | 995,000 | | | | 0.100 | | | | 03/07/13 | | | | 995,000 | |
| California Educational Facilities Authority VRDN RB for University of Southern
California Floater Trust Series 2009-11B Reg D (Barclays Bank PLC, LIQ)(a) |
|
| | 2,300,000 | | | | 0.120 | | | | 03/07/13 | | | | 2,300,000 | |
| California Educational Facilities Authority VRDN RB for University of Southern
California Floaters Series 2010-3144 (Morgan Stanley Bank, LIQ)(a) |
|
| | 5,600,000 | | | | 0.080 | | | | 03/01/13 | | | | 5,600,000 | |
| California Educational Facilities Authority VRDN RB for University of Southern
California Putters Series 2009-3424 (JPMorgan Chase Bank N.A., LIQ)(a) |
|
| | 690,000 | | | | 0.120 | | | | 03/07/13 | | | | 690,000 | |
| California Educational Facilities Authority VRDN RB for California Institute of
Technology Series 2006-B (GO of Institution) |
|
| | 1,200,000 | | | | 0.080 | | | | 03/07/13 | | | | 1,200,000 | |
| California Educational Facilities Authority VRDN RB for Claremont McKenna
College Putters Series 2009-3580 (JPMorgan Chase Bank, LIQ)(a) |
|
| | 2,025,000 | | | | 0.120 | | | | 03/07/13 | | | | 2,025,000 | |
| California Educational Facilities Authority VRDN RB Refunding for Stanford
University Series 1993 L |
|
| | 1,650,000 | | | | 0.080 | | | | 03/07/13 | | | | 1,650,000 | |
| California Educational Facilities Authority VRDN RB Refunding for Stanford
University Series 1996 L-4 |
|
| | 1,940,000 | | | | 0.080 | | | | 03/07/13 | | | | 1,940,000 | |
| California Educational Facilities Authority VRDN RB Refunding for Stanford
University Series 1997 L-5 |
|
| | 900,000 | | | | 0.080 | | | | 03/07/13 | | | | 900,000 | |
| California Educational Facilities Authority VRDN RB for University of Southern
California Eagle Series 2007-0064 Class A (Citibank N.A., LIQ) |
|
| | 1,000,000 | | | | 0.120 | | | | 03/07/13 | | | | 1,000,000 | |
| California Educational Facilities Authority VRDN RB for University of Southern
California Putters Series 2008-2953 (JPMorgan Chase Bank, LIQ) |
|
| | 2,300,000 | | | | 0.120 | | | | 03/07/13 | | | | 2,300,000 | |
| California GO VRDN SPEARS Series 2007-DB-457 (AGM) (GTY AGMT-Deutsche
Bank A.G.) (Deutsche Bank A.G., LIQ) |
|
| | 1,725,000 | | | | 0.160 | | | | 03/07/13 | | | | 1,725,000 | |
| California Health Facilities Financing Authority VRDN RB Floater
Series 2012 0-48 (Royal Bank of Canada, LIQ)(a) |
|
| | 4,000,000 | | | | 0.100 | | | | 03/07/13 | | | | 4,000,000 | |
| California Health Facilities Financing Authority VRDN RB Floaters
Series 2007-1858 (GTY AGMT-Wells Fargo & Co.) (Wells Fargo & Co., LIQ) |
|
| | 1,387,000 | | | | 0.110 | | | | 03/07/13 | | | | 1,387,000 | |
| California Health Facilities Financing Authority VRDN RB Adventist Health
System P-Floats Series 2011-PT-4699 (NATL-RE) (GTY AGMT-Bank of America
N.A.) (Bank of America N.A., LIQ)(a) |
|
| | 1,800,000 | | | | 0.280 | | | | 03/07/13 | | | | 1,800,000 | |
| | |
| Principal
Amount |
| |
| Interest
Rate |
| |
| Maturity
Date |
| |
| Amortized
Cost |
|
| | | | | | | | | | | | | | |
| | Municipal Debt Obligations – (continued) | |
| | California – (continued) | |
| California Health Facilities Financing Authority VRDN RB Adventist Health
System WEST Series 2009-B (U.S. Bank N.A., LOC) |
|
| $ | 2,700,000 | | | | 0.070 | % | | | 03/01/13 | | | $ | 2,700,000 | |
| California Health Facilities Financing Authority VRDN RB for Providence Health
Services Putters Series 2010-3630 (JPMorgan Chase Bank, LIQ)(a) |
|
| | 2,440,000 | | | | 0.120 | | | | 03/07/13 | | | | 2,440,000 | |
| California Health Facilities Financing Authority VRDN RB for Sutter Health ROCS
RR-II R-11952 Series 2011 (Citibank N.A., LIQ)(a) |
|
| | 1,500,000 | | | | 0.120 | | | | 03/07/13 | | | | 1,500,000 | |
| California Health Facilities Financing Authority VRDN RB for Dignity Health
SPEARS Series 2012-DBE-1083 (GTY AGMT-Deutsche Bank A.G.) (Deutsche
Bank A.G., LIQ)(a) |
|
| | 900,000 | | | | 0.170 | | | | 03/07/13 | | | | 900,000 | |
| California Health Facilities Financing Authority VRDN RB Refunding for Stanford
Hospital Series 2008-B-1 |
|
| | 5,000,000 | | | | 0.090 | | | | 03/07/13 | | | | 5,000,000 | |
| California Infrastructure & Economic Development Bank VRDN RB Refunding for
J. Paul Getty Series 2007 A-1 RMKT |
|
| | 3,265,000 | | | | 2.500 | | | | 04/01/13 | | | | 3,271,265 | |
| California Municipal Finance Authority VRDN RB for Chevron USA, Inc. Recovery
Zone Series 2010 A (GTY AGMT-Chevron Corp.) |
|
| | 5,050,000 | | | | 0.070 | | | | 03/01/13 | | | | 5,050,000 | |
| California Municipal Finance Authority VRDN RB for Chevron USA, Inc. Recovery
Zone Series 2010 C (GTY AGMT-Chevron Corp.) |
|
| | 750,000 | | | | 0.070 | | | | 03/01/13 | | | | 750,000 | |
| California RANS Series 2012 A-2 | |
| | 3,100,000 | | | | 2.500 | | | | 06/20/13 | | | | 3,121,346 | |
| California School Cash Reserve Program Authority TRANS Series 2012 J | |
| | 1,000,000 | | | | 2.000 | | | | 05/01/13 | | | | 1,002,885 | |
| California School Cash Reserve Program Authority TRANS Series 2013 CC | |
| | 1,000,000 | | | | 2.000 | | | | 12/31/13 | | | | 1,014,733 | |
| California School Cash Reserve Program Authority TRANS Series 2013 W | |
| | 1,000,000 | | | | 2.000 | | | | 01/31/14 | | | | 1,015,756 | |
| California School Cash Reserve Program Authority TRANS Series 2013 Y | |
| | 2,665,000 | | | | 2.000 | | | | 10/01/13 | | | | 2,692,723 | |
| California State Department of Water Resources CP Series 2013-1
(Bank of Montreal) |
|
| | 1,000,000 | | | | 0.160 | | | | 04/03/13 | | | | 1,000,000 | |
| California State Department of Water Resources RB Series 2010 M | |
| | 750,000 | | | | 4.000 | | | | 05/01/13 | | | | 754,713 | |
| | 1,700,000 | | | | 5.000 | | | | 05/01/13 | | | | 1,713,632 | |
| California State Department of Water Resources RB Series 2011 N | |
| | 370,000 | | | | 5.000 | | | | 05/01/13 | | | | 372,945 | |
| California State Department of Water Resources RB Series 2013 AM(b) | |
| | 3,000,000 | | | | 5.000 | | | | 12/01/13 | | | | 3,105,090 | |
| California State Department of Water Resources VRDN RB Putters
Series 2012-4059 (JPMorgan Chase Bank, LIQ)(a) |
|
| | 2,320,000 | | | | 0.110 | | | | 03/01/13 | | | | 2,320,000 | |
| California State University VRDN RB ROCS RR-II R-11568
Series 2008 (BHAC-CR AGM) (Citibank N.A., LIQ) |
|
| | 3,000,000 | | | | 0.160 | | | | 03/07/13 | | | | 3,000,000 | |
| California Statewide Communities Development Authority CP for Kaiser
Permanente Series 2012-08-B |
|
| | 1,500,000 | | | | 0.220 | | | | 07/03/13 | | | | 1,500,000 | |
| | |
| | |
| 30 | | The accompanying notes are an integral part of these financial statements. |
FINANCIAL SQUARE TAX-EXEMPT CALIFORNIA FUND
| | | | | | | | | | | | | | |
Principal
Amount | | | Interest
Rate | | | Maturity
Date | | | Amortized
Cost | |
| | | | | | | | | | | | | | |
| | Municipal Debt Obligations – (continued) | |
| | California – (continued) | |
| California Statewide Communities Development Authority CP for Kaiser
Permanente Series 2012-9B-1 |
|
| $ | 1,000,000 | | | | 0.240 | % | | | 07/01/13 | | | $ | 1,000,000 | |
| | 750,000 | | | | 0.260 | | | | 08/01/13 | | | | 750,000 | |
| California Statewide Communities Development Authority CP for Kaiser
Permanente Series 2012 K |
|
| | 1,000,000 | | | | 0.250 | | | | 08/19/13 | | | | 1,000,000 | |
| California Statewide Communities Development Authority CP for Kaiser
Permanente Series 2013-09-D |
|
| | 2,000,000 | | | | 0.220 | | | | 10/01/13 | | | | 2,000,000 | |
| California Statewide Communities Development Authority VRDN PCRB
Refunding for Chevron USA Inc. Project Series 2002 (GTY
AGMT-Chevron Corp.) |
|
| | 3,700,000 | | | | 0.070 | | | | 03/01/13 | | | | 3,700,000 | |
| California Statewide Communities Development Authority VRDN RB for Health
Facility Community Hospital Monterey Peninsula Series 2011 B (U.S. Bank
N.A., LOC) |
|
| | 7,800,000 | | | | 0.100 | | | | 03/07/13 | | | | 7,800,000 | |
| California Statewide Communities Development Authority VRDN RB for Kaiser
Permanente Series 2004 L |
|
| | 1,900,000 | | | | 0.100 | | | | 03/07/13 | | | | 1,900,000 | |
| California Statewide Communities Development Authority VRDN RB for Sweep
Lane Program Series 2007 A (U.S. Bank N.A., LOC) |
|
| | 2,500,000 | | | | 0.080 | | | | 03/07/13 | | | | 2,500,000 | |
| California University VRDN RB Floater Trust Series 2008 K37W (AGM) (Citibank
N.A., LIQ) |
|
| | 1,475,000 | | | | 0.260 | | | | 03/07/13 | | | | 1,475,000 | |
| Chino Basin Regional Financing Authority VRDN RB Refunding for Inland Empire
Utilities Series 2008 B (Union Bank N.A., LOC) |
|
| | 2,400,000 | | | | 0.100 | | | | 03/07/13 | | | | 2,400,000 | |
| City of Newport Beach VRDN RB Refunding for Hoag memorial Hospital
Series 2008 D (JPMorgan Chase Bank N.A., LOC) |
|
| | 500,000 | | | | 0.100 | | | | 03/07/13 | | | | 500,000 | |
| City of Pasadena VRDN COPS Refunding Series 2008 A (Bank of America
N.A., LOC) |
|
| | 2,000,000 | | | | 0.130 | | | | 03/07/13 | | | | 2,000,000 | |
| Desert Community College District GO VRDN Floaters Series 2009-3016 (AGM)
(Deutsche Bank A.G.)(a) |
|
| | 3,035,000 | | | | 0.170 | | | | 03/07/13 | | | | 3,035,000 | |
| East Bay Municipal Utility District VRDN RB Wastewater System Refunding
Series 2008 A-4 RMKT (Bank of America N.A., SPA) |
|
| | 1,200,000 | | | | 0.120 | | | | 03/07/13 | | | | 1,200,000 | |
| East Bay Municipal Utility District VRDN RB Wastewater System Refunding
Series 2008 C RMKT (Bank of America N.A., SPA) |
|
| | 6,100,000 | | | | 0.120 | | | | 03/07/13 | | | | 6,100,000 | |
| Glendale VRDN COPS for Police Building Project Series 2000 (Morgan Guaranty
Trust, SPA) |
|
| | 7,100,000 | | | | 0.140 | | | | 03/07/13 | | | | 7,100,000 | |
| Harbor Department of the City of Los Angeles CP Series 2013 B-1 (Mizuho Corp.
Bank Ltd., LIQ) |
|
| | 3,000,000 | | | | 0.200 | | | | 03/04/13 | | | | 3,000,000 | |
| Irvine Ranch Water District VRDN Special Assessment Consolidated
Series 2009 B (Bank of America N.A., LOC) |
|
| | 1,700,000 | | | | 0.120 | | | | 03/01/13 | | | | 1,700,000 | |
| | |
| Principal
Amount |
| |
| Interest
Rate |
| |
| Maturity
Date |
| |
| Amortized
Cost |
|
| | | | | | | | | | | | | | |
| | Municipal Debt Obligations – (continued) | |
| | California – (continued) | |
| Irvine Ranch Water District VRDN Special Assessment Series 1995 (Sumitomo
Mitsui Banking Corp., LOC) |
|
| $ | 1,900,000 | | | | 0.090 | % | | | 03/07/13 | | | $ | 1,900,000 | |
| Los Angeles Community College District GO Series 2006 E (AGM) | |
| | 1,600,000 | | | | 5.000 | | | | 08/01/13 | | | | 1,632,050 | |
| Los Angeles Community College District GO VRDN Series 2011-O-4 (Royal Bank
of Canada, LIQ)(a) |
|
| | 2,500,000 | | | | 0.100 | | | | 03/07/13 | | | | 2,500,000 | |
| Los Angeles Community Redevelopment Agency MF Hsg. VRDN RB for
Metropolitan Apartments Series 1985 RMKT (FNMA, LIQ) |
|
| | 5,900,000 | | | | 0.110 | | | | 03/07/13 | | | | 5,900,000 | |
| Los Angeles County Housing Authority MF Hsg. VRDN RB Refunding for Malibu
Meadows II Series 1998 C (FNMA, LIQ) |
|
| | 5,200,000 | | | | 0.090 | | | | 03/07/13 | | | | 5,200,000 | |
| Los Angeles County Housing Authority MF Hsg. VRDN RB Refunding for Malibu
Meadows Project Series 1998 B (FNMA, LIQ) |
|
| | 2,436,000 | | | | 0.090 | | | | 03/07/13 | | | | 2,436,000 | |
| Los Angeles County Metropolitan Transportation Authority Sales Tax RB
Proposition A First Tier Senior Series 2005 A (AMBAC) |
|
| | 460,000 | | | | 5.000 | | | | 07/01/13 | | | | 467,227 | |
| Los Angeles County Schools Pooled Financing Program TRANS Series 2013 C-6 | |
| | 2,000,000 | | | | 2.000 | | | | 12/31/13 | | | | 2,029,125 | |
| Los Angeles County Schools Pooled Financing Program TRANS Series 2012 B-4 | |
| | 500,000 | | | | 2.000 | | | | 10/01/13 | | | | 505,118 | |
| Los Angeles Department of Airports Municipal Trust Receipts VRDN RB for Los
Angeles International Airport Floater Trust Series 2010-27B (Barclays Bank
PLC, LIQ)(a) |
|
| | 1,600,000 | | | | 0.140 | | | | 03/07/13 | | | | 1,600,000 | |
| Los Angeles Department of Airports Municipal Trust Receipts VRDN RB for Los
Angeles International Airport Floater Trust Series 2010-80W (Barclays Bank
PLC, LIQ)(a) |
|
| | 5,245,000 | | | | 0.120 | | | | 03/07/13 | | | | 5,245,000 | |
| Los Angeles Department of Airports VRDN RB Floater Series 2012-0-30 (Royal
Bank of Canada, LIQ)(a) |
|
| | 2,200,000 | | | | 0.100 | | | | 03/07/13 | | | | 2,200,000 | |
| Los Angeles Department of Water & Power RB Series 2011 A | |
| | 3,455,000 | | | | 4.000 | | | | 07/01/13 | | | | 3,498,903 | |
| Los Angeles Department of Water & Power VRDN RB Putters Series 2012-4221
(JPMorgan Chase Bank, LIQ)(a) |
|
| | 2,970,000 | | | | 0.110 | | | | 03/01/13 | | | | 2,970,000 | |
| Los Angeles Department of Water & Power VRDN RB for Power System
Series 2002 Subseries A-5 (Barclays Bank PLC, SPA) |
|
| | 2,000,000 | | | | 0.090 | | | | 03/07/13 | | | | 2,000,000 | |
| Los Angeles Department of Water & Power VRDN RB ROCS RR-II R-12322
Series 2011 (AGM-CR AMBAC) (Citibank N.A.)(a) |
|
| | 3,450,000 | | | | 0.110 | | | | 03/01/13 | | | | 3,450,000 | |
| Metropolitan Water District of Southern California VRDN RB Refunding
Series 2008 A-2 (Barclays Bank PLC, SPA) |
|
| | 15,000 | | | | 0.090 | | | | 03/07/13 | | | | 15,000 | |
| Metropolitan Water District of Southern California VRDN RB Refunding
Series 2011 A-2 |
|
| | 600,000 | | | | 0.260 | | | | 06/01/13 | | | | 600,000 | |
| Metropolitan Water District of Southern California VRDN RB Refunding
Series 2011 A-4 |
|
| | 3,000,000 | | | | 0.260 | | | | 06/01/13 | | | | 3,000,330 | |
| | |
| | |
| The accompanying notes are an integral part of these financial statements. | | 31 |
FINANCIAL SQUARE TAX-EXEMPT CALIFORNIA FUND
Schedule of Investments (continued)
February 28, 2013 (Unaudited)
| | | | | | | | | | | | | | |
| Principal
Amount |
| |
| Interest
Rate |
| |
| Maturity
Date |
| |
| Amortized
Cost |
|
| | | | | | | | | | | | | | |
| | Municipal Debt Obligations – (continued) | |
| | California – (continued) | |
| Orange County Apartment Development VRDN RB Refunding for Park Ridge
Villas Series 1998 (FNMA, LIQ) |
|
| $ | 4,000,000 | | | | 0.100 | % | | | 03/07/13 | | | $ | 4,000,000 | |
| Orange County Apartment Development VRDN RB Refunding for Riverbend
Apartments Series 1999 B (FHLMC, LIQ) |
|
| | 2,600,000 | | | | 0.100 | | | | 03/07/13 | | | | 2,600,000 | |
| Orange County Sanitation District TRANS Series 2012 | |
| | 5,000,000 | | | | 2.000 | | | | 10/30/13 | | | | 5,059,452 | |
| Orange County Sanitation District VRDN COPS Putters Series 2010-3773Z (AGM)
(JPMorgan Chase Bank, LIQ)(a) |
|
| | 2,000,000 | | | | 0.140 | | | | 03/07/13 | | | | 2,000,000 | |
| Orange County Water District VRDN COPS Putters Series 2010-3686Z (JPMorgan
Chase Bank, LIQ)(a) |
|
| | 2,000,000 | | | | 0.120 | | | | 03/07/13 | | | | 2,000,000 | |
| Sacramento County Housing Authority VRDN RB Refunding for River Terrace
Apartments Series 1996 C-RMKT (FNMA, LIQ) |
|
| | 2,550,000 | | | | 0.100 | | | | 03/07/13 | | | | 2,550,000 | |
| Sacramento Suburban Water District VRDN COPS Refunding Series 2009 A
(Sumitomo Mitsui Banking Corp., LOC) |
|
| | 2,000,000 | | | | 0.100 | | | | 03/07/13 | | | | 2,000,000 | |
| San Diego Community College District GO VRDN Floater Series 2011-0-8 (Royal
Bank of Canada, LIQ)(a) |
|
| | 1,000,000 | | | | 0.100 | | | | 03/07/13 | | | | 1,000,000 | |
| San Diego Community College District GO VRDN Putters Series 2009-3415
(JPMorgan Chase Bank N.A., LIQ)(a) |
|
| | 570,000 | | | | 0.120 | | | | 03/07/13 | | | | 570,000 | |
| San Diego County & School District TRANS Series 2012 B-2 (GO of Participants) | |
| | 1,000,000 | | | | 2.000 | | | | 04/30/13 | | | | 1,002,787 | |
| San Diego County Water Authority CP Series 2013-95-1 | |
| | 4,965,000 | | | | 0.170 | | | | 03/01/13 | | | | 4,965,000 | |
| San Diego Unified School District GO TRANS Series 2012 A-2 | |
| | 3,000,000 | | | | 2.000 | | | | 06/28/13 | | | | 3,017,287 | |
| San Diego Unified School District GO VRDN Floater Series 2011-97C (AGM)
(Wells Fargo Bank N.A., LIQ)(a) |
|
| | 800,000 | | | | 0.100 | | | | 03/07/13 | | | | 800,000 | |
| San Francisco City & County Public Utilities Commission Water CP
Series 2013 A-2 (U.S. Bank N.A.) |
|
| | 500,000 | | | | 0.150 | | | | 03/13/13 | | | | 500,000 | |
| San Francisco City & County Public Utilities Commission Water VRDN RB Floater
Certificates Series 2012-63C (Wells Fargo Bank N.A., LIQ)(a) |
|
| | 1,635,000 | | | | 0.100 | | | | 03/07/13 | | | | 1,635,000 | |
| Santa Clara County Financing Authority VRDN RB Refunding for Multiple
Facilities Projects Series 2008 M (Bank of America N.A., LOC) |
|
| | 5,600,000 | | | | 0.120 | | | | 03/07/13 | | | | 5,600,000 | |
| Santa Clara Valley Transportation Authority Sales Tax VRDN RB Refunding
Series 2008 B (Barclays Bank PLC, SPA) |
|
| | 2,200,000 | | | | 0.080 | | | | 03/07/13 | | | | 2,200,000 | |
| Southern California Public Power Authority RB for Milford Corridor
Series 2010-PJ-1 |
|
| | 1,000,000 | | | | 5.000 | | | | 07/01/13 | | | | 1,015,396 | |
| Southern California Public Power Authority VRDN RB for Milford Wind Corridor
Phase II Project SPEARS Series 2012-DB-1048 (Deutsche Bank A.G., LIQ) |
|
| | 1,000,000 | | | | 0.130 | | | | 03/07/13 | | | | 1,000,000 | |
| Southern California Public Power Authority VRDN RB Refunding for Magnolia
Power Project Series 2009 A-1 (U.S. Bank N.A., LOC) |
|
| | 2,050,000 | | | | 0.090 | | | | 03/07/13 | | | | 2,050,000 | |
| | |
| Principal
Amount |
| |
| Interest
Rate |
| |
| Maturity
Date |
| |
| Amortized
Cost |
|
| | | | | | | | | | | | | | |
| | Municipal Debt Obligations – (continued) | |
| | California – (continued) | |
| State of California GO Series 2004 | |
| $ | 1,000,000 | | | | 5.000 | % | | | 02/01/14 | | | $ | 1,044,053 | |
| State of California GO Refunding Series 2005 | |
| | 1,150,000 | | | | 5.000 | | | | 03/01/14 | | | | 1,204,111 | |
| University of California VRDN RB Putters Series 2008-2649Z (JPMorgan Chase
Bank, LIQ) |
|
| | 2,500,000 | | | | 0.120 | | | | 03/07/13 | | | | 2,500,000 | |
| University of California VRDN RB Putters Series 2012-4040 (AGM) (JPMorgan
Chase Bank, LIQ)(a) |
|
| | 2,000,000 | | | | 0.110 | | | | 03/01/13 | | | | 2,000,000 | |
| University of California VRDN RB Floater Trust Series 2012-12UX (Barclays Bank
PLC, LIQ)(a) |
|
| | 1,000,000 | | | | 0.130 | | | | 03/07/13 | | | | 1,000,000 | |
| University of California VRDN RB ROCS RR-II R-11661 Series 2008 (AGM)
(Citibank N.A., LIQ) |
|
| | 2,000,000 | | | | 0.140 | | | | 03/07/13 | | | | 2,000,000 | |
| University of California VRDN RB ROCS RR-II R-12328 Series 2012 (AGM)
(Citibank N.A., LIQ)(a) |
|
| | 3,500,000 | | | | 0.110 | | | | 03/01/13 | | | | 3,500,000 | |
| Victor Valley Community College District GO VRDN Floater Certificates
Series 2009-34C (Wells Fargo & Co., LIQ)(a) |
|
| | 3,000,000 | | | | 0.100 | | | | 03/07/13 | | | | 3,000,000 | |
| West Basin Municipal Water District VRDN COPS Putters Series 2012-4210
(Assured GTY) (JPMorgan Chase Bank N.A., LIQ)(a) |
|
| | 1,795,000 | | | | 0.120 | | | | 03/07/13 | | | | 1,795,000 | |
| West Basin Municipal Water District VRDN COPS Refunding Series 2008 A-1
(Citibank N.A., SPA) |
|
| | 3,205,000 | | | | 0.170 | | | | 03/07/13 | | | | 3,205,000 | |
| West Basin Municipal Water District VRDN COPS Refunding Series 2008 A-2
(Citibank N.A., SPA) |
|
| | 3,200,000 | | | | 0.170 | | | | 03/07/13 | | | | 3,200,000 | |
| | | | | | | | | | | | | | |
| | | | | | | | | | | | | 243,958,927 | |
| | |
| | Puerto Rico – 2.8% | |
| Puerto Rico Sales Tax Financing Corp. VRDN RB Floater Trust Series 2009-10B
(Barclays Bank PLC, LIQ)(a) |
|
| | 1,000,000 | | | | 0.220 | | | | 03/07/13 | | | | 1,000,000 | |
| Puerto Rico Sales Tax Financing Corp. VRDN RB Floater Trust Series 2010-65W
(Barclays Bank PLC, LIQ)(a) |
|
| | 2,600,000 | | | | 0.220 | | | | 03/07/13 | | | | 2,600,000 | |
| Puerto Rico Sales Tax Financing Corp. VRDN RB ROCS-RR-II R-11764
Series 2009 (Citibank N.A., LIQ)(a) |
|
| | 1,200,000 | | | | 0.140 | | | | 03/07/13 | | | | 1,200,000 | |
| Puerto Rico Sales Tax Financing Corp. VRDN RB SPEARS Series 2011-DB-1041
(Deutsche Bank A.G., LIQ)(a) |
|
| | 2,200,000 | | | | 0.130 | | | | 03/07/13 | | | | 2,200,000 | |
| | | | | | | | | | | | | | |
| | | | | | | | | | | | | 7,000,000 | |
| | |
| | TOTAL INVESTMENTS – 101.2% | | | $ | 250,958,927 | |
| | |
| LIABILITIES IN EXCESS OF
OTHER ASSETS – (1.2)% |
| | | (2,887,337 | ) |
| | |
| | NET ASSETS – 100.0% | | | $ | 248,071,590 | |
| | |
| | |
| 32 | | The accompanying notes are an integral part of these financial statements. |
FINANCIAL SQUARE TAX-EXEMPT CALIFORNIA FUND
| | |
| The percentage shown for each investment category reflects the value of investments in that category as a percentage of net assets. |
(a) | | Security not registered under the Securities Act of 1933, as amended. Such securities have been determined to be liquid by the Investment Adviser. At February 28, 2013, these securities amounted to $75,470,000 or approximately 30.4% of net assets. |
(b) | | All or a portion represents a forward commitment. |
Interest rates represent either the stated coupon rate, or for floating rate securities, the current reset rate, which is based upon current interest rate indices.
Maturity dates represent either the final legal maturity date on the security, the demand date for puttable securities, or the prerefunded date for those types of securities.
| | |
|
Investment Abbreviations: |
AGM | | —Insured by Assured Guaranty Municipal Corp. |
AMBAC | | —Insured by American Municipal Bond Assurance Corp. |
BHAC | | —Berkshire Hathaway Assurance Corp. |
COPS | | —Certificates of Participation |
CP | | —Commercial Paper |
CR | | —Custodial Receipts |
FHLMC | | —Insured by Federal Home Loan Mortgage Corp. |
FNMA | | —Insured by Federal National Mortgage Association |
GO | | —General Obligation |
GTY AGMT | | —Guaranty Agreement |
LIQ | | —Liquidity Agreement |
LOC | | —Letter of Credit |
MF Hsg | | —Multi-Family Housing |
NATL-RE | | —National Reinsurance Corp. |
PCRB | | —Pollution Control Revenue Bond |
RANS | | —Revenue Anticipation Notes |
RB | | —Revenue Bond |
RMKT | | —Remarketed |
ROCS | | —Reset Option Certificates |
RR | | —Revenue Refunding |
SPA | | —Stand-by Purchase Agreement |
SPEARS | | —Short Puttable Exempt Adjustable Receipts |
TRANS | | —Tax Revenue Anticipation Notes |
VRDN | | —Variable Rate Demand Notes |
|
| | |
| The accompanying notes are an integral part of these financial statements. | | 33 |
FINANCIAL SQUARE TAX-EXEMPT NEW YORK FUND
Schedule of Investments
February 28, 2013 (Unaudited)
| | | | | | | | | | | | | | |
Principal Amount | | | Interest
Rate | | | Maturity
Date | | | Amortized
Cost | |
| | | | | | | | | | | | | | |
| | Municipal Debt Obligations – 99.9% | |
| | New York – 98.9% | | | | | |
| Buffalo Municipal Water Finance Authority Water Systems VRDN RB Refunding
Series 2008 (JPMorgan Chase Bank N.A., LOC) |
|
| $ | 7,400,000 | | | | 0.110 | % | | | 03/07/13 | | | $ | 7,400,000 | |
| County of Onondaga, New York Trust for Cultural Resources VRDN RB for
Syracuse University Project Series 2010 A (Wells Fargo Bank N.A., LOC) |
|
| | 3,300,000 | | | | 0.100 | | | | 03/07/13 | | | | 3,300,000 | |
| County of Westchester, New York GO Series 2010 B | |
| | 1,350,000 | | | | 3.000 | | | | 06/01/13 | | | | 1,359,612 | |
| County of Westchester, New York GO Series 2010 C-1 | |
| | 2,255,000 | | | | 5.000 | | | | 06/01/13 | | | | 2,282,341 | |
| Erie County Fiscal Stability Authority RB Sales Tax & State Aid Secured
Series 2010 A |
|
| | 700,000 | | | | 4.000 | | | | 05/15/13 | | | | 705,165 | |
| Erie County IDA School Facility VRDN RB for City School District Buffalo Project
Series 2008-3053X (AGM) (Bank of America N.A., LIQ) |
|
| | 2,200,000 | | | | 0.250 | | | | 03/07/13 | | | | 2,200,000 | |
| Metropolitan Transportation Authority Dedicated Tax Fund VRDN RB
Series 2002 Subseries B-1 RMKT (State Street B&T Co., LOC) |
|
| | 6,400,000 | | | | 0.100 | | | | 03/07/13 | | | | 6,400,000 | |
| Monroe County Industrial Development Corp. VRDN RB Floater Series 2011-98C
(Wells Fargo Bank N.A., LIQ) (GTY AGMT-Wells Fargo Bank N.A.)(a) |
|
| | 1,000,000 | | | | 0.100 | | | | 03/07/13 | | | | 1,000,000 | |
| Nassau County IDA Civic Facility VRDN RB Refunding & Improvement for Cold
Spring Harbor Laboratory Series 1999 RMKT (TD Bank N.A., SPA) |
|
| | 6,760,000 | | | | 0.090 | | | | 03/01/13 | | | | 6,760,000 | |
| Nassau County, New York Interim Finance Authority VRDN RB Series 2008 D-2
(JPMorgan Chase Bank N.A., SPA) |
|
| | 600,000 | | | | 0.120 | | | | 03/07/13 | | | | 600,000 | |
| New York City GO Series 2002 C | |
| | 125,000 | | | | 5.500 | | | | 08/01/13 | | | | 125,000 | |
| New York City GO Series 2003 E | |
| | 500,000 | | | | 5.250 | | | | 08/01/13 | | | | 510,422 | |
| New York City GO Series 2003 G Subseries G-3 | |
| | 2,990,000 | | | | 2.000 | | | | 08/01/13 | | | | 3,012,387 | |
| New York City GO VRDN Series 1993 Subseries B-2 (JPMorgan Chase Bank
N.A., LOC) |
|
| | 500,000 | | | | 0.110 | | | | 03/01/13 | | | | 500,000 | |
| New York City GO VRDN Series 2006 I Subseries I-3 (Bank of America
N.A., LOC) |
|
| | 2,350,000 | | | | 0.130 | | | | 03/01/13 | | | | 2,350,000 | |
| New York City GO VRDN Series 2006 I Subseries I-4 (Bank of New York
Mellon, LOC) |
|
| | 200,000 | | | | 0.100 | | | | 03/07/13 | | | | 200,000 | |
| New York City Health & Hospital Corp. VRDN RB Health System Series 2008 B
(GO of Corp.) (TD Bank N.A., LOC) |
|
| | 3,500,000 | | | | 0.100 | | | | 03/07/13 | | | | 3,500,000 | |
| New York City Health & Hospital Corp. VRDN RB Health System Series 2008 C
(GO of Corp.) (TD Bank N.A., LOC) |
|
| | 3,100,000 | | | | 0.100 | | | | 03/07/13 | | | | 3,100,000 | |
| New York City Health & Hospital Corp. VRDN RB Health System Series 2008 E
(GO of Corp.) (JPMorgan Chase Bank N.A., LOC) |
|
| | 1,960,000 | | | | 0.110 | | | | 03/07/13 | | | | 1,960,000 | |
| New York City Housing Development Corp. MF Hsg VRDN RB Series 2012 M | |
| | 2,200,000 | | | | 0.200 | | | | 10/01/13 | | | | 2,200,000 | |
| | |
| | | | | | | | | | | | | | |
| | Municipal Debt Obligations – (continued) | |
| | New York – (continued) | | | | | |
| New York City Municipal Water Finance Authority Water & Sewer System VRDN
RB Second General Resolution Series 2006 CC-2 (Bank of Nova Scotia, SPA) |
|
| $ | 2,300,000 | | | | 0.100 | % | | | 03/01/13 | | | $ | 2,300,000 | |
| New York City Municipal Water Finance Authority Water & Sewer System VRDN
RB Series 2007 BB-2 (Bank of America N.A., SPA) |
|
| | 4,300,000 | | | | 0.120 | | | | 03/01/13 | | | | 4,300,000 | |
| New York City Municipal Water Finance Authority Water & Sewer System VRDN
RB Series 2012 Subseries B-2 (California Public Employees Retirement
System, SPA) |
|
| | 1,100,000 | | | | 0.100 | | | | 03/01/13 | | | | 1,100,000 | |
| New York City Municipal Water Finance Authority Water & Sewer System VRDN
RB Series 2012 Subseries B-3 (State Street B&T Co., SPA) |
|
| | 1,300,000 | | | | 0.100 | | | | 03/01/13 | | | | 1,300,000 | |
| New York City Transitional Finance Authority Building Aid RB Series 2011
Subseries S-1A (State Aid Withholding) |
|
| | 1,000,000 | | | | 3.000 | | | | 07/15/13 | | | | 1,010,448 | |
| New York City Transitional Finance Authority Future Tax Secured RB
Series 2011 A |
|
| | 1,205,000 | | | | 4.000 | | | | 11/01/13 | | | | 1,235,542 | |
| New York City Transitional Finance Authority Future Tax Secured RB
Series 2011 D |
|
| | 705,000 | | | | 5.000 | | | | 02/01/14 | | | | 735,462 | |
| New York City Transitional Finance Authority Future Tax Secured RB Series 2011
Subseries D-1 |
|
| | 2,000,000 | | | | 3.000 | | | | 11/01/13 | | | | 2,037,156 | |
| New York City Transitional Finance Authority VRDN RB Recovery Series 2002-1
Subseries 1A (Landesbank Hessen-Thueringen Girozentrale, LIQ) |
|
| | 2,240,000 | | | | 0.140 | | | | 03/07/13 | | | | 2,240,000 | |
| New York City Transitional Finance Authority VRDN RB Recovery Series 2002-3
Subseries 3G (Bank of NY Mellon, SPA) |
|
| | 2,700,000 | | | | 0.100 | | | | 03/07/13 | | | | 2,700,000 | |
| New York City Trust for Cultural Resources VRDN RB Austin Trust Certificates for
Museum of Modern Art Series 2008-3316 (Bank of America N.A., LIQ)(a) |
|
| | 6,200,000 | | | | 0.150 | | | | 03/07/13 | | | | 6,200,000 | |
| New York City Trust for Cultural Resources VRDN RB for Metropolitan Museum
of Art Series 2006 A1 RMKT |
|
| | 3,950,000 | | | | 0.100 | | | | 03/07/13 | | | | 3,950,000 | |
| New York City Trust for Cultural Resources VRDN RB for Metropolitan Museum
of Art Series 2006 A2 RMKT |
|
| | 4,600,000 | | | | 0.100 | | | | 03/07/13 | | | | 4,600,000 | |
| New York City Trust for Cultural Resources VRDN RB for Pierpont Morgan
Library Series 2004 (JPMorgan Chase Bank N.A., LOC) |
|
| | 3,035,000 | | | | 0.100 | | | | 03/07/13 | | | | 3,035,000 | |
| New York City Trust for Cultural Resources VRDN RB for The Juilliard School
ROCS-RR-II R-11927 Series 2011 (Citibank N.A., LIQ)(a) |
|
| | 2,400,000 | | | | 0.120 | | | | 03/07/13 | | | | 2,400,000 | |
| New York City Trust for Cultural Resources VRDN RB Refunding for American
Museum of Natural History Series 2008 B1 (U.S. Bank N.A., SPA) |
|
| | 3,000,000 | | | | 0.090 | | | | 03/07/13 | | | | 3,000,000 | |
| New York City Trust for Cultural Resources VRDN RB Refunding for The New
York Botanical Garden Series 2009 A (JPMorgan Chase Bank N.A., LOC) |
|
| | 7,700,000 | | | | 0.110 | | | | 03/07/13 | | | | 7,700,000 | |
| New York State Dormitory Authority Non-State Supported Debt RB for School
District Financing Program Series 2012 F (State Aid Withholding) |
|
| | 1,485,000 | | | | 3.000 | | | | 10/01/13 | | | | 1,508,422 | |
| | |
| | |
| 34 | | The accompanying notes are an integral part of these financial statements. |
FINANCIAL SQUARE TAX-EXEMPT NEW YORK FUND
| | | | | | | | | | | | | | |
Principal Amount | | | Interest
Rate | | | Maturity
Date | | | Amortized
Cost | |
| | | | | | | | | | | | | | |
| | Municipal Debt Obligations – (continued) | |
| | New York – (continued) | | | | | |
| New York State Dormitory Authority Non-State Supported Debt VRDN RB for
Columbia University Series 2009 A |
|
| $ | 3,480,000 | | | | 0.090 | % | | | 03/07/13 | | | $ | 3,480,000 | |
| New York State Dormitory Authority Non-State Supported Debt VRDN RB for
Cornell University Floater Certificates Series 2011-3C (Wells Fargo Bank
N.A., LIQ)(a) |
|
| | 2,600,000 | | | | 0.100 | | | | 03/07/13 | | | | 2,600,000 | |
| New York State Dormitory Authority Non-State Supported Debt VRDN RB for
New York University Putters Series 2008-3233Z (JPMorgan Chase Bank
N.A., LIQ)(a) |
|
| | 1,100,000 | | | | 0.120 | | | | 03/07/13 | | | | 1,100,000 | |
| New York State Dormitory Authority Non-State Supported Debt VRDN RB for
Rockefeller University ROCS-RR-II R-11944 Series 2011 (Citibank N.A., LIQ)(a) |
|
| | 1,000,000 | | | | 0.110 | | | | 03/07/13 | | | | 1,000,000 | |
| New York State Dormitory Authority Non-State Supported Debt VRDN RB for
Rockefeller University Series 2009 B (U.S. Bank N.A., SPA) |
|
| | 6,300,000 | | | | 0.100 | | | | 03/07/13 | | | | 6,300,000 | |
| New York State Dormitory Authority Non-State Supported Debt VRDN RB for
University of Rochester Series 2006 A-1 RMKT (Wells Fargo Bank N.A., LOC) |
|
| | 2,000,000 | | | | 0.100 | | | | 03/07/13 | | | | 2,000,000 | |
| New York State Dormitory Authority Non-State Supported Debt VRDN RB for
Vassar College Floaters Series 2007-1861 (Wells Fargo Bank N.A., LIQ) |
|
| | 5,045,000 | | | | 0.110 | | | | 03/07/13 | | | | 5,045,000 | |
| New York State Dormitory Authority Non-State Supported Debt VRDN RB for
Vassar College Putters Series 2008-3204 (JPMorgan Chase Bank N.A., LIQ)(a) |
|
| | 2,900,000 | | | | 0.120 | | | | 03/07/13 | | | | 2,900,000 | |
| New York State Dormitory Authority State Supported Debt VRDN RB for Cornell
University Series 2004 A RMKT (HSBC Bank USA N.A., SPA) |
|
| | 2,100,000 | | | | 0.110 | | | | 03/07/13 | | | | 2,100,000 | |
| New York State Dormitory Authority State Supported Debt VRDN RB for Cornell
University Series 2004 B RMKT (HSBC Bank USA N.A., SPA) |
|
| | 3,885,000 | | | | 0.110 | | | | 03/07/13 | | | | 3,885,000 | |
| New York State Dormitory Authority State Supported Debt VRDN RB for
New York Public Library Series 1999 A RMKT (TD Bank N.A., LOC) |
|
| | 1,920,000 | | | | 0.100 | | | | 03/07/13 | | | | 1,920,000 | |
| New York State Dormitory Authority State Supported Debt VRDN RB for
New York Public Library Series 1999 B RMKT (TD Bank N.A., LOC) |
|
| | 3,255,000 | | | | 0.100 | | | | 03/07/13 | | | | 3,255,000 | |
| New York State Dormitory Authority State Supported Debt VRDN RB for
University of Rochester Series 2003 B Convertible (HSBC Bank USA
N.A., LOC) |
|
| | 3,395,000 | | | | 0.110 | | | | 03/01/13 | | | | 3,395,000 | |
| New York State Dormitory Authority VRDN RB for Columbia University
Series 2003 B RMKT |
|
| | 4,865,000 | | | | 0.090 | | | | 03/07/13 | | | | 4,865,000 | |
| New York State Dormitory Authority VRDN RB for Memorial Sloan-Kettering
Cancer Center Putters Series 2008-3201 (JPMorgan Chase Bank N.A., LIQ)(a) |
|
| | 1,800,000 | | | | 0.120 | | | | 03/07/13 | | | | 1,800,000 | |
| New York State Dormitory Authority VRDN RB for Memorial Sloan-Kettering
Cancer Center Putters Series 2008-3209 (JPMorgan Chase Bank N.A., LIQ)(a) |
|
| | 3,555,000 | | | | 0.120 | | | | 03/07/13 | | | | 3,555,000 | |
| New York State Housing Finance Agency VRDN RB for 20 River Terrace Housing
Series 2002 A RMKT (FNMA, LIQ) |
|
| | 2,600,000 | | | | 0.110 | | | | 03/07/13 | | | | 2,600,000 | |
| | |
| | | | | | | | | | | | | | |
| | Municipal Debt Obligations – (continued) | |
| | New York – (continued) | | | | | |
| New York State Housing Finance Agency VRDN RB for 600 West 42nd Street
Series 2009 A RMKT (FNMA, LIQ) |
|
| $ | 1,000,000 | | | | 0.100 | % | | | 03/07/13 | | | $ | 1,000,000 | |
| New York State Housing Finance Agency VRDN RB for North End Series 2004 A
RMKT (FNMA, LIQ) |
|
| | 1,800,000 | | | | 0.110 | | | | 03/07/13 | | | | 1,800,000 | |
| New York State Housing Finance Agency VRDN RB for Taconic Housing West
17th Street Series 2009 A (FNMA, LIQ) |
|
| | 3,000,000 | | | | 0.100 | | | | 03/07/13 | | | | 3,000,000 | |
| New York State Liberty Development Corp. VRDN RB for 4 World Trade Center
Project SPEARS Series 2011-DB-1036X (GTY AGMT-Deutsche Bank A.G.)
(Deutsche Bank A.G., LIQ)(a) |
|
| | 7,200,000 | | | | 0.160 | | | | 03/07/13 | | | | 7,200,000 | |
| New York State Local Government Assistance Corp. RB Refunding Senior Lien
Series 2008 A |
|
| | 1,400,000 | | | | 5.000 | | | | 04/01/13 | | | | 1,405,596 | |
| New York State Local Government Assistance Corp. RB Series 2008 C
(GO of Corp.) |
|
| | 1,000,000 | | | | 5.000 | | | | 04/01/13 | | | | 1,004,062 | |
| New York State Local Government Assistance Corp. VRDN RB Austin Trust
Certificates Series 2008-3506 (AGM-CR GO of Corp.) (Bank of America
N.A., LIQ) |
|
| | 2,000,000 | | | | 0.150 | | | | 03/07/13 | | | | 2,000,000 | |
| New York State Power Authority CP Series 2013-1 | |
| | 7,500,000 | | | | 0.140 | | | | 04/09/13 | | | | 7,500,000 | |
| New York State Thruway Authority RB for Second General Highway & Bridge
Trust Fund Series 2010 A |
|
| | 1,750,000 | | | | 5.000 | | | | 04/01/13 | | | | 1,757,090 | |
| New York State Thruway Authority RB for Second General Highway & Bridge
Trust Fund Series 2011 A-2 |
|
| | 1,520,000 | | | | 4.000 | | | | 04/01/13 | | | | 1,524,827 | |
| Northport-East Northport Union Free School District Series 2012 (State
Aid Withholding) |
|
| | 1,500,000 | | | | 2.000 | | | | 06/27/13 | | | | 1,508,444 | |
| Port Authority of New York & New Jersey CP Series 2013-B | |
| | 2,420,000 | | | | 0.150 | | | | 05/14/13 | | | | 2,420,000 | |
| Port Authority of New York & New Jersey VRDN RB Floater Trust
Series 2011-17B (GO of Authority) (Barclays Bank PLC, LIQ)(a) |
|
| | 2,150,000 | | | | 0.120 | | | | 03/07/13 | | | | 2,150,000 | |
| Port Authority of New York & New Jersey VRDN RB ROCS-RR-II R-664
Series 2006 (Citibank N.A., LIQ) |
|
| | 2,130,000 | | | | 0.120 | | | | 03/07/13 | | | | 2,130,000 | |
| Town of Islip, New York GO Refunding Series 2012 | |
| | 1,000,000 | | | | 2.000 | | | | 05/15/13 | | | | 1,003,785 | |
| Triborough Bridge & Tunnel Authority VRDN RB General Series 2002 F
(Helaba, SPA) |
|
| | 2,000,000 | | | | 0.160 | | | | 03/01/13 | | | | 2,000,000 | |
| Triborough Bridge & Tunnel Authority VRDN RB General Series 2005 A-1
RMKT (GO of Authority) (California Public Employees Retirement System,
LOC) |
|
| | 3,100,000 | | | | 0.100 | | | | 03/01/13 | | | | 3,100,000 | |
| | | | | | | | | | | | | | |
| | | | | | | | | | | | | 195,120,761 | |
| | |
| | |
| The accompanying notes are an integral part of these financial statements. | | 35 |
FINANCIAL SQUARE TAX-EXEMPT NEW YORK FUND
Schedule of Investments (continued)
February 28, 2013 (Unaudited)
| | | | | | | | | | | | | | |
Principal Amount | | | Interest
Rate | | | Maturity
Date | | | Amortized
Cost | |
| | | | | | | | | | | | | | |
| | Municipal Debt Obligations – (continued) | |
| | Puerto Rico – 1.0% | | | | | |
| Puerto Rico Sales Tax Financing Corp. VRDN RB Floater Trust Series 2009-10B
(Barclays Bank PLC, LIQ)(a) |
|
| $ | 1,200,000 | | | | 0.220 | % | | | 03/07/13 | | | $ | 1,200,000 | |
| Puerto Rico Sales Tax Financing Corp. VRDN RB ROCS-RR-II R-11764
Series 2009 (Citibank N.A., LIQ)(a) |
|
| | 800,000 | | | | 0.140 | | | | 03/07/13 | | | | 800,000 | |
| | | | | | | | | | | | | | |
| | | | | | | | | | | | | 2,000,000 | |
| | |
| | TOTAL INVESTMENTS – 99.9% | | | $ | 197,120,761 | |
| | |
| OTHER ASSETS IN EXCESS OF
LIABILITIES – 0.1% |
| | | 146,668 | |
| | |
| | NET ASSETS – 100.0% | | | $ | 197,267,429 | |
| | |
| | |
| The percentage shown for each investment category reflects the value of investments in that category as a percentage of net assets. |
(a) | | Security not registered under the Securities Act of 1933, as amended. Such securities have been determined to be liquid by the Investment Adviser. At February 28, 2013, these securities amounted to $33,905,000 or approximately 17.2% of net assets. |
Interest rates represent either the stated coupon rate, or for floating rate securities, the current reset rate, which is based upon current interest rate indices. |
| Maturity dates represent either the final legal maturity date on the security, the demand date for puttable securities, or the prerefunded date for those types of securities. |
| | |
|
Investment Abbreviations: |
AGM | | —Insured by Assured Guaranty Municipal Corp. |
CP | | —Commercial Paper |
CR | | —Custodial Receipts |
FNMA | | —Insured by Federal National Mortgage Association |
GO | | —General Obligation |
GTY AGMT | | —Guaranty Agreement |
IDA | | —Industrial Development Agency |
LIQ | | —Liquidity Agreement |
LOC | | —Letter of Credit |
MF Hsg | | —Multi-Family Housing |
RB | | —Revenue Bond |
RMKT | | —Remarketed |
ROCS | | —Reset Option Certificates |
RR | | —Revenue Refunding |
SPA | | —Stand-by Purchase Agreement |
SPEARS | | —Short Puttable Exempt Adjustable Receipts |
VRDN | | —Variable Rate Demand Notes |
|
| | |
| 36 | | The accompanying notes are an integral part of these financial statements. |
FINANCIAL SQUARE TAX-FREE MONEY MARKET FUND
Schedule of Investments
February 28, 2013 (Unaudited)
| | | | | | | | | | | | | | |
Principal Amount | | | Interest
Rate | | | Maturity
Date | | | Amortized Cost | |
| | | | | | | | | | | |
| Municipal Debt Obligations – 99.5% | |
| | Alabama – 3.3% | |
| Alabama Special Care Facilities Financing Authority VRDN RB Birmingham for
Ascension Health Senior Credit Putters Series 2008-2959 (JPMorgan Chase
Bank N.A., LIQ) |
|
| $ | 6,370,000 | | | | 0.120 | % | | | 03/07/13 | | | $ | 6,370,000 | |
| Alabama Special Care Facilities Financing Authority VRDN RB for Solar Eclipse
Series 2007-0046 (U.S. Bank N.A., LOC) (U.S. Bank N.A., LIQ) |
|
| | 16,550,000 | | | | 0.110 | | | | 03/07/13 | | | | 16,550,000 | |
| Columbia IDB VRDN PCRB Refunding for Alabama Power Co. Project
Series 1996 A |
|
| | 21,000,000 | | | | 0.110 | | | | 03/01/13 | | | | 21,000,000 | |
| Columbia IDB VRDN PCRB Refunding for Alabama Power Co. Project
Series 1999 B |
|
| | 25,000,000 | | | | 0.110 | | | | 03/01/13 | | | | 25,000,000 | |
| East Alabama Health Care Authority VRDN RB Series 2012 B | |
| | 15,000,000 | | | | 0.140 | | | | 03/07/13 | | | | 15,000,000 | |
| Huntsville Health Care Authority CP Series 2013 | |
| | 29,000,000 | | | | 0.140 | | | | 03/01/13 | | | | 29,000,000 | |
| | 20,000,000 | | | | 0.180 | | | | 06/03/13 | | | | 20,000,000 | |
| | 7,500,000 | | | | 0.200 | | | | 06/03/13 | | | | 7,500,000 | |
| | 25,000,000 | | | | 0.200 | | | | 07/01/13 | | | | 25,000,000 | |
| West Jefferson IDB VRDN PCRB Refunding for Alabama Power Co. Project
Series 1998 |
|
| | 37,290,000 | | | | 0.110 | | | | 03/07/13 | | | | 37,290,000 | |
| | | | | | | | | | | | | | |
| | | | | | | | | | | | | 202,710,000 | |
| | |
| | Alaska – 1.9% | |
| Alaska Housing Finance Corp. Home Mortgage VRDN RB Series 2009 A | |
| | 79,530,000 | | | | 0.100 | | | | 03/07/13 | | | | 79,530,000 | |
| Alaska Housing Finance Corp. VRDN RB Governmental Purpose Series 2001 B
RMKT (GO of Corp.) |
|
| | 22,900,000 | | | | 0.110 | | | | 03/07/13 | | | | 22,900,000 | |
| Alaska Industrial Development & Export Authority VRDN RB for Providence
Health Services Floater Series 2012-0-49 (Royal Bank of Canada, LIQ)(a) |
|
| | 3,365,000 | | | | 0.110 | | | | 03/07/13 | | | | 3,365,000 | |
| City of Valdez Marine Terminal VRDN RB Floater Certificates Series 2011-73C
(GTY AGMT-Wells Fargo Bank N.A.) (Wells Fargo Bank N.A., LIQ)(a) |
|
| | 9,610,000 | | | | 0.100 | | | | 03/07/13 | | | | 9,610,000 | |
| | | | | | | | | | | | | | |
| | | | | | | | | | | | | 115,405,000 | |
| | |
| | Arizona – 2.5% | |
| Arizona Health Facilities Authority VRDN RB for Banner Health P-Floats-PT-4695
Series 2011 (Bank of America N.A., LIQ)(a) |
|
| | 10,500,000 | | | | 0.240 | | | | 03/07/13 | | | | 10,500,000 | |
| Arizona Health Facilities Authority VRDN RB for Banner Health Putters Series
2012-4215 (JPMorgan Chase Bank N.A., LIQ)(a) |
|
| | 44,195,000 | | | | 0.110 | | | | 03/01/13 | | | | 44,195,000 | |
| Arizona Health Facilities Authority VRDN RB for Dignity Health SPEARS Series
2012-1082 (GTY AGMT-Deutsche Bank A.G.) (Deutsche Bank A.G., LIQ)(a) |
|
| | 18,500,000 | | | | 0.160 | | | | 03/07/13 | | | | 18,500,000 | |
| Arizona State Transportation Board Highway VRDN RB Putters Series 2008-3151
(JPMorgan Chase Bank N.A., LIQ)(a) |
|
| | 6,605,000 | | | | 0.120 | | | | 03/07/13 | | | | 6,605,000 | |
| Arizona State Transportation Board Highway VRDN RB Putters Series 2009-3466
(JPMorgan Chase Bank N.A., LIQ)(a) |
|
| | 4,065,000 | | | | 0.120 | | | | 03/07/13 | | | | 4,065,000 | |
| | |
| | | | | | | | | | | | | | |
| | Municipal Debt Obligations – (continued) | |
| | Arizona – (continued) | |
| Maricopa County Industrial Development Authority VRDN RB Refunding for
Christian Care Apartments Series 2005 A (FNMA, LIQ) |
|
| $ | 10,620,000 | | | | 0.110 | % | | | 03/07/13 | | | $ | 10,620,000 | |
| Phoenix Civic Improvement Corp. Water System VRDN RB Putters
Series 2009-3458 (JPMorgan Chase Bank N.A., LIQ)(a) |
|
| | 7,140,000 | | | | 0.120 | | | | 03/07/13 | | | | 7,140,000 | |
| Phoenix GO VRDN Floaters Series 2007-1882 (Wells Fargo Bank N.A., LIQ) | |
| | 17,200,000 | | | | 0.110 | | | | 03/07/13 | | | | 17,200,000 | |
| Salt River Project Agricultural Improvement & Power District Electric System
Municipal Trust Receipts VRDN RB Floater Trust Series 2010-21W (Barclays
Bank PLC, LIQ)(a) |
|
| | 5,000,000 | | | | 0.140 | | | | 03/07/13 | | | | 5,000,000 | |
| Salt River Project Agricultural Improvement & Power District Electric System
VRDN RB Eagle Series 2006-0014 Class A (Citibank N.A., SPA) |
|
| | 13,275,000 | | | | 0.110 | | | | 03/07/13 | | | | 13,275,000 | |
| Salt River Project Agricultural Improvement & Power District Electric System
VRDN RB Floater Series 2009-40C (Wells Fargo & Co., LIQ)(a) |
|
| | 13,100,000 | | | | 0.100 | | | | 03/07/13 | | | | 13,100,000 | |
| Salt River Project Agricultural Improvement & Power District Electric System
VRDN RB Floaters Trust Series 2009-9W (Barclays Bank PLC, LIQ)(a) |
|
| | 4,050,000 | | | | 0.140 | | | | 03/07/13 | | | | 4,050,000 | |
| | | | | | | | | | | | | | |
| | | | | | | | | | | | | 154,250,000 | |
| | |
| | California – 13.1% | |
| Bay Area Toll Authority California Toll Bridge VRDN RB Floater Certificates
Series 2010-30C (GTY AGMT—Wells Fargo Bank N.A) (Wells Fargo Bank
N.A., LIQ)(a) |
|
| | 22,425,000 | | | | 0.100 | | | | 03/07/13 | | | | 22,425,000 | |
| Bay Area Toll Authority California Toll Bridge VRDN RB for San Francisco Bay
Area SPEARS Series 2011-DB-1043 (Deutsche Bank A.G., LIQ)(a) |
|
| | 6,145,000 | | | | 0.130 | | | | 03/07/13 | | | | 6,145,000 | |
| Bay Area Toll Authority California Toll Bridge VRDN RB Putters
Series 2008-3130 (JPMorgan Chase Bank N.A., LIQ)(a) |
|
| | 6,145,000 | | | | 0.120 | | | | 03/07/13 | | | | 6,145,000 | |
| California Educational Facilities Authority VRDN RB for University of Southern
California Putters Series 2009-3424 (JPMorgan Chase Bank N.A., LIQ)(a) |
|
| | 7,305,000 | | | | 0.120 | | | | 03/07/13 | | | | 7,305,000 | |
| California GO VRDN SPEARS Series 2007-DB-457 (AGM) (GTY AGMT-Deutsche
Bank A.G.) (Deutsche Bank A.G., LIQ) |
|
| | 11,500,000 | | | | 0.160 | | | | 03/07/13 | | | | 11,500,000 | |
| California Health Facilities Financing Authority CP Series 2012 E | |
| | 24,000,000 | | | | 0.250 | | | | 08/13/13 | | | | 24,000,000 | |
| California Health Facilities Financing Authority VRDN RB Floater Certificates
Series 2011-74C (GTY AGMT-Wells Fargo Bank N.A.) (Wells Fargo
Bank N.A., LIQ)(a) |
|
| | 5,800,000 | | | | 0.100 | | | | 03/07/13 | | | | 5,800,000 | |
| California Health Facilities Financing Authority VRDN RB Floaters
Series 2007-1858 (GTY AGMT-Wells Fargo & Co.) (Wells Fargo & Co., LIQ) |
|
| | 11,793,000 | | | | 0.110 | | | | 03/07/13 | | | | 11,793,000 | |
| California Health Facilities Financing Authority VRDN RB for Adventist Health
System P-Floats Series 2011-PT-4699 (NATL-RE) (GTY AGMT-Bank of America
N.A.) (Bank of America N.A., LIQ)(a) |
|
| | 19,920,000 | | | | 0.280 | | | | 03/07/13 | | | | 19,920,000 | |
| | |
| | |
| The accompanying notes are an integral part of these financial statements. | | 37 |
FINANCIAL SQUARE TAX-FREE MONEY MARKET FUND
Schedule of Investments (continued)
February 28, 2013 (Unaudited)
| | | | | | | | | | | | | | |
Principal Amount | | | Interest
Rate | | | Maturity
Date | | | Amortized Cost | |
| | | | | | | | | | | | | | |
| | Municipal Debt Obligations – (continued) | |
| | California – (continued) | |
| California Health Facilities Financing Authority VRDN RB for Dignity Health
SPEARS Series 2012-DBE-1083 (GTY AGMT-Deutsche Bank A.G.) (Deutsche
Bank A.G., LIQ)(a) |
|
| $ | 12,095,000 | | | | 0.170 | % | | | 03/07/13 | | | $ | 12,095,000 | |
| California RANS Series 2012 A-2 | |
| | 60,325,000 | | | | 2.500 | | | | 06/20/13 | | | | 60,741,142 | |
| California School Cash Reserve Program Authority Series 2012 J | |
| | 24,000,000 | | | | 2.000 | | | | 05/01/13 | | | | 24,069,238 | |
| California School Cash Reserve Program Authority Series 2012 L | |
| | 8,200,000 | | | | 2.000 | | | | 06/03/13 | | | | 8,237,026 | |
| California School Cash Reserve Program Authority Series 2013 CC | |
| | 4,000,000 | | | | 2.000 | | | | 12/31/13 | | | | 4,058,934 | |
| California School Cash Reserve Program Authority Series 2013 W | |
| | 18,550,000 | | | | 2.000 | | | | 01/31/14 | | | | 18,842,279 | |
| California School Cash Reserve Program Authority Series 2013 Y | |
| | 89,800,000 | | | | 2.000 | | | | 10/01/13 | | | | 90,734,169 | |
| California State Department of Water Resources CP Series 2013-1
(Bank of Montreal) |
|
| | 6,487,000 | | | | 0.160 | | | | 04/03/13 | | | | 6,487,000 | |
| California Statewide Communities Development Authority CP for Kaiser
Permanente Series 2012 9B-3 |
|
| | 9,500,000 | | | | 0.240 | | | | 04/05/13 | | | | 9,500,000 | |
| California Statewide Communities Development Authority CP for Kaiser
Permanente Series 2012-04-I |
|
| | 27,500,000 | | | | 0.250 | | | | 07/08/13 | | | | 27,500,000 | |
| California Statewide Communities Development Authority CP for Kaiser
Permanente Series 2012-08-B |
|
| | 48,500,000 | | | | 0.220 | | | | 07/03/13 | | | | 48,500,000 | |
| California Statewide Communities Development Authority CP for Kaiser
Permanente Series 2012-9B-1 |
|
| | 12,000,000 | | | | 0.240 | | | | 07/01/13 | | | | 12,000,000 | |
| | 9,250,000 | | | | 0.260 | | | | 08/01/13 | | | | 9,250,000 | |
| California Statewide Communities Development Authority CP for Kaiser
Permanente Series 2013-9B-2 |
|
| | 3,000,000 | | | | 0.220 | | | | 10/01/13 | | | | 3,000,000 | |
| California Statewide Communities Development Authority CP for Kaiser
Permanente Series 2013-09-D |
|
| | 28,000,000 | | | | 0.220 | | | | 10/01/13 | | | | 28,000,000 | |
| California Statewide Communities Development Authority CP Series 2012 K | |
| | 6,000,000 | | | | 0.250 | | | | 08/19/13 | | | | 6,000,000 | |
| California Statewide Communities Development Authority Series CP 2013 D | |
| | 23,000,000 | | | | 0.240 | | | | 09/05/13 | | | | 23,000,000 | |
| California Statewide Communities Development Authority VRDN RB for Kaiser
Permanente ROCS RR-II R-11672 Series 2008 (BHAC-CR) (Citibank
N.A., LIQ)(a) |
|
| | 10,035,000 | | | | 0.120 | | | | 03/07/13 | | | | 10,035,000 | |
| California Statewide Communities Development Authority VRDN RB for Kaiser
Permanente ROCS RR-II R-1563 Series 2008 (BHAC-CR) (Citibank N.A., LIQ) |
|
| | 9,800,000 | | | | 0.140 | | | | 03/07/13 | | | | 9,800,000 | |
| California Statewide Communities Development Authority VRDN RB for Kaiser
Permanente SPEARS Series 2012-DBE-1065 (GTY AGMT-Deutsche Bank A.G.)
(Deutsche Bank A.G., LIQ)(a) |
|
| | 15,315,000 | | | | 0.160 | | | | 03/07/13 | | | | 15,315,000 | |
| California University VRDN RB Floater Trust Series 2008 K37W (AGM) (Citibank
N.A., LIQ) |
|
| | 19,000,000 | | | | 0.260 | | | | 03/07/13 | | | | 19,000,000 | |
| | |
| | | | | | | | | | | | | | |
| | Municipal Debt Obligations – (continued) | |
| | California – (continued) | |
| Desert Community College District GO VRDN Floaters Series 2009-3016 (AGM)
(Deutsche Bank A.G., LIQ)(a) |
|
| $ | 3,000,000 | | | | 0.170 | % | | | 03/07/13 | | | $ | 3,000,000 | |
| Harbor Department of the City of Los Angeles CP Series 2013 B-1 (Mizuho Corp.
Bank Ltd., LIQ) |
|
| | 12,000,000 | | | | 0.200 | | | | 03/04/13 | | | | 12,000,000 | |
| Los Angeles Community Redevelopment Agency MF Hsg. VRDN RB for
Metropolitan Apartments Series 1985 RMKT (FNMA, LIQ) |
|
| | 10,800,000 | | | | 0.110 | | | | 03/07/13 | | | | 10,800,000 | |
| Los Angeles County Schools Pooled Financing Program TRANS Series 2012 B-4 | |
| | 4,500,000 | | | | 2.000 | | | | 10/01/13 | | | | 4,546,065 | |
| Los Angeles County Schools Pooled Financing Program TRANS Series 2013 C-3 | |
| | 2,500,000 | | | | 2.000 | | | | 12/31/13 | | | | 2,535,558 | |
| Los Angeles County Schools Pooled Financing Program TRANS Series 2013 C-5 | |
| | 3,000,000 | | | | 2.000 | | | | 11/29/13 | | | | 3,039,515 | |
| Los Angeles County Schools Pooled Financing Program TRANS Series 2013 C-6 | |
| | 4,000,000 | | | | 2.000 | | | | 12/31/13 | | | | 4,058,249 | |
| Los Angeles Department of Water & Power RB Series 2011 A | |
| | 10,000,000 | | | | 4.000 | | | | 07/01/13 | | | | 10,127,071 | |
| Los Angeles Department of Water & Power VRDN RB Putters Series 2009-3422
(JPMorgan Chase Bank N.A., LIQ)(a) |
|
| | 8,795,000 | | | | 0.120 | | | | 03/07/13 | | | | 8,795,000 | |
| Orange County Sanitation District TRANS Series 2012 | |
| | 45,700,000 | | | | 2.000 | | | | 10/30/13 | | | | 46,242,790 | |
| Orange County Sanitation District VRDN COPS Putters Series 2010-3773Z (AGM)
(JPMorgan Chase Bank, LIQ)(a) |
|
| | 5,350,000 | | | | 0.140 | | | | 03/07/13 | | | | 5,350,000 | |
| San Diego Community College District GO VRDN Austin Trust Certificates
Series 2008-3020X (AGM) (Bank of America N.A., LIQ) |
|
| | 6,000,000 | | | | 0.150 | | | | 03/07/13 | | | | 6,000,000 | |
| San Diego Community College District GO VRDN Putters Series 2009-3415
(JPMorgan Chase Bank N.A., LIQ)(a) |
|
| | 5,470,000 | | | | 0.120 | | | | 03/07/13 | | | | 5,470,000 | |
| San Diego County & School District TRANS Series 2012 B-2 (GO of Participants) | |
| | 8,440,000 | | | | 2.000 | | | | 04/30/13 | | | | 8,463,526 | |
| San Diego Unified School District GO TRANS Series 2012 A-2 | |
| | 28,000,000 | | | | 2.000 | | | | 06/28/13 | | | | 28,161,345 | |
| San Diego Unified School District GO VRDN Floater Series 2011-97C (AGM)
(Wells Fargo Bank N.A., LIQ)(a) |
|
| | 8,800,000 | | | | 0.100 | | | | 03/07/13 | | | | 8,800,000 | |
| San Francisco City & County Public Utilities Commission Water CP
Series 2013 A-2 (U.S. Bank N.A., LOC) |
|
| | 19,500,000 | | | | 0.150 | | | | 03/13/13 | | | | 19,500,000 | |
| San Francisco City & County Public Utilities Commission Water VRDN RB
Floaters Series 2007-2190 (AGM) (Wells Fargo Bank N.A., LIQ) |
|
| | 5,000,000 | | | | 0.140 | | | | 03/07/13 | | | | 5,000,000 | |
| Santa Rosa Wastewater VRDN RB SPEARS Series 2007-DBE-395 (AMBAC) (GTY
AGMT-Deutsche Bank A.G.) (Deutsche Bank A.G., LIQ) |
|
| | 5,080,000 | | | | 0.190 | | | | 03/07/13 | | | | 5,080,000 | |
| Southern California Public Power Authority VRDN RB for Milford Wind Corridor
Phase II Project SPEARS Series 2012-DB-1048 (Deutsche Bank A.G., LIQ) |
|
| | 7,860,000 | | | | 0.130 | | | | 03/07/13 | | | | 7,860,000 | |
| State of California GO Series 2004 | |
| | 9,155,000 | | | | 5.000 | | | | 02/01/14 | | | | 9,558,303 | |
| | |
| | |
| 38 | | The accompanying notes are an integral part of these financial statements. |
FINANCIAL SQUARE TAX-FREE MONEY MARKET FUND
| | | | | | | | | | | | | | |
Principal Amount | | | Interest
Rate | | | Maturity
Date | | | Amortized Cost | |
| | | | | | | | | | | | | | |
| | Municipal Debt Obligations – (continued) | |
| | California – (continued) | |
| University of California VRDN RB Floater Trust Series 2012-12UX
(Barclays Bank PLC, LIQ)(a) |
|
| $ | 7,800,000 | | | | 0.130 | % | | | 03/07/13 | | | $ | 7,800,000 | |
| University of California VRDN RB Putters Series 2012-4040 (AGM) (JPMorgan
Chase Bank)(a) |
|
| | 23,825,000 | | | | 0.110 | | | | 03/01/13 | | | | 23,825,000 | |
| West Basin Municipal Water District VRDN COPS Putters Series 2012-4210
(Assured GTY) (JPMorgan Chase Bank N.A., LIQ)(a) |
|
| | 4,640,000 | | | | 0.120 | | | | 03/07/13 | | | | 4,640,000 | |
| West Basin Municipal Water District VRDN COPS Refunding Series 2008 A-2
(Citibank N.A., SPA) |
|
| | 900,000 | | | | 0.170 | | | | 03/07/13 | | | | 900,000 | |
| | | | | | | | | | | | | | |
| | | | | | | | | | | | | 812,750,210 | |
| | |
| | Colorado – 2.5% | | | | | |
| City of Colorado Springs Utilities System VRDN RB Series 2012 A
(U.S. Bank N.A., SPA) |
|
| | 46,020,000 | | | | 0.110 | | | | 03/07/13 | | | | 46,020,000 | |
| Colorado Educational & Cultural Facilities Authority VRDN RB for Nature
Conservancy Project Series 2012 |
|
| | 9,600,000 | | | | 0.120 | | | | 03/07/13 | | | | 9,600,000 | |
| Colorado Health Facilities Authority VRDN RB for Catholic Health Putters
Series 2013-4283Z (JPMorgan Chase Bank N.A., LIQ)(a) |
|
| | 6,665,000 | | | | 0.120 | | | | 03/07/13 | | | | 6,665,000 | |
| Colorado Health Facilities Authority VRDN RB for Sisters of Leavenworth Health
System Floater Certificates Series 2012-0-15 (Royal Bank of Canada, LIQ)(a) |
|
| | 7,000,000 | | | | 0.110 | | | | 03/07/13 | | | | 7,000,000 | |
| Colorado Springs Utilities Systems VRDN RB for Subordinated Lien Improvement
Series 2005 A (Bank of Montreal, SPA) |
|
| | 23,650,000 | | | | 0.120 | | | | 03/07/13 | | | | 23,650,000 | |
| Colorado Springs Utilities VRDN RB for Subordinated Lien Refunding
Series 2000 A (Citibank N.A., SPA) |
|
| | 9,600,000 | | | | 0.160 | | | | 03/07/13 | | | | 9,600,000 | |
| Colorado Springs Utilities VRDN RB for Subordinated Lien Series 2000 A (MBIA)
(Bayerische Landesbank, SPA) |
|
| | 15,000,000 | | | | 0.170 | | | | 03/07/13 | | | | 15,000,000 | |
| Colorado State Housing Finance Authority VRDN RB Series 2002 B-3 (FHA)
(Barclays Bank PLC, SPA) |
|
| | 7,740,000 | | | | 0.110 | | | | 03/07/13 | | | | 7,740,000 | |
| Denver City & County GO VRDN for Justice System Austin Trust Certificates
Series 2008-1050 (Bank of America N.A., LIQ) |
|
| | 7,500,000 | | | | 0.150 | | | | 03/07/13 | | | | 7,500,000 | |
| Denver City & County VRDN RB SPEARS Series 2012-DBE-1130X (GTY AGMT-
Deutsche Bank A.G.) (Deutsche Bank A.G., LIQ)(a) |
|
| | 14,205,000 | | | | 0.160 | | | | 03/07/13 | | | | 14,205,000 | |
| Jefferson County School District GO Series 2012 (State Aid Withholding) | |
| | 2,020,000 | | | | 2.000 | | | | 12/15/13 | | | | 2,047,931 | |
| Jefferson County School District R-1 TANS Series 2012 A | |
| | 5,635,000 | | | | 1.500 | | | | 06/28/13 | | | | 5,658,574 | |
| | | | | | | | | | | | | | |
| | | | | | | | | | | | | 154,686,505 | |
| | |
| | Connecticut – 2.3% | | | | | |
| Connecticut Housing Finance Authority Housing Mortgage Finance Program
VRDN RB Series 2011 C-1-RMKT (GO of Authority) (Barclays Bank PLC, SPA) |
|
| | 14,195,000 | | | | 0.100 | | | | 03/07/13 | | | | 14,195,000 | |
| | |
| | | | | | | | | | | | | | |
| | Municipal Debt Obligations – (continued) | |
| | Connecticut – (continued) | |
| Connecticut State GO Series 2012 G | |
| $ | 25,000,000 | | | | 1.500 | % | | | 10/15/13 | | | $ | 25,201,365 | |
| Connecticut State GO VRDN Floater Certificates Series 2011-89C (Wells Fargo
Bank N.A., LIQ)(a) |
|
| | 21,900,000 | | | | 0.100 | | | | 03/07/13 | | | | 21,900,000 | |
| Connecticut State Health & Educational Facilities Authority VRDN RB for Yale
University Eagle 7 Series 2005-3031 Class A (Citibank N.A., LIQ) |
|
| | 34,000,000 | | | | 0.110 | | | | 03/07/13 | | | | 34,000,000 | |
| Connecticut State Health & Educational Facilities Authority VRDN RB for Yale
University Putters Series 2008-2861 (JPMorgan Chase Bank N.A., LIQ) |
|
| | 7,880,000 | | | | 0.110 | | | | 03/01/13 | | | | 7,880,000 | |
| Connecticut State Health & Educational Facilities Authority VRDN RB for Yale
University Putters Series 2008-3185Z (JPMorgan Chase Bank N.A., LIQ)(a) |
|
| | 11,995,000 | | | | 0.120 | | | | 03/07/13 | | | | 11,995,000 | |
| Connecticut State Health & Educational Facilities Authority VRDN RB for Yale
University Series 2003 X-2 |
|
| | 30,000,000 | | | | 0.090 | | | | 03/07/13 | | | | 30,000,000 | |
| | | | | | | | | | | | | | |
| | | | | | | | | | | | | 145,171,365 | |
| | |
| | Delaware – 0.3% | | | | | | | | | |
| Delaware State Health Facilities Authority VRDN RB for Christiana Care Health
Services, Inc. Series 2008 B |
|
| | 16,475,000 | | | | 0.100 | | | | 03/07/13 | | | | 16,475,000 | |
| | |
| | District of Columbia – 2.4% | | | | | |
| District of Columbia GO TRANS Series 2012 | |
| | 25,000,000 | | | | 2.000 | | | | 09/30/13 | | | | 25,259,024 | |
| District of Columbia GO VRDN Floaters Series 2007-1920 (FGIC) (GTY AGMT-
Wells Fargo Bank N.A.) (Wells Fargo Bank N.A., LIQ) |
|
| | 16,345,000 | | | | 0.110 | | | | 03/07/13 | | | | 16,345,000 | |
| District of Columbia GO VRDN Putters Series 2012-4198 (AGC) (JPMorgan
Chase Bank N.A., LIQ)(a) |
|
| | 20,000,000 | | | | 0.110 | | | | 03/01/13 | | | | 20,000,000 | |
| District of Columbia Income Tax Secured VRDN RB Putters Series 2009-3354
(JPMorgan Chase Bank N.A., LIQ)(a) |
|
| | 7,080,000 | | | | 0.120 | | | | 03/07/13 | | | | 7,080,000 | |
| District of Columbia Income Tax Secured VRDN RB Putters Series 2009-3369
(JPMorgan Chase Bank N.A., LIQ)(a) |
|
| | 4,500,000 | | | | 0.120 | | | | 03/07/13 | | | | 4,500,000 | |
| District of Columbia Income Tax Secured VRDN RB Putters Series 2012-4093
(JPMorgan Chase Bank N.A., LIQ)(a) |
|
| | 5,685,000 | | | | 0.110 | | | | 03/01/13 | | | | 5,685,000 | |
| District of Columbia Water & Sewer Authority Public Utility Systems VRDN RB
Putters Series 2009-3317 (JPMorgan Chase Bank N.A., LIQ)(a) |
|
| | 8,330,000 | | | | 0.120 | | | | 03/07/13 | | | | 8,330,000 | |
| District of Columbia Water & Sewer Authority Public Utility Systems VRDN RB
Putters Series 2012-4199 (JPMorgan Chase Bank N.A., LIQ)(a) |
|
| | 40,000,000 | | | | 0.110 | | | | 03/01/13 | | | | 40,000,000 | |
| Metropolitan Washington Airports Authority CP Series 2012-2A-1 (Landesbank
Baden-Wurttemberg, LOC) |
|
| | 21,000,000 | | | | 0.270 | | | | 04/03/13 | | | | 21,000,000 | |
| | | | | | | | | | | | | | |
| | | | | | | | | | | | | 148,199,024 | |
| | |
| | Florida – 2.5% | | | | | | | | | |
| Broward County, Florida GO Refunding Series 2007 A | |
| | 2,400,000 | | | | 5.000 | | | | 01/01/14 | | | | 2,496,382 | |
| | |
| | |
| The accompanying notes are an integral part of these financial statements. | | 39 |
FINANCIAL SQUARE TAX-FREE MONEY MARKET FUND
Schedule of Investments (continued)
February 28, 2013 (Unaudited)
| | | | | | | | | | | | | | |
Principal Amount | | | Interest
Rate | | | Maturity
Date | | | Amortized Cost | |
| | | | | | | | | | | | | | |
| | Municipal Debt Obligations – (continued) | |
| | Florida – (continued) | |
| Florida State Board of Education GO VRDN Floater Certificates Series 2011-8C
(Wells Fargo Bank N.A., LIQ)(a) |
|
| $ | 8,800,000 | | | | 0.100 | % | | | 03/07/13 | | | $ | 8,800,000 | |
| Florida State Board of Education GO VRDN Putters Series 2008-2850
(State GTD) (JPMorgan Chase Bank N.A., LIQ) |
|
| | 7,425,000 | | | | 0.120 | | | | 03/07/13 | | | | 7,425,000 | |
| Florida State Board of Education GO VRDN Putters Series 2010-3834Z
(JPMorgan Chase Bank N.A., LIQ)(a) |
|
| | 9,000,000 | | | | 0.120 | | | | 03/07/13 | | | | 9,000,000 | |
| Florida State GO VRDN for DOT – Right of Way Floater Certificate
Series 2012-28C (Wells Fargo Bank N.A., LIQ)(a) |
|
| | 14,335,000 | | | | 0.100 | | | | 03/07/13 | | | | 14,335,000 | |
| Florida State Turnpike Authority VRDN RB Floater Series 2013-4WX
(Barclays Bank PLC, LIQ)(a) |
|
| | 5,860,000 | | | | 0.130 | | | | 03/07/13 | | | | 5,860,000 | |
| Florida State Turnpike Authority VRDN RB Putters Series 2008-2514
(JPMorgan Chase Bank N.A., LIQ) |
|
| | 18,070,000 | | | | 0.120 | | | | 03/07/13 | | | | 18,070,000 | |
| Highlands County Health Facilities Authority VRDN RB Refunding for Adventist
Health System Series 2012 I-2 |
|
| | 5,000,000 | | | | 0.090 | | | | 03/07/13 | | | | 5,000,000 | |
| Jacksonville CP Series 2013 A (Landesbank Baden-Wurttemberg, LOC) | |
| | 10,175,000 | | | | 0.200 | | | | 04/01/13 | | | | 10,175,000 | |
| Jacksonville Electric Authority CP Series 2013 F-2 | |
| | 10,000,000 | | | | 0.140 | | | | 04/01/13 | | | | 10,000,000 | |
| Jacksonville Electric Authority Water & Sewer Systems VRDN RB Floater
Certificates Series 2012-4C (Wells Fargo Bank N.A., LIQ)(a) |
|
| | 5,895,000 | | | | 0.100 | | | | 03/07/13 | | | | 5,895,000 | |
| Jacksonville Electric System VRDN RB Series 2008 Three-A (Royal Bank of
Canada, SPA) |
|
| | 6,380,000 | | | | 0.110 | | | | 03/07/13 | | | | 6,380,000 | |
| Manatee County School District GO TANS Series 2012 | |
| | 43,000,000 | | | | 2.000 | | | | 05/01/13 | | | | 43,117,242 | |
| Miami-Dade County, Florida GO VRDN Floater Series 2013 E-43 (Royal Bank of
Canada, LOC) (Royal Bank of Canada, LIQ)(a) |
|
| | 6,500,000 | | | | 0.110 | | | | 03/07/13 | | | | 6,500,000 | |
| Orange County School Board VRDN COPS Putters Series 2010-3785Z
(NATL-RE FGIC) (JPMorgan Chase Bank N.A., LIQ)(a) |
|
| | 5,000,000 | | | | 0.120 | | | | 03/07/13 | | | | 5,000,000 | |
| | | | | | | | | | | | | | |
| | | | | | | | | | | | | 158,053,624 | |
| | |
| | Georgia – 3.3% | | | | | | | | | |
| Georgia State GO Series 2009 F | |
| | 6,360,000 | | | | 5.000 | | | | 11/01/13 | | | | 6,564,647 | |
| Georgia State GO Series 2009 G | |
| | 5,000,000 | | | | 5.000 | | | | 11/01/13 | | | | 5,160,563 | |
| Georgia State GO Series 2013 A | |
| | 11,005,000 | | | | 3.000 | | | | 01/01/14 | | | | 11,263,773 | |
| Georgia State GO VRDN Putters Series 2012-4170 (JPMorgan Chase Bank
N.A., LIQ)(a) |
|
| | 6,835,000 | | | | 0.120 | | | | 03/07/13 | | | | 6,835,000 | |
| Georgia State Municipal Gas Authority RB Refunding for Gas Portfolio III
Series 2012 P |
|
| | 16,000,000 | | | | 2.000 | | | | 05/22/13 | | | | 16,060,183 | |
| | |
Principal Amount | | | Interest
Rate | | | Maturity
Date | | | Amortized Cost | |
| | | | | | | | | | | | | | |
| | Municipal Debt Obligations – (continued) | |
| | Georgia – (continued) | |
| Georgia State Municipal Gas Authority RB Refunding for Gas Portfolio III
Series 2012 R |
|
| $ | 10,800,000 | | | | 2.000 | % | | | 10/01/13 | | | $ | 10,907,301 | |
| Gwinnett County School District GO VRDN Austin Trust Certificates
Series 2008-1112 (Bank of America N.A., LIQ) |
|
| | 3,375,000 | | | | 0.150 | | | | 03/07/13 | | | | 3,375,000 | |
| Gwinnett County School District GO VRDN Putters Series 2008-2868 (JPMorgan
Chase Bank N.A., LIQ) |
|
| | 8,870,000 | | | | 0.120 | | | | 03/07/13 | | | | 8,870,000 | |
| Metropolitan Atlanta Rapid Transit Authority Sales Tax CP Series 2012 D-1
(The Bank of Tokyo-Mitsubishi UFJ, LOC) |
|
| | 12,500,000 | | | | 0.150 | | | | 04/04/13 | | | | 12,500,000 | |
| Metropolitan Atlanta Rapid Transit Authority Sales Tax VRDN RB
Series 2000 A RMKT |
|
| | 1,400,000 | | | | 0.180 | | | | 07/01/13 | | | | 1,400,000 | |
| Metropolitan Atlanta Rapid Transit Authority Sales Tax VRDN RB Series 2000 B
(PNC Bank N.A., LOC) |
|
| | 25,000,000 | | | | 0.120 | | | | 03/07/13 | | | | 25,000,000 | |
| Metropolitan Atlanta Rapid Transit Authority VRDN RB Austin Trust Certificates
Refunding for Third Indenture Series 2008-3046X (AGM) (Bank of America
N.A., LIQ) |
|
| | 6,665,000 | | | | 0.150 | | | | 03/07/13 | | | | 6,665,000 | |
| Municipal Electric Authority of Georgia VRDN RB Series 1985 Sub Gen-C RMKT
(GO of Participants) (Bayerische Landesbank, LOC) |
|
| | 45,650,000 | | | | 0.180 | | | | 03/07/13 | | | | 45,650,000 | |
| Municipal Electric Authority of Georgia VRDN RB Series 1985 Subseries B RMKT
(GO of Participants) (Barclays Bank PLC, LOC) |
|
| | 11,800,000 | | | | 0.100 | | | | 03/07/13 | | | | 11,800,000 | |
| Private Colleges & Universities Authority VRDN RB for Emory University Floater
Certificates Series 2011-32C (Wells Fargo Bank N.A., LIQ)(a) |
|
| | 5,800,000 | | | | 0.100 | | | | 03/07/13 | | | | 5,800,000 | |
| Private Colleges & Universities Authority VRDN RB for Emory University Floaters
Series 2011-95C (GO of University) (Wells Fargo Bank N.A., LIQ)(a) |
|
| | 4,865,000 | | | | 0.100 | | | | 03/07/13 | | | | 4,865,000 | |
| Private Colleges & Universities Authority VRDN RB for Emory University
Series 2005 C-4-RMKT |
|
| | 19,100,000 | | | | 0.090 | | | | 03/07/13 | | | | 19,100,000 | |
| | | | | | | | | | | | | | |
| | | | | | | | | | | | | 201,816,467 | |
| | |
| | Hawaii – 0.2% | |
| City & County of Honolulu GO Prerefunded Series 2003 A (NATL-RE) | |
| | 4,295,000 | | | | 5.250 | | | | 03/01/13 | | | | 4,295,000 | |
| Hawaii State GO Refunding Series 2005 DG (AMBAC) | |
| | 2,275,000 | | | | 5.000 | | | | 07/01/13 | | | | 2,311,313 | |
| Hawaii State GO VRDN Putters Series 2011-4007 (JPMorgan Chase Bank
N.A., LIQ)(a) |
|
| | 6,665,000 | | | | 0.120 | | | | 03/07/13 | | | | 6,665,000 | |
| | | | | | | | | | | | | | |
| | | | | | | | | | | | | 13,271,313 | |
| | |
| | Illinois – 3.8% | |
| Chicago Board of Education GO VRDN Refunding for Dedicated Revenues
Series 2009 A-2 (Northern Trust Co., LOC) |
|
| | 5,900,000 | | | | 0.100 | | | | 03/07/13 | | | | 5,900,000 | |
| Chicago Sales Tax VRDN RB Floater Certificates Series 2012-0-20 (Royal Bank of
Canada, LIQ)(a) |
|
| | 6,665,000 | | | | 0.110 | | | | 03/07/13 | | | | 6,665,000 | |
| | |
| | |
| 40 | | The accompanying notes are an integral part of these financial statements. |
FINANCIAL SQUARE TAX-FREE MONEY MARKET FUND
| | | | | | | | | | | | | | |
Principal Amount | | | Interest
Rate | | | Maturity
Date | | | Amortized Cost | |
| | | | | | | | | | | | | | |
| | Municipal Debt Obligations – (continued) | |
| | Illinois – (continued) | |
| Chicago Water VRDN RB Floater Series 2012-31C (Wells Fargo Bank N.A., LIQ)(a) | |
| $ | 5,105,000 | | | | 0.100 | % | | | 03/07/13 | | | $ | 5,105,000 | |
| City of Chicago Board of Education GO VRDN SPEARS Series 2007 DB-316
(FGIC) (GTY AGMT-Deutsche Bank A.G.) (Deutsche Bank A.G., LIQ) |
|
| | 7,975,000 | | | | 0.190 | | | | 03/07/13 | | | | 7,975,000 | |
| City of Chicago Board of Education GO VRDN SPEARS Series 2007 DB-338
(FGIC) (GTY AGMT-Deutsche Bank A.G.) (Deutsche Bank A.G., LIQ) |
|
| | 5,300,000 | | | | 0.190 | | | | 03/07/13 | | | | 5,300,000 | |
| City of Chicago GO VRDN Neighborhoods Alive 21 Series 2002-B-3 RMKT
(Royal Bank of Canada, LOC) |
|
| | 30,000,000 | | | | 0.110 | | | | 03/01/13 | | | | 30,000,000 | |
| City of Chicago GO VRDN Neighborhoods Alive 21 Series 2002-B-5 RMKT
(Bank of NY Mellon, LOC) |
|
| | 12,020,000 | | | | 0.110 | | | | 03/01/13 | | | | 12,020,000 | |
| City of Chicago GO VRDN Series 2003 B-1 RMKT (JPMorgan Chase Bank
N.A., SPA) |
|
| | 11,840,000 | | | | 0.130 | | | | 03/01/13 | | | | 11,840,000 | |
| City of Chicago Motor Fuel Tax VRDN RB SPEARS Series 2012 DB-1067X
(Assured GTY) (Deutsche Bank A.G., LIQ)(a) |
|
| | 11,155,000 | | | | 0.180 | | | | 03/07/13 | | | | 11,155,000 | |
| Cook County GO VRDN Floater Series 2012 DB-1076 (Deutsche Bank
A.G., LIQ)(a) |
|
| | 6,660,000 | | | | 0.180 | | | | 03/07/13 | | | | 6,660,000 | |
| Cook County GO VRDN Series 2002 B (Bank of NY Mellon, SPA) | |
| | 40,800,000 | | | | 0.110 | | | | 03/07/13 | | | | 40,800,000 | |
| Illinois Finance Authority VRDN RB Floater Certificates Series 2011-61C (GTY
AGMT-Wells Fargo Bank N.A.) (Wells Fargo Bank N.A., LIQ)(a) |
|
| | 4,785,000 | | | | 0.100 | | | | 03/07/13 | | | | 4,785,000 | |
| Illinois Finance Authority VRDN RB for Methodist Medical Center
Series 2011 B (PNC Bank N.A., LOC) |
|
| | 10,220,000 | | | | 0.120 | | | | 03/07/13 | | | | 10,220,000 | |
| Illinois Finance Authority VRDN RB for Northwestern Memorial Hospital Floaters
Trust Series 2011-16B (Barclays Bank PLC, LIQ)(a) |
|
| | 3,950,000 | | | | 0.140 | | | | 03/07/13 | | | | 3,950,000 | |
| Illinois Finance Authority VRDN RB for Northwestern University
Series 2008 RMKT(b) |
|
| | 10,000,000 | | | | 0.000 | | | | 03/07/13 | | | | 10,000,000 | |
| Illinois Finance Authority VRDN RB for University of Chicago Series 2004 B | |
| | 28,269,000 | | | | 0.100 | | | | 03/07/13 | | | | 28,269,000 | |
| Illinois Finance Authority VRDN RB Refunding for University of Chicago
Series 2004 C |
|
| | 7,100,000 | | | | 0.100 | | | | 03/07/13 | | | | 7,100,000 | |
| Illinois Finance Authority VRDN RB SPEARS Series 2012-DBE-1115 (GTY AGMT-
Deutsche Bank A.G.) (Deutsche Bank A.G., LIQ)(a) |
|
| | 18,300,000 | | | | 0.150 | | | | 03/07/13 | | | | 18,300,000 | |
| University of Illinois Board of Trustees VRDN COPS ROCS RR-II R-11480
Series 2008 (AGM) (Citibank N.A., LIQ) |
|
| | 7,495,000 | | | | 0.230 | | | | 03/07/13 | | | | 7,495,000 | |
| | | | | | | | | | | | | | |
| | | | | | | | | | | | | 233,539,000 | |
| | |
| | Indiana – 4.2% | |
| Indiana Finance Authority Hospital VRDN RB Floater Certificates
Series 2011 E-23 (Royal Bank of Canada, LIQ) (Royal Bank of Canada, LOC)(a) |
|
| | 11,000,000 | | | | 0.110 | | | | 03/07/13 | | | | 11,000,000 | |
| | |
| | | | | | | | | | | | | | |
| | Municipal Debt Obligations – (continued) | |
| | Indiana – (continued) | |
| Indiana Finance Authority Hospital VRDN RB for Parkview Health System Floater
Certificates Series 2009-55C (GTY AGMT-Wells Fargo Bank N.A.)
(Wells Fargo & Co., LIQ)(a) |
|
| $ | 9,715,000 | | | | 0.100 | % | | | 03/07/13 | | | $ | 9,715,000 | |
| Indiana Finance Authority VRDN RB for Ascension Health Series 2008 E-5 | |
| | 24,600,000 | | | | 0.110 | | | | 03/07/13 | | | | 24,600,000 | |
| Indiana Finance Authority VRDN RB for Lease Appropriation
Series 2008 A-2 RMKT |
|
| | 40,000,000 | | | | 0.100 | | | | 03/07/13 | | | | 40,000,000 | |
| Indiana Finance Authority VRDN RB for Midwest Fertilizer Corporation Project
Series 2012 |
|
| | 50,000,000 | | | | 0.200 | | | | 07/01/13 | | | | 50,000,000 | |
| Indiana Finance Authority VRDN RB for Trinity Health Putters Series 2009-3611
(JPMorgan Chase Bank N.A., LIQ)(a) |
|
| | 17,180,000 | | | | 0.150 | | | | 03/07/13 | | | | 17,180,000 | |
| Indiana Finance Authority VRDN RB Lease Appropriation Series 2005 A-1
(JPMorgan Chase Bank, SPA) |
|
| | 14,900,000 | | | | 0.120 | | | | 03/01/13 | | | | 14,900,000 | |
| Indiana Health & Educational Facilities Financing Authority VRDN RB for
Ascension Health Services ROCS-RR-II R-11160 Series 2007
(Citibank N.A., LIQ) |
|
| | 13,785,000 | | | | 0.110 | | | | 03/07/13 | | | | 13,785,000 | |
| Indiana Health Facility Financing Authority VRDN RB for Ascension Health
Series 2005 A-2 RMKT |
|
| | 56,060,000 | | | | 0.110 | | | | 03/07/13 | | | | 56,060,000 | |
| University of Indiana VRDN RB Floater Certificates Series 2009-45C (Wells
Fargo & Co., LIQ)(a) |
|
| | 22,600,000 | | | | 0.100 | | | | 03/07/13 | | | | 22,600,000 | |
| | | | | | | | | | | | | | |
| | | | | | | | | | | | | 259,840,000 | |
| | |
| | Iowa – 0.6% | |
| Iowa Finance Authority Midwestern Disaster Area VRDN RB for Iowa
Fertilizer Co. Series 2012 |
|
| | 37,000,000 | | | | 0.180 | | | | 04/12/13 | | | | 37,000,017 | |
| | |
| | Kansas – 0.3% | |
| City of Wichita, Kansas Water & Sewer Utility RB Refunding Series 2011 A | |
| | 5,425,000 | | | | 3.000 | | | | 10/01/13 | | | | 5,512,891 | |
| Wyandotte County-Kansas City Unified Government GO for Municipal
Temporary Notes Series 2012 I |
|
| | 16,000,000 | | | | 0.240 | | | | 03/01/13 | | | | 16,000,000 | |
| | | | | | | | | | | | | | |
| | | | | | | | | | | | | 21,512,891 | |
| | |
| | Kentucky – 0.5% | |
| Kentucky Economic Development Finance Authority VRDN RB for Baptist
Healthcare System Obligated Group SPEARS Series 2012 DBE-1068 (GTY
AGMT-Deutsche Bank A.G.) (Deutsche Bank A.G., LIQ)(a) |
|
| | 17,700,000 | | | | 0.180 | | | | 03/07/13 | | | | 17,700,000 | |
| Kentucky State Municipal Power Agency VRDN RB SPEARS Series 2011-DB-1025
(BHAC-CR NATL-RE) (Deutsche Bank A.G., LIQ)(a) |
|
| | 13,150,000 | | | | 0.180 | | | | 03/07/13 | | | | 13,150,000 | |
| | | | | | | | | | | | | | |
| | | | | | | | | | | | | 30,850,000 | |
| | |
| | Maine – 0.1% | |
| Maine Health & Higher Educational Facilities Authority VRDN RB for Bowdoin
College Putters Series 2009-3461 (JPMorgan Chase Bank N.A., LIQ)(a) |
|
| | 6,955,000 | | | | 0.120 | | | | 03/07/13 | | | | 6,955,000 | |
| | |
| | |
| The accompanying notes are an integral part of these financial statements. | | 41 |
FINANCIAL SQUARE TAX-FREE MONEY MARKET FUND
Schedule of Investments (continued)
February 28, 2013 (Unaudited)
| | | | | | | | | | | | | | |
Principal Amount | | | Interest
Rate | | | Maturity
Date | | | Amortized Cost | |
| | | | | | | | | | | | | | |
| | Municipal Debt Obligations – (continued) | |
| | Maryland – 1.6% | |
| County of Anne Arundel, Maryland CP Series 2013-97-A (State Street Bank &
Trust Co., LIQ) |
|
| $ | 9,835,000 | | | | 0.190 | % | | | 03/27/13 | | | $ | 9,835,000 | |
| County of Anne Arundel, Maryland CP Series 2013-97-B (State Street Bank &
Trust Co., LIQ) |
|
| | 10,680,000 | | | | 0.150 | | | | 04/01/13 | | | | 10,680,000 | |
| County of Montgomery GO for Consolidated Public Improvement Series 2012 A | |
| | 14,750,000 | | | | 5.000 | | | | 11/01/13 | | | | 15,223,275 | |
| County of Montgomery, Maryland CP Series 2013-10-A (PNC Bank N.A., LIQ) | |
| | 36,605,000 | | | | 0.150 | | | | 04/01/13 | | | | 36,605,000 | |
| Maryland Health & Higher Educational Facilities Authority VRDN RB for
Ascension Health Floater Certificates Series 2012-0-29 (Royal Bank of
Canada, LIQ)(a) |
|
| | 5,000,000 | | | | 0.110 | | | | 03/07/13 | | | | 5,000,000 | |
| Maryland State GO Series 2009 A | |
| | 6,230,000 | | | | 5.000 | | | | 11/01/13 | | | | 6,429,643 | |
| Maryland State Transportation Authority VRDN RB Certificates
Series 2008-3017X (AGM) (Bank of America N.A., LIQ) |
|
| | 5,000,000 | | | | 0.150 | | | | 03/07/13 | | | | 5,000,000 | |
| Washington Suburban Sanitation District GO VRDN Floater Certificates
Series 2011-129C (Wells Fargo Bank N.A., LIQ)(a) |
|
| | 9,140,000 | | | | 0.100 | | | | 03/07/13 | | | | 9,140,000 | |
| | | | | | | | | | | | | | |
| | | | | | | | | | | | | 97,912,918 | |
| | |
| | Massachusetts – 4.8% | |
| City of Quincy GO BANS Series 2012 | |
| | 29,485,000 | | | | 2.500 | | | | 06/21/13 | | | | 29,683,411 | |
| City of Worcester GO BANS Series 2013 A | |
| | 36,582,500 | | | | 0.500 | | | | 11/07/13 | | | | 36,657,876 | |
| Massachusetts Bay Transportation Authority Sales Tax VRDN RB Austin Trust
Certificates Series 2008-1111 (Bank of America N.A., LIQ) |
|
| | 5,000,000 | | | | 0.150 | | | | 03/07/13 | | | | 5,000,000 | |
| Massachusetts Bay Transportation Authority Sales Tax VRDN RB Putters
Series 2006-1387 (JPMorgan Chase Bank N.A., LIQ) |
|
| | 13,315,000 | | | | 0.120 | | | | 03/07/13 | | | | 13,315,000 | |
| Massachusetts Bay Transportation Authority VRDN RB Floater Certificates
Series 2012-51C (Wells Fargo Bank N.A., LIQ)(a) |
|
| | 5,745,000 | | | | 0.100 | | | | 03/07/13 | | | | 5,745,000 | |
| Massachusetts Development Finance Agency VRDN RB for Harvard University
Floater Certificates Series 2010-56C (Wells Fargo Bank N.A., LIQ)(a) |
|
| | 9,440,000 | | | | 0.100 | | | | 03/07/13 | | | | 9,440,000 | |
| Massachusetts Development Finance Agency VRDN RB for Harvard University
Putters Series 2010-3840 (JPMorgan Chase Bank N.A., LOC)(a) |
|
| | 4,000,000 | | | | 0.120 | | | | 03/07/13 | | | | 4,000,000 | |
| Massachusetts GO VRDN Austin Trust Certificates Series 2008-1203
(Bank of America N.A., LIQ)(a) |
|
| | 9,500,000 | | | | 0.150 | | | | 03/07/13 | | | | 9,500,000 | |
| Massachusetts GO VRDN Floater Certificates Series 2012 E-32 (Royal Bank of
Canada, LIQ) (Royal Bank of Canada, LOC)(a) |
|
| | 19,800,000 | | | | 0.110 | | | | 03/07/13 | | | | 19,800,000 | |
| Massachusetts Health & Educational Facilities Authority VRDN RB for Harvard
University Putters Series 2008-3104 (JPMorgan Chase Bank N.A., LIQ) |
|
| | 3,040,000 | | | | 0.120 | | | | 03/07/13 | | | | 3,040,000 | |
| Massachusetts Health & Educational Facilities Authority VRDN RB for Harvard
University ROCS-RR-II R-11514 Series 2008 (Citibank N.A., LIQ) |
|
| | 5,390,000 | | | | 0.110 | | | | 03/07/13 | | | | 5,390,000 | |
| | |
| | | | | | | | | | | | | | |
| | Municipal Debt Obligations – (continued) | |
| | Massachusetts – (continued) | |
| Massachusetts Health & Educational Facilities Authority VRDN RB for Museum
Fine Series 2007 A-2-RMKT (Bank of America N.A., SPA) |
|
| $ | 23,945,000 | | | | 0.130 | % | | | 03/01/13 | | | $ | 23,945,000 | |
| Massachusetts Housing Finance Agency VRDN RB Series 2003 F-RMKT | |
| | 500,000 | | | | 0.230 | | | | 03/07/13 | | | | 500,000 | |
| Massachusetts Port Authority RB Series 2003 A (NATL-RE) | |
| | 10,640,000 | | | | 5.000 | | | | 07/01/13 | | | | 10,809,136 | |
| Massachusetts School Building Authority Sales Tax VRDN RB Putters
Series 2007-2286 (AMBAC) (Deutsche Bank A.G., LIQ) |
|
| | 15,340,000 | | | | 0.130 | | | | 03/07/13 | | | | 15,340,000 | |
| Massachusetts State Development Finance Agency VRDN RB for Partners
HealthCare Systems Series 2011 K-2 (Barclays Bank, SPA) (GTY AGMT-
Bringham and Women’s Hospital, Inc., Faulkner Hospital and Massachusetts
General Hospital) |
|
| | 5,000,000 | | | | 0.090 | | | | 03/07/13 | | | | 5,000,000 | |
| Massachusetts State GO for Consolidated Loan Series 2011 D | |
| | 5,000,000 | | | | 4.000 | | | | 10/01/13 | | | | 5,111,204 | |
| Massachusetts Water Resources Authority CP Series 2013 | |
| | 44,000,000 | | | | 0.330 | | | | 03/01/13 | | | | 44,000,000 | |
| | 43,000,000 | | | | 0.350 | | | | 04/01/13 | | | | 43,000,000 | |
| Massachusetts Water Resources Authority VRDN RB Putters Series 2012-4176
(NATL-RE) (GO of Authority) (JPMorgan Chase Bank N.A., LIQ)(a) |
|
| | 5,720,000 | | | | 0.120 | | | | 03/07/13 | | | | 5,720,000 | |
| | | | | | | | | | | | | | |
| | | | | | | | | | | | | 294,996,627 | |
| | |
| | Michigan – 1.7% | |
| Michigan Finance Authority RN for State Aid Series 2012 B-1 | |
| | 15,000,000 | | | | 2.000 | | | | 08/20/13 | | | | 15,112,601 | |
| Michigan Finance Authority RN for State Aid Series 2012 B-2 (JPMorgan Chase
Bank N.A., LOC) |
|
| | 60,000,000 | | | | 2.000 | | | | 08/20/13 | | | | 60,487,726 | |
| Michigan Finance Authority VRDN RB Refunding for Trinity Health Floater
Certificates Series 2011-111C (Wells Fargo Bank N.A., LIQ)(a) |
|
| | 2,445,000 | | | | 0.100 | | | | 03/07/13 | | | | 2,445,000 | |
| Michigan Finance Authority VRDN RB Refunding for Trinity Health Floater
Certificates Series 2012-0-32 (Royal Bank of Canada, LIQ)(a) |
|
| | 5,000,000 | | | | 0.110 | | | | 03/07/13 | | | | 5,000,000 | |
| Michigan Finance Authority VRDN RB Refunding for Trinity Health SPEARS
Series 2012-DB-1049X (Deutsche Bank A.G., LIQ)(a) |
|
| | 6,150,000 | | | | 0.130 | | | | 03/07/13 | | | | 6,150,000 | |
| Michigan Hospital Finance Authority VRDN RB for McLaren Health Care Putters
Series 2010-3818 (JPMorgan Chase Bank N.A., LIQ)(a) |
|
| | 6,660,000 | | | | 0.190 | | | | 03/07/13 | | | | 6,660,000 | |
| Michigan Hospital Finance Authority VRDN RB for Trinity Health Putters
Series 2008-2976 (JPMorgan Chase Bank N.A., LIQ) |
|
| | 9,595,000 | | | | 0.190 | | | | 03/07/13 | | | | 9,595,000 | |
| | | | | | | | | | | | | | |
| | | | | | | | | | | | | 105,450,327 | |
| | |
| | Minnesota – 1.1% | |
| County of Hennepin, Minnesota GO Series 2010 B | |
| | 4,065,000 | | | | 3.000 | | | | 12/01/13 | | | | 4,150,007 | |
| Minnesota School District Tax and Aid Anticipation Borrowing Program COPS
Series 2012 A (School District Credit Program) |
|
| | 13,130,000 | | | | 2.000 | | | | 09/10/13 | | | | 13,252,256 | |
| Minnesota State GO Series 2011 A | |
| | 4,500,000 | | | | 5.000 | | | | 10/01/13 | | | | 4,626,367 | |
| | |
| | |
| 42 | | The accompanying notes are an integral part of these financial statements. |
FINANCIAL SQUARE TAX-FREE MONEY MARKET FUND
| | | | | | | | | | | | | | |
Principal Amount | | | Interest
Rate | | | Maturity
Date | | | Amortized Cost | |
| | | | | | | | | | | | | | |
| | Municipal Debt Obligations – (continued) | |
| | Minnesota – (continued) | |
| Minnesota State GO Series 2012 A | |
| $ | 37,000,000 | | | | 5.000 | % | | | 08/01/13 | | | $ | 37,747,142 | |
| Rochester GO VRDN Wastewater Series 2007 B (Wells Fargo Bank N.A., SPA) | |
| | 9,900,000 | | | | 0.110 | | | | 03/07/13 | | | | 9,900,000 | |
| | | | | | | | | | | | | | |
| | | | | | | | | | | | | 69,675,772 | |
| | |
| | Mississippi – 0.9% | |
| Mississippi Business Finance Commission Gulf Opportunity Zone VRDN RB for
Chevron USA Inc. Project Series 2010 K (GTY AGMT-Chevron Corp.) |
|
| | 6,400,000 | | | | 0.110 | | | | 03/01/13 | | | | 6,400,000 | |
| Mississippi Business Finance Commission Gulf Opportunity Zone VRDN RB for
Chevron USA, Inc. Project Series 2009 D (GTY AGMT-Chevron Corp.) |
|
| | 20,000,000 | | | | 0.110 | | | | 03/01/13 | | | | 20,000,000 | |
| Mississippi Business Finance Commission Gulf Opportunity Zone VRDN RB for
Chevron USA, Inc. Project Series 2011 B (GTY AGMT-Chevron Corp.) |
|
| | 11,000,000 | | | | 0.110 | | | | 03/01/13 | | | | 11,000,000 | |
| Mississippi Business Finance Commission Gulf Opportunity Zone VRDN RB for
Chevron USA, Inc. Project Series 2011 G (GTY AGMT-Chevron Corp.) |
|
| | 5,200,000 | | | | 0.110 | | | | 03/01/13 | | | | 5,200,000 | |
| Mississippi State GO VRDN Floater Certificates Series 2011-117C (Wells Fargo
Bank N.A., LIQ)(a) |
|
| | 15,395,000 | | | | 0.100 | | | | 03/07/13 | | | | 15,395,000 | |
| | | | | | | | | | | | | | |
| | | | | | | | | | | | | 57,995,000 | |
| | |
| | Missouri – 0.8% | |
| County of St Louis, Missouri TANS Series 2012 | |
| | 19,315,000 | | | | 2.000 | | | | 08/01/13 | | | | 19,453,713 | |
| Missouri Health & Educational Facilities Authority VRDN RB for BJC Health
System Series 2008 A (U.S. Bank N.A. SPA) |
|
| | 10,000,000 | | | | 0.100 | | | | 03/01/13 | | | | 10,000,000 | |
| Missouri Health & Educational Facilities Authority VRDN RB for SSM Health Care
Corp. Series 2005 D4-RMKT (JPMorgan Chase Bank N.A., SPA) |
|
| | 6,700,000 | | | | 0.140 | | | | 03/07/13 | | | | 6,700,000 | |
| Missouri Health & Educational Facilities Authority VRDN RB for Washington
University Putters Series 2009-3546 (JPMorgan Chase Bank N.A., LIQ)(a) |
|
| | 11,395,000 | | | | 0.120 | | | | 03/07/13 | | | | 11,395,000 | |
| | | | | | | | | | | | | | |
| | | | | | | | | | | | | 47,548,713 | |
| | |
| | Nebraska – 0.6% | |
| Lincoln, Nebraska Electric System VRDN RB Floaters Series 2008-2900
(Credit Suisse, LIQ) |
|
| | 21,870,000 | | | | 0.130 | | | | 03/07/13 | | | | 21,870,000 | |
| Omaha Public Power District VRDN RB Series 2006-1289 (FGIC)
(Credit Suisse, LIQ) |
|
| | 3,570,000 | | | | 0.110 | | | | 03/07/13 | | | | 3,570,000 | |
| Omaha Public Power District VRDN RB SPEARS Series 2011-DB-1045
(Deutsche Bank A.G., LIQ)(a) |
|
| | 9,510,000 | | | | 0.130 | | | | 03/07/13 | | | | 9,510,000 | |
| | | | | | | | | | | | | | |
| | | | | | | | | | | | | 34,950,000 | |
| | |
| | Nevada – 0.7% | |
| Clark County Water Reclamation District GO VRDN Putters Series 2009-3366Z
(JPMorgan Chase Bank N.A., LIQ)(a) |
|
| | 6,000,000 | | | | 0.120 | | | | 03/07/13 | | | | 6,000,000 | |
| Clark County Water Reclamation District GO VRDN Putters Series 2009-3488Z
(JPMorgan Chase Bank N.A., LIQ)(a) |
|
| | 6,305,000 | | | | 0.120 | | | | 03/07/13 | | | | 6,305,000 | |
| | |
| | | | | | | | | | | | | | |
| | Municipal Debt Obligations – (continued) | |
| | Nevada – (continued) | |
| Clark County Water Reclamation District GO VRDN Putters Series 2009-3489Z
(JPMorgan Chase Bank N.A., LIQ)(a) |
|
| $ | 7,000,000 | | | | 0.120 | % | | | 03/07/13 | | | $ | 7,000,000 | |
| Clark County, Nevada GO VRDN Floater Certificates Series 2012-47C (Wells
Fargo Bank N.A., LIQ)(a) |
|
| | 7,650,000 | | | | 0.100 | | | | 03/07/13 | | | | 7,650,000 | |
| Nevada State GO VRDN Putters Series 2009-3421
(JPMorgan Chase Bank N.A., LIQ)(a) |
|
| | 8,450,000 | | | | 0.120 | | | | 03/07/13 | | | | 8,450,000 | |
| State of Nevada Highway Improvement RB for Motor Vehicle Fuel Tax
Series 2006 (AGM) |
|
| | 5,000,000 | | | | 5.000 | | | | 12/01/13 | | | | 5,178,711 | |
| | | | | | | | | | | | | | |
| | | | | | | | | | | | | 40,583,711 | |
| | |
| | New Jersey – 0.4% | |
| New Jersey Transportation Trust Fund Authority VRDN RB SPEARS
Series 2012-DBE-1138X (GTY AGMT- Deutsche Bank A.G.) (Deutsche Bank
A.G., LIQ)(a) |
|
| | 23,565,000 | | | | 0.160 | | | | 03/07/13 | | | | 23,565,000 | |
| | |
| | New Mexico – 0.2% | |
| University of New Mexico VRDN RB Putters Series 2008-2533 (AGM)
(Deutsche Bank A.G., LIQ) |
|
| | 9,990,000 | | | | 0.130 | | | | 03/07/13 | | | | 9,990,000 | |
| | |
| | New York – 10.2% | |
| Erie County IDA School Facility VRDN RB for City School District Buffalo Project
Series 2008-3053X (AGM) (Bank of America N.A., LIQ) |
|
| | 2,130,000 | | | | 0.250 | | | | 03/07/13 | | | | 2,130,000 | |
| Monroe County Industrial Development Corp. VRDN RB Floater Series 2011-98C
(Wells Fargo Bank N.A., LIQ) (GTY AGMT-Wells Fargo Bank N.A.)(a) |
|
| | 2,740,000 | | | | 0.100 | | | | 03/07/13 | | | | 2,740,000 | |
| New York City GO Prerefunded Series 2008 Subseries J-1 | |
| | 530,000 | | | | 5.000 | | | | 08/01/13 | | | | 540,580 | |
| New York City GO Series 1994 H Subseries H-6 | |
| | 8,200,000 | | | | 2.000 | | | | 08/01/13 | | | | 8,261,395 | |
| New York City GO Series 2003 E | |
| | 4,635,000 | | | | 5.250 | | | | 08/01/13 | | | | 4,731,616 | |
| New York City GO Series 2012 C | |
| | 5,275,000 | | | | 2.000 | | | | 08/01/13 | | | | 5,314,495 | |
| New York City GO Unrefunded Series 2008 Subseries J-1 | |
| | 3,470,000 | | | | 5.000 | | | | 08/01/13 | | | | 3,539,271 | |
| New York City GO VRDN ROCS RR-II R-14045 Series 2013 (Citibank N.A., LIQ)(a) | |
| | 3,800,000 | | | | 0.120 | | | | 03/07/13 | | | | 3,800,000 | |
| New York City GO VRDN Series 1993 Subseries A-4 (Bayerische
Landesbank, LOC) |
|
| | 16,350,000 | | | | 0.160 | | | | 03/01/13 | | | | 16,350,000 | |
| New York City GO VRDN Series 1995 F-4 (Landesbank Hessen-Thueringen, LOC) | |
| | 14,200,000 | | | | 0.140 | | | | 03/07/13 | | | | 14,200,000 | |
| New York City GO VRDN Series 2006 I Subseries I-3 (Bank of America
N.A., LOC) |
|
| | 1,265,000 | | | | 0.130 | | | | 03/01/13 | | | | 1,265,000 | |
| New York City Housing Development Corp. MF Hsg VRDN RB Series 2012 M | |
| | 13,000,000 | | | | 0.200 | | | | 10/01/13 | | | | 13,000,000 | |
| New York City Municipal Water Finance Authority CP Series 2013-1
(JPMorgan Chase Bank N.A., LOC) |
|
| | 25,000,000 | | | | 0.120 | | | | 03/01/13 | | | | 25,000,000 | |
| | |
| | |
| The accompanying notes are an integral part of these financial statements. | | 43 |
FINANCIAL SQUARE TAX-FREE MONEY MARKET FUND
Schedule of Investments (continued)
February 28, 2013 (Unaudited)
| | | | | | | | | | | | | | |
Principal Amount | | | Interest
Rate | | | Maturity
Date | | | Amortized Cost | |
| | | | | | | | | | | | | | |
| | Municipal Debt Obligations – (continued) | |
| | New York – (continued) | |
| New York City Municipal Water Finance Authority Water & Sewer System VRDN
RB Austin Trust Certificates Series 2008-3306 (Bank of America N.A., LIQ) |
|
| $ | 5,000,000 | | | | 0.150 | % | | | 03/07/13 | | | $ | 5,000,000 | |
| New York City Municipal Water Finance Authority Water & Sewer System VRDN
RB Floater Trust Series 2013-3WX (Barclays Bank PLC, LIQ)(a)(b) |
|
| | 8,600,000 | | | | 0.000 | | | | 03/07/13 | | | | 8,600,000 | |
| New York City Municipal Water Finance Authority Water & Sewer System VRDN
RB Second General Resolution Floater Certificates Series 2011-13C
(Wells Fargo Bank N.A., LIQ)(a) |
|
| | 4,845,000 | | | | 0.100 | | | | 03/07/13 | | | | 4,845,000 | |
| New York City Municipal Water Finance Authority Water & Sewer System VRDN
RB Series 2008 Subseries B-4 (Royal Bank of Canada, SPA) |
|
| | 2,150,000 | | | | 0.090 | | | | 03/07/13 | | | | 2,150,000 | |
| New York City Transitional Finance Authority Building Aid RB Series 2011
Subseries S-1A (State Aid Withholding) |
|
| | 6,000,000 | | | | 3.000 | | | | 07/15/13 | | | | 6,062,688 | |
| New York City Transitional Finance Authority RB for Future Tax Secured
Series 2011 Subseries D-1 |
|
| | 2,500,000 | | | | 3.000 | | | | 11/01/13 | | | | 2,546,445 | |
| New York City Transitional Finance Authority VRDN for Future Tax Secured
Series 2001 C (Landesbank Baden-Wurttemberg, LIQ) |
|
| | 6,300,000 | | | | 0.130 | | | | 03/07/13 | | | | 6,300,000 | |
| New York City Transitional Finance Authority VRDN RB for Future Tax Secured
Floater Certificates Series 2011-133C (Wells Fargo Bank N.A., LIQ)(a) |
|
| | 8,235,000 | | | | 0.100 | | | | 03/07/13 | | | | 8,235,000 | |
| New York City Transitional Finance Authority VRDN RB for Future Tax Secured
Floater Certificates Series 2011-21C (Wells Fargo Bank N.A., LIQ)(a) |
|
| | 2,800,000 | | | | 0.100 | | | | 03/07/13 | | | | 2,800,000 | |
| New York City Transitional Finance Authority VRDN RB for Future Tax Secured
Series 2002-A-3B (Bank of Tokyo Mitsubishi UFJ, LOC) |
|
| | 3,600,000 | | | | 0.090 | | | | 03/07/13 | | | | 3,600,000 | |
| New York City Transitional Finance Authority VRDN RB for NYC Recovery
Series 2002-1 Subseries 1-A (Landesbank Hessen-Thueringen Girozentrale, LIQ) |
|
| | 32,500,000 | | | | 0.140 | | | | 03/07/13 | | | | 32,500,000 | |
| New York City Transitional Finance Authority VRDN RB for NYC Recovery
Series 2002-3 Subseries 3E (Landesbank Baden-Wurttemberg, SPA) |
|
| | 24,545,000 | | | | 0.160 | | | | 03/01/13 | | | | 24,545,000 | |
| New York City Transitional Finance Authority VRDN RB ROCS-RR-I R-11932
Series 2011 (State Aid Withholding) (Citibank N.A., LIQ)(a) |
|
| | 4,000,000 | | | | 0.140 | | | | 03/07/13 | | | | 4,000,000 | |
| New York City Transitional Finance Authority VRDN RB SPEARS
Series 2012-DB-1075X (State Aid Withholding) (Deutsche Bank A.G., LIQ)(a) |
|
| | 18,055,000 | | | | 0.130 | | | | 03/07/13 | | | | 18,055,000 | |
| New York City Transitional Financial Authority VRDN RB Austin Trust
Certificates Series 2008-1190 (Bank of America N.A., LIQ) |
|
| | 3,170,000 | | | | 0.150 | | | | 03/07/13 | | | | 3,170,000 | |
| New York City Trust for Cultural Resources VRDN RB Austin Trust Certificates
for Museum of Modern Art Series 2008-3316 (Bank of America N.A., LIQ)(a) |
|
| | 2,795,000 | | | | 0.150 | | | | 03/07/13 | | | | 2,795,000 | |
| New York City Trust for Cultural Resources VRDN RB for Metropolitan Museum
of Art Series 2006 A2 RMKT |
|
| | 2,140,000 | | | | 0.100 | | | | 03/07/13 | | | | 2,140,000 | |
| New York State Dormitory Authority Non-State Supported Debt RB for School
District Financing Program Series 2012 F (State Aid Withholding) |
|
| | 20,000,000 | | | | 3.000 | | | | 10/01/13 | | | | 20,315,442 | |
| | |
| | | | | | | | | | | | | | |
| | Municipal Debt Obligations – (continued) | |
| | New York – (continued) | |
| New York State Dormitory Authority Non-State Supported Debt VRDN RB for
Cornell University Floater Certificates Series 2011-3C (Wells Fargo Bank
N.A., LIQ)(a) |
|
| $ | 11,740,000 | | | | 0.100 | % | | | 03/07/13 | | | $ | 11,740,000 | |
| New York State Dormitory Authority Non-State Supported Debt VRDN RB for
Memorial Sloan-Kettering Hospital Putters Series 2008-3171 (JPMorgan
Chase Bank N.A., LIQ)(a) |
|
| | 5,110,000 | | | | 0.120 | | | | 03/07/13 | | | | 5,110,000 | |
| New York State Dormitory Authority Personal Income Tax VRDN RB Eagle
Series 2006-0164 Class A (Citibank N.A., LIQ) |
|
| | 11,060,000 | | | | 0.140 | | | | 03/07/13 | | | | 11,060,000 | |
| New York State Dormitory Authority Personal Income Tax VRDN RB Putters
Series 2008-3160 (JPMorgan Chase Bank N.A., LIQ)(a) |
|
| | 6,660,000 | | | | 0.120 | | | | 03/07/13 | | | | 6,660,000 | |
| New York State Dormitory Authority Personal Income Tax VRDN RB Putters
Series 2008-3280 (JPMorgan Chase Bank N.A., LIQ)(a) |
|
| | 5,000,000 | | | | 0.120 | | | | 03/07/13 | | | | 5,000,000 | |
| New York State Dormitory Authority Personal Income Tax VRDN RB Putters
Series 2010-3698Z (JPMorgan Chase Bank N.A., LIQ)(a) |
|
| | 8,600,000 | | | | 0.120 | | | | 03/07/13 | | | | 8,600,000 | |
| New York State Dormitory Authority Personal Income Tax VRDN RB Putters
Series 2010-3792Z (JPMorgan Chase Bank N.A., LIQ)(a) |
|
| | 6,360,000 | | | | 0.120 | | | | 03/07/13 | | | | 6,360,000 | |
| New York State Dormitory Authority Personal Income Tax VRDN RB ROCS-RR-II
R-12121 Series 2007 (Citibank N.A., LIQ) |
|
| | 8,920,000 | | | | 0.140 | | | | 03/07/13 | | | | 8,920,000 | |
| New York State Dormitory Authority VRDN RB for Memorial Sloan-Kettering
Hospital Putters Series 2008-3201 (JPMorgan Chase Bank N.A., LIQ)(a) |
|
| | 8,220,000 | | | | 0.120 | | | | 03/07/13 | | | | 8,220,000 | |
| New York State Dormitory Authority VRDN RB for Mental Health Services
Series 2003 Subseries D-2E (Royal Bank of Canada, LOC) |
|
| | 3,255,000 | | | | 0.090 | | | | 03/07/13 | | | | 3,255,000 | |
| New York State Environmental Facilities Corp. VRDN RB for State Clean Water
& Drinking Putters Series 2008-2870 (JPMorgan Chase Bank N.A., LIQ) |
|
| | 6,245,000 | | | | 0.120 | | | | 03/07/13 | | | | 6,245,000 | |
| New York State Housing Finance Agency VRDN RB for 20 River Terrace Housing
Series 2002 A RMKT (FNMA, LIQ) |
|
| | 18,900,000 | | | | 0.110 | | | | 03/07/13 | | | | 18,900,000 | |
| New York State Housing Finance Agency VRDN RB for 42nd & 10th Housing
Series 2008 A RMKT (FHLMC, LIQ) (FHLMC, LOC) |
|
| | 18,950,000 | | | | 0.130 | | | | 03/07/13 | | | | 18,950,000 | |
| New York State Housing Finance Agency VRDN RB for 42nd & 10th Housing
Series 2010 A RMKT (FHLMC, LIQ) (FHLMC, LOC) |
|
| | 23,050,000 | | | | 0.130 | | | | 03/07/13 | | | | 23,050,000 | |
| New York State Housing Finance Agency VRDN RB for 600 West 42nd Street
Series 2009 A RMKT (FNMA, LIQ) |
|
| | 24,000,000 | | | | 0.100 | | | | 03/07/13 | | | | 24,000,000 | |
| New York State Housing Finance Agency VRDN RB for North End
Series 2004 A RMKT (FNMA, LIQ) |
|
| | 29,900,000 | | | | 0.110 | | | | 03/07/13 | | | | 29,900,000 | |
| New York State Housing Finance Agency VRDN RB for Taconic Housing West
17th Street Series 2009 A (FNMA, LIQ) |
|
| | 28,625,000 | | | | 0.100 | | | | 03/07/13 | | | | 28,625,000 | |
| | |
| | |
| 44 | | The accompanying notes are an integral part of these financial statements. |
FINANCIAL SQUARE TAX-FREE MONEY MARKET FUND
| | | | | | | | | | | | | | |
Principal Amount | | | Interest
Rate | | | Maturity
Date | | | Amortized Cost | |
| | | | | | | | | | | | | | |
| | Municipal Debt Obligations – (continued) | |
| | New York – (continued) | |
| New York State Liberty Development Corp. VRDN RB for 4 World Trade Center
Project SPEARS Series 2011-DB-1036X (GTY AGMT-Deutsche Bank A.G.)
(Deutsche Bank A.G., LIQ)(a) |
|
| $ | 8,425,000 | | | | 0.160 | % | | | 03/07/13 | | | $ | 8,425,000 | |
| New York State Local Government Assistance Corp. VRDN RB Austin Trust
Certificates Series 2008-3506 (AGM-CR GO of Corp.) (Bank of America N.A., LIQ) |
|
| | 1,710,000 | | | | 0.150 | | | | 03/07/13 | | | | 1,710,000 | |
| New York State Local Government Assistance Corp. VRDN RB Refunding
Subordinate Lien Series 2003-4V RMKT (GO of Corp.)
(Bank of America N.A., SPA) |
|
| | 63,595,000 | | | | 0.170 | | | | 03/07/13 | | | | 63,595,000 | |
| New York State Thruway Authority VRDN RB Putters Series 2012-4256 (AGM)
(JPMorgan Chase Bank N.A., LIQ)(a) |
|
| | 31,585,000 | | | | 0.110 | | | | 03/01/13 | | | | 31,585,000 | |
| Northport-East Northport Union Free School District Series 2012
(State Aid Withholding) |
|
| | 28,500,000 | | | | 2.000 | | | | 06/27/13 | | | | 28,660,429 | |
| Triborough Bridge & Tunnel Authority VRDN RB General Series 2002 F
(Helaba, SPA) |
|
| | 14,440,000 | | | | 0.160 | | | | 03/01/13 | | | | 14,440,000 | |
| | | | | | | | | | | | | | |
| | | | | | | | | | | | | 631,542,361 | |
| | |
| | North Carolina – 2.1% | |
| Charlotte Water & Sewer System VRDN RB Putters Series 2009-3443
(JPMorgan Chase Bank N.A., LIQ)(a) |
|
| | 5,930,000 | | | | 0.120 | | | | 03/07/13 | | | | 5,930,000 | |
| County of Union, North Carolina Enterprise System VRDN RB Series 2009
(U.S. Bank N.A., LOC) |
|
| | 18,600,000 | | | | 0.100 | | | | 03/07/13 | | | | 18,600,000 | |
| North Carolina Capital Facilities Finance Agency Educational Facilities VRDN RB
for Wake Forest University Series 2004 A |
|
| | 19,570,000 | | | | 0.090 | | | | 03/07/13 | | | | 19,570,000 | |
| North Carolina Capital Facilities Finance Agency VRDN RB for Duke University
Project Eagle 7 Series 2005-0060 Class A (Citibank N.A., LIQ) |
|
| | 15,600,000 | | | | 0.110 | | | | 03/07/13 | | | | 15,600,000 | |
| North Carolina Capital Facilities Finance Agency VRDN RB for Duke University
Project Eagle Series 2007-0015 Class A (Citibank N.A., LIQ) |
|
| | 10,890,000 | | | | 0.110 | | | | 03/07/13 | | | | 10,890,000 | |
| North Carolina Capital Facilities Finance Agency VRDN RB for Duke University
Project Eagle Series 2007-0016 Class A (Citibank N.A., LIQ) |
|
| | 16,060,000 | | | | 0.110 | | | | 03/07/13 | | | | 16,060,000 | |
| North Carolina Capital Facilities Finance Agency VRDN RB for Duke University
Project Putters Series 2009-3333 (JPMorgan Chase Bank N.A., LIQ)(a) |
|
| | 11,000,000 | | | | 0.120 | | | | 03/07/13 | | | | 11,000,000 | |
| North Carolina Medical Care Commission Health Care Facilities Municipal Trust
Receipts VRDN RB for Duke University Health System Floater Trust
Series 2010-31W (Barclays Bank PLC, LIQ)(a) |
|
| | 2,000,000 | | | | 0.140 | | | | 03/07/13 | | | | 2,000,000 | |
| Raleigh Durham Airport Authority VRDN RB Refunding Series 2008 C RMKT
(U.S. Bank N.A., LOC) |
|
| | 10,300,000 | | | | 0.100 | | | | 03/07/13 | | | | 10,300,000 | |
| State of North Carolina GO Series 2004 A | |
| | 4,000,000 | | | | 5.250 | | | | 03/01/13 | | | | 4,000,000 | |
| | |
| | | | | | | | | | | | | | |
| | Municipal Debt Obligations – (continued) | |
| | North Carolina – (continued) | |
| University of North Carolina at Chapel Hill VRDN RB Eagle-7
Series 2005-3014 Class A (Citibank N.A., LIQ) |
|
| $ | 5,345,000 | | | | 0.120 | % | | | 03/07/13 | | | $ | 5,345,000 | |
| University of North Carolina at Chapel Hill VRDN RB Series 2012-0-24
(Royal Bank of Canada, LIQ)(a) |
|
| | 11,380,000 | | | | 0.110 | | | | 03/07/13 | | | | 11,380,000 | |
| | | | | | | | | | | | | | |
| | | | | | | | | | | | | 130,675,000 | |
| | |
| | North Dakota – 1.0% | |
| County of Mercer CP Series 2012-09-1 | |
| | 64,925,000 | | | | 0.180 | | | | 03/01/13 | | | | 64,925,000 | |
| | |
| | Ohio – 3.1% | |
| Columbus GO for Various Purpose Limited Tax Notes Series 2012-1 | |
| | 5,500,000 | | | | 1.500 | | | | 11/21/13 | | | | 5,551,358 | |
| Columbus GO VRDN for Sanitation Sewer System Series 2006-1 | |
| | 11,480,000 | | | | 0.100 | | | | 03/07/13 | | | | 11,480,000 | |
| Columbus GO VRDN Putters Series 2007-2365 (JPMorgan Chase Bank N.A., LIQ) | |
| | 4,360,000 | | | | 0.120 | | | | 03/07/13 | | | | 4,360,000 | |
| Franklin County Hospital VRDN RB for Ohio Health Corp. Series 2011-C | |
| | 3,500,000 | | | | 0.560 | | | | 06/03/13 | | | | 3,501,762 | |
| Franklin County Hospital VRDN RB for Ohio Health Corp. Series 2011-DB-1040
(Deutsche Bank A.G., LIQ)(a) |
|
| | 11,330,000 | | | | 0.130 | | | | 03/07/13 | | | | 11,330,000 | |
| Franklin County Hospital VRDN RB Refunding for Nationwide Children’s
Hospital Series 2008 D (PNC Bank N.A., SPA) |
|
| | 18,120,000 | | | | 0.110 | | | | 03/07/13 | | | | 18,120,000 | |
| Ohio State GO VRDN Refunding for Infrastructure Improvement Series 2003 B | |
| | 51,580,000 | | | | 0.110 | | | | 03/07/13 | | | | 51,580,000 | |
| Ohio State GO VRDN Refunding for Infrastructure Improvement Series 2004 A | |
| | 13,800,000 | | | | 0.110 | | | | 03/07/13 | | | | 13,800,000 | |
| Ohio State GO VRDN Series 2006 C | |
| | 18,395,000 | | | | 0.090 | | | | 03/07/13 | | | | 18,395,000 | |
| Ohio State Higher Educational Facility Commission CP Series 2013 (JPMorgan
Chase Bank N.A., LOC) |
|
| | 10,000,000 | | | | 0.170 | | | | 05/08/13 | | | | 10,000,000 | |
| Ohio State Higher Educational Facility Commission VRDN RB for Cleveland
Health Clinic Floater Certificates Series 2008-59C (Wells Fargo & Co., LIQ)(a) |
|
| | 19,800,000 | | | | 0.100 | | | | 03/07/13 | | | | 19,800,000 | |
| Ohio State Hospital Facility VRDN RB for Cleveland Health Clinic Putters
Series 2009-3555Z (JPMorgan Chase Bank N.A., LIQ)(a) |
|
| | 6,745,000 | | | | 0.120 | | | | 03/07/13 | | | | 6,745,000 | |
| Ohio State Hospital Facility VRDN RB for Cleveland Health Clinic Putters
Series 2009-3558Z (JPMorgan Chase Bank N.A., LIQ)(a) |
|
| | 7,100,000 | | | | 0.120 | | | | 03/07/13 | | | | 7,100,000 | |
| Ohio State University General Receipts VRDN RB Series 2008 B | |
| | 14,100,000 | | | | 0.090 | | | | 03/07/13 | | | | 14,100,000 | |
| | | | | | | | | | | | | | |
| | | | | | | | | | | | | 195,863,120 | |
| | |
| | Oklahoma – 0.3% | |
| Oklahoma State GO Refunding for Buildings Series 2003 A (NATL-RE FGIC) | |
| | 8,405,000 | | | | 5.000 | | | | 07/15/13 | | | | 8,555,866 | |
| Oklahoma State Turnpike Authority VRDN RB Floater Certificates
Series 2012 E-37 (Royal Bank of Canada, LOC) (Royal Bank of Canada, LIQ)(a) |
|
| | 10,000,000 | | | | 0.110 | | | | 03/07/13 | | | | 10,000,000 | |
| | | | | | | | | | | | | | |
| | | | | | | | | | | | | 18,555,866 | |
| | |
| | |
| The accompanying notes are an integral part of these financial statements. | | 45 |
FINANCIAL SQUARE TAX-FREE MONEY MARKET FUND
Schedule of Investments (continued)
February 28, 2013 (Unaudited)
| | | | | | | | | | | | | | |
Principal Amount | | | Interest
Rate | | | Maturity
Date | | | Amortized Cost | |
| | | | | | | | | | | | | | |
| | Municipal Debt Obligations – (continued) | |
| | Oregon – 1.9% | |
| Oregon State GO TANS Series 2012 A | |
| $ | 65,000,000 | | | | 2.000 | % | | | 06/28/13 | | | $ | 65,381,669 | |
| Oregon State GO VRDN for Veterans Welfare Series 2008-90B-RMKT
(The Bank of Tokyo-Mitsubishi UFJ, SPA) |
|
| | 30,085,000 | | | | 0.100 | | | | 03/07/13 | | | | 30,085,000 | |
| Oregon State GO VRDN Welfare Series 1985-73-H (Bayerische Landesbank, SPA) | |
| | 20,800,000 | | | | 0.140 | | | | 03/07/13 | | | | 20,800,000 | |
| Umatilla County Hospital Facility Authority VRDN RB for Catholic Health
Series 1997 B (Bayerische Landesbank N.A., SPA) |
|
| | 3,200,000 | | | | 0.180 | | | | 03/07/13 | | | | 3,200,000 | |
| | | | | | | | | | | | | | |
| | | | | | | | | | | | | 119,466,669 | |
| | |
| | Pennsylvania – 0.6% | |
| Allegheny County Hospital Development Authority VRDN RB for University
Pittsburg Medical Center Floater Certificates Series 2011 E-29 (Royal Bank of
Canada, LOC) (Royal Bank of Canada, LIQ)(a) |
|
| | 7,000,000 | | | | 0.110 | | | | 03/07/13 | | | | 7,000,000 | |
| Pennsylvania State Turnpike Commission VRDN RB Floater Certificates
Series 2011 E-22 (Royal Bank of Canada, LOC) (Royal Bank of Canada, LIQ)(a) |
|
| | 18,500,000 | | | | 0.110 | | | | 03/07/13 | | | | 18,500,000 | |
| Pennsylvania State Turnpike Commission VRDN RB Series 2011 B | |
| | 5,500,000 | | | | 0.620 | | | | 06/01/13 | | | | 5,501,175 | |
| University of Pittsburgh VRDN RB Floater Series 2009-38C (GO of University)
(Wells Fargo & Co., LIQ)(a) |
|
| | 4,000,000 | | | | 0.100 | | | | 03/07/13 | | | | 4,000,000 | |
| | | | | | | | | | | | | | |
| | | | | | | | | | | | | 35,001,175 | |
| | |
| | Puerto Rico – 1.1% | |
| Puerto Rico Sales Tax Financing Corp. VRDN RB Floater Trust Refunding
Series 2010-65W (Barclays Bank PLC, LIQ)(a) |
|
| | 11,155,000 | | | | 0.220 | | | | 03/07/13 | | | | 11,155,000 | |
| Puerto Rico Sales Tax Financing Corp. VRDN RB Floater Trust Series 2009-10B
(Barclays Bank PLC, LIQ)(a) |
|
| | 9,050,000 | | | | 0.220 | | | | 03/07/13 | | | | 9,050,000 | |
| Puerto Rico Sales Tax Financing Corp. VRDN RB ROCS-RR-II R-11764
Series 2009 (Citibank N.A., LIQ)(a) |
|
| | 5,000,000 | | | | 0.140 | | | | 03/07/13 | | | | 5,000,000 | |
| Puerto Rico Sales Tax Financing Corp. VRDN RB ROCS-RR-II R-11892
Series 2010 (Citibank N.A., LIQ)(a) |
|
| | 17,735,000 | | | | 0.130 | | | | 03/07/13 | | | | 17,735,000 | |
| Puerto Rico Sales Tax Financing Corp. VRDN RB SPEARS Refunding
Series 2011-DB-1041 (Deutsche Bank A.G., LIQ)(a) |
|
| | 24,470,000 | | | | 0.130 | | | | 03/07/13 | | | | 24,470,000 | |
| | | | | | | | | | | | | | |
| | | | | | | | | | | | | 67,410,000 | |
| | |
| | Rhode Island – 0.3% | |
| Rhode Island Health & Educational Building Corp. Higher Education Facilities
VRDN RB for Brown University Putters Series 2009-3517 (JPMorgan Chase
Bank N.A., LIQ)(a) |
|
| | 16,410,000 | | | | 0.120 | | | | 03/07/13 | | | | 16,410,000 | |
| | |
| | South Carolina – 0.4% | |
| Columbia Waterworks & Sewer System VRDN RB Floater Trust Series 2010-42W
(Barclays Bank PLC, LIQ)(a) |
|
| | 3,000,000 | | | | 0.140 | | | | 03/07/13 | | | | 3,000,000 | |
| | |
| | | | | | | | | | | | | | |
| | Municipal Debt Obligations – (continued) | |
| | South Carolina – (continued) | |
| Columbia Waterworks & Sewer System VRDN RB Floater Trust
Series 2010-43W (Barclays Bank PLC, LIQ)(a) |
|
| $ | 3,750,000 | | | | 0.140 | % | | | 03/07/13 | | | $ | 3,750,000 | |
| South Carolina Public Services Authority CP Series 2013 A (JPMorgan Chase
Bank N.A.) |
|
| | 2,126,000 | | | | 0.180 | | | | 03/05/13 | | | | 2,126,000 | |
| South Carolina Public Services Authority VRDN RB Floater Series 2011-0-9
(Royal Bank of Canada, LIQ)(a) |
|
| | 10,300,000 | | | | 0.110 | | | | 03/07/13 | | | | 10,300,000 | |
| South Carolina State Public Service Authority RB for Santee Cooper Refunding
Series 2010 B |
|
| | 3,595,000 | | | | 5.000 | | | | 01/01/14 | | | | 3,733,818 | |
| | | | | | | | | | | | | | |
| | | | | | | | | | | | | 22,909,818 | |
| | |
| | Tennessee – 0.3% | |
| Chattanooga Health Educational & Housing Facility Board VRDN RB for Catholic
Health Series 2004 C |
|
| | 6,700,000 | | | | 0.120 | | | | 03/07/13 | | | | 6,700,000 | |
| Rutherford County Health & Educational Facilities Board VRDN RB for Ascension
Health Senior Credit Group Floater Trust Series 2010-25W (Barclays Bank
PLC, LIQ)(a) |
|
| | 2,000,000 | | | | 0.140 | | | | 03/07/13 | | | | 2,000,000 | |
| Tennessee State School Bond Authority CP Series 2013-97-A (State Street
Bank & Trust Co.) |
|
| | 15,000,000 | | | | 0.150 | | | | 03/01/13 | | | | 15,000,000 | |
| | | | | | | | | | | | | | |
| | | | | | | | | | | | | 23,700,000 | |
| | |
| | Texas – 13.2% | |
| Austin ISD CP Series 2013 A-1 (Sumitomo Mitsui Banking Corp., LOC) | |
| | 15,000,000 | | | | 0.170 | | | | 03/25/13 | | | | 15,000,000 | |
| Board of Regents of the University of Texas System VRDN RB Refunding
Series 2007 B |
|
| | 11,300,000 | | | | 0.100 | | | | 03/07/13 | | | | 11,300,000 | |
| City of Austin, Texas Hotel Occupancy Tax Subordinate Lien VRDN RB Refunding
Series 2008 A RMKT (JPMorgan Chase Bank N.A., LOC) |
|
| | 30,120,000 | | | | 0.130 | | | | 03/07/13 | | | | 30,120,000 | |
| City of El Paso Water & Sewer CP Series 2013 A (JPMorgan Chase Bank N.A.) | |
| | 8,000,000 | | | | 0.160 | | | | 04/02/13 | | | | 8,000,000 | |
| Comal, Texas ISD GO for School Building Series 2006 (PSF-GTD) | |
| | 5,000,000 | | | | 5.000 | | | | 02/01/14 | | | | 5,219,317 | |
| Cypress-Fairbanks ISD GO VRDN Putters Series 2006-1308 (PSF-GTD)
(JPMorgan Chase Bank N.A., LIQ) |
|
| | 6,495,000 | | | | 0.120 | | | | 03/07/13 | | | | 6,495,000 | |
| Cypress-Fairbanks ISD GO VRDN Putters Series 2008-3084Z (PSF-GTD)
(JPMorgan Chase Bank N.A., LIQ) |
|
| | 4,995,000 | | | | 0.120 | | | | 03/07/13 | | | | 4,995,000 | |
| Dallas Area Rapid Transit Sales Tax VRDN RB Putters Series 2010-3687Z
(AMBAC) (JPMorgan Chase Bank N.A., LIQ)(a) |
|
| | 5,360,000 | | | | 0.120 | | | | 03/07/13 | | | | 5,360,000 | |
| Dallas ISD GO Refunding Series 2012 (PSF-GTD) | |
| | 9,325,000 | | | | 2.000 | | | | 08/15/13 | | | | 9,400,893 | |
| Dallas Waterworks & Sewer System CP Series 2013 B (Bank of America N.A.)
(JPMorgan Chase Bank N.A.) |
|
| | 6,350,000 | | | | 0.180 | | | | 03/05/13 | | | | 6,350,000 | |
| | |
| | |
| 46 | | The accompanying notes are an integral part of these financial statements. |
FINANCIAL SQUARE TAX-FREE MONEY MARKET FUND
| | | | | | | | | | | | | | |
Principal Amount | | | Interest
Rate | | | Maturity
Date | | | Amortized Cost | |
| | | | | | | | | | | | | | |
| | Municipal Debt Obligations – (continued) | |
| | Texas – (continued) | |
| Dallas Waterworks & Sewer System CP Series 2013 C (Bank of America N.A.)
(JPMorgan Chase Bank N.A.) |
|
| $ | 4,500,000 | | | | 0.180 | % | | | 03/05/13 | | | $ | 4,500,000 | |
| Dickinson, Texas ISD GO VRDN Series 2000 SGA94 (PSF-GTD) (Societe
Generale, LIQ) |
|
| | 13,350,000 | | | | 0.180 | | | | 03/01/13 | | | | 13,350,000 | |
| Eagle Mountain and Saginaw ISD GO VRDN Floater Certificates Series 2008-53C
(PSF-GTD) (Wells Fargo & Co., LIQ)(a) |
|
| | 26,770,000 | | | | 0.100 | | | | 03/07/13 | | | | 26,770,000 | |
| Fort Bend ISD GO VRDN Floater Series 2008-25C-1 3C7 (PSF-GTD)
(Wells Fargo & Co., LIQ) |
|
| | 9,905,000 | | | | 0.100 | | | | 03/07/13 | | | | 9,905,000 | |
| Frisco ISD GO VRDN Floater Series 2008-19C (PSF-GTD) (Wells Fargo & Co., LIQ) | |
| | 14,555,000 | | | | 0.100 | | | | 03/07/13 | | | | 14,555,000 | |
| Grand Prairie ISD Eclipse Funding Trust GO VRDN Series 2007-0067 (PSF-GTD)
(U.S. Bank N.A., LOC) (U.S. Bank N.A., LIQ) |
|
| | 10,110,000 | | | | 0.110 | | | | 03/07/13 | | | | 10,110,000 | |
| Harris County Health Facilities Development Authority VRDN RB Refunding for
Texas Children’s Hospital Project Series 2008-3 (Bank of America N.A., SPA) |
|
| | 10,400,000 | | | | 0.130 | | | | 03/01/13 | | | | 10,400,000 | |
| Houston, Texas CP Series 2013 H-2 (U.S. Bank N.A., LIQ) | |
| | 4,800,000 | | | | 0.140 | | | | 03/07/13 | | | | 4,800,000 | |
| Keller ISD GO VRDN for School Building Floater Certificates Series 2011-55C
(PSF-GTD) (Wells Fargo Bank N.A., LIQ)(a) |
|
| | 5,630,000 | | | | 0.100 | | | | 03/07/13 | | | | 5,630,000 | |
| Mesquite ISD GO VRDN for School Building Series 2003 A (PSF-GTD) (JPMorgan
Chase Bank N.A., SPA) |
|
| | 18,960,000 | | | | 0.110 | | | | 03/07/13 | | | | 18,960,000 | |
| North Central Texas Health Facilities Development Corp. VRDN RB for Children’s
Medical Center Floater Certificates Series 2012-49C (Wells Fargo Bank
N.A., LIQ)(a) |
|
| | 5,000,000 | | | | 0.100 | | | | 03/07/13 | | | | 5,000,000 | |
| North Central Texas Health Facilities Development Corp. VRDN RB for Children’s
Medical Center Putters Series 2009-3513 (JPMorgan Chase Bank N.A., LIQ)(a) |
|
| | 20,000,000 | | | | 0.120 | | | | 03/07/13 | | | | 20,000,000 | |
| North East ISD GO VRDN Putters Series 2007-2058 (PSF-GTD) (JPMorgan Chase
Bank N.A., LIQ) |
|
| | 8,985,000 | | | | 0.120 | | | | 03/07/13 | | | | 8,985,000 | |
| Port of Port Arthur Navigation District Environmental Facilities VRDN RB for
Motiva Enterprises LLC Series 2009 A |
|
| | 35,100,000 | | | | 0.110 | | | | 03/01/13 | | | | 35,100,000 | |
| Port of Port Arthur Navigation District Environmental Facilities VRDN RB for
Motiva Enterprises LLC Series 2010 A |
|
| | 57,875,000 | | | | 0.110 | | | | 03/01/13 | | | | 57,875,000 | |
| Port of Port Arthur Navigation District Environmental Facilities VRDN RB for
Motiva Enterprises LLC Series 2010 Subseries D |
|
| | 5,525,000 | | | | 0.110 | | | | 03/01/13 | | | | 5,525,000 | |
| Port of Port Arthur Navigation District Environmental Facilities VRDN RB
Refunding for Motiva Enterprises LLC Series 2010 C |
|
| | 37,200,000 | | | | 0.110 | | | | 03/01/13 | | | | 37,200,000 | |
| Port of Port Arthur Navigation District VRDN RB for Motiva Enterprises LLC
Series 2010 Subseries E |
|
| | 39,000,000 | | | | 0.110 | | | | 03/01/13 | | | | 39,000,000 | |
| San Antonio Electric & Gas Systems VRDN RB Putters Series 2008-2957
(JPMorgan Chase Bank N.A., LIQ) |
|
| | 9,995,000 | | | | 0.120 | | | | 03/07/13 | | | | 9,995,000 | |
| | |
| | | | | | | | | | | | | | |
| | Municipal Debt Obligations – (continued) | |
| | Texas – (continued) | |
| San Antonio Electric & Gas Systems VRDN RB Putters Series 2009-3560
(JPMorgan Chase Bank N.A., LIQ)(a) |
|
| $ | 9,015,000 | | | | 0.120 | % | | | 03/07/13 | | | $ | 9,015,000 | |
| San Antonio, Texas CP Series 2013 A (JPMorgan Chase Bank N.A.) | |
| | 10,000,000 | | | | 0.170 | | | | 05/01/13 | | | | 10,000,000 | |
| State of Texas GO VRDN Floater Series 2013-2008-3312 (Credit Suisse, LIQ)(a) | |
| | 10,480,000 | | | | 0.110 | | | | 03/07/13 | | | | 10,480,000 | |
| State of Texas TRANS Series 2012 | |
| | 200,000,000 | | | | 2.500 | | | | 08/30/13 | | | | 202,268,316 | |
| State of Texas VRDN RN Putters Series 2012-4262 (JPMorgan Chase Bank
N.A., LIQ)(a) |
|
| | 72,000,000 | | | | 0.120 | | | | 03/01/13 | | | | 72,000,000 | |
| Tarrant County Cultural Education Facilities Finance Corp. VRDN RB for Texas
Health Resources Series 2008 C |
|
| | 13,185,000 | | | | 0.140 | | | | 03/01/13 | | | | 13,185,000 | |
| Tarrant County Cultural Education Facilities Finance Corp. VRDN RB for Texas
Health Resources Series 2012 B |
|
| | 15,000,000 | | | | 0.110 | | | | 03/07/13 | | | | 15,000,000 | |
| Texas A&M University System Board of Regents VRDN RB Putters
Series 2012-4192 (JPMorgan Chase Bank N.A., LIQ)(a) |
|
| | 10,970,000 | | | | 0.120 | | | | 03/07/13 | | | | 10,970,000 | |
| Texas A&M University VRDN RB Floater Certificates Series 2010-53C
(Wells Fargo Bank N.A., LIQ)(a) |
|
| | 5,555,000 | | | | 0.100 | | | | 03/07/13 | | | | 5,555,000 | |
| Texas A&M University VRDN RB Floaters Trust Series 2010-39W
(Barclays Bank PLC, LIQ)(a) |
|
| | 2,500,000 | | | | 0.140 | | | | 03/07/13 | | | | 2,500,000 | |
| Texas State Transportation Commission VRDN RB Putters Series 2008-2563
(JPMorgan Chase Bank N.A., LIQ) |
|
| | 6,635,000 | | | | 0.120 | | | | 03/07/13 | | | | 6,635,000 | |
| Texas State Transportation Commission VRDN RB Putters Series 2008-2902
(JPMorgan Chase Bank N.A., LIQ) |
|
| | 14,395,000 | | | | 0.120 | | | | 03/07/13 | | | | 14,395,000 | |
| University of Houston VRDN RB Floater Certificates Series 2009-30C
(Wells Fargo & Co., LIQ)(a) |
|
| | 7,710,000 | | | | 0.100 | | | | 03/07/13 | | | | 7,710,000 | |
| | | | | | | | | | | | | | |
| | | | | | | | | | | | | 819,613,526 | |
| | |
| | Utah – 1.2% | |
| City of Riverton Hospital VRDN RB SPEARS Series 2012-1063X (Deutsche Bank
A.G., LIQ)(a) |
|
| | 13,700,000 | | | | 0.140 | | | | 03/07/13 | | | | 13,700,000 | |
| State of Utah GO Series 2011 A | |
| | 3,000,000 | | | | 4.000 | | | | 07/01/13 | | | | 3,038,195 | |
| Utah County Hospital VRDN RB for IHC Health Services, Inc. Series 2002 B
(U.S. Bank N.A., SPA) |
|
| | 39,350,000 | | | | 0.110 | | | | 03/07/13 | | | | 39,350,000 | |
| Utah Transit Authority VRDN RB Austin Trust Certificates Series 2008-3045X
(AGM) (Bank of America N.A., LIQ) |
|
| | 5,000,000 | | | | 0.150 | | | | 03/07/13 | | | | 5,000,000 | |
| Weber County Hospital VRDN RB for IHC Health Services, Inc. Series 2000 C
(Bank of New York Mellon, SPA) |
|
| | 11,500,000 | | | | 0.140 | | | | 03/01/13 | | | | 11,500,000 | |
| | | | | | | | | | | | | | |
| | | | | | | | | | | | | 72,588,195 | |
| | |
| | |
| The accompanying notes are an integral part of these financial statements. | | 47 |
FINANCIAL SQUARE TAX-FREE MONEY MARKET FUND
Schedule of Investments (continued)
February 28, 2013 (Unaudited)
| | | | | | | | | | | | | | |
Principal Amount | | | Interest
Rate | | | Maturity
Date | | | Amortized Cost | |
| | | | | | | | | | | | | | |
| | Municipal Debt Obligations – (continued) | |
| | Virginia – 1.7% | |
| Fairfax County GO VRDN Solar Series 2012-007 Certificates (State Aid
Withholding) (U.S. Bank N.A., LOC) (U.S. Bank N.A., LIQ)(a) |
|
| $ | 15,090,000 | | | | 0.110 | % | | | 03/07/13 | | | $ | 15,090,000 | |
| Fairfax County IDA Inova Health System VRDN RB Floaters Series 2012-3309
(Credit Suisse, LIQ)(a) |
|
| | 5,200,000 | | | | 0.110 | | | | 03/07/13 | | | | 5,200,000 | |
| Loudoun County IDA VRDN RB for Howard Hughes Medical Center
Series 2003 D |
|
| | 39,390,000 | | | | 0.110 | | | | 03/07/13 | | | | 39,390,000 | |
| Loudoun County IDA VRDN RB for Howard Hughes Medical Center
Series 2003 F |
|
| | 12,600,000 | | | | 0.090 | | | | 03/07/13 | | | | 12,600,000 | |
| Montgomery County IDA VRDN RB for Technology Foundation Series 2009 A
Convertible (Bank of NY Mellon, SPA) |
�� |
| | 10,965,000 | | | | 0.110 | | | | 03/07/13 | | | | 10,965,000 | |
| University of Virginia VRDN RB Putters Series 2008-3188Z (JPMorgan Chase
Bank N.A., LIQ)(a) |
|
| | 8,900,000 | | | | 0.110 | | | | 03/01/13 | | | | 8,900,000 | |
| Virginia State Commonwealth Transportation Board VRDN RB for Capital
Projects Floater Certificates Series 2012-44C (Wells Fargo Bank N.A., LIQ)(a) |
|
| | 4,025,000 | | | | 0.100 | | | | 03/07/13 | | | | 4,025,000 | |
| Virginia State Commonwealth Transportation Board VRDN RB for Capital
Projects Putters Series 2012-4272 (JPMorgan Chase Bank N.A., LIQ)(a) |
|
| | 7,500,000 | | | | 0.120 | | | | 03/07/13 | | | | 7,500,000 | |
| | | | | | | | | | | | | | |
| | | | | | | | | | | | | 103,670,000 | |
| | |
| | Washington – 4.5% | |
| Central Puget Sound Washington Regional Transportation Authority VRDN RB
Floaters Series 2007-1C (AGM) (Wells Fargo & Co., LIQ) |
|
| | 5,465,000 | | | | 0.100 | | | | 03/07/13 | | | | 5,465,000 | |
| Energy Northwest Electric VRDN RB Refunding for Columbia Station Putters
Series 2007-2301 (JPMorgan Chase Bank N.A., LIQ) |
|
| | 7,995,000 | | | | 0.120 | | | | 03/07/13 | | | | 7,995,000 | |
| King County CP Series 2013 A (Bayerische Landesbank, LOC) | |
| | 65,720,000 | | | | 0.200 | | | | 04/01/13 | | | | 65,720,000 | |
| King County Municipal Trust Receipts GO VRDN Floater Trust Series 2009 1W
(AGC-ICC) (Barclays Bank PLC, LIQ)(a) |
|
| | 7,500,000 | | | | 0.140 | | | | 03/07/13 | | | | 7,500,000 | |
| King County Municipal Trust Receipts GO VRDN Floater Trust Series 2010-66W
(Barclays Bank PLC, LIQ)(a) |
|
| | 2,500,000 | | | | 0.140 | | | | 03/07/13 | | | | 2,500,000 | |
| King County Sewer RB Refunding Series 2010 | |
| | 6,200,000 | | | | 4.000 | | | | 01/01/14 | | | | 6,395,803 | |
| King County Sewer VRDN RB Floater Certificates Series 2008-46C
(Wells Fargo & Co., LIQ) |
|
| | 9,940,000 | | | | 0.100 | | | | 03/07/13 | | | | 9,940,000 | |
| King County Sewer VRDN RB Putters Series 2011-3941 (JPMorgan Chase Bank
N.A., LIQ)(a) |
|
| | 6,840,000 | | | | 0.120 | | | | 03/07/13 | | | | 6,840,000 | |
| King County Water Sewer RB Refunding Series 2004 A (NATL-RE) | |
| | 5,365,000 | | | | 4.500 | | | | 01/01/14 | | | | 5,557,335 | |
| King County, Washington GO Series 2009 | |
| | 1,680,000 | | | | 5.000 | | | | 01/01/14 | | | | 1,747,093 | |
| King County, Washington GO VRDN Series 2009 A (Bank of America N.A., SPA) | |
| | 30,000,000 | | | | 0.130 | | | | 03/07/13 | | | | 30,000,000 | |
| | |
| | | | | | | | | | | | | | |
| | Municipal Debt Obligations – (continued) | |
| | Washington – (continued) | |
| University of Washington VRDN RB Floater Certificates Series 2012-109C
(Wells Fargo Bank N.A., LIQ)(a)(c) |
|
| $ | 14,475,000 | | | | 0.370 | % | | | 12/05/13 | | | $ | 14,475,000 | |
| University of Washington VRDN RB Floater Trust Series 2012-1W
(Barclays Bank PLC, LIQ)(a) |
|
| | 3,700,000 | | | | 0.140 | | | | 03/07/13 | | | | 3,700,000 | |
| University of Washington VRDN RB Floater Trust Series 2012-7WX
(Barclays Bank PLC, LIQ)(a) |
|
| | 5,430,000 | | | | 0.140 | | | | 03/07/13 | | | | 5,430,000 | |
| Washington State GO for Motor Vehicle Fuel Tax Series 2011 B-2 | |
| | 3,625,000 | | | | 4.000 | | | | 08/01/13 | | | | 3,682,710 | |
| Washington State GO Refunding for Motor Vehicle Fuel Tax Series 2010 | |
| | 5,335,000 | | | | 5.000 | | | | 07/01/13 | | | | 5,421,073 | |
| Washington State GO VRDN for Motor Vehicle Fuel Tax Putters
Series 2012-4211 (AGM) (JPMorgan Chase Bank N.A., LIQ)(a) |
|
| | 12,555,000 | | | | 0.120 | | | | 03/07/13 | | | | 12,555,000 | |
| Washington State GO VRDN Putters Series 2009-3538 (JPMorgan Chase
Bank N.A., LIQ)(a) |
|
| | 10,000,000 | | | | 0.120 | | | | 03/07/13 | | | | 10,000,000 | |
| Washington State GO VRDN ROCS RR-II R-11889 Series 2010 (Citibank
N.A., LIQ)(a) |
|
| | 2,250,000 | | | | 0.110 | | | | 03/07/13 | | | | 2,250,000 | |
| Washington State GO VRDN SPEARS Series 2007-DB-388 (Deutsche Bank A.G.,
LIQ) (GTY-AGMT-Deutsche Bank A.G.) |
|
| | 7,145,000 | | | | 0.170 | | | | 03/07/13 | | | | 7,145,000 | |
| Washington State Health Care Facilities Authority VRDN RB Austin Trust
Certificates for Children’s Hospital Regional Medical Center Series 2008-1180
(Bank of America N.A., LIQ) |
|
| | 15,060,000 | | | | 0.110 | | | | 03/07/13 | | | | 15,060,000 | |
| Washington State Health Care Facilities Authority VRDN RB for PeaceHealth
Putters Series 2009-3608 (JPMorgan Chase Bank N.A., LIQ)(a) |
|
| | 13,050,000 | | | | 0.260 | | | | 03/07/13 | | | | 13,050,000 | |
| Washington State Health Care Facilities Authority VRDN RB for PeaceHealth
ROCS RR-II R-11723 Series 2009 (Citibank N.A., LIQ)(a) |
|
| | 14,625,000 | | | | 0.260 | | | | 03/07/13 | | | | 14,625,000 | |
| Washington State Health Care Facilities Authority VRDN RB for Seattle
Children’s Hospital Floater Certificates Series 2009-51C (Wells Fargo &
Co., LIQ)(a) |
|
| | 10,990,000 | | | | 0.100 | | | | 03/07/13 | | | | 10,990,000 | |
| Washington State VRDN RB for Student Fee Putters Series 2012-4241 (AMBAC)
(Deutsche Bank A.G., LIQ)(a) |
|
| | 8,740,000 | | | | 0.120 | | | | 03/07/13 | | | | 8,740,000 | |
| | | | | | | | | | | | | | |
| | | | | | | | | | | | | 276,784,014 | |
| | |
| | Wisconsin – 1.0% | |
| Wisconsin Health & Educational Facilities Authority RB for SynergyHealth, Inc.
Series 2003 |
|
| | 7,345,000 | | | | 6.000 | | | | 08/01/13 | | | | 7,520,848 | |
| Wisconsin State GO VRDN Floater Certificates Series 2011-14C
(Wells Fargo Bank N.A., LIQ)(a) |
|
| | 10,675,000 | | | | 0.100 | | | | 03/07/13 | | | | 10,675,000 | |
| Wisconsin State GO VRDN Floaters Series 2008-2927 (Credit Suisse, LIQ) | |
| | 13,050,000 | | | | 0.110 | | | | 03/07/13 | | | | 13,050,000 | |
| | |
| | |
| 48 | | The accompanying notes are an integral part of these financial statements. |
FINANCIAL SQUARE TAX-FREE MONEY MARKET FUND
| | | | | | | | | | | | | | |
Principal Amount | | | Interest
Rate | | | Maturity
Date | | | Amortized Cost | |
| | | | | | | | | | | | | | |
| | Municipal Debt Obligations – (continued) | |
| | Wisconsin – (continued) | |
| Wisconsin State Health & Educational Facilities Authority VRDN RB for
Children’s Hospital Floater Certificates Series 2009-58C (Wells Fargo &
Co., LIQ)(a) |
|
| $ | 9,815,000 | | | | 0.100 | % | | | 03/07/13 | | | $ | 9,815,000 | |
| Wisconsin State Health & Educational Facilities Authority VRDN RB for
Children’s Hospital Floater Trust Series 2009-15W (Barclays Bank PLC, LIQ)(a) |
|
| | 2,940,000 | | | | 0.140 | | | | 03/07/13 | | | | 2,940,000 | |
| Wisconsin State Health & Educational Facilities Authority VRDN RB for Ministry
Health Care, Inc. Series 2010 C |
|
| | 20,000,000 | | | | 0.120 | | | | 03/07/13 | | | | 20,000,000 | |
| | | | | | | | | | | | | | |
| | | | | | | | | | | | | 64,000,848 | |
| | |
| | TOTAL INVESTMENTS – 99.5% | | | $ | 6,158,269,076 | |
| | |
| OTHER ASSETS IN EXCESS OF
LIABILITIES – 0.5% |
| | | 31,136,075 | |
| | |
| | NET ASSETS – 100.0% | | | $ | 6,189,405,151 | |
| | |
| | |
| The percentage shown for each investment category reflects the value of investments in that category as a percentage of net assets. |
(a) | | Security not registered under the Securities Act of 1933, as amended. Such securities have been determined to be liquid by the Investment Adviser. At February 28, 2013, these securities amounted to $1,601,415,000 or approximately 25.9% of net assets. |
(b) | | All or a portion represents a forward commitment. |
(c) | | Security not registered under the Securities Act of 1933, as amended. Such securities have been determined to be illiquid by the Investment Adviser. At February 28, 2013, these securities amounted to $14,475,000 or approximately 0.2% of net assets. |
Interest rates represent either the stated coupon rate, or for floating rate securities, the current reset rate, which is based upon current interest rate indices.
Maturity dates represent either the final legal maturity date on the security, the demand date for puttable securities, or the prerefunded date for those types of securities.
| | |
|
Investment Abbreviations: |
AGC-ICC | | —American General Contractors-Interstate Commerce Commission |
AGM | | —Insured by Assured Guaranty Municipal Corp. |
AMBAC | | —Insured by American Municipal Bond Assurance Corp. |
BANS | | —Bond Anticipation Notes |
BHAC | | —Berkshire Hathaway Assurance Corp. |
COPS | | —Certificates of Participation |
CP | | —Commercial Paper |
CR | | —Custodial Receipts |
DOT | | —Department of Transportation |
FGIC | | —Insured by Financial Guaranty Insurance Co. |
FHA | | —Federal Housing Administration |
FHLMC | | —Insured by Federal Home Loan Mortgage Corp. |
FNMA | | —Insured by Federal National Mortgage Association |
GO | | —General Obligation |
GTD | | —Guaranteed |
GTY AGMT | | —Guaranty Agreement |
IDA | | —Industrial Development Agency |
IDB | | —Industrial Development Board |
IHC | | —International Health Care |
ISD | | —Independent School District |
LIQ | | —Liquidity Agreement |
LOC | | —Letter of Credit |
MBIA | | —Insured by Municipal Bond Investors Assurance |
MF Hsg. | | —Multi-Family Housing |
NATL-RE | | —National Reinsurance Corp. |
PCRB | | —Pollution Control Revenue Bond |
PSF-GTD | | —Guaranteed by Permanent School Fund |
RANS | | —Revenue Anticipation Notes |
RB | | —Revenue Bond |
RN | | —Revenue Notes |
RMKT | | —Remarketed |
ROCS | | —Reset Option Certificates |
RR | | —Revenue Refunding |
SPA | | —Stand-by Purchase Agreement |
SPEARS | | —Short Puttable Exempt Adjustable Receipts |
TANS | | —Tax Anticipation Notes |
TRANS | | —Tax Revenue Anticipation Notes |
VRDN | | —Variable Rate Demand Notes |
|
| | |
| The accompanying notes are an integral part of these financial statements. | | 49 |
FINANCIAL SQUARE TREASURY INSTRUMENTS FUND
Schedule of Investments
February 28, 2013 (Unaudited)
| | | | | | | | | | | | | | |
Principal
Amount | | | Interest
Rate | | | Maturity
Date | | | Amortized
Cost | |
| | U.S. Treasury Obligations – 99.8% | |
| United States Treasury Bills | |
| $ | 5,416,800,000 | | | | 0.065 | % | | | 03/07/13 | | | $ | 5,416,741,318 | |
| | 95,000,000 | | | | 0.095 | | | | 03/07/13 | | | | 94,998,496 | |
| | 400,000,000 | | | | 0.080 | | | | 03/14/13 | | | | 399,988,444 | |
| | 1,800,000,000 | | | | 0.090 | | | | 03/14/13 | | | | 1,799,941,500 | |
| | 86,200,000 | | | | 0.095 | | | | 03/14/13 | | | | 86,197,043 | |
| | 850,000,000 | | | | 0.105 | | | | 03/21/13 | | | | 849,950,417 | |
| | 5,700,000,000 | | | | 0.115 | | | | 03/21/13 | | | | 5,699,635,834 | |
| | 1,500,000,000 | | | | 0.110 | | | | 03/28/13 | | | | 1,499,876,250 | |
| | 175,000,000 | | | | 0.090 | | | | 04/18/13 | | | | 174,979,000 | |
| United States Treasury Notes | |
| | 4,914,000,000 | | | | 1.375 | | | | 03/15/13 | | | | 4,916,409,827 | |
| | 278,000,000 | | | | 2.500 | | | | 03/31/13 | | | | 278,529,464 | |
| | 220,000,000 | | | | 3.125 | | | | 04/30/13 | | | | 221,059,823 | |
| | 147,000,000 | | | | 1.375 | | | | 05/15/13 | | | | 147,366,347 | |
| | 795,000,000 | | | | 3.625 | | | | 05/15/13 | | | | 800,752,284 | |
| | 889,000,000 | | | | 0.500 | | | | 05/31/13 | | | | 889,825,466 | |
| | 259,000,000 | | | | 3.500 | | | | 05/31/13 | | | | 261,190,427 | |
| | 350,000,000 | | | | 1.125 | | | | 06/15/13 | | | | 350,908,782 | |
| | 8,000,000 | | | | 0.375 | | | | 06/30/13 | | | | 8,003,472 | |
| | 73,000,000 | | | | 3.375 | | | | 06/30/13 | | | | 73,756,383 | |
| | 380,700,000 | | | | 1.000 | | | | 07/15/13 | | | | 381,843,416 | |
| | 1,433,000,000 | | | | 0.375 | | | | 07/31/13 | | | | 1,434,368,540 | |
| | 800,000,000 | | | | 3.375 | | | | 07/31/13 | | | | 810,823,174 | |
| | 112,000,000 | | | | 4.250 | | | | 08/15/13 | | | | 114,112,752 | |
| | 50,000,000 | | | | 3.125 | | | | 08/31/13 | | | | 50,740,537 | |
| | 537,000,000 | | | | 0.125 | | | | 09/30/13 | | | | 536,772,666 | |
| | 58,900,000 | | | | 3.125 | | | | 09/30/13 | | | | 59,900,979 | |
| | 202,900,000 | | | | 0.500 | | | | 10/15/13 | | | | 203,268,844 | |
| | 150,000,000 | | | | 0.250 | | | | 10/31/13 | | | | 150,107,495 | |
| | 253,000,000 | | | | 2.750 | | | | 10/31/13 | | | | 257,284,166 | |
| | 100,000,000 | | | | 0.500 | | | | 11/15/13 | | | | 100,201,820 | |
| | 54,000,000 | | | | 0.750 | | | | 12/15/13 | | | | 54,250,712 | |
| | 27,000,000 | | | | 1.000 | | | | 01/15/14 | | | | 27,195,746 | |
| | 100,000,000 | | | | 0.250 | | | | 01/31/14 | | | | 100,068,554 | |
| | 120,000,000 | | | | 4.000 | | | | 02/15/14 | | | | 124,400,769 | |
| | 209,000,000 | | | | 1.875 | | | | 02/28/14 | | | | 212,513,322 | |
| | |
| | TOTAL INVESTMENTS – 99.8% | | | $ | 28,587,964,069 | |
| | |
| OTHER ASSETS IN EXCESS OF
LIABILITIES – 0.2% |
| | | 56,469,085 | |
| | |
| | NET ASSETS – 100.0% | | | $ | 28,644,433,154 | |
| | |
| | |
| The percentage shown for each investment category reflects the value of investments in that category as a percentage of net assets. |
Interest rates represent either the stated coupon rate or the annualized yield on date of purchase for discounted securities.
Maturity dates represent either the final legal maturity date on the security, the demand date for puttable securities, or the prerefunded date for those types of securities.
| | |
| 50 | | The accompanying notes are an integral part of these financial statements. |
FINANCIAL SQUARE TREASURY OBLIGATIONS FUND
Schedule of Investments
February 28, 2013 (Unaudited)
| | | | | | | | | | | | | | |
Principal
Amount | | | Interest
Rate | | | Maturity
Date | | | Amortized
Cost | |
| | | | | | | | | | | | | | |
| | U.S. Treasury Obligations – 24.7% | |
| United States Treasury Notes | |
| $ | 89,000,000 | | | | 2.500 | % | | | 03/31/13 | | | $ | 89,168,159 | |
| | 127,000,000 | | | | 3.125 | | | | 04/30/13 | | | | 127,609,066 | |
| | 76,000,000 | | | | 1.375 | | | | 05/15/13 | | | | 76,180,868 | |
| | 150,000,000 | | | | 3.500 | | | | 05/31/13 | | | | 151,230,355 | |
| | 400,000,000 | | | | 1.125 | | | | 06/15/13 | | | | 401,066,475 | |
| | 8,000,000 | | | | 0.375 | | | | 06/30/13 | | | | 8,003,472 | |
| | 92,000,000 | | | | 3.375 | | | | 06/30/13 | | | | 92,953,249 | |
| | 254,000,000 | | | | 1.000 | | | | 07/15/13 | | | | 254,712,553 | |
| | 175,000,000 | | | | 3.375 | | | | 07/31/13 | | | | 177,368,091 | |
| | 270,500,000 | | | | 0.125 | | | | 09/30/13 | | | | 270,384,764 | |
| | 68,000,000 | | | | 3.125 | | | | 09/30/13 | | | | 69,155,938 | |
| | 220,000,000 | | | | 0.250 | | | | 10/31/13 | | | | 220,082,896 | |
| | 100,000,000 | | | | 0.250 | | | | 11/30/13 | | | | 100,034,441 | |
| | 266,800,000 | | | | 2.000 | | | | 11/30/13 | | | | 270,372,758 | |
| | 21,000,000 | | | | 0.750 | | | | 12/15/13 | | | | 21,097,499 | |
| | 110,000,000 | | | | 1.000 | | | | 01/15/14 | | | | 110,779,629 | |
| | 150,000,000 | | | | 1.750 | | | | 01/31/14 | | | | 152,145,704 | |
| | 43,000,000 | | | | 4.000 | | | | 02/15/14 | | | | 44,576,942 | |
| | 82,000,000 | | | | 1.875 | | | | 02/28/14 | | | | 83,378,044 | |
| | |
| TOTAL INVESTMENTS BEFORE
REPURCHASE AGREEMENTS |
| | $ | 2,720,300,903 | |
| | |
| | | | | | | | | | | | | | |
| | Repurchase Agreements(a) – 75.2% | |
| Bank of Nova Scotia (The) | |
| $ | 500,000,000 | | | | 0.130 | %(b)(c) | | | 03/07/13 | | | $ | 500,000,000 | |
| Maturity Value: $500,337,638 | |
| Collateralized by U.S. Treasury Bills, 0.000%, due 03/07/13 to
01/09/14, U.S. Treasury Bonds, 3.000% to 8.875%, due
02/15/19 to 02/15/43, U.S. Treasury Inflation-Indexed Bonds,
0.750% to 3.875%, due 01/15/25 to 02/15/42, U.S. Treasury
Inflation-Indexed Notes, 0.125% to 2.500%, due 04/15/13 to
01/15/23 and U.S. Treasury Notes, 0.125% to 4.750%, due
03/15/13 to 08/15/21. The aggregate market value of the
collateral, including accrued interest, was $510,001,875. |
|
| | |
| BNP Paribas Securities Corp. | |
| | 250,000,000 | | | | 0.150 | (b)(c) | | | 03/01/13 | | | | 250,000,000 | |
| Maturity Value: $250,014,583 | |
| Settlement Date: 02/15/13 | |
| Collateralized by U.S. Treasury Inflation-Indexed Bond, 3.375%,
due 04/15/32 and U.S. Treasury Inflation-Indexed Notes,
1.625% to 2.000%, due 01/15/14 to 01/15/15. The aggregate
market value of the collateral, including accrued interest, was
$255,000,014. |
|
| | 700,000,000 | | | | 0.180 | (b) | | | 03/14/13 | | | | 700,000,000 | |
| Maturity Value: $700,598,500 | |
| Settlement Date: 09/25/12 | |
| Collateralized by U.S. Treasury Bill, 0.000%, due 08/08/13, U.S.
Treasury Inflation-Indexed Note, 1.125%, due 01/15/21 and
U.S. Treasury Notes, 0.125% to 4.875%, due 08/31/13 to
02/15/23. The aggregate market value of the collateral,
including accrued interest, was $714,000,028. |
|
| | |
| | | | | | | | | | | | | | |
| | Repurchase Agreements(a) – (continued) | |
| Credit Agricole Corporate and Investment Bank | |
| $ | 900,000,000 | | | | 0.160 | % | | | 03/01/13 | | | $ | 900,000,000 | |
| Maturity Value: $900,004,000 | |
| Collateralized by U.S. Treasury Notes, 2.125% to 2.625%, due
09/30/14 to 02/29/16. The aggregate market value of the
collateral, including accrued interest, was $918,000,074. |
|
| | 750,000,000 | | | | 0.130 | (b)(c) | | | 03/07/13 | | | | 750,000,000 | |
| Maturity Value: $750,330,416 | |
| Settlement Date: 02/15/13 | |
| Collateralized by U.S. Treasury Bonds, 3.000% to 11.250%, due
02/15/15 to 05/15/42, U.S. Treasury Inflation-Indexed Bond,
0.750%, due 2/15/42, U.S. Treasury Inflation-Indexed Notes,
0.125% to 1.625%, due 1/15/15 to 7/15/22 and U.S. Treasury
Notes, 0.875% to 4.125%, due 02/15/14 to 06/30/18. The
aggregate market value of the collateral, including accrued
interest, was $765,000,035. |
|
| | |
| Credit Suisse Securities (USA) LLC | |
| | 500,000,000 | | | | 0.170 | | | | 03/01/13 | | | | 500,000,000 | |
| Maturity Value: $500,002,361 | |
| Collateralized by U.S. Treasury Notes, 0.250% to 2.125%, due
03/15/14 to 12/31/15. The aggregate market value of the
collateral, including accrued interest, was $510,004,434. |
|
�� | | |
| Deutsche Bank Securities, Inc. | |
| | 500,000,000 | | | | 0.150 | | | | 03/01/13 | | | | 500,000,000 | |
| Maturity Value: $500,029,167 | |
| Settlement Date: 02/15/13 | |
| Collateralized by U.S. Treasury Bill, 0.000%, due 07/05/13, U.S.
Treasury Notes, 1.000% to 2.000%, due 05/15/14 to 02/15/22,
U.S. Treasury Interest-Only Stripped Securities, 0.000%, due
05/15/13 to 05/15/22 and U.S. Treasury Principal-Only
Stripped Securities, 0.000%, due 08/15/17 to 02/15/19. The
aggregate market value of the collateral, including accrued
interest, was $510,000,076. |
|
| | |
| HSBC Securities, Inc. | |
| | 700,000,000 | | | | 0.160 | | | | 03/01/13 | | | | 700,000,000 | |
| Maturity Value: $700,003,111 | |
| Collateralized by U.S. Treasury Bond, 3.125%, due 11/15/41 and
U.S. Treasury Notes, 1.000% to 1.375%, due 11/30/15 to
08/31/16. The aggregate market value of the collateral,
including accrued interest, was $714,000,744. |
|
| | |
| Joint Repurchase Agreement Account I | |
| | 416,200,000 | | | | 0.166 | | | | 03/01/13 | | | | 416,200,000 | |
| Maturity Value: $416,201,921 | |
| | |
| JPMorgan Securities LLC | |
| | 340,000,000 | | | | 0.160 | | | | 03/01/13 | | | | 340,000,000 | |
| Maturity Value: $340,001,511 | |
| Collateralized by U.S. Treasury Note, 1.500%, due 06/30/16 and
U.S. Treasury Principal-Only Stripped Securities, 0.000% to
6.000%, due 05/15/13 to 02/15/43. The aggregate market value
of the collateral, including accrued interest, was $346,802,023. |
|
| | |
| | |
| The accompanying notes are an integral part of these financial statements. | | 51 |
FINANCIAL SQUARE TREASURY OBLIGATIONS FUND
Schedule of Investments (continued)
February 28, 2013 (Unaudited)
| | | | | | | | | | | | | | |
Principal
Amount | | | Interest
Rate | | | Maturity
Date | | | Amortized
Cost | |
| | | | | | | | | | | | | | |
| | Repurchase Agreements(a) – (continued) | |
| Morgan Stanley & Co. LLC | |
| $ | 100,000,000 | | | | 0.200 | % | | | 03/01/13 | | | $ | 100,000,000 | |
| Maturity Value: $100,000,556 | |
| Collateralized by U.S. Treasury Note, 0.250%, due 02/28/15. The
market value of the collateral, including accrued interest, was
$102,000,059. |
|
| | 300,000,000 | | | | 0.200 | | | | 03/01/13 | | | | 300,000,000 | |
| Maturity Value: $300,001,667 | |
| Collateralized by U.S. Treasury Notes, 0.250% to 1.875%, due
12/15/15 to 09/30/17. The aggregate market value of the
collateral, including accrued interest, was $306,000,096. |
|
| | |
| Societe Generale | |
| | 300,000,000 | | | | 0.120 | (b)(c) | | | 03/01/13 | | | | 300,000,000 | |
| Maturity Value: $300,028,000 | |
| Settlement Date: 02/01/13 | |
| Collateralized by U.S. Treasury Inflation-Indexed Notes, 0.125%
to 1.375%, due 04/15/17 to 1/15/21 and U.S. Treasury
Principal-Only Stripped Security, 0.00%, due 11/15/39. The
aggregate market value of the collateral, including accrued
interest, was $306,000,041. |
|
| | 1,470,000,000 | | | | 0.160 | | | | 03/01/13 | | | | 1,470,000,000 | |
| Maturity Value: $1,470,006,533 | |
| Collateralized by U.S. Treasury Notes, 0.125% to 2.125%, due
12/31/13 to 02/15/22. The aggregate market value of the
collateral, including accrued interest, was $1,499,400,094. |
|
| | |
| TD Securities (USA) LLC | |
| | 200,000,000 | | | | 0.160 | | | | 03/01/13 | | | | 200,000,000 | |
| Maturity Value: $200,000,889 | |
| Collateralized by U.S. Treasury Bill, 0.000%, due 05/30/13, U.S.
Treasury Inflation-Indexed Bond, 2.375%, due 01/15/27 and
U.S. Treasury Note, 0.875%, due 01/31/18. The aggregate
market value of the collateral, including accrued interest, was
$204,000,032. |
|
| | |
| UBS Securities LLC | |
| | 125,000,000 | | | | 0.150 | | | | 03/01/13 | | | | 125,000,000 | |
| Maturity Value: $125,000,521 | |
| Collateralized by U.S. Treasury Notes, 0.500% to 0.875%, due
11/30/16 to 07/31/17. The aggregate market value of the
collateral, including accrued interest, was $127,500,089. |
|
| | 240,000,000 | | | | 0.150 | | | | 03/01/13 | | | | 240,000,000 | |
| Maturity Value: $240,001,000 | |
| Collateralized by U.S. Treasury Bonds, 7.625% to 8.750%, due
02/15/20 to 02/15/25, U.S. Treasury Inflation-Indexed Note,
2.500%, due 07/15/16 and U.S. Treasury Notes, 1.250% to
4.125%, due 03/31/13 to.08/31/16. The aggregate market value
of the collateral, including accrued interest, was $244,800,060. |
|
| | |
| | TOTAL REPURCHASE AGREEMENTS | | | $ | 8,291,200,000 | |
| | |
| | TOTAL INVESTMENTS – 99.9% | | | $ | 11,011,500,903 | |
| | |
| OTHER ASSETS IN EXCESS OF
LIABILITIES – 0.1% |
| | | 8,640,297 | |
| | |
| | NET ASSETS – 100.0% | | | $ | 11,020,141,200 | |
| | |
| | |
| The percentage shown for each investment category reflects the value of investments in that category as a percentage of net assets. |
(a) | | Unless noted, all repurchase agreements were entered into on February 28, 2013. Additional information on Joint Repurchase Agreement Account I appears on page 53. |
(b) | | Variable or floating rate security. Interest rate disclosed is that which is in effect at February 28, 2013. |
(c) | | The instrument is subject to a demand feature. |
Interest rates represent either the stated coupon rate, annualized yield on date of purchase for discounted securities, or, for floating rate securities, the current reset rate, which is based upon current interest rate indices.
Maturity dates represent either the final legal maturity date on the security, the demand date for puttable securities, or the prerefunded date for those types of securities.
| | |
| 52 | | The accompanying notes are an integral part of these financial statements. |
GOLDMAN SACHS FUNDS — FINANCIAL SQUARE FUNDS
|
| ADDITIONAL INVESTMENT INFORMATION |
JOINT REPURCHASE AGREEMENT ACCOUNT I — At February 28, 2013, certain Funds had undivided interests in the Joint Repurchase Agreement Account I with a maturity date of March 1, 2013, as follows:
| | | | | | | | | | | | |
| Fund | | Principal Amount | | | Maturity Value | | | Collateral Value
Allocation | |
Government | | $ | 1,698,300,000 | | | $ | 1,698,307,837 | | | $ | 1,732,266,209 | |
Money Market | | | 150,000,000 | | | | 150,000,692 | | | | 153,000,018 | |
Prime Obligations | | | 365,500,000 | | | | 365,501,687 | | | | 372,810,045 | |
Treasury Obligations | | | 416,200,000 | | | | 416,201,921 | | | | 424,524,051 | |
REPURCHASE AGREEMENTS — At February 28, 2013, the Principal Amounts of certain Funds' interest in the Joint Repurchase Agreement Account I were as follows:
| | | | | | | | | | | | | | | | | | | | |
| Counterparty | | Interest
Rate | | | Government | | | Money Market | | | Prime Obligations | | | Treasury
Obligations | |
ABN Amro Bank N.V. | | | 0.160 | % | | $ | 645,741,445 | | | $ | 57,034,220 | | | $ | 138,973,384 | | | $ | 158,250,950 | |
BNP Paribas Securities Corp. | | | 0.160 | | | | 371,301,331 | | | | 32,794,677 | | | | 79,909,696 | | | | 90,994,297 | |
Deutsche Bank Securities, Inc. | | | 0.180 | | | | 519,821,863 | | | | 45,912,548 | | | | 111,873,574 | | | | 127,392,015 | |
Wells Fargo Securities LLC | | | 0.160 | | | | 161,435,361 | | | | 14,258,555 | | | | 34,743,346 | | | | 39,562,738 | |
| TOTAL | | | | | | $ | 1,698,300,000 | | | $ | 150,000,000 | | | $ | 365,500,000 | | | $ | 416,200,000 | |
At February 28, 2013, the Joint Repurchase Agreement Account I was fully collateralized by:
| | | | | | | | |
| Issuer | | Interest Rates | | | Maturity Dates | |
U.S. Treasury Bills | | | 0.000 | % | | | 05/30/13 to 07/25/13 | |
U.S. Treasury Bonds | | | 5.375 to 8.000 | | | | 05/15/16 to 02/15/31 | |
U.S. Treasury Inflation Indexed Bonds | | | 2.125 to 3.875 | | | | 04/15/29 to 02/15/41 | |
U.S. Treasury Inflation Indexed Notes | | | 0.125 to 2.500 | | | | 07/15/14 to 07/15/18 | |
U.S. Treasury Notes | | | 0.125 to 4.750 | | | | 08/15/13 to 11/15/22 | |
| | |
| The accompanying notes are an integral part of these financial statements. | | 53 |
GOLDMAN SACHS FUNDS — FINANCIAL SQUARE FUNDS
Schedule of Investments (continued)
February 28, 2013 (Unaudited)
|
| ADDITIONAL INVESTMENT INFORMATION (continued) |
JOINT REPURCHASE AGREEMENT ACCOUNT III — At February 28, 2013, certain Funds had undivided interests in the Joint Repurchase Agreement Account III with a maturity date of March 1, 2013, as follows:
| | | | | | | | | | | | |
| Fund | | Principal Amount | | | Maturity Value | | | Collateral Value
Allocation | |
Government | | $ | 340,000,000 | | | $ | 340,001,737 | | | $ | 348,875,349 | |
Money Market | | | 1,894,100,000 | | | | 1,894,109,676 | | | | 1,943,543,522 | |
Prime Obligations | | | 1,557,400,000 | | | | 1,557,407,956 | | | | 1,598,054,317 | |
REPURCHASE AGREEMENTS — At February 28, 2013, the Principal Amounts of certain Funds’ interest in the Joint Repurchase Agreement Account III were as follows:
| | | | | | | | | | | | | | | | |
| Counterparty | | Interest
Rate | | | Government | | | Money Market | | | Prime Obligations | |
BNP Paribas Securities Corp. | | | 0.170 | % | | $ | 44,155,844 | | | $ | 245,987,013 | | | $ | 202,259,740 | |
Crédit Agricole Corporate and Investment Bank | | | 0.180 | | | | 207,532,468 | | | | 1,156,138,961 | | | | 950,620,779 | |
Wells Fargo Securities LLC | | | 0.190 | | | | 88,311,688 | | | | 491,974,026 | | | | 404,519,481 | |
| TOTAL | | | | | | $ | 340,000,000 | | | $ | 1,894,100,000 | | | $ | 1,557,400,000 | |
| | |
| 54 | | The accompanying notes are an integral part of these financial statements. |
GOLDMAN SACHS FUNDS — FINANCIAL SQUARE FUNDS
|
| ADDITIONAL INVESTMENT INFORMATION (continued) |
At February 28, 2013, the Joint Repurchase Agreement Account III was fully collateralized by:
| | | | | | | | |
| Issuer | | Interest Rates | | | Maturity Dates | |
Federal Farm Credit Bank | | | 0.250 to 4.875 | % | | | 10/16/14 to 01/17/17 | |
Federal Home Loan Bank | | | 0.000 to 5.125 | | | | 05/15/13 to 03/10/23 | |
Federal Home Loan Mortgage Corp. | | | 0.000 to 5.500 | | | | 07/01/13 to 03/01/43 | |
Federal National Mortgage Association | | | 0.450 to 6.250 | | | | 09/08/14 to 03/01/43 | |
Government National Mortgage Association | | | 4.500 | | | | 05/20/41 | |
Tennessee Valley Authority | | | 1.875 to 6.150 | | | | 03/15/13 to 01/15/48 | |
U.S. Treasury Bills | | | 0.000 | | | | 04/11/13 to 07/05/13 | |
U.S. Treasury Notes | | | 0.125 to 4.750 | | | | 03/31/13 to 05/15/20 | |
| | |
| The accompanying notes are an integral part of these financial statements. | | 55 |
GOLDMAN SACHS FUNDS — FINANCIAL SQUARE FUNDS
Statements of Assets and Liabilities
February 28, 2013 (Unaudited)
| | | | | | |
| | | | | Federal Fund | |
| | Assets: | | | | |
| | Investments based on amortized cost | | $ | 12,004,513,610 | |
| | Repurchase agreements based on amortized cost | | | — | |
| | Cash | | | 21,500 | |
| | Receivables: | | | | |
| | Interest | | | 7,647,748 | |
| | Fund shares sold | | | 95,984 | |
| | Investments sold | | | — | |
| | Reimbursement from investment adviser | | | — | |
| | Other assets | | | 104,895 | |
| | Total assets | | | 12,012,383,737 | |
| | | | | | |
| | Liabilities: | | | | |
| | Payables: | | | | |
| | Investments purchased | | | 979,921,128 | |
| | Amounts owed to affiliates | | | 991,314 | |
| | Dividend distribution | | | 13,025 | |
| | Fund shares redeemed | | | — | |
| | Accrued expenses | | | 138,280 | |
| | Total liabilities | | | 981,063,747 | |
| | | | | | |
| | Net Assets: | | | | |
| | Paid-in capital | | | 11,031,313,762 | |
| | Undistributed (distributions in excess of) net investment income (loss) | | | 13,147 | |
| | Accumulated net realized gain (loss) from investments | | | (6,919 | ) |
| | NET ASSETS | | $ | 11,031,319,990 | |
| | | Net asset value, offering and redemption price per share | | | $1.00 | |
| | | Net Assets: | | | | |
| | | FST Shares | | $ | 8,682,821,294 | |
| | | FST Select Shares | | | 74,678,834 | |
| | | FST Preferred Shares | | | 54,268,995 | |
| | | FST Capital Shares | | | 79,858,882 | |
| | | FST Administration Shares | | | 377,398,285 | |
| | | FST Premier Shares | | | 1,213,424,701 | |
| | | FST Service Shares | | | 484,316,339 | |
| | | FST Class B Shares | | | — | |
| | | FST Class C Shares | | | — | |
| | | FST Resource Shares | | | 1,000 | |
| | | FST Cash Management Shares | | | 64,551,660 | |
| | | Total Net Assets | | $ | 11,031,319,990 | |
| | | Shares outstanding $0.001 par value (unlimited number of shares authorized): | | | | |
| | | FST Shares | | | 8,682,816,392 | |
| | | FST Select Shares | | | 74,678,791 | |
| | | FST Preferred Shares | | | 54,268,965 | |
| | | FST Capital Shares | | | 79,858,836 | |
| | | FST Administration Shares | | | 377,398,072 | |
| | | FST Premier Shares | | | 1,213,424,016 | |
| | | FST Service Shares | | | 484,316,066 | |
| | | FST Class B Shares | | | — | |
| | | FST Class C Shares | | | — | |
| | | FST Resource Shares | | | 1,000 | |
| | | FST Cash Management Shares | | | 64,551,624 | |
| | |
| 56 | | The accompanying notes are an integral part of these financial statements. |
GOLDMAN SACHS FUNDS — FINANCIAL SQUARE FUNDS
| | | | | | | | | | | | | | | | | | | | | | | | | | | | | | | | | | | | | | | | | | | | | | |
| | | Government Fund | | | | | Money Market Fund | | | | | Prime Obligations Fund | | | | | Tax-Exempt
California Fund | | | | | Tax-Exempt
New York Fund | | | | | Tax-Free
Money Market Fund | | | | | Treasury Instruments Fund | | | | | Treasury Obligations Fund | |
| | | | | | | | | | | | | | | | | | | | | | | | | | | | | | | | | | | | | | | | | | | | | | |
| | $ | 12,908,626,006 | | | | | $ | 17,341,642,649 | | | | | $ | 11,063,892,721 | | | | | $ | 250,958,927 | | | | | $ | 197,120,761 | | | | | $ | 6,158,269,076 | | | | | $ | 28,587,964,069 | | | | | $ | 2,720,300,903 | |
| | | 20,099,400,000 | | | | | | 11,033,100,000 | | | | | | 8,750,900,000 | | | | | | — | | | | | | — | | | | | | — | | | | | | — | | | | | | 8,291,200,000 | |
| | | 38,206 | | | | | | 39,936 | | | | | | 76,889 | | | | | | 80,005 | | | | | | 71,824 | | | | | | 12,897,430 | | | | | | 48,999 | | | | | | 5,497 | |
| | | | | | | | | | | | | | | | | | | | | | | | | | | | | | | | | | | | | | | | | | | | | | |
| | | 27,622,074 | | | | | | 8,317,339 | | | | | | 7,138,628 | | | | | | 336,231 | | | | | | 268,361 | | | | | | 11,936,227 | | | | | | 57,631,845 | | | | | | 9,318,639 | |
| | | 1,340,901 | | | | | | 22,398,143 | | | | | | 597,712 | | | | | | — | | | | | | — | | | | | | 74,191 | | | | | | 1,311,997 | | | | | | 489,733 | |
| | | — | | | | | | — | | | | | | — | | | | | | — | | | | | | — | | | | | | 36,820,911 | | | | | | — | | | | | | — | |
| | | 569 | | | | | | — | | | | | | — | | | | | | 32,694 | | | | | | 38,465 | | | | | | 47 | | | | | | — | | | | | | — | |
| | | 342,121 | | | | | | 211,599 | | | | | | 190,154 | | | | | | 1,937 | | | | | | 1,783 | | | | | | 86,215 | | | | | | 343,439 | | | | | | 141,820 | |
| | | 33,037,369,877 | | | | | | 28,405,709,666 | | | | | | 19,822,796,104 | | | | | | 251,409,794 | | | | | | 197,501,194 | | | | | | 6,220,084,097 | | | | | | 28,647,300,349 | | | | | | 11,021,456,592 | |
| | | | | | | | | | | | | | | | | | | | | | | | | | | | | | | | | | | | | | | | | | | | | | |
| | | | | | | | | | | | | | | | | | | | | | | | | | | | | | | | | | | | | | | | | | | | | | |
| | | | | | | | | | | | | | | | | | | | | | | | | | | | | | | | | | | | | | | | | | | | | | |
| | | 263,732,139 | | | | | | 424,870,000 | | | | | | 369,870,000 | | | | | | 3,105,090 | | | | | | — | | | | | | 29,600,826 | | | | | | — | | | | | | — | |
| | | 4,403,641 | | | | | | 3,574,886 | | | | | | 2,668,205 | | | | | | 10,544 | | | | | | 7,640 | | | | | | 648,811 | | | | | | 1,904,676 | | | | | | 1,142,656 | |
| | | 251,319 | | | | | | 1,316,206 | | | | | | 641,393 | | | | | | — | | | | | | — | | | | | | 6,783 | | | | | | 7,706 | | | | | | 24,138 | |
| | | 229,661 | | | | | | 2,103,545 | | | | | | 1,356,304 | | | | | | — | | | | | | — | | | | | | 84,249 | | | | | | 571,987 | | | | | | — | |
| | | 331,651 | | | | | | 326,424 | | | | | | 456,413 | | | | | | 222,570 | | | | | | 226,125 | | | | | | 338,277 | | | | | | 382,826 | | | | | | 148,598 | |
| | | 268,948,411 | | | | | | 432,191,061 | | | | | | 374,992,315 | | | | | | 3,338,204 | | | | | | 233,765 | | | | | | 30,678,946 | | | | | | 2,867,195 | | | | | | 1,315,392 | |
| | | | | | | | | | | | | | | | | | | | | | | | | | | | | | | | | | | | | | | | | | | | | | |
| | | | | | | | | | | | | | | | | | | | | | | | | | | | | | | | | | | | | | | | | | | | | | |
| | | 32,768,263,649 | | | | | | 27,973,301,038 | | | | | | 19,447,959,678 | | | | | | 248,069,067 | | | | | | 197,263,610 | | | | | | 6,189,282,673 | | | | | | 28,644,405,704 | | | | | | 11,020,138,324 | |
| | | (5,467 | ) | | | | | (21,650 | ) | | | | | (263,642 | ) | | | | | — | | | | | | 332 | | | | | | — | | | | | | (232,566 | ) | | | | | 4,585 | |
| | | 163,284 | | | | | | 239,217 | | | | | | 107,753 | | | | | | 2,523 | | | | | | 3,487 | | | | | | 122,478 | | | | | | 260,016 | | | | | | (1,709 | ) |
| | $ | 32,768,421,466 | | | | | $ | 27,973,518,605 | | | | | $ | 19,447,803,789 | | | | | $ | 248,071,590 | | | | | $ | 197,267,429 | | | | | $ | 6,189,405,151 | | | | | $ | 28,644,433,154 | | | | | $ | 11,020,141,200 | |
| | | | $1.00 | | | | | | $1.00 | | | | | | $1.00 | | | | | | $1.00 | | | | | | $1.00 | | | | | | $1.00 | | | | | | $1.00 | | | | | | $1.00 | |
| | | | | | | | | | | | | | | | | | | | | | | | | | | | | | | | | | | | | | | | | | | | | | | |
| | | | $28,906,402,183 | | | | | $ | 27,339,205,809 | | | | | $ | 16,011,610,346 | | | | | $ | 94,394,192 | | | | | $ | 21,502,559 | | | | | $ | 5,189,600,804 | | | | | $ | 26,059,313,633 | | | | | $ | 7,369,406,687 | |
| | | | 186,908,103 | | | | | | 144,701,299 | | | | | | 269,379,494 | | | | | | — | | | | | | — | | | | | | 125,774,717 | | | | | | 314,085,820 | | | | | | 198,456,151 | |
| | | | 399,130,783 | | | | | | 42,821,125 | | | | | | 165,369,040 | | | | | | — | | | | | | — | | | | | | 22,191,286 | | | | | | 142,389,706 | | | | | | 111,448,760 | |
| | | | 384,681,872 | | | | | | 25,195,409 | | | | | | 220,435,691 | | | | | | — | | | | | | — | | | | | | 4,557,709 | | | | | | 202,103,339 | | | | | | 218,734,930 | |
| | | | 2,594,849,352 | | | | | | 350,742,180 | | | | | | 1,801,206,113 | | | | | | 153,674,604 | | | | | | 175,763,036 | | | | | | 198,692,343 | | | | | | 1,331,903,914 | | | | | | 2,055,569,887 | |
| | | | 6,782,283 | | | | | | 40,394,592 | | | | | | 1,000 | | | | | | — | | | | | | — | | | | | | 597,097,495 | | | | | | 381,096,554 | | | | | | 102,053,379 | |
| | | | 289,664,890 | | | | | | 30,456,190 | | | | | | 808,247,171 | | | | | | 1,757 | | | | | | 799 | | | | | | 14,654,065 | | | | | | 213,538,188 | | | | | | 964,469,406 | |
| | | | — | | | | | | — | | | | | | 4,687,983 | | | | | | — | | | | | | — | | | | | | — | | | | | | — | | | | | | — | |
| | | | — | | | | | | — | | | | | | 22,971,765 | | | | | | — | | | | | | — | | | | | | — | | | | | | — | | | | | | — | |
| | | | 1,000 | | | | | | 1,000 | | | | | | 143,894,186 | | | | | | — | | | | | | — | | | | | | 36,835,732 | | | | | | 1,000 | | | | | | 1,000 | |
| | | | 1,000 | | | | | | 1,001 | | | | | | 1,000 | | | | | | 1,037 | | | | | | 1,035 | | | | | | 1,000 | | | | | | 1,000 | | | | | | 1,000 | |
| | | | $32,768,421,466 | | | | | $ | 27,973,518,605 | | | | | $ | 19,447,803,789 | | | | | $ | 248,071,590 | | | | | $ | 197,267,429 | | | | | $ | 6,189,405,151 | | | | | $ | 28,644,433,154 | | | | | $ | 11,020,141,200 | |
| | | | | | | | | | | | | | | | | | | | | | | | | | | | | | | | | | | | | | | | | | | | | | | |
| | | | 28,906,258,147 | | | | | | 27,338,984,671 | | | | | | 16,011,733,628 | | | | | | 94,375,886 | | | | | | 21,501,540 | | | | | | 5,189,455,387 | | | | | | 26,059,288,660 | | | | | | 7,369,404,766 | |
| | | | 186,907,172 | | | | | | 144,700,128 | | | | | | 269,381,560 | | | | | | — | | | | | | — | | | | | | 125,771,193 | | | | | | 314,085,519 | | | | | | 198,456,099 | |
| | | | 399,128,794 | | | | | | 42,820,777 | | | | | | 165,370,309 | | | | | | — | | | | | | — | | | | | | 22,190,664 | | | | | | 142,389,570 | | | | | | 111,448,731 | |
| | | | 384,679,954 | | | | | | 25,195,205 | | | | | | 220,437,382 | | | | | | — | | | | | | — | | | | | | 4,557,582 | | | | | | 202,103,145 | | | | | | 218,734,874 | |
| | | | 2,594,836,422 | | | | | | 350,739,342 | | | | | | 1,801,219,932 | | | | | | 153,644,801 | | | | | | 175,754,704 | | | | | | 198,686,775 | | | | | | 1,331,902,638 | | | | | | 2,055,569,349 | |
| | | | 6,782,250 | | | | | | 40,394,265 | | | | | | 1,000 | | | | | | — | | | | | | — | | | | | | 597,080,764 | | | | | | 381,096,189 | | | | | | 102,053,352 | |
| | | | 289,663,446 | | | | | | 30,455,944 | | | | | | 808,253,372 | | | | | | 1,756 | | | | | | 799 | | | | | | 14,653,654 | | | | | | 213,537,983 | | | | | | 964,469,155 | |
| | | | — | | | | | | — | | | | | | 4,688,018 | | | | | | — | | | | | | — | | | | | | — | | | | | | — | | | | | | — | |
| | | | — | | | | | | — | | | | | | 22,971,942 | | | | | | — | | | | | | — | | | | | | — | | | | | | — | | | | | | — | |
| | | | 1,000 | | | | | | 1,000 | | | | | | 143,895,299 | | | | | | — | | | | | | — | | | | | | 36,834,700 | | | | | | 1,000 | | | | | | 1,000 | |
| | | | 1,000 | | | | | | 1,001 | | | | | | 1,000 | | | | | | 1,036 | | | | | | 1,035 | | | | | | 1,000 | | | | | | 1,000 | | | | | | 1,000 | |
| | |
| The accompanying notes are an integral part of these financial statements. | | 57 |
GOLDMAN SACHS FUNDS — FINANCIAL SQUARE FUNDS
Statements of Operations
For the Six Months Ended February 28, 2013 (Unaudited)
| | | | | | |
| | | | | Federal
Fund | |
| | Investment income: | |
| | Interest income — from unaffiliated issuers | | $ | 8,785,651 | |
| | Interest income — from affiliated issuers | | | — | |
| | Total investment income | | | 8,785,651 | |
| | | | | | |
| Expenses: | | | | |
| | Fund-Level Expenses: | | | | |
| | Management fees | | | 11,611,010 | |
| | Transfer Agent fees | | | 566,391 | |
| | Custody, accounting and administrative services | | | 215,130 | |
| | Registration fees | | | 120,150 | |
| | Printing and mailing fees | | | 72,181 | |
| | Professional fees | | | 32,108 | |
| | Trustee fees | | | 14,867 | |
| | Other | | | 145,755 | |
| | Subtotal | | | 12,777,592 | |
| | Class Specific Expenses: | | | | |
| | FST Premier Share fees | | | 2,215,874 | |
| | FST Service Share fees | | | 1,344,510 | |
| | FST Administration Share fees | | | 494,214 | |
| | FST Cash Management Share fees | | | 316,004 | |
| | Distribution fees — FST Cash Management Shares | | | 189,603 | |
| | FST Capital Share fees | | | 53,412 | |
| | FST Preferred Share fees | | | 25,123 | |
| | FST Select Share fees | | | 12,647 | |
| | FST Resource Share fees | | | 2 | |
| | Distribution fees — FST Resource Share fees | | | 1 | |
| | Distribution and Service fees — FST Class B Shares | | | — | |
| | Distribution and Service fees — FST Class C Shares | | | — | |
| | Total expenses | | | 17,428,982 | |
| | Less — expense reductions | | | (8,862,750 | ) |
| | Net expenses | | | 8,566,232 | |
| | NET INVESTMENT INCOME (LOSS) | | $ | 219,419 | |
| | Net realized gain from investment transactions | | | 132,523 | |
| | NET INCREASE IN NET ASSETS RESULTING FROM OPERATIONS | | $ | 351,942 | |
| | |
| 58 | | The accompanying notes are an integral part of these financial statements. |
GOLDMAN SACHS FUNDS — FINANCIAL SQUARE FUNDS
| | | | | | | | | | | | | | | | | | | | | | | | | | | | | | | | | | | | | | | | | | | | | | |
| | | Government
Fund | | | | | Money
Market
Fund | | | | | Prime
Obligations
Fund | | | | | Tax-Exempt
California
Fund | | | | | Tax-Exempt
New York
Fund | | | | | Tax-Free
Money Market
Fund | | | | | Treasury
Instruments
Fund | | | | | Treasury
Obligations
Fund | |
| | | | | | | | | | | | | | | | | | | | | | | | | | | | | | | | | | | | | | | | | | | | | | |
| | $ | 37,189,449 | | | | | $ | 37,328,321 | | | | | $ | 26,123,286 | | | | | $ | 197,755 | | | | | $ | 164,838 | | | | | $ | 5,947,246 | | | | | $ | 15,465,561 | | | | | $ | 9,761,711 | |
| | | 228,389 | | | | | | 95,594 | | | | | | 86,294 | | | | | | — | | | | | | — | | | | | | — | | | | | | — | | | | | | 167,222 | |
| | | 37,417,838 | | | | | | 37,423,915 | | | | | | 26,209,580 | | | | | | 197,755 | | | | | | 164,838 | | | | | | 5,947,246 | | | | | | 15,465,561 | | | | | | 9,928,933 | |
| | | | | | | | | | | | | | | | | | | | | | | | | | | | | | | | | | | | | | | | | | | | | | |
| | | | | | | | | | | | | | | | | | | | | | | | | | | | | | | | | | | | | | | | | | | | | | |
| | | | | | | | | | | | | | | | | | | | | | | | | | | | | | | | | | | | | | | | | | | | | | |
| | | 34,451,941 | | | | | | 24,759,125 | | | | | | 19,374,924 | | | | | | 409,414 | | | | | | 349,761 | | | | | | 6,532,655 | | | | | | 27,605,202 | | | | | | 11,150,542 | |
| | | 1,680,583 | | | | | | 1,207,762 | | | | | | 945,118 | | | | | | 11,698 | | | | | | 9,993 | | | | | | 318,666 | | | | | | 1,346,595 | | | | | | 543,929 | |
| | | 637,720 | | | | | | 441,637 | | | | | | 352,923 | | | | | | 20,105 | | | | | | 19,290 | | | | | | 126,945 | | | | | | 563,220 | | | | | | 198,123 | |
| | | 186,675 | | | | | | 123,175 | | | | | | 150,789 | | | | | | 18,549 | | | | | | 13,660 | | | | | | 95,243 | | | | | | 82,537 | | | | | | 133,623 | |
| | | 118,501 | | | | | | — | | | | | | 53,034 | | | | | | 33,957 | | | | | | 34,850 | | | | | | 114,094 | | | | | | 658,047 | | | | | | 47,225 | |
| | | 30,246 | | | | | | 33,221 | | | | | | 36,697 | | | | | | 47,887 | | | | | | 47,913 | | | | | | 47,092 | | | | | | 17,124 | | | | | | 26,940 | |
| | | 31,953 | | | | | | 27,671 | | | | | | 25,674 | | | | | | 8,744 | | | | | | 8,647 | | | | | | 13,014 | | | | | | 25,898 | | | | | | 14,460 | |
| | | 281,956 | | | | | | 31,451 | | | | | | 239,118 | | | | | | 6,579 | | | | | | 6,688 | | | | | | 51,525 | | | | | | 273,630 | | | | | | 169,697 | |
| | | 37,419,575 | | | | | | 26,624,042 | | | | | | 21,178,277 | | | | | | 556,933 | | | | | | 490,802 | | | | | | 7,299,234 | | | | | | 30,572,253 | | | | | | 12,284,539 | |
| | | | | | | | | | | | | | | | | | | | | | | | | | | | | | | | | | | | | | | | | | | | | | |
| | | 11,233 | | | | | | 62,354 | | | | | | 2 | | | | | | — | | | | | | — | | | | | | 1,031,844 | | | | | | 698,396 | | | | | | 187,437 | |
| | | 798,833 | | | | | | 71,600 | | | | | | 1,900,300 | | | | | | 3 | | | | | | 2 | | | | | | 40,867 | | | | | | 676,839 | | | | | | 2,332,477 | |
| | | 3,296,374 | | | | | | 470,346 | | | | | | 2,504,978 | | | | | | 111,209 | | | | | | 133,068 | | | | | | 248,735 | | | | | | 1,708,176 | | | | | | 2,185,432 | |
| | | 3 | | | | | | 2 | | | | | | 3 | | | | | | 3 | | | | | | 2 | | | | | | 2 | | | | | | 2 | | | | | | 2 | |
| | | 2 | | | | | | 1 | | | | | | 1 | | | | | | 3 | | | | | | 3 | | | | | | 2 | | | | | | 2 | | | | | | 1 | |
| | | 339,998 | | | | | | 22,528 | | | | | | 200,369 | | | | | | — | | | | | | — | | | | | | 6,985 | | | | | | 130,539 | | | | | | 162,225 | |
| | | 224,076 | | | | | | 19,610 | | | | | | 97,886 | | | | | | — | | | | | | — | | | | | | 11,821 | | | | | | 76,009 | | | | | | 55,429 | |
| | | 47,812 | | | | | | 24,804 | | | | | | 42,430 | | | | | | — | | | | | | — | | | | | | 20,118 | | | | | | 31,143 | | | | | | 24,543 | |
| | | 2 | | | | | | 2 | | | | | | 348,031 | | | | | | — | | | | | | — | | | | | | 68,801 | | | | | | 2 | | | | | | 2 | |
| | | 1 | | | | | | 1 | | | | | | 104,409 | | | | | | — | | | | | | — | | | | | | 20,640 | | | | | | 1 | | | | | | 1 | |
| | | — | | | | | | — | | | | | | 25,586 | | | | | | — | | | | | | — | | | | | | — | | | | | | — | | | | | | — | |
| | | — | | | | | | — | | | | | | 125,617 | | | | | | — | | | | | | — | | | | | | — | | | | | | — | | | | | | — | |
| | | 42,137,909 | | | | | | 27,295,290 | | | | | | 26,527,889 | | | | | | 668,151 | | | | | | 623,877 | | | | | | 8,749,049 | | | | | | 33,893,362 | | | | | | 17,232,088 | |
| | | (11,526,532 | ) | | | | | (5,751,240 | ) | | | | | (7,954,807 | ) | | | | | (477,548 | ) | | | | | (465,151 | ) | | | | | (3,305,236 | ) | | | | | (18,195,235 | ) | | | | | (7,666,900 | ) |
| | | 30,611,377 | | | | | | 21,544,050 | | | | | | 18,573,082 | | | | | | 190,603 | | | | | | 158,726 | | | | | | 5,443,813 | | | | | | 15,698,127 | | | | | | 9,565,188 | |
| | $ | 6,806,461 | | | | | $ | 15,879,865 | | | | | $ | 7,636,498 | | | | | $ | 7,152 | | | | | $ | 6,112 | | | | | $ | 503,433 | | | | | $ | (232,566 | ) | | | | $ | 363,745 | |
| | | 169,014 | | | | | | 398,696 | | | | | | 303,939 | | | | | | 11,614 | | | | | | 12,837 | | | | | | 179,626 | | | | | | 429,252 | | | | | | 4,226 | |
| | $ | 6,975,475 | | | | | $ | 16,278,561 | | | | | $ | 7,940,437 | | | | | $ | 18,766 | | | | | $ | 18,949 | | | | | $ | 683,059 | | | | | $ | 196,686 | | | | | $ | 367,971 | |
| | |
| The accompanying notes are an integral part of these financial statements. | | 59 |
GOLDMAN SACHS FUNDS — FINANCIAL SQUARE FUNDS
Statements of Changes in Net Assets
| | | | | | | | | | | | | | | | | | | | |
| | | | | Federal Fund | | | | | Government Fund | |
| | | | | For the
Six Months Ended
February 28, 2013
(Unaudited) | | | For the Fiscal
Year Ended
August 31, 2012 | | | | | For the
Six Months Ended
February 28, 2013
(Unaudited) | | | For the Fiscal
Year Ended
August 31, 2012 | |
| | From operations: | |
| | Net investment income | | $ | 219,419 | | | $ | 634,396 | | | | | $ | 6,806,461 | | | $ | 8,113,130 | |
| | Net realized gain (loss) from investment transactions | | | 132,523 | | | | 112,225 | | | | | | 169,014 | | | | — | |
| | Net increase in net assets resulting from operations | | | 351,942 | | | | 746,621 | | | | | | 6,975,475 | | | | 8,113,130 | |
| | | | | | | | | | | | | | | | | | | | |
| | Distributions to shareholders: | |
| | From net investment income: | | | | | | | | | | | | | | | | | | |
| | FST Shares | | | (170,338 | ) | | | (495,999 | ) | | | | | (6,654,824 | ) | | | (7,812,380 | ) |
| | FST Select Shares | | | (1,668 | ) | | | (4,091 | ) | | | | | (40,361 | ) | | | (69,381 | ) |
| | FST Preferred Shares | | | (961 | ) | | | (9,219 | ) | | | | | (12,856 | ) | | | (41,076 | ) |
| | FST Capital Shares | | | (1,386 | ) | | | (3,260 | ) | | | | | (13,077 | ) | | | (36,978 | ) |
| | FST Administration Shares | | | (7,712 | ) | | | (20,130 | ) | | | | | (75,993 | ) | | | (128,775 | ) |
| | FST Premier Shares | | | (24,401 | ) | | | (64,948 | ) | | | | | (187 | ) | | | (301 | ) |
| | FST Service Shares | | | (10,206 | ) | | | (30,590 | ) | | | | | (9,159 | ) | | | (24,231 | ) |
| | FST Class B Shares | | | — | | | | — | | | | | | — | | | | — | |
| | FST Class C Shares | | | — | | | | — | | | | | | — | | | | — | |
| | FST Resource Shares | | | (2 | ) | | | (4 | ) | | | | | (2 | ) | | | (4 | ) |
| | FST Cash Management Shares | | | (2,745 | ) | | | (6,155 | ) | | | | | (2 | ) | | | (4 | ) |
| | From net realized gains: | | | | | | | | | | | | | | | | | | |
| | FST Shares | | | (98,438 | ) | | | (112,275 | ) | | | | | (5,093 | ) | | | (63,490 | ) |
| | FST Select Shares | | | (908 | ) | | | (877 | ) | | | | | (32 | ) | | | (1,470 | ) |
| | FST Preferred Shares | | | (574 | ) | | | (2,126 | ) | | | | | (63 | ) | | | (1,973 | ) |
| | FST Capital Shares | | | (790 | ) | | | (730 | ) | | | | | (65 | ) | | | (2,579 | ) |
| | FST Administration Shares | | | (4,370 | ) | | | (4,641 | ) | | | | | (427 | ) | | | (5,723 | ) |
| | FST Premier Shares | | | (14,291 | ) | | | (14,534 | ) | | | | | (1 | ) | | | — | |
| | FST Service Shares | | | (6,230 | ) | | | (6,878 | ) | | | | | (49 | ) | | | (1,449 | ) |
| | FST Class B Shares | | | — | | | | — | | | | | | — | | | | — | |
| | FST Class C Shares | | | — | | | | — | | | | | | — | | | | — | |
| | FST Resource Shares | | | — | | | | — | | | | | | — | | | | — | |
| | FST Cash Management Shares | | | (1,119 | ) | | | (1,451 | ) | | | | | — | | | | — | |
| | Total distributions to shareholders | | | (346,139 | ) | | | (777,908 | ) | | | | | (6,812,191 | ) | | | (8,189,814 | ) |
| | | | | | | | | | | | | | | | | | | | |
| | From share transactions (at $1.00 per share): | |
| | Proceeds from sales of shares | | | 14,997,889,092 | | | | 36,271,036,921 | | | | | | 110,177,992,106 | | | | 195,031,709,781 | |
| | Reinvestment of distributions | | | 254,477 | | | | 552,395 | | | | | | 3,368,194 | | | | 3,919,196 | |
| | Cost of shares redeemed | | | (15,805,930,282 | ) | | | (37,389,325,292 | ) | | | | | (110,169,730,634 | ) | | | (187,616,530,857 | ) |
| | Net increase (decrease) in net assets resulting from share transactions | | | (807,786,713 | ) | | | (1,117,735,976 | ) | | | | | 11,629,666 | | | | 7,419,098,120 | |
| | NET INCREASE (DECREASE) | | | (807,780,910 | ) | | | (1,117,767,263 | ) | | | | | 11,792,950 | | | | 7,419,021,436 | |
| | | | | | | | | | | | | | | | | | | | |
| | Net assets: | |
| | Beginning of period | | | 11,839,100,900 | | | | 12,956,868,163 | | | | | | 32,756,628,516 | | | | 25,337,607,080 | |
| | End of period | | $ | 11,031,319,990 | | | $ | 11,839,100,900 | | | | | $ | 32,768,421,466 | | | $ | 32,756,628,516 | |
| | Undistributed (distributions in excess of) net investment income (loss) | | $ | 13,147 | | | $ | 13,147 | | | | | $ | (5,467 | ) | | $ | (5,467 | ) |
| | |
| 60 | | The accompanying notes are an integral part of these financial statements. |
GOLDMAN SACHS FUNDS — FINANCIAL SQUARE FUNDS
| | | | | | | | | | | | | | | | | | | | | | | | | | | | | | | | | | |
| | | Money Market Fund | | | | | Prime Obligations Fund | | | | | Tax-Exempt California Fund | |
| | | For the
Six Months Ended
February 28, 2013
(Unaudited) | | | | | For the Fiscal
Year Ended
August 31, 2012 | | | | | For the
Six Months Ended
February 28, 2013
(Unaudited) | | | | | For the Fiscal
Year Ended
August 31, 2012 | | | | | For the
Six Months Ended
February 28, 2013
(Unaudited) | | | | | For the Fiscal
Year Ended
August 31, 2012 | |
| | | | | | | | | | | | | | | | | | | | | | | | | | | | | | | | | | |
| | $ | 15,879,865 | | | | | $ | 36,036,421 | | | | | $ | 7,636,498 | | | | | $ | 21,230,089 | | | | | $ | 7,152 | | | | | $ | 15,453 | |
| | | 398,696 | | | | | | (16,099 | ) | | | | | 303,939 | | | | | | 347,771 | | | | | | 11,614 | | | | | | 32,983 | |
| | | 16,278,561 | | | | | | 36,020,322 | | | | | | 7,940,437 | | | | | | 21,577,860 | | | | | | 18,766 | | | | | | 48,436 | |
| | | | | | | | | | | | | | | | | | | | | | | | | | | | | | | | | | |
| | | | | | | | | | | | | | | | | | | | | | | | | | | | | | | | | | |
| | | | | | | | | | | | | | | | | | | | | | | | | | | | | | | | | | |
| | | (15,773,059 | ) | | | | | (35,687,887 | ) | | | | | (7,450,823 | ) | | | | | (20,839,378 | ) | | | | | (2,617 | ) | | | | | (5,760 | ) |
| | | (89,862 | ) | | | | | (280,944 | ) | | | | | (99,798 | ) | | | | | (239,689 | ) | | | | | — | | | | | | — | |
| | | (6,854 | ) | | | | | (32,280 | ) | | | | | (10,521 | ) | | | | | (48,013 | ) | | | | | — | | | | | | — | |
| | | (855 | ) | | | | | (7,451 | ) | | | | | (6,563 | ) | | | | | (6,467 | ) | | | | | — | | | | | | — | |
| | | (7,942 | ) | | | | | (23,702 | ) | | | | | (47,743 | ) | | | | | (66,986 | ) | | | | | (4,531 | ) | | | | | (9,686 | ) |
| | | (715 | ) | | | | | (1,013 | ) | | | | | (2 | ) | | | | | (4 | ) | | | | | — | | | | | | — | |
| | | (574 | ) | | | | | (3,136 | ) | | | | | (17,167 | ) | | | | | (24,156 | ) | | | | | (2 | ) | | | | | (4 | ) |
| | | — | | | | | | — | | | | | | (121 | ) | | | | | (199 | ) | | | | | — | | | | | | — | |
| | | — | | | | | | — | | | | | | (589 | ) | | | | | (896 | ) | | | | | — | | | | | | — | |
| | | (2 | ) | | | | | (4 | ) | | | | | (3,169 | ) | | | | | (4,297 | ) | | | | | — | | | | | | — | |
| | | (2 | ) | | | | | (4 | ) | | | | | (2 | ) | | | | | (4 | ) | | | | | (2 | ) | | | | | (3 | ) |
| | | | | | | | | | | | | | | | | | | | | | | | | | | | | | | | | | |
| | | (139,983 | ) | | | | | (74,172 | ) | | | | | (125,885 | ) | | | | | (515,760 | ) | | | | | (14,551 | ) | | | | | (3,734 | ) |
| | | (611 | ) | | | | | (859 | ) | | | | | (2,004 | ) | | | | | (7,867 | ) | | | | | — | | | | | | — | |
| | | (216 | ) | | | | | (195 | ) | | | | | (1,319 | ) | | | | | (9,367 | ) | | | | | — | | | | | | — | |
| | | (150 | ) | | | | | (135 | ) | | | | | (1,621 | ) | | | | | (6,169 | ) | | | | | — | | | | | | — | |
| | | (1,734 | ) | | | | | (1,592 | ) | | | | | (13,395 | ) | | | | | (67,916 | ) | | | | | (24,490 | ) | | | | | (6,001 | ) |
| | | (202 | ) | | | | | (40 | ) | | | | | — | | | | | | — | | | | | | — | | | | | | — | |
| | | (156 | ) | | | | | (299 | ) | | | | | (6,081 | ) | | | | | (22,834 | ) | | | | | — | | | | | | — | |
| | | — | | | | | | — | | | | | | (37 | ) | | | | | (185 | ) | | | | | — | | | | | | — | |
| | | — | | | | | | — | | | | | | (179 | ) | | | | | (859 | ) | | | | | — | | | | | | — | |
| | | — | | | | | | — | | | | | | (1,087 | ) | | | | | (4,224 | ) | | | | | — | | | | | | — | |
| | | — | | | | | | — | | | | | | — | | | | | | — | | | | | | — | | | | | | — | |
| | | (16,022,917 | ) | | | | | (36,113,713 | ) | | | | | (7,788,106 | ) | | | | | (21,865,270 | ) | | | | | (46,193 | ) | | | | | (25,188 | ) |
| | | | | | | | | | | | | | | | | | | | | | | | | | | | | | | | | | |
| | | | | | | | | | | | | | | | | | | | | | | | | | | | | | | | | | |
| | | 85,763,658,195 | | | | | | 174,527,252,299 | | | | | | 60,201,500,193 | | | | | | 123,274,425,512 | | | | | | 376,119,882 | | | | | | 896,132,340 | |
| | | 7,251,828 | | | | | | 17,729,198 | | | | | | 2,778,006 | | | | | | 8,328,526 | | | | | | 46,013 | | | | | | 25,012 | |
| | | (78,747,605,429 | ) | | | | | (174,390,544,562 | ) | | | | | (58,915,800,399 | ) | | | | | (127,356,958,379 | ) | | | | | (371,396,092 | ) | | | | | (886,025,402 | ) |
| | | 7,023,304,594 | | | | | | 154,436,935 | | | | | | 1,288,477,800 | | | | | | (4,074,204,341 | ) | | | | | 4,769,803 | | | | | | 10,131,950 | |
| | | 7,023,560,238 | | | | | | 154,343,544 | | | | | | 1,288,630,131 | | | | | | (4,074,491,751 | ) | | | | | 4,742,376 | | | | | | 10,155,198 | |
| | | | | | | | | | | | | | | | | | | | | | | | | | | | | | | | | | |
| | | | | | | | | | | | | | | | | | | | | | | | | | | | | | | | | | |
| | | 20,949,958,367 | | | | | | 20,795,614,823 | | | | | | 18,159,173,658 | | | | | | 22,233,665,409 | | | | | | 243,329,214 | | | | | | 233,174,016 | |
| | $ | 27,973,518,605 | | | | | $ | 20,949,958,367 | | | | | $ | 19,447,803,789 | | | | | $ | 18,159,173,658 | | | | | $ | 248,071,590 | | | | | $ | 243,329,214 | |
| | $ | (21,650 | ) | | | | $ | (21,650 | ) | | | | $ | (263,642 | ) | | | | $ | (263,642 | ) | | | | $ | — | | | | | $ | — | |
| | |
| The accompanying notes are an integral part of these financial statements. | | 61 |
GOLDMAN SACHS FUNDS — FINANCIAL SQUARE FUNDS
Statements of Changes in Net Assets (continued)
| | | | | | | | | | |
| | | | | Tax-Exempt New York Fund | |
| | | | | For the Six Months Ended
February 28, 2013
(Unaudited) | | | For the Fiscal Year Ended August 31, 2012 | |
| | From operations: | | | | | | | | |
| | Net investment income | | $ | 6,112 | | | $ | 10,531 | |
| | Net realized gain (loss) from investment transactions | | | 12,837 | | | | 12,369 | |
| | Net increase in net assets resulting from operations | | | 18,949 | | | | 22,900 | |
| | | | | | | | | | |
| | Distributions to shareholders: | | | | | | | | |
| | From net investment income: | | | | | | | | |
| | FST Shares | | | (682 | ) | | | (1,288 | ) |
| | FST Select Shares | | | — | | | | — | |
| | FST Preferred Shares | | | — | | | | — | |
| | FST Capital Shares | | | — | | | | — | |
| | FST Administration Shares | | | (5,426 | ) | | | (9,235 | ) |
| | FST Premier Shares | | | — | | | | — | |
| | FST Service Shares | | | (2 | ) | | | (4 | ) |
| | FST Resource Shares | | | — | | | | — | |
| | FST Cash Management Shares | | | (2 | ) | | | (4 | ) |
| | From net realized gains: | | | | | | | | |
| | FST Shares | | | (1,932 | ) | | | (660 | ) |
| | FST Select Shares | | | — | | | | — | |
| | FST Preferred Shares | | | — | | | | — | |
| | FST Capital Shares | | | — | | | | — | |
| | FST Administration Shares | | | (12,630 | ) | | | (4,621 | ) |
| | FST Premier Shares | | | — | | | | — | |
| | FST Service Shares | | | — | | | | — | |
| | FST Resource Shares | | | — | | | | — | |
| | FST Cash Management Shares | | | — | | | | — | |
| | Total distributions to shareholders | | | (20,674 | ) | | | (15,812 | ) |
| | | | | | | | | | |
| | From share transactions (at $1.00 per share): | | | | | | | | |
| | Proceeds from sales of shares | | | 219,664,801 | | | | 463,693,072 | |
| | Reinvestment of distributions | | | 20,440 | | | | 15,586 | |
| | Cost of shares redeemed | | | (223,903,758 | ) | | | (423,635,845 | ) |
| | Net increase (decrease) in net assets resulting from share transactions | | | (4,218,517 | ) | | | 40,072,813 | |
| | NET INCREASE (DECREASE) | | | (4,220,242 | ) | | | 40,079,901 | |
| | | | | | | | | | |
| | Net assets: | | | | | | | | |
| | Beginning of period | | | 201,487,671 | | | | 161,407,770 | |
| | End of period | | $ | 197,267,429 | | | $ | 201,487,671 | |
| | Undistributed (distributions in excess of) net investment income (loss) | | $ | 332 | | | $ | 332 | |
| | |
| 62 | | The accompanying notes are an integral part of these financial statements. |
GOLDMAN SACHS FUNDS — FINANCIAL SQUARE FUNDS
| | | | | | | | | | | | | | | | | | | | | | | | | | | | | | | | | | |
| | | Tax-Free Money Market Fund | | | | | Treasury Instruments Fund | | | | | Treasury Obligations Fund | |
| | | For the Six Months Ended
February 28, 2013
(Unaudited) | | | | | For the Fiscal Year Ended August 31, 2012 | | | | | For the Six Months Ended
February 28, 2013
(Unaudited) | | | | | For the Fiscal Year Ended August 31, 2012 | | | | | For the Six Months Ended February 28, 2013
(Unaudited) | | | | | For the Fiscal Year Ended August 31, 2012 | |
| | | | | | | | | | | | | | | | | | | | | | | | | | | | | | | | | | |
| | $ | 503,433 | | | | | $ | 1,187,768 | | | | | $ | (232,566 | ) | | | | $ | 111,619 | | | | | $ | 363,745 | | | | | $ | 711,457 | |
| | | 179,626 | | | | | | 498,130 | | | | | | 429,252 | | | | | | 184,350 | | | | | | 4,226 | | | | | | (5,935 | ) |
| | | 683,059 | | | | | | 1,685,898 | | | | | | 196,686 | | | | | | 295,969 | | | | | | 367,971 | | | | | | 705,522 | |
| | | | | | | | | | | | | | | | | | | | | | | | | | | | | | | | | | |
| | | | | | | | | | | | | | | | | | | | | | | | | | | | | | | | | | |
| | | | | | | | | | | | | | | | | | | | | | | | | | | | | | | | | | |
| | | (471,763 | ) | | | | | (1,123,329 | ) | | | | | — | | | | | | (98,873 | ) | | | | | (250,011 | ) | | | | | (515,821 | ) |
| | | (5,223 | ) | | | | | (8,610 | ) | | | | | — | | | | | | (962 | ) | | | | | (4,562 | ) | | | | | (9,474 | ) |
| | | (723 | ) | | | | | (1,405 | ) | | | | | — | | | | | | (1,111 | ) | | | | | (3,061 | ) | | | | | (7,450 | ) |
| | | (285 | ) | | | | | (623 | ) | | | | | — | | | | | | (758 | ) | | | | | (6,026 | ) | | | | | (9,789 | ) |
| | | (6,080 | ) | | | | | (16,867 | ) | | | | | — | | | | | | (6,534 | ) | | | | | (47,708 | ) | | | | | (95,581 | ) |
| | | (18,016 | ) | | | | | (33,367 | ) | | | | | — | | | | | | (1,955 | ) | | | | | (2,975 | ) | | | | | (7,101 | ) |
| | | (500 | ) | | | | | (1,748 | ) | | | | | — | | | | | | (1,418 | ) | | | | | (25,951 | ) | | | | | (66,233 | ) |
| | | (841 | ) | | | | | (1,815 | ) | | | | | — | | | | | | (4 | ) | | | | | (2 | ) | | | | | (4 | ) |
| | | (2 | ) | | | | | (4 | ) | | | | | — | | | | | | (4 | ) | | | | | (2 | ) | | | | | (4 | ) |
| | | | | | | | | | | | | | | | | | | | | | | | | | | | | | | | | | |
| | | (437,559 | ) | | | | | (305,906 | ) | | | | | (134,236 | ) | | | | | (186,427 | ) | | | | | — | | | | | | (13,658 | ) |
| | | (13,606 | ) | | | | | (3,692 | ) | | | | | (1,144 | ) | | | | | (932 | ) | | | | | — | | | | | | (290 | ) |
| | | (1,965 | ) | | | | | (1,206 | ) | | | | | (838 | ) | | | | | (1,079 | ) | | | | | — | | | | | | (190 | ) |
| | | (717 | ) | | | | | (408 | ) | | | | | (959 | ) | | | | | (1,238 | ) | | | | | — | | | | | | (302 | ) |
| | | (15,279 | ) | | | | | (17,130 | ) | | | | | (7,530 | ) | | | | | (10,199 | ) | | | | | — | | | | | | (2,496 | ) |
| | | (49,471 | ) | | | | | (26,746 | ) | | | | | (2,199 | ) | | | | | (3,001 | ) | | | | | — | | | | | | (186 | ) |
| | | (1,065 | ) | | | | | (1,523 | ) | | | | | (1,492 | ) | | | | | (2,308 | ) | | | | | — | | | | | | (1,740 | ) |
| | | (2,139 | ) | | | | | (1,605 | ) | | | | | (2 | ) | | | | | — | | | | | | — | | | | | | — | |
| | | — | | | | | | — | | | | | | (2 | ) | | | | | — | | | | | | — | | | | | | — | |
| | | (1,025,234 | ) | | | | | (1,545,984 | ) | | | | | (148,402 | ) | | | | | (316,803 | ) | | | | | (340,298 | ) | | | | | (730,319 | ) |
| | | | | | | | | | | | | | | | | | | | | | | | | | | | | | | | | | |
| | | | | | | | | | | | | | | | | | | | | | | | | | | | | | | | | | |
| | | 9,499,235,189 | | | | | | 18,003,971,770 | | | | | | 35,825,866,539 | | | | | | 76,506,291,426 | | | | | | 125,388,859,750 | | | | | | 210,074,678,814 | |
| | | 808,049 | | | | | | 1,213,144 | | | | | | 98,151 | | | | | | 201,313 | | | | | | 135,305 | | | | | | 271,676 | |
| | | (9,750,121,356 | ) | | | | | (19,124,615,574 | ) | | | | | (32,988,754,035 | ) | | | | | (73,606,782,778 | ) | | | | | (125,592,363,021 | ) | | | | | (210,440,312,034 | ) |
| | | (250,078,118 | ) | | | | | (1,119,430,660 | ) | | | | | 2,837,210,655 | | | | | | 2,899,709,961 | | | | | | (203,367,966 | ) | | | | | (365,361,544 | ) |
| | | (250,420,293 | ) | | | | | (1,119,290,746 | ) | | | | | 2,837,258,939 | | | | | | 2,899,689,127 | | | | | | (203,340,293 | ) | | | | | (365,386,341 | ) |
| | | | | | | | | | | | | | | | | | | | | | | | | | | | | | | | | | |
| | | | | | | | | | | | | | | | | | | | | | | | | | | | | | | | | | |
| | | 6,439,825,444 | | | | | | 7,559,116,190 | | | | | | 25,807,174,215 | | | | | | 22,907,485,088 | | | | | | 11,223,481,493 | | | | | | 11,588,867,834 | |
| | $ | 6,189,405,151 | | | | | $ | 6,439,825,444 | | | | | $ | 28,644,433,154 | | | | | $ | 25,807,174,215 | | | | | $ | 11,020,141,200 | | | | | $ | 11,223,481,493 | |
| | $ | — | | | | | $ | — | | | | | $ | (232,566 | ) | | | | $ | — | | | | | $ | 4,585 | | | | | $ | (18,862 | ) |
| | |
| The accompanying notes are an integral part of these financial statements. | | 63 |
FINANCIAL SQUARE FEDERAL FUND
Financial Highlights
Selected Data for a Share Outstanding Throughout Each Period
| | | | | | | | | | | | | | |
| | | Year - Share Class | |
Net asset
value,
beginning
of period | | | Net
investment
income (loss) | | | Distributions
from net
investment
income(a) | |
| | FOR THE SIX MONTHS ENDED FEBRUARY 28, (UNAUDITED) | | | | | | | | | | | | |
| | 2013 - FST Shares | | $ | 1.00 | | | $ | — | (c) | | $ | — | (c) |
| | 2013 - FST Select Shares | | | 1.00 | | | | — | (c) | | | — | (c) |
| | 2013 - FST Preferred Shares | | | 1.00 | | | | — | (c) | | | — | (c) |
| | 2013 - FST Capital Shares | | | 1.00 | | | | — | (c) | | | — | (c) |
| | 2013 - FST Administration Shares | | | 1.00 | | | | — | (c) | | | — | (c) |
| | 2013 - FST Premier Shares | | | 1.00 | | | | — | (c) | | | — | (c) |
| | 2013 - FST Service Shares | | | 1.00 | | | | — | (c) | | | — | (c) |
| | 2013 - FST Resource Shares | | | 1.00 | | | | — | (c) | | | — | (c) |
| | 2013 - FST Cash Management Shares | | | 1.00 | | | | — | (c) | | | — | (c) |
| | | | | | | | | | | | | | |
| | FOR THE FISCAL YEARS ENDED AUGUST 31 , | | | | | | | | | | | | |
| | 2012 - FST Shares | | | 1.00 | | | | — | (c) | | | — | (c) |
| | 2012 - FST Select Shares | | | 1.00 | | | | — | (c) | | | — | (c) |
| | 2012 - FST Preferred Shares | | | 1.00 | | | | — | (c) | | | — | (c) |
| | 2012 - FST Capital Shares | | | 1.00 | | | | — | (c) | | | — | (c) |
| | 2012 - FST Administration Shares | | | 1.00 | | | | — | (c) | | | — | (c) |
| | 2012 - FST Premier Shares | | | 1.00 | | | | — | (c) | | | — | (c) |
| | 2012 - FST Service Shares | | | 1.00 | | | | — | (c) | | | — | (c) |
| | 2012 - FST Resource Shares | | | 1.00 | | | | — | (c) | | | — | (c) |
| | 2012 - FST Cash Management Shares | | | 1.00 | | | | — | (c) | | | — | (c) |
| | 2011 - FST Shares | | | 1.00 | | | | — | (c) | | | — | (c) |
| | 2011 - FST Select Shares | | | 1.00 | | | | — | (c) | | | — | (c) |
| | 2011 - FST Preferred Shares | | | 1.00 | | | | — | (c) | | | — | (c) |
| | 2011 - FST Capital Shares | | | 1.00 | | | | — | (c) | | | — | (c) |
| | 2011 - FST Administration Shares | | | 1.00 | | | | — | (c) | | | — | (c) |
| | 2011 - FST Premier Shares | | | 1.00 | | | | — | (c) | | | — | (c) |
| | 2011 - FST Service Shares | | | 1.00 | | | | — | (c) | | | — | (c) |
| | 2011 - FST Resource Shares | | | 1.00 | | | | — | (c) | | | — | (c) |
| | 2011 - FST Cash Management Shares | | | 1.00 | | | | — | (c) | | | — | (c) |
| | 2010 - FST Shares | | | 1.00 | | | | — | (c) | | | — | (c) |
| | 2010 - FST Select Shares | | | 1.00 | | | | — | (c) | | | — | (c) |
| | 2010 - FST Preferred Shares | | | 1.00 | | | | — | (c) | | | — | (c) |
| | 2010 - FST Capital Shares | | | 1.00 | | | | — | (c) | | | — | (c) |
| | 2010 - FST Administration Shares | | | 1.00 | | | | — | (c) | | | — | (c) |
| | 2010 - FST Premier Shares (Commenced May 14, 2010) | | | 1.00 | | | | — | (c) | | | — | (c) |
| | 2010 - FST Service Shares | | | 1.00 | | | | — | (c) | | | — | (c) |
| | 2010 - FST Resource Shares (Commenced May 14, 2010) | | | 1.00 | | | | — | (c) | | | — | (c) |
| | 2010 - FST Cash Management Shares (Commenced May 14, 2010) | | | 1.00 | | | | — | (c) | | | — | (c) |
| | | | | | | | | | | | | | |
| | FOR THE PERIOD JANUARY 1 TO AUGUST 31*, | | | | | | | | | | | | |
| | 2009 - FST Shares | | | 1.00 | | | | 0.002 | (g) | | | (0.002 | )(g) |
| | 2009 - FST Select Shares | | | 1.00 | | | | 0.002 | (g) | | | (0.002 | )(g) |
| | 2009 - FST Preferred Shares | | | 1.00 | | | | 0.002 | (g) | | | (0.002 | )(g) |
| | 2009 - FST Capital Shares | | | 1.00 | | | | 0.001 | (g) | | | (0.001 | )(g) |
| | 2009 - FST Administration Shares | | | 1.00 | | | | 0.001 | (g) | | | (0.001 | )(g) |
| | 2009 - FST Service Shares | | | 1.00 | | | | — | (c)(g) | | | — | (c)(g) |
| | | | | | | | | | | | | | |
| | FOR THE FISCAL YEARS ENDED DECEMBER 31 , | | | | | | | | | | | | |
| | 2008 - FST Shares | | | 1.00 | | | | 0.025 | (g) | | | (0.025 | )(g) |
| | 2008 - FST Select Shares | | | 1.00 | | | | 0.024 | (g) | | | (0.024 | )(g) |
| | 2008 - FST Preferred Shares | | | 1.00 | | | | 0.024 | (g) | | | (0.024 | )(g) |
| | 2008 - FST Capital Shares | | | 1.00 | | | | 0.023 | (g) | | | (0.023 | )(g) |
| | 2008 - FST Administration Shares | | | 1.00 | | | | 0.022 | (g) | | | (0.022 | )(g) |
| | 2008 - FST Service Shares | | | 1.00 | | | | 0.020 | (g) | | | (0.020 | )(g) |
| | 2007 - FST Shares | | | 1.00 | | | | 0.050 | | | | (0.050 | ) |
| | 2007 - FST Select Shares | | | 1.00 | | | | 0.049 | | | | (0.049 | ) |
| | 2007 - FST Preferred Shares | | | 1.00 | | | | 0.049 | | | | (0.049 | ) |
| | 2007 - FST Capital Shares | | | 1.00 | | | | 0.048 | | | | (0.048 | ) |
| | 2007 - FST Administration Shares | | | 1.00 | | | | 0.047 | | | | (0.047 | ) |
| | 2007 - FST Service Shares | | | 1.00 | | | | 0.045 | | | | (0.045 | ) |
| | * | | The Fund changed its fiscal year end from December 31 to August 31. |
| | (a) | | Distributions may not coincide with the current year net investment income or net realized gains as distributions may be paid from current or prior year earnings. |
| | (b) | | Assumes reinvestment of all distributions. Returns do not reflect the deduction of taxes that a shareholder would pay on Fund distributions. Total returns for periods less than one full year are not annualized. |
| | (c) | | Amount is less than $0.0005 per share. |
| | (d) | | Amount is less than 0.005%. |
| | (f) | | Amount is less than 0.005% of average net assets. |
| | (g) | | Net investment income and distributions from net investment income contain $0.0002 and $(0.0002), and $0.0003 and $(0.0003), of net realized gains and distributions from net realized gains for the period ended August 31, 2009 and fiscal year ended December 31, 2008, respectively. |
| | |
| 64 | | The accompanying notes are an integral part of these financial statements. |
FINANCIAL SQUARE FEDERAL FUND
| | | | | | | | | | | | | | | | | | | | | | | | | | | | | | | | | | |
| | | Net asset
value, end
of period | | | | | Total
return(b) | | | | | Net assets
end of
period
(in 000s) | | | | | Ratio of
net expenses
to average
net assets | | | | | Ratio of
total expenses
to average
net assets | | | | | Ratio of
net investment
income (loss)
to average
net assets | |
| | | | | | | | | | | | | | | | | | | | | | | | | | | | | | | | | | |
| | $ | 1.00 | | | | | | — | %(d) | | | | $ | 8,682,821 | | | | | | 0.15 | %(e) | | | | | 0.23 | %(e) | | | | | — | %(e)(f) |
| | | 1.00 | | | | | | — | (d) | | | | | 74,679 | | | | | | 0.15 | (e) | | | | | 0.26 | (e) | | | | | — | (e)(f) |
| | | 1.00 | | | | | | — | (d) | | | | | 54,269 | | | | | | 0.15 | (e) | | | | | 0.33 | (e) | | | | | — | (e)(f) |
| | | 1.00 | | | | | | — | (d) | | | | | 79,859 | | | | | | 0.15 | (e) | | | | | 0.38 | (e) | | | | | — | (e)(f) |
| | | 1.00 | | | | | | — | (d) | | | | | 377,398 | | | | | | 0.15 | (e) | | | | | 0.48 | (e) | | | | | — | (e)(f) |
| | | 1.00 | | | | | | — | (d) | | | | | 1,213,425 | | | | | | 0.15 | (e) | | | | | 0.58 | (e) | | | | | — | (e)(f) |
| | | 1.00 | | | | | | — | (d) | | | | | 484,316 | | | | | | 0.15 | (e) | | | | | 0.73 | (e) | | | | | — | (e)(f) |
| | | 1.00 | | | | | | — | (d) | | | | | 1 | | | | | | 0.15 | (e) | | | | | 0.88 | (e) | | | | | 0.40 | (e) |
| | | 1.00 | | | | | | — | (d) | | | | | 64,552 | | | | | | 0.15 | (e) | | | | | 1.03 | (e) | | | | | — | (e)(f) |
| | | | | | | | | | | | | | | | | | | | | | | | | | | | | | | | | | |
| | | | | | | | | | | | | | | | | | | | | | | | | | | | | | | | | | |
| | | 1.00 | | | | | | 0.01 | | | | | | 9,044,336 | | | | | | 0.12 | | | | | | 0.23 | | | | | | — | (f) |
| | | 1.00 | | | | | | 0.01 | | | | | | 89,636 | | | | | | 0.12 | | | | | | 0.26 | | | | | | 0.01 | |
| | | 1.00 | | | | | | 0.01 | | | | | | 60,660 | | | | | | 0.12 | | | | | | 0.33 | | | | | | — | (f) |
| | | 1.00 | | | | | | 0.01 | | | | | | 71,459 | | | | | | 0.12 | | | | | | 0.38 | | | | | | — | (f) |
| | | 1.00 | | | | | | 0.01 | | | | | | 480,896 | | | | | | 0.12 | | | | | | 0.48 | | | | | | — | (f) |
| | | 1.00 | | | | | | 0.01 | | | | | | 1,313,277 | | | | | | 0.12 | | | | | | 0.58 | | | | | | — | (f) |
| | | 1.00 | | | | | | 0.01 | | | | | | 603,587 | | | | | | 0.12 | | | | | | 0.73 | | | | | | — | (f) |
| | | 1.00 | | | | | | 0.01 | | | | | | 1 | | | | | | 0.12 | | | | | | 0.88 | | | | | | 0.40 | |
| | | 1.00 | | | | | | 0.01 | | | | | | 175,249 | | | | | | 0.12 | | | | | | 1.03 | | | | | | — | (f) |
| | | 1.00 | | | | | | 0.01 | | | | | | 9,888,638 | | | | | | 0.17 | | | | | | 0.23 | | | | | | 0.01 | |
| | | 1.00 | | | | | | 0.01 | | | | | | 74,182 | | | | | | 0.18 | | | | | | 0.26 | | | | | | — | (f) |
| | | 1.00 | | | | | | 0.01 | | | | | | 269,893 | | | | | | 0.18 | | | | | | 0.33 | | | | | | — | (f) |
| | | 1.00 | | | | | | 0.01 | | | | | | 80,713 | | | | | | 0.18 | | | | | | 0.38 | | | | | | — | (f) |
| | | 1.00 | | | | | | 0.01 | | | | | | 454,427 | | | | | | 0.18 | | | | | | 0.48 | | | | | | — | (f) |
| | | 1.00 | | | | | | 0.01 | | | | | | 1,298,287 | | | | | | 0.18 | | | | | | 0.58 | | | | | | — | (f) |
| | | 1.00 | | | | | | 0.01 | | | | | | 739,254 | | | | | | 0.18 | | | | | | 0.73 | | | | | | — | (f) |
| | | 1.00 | | | | | | 0.01 | | | | | | 1 | | | | | | 0.17 | | | | | | 0.88 | | | | | | 0.19 | |
| | | 1.00 | | | | | | 0.01 | | | | | | 151,472 | | | | | | 0.18 | | | | | | 1.03 | | | | | | — | (f) |
| | | 1.00 | | | | | | 0.05 | | | | | | 12,958,372 | | | | | | 0.20 | | | | | | 0.23 | | | | | | 0.03 | |
| | | 1.00 | | | | | | 0.02 | | | | | | 105,245 | | | | | | 0.22 | | | | | | 0.25 | | | | | | 0.01 | |
| | | 1.00 | | | | | | 0.01 | | | | | | 285,291 | | | | | | 0.24 | | | | | | 0.33 | | | | | | (0.01 | ) |
| | | 1.00 | | | | | | 0.01 | | | | | | 72,407 | | | | | | 0.24 | | | | | | 0.37 | | | | | | (0.01 | ) |
| | | 1.00 | | | | | | 0.01 | | | | | | 579,217 | | | | | | 0.25 | | | | | | 0.48 | | | | | | (0.01 | ) |
| | | 1.00 | | | | | | 0.01 | | | | | | 1,479,302 | | | | | | 0.24 | (e) | | | | | 0.58 | (e) | | | | | 0.01 | (e) |
| | | 1.00 | | | | | | 0.01 | | | | | | 774,348 | | | | | | 0.24 | | | | | | 0.73 | | | | | | (0.01 | ) |
| | | 1.00 | | | | | | 0.01 | | | | | | 1 | | | | | | 0.20 | (e) | | | | | 0.73 | (e) | | | | | 0.06 | (e) |
| | | 1.00 | | | | | | 0.01 | | | | | | 210,167 | | | | | | 0.24 | (e) | | | | | 1.03 | (e) | | | | | 0.01 | (e) |
| | | | | | | | | | | | | | | | | | | | | | | | | �� | | | | | | | | | |
| | | | | | | | | | | | | | | | | | | | | | | | | | | | | | | | | | |
| | | 1.00 | | | | | | 0.22 | | | | | | 20,069,801 | | | | | | 0.21 | (e) | | | | | 0.24 | (e) | | | | | 0.32 | (e) |
| | | 1.00 | | | | | | 0.20 | | | | | | 256,463 | | | | | | 0.24 | (e) | | | | | 0.27 | (e) | | | | | 0.24 | (e) |
| | | 1.00 | | | | | | 0.15 | | | | | | 511,911 | | | | | | 0.31 | (e) | | | | | 0.34 | (e) | | | | | 0.19 | (e) |
| | | 1.00 | | | | | | 0.12 | | | | | | 157,721 | | | | | | 0.36 | (e) | | | | | 0.39 | (e) | | | | | 0.09 | (e) |
| | | 1.00 | | | | | | 0.07 | | | | | | 897,620 | | | | | | 0.44 | (e) | | | | | 0.49 | (e) | | | | | 0.10 | (e) |
| | | 1.00 | | | | | | 0.02 | | | | | | 887,368 | | | | | | 0.53 | (e) | | | | | 0.74 | (e) | | | | | — | (e)(f) |
| | | | | | | | | | | | | | | | | | | | | | | | | | | | | | | | | | |
| | | | | | | | | | | | | | | | | | | | | | | | | | | | | | | | | | |
| | | 1.00 | | | | | | 2.48 | | | | | | 31,185,150 | | | | | | 0.21 | | | | | | 0.24 | | | | | | 2.34 | |
| | | 1.00 | | | | | | 2.45 | | | | | | 89,863 | | | | | | 0.24 | | | | | | 0.27 | | | | | | 2.29 | |
| | | 1.00 | | | | | | 2.38 | | | | | | 491,371 | | | | | | 0.31 | | | | | | 0.34 | | | | | | 2.32 | |
| | | 1.00 | | | | | | 2.33 | | | | | | 36,379 | | | | | | 0.36 | | | | | | 0.39 | | | | | | 1.99 | |
| | | 1.00 | | | | | | 2.22 | | | | | | 1,470,423 | | | | | | 0.46 | | | | | | 0.49 | | | | | | 2.01 | |
| | | 1.00 | | | | | | 1.97 | | | | | | 1,331,954 | | | | | | 0.71 | | | | | | 0.74 | | | | | | 1.88 | |
| | | 1.00 | | | | | | 5.07 | | | | | | 15,074,711 | | | | | | 0.20 | | | | | | 0.23 | | | | | �� | 4.92 | |
| | | 1.00 | | | | | | 5.04 | | | | | | 1 | | | | | | 0.23 | | | | | | 0.26 | | | | | | 4.91 | |
| | | 1.00 | | | | | | 4.97 | | | | | | 315,256 | | | | | | 0.30 | | | | | | 0.33 | | | | | | 4.80 | |
| | | 1.00 | | | | | | 4.91 | | | | | | 7,941 | | | | | | 0.35 | | | | | | 0.38 | | | | | | 4.77 | |
| | | 1.00 | | | | | | 4.81 | | | | | | 586,405 | | | | | | 0.45 | | | | | | 0.48 | | | | | | 4.71 | |
| | | 1.00 | | | | | | 4.55 | | | | | | 946,214 | | | | | | 0.70 | | | | | | 0.73 | | | | | | 4.42 | |
| | |
| The accompanying notes are an integral part of these financial statements. | | 65 |
FINANCIAL SQUARE GOVERNMENT FUND
Financial Highlights
Selected Data for a Share Outstanding Throughout Each Period
| | | | | | | | | | | | | | |
| | | Year - Share Class | | Net asset
value,
beginning
of period | | | Net
investment
income (loss) | | |
Distributions
from net
investment
income(a) | |
| | FOR THE SIX MONTHS ENDED FEBRUARY 28, (UNAUDITED) | | | | | | | | | | | | |
| | 2013 - FST Shares | | $ | 1.00 | | | $ | — | (c) | | $ | — | (c) |
| | 2013 - FST Select Shares | | | 1.00 | | | | — | (c) | | | — | (c) |
| | 2013 - FST Preferred Shares | | | 1.00 | | | | — | (c) | | | — | (c) |
| | 2013 - FST Capital Shares | | | 1.00 | | | | — | (c) | | | — | (c) |
| | 2013 - FST Administration Shares | | | 1.00 | | | | — | (c) | | | — | (c) |
| | 2013 - FST Premier Shares | | | 1.00 | | | | — | (c) | | | — | (c) |
| | 2013 - FST Service Shares | | | 1.00 | | | | — | (c) | | | — | (c) |
| | 2013 - FST Resource Shares | | | 1.00 | | | | — | (c) | | | — | (c) |
| | 2013 - FST Cash Management Shares | | | 1.00 | | | | — | (c) | | | — | (c) |
| | | | | | | | | | | | | | |
| | FOR THE FISCAL YEARS ENDED AUGUST 31, | | | | | | | | | | | | |
| | 2012 - FST Shares | | | 1.00 | | | | — | (c) | | | — | (c) |
| | 2012 - FST Select Shares | | | 1.00 | | | | — | (c) | | | — | (c) |
| | 2012 - FST Preferred Shares | | | 1.00 | | | | — | (c) | | | — | (c) |
| | 2012 - FST Capital Shares | | | 1.00 | | | | — | (c) | | | — | (c) |
| | 2012 - FST Administration Shares | | | 1.00 | | | | — | (c) | | | — | (c) |
| | 2012 - FST Premier Shares | | | 1.00 | | | | — | (c) | | | — | (c) |
| | 2012 - FST Service Shares | | | 1.00 | | | | — | (c) | | | — | (c) |
| | 2012 - FST Resource Shares | | | 1.00 | | | | — | (c) | | | — | (c) |
| | 2012 - FST Cash Management Shares | | | 1.00 | | | | — | (c) | | | — | (c) |
| | 2011 - FST Shares | | | 1.00 | | | | — | (c) | | | — | (c) |
| | 2011 - FST Select Shares | | | 1.00 | | | | — | (c) | | | — | (c) |
| | 2011 - FST Preferred Shares | | | 1.00 | | | | — | (c) | | | — | (c) |
| | 2011 - FST Capital Shares | | | 1.00 | | | | — | (c) | | | — | (c) |
| | 2011 - FST Administration Shares | | | 1.00 | | | | — | (c) | | | — | (c) |
| | 2011 - FST Premier Shares | | | 1.00 | | | | — | (c) | | | — | (c) |
| | 2011 - FST Service Shares | | | 1.00 | | | | — | (c) | | | — | (c) |
| | 2011 - FST Resource Shares | | | 1.00 | | | | — | (c) | | | — | (c) |
| | 2011 - FST Cash Management Shares | | | 1.00 | | | | — | (c) | | | — | (c) |
| | 2010 - FST Shares | | | 1.00 | | | | 0.001 | | | | (0.001 | ) |
| | 2010 - FST Select Shares | | | 1.00 | | | | 0.001 | | | | (0.001 | ) |
| | 2010 - FST Preferred Shares | | | 1.00 | | | | — | (c) | | | — | (c) |
| | 2010 - FST Capital Shares | | | 1.00 | | | | — | (c) | | | — | (c) |
| | 2010 - FST Administration Shares | | | 1.00 | | | | — | (c) | | | — | (c) |
| | 2010 - FST Premier Shares (Commenced May 14, 2010) | | | 1.00 | | | | — | (c) | | | — | (c) |
| | 2010 - FST Service Shares | | | 1.00 | | | | — | (c) | | | — | (c) |
| | 2010 - FST Resource Shares (Commenced May 14, 2010) | | | 1.00 | | | | — | (c) | | | — | (c) |
| | 2010 - FST Cash Management Shares (Commenced May 14, 2010) | | | 1.00 | | | | — | (c) | | | — | (c) |
| | | | | | | | | | | | | | |
| | FOR THE PERIOD JANUARY 1 TO AUGUST 31*, | | | | | | | | | | | | |
| | 2009 - FST Shares | | | 1.00 | | | | 0.003 | (g) | | | (0.003 | )(g) |
| | 2009 - FST Select Shares | | | 1.00 | | | | 0.003 | (g) | | | (0.003 | )(g) |
| | 2009 - FST Preferred Shares | | | 1.00 | | | | 0.002 | (g) | | | (0.002 | )(g) |
| | 2009 - FST Capital Shares | | | 1.00 | | | | 0.002 | (g) | | | (0.002 | )(g) |
| | 2009 - FST Administration Shares | | | 1.00 | | | | 0.001 | (g) | | | (0.001 | )(g) |
| | 2009 - FST Service Shares | | | 1.00 | | | | 0.001 | (g) | | | (0.001 | )(g) |
| | | | | | | | | | | | | | |
| | FOR THE FISCAL YEARS ENDED DECEMBER 31 , | | | | | | | | | | | | |
| | 2008 - FST Shares | | | 1.00 | | | | 0.025 | (g) | | | (0.025 | )(g) |
| | 2008 - FST Select Shares | | | 1.00 | | | | 0.025 | (g) | | | (0.025 | )(g) |
| | 2008 - FST Preferred Shares | | | 1.00 | | | | 0.024 | (g) | | | (0.024 | )(g) |
| | 2008 - FST Capital Shares | | | 1.00 | | | | 0.023 | (g) | | | (0.023 | )(g) |
| | 2008 - FST Administration Shares | | | 1.00 | | | | 0.022 | (g) | | | (0.022 | )(g) |
| | 2008 - FST Service Shares | | | 1.00 | | | | 0.020 | (g) | | | (0.020 | )(g) |
| | 2007 - FST Shares | | | 1.00 | | | | 0.050 | | | | (0.050 | ) |
| | 2007 - FST Select Shares | | | 1.00 | | | | 0.050 | | | | (0.050 | ) |
| | 2007 - FST Preferred Shares | | | 1.00 | | | | 0.049 | | | | (0.049 | ) |
| | 2007 - FST Capital Shares | | | 1.00 | | | | 0.049 | | | | (0.049 | ) |
| | 2007 - FST Administration Shares | | | 1.00 | | | | 0.047 | | | | (0.047 | ) |
| | 2007 - FST Service Shares | | | 1.00 | | | | 0.045 | | | | (0.045 | ) |
| | * | | The Fund changed its fiscal year end from December 31 to August 31. |
| | (a) | | Distributions may not coincide with the current year net investment income or net realized gains as distributions may be paid from current or prior year earnings. |
| | (b) | | Assumes reinvestment of all distributions. Returns do not reflect the deduction of taxes that a shareholder would pay on Fund distributions. Total returns for periods less than one full year are not annualized. |
| | (c) | | Amount is less than $0.0005 per share. |
| | (d) | | Amount is less than 0.005%. |
| | (f) | | Amount is less than 0.005% of average net assets. |
| | (g) | | Net investment income and distributions from net investment income contain $0.0005 and $(0.0005), and $0.001 and $(0.001), of net realized gains and distributions from net realized gains for the period ended August 31, 2009 and the fiscal year ended December 31, 2008, respectively. |
| | |
| 66 | | The accompanying notes are an integral part of these financial statements. |
FINANCIAL SQUARE GOVERNMENT FUND
| | | | | | | | | | | | | | | | | | | | | | | | | | | | | | | | | | |
| | | Net asset
value, end
of period | | | | | Total
return(b) | | | | | Net assets end of period (in 000s) | | | | | Ratio of
net expenses
to average
net assets | | | | | Ratio of
total expenses
to average
net assets | | | | | Ratio of
net investment
income (loss)
to average net assets | |
| | | | | | | | | | | | | | | | | | | | | | | | | | | | | | | | | | |
| | $ | 1.00 | | | | | | 0.02 | % | | | | $ | 28,906,402 | | | | | | 0.18 | %(e) | | | | | 0.23 | %(e) | | | | | 0.05 | %(e) |
| | | 1.00 | | | | | | 0.01 | | | | | | 186,908 | | | | | | 0.21 | (e) | | | | | 0.26 | (e) | | | | | 0.03 | (e) |
| | | 1.00 | | | | | | — | (d) | | | | | 399,131 | | | | | | 0.22 | (e) | | | | | 0.33 | (e) | | | | | 0.01 | (e) |
| | | 1.00 | | | | | | — | (d) | | | | | 384,682 | | | | | | 0.22 | (e) | | | | | 0.38 | (e) | | | | | 0.01 | (e) |
| | | 1.00 | | | | | | — | (d) | | | | | 2,594,849 | | | | | | 0.22 | (e) | | | | | 0.48 | (e) | | | | | 0.01 | (e) |
| | | 1.00 | | | | | | — | (d) | | | | | 6,782 | | | | | | 0.22 | (e) | | | | | 0.58 | (e) | | | | | 0.01 | (e) |
| | | 1.00 | | | | | | — | (d) | | | | | 289,665 | | | | | | 0.22 | (e) | | | | | 0.73 | (e) | | | | | 0.01 | (e) |
| | | 1.00 | | | | | | — | (d) | | | | | 1 | | | | | | 0.18 | (e) | | | | | 0.88 | (e) | | | | | 0.40 | (e) |
| | | 1.00 | | | | | | — | (d) | | | | | 1 | | | | | | 0.18 | (e) | | | | | 1.03 | (e) | | | | | 0.40 | (e) |
| | | | | | | | | | | | | | | | | | | | | | | | | | | | | | | | | | |
| | | | | | | | | | | | | | | | | | | | | | | | | | | | | | | | | | |
| | | 1.00 | | | | | | 0.03 | | | | | | 28,326,048 | | | | | | 0.18 | | | | | | 0.23 | | | | | | 0.03 | |
| | | 1.00 | | | | | | 0.01 | | | | | | 628,155 | | | | | | 0.20 | | | | | | 0.26 | | | | | | 0.01 | |
| | | 1.00 | | | | | | 0.01 | | | | | | 546,452 | | | | | | 0.20 | | | | | | 0.33 | | | | | | 0.01 | |
| | | 1.00 | | | | | | 0.01 | | | | | | 493,427 | | | | | | 0.20 | | | | | | 0.38 | | | | | | 0.01 | |
| | | 1.00 | | | | | | 0.01 | | | | | | 2,382,900 | | | | | | 0.20 | | | | | | 0.48 | | | | | | 0.01 | |
| | | 1.00 | | | | | | 0.01 | | | | | | 5,594 | | | | | | 0.21 | | | | | | 0.58 | | | | | | 0.01 | |
| | | 1.00 | | | | | | 0.01 | | | | | | 374,051 | | | | | | 0.20 | | | | | | 0.73 | | | | | | 0.01 | |
| | | 1.00 | | | | | | 0.01 | | | | | | 1 | | | | | | 0.18 | | | | | | 0.88 | | | | | | 0.40 | |
| | | 1.00 | | | | | | 0.01 | | | | | | 1 | | | | | | 0.18 | | | | | | 1.03 | | | | | | 0.40 | |
| | | 1.00 | | | | | | 0.04 | | | | | | 20,959,643 | | | | | | 0.18 | | | | | | 0.23 | | | | | | 0.04 | |
| | | 1.00 | | | | | | 0.02 | | | | | | 474,953 | | | | | | 0.20 | | | | | | 0.26 | | | | | | 0.03 | |
| | | 1.00 | | | | | | 0.01 | | | | | | 652,225 | | | | | | 0.22 | | | | | | 0.33 | | | | | | — | (f) |
| | | 1.00 | | | | | | 0.01 | | | | | | 815,275 | | | | | | 0.22 | | | | | | 0.38 | | | | | | — | (f) |
| | | 1.00 | | | | | | 0.01 | | | | | | 1,956,642 | | | | | | 0.22 | | | | | | 0.48 | | | | | | — | (f) |
| | | 1.00 | | | | | | 0.01 | | | | | | 1 | | | | | | 0.22 | | | | | | 0.58 | | | | | | 0.28 | |
| | | 1.00 | | | | | | 0.01 | | | | | | 478,866 | | | | | | 0.21 | | | | | | 0.73 | | | | | | — | (f) |
| | | 1.00 | | | | | | 0.01 | | | | | | 1 | | | | | | 0.22 | | | | | | 0.88 | | | | | | 0.28 | |
| | | 1.00 | | | | | | 0.01 | | | | | | 1 | | | | | | 0.22 | | | | | | 1.03 | | | | | | — | (f) |
| | | 1.00 | | | | | | 0.08 | | | | | | 26,136,102 | | | | | | 0.18 | | | | | | 0.23 | | | | | | 0.06 | |
| | | 1.00 | | | | | | 0.05 | | | | | | 1,225,360 | | | | | | 0.21 | | | | | | 0.26 | | | | | | 0.03 | |
| | | 1.00 | | | | | | 0.02 | | | | | | 783,466 | | | | | | 0.25 | | | | | | 0.33 | | | | | | (0.01 | ) |
| | | 1.00 | | | | | | 0.01 | | | | | | 859,594 | | | | | | 0.25 | | | | | | 0.38 | | | | | | (0.01 | ) |
| | | 1.00 | | | | | | 0.01 | | | | | | 2,397,534 | | | | | | 0.25 | | | | | | 0.48 | | | | | | (0.02 | ) |
| | | 1.00 | | | | | | 0.01 | | | | | | 1 | | | | | | 0.18 | (e) | | | | | 0.58 | (e) | | | | | 0.25 | (e) |
| | | 1.00 | | | | | | 0.01 | | | | | | 377,138 | | | | | | 0.25 | | | | | | 0.73 | | | | | | (0.02 | ) |
| | | 1.00 | | | | | | 0.01 | | | | | | 1 | | | | | | 0.18 | (e) | | | | | 0.73 | (e) | | | | | 0.25 | (e) |
| | | 1.00 | | | | | | 0.01 | | | | | | 1 | | | | | | 0.30 | (e) | | | | | 1.03 | (e) | | | | | (0.18 | )(e) |
| | | | | | | | | | | | | | | | | | | | | | | | | | | | | | | | | | |
| | | | | | | | | | | | | | | | | | | | | | | | | | | | | | | | | | |
| | | 1.00 | | | | | | 0.29 | | | | | | 51,896,720 | | | | | | 0.19 | (e) | | | | | 0.24 | (e) | | | | | 0.35 | (e) |
| | | 1.00 | | | | | | 0.27 | | | | | | 2,218,312 | | | | | | 0.22 | (e) | | | | | 0.27 | (e) | | | | | 0.30 | (e) |
| | | 1.00 | | | | | | 0.22 | | | | | | 873,242 | | | | | | 0.29 | (e) | | | | | 0.34 | (e) | | | | | 0.26 | (e) |
| | | 1.00 | | | | | | 0.19 | | | | | | 1,022,472 | | | | | | 0.34 | (e) | | | | | 0.39 | (e) | | | | | 0.23 | (e) |
| | | 1.00 | | | | | | 0.13 | | | | | | 3,217,353 | | | | | | 0.43 | (e) | | | | | 0.49 | (e) | | | | | 0.13 | (e) |
| | | 1.00 | | | | | | 0.05 | | | | | | 505,564 | | | | | | 0.58 | (e) | | | | | 0.74 | (e) | | | | | (0.01 | )(e) |
| | | | | | | | | | | | | | | | | | | | | | | | | | | | | | | | | | |
| | | | | | | | | | | | | | | | | | | | | | | | | | | | | | | | | | |
| | | 1.00 | | | | | | 2.51 | | | | | | 48,835,964 | | | | | | 0.19 | | | | | | 0.24 | | | | | | 2.17 | |
| | | 1.00 | | | | | | 2.48 | | | | | | 1,222,242 | | | | | | 0.22 | | | | | | 0.27 | | | | | | 2.24 | |
| | | 1.00 | | | | | | 2.41 | | | | | | 1,022,324 | | | | | | 0.29 | | | | | | 0.34 | | | | | | 2.28 | |
| | | 1.00 | | | | | | 2.36 | | | | | | 1,256,106 | | | | | | 0.34 | | | | | | 0.39 | | | | | | 2.15 | |
| | | 1.00 | | | | | | 2.25 | | | | | | 3,995,979 | | | | | | 0.44 | | | | | | 0.49 | | | | | | 2.06 | |
| | | 1.00 | | | | | | 2.00 | | | | | | 676,581 | | | | | | 0.69 | | | | | | 0.74 | | | | | | 1.85 | |
| | | 1.00 | | | | | | 5.13 | | | | | | 9,944,020 | | | | | | 0.18 | | | | | | 0.24 | | | | | | 4.88 | |
| | | 1.00 | | | | | | 5.10 | | | | | | 438,264 | | | | | | 0.21 | | | | | | 0.27 | | | | | | 4.79 | |
| | | 1.00 | | | | | | 5.03 | | | | | | 666,779 | | | | | | 0.28 | | | | | | 0.34 | | | | | | 4.87 | |
| | | 1.00 | | | | | | 4.97 | | | | | | 354,687 | | | | | | 0.33 | | | | | | 0.39 | | | | | | 4.69 | |
| | | 1.00 | | | | | | 4.87 | | | | | | 1,886,834 | | | | | | 0.43 | | | | | | 0.49 | | | | | | 4.72 | |
| | | 1.00 | | | | | | 4.61 | | | | | | 407,134 | | | | | | 0.68 | | | | | | 0.74 | | | | | | 4.52 | |
| | |
| The accompanying notes are an integral part of these financial statements. | | 67 |
FINANCIAL SQUARE MONEY MARKET FUND
Financial Highlights
Selected Data for a Share Outstanding Throughout Each Period
| | | | | | | | | | | | | | |
| | | Year - Share Class | | Net asset
value,
beginning
of period | | | Net
investment
income (loss) | | |
Distributions
from net
investment
income(a) | |
| | FOR THE SIX MONTHS ENDED FEBRUARY 28, (UNAUDITED) | | | | | | | | | | | | |
| | 2013 - FST Shares | | $ | 1.00 | | | $ | 0.001 | | | $ | (0.001 | ) |
| | 2013 - FST Select Shares | | | 1.00 | | | | 0.001 | | | | (0.001 | ) |
| | 2013 - FST Preferred Shares | | | 1.00 | | | | — | (c) | | | — | (c) |
| | 2013 - FST Capital Shares | | | 1.00 | | | | — | (c) | | | — | (c) |
| | 2013 - FST Administration Shares | | | 1.00 | | | | — | (c) | | | — | (c) |
| | 2013 - FST Premier Shares | | | 1.00 | | | | — | (c) | | | — | (c) |
| | 2013 - FST Service Shares | | | 1.00 | | | | — | (c) | | | — | (c) |
| | 2013 - FST Resource Shares | | | 1.00 | | | | — | (c) | | | — | (c) |
| | 2013 - FST Cash Management Shares | | | 1.00 | | | | — | (c) | | | — | (c) |
| | | | | | | | | | | | | | |
| | FOR THE FISCAL YEARS ENDED AUGUST 31 , | | | | | | | | | | | | |
| | 2012 - FST Shares | | | 1.00 | | | | 0.002 | | | | (0.002 | ) |
| | 2012 - FST Select Shares | | | 1.00 | | | | 0.001 | | | | (0.001 | ) |
| | 2012 - FST Preferred Shares | | | 1.00 | | | | 0.001 | | | | (0.001 | ) |
| | 2012 - FST Capital Shares | | | 1.00 | | | | — | (c) | | | — | (c) |
| | 2012 - FST Administration Shares | | | 1.00 | | | | — | (c) | | | — | (c) |
| | 2012 - FST Premier Shares | | | 1.00 | | | | — | (c) | | | — | (c) |
| | 2012 - FST Service Shares | | | 1.00 | | | | — | (c) | | | — | (c) |
| | 2012 - FST Resource Shares | | | 1.00 | | | | — | (c) | | | — | (c) |
| | 2012 - FST Cash Management Shares | | | 1.00 | | | | — | (c) | | | — | (c) |
| | 2011 - FST Shares | | | 1.00 | | | | 0.001 | | | | (0.001 | ) |
| | 2011 - FST Select Shares | | | 1.00 | | | | 0.001 | | | | (0.001 | ) |
| | 2011 - FST Preferred Shares | | | 1.00 | | | | — | (c) | | | — | (c) |
| | 2011 - FST Capital Shares | | | 1.00 | | | | — | (c) | | | — | (c) |
| | 2011 - FST Administration Shares | | | 1.00 | | | | — | (c) | | | — | (c) |
| | 2011 - FST Premier Shares | | | 1.00 | | | | — | (c) | | | — | (c) |
| | 2011 - FST Service Shares | | | 1.00 | | | | — | (c) | | | — | (c) |
| | 2011 - FST Resource Shares | | | 1.00 | | | | — | (c) | | | — | (c) |
| | 2011 - FST Cash Management Shares | | | 1.00 | | | | — | (c) | | | — | (c) |
| | 2010 - FST Shares | | | 1.00 | | | | 0.001 | | | | (0.001 | ) |
| | 2010 - FST Select Shares | | | 1.00 | | | | 0.001 | | | | (0.001 | ) |
| | 2010 - FST Preferred Shares | | | 1.00 | | | | — | (c) | | | — | (c) |
| | 2010 - FST Capital Shares | | | 1.00 | | | | — | (c) | | | — | (c) |
| | 2010 - FST Administration Shares | | | 1.00 | | | | — | (c) | | | — | (c) |
| | 2010 - FST Premier Shares (Commenced May 14, 2010) | | | 1.00 | | | | — | (c) | | | — | (c) |
| | 2010 - FST Service Shares | | | 1.00 | | | | — | (c) | | | — | (c) |
| | 2010 - FST Resource Shares (Commenced May 14, 2010) | | | 1.00 | | | | — | (c) | | | — | (c) |
| | 2010 - FST Cash Management Shares (Commenced May 14, 2010) | | | 1.00 | | | | — | (c) | | | — | (c) |
| | | | | | | | | | | | | | |
| | FOR THE PERIOD JANUARY 1 TO AUGUST 31*, | | | | | | | | | | | | |
| | 2009 - FST Shares | | | 1.00 | | | | 0.004 | (g) | | | (0.004 | )(g) |
| | 2009 - FST Select Shares | | | 1.00 | | | | 0.004 | (g) | | | (0.004 | )(g) |
| | 2009 - FST Preferred Shares | | | 1.00 | | | | 0.003 | (g) | | | (0.003 | )(g) |
| | 2009 - FST Capital Shares | | | 1.00 | | | | 0.003 | (g) | | | (0.003 | )(g) |
| | 2009 - FST Administration Shares | | | 1.00 | | | | 0.002 | (g) | | | (0.002 | )(g) |
| | 2009 - FST Service Shares | | | 1.00 | | | | 0.001 | (g) | | | (0.001 | )(g) |
| | | | | | | | | | | | | | |
| | FOR THE FISCAL YEARS ENDED DECEMBER 31, | | | | | | | | | | | | |
| | 2008 - FST Shares | | | 1.00 | | | | 0.027 | | | | (0.027 | ) |
| | 2008 - FST Select Shares | | | 1.00 | | | | 0.026 | | | | (0.026 | ) |
| | 2008 - FST Preferred Shares | | | 1.00 | | | | 0.026 | | | | (0.026 | ) |
| | 2008 - FST Capital Shares | | | 1.00 | | | | 0.025 | | | | (0.025 | ) |
| | 2008 - FST Administration Shares | | | 1.00 | | | | 0.024 | | | | (0.024 | ) |
| | 2008 - FST Service Shares | | | 1.00 | �� | | | 0.022 | | | | (0.022 | ) |
| | 2007 - FST Shares | | | 1.00 | | | | 0.051 | | | | (0.051 | ) |
| | 2007 - FST Select Shares | | | 1.00 | | | | 0.051 | | | | (0.051 | ) |
| | 2007 - FST Preferred Shares | | | 1.00 | | | | 0.050 | | | | (0.050 | ) |
| | 2007 - FST Capital Shares | | | 1.00 | | | | 0.050 | | | | (0.050 | ) |
| | 2007 - FST Administration Shares | | | 1.00 | | | | 0.049 | | | | (0.049 | ) |
| | 2007 - FST Service Shares | | | 1.00 | | | | 0.046 | | | | (0.046 | ) |
| | * | | The Fund changed its fiscal year end from December 31 to August 31. |
| | (a) | | Distributions may not coincide with the current year net investment income or net realized gains as distributions may be paid from current or prior year earnings. |
| | (b) | | Assumes reinvestment of all distributions. Returns do not reflect the deduction of taxes that a shareholder would pay on Fund distributions. Total returns for periods less than one full year are not annualized. |
| | (c) | | Amount is less than $0.0005 per share. |
| | (d) | | Amount is less than 0.005%. |
| | (f) | | Amount is less than 0.005% of average net assets. |
| | (g) | | Net investment income and distributions from net investment income contain $0.0001 and $(0.0001) of net realized gains and distributions from net realized gains for the period ended August 31, 2009. |
| | |
| 68 | | The accompanying notes are an integral part of these financial statements. |
FINANCIAL SQUARE MONEY MARKET FUND
| | | | | | | | | | | | | | | | | | | | | | | | | | | | | | | | | | |
| | | Net asset
value, end
of period | | | | | Total
return(b) | | | | | Net assets end of period (in 000s) | | | | | Ratio of
net expenses
to average
net assets | | | | | Ratio of
total expenses
to average
net assets | | | | | Ratio of
net investment
income (loss)
to average net assets | |
| | | | | | | | | | | | | | | | | | | | | | | | | | | | | | | | | | |
| | $ | 1.00 | | | | | | 0.07 | % | | | | $ | 27,339,206 | | | | | | 0.18 | %(e) | | | | | 0.23 | %(e) | | | | | 0.13 | %(e) |
| | | 1.00 | | | | | | 0.05 | | | | | | 144,701 | | | | | | 0.21 | (e) | | | | | 0.26 | (e) | | | | | 0.11 | (e) |
| | | 1.00 | | | | | | 0.02 | | | | | | 42,821 | | | | | | 0.28 | (e) | | | | | 0.33 | (e) | | | | | 0.03 | (e) |
| | | 1.00 | | | | | | — | (d) | | | | | 25,196 | | | | | | 0.31 | (e) | | | | | 0.38 | (e) | | | | | 0.01 | (e) |
| | | 1.00 | | | | | | — | (d) | | | | | 350,742 | | | | | | 0.31 | (e) | | | | | 0.48 | (e) | | | | | — | (e)(f) |
| | | 1.00 | | | | | | — | (d) | | | | | 40,395 | | | | | | 0.31 | (e) | | | | | 0.58 | (e) | | | | | — | (e)(f) |
| | | 1.00 | | | | | | — | (d) | | | | | 30,456 | | | | | | 0.31 | (e) | | | | | 0.73 | (e) | | | | | — | (e)(f) |
| | | 1.00 | | | | | | — | (d) | | | | | 1 | | | | | | 0.18 | (e) | | | | | 0.88 | (e) | | | | | 0.40 | (e) |
| | | 1.00 | | | | | | — | (d) | | | | | 1 | | | | | | 0.18 | (e) | | | | | 1.03 | (e) | | | | | 0.40 | (e) |
| | | | | | | | | | | | | | | | | | | | | | | | | | | | | | | | | | |
| | | | | | | | | | | | | | | | | | | | | | | | | | | | | | | | | | |
| | | 1.00 | | | | | | 0.17 | | | | | | 20,278,527 | | | | | | 0.18 | | | | | | 0.23 | | | | | | 0.17 | |
| | | 1.00 | | | | | | 0.14 | | | | | | 151,931 | | | | | | 0.21 | | | | | | 0.26 | | | | | | 0.14 | |
| | | 1.00 | | | | | | 0.07 | | | | | | 34,142 | | | | | | 0.28 | | | | | | 0.33 | | | | | | 0.07 | |
| | | 1.00 | | | | | | 0.03 | | | | | | 31,393 | | | | | | 0.33 | | | | | | 0.38 | | | | | | 0.02 | |
| | | 1.00 | | | | | | 0.01 | | | | | | 400,478 | | | | | | 0.35 | | | | | | 0.48 | | | | | | 0.01 | |
| | | 1.00 | | | | | | 0.01 | | | | | | 28,554 | | | | | | 0.35 | | | | | | 0.58 | | | | | | 0.01 | |
| | | 1.00 | | | | | | 0.01 | | | | | | 24,931 | | | | | | 0.34 | | | | | | 0.73 | | | | | | 0.01 | |
| | | 1.00 | | | | | | 0.01 | | | | | | 1 | | | | | | 0.18 | | | | | | 0.88 | | | | | | 0.40 | |
| | | 1.00 | | | | | | 0.01 | | | | | | 1 | | | | | | 0.18 | | | | | | 1.03 | | | | | | 0.40 | |
| | | 1.00 | | | | | | 0.14 | | | | | | 19,751,293 | | | | | | 0.18 | | | | | | 0.23 | | | | | | 0.14 | |
| | | 1.00 | | | | | | 0.11 | | | | | | 212,150 | | | | | | 0.21 | | | | | | 0.26 | | | | | | 0.10 | |
| | | 1.00 | | | | | | 0.04 | | | | | | 57,885 | | | | | | 0.28 | | | | | | 0.33 | | | | | | 0.04 | |
| | | 1.00 | | | | | | 0.02 | | | | | | 47,555 | | | | | | 0.31 | | | | | | 0.38 | | | | | | 0.01 | |
| | | 1.00 | | | | | | 0.01 | | | | | | 567,818 | | | | | | 0.32 | | | | | | 0.48 | | | | | | — | (f) |
| | | 1.00 | | | | | | 0.01 | | | | | | 10,572 | | | | | | 0.29 | | | | | | 0.58 | | | | | | — | (f) |
| | | 1.00 | | | | | | 0.01 | | | | | | 148,341 | | | | | | 0.31 | | | | | | 0.73 | | | | | | — | (f) |
| | | 1.00 | | | | | | 0.01 | | | | | | 1 | | | | | | 0.28 | | | | | | 0.88 | | | | | | 0.32 | |
| | | 1.00 | | | | | | 0.01 | | | | | | 1 | | | | | | 0.40 | | | | | | 1.03 | | | | | | (0.07 | ) |
| | | 1.00 | | | | | | 0.13 | | | | | | 15,510,366 | | | | | | 0.18 | | | | | | 0.23 | | | | | | 0.10 | |
| | | 1.00 | | | | | | 0.10 | | | | | | 368,196 | | | | | | 0.21 | | | | | | 0.26 | | | | | | 0.11 | |
| | | 1.00 | | | | | | 0.04 | | | | | | 97,072 | | | | | | 0.27 | | | | | | 0.33 | | | | | | 0.03 | |
| | | 1.00 | | | | | | 0.02 | | | | | | 81,640 | | | | | | 0.29 | | | | | | 0.38 | | | | | | — | (f) |
| | | 1.00 | | | | | | 0.01 | | | | | | 780,326 | | | | | | 0.30 | | | | | | 0.48 | | | | | | (0.01 | ) |
| | | 1.00 | | | | | | 0.01 | | | | | | 1 | | | | | | 0.40 | (e) | | | | | 0.58 | (e) | | | | | 0.01 | (e) |
| | | 1.00 | | | | | | 0.01 | | | | | | 173,360 | | | | | | 0.29 | | | | | | 0.73 | | | | | | (0.02 | ) |
| | | 1.00 | | | | | | 0.01 | | | | | | 1 | | | | | | 0.18 | (e) | | | | | 0.73 | (e) | | | | | 0.31 | (e) |
| | | 1.00 | | | | | | 0.01 | | | | | | 1 | | | | | | 0.48 | (e) | | | | | 0.97 | (e) | | | | | (0.22 | )(e) |
| | | | | | | | | | | | | | | | | | | | | | | | | | | | | | | | | | |
| | | | | | | | | | | | | | | | | | | | | | | | | | | | | | | | | | |
| | | 1.00 | | | | | | 0.38 | | | | | | 21,878,982 | | | | | | 0.21 | (e) | | | | | 0.26 | (e) | | | | | 0.55 | (e) |
| | | 1.00 | | | | | | 0.36 | | | | | | 42,778 | | | | | | 0.24 | (e) | | | | | 0.29 | (e) | | | | | 0.60 | (e) |
| | | 1.00 | | | | | | 0.32 | | | | | | 87,673 | | | | | | 0.31 | (e) | | | | | 0.36 | (e) | | | | | 0.46 | (e) |
| | | 1.00 | | | | | | 0.28 | | | | | | 76,008 | | | | | | 0.36 | (e) | | | | | 0.41 | (e) | | | | | 0.38 | (e) |
| | | 1.00 | | | | | | 0.22 | | | | | | 1,415,175 | | | | | | 0.45 | (e) | | | | | 0.51 | (e) | | | | | 0.23 | (e) |
| | | 1.00 | | | | | | 0.11 | | | | | | 472,480 | | | | | | 0.62 | (e) | | | | | 0.76 | (e) | | | | | 0.15 | (e) |
| | | | | | | | | | | | | | | | | | | | | | | | | | | | | | | | | | |
| | | | | | | | | | | | | | | | | | | | | | | | | | | | | | | | | | |
| | | 1.00 | | | | | | 2.70 | | | | | | 18,340,321 | | | | | | 0.19 | | | | | | 0.24 | | | | | | 2.74 | |
| | | 1.00 | | | | | | 2.67 | | | | | | 54,085 | | | | | | 0.22 | | | | | | 0.27 | | | | | | 2.80 | |
| | | 1.00 | | | | | | 2.60 | | | | | | 87,841 | | | | | | 0.29 | | | | | | 0.34 | | | | | | 2.75 | |
| | | 1.00 | | | | | | 2.54 | | | | | | 50,112 | | | | | | 0.34 | | | | | | 0.39 | | | | | | 2.59 | |
| | | 1.00 | | | | | | 2.44 | | | | | | 684,773 | | | | | | 0.44 | | | | | | 0.49 | | | | | | 2.51 | |
| | | 1.00 | | | | | | 2.19 | | | | | | 559,707 | | | | | | 0.69 | | | | | | 0.74 | | | | | | 2.24 | |
| | | 1.00 | | | | | | 5.26 | | | | | | 22,000,123 | | | | | | 0.18 | | | | | | 0.23 | | | | | | 5.12 | |
| | | 1.00 | | | | | | 5.23 | | | | | | 82,832 | | | | | | 0.21 | | | | | | 0.26 | | | | | | 5.14 | |
| | | 1.00 | | | | | | 5.15 | | | | | | 161,635 | | | | | | 0.28 | | | | | | 0.33 | | | | | | 5.02 | |
| | | 1.00 | | | | | | 5.10 | | | | | | 54,022 | | | | | | 0.33 | | | | | | 0.38 | | | | | | 4.92 | |
| | | 1.00 | | | | | | 5.00 | | | | | | 1,175,106 | | | | | | 0.43 | | | | | | 0.48 | | | | | | 4.87 | |
| | | 1.00 | | | | | | 4.74 | | | | | | 648,195 | | | | | | 0.68 | | | | | | 0.73 | | | | | | 4.63 | |
| | |
| The accompanying notes are an integral part of these financial statements. | | 69 |
FINANCIAL SQUARE PRIME OBLIGATIONS FUND
Financial Highlights
Selected Data for a Share Outstanding Throughout Each Period
| | | | | | | | | | | | | | |
| | | Year - Share Class | | Net asset
value,
beginning
of period | | | Net
investment
income (loss) | | |
Distributions
from net
investment
income(a) | |
| | FOR THE SIX MONTHS ENDED FEBRUARY 28, (UNAUDITED) | | | | | | | | | | | | |
| | 2013 - FST Shares | | $ | 1.00 | | | $ | — | (c) | | $ | — | (c) |
| | 2013 - FST Select Shares | | | 1.00 | | | | — | (c) | | | — | (c) |
| | 2013 - FST Preferred Shares | | | 1.00 | | | | — | (c) | | | — | (c) |
| | 2013 - FST Capital Shares | | | 1.00 | | | | — | (c) | | | — | (c) |
| | 2013 - FST Administration Shares | | | 1.00 | | | | — | (c) | | | — | (c) |
| | 2013 - FST Premier Shares | | | 1.00 | | | | — | (c) | | | — | (c) |
| | 2013 - FST Service Shares | | | 1.00 | | | | — | (c) | | | — | (c) |
| | 2013 - FST Resource Shares | | | 1.00 | | | | — | (c) | | | — | (c) |
| | 2013 - FST Cash Management Shares | | | 1.00 | | | | — | (c) | | | — | (c) |
| | 2013 - FST Class B Shares | | | 1.00 | | | | — | (c) | | | — | (c) |
| | 2013 - FST Class C Shares | | | 1.00 | | | | — | (c) | | | — | (c) |
| | | | | | | | | | | | | | |
| | FOR THE FISCAL YEARS ENDED AUGUST 31 , | | | | | | | | | | | | |
| | 2012 - FST Shares | | | 1.00 | | | | 0.001 | | | | (0.001 | ) |
| | 2012 - FST Select Shares | | | 1.00 | | | | 0.001 | | | | (0.001 | ) |
| | 2012 - FST Preferred Shares | | | 1.00 | | | | — | (c) | | | — | (c) |
| | 2012 - FST Capital Shares | | | 1.00 | | | | — | (c) | | | — | (c) |
| | 2012 - FST Administration Shares | | | 1.00 | | | | — | (c) | | | — | (c) |
| | 2012 - FST Premier Shares | | | 1.00 | | | | — | (c) | | | — | (c) |
| | 2012 - FST Service Shares | | | 1.00 | | | | — | (c) | | | — | (c) |
| | 2012 - FST Resource Shares | | | 1.00 | | | | — | (c) | | | — | (c) |
| | 2012 - FST Cash Management Shares | | | 1.00 | | | | — | (c) | | | — | (c) |
| | 2012 - FST Class B Shares | | | 1.00 | | | | — | (c) | | | — | (c) |
| | 2012 - FST Class C Shares | | | 1.00 | | | | — | (c) | | | — | (c) |
| | 2011 - FST Shares | | | 1.00 | | | | 0.001 | | | | (0.001 | ) |
| | 2011 - FST Select Shares | | | 1.00 | | | | 0.001 | | | | (0.001 | ) |
| | 2011 - FST Preferred Shares | | | 1.00 | | | | — | (c) | | | — | (c) |
| | 2011 - FST Capital Shares | | | 1.00 | | | | — | (c) | | | — | (c) |
| | 2011 - FST Administration Shares | | | 1.00 | | | | — | (c) | | | — | (c) |
| | 2011 - FST Premier Shares | | | 1.00 | | | | — | (c) | | | — | (c) |
| | 2011 - FST Service Shares | | | 1.00 | | | | — | (c) | | | — | (c) |
| | 2011 - FST Resource Shares | | | 1.00 | | | | — | (c) | | | — | (c) |
| | 2011 - FST Cash Management Shares | | | 1.00 | | | | — | (c) | | | — | (c) |
| | 2011 - FST Class B Shares | | | 1.00 | | | | — | (c) | | | — | (c) |
| | 2011 - FST Class C Shares | | | 1.00 | | | | — | (c) | | | — | (c) |
| | 2010 - FST Shares | | | 1.00 | | | | 0.001 | | | | (0.001 | ) |
| | 2010 - FST Select Shares | | | 1.00 | | | | 0.001 | | | | (0.001 | ) |
| | 2010 - FST Preferred Shares | | | 1.00 | | | | — | (c) | | | — | (c) |
| | 2010 - FST Capital Shares | | | 1.00 | | | | — | (c) | | | — | (c) |
| | 2010 - FST Administration Shares | | | 1.00 | | | | — | (c) | | | — | (c) |
| | 2010 - FST Premier Shares (Commenced May 14, 2010) | | | 1.00 | | | | — | (c) | | | — | (c) |
| | 2010 - FST Service Shares | | | 1.00 | | | | — | (c) | | | — | (c) |
| | 2010 - FST Resource Shares (Commenced May 14, 2010) | | | 1.00 | | | | — | (c) | | | — | (c) |
| | 2010 - FST Cash Management Shares (Commenced May 14, 2010) | | | 1.00 | | | | — | (c) | | | — | (c) |
| | 2010 - FST Class B Shares (Commenced May 14, 2010) | | | 1.00 | | | | — | (c) | | | — | (c) |
| | 2010 - FST Class C Shares (Commenced May 14, 2010) | | | 1.00 | | | | — | (c) | | | — | (c) |
| | | | | | | | | | | | | | |
| | FOR THE PERIOD JANUARY 1 TO AUGUST 31*, | | | | | | | | | | | | |
| | 2009 - FST Shares | | | 1.00 | | | | 0.003 | | | | (0.003 | ) |
| | 2009 - FST Select Shares | | | 1.00 | | | | 0.003 | | | | (0.003 | ) |
| | 2009 - FST Preferred Shares | | | 1.00 | | | | 0.003 | | | | (0.003 | ) |
| | 2009 - FST Capital Shares | | | 1.00 | | | | 0.002 | | | | (0.002 | ) |
| | 2009 - FST Administration Shares | | | 1.00 | | | | 0.002 | | | | (0.002 | ) |
| | 2009 - FST Service Shares | | | 1.00 | | | | 0.001 | | | | (0.001 | ) |
| | | | | | | | | | | | | | |
| | FOR THE FISCAL YEARS ENDED DECEMBER 31 , | | | | | | | | | | | | |
| | 2008 - FST Shares | | | 1.00 | | | | 0.026 | (g) | | | (0.026 | ) |
| | 2008 - FST Select Shares | | | 1.00 | | | | 0.026 | (g) | | | (0.026 | ) |
| | 2008 - FST Preferred Shares | | | 1.00 | | | | 0.025 | (g) | | | (0.025 | ) |
| | 2008 - FST Capital Shares | | | 1.00 | | | | 0.025 | (g) | | | (0.025 | ) |
| | 2008 - FST Administration Shares | | | 1.00 | | | | 0.024 | (g) | | | (0.024 | ) |
| | 2008 - FST Service Shares | | | 1.00 | | | | 0.021 | (g) | | | (0.021 | ) |
| | 2007 - FST Shares | | | 1.00 | | | | 0.052 | | | | (0.052 | ) |
| | 2007 - FST Select Shares | | | 1.00 | | | | 0.051 | | | | (0.051 | ) |
| | 2007 - FST Preferred Shares | | | 1.00 | | | | 0.051 | | | | (0.051 | ) |
| | 2007 - FST Capital Shares | | | 1.00 | | | | 0.050 | | | | (0.050 | ) |
| | 2007 - FST Administration Shares | | | 1.00 | | | | 0.049 | | | | (0.049 | ) |
| | 2007 - FST Service Shares | | | 1.00 | | | | 0.047 | | | | (0.047 | ) |
| | * | | The Fund changed its fiscal year end from December 31 to August 31. |
| | (a) | | Distributions may not coincide with the current year net investment income or net realized gains as distributions may be paid from current or prior year earnings. |
| | (b) | | Assumes reinvestment of all distributions. Returns do not reflect the deduction of taxes that a shareholder would pay on Fund distributions. Total returns for periods less than one |
| | full | | year are not annualized. |
| | (c) | | Amount is less than $0.0005 per share. |
| | (d) | | Amount is less than 0.005%. |
| | (f) | | Amount is less than 0.005% of average net assets. |
| | (g) | | Reflects an increase of $0.002 per share and 0.22% as a result of voluntary and irrevocable capital infusion by Goldman Sachs. |
| | |
| 70 | | The accompanying notes are an integral part of these financial statements. |
FINANCIAL SQUARE PRIME OBLIGATIONS FUND
| | | | | | | | | | | | | | | | | | | | | | | | | | | | | | | | | | |
| | | Net asset
value, end
of period | | | | | Total
return(b) | | | | | Net assets end of period (in 000s) | | | | | Ratio of
net expenses
to average
net assets | | | | | Ratio of
total expenses
to average
net assets | | | | | Ratio of
net investment
income (loss)
to average
net assets | |
| | | | | | | | | | | | | | | | | | | | | | | | | | | | | | | | | | |
| | $ | 1.00 | | | | | | 0.05 | % | | | | $ | 16,011,610 | | | | | | 0.18 | %(e) | | | | | 0.23 | %(e) | | | | | 0.10 | %(e) |
| | | 1.00 | | | | | | 0.04 | | | | | | 269,380 | | | | | | 0.21 | (e) | | | | | 0.26 | (e) | | | | | 0.07 | (e) |
| | | 1.00 | | | | | | 0.01 | | | | | | 165,369 | | | | | | 0.27 | (e) | | | | | 0.33 | (e) | | | | | 0.01 | (e) |
| | | 1.00 | | | | | | — | (d) | | | | | 220,436 | | | | | | 0.28 | (e) | | | | | 0.38 | (e) | | | | | — | (e)(f) |
| | | 1.00 | | | | | | — | (d) | | | | | 1,801,206 | | | | | | 0.28 | (e) | | | | | 0.48 | (e) | | | | | — | (e)(f) |
| | | 1.00 | | | | | | — | (d) | | | | | 1 | | | | | | 0.18 | (e) | | | | | 0.58 | (e) | | | | | 0.40 | (e) |
| | | 1.00 | | | | | | — | (d) | | | | | 808,247 | | | | | | 0.27 | (e) | | | | | 0.73 | (e) | | | | | — | (e)(f) |
| | | 1.00 | | | | | | — | (d) | | | | | 143,894 | | | | | | 0.27 | (e) | | | | | 0.88 | (e) | | | | | — | (e)(f) |
| | | 1.00 | | | | | | — | (d) | | | | | 1 | | | | | | 0.18 | (e) | | | | | 1.03 | (e) | | | | | 0.40 | (e) |
| | | 1.00 | | | | | | — | (d) | | | | | 4,688 | | | | | | 0.27 | (e) | | | | | 1.23 | (e) | | | | | — | (e)(f) |
| | | 1.00 | | | | | | — | (d) | | | | | 22,972 | | | | | | 0.27 | (e) | | | | | 1.23 | (e) | | | | | — | (e)(f) |
| | | | | | | | | | | | | | | | | | | | | | | | | | | | | | | | | | |
| | | | | | | | | | | | | | | | | | | | | | | | | | | | | | | | | | |
| | | 1.00 | | | | | | 0.12 | | | | | | 14,614,135 | | | | | | 0.18 | | | | | | 0.23 | | | | | | 0.11 | |
| | | 1.00 | | | | | | 0.09 | | | | | | 325,596 | | | | | | 0.21 | | | | | | 0.26 | | | | | | 0.09 | |
| | | 1.00 | | | | | | 0.02 | | | | | | 206,707 | | | | | | 0.27 | | | | | | 0.33 | | | | | | 0.02 | |
| | | 1.00 | | | | | | 0.01 | | | | | | 187,844 | | | | | | 0.29 | | | | | | 0.38 | | | | | | — | (f) |
| | | 1.00 | | | | | | 0.01 | | | | | | 1,888,821 | | | | | | 0.29 | | | | | | 0.48 | | | | | | — | (f) |
| | | 1.00 | | | | | | 0.01 | | | | | | 1 | | | | | | 0.18 | | | | | | 0.58 | | | | | | 0.40 | |
| | | 1.00 | | | | | | 0.01 | | | | | | 764,803 | | | | | | 0.29 | | | | | | 0.73 | | | | | | — | (f) |
| | | 1.00 | | | | | | 0.01 | | | | | | 139,778 | | | | | | 0.29 | | | | | | 0.88 | | | | | | — | (f) |
| | | 1.00 | | | | | | 0.01 | | | | | | 1 | | | | | | 0.18 | | | | | | 1.03 | | | | | | 0.40 | |
| | | 1.00 | | | | | | 0.01 | | | | | | 5,188 | | | | | | 0.29 | | | | | | 1.23 | | | | | | — | (f) |
| | | 1.00 | | | | | | 0.01 | | | | | | 26,300 | | | | | | 0.29 | | | | | | 1.23 | | | | | | — | (f) |
| | | 1.00 | | | | | | 0.10 | | | | | | 17,670,097 | | | | | | 0.18 | | | | | | 0.23 | | | | | | 0.10 | |
| | | 1.00 | | | | | | 0.07 | | | | | | 151,663 | | | | | | 0.21 | | | | | | 0.26 | | | | | | 0.07 | |
| | | 1.00 | | | | | | 0.02 | | | | | | 406,827 | | | | | | 0.26 | | | | | | 0.33 | | | | | | 0.02 | |
| | | 1.00 | | | | | | 0.01 | | | | | | 179,018 | | | | | | 0.28 | | | | | | 0.38 | | | | | | 0.01 | |
| | | 1.00 | | | | | | 0.01 | | | | | | 2,875,584 | | | | | | 0.27 | | | | | | 0.48 | | | | | | 0.01 | |
| | | 1.00 | | | | | | 0.01 | | | | | | 1 | | | | | | 0.23 | | | | | | 0.58 | | | | | | 0.30 | |
| | | 1.00 | | | | | | 0.01 | | | | | | 762,833 | | | | | | 0.27 | | | | | | 0.73 | | | | | | 0.01 | |
| | | 1.00 | | | | | | 0.01 | | | | | | 147,232 | | | | | | 0.27 | | | | | | 0.88 | | | | | | 0.01 | |
| | | 1.00 | | | | | | 0.01 | | | | | | 1 | | | | | | 0.32 | | | | | | 1.03 | | | | | | 0.03 | |
| | | 1.00 | | | | | | 0.01 | | | | | | 7,762 | | | | | | 0.27 | | | | | | 1.23 | | | | | | 0.01 | |
| | | 1.00 | | | | | | 0.01 | | | | | | 32,646 | | | | | | 0.27 | | | | | | 1.23 | | | | | | 0.01 | |
| | | 1.00 | | | | | | 0.12 | | | | | | 22,977,394 | | | | | | 0.18 | | | | | | 0.23 | | | | | | 0.10 | |
| | | 1.00 | | | | | | 0.09 | | | | | | 106,849 | | | | | | 0.21 | | | | | | 0.26 | | | | | | 0.06 | |
| | | 1.00 | | | | | | 0.04 | | | | | | 350,484 | | | | | | 0.26 | | | | | | 0.33 | | | | | | 0.01 | |
| | | 1.00 | | | | | | 0.02 | | | | | | 325,649 | | | | | | 0.28 | | | | | | 0.38 | | | | | | (0.01 | ) |
| | | 1.00 | | | | | | 0.01 | | | | | | 3,194,694 | | | | | | 0.29 | | | | | | 0.48 | | | | | | (0.01 | ) |
| | | 1.00 | | | | | | 0.01 | | | | | | 1 | | | | | | 0.34 | (e) | | | | | 0.58 | (e) | | | | | 0.11 | (e) |
| | | 1.00 | | | | | | 0.01 | | | | | | 757,826 | | | | | | 0.29 | | | | | | 0.73 | | | | | | (0.01 | ) |
| | | 1.00 | | | | | | 0.01 | | | | | | 7,827 | | | | | | 0.36 | (e) | | | | | 1.23 | (e) | | | | | 0.02 | (e) |
| | | 1.00 | | | | | | 0.01 | | | | | | 29,973 | | | | | | 0.36 | (e) | | | | | 1.23 | (e) | | | | | 0.01 | (e) |
| | | 1.00 | | | | | | 0.01 | | | | | | 134,763 | | | | | | 0.35 | (e) | | | | | 0.73 | (e) | | | | | 0.01 | (e) |
| | | 1.00 | | | | | | 0.01 | | | | | | 1 | | | | | | 0.36 | (e) | | | | | 1.03 | (e) | | | | | (0.37 | )(e) |
| | | | | | | | | | | | | | | | | | | | | | | | | | | | | | | | | | |
| | | | | | | | | | | | | | | | | | | | | | | | | | | | | | | | | | |
| | | 1.00 | | | | | | 0.32 | | | | | | 30,756,777 | | | | | | 0.23 | (e) | | | | | 0.28 | (e) | | | | | 0.47 | (e) |
| | | 1.00 | | | | | | 0.30 | | | | | | 99,249 | | | | | | 0.26 | (e) | | | | | 0.31 | (e) | | | | | 0.48 | (e) |
| | | 1.00 | | | | | | 0.25 | | | | | | 1,226,201 | | | | | | 0.33 | (e) | | | | | 0.38 | (e) | | | | | 0.40 | (e) |
| | | 1.00 | | | | | | 0.22 | | | | | | 568,066 | | | | | | 0.38 | (e) | | | | | 0.43 | (e) | | | | | 0.37 | (e) |
| | | 1.00 | | | | | | 0.16 | | | | | | 3,986,524 | | | | | | 0.47 | (e) | | | | | 0.53 | (e) | | | | | 0.24 | (e) |
| | | 1.00 | | | | | | 0.06 | | | | | | 873,287 | | | | | | 0.63 | (e) | | | | | 0.78 | (e) | | | | | 0.12 | (e) |
| | | | | | | | | | | | | | | | | | | | | | | | | | | | | | | | | | |
| | | | | | | | | | | | | | | | | | | | | | | | | | | | | | | | | | |
| | | 1.00 | | | | | | 2.64 | | | | | | 25,218,329 | | | | | | 0.19 | | | | | | 0.24 | | | | | | 2.72 | |
| | | 1.00 | | | | | | 2.61 | | | | | | 95,807 | | | | | | 0.22 | | | | | | 0.27 | | | | | | 2.77 | |
| | | 1.00 | | | | | | 2.54 | | | | | | 1,385,336 | | | | | | 0.29 | | | | | | 0.34 | | | | | | 2.55 | |
| | | 1.00 | | | | | | 2.49 | | | | | | 777,173 | | | | | | 0.34 | | | | | | 0.39 | | | | | | 2.48 | |
| | | 1.00 | | | | | | 2.39 | | | | | | 4,060,108 | | | | | | 0.44 | | | | | | 0.49 | | | | | | 2.45 | |
| | | 1.00 | | | | | | 2.13 | | | | | | 1,398,311 | | | | | | 0.69 | | | | | | 0.74 | | | | | | 2.19 | |
| | | 1.00 | | | | | | 5.28 | | | | | | 36,224,153 | | | | | | 0.18 | | | | | | 0.23 | | | | | | 5.13 | |
| | | 1.00 | | | | | | 5.24 | | | | | | 267,150 | | | | | | 0.21 | | | | | | 0.26 | | | | | | 5.13 | |
| | | 1.00 | | | | | | 5.17 | | | | | | 1,154,660 | | | | | | 0.28 | | | | | | 0.33 | | | | | | 5.05 | |
| | | 1.00 | | | | | | 5.12 | | | | | | 787,305 | | | | | | 0.33 | | | | | | 0.38 | | | | | | 5.00 | |
| | | 1.00 | | | | | | 5.01 | | | | | | 5,865,430 | | | | | | 0.43 | | | | | | 0.48 | | | | | | 4.90 | |
| | | 1.00 | | | | | | 4.75 | | | | | | 2,097,006 | | | | | | 0.68 | | | | | | 0.73 | | | | | | 4.65 | |
| | |
| The accompanying notes are an integral part of these financial statements. | | 71 |
FINANCIAL SQUARE TAX-EXEMPT CALIFORNIA FUND
Financial Highlights
Selected Data for a Share Outstanding Throughout Each Period
| | | | | | | | | | | | | | |
| | | Year - Share Class | | Net asset
value,
beginning
of period | | | Net
investment
income (loss) | | |
Distributions
from net
investment
income(a) | |
| | FOR THE SIX MONTHS ENDED FEBRUARY 28, (UNAUDITED) | | | | | | | | | | | | |
| | 2013 - FST Shares | | $ | 1.00 | | | $ | — | (c) | | $ | — | (c) |
| | 2013 - FST Administration Shares | | | 1.00 | | | | — | (c) | | | — | (c) |
| | 2013 - FST Service Shares | | | 1.00 | | | | — | (c) | | | — | (c) |
| | 2013 - FST Cash Management Shares | | | 1.00 | | | | — | (c) | | | — | (c) |
| | | | | | | | | | | | | | |
| | FOR THE FISCAL YEARS ENDED AUGUST 31, | | | | | | | | | | | | |
| | 2012 - FST Shares | | | 1.00 | | | | — | (c) | | | — | (c) |
| | 2012 - FST Administration Shares | | | 1.00 | | | | — | (c) | | | — | (c) |
| | 2012 - FST Service Shares | | | 1.00 | | | | — | (c) | | | — | (c) |
| | 2012 - FST Cash Management Shares | | | 1.00 | | | | — | (c) | | | — | (c) |
| | 2011 - FST Shares | | | 1.00 | | | | — | (c) | | | — | (c) |
| | 2011 - FST Administration Shares | | | 1.00 | | | | — | (c) | | | — | (c) |
| | 2011 - FST Service Shares | | | 1.00 | | | | — | (c) | | | — | (c) |
| | 2011 - FST Cash Management Shares | | | 1.00 | | | | — | (c) | | | — | (c) |
| | 2010 - FST Shares | | | 1.00 | | | | — | (c) | | | — | (c) |
| | 2010 - FST Administration Shares | | | 1.00 | | | | — | (c) | | | — | (c) |
| | 2010 - FST Service Shares | | | 1.00 | | | | — | (c) | | | — | (c) |
| | 2010 - FST Cash Management Shares | | | 1.00 | | | | — | (c) | | | — | (c) |
| | | | | | | | | | | | | | |
| | FOR THE PERIOD JANUARY 1 TO AUGUST 31*, | | | | | | | | | | | | |
| | 2009 - FST Shares | | | 1.00 | | | | — | (c) | | | — | (c) |
| | 2009 - FST Administration Shares | | | 1.00 | | | | — | (c) | | | — | (c) |
| | 2009 - FST Service Shares | | | 1.00 | | | | — | (c) | | | — | (c) |
| | 2009 - FST Cash Management Shares | | | 1.00 | | | | — | (c) | | | — | (c) |
| | | | | | | | | | | | | | |
| | FOR THE FISCAL YEARS ENDED DECEMBER 31, | | | | | | | | | | | | |
| | 2008 - FST Shares | | | 1.00 | | | | 0.016 | | | | (0.016 | )(e) |
| | 2008 - FST Administration Shares | | | 1.00 | | | | 0.014 | | | | (0.014 | )(e) |
| | 2008 - FST Service Shares | | | 1.00 | | | | 0.012 | | | | (0.012 | )(e) |
| | 2008 - FST Cash Management Shares | | | 1.00 | | | | 0.011 | | | | (0.011 | )(e) |
| | 2007 - FST Shares | | | 1.00 | | | | 0.031 | | | | (0.031 | )(e) |
| | 2007 - FST Administration Shares | | | 1.00 | | | | 0.030 | | | | (0.030 | )(e) |
| | 2007 - FST Service Shares | | | 1.00 | | | | 0.027 | | | | (0.027 | )(e) |
| | 2007 - FST Cash Management Shares | | | 1.00 | | | | 0.026 | | | | (0.026 | )(e) |
| | * | | The Fund changed its fiscal year end from December 31 to August 31. |
| | (a) | | Distributions may not coincide with the current year net investment income or net realized gains as distributions may be paid from current or prior year earnings. |
| | (b) | | Assumes reinvestment of all distributions. Returns do not reflect the deduction of taxes that a shareholder would pay on Fund distributions. Total returns for periods less than one full year are not annualized. |
| | (c) | | Amount is less than $0.0005 per share. |
| | (e) | | Amount includes $0.00021 and $0.00007 of distributions from net realized gains for the fiscal years ended December 31, 2008 and December 31, 2007, respectively. |
| | |
| 72 | | The accompanying notes are an integral part of these financial statements. |
FINANCIAL SQUARE TAX-EXEMPT CALIFORNIA FUND
| | | | | | | | | | | | | | | | | | | | | | | | | | | | | | | | | | |
| | | Net asset
value, end
of period | | | | | Total
return(b) | | | | | Net assets
end of period (in 000s) | | | | | Ratio of
net expenses
to average
net assets | | | | | Ratio of
total expenses
to average
net assets | | | | | Ratio of
net investment
income (loss)
to average net assets | |
| | | | | | | | | | | | | | | | | | | | | | | | | | | | | | | | | | |
| | $ | 1.00 | | | | | | 0.02 | % | | | | $ | 94,394 | | | | | | 0.16 | %(d) | | | | | 0.47 | %(d) | | | | | 0.01 | %(d) |
| | | 1.00 | | | | | | 0.02 | | | | | | 153,675 | | | | | | 0.16 | (d) | | | | | 0.62 | (d) | | | | | 0.01 | (d) |
| | | 1.00 | | | | | | 0.02 | | | | | | 2 | | | | | | 0.16 | (d) | | | | | 0.87 | (d) | | | | | 0.21 | (d) |
| | | 1.00 | | | | | | 0.02 | | | | | | 1 | | | | | | 0.16 | (d) | | | | | 1.47 | (d) | | | | | 0.35 | (d) |
| | | | | | | | | | | | | | | | | | | | | | | | | | | | | | | | | | |
| | | | | | | | | | | | | | | | | | | | | | | | | | | | | | | | | | |
| | | 1.00 | | | | | | 0.01 | | | | | | 91,478 | | | | | | 0.15 | | | | | | 0.48 | | | | | | 0.01 | |
| | | 1.00 | | | | | | 0.01 | | | | | | 151,848 | | | | | | 0.15 | | | | | | 0.63 | | | | | | 0.01 | |
| | | 1.00 | | | | | | 0.01 | | | | | | 2 | | | | | | 0.15 | | | | | | 0.88 | | | | | | 0.23 | |
| | | 1.00 | | | | | | 0.01 | | | | | | 1 | | | | | | 0.15 | | | | | | 1.48 | | | | | | 0.29 | |
| | | 1.00 | | | | | | 0.01 | | | | | | 88,040 | | | | | | 0.24 | | | | | | 0.50 | | | | | | 0.01 | |
| | | 1.00 | | | | | | 0.01 | | | | | | 145,131 | | | | | | 0.24 | | | | | | 0.65 | | | | | | 0.01 | |
| | | 1.00 | | | | | | 0.01 | | | | | | 2 | | | | | | 0.24 | | | | �� | | 0.90 | | | | | | 0.11 | |
| | | 1.00 | | | | | | 0.01 | | | | | | 1 | | | | | | 0.24 | | | | | | 1.50 | | | | | | 0.09 | |
| | | 1.00 | | | | | | 0.01 | | | | | | 83,316 | | | | | | 0.30 | | | | | | 0.46 | | | | | | 0.01 | |
| | | 1.00 | | | | | | 0.01 | | | | | | 160,396 | | | | | | 0.30 | | | | | | 0.61 | | | | | | 0.01 | |
| | | 1.00 | | | | | | 0.01 | | | | | | 2 | | | | | | 0.30 | | | | | | 0.86 | | | | | | 0.04 | |
| | | 1.00 | | | | | | 0.01 | | | | | | 1 | | | | | | 0.30 | | | | | | 0.96 | | | | | | (0.08 | ) |
| | | | | | | | | | | | | | | | | | | | | | | | | | | | | | | | | | |
| | | | | | | | | | | | | | | | | | | | | | | | | | | | | | | | | | |
| | | 1.00 | | | | | | 0.04 | | | | | | 67,911 | | | | | | 0.44 | (d) | | | | | 0.49 | (d) | | | | | 0.06 | (d) |
| | | 1.00 | | | | | | 0.01 | | | | | | 244,701 | | | | | | 0.49 | (d) | | | | | 0.64 | (d) | | | | | 0.01 | (d) |
| | | 1.00 | | | | | | 0.01 | | | | | | 2 | | | | | | 0.52 | (d) | | | | | 0.89 | (d) | | | | | 0.01 | (d) |
| | | 1.00 | | | | | | 0.01 | | | | | | 1 | | | | | | 0.52 | (d) | | | | | 1.49 | (d) | | | | | (0.09 | )(d) |
| | | | | | | | | | | | | | | | | | | | | | | | | | | | | | | | | | |
| | | | | | | | | | | | | | | | | | | | | | | | | | | | | | | | | | |
| | | 1.00 | | | | | | 1.60 | | | | | | 147,340 | | | | | | 0.44 | | | | | | 0.46 | | | | | | 1.56 | |
| | | 1.00 | | | | | | 1.45 | | | | | | 499,754 | | | | | | 0.59 | | | | | | 0.61 | | | | | | 1.42 | |
| | | 1.00 | | | | | | 1.21 | | | | | | 445 | | | | | | 0.82 | | | | | | 0.86 | | | | | | 0.72 | |
| | | 1.00 | | | | | | 1.05 | | | | | | 1 | | | | | | 0.84 | | | | | | 1.46 | | | | | | 1.18 | |
| | | 1.00 | | | | | | 3.20 | | | | | | 176,449 | | | | | | 0.43 | | | | | | 0.44 | | | | | | 3.14 | |
| | | 1.00 | | | | | | 3.05 | | | | | | 494,463 | | | | | | 0.58 | | | | | | 0.59 | | | | | | 2.99 | |
| | | 1.00 | | | | | | 2.79 | | | | | | 2 | | | | | | 0.83 | | | | | | 0.84 | | | | | | 2.73 | |
| | | 1.00 | | | | | | 2.62 | | | | | | 1 | | | | | | 1.00 | | | | | | 1.44 | | | | | | 2.64 | |
| | |
| The accompanying notes are an integral part of these financial statements. | | 73 |
FINANCIAL SQUARE TAX-EXEMPT NEW YORK FUND
Financial Highlights
Selected Data for a Share Outstanding Throughout Each Period
| | | | | | | | | | | | | | |
| | | Year - Share Class | | Net asset
value,
beginning
of period | | | Net
investment
income (loss) | | |
Distributions
from net
investment
income(a) | |
| | FOR THE SIX MONTHS ENDED FEBRUARY 28, (UNAUDITED) | | | | | | | | | | | | |
| | 2013 - FST Shares | | $ | 1.00 | | | $ | — | (c) | | $ | — | (c) |
| | 2013 - FST Administration Shares | | | 1.00 | | | | — | (c) | | | — | (c) |
| | 2013 - FST Service Shares | | | 1.00 | | | | — | (c) | | | — | (c) |
| | 2013 - FST Cash Management Shares | | | 1.00 | | | | — | (c) | | | — | (c) |
| | | | | | | | | | | | | | |
| | FOR THE FISCAL YEARS ENDED AUGUST 31, | | | | | | | | | | | | |
| | 2012 - FST Shares | | | 1.00 | | | | — | (c) | | | — | (c) |
| | 2012 - FST Administration Shares | | | 1.00 | | | | — | (c) | | | — | (c) |
| | 2012 - FST Service Shares | | | 1.00 | | | | — | (c) | | | — | (c) |
| | 2012 - FST Cash Management Shares | | | 1.00 | | | | — | (c) | | | — | (c) |
| | 2011 - FST Shares | | | 1.00 | | | | — | (c) | | | — | (c) |
| | 2011 - FST Administration Shares | | | 1.00 | | | | — | (c) | | | — | (c) |
| | 2011 - FST Service Shares | | | 1.00 | | | | — | (c) | | | — | (c) |
| | 2011 - FST Cash Management Shares | | | 1.00 | | | | — | (c) | | | — | (c) |
| | 2010 - FST Shares | | | 1.00 | | | | — | (c) | | | — | (c) |
| | 2010 - FST Administration Shares | | | 1.00 | | | | — | (c) | | | — | (c) |
| | 2010 - FST Service Shares | | | 1.00 | | | | — | (c) | | | — | (c) |
| | 2010 - FST Cash Management Shares | | | 1.00 | | | | — | (c) | | | — | (c) |
| | | | | | | | | | | | | | |
| | FOR THE PERIOD JANUARY 1 TO AUGUST 31*, | | | | | | | | | | | | |
| | 2009 - FST Shares | | | 1.00 | | | | — | (c) | | | — | (c) |
| | 2009 - FST Administration Shares | | | 1.00 | | | | — | (c) | | | — | (c) |
| | 2009 - FST Service Shares | | | 1.00 | | | | — | (c) | | | — | (c) |
| | 2009 - FST Cash Management Shares | | | 1.00 | | | | — | (c) | | | — | (c) |
| | | | | | | | | | | | | | |
| | FOR THE FISCAL YEARS ENDED DECEMBER 31, | | | | | | | | | | | | |
| | 2008 - FST Shares | | | 1.00 | | | | 0.017 | | | | (0.017 | )(e) |
| | 2008 - FST Administration Shares | | | 1.00 | | | | 0.015 | | | | (0.015 | )(e) |
| | 2008 - FST Service Shares | | | 1.00 | | | | 0.013 | | | | (0.013 | )(e) |
| | 2008 - FST Cash Management Shares | | | 1.00 | | | | 0.011 | | | | (0.011 | )(e) |
| | 2007 - FST Shares | | | 1.00 | | | | 0.032 | | | | (0.032 | )(e) |
| | 2007 - FST Administration Shares | | | 1.00 | | | | 0.030 | | | | (0.030 | )(e) |
| | 2007 - FST Service Shares | | | 1.00 | | | | 0.028 | | | | (0.028 | )(e) |
| | 2007 - FST Cash Management Shares | | | 1.00 | | | | 0.026 | | | | (0.026 | )(e) |
| | * | | The Fund changed its fiscal year end from December 31 to August 31. |
| | (a) | | Distributions may not coincide with the current year net investment income or net realized gains as distributions may be paid from current or prior year earnings. |
| | (b) | | Assumes reinvestment of all distributions. Returns do not reflect the deduction of taxes that a shareholder would pay on Fund distributions. Total returns for periods less than one full year are not annualized. |
| | (c) | | Amount is less than $0.0005 per share. |
| | (e) | | Amount includes $0.0003 and $0.00005 of distributions from net realized gains for the fiscal years ended December 31, 2008 and December 31, 2007, respectively. |
| | |
| 74 | | The accompanying notes are an integral part of these financial statements. |
FINANCIAL SQUARE TAX-EXEMPT NEW YORK FUND
| | | | | | | | | | | | | | | | | | | | | | | | | | | | | | | | | | |
| | | Net asset
value, end
of period | | | | | Total
return(b) | | | | | Net assets
end of period (in 000s) | | | | | Ratio of
net expenses
to average
net assets | | | | | Ratio of
total expenses
to average
net assets | | | | | Ratio of
net investment
income (loss)
to average net assets | |
| | | | | | | | | | | | | | | | | | | | | | | | | | | | | | | | | | |
| | $ | 1.00 | | | | | | 0.01 | % | | | | $ | 21,502 | | | | | | 0.15 | %(d) | | | | | 0.49 | %(d) | | | | | 0.01 | %(d) |
| | | 1.00 | | | | | | 0.01 | | | | | | 175,763 | | | | | | 0.15 | (d) | | | | | 0.64 | (d) | | | | | 0.01 | (d) |
| | | 1.00 | | | | | | 0.01 | | | | | | 1 | | | | | | 0.15 | (d) | | | | | 0.89 | (d) | | | | | 0.46 | (d) |
| | | 1.00 | | | | | | 0.01 | | | | | | 1 | | | | | | 0.15 | (d) | | | | | 1.49 | (d) | | | | | 0.35 | (d) |
| | | | | | | | | | | | | | | | | | | | | | | | | | | | | | | | | | |
| | | | | | | | | | | | | | | | | | | | | | | | | | | | | | | | | | |
| | | 1.00 | | | | | | 0.01 | | | | | | 21,067 | | | | | | 0.16 | | | | | | 0.52 | | | | | | 0.01 | |
| | | 1.00 | | | | | | 0.01 | | | | | | 180,419 | | | | | | 0.16 | | | | | | 0.67 | | | | | | 0.01 | |
| | | 1.00 | | | | | | 0.01 | | | | | | 1 | | | | | | 0.16 | | | | | | 0.92 | | | | | | 0.50 | |
| | | 1.00 | | | | | | 0.01 | | | | | | 1 | | | | | | 0.16 | | | | | | 1.52 | | | | | | 0.39 | |
| | | 1.00 | | | | | | 0.03 | | | | | | 20,954 | | | | | | 0.22 | | | | | | 0.55 | | | | | | 0.01 | |
| | | 1.00 | | | | | | 0.03 | | | | | | 140,452 | | | | | | 0.22 | | | | | | 0.70 | | | | | | 0.01 | |
| | | 1.00 | | | | | | 0.03 | | | | | | 1 | | | | | | 0.22 | | | | | | 0.95 | | | | | | 0.28 | |
| | | 1.00 | | | | | | 0.03 | | | | | | 1 | | | | | | 0.22 | | | | | | 1.55 | | | | | | 0.08 | |
| | | 1.00 | | | | | | 0.03 | | | | | | 49,859 | | | | | | 0.30 | | | | | | 0.46 | | | | | | 0.01 | |
| | | 1.00 | | | | | | 0.03 | | | | | | 127,395 | | | | | | 0.30 | | | | | | 0.61 | | | | | | 0.01 | |
| | | 1.00 | | | | | | 0.03 | | | | | | 1 | | | | | | 0.30 | | | | | | 0.86 | | | | | | 0.01 | |
| | | 1.00 | | | | | | 0.03 | | | | | | 1 | | | | | | 0.30 | | | | | | 0.96 | | | | | | (0.03 | ) |
| | | | | | | | | | | | | | | | | | | | | | | | | | | | | | | | | | |
| | | | | | | | | | | | | | | | | | | | | | | | | | | | | | | | | | |
| | | 1.00 | | | | | | 0.04 | | | | | | 50,211 | | | | | | 0.42 | (d) | | | | | 0.49 | (d) | | | | | 0.07 | (d) |
| | | 1.00 | | | | | | 0.01 | | | | | | 243,215 | | | | | | 0.47 | (d) | | | | | 0.64 | (d) | | | | | 0.02 | (d) |
| | | 1.00 | | | | | | 0.01 | | | | | | 76 | | | | | | 0.47 | (d) | | | | | 0.89 | (d) | | | | | 0.02 | (d) |
| | | 1.00 | | | | | | 0.01 | | | | | | 1 | | | | | | 0.48 | (d) | | | | | 1.49 | (d) | | | | | 0.02 | (d) |
| | | | | | | | | | | | | | | | | | | | | | | | | | | | | | | | | | |
| | | | | | | | | | | | | | | | | | | | | | | | | | | | | | | | | | |
| | | 1.00 | | | | | | 1.70 | | | | | | 76,958 | | | | | | 0.44 | | | | | | 0.47 | | | | | | 1.67 | |
| | | 1.00 | | | | | | 1.55 | | | | | | 418,830 | | | | | | 0.59 | | | | | | 0.62 | | | | | | 1.48 | |
| | | 1.00 | | | | | | 1.30 | | | | | | 76 | | | | | | 0.84 | | | | | | 0.87 | | | | | | 1.41 | |
| | | 1.00 | | | | | | 1.14 | | | | | | 1 | | | | | | 0.90 | | | | | | 1.47 | | | | | | 1.11 | |
| | | 1.00 | | | | | | 3.24 | | | | | | 56,353 | | | | | | 0.43 | | | | | | 0.46 | | | | | | 3.20 | |
| | | 1.00 | | | | | | 3.09 | | | | | | 253,295 | | | | | | 0.58 | | | | | | 0.61 | | | | | | 3.04 | |
| | | 1.00 | | | | | | 2.83 | | | | | | 468 | | | | | | 0.83 | | | | | | 0.86 | | | | | | 2.79 | |
| | | 1.00 | | | | | | 2.66 | | | | | | 1 | | | | | | 1.00 | | | | | | 1.46 | | | | | | 2.65 | |
| | |
| The accompanying notes are an integral part of these financial statements. | | 75 |
FINANCIAL SQUARE TAX-FREE MONEY MARKET FUND
Financial Highlights
Selected Data for a Share Outstanding Throughout Each Period
| | | | | | | | | | | | | | |
| | | Year - Share Class | | Net asset
value,
beginning
of period | | | Net
investment
income (loss) | | | Distributions
from net
investment
income(a) | |
| | FOR THE SIX MONTHS ENDED FEBRUARY 28, (UNAUDITED) | | | | | | | | | | | | |
| | 2013 - FST Shares | | $ | 1.00 | | | $ | — | (c) | | $ | — | (c) |
| | 2013 - FST Select Shares | | | 1.00 | | | | — | (c) | | | — | (c) |
| | 2013 - FST Preferred Shares | | | 1.00 | | | | — | (c) | | | — | (c) |
| | 2013 - FST Capital Shares | | | 1.00 | | | | — | (c) | | | — | (c) |
| | 2013 - FST Administration Shares | | | 1.00 | | | | — | (c) | | | — | (c) |
| | 2013 - FST Premier Shares | | | 1.00 | | | | — | (c) | | | — | (c) |
| | 2013 - FST Service Shares | | | 1.00 | | | | — | (c) | | | — | (c) |
| | 2013 - FST Resource Shares | | | 1.00 | | | | — | (c) | | | — | (c) |
| | 2013 - FST Cash Management Shares | | | 1.00 | | | | — | (c) | | | — | (c) |
| | | | | | | | | | | | | | |
| | FOR THE FISCAL YEARS ENDED AUGUST 31, | | | | | | | | | | | | |
| | 2012 - FST Shares | | | 1.00 | | | | — | (c) | | | — | (c) |
| | 2012 - FST Select Shares | | | 1.00 | | | | — | (c) | | | — | (c) |
| | 2012 - FST Preferred Shares | | | 1.00 | | | | — | (c) | | | — | (c) |
| | 2012 - FST Capital Shares | | | 1.00 | | | | — | (c) | | | — | (c) |
| | 2012 - FST Administration Shares | | | 1.00 | | | | — | (c) | | | — | (c) |
| | 2012 - FST Premier Shares | | | 1.00 | | | | — | (c) | | | — | (c) |
| | 2012 - FST Service Shares | | | 1.00 | | | | — | (c) | | | — | (c) |
| | 2012 - FST Resource Shares | | | 1.00 | | | | — | (c) | | | — | (c) |
| | 2012 - FST Cash Management Shares | | | 1.00 | | | | — | (c) | | | — | (c) |
| | 2011 - FST Shares | | | 1.00 | | | | 0.001 | | | | (0.001 | ) |
| | 2011 - FST Select Shares | | | 1.00 | | | | 0.001 | | | | (0.001 | ) |
| | 2011 - FST Preferred Shares | | | 1.00 | | | | — | (c) | | | — | (c) |
| | 2011 - FST Capital Shares | | | 1.00 | | | | — | (c) | | | — | (c) |
| | 2011 - FST Administration Shares | | | 1.00 | | | | — | (c) | | | — | (c) |
| | 2011 - FST Premier Shares | | | 1.00 | | | | — | (c) | | | — | (c) |
| | 2011 - FST Service Shares | | | 1.00 | | | | — | (c) | | | — | (c) |
| | 2011 - FST Resource Shares | | | 1.00 | | | | — | (c) | | | — | (c) |
| | 2011 - FST Cash Management Shares | | | 1.00 | | | | — | (c) | | | — | (c) |
| | 2010 - FST Shares | | | 1.00 | | | | 0.002 | | | | (0.002 | ) |
| | 2010 - FST Select Shares | | | 1.00 | | | | 0.001 | | | | (0.001 | ) |
| | 2010 - FST Preferred Shares | | | 1.00 | | | | 0.001 | | | | (0.001 | ) |
| | 2010 - FST Capital Shares | | | 1.00 | | | | — | (c) | | | — | (c) |
| | 2010 - FST Administration Shares | | | 1.00 | | | | — | (c) | | | — | (c) |
| | 2010 - FST Premier Shares (Commenced May 14, 2010) | | | 1.00 | | | | — | (c) | | | — | (c) |
| | 2010 - FST Service Shares | | | 1.00 | | | | — | (c) | | | — | (c) |
| | 2010 - FST Resource Shares (Commenced May 14, 2010) | | | 1.00 | | | | — | (c) | | | — | (c) |
| | 2010 - FST Cash Management Shares (Commenced May 14, 2010) | | | 1.00 | | | | — | (c) | | | — | (c) |
| | | | | | | | | | | | | | |
| | FOR THE PERIOD JANUARY 1 TO AUGUST 31*, | | | | | | | | | | | | |
| | 2009 - FST Shares | | | 1.00 | | | | 0.003 | | | | (0.003 | ) |
| | 2009 - FST Select Shares | | | 1.00 | | | | 0.002 | | | | (0.002 | ) |
| | 2009 - FST Preferred Shares | | | 1.00 | | | | 0.002 | | | | (0.002 | ) |
| | 2009 - FST Capital Shares | | | 1.00 | | | | 0.002 | | | | (0.002 | ) |
| | 2009 - FST Administration Shares | | | 1.00 | | | | 0.001 | | | | (0.001 | ) |
| | 2009 - FST Service Shares | | | 1.00 | | | | — | (c) | | | — | (c) |
| | | | | | | | | | | | | | |
| | FOR THE FISCAL YEARS ENDED DECEMBER 31, | | | | | | | | | | | | |
| | 2008 - FST Shares | | | 1.00 | | | | 0.020 | | | | (0.020 | )(e) |
| | 2008 - FST Select Shares | | | 1.00 | | | | 0.020 | | | | (0.020 | )(e) |
| | 2008 - FST Preferred Shares | | | 1.00 | | | | 0.019 | | | | (0.019 | )(e) |
| | 2008 - FST Capital Shares | | | 1.00 | | | | 0.018 | | | | (0.018 | )(e) |
| | 2008 - FST Administration Shares | | | 1.00 | | | | 0.017 | | | | (0.017 | )(e) |
| | 2008 - FST Service Shares | | | 1.00 | | | | 0.015 | | | | (0.015 | )(e) |
| | 2007 - FST Shares | | | 1.00 | | | | 0.035 | | | | (0.035 | )(e) |
| | 2007 - FST Select Shares | | | 1.00 | | | | 0.035 | | | | (0.035 | )(e) |
| | 2007 - FST Preferred Shares | | | 1.00 | | | | 0.034 | | | | (0.034 | )(e) |
| | 2007 - FST Capital Shares | | | 1.00 | | | | 0.033 | | | | (0.033 | )(e) |
| | 2007 - FST Administration Shares | | | 1.00 | | | | 0.032 | | | | (0.032 | )(e) |
| | 2007 - FST Service Shares | | | 1.00 | | | | 0.030 | | | | (0.030 | )(e) |
| | * | | The Fund changed its fiscal year end from December 31 to August 31. |
| | (a) | | Distributions may not coincide with the current year net investment income or net realized gains as distributions may be paid from current or prior year earnings. |
| | (b) | | Assumes reinvestment of all distributions. Returns do not reflect the deduction of taxes that a shareholder would pay on Fund distributions. Total returns for periods less than one full year are not annualized. |
| | (c) | | Amount is less than $0.0005 per share. |
| | (e) | | Amount includes $0.0001 and $0.0008 of distributions from net realized gains for the fiscal years ended December 31, 2008 and December 31, 2007, respectively. |
| | |
| 76 | | The accompanying notes are an integral part of these financial statements. |
FINANCIAL SQUARE TAX-FREE MONEY MARKET FUND
| | | | | | | | | | | | | | | | | | | | | | | | | | | | | | | | | | |
| | | Net asset
value, end
of period | | | | | Total
return(b) | | | | | Net assets
end of
period
(in 000s) | | | | | Ratio of
net expenses
to average
net assets | | | | | Ratio of
total expenses
to average
net assets | | | | | Ratio of
net investment
income (loss)
to average
net assets | |
| | | | | | | | | | | | | | | | | | | | | | | | | | | | | | | | | | |
| | $ | 1.00 | | | | | | 0.02 | % | | | | $ | 5,189,601 | | | | | | 0.17 | %(d) | | | | | 0.23 | %(d) | | | | | 0.02 | %(d) |
| | | 1.00 | | | | | | 0.01 | | | | | | 125,775 | | | | | | 0.18 | (d) | | | | | 0.26 | (d) | | | | | 0.01 | (d) |
| | | 1.00 | | | | | | 0.01 | | | | | | 22,191 | | | | | | 0.18 | (d) | | | | | 0.33 | (d) | | | | | 0.01 | (d) |
| | | 1.00 | | | | | | 0.01 | | | | | | 4,558 | | | | | | 0.18 | (d) | | | | | 0.38 | (d) | | | | | 0.01 | (d) |
| | | 1.00 | | | | | | 0.01 | | | | | | 198,692 | | | | | | 0.18 | (d) | | | | | 0.48 | (d) | | | | | 0.01 | (d) |
| | | 1.00 | | | | | | 0.01 | | | | | | 597,097 | | | | | | 0.18 | (d) | | | | | 0.58 | (d) | | | | | 0.01 | (d) |
| | | 1.00 | | | | | | 0.01 | | | | | | 14,654 | | | | | | 0.18 | (d) | | | | | 0.73 | (d) | | | | | 0.01 | (d) |
| | | 1.00 | | | | | | 0.01 | | | | | | 36,836 | | | | | | 0.18 | (d) | | | | | 0.88 | (d) | | | | | 0.01 | (d) |
| | | 1.00 | | | | | | 0.01 | | | | | | 1 | | | | | | 0.17 | (d) | | | | | 1.03 | (d) | | | | | 0.37 | (d) |
| | | | | | | | | | | | | | | | | | | | | | | | | | | | | | | | | | |
| | | | | | | | | | | | | | | | | | | | | | | | | | | | | | | | | | |
| | | 1.00 | | | | | | 0.02 | | | | | | 5,462,807 | | | | | | 0.17 | | | | | | 0.23 | | | | | | 0.02 | |
| | | 1.00 | | | | | | 0.02 | | | | | | 102,994 | | | | | | 0.18 | | | | | | 0.26 | | | | | | 0.01 | |
| | | 1.00 | | | | | | 0.01 | | | | | | 22,477 | | | | | | 0.18 | | | | | | 0.33 | | | | | | 0.01 | |
| | | 1.00 | | | | | | 0.01 | | | | | | 11,793 | | | | | | 0.18 | | | | | | 0.38 | | | | | | 0.01 | |
| | | 1.00 | | | | | | 0.01 | | | | | | 217,010 | | | | | | 0.18 | | | | | | 0.48 | | | | | | 0.01 | |
| | | 1.00 | | | | | | 0.01 | | | | | | 565,678 | | | | | | 0.18 | | | | | | 0.58 | | | | | | 0.01 | |
| | | 1.00 | | | | | | 0.01 | | | | | | 29,450 | | | | | | 0.18 | | | | | | 0.73 | | | | | | 0.01 | |
| | | 1.00 | | | | | | 0.01 | | | | | | 27,615 | | | | | | 0.18 | | | | | | 0.88 | | | | | | 0.01 | |
| | | 1.00 | | | | | | 0.01 | | | | | | 1 | | | | | | 0.17 | | | | | | 1.03 | | | | | | 0.40 | |
| | | 1.00 | | | | | | 0.10 | | | | | | 6,489,440 | | | | | | 0.18 | | | | | | 0.23 | | | | | | 0.09 | |
| | | 1.00 | | | | | | 0.07 | | | | | | 44,349 | | | | | | 0.21 | | �� | | | | 0.26 | | | | | | 0.07 | |
| | | 1.00 | | | | | | 0.03 | | | | | | 24,222 | | | | | | 0.25 | | | | | | 0.33 | | | | | | 0.02 | |
| | | 1.00 | | | | | | 0.02 | | | | | | 4,945 | | | | | | 0.26 | | | | | | 0.38 | | | | | | 0.01 | |
| | | 1.00 | | | | | | 0.02 | | | | | | 379,465 | | | | | | 0.26 | | | | | | 0.48 | | | | | | 0.01 | |
| | | 1.00 | | | | | | 0.02 | | | | | | 564,168 | | | | | | 0.26 | | | | | | 0.58 | | | | | | 0.01 | |
| | | 1.00 | | | | | | 0.02 | | | | | | 30,063 | | | | | | 0.27 | | | | | | 0.73 | | | | | | 0.01 | |
| | | 1.00 | | | | | | 0.02 | | | | | | 22,464 | | | | | | 0.25 | | | | | | 0.88 | | | | | | 0.01 | |
| | | 1.00 | | | | | | 0.02 | | | | | | 1 | | | | | | 0.31 | | | | | | 1.03 | | | | | | 0.11 | |
| | | 1.00 | | | | | | 0.15 | | | | | | 8,900,260 | | | | | | 0.18 | | | | | | 0.23 | | | | | | 0.14 | |
| | | 1.00 | | | | | | 0.12 | | | | | | 51,856 | | | | | | 0.21 | | | | | | 0.26 | | | | | | 0.11 | |
| | | 1.00 | | | | | | 0.06 | | | | | | 42,240 | | | | | | 0.28 | | | | | | 0.33 | | | | | | 0.04 | |
| | | 1.00 | | | | | | 0.03 | | | | | | 10,406 | | | | | | 0.30 | | | | | | 0.37 | | | | | | 0.02 | |
| | | 1.00 | | | | | | 0.02 | | | | | | 315,835 | | | | | | 0.33 | | | | | | 0.48 | | | | | | 0.01 | |
| | | 1.00 | | | | | | 0.01 | | | | | | 544,328 | | | | | | 0.30 | (d) | | | | | 0.57 | (d) | | | | | 0.01 | (d) |
| | | 1.00 | | | | | | 0.02 | | | | | | 44,690 | | | | | | 0.31 | | | | | | 0.73 | | | | | | 0.01 | |
| | | 1.00 | | | | | | 0.01 | | | | | | 14,282 | | | | | | 0.32 | (d) | | | | | 0.73 | (d) | | | | | 0.01 | (d) |
| | | 1.00 | | | | | | 0.01 | | | | | | 1 | | | | | | 0.40 | (d) | | | | | 1.02 | (d) | | | | | 0.04 | (d) |
| | | | | | | | | | | | | | | | | | | | | | | | | | | | | | | | | | |
| | | | | | | | | | | | | | | | | | | | | | | | | | | | | | | | | | |
| | | 1.00 | | | | | | 0.25 | | | | | | 9,416,370 | | | | | | 0.21 | (d) | | | | | 0.26 | (d) | | | | | 0.37 | (d) |
| | | 1.00 | | | | | | 0.23 | | | | | | 85,670 | | | | | | 0.24 | (d) | | | | | 0.29 | (d) | | | | | 0.33 | (d) |
| | | 1.00 | | | | | | 0.18 | | | | | | 45,223 | | | | | | 0.31 | (d) | | | | | 0.36 | (d) | | | | | 0.30 | (d) |
| | | 1.00 | | | | | | 0.15 | | | | | | 162,752 | | | | | | 0.36 | (d) | | | | | 0.41 | (d) | | | | | 0.24 | (d) |
| | | 1.00 | | | | | | 0.09 | | | | | | 308,305 | | | | | | 0.45 | (d) | | | | | 0.51 | (d) | | | | | 0.14 | (d) |
| | | 1.00 | | | | | | 0.01 | | | | | | 71,451 | | | | | | 0.61 | (d) | | | | | 0.76 | (d) | | | | | 0.03 | (d) |
| | | | | | | | | | | | | | | | | | | | | | | | | | | | | | | | | | |
| | | | | | | | | | | | | | | | | | | | | | | | | | | | | | | | | | |
| | | 1.00 | | | | | | 2.00 | | | | | | 9,657,508 | | | | | | 0.18 | | | | | | 0.24 | | | | | | 1.95 | |
| | | 1.00 | | | | | | 1.97 | | | | | | 40,707 | | | | | | 0.21 | | | | | | 0.27 | | | | | | 1.98 | |
| | | 1.00 | | | | | | 1.89 | | | | | | 82,211 | | | | | | 0.28 | | | | | | 0.34 | | | | | | 1.87 | |
| | | 1.00 | | | | | | 1.84 | | | | | | 294,058 | | | | | | 0.33 | | | | | | 0.39 | | | | | | 1.84 | |
| | | 1.00 | | | | | | 1.74 | | | | | | 362,529 | | | | | | 0.43 | | | | | | 0.49 | | | | | | 1.73 | |
| | | 1.00 | | | | | | 1.49 | | | | | | 280,303 | | | | | | 0.68 | | | | | | 0.74 | | | | | | 1.52 | |
| | | 1.00 | | | | | | 3.56 | | | | | | 9,069,558 | | | | | | 0.18 | | | | | | 0.23 | | | | | | 3.49 | |
| | | 1.00 | | | | | | 3.53 | | | | | | 71,395 | | | | | | 0.21 | | | | | | 0.26 | | | | | | 3.47 | |
| | | 1.00 | | | | | | 3.46 | | | | | | 220,538 | | | | | | 0.28 | | | | | | 0.33 | | | | | | 3.37 | |
| | | 1.00 | | | | | | 3.41 | | | | | | 317,742 | | | | | | 0.33 | | | | | | 0.38 | | | | | | 3.30 | |
| | | 1.00 | | | | | | 3.30 | | | | | | 757,798 | | | | | | 0.43 | | | | | | 0.48 | | | | | | 3.23 | |
| | | 1.00 | | | | | | 3.05 | | | | | | 332,251 | | | | | | 0.68 | | | | | | 0.73 | | | | | | 2.98 | |
| | |
| The accompanying notes are an integral part of these financial statements. | | 77 |
FINANCIAL SQUARE TREASURY INSTRUMENTS FUND
Financial Highlights
Selected Data for a Share Outstanding Throughout Each Period
| | | | | | | | | | | | | | |
| | | Year - Share Class | | Net asset
value,
beginning
of period | | | Net
investment
income (loss) | | |
Distributions
from net
investment
income(a) | |
| | FOR THE SIX MONTHS ENDED FEBRUARY 28, (UNAUDITED) | | | | | | | | | | | | |
| | 2013 - FST Shares | | $ | 1.00 | | | $ | — | (c) | | $ | — | (c) |
| | 2013 - FST Select Shares | | | 1.00 | | | | — | (c) | | | — | (c) |
| | 2013 - FST Preferred Shares | | | 1.00 | | | | — | (c) | | | — | (c) |
| | 2013 - FST Capital Shares | | | 1.00 | | | | — | (c) | | | — | (c) |
| | 2013 - FST Administration Shares | | | 1.00 | | | | — | (c) | | | — | (c) |
| | 2013 - FST Premier Shares | | | 1.00 | | | | — | (c) | | | — | (c) |
| | 2013 - FST Service Shares | | | 1.00 | | | | — | (c) | | | — | (c) |
| | 2013 - FST Resource Shares | | | 1.00 | | | | — | (c) | | | — | (c) |
| | 2013 - FST Cash Management Shares | | | 1.00 | | | | — | (c) | | | — | (c) |
| | | | | | | | | | | | | | |
| | FOR THE FISCAL YEARS ENDED AUGUST 31, | | | | | | | | | | | | |
| | 2012 - FST Shares | | | 1.00 | | | | — | (c) | | | — | (c) |
| | 2012 - FST Select Shares | | | 1.00 | | | | — | (c) | | | — | (c) |
| | 2012 - FST Preferred Shares | | | 1.00 | | | | — | (c) | | | — | (c) |
| | 2012 - FST Capital Shares | | | 1.00 | | | | — | (c) | | | — | (c) |
| | 2012 - FST Administration Shares | | | 1.00 | | | | — | (c) | | | — | (c) |
| | 2012 - FST Premier Shares | | | 1.00 | | | | — | (c) | | | — | (c) |
| | 2012 - FST Service Shares | | | 1.00 | | | | — | (c) | | | — | (c) |
| | 2012 - FST Resource Shares | | | 1.00 | | | | — | (c) | | | — | (c) |
| | 2012 - FST Cash Management Shares | | | 1.00 | | | | — | (c) | | | — | (c) |
| | 2011 - FST Shares | | | 1.00 | | | | — | (c) | | | — | (c) |
| | 2011 - FST Select Shares | | | 1.00 | | | | — | (c) | | | — | (c) |
| | 2011 - FST Preferred Shares | | | 1.00 | | | | — | (c) | | | — | (c) |
| | 2011 - FST Capital Shares | | | 1.00 | | | | — | (c) | | | — | (c) |
| | 2011 - FST Administration Shares | | | 1.00 | | | | — | (c) | | | — | (c) |
| | 2011 - FST Premier Shares | | | 1.00 | | | | — | (c) | | | — | (c) |
| | 2011 - FST Service Shares | | | 1.00 | | | | — | (c) | | | — | (c) |
| | 2011 - FST Resource Shares | | | 1.00 | | | | — | (c) | | | — | (c) |
| | 2011 - FST Cash Management Shares | | | 1.00 | | | | — | (c) | | | — | (c) |
| | 2010 - FST Shares | | | 1.00 | | | | — | (c) | | | — | (c) |
| | 2010 - FST Select Shares | | | 1.00 | | | | — | (c) | | | — | (c) |
| | 2010 - FST Preferred Shares | | | 1.00 | | | | — | (c) | | | — | (c) |
| | 2010 - FST Capital Shares | | | 1.00 | | | | — | (c) | | | — | (c) |
| | 2010 - FST Administration Shares | | | 1.00 | | | | — | (c) | | | — | (c) |
| | 2010 - FST Premier Shares (Commenced May 14, 2010) | | | 1.00 | | | | — | (c) | | | — | (c) |
| | 2010 - FST Service Shares | | | 1.00 | | | | — | (c) | | | — | (c) |
| | 2010 - FST Resource Shares (Commenced May 14, 2010) | | | 1.00 | | | | — | (c) | | | — | (c) |
| | 2010 - FST Cash Management Shares (Commenced May 14, 2010) | | | 1.00 | | | | — | (c) | | | — | (c) |
| | | | | | | | | | | | | | |
| | FOR THE PERIOD JANUARY 1 TO AUGUST 31*, | | | | | | | | | | | | |
| | 2009 - FST Shares | | | 1.00 | | | | 0.001 | (g) | | | (0.001 | )(g) |
| | 2009 - FST Select Shares | | | 1.00 | | | | 0.001 | (g) | | | (0.001 | )(g) |
| | 2009 - FST Preferred Shares | | | 1.00 | | | | 0.001 | (g) | | | (0.001 | )(g) |
| | 2009 - FST Capital Shares | | | 1.00 | | | | — | (c)(g) | | | — | (c)(g) |
| | 2009 - FST Administration Shares | | | 1.00 | | | | — | (c)(g) | | | — | (c)(g) |
| | 2009 - FST Service Shares | | | 1.00 | | | | — | (c)(g) | | | — | (c)(g) |
| | | | | | | | | | | | | | |
| | FOR THE FISCAL YEARS ENDED DECEMBER 31, | | | | | | | | | | | | |
| | 2008 - FST Shares | | | 1.00 | | | | 0.016 | (g) | | | (0.016 | )(g) |
| | 2008 - FST Select Shares | | | 1.00 | | | | 0.015 | (g) | | | (0.015 | )(g) |
| | 2008 - FST Preferred Shares | | | 1.00 | | | | 0.015 | (g) | | | (0.015 | )(g) |
| | 2008 - FST Capital Shares | | | 1.00 | | | | 0.014 | (g) | | | (0.014 | )(g) |
| | 2008 - FST Administration Shares | | | 1.00 | | | | 0.013 | (g) | | | (0.013 | )(g) |
| | 2008 - FST Service Shares | | | 1.00 | | | | 0.011 | (g) | | | (0.011 | )(g) |
| | 2007 - FST Shares | | | 1.00 | | | | 0.044 | (g) | | | (0.044 | )(g) |
| | 2007 - FST Select Shares | | | 1.00 | | | | 0.043 | (g) | | | (0.043 | )(g) |
| | 2007 - FST Preferred Shares | | | 1.00 | | | | 0.043 | (g) | | | (0.043 | )(g) |
| | 2007 - FST Capital Shares | | | 1.00 | | | | 0.042 | (g) | | | (0.042 | )(g) |
| | 2007 - FST Administration Shares | | | 1.00 | | | | 0.041 | (g) | | | (0.041 | )(g) |
| | 2007 - FST Service Shares | | | 1.00 | | | | 0.039 | (g) | | | (0.039 | )(g) |
| | * | | The Fund changed its fiscal year end from December 31 to August 31. |
| | (a) | | Distributions may not coincide with the current year net investment income or net realized gains as distributions may be paid from current or prior year earnings. |
| | (b) | | Assumes reinvestment of all distributions. Returns do not reflect the deduction of taxes that a shareholder would pay on Fund distributions. Total returns for periods less than one full year are not annualized. |
| | (c) | | Amount is less than $0.0005 per share. |
| | (d) | | Amount is less than 0.005%. |
| | (f) | | Amount is less than 0.005% of average net assets. |
| | (g) | | Net investment income and distributions from net investment income contain $0.0008 and $(0.0008), $0.002 and $(0.002), and $0.001 and $(0.001) of net realized gains and distributions from net realized gains for the period ended August 31, 2009 and the fiscal years ended December 31, 2008 and December 31, 2007, respectively. |
| | |
| 78 | | The accompanying notes are an integral part of these financial statements. |
FINANCIAL SQUARE TREASURY INSTRUMENTS FUND
| | | | | | | | | | | | | | | | | | | | | | | | | | | | | | | | | | |
| | | Net asset
value, end
of period | | | | | Total
return(b) | | | | | Net assets end of period (in 000s) | | | | | Ratio of
net expenses
to average
net assets | | | | | Ratio of
total expenses
to average
net assets | | | | | Ratio of
net investment
income (loss)
to average net
assets | |
| | | | | | | | | | | | | | | | | | | | | | | | | | | | | | | | | | |
| | $ | 1.00 | | | | | | — | %(d) | | | | $ | 26,059,314 | | | | | | 0.11 | %(e) | | | | | 0.23 | %(e) | | | | | — | %(e)(f) |
| | | 1.00 | | | | | | — | (d) | | | | | 314,086 | | | | | | 0.11 | (e) | | | | | 0.26 | (e) | | | | | — | (e)(f) |
| | | 1.00 | | | | | | — | (d) | | | | | 142,390 | | | | | | 0.11 | (e) | | | | | 0.33 | (e) | | | | | — | (e)(f) |
| | | 1.00 | | | | | | — | (d) | | | | | 202,103 | | | | | | 0.11 | (e) | | | | | 0.38 | (e) | | | | | — | (e)(f) |
| | | 1.00 | | | | | | — | (d) | | | | | 1,331,904 | | | | | | 0.11 | (e) | | | | | 0.48 | (e) | | | | | — | (e)(f) |
| | | 1.00 | | | | | | — | (d) | | | | | 381,096 | | | | | | 0.11 | (e) | | | | | 0.58 | (e) | | | | | — | (e)(f) |
| | | 1.00 | | | | | | — | (d) | | | | | 213,538 | | | | | | 0.11 | (e) | | | | | 0.73 | (e) | | | | | — | (e)(f) |
| | | 1.00 | | | | | | — | (d) | | | | | 1 | | | | | | 0.11 | (e) | | | | | 0.88 | (e) | | | | | (0.37 | )(e) |
| | | 1.00 | | | | | | — | (d) | | | | | 1 | | | | | | 0.11 | (e) | | | | | 1.03 | (e) | | | | | (0.37 | )(e) |
| | | | | | | | | | | | | | | | | | | | | | | | | | | | | | | | | | |
| | | | | | | | | | | | | | | | | | | | | | | | | | | | | | | | | | |
| | | 1.00 | | | | | | — | (d) | | | | | 23,364,396 | | | | | | 0.07 | | | | | | 0.23 | | | | | | — | (f) |
| | | 1.00 | | | | | | — | (d) | | | | | 110,090 | | | | | | 0.07 | | | | | | 0.26 | | | | | | — | (f) |
| | | 1.00 | | | | | | — | (d) | | | | | 156,016 | | | | | | 0.07 | | | | | | 0.33 | | | | | | — | (f) |
| | | 1.00 | | | | | | — | (d) | | | | | 157,629 | | | | | | 0.07 | | | | | | 0.38 | | | | | | — | (f) |
| | | 1.00 | | | | | | — | (d) | | | | | 1,319,295 | | | | | | 0.07 | | | | | | 0.48 | | | | | | — | (f) |
| | | 1.00 | | | | | | — | (d) | | | | | 401,333 | | | | | | 0.07 | | | | | | 0.58 | | | | | | — | (f) |
| | | 1.00 | | | | | | — | (d) | | | | | 298,413 | | | | | | 0.07 | | | | | | 0.73 | | | | | | — | (f) |
| | | 1.00 | | | | | | — | (d) | | | | | 1 | | | | | | 0.07 | | | | | | 0.88 | | | | | | 0.40 | |
| | | 1.00 | | | | | | — | (d) | | | | | 1 | | | | | | 0.07 | | | | | | 1.03 | | | | | | 0.40 | |
| | | 1.00 | | | | | | 0.01 | | | | | | 20,395,424 | | | | | | 0.11 | | | | | | 0.23 | | | | | | — | (f) |
| | | 1.00 | | | | | | 0.01 | | | | | | 139,086 | | | | | | 0.11 | | | | | | 0.26 | | | | | | — | (f) |
| | | 1.00 | | | | | | 0.01 | | | | | | 193,741 | | | | | | 0.11 | | | | | | 0.33 | | | | | | — | (f) |
| | | 1.00 | | | | | | 0.01 | | | | | | 170,654 | | | | | | 0.11 | | | | | | 0.38 | | | | | | — | (f) |
| | | 1.00 | | | | | | 0.01 | | | | | | 1,279,893 | | | | | | 0.11 | | | | | | 0.48 | | | | | | — | (f) |
| | | 1.00 | | | | | | 0.01 | | | | | | 429,876 | | | | | | 0.11 | | | | | | 0.58 | | | | | | — | (f) |
| | | 1.00 | | | | | | 0.01 | | | | | | 298,809 | | | | | | 0.11 | | | | | | 0.73 | | | | | | — | (f) |
| | | 1.00 | | | | | | 0.01 | | | | | | 1 | | | | | | 0.11 | | | | | | 0.88 | | | | | | 0.19 | |
| | | 1.00 | | | | | | 0.01 | | | | | | 1 | | | | | | 0.11 | | | | | | 1.03 | | | | | | 0.23 | |
| | | 1.00 | | | | | | 0.01 | | | | | | 16,123,700 | | | | | | 0.14 | | | | | | 0.23 | | | | | | (0.01 | ) |
| | | 1.00 | | | | | | 0.01 | | | | | | 184,151 | | | | | | 0.14 | | | | | | 0.26 | | | | | | (0.02 | ) |
| | | 1.00 | | | | | | 0.01 | | | | | | 309,220 | | | | | | 0.14 | | | | | | 0.33 | | | | | | (0.02 | ) |
| | | 1.00 | | | | | | 0.01 | | | | | | 110,983 | | | | | | 0.14 | | | | | | 0.38 | | | | | | (0.01 | ) |
| | | 1.00 | | | | | | 0.01 | | | | | | 1,427,256 | | | | | | 0.14 | | | | | | 0.48 | | | | | | (0.02 | ) |
| | | 1.00 | | | | | | 0.01 | | | | | | 370,801 | | | | | | 0.14 | (e) | | | | | 0.58 | (e) | | | | | — | (e)(f) |
| | | 1.00 | | | | | | 0.01 | | | | | | 297,319 | | | | | | 0.14 | | | | | | 0.73 | | | | | | (0.01 | ) |
| | | 1.00 | | | | | | 0.01 | | | | | | 1 | | | | | | 0.14 | (e) | | | | | 0.58 | (e) | | | | | — | (e)(f) |
| | | 1.00 | | | | | | 0.01 | | | | | | 1 | | | | | | 0.14 | (e) | | | | | 0.73 | (e) | | | | | 0.09 | (e) |
| | | | | | | | | | | | | | | | | | | | | | | | | | | | | | | | | | |
| | | | | | | | | | | | | | | | | | | | | | | | | | | | | | | | | | |
| | | 1.00 | | | | | | 0.10 | | | | | | 18,393,881 | | | | | | 0.20 | (e) | | | | | 0.23 | (e) | | | | | 0.04 | (e) |
| | | 1.00 | | | | | | 0.08 | | | | | | 173,590 | | | | | | 0.23 | (e) | | | | | 0.26 | (e) | | | | | — | (e)(f) |
| | | 1.00 | | | | | | 0.05 | | | | | | 321,168 | | | | | | 0.27 | (e) | | | | | 0.33 | (e) | | | | | (0.04 | )(e) |
| | | 1.00 | | | | | | 0.03 | | | | | | 65,817 | | | | | | 0.30 | (e) | | | | | 0.38 | (e) | | | | | (0.06 | )(e) |
| | | 1.00 | | | | | | 0.02 | | | | | | 1,476,015 | | | | | | 0.34 | (e) | | | | | 0.48 | (e) | | | | | (0.09 | )(e) |
| | | 1.00 | | | | | | 0.01 | | | | | | 234,595 | | | | | | 0.35 | (e) | | | | | 0.73 | (e) | | | | | (0.11 | )(e) |
| | | | | | | | | | | | | | | | | | | | | | | | | | | | | | | | | | |
| | | | | | | | | | | | | | | | | | | | | | | | | | | | | | | | | | |
| | | 1.00 | | | | | | 1.57 | | | | | | 32,591,735 | | | | | | 0.21 | | | | | | 0.24 | | | | | | 1.05 | |
| | | 1.00 | | | | | | 1.54 | | | | | | 135,437 | | | | | | 0.24 | | | | | | 0.27 | | | | | | 1.01 | |
| | | 1.00 | | | | | | 1.47 | | | | | | 356,612 | | | | | | 0.31 | | | | | | 0.34 | | | | | | 1.15 | |
| | | 1.00 | | | | | | 1.42 | | | | | | 173,751 | | | | | | 0.36 | | | | | | 0.39 | | | | | | 0.64 | |
| | | 1.00 | | | | | | 1.32 | | | | | | 3,083,313 | | | | | | 0.46 | | | | | | 0.49 | | | | | | 0.97 | |
| | | 1.00 | | | | | | 1.09 | | | | | | 612,105 | | | | | | 0.69 | | | | | | 0.74 | | | | | | 0.84 | |
| | | 1.00 | | | | | | 4.46 | | | | | | 9,282,486 | | | | | | 0.20 | | | | | | 0.24 | | | | | | 3.91 | |
| | | 1.00 | | | | | | 4.43 | | | | | | 29,548 | | | | | | 0.23 | | | | | | 0.27 | | | | | | 4.24 | |
| | | 1.00 | | | | | | 4.36 | | | | | | 219,365 | | | | | | 0.30 | | | | | | 0.34 | | | | | | 4.07 | |
| | | 1.00 | | | | | | 4.31 | | | | | | 20,939 | | | | | | 0.35 | | | | | | 0.39 | | | | | | 4.16 | |
| | | 1.00 | | | | | | 4.20 | | | | | | 1,552,156 | | | | | | 0.45 | | | | | | 0.49 | | | | | | 3.89 | |
| | | 1.00 | | | | | | 3.94 | | | | | | 658,252 | | | | | | 0.70 | | | | | | 0.74 | | | | | | 3.51 | |
| | |
| The accompanying notes are an integral part of these financial statements. | | 79 |
FINANCIAL SQUARE TREASURY OBLIGATIONS FUND
Financial Highlights
Selected Data for a Share Outstanding Throughout Each Period
| | | | | | | | | | | | | | |
| | | Year - Share Class | | Net asset
value,
beginning
of period | | | Net
investment
income (loss) | | |
Distributions
from net
investment
income(a) | |
| | FOR THE FISCAL YEARS ENDED AUGUST 31, | | | | | | | | | | | | |
| | 2013 - FST Shares | | $ | 1.00 | | | | — | (c) | | | — | (c) |
| | 2013 - FST Select Shares | | | 1.00 | | | | — | (c) | | | — | (c) |
| | 2013 - FST Preferred Shares | | | 1.00 | | | | — | (c) | | | — | (c) |
| | 2013 - FST Capital Shares | | | 1.00 | | | | — | (c) | | | — | (c) |
| | 2013 - FST Administration Shares | | | 1.00 | | | | — | (c) | | | — | (c) |
| | 2013 - FST Premier Shares | | | 1.00 | | | | — | (c) | | | — | (c) |
| | 2013 - FST Service Shares | | | 1.00 | | | | — | (c) | | | — | (c) |
| | 2013 - FST Resource Shares | | | 1.00 | | | | — | (c) | | | — | (c) |
| | 2013 - FST Cash Management Shares | | | 1.00 | | | | — | (c) | | | — | (c) |
| | | | | | | | | | | | | | |
| | FOR THE FISCAL YEARS ENDED AUGUST 31, | | | | | | | | | | | | |
| | 2012 - FST Shares | | | 1.00 | | | | — | (c) | | | — | (c) |
| | 2012 - FST Select Shares | | | 1.00 | | | | — | (c) | | | — | (c) |
| | 2012 - FST Preferred Shares | | | 1.00 | | | | — | (c) | | | — | (c) |
| | 2012 - FST Capital Shares | | | 1.00 | | | | — | (c) | | | — | (c) |
| | 2012 - FST Administration Shares | | | 1.00 | | | | — | (c) | | | — | (c) |
| | 2012 - FST Premier Shares | | | 1.00 | | | | — | (c) | | | — | (c) |
| | 2012 - FST Service Shares | | | 1.00 | | | | — | (c) | | | — | (c) |
| | 2012 - FST Resource Shares | | | 1.00 | | | | — | (c) | | | — | (c) |
| | 2012 - FST Cash Management Shares | | | 1.00 | | | | — | (c) | | | — | (c) |
| | 2011 - FST Shares | | | 1.00 | | | | — | (c) | | | — | (c) |
| | 2011 - FST Select Shares | | | 1.00 | | | | — | (c) | | | — | (c) |
| | 2011 - FST Preferred Shares | | | 1.00 | | | | — | (c) | | | — | (c) |
| | 2011 - FST Capital Shares | | | 1.00 | | | | — | (c) | | | — | (c) |
| | 2011 - FST Administration Shares | | | 1.00 | | | | — | (c) | | | — | (c) |
| | 2011 - FST Premier Shares | | | 1.00 | | | | — | (c) | | | — | (c) |
| | 2011 - FST Service Shares | | | 1.00 | | | | — | (c) | | | — | (c) |
| | 2011 - FST Resource Shares | | | 1.00 | | | | — | (c) | | | — | (c) |
| | 2011 - FST Cash Management Shares | | | 1.00 | | | | — | (c) | | | — | (c) |
| | 2010 - FST Shares | | | 1.00 | | | | — | (c) | | | — | (c) |
| | 2010 - FST Select Shares | | | 1.00 | | | | — | (c) | | | — | (c) |
| | 2010 - FST Preferred Shares | | | 1.00 | | | | — | (c) | | | — | (c) |
| | 2010 - FST Capital Shares | | | 1.00 | | | | — | (c) | | | — | (c) |
| | 2010 - FST Administration Shares | | | 1.00 | | | | — | (c) | | | — | (c) |
| | 2010 - FST Premier Shares (Commenced May 14, 2010) | | | 1.00 | | | | — | (c) | | | — | (c) |
| | 2010 - FST Service Shares | | | 1.00 | | | | — | (c) | | | — | (c) |
| | 2010 - FST Resource Shares (Commenced May 14, 2010) | | | 1.00 | | | | — | (c) | | | — | (c) |
| | 2010 - FST Cash Management Shares (Commenced May 14, 2010) | | | 1.00 | | | | — | (c) | | | — | (c) |
| | | | | | | | | | | | | | |
| | FOR THE PERIOD JANUARY 1 TO AUGUST 31*, | | | | | | | | | | | | |
| | 2009 - FST Shares | | | 1.00 | | | | 0.001 | | | | (0.001 | ) |
| | 2009 - FST Select Shares | | | 1.00 | | | | 0.001 | | | | (0.001 | ) |
| | 2009 - FST Preferred Shares | | | 1.00 | | | | 0.001 | | | | (0.001 | ) |
| | 2009 - FST Capital Shares | | | 1.00 | | | | 0.001 | | | | (0.001 | ) |
| | 2009 - FST Administration Shares | | | 1.00 | | | | — | (c) | | | — | (c) |
| | 2009 - FST Service Shares | | | 1.00 | | | | — | (c) | | | — | (c) |
| | | | | | | | | | | | | | |
| | FOR THE FISCAL YEARS ENDED DECEMBER 31, | | | | | | | | | | | | |
| | 2008 - FST Shares | | | 1.00 | | | | 0.016 | | | | (0.016 | ) |
| | 2008 - FST Select Shares | | | 1.00 | | | | 0.016 | | | | (0.016 | ) |
| | 2008 - FST Preferred Shares | | | 1.00 | | | | 0.015 | | | | (0.015 | ) |
| | 2008 - FST Capital Shares | | | 1.00 | | | | 0.015 | | | | (0.015 | ) |
| | 2008 - FST Administration Shares | | | 1.00 | | | | 0.014 | | | | (0.014 | ) |
| | 2008 - FST Service Shares | | | 1.00 | | | | 0.012 | | | | (0.012 | ) |
| | 2007 - FST Shares | | | 1.00 | | | | 0.047 | | | | (0.047 | ) |
| | 2007 - FST Select Shares | | | 1.00 | | | | 0.047 | | | | (0.047 | ) |
| | 2007 - FST Preferred Shares | | | 1.00 | | | | 0.046 | | | | (0.046 | ) |
| | 2007 - FST Capital Shares | | | 1.00 | | | | 0.045 | | | | (0.045 | ) |
| | 2007 - FST Administration Shares | | | 1.00 | | | | 0.044 | | | | (0.044 | ) |
| | 2007 - FST Service Shares | | | 1.00 | | | | 0.042 | | | | (0.042 | ) |
| | * | | The Fund changed its fiscal year end from December 31 to August 31. |
| | (a) | | Distributions may not coincide with the current year net investment income or net realized gains as distributions may be paid from current or prior year earnings. |
| | (b) | | Assumes reinvestment of all distributions. Returns do not reflect the deduction of taxes that a shareholder would pay on Fund distributions. Total returns for periods less than one full year are not annualized. |
| | (c) | | Amount is less than $0.0005 per share. |
| | (d) | | Amount is less than 0.005%. |
| | (f) | | Amount is less than 0.005% of average net assets. |
| | |
| 80 | | The accompanying notes are an integral part of these financial statements. |
FINANCIAL SQUARE TREASURY OBLIGATIONS FUND
| | | | | | | | | | | | | | | | | | | | | | | | | | | | | | | | | | |
| | | Net asset
value, end
of period | | | | | Total
return(b) | | | | | Net assets end of period (in 000s) | | | | | Ratio of
net expenses
to average
net assets | | | | | Ratio of
total expenses
to average
net assets | | | | | Ratio of
net investment
income (loss)
to average net assets | |
| | | | | | | | | | | | | | | | | | | | | | | | | | | | | | | | | | |
| | $ | 1.00 | | | | | | — | %(d) | | | | $ | 7,369,407 | | | | | | 0.17 | %(e) | | | | | 0.23 | %(e) | | | | | 0.01 | %(e) |
| | | 1.00 | | | | | | — | (d) | | | | | 198,456 | | | | | | 0.17 | (e) | | | | | 0.26 | (e) | | | | | 0.01 | (e) |
| | | 1.00 | | | | | | — | (d) | | | | | 111,449 | | | | | | 0.17 | (e) | | | | | 0.33 | (e) | | | | | 0.01 | (e) |
| | | 1.00 | | | | | | — | (d) | | | | | 218,735 | | | | | | 0.17 | (e) | | | | | 0.38 | (e) | | | | | 0.01 | (e) |
| | | 1.00 | | | | | | — | (d) | | | | | 2,055,570 | | | | | | 0.17 | (e) | | | | | 0.48 | (e) | | | | | 0.01 | (e) |
| | | 1.00 | | | | | | — | (d) | | | | | 102,053 | | | | | | 0.17 | (e) | | | | | 0.58 | (e) | | | | | — | (e)(f) |
| | | 1.00 | | | | | | — | (d) | | | | | 964,469 | | | | | | 0.17 | (e) | | | | | 0.73 | (e) | | | | | 0.01 | (e) |
| | | 1.00 | | | | | | — | (d) | | | | | 1 | | | | | | 0.17 | (e) | | | | | 0.88 | (e) | | | | | 0.37 | (e) |
| | | 1.00 | | | | | | — | (d) | | | | | 1 | | | | | | 0.17 | (e) | | | | | 1.03 | (e) | | | | | 0.37 | (e) |
| | | | | | | | | | | | | | | | | | | | | | | | | | | | | | | | | | |
| | | | | | | | | | | | | | | | | | | | | | | | | | | | | | | | | | |
| | | 1.00 | | | | | | 0.01 | | | | | | 8,084,641 | | | | | | 0.12 | | | | | | 0.23 | | | | | | 0.01 | |
| | | 1.00 | | | | | | 0.01 | | | | | | 152,228 | | | | | | 0.12 | | | | | | 0.26 | | | | | | — | (f) |
| | | 1.00 | | | | | | 0.01 | | | | | | 95,065 | | | | | | 0.12 | | | | | | 0.33 | | | | | | — | (f) |
| | | 1.00 | | | | | | 0.01 | | | | | | 216,015 | | | | | | 0.12 | | | | | | 0.38 | | | | | | 0.01 | |
| | | 1.00 | | | | | | 0.01 | | | | | | 1,525,805 | | | | | | 0.12 | | | | | | 0.48 | | | | | | 0.01 | |
| | | 1.00 | | | | | | 0.01 | | | | | | 124,439 | | | | | | 0.12 | | | | | | 0.58 | | | | | | 0.01 | |
| | | 1.00 | | | | | | 0.01 | | | | | | 1,025,286 | | | | | | 0.12 | | | | | | 0.73 | | | | | | — | (f) |
| | | 1.00 | | | | | | 0.01 | | | | | | 1 | | | | | | 0.12 | | | | | | 0.88 | | | | | | 0.40 | |
| | | 1.00 | | | | | | 0.01 | | | | | | 1 | | | | | | 0.12 | | | | | | 1.03 | | | | | | 0.40 | |
| | | 1.00 | | | | | | 0.01 | | | | | | 7,991,142 | | | | | | 0.15 | | | | | | 0.23 | | | | | | 0.01 | |
| | | 1.00 | | | | | | 0.01 | | | | | | 197,349 | | | | | | 0.15 | | | | | | 0.26 | | | | | | 0.01 | |
| | | 1.00 | | | | | | 0.01 | | | | | | 141,554 | | | | | | 0.15 | | | | | | 0.33 | | | | | | 0.01 | |
| | | 1.00 | | | | | | 0.01 | | | | | | 142,775 | | | | | | 0.15 | | | | | | 0.38 | | | | | | 0.01 | |
| | | 1.00 | | | | | | 0.01 | | | | | | 1,676,083 | | | | | | 0.15 | | | | | | 0.48 | | | | | | 0.01 | |
| | | 1.00 | | | | | | 0.01 | | | | | | 121,171 | | | | | | 0.15 | | | | | | 0.58 | | | | | | 0.01 | |
| | | 1.00 | | | | | | 0.01 | | | | | | 1,318,792 | | | | | | 0.15 | | | | | | 0.73 | | | | | | 0.01 | |
| | | 1.00 | | | | | | 0.01 | | | | | | 1 | | | | | | 0.15 | | | | | | 0.88 | | | | | | 0.23 | |
| | | 1.00 | | | | | | 0.01 | | | | | | 1 | | | | | | 0.15 | | | | | | 1.03 | | | | | | 0.10 | |
| | | 1.00 | | | | | | 0.04 | | | | | | 8,654,414 | | | | | | 0.19 | | | | | | 0.22 | | | | | | — | (f) |
| | | 1.00 | | | | | | 0.02 | | | | | | 199,595 | | | | | | 0.21 | | | | | | 0.25 | | | | | | (0.03 | ) |
| | | 1.00 | | | | | | 0.01 | | | | | | 206,610 | | | | | | 0.21 | | | | | | 0.32 | | | | | | (0.03 | ) |
| | | 1.00 | | | | | | 0.01 | | | | | | 223,476 | | | | | | 0.21 | | | | | | 0.37 | | | | | | (0.02 | ) |
| | | 1.00 | | | | | | 0.01 | | | | | | 1,875,928 | | | | | | 0.21 | | | | | | 0.47 | | | | | | (0.02 | ) |
| | | 1.00 | | | | | | 0.01 | | | | | | 125,136 | | | | | | 0.21 | (e) | | | | | 0.57 | (e) | | | | | 0.13 | (e) |
| | | 1.00 | | | | | | 0.01 | | | | | | 1,232,186 | | | | | | 0.21 | | | | | | 0.72 | | | | | | (0.02 | ) |
| | | 1.00 | | | | | | 0.01 | | | | | | 1 | | | | | | 0.19 | (e) | | | | | 0.72 | (e) | | | | | 0.10 | (e) |
| | | 1.00 | | | | | | 0.01 | | | | | | 1 | | | | | | 0.20 | (e) | | | | | 1.02 | (e) | | | | | (0.04 | )(e) |
| | | | | | | | | | | | | | | | | | | | | | | | | | | | | | | | | | |
| | | | | | | | | | | | | | | | | | | | | | | | | | | | | | | | | | |
| | | 1.00 | | | | | | 0.14 | | | | | | 16,942,168 | | | | | | 0.20 | (e) | | | | | 0.23 | (e) | | | | | 0.07 | (e) |
| | | 1.00 | | | | | | 0.12 | | | | | | 670,028 | | | | | | 0.23 | (e) | | | | | 0.26 | (e) | | | | | (0.01 | )(e) |
| | | 1.00 | | | | | | 0.08 | | | | | | 304,897 | | | | | | 0.29 | (e) | | | | | 0.33 | (e) | | | | | (0.02 | )(e) |
| | | 1.00 | | | | | | 0.06 | | | | | | 330,368 | | | | | | 0.33 | (e) | | | | | 0.38 | (e) | | | | | (0.05 | )(e) |
| | | 1.00 | | | | | | 0.02 | | | | | | 2,196,762 | | | | | | 0.37 | (e) | | | | | 0.48 | (e) | | | | | (0.10 | )(e) |
| | | 1.00 | | | | | | 0.01 | | | | | | 1,058,820 | | | | | | 0.41 | (e) | | | | | 0.73 | (e) | | | | | (0.12 | )(e) |
| | | | | | | | | | | | | | | | | | | | | | | | | | | | | | | | | | |
| | | | | | | | | | | | | | | | | | | | | | | | | | | | | | | | | | |
| | | 1.00 | | | | | | 1.64 | | | | | | 12,010,372 | | | | | | 0.21 | | | | | | 0.24 | | | | | | 1.51 | |
| | | 1.00 | | | | | | 1.61 | | | | | | 32,927 | | | | | | 0.24 | | | | | | 0.27 | | | | | | 0.42 | |
| | | 1.00 | | | | | | 1.54 | | | | | | 246,788 | | | | | | 0.31 | | | | | | 0.34 | | | | | | 1.46 | |
| | | 1.00 | | | | | | 1.49 | | | | | | 360,461 | | | | | | 0.36 | | | | | | 0.39 | | | | | | 1.30 | |
| | | 1.00 | | | | | | 1.39 | | | | | | 1,995,689 | | | | | | 0.46 | | | | | | 0.49 | | | | | | 1.40 | |
| | | 1.00 | | | | | | 1.17 | | | | | | 1,357,797 | | | | | | 0.67 | | | | | | 0.74 | | | | | | 1.17 | |
| | | 1.00 | | | | | | 4.80 | | | | | | 11,652,689 | | | | | | 0.20 | | | | | | 0.24 | | | | | | 4.32 | |
| | | 1.00 | | | | | | 4.77 | | | | | | 26 | | | | | | 0.23 | | | | | | 0.27 | | | | | | 4.62 | |
| | | 1.00 | | | | | | 4.70 | | | | | | 646,792 | | | | | | 0.30 | | | | | | 0.34 | | | | | | 4.52 | |
| | | 1.00 | | | | | | 4.65 | | | | | | 318,665 | | | | | | 0.35 | | | | | | 0.39 | | | | | | 4.39 | |
| | | 1.00 | | | | | | 4.54 | | | | | | 2,787,538 | | | | | | 0.45 | | | | | | 0.49 | | | | | | 4.44 | |
| | | 1.00 | | | | | | 4.28 | | | | | | 1,837,123 | | | | | | 0.70 | | | | | | 0.74 | | | | | | 4.19 | |
| | |
| The accompanying notes are an integral part of these financial statements. | | 81 |
GOLDMAN SACHS FUNDS — FINANCIAL SQUARE FUNDS
Notes to Financial Statements
February 28, 2013 (Unaudited)
Goldman Sachs Trust (the “Trust”) is a Delaware statutory trust registered under the Investment Company Act of 1940, as amended (the “Act”), as an open-end management investment company. The following table lists those series of the Trust that are included in this report (collectively, the “Funds” or individually a “Fund”), along with their corresponding share classes and respective diversification status under the Act:
| | | | |
| Fund | | Share Classes Offered | | Diversified/ Non-Diversified |
Federal, Government, Money Market, Tax-Free Money Market, Treasury
Instruments and Treasury Obligations | | FST, FST Select, FST Preferred, FST Capital, FST Administration, FST Premier, FST Service, FST Resource and FST Cash Management | | Diversified |
Prime Obligations | | FST, FST Select, FST Preferred, FST Capital, FST Administration, FST Premier, FST Service, FST Class B, FST Class C, FST Resource and FST Cash Management | | Diversified |
Tax-Exempt California and Tax-Exempt New York | | FST, FST Administration, FST Service and FST Cash Management | | Non-Diversified |
FST Class B and FST Class C Shares are generally not available for purchase, although shareholders invested in Class B and Class C Shares of other Goldman Sachs Funds may exchange their shares for FST Class B and FST Class C Shares, respectively (and shareholders of FST Class B and FST Class C Shares may continue to reinvest dividends and capital gains into FST Class B and FST Class C Shares, respectively). FST Class B Shares may be subject to a contingent deferred sales charge (“CDSC”) that may start at a rate as high as 5% in the first year and decline to 1% in the sixth year, before being eliminated thereafter, depending upon the date the original shares subject to the CDSC were acquired (along with the CDSC schedule applicable to those original shares). FST Class C Shares are subject to a CDSC of 1% during the first 12 months, measured from the time the original shares subject to the CDSC were acquired.
Goldman Sachs Asset Management, L.P. (“GSAM”), an affiliate of Goldman, Sachs & Co. (“Goldman Sachs”), serves as investment adviser to the Funds pursuant to management agreements (the “Agreements”) with the Trust.
|
| 2. SIGNIFICANT ACCOUNTING POLICIES |
The financial statements have been prepared in accordance with accounting principles generally accepted in the United States of America (“GAAP”) and require management to make estimates and assumptions that may affect the reported amounts and disclosures. Actual results may differ from those estimates and assumptions.
A. Investment Valuation — The investment valuation policy of the Funds is to use the amortized-cost method permitted by Rule 2a-7 under the Act, which approximates market value, for valuing portfolio securities. Under this method, all investments purchased at a discount or premium are valued by accreting or amortizing the difference between the original purchase price and maturity value of the issue, as an adjustment to interest income. Under procedures and tolerances approved by the Trustees, GSAM evaluates the difference between the Funds’ net asset value per share (“NAV”) based upon the amortized cost of the Funds’ securities and the NAV based upon available market quotations (or permitted substitutes).
82
GOLDMAN SACHS FUNDS — FINANCIAL SQUARE FUNDS
|
| 2. SIGNIFICANT ACCOUNTING POLICIES (continued) |
B. Investment Income and Investments — Interest income is accrued daily and adjusted for amortization of premiums and accretion of discounts. Investment transactions are reflected on trade date. Realized gains and losses are calculated using identified cost.
C. Class Allocations and Expenses — Investment income, realized and unrealized gain (loss), and non-class specific expenses of each Fund are allocated daily based upon the proportion of net assets of each class. Class specific expenses, where applicable, are borne by the respective share classes and include Distribution and Service, Transfer Agent and Service and Shareholder Administration fees. Non-class specific expenses directly incurred by a Fund are charged to that Fund, while such expenses incurred by the Trust are allocated across the respective Funds on a straight-line and/or pro-rata basis depending upon the nature of the expenses.
D. Federal Taxes and Distributions to Shareholders — It is each Fund’s policy to comply with the requirements of the Internal Revenue Code of 1986, as amended (the “Code”), applicable to regulated investment companies (mutual funds) and to distribute each year substantially all of its investment company taxable and tax-exempt income and capital gains to its shareholders. Accordingly, the Funds are not required to make any provisions for the payment of federal income tax. Distributions to shareholders are declared and recorded daily and paid monthly by the Funds and may include short-term capital gains. Long-term capital gain distributions, if any, are declared and paid annually.
Net capital losses are carried forward to future fiscal years and may be used to the extent allowed by the Code to offset any future capital gains. Utilization of capital loss carryforwards will reduce the requirement of future capital gains distributions.
Under the Regulated Investment Company Modernization Act of 2010, the Funds are permitted to carry forward capital losses incurred in taxable years beginning after December 22, 2010 for an unlimited period. However, any losses incurred during those future taxable years will be required to be utilized prior to the losses incurred in pre-enactment taxable years. As a result of this ordering rule, pre-enactment capital loss carryforwards may be more likely to expire unused. Additionally, post-enactment capital losses that are carried forward will retain their character as either short-term or long-term capital losses rather than being considered all short-term as under previous law.
The characterization of distributions to shareholders for financial reporting purposes is determined in accordance with federal income tax rules, which may differ from GAAP. The source of each Fund’s distributions may be shown in the accompanying financial statements as either from net investment income, net realized gain or capital. Certain components of the Funds’ net assets on the Statements of Assets and Liabilities reflect permanent GAAP/tax differences based on the appropriate tax character.
The amortized cost for each Fund stated in the accompanying Statements of Assets and Liabilities also represents aggregate costs for U.S. federal income tax purposes. GSAM has reviewed the Funds’ tax provisions for all open tax years (the current and prior three tax years, as applicable) and has concluded that no provision for income tax is required in the Funds’ financial statements. Such open tax years remain subject to examination and adjustment by tax authorities.
E. Forward Commitment Transactions — A forward commitment involves entering into a contract to purchase or sell securities, typically on an extended settlement basis, for a fixed price at a future date. The purchase of securities involves a risk of loss if the value of the security to be purchased declines before the settlement date. Conversely, the sale of securities involves the risk that the value of the securities sold may increase before the settlement date. Although a Fund will generally purchase securities on a forward commitment basis with the intention of acquiring the securities for its portfolio, the Fund may dispose of forward commitments prior to settlement which may result in a realized gain or loss.
83
GOLDMAN SACHS FUNDS — FINANCIAL SQUARE FUNDS
Notes to Financial Statements (continued)
February 28, 2013 (Unaudited)
|
| 2. SIGNIFICANT ACCOUNTING POLICIES (continued) |
F. Repurchase Agreements — Repurchase agreements involve the purchase of securities subject to the seller’s agreement to repurchase the securities at a mutually agreed upon date and price. During the term of a repurchase agreement, the value of the underlying securities held as collateral on behalf of a Fund, including accrued interest is required to exceed the value of the repurchase agreement, including accrued interest. The underlying securities for all repurchase agreements are held at the Funds’ custodian or designated sub-custodians under tri-party repurchase agreements.
Pursuant to exemptive relief granted by the Securities and Exchange Commission (“SEC”) and terms and conditions contained therein, the Funds, together with other funds of the Trust and registered investment companies having management agreements with GSAM, or its affiliates, may transfer uninvested cash into joint accounts, the daily aggregate balance of which is invested in one or more repurchase agreements. Under these joint accounts, the Funds maintain pro-rata credit exposure to the underlying repurchase agreements’ counterparties. With the exception of certain transaction fees, the Funds are not subject to any expenses in relation to these investments.
| | |
| 3. INVESTMENTS AND FAIR VALUE MEASUREMENTS | | |
The fair value of a financial instrument is the amount that would be received to sell an asset or paid to transfer a liability in an orderly transaction between market participants at the measurement date (i.e., the exit price). GAAP establishes a fair value hierarchy that prioritizes the inputs to valuation techniques used to measure fair value. The hierarchy gives the highest priority to unadjusted quoted prices in active markets for identical assets or liabilities (Level 1 measurements) and the lowest priority to unobservable inputs (Level 3 measurements). The levels used for classifying investments are not necessarily an indication of the risk associated with investing in these investments. The three levels of the fair value hierarchy are described below:
Level 1 — Unadjusted quoted prices in active markets that are accessible at the measurement date for identical, unrestricted assets or liabilities;
Level 2 — Quoted prices in markets that are not active or financial instruments for which significant inputs are observable (including, but not limited to, quoted prices for similar investments, interest rates, foreign exchange rates, volatility and credit spreads), either directly or indirectly;
Level 3 — Prices or valuations that require significant unobservable inputs (including GSAM’s assumptions in determining fair value measurement).
The Trustees have adopted Valuation Procedures that govern the valuation of the portfolio investments held by the Funds, including investments for which market quotations are not readily available. The Trustees have delegated to GSAM day-to-day responsibility for implementing and maintaining internal controls and procedures related to the valuation of the Funds’ portfolio investments. To assess the continuing appropriateness of pricing sources and methodologies, GSAM regularly performs price verification procedures and issues challenges as necessary to third party pricing vendors or brokers, and any differences are reviewed in accordance with the Valuation Procedures.
As of February 28, 2013, all investments are classified as Level 2. Please refer to the Schedules of Investments for further detail.
| | |
| 4. AGREEMENTS AND AFFILIATED TRANSACTIONS | | |
The Fund Contractual Fees Table on the following pages summarizes the relevant contractual fee arrangements.
A. Management Agreements — Under the Agreements, GSAM manages the Funds, subject to the general supervision of the Trustees.
84
GOLDMAN SACHS FUNDS — FINANCIAL SQUARE FUNDS
|
| 4. AGREEMENTS AND AFFILIATED TRANSACTIONS (continued) |
As compensation for the services rendered pursuant to the Agreements, the assumption of the expenses related thereto and administration of the Funds’ business affairs, including providing facilities, GSAM is entitled to a management fee, accrued daily and paid monthly, equal to an annual percentage rate of each Fund’s average daily net assets.
B. Administration, Service and Shareholder Administration Plans — The Trust, on behalf of each applicable Fund, has adopted Administration, Service and Shareholder Administration Plans (the “Plans”) to allow FST Select, FST Preferred, FST Capital, FST Administration, FST Premier, FST Service, FST Resource and FST Cash Management Shares (“CMS”) to compensate service organizations for providing varying levels of account administration and/or personal and account maintenance services to their customers who are beneficial owners of such shares. The Plans provide for compensation to the service organizations equal to an annual percentage rate of the average daily net assets of such shares.
C. Distribution and Service Plans — The Trust, on behalf of the Prime Obligations Fund’s FST Class B and FST Class C Shares, has adopted Distribution and Service Plans. Under the respective Distribution and Service Plans, Goldman Sachs as Distributor is entitled to a fee accrued daily and paid monthly from the Prime Obligations Fund’s FST Class B and FST Class C Shares for distribution services and personal and account maintenance services. These fees are equal to an annual percentage rate of the average daily net assets attributable to both FST Class B and FST Class C Shares, which may then be paid by Goldman Sachs to authorized dealers.
The Trust, on behalf of the FST Resource Shares and FST CMS of each applicable Fund, has adopted Distribution Plans. Under the Distribution Plans, Goldman Sachs is entitled to a monthly fee from the applicable Fund’s FST Resource Shares and FST CMS for distribution services equal to an annual percentage rate of the average daily net assets attributable to FST Resource Shares and FST CMS, which may then be paid by Goldman Sachs to authorized dealers.
D. Distribution Agreement — Goldman Sachs serves as Distributor of the shares of the Funds pursuant to a Distribution Agreement. Pursuant to the Distribution Agreement, the Distributor receives no additional compensation other than retained amounts related to the Distribution and Service Plans and the portion of the Prime Obligations Fund’s FST Class B and FST Class C Shares’ CDSCs that it retains. During the six months ended February 28, 2013, Goldman Sachs has advised that it retained approximately $1,998 in CDSCs from FST Class C Shares only (there were no CDSCs retained from FST Class B Shares).
E. Transfer Agency Agreement — Goldman Sachs also serves as the transfer agent of the Funds for a fee pursuant to a Transfer Agency Agreement. The fee charged for such transfer agency services is accrued daily and paid monthly and is equal to an annual percentage rate of each Fund’s average daily net assets.
F. Other Agreements — GSAM has agreed to limit certain “Other Expense” of the Funds (except for the Tax-Exempt California and Tax-Exempt New York Funds) (excluding management fees, transfer agent fees and expenses, acquired fund fees and expenses, FST Class B and FST Class C distribution and service fees, FST Select fees, FST Preferred fees, FST Capital fees, FST Administration fees, FST Premier fees, FST Service fees, FST Resource fees, FST CMS fees, taxes, interest, brokerage fees, litigation, indemnification, shareholder meetings and other extraordinary expenses) to the extent such expenses exceed, on an annual basis, 0.014% of the average daily net assets of each Fund. Such Other Expense reimbursements, if any, are accrued daily and paid monthly. These Other Expense reimbursements will remain in place through at least December 29, 2013, and prior to such date GSAM may not terminate the arrangements without the approval of the Trustees. In addition, the Funds have entered into certain offset arrangements with the custodian and transfer agent, which may result in a reduction in the Funds’ expenses and are received irrespective of the application of the “Other Expense” limitations described above.
85
GOLDMAN SACHS FUNDS — FINANCIAL SQUARE FUNDS
Notes to Financial Statements (continued)
February 28, 2013 (Unaudited)
|
| 4. AGREEMENTS AND AFFILIATED TRANSACTIONS (continued) |
GSAM has agreed to reduce or limit the “Total Annual Fund Operating Expenses” of the Tax-Exempt California and Tax-Exempt New York Funds (excluding distribution, acquired fund fees and expenses, administration, service and shareholder administration plan fees, taxes, interest, brokerage fees, litigation, indemnification, shareholder meeting costs and other extraordinary expenses) such that the “Total Annual Fund Operating Expenses” will not exceed 0.434% of each Fund’s average daily net assets. Such expense reimbursements, if any, are accrued daily and paid monthly. These expense reimbursements will remain in place through at least December 29, 2013, and prior to such date GSAM may not terminate the arrangements without the approval of the Trustees. In addition, the Tax-Exempt California and Tax-Exempt New York Funds have entered into certain offset agreements with the custodian and transfer agent, which may result in a further reduction of the Funds’ net expenses and are received irrespective of the application of the “Total Annual Fund Operating Expense” limitations described above.
G. Total Fund Expenses
Fund Contractual Fees
The contractual annualized rates for each of the Funds (except Tax-Exempt California and Tax-Exempt New York Funds) are as follows:
| | | | | | | | | | | | | | | | | | | | | | | | | | | | | | | | | | | | | | | | | | | | | | |
| | | | | All Funds Except Tax-Exempt California and Tax-Exempt New York Funds | |
| | | | | FST
Shares | | | FST
Select
Shares | | | FST
Preferred
Shares | | | FST
Capital
Shares | | | FST
Administration
Shares | | | FST
Premier
Shares | | | FST
Service
Shares | | | FST
Resource
Shares | | | FST
CMS | | | FST
Class B
Shares(a) | | | FST
Class C
Shares(a) | |
Management Fee | | | | | 0.205 | % | | | 0.205 | % | | | 0.205 | % | | | 0.205 | % | | | 0.205 | % | | | 0.205 | % | | | 0.205 | % | | | 0.205 | % | | | 0.205 | % | | | 0.205 | % | | | 0.205 | % |
Administration, Service
and/or Shareholder
Administration Fees | | | | | N/A | | | | 0.03 | | | | 0.10 | | | | 0.15 | | | | 0.25 | | | | 0.35 | | | | 0.50 | | | | 0.50 | | | | 0.50 | | | | N/A | | | | N/A | |
Distribution (12b-1) and/or
Service Fees | | | | | N/A | | | | N/A | | | | N/A | | | | N/A | | | | N/A | | | | N/A | | | | N/A | | | | 0.15 | (b) | | | 0.30 | (b) | | | 1.00 | (c) | | | 1.00 | (c) |
Transfer Agency Fee | | | | | 0.01 | | | | 0.01 | | | | 0.01 | | | | 0.01 | | | | 0.01 | | | | 0.01 | | | | 0.01 | | | | 0.01 | | | | 0.01 | | | | 0.01 | | | | 0.01 | |
N/A — Fees not applicable to respective share class
| (a) | | Prime Obligations Fund only. |
| (b) | | Distribution (12b-1) fee only. |
| (c) | | Consists of fees paid for distribution services and personal and account maintenance services equal to 0.75 and 0.25, respectively. |
86
GOLDMAN SACHS FUNDS — FINANCIAL SQUARE FUNDS
|
| 4. AGREEMENTS AND AFFILIATED TRANSACTIONS (continued) |
The contractual annualized rates for the Tax-Exempt California and Tax-Exempt New York Funds are as follows:
| | | | | | | | | | | | | | | | | | |
| | | | | FST
Shares | | | FST
Administration
Shares | | | FST
Service
Shares | | | FST
CMS | |
Management Fee | | | | | 0.35 | % | | | 0.35 | % | | | 0.35 | % | | | 0.35 | % |
Administration, Service and/or Shareholder Administration Fees | | | | | N/A | | | | 0.15 | | | | 0.40 | | | | 0.50 | |
Distribution (12b-1) Fees | | | | | N/A | | | | N/A | | | | N/A | | | | 0.50 | |
Transfer Agency Fee | | | | | 0.01 | | | | 0.01 | | | | 0.01 | | | | 0.01 | |
N/A — Fees not applicable to respective share class
Fund Effective Net Expenses (After Waivers and Reimbursements)
During the six months ended February 28, 2013, GSAM and Goldman Sachs (as applicable) voluntarily agreed to waive all or a portion of the management fees, respective class-specific fees (consisting of Distribution and/or Service, Administration, Service and/or Shareholder Administration Plan fees) and transfer agency fees attributable to the Funds. These waivers may be modified or terminated at any time at the option of GSAM or Goldman Sachs (as applicable), with the exception of (i) GSAM’s agreement not to impose a portion of the management fee equal annually to 0.025% of the Treasury Obligations, Treasury Instruments and Federal Funds’ average daily net assets and 0.045% of the Prime Obligations, Money Market, Government and Tax-Free Money Market Funds’ average daily net assets, and (ii) Goldman Sachs’ agreement to limit the amount of annual distribution fees payable by Tax-Exempt California and Tax-Exempt New York Funds to 0.07% of each Fund’s average daily net assets attributable to FST CMS. The following tables outline such fees (net of any waivers) and Other Expenses (net of reimbursements and custodian fee credit reductions) in order to determine each Fund’s ratio of net expenses for the six months ended February 28, 2013. The Funds are not obligated to reimburse GSAM or Goldman Sachs for prior fiscal year fee waivers and/or expense reimbursements, if any.
87
GOLDMAN SACHS FUNDS — FINANCIAL SQUARE FUNDS
Notes to Financial Statements (continued)
February 28, 2013 (Unaudited)
|
| 4. AGREEMENTS AND AFFILIATED TRANSACTIONS (continued) |
| | | | | | | | | | | | | | | | | | | | | | | | | | | | | | | | | | | | | | | | | | | | | | |
| | | | | Ratio of Net Expenses to Average Net Assets for the Six Months Ended February 28, 2013* | |
| | | | | FST
Shares | | | FST
Select
Shares | | | FST
Preferred
Shares | | | FST
Capital
Shares | | | FST
Administration
Shares | | | FST
Premier
Shares | | | FST
Service
Shares | | | FST
Resource
Shares | | | FST
CMS | | | FST
Class B
Shares | | | FST
Class C
Shares | |
| | | | | | | | | | | | |
| Prime Obligations | | | | | | | | | | | | | | | | | | | | | | | | | | | | | | | | | | | | | | | | | | | | | | |
Management Fee(a) | | | | | 0.16 | % | | | 0.16 | % | | | 0.16 | % | | | 0.16 | % | | | 0.16 | % | | | 0.16 | % | | | 0.16 | % | | | 0.16 | % | | | 0.16 | % | | | 0.16 | % | | | 0.16 | % |
Administration Service
and/or Shareholder
Administration Fees | | | | | N/A | | | | 0.03 | | | | 0.09 | | | | 0.10 | | | | 0.10 | | | | 0.00 | | | | 0.09 | | | | 0.00 | | | | 0.00 | | | | N/A | | | | N/A | |
Distribution (12b-1) and/or
Service Fees | | | | | N/A | | | | N/A | | | | N/A | | | | N/A | | | | N/A | | | | N/A | | | | N/A | | | | 0.09 | | | | 0.00 | | | | 0.09 | | | | 0.09 | |
Transfer Agency Fee | | | | | 0.01 | | | | 0.01 | | | | 0.01 | | | | 0.01 | | | | 0.01 | | | | 0.01 | | | | 0.01 | | | | 0.01 | | | | 0.01 | | | | 0.01 | | | | 0.01 | |
Other Expenses | | | | | 0.01 | | | | 0.01 | | | | 0.01 | | | | 0.01 | | | | 0.01 | | | | 0.01 | | | | 0.01 | | | | 0.01 | | | | 0.01 | | | | 0.01 | | | | 0.01 | |
| Net Expenses | | | | | 0.18 | | | | 0.21 | | | | 0.27 | | | | 0.28 | | | | 0.28 | | | | 0.18 | | | | 0.27 | | | | 0.27 | | | | 0.18 | | | | 0.27 | | | | 0.27 | |
* Annualized
N/A — Fees not applicable to respective share class.
| (a) | | GSAM waived a portion of its management fee in order to achieve the effective net management rates above. |
88
GOLDMAN SACHS FUNDS — FINANCIAL SQUARE FUNDS
|
| 4. AGREEMENTS AND AFFILIATED TRANSACTIONS (continued) |
| | | | | | | | | | | | | | | | | | | | | | | | | | | | | | | | | | | | |
| | | Ratio of Net Expenses to Average Net Assets for the Six Months Ended February 28, 2013* | |
| | | FST
Shares | | | FST
Select
Shares | | | FST
Preferred
Shares | | | FST
Capital
Shares | | | FST
Administration
Shares | | | FST
Premier
Shares | | | FST
Service
Shares | | | FST
Resource
Shares | | | FST
CMS | |
| | | | | | | | | |
| Federal | | | | | | | | | | | | | | | | | | | | | | | | | | | | | | | | | | | | |
Management Fee(a) | | | 0.14 | % | | | 0.14 | % | | | 0.14 | % | | | 0.14 | % | | | 0.14 | % | | | 0.14 | % | | | 0.14 | % | | | 0.14 | % | | | 0.14 | % |
Administration Service and/or Shareholder Administration Fees | | | N/A | | | | 0.00 | | | | 0.00 | | | | 0.00 | | | | 0.00 | | | | 0.00 | | | | 0.00 | | | | 0.00 | | | | 0.00 | |
Distribution (12b-1) and/or Service Fees | | | N/A | | | | N/A | | | | N/A | | | | N/A | | | | N/A | | | | N/A | | | | N/A | | | | 0.00 | | | | 0.00 | |
Transfer Agency Fee | | | 0.00 | | | | 0.00 | | | | 0.00 | | | | 0.00 | | | | 0.00 | | | | 0.00 | | | | 0.00 | | | | 0.00 | | | | 0.00 | |
Other Expenses | | | 0.01 | | | | 0.01 | | | | 0.01 | | | | 0.01 | | | | 0.01 | | | | 0.01 | | | | 0.01 | | | | 0.01 | | | | 0.01 | |
| Net Expenses | | | 0.15 | | | | 0.15 | | | | 0.15 | | | | 0.15 | | | | 0.15 | | | | 0.15 | | | | 0.15 | | | | 0.15 | | | | 0.15 | |
| Government | | | | | | | | | | | | | | | | | | | | | | | | | | | | | | | | | | | | |
Management Fee(a) | | | 0.16 | % | | | 0.16 | % | | | 0.16 | % | | | 0.16 | % | | | 0.16 | % | | | 0.16 | % | | | 0.16 | % | | | 0.16 | % | | | 0.16 | % |
Administration Service and/or Shareholder Administration Fees | | | N/A | | | | 0.03 | | | | 0.04 | | | | 0.04 | | | | 0.04 | | | | 0.04 | | | | 0.04 | | | | 0.00 | | | | 0.00 | |
Distribution (12b-1) and/or Service Fees | | | N/A | | | | N/A | | | | N/A | | | | N/A | | | | N/A | | | | N/A | | | | N/A | | | | 0.00 | | | | 0.00 | |
Transfer Agency Fee | | | 0.01 | | | | 0.01 | | | | 0.01 | | | | 0.01 | | | | 0.01 | | | | 0.01 | | | | 0.01 | | | | 0.01 | | | | 0.01 | |
Other Expenses | | | 0.01 | | | | 0.01 | | | | 0.01 | | | | 0.01 | | | | 0.01 | | | | 0.01 | | | | 0.01 | | | | 0.01 | | | | 0.01 | |
| Net Expenses | | | 0.18 | | | | 0.21 | | | | 0.22 | | | | 0.22 | | | | 0.22 | | | | 0.22 | | | | 0.22 | | | | 0.18 | | | | 0.18 | |
| Money Market | | | | | | | | | | | | | | | | | | | | | | | | | | | | | | | | | | | | |
Management Fee(a) | | | 0.16 | % | | | 0.16 | % | | | 0.16 | % | | | 0.16 | % | | | 0.16 | % | | | 0.16 | % | | | 0.16 | % | | | 0.16 | % | | | 0.16 | % |
Administration Service and/or Shareholder Administration Fees | | | N/A | | | | 0.03 | | | | 0.10 | | | | 0.13 | | | | 0.13 | | | | 0.13 | | | | 0.13 | | | | 0.00 | | | | 0.00 | |
Distribution (12b-1) and/or Service Fees | | | N/A | | | | N/A | | | | N/A | | | | N/A | | | | N/A | | | | N/A | | | | N/A | | | | 0.00 | | | | 0.00 | |
Transfer Agency Fee | | | 0.01 | | | | 0.01 | | | | 0.01 | | | | 0.01 | | | | 0.01 | | | | 0.01 | | | | 0.01 | | | | 0.01 | | | | 0.01 | |
Other Expenses | | | 0.01 | | | | 0.01 | | | | 0.01 | | | | 0.01 | | | | 0.01 | | | | 0.01 | | | | 0.01 | | | | 0.01 | | | | 0.01 | |
| Net Expenses | | | 0.18 | | | | 0.21 | | | | 0.28 | | | | 0.31 | | | | 0.31 | | | | 0.31 | | | | 0.31 | | | | 0.18 | | | | 0.18 | |
| Tax-Exempt California | | | | | | | | | | | | | | | | | | | | | | | | | | | | | | | | | | | | |
Management Fee(a) | | | 0.09 | % | | | N/A | | | | N/A | | | | N/A | | | | 0.09 | % | | | N/A | | | | 0.09 | % | | | N/A | | | | 0.09 | % |
Administration Service and/or Shareholder Administration Fees | | | N/A | | | | N/A | | | | N/A | | | | N/A | | | | 0.00 | | | | N/A | | | | 0.00 | | | | N/A | | | | 0.00 | |
Distribution (12b-1) Fees | | | N/A | | | | N/A | | | | N/A | | | | N/A | | | | N/A | | | | N/A | | | | N/A | | | | N/A | | | | 0.00 | |
Transfer Agency Fee | | | 0.00 | | | | N/A | | | | N/A | | | | N/A | | | | 0.00 | | | | N/A | | | | 0.00 | | | | N/A | | | | 0.00 | |
Other Expenses | | | 0.07 | | | | N/A | | | | N/A | | | | N/A | | | | 0.07 | | | | N/A | | | | 0.07 | | | | N/A | | | | 0.07 | |
| Net Expenses | | | 0.16 | | | | N/A | | | | N/A | | | | N/A | | | | 0.16 | | | | N/A | | | | 0.16 | | | | N/A | | | | 0.16 | |
| N/A | | — Fees not applicable to respective share class. |
| (a) | | GSAM waived a portion of its management fee in order to achieve the effective net management rates above. |
89
GOLDMAN SACHS FUNDS — FINANCIAL SQUARE FUNDS
Notes to Financial Statements (continued)
February 28, 2013 (Unaudited)
|
| 4. AGREEMENTS AND AFFILIATED TRANSACTIONS (continued) |
| | | | | | | | | | | | | | | | | | | | | | | | | | | | | | | | | | | | |
| | | Ratio of Net Expenses to Average Net Assets for the Six Months Ended February 28, 2013* | |
| | | FST
Shares | | | FST
Select
Shares | | | FST
Preferred
Shares | | | FST
Capital
Shares | | | FST
Administration
Shares | | | FST
Premier
Shares | | | FST
Service
Shares | | | FST
Resource
Shares | | | FST
CMS | |
| Tax-Exempt New York | | | | | | | | | | | | | | | | | | | | | | | | | | | | | | | | | | | | |
Management Fee(a) | | | 0.08 | % | | | N/A | | | | N/A | | | | N/A | | | | 0.08 | % | | | N/A | | | | 0.08 | % | | | N/A | | | | 0.08 | % |
Administration Service and/or Shareholder Administration Fees | | | N/A | | | | N/A | | | | N/A | | | | N/A | | | | 0.00 | | | | N/A | | | | 0.00 | | | | N/A | | | | 0.00 | |
Distribution (12b-1) Fees | | | N/A | | | | N/A | | | | N/A | | | | N/A | | | | N/A | | | | N/A | | | | N/A | | | | N/A | | | | 0.00 | |
Transfer Agency Fee | | | 0.00 | | | | N/A | | | | N/A | | | | N/A | | | | 0.00 | | | | N/A | | | | 0.00 | | | | N/A | | | | 0.00 | |
Other Expenses | | | 0.07 | | | | N/A | | | | N/A | | | | N/A | | | | 0.07 | | | | N/A | | | | 0.07 | | | | N/A | | | | 0.07 | |
| Net Expenses | | | 0.15 | | | | N/A | | | | N/A | | | | N/A | | | | 0.15 | | | | N/A | | | | 0.15 | | | | N/A | | | | 0.15 | |
| Tax-Free Money Market | | | | | | | | | | | | | | | | | | | | | | | | | | | | | | | | | | | | |
Management Fee(a) | | | 0.15 | % | | | 0.15 | % | | | 0.15 | % | | | 0.15 | % | | | 0.15 | % | | | 0.15 | % | | | 0.15 | % | | | 0.15 | % | | | 0.15 | % |
Administration Service and/or Shareholder Administration Fees | | | N/A | | | | 0.01 | | | | 0.01 | | | | 0.01 | | | | 0.01 | | | | 0.01 | | | | 0.01 | | | | 0.00 | | | | 0.00 | |
Distribution (12b-1) and/or Service Fees | | | N/A | | | | N/A | | | | N/A | | | | N/A | | | | N/A | | | | N/A | | | | N/A | | | | 0.01 | | | | 0.00 | |
Transfer Agency Fee | | | 0.01 | | | | 0.01 | | | | 0.01 | | | | 0.01 | | | | 0.01 | | | | 0.01 | | | | 0.01 | | | | 0.01 | | | | 0.01 | |
Other Expenses | | | 0.01 | | | | 0.01 | | | | 0.01 | | | | 0.01 | | | | 0.01 | | | | 0.01 | | | | 0.01 | | | | 0.01 | | | | 0.01 | |
| Net Expenses | | | 0.17 | | | | 0.18 | | | | 0.18 | | | | 0.18 | | | | 0.18 | | | | 0.18 | | | | 0.18 | | | | 0.18 | | | | 0.17 | |
| Treasury Instruments | | | | | | | | | | | | | | | | | | | | | | | | | | | | | | | | | | | | |
Management Fee(a) | | | 0.10 | % | | | 0.10 | % | | | 0.10 | % | | | 0.10 | % | | | 0.10 | % | | | 0.10 | % | | | 0.10 | % | | | 0.10 | % | | | 0.10 | % |
Administration Service and/or Shareholder Administration Fees | | | N/A | | | | 0.00 | | | | 0.00 | | | | 0.00 | | | | 0.00 | | | | 0.00 | | | | 0.00 | | | | 0.00 | | | | 0.00 | |
Distribution (12b-1) and/or Service Fees | | | N/A | | | | N/A | | | | N/A | | | | N/A | | | | N/A | | | | N/A | | | | N/A | | | | 0.00 | | | | 0.00 | |
Transfer Agency Fee | | | 0.00 | | | | 0.00 | | | | 0.00 | | | | 0.00 | | | | 0.00 | | | | 0.00 | | | | 0.00 | | | | 0.00 | | | | 0.00 | |
Other Expenses | | | 0.01 | | | | 0.01 | | | | 0.01 | | | | 0.01 | | | | 0.01 | | | | 0.01 | | | | 0.01 | | | | 0.01 | | | | 0.01 | |
| Net Expenses | | | 0.11 | | | | 0.11 | | | | 0.11 | | | | 0.11 | | | | 0.11 | | | | 0.11 | | | | 0.11 | | | | 0.11 | | | | 0.11 | |
| Treasury Obligations | | | | | | | | | | | | | | | | | | | | | | | | | | | | | | | | | | | | |
Management Fee(a) | | | 0.16 | % | | | 0.16 | % | | | 0.16 | % | | | 0.16 | % | | | 0.16 | % | | | 0.16 | % | | | 0.16 | % | | | 0.16 | % | | | 0.16 | % |
Administration Service and/or Shareholder Administration Fees | | | N/A | | | | 0.00 | | | | 0.00 | | | | 0.00 | | | | 0.00 | | | | 0.00 | | | | 0.00 | | | | 0.00 | | | | 0.00 | |
Distribution (12b-1) and/or Service Fees | | | N/A | | | | N/A | | | | N/A | | | | N/A | | | | N/A | | | | N/A | | | | N/A | | | | 0.00 | | | | 0.00 | |
Transfer Agency Fee | | | 0.00 | | | | 0.00 | | | | 0.00 | | | | 0.00 | | | | 0.00 | | | | 0.00 | | | | 0.00 | | | | 0.00 | | | | 0.00 | |
Other Expenses | | | 0.01 | | | | 0.01 | | | | 0.01 | | | | 0.01 | | | | 0.01 | | | | 0.01 | | | | 0.01 | | | | 0.01 | | | | 0.01 | |
| Net Expenses | | | 0.17 | | | | 0.17 | | | | 0.17 | | | | 0.17 | | | | 0.17 | | | | 0.17 | | | | 0.17 | | | | 0.17 | | | | 0.17 | |
| N/A | | — Fees not applicable to respective share class. |
| (a) | | GSAM waived a portion of its management fee in order to achieve the effective net management rates above. |
90
GOLDMAN SACHS FUNDS �� FINANCIAL SQUARE FUNDS
|
| 4. AGREEMENTS AND AFFILIATED TRANSACTIONS (continued) |
For the six months ended February 28, 2013, expense reductions including any fee waivers and Other Expense reimbursements were as follows (in thousands):
| | | | | | | | | | | | | | | | | | | | | | | | | | |
| Fund | | | | Management
Fee Waivers | | | Transfer
Agent Fee
Waivers | | | Distribution, Administration,
Service and/or
Shareholder Administration
Plans Fee Waivers | | | Custody Fee
Reduction | | | Other Expense
Reimbursements | | | Total
Expense
Reductions | |
Federal | | | | $ | 3,642 | | | $ | 566 | | | $ | 4,652 | | | $ | 3 | | | $ | — | | | $ | 8,863 | |
Government | | | | | 7,572 | | | | 59 | | | | 3,888 | | | | 8 | | | | — | | | | 11,527 | |
Money Market | | | | | 5,435 | | | | — | | | | 315 | | | | 1 | | | | — | | | | 5,751 | |
Prime Obligations | | | | | 4,253 | | | | — | | | | 3,701 | | | | 1 | | | | — | | | | 7,955 | |
Tax-Exempt California | | | | | 306 | | | | 12 | | | | 111 | | | | — | | | | 49 | | | | 478 | |
Tax-Exempt New York | | | | | 265 | | | | 10 | | | | 133 | | | | — | | | | 57 | | | | 465 | |
Tax-Free Money Market | | | | | 1,754 | | | | 154 | | | | 1,395 | | | | 1 | | | | 1 | | | | 3,305 | |
Treasury Instruments | | | | | 13,511 | | | | 1,346 | | | | 3,321 | | | | 17 | | | | — | | | | 18,195 | |
Treasury Obligations | | | | | 2,327 | | | | 402 | | | | 4,932 | | | | 6 | | | | — | | | | 7,667 | |
As of February 28, 2013, the amounts owed to affiliates of the Funds were as follows (in thousands):
| | | | | | | | | | | | | | | | | | | | | | |
| Fund | | | | Management
Fees | | | Transfer
Agent
Fees | | | Distribution
and Service
Fees | | | Other
Expense | | | Total | |
Federal | | | | $ | 991 | | | $ | — | | | $ | — | | | $ | — | | | $ | 991 | |
Government | | | | | 4,190 | | | | 214 | | | | — | | | | — | | | | 4,404 | |
Money Market | | | | | 3,365 | | | | 210 | | | | — | | | | — | | | | 3,575 | |
Prime Obligations | | | | | 2,503 | | | | 156 | | | | 9 | | | | — | | | | 2,668 | |
Tax-Exempt California | | | | | 11 | | | | — | | | | — | | | | — | | | | 11 | |
Tax-Exempt New York | | | | | 8 | | | | — | | | | — | | | | — | | | | 8 | |
Tax-Free Money Market | | | | | 649 | | | | — | | | | — | | | | — | | | | 649 | |
Treasury Instruments | | | | | 1,904 | | | | — | | | | — | | | | 1 | | | | 1,905 | |
Treasury Obligations | | | | | 1,143 | | | | — | | | | — | | | | — | | | | 1,143 | |
H. Line of Credit Facility — As of February 28, 2013, the Funds participated in a $630,000,000 committed, unsecured revolving line of credit facility (the “facility”) together with other funds of the Trust and registered investment companies having management agreements with GSAM or its affiliates (“Other Borrowers”). Pursuant to the terms of the facility, the Funds and Other Borrowers could increase the credit amount by an additional $340,000,000, for a total of up to $970,000,000. This facility is to be used solely for temporary or emergency purposes. The interest rate on borrowings is based on the federal funds rate. The facility also requires a fee to be paid by the Funds based on the amount of the commitment that has not been utilized. For the six months ended February 28, 2013, the Funds did not have any borrowings under the facility.
91
GOLDMAN SACHS FUNDS — FINANCIAL SQUARE FUNDS
Notes to Financial Statements (continued)
February 28, 2013 (Unaudited)
The Funds’ risks include, but are not limited to, the following:
Interest Rate Risk — When interest rates increase, a Fund’s yield will tend to be lower than prevailing market rates, and the market value of its securities or instruments may also be adversely affected. A low interest rate environment poses additional risks to a Fund, because low yields on the Fund’s portfolio holdings may have an adverse impact on the Fund’s ability to provide a positive yield to its shareholders, pay expenses out of Fund assets, or, at times, maintain a stable $1.00 share price.
Market and Credit Risks — In the normal course of business, the Funds trade financial instruments and enter into financial transactions where risk of potential loss exists due to changes in the market (market risk). Additionally, the Funds may also be exposed to credit risk in the event that an issuer fails to perform or that an institution or entity with which the Funds have unsettled or open transaction defaults.
Geographic Risk — The Tax-Exempt California, Tax-Exempt New York and Tax-Free Money Market Funds have the ability to invest a significant portion of their assets in certain issuers within the same state, geographic region or sector, subjecting them to possible risks associated with an adverse economic, business or political development affecting that state, region or sector. In particular, the Tax-Exempt California and Tax-Exempt New York Funds may be affected by the adverse events affecting these states’ economies. If California, New York or any of their local governmental entities are unable to meet their financial obligations, the corresponding Fund’s income, NAV and ability to preserve capital or liquidity could be adversely affected.
Under the Trust’s organizational documents, its Trustees, officers, employees and agents are indemnified, to the extent permitted by the Act, against certain liabilities that may arise out of performance of their duties to the Funds. Additionally, in the course of business, the Funds enter into contracts that contain a variety of indemnification clauses. The Funds’ maximum exposure under these arrangements is unknown, as this would involve future claims that may be made against the Funds that have not yet occurred. However, GSAM believes the risk of loss under these arrangements to be remote.
Exemptive Orders — Pursuant to SEC exemptive orders, the Funds may enter into certain principal transactions, including repurchase agreements, with Goldman Sachs.
New Accounting Pronouncement — In December 2011, the Financial Accounting Standards Board issued an Accounting Standards Update (“ASU”) to enhance disclosures about financial instruments and derivative instruments that are subject to offsetting (“netting”) on the Statements of Assets and Liabilities. This information will enable users of the Funds’ financial statements to evaluate the effect or potential effect of netting arrangements on the Funds’ financial position. The ASU is effective for financial statements with fiscal years beginning on or after January 1, 2013, and interim periods within those fiscal years. At this time, GSAM is evaluating the implications of these changes on the financial statements.
Subsequent events after the Statements of Assets and Liabilities date have been evaluated through the date the financial statements were issued. GSAM has concluded that there is no impact requiring adjustment or disclosure in the financial statements.
92
GOLDMAN SACHS FUNDS — FINANCIAL SQUARE FUNDS
|
| 9. SUMMARY OF SHARE TRANSACTIONS (AT $1.00 PER SHARE) |
Share activity is as follows:
| | | | | | | | |
| | | Federal Fund | |
| | | | |
| | | For the Six Months Ended
February 28, 2013
(Unaudited) | | | For the Fiscal Year Ended
August 31, 2012 | |
| | | | |
| FST Shares | | | | | | | | |
Shares sold | | | 12,058,581,092 | | | | 28,452,765,233 | |
Reinvestment of distributions | | | 199,257 | | | | 428,119 | |
Shares redeemed | | | (12,420,300,200 | ) | | | (29,297,470,974 | ) |
| | | | (361,519,851 | ) | | | (844,277,622 | ) |
| FST Select Shares | | | | | | | | |
Shares sold | | | 57,110,639 | | | | 121,930,430 | |
Reinvestment of distributions | | | 2,576 | | | | 4,948 | |
Shares redeemed | | | (72,070,501 | ) | | | (106,481,353 | ) |
| | | | (14,957,286 | ) | | | 15,454,025 | |
| FST Preferred Shares | | | | | | | | |
Shares sold | | | 403,445,392 | | | | 1,324,310,474 | |
Reinvestment of distributions | | | 1,258 | | | | 10,712 | |
Shares redeemed | | | (409,837,283 | ) | | | (1,533,554,268 | ) |
| | | | (6,390,633 | ) | | | (209,233,082 | ) |
| FST Capital Shares | | | | | | | | |
Shares sold | | | 203,850,408 | | | | 627,006,479 | |
Reinvestment of distributions | | | 181 | | | | 674 | |
Shares redeemed | | | (195,450,498 | ) | | | (636,261,568 | ) |
| | | | 8,400,091 | | | | (9,254,415 | ) |
| FST Administration Shares | | | | | | | | |
Shares sold | | | 374,444,529 | | | | 989,316,222 | |
Reinvestment of distributions | | | 5,550 | | | | 12,300 | |
Shares redeemed | | | (477,948,183 | ) | | | (962,858,372 | ) |
| | | | (103,498,104 | ) | | | 26,470,150 | |
| FST Premier Shares | | | | | | | | |
Shares sold | | | 526,978,861 | | | | 1,289,995,267 | |
Reinvestment of distributions | | | 38,662 | | | | 79,170 | |
Shares redeemed | | | (626,870,216 | ) | | | (1,275,081,264 | ) |
| | | | (99,852,693 | ) | | | 14,993,173 | |
| FST Service Shares | | | | | | | | |
Shares sold | | | 1,162,304,175 | | | | 3,011,268,029 | |
Reinvestment of distributions | | | 6,993 | | | | 16,472 | |
Shares redeemed | | | (1,281,582,000 | ) | | | (3,146,949,763 | ) |
| | | | (119,270,832 | ) | | | (135,665,262 | ) |
| FST Resource Shares | | | | | | | | |
Shares sold | | | — | | | | — | |
Reinvestment of distributions | | | — | | | | — | |
Shares redeemed | | | — | | | | — | |
| | | | — | | | | — | |
| FST Cash Management Shares | | | | | | | | |
Shares sold | | | 211,173,996 | | | | 454,444,787 | |
Reinvestment of distributions | | | — | | | | — | |
Shares redeemed | | | (321,871,401 | ) | | | (430,667,730 | ) |
| | | | (110,697,405 | ) | | | 23,777,057 | |
NET INCREASE (DECREASE) IN SHARES | | | (807,786,713 | ) | | | (1,117,735,976 | ) |
93
GOLDMAN SACHS FUNDS — FINANCIAL SQUARE FUNDS
Notes to Financial Statements (continued)
February 28, 2013 (Unaudited)
|
| 9. SUMMARY OF SHARE TRANSACTIONS (AT $1.00 PER SHARE) |
Share activity is as follows:
| | | | | | | | |
| | | Government Fund | |
| | | | |
| | | For the Six Months Ended
February 28, 2013
(Unaudited) | | | For the Fiscal Year Ended
August 31, 2012 | |
| | | | |
| FST Shares | | | | | | | | |
Shares sold | | | 100,466,750,321 | | | | 171,118,866,826 | |
Reinvestment of distributions | | | 3,315,108 | | | | 3,785,792 | |
Shares redeemed | | | (99,889,855,216 | ) | | | (163,756,184,292 | ) |
| | | | 580,210,213 | | | | 7,366,468,326 | |
| FST Select Shares | | | | | | | | |
Shares sold | | | 217,491,358 | | | | 912,915,116 | |
Reinvestment of distributions | | | 30,128 | | | | 68,683 | |
Shares redeemed | | | (658,768,982 | ) | | | (759,780,859 | ) |
| | | | (441,247,496 | ) | | | 153,202,940 | |
| FST Preferred Shares | | | | | | | | |
Shares sold | | | 978,289,939 | | | | 5,504,811,756 | |
Reinvestment of distributions | | | 8,233 | | | | 26,393 | |
Shares redeemed | | | (1,125,621,115 | ) | | | (5,610,609,259 | ) |
| | | | (147,322,943 | ) | | | (105,771,110 | ) |
| FST Capital Shares | | | | | | | | |
Shares sold | | | 2,356,200,344 | | | | 7,475,567,007 | |
Reinvestment of distributions | | | 7,623 | | | | 17,958 | |
Shares redeemed | | | (2,464,955,362 | ) | | | (7,797,429,771 | ) |
| | | | (108,747,395 | ) | | | (321,844,806 | ) |
| FST Administration Shares | | | | | | | | |
Shares sold | | | 5,511,228,331 | | | | 8,741,093,244 | |
Reinvestment of distributions | | | 4,029 | | | | 14,292 | |
Shares redeemed | | | (5,299,295,481 | ) | | | (8,314,844,539 | ) |
| | | | 211,936,879 | | | | 426,262,997 | |
| FST Premier Shares | | | | | | | | |
Shares sold | | | 3,037,179 | | | | 6,397,762 | |
Reinvestment of distributions | | | 196 | | | | 299 | |
Shares redeemed | | | (1,849,320 | ) | | | (804,871 | ) |
| | | | 1,188,055 | | | | 5,593,190 | |
| FST Service Shares | | | | | | | | |
Shares sold | | | 644,994,624 | | | | 1,272,058,070 | |
Reinvestment of distributions | | | 2,877 | | | | 5,779 | |
Shares redeemed | | | (729,385,148 | ) | | | (1,376,877,263 | ) |
| | | | (84,387,647 | ) | | | (104,813,414 | ) |
| FST Resource Shares | | | | | | | | |
Shares sold | | | 5 | | | | — | |
Reinvestment of distributions | | | — | | | | — | |
Shares redeemed | | | (5 | ) | | | (3 | ) |
| | | | — | | | | (3 | ) |
| FST Cash Management Shares | | | | | | | | |
Shares sold | | | 5 | | | | — | |
Reinvestment of distributions | | | — | | | | — | |
Shares redeemed | | | (5 | ) | | | — | |
| | | | — | | | | — | |
NET INCREASE (DECREASE) IN SHARES | | | 11,629,666 | | | | 7,419,098,120 | |
94
GOLDMAN SACHS FUNDS — FINANCIAL SQUARE FUNDS
|
| 9. SUMMARY OF SHARE TRANSACTIONS (AT $1.00 PER SHARE) (continued) |
Share activity is as follows:
| | | | | | | | |
| | | Money Market Fund | |
| | | | |
| | | For the Six Months Ended
February 28, 2013
(Unaudited) | | | For the Fiscal Year Ended
August 31, 2012 | |
| | | | |
| FST Shares | | | | | | | | |
Shares sold | | | 83,856,627,507 | | | | 171,352,317,241 | |
Reinvestment of distributions | | | 7,198,948 | | | | 17,563,776 | |
Shares redeemed | | | (76,803,397,284 | ) | | | (170,842,557,294 | ) |
| | | | 7,060,429,171 | | | | 527,323,723 | |
| FST Select Shares | | | | | | | | |
Shares sold | | | 885,290,856 | | | | 1,302,569,911 | |
Reinvestment of distributions | | | 39,498 | | | | 124,519 | |
Shares redeemed | | | (892,561,329 | ) | | | (1,362,912,875 | ) |
| | | | (7,230,975 | ) | | | (60,218,445 | ) |
| FST Preferred Shares | | | | | | | | |
Shares sold | | | 156,183,531 | | | | 300,086,821 | |
Reinvestment of distributions | | | 2,780 | | | | 11,686 | |
Shares redeemed | | | (147,507,608 | ) | | | (323,841,225 | ) |
| | | | 8,678,703 | | | | (23,742,718 | ) |
| FST Capital Shares | | | | | | | | |
Shares sold | | | 30,931,235 | | | | 72,885,132 | |
Reinvestment of distributions | | | 1,147 | | | | 7,540 | |
Shares redeemed | | | (37,129,865 | ) | | | (89,054,503 | ) |
| | | | (6,197,483 | ) | | | (16,161,831 | ) |
| FST Administration Shares | | | | | | | | |
Shares sold | | | 681,222,587 | | | | 1,018,675,358 | |
Reinvestment of distributions | | | 7,741 | | | | 18,646 | |
Shares redeemed | | | (730,969,182 | ) | | | (1,186,031,859 | ) |
| | | | (49,738,854 | ) | | | (167,337,855 | ) |
| FST Premier Shares | | | | | | | | |
Shares sold | | | 34,051,460 | | | | 76,049,539 | |
Reinvestment of distributions | | | 1,084 | | | | 962 | |
Shares redeemed | | | (22,212,824 | ) | | | (58,067,926 | ) |
| | | | 11,839,720 | | | | 17,982,575 | |
| FST Service Shares | | | | | | | | |
Shares sold | | | 119,351,019 | | | | 404,668,297 | |
Reinvestment of distributions | | | 630 | | | | 2,069 | |
Shares redeemed | | | (113,827,337 | ) | | | (528,078,878 | ) |
| | | | 5,524,312 | | | | (123,408,512 | ) |
| FST Resource Shares | | | | | | | | |
Shares sold | | | — | | | | — | |
Reinvestment of distributions | | | — | | | | — | |
Shares redeemed | | | — | | | | (2 | ) |
| | | | — | | | | (2 | ) |
| FST Cash Management Shares | | | | | | | | |
Shares sold | | | — | | | | — | |
Reinvestment of distributions | | | — | | | | — | |
Shares redeemed | | | — | | | | — | |
| | | | — | | | | — | |
NET INCREASE (DECREASE) IN SHARES | | | 7,023,304,594 | | | | 154,436,935 | |
95
GOLDMAN SACHS FUNDS — FINANCIAL SQUARE FUNDS
Notes to Financial Statements (continued)
February 28, 2013 (Unaudited)
|
| 9. SUMMARY OF SHARE TRANSACTIONS (AT $1.00 PER SHARE) (continued) |
Share activity is as follows:
| | | | | | | | |
| | | Prime Obligations Fund | |
| | | | |
| | | For the Six Months Ended
February 28, 2013
(Unaudited) | | | For the Fiscal Year Ended
August 31, 2012 | |
| | | | |
| FST Shares | | | | | | | | |
Shares sold | | | 50,000,518,818 | | | | 100,671,889,934 | |
Reinvestment of distributions | | | 2,664,465 | | | | 8,040,107 | |
Shares redeemed | | | (48,605,827,457 | ) | | | (103,735,660,803 | ) |
| | | | 1,397,355,826 | | | | (3,055,730,762 | ) |
| FST Select Shares | | | | | | | | |
Shares sold | | | 394,870,031 | | | | 960,571,685 | |
Reinvestment of distributions | | | 81,449 | | | | 206,418 | |
Shares redeemed | | | (451,171,294 | ) | | | (786,839,482 | ) |
| | | | (56,219,814 | ) | | | 173,938,621 | |
| FST Preferred Shares | | | | | | | | |
Shares sold | | | 1,412,265,334 | | | | 4,291,453,836 | |
Reinvestment of distributions | | | 3,621 | | | | 20,152 | |
Shares redeemed | | | (1,453,608,596 | ) | | | (4,491,591,718 | ) |
| | | | (41,339,641 | ) | | | (200,117,730 | ) |
| FST Capital Shares | | | | | | | | |
Shares sold | | | 653,568,847 | | | | 1,971,075,254 | |
Reinvestment of distributions | | | 1,234 | | | | 4,085 | |
Shares redeemed | | | (620,980,149 | ) | | | (1,962,250,170 | ) |
| | | | 32,589,932 | | | | 8,829,169 | |
| FST Administration Shares | | | | | | | | |
Shares sold | | | 5,582,403,474 | | | | 11,157,851,955 | |
Reinvestment of distributions | | | 5,740 | | | | 15,767 | |
Shares redeemed | | | (5,670,041,515 | ) | | | (12,144,601,727 | ) |
| | | | (87,632,301 | ) | | | (986,734,005 | ) |
| FST Premier Shares | | | | | | | | |
Shares sold | | | — | | | | — | |
Reinvestment of distributions | | | — | | | | — | |
Shares redeemed | | | — | | | | — | |
| | | | — | | | | — | |
| FST Service Shares | | | | | | | | |
Shares sold | | | 2,086,357,342 | | | | 4,136,423,201 | |
Shares converted from Class B Shares(a) | | | 214,295 | | | | 1,055,537 | |
Reinvestment of distributions | | | 16,522 | | | | 31,683 | |
Shares redeemed | | | (2,043,149,957 | ) | | | (4,135,528,977 | ) |
| | | | 43,438,202 | | | | 1,981,444 | |
| FST Class B Shares | | | | | | | | |
Shares sold | | | 891,674 | | | | 1,535,891 | |
Shares converted to Service Shares(a) | | | (214,295 | ) | | | (1,055,537 | ) |
Reinvestment of distributions | | | 89 | | | | 251 | |
Shares redeemed | | | (1,177,779 | ) | | | (3,054,541 | ) |
| | | | (500,311 | ) | | | (2,573,936 | ) |
| FST Class C Shares | | | | | | | | |
Shares sold | | | 4,879,631 | | | | 9,869,827 | |
Reinvestment of distributions | | | 665 | | | | 1,572 | |
Shares redeemed | | | (8,209,137 | ) | | | (16,216,682 | ) |
| | | | (3,328,841 | ) | | | (6,345,283 | ) |
| FST Resource Shares | | | | | | | | |
Shares sold | | | 65,745,042 | | | | 73,753,929 | |
Reinvestment of distributions | | | 4,221 | | | | 8,491 | |
Shares redeemed | | | (61,634,515 | ) | | | (81,214,279 | ) |
| | | | 4,114,748 | | | | (7,451,859 | ) |
| FST Cash Management Shares | | | | | | | | |
Shares sold | | | — | | | | — | |
Reinvestment of distributions | | | — | | | | — | |
Shares redeemed | | | — | | | | — | |
| | | | — | | | | — | |
NET INCREASE (DECREASE) IN SHARES | | | 1,288,477,800 | | | | (4,074,204,341 | ) |
| (a) | | Class B Shares will automatically convert into Service Shares at the end of the calendar quarter that is eight years after the initial purchase date of either the Fund or another Goldman Sachs Fund. |
96
GOLDMAN SACHS FUNDS — FINANCIAL SQUARE FUNDS
|
| 9. SUMMARY OF SHARE TRANSACTIONS (AT $1.00 PER SHARE) (continued) |
Share activity is as follows:
| | | | | | | | |
| | | Tax-Exempt California Fund | |
| | | | |
| | | For the Six Months Ended
February 28, 2013
(Unaudited) | | | For the Fiscal Year Ended
August 31, 2012 | |
| | | | |
| FST Shares | | | | | | | | |
Shares sold | | | 72,865,223 | | | | 118,586,245 | |
Reinvestment of distributions | | | 17,002 | | | | 9,382 | |
Shares redeemed | | | (69,956,601 | ) | | | (115,166,027 | ) |
| | | | 2,925,624 | | | | 3,429,600 | |
| FST Administration Shares | | | | | | | | |
Shares sold | | | 303,254,559 | | | | 777,545,885 | |
Reinvestment of distributions | | | 29,011 | | | | 15,630 | |
Shares redeemed | | | (301,439,391 | ) | | | (770,859,165 | ) |
| | | | 1,844,179 | | | | 6,702,350 | |
| FST Service Shares | | | | | | | | |
Shares sold | | | 100 | | | | 210 | |
Reinvestment of distributions | | | — | | | | — | |
Shares redeemed | | | (100 | ) | | | (210 | ) |
| | | | — | | | | — | |
| FST Cash Management Shares | | | | | | | | |
Shares sold | | | — | | | | — | |
Reinvestment of distributions | | | — | | | | — | |
Shares redeemed | | | — | | | | — | |
| | | | — | | | | — | |
NET INCREASE (DECREASE) IN SHARES | | | 4,769,803 | | | | 10,131,950 | |
97
GOLDMAN SACHS FUNDS — FINANCIAL SQUARE FUNDS
Notes to Financial Statements (continued)
February 28, 2013 (Unaudited)
|
| 9. SUMMARY OF SHARE TRANSACTIONS (AT $1.00 PER SHARE) (continued) |
Share activity is as follows:
| | | | | | | | |
| | | Tax-Exempt New York Fund | |
| | | | |
| | | For the Six Months Ended
February 28, 2013
(Unaudited) | | | For the Fiscal Year Ended
August 31, 2012 | |
| | | | |
| FST Shares | | | | | | | | |
Shares sold | | | 24,816,233 | | | | 45,497,014 | |
Reinvestment of distributions | | | 2,430 | | | | 1,810 | |
Shares redeemed | | | (24,382,946 | ) | | | (45,386,241 | ) |
| | | | 435,717 | | | | 112,583 | |
| FST Administration Shares | | | | | | | | |
Shares sold | | | 194,848,568 | | | | 418,196,058 | |
Reinvestment of distributions | | | 18,010 | | | | 13,776 | |
Shares redeemed | | | (199,520,812 | ) | | | (378,249,604 | ) |
| | | | (4,654,234 | ) | | | 39,960,230 | |
| FST Service Shares | | | | | | | | |
Shares sold | | | — | | | | — | |
Reinvestment of distributions | | | — | | | | — | |
Shares redeemed | | | — | | | | — | |
| | | | — | | | | — | |
| FST Cash Management Shares | | | | | | | | |
Shares sold | | | — | | | | — | |
Reinvestment of distributions | | | — | | | | — | |
Shares redeemed | | | — | | | | — | |
| | | | — | | | | — | |
NET INCREASE (DECREASE) IN SHARES | | | (4,218,517 | ) | | | 40,072,813 | |
98
GOLDMAN SACHS FUNDS — FINANCIAL SQUARE FUNDS
|
| 9. SUMMARY OF SHARE TRANSACTIONS (AT $1.00 PER SHARE) (continued) |
Share activity is as follows:
| | | | | | | | |
| | | Tax-Free Money Market Fund | |
| | | | |
| | | For the Six Months Ended
February 28, 2013
(Unaudited) | | | For the Fiscal Year Ended
August 31, 2012 | |
| | | | |
| FST Shares | | | | | | | | |
Shares sold | | | 7,722,213,053 | | | | 14,178,009,492 | |
Reinvestment of distributions | | | 713,890 | | | | 1,131,613 | |
Shares redeemed | | | (7,995,841,648 | ) | | | (15,205,888,489 | ) |
| | | | (272,914,705 | ) | | | (1,026,747,384 | ) |
| FST Select Shares | | | | | | | | |
Shares sold | | | 167,118,680 | | | | 227,643,442 | |
Reinvestment of distributions | | | 18,819 | | | | 12,279 | |
Shares redeemed | | | (144,351,650 | ) | | | (169,017,171 | ) |
| | | | 22,785,849 | | | | 58,638,550 | |
| FST Preferred Shares | | | | | | | | |
Shares sold | | | 29,666,262 | | | | 54,081,670 | |
Reinvestment of distributions | | | 1,374 | | | | 1,584 | |
Shares redeemed | | | (29,952,078 | ) | | | (55,828,603 | ) |
| | | | (284,442 | ) | | | (1,745,349 | ) |
| FST Capital Shares | | | | | | | | |
Shares sold | | | 15,596,393 | | | | 44,408,095 | |
Reinvestment of distributions | | | 113 | | | | 238 | |
Shares redeemed | | | (22,830,777 | ) | | | (37,560,872 | ) |
| | | | (7,234,271 | ) | | | 6,847,461 | |
| FST Administration Shares | | | | | | | | |
Shares sold | | | 344,363,039 | | | | 912,489,106 | |
Reinvestment of distributions | | | 2,820 | | | | 2,897 | |
Shares redeemed | | | (362,671,441 | ) | | | (1,074,945,959 | ) |
| | | | (18,305,582 | ) | | | (162,453,956 | ) |
| FST Premier Shares | | | | | | | | |
Shares sold | | | 1,143,971,401 | | | | 2,332,615,375 | |
Reinvestment of distributions | | | 67,420 | | | | 59,938 | |
Shares redeemed | | | (1,112,590,760 | ) | | | (2,331,182,237 | ) |
| | | | 31,448,061 | | | | 1,493,076 | |
| FST Service Shares | | | | | | | | |
Shares sold | | | 52,979,968 | | | | 215,986,319 | |
Reinvestment of distributions | | | 841 | | | | 1,394 | |
Shares redeemed | | | (67,775,374 | ) | | | (216,600,906 | ) |
| | | | (14,794,565 | ) | | | (613,193 | ) |
| FST Resource Shares | | | | | | | | |
Shares sold | | | 23,326,393 | | | | 38,738,271 | |
Reinvestment of distributions | | | 2,772 | | | | 3,201 | |
Shares redeemed | | | (14,107,628 | ) | | | (33,591,335 | ) |
| | | | 9,221,537 | | | | 5,150,137 | |
| FST Cash Management Shares | | | | | | | | |
Shares sold | | | — | | | | — | |
Reinvestment of distributions | | | — | | | | — | |
Shares redeemed | | | — | | | | (2 | ) |
| | | | — | | | | (2 | ) |
NET INCREASE (DECREASE) IN SHARES | | | (250,078,118 | ) | | | (1,119,430,660 | ) |
99
GOLDMAN SACHS FUNDS — FINANCIAL SQUARE FUNDS
Notes to Financial Statements (continued)
February 28, 2013 (Unaudited)
|
| 9. SUMMARY OF SHARE TRANSACTIONS (AT $1.00 PER SHARE) (continued) |
Share activity is as follows:
| | | | | | | | |
| | | Treasury Instruments Fund | |
| | | | |
| | | For the Six Months Ended
February 28, 2013
(Unaudited) | | | For the Fiscal Year Ended
August 31, 2012 | |
| | | | |
| FST Shares | | | | | | | | |
Shares sold | | | 32,138,708,981 | | | | 68,331,493,623 | |
Reinvestment of distributions | | | 89,713 | | | | 180,861 | |
Shares redeemed | | | (29,443,924,874 | ) | | | (65,362,683,260 | ) |
| | | | 2,694,873,820 | | | | 2,968,991,224 | |
| FST Select Shares | | | | | | | | |
Shares sold | | | 661,196,997 | | | | 1,256,530,720 | |
Reinvestment of distributions | | | 1,133 | | | | 1,861 | |
Shares redeemed | | | (457,203,011 | ) | | | (1,285,528,163 | ) |
| | | | 203,995,119 | | | | (28,995,582 | ) |
| FST Preferred Shares | | | | | | | | |
Shares sold | | | 85,450,055 | | | | 458,957,416 | |
Reinvestment of distributions | | | 432 | | | | 1,602 | |
Shares redeemed | | | (99,076,831 | ) | | | (496,684,555 | ) |
| | | | (13,626,344 | ) | | | (37,725,537 | ) |
| FST Capital Shares | | | | | | | | |
Shares sold | | | 278,480,490 | | | | 293,547,696 | |
Reinvestment of distributions | | | 623 | | | | 1,212 | |
Shares redeemed | | | (234,007,686 | ) | | | (306,572,918 | ) |
| | | | 44,473,427 | | | | (13,024,010 | ) |
| FST Administration Shares | | | | | | | | |
Shares sold | | | 2,044,667,586 | | | | 4,718,160,187 | |
Reinvestment of distributions | | | 3,091 | | | | 8,215 | |
Shares redeemed | | | (2,032,064,378 | ) | | | (4,678,764,658 | ) |
| | | | 12,606,299 | | | | 39,403,744 | |
| FST Premier Shares | | | | | | | | |
Shares sold | | | 357,422,040 | | | | 713,216,363 | |
Reinvestment of distributions | | | 2,188 | | | | 4,942 | |
Shares redeemed | | | (377,660,998 | ) | | | (741,764,677 | ) |
| | | | (20,236,770 | ) | | | (28,543,372 | ) |
| FST Service Shares | | | | | | | | |
Shares sold | | | 259,940,390 | | | | 734,385,421 | |
Reinvestment of distributions | | | 971 | | | | 2,620 | |
Shares redeemed | | | (344,816,257 | ) | | | (734,784,547 | ) |
| | | | (84,874,896 | ) | | | (396,506 | ) |
| FST Resource Shares | | | | | | | | |
Shares sold | | | — | | | | — | |
Reinvestment of distributions | | | — | | | | — | |
Shares redeemed | | | — | | | | — | |
| | | | — | | | | — | |
| FST Cash Management Shares | | | | | | | | |
Shares sold | | | — | | | | — | |
Reinvestment of distributions | | | — | | | | — | |
Shares redeemed | | | — | | | | — | |
| | | | — | | | | — | |
NET INCREASE (DECREASE) IN SHARES | | | 2,837,210,655 | | | | 2,899,709,961 | |
100
GOLDMAN SACHS FUNDS — FINANCIAL SQUARE FUNDS
|
| 9. SUMMARY OF SHARE TRANSACTIONS (AT $1.00 PER SHARE) (continued) |
Share activity is as follows:
| | | | | | | | |
| | | Treasury Obligations Fund | |
| | | | |
| | | For the Six Months Ended
February 28, 2013
(Unaudited) | | | For the Fiscal Year Ended
August 31, 2012 | |
| | | | |
| FST Shares | | | | | | | | |
Shares sold | | | 108,845,758,177 | | | | 184,556,011,046 | |
Reinvestment of distributions | | | 98,280 | | | | 196,273 | |
Shares redeemed | | | (109,561,110,173 | ) | | | (184,462,691,170 | ) |
| | | | (715,253,716 | ) | | | 93,516,149 | |
| FST Select Shares | | | | | | | | |
Shares sold | | | 260,766,583 | | | | 493,702,068 | |
Reinvestment of distributions | | | 4,330 | | | | 7,514 | |
Shares redeemed | | | (214,543,354 | ) | | | (538,830,234 | ) |
| | | | 46,227,559 | | | | (45,120,652 | ) |
| FST Preferred Shares | | | | | | | | |
Shares sold | | | 507,022,556 | | | | 503,748,204 | |
Reinvestment of distributions | | | 2,374 | | | | 6,091 | |
Shares redeemed | | | (490,641,653 | ) | | | (550,242,455 | ) |
| | | | 16,383,277 | | | | (46,488,160 | ) |
| FST Capital Shares | | | | | | | | |
Shares sold | | | 144,335,284 | | | | 1,134,656,978 | |
Reinvestment of distributions | | | 4,474 | | | | 5,778 | |
Shares redeemed | | | (141,620,417 | ) | | | (1,061,422,011 | ) |
| | | | 2,719,341 | | | | 73,240,745 | |
| FST Administration Shares | | | | | | | | |
Shares sold | | | 13,557,993,626 | | | | 18,458,031,123 | |
Reinvestment of distributions | | | 14,645 | | | | 29,157 | |
Shares redeemed | | | (13,028,247,656 | ) | | | (18,608,334,301 | ) |
| | | | 529,760,615 | | | | (150,274,021 | ) |
| FST Premier Shares | | | | | | | | |
Shares sold | | | 35,132,777 | | | | 263,552,535 | |
Reinvestment of distributions | | | 3,264 | | | | 7,271 | |
Shares redeemed | | | (57,521,628 | ) | | | (260,291,894 | ) |
| | | | (22,385,587 | ) | | | 3,267,912 | |
| FST Service Shares | | | | | | | | |
Shares sold | | | 2,037,850,747 | | | | 4,664,976,860 | |
Reinvestment of distributions | | | 7,938 | | | | 19,592 | |
Shares redeemed | | | (2,098,678,140 | ) | | | (4,958,499,968 | ) |
| | | | (60,819,455 | ) | | | (293,503,516 | ) |
| FST Resource Shares | | | | | | | | |
Shares sold | | | — | | | | — | |
Reinvestment of distributions | | | — | | | | — | |
Shares redeemed | | | — | | | | (1 | ) |
| | | | — | | | | (1 | ) |
| FST Cash Management Shares | | | | | | | | |
Shares sold | | | — | | | | — | |
Reinvestment of distributions | | | — | | | | — | |
Shares redeemed | | | — | | | | — | |
| | | | — | | | | — | |
NET INCREASE (DECREASE) IN SHARES | | | (203,367,966 | ) | | | (365,361,544 | ) |
101
GOLDMAN SACHS FUNDS — FINANCIAL SQUARE FUNDS
Fund Expenses — Six Month Period Ended February 28, 2013 (Unaudited)
As a shareholder of FST Shares, FST Select Shares, FST Preferred Shares, FST Capital Shares, FST Administration Shares, FST Premier, FST Service, FST Class B, FST Class C, FST Resource or FST Cash Management Shares of a Fund you incur two types of cost: (1) transaction costs, including contingent deferred sales charges (with respect to FST Class B and FST Class C Shares); and (2) ongoing costs, including management fees and distribution, service and/or shareholder administration fees (with respect to all share classes except FST Shares) and other Fund expenses. This Example is intended to help you understand your ongoing costs (in dollars) of investing in FST Shares, FST Select Shares, FST Preferred Shares, FST Capital Shares, FST Administration Shares, FST Premier, FST Service, FST Class B, FST Class C, FST Resource or FST Cash Management Shares of the Funds and to compare these costs with the ongoing costs of investing in other mutual funds.
The Example is based on an investment of $1,000 invested at the beginning of the period and held for the entire period from September 1, 2012 through February 28, 2013.
Actual Expenses — The first line under each share class in the table below provides information about actual account values and actual expenses. You may use the information in this line, together with the amount you invested, to estimate the expenses that you paid over the period. Simply divide your account value by $1,000 (for example, an $8,600 account value divided by $1,000=8.6), then multiply the result by the number in the first line under the column heading entitled “Expenses Paid” to estimate the expenses you paid on your account for this period.
Hypothetical Example for Comparison Purposes — The second line under each share class in the table below provides information about hypothetical account values and hypothetical expenses based on the Funds’ actual net expense ratio and an assumed rate of return of 5% per year before expenses, which is not the Funds’ actual return. The hypothetical account values and expenses may not be used to estimate the actual ending account balance or expenses you paid for the period. You may use this information to compare the ongoing costs of investing in the Funds and other funds. To do so, compare this 5% hypothetical example with the 5% hypothetical examples that appear in the shareholder reports of the other funds.
Please note that the expenses shown in the table are meant to highlight your ongoing costs only and do not reflect any transactional costs, such as sales charges, redemption fees, or exchange fees. Therefore, the second line of the table is useful in comparing ongoing costs only, and will not help you determine the relative total costs of owning different funds. In addition, if these transactional costs were included, your costs would have been higher.
| | | | | | | | | | | | | | | | | | | | | | | | | | | | | | | | | | | | |
| | | Federal Fund | | | Government Fund | | | Money Market Fund | |
| Share Class | | Beginning
Account
Value 9/1/12 | | | Ending
Account
Value
2/28/13 | | | Expenses
Paid for the
6 months ended
2/28/13* | | | Beginning
Account
Value
9/1/12 | | | Ending
Account
Value
2/28/13 | | | Expenses
Paid for the
6 months ended
2/28/13* | | | Beginning
Account
Value
9/1/12 | | | Ending
Account
Value
2/28/13 | | | Expenses
Paid for the
6 months ended
2/28/13* | |
| FST Shares | | | | | | | | | | | | | | | | | | | | | | | | | | | | | | | | | | | | |
Actual | | $ | 1,000.00 | | | $ | 1,000.03 | | | $ | 0.74 | | | $ | 1,000.00 | | | $ | 1,000.23 | | | $ | 0.89 | | | $ | 1,000.00 | | | $ | 1,000.68 | | | $ | 0.89 | |
Hypothetical (5% return before expenses) | | | 1,000.00 | | | | 1,024.05 | + | | | 0.75 | | | | 1,000.00 | | | | 1,023.90 | + | | | 0.90 | | | | 1,000.00 | | | | 1,023.90 | + | | | 0.90 | |
| FST Select Shares | | | | | | | | | | | | | | | | | | | | | | | | | | | | | | | | | | | | |
Actual | | | 1,000.00 | | | | 1,000.03 | | | | 0.74 | | | | 1,000.00 | | | | 1,000.11 | | | | 1.04 | | | | 1,000.00 | | | | 1,000.54 | | | | 1.04 | |
Hypothetical (5% return before expenses) | | | 1,000.00 | | | | 1,024.05 | + | | | 0.75 | | | | 1,000.00 | | | | 1,023.75 | + | | | 1.05 | | | | 1,000.00 | | | | 1,023.75 | + | | | 1.05 | |
| FST Preferred Shares | | | | | | | | | | | | | | | | | | | | | | | | | | | | | | | | | | | | |
Actual | | | 1,000.00 | | | | 1,000.03 | | | | 0.74 | | | | 1,000.00 | | | | 1,000.03 | | | | 1.09 | | | | 1,000.00 | | | | 1,000.19 | | | | 1.39 | |
Hypothetical (5% return before expenses) | | | 1,000.00 | | | | 1,024.05 | + | | | 0.75 | | | | 1,000.00 | | | | 1,023.70 | + | | | 1.10 | | | | 1,000.00 | | | | 1,023.41 | + | | | 1.40 | |
| FST Capital Shares | | | | | | | | | | | | | | | | | | | | | | | | | | | | | | | | | | | | |
Actual | | | 1,000.00 | | | | 1,000.03 | | | | 0.74 | | | | 1,000.00 | | | | 1,000.03 | | | | 1.09 | | | | 1,000.00 | | | | 1,000.04 | | | | 1.54 | |
Hypothetical (5% return before expenses) | | | 1,000.00 | | | | 1,024.05 | + | | | 0.75 | | | | 1,000.00 | | | | 1,023.70 | + | | | 1.10 | | | | 1,000.00 | | | | 1,023.26 | + | | | 1.56 | |
| FST Administration Shares | | | | | | | | | | | | | | | | | | | | | | | | | | | | | | | | | | | | |
Actual | | | 1,000.00 | | | | 1,000.03 | | | | 0.74 | | | | 1,000.00 | | | | 1,000.03 | | | | 1.09 | | | | 1,000.00 | | | | 1,000.03 | | | | 1.54 | |
Hypothetical (5% return before expenses) | | | 1,000.00 | | | | 1,024.05 | + | | | 0.75 | | | | 1,000.00 | | | | 1,023.70 | + | | | 1.10 | | | | 1,000.00 | | | | 1,023.26 | + | | | 1.56 | |
| FST Premier Shares | | | | | | | | | | | | | | | | | | | | | | | | | | | | | | | | | | | | |
Actual | | | 1,000.00 | | | | 1,000.03 | | | | 0.74 | | | | 1,000.00 | | | | 1,000.03 | | | | 1.09 | | | | 1,000.00 | | | | 1,000.03 | | | | 1.54 | |
Hypothetical (5% return before expenses) | | | 1,000.00 | | | | 1,024.05 | + | | | 0.75 | | | | 1,000.00 | | | | 1,023.70 | + | | | 1.10 | | | | 1,000.00 | | | | 1,023.26 | + | | | 1.56 | |
| FST Service Shares | | | | | | | | | | | | | | | | | | | | | | | | | | | | | | | | | | | | |
Actual | | | 1,000.00 | | | | 1,000.03 | | | | 0.74 | | | | 1,000.00 | | | | 1,000.03 | | | | 1.09 | | | | 1,000.00 | | | | 1,000.03 | | | | 1.54 | |
Hypothetical (5% return before expenses) | | | 1,000.00 | | | | 1,024.05 | + | | | 0.75 | | | | 1,000.00 | | | | 1,023.70 | + | | | 1.10 | | | | 1,000.00 | | | | 1,023.26 | + | | | 1.56 | |
| FST Resource Shares | | | | | | | | | | | | | | | | | | | | | | | | | | | | | | | | | | | | |
Actual | | | 1,000.00 | | | | 1,000.03 | | | | 0.74 | | | | 1,000.00 | | | | 1,000.03 | | | | 0.89 | | | | 1,000.00 | | | | 1,000.03 | | | | 0.89 | |
Hypothetical (5% return before expenses) | | | 1,000.00 | | | | 1,024.05 | + | | | 0.75 | | | | 1,000.00 | | | | 1,023.90 | + | | | 0.90 | | | | 1,000.00 | | | | 1,023.90 | + | | | 0.90 | |
| FST Cash Management Shares | | | | | | | | | | | | | | | | | | | | | | | | | | | | | | | | | | | | |
Actual | | | 1,000.00 | | | | 1,000.03 | | | | 0.74 | | | | 1,000.00 | | | | 1,000.03 | | | | 0.89 | | | | 1,000.00 | | | | 1,000.03 | | | | 0.89 | |
Hypothetical (5% return before expenses) | | | 1,000.00 | | | | 1,024.05 | + | | | 0.75 | | | | 1,000.00 | | | | 1,023.90 | + | | | 0.90 | | | | 1,000.00 | | | | 1,023.90 | + | | | 0.90 | |
102
GOLDMAN SACHS FUNDS — FINANCIAL SQUARE FUNDS
Fund Expenses — Six Month Period Ended February 28, 2013 (Unaudited) (continued)
| | | | | | | | | | | | | | | | | | | | | | | | | | | | | | | | | | | | |
| | | Prime Obligations | | | Tax-Exempt California | | | Tax-Exempt New York | |
| Share Class | | Beginning
Account
Value
9/1/12 | | | Ending
Account
Value
2/28/13 | | | Expenses
Paid for the
6 months ended
2/28/13* | | | Beginning
Account
Value
9/1/12 | | | Ending
Account
Value
2/28/13 | | | Expenses
Paid for the
6 months ended
2/28/13* | | | Beginning
Account
Value
9/1/12 | | | Ending
Account
Value
2/28/13 | | | Expenses
Paid for the
6 months ended
2/28/13* | |
| FST Shares | | | | | | | | | | | | | | | | | | | | | | | | | | | | | | | | | | | | |
Actual | | $ | 1,000.00 | | | $ | 1,000.50 | | | $ | 0.89 | | | $ | 1,000.00 | | | $ | 1,000.20 | | | $ | 0.79 | | | $ | 1,000.00 | | | $ | 1,000.10 | | | $ | 0.74 | |
Hypothetical (5% return before expenses) | | | 1,000.00 | | | | 1,023.90 | + | | | 0.90 | | | | 1,000.00 | | | | 1,024.00 | + | | | 0.80 | | | | 1,000.00 | | | | 1,024.05 | + | | | 0.75 | |
| FST Select Shares | | | | | | | | | | | | | | | | | | | | | | | | | | | | | | | | | | | | |
Actual | | | 1,000.00 | | | | 1,000.35 | | | | 1.04 | | | | N/A | | | | N/A | | | | N/A | | | | N/A | | | | N/A | | | | N/A | |
Hypothetical (5% return before expenses) | | | 1,000.00 | | | | 1,023.75 | + | | | 1.05 | | | | N/A | | | | N/A | | | | N/A | | | | N/A | | | | N/A | | | | N/A | |
| FST Preferred Shares | | | | | | | | | | | | | | | | | | | | | | | | | | | | | | | | | | | | |
Actual | | | 1,000.00 | | | | 1,000.06 | | | | 1.34 | | | | N/A | | | | N/A | | | | N/A | | | | N/A | | | | N/A | | | | N/A | |
Hypothetical (5% return before expenses) | | | 1,000.00 | | | | 1,023.46 | + | | | 1.35 | | | | N/A | | | | N/A | | | | N/A | | | | N/A | | | | N/A | | | | N/A | |
| FST Capital Shares | | | | | | | | | | | | | | | | | | | | | | | | | | | | | | | | | | | | |
Actual | | | 1,000.00 | | | | 1,000.03 | | | | 1.39 | | | | N/A | | | | N/A | | | | N/A | | | | N/A | | | | N/A | | | | N/A | |
Hypothetical (5% return before expenses) | | | 1,000.00 | | | | 1,023.41 | + | | | 1.40 | | | | N/A | | | | N/A | | | | N/A | | | | N/A | | | | N/A | | | | N/A | |
| FST Administration Shares | | | | | | | | | | | | | | | | | | | | | | | | | | | | | | | | | | | | |
Actual | | | 1,000.00 | | | | 1,000.03 | | | | 1.39 | | | | 1,000.00 | | | | 1,000.20 | | | | 0.79 | | | | 1,000.00 | | | | 1,000.10 | | | | 0.74 | |
Hypothetical (5% return before expenses) | | | 1,000.00 | | | | 1,023.41 | + | | | 1.40 | | | | 1,000.00 | | | | 1,024.00 | + | | | 0.80 | | | | 1,000.00 | | | | 1,024.05 | + | | | 0.75 | |
| FST Premier Shares | | | | | | | | | | | | | | | | | | | | | | | | | | | | | | | | | | | | |
Actual | | | 1,000.00 | | | | 1,000.03 | | | | 0.89 | | | | N/A | | | | N/A | | | | N/A | | | | N/A | | | | N/A | | | | N/A | |
Hypothetical (5% return before expenses) | | | 1,000.00 | | | | 1,023.90 | + | | | 0.90 | | | | N/A | | | | N/A | | | | N/A | | | | N/A | | | | N/A | | | | N/A | |
| FST Service Shares | | | | | | | | | | | | | | | | | | | | | | | | | | | | | | | | | | | | |
Actual | | | 1,000.00 | | | | 1,000.03 | | | | 1.34 | | | | 1,000.00 | | | | 1,000.20 | | | | 0.79 | | | | 1,000.00 | | | | 1,000.10 | | | | 0.74 | |
Hypothetical (5% return before expenses) | | | 1,000.00 | | | | 1,023.46 | + | | | 1.35 | | | | 1,000.00 | | | | 1,024.00 | + | | | 0.80 | | | | 1,000.00 | | | | 1,024.05 | + | | | 0.75 | |
| FST Class B Shares | | | | | | | | | | | | | | | | | | | | | | | | | | | | | | | | | | | | |
Actual | | | 1,000.00 | | | | 1,000.03 | | | | 1.34 | | | | N/A | | | | N/A | | | | N/A | | | | N/A | | | | N/A | | | | N/A | |
Hypothetical (5% return before expenses) | | | 1,000.00 | | | | 1,023.46 | + | | | 1.35 | | | | N/A | | | | N/A | | | | N/A | | | | N/A | | | | N/A | | | | N/A | |
| FST Class C Shares | | | | | | | | | | | | | | | | | | | | | | | | | | | | | | | | | | | | |
Actual | | | 1,000.00 | | | | 1,000.03 | | | | 1.34 | | | | N/A | | | | N/A | | | | N/A | | | | N/A | | | | N/A | | | | N/A | |
Hypothetical (5% return before expenses) | | | 1,000.00 | | | | 1,023.46 | + | | | 1.35 | | | | N/A | | | | N/A | | | | N/A | | | | N/A | | | | N/A | | | | N/A | |
| FST Resource Shares | | | | | | | | | | | | | | | | | | | | | | | | | | | | | | | | | | | | |
Actual | | | 1,000.00 | | | | 1,000.03 | | | | 1.34 | | | | N/A | | | | N/A | | | | N/A | | | | N/A | | | | N/A | | | | N/A | |
Hypothetical (5% return before expenses) | | | 1,000.00 | | | | 1,023.46 | + | | | 1.35 | | | | N/A | | | | N/A | | | | N/A | | | | N/A | | | | N/A | | | | N/A | |
| FST Cash Management Shares | | | | | | | | | | | | | | | | | | | | | | | | | | | | | | | | | | | | |
Actual | | | 1,000.00 | | | | 1,000.03 | | | | 0.89 | | | | 1,000.00 | | | | 1,000.20 | | | | 0.79 | | | | 1,000.00 | | | | 1,000.10 | | | | 0.74 | |
Hypothetical (5% return before expenses) | | | 1,000.00 | | | | 1,023.90 | + | | | 0.90 | | | | 1,000.00 | | | | 1,024.00 | + | | | 0.80 | | | | 1,000.00 | | | | 1,024.05 | + | | | 0.75 | |
103
GOLDMAN SACHS FUNDS — FINANCIAL SQUARE FUNDS
Fund Expenses — Six Month Period Ended February 28, 2013 (Unaudited) (continued)
| | | | | | | | | | | | | | | | | | | | | | | | | | | | | | | | | | | | |
| | | Tax-Free Money Market Fund | | | Treasury Instruments Fund | | | Treasury Obligations Fund | |
| Share Class | | Beginning
Account Value
9/1/12 | | | Ending
Account
Value
2/28/13 | | | Expenses
Paid for the
6 months ended
2/28/13* | | | Beginning
Account
Value
9/1/12 | | | Ending
Account
Value
2/28/13 | | | Expenses
Paid for the 6
months ended
2/28/13* | | | Beginning
Account
Value
9/1/12 | | | Ending
Account
Value
2/28/13 | | | Expenses
Paid for the
6 months ended
2/28/13* | |
| FST Shares | | | | | | | | | | | | | | | | | | | | | | | | | | | | | | | | | | | | |
Actual | | $ | 1,000.00 | | | $ | 1,000.17 | | | $ | 0.84 | | | $ | 1,000.00 | | | $ | 1,000.01 | | | $ | 0.55 | | | $ | 1,000.00 | | | $ | 1,000.04 | | | $ | 0.84 | |
Hypothetical (5% return before expenses) | | | 1,000.00 | | | | 1,023.95 | + | | | 0.85 | | | | 1,000.00 | | | | 1,024.25 | + | | | 0.55 | | | | 1,000.00 | | | | 1,023.95 | + | | | 0.85 | |
| FST Select Shares | | | | | | | | | | | | | | | | | | | | | | | | | | | | | | | | | | | | |
Actual | | | 1,000.00 | | | | 1,000.12 | | | | 0.89 | | | | 1,000.00 | | | | 1,000.01 | | | | 0.55 | | | | 1,000.00 | | | | 1,000.03 | | | | 0.84 | |
Hypothetical (5% return before expenses) | | | 1,000.00 | | | | 1,023.90 | + | | | 0.90 | | | | 1,000.00 | | | | 1,024.25 | + | | | 0.55 | | | | 1,000.00 | | | | 1,023.95 | + | | | 0.85 | |
| FST Preferred Shares | | | | | | | | | | | | | | | | | | | | | | | | | | | | | | | | | | | | |
Actual | | | 1,000.00 | | | | 1,000.11 | | | | 0.89 | | | | 1,000.00 | | | | 1,000.01 | | | | 0.55 | | | | 1,000.00 | | | | 1,000.03 | | | | 0.84 | |
Hypothetical (5% return before expenses) | | | 1,000.00 | | | | 1,023.90 | + | | | 0.90 | | | | 1,000.00 | | | | 1,024.25 | + | | | 0.55 | | | | 1,000.00 | | | | 1,023.95 | + | | | 0.85 | |
| FST Capital Shares | | | | | | | | | | | | | | | | | | | | | | | | | | | | �� | | | | | | | | |
Actual | | | 1,000.00 | | | | 1,000.11 | | | | 0.89 | | | | 1,000.00 | | | | 1,000.01 | | | | 0.55 | | | | 1,000.00 | | | | 1,000.03 | | | | 0.84 | |
Hypothetical (5% return before expenses) | | | 1,000.00 | | | | 1,023.90 | + | | | 0.90 | | | | 1,000.00 | | | | 1,024.25 | + | | | 0.55 | | | | 1,000.00 | | | | 1,023.95 | + | | | 0.85 | |
| FST Administration Shares | | | | | | | | | | | | | | | | | | | | | | | | | | | | | | | | | | | | |
Actual | | | 1,000.00 | | | | 1,000.11 | | | | 0.89 | | | | 1,000.00 | | | | 1,000.01 | | | | 0.55 | | | | 1,000.00 | | | | 1,000.03 | | | | 0.84 | |
Hypothetical (5% return before expenses) | | | 1,000.00 | | | | 1,023.90 | + | | | 0.90 | | | | 1,000.00 | | | | 1,024.25 | + | | | 0.55 | | | | 1,000.00 | | | | 1,023.95 | + | | | 0.85 | |
| FST Premier Shares | | | | | | | | | | | | | | | | | | | | | | | | | | | | | | | | | | | | |
Actual | | | 1,000.00 | | | | 1,000.11 | | | | 0.89 | | | | 1,000.00 | | | | 1,000.01 | | | | 0.55 | | | | 1,000.00 | | | | 1,000.03 | | | | 0.84 | |
Hypothetical (5% return before expenses) | | | 1,000.00 | | | | 1,023.90 | + | | | 0.90 | | | | 1,000.00 | | | | 1,024.25 | + | | | 0.55 | | | | 1,000.00 | | | | 1,023.95 | + | | | 0.85 | |
| FST Service Shares | | | | | | | | | | | | | | | | | | | | | | | | | | | | | | | | | | | | |
Actual | | | 1,000.00 | | | | 1,000.11 | | | | 0.89 | | | | 1,000.00 | | | | 1,000.01 | | | | 0.55 | | | | 1,000.00 | | | | 1,000.03 | | | | 0.84 | |
Hypothetical (5% return before expenses) | | | 1,000.00 | | | | 1,023.90 | + | | | 0.90 | | | | 1,000.00 | | | | 1,024.25 | + | | | 0.55 | | | | 1,000.00 | | | | 1,023.95 | + | | | 0.85 | |
| FST Resource Shares | | | | | | | | | | | | | | | | | | | | | | | | | | | | | | | | | | | | |
Actual | | | 1,000.00 | | | | 1,000.11 | | | | 0.89 | | | | 1,000.00 | | | | 1,000.01 | | | | 0.55 | | | | 1,000.00 | | | | 1,000.03 | | | | 0.84 | |
Hypothetical (5% return before expenses) | | | 1,000.00 | | | | 1,023.90 | + | | | 0.90 | | | | 1,000.00 | | | | 1,024.25 | + | | | 0.55 | | | | 1,000.00 | | | | 1,023.95 | + | | | 0.85 | |
| FST Cash Management Shares | | | | | | | | | | | | | | | | | | | | | | | | | | | | | | | | | | | | |
Actual | | | 1,000.00 | | | | 1,000.11 | | | | 0.84 | | | | 1,000.00 | | | | 1,000.01 | | | | 0.55 | | | | 1,000.00 | | | | 1,000.03 | | | | 0.84 | |
Hypothetical (5% return before expenses) | | | 1,000.00 | | | | 1,023.95 | + | | | 0.85 | | | | 1,000.00 | | | | 1,024.25 | + | | | 0.55 | | | | 1,000.00 | | | | 1,023.95 | + | | | 0.85 | |
| * | | Expenses for each share class are calculated using each Fund’s annualized net expense ratio for each class, which represents the ongoing expenses as a percentage of net assets for the six months ended February 28, 2013. Expenses are calculated by multiplying the annualized net expense ratio by the average account value for the period; then multiplying the result by the number of days in the most recent fiscal half year; and then dividing that result by the number of days in the fiscal year. The annualized net expense ratios for the period were as follows: |
| | | | | | | | | | | | | | | | | | | | | | | | | | | | | | | | | | | | | | | | | | | | |
| Fund | | FST
Shares | | | FST Select
Shares | | | FST Preferred
Shares | | | FST Capital
Shares | | | FST Administration
Shares | | | FST Premier
Shares | | | FST Service
Shares | | | FST Class B
Shares | | | FST Class C
Shares | | | FST Resource
Shares | | | FST Cash Management
Shares | |
Federal | | | 0.15 | % | | | 0.15 | % | | | 0.15 | % | | | 0.15 | % | | | 0.15 | % | | | 0.15 | % | | | 0.15 | % | | | N/A | | | | N/A | | | | 0.15 | % | | | 0.15 | % |
Government | | | 0.18 | % | | | 0.21 | % | | | 0.22 | % | | | 0.22 | % | | | 0.22 | % | | | 0.22 | % | | | 0.22 | % | | | N/A | | | | N/A | | | | 0.18 | % | | | 0.18 | % |
Money Market | | | 0.18 | % | | | 0.21 | % | | | 0.28 | % | | | 0.31 | % | | | 0.31 | % | | | 0.31 | % | | | 0.31 | % | | | N/A | | | | N/A | | | | 0.18 | % | | | 0.18 | % |
Prime Obligations | | | 0.18 | % | | | 0.21 | % | | | 0.27 | % | | | 0.28 | % | | | 0.28 | % | | | 0.18 | % | | | 0.27 | % | | | 0.27 | % | | | 0.27 | % | | | 0.27 | % | | | 0.18 | % |
Tax-Exempt California | | | 0.16 | % | | | N/A | | | | N/A | | | | N/A | | | | 0.16 | % | | | N/A | | | | 0.16 | % | | | N/A | | | | N/A | | | | N/A | | | | 0.16 | % |
Tax-Exempt New York | | | 0.15 | % | | | N/A | | | | N/A | | | | N/A | | | | 0.15 | % | | | N/A | | | | 0.15 | % | | | N/A | | | | N/A | | | | N/A | | | | 0.15 | % |
Tax-Free Money Market | | | 0.17 | % | | | 0.18 | % | | | 0.18 | % | | | 0.18 | % | | | 0.18 | % | | | 0.18 | % | | | 0.18 | % | | | N/A | | | | N/A | | | | 0.18 | % | | | 0.17 | % |
Treasury Instruments | | | 0.11 | % | | | 0.11 | % | | | 0.11 | % | | | 0.11 | % | | | 0.11 | % | | | 0.11 | % | | | 0.11 | % | | | N/A | | | | N/A | | | | 0.11 | % | | | 0.11 | % |
Treasury Obligations | | | 0.17 | % | | | 0.17 | % | | | 0.17 | % | | | 0.17 | % | | | 0.17 | % | | | 0.17 | % | | | 0.17 | % | | | N/A | | | | N/A | | | | 0.17 | % | | | 0.17 | % |
| + | | Hypothetical expenses are based on each Fund’s actual annualized net expense ratios and an assumed rate of return of 5% per year before expenses. |
104
FUNDS PROFILE
Goldman Sachs Funds

Goldman Sachs is a premier financial services firm, known since 1869 for creating thoughtful and customized investment solutions in complex global markets.
Today, the Investment Management Division of Goldman Sachs serves a diverse set of clients worldwide, including private institutions, public entities and individuals. With approximately $742.4 billion in assets under management as of December 31, 2012, Goldman Sachs Asset Management (“GSAM”) has portfolio management teams located around the world and our investment professionals bring firsthand knowledge of local markets to every investment decision. GSAM’s assets under management includes assets managed by Goldman Sachs Asset Management, LP and its Investment Advisory Affiliates.
|
| OVERVIEW OF GOLDMAN SACHS FUNDS |

Money Market1
Financial Square FundsSM
| n | | Financial Square Tax-Exempt Funds |
| n | | Financial Square Federal Fund |
| n | | Financial Square Government Fund |
| n | | Financial Square Money Market Fund |
| n | | Financial Square Prime Obligations Fund |
| n | | Financial Square Treasury Instruments Fund |
| n | | Financial Square Treasury Obligations Fund |
Fixed Income
Short Duration and Government
| n | | High Quality Floating Rate Fund2 |
| n | | Short Duration Government Fund |
| n | | Short Duration Income Fund |
| n | | Inflation Protected Securities Fund |
Multi-Sector
| n | | Core Plus Fixed Income Fund |
Municipal and Tax-Free
| n | | High Yield Municipal Fund |
| n | | Short Duration Tax-Free Fund |
Single Sector
| n | | Investment Grade Credit Fund |
| n | | High Yield Floating Rate Fund |
| n | | Emerging Markets Debt Fund |
| n | | Local Emerging Markets Debt Fund |
Corporate Credit
Fundamental Equity
| n | | Small/Mid Cap Growth Fund |
| n | | Flexible Cap Growth Fund |
| n | | Concentrated Growth Fund |
| n | | Technology Tollkeeper Fund |
| n | | Growth Opportunities Fund |
| n | | Rising Dividend Growth Fund |
Structured Equity
| n | | Structured Small Cap Equity Fund |
| n | | Structured U.S. Equity Fund |
| n | | Structured Small Cap Growth Fund |
| n | | Structured Large Cap Growth Fund |
| n | | Structured Large Cap Value Fund |
| n | | Structured Small Cap Value Fund |
| n | | Structured Tax-Managed Equity Fund |
| n | | Structured International Tax-Managed Equity Fund |
| n | | U.S. Equity Dividend and Premium Fund |
| n | | International Equity Dividend and Premium Fund |
| n | | Structured International Small Cap Fund |
| n | | Structured International Equity Fund |
| n | | Structured Emerging Markets Equity Fund |
Fundamental Equity International
| n | | Strategic International Equity Fund |
| n | | Concentrated International Equity Fund |
| n | | International Small Cap Fund |
| n | | Emerging Markets Equity Fund |
| n | | BRIC Fund (Brazil, Russia, India, China) |
Select Satellite4
| n | | Real Estate Securities Fund |
| n | | International Real Estate Securities Fund |
| n | | Commodity Strategy Fund |
| n | | Dynamic Allocation Fund |
| n | | Absolute Return Tracker Fund |
| n | | Managed Futures Strategy Fund |
| n | | Retirement Portfolio Completion Fund |
| n | | Income Strategies Portfolio |
Total Portfolio Solutions4
| n | | Balanced Strategy Portfolio |
| n | | Growth and Income Strategy Portfolio |
| n | | Growth Strategy Portfolio |
| n | | Equity Growth Strategy Portfolio |
| n | | Satellite Strategies Portfolio |
| n | | Enhanced Dividend Global Equity Portfolio |
| n | | Tax Advantaged Global Equity Portfolio |
| 1 | | An investment in a money market fund is neither insured nor guaranteed by the Federal Deposit Insurance Corporation (“FDIC”) or any other government agency. Although the Funds seek to preserve the value of your investment at $1.00 per share, it is possible to lose money by investing in the Funds. |
| 2 | | Effective at the close of business on July 27, 2012, the Goldman Sachs Ultra-Short Duration Government Fund was renamed the Goldman Sachs High Quality Floating Rate Fund. |
| 3 | | Effective at the close of business on June 29, 2012, the Goldman Sachs Balanced Fund was renamed the Goldman Sachs Income Builder Fund. |
| 4 | | Individual Funds within the Total Portfolio Solutions and Select Satellite categories will have various placement on the risk/return spectrum and may have greater or lesser risk than that indicated by the placement of the general Total Portfolio Solutions or Select Satellite category. |
Financial Square FundsSM is a registered service mark of Goldman, Sachs & Co.
| | |
TRUSTEES
Ashok N. Bakhru, Chairman
Donald C. Burke
John P. Coblentz, Jr.
Diana M. Daniels
Joseph P. LoRusso
James A. McNamara
Jessica Palmer
Alan A. Shuch
Richard P. Strubel | | OFFICERS
James A. McNamara, President
George F. Travers, Principal Financial Officer
Caroline Kraus, Secretary
Scott M. McHugh, Treasurer |
| |
GOLDMAN, SACHS & CO.
Distributor and Transfer Agent | | GOLDMAN SACHS ASSET MANAGEMENT, L.P.
Investment Adviser |
Visit our Web site at www.goldmansachsfunds.com to obtain the most recent month-end returns.
Goldman Sachs Asset Management, L.P., 200 West Street, New York, New York 10282
The reports concerning the Funds included in this shareholder report may contain certain forward-looking statements about the factors that may affect the performance of the Funds in the future. These statements are based on Fund management’s predictions and expectations concerning certain future events and their expected impact on the Funds, such as performance of the economy as a whole and of specific industry sectors, changes in the levels of interest rates, the impact of developing world events, and other factors that may influence the future performance of the Funds.
Economic and market forecasts presented herein reflect our judgment as of the date of this presentation and are subject to change without notice. These forecasts do not take into account the specific investment objectives, restrictions, tax and financial situation or other needs of any specific client. Actual data will vary and may not be reflected here. These forecasts are subject to high levels of uncertainty that may affect actual performance. Accordingly, these forecasts should be viewed as merely representative of a broad range of possible outcomes. These forecasts are estimated, based on assumptions, and are subject to significant revision and may change materially as economic and market conditions change. Goldman Sachs has no obligation to provide updates or changes to these forecasts. Case studies and examples are for illustrative purposes only.
Management believes these forward-looking statements to be reasonable, although they are inherently uncertain and difficult to predict. Actual events may cause adjustments in portfolio management strategies from those currently expected to be employed.
A description of the policies and procedures that the Funds use to determine how to vote proxies relating to portfolio securities and information regarding how a Fund voted proxies relating to portfolio securities during the most recent 12-month period ended June 30 is available (I) without charge, upon request by calling 1-800-621-2550; and (II) on the Securities and Exchange Commission (“SEC”) Web site at http://www.sec.gov.
The Funds file their complete schedule of portfolio holdings with the SEC for the first and third quarters of each fiscal year on Form N-Q. The Funds’ Form N-Q will become available on the SEC’s Web site at http://www.sec.gov within 60 days after the Funds’ first and third fiscal quarters. The Funds’ Forms N-Q may be reviewed and copied at the SEC’s Public Reference Room in Washington, D.C. and information on the operation of the Public Reference Room may also be obtained by calling 1-800-SEC-0330. Form N-Q may be obtained upon request and without charge by calling 1-800-526-7384 (for Retail Shareholders) or 1-800-621-2550 (for Institutional Shareholders).
Holdings and allocations shown are as of February 28, 2013 and may not be representative of future investments. Fund holdings should not be relied on in making investment decisions and should not be construed as research or investment advice regarding particular securities.
This material is not authorized for distribution to prospective investors unless preceded or accompanied by a current Prospectus or summary prospectus, if applicable. Investors should consider a Fund’s objective, risks, and charges and expenses, and read the summary prospectus, if available, and/or the Prospectus carefully before investing or sending money. The summary prospectus, if available, and the Prospectus contain this and other information about a Fund and may be obtained from your authorized dealer or from Goldman, Sachs & Co. by calling (retail – 1-800-526-7384) (institutional – 1-800-621-2550).
Financial Square FundsSM is a registered service mark of Goldman, Sachs & Co.
Goldman, Sachs & Co. is the distributor of the Goldman Sachs Funds.
© 2013 Goldman Sachs. All rights reserved. 97072.MF.MED.TMPL/4/2013 FSQSAR13 / 85K
| | The information required by this Item is only required in an annual report on this Form N-CSR. |
| ITEM 3. | AUDIT COMMITTEE FINANCIAL EXPERT. |
| | The information required by this Item is only required in an annual report on this Form N-CSR. |
| ITEM 4. | PRINCIPAL ACCOUNTANT FEES AND SERVICES. |
| | The information required by this Item is only required in an annual report on this Form N-CSR. |
| ITEM 5. | AUDIT COMMITTEE OF LISTED REGISTRANTS. |
| ITEM 6. | SCHEDULE OF INVESTMENTS. |
| | Schedule of Investments is included as part of the Report to Stockholders filed under Item 1. |
| ITEM 7. | DISCLOSURE OF PROXY VOTING POLICIES AND PROCEDURES FOR CLOSED-END MANAGEMENT INVESTMENT COMPANIES. |
| ITEM 8. | PORTFOLIO MANAGERS OF CLOSED-END MANAGEMENT INVESTMENT COMPANIES. |
| ITEM 9. | PURCHASES OF EQUITY SECURITIES BY CLOSED-END MANAGEMENT INVESTMENT COMPANY AND AFFILIATED PURCHASERS. |
| ITEM 10. | SUBMISSION OF MATTERS TO A VOTE OF SECURITY HOLDERS. |
| | There have been no material changes to the procedures by which shareholders may recommend nominees to the registrant’s board of trustees. |
| ITEM 11. | CONTROLS AND PROCEDURES. |
| | (a) | The registrant’s principal executive and principal financial officers, or persons performing similar functions have concluded that the registrant’s disclosure controls and procedures (as defined in Rule 30a-3(c) under the Investment Company Act of 1940, as amended (the “1940 Act”)) are effective as of a date within 90 days of the filing of this report that includes the disclosure required by this paragraph, based on the evaluation of these controls and procedures required by Rule 30a-3(b) under the 1940 Act and 15d-15(b) under the Securities Exchange Act of 1934, as amended. |
| | (b) | There were no changes in the registrant’s internal control over financial reporting (as defined in Rule 30a-3(d) under the 1940 Act) that occurred during the registrant’s second fiscal quarter of the period covered by this report that have materially affected, or are reasonably likely to materially affect, the registrant’s internal control over financial reporting. |
| | | | |
| (a)(1) | | The information required by this Item is only required in connection with an annual report on this Form N-CSR. |
| | |
| (a)(2) | | Exhibit 99.CERT | | Certifications pursuant to Section 302 of the Sarbanes-Oxley Act of 2002 filed herewith. |
| | |
| (b) | | Exhibit 99.906CERT | | Certifications pursuant to Section 906 of the Sarbanes-Oxley Act of 2002 filed herewith. |
SIGNATURES
Pursuant to the requirements of the Securities Exchange Act of 1934 and the Investment Company Act of 1940, the registrant has duly caused this report to be signed on its behalf by the undersigned, thereunto duly authorized.
| | | | |
| | | | Goldman Sachs Trust |
| | |
| By: | | | | /s/ James A. McNamara |
| | | | James A. McNamara |
| | | | President/Principal Executive Officer |
| | | | Goldman Sachs Trust |
| | |
| Date: | | | | April 18, 2013 |
Pursuant to the requirements of the Securities Exchange Act of 1934 and the Investment Company Act of 1940, this report has been signed below by the following persons on behalf of the registrant and in the capacities and on the dates indicated.
| | | | |
| By: | | | | /s/ James A. McNamara |
| | | | James A. McNamara |
| | | | President/Principal Executive Officer |
| | | | Goldman Sachs Trust |
| | |
| Date: | | | | April 18, 2013 |
| | |
| By: | | | | /s/ George F. Travers |
| | | | George F. Travers |
| | | | Principal Financial Officer |
| | | | Goldman Sachs Trust |
| | |
| Date: | | | | April 18, 2013 |