UNITED STATES
SECURITIES AND EXCHANGE COMMISSION
Washington, D.C. 20549
FORM N-CSR
CERTIFIED SHAREHOLDER REPORT OF REGISTERED
MANAGEMENT INVESTMENT COMPANIES
Investment Company Act file number 811-05349
Goldman Sachs Trust
(Exact name of registrant as specified in charter)
71 South Wacker Drive,
Chicago, Illinois 60606
(Address of principal executive offices) (Zip code)
| | |
Copies to: |
Caroline Kraus | | Geoffrey R.T. Kenyon, Esq. |
Goldman, Sachs & Co. | | Dechert LLP |
200 West Street | | 200 Clarendon Street |
New York, New York 10282 | | 27th Floor |
| | Boston, MA 02116-5021 |
(Name and address of agents for service)
Registrant’s telephone number, including area code: (312) 655-4400
Date of fiscal year end: March 31
Date of reporting period: September 30, 2012
| ITEM 1. | REPORTS TO STOCKHOLDERS. |
| | The Semi-Annual Report to Stockholders is filed herewith. |
Goldman Sachs Funds

| | | | |
| | |
| Semi-Annual Report | | | | September 30, 2012 |
| | |
| | | | Single Sector Fixed Income Funds |
| | | | Emerging Markets Debt |
| | | | High Yield |
| | | | High Yield Floating Rate |
| | | | Investment Grade Credit |
| | | | Local Emerging Markets Debt |
| | | | U.S. Mortgages |

Goldman Sachs Single Sector Fixed Income Funds
| n | | HIGH YIELD FLOATING RATE |
| n | | INVESTMENT GRADE CREDIT |
| n | | LOCAL EMERGING MARKETS DEBT |
| | | | |
TABLE OF CONTENTS | | | | |
| |
Principal Investment Strategies and Risks | | | 1 | |
| |
Investment Process | | | 3 | |
| |
Market Review | | | 4 | |
| |
Portfolio Management Discussions and
Performance Summaries | | | 7 | |
| |
Schedules of Investments | | | 37 | |
| |
Financial Statements | | | 96 | |
| |
Financial Highlights | | | 104 | |
| |
Notes to the Financial Statements | | | 116 | |
| |
Other Information | | | 140 | |
| | | | |
| | | |
| NOT FDIC-INSURED | | May Lose Value | | No Bank Guarantee |
GOLDMAN SACHS SINGLE SECTOR FIXED INCOME FUNDS
Principal Investment Strategies and Risks
This is not a complete list of risks that affect the Funds. For additional information concerning the risks applicable to the Funds, please see the Funds’ prospectus.
The Emerging Markets Debt Fund invests primarily in sovereign and corporate debt of issuers located in or tied economically to emerging countries. The Fund’s investments in fixed income securities are subject to the risks associated with debt securities generally, including credit, liquidity and interest rate risk. The Fund’s foreign and emerging market investments may be more volatile and less liquid than investments in U.S. securities and will be subject to the risks of currency fluctuations and adverse economic or political developments. The countries in which the Fund invests may have sovereign ratings that are below investment grade or are unrated. High yield, lower rated securities involve greater price volatility and present greater risks than higher rated fixed income securities. The securities markets of emerging countries have less government regulation and are subject to less extensive accounting and financial reporting requirements than the markets of more developed countries. Such securities are also subject to foreign custody risk. The Fund is also subject to the risk that the issuers of sovereign debt or the government authorities that control the payment of debt may be unable or unwilling to repay principal or interest when due. Derivative instruments may involve a high degree of financial risk. These risks include the risk that a small movement in the price of the underlying security or benchmark may result in a disproportionately large movement, unfavorable or favorable, in the price of the derivative instrument; the risk of default by a counterparty; and liquidity risk. At times, the Fund may be unable to sell certain of its investments without a substantial drop in price, if at all. The Fund is “non-diversified” and may invest more of its assets in fewer issuers than “diversified” funds. Accordingly, the Fund may be more susceptible to adverse developments affecting any single issuer held in its portfolio and to greater losses resulting from these developments.
The High Yield Fund invests primarily in high yield, fixed income securities that, at the time of purchase, are non-investment grade securities. The Fund’s investments in fixed income securities are subject to the risks associated with debt securities generally, including credit, liquidity and interest rate risk. High yield, lower rated securities involve greater price volatility and present greater risks than higher rated fixed income securities. The Fund’s foreign and emerging market investments may be more volatile and less liquid than investments in U.S. securities and will be subject to the risks of currency fluctuations and adverse economic or political developments. Derivative instruments may involve a high degree of financial risk. These risks include the risk that a small movement in the price of the underlying security or benchmark may result in a disproportionately large movement, unfavorable or favorable, in the price of the derivative instrument; the risk of default by a counterparty; and liquidity risk. At times, the Fund may be unable to sell certain of its investments without a substantial drop in price, if at all.
The High Yield Floating Rate Fund invests primarily in domestic or foreign floating rate loans and other floating or variable rate obligations rated below investment grade. Indirect loan participations may subject the Fund to greater delays, expenses and risks than direct obligations in the case that a borrower fails to pay scheduled principal and interest. The Fund’s investments in loans and fixed income instruments are subject to the risks associated with debt instruments generally, including credit, liquidity and interest rate risk. The Fund’s foreign and emerging market investments may be more volatile and less liquid than investments in U.S. securities and will be subject to the risks of currency fluctuations and adverse economic or political developments. High yield, lower rated investments involve greater price volatility and present greater risks than higher rated investments. At times, the Fund may be unable to sell certain of its investments without a substantial drop in price, if at all. Derivative instruments may involve a high degree of financial risk. These risks include the risk that a small movement in the price of the underlying security or benchmark may result in a disproportionately large movement, unfavorable or favorable, in the price of the derivative instrument; the risk of default by a counterparty; and liquidity risk.
1
GOLDMAN SACHS SINGLE SECTOR FIXED INCOME FUNDS
The Investment Grade Credit Fund invests primarily in investment grade fixed income securities. The Fund’s investments in fixed income securities are subject to the risks associated with debt securities generally, including credit, liquidity and interest rate risk. Any guarantee on U.S. government securities applies only to the underlying securities of the Fund if held to maturity and not to the value of the Fund’s shares. The Fund may invest in foreign and emerging markets securities, which may be more volatile and less liquid than its investment in U.S. securities and will be subject to the risks of currency fluctuations and adverse economic or political developments. Derivative instruments may involve a high degree of financial risk. These risks include the risk that a small movement in the price of the underlying security or benchmark may result in a disproportionately large movement, unfavorable or favorable, in the price of the derivative instrument; the risk of default by a counterparty; and liquidity risk.
The Local Emerging Markets Debt Fund invests primarily in sovereign and corporate debt of issuers located in or tied economically to emerging countries, denominated in the local currency of such emerging countries, or in currencies of such emerging countries. The Fund’s investments in fixed income securities are subject to the risks associated with debt securities generally, including credit, liquidity and interest rate risk. The Fund’s foreign and emerging market investments may be more volatile and less liquid than investments in U.S. securities and will be subject to the risks of currency fluctuations and adverse economic or political developments. The securities markets of emerging countries have less government regulation and are subject to less extensive accounting and financial reporting requirements than the markets of more developed countries. Such securities are also subject to foreign custody risk. The Fund is also subject to the risk that the issuers of sovereign debt or the government authorities that control the payment of debt may be unable or unwilling to repay principal or interest when due. High yield, lower rated securities involve greater price volatility and present greater risks than higher rated fixed income securities. Derivative instruments may involve a high degree of financial risk. These risks include the risk that a small movement in the price of the underlying security or benchmark may result in a disproportionately large movement, unfavorable or favorable, in the price of the derivative instrument; the risk of default by a counterparty; and liquidity risk. At times, the Fund may be unable to sell certain of its investments without a substantial drop in price, if at all. The Fund is “non-diversified” and may invest more of its assets in fewer issuers than “diversified” funds. Accordingly, the Fund may be more susceptible to adverse developments affecting any single issuer held in its portfolio and to greater losses resulting from these developments.
The U.S. Mortgages Fund invests primarily in mortgage-backed securities (MBS) of U.S. issuers. The Fund’s investments in fixed income securities are subject to the risks associated with debt securities generally, including credit, liquidity and interest rate risk. The Fund’s investments in MBS are also subject to prepayment risk, the risk that in a declining interest rate environment the Fund’s underlying mortgages may be prepaid, causing the Fund to have to reinvest at lower interest rates. Any guarantee on U.S. government securities applies only to the underlying securities of the Fund if held to maturity and not to the value of the Fund’s shares. Derivative instruments may involve a high degree of financial risk. These risks include the risk that a small movement in the price of the underlying security or benchmark may result in a disproportionately large movement, unfavorable or favorable, in the price of the derivative instrument; the risk of default by a counterparty; and liquidity risk.
2
GOLDMAN SACHS SINGLE SECTOR FIXED INCOME FUNDS
What Differentiates the Goldman Sachs Asset Management Fixed Income Investment Process?
At Goldman Sachs Asset Management, L.P. (“GSAM”), the goal of our fixed income investment process is to provide consistent, strong performance by actively managing our portfolios within a research-intensive, risk-managed framework.
A key element of our fixed income investment philosophy is to evaluate the broadest global opportunity set to capture relative value across sectors and instruments. Our globally integrated investment process involves managing dynamically along the risk/return spectrum, as we continue to develop value-added strategies through:

| n | | Assess relative value among securities and sectors |
| n | | Leverage the vast resources of GSAM in selecting securities for each portfolio |

| n | | Team approach to decision making |
| n | | Manage risk by avoiding significant sector and interest rate bets |

Fixed Income portfolios that:
| | n | | Include domestic and global investment options, income opportunities, and access to areas of specialization such as high yield | |
| | n | | Capitalize on GSAM’s industry-renowned credit research capabilities | |
| | n | | Use a risk-managed framework to seek total return, recognizing the importance of investors’ capital accumulation goals as well as their need for income | |
3
MARKET REVIEW
Goldman Sachs Single Sector Fixed Income Funds
Market Review
Fixed income market performance during the six months ended September 30, 2012 (the “Reporting Period”) was strong but volatile, as corporate bonds and other riskier sectors of the market posted solid gains even as government bond yields fell to new lows.
Riskier fixed income assets (i.e., non-U.S. Treasury sectors) began the Reporting Period under pressure, as U.S. economic data softened in April after a strong start to the year 2012. In particular, March payroll data released in early April showed a significant slowing in job gains. In January and February, payrolls had climbed by more than 200,000 jobs per month, but the March report showed a gain of just more than 100,000 jobs. That report set the tone for April fixed income performance, as U.S. Treasury yields declined, and non-U.S. Treasury sectors underperformed. (Remember, there is usually an inverse relationship between bond prices and yield movements, such that bond prices rise when yields decline and vice versa.)
The performance trend continued in May, as the benchmark 10-year U.S. Treasury yield fell to a new low of 1.56%, and non-U.S. Treasury sectors of the fixed income market continued to perform poorly. Economic data was again a key driver of the weakness in riskier assets, as U.S. payrolls added just 69,000 jobs, less than half the expected gain. Concerns about Europe, and the health of the Spanish banking system in particular, also weighed on investors’ risk appetites. Although Spain announced several measures in May to support its banks, Spanish government bond yields spiked on investor worries about the country’s ability to support its banks given its own debt challenges.
June marked a turning point for non-U.S. Treasury sectors, although U.S. Treasury yields continued to decline. Developments in Europe were again a key driver of risk sentiment, as Greece held a presidential election that raised concerns about the country potentially exiting the Eurozone, and Spain finally appealed to the European Union for assistance for its banking system. Continued weakness in U.S. and global economic data also weighed on sentiment. As a result, U.S. Treasury yields continued to decline, but non-U.S. Treasury sectors gained ground during the month as Greece elected a pro-Eurozone administration and the European Union agreed to provide support to Spain’s banking system. Even as government bond yields hit new record lows, investors began moving back into higher-yielding corporate and emerging market bonds.
Non-U.S. Treasury sectors continued to outperform U.S. Treasuries through the remainder of the Reporting Period, largely as a function of the market searching for yield in an environment of extremely low interest rates. In addition, market expectations for more quantitative easing by the U.S. Federal Reserve (the “Fed”) increased in August in light of minutes from the August 1, 2012 Federal Open Market Committee meeting and Fed Chairman Ben Bernanke’s speech at the Fed’s annual conference in Jackson Hole, Wyoming. Overall economic growth in the U.S. remained sluggish, with housing a key exception as the Standard & Poor’s/Case-Shiller Home Price Index data showed the strongest house price gains since the index’s inception.
In September, the Fed exceeded most expectations for additional quantitative easing, with an announcement of open-ended asset purchases, dubbed QE3, and an extension of the likely period of low short-term interest rates from mid-2014 to at least mid-2015. With the Fed holding short-term interest rates at low levels, demand for higher yielding sectors remained strong. As evidence, the high yield corporate bond sector received record investment inflows on a year-to-date basis during September.
4
MARKET REVIEW
Looking Ahead
Going forward, we believe aggressive central bank action may not provide much of a boost to global economic growth, but we think recent policy measures significantly reduce the downside risks. The Fed has committed to purchase bonds until the U.S. labor market improves substantially, while the European Central Bank has committed to unlimited bond purchases to preserve the euro. These open-ended commitments are a significant departure from previous central bank policies, which focused on specific amounts of bond purchases or liquidity support. We not only doubt these measures will have a significant positive effect on economic growth, but we also worry about the longer-term consequences of further central bank balance sheet expansion. However, in the intermediate term, we think the open-ended nature of the Fed and European Central Bank bond purchases has meaningfully reduced the probability — and the potential severity — of downside economic and market scenarios.
In the U.S., we believe economic growth could see some benefit if there is a reduction in downside scenarios related to Europe and resolution of the uncertainties related to the fiscal cliff and November elections. (The major components of the so-called fiscal cliff include tax increases and spending cuts totaling approximately $576 billion scheduled to take effect on January 1, 2013.) The U.S. corporate sector has continued to stockpile cash and defer hiring and investment as a form of self-insurance against risk and uncertainty. However, the timeline for resolving uncertainties around the fiscal cliff and election is finite in our view. One way or another, within a few months, businesses will have a much better sense of U.S. fiscal policy and the regulatory regime going forward. We think politicians will ultimately defer most of the impact of the fiscal cliff, leaving the U.S. with fiscal restraint of about 1.5% of Gross Domestic Product (“GDP”) in 2013, which is close to the level of fiscal restraint1 seen at the end of the Reporting Period. We believe the combination of a lower than feared fiscal impact, reduced risk of a crisis in Europe and the Fed’s additional support for the U.S. housing recovery should provide modest upside potential for U.S. economic growth in 2013.
China’s economic slowdown, on the other hand, remains a source of greater uncertainty, in our view, as policymakers attempt to transition the Chinese economy from growth driven by exports and investment to growth driven by domestic consumption. China’s leaders have said economic growth will slow, and policymakers are targeting GDP of 7.5% in their latest five-year plan, which is close to the economy’s growth rate over the first half of 2012. Policymakers appear to be taking a conservative approach to stimulating economic growth and are focusing on measures such as subsidies for energy-efficient appliances rather than large infrastructure projects. China has virtually no track record when it comes to stimulating consumption, thereby raising concerns the economic slowdown could be deeper than targeted. That said, we are cautious about overreacting to the short-term trend in Chinese economic growth given policymakers’ long-term focus and 7.5% GDP growth target. Should economic growth slow more significantly, we would expect additional policy responses.
| 1 | | Fiscal restraint in this context refers to the net dollar amount of tax increase and/or government spending decrease, expressed as a percent of the dollar amount of US GDP, for the purpose of indicating the size of the change in taxes and government spending relative to the size of the economy. |
5
MARKET REVIEW
From an investment perspective, we believe the policy and economic growth backdrop anticipated for the coming months favors U.S. non-Treasury sectors. We think strong economic growth is probably the only scenario that could lead central banks to allow a significant rise in real yields, and we believe strong economic growth is a low probability. As a result, we expect yields on government bonds to generally remain in the range seen at the end of the Reporting Period, and we favor a tactical approach to duration management. We also think U.S. corporate credit valuations were attractive relative to fundamentals at the end of the Reporting Period, due largely to risk premiums for European tail risk. (Here, tail risk simply means the risk or probability of rare events.) Should European risk decline and government bond yields remain low as expected, we think U.S. corporate credit should benefit from investor demand for yield as well as from favorable fundamentals. In emerging markets, we do not see the slowdown in China leading to a boom/bust cycle in emerging countries broadly. We believe emerging market countries with good economic growth and strong balance sheets should continue to perform well.
6
PORTFOLIO RESULTS
Goldman Sachs Emerging Markets Debt Fund
Investment Objective
The Fund seeks a high level of total return consisting of income and capital appreciation.
Portfolio Management Discussion and Analysis
Below, the Goldman Sachs Global Fixed Income Investment Management Team discusses the Goldman Sachs Emerging Markets Debt Fund’s (the “Fund”) performance and positioning for the six-month period ended September 30, 2012 (the “Reporting Period”).
| Q | | How did the Fund perform during the Reporting Period? |
| A | | During the Reporting Period, the Fund’s Class A, C, Institutional and IR Shares generated cumulative total returns, without sales charges, of 9.33%, 8.93%, 9.51% and 9.46%, respectively. These returns compare to the 9.59% cumulative total return of the Fund’s benchmark, the J.P. Morgan EMBI Global Diversified Index (with dividends reinvested) (the “Index”), during the same time period. |
| Q | | What economic and market factors most influenced emerging markets debt as a whole during the Reporting Period? |
| A | | External emerging markets debt posted a solid positive return during the Reporting Period. Sovereign spreads (that is, the difference in yields between external emerging markets debt and U.S. Treasuries) tightened 38 basis points to close the Reporting Period 291 basis points wider than U.S. Treasury securities. (A basis point is 1/100th of a percentage point.) The top performing external emerging debt markets during the Reporting Period, as represented by the Index, were (in U.S. dollar terms1) Turkey (+12.3%) and the Philippines (+10.7%) . Belize (-21.6%) and Jordan (+3.6%) lagged most. |
| | | During the Reporting Period, external emerging markets debt performed well, driven largely, per widely held consensus view, by accommodative monetary policy and supportive fiscal measures from global central banks. A particularly significant driver was the commitment in July from the European Central Bank to “do what it takes” to save the Eurozone. During September, the U.S. Federal Reserve (the “Fed”) announced quantitative easing, dubbed QE3, in the form of a $40 billion per month stimulus program. These measures underpinned government bond yields in the developed markets, keeping their yields near record lows. External emerging markets debt mutual funds received significant investment inflows during the Reporting Period as investors sought higher yields through investments in countries they consider economically and financially healthy. |
| Q | | What key factors were responsible for the Fund’s performance during the Reporting Period? |
| A | | The Fund’s sector positioning in external emerging markets debt detracted the most from relative returns during the Reporting Period. Country and issue selection among emerging market corporate bonds and emerging market quasi-sovereign bonds also dampened performance. The Fund's duration and yield curve strategy detracted slightly as well. Duration is a measure of the Fund’s sensitivity to changes in interest rates. Yield curve indicates the spectrum of maturities within a particular sector. |
| | | On the positive side, country and issue selection in external hard currency denominated debt added to relative performance. Also contributing positively was our active currency management through which the Fund invests in local currencies (accomplished through the use of forward foreign currency exchange contracts as well as bonds denominated in local currencies). In addition, country and issue selection of external emerging markets debt added modestly as did the Fund’s sector positioning in emerging market quasi-sovereign bonds and emerging market corporate bonds. |
| | 1 | | All regional and market returns are in U.S. dollar terms (unless otherwise specified), are based on country-specific stock market indices and reflect the reinvestment of any dividends if applicable. |
7
PORTFOLIO RESULTS
| Q | | Which segments of emerging markets debt most significantly affected Fund performance? |
| A | | The Fund’s underweight in Hungarian external debt detracted from relative returns. The Fund was underweight Hungarian debt because of our concern about potential Eurozone bank deleveraging. However, Hungarian external debt performed better than we expected. The Fund was also hampered by its overweighted exposure to Venezuelan and Indonesian external debt, both of which underperformed the Index early in the Reporting Period before rebounding slightly. |
| | | The Fund’s overweight in Russian external debt contributed positively to relative performance, as the Russian external debt market outperformed the Index during the Reporting Period. The Fund also benefited from its holdings of Ivory Coast external debt. As a result of a debt relief program, the Ivory Coast had shaved its debt-to-GDP ratio from approximately 60% to approximately 14%. The country’s fiscal outlook had also improved because of a gradual recovery in tax revenues. In addition, the Fund’s long position in the Indian rupee, accomplished through the use of forward foreign currency exchange contracts, enhanced returns. The Fund’s investment in Mexican local debt added to relative performance, as the Mexican central bank held interest rates steady and consumer prices increased. |
| Q | | Did the Fund’s duration and yield curve positioning strategy help or hurt its results during the Reporting Period? |
| A | | The Fund’s U.S. duration and yield curve positioning detracted slightly from relative returns. During the Reporting Period, we tactically adjusted the Fund’s duration position relative to the Index, shifting between a short duration bias and a long duration bias. Most of the underperformance occurred during the first half of the Reporting Period when the Fund had a modestly short duration bias and yields declined. |
| Q | | How did the Fund use derivatives and similar instruments during the Reporting Period? |
| A | | The Fund invested in U.S. Treasury futures, Eurodollar futures, forward foreign currency exchange contracts, interest rate swaps and credit linked notes. U.S. Treasury futures were used to manage U.S. interest rate duration. Eurodollar futures were used to express our views on the direction of interest rates and to facilitate specific duration and yield curve strategies. Eurodollar futures are contracts which have underlying assets linked to time deposits denominated in U.S. dollars at banks outside the U.S. Forward foreign currency exchange contracts were used for hedging purposes or to express a positive view on a given currency. Interest rate swaps were used to express our views on the direction of a country’s interest rates. Total return swaps and credit linked notes were used in place of buying a local currency denominated bond when a particular market was otherwise inaccessible or as a more efficient means of gaining access to a local market. |
| Q | | Were there any notable changes in the Fund’s weightings during the Reporting Period? |
| A | | During the Reporting Period, we increased the Fund’s already overweighted position in Indonesian external debt. We shifted the Fund from an underweight in Panamanian local debt at the beginning of the Reporting Period to a neutral position relative to the Index at the end of the Reporting Period. We decreased the Fund’s position in Colombian external debt from a strong overweight to a slight overweight. |
| Q | | How was the Fund positioned relative to its benchmark index at the end of the Reporting Period? |
| A | | At the end of the Reporting Period, the Fund had overweighted positions relative to the Index in Indonesian, Russian, Venezuelan and Ivory Coast external debt. It was underweight Polish, Hungarian, Lithuanian, Croatian, South African and Brazilian external debt relative to the Index. |
8
PORTFOLIO RESULTS
| Q | | What is the Fund’s tactical view and strategy for the months ahead? |
| A | | At the end of the Reporting Period, we continued to have a long-term positive outlook on emerging markets debt because we believe the asset class is shifting from a niche investment to a core portfolio component. Emerging market countries produce nearly 50% of global GDP, and yet emerging markets at the end of the Reporting Period accounted for only approximately 10% of the global fixed income market. In addition, emerging markets debt is backed by faster-growing economies. Growth in the developing world was 6.2% during 2011, according to the International Monetary Fund (“IMF”), almost four times that of developed economies. Also, emerging market economies generally have lower levels of debt-to-GDP relative to developed economies. In addition, emerging markets debt can potentially benefit from a growing investor base, which, in our view, would promote market depth and stability. During 2012 through the end of the Reporting Period, investment inflows into emerging markets debt mutual funds were robust. |
| | | In our view, emerging market economies have become far better able to withstand shocks to the global financial system, thanks in part to reserve accumulation and improved external debt positions. We believe that greater policy autonomy has also played a key role, as credible monetary policy has helped to moderate inflation, and fiscal consolidation has reduced public sector debt. At the end of the Reporting Period, stand-alone valuations in the emerging markets reflected these fundamental improvements to some extent, but we believe the increasing recognition of emerging markets as a mature asset class should lead to more strategic allocations and could consequently boost valuations. We believe supply and demand factors are likely to remain positive for emerging markets. Furthermore, the overall institutional under-allocation to emerging markets debt suggests to us there is potential for further growth of investment in the asset class. |
9
FUND BASICS
Emerging Markets Debt Fund
as of September 30, 2012
| | | | | | | | | | | | | | | | | | |
| | PERFORMANCE REVIEW | |
| | | April 1, 2012– September 30, 2012 | | Fund Total Return
(based on NAV)1 | | | J.P. Morgan EMBI
Global Diversified
Index2 | | | 30-Day
Standardized
Subsidized Yield3 | | | 30-Day
Standardized
Unsubsidized Yield3 | |
| | Class A | | | 9.33 | % | | | 9.59 | % | | | 2.92 | % | | | 2.87 | % |
| | Class C | | | 8.93 | | | | 9.59 | | | | 2.31 | | | | 2.26 | |
| | Institutional | | | 9.51 | | | | 9.59 | | | | 3.39 | | | | 3.34 | |
| | | Class IR | | | 9.46 | | | | 9.59 | | | | 3.30 | | | | 3.25 | |
| | 1 | | The net asset value (“NAV”) represents the net assets of the class of the Fund (ex-dividend) divided by the total number of shares of the class outstanding. The Fund’s performance assumes the reinvestment of dividends and other distributions. The Fund’s performance does not reflect the deduction of any applicable sales charges. |
| | 2 | | The J.P. Morgan EMBI Global Diversified Index (with dividends reinvested) is an unmanaged index of debt instruments of 50 emerging countries. The Index figures do not reflect any deduction for fees, expenses or taxes. It is not possible to invest directly in an index. |
| | 3 | | The 30-Day Standardized Subsidized Yield of the Fund is calculated by dividing the net investment income per share (as defined by securities industry regulations) earned by the Fund over a 30-day period (ending on the stated month-end date) by the maximum public offering price (“POP”) per share of the Fund on the last day of the period. This number is then annualized. This yield does not necessarily reflect income actually earned and distributed by the Fund and, therefore, may not be correlated with the dividends or other distributions paid to shareholders. The 30-Day Standardized Unsubsidized Yield does not reflect any applicable expense reductions. |
| | | | | | | | | | | | | | | | |
| | STANDARDIZED TOTAL RETURNS4 |
| | | For the period ended 9/30/12 | | One Year | | | Five Years | | | Since Inception | | | Inception Date |
| | Class A | | | 16.22 | % | | | 8.85 | % | | | 10.75 | % | | 8/29/03 |
| | Class C | | | 19.77 | | | | 9.06 | | | | 8.82 | | | 9/29/06 |
| | Institutional | | | 22.09 | | | | 10.22 | | | | 11.71 | | | 8/29/03 |
| | | Class IR | | | 22.09 | | | | N/A | | | | 11.38 | | | 7/30/10 |
| | 4 | | The Standardized Total Returns are average annual total returns as of the most recent calendar quarter-end. They assume reinvestment of all distributions at NAV. These returns reflect a maximum initial sales charge of 4.5% for Class A Shares and the assumed contingent deferred sales charge for Class C Shares (1% if redeemed within 12 months of purchase). Because Institutional and Class IR Shares do not involve a sales charge, such a charge is not applied to their Standardized Total Returns. The Fund will charge a 2% redemption fee on the redemption of shares (including by exchange) held for 30 calendar days or less. The performance figures do not reflect the deduction of the redemption fee. If reflected, the redemption fee would reduce the performance quoted. |
| | | | The returns set forth in the tables above represent past performance. Past performance does not guarantee future results. The Fund’s investment return and principal value will fluctuate so that an investor’s shares, when redeemed, may be worth more or less than their original cost. Current performance may be lower or higher than the performance quoted above. Please visit our web site at www.goldmansachsfunds.com to obtain the most recent month-end returns. Performance reflects fee waivers and/or expense limitations in effect. In their absence, performance would be reduced. Returns do not reflect the deduction of taxes that a shareholder would pay on Fund distributions or the redemption of Fund shares. |
10
FUND BASICS
| | | | | | | | | | |
| | EXPENSE RATIOS5 | |
| | | | | Net Expense Ratio
(Current) | | | Gross Expense Ratio
(Before Waivers) | |
| | Class A | | | 1.23 | % | | | 1.27 | % |
| | Class C | | | 1.98 | | | | 2.02 | |
| | Institutional | | | 0.89 | | | | 0.93 | |
| | | Class IR | | | 0.98 | | | | 1.02 | |
| | 5 | | The expense ratios of the Fund, both current (net of applicable fee waivers and/or expense limitations) and before waivers (gross of applicable fee waivers and/or expense limitations) are as set forth above according to the most recent publicly available Prospectus for the Fund and may differ from the expense ratios disclosed in the Financial Highlights in this report. The Fund’s waivers and/or expense limitations will remain in place through at least July 27, 2013, and prior to such date the investment adviser may not terminate the arrangements without the approval of the Fund’s Board of Trustees. If these arrangements are discontinued in the future, the expense ratios may change without shareholder approval. |
| | | | | | | | | | |
| | TOP TEN COUNTRY ALLOCATION6 | |
| | | | | Percentage of Net Assets | |
| | | | | as of 9/30/12 | | | as of 3/31/12 | |
| | Indonesia | | | 10.7 | % | | | 7.2 | % |
| | Mexico | | | 6.6 | | | | 7.6 | |
| | Venezuela | | | 6.6 | | | | 8.5 | |
| | Turkey | | | 6.5 | | | | 3.8 | |
| | Colombia | | | 5.9 | | | | 7.7 | |
| | Brazil | | | 5.2 | | | | 4.9 | |
| | Philippines | | | 5.1 | | | | 4.6 | |
| | Luxembourg | | | 4.2 | | | | 2.4 | |
| | Chile | | | 4.1 | | | | 2.6 | |
| | | Russia | | | 3.8 | | | | 7.5 | |
| | 6 | | The percentage shown for each investment category reflects the value of investments in that country as a percentage of net assets. The table does not include repurchase agreements of 5.9% as of 9/30/12 and 9.1% as of 3/31/12. The table depicts the Fund’s investments but may not represent the Fund’s market exposure due to the exclusion of derivatives, if any, as listed in the Additional Investment Information section of the Schedule of Investments. |
11
PORTFOLIO RESULTS
Goldman Sachs High Yield Fund
Investment Objective
The Fund seeks a high level of current income and may also consider the potential for capital appreciation.
Portfolio Management Discussion and Analysis
Below, the Goldman Sachs High Yield Fixed Income Investment Management Team discusses the Goldman Sachs High Yield Fund’s (the “Fund”) performance and positioning for the six-month period ended September 30, 2012 (the “Reporting Period”).
| Q | | How did the Fund perform during the Reporting Period? |
| A | | During the Reporting Period, the Fund’s Class A, B, C, Institutional, Service, IR and R Shares generated cumulative total returns, without sales charges, of 5.80%, 5.55%, 5.40%, 5.97%, 5.86%, 6.07% and 5.67%, respectively. These returns compare to the 6.40% cumulative total return of the Fund’s benchmark, the Barclays U.S. Corporate High Yield Bond Index, 2% Issuer Capped (the “Index”), during the same time period. |
| Q | | What economic and market factors most influenced the high yield bond market as a whole during the Reporting Period? |
| A | | The high yield corporate bond market generated solid returns during the Reporting Period. The first half of the Reporting Period was characterized by increased risk aversion, driven by concerns about the Eurozone and weaker than expected U.S. economic data, including disappointing jobs reports. A flight to quality drove yields on U.S. Treasury securities to new lows and increased stock market volatility. Nevertheless, high yield corporate bonds generally outperformed stocks and high yield bank loans, with higher quality high yield corporate bonds posting stronger gains than those of lower quality. |
| | | The second half of the Reporting Period was characterized by lower volatility. High yield corporate bonds outperformed on strong demand for higher yielding assets and in anticipation of new action by global central banks. Indeed, the bond purchase program announced by the European Central Bank in September improved sentiment for riskier asset classes, reducing market concerns of an imminent crisis in the Eurozone. The U.S. Federal Reserve’s (the “Fed”) announcement of its open-ended commitment to buy mortgage-backed securities also drove investors to riskier, higher yielding assets. The high yield corporate bond market benefited from the rally in riskier asset classes, with high yield corporate bonds outperforming high yield bank loans but falling short of the strong performance of the broad U.S stock market. Lower quality high yield corporate bonds generally outperformed those of higher quality during the second half of the Reporting Period. |
| | | Market technicals also supported high yield corporate bonds during the Reporting Period. Demand was strong and with yields on high yield corporate bonds near all time lows, issuers rushed to refinance their existing debt. This resulted in $156.3 billion in new bonds issued during the Reporting Period, bringing total issuance between January 1, 2012 and September 30, 2012 to $263.4 billion and surpassing, in only nine months, the total new issuance of $246 billion in new bonds during all of 2011. Investment inflows were also robust. During the Reporting Period, high yield corporate bond mutual funds saw investment inflows of $13.1 billion, according to AMG/Lipper. There were 10 defaults among high yield issuers during the Reporting Period, affecting $6.47 billion in bonds. The 12-month par-weighted high yield corporate bond default rate through September 30, 2012 was 1.83%, well below the historical average of 4.2%.1 |
| Q | | What key factors were responsible for the Fund’s performance during the Reporting Period? |
| A | | The Fund’s sector allocation was most responsible for its relative underperformance during the Reporting Period. In addition, for the Reporting Period overall, the Fund’s underweight in higher quality credits hampered relative returns. As high yield corporate bonds posted gains, the Fund’s overweight in cash was also a drag on performance. The Fund’s duration positioning further detracted from results. Duration is a measure of the Fund’s sensitivity to changes in interest rates. |
| | 1 | | Source: J.P. Morgan as of September 30, 2012. |
12
PORTFOLIO RESULTS
| | | On the positive side, the Fund benefited from issue selection and an overweight in euro-denominated bonds. |
| Q | | Which segments within high yield most significantly affected Fund performance? |
| A | | The Fund’s underweighted position in higher quality credits, particularly BB-rated and C-rated credits, detracted from relative results, as higher quality bonds outperformed lower quality bonds during the Reporting Period. In terms of sector positioning, the Fund’s underweighted positions in utilities, financials and home construction dampened returns. This was offset slightly by the Fund’s underweighted allocations to technology and energy and its overweighted allocation to cellular telecommunications, which contributed positively. In addition, the Fund benefited from its overweighted position in euro-denominated bonds, which outperformed U.S.-dollar denominated debt during the Reporting Period. |
| | | Relative to issue selection, an overweight in investment grade corporate bonds issued by automobile manufacturer Ford Motor was the Fund’s largest relative detractor. Ford Motor reported slower than expected car sales during the summer and lowered its forecast for 2012 auto sales. The Fund was also hampered by its lack of exposure to power company Energy Future Holdings, which performed well during the Reporting Period. |
| | | The Fund’s strongest performing name during the Reporting Period was wireless operator Sprint Nextel. Sprint Nextel appreciated on stronger than expected second quarter earnings and improved earnings guidance by its company management. Sprint Nextel also reported a significant increase in the average revenue per subscriber during the second quarter. In addition, it announced it had experienced a strong profit margin recovery, driven by improved operating leverage, tighter cost controls and lower than forecasted expenses for its Network Vision program. Also, during the Reporting Period, the Fund benefited by not owning the high yield debt of ATP Oil and Gas, which filed for bankruptcy in the face of falling production. |
| Q | | Did the Fund’s duration and yield curve positioning strategy help or hurt its results during the Reporting Period? |
| A | | During the Reporting Period, the Fund’s slightly short duration bias compared to the Index detracted from relative performance as interest rates declined. |
| Q | | How did the Fund use derivatives and similar instruments during the Reporting Period? |
| A | | To hedge against currency risk (that is, the risk that certain currencies might fluctuate in value), the Fund employed forward foreign currency exchange contracts during the Reporting Period. |
| Q | | Were there any notable changes in the Fund’s weightings during the Reporting Period? |
| A | | Though we were constructive on high yield corporate bonds when the Reporting Period started, we shifted the Fund to a more conservative stance during the first half of the Reporting Period. Our decision to reduce risk in the Fund was based on a number of factors. We believed the downside risks to global economic growth were not fully reflected in spreads (the difference in yields between high yield corporate bonds and U.S. Treasury securities). In addition, we believed high yield corporate bonds could potentially experience further declines if risk appetite weakened. In our opinion, the performance of high yield corporate bonds was hampered by the slowing U.S. economic recovery and heightened market uncertainty. |
| | | To reduce the Fund’s risk exposure, we adopted a more defensive profile by rotating into higher quality credits, including BB-rated securities, leveraged loans and cushion paper. (Cushion paper is a callable bond that sells at premium because its coupon is higher than market interest rates.) We also trimmed the Fund’s allocation to B-rated and CCC-rated credits, while maintaining a larger than usual position in cash. We scaled back the Fund’s holdings of certain distressed credits and more volatile names. We added to the Fund’s holdings in traditionally defensive industries, such as telecommunications, and sold select cyclical credits. As volatility declined and investor sentiment improved in the second half of the Reporting Period, we began increasing the Fund’s risk exposure. |
| Q | | How was the Fund positioned relative to its benchmark index at the end of the Reporting Period? |
| A | | At the end of the Reporting Period, the Fund was overweight gaming and lodging, non-cellular telecommunications and consumer products relative to the Index. It was underweight electric utilities, energy and gas utilities versus the Index. |
13
PORTFOLIO RESULTS
| Q | | What is the Fund’s tactical view and strategy for the months ahead? |
| A | | At the end of the Reporting Period, we were optimistic about the outlook for high yield corporate bonds. We believed the Fed’s open-ended commitment to purchase mortgage-backed securities would continue to underpin riskier asset classes and could further incentivize investors to seek higher yielding securities. In our opinion, this will benefit high yield corporate bonds. Additionally, we believe high yield companies generally have healthy balance sheets and that they will continue to post attractive profits even in sluggish economic conditions. Although yields on high yield corporate bonds reached new historic lows during the Reporting Period, we think spreads remain wide relative to our default expectations. |
| | | We believe the recent relative outperformance of BB-rated credits has likely run its course, and as a result, we seek to augment the Fund’s yield by adding exposures to companies with what we believe to have sufficient operating momentum to allow substantial deleveraging over the medium term. We plan to make these purchases both in traditionally defensive sectors, including health care and energy, and in more cyclical sectors, including gaming and media. In addition, we continue to see signs of improvement in the housing market and believe that investments in building materials, homebuilders and certain financials would likely benefit from a real estate recovery. We will seek to minimize the Fund’s exposure to sectors that are negatively impacted by low natural gas prices, such as utilities. Finally, we plan to remain active participants in the primary market where we see improved liquidity and modest opportunities for capital appreciation. |
14
FUND BASICS
High Yield Fund
as of September 30, 2012
| | | | | | | | | | | | | | | | | | |
| | PERFORMANCE REVIEW | |
| | | April 1, 2012– September 30, 2012 | | Fund Total Return
(based on NAV)1 | | | Barclays U.S.
Corporate High
Yield Bond Index
2% Issuer Capped2 | | | 30-Day
Standardized
Subsidized Yield3 | | | 30-Day
Standardized
Unsubsidized Yield3 | |
| | Class A | | | 5.80 | % | | | 6.40 | % | | | 4.74 | % | | | 4.74 | % |
| | Class B | | | 5.55 | | | | 6.40 | | | | 4.21 | | | | 4.21 | |
| | Class C | | | 5.40 | | | | 6.40 | | | | 4.21 | | | | 4.21 | |
| | Institutional | | | 5.97 | | | | 6.40 | | | | 5.31 | | | | 5.31 | |
| | Service | | | 5.86 | | | | 6.40 | | | | 4.80 | | | | 4.80 | |
| | Class IR | | | 6.07 | | | | 6.40 | | | | 5.21 | | | | 5.21 | |
| | | Class R | | | 5.67 | | | | 6.40 | | | | 4.71 | | | | 4.71 | |
| | 1 | | The net asset value (“NAV”) represents the net assets of the class of the Fund (ex-dividend) divided by the total number of shares of the class outstanding. The Fund’s performance assumes the reinvestment of dividends and other distributions. The Fund’s performance does not reflect the deduction of any applicable sales charges. |
| | 2 | | The Barclays U.S. Corporate High Yield Bond Index, 2% Issuer Capped, an unmanaged index, covers the universe of U.S. dollar denominated, non-convertible, fixed rate, non-investment grade debt. Index holdings must have at least one year to final maturity, at least $150 million par amount outstanding, and be publicly issued with a rating of Ba1 or lower. The Index figures do not reflect any deduction for fees, expenses or taxes. It is not possible to invest directly in an index. |
| | 3 | | The 30-Day Standardized Subsidized Yield of the Fund is calculated by dividing the net investment income per share (as defined by securities industry regulations) earned by the Fund over a 30-day period (ending on the stated month-end date) by the maximum public offering price (“POP”) per share of the Fund on the last day of the period. This number is then annualized. This yield does not necessarily reflect income actually earned and distributed by the Fund and, therefore, may not be correlated with the dividends or other distributions paid to shareholders. The 30-Day Standardized Unsubsidized Yield does not reflect any applicable expense reductions. |
| | | | The returns set forth in the table above represent past performance. Past performance does not guarantee future results. The Fund’s investment return and principal value will fluctuate so that an investor’s shares, when redeemed, may be worth more or less than their original cost. Current performance may be lower or higher than the performance quoted above. Please visit our web site at www.goldmansachsfunds.com to obtain the most recent month-end returns. Performance reflects fee waivers and/or expense limitations in effect. In their absence, performance would be reduced. Returns do not reflect the deduction of taxes that a shareholder would pay on Fund distributions or the redemption of Fund shares. |
15
FUND BASICS
| | | | | | | | | | | | | | | | |
| | STANDARDIZED TOTAL RETURNS4 |
| | | For the period ended 9/30/12 | | One Year | | | Five Years | | Ten Years | | | Since Inception | | Inception Date |
| | Class A | | | 13.69 | % | | 5.72% | | | 9.16 | % | | 6.38% | | 8/1/97 |
| | Class B | | | 12.76 | | | 5.52 | | | 9.01 | | | 6.28 | | 8/1/97 |
| | Class C | | | 17.04 | | | 5.92 | | | 8.87 | | | 5.95 | | 8/15/97 |
| | Institutional | | | 19.37 | | | 7.07 | | | 10.07 | | | 7.10 | | 8/1/97 |
| | Service | | | 18.82 | | | 6.55 | | | 9.50 | | | 6.56 | | 8/1/97 |
| | Class IR | | | 19.26 | | | N/A | | | N/A | | | 7.67 | | 11/30/07 |
| | | Class R | | | 18.71 | | | N/A | | | N/A | | | 7.08 | | 11/30/07 |
| | 4 | | The Standardized Total Returns are average annual total returns as of the most recent calendar quarter-end. They assume reinvestment of all distributions at NAV. These returns reflect a maximum initial sales charge of 4.5% for Class A Shares, the assumed contingent deferred sales charge for Class B Shares (5% maximum declining to 0% after six years) and the assumed contingent deferred sales charge for Class C Shares (1% if redeemed within 12 months of purchase). Class B Shares convert automatically to Class A Shares on or about the fifteenth day of the last month of the calendar quarter that is eight years after purchase. Returns for Class B Shares for the period after conversion reflect the performance of Class A Shares. Because Institutional, Service, Class R and IR Shares do not involve a sales charge, such a charge is not applied to their Standardized Total Returns. The Fund will charge a 2% redemption fee on the redemption of shares (including by exchange) held for 60 calendar days or less. The performance figures do not reflect the deduction of the redemption fee. If reflected, the redemption fee would reduce the performance quoted. The Fund’s Class B Shares are no longer available for purchase by new or existing shareholders (although current Class B shareholders may continue to reinvest income and capital gains distributions into Class B Shares, and Class B shareholders may continue to exchange their shares for Class B Shares of certain other Goldman Sachs Funds). |
| | | | The returns set forth in the table above represent past performance. Past performance does not guarantee future results. The Fund’s investment return and principal value will fluctuate so that an investor’s shares, when redeemed, may be worth more or less than their original cost. Current performance may be lower or higher than the performance quoted above. Please visit our web site at www.goldmansachsfunds.com to obtain the most recent month-end returns. Performance reflects fee waivers and/or expense limitations in effect. In their absence, performance would be reduced. Returns do not reflect the deduction of taxes that a shareholder would pay on Fund distributions or the redemption of Fund shares. |
| | | | | | | | | | |
| | EXPENSE RATIOS5 | |
| | | | | Net Expense Ratio
(Current) | | | Gross Expense Ratio
(Before Waivers) | |
| | Class A | | | 1.06 | % | | | 1.06 | % |
| | Class B | | | 1.81 | | | | 1.81 | |
| | Class C | | | 1.81 | | | | 1.81 | |
| | Institutional | | | 0.72 | | | | 0.72 | |
| | Service | | | 1.22 | | | | 1.22 | |
| | Class IR | | | 0.81 | | | | 0.81 | |
| | | Class R | | | 1.31 | | | | 1.31 | |
| | 5 | | The expense ratios of the Fund, both current (net of applicable fee waivers and/or expense limitations) and before waivers (gross of applicable fee waivers and/or expense limitations) are as set forth above according to the most recent publicly available Prospectus for the Fund and may differ from the expense ratios disclosed in the Financial Highlights in this report. The Fund’s waivers and/or expense limitations will remain in place through at least July 27, 2013, and prior to such date the investment adviser may not terminate the arrangements without the approval of the Fund’s Board of Trustees. If these arrangements are discontinued in the future, the expense ratios may change without shareholder approval. |
16
FUND BASICS
| | | | | | | | |
| | TOP TEN ISSUERS AS OF 9/30/126 |
| | | Company | | % of Net Assets | | | Line of Business |
| | Sprint Nextel Corp. | | | 3.2 | % | | Telecommunications – Cellular |
| | HCA, Inc. | | | 2.5 | | | Health Care – Services |
| | First Data Corp. | | | 2.0 | | | Technology – Software/Services |
| | MGM Resorts International | | | 1.9 | | | Gaming |
| | Beverage Packaging Holdings Luxembourg II SA | | | 1.8 | | | Packaging |
| | CIT Group, Inc. | | | 1.7 | | | Finance |
| | Intelsat Jackson Holdings SA | | | 1.7 | | | Telecommunications – Satellites |
| | DPL, Inc. | | | 1.6 | | | Utilities – Electric |
| | Frontier Communications Corp. | | | 1.6 | | | Telecommunications |
| | | Ally Financial, Inc. | | | 1.5 | | | Finance |
| | 6 | | The top 10 issuers may not be representative of the Fund’s future investments. |
| | | | | | | | | | |
| | TOP TEN INDUSTRY ALLOCATION7 | |
| | | | | Percentage of Net Assets | |
| | | | | as of 9/30/12 | | | as of 3/31/12 | |
| | Energy | | | 10.8 | % | | | 10.0 | % |
| | Health Care | | | 9.6 | | | | 8.1 | |
| | Telecommunications | | | 9.4 | | | | 8.2 | |
| | Finance | | | 7.2 | | | | 6.9 | |
| | Media | | | 7.2 | | | | 6.2 | |
| | Gaming | | | 6.2 | | | | 5.8 | |
| | Technology | | | 5.3 | | | | 5.4 | |
| | Utilities | | | 4.9 | | | | 6.0 | |
| | Consumer Products | | | 4.2 | | | | 2.7 | |
| | | Packaging | | | 3.6 | | | | 3.4 | |
| | 7 | | The percentage shown for each investment category reflects the value of investments in that category as a percentage of net assets. The above table does not include repurchase agreements of 3.5% as of 9/30/12 and 7.1% as of 03/31/12. The above table depicts the Fund’s Investments but may not represent the Fund’s market exposure due to the exclusion of derivatives, if any as listed in the Additional Investment Information section of the Schedule of Investments. |
17
PORTFOLIO RESULTS
Goldman Sachs High Yield Floating Rate Fund
Investment Objective
The Fund seeks a high level of current income.
Portfolio Management Discussion and Analysis
Below, the Goldman Sachs High Yield Fixed Income Investment Management Team discusses the Goldman Sachs High Yield Floating Rate Fund’s (the “Fund”) performance and positioning for the six-month period ended September 30, 2012 (the “Reporting Period”).
| Q | | How did the Fund perform during the Reporting Period? |
| A | | During the Reporting Period, the Fund’s Class A, C, Institutional, IR and R Shares generated cumulative total returns, without sales charges, of 2.75%, 2.47%, 3.03%, 2.98% and 2.62%, respectively. These returns compare to the 4.52% cumulative total return of the Fund’s benchmark, the Barclays Bank Loan Index/U.S. High-Yield Loan Index (the “Index”), during the same time period. |
| Q | | What economic and market factors most influenced the high yield floating rate loan market as a whole during the Reporting Period? |
| A | | The high yield loan market remained relatively firm throughout the Reporting Period. Like other riskier asset classes, high yield loans benefited from the Federal Reserve’s (the “Fed”) announcement of an open-ended commitment to purchase mortgage debt, via a program dubbed QE3, and the Fed’s decision to keep interest rates low until at least mid-2015. Lower-rated and non-rated credits generally performed the best during the Reporting Period. |
| | Primary market activity was robust as investors capitalized on market liquidity. According to J.P. Morgan, institutional loan market volume between January 1, 2012 and September 30, 2012 was $185.9 billion compared to $201.4 billion over the same nine-month period in 2011. Most of the new issuance was refinancing, though some issuers took advantage of market conditions to seek loans for acquisition and recapitalization purposes. |
| | Default rates remained well below historical averages of between 3% and 4%. As of September 30, 2012, J.P. Morgan reported a loan-only default rate of 1.3% on a trailing twelve-month basis, with a modest $6.8 billion in loans defaulting during the first nine months of 2012. |
| Q | | What key factors were responsible for the Fund’s performance during the Reporting Period? |
| A | | The Fund’s bias toward higher quality securities was responsible for most of its underperformance during the Reporting Period. In addition, the Fund’s focus on traditionally defensive sectors detracted. Slightly offsetting these results was issue selection, which contributed positively. |
| Q | | Which segments of the high yield floating rate loan market significantly affected Fund performance? |
| A | | During the Reporting Period, the Fund was hampered by its “up-in-quality” bias. The Fund was overweight higher quality BB-rated high yield bank loans, which lagged during the Reporting Period. It was underweight non-rated bank loans and bank loans rated CCC or less, which recorded solid gains. In addition, during the Reporting Period, the Fund’s overweighted positions in traditionally defensive market segments, including food and beverage and health care, dampened relative returns. |
18
PORTFOLIO RESULTS
| | These results were offset somewhat by effective issue selection. The Fund benefited from its exposure to Delta Airlines, a commercial airline; First Data Corporation, a global payment processing company; Univision, a Spanish language media company; and Multiplan, a managed health care provider. The Fund’s exposure to a Delta Airlines term loan especially enhanced performance, as the airline continued its robust earnings momentum, reflecting strong top-line growth driven by increased pricing. Despite the uncertain macroeconomic environment, Delta Airlines has been able to pass on fully higher fuel costs and has consistently reduced seat capacity in weak markets. Detracting from Fund results were positions in Rovi Solutions, a digital entertainment technology company; Fram Group Holdings, a manufacturer of automotive care products; and Sensata Technologies BV, a subsidiary of industrial technology company Sensata Technologies Holdings N.V. |
| Q | | Did the Fund’s duration and yield curve positioning strategy help or hurt its results during the Reporting Period? |
| A | | The Fund does not use duration and yield curve positioning as active management strategies within its investment process. |
| Q | | How did the Fund use derivatives and similar instruments during the Reporting Period? |
| A | | To hedge against currency risk (that is, the risk that certain currencies might fluctuate in value), the Fund employed forward foreign currency exchange contracts during the Reporting Period. |
| Q | | Were there any notable changes in the Fund’s weightings during the Reporting Period? |
| A | | No significant changes were made to the Fund’s weightings during the Reporting Period. However, because of our constructive view of underlying corporate fundamentals, we modestly increased the Fund’s risk exposure. |
| Q | | How was the Fund positioned relative to its benchmark index at the end of the Reporting Period? |
| A | | At the end of the Reporting Period, the Fund was overweight commercial services, non-cable media and retail and apparel relative to the Index. It was underweight cable and satellite television, consumer services and electric utilities versus the Index at the end of the Reporting Period. |
| Q | | What is the Fund’s tactical view and strategy for the months ahead? |
| A | | At the end of the Reporting Period, we had a constructive outlook for high yield bank loans primarily because of underlying corporate fundamentals. We believe that despite the slowing momentum reflected in U.S. economic indicators, near-term default rates for high yield bank loans should remain well below their longer term average of between 3% and 4% as a result of healthy balance sheets, reasonable profit margins and attractive free cash flow generation for U.S. high yield bank loan issuers. |
| | Our outlook is tempered by concerns about systematic risk, such as a disorderly outcome in Europe or potential policy missteps associated with the U.S. fiscal situation, which could overwhelm the factors supporting the high yield bank loan market and possibly lead to declines across riskier asset classes. Because of these concerns and based on slowing macroeconomic data, we plan to maintain the Fund’s bias toward higher quality securities and its underweight in CCC-rated high yield bank loans. |
19
FUND BASICS
High Yield Floating Rate Fund
as of September 30, 2012
| | | | | | | | | | | | | | | | | | |
| | PERFORMANCE REVIEW | |
| | | April 1, 2012–
September 30, 2012 | | Fund Total Return
(based on NAV)1 | | | Barclays Bank
Loan Index/U.S.
High-Yield Loan
Index2 | | | 30-Day
Standardized
Subsidized Yield3 | | | 30-Day
Standardized
Unsubsidized Yield3 | |
| | Class A | | | 2.75 | % | | | 4.52 | % | | | 3.55 | % | | | 3.55 | % |
| | Class C | | | 2.47 | | | | 4.52 | | | | 2.89 | | | | 2.89 | |
| | Institutional | | | 3.03 | | | | 4.52 | | | | 3.97 | | | | 3.97 | |
| | Class IR | | | 2.98 | | | | 4.52 | | | | 3.88 | | | | 3.88 | |
| | | Class R | | | 2.62 | | | | 4.52 | | | | 3.40 | | | | 3.40 | |
| | 1 | | The net asset value (“NAV”) represents the net assets of the class of the Fund (ex-dividend) divided by the total number of shares of the class outstanding. The Fund’s performance assumes the reinvestment of dividends and other distributions. The Fund’s performance does not reflect the deduction of any applicable sales charges. |
| | 2 | | The Barclays Bank Loan Index/U.S. High-Yield Loan Index provides broad and comprehensive total return metrics of the universe of syndicated term loans. To be included in the index, a bank loan must be dollar denominated, have at least $150 million, a minimum term of one year, and a minimum initial spread of LIBOR+125. It is not possible to invest directly in an index. |
| | 3 | | The 30-Day Standardized Subsidized Yield of the Fund is calculated by dividing the net investment income per share (as defined by securities industry regulations) earned by the Fund over a 30-day period (ending on the stated month-end date) by the maximum public offering price (“POP”) per share of the Fund on the last day of the period. This number is then annualized. This yield does not necessarily reflect income actually earned and distributed by the Fund and, therefore, may not be correlated with the dividends or other distributions paid to shareholders. The 30-Day Standardized Unsubsidized Yield does not reflect any applicable expense reductions. |
| | | | | | | | | | |
| | STANDARDIZED TOTAL RETURNS4 |
| | | For the period ended 9/30/12 | | One Year | | | Since Inception | | Inception Date |
| | Class A | | | 6.41 | % | | 1.78% | | 3/31/11 |
| | Class C | | | 7.02 | | | 2.57 | | 3/31/11 |
| | Institutional | | | 9.23 | | | 3.74 | | 3/31/11 |
| | Class IR | | | 9.12 | | | 3.64 | | 3/31/11 |
| | | Class R | | | 8.47 | | | 3.07 | | 3/31/11 |
| | 4 | | The Standardized Total Returns are average annual total returns as of the most recent calendar quarter-end. They assume reinvestment of all distributions at NAV. These returns reflect a maximum initial sales charge of 2.25% for Class A Shares and the assumed contingent deferred sales charge for Class C Shares (1% if redeemed within 12 months of purchase). Because Institutional, Class IR and Class R Shares do not involve a sales charge, such a charge is not applied to their Standardized Total Returns. |
| | | | The returns set forth in the tables above represent past performance. Past performance does not guarantee future results. The Fund’s investment return and principal value will fluctuate so that an investor’s shares, when redeemed, may be worth more or less than their original cost. Current performance may be lower or higher than the performance quoted above. Please visit our web site at www.goldmansachsfunds.com to obtain the most recent month-end returns. Performance reflects fee waivers and/or expense limitations in effect. In their absence, performance would be reduced. Returns do not reflect the deduction of taxes that a shareholder would pay on Fund distributions or the redemption of Fund shares. |
20
FUND BASICS
| | | | | | | | | | |
| | EXPENSE RATIOS5 | |
| | | | | Net Expense Ratio
(Current) | | | Gross Expense Ratio
(Before Waivers) | |
| | Class A | | | 1.08 | % | | | 1.13 | % |
| | Class C | | | 1.83 | | | | 1.88 | |
| | Institutional | | | 0.74 | | | | 0.79 | |
| | Class IR | | | 0.83 | | | | 0.88 | |
| | | Class R | | | 1.33 | | | | 1.38 | |
| | 5 | | The expense ratios of the Fund, both current (net of applicable fee waivers and/or expense limitations) and before waivers (gross of applicable fee waivers and/or expense limitations) are as set forth above according to the most recent publicly available Prospectus for the Fund and may differ from the expense ratios disclosed in the Financial Highlights in this report. The Fund’s waivers and/or expense limitations will remain in place through at least July 27, 2013, and prior to such date the investment adviser may not terminate the arrangements without the approval of the Fund’s Board of Trustees. If these arrangements are discontinued in the future, the expense ratios may change without shareholder approval. |
| | | | | | | | | | |
| | TOP TEN INDUSTRY ALLOCATION6 | |
| | | | | Percentage of Net Assets | |
| | | | | as of 9/30/12 | | | as of 3/31/12 | |
| | Retailers | | | 7.5 | % | | | 7.1 | % |
| | Health Care | | | 5.6 | | | | 6.7 | |
| | Food & Beverages | | | 5.2 | | | | 5.6 | |
| | Services Cyclical – Business Services | | | 4.9 | | | | 5.1 | |
| | Technology – Software/Services | | | 4.8 | | | | 3.6 | |
| | Media – Broadcasting & Radio | | | 4.7 | | | | 4.6 | |
| | Wireless Telecommunications | | | 4.3 | | | | 5.5 | |
| | Consumer Products – Household & Leisure | | | 3.6 | | | | 3.6 | |
| | Media – Cable | | | 3.2 | | | | 1.1 | |
| | | Restaurants | | | 3.0 | | | | 2.1 | |
| | 6 | | The percentage shown for each investment category reflects the value of investments in that category as a percentage of net assets. The above table does not include repurchase agreements of 11.4% as of 09/30/12 and 10.1% as of 03/31/12. The above table depicts the Fund’s investments but may not represent the Fund’s market exposure due to the exclusion of derivatives, if any, as listed in the Additional Investment Information section of the Schedule of Investments. |
21
PORTFOLIO RESULTS
Goldman Sachs Investment Grade Credit Fund
Investment Objective
The Fund seeks a high level of total return consisting of capital appreciation and income that exceeds the total return of the Barclays U.S. Credit Index.
Portfolio Management Discussion and Analysis
Below, the Goldman Sachs U.S. Fixed Income Investment Management Team discusses the Goldman Sachs Investment Grade Credit Fund’s (the “Fund”) performance and positioning for the six-month period ended September 30, 2012 (the “Reporting Period”).
| Q | | How did the Fund perform during the Reporting Period? |
| A | | During the Reporting Period, the Fund’s Class A, Institutional, IR and Separate Account Institutional Shares generated cumulative total returns, without sales charges, of 6.77%, 7.06%, 7.01% and 7.06%, respectively. These returns compare to the 6.09% cumulative total return of the Fund’s benchmark, the Barclays U.S. Credit Index (the “Index”), during the same time period. |
| Q | | What economic and market factors most influenced the investment grade credit market as a whole during the Reporting Period? |
| A | | In the first half of the Reporting Period, widely held consensus view was that the investment grade credit market weakened in response to the slowing U.S. economy and increased concerns about the Eurozone’s financial problems, including downgrades by Moody’s Investors Service (“Moody’s”) of Spanish and Italian bank credit ratings. Although Moody’s also downgraded 15 large global banks, those downgrades were widely anticipated and had little market impact. In early June 2012, Eurozone leaders pledged up to €100 billion in bailout funds for Spanish banks, following weeks of nervousness about Spain’s ability to support its banks after its bailout of Bankia, the country’s fourth-largest bank. Meanwhile, in the U.K., regulators fined Barclays £290 million for misconduct relating to the setting of LIBOR and EURIBOR rates. (LIBOR, or London interbank offered rates, are floating interest rates that are widely used as reference rates in bank, corporate and government lending agreements. Euribor, or the euro interbank offered rate, is a reference rate based on the average interest rates at which Eurozone banks lend to each other.) During May, the debt of Ford Motor was returned to investment grade status. |
| | | During the second half of the Reporting Period, the investment grade bond market rallied, with financials in the lead, as unconventional central bank policy measures incentivized investors to seek higher yielding assets. The new bond purchase program by the European Central Bank (“ECB”) improved sentiment for riskier asset classes because it reduced market concerns of an imminent crisis in the Eurozone. In the U.S., the Federal Reserve (the “Fed”) announced a new round of quantitative easing, dubbed QE3, which was expected to remove high quality assets from the market, increasing the scarcity of investment grade bonds. During August 2012, the world’s largest steel company, ArcelorMittal, was downgraded by Standard & Poor’s Ratings Services to BB+ and put on negative outlook by Moody’s because of deteriorating steel and iron-ore fundamentals and increased deleveraging requirements. In the banking sector, Bank of America reached a $2.4 billion legal settlement related to the Merrill Lynch acquisition, and the management consulting firm Oliver Wyman Group announced the results of its capital stress test of Spanish banks, reporting that Bankia needed the largest recapitalization and that Banco Santander and Banco Bilbao Vizcaya Argentaria (BBVA) required no capital injections. |
| | | Issuance was strong during the Reporting Period. Approximately $168 billion of new investment grade bonds were issued in the first half of the Reporting Period and approximately $236 billion were issued in the second half, bringing the total new issuance for 2012 through September 30, 2012 to $710 billion.1 |
22
PORTFOLIO RESULTS
| | | Investment grade credit spreads, or the difference in yields between corporate bonds and duration-equivalent U.S. Treasury securities, tightened by 20 basis points during the Reporting Period to 156 basis points. (A basis point is 1/100th of a percentage point.) |
| Q | | What key factors were responsible for the Fund’s performance during the Reporting Period? |
| A | | Issue selection among investment grade corporate bonds was most responsible for the Fund’s relative outperformance during the Reporting Period. The Fund’s cross-sector strategy also enhanced relative returns. In our cross-sector strategy, we invest Fund assets across a variety of fixed income sectors, including some that may not be included in the Fund’s benchmark. |
| | | The combined effect of the Fund’s duration positioning and its positioning relative to the U.S. Treasury yield curve further added to results. The Fund was hampered, however, by its yield curve management relative to the Index. Duration is a measure of the Fund’s sensitivity to changes in interest rates. Yield curve indicates the spectrum of maturities within a particular sector. |
| Q | | Which segments of investment grade credit most significantly affected Fund performance? |
| A | | Our individual issue selection of investment grade corporate bonds added to relative performance. Specifically, the Fund benefited from select investments in the investment grade corporate bonds of financials and industrials companies. In terms of sector positioning, the Fund benefited from its overweighted position relative to the Index in banking and its underweighted allocation relative to the Index in technology. |
| Q | | Did the Fund’s duration and yield curve positioning strategy help or hurt its results during the Reporting Period? |
| A | | The Fund’s duration positioning and its positioning relative to the U.S. Treasury yield curve contributed positively to its relative returns during the Reporting Period. When the Reporting Period began, the Fund had a short duration bias, and though we tactically adjusted its duration positioning thereafter, the Fund generally had a long duration bias for most of the Reporting Period. This enhanced the Fund’s performance as U.S. government yields declined. Ten-year U.S. government yields fell from 2.22% at the beginning of the Reporting Period to 1.63% at the end of the Reporting Period. Yields of 30-year U.S. government bonds started the Reporting Period at 3.34% and ended the Reporting Period at 2.28%. |
| | | As mentioned above, however, the Fund’s yield curve management relative to the Index detracted. That is, its positioning in issues of various maturities across the corporate credit yield curve hurt during the Reporting Period. |
| Q | | How did the Fund use derivatives and similar instruments during the Reporting Period? |
| A | | As market conditions warranted during the Reporting Period, the Fund used U.S. Treasury futures and Eurodollar futures to hedge interest rate exposure and facilitate specific duration and yield curve strategies. Eurodollar futures are contracts which have underlying assets linked to time deposits denominated in U.S. dollars at banks outside the U.S. It employed interest rate swaps and swaptions (options on interest rate swap contracts) to hedge interest rate exposure and express an outright term structure view (term structure, most often depicted as a yield curve, refers to the term structure of interest rates, which is the relationship between the yield to maturity and the time to maturity for pure discount bonds). In addition, it used credit default swaps to implement specific credit-related investment strategies and hedge corporate spread duration (the price sensitivity of a corporate bond to a 100 basis point change in its spread over LIBOR). It utilized forward foreign currency exchange contracts to hedge currency exposure. |
| Q | | Were there any notable changes in the Fund’s weightings during the Reporting Period? |
| A | | During the Reporting Period, we moved from a neutral position relative to the Index in investment grade corporate bonds to an overweighted position. We adopted the overweight for three reasons. First, the ECB offered to buy sovereign government bonds in potentially unlimited amounts on request by a national government and in return for certain policy commitments. As result, we saw a lower risk of financial crisis in the Eurozone, although we expect a continued recession, sovereign debt flare-ups and potential further declines for German government yields. Second, the Fed’s QE3 action exceeded most expectations because it includes an open-ended commitment to buy mortgage-backed securities. At the same time, the Fed extended the likely period of low short-term interest rates to at least mid-2015. As a result, we believed inflation expectations would pick up, and we positioned the Fund in anticipation that the U.S. Treasury yield curve would steepen. Third, we wanted to increase the Fund’s overweight to riskier assets, such as investment grade corporate credit, after the ECB and Fed announcements because we believed these new policy |
23
PORTFOLIO RESULTS
| | commitments would increase the incentive for investors to seek out higher yielding assets. |
| | | We maintained the Fund’s overweight to issues lower on the credit quality spectrum. In addition, we shifted the Fund to an overweight in intermediate maturities based on valuations. Otherwise, there were no notable changes in the Fund’s weightings during the Reporting Period. |
| Q | | How was the Fund positioned relative to its benchmark index at the end of the Reporting Period? |
| A | | At the end of the Reporting Period, the Fund was overweight relative to the Index in real estate investment trusts (“REITs”), banking and insurance. The Fund was also overweight energy, consumer non-cyclical sectors and natural gas utilities. Compared to the Index, the Fund was underweight consumer cyclical sectors, electric utilities, capital goods, technology and communications. In terms of maturities, we favored credits in the intermediate part of the corporate credit yield curve. |
| Q | | What is the Fund’s tactical view and strategy for the months ahead? |
| A | | At the end of the Reporting Period, we were targeting an overweight position relative to the Index in investment grade corporate credit. We believed underlying corporate fundamentals were strong in most sectors, with most companies enjoying high profit margins and healthy cash balances. In addition, we believed investment grade bonds would continue to benefit from strong demand for high quality securities, which offer yield opportunities in the exceptionally low-interest rate environment that persists. The asset class, in our view, has benefited from the actions of central banks, which have reduced near-term risks and reduced the availability of higher quality assets. There remain longer term concerns, however, including Eurozone sovereign risk, continuing economic slowdown in China and China’s changing economic policies, weakening global economic growth and political and fiscal uncertainty in the U.S. |
| | | Overall, at the end of the Reporting Period, we favored U.S. banks over European banks, and we planned to maintain the Fund’s overweight to selected insurance issuers. Near term, uncertainty about the regulatory outlook could drive credit spreads in the financials sector wider, but we believe changes to the regulatory framework — including the Dodd-Frank legislation in the U.S. and Basel III globally — should be beneficial for the banking sector in the long run. (Basel III is a global regulatory standard relating to banks’ capital adequacy and liquidity.) |
24
FUND BASICS
Investment Grade Credit Fund
as of September 30, 2012
| | | | | | | | | | | | | | | | | | |
| | PERFORMANCE REVIEW | |
| | | April 1, 2012– September 30, 2012 | | Fund Total Return
(based on NAV)1 | | | Barclays U.S.
Credit Index2 | | | 30-Day
Standardized
Subsidized Yield3 | | | 30-Day
Standardized
Unsubsidized Yield3 | |
| | Class A | | | 6.77 | % | | | 6.09 | % | | | 2.23 | % | | | 2.10 | % |
| | Institutional | | | 7.06 | | | | 6.09 | | | | 2.65 | | | | 2.51 | |
| | Class IR | | | 7.01 | | | | 6.09 | | | | 2.56 | | | | 2.43 | |
| | | Separate Account Institutional | | | 7.06 | | | | 6.09 | | | | 2.65 | | | | 2.52 | |
| | 1 | | The net asset value (“NAV”) represents the net assets of the class of the Fund (ex-dividend) divided by the total number of shares of the class outstanding. The Fund’s performance assumes the reinvestment of dividends and other distributions. The Fund’s performance does not reflect the deduction of any applicable sales charges. |
| | 2 | | The Barclays U.S. Credit Index is an unmanaged index which is unbundled into pure corporates (industrial, utility, and finance, including both U.S. and non-U.S. corporations) and non-corporates (sovereign, supranational, foreign agencies, and foreign local governments). The index figures do not reflect any deduction for fees, expenses or taxes. It is not possible to invest directly in an index. |
| | 3 | | The 30-Day Standardized Subsidized Yield of the Fund is calculated by dividing the net investment income per share (as defined by securities industry regulations) earned by the Fund over a 30-day period (ending on the stated month-end date) by the maximum public offering price (“POP”) per share of the Fund on the last day of the period. This number is then annualized. This yield does not necessarily reflect income actually earned and distributed by the Fund and, therefore, may not be correlated with the dividends or other distributions paid to shareholders. The 30-Day Standardized Unsubsidized Yield does not reflect any applicable expense reductions. |
| | | | | | | | | | | | |
| | STANDARDIZED TOTAL RETURNS4 |
| | | For the period ended 9/30/12 | | One Year | | | Five Years | | Since Inception | | Inception Date |
| | Class A | | | 7.34 | % | | 5.41% | | 4.81% | | 11/3/03 |
| | Institutional | | | 11.99 | | | 6.56 | | 5.67 | | 11/3/03 |
| | Class IR | | | 11.91 | | | N/A | | 9.74 | | 7/29/11 |
| | | Separate Account Institutional | | | 11.99 | | | 6.61 | | 5.71 | | 11/3/03 |
| | 4 | | The Standardized Total Returns are average annual total returns as of the most recent calendar quarter-end. They assume reinvestment of all distributions at NAV. These returns reflect a maximum initial sales charge of 3.75% for Class A Shares. Prior to July 29, 2009, the maximum initial sales charge applicable to Class A Shares was 4.5%, which is not reflected in the average annual total return figures shown. Because Institutional, Separate Account Institutional and Class IR Shares do not involve a sales charge, such a charge is not applied to their Standardized Total Returns. |
| | | | The returns set forth in the tables above represent past performance. Past performance does not guarantee future results. The Fund’s investment return and principal value will fluctuate so that an investors share’s, when redeemed, may be worth more or less than their original cost. Current performance may be lower or higher than the performance quoted above. Please visit our web site at www.goldmansachsfunds.com to obtain the most recent month-end returns. Performance reflects fee waivers and/or expense limitations in effect. In their absence, performance would be reduced. Returns do not reflect the deduction of taxes that a shareholder would pay on Fund distributions or the redemption of Fund shares. |
25
FUND BASICS
| | | | | | | | | | |
| | EXPENSE RATIOS5 | |
| | | | | Net Expense Ratio
(Current) | | | Gross Expense Ratio
(Before Waivers) | |
| | Class A | | | 0.71 | % | | | 0.85 | % |
| | Institutional | | | 0.37 | | | | 0.51 | |
| | Class IR | | | 0.46 | | | | 0.60 | |
| | | Separate Account Institutional | | | 0.37 | | | | 0.51 | |
| | 5 | | The expense ratios of the Fund, both current (net of applicable fee waivers and/or expense limitations) and before waivers (gross of applicable fee waivers and/or expense limitations) are as set forth above according to the most recent publicly available Prospectus for the Fund and may differ from the expense ratios disclosed in the Financial Highlights in this report. The Fund’s waivers and/or expense limitations will remain in place through at least July 27, 2013, and prior to such date the investment adviser may not terminate the arrangements without the approval of the Fund’s Board of Trustees. If these arrangements are discontinued in the future, the expense ratios may change without shareholder approval. |
|
| SECTOR ALLOCATIONS6 |
| Percentage of Net Assets |
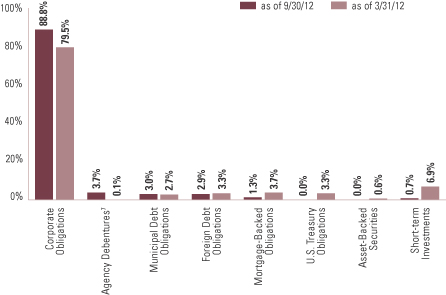
| | 6 | | The percentage shown for each investment category reflects the value of investments in that category as a percentage of net assets. Short-term investments represent repurchase agreements. Figures in the graph may not sum to 100% due to the exclusion of other assets and liabilities. The graph depicts the Fund’s investments but may not represent the Fund’s market exposure due to the exclusion of certain derivatives, if any, as listed in the Additional Investment Information section of the Schedule of Investments. |
| | 7 | | “Agency Debentures” include agency securities offered by companies such as Federal National Mortgage Association (“FNMA”) and Federal Home Loan Mortgage Corp. (“FHLMC”), which operate under a government charter. While they are required to report to a government regulator, their assets are not explicitly guaranteed by the government and they otherwise operate similarly to any other publicly traded company. |
26
FUND BASICS
| | | | | | | | | | |
| | TOP TEN INDUSTRY ALLOCATION8 | |
| | | | | Percentage of Net Assets | |
| | | | | as of 9/30/12 | | | as of 3/31/12 | |
| | Banks | | | 21.3 | % | | | 19.9 | % |
| | Energy | | | 11.3 | | | | 10.1 | |
| | Real Estate Investment Trusts | | | 8.0 | | | | 6.1 | |
| | Food & Beverage | | | 7.9 | | | | 6.8 | |
| | Pipelines | | | 4.8 | | | | 4.1 | |
| | Insurance | | | 4.1 | | | | 3.8 | |
| | Media | | | 4.0 | | | | 4.7 | |
| | Electric | | | 3.3 | | | | 3.3 | |
| | Health Care | | | 3.1 | | | | 4.3 | |
| | | Brokerage | | | 2.9 | | | | 1.6 | |
| | 8 | | The percentage shown for each investment category reflects the value of investments in that category as a percentage of net assets. The table does not include repurchase agreements of 0.7% as of 9/30/12 and 6.9% as of 3/31/12. The above table depicts the fund’s investments but may not represent the Fund’s market exposure due to the exclusion of certain derivatives, if any, as listed in the Additional Investment Information section of the Schedule of Investments. |
27
PORTFOLIO RESULTS
Goldman Sachs Local Emerging Markets Debt Fund
Investment Objective
The Fund seeks a high level of total return consisting of income and capital appreciation.
Portfolio Management Discussion and Analysis
Below, the Goldman Sachs Global Fixed Income Investment Management Team discusses the Goldman Sachs Local Emerging Markets Debt Fund’s (the “Fund”) performance and positioning for the six-month period ended September 30, 2012 (the “Reporting Period”).
| Q | | How did the Fund perform during the Reporting Period? |
| A | | During the Reporting Period, the Fund’s Class A, C, Institutional and IR Shares generated cumulative total returns, without sales charges, of 4.62%, 4.12%, 4.80% and 4.75%, respectively. These returns compare to the 3.53% cumulative total return of the Fund’s benchmark, the J.P. Morgan Government Bond Index — Emerging Markets Global Diversified Index (with dividends reinvested) (the “Index”), during the same time period. |
| Q | | What economic and market factors most influenced local emerging markets debt as a whole during the Reporting Period? |
| A | | Local emerging markets debt posted a positive return during the Reporting Period, with the appreciation of emerging market currencies driving most of the gains. Emerging market currencies rallied broadly after the U.S. Federal Reserve (the “Fed”) launched a third round of quantitative easing, dubbed QE3, in the form of a $40 billion per month stimulus program, to boost a stalling U.S. economy. As with previous rounds of Fed quantitative easing, emerging market currencies appreciated significantly, as investors borrowed cheap U.S. dollars to purchase currencies in emerging market countries that offered higher yields. Emerging market currencies, as represented by the J.P. Morgan Emerging Local Markets Plus (ELMI+) Index, returned 3.14%, while the U.S. Dollar Index, a measure of the value of the U.S. dollar against a basket of international currencies, returned -2.07%. Among countries, on a total market-value weighted basis, the top performers during the Reporting Period (in U.S. dollar terms1) were Poland (+7.41%) and Russia (+7.86%). Chile (+6.25%) and the Philippines (+4.79%) contributed the least. |
| Q | | What key factors were responsible for the Fund’s performance during the Reporting Period? |
| A | | The Fund’s relative outperformance was the result of our sector positioning as well as country and issue selection among local currency denominated bonds. Country and issue selection of external hard currency denominated debt also contributed modestly. |
| | | Our active currency management, through which the Fund invests in local currencies (accomplished through the use of forward foreign currency exchange contracts and bonds denominated in local currencies), detracted slightly from the Fund’s relative performance. |
| Q | | Which segments of local emerging markets debt most significantly affected Fund performance? |
| A | | The Fund’s holdings of Mexican local debt added to relative performance during the Reporting Period, as the Mexican central bank held interest rates steady and consumer prices increased. In addition, an investment in Brazilian local debt contributed positively, benefiting from interest rate cuts by the Brazilian central bank. The Fund’s long position in the Indian rupee, accomplished through the use of forward foreign currency exchange contracts, enhanced returns. The Fund’s investment in Russian external debt also added to relative performance. Russia is one of the few emerging market countries in which the central bank has been increasing interest rates, citing inflation concerns following larger than expected consumer price growth. |
| | | The Fund’s underweight in Polish local debt detracted, as Poland’s bond market rallied, driven by the appreciation of the Polish zloty. For the same reason, the Fund was hampered by its underweight to the Polish zloty, accomplished through the use of forward foreign currency exchange contracts. |
| | 1 | | All regional and market returns are in U.S. dollar terms (unless otherwise specified), are based on country-specific stock market indices and reflect the reinvestment of any dividends if applicable. |
28
PORTFOLIO RESULTS
| | | A slight underweight to Hungarian local debt, which outperformed early in the Reporting Period, also hindered returns. In addition, the Fund was underweight, through the use of forward foreign currency exchange contracts, the Hungarian forint because of our concern about potential Eurozone bank deleveraging. This dampened performance as the forint appreciated during the Reporting Period. |
| Q | | Did the Fund’s duration and yield curve positioning strategy help or hurt its results during the Reporting Period? |
| A | | The Fund does not use duration and yield curve positioning as active management strategies within its investment process. |
| Q | | How did the Fund use derivatives and similar instruments during the Reporting Period? |
| A | | The Fund invested in forward foreign currency exchange contracts, U.S. Treasury futures, Eurodollar futures, interest rate swaps, credit default swaps, total return swaps and credit linked notes. Forward foreign currency exchange contracts were used for hedging purposes or to express a positive view on a given currency. U.S. Treasury futures were used to manage U.S. interest rate duration. Eurodollar futures were used to express our views on the direction of interest rates and to facilitate specific duration and yield curve strategies. Eurodollar futures are contracts which have underlying assets linked to time deposits denominated in U.S. dollars at banks outside the U.S. Interest rate swaps were used to express our views on the direction of a country’s interest rates. Credit default swaps were used to implement specific credit-related investment strategies. Total return swaps and credit linked notes were used in place of buying a local currency denominated bond when a particular market was otherwise inaccessible or as a more efficient means of gaining access to a local market. |
| Q | | Were there any notable changes in the Fund’s weightings during the Reporting Period? |
| A | | During the Reporting Period, we increased the Fund’s overweighted position relative to the Index in Brazilian local debt. We shifted the Fund from an underweight compared to the Index in Thailand’s local bonds to a slight overweight. From a relatively neutral position in South Korean local debt at the beginning of the Reporting Period, we moved the Fund to an underweight position relative to the Index by the end of the Reporting Period. At the start of the Reporting Period, the Fund had a comparatively overweighted allocation to Mexican local debt, which we reduced to relatively neutral by the end of the Reporting Period. |
| Q | | How was the Fund positioned relative to its benchmark index at the end of the Reporting Period? |
| A | | At the end of the Reporting Period, the Fund had overweighted positions relative to the Index in Brazilian, Turkish and Mexican local bonds. It was also overweight compared to the Index in Venezuelan and Ivory Coast external U.S. denominated debt. The Fund held underweighted positions in Polish, Taiwanese and Indonesian local debt relative to the Index. |
| | | At the end of the Reporting Period, the Fund was overweight, through the use of forward foreign currency exchange contracts, in the Indian rupee, Mexican peso and Russian ruble. It was underweight, through the use of forward foreign currency exchange contracts, in the Bulgarian lev, Polish zloty, Hungarian forint and Czech koruna. |
| Q | | What is the Fund’s tactical view and strategy for the months ahead? |
| A | | At the end of the Reporting Period, we favored the Indian rupee because of what we consider its attractive valuations and positive carry. (A positive carry is a strategy of holding two offsetting positions, one of which creates incoming cash flow that is greater than the obligations of the other.) In our opinion, India has strong domestic prospects, and the country exhibits less risk relative to the global economic cycle than other emerging nations. However, we remain cautious, given the challenging political atmosphere in India for introducing major reforms, and we continue to monitor actions by the Indian government designed to address the perception of a “policy paralysis” within the country. These actions include lifting diesel subsidies by 12% and simplifying other fuel price controls; allowing major retailers to enter the country, an action that was cancelled earlier in 2012 and then reversed under strong internal political pressure; and selling partial stakes in government controlled enterprises. Rules about investment in broadcasting, power and civil aviation are also being simplified. We believe these actions could potentially trim the country’s budget deficit (by curbing state spending on subsidies) and dissuade rating agencies from downgrading Indian government debt. (Both Standard & Poor’s Ratings Services and Fitch Ratings placed India’s foreign currency debt rating on negative outlook earlier in 2012.) |
29
PORTFOLIO RESULTS
| | | We were cautious regarding Central and Eastern European currencies (Bulgarian lev, Polish zloty, Hungarian forint and Czech koruna) at the end of the Reporting Period. In our view, European bank deleveraging could cause these currencies to underperform as banks halt credit lines or sell assets in the region, causing hard currency to flow back into the Eurozone. |
| | | Regarding emerging market nations’ management of interest rates, we believe the process has undergone a structural shift during the last decade. Historically, emerging market countries tended to follow pro-cyclical monetary policies in which they tightened liquidity during times of stress in order to prevent currency depreciation. However, because most emerging market nations have pursued what we believe are sound economic policies in recent years and have benefited from strong economic growth, we believe they are in a position to follow counter-cyclical monetary policies. In our view, overall, their yields are more sensitive to developed market interest rates than to the behavior of the credit markets. As such, we believe local currency denominated bonds offer attractive risk profiles. |
30
FUND BASICS
Local Emerging Markets Debt Fund
as of September 30, 2012
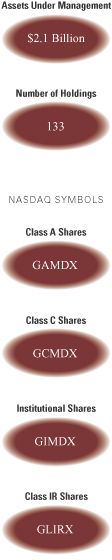
| | | | | | | | | | | | | | | | | | |
| | PERFORMANCE REVIEW | |
| | | April 1, 2012–
September 30, 2012 | | Fund Total Return
(based on NAV)1 | | | J.P. Morgan
GBI EM Global
Diversified Index2 | | | 30-Day
Standardized
Subsidized Yield3 | | | 30-Day
Standardized
Unsubsidized Yield3 | |
| | Class A | | | 4.62 | % | | | 3.53 | % | | | 4.41 | % | | | 4.30 | % |
| | Class C | | | 4.12 | | | | 3.53 | | | | 3.87 | | | | 3.76 | |
| | Institutional | | | 4.80 | | | | 3.53 | | | | 4.96 | | | | 4.84 | |
| | | Class IR | | | 4.75 | | | | 3.53 | | | | 4.86 | | | | 4.74 | |
| | 1 | | The net asset value (“NAV”) represents the net assets of the class of the Fund (ex-dividend) divided by the total number of shares of the class outstanding. The Fund’s performance assumes the reinvestment of dividends and other distributions. The Fund’s performance does not reflect the deduction of any applicable sales charges. |
| | 2 | | The J.P. Morgan Government Bond Index-Emerging Markets (GBI-EM) Global Diversified Index (with dividends reinvested) is an unmanaged index of debt instruments of 14 Emerging Countries. The Index figures do not reflect any deduction for fees, expenses or taxes. It is not possible to invest directly in an index. |
| | 3 | | The 30-Day Standardized Subsidized Yield of the Fund is calculated by dividing the net investment income per share (as defined by securities industry regulations) earned by the Fund over a 30-day period (ending on the stated month-end date) by the maximum public offering price (“POP”) per share of the Fund on the last day of the period. This number is then annualized. This yield does not necessarily reflect income actually earned and distributed by the Fund and, therefore, may not be correlated with the dividends or other distributions paid to shareholders. The 30-Day Standardized Unsubsidized Yield does not reflect any applicable expense reductions. |
| | | | | | | | | | |
| | STANDARDIZED TOTAL RETURNS4 |
| | | For the period ended 9/30/12 | | One Year | | | Since Inception | | Inception Date |
| | Class A | | | 11.14 | % | | 3.83% | | 2/15/08 |
| | Class C | | | 14.33 | | | 4.11 | | 2/15/08 |
| | Institutional | | | 16.64 | | | 5.23 | | 2/15/08 |
| | | Class IR | | | 16.67 | | | 7.33 | | 7/30/10 |
| | 4 | | The Standardized Total Returns are average annual total returns as of the most recent calendar quarter-end. They assume reinvestment of all distributions at NAV. These returns reflect a maximum initial sales charge of 4.5% for Class A Shares and the assumed contingent deferred sales charge for Class C Shares (1% if redeemed within 12 months of purchase). Because Institutional and Class IR Shares do not involve a sales charge, such a charge is not applied to their Standardized Total Returns. The Fund will charge a 2% redemption fee on the redemption of shares (including by exchange) held for 30 calendar days or less. The performance figures do not reflect the deduction of the redemption fee. If reflected, the redemption fee would reduce the performance quoted. |
| | | | The returns set forth in the tables above represent past performance. Past performance does not guarantee future results. The Fund’s investment return and principal value will fluctuate so that an investor’s shares, when redeemed, may be worth more or less than their original cost. Current performance may be lower or higher than the performance quoted above. Please visit our web site at www.goldmansachsfunds.com to obtain the most recent month-end returns. Performance reflects fee waivers and/or expense limitations in effect. In their absence, performance would be reduced. Returns do not reflect the deduction of taxes that a shareholder would pay on Fund distributions or the redemption of Fund shares. |
31
FUND BASICS
| | | | | | | | | | |
| | EXPENSE RATIOS5 | |
| | | | | Net Expense Ratio
(Current) | | | Gross Expense Ratio
(Before Waivers) | |
| | Class A | | | 1.25 | % | | | 1.38 | % |
| | Class C | | | 2.00 | | | | 2.13 | |
| | Institutional | | | 0.91 | | | | 1.04 | |
| | | Class IR | | | 1.00 | | | | 1.13 | |
| | 5 | | The expense ratios of the Fund, both current (net of applicable fee waivers and/or expense limitations) and before waivers (gross of applicable fee waivers and/or expense limitations) are as set forth above according to the most recent publicly available Prospectus for the Fund and may differ from the expense ratios disclosed in the Financial Highlights in this report. The Fund’s waivers and/or expense limitations will remain in place through at least July 27, 2013, and prior to such date the investment adviser may not terminate the arrangements without the approval of the Fund’s Board of Trustees. If these arrangements are discontinued in the future, the expense ratios may change without shareholder approval. |
| | | | | | | | | | |
| | TOP TEN COUNTRY ALLOCATION6 | |
| | | | | Percentage of Net Assets | |
| | | | | as of 9/30/12 | | | as of 3/31/12 | |
| | Turkey | | | 12.4 | % | | | 12.7 | % |
| | Thailand | | | 10.0 | | | | 7.5 | |
| | Russia | | | 8.6 | | | | 9.1 | |
| | Brazil | | | 8.3 | | | | 9.6 | |
| | Malaysia | | | 8.1 | | | | 6.4 | |
| | South Africa | | | 8.1 | | | | 7.0 | |
| | Indonesia | | | 7.1 | | | | 7.8 | |
| | Mexico | | | 5.9 | | | | 11.2 | |
| | Hungary | | | 4.0 | | | | 2.7 | |
| | | Colombia | | | 3.5 | | | | 4.7 | |
| | 6 | | The percentage shown for each investment category reflects the value of investments in that country as a percentage of net assets. The table does not include repurchase agreements of 8.9% as of 9/30/12 and 8.9% as of 3/31/12. The table depicts the Fund’s investments but may not represent the Fund’s market exposure due to the exclusion of derivatives, if any, as listed in the Additional Investment Information section of the Schedule of Investments. |
32
PORTFOLIO RESULTS
Goldman Sachs U.S. Mortgages Fund
Investment Objective
The Fund seeks a high level of total return consisting of income and capital appreciation.
Portfolio Management Discussion and Analysis
Below, the Goldman Sachs U.S. Fixed Income Investment Management Team discusses the Goldman Sachs U.S. Mortgages Fund’s (the “Fund”) performance and positioning for the six-month period ended September 30, 2012 (the “Reporting Period”).
| Q | | How did the Fund perform during the Reporting Period? |
| A | | During the Reporting Period, the Fund’s Class A, Institutional, IR and Separate Account Institutional Shares generated cumulative total returns, without sales charges, of 3.69%, 3.95%, 4.04% and 3.86%, respectively. These returns compare to the 2.37% cumulative total return of the Fund’s benchmark, the Barclays U.S. Securitized Bond Index (with dividends reinvested) (the “Index”), during the same time period. |
| Q | | What economic and market factors most influenced the U.S. mortgage markets as a whole during the Reporting Period? |
| A | | Federal Reserve (the “Fed”) policy had a material impact on the U.S. mortgage markets during the Reporting Period. During his speech at the Fed’s annual conference in Jackson Hole, Wyoming, Fed Chairman Ben Bernanke specifically addressed his concerns around the nation’s weak job market. Market participants appeared to interpret his comments as a sign that a third round of quantitative easing, dubbed QE3, was imminent. In general, they seemed to believe the Fed would embark upon a program of large-scale asset purchases, which could potentially benefit the mortgage markets. Meanwhile, the Fed continued to reinvest the proceeds of paydowns within its portfolio of mortgage-backed securities in additional purchases of mortgage-backed securities. In September, the Fed formally announced QE3 through which it planned to purchase $40 billion in agency mortgage-backed securities every month. QE3, in conjunction with the Fed’s re-investment program, substantially improved the technical landscape for the mortgage markets, particularly for agency mortgage-backed securities, during the Reporting Period. |
| Q | | What key factors were responsible for the Fund’s performance during the Reporting Period? |
| A | | Our cross-sector strategy contributed to the Fund’s relative outperformance during the Reporting Period. In our cross-sector strategy, we invest Fund assets across a variety of fixed income sectors, including some that may not be included in the Fund’s benchmark. The Fund also benefited from our bottom-up individual issue selection within the agency mortgage-backed securities and non-agency mortgage-backed securities sectors. In addition, the Fund’s yield curve and duration strategy added slightly to relative returns during the Reporting Period. Yield curve indicates the spectrum of maturities within a particular sector. Duration is a measure of the Fund’s sensitivity to changes in interest rates. |
| Q | | Which segments of the U.S. mortgage-backed securities sector most significantly affected Fund performance? |
| A | | During the Reporting Period, the Fund’s cross-sector positioning in both agency mortgage-backed securities and non-agency mortgage-backed securities added to relative returns. Specifically, the Fund benefited from an overweighted bias relative to the Index in agency mortgage-backed securities, particularly during June and July 2012. Its position in non-agency mortgage-backed securities, private-label mortgage-backed securities, was also advantageous. The valuations of non-agency mortgage-backed securities increased during the Reporting Period as the U.S. housing market improved. (Private-label mortgage-backed securities are issued by private institutions, such as investment banks, financial institutions and home builders, with underlying collateral that often includes types of mortgage loans or mortgage loan pools that do not qualify for agency mortgage-backed securities.) |
33
PORTFOLIO RESULTS
| Q | | Did the Fund’s duration and yield curve positioning strategy help or hurt its results during the Reporting Period? |
| A | | The Fund’s duration and yield curve positioning strategy added slightly to relative performance. During the Reporting Period, the Fund generally held a long duration position compared to the Index because of our concerns about slowing global growth, the potential of a Greek exit from the European Union and uncertainty about the U.S. election and fiscal cliff. |
| Q | | How did the Fund use derivatives and similar instruments during the Reporting Period? |
| A | | The Fund used U.S. Treasury futures to hedge interest rate exposure and to facilitate specific duration and yield curve strategies. It used Eurodollar futures to express our views on the direction of interest rates and to facilitate specific duration and yield curve strategies. Eurodollar futures are contracts which have underlying assets linked to time deposits denominated in U.S. dollars at banks outside the U.S. Interest rate swaps were used to hedge interest rate exposure and express an outright term structure view. (Term structure, most often depicted as a yield curve, refers to the terms structure of interest rates, which is the relationship between the yield to the maturity and the time to maturity for pure discount bonds.) The Fund employed forward contracts to hedge interest rate exposure. It used swaptions to hedge volatility and yield curve risks in the portfolio and/or to express tactical views on rate markets. The Fund held various swaptions at the end of the Reporting Period. |
| Q | | Were there any notable changes in the Fund’s weightings during the Reporting Period? |
| A | | Throughout the Reporting Period, the Fund generally held a long duration bias relative to the Index. We maintained the Fund’s exposure to non-agency mortgage-backed securities. We tactically shifted the Fund’s positioning in agency mortgage-backed securities throughout the Reporting Period. |
| Q | | How was the Fund positioned relative to its benchmark index at the end of the Reporting Period? |
| A | | At the end of the Reporting Period, the Fund was overweight relative to the Index in agency collateralized mortgage obligations (“CMOs”), non-agency mortgage-backed securities, asset-backed securities (“ABS”), commercial mortgage-backed securities (“CMBS”) and U.S. government securities. It was underweight relative to the Index in agency mortgage-backed securities and pass-through mortgage securities. (Pass-through mortgage securities consist of a pool of residential mortgage loans, where homeowners’ monthly payments of principal, interest and prepayments pass from the original bank through a government agency or investment bank to investors.) The Fund had 28.0% of its net assets invested in short-term investments at the end of the Reporting Period. |
| Q | | What is the Fund’s tactical view and strategy for the months ahead? |
| A | | In the months ahead, we expect to shift the Fund to a neutral position relative to the Index in agency mortgage-backed securities. We also expect to move the Fund to a neutral position in premium pass-through mortgage securities, as we believe the mortgage market has fully priced in the impact of increased prepayments resulting from the implementation of the U.S. administration’s Home Affordable Refinance Program (“HARP”). At the end of the Reporting Period, we were finding value in agency multi-family securities, based on attractive valuations and stable cash flows. Because of increased refinancing risk, we favored multi-family securities since their prepayment protection allows them to trade more in line with non-callable agency debentures. We maintained the Fund’s underweight to Ginnie Mae (“GNMA”) securities based on what we consider to be their expensive valuations and increased prepayment risk. |
34
FUND BASICS
U.S. Mortgages Fund
as of September 30, 2012
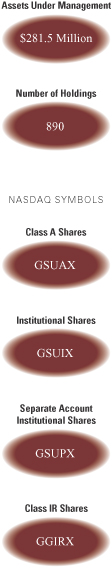
| | | | | | | | | | | | | | | | | | |
| | PERFORMANCE REVIEW | |
| | | April 1, 2012–
September 30, 2012 | | Fund Total Return
(based on NAV)1 | | | Barclays U.S.
Securitized
Bond Index2 | | | 30-Day
Standardized
Subsidized Yield3 | | | 30-Day
Standardized
Unsubsidized Yield3 | |
| | Class A | | | 3.69 | % | | | 2.37 | % | | | 0.83 | % | | | 0.64 | % |
| | Institutional | | | 3.95 | | | | 2.37 | | | | 1.20 | | | | 1.01 | |
| | Class IR | | | 4.04 | | | | 2.37 | | | | 1.44 | | | | 1.26 | |
| | | Separate Account Institutional | | | 3.86 | | | | 2.37 | | | | 1.17 | | | | 0.97 | |
| | 1 | | The net asset value (“NAV”) represents the net assets of the class of the Fund (ex-dividend) divided by the total number of shares of the class outstanding. The Fund’s performance assumes the reinvestment of dividends and other distributions. The Fund’s performance does not reflect the deduction of any applicable sales charges. |
| | 2 | | The Barclays U.S. Securitized Bond Index (with dividends reinvested) is an unmanaged composite of asset-backed securities, collateralized mortgage-backed securities and fixed rate mortgage-backed securities. The index figures do not reflect any deduction for fees, expenses or taxes. It is not possible to invest directly in an index. |
| | 3 | | The 30-Day Standardized Subsidized Yield of the Fund is calculated by dividing the net investment income per share (as defined by securities industry regulations) earned by the Fund over a 30-day period (ending on the stated month-end date) by the maximum public offering price (“POP”) per share of the Fund on the last day of the period. This number is then annualized. This yield does not necessarily reflect income actually earned and distributed by the Fund and, therefore, may not be correlated with the dividends or other distributions paid to shareholders. The 30-Day Standardized Unsubsidized Yield does not reflect any applicable expense reductions. |
| | | | | | | | | | | | |
| | STANDARDIZED TOTAL RETURNS4 |
| | | For the period ended 9/30/12 | | One Year | | | Five Years | | Since Inception | | Inception Date |
| | Class A | | | 1.79 | % | | 4.46% | | 4.29 | | 11/3/03 |
| | Institutional | | | 6.21 | | | 5.64 | | 5.15 | | 11/3/03 |
| | Class IR | | | 6.33 | | | N/A | | 6.22 | | 7/29/11 |
| | | Separate Account Institutional | | | 6.11 | | | 5.63 | | 5.16 | | 11/3/03 |
| | 4 | | The Standardized Total Returns are average annual total returns as of the most recent calendar quarter-end. They assume reinvestment of all distributions at NAV. These returns reflect a maximum initial sales charge of 3.75% for Class A Shares. Prior to July 29, 2009, the maximum initial sales charge applicable to Class A Shares was 4.5%, which is not reflected in the average annual return figures shown. Because Institutional, Separate Account Institutional and Class IR Shares do not involve a sales charge, such a charge is not applied to their Standardized Total Returns. |
| | | | The returns set forth in the tables above represent past performance. Past performance does not guarantee future results. The Fund’s investment return and principal value will fluctuate so that an investor’s shares, when redeemed, may be worth more or less than their original cost. Current performance may be lower or higher than the performance quoted above. Please visit our web site at www.goldmansachsfunds.com to obtain the most recent month-end returns. Performance reflects fee waivers and/or expense limitations in effect. In their absence, performance would be reduced. Returns do not reflect the deduction of taxes that a shareholder would pay on Fund distributions or the redemption of Fund shares. |
35
FUND BASICS
| | | | | | | | | | |
| | EXPENSE RATIOS5 | |
| | | | | Net Expense Ratio
(Current) | | | Gross Expense Ratio
(Before Waivers) | |
| | Class A | | | 0.71 | % | | | 0.91 | % |
| | Institutional | | | 0.37 | | | | 0.57 | |
| | Class IR | | | 0.46 | | | | 0.66 | |
| | | Separate Account Institutional | | | 0.37 | | | | 0.57 | |
| | 5 | | The expense ratios of the Fund, both current (net of applicable fee waivers and/or expense limitations) and before waivers (gross of applicable fee waivers and/or expense limitations) are as set forth above according to the most recent publicly available Prospectus for the Fund and may differ from the expense ratios disclosed in the Financial Highlights in this report. The Fund’s waivers and/or expense limitations will remain in place through at least July 27, 2013, and prior to such date the investment adviser may not terminate the arrangements without the approval of the Fund’s Board of Trustees. If these arrangements are discontinued in the future, the expense ratios may change without shareholder approval. |
|
| SECTOR ALLOCATIONS6 |
| Percentage of Net Assets |
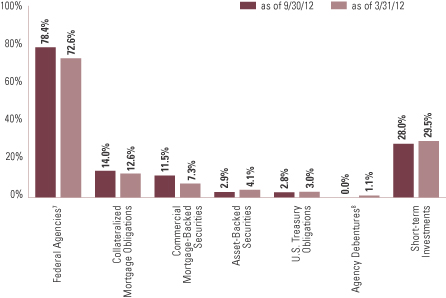
| | 6 | | The percentage shown for each investment category reflects the value of investments in that category as a percentage of net assets. Short-term investments represent repurchase agreements. Figures in the graph may not sum to 100% due to the exclusion of other assets and liabilities. The graph depicts the Fund’s investments but may not represent the Fund’s market exposure due to the exclusion of certain derivatives, if any, as listed in the Additional Investment Information section of the Schedule of Investments. |
| | 7 | | “Federal Agencies” are mortgage-backed securities guaranteed by the Government National Mortgage Association (“GNMA”), Federal National Mortgage Association (“FNMA”) and Federal Home Loan Mortgage Corp. (“FHLMC”). GNMA instruments are backed by the full faith and credit of the U.S. Government. |
| | 8 | | “Agency Debentures” include agency securities offered by companies such as FNMA and FHLMC, which operate under a government charter. While they are required to report to a government regulator, their assets are not explicitly guaranteed by the government and they otherwise operate like any other publicly traded company. |
36
GOLDMAN SACHS EMERGING MARKETS DEBT FUND
Schedule of Investments
September 30, 2012 (Unaudited)
| | | | | | | | | | | | | | |
Principal
Amount | | | Interest
Rate | | | Maturity
Date | | | Value | |
| | | | | | | | | | | | | | |
| | Sovereign Debt Obligations – 62.9% | |
| | Argentina – 2.5% | |
| Republic of Argentina (NR/NR) | |
| EUR | 7,358,894 | | | | 7.820 | % | | | 12/31/33 | | | $ | 6,146,754 | |
| $ | 4,080,333 | | | | 8.280 | | | | 12/31/33 | | | | 3,070,451 | |
| EUR | 93,162,341 | | | | 0.000 | (a) | | | 12/15/35 | | | | 14,366,189 | |
| $ | 27,630,000 | | | | 0.000 | (a) | | | 12/15/35 | | | | 3,522,825 | |
| EUR | 9,650,247 | | | | 7.820 | | | | 12/31/33 | | | | 8,060,681 | |
| $ | 25,860,000 | | | | 0.000 | (a) | | | 12/15/35 | | | | 3,400,590 | |
| | | | | | | | | | | | | | |
| | | | | | | | | | | | | 38,567,490 | |
| | |
| | Belarus – 0.5% | |
| Republic of Belarus (B-/B3) | | | | | |
| | 4,819,000 | | | | 8.750 | | | | 08/03/15 | | | | 4,764,786 | |
| | 3,520,000 | | | | 8.950 | | | | 01/26/18 | | | | 3,467,200 | |
| | | | | | | | | | | | | | |
| | | | | | | | | | | | | 8,231,986 | |
| | |
| | Belize(b) – 0.1% | |
| Government of Belize (D/Ca) | |
| | 2,520,000 | | | | 8.500 | | | | 02/20/29 | | | | 957,215 | |
| | |
| | Brazil – 1.4% | | | | | | | | | | | | | |
| Federal Republic of Brazil (BBB/Baa2) | |
| | 1,000,000 | | | | 8.875 | | | | 10/14/19 | | | | 1,450,000 | |
| | 11,310,000 | | | | 2.625 | | | | 01/05/23 | | | | 11,298,690 | |
| | 50,000 | | | | 8.250 | | | | 01/20/34 | | | | 82,250 | |
| | 1,480,000 | | | | 7.125 | | | | 01/20/37 | | | | 2,227,400 | |
| | 5,330,000 | | | | 5.625 | | | | 01/07/41 | | | | 6,809,075 | |
| | | | | | | | | | | | | | |
| | | | | | | | | | | | | 21,867,415 | |
| | |
| | Chile – 0.8% | | | | | | | | | | | | | |
| Republic of Chile (A+/Aa3) | |
| | 1,750,000 | | | | 3.875 | | | | 08/05/20 | | | | 1,972,600 | |
| | 9,231,000 | | | | 3.250 | | | | 09/14/21 | | | | 9,977,596 | |
| | | | | | | | | | | | | | |
| | | | | | | | | | | | | 11,950,196 | |
| | |
| | Colombia – 3.7% | | | | | | | | | | | | | |
| | Republic of Colombia (BBB-/Baa3) | |
| | 3,540,000 | | | | 8.250 | | | | 12/22/14 | | | | 4,097,550 | |
| | 3,368,000 | | | | 7.375 | | | | 01/27/17 | | | | 4,183,056 | |
| | 19,030,000 | | | | 7.375 | | | | 03/18/19 | | | | 25,167,175 | |
| | 4,540,000 | | | | 7.375 | | | | 09/18/37 | | | | 6,968,900 | |
| | 12,517,000 | | | | 6.125 | | | | 01/18/41 | | | | 16,960,535 | |
| | | | | | | | | | | | | | |
| | | | | | | | | | | | | 57,377,216 | |
| | |
| | Dominican Republic – 3.2% | |
| Dominican Republic (B+/B1) | |
| | 7,038,771 | | | | 9.040 | | | | 01/23/18 | | | | 7,901,021 | |
| | 3,320,000 | | | | 7.500 | (c) | | | 05/06/21 | | | | 3,735,000 | |
| | 32,912,000 | | | | 7.500 | | | | 05/06/21 | | | | 37,026,000 | |
| | 1,060,000 | | | | 8.625 | | | | 04/20/27 | | | | 1,197,800 | |
| | | | | | | | | | | | | | |
| | | | | | | | | | | | | 49,859,821 | |
| | |
| | Egypt – 0.5% | |
| Republic of Egypt (B/B2) | |
| | 7,130,000 | | | | 5.750 | | | | 04/29/20 | | | | 7,138,912 | |
| | 990,000 | | | | 6.875 | | | | 04/30/40 | | | | 977,625 | |
| | | | | | | | | | | | | | |
| | | | | | | | | | | | | 8,116,537 | |
| | |
| | | | | | | | | | | | | | |
Principal
Amount | | | Interest
Rate | | | Maturity
Date | | | Value | |
| | | | | | | | | | | | | | |
| | Sovereign Debt Obligations – (continued) | |
| | Gabon – 0.3% | |
| Republic of Gabon (BB-/NR) | |
| $ | 590,000 | | | | 8.200 | %(c) | | | 12/12/17 | | | $ | 719,063 | |
| | 3,380,000 | | | | 8.200 | | | | 12/12/17 | | | | 4,119,375 | |
| | | | | | | | | | | | | | |
| | | | | | | | | | | | | 4,838,438 | |
| | |
| | Ghana – 0.3% | |
| Republic of Ghana (B/NR) | |
| | 3,659,000 | | | | 8.500 | | | | 10/04/17 | | | | 4,294,751 | |
| | |
| | Greece(b) – 0.2% | |
| Hellenic Republic Government Bond (CCC/NR) | |
| EUR | 302,000 | | | | 2.000 | | | | 02/24/23 | | | | 102,570 | |
| | 312,000 | | | | 2.000 | | | | 02/24/24 | | | | 94,401 | |
| | 312,000 | | | | 2.000 | | | | 02/24/25 | | | | 90,939 | |
| | 302,000 | | | | 2.000 | | | | 02/24/26 | | | | 83,352 | |
| | 302,000 | | | | 2.000 | | | | 02/24/27 | | | | 80,028 | |
| | 312,000 | | | | 2.000 | | | | 02/24/28 | | | | 78,402 | |
| | 472,000 | | | | 2.000 | | | | 02/24/29 | | | | 113,664 | |
| | 452,000 | | | | 2.000 | | | | 02/24/30 | | | | 109,212 | |
| | 402,000 | | | | 2.000 | | | | 02/24/31 | | | | 99,134 | |
| | 572,000 | | | | 2.000 | | | | 02/24/32 | | | | 138,145 | |
| | 302,000 | | | | 2.000 | | | | 02/24/33 | | | | 67,866 | |
| | 1,002,000 | | | | 2.000 | | | | 02/24/34 | | | | 222,029 | |
| | 1,262,000 | | | | 2.000 | | | | 02/24/35 | | | | 272,644 | |
| | 1,082,000 | | | | 2.000 | | | | 02/24/36 | | | | 230,107 | |
| | 1,002,000 | | | | 2.000 | | | | 02/24/37 | | | | 224,046 | |
| | 2,092,000 | | | | 2.000 | | | | 02/24/38 | | | | 467,486 | |
| | 1,612,000 | | | | 2.000 | | | | 02/24/39 | | | | 333,575 | |
| | 2,202,000 | | | | 2.000 | | | | 02/24/40 | | | | 482,537 | |
| | 1,242,000 | | | | 2.000 | | | | 02/24/41 | | | | 254,542 | |
| | 592,000 | | | | 2.000 | | | | 02/24/42 | | | | 121,251 | |
| | | | | | | | | | | | | | |
| | | | | | | | | | | | | 3,665,930 | |
| | |
| | Guatemala(c) – 0.2% | |
| Republic of Guatemala (BB/Ba1) | |
| $ | 3,300,000 | | | | 5.750 | | | | 06/06/22 | | | | 3,671,250 | |
| | |
| | Hungary – 0.4% | |
| Hungary Government Bond (BB+/Ba1) | |
| EUR | 990,000 | | | | 3.500 | | | | 07/18/16 | | | | 1,187,916 | |
| | 2,950,000 | | | | 4.375 | | | | 07/04/17 | | | | 3,577,659 | |
| | 170,000 | | | | 6.000 | | | | 01/11/19 | | | | 217,639 | |
| | 237,000 | | | | 3.875 | | | | 02/24/20 | | | | 268,771 | |
| | | | | | | | | | | | | | |
| | | | | | | | | | | | | 5,251,985 | |
| | |
| | Iceland – 0.9% | |
| Republic of Iceland (BBB-/Baa3) | |
| $ | 5,730,000 | | | | 4.875 | (c) | | | 06/16/16 | | | | 5,959,583 | |
| | 2,740,000 | | | | 4.875 | | | | 06/16/16 | | | | 2,850,339 | |
| | 1,800,000 | | | | 5.875 | | | | 05/11/22 | | | | 1,945,322 | |
| | 3,250,000 | | | | 5.875 | (c) | | | 05/11/22 | | | | 3,504,998 | |
| | | | | | | | | | | | | | |
| | | | | | | | | | | | | 14,260,242 | |
| | |
| | Indonesia – 10.5% | |
| Perusahaan Penerbit SBSN (BB+/Baa3) | |
| | 5,125,000 | | | | 4.000 | | | | 11/21/18 | | | | 5,406,875 | |
| | 1,850,000 | | | | 4.000 | (c) | | | 11/21/18 | | | | 1,951,750 | |
| | |
| | |
| The accompanying notes are an integral part of these financial statements. | | 37 |
GOLDMAN SACHS EMERGING MARKETS DEBT FUND
Schedule of Investments (continued)
September 30, 2012 (Unaudited)
| | | | | | | | | | | | | | |
Principal
Amount | | | Interest
Rate | | | Maturity
Date | | | Value | |
| | | | | | | | | | | | | | |
| | Sovereign Debt Obligations – (continued) | |
| | Indonesia – (continued) | | | | | |
| Republic of Indonesia (BB+/Baa3) | |
| $ | 4,650,000 | | | | 6.750 | % | | | 03/10/14 | | | $ | 4,975,500 | |
| | 820,000 | | | | 7.500 | | | | 01/15/16 | | | | 965,550 | |
| | 580,000 | | | | 6.875 | | | | 03/09/17 | | | | 696,000 | |
| | 5,750,000 | | | | 11.625 | (c) | | | 03/04/19 | | | | 8,790,313 | |
| | 9,454,000 | | | | 11.625 | | | | 03/04/19 | | | | 14,452,802 | |
| | 11,870,000 | | | | 5.875 | | | | 03/13/20 | | | | 14,273,675 | |
| | 5,929,000 | | | | 5.875 | (c) | | | 03/13/20 | | | | 7,129,623 | |
| | 4,950,000 | | | | 4.875 | (c) | | | 05/05/21 | | | | 5,649,188 | |
| | 17,402,000 | | | | 4.875 | | | | 05/05/21 | | | | 19,860,032 | |
| | 14,950,000 | | | | 3.750 | (c) | | | 04/25/22 | | | | 15,781,417 | |
| | 8,840,000 | | | | 3.750 | | | | 04/25/22 | | | | 9,348,300 | |
| | 2,190,000 | | | | 8.500 | | | | 10/12/35 | | | | 3,462,938 | |
| | 3,440,000 | | | | 6.625 | | | | 02/17/37 | | | | 4,549,400 | |
| | 3,198,000 | | | | 7.750 | (c) | | | 01/17/38 | | | | 4,765,020 | |
| | 15,554,000 | | | | 7.750 | | | | 01/17/38 | | | | 23,175,460 | |
| | 10,650,000 | | | | 5.250 | (c) | | | 01/17/42 | | | | 12,074,437 | |
| | 4,260,000 | | | | 5.250 | | | | 01/17/42 | | | | 4,829,775 | |
| | | | | | | | | | | | | | |
| | | | | | | | | | | | | 162,138,055 | |
| | |
| Iraq – 0.7% | |
| Republic of Iraq (NR/NR) | |
| | 12,410,000 | | | | 5.800 | | | | 01/15/28 | | | | 11,386,175 | |
| | |
| Ivory Coast – 2.6% | |
| Republic of Ivory Coast (NR/NR) | |
| | 1,000,000 | | | | 3.750 | (c) | | | 12/31/32 | | | | 847,708 | |
| | 45,425,000 | | | | 3.750 | | | | 12/31/32 | | | | 38,507,150 | |
| | | | | | | | | | | | | | |
| | | | | | | | | | | | | 39,354,858 | |
| | |
| Malaysia – 0.4% | |
| Wakala Global Sukuk Bhd (A-/A3) | |
| | 5,060,000 | | | | 4.646 | | | | 07/06/21 | | | | 5,825,564 | |
| | |
| Mexico – 4.8% | |
| United Mexican States (NR/NR) | |
| MXN | 141,707,900 | | | | 0.000 | (d) | | | 10/04/12 | | | | 11,006,444 | |
| United Mexican States (A-/Baa1) | |
| | 72,942,000 | | | | 8.500 | | | | 11/18/38 | | | | 7,140,657 | |
| United Mexican States (BBB/Baa1) | |
| $ | 7,740,000 | | | | 6.375 | | | | 01/16/13 | | | | 7,836,750 | |
| | 10,570,000 | | | | 5.875 | | | | 01/15/14 | | | | 11,204,200 | |
| | 250,000 | | | | 6.625 | | | | 03/03/15 | | | | 283,000 | |
| | 1,040,000 | | | | 5.625 | | | | 01/15/17 | | | | 1,216,800 | |
| | 520,000 | | | | 5.950 | | | | 03/19/19 | | | | 644,800 | |
| | 7,340,000 | | | | 3.625 | | | | 03/15/22 | | | | 8,018,950 | |
| | 1,140,000 | | | | 6.050 | | | | 01/11/40 | | | | 1,519,050 | |
| | 22,610,000 | | | | 4.750 | | | | 03/08/44 | | | | 25,210,150 | |
| | | | | | | | | | | | | | |
| | | | | | | | | | | | | 74,080,801 | |
| | |
| Nigeria – 0.7% | |
| Republic of Nigeria (B+/NR) | |
| | 800,000 | | | | 6.750 | (c) | | | 01/28/21 | | | | 904,000 | |
| | 8,050,000 | | | | 6.750 | | | | 01/28/21 | | | | 9,096,500 | |
| | | | | | | | | | | | | | |
| | | | | | | | | | | | | 10,000,500 | |
| | |
Principal
Amount | | | Interest
Rate | | | Maturity
Date | | | Value | |
| | | | | | | | | | | | | | |
| | Sovereign Debt Obligations – (continued) | |
| Pakistan – 0.3% | |
| Islamic Republic of Pakistan (B-/Caa1) | |
| $ | 1,070,000 | | | | 6.875 | %(c) | | | 06/01/17 | | | $ | 893,450 | |
| | 1,950,000 | | | | 6.875 | | | | 06/01/17 | | | | 1,628,250 | |
| | 1,420,000 | | | | 7.875 | | | | 03/31/36 | | | | 994,000 | |
| | 1,480,000 | | | | 7.875 | | | | 03/31/36 | | | | 1,036,000 | |
| | | | | | | | | | | | | | |
| | | | | | | | | | | | | 4,551,700 | |
| | |
| Panama – 2.7% | |
| Republic of Panama (BBB/Baa3) | |
| | 6,810,000 | | | | 7.250 | | | | 03/15/15 | | | | 7,787,235 | |
| | 4,147,000 | | | | 8.875 | | | | 09/30/27 | | | | 6,697,405 | |
| | 3,610,000 | | | | 9.375 | | | | 04/01/29 | | | | 6,137,000 | |
| | 14,450,000 | | | | 6.700 | | | | 01/26/36 | | | | 20,302,250 | |
| | | | | | | | | | | | | | |
| | | | | | | | | | | | | 40,923,890 | |
| | |
| Peru – 1.9% | |
| Republic of Peru (BBB/Baa2) | |
| | 7,152,000 | | | | 7.350 | | | | 07/21/25 | | | | 10,449,073 | |
| | 7,554,000 | | | | 8.750 | | | | 11/21/33 | | | | 13,106,190 | |
| | 700,000 | | | | 6.550 | | | | 03/14/37 | | | | 1,027,250 | |
| | 3,710,000 | | | | 5.625 | | | | 11/18/50 | | | | 4,804,450 | |
| | | | | | | | | | | | | | |
| | | | | | | | | | | | | 29,386,963 | |
| | |
| Philippines – 4.8% | |
| Republic of Philippines (BB+/Ba2) | |
| | 720,000 | | | | 9.375 | | | | 01/18/17 | | | | 946,800 | |
| | 5,449,000 | | | | 8.375 | | | | 06/17/19 | | | | 7,505,997 | |
| | 8,160,000 | | | | 6.500 | | | | 01/20/20 | | | | 10,393,800 | |
| | 1,440,000 | | | | 9.500 | | | | 10/21/24 | | | | 2,332,800 | |
| | 3,990,000 | | | | 5.500 | | | | 03/30/26 | | | | 5,002,463 | |
| | 3,882,000 | | | | 9.500 | | | | 02/02/30 | | | | 6,706,155 | |
| | 7,412,000 | | | | 7.750 | | | | 01/14/31 | | | | 11,349,625 | |
| | 6,500,000 | | | | 6.375 | | | | 01/15/32 | | | | 8,791,250 | |
| | 13,026,000 | | | | 6.375 | | | | 10/23/34 | | | | 17,927,032 | |
| | 2,560,000 | | | | 5.000 | | | | 01/13/37 | | | | 3,036,800 | |
| | | | | | | | | | | | | | |
| | | | | | | | | | | | | 73,992,722 | |
| | |
| Romania – 0.5% | |
| Republic of Romania (BB+/Baa3) | |
| | 1,930,000 | | | | 6.750 | | | | 02/07/22 | | | | 2,164,012 | |
| | 4,720,000 | | | | 6.750 | (c) | | | 02/07/22 | | | | 5,292,300 | |
| | | | | | | | | | | | | | |
| | | | | | | | | | | | | 7,456,312 | |
| | |
| Russia – 3.7% | |
| Russian Federation (BBB/Baa1) | |
| | 1,200,000 | | | | 3.250 | (c) | | | 04/04/17 | | | | 1,263,000 | |
| | 900,000 | | | | 5.000 | | | | 04/29/20 | | | | 1,037,250 | |
| | 27,200,000 | | | | 4.500 | (c) | | | 04/04/22 | | | | 30,328,000 | |
| | 19,078,500 | | | | 7.500 | (b) | | | 03/31/30 | | | | 24,086,606 | |
| | | | | | | | | | | | | | |
| | | | | | | | | | | | | 56,714,856 | |
| | |
| Serbia – 0.6% | |
| Republic of Serbia (BB-/NR) | |
| | 5,833,000 | | | | 7.250 | | | | 09/28/21 | | | | 6,168,398 | |
| | 2,208,334 | | | | 6.750 | (b) | | | 11/01/24 | | | | 2,158,646 | |
| | 1,200,000 | | | | 7.250 | (c) | | | 09/28/21 | | | | 1,269,000 | |
| | | | | | | | | | | | | | |
| | | | | | | | | | | | | 9,596,044 | |
| | |
| | |
| 38 | | The accompanying notes are an integral part of these financial statements. |
GOLDMAN SACHS EMERGING MARKETS DEBT FUND
| | | | | | | | | | | | | | |
Principal
Amount | | | Interest
Rate | | | Maturity
Date | | | Value | |
| | | | | | | | | | | | | | |
| | Sovereign Debt Obligations – (continued) | |
| South Korea – 0.7% | |
| Republic of Korea (A+/Aa3) | |
| $ | 8,339,000 | | | | 7.125 | % | | | 04/16/19 | | | $ | 10,891,587 | |
| | |
| Sri Lanka – 0.3% | |
| Republic of Sri Lanka (B+/NR) | |
| | 274,000 | | | | 7.400 | | | | 01/22/15 | | | | 300,373 | |
| | 540,000 | | | | 7.400 | (c) | | | 01/22/15 | | | | 591,975 | |
| Republic of Sri Lanka (B+/B1)(c) | |
| | 1,170,000 | | | | 6.250 | | | | 07/27/21 | | | | 1,273,837 | |
| | 2,600,000 | | | | 5.875 | | | | 07/25/22 | | | | 2,796,515 | |
| | | | | | | | | | | | | | |
| | | | | | | | | | | | | 4,962,700 | |
| | |
| Turkey – 5.9% | |
| Republic of Turkey (NR/NR) | |
| TRY | 29,500,000 | | | | 0.000 | (d) | | | 09/11/13 | | | | 15,320,868 | |
| Republic of Turkey (BB/Ba1) | |
| $ | 2,370,000 | | | | 7.000 | | | | 09/26/16 | | | | 2,758,088 | |
| | 1,060,000 | | | | 7.500 | | | | 07/14/17 | | | | 1,281,275 | |
| | 6,930,000 | | | | 6.750 | | | | 04/03/18 | | | | 8,212,050 | |
| | 11,650,000 | | | | 7.000 | | | | 03/11/19 | | | | 14,242,125 | |
| | 16,675,000 | | | | 5.625 | | | | 03/30/21 | | | | 19,217,937 | |
| | 20,370,000 | | | | 6.250 | | | | 09/26/22 | | | | 24,494,925 | |
| | 4,300,000 | | | | 7.375 | | | | 02/05/25 | | | | 5,622,250 | |
| | | | | | | | | | | | | | |
| | | | | | | | | | | | | 91,149,518 | |
| | |
| Ukraine – 0.0% | |
| Financing of Infrastructural Projects State Enterprise (NR/B2) | |
| | 630,000 | | | | 7.400 | | | | 04/20/18 | | | | 560,792 | |
| | |
| Uruguay – 1.2% | |
| Republic of Uruguay (BBB-/Baa3) | |
| | 1,000,181 | | | | 8.000 | | | | 11/18/22 | | | | 1,452,763 | |
| | 3,066,000 | | | | 6.875 | | | | 09/28/25 | | | | 4,215,750 | |
| | 7,926,000 | | | | 7.625 | | | | 03/21/36 | | | | 12,344,745 | |
| | | | | | | | | | | | | | |
| | | | | | | | | | | | | 18,013,258 | |
| | |
| Venezuela – 5.2% | |
| Republic of Venezuela (B+/B2) | |
| | 820,000 | | | | 7.750 | | | | 10/13/19 | | | | 711,350 | |
| | 4,781,000 | | | | 6.000 | | | | 12/09/20 | | | | 3,609,655 | |
| | 4,740,000 | | | | 12.750 | | | | 08/23/22 | | | | 5,048,100 | |
| | 21,280,000 | | | | 9.000 | | | | 05/07/23 | | | | 18,726,400 | |
| | 40,680,000 | | | | 8.250 | | | | 10/13/24 | | | | 33,459,300 | |
| | 4,920,000 | | | | 7.650 | | | | 04/21/25 | | | | 3,849,900 | |
| | 3,160,000 | | | | 11.750 | | | | 10/21/26 | | | | 3,183,700 | |
| | 920,000 | | | | 9.250 | | | | 05/07/28 | | | | 809,600 | |
| | 10,400,000 | | | | 11.950 | | | | 08/05/31 | | | | 10,608,000 | |
| | | | | | | | | | | | | | |
| | | | | | | | | | | | | 80,006,005 | |
| | |
| Vietnam – 0.1% | |
| Socialist Republic of Vietnam (BB-/B2) | |
| | 1,270,000 | | | | 6.875 | | | | 01/15/16 | | | | 1,389,063 | |
| | 120,000 | | | | 6.750 | | | | 01/29/20 | | | | 134,100 | |
| | | | | | | | | | | | | | |
| | | | | | | | | | | | | 1,523,163 | |
| | |
Principal
Amount | | | Interest
Rate | | | Maturity
Date | | | Value | |
| | | | | | | | | | | | | | |
| | Sovereign Debt Obligations – (continued) | |
| Zambia(c) – 0.3% | |
| Republic of Zambia (B+/NR) | |
| $ | 4,430,000 | | | | 5.375 | % | | | 09/20/22 | | | $ | 4,452,150 | |
| | |
| | TOTAL SOVEREIGN DEBT OBLIGATIONS | |
| | (Cost $891,458,684) | | | | | | | | | | | $ | 969,878,085 | |
| | |
| | | | | | | | | | | | | | |
| | Foreign Debt Obligations – 1.4% | |
| Supranational – 1.4% | |
| Corporacion Andina de Fomento (A+/Aa3) | |
| $ | 10,149,000 | | | | 3.750 | % | | | 01/15/16 | | | $ | 10,668,161 | |
| | 9,664,000 | | | | 4.375 | | | | 06/15/22 | | | | 10,485,440 | |
| | |
| | TOTAL FOREIGN DEBT OBLIGATIONS | |
| | (Cost $20,228,282) | | | | | | | | | | | $ | 21,153,601 | |
| | |
| | | | | | | | | | | | | | |
| | Corporate Obligations – 26.2% | |
| Austria(e) – 0.1% | |
| OGX Austria GMBH (B/B1) | |
| $ | 281,000 | | | | 8.375 | % | | | 04/01/22 | | | $ | 242,899 | |
| | 1,580,000 | | | | 8.375 | (c) | | | 04/01/22 | | | | 1,363,385 | |
| | | | | | | | | | | | | | |
| | | | | | | | | | | | | 1,606,284 | |
| | |
| Azerbaijan – 0.3% | |
| State Oil Company of the Azerbaijan Republic (BB+/Ba1) | |
| | 4,160,000 | | | | 5.450 | | | | 02/09/17 | | | | 4,441,825 | |
| | |
| Bangladesh(c)(e) – 0.3% | |
| Digicel Group Ltd. (NR/Caa1) | |
| | 4,710,000 | | | | 8.250 | | | | 09/30/20 | | | | 4,945,500 | |
| | |
| Brazil – 2.6% | |
| Banco do Estado do Rio Grande do Sul (NR/Ba1) | |
| | 2,720,000 | | | | 7.375 | | | | 02/02/22 | | | | 3,041,805 | |
| | 6,860,000 | | | | 7.375 | (c) | | | 02/02/22 | | | | 7,656,893 | |
| CCL Finance Ltd. (BBB/Baa3)(e) | |
| | 5,458,000 | | | | 9.500 | | | | 08/15/14 | | | | 6,139,803 | |
| Companhia Energetica de Sao Paulo (NR/Ba1) | |
| BRL | 2,450,523 | | | | 9.750 | | | | 01/15/15 | | | | 1,292,079 | |
| Independencia International Ltd. (NR/NR)(c)(e)(f) | |
| $ | 1,277,436 | | | | 12.000 | | | | 12/30/16 | | | | — | |
| Petrobras International Finance Co. (BBB/A3)(e) | |
| | 4,340,000 | | | | 5.750 | | | | 01/20/20 | | | | 4,925,843 | |
| | 11,810,000 | | | | 5.375 | | | | 01/27/21 | | | | 13,311,260 | |
| Vale Overseas Ltd. (A-/Baa2) | |
| | 1,144,000 | | | | 4.625 | (e) | | | 09/15/20 | | | | 1,217,344 | |
| | 260,000 | | | | 8.250 | | | | 01/17/34 | | | | 335,341 | |
| | 870,000 | | | | 6.875 | (e) | | | 11/21/36 | | | | 1,009,272 | |
| | 1,100,000 | | | | 6.875 | (e) | | | 11/10/39 | | | | 1,285,578 | |
| | | | | | | | | | | | | | |
| | | | | | | | | | | | | 40,215,218 | |
| | |
| British Virgin Islands – 0.6% | |
| PCCW Capital No 4 Ltd. (NR/NR) | |
| | 1,070,000 | | | | 5.750 | | | | 04/17/22 | | | | 1,158,575 | |
| | |
| | |
| The accompanying notes are an integral part of these financial statements. | | 39 |
GOLDMAN SACHS EMERGING MARKETS DEBT FUND
Schedule of Investments (continued)
September 30, 2012 (Unaudited)
| | | | | | | | | | | | | | |
Principal
Amount | | | Interest
Rate | | | Maturity
Date | | | Value | |
| | | | | | | | | | | | | | |
| | Corporate Obligations – (continued) | |
| British Virgin Islands – (continued) | |
| Talent Yield Investments Ltd. (A-/Baa1) | |
| $ | 5,000,000 | | | | 4.500 | %(c) | | | 04/25/22 | | | $ | 5,388,861 | |
| | 1,890,000 | | | | 4.500 | | | | 04/25/22 | | | | 2,044,494 | |
| | | | | | | | | | | | | | |
| | | | | | | | | | | | | 8,591,930 | |
| | |
| Canada – 1.0% | |
| Nexen, Inc. (BBB-/Baa3)(e) | |
| | 1,155,000 | | | | 6.400 | | | | 05/15/37 | | | | 1,466,945 | |
| PTT Exploration and Production Public Co. Ltd. (BBB+/Baa1) | |
| | 3,080,000 | | | | 5.692 | (c) | | | 04/05/21 | | | | 3,551,659 | |
| | 3,805,000 | | | | 5.692 | | | | 04/05/21 | | | | 4,364,373 | |
| PTTEP Canada International Finance Ltd. (BBB+/Baa1) | |
| | 3,540,000 | | | | 6.350 | (c) | | | 06/12/42 | | | | 4,071,000 | |
| | 2,130,000 | | | | 6.350 | | | | 06/12/42 | | | | 2,452,503 | |
| | | | | | | | | | | | | | |
| | | | | | | | | | | | | 15,906,480 | |
| | |
| Chile – 3.0% | |
| AES Gener SA (BBB-/Baa3)(e) | |
| | 1,320,000 | | | | 5.250 | (c) | | | 08/15/21 | | | | 1,464,527 | |
| | 1,220,000 | | | | 5.250 | | | | 08/15/21 | | | | 1,353,578 | |
| Banco de Credito e Inversiones (NR/A1) | |
| | 14,250,000 | | | | 3.000 | | | | 09/13/17 | | | | 14,308,573 | |
| Banco del Estado de Chile (A+/Aa3)(e) | |
| | 4,670,000 | | | | 4.125 | (c) | | | 10/07/20 | | | | 5,037,956 | |
| | 770,000 | | | | 4.125 | | | | 10/07/20 | | | | 830,669 | |
| | 2,340,000 | | | | 3.875 | (c) | | | 02/08/22 | | | | 2,484,000 | |
| | 510,000 | | | | 3.875 | | | | 02/08/22 | | | | 542,578 | |
| Banco Santander Chile (A/Aa3)(c) | |
| | 4,760,000 | | | | 3.875 | | | | 09/20/22 | | | | 4,679,765 | |
| Corporacion Nacional del Cobre (A/A1) | |
| | 1,980,000 | | | | 7.500 | | | | 01/15/19 | | | | 2,557,262 | |
| | 1,160,000 | | | | 3.750 | (c) | | | 11/04/20 | | | | 1,237,852 | |
| | 2,410,000 | | | | 3.750 | | | | 11/04/20 | | | | 2,576,375 | |
| | 2,320,000 | | | | 3.875 | | | | 11/03/21 | | | | 2,503,312 | |
| | 1,448,000 | | | | 6.150 | | | | 10/24/36 | | | | 1,845,563 | |
| | 2,600,000 | | | | 4.250 | (c) | | | 07/17/42 | | | | 2,537,190 | |
| E-CL SA (BBB-/NR)(c)(e) | |
| | 2,490,000 | | | | 5.625 | | | | 01/15/21 | | | | 2,747,676 | |
| | | | | | | | | | | | | | |
| | | | | | | | | | | | | 46,706,876 | |
| | |
| Colombia – 2.2% | |
| Banco de Bogota SA (BBB-/Baa2)(e) | |
| | 5,534,000 | | | | 5.000 | | | | 01/15/17 | | | | 5,839,405 | |
| | 1,450,000 | | | | 5.000 | (c) | | | 01/15/17 | | | | 1,529,410 | |
| Bancolombia SA (NR/Baa2) | |
| | 2,500,000 | | | | 5.950 | (e) | | | 06/03/21 | | | | 2,808,496 | |
| Bancolombia SA (NR/Baa3) | |
| | 4,940,000 | | | | 5.125 | | | | 09/11/22 | | | | 4,968,078 | |
| Colombia Telecomunicaciones SA ESP (BB/NR)(c)(e) | |
| | 2,890,000 | | | | 5.375 | | | | 09/27/22 | | | | 2,914,720 | |
| Empresa de Energia de Bogota SA (BB+/Baa3)(e) | |
| | 4,100,000 | | | | 6.125 | (c) | | | 11/10/21 | | | | 4,492,991 | |
| | 4,627,000 | | | | 6.125 | | | | 11/10/21 | | | | 5,080,368 | |
| Empresas Publicas de Medellin ESP (NR/Baa3)(e) | |
| | 1,100,000 | | | | 7.625 | | | | 07/29/19 | | | | 1,388,790 | |
| | |
Principal
Amount | | | Interest
Rate | | | Maturity
Date | | | Value | |
| | | | | | | | | | | | | | |
| | Corporate Obligations – (continued) | |
| Colombia – (continued) | |
| Transportadora de Gas Internacional SA (BB/Baa3)(e) | |
| $ | 1,660,000 | | | | 5.700 | % | | | 03/20/22 | | | $ | 1,777,385 | |
| | 3,250,000 | | | | 5.700 | (c) | | | 03/20/22 | | | | 3,472,522 | |
| | | | | | | | | | | | | | |
| | | | | | | | | | | | | 34,272,165 | |
| | |
| Guatemala(e) – 0.1% | |
| Central American Bottling Corp. (BB/Ba2) | |
| | 200,000 | | | | 6.750 | | | | 02/09/22 | | | | 219,733 | |
| | 480,000 | | | | 6.750 | (c) | | | 02/09/22 | | | | 527,359 | |
| | | | | | | | | | | | | | |
| | | | | | | | | | | | | 747,092 | |
| | |
| Hong Kong – 0.7% | |
| China Resources Gas Group Ltd. (NR/Baa1) | |
| | 1,870,000 | | | | 4.500 | | | | 04/05/22 | | | | 2,025,659 | |
| | 2,200,000 | | | | 4.500 | (c) | | | 04/05/22 | | | | 2,378,998 | |
| Country Garden Holdings Co. Ltd. (BB-/Ba3) | |
| CNY | 6,700,000 | | | | 2.500 | | | | 02/22/13 | | | | 1,280,120 | |
| ENN Energy Holdings Ltd. (BBB-/Baa3)(e) | |
| $ | 1,010,000 | | | | 6.000 | (c) | | | 05/13/21 | | | | 1,117,872 | |
| | 429,000 | | | | 6.000 | | | | 05/13/21 | | | | 474,819 | |
| Evergrande Real Estate Group Ltd. (BB-/B2) | |
| CNY | 14,110,000 | | | | 7.500 | | | | 01/19/14 | | | | 2,122,146 | |
| $ | 400,000 | | | | 13.000 | (e) | | | 01/27/15 | | | | 400,011 | |
| Zijin International Finance Co., Ltd. (NR/A1) | |
| | 1,260,000 | | | | 4.250 | | | | 06/30/16 | | | | 1,333,207 | |
| | | | | | | | | | | | | | |
| | | | | | | | | | | | | 11,132,832 | |
| | |
| Indonesia(e) – 0.2% | |
| Berau Coal Energy Tbk Pt (BB-/B1) | |
| | 2,100,000 | | | | 7.250 | | | | 03/13/17 | | | | 1,958,250 | |
| | 1,350,000 | | | | 7.250 | (c) | | | 03/13/17 | | | | 1,268,564 | |
| | | | | | | | | | | | | | |
| | | | | | | | | | | | | 3,226,814 | |
| | |
| Ireland – 1.0% | |
| MTS International Funding Ltd. (BB/Ba2) | |
| | 10,860,000 | | | | 8.625 | | | | 06/22/20 | | | | 13,086,300 | |
| VIP Finance Ireland Ltd. for OJSC Vimpel Communications
(BB/Ba3) |
|
| | 270,000 | | | | 9.125 | | | | 04/30/18 | | | | 307,125 | |
| | 1,850,000 | | | | 7.748 | (c) | | | 02/02/21 | | | | 1,965,625 | |
| | | | | | | | | | | | | | |
| | | | | | | | | | | | | 15,359,050 | |
| | |
| Kazakhstan – 1.5% | |
| Kazakhstan Temir Zholy Finance BV (BBB-/Baa3) | |
| | 700,000 | | | | 6.375 | (c) | | | 10/06/20 | | | | 836,500 | |
| | 330,000 | | | | 6.375 | | | | 10/06/20 | | | | 394,350 | |
| Kazatomprom (NR/Baa3) | |
| | 1,780,000 | | | | 6.250 | | | | 05/20/15 | | | | 1,935,750 | |
| | 700,000 | | | | 6.250 | (c) | | | 05/20/15 | | | | 761,250 | |
| KazMunaiGaz Finance Sub BV (BBB-/Baa3) | |
| | 2,100,000 | | | | 11.750 | (c) | | | 01/23/15 | | | | 2,525,250 | |
| | 2,620,000 | | | | 11.750 | | | | 01/23/15 | | | | 3,150,550 | |
| | 1,080,000 | | | | 7.000 | (c) | | | 05/05/20 | | | | 1,323,000 | |
| | |
| | |
| 40 | | The accompanying notes are an integral part of these financial statements. |
GOLDMAN SACHS EMERGING MARKETS DEBT FUND
| | | | | | | | | | | | | | |
Principal
Amount | | | Interest
Rate | | | Maturity
Date | | | Value | |
| | | | | | | | | | | | | | |
| | Corporate Obligations – (continued) | |
| Kazakhstan – (continued) | |
| KazMunayGas National Co. (BBB-/Baa3) | |
| $ | 2,000,000 | | | | 9.125 | % | | | 07/02/18 | | | $ | 2,575,000 | |
| | 2,130,000 | | | | 7.000 | | | | 05/05/20 | | | | 2,609,250 | |
| | 2,530,000 | | | | 6.375 | (c) | | | 04/09/21 | | | | 3,036,000 | |
| | 3,170,000 | | | | 6.375 | | | | 04/09/21 | | | | 3,804,000 | |
| | | | | | | | | | | | | | |
| | | | | | | | | | | | | 22,950,900 | |
| | |
| Luxembourg – 4.2% | |
| Gaz Capital SA for Gazprom (BBB/Baa1) | |
| | 8,828,000 | | | | 9.250 | | | | 04/23/19 | | | | 11,476,400 | |
| | 4,560,000 | | | | 5.999 | (c) | | | 01/23/21 | | | | 5,158,500 | |
| | 7,850,000 | | | | 5.999 | | | | 01/23/21 | | | | 8,880,312 | |
| Gazprom International SA for Gazprom (BBB+/NR) | |
| | 871,039 | | | | 7.201 | | | | 02/01/20 | | | | 979,919 | |
| Gazprom Neft OAO Via GPN Capital SA (BBB-/Baa3)(c) | |
| | 7,340,000 | | | | 4.375 | | | | 09/19/22 | | | | 7,421,513 | |
| Gazprom OAO Via Gaz Capital SA (BBB/Baa1)(c) | |
| | 13,780,000 | | | | 4.950 | | | | 07/19/22 | | | | 14,434,550 | |
| TNK-BP Finance SA (BBB-/Baa2) | |
| | 340,000 | | | | 7.500 | | | | 07/18/16 | | | | 393,550 | |
| | 1,180,000 | | | | 6.625 | (c) | | | 03/20/17 | | | | 1,339,300 | |
| | 1,030,000 | | | | 6.625 | | | | 03/20/17 | | | | 1,169,050 | |
| | 7,150,000 | | | | 7.875 | | | | 03/13/18 | | | | 8,615,750 | |
| | 2,340,000 | | | | 7.250 | | | | 02/02/20 | | | | 2,831,400 | |
| Wind Acquisition Finance SA (BB-/B3)(e) | |
| | 1,040,000 | | | | 11.750 | (c) | | | 07/15/17 | | | | 982,800 | |
| | 1,000,000 | | | | 11.750 | | | | 07/15/17 | | | | 930,000 | |
| | | | | | | | | | | | | | |
| | | | | | | | | | | | | 64,613,044 | |
| | |
| Mexico(f) – 1.8% | |
| America Movil SAB de CV (A-/A2) | |
| | 4,000,000 | | | | 3.125 | | | | 07/16/22 | | | | 4,110,267 | |
| GEO Maquinaria (NR/NR) | |
| | 1,099,000 | | | | 9.625 | | | | 05/02/21 | | | | 1,011,359 | |
| | 1,079,375 | | | | 9.625 | (c) | | | 05/02/21 | | | | 992,266 | |
| Mexichem SAB de CV (BBB-/Ba1)(c) | |
| | 1,820,000 | | | | 4.875 | | | | 09/19/22 | | | | 1,840,405 | |
| Pemex Project Funding Master Trust (BBB/Baa1) | |
| | 10,320,000 | | | | 6.625 | | | | 06/15/35 | | | | 12,900,000 | |
| Petroleos Mexicanos (BBB/Baa1) | |
| | 512,000 | | | | 8.000 | | | | 05/03/19 | | | | 670,720 | |
| | 5,130,000 | | | | 5.500 | | | | 01/21/21 | | | | 6,002,100 | |
| | 630,000 | | | | 6.500 | | | | 06/02/41 | | | | 781,200 | |
| | | | | | | | | | | | | | |
| | | | | | | | | | | | | 28,308,317 | |
| | |
| Netherlands – 1.5% | |
| Arcos Dorados Holdings, Inc. (NR/Ba2)(e) | |
| | 1,229,000 | | | | 7.500 | | | | 10/01/19 | | | | 1,365,975 | |
| Kazakhstan Temir Zholy Finance BV (BBB-/Baa3) | |
| | 3,200,000 | | | | 6.950 | (c) | | | 07/10/42 | | | | 3,819,525 | |
| | 1,100,000 | | | | 6.950 | | | | 07/10/42 | | | | 1,309,000 | |
| Listrindo Capital BV (BB-/Ba2)(e) | |
| | 3,560,000 | | | | 6.950 | | | | 02/21/19 | | | | 3,880,400 | |
| | 1,290,000 | | | | 6.950 | (c) | | | 02/21/19 | | | | 1,422,098 | |
| Republic of Angola Via Northern Lights III BV (BB-/Ba3) | |
| | 4,800,000 | | | | 7.000 | | | | 08/16/19 | | | | 5,262,000 | |
| | |
Principal
Amount | | | Interest
Rate | | | Maturity
Date | | | Value | |
| | | | | | | | | | | | | | |
| | Corporate Obligations – (continued) | |
| Netherlands – (continued) | |
| VimpelCom Holdings BV (BB/Ba3) | |
| $ | 1,180,000 | | | | 7.504 | %(c) | | | 03/01/22 | | | $ | 1,230,150 | |
| | 4,260,000 | | | | 7.504 | | | | 03/01/22 | | | | 4,441,050 | |
| | | | | | | | | | | | | | |
| | | | | | | | | | | | | 22,730,198 | |
| | |
| Peru(e) – 0.5% | |
| Corp Financiera de Desarrollo SA (BBB/NR) | |
| | 2,430,000 | | | | 4.750 | | | | 02/08/22 | | | | 2,710,740 | |
| | 1,415,000 | | | | 4.750 | (c) | | | 02/08/22 | | | | 1,575,103 | |
| Corp Lindley S.A. (BB+/NR) | |
| | 1,070,000 | | | | 6.750 | | | | 11/23/21 | | | | 1,201,429 | |
| | 880,000 | | | | 6.750 | (c) | | | 11/23/21 | | | | 986,397 | |
| Volcan Cia Minera SAA (BBB-/Baa3) | |
| | 1,010,000 | | | | 5.375 | | | | 02/02/22 | | | | 1,092,063 | |
| | 760,000 | | | | 5.375 | (c) | | | 02/02/22 | | | | 821,750 | |
| | | | | | | | | | | | | | |
| | | | | | | | | | | | | 8,387,482 | |
| | |
| Philippines – 0.3% | |
| Development Bank of Philippines (BB+/NR) | |
| | 1,610,000 | | | | 5.500 | | | | 03/25/21 | | | | 1,795,150 | |
| Energy Development Corp. (NR/NR) | |
| | 1,820,000 | | | | 6.500 | | | | 01/20/21 | | | | 1,974,700 | |
| | | | | | | | | | | | | | |
| | | | | | | | | | | | | 3,769,850 | |
| | |
| Qatar(e) – 0.2% | |
| Ras Laffan Liquefied Natural Gas Co. Ltd. II (A/Aa3) | |
| | 2,393,430 | | | | 5.298 | | | | 09/30/20 | | | | 2,692,609 | |
| Ras Laffan Liquefied Natural Gas Co. Ltd. III (A/Aa3) | |
| | 180,000 | | | | 5.500 | (c) | | | 09/30/14 | | | | 193,950 | |
| | 177,775 | | | | 5.832 | | | | 09/30/16 | | | | 194,219 | |
| | | | | | | | | | | | | | |
| | | | | | | | | | | | | 3,080,778 | |
| | |
| Russia(c) – 0.1% | |
| Novolipetsk Steel OJSC (BBB-/Baa3) | |
| | 1,520,000 | | | | 4.950 | | | | 09/26/19 | | | | 1,506,541 | |
| | |
| Singapore(e) – 0.1% | |
| Berau Capital Resources Pte, Ltd. (BB-/B1) | |
| | 1,340,000 | | | | 12.500 | | | | 07/08/15 | | | | 1,420,400 | |
| | |
| South Africa – 0.8% | |
| Peermont Proprietary Global Ltd. (B-/B3)(e) | |
| EUR | 5,700,000 | | | | 7.750 | | | | 04/30/14 | | | | 7,019,853 | |
| Transnet SOC Ltd. (BBB+/A3)(c) | |
| $ | 4,440,000 | | | | 4.000 | | | | 07/26/22 | | | | 4,484,400 | |
| | | | | | | | | | | | | | |
| | | | | | | | | | | | | 11,504,253 | |
| | |
| Thailand(c)(e) – 0.2% | |
| Bangkok Bank PCL (BBB+/A3) | |
| | 1,820,000 | | | | 3.875 | | | | 09/27/22 | | | | 1,818,704 | |
| PTT Global Chemical PCL (BBB/Baa2) | |
| | 1,800,000 | | | | 4.250 | | | | 09/19/22 | | | | 1,832,996 | |
| | | | | | | | | | | | | | |
| | | | | | | | | | | | | 3,651,700 | |
| | |
| | |
| The accompanying notes are an integral part of these financial statements. | | 41 |
GOLDMAN SACHS EMERGING MARKETS DEBT FUND
Schedule of Investments (continued)
September 30, 2012 (Unaudited)
| | | | | | | | | | | | | | |
Principal
Amount | | | Interest
Rate | | | Maturity
Date | | | Value | |
| | | | | | | | | | | | | | |
| | Corporate Obligations – (continued) | |
| Turkey – 0.6% | |
| Export Credit Bank of Turkey (BB/Ba1) | |
| $ | 2,150,000 | | | | 5.375 | %(c) | | | 11/04/16 | | | $ | 2,305,875 | |
| | 2,240,000 | | | | 5.375 | | | | 11/04/16 | | | | 2,402,400 | |
| | 600,000 | | | | 5.875 | | | | 04/24/19 | | | | 660,000 | |
| | 1,430,000 | | | | 5.875 | (c) | | | 04/24/19 | | | | 1,575,329 | |
| Turkiye Halk Bankasi AS (NR/Baa2)(c) | |
| | 2,490,000 | | | | 4.875 | | | | 07/19/17 | | | | 2,539,774 | |
| | | | | | | | | | | | | | |
| | | | | | | | | | | | | 9,483,378 | |
| | |
| Ukraine – 0.1% | |
| Financing of Infrastructural Projects State Enterprise (NR/B2) | |
| | 1,260,000 | | | | 8.375 | | | | 11/03/17 | | | | 1,170,761 | |
| | |
| United Arab Emirates – 0.8% | |
| Dolphin Energy Ltd. (NR/A1) | |
| | 3,633,816 | | | | 5.888 | (e) | | | 06/15/19 | | | | 4,115,296 | |
| | 2,210,000 | | | | 5.500 | | | | 12/15/21 | | | | 2,555,865 | |
| | 377,789 | | | | 5.888 | (c)(e) | | | 06/15/19 | | | | 427,846 | |
| Dubai Holding Commercial Operations MTN Ltd. (NR/B2) | |
| EUR | 1,050,000 | | | | 4.750 | | | | 01/30/14 | | | | 1,295,330 | |
| GBP | 1,450,000 | | | | 6.000 | | | | 02/01/17 | | | | 2,159,996 | |
| National Bank of Abu Dhabi (A+/Aa3) | |
| $ | 1,530,000 | | | | 3.000 | | | | 08/13/19 | | | | 1,530,000 | |
| | | | | | | | | | | | | | |
| | | | | | | | | | | | | 12,084,333 | |
| | |
| Venezuela(e) – 1.4% | |
| Petroleos de Venezuela SA (B+/NR) | |
| | 8,841,900 | | | | 5.250 | | | | 04/12/17 | | | | 6,962,996 | |
| | 4,020,000 | | | | 8.500 | | | | 11/02/17 | | | | 3,628,050 | |
| | 10,090,000 | | | | 9.000 | | | | 11/17/21 | | | | 8,626,950 | |
| | 3,720,000 | | | | 5.375 | | | | 04/12/27 | | | | 2,306,400 | |
| | 310,000 | | | | 5.500 | | | | 04/12/37 | | | | 188,325 | |
| | | | | | | | | | | | | | |
| | | | | | | | | | | | | 21,712,721 | |
| | |
| | TOTAL CORPORATE OBLIGATIONS | | | | | |
| | (Cost $386,245,051) | | | | | | | | | | | $ | 403,526,722 | |
| | |
| | | | | | | | | | | | | | |
| | Structured Notes – 1.8% | |
| Brazil – 1.2% | |
| Notas do Tesouro Nacional (Issuer Credit Suisse Nassau)
(NR/NR) |
|
| BRL | 8,286,681 | | | | 6.000 | % | | | 08/19/40 | | | $ | 5,198,339 | |
| Notas do Tesouro Nacional Series B (Issuer HSBC Corp.)
(NR/NR) |
|
| | 21,152,843 | | | | 6.000 | | | | 08/15/40 | | | | 13,269,444 | |
| | | | | | | | | | | | | | |
| | | | | | | | | | | | | 18,467,783 | |
| | |
| Nigeria(c)(d) – 0.6% | |
| Nigeria Government International Bond (Issuer HSBC Corp.)
(NR/NR) |
|
| NGN | 1,491,000,000 | | | | 0.000 | | | | 08/12/13 | | | | 8,466,607 | |
| | |
| | TOTAL STRUCTURED NOTES | |
| | (Cost $25,693,680) | | | | | | | | | | | $ | 26,934,390 | |
| | |
Principal
Amount | | | Interest
Rate | | | Maturity
Date | | | Value | |
| | | | | | | | | | | | | | |
| | U.S. Treasury Obligation(g) – 1.2% | |
| United States – 1.2% | |
| United States Treasury Note (NR/NR) | |
| $ | 19,100,000 | | | | 0.125 | % | | | 12/31/13 | | | $ | 19,079,944 | |
| | (Cost $19,069,990) | | | | | | | | | | | | | |
| | |
| TOTAL INVESTMENTS BEFORE SHORT-TERM
INVESTMENT |
|
| | (Cost $1,342,695,687) | | | $ | 1,440,572,742 | |
| | |
| | | | | | | | | | | | | | |
| | Short-term Investments – 6.2% | |
| Certificates of Deposit – 0.3% | |
| Banco del Estado de Chile (NR/NR) | |
| $ | 4,700,000 | | | | 0.280 | % | | | 10/19/12 | | | $ | 4,700,000 | |
| | |
| Repurchase Agreement(h) – 5.9% | |
| Joint Repurchase Agreement Account II | |
| | 91,600,000 | | | | 0.245 | | | | 10/01/12 | | | | 91,600,000 | |
| | |
| | TOTAL SHORT-TERM INVESTMENTS – 6.2% | |
| | (Cost $96,300,000) | | | | | | | | | | | $ | 96,300,000 | |
| | |
| | TOTAL INVESTMENTS – 99.7% | | | | | |
| | (Cost $1,438,995,687) | | | | | | | $ | 1,536,872,742 | |
| | |
| OTHER ASSETS IN EXCESS OF
LIABILITIES – 0.3% |
| | | 4,789,956 | |
| | |
| | NET ASSETS – 100.0% | | | | | | | $ | 1,541,662,698 | |
| | |
| | |
| The percentage shown for each investment category reflects the value of investments in that category as a percentage of net assets. |
(a) | | Variable rate security. Interest rate disclosed is that which is in effect at September 30, 2012. |
(b) | | Coupon increases periodically based upon a predetermined schedule. Stated interest rate in effect at September 30, 2012. |
(c) | | Exempt from registration under Rule 144A of the Securities Act of 1933. Under procedures approved by the Board of Trustees, such securities have been determined to be liquid by the investment adviser and may be resold, normally to qualified institutional buyers in transactions exempt from registration. Total market value of Rule 144A securities amounts to $266,136,281, which represents approximately 17.3% of net assets as of September 30, 2012. |
(d) | | Issued with a zero coupon. Income is recognized through the accretion of discount. |
(e) | | Security with “Call” features with resetting interest rates. Maturity dates disclosed are the final maturity dates. |
(f) | | Security is currently in default and/or non-income producing. |
(g) | | All or a portion of security is segregated as collateral for initial margin requirement on futures transactions. |
(h) | | Joint repurchase agreement was entered into on September 28, 2012. Additional information appears on page 95. |
| | |
| 42 | | The accompanying notes are an integral part of these financial statements. |
GOLDMAN SACHS EMERGING MARKETS DEBT FUND
Security ratings disclosed, if any, are obtained from by Standard & Poor’s/Moody’s Investor Service. A brief description of the ratings is available in the Fund’s Statement of Additional Information.
| | |
|
Currency Abbreviations: |
BRL | | —Brazilian Real |
CNY | | —Chinese Yuan |
COP | | —Colombian Peso |
EUR | | —Euro |
GBP | | —British Pound |
ILS | | —Israeli Shekel |
INR | | —Indian Rupee |
JPY | | —Japanese Yen |
MXN | | —Mexican Peso |
MYR | | —Malaysian Ringgit |
NGN | | —Nigerian Naira |
PHP | | —Philippine Peso |
RUB | | —Russian Ruble |
TRY | | —Turkish Lira |
ZAR | | —South African Rand |
| | |
Investment Abbreviations: |
MTN | | —Medium Term Note |
NR | | —Not Rated |
|
| | |
| The accompanying notes are an integral part of these financial statements. | | 43 |
GOLDMAN SACHS EMERGING MARKETS DEBT FUND
Schedule of Investments (continued)
September 30, 2012 (Unaudited)
|
| ADDITIONAL INVESTMENT INFORMATION |
FORWARD FOREIGN CURRENCY EXCHANGE CONTRACTS — At September 30, 2012, the Fund had the following forward foreign currency exchange contracts:
FORWARD FOREIGN CURRENCY EXCHANGE CONTRACTS WITH UNREALIZED GAIN
| | | | | | | | | | | | | | |
| Counterparty | | Contracts to
Buy/Sell | | Settlement
Date
| | | Current
Value | | | Unrealized
Gain | |
Barclays Bank PLC | | JPY/USD | | | 12/19/12 | | | $ | 1,917,052 | | | $ | 19,052 | |
| | MYR/USD | | | 10/30/12 | | | | 7,365,709 | | | | 35,770 | |
| | USD/ZAR | | | 12/19/12 | | | | 7,140,554 | | | | 49,925 | |
Citibank NA | | RUB/USD | | | 10/22/12 | | | | 1,915,862 | | | | 2,862 | |
| | USD/JPY | | | 12/19/12 | | | | 7,213,132 | | | | 37,711 | |
| | USD/RUB | | | 10/11/12 | | | | 10,985,361 | | | | 259,639 | |
Credit Suisse International (London) | | MXN/USD | | | 12/19/12 | | | | 7,531,592 | | | | 77,592 | |
| | RUB/USD | | | 10/09/12 | | | | 3,826,845 | | | | 120,845 | |
| | USD/TRY | | | 12/19/12 | | | | 3,787,920 | | | | 7,080 | |
Deutsche Bank AG (London) | | INR/USD | | | 10/04/12 | | | | 4,263,615 | | | | 225,059 | |
| | INR/USD | | | 10/10/12 | | | | 11,170,717 | | | | 635,432 | |
| | INR/USD | | | 10/18/12 | | | | 11,517,641 | | | | 127,974 | |
| | MYR/USD | | | 10/19/12 | | | | 5,274,097 | | | | 3,622 | |
| | MYR/USD | | | 10/30/12 | | | | 4,406,580 | | | | 2,156 | |
| | USD/EUR | | | 12/19/12 | | | | 44,209,274 | | | | 204,457 | |
| | USD/MXN | | | 12/19/12 | | | | 1,905,025 | | | | 7,975 | |
| | USD/TRY | | | 09/27/13 | | | | 14,565,582 | | | | 100,105 | |
HSBC Bank PLC | | CNY/USD | | | 02/04/13 | | | | 6,999,088 | | | | 31,088 | |
| | INR/USD | | | 10/18/12 | | | | 7,525,386 | | | | 155,048 | |
| | MXN/JPY | | | 12/19/12 | | | | 1,414,460 | | | | 7,088 | |
| | RUB/USD | | | 10/11/12 | | | | 20,626,630 | | | | 722,513 | |
| | USD/MXN | | | 12/19/12 | | | | 1,912,572 | | | | 428 | |
JPMorgan Securities, Inc. | | ILS/USD | | | 12/19/12 | | | | 1,702,982 | | | | 44,914 | |
| | TRY/USD | | | 12/19/12 | | | | 6,712,051 | | | | 14,555 | |
| | USD/BRL | | | 10/11/12 | | | | 906,612 | | | | 14 | |
| | USD/EUR | | | 12/19/12 | | | | 3,666,889 | | | | 82,176 | |
Morgan Stanley & Co. | | USD/EUR | | | 12/19/12 | | | | 1,893,252 | | | | 13,665 | |
Royal Bank of Scotland PLC | | INR/USD | | | 10/10/12 | | | | 15,665,133 | | | | 811,629 | |
| | INR/USD | | | 10/18/12 | | | | 11,756,380 | | | | 394,380 | |
| | INR/USD | | | 11/06/12 | | | | 4,234,830 | | | | 26,879 | |
| | USD/TRY | | | 12/19/12 | | | | 2,741,899 | | | | 13,101 | |
State Street Bank | | MXN/USD | | | 12/19/12 | | | | 6,141,840 | | | | 96,096 | |
UBS AG (London) | | BRL/USD | | | 10/05/12 | | | | 1,873,570 | | | | 24,570 | |
| | BRL/USD | | | 10/19/12 | | | | 3,801,742 | | | | 6,742 | |
| | RUB/USD | | | 10/11/12 | | | | 11,460,326 | | | | 215,326 | |
| | RUB/USD | | | 10/22/12 | | | | 3,799,163 | | | | 4,163 | |
| | | USD/MXN | | | 12/19/12 | | | | 3,837,427 | | | | 11,573 | |
| TOTAL | | | | | | | | | | | | $ | 4,593,204 | |
| | |
| 44 | | The accompanying notes are an integral part of these financial statements. |
GOLDMAN SACHS EMERGING MARKETS DEBT FUND
|
| ADDITIONAL INVESTMENT INFORMATION (continued) |
FORWARD FOREIGN CURRENCY EXCHANGE CONTRACTS WITH UNREALIZED LOSS
| | | | | | | | | | | | | | |
| Counterparty | | Contracts to
Buy/Sell | | Settlement
Date
| | | Current
Value | | | Unrealized
Loss | |
Bank of America NA | | COP/USD | | | 10/17/12 | | | $ | 2,844,711 | | | $ | (5,088 | ) |
Citibank NA | | EUR/USD | | | 12/19/12 | | | | 7,444,389 | | | | (153,576 | ) |
| | PHP/USD | | | 10/15/12 | | | | 3,787,296 | | | | (704 | ) |
| | USD/BRL | | | 10/11/12 | | | | 18,682,799 | | | | (249,361 | ) |
| | USD/INR | | | 10/18/12 | | | | 1,930,159 | | | | (17,159 | ) |
| | USD/JPY | | | 12/19/12 | | | | 6,131,808 | | | | (68,208 | ) |
| | USD/RUB | | | 10/09/12 | | | | 1,952,582 | | | | (36,716 | ) |
Credit Suisse International (London) | | RUB/USD | | | 10/17/12 | | | | 12,553,094 | | | | (137,376 | ) |
| | USD/TRY | | | 12/19/12 | | | | 7,653,263 | | | | (23,262 | ) |
Deutsche Bank AG (London) | | ILS/USD | | | 12/19/12 | | | | 7,485,847 | | | | (11,153 | ) |
| | MYR/USD | | | 10/19/12 | | | | 7,541,569 | | | | (32,431 | ) |
| | PHP/USD | | | 10/15/12 | | | | 1,896,633 | | | | (5,367 | ) |
| | USD/INR | | | 10/18/12 | | | | 7,750,040 | | | | (181,040 | ) |
HSBC Bank PLC | | PHP/USD | | | 10/17/12 | | | | 7,499,275 | | | | (74,725 | ) |
| | USD/MXN | | | 12/19/12 | | | | 7,784,792 | | | | (29,711 | ) |
JPMorgan Securities, Inc. | | BRL/USD | | | 10/19/12 | | | | 1,858,542 | | | | (2,855 | ) |
| | MXN/USD | | | 12/19/12 | | | | 13,277,053 | | | | (80,797 | ) |
| | TRY/USD | | | 12/19/12 | | | | 18,909,000 | | | | (27,000 | ) |
| | USD/CNY | | | 02/04/13 | | | | 3,291,832 | | | | (19,751 | ) |
| | USD/EUR | | | 10/12/12 | | | | 32,809,869 | | | | (768,259 | ) |
Royal Bank of Canada | | BRL/USD | | | 10/17/12 | | | | 7,566,674 | | | | (9,326 | ) |
| | ZAR/USD | | | 12/19/12 | | | | 3,783,257 | | | | (65,743 | ) |
Royal Bank of Scotland PLC | | USD/INR | | | 10/04/12 | | | | 4,263,615 | | | | (39,078 | ) |
| | USD/INR | | | 10/18/12 | | | | 3,585,507 | | | | (93,507 | ) |
State Street Bank | | MXN/USD | | | 12/19/12 | | | | 16,975,872 | | | | (78,128 | ) |
UBS AG (London) | | ZAR/USD | | | 12/19/12 | | | | 3,357,298 | | | | (28,096 | ) |
| TOTAL | | | | | | | | | | | | $ | (2,238,417 | ) |
FUTURES CONTRACTS — At September 30, 2012, the Fund had the following futures contracts:
| | | | | | | | | | | | | | |
| Type | | Number of
Contracts
Long (Short) | | | Expiration
Date | | Current
Value | | | Unrealized
Gain (Loss) | |
Eurodollars | | | 225 | | | September 2014 | | $ | 55,977,188 | | | $ | 89,435 | |
Eurodollars | | | (225 | ) | | September 2015 | | | (55,816,875 | ) | | | (141,991 | ) |
Ultra Long U.S. Treasury Bonds | | | (314 | ) | | December 2012 | | | (51,878,688 | ) | | | (224,803 | ) |
2 Year U.S. Treasury Notes | | | 188 | | | December 2012 | | | 41,459,875 | | | | 19,620 | |
5 Year U.S. Treasury Notes | | | 941 | | | December 2012 | | | 117,279,477 | | | | 382,393 | |
10 Year U.S. Treasury Notes | | | 752 | | | December 2012 | | | 100,380,250 | | | | 537,451 | |
30 Year U.S. Treasury Bonds | | | 553 | | | December 2012 | | | 82,604,375 | | | | (381,773 | ) |
| TOTAL | | | | | | | | | | | | $ | 280,332 | |
| | |
| The accompanying notes are an integral part of these financial statements. | | 45 |
GOLDMAN SACHS EMERGING MARKETS DEBT FUND
Schedule of Investments (continued)
September 30, 2012 (Unaudited)
|
| ADDITIONAL INVESTMENT INFORMATION (continued) |
SWAP CONTRACTS — At September 30, 2012, the Fund had the following swap contracts:
INTEREST RATE SWAP CONTRACTS
| | | | | | | | | | | | | | | | | | | | |
| | | | | | | | | | | | Rates Exchanged | | | |
| Counterparty | | | | | Notional
Amount
(000s) | | | Termination
Date | | | Payments
Received | | Payments
Made | | Unrealized
Gain (Loss)* | |
Bank of America Securities LLC | | | BRL | | | | 11,950 | | | | 01/02/14 | | | 7.750% | | 1 month Brazilian
Interbank Deposit Average | | $ | 3,673 | |
| | | | | | | 70,000 | | | | 01/02/14 | | | 7.775 | | 1 month Brazilian
Interbank Deposit Average | | | 32,774 | |
| | | | | | | 70,000 | | | | 01/02/14 | | | 7.760 | | 1 month Brazilian
Interbank Deposit Average | | | 32,783 | |
Barclays Bank PLC | | | | | | | 5,110 | | | | 01/02/14 | | | 7.780 | | 1 month Brazilian
Interbank Deposit Average | | | 2,323 | |
Deutsche Bank Securities, Inc. | | | | | | | 3,380 | | | | 01/02/14 | | | 7.770 | | 1 month Brazilian
Interbank Deposit Average | | | 1,363 | |
| | | | | | | 34,680 | | | | 01/02/14 | | | 7.740 | | 1 month Brazilian
Interbank Deposit Average | | | 8,874 | |
| | | | | | | | 68,180 | | | | 01/02/14 | | | 7.765 | | 1 month Brazilian
Interbank Deposit Average | | | 31,928 | |
| TOTAL | | | | | | | | | | | | | | | | | | $ | 113,718 | |
| | * | | There are no upfront payments on the swap contract(s), therefore the unrealized gain (loss) of the swap contracts is equal to their market value. |
| | |
| 46 | | The accompanying notes are an integral part of these financial statements. |
GOLDMAN SACHS HIGH YIELD FUND
Schedule of Investments
September 30, 2012 (Unaudited)
| | | | | | | | | | | | | | |
Principal
Amount | | | Interest
Rate | | | Maturity
Date | | | Value | |
| | | | | | | | | | | | | | |
| | Corporate Obligations – 91.2% | |
| Aerospace – 0.4% | |
| Spirit AeroSystems, Inc. (BB-/Ba3) | |
| $ | 3,000,000 | | | | 7.500 | % | | | 10/01/17 | | | $ | 3,232,500 | |
| | 4,900,000 | | | | 6.750 | | | | 12/15/20 | | | | 5,341,000 | |
| TransDigm, Inc. (B-/B3) | |
| | 12,000,000 | | | | 7.750 | | | | 12/15/18 | | | | 13,275,000 | |
| | | | | | | | | | | | | | |
| | | | | | | | | | | | | 21,848,500 | |
| | |
| Airlines(a) – 0.4% | |
| Air Canada (B+/B2) | |
| | 20,500,000 | | | | 9.250 | | | | 08/01/15 | | | | 21,294,375 | |
| Delta Air Lines, Inc. (BB-/Ba2) | |
| | 5,654,000 | | | | 9.500 | | | | 09/15/14 | | | | 5,936,700 | |
| | | | | | | | | | | | | | |
| | | | | | | | | | | | | 27,231,075 | |
| | |
| Automotive – 1.4% | |
| Ford Motor Credit Co. LLC (BB+/Baa3) | |
| | 19,750,000 | | | | 7.000 | | | | 04/15/15 | | | | 22,112,383 | |
| | 8,000,000 | | | | 12.000 | | | | 05/15/15 | | | | 9,934,969 | |
| | 20,000,000 | | | | 8.000 | | | | 12/15/16 | | | | 24,100,002 | |
| | 1,400,000 | | | | 4.250 | | | | 02/03/17 | | | | 1,482,909 | |
| | 8,700,000 | | | | 6.625 | | | | 08/15/17 | | | | 10,088,359 | |
| General Motors Financial Co., Inc. (BB-/Ba3) | |
| | 5,400,000 | | | | 4.750 | (a) | | | 08/15/17 | | | | 5,562,000 | |
| | 8,250,000 | | | | 6.750 | | | | 06/01/18 | | | | 9,178,125 | |
| General Motors Liquidation Co. (NR/NR)(b) | |
| | 7,125,000 | | | | 7.125 | | | | 07/15/13 | | | | — | |
| | 2,000,000 | | | | 7.700 | | | | 04/15/16 | | | | — | |
| | 1,000,000 | | | | 8.800 | | | | 03/01/49 | | | | — | |
| | 14,500,000 | | | | 8.375 | | | | 07/15/49 | | | | — | |
| | | | | | | | | | | | | | |
| | | | | | | | | | | | | 82,458,747 | |
| | |
| Automotive Parts – 2.2% | |
| Accuride Corp. (B/B2) | |
| | 16,350,000 | | | | 9.500 | | | | 08/01/18 | | | | 16,758,750 | |
| Allison Transmission, Inc. (B-/B3)(a) | |
| | 11,750,000 | | | | 7.125 | | | | 05/15/19 | | | | 12,631,250 | |
| American Axle & Manufacturing Holdings, Inc. (B/B2) | |
| | 100,000 | | | | 7.875 | | | | 03/01/17 | | | | 104,000 | |
| American Axle & Manufacturing Holdings, Inc. (BB/Ba1)(a) | |
| | 9,000,000 | | | | 9.250 | | | | 01/15/17 | | | | 10,012,500 | |
| American Axle & Manufacturing, Inc. (B/B2) | |
| | 7,500,000 | | | | 7.750 | | | | 11/15/19 | | | | 8,231,250 | |
| | 6,250,000 | | | | 6.625 | | | | 10/15/22 | | | | 6,328,125 | |
| American Tire Distributors Holdings, Inc. (B-/B2) | |
| | 8,625,000 | | | | 9.750 | | | | 06/01/17 | | | | 9,185,625 | |
| ArvinMeritor, Inc. (B-/B3) | |
| | 4,550,000 | | | | 10.625 | | | | 03/15/18 | | | | 4,823,000 | |
| Mark IV USA Lux SCA/Mark IV USA SCA (BB-/Ba3) | |
| | EUR4,500,000 | | | | 8.875 | | | | 12/15/17 | | | | 6,129,687 | |
| Meritor, Inc. (B-/B3) | |
| $ | 940,000 | | | | 8.125 | | | | 09/15/15 | | | | 989,350 | |
| Meritor, Inc. (B-/NR)(c)(d) | |
| | 6,250,000 | | | | 4.625 | | | | 03/01/16 | | | | 5,587,500 | |
| | 2,150,000 | | | | 4.000 | | | | 02/15/19 | | | | 1,578,573 | |
| Navistar International Corp. (CCC+/B2) | |
| | 18,550,000 | | | | 8.250 | | | | 11/01/21 | | | | 17,622,500 | |
| | |
Principal
Amount | | | Interest
Rate | | | Maturity
Date | | | Value | |
| | | | | | | | | | | | | | |
| | Corporate Obligations – (continued) | |
| Automotive Parts – (continued) | |
| Navistar International Corp. (CCC+/NR) | |
| $ | 4,800,000 | | | | 3.000 | % | | | 10/15/14 | | | $ | 4,262,880 | |
| Schaeffler Finance BV (B+/Ba3)(a) | |
| | 6,200,000 | | | | 7.750 | | | | 02/15/17 | | | | 6,727,000 | |
| Tenneco, Inc. (BB-/B1) | |
| | 5,400,000 | | | | 7.750 | | | | 08/15/18 | | | | 5,886,000 | |
| | 5,500,000 | | | | 6.875 | | | | 12/15/20 | | | | 6,022,500 | |
| The Goodyear Tire & Rubber Co. (B+/B1) | |
| | 5,450,000 | | | | 8.750 | | | | 08/15/20 | | | | 6,199,375 | |
| Tomkins LLC/Tomkins, Inc. (BB-/B1) | |
| | 3,786,000 | | | | 9.000 | | | | 10/01/18 | | | | 4,202,460 | |
| | | | | | | | | | | | | | |
| | | | | | | | | | | | | 133,282,325 | |
| | |
| Banks – 1.0% | |
| Bank of America Corp. (BB+/B1)(e) | |
| | 8,050,000 | | | | 8.000 | | | | 01/30/49 | | | | 8,694,000 | |
| BNP Paribas (BBB+/Ba2)(a)(e) | |
| | 13,700,000 | | | | 5.186 | | | | 06/29/49 | | | | 12,604,000 | |
| Merrill Lynch & Co., Inc. (BBB+/Baa3) | |
| | 14,900,000 | | | | 6.110 | | | | 01/29/37 | | | | 15,792,123 | |
| | 18,500,000 | | | | 7.750 | | | | 05/14/38 | | | | 23,099,567 | |
| | | | | | | | | | | | | | |
| | | | | | | | | | | | | 60,189,690 | |
| | |
| Building Materials – 0.6% | |
| Headwaters, Inc. (B+/B2) | |
| | 8,100,000 | | | | 7.625 | | | | 04/01/19 | | | | 8,302,500 | |
| Isabelle Acquisition Sub, Inc. (B-/Caa1)(a)(f) | |
| | 8,545,000 | | | | 10.000 | | | | 11/15/18 | | | | 9,249,962 | |
| PLY Gem Industries, Inc. (B-/Caa1) | |
| | 11,500,000 | | | | 8.250 | | | | 02/15/18 | | | | 11,960,000 | |
| PLY Gem Industries, Inc. (CCC/Caa3)(a) | |
| | 1,500,000 | | | | 9.375 | | | | 04/15/17 | | | | 1,522,500 | |
| USG Corp. (BB-/B2)(a) | |
| | 5,250,000 | | | | 9.750 | | | | 08/01/14 | | | | 5,676,563 | |
| | | | | | | | | | | | | | |
| | | | | | | | | | | | | 36,711,525 | |
| | |
| Capital Goods – 0.6% | |
| Dynacast International LLC/Dynacast Finance, Inc. (B/B2) | |
| | 11,335,000 | | | | 9.250 | | | | 07/15/19 | | | | 11,958,425 | |
| Mueller Water Products, Inc. (CCC+/Caa2) | |
| | 5,700,000 | | | | 7.375 | | | | 06/01/17 | | | | 5,842,500 | |
| RBS Global, Inc./Rexnord LLC (B/B3) | |
| | 16,250,000 | | | | 8.500 | | | | 05/01/18 | | | | 17,834,375 | |
| Thermon Industries, Inc. (BB-/B1) | |
| | 3,010,000 | | | | 9.500 | | | | 05/01/17 | | | | 3,348,625 | |
| | | | | | | | | | | | | | |
| | | | | | | | | | | | | 38,983,925 | |
| | |
| Chemicals – 2.2% | |
| Hexion U.S. Finance Corp./Hexion Nova Scotia Finance ULC
(CCC+/B3) |
|
| | 15,000,000 | | | | 8.875 | | | | 02/01/18 | | | | 15,412,500 | |
| Huntsman International LLC (B+/B2) | |
| | 3,000,000 | | | | 8.625 | | | | 03/15/20 | | | | 3,405,000 | |
| | 19,750,000 | | | | 8.625 | | | | 03/15/21 | | | | 22,613,750 | |
| Kraton Polymers LLC/Kraton Polymers Capital Corp. (B+/B1) | |
| | 13,350,000 | | | | 6.750 | | | | 03/01/19 | | | | 13,717,125 | |
| | |
| | |
| The accompanying notes are an integral part of these financial statements. | | 47 |
GOLDMAN SACHS HIGH YIELD FUND
Schedule of Investments (continued)
September 30, 2012 (Unaudited)
| | | | | | | | | | | | | | |
Principal
Amount | | | Interest
Rate | | | Maturity
Date | | | Value | |
| | | | | | | | | | | | | | |
| | Corporate Obligations – (continued) | |
| Chemicals – (continued) | |
| LyondellBasell Industries NV (BB+/Ba2) | |
| $ | 10,800,000 | | | | 5.000 | % | | | 04/15/19 | | | $ | 11,502,000 | |
| MacDermid, Inc. (CCC+/Caa1)(a) | |
| | 7,750,000 | | | | 9.500 | | | | 04/15/17 | | | | 8,098,750 | |
| Omnova Solutions, Inc. (B-/B2) | |
| | 14,775,000 | | | | 7.875 | | | | 11/01/18 | | | | 15,033,563 | |
| OXEA Finance/Cy SCA (B+/B2)(a) | |
| | 4,180,000 | | | | 9.500 | | | | 07/15/17 | | | | 4,577,100 | |
| Polymer Group, Inc. (B/B1) | |
| | 14,987,000 | | | | 7.750 | | | | 02/01/19 | | | | 15,998,622 | |
| Polypore International, Inc. (B+/B3) | |
| | 10,130,000 | | | | 7.500 | | | | 11/15/17 | | | | 10,864,425 | |
| Rockwood Specialties Group, Inc. (BB/Ba2) | |
| | 9,500,000 | | | | 4.625 | | | | 10/15/20 | | | | 9,630,625 | |
| | | | | | | | | | | | | | |
| | | | | | | | | | | | | 130,853,460 | |
| | |
| Conglomerates – 0.4% | |
| Park-Ohio Industries, Inc. (CCC+/B3) | |
| | 15,032,000 | | | | 8.125 | | | | 04/01/21 | | | | 15,558,120 | |
| TriMas Corp. (B/B1) | |
| | 7,200,000 | | | | 9.750 | | | | 12/15/17 | | | | 8,280,000 | |
| | | | | | | | | | | | | | |
| | | | | | | | | | | | | 23,838,120 | |
| | |
| Construction Machinery – 0.8% | |
| Case New Holland, Inc. (BB+/Ba2) | |
| | 465,000 | | | | 7.750 | | | | 09/01/13 | | | | 487,669 | |
| | 10,850,000 | | | | 7.875 | | | | 12/01/17 | | | | 12,694,500 | |
| CNH America LLC (BB+/Ba2) | |
| | 953,000 | | | | 7.250 | | | | 01/15/16 | | | | 1,074,507 | |
| Dematic SA (B/B2)(a) | |
| | 11,500,000 | | | | 8.750 | | | | 05/01/16 | | | | 12,276,935 | |
| Mcron Finance Sub LLC (B+/B1)(a) | |
| | 5,700,000 | | | | 8.375 | | | | 05/15/19 | | | | 5,871,000 | |
| The Manitowoc Co., Inc. (B+/B3) | |
| | 5,200,000 | | | | 9.500 | | | | 02/15/18 | | | | 5,798,000 | |
| | 9,200,000 | | | | 8.500 | | | | 11/01/20 | | | | 10,258,000 | |
| | | | | | | | | | | | | | |
| | | | | | | | | | | | | 48,460,611 | |
| | |
| Consumer Products – Household & Leisure – 2.0% | |
| Affinion Group, Inc. (CCC+/Caa1) | |
| | 19,550,000 | | | | 7.875 | | | | 12/15/18 | | | | 15,982,125 | |
| Armored Autogroup, Inc. (CCC/Caa1) | |
| | 8,800,000 | | | | 9.250 | | | | 11/01/18 | | | | 7,898,000 | |
| Easton-Bell Sports, Inc. (B-/B2) | |
| | 10,500,000 | | | | 9.750 | | | | 12/01/16 | | | | 11,340,000 | |
| Elizabeth Arden, Inc. (BB-/B1) | |
| | 5,000,000 | | | | 7.375 | | | | 03/15/21 | | | | 5,587,500 | |
| Jarden Corp. (B/B2) | |
| | 19,100,000 | | | | 7.500 | | | | 05/01/17 | | | | 21,869,500 | |
| | 1,271,000 | | | | 7.500 | | | | 01/15/20 | | | | 1,410,810 | |
| Jarden Corp. (BB-/Ba3) | |
| | 2,375,000 | | | | 8.000 | | | | 05/01/16 | | | | 2,541,250 | |
| Serta Simmons Holdings LLC (CCC+/Caa1)(a) | |
| | 15,150,000 | | | | 8.125 | | | | 10/01/20 | | | | 15,036,375 | |
| Spectrum Brands Holdings, Inc. (B-/B3)(a) | |
| | 2,050,000 | | | | 6.750 | | | | 03/15/20 | | | | 2,121,750 | |
| | |
Principal
Amount | | | Interest
Rate | | | Maturity
Date | | | Value | |
| | | | | | | | | | | | | | |
| | Corporate Obligations – (continued) | |
| Consumer Products – Household & Leisure – (continued) | |
| Spectrum Brands, Inc. (B/B1) | |
| $ | 5,600,000 | | | | 9.500 | %(a) | | | 06/15/18 | | | $ | 6,286,000 | |
| | 15,000,000 | | | | 9.500 | | | | 06/15/18 | | | | 16,912,500 | |
| Visant Corp. (B-/Caa1) | |
| | 11,650,000 | | | | 10.000 | | | | 10/01/17 | | | | 11,620,875 | |
| | | | | | | | | | | | | | |
| | | | | | | | | | | | | 118,606,685 | |
| | |
| Consumer Products – Industrial(a) – 0.8% | |
| ADS Waste Holdings, Inc. (NR/Caa1) | |
| | 9,750,000 | | | | 8.250 | | | | 10/01/20 | | | | 9,871,875 | |
| HD Supply, Inc. (B+/B2) | |
| | 18,000,000 | | | | 8.125 | | | | 04/15/19 | | | | 19,620,000 | |
| HD Supply, Inc. (CCC+/Caa1) | |
| | 15,300,000 | | | | 11.000 | | | | 04/15/20 | | | | 16,906,500 | |
| | | | | | | | | | | | | | |
| | | | | | | | | | | | | 46,398,375 | |
| | |
| Consumer Products – Non Durable – 0.8% | |
| Constellation Brands, Inc. (BB+/Ba1) | |
| | 4,500,000 | | | | 8.375 | | | | 12/15/14 | | | | 5,062,500 | |
| | 9,443,000 | | | | 7.250 | | | | 05/15/17 | | | | 10,977,487 | |
| | 2,750,000 | | | | 4.625 | | | | 03/01/23 | | | | 2,791,250 | |
| Prestige Brands, Inc. (B-/B3) | |
| | 2,700,000 | | | | 8.125 | | | | 02/01/20 | | | | 3,010,500 | |
| Prestige Brands, Inc. (BB-/Ba3) | |
| | 6,000,000 | | | | 8.250 | | | | 04/01/18 | | | | 6,615,000 | |
| Sally Holdings LLC (BB+/Ba3) | |
| | 7,150,000 | | | | 6.875 | | | | 11/15/19 | | | | 7,936,500 | |
| | 11,300,000 | | | | 5.750 | | | | 06/01/22 | | | | 11,949,750 | |
| | | | | | | | | | | | | | |
| | | | | | | | | | | | | 48,342,987 | |
| | |
| Defense – 0.3% | |
| ADS Tactical, Inc. (B/B3)(a) | |
| | 10,006,000 | | | | 11.000 | | | | 04/01/18 | | | | 9,955,970 | |
| Huntington Ingalls Industries, Inc. (B+/Ba3) | |
| | 4,000,000 | | | | 6.875 | | | | 03/15/18 | | | | 4,335,000 | |
| L-3 Communications Corp. (BB+/Ba1) | |
| | 3,566,000 | | | | 6.375 | | | | 10/15/15 | | | | 3,610,575 | |
| | | | | | | | | | | | | | |
| | | | | | | | | | | | | 17,901,545 | |
| | |
| Emerging Markets – 0.6% | |
| Digicel Group Ltd. (NR/Caa1)(a) | |
| | 5,500,000 | | | | 10.500 | | | | 04/15/18 | | | | 6,063,750 | |
| | 13,900,000 | | | | 8.250 | | | | 09/30/20 | | | | 14,595,000 | |
| Digicel Ltd. (NR/B1)(a) | |
| | 400,000 | | | | 8.250 | | | | 09/01/17 | | | | 430,000 | |
| | 7,800,000 | | | | 7.000 | | | | 02/15/20 | | | | 8,004,750 | |
| Fosun International Ltd. (BB+/B1) | |
| | 4,500,000 | | | | 7.500 | | | | 05/12/16 | | | | 4,387,500 | |
| | | | | | | | | | | | | | |
| | | | | | | | | | | | | 33,481,000 | |
| | |
| Energy – Coal – 1.0% | |
| Arch Coal, Inc. (B-/B3) | |
| | 20,550,000 | | | | 7.000 | | | | 06/15/19 | | | | 17,313,375 | |
| Peabody Energy Corp. (B+/Ba3) | |
| | 7,250,000 | | | | 4.750 | | | | 12/15/41 | | | | 6,143,164 | |
| | |
| | |
| 48 | | The accompanying notes are an integral part of these financial statements. |
GOLDMAN SACHS HIGH YIELD FUND
| | | | | | | | | | | | | | |
Principal
Amount | | | Interest
Rate | | | Maturity
Date | | | Value | |
| | | | | | | | | | | | | | |
| | Corporate Obligations – (continued) | |
| Energy – Coal – (continued) | |
| Peabody Energy Corp. (BB+/Ba1) | |
| $ | 2,500,000 | | | | 7.375 | % | | | 11/01/16 | | | $ | 2,825,000 | |
| | 14,600,000 | | | | 6.000 | (a) | | | 11/15/18 | | | | 14,709,500 | |
| | 8,750,000 | | | | 6.250 | (a) | | | 11/15/21 | | | | 8,728,125 | |
| Penn Virginia Resource Partners LP/Penn Virginia Resource
Finance Corp. (B/B2) |
|
| | 7,050,000 | | | | 8.250 | | | | 04/15/18 | | | | 7,279,125 | |
| SunCoke Energy, Inc. (B+/B1) | |
| | 4,700,000 | | | | 7.625 | | | | 08/01/19 | | | | 4,770,500 | |
| | | | | | | | | | | | | | |
| | | | | | | | | | | | | 61,768,789 | |
| | |
| Energy – Exploration & Production – 7.9% | |
| Berry Petroleum Co. (B+/B1) | |
| | 12,550,000 | | | | 6.375 | | | | 09/15/22 | | | | 13,146,125 | |
| Chaparral Energy, Inc. (B-/B3) | |
| | 10,300,000 | | | | 9.875 | | | | 10/01/20 | | | | 11,587,500 | |
| | 6,400,000 | | | | 8.250 | | | | 09/01/21 | | | | 6,912,000 | |
| | 6,250,000 | | | | 7.625 | (a) | | | 11/15/22 | | | | 6,718,750 | |
| Chesapeake Energy Corp. (BB-/Ba3)(c) | |
| | 18,550,000 | | | | 2.500 | | | | 12/15/18 | | | | 16,687,580 | |
| | 850,000 | | | | 2.250 | | | | 12/15/18 | | | | 684,459 | |
| Concho Resources, Inc. (BB+/B1) | |
| | 760,000 | | | | 7.000 | | | | 01/15/21 | | | | 847,400 | |
| | 4,650,000 | | | | 6.500 | | | | 01/15/22 | | | | 5,115,000 | |
| | 8,850,000 | | | | 5.500 | | | | 04/01/23 | | | | 9,248,250 | |
| Continental Resources, Inc. (BB+/Ba2) | |
| | 4,103,000 | | | | 7.375 | | | | 10/01/20 | | | | 4,595,360 | |
| | 6,550,000 | | | | 5.000 | | | | 09/15/22 | | | | 6,828,375 | |
| | 5,800,000 | | | | 5.000 | (a) | | | 09/15/22 | | | | 6,032,000 | |
| Copano Energy LLC/ Copano Energy Finance Corp. (B/B1) | |
| | 6,000,000 | | | | 7.125 | | | | 04/01/21 | | | | 6,285,000 | |
| Denbury Resources, Inc. (BB/B1) | |
| | 4,150,000 | | | | 9.750 | | | | 03/01/16 | | | | 4,461,250 | |
| | 5,000,000 | | | | 8.250 | | | | 02/15/20 | | | | 5,625,000 | |
| | 3,500,000 | | | | 6.375 | | | | 08/15/21 | | | | 3,797,500 | |
| Eagle Rock Energy Partners LP/Eagle Rock Energy Finance
Corp. (B/B3) |
|
| | 11,195,000 | | | | 8.375 | | | | 06/01/19 | | | | 11,027,075 | |
| Encore Acquisition Co. (BB/B1) | |
| | 3,750,000 | | | | 9.500 | | | | 05/01/16 | | | | 4,031,250 | |
| Gulfmark Offshore, Inc. (BB-/B1)(a) | |
| | 2,200,000 | | | | 6.375 | | | | 03/15/22 | | | | 2,277,000 | |
| Key Energy Services, Inc. (BB-/B1) | |
| | 2,000,000 | | | | 6.750 | | | | 03/01/21 | | | | 2,030,000 | |
| Kodiak Oil & Gas Corp. (CCC+/Caa1)(a) | |
| | 14,550,000 | | | | 8.125 | | | | 12/01/19 | | | | 15,423,000 | |
| Laredo Petroleum, Inc. (B-/B3) | |
| | 15,850,000 | | | | 9.500 | | | | 02/15/19 | | | | 17,950,125 | |
| Linn Energy LLC/Linn Energy Finance Corp. (B/B2) | |
| | 8,000,000 | | | | 6.500 | (a) | | | 05/15/19 | | | | 7,980,000 | |
| | 10,000,000 | | | | 6.250 | (a) | | | 11/01/19 | | | | 9,925,000 | |
| | 5,600,000 | | | | 7.750 | | | | 02/01/21 | | | | 5,922,000 | |
| MEG Energy Corp. (BB/B1)(a) | |
| | 15,600,000 | | | | 6.500 | | | | 03/15/21 | | | | 16,692,000 | |
| | 21,900,000 | | | | 6.375 | | | | 01/30/23 | | | | 23,378,250 | |
| | |
Principal
Amount | | | Interest
Rate | | | Maturity
Date | | | Value | |
| | | | | | | | | | | | | | |
| | Corporate Obligations – (continued) | |
| Energy – Exploration & Production – (continued) | |
| Newfield Exploration Co. (BB+/Ba2) | |
| $ | 3,800,000 | | | | 7.125 | % | | | 05/15/18 | | | $ | 4,028,000 | |
| | 8,250,000 | | | | 6.875 | | | | 02/01/20 | | | | 8,992,500 | |
| Newfield Exploration Co. (BBB-/Ba1) | |
| | 5,400,000 | | | | 5.750 | | | | 01/30/22 | | | | 6,007,500 | |
| | 10,200,000 | | | | 5.625 | | | | 07/01/24 | | | | 11,322,000 | |
| NFR Energy LLC/NFR Energy Finance Corp. (B-/Caa1)(a) | |
| | 6,250,000 | | | | 9.750 | | | | 02/15/17 | | | | 5,593,750 | |
| Petroleos de Venezuela SA (B+/NR) | |
| | 5,000,000 | | | | 5.250 | | | | 04/12/17 | | | | 3,937,500 | |
| | 12,000,000 | | | | 8.500 | | | | 11/02/17 | | | | 10,830,000 | |
| Plains Exploration & Production Co. (BB-/B1) | |
| | 12,100,000 | | | | 6.125 | | | | 06/15/19 | | | | 12,221,000 | |
| | 8,000,000 | | | | 8.625 | | | | 10/15/19 | | | | 8,900,000 | |
| | 7,250,000 | | | | 7.625 | | | | 04/01/20 | | | | 7,739,375 | |
| | 20,750,000 | | | | 6.625 | | | | 05/01/21 | | | | 21,061,250 | |
| | 27,400,000 | | | | 6.750 | | | | 02/01/22 | | | | 27,674,000 | |
| Precision Drilling Corp. (BB/Ba1) | |
| | 1,650,000 | | | | 6.500 | | | | 12/15/21 | | | | 1,757,250 | |
| QEP Resources, Inc. (BB+/Ba1) | |
| | 11,700,000 | | | | 5.250 | | | | 05/01/23 | | | | 11,934,000 | |
| Quicksilver Resources, Inc. (CCC+/B3) | |
| | 10,000,000 | | | | 11.750 | | | | 01/01/16 | | | | 10,100,000 | |
| Range Resources Corp. (BB/Ba3) | |
| | 1,700,000 | | | | 8.000 | | | | 05/15/19 | | | | 1,878,500 | |
| | 1,000,000 | | | | 6.750 | | | | 08/01/20 | | | | 1,100,000 | |
| | 2,950,000 | | | | 5.000 | | | | 08/15/22 | | | | 3,097,500 | |
| Resolute Energy Corp. (B-/B3)(a) | |
| | 9,500,000 | | | | 8.500 | | | | 05/01/20 | | | | 9,737,500 | |
| Samson Investment Co. (B-/B3)(a) | |
| | 13,100,000 | | | | 9.750 | | | | 02/15/20 | | | | 13,460,250 | |
| SandRidge Energy, Inc. (B/B2) | |
| | 2,650,000 | | | | 9.875 | | | | 05/15/16 | | | | 2,888,500 | |
| | 6,925,000 | | | | 8.000 | (a) | | | 06/01/18 | | | | 7,271,250 | |
| | 3,250,000 | | | | 8.750 | | | | 01/15/20 | | | | 3,510,000 | |
| | 6,875,000 | | | | 7.500 | | | | 03/15/21 | | | | 7,081,250 | |
| | 2,252,000 | | | | 7.500 | (a) | | | 03/15/21 | | | | 2,313,930 | |
| | 12,250,000 | | | | 8.125 | (a) | | | 10/15/22 | | | | 13,046,250 | |
| | 5,100,000 | | | | 7.500 | (a) | | | 02/15/23 | | | | 5,253,000 | |
| SM Energy Co. (BB/B1) | |
| | 6,050,000 | | | | 6.500 | | | | 11/15/21 | | | | 6,367,625 | |
| Stone Energy Corp. (B/B3) | |
| | 11,575,000 | | | | 8.625 | | | | 02/01/17 | | | | 12,356,313 | |
| Whiting Petroleum Corp. (BB+/Ba3) | |
| | 5,000,000 | | | | 7.000 | | | | 02/01/14 | | | | 5,337,500 | |
| | 1,015,000 | | | | 6.500 | | | | 10/01/18 | | | | 1,096,200 | |
| | | | | | | | | | | | | | |
| | | | | | | | | | | | | 473,100,942 | |
| | |
| Energy – Services – 1.5% | |
| Atwood Oceanics, Inc. (BB/Ba3) | |
| | 6,750,000 | | | | 6.500 | | | | 02/01/20 | | | | 7,222,500 | |
| Basic Energy Services, Inc. (B+/B2) | |
| | 12,450,000 | | | | 7.750 | | | | 02/15/19 | | | | 12,761,250 | |
| Bristow Group, Inc. (BB/Ba3) | |
| | 2,550,000 | | | | 7.500 | | | | 09/15/17 | | | | 2,652,000 | |
| | 4,450,000 | | | | 6.250 | | | | 10/15/22 | | | | 4,555,687 | |
| | |
| | |
| The accompanying notes are an integral part of these financial statements. | | 49 |
GOLDMAN SACHS HIGH YIELD FUND
Schedule of Investments (continued)
September 30, 2012 (Unaudited)
| | | | | | | | | | | | | | |
Principal
Amount | | | Interest
Rate | | | Maturity
Date | | | Value | |
| | | | | | | | | | | | | | |
| | Corporate Obligations – (continued) | |
| Energy – Services – (continued) | |
| Hiland Partners LP/Hiland Partners Finance Corp. (B-/B3)(a) | |
| $ | 3,300,000 | | | | 7.250 | % | | | 10/01/20 | | | $ | 3,456,750 | |
| Key Energy Services, Inc. (BB-/B1)(a) | |
| | 8,400,000 | | | | 6.750 | | | | 03/01/21 | | | | 8,526,000 | |
| OGX Austria GMBH (B/B1)(a) | |
| | 8,800,000 | | | | 8.375 | | | | 04/01/22 | | | | 7,593,538 | |
| OGX Petroleo e Gas Participacoes SA (B/B1)(a) | |
| | 7,600,000 | | | | 8.500 | | | | 06/01/18 | | | | 6,809,959 | |
| Pioneer Drilling Co. (B+/B2) | |
| | 8,000,000 | | | | 9.875 | | | | 03/15/18 | | | | 8,680,000 | |
| SESI LLC (BBB-/Ba3) | |
| | 2,550,000 | | | | 6.875 | | | | 06/01/14 | | | | 2,553,187 | |
| | 6,200,000 | | | | 7.125 | | | | 12/15/21 | | | | 6,835,500 | |
| Trinidad Drilling Ltd. (BB-/B1)(a) | |
| | 17,053,000 | | | | 7.875 | | | | 01/15/19 | | | | 18,423,635 | |
| | | | | | | | | | | | | | |
| | | | | | | | | | | | | 90,070,006 | |
| | |
| Entertainment & Leisure – 0.8% | |
| AMC Entertainment, Inc. (CCC+/Caa1) | |
| | 3,800,000 | | | | 9.750 | | | | 12/01/20 | | | | 4,275,000 | |
| Carmike Cinemas, Inc. (B/B2) | |
| | 7,650,000 | | | | 7.375 | | | | 05/15/19 | | | | 8,185,500 | |
| Cedar Fair LP/Canada’s Wonderland Co./Magnum Management
Corp. (B/B2) |
|
| | 6,625,000 | | | | 9.125 | | | | 08/01/18 | | | | 7,519,375 | |
| Cinemark USA, Inc. (B/B3) | |
| | 3,850,000 | | | | 7.375 | | | | 06/15/21 | | | | 4,283,125 | |
| Cinemark USA, Inc. (B+/B2) | |
| | 1,075,000 | | | | 8.625 | | | | 06/15/19 | | | | 1,193,250 | |
| GWR Operating Partnership LLP (BB-/B3) | |
| | 8,167,000 | | | | 10.875 | | | | 04/01/17 | | | | 9,371,632 | |
| MU Finance PLC (NR/NR)(a) | |
| | 8,407,549 | | | | 8.375 | | | | 02/01/17 | | | | 9,164,229 | |
| Palace Entertainment Holdings LLC/Palace Entertainment
Holdings Corp. (B-/B2)(a) |
|
| | 2,225,000 | | | | 8.875 | | | | 04/15/17 | | | | 2,347,375 | |
| | | | | | | | | | | | | | |
| | | | | | | | | | | | | 46,339,486 | |
| | |
| Environmental – 0.3% | |
| Casella Waste Systems, Inc. (CCC+/Caa2) | |
| | 7,500,000 | | | | 7.750 | | | | 02/15/19 | | | | 7,387,500 | |
| Casella Waste Systems, Inc. (NR/Caa1)(a) | |
| | 8,000,000 | | | | 7.750 | | | | 02/15/19 | | | | 7,840,000 | |
| | | | | | | | | | | | | | |
| | | | | | | | | | | | | 15,227,500 | |
| | |
| Finance – 6.3% | |
| ACE Cash Express, Inc. (B/B3)(a) | |
| | 10,050,000 | | | | 11.000 | | | | 02/01/19 | | | | 9,472,125 | |
| Ally Financial, Inc. (B+/B1) | |
| | 14,900,000 | | | | 6.750 | | | | 12/01/14 | | | | 15,943,000 | |
| | 8,000,000 | | | | 4.625 | | | | 06/26/15 | | | | 8,200,000 | |
| | 34,080,000 | | | | 6.250 | | | | 12/01/17 | | | | 36,806,400 | |
| | 10,050,000 | | | | 8.000 | | | | 03/15/20 | | | | 11,733,375 | |
| | 5,750,000 | | | | 8.000 | | | | 11/01/31 | | | | 6,713,125 | |
| American General Finance Corp. (CCC/Caa1) | |
| | 12,164,000 | | | | 6.900 | | | | 12/15/17 | | | | 10,339,400 | |
| | |
Principal
Amount | | | Interest
Rate | | | Maturity
Date | | | Value | |
| | | | | | | | | | | | | | |
| | Corporate Obligations – (continued) | |
| Finance – (continued) | |
| CIT Group, Inc. (BB-/B1) | |
| $ | 12,900,000 | | | | 5.250 | %(a) | | | 04/01/14 | | | $ | 13,416,000 | |
| | 14,000,000 | | | | 4.750 | (a) | | | 02/15/15 | | | | 14,560,000 | |
| | 13,200,000 | | | | 5.000 | | | | 05/15/17 | | | | 14,157,000 | |
| | 9,400,000 | | | | 4.250 | | | | 08/15/17 | | | | 9,776,000 | |
| | 9,950,000 | | | | 5.250 | | | | 03/15/18 | | | | 10,671,375 | |
| | 30,700,000 | | | | 5.500 | (a) | | | 02/15/19 | | | | 33,463,000 | |
| | 8,600,000 | | | | 5.000 | | | | 08/15/22 | | | | 8,965,500 | |
| GMAC International Finance BV (B+/B1) | |
| EUR | 7,200,000 | | | | 7.500 | | | | 04/21/15 | | | | 9,970,341 | |
| International Lease Finance Corp. (BBB-/Ba2)(a) | |
| $ | 1,000,000 | | | | 6.750 | | | | 09/01/16 | | | | 1,117,500 | |
| | 4,900,000 | | | | 7.125 | | | | 09/01/18 | | | | 5,684,000 | |
| International Lease Finance Corp. (BBB-/Ba3) | |
| | 4,535,000 | | | | 6.625 | | | | 11/15/13 | | | | 4,716,400 | |
| | 1,000,000 | | | | 5.650 | | | | 06/01/14 | | | | 1,045,000 | |
| | 3,750,000 | | | | 4.875 | | | | 04/01/15 | | | | 3,881,250 | |
| | 12,125,000 | | | | 8.625 | | | | 09/15/15 | | | | 13,761,875 | |
| | 20,950,000 | | | | 5.750 | | | | 05/15/16 | | | | 22,207,000 | |
| | 5,000,000 | | | | 8.750 | | | | 03/15/17 | | | | 5,850,000 | |
| National Money Mart Co. (B+/B2) | |
| | 8,800,000 | | | | 10.375 | | | | 12/15/16 | | | | 9,812,000 | |
| Nationstar Mortgage LLC (NR/B2)(a) | |
| | 3,050,000 | | | | 7.875 | | | | 10/01/20 | | | | 3,111,000 | |
| Nuveen Investments, Inc. (CCC/Caa2)(a) | |
| | 19,250,000 | | | | 9.500 | | | | 10/15/20 | | | | 19,105,625 | |
| Oppenheimer Holdings, Inc. (B+/B2) | |
| | 4,500,000 | | | | 8.750 | | | | 04/15/18 | | | | 4,612,500 | |
| Provident Funding Associates (B/B2)(a) | |
| | 7,075,000 | | | | 10.125 | | | | 02/15/19 | | | | 7,304,938 | |
| Provident Funding Associates (BB/Ba3)(a) | |
| | 2,750,000 | | | | 10.250 | | | | 04/15/17 | | | | 2,956,250 | |
| RBS Capital Trust I (BB/B3)(e) | |
| | 6,375,000 | | | | 4.709 | | | | 12/29/49 | | | | 3,888,750 | |
| RBS Capital Trust III (BB/B3)(e) | |
| | 22,750,000 | | | | 5.512 | | | | 09/29/49 | | | | 14,105,000 | |
| Regions Bank (BBB-/Ba3) | |
| | 7,000,000 | | | | 7.500 | | | | 05/15/18 | | | | 8,225,000 | |
| Royal Bank of Scotland Group PLC (BB/Ba3)(a)(e) | |
| | 8,415,000 | | | | 6.990 | | | | 10/29/49 | | | | 7,531,425 | |
| Royal Bank of Scotland PLC (BBB-/NR)(e) | |
| | 8,850,000 | | | | 9.500 | | | | 03/16/22 | | | | 9,894,300 | |
| Speedy Cash, Inc. (B/B3)(a) | |
| | 11,000,000 | | | | 10.750 | | | | 05/15/18 | | | | 11,632,500 | |
| Synovus Financial Corp. (B/B2) | |
| | 4,650,000 | | | | 7.875 | | | | 02/15/19 | | | | 5,301,000 | |
| | | | | | | | | | | | | | |
| | | | | | | | | | | | | 379,929,954 | |
| | |
| Finance Insurance – 0.8% | |
| AXA SA (BBB/Baa1)(a)(e) | |
| | 14,300,000 | | | | 6.463 | | | | 12/14/49 | | | | 13,156,000 | |
| HUB International Holdings, Inc. (CCC+/Caa1)(a) | |
| | 4,500,000 | | | | 9.000 | | | | 12/15/14 | | | | 4,702,500 | |
| Hub International Ltd. (CCC+/Caa2)(a) | |
| | 4,850,000 | | | | 8.125 | | | | 10/15/18 | | | | 4,947,000 | |
| | |
| | |
| 50 | | The accompanying notes are an integral part of these financial statements. |
GOLDMAN SACHS HIGH YIELD FUND
| | | | | | | | | | | | | | |
Principal
Amount | | | Interest
Rate | | | Maturity
Date | | | Value | |
| | | | | | | | | | | | | | |
| | Corporate Obligations – (continued) | |
| Finance Insurance – (continued) | |
| Liberty Mutual Group, Inc. (BB/Baa3)(a) | |
| $ | 14,625,000 | | | | 7.800 | % | | | 03/15/37 | | | $ | 15,868,125 | |
| Towergate Finance PLC (NR/Ba3) | |
| GBP | 6,250,000 | | | | 8.500 | | | | 02/15/18 | | | | 9,991,571 | |
| | | | | | | | | | | | | | |
| | | | | | | | | | | | | 48,665,196 | |
| | |
| | Food – 0.9% | | | | | | | | | | | | | |
| Bumble Bee Acquisition Corp. (B/B2)(a) | |
| $ | 6,082,000 | | | | 9.000 | | | | 12/15/17 | | | | 6,325,280 | |
| Bumble Bee Holdco SCA (CCC+/Caa1)(a)(f) | |
| | 10,375,000 | | | | 9.625 | | | | 03/15/18 | | | | 9,882,187 | |
| Del Monte Corp. (CCC+/B3) | |
| | 13,000,000 | | | | 7.625 | | | | 02/15/19 | | | | 13,325,000 | |
| Pilgrim’s Pride Corp. (B-/Caa1) | |
| | 9,850,000 | | | | 7.875 | | | | 12/15/18 | | | | 9,431,375 | |
| Pinnacle Foods Finance LLC (CCC+/Caa1) | |
| | 7,561,000 | | | | 9.250 | | | | 04/01/15 | | | | 7,731,123 | |
| Post Holdings, Inc. (B+/B1)(a) | |
| | 5,600,000 | | | | 7.375 | | | | 02/15/22 | | | | 5,936,000 | |
| | | | | | | | | | | | | | |
| | | | | | | | | | | | | 52,630,965 | |
| | |
| Gaming – 6.1% | |
| Boyd Acquisition Sub LLC (CCC+/Caa1)(a) | |
| | 2,650,000 | | | | 8.375 | | | | 02/15/18 | | | | 2,736,125 | |
| Caesars Entertainment Operating Co., Inc. (B/B2) | |
| | 14,700,000 | | | | 11.250 | | | | 06/01/17 | | | | 15,765,750 | |
| Caesars Entertainment Operating Co., Inc. (CCC/Caa2) | |
| | 7,050,000 | | | | 12.750 | | | | 04/15/18 | | | | 5,181,750 | |
| Caesars Entertainment Operating Co., Inc. (CCC/Caa3) | |
| | 2,564,000 | | | | 5.625 | | | | 06/01/15 | | | | 2,076,840 | |
| | 6,850,000 | | | | 10.750 | | | | 02/01/16 | | | | 5,445,750 | |
| Caesars Entertainment Operating Co., Inc. (CCC/NR) | |
| | 14,750,000 | | | | 10.000 | | | | 12/15/15 | | | | 12,832,500 | |
| | 24,950,000 | | | | 10.000 | | | | 12/15/18 | | | | 16,342,250 | |
| CCM Merger, Inc. (CCC+/Caa2)(a) | |
| | 12,150,000 | | | | 9.125 | | | | 05/01/19 | | | | 12,241,125 | |
| Chester Downs & Marina LLC (B+/B3)(a) | |
| | 6,650,000 | | | | 9.250 | | | | 02/01/20 | | | | 6,683,250 | |
| Chukchansi Economic Development Authority (NR/Caa2)(a) | |
| | 5,078,000 | | | | 9.750 | | | | 05/30/20 | | | | 3,554,600 | |
| CityCenter Holdings LLC/CityCenter Finance Corp.
(CCC/Caa2)(f) |
|
| | 24,450,000 | | | | 10.750 | | | | 01/15/17 | | | | 26,039,250 | |
| Downstream Development Authority of the Quapaw Tribe of
Oklahoma (B/B3)(a) |
|
| | 7,000,000 | | | | 10.500 | | | | 07/01/19 | | | | 7,525,000 | |
| Gala Group Finance PLC (B+/B3) | |
| GBP | 4,300,000 | | | | 8.875 | | | | 09/01/18 | | | | 6,631,173 | |
| Gateway Casinos & Entertainment Ltd. (BB-/Caa1)(a) | |
| CAD | 6,375,000 | | | | 8.875 | | | | 11/15/17 | | | | 6,826,976 | |
| Graton Economic Development Authority (B/B3)(a) | |
| $ | 8,974,000 | | | | 9.625 | | | | 09/01/19 | | | | 9,377,830 | |
| Marina District Finance Co., Inc. (B+/B2) | |
| | 7,525,000 | | | | 9.500 | | | | 10/15/15 | | | | 7,581,438 | |
| | 8,650,000 | | | | 9.875 | | | | 08/15/18 | | | | 8,671,625 | |
| | |
Principal
Amount | | | Interest
Rate | | | Maturity
Date | | | Value | |
| | | | | | | | | | | | | | |
| | Corporate Obligations – (continued) | |
| Gaming – (continued) | |
| MCE Finance Ltd. (BB-/B1) | |
| $ | 10,875,000 | | | | 10.250 | % | | | 05/15/18 | | | $ | 12,315,937 | |
| MGM Resorts International (B+/Ba2) | |
| | 11,500,000 | | | | 13.000 | | | | 11/15/13 | | | | 12,966,250 | |
| | 4,750,000 | | | | 11.125 | | | | 11/15/17 | | | | 5,236,875 | |
| | 2,500,000 | | | | 9.000 | | | | 03/15/20 | | | | 2,787,500 | |
| MGM Resorts International (B-/B3) | |
| | 5,500,000 | | | | 4.250 | | | | 04/15/15 | | | | 5,715,875 | |
| | 24,950,000 | | | | 6.625 | | | | 07/15/15 | | | | 26,696,500 | |
| | 20,000,000 | | | | 6.875 | | | | 04/01/16 | | | | 20,950,000 | |
| | 3,600,000 | | | | 7.500 | | | | 06/01/16 | | | | 3,852,000 | |
| | 10,000,000 | | | | 10.000 | | | | 11/01/16 | | | | 11,425,000 | |
| | 7,800,000 | | | | 7.625 | | | | 01/15/17 | | | | 8,268,000 | |
| | 7,650,000 | | | | 11.375 | | | | 03/01/18 | | | | 9,007,875 | |
| | 5,400,000 | | | | 6.750 | (a) | | | 10/01/20 | | | | 5,373,000 | |
| | 3,100,000 | | | | 7.750 | | | | 03/15/22 | | | | 3,231,750 | |
| Mohegan Tribal Gaming Authority (CCC/NR)(a) | |
| | 16,000,000 | | | | 10.500 | | | | 12/15/16 | | | | 14,480,000 | |
| | 1,555,000 | | | | 11.000 | | | | 09/15/18 | | | | 1,072,950 | |
| Peermont Proprietary Global Ltd. (B-/B3) | |
| EUR | 10,050,000 | | | | 7.750 | | | | 04/30/14 | | | | 12,377,109 | |
| Peninsula Gaming LLC (B/Caa1) | |
| $ | 10,000,000 | | | | 10.750 | | | | 08/15/17 | | | | 11,275,000 | |
| Pinnacle Entertainment, Inc. (B/B3) | |
| | 7,375,000 | | | | 8.750 | | | | 05/15/20 | | | | 8,130,938 | |
| | 4,400,000 | | | | 7.750 | | | | 04/01/22 | | | | 4,785,000 | |
| Pinnacle Entertainment, Inc. (BB-/B1) | |
| | 8,768,000 | | | | 8.625 | | | | 08/01/17 | | | | 9,535,200 | |
| Shingle Springs Tribal Gaming Authority (CCC/Caa2)(a) | |
| | 7,650,000 | | | | 9.375 | | | | 06/15/15 | | | | 6,311,250 | |
| Snoqualmie Entertainment Authority (B/B3)(a) | |
| | 4,050,000 | | | | 4.476 | (e) | | | 02/01/14 | | | | 4,029,750 | |
| | 9,988,000 | | | | 9.125 | | | | 02/01/15 | | | | 10,137,820 | |
| | | | | | | | | | | | | | |
| | | | | | | | | | | | | 365,474,811 | |
| | |
| Health Care – Medical Products – 1.0% | |
| Catalent Pharma Solutions, Inc. (B/Caa1) | |
| | 1,249,943 | | | | 9.500 | | | | 04/15/15 | | | | 1,284,316 | |
| | 9,300,000 | | | | 7.875 | (a) | | | 10/15/18 | | | | 9,439,500 | |
| ConvaTec Healthcare E SA (B/Caa1)(a) | |
| �� | 4,007,000 | | | | 10.500 | | | | 12/15/18 | | | | 4,277,473 | |
| ConvaTec Healthcare E SA (B+/Ba3) | |
| EUR | 750,000 | | | | 7.375 | | | | 12/15/17 | | | | 1,038,018 | |
| DJO Finance LLC/DJO Finance Corp. (CCC+/Caa1) | |
| $ | 4,250,000 | | | | 7.750 | | | | 04/15/18 | | | | 3,931,250 | |
| | 15,000,000 | | | | 9.875 | (a) | | | 04/15/18 | | | | 14,850,000 | |
| Fresenius Medical Care US Finance, Inc. (BB+/Ba2) | |
| | 6,625,000 | | | | 6.875 | | | | 07/15/17 | | | | 7,646,007 | |
| | 1,000,000 | | | | 6.500 | (a) | | | 09/15/18 | | | | 1,125,000 | |
| | 8,200,000 | | | | 5.750 | (a) | | | 02/15/21 | | | | 8,733,000 | |
| PSS World Medical, Inc. (BB-/Ba3) | |
| | 5,450,000 | | | | 6.375 | | | | 03/01/22 | | | | 5,831,500 | |
| | | | | | | | | | | | | | |
| | | | | | | | | | | | | 58,156,064 | |
| | |
| | |
| The accompanying notes are an integral part of these financial statements. | | 51 |
GOLDMAN SACHS HIGH YIELD FUND
Schedule of Investments (continued)
September 30, 2012 (Unaudited)
| | | | | | | | | | | | | | |
Principal
Amount | | | Interest
Rate | | | Maturity
Date | | | Value | |
| | | | | | | | | | | | | | |
| | Corporate Obligations – (continued) | |
| Health Care – Pharmaceuticals – 1.0% | |
| Capsugel FinanceCo. SCA (B/Caa1) | |
| EUR | 6,600,000 | | | | 9.875 | % | | | 08/01/19 | | | $ | 9,562,698 | |
| Endo Pharmaceuticals Holdings, Inc. (BB-/Ba3) | |
| $ | 10,600,000 | | | | 7.250 | | | | 01/15/22 | | | | 11,448,000 | |
| Valeant Pharmaceuticals International (BB-/B1)(a) | |
| | 8,000,000 | | | | 6.500 | | | | 07/15/16 | | | | 8,390,000 | |
| | 15,742,000 | | | | 6.875 | | | | 12/01/18 | | | | 16,568,455 | |
| | 50,000 | | | | 7.250 | | | | 07/15/22 | | | | 52,687 | |
| Valeant Pharmaceuticals International (NR/B1)(a) | |
| | 14,900,000 | | | | 6.375 | | | | 10/15/20 | | | | 15,198,000 | |
| | | | | | | | | | | | | | |
| | | | | | | | | | | | | 61,219,840 | |
| | |
| Health Care – Services – 7.0% | |
| American Renal Associates Holdings Inc. (CCC+/Caa2)(f) | |
| | 20,866,814 | | | | 9.750 | | | | 03/01/16 | | | | 22,040,572 | |
| American Renal Holdings Co., Inc. (B/B2) | |
| | 15,726,000 | | | | 8.375 | | | | 05/15/18 | | | | 16,630,245 | |
| CDRT Holding Corp. (B-/Caa1)(a)(f) | |
| | 15,200,000 | | | | 9.250 | | | | 10/01/17 | | | | 14,668,000 | |
| Community Health Systems, Inc. (B/B3) | |
| | 12,750,000 | | | | 8.000 | | | | 11/15/19 | | | | 13,961,250 | |
| | 13,000,000 | | | | 7.125 | | | | 07/15/20 | | | | 13,845,000 | |
| Community Health Systems, Inc. (BB/Ba3) | |
| | 32,200,000 | | | | 5.125 | | | | 08/15/18 | | | | 33,407,500 | |
| DaVita, Inc. (B/B2) | |
| | 12,200,000 | | | | 6.375 | | | | 11/01/18 | | | | 12,993,000 | |
| | 13,300,000 | | | | 5.750 | | | | 08/15/22 | | | | 13,832,000 | |
| Emergency Medical Services Corp. (B-/B3) | |
| | 8,650,000 | | | | 8.125 | | | | 06/01/19 | | | | 9,190,625 | |
| HCA, Inc. (B-/B3) | |
| | 1,000,000 | | | | 6.375 | | | | 01/15/15 | | | | 1,075,000 | |
| | 41,000,000 | | | | 7.500 | | | | 02/15/22 | | | | 46,330,000 | |
| HCA, Inc. (BB/B2) | |
| | 1,625,000 | | | | 9.875 | | | | 02/15/17 | | | | 1,746,875 | |
| HCA, Inc. (BB/Ba3) | |
| | 7,500,000 | | | | 8.500 | | | | 04/15/19 | | | | 8,465,625 | |
| | 41,500,000 | | | | 6.500 | | | | 02/15/20 | | | | 46,065,000 | |
| | 22,175,000 | | | | 7.875 | | | | 02/15/20 | | | | 24,919,156 | |
| | 21,250,000 | | | | 7.250 | | | | 09/15/20 | | | | 23,800,000 | |
| Health Management Associates, Inc. (B-/B3) | |
| | 17,100,000 | | | | 7.375 | | | | 01/15/20 | | | | 17,263,066 | |
| Health Management Associates, Inc. (BB-/NR) | |
| | 4,900,000 | | | | 6.125 | | | | 04/15/16 | | | | 5,353,250 | |
| HEALTHSOUTH Corp. (BB-/B1) | |
| | 4,800,000 | | | | 7.250 | | | | 10/01/18 | | | | 5,220,000 | |
| | 6,000,000 | | | | 8.125 | | | | 02/15/20 | | | | 6,690,000 | |
| | 6,450,000 | | | | 7.750 | | | | 09/15/22 | | | | 7,062,750 | |
| MPT Operating Partnership LP/MPT Finance Corp. (BB/Ba1) | |
| | 25,000,000 | | | | 6.875 | | | | 05/01/21 | | | | 27,312,500 | |
| | 12,500,000 | | | | 6.375 | | | | 02/15/22 | | | | 13,281,250 | |
| Radiation Therapy Services, Inc. (CCC+/Caa2) | |
| | 10,725,000 | | | | 9.875 | | | | 04/15/17 | | | | 7,829,250 | |
| Tenet Healthcare Corp. (B+/B1) | |
| | 15,000,000 | | | | 6.250 | | | | 11/01/18 | | | | 16,500,000 | |
| US Oncology, Inc. (NR/NR) | |
| | 32,250,000 | | | | 0.000 | | | | 08/15/17 | | | | 483,750 | |
| | |
Principal
Amount | | | Interest
Rate | | | Maturity
Date | | | Value | |
| | | | | | | | | | | | | | |
| | Corporate Obligations – (continued) | |
| Health Care – Services – (continued) | |
| USPI Finance Corp. (CCC+/Caa1)(a) | |
| $ | 9,400,000 | | | | 9.000 | % | | | 04/01/20 | | | $ | 10,199,000 | |
| | | | | | | | | | | | | | |
| | | | | | | | | | | | | 420,164,664 | |
| | |
| Home Construction – 0.9% | |
| Beazer Homes USA, Inc. (B/B3)(a) | |
| | 7,100,000 | | | | 6.625 | | | | 04/15/18 | | | | 7,508,250 | |
| Beazer Homes USA, Inc. (CCC/Caa3) | |
| | 6,350,000 | | | | 9.125 | | | | 06/15/18 | | | | 6,413,500 | |
| Meritage Homes Corp. (B+/B1) | |
| | 5,001,000 | | | | 7.150 | | | | 04/15/20 | | | | 5,388,577 | |
| | 13,850,000 | | | | 7.000 | | | | 04/01/22 | | | | 14,819,500 | |
| PulteGroup, Inc. (BB-/B1) | |
| | 6,400,000 | | | | 5.200 | | | | 02/15/15 | | | | 6,768,000 | |
| Ryland Group Co. (BB-/B1) | |
| | 8,800,000 | | | | 5.375 | | | | 10/01/22 | | | | 8,800,000 | |
| Toll Brothers Finance Corp. (BB+/Ba1) | |
| | 5,000,000 | | | | 5.875 | | | | 02/15/22 | | | | 5,575,000 | |
| | | | | | | | | | | | | | |
| | | | | | | | | | | | | 55,272,827 | |
| | |
| Lodging – 0.8% | |
| Felcor Lodging LP (B-/B2) | |
| | 5,802,000 | | | | 10.000 | | | | 10/01/14 | | | | 6,657,795 | |
| | 10,000,000 | | | | 6.750 | | | | 06/01/19 | | | | 10,725,000 | |
| Host Hotels & Resorts LP (BB+/Ba1) | |
| | 3,000,000 | | | | 6.750 | | | | 06/01/16 | | | | 3,082,500 | |
| | 8,300,000 | | | | 6.000 | | | | 11/01/20 | | | | 9,213,000 | |
| | 9,000,000 | | | | 6.000 | | | | 10/01/21 | | | | 10,237,500 | |
| | 4,000,000 | | | | 5.250 | (a) | | | 03/15/22 | | | | 4,310,000 | |
| | 6,700,000 | | | | 4.750 | | | | 03/01/23 | | | | 6,968,000 | |
| | | | | | | | | | | | | | |
| | | | | | | | | | | | | 51,193,795 | |
| | |
| Machinery – 0.3% | |
| Constellation Enterprises LLC (B/B2)(a) | |
| | 6,650,000 | | | | 10.625 | | | | 02/01/16 | | | | 6,965,875 | |
| Dresser-Rand Group, Inc. (B+/Ba3) | |
| | 11,500,000 | | | | 6.500 | | | | 05/01/21 | | | | 12,075,000 | |
| | | | | | | | | | | | | | |
| | | | | | | | | | | | | 19,040,875 | |
| | |
| Media – Broadcasting & Radio – 2.1% | |
| Bonten Media Acquisition Co. (CC/Caa3)(a) | |
| | 4,031,664 | | | | 9.000 | | | | 06/01/15 | | | | 3,023,748 | |
| Entercom Radio LLC (B-/Caa1) | |
| | 9,475,000 | | | | 10.500 | | | | 12/01/19 | | | | 10,327,750 | |
| Fox Acquisition Sub LLC (B-/Caa1)(a) | |
| | 8,350,000 | | | | 13.375 | | | | 07/15/16 | | | | 8,924,062 | |
| Gray Television, Inc. (CCC+/Caa2) | |
| | 13,729,000 | | | | 10.500 | | | | 06/29/15 | | | | 14,861,642 | |
| | 7,100,000 | | | | 7.500 | (a) | | | 10/01/20 | | | | 7,055,625 | |
| LIN Television Corp. (CCC+/Caa1) | |
| | 14,200,000 | | | | 8.375 | | | | 04/15/18 | | | | 15,052,000 | |
| Local TV Finance LLC (CCC+/Caa2)(a) | |
| | 7,315,376 | | | | 9.250 | | | | 06/15/15 | | | | 7,425,107 | |
| Nexstar Broadcasting, Inc./Mission Broadcasting, Inc. (B/B3) | |
| | 4,000,000 | | | | 8.875 | | | | 04/15/17 | | | | 4,340,000 | |
| Salem Communications Corp. (B/B2) | |
| | 2,593,000 | | | | 9.625 | | | | 12/15/16 | | | | 2,884,713 | |
| | |
| | |
| 52 | | The accompanying notes are an integral part of these financial statements. |
GOLDMAN SACHS HIGH YIELD FUND
| | | | | | | | | | | | | | |
Principal
Amount | | | Interest
Rate | | | Maturity
Date | | | Value | |
| | | | | | | | | | | | | | |
| | Corporate Obligations – (continued) | |
| Media – Broadcasting & Radio – (continued) | |
| Sinclair Television Group, Inc. (BB/Ba3)(a) | |
| $ | 2,000,000 | | | | 9.250 | % | | | 11/01/17 | | | $ | 2,215,000 | |
| Univision Communications, Inc. (B+/B2)(a) | |
| | 16,500,000 | | | | 6.875 | | | | 05/15/19 | | | | 16,974,375 | |
| | 1,100,000 | | | | 7.875 | | | | 11/01/20 | | | | 1,177,000 | |
| | 18,250,000 | | | | 6.750 | | | | 09/15/22 | | | | 18,250,000 | |
| Univision Communications, Inc. (CCC+/Caa2)(a) | |
| | 6,000,000 | | | | 8.500 | | | | 05/15/21 | | | | 6,090,000 | |
| XM Satellite Radio, Inc. (BB/B1)(a) | |
| | 6,000,000 | | | | 7.625 | | | | 11/01/18 | | | | 6,630,000 | |
| | | | | | | | | | | | | | |
| | | | | | | | | | | | | 125,231,022 | |
| | |
| Media – Cable – 3.7% | |
| Adelphia Communications Corp. (BB/B1) | |
| | 2,000,000 | | | | 10.250 | | | | 06/15/49 | | | | 15,200 | |
| Cablevision Systems Corp. (B+/B1) | |
| | 12,600,000 | | | | 7.750 | | | | 04/15/18 | | | | 13,923,000 | |
| CCO Holdings LLC/CCO Holdings Capital Corp. (B/B2) | |
| | 6,080,000 | | | | 13.500 | | | | 11/30/16 | | | | 6,612,000 | |
| CCO Holdings LLC/CCO Holdings Capital Corp. (BB-/B1) | |
| | 1,000,000 | | | | 7.250 | | | | 10/30/17 | | | | 1,090,000 | |
| | 4,125,000 | | | | 7.875 | | | | 04/30/18 | | | | 4,455,000 | |
| | 15,000,000 | | | | 7.000 | | | | 01/15/19 | | | | 16,293,750 | |
| | 5,500,000 | | | | 7.375 | | | | 06/01/20 | | | | 6,118,750 | |
| | 15,000,000 | | | | 6.500 | | | | 04/30/21 | | | | 16,087,500 | |
| | 12,150,000 | | | | 6.625 | | | | 01/31/22 | | | | 13,273,875 | |
| CSC Holdings LLC (BB+/Ba3) | |
| | 1,561,000 | | | | 7.875 | | | | 02/15/18 | | | | 1,787,345 | |
| | 1,750,000 | | | | 7.625 | | | | 07/15/18 | | | | 2,023,437 | |
| | 5,100,000 | | | | 8.625 | | | | 02/15/19 | | | | 6,043,500 | |
| | 7,650,000 | | | | 6.750 | (a) | | | 11/15/21 | | | | 8,434,125 | |
| DISH DBS Corp. (BB-/Ba2) | |
| | 6,650,000 | | | | 7.750 | | | | 05/31/15 | | | | 7,481,250 | |
| | 9,850,000 | | | | 7.125 | | | | 02/01/16 | | | | 10,884,250 | |
| | 800,000 | | | | 7.875 | | | | 09/01/19 | | | | 928,000 | |
| | 26,800,000 | | | | 6.750 | | | | 06/01/21 | | | | 29,245,500 | |
| | 6,550,000 | | | | 5.875 | (a) | | | 07/15/22 | | | | 6,697,375 | |
| Harron Communications LP/Harron Finance Corp. (B-/Caa1)(a) | |
| | 7,480,000 | | | | 9.125 | | | | 04/01/20 | | | | 8,078,400 | |
| Unitymedia GmbH (B-/B3) | |
| EUR | 750,000 | | | | 9.625 | | | | 12/01/19 | | | | 1,062,575 | |
| Unitymedia Hessen GmbH (BB-/Ba3)(a) | |
| | 885,000 | | | | 8.125 | | | | 12/01/17 | | | | 958,796 | |
| UPC Holding BV (B-/B2) | |
| EUR | 20,100,000 | | | | 8.375 | | | | 08/15/20 | | | | 27,889,584 | |
| | 10,900,000 | | | | 6.375 | (a) | | | 09/15/22 | | | | 13,481,778 | |
| Virgin Media Finance PLC (BB-/Ba2) | |
| $ | 3,000,000 | | | | 9.500 | | | | 08/15/16 | | | | 3,315,000 | |
| | 11,000,000 | | | | 8.375 | | | | 10/15/19 | | | | 12,485,000 | |
| | 4,200,000 | | | | 5.250 | | | | 02/15/22 | | | | 4,413,133 | |
| Virgin Media Investment Holdings Ltd. (BBB-/Baa3) | |
| | 125,000 | | | | 6.500 | | | | 01/15/18 | | | | 136,830 | |
| | | | | | | | | | | | | | |
| | | | | | | | | | | | | 223,214,953 | |
| | |
Principal
Amount | | | Interest
Rate | | | Maturity
Date | | | Value | |
| | | | | | | | | | | | | | |
| | Corporate Obligations – (continued) | |
| Media – Diversified – 0.5% | |
| Quebecor Media, Inc. (B+/B2)(a) | |
| CAD | 12,875,000 | | | | 7.375 | % | | | 01/15/21 | | | $ | 13,917,468 | |
| Videotron Ltee (BB/Ba2) | |
| $ | 5,625,000 | | | | 9.125 | | | | 04/15/18 | | | | 6,089,062 | |
| | 11,350,000 | | | | 5.000 | | | | 07/15/22 | | | | 11,889,125 | |
| | | | | | | | | | | | | | |
| | | | | | | | | | | | | 31,895,655 | |
| | |
| Metals – 1.9% | |
| AK Steel Corp. (B+/B2) | |
| | 10,850,000 | | | | 7.625 | | | | 05/15/20 | | | | 9,520,875 | |
| | 12,500,000 | | | | 8.375 | | | | 04/01/22 | | | | 10,750,000 | |
| Calcipar SA (BB/B1) | |
| EUR | 4,400,000 | | | | 1.421 | (e) | | | 07/01/14 | | | | 5,512,863 | |
| $ | 17,950,000 | | | | 6.875 | (a) | | | 05/01/18 | | | | 17,763,354 | |
| FMG Resources (August 2006) Pty Ltd. (B+/B1)(a) | |
| | 19,900,000 | | | | 6.375 | | | | 02/01/16 | | | | 19,253,250 | |
| | 2,550,000 | | | | 6.000 | | | | 04/01/17 | | | | 2,377,875 | |
| Inmet Mining Corp. (B+/B1)(a) | |
| | 16,400,000 | | | | 8.750 | | | | 06/01/20 | | | | 17,015,000 | |
| Novelis, Inc. (B/B2) | |
| | 4,000,000 | | | | 8.375 | | | | 12/15/17 | | | | 4,380,000 | |
| | 5,900,000 | | | | 8.750 | | | | 12/15/20 | | | | 6,534,250 | |
| Steel Dynamics, Inc. (BB+/Ba2)(a) | |
| | 4,050,000 | | | | 6.125 | | | | 08/15/19 | | | | 4,212,000 | |
| | 3,350,000 | | | | 6.375 | | | | 08/15/22 | | | | 3,450,500 | |
| Thompson Creek Metals Co., Inc. (CCC/Caa2) | |
| | 14,110,000 | | | | 7.375 | | | | 06/01/18 | | | | 11,429,100 | |
| | | | | | | | | | | | | | |
| | | | | | | | | | | | | 112,199,067 | |
| | |
| Packaging – 3.6% | |
| ARD Finance SA (CCC+/Caa1)(a)(f) | |
| | 800,000 | | | | 11.125 | | | | 06/01/18 | | | | 772,333 | |
| Ardagh Glass Finance PLC (CCC+/B3) | |
| EUR | 6,000,000 | | | | 8.750 | | | | 02/01/20 | | | | 7,710,298 | |
| Ardagh Packaging Finance PLC (B+/Ba3) | |
| $ | 3,000,000 | | | | 7.375 | | | | 10/15/17 | | | | 4,125,010 | |
| Ardagh Packaging Finance PLC (B+/Ba3e) | |
| | 2,200,000 | | | | 7.375 | (a) | | | 10/15/17 | | | | 2,376,000 | |
| Ardagh Packaging Finance PLC (CCC+/B3) | |
| | 9,875,000 | | | | 9.125 | (a) | | | 10/15/20 | | | | 10,466,187 | |
| EUR | 3,300,000 | | | | 9.250 | | | | 10/15/20 | | | | 4,346,681 | |
| Ball Corp. (BB+/Ba1) | |
| $ | 5,000,000 | | | | 5.750 | | | | 05/15/21 | | | | 5,400,000 | |
| | 5,000,000 | | | | 5.000 | | | | 03/15/22 | | | | 5,275,000 | |
| Berry Plastics Corp. (B/B1)(e) | |
| | 11,450,000 | | | | 5.205 | | | | 02/15/15 | | | | 11,478,625 | |
| Beverage Packaging Holdings Luxembourg II SA (CCC+/Caa2) | |
| EUR | 9,500,000 | | | | 8.000 | | | | 12/15/16 | | | | 12,116,413 | |
| | 22,375,000 | | | | 9.500 | | | | 06/15/17 | | | | 28,321,693 | |
| Crown Americas LLC (BB/Ba2) | |
| $ | 7,500,000 | | | | 7.625 | | | | 05/15/17 | | | | 8,025,000 | |
| | 6,750,000 | | | | 6.250 | | | | 02/01/21 | | | | 7,509,375 | |
| Crown Cork & Seal Co., Inc. (BB-/Ba3) | |
| | 1,000,000 | | | | 7.375 | | | | 12/15/26 | | | | 1,097,500 | |
| Crown European Holdings SA (BB/Baa3) | |
| EUR | 3,625,000 | | | | 7.125 | | | | 08/15/18 | | | | 5,089,199 | |
| | |
| | |
| The accompanying notes are an integral part of these financial statements. | | 53 |
GOLDMAN SACHS HIGH YIELD FUND
Schedule of Investments (continued)
September 30, 2012 (Unaudited)
| | | | | | | | | | | | | | |
Principal
Amount | | | Interest
Rate | | | Maturity
Date | | | Value | |
| | | | | | | | | | | | | | |
| | Corporate Obligations – (continued) | |
| Packaging – (continued) | |
| Graphic Packaging International, Inc. (BB+/B2) | |
| $ | 5,300,000 | | | | 9.500 | % | | | 06/15/17 | | | $ | 5,816,750 | |
| Kloeckner Penta Plast GMBH & Co. (CCC/Caa1)(a) | |
| EUR | 5,700,000 | | | | 11.625 | | | | 07/15/17 | | | | 7,654,325 | |
| Owens-Brockway Glass Container, Inc. (BB/Ba3)(a) | |
| | 9,000,000 | | | | 3.000 | | | | 06/01/15 | | | | 8,836,623 | |
| Reynolds Group Holding Ltd. (B+/B1) | |
| | 9,100,000 | | | | 5.750 | (a) | | | 10/15/20 | | | | 9,077,250 | |
| Reynolds Group Holding Ltd. (CCC+/Caa2) | |
| | 11,300,000 | | | | 9.875 | | | | 08/15/19 | | | | 11,978,000 | |
| Reynolds Group Issuer, Inc. (B+/B1) | |
| | 7,125,000 | | | | 7.125 | | | | 04/15/19 | | | | 7,481,250 | |
| | 10,200,000 | | | | 7.875 | | | | 08/15/19 | | | | 10,990,500 | |
| | 1,625,000 | | | | 6.875 | | | | 02/15/21 | | | | 1,706,250 | |
| Reynolds Group Issuer, Inc. (CCC+/Caa2) | |
| | 7,600,000 | | | | 9.000 | | | | 04/15/19 | | | | 7,752,000 | |
| | 17,500,000 | | | | 8.250 | | | | 02/15/21 | | | | 17,368,750 | |
| Sealed Air Corp. (BB-/B1)(a) | |
| | 5,250,000 | | | | 8.125 | | | | 09/15/19 | | | | 5,801,250 | |
| Silgan Holdings, Inc. (BB-/Ba2) | |
| | 8,400,000 | | | | 5.000 | | | | 04/01/20 | | | | 8,757,000 | |
| | | | | | | | | | | | | | |
| | | | | | | | | | | | | 217,329,262 | |
| | |
| Paper – 1.6% | |
| Ainsworth Lumber Co., Ltd. (B-/Caa1)(a)(f) | |
| | 9,557,403 | | | | 11.000 | | | | 07/29/15 | | | | 9,175,107 | |
| Clearwater Paper Corp. (BB/Ba3) | |
| | 8,014,000 | | | | 7.125 | | | | 11/01/18 | | | | 8,715,225 | |
| Longview Fibre Paper & Packaging, Inc. (B+/B2)(a) | |
| | 14,000,000 | | | | 8.000 | | | | 06/01/16 | | | | 14,595,000 | |
| NewPage Corp. (NR/WR)(b) | |
| | 10,050,000 | | | | 11.375 | | | | 12/31/14 | | | | 6,331,500 | |
| Sappi Papier Holding GmbH (B/B2)(a) | |
| | 3,875,000 | | | | 7.500 | | | | 06/15/32 | | | | 3,361,563 | |
| Sappi Papier Holding GmbH (BB/Ba2)(a) | |
| | 15,400,000 | | | | 7.750 | | | | 07/15/17 | | | | 16,439,500 | |
| | 8,525,000 | | | | 6.625 | | | | 04/15/21 | | | | 8,269,250 | |
| Stone Container Finance Co. of Canada II (NR/WR)(b) | |
| | 2,250,000 | | | | 7.375 | | | | 07/15/14 | | | | — | |
| Stora Enso OYJ (BB/Ba2)(a) | |
| | 4,900,000 | | | | 7.250 | | | | 04/15/36 | | | | 4,410,000 | |
| Verso Paper Holdings LLC/Verso Paper, Inc. (BB-/Ba2)(a) | |
| | 3,550,000 | | | | 11.750 | | | | 01/15/19 | | | | 3,727,500 | |
| Weyerhaeuser Co. (BBB-/Ba1) | |
| | 17,865,000 | | | | 7.375 | | | | 03/15/32 | | | | 21,182,280 | |
| | | | | | | | | | | | | | |
| | | | | | | | | | | | | 96,206,925 | |
| | |
| Printing – 0.1% | |
| Checkout Holding Corp. (CCC+/Caa1)(a)(g) | |
| | 6,375,000 | | | | 0.000 | | | | 11/15/15 | | | | 3,761,250 | |
| SGS International, Inc. (B-/B2) | |
| | 5,256,000 | | | | 12.000 | | | | 12/15/13 | | | | 5,308,560 | |
| | | | | | | | | | | | | | |
| | | | | | | | | | | | | 9,069,810 | |
| | |
Principal
Amount | | | Interest
Rate | | | Maturity
Date | | | Value | |
| | | | | | | | | | | | | | |
| | Corporate Obligations – (continued) | |
| Publishing – 0.4% | |
| Houghton Mifflin Harcourt Publishing Co. (NR/WR)(a)(b) | |
| $ | 14,050,000 | | | | 10.500 | % | | | 06/01/19 | | | $ | 7,622,125 | |
| Nielsen Finance LLC (BB-/B2) | |
| | 3,250,000 | | | | 11.500 | | | | 05/01/16 | | | | 3,627,813 | |
| ProQuest LLC/ProQuest Notes Co. (B-/Caa1)(a) | |
| | 14,000,000 | | | | 9.000 | | | | 10/15/18 | | | | 13,020,000 | |
| Truvo Subsidiary Corp. (NR/WR)(b) | |
| EUR | 16,750,000 | | | | 8.500 | | | | 12/01/14 | | | | — | |
| | | | | | | | | | | | | | |
| | | | | | | | | | | | | 24,269,938 | |
| | |
| Real Estate – 0.6% | |
| CB Richard Ellis Services, Inc. (B+/Ba1) | |
| $ | 6,150,000 | | | | 6.625 | | | | 10/15/20 | | | | 6,718,875 | |
| CB Richard Ellis Services, Inc. (B+/Ba2) | |
| | 9,900,000 | | | | 11.625 | | | | 06/15/17 | | | | 11,088,000 | |
| Crescent Resources LLC (B/Caa2)(a) | |
| | 3,750,000 | | | | 10.250 | | | | 08/15/17 | | | | 3,890,625 | |
| Realogy Corp. (CC/Caa3) | |
| | 1,000,000 | | | | 11.500 | | | | 04/15/17 | | | | 1,070,000 | |
| Realogy Corp. (CCC-/Caa1)(a) | |
| | 12,000,000 | | | | 9.000 | | | | 01/15/20 | | | | 13,200,000 | |
| | | | | | | | | | | | | | |
| | | | | | | | | | | | | 35,967,500 | |
| | |
| Restaurants – 0.4% | |
| DineEquity, Inc. (B-/B3) | |
| | 13,300,000 | | | | 9.500 | | | | 10/30/18 | | | | 14,896,000 | |
| Seminole Hard Rock Entertainment, Inc. (BB/B2)(a)(e) | |
| | 7,000,000 | | | | 2.889 | | | | 03/15/14 | | | | 6,965,000 | |
| | | | | | | | | | | | | | |
| | | | | | | | | | | | | 21,861,000 | |
| | |
| Retailers – 1.2% | |
| AutoNation, Inc. (BB+/Ba2) | |
| | 4,150,000 | | | | 5.500 | | | | 02/01/20 | | | | 4,435,313 | |
| Burlington Coat Factory Warehouse Corp. (CCC/Caa1) | |
| | 10,350,000 | | | | 10.000 | | | | 02/15/19 | | | | 11,359,125 | |
| Claire’s Stores, Inc. (B/B2)(a) | |
| | 4,400,000 | | | | 9.000 | | | | 03/15/19 | | | | 4,554,000 | |
| Claire’s Stores, Inc. (CCC/Caa2) | |
| | 14,800,000 | | | | 8.875 | | | | 03/15/19 | | | | 13,542,000 | |
| Limited Brands, Inc. (BB+/Ba1) | |
| | 14,337,000 | | | | 6.625 | | | | 04/01/21 | | | | 16,308,337 | |
| | 7,050,000 | | | | 5.625 | | | | 02/15/22 | | | | 7,569,938 | |
| Toys R Us, Inc. (CCC+/B3)(a) | |
| | 9,750,000 | | | | 10.375 | | | | 08/15/17 | | | | 9,932,812 | |
| Wolverine World Wide, Inc. (NR/B2)(a) | |
| | 3,200,000 | | | | 6.125 | | | | 10/15/20 | | | | 3,304,000 | |
| | | | | | | | | | | | | | |
| | | | | | | | | | | | | 71,005,525 | |
| | |
| Retailers – Food & Drug – 1.4% | |
| Ingles Markets, Inc. (BB-/B1) | |
| | 6,000,000 | | | | 8.875 | | | | 05/15/17 | | | | 6,472,500 | |
| Rite Aid Corp. (B+/B2) | |
| | 1,250,000 | | | | 8.000 | | | | 08/15/20 | | | | 1,418,750 | |
| Rite Aid Corp. (B-/Caa1) | |
| | 2,500,000 | | | | 10.375 | | | | 07/15/16 | | | | 2,637,500 | |
| | 12,000,000 | | | | 7.500 | | | | 03/01/17 | | | | 12,330,000 | |
| | |
| | |
| 54 | | The accompanying notes are an integral part of these financial statements. |
GOLDMAN SACHS HIGH YIELD FUND
| | | | | | | | | | | | | | |
Principal
Amount | | | Interest
Rate | | | Maturity
Date | | | Value | |
| | | | | | | | | | | | | | |
| | Corporate Obligations – (continued) | |
| Retailers – Food & Drug – (continued) | |
| Rite Aid Corp. (CCC/Caa2) | |
| $ | 24,050,000 | | | | 9.500 | % | | | 06/15/17 | | | $ | 24,771,500 | |
| Rite Aid Corp. (CCC/NR) | |
| | 18,285,000 | | | | 9.250 | | | | 03/15/20 | | | | 18,742,125 | |
| Supervalu, Inc. (B-/Caa1) | |
| | 5,375,000 | | | | 7.500 | | | | 11/15/14 | | | | 5,160,000 | |
| | 5,500,000 | | | | 8.000 | | | | 05/01/16 | | | | 4,908,750 | |
| The Pantry, Inc. (B+/Caa1)(a) | |
| | 6,100,000 | | | | 8.375 | | | | 08/01/20 | | | | 6,283,000 | |
| | | | | | | | | | | | | | |
| | | | | | | | | | | | | 82,724,125 | |
| | |
| Services Cyclical – Business Services – 1.1% | |
| CoreLogic, Inc. (B+/Ba3) | |
| | 16,150,000 | | | | 7.250 | | | | 06/01/21 | | | | 17,482,375 | |
| Equinix, Inc. (BB-/Ba2) | |
| | 1,900,000 | | | | 8.125 | | | | 03/01/18 | | | | 2,104,250 | |
| iPayment, Inc. (CCC+/B3) | |
| | 4,950,000 | | | | 10.250 | | | | 05/15/18 | | | | 4,331,250 | |
| Lender Process Services, Inc. (BB+/Ba2) | |
| | 7,100,000 | | | | 5.750 | | | | 04/15/23 | | | | 7,100,000 | |
| Sabre, Inc. (B/B1)(a) | |
| | 3,700,000 | | | | 8.500 | | | | 05/15/19 | | | | 3,820,250 | |
| Sitel LLC / Sitel Finance Corp. (B/B1)(a) | |
| | 500,000 | | | | 11.000 | | | | 08/01/17 | | | | 502,500 | |
| Sitel LLC / Sitel Finance Corp. (B-/Caa2) | |
| | 11,225,000 | | | | 11.500 | | | | 04/01/18 | | | | 8,138,125 | |
| SPL Logistics Escrow LLC (B+/B2)(a) | |
| | 7,550,000 | | | | 8.875 | | | | 08/01/20 | | | | 8,078,500 | |
| The Geo Group, Inc. (B+/B1) | |
| | 11,425,000 | | | | 6.625 | | | | 02/15/21 | | | | 12,224,750 | |
| | | | | | | | | | | | | | |
| | | | | | | | | | | | | 63,782,000 | |
| | |
| Services Cyclical – Rental Equipment – 1.2% | |
| Ashtead Capital, Inc. (B+/B2)(a) | |
| | 3,000,000 | | | | 6.500 | | | | 07/15/22 | | | | 3,150,000 | |
| B-Corp Merger Sub, Inc. (CCC+/Caa1)(a) | |
| | 13,485,000 | | | | 8.250 | | | | 06/01/19 | | | | 13,619,850 | |
| Maxim Crane Works LP (B/Caa2)(a) | |
| | 6,507,000 | | | | 12.250 | | | | 04/15/15 | | | | 6,572,070 | |
| Mobile Mini, Inc. (B+/B2) | |
| | 2,415,000 | | | | 7.875 | | | | 12/01/20 | | | | 2,620,275 | |
| NESCO LLC (B-/Caa1)(a) | |
| | 11,350,000 | | | | 11.750 | | | | 04/15/17 | | | | 12,031,000 | |
| RSC Equipment Rental/RSC Holdings Inc. (B+/B3) | |
| | 5,250,000 | | | | 8.250 | | | | 02/01/21 | | | | 5,768,437 | |
| United Rentals North America, Inc. (B-/Caa1) | |
| | 3,000,000 | | | | 8.375 | | | | 09/15/20 | | | | 3,210,000 | |
| UR Financing Escrow Corp. (B+/B3) | |
| | 6,500,000 | | | | 10.875 | | | | 06/15/16 | | | | 7,215,000 | |
| | 7,250,000 | | | | 7.375 | (a) | | | 05/15/20 | | | | 7,793,750 | |
| | 8,700,000 | | | | 7.625 | (a) | | | 04/15/22 | | | | 9,526,500 | |
| UR Financing Escrow Corp. (BB/Ba3)(a) | |
| | 2,900,000 | | | | 5.750 | | | | 07/15/18 | | | | 3,052,250 | |
| | | | | | | | | | | | | | |
| | | | | | | | | | | | | 74,559,132 | |
| | |
Principal
Amount | | | Interest
Rate | | | Maturity
Date | | | Value | |
| | | | | | | | | | | | | | |
| | Corporate Obligations – (continued) | |
| Technology – Hardware – 1.8% | |
| Alcatel-Lucent (B/B3) | |
| EUR | 2,650,000 | | | | 8.500 | % | | | 01/15/16 | | | $ | 3,188,289 | |
| Alcatel-Lucent USA, Inc. (B/WR) | |
| $ | 9,950,000 | | | | 6.450 | | | | 03/15/29 | | | | 6,467,500 | |
| Brightstar Corp. (BB-/B1)(a) | |
| | 4,000,000 | | | | 9.500 | | | | 12/01/16 | | | | 4,300,000 | |
| CDW LLC/CDW Finance Corp. (CCC+/B3) | |
| | 20,300,000 | | | | 8.500 | | | | 04/01/19 | | | | 22,076,250 | |
| CDW LLC/CDW Finance Corp. (CCC+/Caa1) | |
| | 7,750,000 | | | | 12.535 | | | | 10/12/17 | | | | 8,273,125 | |
| CommScope, Inc. (B/B3)(a) | |
| | 15,000,000 | | | | 8.250 | | | | 01/15/19 | | | | 16,125,000 | |
| EN Germany Holdings BV (B-/B3) | |
| EUR | 10,037,000 | | | | 10.750 | | | | 11/15/15 | | | | 12,349,877 | |
| Freescale Semiconductor, Inc. (B/B1)(a) | |
| $ | 7,500,000 | | | | 10.125 | | | | 03/15/18 | | | | 8,250,000 | |
| Freescale Semiconductor, Inc. (CCC+/Caa1) | |
| | 5,500,000 | | | | 10.750 | | | | 08/01/20 | | | | 5,912,500 | |
| MEMC Electronic Materials, Inc. (B+/Caa1) | |
| | 16,450,000 | | | | 7.750 | | | | 04/01/19 | | | | 13,489,000 | |
| NCR Corp. (BB/Ba2)(a) | |
| | 3,650,000 | | | | 5.000 | | | | 07/15/22 | | | | 3,741,250 | |
| Welltec A/S (BB-/B1)(a) | |
| | 4,100,000 | | | | 8.000 | | | | 02/01/19 | | | | 4,192,250 | |
| | | | | | | | | | | | | | |
| | | | | | | | | | | | | 108,365,041 | |
| | |
| Technology – Software/Services – 3.4% | |
| Aspect Software, Inc. (CCC+/Caa1) | |
| | 5,585,000 | | | | 10.625 | | | | 05/15/17 | | | | 5,752,550 | |
| Equinix, Inc. (BB-/Ba2) | |
| | 11,331,000 | | | | 7.000 | | | | 07/15/21 | | | | 12,690,720 | |
| Fidelity National Information Services, Inc. (BB+/Ba2) | |
| | 6,100,000 | | | | 7.625 | | | | 07/15/17 | | | | 6,679,500 | |
| | 11,250,000 | | | | 7.875 | | | | 07/15/20 | | | | 12,543,750 | |
| First Data Corp. (B+/B1)(a) | |
| | 9,000,000 | | | | 7.375 | | | | 06/15/19 | | | | 9,270,000 | |
| First Data Corp. (B-/Caa1) | |
| | 22,750,000 | | | | 10.550 | | | | 09/24/15 | | | | 23,261,875 | |
| | 31,050,000 | | | | 8.250 | (a) | | | 01/15/21 | | | | 30,972,375 | |
| | 15,850,000 | | | | 12.625 | | | | 01/15/21 | | | | 16,404,750 | |
| | 40,100,000 | | | | 8.750 | (a)(f) | | | 01/15/22 | | | | 40,300,500 | |
| Infor (US), Inc. (B-/Caa1)(a) | |
| | 10,000,000 | | | | 9.375 | | | | 04/01/19 | | | | 11,000,000 | |
| EUR | 680,000 | | | | 10.000 | | | | 04/01/19 | | | | 943,741 | |
| Nuance Communications, Inc. (BB-/Ba3)(a) | |
| $ | 8,200,000 | | | | 5.375 | | | | 08/15/20 | | | | 8,364,000 | |
| Sabre Holdings Corp. (CCC+/Caa1) | |
| | 11,650,000 | | | | 8.350 | | | | 03/15/16 | | | | 11,824,750 | |
| Serena Software, Inc. (CCC+/Caa1) | |
| | 6,076,000 | | | | 10.375 | | | | 03/15/16 | | | | 6,243,090 | |
| SunGard Data Systems, Inc. (B/Caa1) | |
| | 5,000,000 | | | | 7.375 | | | | 11/15/18 | | | | 5,375,000 | |
| | | | | | | | | | | | | | |
| | | | | | | | | | | | | 201,626,601 | |
| | |
| | |
| The accompanying notes are an integral part of these financial statements. | | 55 |
GOLDMAN SACHS HIGH YIELD FUND
Schedule of Investments (continued)
September 30, 2012 (Unaudited)
| | | | | | | | | | | | | | |
Principal
Amount | | | Interest
Rate | | | Maturity
Date | | | Value | |
| | | | | | | | | | | | | | |
| | Corporate Obligations – (continued) | |
| Telecommunications – 3.3% | |
| Frontier Communications Corp. (BB/Ba2) | |
| $ | 3,720,000 | | | | 6.625 | % | | | 03/15/15 | | | $ | 4,017,600 | |
| | 17,100,000 | | | | 7.875 | | | | 04/15/15 | | | | 19,109,250 | |
| | 37,900,000 | | | | 8.250 | | | | 04/15/17 | | | | 43,016,500 | |
| | 21,800,000 | | | | 8.125 | | | | 10/01/18 | | | | 24,525,000 | |
| | 5,200,000 | | | | 8.500 | | | | 04/15/20 | | | | 5,895,500 | |
| Level 3 Communications, Inc. (CCC/Caa2)(a) | |
| | 7,200,000 | | | | 8.875 | | | | 06/01/19 | | | | 7,542,000 | |
| Level 3 Financing, Inc. (CCC/B3) | |
| | 14,500,000 | | | | 4.469 | (e) | | | 02/15/15 | | | | 14,391,250 | |
| | 14,500,000 | | | | 10.000 | | | | 02/01/18 | | | | 16,131,250 | |
| | 3,650,000 | | | | 9.375 | | | | 04/01/19 | | | | 4,051,500 | |
| | 11,600,000 | | | | 8.125 | | | | 07/01/19 | | | | 12,383,000 | |
| Matterhorn Mobile SA (BB-/B1)(a)(e) | |
| CHF | 1,700,000 | | | | 5.421 | | | | 05/15/19 | | | | 1,816,587 | |
| PAETEC Holding Corp. (NR/WR) | |
| $ | 6,800,000 | | | | 9.875 | | | | 12/01/18 | | | | 7,786,000 | |
| Sunrise Communications Holdings SA (B-/B3) | |
| EUR | 2,500,000 | | | | 8.500 | | | | 12/31/18 | | | | 3,472,461 | |
| Sunrise Communications International SA (BB-/Ba3) | |
| CHF | 600,000 | | | | 5.625 | (a) | | | 12/31/17 | | | | 655,503 | |
| $ | 2,625,000 | | | | 7.000 | | | | 12/31/17 | | | | 2,986,443 | |
| tw telecom holdings, Inc. (BB-/B1)(a) | |
| | 4,500,000 | | | | 5.375 | | | | 10/01/22 | | | | 4,584,375 | |
| Windstream Corp. (B/Ba3) | |
| | 5,000,000 | | | | 8.125 | | | | 08/01/13 | | | | 5,256,250 | |
| | 7,375,000 | | | | 7.875 | | | | 11/01/17 | | | | 8,241,563 | |
| | 1,750,000 | | | | 8.125 | | | | 09/01/18 | | | | 1,863,750 | |
| | 8,000,000 | | | | 7.750 | | | | 10/15/20 | | | | 8,580,000 | |
| | 3,500,000 | | | | 7.500 | | | | 06/01/22 | | | | 3,710,000 | |
| | | | | | | | | | | | | | |
| | | | | | | | | | | | | 200,015,782 | |
| | |
| Telecommunications – Cellular – 4.1% | |
| CC Holdings GS V LLC/Crown Castle GS III Corp. (BB/Baa2)(a) | |
| | 5,125,000 | | | | 7.750 | | | | 05/01/17 | | | | 5,464,531 | |
| Crown Castle International Corp. (B-/B1) | |
| | 10,600,000 | | | | 9.000 | | | | 01/15/15 | | | | 11,395,000 | |
| | 4,300,000 | | | | 7.125 | | | | 11/01/19 | | | | 4,676,250 | |
| Matterhorn Midco & CY SCA (B-/Caa1)(a) | |
| EUR | 1,900,000 | | | | 7.750 | | | | 02/15/20 | | | | 2,417,179 | |
| SBA Telecommunications, Inc. (B+/B1)(a) | |
| $ | 7,400,000 | | | | 5.750 | | | | 07/15/20 | | | | 7,751,500 | |
| Sprint Capital Corp. (B+/B3) | |
| | 28,550,000 | | | | 6.900 | | | | 05/01/19 | | | | 29,692,000 | |
| | 41,900,000 | | | | 8.750 | | | | 03/15/32 | | | | 43,366,500 | |
| Sprint Nextel Corp. (B+/B3) | |
| | 11,768,000 | | | | 6.000 | | | | 12/01/16 | | | | 12,150,460 | |
| | 30,050,000 | | | | 8.375 | | | | 08/15/17 | | | | 33,505,750 | |
| | 17,900,000 | | | | 7.000 | | | | 08/15/20 | | | | 18,616,000 | |
| | 20,000,000 | | | | 11.500 | | | | 11/15/21 | | | | 25,000,000 | |
| Sprint Nextel Corp. (BB-/Ba3)(a) | |
| | 24,650,000 | | | | 9.000 | | | | 11/15/18 | | | | 29,518,375 | |
| Wind Acquisition Finance SA (BB/Ba3)(a) | |
| | 19,025,000 | | | | 7.250 | | | | 02/15/18 | | | | 17,978,625 | |
| | |
Principal
Amount | | | Interest
Rate | | | Maturity
Date | | | Value | |
| | | | | | | | | | | | | | |
| | Corporate Obligations – (continued) | |
| Telecommunications – Cellular – (continued) | |
| Wind Acquisition Finance SA (BB-/B3)(a) | |
| $ | 3,800,000 | | | | 11.750 | % | | | 07/15/17 | | | $ | 3,591,000 | |
| | | | | | | | | | | | | | |
| | | | | | | | | | | | | 245,123,170 | |
| | |
| Telecommunications – Satellites – 1.7% | |
| Inmarsat Finance PLC (BB+/Ba2)(a) | | | | | |
| | 700,000 | | | | 7.375 | | | | 12/01/17 | | | | 756,000 | |
| Intelsat Jackson Holdings SA (B/B3) | |
| | 6,800,000 | | | | 7.250 | | | | 10/15/20 | | | | 7,327,000 | |
| | 8,520,000 | | | | 7.250 | (a) | | | 10/15/20 | | | | 9,180,300 | |
| | 10,100,000 | | | | 7.500 | | | | 04/01/21 | | | | 10,933,250 | |
| Intelsat Jackson Holdings SA (CCC+/Caa2) | |
| | 8,861,000 | | | | 11.250 | | | | 06/15/16 | | | | 9,248,669 | |
| Intelsat Luxembourg SA (CCC+/Caa3) | |
| | 7,500,000 | | | | 11.250 | | | | 02/04/17 | | | | 7,950,000 | |
| | 51,550,000 | | | | 11.500 | (f) | | | 02/04/17 | | | | 54,643,000 | |
| Unitymedia Hessen GmbH & Co. KG (BB-/Ba3)(a) | |
| | 3,750,000 | | | | 7.500 | | | | 03/15/19 | | | | 4,123,268 | |
| | | | | | | | | | | | | | |
| | | | | | | | | | | | | 104,161,487 | |
| | |
| Textiles & Apparel – 0.6% | |
| Hanesbrands, Inc. (BB-/B1) | |
| | 14,000,000 | | | | 6.375 | | | | 12/15/20 | | | | 15,120,000 | |
| Levi Strauss & Co. (B+/B2) | |
| | 3,350,000 | | | | 6.875 | | | | 05/01/22 | | | | 3,484,000 | |
| Quiksilver, Inc. (B/Ba3) | |
| EUR | 2,825,000 | | | | 8.875 | | | | 12/15/17 | | | | 3,693,795 | |
| The Jones Group, Inc. (B+/Ba3) | |
| $ | 13,000,000 | | | | 6.875 | | | | 03/15/19 | | | | 13,390,000 | |
| | | | | | | | | | | | | | |
| | | | | | | | | | | | | 35,687,795 | |
| | |
| Transportation – 0.7% | |
| ACL I Corp. (B-/Caa1)(f) | |
| | 8,145,637 | | | | 10.625 | | | | 02/15/16 | | | | 7,966,151 | |
| Aguila 3 SA (B/B2)(a) | |
| | 18,400,000 | | | | 7.875 | | | | 01/31/18 | | | | 19,366,000 | |
| Commercial Barge Line Co. (BB-/B2) | |
| | 3,475,000 | | | | 12.500 | | | | 07/15/17 | | | | 3,883,312 | |
| Florida East Coast Holdings Corp. (CCC/Caa3)(f) | |
| | 8,609,881 | | | | 10.500 | | | | 08/01/17 | | | | 7,544,408 | |
| Florida East Coast Railway Corp. (B-/B3) | |
| | 1,650,000 | | | | 8.125 | | | | 02/01/17 | | | | 1,740,750 | |
| | | | | | | | | | | | | | |
| | | | | | | | | | | | | 40,500,621 | |
| | |
| Utilities – Distribution – 0.6% | |
| AmeriGas Finance LLC/AmeriGas Finance Corp. (NR/Ba2) | |
| | 11,400,000 | | | | 6.750 | | | | 05/20/20 | | | | 12,141,000 | |
| AmeriGas Partners LP/AmeriGas Finance Corp. (NR/Ba3) | |
| | 3,000,000 | | | | 6.250 | | | | 08/20/19 | | | | 3,120,000 | |
| Ferrellgas LP/Ferrellgas Finance Corp. (B-/B2) | |
| | 2,558,000 | | | | 9.125 | | | | 10/01/17 | | | | 2,743,455 | |
| | 3,900,000 | | | | 6.500 | | | | 05/01/21 | | | | 3,822,000 | |
| Ferrellgas Partners LP/Ferellgas Partners Finance Corp.
(CCC+/B3) |
|
| | 2,250,000 | | | | 8.625 | | | | 06/15/20 | | | | 2,182,500 | |
| | |
| | |
| 56 | | The accompanying notes are an integral part of these financial statements. |
GOLDMAN SACHS HIGH YIELD FUND
| | | | | | | | | | | | | | |
Principal
Amount | | | Interest
Rate | | | Maturity
Date | | | Value | |
| | | | | | | | | | | | | | |
| | Corporate Obligations – (continued) | |
| Utilities – Distribution – 0.6% | |
| Suburban Propane Partners LP/Suburban Energy Finance Corp.
(BB-/Ba3)(a) |
|
| $ | 4,433,000 | | | | 7.500 | % | | | 10/01/18 | | | $ | 4,754,393 | |
| | 7,072,000 | | | | 7.375 | | | | 08/01/21 | | | | 7,531,680 | |
| | | | | | | | | | | | | | |
| | | | | | | | | | | | | 36,295,028 | |
| | |
| Utilities – Electric – 2.9% | |
| Calpine Corp. (BB-/B1)(a) | |
| | 10,800,000 | | | | 7.250 | | | | 10/15/17 | | | | 11,515,500 | |
| | 7,400,000 | | | | 7.500 | | | | 02/15/21 | | | | 8,029,000 | |
| CMS Energy Corp. (BB+/Ba1) | |
| | 5,000,000 | | | | 5.050 | | | | 03/15/22 | | | | 5,525,000 | |
| DPL, Inc. (BB+/Ba1)(a) | |
| | 10,850,000 | | | | 6.500 | | | | 10/15/16 | | | | 11,880,750 | |
| | 38,050,000 | | | | 7.250 | | | | 10/15/21 | | | | 43,186,750 | |
| NRG Energy, Inc. (BB-/B1) | |
| | 11,750,000 | | | | 7.625 | | | | 01/15/18 | | | | 12,690,000 | |
| | 11,600,000 | | | | 7.875 | | | | 05/15/21 | | | | 12,586,000 | |
| | 6,450,000 | | | | 6.625 | (a) | | | 03/15/23 | | | | 6,579,000 | |
| NV Energy, Inc. (BB+/Ba1) | |
| | 11,000,000 | | | | 6.250 | | | | 11/15/20 | | | | 12,760,000 | |
| Puget Energy, Inc. (BB+/Ba1) | |
| | 16,200,000 | | | | 6.000 | | | | 09/01/21 | | | | 17,933,179 | |
| The AES Corp. (BB-/Ba3) | |
| | 10,650,000 | | | | 8.000 | | | | 10/15/17 | | | | 12,300,750 | |
| | 9,650,000 | | | | 8.000 | | | | 06/01/20 | | | | 11,194,000 | |
| | 9,250,000 | | | | 7.375 | | | | 07/01/21 | | | | 10,545,000 | |
| | | | | | | | | | | | | | |
| | | | | | | | | | | | | 176,724,929 | |
| | |
| Utilities – Pipelines – 1.2% | |
| Crosstex Energy LP/Crosstex Energy Finance Corp. (B+/B2) | |
| | 5,000,000 | | | | 8.875 | | | | 02/15/18 | | | | 5,350,000 | |
| El Paso Corp. (BB/Ba2) | |
| | 10,500,000 | | | | 7.000 | | | | 06/15/17 | | | | 12,022,500 | |
| | 2,555,000 | | | | 7.250 | | | | 06/01/18 | | | | 2,951,025 | |
| | 4,000,000 | | | | 6.500 | | | | 09/15/20 | | | | 4,500,000 | |
| | 3,944,000 | | | | 7.800 | | | | 08/01/31 | | | | 4,732,800 | |
| El Paso Pipeline Partners Operating Co. LLC (BBB-/Ba1) | |
| | 4,750,000 | | | | 5.000 | | | | 10/01/21 | | | | 5,242,886 | |
| Enterprise Products Operating LLC (BB+/Baa3)(e) | |
| | 3,750,000 | | | | 8.375 | | | | 08/01/66 | | | | 4,218,750 | |
| | 3,285,000 | | | | 7.034 | | | | 01/15/68 | | | | 3,687,412 | |
| MarkWest Energy Partners LP/MarkWest Energy Finance Corp.
(BB/Ba3) |
|
| | 3,800,000 | | | | 5.500 | | | | 02/15/23 | | | | 3,980,500 | |
| Regency Energy Partners LP (BB/B1) | |
| | 6,200,000 | | | | 9.375 | | | | 06/01/16 | | | | 6,765,750 | |
| | 8,250,000 | | | | 6.500 | | | | 07/15/21 | | | | 8,827,500 | |
| | 5,200,000 | | | | 5.500 | | | | 04/15/23 | | | | 5,239,000 | |
| Targa Resources Partners LP (BB/Ba3) | |
| | 2,725,000 | | | | 11.250 | | | | 07/15/17 | | | | 3,072,438 | |
| | | | | | | | | | | | | | |
| | | | | | | | | | | | | 70,590,561 | |
| | |
| | TOTAL CORPORATE OBLIGATIONS | |
| | (Cost $5,234,797,390) | | | $ | 5,475,251,213 | |
| | |
| | | | | | | | | | | | | | |
Principal
Amount | | | Interest
Rate | | | Maturity
Date | | | Value | |
| | | | | | | | | | | | | | |
| | Senior Term Loans(h) – 4.7% | |
| Airlines – 0.3% | |
| Delta Air Lines, Inc. (BB-/Ba2) | |
| $ | 16,586,759 | | | | 5.500 | % | | | 04/20/17 | | | $ | 16,654,101 | |
| | |
| Automotive – 0.3% | |
| Chrysler Group LLC (B+/B2) | |
| | 16,466,624 | | | | 6.000 | | | | 05/24/17 | | | | 16,792,170 | |
| | |
| Automotive Parts – 0.0% | |
| Allison Transmission, Inc. (B-/B2) | |
| | 432,968 | | | | 2.720 | | | | 08/07/14 | | | | 433,025 | |
| | |
| Consumer Products – Household & Leisure – 0.1% | |
| BJ’s Wholesale Club, Inc. (B/B3) | |
| | 4,175,000 | | | | 9.750 | | | | 03/26/20 | | | | 4,214,662 | |
| Prestige Brands, Inc. (BB-/Ba3) | |
| | 1,712,121 | | | | 5.268 | | | | 01/31/19 | | | | 1,728,712 | |
| Yankee Candle Co., Inc. (B+/B1) | |
| | 3,184,000 | | | | 5.250 | | | | 04/02/19 | | | | 3,208,676 | |
| | | | | | | | | | | | | | |
| | | | | | | | | | | | | 9,152,050 | |
| | |
| Consumer Products – Industrial – 0.5% | |
| CPM Acquisition, Inc. (B+/B1) | |
| | 10,700,000 | | | | 6.250 | | | | 08/29/17 | | | | 10,673,250 | |
| CPM Acquisition, Inc. (B/Caa1) | |
| | 7,570,000 | | | | 10.250 | | | | 03/01/18 | | | | 7,607,850 | |
| HD Supply, Inc. (B+/B2) | |
| | 10,400,000 | | | | 7.250 | | | | 10/12/17 | | | | 10,717,200 | |
| | | | | | | | | | | | | | |
| | | | | | | | | | | | | 28,998,300 | |
| | |
| Energy – 0.4% | |
| AES Corp. (BB+/Ba1) | |
| | 8,425,232 | | | | 4.250 | | | | 06/01/18 | | | | 8,463,820 | |
| Chesapeake Energy Corp. (BB-/Ba2) | |
| | 8,100,000 | | | | 8.500 | | | | 12/01/17 | | | | 8,120,655 | |
| Frac Tech International LLC (NR/B2) | |
| | 7,328,742 | | | | 8.500 | | | | 05/06/16 | | | | 7,048,710 | |
| Samson Investment Co. (B+/B1) | |
| | 2,800,000 | | | | 6.000 | | | | 09/13/18 | | | | 2,815,176 | |
| | | | | | | | | | | | | | |
| | | | | | | | | | | | | 26,448,361 | |
| | |
| Entertainment – 0.1% | |
| EMI Music Publishing, Ltd. (BB-/Ba3) | |
| | 8,179,500 | | | | 5.500 | | | | 06/29/18 | | | | 8,267,430 | |
| | |
| Food & Beverages – 0.4% | |
| Blue Buffalo Co., Ltd. (B/B1) | |
| | 18,850,000 | | | | 6.500 | | | | 08/08/19 | | | | 18,850,000 | |
| US Foods, Inc. (NR/B3) | |
| | 5,724,467 | | | | 2.720 | | | | 07/03/14 | | | | 5,651,136 | |
| | | | | | | | | | | | | | |
| | | | | | | | | | | | | 24,501,136 | |
| | |
| Gaming – 0.1% | |
| Caesars Entertainment Operating Co. (B/Caa1) | |
| | 3,750,000 | | | | 3.217 | | | | 01/28/15 | | | | 3,632,137 | |
| | |
| Health Care – 0.1% | |
| Community Health Systems, Inc. (BB/Ba3) | |
| | 707,392 | | | | 3.921 | | | | 01/25/17 | | | | 709,826 | |
| | |
| | |
| The accompanying notes are an integral part of these financial statements. | | 57 |
GOLDMAN SACHS HIGH YIELD FUND
Schedule of Investments (continued)
September 30, 2012 (Unaudited)
| | | | | | | | | | | | | | |
Principal
Amount | | | Interest
Rate | | | Maturity
Date | | | Value | |
| | | | | | | | | | | | | | |
| | Senior Term Loans(h) – (continued) | |
| Health Care – (continued) | |
| Health Management Associates, Inc. (BB-/B1) | |
| $ | 4,726,190 | | | | 4.500 | % | | | 11/16/18 | | | $ | 4,758,281 | |
| | | | | | | | | | | | | | |
| | | | | | | | | | | | | 5,468,107 | |
| | |
| Health Care – Pharmaceuticals – 0.1% | |
| Catalent Pharma Solutions, Inc. (BB-/Ba3) | |
| | 9,960,572 | | | | 5.250 | | | | 09/15/17 | | | | 10,010,375 | |
| | |
| Health Care – Services – 0.1% | |
| U.S. Renal Care, Inc. (B/B2) | |
| | 7,082,250 | | | | 6.251 | | | | 07/02/19 | | | | 7,153,073 | |
| | |
| Media – Broadcasting & Radio – 0.4% | |
| Clear Channel Communications, Inc. (CCC+/Caa1) | |
| | 28,022,577 | | | | 3.866 | | | | 01/28/16 | | | | 22,892,764 | |
| | |
| Media – Cable – 0.3% | |
| Atlantic Broadband Finance LLC (B+/Ba3) | |
| | 6,603,450 | | | | 5.250 | | | | 04/04/19 | | | | 6,608,138 | |
| Atlantic Broadband Finance LLC (B-/Caa1) | |
| | 4,135,000 | | | | 0.000 | | | | 09/15/19 | | | | 4,166,013 | |
| Foxco Acquisition Sub LLC (B+/B2) | |
| | 5,550,000 | | | | 5.500 | | | | 07/31/17 | | | | 5,582,911 | |
| | | | | | | | | | | | | | |
| | | | | | | | | | | | | 16,357,062 | |
| | |
| Metals & Mining – 0.1% | |
| Kleopatra Acquisition Corp. (B/Ba3) | |
| | 4,912,688 | | | | 6.750 | | | | 12/21/16 | | | | 4,940,346 | |
| | |
| Real Estate – 0.3% | |
| Realogy Corp. (CCC-/Caa1) | |
| | 1,204,327 | | | | 4.466 | | | | 10/10/16 | | | | 1,187,767 | |
| | 15,391,150 | | | | 4.478 | | | | 10/10/16 | | | | 15,179,522 | |
| | | | | | | | | | | | | | |
| | | | | | | | | | | | | 16,367,289 | |
| | |
| Restaurants – 0.0% | |
| NPC International, Inc. (B/Ba3) | |
| | 2,437,750 | | | | 5.250 | | | | 12/28/18 | | | | 2,456,033 | |
| | |
| Retailers – 0.3% | |
| 99 Cents Only Stores (B+/B2) | |
| | 8,557,000 | | | | 5.250 | | | | 01/11/19 | | | | 8,631,874 | |
| Neiman-Marcus Group, Inc. (BB-/B3) | |
| | 8,500,000 | | | | 4.750 | | | | 05/16/18 | | | | 8,538,675 | |
| | | | | | | | | | | | | | |
| | | | | | | | | | | | | 17,170,549 | |
| | |
| Services Cyclical – Business Services – 0.0% | |
| Infor (US), Inc. (B+/B1) | |
| | 1,624,769 | | | | 5.250 | | | | 04/05/18 | | | | 1,628,831 | |
| | |
| Services Cyclical - Consumer Services – 0.1% | |
| Lonestar Intermediate Super Holdings LLC (BB-/Ba3) | |
| | 2,850,000 | | | | 11.000 | | | | 09/02/19 | | | | 3,025,759 | |
| | |
| Services Cyclical – Rental Equipment – 0.1% | |
| Ahern Rentals, Inc. (NR/NR) | |
| | 3,962,721 | | | | 16.000 | | | | 12/15/12 | | | | 3,962,721 | |
| | |
| Technology – Software/Services – 0.1% | |
| Lawson Software, Inc. (B+/B1) | |
| | 5,496,225 | | | | 6.250 | | | | 04/05/18 | | | | 5,519,584 | |
| | |
Principal
Amount | | | Interest
Rate | | | Maturity
Date | | | Value | |
| | | | | | | | | | | | | | |
| | Senior Term Loans(h) – (continued) | |
| Telecommunications – Internet & Data – 0.3% | |
| Level 3 Financing, Inc. (B-/Ba3) | |
| $ | 5,600,000 | | | | 5.750 | % | | | 08/31/18 | | | $ | 5,597,648 | |
| Level 3 Financing, Inc. (B+/Ba3) | |
| | 7,675,000 | | | | 5.250 | | | | 08/01/19 | | | | 7,708,616 | |
| Level 3 Financing, Inc. (B-/Caa1) | |
| | 5,600,000 | | | | 5.750 | | | | 08/01/19 | | | | 5,600,000 | |
| | | | | | | | | | | | | | |
| | | | | | | | | | | | | 18,906,264 | |
| | |
| Utilities – Pipelines – 0.2% | |
| Energy Transfer Equity LP (BB-/Ba2) | |
| | 10,375,000 | | | | 3.750 | | | | 03/24/17 | | | | 10,367,634 | |
| | |
| | TOTAL SENIOR TERM LOANS | |
| | (Cost $277,616,579) | | | $ | 281,105,101 | |
| | |
| | | | | | | | |
| Shares | | Rate | | | Value | |
| | | | | | | | |
| Preferred Stocks – 0.1% | |
Ally Financial, Inc.(a) | |
| 3,070 | | | 7.000 | % | | $ | 2,871,889 | |
Lucent Technologies Capital Trust I | |
| 3,050 | | | 7.750 | | | | 1,769,000 | |
Spanish Broadcasting Systems, Inc.(c)(f) | |
| 3,074 | | | 10.750 | | | | 1,537,000 | |
| |
| TOTAL PREFERRED STOCKS | |
| (Cost $7,084,017) | | | $ | 6,177,889 | |
| |
| | | | | | | | |
| Shares | | | Description | | Value | |
| | | | | | | | |
| | Common Stocks – 0.2% | |
| | 600,000 | | | Cablevision Systems Corp. Class A | | $ | 9,510,000 | |
| | 112,122 | | | General Motors Co.(b) | | | 2,550,776 | |
| | 6,252 | | | Masonite Worldwide Holdings(b) | | | 218,820 | |
| | 28,148 | | | Motors Liquidation Co.(b) | | | 472,886 | |
| | 71 | | | Nycomed(b) | | | 1 | |
| | 3,874 | | | Panolam Holdings Co.(b) | | | 39 | |
| | 2,500 | | | Port Townsend Holdings Co., Inc.(b) | | | — | |
| | 250 | | | Simmons Bedding Co.(b) | | | — | |
| | |
| | TOTAL COMMON STOCKS | |
| | (Cost $27,026,923) | | $ | 12,752,522 | |
| | |
| | | | | | | | | | | | |
| Units | | | Description | | Expiration
Date | | | Value | |
| | | | | | | | | | | | |
| | Warrants(b) – 0.0% | |
| General Motors Co. | |
| | 101,928 | | | | | | 07/10/16 | | | $ | 1,404,568 | |
| | 101,928 | | | | | | 07/10/19 | | | | 841,925 | |
| Masonite Worldwide Holdings | |
| | 30,311 | | | | | | 06/09/14 | | | | 22,733 | |
| | 22,734 | | | | | | 05/20/16 | | | | 39,785 | |
| | |
| | |
| 58 | | The accompanying notes are an integral part of these financial statements. |
GOLDMAN SACHS HIGH YIELD FUND
| | | | | | | | | | | | |
| Units | | | Description | | Expiration
Date | | | Value | |
| | Warrants(b) – 0.0% | |
| | | | | | | | | | | | |
| Nortek, Inc. | |
| | 11,520 | | | | | | 12/07/14 | | | $ | 57,600 | |
| | |
| | TOTAL WARRANTS | | | | | |
| | (Cost $8,012,427) | | | $ | 2,366,611 | |
| | |
| TOTAL INVESTMENTS BEFORE SHORT-TERM
INVESTMENT |
|
| | (Cost $5,554,537,336) | | | $ | 5,777,653,336 | |
| | |
| | | | | | | | | | | | | | |
Principal Amount | | | Interest
Rate | | | Maturity
Date | | | Value | |
| | | | | | | | | | | | | | |
| | Short-term Investment(i) – 3.5% | |
| Repurchase Agreement – 3.5% | |
| Joint Repurchase Agreement Account II | |
| $ | 209,700,000 | | | | 0.245 | % | | | 10/01/12 | | | $ | 209,700,000 | |
| | (Cost $209,700,000) | |
| | |
| | TOTAL INVESTMENTS — 99.7% | | | | | |
| | (Cost $5,764,237,336) | | | $ | 5,987,353,336 | |
| | |
| OTHER ASSETS IN EXCESS OF
LIABILITIES — 0.3% |
| | | 16,763,926 | |
| | |
| | NET ASSETS — 100.0% | | | $ | 6,004,117,262 | |
| | |
| | |
| The percentage shown for each investment category reflects the value of investments in that category as a percentage of net assets. |
(a) | | Exempt from registration under Rule 144A of the Securities Act of 1933. Under procedures approved by the Board of Trustees, such securities have been determined to be liquid by the investment adviser and may be resold, normally to qualified institutional buyers in transactions exempt from registration. Total market value of Rule 144A securities amounts to $1,654,039,546, which represents approximately 27.5% of net assets as of September 30, 2012. |
(b) | | Security is currently in default and/or non-income producing. |
(c) | | Security with “Put” features with resetting interest rates. Maturity dates disclosed are the puttable dates. Interest rate disclosed is that which is in effect at September 30, 2012. |
(d) | | Coupon changes periodically based upon a predetermined schedule. Interest rate disclosed is that which is in effect at September 30, 2012. |
(e) | | Variable rate security. Interest rate disclosed is that which is in effect at September 30, 2012. |
(f) | | Pay-in-kind securities. |
(g) | | Issued with a zero coupon. Income is recognized through the accretion of discount. |
| | |
(h) | | Senior Term Loans often require prepayments from excess cash flows or permit the borrower to repay at its election. The degree to which borrowers repay, whether as a contractual requirement or at their election, cannot be predicted with accuracy. As a result, the actual remaining maturity may be substantially less than the stated maturities shown. The stated interest rate represents the weighted average interest rate of all contracts within the senior loan facility at September 30, 2012. Senior Term Loans typically have rates of interest which are redetermined either daily, monthly, quarterly or semi-annually by reference to a base lending rate, plus a premium. These base lending rates are primarily the London-interbank Offered Rate (“LIBOR”), and secondarily the prime rate offered by one or more major United States banks (the “Prime Rate”) and the certificate of deposit (“CD”) rate or other base lending rates used by commercial lenders. |
(i) | | Joint repurchase agreement was entered into on September 28, 2012. Additional information appears on page 95. |
Security ratings disclosed, if any, are obtained from Standard & Poor’s /Moody’s Investors Service. A brief description of the ratings is available in the Fund’s Statement of Additional Information.
| | |
|
Currency Abbreviations: |
CAD | | —Canadian Dollar |
CHF | | —Swiss Franc |
EUR | | —Euro |
GBP | | —British Pound |
| | |
Investment Abbreviations: |
NR | | —Not Rated |
WR | | —Withdrawn Rating |
|
| | |
| The accompanying notes are an integral part of these financial statements. | | 59 |
GOLDMAN SACHS HIGH YIELD FUND
Schedule of Investments (continued)
September 30, 2012 (Unaudited)
| | | | |
| | | As a % of
Net Assets | |
| Investments Industry Classifications† | | | | |
Aerospace | | | 0.4 | % |
Airlines | | | 0.7 | |
Auto Manufacturers | | | 0.1 | |
Automotive | | | 1.6 | |
Automotive Parts | | | 2.2 | |
Banks | | | 1.0 | |
Building Materials | | | 0.6 | |
Capital Goods | | | 0.6 | |
Chemicals | | | 2.2 | |
Conglomerates | | | 0.4 | |
Construction Machinery | | | 0.8 | |
Consumer Products | | | 4.2 | |
Defense | | | 0.3 | |
Emerging Markets | | | 0.6 | |
Energy | | | 10.8 | |
Entertainment | | | 0.8 | |
Environmental | | | 0.3 | |
Finance | | | 7.2 | |
Food | | | 1.4 | |
Gaming | | | 6.1 | |
Health Care | | | 9.4 | |
Home Construction | | | 0.9 | |
Lodging | | | 0.8 | |
Machinery | | | 0.3 | |
Media | | | 7.3 | |
Metals | | | 1.9 | |
Packaging | | | 3.6 | |
Paper | | | 1.6 | |
Printing | | | 0.2 | |
Publishing | | | 0.4 | |
Real Estate | | | 0.9 | |
Restaurants | | | 0.4 | |
Retailers | | | 2.9 | |
Services Cyclical | | | 2.5 | |
Short-term Investments# | | | 3.8 | |
Technology | | | 5.2 | |
Telecommunications | | | 9.4 | |
Textiles & Apparel | | | 0.6 | |
Transportation | | | 0.7 | |
Utilities | | | 4.9 | |
| |
| TOTAL INVESTMENTS | | | 100.0 | % |
| |
| | † | | Industry concentrations greater than one-tenth of one percent are disclosed. |
| | # | | Short-term Investments include repurchase agreements and other assets/liabilities. |
| | |
| 60 | | The accompanying notes are an integral part of these financial statements. |
GOLDMAN SACHS HIGH YIELD FUND
|
| ADDITIONAL INVESTMENT INFORMATION |
FORWARD FOREIGN CURRENCY EXCHANGE CONTRACTS — At September 30, 2012, the Fund had the following forward foreign currency exchange contracts:
FORWARD FOREIGN CURRENCY EXCHANGE CONTRACTS WITH UNREALIZED GAIN
| | | | | | | | | | | | |
| Counterparty | | Contracts to
Buy/Sell | | Settlement
Date | | Current
Value | | | Unrealized
Gain | |
Deutsche Bank AG (London) | | USD/EUR | | 10/03/12 | | $ | 13,880,559 | | | $ | 236,021 | |
FORWARD FOREIGN CURRENCY EXCHANGE CONTRACTS WITH UNREALIZED LOSS
| | | | | | | | | | | | |
| Counterparty | | Contracts to
Buy/Sell | | Settlement
Date | | Current
Value | | | Unrealized
Loss | |
Citibank NA | | USD/EUR | | 10/03/12 | | $ | 175,629,788 | | | $ | (3,304,170 | ) |
| | USD/GBP | | 10/03/12 | | | 16,788,912 | | | | (283,311 | ) |
Royal Bank of Canada | | USD/CAD | | 10/03/12 | | | 19,832,907 | | | | (48,116 | ) |
| TOTAL | | | | | | | | | | $ | (3,635,597 | ) |
| | |
| The accompanying notes are an integral part of these financial statements. | | 61 |
GOLDMAN SACHS HIGH YIELD FLOATING RATE FUND
Schedule of Investments
September 30, 2012 (Unaudited)
| | | | | | | | | | | | | | |
Principal
Amount | | | Interest
Rate | | | Maturity
Date | | | Value | |
| | | | | | | | | | | | | | |
| | Senior Term Loans(a) – 80.4% | |
| Aerospace – 0.9% | |
| Sequa Corp. (B-/B1) | |
| $ | 1,488,750 | | | | 6.250 | % | | | 12/03/14 | | | $ | 1,496,194 | |
| Transdigm, Inc. (BB-/Ba2) | |
| | 5,523,958 | | | | 4.000 | | | | 02/14/17 | | | | 5,550,098 | |
| | | | | | | | | | | | | | |
| | | | | | | | | | | | | 7,046,292 | |
| | |
| Airlines – 2.2% | |
| Delta Air Lines, Inc. (BB-/Ba2) | |
| | 2,976,219 | | | | 4.250 | | | | 03/07/16 | | | | 2,968,778 | |
| | 8,351,837 | | | | 5.500 | | | | 04/20/17 | | | | 8,385,746 | |
| Flying Fortress, Inc. (BB-/Ba3) | |
| | 4,850,000 | | | | 5.000 | | | | 06/30/17 | | | | 4,904,562 | |
| | | | | | | | | | | | | | |
| | | | | | | | | | | | | 16,259,086 | |
| | |
| Automotive – 0.9% | |
| Chrysler Group LLC (B+/B2) | |
| | 4,684,991 | | | | 6.000 | | | | 05/24/17 | | | | 4,777,613 | |
| Meritor, Inc. (BB-/B2) | |
| | 1,629,854 | | | | 4.500 | | | | 04/23/17 | | | | 1,605,406 | |
| | | | | | | | | | | | | | |
| | | | | | | | | | | | | 6,383,019 | |
| | |
| Automotive – Parts – 2.9% | |
| Allison Transmission, Inc. (B/B2) | |
| | 3,264,903 | | | | 2.720 | | | | 08/07/14 | | | | 3,265,327 | |
| Allison Transmission, Inc. (BB-/Ba3) | |
| | 4,791,125 | | | | 4.250 | | | | 08/23/19 | | | | 4,799,126 | |
| | Delphi Corp. (BBB/Baa3) | |
| | 1,462,745 | | | | 3.500 | | | | 03/31/17 | | | | 1,465,188 | |
| Remy International, Inc. (B+/B1) | |
| | 3,840,288 | | | | 6.250 | | | | 12/16/16 | | | | 3,840,288 | |
| Tomkins LLC (BB/Ba2) | |
| | 488,467 | | | | 4.250 | | | | 09/29/15 | | | | 488,467 | |
| | 7,870,772 | | | | 4.250 | | | | 09/29/16 | | | | 7,887,144 | |
| | | | | | | | | | | | | | |
| | | | | | | | | | | | | 21,745,540 | |
| | |
| Building Materials – 0.7% | |
| Armstrong World Industries, Inc. (BB-/B1) | |
| | 2,731,384 | | | | 4.000 | | | | 03/09/18 | | | | 2,735,372 | |
| CPG International, Inc. (B/B1) | |
| | 1,000,000 | | | | 5.750 | | | | 09/21/19 | | | | 1,000,310 | |
| Tube City IMS Corp. (B+/B1) | |
| | 1,542,250 | | | | 5.750 | | | | 03/20/19 | | | | 1,559,600 | |
| | | | | | | | | | | | | | |
| | | | | | | | | | | | | 5,295,282 | |
| | |
| Capital Goods – Others – 0.3% | |
| Colfax, Corp. (NR/Ba2) | |
| | 2,481,250 | | | | 4.500 | | | | 01/11/19 | | | | 2,491,448 | |
| | |
| Chemicals – 1.4% | |
| Ashland, Inc. (BB/Baa3) | |
| | 2,960,000 | | | | 3.750 | | | | 08/23/18 | | | | 2,977,819 | |
| Chemtura, Corp. (NR/Ba1) | |
| | 2,000,000 | | | | 5.500 | | | | 08/27/16 | | | | 2,016,880 | |
| Rockwood Specialties Group, Inc. (BBB-/Ba1) | |
| | 2,452,601 | | | | 3.500 | | | | 02/09/18 | | | | 2,458,732 | |
| | |
| Principal
Amount |
| |
| Interest
Rate |
| |
| Maturity
Date |
| | | Value | |
| | | | | | | | | | | | | | |
| | Senior Term Loans – (continued) | |
| Chemicals – (continued) | |
| Univar, Inc. (B+/B2) | |
| $ | 3,296,203 | | | | 5.000 | % | | | 06/30/17 | | | $ | 3,277,447 | |
| | | | | | | | | | | | | | |
| | | | | | | | | | | | | 10,730,878 | |
| | |
| Consumer Products – Household & Leisure – 2.5% | |
| ACCO Brands Corp. (BB+/Baa1) | |
| | 1,243,750 | | | | 4.250 | | | | 04/30/19 | | | | 1,249,969 | |
| Armored Autogroup, Inc. (B+/Ba3) | |
| | 2,194,095 | | | | 6.000 | | | | 11/04/16 | | | | 2,185,867 | |
| B&G Foods, Inc. (NR/Ba2) | |
| | 1,240,625 | | | | 4.500 | | | | 11/30/18 | | | | 1,250,451 | |
| Huish Detergents, Inc. (B+/Ba3) | |
| | 5,225,720 | | | | 2.220 | | | | 04/26/14 | | | | 4,987,323 | |
| Huish Detergents, Inc. (BB/B2) | |
| | 1,000,000 | | | | 4.470 | | | | 10/26/14 | | | | 925,000 | |
| Prestige Brands, Inc. (BB-/Ba3) | |
| | 984,470 | | | | 5.268 | | | | 01/31/19 | | | | 994,009 | |
| Renfro Corp. (B/B2) | |
| | 2,242,466 | | | | 5.500 | | | | 05/23/17 | | | | 2,238,272 | |
| Spectrum Brands, Inc. (B/B1) | |
| | 1,246,795 | | | | 5.018 | | | | 06/17/16 | | | | 1,251,159 | |
| Visant Holding Corp. (BB-/B1) | |
| | 1,416,360 | | | | 5.250 | | | | 12/22/16 | | | | 1,361,477 | |
| Yankee Candle Co., Inc. (B+/B1) | |
| | 2,139,250 | | | | 5.250 | | | | 04/02/19 | | | | 2,155,829 | |
| | | | | | | | | | | | | | |
| | | | | | | | | | | | | 18,599,356 | |
| | |
| Consumer Products – Industrial – 1.5% | |
| CPM Acquisition, Inc. (B+/B1) | |
| | 4,300,000 | | | | 6.250 | | | | 08/29/17 | | | | 4,289,250 | |
| CPM Acquisition, Inc. (B/Caa1) | |
| | 2,150,000 | | | | 10.250 | | | | 03/01/18 | | | | 2,160,750 | |
| Harbor Freight Tools USA, Inc. (B+/B1) | |
| | 2,000,000 | | | | 5.500 | | | | 11/14/17 | | | | 2,007,080 | |
| Schaeffler AG (B/B2) | |
| | 3,000,000 | | | | 6.000 | | | | 01/27/17 | | | | 3,028,140 | |
| | | | | | | | | | | | | | |
| | | | | | | | | | | | | 11,485,220 | |
| | |
| Diversified Manufacturing – 0.5% | |
| Manitowoc Co., Inc. (BB/Ba2) | |
| | 1,660,000 | | | | 4.250 | | | | 11/13/17 | | | | 1,669,346 | |
| Rexnord Corp. (BB-/Ba3) | |
| | 1,650,373 | | | | 5.000 | | | | 04/02/18 | | | | 1,657,074 | |
| | | | | | | | | | | | | | |
| | | | | | | | | | | | | 3,326,420 | |
| | |
| Educational Services – 0.2% | |
| Laureate Education, Inc. (B/B1) | |
| | 1,238,656 | | | | 5.250 | | | | 06/18/18 | | | | 1,222,009 | |
| | |
| Energy – 2.7% | |
| AES Corp. (BB+/Ba1) | |
| | 7,897,412 | | | | 4.250 | | | | 06/01/18 | | | | 7,933,582 | |
| Chesapeake Energy Corp. (BB-/Ba2) | |
| | 6,000,000 | | | | 8.500 | | | | 12/01/17 | | | | 6,015,300 | |
| Frac Tech International LLC (NR/B2) | |
| | 4,791,305 | | | | 8.500 | | | | 05/06/16 | | | | 4,608,229 | |
| | |
| | | | | | | | | | | | | | |
| | |
| 62 | | The accompanying notes are an integral part of these financial statements. |
GOLDMAN SACHS HIGH YIELD FLOATING RATE FUND
| | | | | | | | | | | | | | |
Principal
Amount | | | Interest
Rate | | | Maturity
Date | | | Value | |
| | | | | | | | | | | | | | |
| | Senior Term Loans – (continued) | |
| Energy – (continued) | |
| Samson Investment Co. (B+/B1) | |
| $ | 1,925,000 | | | | 6.000 | % | | | 09/13/18 | | | $ | 1,935,434 | |
| | | | | | | | | | | | | | |
| | | | | | | | | | | | | 20,492,545 | |
| | |
| Energy – Coal – 1.2% | |
| Walter Energy, Inc. (BB-/NR) | |
| | 9,258,910 | | | | 4.000 | | | | 04/02/18 | | | | 9,206,875 | |
| | |
| Entertainment – 1.2% | |
| EMI Music Publishing, Ltd. (BB-/Ba3) | |
| | 2,344,125 | | | | 5.500 | | | | 06/29/18 | | | | 2,369,324 | |
| Rovi Solutions Corp. (NR/Ba2) | |
| | 6,965,000 | | | | 4.000 | | | | 03/29/19 | | | | 6,782,169 | |
| | | | | | | | | | | | | | |
| | | | | | | | | | | | | 9,151,493 | |
| | |
| Environmental – 0.6% | |
| EnergySolutions LLC (BB+/Ba2) | |
| | 4,844,548 | | | | 6.250 | | | | 08/12/16 | | | | 4,665,930 | |
| | |
| Finance – 1.9% | |
| iPayment, Inc. (B+/Ba2) | |
| | 2,575,809 | | | | 5.750 | | | | 05/08/17 | | | | 2,543,611 | |
| Local TV Finance LLC (B+/B1) | |
| | 2,500,000 | | | | 4.220 | | | | 05/07/15 | | | | 2,506,250 | |
| Local TV Finance LLC (B1/B+) | |
| | 750,000 | | | | 4.220 | | | | 05/31/15 | | | | 751,875 | |
| Nuveen Investments, Inc. (B/B3) | |
| | 1,500,000 | | | | 5.898 | | | | 05/13/17 | | | | 1,489,380 | |
| Nuveen Investments, Inc. (B/B2) | |
| | 1,000,000 | | | | 8.250 | | | | 02/28/19 | | | | 1,006,880 | |
| ROC Finance LLC (B/NR) | |
| | 1,466,667 | | | | 8.500 | | | | 08/18/17 | | | | 1,499,667 | |
| SBA Senior Finance II LLC (BB/Ba2) | |
| | 4,500,000 | | | | 3.750 | | | | 09/20/19 | | | | 4,513,140 | |
| | | | | | | | | | | | | | |
| | | | | | | | | | | | | 14,310,803 | |
| | |
| Food & Beverages – 4.9% | |
| Blue Buffalo Co., Ltd. (B/B1) | |
| | 3,700,000 | | | | 6.500 | | | | 08/08/19 | | | | 3,700,000 | |
| Burger King Corp. (BB-/Ba3) | |
| | 1,300,000 | | | | 3.750 | | | | 10/19/16 | | | | 1,300,000 | |
| Del Monte Foods Co. (B+/Ba3) | |
| | 4,308,409 | | | | 4.500 | | | | 03/08/18 | | | | 4,300,697 | |
| Dole Food Company Inc. (BB-/Ba2) | |
| | 1,661,819 | | | | 5.040 | | | | 07/06/18 | | | | 1,665,458 | |
| | 2,973,785 | | | | 6.000 | | | | 07/06/18 | | | | 2,980,298 | |
| Michael Foods Group, Inc. (BB-/B1) | |
| | 8,881,998 | | | | 4.250 | | | | 02/23/18 | | | | 8,922,677 | |
| NBTY, Inc. (BB-/Ba3) | |
| | 3,862,216 | | | | 4.250 | | | | 10/02/17 | | | | 3,874,961 | |
| Pinnacle Foods Finance LLC (B+/NR) | |
| | 1,995,000 | | | | 4.750 | | | | 10/17/18 | | | | 1,996,257 | |
| Pinnacle Foods Finance LLC (B+/Ba3) | |
| | 2,487,500 | | | | 4.750 | | | | 10/17/18 | | | | 2,487,500 | |
| US Foods, Inc. (NR/B3) | |
| | 5,677,113 | | | | 2.720 | | | | 07/03/14 | | | | 5,604,389 | |
| | | | | | | | | | | | | | |
| | | | | | | | | 36,832,237 | |
| | |
| Principal
Amount |
| |
| Interest
Rate |
| |
| Maturity
Date |
| | | Value | |
| | | | | | | | | | | | | | |
| | Senior Term Loans – (continued) | |
| Gaming – 1.4% | |
| Caesars Entertainment Operating Co. (B/B2) | |
| $ | 2,000,000 | | | | 3.211 | % | | | 01/28/15 | | | $ | 1,937,140 | |
| Caesars Entertainment Operating Co. (B/Caa1) | |
| | 4,000,000 | | | | 3.211 | | | | 01/28/15 | | | | 3,874,280 | |
| CCM Merger, Inc. (BB-/B3) | |
| | 4,674,711 | | | | 6.000 | | | | 03/01/17 | | | | 4,721,458 | |
| | | | | | | | | | | | | | |
| | | | | | | | | | | | | 10,532,878 | |
| | |
| Health Care – 3.6% | |
| Community Health Systems, Inc. (BB/Ba3) | |
| | 580,281 | | | | 3.921 | | | | 01/25/17 | | | | 582,277 | |
| Convatec, Inc. (B+/Ba3) | |
| | 3,007,154 | | | | 5.750 | | | | 12/22/16 | | | | 3,010,431 | |
| HCA, Inc. (BB-/Ba3) | |
| | 7,000,000 | | | | 3.612 | | | | 03/31/17 | | | | 7,006,580 | |
| Health Management Associates, Inc. (BB-/B1) | |
| | 2,678,260 | | | | 4.500 | | | | 11/16/18 | | | | 2,696,446 | |
| MedAssets, Inc. (BB-/Ba3) | |
| | 3,149,921 | | | | 5.250 | | | | 11/16/16 | | | | 3,163,309 | |
| Multiplan, Inc. (B/Ba3) | |
| | 10,180,023 | | | | 4.750 | | | | 08/26/17 | | | | 10,202,317 | |
| | | | | | | | | | | | | | |
| | | | | | | | | | | | | 26,661,360 | |
| | |
| Health Care – Medical Products – 0.5% | |
| Biomet, Inc. (BB-/B1) | |
| | 1,961,406 | | | | 3.966 | | | | 07/25/17 | | | | 1,967,231 | |
| Grifols, Inc. (BB-/Ba3) | |
| | 2,005,346 | | | | 4.500 | | | | 06/01/17 | | | | 2,016,636 | |
| | | | | | | | | | | | | | |
| | | | | | | | | | | | | 3,983,867 | |
| | |
| Health Care – Pharmaceuticals – 1.2% | |
| Aptalis Pharma, Inc. (NR/B1) | |
| | 1,226,253 | | | | 5.500 | | | | 02/10/17 | | | | 1,225,101 | |
| Catalent Pharma Solutions, Inc. (BB-/Ba3) | |
| | 4,985,278 | | | | 5.250 | | | | 09/15/17 | | | | 5,010,204 | |
| Warner Chilcott Co. LLC (BBB-/Ba3) | |
| | 575,519 | | | | 4.250 | | | | 03/15/18 | | | | 575,882 | |
| Warner Chilcott Corp. (BBB-/NR) | |
| | 437,117 | | | | 4.250 | | | | 03/15/18 | | | | 437,392 | |
| Warner Chilcott Corp. (BBB-/Ba3) | |
| | 1,942,378 | | | | 4.250 | | | | 03/15/18 | | | | 1,943,602 | |
| | | | | | | | | | | | | | |
| | | | | | | | | | | | | 9,192,181 | |
| | |
| Health Care – Services – 2.8% | |
| DaVita, Inc. (BB/Ba2) | |
| | 6,829,323 | | | | 4.500 | | | | 10/20/16 | | | | 6,848,514 | |
| DaVita, Inc. (BB-/Ba2) | |
| | 4,500,000 | | | | 4.000 | | | | 08/19/19 | | | | 4,503,195 | |
| Emergency Medical Services Corp. (B+/B1) | |
| | 1,905,132 | | | | 5.250 | | | | 05/25/18 | | | | 1,915,248 | |
| U.S. Renal Care, Inc. (B/B2) | |
| | 2,493,750 | | | | 6.251 | | | | 07/03/19 | | | | 2,518,687 | |
| U.S. Renal Care, Inc. (CCC+/NR) | |
| | 1,000,000 | | | | 10.250 | | | | 01/03/30 | | | | 1,025,000 | |
| Universal Health Services, Inc. (BB+/NR) | |
| | 2,146,706 | | | | 3.750 | | | | 11/15/16 | | | | 2,149,927 | |
| | |
| | |
| The accompanying notes are an integral part of these financial statements. | | 63 |
GOLDMAN SACHS HIGH YIELD FLOATING RATE FUND
Schedule of Investments (continued)
September 30, 2012 (Unaudited)
| | | | | | | | | | | | | | |
Principal Amount | | | Interest
Rate | | | Maturity
Date | | | Value | |
| | | | | | | | | | | | | | |
| | Senior Term Loans – (continued) | |
| Health Care – Services – (continued) | |
| Valitas Health Services, Inc. (NR/Ba3) | |
| $ | 1,967,538 | | | | 5.750 | % | | | 06/02/17 | | | $ | 1,952,781 | |
| | | | | | | | | | | | | | |
| | | | | | | | | 20,913,352 | |
| | |
| Lodging – 0.7% | |
| Peninsula Gaming LLC (B+/NR) | |
| | 4,000,000 | | | | 3.250 | | | | 08/03/17 | | | | 4,057,520 | |
| Pinnacle Entertainment, Inc. (BB+/Ba1) | |
| | 1,243,750 | | | | 4.000 | | | | 03/19/19 | | | | 1,245,305 | |
| | | | | | | | | | | | | | |
| | | | | | | | | | | | | 5,302,825 | |
| | |
| Media – Broadcasting & Radio – 3.4% | |
| Cumulus Media, Inc. (B/Ba2) | |
| | 1,834,642 | | | | 5.750 | | | | 09/17/18 | | | | 1,842,292 | |
| Cumulus Media, Inc. (CCC+/B2) | |
| | 1,000,000 | | | | 7.500 | | | | 09/16/19 | | | | 1,009,000 | |
| Entercom Radio LLC (NR/Ba3) | |
| | 2,828,000 | | | | 6.250 | | | | 11/23/18 | | | | 2,852,745 | |
| Gray Television, Inc. (B+/NR) | |
| | 1,988,448 | | | | 3.720 | | | | 12/31/14 | | | | 1,984,093 | |
| Hubbard Radio LLC (B+/Ba3) | |
| | 2,822,829 | | | | 5.250 | | | | 04/28/17 | | | | 2,844,000 | |
| Hubbard Radio LLC (NR/Caa1) | |
| | 2,750,000 | | | | 8.750 | | | | 04/30/18 | | | | 2,791,250 | |
| Mission Broadcasting, Inc. (BB-/Ba3) | |
| | 457,470 | | | | 5.000 | | | | 09/30/16 | | | | 454,611 | |
| Sinclair Television Group, Inc. (BB+/Ba1) | |
| | 4,466,481 | | | | 4.000 | | | | 10/28/16 | | | | 4,473,181 | |
| SuperMedia, Inc. (B-/B3) | |
| | 600,000 | | | | 11.000 | | | | 12/31/15 | | | | 391,998 | |
| Telesat Canada (BB-/Ba3) | |
| | 3,990,000 | | | | 4.250 | | | | 03/28/19 | | | | 4,015,935 | |
| Univision Communications, Inc. (B+/B2) | |
| | 1,441,177 | | | | 2.212 | | | | 09/29/14 | | | | 1,435,773 | |
| | 1,596,860 | | | | 4.462 | | | | 03/31/17 | | | | 1,576,100 | |
| | | | | | | | | | | | | | |
| | | | | | | | | | | | | 25,670,978 | |
| | |
| Media – Cable – 2.7% | |
| Atlantic Broadband Finance LLC (B+/Ba3) | |
| | 1,695,750 | | | | 5.250 | | | | 04/04/19 | | | | 1,696,954 | |
| Atlantic Broadband Finance LLC (B-/Caa1) | |
| | 1,100,000 | | | | 5.000 | | | | 09/15/19 | | | | 1,108,250 | |
| Charter Communications Operating LLC (BB+/Ba2) | |
| | 3,849,757 | | | | 3.470 | | | | 09/06/16 | | | | 3,852,491 | |
| Charter Communications Operating LLC (BB+/Ba1) | |
| | 2,686,500 | | | | 4.000 | | | | 05/15/19 | | | | 2,696,010 | |
| Clear Channel Communications, Inc. (CCC+/Caa1) | |
| | 5,750,000 | | | | 3.616 | | | | 07/29/14 | | | | 5,396,375 | |
| Foxco Acquisition Sub LLC (B+/B2) | |
| | 1,700,000 | | | | 5.500 | | | | 07/14/17 | | | | 1,710,081 | |
| Nexstar Broadcasting, Inc. (BB-/Ba3) | |
| | 1,208,036 | | | | 5.000 | | | | 09/30/16 | | | | 1,200,486 | |
| WaveDivision Holdings LLC (BB-/B1) | |
| | 2,500,000 | | | | 5.500 | | | | 08/09/19 | | | | 2,526,500 | |
| | | | | | | | | | | | | | |
| | | | | | | | | | | | | 20,187,147 | |
| | |
| Principal
Amount |
| |
| Interest
Rate |
| |
| Maturity
Date |
| | | Value | |
| | | | | | | | | | | | | | |
| | Senior Term Loans – (continued) | |
| Media – Non Cable – 2.8% | |
| Crown Castle Operating Co. (B+/Ba3) | |
| $ | 5,458,750 | | | | 4.000 | % | | | 01/31/19 | | | $ | 5,465,027 | |
| Houghton Mifflin Harcourt Publishing Co. (NR/B2) | |
| | 4,477,500 | | | | 7.250 | | | | 06/01/18 | | | | 4,522,275 | |
| Nielsen Finance LLC (NR/Ba2) | |
| | 4,417,067 | | | | 3.478 | | | | 05/02/16 | | | | 4,432,262 | |
| TWCC Holding Corp. (BB-/Ba3) | |
| | 6,847,728 | | | | 4.250 | | | | 02/13/17 | | | | 6,881,967 | |
| | | | | | | | | | | | | | |
| | | | | | | | | | | | | 21,301,531 | |
| | |
| Metals – 2.0% | |
| Metaldyne Co. LLC (B+/B1) | |
| | 2,955,000 | | | | 5.250 | �� | | | 05/18/17 | | | | 2,995,631 | |
| Novelis, Inc. (NR/B1) | |
| | 1,237,500 | | | | 4.000 | | | | 03/10/17 | | | | 1,239,047 | |
| Novelis, Inc. (BB-/Ba2) | |
| | 8,859,712 | | | | 4.000 | | | | 03/10/17 | | | | 8,853,067 | |
| Potters Industries (NR/Ba3) | |
| | 990,000 | | | | 6.000 | | | | 05/05/17 | | | | 992,475 | |
| Potters Industries (NR/Caa1) | |
| | 1,000,000 | | | | 10.250 | | | | 11/06/17 | | | | 1,005,830 | |
| | | | | | | | | | | | | | |
| | | | | | | | | | | | | 15,086,050 | |
| | |
| Metals & Mining – 1.1% | |
| Arch Coal, Inc. (BB/Ba2) | |
| | 2,394,000 | | | | 5.750 | | | | 05/16/18 | | | | 2,410,159 | |
| Kleopatra Acquisition Corp. (B/Ba3) | |
| | 2,992,500 | | | | 6.750 | | | | 12/21/16 | | | | 3,009,348 | |
| SunCoke Energy, Inc. (BB+/Ba1) | |
| | 2,468,756 | | | | 4.000 | | | | 07/26/18 | | | | 2,468,756 | |
| | | | | | | | | | | | | | |
| | | | | | | | | | | | | 7,888,263 | |
| | |
| Packaging – 1.1% | |
| Consolidated Container Co. LLC (B/B1) | |
| | 906,892 | | | | 5.750 | | | | 07/03/19 | | | | 916,532 | |
| Reynolds Group Holdings, Inc. (B+/B1) | |
| | 5,200,000 | | | | 4.750 | | | | 09/18/18 | | | | 5,216,692 | |
| Sealed Air Corp. (BB/Ba3) | |
| | 2,096,589 | | | | 4.750 | | | | 10/03/18 | | | | 2,106,296 | |
| | | | | | | | | | | | | | |
| | | | | | | | | | | | | 8,239,520 | |
| | |
| Restaurants – 3.0% | |
| DineEquity, Inc. (BB-/Ba2) | |
| | 3,260,286 | | | | 4.298 | | | | 10/19/17 | | | | 3,278,642 | |
| Dunkin’ Brands, Inc. (B/B3) | |
| | 7,847,964 | | | | 4.000 | | | | 11/23/17 | | | | 7,830,776 | |
| NPC International, Inc. (B/Ba3) | |
| | 1,990,000 | | | | 5.250 | | | | 12/28/18 | | | | 2,004,925 | |
| OSI Restaurant Partners LLC (BB-/B1) | |
| | 87,832 | | | | 2.496 | | | | 06/14/13 | | | | 87,250 | |
| OSI Restaurant Partners LLC (B+/B3) | |
| | 1,802,415 | | | | 2.500 | | | | 06/14/14 | | | | 1,790,483 | |
| Wendy’s International, Inc. (BB-/B2) | |
| | 7,150,000 | | | | 4.750 | | | | 05/15/19 | | | | 7,199,192 | |
| | | | | | | | | | | | | | |
| | | | | | | | | | | | | 22,191,268 | |
| | |
| | |
| 64 | | The accompanying notes are an integral part of these financial statements. |
GOLDMAN SACHS HIGH YIELD FLOATING RATE FUND
| | | | | | | | | | | | | | |
Principal Amount | | | Interest
Rate | | | Maturity
Date | | | Value | |
| | | | | | | | | | | | | | |
| | Senior Term Loans – (continued) | |
| Retailers – 8.4% | |
| 99 Cents Only Stores (B+/B2) | |
| $ | 2,886,747 | | | | 5.250 | % | | | 01/11/19 | | | $ | 2,912,006 | |
| Academy Ltd. (B/B2) | |
| | 4,466,250 | | | | 6.000 | | | | 08/03/18 | | | | 4,477,416 | |
| Ascena Retail Group, Inc. (BB-/Ba2) | |
| | 997,500 | | | | 4.750 | | | | 06/14/18 | | | | 1,002,487 | |
| Bass Pro Group LLC (BB-/Ba3) | |
| | 3,505,993 | | | | 5.250 | | | | 06/13/17 | | | | 3,541,929 | |
| BJ’s Wholesale Club, Inc. (B/B3) | |
| | 700,000 | | | | 9.750 | | | | 03/26/20 | | | | 706,650 | |
| BJ’s Wholesale Club, Inc. (B/B3) | |
| | 6,150,000 | | | | 5.750 | | | | 09/26/19 | | | | 6,173,062 | |
| Burlington Coat Factory Warehouse Corp. (B/B3) | |
| | 4,288,284 | | | | 5.500 | | | | 02/23/17 | | | | 4,327,822 | |
| CDW LLC (B/B2) | |
| | 3,043,330 | | | | 4.000 | | | | 07/14/17 | | | | 2,997,680 | |
| Collective Brands Finance, Inc. (B/B1) | |
| | 6,000,000 | | | | 7.250 | | | | 09/19/19 | | | | 6,011,280 | |
| Dollar General Corp. (BB-/Ba3) | |
| | 1,000,000 | | | | 2.966 | | | | 07/07/14 | | | | 1,003,540 | |
| Fairway Group Acquisition Co. (B-/B2) | |
| | 3,000,000 | | | | 8.250 | | | | 08/17/18 | | | | 3,018,750 | |
| General Nutrition Centers, Inc. (B+/B1) | |
| | 1,999,091 | | | | 5.250 | | | | 03/02/18 | | | | 1,997,432 | |
| Michaels Stores, Inc. (B/B2) | |
| | 6,239,496 | | | | 4.912 | | | | 07/29/16 | | | | 6,290,723 | |
| Neiman-Marcus Group, Inc. (BB-/B3) | |
| | 3,625,000 | | | | 4.750 | | | | 05/16/18 | | | | 3,641,494 | |
| Ollie’s Bargain Outlet, Inc. (B/B2) | |
| | 2,000,000 | | | | 6.250 | | | | 09/15/15 | | | | 2,000,000 | |
| Petco Animal Supplies, Inc. (B/B1) | |
| | 5,444,444 | | | | 4.500 | | | | 11/24/17 | | | | 5,461,486 | |
| Pilot Travel Centers LLC (BB+/Ba2) | |
| | 2,376,148 | | | | 4.250 | | | | 03/30/18 | | | | 2,380,900 | |
| Pilot Travel Centers LLC (BB+/NR) | |
| | 2,500,000 | | | | 4.250 | | | | 08/07/19 | | | | 2,515,625 | |
| Roundy’s Supermarkets, Inc. (BB-/B1) | |
| | 2,487,500 | | | | 5.750 | | | | 02/13/19 | | | | 2,433,745 | |
| | | | | | | | | | | | | | |
| | | | | | | | | | | | | 62,894,027 | |
| | |
| Services Cyclical – Business Services – 4.7% | |
| ADS Waste Holdings, Inc. (B+/B1) | |
| | 3,000,000 | | | | 5.250 | | | | 09/11/19 | | | | 3,013,140 | |
| First Data Corp. (B+/B1) | |
| | 262,146 | | | | 2.967 | | | | 09/24/14 | | | | 261,294 | |
| | 2,138,552 | | | | 5.217 | | | | 03/24/17 | | | | 2,108,078 | |
| | 7,785,076 | | | | 4.217 | | | | 03/23/18 | | | | 7,392,552 | |
| Genpact International LLC (BB+/Ba2) | |
| | 4,000,000 | | | | 4.250 | | | | 08/30/19 | | | | 4,010,000 | |
| Infor (US), Inc. (B+/Ba3) | |
| | 1,135,275 | | | | 5.250 | | | | 04/05/18 | | | | 1,138,113 | |
| Sabre, Inc. (B/B1) | |
| | 2,970,368 | | | | 5.966 | | | | 12/29/17 | | | | 2,945,863 | |
| TransUnion LLC (NR/Ba3) | |
| | 2,420,396 | | | | 5.500 | | | | 02/12/18 | | | | 2,446,609 | |
| | |
| Principal
Amount |
| |
| Interest
Rate |
| |
| Maturity
Date |
| | | Value | |
| | | | | | | | | | | | | | |
| | Senior Term Loans – (continued) | |
| Services Cyclical – Business Services – (continued) | |
| Vantiv, LLC (BBB-/Ba2) | |
| $ | 2,757,571 | | | | 3.750 | % | | | 03/27/19 | | | $ | 2,762,177 | |
| VeriFone Systems, Inc. (BB/Ba3) | |
| | 952,909 | | | | 4.250 | | | | 12/28/18 | | | | 951,003 | |
| Waste Industries USA, Inc. (B+/B1) | |
| | 3,107,920 | | | | 4.750 | | | | 03/17/17 | | | | 3,115,690 | |
| WCA Waste Systems, Inc. (B+/B1) | |
| | 1,492,500 | | | | 5.500 | | | | 03/22/18 | | | | 1,496,231 | |
| West Corp. (BB-/Ba3) | |
| | 3,557,305 | | | | 5.500 | | | | 07/15/16 | | | | 3,584,625 | |
| | | | | | | | | | | | | | |
| | | | | | | | | | | | | 35,225,375 | |
| | |
| Services Cyclical – Consumer Services – 0.8% | |
| Acosta, Inc. (B+/NR) | |
| | 4,432,677 | | | | 5.750 | | | | 03/01/18 | | | | 4,445,310 | |
| Lonestar Intermediate Super Holdings LLC (BB-/Ba3) | |
| | 1,500,000 | | | | 11.000 | | | | 09/02/19 | | | | 1,592,505 | |
| | | | | | | | | | | | | | |
| | | | | | | | | | | | | 6,037,815 | |
| | |
| Services Cyclical – Rental Equipment – 0.3% | |
| BakerCorp International, Inc. (B/Ba3) | |
| | 1,980,000 | | | | 5.000 | | | | 06/01/18 | | | | 1,980,713 | |
| | |
| Technology – Software/Services – 4.8% | |
| Aspect Software, Inc. (B+/Ba3) | |
| | 2,670,129 | | | | 6.250 | | | | 05/06/16 | | | | 2,626,739 | |
| Autotrader.com, Inc. (BB+/Ba3) | |
| | 6,897,469 | | | | 4.000 | | | | 12/15/16 | | | | 6,919,058 | |
| CCC Information Services, Inc. (B+/B1) | |
| | 1,919,024 | | | | 5.750 | | | | 11/11/15 | | | | 1,917,105 | |
| Dealer Computer Services, Inc. (BB+/Ba2) | |
| | 2,701,429 | | | | 3.750 | | | | 04/20/18 | | | | 2,704,805 | |
| Emdeon, Inc. (BB-/B1) | |
| | 5,478,731 | | | | 5.000 | | | | 11/02/18 | | | | 5,506,125 | |
| Lawson Software, Inc. (B+/B1) | |
| | 3,840,375 | | | | 6.250 | | | | 04/05/18 | | | | 3,856,696 | |
| SS&C Technologies, Inc. (BB-/Ba3) | |
| | 2,888,365 | | | | 5.000 | | | | 06/07/19 | | | | 2,913,639 | |
| Sungard Data Systems, Inc. (BB/Ba3) | |
| | 5,711,939 | | | | 3.906 | | | | 02/26/16 | | | | 5,711,939 | |
| Zayo Group LLC (B/B1) | |
| | 3,740,625 | | | | 7.125 | | | | 07/02/19 | | | | 3,771,036 | |
| | | | | | | | | | | | | | |
| | | | | | | | | | | | | 35,927,142 | |
| | |
| Telecommunications – Internet & Data – 2.0% | |
| Level 3 Financing, Inc. (B-/Ba3) | |
| | 3,100,000 | | | | 5.750 | | | | 09/01/18 | | | | 3,098,698 | |
| Level 3 Financing, Inc. (B-/Caa1) | |
| | 3,000,000 | | | | 5.750 | | | | 09/01/18 | | | | 2,998,740 | |
| Level 3 Financing, Inc. (B+/Ba3) | |
| | 6,000,000 | | | | 4.750 | | | | 08/01/19 | | | | 6,000,000 | |
| Level 3 Financing, Inc. (B+/Ba3) | |
| | 2,500,000 | | | | 5.250 | | | | 08/01/19 | | | | 2,510,950 | |
| | | | | | | | | | | | | | |
| | | | | | | | | | | | | 14,608,388 | |
| | |
| | |
| The accompanying notes are an integral part of these financial statements. | | 65 |
GOLDMAN SACHS HIGH YIELD FLOATING RATE FUND
Schedule of Investments (continued)
September 30, 2012 (Unaudited)
| | | | | | | | | | | | | | |
Principal Amount | | | Interest
Rate | | | Maturity
Date | | | Value | |
| | | | | | | | | | | | | | |
| | Senior Term Loans – (continued) | |
| Transportation Services – 0.8% | |
| RailAmerica, Inc. (BB+/B1) | |
| $ | 3,980,000 | | | | 4.000 | % | | | 03/01/19 | | | $ | 3,980,000 | |
| Swift Transportation Co., Inc. (BB/B1) | |
| | 2,009,199 | | | | 5.000 | | | | 12/21/17 | | | | 2,017,357 | |
| | | | | | | | | | | | | | |
| | | | | | | | | | | | | 5,997,357 | |
| | |
| Utilities – Distribution – 0.2% | |
| Energy Transfer Equity LP (BB-/Ba2) | |
| | 1,625,000 | | | | 3.750 | | | | 03/24/17 | | | | 1,623,846 | |
| | |
| Utilities – Electric – 1.3% | |
| Calpine Corp. (BB-/B1) | |
| | 1,496,212 | | | | 4.500 | | | | 04/02/18 | | | | 1,497,619 | |
| Calpine Corp. (BB-/B1) | |
| | 3,624,028 | | | | 4.500 | | | | 04/02/18 | | | | 3,627,434 | |
| Calpine Corp. (BB-/B1) | |
| | 1,500,000 | | | | 4.500 | | | | 09/27/19 | | | | 1,492,500 | |
| Covanta Energy Corp. (BB+/Ba1) | |
| | 1,243,750 | | | | 4.000 | | | | 03/28/19 | | | | 1,246,474 | |
| Genon Energy, Inc. (B+/NR) | |
| | 2,000,000 | | | | 6.500 | | | | 12/01/17 | | | | 2,011,260 | |
| | | | | | | | | | | | | | |
| | | | | | | | | | | | | 9,875,287 | |
| | |
| Wireless Telecommunications – 4.3% | |
| Asurion Corp. (B+/NR) | |
| | 2,976,190 | | | | 5.500 | | | | 05/24/18 | | | | 2,992,946 | |
| BBHI Acquisition LLC (BB+/Ba3) | |
| | 7,829,359 | | | | 4.500 | | | | 12/14/17 | | | | 7,858,720 | |
| Intelsat Jackson Holdings Ltd. (B/NR) | |
| | 2,000,000 | | | | 3.221 | | | | 02/03/14 | | | | 1,985,000 | |
| Intelsat Jackson Holdings SA (BB-/B1) | |
| | 14,827,424 | | | | 5.250 | | | | 04/02/18 | | | | 14,836,766 | |
| NeuStar, Inc. (NR/Ba2) | |
| | 4,198,149 | | | | 5.000 | | | | 11/08/18 | | | | 4,220,902 | |
| | | | | | | | | | | | | | |
| | | | | | | | | | | | | 31,894,334 | |
| | |
| | TOTAL SENIOR TERM LOANS | | | | | |
| | (Cost $596,112,866) | | | $ | 602,459,937 | |
| | |
| | | | | | | | | | | | | | |
| | Corporate Obligations – 10.9% | |
| Airlines(b)(c) – 0.4% | |
| Delta Air Lines, Inc. (BB-/Ba2) | |
| $ | 1,988,000 | | | | 9.500 | % | | | 09/15/14 | | | $ | 2,087,400 | |
| United Air Lines, Inc. (BB-/Ba3) | |
| | 1,099,000 | | | | 9.875 | | | | 08/01/13 | | | | 1,126,475 | |
| | | | | | | | | | | | | | |
| | | | | | | | | | | | | 3,213,875 | |
| | |
| Beverages(b) – 0.0% | |
| Constellation Brands, Inc. (BB+/Ba1) | |
| | 300,000 | | | | 4.625 | | | | 03/01/23 | | | | 304,500 | |
| | |
| Commercial Services(b)(c) – 0.2% | |
| Altegrity, Inc. (CCC/Caa1) | |
| | 2,000,000 | | | | 10.500 | | | | 11/01/15 | | | | 1,755,000 | |
| | |
| Principal
Amount |
| |
| Interest
Rate |
| |
| Maturity
Date |
| | | Value | |
| | | | | | | | | | | | | | |
| | Corporate Obligations – (continued) | |
| Consumer Products – Household & Leisure(b) – 0.2% | |
| Spectrum Brands, Inc. (B/B1) | |
| $ | 800,000 | | | | 9.500 | %(c) | | | 06/15/18 | | | $ | 898,000 | |
| | 750,000 | | | | 9.500 | | | | 06/15/18 | | | | 845,625 | |
| | | | | | | | | | | | | | |
| | | | | | | | | | | | | 1,743,625 | |
| | |
| Finance – 0.7% | |
| Ally Financial, Inc. (B+/B1) | |
| | 1,250,000 | | | | 4.625 | | | | 06/26/15 | | | | 1,281,250 | |
| CIT Group, Inc. (BB-/B1)(b) | |
| | 1,650,000 | | | | 4.250 | | | | 08/15/17 | | | | 1,716,000 | |
| International Lease Finance Corp. (BBB-/Ba2)(b)(c) | |
| | 2,000,000 | | | | 7.125 | | | | 09/01/18 | | | | 2,320,000 | |
| | | | | | | | | | | | | | |
| | | | | | | | | | | | | 5,317,250 | |
| | |
| Food and Beverage(b)(c) – 0.3% | |
| Bumble Bee Acquisition Corp. (B/B2) | |
| | 2,000,000 | | | | 9.000 | | | | 12/15/17 | | | | 2,080,000 | |
| | |
| Gaming(b) – 0.5% | |
| Chester Downs & Marina LLC (B+/B3)(c) | |
| | 1,500,000 | | | | 9.250 | | | | 02/01/20 | | | | 1,507,500 | |
| Graton Economic Development Authority (B/B3)(c) | |
| | 200,000 | | | | 9.625 | | | | 09/01/19 | | | | 209,000 | |
| MGM Resorts International (B+/Ba2) | |
| | 1,000,000 | | | | 11.125 | | | | 11/15/17 | | | | 1,102,500 | |
| | 1,000,000 | | | | 9.000 | | | | 03/15/20 | | | | 1,115,000 | |
| | | | | | | | | | | | | | |
| | | | | | | | | | | | | 3,934,000 | |
| | |
| Health Care(b) – 1.5% | |
| Community Health Systems, Inc. (BB/Ba3) | |
| | 7,550,000 | | | | 5.125 | | | | 08/15/18 | | | | 7,833,125 | |
| DaVita, Inc. (B/B2) | |
| | 1,400,000 | | | | 5.750 | | | | 08/15/22 | | | | 1,456,000 | |
| HCA, Inc. (BB/Ba3) | |
| | 500,000 | | | | 8.500 | | | | 04/15/19 | | | | 564,375 | |
| | 1,400,000 | | | | 6.500 | | | | 02/15/20 | | | | 1,554,000 | |
| | | | | | | | | | | | | | |
| | | | | | | | | | | | | 11,407,500 | |
| | |
| Health Care – Pharmaceuticals(b)(c) – 0.3% | |
| Valeant Pharmaceuticals International (BB-/B1) | |
| | 2,000,000 | | | | 6.500 | | | | 07/15/16 | | | | 2,097,500 | |
| | |
| Health Care – Services(b) – 0.6% | |
| American Renal Holdings Co., Inc. (B/B2) | |
| | 1,875,000 | | | | 8.375 | | | | 05/15/18 | | | | 1,982,812 | |
| MPT Operating Partnership LP/MPT Finance Corp. (BB/Ba1) | |
| | 2,000,000 | | | | 6.375 | | | | 02/15/22 | | | | 2,125,000 | |
| | | | | | | | | | | | | | |
| | | | | | | | | | | | | 4,107,812 | |
| | |
| Media – Broadcasting & Radio(b)(c) – 1.3% | |
| Univision Communications, Inc. (B+/B2) | |
| | 2,400,000 | | | | 6.875 | | | | 05/15/19 | | | | 2,469,000 | |
| | 7,100,000 | | | | 6.750 | | | | 09/15/22 | | | | 7,100,000 | |
| | | | | | | | | | | | | | |
| | | | | | | | | | | | | 9,569,000 | |
| | |
| Media – Cable(b) – 0.5% | |
| CCO Holdings LLC/CCO Holdings Capital Corp. (BB-/B1) | |
| | 2,000,000 | | | | 7.875 | | | | 04/30/18 | | | | 2,160,000 | |
| | |
| | |
| 66 | | The accompanying notes are an integral part of these financial statements. |
GOLDMAN SACHS HIGH YIELD FLOATING RATE FUND
| | | | | | | | | | | | | | |
Principal Amount | | | Interest
Rate | | | Maturity
Date | | | Value | |
| | | | | | | | | | | | | | |
| | Corporate Obligations – (continued) | |
| Media – Cable – (continued) | |
| DISH DBS Corp. (BB-/Ba2) | |
| $ | 1,550,000 | | | | 6.625 | % | | | 10/01/14 | | | $ | 1,677,875 | |
| | | | | | | | | | | | | | |
| | | | | | | | | | | | | 3,837,875 | |
| | |
| Packaging(b) – 1.0% | |
| Ardagh Packaging Finance PLC (B+/Ba3)(c) | |
| | 800,000 | | | | 7.375 | | | | 10/15/17 | | | | 857,665 | |
| Berry Plastics Corp. (B/B1)(d) | |
| | 4,500,000 | | | | 5.205 | | | | 02/15/15 | | | | 4,511,250 | |
| Reynolds Group Holding Ltd. (B+/B1)(c) | |
| | 2,300,000 | | | | 5.750 | | | | 10/15/20 | | | | 2,294,250 | |
| | | | | | | | | | | | | | |
| | | | | | | | | | | | | 7,663,165 | |
| | |
| Paper(b)(c) – 0.1% | |
| Longview Fibre Paper & Packaging, Inc. (B+/B2) | |
| | 750,000 | | | | 8.000 | | | | 06/01/16 | | | | 781,875 | |
| | |
| Services Cyclical – Business Services(b)(c) – 0.2% | |
| First Data Corp. (B+/B1) | |
| | 1,500,000 | | | | 6.750 | | | | 11/01/20 | | | | 1,485,000 | |
| | |
| Telecommunications(b)(c) – 0.3% | |
| Sunrise Communications International SA (BB-/Ba3) | |
| CHF | 2,050,000 | | | | 5.625 | | | | 12/31/17 | | | | 2,239,633 | |
| | |
| Telecommunications – Cellular(b) – 1.4% | |
| Matterhorn Mobile SA (BB-/B1)(c)(d) | |
| | 750,000 | | | | 5.421 | | | | 05/15/19 | | | | 801,435 | |
| Nextel Communications, Inc. (B+/WR) | |
| $ | 3,250,000 | | | | 5.950 | | | | 03/15/14 | | | | 3,254,063 | |
| Sprint Nextel Corp. (BB-/Ba3)(c) | |
| | 3,500,000 | | | | 9.000 | | | | 11/15/18 | | | | 4,191,250 | |
| Wind Acquisition Finance SA (BB/Ba3)(c) | |
| | 2,000,000 | | | | 7.250 | | | | 02/15/18 | | | | 1,890,000 | |
| | | | | | | | | | | | | | |
| | | | | | | | | | | | | 10,136,748 | |
| | |
| Telecommunications – Wirelines(b) – 0.8% | |
| Frontier Communications Corp. (BB/Ba2) | |
| | 3,000,000 | | | | 7.875 | | | | 04/15/15 | | | | 3,352,500 | |
| PAETEC Holding Corp. (NR/WR) | |
| | 2,000,000 | | | | 9.875 | | | | 12/01/18 | | | | 2,290,000 | |
| | | | | | | | | | | | | | |
| | | | | | | | | | | | | 5,642,500 | |
| | |
| Textiles & Apparel(b)(d) – 0.1% | |
| Hanesbrands, Inc. (BB-/B1) | |
| | 740,000 | | | | 4.113 | | | | 12/15/14 | | | | 745,550 | |
| | |
| Transportation(b)(c) – 0.2% | |
| Aguila 3 SA (B/B2) | |
| | 1,650,000 | | | | 7.875 | | | | 01/31/18 | | | | 1,736,625 | |
| | |
| Utilities – Electric(b)(c) – 0.3% | |
| DPL, Inc. (BB+/Ba1) | |
| | 2,000,000 | | | | 6.500 | | | | 10/15/16 | | | | 2,190,000 | |
| | |
| | TOTAL CORPORATE OBLIGATIONS | | | | | |
| | (Cost $80,224,549) | | | $ | 81,989,033 | |
| | |
| TOTAL INVESTMENTS BEFORE
SHORT-TERM INVESTMENT |
| | | | |
| | (Cost $676,337,415) | | | $ | 684,448,970 | |
| | |
| Principal
Amount |
| |
| Interest
Rate |
| |
| Maturity
Date |
| | | Value | |
| | | | | | | | | | | | | | |
| | Short-term Investment(e) – 11.4% | |
| Repurchase Agreement – 11.4% | |
| Joint Repurchase Agreement Account II | |
| $ | 85,500,000 | | | | 0.245 | % | | | 10/01/12 | | | $ | 85,500,000 | |
| | (Cost $85,500,000) | |
| | |
| | TOTAL INVESTMENTS — 102.7% | | | | | |
| | (Cost $761,837,415) | | | $ | 769,948,970 | |
| | |
| LIABILITIES IN EXCESS OF
OTHER ASSETS — (2.7)% |
| | | (20,076,563 | ) |
| | |
| | NET ASSETS — 100.0% | | | $ | 749,872,407 | |
| | |
| | |
| The percentage shown for each investment category reflects the value of investments in that category as a percentage of net assets. |
(a) | | Senior Term Loans often require prepayments from excess cash flows or permit the borrower to repay at its election. The degree to which borrowers repay, whether as a contractual requirement or at their election, cannot be predicted with accuracy. As a result, the actual remaining maturity may be substantially less than the stated maturities shown. The stated interest rate represents the weighted average interest rate of all contracts within the senior loan facility at September 30, 2012. Senior Term Loans typically have rates of interest which are redetermined either daily, monthly, quarterly or semi-annually by reference to a base lending rate, plus a premium. These base lending rates are primarily the London-interbank Offered Rate (“LIBOR”), and secondarily the prime rate offered by one or more major United States banks (the “Prime Rate”) and the certificate of deposit (“CD”) rate or other base lending rates used by commercial lenders. |
(b) | | Security with “Call” features with resetting interest rates. Maturity dates disclosed are the final maturity dates. |
(c) | | Exempt from registration under Rule 144A of the Securities Act of 1933. Under procedures approved by the Board of Trustees, such securities have been determined to be liquid by the investment adviser and may be resold, normally to qualified institutional buyers in transactions exempt from registration. Total market value of Rule 144A securities amounts to $42,117,608, which represents approximately 5.6% of net assets as of September 30, 2012. |
(d) | | Variable rate security. Interest rate disclosed is that which is in effect at September 30, 2012. |
(e) | | Joint repurchase agreement was entered into on September 28, 2012. Additional information appears on page 94. |
| Security ratings disclosed, if any, are obtained from Standard & Poor’s/Moody’s Investors Service. A brief description of the ratings is available in the Fund’s Statement of Additional Information. |
| | |
|
Investment Abbreviations: |
NR | | —Not Rated |
WR | | —Withdrawn Rating |
|
| | |
| The accompanying notes are an integral part of these financial statements. | | 67 |
GOLDMAN SACHS HIGH YIELD FLOATING RATE FUND
Schedule of Investments (continued)
September 30, 2012 (Unaudited)
|
| ADDITIONAL INVESTMENT INFORMATION |
UNFUNDED LOAN COMMITMENT — At September 30, 2012, the Fund had an unfunded loan commitment which could be extended at the option of the borrower, pursuant to the following loan agreement:
| | | | | | | | | | |
| Borrower | | Principal
Amount | | Current
Value | | | Unrealized Gain (Loss) | |
ROC Finance LLC, due 08/18/17 | | $533,333 | | $ | 545,333 | | | $ | 12,000 | |
FORWARD FOREIGN CURRENCY EXCHANGE CONTRACTS — At September 30, 2012, the Fund had the following forward foreign currency exchange contracts:
FORWARD FOREIGN CURRENCY EXCHANGE CONTRACTS WITH UNREALIZED LOSS
| | | | | | | | | | | | | | |
| Counterparty | | Contracts to
Buy/Sell | | Settlement
Date | | | Current
Value | | | Unrealized
Loss | |
UBS AG (London) | | USD/CHF | | | 10/03/12 | | | $ | 797,493 | | | $ | (3,842 | ) |
Westpac Banking Corp. | | USD/CHF | | | 10/03/12 | | | | 2,219,157 | | | | (28,082 | ) |
| TOTAL | | | | | | | | | | | | $ | (31,924 | ) |
| | |
| 68 | | The accompanying notes are an integral part of these financial statements. |
GOLDMAN SACHS INVESTMENT GRADE CREDIT FUND
Schedule of Investments
September 30, 2012 (Unaudited)
| | | | | | | | | | | | | | |
Principal
Amount | | | Interest
Rate | | | Maturity
Date | | | Value | |
| | | | | | | | | | | | | | |
| | Corporate Obligations – 88.8% | |
| Automotive – 1.5% | |
| Ford Motor Credit Co. LLC | |
| $ | 5,350,000 | | | | 3.984 | % | | | 06/15/16 | | | $ | 5,623,249 | |
| | 2,400,000 | | | | 8.000 | | | | 12/15/16 | | | | 2,892,000 | |
| | | | | | | | | | | | | | |
| | | | | | | | | | | | | 8,515,249 | |
| | |
| Banks – 21.3% | |
| Abbey National Treasury Services PLC | |
| | 2,700,000 | | | | 2.875 | | | | 04/25/14 | | | | 2,736,658 | |
| GBP | 600,000 | | | | 2.300 | (a) | | | 02/16/15 | | | | 981,467 | |
| ANZ Capital Trust II(b)(c) | |
| $ | 4,200,000 | | | | 5.360 | | | | 12/15/49 | | | | 4,273,500 | |
| Bank of America Corp. | |
| | 3,400,000 | | | | 6.000 | | | | 09/01/17 | | | | 3,916,575 | |
| | 1,600,000 | | | | 5.625 | | | | 07/01/20 | | | | 1,807,185 | |
| | 1,150,000 | | | | 5.875 | | | | 01/05/21 | | | | 1,318,825 | |
| | 6,025,000 | | | | 5.000 | | | | 05/13/21 | | | | 6,613,160 | |
| | 5,300,000 | | | | 5.700 | | | | 01/24/22 | | | | 6,156,601 | |
| Bank of Scotland PLC(c) | |
| | 1,500,000 | | | | 5.250 | | | | 02/21/17 | | | | 1,703,069 | |
| BB&T Corp.(b) | |
| | 850,000 | | | | 1.600 | | | | 08/15/17 | | | | 864,805 | |
| Capital One Capital IV(a)(b) | |
| | 6,400,000 | | | | 6.745 | | | | 02/17/37 | | | | 6,432,000 | |
| Citigroup, Inc. | |
| | 7,575,000 | | | | 4.450 | | | | 01/10/17 | | | | 8,311,859 | |
| | 1,049,000 | | | | 6.125 | | | | 05/15/18 | | | | 1,236,380 | |
| | 2,750,000 | | | | 5.375 | | | | 08/09/20 | | | | 3,164,953 | |
| | 850,000 | | | | 4.500 | | | | 01/14/22 | | | | 924,742 | |
| Discover Bank | |
| | 3,700,000 | | | | 8.700 | | | | 11/18/19 | | | | 4,750,856 | |
| DnB Boligkreditt AS(c) | |
| | 500,000 | | | | 2.900 | | | | 03/29/16 | | | | 532,150 | |
| Fifth Third Bank(a) | |
| | 2,950,000 | | | | 0.545 | | | | 05/17/13 | | | | 2,946,162 | |
| HSBC Capital Funding LP(a)(b)(c) | |
| | 1,050,000 | | | | 4.610 | | | | 12/29/49 | | | | 1,042,653 | |
| ING Bank NV(c) | |
| | 5,400,000 | | | | 2.375 | | | | 06/09/14 | | | | 5,429,160 | |
| | 1,375,000 | | | | 2.000 | | | | 09/25/15 | | | | 1,377,056 | |
| JPMorgan Chase & Co. | |
| | 7,200,000 | | | | 4.350 | | | | 08/15/21 | | | | 7,859,453 | |
| Merrill Lynch & Co., Inc. | |
| | 1,250,000 | | | | 6.400 | | | | 08/28/17 | | | | 1,453,093 | |
| Mizuho Corporate Bank Ltd.(c) | |
| | 2,525,000 | | | | 2.550 | | | | 03/17/17 | | | | 2,638,620 | |
| MUFG Capital Finance 1 Ltd.(a)(b) | |
| | 2,650,000 | | | | 6.346 | | | | 07/25/49 | | | | 2,887,673 | |
| Nordea Bank AB(c) | |
| | 2,850,000 | | | | 4.250 | | | | 09/21/22 | | | | 2,832,344 | |
| Northern Rock Asset Management PLC(c) | |
| | 1,000,000 | | | | 5.625 | | | | 06/22/17 | | | | 1,123,700 | |
| Oversea-Chinese Banking Corp. Ltd.(a)(b)(c) | |
| | 2,900,000 | | | | 3.150 | | | | 03/11/23 | | | | 2,912,659 | |
| Regions Financial Corp. | |
| | 3,850,000 | | | | 5.750 | | | | 06/15/15 | | | | 4,119,500 | |
| | |
| Principal
Amount |
| |
| Interest
Rate |
| |
| Maturity
Date |
| | | Value | |
| | | | | | | | | | | | | | |
| | Corporate Obligations – (continued) | |
| Banks – (continued) | |
| Royal Bank of Scotland Group PLC | |
| $ | 4,250,000 | | | | 2.550 | | | | 09/18/15 | | | $ | 4,303,453 | |
| Santander Holdings USA, Inc. | |
| | 3,000,000 | | | | 3.000 | (b) | | | 09/24/15 | | | | 3,013,300 | |
| | 855,000 | | | | 4.625 | | | | 04/19/16 | | | | 892,338 | |
| Stadshypotek AB(c) | |
| | 2,100,000 | | | | 1.875 | | | | 10/02/19 | | | | 2,099,370 | |
| Standard Chartered PLC(c) | |
| | 2,275,000 | | | | 3.200 | | | | 05/12/16 | | | | 2,374,440 | |
| Sumitomo Mitsui Banking Corp.(c) | |
| | 5,325,000 | | | | 2.900 | | | | 07/22/16 | | | | 5,609,201 | |
| UBS AG | |
| | 875,000 | | | | 7.625 | | | | 08/17/22 | | | | 902,904 | |
| Union Bank NA | |
| | 6,600,000 | | | | 2.125 | | | | 06/16/17 | | | | 6,747,276 | |
| Westpac Capital Trust III(a)(b)(c) | |
| | 1,685,000 | | | | 5.819 | | | | 09/30/49 | | | | 1,675,362 | |
| | | | | | | | | | | | | | |
| | | | | | | | | | | | | 119,964,502 | |
| | |
| Brokerage(b) – 2.9% | |
| Morgan Stanley | |
| | 10,700,000 | | | | 6.250 | | | | 08/28/17 | | | | 12,103,395 | |
| | 600,000 | | | | 6.625 | | | | 04/01/18 | | | | 682,445 | |
| | 3,325,000 | | | | 5.500 | | | | 07/28/21 | | | | 3,605,624 | |
| | | | | | | | | | | | | | |
| | | | | | | | | | | | | 16,391,464 | |
| | |
| Chemicals(b) – 2.6% | |
| CF Industries, Inc. | |
| | 1,275,000 | | | | 6.875 | | | | 05/01/18 | | | | 1,555,500 | |
| | 400,000 | | | | 7.125 | | | | 05/01/20 | | | | 500,739 | |
| Eastman Chemical Co. | |
| | 3,700,000 | | | | 2.400 | | | | 06/01/17 | | | | 3,869,887 | |
| Ecolab, Inc. | |
| | 2,225,000 | | | | 4.350 | | | | 12/08/21 | | | | 2,504,903 | |
| Incitec Pivot Ltd.(c) | |
| | 3,700,000 | | | | 4.000 | | | | 12/07/15 | | | | 3,838,783 | |
| The Dow Chemical Co. | |
| | 2,328,000 | | | | 7.600 | | | | 05/15/14 | | | | 2,570,992 | |
| | | | | | | | | | | | | | |
| | | | | | | | | | | | | 14,840,804 | |
| | |
| Consumer Products(b)(c) – 0.6% | |
| LVMH Moet Hennessy Louis Vuitton SA | |
| | 3,575,000 | | | | 1.625 | | | | 06/29/17 | | | | 3,605,387 | |
| | |
| Distributor(b)(c) – 0.2% | |
| Southern Star Central Gas Pipeline, Inc. | |
| | 1,100,000 | | | | 6.000 | | | | 06/01/16 | | | | 1,212,001 | |
| | |
| Diversified Manufacturing(b) – 0.7% | |
| Xylem, Inc. | |
| | 3,650,000 | | | | 3.550 | | | | 09/20/16 | | | | 3,874,818 | |
| | |
| Electric – 3.3% | |
| Arizona Public Service Co.(b) | |
| | 3,965,000 | | | | 8.750 | | | | 03/01/19 | | | | 5,284,446 | |
| Nevada Power Co.(b) | |
| | 2,675,000 | | | | 7.125 | | | | 03/15/19 | | | | 3,419,706 | |
| | |
| | |
| The accompanying notes are an integral part of these financial statements. | | 69 |
GOLDMAN SACHS INVESTMENT GRADE CREDIT FUND
Schedule of Investments (continued)
September 30, 2012 (Unaudited)
| | | | | | | | | | | | | | |
| Principal
Amount |
| |
| Interest
Rate |
| |
| Maturity
Date |
| | | Value | |
| | | | | | | | | | | | | | |
| | Corporate Obligations – (continued) | |
| Electric – (continued) | |
| NextEra Energy Capital Holdings, Inc. | |
| $ | 1,950,000 | | | | 1.611 | % | | | 06/01/14 | | | $ | 1,966,083 | |
| PPL WEM Holdings PLC(b)(c) | |
| | 3,700,000 | | | | 5.375 | | | | 05/01/21 | | | | 4,126,792 | |
| Progress Energy, Inc.(b) | |
| | 1,000,000 | | | | 7.000 | | | | 10/30/31 | | | | 1,315,952 | |
| Puget Sound Energy, Inc.(a)(b) | |
| | 2,000,000 | | | | 6.974 | | | | 06/01/67 | | | | 2,140,000 | |
| | | | | | | | | | | | | | |
| | | | | | | | | | | | | 18,252,979 | |
| | |
| Energy – 11.3% | |
| Anadarko Petroleum Corp.(b) | |
| | 4,225,000 | | | | 8.700 | | | | 03/15/19 | | | | 5,675,618 | |
| BG Energy Capital PLC(a)(b) | |
| | 2,550,000 | | | | 6.500 | | | | 11/30/72 | | | | 2,728,160 | |
| BP Capital Markets PLC(b) | |
| | 8,600,000 | | | | 4.500 | | | | 10/01/20 | | | | 9,929,246 | |
| | 3,850,000 | | | | 3.245 | | | | 05/06/22 | | | | 4,036,996 | |
| Dolphin Energy Ltd.(c) | |
| | 440,220 | | | | 5.888 | (b) | | | 06/15/19 | | | | 498,549 | |
| | 600,000 | | | | 5.500 | | | | 12/15/21 | | | | 694,328 | |
| Gaz Capital SA for Gazprom | |
| | 990,000 | | | | 9.250 | | | | 04/23/19 | | | | 1,287,000 | |
| Nexen, Inc.(b) | |
| | 945,000 | | | | 6.400 | | | | 05/15/37 | | | | 1,200,228 | |
| | 2,525,000 | | | | 7.500 | | | | 07/30/39 | | | | 3,605,915 | |
| Pemex Project Funding Master Trust(b) | |
| | 900,000 | | | | 6.625 | | | | 06/15/35 | | | | 1,125,000 | |
| Petrobras International Finance Co.(b) | |
| | 430,000 | | | | 5.750 | | | | 01/20/20 | | | | 488,044 | |
| | 2,440,000 | | | | 5.375 | | | | 01/27/21 | | | | 2,750,167 | |
| Petroleos Mexicanos(b) | |
| | 1,130,000 | | | | 5.500 | | | | 01/21/21 | | | | 1,322,100 | |
| PTTEP Canada International Finance Ltd.(c) | |
| | 820,000 | | | | 5.692 | | | | 04/05/21 | | | | 945,572 | |
| | 490,000 | | | | 6.350 | | | | 06/12/42 | | | | 563,500 | |
| Rowan Cos., Inc.(b) | |
| | 2,425,000 | | | | 4.875 | | | | 06/01/22 | | | | 2,602,069 | |
| Schlumberger Investment SA(b)(c) | |
| | 825,000 | | | | 1.250 | | | | 08/01/17 | | | | 824,010 | |
| Schlumberger Norge AS(b)(c) | |
| | 800,000 | | | | 1.250 | | | | 08/01/17 | | | | 797,728 | |
| TNK-BP Finance SA | |
| | 470,000 | | | | 7.500 | | | | 07/18/16 | | | | 544,025 | |
| Transocean, Inc.(b) | |
| | 1,300,000 | | | | 6.000 | | | | 03/15/18 | | | | 1,514,063 | |
| | 9,700,000 | | | | 6.500 | | | | 11/15/20 | | | | 11,561,515 | |
| | 2,375,000 | | | | 6.375 | | | | 12/15/21 | | | | 2,842,516 | |
| | 175,000 | | | | 7.350 | | | | 12/15/41 | | | | 229,694 | |
| Valero Logistics(b) | |
| | 2,000,000 | | | | 6.050 | | | | 03/15/13 | | | | 2,038,318 | |
| Weatherford International Ltd.(b) | |
| | 2,685,000 | | | | 9.625 | | | | 03/01/19 | | | | 3,507,688 | |
| | | | | | | | | | | | | | |
| | | | | | | | | | | | | 63,312,049 | |
| | |
| Principal
Amount |
| |
| Interest
Rate |
| |
| Maturity
Date |
| | | Value | |
| | | | | | | | | | | | | | |
| | Corporate Obligations – (continued) | |
| Food & Beverage – 7.9% | |
| Anheuser-Busch InBev Worldwide, Inc.(b) | |
| $ | 3,156,000 | | | | 4.125 | % | | | 01/15/15 | | | $ | 3,404,000 | |
| | 2,475,000 | | | | 1.375 | | | | 07/15/17 | | | | 2,497,340 | |
| Diageo Capital PLC(b) | |
| | 2,925,000 | | | | 1.500 | | | | 05/11/17 | | | | 2,970,773 | |
| Heineken NV(b)(c) | |
| | 3,325,000 | | | | 3.400 | | | | 04/01/22 | | | | 3,462,954 | |
| Kraft Foods Group, Inc.(c) | |
| | 950,000 | | | | 2.250 | | | | 06/05/17 | | | | 982,912 | |
| | 702,000 | | | | 6.125 | | | | 08/23/18 | | | | 859,823 | |
| | 1,475,000 | | | | 3.500 | | | | 06/06/22 | | | | 1,554,569 | |
| Kraft Foods, Inc. | |
| | 248,000 | | | | 6.125 | | | | 02/01/18 | | | | 303,288 | |
| Mondelez International, Inc. | |
| | 5,425,000 | | | | 6.500 | | | | 02/09/40 | | | | 7,373,006 | |
| Pernod-Ricard SA(b)(c) | |
| | 8,850,000 | | | | 4.450 | | | | 01/15/22 | | | | 9,756,718 | |
| SABMiller Holdings, Inc.(b)(c) | |
| | 4,850,000 | | | | 2.450 | | | | 01/15/17 | | | | 5,072,911 | |
| | 5,825,000 | | | | 3.750 | | | | 01/15/22 | | | | 6,325,583 | |
| | | | | | | | | | | | | | |
| | | | | | | | | | | | | 44,563,877 | |
| | |
| Health Care – Medical Products(b) – 1.2% | |
| Humana, Inc. | |
| | 2,765,000 | | | | 7.200 | | | | 06/15/18 | | | | 3,364,716 | |
| PerkinElmer, Inc. | |
| | 3,175,000 | | | | 5.000 | | | | 11/15/21 | | | | 3,500,450 | |
| | | | | | | | | | | | | | |
| | | | | | | | | | | | | 6,865,166 | |
| | |
| Health Care – Services(b) – 1.9% | |
| Coventry Health Care, Inc. | |
| | 2,550,000 | | | | 6.300 | | | | 08/15/14 | | | | 2,765,684 | |
| Express Scripts Holding Co. | |
| | 3,825,000 | | | | 3.125 | | | | 05/15/16 | | | | 4,039,070 | |
| | 3,575,000 | | | | 3.500(c | ) | | | 11/15/16 | | | | 3,843,325 | |
| | | | | | | | | | | | | | |
| | | | | | | | | | | | | 10,648,079 | |
| | |
| Life Insurance(b) – 1.0% | |
| American International Group, Inc. | |
| | 1,550,000 | | | | 2.375 | | | | 08/24/15 | | | | 1,565,836 | |
| MetLife Capital Trust X(c) | |
| | 1,500,000 | | | | 9.250 | | | | 04/08/38 | | | | 1,980,000 | |
| Reinsurance Group of America, Inc. | |
| | 1,650,000 | | | | 5.000 | | | | 06/01/21 | | | | 1,783,841 | |
| | | | | | | | | | | | | | |
| | | | | | | | | | | | | 5,329,677 | |
| | |
| Media – Cable – 0.9% | |
| Comcast Cable Communications Holdings, Inc. | |
| | 2,200,000 | | | | 8.375 | | | | 03/15/13 | | | | 2,278,177 | |
| DIRECTV Holdings LLC / DIRECTV Financing Co, Inc.(b) | |
| | 2,825,000 | | | | 3.800 | | | | 03/15/22 | | | | 2,906,964 | |
| | | | | | | | | | | | | | |
| | | | | | | | | | | | | 5,185,141 | |
| | |
| Media – Non Cable(b) – 3.1% | |
| NBCUniversal Media LLC | |
| | 7,325,000 | | | | 2.875 | | | | 04/01/16 | | | | 7,723,523 | |
| | |
| | |
| 70 | | The accompanying notes are an integral part of these financial statements. |
GOLDMAN SACHS INVESTMENT GRADE CREDIT FUND
| | | | | | | | | | | | | | |
| Principal
Amount |
| |
| Interest
Rate |
| |
| Maturity
Date |
| | | Value | |
| | | | | | | | | | | | | | |
| | Corporate Obligations – (continued) | |
| Media – Non Cable(b) – (continued) | |
| News America, Inc. | |
| $ | 650,000 | | | | 6.650 | % | | | 11/15/37 | | | $ | 825,246 | |
| | 4,700,000 | | | | 6.150 | | | | 02/15/41 | | | | 5,793,788 | |
| WPP Finance UK | |
| | 2,875,000 | | | | 8.000 | | | | 09/15/14 | | | | 3,219,520 | |
| | | | | | | | | | | | | | |
| | | | | | | | | | | | | 17,562,077 | |
| | |
| Metals & Mining(b)(c) – 0.4% | |
| Newcrest Finance Pty Ltd. | |
| | 2,400,000 | | | | 4.450 | | | | 11/15/21 | | | | 2,460,509 | |
| | |
| Noncaptive – Financial – 2.6% | |
| Blackstone Holdings Finance Co. LLC(b)(c) | |
| | 1,525,000 | | | | 4.750 | | | | 02/15/23 | | | | 1,590,020 | |
| | 1,500,000 | | | | 6.250 | | | | 08/15/42 | | | | 1,591,614 | |
| GE Capital Trust I(a)(b) | |
| | 3,280,000 | | | | 6.375 | | | | 11/15/67 | | | | 3,452,200 | |
| General Electric Capital Corp. | |
| | 2,650,000 | | | | 2.300 | | | | 04/27/17 | | | | 2,725,487 | |
| | 1,325,000 | | | | 5.875 | | | | 01/14/38 | | | | 1,573,123 | |
| International Lease Finance Corp. | |
| | 3,225,000 | | | | 5.750 | | | | 05/15/16 | | | | 3,418,500 | |
| | | | | | | | | | | | | | |
| | | | | | | | | | | | | 14,350,944 | |
| | |
| Pharmaceuticals(b) – 0.5% | |
| Watson Pharmaceuticals, Inc. | |
| | 2,550,000 | | | | 3.250 | | | | 10/01/22 | | | | 2,585,343 | |
| | |
| Pipelines(b) – 4.8% | |
| Energy Transfer Partners LP | |
| | 3,727,000 | | | | 5.950 | | | | 02/01/15 | | | | 4,090,084 | |
| Enterprise Products Operating LLC | |
| | 2,650,000 | | | | 5.250 | | | | 01/31/20 | | | | 3,089,347 | |
| | 1,975,000 | | | | 8.375 | (a) | | | 08/01/66 | | | | 2,221,875 | |
| | 1,770,000 | | | | 7.034 | (a) | | | 01/15/68 | | | | 1,986,825 | |
| ONEOK Partners LP | |
| | 825,000 | | | | 3.375 | | | | 10/01/22 | | | | 833,172 | |
| | 1,055,000 | | | | 6.850 | | | | 10/15/37 | | | | 1,286,575 | |
| | 775,000 | | | | 6.125 | | | | 02/01/41 | | | | 923,348 | |
| Tennessee Gas Pipeline Co. | |
| | 1,460,000 | | | | 7.000 | | | | 10/15/28 | | | | 1,951,199 | |
| | 2,125,000 | | | | 8.375 | | | | 06/15/32 | | | | 3,063,740 | |
| TransCanada PipeLines Ltd.(a) | |
| | 3,875,000 | | | | 6.350 | | | | 05/15/67 | | | | 4,126,875 | |
| Western Gas Partners LP | |
| | 586,000 | | | | 5.375 | | | | 06/01/21 | | | | 658,743 | |
| | 2,575,000 | | | | 4.000 | | | | 07/01/22 | | | | 2,683,229 | |
| | | | | | | | | | | | | | |
| | | | | | | | | | | | | 26,915,012 | |
| | |
| Property Insurance(b) – 0.6% | |
| American International Group, Inc. | |
| | 2,850,000 | | | | 4.875 | | | | 06/01/22 | | | | 3,214,311 | |
| | |
| Property/Casualty Insurance(b) – 2.5% | |
| Arch Capital Group Ltd. | |
| | 1,245,000 | | | | 7.350 | | | | 05/01/34 | | | | 1,596,913 | |
| Infinity Property & Casualty Corp. | |
| | 4,050,000 | | | | 5.000 | | | | 09/19/22 | | | | 4,208,533 | |
| | |
| Principal
Amount |
| |
| Interest
Rate |
| |
| Maturity
Date |
| | | Value | |
| | | | | | | | | | | | | | |
| | Corporate Obligations – (continued) | |
| Property/Casualty Insurance(b) – (continued) | |
| Mitsui Sumitomo Insurance Co. Ltd.(a)(c) | |
| $ | 900,000 | | | | 7.000 | % | | | 03/15/72 | | | $ | 992,356 | |
| QBE Capital Funding III Ltd.(a)(c) | |
| | 3,175,000 | | | | 7.250 | | | | 05/24/41 | | | | 3,214,688 | |
| QBE Insurance Group Ltd.(a)(c) | |
| | 855,000 | | | | 5.647 | | | | 07/01/23 | | | | 842,247 | |
| Transatlantic Holdings, Inc. | |
| | 2,600,000 | | | | 8.000 | | | | 11/30/39 | | | | 3,246,160 | |
| | | | | | | | | | | | | | |
| | | | | | | | | | | | | 14,100,897 | |
| | |
| Real Estate Investment Trusts(b) – 8.0% | |
| Camden Property Trust | |
| | 1,150,000 | | | | 5.700 | | | | 05/15/17 | | | | 1,312,679 | |
| CubeSmart LP | |
| | 1,625,000 | | | | 4.800 | | | | 07/15/22 | | | | 1,737,760 | |
| Developers Diversified Realty Corp. | |
| | 590,000 | | | | 9.625 | | | | 03/15/16 | | | | 729,387 | |
| | 3,750,000 | | | | 7.500 | | | | 04/01/17 | | | | 4,453,062 | |
| Duke Realty LP | |
| | 2,200,000 | | | | 4.375 | | | | 06/15/22 | | | | 2,310,759 | |
| Entertainment Properties Trust | |
| | 2,975,000 | | | | 5.750 | | | | 08/15/22 | | | | 3,066,239 | |
| ERP Operating LP | |
| | 4,005,000 | | | | 5.250 | | | | 09/15/14 | | | | 4,334,607 | |
| HCP, Inc. | |
| | 2,975,000 | | | | 6.300 | | | | 09/15/16 | | | | 3,449,259 | |
| Health Care REIT, Inc. | |
| | 1,250,000 | | | | 4.700 | | | | 09/15/17 | | | | 1,375,546 | |
| | 775,000 | | | | 4.125 | | | | 04/01/19 | | | | 824,062 | |
| Kilroy Realty LP | |
| | 2,300,000 | | | | 5.000 | | | | 11/03/15 | | | | 2,504,953 | |
| | 1,125,000 | | | | 6.625 | | | | 06/01/20 | | | | 1,345,445 | |
| National Retail Properties, Inc. | |
| | 2,650,000 | | | | 3.800 | | | | 10/15/22 | | | | 2,696,764 | |
| Pan Pacific Retail Properties, Inc. | |
| | 1,350,000 | | | | 5.950 | | | | 06/01/14 | | | | 1,447,238 | |
| Post Apartment Homes LP | |
| | 3,000,000 | | | | 6.300 | | | | 06/01/13 | | | | 3,089,159 | |
| ProLogis LP | |
| | 2,075,000 | | | | 6.125 | | | | 12/01/16 | | | | 2,385,839 | |
| UDR, Inc. | |
| | 1,900,000 | | | | 4.250 | | | | 06/01/18 | | | | 2,081,926 | |
| Ventas Realty LP | |
| | 2,625,000 | | | | 4.250 | | | | 03/01/22 | | | | 2,784,352 | |
| WEA Finance LLC(c) | |
| | 3,250,000 | | | | 3.375 | | | | 10/03/22 | | | | 3,230,893 | |
| | | | | | | | | | | | | | |
| | | | | | | | | | | | | 45,159,929 | |
| | |
| Retailers(b) – 2.3% | |
| CVS Caremark Corp. | |
| | 1,625,000 | | | | 5.750 | | | | 06/01/17 | | | | 1,948,876 | |
| | 2,750,000 | | | | 5.750 | | | | 05/15/41 | | | | 3,449,285 | |
| Walgreen Co. | |
| | 3,950,000 | | | | 1.800 | | | | 09/15/17 | | | | 4,010,077 | |
| | 3,575,000 | | | | 3.100 | | | | 09/15/22 | | | | 3,649,520 | |
| | | | | | | | | | | | | | |
| | | | | | | | | | | | | 13,057,758 | |
| | |
| | |
| The accompanying notes are an integral part of these financial statements. | | 71 |
GOLDMAN SACHS INVESTMENT GRADE CREDIT FUND
Schedule of Investments (continued)
September 30, 2012 (Unaudited)
| | | | | | | | | | | | | | |
| Principal
Amount |
| |
| Interest
Rate |
| |
| Maturity
Date |
| | | Value | |
| | | | | | | | | | | | | | |
| | Corporate Obligations – (continued) | |
| Technology – Hardware(b) – 1.4% | |
| Hewlett-Packard Co. | |
| $ | 1,400,000 | | | | 3.000 | % | | | 09/15/16 | | | $ | 1,443,784 | |
| | 4,375,000 | | | | 2.600 | | | | 09/15/17 | | | | 4,399,213 | |
| | 1,680,000 | | | | 4.300 | | | | 06/01/21 | | | | 1,709,400 | |
| | | | | | | | | | | | | | |
| | | | | | | | | | | | | 7,552,397 | |
| | |
| Tobacco – 0.8% | |
| Altria Group, Inc. | |
| | 583,000 | | | | 9.700 | | | | 11/10/18 | | | | 832,420 | |
| | 1,650,000 | | | | 2.850 | | | | 08/09/22 | | | | 1,630,675 | |
| Philip Morris International, Inc. | |
| | 2,050,000 | | | | 1.125 | | | | 08/21/17 | | | | 2,044,606 | |
| | | | | | | | | | | | | | |
| | | | | | | | | | | | | 4,507,701 | |
| | |
| Transportation(b) – 0.6% | |
| Burlington Northern Santa Fe LLC | |
| | 3,050,000 | | | | 4.375 | | | | 09/01/42 | | | | 3,214,141 | |
| | |
| Trucking & Leasing(b)(c) – 1.0% | |
| Penske Truck Leasing Co. LP / PTL Finance Corp. | |
| | 2,450,000 | | | | 3.125 | | | | 05/11/15 | | | | 2,506,548 | |
| | 3,100,000 | | | | 2.500 | | | | 03/15/16 | | | | 3,099,191 | |
| | | | | | | | | | | | | | |
| | | | | | | | | | | | | 5,605,739 | |
| | |
| Wireless Telecommunications(b) – 0.7% | |
| America Movil SAB de C.V. | |
| | 3,925,000 | | | | 2.375 | | | | 09/08/16 | | | | 4,082,912 | |
| | |
| Wirelines Telecommunications(b) – 2.2% | |
| AT&T, Inc. | |
| | 6,375,000 | | | | 2.950 | | | | 05/15/16 | | | | 6,820,698 | |
| | 1,325,000 | | | | 3.875 | | | | 08/15/21 | | | | 1,496,381 | |
| Telefonica Emisiones SAU | |
| | 975,000 | | | | 5.462 | | | | 02/16/21 | | | | 953,063 | |
| Verizon Communications, Inc. | |
| | 2,700,000 | | | | 3.500 | | | | 11/01/21 | | | | 2,978,677 | |
| | | | | | | | | | | | | | |
| | | | | | | | | | | | | 12,248,819 | |
| | |
| | TOTAL CORPORATE OBLIGATIONS | | | | | |
| | (Cost $468,616,495) | | | $ | 499,179,682 | |
| | |
| | | | | | | | | | | | | | |
| | Mortgage-Backed Obligations – 1.3% | |
| Federal Agencies – 1.3% | |
| FHLMC – 1.3% | |
| $ | 3,800,000 | | | | 1.000 | % | | | 03/08/17 | | | $ | 3,857,471 | |
| | 200,000 | | | | 1.000 | | | | 06/29/17 | | | | 202,518 | |
| | 3,200,000 | | | | 2.375 | (d) | | | 01/13/22 | | | | 3,358,246 | |
| | |
| | TOTAL MORTGAGE-BACKED OBLIGATIONS | |
| | (Cost $7,196,026) | | | $ | 7,418,235 | |
| | |
| Principal
Amount |
| |
| Interest
Rate |
| |
| Maturity
Date |
| | | Value | |
| | | | | | | | | | | | | | |
| | Agency Debentures – 3.7% | |
| FHLMC | |
| $ | 1,600,000 | | | | 1.000 | % | | | 07/28/17 | | | $ | 1,619,683 | |
| | 2,100,000 | | | | 1.250 | | | | 08/01/19 | | | | 2,102,369 | |
| | 4,200,000 | | | | 1.250 | | | | 10/02/19 | | | | 4,193,322 | |
| FNMA | |
| | 4,300,000 | | | | 0.875 | | | | 08/28/17 | | | | 4,321,655 | |
| | 7,600,000 | | | | 0.875 | | | | 10/26/17 | | | | 7,630,217 | |
| Tennessee Valley Authority | |
| | 500,000 | | | | 4.625 | | | | 09/15/60 | | | | 611,597 | |
| | |
| | TOTAL AGENCY DEBENTURES | | | | | |
| | (Cost $20,259,093) | | | $ | 20,478,843 | |
| | |
| | | | | | | | | | | | | | |
| | Foreign Debt Obligations – 2.9% | |
| Sovereign – 2.5% | |
| Federal Republic of Brazil | |
| $ | 1,175,000 | | | | 7.125 | % | | | 01/20/37 | | | $ | 1,768,375 | |
| Republic of Colombia | |
| | 230,000 | | | | 7.375 | | | | 09/18/37 | | | | 353,050 | |
| | 930,000 | | | | 6.125 | | | | 01/18/41 | | | | 1,260,150 | |
| Republic of Indonesia | |
| | 830,000 | | | | 8.500 | | | | 10/12/35 | | | | 1,312,438 | |
| Russian Federation | |
| | 3,308,550 | | | | 7.500 | | | | 03/31/30 | | | | 4,177,044 | |
| United Mexican States | |
| | 3,800,000 | | | | 6.050 | | | | 01/11/40 | | | | 5,063,500 | |
| | | | | | | | | | | | | | |
| | | | | | | | | | | | | 13,934,557 | |
| | |
| Supranational – 0.4% | |
| North American Development Bank | |
| | 2,000,000 | | | | 4.375 | | | | 02/11/20 | | | | 2,259,577 | |
| | |
| | TOTAL FOREIGN DEBT OBLIGATIONS | | | | | |
| | (Cost $13,715,956) | | | $ | 16,194,134 | |
| | |
| | | | | | | | | | | | | | |
| | Municipal Debt Obligations – 3.0% | |
| California – 1.6% | |
| California State GO Bonds Build America Taxable Series 2009 | |
| $ | 1,450,000 | | | | 7.500 | % | | | 04/01/34 | | | $ | 1,911,187 | |
| | 455,000 | | | | 7.300 | | | | 10/01/39 | | | | 594,599 | |
| California State GO Bonds Build America Taxable Series 2010 | |
| | 2,320,000 | | | | 7.625 | | | | 03/01/40 | | | | 3,156,499 | |
| California State University RB Build America Bonds Series 2010 | |
| | 2,825,000 | | | | 6.484 | | | | 11/01/41 | | | | 3,384,011 | |
| | | | | | | | | | | | | | |
| | | | | | | | | | | | | 9,046,296 | |
| | |
| Illinois – 1.0% | |
| Chicago Illinois Metropolitan Water Reclamation District GO
Bonds Build America Bonds Taxable Direct Payment
Series 2009 |
|
| | 1,775,000 | | | | 5.720 | | | | 12/01/38 | | | | 2,303,790 | |
| Illinois State GO Bonds Build America Series 2010 | |
| | 3,225,000 | | | | 6.630 | | | | 02/01/35 | | | | 3,595,972 | |
| | | | | | | | | | | | | | |
| | | | | | | | | | | | | 5,899,762 | |
| | |
| | |
| 72 | | The accompanying notes are an integral part of these financial statements. |
GOLDMAN SACHS INVESTMENT GRADE CREDIT FUND
| | | | | | | | | | | | | | |
| Principal
Amount |
| |
| Interest
Rate |
| |
| Maturity
Date |
| | | Value | |
| | | | | | | | | | | | | | |
| | Municipal Debt Obligations – (continued) | |
| Louisiana(a) – 0.3% | |
| Louisiana Public Facilities Authority Series 2011-A, Class A3 | |
| $ | 1,500,000 | | | | 1.401 | % | | | 04/25/35 | | | $ | 1,480,470 | |
| | |
| New Jersey – 0.1% | |
| New Jersey State Turnpike Authority RB Build America Taxable
Series 2009 F |
|
| | 350,000 | | | | 7.414 | | | | 01/01/40 | | | | 516,463 | |
| | |
| TOTAL MUNICIPAL DEBT
OBLIGATIONS |
| | | | |
| | (Cost $13,993,695) | | | $ | 16,942,991 | |
| | |
| | | | | | | | | | | | | | |
| Contracts | | | Exercise
Rate | | | Expiration
Date | | | Value | |
| | | | | | | | | | | | | | |
| | Options Purchased – 0.1% | |
| Interest Rate Swaptions | |
| Citibank NA Put– OTC – 10 year Interest Rate Swap Strike Price
1.895% |
|
| $ | 9,500,000 | | | | 1.895 | % | | | 02/18/13 | | | $ | 208,398 | |
| Citibank NA Call – OTC – 10 year Interest Rate Swap Strike
Price 1.895% |
|
| | 9,500,000 | | | | 1.895 | | | | 02/18/13 | | | | 150,338 | |
| Deutsche Bank Securities, Inc. Put – OTC – 10 year Interest Rate
Swap Strike Price 2.060% |
|
| | 9,400,000 | | | | 2.060 | | | | 02/19/13 | | | | 302,643 | |
| Deutsche Bank Securities, Inc. Call – OTC – 10 year Interest Rate
Swap Strike Price 2.060% |
|
| | 9,400,000 | | | | 2.060 | | | | 02/19/13 | | | | 91,448 | |
| | |
| | TOTAL OPTIONS PURCHASED – 0.1% | |
| | (Cost $843,820) | | | $ | 752,827 | |
| | |
| TOTAL INVESTMENTS BEFORE SHORT-TERM
INVESTMENT |
|
| | (Cost $524,625,085) | | | $ | 560,966,712 | |
| | |
| | | | | | | | | | | | | | |
Principal
Amount | | | Interest
Rate | | | Maturity
Date | | | Value | |
| | | | | | | | | | | | | | |
| | Short-term Investment(e) – 0.7% | |
| Repurchase Agreement – 0.7% | |
| Joint Repurchase Agreement Account II | |
| $ | 4,000,000 | | | | 0.245 | % | | | 10/01/12 | | | $ | 4,000,000 | |
| | (Cost $4,000,000) | | | | | |
| | |
| | TOTAL INVESTMENTS – 100.5% | | | | | |
| | (Cost $528,625,085) | | | $ | 564,966,712 | |
| | |
| LIABILITIES IN EXCESS OF
OTHER ASSETS – (0.5)% |
| | | (2,803,031 | ) |
| | |
| | NET ASSETS – 100.0% | | | $ | 562,163,681 | |
| | |
| | |
| The percentage shown for each investment category reflects the value of investments in that category as a percentage of net assets. |
(a) | | Variable rate security. Interest rate disclosed is that which is in effect at September 30, 2012. |
(b) | | Security with “Call” features with resetting interest rates. Maturity dates disclosed are the final maturity dates. |
(c) | | Exempt from registration under Rule 144A of the Securities Act of 1933. Under procedures approved by the Board of Trustees, such securities have been determined to be liquid by the investment adviser and may be resold, normally to qualified institutional buyers in transactions exempt from registration. Total market value of Rule 144A securities amounts to $106,096,795, which represents approximately 18.9% of net assets as of September 30, 2012. |
(d) | | All or a portion of security is segregated as collateral for initial margin requirements on futures transactions. |
(e) | | Joint repurchase agreement was entered into on September 28, 2012. Additional information appears on page 95. |
| | |
|
Investment Abbreviations: |
FHLMC | | —Federal Home Loan Mortgage Corp. |
FNMA | | —Federal National Mortgage Association |
GO | | —General Obligation |
LIBOR | | —London Interbank Offered Rate |
OTC | | —Over the Counter |
RB | | —Revenue Bond |
REIT | | —Real Estate Investment Trust |
|
| | |
| The accompanying notes are an integral part of these financial statements. | | 73 |
GOLDMAN SACHS INVESTMENT GRADE CREDIT FUND
Schedule of Investments (continued)
September 30, 2012 (Unaudited)
|
| ADDITIONAL INVESTMENT INFORMATION |
FUTURES CONTRACTS — At September 30, 2012, the Fund had the following futures contracts:
| | | | | | | | | | | | | | |
| Type | | Number of
Contracts
Long (Short) | | | Expiration
Date | | Current
Value | | | Unrealized
Gain (Loss) | |
Eurodollars | | | 63 | | | September 2014 | | $ | 15,673,612 | | | $ | 121,198 | |
Eurodollars | | | (63 | ) | | September 2015 | | | (15,628,725 | ) | | | (196,620 | ) |
Ultra Long U.S. Treasury Bonds | | | 201 | | | December 2012 | | | 33,208,969 | | | | (243,656 | ) |
2 Year U.S. Treasury Notes | | | 103 | | | December 2012 | | | 22,714,719 | | | | 10,559 | |
5 Year U.S. Treasury Notes | | | 858 | | | December 2012 | | | 106,934,953 | | | | 242,708 | |
10 Year U.S. Treasury Notes | | | 127 | | | December 2012 | | | 16,952,516 | | | | 95,751 | |
30 Year U.S. Treasury Bonds | | | (73 | ) | | December 2012 | | | (10,904,375 | ) | | | (57,998 | ) |
| TOTAL | | | | | | | | | | | | $ | (28,058 | ) |
SWAP CONTRACTS — At September 30, 2012, the Fund had the following swap contracts:
INTEREST RATE SWAP CONTRACTS
| | | | | | | | | | | | | | | | | | | | |
| | | | | | | | | Rates Exchanged | | Market Value | |
| Counterparty | | Notional
Amount
(000s)(a) | | | Termination
Date | | | Payments
Received | | Payments
Made | | Upfront
Payments
Made (Received) | | | Unrealized
Gain (Loss) | |
Bank of America Securities LLC | | $ | 10,700 | | | | 02/28/17 | | | 3 month LIBOR | | 0.750% | | $ | (12,044 | ) | | $ | (22,605 | ) |
| | | 1,700 | | | | 07/23/24 | | | 2.150% | | 3 month LIBOR | | | — | | | | (16,282 | ) |
Barclays Bank PLC | | | 29,400 | | | | 02/28/17 | | | 3 month LIBOR | | 0.750 | | | (55,057 | ) | | | (40,146 | ) |
| | | 1,200 | | | | 07/21/24 | | | 2.160 | | 3 month LIBOR | | | — | | | | (10,262 | ) |
Citibank NA | | | 10,200 | | | | 02/28/17 | | | 3 month LIBOR | | 0.750 | | | (10,025 | ) | | | (23,005 | ) |
| | | 10,000 | | | | 12/19/17 | | | 3 month LIBOR | | 1.250 | | | (35,672 | ) | | | (167,853 | ) |
Credit Suisse | | | 16,000 | | | | 02/28/17 | | | 3 month LIBOR | | 0.750 | | | (19,579 | ) | | | (32,232 | ) |
Deutsche Bank Securities, Inc. | | | 14,100 | | | | 02/28/17 | | | 3 month LIBOR | | 0.750 | | | (36,984 | ) | | | (8,674 | ) |
| | | 1,600 | | | | 07/22/24 | | | 2.130 | | 3 month LIBOR | | | — | | | | (18,113 | ) |
| | | 2,600 | | | | 07/28/24 | | | 2.060 | | 3 month LIBOR | | | — | | | | (47,178 | ) |
JPMorgan Securities, Inc. | | | 6,200 | | | | 02/28/17 | | | 3 month LIBOR | | 0.750 | | | (10,115 | ) | | | (9,962 | ) |
Morgan Stanley Capital Services, Inc. | | | 19,000 | | | | 02/28/17 | | | 3 month LIBOR | | 0.750 | | | (42,252 | ) | | | (19,273 | ) |
| TOTAL | | | | | | | | | | | | | | $ | (221,728 | ) | | $ | (415,585 | ) |
| | (a) | | Represents forward starting interest rate swaps whose effective dates of commencement of accruals and cash flows occur subsequent to September 30, 2012. |
CREDIT DEFAULT SWAP CONTRACTS
| | | | | | | | | | | | | | | | | | | | | | | | | | |
| | | | | | | | | | | | | | | | | Market Value | |
| Counterparty | | Referenced
Obligation | | Notional
Amount
(000s) | | | Rates
Received
(Paid) | | | Termination
Date | | | Credit
Spread at
September 30,
2012(b) | | | Upfront
Payments
Made (Received) | | | Unrealized
Gain (Loss) | |
Protection Purchased: | | | | | | | | | | | | | | | | | | | | | | | | | | |
Bank of America Securities LLC | | CDX North America Investment Grade Index 16 | | $ | 2,175 | | | | (1.000 | )% | | | 06/20/14 | | | | 0.322 | % | | $ | (13,745 | ) | | $ | (12,505 | ) |
Deutsche Bank Securities, Inc. | | CDX North America Investment Grade Index 16 | | | 3,900 | | | | (1.000 | ) | | | 06/20/14 | | | | 0.322 | | | | (26,076 | ) | | | (20,992 | ) |
JPMorgan Securities, Inc. | | CDX North America Investment Grade Index 16 | | | 10,400 | | | | (1.000 | ) | | | 06/20/14 | | | | 0.322 | | | | (72,208 | ) | | | (53,306 | ) |
Morgan Stanley Capital Services, Inc. | | CDX North America Investment Grade Index 16 | | | 4,575 | | | | (1.000 | ) | | | 06/20/14 | | | | 0.322 | | | | (26,946 | ) | | | (28,268 | ) |
| | |
| 74 | | The accompanying notes are an integral part of these financial statements. |
GOLDMAN SACHS INVESTMENT GRADE CREDIT FUND
|
| ADDITIONAL INVESTMENT INFORMATION (continued) |
CREDIT DEFAULT SWAP CONTRACTS (continued)
| | | | | | | | | | | | | | | | | | | | | | | | | | |
| | | | | | | | | | | | | | | | | Market Value | |
| Counterparty | | Referenced
Obligation | | Notional
Amount
(000s) | | | Rates
Received
(Paid) | | | Termination
Date | | | Credit
Spread at
September 30,
2012(b) | | | Upfront
Payments
Made (Received) | | | Unrealized
Gain (Loss) | |
Protection Sold: | | | | | | | | | | | | | | | | | | | | | | | | | | |
Credit Suisse International (London) | | Prudential Financial, Inc. 4.50% 07/15/13 | | $ | 2,350 | | | | 1.000 | % | | | 06/22/15 | | | | 1.185 | % | | $ | (64,889 | ) | | $ | 53,913 | |
Deutsche Bank Securities, Inc. | | MetLife, Inc. 5.00% 06/15/15 | | | 1,825 | | | | 1.000 | | | | 03/20/15 | | | | 1.198 | | | | (48,048 | ) | | | 39,739 | |
| | MetLife, Inc. 5.00% 06/15/15 | | | 5,200 | | | | 1.000 | | | | 09/21/15 | | | | 1.392 | | | | (182,654 | ) | | | 124,593 | |
Morgan Stanley Capital Services, Inc. | | CDX North America Investment Grade Index 16 | | | 9,825 | | | | 1.000 | | | | 06/20/16 | | | | 0.722 | | | | 9,970 | | | | 93,003 | |
| TOTAL | | | | | | | | | | | | | | | | | | | | $ | (424,596 | ) | | $ | 196,177 | |
| | (b) | | Credit spread on the Referenced Obligation, together with the term of the swap contract, are indicators of payment/performance risk. The likelihood of a credit event occurring which would require a fund to make a payment or otherwise be required to perform under the swap contract is generally greater as the credit spread and the term of the swap contract increase. |
WRITTEN OPTIONS CONTRACTS
INTEREST RATE SWAPTION CONTRACTS — At September 30, 2012, the Fund had the following written swaptions:
| | | | | | | | | | | | | | | | | | | | | | |
| Counterparty | | Description | | Notional
Amount
(000s) | | | Expiration
Date | | | Strike
Price | | |
Market
Value | | |
Premiums
Received | |
Bank of America N.A. | | Put — OTC — 10 year Interest Rate Swap for the obligation to pay a fixed rate of 1.640% versus the 3 month LIBOR maturing on July 23, 2024 | | $ | 6,100 | | | | 07/21/14 | | | | 1.640 | % | | $ | (94,880 | ) | | $ | (136,030 | ) |
Barclays Bank PLC | | Put — OTC — 10 year Interest Rate Swap for the obligation to pay a fixed rate of 1.650% versus the 3 month LIBOR maturing on July 21, 2024 | | | 4,500 | | | | 07/17/14 | | | | 1.650 | | | | (71,154 | ) | | | (101,250 | ) |
Deutsche Bank Securities Inc. | | Put — OTC — 10 year Interest Rate Swap for the obligation to pay a fixed rate of 1.620% versus the 3 month LIBOR maturing on July 22, 2024 | | | 6,000 | | | | 07/18/14 | | | | 1.620 | | | | (90,000 | ) | | | (135,000 | ) |
| | | Put — OTC — 10 year Interest Rate Swap for the obligation to pay a fixed rate of 1.550% versus the 3 month LIBOR maturing on July 28, 2024 | | | 7,300 | | | | 07/24/14 | | | | 1.550 | | | | (95,231 | ) | | | (157,680 | ) |
| TOTAL | | | | $ | 23,900 | | | | | | | | | | | $ | (351,265 | ) | | $ | (529,960 | ) |
| | |
| The accompanying notes are an integral part of these financial statements. | | 75 |
GOLDMAN SACHS INVESTMENT GRADE CREDIT FUND
Schedule of Investments (continued)
September 30, 2012 (Unaudited)
|
| ADDITIONAL INVESTMENT INFORMATION (continued) |
WRITTEN OPTIONS CONTRACTS — For the six months ended September 30, 2012, the Fund had the following written swaptions activity:
| | | | | | | | |
| | | Notional
Amount
(000s) | | | Premiums
Received | |
Contracts Outstanding March 31, 2012 | | $ | — | | | $ | — | |
Contracts Written | | | 23,900 | | | | 529,960 | |
Contracts Outstanding September 30, 2012 | | $ | 23,900 | | | | $529,960 | |
| | |
| 76 | | The accompanying notes are an integral part of these financial statements. |
GOLDMAN SACHS LOCAL EMERGING MARKETS DEBT FUND
Schedule of Investments
September 30, 2012 (Unaudited)
| | | | | | | | | | | | | | |
Principal
Amount | | | Interest
Rate | | | Maturity
Date | | | Value | |
| | | | | | | | | | | | | | |
| | Sovereign Debt Obligations – 62.8% | |
| Argentina(a) – 0.9% | |
| Republic of Argentina (NR/NR) | |
| | EUR72,401,000 | | | | 0.000 | % | | | 12/15/35 | | | $ | 11,164,666 | |
| $ | 2,350,000 | | | | 0.000 | | | | 12/15/35 | | | | 309,025 | |
| | 8,720,000 | | | | 0.000 | | | | 12/15/35 | | | | 1,111,800 | |
| | ARS56,087,223 | | | | 5.830 | | | | 12/31/33 | | | | 5,660,661 | |
| | | | | | | | | | | | | | |
| | | | | | | | | | | | | 18,246,152 | |
| | |
| Brazil – 7.1% | |
| Brazil Letras do Tesouro Nacional (NR/NR) | |
| | BRL69,896,000 | | | | 0.000 | (b) | | | 01/01/13 | | | | 33,874,068 | |
| Brazil Notas do Tesouro Nacional (NR/Baa2) | |
| | 30,694,000 | | | | 10.000 | | | | 01/01/13 | | | | 15,232,484 | |
| | 28,004,620 | | | | 6.000 | | | | 05/15/17 | | | | 15,589,816 | |
| | 28,800,000 | | | | 10.000 | | | | 01/01/21 | | | | 14,498,347 | |
| | 37,793,000 | | | | 10.000 | | | | 01/01/23 | | | | 18,945,397 | |
| Brazil Notas do Tesouro Nacional (NR/NR) | |
| | 31,308,389 | | | | 6.000 | | | | 08/15/16 | | | | 17,125,952 | |
| | 22,670,000 | | | | 10.000 | | | | 01/01/18 | | | | 11,537,804 | |
| | 10,419,411 | | | | 6.000 | | | | 08/15/22 | | | | 6,077,961 | |
| | 27,193,397 | | | | 6.000 | | | | 08/15/40 | | | | 17,058,760 | |
| | | | | | | | | | | | | | |
| | | | | | | | | | | | | 149,940,589 | |
| | |
| Chile – 0.7% | |
| Bonos de la Tesoreria de la Republica (NR/NR) | |
| | CLP1,954,125,825 | | | | 3.000 | | | | 01/01/15 | | | | 4,170,507 | |
| Bonos de la Tesoreria de la Republica en pesos (NR/NR) | |
| | 3,885,000,000 | | | | 6.000 | | | | 01/01/22 | | | | 8,554,572 | |
| Bonos del Banco Central de Chile en Pesos (NR/NR) | |
| | 1,270,000,000 | | | | 6.000 | | | | 02/01/21 | | | | 2,789,170 | |
| | | | | | | | | | | | | | |
| | | | | | | | | | | | | 15,514,249 | |
| | |
| Colombia – 1.2% | |
| Republic of Colombia (BBB-/Baa3) | |
| | COP2,399,000,000 | | | | 12.000 | | | | 10/22/15 | | | | 1,639,663 | |
| | 5,702,000,000 | �� | | | 7.750 | | | | 04/14/21 | | | | 3,895,192 | |
| | 16,912,000,000 | | | | 9.850 | | | | 06/28/27 | | | | 14,263,861 | |
| Republic of Colombia (NR/Baa3) | |
| | 8,159,000,000 | | | | 4.375 | | | | 03/21/23 | | | | 4,576,321 | |
| | | | | | | | | | | | | | |
| | | | | | | | | | | | | 24,375,037 | |
| | |
| Dominican Republic – 0.5% | |
| Dominican Republic (NR/NR) | |
| | DOP309,000,000 | | | | 16.950 | | | | 02/04/22 | | | | 9,560,932 | |
| | |
| Hungary – 4.0% | |
| Hungary Government Bond (BB+/Ba1) | |
| | HUF2,285,200,000 | | | | 8.000 | | | | 02/12/15 | | | | 10,613,574 | |
| | 9,084,320,000 | | | | 5.500 | | | | 02/12/16 | | | | 39,605,614 | |
| | 1,531,700,000 | | | | 6.750 | | | | 02/24/17 | | | | 6,907,771 | |
| | 3,225,050,000 | | | | 6.750 | | | | 11/24/17 | | | | 14,501,870 | |
| | 487,500,000 | | | | 7.500 | | | | 11/12/20 | | | | 2,233,854 | |
| Hungary Government Bond (BB+/NR) | |
| | 2,602,300,000 | | | | 7.000 | | | | 06/24/22 | | | | 11,483,510 | |
| | | | | | | | | | | | | | |
| | | | | | | | | | | | | 85,346,193 | |
| | |
| | | | | | | | | | | | | | |
| | Sovereign Debt Obligations – (continued) | |
| Indonesia – 2.3% | |
| Republic of Indonesia (BB+/Baa3) | |
| | IDR63,600,000,000 | | | | 11.000 | % | | | 11/15/20 | | | $ | 8,854,401 | |
| Republic of Indonesia (NR/Baa3) | |
| | 265,462,000,000 | | | | 10.500 | | | | 08/15/30 | | | | 38,896,056 | |
| | | | | | | | | | | | | | |
| | | | | | | | | | | | | 47,750,457 | |
| | |
| Ivory Coast – 0.8% | |
| Republic of Ivory Coast (NR/NR) | |
| | 20,001,000 | | | | 3.750 | | | | 12/31/32 | | | | 16,955,014 | |
| | |
| Malaysia – 8.1% | |
| Malaysia Government Bond (NR/A3) | |
| | MYR46,000,000 | | | | 4.262 | | | | 09/15/16 | | | | 15,596,205 | |
| | 23,740,000 | | | | 4.012 | | | | 09/15/17 | | | | 7,986,473 | |
| | 106,025,000 | | | | 4.378 | | | | 11/29/19 | | | | 36,535,525 | |
| | 157,435,000 | | | | 4.160 | | | | 07/15/21 | | | | 53,787,502 | |
| Malaysia Government Bond (NR/NR) | |
| | 98,300,000 | | | | 3.314 | | | | 10/31/17 | | | | 32,129,650 | |
| | 77,450,000 | | | | 3.580 | | | | 09/28/18 | | | | 25,529,838 | |
| | | | | | | | | | | | | | |
| | | | | | | | | | | | | 171,565,193 | |
| | |
| Mexico – 3.7% | |
| Mexican Bonos (A-/Baa1) | |
| | MXN494,648,800 | | | | 9.500 | | | | 12/18/14 | | | | 42,347,632 | |
| | 55,912,400 | | | | 7.500 | | | | 06/03/27 | | | | 5,053,585 | |
| | 16,299,200 | | | | 10.000 | | | | 11/20/36 | | | | 1,817,703 | |
| United Mexican States (A-/Baa1) | |
| | 226,023,200 | | | | 8.500 | | | | 11/18/38 | | | | 22,126,542 | |
| | 70,783,400 | | | | 7.750 | | | | 11/13/42 | | | | 6,433,100 | |
| | | | | | | | | | | | | | |
| | | | | | | | | | | | | 77,778,562 | |
| | |
| Nigeria(b) – 0.0% | |
| Nigeria Government International Bond (NR/NR) | |
| | NGN172,000,000 | | | | 0.000 | | | | 02/21/13 | | | | 1,038,019 | |
| | |
| Peru – 2.8% | |
| Peru Government Bond (BBB+/Baa2) | |
| | PEN1,971,000 | | | | 9.910 | | | | 05/05/15 | | | | 883,869 | |
| | 73,190,000 | | | | 7.840 | | | | 08/12/20 | | | | 34,876,874 | |
| | 21,704,000 | | | | 8.200 | | | | 08/12/26 | | | | 11,275,964 | |
| | 6,211,000 | | | | 6.900 | | | | 08/12/37 | | | | 2,887,757 | |
| Peru Government Bond (NR/Baa2) | |
| | 1,390,000 | | | | 9.910 | | | | 05/05/15 | | | | 623,327 | |
| | 1,331,000 | | | | 6.950 | | | | 08/12/31 | | | | 615,341 | |
| | 3,840,000 | | | | 6.850 | | | | 02/12/42 | | | | 1,751,940 | |
| Peru Government Bond (NR/NR) | |
| | 1,390,000 | | | | 4.400 | | | | 09/12/13 | | | | 542,033 | |
| | 12,000,000 | | | | 5.200 | | | | 09/12/23 | | | | 4,854,024 | |
| | | | | | | | | | | | | | |
| | | | | | | | | | | | | 58,311,129 | |
| | |
| Philippines – 0.9% | |
| Republic of Philippines (BB/Ba2) | |
| | PHP613,000,000 | | | | 4.950 | | | | 01/15/21 | | | | 15,562,550 | |
| | 166,000,000 | | | | 6.250 | | | | 01/14/36 | | | | 4,406,506 | |
| | | | | | | | | | | | | | |
| | | | | | | | | | | | | 19,969,056 | |
| | |
| | |
| The accompanying notes are an integral part of these financial statements. | | 77 |
GOLDMAN SACHS LOCAL EMERGING MARKETS DEBT FUND
Schedule of Investments (continued)
September 30, 2012 (Unaudited)
| | | | | | | | | | | | | | |
Principal
Amount | | | Interest
Rate | | | Maturity
Date | | | Value | |
| | | | | | | | | | | | | | |
| | Sovereign Debt Obligations – (continued) | |
| Poland – 3.3% | |
| Poland Government Bond (A/A2) | |
| | PLN107,034,392 | | | | 3.000 | % | | | 08/24/16 | | | $ | 34,863,480 | |
| | 19,600,000 | | | | 5.250 | | | | 10/25/20 | | | | 6,397,765 | |
| | 86,090,000 | | | | 5.750 | | | | 10/25/21 | | | | 28,949,923 | |
| | | | | | | | | | | | | | |
| | | | | | | | | | | | | 70,211,168 | |
| | |
| South Africa – 6.0% | |
| Republic of South Africa (A/Baa1) | |
| | ZAR335,793,342 | | | | 10.500 | | | | 12/21/26 | | | | 51,129,134 | |
| Republic of South Africa (NR/Baa1) | |
| | 84,520,000 | | | | 6.250 | | | | 03/31/36 | | | | 8,087,154 | |
| Republic of South Africa (NR/NR) | |
| | 390,500,000 | | | | 7.750 | | | | 02/28/23 | | | | 49,443,328 | |
| | 135,530,000 | | | | 8.750 | | | | 02/28/48 | | | | 17,024,067 | |
| | | | | | | | | | | | | | |
| | | | | | | | | | | | | 125,683,683 | |
| | |
| Sri Lanka – 0.1% | |
| Sri Lanka Government Bonds (B+/NR) | |
| | LKR123,000,000 | | | | 7.500 | | | | 08/15/18 | | | | 711,323 | |
| Sri Lanka Government Bonds (NR/NR) | |
| | 123,000,000 | | | | 8.000 | | | | 06/15/17 | | | | 761,124 | |
| | | | | | | | | | | | | | |
| | | | | | | | | | | | | 1,472,447 | |
| | |
| Thailand – 7.1% | |
| Thailand Government Bond (A-/Baa1) | |
| | THB116,300,000 | | | | 5.250 | | | | 05/12/14 | | | | 3,899,826 | |
| | 1,217,955,000 | | | | 3.625 | | | | 05/22/15 | | | | 40,000,456 | |
| | 385,300,000 | | | | 3.125 | | | | 12/11/15 | | | | 12,494,404 | |
| | 951,125,000 | | | | 4.125 | | | | 11/18/16 | | | | 31,932,727 | |
| | 666,433,565 | | | | 1.200 | | | | 07/14/21 | | | | 21,940,485 | |
| | 247,400,000 | | | | 3.650 | | | | 12/17/21 | | | | 8,115,644 | |
| | 323,800,000 | | | | 3.625 | | | | 06/16/23 | | | | 10,454,090 | |
| Thailand Government Bond (NR/Baa1) | |
| | 392,400,000 | | | | 3.250 | | | | 06/16/17 | | | | 12,711,795 | |
| | 282,100,000 | | | | 3.580 | | | | 12/17/27 | | | | 8,870,874 | |
| | | | | | | | | | | | | | |
| | | | | | | | | | | | | 150,420,301 | |
| | |
| Turkey – 12.4% | |
| Turkey Government Bond (BBB-/Ba1) | |
| | TRY101,850,000 | | | | 9.000 | | | | 03/05/14 | | | | 57,784,740 | |
| Turkey Government Bond (BBB-/NR) | |
| | 85,300,000 | | | | 0.000 | (b) | | | 07/17/13 | | | | 44,902,717 | |
| | 58,275,000 | | | | 10.000 | | | | 12/04/13 | | | | 33,314,260 | |
| | 20,025,000 | | | | 11.000 | | | | 08/06/14 | | | | 11,810,786 | |
| | 25,150,000 | | | | 9.000 | | | | 01/27/16 | | | | 14,561,004 | |
| | 60,100,000 | | | | 9.000 | | | | 03/08/17 | | | | 34,986,583 | |
| | 16,800,000 | | | | 10.500 | | | | 01/15/20 | | | | 10,574,704 | |
| | 47,200,000 | | | | 9.500 | | | | 01/12/22 | | | | 28,458,242 | |
| | 43,976,808 | | | | 3.000 | | | | 02/23/22 | | | | 25,829,341 | |
| | | | | | | | | | | | | | |
| | | | | | | | | | | | | 262,222,377 | |
| | |
| Venezuela – 0.9% | |
| Republic of Venezuela (B+/B2) | |
| $ | 5,890,000 | | | | 9.000 | | | | 05/07/23 | | | | 5,183,200 | |
| | 12,110,000 | | | | 8.250 | | | | 10/13/24 | | | | 9,960,475 | |
| | |
Principal
Amount | | | Interest
Rate | | | Maturity
Date | | | Value | |
| | | | | | | | | | | | | | |
| | Sovereign Debt Obligations – (continued) | |
| Venezuela – (continued) | |
| Republic of Venezuela (B+/B2) – (continued) | |
| $ | 4,820,000 | | | | 9.250 | % | | | 05/07/28 | | | $ | 4,241,600 | |
| | | | | | | | | | | | | | |
| | | | | | | | | | | | | 19,385,275 | |
| | |
| | TOTAL SOVEREIGN DEBT OBLIGATIONS | |
| | (Cost $1,293,662,519) | | | $ | 1,325,745,833 | |
| | |
| | | | | | | | | | | | | | |
| | Structured Notes – 16.8% | |
| Brazil – 1.2% | |
| Notas do Tesouro Nacional (Issuer Credit Suisse Nassau)
(NR/NR) |
|
| | BRL12,430,021 | | | | 6.000 | % | | | 08/19/40 | | | $ | 7,797,508 | |
| | 21,588,984 | | | | 6.000 | | | | 08/19/40 | | | | 13,543,041 | |
| Notas do Tesouro Nacional Series B (Issuer HSBC Corp.)
(NR/NR) |
|
| | 6,847,415 | | | | 6.000 | | | | 08/15/40 | | | | 4,295,470 | |
| | | | | | | | | | | | | | |
| | | | | | | | | | | | | 25,636,019 | |
| | |
| Colombia – 1.9% | |
| Republic of Columbia (Issuer Citigroup Funding, Inc.) (NR/NR) | |
| | COP24,174,000,000 | | | | 11.250 | (c) | | | 10/25/18 | | | | 17,146,613 | |
| | 15,491,000,000 | | | | 11.250 | (c) | | | 10/25/18 | | | | 10,987,763 | |
| | 11,545,000,000 | | | | 11.000 | | | | 07/27/20 | | | | 8,310,860 | |
| | 4,226,000,000 | | | | 11.000 | | | | 07/25/24 | | | | 3,043,088 | |
| | | | | | | | | | | | | | |
| | | | | | | | | | | | | 39,488,324 | |
| | |
| Indonesia – 4.8% | |
| Republic of Indonesia (Issuer Barclays Bank PLC) (NR/NR) | |
| | IDR140,000,000,000 | | | | 10.000 | | | | 07/17/17 | | | | 17,366,683 | |
| Republic of Indonesia (Issuer Deutsche Bank AG (London)
(NR/NR) |
|
| | 75,000,000,000 | | | | 8.250 | | | | 07/19/21 | | | | 9,103,299 | |
| | 217,500,000,000 | | | | 7.000 | (c) | | | 05/17/22 | | | | 24,417,920 | |
| | 35,400,000,000 | | | | 7.000 | (c) | | | 05/17/27 | | | | 3,918,272 | |
| | 29,500,000,000 | | | | 8.250 | (c) | | | 06/17/32 | | | | 3,618,784 | |
| Republic of Indonesia (Issuer HSBC Corp.) (NR/NR) | |
| | 46,000,000,000 | | | | 10.000 | | | | 07/15/17 | | | | 5,706,196 | |
| | 77,000,000,000 | | | | 7.000 | | | | 05/15/22 | | | | 8,644,505 | |
| Republic of Indonesia (Issuer JPMorgan Chase Bank NA) (A/NR) | |
| | 50,100,000,000 | | | | 10.000 | | | | 07/17/17 | | | | 6,214,791 | |
| Republic of Indonesia (Issuer JPMorgan Chase Bank NA)
(NR/NR) |
|
| | 80,000,000,000 | | | | 11.000 | | | | 11/17/20 | | | | 11,137,612 | |
| | 118,000,000,000 | | | | 6.625 | (c) | | | 05/17/33 | | | | 12,155,036 | |
| | | | | | | | | | | | | | |
| | | | | | | | | | | | | 102,283,098 | |
| | |
| Nigeria(c) – 1.5% | |
| Nigeria Government International Bond (Issuer Deutsch Bank AG
(London) (NR/NR) |
|
| | NGN605,000,000 | | | | 0.000 | (b) | | | 10/15/12 | | | | 3,830,503 | |
| | 715,000,000 | | | | 0.000 | (b) | | | 04/08/13 | | | | 4,261,346 | |
| | 351,800,000 | | | | 0.000 | (b) | | | 07/01/13 | | | | 2,027,492 | |
| | 141,100,000 | | | | 16.390 | | | | 01/31/22 | | | | 1,065,656 | |
| | |
| | |
| 78 | | The accompanying notes are an integral part of these financial statements. |
GOLDMAN SACHS LOCAL EMERGING MARKETS DEBT FUND
| | | | | | | | | | | | | | |
Principal
Amount | | | Interest
Rate | | | Maturity
Date | | | Value | |
| | | | | | | | | | | | | | |
| | Structured Notes – (continued) | |
| Nigeria(c) – (continued) | |
| Nigeria Government International Bond (Issuer HSBC Corp.)
(NR/NR)(b) |
|
| | NGN2,444,000,000 | | | | 0.000 | % | | | 08/12/13 | | | $ | 13,878,193 | |
| Nigeria Government International Bond (Issuer JPMorgan Chase
Bank NA) (NR/NR)(b) |
|
| | 1,278,400,000 | | | | 0.000 | | | | 02/25/13 | | | | 7,715,134 | |
| | | | | | | | | | | | | | |
| | | | | | | | | | | | | 32,778,324 | |
| | |
| Russia – 7.4% | |
| Russian Federation (Issuer Credit Suisse Nassau) (NR/NR) | |
| | RUB279,400,000 | | | | 7.500 | | | | 03/15/18 | | | | 8,995,629 | |
| | 1,981,000,000 | | | | 7.500 | | | | 02/27/19 | | | | 63,313,255 | |
| Russian Federation (Issuer Deutsche Bank AG (London)
(NR/NR) |
|
| | 85,000,000 | | | | 7.350 | | | | 01/22/16 | | | | 2,743,116 | |
| | 450,000,000 | | | | 7.350 | (c) | | | 01/22/16 | | | | 14,522,378 | |
| | 250,000,000 | | | | 7.350 | (c) | | | 01/22/16 | | | | 8,067,988 | |
| | 400,930,000 | | | | 7.500 | (c) | | | 03/01/19 | | | | 12,807,410 | |
| Russian Federation (Issuer JPMorgan Chase Bank NA) (NR/NR) | |
| | 631,400,000 | | | | 7.350 | | | | 01/22/16 | | | | 20,376,509 | |
| | 781,400,000 | | | | 7.500 | | | | 03/17/18 | | | | 25,158,142 | |
| | | | | | | | | | | | | | |
| | | | | | | | | | | | | 155,984,427 | |
| | |
| | TOTAL STRUCTURED NOTES | | | | | |
| | (Cost $348,225,391) | | | $ | 356,170,192 | |
| | |
| | | | | | | | | | | | | | |
| | Corporate Obligations – 9.5% | |
| Colombia – 0.4% | |
| Empresas Publicas de Medellin ESP (NR/Baa3) | |
| | COP12,664,000,000 | | | | 8.375 | % | | | 02/01/21 | | | $ | 7,907,139 | |
| | |
| Hong Kong – 0.5% | |
| Evergrande Real Estate Group Ltd. (BB-/B2) | |
| | CNY46,670,000 | | | | 7.500 | | | | 01/19/14 | | | | 7,019,176 | |
| Melco Crown Entertainment Ltd. (NR/NR) | |
| | 21,750,000 | | | | 3.750 | | | | 05/09/13 | | | | 3,420,601 | |
| | | | | | | | | | | | | | |
| | | | | | | | | | | | | 10,439,777 | |
| | |
| Mexico(c) – 2.2% | |
| Petroleos Mexicanos (A-/Baa1) | |
| | MXN571,621,400 | | | | 7.650 | | | | 11/24/21 | | | | 46,528,501 | |
| | |
| Russia – 1.2% | |
| RSHB Capital SA for OJSC Russian Agricultural Bank
(NR/Baa1) |
|
| | RUB632,800,000 | | | | 7.500 | | | | 03/25/13 | | | | 20,386,729 | |
| | 188,000,000 | | | | 8.700 | | | | 03/17/16 | | | | 6,252,604 | |
| | | | | | | | | | | | | | |
| | | | | | | | | | | | | 26,639,333 | |
| | |
| South Africa – 2.1% | |
| Transnet Ltd. (NR/NR) | |
| | ZAR8,000,000 | | | | 9.250 | | | | 11/14/17 | | | | 1,058,963 | |
| | 46,000,000 | | | | 10.500 | | | | 09/17/20 | | | | 6,473,990 | |
| | 18,000,000 | | | | 10.800 | | | | 11/06/23 | | | | 2,598,460 | |
| | 93,000,000 | | | | 9.500 | | | | 08/19/25 | | | | 12,024,620 | |
| | |
Principal
Amount | | | Interest
Rate | | | Maturity
Date | | | Value | |
| | | | | | | | | | | | | | |
| | Corporate Obligations – (continued) | |
| South Africa – (continued) | |
| Transnet Ltd. (NR /NR) – (continued) | |
| | ZAR181,000,000 | | | | 8.900 | % | | | 11/14/27 | | | $ | 22,481,935 | |
| | | | | | | | | | | | | | |
| | | | | | | | | | | | | 44,637,968 | |
| | |
| Thailand – 2.9% | |
| Bank of Thailand (NR/NR)(b) | |
| | THB1,002,000,000 | | | | 0.000 | | | | 03/07/13 | | | | 32,122,513 | |
| Bank of Thailand (NR/Baa1) | |
| | 533,700,000 | | | | 3.420 | | | | 08/18/13 | | | | 17,375,183 | |
| | 92,000,000 | | | | 3.300 | | | | 04/30/14 | | | | 2,993,258 | |
| | 290,200,000 | | | | 3.220 | | | | 03/01/16 | | | | 9,372,050 | |
| | | | | | | | | | | | | | |
| | | | | | | | | | | | | 61,863,004 | |
| | |
| United States – 0.1% | |
| JPMorgan Chase & Co. (A/A2) | |
| | PHP52,000,000 | | | | 6.000 | | | | 10/10/12 | | | | 1,237,579 | |
| | |
| Venezuela(d) – 0.1% | |
| Petroleos de Venezuela SA (B+/NR) | |
| $ | 1,500,000 | | | | 5.250 | | | | 04/12/17 | | | | 1,181,250 | |
| | |
| | TOTAL CORPORATE OBLIGATIONS | | | | | |
| | (Cost $198,056,479) | | | $ | 200,434,551 | |
| | |
| TOTAL INVESTMENTS BEFORE
SHORT-TERM INVESTMENT |
| | | | |
| | (Cost $1,839,944,389) | | | $ | 1,882,350,576 | |
| | |
| | | | | | | | | | | | | | |
| | Short-term Investment(e) – 8.9% | |
| Repurchase Agreement – 8.9% | |
| Joint Repurchase Agreement Account II | |
| $ | 187,400,000 | | | | 0.245 | % | | | 10/01/12 | | | $ | 187,400,000 | |
| | (Cost $187,400,000) | | | | | |
| | |
| | TOTAL INVESTMENTS – 98.0% | |
| | (Cost $2,027,344,389) | | | $ | 2,069,750,576 | |
| | |
| OTHER ASSETS IN EXCESS OF
LIABILITIES – 2.0% |
| | | 41,271,095 | |
| | |
| | NET ASSETS – 100.0% | | | $ | 2,111,021,671 | |
| | |
| | |
| The percentage shown for each investment category reflects the value of investments in that category as a percentage of net assets. |
(a) | | Variable rate security. Interest rate disclosed is that which is in effect at September 30, 2012. |
(b) | | Issued with a zero coupon. Income is recognized through the accretion of discount. |
(c) | | Exempt from registration under Rule 144A of the Securities Act of 1933. Under procedures approved by the Board of Trustees, such securities have been determined to be liquid by the investment adviser and may be resold, normally to qualified institutional buyers in transactions exempt from registration. Total market value of Rule 144A securities amounts to $ 186,948,989, which represents approximately 8.9% of net assets as of September 30, 2012. |
(d) | | Security with “Call” features with resetting interest rates. Maturity dates disclosed are the final maturity dates. |
| | |
| The accompanying notes are an integral part of these financial statements. | | 79 |
GOLDMAN SACHS LOCAL EMERGING MARKETS DEBT FUND
Schedule of Investments (continued)
September 30, 2012 (Unaudited)
| | |
(e) | | Joint repurchase agreement was entered into on September 28, 2012. Additional information appears on page 95. |
| Security ratings disclosed, if any, are obtained from Standard & Poor’s/Moody’s Investor Service. A brief description of the ratings is available in the Fund’s Statement of Additional Information. |
| | |
|
Currency Abbreviations: |
ARS | | —Argentine Peso |
BGN | | —New Bulgarian Lev |
BRL | | —Brazilian Real |
CLP | | —Chilean Peso |
CNY | | —Chinese Yuan |
COP | | —Colombian Peso |
CZK | | —Czech Koruna |
DOP | | —Dominican Peso |
EUR | | —Euro |
HUF | | —Hungarian Forint |
IDR | | —Indonesian Rupiah |
ILS | | —Israeli Shekel |
INR | | —Indian Rupee |
JPY | | —Japanese Yen |
KRW | | —South Korean Won |
LKR | | —Sri Lanka Rupee |
MXN | | —Mexican Peso |
MYR | | —Malaysian Ringgit |
NGN | | —Nigerian Naira |
PEN | | —Peruvian Nuevo Sol |
PHP | | —Philippine Peso |
PLN | | —Polish Zloty |
RUB | | —Russian Ruble |
SGD | | —Singapore Dollar |
THB | | —Thai Baht |
TRY | | —Turkish Lira |
TWD | | —Taiwan Dollar |
ZAR | | —South African Rand |
| | |
Investment Abbreviations: |
BUBOR | | —Budapest Interbank Offered Rate |
CLICP | | —Sinacofi Chile Interbank Rate |
JIBAR | | —Johannesburg Interbank Agreed Rate |
KLIBOR | | —Kuala Lumpur Interbank Offered Rate |
KWCDC | | —South Korean Won Certificate of Deposit |
LIBOR | | —London Interbank Offered Rate |
NR | | —Not Rated |
TELBOR | | —Tel Aviv Interbank Offered Rate |
TIIE | | —La Tasa de Interbank Equilibrium Interest Rate |
WIBOR | | —Warsaw Interbank Offered Rate |
|
| | |
| 80 | | The accompanying notes are an integral part of these financial statements. |
GOLDMAN SACHS LOCAL EMERGING MARKETS DEBT FUND
|
| ADDITIONAL INVESTMENT INFORMATION |
FORWARD FOREIGN CURRENCY EXCHANGE CONTRACTS — At September 30, 2012, the Fund had the following forward foreign currency exchange contracts:
FORWARD FOREIGN CURRENCY EXCHANGE CONTRACTS WITH UNREALIZED GAIN
| | | | | | | | | | | | | | |
| Counterparty | | Contracts to
Buy/Sell | | Settlement
Date | | | Current
Value | | | Unrealized
Gain | |
Barclays Bank PLC | | EUR/CZK | | | 12/19/12 | | | $ | 2,448,722 | | | $ | 73,361 | |
| | IDR/USD | | | 10/11/12 | | | | 11,209,227 | | | | 25,227 | |
| | JPY/USD | | | 12/19/12 | | | | 5,190,586 | | | | 51,586 | |
| | MYR/USD | | | 10/11/12 | | | | 4,081,366 | | | | 99,443 | |
| | MYR/USD | | | 10/30/12 | | | | 19,764,077 | | | | 95,978 | |
| | PLN/EUR | | | 12/19/12 | | | | 5,054,673 | | | | 15,171 | |
| | USD/PHP | | | 10/11/12 | | | | 3,286,952 | | | | 16,177 | |
| | USD/TWD | | | 10/18/12 | | | | 10,090,557 | | | | 4,443 | |
| | USD/ZAR | | | 12/19/12 | | | | 29,857,615 | | | | 244,454 | |
Citibank NA | | BRL/USD | | | 10/11/12 | | | | 17,218,151 | | | | 229,812 | |
| | COP/USD | | | 10/17/12 | | | | 13,908,964 | | | | 1,606 | |
| | MYR/USD | | | 10/11/12 | | | | 25,264,593 | | | | 1,139,546 | |
| | RUB/USD | | | 10/11/12 | | | | 103,809,598 | | | | 4,279,034 | |
| | RUB/USD | | | 10/22/12 | | | | 5,185,748 | | | | 7,748 | |
| | SGD/USD | | | 12/19/12 | | | | 15,144,078 | | | | 24,078 | |
| | USD/JPY | | | 12/19/12 | | | | 19,570,120 | | | | 102,316 | |
| | USD/RUB | | | 10/17/12 | | | | 3,356,996 | | | | 18,390 | |
Credit Suisse International (London) | | MXN/USD | | | 12/19/12 | | | | 20,050,565 | | | | 206,565 | |
| | PEN/USD | | | 10/22/12 | | | | 22,652,211 | | | | 8,703 | |
| | RUB/USD | | | 10/09/12 | | | | 10,125,752 | | | | 319,752 | |
| | USD/TRY | | | 12/19/12 | | | | 6,544,768 | | | | 12,232 | |
Deutsche Bank AG (London) | | EUR/CZK | | | 12/19/12 | | | | 4,960,712 | | | | 83,453 | |
| | EUR/HUF | | | 12/19/12 | | | | 5,102,861 | | | | 32,841 | |
| | HUF/PLN | | | 12/19/12 | | | | 5,133,259 | | | | 2,424 | |
| | IDR/USD | | | 10/11/12 | | | | 9,047,954 | | | | 10,954 | |
| | INR/USD | | | 10/04/12 | | | | 11,492,979 | | | | 606,645 | |
| | KRW/USD | | | 10/05/12 | | | | 15,281,347 | | | | 242,347 | |
| | MYR/USD | | | 10/19/12 | | | | 23,260,398 | | | | 15,972 | |
| | USD/EUR | | | 12/19/12 | | | | 88,190,097 | | | | 450,127 | |
| | USD/MXN | | | 12/19/12 | | | | 5,156,413 | | | | 21,587 | |
| | USD/THB | | | 11/09/12 | | | | 9,234,846 | | | | 85,154 | |
HSBC Bank PLC | | CNY/USD | | | 02/04/13 | | | | 18,898,944 | | | | 83,944 | |
| | EUR/CZK | | | 12/19/12 | | | | 4,922,109 | | | | 122,056 | |
| | HUF/EUR | | | 12/19/12 | | | | 5,007,085 | | | | 80,708 | |
| | IDR/USD | | | 10/11/12 | | | | 9,080,959 | | | | 43,959 | |
| | INR/USD | | | 10/18/12 | | | | 20,443,266 | | | | 421,199 | |
| | KRW/USD | | | 10/05/12 | | | | 14,803,449 | | | | 181,180 | |
| | MXN/JPY | | | 12/19/12 | | | | 3,747,889 | | | | 18,781 | |
| | MYR/USD | | | 10/11/12 | | | | 4,603,714 | | | | 105,714 | |
| | TRY/USD | | | 12/19/12 | | | | 49,208,274 | | | | 436,122 | |
| | USD/COP | | | 10/17/12 | | | | 4,435,612 | | | | 9,216 | |
| | USD/MXN | | | 12/19/12 | | | | 5,176,842 | | | | 1,158 | |
| | USD/TRY | | | 12/19/12 | | | | 2,074,201 | | | | 3,603 | |
JPMorgan Securities, Inc. | | HUF/EUR | | | 12/19/12 | | | | 5,007,085 | | | | 73,760 | |
| | ILS/USD | | | 12/19/12 | | | | 8,568,684 | | | | 225,988 | |
| | INR/USD | | | 10/10/12 | | | | 30,052,591 | | | | 1,696,856 | |
| | INR/USD | | | 10/18/12 | | | | 30,693,579 | | | | 341,039 | |
| | TRY/USD | | | 12/19/12 | | | | 21,147,763 | | | | 100,180 | |
| | USD/EUR | | | 12/19/12 | | | | 9,808,381 | | | | 219,809 | |
| | |
| The accompanying notes are an integral part of these financial statements. | | 81 |
GOLDMAN SACHS LOCAL EMERGING MARKETS DEBT FUND
Schedule of Investments (continued)
September 30, 2012 (Unaudited)
|
| ADDITIONAL INVESTMENT INFORMATION (continued) |
FORWARD FOREIGN CURRENCY EXCHANGE CONTRACTS WITH UNREALIZED GAIN (continued)
| | | | | | | | | | | | | | |
| Counterparty | | Contracts to
Buy/Sell | | Settlement
Date | | | Current
Value | | | Unrealized
Gain | |
Merrill Lynch International | | TRY/USD | | | 12/19/12 | | | $ | 11,416,535 | | | $ | 18,498 | |
| | USD/PLN | | | 12/19/12 | | | | 29,752,778 | | | | 120,787 | |
Morgan Stanley & Co. | | USD/EUR | | | 12/19/12 | | | | 5,102,262 | | | | 36,828 | |
Royal Bank of Canada | | MXN/USD | | | 12/19/12 | | | | 3,539,890 | | | | 10,231 | |
| | PLN/USD | | | 12/19/12 | | | | 125,988,797 | | | | 3,850,143 | |
Royal Bank of Scotland PLC | | INR/USD | | | 10/10/12 | | | | 41,621,347 | | | | 2,156,203 | |
| | INR/USD | | | 10/18/12 | | | | 31,335,170 | | | | 1,051,170 | |
| | INR/USD | | | 11/06/12 | | | | 11,415,387 | | | | 72,453 | |
| | TRY/USD | | | 12/19/12 | | | | 20,258,044 | | | | 148,831 | |
| | USD/TRY | | | 12/19/12 | | | | 4,119,318 | | | | 19,682 | |
State Street Bank | | MXN/USD | | | 12/19/12 | | | | 16,275,050 | | | | 254,641 | |
UBS AG (London) | | BRL/USD | | | 10/05/12 | | | | 4,924,581 | | | | 64,581 | |
| | BRL/USD | | | 10/19/12 | | | | 16,267,850 | | | | 28,850 | |
| | RUB/USD | | | 10/22/12 | | | | 10,256,239 | | | | 11,239 | |
| | | USD/MXN | | | 12/19/12 | | | | 10,325,859 | | | | 31,141 | |
| TOTAL | | | | | | | | | | | | $ | 20,567,676 | |
FORWARD FOREIGN CURRENCY EXCHANGE CONTRACTS WITH UNREALIZED LOSS
| | | | | | | | | | | | | | |
| Counterparty | | Contracts to
Buy/Sell | | Settlement
Date | | | Current
Value | | | Unrealized
Loss | |
Bank of America N.A. | | COP/USD | | | 10/17/12 | | | $ | 7,686,253 | | | $ | (13,747 | ) |
| | CZK/EUR | | | 12/19/12 | | | | 7,952,428 | | | | (71,353 | ) |
| | EUR/HUF | | | 12/19/12 | | | | 10,515,143 | | | | (40,070 | ) |
| | USD/CLP | | | 10/04/12 | | | | 9,986,745 | | | | (184,745 | ) |
Barclays Bank PLC | | PHP/USD | | | 10/15/12 | | | | 5,105,626 | | | | (11,374 | ) |
| | USD/PHP | | | 10/11/12 | | | | 4,211,132 | | | | (43,020 | ) |
| | USD/PLN | | | 12/19/12 | | | | 10,489,542 | | | | (79,542 | ) |
| | USD/TWD | | | 10/18/12 | | | | 10,378,704 | | | | (23,704 | ) |
| | ZAR/USD | | | 12/19/12 | | | | 5,147,939 | | | | (57,061 | ) |
Citibank NA | | EUR/USD | | | 12/19/12 | | | | 16,731,868 | | | | (345,176 | ) |
| | IDR/USD | | | 10/11/12 | | | | 39,047,777 | | | | (132,905 | ) |
| | PHP/USD | | | 10/15/12 | | | | 8,264,465 | | | | (1,535 | ) |
| | SGD/USD | | | 12/19/12 | | | | 9,900,971 | | | | (44,536 | ) |
| | USD/IDR | | | 10/11/12 | | | | 8,795,116 | | | | (36,208 | ) |
| | USD/INR | | | 10/18/12 | | | | 5,224,446 | | | | (46,446 | ) |
| | USD/JPY | | | 12/19/12 | | | | 16,248,467 | | | | (180,742 | ) |
| | USD/KRW | | | 10/05/12 | | | | 20,007,404 | | | | (394,404 | ) |
| | USD/MYR | | | 10/11/12 | | | | 10,974,787 | | | | (203,851 | ) |
| | USD/RUB | | | 10/09/12 | | | | 5,247,825 | | | | (98,678 | ) |
| | USD/SGD | | | 12/19/12 | | | | 45,321,497 | | | | (705,497 | ) |
Credit Suisse International (London) | | CLP/USD | | | 10/04/12 | | | | 9,986,745 | | | | (45,085 | ) |
| | RUB/USD | | | 10/17/12 | | | | 33,459,726 | | | | (366,170 | ) |
| | USD/CLP | | | 10/11/12 | | | | 11,993,703 | | | | (596,480 | ) |
| | USD/TRY | | | 12/19/12 | | | | 25,080,099 | | | | (149,099 | ) |
Deutsche Bank AG (London) | | CZK/EUR | | | 12/19/12 | | | | 2,522,083 | | | | (68,849 | ) |
| | EUR/BGN | | | 11/23/12 | | | | 30,398,611 | | | | (69,111 | ) |
| | ILS/USD | | | 12/19/12 | | | | 20,023,169 | | | | (29,831 | ) |
| | MYR/USD | | | 10/19/12 | | | | 20,102,554 | | | | (86,446 | ) |
| | USD/INR | | | 10/18/12 | | | | 14,074,544 | | | | (315,544 | ) |
| | USD/KRW | | | 10/05/12 | | | | 10,077,393 | | | | (253,393 | ) |
| | |
| 82 | | The accompanying notes are an integral part of these financial statements. |
GOLDMAN SACHS LOCAL EMERGING MARKETS DEBT FUND
|
| ADDITIONAL INVESTMENT INFORMATION (continued) |
FORWARD FOREIGN CURRENCY EXCHANGE CONTRACTS WITH UNREALIZED LOSS (continued)
| | | | | | | | | | | | | | |
| Counterparty | | Contracts to
Buy/Sell | | Settlement
Date | | | Current
Value | | | Unrealized
Loss | |
Deutsche Bank AG (London) (continued) | | USD/THB | | | 11/09/12 | | | $ | 61,897,605 | | | $ | (1,406,593 | ) |
| | USD/TWD | | | 10/18/12 | | | | 10,459,399 | | | | (49,399 | ) |
| | USD/ZAR | | | 10/09/12 | | | | 18,551,660 | | | | (229,606 | ) |
HSBC Bank PLC | | EUR/HUF | | | 12/19/12 | | | | 5,207,034 | | | | (4,451 | ) |
| | PHP/USD | | | 10/17/12 | | | | 19,989,817 | | | | (199,183 | ) |
| | USD/CNH | | | 10/22/12 | | | | 3,436,975 | | | | (41,975 | ) |
| | USD/MXN | | | 12/19/12 | | | | 2,959,458 | | | | (11,295 | ) |
| | USD/RUB | | | 10/11/12 | | | | 29,925,859 | | | | (1,048,249 | ) |
| | USD/TWD | | | 10/18/12 | | | | 10,287,967 | | | | (33,967 | ) |
JPMorgan Securities, Inc. | | BRL/USD | | | 10/11/12 | | | | 10,228,155 | | | | (159 | ) |
| | BRL/USD | | | 10/19/12 | | | | 4,952,737 | | | | (7,609 | ) |
| | EUR/BGN | | | 11/23/12 | | | | 15,084,938 | | | | (13,239 | ) |
| | IDR/USD | | | 10/11/12 | | | | 5,312,182 | | | | (767 | ) |
| | MXN/USD | | | 12/19/12 | | | | 145,803,305 | | | | (1,182,157 | ) |
| | TRY/USD | | | 12/19/12 | | | | 50,401,033 | | | | (71,967 | ) |
| | USD/CNY | | | 02/04/13 | | | | 7,630,026 | | | | (45,779 | ) |
| | USD/IDR | | | 10/11/12 | | | | 10,559,114 | | | | (51,114 | ) |
| | USD/TRY | | | 12/19/12 | | | | 140,011,836 | | | | (561,837 | ) |
Royal Bank of Canada | | BRL/USD | | | 10/17/12 | | | | 21,747,198 | | | | (26,802 | ) |
| | RUB/USD | | | 10/22/12 | | | | 26,805,193 | | | | (118,807 | ) |
| | USD/BRL | | | 10/11/12 | | | | 9,668,845 | | | | (159,087 | ) |
| | USD/MXN | | | 12/19/12 | | | | 3,777,486 | | | | (19,524 | ) |
| | ZAR/USD | | | 10/09/12 | | | | 52,992,374 | | | | (677,273 | ) |
| | ZAR/USD | | | 12/19/12 | | | | 10,180,096 | | | | (176,904 | ) |
Royal Bank of Scotland PLC | | USD/INR | | | 10/04/12 | | | | 11,492,979 | | | | (105,338 | ) |
| | USD/INR | | | 10/18/12 | | | | 9,467,915 | | | | (246,915 | ) |
Standard Chartered Bank | | MYR/USD | | | 10/30/12 | | | | 20,436,741 | | | | (8,008 | ) |
| | USD/INR | | | 10/18/12 | | | | 5,259,891 | | | | (136,891 | ) |
State Street Bank | | MXN/USD | | | 12/19/12 | | | | 45,230,801 | | | | (208,199 | ) |
UBS AG (London) | | USD/CZK | | | 12/19/12 | | | | 34,459,128 | | | | (362,767 | ) |
| | USD/RUB | | | 10/11/12 | | | | 12,829,113 | | | | (70,800 | ) |
| | | ZAR/USD | | | 12/19/12 | | | | 8,884,658 | | | | (74,353 | ) |
| TOTAL | | | | | | | $ | (12,045,616 | ) |
FUTURES CONTRACTS — At September 30, 2012, the Fund had the following futures contracts:
| | | | | | | | | | | | | | |
| Type | | Number of
Contracts
Long (Short) | | | Expiration
Date | | Current
Value | | | Unrealized
Gain (Loss) | |
Ultra Long U.S. Treasury Bonds | | | (27 | ) | | December 2012 | | $ | (4,460,906 | ) | | $ | 53,206 | |
5 Year U.S. Treasury Notes | | | 55 | | | December 2012 | | | 6,854,805 | | | | 26,860 | |
10 Year U.S. Treasury Notes | | | (25 | ) | | December 2012 | | | (3,337,110 | ) | | | (14,183 | ) |
| TOTAL | | | | | | | | | | | | $ | 65,883 | |
| | |
| The accompanying notes are an integral part of these financial statements. | | 83 |
GOLDMAN SACHS LOCAL EMERGING MARKETS DEBT FUND
Schedule of Investments (continued)
September 30, 2012 (Unaudited)
|
| ADDITIONAL INVESTMENT INFORMATION (continued) |
SWAP CONTRACTS — At September 30, 2012, the Fund had the following swap contracts:
INTEREST RATE SWAP CONTRACTS
| | | | | | | | | | | | | | | | | | | | |
| | | | | | | | | | Rates Exchanged | | Market Value | |
| Counterparty | | | | Notional
Amount
(000s) | | | Termination
Date | | Payments
Received | | Payments
Made | | Upfront
Payments
Made (Received) | | | Unrealized
Gain (Loss) | |
Bank of America Securities LLC | | BRL | | | 32,350 | | | 01/02/14 | | 7.750% | | 1 month Brazilian Interbank Deposit Average | | $ | — | | | $ | 9,942 | |
| | | | | 186,520 | | | 01/02/14 | | 7.775 | | 1 month Brazilian Interbank Deposit Average | | | — | | | | 87,330 | |
| | | | | 186,520 | | | 01/02/14 | | 7.760 | | 1 month Brazilian Interbank Deposit Average | | | — | | | | 87,352 | |
| | | | | 31,000 | | | 01/02/17 | | 9.025 | | 1 month Brazilian Interbank Deposit Average | | | — | | | | (9,470 | ) |
| | CLP | | | 1,959,710 | (a) | | 07/05/22 | | 6 month CLICP | | 5.160% | | | — | | | | 61,846 | |
| | KRW | | | 48,420,000 | (a) | | 08/13/22 | | 3 month KWCDC | | 3.120 | | | — | | | | 22,428 | |
| | MXN | | | 435,070 | (a) | | 04/22/27 | | 9.300 | | Mexico Interbank
TIIE 28 Days | | | — | | | | 1,136,416 | |
| | | | | 158,630 | (a) | | 09/03/27 | | 8.590 | | Mexico Interbank
TIIE 28 Days | | | — | | | | 129,163 | |
Barclays Bank PLC | | HUF | | | 6,390,000 | | | 09/29/13 | | 6.420 | | 6 month BUBOR | | | — | | | | 27,841 | |
| | BRL | | | 13,820 | | | 01/02/14 | | 7.780 | | 1 month Brazilian Interbank Deposit Average | | | — | | | | 6,282 | |
| | | | | 600 | | | 01/02/15 | | 10.040 | | 1 month Brazilian Interbank Deposit Average | | | — | | | | 10,224 | |
| | HUF | | | 351,610 | | | 10/04/16 | | 7.020 | | 6 month BUBOR | | | — | | | | 104,290 | |
| | | | | 1,051,500 | | | 10/11/16 | | 6.817 | | 6 month BUBOR | | | — | | | | 268,949 | |
| | | | | 597,910 | | | 10/14/16 | | 6.560 | | 6 month BUBOR | | | — | | | | 121,904 | |
| | | | | 360,430 | | | 10/20/16 | | 6.750 | | 6 month BUBOR | | | — | | | | 87,159 | |
| | | | | 861,330 | | | 10/21/16 | | 6.680 | | 6 month BUBOR | | | — | | | | 197,387 | |
| | BRL | | | 33,710 | | | 01/02/17 | | 9.550 | | 1 month Brazilian Interbank Deposit Average | | | — | | | | 238,988 | |
| | | | | 48,150 | | | 01/02/17 | | 9.585 | | 1 month Brazilian Interbank Deposit Average | | | — | | | | 361,798 | |
| | MYR | | | 48,470 | | | 05/23/17 | | 3 month KLIBOR | | 3.250 | | | 47 | | | | 31,691 | |
| | TWD | | | 587,590 | | | 09/11/17 | | 3 month TWD | | 1.030 | | | — | | | | (1,756 | ) |
| | PLN | | | 67,100 | | | 07/27/22 | | 6 month WIBOR | | 4.631 | | | — | | | | (412,769 | ) |
| | KRW | | | 26,091,240 | (a) | | 09/18/22 | | 3 month KWCDC | | 3.300 | | | — | | | | (152,747 | ) |
| | MXN | | | 703,500 | (a) | | 06/29/27 | | 8.010 | | Mexico Interbank
TIIE 28 Days | | | — | | | | (201,801 | ) |
Barclays Bank PLC (continued) | | MXN | | | 301,660 | (a) | | 07/30/27 | | 8.650% | | Mexico Interbank
TIIE 28 Days | | | — | | | | 303,658 | |
Citibank NA | | BRL | | | 54,430 | | | 01/02/15 | | 8.450 | | 1 month Brazilian Interbank Deposit Average | | | — | | | | 84,107 | |
| | | | | 25,950 | | | 01/02/17 | | 9.260 | | 1 month Brazilian Interbank Deposit Average | | | — | | | | 89,509 | |
| | MYR | | | 146,900 | | | 07/02/17 | | 3 month KLIBOR | | 3.265 | | | 181 | | | | 86,554 | |
| | | | | 74,800 | | | 07/25/17 | | 3 month KLIBOR | | 2.920 | | | (348 | ) | | | 436,659 | |
| | MXN | | | 94,190 | (a) | | 09/03/27 | | 8.520 | | Mexico Interbank
TIIE 28 Days | | | — | | | | 62,894 | |
| | |
| 84 | | The accompanying notes are an integral part of these financial statements. |
GOLDMAN SACHS LOCAL EMERGING MARKETS DEBT FUND
|
| ADDITIONAL INVESTMENT INFORMATION (continued) |
INTEREST RATE SWAP CONTRACTS (continued)
| | | | | | | | | | | | | | | | | | | | |
| | | | | | | | | | Rates Exchanged | | Market Value | |
| Counterparty | | | | Notional
Amount
(000s) | | | Termination
Date | | Payments
Received | | Payments
Made | | Upfront
Payments
Made (Received) | | | Unrealized
Gain (Loss) | |
Deutsche Bank Securities, Inc. | | BRL | | | 93,900 | | | 01/02/14 | | 7.740% | | 1 month Brazilian Interbank Deposit Average | | $ | — | | | $ | 24,027 | |
| | | | | 181,670 | | | 01/02/14 | | 7.765 | | 1 month Brazilian Interbank Deposit Average | | | — | | | | 85,073 | |
| | | | | 74,070 | | | 01/02/15 | | 8.445 | | 1 month Brazilian Interbank Deposit Average | | | — | | | | 111,256 | |
| | | | | 130,000 | | | 01/02/15 | | 9.960 | | 1 month Brazilian Interbank Deposit Average | | | — | | | | 2,115,975 | |
| | MYR | | | 75,300 | | | 12/19/16 | | 3.280 | | 3 month KLIBOR | | | (66 | ) | | | 17,688 | |
| | BRL | | | 47,070 | | | 01/02/17 | | 9.450 | | 1 month Brazilian Interbank Deposit Average | | | — | | | | (72,029 | ) |
| | | | | 137,920 | | | 01/02/17 | | 9.565 | | 1 month Brazilian Interbank Deposit Average | | | — | | | | (79,624 | ) |
| | TWD | | | 758,600 | | | 08/17/17 | | 3 month TWD | | 0.990% | | | — | | | | 45,088 | |
| | | | | 501,620 | | | 09/12/17 | | 3 month TWD | | 1.030 | | | — | | | | (1,331 | ) |
| | ILS | | | 42,450 | | | 09/14/17 | | 2.935 | | 3 month TELBOR | | | — | | | | 64,688 | |
| | MXN | | | 253,660 | | | 07/18/22 | | 5.710 | | Mexico Interbank
TIIE 28 Days | | | (487 | ) | | | (177,431 | ) |
| | PLN | | | 43,900 | | | 07/24/22 | | 6 month WIBOR | | 4.495 | | | — | | | | (119,859 | ) |
| | KRW | | | 22,865,240 | (a) | | 09/14/22 | | 3 month
KWCDC | | 3.210 | | | — | | | | (59,976 | ) |
| | | | | 26,091,240 | (a) | | 09/18/22 | | 3 month
KWCDC | | 3.320 | | | — | | | | (171,642 | ) |
| | MXN | | | 159,380 | (a) | | 04/22/27 | | 9.290 | | Mexico Interbank
TIIE 28 Days | | | — | | | | 412,885 | |
| | | | | 159,100 | (a) | | 06/11/27 | | 8.700 | | Mexico Interbank
TIIE 28 Days | | | — | | | | 193,000 | |
JPMorgan Securities, Inc. | | PLN | | | 47,600 | | | 07/27/17 | | 6 month WIBOR | | 4.410 | | | — | | | | (92,554 | ) |
| | TWD | | | 1,148,800 | | | 07/27/17 | | 3 month TWD | | 0.925 | | | — | | | | 181,017 | |
| | | | | 597,390 | | | 09/11/17 | | 3 month TWD | | 1.020 | | | — | | | | 8,178 | |
| | ILS | | | 53,880 | | | 09/14/17 | | 2.915 | | 3 month TELBOR | | | — | | | | 69,303 | |
| | ZAR | | | 125,000 | | | 12/20/21 | | 7.760 | | 3 month JIBAR | | | (1,667 | ) | | | 1,219,139 | |
| | PLN | | | 18,000 | | | 07/26/22 | | 6 month WIBOR | | 4.570 | | | — | | | | (83,171 | ) |
Morgan Stanley & Co. | | BRL | | | 13,820 | | | 01/02/15 | | 10.025 | | 1 month Brazilian Interbank Deposit Average | | | — | | | | 233,523 | |
| | | | | 20,570 | | | 01/02/15 | | 9.270 | | 1 month Brazilian Interbank Deposit Average | | | — | | | | 198,118 | |
| | | | | 47,980 | | | 01/02/17 | | 9.550 | | 1 month Brazilian Interbank Deposit Average | | | — | | | | 340,156 | |
UBS AG (London) | | ILS | | | 76,090 | | | 09/19/17 | | 2.920 | | 3 month TELBOR | | | — | | | | 97,530 | |
| TOTAL | | | | | | | | | | | | | | $ | (2,340 | ) | | $ | 7,834,855 | |
| | (a) | | Represents forward starting interest rate swaps whose effective dates of commencement of accruals and cash flows occur subsequent to September 30, 2012. |
| | |
| The accompanying notes are an integral part of these financial statements. | | 85 |
GOLDMAN SACHS U.S. MORTGAGES FUND
Schedule of Investments
September 30, 2012 (Unaudited)
| | | | | | | | | | | | | | |
Principal
Amount | | | Interest
Rate | | | Maturity
Date | | | Value | |
| | | | | | | | | | | | | | |
| | Mortgage-Backed Obligations – 103.9% | |
| Collateralized Mortgage Obligations – 11.8% | |
| Adjustable Rate Non-Agency(a) – 2.4% | |
| Adjustable Rate Mortgage Trust Series 2004-5, Class 2A1 | |
| $ | 235,486 | | | | 2.821 | % | | | 04/25/35 | | | $ | 224,360 | |
| American Home Mortgage Investment Trust Series 2004-3,
Class 1A |
|
| | 2,637 | | | | 0.587 | | | | 10/25/34 | | | | 2,622 | |
| Bear Stearns Adjustable Rate Mortgage Trust Series 2004-1,
Class 21A1 |
|
| | 212,121 | | | | 2.722 | | | | 04/25/34 | | | | 201,094 | |
| Bear Stearns Alt-A Trust Series 2005-5, Class 21A1 | |
| | 1,222,907 | | | | 2.751 | | | | 07/25/35 | | | | 894,153 | |
| Countrywide Alternative Loan Trust Series 2005-16, Class A1 | |
| | 851,872 | | | | 1.793 | | | | 06/25/35 | | | | 553,133 | |
| Countrywide Alternative Loan Trust Series 2005-38, Class A1 | |
| | 239,981 | | | | 1.648 | | | | 09/25/35 | | | | 161,260 | |
| Countrywide Home Loan Mortgage Pass-Through Trust Series
2003-52, Class A1 |
|
| | 275,295 | | | | 2.718 | | | | 02/19/34 | | | | 245,323 | |
| Countrywide Home Loan Mortgage Pass-Through Trust Series
2004-HYB6, Class A2 |
|
| | 306,482 | | | | 2.801 | | | | 11/20/34 | | | | 272,070 | |
| Harborview Mortgage Loan Trust Series 2005-15, Class 2A11 | |
| | 583,518 | | | | 0.489 | | | | 10/20/45 | | | | 428,102 | |
| Harborview Mortgage Loan Trust Series 2005-16, Class 2A1A | |
| | 333,375 | | | | 0.459 | | | | 01/19/36 | | | | 199,387 | |
| Impac CMB Trust Series 2004-08, Class 1A | |
| | 89,881 | | | | 0.937 | | | | 10/25/34 | | | | 73,926 | |
| JPMorgan Mortgage Trust Series 2005-A4, Class 2A1 | |
| | 976,548 | | | | 3.071 | | | | 07/25/35 | | | | 890,747 | |
| Master Adjustable Rate Mortgages Trust Series 2007-1,
Class I2A3 |
|
| | 9,968 | | | | 0.888 | | | | 01/25/47 | | | | 5,046 | |
| Morgan Stanley Mortgage Loan Trust Series 2004-8AR,
Class 4A1 |
|
| | 1,093,856 | | | | 2.828 | | | | 10/25/34 | | | | 964,843 | |
| Mortgage IT Trust Series 2005-5, Class A1 | |
| | 811,418 | | | | 0.477 | | | | 12/25/35 | | | | 568,006 | |
| Sequoia Mortgage Trust Series 2004-09, Class A2 | |
| | 336,353 | | | | 1.024 | | | | 10/20/34 | | | | 293,236 | |
| Structured Adjustable Rate Mortgage Loan Trust Series 2004-12,
Class 3A2 |
|
| | 201,643 | | | | 2.785 | | | | 09/25/34 | | | | 200,878 | |
| Structured Adjustable Rate Mortgage Loan Trust Series 2004-5,
Class 3A1 |
|
| | 470,908 | | | | 2.804 | | | | 05/25/34 | | | | 470,352 | |
| | | | | | | | | | | | | | |
| | | | | | | | | | | | | 6,648,538 | |
| | |
| Interest Only(b) – 0.7% | |
| ABN AMRO Mortgage Corp. Series 2003-8, Class A2 | |
| | 5,317 | | | | 5.500 | | | | 06/25/33 | | | | 171 | |
| CS First Boston Mortgage Securities Corp. Series 2002-AR31,
Class 5X(a)(c) |
|
| | 57,196 | | | | 0.000 | | | | 11/25/32 | | | | — | |
| CS First Boston Mortgage Securities Corp. Series 2003-19,
Class 1A2 |
|
| | 21,648 | | | | 5.250 | | | | 07/25/33 | | | | 1,812 | |
| | |
Principal
Amount | | | Interest
Rate | | | Maturity
Date | | | Value | |
| | | | | | | | | | | | | | |
| | Mortgage-Backed Obligations – (continued) | |
| Interest Only(b) – (continued) | |
| FHLMC REMIC Series 3404, Class SB(a) | |
| $ | 2,089,426 | | | | 5.779 | % | | | 01/15/38 | | | $ | 332,887 | |
| FHLMC REMIC Series 3405, Class SC(a) | |
| | 1,839,523 | | | | 5.779 | | | | 01/15/38 | | | | 345,829 | |
| FNMA REMIC Series 2007-22, Class SD(a) | |
| | 1,913,645 | | | | 6.184 | | | | 03/25/37 | | | | 329,805 | |
| FNMA REMIC Series 2008-18, Class SC(a) | |
| | 1,077,512 | | | | 5.634 | | | | 03/25/38 | | | | 163,511 | |
| FNMA REMIC Series 2009-104 ,Class KS(a) | |
| | 2,512,209 | | | | 5.984 | | | | 12/25/39 | | | | 398,082 | |
| FNMA REMIC Series 2010-126, Class LS(a) | |
| | 2,039,747 | | | | 4.786 | | | | 11/25/40 | | | | 126,464 | |
| FNMA REMIC Series 2010-134, Class SV(a) | |
| | 1,385,736 | | | | 5.804 | | | | 12/25/40 | | | | 214,073 | |
| Master Adjustable Rate Mortgages Trust Series 2003-2,
Class 3AX(a) |
|
| | 23,601 | | | | 0.123 | | | | 08/25/33 | | | | 92 | |
| Master Adjustable Rate Mortgages Trust Series 2003-2,
Class 4AX(a) |
|
| | 7,620 | | | | 0.320 | | | | 07/25/33 | | | | 54 | |
| | | | | | | | | | | | | | |
| | | | | | | | | | | | | 1,912,780 | |
| | |
| Inverse Floaters(a) – 0.0% | |
| GNMA Series 2001-48, Class SA | |
| | 11,057 | | | | 25.770 | | | | 10/16/31 | | | | 17,902 | |
| GNMA Series 2001-51, Class SB | |
| | 10,883 | | | | 25.770 | | | | 10/16/31 | | | | 18,524 | |
| | | | | | | | | | | | | | |
| | | | | | | | | | | | | 36,426 | |
| | |
| Planned Amortization Class – 1.5% | |
| FHLMC REMIC Series 3748 | |
| | 1,000,000 | | | | 4.000 | | | | 11/15/39 | | | | 1,122,854 | |
| FHLMC REMIC Series 3906 , Class HG | |
| | 2,868,974 | | | | 4.000 | | | | 08/15/26 | | | | 3,045,272 | |
| | | | | | | | | | | | | | |
| | | | | | | | | | | | | 4,168,126 | |
| | |
| Sequential Fixed Rate – 3.2% | |
| FHLMC Multifamily Structured Pass-Through Certificates
Series K005, Class A2 |
|
| | 2,000,000 | | | | 4.317 | | | | 11/25/19 | | | | 2,341,809 | |
| FHLMC Multifamily Structured Pass-Through Certificates
Series K705, Class A2 |
|
| | 3,500,000 | | | | 2.303 | | | | 09/25/18 | | | | 3,716,092 | |
| FHLMC Multifamily Structured Pass-Through Certificates
Series K706, Class A2 |
|
| | 1,900,000 | | | | 2.323 | | | | 10/25/18 | | | | 2,011,166 | |
| FHLMC Multifamily Structured Pass-Through Certificates
Series K710, Class A2 |
|
| | 200,000 | | | | 1.883 | | | | 05/25/19 | | | | 205,973 | |
| FHLMC REMIC Series 2042, Class N | |
| | 257,471 | | | | 6.500 | | | | 03/15/28 | | | | 292,106 | |
| FHLMC REMIC Series 2844, Class BY | |
| | 7,786 | | | | 4.000 | | | | 06/15/18 | | | | 7,785 | |
| FNMA REMIC Series 2000-16, Class ZG | |
| | 442,055 | | | | 8.500 | | | | 06/25/30 | | | | 512,827 | |
| | | | | | | | | | | | | | |
| | | | | | | | | | | | | 9,087,758 | |
| | |
| | |
| 86 | | The accompanying notes are an integral part of these financial statements. |
GOLDMAN SACHS U.S. MORTGAGES FUND
| | | | | | | | | | | | | | |
Principal
Amount | | | Interest
Rate | | | Maturity
Date | | | Value | |
| | | | | | | | | | | | | | |
| | Mortgage-Backed Obligations – (continued) | |
| Sequential Floating Rate(a) – 4.0% | |
| FHLMC REMIC Series 4103, Class BF | |
| $ | 2,857,143 | | | | 0.590 | % | | | 12/15/38 | | | $ | 2,860,466 | |
| FNMA REMIC Series 2011-63, Class FG | |
| | 816,796 | | | | 0.667 | | | | 07/25/41 | | | | 820,355 | |
| FNMA REMIC Series 2012-68, Class AF | |
| | 1,980,744 | | | | 0.667 | | | | 02/25/39 | | | | 1,991,691 | |
| FNMA REMIC Series 2012-68, Class FB | |
| | 5,487,126 | | | | 0.667 | | | | 04/25/39 | | | | 5,516,645 | |
| | | | | | | | | | | | | | |
| | | | | | | | | | | | | 11,189,157 | |
| | |
| TOTAL COLLATERALIZED
MORTGAGE OBLIGATIONS |
| | $ | 33,042,785 | |
| | |
| Commercial Mortgage-Backed Securities – 13.8% | |
| Sequential Fixed Rate – 5.3% | |
| Citigroup Commercial Mortgage Trust Series 2006-C5, Class A4 | |
| $ | 1,750,000 | | | | 5.431 | % | | | 10/15/49 | | | $ | 2,028,361 | |
| Commercial Mortgage Pass-Through Certificates Series 2006-C8,
Class AM |
|
| | 50,000 | | | | 5.347 | | | | 12/10/46 | | | | 53,019 | |
| Commercial Mortgage-Pass Through Certificates Series 2006-C8,
Class A4 |
|
| | 1,300,000 | | | | 5.306 | | | | 12/10/46 | | | | 1,498,119 | |
| DBUBS Mortgage Trust Series 2011-LC2A, Class A4(d) | |
| | 1,000,000 | | | | 4.537 | | | | 07/10/44 | | | | 1,166,710 | |
| FNMA ACES Series 2012-M8, Class ASQ3 | |
| | 2,000,000 | | | | 1.801 | | | | 12/25/19 | | | | 2,050,868 | |
| LB-UBS Commercial Mortgage Trust Series 2006-C1, Class A4 | |
| | 3,640,000 | | | | 5.156 | | | | 02/15/31 | | | | 4,088,543 | |
| UBS Barclays Commercial Mortgage Trust Series 2012-C3,
Class A4 |
|
| | 2,800,000 | | | | 3.091 | | | | 08/10/49 | | | | 2,933,833 | |
| UBS Commercial Mortgage Trust Series 2012-C1, Class A3 | |
| | 1,000,000 | | | | 3.400 | | | | 05/10/45 | | | | 1,078,520 | |
| | | | | | | | | | | | | | |
| | | | | | | | | | | | | 14,897,973 | |
| | |
| Sequential Floating Rate(a) – 8.5% | |
| Banc of America Commercial Mortgage, Inc. Series 2007-2,
Class AM |
|
| | 150,000 | | | | 5.813 | | | | 04/10/49 | | | | 161,880 | |
| Bear Stearns Commercial Mortgage Securities Series 2007-PW16,
Class AM |
|
| | 150,000 | | | | 5.906 | | | | 06/11/40 | | | | 164,343 | |
| FNMA ACES Series 2012-M12, Class 2A | |
| | 1,800,000 | | | | 2.710 | | | | 09/25/22 | | | | 1,894,219 | |
| FNMA ACES Series 2012-M4, Class 1A2 | |
| | 2,300,000 | | | | 2.976 | | | | 04/25/22 | | | | 2,452,177 | |
| FREMF Mortgage Trust Series 2012-K17, Class B(d) | |
| | 325,000 | | | | 4.499 | | | | 12/25/44 | | | | 342,718 | |
| FREMF Mortgage Trust Series 2012-K706, Class B(d) | |
| | 900,000 | | | | 4.162 | | | | 11/25/44 | | | | 948,624 | |
| FREMF Mortgage Trust Series 2012-K706, Class C(d) | |
| | 625,000 | | | | 4.162 | | | | 11/25/44 | | | | 600,542 | |
| FREMF Mortgage Trust Series 2012-K707, Class C(d) | |
| | 425,000 | | | | 4.018 | | | | 01/25/47 | | | | 404,629 | |
| GS Mortgage Securities Corp. II Series 2007-GG10, Class A4 | |
| | 5,000,000 | | | | 5.983 | | | | 08/10/45 | | | | 5,739,988 | |
| | |
Principal
Amount | | | Interest
Rate | | | Maturity
Date | | | Value | |
| | | | | | | | | | | | | | |
| | Mortgage-Backed Obligations – (continued) | |
| Sequential Floating Rate – (continued) | |
| JP Morgan Chase Commercial Mortgage Securities Corp. Series
2005-CB11, Class A4 |
|
| $ | 3,750,000 | | | | 5.335 | % | | | 08/12/37 | | | $ | 4,125,930 | |
| JPMorgan Chase Commercial Mortgage Securities Corp. Series
2006-LDP7, Class A4 |
|
| | 925,000 | | | | 6.061 | | | | 04/15/45 | | | | 1,060,093 | |
| LB-UBS Commercial Mortgage Trust Series 2007-C7, Class A3 | |
| | 1,000,000 | | | | 5.866 | | | | 09/15/45 | | | | 1,190,793 | |
| Morgan Stanley Capital I Series 2006-HQ9, Class A4 | |
| | 2,769,000 | | | | 5.731 | | | | 07/12/44 | | | | 3,186,910 | |
| Morgan Stanley Capital I, Inc. Series 2007-HQ11, Class AM | |
| | 50,000 | | | | 5.478 | | | | 02/12/44 | | | | 53,693 | |
| Morgan Stanley Capital I, Inc. Series 2007-HQ13, Class AM | |
| | 50,000 | | | | 5.931 | | | | 12/15/44 | | | | 47,790 | |
| WF-RBS Commercial Mortgage Trust Series 2011-C2,
Class A4(d) |
|
| | 1,300,000 | | | | 4.869 | | | | 02/15/44 | | | | 1,546,664 | |
| | | | | | | | | | | | | | |
| | | | | | | | | | | | | 23,920,993 | |
| | |
| TOTAL COMMERCIAL MORTGAGE-
BACKED SECURITIES |
| | $ | 38,818,966 | |
| | |
| Federal Agencies – 78.3% | |
| Adjustable Rate FHLMC(a) – 0.3% | |
| $ | 189,018 | | | | 2.375 | % | | | 04/01/33 | | | $ | 201,959 | |
| | 81,861 | | | | 2.410 | | | | 09/01/33 | | | | 87,469 | |
| | 35,979 | | | | 2.280 | | | | 10/01/34 | | | | 38,280 | |
| | 70,294 | | | | 2.378 | | | | 11/01/34 | | | | 75,254 | |
| | 68,891 | | | | 2.372 | | | | 02/01/35 | | | | 73,752 | |
| | 249,864 | | | | 2.381 | | | | 06/01/35 | | | | 267,369 | |
| | 248,015 | | | | 2.381 | | | | 08/01/35 | | | | 265,435 | |
| | | | | | | | | | | | | | |
| | | | | | | | | | | | | 1,009,518 | |
| | |
| Adjustable Rate FNMA(a) – 0.9% | |
| | 7,900 | | | | 2.368 | | | | 07/01/22 | | | | 8,157 | |
| | 21,958 | | | | 2.344 | | | | 07/01/27 | | | | 22,882 | |
| | 31,744 | | | | 2.344 | | | | 11/01/27 | | | | 33,072 | |
| | 7,541 | | | | 2.344 | | | | 01/01/31 | | | | 7,904 | |
| | 9,007 | | | | 2.344 | | | | 06/01/32 | | | | 9,450 | |
| | 21,859 | | | | 2.368 | | | | 08/01/32 | | | | 22,876 | |
| | 55,294 | | | | 2.368 | | | | 05/01/33 | | | | 57,917 | |
| | 26,648 | | | | 2.165 | | | | 06/01/33 | | | | 27,945 | |
| | 327,636 | | | | 2.395 | | | | 06/01/33 | | | | 351,746 | |
| | 23,260 | | | | 2.360 | | | | 07/01/33 | | | | 24,923 | |
| | 312,914 | | | | 2.366 | | | | 08/01/33 | | | | 326,581 | |
| | 3,176 | | | | 3.000 | | | | 09/01/33 | | | | 3,382 | |
| | 179,904 | | | | 2.538 | | | | 12/01/33 | | | | 193,340 | |
| | 1,338 | | | | 2.574 | | | | 12/01/33 | | | | 1,372 | |
| | 6,754 | | | | 2.436 | | | | 04/01/34 | | | | 7,236 | |
| | 460,892 | | | | 2.655 | | | | 08/01/34 | | | | 495,603 | |
| | 83,693 | | | | 2.583 | | | | 11/01/34 | | | | 89,853 | |
| | 118,110 | | | | 2.320 | | | | 02/01/35 | | | | 126,218 | |
| | 174,665 | | | | 2.677 | | | | 03/01/35 | | | | 185,498 | |
| | 82,007 | | | | 2.933 | | | | 04/01/35 | | | | 88,132 | |
| | 139,766 | | | | 2.968 | | | | 05/01/35 | | | | 150,205 | |
| | 19,032 | | | | 2.344 | | | | 11/01/35 | | | | 19,834 | |
| | 91,429 | | | | 2.344 | | | | 12/01/37 | | | | 95,339 | |
| | |
| | |
| The accompanying notes are an integral part of these financial statements. | | 87 |
GOLDMAN SACHS U.S. MORTGAGES FUND
Schedule of Investments (continued)
September 30, 2012 (Unaudited)
| | | | | | | | | | | | | | |
Principal
Amount | | | Interest
Rate | | | Maturity
Date | | | Value | |
| | | | | | | | | | | | | | |
| | Mortgage-Backed Obligations – (continued) | |
| Adjustable Rate FNMA – (continued) | |
| $ | 46,106 | | | | 2.344 | % | | | 01/01/38 | | | $ | 48,086 | |
| | 37,822 | | | | 2.344 | | | | 11/01/40 | | | | 39,636 | |
| | | | | | | | | | | | | | |
| | | | | | | | | | | | | 2,437,187 | |
| | |
| Adjustable Rate GNMA(a) – 0.9% | |
| | 46,413 | | | | 1.750 | | | | 06/20/23 | | | | 47,929 | |
| | 22,096 | | | | 1.625 | | | | 07/20/23 | | | | 22,828 | |
| | 23,553 | | | | 1.625 | | | | 08/20/23 | | | | 24,337 | |
| | 60,338 | | | | 1.625 | | | | 09/20/23 | | | | 62,359 | |
| | 17,109 | | | | 1.625 | | | | 03/20/24 | | | | 17,682 | |
| | 150,060 | | | | 1.750 | | | | 04/20/24 | | | | 155,253 | |
| | 18,377 | | | | 1.750 | | | | 05/20/24 | | | | 19,015 | |
| | 123,340 | | | | 1.750 | | | | 06/20/24 | | | | 127,646 | |
| | 32,806 | | | | 2.000 | | | | 06/20/24 | | | | 34,438 | |
| | 42,866 | | | | 1.625 | | | | 07/20/24 | | | | 44,381 | |
| | 44,816 | | | | 2.000 | | | | 07/20/24 | | | | 47,069 | |
| | 76,678 | | | | 1.625 | | | | 08/20/24 | | | | 79,309 | |
| | 40,261 | | | | 2.000 | | | | 08/20/24 | | | | 42,295 | |
| | 37,616 | | | | 1.625 | | | | 09/20/24 | | | | 38,959 | |
| | 44,621 | | | | 2.000 | | | | 11/20/24 | | | | 46,912 | |
| | 16,957 | | | | 2.000 | | | | 12/20/24 | | | | 17,832 | |
| | 24,515 | | | | 2.500 | | | | 12/20/24 | | | | 26,015 | |
| | 29,557 | | | | 2.000 | | | | 01/20/25 | | | | 31,088 | |
| | 15,638 | | | | 2.000 | | | | 02/20/25 | | | | 16,454 | |
| | 52,902 | | | | 2.000 | | | | 05/20/25 | | | | 55,701 | |
| | 42,864 | | | | 2.000 | | | | 07/20/25 | | | | 45,155 | |
| | 20,955 | | | | 1.625 | | | | 02/20/26 | | | | 21,747 | |
| | 1,142 | | | | 1.625 | | | | 07/20/26 | | | | 1,188 | |
| | 27,193 | | | | 1.625 | | | | 01/20/27 | | | | 28,267 | |
| | 29,852 | | | | 2.000 | | | | 01/20/27 | | | | 31,579 | |
| | 21,391 | | | | 1.625 | | | | 02/20/27 | | | | 22,239 | |
| | 158,751 | | | | 1.750 | | | | 04/20/27 | | | | 165,213 | |
| | 17,191 | | | | 1.750 | | | | 05/20/27 | | | | 17,865 | |
| | 16,950 | | | | 1.750 | | | | 06/20/27 | | | | 17,645 | |
| | 6,453 | | | | 1.625 | | | | 11/20/27 | | | | 6,718 | |
| | 25,993 | | | | 1.625 | | | | 12/20/27 | | | | 27,064 | |
| | 51,136 | | | | 1.625 | | | | 01/20/28 | | | | 53,248 | |
| | 17,879 | | | | 1.625 | | | | 02/20/28 | | | | 18,620 | |
| | 18,670 | | | | 1.625 | | | | 03/20/28 | | | | 19,446 | |
| | 100,209 | | | | 1.625 | | | | 07/20/29 | | | | 104,705 | |
| | 41,688 | | | | 1.625 | | | | 08/20/29 | | | | 43,563 | |
| | 12,760 | | | | 1.625 | | | | 09/20/29 | | | | 13,335 | |
| | 49,701 | | | | 1.625 | | | | 10/20/29 | | | | 51,869 | |
| | 56,291 | | | | 1.625 | | | | 11/20/29 | | | | 58,788 | |
| | 14,533 | | | | 1.625 | | | | 12/20/29 | | | | 15,179 | |
| | 18,314 | | | | 1.625 | | | | 01/20/30 | | | | 19,132 | |
| | 9,885 | | | | 1.625 | | | | 02/20/30 | | | | 10,329 | |
| | 45,428 | | | | 1.625 | | | | 03/20/30 | | | | 47,463 | |
| | 54,834 | | | | 1.750 | | | | 04/20/30 | | | | 57,344 | |
| | 87,351 | | | | 1.750 | | | | 05/20/30 | | | | 91,354 | |
| | 58,101 | | | | 2.000 | | | | 05/20/30 | | | | 61,656 | |
| | 13,351 | | | | 1.750 | | | | 06/20/30 | | | | 13,964 | |
| | 120,946 | | | | 2.000 | | | | 07/20/30 | | | | 128,346 | |
| | 22,692 | | | | 2.000 | | | | 09/20/30 | | | | 24,080 | |
| | |
Principal
Amount | | | Interest
Rate | | | Maturity
Date | | | Value | |
| | | | | | | | | | | | | | |
| | Mortgage-Backed Obligations – (continued) | |
| Adjustable Rate GNMA – (continued) | |
| $ | 42,618 | | | | 1.625 | % | | | 10/20/30 | | | $ | 44,570 | |
| | 189,885 | | | | 1.625 | | | | 12/20/34 | | | | 199,145 | |
| | | | | | | | | | | | | | |
| | | | | | | | | | | | | 2,418,318 | |
| | |
| FHLMC – 10.2% | |
| | 5,055 | | | | 6.000 | | | | 12/01/14 | | | | 5,172 | |
| | 9,594 | | | | 6.000 | | | | 03/01/16 | | | | 10,234 | |
| | 936 | | | | 5.000 | | | | 09/01/16 | | | | 1,010 | |
| | 9,573 | | | | 5.000 | | | | 11/01/16 | | | | 10,299 | |
| | 31,926 | | | | 5.000 | | | | 01/01/17 | | | | 34,502 | |
| | 52,242 | | | | 5.000 | | | | 02/01/17 | | | | 56,636 | |
| | 41,727 | | | | 5.000 | | | | 03/01/17 | | | | 45,234 | |
| | 82,483 | | | | 5.000 | | | | 04/01/17 | | | | 89,418 | |
| | 2,123 | | | | 5.000 | | | | 05/01/17 | | | | 2,301 | |
| | 1,645 | | | | 5.000 | | | | 08/01/17 | | | | 1,784 | |
| | 220,876 | | | | 5.000 | | | | 09/01/17 | | | | 239,446 | |
| | 258,610 | | | | 5.000 | | | | 10/01/17 | | | | 280,352 | |
| | 142,776 | | | | 5.000 | | | | 11/01/17 | | | | 154,780 | |
| | 144,570 | | | | 5.000 | | | | 12/01/17 | | | | 156,721 | |
| | 176,553 | | | | 5.000 | | | | 01/01/18 | | | | 191,525 | |
| | 423,780 | | | | 5.000 | | | | 02/01/18 | | | | 459,246 | |
| | 430,540 | | | | 5.000 | | | | 03/01/18 | | | | 466,908 | |
| | 361,450 | | | | 5.000 | | | | 04/01/18 | | | | 392,122 | |
| | 38,773 | | | | 4.500 | | | | 05/01/18 | | | | 41,621 | |
| | 261,562 | | | | 5.000 | | | | 05/01/18 | | | | 283,796 | |
| | 69,221 | | | | 5.000 | | | | 06/01/18 | | | | 74,946 | |
| | 66,752 | | | | 5.000 | | | | 07/01/18 | | | | 72,037 | |
| | 36,296 | | | | 5.000 | | | | 08/01/18 | | | | 39,254 | |
| | 24,729 | | | | 5.000 | | | | 09/01/18 | | | | 26,860 | |
| | 80,377 | | | | 5.000 | | | | 10/01/18 | | | | 87,234 | |
| | 95,795 | | | | 5.000 | | | | 11/01/18 | | | | 103,919 | |
| | 46,260 | | | | 5.000 | | | | 12/01/18 | | | | 50,246 | |
| | 8,072 | | | | 5.000 | | | | 01/01/19 | | | | 8,767 | |
| | 3,627 | | | | 5.000 | | | | 02/01/19 | | | | 3,943 | |
| | 270,709 | | | | 5.500 | | | | 04/01/20 | | | | 294,520 | |
| | 944,228 | | | | 4.500 | | | | 08/01/23 | | | | 1,031,106 | |
| | 3,309,134 | | | | 4.500 | | | | 06/01/26 | | | | 3,564,005 | |
| | 95,181 | | | | 7.000 | | | | 04/01/31 | | | | 109,305 | |
| | 1,366,628 | | | | 7.000 | | | | 09/01/31 | | | | 1,569,455 | |
| | 950,943 | | | | 4.000 | | | | 02/01/32 | | | | 1,032,060 | |
| | 479,696 | | | | 7.000 | | | | 04/01/32 | | | | 549,476 | |
| | 1,154,428 | | | | 7.000 | | | | 05/01/32 | | | | 1,322,360 | |
| | 540,926 | | | | 6.000 | | | | 05/01/33 | | | | 603,555 | |
| | 31,957 | | | | 5.500 | | | | 12/01/33 | | | | 35,365 | |
| | 436,891 | | | | 5.000 | | | | 12/01/35 | | | | 478,105 | |
| | 321,003 | | | | 5.500 | | �� | | 01/01/36 | | | | 351,975 | |
| | 936 | | | | 5.500 | | | | 02/01/36 | | | | 1,025 | |
| | 49,187 | | | | 4.000 | | | | 08/01/36 | | | | 52,797 | |
| | 142,203 | | | | 4.000 | | | | 09/01/36 | | | | 152,641 | |
| | 150,244 | | | | 4.000 | | | | 10/01/36 | | | | 161,272 | |
| | 228,518 | | | | 4.000 | | | | 12/01/36 | | | | 245,290 | |
| | 23,545 | | | | 5.000 | | | | 02/01/37 | | | | 25,777 | |
| | 10,892 | | | | 6.000 | | | | 04/01/37 | | | | 12,128 | |
| | 2,887 | | | | 6.000 | | | | 07/01/37 | | | | 3,211 | |
| | 119,894 | | | | 6.000 | | | | 09/01/37 | | | | 133,386 | |
| | 46,627 | | | | 6.000 | | | | 07/01/38 | | | | 52,012 | |
| | |
| | |
| 88 | | The accompanying notes are an integral part of these financial statements. |
GOLDMAN SACHS U.S. MORTGAGES FUND
| | | | | | | | | | | | | | |
Principal
Amount | | | Interest
Rate | | | Maturity Date | | | Value | |
| | | | | | | | | | | | | | |
| | Mortgage-Backed Obligations – (continued) | |
| FHLMC – (continued) | |
| $ | 128,486 | | | | 6.000 | % | | | 12/01/38 | | | $ | 143,327 | |
| | 67,023 | | | | 6.000 | | | | 01/01/39 | | | | 75,110 | |
| | 836,189 | | | | 4.500 | | | | 09/01/39 | | | | 919,743 | |
| | 25,681 | | | | 4.500 | | | | 03/01/41 | | | | 27,664 | |
| | 2,797,415 | | | | 4.000 | | | | 11/01/41 | | | | 3,036,114 | |
| | 9,000,000 | | | | 3.000 | | | | TBA – 30yr | (e) | | | 9,487,969 | |
| | | | | | | | | | | | | | |
| | | | | | | | | | | | | 28,861,066 | |
| | |
| FNMA – 64.6% | |
| | 1,439 | | | | 5.500 | | | | 04/01/16 | | | | 1,557 | |
| | 1,835 | | | | 5.500 | | | | 08/01/16 | | | | 1,985 | |
| | 19,535 | | | | 5.500 | | | | 11/01/16 | | | | 21,136 | |
| | 15,854 | | | | 5.500 | | | | 12/01/16 | | | | 17,154 | |
| | 22,770 | | | | 5.500 | | | | 01/01/17 | | | | 24,637 | |
| | 1,820 | | | | 5.500 | | | | 05/01/17 | | | | 1,970 | |
| | 8,009 | | | | 5.500 | | | | 07/01/17 | | | | 8,668 | |
| | 1,286 | | | | 5.500 | | | | 09/01/17 | | | | 1,391 | |
| | 15,870 | | | | 5.500 | | | | 01/01/18 | | | | 17,176 | |
| | 13,130 | | | | 5.500 | | | | 02/01/18 | | | | 14,211 | |
| | 1,270 | | | | 6.000 | | | | 02/01/18 | | | | 1,402 | |
| | 874,125 | | | | 2.800 | | | | 03/01/18 | | | | 941,139 | |
| | 401,828 | | | | 5.000 | | | | 03/01/18 | | | | 435,890 | |
| | 27,203 | | | | 5.500 | | | | 04/01/18 | | | | 29,454 | |
| | 2,530,000 | | | | 3.840 | | | | 05/01/18 | | | | 2,838,357 | |
| | 5,845 | | | | 5.500 | | | | 05/01/18 | | | | 6,328 | |
| | 19,267 | | | | 6.000 | | | | 05/01/18 | | | | 21,276 | |
| | 528,221 | | | | 5.000 | | | | 06/01/18 | | | | 572,997 | |
| | 1,227,285 | | | | 4.000 | | | | 08/01/18 | | | | 1,313,422 | |
| | 27,683 | | | | 5.000 | | | | 09/01/18 | | | | 30,029 | |
| | 112,731 | | | | 6.000 | | | | 11/01/18 | | | | 124,489 | |
| | 100,504 | | | | 7.000 | | | | 11/01/18 | | | | 109,478 | |
| | 980,052 | | | | 4.500 | | | | 12/01/18 | | | | 1,055,671 | |
| | 201,414 | | | | 6.000 | | | | 12/01/18 | | | | 222,423 | |
| | 170,406 | | | | 6.000 | | | | 01/01/19 | | | | 188,180 | |
| | 4,463 | | | | 5.500 | | | | 02/01/19 | | | | 4,851 | |
| | 23,744 | | | | 5.500 | | | | 04/01/19 | | | | 25,805 | |
| | 56,612 | | | | 6.000 | | | | 04/01/19 | | | | 62,517 | |
| | 4,444 | | | | 5.500 | | | | 05/01/19 | | | | 4,823 | |
| | 12,581 | | | | 6.000 | | | | 05/01/19 | | | | 13,893 | |
| | 28,810 | | | | 5.500 | | | | 07/01/19 | | | | 31,311 | |
| | 72,739 | | | | 5.500 | | | | 08/01/19 | | | | 79,052 | |
| | 34,035 | | | | 5.500 | | | | 09/01/19 | | | | 36,989 | |
| | 75,663 | | | | 5.500 | | | | 10/01/19 | | | | 82,229 | |
| | 30,626 | | | | 5.500 | | | | 11/01/19 | | | | 33,284 | |
| | 18,884 | | | | 5.500 | | | | 12/01/19 | | | | 20,523 | |
| | 121,109 | | | | 5.500 | | | | 02/01/20 | | | | 131,621 | |
| | 533,875 | | | | 4.500 | | | | 03/01/20 | | | | 575,068 | |
| | 879,360 | | | | 3.416 | | | | 10/01/20 | | | | 976,296 | |
| | 37,537 | | | | 5.500 | | | | 01/01/21 | | | | 40,795 | |
| | 48,731 | | | | 7.000 | | | | 09/01/21 | | | | 55,502 | |
| | 154,125 | | | | 7.000 | | | | 06/01/22 | | | | 176,237 | |
| | 64,959 | | | | 7.000 | | | | 07/01/22 | | | | 74,337 | |
| | 11,291 | | | | 4.500 | | | | 04/01/23 | | | | 12,152 | |
| | 47,722 | | | | 3.500 | | | | 10/01/26 | | | | 50,787 | |
| | 116,088 | | | | 3.500 | | | | 11/01/26 | | | | 123,543 | |
| | 1,665,969 | | | | 3.500 | | | | 01/01/27 | | | | 1,772,967 | |
| | |
Principal
Amount | | | Interest
Rate | | | Maturity
Date | | | Value | |
| | | | | | | | | | | | | | |
| | Mortgage-Backed Obligations – (continued) | |
| FNMA – (continued) | |
| $ | 50,354 | | | | 3.500 | % | | | 03/01/27 | | | $ | 53,930 | |
| | 598 | | | | 7.000 | | | | 01/01/29 | | | | 696 | |
| | 380 | | | | 5.500 | | | | 04/01/29 | | | | 420 | |
| | 2,684 | | | | 7.000 | | | | 09/01/29 | | | | 3,209 | |
| | 28,728 | | | | 7.000 | | | | 08/01/31 | | | | 31,938 | |
| | 2,012 | | | | 7.000 | | | | 03/01/32 | | | | 2,334 | |
| | 2,410 | | | | 7.000 | | | | 04/01/32 | | | | 2,796 | |
| | 1,390 | | | | 7.000 | | | | 05/01/32 | | | | 1,612 | |
| | 7,657 | | | | 7.000 | | | | 06/01/32 | | | | 8,883 | |
| | 2,729 | | | | 7.000 | | | | 07/01/32 | | | | 3,166 | |
| | 105,152 | | | | 6.000 | | | | 01/01/33 | | | | 117,375 | |
| | 4,739 | | | | 6.000 | | | | 02/01/33 | | | | 5,290 | |
| | 476,594 | | | | 5.500 | | | | 04/01/33 | | | | 529,913 | |
| | 71,837 | | | | 6.000 | | | | 06/01/33 | | | | 80,454 | |
| | 22,882 | | | | 6.000 | | | | 07/01/33 | | | | 25,655 | |
| | 83,337 | | | | 5.000 | | | | 08/01/33 | | | | 91,647 | |
| | 5,081 | | | | 5.000 | | | | 09/01/33 | | | | 5,548 | |
| | 12,094 | | | | 5.500 | | | | 09/01/33 | | | | 13,400 | |
| | 63,072 | | | | 6.000 | | | | 09/01/33 | | | | 70,874 | |
| | 12,545 | | | | 6.000 | | | | 10/01/33 | | | | 14,096 | |
| | 88,136 | | | | 5.500 | | | | 02/01/34 | | | | 97,611 | |
| | 17,844 | | | | 5.500 | | | | 03/01/34 | | | | 19,762 | |
| | 25,458 | | | | 5.500 | | | | 04/01/34 | | | | 28,202 | |
| | 302 | | | | 5.500 | | | | 06/01/34 | | | | 334 | |
| | 107,327 | | | | 5.500 | | | | 07/01/34 | | | | 118,846 | |
| | 18,489 | | | | 5.500 | | | | 08/01/34 | | | | 20,520 | |
| | 44,192 | | | | 5.500 | | | | 10/01/34 | | | | 48,836 | |
| | 50,456 | | | | 6.000 | | | | 11/01/34 | | | | 56,529 | |
| | 530,723 | | | | 5.500 | | | | 12/01/34 | | | | 586,449 | |
| | 1,001,571 | | | | 6.000 | | | | 12/01/34 | | | | 1,122,110 | |
| | 758,558 | | | | 5.000 | | | | 03/01/35 | | | | 826,003 | |
| | 9,825 | | | | 5.000 | | | | 04/01/35 | | | | 10,698 | |
| | 518,311 | | | | 6.000 | | | | 04/01/35 | | | | 578,752 | |
| | 116,103 | | | | 5.000 | | | | 06/01/35 | | | | 126,678 | |
| | 15,681 | | | | 5.500 | | | | 06/01/35 | | | | 17,296 | |
| | 715,078 | | | | 5.000 | | | | 07/01/35 | | | | 780,367 | |
| | 37,268 | | | | 5.500 | | | | 07/01/35 | | | | 41,108 | |
| | 14,666 | | | | 5.000 | | | | 08/01/35 | | | | 15,970 | |
| | 23,370 | | | | 5.500 | | | | 08/01/35 | | | | 25,782 | |
| | 65,114 | | | | 5.000 | | | | 09/01/35 | | | | 70,902 | |
| | 21,602 | | | | 5.500 | | | | 09/01/35 | | | | 23,820 | |
| | 11,048 | | | | 5.000 | | | | 10/01/35 | | | | 12,031 | |
| | 293,871 | | | | 6.000 | | | | 10/01/35 | | | | 328,373 | |
| | 15,078 | | | | 5.000 | | | | 11/01/35 | | | | 16,419 | |
| | 8,725 | | | | 5.500 | | | | 12/01/35 | | | | 9,664 | |
| | 8,397 | | | | 6.000 | | | | 12/01/35 | | | | 9,367 | |
| | 404 | | | | 5.500 | | | | 02/01/36 | | | | 444 | |
| | 20,005 | | | | 5.500 | | | | 04/01/36 | | | | 22,028 | |
| | 10,944 | | | | 6.000 | | | | 04/01/36 | | | | 12,186 | |
| | 64,229 | | | | 6.000 | | | | 05/01/36 | | | | 70,768 | |
| | 93,980 | | | | 4.000 | | | | 09/01/36 | | | | 101,113 | |
| | 294,806 | | | | 5.000 | | | | 12/01/36 | | | | 321,018 | |
| | 180,752 | | | | 6.000 | | | | 01/01/37 | | | | 199,153 | |
| | 178,030 | | | | 4.000 | | | | 02/01/37 | | | | 191,541 | |
| | 586,304 | | | | 5.000 | | | | 02/01/37 | | | | 637,303 | |
| | 13,736 | | | | 5.500 | | | | 02/01/37 | | | | 15,113 | |
| | |
| | |
| The accompanying notes are an integral part of these financial statements. | | 89 |
GOLDMAN SACHS U.S. MORTGAGES FUND
Schedule of Investments (continued)
September 30, 2012 (Unaudited)
| | | | | | | | | | | | | | |
Principal
Amount | | | Interest
Rate | | | Maturity
Date | | | Value | |
| | | | | | | | | | | | | | |
| | Mortgage-Backed Obligations – (continued) | |
| FNMA – (continued) | |
| $ | 1,126,651 | | | | 6.000 | % | | | 03/01/37 | | | $ | 1,241,350 | |
| | 47,012 | | | | 5.500 | | | | 04/01/37 | | | | 51,769 | |
| | 940,876 | | | | 5.000 | | | | 05/01/37 | | | | 1,022,717 | |
| | 3,639 | | | | 5.500 | | | | 05/01/37 | | | | 3,996 | |
| | 127,783 | | | | 5.000 | | | | 06/01/37 | | | | 140,247 | |
| | 1,342 | | | | 5.500 | | | | 06/01/37 | | | | 1,474 | |
| | 159,504 | | | | 6.000 | | | | 06/01/37 | | | | 175,747 | |
| | 639,942 | | | | 5.000 | | | | 07/01/37 | | | | 695,607 | |
| | 24,269 | | | | 5.500 | | | | 07/01/37 | | | | 26,650 | |
| | 5,047 | | | | 5.500 | | | | 08/01/37 | | | | 5,543 | |
| | 284,499 | | | | 6.500 | | | | 10/01/37 | | | | 320,783 | |
| | 714 | | | | 5.500 | | | | 12/01/37 | | | | 784 | |
| | 180,204 | | | | 6.000 | | | | 12/01/37 | | | | 199,452 | |
| | 5,999,402 | | | | 5.000 | | | | 02/01/38 | | | | 6,532,827 | |
| | 1,598 | | | | 5.500 | | | | 02/01/38 | | | | 1,755 | |
| | 407,780 | | | | 5.000 | | | | 03/01/38 | | | | 443,142 | |
| | 20,120 | | | | 5.500 | | | | 03/01/38 | | | | 22,119 | |
| | 84,231 | | | | 5.500 | | | | 04/01/38 | | | | 92,581 | |
| | 19,576 | | | | 5.500 | | | | 05/01/38 | | | | 21,550 | |
| | 250,873 | | | | 6.000 | | | | 05/01/38 | | | | 276,363 | |
| | 60,000 | | | | 5.000 | | | | 06/01/38 | | | | 65,461 | |
| | 5,271 | | | | 5.500 | | | | 06/01/38 | | | | 5,795 | |
| | 6,530 | | | | 5.500 | | | | 07/01/38 | | | | 7,178 | |
| | 4,701 | | | | 5.500 | | | | 08/01/38 | | | | 5,171 | |
| | 3,729 | | | | 5.500 | | | | 09/01/38 | | | | 4,102 | |
| | 1,376,730 | | | | 6.000 | | | | 11/01/38 | | | | 1,516,928 | |
| | 1,986 | | | | 5.500 | | | | 12/01/38 | | | | 2,184 | |
| | 1,969,651 | | | | 5.000 | | | | 01/01/39 | | | | 2,146,471 | |
| | 973,191 | | | | 6.500 | | | | 01/01/39 | | | | 1,099,093 | |
| | 21,005 | | | | 5.500 | | | | 02/01/39 | | | | 23,178 | |
| | 3,000,000 | | | | 5.000 | | | | 06/01/39 | | | | 3,260,952 | |
| | 385,503 | | | | 5.000 | | | | 07/01/39 | | | | 418,933 | |
| | 20,529 | | | | 4.000 | | | | 08/01/39 | | | | 22,069 | |
| | 922,119 | | | | 5.500 | | | | 09/01/39 | | | | 1,009,432 | |
| | 312,683 | | | | 5.000 | | | | 10/01/39 | | | | 341,243 | |
| | 207,114 | | | | 6.000 | | | | 10/01/39 | | | | 229,235 | |
| | 814,832 | | | | 5.000 | | | | 09/01/40 | | | | 891,380 | |
| | 47,114 | | | | 4.000 | | | | 10/01/40 | | | | 50,695 | |
| | 282,072 | | | | 4.000 | | | | 11/01/40 | | | | 303,510 | |
| | 1,805,309 | | | | 4.500 | | | | 11/01/40 | | | | 1,953,894 | |
| | 38,636 | | | | 4.000 | | | | 12/01/40 | | | | 41,572 | |
| | 4,880,036 | | | | 4.500 | | | | 12/01/40 | | | | 5,280,480 | |
| | 39,466 | | | | 4.000 | | | | 01/01/41 | | | | 42,465 | |
| | 403,744 | | | | 4.500 | | | | 01/01/41 | | | | 436,875 | |
| | 62,175 | | | | 4.000 | | | | 02/01/41 | | | | 66,947 | |
| | 1,342,276 | | | | 4.500 | | | | 02/01/41 | | | | 1,455,208 | |
| | 2,327,154 | | | | 5.000 | | | | 02/01/41 | | | | 2,553,590 | |
| | 1,089,753 | | | | 4.000 | | | | 03/01/41 | | | | 1,173,386 | |
| | 791,283 | | | | 5.000 | | | | 04/01/41 | | | | 868,276 | |
| | 20,462 | | | | 4.000 | | | | 05/01/41 | | | | 22,033 | |
| | 1,896,805 | | | | 5.000 | | | | 05/01/41 | | | | 2,070,056 | |
| | 281,244 | | | | 5.000 | | | | 06/01/41 | | | | 306,932 | |
| | 910,675 | | | | 4.500 | | | | 07/01/41 | | | | 990,552 | |
| | 110,875 | | | | 4.000 | | | | 08/01/41 | | | | 119,385 | |
| | 209,508 | | | | 4.500 | | | | 08/01/41 | | | | 227,135 | |
| | 58,406 | | | | 4.000 | | | | 09/01/41 | | | | 62,888 | |
| | |
Principal
Amount | | | Interest
Rate | | | Maturity Date | | | Value | |
| | | | | | | | | | | | | | |
| | Mortgage-Backed Obligations – (continued) | |
| FNMA – (continued) | |
| $ | 2,402,173 | | | | 4.500 | % | | | 09/01/41 | | | $ | 2,612,373 | |
| | 52,019 | | | | 4.000 | | | | 10/01/41 | | | | 56,012 | |
| | 54,201 | | | | 4.500 | | | | 10/01/41 | | | | 58,762 | |
| | 13,212,028 | | | | 5.000 | | | | 10/01/41 | | | | 14,516,921 | |
| | 1,569,155 | | | | 4.000 | | | | 11/01/41 | | | | 1,692,256 | |
| | 1,336,046 | | | | 4.000 | | | | 12/01/41 | | | | 1,438,580 | |
| | 76,826 | | | | 4.000 | | | | 01/01/42 | | | | 83,227 | |
| | 1,975,417 | | | | 4.000 | | | | 02/01/42 | | | | 2,158,341 | |
| | 21,000,000 | | | | 2.500 | | | | TBA – 15yr | (e) | | | 22,076,250 | |
| | 13,000,000 | | | | 3.000 | | | | TBA – 30yr | (e) | | | 13,722,110 | |
| | 14,000,000 | | | | 3.500 | | | | TBA – 30yr | (e) | | | 15,015,000 | |
| | 30,000,000 | | | | 5.000 | | | | TBA – 30yr | (e) | | | 32,711,718 | |
| | 14,000,000 | | | | 6.000 | | | | TBA – 30yr | (e) | | | 15,460,157 | |
| | | | | | | | | | | | | | |
| | | | | | | | | | | | | 181,964,181 | |
| | |
| GNMA – 1.4% | |
| | 209,741 | | | | 5.500 | | | | 07/15/20 | | | | 226,912 | |
| | 350,223 | | | | 3.950 | | | | 07/15/25 | | | | 384,973 | |
| | 1,589 | | | | 6.000 | | | | 03/15/26 | | | | 1,801 | |
| | 16,348 | | | | 6.000 | | | | 04/15/26 | | | | 18,562 | |
| | 3,000,000 | | | | 3.000 | | | | TBA – 30yr | (e) | | | 3,212,578 | |
| | | | | | | | | | | | | | |
| | | | | | | | | | | | | 3,844,826 | |
| | |
| | TOTAL FEDERAL AGENCIES | | | $ | 220,535,096 | |
| | |
| | TOTAL MORTGAGE-BACKED OBLIGATIONS | |
| | (Cost $287,793,949) | | | $ | 292,396,847 | |
| | |
| | | | | | | | | | | | | | |
| | Asset-Backed Securities – 2.9% | |
| Home Equity – 0.8% | |
| CIT Mortgage Loan Trust Series 2007-1, Class 2A3(a)(d) | |
| $ | 1,100,000 | | | | 1.667 | % | | | 10/25/37 | | | $ | 669,977 | |
| Countrywide Home Equity Loan Trust Series 2002-E, Class A(a) | |
| | 6,407 | | | | 0.481 | | | | 10/15/28 | | | | 5,991 | |
| Countrywide Home Equity Loan Trust Series 2003-D, Class A(a) | |
| | 55,011 | | | | 0.481 | | | | 06/15/29 | | | | 50,849 | |
| Countrywide Home Equity Loan Trust Series 2004-G, Class 2A(a) | |
| | 42,521 | | | | 0.441 | | | | 12/15/29 | | | | 31,091 | |
| Countrywide Home Equity Loan Trust Series 2004-I, Class A(a) | |
| | 437,938 | | | | 0.511 | | | | 02/15/34 | | | | 307,584 | |
| Countrywide Home Equity Loan Trust Series 2004-J, Class 2A(a) | |
| | 48,114 | | | | 0.511 | | | | 12/15/33 | | | | 34,867 | |
| Countrywide Home Equity Loan Trust Series 2004-O, Class 1A(a) | |
| | 177,984 | | | | 0.501 | | | | 02/15/34 | | | | 132,908 | |
| Countrywide Home Equity Loan Trust Series 2005-A, Class 2A(a) | |
| | 264,583 | | | | 0.461 | | | | 04/15/35 | | | | 172,390 | |
| GMAC Mortgage Corp. Loan Trust Series 2007-HE3, Class 1A1 | |
| | 297,519 | | | | 7.000 | | | | 09/25/37 | | | | 257,596 | |
| GMAC Mortgage Corp. Loan Trust Series 2007-HE3, Class 2A1 | |
| | 411,958 | | | | 7.000 | | | | 09/25/37 | | | | 356,186 | |
| Residential Asset Mortgage Products, Inc. Series 2004-RZ1,
Class AII(a) |
|
| | 194,254 | | | | 0.697 | | | | 03/25/34 | | | | 151,163 | |
| | | | | | | | | | | | | | |
| | | | | | | | | | | | | 2,170,602 | |
| | |
| | |
| 90 | | The accompanying notes are an integral part of these financial statements. |
GOLDMAN SACHS U.S. MORTGAGES FUND
| | | | | | | | | | | | | | |
Principal
Amount | | | Interest
Rate | | | Maturity
Date | | | Value | |
| | Asset-Backed Securities – (continued) | |
| Student Loan(a) – 2.1% | |
| Brazos Higher Education Authority, Inc. Student Loan Revenue
Series 2004 I-A-2 |
|
| $ | 1,961,425 | | | | 0.529 | % | | | 06/27/22 | | | $ | 1,957,516 | |
| College Loan Corp. Trust Series 2004-1, Class A3 | |
| | 467,050 | | | | 0.611 | | | | 04/25/21 | | | | 466,321 | |
| Education Funding Capital Trust I Series 2004-1, Class A2 | |
| | 385,581 | | | | 0.549 | | | | 12/15/22 | | | | 384,359 | |
| GCO Education Loan Funding Trust Series 2006-1, Class A11L | |
| | 300,000 | | | | 0.657 | | | | 05/25/36 | | | | 259,943 | |
| Louisiana Public Facilities Authority Series 2011-A, Class A3 | |
| | 1,200,000 | | | | 1.401 | | | | 04/25/35 | | | | 1,184,376 | |
| Northstar Education Finance, Inc. Series 2004-1, Class A4 | |
| | 1,484,444 | | | | 0.637 | | | | 04/29/19 | | | | 1,479,493 | |
| Northstar Education Finance, Inc. Series 2005-1, Class A1 | |
| | 158,622 | | | | 0.547 | | | | 10/28/26 | | | | 158,041 | |
| US Education Loan Trust LLC Series 2006-1, Class A2(d) | |
| | 201,559 | | | | 0.551 | | | | 03/01/25 | | | | 200,200 | |
| | | | | | | | | | | | | | |
| | | | | | | | | | | | | 6,090,249 | |
| | |
| | TOTAL ASSET-BACKED SECURITIES | | | | | |
| | (Cost $9,049,883) | | | $ | 8,260,851 | |
| | |
| | | | | | | | | | | | | | |
| | U.S. Treasury Obligations – 2.8% | |
| United States Treasury Notes | |
| $ | 4,100,000 | | | | 0.625 | % | | | 09/30/17 | | | $ | 4,098,893 | |
| | 1,300,000 | | | | 1.000 | | | | 09/30/19 | | | | 1,295,021 | |
| | 2,400,000 | | | | 1.625 | (f) | | | 08/15/22 | | | | 2,397,192 | |
| | |
| | TOTAL U.S. TREASURY OBLIGATIONS | |
| | (Cost $7,790,473) | | | $ | 7,791,106 | |
| | |
| | | | | | | | | | | | | | |
Notional
Amount | | | Exercise
Rate | | | Expiration
Date | | | Value | |
| | Options Purchased – 0.2% | |
| Interest Rate Swaptions | |
| Citibank NA Put - OTC - 10 year Interest Rate Swap Strike
Price 1.895% |
|
| | 7,600,000 | | | | 1.895 | % | | | 02/28/13 | | | $ | 166,718 | |
| Citibank NA Call - OTC - 10 year Interest Rate Swap Strike
Price 1.895% |
|
| | 7,600,000 | | | | 1.895 | | | | 02/28/13 | | | | 120,270 | |
| Deutsche Bank AG Put - OTC - 10 year Interest Rate Swap Strike
Price 2.060% |
|
| | 7,600,000 | | | | 2.060 | | | | 02/19/13 | | | | 244,690 | |
| Deutsche Bank AG Call - OTC - 10 year Interest Rate Swap
Strike Price 2.060% |
|
| | 7,600,000 | | | | 2.060 | | | | 02/19/13 | | | | 73,937 | |
| | |
| | TOTAL OPTIONS PURCHASED – 0.2% | |
| | (Cost $678,680) | | | $ | 605,615 | |
| | |
| TOTAL INVESTMENTS BEFORE
SHORT-TERM INVESTMENT |
| | | | |
| | (Cost $305,312,985) | | | $ | 309,054,419 | |
| | |
Principal
Amount | | | Interest
Rate | | | Maturity
Date | | | Value | |
| | Short-term Investment(g) – 28.0% | |
| Repurchase Agreement – 28.0% | |
| Joint Repurchase Agreement Account II | |
| $ | 78,900,000 | | | | 0.245 | % | | | 10/01/12 | | | $ | 78,900,000 | |
| | (Cost $78,900,000) | | | | | |
| | |
| | TOTAL INVESTMENTS – 137.8% | | | | | |
| | (Cost $384,212,985) | | | $ | 387,954,419 | |
| | |
| LIABILITIES IN EXCESS OF
OTHER ASSETS – (37.8)% |
| | | (106,422,743 | ) |
| | |
| | NET ASSETS – 100.00% | | | $ | 281,531,676 | |
| | |
| | |
| The percentage shown for each investment category reflects the value of investments in that category as a percentage of net assets. |
(a) | | Variable rate security. Interest rate disclosed is that which is in effect at September 30, 2012. |
(b) | | Security with a notional or nominal principal amount. The actual effective yield of this security is different than the stated interest rate. |
(c) | | Issued with zero coupon and interest rate is contingent upon LIBOR reaching a predetermined level. |
(d) | | Exempt from registration under Rule 144A of the Securities Act of 1933. Under procedures approved by the Board of Trustees, such securities have been determined to be liquid by the Investment Adviser and may be resold, normally to qualified institutional buyers in transactions exempt from registration. Total market value of Rule 144A securities amounted to $5,880,064, which represents approximately 2.1% of net assets as of September 30, 2012. |
(e) | | TBA (To Be Announced) Securities are purchased on a forward commitment basis with an approximate principal amount and no defined maturity date. The actual principal and maturity date will be determined upon settlement when the specific mortgage pools are assigned. Total market value of TBA securities (excluding forward sales contracts, if any) amounts to $111,685,782 which represents approximately 39.7% of net assets as of September 30, 2012. |
(f) | | All or a portion of security is segregated as collateral for initial margin requirement on futures transactions. |
(g) | | Joint repurchase agreement was entered into on September 28, 2012. Additional information appears on page 95. |
| | |
|
Investment Abbreviations: |
ACES | | —Alternative Credit Enhancement Securities |
FHLMC | | —Federal Home Loan Mortgage Corp. |
FNMA | | —Federal National Mortgage Association |
FREMF | | —Freddie Mac Multi Family |
GNMA | | —Government National Mortgage Association |
LIBOR | | —London Interbank Offered Rate |
OTC | | —Over the Counter |
REMIC | | —Real Estate Mortgage Investment Conduit |
|
| | |
| The accompanying notes are an integral part of these financial statements. | | 91 |
GOLDMAN SACHS U.S. MORTGAGES FUND
Schedule of Investments (continued)
September 30, 2012 (Unaudited)
|
| ADDITIONAL INVESTMENT INFORMATION |
FORWARD SALES CONTRACTS — At September 30, 2012, the Fund had the following forward sales contracts:
| | | | | | | | | | | | | | | | | | |
| Description | | Interest
Rate | | | Maturity
Date(e) | | Settlement
Date | | | Principal
Amount | | | Value | |
FNMA | | | 3.500 | % | | TBA - 15yr | | | 10/16/12 | | | $ | (1,000,000 | ) | | $ | (1,064,063 | ) |
FNMA | | | 4.500 | | | TBA - 30yr | | | 11/14/12 | | | | (4,000,000 | ) | | | (4,328,281 | ) |
FNMA | | | 5.000 | | | TBA - 30yr | | | 11/10/12 | | | | (13,000,000 | ) | | | (14,182,188 | ) |
| TOTAL (Proceeds Receivable: $19,622,969) | | | | | | | $ | (19,574,532 | ) |
FUTURES CONTRACTS — At September 30, 2012, the Fund had the following futures contracts:
| | | | | | | | | | | | | | |
| Type | | Number of
Contracts
Long (Short) | | | Expiration
Date | | Current
Value | | | Unrealized
Gain (Loss) | |
Eurodollars | | | 55 | | | December 2012 | | $ | 13,706,000 | | | $ | 36,700 | |
Eurodollars | | | 55 | | | March 2013 | | | 13,705,312 | | | | 40,114 | |
Eurodollars | | | 38 | | | June 2013 | | | 9,467,700 | | | | 25,090 | |
Eurodollars | | | 46 | | | September 2014 | | | 11,444,225 | | | | 88,488 | |
Eurodollars | | | (46 | ) | | September 2015 | | | (11,411,450 | ) | | | (143,531 | ) |
Ultra Long U.S. Treasury Bonds | | | 26 | | | December 2012 | | | 4,295,688 | | | | (27,590 | ) |
2 Year U.S. Treasury Notes | | | (77 | ) | | December 2012 | | | (16,980,906 | ) | | | (8,709 | ) |
5 Year U.S. Treasury Notes | | | 471 | | | December 2012 | | | 58,702,055 | | | | 125,856 | |
10 Year U.S. Treasury Notes | | | 110 | | | December 2012 | | | 14,683,281 | | | | 54,153 | |
30 Year U.S. Treasury Bonds | | | (88 | ) | | December 2012 | | | (13,145,000 | ) | | | (26,401 | ) |
| TOTAL | | | | | | | | | | | | $ | 164,170 | |
| | |
| 92 | | The accompanying notes are an integral part of these financial statements. |
GOLDMAN SACHS U.S. MORTGAGES FUND
|
| ADDITIONAL INVESTMENT INFORMATION (continued) |
SWAP CONTRACTS — At September 30, 2012, the Fund had the following swap contracts:
INTEREST RATE SWAP CONTRACTS
| | | | | | | | | | | | | | | | | | | | | | |
| | | | | | | | | Rates Exchanged | | | | Market Value | |
| Counterparty | | Notional
Amount
(000s)(a) | | | Termination
Date | | | Payments
Received | | Payments
Made | | | | Upfront
Payments
Made (Received) | | | Unrealized
Gain (Loss) | |
Bank of America Securities LLC | | $ | 6,400 | | | | 02/28/17 | | | 3 month LIBOR | | 0.750% | | | | $ | (7,204 | ) | | $ | (13,521 | ) |
| | | 2,000 | | | | 07/23/24 | | | 2.150% | | 3 month LIBOR | | | | | — | | | | (19,155 | ) |
Barclays Bank PLC | | | 20,500 | | | | 02/28/17 | | | 3 month LIBOR | | 0.750 | | | | | (36,649 | ) | | | (29,734 | ) |
Citibank NA | | | 6,100 | | | | 02/28/17 | | | 3 month LIBOR | | 0.750 | | | | | (5,996 | ) | | | (13,757 | ) |
| | | 5,600 | | | | 12/19/17 | | | 3 month LIBOR | | 1.250 | | | | | (19,976 | ) | | | (93,998 | ) |
| | | 1,200 | | | | 12/19/19 | | | 3 month LIBOR | | 1.750 | | | | | (17,400 | ) | | | (22,244 | ) |
| | | 3,000 | | | | 12/19/22 | | | 3 month LIBOR | | 2.000 | | | | | (12,591 | ) | | | (52,864 | ) |
Credit Suisse International (London) | | | 4,900 | | | | 02/28/17 | | | 3 month LIBOR | | 0.750 | | | | | (5,201 | ) | | | (10,666 | ) |
| | | 16,100 | | | | 12/19/19 | | | 3 month LIBOR | | 1.750 | | | | | (224,552 | ) | | | (307,339 | ) |
| | | 6,100 | | | | 12/19/32 | | | 3 month LIBOR | | 2.500 | | | | | (18,599 | ) | | | (15,707 | ) |
| | | 6,600 | | | | 12/19/32 | | | 2.500 | | 3 month LIBOR | | | | | 81,979 | | | | (44,861 | ) |
| | | 3,100 | | | | 12/19/42 | | | 3 month LIBOR | | 2.500 | | | | | (4,846 | ) | | | 93,452 | |
Deutsche Bank Securities, Inc. | | | 13,300 | | | | 02/28/17 | | | 3 month LIBOR | | 0.750 | | | | | (33,768 | ) | | | (9,300 | ) |
| | | 3,100 | | | | 07/28/24 | | | 2.060 | | 3 month LIBOR | | | | | — | | | | (56,251 | ) |
JPMorgan Securities, Inc. | | | 5,700 | | | | 02/28/17 | | | 3 month LIBOR | | 0.750 | | | | | (9,299 | ) | | | (9,159 | ) |
| | | 500 | | | | 12/19/32 | | | 3 month LIBOR | | 2.500 | | | | | (8,633 | ) | | | 5,821 | |
Morgan Stanley Capital Services, Inc. | | | 6,300 | | | | 02/28/17 | | | 3 month LIBOR | | 0.750 | | | | | (14,506 | ) | | | (5,895 | ) |
| TOTAL | | | | | | | | | | | | | | | | $ | (337,241 | ) | | $ | (605,178 | ) |
| | (a) | | Represents forward starting interest rate swaps whose effective dates of commencement of accruals and cash flows occur subsequent to September 30, 2012. |
| | |
| The accompanying notes are an integral part of these financial statements. | | 93 |
GOLDMAN SACHS U.S. MORTGAGES FUND
Schedule of Investments (continued)
September 30, 2012 (Unaudited)
|
| ADDITIONAL INVESTMENT INFORMATION (continued) |
WRITTEN OPTIONS CONTRACTS
INTEREST RATE SWAPTION CONTRACTS — At September 30, 2012, the Fund had the following written swaptions:
| | | | | | | | | | | | | | | | | | |
| Counterparty | | Description | | Notional
Amount
(000s) | | | Expiration
Date | | Strike
Price | |
Market
Value | | | Premiums
Received | |
Bank of America N.A. | | Put – OTC – 10 year Interest Rate Swap for the obligation to pay a fixed rate of 1.640% versus the 3 month LIBOR maturing on July 23, 2024 | | $ | 7,200 | | | 07/21/14 | | 1.640% | | $ | (111,990 | ) | | $ | (160,560 | ) |
Deutsche Bank Securities Inc. | | Put – OTC – 10 year Interest Rate Swap for the obligation to pay a fixed rate of 1.550% versus the 3 month LIBOR maturing on July 21, 2024 | | | 8,700 | | | 07/24/14 | | 1.550 | | | (113,494 | ) | | | (187,920 | ) |
| TOTAL | | | | $ | 15,900 | | | | | | | $ | (225,484 | ) | | $ | (348,480 | ) |
WRITTEN OPTIONS CONTRACTS — For the six months ended September 30, 2012, the Fund had the following written swaptions activity:
| | | | | | |
| | | Notional
Amount
(000s) | | | Premiums
Received |
Contracts Outstanding March 31, 2012 | | $ | — | | | $ — |
Contracts Written | | | 15,900 | | | 348,480 |
Contracts Outstanding September 30, 2012 | | $ | 15,900 | | | $348,480 |
| | |
| 94 | | The accompanying notes are an integral part of these financial statements. |
GOLDMAN SACHS SINGLE SECTOR FIXED INCOME FUNDS
Schedule of Investments
September 30, 2012 (Unaudited)
|
| ADDITIONAL INVESTMENT INFORMATION |
JOINT REPURCHASE AGREEMENT ACCOUNT II — At September 30, 2012, the Funds had undivided interests in the Joint Repurchase Agreement Account II, with a maturity date of October 1, 2012, as follows:
| | | | | | | | | | | | |
| Fund | | Principal Amount | | | Maturity Value | | | Collateral
Allocation
Value | |
Emerging Markets Debt | | $ | 91,600,000 | | | $ | 91,601,870 | | | $ | 93,772,321 | |
High Yield | | | 209,700,000 | | | | 209,704,281 | | | | 214,673,097 | |
High Yield Floating Rate | | | 85,500,000 | | | | 85,501,746 | | | | 87,527,657 | |
Investment Grade Credit | | | 4,000,000 | | | | 4,000,082 | | | | 4,094,861 | |
Local Emerging Markets Debt | | | 187,400,000 | | | | 187,403,826 | | | | 191,844,246 | |
U.S. Mortgages | | | 78,900,000 | | | | 78,901,611 | | | | 80,771,136 | |
REPURCHASE AGREEMENTS — At September 30, 2012, the Principal Amounts of the Funds’ interest in the Joint Repurchase Agreement Account II were as follows:
| | | | | | | | | | | | | | | | | | | | | | | | | | | | |
| Counterparty | | Interest
Rate | | | Emerging
Markets Debt | | | High
Yield | | | High Yield
Floating
Rate | | | Investment
Grade Credit
Fund | | | Local
Emerging
Markets Debt | | | U.S.
Mortgages | |
BNP Paribas Securities Co. | | | 0.250 | % | | $ | 10,279,696 | | | $ | 23,533,322 | | | $ | 9,595,131 | | | $ | 448,895 | | | $ | 21,030,732 | | | $ | 8,854,454 | |
Credit Suisse Securities LLC | | | 0.200 | | | | 3,690,147 | | | | 8,447,859 | | | | 3,444,406 | | | | 161,142 | | | | 7,549,494 | | | | 3,178,522 | |
Deutsche Bank Securities, Inc. | | | 0.250 | | | | 17,269,890 | | | | 39,535,981 | | | | 16,119,820 | | | | 754,144 | | | | 35,331,630 | | | | 14,875,483 | |
JPMorgan Securities LLC | | | 0.250 | | | | 34,002,072 | | | | 77,840,987 | | | | 31,737,742 | | | | 1,484,806 | | | | 69,563,190 | | | | 29,287,811 | |
Wells Fargo Securities LLC | | | 0.240 | | | | 26,358,195 | | | | 60,341,851 | | | | 24,602,901 | | | | 1,151,013 | | | | 53,924,954 | | | | 22,703,730 | |
| TOTAL | | | | | | $ | 91,600,000 | | | $ | 209,700,000 | | | $ | 85,500,000 | | | $ | 4,000,000 | | | $ | 187,400,000 | | | $ | 78,900,000 | |
At September 30, 2012, the Joint Repurchase Agreement Account II was fully collateralized by:
| | | | | | | | |
| Issuer | | Interest Rates | | | Maturity Dates | |
Federal Home Loan Mortgage Corp. | | | 2.500 to 5.500 | % | | | 08/01/22 to 09/01/42 | |
Federal National Mortgage Association | | | 2.500 to 8.500 | | | | 06/01/14 to 07/01/51 | |
Government National Mortgage Association | | | 2.500 to 4.500 | | | | 04/15/27 to 09/20/42 | |
U.S. Treasury Notes | | | 0.375 to 4.875 | | | | 10/15/12 to 05/15/19 | |
| | |
| The accompanying notes are an integral part of these financial statements. | | 95 |
GOLDMAN SACHS SINGLE SECTOR FIXED INCOME FUNDS
Statements of Assets and Liabilities
September 30, 2012 (Unaudited)
| | | | | | |
| | | | | Emerging Markets Debt Fund | |
| | Assets: | | | | |
| | Investments, at value (cost $1,347,395,687, $5,554,537,336, $676,337,415, $524,625,085, $1,839,944,389 and $305,312,985) | | $ | 1,445,272,742 | |
| | Repurchase agreement, at value which equals cost | | | 91,600,000 | |
| | Cash | | | 6,874,309 | |
| | Foreign currencies, at value (cost $46, $17,357 and $3,035,003 for Emerging Markets Debt, High Yield Floating Rate and
Local Emerging Markets Debt Funds) | | | 39 | |
| | Receivables: | | | | |
| | Interest | | | 20,263,263 | |
| | Fund shares sold | | | 11,338,462 | |
| | Investments sold | | | 9,875,276 | |
| | Investments sold on an extended settlement basis | | | 1,599,312 | |
| | Unrealized gain on forward foreign currency exchange contracts | | | 4,593,204 | |
| | Collateral on certain derivative contracts(a) | | | 330,000 | |
| | Unrealized gain on swap contracts | | | 113,718 | |
| | Reimbursement from investment adviser | | | 65,253 | |
| | Futures — variation margin | | | 26,292 | |
| | Due from broker — upfront payment | | | — | |
| | Foreign tax reclaims, at value | | | — | |
| | Unfunded loan commitment | | | — | |
| | Upfront payments made on swap contracts | | | — | |
| | Other assets | | | 1,530 | |
| | Total assets | | | 1,591,953,400 | |
| | | | | | |
| | Liabilities: | | | | |
| | Payables: | | | | |
| | Investments purchased | | | 28,702,608 | |
| | Investments purchased on an extended settlement basis | | | 2,816,095 | |
| | Fund shares redeemed | | | 14,904,414 | |
| | Unrealized loss on forward foreign currency exchange contracts | | | 2,238,417 | |
| | Amounts owed to affiliates | | | 1,135,001 | |
| | Income distributions | | | 324,472 | |
| | Collateral on certain derivative contracts | | | — | |
| | Futures — variation margin | | | — | |
| | Forward sale contracts, at value (proceeds receivable $19,622,969 for U.S. Mortgages Fund) | | | — | |
| | Written option contracts, at value (premium received $529,960 and $348,480 for Investment Grade Credit and U.S. Mortgages Funds) | | | — | |
| | Unrealized loss on swap contracts | | | — | |
| | Deferred foreign capital gains tax | | | — | |
| | Upfront payments received on swap contracts | | | — | |
| | Accrued expenses and other liabilities | | | 169,695 | |
| | Total liabilities | | | 50,290,702 | |
| | | | | | |
| | Net Assets: | | | | |
| | Paid-in capital | | | 1,403,001,524 | |
| | Undistributed (distributions in excess of) net investment income | | | (99,184 | ) |
| | Accumulated net realized gain (loss) | | | 38,106,976 | |
| | Net unrealized gain | | | 100,653,382 | |
| | | NET ASSETS | | $ | 1,541,662,698 | |
| | | Net Assets: | | | | |
| | | Class A | | $ | 216,745,730 | |
| | | Class B | | | — | |
| | | Class C | | | 40,588,467 | |
| | | Institutional | | | 1,271,347,498 | |
| | | Service | | | — | |
| | | Separate Account Institutional Shares | | | — | |
| | | Class IR | | | 12,981,003 | |
| | | Class R | | | — | |
| | | Total Net Assets | | $ | 1,541,662,698 | |
| | | Shares Outstanding $0.001 par value (unlimited shares authorized): | | | | |
| | | Class A | | | 15,618,878 | |
| | | Class B | | | — | |
| | | Class C | | | 2,927,001 | |
| | | Institutional | | | 91,527,670 | |
| | | Service | | | — | |
| | | Separate Account Institutional Shares | | | — | |
| | | Class IR | | | 934,592 | |
| | | Class R | | | — | |
| | | Net asset value, offering and redemption price per share:(b) | | | | |
| | | Class A | | | $13.88 | |
| | | Class B | | | — | |
| | | Class C | | | 13.87 | |
| | | Institutional | | | 13.89 | |
| | | Service | | | — | |
| | | Separate Account Institutional Shares | | | — | |
| | | Class IR | | | 13.89 | |
| | | Class R | | | — | |
| | (a) | | Includes segregated cash of $175,000 for Local Emerging Markets Debt Fund relating to initial margin requirements on futures transaction. |
| | (b) | | Maximum public offering price per share for Class A shares of Emerging Markets Debt, High Yield, High Yield Floating Rate, Investment Grade Credit, Local Emerging Markets Debt and U.S. Mortgages Funds is $14.53, $7.64, $10.22, $10.40, $10.03 and $11.29, respectively. At redemption, Class B and Class C Shares may be subject to a contingent deferred sales charge, assessed on the amount equal to the lesser of the current net asset value or the original purchase price of the shares. |
| | |
| 96 | | The accompanying notes are an integral part of these financial statements. |
GOLDMAN SACHS SINGLE SECTOR FIXED INCOME FUNDS
| | | | | | | | | | | | | | | | | | | | | | | | | | | | |
| | | High Yield Fund | | | | | High Yield Floating
Rate Fund | | | | | Investment Grade
Credit Fund | | | | | Local Emerging
Markets Debt Fund | | | | | U.S. Mortgages
Fund | |
| | | | | | | | | | | | | | | | | | | | | | | | | | | | |
| | $ | 5,777,653,336 | | | | | $ | 684,448,970 | | | | | $ | 560,966,712 | | | | | $ | 1,882,350,576 | | | | | $ | 309,054,419 | |
| | | 209,700,000 | | | | | | 85,500,000 | | | | | | 4,000,000 | | | | | | 187,400,000 | | | | | | 78,900,000 | |
| | | 5,857,631 | | | | | | 11,738,667 | | | | | | 79,017 | | | | | | 1,110,537 | | | | | | 3,078,354 | |
| | | — | | | | | | 17,348 | | | | | | — | | | | | | 3,054,075 | | | | | | — | |
| | | | | | | | | | | | | | | | | | | | | | | | | | | | |
| | | 113,527,274 | | | | | | 4,804,566 | | | | | | 5,771,076 | | | | | | 29,048,994 | | | | | | 621,938 | |
| | | 21,955,692 | | | | | | 9,812,235 | | | | | | 2,376,675 | | | | | | 40,064,862 | | | | | | 929,900 | |
| | | 82,011,119 | | | | | | 55,181,050 | | | | | | 14,149,824 | | | | | | 465,120 | | | | | | 1,908,993 | |
| | | 12,731,246 | | | | | | 8,370,858 | | | | | | — | | | | | | — | | | | | | 356,286,213 | |
| | | 236,021 | | | | | | — | | | | | | — | | | | | | 20,567,676 | | | | | | — | |
| | | — | | | | | | — | | | | | | 450,020 | | | | | | 175,000 | | | | | | 561,622 | |
| | | — | | | | | | — | | | | | | 311,248 | | | | | | 9,471,015 | | | | | | 99,273 | |
| | | — | | | | | | — | | | | | | 30,901 | | | | | | 30,763 | | | | | | 34,410 | |
| | | — | | | | | | — | | | | | | — | | | | | | 8,015 | | | | | | 24,729 | |
| | | — | | | | | | — | | | | | | 26,883 | | | | | | — | | | | | | 18,846 | |
| | | 23,278 | | | | | | — | | | | | | — | | | | | | 74,723 | | | | | | — | |
| | | — | | | | | | 12,000 | | | | | | — | | | | | | — | | | | | | — | |
| | | — | | | | | | — | | | | | | 9,970 | | | | | | 228 | | | | | | 81,979 | |
| | | 26,343 | | | | | | 1,683 | | | | | | 1,256 | | | | | | 3,611 | | | | | | 945 | |
| | | 6,223,721,940 | | | | | | 859,887,377 | | | | | | 588,173,582 | | | | | | 2,173,825,195 | | | | | | 751,601,621 | |
| | | | | | | | | | | | | | | | | | | | | | | | | | | | |
| | | | | | | | | | | | | | | | | | | | | | | | | | | | |
| | | | | | | | | | | | | | | | | | | | | | | | | | | | |
| | | 54,284,183 | | | | | | 42,234,780 | | | | | | 16,256,997 | | | | | | 9,050,052 | | | | | | 9,348,439 | |
| | | 129,315,140 | | | | | | 66,090,302 | | | | | | 5,301,134 | | | | | | 19,181,154 | | | | | | 439,299,844 | |
| | | 26,047,585 | | | | | | 1,159,439 | | | | | | 2,401,628 | | | | | | 10,780,001 | | | | | | 174,779 | |
| | | 3,635,597 | | | | | | 31,924 | | | | | | — | | | | | | 12,045,616 | | | | | | — | |
| | | 3,688,579 | | | | | | 386,289 | | | | | | 216,918 | | | | | | 1,456,373 | | | | | | 101,254 | |
| | | 1,437,548 | | | | | | 9,958 | | | | | | 118,491 | | | | | | 370,360 | | | | | | 94,306 | |
| | | — | | | | | �� | — | | | | | | 70,000 | | | | | | 6,230,948 | | | | | | — | |
| | | — | | | | | | — | | | | | | 4,478 | | | | | | — | | | | | | — | |
| | | — | | | | | | — | | | | | | — | | | | | | — | | | | | | 19,574,532 | |
| | | — | | | | | | — | | | | | | 351,265 | | | | | | — | | | | | | 225,484 | |
| | | — | | | | | | — | | | | | | 530,656 | | | | | | 1,636,160 | | | | | | 704,451 | |
| | | — | | | | | | — | | | | | | — | | | | | | 1,663,937 | | | | | | — | |
| | | — | | | | | | — | | | | | | 656,294 | | | | | | 2,568 | | | | | | 419,220 | |
| | | 1,196,046 | | | | | | 102,278 | | | | | | 102,040 | | | | | | 386,355 | | | | | | 127,636 | |
| | | 219,604,678 | | | | | | 110,014,970 | | | | | | 26,009,901 | | | | | | 62,803,524 | | | | | | 470,069,945 | |
| | | | | | | | | | | | | | | | | | | | | | | | | | | | |
| | | | | | | | | | | | | | | | | | | | | | | | | | | | |
| | | 5,697,581,147 | | | | | | 747,904,139 | | | | | | 508,665,374 | | | | | | 2,082,685,121 | | | | | | 273,055,294 | |
| | | 1,218,687 | | | | | | 129,741 | | | | | | (118,934 | ) | | | | | (22,126,953 | ) | | | | | (1,120,208 | ) |
| | | 85,488,099 | | | | | | (6,253,574 | ) | | | | | 17,344,357 | | | | | | (6,952,139 | ) | | | | | 6,124,731 | |
| | | 219,829,329 | | | | | | 8,092,101 | | | | | | 36,272,884 | | | | | | 57,415,642 | | | | | | 3,471,859 | |
| | | $ | 6,004,117,262 | | | | | $ | 749,872,407 | | | | | $ | 562,163,681 | | | | | $ | 2,111,021,671 | | | | | $ | 281,531,676 | |
| | | | | | | | | | | | | | | | | | | | | | | | | | | | | |
| | | $ | 609,982,163 | | | | | $ | 3,509,723 | | | | | $ | 178,390,964 | | | | | $ | 166,498,360 | | | | | $ | 7,508,754 | |
| | | | 26,142,173 | | | | | | — | | | | | | — | | | | | | — | | | | | | — | |
| | | | 110,316,341 | | | | | | 714,126 | | | | | | — | | | | | | 21,379,626 | | | | | | — | |
| | | | 5,185,167,612 | | | | | | 741,647,678 | | | | | | 142,316,362 | | | | | | 1,909,685,970 | | | | | | 10,400,393 | |
| | | | 21,106,344 | | | | | | — | | | | | | — | | | | | | — | | | | | | — | |
| | | | — | | | | | | — | | | | | | 240,468,040 | | | | | | — | | | | | | 263,621,455 | |
| | | | 32,617,399 | | | | | | 3,990,409 | | | | | | 988,315 | | | | | | 13,457,715 | | | | | | 1,074 | |
| | | | 18,785,230 | | | | | | 10,471 | | | | | | — | | | | | | — | | | | | | — | |
| | | $ | 6,004,117,262 | | | | | $ | 749,872,407 | | | | | $ | 562,163,681 | | | | | $ | 2,111,021,671 | | | | | $ | 281,531,676 | |
| | | | | | | | | | | | | | | | | | | | | | | | | | | | | |
| | | | 83,585,246 | | | | | | 351,436 | | | | | | 17,813,041 | | | | | | 17,375,699 | | | | | | 691,094 | |
| | | | 3,574,098 | | | | | | — | | | | | | — | | | | | | — | | | | | | — | |
| | | | 15,095,572 | | | | | | 71,495 | | | | | | — | | | | | | 2,227,507 | | | | | | — | |
| | | | 708,393,613 | | | | | | 74,183,103 | | | | | | 14,207,513 | | | | | | 199,220,267 | | | | | | 955,318 | |
| | | | 2,893,454 | | | | | | — | | | | | | — | | | | | | — | | | | | | — | |
| | | | — | | | | | | — | | | | | | 24,000,388 | | | | | | — | | | | | | 24,264,220 | |
| | | | 4,459,340 | | | | | | 399,213 | | | | | | 98,643 | | | | | | 1,404,587 | | | | | | 99 | |
| | | | 2,573,887 | | | | | | 1,048 | | | | | | — | | | | | | — | | | | | | — | |
| | | | | | | | | | | | | | | | | | | | | | | | | | | | | |
| | | | $7.30 | | | | | | $ 9.99 | | | | | | $10.01 | | | | | | $9.58 | | | | | | $10.87 | |
| | | | 7.31 | | | | | | — | | | | | | — | | | | | | — | | | | | | — | |
| | | | 7.31 | | | | | | 9.99 | | | | | | — | | | | | | 9.60 | | | | | | — | |
| | | | 7.32 | | | | | | 10.00 | | | | | | 10.02 | | | | | | 9.59 | | | | | | 10.89 | |
| | | | 7.29 | | | | | | — | | | | | | — | | | | | | — | | | | | | — | |
| | | | — | | | | | | — | | | | | | 10.02 | | | | | | — | | | | | | 10.86 | |
| | | | 7.31 | | | | | | 10.00 | | | | | | 10.02 | | | | | | 9.58 | | | | | | 10.89 | |
| | | | 7.30 | | | | | | 9.99 | | | | | | — | | | | | | — | | | | | | — | |
| | |
| The accompanying notes are an integral part of these financial statements. | | 97 |
GOLDMAN SACHS SINGLE SECTOR FIXED INCOME FUNDS
Statements of Operations
For the Six Months Ended September 30, 2012 (Unaudited)
| | | | | | |
| | | | |
Emerging Markets
Debt Fund | |
| | Investment income: | |
| | Interest (net of foreign withholding taxes of $513,054 for Local Emerging Markets Debt Fund) | | $ | 33,236,215 | |
| | Dividends | | | — | |
| | Total investment income | | | 33,236,215 | |
| | | | | | |
| | Expenses: | |
| | Management fees | | | 5,119,669 | |
| | Distribution and Service fees(a) | | | 406,670 | |
| | Transfer Agent fees(a) | | | 359,678 | |
| | Custody and accounting fees | | | 211,904 | |
| | Printing and mailing costs | | | 138,641 | |
| | Registration fees | | | 92,058 | |
| | Professional fees | | | 46,281 | |
| | Trustee fees | | | 9,105 | |
| | Service Share fees — Shareholder Administration Plan | | | — | |
| | Service Share fees — Service Plan | | | — | |
| | Other | | | 17,924 | |
| | Total expenses | | | 6,401,930 | |
| | Less — expense reductions | | | (210,945 | ) |
| | Net expenses | | | 6,190,985 | |
| | NET INVESTMENT INCOME | | | 27,045,230 | |
| | | | | | |
| | Realized and unrealized gain (loss): | |
| | Net realized gain (loss) from: | | | | |
| | Investments (net of foreign tax of $906,534 for Local Emerging Markets Debt Fund) | | | 26,745,156 | |
| | Futures contracts | | | 1,313,936 | |
| | Swap contracts | | | (291,971 | ) |
| | Non-deliverable bond forward contracts | | | — | |
| | Forward foreign currency exchange contracts | | | 5,206,225 | |
| | Foreign currency transactions | | | (3,425,753 | ) |
| | Net change in unrealized gain (loss) on: | | | | |
| | Investments (net of deferred foreign taxes of $1,663,937 for Local Emerging Markets Debt Fund) | | | 66,959,327 | |
| | Futures contracts | | | 120,714 | |
| | Written options | | | — | |
| | Swap contracts | | | 42,184 | |
| | Unfunded loan commitments | | | — | |
| | Forward foreign currency exchange contracts | | | 4,362,922 | |
| | Foreign currency transactions | | | (94,239 | ) |
| | Net realized and unrealized gain | | | 100,938,501 | |
| | NET INCREASE IN NET ASSETS RESULTING FROM OPERATIONS | | $ | 127,983,731 | |
| | (a) | | Class specific Distribution and Service, and Transfer Agent fees were as follows: |
| | | | | | | | | | | | | | | | | | | | | | | | | | | | | | | | | | | | | | | | | | | | | | | | |
| | | Distribution and Service Fees | | | Transfer Agent Fees | |
Fund | | Class A | | | Class B | | | Class C | | | Class R | | | Class A | | | Class B | | | Class C | | | Institutional | | | Service | | | Separate Account Institutional Shares | | | Class IR | | | Class R | |
Emerging Markets Debt | | $ | 232,911 | | | $ | N/A | | | $ | 173,759 | | | $ | N/A | | | $ | 121,113 | | | $ | N/A | | | $ | 22,589 | | | $ | 209,897 | | | $ | N/A | | | $ | N/A | | | $ | 6,079 | | | | N/A | |
High Yield | | | 773,141 | | | | 143,665 | | | | 545,330 | | | | 44,575 | | | | 402,033 | | | | 18,676 | | | | 70,893 | | | | 1,005,319 | | | | 4,302 | | | | N/A | | | | 22,315 | | | $ | 11,590 | |
High Yield Floating Rate | | | 6,239 | | | | N/A | | | | 3,100 | | | | 26 | | | | 3,244 | | | | N/A | | | | 403 | | | | 136,194 | | | | N/A | | | | N/A | | | | 1,580 | | | | 8 | |
Investment Grade Credit | | | 202,563 | | | | N/A | | | | N/A | | | | N/A | | | | 105,333 | | | | N/A | | | | N/A | | | | 29,473 | | | | N/A | | | | 47,992 | | | | 820 | | | | N/A | |
Local Emerging Markets Debt | | | 210,266 | | | | N/A | | | | 101,914 | | | | N/A | | | | 109,338 | | | | N/A | | | | 13,249 | | | | 333,007 | | | | N/A | | | | N/A | | | | 5,879 | | | | N/A | |
U.S. Mortgages | | | 7,033 | | | | N/A | | | | N/A | | | | N/A | | | | 3,657 | | | | N/A | | | | N/A | | | | 1,997 | | | | N/A | | | | 68,771 | | | | 0 | | | | N/A | |
| | |
| 98 | | The accompanying notes are an integral part of these financial statements. |
GOLDMAN SACHS SINGLE SECTOR FIXED INCOME FUNDS
| | | | | | | | | | | | | | | | | | | | | | | | | | | | |
| | | High Yield Fund | | | | | High Yield
Floating Rate
Fund | | | | | Investment Grade
Credit Fund | | | | | Local Emerging
Markets Debt
Fund | | | | | U.S. Mortgages
Fund | |
| | | | | | | | | | | | | | | | | | | | | | | | | | | | |
| | | $214,277,145 | | | | | $ | 16,748,459 | | | | | $ | 10,760,070 | | | | | $ | 58,674,036 | | | | | $ | 3,671,228 | |
| | | 429,158 | | | | | | — | | | | | | — | | | | | | — | | | | | | — | |
| | | 214,706,303 | | | | | | 16,748,459 | | | | | | 10,760,070 | | | | | | 58,674,036 | | | | | | 3,671,228 | |
| | | | | | | | | | | | | | | | | | | | | | | | | | | | |
| | | | | | | | | | | | | | | | | | | | | | | | | | | | |
| | | 19,023,702 | | | | | | 2,067,069 | | | | | | 1,101,275 | | | | | | 8,380,048 | | | | | | 718,931 | |
| | | 1,506,711 | | | | | | 9,365 | | | | | | 202,563 | | | | | | 312,180 | | | | | | 7,033 | |
| | | 1,535,128 | | | | | | 141,429 | | | | | | 183,618 | | | | | | 461,473 | | | | | | 74,425 | |
| | | 203,212 | | | | | | 118,766 | | | | | | 59,909 | | | | | | 871,561 | | | | | | 99,080 | |
| | | 69,837 | | | | | | 3,245 | | | | | | 5,354 | | | | | | 57,014 | | | | | | 3,142 | |
| | | 59,711 | | | | | | 28,093 | | | | | | 35,384 | | | | | | 44,109 | | | | | | 31,363 | |
| | | 49,711 | | | | | | 60,847 | | | | | | 25,969 | | | | | | 50,725 | | | | | | 49,412 | |
| | | 14,960 | | | | | | 8,154 | | | | | | 7,904 | | | | | | 9,696 | | | | | | 7,721 | |
| | | 26,885 | | | | | | — | | | | | | — | | | | | | — | | | | | | — | |
| | | 26,885 | | | | | | — | | | | | | — | | | | | | — | | | | | | — | |
| | | 77,127 | | | | | | 18,629 | | | | | | 14,031 | | | | | | 30,181 | | | | | | 11,767 | |
| | | 22,593,869 | | | | | | 2,455,597 | | | | | | 1,636,007 | | | | | | 10,216,987 | | | | | | 1,002,874 | |
| | | (3,524 | ) | | | | | (2,534 | ) | | | | | (330,966 | ) | | | | | (1,303,112 | ) | | | | | (321,514 | ) |
| | | 22,590,345 | | | | | | 2,453,063 | | | | | | 1,305,041 | | | | | | 8,913,875 | | | | | | 681,360 | |
| | | 192,115,958 | | | | | | 14,295,396 | | | | | | 9,455,029 | | | | | | 49,760,161 | | | | | | 2,989,868 | |
| | | | | | | | | | | | | | | | | | | | | | | | | | | | |
| | | | | | | | | | | | | | | | | | | | | | | | | | | | |
| | | | | | | | | | | | | | | | | | | | | | | | | | | | |
| | | 48,997,005 | | | | | | 897,036 | | | | | | 11,231,950 | | | | | | 41,452,585 | | | | | | 8,850,428 | |
| | | — | | | | | | — | | | | | | 2,614,025 | | | | | | 41,176 | | | | | | 39,800 | |
| | | (4,446,282 | ) | | | | | — | | | | | | (428,458 | ) | | | | | 4,774,607 | | | | | | (761,275 | ) |
| | | — | | | | | | — | | | | | | — | | | | | | 1,799,588 | | | | | | — | |
| | | 17,561,185 | | | | | | (71,352 | ) | | | | | 58,446 | | | | | | (9,446,268 | ) | | | | | — | |
| | | (12,073,608 | ) | | | | | 1,718 | | | | | | (27,094 | ) | | | | | (38,760,761 | ) | | | | | — | |
| | | | | | | | | | | | | | | | | | | | | | | | | | | | |
| | | 101,250,541 | | | | | | 5,488,923 | | | | | | 12,850,850 | | | | | | 24,495,529 | | | | | | 3,019,433 | |
| | | — | | | | | | — | | | | | | 1,100,986 | | | | | | 82,642 | | | | | | 119,336 | |
| | | — | | | | | | — | | | | | | 178,695 | | | | | | — | | | | | | 122,996 | |
| | | (1,456,241 | ) | | | | | — | | | | | | (397,044 | ) | | | | | 9,541,560 | | | | | | (675,225 | ) |
| | | — | | | | | | 12,000 | | | | | | — | | | | | | — | | | | | | — | |
| | | (2,963,844 | ) | | | | | (31,924 | ) | | | | | — | | | | | | 9,033,170 | | | | | | — | |
| | | 40,987 | | | | | | 470 | | | | | | 28 | | | | | | 223,606 | | | | | | — | |
| | | 146,909,743 | | | | | | 6,296,871 | | | | | | 27,182,384 | | | | | | 43,237,434 | | | | | | 10,715,493 | |
| | | $339,025,701 | | | | | $ | 20,592,267 | | | | | $ | 36,637,413 | | | | | $ | 92,997,595 | | | | | $ | 13,705,361 | |
| | |
| The accompanying notes are an integral part of these financial statements. | | 99 |
GOLDMAN SACHS SINGLE SECTOR FIXED INCOME FUNDS
Statements of Changes in Net Assets
| | | | | | | | | | |
| | | | | Emerging Markets Debt Fund | |
| | | | | For the
Six Months Ended
September 30, 2012
(Unaudited) | | | For the Fiscal
Year Ended
March 31, 2012 | |
| | From operations: | | | | | | | | |
| | Net investment income | | $ | 27,045,230 | | | $ | 33,826,669 | |
| | Net realized gain (loss) | | | 29,547,593 | | | | 22,101,037 | |
| | Net change in unrealized gain (loss) | | | 71,390,908 | | | | 20,076,146 | |
| | Net increase in net assets resulting from operations | | | 127,983,731 | | | | 76,003,852 | |
| | | | | | | | | | |
| | Distributions to shareholders: | | | | | | | | |
| | From net investment income | | | | | | | | |
| | Class A Shares | | | (3,692,710 | ) | | | (7,419,057 | ) |
| | Class B Shares | | | — | | | | — | |
| | Class C Shares | | | (558,607 | ) | | | (1,265,148 | ) |
| | Institutional Shares | | | (22,552,448 | ) | | | (25,181,576 | ) |
| | Service Shares | | | — | | | | — | |
| | Class IR Shares | | | (193,924 | ) | | | (153,928 | ) |
| | Class R Shares | | | — | | | | — | |
| | From net realized gains | | | | | | | | |
| | Class A Shares | | | — | | | | (1,560,111 | ) |
| | Class B Shares | | | — | | | | — | |
| | Class C Shares | | | — | | | | (319,213 | ) |
| | Institutional Shares | | | — | | | | (5,123,466 | ) |
| | Service Shares | | | — | | | | — | |
| | Class IR Shares | | | — | | | | (30,730 | ) |
| | Class R Shares | | | — | | | | — | |
| | Total distributions to shareholders | | | (26,997,689 | ) | | | (41,053,229 | ) |
| | | | | | | | | | |
| | From share transactions: | | | | | | | | |
| | Proceeds from sales of shares | | | 691,917,554 | | | | 504,354,419 | |
| | Reinvestment of distributions | | | 25,155,287 | | | | 35,913,006 | |
| | Cost of shares redeemed | | | (204,393,411 | )(a) | | | (272,787,509 | )(a) |
| | Net increase in net assets resulting from share transactions | | | 512,679,430 | | | | 267,479,916 | |
| | TOTAL INCREASE | | | 613,665,472 | | | | 302,430,539 | |
| | | | | | | | | | |
| | Net assets: | | | | | | | | |
| | Beginning of period | | | 927,997,226 | | | | 625,566,687 | |
| | End of period | | $ | 1,541,662,698 | | | $ | 927,997,226 | |
| | Undistributed (distribution in excess of) net investment income | | $ | (99,184 | ) | | $ | (146,725 | ) |
| | (a) | | Net of $17,675 and $68,823, and $175,799 and $472,241 of redemption fees for Emerging Markets Debt Fund and High Yield Fund, respectively, for the six months ended September 30, 2012 and the fiscal year ended March 31, 2012, respectively. |
| | |
| 100 | | The accompanying notes are an integral part of these financial statements. |
GOLDMAN SACHS SINGLE SECTOR FIXED INCOME FUNDS
| | | | | | | | | | | | | | | | | | | | | | |
| | | High Yield Fund | | | | | High Yield Floating Rate Fund | |
| | | For the
Six Months Ended
September 30, 2012
(Unaudited) | | | | | For the Fiscal
Year Ended
March 31, 2012 | | | | | For the
Six Months Ended
September 30, 2012
(Unaudited) | | | | | For the Fiscal
Year Ended
March 31, 2012 | |
| | | | | | | | | | | | | | | | | | | | | | |
| | $ | 192,115,958 | | | | | $ | 363,205,073 | | | | | $ | 14,295,396 | | | | | $ | 20,109,181 | |
| | | 50,038,300 | | | | | | 128,333,718 | | | | | | 827,402 | | | | | | (7,154,056 | ) |
| | | 96,871,443 | | | | | | (209,743,734 | ) | | | | | 5,469,469 | | | | | | 2,677,122 | |
| | | 339,025,701 | | | | | | 281,795,057 | | | | | | 20,592,267 | | | | | | 15,632,247 | |
| | | | | | | | | | | | | | | | | | | | | | |
| | | | | | | | | | | | | | | | | | | | | | |
| | | | | | | | | | | | | | | | | | | | | | |
| | | (19,481,876 | ) | | | | | (51,331,235 | ) | | | | | (94,768 | ) | | | | | (46,110 | ) |
| | | (798,245 | ) | | | | | (2,336,337 | ) | | | | | — | | | | | | — | |
| | | (3,026,821 | ) | | | | | (6,763,672 | ) | | | | | (9,553 | ) | | | | | (6,367 | ) |
| | | (166,834,482 | ) | | | | | (302,558,763 | ) | | | | | (14,146,011 | ) | | | | | (20,066,322 | ) |
| | | (660,073 | ) | | | | | (1,446,006 | ) | | | | | — | | | | | | — | |
| | | (1,125,329 | ) | | | | | (1,858,651 | ) | | | | | (50,888 | ) | | | | | (7,042 | ) |
| | | (539,271 | ) | | | | | (993,976 | ) | | | | | (183 | ) | | | | | (286 | ) |
| | | | | | | | | | | | | | | | | | | | | | |
| | | — | | | | | | (6,666,898 | ) | | | | | — | | | | | | — | |
| | | — | | | | | | (339,850 | ) | | | | | — | | | | | | — | |
| | | — | | | | | | (1,039,980 | ) | | | | | — | | | | | | — | |
| | | — | | | | | | (41,862,692 | ) | | | | | — | | | | | | — | |
| | | — | | | | | | (193,678 | ) | | | | | — | | | | | | — | |
| | | — | | | | | | (354,064 | ) | | | | | — | | | | | | — | |
| | | — | | | | | | (149,934 | ) | | | | | — | | | | | | — | |
| | | (192,466,097 | ) | | | | | (417,895,736 | ) | | | | | (14,301,403 | ) | | | | | (20,126,127 | ) |
| | | | | | | | | | | | | | | | | | | | | | |
| | | | | | | | | | | | | | | | | | | | | | |
| | | 697,556,179 | | | | | | 2,455,344,528 | | | | | | 170,906,678 | | | | | | 750,108,937 | |
| | | 183,220,505 | | | | | | 382,426,525 | | | | | | 14,225,566 | | | | | | 20,029,479 | |
| | | (856,309,306 | )(a) | | | | | (2,423,711,185 | )(a) | | | | | (89,073,103 | ) | | | | | (236,979,071 | ) |
| | | 24,467,378 | | | | | | 414,059,868 | | | | | | 96,059,141 | | | | | | 533,159,345 | |
| | | 171,026,982 | | | | | | 277,959,189 | | | | | | 102,350,005 | | | | | | 528,665,465 | |
| | | | | | | | | | | | | | | | | | | | | | |
| | | | | | | | | | | | | | | | | | | | | | |
| | | 5,833,090,280 | | | | | | 5,555,131,091 | | | | | | 647,522,402 | | | | | | 118,856,937 | |
| | $ | 6,004,117,262 | | | | | $ | 5,833,090,280 | | | | | $ | 749,872,407 | | | | | $ | 647,522,402 | |
| | $ | 1,218,687 | | | | | $ | 1,568,826 | | | | | $ | 129,741 | | | | | $ | 135,748 | |
| | |
| The accompanying notes are an integral part of these financial statements. | | 101 |
GOLDMAN SACHS SINGLE SECTOR FIXED INCOME FUNDS
Statements of Changes in Net Assets (continued)
| | | | | | | | | | |
| | | | | Investment Grade Credit Fund | |
| | | | | For the
Six Months Ended September 30, 2012
(Unaudited) | | | For the Fiscal
Year Ended
March 31, 2012 | |
| | From operations: | | | | | | | | |
| | Net investment income | | $ | 9,455,029 | | | $ | 21,607,631 | |
| | Net realized gain (loss) | | | 13,448,869 | | | | 20,197,705 | |
| | Net change in unrealized gain (loss) | | | 13,733,515 | | | | 7,806,065 | |
| | Net increase in net assets resulting from operations | | | 36,637,413 | | | | 49,611,401 | |
| | | | | | | | | | |
| | Distributions to shareholders: | | | | | | | | |
| | From net investment income | | | | | | | | |
| | Class A Shares | | | (2,660,502 | ) | | | (5,503,699 | ) |
| | Class C Shares | | | — | | | | — | |
| | Institutional Shares | | | (2,674,860 | ) | | | (6,105,722 | ) |
| | Separate Account Institutional Shares | | | (4,357,975 | ) | | | (10,042,509 | ) |
| | Class IR(a) | | | (22,430 | ) | | | (19,329 | ) |
| | From net realized gains | | | | | | | | |
| | Class A Shares | | | — | | | | (6,866,316 | ) |
| | Class C Shares | | | — | | | | — | |
| | Institutional Shares | | | — | | | | (7,226,774 | ) |
| | Separate Account Institutional Shares | | | — | | | | (11,883,193 | ) |
| | Class IR(a) | | | — | | | | (33,799 | ) |
| | Total distributions to shareholders | | | (9,715,767 | ) | | | (47,681,341 | ) |
| | | | | | | | | | |
| | From share transactions: | | | | | | | | |
| | Proceeds from sales of shares | | | 74,826,282 | | | | 162,548,214 | |
| | Reinvestment of distributions | | | 8,921,146 | | | | 44,020,198 | |
| | Cost of shares redeemed | | | (106,641,411 | ) | | | (204,145,826 | ) |
| | Net increase (decrease) in net assets resulting from share transactions | | | (22,893,983 | ) | | | 2,422,586 | |
| | TOTAL INCREASE (DECREASE) | | | 4,027,663 | | | | 4,352,646 | |
| | | | | | | | | | |
| | Net assets: | | | | | | | | |
| | Beginning of period | | | 558,136,018 | | | | 553,783,372 | |
| | End of period | | $ | 562,163,681 | | | $ | 558,136,018 | |
| | Undistributed (distribution in excess of) net investment income | | $ | (118,934 | ) | | $ | 141,804 | |
| | (a) | | Commenced operations on July 29, 2011 for Investment Grade Credit and U.S. Mortgages Funds. |
| | (b) | | Net of $15,115 and $95,667 of redemption fees for Local Emerging Markets Debt Fund for the six months ended September 30, 2012 and the fiscal year ended March 31, 2012, respectively. |
| | |
| 102 | | The accompanying notes are an integral part of these financial statements. |
GOLDMAN SACHS SINGLE SECTOR FIXED INCOME FUNDS
| | | | | | | | | | | | | | | | | | | | | | |
| | Local Emerging Markets Debt Fund | | | | | U.S. Mortgages Fund | |
| | | For the
Six Months Ended
September 30, 2012 (Unaudited) | | | | | For the Fiscal
Year Ended
March 31, 2012 | | | | | For the
Six Months Ended
September 30, 2012
(Unaudited) | | | | | For the Fiscal
Year Ended
March 31, 2012 | |
| | | | | | | | | | | | | | | | | | | | | | |
| | $ | 49,760,161 | | | | | $ | 94,974,508 | | | | | $ | 2,989,868 | | | | | $ | 7,574,023 | |
| | | (139,073 | ) | | | | | 6,494,477 | | | | | | 8,128,953 | | | | | | 14,862,188 | |
| | | 43,376,507 | | | | | | (62,999,408 | ) | | | | | 2,586,540 | | | | | | 368,710 | |
| | | 92,997,595 | | | | | | 38,469,577 | | | | | | 13,705,361 | | | | | | 22,804,921 | |
| | | | | | | | | | | | | | | | | | | | | | |
| | | | | | | | | | | | | | | | | | | | | | |
| | | | | | | | | | | | | | | | | | | | | | |
| | | (4,245,842 | ) | | | | | (26,688,249 | ) | | | | | (56,306 | ) | | | | | (105,142 | ) |
| | | (436,201 | ) | | | | | (776,991 | ) | | | | | — | | | | | | — | |
| | | (44,573,158 | ) | | | | | (66,428,614 | ) | | | | | (117,793 | ) | | | | | (512,539 | ) |
| | | — | | | | | | — | | | | | | (4,023,119 | ) | | | | | (8,517,765 | ) |
| | | (236,332 | ) | | | | | (566,334 | ) | | | | | (13 | ) | | | | | (17 | ) |
| | | | | | | | | | | | | | | | | | | | | | |
| | | — | | | | | | (542,226 | ) | | | | | — | | | | | | — | |
| | | — | | | | | | (58,118 | ) | | | | | — | | | | | | — | |
| | | — | | | | | | (4,360,226 | ) | | | | | — | | | | | | — | |
| | | — | | | | | | — | | | | | | — | | | | | | — | |
| | | — | | | | | | (35,990 | ) | | | | | — | | | | | | — | |
| | | (49,491,533 | ) | | | | | (99,456,748 | ) | | | | | (4,197,231 | ) | | | | | (9,135,463 | ) |
| | | | | | | | | | | | | | | | | | | | | | |
| | | | | | | | | | | | | | | | | | | | | | |
| | | 508,134,043 | | | | | | 1,533,231,594 | | | | | | 147,499,252 | | | | | | 139,367,531 | |
| | | 47,144,043 | | | | | | 94,573,729 | | | | | | 3,387,124 | | | | | | 7,266,788 | |
| | | (268,321,667 | )(b) | | | | | (1,915,056,791 | )(b) | | | | | (269,735,185 | ) | | | | | (177,485,217 | ) |
| | | 286,956,419 | | | | | | (287,251,468 | ) | | | | | (118,848,809 | ) | | | | | (30,850,898 | ) |
| | | 330,462,481 | | | | | | (348,238,639 | ) | | | | | (109,340,679 | ) | | | | | (17,181,440 | ) |
| | | | | | | | | | | | | | | | | | | | | | |
| | | | | | | | | | | | | | | | | | | | | | |
| | | 1,780,559,190 | | | | | | 2,128,797,829 | | | | | | 390,872,355 | | | | | | 408,053,795 | |
| | $ | 2,111,021,671 | | | | | $ | 1,780,559,190 | | | | | $ | 281,531,676 | | | | | $ | 390,872,355 | |
| | $ | (22,126,953 | ) | | | | $ | (22,395,581 | ) | | | | $ | (1,120,208 | ) | | | | $ | 87,155 | |
| | |
| The accompanying notes are an integral part of these financial statements. | | 103 |
GOLDMAN SACHS EMERGING MARKETS DEBT FUND
Financial Highlights
Selected Data for a Share Outstanding Throughout Each Period
| | | | | | | | | | | | | | | | | | | | | | | | | | | | | | |
| | | | | | | | Income (loss) from
investment operations | | | Distributions
to shareholders | |
| | | Year - Share Class | | Net asset
value,
beginning
of period | | | Net
investment
income(a) | | | Net realized
and unrealized
gain (loss) | | | Total from
investment
operations | | | From net
investment
income | | | From net
realized
gains | | | Total
distributions | |
| | FOR THE SIX MONTHS ENDED SEPTEMBER 30, (UNAUDITED) | |
| | 2012 - A | | $ | 12.95 | | | $ | 0.26 | | | $ | 0.93 | | | $ | 1.19 | | | $ | (0.26 | ) | | $ | — | | | $ | (0.26 | ) |
| | 2012 - C | | | 12.94 | | | | 0.21 | | | | 0.93 | | | | 1.14 | | | | (0.21 | ) | | | — | | | | (0.21 | ) |
| | 2012 - Institutional | | | 12.96 | | | | 0.29 | | | | 0.93 | | | | 1.22 | | | | (0.29 | ) | | | — | | | | (0.29 | ) |
| | 2012 - IR | | | 12.96 | | | | 0.28 | | | | 0.93 | | | | 1.21 | | | | (0.28 | ) | | | — | | | | (0.28 | ) |
| | | | | | | | | | | | | | | | | | | | | | | | | | | | | | |
| | FOR THE FISCAL YEARS ENDED MARCH 31, | |
| | 2012 - A | | | 12.28 | | | | 0.61 | | | | 0.81 | | | | 1.42 | | | | (0.61 | ) | | | (0.14 | ) | | | (0.75 | ) |
| | 2012 - C | | | 12.27 | | | | 0.52 | | | | 0.80 | | | | 1.32 | | | | (0.51 | ) | | | (0.14 | ) | | | (0.65 | ) |
| | 2012 - Institutional | | | 12.29 | | | | 0.65 | | | | 0.81 | | | | 1.46 | | | | (0.65 | ) | | | (0.14 | ) | | | (0.79 | ) |
| | 2012 - IR | | | 12.29 | | | | 0.63 | | | | 0.82 | | | | 1.45 | | | | (0.64 | ) | | | (0.14 | ) | | | (0.78 | ) |
| | 2011 - A | | | 11.99 | | | | 0.59 | | | | 0.42 | | | | 1.01 | | | | (0.71 | ) | | | (0.01 | ) | | | (0.72 | ) |
| | 2011 - C | | | 11.98 | | | | 0.49 | | | | 0.43 | | | | 0.92 | | | | (0.62 | ) | | | (0.01 | ) | | | (0.63 | ) |
| | 2011 - Institutional | | | 12.00 | | | | 0.63 | | | | 0.42 | | | | 1.05 | | | | (0.75 | ) | | | (0.01 | ) | | | (0.76 | ) |
| | 2011 - IR (Commenced July 30, 2010) | | | 12.44 | | | | 0.41 | | | | (0.04 | ) | | | 0.37 | | | | (0.51 | ) | | | (0.01 | ) | | | (0.52 | ) |
| | 2010 - A | | | 9.19 | | | | 0.70 | | | | 2.96 | | | | 3.66 | | | | (0.86 | ) | | | — | | | | (0.86 | ) |
| | 2010 - C | | | 9.16 | | | | 0.61 | | | | 2.99 | | | | 3.60 | | | | (0.78 | ) | | | — | | | | (0.78 | ) |
| | 2010 - Institutional | | | 9.20 | | | | 0.74 | | | | 2.96 | | | | 3.70 | | | | (0.90 | ) | | | — | | | | (0.90 | ) |
| | 2009 - A | | | 11.63 | | | | 0.68 | | | | (2.50 | ) | | | (1.82 | ) | | | (0.57 | ) | | | (0.05 | ) | | | (0.62 | ) |
| | 2009 - C | | | 11.60 | | | | 0.60 | | | | (2.50 | ) | | | (1.90 | ) | | | (0.49 | ) | | | (0.05 | ) | | | (0.54 | ) |
| | 2009 - Institutional | | | 11.63 | | | | 0.72 | | | | (2.50 | ) | | | (1.78 | ) | | | (0.60 | ) | | | (0.05 | ) | | | (0.65 | ) |
| | | | | | | | | | | | | | | | | | | | | | | | | | | | | | |
| | FOR THE PERIOD NOVEMBER 1, 2007 TO MARCH 31, 2008* | |
| | 2008 - A | | | 12.16 | | | | 0.30 | | | | (0.37 | ) | | | (0.07 | ) | | | (0.31 | ) | | | (0.15 | ) | | | (0.46 | ) |
| | 2008 - C | | | 12.14 | | | | 0.25 | | | | (0.36 | ) | | | (0.11 | ) | | | (0.28 | ) | | | (0.15 | ) | | | (0.43 | ) |
| | 2008 - Institutional | | | 12.17 | | | | 0.32 | | | | (0.38 | ) | | | (0.06 | ) | | | (0.33 | ) | | | (0.15 | ) | | | (0.48 | ) |
| | | | | | | | | | | | | | | | | | | | | | | | | | | | | | |
| | FOR THE FISCAL YEAR ENDED OCTOBER 31, | |
| | 2007 - A | | | 11.98 | | | | 0.63 | | | | 0.38 | | | | 1.01 | | | | (0.62 | ) | | | (0.21 | ) | | | (0.83 | ) |
| | 2007 - C | | | 11.97 | | | | 0.53 | | | | 0.38 | | | | 0.91 | | | | (0.53 | ) | | | (0.21 | ) | | | (0.74 | ) |
| | 2007 - Institutional | | | 11.99 | | | | 0.67 | | | | 0.39 | | | | 1.06 | | | | (0.67 | ) | | | (0.21 | ) | | | (0.88 | ) |
| | * | | The Fund changed its fiscal year end from October 31 to March 31. |
| | (a) | | Calculated based on the average shares outstanding methodology. |
| | (b) | | Assumes investment at the net asset value at the beginning of the period, reinvestment of all dividends and distributions, a complete redemption of the investment at the net asset value at the end of the period and no sales or redemption charges. Total returns would be reduced if a sales or redemption charge was taken into account. Returns do not reflect the deduction of taxes that a shareholder would pay on Fund distributions or the redemption of Fund shares. Total returns for periods less than one full year are not annualized. |
| | (c) | | The Fund’s portfolio turnover rate is calculated in accordance with regulatory requirements, without regard to transactions involving short term investments and certain derivatives. If such transactions were included, the Fund’s portfolio turnover rate may be higher. |
| | (e) | | Portfolio turnover rates exclude portfolio securities received as a result of in-kind subscriptions. |
| | |
| 104 | | The accompanying notes are an integral part of these financial statements. |
GOLDMAN SACHS EMERGING MARKETS DEBT FUND
| | | | | | | | | | | | | | | | | | | | | | | | | | | | | | | | | | | | | | | | |
| | | | | | | | | | | | | | | | | | | | | | | | | | | | | | | | | | |
| | | Net asset
value, end
of period | | | | | Total
return(b) | | | | | Net assets,
end of
period
(in 000s) | | | | | Ratio of
net expenses
to average
net assets | | | | | Ratio of
total expenses
to average
net assets | | | | | Ratio of
net investment
income
to average
net assets | | | | | Portfolio
turnover
rate(c) | |
| | | | | | | | | | | | | | | | | | | | | | | | | | | | | | | | | | | | | | | | |
| | $ | 13.88 | | | | | | 9.33 | % | | | | $ | 216,746 | | | | | | 1.22 | %(d) | | | | | 1.25 | %(d) | | | | | 3.96 | %(d) | | | | | 43 | % |
| | | 13.87 | | | | | | 8.93 | | | | | | 40,588 | | | | | | 1.97 | (d) | | | | | 2.00 | (d) | | | | | 3.21 | (d) | | | | | 43 | |
| | | 13.89 | | | | | | 9.51 | | | | | | 1,271,347 | | | | | | 0.88 | (d) | | | | | 0.91 | (d) | | | | | 4.28 | (d) | | | | | 43 | |
| | | 13.89 | | | | | | 9.46 | | | | | | 12,981 | | | | | | 0.97 | (d) | | | | | 1.00 | (d) | | | | | 4.12 | (d) | | | | | 43 | |
| | | | | | | | | | | | | | | | | | | | | | | | | | | | | | | | | | | | | | | | |
| | | | | | | | | | | | | | | | | | | | | | | | | | | | | | | | | | | | | | | | |
| | | 12.95 | | | | | | 11.87 | | | | | | 169,491 | | | | | | 1.22 | | | | | | 1.27 | | | | | | 4.84 | | | | | | 86 | |
| | | 12.94 | | | | | | 11.05 | | | | | | 31,893 | | | | | | 1.97 | | | | | | 2.02 | | | | | | 4.11 | | | | | | 86 | |
| | | 12.96 | | | | | | 12.24 | | | | | | 720,098 | | | | | | 0.88 | | | | | | 0.93 | | | | | | 5.18 | | | | | | 86 | |
| | | 12.96 | | | | | | 12.14 | | | | | | 6,515 | | | | | | 0.97 | | | | | | 1.02 | | | | | | 5.05 | | | | | | 86 | |
| | | 12.28 | | | | | | 8.46 | | | | | | 156,901 | | | | | | 1.22 | | | | | | 1.29 | | | | | | 4.75 | | | | | | 116 | (e) |
| | | 12.27 | | | | | | 7.65 | | | | | | 31,205 | | | | | | 1.97 | | | | | | 2.04 | | | | | | 4.00 | | | | | | 116 | (e) |
| | | 12.29 | | | | | | 8.82 | | | | | | 436,068 | | | | | | 0.88 | | | | | | 0.95 | | | | | | 5.12 | | | | | | 116 | (e) |
| | | 12.29 | | | | | | 2.96 | | | | | | 1,392 | | | | | | 0.97 | (d) | | | | | 1.05 | (d) | | | | | 4.96 | (d) | | | | | 116 | (e) |
| | | 11.99 | | | | | | 40.98 | | | | | | 105,352 | | | | | | 1.22 | | | | | | 1.31 | | | | | | 6.27 | | | | | | 121 | |
| | | 11.98 | | | | | | 40.28 | | | | | | 10,629 | | | | | | 1.97 | | | | | | 2.06 | | | | | | 5.41 | | | | | | 121 | |
| | | 12.00 | | | | | | 41.42 | | | | | | 278,030 | | | | | | 0.88 | | | | | | 0.97 | | | | | | 6.63 | | | | | | 121 | |
| | | 9.19 | | | | | | (15.89 | ) | | | | | 40,814 | | | | | | 1.22 | | | | | | 1.44 | | | | | | 6.58 | | | | | | 132 | |
| | | 9.16 | | | | | | (16.57 | ) | | | | | 1,661 | | | | | | 1.97 | | | | | | 2.19 | | | | | | 5.97 | | | | | | 132 | |
| | | 9.20 | | | | | | (15.59 | ) | | | | | 109,375 | | | | | | 0.88 | | | | | | 1.10 | | | | | | 7.03 | | | | | | 132 | |
| | | | | | | | | | | | | | | | | | | | | | | | | | | | | | | | | | | | | | | | |
| | | | | | | | | | | | | | | | | | | | | | | | | | | | | | | | | | | | | | | | |
| | | 11.63 | | | | | | (0.51 | ) | | | | | 87,818 | | | | | | 1.21 | (d) | | | | | 1.36 | (d) | | | | | 6.03 | (d) | | | | | 41 | |
| | | 11.60 | | | | | | (0.82 | ) | | | | | 1,890 | | | | | | 1.96 | (d) | | | | | 2.11 | (d) | | | | | 5.20 | (d) | | | | | 41 | |
| | | 11.63 | | | | | | (0.37 | ) | | | | | 145,067 | | | | | | 0.87 | (d) | | | | | 1.02 | (d) | | | | | 6.51 | (d) | | | | | 41 | |
| | | | | | | | | | | | | | | | | | | | | | | | | | | | | | | | | | | | | | | | |
| | | | | | | | | | | | | | | | | | | | | | | | | | | | | | | | | | | | | | | | |
| | | 12.16 | | | | | | 8.86 | | | | | | 84,661 | | | | | | 1.23 | | | | | | 1.38 | | | | | | 5.23 | | | | | | 81 | |
| | | 12.14 | | | | | | 7.80 | | | | | | 995 | | | | | | 1.98 | | | | | | 2.13 | | | | | | 4.64 | | | | | | 81 | |
| | | 12.17 | | | | | | 9.25 | | | | | | 188,311 | | | | | | 0.87 | | | | | | 1.02 | | | | | | 5.68 | | | | | | 81 | |
| | |
| The accompanying notes are an integral part of these financial statements. | | 105 |
GOLDMAN SACHS HIGH YIELD FUND
Financial Highlights
Selected Data for a Share Outstanding Throughout Each Period
| | | | | | | | | | | | | | | | | | | | | | | | | | | | | | |
| | | | | | | | Income (loss) from
investment operations | | | Distributions
to shareholders | |
| | | Year - Share Class | | Net asset
value,
beginning
of period | | | Net
investment
income(a) | | | Net realized
and unrealized
gain (loss) | | | Total from
investment
operations | | | From net
investment
income | | | From net
realized
gains | | | Total
distributions | |
| | FOR THE SIX MONTHS ENDED SEPTEMBER 30, (UNAUDITED) | |
| | 2012 - A | | $ | 7.12 | | | $ | 0.23 | | | $ | 0.18 | | | $ | 0.41 | | | $ | (0.23 | ) | | $ | — | | | $ | (0.23 | ) |
| | 2012 - B | | | 7.13 | | | | 0.20 | | | | 0.18 | | | | 0.38 | | | | (0.20 | ) | | | — | | | | (0.20 | ) |
| | 2012 - C | | | 7.13 | | | | 0.20 | | | | 0.18 | | | | 0.38 | | | | (0.20 | ) | | | — | | | | (0.20 | ) |
| | 2012 - Institutional | | | 7.14 | | | | 0.24 | | | | 0.18 | | | | 0.42 | | | | (0.24 | ) | | | — | | | | (0.24 | ) |
| | 2012 - Service | | | 7.11 | | | | 0.22 | | | | 0.18 | | | | 0.40 | | | | (0.22 | ) | | | — | | | | (0.22 | ) |
| | 2012 - IR | | | 7.13 | | | | 0.24 | | | | 0.18 | | | | 0.42 | | | | (0.24 | ) | | | — | | | | (0.24 | ) |
| | 2012 - R | | | 7.12 | | | | 0.22 | | | | 0.18 | | | | 0.40 | | | | (0.22 | ) | | | — | | | | (0.22 | ) |
| | | | | | | | | | | | | | | | | | | | | | | | | | | | | | |
| | FOR THE FISCAL YEARS ENDED MARCH 31, | |
| | 2012 - A | | | 7.38 | | | | 0.49 | | | | (0.18 | ) | | | 0.31 | | | | (0.50 | ) | | | (0.07 | ) | | | (0.57 | ) |
| | 2012 - B | | | 7.40 | | | | 0.44 | | | | (0.19 | ) | | | 0.25 | | | | (0.45 | ) | | | (0.07 | ) | | | (0.52 | ) |
| | 2012 - C | | | 7.39 | | | | 0.44 | | | | (0.19 | ) | | | 0.25 | | | | (0.44 | ) | | | (0.07 | ) | | | (0.51 | ) |
| | 2012 - Institutional | | | 7.40 | | | | 0.51 | | | | (0.18 | ) | | | 0.33 | | | | (0.52 | ) | | | (0.07 | ) | | | (0.59 | ) |
| | 2012 - Service | | | 7.38 | | | | 0.48 | | | | (0.19 | ) | | | 0.29 | | | | (0.49 | ) | | | (0.07 | ) | | | (0.56 | ) |
| | 2012 - IR | | | 7.39 | | | | 0.50 | | | | (0.17 | ) | | | 0.33 | | | | (0.52 | ) | | | (0.07 | ) | | | (0.59 | ) |
| | 2012 - R | | | 7.38 | | | | 0.47 | | | | (0.18 | ) | | | 0.29 | | | | (0.48 | ) | | | (0.07 | ) | | | (0.55 | ) |
| | 2011 - A | | | 7.07 | | | | 0.55 | | | | 0.30 | | | | 0.85 | | | | (0.54 | ) | | | — | | | | (0.54 | ) |
| | 2011 - B | | | 7.08 | | | | 0.49 | | | | 0.32 | | | | 0.81 | | | | (0.49 | ) | | | — | | | | (0.49 | ) |
| | 2011 - C | | | 7.08 | | | | 0.49 | | | | 0.31 | | | | 0.80 | | | | (0.49 | ) | | | — | | | | (0.49 | ) |
| | 2011 - Institutional | | | 7.09 | | | | 0.57 | | | | 0.31 | | | | 0.88 | | | | (0.57 | ) | | | — | | | | (0.57 | ) |
| | 2011 - Service | | | 7.06 | | | | 0.53 | | | | 0.32 | | | | 0.85 | | | | (0.53 | ) | | | — | | | | (0.53 | ) |
| | 2011 - IR | | | 7.07 | | | | 0.56 | | | | 0.32 | | | | 0.88 | | | | (0.56 | ) | | | — | | | | (0.56 | ) |
| | 2011 - R | | | 7.07 | | | | 0.53 | | | | 0.31 | | | | 0.84 | | | | (0.53 | ) | | | — | | | | (0.53 | ) |
| | 2010 - A | | | 5.18 | | | | 0.53 | | | | 1.90 | | | | 2.43 | | | | (0.54 | ) | | | — | | | | (0.54 | ) |
| | 2010 - B | | | 5.18 | | | | 0.49 | | | | 1.90 | | | | 2.39 | | | | (0.49 | ) | | | — | | | | (0.49 | ) |
| | 2010 - C | | | 5.18 | | | | 0.49 | | | | 1.90 | | | | 2.39 | | | | (0.49 | ) | | | — | | | | (0.49 | ) |
| | 2010 - Institutional | | | 5.19 | | | | 0.56 | | | | 1.91 | | | | 2.47 | | | | (0.57 | ) | | | — | | | | (0.57 | ) |
| | 2010 - Service | | | 5.17 | | | | 0.53 | | | | 1.89 | | | | 2.42 | | | | (0.53 | ) | | | — | | | | (0.53 | ) |
| | 2010 - IR | | | 5.18 | | | | 0.55 | | | | 1.90 | | | | 2.45 | | | | (0.56 | ) | | | — | | | | (0.56 | ) |
| | 2010 - R | | | 5.17 | | | | 0.52 | | | | 1.91 | | | | 2.43 | | | | (0.53 | ) | | | — | | | | (0.53 | ) |
| | 2009 - A | | | 7.12 | | | | 0.55 | | | | (1.92 | ) | | | (1.37 | ) | | | (0.57 | ) | | | — | | | | (0.57 | ) |
| | 2009 - B | | | 7.13 | | | | 0.51 | | | | (1.94 | ) | | | (1.43 | ) | | | (0.52 | ) | | | — | | | | (0.52 | ) |
| | 2009 - C | | | 7.12 | | | | 0.51 | | | | (1.93 | ) | | | (1.42 | ) | | | (0.52 | ) | | | — | | | | (0.52 | ) |
| | 2009 - Institutional | | | 7.13 | | | | 0.57 | | | | (1.92 | ) | | | (1.35 | ) | | | (0.59 | ) | | | — | | | | (0.59 | ) |
| | 2009 - Service | | | 7.12 | | | | 0.54 | | | | (1.93 | ) | | | (1.39 | ) | | | (0.56 | ) | | | — | | | | (0.56 | ) |
| | 2009 - IR | | | 7.12 | | | | 0.57 | | | | (1.93 | ) | | | (1.36 | ) | | | (0.58 | ) | | | — | | | | (0.58 | ) |
| | 2009 - R | | | 7.12 | | | | 0.53 | | | | (1.93 | ) | | | (1.40 | ) | | | (0.55 | ) | | | — | | | | (0.55 | ) |
| | | | | | | | | | | | | | | | | | | | | | | | | | | | | | |
| | FOR THE PERIOD NOVEMBER 1, 2007 TO MARCH 31, 2008* | |
| | 2008 - A | | | 7.93 | | | | 0.24 | | | | (0.78 | ) | | | (0.54 | ) | | | (0.27 | ) | | | — | | | | (0.27 | ) |
| | 2008 - B | | | 7.94 | | | | 0.22 | | | | (0.79 | ) | | | (0.57 | ) | | | (0.24 | ) | | | — | | | | (0.24 | ) |
| | 2008 - C | | | 7.93 | | | | 0.22 | | | | (0.79 | ) | | | (0.57 | ) | | | (0.24 | ) | | | — | | | | (0.24 | ) |
| | 2008 - Institutional | | | 7.94 | | | | 0.25 | | | | (0.78 | ) | | | (0.53 | ) | | | (0.28 | ) | | | — | | | | (0.28 | ) |
| | 2008 - Service | | | 7.92 | | | | 0.24 | | | | (0.78 | ) | | | (0.54 | ) | | | (0.26 | ) | | | — | | | | (0.26 | ) |
| | 2008 - IR (Commenced November 30, 2007) | | | 7.68 | | | | 0.20 | | | | (0.54 | ) | | | (0.34 | ) | | | (0.22 | ) | | | — | | | | (0.22 | ) |
| | 2008 - R (Commenced November 30, 2007) | | | 7.68 | | | | 0.19 | | | | (0.54 | ) | | | (0.35 | ) | | | (0.21 | ) | | | — | | | | (0.21 | ) |
| | | | | | | | | | | | | | | | | | | | | | | | | | | | | | |
| | FOR THE FISCAL YEAR ENDED OCTOBER 31, | |
| | 2007 - A | | | 8.04 | | | | 0.60 | | | | (0.10 | ) | | | 0.50 | | | | (0.61 | ) | | | — | | | | (0.61 | ) |
| | 2007 - B | | | 8.05 | | | | 0.54 | | | | (0.10 | ) | | | 0.44 | | | | (0.55 | ) | | | — | | | | (0.55 | ) |
| | 2007 - C | | | 8.04 | | | | 0.54 | | | | (0.10 | ) | | | 0.44 | | | | (0.55 | ) | | | — | | | | (0.55 | ) |
| | 2007 - Institutional | | | 8.05 | | | | 0.63 | | | | (0.10 | ) | | | 0.53 | | | | (0.64 | ) | | | — | | | | (0.64 | ) |
| | 2007 - Service | | | 8.03 | | | | 0.59 | | | | (0.10 | ) | | | 0.49 | | | | (0.60 | ) | | | — | | | | (0.60 | ) |
| | * | | The Fund changed its fiscal year end from October 31 to March 31. |
| | (a) | | Calculated based on the average shares outstanding methodology. |
| | (b) | | Assumes investment at the net asset value at the beginning of the period, reinvestment of all dividends and distributions, a complete redemption of the investment at the net asset value at the end of the period and no sales or redemption charges. Total returns would be reduced if a sales or redemption charge was taken into account. Returns do not reflect the deduction of taxes that a shareholder would pay on Fund distributions or the redemption of Fund shares. Total returns for periods less than one full year are not annualized. |
| | (c) | | The Fund’s portfolio turnover rate is calculated in accordance with regulatory requirements, without regard to transactions involving short term investments and certain derivatives. If such transactions were included, the Fund’s portfolio turnover rate may be higher. |
| | |
| 106 | | The accompanying notes are an integral part of these financial statements. |
GOLDMAN SACHS HIGH YIELD FUND
| | | | | | | | | | | | | | | | | | | | | | | | | | | | | | | | | | | | | | | | |
| | | | | | | | | | | | | | | | | | | | | | | | | | | | | | | | | | |
| | | Net asset
value, end
of period | | | | | Total
return(b) | | | | | Net assets,
end of
period
(in 000s) | | | | | Ratio of
net expenses
to average
net assets | | | | | Ratio of
total expenses
to average
net assets | | | | | Ratio of
net investment
income
to average
net assets | | | | | Portfolio
turnover
rate(c) | |
| | | | | | | | | | | | | | | | | | | | | | | | | | | | | | | | | | | | | | | | |
| | $ | 7.30 | | | | | | 5.80 | % | | | | $ | 609,982 | | | | | | 1.05 | %(d) | | | | | 1.05 | %(d) | | | | | 6.29 | %(d) | | | | | 29 | % |
| | | 7.31 | | | | | | 5.55 | | | | | | 26,142 | | | | | | 1.80 | (d) | | | | | 1.80 | (d) | | | | | 5.55 | (d) | | | | | 29 | |
| | | 7.31 | | | | | | 5.40 | | | | | | 110,316 | | | | | | 1.80 | (d) | | | | | 1.80 | (d) | | | | | 5.54 | (d) | | | | | 29 | |
| | | 7.32 | | | | | | 5.97 | | | | | | 5,185,168 | | | | | | 0.71 | (d) | | | | | 0.71 | (d) | | | | | 6.63 | (d) | | | | | 29 | |
| | | 7.29 | | | | | | 5.86 | | | | | | 21,106 | | | | | | 1.21 | (d) | | | | | 1.21 | (d) | | | | | 6.13 | (d) | | | | | 29 | |
| | | 7.31 | | | | | | 6.07 | | | | | | 32,617 | | | | | | 0.80 | (d) | | | | | 0.80 | (d) | | | | | 6.54 | (d) | | | | | 29 | |
| | | 7.30 | | | | | | 5.67 | | | | | | 18,785 | | | | | | 1.30 | (d) | | | | | 1.30 | (d) | | | | | 6.03 | (d) | | | | | 29 | |
| | | | | | | | | | | | | | | | | | | | | | | | | | | | | | | | | | | | | | | | |
| | | | | | | | | | | | | | | | | | | | | | | | | | | | | | | | | | | | | | | | |
| | | 7.12 | | | | | | 4.53 | | | | | | 630,049 | | | | | | 1.06 | | | | | | 1.06 | | | | | | 6.97 | | | | | | 71 | |
| | | 7.13 | | | | | | 3.62 | | | | | | 30,572 | | | | | | 1.81 | | | | | | 1.81 | | | | | | 6.24 | | | | | | 71 | |
| | | 7.13 | | | | | | 3.76 | | | | | | 108,682 | | | | | | 1.81 | | | | | | 1.81 | | | | | | 6.21 | | | | | | 71 | |
| | | 7.14 | | | | | | 4.89 | | | | | | 4,988,221 | | | | | | 0.72 | | | | | | 0.72 | | | | | | 7.25 | | | | | | 71 | |
| | | 7.11 | | | | | | 4.22 | | | | | | 21,420 | | | | | | 1.22 | | | | | | 1.22 | | | | | | 6.81 | | | | | | 71 | |
| | | 7.13 | | | | | | 4.79 | | | | | | 37,059 | | | | | | 0.81 | | | | | | 0.81 | | | | | | 7.13 | | | | | | 71 | |
| | | 7.12 | | | | | | 4.28 | | | | | | 17,087 | | | | | | 1.31 | | | | | | 1.31 | | | | | | 6.69 | | | | | | 71 | |
| | | 7.38 | | | | | | 12.56 | | | | | | 862,655 | | | | | | 1.05 | | | | | | 1.06 | | | | | | 7.63 | | | | | | 46 | |
| | | 7.40 | | | | | | 11.87 | | | | | | 45,430 | | | | | | 1.80 | | | | | | 1.81 | | | | | | 6.86 | | | | | | 46 | |
| | | 7.39 | | | | | | 11.72 | | | | | | 114,921 | | | | | | 1.80 | | | | | | 1.81 | | | | | | 6.85 | | | | | | 46 | |
| | | 7.40 | | | | | | 12.93 | | | | | | 4,492,556 | | | | | | 0.71 | | | | | | 0.72 | | | | | | 7.94 | | | | | | 46 | |
| | | 7.38 | | | | | | 12.54 | | | | | | 23,208 | | | | | | 1.21 | | | | | | 1.22 | | | | | | 7.44 | | | | | | 46 | |
| | | 7.39 | | | | | | 12.99 | | | | | | 3,081 | | | | | | 0.80 | | | | | | 0.81 | | | | | | 7.79 | | | | | | 46 | |
| | | 7.38 | | | | | | 12.29 | | | | | | 13,279 | | | | | | 1.30 | | | | | | 1.31 | | | | | | 7.36 | | | | | | 46 | |
| | | 7.07 | | | | | | 48.28 | | | | | | 1,339,958 | | | | | | 1.05 | | | | | | 1.06 | | | | | | 8.38 | | | | | | 35 | |
| | | 7.08 | | | | | | 47.38 | | | | | | 60,649 | | | | | | 1.80 | | | | | | 1.81 | | | | | | 7.61 | | | | | | 35 | |
| | | 7.08 | | | | | | 47.38 | | | | | | 111,997 | | | | | | 1.80 | | | | | | 1.81 | | | | | | 7.56 | | | | | | 35 | |
| | | 7.09 | | | | | | 48.88 | | | | | | 4,655,677 | | | | | | 0.71 | | | | | | 0.72 | | | | | | 8.64 | | | | | | 35 | |
| | | 7.06 | | | | | | 48.13 | | | | | | 22,639 | | | | | | 1.21 | | | | | | 1.22 | | | | | | 8.14 | | | | | | 35 | |
| | | 7.07 | | | | | | 48.63 | | | | | | 786 | | | | | | 0.80 | | | | | | 0.81 | | | | | | 8.01 | | | | | | 35 | |
| | | 7.07 | | | | | | 48.20 | | | | | | 5,404 | | | | | | 1.30 | | | | | | 1.31 | | | | | | 7.78 | | | | | | 35 | |
| | | 5.18 | | | | | | (20.12 | ) | | | | | 1,636,406 | | | | | | 1.07 | | | | | | 1.08 | | | | | | 9.10 | | | | | | 14 | |
| | | 5.18 | | | | | | (20.73 | ) | | | | | 53,589 | | | | | | 1.82 | | | | | | 1.83 | | | | | | 8.20 | | | | | | 14 | |
| | | 5.18 | | | | | | (20.72 | ) | | | | | 74,325 | | | | | | 1.82 | | | | | | 1.83 | | | | | | 8.25 | | | | | | 14 | |
| | | 5.19 | | | | | | (19.81 | ) | | | | | 1,986,033 | | | | | | 0.73 | | | | | | 0.74 | | | | | | 9.49 | | | | | | 14 | |
| | | 5.17 | | | | | | (20.28 | ) | | | | | 12,582 | | | | | | 1.23 | | | | | | 1.24 | | | | | | 8.98 | | | | | | 14 | |
| | | 5.18 | | | | | | (19.91 | ) | | | | | 8 | | | | | | 0.82 | | | | | | 0.83 | | | | | | 9.31 | | | | | | 14 | |
| | | 5.17 | | | | | | (20.47 | ) | | | | | 183 | | | | | | 1.32 | | | | | | 1.33 | | | | | | 9.95 | | | | | | 14 | |
| | | | | | | | | | | | | | | | | | | | | | | | | | | | | | | | | | | | | | | | |
| | | | | | | | | | | | | | | | | | | | | | | | | | | | | | | | | | | | | | | | |
| | | 7.12 | | | | | | (6.82 | ) | | | | | 1,650,027 | | | | | | 1.07 | (d) | | | | | 1.09 | (d) | | | | | 7.87 | (d) | | | | | 11 | |
| | | 7.13 | | | | | | (7.23 | ) | | | | | 92,953 | | | | | | 1.82 | (d) | | | | | 1.84 | (d) | | | | | 7.12 | (d) | | | | | 11 | |
| | | 7.12 | | | | | | (7.11 | ) | | | | | 101,138 | | | | | | 1.82 | (d) | | | | | 1.84 | (d) | | | | | 7.12 | (d) | | | | | 11 | |
| | | 7.13 | | | | | | (6.68 | ) | | | | | 1,628,668 | | | | | | 0.73 | (d) | | | | | 0.75 | (d) | | | | | 8.22 | (d) | | | | | 11 | |
| | | 7.12 | | | | | | (6.89 | ) | | | | | 10,573 | | | | | | 1.23 | (d) | | | | | 1.25 | (d) | | | | | 7.72 | (d) | | | | | 11 | |
| | | 7.12 | | | | | | (4.35 | ) | | | | | 10 | | | | | | 0.82 | (d) | | | | | 0.84 | (d) | | | | | 8.20 | (d) | | | | | 11 | |
| | | 7.12 | | | | | | (4.51 | ) | | | | | 9 | | | | | | 1.32 | (d) | | | | | 1.34 | (d) | | | | | 7.73 | (d) | | | | | 11 | |
| | | | | | | | | | | | | | | | | | | | | | | | | | | | | | | | | | | | | | | | |
| | | | | | | | | | | | | | | | | | | | | | | | | | | | | | | | | | | | | | | | |
| | | 7.93 | | | | | | 6.41 | | | | | | 1,777,150 | | | | | | 1.09 | | | | | | 1.11 | | | | | | 7.46 | | | | | | 50 | |
| | | 7.94 | | | | | | 5.61 | | | | | | 115,817 | | | | | | 1.84 | | | | | | 1.86 | | | | | | 6.72 | | | | | | 50 | |
| | | 7.93 | | | | | | 5.61 | | | | | | 119,073 | | | | | | 1.84 | | | | | | 1.86 | | | | | | 6.71 | | | | | | 50 | |
| | | 7.94 | | | | | | 6.79 | | | | | | 1,646,138 | | | | | | 0.73 | | | | | | 0.75 | | | | | | 7.82 | | | | | | 50 | |
| | | 7.92 | | | | | | 6.28 | | | | | | 8,399 | | | | | | 1.24 | | | | | | 1.26 | | | | | | 7.34 | | | | | | 50 | |
| | |
| The accompanying notes are an integral part of these financial statements. | | 107 |
GOLDMAN SACHS HIGH YIELD FLOATING RATE FUND
Financial Highlights
Selected Data for a Share Outstanding Throughout Each Period
| | | | | | | | | | | | | | | | | | | | | | |
| | | | | | | | Income (loss) from
investment operations | | | | |
| | | Year - Share Class | |
Net asset
value,
beginning
of period | | | Net
investment
income(a) | | | Net realized
and unrealized
gain (loss) | | | Total from
investment
operations | | | Distributions
to shareholders
from net
investment
income | |
| | FOR THE SIX MONTHS ENDED SEPTEMBER 30, (UNAUDITED) | |
| | 2012 - A | | $ | 9.91 | | | $ | 0.18 | | | $ | 0.09 | | | $ | 0.27 | | | $ | (0.19 | ) |
| | 2012 - C | | | 9.90 | | | | 0.15 | | | | 0.09 | | | | 0.24 | | | | (0.15 | ) |
| | 2012 - Institutional | | | 9.91 | | | | 0.21 | | | | 0.09 | | | | 0.30 | | | | (0.21 | ) |
| | 2012 - IR | | | 9.91 | | | | 0.21 | | | | 0.08 | | | | 0.29 | | | | (0.20 | ) |
| | 2012 - R | | | 9.91 | | | | 0.18 | | | | 0.08 | | | | 0.26 | | | | (0.18 | ) |
| | | | | | | | | | | | | | | | | | | | | | |
| | FOR THE FISCAL YEAR ENDED MARCH 31, | |
| | 2012 - A | | | 10.00 | | | | 0.33 | | | | (0.11 | ) | | | 0.22 | | | | (0.31 | ) |
| | 2012 - C | | | 9.99 | | | | 0.26 | | | | (0.12 | ) | | | 0.14 | | | | (0.23 | ) |
| | 2012 - Institutional | | | 9.99 | | | | 0.35 | | | | (0.09 | ) | | | 0.26 | | | | (0.34 | ) |
| | 2012 - IR | | | 10.00 | | | | 0.34 | | | | (0.10 | ) | | | 0.24 | | | | (0.33 | ) |
| | 2012 - R | | | 10.00 | | | | 0.28 | | | | (0.09 | ) | | | 0.19 | | | | (0.28 | ) |
| | | | | | | | | | | | | | | | | | | | | | |
| | FOR THE PERIOD ENDED MARCH 31, | |
| | 2011 - A (Commenced March 31, 2011) | | | 10.00 | | | | — | (e) | | | — | (e) | | | — | (e) | | | — | |
| | 2011 - C (Commenced March 31, 2011) | | | 10.00 | | | | — | (e) | | | (0.01 | ) | | | (0.01 | ) | | | — | |
| | 2011 - Institutional (Commenced March 31, 2011) | | | 10.00 | | | | — | (e) | | | (0.01 | ) | | | (0.01 | ) | | | — | |
| | 2011 - IR (Commenced March 31, 2011) | | | 10.00 | | | | — | (e) | | | — | (e) | | | — | (e) | | | — | |
| | 2011 - R (Commenced March 31, 2011) | | | 10.00 | | | | — | (e) | | | — | (e) | | | — | (e) | | | — | |
| | (a) | | Calculated based on the average shares outstanding methodology. |
| | (b) | | Assumes investment at the net asset value at the beginning of the period, reinvestment of all dividends and distributions, a complete redemption of the investment at the net asset value at the end of the period and no sales or redemption charges. Total returns would be reduced if a sales or redemption charge was taken into account. Returns do not reflect the deduction of taxes that a shareholder would pay on Fund distributions or the redemption of Fund shares. Total returns for periods less than one full year are not annualized. |
| | (c) | | The Fund’s portfolio turnover rate is calculated in accordance with regulatory requirements, without regard to transactions involving short term investments and certain derivatives. If such transactions were included, the Fund’s portfolio turnover rate may be higher. |
| | (e) | | Amount is less than $0.005 per share. |
| | |
| 108 | | The accompanying notes are an integral part of these financial statements. |
GOLDMAN SACHS HIGH YIELD FLOATING RATE FUND
| | | | | | | | | | | | | | | | | | | | | | | | | | | | | | | | | | | | | | | | |
| | | | | | | | | | | | | | | | | | | | | | | | | | | | | | | | | | |
| | | Net asset
value, end
of period | | | | | Total
return(b) | | | | | Net assets,
end of
period
(in 000s) | | | | | Ratio of
net expenses
to average
net assets | | | | | Ratio of
total expenses
to average
net assets | | | | | Ratio of
net investment
income (loss)
to average
net assets | | | | | Portfolio
turnover
rate(c) | |
| | | | | | | | | | | | | | | | | | | | | | | | | | | | | | | | | | | | | | | | |
| | $ | 9.99 | | | | | | 2.75 | % | | | | $ | 3,510 | | | | | | 1.05 | %(d) | | | | | 1.05 | %(d) | | | | | 3.72 | %(d) | | | | | 36 | % |
| | | 9.99 | | | | | | 2.47 | | | | | | 714 | | | | | | 1.80 | (d) | | | | | 1.80 | (d) | | | | | 3.07 | (d) | | | | | 36 | |
| | | 10.00 | | | | | | 3.03 | | | | | | 741,648 | | | | | | 0.71 | (d) | | | | | 0.71 | (d) | | | | | 4.15 | (d) | | | | | 36 | |
| | | 10.00 | | | | | | 2.98 | | | | | | 3,990 | | | | | | 0.80 | (d) | | | | | 0.80 | (d) | | | | | 4.12 | (d) | | | | | 36 | |
| | | 9.99 | | | | | | 2.62 | | | | | | 10 | | | | | | 1.30 | (d) | | | | | 1.30 | (d) | | | | | 3.54 | (d) | | | | | 36 | |
| | | | | | | | | | | | | | | | | | | | | | | | | | | | | | | | | | | | | | | | |
| | | | | | | | | | | | | | | | | | | | | | | | | | | | | | | | | | | | | | | | |
| | | 9.91 | | | | | | 2.24 | | | | | | 1,910 | | | | | | 1.08 | | | | | | 1.13 | | | | | | 3.41 | | | | | | 73 | |
| | | 9.90 | | | | | | 1.40 | | | | | | 517 | | | | | | 1.83 | | | | | | 1.88 | | | | | | 2.69 | | | | | | 73 | |
| | | 9.91 | | | | | | 2.58 | | | | | | 644,969 | | | | | | 0.74 | | | | | | 0.79 | | | | | | 3.63 | | | | | | 73 | |
| | | 9.91 | | | | | | 2.48 | | | | | | 116 | | | | | | 0.83 | | | | | | 0.88 | | | | | | 3.51 | | | | | | 73 | |
| | | 9.91 | | | | | | 1.99 | | | | | | 10 | | | | | | 1.33 | | | | | | 1.38 | | | | | | 2.86 | | | | | | 73 | |
| | | | | | | | | | | | | | | | | | | | | | | | | | | | | | | | | | | | | | | | |
| | | | | | | | | | | | | | | | | | | | | | | | | | | | | | | | | | | | | | | | |
| | | 10.00 | | | | | | — | | | | | | 10 | | | | | | 1.08 | (d) | | | | | 1.47 | (d) | | | | | (1.08 | )(d) | | | | | — | |
| | | 9.99 | | | | | | — | | | | | | 10 | | | | | | 1.83 | (d) | | | | | 2.22 | (d) | | | | | (1.83 | )(d) | | | | | — | |
| | | 9.99 | | | | | | — | | | | | | 118,817 | | | | | | 0.74 | (d) | | | | | 1.13 | (d) | | | | | (0.74 | )(d) | | | | | — | |
| | | 10.00 | | | | | | — | | | | | | 10 | | | | | | 0.83 | (d) | | | | | 1.22 | (d) | | | | | (0.83 | )(d) | | | | | — | |
| | | 10.00 | | | | | | — | | | | | | 10 | | | | | | 1.33 | (d) | | | | | 1.72 | (d) | | | | | (1.33 | )(d) | | | | | — | |
| | |
| The accompanying notes are an integral part of these financial statements. | | 109 |
GOLDMAN SACHS INVESTMENT GRADE CREDIT FUND
Financial Highlights
Selected Data for a Share Outstanding Throughout Each Period
| | | | | | | | | | | | | | | | | | | | | | | | | | | | | | |
| | | | | | | | Income (loss) from
investment operations | | | Distributions
to shareholders | |
| | | Year - Share Class | |
Net asset
value,
beginning
of period | | | Net
investment
income(a) | | | Net realized
and unrealized
gain (loss) | | | Total from
investment
operations | | | From net
investment
income | | | From net
realized
gains | | | Total
distributions | |
| | FOR THE SIX MONTHS ENDED SEPTEMBER 30, (UNAUDITED) | |
| | 2012 - A | | $ | 9.53 | | | $ | 0.16 | | | $ | 0.48 | | | $ | 0.64 | | | $ | (0.16 | ) | | $ | — | | | $ | (0.16 | ) |
| | 2012 - Institutional | | | 9.53 | | | | 0.17 | | | | 0.50 | | | | 0.67 | | | | (0.18 | ) | | | — | | | | (0.18 | ) |
| | 2012 - Separate Account Institutional | | | 9.53 | | | | 0.17 | | | | 0.50 | | | | 0.67 | | | | (0.18 | ) | | | — | | | | (0.18 | ) |
| | 2012 - IR | | | 9.53 | | | | 0.17 | | | | 0.49 | | | | 0.66 | | | | (0.17 | ) | | | — | | | | (0.17 | ) |
| | | | | | | | | | | | | | | | | | | | | | | | | | | | | | |
| | FOR THE FISCAL YEARS ENDED MARCH 31, | |
| | 2012 - A | | | 9.50 | | | | 0.37 | | | | 0.50 | | | | 0.87 | | | | (0.37 | ) | | | (0.47 | ) | | | (0.84 | ) |
| | 2012 - Institutional | | | 9.51 | | | | 0.40 | | | | 0.50 | | | | 0.90 | | | | (0.41 | ) | | | (0.47 | ) | | | (0.88 | ) |
| | 2012 - Separate Account Institutional | | | 9.51 | | | | 0.40 | | | | 0.50 | | | | 0.90 | | | | (0.41 | ) | | | (0.47 | ) | | | (0.88 | ) |
| | 2012 - IR (Commenced July 29, 2011) | | | 9.86 | | | | 0.25 | | | | 0.15 | | | | 0.40 | | | | (0.26 | ) | | | (0.47 | ) | | | (0.73 | ) |
| | 2011 - A | | | 9.14 | | | | 0.38 | | | | 0.37 | | | | 0.75 | | | | (0.38 | ) | | | (0.01 | ) | | | (0.39 | ) |
| | 2011 - Institutional | | | 9.14 | | | | 0.41 | | | | 0.38 | | | | 0.79 | | | | (0.41 | ) | | | (0.01 | ) | | | (0.42 | ) |
| | 2011 - Separate Account Institutional | | | 9.14 | | | | 0.41 | | | | 0.38 | | | | 0.79 | | | | (0.41 | ) | | | (0.01 | ) | | | (0.42 | ) |
| | 2010 - A | | | 7.75 | | | | 0.43 | | | | 1.40 | | | | 1.83 | | | | (0.44 | ) | | | — | | | | (0.44 | ) |
| | 2010 - Institutional | | | 7.75 | | | | 0.46 | | | | 1.40 | | | | 1.86 | | | | (0.47 | ) | | | — | | | | (0.47 | ) |
| | 2010 - Separate Account Institutional | | | 7.75 | | | | 0.47 | | | | 1.39 | | | | 1.86 | | | | (0.47 | ) | | | — | | | | (0.47 | ) |
| | 2009 - A | | | 9.64 | | | | 0.51 | | | | (1.83 | ) | | | (1.32 | ) | | | (0.57 | ) | | | — | | | | (0.57 | ) |
| | 2009 - Institutional | | | 9.66 | | | | 0.55 | | | | (1.85 | ) | | | (1.30 | ) | | | (0.61 | ) | | | — | | | | (0.61 | ) |
| | 2009 - Separate Account Institutional | | | 9.65 | | | | 0.57 | | | | (1.86 | ) | | | (1.29 | ) | | | (0.61 | ) | | | — | | | | (0.61 | ) |
| | | | | | | | | | | | | | | | | | | | | | | | | | | | | | |
| | FOR THE PERIOD NOVEMBER 1, 2007 TO MARCH 31, 2008* | |
| | 2008 - A | | | 9.90 | | | | 0.22 | | | | (0.27 | ) | | | (0.05 | ) | | | (0.21 | ) | | | — | | | | (0.21 | ) |
| | 2008 - Institutional | | | 9.92 | | | | 0.23 | | | | (0.27 | ) | | | (0.04 | ) | | | (0.22 | ) | | | — | | | | (0.22 | ) |
| | 2008 - Separate Account Institutional | | | 9.91 | | | | 0.23 | | | | (0.26 | ) | | | (0.03 | ) | | | (0.23 | ) | | | — | | | | (0.23 | ) |
| | | | | | | | | | | | | | | | | | | | | | | | | | | | | | |
| | FOR THE FISCAL YEAR ENDED OCTOBER 31, | |
| | 2007 - A | | | 9.95 | | | | 0.51 | | | | (0.08 | ) | | | 0.43 | | | | (0.48 | ) | | | — | | | | (0.48 | ) |
| | 2007 - Institutional | | | 9.97 | | | | 0.55 | | | | (0.08 | ) | | | 0.47 | | | | (0.52 | ) | | | — | | | | (0.52 | ) |
| | 2007 - Separate Account Institutional | | | 9.96 | | | | 0.56 | | | | (0.08 | ) | | | 0.48 | | | | (0.53 | ) | | | — | | | | (0.53 | ) |
| | * | | The Fund changed its fiscal year end from October 31 to March 31. |
| | (a) | | Calculated based on the average shares outstanding methodology. |
| | (b) | | Assumes investment at the net asset value at the beginning of the period, reinvestment of all dividends and distributions, a complete redemption of the investment at the net asset value at the end of the period and no sales or redemption charges. Total returns would be reduced if a sales or redemption charge was taken into account. Returns do not reflect the deduction of taxes that a shareholder would pay on Fund distributions or the redemption of Fund shares. Total returns for periods less than one full year are not annualized. |
| | (c) | | The Fund’s portfolio turnover rate is calculated in accordance with regulatory requirements, without regard to transactions involving short term investments and certain derivatives. If such transactions were included, the Fund’s portfolio turnover rate may be higher. |
| | (e) | | Portfolio turnover rates exclude portfolio securities received as a result of in-kind subscriptions. |
| | |
| 110 | | The accompanying notes are an integral part of these financial statements. |
GOLDMAN SACHS INVESTMENT GRADE CREDIT FUND
| | | | | | | | | | | | | | | | | | | | | | | | | | | | | | | | | | | | | | | | |
| | | | | | | | | | | | | | | | | | | | | | | | | | | | | | | | | | |
| | | Net asset
value, end
of period | | | | | Total
return(b) | | | | | Net assets,
end of
period
(in 000s) | | | | | Ratio of
net expenses
to average
net assets | | | | | Ratio of
total expenses
to average
net assets | | | | | Ratio of
net investment
income to
average
net assets | | | | | Portfolio
turnover
rate(c) | |
| | | | | | | | | | | | | | | | | | | | | | | | | | | | | | | | | | | | | | | | |
| | $ | 10.01 | | | | | | 6.77 | % | | | | $ | 178,391 | | | | | | 0.71 | %(d) | | | | | 0.83 | %(d) | | | | | 3.19 | %(d) | | | | | 110 | % |
| | | 10.02 | | | | | | 7.06 | | | | | | 142,316 | | | | | | 0.37 | (d) | | | | | 0.49 | (d) | | | | | 3.54 | (d) | | | | | 110 | |
| | | 10.02 | | | | | | 7.06 | | | | | | 240,468 | | | | | | 0.37 | (d) | | | | | 0.49 | (d) | | | | | 3.54 | (d) | | | | | 110 | |
| | | 10.02 | | | | | | 7.01 | | | | | | 988 | | | | | | 0.46 | (d) | | | | | 0.58 | (d) | | | | | 3.47 | (d) | | | | | 110 | |
| | | | | | | | | | | | | | | | | | | | | | | | | | | | | | | | | | | | | | | | |
| | | | | | | | | | | | | | | | | | | | | | | | | | | | | | | | | | | | | | | | |
| | | 9.53 | | | | | | 9.37 | | | | | | 155,684 | | | | | | 0.71 | | | | | | 0.85 | | | | | | 3.78 | | | | | | 120 | |
| | | 9.53 | | | | | | 9.73 | | | | | | 163,886 | | | | | | 0.37 | | | | | | 0.51 | | | | | | 4.12 | | | | | | 120 | |
| | | 9.53 | | | | | | 9.73 | | | | | | 237,266 | | | | | | 0.37 | | | | | | 0.51 | | | | | | 4.13 | | | | | | 120 | |
| | | 9.53 | | | | | | 4.26 | | | | | | 1,300 | | | | | | 0.46 | (d) | | | | | 0.60 | (d) | | | | | 3.91 | (d) | | | | | 120 | |
| | | 9.50 | | | | | | 8.37 | | | | | | 147,820 | | | | | | 0.74 | | | | | | 0.87 | | | | | | 3.98 | | | | | | 100 | (e) |
| | | 9.51 | | | | | | 8.73 | | | | | | 143,057 | | | | | | 0.40 | | | | | | 0.53 | | | | | | 4.33 | | | | | | 100 | (e) |
| | | 9.51 | | | | | | 8.77 | | | | | | 262,907 | | | | | | 0.37 | | | | | | 0.50 | | | | | | 4.36 | | | | | | 100 | (e) |
| | | 9.14 | | | | | | 23.96 | | | | | | 167,774 | | | | | | 0.76 | | | | | | 0.89 | | | | | | 4.90 | | | | | | 90 | |
| | | 9.14 | | | | | | 24.39 | | | | | | 190,478 | | | | | | 0.41 | | | | | | 0.55 | | | | | | 5.17 | | | | | | 90 | |
| | | 9.14 | | | | | | 24.45 | | | | | | 272,812 | | | | | | 0.36 | | | | | | 0.50 | | | | | | 5.39 | | | | | | 90 | |
| | | 7.75 | | | | | | (14.00 | ) | | | | | 53,185 | | | | | | 0.76 | | | | | | 0.97 | | | | | | 6.22 | | | | | | 135 | |
| | | 7.75 | | | | | | (13.83 | ) | | | | | 22,809 | | | | | | 0.40 | | | | | | 0.63 | | | | | | 6.52 | | | | | | 135 | |
| | | 7.75 | | | | | | (13.72 | ) | | | | | 171,003 | | | | | | 0.35 | | | | | | 0.58 | | | | | | 6.52 | | | | | | 135 | |
| | | | | | | | | | | | | | | | | | | | | | | | | | | | | | | | | | | | | | | | |
| | | | | | | | | | | | | | | | | | | | | | | | | | | | | | | | | | | | | | | | |
| | | 9.64 | | | | | | (0.54 | ) | | | | | 9,455 | | | | | | 0.76 | (d) | | | | | 0.95 | (d) | | | | | 5.31 | (d) | | | | | 15 | |
| | | 9.66 | | | | | | (0.39 | ) | | | | | 10,504 | | | | | | 0.40 | (d) | | | | | 0.61 | (d) | | | | | 5.67 | (d) | | | | | 15 | |
| | | 9.65 | | | | | | (0.37 | ) | | | | | 226,207 | | | | | | 0.35 | (d) | | | | | 0.56 | (d) | | | | | 5.72 | (d) | | | | | 15 | |
| | | | | | | | | | | | | | | | | | | | | | | | | | | | | | | | | | | | | | | | |
| | | | | | | | | | | | | | | | | | | | | | | | | | | | | | | | | | | | | | | | |
| | | 9.90 | | | | | | 4.44 | | | | | | 8,615 | | | | | | 0.79 | | | | | | 0.97 | | | | | | 5.17 | | | | | | 74 | |
| | | 9.92 | | | | | | 4.83 | | | | | | 10,893 | | | | | | 0.40 | | | | | | 0.60 | | | | | | 5.59 | | | | | | 74 | |
| | | 9.91 | | | | | | 4.89 | | | | | | 239,358 | | | | | | 0.35 | | | | | | 0.55 | | | | | | 5.61 | | | | | | 74 | |
| | |
| The accompanying notes are an integral part of these financial statements. | | 111 |
GOLDMAN SACHS LOCAL EMERGING MARKETS DEBT FUND
Financial Highlights
Selected Data for a Share Outstanding Throughout Each Period
| | | | | | | | | | | | | | | | | | | | | | | | | | | | | | | | | | |
| | | | | | | | Income (loss) from
investment operations | | | Distributions
to shareholders | |
| | | Year - Share Class | |
Net asset
value,
beginning
of period | | | Net
investment
income(a) | | | Net realized
and unrealized
gain (loss) | | | Total from
investment
operations | | | From net
investment
income | | | From net
realized
gains | | | From
capital | | | Total
distributions | |
| | FOR THE SIX MONTHS ENDED SEPTEMBER 30, (UNAUDITED) | |
| | 2012 - A | | $ | 9.38 | | | $ | 0.23 | | | $ | 0.20 | | | $ | 0.43 | | | $ | (0.23 | ) | | $ | — | | | $ | — | | | $ | (0.23 | ) |
| | 2012 - C | | | 9.40 | | | | 0.20 | | | | 0.20 | | | | 0.40 | | | | (0.20 | ) | | | — | | | | — | | | | (0.20 | ) |
| | 2012 - Institutional | | | 9.38 | | | | 0.25 | | | | 0.21 | | | | 0.46 | | | | (0.25 | ) | | | — | | | | — | | | | (0.25 | ) |
| | 2012 - IR | | | 9.38 | | | | 0.24 | | | | 0.20 | | | | 0.44 | | | | (0.24 | ) | | | — | | | | — | | | | (0.24 | ) |
| | | | | | | | | | | | | | | | | | | | | | | | | | | | | | | | | | |
| | FOR THE FISCAL YEARS ENDED MARCH 31, | |
| | 2012 - A | | | 9.59 | | | | 0.42 | | | | (0.16 | ) | | | 0.26 | | | | (0.44 | ) | | | (0.03 | ) | | | — | | | | (0.47 | ) |
| | 2012 - C | | | 9.61 | | | | 0.37 | | | | (0.18 | ) | | | 0.19 | | | | (0.37 | ) | | | (0.03 | ) | | | — | | | | (0.40 | ) |
| | 2012 - Institutional | | | 9.59 | | | | 0.48 | | | | (0.19 | ) | | | 0.29 | | | | (0.47 | ) | | | (0.03 | ) | | | — | | | | (0.50 | ) |
| | 2012 - IR | | | 9.59 | | | | 0.46 | | | | (0.18 | ) | | | 0.28 | | | | (0.46 | ) | | | (0.03 | ) | | | — | | | | (0.49 | ) |
| | 2011 - A | | | 9.31 | | | | 0.41 | | | | 0.60 | | | | 1.01 | | | | (0.64 | ) | | | (0.09 | ) | | | — | | | | (0.73 | ) |
| | 2011 - C | | | 9.33 | | | | 0.32 | | | | 0.61 | | | | 0.93 | | | | (0.56 | ) | | | (0.09 | ) | | | — | | | | (0.65 | ) |
| | 2011 - Institutional | | | 9.31 | | | | 0.44 | | | | 0.60 | | | | 1.04 | | | | (0.67 | ) | | | (0.09 | ) | | | — | | | | (0.76 | ) |
| | 2011 - IR (Commenced July 30, 2010) | | | 9.43 | | | | 0.28 | | | | 0.46 | | | | 0.74 | | | | (0.49 | ) | | | (0.09 | ) | | | — | | | | (0.58 | ) |
| | 2010 - A | | | 7.23 | | | | 0.42 | | | | 2.10 | | | | 2.52 | | | | (0.44 | ) | | | — | | | | — | | | | (0.44 | ) |
| | 2010 - C | | | 7.24 | | | | 0.36 | | | | 2.10 | | | | 2.46 | | | | (0.37 | ) | | | — | | | | — | | | | (0.37 | ) |
| | 2010 - Institutional | | | 7.23 | | | | 0.45 | | | | 2.10 | | | | 2.55 | | | | (0.47 | ) | | | — | | | | — | | | | (0.47 | ) |
| | 2009 - A | | | 9.85 | | | | 0.50 | | | | (2.64 | ) | | | (2.14 | ) | | | (0.20 | ) | | | — | | | | (0.28 | ) | | | (0.48 | ) |
| | 2009 - C | | | 9.85 | | | | 0.48 | | | | (2.67 | ) | | | (2.19 | ) | | | (0.18 | ) | | | — | | | | (0.24 | ) | | | (0.42 | ) |
| | 2009 - Institutional | | | 9.85 | | | | 0.53 | | | | (2.64 | ) | | | (2.11 | ) | | | (0.22 | ) | | | — | | | | (0.29 | ) | | | (0.51 | ) |
| | | | | | | | | | | | | | | | | | | | | | | | | | | | | | | | | | |
| | FOR THE PERIOD ENDED MARCH 31, | |
| | 2008 - A (Commenced February 15, 2008) | | | 10.00 | | | | 0.04 | | | | (0.14 | ) | | | (0.10 | ) | | | (0.05 | ) | | | — | | | | — | | | | (0.05 | ) |
| | 2008 - C (Commenced February 15, 2008) | | | 10.00 | | | | 0.04 | | | | (0.14 | ) | | | (0.10 | ) | | | (0.05 | ) | | | — | | | | — | | | | (0.05 | ) |
| | 2008 - Institutional (Commenced February 15, 2008) | | | 10.00 | | | | 0.06 | | | | (0.15 | ) | | | (0.09 | ) | | | (0.06 | ) | | | — | | | | — | | | | (0.06 | ) |
| | (a) | | Calculated based on the average shares outstanding methodology. |
| | (b) | | Assumes investment at the net asset value at the beginning of the period, reinvestment of all dividends and distributions, a complete redemption of the investment at the net asset value at the end of the period and no sales or redemption charges. Total returns would be reduced if a sales or redemption charge was taken into account. Returns do not reflect the deduction of taxes that a shareholder would pay on Fund distributions or the redemption of Fund shares. Total returns for periods less than one full year are not annualized. |
| | (c) | | The Fund’s portfolio turnover rate is calculated in accordance with regulatory requirements, without regard to transactions involving short term investments and certain derivatives. If such transactions were included, the Fund’s portfolio turnover rate may be higher. |
| | |
| 112 | | The accompanying notes are an integral part of these financial statements. |
GOLDMAN SACHS LOCAL EMERGING MARKETS DEBT FUND
| | | | | | | | | | | | | | | | | | | | | | | | | | | | | | | | | | | | | | | | |
| | | | | | | | | | | | | | | | | | | | | | | | | | | | | | | | | | |
| | | Net asset
value, end
of period | | | | | Total
return(b) | | | | | Net assets,
end of
period
(in 000s) | | | | | Ratio of
net expenses
to average
net assets | | | | | Ratio of
total expenses
to average
net assets | | | | | Ratio of
net investment
income
to average
net assets | | | | | Portfolio
turnover
rate(c) | |
| | | | | | | | | | | | | | | | | | | | | | | | | | | | | | | | | | | | | | | | |
| | $ | 9.58 | | | | | | 4.62 | % | | | | $ | 166,498 | | | | | | 1.25 | %(d) | | | | | 1.39 | %(d) | | | | | 5.07 | %(d) | | | | | 60 | % |
| | | 9.60 | | | | | | 4.12 | | | | | | 21,380 | | | | | | 2.00 | (d) | | | | | 2.14 | (d) | | | | | 4.31 | (d) | | | | | 60 | |
| | | 9.59 | | | | | | 4.80 | | | | | | 1,909,686 | | | | | | 0.91 | (d) | | | | | 1.05 | (d) | | | | | 5.37 | (d) | | | | | 60 | |
| | | 9.58 | | | | | | 4.75 | | | | | | 13,458 | | | | | | 1.00 | (d) | | | | | 1.14 | (d) | | | | | 5.23 | (d) | | | | | 60 | |
| | | | | | | | | | | | | | | | | | | | | | | | | | | | | | | | | | | | | | | | |
| | | | | | | | | | | | | | | | | | | | | | | | | | | | | | | | | | | | | | | | |
| | | 9.38 | | | | | | 2.71 | | | | | | 166,407 | | | | | | 1.27 | | | | | | 1.38 | | | | | | 4.31 | | | | | | 183 | |
| | | 9.40 | | | | | | 1.96 | | | | | | 20,704 | | | | | | 2.02 | | | | | | 2.13 | | | | | | 3.98 | | | | | | 183 | |
| | | 9.38 | | | | | | 3.06 | | | | | | 1,586,055 | | | | | | 0.93 | | | | | | 1.04 | | | | | | 5.18 | | | | | | 183 | |
| | | 9.38 | | | | | | 2.97 | | | | | | 7,393 | | | | | | 1.02 | | | | | | 1.13 | | | | | | 4.91 | | | | | | 183 | |
| | | 9.59 | | | | | | 11.30 | | | | | | 1,055,640 | | | | | | 1.35 | | | | | | 1.43 | | | | | | 4.30 | | | | | | 154 | |
| | | 9.61 | | | | | | 10.45 | | | | | | 16,724 | | | | | | 2.10 | | | | | | 2.18 | | | | | | 3.37 | | | | | | 154 | |
| | | 9.59 | | | | | | 11.68 | | | | | | 1,048,186 | | | | | | 1.01 | | | | | | 1.09 | | | | | | 4.63 | | | | | | 154 | |
| | | 9.59 | | | | | | 8.13 | | | | | | 8,247 | | | | | | 1.10 | (d) | | | | | 1.16 | (d) | | | | | 4.40 | (d) | | | | | 154 | |
| | | 9.31 | | | | | | 35.39 | | | | | | 419,456 | | | | | | 1.35 | | | | | | 1.49 | | | | | | 4.74 | | | | | | 134 | |
| | | 9.33 | | | | | | 34.47 | | | | | | 936 | | | | | | 2.10 | | | | | | 2.24 | | | | | | 4.09 | | | | | | 134 | |
| | | 9.31 | | | | | | 35.84 | | | | | | 377,691 | | | | | | 1.01 | | | | | | 1.15 | | | | | | 5.16 | | | | | | 134 | |
| | | 7.23 | | | | | | (22.32 | ) | | | | | 20,385 | | | | | | 1.33 | | | | | | 1.65 | | | | | | 5.99 | | | | | | 92 | |
| | | 7.24 | | | | | | (22.79 | ) | | | | | 30 | | | | | | 2.08 | | | | | | 2.40 | | | | | | 5.17 | | | | | | 92 | |
| | | 7.23 | | | | | | (22.05 | ) | | | | | 97,877 | | | | | | 0.99 | | | | | | 1.31 | | | | | | 6.30 | | | | | | 92 | |
| | | | | | | | | | | | | | | | | | | | | | | | | | | | | | | | | | | | | | | | |
| | | | | | | | | | | | | | | | | | | | | | | | | | | | | | | | | | | | | | | | |
| | | 9.85 | | | | | | (0.93 | ) | | | | | 1,482 | | | | | | 1.35 | (d) | | | | | 2.98 | (d) | | | | | 4.29 | (d) | | | | | 3 | |
| | | 9.85 | | | | | | (1.01 | ) | | | | | 127 | | | | | | 2.10 | (d) | | | | | 3.73 | (d) | | | | | 4.30 | (d) | | | | | 3 | |
| | | 9.85 | | | | | | (0.89 | ) | | | | | 60,432 | | | | | | 1.01 | (d) | | | | | 2.64 | (d) | | | | | 5.52 | (d) | | | | | 3 | |
| | |
| The accompanying notes are an integral part of these financial statements. | | 113 |
GOLDMAN SACHS U.S. MORTGAGES FUND
Financial Highlights
Selected Data for a Share Outstanding Throughout Each Period
| | | | | | | | | | | | | | | | | | | | | | | | | | | | | | |
| | | | | | | | Income (loss) from
investment operations | | | Distributions
to shareholders | |
| | | Year - Share Class | |
Net asset
value,
beginning
of period | | | Net
investment
income(a) | | | Net realized
and unrealized
gain (loss) | | | Total from
investment
operations | | | From net
investment
income | | | From net
realized
gains | | | Total
distributions | |
| | FOR THE SIX MONTHS ENDED SEPTEMBER 30, (UNAUDITED) | |
| | 2012 - A | | $ | 10.58 | | | $ | 0.07 | | | $ | 0.33 | | | $ | 0.40 | | | $ | (0.11 | ) | | $ | — | | | $ | (0.11 | ) |
| | 2012 - Institutional | | | 10.60 | | | | 0.09 | | | | 0.33 | | | | 0.42 | | | | (0.13 | ) | | | — | | | | (0.13 | ) |
| | 2012 - Separate Account Institutional | | | 10.58 | | | | 0.09 | | | | 0.32 | | | | 0.41 | | | | (0.13 | ) | | | — | | | | (0.13 | ) |
| | 2012 - IR | | | 10.60 | | | | 0.10 | | | | 0.33 | | | | 0.43 | | | | (0.14 | ) | | | — | | | | (0.14 | ) |
| | | | | | | | | | | | | | | | | | | | | | | | | | | | | | |
| | FOR THE FISCAL YEARS ENDED MARCH 31, | |
| | 2012 - A | | | 10.20 | | | | 0.17 | | | | 0.42 | | | | 0.59 | | | | (0.21 | ) | | | — | | | | (0.21 | ) |
| | 2012 - Institutional | | | 10.21 | | | | 0.20 | | | | 0.44 | | | | 0.64 | | | | (0.25 | ) | | | — | | | | (0.25 | ) |
| | 2012 - Separate Account Institutional | | | 10.20 | | | | 0.21 | | | | 0.42 | | | | 0.63 | | | | (0.25 | ) | | | — | | | | (0.25 | ) |
| | 2012 - IR (Commenced July 29, 2011) | | | 10.45 | | | | 0.14 | | | | 0.19 | | | | 0.33 | | | | (0.18 | ) | | | — | | | | (0.18 | ) |
| | 2011 - A | | | 9.99 | | | | 0.22 | | | | 0.22 | | | | 0.44 | | | | (0.23 | ) | | | — | | | | (0.23 | ) |
| | 2011 - Institutional | | | 10.00 | | | | 0.25 | | | | 0.23 | | | | 0.48 | | | | (0.27 | ) | | | — | | | | (0.27 | ) |
| | 2011 - Separate Account Institutional | | | 9.99 | | | | 0.25 | | | | 0.23 | | | | 0.48 | | | | (0.27 | ) | | | — | | | | (0.27 | ) |
| | 2010 - A | | | 9.27 | | | | 0.32 | | | | 0.76 | | | | 1.08 | | | | (0.36 | ) | | | — | | | | (0.36 | ) |
| | 2010 - Institutional | | | 9.29 | | | | 0.38 | | | | 0.73 | | | | 1.11 | | | | (0.40 | ) | | | — | | | | (0.40 | ) |
| | 2010 - Separate Account Institutional | | | 9.28 | | | | 0.38 | | | | 0.73 | | | | 1.11 | | | | (0.40 | ) | | | — | | | | (0.40 | ) |
| | 2009 - A | | | 9.62 | | | | 0.37 | | | | (0.27 | ) | | | 0.10 | | | | (0.38 | ) | | | (0.07 | ) | | | (0.45 | ) |
| | 2009 - Institutional | | | 9.64 | | | | 0.39 | | | | (0.26 | ) | | | 0.13 | | | | (0.41 | ) | | | (0.07 | ) | | | (0.48 | ) |
| | 2009 - Separate Account Institutional | | | 9.64 | | | | 0.41 | | | | (0.29 | ) | | | 0.12 | | | | (0.41 | ) | | | (0.07 | ) | | | (0.48 | ) |
| | | | | | | | | | | | | | | | | | | | | | | | | | | | | | |
| | FOR THE PERIOD NOVEMBER 1, 2007 TO MARCH 31, 2008* | |
| | 2008 - A | | | 9.91 | | | | 0.19 | | | | (0.29 | ) | | | (0.10 | ) | | | (0.19 | ) | | | — | | | | (0.19 | ) |
| | 2008 - Institutional | | | 9.93 | | | | 0.20 | | | | (0.28 | ) | | | (0.08 | ) | | | (0.21 | ) | | | — | | | | (0.21 | ) |
| | 2008 - Separate Account Institutional | | | 9.93 | | | | 0.21 | | | | (0.29 | ) | | | (0.08 | ) | | | (0.21 | ) | | | — | | | | (0.21 | ) |
| | | | | | | | | | | | | | | | | | | | | | | | | | | | | | |
| | FOR THE FISCAL YEAR ENDED OCTOBER 31, | |
| | 2007 - A | | | 9.90 | | | | 0.44 | | | | 0.04 | | | | 0.48 | | | | (0.47 | ) | | | — | | | | (0.47 | ) |
| | 2007 - Institutional | | | 9.91 | | | | 0.47 | | | | 0.05 | | | | 0.52 | | | | (0.50 | ) | | | — | | | | (0.50 | ) |
| | 2007 - Separate Account Institutional | | | 9.91 | | | | 0.48 | | | | 0.05 | | | | 0.53 | | | | (0.51 | ) | | | — | | | | (0.51 | ) |
| | * | | The Fund changed its fiscal year end from October 31 to March 31. |
| | (a) | | Calculated based on the average shares outstanding methodology. |
| | (b) | | Assumes investment at the net asset value at the beginning of the period, reinvestment of all dividends and distributions, a complete redemption of the investment at the net asset value at the end of the period and no sales or redemption charges. Total returns would be reduced if a sales or redemption charge was taken into account. Returns do not reflect the deduction of taxes that a shareholder would pay on Fund distributions or the redemption of Fund shares. Total returns for periods less than one full year are not annualized. |
| | (c) | | The Fund’s portfolio turnover rate is calculated in accordance with regulatory requirements, without regard to transactions involving short term investments and certain derivatives. If such transactions were included, the Fund’s portfolio turnover rate may be higher. |
| | (e) | | Portfolio turnover rates exclude portfolio securities received as a result of in-kind subscriptions. |
| | |
| 114 | | The accompanying notes are an integral part of these financial statements. |
GOLDMAN SACHS U.S. MORTGAGES FUND
| | | | | | | | | | | | | | | | | | | | | | | | | | | | | | | | | | | | | | | | |
| | | | | | | | | | | | | | | | | | | | | | | | | | | | | | | | | | |
| | | Net asset
value, end
of period | | | | | Total
return(b) | | | | | Net assets,
end of
period
(in 000s) | | | | | Ratio of
net expenses
to average
net assets | | | | | Ratio of
total expenses
to average
net assets | | | | | Ratio of
net investment
income
to average
net assets | | | | | Portfolio
turnover
rate(c) | |
| | | | | | | | | | | | | | | | | | | | | | | | | | | | | | | | | | | | | | | | |
| | $ | 10.87 | | | | | | 3.69 | % | | | | $ | 7,509 | | | | | | 0.71 | %(d) | | | | | 0.89 | %(d) | | | | | 1.34 | %(d) | | | | | 855 | % |
| | | 10.89 | | | | | | 3.95 | | | | | | 10,400 | | | | | | 0.37 | (d) | | | | | 0.55 | (d) | | | | | 1.68 | (d) | | | | | 855 | |
| | | 10.86 | | | | | | 3.86 | | | | | | 263,621 | | | | | | 0.37 | (d) | | | | | 0.55 | (d) | | | | | 1.68 | (d) | | | | | 855 | |
| | | 10.89 | | | | | | 4.04 | | | | | | 1 | | | | | | 0.46 | (d) | | | | | 0.64 | (d) | | | | | 1.83 | (d) | | | | | 855 | |
| | | | | | | | | | | | | | | | | | | | | | | | | | | | | | | | | | | | | | | | |
| | | | | | | | | | | | | | | | | | | | | | | | | | | | | | | | | | | | | | | | |
| | | 10.58 | | | | | | 5.82 | | | | | | 5,437 | | | | | | 0.71 | | | | | | 0.91 | | | | | | 1.62 | | | | | | 1,342 | |
| | | 10.60 | | | | | | 6.28 | | | | | | 9,984 | | | | | | 0.37 | | | | | | 0.57 | | | | | | 1.89 | | | | | | 1,342 | |
| | | 10.58 | | | | | | 6.18 | | | | | | 375,451 | | | | | | 0.37 | | | | | | 0.58 | | | | | | 1.97 | | | | | | 1,342 | |
| | | 10.60 | | | | | | 3.20 | | | | | | 1 | | | | | | 0.46 | (d) | | | | | 0.66 | (d) | | | | | 2.06 | (d) | | | | | 1,342 | |
| | | 10.20 | | | | | | 4.46 | | | | | | 5,511 | | | | | | 0.74 | | | | | | 0.92 | | | | | | 2.14 | | | | | | 905 | (e) |
| | | 10.21 | | | | | | 4.81 | | | | | | 54,096 | | | | | | 0.40 | | | | | | 0.58 | | | | | | 2.41 | | | | | | 905 | (e) |
| | | 10.20 | | | | | | 4.84 | | | | | | 348,447 | | | | | | 0.37 | | | | | | 0.55 | | | | | | 2.42 | | | | | | 905 | (e) |
| | | 9.99 | | | | | | 11.84 | | | | | | 12,791 | | | | | | 0.76 | | | | | | 0.94 | | | | | | 3.29 | | | | | | 628 | |
| | | 10.00 | | | | | | 12.11 | | | | | | 62,950 | | | | | | 0.41 | | | | | | 0.60 | | | | | | 3.88 | | | | | | 628 | |
| | | 9.99 | | | | | | 12.17 | | | | | | 369,251 | | | | | | 0.36 | | | | | | 0.55 | | | | | | 3.91 | | | | | | 628 | |
| | | 9.27 | | | | | | 0.90 | | | | | | 3,637 | | | | | | 0.76 | | | | | | 0.91 | | | | | | 3.93 | | | | | | 560 | |
| | | 9.29 | | | | | | 1.38 | | | | | | 89,617 | | | | | | 0.40 | | | | | | 0.57 | | | | | | 4.22 | | | | | | 560 | |
| | | 9.28 | | | | | | 1.32 | | | | | | 431,500 | | | | | | 0.35 | | | | | | 0.52 | | | | | | 4.39 | | | | | | 560 | |
| | | | | | | | | | | | | | | | | | | | | | | | | | | | | | | | | | | | | | | | |
| | | | | | | | | | | | | | | | | | | | | | | | | | | | | | | | | | | | | | | | |
| | | 9.62 | | | | | | (0.80 | ) | | | | | 7,021 | | | | | | 0.76 | (d) | | | | | 0.91 | (d) | | | | | 4.58 | (d) | | | | | 483 | |
| | | 9.64 | | | | | | (0.75 | ) | | | | | 164,236 | | | | | | 0.40 | (d) | | | | | 0.57 | (d) | | | | | 4.94 | (d) | | | | | 483 | |
| | | 9.64 | | | | | | (0.73 | ) | | | | | 507,194 | | | | | | 0.35 | (d) | | | | | 0.52 | (d) | | | | | 4.98 | (d) | | | | | 483 | |
| | | | | | | | | | | | | | | | | | | | | | | | | | | | | | | | | | | | | | | | |
| | | | | | | | | | | | | | | | | | | | | | | | | | | | | | | | | | | | | | | | |
| | | 9.91 | | | | | | 4.96 | | | | | | 7,044 | | | | | | 0.78 | | | | | | 0.94 | | | | | | 4.43 | | | | | | 610 | |
| | | 9.93 | | | | | | 5.43 | | | | | | 153,795 | | | | | | 0.40 | | | | | | 0.58 | | | | | | 4.81 | | | | | | 610 | |
| | | 9.93 | | | | | | 5.48 | | | | | | 532,819 | | | | | | 0.35 | | | | | | 0.53 | | | | | | 4.84 | | | | | | 610 | |
| | |
| The accompanying notes are an integral part of these financial statements. | | 115 |
GOLDMAN SACHS SINGLE SECTOR FIXED INCOME FUNDS
Notes to Financial Statements
September 30, 2012 (Unaudited)
Goldman Sachs Trust (the “Trust”) is a Delaware statutory trust registered under the Investment Company Act of 1940, as amended (the “Act”), as an open-end management investment company. The following table lists those series of the Trust that are included in this report (collectively, the “Funds” or individually a “Fund”), along with their corresponding share classes and respective diversification status under the Act:
| | | | |
| Fund | | Share Classes Offered* | | Diversified/
Non-diversified |
Emerging Markets Debt, Local Emerging Markets Debt | | A, C, Institutional and IR | | Non-diversified |
High Yield | | A, B, C, Institutional, Service, IR and R | | Diversified |
High Yield Floating Rate | | A, C, Institutional, IR and R | | Diversified |
Investment Grade Credit, U.S. Mortgages | | A, Institutional, IR and Separate Account Institutional | | Diversified |
| * | | The High Yield Fund’s Class B Shares are generally no longer available for purchase by current or prospective investors. |
Class A Shares of the Emerging Markets Debt, High Yield, High Yield Floating Rate, Investment Grade Credit, Local Emerging Markets Debt and U.S. Mortgages Funds are sold with a front-end sales charge of up to 4.50%, 4.50%, 2.25%, 3.75%, 4.50% and 3.75%, respectively. Class B Shares were sold with a contingent deferred sales charge (“CDSC”) that declines from 5.00% to zero, depending upon the period of time the shares are held. Class C Shares are sold with a CDSC of 1.00%, which is imposed on redemptions made within 12 months of purchase. Institutional, Service, Separate Account Institutional, Class IR and Class R Shares are not subject to a sales charge. Class IR Shares of the Investment Grade Credit and U.S. Mortgages Funds commenced operations on July 29, 2011.
Goldman Sachs Asset Management, L.P. (“GSAM”), an affiliate of Goldman, Sachs & Co. (“Goldman Sachs”), serves as investment adviser to the Funds pursuant to a management agreement (the “Agreement”) with the Trust.
|
| 2. SIGNIFICANT ACCOUNTING POLICIES |
The financial statements have been prepared in accordance with accounting principles generally accepted in the United States of America (“GAAP”) and require management to make estimates and assumptions that may affect the reported amounts and disclosures. Actual results may differ from those estimates and assumptions.
A. Investment Valuation — The Funds’ valuation policy is to value investments at fair value.
B. Investment Income and Investments — Investment income includes interest income and dividend income, net of any foreign withholding taxes, less any amounts reclaimable. Interest income is accrued daily and adjusted for amortization of premiums and accretion of discounts. Dividend income is recognized on ex-dividend date or, for certain foreign securities, as soon as such information is obtained subsequent to the ex-dividend date. Investment transactions are reflected on trade date. Realized gains and losses are calculated using identified cost. Investment transactions are recorded on the following business day for daily net asset value (“NAV”) calculations. Any foreign capital gains tax is accrued daily based upon net unrealized gains, and is payable upon sale of such investments.
For derivatives, realized gains and losses are recorded upon termination of the contract or upon receipt of cash. Upfront payments on swaps are recorded as realized gains or losses and are recognized over the contract’s term/event, with realized gain or losses on forward starting interest rate swaps recognized from the effective start date. For securities with paydown provisions, principal payments received are treated as a proportionate reduction to the cost basis of the securities and excess amounts are recorded as gains. For treasury inflation protected securities (“TIPS”), adjustments to principal due to inflation/deflation are reflected as increases/decreases to interest income with a corresponding adjustment to cost.
C. Class Allocations and Expenses — Investment income, realized and unrealized gain (loss), and non-class specific expenses of each Fund are allocated daily based upon the proportion of net assets of each class. Class specific expenses, where applicable,
116
GOLDMAN SACHS SINGLE SECTOR FIXED INCOME FUNDS
|
| 2. SIGNIFICANT ACCOUNTING POLICIES (continued) |
are borne by the respective share classes and include Distribution and Service, Transfer Agent and Service and Shareholder Administration fees. Non-class specific expenses directly incurred by a Fund are charged to that Fund, while such expenses incurred by the Trust are allocated across the respective Funds on a straight-line and/or pro-rata basis depending upon the nature of the expenses.
D. Redemption Fees — A 2% redemption fee will be imposed on the redemption of shares (including by exchange) held for 60 calendar days or less with respect to the High Yield Fund and 30 calendar days or less with respect to the Emerging Markets Debt and Local Emerging Markets Debt Funds. For this purpose, the Funds use a first-in first-out method so that shares held longest will be treated as being redeemed first and shares held shortest will be treated as being redeemed last. Redemption fees are reimbursed to a Fund and are reflected as a reduction in share redemptions. Redemption fees are credited to Paid-in Capital and are allocated to each share class of a Fund on a pro-rata basis.
E. Federal Taxes and Distributions to Shareholders — It is each Fund’s policy to comply with the requirements of the Internal Revenue Code of 1986, as amended (the “Code”), applicable to regulated investment companies (mutual funds) and to distribute each year substantially all of its investment company taxable income and capital gains to its shareholders. Accordingly, the Funds are not required to make any provisions for the payment of federal income tax. Distributions to shareholders are recorded on the ex-dividend date. Income distributions, if any, are declared daily and paid monthly, and capital gains distributions, if any, are declared and paid annually.
Net capital losses are carried forward to future fiscal years and may be used to the extent allowed by the Code to offset any future capital gains. Utilization of capital loss carryforwards will reduce the requirement of future capital gains distributions.
The characterization of distributions to shareholders for financial reporting purposes is determined in accordance with federal income tax rules, which may differ from GAAP. The source of each Fund’s distributions may be shown in the accompanying financial statements as either from net investment income, net realized gain or capital. Certain components of the Funds’ net assets on the Statements of Assets and Liabilities reflect permanent GAAP/tax differences based on the appropriate tax character.
F. Foreign Currency Translation — The accounting records and reporting currency of the Funds are maintained in United States (“U.S.”) dollars. Assets and liabilities denominated in foreign currencies are translated into U.S. dollars using the current exchange rates at the close of each business day. The effect of changes in foreign currency exchange rates on investments is included within net realized and unrealized gain (loss) on investments. Changes in the value of other assets and liabilities as a result of fluctuations in foreign exchange rates are included in the Statements of Operations within net change in unrealized gain (loss) on foreign currency transactions. Transactions denominated in foreign currencies are translated into U.S. dollars on the date the transaction occurred, the effects of which are included within net realized gain (loss) on foreign currency transactions.
| | |
| 3. INVESTMENTS AND FAIR VALUE MEASUREMENTS | | |
The fair value of a financial instrument is the amount that would be received to sell an asset or paid to transfer a liability in an orderly transaction between market participants at the measurement date (i.e., the exit price). GAAP establishes a fair value hierarchy that prioritizes the inputs to valuation techniques used to measure fair value. The hierarchy gives the highest priority to unadjusted quoted prices in active markets for identical assets or liabilities (Level 1 measurements) and the lowest priority to unobservable inputs (Level 3 measurements). The levels used for classifying investments are not necessarily an indication of the risk associated with investing in these investments. The three levels of the fair value hierarchy are described below:
Level 1 — Unadjusted quoted prices in active markets that are accessible at the measurement date for identical, unrestricted assets or liabilities;
Level 2 — Quoted prices in markets that are not active or financial instruments for which significant inputs are observable (including, but not limited to, quoted prices for similar investments, interest rates, foreign exchange rates, volatility and credit spreads), either directly or indirectly;
Level 3 — Prices or valuations that require significant unobservable inputs (including GSAM’s assumptions in determining fair value measurement).
117
GOLDMAN SACHS SINGLE SECTOR FIXED INCOME FUNDS
Notes to Financial Statements (continued)
September 30, 2012 (Unaudited)
|
| 3. INVESTMENTS AND FAIR VALUE MEASUREMENTS (continued) |
A. Level 1 and Level 2 Fair Value Investments — The valuation techniques and significant inputs used in determining the fair values for investments classified as Level 1 and Level 2 are as follows:
Debt Securities — Debt securities for which market quotations are readily available are valued daily on the basis of quotations supplied by dealers or an independent pricing service approved by the trustees. The pricing services may use valuation models or matrix pricing, which consider: (i) yield or price with respect to bonds that are considered comparable in characteristics such as rating, interest rate and maturity date or (ii) quotations from securities dealers to determine current value. Short-term debt obligations that mature in sixty days or less and that do not exhibit signs of credit deterioration are valued at amortized cost, which approximates fair value. With the exception of treasury securities which are generally classified as Level 1, these investments are generally classified as Level 2 of the fair value hierarchy.
i. Mortgage-Backed and Asset-Backed Securities — Mortgage-backed securities represent direct or indirect participations in, or are collateralized by and payable from, mortgage loans secured by residential and/or commercial real property. Asset-backed securities include securities whose principal and interest payments are collateralized by pools of assets. The value of certain mortgage-backed and asset-backed securities (including adjustable rate mortgage loans) may be particularly sensitive to changes in the prevailing interest rates. The value of these securities may also fluctuate in response to the market’s perception of the creditworthiness of the issuers.
Asset-backed securities may present credit risks that are not presented by mortgage-backed securities because they generally do not have the benefit of a security interest in collateral that is comparable to mortgage assets. Some asset-backed securities may only have a subordinated claim on collateral.
Stripped mortgage-backed securities are usually structured with two different classes: one that receives substantially all of the interest payments (the interest-only, or “IO” and/or the high coupon rate with relatively low principal amount, or “IOette”), and the other that receives substantially all of the principal payments (the principal-only, or “PO”) from a pool of mortgage loans. Little to no principal will be received at the maturity of an IO; as a result, periodic adjustments are recorded to reduce the cost of the security through maturity. These adjustments are included in interest income.
ii. Mortgage Dollar Rolls — Mortgage dollar rolls are transactions whereby the Funds sell mortgage backed securities and simultaneously contract with the same counterparty to repurchase similar securities on a specified future date. During the settlement period, the Funds will not be entitled to accrue interest and principal payments on the securities sold.
iii. Senior Term Loans — Senior Term Loans (“Loans”) are interests in amounts owed by corporate, governmental, or other borrowers to lenders or lending syndicates. Loans are arranged through private negotiations between the borrower and one or more financial institutions (“Lenders”). Investments in Loans are in the form of either participations in Loans (“Participations”) or assignments of all or a portion of Loans from third parties (“Assignments”). A Fund has the right to receive payments of principal, interest and any fees to which it is entitled from the Lender selling the Participations and only upon receipt by the Lender of the payments from the borrower. A Fund generally has no right to enforce compliance by the borrower with the terms of the loan agreement. Assignments typically result in the Fund having a direct contractual relationship with the borrower, and the Fund may enforce compliance by the borrower with the terms of the loan agreement.
The High Yield Floating Rate Fund may also enter into certain credit arrangements, all or a portion of which may be unfunded. Unfunded Loan Commitments represent the remaining obligation of the Fund to the borrower. The Fund is obligated to fund these commitments at the borrower’s discretion. The Fund may receive a commitment fee based on the undrawn portion of the underlying line of credit of a Senior Term Loan. All Senior Term Loans and Unfunded Loan commitments involve interest rate risk, liquidity risk and credit risk, including the potential default or insolvency of the borrower. Senior Term Loans including Unfunded Loan Commitments are marked to market daily using pricing vendor quotations and the change in value, if any, is recorded as an unrealized gain or loss.
iv. Structured Notes — The value of structured notes are based on the price movements of a reference security or index. Upon termination, the Funds will receive a payment from the issuer based on the value of the referenced security (notional amount multiplied by price of the referenced security) and record a realized gain or loss.
118
GOLDMAN SACHS SINGLE SECTOR FIXED INCOME FUNDS
|
| 3. INVESTMENTS AND FAIR VALUE MEASUREMENTS (continued) |
v. When-Issued Securities and Forward Commitments — When-issued securities, including TBA (“To Be Announced”) securities, are securities that are authorized but not yet issued in the market and purchased in order to secure what is considered to be an advantageous price or yield to the Fund. A forward commitment involves entering into a contract to purchase or sell securities, typically on an extended settlement basis, for a fixed price at a future date. The purchase of securities on a when-issued or forward commitment basis involves a risk of loss if the value of the security to be purchased declines before the settlement date. Conversely, the sale of securities on a forward commitment basis involves the risk that the value of the securities sold may increase before the settlement date. Although the Funds will generally purchase securities on a when-issued or forward commitment basis with the intention of acquiring the securities for their portfolios, the Funds may dispose of when-issued securities or forward commitments prior to settlement which may result in a realized gain or loss.
Equity Securities — Equity securities and investment companies traded on a U.S. securities exchange or the NASDAQ system, or those located on certain foreign exchanges including, but not limited to the Americas, are valued daily at their last sale price or official closing price on the principal exchange or system on which they are traded. If no sale occurs, equity securities and exchange traded investment companies are valued at the last bid price for long positions and at the last ask price for short positions. Investments in investment companies (other than those that are exchange traded) are valued at the NAV on the valuation date. To the extent these investments are actively traded, they are classified as Level 1 of the fair value hierarchy.
Unlisted equity securities for which market quotations are available are valued at the last sale price on the valuation date, or if no sale occurs, at the last bid price. Securities traded on certain foreign securities exchanges are valued daily at fair value determined by an independent fair value service (if available) under valuation procedures approved by the trustees and consistent with applicable regulatory guidance. The independent fair value service takes into account multiple factors including, but not limited to, movements in the securities markets, certain depositary receipts, futures contracts and foreign currency exchange rates that have occurred subsequent to the close of the foreign securities exchange. Investments applying these valuation adjustments are classified as Level 2 of the fair value hierarchy.
Derivative Contracts — A derivative is an instrument whose value is derived from underlying assets, indices, reference rates or a combination of these factors.
Exchange-traded derivatives, including futures contracts, typically fall within Level 1 of the fair value hierarchy. Over-the-counter (“OTC”) derivatives are valued using market transactions and other market evidence, including market-based inputs to models, calibration to market-clearing transactions, broker or dealer quotations or other alternative pricing. Where models are used, the selection of a particular model to value an OTC derivative depends upon the contractual terms of, and specific risks inherent in, the instrument, as well as the availability of pricing information in the market. Valuation models require a variety of inputs, including contractual terms, market prices, yield curves, credit curves, measures of volatility, voluntary and involuntary prepayment rates, loss severity rates and correlations of such inputs. For OTC derivatives that trade in liquid markets, model inputs can generally be verified and model selection does not involve significant management judgment. OTC derivatives are classified within Level 2 of the fair value hierarchy when significant inputs are corroborated by market evidence.
i. Forward Foreign Currency Exchange Contracts — In a forward foreign currency contract, the Funds agree to receive or deliver a fixed quantity of one currency for another, at a pre-determined price at a future date. All forward foreign currency exchange contracts are marked to market daily at the applicable forward rate.
ii. Futures Contracts — Future contracts are contracts to buy or sell a standardized quantity of a specified commodity or security and are valued based on exchanged settlement prices or independent market quotes. Futures contracts are valued at the last settlement price, or in the absence of a sale, the last bid price for long positions and at the last ask price for short positions, at the end of each day on the board of trade or exchange upon which they are traded. Upon entering into a futures contract, the Funds deposit cash or securities in an account on behalf of the broker in an amount sufficient to meet the initial margin requirement. Subsequent payments are made or received by the Funds equal to the daily change in the contract value and are recorded as variation margin receivable or payable with a corresponding offset in gains or losses.
119
GOLDMAN SACHS SINGLE SECTOR FIXED INCOME FUNDS
Notes to Financial Statements (continued)
September 30, 2012 (Unaudited)
|
| 3. INVESTMENTS AND FAIR VALUE MEASUREMENTS (continued) |
iii. Options — When the Funds write call or put options, an amount equal to the premium received is recorded as a liability and is subsequently marked-to-market to reflect the current market value of the option written. Swaptions are options on swap contracts. Options on a futures contract may be written with premiums to be determined on a future date. The premiums for these options are based upon implied volatility parameters at specified terms.
Upon the purchase of a call option or a put option by the Funds, the premium paid is recorded as an investment and subsequently marked-to-market to reflect the current market value of the option. Certain options may be purchased with premiums to be determined on a future date. The premiums for these options are based upon implied voluntary parameters at specified terms.
iv. Swap Contracts — Swaps are marked to market daily using pricing vendor quotations, counterparty prices or model prices, and the change in value, if any, is recorded as an unrealized gain or loss.
An interest rate swap is an agreement that obligates two parties to exchange a series of cash flows at specified intervals, based upon or calculated by reference to changes in specified prices, rates or indices for a specified amount of an underlying asset or notional principal amount. The payment flows are usually netted against each other, with the difference being paid by one party to the other.
A credit default swap is an agreement that involves one party making a stream of payments to another party in exchange for the right to receive protection on a reference security or obligation. A Fund may use credit default swaps to provide a measure of protection against defaults of the reference security or obligation or to take a short position with respect to the likelihood of default. A Fund’s investment in credit default swaps may involve greater risks than if the Fund had invested in the referenced obligation directly. Credit events are contract specific but may include bankruptcy, failure to pay, restructuring and obligation acceleration. If a Fund buys protection through a credit default swap and no credit event occurs, its payments are limited to the periodic payments previously made to the counterparty. Upon the occurrence of a specified credit event, a Fund, as a buyer of credit protection, is entitled to receive an amount equal to the notional amount of the swap and deliver to the seller the defaulted reference obligation in a physically settled trade. A Fund may also receive a net settlement amount in the form of cash or securities equal to the notional amount of the swap reduced by the recovery value of the reference obligation in cash settled trade.
As a seller of protection, a Fund generally receives a payment stream throughout the term of the swap, provided that there is no credit event. In addition, if the Fund sells protection through a credit default swap, the Fund could suffer a loss because the value of the referenced obligation may be less than the premium payments received. Upon the occurrence of a specified credit event, a Fund, as a seller of credit protection, may be required to take possession of the defaulted reference obligation and pay the buyer an amount equal to the notional amount of the swap in a physically settled trade. A Fund may also pay a net settlement amount in the form of cash or securities equal to the notional amount of the swap reduced by the recovery value of the reference obligation in cash settled trade. Recovery values are at times established through the credit event auction process in which market participants are ensured that a transparent price has been set for the defaulted security or obligation. In addition, a Fund is entitled to a return of any assets, which have been pledged as collateral to the counterparty.
The maximum potential amount of future payments (undiscounted) that the Funds as sellers of protection could be required to make under a credit default swap would be an amount equal to the notional amount of the agreement. These potential amounts would be partially offset by any recovery values of the respective referenced obligations or net amounts received from a settlement of a credit default swap for the same reference security or obligation where the Funds bought credit protection.
Short Term Investments — Short-term investments having a maturity of 60 days or less are generally valued at amortized cost which approximates fair market value. These investments are classified as Level 2 of the fair value hierarchy.
i. Repurchase Agreements — Repurchase agreements involve the purchase of securities subject to the seller’s agreement to repurchase the securities at a mutually agreed upon date and price. During the term of a repurchase agreement, the value of the underlying securities held as collateral on behalf of the Funds, including accrued interest is required to exceed the value of
120
GOLDMAN SACHS SINGLE SECTOR FIXED INCOME FUNDS
|
| 3. INVESTMENTS AND FAIR VALUE MEASUREMENTS (continued) |
the repurchase agreement, including accrued interest. The underlying securities for all repurchase agreements are held at the Funds’ custodian or designated sub-custodians under tri-party repurchase agreements.
Pursuant to exemptive relief granted by the Securities and Exchange Commission (“SEC”) and terms and conditions contained therein, the Funds, together with other registered investment companies having management agreements with GSAM or its affiliates, may transfer uninvested cash into joint accounts, the daily aggregate balance of which is invested in one or more repurchase agreements. Under these joint accounts, the Funds maintain pro rata credit exposure to the underlying repurchase agreements’ counterparties. With the exception of certain transaction fees, the Funds are not subject to any expenses in relation to these investments.
B. Level 3 Fair Value Investments — The valuation techniques and significant inputs used in determining the fair values for investments classified as Level 3 are as follows:
To the extent that the aforementioned significant inputs are unobservable, or if quotations are not readily available, or if GSAM believes that such quotations do not accurately reflect fair value, the fair value of the Funds’ investments may be determined under valuation procedures approved by the trustees. GSAM, consistent with its procedures and applicable regulatory guidance, may make an adjustment to the most recent valuation prices of either domestic or foreign securities in light of significant events to reflect what it believes to be the fair value of the securities at the time of determining a Fund’s NAV. Significant events which could affect a large number of securities in a particular market may include, but are not limited to: significant fluctuations in U.S. or foreign markets; market dislocations; market disruptions; or unscheduled market closings. Significant events which could also affect a single issuer may include, but are not limited to: corporate actions such as reorganizations, mergers and buy-outs; ratings downgrades; and bankruptcies.
121
GOLDMAN SACHS SINGLE SECTOR FIXED INCOME FUNDS
Notes to Financial Statements (continued)
September 30, 2012 (Unaudited)
|
| 3. INVESTMENTS AND FAIR VALUE MEASUREMENTS (continued) |
C. Fair Value Hierarchy — The following is a summary of the Funds’ investments and derivatives classified in the fair value hierarchy as of September 30, 2012:
| | | | | | | | | | | | |
| | | |
| EMERGING MARKETS DEBT | | | | | | | | | | | | |
| | | |
| Investment Type | | Level 1 | | | Level 2 | | | Level 3 | |
| | | | | | | | | | | | |
| Assets | | | | | | | | | | | | |
Fixed Income | | | | | | | | | | | | |
Sovereign Debt Obligations | | $ | — | | | $ | 969,878,085 | | | $ | — | |
Foreign Debt Obligations | | | — | | | | 21,153,601 | | | | — | |
Corporate Obligations | | | — | | | | 403,526,722 | | | | — | |
Structured Notes | | | — | | | | 26,934,390 | | | | — | |
U.S. Treasury Obligations | | | 19,079,944 | | | | — | | | | — | |
Short-term Investments | | | — | | | | 96,300,000 | | | | — | |
| Total | | $ | 19,079,944 | | | $ | 1,517,792,798 | | | $ | — | |
| | | |
| Derivative Type | | | | | | | | | |
| Assets(a) | | | | | | | | | | | | |
Forward Foreign Currency Exchange Contracts | | $ | — | | | $ | 4,593,204 | | | $ | — | |
Futures Contracts | | | 1,028,899 | | | | — | | | | — | |
Interest Rate Swap Contracts | | | — | | | | 113,718 | | | | — | |
| Total | | $ | 1,028,899 | | | $ | 4,706,922 | | | $ | — | |
| Liabilities(a) | | | | | | | | | | | | |
Forward Foreign Currency Exchange Contracts | | $ | — | | | $ | (2,238,417 | ) | | $ | — | |
Futures Contracts | | | (748,657 | ) | | | — | | | | — | |
| Total | | $ | (748,657 | ) | | $ | (2,238,417 | ) | | $ | — | |
| | | |
| HIGH YIELD | | | | | | | | | | | | |
| | | |
| Investment Type | | Level 1 | | | Level 2 | | | Level 3 | |
| Assets | | | | | | | | | | | | |
Fixed Income | | | | | | | | | | | | |
Corporate Obligations | | $ | — | | | $ | 5,475,251,213 | | | $ | — | |
Senior Term Loans | | | — | | | | 277,142,380 | | | | 3,962,721 | |
Common Stock and/or Other Equity Investments | | | 12,533,662 | | | | 6,396,709 | | | | 40 | |
Warrants | | | — | | | | 2,366,611 | | | | — | |
Short-term Investments | | | — | | | | 209,700,000 | | | | — | |
| Total | | $ | 12,533,662 | | | $ | 5,970,856,913 | | | $ | 3,962,761 | |
122
GOLDMAN SACHS SINGLE SECTOR FIXED INCOME FUNDS
|
| 3. INVESTMENTS AND FAIR VALUE MEASUREMENTS (continued) |
| | | | | | | | | | | | |
| | | |
| HIGH YIELD (continued) | | | | | | | | | | | | |
| | | |
| Derivative Type | | Level 1 | | | Level 2 | | | Level 3 | |
| | | | | | | | | | | | |
| Assets(a) | | | | | | | | | | | | |
Forward Foreign Currency Exchange Contracts | | $ | — | | | $ | 236,021 | | | $ | — | |
| Liabilities(a) | | | | | | | | | | | | |
Forward Foreign Currency Exchange Contracts | | $ | — | | | $ | (3,635,597 | ) | | $ | — | |
| | | |
| HIGH YIELD FLOATING RATE | | | | | | | | | | | | |
| | | |
| Investment Type | | Level 1 | | | Level 2 | | | Level 3 | |
| Assets | | | | | | | | | | | | |
Fixed Income | | | | | | | | | | | | |
Senior Term Loans | | $ | — | | | $ | 602,459,937 | | | $ | — | |
Corporate Obligations | | | — | | | | 81,989,033 | | | | — | |
Unfunded Loan Commitment(a) | | | — | | | | 12,000 | | | | — | |
Short-term Investments | | | — | | | | 85,500,000 | | | | — | |
| Total | | $ | — | | | $ | 769,960,970 | | | $ | — | |
| | | |
| Derivative Type | | | | | | | | | |
| Liabilities(a) | | | | | | | | | | | | |
Forward Foreign Currency Exchange Contracts | | $ | — | | | $ | (31,924 | ) | | $ | — | |
| | | |
| INVESTMENT GRADE CREDIT | | | | | | | | | | | | |
| | | |
| Investment Type | | Level 1 | | | Level 2 | | | Level 3 | |
| Assets | | | | | | | | | | | | |
Fixed Income | | | | | | | | | | | | |
Corporate Obligations | | $ | — | | | $ | 499,179,682 | | | $ | — | |
Mortgage-Backed Obligations | | | — | | | | 7,418,235 | | | | — | |
Foreign Debt Obligations | | | — | | | | 16,194,134 | | | | — | |
Municipal Debt Obligations | | | — | | | | 16,942,991 | | | | — | |
U.S. Treasury Obligations and/or Other U.S. Government Agencies | | | — | | | | 20,478,843 | | | | — | |
Short-term Investments | | | — | | | | 4,000,000 | | | | — | |
| Total | | $ | — | | | $ | 564,213,885 | | | $ | — | |
| | | |
| Derivative Type | | | | | | | | | |
| Assets | | | | | | | | | | | | |
Options Purchased | | $ | — | | | $ | 752,827 | | | $ | — | |
Futures Contracts(a) | | | 470,216 | | | | — | | | | — | |
Credit Default Swap Contracts(a) | | | — | | | | 311,248 | | | | — | |
| Total | | $ | 470,216 | | | $ | 1,064,075 | | | $ | — | |
123
GOLDMAN SACHS SINGLE SECTOR FIXED INCOME FUNDS
Notes to Financial Statements (continued)
September 30, 2012 (Unaudited)
|
| 3. INVESTMENTS AND FAIR VALUE MEASUREMENTS (continued) |
| | | | | | | | | | | | |
| | | |
| INVESTMENT GRADE CREDIT (continued) | | | | | | | | | | | | |
| | | |
| | | Level 1 | | | Level 2 | | | Level 3 | |
| | | | | | | | | | | | |
| Liabilities | | | | | | | | | | | | |
Futures Contracts(a) | | $ | (498,274 | ) | | $ | — | | | $ | — | |
Interest Rate Swap Contracts(a) | | | — | | | | (415,585 | ) | | | — | |
Credit Default Swap Contracts(a) | | | — | | | | (115,071 | ) | | | — | |
Written Options Contracts | | | — | | | | (351,265 | ) | | | — | |
| Total | | $ | (498,274 | ) | | $ | (881,921 | ) | | $ | — | |
| | | |
| LOCAL EMERGING MARKETS DEBT | | | | | | | | | | | | |
| | | |
| Investment Type | | Level 1 | | | Level 2 | | | Level 3 | |
| Assets | | | | | | | | | | | | |
Fixed Income | | | | | | | | | | | | |
Sovereign Debt Obligations | | $ | — | | | $ | 1,325,745,833 | | | $ | — | |
Structured Notes | | | — | | | | 356,170,192 | | | | — | |
Corporate Obligations | | | — | | | | 200,434,551 | | | | — | |
Short-term Investments | | | — | | | | 187,400,000 | | | | — | |
| Total | | $ | — | | | $ | 2,069,750,576 | | | $ | — | |
| | | |
| Derivative Type | | | | | | | | | |
| Assets(a) | | | | | | | | | | | | |
Forward Foreign Currency Exchange Contracts | | $ | — | | | $ | 20,567,676 | | | $ | — | |
Futures Contracts | | | 80,066 | | | | — | | | | — | |
Interest Rate Swap Contracts | | | — | | | | 9,471,015 | | | | — | |
| Total | | $ | 80,066 | | | $ | 30,038,691 | | | $ | — | |
| Liabilities(a) | | | | | | | | | | | | |
Forward Foreign Currency Exchange Contracts | | $ | — | | | $ | (12,045,616 | ) | | $ | — | |
Futures Contracts | | | (14,183 | ) | | | — | | | | — | |
Interest Rate Swap Contracts | | | — | | | | (1,636,160 | ) | | | — | |
| Total | | $ | (14,183 | ) | | $ | (13,681,776 | ) | | $ | — | |
124
GOLDMAN SACHS SINGLE SECTOR FIXED INCOME FUNDS
|
| 3. INVESTMENTS AND FAIR VALUE MEASUREMENTS (continued) |
| | | | | | | | | | | | |
| | | |
| U.S. MORTGAGES | | | | | | | | | | | | |
| | | |
| Investment Type | | Level 1 | | | Level 2 | | | Level 3 | |
| | | | | | | | | | | | |
| Assets | | | | | | | | | | | | |
Fixed Income | | | | | | | | | | | | |
Mortgage-Backed Obligations | | $ | — | | | $ | 292,396,847 | | | $ | — | |
Asset-Backed Securities | | | — | | | | 8,260,851 | | | | — | |
U.S. Treasury Obligations and/or Other U.S. Government Agencies | | | 7,791,106 | | | | — | | | | — | |
Short-term Investments | | | — | | | | 78,900,000 | | | | — | |
| Total | | $ | 7,791,106 | | | $ | 379,557,698 | | | $ | — | |
| Liabilities | | | | | | | | | | | | |
Fixed Income | | | | | | | | | | | | |
Mortgage-Backed Obligations — Forward Sales Contracts | | $ | — | | | $ | (19,574,532 | ) | | $ | — | |
| | | |
| Derivative Type | | | | | | | | | |
| Assets | | | | | | | | | | | | |
Options Purchased | | $ | — | | | $ | 605,615 | | | $ | — | |
Futures Contracts(a) | | | 370,401 | | | | — | | | | — | |
Interest Rate Swap Contracts(a) | | | — | | | | 99,273 | | | | — | |
| Total | | $ | 370,401 | | | $ | 704,888 | | | $ | — | |
| Liabilities | | | | | | | | | | | | |
Futures Contracts(a) | | $ | (206,231 | ) | | $ | — | | | $ | — | |
Interest Rate Swap Contracts(a) | | | — | | | | (704,451 | ) | | | — | |
Written Options Contracts | | | — | | | | (225,484 | ) | | | — | |
| Total | | $ | (206,231 | ) | | $ | (929,935 | ) | | $ | — | |
| (a) | | Amount shown represents unrealized gain (loss) at period end. |
| | |
| 4. INVESTMENTS IN DERIVATIVES | | |
During the six months ended September 30, 2012, the Fund entered into certain derivative contract types. These instruments were used to meet the Funds’ investment objectives and to obtain and/or manage exposure related to the risks below. The following tables set forth, by certain risk types, the gross value of derivative contracts as of September 30, 2012. The values in the table below exclude the effects of cash collateral received or posted pursuant to these derivative contracts, and therefore are not representative of the Funds’ net exposure.
125
GOLDMAN SACHS SINGLE SECTOR FIXED INCOME FUNDS
Notes to Financial Statements (continued)
September 30, 2012 (Unaudited)
|
| 4. INVESTMENTS IN DERIVATIVES (continued) |
| | | | | | | | | | | | |
| | | |
| Emerging Markets Debt | | | | | | | | | | |
| Risk | | Statements of Assets
and Liabilities | | Assets | | | Statements of Assets
and Liabilities | | Liabilities | |
| | | | | | | | | | | | |
Interest rate | | Receivable for unrealized gain on swap contracts; Unrealized gain on futures variation margin | | $ | 1,142,617 | (a) | | Unrealized loss on futures variation margin | | $ | (748,567) | (a) |
Currency | | Receivable for unrealized gain on forward foreign currency exchange contracts | | | 4,593,204 | | | Payable for unrealized loss on forward foreign currency exchange contracts | | | (2,238,417) | |
| Total | | | | $ | 5,735,821 | | | | | $ | (2,986,984) | |
| | | |
| High Yield | | | | | | | | | | |
| Risk | | Statements of Assets
and Liabilities | | Assets | | | Statements of Assets
and Liabilities | | Liabilities | |
Currency | | Receivable for unrealized gain on forward foreign currency exchange contracts | | $ | 236,021 | | | Payable for unrealized loss on forward foreign currency exchange contracts | | $ | (3,635,597) | |
| | | |
| High Yield Floating Rate | | | | | | | | | | |
| Risk | | Statements of Assets
and Liabilities | | Assets | | | Statements of Assets
and Liabilities | | Liabilities | |
Currency | | — | | $ | — | | | Payable for unrealized loss on forward foreign currency exchange contracts | | $ | (31,924) | |
| | | |
| Investment Grade Credit | | | | | | | | | | |
| Risk | | Statements of Assets
and Liabilities | | Assets | | | Statements of Assets
and Liabilities | | Liabilities | |
Interest rate | | Unrealized gain on futures variation margin; Investments, at value | | $ | 1,223,043 | (a) | | Payable for unrealized loss on swap contracts; Unrealized loss on futures variation margin; Written options, at value | | $ | (1,265,124) | (a)(b) |
Credit | | Receivable for unrealized gain on swap contracts | | | 311,248 | | | Payable for unrealized loss on swap contracts | | | (115,071) | (b) |
| Total | | | | $ | 1,534,291 | | | | | $ | (1,380,195) | |
126
GOLDMAN SACHS SINGLE SECTOR FIXED INCOME FUNDS
|
| 4. INVESTMENTS IN DERIVATIVES (continued) |
| | | | | | | | | | | | |
| | | |
Local Emerging Markets Debt | | | | | | | | | | |
| Risk | | Statements of Assets
and Liabilities | | Assets | | | Statements of Assets
and Liabilities | | Liabilities | |
Interest rate | | Receivable for unrealized gain on swap contracts; Unrealized gain on futures variation margin | | $ | 9,551,081 | (a) | | Payable for unrealized loss on swap contracts; Unrealized loss on futures variation margin | | $ | (1,650,343) | (a)(b) |
Currency | | Receivable for unrealized gain on forward foreign currency exchange contracts | | | 20,567,676 | | | Payable for unrealized loss on forward foreign currency exchange contracts | | | (12,045,616) | |
| Total | | | | $ | 30,118,757 | | | | | $ | (13,695,959) | |
| | | |
| U.S. Mortgages | | | | | | | | | | |
| Risk | | Statements of Assets
and Liabilities | | Assets | | | Statements of Assets
and Liabilities | | Liabilities | |
Interest rate | | Receivable for unrealized gain on swap contracts; Unrealized gain on futures variation margin; Investments, at value | | $ | 1,075,289 | (a) | | Payable for unrealized loss on swap contracts; Unrealized loss on futures variation margin; Written options, at value | | $ | (1,136,166) | (a)(b) |
| (a) | | Includes unrealized gain (loss) on futures contracts described in the Additional Investment Information sections of the Schedules of Investments. Only current day’s variation margin is reported within the Statements of Assets and Liabilities. |
| (b) | | Aggregate of amounts include $530,656, $1,636,160 and $704,451 for Investment Grade Credit, Local Emerging Markets Debt and U.S. Mortgages, respectively, which represent the payments to be made pursuant to bilateral agreements should counterparties exercise their “right to terminate” provisions based on, among others, the Fund’s performance, their failure to pay on its obligations or failure to pledge collateral. Such amounts do not include incremental charges directly associated with the close-out of the agreements. They also do not reflect the fair value of any assets pledged as collateral which, through the daily margining process, substantially offsets the aforementioned amounts and for which the Fund is entitled to a full return. |
The following tables set forth, by certain risk types, the Funds’ gains (losses) related to these derivatives and their indicative volumes for the six months ended September 30, 2012. These gains (losses) should be considered in the context that these derivative contracts may have been executed to economically hedge certain investments, and accordingly, certain gains (losses) on such derivative contracts may offset certain (losses) gains attributable to investments. These gains (losses) are included in “Net realized gain (loss)” or “Net change in unrealized gain (loss)” on the Statements of Operations:
| | | | | | | | | | | | | | |
| | | |
| Emerging Markets Debt | | | | | | | | | | | | |
| Risk | | Statements of Operations | | Net
Realized
Gain (Loss) | | | Net Change in
Unrealized
Gain (Loss) | | | Average
Number of
Contracts(a) | |
| | | | | | | | | | | | | | |
| Interest rate | | Net realized gain (loss) from futures contracts and swap contracts/Net change in unrealized gain (loss) on futures contracts and swap contracts | | $ | 1,466,296 | | | $ | 162,898 | | | | 2,697 | |
| Credit | | Net realized gain (loss) from swap contracts/Net change in unrealized gain (loss) on swap contracts | | | (444,331 | ) | | | — | | | | 1 | |
| Currency | | Net realized gain (loss) from forward foreign currency exchange contracts/Net change in unrealized gain (loss) on forward foreign currency exchange contracts | | | 5,206,225 | | | | 4,362,922 | | | | 151 | |
| Total | | | | $ | 6,228,190 | | | $ | 4,525,820 | | | | 2,849 | |
127
GOLDMAN SACHS SINGLE SECTOR FIXED INCOME FUNDS
Notes to Financial Statements (continued)
September 30, 2012 (Unaudited)
|
| 4. INVESTMENTS IN DERIVATIVES (continued) |
| | | | | | | | | | | | | | |
| | | |
| High Yield | | | | | | | | | | | | |
| Risk | | Statements of Operations | | Net
Realized
Gain (Loss) | | | Net Change in
Unrealized
Gain (Loss) | | | Average
Number of
Contracts(a) | |
| | | | | | | | | | | | | | |
| Credit | | Net realized gain (loss) from swap contracts/Net change in unrealized gain (loss) on swap contracts | | $ | (4,446,282 | ) | | $ | (1,456,241 | ) | | | 1 | |
| Currency | | Net realized gain (loss) from forward foreign currency exchange contracts/Net change in unrealized gain (loss) on forward foreign currency exchange contracts | | | 17,561,185 | | | | (2,963,844 | ) | | | 4 | |
| Total | | | | $ | 13,114,903 | | | $ | (4,420,085 | ) | | | 5 | |
| | | |
| High Yield Floating Rate | | | | | | | | | | | | |
| Risk | | Statements of Operations | | Net
Realized
Gain (Loss) | | | Net Change in
Unrealized
Gain (Loss) | | | Average
Number of
Contracts(a) | |
| Currency | | Net realized gain (loss) from forward foreign currency exchange contracts/Net change in unrealized gain (loss) on forward foreign currency exchange contracts | | $ | (71,352 | ) | | $ | (31,924 | ) | | | 1 | |
| | | |
| Investment Grade Credit | | | | | | | | | | | | |
| Risk | | Statements of Operations | | Net
Realized
Gain (Loss) | | | Net Change in
Unrealized
Gain (Loss) | | | Average
Number of
Contracts(a) | |
| Interest rate | | Net realized gain (loss) from investments, futures contracts and swap contracts /Net change in unrealized gain (loss) on investments, futures contracts, swap contracts and written options | | $ | 2,244,866 | | | $ | 930,682 | | | | 1,017 | |
| Credit | | Net realized gain (loss) from swap contracts/Net change in unrealized gain (loss) on swap contracts | | | (361,872 | ) | | | 36,590 | | | | 13 | |
| Currency | | Net realized gain (loss) from forward foreign currency exchange contracts/Net change in unrealized gain (loss) on forward foreign currency exchange contracts | | | 58,446 | | | | — | | | | 1 | |
| Total | | | | $ | 1,941,440 | | | $ | 967,272 | | | | 1,031 | |
| | | |
| Local Emerging Markets Debt | | | | | | | | | | | | |
| Risk | | Statements of Operations | | Net
Realized
Gain (Loss) | | | Net Change in
Unrealized
Gain (Loss) | | | Average
Number of
Contracts(a) | |
| Interest rate | | Net realized gain (loss) from futures contracts, non-deliverable bond forwards and swap contracts/Net change in unrealized gain (loss) on futures contracts and swap contracts | | $ | 6,621,927 | | | $ | 9,618,700 | | | | 169 | |
| Credit | | Net realized gain (loss) from swap contracts/Net change in unrealized gain (loss) on swap contracts | | | (6,556 | ) | | | 5,502 | | | | — | * |
| Currency | | Net realized gain (loss) from forward foreign currency exchange contracts/Net change in unrealized gain (loss) on forward foreign currency exchange contracts | | | (9,446,268 | ) | | | 9,033,170 | | | | 340 | |
| Total | | | | $ | (2,830,897 | ) | | $ | 18,657,372 | | | | 509 | |
| * | | There were no contracts for credit default swaps for the six months ended September 30, 2012. |
128
GOLDMAN SACHS SINGLE SECTOR FIXED INCOME FUNDS
|
| 4. INVESTMENTS IN DERIVATIVES (continued) |
| | | | | | | | | | | | | | |
| | | |
| U.S. Mortgages | | | | | | | | | | | | |
| Risk | | Statements of Operations Location | | Net
Realized
Gain (Loss) | | | Net Change in
Unrealized
Gain (Loss) | | | Average
Number of
Contracts(a) | |
| | | | | | | | | | | | | | |
| Interest rate | | Net realized gain (loss) from investments, futures contracts and swap contracts/Net change in unrealized gain (loss) on investments, futures contracts, swap contracts and written options | | $ | (902,708 | ) | | $ | (400,758 | ) | | | 712 | |
| (a) | | Average number of contracts is based on the average of month end balances for the period ended September 30, 2012. |
| | |
| 5. AGREEMENTS AND AFFILIATED TRANSACTIONS | | |
A. Management Agreement — Under the Agreement, GSAM manages the Funds, subject to the general supervision of the trustees.
As compensation for the services rendered pursuant to the Agreement, the assumption of the expenses related thereto and administration of the Funds’ business affairs, including providing facilities, GSAM is entitled to a management fee accrued daily and paid monthly, equal to an annual percentage rate of each Fund’s average daily net assets.
For the six months ended September 30, 2012, contractual and effective net management fees with GSAM were at the following rates:
| | | | | | | | | | | | | | | | | | | | | | | | | | | | | | |
| | | | | Contractual Management Fee Rate | | | | |
| Fund | | | | First $1 billion | | | Next
$1 billion | | | Next
$3 billion | | | Next
$3 billion | | | Over
$8 billion | | | Effective
Rate | | | Effective Net
Management
Fee Rate | |
Emerging Markets Debt | | | | | 0.80 | % | | | 0.80 | % | | | 0.72 | % | | | 0.68 | % | | | 0.67 | % | | | 0.80 | % | | | 0.80 | % |
High Yield | | | | | 0.70 | | | | 0.70 | | | | 0.63 | | | | 0.60 | | | | 0.59 | | | | 0.65 | | | | 0.65 | |
High Yield Floating Rate | | | | | 0.60 | | | | 0.54 | | | | 0.51 | | | | 0.50 | | | | 0.49 | | | | 0.60 | | | | 0.60 | |
Investment Grade Credit | | | | | 0.40 | | | | 0.36 | | | | 0.34 | | | | 0.33 | | | | 0.32 | | | | 0.40 | | | | 0.33 | # |
Local Emerging Markets Debt | | | | | 0.90 | | | | 0.90 | | | | 0.81 | | | | 0.77 | | | | 0.75 | | | | 0.90 | | | | 0.80 | # |
U.S. Mortgages | | | | | 0.40 | | | | 0.36 | | | | 0.34 | | | | 0.33 | | | | 0.32 | | | | 0.40 | | | | 0.33 | # |
| # | | GSAM has agreed to waive a portion of its management fees in order to achieve effective net management rates of 0.33%, 0.80% and 0.33%, respectively as an annual percentage rate of the average daily net assets of the Investment Grade Credit, Local Emerging Markets Debt and U.S. Mortgages Funds through at least July 27, 2013. Prior to such date GSAM may not terminate the arrangement without the approval of the trustees. |
129
GOLDMAN SACHS SINGLE SECTOR FIXED INCOME FUNDS
Notes to Financial Statements (continued)
September 30, 2012 (Unaudited)
|
| 5. AGREEMENTS AND AFFILIATED TRANSACTIONS (continued) |
B. Distribution and Service Plans — The Trust, on behalf of each Fund, has adopted Distribution and Service Plans (the “Plans”). Under the Plans, Goldman Sachs, which serves as distributor (the “Distributor”), is entitled to a fee, accrued daily and paid monthly, for distribution services and personal and account maintenance services, which may then be paid by Goldman Sachs to authorized dealers, at the following annual rates calculated on a Fund’s average daily net assets of each respective share class:
| | | | | | | | | | | | | | | | |
| | | Distribution and Service Plan Rates | |
| | | Class A* | | | Class B | | | Class C | | | Class R* | |
Distribution Plan | | | 0.25 | % | | | 0.75 | % | | | 0.75 | % | | | 0.50 | % |
Service Plan | | | — | | | | 0.25 | | | | 0.25 | | | | — | |
| * | | With respect to Class A and Class R Shares, the Distributor at its discretion may use compensation for distribution services paid under the Distribution Plan to compensate service organizations for personal and account maintenance services and expenses as long as such total compensation does not exceed the maximum cap on “service fees” imposed by the Financial Industry Regulatory Authority. |
C. Distribution Agreement — Goldman Sachs, as Distributor of the shares of the Funds pursuant to a Distribution Agreement, may retain a portion of the Class A front end sales charge and Class B and Class C CDSC. During the six months ended September 30, 2012, Goldman Sachs advised that it retained the following approximate amounts:
| | | | | | | | | | | | | | |
| | | | | Front End
Sales Charge | | | Contingent Deferred
Sales Charge | |
| Fund | | | | Class A | | | Class B | | | Class C | |
Emerging Markets Debt | | | | $ | 12,700 | | | | N/A | | | $ | — | * |
High Yield | | | | | 40,500 | | | | — | | | | — | * |
High Yield Floating Rate | | | | | 800 | | | | N/A | | | | — | |
Investment Grade Credit | | | | | 1,000 | | | | N/A | | | | N/A | |
Local Emerging Markets Debt | | | | | 6,400 | | | | N/A | | | | — | * |
U.S. Mortgages | | | | | — | | | | N/A | | | | N/A | |
| * | | Amount is less than $100. |
D. Service Plan and Shareholder Administration Plan — The Trust, on behalf of each Fund that offers Service Shares, has adopted a Service Plan and a Shareholder Administration Plan. These plans allow service organizations to provide varying levels of personal and account maintenance and shareholder administration services to their customers who are beneficial owners of such shares. The Service Plan and Shareholder Administration Plan each provide for compensation to the service organizations which is accrued daily and paid monthly at an annual rate of 0.25% (0.50% in aggregate) of the average daily net assets of the Service Shares.
E. Transfer Agency Agreement — Goldman Sachs also serves as the transfer agent of the Funds for a fee pursuant to a Transfer Agency Agreement. The fees charged for such transfer agency services are accrued daily and paid monthly at annual rates as follows: 0.13% of the average daily net assets of Class A, Class B, Class C, Class IR and Class R Shares; and 0.04% of the average daily net assets for Institutional, Separate Account Institutional and Service Shares.
F. Other Expense Agreements and Affiliated Transactions — GSAM has agreed to limit certain “Other Expense” of the Funds (excluding management fees, distribution and service fees, acquired fund fees and expenses, transfer agent fees and expenses, service fees and shareholder administration fees (as applicable), taxes, interest, brokerage fees, litigation, indemnification, shareholder meetings and other extraordinary expenses, exclusive of any custody and transfer agent fee reductions) to the extent such expenses exceed, on an annual basis, a percentage rate of the average daily net assets of each Fund. Such Other Expense reimbursements, if any, are accrued daily and paid monthly. In addition, the Funds are not obligated to
130
GOLDMAN SACHS SINGLE SECTOR FIXED INCOME FUNDS
|
| 5. AGREEMENTS AND AFFILIATED TRANSACTIONS (continued) |
reimburse GSAM for prior fiscal year expense reimbursements, if any. The Other Expense limitations for the Emerging Markets Debt, High Yield, High Yield Floating Rate, Investment Grade Credit, Local Emerging Markets Debt and U.S. Mortgages Funds, as an annual percentage rate of average daily net assets are 0.054%, 0.024%, 0.104%, 0.004%, 0.074% and 0.004%, respectively. Prior to July 27, 2012, the Other Expense limitation for the Emerging Markets Debt Fund was 0.044%. These Other Expense reimbursements will remain in place through at least July 27, 2013, and prior to such date GSAM may not terminate the arrangements without the approval of the trustees. In addition, the Funds have entered into certain offset arrangements with the custodian and the transfer agent, which may result in a reduction of the Funds’ expenses.
For the six months ended September 30, 2012, these expense reductions, including any fee waivers and Other Expense reimbursements, were as follows (in thousands):
| | | | | | | | | | | | | | | | | | |
| Fund | | | | Management
Fee Waivers | | | Custody Fee
Credits | | | Other
Expense
Reimbursements | | | Total
Expense
Reductions | |
Emerging Markets Debt | | | | $ | — | | | $ | 2 | | | $ | 209 | | | $ | 211 | |
High Yield | | | | | — | | | | 4 | | | | — | | | | 4 | |
High Yield Floating Rate | | | | | — | | | | 3 | | | | — | | | | 3 | |
Investment Grade Credit | | | | | 193 | | | | 1 | | | | 137 | | | | 331 | |
Local Emerging Markets Debt | | | | | 929 | | | | 1 | | | | 373 | | | | 1,303 | |
U.S. Mortgages | | | | | 126 | | | | 1 | | | | 195 | | | | 322 | |
As of September 30, 2012, the amounts owed to affiliates of the Funds were as follows (in thousands):
| | | | | | | | | | | | | | | | | | |
| Fund | | | | Management
Fees | | | Distribution
and Service
Fees | | | Transfer
Agent
Fees | | | Total | |
Emerging Markets Debt | | | | $ | 991 | | | $ | 75 | | | $ | 69 | | | $ | 1,135 | |
High Yield | | | | | 3,185 | | | | 248 | | | | 256 | | | | 3,689 | |
High Yield Floating Rate | | | | | 360 | | | | 1 | | | | 25 | | | | 386 | |
Investment Grade Credit | | | | | 150 | | | | 36 | | | | 31 | | | | 217 | |
Local Emerging Markets Debt | | | | | 1,325 | | | | 51 | | | | 80 | | | | 1,456 | |
U.S. Mortgages | | | | | 89 | | | | 1 | | | | 11 | | | | 101 | |
G. Line of Credit Facility — As of September 30, 2012, the Funds participated in a $630,000,000 committed, unsecured revolving line of credit facility (the “facility”) together with other funds of the Trust and registered investment companies having management agreements with GSAM or its affiliates (“Other Borrowers”). Pursuant to the terms of the facility, the Funds and Other Borrowers could increase the credit amount by an additional $340,000,000, for a total of up to $970,000,000. This facility is to be used solely for temporary or emergency purposes. The interest rate on borrowings is based on the federal funds rate. The facility also requires a fee to be paid by the Funds based on the amount of the commitment that has not been utilized. For the six months ended September 30, 2012, the Funds did not have any borrowings under the facility. Prior to May 8, 2012, the amount available through the facility was $580,000,000.
131
GOLDMAN SACHS SINGLE SECTOR FIXED INCOME FUNDS
Notes to Financial Statements (continued)
September 30, 2012 (Unaudited)
|
| 5. AGREEMENTS AND AFFILIATED TRANSACTIONS (continued) |
H. Other Transactions with Affiliates — For the six months ended September 30, 2012, Goldman Sachs earned approximately $27,100, $15,400, $3,600, and $8,500 in brokerage commissions from portfolio transactions, including futures transactions executed with Goldman Sachs as the Futures Commission Merchant on behalf of Emerging Markets Debt, Investment Grade Credit, Local Emerging Markets Debt, and U.S. Mortgages Funds, respectively.
As of September 30, 2012, the Goldman Sachs Satellite Strategies Portfolio was the beneficial owner of 14%, 19%, and 8% of total outstanding shares of the Emerging Markets Debt, High Yield Floating Rate, and Local Emerging Markets Debt Funds, respectively.
As of September 30, 2012, Goldman Sachs Group, Inc. was the beneficial owner of approximately 100% of the Class R Shares of the High Yield Floating Rate Fund and 100% of the Class IR Shares of the U.S. Mortgages Fund.
| | |
| 6. PORTFOLIO SECURITIES TRANSACTIONS | | |
The cost of purchases and proceeds from sales and maturities of long-term securities for the six months ended September 30, 2012, were as follows:
| | | | | | | | | | | | | | | | | | |
Fund | | | | Purchases of
U.S. Government and
Agency Obligations | | | Purchases (Excluding
U.S. Government and
Agency Obligations) | | | Sales and
Maturities of
U.S. Government and
Agency Obligations | | | Sales and
Maturities (Excluding
U.S. Government and
Agency Obligations) | |
Emerging Markets Debt | | | | $ | — | | | $ | 979,764,465 | | | $ | — | | | $ | 490,562,194 | |
High Yield | | | | | — | | | | 1,826,718,107 | | | | — | | | | 1,615,526,477 | |
High Yield Floating Rate | | | | | — | | | | 315,190,848 | | | | — | | | | 226,057,733 | |
Investment Grade Credit | | | | | 386,737,198 | | | | 215,234,770 | | | | 387,771,080 | | | | 198,011,395 | |
Local Emerging Markets Debt | | | | | — | | | | 1,288,223,202 | | | | — | | | | 1,027,686,212 | |
U.S. Mortgages | | | | | 3,445,232,051 | | | | 31,174,419 | | | | 3,555,812,928 | | | | 37,272,391 | |
As of the Funds’ most recent fiscal year end, March 31, 2012, the Funds’ capital loss carryforwards and certain timing differences, on a tax basis were as follows:
| | | | | | | | | | | | | | | | | | | | | | | | |
| | | Emerging
Markets Debt | | | High Yield | | | High Yield
Floating Rate | | | Investment
Grade Credit | | | Local Emerging
Markets Debt | | | U.S. Mortgages | |
Capital loss carryforwards: | | | | | | | | | | | | | | | | | | | | | | | | |
Expiring 2018(1) | | $ | — | | | $ | — | | | $ | — | | | $ | — | | | $ | — | | | $ | (1,816,024 | ) |
Perpetual Short-term | | | — | | | | — | | | | (7,538,727 | ) | | | — | | | | — | | | | — | |
Timing differences (Post-October Losses, Income Distribution Payable and Straddle Losses) | | $ | (1,831,257 | ) | | $ | (2,119,582 | ) | | $ | (18,835 | ) | | $ | (1,126,629 | ) | | $ | (23,144,742 | ) | | $ | (242,005 | ) |
| (1) | | Expiration occurs on March 31 of the year indicated. |
132
GOLDMAN SACHS SINGLE SECTOR FIXED INCOME FUNDS
|
| 7. TAX INFORMATION (continued) |
As of September 30, 2012, the Funds’ aggregate security unrealized gains and losses based on cost for U.S. federal income tax purposes were as follows:
| | | | | | | | | | | | | | | | | | | | | | | | |
| | | Emerging
Markets Debt | | | High Yield | | | High Yield
Floating Rate | | | Investment
Grade Credit | | | Local Emerging
Markets Debt | | | U.S. Mortgages | |
Tax Cost | | $ | 1,440,862,517 | | | $ | 5,766,296,574 | | | $ | 761,369,137 | | | $ | 528,648,731 | | | $ | 2,033,865,367 | | | $ | 384,321,577 | |
Gross unrealized gain | | | 105,566,117 | | | | 324,817,736 | | | | 9,776,865 | | | | 36,669,880 | | | | 66,532,789 | | | | 6,400,155 | |
Gross unrealized loss | | | (9,555,892 | ) | | | (103,760,974 | ) | | | (1,197,032 | ) | | | (351,899 | ) | | | (30,647,580 | ) | | | (2,767,313 | ) |
Net unrealized security gain | | $ | 96,010,225 | | | $ | 221,056,762 | | | $ | 8,579,833 | | | $ | 36,317,981 | | | $ | 35,885,209 | | | $ | 3,632,842 | |
The difference between GAAP-basis and tax-basis unrealized gains (losses) is attributable primarily to net mark-to-market gains (losses) on regulated futures contracts and foreign currency contracts, wash sales, differences related to the tax treatment of swap transactions and paydowns, material modification of debt securities and inflation protected securities.
GSAM has reviewed the Funds’ tax positions for all open tax years (the current and prior three years, as applicable) and has concluded that no provision for income tax is required in the Funds’ financial statements. Such open tax years remain subject to examination and adjustment by tax authorities.
The Funds’ risks include, but are not limited to, the following:
Foreign Custody Risk — A fund that invests in foreign securities may hold such securities and foreign currency with foreign banks, agents, and securities depositories appointed by the Fund’s custodian (each a “Foreign Custodian”). In some countries, Foreign Custodians may be subject to little or no regulatory oversight or independent evaluation of their operations. Further, the laws of certain countries may place limitations on the Fund’s ability to recover its assets if a Foreign Custodian enters into bankruptcy. Investments in emerging markets may be subject to greater custody risks than investments in more developed markets. Custody services in emerging market countries are often undeveloped and may be less regulated than in more developed countries, and thus may not afford the same level of investor protection as would apply in developed countries.
Liquidity Risk — The Funds may make investments that may be illiquid or that may become less liquid in response to market developments or adverse investor perceptions. Liquidity risk may also refer to the risk that a Fund will not be able to pay redemption proceeds within the allowable time period because of unusual market conditions, an unusually high volume of redemption requests, or other reasons. To meet redemption requests, a Fund may be forced to sell investments at an unfavorable time and/or under unfavorable conditions.
Market and Credit Risks — In the normal course of business, the Funds trade financial instruments and enter into financial transactions where risk of potential loss exists due to changes in the market (market risk). Additionally, the Funds may also be exposed to credit risk in the event that an issuer fails to perform or that an institution or entity with which the Funds have unsettled or open transaction defaults.
Investing in foreign markets may involve special risks and considerations not typically associated with investing in the U.S. These risks include revaluation of currencies, high rates of inflation, repatriation restrictions on income and capital, and adverse political and economic developments. Moreover, securities issued in these markets may be less liquid, be subject to government ownership controls, have delayed settlements and their prices may be more volatile than those of comparable securities in the U.S.
133
GOLDMAN SACHS SINGLE SECTOR FIXED INCOME FUNDS
Notes to Financial Statements (continued)
September 30, 2012 (Unaudited)
|
| 8. OTHER RISKS (continued) |
Non-Diversification Risk — Emerging Markets Debt and Local Emerging Markets Debt Funds are non-diversified and are permitted to invest more of their assets in fewer issuers than “diversified” mutual funds. Thus, these Funds may be subject to greater risks than a fund that invests in a greater number of issuers.
Portfolio Concentration Risk — As a result of certain of the Funds’ ability to invest a large percentage of their assets in obligations of issuers within the same country, state, region, currency or economic sector, an adverse economic, business or political development may affect the value of the Funds’ investments more than if their investments were not so concentrated.
Redemption Proceeds Risk — The High Yield Floating Rate Fund may at times purchase securities with settlement periods that are longer than the time period required to pay redemption proceeds. In unusual circumstances, the High Yield Floating Rate Fund may pay redemption proceeds up to seven calendar days following receipt of a properly executed redemption request.
Shareholder Concentration Risk — Certain funds, accounts, individuals or Goldman Sachs affiliates may from time to time own (beneficially or of record) or control a significant percentage of the Funds’ shares. Redemptions by these entities of their holdings in the Funds may impact the Funds’ liquidity and NAV. These redemptions may also force the Funds to sell securities.
Under the Trust’s organizational documents, its trustees, officers, employees and agents are indemnified, to the extent permitted by the Act, against certain liabilities that may arise out of performance of their duties to the Funds. Additionally, in the course of business, the Funds enter into contracts that contain a variety of indemnification clauses. The Funds’ maximum exposure under these arrangements is unknown, as this would involve future claims that may be made against the Funds that have not yet occurred. However, GSAM believes the risk of loss under these arrangements to be remote.
Other — On February 8, 2012, the Commodity Futures Trading Commission (CFTC) adopted amendments to several of its rules relating to commodity pool operators, including Rule 4.5. The Funds currently rely on Rule 4.5’s exclusion from CFTC regulation for regulated investment companies. GSAM is currently evaluating the amendments and their impact, if any, on the Funds’ financial statements.
134
GOLDMAN SACHS SINGLE SECTOR FIXED INCOME FUNDS
Subsequent events after the balance sheet date have been evaluated through the date the financial statements were issued. GSAM has concluded that there is no impact requiring adjustment or disclosure in the financial statements.
135
GOLDMAN SACHS SINGLE SECTOR FIXED INCOME FUNDS
Notes to Financial Statements (continued)
September 30, 2012 (Unaudited)
|
| 12. SUMMARY OF SHARE TRANSACTIONS |
Share activity is as follows:
| | | | | | | | | | | | | | | | |
| | | Emerging Markets Debt Fund | |
| | | | |
| | | For the Six Months Ended September 30, 2012 (Unaudited) | | | For the Fiscal Year Ended March 31, 2012 | |
| | | | |
| | | Shares | | | Dollars | | | Shares | | | Dollars | |
| | | | |
| Class A Shares | | | | | | | | | | | | | | | | |
Shares sold | | | 5,706,178 | | | $ | 76,300,854 | | | | 6,816,607 | | | $ | 86,008,912 | |
Reinvestment of distributions | | | 267,849 | | | | 3,567,402 | | | | 668,306 | | | | 8,405,041 | |
Shares converted from Class B(a) | | | — | | | | — | | | | — | | | | — | |
Shares redeemed | | | (3,446,630 | ) | | | (45,891,088 | ) | | | (7,168,244 | ) | | | (89,899,062 | ) |
| | | | 2,527,397 | | | | 33,977,168 | | | | 316,669 | | | | 4,514,891 | |
| Class B Shares | | | | | | | | | | | | | | | | |
Shares sold | | | — | | | | — | | | | — | | | | — | |
Reinvestment of distributions | | | — | | | | — | | | | — | | | | — | |
Shares converted to Class A(a) | | | — | | | | — | | | | — | | | | — | |
Shares redeemed | | | — | | | | — | | | | — | | | | — | |
| | | | — | | | | — | | | | — | | | | — | |
| Class C Shares | | | | | | | | | | | | | | | | |
Shares sold | | | 627,850 | | | | 8,417,740 | | | | 728,389 | | | | 9,213,200 | |
Reinvestment of distributions | | | 27,266 | | | | 362,709 | | | | 80,844 | | | | 1,015,116 | |
Shares redeemed | | | (193,322 | ) | | | (2,557,293 | ) | | | (886,600 | ) | | | (11,105,769 | ) |
| | | | 461,794 | | | | 6,223,156 | | | | (77,367 | ) | | | (877,453 | ) |
| Institutional Shares | | | | | | | | | | | | | | | | |
Shares sold | | | 45,978,379 | | | | 599,726,406 | | | | 31,385,047 | | | | 400,797,021 | |
Reinvestment of distributions | | | 1,574,257 | | | | 21,031,257 | | | | 2,088,337 | | | | 26,308,230 | |
Shares redeemed | | | (11,590,718 | ) | | | (153,983,319 | ) | | | (13,377,912 | ) | | | (168,339,331 | ) |
| | | | 35,961,918 | | | | 466,774,344 | | | | 20,095,472 | | | | 258,765,920 | |
| Service Shares | | | | | | | | | | | | | | | | |
Shares sold | | | — | | | | — | | | | — | | | | — | |
Reinvestment of distributions | | | — | | | | — | | | | — | | | | — | |
Shares redeemed | | | — | | | | — | | | | — | | | | — | |
| | | | — | | | | — | | | | — | | | | — | |
| Class IR Shares | | | | | | | | | | | | | | | | |
Shares sold | | | 564,165 | | | | 7,472,554 | | | | 653,385 | | | | 8,335,286 | |
Reinvestment of distributions | | | 14,482 | | | | 193,919 | | | | 14,643 | | | | 184,619 | |
Shares redeemed | | | (146,916 | ) | | | (1,961,711 | ) | | | (278,424 | ) | | | (3,443,347 | ) |
| | | | 431,731 | | | | 5,704,762 | | | | 389,604 | | | | 5,076,558 | |
| Class R Shares | | | | | | | | | | | | | | | | |
Shares sold | | | — | | | | — | | | | — | | | | — | |
Reinvestment of distributions | | | — | | | | — | | | | — | | | | — | |
Shares redeemed | | | — | | | | — | | | | — | | | | — | |
| | | | — | | | | — | | | | — | | | | — | |
NET INCREASE | | | 39,382,840 | | | $ | 512,679,430 | | | | 20,724,378 | | | $ | 267,479,916 | |
| (a) | | Class B Shares automatically convert into Class A Shares on or about the fifteenth day of the last month of the calendar quarter that is eight years after the initial purchase date of either the Fund or another Goldman Sachs Fund. |
136
GOLDMAN SACHS SINGLE SECTOR FIXED INCOME FUNDS
| | | | | | | | | | | | | | | | | | | | | | | | | | | | | | |
| High Yield Fund | | | High Yield Floating Rate Fund | |
For the Six Months Ended September 30, 2012 (Unaudited) | | | For the Fiscal Year Ended March 31, 2012 | | | For the Six Months Ended
September 30, 2012
(Unaudited) | | | For the Fiscal Year Ended
March 31, 2012 | |
| Shares | | | Dollars | | | Shares | | | Dollars | | | Shares | | | Dollars | | | Shares | | | Dollars | |
| | | | | | | | | | | | | | | | | | | | | | | | | | | | | | |
| | 12,767,385 | | | $ | 91,177,315 | | | | 24,230,937 | | | $ | 170,904,936 | | | | 1,893,372 | | | $ | 18,634,359 | | | | 327,278 | | | $ | 3,214,830 | |
| | 2,558,423 | | | | 18,333,693 | | | | 7,502,592 | | | | 52,887,514 | | | | 5,781 | | | | 57,296 | | | | 4,404 | | | | 43,194 | |
| | 70,078 | | | | 502,935 | | | | 414,394 | | | | 2,913,955 | | | | — | | | | — | | | | — | | | | — | |
| | (20,324,314 | ) | | | (145,103,780 | ) | | | (60,475,812 | ) | | | (427,785,302 | ) | | | (1,740,452 | ) | | | (17,220,353 | ) | | | (139,947 | ) | | | (1,370,040 | ) |
| | (4,928,428 | ) | | | (35,089,837 | ) | | | (28,327,889 | ) | | | (201,078,897 | ) | | | 158,701 | | | | 1,471,302 | | | | 191,735 | | | | 1,887,984 | |
| | | | | | | | | | | | | | | | | | | | | | | | | | | | | | |
| | 65,024 | | | | 465,359 | | | | 199,606 | | | | 1,422,341 | | | | — | | | | — | | | | — | | | | — | |
| | 96,050 | | | | 689,828 | | | | 316,560 | | | | 2,236,418 | | | | — | | | | — | | | | — | | | | — | |
| | (69,940 | ) | | | (502,935 | ) | | | (413,504 | ) | | | (2,913,955 | ) | | | — | | | | — | | | | — | | | | — | |
| | (802,586 | ) | | | (5,779,816 | ) | | | (1,957,221 | ) | | | (13,858,138 | ) | | | — | | | | — | | | | — | | | | — | |
| | (711,452 | ) | | | (5,127,564 | ) | | | (1,854,559 | ) | | | (13,113,334 | ) | | | — | | | | — | | | | — | | | | — | |
| | | | | | | | | | | | | | | | | | | | | | | | | | | | | | |
| | 961,028 | | | | 6,875,864 | | | | 2,917,297 | | | | 20,671,865 | | | | 20,294 | | | | 201,205 | | | | 57,181 | | | | 560,889 | |
| | 331,533 | | | | 2,379,473 | | | | 816,380 | | | | 5,747,609 | | | | 940 | | | | 9,316 | | | | 623 | | | | 6,096 | |
| | (1,445,296 | ) | | | (10,351,679 | ) | | | (4,030,512 | ) | | | (28,493,700 | ) | | | (1,981 | ) | | | (19,568 | ) | | | (6,562 | ) | | | (64,689 | ) |
| | (152,735 | ) | | | (1,096,342 | ) | | | (296,835 | ) | | | (2,074,226 | ) | | | 19,253 | | | | 190,953 | | | | 51,242 | | | | 502,296 | |
| | | | | | | | | | | | | | | | | | | | | | | | | | | | | | |
| | 82,767,546 | | | | 592,333,271 | | | | 316,942,691 | | | | 2,209,750,502 | | | | 14,928,437 | | | | 148,228,641 | | | | 75,302,011 | | | | 745,221,511 | |
| | 22,195,634 | | | | 159,566,941 | | | | 44,883,502 | | | | 316,729,814 | | | | 1,422,596 | | | | 14,107,883 | | | | 2,043,435 | | | | 19,972,861 | |
| | (95,303,549 | ) | | | (681,348,567 | ) | | | (269,817,960 | ) | | | (1,933,952,375 | ) | | | (7,235,175 | ) | | | (71,731,260 | ) | | | (24,166,093 | ) | | | (234,555,625 | ) |
| | 9,659,631 | | | | 70,551,645 | | | | 92,008,233 | | | | 592,527,941 | | | | 9,115,858 | | | | 90,605,264 | | | | 53,179,353 | | | | 530,638,747 | |
| | | | | | | | | | | | | | | | | | | | | | | | | | | | | | |
| | 355,849 | | | | 2,538,900 | | | | 827,153 | | | | 5,881,062 | | | | — | | | | — | | | | — | | | | — | |
| | 81,828 | | | | 586,092 | | | | 210,921 | | | | 1,485,240 | | | | — | | | | — | | | | — | | | | — | |
| | (555,037 | ) | | | (3,960,472 | ) | | | (1,172,341 | ) | | | (8,246,269 | ) | | | — | | | | — | | | | — | | | | — | |
| | (117,360 | ) | | | (835,480 | ) | | | (134,267 | ) | | | (879,967 | ) | | | — | | | | — | | | | — | | | | — | |
| | | | | | | | | | | | | | | | | | | | | | | | | | | | | | |
| | 272,777 | | | | 1,953,925 | | | | 5,703,833 | | | | 40,953,705 | | | | 392,715 | | | | 3,842,473 | | | | 113,621 | | | | 1,111,707 | |
| | 156,686 | | | | 1,125,207 | | | | 315,722 | | | | 2,196,850 | | | | 5,121 | | | | 50,888 | | | | 731 | | | | 7,042 | |
| | (1,165,120 | ) | | | (8,256,804 | ) | | | (1,241,490 | ) | | | (8,719,242 | ) | | | (10,326 | ) | | | (101,922 | ) | | | (103,649 | ) | | | (988,717 | ) |
| | (735,657 | ) | | | (5,177,672 | ) | | | 4,778,065 | | | | 34,431,313 | | | | 387,510 | | | | 3,791,439 | | | | 10,703 | | | | 130,032 | |
| | | | | | | | | | | | | | | | | | | | | | | | | | | | | | |
| | 309,941 | | | | 2,211,545 | | | | 811,750 | | | | 5,760,117 | | | | — | | | | — | | | | — | | | | — | |
| | 75,235 | | | | 539,271 | | | | 162,704 | | | | 1,143,080 | | | | 19 | | | | 183 | | | | 29 | | | | 286 | |
| | (211,789 | ) | | | (1,508,188 | ) | | | (372,565 | ) | | | (2,656,159 | ) | | | — | | | | — | | | | — | | | | — | |
| | 173,387 | | | | 1,242,628 | | | | 601,889 | | | | 4,247,038 | | | | 19 | | | | 183 | | | | 29 | | | | 286 | |
| | 3,187,386 | | | $ | 24,467,378 | | | | 66,774,637 | | | $ | 414,059,868 | | | | 9,681,341 | | | $ | 96,059,141 | | | | 53,433,062 | | | $ | 533,159,345 | |
137
GOLDMAN SACHS SINGLE SECTOR FIXED INCOME FUNDS
Notes to Financial Statements (continued)
September 30, 2012 (Unaudited)
|
| 12. SUMMARY OF SHARE TRANSACTIONS (continued) |
Share activity is as follows:
| | | | | | | | | | | | | | | | |
| | | Investment Grade Credit Fund | |
| | | | |
| | | For the Six Months Ended September 30, 2012 (Unaudited) | | | For the Fiscal Year Ended March 31, 2012 | |
| | | | |
| | | Shares | | | Dollars | | | Shares | | | Dollars | |
| | | | |
| Class A Shares | | | | | | | | | | | | | | | | |
Shares sold | | | 3,290,170 | | | $ | 32,394,047 | | | | 4,678,568 | | | $ | 44,996,752 | |
Reinvestment of distributions | | | 267,466 | | | | 2,628,021 | | | | 1,286,874 | | | | 12,212,406 | |
Shares redeemed | | | (2,081,080 | ) | | | (20,242,938 | ) | | | (5,181,187 | ) | | | (50,061,272 | ) |
| | | | 1,476,556 | | | | 14,779,130 | | | | 784,255 | | | | 7,147,886 | |
| Class C Shares | | | | | | | | | | | | | | | | |
Shares sold | | | — | | | | — | | | | — | | | | — | |
Reinvestment of distributions | | | — | | | | — | | | | — | | | | — | |
Shares redeemed | | | — | | | | — | | | | — | | | | — | |
| | | | — | | | | — | | | | — | | | | — | |
| Institutional Shares | | | | | | | | | | | | | | | | |
Shares sold | | | 2,461,979 | | | | 24,235,398 | | | | 6,171,941 | | | | 59,445,734 | |
Reinvestment of distributions | | | 266,654 | | | | 2,617,878 | | | | 1,392,392 | | | | 13,226,701 | |
Shares redeemed | | | (5,714,888 | ) | | | (55,546,113 | ) | | | (5,418,519 | ) | | | (52,180,733 | ) |
| | | | (2,986,255 | ) | | | (28,692,837 | ) | | | 2,145,814 | | | | 20,491,702 | |
| Separate Account Institutional Shares | | | | | | | | | | | | | | | | |
Shares sold | | | 1,871,815 | | | | 18,186,837 | | | | 5,853,532 | | | | 56,189,776 | |
Reinvestment of distributions | | | 371,626 | | | | 3,652,817 | | | | 1,950,354 | | | | 18,527,963 | |
Shares redeemed | | | (3,130,149 | ) | | | (30,446,546 | ) | | | (10,566,519 | ) | | | (101,236,412 | ) |
| | | | (886,708 | ) | | | (8,606,892 | ) | | | (2,762,633 | ) | | | (26,518,673 | ) |
| Class IR Shares(a) | | | | | | | | | | | | | | | | |
Shares sold | | | 1,034 | | | | 10,000 | | | | 199,773 | | | | 1,915,952 | |
Reinvestment of distributions | | | 2,286 | | | | 22,430 | | | | 5,637 | | | | 53,128 | |
Shares redeemed | | | (41,042 | ) | | | (405,814 | ) | | | (69,045 | ) | | | (667,409 | ) |
| | | | (37,722 | ) | | | (373,384 | ) | | | 136,365 | | | | 1,301,671 | |
NET INCREASE (DECREASE) | | | (2,434,129 | ) | | $ | (22,893,983 | ) | | | 303,801 | | | $ | 2,422,586 | |
| (a) | | Commenced operations on July 29, 2011 for Investment Grade Credit and U.S. Mortgages Funds. |
138
GOLDMAN SACHS SINGLE SECTOR FIXED INCOME FUNDS
| | | | | | | | | | | | | | | | | | | | | | | | | | | | | | |
| Local Emerging Markets Debt Fund | | | U.S. Mortgages Fund | |
For the Six Months Ended
September 30, 2012
(Unaudited) | | | For the Fiscal Year Ended
March 31, 2012 | | | For the Six Months Ended
September 30, 2012
(Unaudited) | | | For the Fiscal Year Ended
March 31, 2012 | |
| Shares | | | Dollars | | | Shares | | | Dollars | | | Shares | | | Dollars | | | Shares | | | Dollars | |
| | | | | | | | | | | | | | | | | | | | | | | | | | | | | | |
| | 4,028,771 | | | $ | 37,623,532 | | | | 27,862,993 | | | $ | 270,692,200 | | | | 212,178 | | | $ | 2,286,431 | | | | 63,361 | | | $ | 667,170 | |
| | 438,780 | | | | 4,046,586 | | | | 2,778,208 | | | | 26,672,249 | | | | 5,207 | | | | 55,790 | | | | 9,942 | | | | 104,193 | |
| | (4,831,149 | ) | | | (44,480,649 | ) | | | (122,961,618 | ) | | | (1,127,904,827 | ) | | | (40,298 | ) | | | (428,431 | ) | | | (99,503 | ) | | | (1,032,303 | ) |
| | (363,598 | ) | | | (2,810,531 | ) | | | (92,320,417 | ) | | | (830,540,378 | ) | | | 177,087 | | | | 1,913,790 | | | | (26,200 | ) | | | (260,940 | ) |
| | | | | | | | | | | | | | | | | | | | | | | | | | | | | | |
| | 330,815 | | | | 3,074,630 | | | | 987,491 | | | | 9,481,610 | | | | — | | | | — | | | | — | | | | — | |
| | 41,604 | | | | 384,502 | | | | 78,137 | | | | 727,869 | | | | — | | | | — | | | | — | | | | — | |
| | (348,183 | ) | | | (3,206,685 | ) | | | (602,716 | ) | | | (5,555,634 | ) | | | — | | | | — | | | | — | | | | — | |
| | 24,236 | | | | 252,447 | | | | 462,912 | | | | 4,653,845 | | | | — | | | | — | | | | — | | | | — | |
| | | | | | | | | | | | | | | | | | | | | | | | | | | | | | |
| | 49,653,649 | | | | 460,861,486 | | | | 134,890,580 | | | | 1,236,455,672 | | | | 136,799 | | | | 1,480,911 | | | | 97,383 | | | | 1,019,676 | |
| | 4,597,508 | | | | 42,479,385 | | | | 7,154,789 | | | | 66,571,402 | | | | 9,752 | | | | 104,635 | | | | 39,723 | | | | 414,203 | |
| | (24,046,501 | ) | | | (219,580,003 | ) | | | (82,305,972 | ) | | | (764,924,801 | ) | | | (133,154 | ) | | | (1,430,367 | ) | | | (4,493,167 | ) | | | (46,715,553 | ) |
| | 30,204,656 | | | | 283,760,868 | | | | 59,739,397 | | | | 538,102,273 | | | | 13,397 | | | | 155,179 | | | | (4,356,061 | ) | | | (45,281,674 | ) |
| | | | | | | | | | | | | | | | | | | | | | | | | | | | | | |
| | — | | | | — | | | | — | | | | — | | | | 13,409,311 | | | | 143,731,910 | | | | 13,159,228 | | | | 137,679,685 | |
| | — | | | | — | | | | — | | | | — | | | | 301,531 | | | | 3,226,686 | | | | 643,701 | | | | 6,748,375 | |
| | — | | | | — | | | | — | | | | — | | | | (24,935,555 | ) | | | (267,876,387 | ) | | | (12,467,244 | ) | | | (129,737,361 | ) |
| | — | | | | — | | | | — | | | | — | | | | (11,224,713 | ) | | | (120,917,791 | ) | | | 1,335,685 | | | | 14,690,699 | |
| | | | | | | | | | | | | | | | | | | | | | | | | | | | | | |
| | 704,744 | | | | 6,574,395 | | | | 1,710,898 | | | | 16,602,112 | | | | — | | | | — | | | | 95 | | | | 1,000 | |
| | 25,200 | | | | 233,570 | | | | 64,930 | | | | 602,209 | | | | 2 | | | | 13 | | | | 2 | | | | 17 | |
| | (113,543 | ) | | | (1,054,330 | ) | | | (1,847,281 | ) | | | (16,671,529 | ) | | | — | | | | — | | | | — | | | | — | |
| | 616,401 | | | | 5,753,635 | | | | (71,453 | ) | | | 532,792 | | | | 2 | | | | 13 | | | | 97 | | | | 1,017 | |
| | 30,481,695 | | | $ | 286,956,419 | | | | (32,189,561 | ) | | $ | (287,251,468 | ) | | | (11,034,227 | ) | | $ | (118,848,809 | ) | | | (3,046,479 | ) | | $ | (30,850,898 | ) |
139
GOLDMAN SACHS SINGLE SECTOR FIXED INCOME FUNDS
Fund Expenses — Six Month Period Ended September 30, 2012 (Unaudited)
As a shareholder of Class A, Class B, Class C, Institutional, Service, Separate Account Institutional, Class IR or Class R Shares of a Fund, you incur two types of costs: (1) transaction costs, including sales charges on purchase payments (with respect to Class A Shares), contingent deferred sales charges on redemptions (with respect to Class B and Class C Shares, and redemption fees (if any); and (2) ongoing costs, including management fees; distribution and service (12b-1) fees (with respect to Class A, Class B, Class C and Class R Shares); and other Fund expenses. This Example is intended to help you understand your ongoing costs (in dollars) of investing in Class A, Class B, Class C, Institutional, Service, Separate Account Institutional, Class IR or Class R Shares of the Funds and to compare these costs with the ongoing costs of investing in other mutual funds.
The Example is based on an investment of $1,000 invested at the beginning of the period and held for the entire period from April 1, 2012 through September 30, 2012.
Actual Expenses — The first line under each share class in the table below provides information about actual account values and actual expenses. You may use the information in this line, together with the amount you invested, to estimate the expenses that you paid over the period. Simply divide your account value by $1,000 (for example, an $8,600 account value divided by $1,000=8.6), then multiply the result by the number in the first line under the heading entitled “Expenses Paid” to estimate the expenses you paid on your account during this period.
Hypothetical Example for Comparison Purposes — The second line under each share class in the table below provides information about hypothetical account values and hypothetical expenses based on the Funds’ actual net expense ratios and an assumed rate of return of 5% per year before expenses, which is not the Funds’ actual return. The hypothetical account values and expenses may not be used to estimate the actual ending account balance or expenses you paid for the period. You may use this information to compare the ongoing costs of investing in the Funds and other funds. To do so, compare this 5% hypothetical example with the 5% hypothetical examples that appear in the shareholder reports of the other funds.
Please note that the expenses shown in the table are meant to highlight your ongoing costs only and do not reflect any transactional costs, such as sales charges, redemption fees, or exchange fees. Therefore, the second line of the table is useful in comparing ongoing costs only, and will not help you determine the relative total costs of owning different funds. In addition, if these transactional costs were included, your costs would have been higher.
| | | | | | | | | | | | | | | | | | | | | | | | | | | | | | | | | | | | |
| | | Emerging Markets Debt Fund | | | High Yield Fund | | | High Yield Floating Rate Fund | |
| Share Class | | Beginning
Account
Value
4/1/12 | | | Ending
Account
Value
9/30/12 | | | Expenses
Paid for the
6 months ended
9/30/12* | | | Beginning
Account
Value
4/1/12 | | | Ending
Account
Value
9/30/12 | | | Expenses
Paid for the
6 months ended
9/30/12* | | | Beginning
Account
Value
4/1/12 | | | Ending
Account
Value
9/30/12 | | | Expenses
Paid for the
6 months ended
9/30/12* | |
| Class A | | | | | | | | | | | | | | | | | | | | | | | | | | | | | | | | | | | | |
Actual | | $ | 1,000.00 | | | $ | 1,093.30 | | | $ | 6.40 | | | $ | 1,000.00 | | | $ | 1,058.00 | | | $ | 5.42 | | | $ | 1,000.00 | | | $ | 1,027.50 | | | $ | 5.34 | |
Hypothetical 5% return | | | 1,000.00 | | | | 1,018.95 | + | | | 6.17 | | | | 1,000.00 | | | | 1,019.80 | + | | | 5.32 | | | | 1,000.00 | | | | 1,019.80 | + | | | 5.32 | |
| Class B | | | | | | | | | | | | | | | | | | | | | | | | | | | | | | | | | | | | |
Actual | | | N/A | | | | N/A | | | | N/A | | | | 1,000.00 | | | | 1,055.50 | | | | 9.28 | | | | N/A | | | | N/A | | | | N/A | |
Hypothetical 5% return | | | N/A | | | | N/A | | | | N/A | | | | 1,000.00 | | | | 1,016.04 | + | | | 9.10 | | | | N/A | | | | N/A | | | | N/A | |
| Class C | | | | | | | | | | | | | | | | | | | | | | | | | | | | | | | | | | | | |
Actual | | | 1,000.00 | | | | 1,089.30 | | | | 10.32 | | | | 1,000.00 | | | | 1,054.00 | | | | 9.27 | | | | 1,000.00 | | | | 1,024.70 | | | | 9.14 | |
Hypothetical 5% return | | | 1,000.00 | | | | 1,015.19 | + | | | 9.95 | | | | 1,000.00 | | | | 1,016.04 | + | | | 9.10 | | | | 1,000.00 | | | | 1,016.04 | + | | | 9.10 | |
| Institutional | | | | | | | | | | | | | | | | | | | | | | | | | | | | | | | | | | | | |
Actual | | | 1,000.00 | | | | 1,095.10 | | | | 4.62 | | | | 1,000.00 | | | | 1,059.70 | | | | 3.67 | | | | 1,000.00 | | | | 1,030.30 | | | | 3.61 | |
Hypothetical 5% return | | | 1,000.00 | | | | 1,020.66 | + | | | 4.46 | | | | 1,000.00 | | | | 1,021.51 | + | | | 3.60 | | | | 1,000.00 | | | | 1,021.51 | + | | | 3.60 | |
| Service | | | | | | | | | | | | | | | | | | | | | | | | | | | | | | | | | | | | |
Actual | | | N/A | | | | N/A | | | | N/A | | | | 1,000.00 | | | | 1,058.60 | | | | 6.24 | | | | N/A | | | | N/A | | | | N/A | |
Hypothetical 5% return | | | N/A | | | | N/A | | | | N/A | | | | 1,000.00 | | | | 1,019.00 | + | | | 6.12 | | | | N/A | | | | N/A | | | | N/A | |
| Separate Account Institutional | | | | | | | | | | | | | | | | | | | | | | | | | | | | | | | | | | | | |
Actual | | | N/A | | | | N/A | | | | N/A | | | | N/A | | | | N/A | | | | N/A | | | | N/A | | | | N/A | | | | N/A | |
Hypothetical 5% return | | | N/A | | | | N/A | | | | N/A | | | | N/A | | | | N/A | | | | N/A | | | | N/A | | | | N/A | | | | N/A | |
| Class IR | | | | | | | | | | | | | | | | | | | | | | | | | | | | | | | | | | | | |
Actual | | | 1,000.00 | | | | 1,094.60 | | | | 5.09 | | | | 1,000.00 | | | | 1,060.70 | | | | 4.13 | | | | 1,000.00 | | | | 1,029.80 | | | | 4.07 | |
Hypothetical 5% return | | | 1,000.00 | | | | 1,020.21 | + | | | 4.91 | | | | 1,000.00 | | | | 1,021.06 | + | | | 4.05 | | | | 1,000.00 | | | | 1,021.06 | + | | | 4.21 | |
| Class R | | | | | | | | | | | | | | | | | | | | | | | | | | | | | | | | | | | | |
Actual | | | N/A | | | | N/A | | | | N/A | | | | 1,000.00 | | | | 1,056.70 | | | | 6.70 | | | | 1,000.00 | | | | 1,026.20 | | | | 6.60 | |
Hypothetical 5% return | | | N/A | | | | N/A | | | | N/A | | | | 1,000.00 | | | | 1,018.55 | + | | | 6.58 | | | | 1,000.00 | | | | 1,018.55 | + | | | 6.58 | |
140
GOLDMAN SACHS SINGLE SECTOR FIXED INCOME FUNDS
Fund Expenses — Six Month Period Ended September 30, 2012 (Unaudited) (continued)
| | | | | | | | | | | | | | | | | | | | | | | | | | | | | | | | | | | | |
| | | Investment Grade Credit Fund | | | Local Emerging Markets Debt Fund | | | U.S. Mortgages Fund | |
| Share Class | | Beginning
Account
Value
4/1/12 | | | Ending
Account
Value
9/30/12 | | | Expenses
Paid for the
6 months ended
9/30/12* | | | Beginning
Account
Value
4/1/12 | | | Ending
Account
Value
9/30/12 | | | Expenses
Paid for the
6 months ended
9/30/12* | | | Beginning
Account
Value
4/1/12 | | | Ending
Account
Value
9/30/12 | | | Expenses
Paid for the
6 months ended
9/30/12* | |
| Class A | | | | | | | | | | | | | | | | | | | | | | | | | | | | | | | | | | | | |
Actual | | $ | 1,000.00 | | | $ | 1,067.70 | | | $ | 3.68 | | | $ | 1,000.00 | | | $ | 1,046.20 | | | $ | 6.41 | | | $ | 1,000.00 | | | $ | 1,036.90 | | | $ | 3.63 | |
Hypothetical 5% return | | | 1,000.00 | | | | 1,021.51 | + | | | 3.60 | | | | 1,000.00 | | | | 1,018.80 | + | | | 6.33 | | | | 1,000.00 | | | | 1,021.51 | + | | | 3.50 | |
| Class B | | | | | | | | | | | | | | | | | | | | | | | | | | | | | | | | | | | | |
Actual | | | N/A | | | | N/A | | | | N/A | | | | N/A | | | | N/A | | | | N/A | | | | N/A | | | | N/A | | | | N/A | |
Hypothetical 5% return | | | N/A | | | | N/A | | | | N/A | | | | N/A | | | | N/A | | | | N/A | | | | N/A | | | | N/A | | | | N/A | |
| Class C | | | | | | | | | | | | | | | | | | | | | | | | | | | | | | | | | | | | |
Actual | | | N/A | | | | N/A | | | | N/A | | | | 1,000.00 | | | | 1,041.20 | | | | 10.23 | | | | N/A | | | | N/A | | | | N/A | |
Hypothetical 5% return | | | N/A | | | | N/A | | | | N/A | | | | 1,000.00 | | | | 1,015.04 | + | | | 10.10 | | | | N/A | | | | N/A | | | | N/A | |
| Institutional | | | | | | | | | | | | | | | | | | | | | | | | | | | | | | | | | | | | |
Actual | | | 1,000.00 | | | | 1,070.60 | | | | 1.92 | | | | 1,000.00 | | | | 1,048.00 | | | | 4.67 | | | | 1,000.00 | | | | 1,039.50 | | | | 1.89 | |
Hypothetical 5% return | | | 1,000.00 | | | | 1,023.21 | + | | | 1.88 | | | | 1,000.00 | | | | 1,020.51 | + | | | 4.61 | | | | 1,000.00 | | | | 1,023.21 | + | | | 1.88 | |
| Separate Account Institutional | | | | | | | | | | | | | | | | | | | | | | | | | | | | | | | | | | | | |
Actual | | | 1,000.00 | | | | 1,070.60 | | | | 1.92 | | | | N/A | | | | N/A | | | | N/A | | | | 1,000.00 | | | | 1,038.60 | | | | 1.89 | |
Hypothetical 5% return | | | 1,000.00 | | | | 1,023.21 | + | | | 1.88 | | | | N/A | | | | N/A | | | | N/A | | | | 1,000.00 | | | | 1,023.21 | + | | | 1.88 | |
| Service | | | | | | | | | | | | | | | | | | | | | | | | | | | | | | | | | | | | |
Actual | | | N/A | | | | N/A | | | | N/A | | | | N/A | | | | N/A | | | | N/A | | | | N/A | | | | N/A | | | | N/A | |
Hypothetical 5% return | | | N/A | | | | N/A | | | | N/A | | | | N/A | | | | N/A | | | | N/A | | | | N/A | | | | N/A | | | | N/A | |
| Class IR | | | | | | | | | | | | | | | | | | | | | | | | | | | | | | | | | | | | |
Actual | | | 1,000.00 | | | | 1,070.10 | | | | 2.39 | | | | 1,000.00 | | | | 1,047.50 | | | | 5.13 | | | | 1,000.00 | | | | 1,040.40 | | | | 2.35 | |
Hypothetical 5% return | | | 1,000.00 | | | | 1,022.76 | + | | | 2.33 | | | | 1,000.00 | | | | 1,020.05 | + | | | 5.06 | | | | 1,000.00 | | | | 1,022.76 | + | | | 2.33 | |
| Class R | | | | | | | | | | | | | | | | | | | | | | | | | | | | | | | | | | | | |
Actual | | | N/A | | | | N/A | | | | N/A | | | | N/A | | | | N/A | | | | N/A | | | | N/A | | | | N/A | | | | N/A | |
Hypothetical 5% return | | | N/A | | | | N/A | | | | N/A | | | | N/A | | | | N/A | | | | N/A | | | | N/A | | | | N/A | | | | N/A | |
| * | | Expenses for each share class are calculated using each Fund’s annualized net expense ratio for each class, which represents the ongoing expenses as a percentage of net assets for the six months ended September 30, 2012. Expenses are calculated by multiplying the annualized net expense ratio by the average account value for the period; then multiplying the result by the number of days in the most recent fiscal half year; and then dividing that result by the number of days in the fiscal year. The annualized net expense ratios for the period were as follows: |
| | | | | | | | | | | | | | | | | | | | | | | | | | | | | | | | |
| Fund | | Class A | | | Class B | | | Class C | | | Institutional | | | Service | | | Separate
Account
Institutional | | | Class IR | | | Class R | |
Emerging Markets Debt | | | 1.22 | % | | | N/A | | | | 1.97 | % | | | 0.88 | % | | | N/A | | | | N/A | | | | 0.97 | % | | | N/A | |
High Yield | | | 1.05 | | | | 1.80 | % | | | 1.80 | | | | 0.71 | | | | 1.21 | % | | | N/A | | | | 0.80 | | | | 1.30 | % |
High Yield Floating Rate | | | 1.05 | | | | N/A | | | | 1.80 | | | | 0.71 | | | | N/A | | | | N/A | | | | 0.80 | | | | 1.30 | |
Investment Grade Credit | | | 0.71 | | | | N/A | | | | N/A | | | | 0.37 | | | | N/A | | | | 0.37 | % | | | 0.46 | | | | N/A | |
Local Emerging Markets Debt | | | 1.25 | | | | N/A | | | | 2.00 | | | | 0.91 | | | | N/A | | | | N/A | | | | 1.00 | | | | N/A | |
U.S. Mortgages | | | 0.71 | | | | N/A | | | | N/A | | | | 0.37 | | | | N/A | | | | 0.37 | | | | 0.46 | | | | N/A | |
| + | | Hypothetical expenses are based on each Fund’s actual annualized net expense ratios and an assumed rate of return of 5% per year before expenses. |
141
GOLDMAN SACHS SINGLE SECTOR FIXED INCOME FUNDS
Statement Regarding Basis for Approval of Management Agreement (Unaudited)
Background
The Goldman Sachs Emerging Markets Debt, Goldman Sachs High Yield, Goldman Sachs High Yield Floating Rate, Goldman Sachs Investment Grade Credit, Goldman Sachs Local Emerging Markets Debt and Goldman Sachs U.S. Mortgages Funds (the “Funds”) are investment portfolios of Goldman Sachs Trust (the “Trust”). The Board of Trustees oversees the management of the Trust and reviews the investment performance and expenses of the Funds at regularly scheduled meetings held during the year. In addition, the Board of Trustees determines annually whether to approve the continuance of the Trust’s investment management agreement (the “Management Agreement”) with Goldman Sachs Asset Management, L.P. (the “Investment Adviser”) on behalf of the Funds.
The Management Agreement was most recently approved for continuation until June 30, 2013 by the Board of Trustees, including those Trustees who are not parties to the Management Agreement or “interested persons” (as defined in the Investment Company Act of 1940, as amended) of any party thereto (the “Independent Trustees”), at a meeting held on June 13, 2012 (the “Annual Meeting”).
The review process undertaken by the Trustees spans the course of the year and culminates with the Annual Meeting. To assist the Trustees in their deliberations, the Trustees have established a Contract Review Committee (the “Committee”), comprised of the Independent Trustees. The Committee held three meetings over the course of the year since the Management Agreement was last approved. At those Committee meetings, regularly scheduled Board meetings and/or the Annual Meeting, the Board, or the Independent Trustees, as applicable, considered matters relating to the Management Agreement, including:
| | (a) | | the nature and quality of the advisory, administrative and other services provided to the Funds by the Investment Adviser and its affiliates, including information about: |
| | (i) | | the structure, staff and capabilities of the Investment Adviser and its portfolio management teams; |
| | (ii) | | the groups within the Investment Adviser and its affiliates that support the portfolio management teams or provide other types of necessary services, including fund services groups (e.g., accounting and financial reporting, tax, shareholder services and operations), controls and risk management groups (e.g., legal, compliance, valuation oversight, credit risk management, internal audit, compliance testing, market risk analysis, finance and strategy and central funding), sales and distribution support groups and others (e.g., information technology and training); |
| | (iii) | | trends in headcount; |
| | (iv) | | the Investment Adviser’s financial resources and ability to hire and retain talented personnel and strengthen its operations; and |
| | (v) | | the parent company’s support of the Investment Adviser and its mutual fund business, as expressed by the firm’s senior management; |
| | (b) | | information on the investment performance of the Funds, including, with respect to each Fund (except the High Yield Floating Rate Fund, which commenced operations in 2011), comparisons to the performance of similar mutual funds, as provided by a third party mutual fund data provider engaged as part of the contract review process (the “Outside Data Provider”), benchmark performance indices, and comparable institutional composites managed by the Investment Adviser (in the case of the High Yield and U.S. Mortgages Funds), and general investment outlooks in the markets in which the Funds invest; |
| | (c) | | the terms of the Management Agreement and agreements with affiliated service providers entered into by the Trust on behalf of the Funds; |
142
GOLDMAN SACHS SINGLE SECTOR FIXED INCOME FUNDS
Statement Regarding Basis for Approval of Management Agreement (Unaudited) (continued)
| | (d) | | expense information for the Funds, including: |
| | (i) | | the relative management fee and expense levels of the Funds as compared to those of comparable funds managed by other advisers, as provided by the Outside Data Provider; |
| | (ii) | | expense trends over time of each Fund (except for the High Yield Floating Rate Fund, which commenced operations in 2011); and |
| | (iii) | | to the extent the Investment Adviser manages institutional accounts or collective investment vehicles having investment objectives and policies similar to those of the Funds, comparative information on the advisory fees charged and services provided to those accounts by the Investment Adviser; |
| | (e) | | with respect to the extensive investment performance and expense comparison data provided by the Outside Data Provider, its processes in producing that data for the Funds; |
| | (f) | | the undertakings of the Investment Adviser to waive a portion of its management fees (with respect to the Investment Grade Credit, Local Emerging Markets Debt and U.S. Mortgages Funds) and limit certain expenses of each of the Funds that exceed specified levels, and a summary of contractual fee reductions made by the Investment Adviser and its affiliates over the past several years with respect to the Funds; |
| | (g) | | information relating to the profitability of the Management Agreement and the transfer agency and distribution and service arrangements of each of the Funds and the Trust as a whole to the Investment Adviser and its affiliates; |
| | (h) | | whether each Fund’s existing management fee schedule adequately addressed any economies of scale; |
| | (i) | | a summary of the “fall-out” benefits derived by the Investment Adviser and its affiliates from their relationships with the Funds, including the fees received by the Investment Adviser’s affiliates from the Funds for transfer agency, portfolio trading, distribution and other services; |
| | (j) | | a summary of potential benefits derived by the Funds as a result of their relationship with the Investment Adviser; |
| | (k) | | information regarding portfolio trading and how the Investment Adviser carries out its duty to seek best execution; |
| | (l) | | portfolio manager ownership of Fund shares; the manner in which portfolio manager compensation is determined; and the number and types of accounts managed by the portfolio managers; |
| | (m) | | the nature and quality of the services provided to the Funds by their unaffiliated service providers, and the Investment Adviser’s general oversight and evaluation (including reports on due diligence) of those service providers as part of the administration services provided under the Management Agreement; and |
| | (n) | | the Investment Adviser’s processes and policies addressing various types of potential conflicts of interest; its approach to risk management; the annual review of the effectiveness of the Funds’ compliance program; and compliance reports. |
The Trustees also received an overview of the Funds’ distribution arrangements. They received information regarding the Funds’ assets, share purchase and redemption activity and the payment of Rule 12b-1 distribution and service fees by the Funds and the payment of non-Rule 12b-1 shareholder service and/or administration fees by the High Yield Fund’s Service Shares. Information was also provided to the Trustees relating to revenue sharing payments made by and services provided by the Investment Adviser and its affiliates to intermediaries that promote the sale, distribution and/or servicing of Fund shares.
143
GOLDMAN SACHS SINGLE SECTOR FIXED INCOME FUNDS
Statement Regarding Basis for Approval of Management Agreement (Unaudited) (continued)
The presentations made at the Board and Committee meetings and at the Annual Meeting encompassed the Funds and other mutual fund portfolios for which the Board of Trustees has responsibility. In evaluating the Management Agreement at the Annual Meeting, the Trustees relied upon their knowledge, resulting from their meetings and other interactions throughout the year, of the Investment Adviser, its affiliates, their services and the Funds. In conjunction with these meetings, the Trustees received written materials and oral presentations on the topics covered, and were advised by their independent legal counsel regarding their responsibilities and other regulatory requirements related to the approval and continuation of mutual fund investment management agreements under applicable law. In addition, the Investment Adviser and its affiliates provided the Independent Trustees with a written response to a formal request for information sent on behalf of the Independent Trustees by their independent legal counsel. During the course of their deliberations, the Independent Trustees met in executive sessions with their independent legal counsel, without representatives of the Investment Adviser or its affiliates present. The Independent Trustees also discussed the broad range of other investment choices that are available to Fund investors, including the availability of comparable funds managed by other advisers.
Nature, Extent and Quality of the Services Provided Under the Management Agreement
As part of their review, the Trustees considered the nature, extent and quality of the services provided by the Investment Adviser. In this regard, the Trustees considered both the investment advisory services, and the other, non-advisory services, that are provided to the Funds by the Investment Adviser and its affiliates. The Trustees noted the transition in the leadership and changes in personnel of various of the Investment Adviser’s portfolio management teams that had occurred in recent periods, and the potential benefit to the Funds of the ongoing recruitment efforts aimed at bringing high quality investment talent to the Investment Adviser. The Independent Trustees concluded that the Investment Adviser continued to commit substantial financial and operational resources to the Funds and expressed confidence that the Investment Adviser would continue to do so in the future. The Trustees also observed that the Investment Adviser had made significant commitments to address regulatory compliance requirements applicable to the Funds and the Investment Adviser.
Investment Performance
The Trustees also considered the investment performance of the Funds and the Investment Adviser. In this regard, they compared the investment performance of each Fund (with the exception of the High Yield Floating Rate Fund, which commenced operations in 2011) to its peers using rankings and ratings compiled by the Outside Data Provider as of December 31, 2011, and updated performance information for each Fund prepared by the Investment Adviser using the peer groups identified by the Outside Data Provider as of March 31, 2012. The information on each Fund’s investment performance was provided for the one-, three-, five- and ten-year periods ending on the applicable dates, to the extent that each Fund had been in existence for those periods. The Trustees also reviewed each Fund’s investment performance over time on a year-by-year basis relative to its performance benchmark. In addition, they considered the investment performance trends of the Funds over time, and reviewed the investment performance of each Fund in light of its investment objective and policies, market conditions and credit and duration parameters. The Trustees also received information comparing the High Yield and U.S. Mortgages Funds’ performance to that of comparable institutional composites managed by the Investment Adviser.
In addition, the Trustees considered materials prepared and presentations made by the Investment Adviser’s senior management and portfolio management personnel, in which Fund performance was assessed. The Trustees also considered the Investment Adviser’s periodic reports with respect to the Funds’ risk profiles, and how the Investment Adviser’s approach to risk monitoring and management influences portfolio management.
144
GOLDMAN SACHS SINGLE SECTOR FIXED INCOME FUNDS
Statement Regarding Basis for Approval of Management Agreement (Unaudited) (continued)
The Independent Trustees noted that the High Yield Fund had placed in the top half of its peer group for the ten-year period, had placed in the bottom half of its peer group for the one-, three- and five-year periods, and underperformed its benchmark index for each of the one-, three-, five-, and ten-year periods ended March 31, 2012. They also observed that the Investment Grade Credit Fund had placed in the top half of its peer group during the one- and three-year periods, in the third quartile of its peer group during the five-year period, outperformed its benchmark index during the three-year period and underperformed its benchmark index during the one- and five-year periods ended March 31, 2012. The Independent Trustees noted that the Local Emerging Markets Debt Fund had placed in the bottom half of its peer group and underperformed its benchmark index during the one- and three-year periods ended March 31, 2012. The Independent Trustees observed that the U.S. Mortgages Fund had placed in the top quartile of its peer group and outperformed its benchmark index during the three-year period and had placed in the third quartile and underperformed its benchmark index during the one- and five-year periods ended March 31, 2012. They observed that the Emerging Markets Debt Fund had placed in the top half of its peer group during the one-, three-, and five-year periods, outperformed its benchmark index during the one- and three-year periods and underperformed its benchmark index for the five-year period ended March 31, 2012. The Independent Trustees noted that the Local Emerging Markets Debt Fund had certain significant differences from its peer group (Emerging Markets Bond) that caused the peer group to be an imperfect basis for performance comparison. They noted the addition of certain key hires to the Fixed Income team in 2011, and that the Fixed Income Team had adjusted its investment process and scenario analysis in 2011 in an effort to provide stronger investment performance. The Independent Trustees noted that the High Yield Floating Rate Fund had commenced operations in 2011 and did not yet have a meaningful performance history.
Costs of Services Provided and Competitive Information
The Trustees considered the contractual fee rates payable by each Fund under the Management Agreement. In this regard, the Trustees considered information on the services rendered by the Investment Adviser to the Funds, which included both advisory and administrative services that were directed to the needs and operations of the Funds as registered mutual funds.
In particular, the Trustees reviewed analyses prepared by the Outside Data Provider regarding the expense rankings of the Funds. The analyses provided a comparison of the Funds’ management fees and breakpoints to those of relevant peer groups and category universes; an expense analysis which compared each Fund’s overall net and gross expenses to a peer group and a category universe; and a five-year history (one- and four-year, in the case of the High Yield Floating Rate and Local Emerging Markets Debt Funds, respectively) comparing each Fund’s net expenses to the peer and category medians. The analyses also compared each Fund’s transfer agency, custody and distribution fees, other expenses and fee waivers/reimbursements to those of other funds in the peer group and the peer group and category medians. The Trustees concluded that the comparisons provided by the Outside Data Provider were useful in evaluating the reasonableness of the management fees and total expenses paid by the Funds.
In addition, the Trustees considered the Investment Adviser’s undertakings to waive a portion of its management fees (with respect to the Investment Grade Credit, Local Emerging Markets Debt and U.S. Mortgages Funds) and limit certain expenses of each of the Funds that exceed specified levels. The Trustees also noted that a change was being made to the existing expense limitation arrangement for the Emerging Markets Debt Fund that would have the effect of increasing total Fund expenses, with such change taking effect in connection with the Fund’s next annual registration statement update. They also considered, to the extent that the Investment Adviser manages institutional accounts or collective investment vehicles having investment objectives and
145
GOLDMAN SACHS SINGLE SECTOR FIXED INCOME FUNDS
Statement Regarding Basis for Approval of Management Agreement (Unaudited) (continued)
policies similar to those of the Funds, comparative fee information for services provided by the Investment Adviser to those accounts, and information that indicated that services provided to the Funds differed in various significant respects from the services provided to institutional accounts, which generally operated under less stringent legal and regulatory structures, required fewer services from the Investment Adviser to a smaller number of client contact points, were less time-intensive and paid lower fees. By contrast, the Trustees noted that the Investment Adviser provides substantial administrative services to the Funds under the terms of the Management Agreement.
In addition, the Trustees noted that shareholders are able to redeem their Fund shares at any time if they believe that the Fund fees and expenses are too high or if they are dissatisfied with the performance of the Fund.
Profitability
The Trustees reviewed the Investment Adviser’s revenues and pre-tax profit margins with respect to the Trust and each of the Funds. In this regard the Trustees noted that they had received, among other things, profitability analyses and summaries, revenue and expense schedules by Fund and by function (i.e., investment management, transfer agency and distribution and service) and the Investment Adviser’s expense allocation methodology. They observed that the profitability and expense figures are substantially similar to those used by the Investment Adviser for many internal purposes, including compensation decisions among various business groups, and are thus subject to a vigorous internal debate about how certain revenue and expenses should be allocated. The Trustees also reviewed the report of the internal audit group within the Goldman Sachs organization, which included an assessment of the reasonableness and consistency of the Investment Adviser’s expense allocation methodology and an evaluation of the accuracy of the Investment Adviser’s profitability analysis calculations. Profitability data for the Trust and each Fund were provided for 2011 and 2010 (2011 only for the High Yield Floating Rate Fund), and the Trustees considered this information in relation to the Investment Adviser’s overall profitability. The Trustees considered the Investment Adviser’s revenues and pre-tax profit margins both in absolute terms and in comparison to information on the reported pre-tax profit margins earned by certain other asset management firms.
Economies of Scale
The Trustees considered the information that had been provided regarding the Investment Adviser’s profitability. The Trustees also considered the breakpoints in the fee rate payable under the Management Agreement for each of the Funds at the following annual percentage rates of the average daily net assets of the Funds:
| | | | | | | | | | | | | | | | | | | | | | | | |
Average Daily
Net Assets | | Emerging
Markets
Debt
Fund | | | High Yield
Fund | | | High Yield
Floating
Rate
Fund | | | Investment
Grade
Credit
Fund | | | Local
Emerging
Markets
Debt
Fund | | | U.S.
Mortgages
Fund | |
| First $1 billion | | | 0.80 | % | | | 0.70 | % | | | 0.60 | % | | | 0.40 | % | | | 0.90 | % | | | 0.40 | % |
| Next $1 billion | | | 0.80 | | | | 0.70 | | | | 0.54 | | | | 0.36 | | | | 0.90 | | | | 0.36 | |
| Next $3 billion | | | 0.72 | | | | 0.63 | | | | 0.51 | | | | 0.34 | | | | 0.81 | | | | 0.34 | |
| Next $3 billion | | | 0.68 | | | | 0.60 | | | | 0.50 | | | | 0.33 | | | | 0.77 | | | | 0.33 | |
| Over $8 billion | | | 0.67 | | | | 0.59 | | | | 0.49 | | | | 0.32 | | | | 0.75 | | | | 0.32 | |
The Trustees noted that the breakpoints were meant to share potential economies of scale, if any, with the Funds and their shareholders as assets under management reach those asset levels. The Trustees considered the amounts of assets in the Funds; the
146
GOLDMAN SACHS SINGLE SECTOR FIXED INCOME FUNDS
Statement Regarding Basis for Approval of Management Agreement (Unaudited) (continued)
Funds’ recent share purchase and redemption activity; the information provided by the Investment Adviser relating to the costs of the services provided by the Investment Adviser and its affiliates and their realized profits; information comparing fee rates charged by the Investment Adviser with fee rates charged to other funds in the peer groups; and the Investment Adviser’s undertakings to waive a portion of the management fees (with respect to the Investment Grade Credit, Local Emerging Markets Debt and U.S. Mortgages Funds) and limit certain expenses of each of the Funds that exceed specified levels. Upon reviewing these matters at the Annual Meeting, the Trustees concluded that the fee breakpoints represented a means of assuring that benefits of scalability, if any, would be passed along to shareholders at the specified asset levels. They also noted that the Investment Adviser had passed along savings to shareholders of the High Yield and Local Emerging Markets Debt Funds, which had asset levels above at least the first breakpoint during the prior fiscal year.
Other Benefits to the Investment Adviser and Its Affiliates
The Trustees also considered the other benefits derived by the Investment Adviser and its affiliates from their relationship with the Funds as stated above, including: (a) transfer agency fees received by Goldman, Sachs & Co. (“Goldman Sachs”); (b) futures commissions earned by Goldman Sachs for executing futures transactions on behalf of the Funds; (c) trading efficiencies resulting from aggregation of orders of the Funds with those for other funds or accounts managed by the Investment Adviser; (d) the Investment Adviser’s ability to leverage the infrastructure designed to service the Funds on behalf of its other clients; (e) the Investment Adviser’s ability to cross-market other products and services to Fund shareholders; (f) Goldman Sachs’ retention of certain fees as Fund Distributor; (g) the Investment Adviser’s ability to negotiate better pricing with custodians on behalf of its other clients, as a result of the relationship with the Funds; and (h) the possibility that the working relationship between the Investment Adviser and the Funds’ third party service providers may cause those service providers to be open to doing business with other areas of Goldman Sachs. In the course of considering the foregoing, the Independent Trustees requested and received further information quantifying certain of these fall-out benefits.
Other Benefits to the Funds and Their Shareholders
The Trustees also noted that the Funds receive certain potential benefits as a result of their relationship with the Investment Adviser, including: (a) trading efficiencies resulting from aggregation of orders of the Funds with those of other funds or accounts managed by the Investment Adviser; (b) improved servicing and pricing from vendors because of the volume of business generated by the Investment Adviser and its affiliates; (c) improved servicing from broker-dealers because of the volume of business generated by the Investment Adviser and its affiliates; (d) the Investment Adviser’s ability to negotiate favorable terms with derivatives counterparties as a result of the size and reputation of the Goldman Sachs organization; (e) the Investment Adviser’s knowledge and experience gained from managing other accounts and products; (f) the Investment Adviser’s ability to hire and retain qualified personnel to provide services to the Funds because of the reputation of the Goldman Sachs organization; (g) the Funds’ access, through the Investment Adviser, to certain firmwide resources (e.g., proprietary risk management systems and databases), subject to certain restrictions; and (h) the Funds’ access to certain affiliated distribution channels. The Trustees noted the competitive nature of the mutual fund marketplace, and noted further that many of the Funds’ shareholders invested in the Funds in part because of the Funds’ relationship with the Investment Adviser and that those shareholders have a general expectation that the relationship will continue.
147
GOLDMAN SACHS SINGLE SECTOR FIXED INCOME FUNDS
Statement Regarding Basis for Approval of Management Agreement (Unaudited) (continued)
Conclusion
In connection with their consideration of the Management Agreement, the Trustees gave weight to each of the factors described above, but did not identify any particular factor as controlling their decision. After deliberation and consideration of all of the information provided, including the factors described above, the Trustees concluded, in the exercise of their business judgment, that the management fees paid by each of the Funds were reasonable in light of the services provided to it by the Investment Adviser, the Investment Adviser’s costs and each Fund’s current and reasonably foreseeable asset levels. The Trustees unanimously concluded that the Investment Adviser’s continued management likely would benefit each Fund and its shareholders and that the Management Agreement should be approved and continued with respect to each Fund until June 30, 2013.
148
FUNDS PROFILE
Goldman Sachs Funds

Goldman Sachs is a premier financial services firm, known since 1869 for creating thoughtful and customized investment solutions in complex global markets.
Today, the Investment Management Division of Goldman Sachs serves a diverse set of clients worldwide, including private institutions, public entities and individuals. With approximately $735.5 billion in assets under management as of September 30, 2012, Goldman Sachs Asset Management (“GSAM”) has portfolio management teams located around the world and our investment professionals bring firsthand knowledge of local markets to every investment decision. GSAM’s assets under management includes assets managed by Goldman Sachs Asset Management, LP and its Investment Advisory Affiliates.
|
| OVERVIEW OF GOLDMAN SACHS FUNDS |

Money Market1
Financial Square FundsSM
| n | | Financial Square Tax-Exempt Funds |
| n | | Financial Square Federal Fund |
| n | | Financial Square Government Fund |
| n | | Financial Square Money Market Fund |
| n | | Financial Square Prime Obligations Fund |
| n | | Financial Square Treasury Instruments Fund |
| n | | Financial Square Treasury Obligations Fund |
Fixed Income
Short Duration and Government
| n | | High Quality Floating Rate Fund2 |
| n | | Short Duration Government Fund |
| n | | Short Duration Income Fund |
| n | | Inflation Protected Securities Fund |
Multi-Sector
| n | | Core Plus Fixed Income Fund |
Municipal and Tax-Free
| n | | High Yield Municipal Fund |
| n | | Short Duration Tax-Free Fund |
Single Sector
| n | | Investment Grade Credit Fund |
| n | | High Yield Floating Rate Fund |
| n | | Emerging Markets Debt Fund |
| n | | Local Emerging Markets Debt Fund |
Corporate Credit
Fundamental Equity
| n | | Small/Mid Cap Growth Fund |
| n | | Flexible Cap Growth Fund |
| n | | Concentrated Growth Fund |
| n | | Technology Tollkeeper Fund |
| n | | Growth Opportunities Fund |
| n | | Rising Dividend Growth Fund |
Structured Equity
| n | | Structured Small Cap Equity Fund |
| n | | Structured U.S. Equity Fund |
| n | | Structured Small Cap Growth Fund |
| n | | Structured Large Cap Growth Fund |
| n | | Structured Large Cap Value Fund |
| n | | Structured Small Cap Value Fund |
| n | | Structured Tax-Managed Equity Fund |
| n | | Structured International Tax-Managed Equity Fund |
| n | | U.S. Equity Dividend and Premium Fund |
| n | | International Equity Dividend and Premium Fund |
| n | | Structured International Small Cap Fund |
| n | | Structured International Equity Fund |
| n | | Structured Emerging Markets Equity Fund |
Fundamental Equity International4
| n | | Strategic International Equity Fund |
| n | | Concentrated International Equity Fund |
| n | | International Small Cap Fund |
| n | | Emerging Markets Equity Fund |
| n | | BRIC Fund (Brazil, Russia, India, China) |
Select Satellite5
| n | | Real Estate Securities Fund |
| n | | International Real Estate Securities Fund |
| n | | Commodity Strategy Fund |
| n | | Dynamic Allocation Fund |
| n | | Absolute Return Tracker Fund |
| n | | Managed Futures Strategy Fund |
| n | | Retirement Portfolio Completion Fund |
Total Portfolio Solutions5
| n | | Balanced Strategy Portfolio |
| n | | Growth and Income Strategy Portfolio |
| n | | Growth Strategy Portfolio |
| n | | Equity Growth Strategy Portfolio |
| n | | Income Strategies Portfolio |
| n | | Satellite Strategies Portfolio |
| n | | Retirement Strategies Portfolios6 |
| n | | Enhanced Dividend Global Equity Portfolio |
| n | | Tax Advantaged Global Equity Portfolio |
| 1 | | An investment in a money market fund is neither insured nor guaranteed by the Federal Deposit Insurance Corporation (“FDIC”) or any other government agency. Although the Funds seek to preserve the value of your investment at $1.00 per share, it is possible to lose money by investing in the Funds. |
| 2 | | Effective at the close of business on July 27, 2012, the Goldman Sachs Ultra-Short Duration Government Fund was renamed the Goldman Sachs High Quality Floating Rate Fund. |
| 3 | | Effective at the close of business on June 29, 2012, the Goldman Sachs Balanced Fund was renamed the Goldman Sachs Income Builder Fund. |
| 4 | | Since October 18, 2012, shares of the Goldman Sachs Brazil Equity, India Equity and Korea Equity Funds (each, a “Fund,” and collectively, the “Funds”) have not been available for purchase by investors. Each Fund will be liquidated pursuant to a Board-approved Plan of Liquidation on or about November 30, 2012 (the “Liquidation Date”). At any time prior to the Liquidation Date, shareholders may redeem their shares of the Funds and receive the net asset value thereof in cash or in kind, as provided in the Prospectus. |
| 5 | | Individual Funds within the Total Portfolio Solutions and Select Satellite categories will have various placement on the risk/return spectrum and may have greater or lesser risk than that indicated by the placement of the general Total Portfolio Solutions or Select Satellite category. |
| 6 | | Since July 28, 2012, shares of each of the Goldman Sachs Retirement Strategy Portfolios (the “Portfolios”) have not been available for purchase except to participants within certain Retirement Plans (as defined in the Prospectus). As of the close of business on December 6, 2012, shares of the Portfolios will no longer be available for purchase by any investors. |
Financial Square FundsSM is a registered service mark of Goldman, Sachs & Co.
| | |
TRUSTEES Ashok N. Bakhru, Chairman Donald C. Burke John P. Coblentz, Jr. Diana M. Daniels Joseph P. LoRusso James A. McNamara Jessica Palmer Alan A. Shuch Richard P. Strubel | | OFFICERS James A. McNamara, President George F. Travers, Principal Financial Officer Caroline Kraus, Secretary Scott M. McHugh, Treasurer |
| |
GOLDMAN, SACHS & CO. Distributor and Transfer Agent | | GOLDMAN SACHS ASSET MANAGEMENT, L.P. Investment Adviser |
Visit our Web site at www.goldmansachsfunds.com to obtain the most recent month-end returns.
Goldman Sachs Asset Management, L.P. 200 West Street, New York, New York 10282
The reports concerning the Funds included in this shareholder report may contain certain forward-looking statements about the factors that may affect the performance of the Funds in the future. These statements are based on Fund management’s predictions and expectations concerning certain future events and their expected impact on the Funds, such as performance of the economy as a whole and of specific industry sectors, changes in the levels of interest rates, the impact of developing world events, and other factors that may influence the future performance of the Funds. Management believes these forward-looking statements to be reasonable, although they are inherently uncertain and difficult to predict. Actual events may cause adjustments in portfolio management strategies from those currently expected to be employed.
A description of the policies and procedures that the Funds use to determine how to vote proxies relating to portfolio securities and information regarding how the Funds voted proxies relating to portfolio securities for the most recent 12-month period ended June 30 are available (I) without charge, upon request by calling 1-800-526-7384 (for Retail Shareholders) or 1-800-621-2550 (for Institutional Shareholders); and (II) on the Securities and Exchange Commission (“SEC“) web site at http://www.sec.gov.
The Funds file their complete schedule of portfolio holdings with the SEC for the first and third quarters of each fiscal year on Form N-Q. The Funds’ Forms N-Q are available on the SEC’s web site at http://www.sec.gov within 60 days after the Funds’ first and third fiscal quarters. The Funds’ Forms N-Q may be reviewed and copied at the SEC’s Public Reference Room in Washington, D.C., and information on the operation of the Public Reference Room may also be obtained by calling 1-800-SEC-0330. Forms N-Q may be obtained upon request and without charge by calling 1-800-526-7384 (for Retail Shareholders) or 1-800-621-2550 (for Institutional Shareholders).
Economic and market forecasts presented herein reflect our judgment as of the date of this presentation and are subject to change without notice. These forecasts do not take into account the specific investment objectives, restrictions, tax and financial situation or other needs of any specific client. Actual data will vary and may not be reflected here. These forecasts are subject to high levels of uncertainty that may affect actual performance. Accordingly, these forecasts should be viewed as merely representative of a broad range of possible outcomes. These forecasts are estimated, based on assumptions, and are subject to significant revision and may change materially as economic and market conditions change. Goldman Sachs has no obligation to provide updates or changes to these forecasts. Case studies and examples are for illustrative purposes only.
Holdings and allocations shown are as of September 30, 2012 and may not be representative of future investments. Fund holdings should not be relied on in making investment decisions and should not be construed as research or investment advice regarding particular securities.
This material is not authorized for distribution to prospective investors unless preceded or accompanied by a current Prospectus or summary prospectus, if applicable. Investors should consider a Fund’s objective, risks, and charges and expenses, and read the summary prospectus, if available, and/or the Prospectus carefully before investing or sending money. The summary prospectus, if available, and the Prospectus contain this and other information about a Fund and may be obtained from your authorized dealer or from Goldman, Sachs & Co. by calling (retail – 1-800-526-7384) (institutional – 1-800-621-2550).
© 2012 Goldman Sachs. All rights reserved. 86278.MF.MED.TMPL / 11/2012 SSFISAR12 / 84K
| | The information required by this Item is only required in an annual report on this Form N-CSR. |
| ITEM 3. | AUDIT COMMITTEE FINANCIAL EXPERT. |
| | The information required by this Item is only required in an annual report on this Form N-CSR. |
| ITEM 4. | PRINCIPAL ACCOUNTANT FEES AND SERVICES. |
| | The information required by this Item is only required in an annual report on this Form N-CSR. |
| ITEM 5. | AUDIT COMMITTEE OF LISTED REGISTRANTS. |
| ITEM 6. | SCHEDULE OF INVESTMENTS. |
| | Schedule of Investments is included as part of the Report to Stockholders filed under Item 1. |
| ITEM 7. | DISCLOSURE OF PROXY VOTING POLICIES AND PROCEDURES FOR CLOSED-END MANAGEMENT INVESTMENT COMPANIES. |
| ITEM 8. | PORTFOLIO MANAGERS OF CLOSED-END MANAGEMENT INVESTMENT COMPANIES. |
| ITEM 9. | PURCHASES OF EQUITY SECURITIES BY CLOSED-END MANAGEMENT INVESTMENT COMPANY AND AFFILIATED PURCHASERS. |
| ITEM 10. | SUBMISSION OF MATTERS TO A VOTE OF SECURITY HOLDERS. |
| | There have been no material changes to the procedures by which shareholders may recommend nominees to the registrant’s board of trustees. |
| ITEM 11. | CONTROLS AND PROCEDURES. |
| | (a) | The registrant’s principal executive and principal financial officers, or persons performing similar functions have concluded that the registrant’s disclosure controls and procedures (as defined in Rule 30a-3(c) under the Investment Company Act of 1940, as amended (the “1940 Act”)) are effective as of a date within 90 days of the filing of this report that includes the disclosure required by this paragraph, based on the evaluation of these controls and procedures required by Rule 30a-3(b) under the 1940 Act and 15d-15(b) under the Securities Exchange Act of 1934, as amended. |
| | (b) | There were no changes in the registrant’s internal control over financial reporting (as defined in Rule 30a-3(d) under the 1940 Act) that occurred during the registrant’s second fiscal quarter of the period covered by this report that have materially affected, or are reasonably likely to materially affect, the registrant’s internal control over financial reporting. |
| | | | |
| (a)(1) | | The information required by this Item is only required in connection with an annual report on this Form N-CSR. |
| | |
| (a)(2) | | Exhibit 99.CERT | | Certifications pursuant to Section 302 of the Sarbanes-Oxley Act of 2002 filed herewith. |
| | |
| (b) | | Exhibit 99.906CERT | | Certifications pursuant to Section 906 of the Sarbanes-Oxley Act of 2002 filed herewith. |
SIGNATURES
Pursuant to the requirements of the Securities Exchange Act of 1934 and the Investment Company Act of 1940, the registrant has duly caused this report to be signed on its behalf by the undersigned, thereunto duly authorized.
| | | | |
| | | | Goldman Sachs Trust |
| | |
| By: | | | | /s/ James A. McNamara |
| | | | James A. McNamara |
| | | | President/Principal Executive Officer |
| | | | Goldman Sachs Trust |
| | |
| Date: | | | | November 19, 2012 |
Pursuant to the requirements of the Securities Exchange Act of 1934 and the Investment Company Act of 1940, this report has been signed below by the following persons on behalf of the registrant and in the capacities and on the dates indicated.
| | | | |
| By: | | | | /s/ James A. McNamara |
| | | | James A. McNamara |
| | | | President/Principal Executive Officer |
| | | | Goldman Sachs Trust |
| | |
| Date: | | | | November 19, 2012 |
| | |
| By: | | | | /s/ George F. Travers |
| | | | George F. Travers |
| | | | Principal Financial Officer |
| | | | Goldman Sachs Trust |
| | |
| Date: | | | | November 16, 2012 |