UNITED STATES
SECURITIES AND EXCHANGE COMMISSION
Washington, D.C. 20549
FORM N-CSR
CERTIFIED SHAREHOLDER REPORT OF REGISTERED
MANAGEMENT INVESTMENT COMPANIES
Investment Company Act file number 811-05349
Goldman Sachs Trust
(Exact name of registrant as specified in charter)
71 South Wacker Drive,
Chicago, Illinois 60606
(Address of principal executive offices) (Zip code)
| | |
Copies to: |
Caroline Kraus | | Geoffrey R.T. Kenyon, Esq. |
Goldman, Sachs & Co. | | Dechert LLP |
200 West Street | | 200 Clarendon Street |
New York, New York 10282 | | 27th Floor |
| | Boston, MA 02116-5021 |
(Name and address of agents for service)
Registrant’s telephone number, including area code: (312) 655-4400
Date of fiscal year end: October 31
Date of reporting period: April 30, 2013
| ITEM 1. | REPORTS TO STOCKHOLDERS. |
| | The Semi-Annual Report to Stockholders is filed herewith. |
Goldman Sachs Funds

| | | | |
| | |
| Semi-Annual Report | | | | April 30, 2013 |
| | |
| | | | Fundamental International Equity Funds |
| | | | Concentrated International Equity |
| | | | International Small Cap |
| | | | Strategic International Equity |

Goldman Sachs Fundamental International Equity Funds
| n | | CONCENTRATED INTERNATIONAL EQUITY |
| n | | INTERNATIONAL SMALL CAP |
| n | | STRATEGIC INTERNATIONAL EQUITY |
| | | | |
TABLE OF CONTENTS | | | | |
| |
Principal Investment Strategies and Risks | | | 1 | |
| |
Investment Process | | | 2 | |
| |
Market Review | | | 3 | |
| |
Portfolio Management Discussions and Performance Summaries | | | 5 | |
| |
Schedule of Investments | | | 23 | |
| |
Financial Statements | | | 30 | |
| |
Financial Highlights | | | 34 | |
| |
Notes to the Financial Statements | | | 40 | |
| |
Other Information | | | 52 | |
| | | | |
| | | |
| NOT FDIC-INSURED | | May Lose Value | | No Bank Guarantee |
GOLDMAN SACHS FUNDAMENTAL EQUITY INTERNATIONAL FUNDS
Principal Investment Strategies and Risks
This is not a complete list of risks that may affect the Funds. For additional information concerning the risks applicable to the Funds, please see the Funds’ Prospectus.
The Goldman Sachs Concentrated International Equity Fund invests primarily in a diversified portfolio of equity investments in companies that are organized outside the United States or whose securities are principally traded outside the United States. The Fund is subject to market risk, which means that the value of the securities in which it invests may go up or down in response to the prospects of individual companies, particular sectors and/or general economic conditions. Foreign and emerging markets investments may be more volatile and less liquid than investments in U.S. securities and are subject to the risks of currency fluctuations and adverse economic or political developments. Because the Fund may invest in a relatively small number of issuers, the Fund is subject to greater risk of loss.
The Goldman Sachs International Small Cap Fund invests primarily in a diversified portfolio of equity investments in non-U.S. small-capitalization companies. The Fund is subject to market risk, which means that the value of the securities in which it invests may go up or down in response to the prospects of individual companies, particular sectors and/or general economic conditions. Foreign and emerging markets investments may be more volatile and less liquid than investments in U.S. securities and are subject to the risks of currency fluctuations and adverse economic or political developments. The securities of mid- and small-capitalization companies involve greater risks than those associated with larger, more established companies and may be subject to more abrupt or erratic price movements.
The Goldman Sachs Strategic International Equity Fund invests primarily in a diversified portfolio of equity investments in companies that are organized outside the United States or whose securities are principally traded outside the United States. The Fund’s equity investments are subject to market risk, which means that the value of the securities in which it invests may go up or down in response to the prospects of individual companies, particular sectors and/or general economic conditions. Foreign and emerging markets investments may be more volatile and less liquid than investments in U.S. securities and are subject to the risks of currency fluctuations and adverse economic or political developments.
1
GOLDMAN SACHS FUNDAMENTAL EQUITY INTERNATIONAL FUNDS
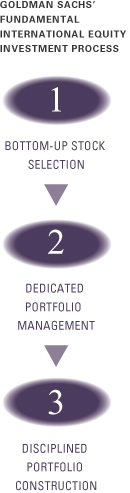
What Differentiates Goldman Sachs’ Fundamental International Equity Investment Process?
Goldman Sachs’ Fundamental International Equity investment process is based on the belief that strong, consistent results are best achieved through expert stock selection, performed by research teams working together on a global scale. Our deep, diverse and experienced team of research analysts and portfolio managers combines local insights with global, industry-specific expertise to identify its best investment ideas.

| n | | Fundamental research teams based in the United States, United Kingdom, Japan, China, Korea, Singapore, Brazil, and India and focusing on long-term business and management quality |
| n | | Analysts collaborate regularly to leverage regional and industry-specific research and insights |
| n | | Global perspective is informed by local market expertise |
| n | | A common valuation framework, focusing on long-term earnings power, ensures consistency when valuing and comparing a company to its peers globally |

| n | | Team of experienced Research Analysts is regionally aligned and has sector expertise |
| n | | Team leverages the research of the approximately 40+ regional investment professionals |
| n | | Decision-making process is informed by active participation in the global research process |

| n | | Security selections are aligned with level of investment conviction |
| n | | Risk monitoring considers whether investment and other risks to the Funds are intended and justified |
| n | | Dedicated portfolio construction team assists in ongoing monitoring and adjustment of the Funds |

International equity portfolios that strive to offer:
| | n | | Access to markets across the world | |
| | n | | Disciplined approach to stock selection | |
| | n | | Optimal risk/return profiles | |
2
MARKET REVIEW
Goldman Sachs Fundamental Equity
International Funds
Market Review
International equities rallied during the six-month period ended April 30, 2013 (the “Reporting Period”). The MSCI Europe, Australasia, Far East (EAFE) Index (net, unhedged) (the “MSCI EAFE Index”) posted a return of 16.90%.* The commitment to low interest rates and easy monetary policy from central banks in the U.S., Europe and Japan was one of the biggest drivers of equity markets during the Reporting Period and contributed to particularly strong returns amongst financials stocks.
Japanese equities surged during the Reporting Period and led returns within the MSCI EAFE Index. Japan’s Liberal Democratic Party returned to power late in 2012 after campaigning on a platform of establishing an inflation target and weakening the yen. Once elected, Japan’s new prime minister, Shinzo Abe, followed through on setting an inflation target, while the new head of the Bank of Japan, Haruhiku Kuroda, announced a decision to double Japan’s monetary base. The yen subsequently weakened to its lowest level against the U.S. dollar in four years. The sharp rally in Japanese equity markets reflected optimism that the aggressive policies from its government and central bank would end deflation and stimulate Japan’s economy. In addition, the Japanese equity market responded positively to the weaker yen, which benefits Japan’s export-oriented economy.
European equities advanced solidly, generally reflecting optimism regarding Europe’s ability to work through its debt issues, despite some volatility during the Reporting Period driven by a banking crisis in Cyprus and by Italy’s political stalemate. In April 2013, the International Monetary Fund (“IMF”) lowered slightly its forecast for the Eurozone to a 0.3% contraction in economic growth for calendar year 2013. Other lackluster economic data points for Europe during April 2013 fueled speculation that the European Central Bank (“ECB”) would cut interest rates in early May 2013. Such speculation boosted equity markets broadly and financials stocks in particular. Additionally, a previously well-regarded academic paper linking lower debt-to-GDP ratios and economic growth was repudiated, leading equity markets to reflect the possibility of less austerity in Europe’s future.
For the Reporting Period overall, the consumer discretionary and financials sectors drove international equity market performance, followed closely by health care and information technology. Energy, materials and utilities were the weakest sectors, posting positive but more muted returns. From a country perspective, Japan was the best performer, followed by Greece, Switzerland and New Zealand. Israel, Norway, Italy and the U.K. each posted positive returns during the Reporting Period, but lagged the MSCI EAFE Index most.
Looking Ahead
We believe we will continue to see below-trend global GDP growth for 2013.1 However, we also believe there are companies in all regions of the world that can potentially grow faster than the global GDP average and stocks that will return more than the broader market averages. Looking ahead, we expect our stock selection to reflect two main themes. First, we intend to seek investments in the highest portion of the value chain. We favor business models that can win in a variety of market conditions, have high barriers to entry and/or less risk. An important part of our stock selection process also considers these top companies in light of potential alternatives in other industries, sectors and regions.
| *All | | index returns are expressed in U.S. dollar terms. |
| 1Source: | | The Outlook for 2013 and 2014. Office of the Chairman, GSAM (Nov 2012) |
3
MARKET REVIEW
Secondly, we are looking to gain exposure to secular growth. Many qualities of a good business offer secular growth opportunities — a specialized niche, a strong brand, new technology or potential for market penetration, market share gains or new end markets. These advantages often translate to premium valuations on near-term earnings. However, we are only willing to pay for this growth potential when we judge it to be sustainable and when it is coupled with high returns on capital, particularly in light of modest global GDP growth and corporate earnings outlooks. In this transitioning world, we believe companies with secular growth are likely to be better able to retain margins, which, in our view, are peaking for many other firms. We believe companies that can better protect profits are those that may be rewarded.
Not surprisingly, companies with secular growth are often benefitting from broader secular growth trends that cut across almost all industries and regions of the world. Two of the biggest themes currently expressed in our Funds’ portfolios are the expansion of the growth markets’ middle class and the growing demand for mobile data.
Going forward, we believe equities are likely to look attractive versus other asset classes, as we expect interest rates to remain low in light of modest expectations for global economic growth. In addition, we think companies may take advantage of low financing rates and put high levels of cash to work via mergers and acquisitions, further supporting valuations. Overall, we have positioned our Funds’ portfolios with what we consider to be many higher quality stocks. We believe their better growth profiles and business models can drive returns in a market without a strong macro catalyst.
As always, we maintain our focus on seeking companies that we believe will generate long-term growth in today’s ever-changing market conditions.
4
PORTFOLIO RESULTS
Goldman Sachs Concentrated International
Equity Fund
Portfolio Management Discussion and Analysis
Below, the Goldman Sachs Global Equity Team discusses the Goldman Sachs Concentrated International Equity Fund’s (the “Fund”) performance and positioning for the six-month period ended April 30, 2013 (the “Reporting Period”).
| Q | | How did the Fund perform during the Reporting Period? |
| A | | During the Reporting Period, the Fund’s Class A, B, C, Institutional, Service and IR Shares generated cumulative total returns, without sales charges, of 15.44%, 14.97%, 15.02%, 15.66%, 15.38% and 15.60%, respectively. These returns compare to the 16.90% cumulative total return of the Fund’s benchmark, the MSCI EAFE Index (net, unhedged) (the “MSCI Index”), during the same period. |
| Q | | What key factors were responsible for the Fund’s performance during the Reporting Period? |
| A | | The Fund’s underperformance of the MSCI Index during the Reporting Period can be primarily attributed to individual stock selection. |
| Q | | Which stocks detracted significantly from the Fund’s performance during the Reporting Period? |
| A | | The biggest detractors from Fund performance relative to the MSCI Index during the Reporting Period were BG Group, CGG and BNP Paribas. |
| | | BG Group, a U.K. company that specializes in the exploration, production, transmission and distribution of gas, oil and liquefied natural gas, was the biggest detractor from the Fund’s results during the Reporting Period. Its shares fell significantly in October 2012 following a profit warning and an announcement that the company’s production growth rate would be flat in 2013. Our investment thesis for BG Group is that we believe it has the best organic growth potential amongst the global oil majors, mainly driven by developments in Brazil and Australia. The company attributed the slide in its production outlook to a series of delays on projects in the North Sea, Egypt, the U.S. and Brazil. While we were disappointed by the news and by the company’s stock performance, we believe that production expectations for 2013 and beyond remain intact. We think the market overreacted to the company’s news, but we continue to monitor the situation. |
| | | CGG, a French-based seismic company, detracted from the Fund’s relative performance. A new purchase for the Fund during the Reporting Period, our investment thesis for CGG is based on what we see as the cyclical upturn in demand for marine seismic services over the next few years, driven by limited new capacity. However, due to recent delays in licensing in markets such as Brazil, the rate of upturn lagged market expectations. The story has been further complicated by CGG’s acquisition of the seismic business from oilfield services firm Fugro and by the fact that Fugro’s seismic business has disappointed due to the uncertainty with customers regarding this acquisition. We expect to see improvement in CGG’s results during the second half of 2013, with stronger multi-client sales, seismic pricing/utilization, equipment sales with new products and potential integration issues completed. |
| | | French-based financial services firm BNP Paribas, one of the largest banks in Europe, disappointed, with its lagging performance primarily attributable to February and March 2013 when concerns renewed about the European banking sector following the bail-out of Cyprus and its banks. Although regulatory pressures are not going to go away, we believe BNP Paribas, a newly established position for the Fund during the Reporting Period, is a strong bank that can adapt to any environment, including a no or slow growth one, and create value for its shareholders. We see BNP Paribas as a company with a relatively stable return on equity, focused on returning capital to shareholders. |
5
PORTFOLIO RESULTS
| Q | | What were some of the Fund’s best-performing individual stocks? |
| A | | The greatest contributors to Fund performance relative to the MSCI Index during the Reporting Period were Ericsson, Kubota and Mitsubishi Estate. |
| | | Ericsson, the Sweden-based world’s largest maker of wireless network equipment, was the strongest contributor to the Fund’s performance during the Reporting Period. The company saw its sales and profit margin increase sharply during the fourth quarter of 2012, beating consensus estimates. Specifically, Ericsson’s earnings report showed that its sales in North America grew by 51%, as wireless operators and mobile carriers increased their spending to adapt to a growing trend in data consumption and to upgrade their networks to accommodate increased data usage. |
| | | The Fund’s holding in Japanese agricultural and construction machinery company Kubota performed well. Its business was strong during the Reporting Period, as the improving housing environment in the U.S. drove the company’s U.S. business to recover. The depreciating Japanese yen supported the company’s earnings as well. |
| | | Japanese real estate company Mitsubishi Estate was a strong contributor during the Reporting Period. Office fundamentals in Japan have been improving, and there was a market expectation that vacancy rates might have peaked in mid-2012. More specifically, the Tokyo office vacancy rate in October 2012 was 8.74%, further improved from 8.90% in September 2012 and the fourth consecutive month of declines from the 9.43% Tokyo office vacancy rate seen in June 2012. Additionally, aggressive monetary easing driven by the Japanese government and the Bank of Japan and expectations of potential reflation led to a rally in the Japanese real estate sector broadly. |
| | | We sold the Fund’s position in each of these three top contributors during the Reporting Period, as their stocks approached the target price we had set for each. |
| Q | | Which equity market sectors most significantly affected Fund performance during the Reporting Period? |
| A | | The biggest detractors from the Fund’s relative results during the Reporting Period were consumer discretionary, energy and consumer staples, where stock selection in each of these sectors weighed most negatively on performance. |
| | | The sectors that contributed most to the Fund’s performance relative to the MSCI Index were information technology, telecommunication services and industrials, due primarily to effective stock selection in each. Having an overweighted allocation to information technology, which outpaced the MSCI Index during the Reporting Period, also helped. |
| Q | | Which countries most affected the Fund’s performance during the Reporting Period? |
| A | | Typically, the Fund’s individual stock holdings will significantly influence the Fund’s performance within a particular country or region relative to the MSCI Index. This effect may be even more pronounced in a concentrated portfolio or in countries that represent only a modest proportion of the MSCI Index. |
| | | That said, the countries that detracted most from the Fund’s performance during the Reporting Period were France, the U.K. and Finland, where stock selection in each hampered results. Having an overweighted allocation to the U.K., which lagged the MSCI Index during the Reporting Period, also hurt. On the positive side, effective stock selection in Sweden, stock selection in and having an underweighted allocation to Germany and having exposure to China, which is not a component of the MSCI Index but which performed quite well, boosted its returns most relative to the MSCI Index. |
| Q | | How did the Fund use derivatives and similar instruments during the Reporting Period? |
| A | | During the Reporting Period, we did not use derivatives to hedge positions or as part of an active management strategy, but we used index futures on an opportunistic basis to ensure the Fund remained almost fully exposed to equities following cash inflows or stock sales. |
6
PORTFOLIO RESULTS
| Q | | Did the Fund make any significant purchases or sales during the Reporting Period? |
| A | | In addition to those purchases already mentioned, we established new Fund positions during the Reporting Period in Belgium-based diversified chemicals company Solvay and in Japanese credit card company Credit Saison. |
| | | Solvay introduced a new strategy in 2012 aimed at improving returns and boosting free cash flow. We have conviction that its chief executive officer, with his strong track record, should achieve the company’s target of €3 billion earnings before interest, taxes, depreciation and amortization (“EBITDA”) by 2016. |
| | | Credit Saison is the largest independent credit card company in Japan and the exclusive issuer of American Express. Should Japanese consumers start spending more due to rising wages and higher anticipated inflation, we believe Credit Saison should benefit from increased leverage by consumers. |
| | | In addition to those sales already mentioned, we sold out of the Fund’s positions in Imperial Tobacco Group and SKF during the Reporting Period. |
| | | We eliminated the Fund’s position in U.K.-based international tobacco company Imperial Tobacco during the Reporting Period, as volume trends in the U.K. and Europe have been deteriorating, mainly due to concerns about the regulatory environment. We felt this development put our investment rationale on the stock at risk, so we decided to sell. |
| | | We sold the Fund’s position in Sweden’s ball bearings manufacturer SKF, as the stock got close to our target price given higher market expectations for an economic recovery that would potentially increase demand for the company’s products. |
| Q | | Were there any notable changes in the Fund’s weightings during the Reporting Period? |
| A | | In this Fund, both sector weightings and country allocations are largely the result of our bottom-up stock selection process rather than any top-down macroeconomic views or industry bets. That said, during the Reporting Period, there were no notable changes in the Fund’s sector or country weightings during the Reporting Period. |
| Q | | How was the Fund positioned relative to the MSCI Index at the end of the Reporting Period? |
| A | | At the end of the Reporting Period, the Fund had more exposure to France, the U.K. and Finland and less exposure to Japan, Switzerland and Spain relative to the MSCI Index. At the end of the Reporting Period, the Fund held neutral positions relative to the MSCI Index in several countries and had no position at all in several other countries, most notably Greece. |
| | | From a sector allocation perspective, the Fund had overweight positions relative to the MSCI Index in financials, industrials and information technology at the end of the Reporting Period. On the same date, the Fund had underweighted positions compared to the MSCI Index in telecommunication services, consumer discretionary, consumer staples, utilities and health care and was rather neutrally weighted compared to the MSCI Index in energy and materials. |
| | | As always, we remained focused on individual stock selection, with sector and country positioning being a secondary, closely-monitored effect. |
7
FUND BASICS
Concentrated International Equity Fund
as of April 30, 2013
| | | | | | | | | | |
| | PERFORMANCE REVIEW | |
| | | November 1, 2012–April 30, 2013 | | Fund Total Return
(based on NAV)1 | | | MSCI EAFE (Net)
Index (unhedged)2 | |
| | Class A | | | 15.44 | % | | | 16.90 | % |
| | Class B | | | 14.97 | | | | 16.90 | |
| | Class C | | | 15.02 | | | | 16.90 | |
| | Institutional | | | 15.66 | | | | 16.90 | |
| | Service | | | 15.38 | | | | 16.90 | |
| | | Class IR | | | 15.60 | | | | 16.90 | |
| | 1 | | The net asset value (“NAV”) represents the net assets of the class of the Fund (ex-dividend) divided by the total number of shares of the class outstanding. The Fund’s performance assumes the reinvestment of dividends and other distributions. The Fund’s performance does not reflect the deduction of any applicable sales charges. |
| | 2 | | The MSCI EAFE Index (net, unhedged, with dividends reinvested) is a market capitalization-weighted composite of securities in 22 developed markets. The Index approximates the minimum possible dividend reinvestment. The dividend is reinvested after deduction for withholding tax, applying the rate to non-resident individuals who do not benefit from double taxation treaties. MSCI Barra uses withholding tax rates applicable to Luxembourg holding companies, as Luxembourg applies the highest rates. The Index is unmanaged and the figures for the Index do not include any deduction for fees or expenses. It is not possible to invest directly in an index. |
| | | | | | | | | | | | | | | | | | |
| | STANDARDIZED TOTAL RETURNS3 |
| | | For the period ended 3/31/13 | | One Year | | | Five Years | | | Ten Years | | | Since Inception | | Inception Date |
| | Class A | | | 7.88 | % | | | -3.01% | | | | 6.56% | | | 4.35% | | 12/01/92 |
| | Class B | | | 8.29 | | | | -3.01 | | | | 6.54 | | | 2.83 | | 5/01/96 |
| | Class C | | | 12.37 | | | | -2.63 | | | | 6.40 | | | 1.41 | | 8/15/97 |
| | Institutional | | | 14.71 | | | | -1.51 | | | | 7.63 | | | 4.06 | | 2/07/96 |
| | Service | | | 14.12 | | | | -2.01 | | | | 7.08 | | | 4.66 | | 3/06/96 |
| | | Class IR | | | 14.56 | | | | N/A | | | | N/A | | | 8.80 | | 8/31/10 |
| | 3 | | The Standardized Total Returns are average annual total returns as of the most recent calendar quarter-end. They assume reinvestment of all distributions at NAV. These returns reflect a maximum initial sales charge of 5.5% for Class A Shares, the assumed contingent deferred sales charge for Class B Shares (5% maximum declining to 0% after six years) and the assumed contingent deferred sales charge for Class C Shares (1% if redeemed within 12 months of purchase). Class B Shares convert automatically to Class A Shares on or about the fifteenth day of the last month of the calendar quarter that is eight years after purchase. Returns for Class B Shares for the period after conversion reflect the performance of Class A Shares. Because Institutional, Service and Class IR Shares do not involve a sales charge, such a charge is not applied to their Standardized Total Returns. The Fund’s Class B Shares are no longer available for purchase by new or existing shareholders (although current Class B shareholders may continue to reinvest income and capital gains distributions into Class B Shares, and Class B shareholders may continue to exchange their shares for Class B Shares of certain other Goldman Sachs Funds). |
The returns set forth in the tables above represent past performance. Past performance does not guarantee future results. The Fund’s investment return and principal value will fluctuate so that an investor’s shares, when redeemed, may be worth more or less than their original cost. Current performance may be lower or higher than the performance quoted above. Please visit our web site at www.goldmansachsfunds.com to obtain the most recent month-end returns. Performance reflects applicable fee waivers and/or expense limitations in effect during the periods shown. In their absence, performance would be reduced. Returns do not reflect the deduction of taxes that a shareholder would pay on Fund distributions or the redemption of Fund shares.
8
FUND BASICS
| | | | | | | | | | |
| | EXPENSE RATIOS4 | |
| | | | | Net Expense Ratio (Current) | | | Gross Expense Ratio (Before Waivers) | |
| | Class A | | | 1.44 | % | | | 1.72 | % |
| | Class B | | | 2.19 | | | | 2.47 | |
| | Class C | | | 2.19 | | | | 2.47 | |
| | Institutional | | | 1.04 | | | | 1.31 | |
| | Service | | | 1.54 | | | | 1.82 | |
| | | Class IR | | | 1.19 | | | | 1.46 | |
| | 4 | | The expense ratios of the Fund, both current (net of applicable fee waivers and/or expense limitations) and before waivers (gross of applicable fee waivers and/or expense limitations) are as set forth above according to the most recent publicly available Prospectus for the Fund and may differ from the expense ratios disclosed in the Financial Highlights in this report. The Fund’s waivers and/or expense limitations will remain in place through at least February 28, 2014, and prior to such date the Investment Adviser may not terminate the arrangements without the approval of the Fund’s Board of Trustees. If these arrangements are discontinued in the future, the expense ratios may change without shareholder approval. |
| | | | | | | | | | |
| | TOP TEN HOLDINGS AS OF 4/30/135 |
| | | Holding | | % of Net Assets | | | Line of Business | | Country |
| | Isuzu Motors Ltd. | | | 4.0 | % | | Automobiles & Components | | Japan |
| | Scania AB Class B | | | 4.0 | | | Capital Goods | | Sweden |
| | Aurizon Holdings Ltd. | | | 4.0 | | | Transportation | | Australia |
| | BG Group PLC | | | 4.0 | | | Energy | | United Kingdom |
| | Direct Line Insurance Group | | | 3.9 | | | Insurance | | United Kingdom |
| | PLC | | | | | | | | |
| | Shire PLC | | | 3.8 | | | Pharmaceuticals,
Biotechnology & Life
Sciences | | Ireland |
| | Rio Tinto PLC | | | 3.8 | | | Materials | | United Kingdom |
| | Solvay SA | | | 3.3 | | | Materials | | Belgium |
| | Safran SA | | | 3.1 | | | Capital Goods | | France |
| | | Credit Saison Co. Ltd. | | | 3.1 | | | Diversified Financials | | Japan |
| | 5 | | The top 10 holdings may not be representative of the Fund’s future investments. |
9
FUND BASICS
|
| FUND VS. BENCHMARK SECTOR ALLOCATIONS6 |
| As of April 30, 2013 |
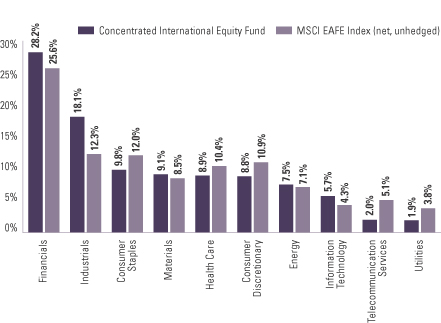
| | 6 | | The Fund is actively managed and, as such, its composition may differ over time. Consequently, the Fund’s overall sector allocations may differ from percentages contained in the graph above. The graph categorizes investments using Global Industry Classification Standard (“GICS”), however, the sector classifications used by the portfolio management team may differ from GICS. The percentage shown for each investment category reflects the value of investments in that category as a percentage of market value. The graph depicts the Fund’s investments but may not represent the Fund’s market exposure due to the exclusion of certain derivatives, if any, as listed in the Additional Investment Information section of the Schedule of Investments. |
10
PORTFOLIO RESULTS
Goldman Sachs International Small Cap Fund
Portfolio Management Discussion and Analysis
Below, the Goldman Sachs Global Equity Team discusses the Goldman Sachs International Small Cap Fund’s (the “Fund”) performance and positioning for the six-month period ended April 30, 2013 (the “Reporting Period”).
| Q | | How did the Fund perform during the Reporting Period? |
| A | | During the Reporting Period, the Fund’s Class A, B, C, Institutional, Service and IR Shares generated cumulative total returns, without sales charges, of 15.81%, 15.32%, 15.31%, 16.05%, 15.71% and 15.94%, respectively. These returns compare to the 15.25% cumulative total return of the Fund’s benchmark, the S&P Developed ex-US Small Cap Index (net) (the “S&P Index”), during the same period. |
| Q | | What key factors were responsible for the Fund’s performance during the Reporting Period? |
| A | | The Fund’s outperformance of the S&P Index during the Reporting Period can be primarily attributed to individual stock selection. |
| Q | | What were some of the Fund’s best-performing individual stocks? |
| A | | The greatest contributors to Fund performance relative to the S&P Index during the Reporting Period were Tokai Tokyo Financial Holdings, Eugene Technology and Takara Leben. |
| | Japanese securities firm Tokai Tokyo Financial Holdings was the greatest contributor to the Fund’s relative performance during the Reporting Period. Tokai Tokyo Financial Holdings performed well as a result of strong stock market transactions volume. For example, monthly transaction value of Japanese stocks and unit trust sales increased significantly in December 2012 and did so even more dramatically in January and February 2013. |
| | South Korean semiconductor equipment company Eugene Technology, a new purchase for the Fund during the Reporting Period, was also a strong contributor to the Fund’s relative results. Its shares were strong as a result of an improved memory capital expenditure outlook for the second half of 2013 and for 2014. Additionally, anticipation of overseas client expansion and newly launched equipment for its non-memory business benefited returns, in our view. |
| | Japanese real estate operator and developer Takara Leben’s condo business performed well, supported by the Japanese government’s tax break program for housing. The company provides condos with solar panels, which became popular for electricity savings. Also, aggressive monetary easing, driven by the government and the Bank of Japan, and expectations regarding potential reflation led to a rally in Japan’s real estate sector broadly during the Reporting Period. |
| Q | | Which stocks detracted significantly from the Fund’s performance during the Reporting Period? |
| A | | The biggest detractors from Fund performance relative to the S&P Index during the Reporting Period were CGG, Kenmare Resources and Alamos Gold. |
| | CGG, a French-based seismic company, detracted from the Fund’s relative performance most during the Reporting Period. Our investment thesis for CGG is based on what we see as the cyclical upturn in demand for marine seismic services over the next few years, driven by limited new capacity. However, due to recent delays in licensing in markets such as Brazil, the rate of upturn lagged market expectations. The story has been further complicated by CGG’s acquisition of the seismic business from oilfield services firm Fugro and by the fact that Fugro’s seismic business has disappointed due to the uncertainty with customers regarding this acquisition. We believe we should see improvement in CGG’s results during the second half of 2013, with stronger multi-client sales, seismic pricing/ utilization, equipment sales with new products and potential integration issues completed, and thus we added to the Fund’s position in the stock on weakness during the Reporting Period. |
| | A position in U.K.-listed mineral sands mining company Kenmare Resources weighed negatively on the Fund’s relative performance during the Reporting Period. The investment thesis for Kenmare Resources was based on a supply deficit in its key commodities — titanium dioxide and zircon, a 50% production expansion, just completing, and an unwinding of most of its fixed priced legacy contracts in 2012. However, the stock was impacted by sharply weaker global demand for its products, and some minor delays and cost overruns in its expansion. While demand was softer, the sharp downturn in its stock price was caused by destocking, |
11
PORTFOLIO RESULTS
| | or inventory reduction, and by the industry’s reaction of lower output, particularly of zircon. As a result, industry price declines were limited. We believe the company’s stock should benefit if demand recovers with the end of destocking, and if its expansion comes on stream during 2013. At the end of the Reporting Period, we held the position, as we believed the stock has significant upside potential. |
| | Canadian gold miner Alamos Gold is a preferred holding of our team’s within the gold sector, featuring low cost production in Mexico and another low cost project in Turkey entering the development stage. The company is also debt free with a meaningful cash position. However, in January 2013, Alamos Gold announced a takeover bid for fellow Canadian miner Aurizon Mines. Although eventually outbid by another company, the move negatively impacted its stock price performance. Even more significant was a decline in the price of gold bullion in 2013 year-to-date and negative sentiment toward the gold mining sector broadly. |
| Q | | Which equity market sectors most significantly affected Fund performance during the Reporting Period? |
| A | | The sectors that contributed most to the Fund’s performance relative to the S&P Index were information technology, industrials and financials, due primarily to effective stock selection in each. |
| | The biggest detractors from the Fund’s results during the Reporting Period were health care, materials and consumer discretionary, where stock selection overall hurt relative performance. |
| Q | | Which countries most affected the Fund’s performance during the Reporting Period? |
| A | | Typically, the Fund’s individual stock holdings will significantly influence the Fund’s performance within a particular country or region relative to the S&P Index. This effect may be even more pronounced in countries that represent only a modest proportion of the S&P Index. |
| | That said, the Fund’s stock selection in Japan, Canada and Australia contributed most positively to the Fund’s performance during the Reporting Period. The countries that detracted most from the Fund’s performance during the Reporting Period were France, the Netherlands and Italy, each due primarily to weak stock selection. |
| Q | | How did the Fund use derivatives and similar instruments during the Reporting Period? |
| A | | During the Reporting Period, we did not use derivatives to hedge positions or as part of an active management strategy, but we used index futures on an opportunistic basis to ensure the portfolio remained almost fully exposed to equities following cash inflows or stock sales. |
| Q | | Did the Fund make any significant purchases or sales during the Reporting Period? |
| A | | In addition to those purchases already mentioned, we established Fund positions in Melrose Industries, IMI and C&C Group during the Reporting Period. |
| | Melrose Industries is U.K.-based international engineering group with worldwide interests in the design, development and manufacture of specialist components for a wide range of markets, including aerospace, information technology, telecommunications, consumer electronics, automotive, medical and consumer durables. We believe Melrose Industries has historically generated significant returns for its shareholders. |
| | U.K.-based IMI applies leading edge valve technology solutions to end markets ranging from truck engines to power stations to beverage dispensers. By moving its portfolio toward engineering-based solutions in niche applications and away from more generic “off the shelf” products, IMI has enjoyed strong returns and performance versus its engineering peer group through the economic cycle. Its management appears to be continuing to drive what we consider to be this positive portfolio mix, supported by a strong balance sheet that provides merger and acquisition optionality should the right opportunity arise. The company’s announcement during the Reporting Period of a stock buy- back program was well received by the market, but we believe the fundamental quality of its current business, coupled with its prospects ahead, were yet to be fully reflected in its share price at the time of our purchase. |
| | C&C Group has a strong franchise in the cider market, predominantly in the U.K. and Ireland. Although the consumer and competitive environment has been challenging for beverage companies in recent years, what we consider to be a strong management team at C&C Group has |
12
PORTFOLIO RESULTS
| | successfully diversified its product portfolio and defended attractive profit margins. We felt the two most positive drivers not being reflected in the company’s share price were a) the strategy of consolidating its Irish drinks market with a broad stable of its own and distributed brands and b) its significant growth opportunity in the U.S. through the acquisition of Vermont Hard Cider Company, giving C&C Group an approximately 50% share in a rapidly growing niche of the U.S. alcoholic beverages market. |
| | We eliminated the Fund’s positions in D’Ieteren, Kabel Deutschland and Andritz during the Reporting Period. |
| | We eliminated the Fund’s position in D’Ieteren, a Belgium-based auto importer/distributor and vehicle glass repair and replacement services company. The hoped-for recovery in the auto glass repair market did not materialize as expected, and difficult market dynamics in the U.K. caused us to question the robustness of the company’s business model more broadly. We sold the Fund’s position after the stock recovered relatively well early in 2013. |
| | We eliminated the Fund’s position in German cable operator Kabel Deutschland following the stock’s sharp upward move in February 2013 on market rumors that Vodafone was considering a bid for the company. |
| | A significant acquisition made by Austrian diversified machinery manufacturer Andritz raised concerns over the strategic direction of the company. Also, the order book in one of its key divisions had reached a peak in our view. We also felt the company’s valuation had reached an expensive level, and thus we sold the Fund’s position in Andritz. |
| Q | | Were there any notable changes in the Fund’s weightings during the Reporting Period? |
| A | | In this Fund, both sector weightings and country allocations are largely the result of our bottom-up stock selection process rather than any top-down macroeconomic views or industry bets. That said, during the Reporting Period, there were no notable changes in the Fund’s sector or country weightings during the Reporting Period. |
| Q | | How was the Fund positioned relative to the S&P Index at the end of the Reporting Period? |
| A | | At the end of the Reporting Period, the Fund had more exposure to the U.K., China and Ireland and less exposure to Hong Kong, Sweden and Italy relative to the S&P Index. At the end of the Reporting Period, the Fund held neutral positions relative to the S&P Index in several countries, most notably Canada. |
| | From a sector allocation perspective, the Fund had overweighted positions relative to the S&P Index in information technology and consumer discretionary at the end of the Reporting Period. On the same date, the Fund had underweighted positions compared to the S&P Index in financials, industrials, telecommunication services, utilities, health care, materials and consumer staples and was rather neutrally weighted relative to the S&P Index in energy. |
| | As always, we remained focused on individual stock selection, with sector and country positioning being a secondary, closely-monitored effect. |
13
FUND BASICS
International Small Cap Fund
as of April 30, 2013
| | | | | | | | | | |
| | PERFORMANCE REVIEW | |
| | | November 1, 2012–April 30, 2013 | | Fund Total Return
(based on NAV)1 | | | S&P Developed
ex-US Small Cap
Index (Net)2 | |
| | Class A | | | 15.81 | % | | | 15.25 | % |
| | Class B | | | 15.32 | | | | 15.25 | |
| | Class C | | | 15.31 | | | | 15.25 | |
| | Institutional | | | 16.05 | | | | 15.25 | |
| | Service | | | 15.71 | | | | 15.25 | |
| | | Class IR | | | 15.94 | | | | 15.25 | |
| | 1 | | The net asset value (“NAV”) represents the net assets of the class of the Fund (ex-dividend) divided by the total number of shares of the class outstanding. The Fund’s performance assumes the reinvestment of dividends and other distributions. The Fund’s performance does not reflect the deduction of any applicable sales charges. |
| | 2 | | The S&P Developed ex-US Small Cap Index (net) is the small capitalization stock component of the S&P Developed Broad Market Index (BMI). The BMI is a float-weighted index that spans 22 countries (inclusive of the US) and includes the listed shares of all companies with an available market capitalization (float) of at least $100 million at the annual rebalance. At rebalance, companies are deleted from the index if their float falls below $75 million. The Small Cap ex-US is defined as those stocks falling in the bottom 15% of the cumulative available capital in each country. The Index reflects returns net of withholding taxes applied to foreign investors, calculated daily based on tax rates that would be applied to a Luxembourg-based investor. The Index is unmanaged and the figures for the Index do not include any deduction for fees or expenses. It is not possible to invest directly in an index. |
| | | | | | | | | | | | | | | | | | |
| | STANDARDIZED TOTAL RETURNS3 |
| | | For the period ended 3/31/13 | | One Year | | | Five Years | | | Ten Years | | | Since Inception | | Inception Date |
| | Class A | | | 6.42 | % | | | 0.62% | | | | 10.65% | | | 5.19% | | 5/01/98 |
| | Class B | | | 6.75 | | | | 0.63 | | | | 10.64 | | | 5.28 | | 5/01/98 |
| | Class C | | | 10.83 | | | | 1.03 | | | | 10.49 | | | 4.92 | | 5/01/98 |
| | Institutional | | | 13.03 | | | | 2.22 | | | | 11.79 | | | 6.13 | | 5/01/98 |
| | Service | | | 12.54 | | | | 1.69 | | | | 11.21 | | | 5.59 | | 5/01/98 |
| | | Class IR | | | 12.91 | | | | N/A | | | | N/A | | | 13.92 | | 8/31/10 |
| | 3 | | The Standardized Total Returns are average annual total returns as of the most recent calendar quarter-end. They assume reinvestment of all distributions at NAV. These returns reflect a maximum initial sales charge of 5.5% for Class A Shares, the assumed contingent deferred sales charge for Class B Shares (5% maximum declining to 0% after six years) and the assumed contingent deferred sales charge for Class C Shares (1% if redeemed within 12 months of purchase). Class B Shares convert automatically to Class A Shares on or about the fifteenth day of the last month of the calendar quarter that is eight years after purchase. Returns for Class B Shares for the period after conversion reflect the performance of Class A Shares. Because Institutional, Service and Class IR Shares do not involve a sales charge, such a charge is not applied to their Standardized Total Returns. The Fund’s Class B Shares are no longer available for purchase by new or existing shareholders (although current Class B shareholders may continue to reinvest income and capital gains distributions into Class B Shares, and Class B shareholders may continue to exchange their shares for Class B Shares of certain other Goldman Sachs Funds). |
The returns set forth in the tables above represent past performance. Past performance does not guarantee future results. The Fund’s investment return and principal value will fluctuate so that an investor’s shares, when redeemed, may be worth more or less than their original cost. Current performance may be lower or higher than the performance quoted above. Please visit our web site at www.goldmansachsfunds.com to obtain the most recent month-end returns. Performance reflects applicable fee waivers and/or expense limitations in effect during the periods shown. In their absence, performance would be reduced. Returns do not reflect the deduction of taxes that a shareholder would pay on Fund distributions or the redemption of Fund shares.
14
FUND BASICS
| | | | | | | | | | |
| | EXPENSE RATIOS4 | |
| | | | | Net Expense Ratio (Current) | | | Gross Expense Ratio (Before Waivers) | |
| | Class A | | | 1.55 | % | | | 2.18 | % |
| | Class B | | | 2.30 | | | | 2.92 | |
| | Class C | | | 2.30 | | | | 2.92 | |
| | Institutional | | | 1.15 | | | | 1.73 | |
| | Service | | | 1.65 | | | | 2.25 | |
| | | Class IR | | | 1.30 | | | | 1.84 | |
| | 4 | | The expense ratios of the Fund, both current (net of applicable fee waivers and/or expense limitations) and before waivers (gross of applicable fee waivers and/or expense limitations) are as set forth above according to the most recent publicly available Prospectus for the Fund and may differ from the expense ratios disclosed in the Financial Highlights in this report. The Fund’s waivers and/or expense limitations will remain in place through at least February 28, 2014, and prior to such date the Investment Adviser may not terminate the arrangements without the approval of the Fund’s Board of Trustees. If these arrangements are discontinued in the future, the expense ratios may change without shareholder approval. |
| | | | | | | | | | |
| | TOP TEN HOLDINGS AS OF 4/30/135 |
| | | Holding | | % of Net Assets | | | Line of Business | | Country |
| | Telecity Group PLC | | | 1.2 | % | | Software & Services | | United Kingdom |
| | Persimmon PLC | | | 1.2 | | | Consumer Durables
& Apparel | | United Kingdom |
| | Ingenico | | | 1.1 | | | Technology Hardware
& Equipment | | France |
| | Spirax-Sarco Engineering PLC | | | 1.1 | | | Capital Goods | | United Kingdom |
| | Melrose Industries PLC | | | 1.1 | | | Capital Goods | | United Kingdom |
| | IMI PLC | | | 1.1 | | | Capital Goods | | United Kingdom |
| | C&C Group PLC | | | 1.1 | | | Food, Beverage &
Tobacco | | Ireland |
| | Pfeiffer Vacuum Technology AG | | | 1.1 | | | Capital Goods | | Germany |
| | Lindt & Spruengli AG | | | 1.1 | | | Food, Beverage &
Tobacco | | Switzerland |
| | | GfK SE | | | 1.0 | | | Media | | Germany |
| | 5 | | The top 10 holdings may not be representative of the Fund’s future investments. |
15
FUND BASICS
| | |
| FUND VS. BENCHMARK SECTOR ALLOCATIONS6 | | |
| As of April 30, 2013 | | |
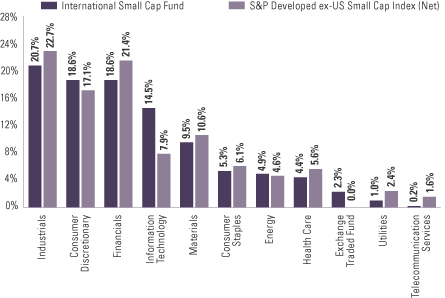
| | 6 | | The Fund is actively managed and, as such, its composition may differ over time. Consequently, the Fund’s overall sector allocations may differ from percentages contained in the graph above. The graph categorizes investments using Global Industry Classification Standard (“GICS”), however, the sector classifications used by the portfolio management team may differ from GICS. Underlying sector allocations of exchange traded funds held by the Fund are not reflected in the graph above. The percentage shown for each investment category reflects the value of investments in that category as a percentage of market value. The graph depicts the Fund’s investments but may not represent the Fund’s market exposure due to the exclusion of certain derivatives, if any, as listed in the Additional Investment Information section of the Schedule of Investments. |
16
PORTFOLIO RESULTS
Goldman Sachs Strategic International Equity Fund
Portfolio Management Discussion and Analysis
Below, the Goldman Sachs Global Equity Team discusses the Goldman Sachs Strategic International Equity Fund’s (the “Fund”) performance and positioning for the six-month period ended April 30, 2013 (the “Reporting Period”).
| Q | | How did the Fund perform during the Reporting Period? |
| A | | During the Reporting Period, the Fund’s Class A, B, C, Institutional, IR and R Shares generated cumulative total returns, without sales charges, of 14.88%, 14.45%, 14.42%, 15.08%, 14.95% and 14.67%, respectively. These returns compare to the 16.90% cumulative total return of the Fund’s benchmark, the MSCI EAFE Index (net, unhedged) (the “MSCI Index”), during the same period. |
| Q | | What key factors were responsible for the Fund’s performance during the Reporting Period? |
| A | | The Fund’s underperformance of the MSCI Index during the Reporting Period can be primarily attributed to individual stock selection. |
| Q | | Which stocks detracted significantly from the Fund’s performance during the Reporting Period? |
| A | | Among the biggest detractors from Fund performance relative to the MSCI Index during the Reporting Period were CGG, Rio Tinto and Lixil Group. |
| | CGG, a French-based seismic company, detracted from the Fund’s relative performance most during the Reporting Period. Our investment thesis for CGG is based on what we see as the cyclical upturn in demand for marine seismic services over the next few years, driven by limited new capacity. However, due to recent delays in licensing in markets such as Brazil, the rate of upturn lagged market expectations. The story has been further complicated by CGG’s acquisition of the seismic business from oilfield services firm Fugro and by the fact that Fugro’s seismic business has disappointed due to the uncertainty with customers regarding this acquisition. We expect to see improvement in CGG’s results during the second half of 2013, with stronger multi-client sales, seismic pricing/utilization, equipment sales with new products and potential integration issues completed, and thus we added to the Fund’s position in the stock on weakness during the Reporting Period. |
| | Rio Tinto, a U.K.-based world leader in mining mineral resources, also detracted from the Fund’s results during the Reporting Period. Iron ore prices moved from highs of $160 per tonne at the end of January 2013 to $138 per tonne in March 2013. This price decline, along with a negative sentiment on China’s economy, caused Rio Tinto’s share price to weaken. We added to the Fund’s position in the stock on weakness. |
| | Japanese building materials company Lixil Group’s share price declined, as investors had concern the company might miss its guidance. There had been a delay in launching a new product, and its cost reduction plans did not go as well as anticipated as the company increased bonuses. In turn, Lixil Group’s earnings momentum was not as strong as expected, and the stock underperformed the MSCI Index. |
| Q | | What were some of the Fund’s best-performing individual stocks? |
| A | | The greatest contributors to Fund performance relative to the MSCI Index during the Reporting Period were Ericsson, Mitsubishi Estate and Sumitomo Mitsui Financial Group. |
| | Ericsson, the Sweden-based world’s largest maker of wireless network equipment, was the strongest contributor to the Fund’s performance during the Reporting Period. The company saw its sales and profit margin increase sharply during the fourth quarter of 2012, beating consensus estimates. Specifically, Ericsson’s earnings report showed that its sales in North America grew by 51%, as wireless operators and mobile carriers increased their spending to adapt to a growing trend in data consumption and to upgrade their networks to accommodate increased data usage. At the end of the Reporting Period, we expected this data consumption trend to continue over the long term and still believed Ericsson was well positioned to benefit. |
17
PORTFOLIO RESULTS
| | Japanese real estate company Mitsubishi Estate was a strong contributor during the Reporting Period. Office fundamentals in Japan have been improving, and there was a market expectation that vacancy rates might have peaked in mid-2012. More specifically, the Tokyo office vacancy rate in October 2012 was 8.74%, further improved from 8.90% in September 2012 and the fourth consecutive month of declines from the 9.43% Tokyo office vacancy rate seen in June 2012. Additionally, aggressive monetary easing driven by the Japanese government and the Bank of Japan and expectations of potential reflation led to a rally in the Japanese real estate sector broadly. We sold the Fund’s position in the company to take profits and used the proceeds for what we considered to be better risk/reward opportunities. |
| | Japan’s Sumitomo Mitsui Financial Group performed well on good fundamentals. Its retail business, including mutual fund sales, was strong, given positive market sentiment, and credit costs were reduced. On the back of these positive fundamentals, the company announced an upward revision of its earnings, which contributed to the stock price increase as well. |
| Q | | Which equity market sectors most significantly affected Fund performance during the Reporting Period? |
| A | | The biggest detractors from the Fund’s results during the Reporting Period were consumer discretionary, energy and consumer staples, where weak stock selection in each hurt most. |
| | | The sectors that contributed most to the Fund’s performance relative to the MSCI Index were health care, industrials and information technology. Stock selection in all three sectors proved effective during the Reporting Period. |
| Q | | Which countries most affected the Fund’s performance during the Reporting Period? |
| A | | Typically, the Fund’s individual stock holdings will significantly influence the Fund’s performance within a particular country or region relative to the MSCI Index. This effect may be even more pronounced in countries that represent only a modest proportion of the MSCI Index. |
| | That said, the countries that detracted most from the Fund’s performance during the Reporting Period were France, the U.K. and Japan. Both stock selection in and having overweighted allocations to France and the U.K., each of which lagged the MSCI Index during the Reporting Period, weighed negatively on relative performance. Having an underweighted exposure to the comparative strong Japanese equity market hampered results. |
| | Conversely, effective individual stock selection in Sweden contributed most positively to the Fund’s results relative to the MSCI Index. Both stock selection in and having an underweighted allocation to Germany, which lagged the MSCI Index during the Reporting Period, boosted the Fund’s performance. Having only a modest exposure to Italy, which significantly lagged the MSCI Index, added value as well. |
| Q | | How did the Fund use derivatives and similar instruments during the Reporting Period? |
| A | | During the Reporting Period, we did not use derivatives to hedge positions or as part of an active management strategy, but we used index futures on an opportunistic basis to ensure the portfolio remained almost fully exposed to equities following cash inflows or stock sales. |
| Q | | Did the Fund make any significant purchases or sales during the Reporting Period? |
| A | | During the Reporting Period, we purchased Fund positions in Sanofi, Anheuser-Busch InBev and AXA. |
| | We initiated a Fund position in Sanofi, a France-based global pharmaceutical company, because of its focus on “long duration assets,” which we characterize as less reliant on cyclical research and development investment and/or less exposed to intellectual property erosion. These long-term assets currently represent 60% of Sanofi’s sales, and we believe this proportion may well grow to 70% by 2016. Compared to its peers, the company has high exposure to emerging markets, providing diversified exposure. |
18
PORTFOLIO RESULTS
| | We established a Fund position in Belgium-based brewer Anheuser-Busch InBev on prospects for higher earnings growth after its proposal to buy control of the Mexican brewer Modelo. |
| | We initiated a Fund position in France-based global insurer AXA because we believe the company was undervalued compared to its peers and that the market was overlooking AXA’s powerful recovery story following the financial crisis. We believe management has been taking the right steps to ensure the business moves forward and generates more cash to support its dividend. |
| | In addition to the sales already mentioned, we sold out of the Fund’s positions in Westpac Banking and UBS during the Reporting Period. |
| | We sold out of the Fund’s position in Westpac, the second largest Australian bank, as it reached our target price given better earnings driven by the solid economic environment in Australia and given the search for stable high yielding stocks. |
| | Similarly, we eliminated the Fund’s position in Swiss diversified banking institution UBS, as it had performed well and approached its target price. We switched into French- based financial services firm BNP Paribas, one of the largest banks in Europe. |
| Q | | Were there any notable changes in the Fund’s weightings during the Reporting Period? |
| A | | In this Fund, both sector weightings and country allocations are largely the result of our bottom-up stock selection process rather than any top-down macroeconomic views or industry bets. That said, during the Reporting Period, there were no notable changes in the Fund’s sector or country weightings during the Reporting Period. |
| Q | | How was the Fund positioned relative to the MSCI Index at the end of the Reporting Period? |
| A | | At the end of the Reporting Period, the Fund had more exposure to France, Russia and Belgium and less exposure to Australia, Japan and Germany relative to the MSCI Index. At the end of the Reporting Period, the Fund held neutral positions relative to the MSCI Index in several countries, most notably Switzerland and Sweden. |
| | From a sector allocation perspective, the Fund had overweight positions relative to the MSCI Index in health care and telecommunication services at the end of the Reporting Period. On the same date, the Fund had underweighted positions compared to the MSCI Index in financials and utilities and rather neutral positions relative to the MSCI Index in consumer staples, consumer discretionary, information technology, materials, industrials and energy. |
| | As always, we remained focused on individual stock selection, with sector and country positioning being a secondary, closely-monitored effect. |
19
FUND BASICS
Strategic International Equity Fund
as of April 30, 2013
| | | | | | | | | | |
| | PERFORMANCE REVIEW | |
| | | November 1, 2012–April 30, 2013 | | Fund Total Return
(based on NAV)1 | | | MSCI EAFE (Net)
Index (unhedged)2 | |
| | Class A | | | 14.88 | % | | | 16.90 | % |
| | Class B | | | 14.45 | | | | 16.90 | |
| | Class C | | | 14.42 | | | | 16.90 | |
| | Institutional | | | 15.08 | | | | 16.90 | |
| | Class IR | | | 14.95 | | | | 16.90 | |
| | | Class R | | | 14.67 | | | | 16.90 | |
| | 1 | | The net asset value (“NAV”) represents the net assets of the class of the Fund (ex-dividend) divided by the total number of shares of the class outstanding. The Fund’s performance assumes the reinvestment of dividends and other distributions. The Fund’s performance does not reflect the deduction of any applicable sales charges. |
| | 2 | | The MSCI EAFE Index (net, unhedged, with dividends reinvested) is a market capitalization-weighted composite of securities in 22 developed markets. The Index approximates the minimum possible dividend reinvestment. The dividend is reinvested after deduction for withholding tax, applying the rate to non-resident individuals who do not benefit from double taxation treaties. MSCI Barra uses withholding tax rates applicable to Luxembourg holding companies, as Luxembourg applies the highest rates. The Index is unmanaged and the figures for the Index do not include any deduction for fees or expenses. It is not possible to invest directly in an index. |
| | | | | | | | | | | | |
| | STANDARDIZED TOTAL RETURNS3 |
| | | For the period ended 3/31/13 | | One Year | | | Five Years | | Since Inception | | Inception Date |
| | Class A | | | 5.15 | % | | -3.09% | | -3.86% | | 6/25/07 |
| | Class B | | | 5.45 | | | -3.13 | | -3.83 | | 6/25/07 |
| | Class C | | | 9.42 | | | -2.72 | | -3.65 | | 6/25/07 |
| | Institutional | | | 11.76 | | | -1.62 | | -2.55 | | 6/25/07 |
| | Class IR | | | 11.57 | | | -1.68 | | -4.17 | | 11/30/07 |
| | | Class R | | | 11.01 | | | -2.26 | | -4.73 | | 11/30/07 |
| | 3 | | The Standardized Total Returns are average annual total returns as of the most recent calendar quarter-end. They assume reinvestment of all distributions at NAV. These returns reflect a maximum initial sales charge of 5.5% for Class A Shares, the assumed contingent deferred sales charge for Class B Shares (5% maximum declining to 0% after six years) and the assumed contingent deferred sales charge for Class C Shares (1% if redeemed within 12 months of purchase). Class B Shares convert automatically to Class A Shares on or about the fifteenth day of the last month of the calendar quarter that is eight years after purchase. Returns for Class B Shares for the period after conversion reflect the performance of Class A Shares. Because Institutional, Class R and Class IR Shares do not involve a sales charge, such a charge is not applied to their Standardized Total Returns. The Fund’s Class B Shares are no longer available for purchase by new or existing shareholders (although current Class B shareholders may continue to reinvest income and capital gains distributions into Class B Shares, and Class B shareholders may continue to exchange their shares for Class B Shares of certain other Goldman Sachs Funds). |
The returns set forth in the tables above represent past performance. Past performance does not guarantee future results. The Fund’s investment return and principal value will fluctuate so that an investor’s shares, when redeemed, may be worth more or less than their original cost. Current performance may be lower or higher than the performance quoted above. Please visit our web site at www.goldmansachsfunds.com to obtain the most recent month-end returns. Performance reflects applicable fee waivers and/or expense limitations in effect during the periods shown. In their absence, performance would be reduced. Returns do not reflect the deduction of taxes that a shareholder would pay on Fund distributions or the redemption of Fund shares.
20
FUND BASICS
| | | | | | | | | | |
| | EXPENSE RATIOS4 | |
| | | | | Net Expense Ratio (Current) | | | Gross Expense Ratio (Before Waivers) | |
| | Class A | | | 1.47 | % | | | 1.97 | % |
| | Class B | | | 2.22 | | | | 2.72 | |
| | Class C | | | 2.22 | | | | 2.72 | |
| | Institutional | | | 1.07 | | | | 1.53 | |
| | Class IR | | | 1.22 | | | | 1.70 | |
| | | Class R | | | 1.72 | | | | 2.21 | |
| | 4 | | The expense ratios of the Fund, both current (net of applicable fee waivers and/or expense limitations) and before waivers (gross of applicable fee waivers and/or expense limitations) are as set forth above according to the most recent publicly available Prospectus for the Fund and may differ from the expense ratios disclosed in the Financial Highlights in this report. The Fund’s waivers and/or expense limitations will remain in place through at least February 28, 2014, and prior to such date the Investment Adviser may not terminate the arrangements without the approval of the Fund’s Board of Trustees. If these arrangements are discontinued in the future, the expense ratios may change without shareholder approval. |
| | | | | | | | | | |
| | TOP TEN HOLDINGS AS OF 4/30/135 | | |
| | | Holding | | % of Net Assets | | | Line of Business | | Country |
| | HSBC Holdings PLC | | | 3.4 | % | | Banks | | United Kingdom |
| | Novartis AG (Registered) | | | 3.0 | | | Pharmaceuticals, Biotechnology
& Life Sciences | | Switzerland |
| | Vodafone Group PLC | | | 2.9 | | | Telecommunication Services | | United Kingdom |
| | Rio Tinto PLC | | | 2.8 | | | Materials | | United Kingdom |
| | Sanofi | | | 2.4 | | | Pharmaceuticals, Biotechnology
& Life Sciences | | France |
| | Anheuser-Busch InBev NV | | | 2.3 | | | Food, Beverage & Tobacco | | Belgium |
| | Air Liquide SA | | | 2.1 | | | Materials | | France |
| | Sumitomo Mitsui | | | 2.1 | | | Banks | | Japan |
| | Financial Group, Inc. AXA SA | | | 2.0 | | | Insurance | | France |
| | | Unilever NV CVA | | | 2.0 | | | Food, Beverage & Tobacco | | Netherlands |
| | 5 | | The top 10 holdings may not be representative of the Fund’s future investments. |
21
FUND BASICS
|
| FUND VS. BENCHMARK SECTOR ALLOCATIONS6 |
| As of April 30, 2013 |
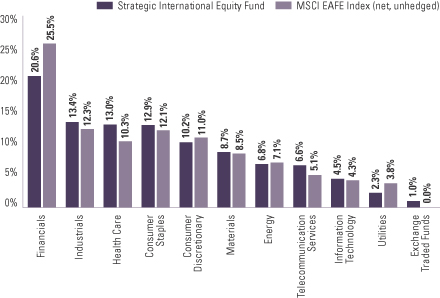
| | 6 | | The Fund is actively managed and, as such, its composition may differ over time. Consequently, the Fund’s overall sector allocations may differ from percentages contained in the graph above. The graph categorizes investments using Global Industry Classification Standard (“GICS”), however, the sector classifications used by the portfolio management team may differ from GICS. Underlying sector allocations of exchange traded funds held by the Fund are not reflected in the graph above. The percentage shown for each investment category reflects the value of investments in that category as a percentage of market value. The graph depicts the Fund’s investments but may not represent the Fund’s market exposure due to the exclusion of certain derivatives, if any, as listed in the Additional Investment Information section of the Schedule of Investments. |
22
GOLDMAN SACHS CONCENTRATED INTERNATIONAL EQUITY FUND
Schedule of Investments
April 30, 2013 (Unaudited)
| | | | | | | | |
| Shares | | | Description | | Value | |
| | | | | | | | |
| | Common Stocks – 99.6% | | | | |
| | Australia – 6.8% | | | | |
| | 1,341,495 | | | Aurizon Holdings Ltd. (Transportation) | | $ | 5,774,627 | |
| | 388,131 | | | Computershare Ltd. (Software & Services) | | | 3,998,334 | |
| | | | | | | | |
| | | | | | | 9,772,961 | |
| | |
| | Belgium – 3.2% | | | | |
| | 32,109 | | | Solvay SA (Materials) | | | 4,704,358 | |
| | |
| | Finland – 3.7% | | | | |
| | 148,893 | | | Fortum OYJ (Utilities) | | | 2,767,546 | |
| | 59,630 | | | Nokian Renkaat OYJ (Automobiles & Components) | | | 2,590,323 | |
| | | | | | | | |
| | | | | | | 5,357,869 | |
| | |
| | France – 17.6% | | | | |
| | 23,166 | | | Air Liquide SA (Materials) | | | 2,935,044 | |
| | 231,241 | | | AXA SA (Insurance) | | | 4,330,363 | |
| | 77,870 | | | BNP Paribas SA (Banks) | | | 4,341,868 | |
| | 96,738 | | | Compagnie Generale de Geophysique-Veritas (Energy)* | | | 2,092,696 | |
| | 91,931 | | | Safran SA (Capital Goods) | | | 4,518,934 | |
| | 59,104 | | | Total SA (Energy) | | | 2,975,122 | |
| | 86,853 | | | Vinci SA (Capital Goods) | | | 4,186,909 | |
| | | | | | | | |
| | | | | | | 25,380,936 | |
| | |
| | Germany – 8.0% | | | | |
| | 41,700 | | | Bayer AG (Registered) (Pharmaceuticals, Biotechnology & Life Sciences) | | | 4,359,589 | |
| | 46,086 | | | Beiersdorf AG (Household & Personal Products) | | | 4,174,574 | |
| | 24,558 | | | Pfeiffer Vacuum Technology AG (Capital Goods) | | | 2,988,452 | |
| | | | | | | | |
| | | | | | | 11,522,615 | |
| | |
| | Hong Kong – 3.0% | | | | |
| | 967,528 | | | AIA Group Ltd. (Insurance) | | | 4,304,009 | |
| | |
| | Ireland – 5.7% | | | | |
| | 441,059 | | | C&C Group PLC (Food, Beverage & Tobacco) | | | 2,739,856 | |
| | 176,972 | | | Shire PLC (Pharmaceuticals, Biotechnology & Life Sciences) | | | 5,516,567 | |
| | | | | | | | |
| | | | | | | 8,256,423 | |
| | |
| | Japan – 15.2% | | | | |
| | 152,400 | | | Credit Saison Co. Ltd. (Diversified Financials) | | | 4,457,945 | |
| | 873,000 | | | Isuzu Motors Ltd. (Automobiles & Components) | | | 5,817,963 | |
| | 105,100 | | | Nomura Real Estate Holdings, Inc. (Real Estate) | | | 2,825,491 | |
| | |
| | | | | | | | |
| | Common Stocks – (continued) | | | | |
| | Japan – (continued) | | | | |
| | 94,200 | | | Sumitomo Mitsui Financial Group, Inc. (Banks) | | $ | 4,452,585 | |
| | 67,300 | | | Unicharm Corp. (Household & Personal Products) | | | 4,351,713 | |
| | | | | | | | |
| | | | | | | 21,905,697 | |
| | |
| | Russia – 2.0% | | | | |
| | 223,005 | | | Sberbank of Russia ADR (Banks) | | | 2,878,264 | |
| | |
| | South Korea – 2.9% | | | | |
| | 84,871 | | | Kia Motors Corp. (Automobiles & Components) | | | 4,233,461 | |
| | |
| | Sweden – 4.0% | | | | |
| | 271,190 | | | Scania AB Class B (Capital Goods) | | | 5,799,754 | |
| | |
| | Switzerland – 4.0% | | | | |
| | 73,361 | | | Julius Baer Group Ltd. (Diversified Financials)* | | | 2,924,491 | |
| | 38,170 | | | Novartis AG (Registered) (Pharmaceuticals, Biotechnology & Life Sciences) | | | 2,825,633 | |
| | | | | | | | |
| | | | | | | 5,750,124 | |
| | |
| | United Kingdom – 23.5% | | | | |
| | 340,386 | | | BG Group PLC (Energy) | | | 5,746,172 | |
| | 1,790,312 | | | Direct Line Insurance Group PLC (Insurance) | | | 5,631,487 | |
| | 399,953 | | | HSBC Holdings PLC (Banks) | | | 4,380,281 | |
| | 726,488 | | | Melrose Industries PLC (Capital Goods) | | | 2,753,776 | |
| | 38,891 | | | Reckitt Benckiser Group PLC (Household & Personal Products) | | | 2,839,081 | |
| | 119,866 | | | Rio Tinto PLC (Materials) | | | 5,504,258 | |
| | 296,168 | | | Telecity Group PLC (Software & Services) | | | 4,250,600 | |
| | 927,553 | | | Vodafone Group PLC (Telecommunication Services) | | | 2,830,239 | |
| | | | | | | | |
| | | | | | | 33,935,894 | |
| | |
| | TOTAL INVESTMENTS – 99.6% | | | | |
| | (Cost $135,932,478) | | $ | 143,802,365 | |
| | |
| OTHER ASSETS IN EXCESS OF
LIABILITIES – 0.4% | | | 545,804 | |
| | |
| | NET ASSETS – 100.0% | | $ | 144,348,169 | |
| | |
| | |
| The percentage shown for each investment category reflects the value of investments in that category as a percentage of net assets. |
* | | Non-income producing security. |
| | | | |
|
Investment Abbreviation: |
ADR | | —American Depositary Receipt |
|
| | |
| The accompanying notes are an integral part of these financial statements. | | 23 |
GOLDMAN SACHS INTERNATIONAL SMALL CAP FUND
Schedule of Investments
April 30, 2013 (Unaudited)
| | | | | | | | |
| Shares | | | Description | | Value | |
| | | | | | | | |
| | Common Stocks – 92.4% | |
| | Australia – 6.5% | | | | |
| | 30,262 | | | Ansell Ltd. (Health Care Equipment & Services) | | $ | 496,189 | |
| | 188,116 | | | Aristocrat Leisure Ltd. (Consumer Services) | | | 768,843 | |
| | 76,536 | | | Bank of Queensland Ltd. (Banks) | | | 796,776 | |
| | 79,014 | | | Boral Ltd. (Materials) | | | 410,128 | |
| | 32,111 | | | Caltex Australia Ltd. (Energy) | | | 717,299 | |
| | 77,618 | | | Computershare Ltd. (Software & Services) | | | 799,582 | |
| | 132,730 | | | David Jones Ltd. (Retailing) | | | 410,273 | |
| | 151,542 | | | Echo Entertainment Group Ltd. (Consumer Services) | | | 568,736 | |
| | 187,182 | | | FKP Property Group (Real Estate) | | | 319,137 | |
| | 42,883 | | | iiNET Ltd. (Telecommunication Services) | | | 274,345 | |
| | 140,782 | | | Metcash Ltd. (Food & Staples Retailing) | | | 597,411 | |
| | 156,904 | | | NIB Holdings Ltd. (Insurance) | | | 382,808 | |
| | 67,632 | | | OZ Minerals Ltd. (Materials) | | | 303,138 | |
| | 223,007 | | | PanAust Ltd. (Materials) | | | 538,686 | |
| | 77,899 | | | Seek Ltd. (Commercial & Professional Services) | | | 903,783 | |
| | | | | | | | |
| | | | | | | 8,287,134 | |
| | |
| | Bermuda – 0.9% | | | | |
| | 114,654 | | | Hiscox Ltd. (Insurance) | | | 999,385 | |
| | 111,740 | | | Hiscox Ltd. Class B (Insurance)* | | | 86,786 | |
| | | | | | | | |
| | | | | | | 1,086,171 | |
| | |
| | Canada – 9.2% | | | | |
| | 42,200 | | | Aimia, Inc. (Media) | | | 666,018 | |
| | 37,800 | | | Alamos Gold, Inc. (Materials) | | | 527,913 | |
| | 9,700 | | | AltaGas Ltd. (Energy) | | | 361,445 | |
| | 87,200 | | | Bellatrix Exploration Ltd. (Energy)* | | | 546,163 | |
| | 8,900 | | | Canadian Real Estate Investment Trust (REIT) | | | 421,126 | |
| | 20,200 | | | Canadian Western Bank (Banks) | | | 570,641 | |
| | 176,200 | | | Capstone Mining Corp. (Materials)* | | | 356,790 | |
| | 74,800 | | | Copper Mountain Mining Corp. (Materials)* | | | 149,979 | |
| | 24,300 | | | Dominion Diamond Corp. (Materials)* | | | 385,201 | |
| | 19,800 | | | Dorel Industries, Inc. Class B (Consumer Durables & Apparel) | | | 854,931 | |
| | 34,800 | | | Enerflex Ltd. (Energy) | | | 480,143 | |
| | 16,100 | | | Ensign Energy Services, Inc. (Energy) | | | 271,037 | |
| | 28,500 | | | Evertz Technologies Ltd. (Technology Hardware & Equipment) | | | 442,727 | |
| | 54,700 | | | Gran Tierra Energy, Inc. (Energy)* | | | 304,055 | |
| | 30,003 | | | Legacy Oil + Gas, Inc. (Energy)* | | | 158,436 | |
| | 29,100 | | | Linamar Corp. (Automobiles & Components) | | | 688,903 | |
| | 8,289 | | | MacDonald Dettwiler & Associates Ltd. (Software & Services) | | | 598,730 | |
| | 164,900 | | | MBAC Fertilizer Corp. (Materials)* | | | 366,644 | |
| | 9,500 | | | Methanex Corp. (Materials) | | | 402,650 | |
| | |
| | | | | | | | |
| | Common Stocks – (continued) | |
| | Canada – (continued) | | | | |
| | 36,800 | | | Progressive Waste Solutions Ltd. (Commercial & Professional Services) | | $ | 820,051 | |
| | 186,500 | | | Rubicon Minerals Corp. (Materials)* | | | 323,961 | |
| | 11,400 | | | ShawCor Ltd. (Energy) | | | 457,946 | |
| | 224,245 | | | Southern Pacific Resource Corp. (Energy)* | | | 146,907 | |
| | 21,900 | | | Toromont Industries Ltd. (Capital Goods) | | | 482,585 | |
| | 36,800 | | | Westjet Airlines Ltd. Class A (Transportation) | | | 903,699 | |
| | | | | | | | |
| | | | | | | 11,688,681 | |
| | |
| | China – 1.9% | | | | |
| | 204,800 | | | China International Marine Containers Group Co. Ltd. Class H (Capital Goods)* | | | 327,906 | |
| | 66,000 | | | ENN Energy Holdings Ltd. (Utilities) | | | 382,111 | |
| | 908,000 | | | Foxconn International Holdings Ltd. (Technology Hardware & Equipment)* | | | 351,094 | |
| | 512,000 | | | Haitian International Holdings Ltd. (Capital Goods) | | | 876,189 | |
| | 40,926 | | | Hollysys Automation Technologies Ltd. (Technology Hardware & Equipment)* | | | 492,749 | |
| | | | | | | | |
| | | | | | | 2,430,049 | |
| | |
| | Denmark – 0.7% | | | | |
| | 32,574 | | | Auriga Industries Class B (Materials)* | | | 848,716 | |
| | |
| | Finland – 0.9% | | | | |
| | 25,497 | | | Nokian Renkaat OYJ (Automobiles & Components) | | | 1,107,588 | |
| | |
| | France – 6.3% | | | | |
| | 10,400 | | | bioMerieux (Health Care Equipment & Services) | | | 989,459 | |
| | 25,915 | | | Cap Gemini SA (Software & Services) | | | 1,194,840 | |
| | 39,778 | | | Compagnie Generale de Geophysique-Veritas (Energy)* | | | 860,502 | |
| | 20,781 | | | Ingenico (Technology Hardware & Equipment) | | | 1,396,051 | |
| | 40,829 | | | JCDecaux SA (Media) | | | 1,123,328 | |
| | 67,617 | | | M6 Metropole Television SA (Media) | | | 1,132,967 | |
| | 35,211 | | | Nexity SA (Consumer Durables & Apparel) | | | 1,267,263 | |
| | | | | | | | |
| | | | | | | 7,964,410 | |
| | |
| | Germany – 5.0% | | | | |
| | 14,037 | | | Delticom AG (Retailing) | | | 690,437 | |
| | 22,951 | | | GfK SE (Media) | | | 1,309,663 | |
| | 54,661 | | | Infineon Technologies AG (Semiconductors & Semiconductor Equipment) | | | 432,376 | |
| | 13,008 | | | MTU Aero Engines Holding AG (Capital Goods) | | | 1,232,203 | |
| | |
| | |
| 24 | | The accompanying notes are an integral part of these financial statements. |
GOLDMAN SACHS INTERNATIONAL SMALL CAP FUND
| | | | | | | | |
| Shares | | | Description | | Value | |
| | | | | | | | |
| | Common Stocks – (continued) | |
| | Germany – (continued) | | | | |
| | 10,955 | | | Pfeiffer Vacuum Technology AG (Capital Goods) | | $ | 1,333,109 | |
| | 2,558 | | | Rational AG (Capital Goods) | | | 794,122 | |
| | 12,259 | | | Salzgitter AG (Materials) | | | 482,529 | |
| | | | | | | | |
| | | | | | | 6,274,439 | |
| | |
| | Hong Kong – 0.3% | | | | |
| | 1,096,000 | | | Kingway Brewery Holdings Ltd. (Food, Beverage & Tobacco) | | | 436,653 | |
| | |
| | Ireland – 1.9% | | | | |
| | 215,337 | | | C&C Group PLC (Food, Beverage & Tobacco) | | | 1,338,353 | |
| | 56,749 | | | James Hardie Industries PLC CDI (Materials) | | | 597,739 | |
| | 1,082,398 | | | Kenmare Resources PLC (Materials)* | | | 447,525 | |
| | | | | | | | |
| | | | | | | 2,383,617 | |
| | |
| | Italy – 1.1% | | | | |
| | 84,535 | | | Davide Campari-Milano SpA (Food, Beverage & Tobacco) | | | 686,649 | |
| | 166,471 | | | Unione di Banche Italiane ScpA (Banks) | | | 696,218 | |
| | | | | | | | |
| | | | | | | 1,382,867 | |
| | |
| | Japan – 20.3% | | | | |
| | 16,700 | | | Aoyama Trading Co. Ltd. (Retailing) | | | 499,739 | |
| | 27,900 | | | Asics Corp. (Consumer Durables & Apparel) | | | 503,670 | |
| | 25,200 | | | Daibiru Corp. (Real Estate) | | | 351,375 | |
| | 79,500 | | | Daifuku Co. Ltd. (Capital Goods) | | | 703,566 | |
| | 9,000 | | | Daiichikosho Co. Ltd. (Media) | | | 267,641 | |
| | 48,300 | | | Doutor Nichires Holdings Co. Ltd. (Consumer Services) | | | 689,100 | |
| | 85,000 | | | Dowa Holdings Co. Ltd. (Materials) | | | 609,242 | |
| | 53 | | | Dwango Co. Ltd. (Software & Services) | | | 268,061 | |
| | 121,000 | | | Ebara Corp. (Capital Goods) | | | 508,056 | |
| | 26,900 | | | Eiken Chemical Co. Ltd. (Health Care Equipment & Services) | | | 444,160 | |
| | 104,000 | | | Furukawa Electric Co. Ltd. (Capital Goods) | | | 263,180 | |
| | 30,300 | | | GMO internet Inc. (Software & Services) | | | 396,669 | |
| | 23,000 | | | Hitachi Kokusai Electric, Inc. (Technology Hardware & Equipment) | | | 270,867 | |
| | 36,100 | | | Ibiden Co. Ltd. (Technology Hardware & Equipment) | | | 632,793 | |
| | 16,400 | | | Jafco Co. Ltd. (Diversified Financials) | | | 794,284 | |
| | 25,100 | | | Kakaku.com, Inc. (Software & Services) | | | 648,884 | |
| | 27,900 | | | K’s Holdings Corp. (Retailing) | | | 983,569 | |
| | 68,300 | | | Macromill, Inc. (Software & Services) | | | 977,555 | |
| | 10,100 | | | Maeda Kosen Co. Ltd. (Capital Goods) | | | 447,602 | |
| | |
| | | | | | | | |
| | Common Stocks – (continued) | |
| | Japan – (continued) | | | | |
| | 26,700 | | | Maruwa Co. Ltd. (Technology Hardware & Equipment) | | $ | 813,158 | |
| | 72,100 | | | Nichii Gakkan Co. (Health Care Equipment & Services) | | | 734,000 | |
| | 46,000 | | | Nippo Corp. (Capital Goods) | | | 689,368 | |
| | 146,000 | | | Nippon Chemi-Con Corp. (Technology Hardware & Equipment)* | | | 497,726 | |
| | 46,400 | | | Nisshin Steel Holdings Co. Ltd. (Materials) | | | 390,484 | |
| | 90 | | | Nuflare Technology, Inc. (Semiconductors & Semiconductor Equipment) | | | 700,642 | |
| | 69,000 | | | Pocket Card Co. Ltd. (Diversified Financials) | | | 624,970 | |
| | 155,000 | | | Press Kogyo Co. Ltd. (Automobiles & Components) | | | 792,918 | |
| | 95,000 | | | Sankyu, Inc. (Transportation) | | | 424,609 | |
| | 128,000 | | | Sapporo Holdings Ltd. (Food, Beverage & Tobacco) | | | 582,747 | |
| | 4,100 | | | Sawai Pharmaceutical Co. Ltd. (Pharmaceuticals, Biotechnology & Life Sciences) | | | 529,621 | |
| | 23,400 | | | SCSK Corp. (Software & Services) | | | 521,446 | |
| | 91,000 | | | Shinmaywa Industries Ltd. (Capital Goods) | | | 740,985 | |
| | 39,000 | | | Sohgo Security Services Co. Ltd. (Commercial & Professional Services) | | | 623,710 | |
| | 163,000 | | | Taiheiyo Cement Corp. (Materials) | | | 423,329 | |
| | 36,700 | | | Taiyo Yuden Co. Ltd. (Technology Hardware & Equipment) | | | 531,610 | |
| | 47,900 | | | Takara Leben Co. Ltd. (Real Estate) | | | 986,065 | |
| | 136,000 | | | The Gunma Bank Ltd. (Banks) | | | 865,201 | |
| | 109,000 | | | The Hachijuni Bank Ltd. (Banks) | | | 742,114 | |
| | 117,000 | | | The Higo Bank Ltd. (Banks) | | | 793,402 | |
| | 118,800 | | | Tokai Tokyo Financial Holdings, Inc. (Diversified Financials) | | | 1,080,371 | |
| | 22,200 | | | Tokyo Derica Co. Ltd. (Retailing) | | | 388,446 | |
| | 145,900 | | | Tokyo Steel Manufacturing Co. Ltd. (Materials) | | | 595,509 | |
| | 47,000 | | | Toshiba Machine Co. Ltd. (Capital Goods) | | | 287,406 | |
| | | | | | | | |
| | | | | | | 25,619,850 | |
| | |
| | Luxembourg – 0.9% | | | | |
| | 438,660 | | | Regus PLC (Commercial & Professional Services) | | | 1,117,289 | |
| | |
| | Netherlands – 2.3% | | | | |
| | 15,372 | | | Corio NV (REIT) | | | 711,932 | |
| | 47,159 | | | Delta Lloyd NV (Insurance) | | | 906,788 | |
| | 8,882 | | | Fugro NV CVA (Energy) | | | 513,168 | |
| | 8,785 | | | Nutreco NV (Food, Beverage & Tobacco) | | | 835,334 | |
| | | | | | | | |
| | | | | | | 2,967,222 | |
| | |
| | |
| The accompanying notes are an integral part of these financial statements. | | 25 |
GOLDMAN SACHS INTERNATIONAL SMALL CAP FUND
Schedule of Investments (continued)
April 30, 2013 (Unaudited)
| | | | | | | | |
| Shares | | | Description | | Value | |
| | | | | | | | |
| | Common Stocks – (continued) | |
| | Portugal – 0.8% | | | | |
| | 232,454 | | | Zon Multimedia Servicos de Telecomunicacoes e Multimedia SGPS SA (Media) | | $ | 1,043,904 | |
| | |
| | Singapore – 0.5% | | | | |
| | 532,000 | | | Tat Hong Holdings Ltd. (Capital Goods) | | | 644,237 | |
| | |
| | South Korea – 2.6% | | | | |
| | 53,586 | | | Eugene Technology Co. Ltd. (Semiconductors & Semiconductor Equipment) | | | 1,105,477 | |
| | 25,900 | | | KT Skylife Co. Ltd. (Media) | | | 1,001,977 | |
| | 3,803 | | | NCSoft Corp. (Software & Services) | | | 574,033 | |
| | 1,874 | | | NongShim Co. Ltd. (Food, Beverage & Tobacco) | | | 571,128 | |
| | | | | | | | |
| | | | | | | 3,252,615 | |
| | |
| | Spain – 1.8% | | | | |
| | 39,413 | | | Amadeus IT Holding SA Class A (Software & Services) | | | 1,162,943 | |
| | 21,766 | | | Tecnicas Reunidas SA (Energy) | | | 1,054,707 | |
| | | | | | | | |
| | | | | | | 2,217,650 | |
| | |
| | Sweden – 1.3% | | | | |
| | 32,300 | | | Boliden AB (Materials) | | | 515,829 | |
| | 78,226 | | | Castellum AB (Real Estate) | | | 1,171,320 | |
| | | | | | | | |
| | | | | | | 1,687,149 | |
| | |
| | Switzerland – 6.5% | | | | |
| | 7,104 | | | Dufry AG (Registered) (Retailing)* | | | 946,419 | |
| | 2,405 | | | Flughafen Zuerich AG (Registered) (Transportation) | | | 1,170,175 | |
| | 5,259 | | | Geberit AG (Registered) (Capital Goods) | | | 1,285,207 | |
| | 343 | | | Lindt & Spruengli AG (Food, Beverage & Tobacco) | | | 1,328,651 | |
| | 8,027 | | | Panalpina Welttransport Holding AG (Registered) (Transportation) | | | 781,656 | |
| | 4,807 | | | Partners Group Holding AG (Diversified Financials) | | | 1,233,308 | |
| | 2,523 | | | Sonova Holding AG (Registered) (Health Care Equipment & Services)* | | | 274,851 | |
| | 7,302 | | | Sulzer AG (Registered) (Capital Goods) | | | 1,247,839 | |
| | | | | | | | |
| | | | | | | 8,268,106 | |
| | |
| | United Kingdom – 20.7% | | | | |
| | 127,258 | | | Abcam PLC (Pharmaceuticals, Biotechnology & Life Sciences) | | | 867,799 | |
| | 176,045 | | | Aberdeen Asset Management PLC (Diversified Financials) | | | 1,228,849 | |
| | 128,516 | | | Ashmore Group PLC (Diversified Financials) | | | 798,177 | |
| | 203,710 | | | AZ Electronic Materials SA (Materials) | | | 902,037 | |
| | 161,271 | | | Bodycote PLC (Capital Goods) | | | 1,299,361 | |
| | |
| | | | | | | | |
| | Common Stocks – (continued) | |
| | United Kingdom – (continued) | | | | |
| | 70,903 | | | Close Brothers Group PLC (Diversified Financials) | | $ | 1,144,694 | |
| | 27,290 | | | Croda International PLC (Materials) | | | 1,052,016 | |
| | 32,731 | | | Derwent London PLC (REIT) | | | 1,174,397 | |
| | 242,420 | | | Direct Line Insurance Group PLC (Insurance) | | | 762,540 | |
| | 88,811 | | | Greene King PLC (Consumer Services) | | | 1,003,741 | |
| | 145,650 | | | Halma PLC (Technology Hardware & Equipment) | | | 1,133,849 | |
| | 70,614 | | | IMI PLC (Capital Goods) | | | 1,361,167 | |
| | 164,209 | | | Inchcape PLC (Retailing) | | | 1,280,128 | |
| | 33,835 | | | InterContinental Hotels Group PLC (Consumer Services) | | | 999,693 | |
| | 588,761 | | | Londonmetric Property PLC (REIT) | | | 1,047,384 | |
| | 364,587 | | | Melrose Industries PLC (Capital Goods) | | | 1,381,978 | |
| | 75,967 | | | Pennon Group PLC (Utilities) | | | 809,149 | |
| | 77,424 | | | Persimmon PLC (Consumer Durables & Apparel)* | | | 90,200 | |
| | 84,143 | | | Persimmon PLC (Consumer Durables & Apparel) | | | 1,413,493 | |
| | 34,019 | | | Spirax-Sarco Engineering PLC (Capital Goods) | | | 1,389,716 | |
| | 121,808 | | | St. James’s Place PLC (Insurance) | | | 1,048,647 | |
| | 106,108 | | | Telecity Group PLC (Software & Services) | | | 1,522,861 | |
| | 44,467 | | | Travis Perkins PLC (Capital Goods) | | | 992,182 | |
| | 125,775 | | | Unite Group PLC (Real Estate) | | | 680,648 | |
| | 32,788 | | | Victrex PLC (Materials) | | | 818,022 | |
| | | | | | | | |
| | | | | | | 26,202,728 | |
| | |
| | TOTAL COMMON STOCKS | | | | |
| | (Cost $104,189,644) | | $ | 116,911,075 | |
| | |
| | | | | | | | |
| | Preferred Stock – 0.8% | | | | |
| | Germany – 0.8% | | | | |
| | 9,076 | | | Sartorius AG Preference Shares (Health Care Equipment & Services) | | $ | 973,781 | |
| | (Cost $813,418) | | | | |
| | |
| | | | | | | | |
| | Exchange Traded Funds – 2.2% | | | | |
| | Israel – 0.4% | | | | |
| | 12,062 | | | iShares MSCI Israel Capped Index Fund | | $ | 537,724 | |
| | |
| | |
| 26 | | The accompanying notes are an integral part of these financial statements. |
GOLDMAN SACHS INTERNATIONAL SMALL CAP FUND
| | | | | | | | |
| Shares | | | Description | | Value | |
| | | | | | | | |
| | Exchange Traded Funds – (continued) | | | | |
| | South Korea – 1.8% | | | | |
| | 39,369 | | | iShares MSCI South Korea Index Fund | | $ | 2,299,937 | |
| | |
| | TOTAL EXCHANGE TRADED FUNDS | | | | |
| | (Cost $2,891,868) | | $ | 2,837,661 | |
| | |
| | TOTAL INVESTMENTS – 95.4% | | | | |
| | (Cost $107,894,930) | | $ | 120,722,517 | |
| | |
| OTHER ASSETS IN EXCESS OF
LIABILITIES – 4.6% | | | 5,784,283 | |
| | |
| | NET ASSETS – 100.0% | | $ | 126,506,800 | |
| | |
| | |
| The percentage shown for each investment category reflects the value of investments in that category as a percentage of net assets. |
* | | Non-income producing security. |
| | | | |
|
Investment Abbreviations: |
CDI | | —CHESS Depositary Interest |
CVA | | —Dutch Certification |
REIT | | —Real Estate Investment Trust |
|
| | |
| ADDITIONAL INVESTMENT INFORMATION |
FUTURES CONTRACTS — At April 30, 2013, the Fund had the following futures contracts:
| | | | | | | | | | | | | | |
| Type | | Number of
Contracts
Long (Short) | | | Expiration
Date | | Current Value | | | Unrealized
Gain (Loss) | |
MSCI Singapore Index | | | 21 | | | May 2013 | | $ | 1,296,452 | | | $ | 15,136 | |
Stoxx Europe Small 200 Index | | | 118 | | | June 2013 | | | 1,484,071 | | | | 20,008 | |
| TOTAL | | | | | | | | | | | | $ | 35,144 | |
| | |
| The accompanying notes are an integral part of these financial statements. | | 27 |
GOLDMAN SACHS STRATEGIC INTERNATIONAL EQUITY FUND
Schedule of Investments
April 30, 2013 (Unaudited)
| | | | | | | | |
| Shares | | | Description | | Value | |
| | | | | | | | |
| | Common Stocks – 96.5% | |
| | Australia – 3.1% | |
| | 229,407 | | | Aurizon Holdings Ltd. (Transportation) | | $ | 987,510 | |
| | 60,451 | | | Computershare Ltd. (Software & Services) | | | 622,737 | |
| | 117,106 | | | PanAust Ltd. (Materials) | | | 282,876 | |
| | | | | | | | |
| | | | | | | 1,893,123 | |
| | |
| | Belgium – 3.8% | |
| | 14,311 | | | Anheuser-Busch InBev NV (Food, Beverage & Tobacco) | | | 1,374,866 | |
| | 6,027 | | | Solvay SA (Materials) | | | 883,029 | |
| | | | | | | | |
| | | | | | | 2,257,895 | |
| | |
| | Brazil – 0.5% | |
| | 26,773 | | | Transmissora Alianca de Energia Eletrica SA (Utilities) | | | 308,042 | |
| | |
| | Finland – 1.8% | |
| | 28,751 | | | Fortum OYJ (Utilities) | | | 534,408 | |
| | 13,274 | | | Nokian Renkaat OYJ (Automobiles & Components) | | | 576,622 | |
| | | | | | | | |
| | | | | | | 1,111,030 | |
| | |
| | France – 16.8% | |
| | 10,086 | | | Air Liquide SA (Materials) | | | 1,277,858 | |
| | 3,742 | | | Air Liquide SA-Prime De Fidelite (Materials)* | | | 474,097 | |
| | 65,681 | | | AXA SA (Insurance) | | | 1,229,983 | |
| | 18,700 | | | BNP Paribas SA (Banks) | | | 1,042,673 | |
| | 19,180 | | | Compagnie Generale de Geophysique-Veritas (Energy)* | | | 414,914 | |
| | 6,388 | | | LVMH Moet Hennessy Louis Vuitton SA (Consumer Durables & Apparel) | | | 1,106,943 | |
| | 20,193 | | | Safran SA (Capital Goods) | | | 992,601 | |
| | 13,200 | | | Sanofi (Pharmaceuticals, Biotechnology & Life Sciences) | | | 1,427,126 | |
| | 22,626 | | | Total SA (Energy) | | | 1,138,926 | |
| | 20,837 | | | Vinci SA (Capital Goods) | | | 1,004,486 | |
| | | | | | | | |
| | | | | | | 10,109,607 | |
| | |
| | Germany – 5.2% | |
| | 11,250 | | | Bayer AG (Registered) (Pharmaceuticals, Biotechnology & Life Sciences) | | | 1,176,148 | |
| | 10,347 | | | Bayerische Motoren Werke AG (Automobiles & Components) | | | 956,788 | |
| | 10,920 | | | Beiersdorf AG (Household & Personal Products) | | | 989,159 | |
| | | | | | | | |
| | | | | | | 3,122,095 | |
| | |
| | Hong Kong – 2.7% | |
| | 262,241 | | | AIA Group Ltd. (Insurance) | | | 1,166,569 | |
| | 160,000 | | | China Mengniu Dairy Co. Ltd. (Food, Beverage & Tobacco) | | | 450,382 | |
| | | | | | | | |
| | | | | | | 1,616,951 | |
| | |
| | | | | | | | |
| | Common Stocks – (continued) | |
| | India – 0.7% | |
| | 13,376 | | | Hero Motocorp Ltd. (Automobiles & Components) | | $ | 408,671 | |
| | |
| | Ireland – 2.5% | |
| | 11,531 | | | Kerry Group PLC Class A (Food, Beverage & Tobacco) | | | 681,992 | |
| | 26,969 | | | Shire PLC (Pharmaceuticals, Biotechnology & Life Sciences) | | | 840,677 | |
| | | | | | | | |
| | | | | | | 1,522,669 | |
| | |
| | Japan – 17.1% | |
| | 7,600 | | | Astellas Pharma, Inc. (Pharmaceuticals, Biotechnology & Life Sciences) | | | 442,967 | |
| | 21,800 | | | Credit Saison Co. Ltd. (Diversified Financials) | | | 637,685 | |
| | 44,000 | | | Fujitec Co. Ltd. (Capital Goods) | | | 477,021 | |
| | 102,000 | | | Isuzu Motors Ltd. (Automobiles & Components) | | | 679,762 | |
| | 16,000 | | | KDDI Corp. (Telecommunication Services) | | | 769,397 | |
| | 57,000 | | | Kubota Corp. (Capital Goods) | | | 818,732 | |
| | 14,300 | | | Makita Corp. (Capital Goods) | | | 872,272 | |
| | 22,400 | | | Nomura Real Estate Holdings, Inc. (Real Estate) | | | 602,198 | |
| | 29,700 | | | Seven & I Holdings Co. Ltd. (Food & Staples Retailing) | | | 1,142,445 | |
| | 26,100 | | | Sumitomo Mitsui Financial Group, Inc. (Banks) | | | 1,233,678 | |
| | 30,400 | | | Taiyo Yuden Co. Ltd. (Technology Hardware & Equipment) | | | 440,352 | |
| | 94,000 | | | Tokyo Gas Co. Ltd. (Utilities) | | | 536,566 | |
| | 17,400 | | | Unicharm Corp. (Household & Personal Products) | | | 1,125,109 | |
| | 1,005 | | | Yahoo Japan Corp. (Software & Services) | | | 505,002 | |
| | | | | | | | |
| | | | | | | 10,283,186 | |
| | |
| | Netherlands – 2.6% | |
| | 28,691 | | | Unilever NV CVA (Food, Beverage & Tobacco) | | | 1,222,562 | |
| | 8,689 | | | Ziggo NV (Telecommunication Services) | | | 310,727 | |
| | | | | | | | |
| | | | | | | 1,533,289 | |
| | |
| | Russia – 2.7% | |
| | 3,036 | | | Magnit OJSC (Food & Staples Retailing) | | | 651,252 | |
| | 8,580 | | | OAO Lukoil ADR (Energy) | | | 545,550 | |
| | 34,146 | | | Sberbank of Russia ADR (Banks) | | | 440,713 | |
| | | | | | | | |
| | | | | | | 1,637,515 | |
| | |
| | Singapore – 1.8% | |
| | 81,000 | | | DBS Group Holdings Ltd. (Banks) | | | 1,104,943 | |
| | |
| | South Africa – 0.9% | |
| | 143,592 | | | Nampak Ltd. (Materials) | | | 527,965 | |
| | |
| | South Korea – 1.0% | |
| | 11,684 | | | Kia Motors Corp. (Automobiles & Components) | | | 582,811 | |
| | |
| | |
| 28 | | The accompanying notes are an integral part of these financial statements. |
GOLDMAN SACHS STRATEGIC INTERNATIONAL EQUITY FUND
| | | | | | | | |
| Shares | | | Description | | Value | |
| | | | | | | | |
| | Common Stocks – (continued) | |
| | Spain – 1.7% | |
| | 71,550 | | | Telefonica SA (Telecommunication Services) | | $ | 1,047,658 | |
| | |
| | Sweden – 2.4% | |
| | 29,233 | | | Scania AB Class B (Capital Goods) | | | 625,186 | |
| | 63,773 | | | Telefonaktiebolaget LM Ericsson Class B (Technology Hardware & Equipment) | | | 793,105 | |
| | | | | | | | |
| | | | | | | 1,418,291 | |
| | |
| | Switzerland – 10.3% | |
| | 33,226 | | | Credit Suisse Group AG (Registered) (Diversified Financials)* | | | 922,721 | |
| | 94,324 | | | Informa PLC (Media) | | | 701,858 | |
| | 23,255 | | | Julius Baer Group Ltd. (Diversified Financials)* | | | 927,046 | |
| | 24,758 | | | Novartis AG (Registered) (Pharmaceuticals, Biotechnology & Life Sciences) | | | 1,832,775 | |
| | 3,690 | | | Roche Holding AG (Pharmaceuticals, Biotechnology & Life Sciences) | | | 923,757 | |
| | 2,597 | | | Sulzer AG (Registered) (Capital Goods) | | | 443,802 | |
| | 8,772 | | | Wolseley PLC (Capital Goods) | | | 434,469 | |
| | | | | | | | |
| | | | | | | 6,186,428 | |
| | |
| | United Kingdom – 18.9% | |
| | 101,024 | | | Abcam PLC (Pharmaceuticals, Biotechnology & Life Sciences) | | | 688,903 | |
| | 42,080 | | | BG Group PLC (Energy) | | | 710,367 | |
| | 162,869 | | | BP PLC (Energy) | | | 1,180,173 | |
| | 49,713 | | | Burberry Group PLC (Consumer Durables & Apparel) | | | 1,034,195 | |
| | 237,667 | | | Direct Line Insurance Group PLC (Insurance) | | | 747,589 | |
| | 189,283 | | | HSBC Holdings PLC (Banks) | | | 2,073,026 | |
| | 164,230 | | | Melrose Industries PLC (Capital Goods) | | | 622,519 | |
| | 36,156 | | | Rio Tinto PLC (Materials) | | | 1,660,287 | |
| | 15,583 | | | Spirax-Sarco Engineering PLC (Capital Goods) | | | 636,584 | |
| | 21,146 | | | Telecity Group PLC (Software & Services) | | | 303,487 | |
| | 569,947 | | | Vodafone Group PLC (Telecommunication Services) | | | 1,739,077 | |
| | | | | | | | |
| | | | | | | 11,396,207 | |
| | |
| | TOTAL COMMON STOCKS | |
| | (Cost $50,665,004) | | $ | 58,068,376 | |
| | |
| | | | | | | | |
| | Preferred Stock – 0.6% | |
| | Germany – 0.6% | | | | |
| | 3,150 | | | Sartorius AG Preference Shares (Health Care Equipment & Services) | | $ | 337,969 | |
| | (Cost $274,625) | | | | |
| | |
| | | | | | | | |
| | Exchange Traded Fund – 1.0% | |
| | Japan – 1.0% | | | | |
| | 50,278 | | | iShares MSCI Japan Index Fund | | $ | 588,253 | |
| | (Cost $568,146) | | | | |
| | |
| | TOTAL INVESTMENTS – 98.1% | | | | |
| | (Cost $51,507,775) | | $ | 58,994,598 | |
| | |
| OTHER ASSETS IN EXCESS OF
LIABILITIES – 1.9% | | | 1,151,426 | |
| | |
| | NET ASSETS – 100.0% | | $ | 60,146,024 | |
| | |
| | |
| The percentage shown for each investment category reflects the value of investments in that category as a percentage of net assets. |
* | | Non-income producing security. |
| | | | |
|
Investment Abbreviations: |
ADR | | — | | American Depositary Receipt |
CVA | | — | | Dutch Certification |
|
| | |
| The accompanying notes are an integral part of these financial statements. | | 29 |
GOLDMAN SACHS FUNDAMENTAL INTERNATIONAL EQUITY FUNDS
Statements of Assets and Liabilities
April 30, 2013 (Unaudited)
| | | | | | | | | | | | | | |
| | | | | Concentrated
International
Equity Fund | | | International
Small Cap
Fund | | | Strategic
International
Equity Fund | |
| | Assets: | |
| | Investments, at value (cost $135,932,478, $107,894,930 and $51,507,775) | | $ | 143,802,365 | | | $ | 120,722,517 | | | $ | 58,994,598 | |
| | Cash | | | 789,372 | | | | 3,251,125 | | | | 701,432 | |
| | Foreign currencies, at value (cost $188,747, $306,057 and $99,940) | | | 191,028 | | | | 301,483 | | | | 99,593 | |
| | Receivables: | | | | | | | | | | | | |
| | Dividends | | | 615,909 | | | | 369,721 | | | | 238,352 | |
| | Foreign tax reclaims | | | 346,379 | | | | 62,312 | | | | 144,899 | |
| | Fund shares sold | | | 58,572 | | | | 11,072,881 | | | | 40,028 | |
| | Reimbursement from investment adviser | | | 36,232 | | | | 51,579 | | | | 40,802 | |
| | Investments sold | | | — | | | | 2,045,771 | | | | 418,630 | |
| | Collateral on certain derivative contracts(a) | | | — | | | | 147,398 | | | | — | |
| | Other assets | | | 81,859 | | | | 44,486 | | | | 311 | |
| | Total assets | | | 145,921,716 | | | | 138,069,273 | | | | 60,678,645 | |
| | | | | | | | | | | | | | |
| | Liabilities: | | | | | | | | | | | | |
| | Payables: | | | | | | | | | | | | |
| | Fund shares redeemed | | | 1,336,978 | | | | 11,913 | | | | 162,299 | |
| | Amounts owed to affiliates | | | 146,484 | | | | 106,931 | | | | 57,271 | |
| | Investments purchased | | | 441 | | | | 11,343,545 | | | | 247,127 | |
| | Futures variation margin | | | — | | | | 9,864 | | | | — | |
| | Accrued expenses | | | 89,644 | | | | 90,220 | | | | 65,924 | |
| | Total liabilities | | | 1,573,547 | | | | 11,562,473 | | | | 532,621 | |
| | | | | | | | | | | | | | |
| | Net Assets: | | | | | | | | | | | | |
| | Paid-in capital | | | 366,704,680 | | | | 147,799,628 | | | | 106,122,821 | |
| | Undistributed (distributions in excess of) net investment income | | | (159,474 | ) | | | 28,871 | | | | 12,020 | |
| | Accumulated net realized loss | | | (230,083,937 | ) | | | (34,171,780 | ) | | | (53,480,392 | ) |
| | Net unrealized gain | | | 7,886,900 | | | | 12,850,081 | | | | 7,491,575 | |
| | | NET ASSETS | | $ | 144,348,169 | | | $ | 126,506,800 | | | $ | 60,146,024 | |
| | | Net Assets: | | | | | | | | | | | | |
| | | Class A | | $ | 54,026,728 | | | $ | 11,186,595 | | | $ | 22,827,348 | |
| | | Class B | | | 673,821 | | | | 448,836 | | | | 2,858,748 | |
| | | Class C | | | 15,611,355 | | | | 1,996,792 | | | | 5,282,456 | |
| | | Institutional | | | 73,302,178 | | | | 111,050,839 | | | | 29,088,089 | |
| | | Service | | | 327,521 | | | | 938,109 | | | | — | |
| | | Class IR | | | 406,566 | | | | 885,629 | | | | 81,313 | |
| | | Class R | | | — | | | | — | | | | 8,070 | |
| | | Total Net Assets | | $ | 144,348,169 | | | $ | 126,506,800 | | | $ | 60,146,024 | |
| | | Shares outstanding $0.001 par value (unlimited shares authorized): | | | | | | | | | | | | |
| | | Class A | | | 3,089,612 | | | | 641,542 | | | | 1,828,184 | |
| | | Class B | | | 38,971 | | | | 26,195 | | | | 256,200 | |
| | | Class C | | | 953,784 | | | | 118,590 | | | | 467,523 | |
| | | Institutional | | | 4,119,976 | | | | 6,201,721 | | | | 2,233,488 | |
| | | Service | | | 18,642 | | | | 54,505 | | | | — | |
| | | Class IR | | | 22,944 | | | | 49,543 | | | | 6,509 | |
| | | Class R | | | — | | | | — | | | | 642 | |
| | | Net asset value, offering and redemption price per share:(b) | | | | | | | | | | | | |
| | | Class A | | | $17.49 | | | | $17.44 | | | | $12.49 | |
| | | Class B | | | 17.29 | | | | 17.13 | | | | 11.16 | |
| | | Class C | | | 16.37 | | | | 16.84 | | | | 11.30 | |
| | | Institutional | | | 17.79 | | | | 17.91 | | | | 13.02 | |
| | | Service | | | 17.57 | | | | 17.21 | | | | — | |
| | | Class IR | | | 17.72 | | | | 17.88 | | | | 12.49 | |
| | | Class R | | | — | | | | — | | | | 12.56 | |
| | (a) | | Represents segregated cash on deposit with counterparty for the International Small Cap Fund relating to initial margin requirements on futures transactions. |
| | (b) | | Maximum public offering price per share for Class A shares of the Concentrated International Equity, International Small Cap, and Strategic International Equity Funds is $18.51, $18.46, and $13.22, respectively. At redemption, Class B and Class C Shares may be subject to a contingent deferred sales charge assessed on the amount equal to the lesser of the current NAV or the original purchase price of the shares. |
| | |
| 30 | | The accompanying notes are an integral part of these financial statements. |
GOLDMAN SACHS FUNDAMENTAL INTERNATIONAL EQUITY FUNDS
Statements of Operations
For the Six Months Ended April 30, 2013 (Unaudited)
| | | | | | | | | | | | | | |
| | | | | Concentrated International Equity Fund | | | International
Small Cap
Fund | | | Strategic International Equity Fund | |
| | Investment income: | | | | | | | | | | | | |
| | Dividends (net of foreign taxes withheld of $137,934, $77,538 and $51,799) | | $ | 1,523,557 | | | $ | 1,046,892 | | | $ | 778,230 | |
| | Interest | | | 1,666 | | | | — | | | | — | |
| | Total investment income | | | 1,525,223 | | | | 1,046,892 | | | | 778,230 | |
| | | | | | | | | | | | | | |
| | Expenses: | | | | | | | | | | | | |
| | Management fees | | | 679,684 | | | | 510,452 | | | | 239,710 | |
| | Distribution and Service fees(a) | | | 143,446 | | | | 24,580 | | | | 68,905 | |
| | Transfer Agent fees(a) | | | 78,890 | | | | 28,612 | | | | 34,106 | |
| | Custody, accounting and administrative services | | | 53,069 | | | | 87,949 | | | | 57,429 | |
| | Registration fees | | | 38,139 | | | | 38,972 | | | | 38,300 | |
| | Professional fees | | | 37,904 | | | | 34,297 | | | | 36,309 | |
| | Printing and mailing costs | | | 25,135 | | | | 18,836 | | | | 17,369 | |
| | Trustee fees | | | 8,762 | | | | 8,487 | | | | 8,480 | |
| | Service share fees — Service Plan | | | 384 | | | | 1,058 | | | | — | |
| | Service share fees — Shareholder Administration Plan | | | 384 | | | | 1,058 | | | | — | |
| | Other | | | 5,546 | | | | 7,521 | | | | 8,433 | |
| | Total expenses | | | 1,071,343 | | | | 761,822 | | | | 509,041 | |
| | Less — expense reductions | | | (149,169 | ) | | | (182,506 | ) | | | (120,925 | ) |
| | Net expenses | | | 922,174 | | | | 579,316 | | | | 388,116 | |
| | NET INVESTMENT INCOME | | | 603,049 | | | | 467,576 | | | | 390,114 | |
| | | | | | | | | | | | | | |
| | Realized and unrealized gain (loss): | | | | | | | | | | | | |
| | Net realized gain (loss) from: | | | | | | | | | | | | |
| | Investments | | | 11,805,021 | | | | 4,299,482 | | | | 4,388,518 | |
| | Futures contracts | | | — | | | | 190,354 | | | | (5,890 | ) |
| | Foreign currency transactions | | | (38,810 | ) | | | 8,909 | | | | (37,811 | ) |
| | Net change in unrealized gain (loss) on: | | | | | | | | | | | | |
| | Investments | | | 7,284,809 | | | | 9,282,997 | | | | 3,135,499 | |
| | Futures contracts | | | — | | | | 33,725 | | | | 4,629 | |
| | Foreign currency translation | | | 6,140 | | | | 1,900 | | | | 1,459 | |
| | Net realized and unrealized gain | | | 19,057,160 | | | | 13,817,367 | | | | 7,486,404 | |
| | NET INCREASE IN NET ASSETS RESULTING FROM OPERATIONS | | $ | 19,660,209 | | | $ | 14,284,943 | | | $ | 7,876,518 | |
| | (a) | | Class specific Distribution and Service, and Transfer Agent fees were as follows: |
| | | | | | | | | | | | | | | | | | | | | | | | | | | | | | | | | | | | | | | | | | | | |
| | | Distribution and Service Fees | | | Transfer Agent Fees | |
Fund | | Class A | | | Class B | | | Class C | | | Class R | | | Class A | | | Class B | | | Class C | | | Institutional | | | Service | | | Class IR | | | Class R | |
Concentrated International Equity | | $ | 66,495 | | | $ | 3,759 | | | $ | 73,192 | | | | N/A | | | $ | 50,536 | | | $ | 714 | | | $ | 13,907 | | | $ | 13,339 | | | $ | 62 | | | $ | 332 | | | | N/A | |
International Small Cap | | | 13,205 | | | | 2,220 | | | | 9,155 | | | | N/A | | | | 10,035 | | | | 422 | | | | 1,740 | | | | 15,713 | | | | 169 | | | | 533 | | | | N/A | |
Strategic International Equity | | | 27,600 | | | | 14,919 | | | | 26,367 | | | $ | 19 | | | | 20,976 | | | | 2,835 | | | | 5,010 | | | | 5,194 | | | | N/A | | | | 84 | | | $ | 7 | |
| | |
| The accompanying notes are an integral part of these financial statements. | | 31 |
GOLDMAN SACHS FUNDAMENTAL INTERNATIONAL EQUITY FUNDS
Statements of Changes in Net Assets
| | | | | | | | | | |
| | | | | Concentrated International Equity Fund | |
| | | | | For the Six Months Ended April 30, 2013 (Unaudited) | | | For the Fiscal Year Ended October 31, 2012 | |
| | From operations: | | | | | | | | |
| | Net investment income | | $ | 603,049 | | | $ | 2,606,799 | |
| | Net realized gain (loss) | | | 11,766,211 | | | | (12,966,009 | ) |
| | Net change in unrealized gain | | | 7,290,949 | | | | 20,503,609 | |
| | Net increase in net assets resulting from operations | | | 19,660,209 | | | | 10,144,399 | |
| | | | | | | | | | |
| | Distributions to shareholders: | | | | | | | | |
| | From net investment income | | | | | | | | |
| | Class A Shares | | | (1,458,280 | ) | | | (3,633,195 | ) |
| | Class B Shares | | | (17,987 | ) | | | (25,585 | ) |
| | Class C Shares | | | (358,173 | ) | | | (397,748 | ) |
| | Institutional Shares | | | (2,144,339 | ) | | | (1,037,106 | ) |
| | Service Shares | | | (8,887 | ) | | | (9,638 | ) |
| | Class IR Shares | | | (12,406 | ) | | | (1,281 | ) |
| | Class R Shares | | | — | | | | — | |
| | Total distributions to shareholders | | | (4,000,072 | ) | | | (5,104,553 | ) |
| | | | | | | | | | |
| | From share transactions: | | | | | | | | |
| | Proceeds from sales of shares | | | 10,300,708 | | | | 46,768,544 | |
| | Reinvestment of distributions | | | 3,889,489 | | | | 4,902,450 | |
| | Cost of shares redeemed | | | (15,123,719 | ) | | | (92,585,677 | ) |
| | Net increase (decrease) in net assets resulting from share transactions | | | (933,522 | ) | | | (40,914,683 | ) |
| | Increase from regulatory settlements | | | — | | | | 1,002,638 | |
| | Net increase (decrease) in net assets resulting from capital transactions | | | (933,522 | ) | | | (39,912,045 | ) |
| | TOTAL INCREASE (DECREASE) | | | 14,726,615 | | | | (34,872,199 | ) |
| | | | | | | | | | |
| | Net assets: | | | | | | | | |
| | Beginning of period | | | 129,621,554 | | | | 164,493,753 | |
| | End of period | | $ | 144,348,169 | | | $ | 129,621,554 | |
| | Undistributed (distributions in excess of) net investment income | | $ | (159,474 | ) | | $ | 3,237,549 | |
| | |
| 32 | | The accompanying notes are an integral part of these financial statements. |
GOLDMAN SACHS FUNDAMENTAL INTERNATIONAL EQUITY FUNDS
| | | | | | | | | | | | | | | | | | | | | | |
| | | International Small Cap Fund | | | | | Strategic International Equity Fund | |
| | | For the Six Months Ended April 30, 2013 (Unaudited) | | | | | For the Fiscal Year Ended October 31, 2012 | | | | | For the Six Months Ended April 30, 2013 (Unaudited) | | | | | For the Fiscal Year Ended October 31, 2012 | |
| | | | | | | | | | | | | | | | | | | | | | |
| | $ | 467,576 | | | | | $ | 639,533 | | | | | $ | 390,114 | | | | | $ | 943,082 | |
| | | 4,498,745 | | | | | | (2,760,412 | ) | | | | | 4,344,817 | | | | | | (345,319 | ) |
| | | 9,318,622 | | | | | | 8,449,022 | | | | | | 3,141,587 | | | | | | 3,473,385 | |
| | | 14,284,943 | | | | | | 6,328,143 | | | | | | 7,876,518 | | | | | | 4,071,148 | |
| | | | | | | | | | | | | | | | | | | | | | |
| | | | | | | | | | | | | | | | | | | | | | |
| | | | | | | | | | | | | | | | | | | | | | |
| | | (82,903 | ) | | | | | (369,815 | ) | | | | | (373,449 | ) | | | | | (1,361,342 | ) |
| | | (1,373 | ) | | | | | (4,225 | ) | | | | | (41,315 | ) | | | | | (133,041 | ) |
| | | (5,492 | ) | | | | | (20,832 | ) | | | | | (70,264 | ) | | | | | (195,805 | ) |
| | | (1,022,694 | ) | | | | | (802,770 | ) | | | | | (545,277 | ) | | | | | (240,702 | ) |
| | | (9,020 | ) | | | | | (14,688 | ) | | | | | — | | | | | | — | |
| | | (5,266 | ) | | | | | (2,360 | ) | | | | | (1,935 | ) | | | | | (2,189 | ) |
| | | — | | | | | | — | | | | | | (121 | ) | | | | | (142 | ) |
| | | (1,126,748 | ) | | | | | (1,214,690 | ) | | | | | (1,032,361 | ) | | | | | (1,933,221 | ) |
| | | | | | | | | | | | | | | | | | | | | | |
| | | | | | | | | | | | | | | | | | | | | | |
| | | 40,685,528 | | | | | | 36,749,367 | | | | | | 5,389,599 | | | | | | 24,664,908 | |
| | | 1,108,249 | | | | | | 1,125,734 | | | | | | 1,014,248 | | | | | | 1,879,700 | |
| | | (10,025,794 | ) | | | | | (23,585,561 | ) | | | | | (7,076,042 | ) | | | | | (34,034,953 | ) |
| | | 31,767,983 | | | | | | 14,289,540 | | | | | | (672,195 | ) | | | | | (7,490,345 | ) |
| | | — | | | | | | 21,131 | | | | | | — | | | | | | — | |
| | | 31,767,983 | | | | | | 14,310,671 | | | | | | (672,195 | ) | | | | | (7,490,345 | ) |
| | | 44,926,178 | | | | | | 19,424,124 | | | | | | 6,171,962 | | | | | | (5,352,418 | ) |
| | | | | | | | | | | | | | | | | | | | | | |
| | | | | | | | | | | | | | | | | | | | | | |
| | | 81,580,622 | | | | | | 62,156,498 | | | | | | 53,974,062 | | | | | | 59,326,480 | |
| | $ | 126,506,800 | | | | | $ | 81,580,622 | | | | | $ | 60,146,024 | | | | | $ | 53,974,062 | |
| | $ | 28,871 | | | | | $ | 688,043 | | | | | $ | 12,020 | | | | | $ | 654,267 | |
| | |
| The accompanying notes are an integral part of these financial statements. | | 33 |
GOLDMAN SACHS CONCENTRATED INTERNATIONAL EQUITY FUND
Financial Highlights
Selected Data for a Share Outstanding Throughout Each Period
| | | | | | | | | | | | | | | | | | | | | | |
| | | | | | | | Income (loss) from
investment operations | | | | |
| | | Year - Share Class | | Net asset
value,
beginning
of period | | | Net investment
income (loss)(a) | | | Net realized
and unrealized
gain (loss) | | | Total from
investment
operations | | | Distribution
to shareholders
from net
investment
income | |
| | FOR THE SIX MONTHS ENDED APRIL 30, (UNAUDITED) | |
| | 2013 - A | | $ | 15.58 | | | $ | 0.06 | | | $ | 2.29 | | | $ | 2.35 | | | $ | (0.44 | ) |
| | 2013 - B | | | 15.37 | | | | (0.01 | ) | | | 2.27 | | | | 2.26 | | | | (0.34 | ) |
| | 2013 - C | | | 14.60 | | | | — | (f) | | | 2.15 | | | | 2.15 | | | | (0.38 | ) |
| | 2013 - Institutional | | | 15.92 | | | | 0.10 | | | | 2.32 | | | | 2.42 | | | | (0.55 | ) |
| | 2013 - Service | | | 15.69 | | | | 0.05 | | | | 2.30 | | | | 2.35 | | | | (0.47 | ) |
| | 2013 - IR | | | 15.87 | | | | 0.09 | | | | 2.32 | | | | 2.41 | | | | (0.56 | ) |
| | | | | | | | | | | | | | | | | | | | | | |
| | FOR THE FISCAL YEARS ENDED OCTOBER 31, | |
| | 2012 - A | | | 14.74 | | | | 0.28 | | | | 0.93 | | | | 1.21 | | | | (0.47 | ) |
| | 2012 - B | | | 14.48 | | | | 0.16 | | | | 0.94 | | | | 1.10 | | | | (0.31 | ) |
| | 2012 - C | | | 13.82 | | | | 0.16 | | | | 0.87 | | | | 1.03 | | | | (0.35 | ) |
| | 2012 - Institutional | | | 15.07 | | | | 0.32 | | | | 0.97 | | | | 1.29 | | | | (0.54 | ) |
| | 2012 - Service | | | 14.85 | | | | 0.26 | | | | 0.94 | | | | 1.20 | | | | (0.46 | ) |
| | 2012 - IR | | | 15.06 | | | | 0.28 | | | | 0.98 | | | | 1.26 | | | | (0.55 | ) |
| | 2011 - A | | | 16.81 | | | | 0.42 | (g) | | | (2.22 | ) | | | (1.80 | ) | | | (0.27 | ) |
| | 2011 - B | | | 16.46 | | | | 0.28 | (g) | | | (2.15 | ) | | | (1.87 | ) | | | (0.11 | ) |
| | 2011 - C | | | 15.79 | | | | 0.29 | (g) | | | (2.09 | ) | | | (1.80 | ) | | | (0.17 | ) |
| | 2011 - Institutional | | | 17.18 | | | | 0.50 | (g) | | | (2.27 | ) | | | (1.77 | ) | | | (0.34 | ) |
| | 2011 - Service | | | 16.92 | | | | 0.42 | (g) | | | (2.24 | ) | | | (1.82 | ) | | | (0.25 | ) |
| | 2011 - IR | | | 17.22 | | | | 0.63 | (g) | | | (2.45 | ) | | | (1.82 | ) | | | (0.34 | ) |
| | 2010 - A | | | 15.22 | | | | 0.10 | | | | 1.79 | | | | 1.89 | | | | (0.30 | ) |
| | 2010 - B | | | 14.90 | | | | (0.01 | ) | | | 1.74 | | | | 1.73 | | | | (0.17 | ) |
| | 2010 - C | | | 14.35 | | | | (0.02 | ) | | | 1.69 | | | | 1.67 | | | | (0.23 | ) |
| | 2010 - Institutional | | | 15.55 | | | | 0.16 | | | | 1.82 | | | | 1.98 | | | | (0.35 | ) |
| | 2010 - Service | | | 15.32 | | | | 0.08 | | | | 1.80 | | | | 1.88 | | | | (0.28 | ) |
| | 2010 - IR (Commenced August 31, 2010) | | | 15.13 | | | | 0.02 | | | | 2.07 | | | | 2.09 | | | | — | |
| | 2009 - A | | | 13.18 | | | | 0.21 | | | | 2.41 | | | | 2.62 | | | | (0.75 | ) |
| | 2009 - B | | | 12.72 | | | | 0.12 | | | | 2.36 | | | | 2.48 | | | | (0.47 | ) |
| | 2009 - C | | | 12.40 | | | | 0.10 | | | | 2.29 | | | | 2.39 | | | | (0.61 | ) |
| | 2009 - Institutional | | | 13.50 | | | | 0.26 | | | | 2.48 | | | | 2.74 | | | | (0.86 | ) |
| | 2009 - Service | | | 13.28 | | | | 0.19 | | | | 2.43 | | | | 2.62 | | | | (0.75 | ) |
| | | | | | | | | | | | | | | | | | | | | | |
| | FOR THE PERIOD SEPTEMBER 1, 2008 TO OCTOBER 31, 2008* | |
| | 2008 - A | | | 19.40 | | | | — | (f) | | | (6.22 | ) | | | (6.22 | ) | | | — | |
| | 2008 - B | | | 18.75 | | | | (0.02 | ) | | | (6.01 | ) | | | (6.03 | ) | | | — | |
| | 2008 - C | | | 18.28 | | | | (0.02 | ) | | | (5.86 | ) | | | (5.88 | ) | | | — | |
| | 2008 - Institutional | | | 19.87 | | | | 0.01 | | | | (6.38 | ) | | | (6.37 | ) | | | — | |
| | 2008 - Service | | | 19.55 | | | | — | (f) | | | (6.27 | ) | | | (6.27 | ) | | | — | |
| | | | | | | | | | | | | | | | | | | | | | |
| | FOR THE FISCAL YEAR ENDED AUGUST 31, | |
| | 2008 - A | | | 24.04 | | | | 0.44 | (h) | | | (4.89 | ) | | | (4.45 | ) | | | (0.28 | ) |
| | 2008 - B | | | 23.19 | | | | 0.21 | (h) | | | (4.71 | ) | | | (4.50 | ) | | | (0.03 | ) |
| | 2008 - C | | | 22.68 | | | | 0.26 | (h) | | | (4.63 | ) | | | (4.37 | ) | | | (0.12 | ) |
| | 2008 - Institutional | | | 24.61 | | | | 0.58 | (h) | | | (5.03 | ) | | | (4.45 | ) | | | (0.38 | ) |
| | 2008 - Service | | | 24.17 | | | | 0.41 | (h) | | | (4.93 | ) | | | (4.52 | ) | | | (0.19 | ) |
| | * | | The Fund changed its fiscal year end from August 31 to October 31. |
| | (a) | | Calculated based on the average shares outstanding methodology. |
| | (b) | | Assumes investment at the net asset value at the beginning of the period, reinvestment of all distributions, a complete redemption of the investment at the net asset value at the end of the period and no sales or redemption charges. Total returns would be reduced if a sales or redemption charge was taken into account. Returns do not reflect the deduction of taxes that a shareholder would pay on Fund distributions or the redemption of Fund shares. Total returns for periods less than one full year are not annualized. |
| | (c) | | The Fund’s portfolio turnover rate is calculated in accordance with regulatory requirements, without regard to transactions involving short term investments and certain derivatives. If such transactions were included, the Fund’s portfolio turnover rate may be higher. |
| | (d) | | Total return reflects the impact of payments for regulatory settlements entitled to be received during the period and recorded as an increase to capital by the Fund. Excluding such payments, the total return would have been: |
| | | | | | | | | | | | | | | | | | | | | | | | |
| | | Class A | | | Class B | | | Class C | | | Institutional | | | Service | | | Class IR | |
For the Fiscal Year Ended October 31, 2012 | | | 8.66 | % | | | 7.91 | % | | | 7.81 | % | | | 9.15 | % | | | 8.57 | % | | | 8.92 | % |
For the Fiscal Year Ended October 31, 2009 | | | 21.64 | | | | 20.44 | | | | 20.79 | | | | 21.99 | | | | 21.50 | | | | N/A | |
For the Fiscal Year Ended August 31, 2008 | | | (18.88 | ) | | | (19.52 | ) | | | (19.48 | ) | | | (18.54 | ) | | | (18.97 | ) | | | N/A | |
| | (f) | | Amount is less than $0.005 per share. |
| | (g) | | Reflects income recognized from a corporate action which amounted to $0.26 per share and 1.55% of average net assets. |
| | (h) | | Reflects income recognized from a corporate action which amounted to $0.23 per share and 0.98% of average net assets. |
| | |
| 34 | | The accompanying notes are an integral part of these financial statements. |
GOLDMAN SACHS CONCENTRATED INTERNATIONAL EQUITY FUND
| | | | | | | | | | | | | | | | | | | | | | | | | | | | | | | | | | | | | | | | | | | | | | |
| | | Increase from
regulatory
settlements | | | | | Net asset
value, end
of period | | | | | Total
return(b) | | | | | Net assets,
end of
period
(in 000s) | | | | | Ratio of
net expenses
to average
net assets | | | | | Ratio of
total expenses
to average
net assets | | | | | Ratio of
net investment
income (loss)
to average
net assets | | | | | Portfolio
turnover
rate(c) | |
| | | | |
| | $ | — | | | | | $ | 17.49 | | | | | | 15.44 | % | | | | $ | 54,027 | | | | | | 1.47 | %(e) | | | | | 1.68 | %(e) | | | | | 0.73 | %(e) | | | | | 85 | % |
| | | — | | | | | | 17.29 | | | | | | 14.97 | | | | | | 674 | | | | | | 2.22 | (e) | | | | | 2.43 | (e) | | | | | (0.18 | )(e) | | | | | 85 | |
| | | — | | | | | | 16.37 | | | | | | 15.02 | | | | | | 15,611 | | | | | | 2.22 | (e) | | | | | 2.43 | (e) | | | | | 0.02 | (e) | | | | | 85 | |
| | | — | | | | | | 17.79 | | | | | | 15.66 | | | | | | 73,302 | | | | | | 1.07 | (e) | | | | | 1.29 | (e) | | | | | 1.21 | (e) | | | | | 85 | |
| | | — | | | | | | 17.57 | | | | | | 15.38 | | | | | | 328 | | | | | | 1.57 | (e) | | | | | 1.79 | (e) | | | | | 0.66 | (e) | | | | | 85 | |
| | | — | | | | | | 17.72 | | | | | | 15.60 | | | | | | 407 | | | | | | 1.21 | (e) | | | | | 1.43 | (e) | | | | | 1.06 | (e) | | | | | 85 | |
| | | | | | | | | | | | | | | | | | | | | | | | | | | | | | | | | | | | | | | | | | | | | | |
| | | | |
| | | 0.10 | | | | | | 15.58 | | | | | | 9.36 | (d) | | | | | 52,564 | | | | | | 1.48 | | | | | | 1.72 | | | | | | 1.95 | | | | | | 144 | |
| | | 0.10 | | | | | | 15.37 | | | | | | 8.61 | (d) | | | | | 815 | | | | | | 2.23 | | | | | | 2.47 | | | | | | 1.13 | | | | | | 144 | |
| | | 0.10 | | | | | | 14.60 | | | | | | 8.55 | (d) | | | | | 14,039 | | | | | | 2.23 | | | | | | 2.47 | | | | | | 1.14 | | | | | | 144 | |
| | | 0.10 | | | | | | 15.92 | | | | | | 9.84 | (d) | | | | | 61,874 | | | | | | 1.08 | | | | | | 1.31 | | | | | | 2.11 | | | | | | 144 | |
| | | 0.10 | | | | | | 15.69 | | | | | | 9.26 | (d) | | | | | 299 | | | | | | 1.58 | | | | | | 1.82 | | | | | | 1.77 | | | | | | 144 | |
| | | 0.10 | | | | | | 15.87 | | | | | | 9.61 | (d) | | | | | 30 | | | | | | 1.23 | | | | | | 1.46 | | | | | | 1.87 | | | | | | 144 | |
| | | — | | | | | | 14.74 | | | | | | (10.89 | ) | | | | | 118,977 | | | | | | 1.53 | | | | | | 1.67 | | | | | | 2.55 | (g) | | | | | 135 | |
| | | — | | | | | | 14.48 | | | | | | (11.46 | ) | | | | | 1,225 | | | | | | 2.28 | | | | | | 2.42 | | | | | | 1.70 | (g) | | | | | 135 | |
| | | — | | | | | | 13.82 | | | | | | (11.55 | ) | | | | | 15,883 | | | | | | 2.28 | | | | | | 2.42 | | | | | | 1.86 | (g) | | | | | 135 | |
| | | — | | | | | | 15.07 | | | | | | (10.53 | ) | | | | | 28,105 | | | | | | 1.13 | | | | | | 1.27 | | | | | | 2.94 | (g) | | | | | 135 | |
| | | — | | | | | | 14.85 | | | | | | (10.96 | ) | | | | | 300 | | | | | | 1.63 | | | | | | 1.77 | | | | | | 2.51 | (g) | | | | | 135 | |
| | | — | | | | | | 15.06 | | | | | | (10.80 | ) | | | | | 3 | | | | | | 1.28 | | | | | | 1.42 | | | | | | 3.87 | (g) | | | | | 135 | |
| | | — | | | | | | 16.81 | | | | | | 12.48 | | | | | | 162,231 | | | | | | 1.54 | | | | | | 1.61 | | | | | | 0.66 | | | | | | 182 | |
| | | — | | | | | | 16.46 | | | | | | 11.69 | | | | | | 1,944 | | | | | | 2.29 | | | | | | 2.36 | | | | | | (0.07 | ) | | | | | 182 | |
| | | — | | | | | | 15.79 | | | | | | 11.72 | | | | | | 20,031 | | | | | | 2.29 | | | | | | 2.36 | | | | | | (0.11 | ) | | | | | 182 | |
| | | — | | | | | | 17.18 | | | | | | 12.95 | | | | | | 36,693 | | | | | | 1.14 | | | | | | 1.21 | | | | | | 1.05 | | | | | | 182 | |
| | | — | | | | | | 16.92 | | | | | | 12.37 | | | | | | 354 | | | | | | 1.64 | | | | | | 1.71 | | | | | | 0.54 | | | | | | 182 | |
| | | — | | | | | | 17.22 | | | | | | 13.81 | | | | | | 1 | | | | | | 1.29 | (e) | | | | | 1.36 | (e) | | | | | 0.08 | (e) | | | | | 182 | |
| | | 0.17 | | | | | | 15.22 | | | | | | 22.88 | (d) | | | | | 165,054 | | | | | | 1.54 | | | | | | 1.65 | | | | | | 1.65 | | | | | | 129 | |
| | | 0.17 | | | | | | 14.90 | | | | | | 21.81 | (d) | | | | | 2,893 | | | | | | 2.29 | | | | | | 2.40 | | | | | | 0.93 | | | | | | 129 | |
| | | 0.17 | | | | | | 14.35 | | | | | | 21.84 | (d) | | | | | 18,510 | | | | | | 2.29 | | | | | | 2.40 | | | | | | 0.80 | | | | | | 129 | |
| | | 0.17 | | | | | | 15.55 | | | | | | 23.28 | (d) | | | | | 30,009 | | | | | | 1.14 | | | | | | 1.25 | | | | | | 1.95 | | | | | | 129 | |
| | | 0.17 | | | | | | 15.32 | | | | | | 22.69 | (d) | | | | | 493 | | | | | | 1.64 | | | | | | 1.75 | | | | | | 1.51 | | | | | | 129 | |
| | | | | | | | | | | | | | | | | | | | | | | | | | | | | | | | | | | | | | | | | | | | | | |
| | | | |
| | | — | | | | | | 13.18 | | | | | | (32.11 | ) | | | | | 187,435 | | | | | | 1.54 | (e) | | | | | 1.72 | (e) | | | | | 0.02 | (e) | | | | | 21 | |
| | | — | | | | | | 12.72 | | | | | | (32.16 | ) | | | | | 3,686 | | | | | | 2.29 | (e) | | | | | 2.47 | (e) | | | | | (0.74 | )(e) | | | | | 21 | |
| | | — | | | | | | 12.40 | | | | | | (32.17 | ) | | | | | 14,057 | | | | | | 2.29 | (e) | | | | | 2.47 | (e) | | | | | (0.74 | )(e) | | | | | 21 | |
| | | — | | | | | | 13.50 | | | | | | (32.06 | ) | | | | | 40,837 | | | | | | 1.14 | (e) | | | | | 1.32 | (e) | | | | | 0.54 | (e) | | | | | 21 | |
| | | — | | | | | | 13.28 | | | | | | (32.12 | ) | | | | | 518 | | | | | | 1.64 | (e) | | | | | 1.82 | (e) | | | | | (0.09 | )(e) | | | | | 21 | |
| | | | | | | | | | | | | | | | | | | | | | | | | | | | | | | | | | | | | | | | | | | | | | |
| | | | |
| | | 0.09 | | | | | | 19.40 | | | | | | (18.37 | )(d) | | | | | 297,558 | | | | | | 1.54 | | | | | | 1.55 | | | | | | (1.92 | )(h) | | | | | 178 | |
| | | 0.09 | | | | | | 18.75 | | | | | | (19.01 | )(d) | | | | | 6,424 | | | | | | 2.29 | | | | | | 2.30 | | | | | | 0.96 | (h) | | | | | 178 | |
| | | 0.09 | | | | | | 18.28 | | | | | | (18.97 | )(d) | | | | | 21,480 | | | | | | 2.29 | | | | | | 2.30 | | | | | | 1.18 | (h) | | | | | 178 | |
| | | 0.09 | | | | | | 19.87 | | | | | | (18.03 | )(d) | | | | | 107,197 | | | | | | 1.14 | | | | | | 1.15 | | | | | | 2.46 | (h) | | | | | 178 | |
| | | 0.09 | | | | | | 19.55 | | | | | | (18.46 | )(d) | | | | | 755 | | | | | | 1.64 | | | | | | 1.65 | | | | | | 1.79 | (h) | | | | | 178 | |
| | |
| The accompanying notes are an integral part of these financial statements. | | 35 |
GOLDMAN SACHS INTERNATIONAL SMALL CAP FUND
Financial Highlights
Selected Data for a Share Outstanding Throughout Each Period
| | | | | | | | | | | | | | | | | | | | | | |
| | | | | | | | Income (loss) from
investment operations | | | | |
| | | Year - Share Class | | Net asset
value,
beginning
of period | | | Net
investment
income (loss)(a) | | | Net realized
and unrealized
gain (loss) | | | Total from
investment
operations | | | Distributions
to shareholders
from net
investment
income | |
| | FOR THE SIX MONTHS ENDED APRIL 30, (UNAUDITED) | |
| | 2013 - A | | $ | 15.18 | | | $ | 0.04 | | | $ | 2.34 | | | $ | 2.38 | | | $ | (0.12 | ) |
| | 2013 - B | | | 14.90 | | | | (0.02 | ) | | | 2.30 | | | | 2.28 | | | | (0.05 | ) |
| | 2013 - C | | | 14.65 | | | | (0.01 | ) | | | 2.25 | | | | 2.24 | | | | (0.05 | ) |
| | 2013 - Institutional | | | 15.67 | | | | 0.09 | | | | 2.39 | | | | 2.48 | | | | (0.24 | ) |
| | 2013 - Service | | | 15.04 | | | | 0.04 | | | | 2.30 | | | | 2.34 | | | | (0.17 | ) |
| | 2013 - IR | | | 15.65 | | | | 0.11 | | | | 2.35 | | | | 2.46 | | | | (0.23 | ) |
| | | | | | | | | | | | | | | | | | | | | | |
| | FOR THE FISCAL YEARS ENDED OCTOBER 31, | |
| | 2012 - A | | | 14.06 | | | | 0.11 | | | | 1.26 | | | | 1.37 | | | | (0.25 | ) |
| | 2012 - B | | | 13.74 | | | | (0.01 | ) | | | 1.27 | | | | 1.26 | | | | (0.10 | ) |
| | 2012 - C | | | 13.54 | | | | — | (e) | | | 1.24 | | | | 1.24 | | | | (0.13 | ) |
| | 2012 - Institutional | | | 14.53 | | | | 0.17 | | | | 1.29 | | | | 1.46 | | | | (0.32 | ) |
| | 2012 - Service | | | 13.98 | | | | 0.09 | | | | 1.25 | | | | 1.34 | | | | (0.28 | ) |
| | 2012 - IR | | | 14.50 | | | | 0.14 | | | | 1.30 | | | | 1.44 | | | | (0.29 | ) |
| | 2011 - A | | | 14.62 | | | | 0.08 | (f) | | | (0.39 | ) | | | (0.31 | ) | | | (0.25 | ) |
| | 2011 - B | | | 14.29 | | | | (0.04 | )(f) | | | (0.38 | ) | | | (0.42 | ) | | | (0.13 | ) |
| | 2011 - C | | | 14.10 | | | | (0.03 | )(f) | | | (0.38 | ) | | | (0.41 | ) | | | (0.15 | ) |
| | 2011 - Institutional | | | 15.06 | | | | 0.15 | (f) | | | (0.38 | ) | | | (0.23 | ) | | | (0.30 | ) |
| | 2011 - Service | | | 14.53 | | | | 0.06 | (f) | | | (0.38 | ) | | | (0.32 | ) | | | (0.23 | ) |
| | 2011 - IR | | | 15.09 | | | | 0.18 | (f) | | | (0.47 | ) | | | (0.29 | ) | | | (0.30 | ) |
| | 2010 - A | | | 12.27 | | | | 0.04 | (g) | | | 2.74 | | | | 2.78 | | | | (0.43 | ) |
| | 2010 - B | | | 12.01 | | | | (0.06 | )(g) | | | 2.69 | | | | 2.63 | | | | (0.35 | ) |
| | 2010 - C | | | 11.85 | | | | (0.05 | )(g) | | | 2.64 | | | | 2.59 | | | | (0.34 | ) |
| | 2010 - Institutional | | | 12.62 | | | | 0.10 | (g) | | | 2.81 | | | | 2.91 | | | | (0.47 | ) |
| | 2010 - Service | | | 12.20 | | | | 0.03 | (g) | | | 2.72 | | | | 2.75 | | | | (0.42 | ) |
| | 2010 - IR (Commenced August 31, 2010) | | | 12.90 | | | | 0.02 | (g) | | | 2.17 | | | | 2.19 | | | | — | |
| | 2009 - A | | | 9.48 | | | | 0.10 | | | | 3.25 | | | | 3.35 | | | | (0.56 | ) |
| | 2009 - B | | | 9.12 | | | | 0.02 | | | | 3.20 | | | | 3.22 | | | | (0.33 | ) |
| | 2009 - C | | | 9.06 | | | | 0.01 | | | | 3.17 | | | | 3.18 | | | | (0.39 | ) |
| | 2009 - Institutional | | | 9.82 | | | | 0.15 | | | | 3.35 | | | | 3.50 | | | | (0.70 | ) |
| | 2009 - Service | | | 9.42 | | | | 0.09 | | | | 3.24 | | | | 3.33 | | | | (0.55 | ) |
| | | | | | | | | | | | | | | | | | | | | | |
| | FOR THE PERIOD SEPTEMBER 1, 2008 TO OCTOBER 31, 2008* | |
| | 2008 - A | | | 15.26 | | | | 0.02 | | | | (5.80 | ) | | | (5.78 | ) | | | — | |
| | 2008 - B | | | 14.70 | | | | — | (e) | | | (5.58 | ) | | | (5.58 | ) | | | — | |
| | 2008 - C | | | 14.60 | | | | — | (e) | | | (5.54 | ) | | | (5.54 | ) | | | — | |
| | 2008 - Institutional | | | 15.81 | | | | 0.03 | | | | (6.02 | ) | | | (5.99 | ) | | | — | |
| | 2008 - Service | | | 15.18 | | | | 0.02 | | | | (5.78 | ) | | | (5.76 | ) | | | — | |
| | | | | | | | | | | | | | | | | | | | | | |
| | FOR THE FISCAL YEAR ENDED AUGUST 31, | |
| | 2008 - A | | | 21.18 | | | | 0.16 | (h) | | | (5.57 | ) | | | (5.41 | ) | | | (0.51 | ) |
| | 2008 - B | | | 20.41 | | | | 0.03 | (h) | | | (5.39 | ) | | | (5.36 | ) | | | (0.35 | ) |
| | 2008 - C | | | 20.27 | | | | 0.03 | (h) | | | (5.35 | ) | | | (5.32 | ) | | | (0.35 | ) |
| | 2008 - Institutional | | | 21.94 | | | | 0.28 | (h) | | | (5.78 | ) | | | (5.50 | ) | | | (0.63 | ) |
| | 2008 - Service | | | 21.10 | | | | 0.16 | (h) | | | (5.54 | ) | | | (5.38 | ) | | | (0.54 | ) |
| | * | | The Fund changed its fiscal year end from August 31 to October 31. |
| | (a) | | Calculated based on the average shares outstanding methodology. |
| | (b) | | Assumes investment at the net asset value at the beginning of the period, reinvestment of all distributions, a complete redemption of the investment at the net asset value at the end of the period and no sales or redemption charges. Total returns would be reduced if a sales or redemption charge was taken into account. Returns do not reflect the deduction of taxes that a shareholder would pay on Fund distributions or the redemption of Fund shares. Total returns for periods less than one full year are not annualized. |
| | (c) | | The Fund’s portfolio turnover rate is calculated in accordance with regulatory requirements, without regard to transactions involving short term investments and certain derivatives. If such transactions were included, the Fund’s portfolio turnover rate may be higher. |
| | (e) | | Amount is less than $0.005 per share. |
| | (f) | | Reflects income recognized from non-recurring special dividends which amounted to $0.03 per share and 0.16% of average net assets. |
| | (g) | | Reflects income recognized from non-recurring special dividends which amounted to $0.01 per share and 0.10% of average net assets. |
| | (h) | | Reflects income recognized from a corporate action which amounted to $0.08 per share and 0.41% of average net assets. |
| | (i) | | Total return reflects the impact of payments for regulatory settlements amounting to $0.01 per share, received during the year and recorded as an increase to capital by the Fund. Excluding such payments, the total return would have been (26.18)%, (26.77)%, (26.73)%, (25.89)% and (26.24)%, respectively. |
| | |
| 36 | | The accompanying notes are an integral part of these financial statements. |
GOLDMAN SACHS INTERNATIONAL SMALL CAP FUND
| | | | | | | | | | | | | | | | | | | | | | | | | | | | | | | | | | | | | | | | |
| | | | | | | | | | | | | | | | | | | | | | | | | | | | | | | | | | |
| | | Net asset
value, end
of period | | | | | Total
return(b) | | | | | Net assets,
end of
period
(in 000s) | | | | | Ratio of
net expenses
to average
net assets | | | | | Ratio of
total expenses
to average
net assets | | | | | Ratio of
net investment
income (loss)
to average
net assets | | | | | Portfolio
turnover
rate(c) | |
| | | | | | | | | | | | | | | | | | | | | | | | | | | | | | | | | | | | | | | | |
| | $ | 17.44 | | | | | | 15.81 | % | | | | $ | 11,187 | | | | | | 1.57 | %(d) | | | | | 1.96 | %(d) | | | | | 0.56 | %(d) | | | | | 48 | % |
| | | 17.13 | | | | | | 15.32 | | | | | | 449 | | | | | | 2.32 | (d) | | | | | 2.70 | (d) | | | | | (0.22 | )(d) | | | | | 48 | |
| | | 16.84 | | | | | | 15.31 | | | | | | 1,997 | | | | | | 2.32 | (d) | | | | | 2.70 | (d) | | | | | (0.15 | )(d) | | | | | 48 | |
| | | 17.91 | | | | | | 16.05 | | | | | | 111,051 | | | | | | 1.17 | (d) | | | | | 1.56 | (d) | | | | | 1.10 | (d) | | | | | 48 | |
| | | 17.21 | | | | | | 15.71 | | | | | | 938 | | | | | | 1.67 | (d) | | | | | 2.06 | (d) | | | | | 0.50 | (d) | | | | | 48 | |
| | | 17.88 | | | | | | 15.94 | | | | | | 886 | | | | | | 1.31 | (d) | | | | | 1.72 | (d) | | | | | 1.28 | (d) | | | | | 48 | |
| | | | | | | | | | | | | | | | | | | | | | | | | | | | | | | | | | | | | | | | |
| | | | | | | | | | | | | | | | | | | | | | | | | | | | | | | | | | | | | | | | |
| | | 15.18 | | | | | | 9.84 | | | | | | 10,551 | | | | | | 1.58 | | | | | | 2.18 | | | | | | 0.80 | | | | | | 85 | |
| | | 14.90 | | | | | | 9.10 | | | | | | 452 | | | | | | 2.33 | | | | | | 2.92 | | | | | | (0.05 | ) | | | | | 85 | |
| | | 14.65 | | | | | | 9.14 | | | | | | 1,796 | | | | | | 2.33 | | | | | | 2.92 | | | | | | (0.01 | ) | | | | | 85 | |
| | | 15.67 | | | | | | 10.49 | | | | | | 67,614 | | | | | | 1.18 | | | | | | 1.73 | | | | | | 1.14 | | | | | | 85 | |
| | | 15.04 | | | | | | 9.77 | | | | | | 805 | | | | | | 1.68 | | | | | | 2.25 | | | | | | 0.65 | | | | | | 85 | |
| | | 15.65 | | | | | | 10.13 | | | | | | 362 | | | | | | 1.33 | | | | | | 1.84 | | | | | | 0.93 | | | | | | 85 | |
| | | 14.06 | | | | | | (1.97 | ) | | | | | 22,537 | | | | | | 1.60 | | | | | | 1.94 | | | | | | 0.54 | (f) | | | | | 117 | |
| | | 13.74 | | | | | | (2.71 | ) | | | | | 622 | | | | | | 2.35 | | | | | | 2.69 | | | | | | (0.25 | )(f) | | | | | 117 | |
| | | 13.54 | | | | | | (2.68 | ) | | | | | 2,177 | | | | | | 2.35 | | | | | | 2.69 | | | | | | (0.23 | )(f) | | | | | 117 | |
| | | 14.53 | | | | | | (1.59 | ) | | | | | 36,067 | | | | | | 1.20 | | | | | | 1.54 | | | | | | 0.95 | (f) | | | | | 117 | |
| | | 13.98 | | | | | | (2.05 | ) | | | | | 730 | | | | | | 1.70 | | | | | | 2.04 | | | | | | 0.41 | (f) | | | | | 117 | |
| | | 14.50 | | | | | | (1.72 | ) | | | | | 24 | | | | | | 1.35 | | | | | | 1.69 | | | | | | 1.12 | (f) | | | | | 117 | |
| | | 14.62 | | | | | | 23.11 | | | | | | 23,503 | | | | | | 1.60 | | | | | | 1.86 | | | | | | 0.31 | (g) | | | | | 155 | |
| | | 14.29 | | | | | | 22.24 | | | | | | 919 | | | | | | 2.35 | | | | | | 2.61 | | | | | | (0.45 | )(g) | | | | | 155 | |
| | | 14.10 | | | | | | 22.18 | | | | | | 2,120 | | | | | | 2.35 | | | | | | 2.61 | | | | | | (0.43 | )(g) | | | | | 155 | |
| | | 15.06 | | | | | | 23.61 | | | | | | 89,035 | | | | | | 1.20 | | | | | | 1.46 | | | | | | 0.78 | (g) | | | | | 155 | |
| | | 14.53 | | | | | | 22.91 | | | | | | 490 | | | | | | 1.70 | | | | | | 1.96 | | | | | | 0.23 | (g) | | | | | 155 | |
| | | 15.09 | | | | | | 16.74 | | | | | | 1 | | | | | | 1.35 | (d) | | | | | 1.61 | (d) | | | | | 0.73 | (d)(g) | | | | | 155 | |
| | | 12.27 | | | | | | 37.78 | | | | | | 22,952 | | | | | | 1.60 | | | | | | 2.08 | | | | | | 0.93 | | | | | | 161 | |
| | | 12.01 | | | | | | 36.79 | | | | | | 1,015 | | | | | | 2.35 | | | | | | 2.83 | | | | | | 0.18 | | | | | | 161 | |
| | | 11.85 | | | | | | 36.79 | | | | | | 1,924 | | | | | | 2.35 | | | | | | 2.83 | | | | | | 0.12 | | | | | | 161 | |
| | | 12.62 | | | | | | 38.50 | | | | | | 68,199 | | | | | | 1.20 | | | | | | 1.68 | | | | | | 1.45 | | | | | | 161 | |
| | | 12.20 | | | | | | 37.85 | | | | | | 414 | | | | | | 1.70 | | | | | | 2.18 | | | | | | 0.86 | | | | | | 161 | |
| | | | | | | | | | | | | | | | | | | | | | | | | | | | | | | | | | | | | | | | |
| | | | | | | | | | | | | | | | | | | | | | | | | | | | | | | | | | | | | | | | |
| | | 9.48 | | | | | | (37.88 | ) | | | | | 21,650 | | | | | | 1.60 | (d) | | | | | 2.39 | (d) | | | | | 0.99 | (d) | | | | | 24 | |
| | | 9.12 | | | | | | (37.92 | ) | | | | | 986 | | | | | | 2.35 | (d) | | | | | 3.14 | (d) | | | | | 0.23 | (d) | | | | | 24 | |
| | | 9.06 | | | | | | (37.95 | ) | | | | | 2,239 | | | | | | 2.35 | (d) | | | | | 3.14 | (d) | | | | | 0.22 | (d) | | | | | 24 | |
| | | 9.82 | | | | | | (37.85 | ) | | | | | 28,581 | | | | | | 1.20 | (d) | | | | | 1.99 | (d) | | | | | 1.43 | (d) | | | | | 24 | |
| | | 9.42 | | | | | | (37.90 | ) | | | | | 294 | | | | | | 1.70 | (d) | | | | | 2.49 | (d) | | | | | 0.87 | (d) | | | | | 24 | |
| | | | | | | | | | | | | | | | | | | | | | | | | | | | | | | | | | | | | | | | |
| | | | | | | | | | | | | | | | | | | | | | | | | | | | | | | | | | | | | | | | |
| | | 15.26 | | | | | | (26.10 | )(i) | | | | | 39,376 | | | | | | 1.64 | | | | | | 1.78 | | | | | | 0.85 | (h) | | | | | 117 | |
| | | 14.70 | | | | | | (26.69 | )(i) | | | | | 1,862 | | | | | | 2.39 | | | | | | 2.53 | | | | | | 0.14 | (h) | | | | | 117 | |
| | | 14.60 | | | | | | (26.65 | )(i) | | | | | 3,950 | | | | | | 2.39 | | | | | | 2.53 | | | | | | 0.18 | (h) | | | | | 117 | |
| | | 15.81 | | | | | | (25.81 | )(i) | | | | | 55,901 | | | | | | 1.24 | | | | | | 1.38 | | | | | | 1.42 | (h) | | | | | 117 | |
| | | 15.18 | | | | | | (26.16 | )(i) | | | | | 454 | | | | | | 1.74 | | | | | | 1.88 | | | | | | 0.84 | (h) | | | | | 117 | |
| | |
| The accompanying notes are an integral part of these financial statements. | | 37 |
GOLDMAN SACHS STRATEGIC INTERNATIONAL EQUITY FUND
Financial Highlights
Selected Data for a Share Outstanding Throughout Each Period
| | | | | | | | | | | | | | | | | | | | | | | | | | | | | | |
| | | | | | | | Income (loss) from
investment operations | | | Distributions
to shareholders | |
| | | Year - Share Class | | Net asset
value,
beginning
of period | | | Net
investment
income(a) | | | Net realized
and unrealized
gain (loss) | | | Total from
investment
operations | | | From net
investment
income | | | From net
realized
gains | | | Total
distributions | |
| | FOR THE SIX MONTHS ENDED APRIL 30, (UNAUDITED) | |
| | 2013 - A | | $ | 11.06 | | | $ | 0.07 | | | $ | 1.55 | | | $ | 1.62 | | | $ | (0.19 | ) | | $ | — | | | $ | (0.19 | ) |
| | 2013 - B | | | 9.88 | | | | 0.02 | | | | 1.39 | | | | 1.41 | | | | (0.13 | ) | | | — | | | | (0.13 | ) |
| | 2013 - C | | | 10.01 | | | | 0.03 | | | | 1.40 | | | | 1.43 | | | | (0.14 | ) | | | — | | | | (0.14 | ) |
| | 2013 - Institutional | | | 11.58 | | | | 0.11 | | | | 1.59 | | | | 1.70 | | | | (0.26 | ) | | | — | | | | (0.26 | ) |
| | 2013 - IR | | | 11.11 | | | | 0.09 | | | | 1.54 | | | | 1.63 | | | | (0.25 | ) | | | — | | | | (0.25 | ) |
| | 2013 - R | | | 11.14 | | | | 0.06 | | | | 1.55 | | | | 1.61 | | | | (0.19 | ) | | | — | | | | (0.19 | ) |
| | | | | | | | | | | | | | | | | | | | | | | | | | | | | | |
| | FOR THE FISCAL YEARS ENDED OCTOBER 31, | |
| | 2012 - A | | | 10.62 | | | | 0.20 | | | | 0.61 | | | | 0.81 | | | | (0.37 | ) | | | — | | | | (0.37 | ) |
| | 2012 - B | | | 9.51 | | | | 0.09 | | | | 0.57 | | | | 0.66 | | | | (0.29 | ) | | | — | | | | (0.29 | ) |
| | 2012 - C | | | 9.64 | | | | 0.10 | | | | 0.57 | | | | 0.67 | | | | (0.30 | ) | | | — | | | | (0.30 | ) |
| | 2012 - Institutional | | | 11.11 | | | | 0.19 | | | | 0.71 | | | | 0.90 | | | | (0.43 | ) | | | — | | | | (0.43 | ) |
| | 2012 - IR | | | 10.70 | | | | 0.21 | | | | 0.63 | | | | 0.84 | | | | (0.43 | ) | | | — | | | | (0.43 | ) |
| | 2012 - R | | | 10.57 | | | | 0.16 | | | | 0.64 | | | | 0.80 | | | | (0.23 | ) | | | — | | | | (0.23 | ) |
| | 2011 - A | | | 11.71 | | | | 0.28 | (e) | | | (1.25 | ) | | | (0.97 | ) | | | (0.12 | ) | | | — | | | | (0.12 | ) |
| | 2011 - B | | | 10.49 | | | | 0.17 | (e) | | | (1.12 | ) | | | (0.95 | ) | | | (0.03 | ) | | | — | | | | (0.03 | ) |
| | 2011 - C | | | 10.63 | | | | 0.17 | (e) | | | (1.12 | ) | | | (0.95 | ) | | | (0.04 | ) | | | — | | | | (0.04 | ) |
| | 2011 - Institutional | | | 12.24 | | | | 0.25 | (e) | | | (1.22 | ) | | | (0.97 | ) | | | (0.16 | ) | | | — | | | | (0.16 | ) |
| | 2011 - IR | | | 11.70 | | | | 0.17 | (e) | | | (1.06 | ) | | | (0.89 | ) | | | (0.11 | ) | | | — | | | | (0.11 | ) |
| | 2011 - R | | | 11.64 | | | | 0.27 | (e) | | | (1.26 | ) | | | (0.99 | ) | | | (0.08 | ) | | | — | | | | (0.08 | ) |
| | 2010 - A | | | 10.55 | | | | 0.10 | | | | 1.19 | | | | 1.29 | | | | (0.13 | ) | | | — | | | | (0.13 | ) |
| | 2010 - B | | | 9.46 | | | | 0.01 | | | | 1.07 | | | | 1.08 | | | | (0.05 | ) | | | — | | | | (0.05 | ) |
| | 2010 - C | | | 9.59 | | | | 0.01 | | | | 1.09 | | | | 1.10 | | | | (0.06 | ) | | | — | | | | (0.06 | ) |
| | 2010 - Institutional | | | 11.02 | | | | 0.10 | | | | 1.28 | | | | 1.38 | | | | (0.16 | ) | | | — | | | | (0.16 | ) |
| | 2010 - IR | | | 10.54 | | | | 0.12 | | | | 1.19 | | | | 1.31 | | | | (0.15 | ) | | | — | | | | (0.15 | ) |
| | 2010 - R | | | 10.52 | | | | 0.07 | | | | 1.19 | | | | 1.26 | | | | (0.14 | ) | | | — | | | | (0.14 | ) |
| | 2009 - A | | | 9.01 | | | | 0.14 | | | | 1.77 | | | | 1.91 | | | | (0.38 | ) | | | — | | | | (0.38 | ) |
| | 2009 - B | | | 8.08 | | | | 0.07 | | | | 1.58 | | | | 1.65 | | | | (0.28 | ) | | | — | | | | (0.28 | ) |
| | 2009 - C | | | 8.17 | | | | 0.07 | | | | 1.61 | | | | 1.68 | | | | (0.27 | ) | | | — | | | | (0.27 | ) |
| | 2009 - Institutional | | | 9.42 | | | | 0.19 | | | | 1.84 | | | | 2.03 | | | | (0.44 | ) | | | — | | | | (0.44 | ) |
| | 2009 - IR | | | 9.03 | | | | 0.17 | | | | 1.76 | | | | 1.93 | | | | (0.43 | ) | | | — | | | | (0.43 | ) |
| | 2008 - A | | | 27.90 | | | | 0.28 | (g) | | | (9.45 | ) | | | (9.17 | ) | | | — | | | | (9.74 | ) | | | (9.74 | ) |
| | 2008 - B | | | 26.18 | | | | 0.15 | (g) | | | (8.53 | ) | | | (8.38 | ) | | | — | | | | (9.74 | ) | | | (9.74 | ) |
| | 2008 - C | | | 26.35 | | | | 0.14 | (g) | | | (8.60 | ) | | | (8.46 | ) | | | — | | | | (9.74 | ) | | | (9.74 | ) |
| | 2008 - Institutional | | | 28.64 | | | | 0.40 | (g) | | | (9.90 | ) | | | (9.50 | ) | | | — | | | | (9.74 | ) | | | (9.74 | ) |
| | 2008 - IR (Commenced November 30, 2007) | | | 26.87 | | | | 0.29 | (g) | | | (8.41 | ) | | | (8.12 | ) | | | — | | | | (9.74 | ) | | | (9.74 | ) |
| | 2008 - R (Commenced November 30, 2007) | | | 26.87 | | | | 0.23 | (g) | | | (8.39 | ) | | | (8.16 | ) | | | — | | | | (9.74 | ) | | | (9.74 | ) |
| | (a) | | Calculated based on the average shares outstanding methodology. |
| | (b) | | Assumes investment at the net asset value at the beginning of the period, reinvestment of all distributions, a complete redemption of the investment at the net asset value at the end of the period and no sales or redemption charges. Total returns would be reduced if a sales or redemption charge was taken into account. Returns do not reflect the deduction of taxes that a shareholder would pay on Fund distributions or the redemption of Fund shares. Total returns for periods less than one full year are not annualized. |
| | (c) | | The Fund’s portfolio turnover rate is calculated in accordance with regulatory requirements, without regard to transactions involving short term investments and certain derivatives. If such transactions were included, the Fund’s portfolio turnover rate may be higher. |
| | (e) | | Reflects income recognized from a corporate action which amounted to $0.14 per share and 1.22% of average net assets. |
| | (f) | | Total return reflects the impact of payments for regulatory settlements entitled to be received during the period and recorded as an increase to capital by the Fund. Excluding such payments, the total return would have been: |
| | | | | | | | | | | | | | | | | | | | | | | | |
| | | Class A | | | Class B | | | Class C | | | Institutional | | | Service | | | Class IR | |
For the Fiscal Year Ended October 31, 2009 | | | 22.37 | % | | | 21.4 | % | | | 21.31 | % | | | 22.76 | % | | | 22.57 | % | | | 22.02 | % |
For the Fiscal Year Ended August 31, 2008 | | | (49.92 | ) | | | (50.39 | ) | | | (50.31 | ) | | | (50.09 | ) | | | (47.93 | ) | | | (48.16 | ) |
| | (g) | | Reflects income recognized from a corporate action which amounted to $0.08 per share and 0.56% of average net assets. |
| | |
| 38 | | The accompanying notes are an integral part of these financial statements. |
GOLDMAN SACHS STRATEGIC INTERNATIONAL EQUITY FUND
| | | | | | | | | | | | | | | | | | | | | | | | | | | | | | | | | | | | | | | | | | | | | | |
| | | | | | | | | | | | | | | | | | | | | | | | | | | | | | | | | | | | | | | |
| | | Increase from
regulatory
settlements | | | | | Net asset
value, end
of period | | | | | Total
return(b) | | | | | Net assets,
end of
period
(in 000s) | | | | | Ratio of
net expenses
to average
net assets | | | | | Ratio of
total expenses
to average
net assets | | | | | Ratio of
net investment
income
to average
net assets | | | | | Portfolio
turnover
rate(c) | |
| | | | | | | | | | | | | | | | | | | | | | | | | | | | | | | | | | | | | | | | | | | | | | |
| | $ | — | | | | | $ | 12.49 | | | | | | 14.88 | % | | | | $ | 22,827 | | | | | | 1.45 | %(d) | | | | | 1.88 | %(d) | | | | | 1.28 | %(d) | | | | | 57 | % |
| | | — | | | | | | 11.16 | | | | | | 14.45 | | | | | | 2,859 | | | | | | 2.20 | (d) | | | | | 2.62 | (d) | | | | | 0.46 | (d) | | | | | 57 | |
| | | — | | | | | | 11.30 | | | | | | 14.42 | | | | | | 5,282 | | | | | | 2.20 | (d) | | | | | 2.62 | (d) | | | | | 0.49 | (d) | | | | | 57 | |
| | | — | | | | | | 13.02 | | | | | | 15.08 | | | | | | 29,088 | | | | | | 1.05 | (d) | | | | | 1.48 | (d) | | | | | 1.75 | (d) | | | | | 57 | |
| | | — | | | | | | 12.49 | | | | | | 14.95 | | | | | | 81 | | | | | | 1.20 | (d) | | | | | 1.61 | (d) | | | | | 1.55 | (d) | | | | | 57 | |
| | | — | | | | | | 12.56 | | | | | | 14.67 | | | | | | 8 | | | | | | 1.70 | (d) | | | | | 2.12 | (d) | | | | | 1.07 | (d) | | | | | 57 | |
| | | | | | | | | | | | | | | | | | | | | | | | | | | | | | | | | | | | | | | | | | | | | | |
| | | | | | | | | | | | | | | | | | | | | | | | | | | | | | | | | | | | | | | | | | | | | | |
| | | — | | | | | | 11.06 | | | | | | 8.17 | | | | | | 21,854 | | | | | | 1.45 | | | | | | 1.95 | | | | | | 1.91 | | | | | | 119 | |
| | | — | | | | | | 9.88 | | | | | | 7.41 | | | | | | 3,203 | | | | | | 2.20 | | | | | | 2.70 | | | | | | 1.00 | | | | | | 119 | |
| | | — | | | | | | 10.01 | | | | | | 7.35 | | | | | | 5,147 | | | | | | 2.20 | | | | | | 2.70 | | | | | | 1.01 | | | | | | 119 | |
| | | — | | | | | | 11.58 | | | | | | 8.58 | | | | | | 23,684 | | | | | | 1.05 | | | | | | 1.51 | | | | | | 1.68 | | | | | | 119 | |
| | | — | | | | | | 11.11 | | | | | | 8.42 | | | | | | 79 | | | | | | 1.20 | | | | | | 1.68 | | | | | | 2.01 | | | | | | 119 | |
| | | — | | | | | | 11.14 | | | | | | 7.87 | | | | | | 7 | | | | | | 1.70 | | | | | | 2.19 | | | | | | 1.49 | | | | | | 119 | |
| | | — | | | | | | 10.62 | | | | | | (8.40 | ) | | | | | 41,862 | | | | | | 1.45 | | | | | | 1.78 | | | | | | 2.36 | (e) | | | | | 139 | |
| | | — | | | | | | 9.51 | | | | | | (9.08 | ) | | | | | 4,344 | | | | | | 2.20 | | | | | | 2.53 | | | | | | 1.57 | (e) | | | | | 139 | |
| | | — | | | | | | 9.64 | | | | | | (9.00 | ) | | | | | 6,643 | | | | | | 2.20 | | | | | | 2.53 | | | | | | 1.63 | (e) | | | | | 139 | |
| | | — | | | | | | 11.11 | | | | | | (8.04 | ) | | | | | 6,416 | | | | | | 1.05 | | | | | | 1.38 | | | | | | 2.02 | (e) | | | | | 139 | |
| | | — | | | | | | 10.70 | | | | | | (7.69 | ) | | | | | 56 | | | | | | 1.20 | | | | | | 1.53 | | | | | | 1.56 | (e) | | | | | 139 | |
| | | — | | | | | | 10.57 | | | | | | (8.61 | ) | | | | | 7 | | | | | | 1.70 | | | | | | 2.03 | | | | | | 2.30 | (e) | | | | | 139 | |
| | | — | | | | | | 11.71 | | | | | | 12.34 | | | | | | 60,561 | | | | | | 1.45 | | | | | | 1.71 | | | | | | 0.89 | | | | | | 121 | |
| | | — | | | | | | 10.49 | | | | | | 11.44 | | | | | | 6,814 | | | | | | 2.20 | | | | | | 2.46 | | | | | | 0.12 | | | | | | 121 | |
| | | — | | | | | | 10.63 | | | | | | 11.48 | | | | | | 8,845 | | | | | | 2.20 | | | | | | 2.46 | | | | | | 0.13 | | | | | | 121 | |
| | | — | | | | | | 12.24 | | | | | | 12.69 | | | | | | 21,434 | | | | | | 1.05 | | | | | | 1.31 | | | | | | 0.90 | | | | | | 121 | |
| | | — | | | | | | 11.70 | | | | | | 12.55 | | | | | | 7 | | | | | | 1.20 | | | | | | 1.46 | | | | | | 1.13 | | | | | | 121 | |
| | | — | | | | | | 11.64 | | | | | | 12.06 | | | | | | 28 | | | | | | 1.70 | | | | | | 1.96 | | | | | | 0.67 | | | | | | 121 | |
| | | 0.01 | | | | | | 10.55 | | | | | | 22.50 | (f) | | | | | 55,454 | | | | | | 1.45 | | | | | | 1.98 | | | | | | 1.52 | | | | | | 133 | |
| | | 0.01 | | | | | | 9.46 | | | | | | 21.58 | (f) | | | | | 8,958 | | | | | | 2.20 | | | | | | 2.73 | | | | | | 0.93 | | | | | | 133 | |
| | | 0.01 | | | | | | 9.59 | | | | | | 21.47 | (f) | | | | | 9,520 | | | | | | 2.20 | | | | | | 2.73 | | | | | | 0.92 | | | | | | 133 | |
| | | 0.01 | | | | | | 11.02 | | | | | | 22.91 | (f) | | | | | 6,408 | | | | | | 1.05 | | | | | | 1.58 | | | | | | 2.02 | | | | | | 133 | |
| | | 0.01 | | | | | | 10.54 | | | | | | 22.71 | (f) | | | | | 6 | | | | | | 1.20 | | | | | | 1.73 | | | | | | 1.88 | | | | | | 133 | |
| | | 0.02 | | | | | | 9.01 | | | | | | (49.64 | )(f) | | | | | 38,194 | | | | | | 1.40 | | | | | | 1.73 | | | | | | 1.80 | (g) | | | | | 108 | |
| | | 0.02 | | | | | | 8.08 | | | | | | (50.09 | )(f) | | | | | 10,697 | | | | | | 2.15 | | | | | | 2.48 | | | | | | 1.01 | (g) | | | | | 108 | |
| | | 0.02 | | | | | | 8.17 | | | | | | (50.00 | )(f) | | | | | 10,577 | | | | | | 2.15 | | | | | | 2.48 | | | | | | 1.00 | (g) | | | | | 108 | |
| | | 0.02 | | | | | | 9.42 | | | | | | (49.45 | )(f) | | | | | 5,499 | | | | | | 1.00 | | | | | | 1.33 | | | | | | 2.46 | (g) | | | | | 108 | |
| | | 0.02 | | | | | | 9.03 | | | | | | (47.70 | )(f) | | | | | 5 | | | | | | 1.15 | (d) | | | | | 1.48 | (d) | | | | | 2.18 | (d)(g) | | | | | 108 | |
| | | 0.02 | | | | | | 8.99 | | | | | | (47.93 | )(f) | | | | | 5 | | | | | | 1.65 | (d) | | | | | 1.98 | (d) | | | | | 1.68 | (d)(g) | | | | | 108 | |
| | |
| The accompanying notes are an integral part of these financial statements. | | 39 |
GOLDMAN SACHS FUNDAMENTAL INTERNATIONAL EQUITY FUNDS
Notes to Financial Statements
April 30, 2013 (Unaudited)
Goldman Sachs Trust (the “Trust”) is a Delaware statutory trust registered under the Investment Company Act of 1940, as amended (the “Act”), as an open-end management investment company. The following table lists those series of the Trust that are included in this report (collectively, the “Funds” or individually a “Fund”), along with their corresponding share classes and respective diversification status under the Act:
| | | | |
| Fund | | Share Classes Offered* | | Diversified/ Non-diversified |
| Concentrated International Equity and International Small Cap | | A, B, C, Institutional, Service and IR | | Diversified |
Strategic International Equity | | A, B, C, Institutional, IR and R | | Diversified |
| * | | Class B Shares are generally no longer available for purchase by current or prospective investors. |
Class A Shares are sold with a front-end sales charge of up to 5.50%. Class B Shares were sold with a contingent deferred sales charge (“CDSC”) that declines from 5.00% to zero, depending upon the period of time the shares are held. Class C Shares are sold with a CDSC of 1.00%, which is imposed on redemptions made within 12 months of purchase. Institutional, Service, Class IR and Class R Shares are not subject to a sales charge.
Goldman Sachs Asset Management International (“GSAMI”), an affiliate of Goldman, Sachs & Co. (“Goldman Sachs”), serves as investment adviser to the Funds pursuant to a management agreement (the “Agreement”) with the Trust.
|
| 2. SIGNIFICANT ACCOUNTING POLICIES |
The financial statements have been prepared in accordance with accounting principles generally accepted in the United States of America (“GAAP”) and require management to make estimates and assumptions that may affect the reported amounts and disclosures. Actual results may differ from those estimates and assumptions.
A. Investment Valuation — The Funds’ valuation policy is to value investments at fair value.
B. Investment Income and Investments — Investment income includes interest income and dividend income, net of any foreign withholding taxes, less any amounts reclaimable. Interest income is accrued daily and adjusted for amortization of premiums and accretion of discounts. Dividend income is recognized on ex-dividend date or, for certain foreign securities, as soon as such information is obtained subsequent to the ex-dividend date. Investment transactions are reflected on trade date. Realized gains and losses are calculated using identified cost. Investment transactions are recorded on the following business day for daily net asset value (“NAV”) calculations. Any foreign capital gains tax is accrued daily based upon net unrealized gains, and is payable upon sale of such investments. Distributions received from the Funds’ investments in United States (“U.S.”) real estate investment trusts (“REITs”) may be characterized as ordinary income, net capital gain or a return of capital. A return of capital is recorded by the Funds as a reduction to the cost basis of the REIT.
For derivative contracts, realized gains and losses are recorded upon settlement of the contract.
C. Class Allocations and Expenses — Investment income, realized and unrealized gain (loss), and non-class specific expenses of each Fund are allocated daily based upon the proportion of net assets of each class. Class specific expenses, where applicable, are borne by the respective share classes and include Distribution and Service, Transfer Agent and Service and Shareholder Administration fees. Non-class specific expenses directly incurred by a Fund are charged to that Fund, while such expenses incurred by the Trust are allocated across the respective Funds on a straight-line and/or pro-rata basis depending upon the nature of the expenses.
D. Federal Taxes and Distributions to Shareholders — It is each Fund’s policy to comply with the requirements of the Internal Revenue Code of 1986, as amended (the “Code”), applicable to regulated investment companies (mutual funds) and to distribute each year substantially all of its investment company taxable income and capital gains to its shareholders. Accordingly, the Funds are not required to make any provisions for the payment of federal income tax. Distributions to shareholders are recorded on the ex-dividend date. Income and capital gains distributions, if any, are declared and paid annually.
Net capital losses are carried forward to future fiscal years and may be used to the extent allowed by the Code to offset any future capital gains. Utilization of capital loss carryforwards will reduce the requirement of future capital gains distributions.
40
GOLDMAN SACHS FUNDAMENTAL INTERNATIONAL EQUITY FUNDS
|
| 2. SIGNIFICANT ACCOUNTING POLICIES (continued) |
Under the Regulated Investment Company Modernization Act of 2010, the Funds are permitted to carry forward capital losses incurred in taxable years beginning after December 22, 2010 for an unlimited period. However, any losses incurred during those future taxable years will be required to be utilized prior to the losses incurred in pre-enactment taxable years. As a result of this ordering rule, pre-enactment capital loss carryforwards may be more likely to expire unused. Additionally, post-enactment capital losses that are carried forward will retain their character as either short-term or long term capital losses rather than being considered all short-term as under previous law.
The characterization of distributions to shareholders for financial reporting purposes is determined in accordance with federal income tax rules, which may differ from GAAP. The source of each Fund’s distributions may be shown in the accompanying financial statements as either from net investment income, net realized gain or capital. Certain components of the Funds’ net assets on the Statements of Assets and Liabilities reflect permanent GAAP/tax differences based on the appropriate tax character.
E. Foreign Currency Translation — The accounting records and reporting currency of the Funds are maintained in U.S. dollars. Assets and liabilities denominated in foreign currencies are translated into U.S. dollars using the current exchange rates at the close of each business day. The effect of changes in foreign currency exchange rates on investments is included within net realized and unrealized gain (loss) on investments. Changes in the value of other assets and liabilities as a result of fluctuations in foreign exchange rates are included in the Statements of Operations within net change in unrealized gain (loss) on foreign currency transactions. Transactions denominated in foreign currencies are translated into U.S. dollars on the date the transaction occurred, the effects of which are included within net realized gain (loss) on foreign currency transactions.
|
| 3. INVESTMENTS AND FAIR VALUE MEASUREMENTS |
The fair value of a financial instrument is the amount that would be received to sell an asset or paid to transfer a liability in an orderly transaction between market participants at the measurement date (i.e., the exit price). GAAP establishes a fair value hierarchy that prioritizes the inputs to valuation techniques used to measure fair value. The hierarchy gives the highest priority to unadjusted quoted prices in active markets for identical assets or liabilities (Level 1 measurements) and the lowest priority to unobservable inputs (Level 3 measurements). The levels used for classifying investments are not necessarily an indication of the risk associated with investing in these investments. The three levels of the fair value hierarchy are described below:
Level 1 — Unadjusted quoted prices in active markets that are accessible at the measurement date for identical, unrestricted assets or liabilities;
Level 2 — Quoted prices in markets that are not active or financial instruments for which significant inputs are observable (including, but not limited to, quoted prices for similar investments, interest rates, foreign exchange rates, volatility and credit spreads), either directly or indirectly;
Level 3 — Prices or valuations that require significant unobservable inputs (including GSAMI’s assumptions in determining fair value measurement).
The Trustees have adopted Valuation Procedures that govern the valuation of the portfolio investments held by the Funds, including investments for which market quotations are not readily available. The Trustees have delegated to GSAMI day-to-day responsibility for implementing and maintaining internal controls and procedures related to the valuation of the Funds’ portfolio investments. To assess the continuing appropriateness of pricing sources and methodologies, GSAMI regularly performs price verification procedures and issues challenges as necessary to third party pricing vendors or brokers, and any differences are reviewed in accordance with the Valuation Procedures.
A. Level 1 and Level 2 Fair Value Investments — The valuation techniques and significant inputs used in determining the fair values for investments classified as Level 1 and Level 2 are as follows:
Equity Securities — Equity securities and investment companies traded on a U.S. securities exchange or the NASDAQ system, or those located on certain foreign exchanges, including but not limited to the Americas, are valued daily at their last sale price or official closing price on the principal exchange or system on which they are traded. If no sale occurs, equity securities and
41
GOLDMAN SACHS FUNDAMENTAL INTERNATIONAL EQUITY FUNDS
Notes to Financial Statements (continued)
April 30, 2013 (Unaudited)
|
| 3. INVESTMENTS AND FAIR VALUE MEASUREMENTS (continued) |
exchange traded investment companies are valued at the last bid price for long positions and at the last ask price for short positions. Investments in investment companies (other than those that are exchange traded) are valued at the NAV on the valuation date. To the extent these investments are actively traded, they are classified as Level 1 of the fair value hierarchy.
Unlisted equity securities for which market quotations are available are valued at the last sale price on the valuation date, or if no sale occurs, at the last bid price. Securities traded on certain foreign securities exchanges are valued daily at fair value determined by an independent fair value service (if available) under Valuation Procedures approved by the Trustees and consistent with applicable regulatory guidance. The independent fair value service takes into account multiple factors including, but not limited to, movements in the securities markets, certain depositary receipts, futures contracts and foreign currency exchange rates that have occurred subsequent to the close of the foreign securities exchange. These investments are generally classified as Level 2 of the fair value hierarchy.
Debt Securities — Debt securities for which market quotations are readily available are valued daily on the basis of quotations supplied by dealers or an independent pricing service approved by the Trustees. The pricing services may use valuation models or matrix pricing, which consider: (i) yield or price with respect to bonds that are considered comparable in characteristics such as rating, interest rate and maturity date or (ii) quotations from securities dealers to determine current value. Short-term debt obligations that mature in sixty days or less and that do not exhibit signs of credit deterioration are valued at amortized cost, which approximates fair value. With the exception of treasury securities, which are generally classified as Level 1, these investments are generally classified as Level 2 of the fair value hierarchy.
Derivative Contracts — A derivative is an instrument whose value is derived from underlying assets, indices, reference rates or a combination of these factors.
Exchange-traded derivatives, including futures contracts, typically fall within Level 1 of the fair value hierarchy. Over-the-counter (“OTC”) derivatives are valued using market transactions and other market evidence, including market-based inputs to models, calibration to market-clearing transactions, broker or dealer quotations, or other alternative pricing sources. Where models are used, the selection of a particular model to value an OTC derivative depends upon the contractual terms of, and specific risks inherent in, the instrument, as well as the availability of pricing information in the market. Valuation models require a variety of inputs, including contractual terms, market prices, yield curves, credit curves, measures of volatility, voluntary and involuntary prepayment rates, loss severity rates and correlations of such inputs. For OTC derivatives that trade in liquid markets, model inputs can generally be verified and model selection does not involve significant management judgment. OTC derivatives are classified within Level 2 of the fair value hierarchy when significant inputs are corroborated by market evidence.
i. Futures Contracts — Futures contracts are contracts to buy or sell a standardized quantity of a specified commodity or security and are valued based on exchanged settlement prices or independent market quotes. Futures contracts are valued at the last settlement price, or in the absence of a sale, the last bid price for long positions and at the last ask price for short positions, at the end of each day on the board of trade or exchange upon which they are traded. Upon entering into a futures contract, a Fund deposits cash or securities in an account on behalf of the broker in an amount sufficient to meet the initial margin requirement. Subsequent payments are made or received by the Fund equal to the daily change in the contract value and are recorded as variation margin receivable or payable with a corresponding offset to unrealized gains or losses.
B. Level 3 Fair Value Investments — To the extent that the aforementioned significant inputs are unobservable, or if quotations are not readily available, or if GSAMI believes that such quotations do not accurately reflect fair value, the fair value of the Funds’ investments may be determined under Valuation Procedures approved by the Trustees. GSAMI consistent with its procedures and applicable regulatory guidance, may make an adjustment to the most recent valuation prices of either domestic or foreign securities in light of significant events to reflect what it believes to be the fair value of the securities at the time of determining a Fund’s NAV. Significant events which could affect a large number of securities in a particular market may include, but are not limited to: significant fluctuations in U.S. or foreign markets; market dislocations; market disruptions; or unscheduled market closings. Significant events which could also affect a single issuer may include, but are not limited to: corporate actions such as reorganizations, mergers and buy-outs; ratings downgrades; and bankruptcies.
42
GOLDMAN SACHS FUNDAMENTAL INTERNATIONAL EQUITY FUNDS
|
| 3. INVESTMENTS AND FAIR VALUE MEASUREMENTS (continued) |
C. Fair Value Hierarchy — The following is a summary of the Funds’ investments and derivatives classified in the fair value hierarchy as of April 30, 2013:
| | | | | | | | | | | | |
| | | |
| CONCENTRATED INTERNATIONAL EQUITY | | | | | | | | | | | | |
| | | |
| Investment Type | | Level 1 | | | Level 2 | | | Level 3 | |
| Assets | | | | | | | | | | | | |
Common Stock and/or Other Equity Investments | | | | | | | | | | | | |
Other | | $ | — | | | $ | 143,802,365 | (a) | | $ | — | |
| | | |
| INTERNATIONAL SMALL CAP | | | | | | | | | | | | |
| | | |
| Investment Type | | Level 1 | | | Level 2 | | | Level 3 | |
| Assets | | | | | | | | | | | | |
Common Stock and/or Other Equity Investments | | | | | | | | | | | | |
North and South America | | $ | 11,688,681 | | | $ | 1,086,171 | (a) | | $ | — | |
Other | | | 3,330,409 | | | | 104,617,256 | (a) | | | — | |
| Total | | $ | 15,019,090 | | | $ | 105,703,427 | | | $ | — | |
| | | |
| Derivative Type | | | | | | | | | |
| Assets(b) | | | | | | | | | | | | |
Futures Contracts | | $ | 35,144 | | | $ | — | | | $ | — | |
| | | |
| STRATEGIC INTERNATIONAL EQUITY | | | | | | | | | | | | |
| | | |
| Investment Type | | Level 1 | | | Level 2 | | | Level 3 | |
| Assets | | | | | | | | | | | | |
Common Stock and/or Other Equity Investments | | | | | | | | | | | | |
North and South America | | $ | 26,773 | | | $ | 281,269 | | | $ | — | |
Other | | | 588,253 | | | | 58,098,303 | (a) | | | — | |
| Total | | $ | 615,026 | | | $ | 58,379,572 | | | $ | — | |
| (a) | | To adjust for the time difference between local market close and the calculation of net asset value, the Funds utilize fair value model prices for international equities provided by an independent fair value service resulting in a Level 2 classification. |
| (b) | | Amount shown represents unrealized gain at period end. |
For further information regarding security characteristics, see the Schedules of Investments.
|
| 4. INVESTMENTS IN DERIVATIVES |
The following table sets forth, by certain risk types, the gross value of derivative contracts as of April 30, 2013. These instruments were used to meet the Fund’s investment objectives and to obtain and/or manage exposure related to the risk below. The value in the table below excludes the effects of cash collateral received or posted pursuant to these derivative contracts, and therefore are not representative of the Fund’s net exposure:
| | | | | | | | |
| Fund | | Risk | | Statements of Assets and Liabilities | | Assets | |
International Small Cap | | Equity | | Receivable for unrealized gain on futures variation margin | | $ | 35,144 | (a) |
| (a) | | Includes unrealized gain (loss) on futures contracts described in the Additional Investment Information sections of the Schedule of Investments. Only current day’s variation margin is reported within the Statement of Assets and Liabilities. |
43
GOLDMAN SACHS FUNDAMENTAL INTERNATIONAL EQUITY FUNDS
Notes to Financial Statements (continued)
April 30, 2013 (Unaudited)
|
| 4. INVESTMENTS IN DERIVATIVES (continued) |
The following table sets forth, by certain risk types, the Funds’ gains (losses) related to these derivatives and their indicative volumes for the six months ended April 30, 2013. These gains (losses) should be considered in the context that these derivative contracts may have been executed to economically hedge certain investments, and accordingly, certain gains (losses) on such derivative contracts may offset certain (losses) gains attributable to investments. These gains (losses) are included in “Net realized gain (loss)” or “Net change in unrealized gain (loss)” on the Statements of Operations:
| | | | | | | | | | | | | | | | |
| Fund | | Risk | | Statements of Operations | | Net
Realized
Gain (Loss) | | | Net Change in
Unrealized
Gain (Loss) | | | Average
Number of
Contracts(a) | |
International Small Cap | | Equity | | Net realized gain (loss) from futures contracts/Net change in unrealized gain (loss) on futures contracts | | $ | 190,354 | | | $ | 33,725 | | | | 92 | |
Strategic International Equity | | Equity | | Net realized gain (loss) from futures contracts/Net change in unrealized gain (loss) on futures contracts | | | (5,890 | ) | | | 4,629 | | | | 24 | |
| (a) | | Average number of contracts is based on the average of month end balances for the six months ended April 30, 2013. |
|
| 5. AGREEMENTS AND AFFILIATED TRANSACTIONS |
A. Management Agreement — Under the Agreement, GSAMI manages the Funds, subject to the general supervision of the Trustees.
As compensation for the services rendered pursuant to the Agreement, the assumption of the expenses related thereto and administration of the Funds’ business affairs, including providing facilities, GSAMI is entitled to a management fee, accrued daily and paid monthly, equal to an annual percentage rate of each Fund’s average daily net assets.
For the six months ended April 30, 2013, contractual and effective net management fees with GSAMI were at the following rates:
| | | | | | | | | | | | | | | | | | | | | | | | | | | | | | |
| | | | | Contractual Management Fee Rate | | | Effective Net
Management
Fee Rate | |
| Fund | | | | First $1 billion | | | Next $1 billion | | | Next $3 billion | | | Next $3 billion | | | Over $8 billion | | | Effective
Rate | | |
Concentrated International Equity | | | | | 1.00 | % | | | 0.90 | % | | | 0.86 | % | | | 0.84 | % | | | 0.82 | % | | | 1.00 | % | | | 0.94 | %* |
International Small Cap | | | | | 1.10 | | | | 1.10 | | | | 0.99 | | | | 0.94 | | | | 0.92 | | | | 1.10 | | | | 1.08 | * |
Strategic International Equity | | | | | 0.85 | | | | 0.77 | | | | 0.73 | | | | 0.72 | | | | 0.71 | | | | 0.85 | | | | 0.85 | |
| * | | GSAMI agreed to waive a portion of its management fee in order to achieve effective net management fee rates shown above for the Concentrated International Equity and International Small Cap Funds, respectively, through at least February 28, 2014. Prior to such date GSAMI may not terminate the arrangements without the approval of the trustees. |
B. Distribution and Service Plans — The Trust, on behalf of each Fund, has adopted Distribution and Service Plans (the “Plans”). Under the Plans, Goldman Sachs, which serves as distributor (the “Distributor”), is entitled to a fee accrued daily and paid monthly, for distribution services and personal and account maintenance services, which may then be paid by Goldman Sachs to authorized dealers, at the following annual rates calculated on a Fund’s average daily net assets of each respective share class:
| | | | | | | | | | | | | | | | |
| | | Distribution and Service Plan Rates | |
| | | Class A* | | | Class B | | | Class C | | | Class R* | |
Distribution Plan | | | 0.25 | % | | | 0.75 | % | | | 0.75 | % | | | 0.50 | % |
Service Plan | | | — | | | | 0.25 | | | | 0.25 | | | | — | |
| * | | With respect to Class A and Class R Shares, the Distributor at its discretion may use compensation for distribution services paid under the Distribution Plan to compensate service organizations for personal and account maintenance services and expenses as long as such total compensation does not exceed the maximum cap on “service fees” imposed by the Financial Industry Regulatory Authority. |
44
GOLDMAN SACHS FUNDAMENTAL INTERNATIONAL EQUITY FUNDS
|
| 5. AGREEMENTS AND AFFILIATED TRANSACTIONS (continued) |
C. Distribution Agreement — Goldman Sachs, as Distributor of the shares of the Funds pursuant to a Distribution Agreement, may retain a portion of the Class A front end sales charge and Class B and Class C Shares’ CDSC. During the six months ended April 30, 2013, Goldman Sachs advised that it retained the following amounts:
| | | | | | | | | | | | | | |
| | | | | Front End
Sales Charge | | | Contingent Deferred
Sales Charge | |
| Fund | | | | Class A | | | Class B | | | Class C | |
Concentrated International Equity | | | | $ | 1,013 | | | $ | — | | | $ | 225 | |
International Small Cap | | | | | 690 | | | | — | | | | — | |
Strategic International Equity | | | | | 1,228 | | | | — | | | | — | |
D. Service Plan and Shareholder Administration Plan — The Trust, on behalf of each Fund that offers Service Shares, has adopted a Service Plan and a Shareholder Administration Plan. These plans allow for service organizations to provide varying levels of personal and account maintenance and shareholder administration services to their customers who are beneficial owners of such shares. The Service Plan and Shareholder Administration Plan each provide for compensation to the service organizations which is accrued daily and paid monthly at an annual rate of 0.25% (0.50% in aggregate) of the average daily net assets of the Service Shares.
E. Transfer Agency Agreement — Goldman Sachs also serves as the transfer agent of the Funds for a fee pursuant to a Transfer Agency Agreement. The fees charged for such transfer agency services are accrued daily and paid monthly at annual rates as follows: 0.19% of the average daily net assets of Class A, Class B, Class C, Class IR and Class R Shares; and 0.04% of the average daily net assets of Institutional and Service Shares.
F. Other Expense Agreements and Affiliated Transactions — GSAMI has agreed to limit certain “Other Expense” of the Funds (excluding transfer agent fees and expenses, service fees and shareholder administration fees (as applicable), taxes, interest, brokerage fees, litigation, indemnification, shareholder meeting and other extraordinary expenses) to the extent such expenses exceed, on an annual basis, a percentage rate of the average daily net assets of each Fund. Such Other Expense reimbursements, if any, are accrued daily and paid monthly. In addition, the Funds are not obligated to reimburse GSAMI for prior fiscal year expense reimbursements, if any. The Other Expense limitations as an annual percentage rate of average daily net assets for the Concentrated International Equity, International Small Cap and Strategic International Equity Funds are 0.064%, 0.034% and 0.164%, respectively. Prior to February 28, 2013, the Other Expense limitations for the Concentrated International Equity and International Small Cap were 0.104% and .064%, respectively. These Other Expense reimbursements will remain in place through at least February 28, 2014, and prior to such date GSAMI may not terminate the arrangements without the approval of the Trustees. In addition, the Funds have entered into certain offset arrangements with the custodian and the transfer agent, which may result in a reduction of the Funds’ expenses and are received irrespective of the application of the “Other Expense” limitations described above.
For the six months ended April 30, 2013, these expense reductions, including any fee waivers and Other Expense reimbursements, were as follows:
| | | | | | | | | | | | | | | | | | |
| Fund | | | | Management
Fee Waiver | | | Custody Fee
Credits | | | Other Expense
Reimbursement | | | Total
Expense
Reductions | |
Concentrated International Equity | | | | $ | 40,780 | | | $ | 976 | | | $ | 107,413 | | | $ | 149,169 | |
International Small Cap | | | | | 9,280 | | | | 1,450 | | | | 171,776 | | | | 182,506 | |
Strategic International Equity | | | | | — | | | | 926 | | | | 119,999 | | | | 120,925 | |
45
GOLDMAN SACHS FUNDAMENTAL INTERNATIONAL EQUITY FUNDS
Notes to Financial Statements (continued)
April 30, 2013 (Unaudited)
|
| 5. AGREEMENTS AND AFFILIATED TRANSACTIONS (continued) |
As of April 30, 2013, the amounts owed to affiliates of the Funds were as follows:
| | | | | | | | | | | | | | | | | | |
| Fund | | | | Management
Fees | | | Distribution
and Service
Fees | | | Transfer
Agent
Fees | | | Total | |
Concentrated International Equity | | | | $ | 109,101 | | | $ | 24,140 | | | $ | 13,243 | | | $ | 146,484 | |
International Small Cap | | | | | 97,112 | | | | 4,503 | | | | 5,316 | | | | 106,931 | |
Strategic International Equity | | | | | 40,579 | | | | 11,056 | | | | 5,636 | | | | 57,271 | |
G. Line of Credit Facility — As of April 30, 2013, the Funds participated in a $630,000,000 committed, unsecured revolving line of credit facility (the “facility”) together with other funds of the Trust and registered investment companies having management agreements with GSAMI or its affiliates (“Other Borrowers”). Pursuant to the terms of the facility, the Funds and Other Borrowers could increase the credit amount by an additional $340,000,000, for a total of up to $970,000,000. This facility is to be used solely for temporary or emergency purposes, which may include the funding of redemptions. The interest rate on borrowings is based on the federal funds rate. The facility also requires a fee to be paid by the Funds based on the amount of the commitment that has not been utilized. For the six months ended April 30, 2013, the Funds did not have any borrowings under the facility. Effective May 8, 2013, the committed amount available through the facility increased to $780,000,000.
H. Other Transactions with Affiliates — For the six months ended April 30, 2013, Goldman Sachs earned $3,911 and $524 in brokerage commissions from portfolio transactions, including futures transactions executed with Goldman Sachs as the Futures Commission Merchant, on behalf of the International Small Cap and Strategic International Equity Funds, respectively.
As of April 30, 2013, the Goldman Sachs Satellite Strategies Portfolio was the beneficial owner of approximately 40% of the total outstanding shares of the International Small Cap Fund.
As of April 30, 2013, the Goldman Sachs Group, Inc. was the beneficial owner of approximately 10% and 100% of the Class IR and Class R Shares of the Strategic International Equity Fund, respectively.
|
| 6. PORTFOLIO SECURITIES TRANSACTIONS |
The cost of purchases and proceeds from sales and maturities of long-term securities for the six months ended April 30, 2013, were as follows:
| | | | | | | | | | |
| Fund | | | | Purchases | | | Sales and Maturities | |
Concentrated International Equity | | | | $ | 115,303,066 | | | $ | 119,899,525 | |
International Small Cap | | | | | 73,104,969 | | | | 44,924,727 | |
Strategic International Equity | | | | | 31,091,353 | | | | 31,252,121 | |
46
GOLDMAN SACHS FUNDAMENTAL INTERNATIONAL EQUITY FUNDS
As of the Funds’ most recent fiscal year end, October 31, 2012, the Funds’ capital loss carryforwards on a tax-basis were as follows:
| | | | | | | | | | | | |
| | | Concentrated
International Equity | | | International
Small Cap | | | Strategic
International
Equity | |
Capital loss carryforwards: | | | | | | | | | | | | |
Expiring 2016(1) | | $ | (112,531,656 | ) | | $ | (16,365,954 | ) | | $ | (27,716,666 | ) |
Expiring 2017(1) | | | (106,107,378 | ) | | | (19,170,113 | ) | | | (28,233,535 | ) |
Expiring 2019(1) | | | (9,250,431 | ) | | | — | | | | — | |
Perpetual Long-term | | | (8,348,785 | ) | | | (1,880,845 | ) | | | — | |
Perpetual Short-term | | | (4,649,458 | ) | | | (928,198 | ) | | | (1,231,095 | ) |
Total capital loss carryforwards | | $ | (240,887,708 | ) | | $ | (38,345,110 | ) | | $ | (57,181,296 | ) |
| (1) | | Expiration occurs on October 31 of the year indicated. |
As of April 30, 2013, the Funds’ aggregate security unrealized gains and losses based on cost for U.S. federal income tax purposes were as follows:
| | | | | | | | | | | | |
| | | Concentrated
International Equity | | | International Small Cap | | | Strategic
International
Equity | |
Tax cost | | $ | 136,894,918 | | | $ | 108,659,010 | | | $ | 52,151,687 | |
Gross unrealized gain | | | 11,823,457 | | | | 16,239,223 | | | | 8,216,238 | |
Gross unrealized loss | | | (4,916,010 | ) | | | (4,175,716 | ) | | | (1,373,327 | ) |
Net unrealized security gain | | $ | 6,907,447 | | | $ | 12,063,507 | | | $ | 6,842,911 | |
The difference between GAAP-basis and tax-basis unrealized gains (losses) is attributable primarily to wash sales and differences related to the tax treatment of passive foreign investment company investments.
GSAMI has reviewed the Funds’ tax positions for all open tax years (the current and prior three years, as applicable) and has concluded that no provision for income tax is required in the Funds’ financial statements. Such open tax years remain subject to examination and adjustment by tax authorities.
The Funds’ risks include, but are not limited to, the following:
Foreign Custody Risk — A Fund that invests in foreign securities may hold such securities and foreign currency with foreign banks, agents, and securities depositories appointed by the Fund’s custodian (each a “Foreign Custodian”). In some countries, Foreign Custodians may be subject to little or no regulatory oversight or independent evaluation of their operations. Further, the laws of certain countries may place limitations on a Fund’s ability to recover its assets if a Foreign Custodian enters into bankruptcy. Investments in emerging markets may be subject to greater custody risks than investments in more developed markets. Custody services in emerging market countries are often undeveloped and may be less regulated than in more developed countries, and thus may not afford the same level of investor protection as would apply in developed countries.
Shareholder Concentration Risk — Certain funds, accounts, individuals or Goldman Sachs affiliates may from time to time own (beneficially or of record) or control a significant percentage of the Funds’ shares. Redemptions by these entities of their holdings in the Funds may impact the Funds’ liquidity and NAV. These redemptions may also force the Funds to sell securities.
Issuer Concentration Risk — The Concentrated International Equity Fund intends to invest in a relatively small number of issuers. As a result, it may be subject to greater risks than a fund that invests in a greater number of issuers. A change in the value of any single investment held by the Fund may affect the overall value of the Fund more than it would affect a mutual fund that
47
GOLDMAN SACHS FUNDAMENTAL INTERNATIONAL EQUITY FUNDS
Notes to Financial Statements (continued)
April 30, 2013 (Unaudited)
|
| 8. OTHER RISKS (continued) |
holds more investments. In particular, the Fund may be more susceptible to adverse developments affecting any single issuer in the Fund and may be susceptible to greater losses because of these developments.
Investments in Other Investment Companies — As a shareholder of another investment company, including an exchange traded fund (“ETF”), a Fund will directly bear its proportionate share of any management fees and other expenses paid by such other investment companies, in addition to the fees and expenses regularly borne by the Fund. ETFs are subject to risks that do not apply to conventional mutual funds, including but not limited to the following: (i) the market price of the ETF’s shares may trade at a premium or a discount to their NAV; and (ii) an active trading market for an ETF’s shares may not develop or be maintained.
Liquidity Risk —The Funds may make investments that are illiquid or that may become less liquid in response to market developments or adverse investor perceptions. Illiquid investments may be more difficult to value. Liquidity risk may also refer to the risk that a Fund will not be able to pay redemption proceeds within the allowable time period because of unusual market conditions, an unusually high volume of redemption requests, or other reasons. To meet redemption requests, a Fund may be forced to sell investments at an unfavorable time and/or under unfavorable conditions.
Market and Credit Risks — In the normal course of business, the Funds trade financial instruments and enter into financial transactions where risk of potential loss exists due to changes in the market (market risk). Additionally, the Funds may also be exposed to credit risk in the event that an issuer fails to perform or that an institution or entity with which the Funds have unsettled or open transactions defaults.
Investing in foreign markets may involve special risks and considerations not typically associated with investing in the U.S. These risks include revaluation of currencies, high rates of inflation, repatriation restrictions on income and capital, and adverse political and economic developments. Moreover, securities issued in these markets may be less liquid, be subject to government ownership controls, have delayed settlements and their prices may be more volatile than those of comparable securities in the U.S.
Under the Trust’s organizational documents, its Trustees, officers, employees and agents are indemnified, to the extent permitted by the Act and State law, against certain liabilities that may arise out of performance of their duties to the Funds. Additionally, in the course of business, the Funds enter into contracts that contain a variety of indemnification clauses. The Funds’ maximum exposure under these arrangements is unknown, as this would involve future claims that may be made against the Funds that have not yet occurred. However, GSAMI believes the risk of loss under these arrangements to be remote.
New Accounting Pronouncement — In December 2011, the Financial Accounting Standards Board issued an Accounting Standards Update No. 2011-11: Disclosures about Offsetting Assets and Liabilities (“ASU”) to enhance disclosures about financial instruments and derivative instruments that are subject to offsetting (“netting”) on the Statements of Assets and Liabilities. This information will enable users of the Funds’ financial statements to evaluate the effect or potential effect of netting arrangements on the Funds’ financial position. The ASU is effective for financial statements with fiscal years beginning on or after January 1, 2013, and interim periods within those fiscal years. At this time, GSAMI is evaluating the implications of these changes on the financial statements.
Subsequent events after the Statement of Assets and Liabilities date have been evaluated through the date the financial statements were issued. GSAMI has concluded that there is no impact requiring adjustment or disclosure in the financial statements.
48
GOLDMAN SACHS FUNDAMENTAL INTERNATIONAL EQUITY FUNDS
|
| 12. SUMMARY OF SHARE TRANSACTIONS |
Share activity is as follows:
| | | | | | | | | | | | | | | | |
| | | Concentrated International Equity Fund | |
| | | | |
| | | For the Six Months Ended
April 30, 2013
(Unaudited) | | | For the Fiscal Year Ended
October 31, 2012 | |
| | | | |
| | | Shares | | | Dollars | | | Shares | | | Dollars | |
| | | | |
| Class A Shares | | | | | | | | | | | | | | | | |
Shares sold | | | 121,705 | | | $ | 2,009,417 | | | | 280,427 | | | $ | 4,781,458 | |
Shares converted from Class B(a) | | | 1,729 | | | | 29,063 | | | | 6,886 | | | | 98,309 | |
Reinvestment of distributions | | | 91,194 | | | | 1,418,987 | | | | 266,286 | | | | 3,562,905 | |
Shares redeemed | | | (498,727 | ) | | | (8,227,834 | ) | | | (5,250,409 | ) | | | (74,406,755 | ) |
| | | | (284,099 | ) | | | (4,770,367 | ) | | | (4,696,810 | ) | | | (65,964,083 | ) |
| Class B Shares | | | | | | | | | | | | | | | | |
Shares sold | | | 513 | | | | 8,456 | | | | 45 | | | | 8,443 | |
Shares converted to Class A(a) | | | (1,745 | ) | | | (29,063 | ) | | | (6,819 | ) | | | (98,309 | ) |
Reinvestment of distributions | | | 1,140 | | | | 17,595 | | | | 1,852 | | | | 24,589 | |
Shares redeemed | | | (13,958 | ) | | | (229,351 | ) | | | (26,646 | ) | | | (378,056 | ) |
| | | | (14,050 | ) | | | (232,363 | ) | | | (31,568 | ) | | | (443,333 | ) |
| Class C Shares | | | | | | | | | | | | | | | | |
Shares sold | | | 76,735 | | | | 1,184,453 | | | | 210,571 | | | | 2,906,921 | |
Reinvestment of distributions | | | 23,511 | | | | 343,499 | | | | 29,969 | | | | 378,213 | |
Shares redeemed | | | (107,927 | ) | | | (1,658,968 | ) | | | (428,367 | ) | | | (5,773,005 | ) |
| | | | (7,681 | ) | | | (131,016 | ) | | | (187,827 | ) | | | (2,487,871 | ) |
| Institutional Shares | | | | | | | | | | | | | | | | |
Shares sold | | | 401,563 | | | | 6,758,471 | | | | 2,774,476 | | | | 40,001,836 | |
Reinvestment of distributions | | | 132,560 | | | | 2,095,772 | | | | 68,565 | | | | 933,857 | |
Shares redeemed | | | (299,781 | ) | | | (4,972,861 | ) | | | (821,895 | ) | | | (11,960,654 | ) |
| | | | 234,342 | | | | 3,881,382 | | | | 2,021,146 | | | | 28,975,039 | |
| Service Shares | | | | | | | | | | | | | | | | |
Shares sold | | | 494 | | | | 7,740 | | | | 1,250 | | | | 19,247 | |
Reinvestment of distributions | | | 79 | | | | 1,230 | | | | 119 | | | | 1,605 | |
Shares redeemed | | | (988 | ) | | | (15,878 | ) | | | (2,541 | ) | | | (37,739 | ) |
| | | | (415 | ) | | | (6,908 | ) | | | (1,172 | ) | | | (16,887 | ) |
| Class IR Shares | | | | | | | | | | | | | | | | |
Shares sold | | | 21,347 | | | | 332,171 | | | | 3,549 | | | | 53,277 | |
Reinvestment of distributions | | | 788 | | | | 12,406 | | | | 94 | | | | 1,281 | |
Shares redeemed | | | (1,108 | ) | | | (18,827 | ) | | | (1,943 | ) | | | (29,468 | ) |
| | | | 21,027 | | | | 325,750 | | | | 1,700 | | | | 25,090 | |
NET DECREASE | | | (50,876 | ) | | $ | (933,522 | ) | | | (2,894,531 | ) | | $ | (39,912,045 | ) |
| (a) | | Class B Shares automatically convert into Class A Shares on or about the fifteenth day of the last month of the calendar quarter that is eight years after the initial purchase date of either the Fund or another Goldman Sachs Fund. |
49
GOLDMAN SACHS FUNDAMENTAL INTERNATIONAL EQUITY FUNDS
Notes to Financial Statements (continued)
April 30, 2013 (Unaudited)
|
| 12. SUMMARY OF SHARE TRANSACTIONS (continued) |
Share activity is as follows:
| | | | | | | | | | | | | | | | |
| | | International Small Cap Fund | |
| | | | |
| | | For the Six Months Ended
April 30, 2013
(Unaudited) | | | For the Fiscal Year Ended
October 31, 2012 | |
| | | | |
| | | Shares | | | Dollars | | | Shares | | | Dollars | |
| | | | |
| Class A Shares | | | | | | | | | | | | | | | | |
Shares sold | | | 97,628 | | | $ | 1,584,654 | | | | 217,077 | | | $ | 2,973,403 | |
Shares converted from Class B(a) | | | 586 | | | | 9,365 | | | | 1,585 | | | | 23,206 | |
Reinvestment of distributions | | | 5,193 | | | | 78,988 | | | | 27,182 | | | | 350,377 | |
Shares redeemed | | | (156,737 | ) | | | (2,519,207 | ) | | | (1,154,032 | ) | | | (15,962,896 | ) |
| | | | (53,330 | ) | | | (846,200 | ) | | | (908,188 | ) | | | (12,615,910 | ) |
| Class B Shares | | | | | | | | | | | | | | | | |
Shares sold | | | 280 | | | | 4,544 | | | | 3,815 | | | | 53,981 | |
Shares converted to Class A(a) | | | (595 | ) | | | (9,365 | ) | | | (1,612 | ) | | | (23,206 | ) |
Reinvestment of distributions | | | 82 | | | | 1,223 | | | | 310 | | | | 3,950 | |
Shares redeemed | | | (3,894 | ) | | | (62,134 | ) | | | (17,470 | ) | | | (238,438 | ) |
| | | | (4,127 | ) | | | (65,732 | ) | | | (14,957 | ) | | | (203,713 | ) |
| Class C Shares | | | | | | | | | | | | | | | | |
Shares sold | | | 6,917 | | | | 108,777 | | | | 13,811 | | | | 194,428 | |
Reinvestment of distributions | | | 300 | | | | 4,425 | | | | 1,140 | | | | 14,270 | |
Shares redeemed | | | (11,261 | ) | | | (173,966 | ) | | | (53,055 | ) | | | (726,048 | ) |
| | | | (4,044 | ) | | | (60,764 | ) | | | (38,104 | ) | | | (517,350 | ) |
| Institutional Shares | | | | | | | | | | | | | | | | |
Shares sold | | | 2,277,090 | | | | 38,499,760 | | | | 2,235,787 | | | | 33,194,239 | |
Reinvestment of distributions | | | 64,742 | | | | 1,009,327 | | | | 55,817 | | | | 740,136 | |
Shares redeemed | | | (453,801 | ) | | | (7,226,356 | ) | | | (460,974 | ) | | | (6,619,666 | ) |
| | | | 1,888,031 | | | | 32,282,731 | | | | 1,830,630 | | | | 27,314,709 | |
| Service Shares | | | | | | | | | | | | | | | | |
Shares sold | | | 375 | | | | 6,040 | | | | 334 | | | | 5,106 | |
Reinvestment of distributions | | | 601 | | | | 9,020 | | | | 1,146 | | | | 14,641 | |
Shares redeemed | | | — | | | | — | | | | (167 | ) | | | (2,111 | ) |
| | | | 976 | | | | 15,060 | | | | 1,313 | | | | 17,636 | |
| Class IR Shares | | | | | | | | | | | | | | | | |
Shares sold | | | 28,823 | | | | 481,753 | | | | 23,705 | | | | 349,341 | |
Reinvestment of distributions | | | 338 | | | | 5,266 | | | | 178 | | | | 2,360 | |
Shares redeemed | | | (2,733 | ) | | | (44,131 | ) | | | (2,423 | ) | | | (36,402 | ) |
| | | | 26,428 | | | | 442,888 | | | | 21,460 | | | | 315,299 | |
NET INCREASE | | | 1,853,934 | | | $ | 31,767,983 | | | | 892,154 | | | $ | 14,310,671 | |
| (a) | | Class B Shares automatically convert into Class A Shares on or about the fifteenth day of the last month of the calendar quarter that is eight years after the initial purchase date of either the Fund or another Goldman Sachs Fund. |
50
GOLDMAN SACHS FUNDAMENTAL INTERNATIONAL EQUITY FUNDS
|
| 12. SUMMARY OF SHARE TRANSACTIONS (continued) |
Share activity is as follows:
| | | | | | | | | | | | | | | | |
| | | Strategic International Equity Fund | |
| | | | |
| | | For the Six Months Ended
April 30, 2013
(Unaudited) | | | For the Fiscal Year Ended
October 31, 2012 | |
| | | | |
| | | Shares | | | Dollars | | | Shares | | | Dollars | |
| | | | |
| Class A Shares | | | | | | | | | | | | | | | | |
Shares sold | | | 91,061 | | | $ | 1,056,387 | | | | 672,334 | | | $ | 6,889,405 | |
Shares converted from Class B(a) | | | 26,039 | | | | 307,261 | | | | 61,941 | | | | 641,950 | |
Reinvestment of distributions | | | 32,705 | | | | 366,299 | | | | 139,238 | | | | 1,338,080 | |
Shares redeemed | | | (297,114 | ) | | | (3,457,158 | ) | | | (2,840,387 | ) | | | (29,018,009 | ) |
| | | | (147,309 | ) | | | (1,727,211 | ) | | | (1,966,874 | ) | | | (20,148,574 | ) |
| Class B Shares | | | | | | | | | | | | | | | | |
Shares sold | | | 6,649 | | | | 70,576 | | | | 6,714 | | | | 60,372 | |
Shares converted to Class A(a) | | | (29,087 | ) | | | (307,261 | ) | | | (69,077 | ) | | | (641,950 | ) |
Reinvestment of distributions | | | 4,050 | | | | 40,625 | | | | 15,121 | | | | 130,647 | |
Shares redeemed | | | (49,484 | ) | | | (512,562 | ) | | | (85,274 | ) | | | (791,750 | ) |
| | | | (67,872 | ) | | | (708,622 | ) | | | (132,516 | ) | | | (1,242,681 | ) |
| Class C Shares | | | | | | | | | | | | | | | | |
Shares sold | | | 57,437 | | | | 605,730 | | | | 42,011 | | | | 395,250 | |
Reinvestment of distributions | | | 6,074 | | | | 61,707 | | | | 19,438 | | | | 170,082 | |
Shares redeemed | | | (110,087 | ) | | | (1,167,633 | ) | | | (236,655 | ) | | | (2,243,131 | ) |
| | | | (46,576 | ) | | | (500,196 | ) | | | (175,206 | ) | | | (1,677,799 | ) |
| Institutional Shares | | | | | | | | | | | | | | | | |
Shares sold | | | 298,574 | | | | 3,641,971 | | | | 1,623,162 | | | | 17,291,342 | |
Reinvestment of distributions | | | 46,618 | | | | 543,561 | | | | 23,808 | | | | 238,560 | |
Shares redeemed | | | (157,562 | ) | | | (1,914,196 | ) | | | (178,534 | ) | | | (1,972,971 | ) |
| | | | 187,630 | | | | 2,271,336 | | | | 1,468,436 | | | | 15,556,931 | |
| Class IR Shares | | | | | | | | | | | | | | | | |
Shares sold | | | 1,327 | | | | 14,860 | | | | 2,581 | | | | 28,539 | |
Reinvestment of distributions | | | 173 | | | | 1,935 | | | | 227 | | | | 2,189 | |
Shares redeemed | | | (2,091 | ) | | | (24,416 | ) | | | (925 | ) | | | (9,092 | ) |
| | | | (591 | ) | | | (7,621 | ) | | | 1,883 | | | | 21,636 | |
| Class R Shares | | | | | | | | | | | | | | | | |
Shares sold | | | 5 | | | | 75 | | | | — | | | | — | |
Reinvestment of distributions | | | 11 | | | | 121 | | | | 15 | | | | 142 | |
Shares redeemed | | | (6 | ) | | | (77 | ) | | | — | | | | — | |
| | | | 10 | | | | 119 | | | | 15 | | | | 142 | |
NET DECREASE | | | (74,708 | ) | | $ | (672,195 | ) | | | (804,262 | ) | | $ | (7,490,345 | ) |
| (a) | | Class B Shares automatically convert into Class A Shares on or about the fifteenth day of the last month of the calendar quarter that is eight years after the initial purchase date of either the Fund or another Goldman Sachs Fund. |
51
GOLDMAN SACHS FUNDAMENTAL INTERNATIONAL EQUITY FUNDS
Fund Expenses — Six Month Period Ended April 30, 2013 (Unaudited)
As a shareholder of Class A, Class B, Class C, Institutional, Service, Class IR or Class R Shares of a Fund you incur two types of costs: (1) transaction costs, including sales charges on purchase payments (with respect to Class A Shares) and contingent deferred sales charges on redemptions (with respect to Class B and Class C Shares); and (2) ongoing costs, including management fees; distribution and service (12b-1) fees (with respect to Class A, Class B, Class C and Class R Shares); and other Fund expenses. This example is intended to help you understand your ongoing costs (in dollars) of investing in Class A, Class B, Class C, Institutional, Service, Class IR and Class R Shares of the Funds and to compare these costs with the ongoing costs of investing in other mutual funds.
The example is based on an investment of $1,000 invested at the beginning of the period and held for the entire period from November 1, 2012 through April 30, 2013.
Actual Expenses — The first line under each share class in the table below provides information about actual account values and actual expenses. You may use the information in this line, together with the amount you invested, to estimate the expenses that you paid over the period. Simply divide your account value by $1,000 (for example, an $8,600 account value divided by $1,000=8.6), then multiply the result by the number in the first line under the heading entitled “Expenses Paid” to estimate the expenses you paid on your account during this period.
Hypothetical Example for Comparison Purposes — The second line under each share class in the table below provides information about hypothetical account values and hypothetical expenses based on the Funds’ actual net expense ratio and an assumed rate of return of 5% per year before expenses, which is not the Funds’ actual return. The hypothetical account values and expenses may not be used to estimate the actual ending account balance or expenses you paid for the period. You may use this information to compare the ongoing costs of investing in the Funds and other funds. To do so, compare this 5% hypothetical example with the 5% hypothetical examples that appear in the shareholder reports of the other funds.
Please note that the expenses shown in the table are meant to highlight your ongoing costs only and do not reflect any transactional costs, such as sales charges, redemption fee or exchange fees. Therefore, the second line of the table is useful in comparing ongoing costs only, and will not help you determine the relative total costs of owning different funds. In addition, if these transactional costs were included, your costs would have been higher.
| | | | | | | | | | | | | | | | | | | | | | | | | | | | | | | | | | | | |
| | | Concentrated International Equity Fund | | | International Small Cap Fund | | | Strategic International Equity Fund | |
| Share Class | | Beginning
Account
Value
11/01/12 | | | Ending
Account
Value
04/30/13 | | | Expenses
Paid for the
6 Months Ended
04/30/13* | | | Beginning
Account
Value
11/01/12 | | | Ending
Account
Value
04/30/13 | | | Expenses
Paid for the
6 Months Ended
04/30/13* | | | Beginning
Account
Value
11/01/12 | | | Ending
Account
Value
04/30/13 | | | Expenses
Paid for the
6 Months Ended
04/30/13* | |
| Class A | | | | | | | | | | | | | | | | | | | | | | | | | | | | | | | | | | | | |
Actual | | $ | 1,000 | | | $ | 1,154.40 | | | $ | 7.85 | | | $ | 1,000 | | | $ | 1,158.10 | | | $ | 8.40 | | | $ | 1,000 | | | $ | 1,148.80 | | | $ | 7.73 | |
Hypothetical 5% return | | | 1,000 | | | | 1,017.5 | + | | | 7.35 | | | | 1,000 | | | | 1,017.01 | + | | | 7.85 | | | | 1,000 | | | | 1,017.60 | + | | | 7.25 | |
| Class B | | | | | | | | | | | | | | | | | | | | | | | | | | | | | | | | | | | | |
Actual | | | 1,000 | | | | 1,149.70 | | | | 11.83 | | | | 1,000 | | | | 1,153.20 | | | | 12.39 | | | | 1,000 | | | | 1,144.50 | | | | 11.70 | |
Hypothetical 5% return | | | 1,000 | | | | 1,013.79 | + | | | 11.08 | | | | 1,000 | | | | 1,013.29 | + | | | 11.58 | | | | 1,000 | | | | 1,013.88 | + | | | 10.99 | |
| Class C | | | | | | | | | | | | | | | | | | | | | | | | | | | | | | | | | | | | |
Actual | | | 1,000 | | | | 1,150.20 | | | | 11.84 | | | | 1,000 | | | | 1,153.10 | | | | 12.39 | | | | 1,000 | | | | 1,144.20 | | | | 11.70 | |
Hypothetical 5% return | | | 1,000 | | | | 1,013.79 | + | | | 11.08 | | | | 1,000 | | | | 1,013.29 | + | | | 11.58 | | | | 1,000 | | | | 1,013.88 | + | | | 10.99 | |
| Institutional | | | | | | | | | | | | | | | | | | | | | | | | | | | | | | | | | | | | |
Actual | | | 1,000 | | | | 1,156.60 | | | | 5.72 | | | | 1,000 | | | | 1,160.50 | | | | 6.27 | | | | 1,000 | | | | 1,150.80 | | | | 5.60 | |
Hypothetical 5% return | | | 1,000 | | | | 1,019.49 | + | | | 5.36 | | | | 1,000 | | | | 1,018.99 | + | | | 5.86 | | | | 1,000 | | | | 1,019.59 | + | | | 5.26 | |
| Service | | | | | | | | | | | | | | | | | | | | | | | | | | | | | | | | | | | | |
Actual | | | 1,000 | | | | 1,153.80 | | | | 8.38 | | | | 1,000 | | | | 1,157.10 | | | | 8.93 | | | | N/A | | | | N/A | | | | N/A | |
Hypothetical 5% return | | | 1,000 | | | | 1,017.01 | + | | | 7.85 | | | | 1,000 | | | | 1,016.51 | + | | | 8.35 | | | | N/A | | | | N/A | | | | N/A | |
| Class IR | | | | | | | | | | | | | | | | | | | | | | | | | | | | | | | | | | | | |
Actual | | | 1,000 | | | | 1,156.00 | | | | 6.47 | | | | 1,000 | | | | 1,159.40 | | | | 7.01 | | | | 1,000 | | | | 1,149.50 | | | | 6.40 | |
Hypothetical 5% return | | | 1,000 | | | | 1,018.79 | + | | | 6.06 | | | | 1,000 | | | | 1,018.30 | + | | | 6.56 | | | | 1,000 | | | | 1,018.84 | + | | | 6.01 | |
| Class R | | | | | | | | | | | | | | | | | | | | | | | | | | | | | | | | | | | | |
Actual | | | N/A | | | | N/A | | | | N/A | | | | N/A | | | | N/A | | | | N/A | | | | 1,000 | | | | 1,146.70 | | | | 9.05 | |
Hypothetical 5% return | | | N/A | | | | N/A | | | | N/A | | | | N/A | | | | N/A | | | | N/A | | | | 1,000 | | | | 1,016.36 | + | | | 8.50 | |
| * | | Expenses are calculated using each Fund’s annualized net expense ratio for each class, which represents the ongoing expenses as a percentage of net assets for the six months ended April 30, 2013. Expenses are calculated by multiplying the annualized net expense ratio by the average account value for the period; then multiplying the result by the number of days in the most recent fiscal half year; and then dividing that result by the number of days in the fiscal year. The annualized net expense ratios for the period were as follows: |
| | | | | | | | | | | | | | | | | | | | | | | | | | | | |
| Fund | | Class A | | | Class B | | | Class C | | | Institutional | | | Service | | | Class IR | | | Class R | |
Concentrated International Equity | | | 1.47 | % | | | 2.22 | % | | | 2.22 | % | | | 1.07 | % | | | 1.57 | % | | | 1.21 | % | | | N/A | |
International Small Cap | | | 1.57 | | | | 2.32 | | | | 2.32 | | | | 1.17 | | | | 1.67 | | | | 1.31 | | | | N/A | |
Strategic International Equity | | | 1.45 | | | | 2.20 | | | | 2.20 | | | | 1.05 | | | | N/A | | | | 1.20 | | | | 1.70 | % |
| + | | Hypothetical expenses are based on each Fund’s actual annualized net expense ratios and an assumed rate of return of 5% per year before expenses. |
52
FUNDS PROFILE
Goldman Sachs Funds

Goldman Sachs is a premier financial services firm, known since 1869 for creating thoughtful and customized investment solutions in complex global markets.
Today, the Investment Management Division of Goldman Sachs serves a diverse set of clients worldwide, including private institutions, public entities and individuals. With approximately $748.1 billion in assets under management as of March 31, 2013, Goldman Sachs Asset Management (“GSAM”) has portfolio management teams located around the world and our investment professionals bring firsthand knowledge of local markets to every investment decision. GSAM’s assets under management includes assets managed by Goldman Sachs Asset Management, L.P. and its Investment Advisory Affiliates.
|
| OVERVIEW OF GOLDMAN SACHS FUNDS |

Money Market1
Financial Square FundsSM
| n | | Financial Square Tax-Exempt Funds |
| n | | Financial Square Federal Fund |
| n | | Financial Square Government Fund |
| n | | Financial Square Money Market Fund |
| n | | Financial Square Prime Obligations Fund |
| n | | Financial Square Treasury Instruments Fund |
| n | | Financial Square Treasury Obligations Fund |
Fixed Income
Short Duration and Government
| n | | High Quality Floating Rate Fund2 |
| n | | Short Duration Government Fund |
| n | | Short Duration Income Fund |
| n | | Inflation Protected Securities Fund |
Multi-Sector
| n | | Core Plus Fixed Income Fund |
Municipal and Tax-Free
| n | | High Yield Municipal Fund |
| n | | Short Duration Tax-Free Fund |
Single Sector
| n | | Investment Grade Credit Fund |
| n | | High Yield Floating Rate Fund |
| n | | Emerging Markets Debt Fund |
| n | | Local Emerging Markets Debt Fund |
Corporate Credit
Fundamental Equity
| n | | Small/Mid Cap Growth Fund |
| n | | Flexible Cap Growth Fund |
| n | | Concentrated Growth Fund |
| n | | Technology Tollkeeper Fund |
| n | | Growth Opportunities Fund |
| n | | Rising Dividend Growth Fund |
Structured Equity
| n | | Structured Tax-Managed Equity Fund |
| n | | Structured International Tax-Managed Equity Fund |
| n | | U.S. Equity Dividend and Premium Fund |
| n | | International Equity Dividend and Premium Fund |
Equity Insights4
| n | | Small Cap Equity Insights Fund |
| n | | U.S. Equity Insights Fund |
| n | | Small Cap Growth Insights Fund |
| n | | Large Cap Growth Insights Fund |
| n | | Large Cap Value Insights Fund |
| n | | Small Cap Value Insights Fund |
| n | | International Small Cap Insights Fund |
| n | | International Equity Insights Fund |
| n | | Emerging Markets Equity Insights Fund |
Fundamental Equity International
| n | | Strategic International Equity Fund |
| n | | Concentrated International Equity Fund |
| n | | International Small Cap Fund |
| n | | Emerging Markets Equity Fund |
| n | | BRIC Fund (Brazil, Russia, India, China) |
Select Satellite5
| n | | Real Estate Securities Fund |
| n | | International Real Estate Securities Fund |
| n | | Commodity Strategy Fund |
| n | | Dynamic Allocation Fund |
| n | | Absolute Return Tracker Fund |
| n | | Managed Futures Strategy Fund |
| n | | MLP Energy Infrastructure Fund |
| n | | Multi-Manager Alternatives Fund |
| n | | Retirement Portfolio Completion Fund |
| n | | Income Strategies Portfolio |
Total Portfolio Solutions5
| n | | Balanced Strategy Portfolio |
| n | | Growth and Income Strategy Portfolio |
| n | | Growth Strategy Portfolio |
| n | | Equity Growth Strategy Portfolio |
| n | | Satellite Strategies Portfolio |
| n | | Enhanced Dividend Global Equity Portfolio |
| n | | Tax Advantaged Global Equity Portfolio |
| 1 | | An investment in a money market fund is neither insured nor guaranteed by the Federal Deposit Insurance Corporation (“FDIC”) or any other government agency. Although the Funds seek to preserve the value of your investment at $1.00 per share, it is possible to lose money by investing in the Funds. |
| 2 | | Effective at the close of business on July 27, 2012, the Goldman Sachs Ultra-Short Duration Government Fund was renamed the Goldman Sachs High Quality Floating Rate Fund. |
| 3 | | Effective at the close of business on June 29, 2012, the Goldman Sachs Balanced Fund was renamed the Goldman Sachs Income Builder Fund. |
| 4 | | Effective at the close of business May 3, 2013, the Goldman Sachs Structured Large Cap Growth, Structured Large Cap Value, Structured Small Cap Equity, Structured Small Cap Growth, Structured Small Cap Value, Structured U.S. Equity, Structured Emerging Markets Equity, Structured International Equity and Structured International Small Cap Funds were renamed the Goldman Sachs Large Cap Growth Insights, Large Cap Value Insights, Small Cap Equity Insights, Small Cap Growth Insights, Small Cap Value Insights, U.S. Equity Insights, Emerging Markets Equity Insights, International Equity Insights and International Small Cap Insights Funds, respectively. |
| 5 | | Individual Funds within the Total Portfolio Solutions and Select Satellite categories will have various placement on the risk/return spectrum and may have greater or lesser risk than that indicated by the placement of the general Total Portfolio Solutions or Select Satellite category. |
Financial Square FundsSM is a registered service mark of Goldman, Sachs & Co.
| | |
TRUSTEES Ashok N. Bakhru, Chairman Donald C. Burke John P. Coblentz, Jr. Diana M. Daniels Joseph P. LoRusso James A. McNamara Jessica Palmer Alan A. Shuch Richard P. Strubel | | OFFICERS James A. McNamara, President George F. Travers, Principal Financial Officer Caroline Kraus, Secretary Scott M. McHugh, Treasurer |
| |
GOLDMAN, SACHS & CO. Distributor and Transfer Agent | | GOLDMAN SACHS ASSET MANAGEMENT INTERNATIONAL Investment Adviser |
Visit our web site at www.goldmansachsfunds.com to obtain the most recent month-end returns.
Goldman Sachs Asset Management, L.P., 200 West Street, New York, New York 10282
The reports concerning the Funds included in this shareholder report may contain certain forward-looking statements about the factors that may affect the performance of the Funds in the future. These statements are based on Fund management’s predictions and expectations concerning certain future events and their expected impact on the Funds, such as performance of the economy as a whole and of specific industry sectors, changes in the levels of interest rates, the impact of developing world events, and other factors that may influence the future performance of the Funds. Management believes these forward-looking statements to be reasonable, although they are inherently uncertain and difficult to predict. Actual events may cause adjustments in portfolio management strategies from those currently expected to be employed.
A description of the policies and procedures that the Funds use to determine how to vote proxies relating to portfolio securities and information regarding how a Fund voted proxies relating to portfolio securities during the most recent 12-month period ended June 30 is available (I) without charge, upon request by calling 1-800-526-7384 (for Retail Shareholders) or 1-800-621-2550 (for Institutional Shareholders); and (II) on the Securities and Exchange Commission (“SEC”) web site at http://www.sec.gov.
The Funds file their complete schedule of portfolio holdings with the SEC for the first and third quarters of each fiscal year on Form N-Q. The Funds’ Forms N-Q are available on the SEC’s web site at http://www.sec.gov within 60 days after the Funds’ first and third fiscal quarters. The Funds’ Forms N-Q may be reviewed and copied at the SEC’s Public Reference Room in Washington, D.C. and information on the operation of the Public Reference Room may also be obtained by calling 1-800-SEC-0330. Forms N-Q may be obtained upon request and without charge by calling 1-800-526-7384 (for Retail Shareholders) or 1-800-621-2550 (for Institutional Shareholders).
Holdings and allocations shown are as of April 30, 2013 and may not be representative of future investments. Fund holdings should not be relied on in making investment decisions and should not be construed as research or investment advice regarding particular securities. Current and future holdings are subject to risk.
The Global Industry Classification Standard (GICS) was developed by and is the exclusive property and a service mark of Morgan Stanley Capital International Inc. (MSCI) and Standard & Poor’s, a division of The McGraw-Hill Companies, Inc. (S&P) and is licensed for use by Goldman Sachs. Neither MSCI, S&P nor any other party involved in making or compiling the GICS or any GICS classifications makes any express or implied warranties or representations with respect to such standard or classification (or the results to be obtained by the use thereof), and all such parties hereby expressly disclaim all warranties of originality, accuracy, completeness, merchantability or fitness for a particular purpose with respect to any of such standard or classification. Without limiting any of the foregoing, in no event shall MSCI, S&P, any of their affiliates or any third party involved in making or compiling the GICS or any GICS classifications have any liability for any direct, indirect, special, punitive, consequential or any other damages (including lost profits) even if notified of the possibility of such damages.
The portfolio risk management process includes an effort to monitor and manage risk, but does not imply low risk.
This material is not authorized for distribution to prospective investors unless preceded or accompanied by a current Prospectus or summary prospectus, if applicable. Investors should consider a Fund’s objective, risks, and charges and expenses, and read the summary prospectus, if available, and/or the Prospectus carefully before investing or sending money. The summary prospectus, if available, and the Prospectus contain this and other information about a Fund and may be obtained from your authorized dealer or from Goldman, Sachs & Co. by calling (retail – 1-800-526-7384) (institutional – 1-800-621-2550).
© 2013 Goldman Sachs. All rights reserved. 102366.MF.MED.TMPL/6/2013/EQINTSAR13/11.6K
| | The information required by this Item is only required in an annual report on this Form N-CSR. |
| ITEM 3. | AUDIT COMMITTEE FINANCIAL EXPERT. |
| | The information required by this Item is only required in an annual report on this Form N-CSR. |
| ITEM 4. | PRINCIPAL ACCOUNTANT FEES AND SERVICES. |
| | The information required by this Item is only required in an annual report on this Form N-CSR. |
| ITEM 5. | AUDIT COMMITTEE OF LISTED REGISTRANTS. |
| ITEM 6. | SCHEDULE OF INVESTMENTS. |
| | Schedule of Investments is included as part of the Report to Stockholders filed under Item 1. |
| ITEM 7. | DISCLOSURE OF PROXY VOTING POLICIES AND PROCEDURES FOR CLOSED-END MANAGEMENT INVESTMENT COMPANIES. |
| ITEM 8. | PORTFOLIO MANAGERS OF CLOSED-END MANAGEMENT INVESTMENT COMPANIES. |
| ITEM 9. | PURCHASES OF EQUITY SECURITIES BY CLOSED-END MANAGEMENT INVESTMENT COMPANY AND AFFILIATED PURCHASERS. |
| ITEM 10. | SUBMISSION OF MATTERS TO A VOTE OF SECURITY HOLDERS. |
| | There have been no material changes to the procedures by which shareholders may recommend nominees to the registrant’s board of trustees. |
| ITEM 11. | CONTROLS AND PROCEDURES. |
| | (a) | The registrant’s principal executive and principal financial officers, or persons performing similar functions have concluded that the registrant’s disclosure controls and procedures (as defined in Rule 30a-3(c) under the Investment Company Act of 1940, as amended (the “1940 Act”)) are effective as of a date within 90 days of the filing of this report that includes the disclosure required by this paragraph, based on the evaluation of these controls and procedures required by Rule 30a-3(b) under the 1940 Act and 15d-15(b) under the Securities Exchange Act of 1934, as amended. |
| | (b) | There were no changes in the registrant’s internal control over financial reporting (as defined in Rule 30a-3(d) under the 1940 Act) that occurred during the registrant’s second fiscal quarter of the period covered by this report that have materially affected, or are reasonably likely to materially affect, the registrant’s internal control over financial reporting. |
| | | | |
| (a)(1) | | The information required by this Item is only required in connection with an annual report on this Form N-CSR. |
| | |
| (a)(2) | | Exhibit 99.CERT | | Certifications pursuant to Section 302 of the Sarbanes-Oxley Act of 2002 filed herewith. |
| | |
| (b) | | Exhibit 99.906CERT | | Certifications pursuant to Section 906 of the Sarbanes-Oxley Act of 2002 filed herewith. |
SIGNATURES
Pursuant to the requirements of the Securities Exchange Act of 1934 and the Investment Company Act of 1940, the registrant has duly caused this report to be signed on its behalf by the undersigned, thereunto duly authorized.
| | | | |
| | | | Goldman Sachs Trust |
| | |
| By: | | | | /s/ James A. McNamara |
| | | | James A. McNamara |
| | | | President/Principal Executive Officer |
| | | | Goldman Sachs Trust |
| | |
| Date: | | | | June 20, 2013 |
Pursuant to the requirements of the Securities Exchange Act of 1934 and the Investment Company Act of 1940, this report has been signed below by the following persons on behalf of the registrant and in the capacities and on the dates indicated.
| | | | |
| By: | | | | /s/ James A. McNamara |
| | | | James A. McNamara |
| | | | President/Principal Executive Officer |
| | | | Goldman Sachs Trust |
| | |
| Date: | | | | June 20, 2013 |
| | |
| By: | | | | /s/ George F. Travers |
| | | | George F. Travers |
| | | | Principal Financial Officer |
| | | | Goldman Sachs Trust |
| | |
| Date: | | | | June 20, 2013 |