UNITED STATES
SECURITIES AND EXCHANGE COMMISSION
Washington, D.C. 20549
FORM N-CSR
CERTIFIED SHAREHOLDER REPORT OF REGISTERED
MANAGEMENT INVESTMENT COMPANIES
Investment Company Act file number 811-05349
Goldman Sachs Trust
(Exact name of registrant as specified in charter)
71 South Wacker Drive,
Chicago, Illinois 60606
(Address of principal executive offices) (Zip code)
| | |
Copies to: |
Caroline Kraus | | Geoffrey R.T. Kenyon, Esq. |
Goldman, Sachs & Co. | | Dechert LLP |
200 West Street | | 100 Oliver Street |
New York, New York 10282 | | 40th Floor |
| | Boston, MA 02110-2605 |
(Name and address of agents for service)
Registrant’s telephone number, including area code: (312) 655-4400
Date of fiscal year end: December 31
Date of reporting period: June 30, 2013
| ITEM 1. | REPORTS TO STOCKHOLDERS. |
| | The Semi-Annual Report to Stockholders is filed herewith. |
Goldman Sachs Funds

| | | | |
| | |
| Semi-Annual Report | | | | June 30, 2013 |
| | |
| | | | Fund of Funds Portfolios |
| | | | Balanced Strategy |
| | | | Equity Growth Strategy |
| | | | Growth and Income Strategy |
| | | | Growth Strategy |
| | | | Income Strategies |
| | | | Satellite Strategies |

Goldman Sachs Fund of Funds Portfolios
| n | | GROWTH AND INCOME STRATEGY |
| | | | |
TABLE OF CONTENTS | | | | |
| |
Principal Investment Strategies and Risks | | | 1 | |
| |
Market Review | | | 3 | |
| |
Investment Process | | | 6 | |
| |
Portfolio Management Discussions and Performance Summaries | | | 8 | |
| |
Schedules of Investments | | | 39 | |
| |
Financial Statements | | | 46 | |
| |
Financial Highlights | | | 54 | |
| |
Notes to Financial Statements | | | 66 | |
| |
Other Information | | | 82 | |
| | | | |
| | | |
| NOT FDIC-INSURED | | May Lose Value | | No Bank Guarantee |
GOLDMAN SACHS FUND OF FUNDS PORTFOLIOS
Principal Investment Strategies and Risks
This is not a complete list of risks that may affect the Portfolios. For additional information concerning the risks applicable to the Portfolios, please see the Portfolios’ Prospectus.
The Goldman Sachs Balanced Strategy Portfolio invests in affiliated domestic and international fixed income and equity funds (“underlying funds”). The Portfolio’s investment in any of the underlying funds may exceed 25% of its assets. The Portfolio currently expects to invest a relatively significant percentage of its assets in the Goldman Sachs Short Duration Government, Goldman Sachs Global Income, Goldman Sachs Core Fixed Income, Goldman Sachs Structured Large Cap Growth, Goldman Sachs Structured Large Cap Value, and Goldman Sachs Structured International Equity Funds. The Portfolio is subject to the risk factors of the underlying funds in direct proportion to its investments in those underlying funds, and the ability of the Portfolio to meet its investment objective is directly related to the ability of the underlying funds to meet their investment objectives, as well as the allocation among those underlying funds by the Investment Adviser. An underlying fund is subject to the risks associated with its investments, including (as applicable) those associated with equity, fixed income, foreign and derivative investments generally. From time to time, the underlying funds in which the Portfolio invests, and the size of the investments in the underlying funds, may change. Because the Portfolio is subject to the underlying fund expenses as well as its own expenses, the cost of investing in the Portfolio may be higher than investing in a mutual fund that only invests directly in stocks and bonds.
The Goldman Sachs Equity Growth Strategy Portfolio invests substantially all of its assets in affiliated domestic and international equity funds (“underlying funds”). The Portfolio’s investment in any of the underlying funds may exceed 25% of its assets. The Portfolio currently expects to invest a relatively significant percentage of its assets in the Goldman Sachs Structured Large Cap Growth, Goldman Sachs Structured Large Cap Value and Goldman Sachs Structured International Equity Funds. The Portfolio is subject to the risk factors of the underlying funds in direct proportion to its investments in those underlying funds, and the ability of the Portfolio to meet its investment objective is directly related to the ability of the underlying funds to meet their investment objectives, as well as the allocation among those underlying funds by the Investment Adviser. An underlying fund is subject to the risks associated with its investments, including (as applicable) those associated with equity, fixed income, foreign and derivative investments generally. From time to time, the underlying funds in which the Portfolio invests, and the size of the investments in the underlying funds, may change. Because the Portfolio is subject to the underlying fund expenses as well as its own expenses, the cost of investing in the Portfolio may be higher than investing in a mutual fund that only invests directly in stocks and bonds.
The Goldman Sachs Growth and Income Strategy Portfolio invests in affiliated domestic and international fixed income and equity funds (“underlying funds”). The Portfolio’s investment in any of the underlying funds may exceed 25% of its assets. The Portfolio currently expects to invest a relatively significant percentage of its assets in the Goldman Sachs Structured Large Cap Growth, Goldman Sachs Structured Large Cap Value, Goldman Sachs Structured International Equity, Goldman Sachs Core Fixed Income and Goldman Sachs Global Income Funds. The Portfolio is subject to the risk factors of the underlying funds in direct proportion to its investments in those underlying funds, and the ability of the Portfolio to meet its investment objective is directly related to the ability of the underlying funds to meet their investment objectives, as well as the allocation among those underlying funds by the Investment Adviser. An underlying fund is subject to the risks associated with its investments, including (as applicable) those associated with equity, fixed income, foreign and derivative investments generally. From time to time, the underlying funds in which the Portfolio invests, and the size of the investments in the underlying funds, may change. Because the Portfolio is subject to the underlying fund expenses as well as its own expenses, the cost of investing in the Portfolio may be higher than investing in a mutual fund that only invests directly in stocks and bonds.
1
GOLDMAN SACHS FUND OF FUNDS PORTFOLIOS
The Goldman Sachs Growth Strategy Portfolio invests in affiliated domestic and international fixed income and equity funds (“underlying funds”). The Portfolio’s investment in any of the underlying funds may exceed 25% of its assets. The Portfolio currently expects to invest a relatively significant percentage of its assets in the Goldman Sachs Structured Large Cap Growth, Goldman Sachs Structured Large Cap Value and Goldman Sachs Structured International Equity Funds. The Portfolio is subject to the risk factors of the underlying funds in direct proportion to its investments in those underlying funds, and the ability of the Portfolio to meet its investment objective is directly related to the ability of the underlying funds to meet their investment objectives, as well as the allocation among those underlying funds by the Investment Adviser. An underlying fund is subject to the risks associated with its investments, including (as applicable) those associated with equity, fixed income, foreign and derivative investments generally. From time to time, the underlying funds in which the Portfolio invests, and the size of the investments in the underlying funds, may change. Because the Portfolio is subject to the underlying fund expenses as well as its own expenses, the cost of investing in the Portfolio may be higher than investing in a mutual fund that only invests directly in stocks and bonds.
The Goldman Sachs Income Strategies Portfolio invests in affiliated domestic and international fixed income and equity funds (“underlying funds”). The Portfolio’s investment in any of the underlying funds may exceed 25% of its assets. The Portfolio currently expects to invest a relatively significant percentage of its assets in the Goldman Sachs U.S. Equity Dividend and Premium, Goldman Sachs International Equity Dividend and Premium, Goldman Sachs International Real Estate Securities, Goldman Sachs High Yield, Goldman Sachs Global Income, Goldman Sachs Local Emerging Markets Debt, Goldman Sachs Investment Grade Credit and Goldman Sachs Emerging Markets Debt Funds. The Portfolio is subject to the risk factors of the underlying funds in direct proportion to its investments in those underlying funds, and the ability of the Portfolio to meet its investment objective is directly related to the ability of the underlying funds to meet their investment objectives, as well as the allocation among those underlying funds by the Investment Adviser. An underlying fund is subject to the risks associated with its investments, including (as applicable) those associated with equity, fixed income, foreign and derivative investments generally. From time to time, the underlying funds in which the Portfolio invests, and the size of the investments in the underlying funds, may change. Because the Portfolio is subject to the underlying fund expenses as well as its own expenses, the cost of investing in the Portfolio may be higher than investing in a mutual fund that only invests directly in stocks and bonds.
The Goldman Sachs Satellite Strategies Portfolio invests primarily in affiliated fixed income and equity funds (“underlying funds”) which are considered to invest in satellite asset classes. Satellite asset classes are those that have traditionally had low correlations to traditional market exposures such as large capitalization equities and investment grade fixed income. The Portfolio’s investment in any of the underlying funds may exceed 25% of its assets. The Investment Adviser expects to invest relatively significant percentages in the following satellite equity asset classes: emerging markets equity, international small cap, U.S. and international real estate securities. The Investment Adviser may invest a relatively significant percentage in the following satellite fixed income asset classes: high yield, emerging markets debt and commodities. The Portfolio is subject to the risk factors of the underlying funds in direct proportion to its investments in those underlying funds, and the ability of the Portfolio to meet its investment objective is directly related to the ability of the underlying funds to meet their investment objectives, as well as the allocation among those underlying funds by the Investment Adviser. An underlying fund is subject to the risks associated with its investments, including (as applicable) those associated with equity, fixed income, foreign, commodity and derivative investments generally. From time to time, the underlying funds in which the Portfolio invests, and the size of the investments in the underlying funds, may change. Because the Portfolio is subject to the underlying fund expenses as well as its own expenses, the cost of investing in the Portfolio may be higher than investing in a mutual fund that only invests directly in stocks and bonds.
2
MARKET REVIEW
Fund of Funds Portfolios
Dear Shareholder:
This report provides an overview of regional and sector preferences of the Goldman Sachs Fund of Funds Portfolios (each, a “Portfolio,” and collectively, the “Portfolios”) during the six-month period ended June 30, 2013 (the
“Reporting Period”).
Market Review
During the six months ended June 30, 2013 (the “Reporting Period”), global equity markets overall recorded positive returns, while global fixed income markets generally declined.
U.S. Equity Markets
U.S. equities, as represented by the S&P® 500 Index, extended their rally from 2012 with a strong first quarter in 2013. Indeed, the S&P® 500 Index finished the first quarter of 2013 with significant gains, making a five-year high during these months. The Dow Jones Industrial Average also hit a new record high during the first calendar quarter.
Despite the overhang of automatic spending cuts, or sequestration, that went into effect in March 2013, U.S. equity markets reflected a variety of improving economic indicators. Strong momentum in the housing market continued, as the Case-Shiller Index of house prices rose 8.1% in January 2013, year-over-year the fastest pace since mid-2006. The employment picture also improved, with the unemployment rate dropping to 7.7%. Strong retail sales suggested consumers may have been feeling the effects of better housing and labor market conditions.
After a strong start to the second quarter of 2013, bullish sentiment began to fade, and the U.S. equity rally halted in mid-May 2013 when Federal Reserve (“Fed”) Chair Bernanke announced the potential “tapering” of the pace of quantitative easing asset purchases. U.S. equity markets reacted negatively again in June to news the slowing of the asset purchase program could begin later this year, with the program ending by the middle of 2014 if the economy grows as expected. U.S. equity markets calmed toward the end of the month as a downward revision of first quarter Gross Domestic Product (“GDP”) from 2.4% to 1.8% supported reassurance from the Fed that it would only begin reducing asset purchases if the economy was clearly on track. Still, the S&P® 500 Index declined modestly in June 2013, ending seven consecutive months of gains and muting returns for the quarter as a whole. Even with that, both the S&P® 500 Index and the Dow Jones Industrial Average made fresh record highs, fueled by the continued strong rebound in house prices during the second calendar quarter, and returns for the Reporting Period overall were still significantly up.
International Equity Markets
European equity markets managed gains during the Reporting Period, despite a banking crisis in Cyprus and further economic contraction in the Eurozone. Strong performance by the Japanese equity market dominated returns for the Reporting Period but was partially offset by weaker returns for the Asia ex-Japan region, where such returns were exaggerated by depreciating currencies. The yen weakened to its lowest level against the U.S. dollar since mid-2009 on expectations the new head of the Bank of Japan will aggressively pursue a 2% inflation target. Japanese equities hit a five-year high during May 2013 before taking a sharp turn down with a number of other global equity markets. In mid-May, Fed Chair Bernanke’s announcement regarding the potential “tapering” of the pace of quantitative easing asset
3
MARKET REVIEW
purchases led to a virtual halt in the broad international equity rally. The international equity markets also reacted negatively in June to news the Fed could begin slowing its asset purchase program later in 2013. In China, a sharp spike in interbank lending rates in June 2013 further pressured global equity markets. Concerns that tighter monetary conditions would exacerbate an already slowing Chinese economy weakened commodity prices.
Fixed Income Markets
When the Reporting Period began in January 2013, risk appetite in the fixed income markets was supported by a last-minute deal on the fiscal cliff, as U.S. lawmakers agreed to extend the Bush-era tax cuts for all but the highest income earners. Spread, or non-U.S. Treasury, fixed income sectors rallied and the yields on government bonds generally rose. This trend reversed itself during February 2013, as market volatility increased, primarily on worries about U.S. fiscal policy gridlock and Italy’s elections. The center-left’s failure to gain a majority in the upper house of Italy’s legislature raised concerns about the prospects for a stable coalition government and the country’s commitment to reform.
In March 2013, tensions resurfaced in the Eurozone, as Cyprus’ bailout by Euro-area finance ministers raised the prospect of a tax on bank deposits, prompting fears of a more widespread run on European banks. As investors grew more defensive, government bond yields declined. Spread sectors remained relatively firm. In the U.S., Congress chose to not act on the automatic federal spending cuts known as the sequester, allowing them to start taking effect. Still, the U.S. housing and labor markets continued to show signs of strength, which was interpreted to mean the Fed could begin laying the groundwork for policy tightening. Meanwhile, the Bank of Japan announced surprisingly aggressive new easing measures in its first policy meeting since the induction of Governor Haruhiko Kuroda and deputies Kazumasa Iwata and Hiroshi Nakaso.
In April 2013, European peripherals performed well despite weaker economic data. Italian President Giorgio Napolitano was re-elected and Enrico Letta was named as Prime Minister, easing political uncertainty in Italy. U.S. economic data softened somewhat early in April but was followed later in the month by more positive signs — employment and housing market data were strong. Government bond yields declined on the disappointing economic data in early April, stabilizing later in the month. Spread sectors also performed well, as investors looked past sluggish economic data for higher yielding assets in the exceptionally low interest rate environment.
At the beginning of May 2013, the European Central Bank cut its main policy interest rate by 25 basis points to a record low 0.50%, citing weak Eurozone growth and slowing inflation. (A basis point equals 1/100th of a percentage point.) In the U.S., economic data continued to show signs of recovery with strong housing price appreciation and improvement in the jobs picture. Later in May, during testimony to Congress, Fed Chair Ben Bernanke said the central bank could begin reducing asset purchases. The case for the “taper” was supported by more positive economic reports, including better payrolls, consumer confidence and housing data. In response to Bernanke’s testimony, government bond yields rose substantially. At the same time, spread sectors grew more volatile, reflecting widespread uncertainty over how markets might function should the Fed withdraw support.
4
MARKET REVIEW
In June 2013, bond investors focused on the U.S. economy and stronger than expected payrolls data, which reinforced expectations the Fed will start reducing its quantitative easing during 2013. Government bond yields continued to rise, as the Fed meeting and press conference were more hawkish than expected. Spread sectors remained volatile. Meanwhile, European data improved, with very modest increases in the Eurozone Purchasing Managers Indices and accelerating expansion in the U.K. Japan’s economy continued to respond positively to its government and central bank’s policies. In contrast, China’s economic data raised concerns about the extent of that nation’s slowdown.
5
GOLDMAN SACHS FUND OF FUNDS PORTFOLIOS
What Differentiates Goldman Sachs’
Approach to Asset Allocation?
We believe that strong, consistent investment results through asset allocation are best achieved through teams of experts working together on a global scale:
| n | | Goldman Sachs’ Quantitative Investment Strategies Team determines the strategic and quarterly tactical asset allocations. The team is comprised of over 90 professionals with significant academic and practitioner experience. |
| n | | Goldman Sachs’ Portfolio Management Teams offer expert management of the mutual funds that are contained within each Asset Allocation Portfolio (each, a “Portfolio”). These same teams manage portfolios for institutional and high net worth investors. |
Goldman Sachs Asset Allocation Investment Process

Quantitative Investment Strategies Team
Each Fund of Funds Portfolio represents a diversified global portfolio on the efficient frontier.* The Portfolios differ in their long-term objective, and therefore, their asset allocation mix. The long-term strategic asset allocation is the primary source of risk and the corresponding primary determinant of total return. It therefore represents an anchor, or neutral starting point, from which tactical asset allocation decisions are made.

Quantitative Investment Strategies Team
For each Portfolio, the strategic asset allocation is combined with a measured amount of tactical risk. Changing market conditions create opportunities to capitalize on investing in different countries and asset classes relative to others over time. Within each strategy, we shift assets away from the strategic allocation (over and underweighting certain asset classes and countries) to seek to benefit from changing conditions in global capital markets.
Using proprietary portfolio construction models to maintain each Portfolio’s original risk/ return profile over time, the team makes ten active decisions based on its current outlook on global equity, fixed income and currency markets.
| | |
n Asset class selection | | Are stocks, bonds or cash more attractive? |
n Regional equity selection | | Are U.S. or non-U.S. equities more attractive? |
n Regional bond selection | | Are U.S. or non-U.S. bonds more attractive? |
n U.S. equity style selection | | Are U.S. value or U.S. growth equities more attractive? |
n U.S. equity size selection | | Are U.S. large-cap or U.S. small-cap equities more attractive? |
n Emerging/developed equity selection | | Are emerging or developed equities more attractive? |
| *Portfolios | | on the efficient frontier are optimal in both the sense that they offer maximal expected return for some given level of risk and minimal risk for some given level of expected return. The efficient frontier is the line created from the risk-reward graph, comprised of optimal portfolios. The optimal portfolios plotted along the curve have the highest expected return possible for the given amount of risk. |
6
GOLDMAN SACHS FUND OF FUNDS PORTFOLIOS

| | |
n Developed equity country selection | | Which international countries are more attractive? |
n Emerging equity country selection | | Which emerging market countries are more attractive? |
n High yield selection | | Are high yield or core fixed income securities more attractive? |
n Emerging/developed bond selection | | Are emerging or developed bonds more attractive? |

Mutual Fund Portfolio Management Teams
Each Portfolio is comprised of underlying Goldman Sachs Mutual Funds managed by broad, deep portfolio management teams. In addition to global tactical asset allocation, we seek to generate excess returns through security selection within each underlying mutual fund. Whether in the equity or fixed income arenas, these portfolio management teams share a commitment to firsthand fundamental research and seek performance driven by successful security selection.
7
PORTFOLIO RESULTS
Fund of Funds Portfolios – Asset Allocation
Investment Process and Principal Strategies
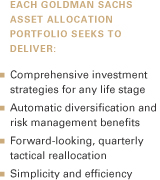
Each Portfolio seeks to achieve its investment objective by investing in a combination of underlying funds that currently exist or that may become available for investment in the future for which Goldman Sachs Asset Management (“GSAM”) or an affiliate, now or in the future, acts as investment adviser or principal underwriter (the “underlying funds”). Some of the Portfolios’ underlying funds invest primarily in fixed income or money market instruments, and some invest primarily in equity securities. Some underlying funds also invest dynamically across equity, fixed income and commodity investment through a managed-volatility approach.
The investment adviser allows the Portfolios’ strategic targets to shift with their respective market returns but continues to adjust tactical tilts on a quarterly basis to reflect the investment adviser’s latest views. The investment adviser adjusts the overall asset allocation of the Portfolios based on current market conditions and the investment adviser’s economic and market forecasts.
Portfolio Management Discussion and Analysis
Below, the Goldman Sachs Quantitative Investment Strategies Team discusses the Portfolios’ performance and positioning for the six-month period ended June 30, 2013 (the “Reporting Period”)
| Q | | How did the Portfolios perform during the Reporting Period? |
| A | | Goldman Sachs Balanced Strategy Portfolio — During the Reporting Period, the Balanced Strategy Portfolio’s Class A, B, C, Institutional, Service, IR and R Shares generated cumulative total returns of 0.85%, 0.54%, 0.46%, 1.15%, 0.78%, 0.99% and 0.82%, respectively. This compares to the 1.70% cumulative total return of the Portfolio’s blended benchmark, which is comprised 60% of the Barclays Global Aggregate Bond Index (hedged to U.S. dollars) (“Barclays Global Index”) and 40% of the MSCI All Country World Index (unhedged) (“MSCI ACWI Index”), during the same period. |
| | The components of the Portfolio’s blended benchmarks, the Barclays Global Index and the MSCI ACWI Index, generated cumulative total returns of -1.17% and 6.05%, respectively, during the same period. |
| | Goldman Sachs Equity Growth Strategy Portfolio — During the Reporting Period, the Equity Growth Strategy Portfolio’s Class A, B, C, Institutional, Service, IR and R Shares generated cumulative total returns of 6.38%, 5.92%, 5.95%, 6.50%, 6.23%, 6.45% and 6.27%, respectively. This compares to the 6.05% cumulative total return of the Portfolio’s benchmark, MSCI ACWI Index, during the same period. |
| | The components of the Portfolio’s blended benchmarks, the Barclays Global Index and the MSCI ACWI Index, generated cumulative total returns of -1.17% and 6.05%, respectively, during the same period. |
| | Goldman Sachs Growth and Income Strategy Portfolio — During the Reporting Period, the Growth and Income Strategy Portfolio’s Class A, B, C, Institutional, Service, IR and R Shares generated cumulative total returns of 2.49%, 2.11%, 2.12%, 2.70%, 2.54%, 2.55% and 2.38%, respectively. This compares to the 3.15% cumulative total return of the Portfolio’s blended benchmark, which is comprised 40% of the Barclays Global Index and 60% of the MSCI ACWI Index, during the same period. |
| | The components of the Portfolio’s blended benchmarks, the Barclays Global Index and the MSCI ACWI Index, generated cumulative total returns of -1.17% and 6.05%, respectively, during the same period. |
| | Goldman Sachs Growth Strategy Portfolio — During the Reporting Period, the Growth Strategy Portfolio’s Class A, B, C, Institutional, Service, IR and R Shares generated cumulative total returns of 4.34%, 3.96%, 3.90%, 4.62%, 4.36%, 4.58% and 4.17%, respectively. This compares to the 4.60% cumulative total return of the Portfolio’s blended benchmark, which is comprised 80% of the MSCI ACWI Index and 20% of the Barclays Global Index, during the same period. |
| | The components of the Portfolio’s blended benchmarks, the Barclays Global Index and the MSCI ACWI Index, |
8
PORTFOLIO RESULTS
| | generated cumulative total returns of -1.17% and 6.05%, respectively, during the same period. |
| Q | | What key factors affected the Portfolios’ performance during the Reporting Period? |
| A | | During the Reporting Period, the Portfolios generated positive absolute returns. However, with the exception of certain share classes, the Portfolios underperformed their respective blended benchmarks after fees and expenses. Overall, our strategic, long-term asset allocation policy detracted from relative performance. On the positive side, our quarterly tactical views enhanced relative results, especially in Portfolios with greater equity exposure. Security selection within the underlying funds also contributed positively to the performance of each of the Portfolios. |
| Q | | How did Global Tactical Asset Allocation decisions affect the Portfolios’ performance during the Reporting Period? |
| A | | As indicated, the implementation of our quarterly tactical views added to the performance of the Portfolios during the Reporting Period. Overall, the Portfolios’ overweight in equities versus fixed income was the largest positive contributor to relative returns. These gains were partially offset by the Portfolios’ overweight in emerging markets equities over developed markets equities during the Reporting Period. In addition, the Portfolios’ overweight in local emerging markets debt (through which the Portfolios gain exposure to local currencies) versus developed markets debt dampened relative results. |
| | Our other asset class tactical views did not have a significant impact on performance during the Reporting Period. |
| Q | | How did the Portfolios’ underlying funds perform relative to their respective benchmark indices during the Reporting Period? |
| A | | Of the Portfolios’ underlying equity funds, the Goldman Sachs Large Cap Growth Insights Fund and the Goldman Sachs International Equity Insights Fund performed best relative to their respective benchmark indices.1 The Goldman Sachs Strategic Growth Fund underperformed its benchmark index most during the Reporting Period. |
| | On the fixed income side, the Goldman Sachs Global Income Fund and the Goldman Sachs High Yield Fund outperformed their respective benchmark indices most. The Goldman Sachs Local Emerging Markets Debt Fund underperformed its benchmark index most during the Reporting Period. |
| | Among alternative investment classes, the Goldman Sachs International Real Estate Securities Fund significantly outperformed its benchmark index. The Goldman Sachs Commodity Strategy Fund underperformed its benchmark most during the Reporting Period. |
| Q | | How did the Portfolios use derivatives and similar instruments during the Reporting Period? |
| A | | The Portfolios do not directly invest in derivatives. However, some of the underlying funds used derivatives during the Reporting Period to apply their active investment views with greater versatility and to afford greater risk management precision. As market conditions warranted during the Reporting Period, some of these underlying funds engaged in forward foreign currency exchange contracts, financial futures contracts, options, swap contracts and structured securities to attempt to enhance portfolio return and for hedging purposes. |
| Q | | What changes did you make during the Reporting Period within both the equity and fixed income portions of the Portfolio? |
| A | | Throughout the Reporting Period, we favored equities over fixed income in implementing our strategies. |
| | Within equities, at the beginning of the Reporting Period, we were bullish on U.S. stocks versus international stocks. During the first quarter of 2013, we became bullish on international equities over U.S. equities given supportive macroeconomic conditions for international equities relative to U.S. equities. We remained bullish on international equities over U.S. equities during the second quarter of 2013 because of supportive macroeconomic conditions and attractive valuations of international equities. Also, when the Reporting Period started, we were modestly bullish on emerging markets equities versus developed markets equities and grew increasingly more bullish during the first quarter of 2013. During the second calendar quarter, we became bullish on developed markets equities versus emerging markets equities because of the attractive relative valuations of developed markets equities. |
| | 1 | | Effective at the close of business May 3, 2013, the Goldman Sachs Structured Large Cap Growth Fund was renamed the Goldman Sachs Large Cap Growth Insights Fund and the Goldman Sachs Structured International Equity Fund was renamed the Goldman Sachs International Equity Insights Fund. |
9
PORTFOLIO RESULTS
| | We implemented our country level views within the Goldman Sachs International Equity Insights Fund and the Goldman Sachs Emerging Markets Equity Insights Fund,2 which served as underlying funds during the Reporting Period. At the end of the Reporting Period, we were bullish on Japan because of supportive macroeconomic conditions, strong momentum and good investment flows. We favored Switzerland primarily as a result of supportive macroeconomic conditions and good investment flows. We had a bearish view on Australia because of unattractive valuations, low risk premiums and poor investment flows. We were bearish on Canada as a result of weak momentum and unattractive valuations. Within emerging markets equities at the end of the Reporting Period, we favored the Czech Republic as a result of high risk premiums and attractive valuations. We were bullish on Turkey because of high risk premiums. We held a bearish view on Taiwan given low risk premiums, and we were bearish on Chile because of unattractive valuations. |
| | Among U.S. equities, we began the Reporting Period slightly bullish on value stocks versus growth stocks because of strong sentiment and high risk premiums for value stocks. We became more bullish on value stocks over growth stocks during the first quarter of 2013 as a result of high risk premiums for value stocks. In the second calendar quarter, we remained bullish on value stocks versus growth stocks given strong sentiment for value stocks. |
| | We were bullish at the beginning of the Reporting Period on U.S. small-cap stocks relative to U.S. large-cap stocks because of the strong sentiment and high risk premiums for small-cap equities. We grew more bullish on U.S. small-cap stocks over U.S. large-cap stocks during the first quarter of 2013 due to strong sentiment and high risk premiums for U.S. small-cap stocks. During the second calendar quarter, we maintained our bullish view on U.S. small-cap stocks relative to U.S. large-cap stocks as a result of strong sentiment for U.S. small-cap stocks. |
| | Within fixed income, throughout the Reporting Period, we remained neutral on international fixed income versus U.S. fixed income. We also were bullish on high yield bonds versus investment grade bonds throughout the Reporting Period because of the relatively strong momentum of high yield bonds. |
| | When the Reporting Period started, we held a bullish view on U.S. dollar denominated emerging markets debt versus developed markets debt as a result of strong momentum for U.S. dollar denominated emerging markets debt. During the first quarter of 2013, we became bullish on developed markets debt relative to U.S. dollar denominated emerging markets debt primarily because of weakening momentum in U.S. dollar denominated emerging markets debt. In the second calendar quarter, we became neutral on U.S. dollar denominated emerging markets debt relative to developed markets debt as a result of weak momentum in U.S. dollar denominated emerging markets debt. |
| | At the beginning of the Reporting Period, we were bullish on local emerging markets debt relative to developed markets debt due to supportive macroeconomic conditions. We remained bullish on local emerging markets debt relative to developed markets debt in the first quarter of 2013 because of strong currency momentum and high risk premiums. During the second calendar quarter, we became bearish on local emerging markets debt versus developed markets debt primarily because of poor momentum for local emerging markets debt. |
| Q | | What is the Portfolios’ tactical view and strategy for the months ahead? |
| A | | Global equilibrium is the foundation of our strategic asset allocation process — that is, we believe that a globally-diversified portfolio of asset classes, weighted by their market capitalization, is designed to provide economically intuitive, meaningful and balanced exposures to investment opportunities. We make 10 active decisions within the Portfolios based on our current outlook on global equity, fixed income and currency markets. On a quarterly basis, we shift assets away from the strategic allocation (tilting our positions in certain asset classes and countries from their longer-term, strategic weights) in an effort to benefit from changing conditions in global capital markets. |
| | At the end of the Reporting Period, we were bullish on equities relative to fixed income as a result of strong momentum and supportive macroeconomic conditions for equities. We were modestly bullish on developed markets equities versus emerging markets equities, and we remained slightly bullish on international equities versus U.S. equities. Within U.S. equities, we were slightly bullish on value stocks relative to growth stocks. Also, we had slightly moderated our bullish view on U.S. small-cap stocks versus U.S. large-cap stocks. |
| | 2 | | Effective at the close of business May 3, 2013, the Goldman Sachs Structured Emerging Markets Equity Fund was renamed the Goldman Sachs Emerging Markets Equity Insights Fund. |
10
PORTFOLIO RESULTS
| | In fixed income at the end of the Reporting Period, we were neutral on international fixed income relative to U.S. fixed income. We had increased our bullish view on high yield bonds relative to investment grade bonds. We were neutral on U.S. dollar-denominated emerging markets debt versus developed markets debt and were bearish on local emerging markets debt versus developed markets debt. |
11
FUND BASICS
Balanced Strategy
as of June 30, 2013
| | | | | | | | | | |
| | PERFORMANCE REVIEW | |
| | | January 1, 2013–June 30, 2013 | | Portfolio Total Return
(based on NAV)1 | | | Balanced Strategy
Composite Index2 | |
| | Class A | | | 0.85 | % | | | 1.70 | % |
| | Class B | | | 0.54 | | | | 1.70 | |
| | Class C | | | 0.46 | | | | 1.70 | |
| | Institutional | | | 1.15 | | | | 1.70 | |
| | Service | | | 0.78 | | | | 1.70 | |
| | Class IR | | | 0.99 | | | | 1.70 | |
| | | Class R | | | 0.82 | | | | 1.70 | |
| | 1 | | The net asset value (“NAV”) represents the net assets of the class of the Portfolio (ex-dividend) divided by the total number of shares of the class outstanding. The Portfolio’s performance assumes the reinvestment of dividends and other distributions. The Portfolio’s performance does not reflect the deduction of any applicable sales charges. |
| | 2 | | The Balanced Strategy Composite Index (“Balanced Composite”) is a composite representation prepared by the investment adviser of the performance of the Portfolio’s asset classes weighted according to their respective weightings in the Portfolio’s target range. The Balanced Strategy Composite Index (“Balanced Composite”) is comprised of a blend of the Barclays Global Aggregate Bond Index (hedged to U.S. dollars) (60%) and the MSCI All Country World Index (unhedged) (the “MSCI ACWI Index”) (40%). The Balanced Composite figures do not reflect any deduction for fees, expenses or taxes. The Barclays Global Aggregate Bond Index hedged to the U.S. dollar, is an unmanaged index, provides a broad-based measure of the global investment-grade fixed-rate debt markets and covers the most liquid portion of the global investment grade fixed-rate bond market, including government, credit and collateralized securities. The Index figures do not include any deduction for fees, expenses or taxes. It is not possible to invest directly in an unmanaged index. The MSCI ACWI Index is a free float-adjusted market capitalization weighted index that is designed to measure the equity market performance of developed and emerging markets. The MSCI ACWI consists of 45 country indices comprising 24 developed and 21 emerging market country indices. The developed market country indices included are: Australia, Austria, Belgium, Canada, Denmark, Finland, France, Germany, Greece, Hong Kong, Ireland, Israel, Italy, Japan, Netherlands, New Zealand, Norway, Portugal, Singapore, Spain, Sweden, Switzerland, the United Kingdom and the United States. The emerging market country indices are: Brazil, Chile, China, Colombia, Czech Republic, Egypt, Hungary, India, Indonesia, Korea, Malaysia, Mexico, Morocco, Peru, Philippines, Poland, Russia, South Africa, Taiwan, Thailand, and Turkey. The Index figures do not include any deduction for fees, expenses or taxes. It is not possible to invest directly in an unmanaged index. |
| | | | The returns set forth in the table above represent past performance. Past performance does not guarantee future results. The Portfolio’s investment return and principal value will fluctuate so that an investor’s shares, when redeemed, may be worth more or less than their original cost. Current performance may be lower or higher than the performance quoted above. Please visit our web site at www.goldmansachsfunds. com to obtain the most recent month-end returns. Performance reflects applicable fee waivers and/or expense limitations in effect during the periods shown. In their absence, performance would be reduced. Returns do not reflect the deduction of taxes that a shareholder would pay on Portfolio distributions or the redemption of Portfolio shares. |
12
FUND BASICS
| | | | | | | | | | | | | | |
| | STANDARDIZED TOTAL RETURNS3 |
| | | For the period ended 6/30/13 | | One Year | | | Five Years | | Ten Years | | Since Inception | | Inception Date |
| | Class A | | | 0.82 | % | | 1.89% | | 4.73% | | 3.99% | | 1/2/98 |
| | Class B | | | 0.73 | | | 1.87 | | 4.69 | | 3.97 | | 1/2/98 |
| | Class C | | | 4.85 | | | 2.30 | | 4.55 | | 3.60 | | 1/2/98 |
| | Institutional | | | 7.10 | | | 3.49 | | 5.77 | | 4.80 | | 1/2/98 |
| | Service | | | 6.54 | | | 2.95 | | 5.22 | | 4.27 | | 1/2/98 |
| | Class IR | | | 6.99 | | | 3.30 | | N/A | | 2.33 | | 11/30/07 |
| | | Class R | | | 6.44 | | | 2.82 | | N/A | | 1.85 | | 11/30/07 |
| | 3 | | The Standardized Total Returns are average annual total returns as of the most recent calendar quarter-end. They assume reinvestment of all distributions at NAV. These returns reflect a maximum initial sales charge of 5.5% for Class A Shares and the assumed contingent deferred sales charge for Class B Shares (5% maximum declining to 0% after six years) and the assumed contingent deferred sales charge for Class C Shares (1% if redeemed within 12 months of purchase). Because Institutional, Service, Class IR and Class R Shares do not involve a sales charge, such a charge is not applied to their Standardized Total Returns. The Portfolio’s Class B Shares are no longer available for purchase by new or existing shareholders (although current Class B shareholders may continue to reinvest income and capital gains distributions into Class B Shares, and Class B shareholders may continue to exchange their shares for Class B Shares of certain other Goldman Sachs Funds). |
| | | | The returns set forth in the table above represent past performance. Past performance does not guarantee future results. The Portfolio’s investment return and principal value will fluctuate so that an investor’s shares, when redeemed, may be worth more or less than their original cost. Current performance may be lower or higher than the performance quoted above. Please visit our web site at www.goldmansachsfunds.com to obtain the most recent month-end returns. Performance reflects applicable fee waivers and/or expense limitations in effect during the periods shown. In their absence, performance would be reduced. Returns do not reflect the deduction of taxes that a shareholder would pay on Portfolio distributions or the redemption of Portfolio shares. |
| | | | | | | | | | |
| | EXPENSE RATIOS4 | |
| | | | | Net Expense Ratio (Current) | | | Gross Expense Ratio (Before Waivers) | |
| | Class A | | | 1.28 | % | | | 1.34 | % |
| | Class B | | | 2.04 | | | | 2.09 | |
| | Class C | | | 2.03 | | | | 2.09 | |
| | Institutional | | | 0.88 | | | | 0.94 | |
| | Service | | | 1.38 | | | | 1.44 | |
| | Class IR | | | 1.03 | | | | 1.09 | |
| | | Class R | | | 1.53 | | | | 1.59 | |
| | 4 | | The expense ratios of the Portfolio, both current (net of applicable fee waivers and/or expense limitations) and before waivers (gross of applicable fee waivers and/or expense limitations) are as set forth above according to the most recent publicly available Prospectus for the Portfolio and will differ from the expense ratios disclosed in the Financial Highlights in this report due to the inclusion of Underlying Fund fees and expenses, which are not included in the operating expenses of the Portfolio reflected in the Financial Highlights. The Portfolio’s waivers and/or expense limitations will remain in place through at least April 30, 2014, and prior to such date the Investment Adviser may not terminate the arrangements without the approval of the Portfolio’s Board of Trustees. If these arrangements are discontinued in the future, the expense ratios may change without shareholder approval. |
13
FUND BASICS
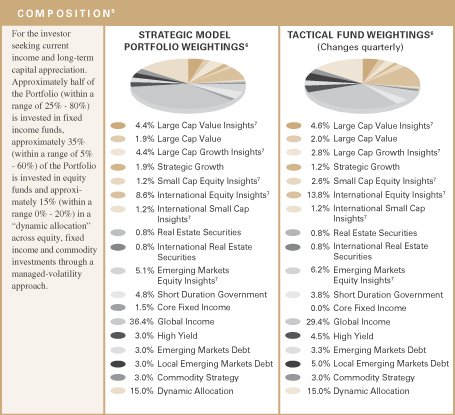
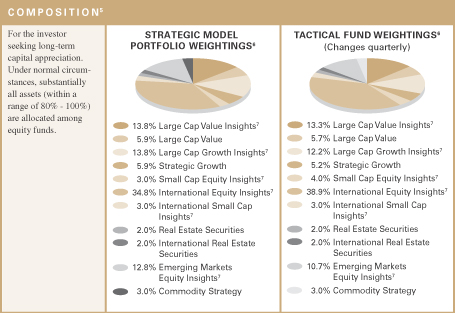
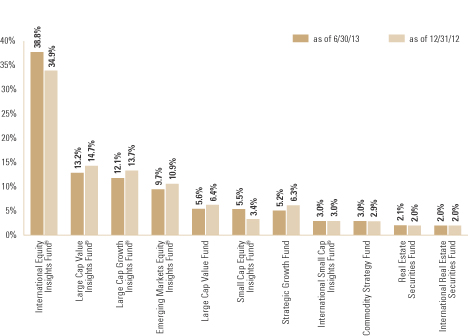
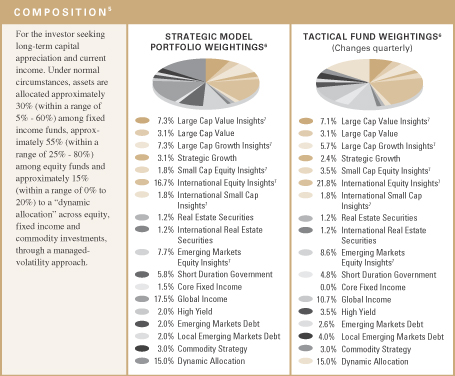
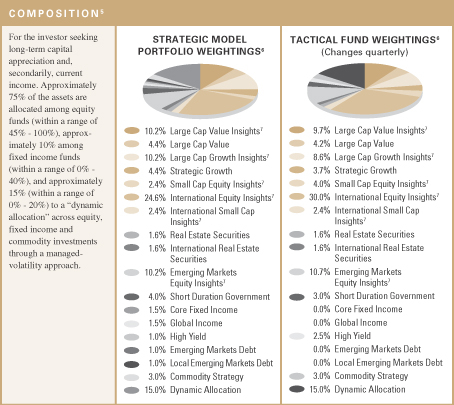
| | 5 | | The tactical fund weightings are set at the beginning of each calendar quarter. The weighting in the chart above reflects the allocations from March 31, 2013 to June 30, 2013. Actual Fund weighting in the Asset Allocation Portfolios may differ from the figures shown above due to rounding, differences in returns of the Underlying Funds, or both. The above figures are not indicative of future allocations. |
| | 6 | | Strategic allocation is the process of determining the areas of the global markets in which to invest, and in what long-term proportion, for each Fund. Our global approach attempts to generate strong potential long-term returns across geographies and asset classes, and is determined through a careful review of market opportunities and risk/return tradeoffs. It is rebalanced annually. On a quarterly basis, we shift assets around the strategic allocation, over and under-weighting asset classes and countries relative to the neutral starting point, seeking to benefit from changing short-term conditions in global capital markets. This is called tactical asset allocation. |
| | 7 | | Effective at the close of business May 3, 2013, the Goldman Sachs Structured International Equity, Structured Large Cap Value, Structured Large Cap Growth, Structured Emerging Markets Equity, Structured Small Cap Equity and Structured International Small Cap Funds were renamed the Goldman Sachs International Equity Insights, Large Cap Value Insights, Large Cap Growth Insights, Emerging Markets Equity Insights, Small Cap Equity Insights and International Small Cap Insights Funds, respectively. |
14
FUND BASICS
| | |
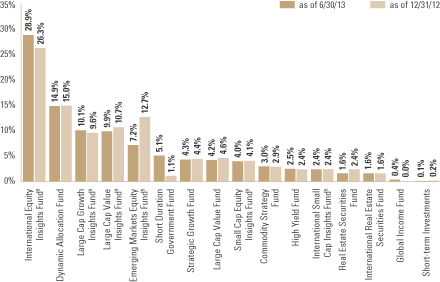
| OVERALL UNDERLYING FUND WEIGHTINGS8 | | |
| Percentage of Net Assets | | |
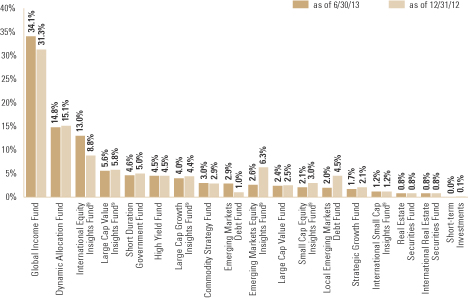
| | 8 | | The Portfolio is actively managed and, as such, its composition may differ over time. The percentage shown for each underlying fund reflects the value of that underlying fund as a percentage of net assets of the Portfolio. Short-term investments represent repurchase agreements. Figures in the above graph may not sum to 100% due to rounding and/or the exclusion of other assets and liabilities. |
| | 9 | | Effective at the close of business May 3, 2013, the Goldman Sachs Structured International Equity, Structured Large Cap Value, Structured Large Cap Growth, Structured Emerging Markets Equity, Structured Small Cap Equity and Structured International Small Cap Funds were renamed the Goldman Sachs International Equity Insights, Large Cap Value Insights, Large Cap Growth Insights, Emerging Markets Equity Insights, Small Cap Equity Insights and International Small Cap Insights Funds, respectively. |
15
FUND BASICS
Equity Growth Strategy
as of June 30, 2013
| | | | | | | | | | |
| | PERFORMANCE REVIEW | |
| | | January 1, 2013–June 30, 2013 | | Portfolio Total Return
(based on NAV)1 | | | MSCI All Country World Index (net, unhedged)2 | |
| | Class A | | | 6.38 | % | | | 6.05 | % |
| | Class B | | | 5.92 | | | | 6.05 | |
| | Class C | | | 5.95 | | | | 6.05 | |
| | Institutional | | | 6.50 | | | | 6.05 | |
| | Service | | | 6.23 | | | | 6.05 | |
| | Class IR | | | 6.45 | | | | 6.05 | |
| | | Class R | | | 6.27 | | | | 6.05 | |
| | 1 | | The net asset value (“NAV”) represents the net assets of the class of the Portfolio (ex-dividend) divided by the total number of shares of the class outstanding. The Portfolio’s performance assumes the reinvestment of dividends and other distributions. The Portfolio’s performance does not reflect the deduction of any applicable sales charges. |
| | 2 | | The Equity Growth Strategy Composite Index (“Equity Growth Composite”) is a composite representation prepared by the investment adviser of the performance of the Portfolio’s asset classes weighted according to their respective weightings in the Portfolio’s target range. The Fund’s Index is the MSCI All Country World Index (unhedged) (the “MSCI ACWI Index”). The MSCI ACWI Index figures do not reflect any deduction for fees, expenses or taxes. The MSCI ACWI Index is a free float-adjusted market capitalization weighted index that is designed to measure the equity market performance of developed and emerging markets. The MSCI ACWI consists of 45 country indices comprising 24 developed and 21 emerging market country indices. The developed market country indices included are: Australia, Austria, Belgium, Canada, Denmark, Finland, France, Germany, Greece, Hong Kong, Ireland, Israel, Italy, Japan, Netherlands, New Zealand, Norway, Portugal, Singapore, Spain, Sweden, Switzerland, the United Kingdom and the United States. The emerging market country indices are: Brazil, Chile, China, Colombia, Czech Republic, Egypt, Hungary, India, Indonesia, Korea, Malaysia, Mexico, Morocco, Peru, Philippines, Poland, Russia, South Africa, Taiwan, Thailand, and Turkey. The Index figures do not include any deduction for fees, expenses or taxes. It is not possible to invest directly in an unmanaged index. |
| | | | The returns set forth in the table above represent past performance. Past performance does not guarantee future results. The Portfolio’s investment return and principal value will fluctuate so that an investor’s shares, when redeemed, may be worth more or less than their original cost. Current performance may be lower or higher than the performance quoted above. Please visit our web site at www.goldmansachsfunds.com to obtain the most recent month-end returns. Performance reflects applicable fee waivers and/or expense limitations in effect during the periods shown. In their absence, performance would be reduced. Returns do not reflect the deduction of taxes that a shareholder would pay on Portfolio distributions or the redemption of Portfolio shares. |
16
FUND BASICS
| | | | | | | | | | | | | | | | |
| | STANDARDIZED TOTAL RETURNS3 |
| | | For the period ended 6/30/13 | | One Year | | | Five Years | | Ten Years | | Since Inception | | | Inception Date |
| | Class A | | | 10.15 | % | | 0.08% | | 6.50% | | | 3.51 | % | | 1/2/98 |
| | Class B | | | 10.64 | | | 0.03 | | 6.44 | | | 3.49 | | | 1/2/98 |
| | Class C | | | 14.73 | | | 0.45 | | 6.31 | | | 3.13 | | | 1/2/98 |
| | Institutional | | | 16.98 | | | 1.60 | | 7.53 | | | 4.28 | | | 1/2/98 |
| | Service | | | 16.38 | | | 1.09 | | 6.98 | | | 3.78 | | | 1/2/98 |
| | Class IR | | | 16.96 | | | 1.45 | | N/A | | | -0.70 | | | 11/30/07 |
| | | Class R | | | 16.28 | | | 1.05 | | N/A | | | -1.11 | | | 11/30/07 |
| | 3 | | The Standardized Total Returns are average annual total returns as of the most recent calendar quarter-end. They assume reinvestment of all distributions at NAV. These returns reflect a maximum initial sales charge of 5.5% for Class A Shares and the assumed contingent deferred sales charge for Class B Shares (5% maximum declining to 0% after six years) and the assumed contingent deferred sales charge for Class C Shares (1% if redeemed within 12 months of purchase). Because Institutional, Service, Class IR and Class R Shares do not involve a sales charge, such a charge is not applied to their Standardized Total Returns. The Portfolio’s Class B Shares are no longer available for purchase by new or existing shareholders (although current Class B shareholders may continue to reinvest income and capital gains distributions into Class B Shares, and Class B shareholders may continue to exchange their shares for Class B Shares of certain other Goldman Sachs Funds). |
| | | | The returns set forth in the table above represent past performance. Past performance does not guarantee future results. The Portfolio’s investment return and principal value will fluctuate so that an investor’s shares, when redeemed, may be worth more or less than their original cost. Current performance may be lower or higher than the performance quoted above. Please visit our web site at www.goldmansachsfunds.com to obtain the most recent month-end returns. Performance reflects applicable fee waivers and/or expense limitations in effect during the periods shown. In their absence, performance would be reduced. Returns do not reflect the deduction of taxes that a shareholder would pay on Portfolio distributions or the redemption of Portfolio shares. |
| | | | | | | | |
| | EXPENSE RATIOS4 |
| | | | | Net Expense Ratio (Current) | | | Gross Expense Ratio (Before Waivers) |
| | Class A | | | 1.35 | % | | 1.44% |
| | Class B | | | 2.10 | | | 2.19 |
| | Class C | | | 2.10 | | | 2.19 |
| | Institutional | | | 0.95 | | | 1.02 |
| | Service | | | 1.46 | | | 1.54 |
| | Class IR | | | 1.10 | | | 1.18 |
| | | Class R | | | 1.60 | | | 1.68 |
| | 4 | | The expense ratios of the Portfolio, both current (net of applicable fee waivers and/or expense limitations) and before waivers (gross of applicable fee waivers and/or expense limitations) are as set forth above according to the most recent publicly available Prospectus for the Portfolio and will differ from the expense ratios disclosed in the Financial Highlights in this report due to the inclusion of Underlying Fund fees and expenses, which are not included in the operating expenses of the Portfolio reflected in the Financial Highlights. The Portfolio’s waivers and/or expense limitations will remain in place through at least April 30, 2014, and prior to such date the Investment Adviser may not terminate the arrangements without the approval of the Portfolio’s Board of Trustees. If these arrangements are discontinued in the future, the expense ratios may change without shareholder approval. |
17
FUND BASICS
| | 5 | | The tactical fund weightings are set at the beginning of each calendar quarter. The weighting in the chart above reflects the allocations from March 31, 2013 to June 30, 2013. Actual Fund weighting in the Asset Allocation Portfolios may differ from the figures shown above due to rounding, differences in returns of the Underlying Funds, or both. The above figures are not indicative of future allocations. |
| | 6 | | Strategic allocation is the process of determining the areas of the global markets in which to invest, and in what long-term proportion, for each Fund. Our global approach attempts to generate strong potential long-term returns across geographies and asset classes, and is determined through a careful review of market opportunities and risk/return tradeoffs. It is rebalanced annually. On a quarterly basis, we shift assets around the strategic allocation, over and under-weighting asset classes and countries relative to the neutral starting point, seeking to benefit from changing short-term conditions in global capital markets. This is called tactical asset allocation. |
| | 7 | | Effective at the close of business May 3, 2013, the Goldman Sachs Structured International Equity, Structured Large Cap Value, Structured Large Cap Growth, Structured Emerging Markets Equity, Structured Small Cap Equity and Structured International Small Cap Funds were renamed the Goldman Sachs International Equity Insights, Large Cap Value Insights, Large Cap Growth Insights, Emerging Markets Equity Insights, Small Cap Equity Insights and International Small Cap Insights Funds, respectively. |
18
FUND BASICS
| | |
| OVERALL UNDERLYING FUND WEIGHTINGS8 | | |
| Percentage of Net Assets | | |
| | 8 | | The Portfolio is actively managed and, as such, its composition may differ over time. The percentage shown for each underlying fund reflects the value of that underlying fund as a percentage of net assets of the Portfolio. Figures in the above graph may not sum to 100% due to rounding and/or the exclusion of other assets and liabilities. |
| | 9 | | Effective at the close of business May 3, 2013, the Goldman Sachs Structured International Equity, Structured Large Cap Value, Structured Large Cap Growth, Structured Emerging Markets Equity, Structured Small Cap Equity and Structured International Small Cap Funds were renamed the Goldman Sachs International Equity Insights, Large Cap Value Insights, Large Cap Growth Insights, Emerging Markets Equity Insights, Small Cap Equity Insights and International Small Cap Insights Funds, respectively. |
19
FUND BASICS
Growth and Income Strategy
as of June 30, 2013
| | | | | | | | | | |
| | PERFORMANCE REVIEW | |
| | | January 1, 2013–June 30, 2013 | | Portfolio Total Return
(based on NAV)1 | | | Growth and Income
Strategy
Composite Index2 | |
| | Class A | | | 2.49 | % | | | 3.15 | % |
| | Class B | | | 2.11 | | | | 3.15 | |
| | Class C | | | 2.12 | | | | 3.15 | |
| | Institutional | | | 2.70 | | | | 3.15 | |
| | Service | | | 2.54 | | | | 3.15 | |
| | Class IR | | | 2.55 | | | | 3.15 | |
| | | Class R | | | 2.38 | | | | 3.15 | |
| | 1 | | The net asset value (“NAV”) represents the net assets of the class of the Portfolio (ex-dividend) divided by the total number of shares of the class outstanding. The Portfolio’s performance assumes the reinvestment of dividends and other distributions. The Portfolio’s performance does not reflect the deduction of any applicable sales charges. |
| | 2 | | The Growth and Income Strategy Composite (“Growth and Income Composite”) is comprised of a blend of the Barclays Global Aggregate Bond Index (hedged to U.S. dollars) (40%) and the MSCI All Country World Index (unhedged) (the “MSCI ACWI Index”) (60%). The Growth and Income Composite figures do not reflect any deduction for fees, expenses or taxes. The Barclays Global Aggregate Bond Index hedged to the U.S. dollar, is an unmanaged index, provides a broad-based measure of the global investment-grade fixed-rate debt markets and covers the most liquid portion of the global investment grade fixed-rate bond market, including government, credit and collateralized securities. The Index figures do not include any deduction for fees, expenses or taxes. It is not possible to invest directly in an unmanaged index. The MSCI ACWI Index is a free float-adjusted market capitalization weighted index that is designed to measure the equity market performance of developed and emerging markets. The MSCI ACWI consists of 45 country indices comprising 24 developed and 21 emerging market country indices. The developed market country indices included are: Australia, Austria, Belgium, Canada, Denmark, Finland, France, Germany, Greece, Hong Kong, Ireland, Israel, Italy, Japan, Netherlands, New Zealand, Norway, Portugal, Singapore, Spain, Sweden, Switzerland, the United Kingdom and the United States. The emerging market country indices are: Brazil, Chile, China, Colombia, Czech Republic, Egypt, Hungary, India, Indonesia, Korea, Malaysia, Mexico, Morocco, Peru, Philippines, Poland, Russia, South Africa, Taiwan, Thailand, and Turkey. The Index figures do not include any deduction for fees, expenses or taxes. It is not possible to invest directly in an unmanaged index. |
| | | | The returns set forth in the table above represent past performance. Past performance does not guarantee future results. The Portfolio’s investment return and principal value will fluctuate so that an investor’s shares, when redeemed, may be worth more or less than their original cost. Current performance may be lower or higher than the performance quoted above. Please visit our web site at www.goldmansachsfunds.com to obtain the most recent month-end returns. Performance reflects applicable fee waivers and/or expense limitations in effect during the periods shown. In their absence, performance would be reduced. Returns do not reflect the deduction of taxes that a shareholder would pay on Portfolio distributions or the redemption of Portfolio shares. |
20
FUND BASICS
| | | | | | | | | | | | | | |
| | STANDARDIZED TOTAL RETURNS3 |
| | | For the period ended 6/30/13 | | One Year | | | Five Years | | Ten Years | | Since Inception | | Inception Date |
| | Class A | | | 3.63 | % | | 1.18% | | 5.47% | | 4.05% | | 1/2/98 |
| | Class B | | | 3.75 | | | 1.14 | | 5.42 | | 4.02 | | 1/2/98 |
| | Class C | | | 7.86 | | | 1.55 | | 5.26 | | 3.64 | | 1/2/98 |
| | Institutional | | | 10.10 | | | 2.72 | | 6.48 | | 4.84 | | 1/2/98 |
| | Service | | | 9.63 | | | 2.23 | | 5.96 | | 4.32 | | 1/2/98 |
| | Class IR | | | 9.91 | | | 2.51 | | N/A | | 0.90 | | 11/30/07 |
| | | Class R | | | 9.51 | | | 2.08 | | N/A | | 0.46 | | 11/30/07 |
| | 3 | | The Standardized Total Returns are average annual total returns as of the most recent calendar quarter-end. They assume reinvestment of all distributions at NAV. These returns reflect a maximum initial sales charge of 5.5% for Class A Shares and the assumed contingent deferred sales charge for Class B Shares (5% maximum declining to 0% after six years) and the assumed contingent deferred sales charge for Class C Shares (1% if redeemed within 12 months of purchase). Because Institutional, Service, Class IR and Class R Shares do not involve a sales charge, such a charge is not applied to their Standardized Total Returns. The Portfolio’s Class B Shares are no longer available for purchase by new or existing shareholders (although current Class B shareholders may continue to reinvest income and capital gains distributions into Class B Shares, and Class B shareholders may continue to exchange their shares for Class B Shares of certain other Goldman Sachs Funds). |
| | | | The returns set forth in the table above represent past performance. Past performance does not guarantee future results. The Portfolio’s investment return and principal value will fluctuate so that an investor’s shares, when redeemed, may be worth more or less than their original cost. Current performance may be lower or higher than the performance quoted above. Please visit our web site at www.goldmansachsfunds.com to obtain the most recent month-end returns. Performance reflects applicable fee waivers and/or expense limitations in effect during the periods shown. In their absence, performance would be reduced. Returns do not reflect the deduction of taxes that a shareholder would pay on Portfolio distributions or the redemption of Portfolio shares. |
| | | | | | | | |
| | EXPENSE RATIOS4 |
| | | | | Net Expense Ratio (Current) | | | Gross Expense Ratio (Before Waivers) |
| | Class A | | | 1.31 | % | | 1.35% |
| | Class B | | | 2.07 | | | 2.10 |
| | Class C | | | 2.06 | | | 2.10 |
| | Institutional | | | 0.91 | | | 0.94 |
| | Service | | | 1.41 | | | 1.45 |
| | Class IR | | | 1.06 | | | 1.10 |
| | | Class R | | | 1.56 | | | 1.60 |
| | 4 | | The expense ratios of the Portfolio, both current (net of applicable fee waivers and/or expense limitations) and before waivers (gross of applicable fee waivers and/or expense limitations) are as set forth above according to the most recent publicly available Prospectus for the Portfolio and will differ from the expense ratios disclosed in the Financial Highlights in this report due to the inclusion of Underlying Fund fees and expenses, which are not included in the operating expenses of the Portfolio reflected in the Financial Highlights. The Portfolio’s waivers and/or expense limitations will remain in place through at least April 30, 2014, and prior to such date the Investment Adviser may not terminate the arrangements without the approval of the Portfolio’s Board of Trustees. If these arrangements are discontinued in the future, the expense ratios may change without shareholder approval. |
21
FUND BASICS
| | 5 | | The tactical fund weightings are set at the beginning of each calendar quarter. The weighting in the chart above reflects the allocations from March 31, 2013 to June 30, 2013. Actual Fund weighting in the Asset Allocation Portfolios may differ from the figures shown above due to rounding, differences in returns of the Underlying Funds, or both. The above figures are not indicative of future allocations. |
| | 6 | | Strategic allocation is the process of determining the areas of the global markets in which to invest, and in what long-term proportion, for each Fund. Our global approach attempts to generate strong potential long-term returns across geographies and asset classes, and is determined through a careful review of market opportunities and risk/return tradeoffs. It is rebalanced annually. On a quarterly basis, we shift assets around the strategic allocation, over and under-weighting asset classes and countries relative to the neutral starting point, seeking to benefit from changing short-term conditions in global capital markets. This is called tactical asset allocation. |
| | 7 | | Effective at the close of business May 3, 2013, the Goldman Sachs Structured International Equity, Structured Large Cap Value, Structured Large Cap Growth, Structured Emerging Markets Equity, Structured Small Cap Equity and Structured International Small Cap Funds were renamed the Goldman Sachs International Equity Insights, Large Cap Value Insights, Large Cap Growth Insights, Emerging Markets Equity Insights, Small Cap Equity Insights and International Small Cap Insights Funds, respectively. |
22
FUND BASICS
| | |
| OVERALL UNDERLYING FUND WEIGHTINGS8 | | |
| Percentage of Net Assets | | |
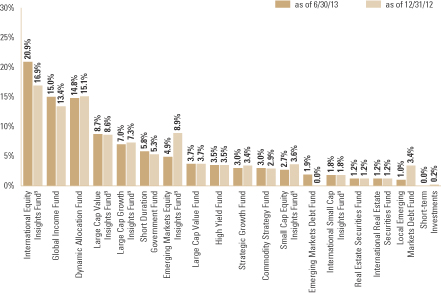
| | 8 | | The Portfolio is actively managed and, as such, its composition may differ over time. The percentage shown for each underlying fund reflects the value of that underlying fund as a percentage of net assets of the Portfolio. Short-term investments represent repurchase agreements. Figures in the above graph may not sum to 100% due to rounding and/or the exclusion of other assets and liabilities. |
| | 9 | | Effective at the close of business May 3, 2013, the Goldman Sachs Structured International Equity, Structured Large Cap Value, Structured Large Cap Growth, Structured Emerging Markets Equity, Structured Small Cap Equity and Structured International Small Cap Funds were renamed the Goldman Sachs International Equity Insights, Large Cap Value Insights, Large Cap Growth Insights, Emerging Markets Equity Insights, Small Cap Equity Insights and International Small Cap Insights Funds, respectively. |
23
FUND BASICS
Growth Strategy
as of June 30, 2013
| | | | | | | | | | |
| | PERFORMANCE REVIEW | |
| | | January 1, 2013–June 30, 2013 | | Portfolio Total Return
(based on NAV)1 | | | Growth Strategy
Composite Index2 | |
| | Class A | | | 4.34 | % | | | 4.60 | % |
| | Class B | | | 3.96 | | | | 4.60 | |
| | Class C | | | 3.90 | | | | 4.60 | |
| | Institutional | | | 4.62 | | | | 4.60 | |
| | Service | | | 4.36 | | | | 4.60 | |
| | Class IR | | | 4.58 | | | | 4.60 | |
| | | Class R | | | 4.17 | | | | 4.60 | |
| | 1 | | The net asset value (“NAV”) represents the net assets of the class of the Portfolio (ex-dividend) divided by the total number of shares of the class outstanding. The Portfolio’s performance assumes the reinvestment of dividends and other distributions. The Portfolio’s performance does not reflect the deduction of any applicable sales charges. |
| | 2 | | The Growth Strategy Composite Index (“Growth Strategy Composite”) is comprised of a blend of the Barclays Global Aggregate Bond Index (hedged to U.S. dollars) (20%) and the MSCI All Country World Index (unhedged) (the “MSCI ACWI Index”) (80%). The Growth Strategy Composite figures do not reflect any deduction for fees, expenses or taxes. The Barclays Global Aggregate Bond Index hedged to the U.S. dollar, is an unmanaged index, provides a broad-based measure of the global investment-grade fixed-rate debt markets and covers the most liquid portion of the global investment grade fixed-rate bond market, including government, credit and collateralized securities. The Index figures do not include any deduction for fees, expenses or taxes. It is not possible to invest directly in an unmanaged index. The MSCI ACWI Index is a free float-adjusted market capitalization weighted index that is designed to measure the equity market performance of developed and emerging markets. The MSCI ACWI consists of 45 country indices comprising 24 developed and 21 emerging market country indices. The developed market country indices included are: Australia, Austria, Belgium, Canada, Denmark, Finland, France, Germany, Greece, Hong Kong, Ireland, Israel, Italy, Japan, Netherlands, New Zealand, Norway, Portugal, Singapore, Spain, Sweden, Switzerland, the United Kingdom and the United States. The emerging market country indices are: Brazil, Chile, China, Colombia, Czech Republic, Egypt, Hungary, India, Indonesia, Korea, Malaysia, Mexico, Morocco, Peru, Philippines, Poland, Russia, South Africa, Taiwan, Thailand, and Turkey. The Index figures do not include any deduction for fees, expenses or taxes. It is not possible to invest directly in an unmanaged index. |
| | | | The returns set forth in the table above represent past performance. Past performance does not guarantee future results. The Portfolio’s investment return and principal value will fluctuate so that an investor’s shares, when redeemed, may be worth more or less than their original cost. Current performance may be lower or higher than the performance quoted above. Please visit our web site at www.goldmansachsfunds.com to obtain the most recent month-end returns. Performance reflects applicable fee waivers and/or expense limitations in effect during the periods shown. In their absence, performance would be reduced. Returns do not reflect the deduction of taxes that a shareholder would pay on Portfolio distributions or the redemption of Portfolio shares. |
24
FUND BASICS
| | | | | | | | | | | | | | | | |
| | STANDARDIZED TOTAL RETURNS3 |
| | | For the period ended 6/30/13 | | One Year | | | Five Years | | Ten Years | | Since Inception | | | Inception Date |
| | Class A | | | 6.73 | % | | 0.12% | | 5.74% | | | 3.50 | % | | 1/2/98 |
| | Class B | | | 7.11 | | | 0.08 | | 5.69 | | | 3.47 | | | 1/2/98 |
| | Class C | | | 11.13 | | | 0.50 | | 5.55 | | | 3.11 | | | 1/2/98 |
| | Institutional | | | 13.46 | | | 1.67 | | 6.77 | | | 4.29 | | | 1/2/98 |
| | Service | | | 13.01 | | | 1.17 | | 6.24 | | | 3.77 | | | 1/2/98 |
| | Class IR | | | 13.35 | | | 1.52 | | N/A | | | -0.41 | | | 11/30/07 |
| | | Class R | | | 12.80 | | | 1.02 | | N/A | | | -0.90 | | | 11/30/07 |
| | 3 | | The Standardized Total Returns are average annual total returns as of the most recent calendar quarter-end. They assume reinvestment of all distributions at NAV. These returns reflect a maximum initial sales charge of 5.5% for Class A Shares and the assumed contingent deferred sales charge for Class B Shares (5% maximum declining to 0% after six years) and the assumed contingent deferred sales charge for Class C Shares (1% if redeemed within 12 months of purchase). Because Institutional, Service, Class IR and Class R Shares do not involve a sales charge, such a charge is not applied to their Standardized Total Returns. The Portfolio’s Class B Shares are no longer available for purchase by new or existing shareholders (although current Class B shareholders may continue to reinvest income and capital gains distributions into Class B Shares, and Class B shareholders may continue to exchange their shares for Class B Shares of certain other Goldman Sachs Funds). |
| | | | The returns represent past performance. Past performance does not guarantee future results. The Portfolio’s investment return and principal value will fluctuate so that an investor’s shares, when redeemed, may be worth more or less than their original cost. Current performance may be lower or higher than the performance quoted above. Please visit our web site at www.goldmansachsfunds.com to obtain the most recent month-end returns. Performance reflects applicable fee waivers and/or expense limitations in effect during the periods shown. In their absence, performance would be reduced. Returns do not reflect the deduction of taxes that a shareholder would pay on Portfolio distributions or the redemption of Portfolio shares. |
| | | | | | | | | | |
| | EXPENSE RATIOS4 | |
| | | | | Net Expense Ratio (Current) | | | Gross Expense Ratio (Before Waivers) | |
| | Class A | | | 1.35 | % | | | 1.40 | % |
| | Class B | | | 2.10 | | | | 2.15 | |
| | Class C | | | 2.10 | | | | 2.15 | |
| | Institutional | | | 0.95 | | | | 0.99 | |
| | Service | | | 1.45 | | | | 1.50 | |
| | Class IR | | | 1.10 | | | | 1.14 | |
| | | Class R | | | 1.60 | | | | 1.64 | |
| | 4 | | The expense ratios of the Portfolio, both current (net of applicable fee waivers and/or expense limitations) and before waivers (gross of applicable fee waivers and/or expense limitations) are as set forth above according to the most recent publicly available Prospectus for the Portfolio and will differ from the expense ratios disclosed in the Financial Highlights in this report due to the inclusion of Underlying Fund fees and expenses, which are not included in the operating expenses of the Portfolio reflected in the Financial Highlights. The Portfolio’s waivers and/or expense limitations will remain in place through at least April 30, 2014, and prior to such date the Investment Adviser may not terminate the arrangements without the approval of the Portfolio’s Board of Trustees. If these arrangements are discontinued in the future, the expense ratios may change without shareholder approval. |
25
FUND BASICS
| | 5 | | The tactical fund weightings are set at the beginning of each calendar quarter. The weighting in the chart above reflects the allocations from March 31, 2013 to June 30, 2013. Actual Fund weighting in the Asset Allocation Portfolios may differ from the figures shown above due to rounding, differences in returns of the Underlying Funds, or both. The above figures are not indicative of future allocations. |
| | 6 | | Strategic allocation is the process of determining the areas of the global markets in which to invest, and in what long-term proportion, for each Fund. Our global approach attempts to generate strong potential long-term returns across geographies and asset classes, and is determined through a careful review of market opportunities and risk/return tradeoffs. It is rebalanced annually. On a quarterly basis, we shift assets around the strategic allocation, over and under-weighting asset classes and countries relative to the neutral starting point, seeking to benefit from changing short-term conditions in global capital markets. This is called tactical asset allocation. |
| | 7 | | Effective at the close of business May 3, 2013, the Goldman Sachs Structured International Equity, Structured Large Cap Value, Structured Large Cap Growth, Structured Emerging Markets Equity, Structured Small Cap Equity and Structured International Small Cap Funds were renamed the Goldman Sachs International Equity Insights, Large Cap Value Insights, Large Cap Growth Insights, Emerging Markets Equity Insights, Small Cap Equity Insights and International Small Cap Insights Funds, respectively. |
26
FUND BASICS
| | |
| OVERALL UNDERLYING FUND WEIGHTINGS8 | | |
| Percentage of Net Assets | | |
| | 8 | | The Portfolio is actively managed and, as such, its composition may differ over time. The percentage shown for each underlying fund reflects the value of that underlying fund as a percentage of net assets of the Portfolio. Short-term investments represent repurchase agreements. Figures in the above graph may not sum to 100% due to rounding and/or the exclusion of other assets and liabilities. |
| | 9 | | Effective at the close of business May 3, 2013, the Goldman Sachs Structured International Equity, Structured Large Cap Growth, Structured Large Cap Value, Structured Emerging Markets Equity, Structured Small Cap Equity and Structured International Small Cap Funds were renamed the Goldman Sachs International Equity Insights, Large Cap Growth Insights, Large Cap Value Insights, Emerging Markets Equity Insights, Small Cap Equity Insights and International Small Cap Insights Funds, respectively. |
27
PORTFOLIO RESULTS
Fund of Funds Portfolios – Income Strategies
Investment Process and Principal Strategy
The Portfolio seeks to achieve its investment objective by investing in a combination of underlying funds that currently exist or that may become available for investment in the future for which Goldman Sachs Asset Management (“GSAM”) or an affiliate, now or in the future, acts as investment adviser or principal underwriter (the “underlying funds”). Some of the Portfolios’ underlying funds invest primarily in fixed income or money market instruments, and some invest primarily in equity securities.
The Portfolio invests assets in a strategic mix of underlying funds, which the investment adviser considers to be invested in income-producing satellite asset classes. Satellite asset classes are those that may have lower correlations to traditional market exposures such as large cap equities and may have more attractive risk-return characteristics. The investment adviser allows strategic targets to shift with their respective market returns but continues to adjust tactical tilts on a quarterly basis to reflect the investment adviser’s latest views. The investment adviser adjusts the overall asset allocation of the Portfolio based on current market conditions and the investment adviser’s economic and market forecasts.
Portfolio Management Discussion and Analysis
Below, the Goldman Sachs Quantitative Investment Strategies Team discusses the Goldman Sachs Income Strategies Portfolio’s (the “Portfolio”) performance and positioning for the six-month period ended June 30, 2013 (the “Reporting Period”).
| Q | | How did the Portfolio perform during the Reporting Period? |
| A | | During the Reporting Period, the Portfolio’s Class A, C, Institutional, IR and R Shares generated cumulative total returns of -2.12%, -2.48%, -1.93%, -2.00% and -2.23%, respectively. This compares to the 2.63% cumulative total return of the Portfolio’s blended benchmark, which is comprised 60% of the Barclays Global Aggregate Bond Index (hedged to U.S. dollars) (“Barclays Global Index”) and 40% of the MSCI World Index (net, unhedged), during the same period. |
| The | components of the Portfolio’s blended benchmark, the Barclays Global Index and the MSCI World Index, generated cumulative total returns of -1.17% and 8.43%, respectively, during the same period. |
| Q | | How did the various income-producing satellite asset classes perform during the Reporting Period? |
| A | | During the first quarter of 2013, income-producing satellite asset classes, with the exception of emerging markets debt, generated positive performance in response to global economic stimulus measures. However, in the second calendar quarter, income-producing satellite asset classes largely retreated on the heels of Federal Reserve (“Fed”) Chairman Ben Bernanke’s Congressional testimony on May 22nd and his subsequent “tapering” language at the Fed meeting on June 19th. In addition, heightened volatility across equity and fixed income markets coincided with a sell-off in riskier asset classes globally, particularly in the emerging markets. U.S. dollar denominated emerging markets debt and local emerging markets debt had especially poor performance during the Reporting Period, declining -7.8% and -7.2%, respectively. U.S. real estate securities, up 5.9%, turned in the strongest returns of the Reporting Period. High yield floating rate debt returned 2.4% during the Reporting Period. |
| Q | | What key factors affected the Portfolio’s performance during the Reporting Period? |
| A | | The Portfolio underperformed its blended benchmark during the Reporting Period, largely because of the negative performance overall of its underlying funds. That said, in keeping with our investment approach, we dynamically adjusted Portfolio weights to ensure that overall risk and individual underlying fund contributions to risk remained within the ranges we feel are appropriate for a diversified income-producing satellite portfolio. |
28
PORTFOLIO RESULTS
| Q | | How did the Portfolio’s underlying funds perform relative to their respective benchmark indices during the Reporting Period? |
| A | | Of the Portfolio’s underlying funds, the Goldman Sachs Local Emerging Markets Debt Fund, the Goldman Sachs High Yield Floating Rate Fund, the Goldman Emerging Markets Debt Fund and the Goldman Sachs Real Estate Securities Fund underperformed their respective benchmark indices. The Goldman Sachs High Yield Fund and the Goldman Sachs International Real Securities Fund outperformed their respective benchmark indices. |
| Q | | How did the Portfolio use derivatives and similar instruments during the Reporting Period? |
| A | | The Portfolio does not directly invest in derivatives. However, some of the underlying funds used derivatives during the Reporting Period to apply their active investment views with greater versatility and to afford greater risk management precision. As market conditions warranted during the Reporting Period, some of these underlying funds engaged in forward foreign currency exchange contracts, financial futures contracts, options, swap contracts and structured securities to enhance portfolio return and for hedging purposes. |
| Q | | What changes did you make during the Reporting Period within both the equity and fixed income portions of the Portfolio? |
| A | | In January 2013, through the Portfolio’s underlying funds, we reduced the Portfolio’s exposure to high yield bonds, U.S. real estate securities and international real estate securities, reallocating the proceeds to emerging markets debt and local emerging markets debt (through which the Portfolio gains exposure to local currencies). In February and March 2013, contributions to portfolio risk from the underlying asset classes remained in line with our objectives, and the Portfolio’s underlying fund exposures were maintained. During the second quarter of 2013, we reduced the Portfolio’s exposure through the underlying funds to high yield bonds and emerging markets debt, reallocating the proceeds to U.S. and international real estate securities. |
| Q | | Did you make any changes regarding the underlying funds during the Reporting Period? |
| A | | We made no changes regarding the underlying funds during the Reporting Period. |
| Q | | What is the Portfolio’s tactical view and strategy for the months ahead? |
| A | | We manage the Portfolio using a dynamic, risk-responsive rebalancing process. Using our sophisticated, proprietary risk models, we evaluate the overall risk of the Portfolio each month as well as the portion of risk contributed by each individual asset class. |
| | At the end of the Reporting Period, through its underlying funds, the Portfolio had larger allocations than it did at the beginning of the Reporting Period to local emerging markets debt and to U.S. and international real estate securities. It had reduced exposure to high yield bonds, high yield floating rate securities and U.S. dollar denominated emerging markets debt. |
| | | We will continue to monitor risk on a monthly basis and adjust our allocation to the income-producing satellite asset classes as the underlying funds drift beyond our longer-term risk-related guidelines. |
29
FUND BASICS
Income Strategies
as of June 30, 2013
| | | | | | | | | | |
| | PERFORMANCE REVIEW | |
| | | January 1, 2013–June 30, 2013 | | Portfolio Total Return
(based on NAV)1 | | | Income Strategies
Composite Index2 | |
| | Class A | | | -2.12% | | | | 2.63 | % |
| | Class C | | | -2.48 | | | | 2.63 | |
| | Institutional | | | -1.93 | | | | 2.63 | |
| | Class IR | | | -2.00 | | | | 2.63 | |
| | | Class R | | | -2.23 | | | | 2.63 | |
| | 1The | | net asset value (“NAV”) represents the net assets of the class of the Portfolio (ex-dividend) divided by the total number of shares of the class outstanding. The Portfolio’s performance assumes the reinvestment of dividends and other distributions. The Portfolio’s performance does not reflect the deduction of any applicable sales charges. |
| | 2 | | The Income Strategies Composite Index (“Income Strategies Composite”) is comprised of a blend of the Barclays Global Aggregate Bond Index (hedged to U.S. dollars) (60%) and the MSCI World Index (40%). The Income Strategies Composite figures do not reflect any deduction for fees, expenses or taxes. The Barclays Global Aggregate Bond Index hedged to the U.S. dollar, is an unmanaged index, provides a broad-based measure of the global investment-grade fixed-rate debt markets and covers the most liquid portion of the global investment grade fixed-rate bond market, including government, credit and collateralized securities. The Index figures do not include any deduction for fees, expenses or taxes. It is not possible to invest directly in an unmanaged index. The MSCI ACWI Index is a free float-adjusted market capitalization weighted index that is designed to measure the equity market performance of developed and emerging markets. The MSCI ACWI consists of 45 country indices comprising 24 developed and 21 emerging market country indices. The developed market country indices included are: Australia, Austria, Belgium, Canada, Denmark, Finland, France, Germany, Greece, Hong Kong, Ireland, Israel, Italy, Japan, Netherlands, New Zealand, Norway, Portugal, Singapore, Spain, Sweden, Switzerland, the United Kingdom and the United States. The emerging market country indices are: Brazil, Chile, China, Colombia, Czech Republic, Egypt, Hungary, India, Indonesia, Korea, Malaysia, Mexico, Morocco, Peru, Philippines, Poland, Russia, South Africa, Taiwan, Thailand, and Turkey. The Index figures do not include any deduction for fees, expenses or taxes. It is not possible to invest directly in an unmanaged index. |
| | | | The returns set forth in the table above represent past performance. Past performance does not guarantee future results. The Portfolio’s investment return and principal value will fluctuate so that an investor’s shares, when redeemed, may be worth more or less than their original cost. Current performance may be lower or higher than the performance quoted above. Please visit our web site at www.goldmansachsfunds. com to obtain the most recent month-end returns. Performance reflects applicable fee waivers and/or expense limitations in effect during the periods shown. In their absence, performance would be reduced. Returns do not reflect the deduction of taxes that a shareholder would pay on Portfolio distributions or the redemption of Portfolio shares. |
30
FUND BASICS
| | | | | | | | | | | | |
| STANDARDIZED TOTAL RETURNS3 |
| For the period ended 6/30/13 | | One Year | | | Five Years | | | Since Inception | | Inception Date |
| Class A | | | -0.68 | % | | | 2.94 | % | | 1.47% | | 3/30/07 |
| Class C | | | 3.30 | | | | 3.32 | | | 1.62 | | 3/30/07 |
| Institutional | | | 5.35 | | | | 4.49 | | | 2.77 | | 3/30/07 |
| Class IR | | | 5.54 | | | | 4.38 | | | 2.64 | | 11/30/07 |
| Class R | | | 4.87 | | | | 3.85 | | | 2.15 | | 11/30/07 |
| | 3 | | The Standardized Total Returns are average annual total returns as of the most recent calendar quarter-end. They assume reinvestment of all distributions at NAV. These returns reflect a maximum initial sales charge of 5.5% for Class A Shares and the assumed contingent deferred sales charge for Class C Shares (1% if redeemed within 12 months of purchase). Because Institutional, Class IR and Class R Shares do not involve a sales charge, such a charge is not applied to their Standardized Total Returns. |
| | | | The returns set forth in the table above represent past performance. Past performance does not guarantee future results. The Portfolio’s investment return and principal value will fluctuate so that an investor’s shares, when redeemed, may be worth more or less than their original cost. Current performance may be lower or higher than the performance quoted above. Please visit our web site at www.goldmansachsfunds.com to obtain the most recent month-end returns. Performance reflects applicable fee waivers and/or expense limitations in effect during the periods shown. In their absence, performance would be reduced. Returns do not reflect the deduction of taxes that a shareholder would pay on Portfolio distributions or the redemption of Portfolio shares. |
| | | | | | | | | | |
| | EXPENSE RATIOS4 | |
| | | | | Net Expense Ratio (Current) | | | Gross Expense Ratio (Before Waivers) | |
| | Class A | | | 1.36 | % | | | 2.02 | % |
| | Class C | | | 2.11 | | | | 2.78 | |
| | Institutional | | | 0.96 | | | | 1.59 | |
| | Class IR | | | 1.11 | | | | 1.79 | |
| | | Class R | | | 1.61 | | | | 2.30 | |
| | 4 | | The expense ratios of the Portfolio, both current (net of applicable fee waivers and/or expense limitations) and before waivers (gross of applicable fee waivers and/or expense limitations) are as set forth above according to the most recent publicly available Prospectus for the Portfolio and will differ from the expense ratios disclosed in the Financial Highlights in this report due to the inclusion of Underlying Fund fees and expenses, which are not included in the operating expenses of the Portfolio reflected in the Financial Highlights. The Portfolio’s waivers and/or expense limitations will remain in place through at least April 30, 2014, and prior to such date the Investment Adviser may not terminate the arrangements without the approval of the Portfolio’s Board of Trustees. If these arrangements are discontinued in the future, the expense ratios may change without shareholder approval. |
31
FUND BASICS
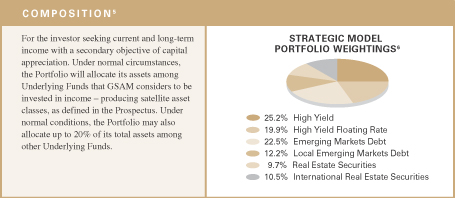
| | 5 | | The weighting in the chart above reflects the allocations from March 31, 2013 to June 30, 2013. Actual Fund weighting in the Asset Allocation Portfolios may differ from the figures shown above due to rounding, differences in returns of the Underlying Funds, or both. The above figures are not indicative of future allocations. |
| | 6 | | Strategic allocation is the process of determining the areas of the global markets in which to invest, and in what long-term proportion, for each Fund. Our global approach attempts to generate strong potential long-term returns across geographies and asset classes, and is determined through a careful review of market opportunities and risk/return tradeoffs. It is rebalanced annually. |
32
FUND BASICS
|
| OVERALL UNDERLYING FUND WEIGHTINGS7 |
| Percentage of Net Assets |
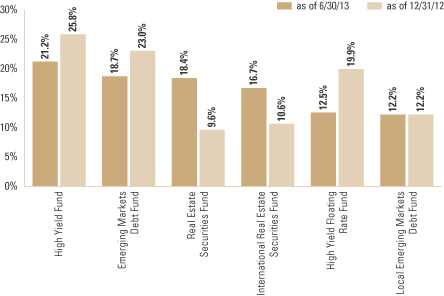
| | 7 | | The Portfolio is actively managed and, as such, its composition may differ over time. The percentage shown for each underlying fund reflects the value of that underlying fund as a percentage of net assets of the Portfolio. Figures in the above graph may not sum to 100% due to rounding and/or the exclusion of other assets and liabilities. |
33
PORTFOLIO RESULTS
Goldman Sachs Satellite Strategies Portfolio
Portfolio Management Discussion and Analysis
Below, the Goldman Sachs Quantitative Investment Strategies Team discusses the Goldman Sachs Satellite Strategies Portfolio’s (the “Portfolio”) performance and positioning for the six-month period ended June 30, 2013 (the “Reporting Period”).
| Q | | How did the Portfolio perform during the Reporting Period? |
| A | | During the Reporting Period, the Portfolio’s Class A, C, Institutional, Service, IR and R Shares generated cumulative total returns of -3.04%, -3.42%, -2.85%, -3.11%, -2.92% and -3.04%, respectively. This compares to the 4.40% cumulative total return of the Fund’s blended benchmark, which is comprised 40% of the Barclays U.S. Aggregate Bond Index, 30% of the S&P® 500 Index and 30% of the MSCI EAFE Index, during the same period. |
| The | components of the blended benchmark, the Barclays U.S. Aggregate Bond Index, the S&P® 500 Index and the MSCI EAFE Index, generated cumulative total returns of -2.44%, 13.82%, and 4.47%, respectively, during the same period. |
| Q | | How did the various satellite asset classes perform during the Reporting Period? |
| A | During the first quarter of 2013, satellite asset classes, with the exception of emerging markets equities and emerging markets debt, generated positive performance in response to global economic stimulus measures. However, in the second calendar quarter, satellite asset classes largely retreated on the heels of Federal Reserve (“Fed”) Chairman Ben Bernanke’s Congressional testimony on May 22nd and his subsequent “tapering” language at the Fed meeting on June 19th. In addition, heightened volatility across equity and fixed income markets coincided with a sell-off in riskier asset classes globally, particularly in the emerging markets. Emerging markets equities, U.S. dollar denominated emerging markets debt and local emerging markets debt had especially poor performance during the Reporting Period, declining -9.5%, -7.8% and -7.2%, respectively. Commodities also declined, dropping -5.4% during the Reporting Period. U.S. real estate securities and international small-cap equities performed most strongly during the Reporting Period. |
| Q | | What key factors affected the Portfolio’s performance during the Reporting Period? |
| A | The Portfolio underperformed its blended benchmark during the Reporting Period, largely because of the negative performance overall of its underlying funds. That said, in keeping with our investment approach, we dynamically adjusted Portfolio weights to ensure that overall risk and individual underlying fund contributions to risk remained within the ranges we feel are appropriate for a diversified satellite portfolio. |
| Q | | How did the Portfolio’s underlying funds perform relative to their respective benchmark indices during the Reporting Period? |
| A | Overall, as mentioned earlier, the performance of the underlying funds detracted from the Portfolio’s performance. The Goldman Sachs Emerging Markets Equity Fund, the Goldman Sachs Commodity Strategy Fund and the Goldman Sachs Emerging Markets Debt Fund underperformed most relative to their benchmark indices. The Goldman Sachs Small Cap Fund, the Goldman Sachs International Real Estate Securities Fund and the Goldman Sachs Small Cap Insights Fund outperformed most relative to their respective benchmark indices.3 |
| Q | | How did the Portfolio use derivatives and similar instruments during the Reporting Period? |
| A | | The Portfolio does not directly invest in derivatives. However, some of the underlying funds used derivatives during the Reporting Period to apply their active investment views with greater versatility and to afford greater risk management precision. As market conditions warranted during the Reporting Period, some of these underlying funds engaged in forward foreign currency exchange contracts, financial futures contracts, options, swap contracts and structured securities to enhance portfolio return and for hedging purposes. |
| | 3 | | Effective at the close of business May 3, 2013, the Goldman Sachs Structured Small Cap Fund was renamed the Goldman Sachs Small Cap Insights Fund. |
34
PORTFOLIO RESULTS
| Q | | What changes did you make during the Reporting Period within both the equity and fixed income portions of the Portfolio? |
| A | | During January 2013, at the beginning of the Reporting Period, we rebalanced the Portfolio to maintain our target risk objectives in the Portfolio. The risk contributions of real estate securities had increased compared to other satellite asset classes in the Portfolio. In response, we reduced the Portfolio’s weightings in U.S. and international real estate securities while increasing its allocations to high yield bonds, emerging markets debt and commodities. |
| In | February and March 2013, contributions to portfolio risk from the underlying asset classes remained in line with our objectives. As a result, rebalancing trades were not required. Because of the reduced volatility of satellite asset classes compared to their longer-term averages, the Portfolio’s asset class weightings remained relatively stable. There were no outsized contributions to risk from any individual asset class or region. |
| During | April 2013, we rebalanced the Portfolio to maintain our target risk objectives in the Portfolio. The risk contributions of high yield bonds and real estate securities had increased compared to other satellite asset classes in the Portfolio. In response, we reduced the Portfolio’s weightings in U.S. real estate securities, international real estate securities and high yield bonds while increasing its allocation to emerging markets equities. |
| In | May 2013, we rebalanced the Portfolio to maintain our target risk objectives in the Portfolio. The risk contributions of fixed income had increased compared to other satellite asset classes in the Portfolio. In response, we reduced the Portfolio’s weighting in fixed income while increasing its allocations to emerging markets equities and international small-cap equities. |
| In | June 2013, we rebalanced the Portfolio to maintain our target risk objectives in the Portfolio. The risk contributions of fixed income had increased compared to other satellite asset classes in the Portfolio. In response, we reduced the Portfolio’s weighting in fixed income while increasing its allocations to U.S. real estate securities, international small-cap equities and emerging markets equities. |
| Q | | What is the Portfolio’s tactical view and strategy for the months ahead? |
| A | | We manage the Portfolio using a dynamic, risk-responsive rebalancing process. Using our sophisticated, proprietary risk models, we evaluate the overall risk of the Portfolio each month as well as the portion of risk contributed by each individual asset class. |
| At | the end of the Reporting Period, through its underlying funds, the Portfolio had larger allocations than it did at the beginning of the Reporting Period to international small-cap equities, emerging markets equities, commodities and U.S. and international real estate securities. It had reduced exposure to high yield bonds, high yield floating rate securities, U.S. dollar denominated emerging markets debt and local emerging markets debt. |
| We | will continue to monitor risk on a monthly basis and adjust our allocation to the satellite asset classes as the underlying funds drift beyond our longer-term risk-related guidelines. |
35
FUND BASICS
Satellite Strategies Portfolio
as of June 30, 2013
| | | | | | | | | | |
| | PERFORMANCE REVIEW | | | | | |
| | | January 1, 2013–June 30, 2013 | | Fund Total Return
(based on NAV)1 | | | Satellite Strategies
Composite Index2 | |
| | Class A | | | -3.04 | % | | | 4.40 | % |
| | Class C | | | -3.42 | | | | 4.40 | |
| | Institutional | | | -2.85 | | | | 4.40 | |
| | Service | | | -3.11 | | | | 4.40 | |
| | Class IR | | | -2.92 | | | | 4.40 | |
| | | Class R | | | -3.04 | | | | 4.40 | |
| | 1 | | The net asset value (“NAV”) represents the net assets of the class of the Portfolio (ex-dividend) divided by the total number of shares of the class outstanding. The Portfolio’s performance reflects the reinvestment of dividends and other distributions. The Portfolio’s performance does not reflect the deduction of any applicable sales charges. |
| | 2 | | The Satellite Strategies Composite Index (“Satellite Composite”) is a composite representation prepared by the investment adviser of the performance of the Portfolio’s asset classes weighted according to their respective weightings in the Portfolio’s target range. The Satellite Composite is comprised of the S&P 500 Index (30%), the MSCI EAFE Index (unhedged) (30%) and the Barclays U.S. Aggregate Bond Index (hedged to U.S. dollars) (40%). The Satellite Composite figures do not reflect any deduction for fees, expenses or taxes. The Barclays Aggregate Bond Index (hedged to U.S. dollars) represents an unmanaged diversified portfolio of fixed income securities, including U.S. Treasuries, investment-grade corporate bonds, and mortgage-backed and asset-backed securities. The S&P 500 Index is the Standard & Poor’s 500 Composite Index of 500 stocks, an unmanaged index of common stock prices. The unmanaged MSCI EAFE Index (unhedged) is a market capitalization weighted composite of securities in 22 developed markets. The Index figures do not include any deduction for fees, expenses or taxes. It is not possible to invest directly in an unmanaged index. |
| | | | | | | | | | | | | | | | |
| | STANDARDIZED TOTAL RETURNS3 | | | |
| | | For the period ended 6/30/13 | | One Year | | | Five Years | | | Since Inception | | | Inception Date |
| | Class A | | | 0.32 | % | | | -1.35 | % | | | -0.18 | % | | 3/30/07 |
| | Class C | | | 4.37 | | | | -0.95 | | | | -0.03 | | | 3/30/07 |
| | Institutional | | | 6.59 | | | | 0.19 | | | | 1.09 | | | 3/30/07 |
| | Service | | | 6.08 | | | | N/A | | | | 1.39 | | | 8/29/08 |
| | Class IR | | | 6.44 | | | | 0.03 | | | | 0.00 | | | 11/30/07 |
| | | Class R | | | 5.93 | | | | -0.44 | | | | -0.49 | | | 11/30/07 |
| | 3 | | The Standardized Total Returns are average annual total returns as of the most recent calendar quarter-end. They assume reinvestment of all distributions at NAV. These returns reflect a maximum initial sales charge of 5.5% for Class A Shares and the assumed contingent deferred sales charge for Class C Shares (1% if redeemed within 12 months of purchase). Because Institutional, Service, Class IR and Class R Shares do not involve a sales charge, such a charge is not applied to their Standardized Total Returns. |
| | | | The returns set forth in the tables above represent past performance. Past performance does not guarantee future results. The Fund’s investment return and principal value will fluctuate so that an investor’s shares, when redeemed, may be worth more or less than their original cost. Current performance may be lower or higher than the performance quoted above. Please visit our web site at www.goldmansachsfunds. com to obtain the most recent month-end returns. Performance reflects applicable fee waivers and/or expense limitations in effect during the periods shown. In their absence, performance would be reduced. Returns do not reflect the deduction of taxes that a shareholder would pay on Fund distributions or the redemption of Fund shares. |
36
FUND BASICS
| | | | | | | | | | |
| | EXPENSE RATIOS4 | | | | | |
| | | | | Net Expense Ratio (Current) | | | Gross Expense Ratio (Before Waivers) | |
| | Class A | | | 1.44 | % | | | 1.47 | % |
| | Class C | | | 2.19 | | | | 2.22 | |
| | Institutional | | | 1.04 | | | | 1.07 | |
| | Service | | | 1.54 | | | | 1.57 | |
| | Class IR | | | 1.19 | | | | 1.22 | |
| | | Class R | | | 1.69 | | | | 1.72 | |
| | 4 | | The expense ratios of the Portfolio, both current (net of applicable fee waivers and/or expense limitations) and before waivers (gross of applicable fee waivers and/or expense limitations) are as set forth above according to the most recent publicly available Prospectus for the Portfolio and will differ from the expense ratios disclosed in the Financial Highlights in this report due to the inclusion of Underlying Fund fees and expenses, which are not included in the operating expenses of the Portfolio reflected in the Financial Highlights. The Portfolio’s waivers and/or expense limitations will remain in place through at least April 30, 2014, and prior to such date the Investment Adviser may not terminate the arrangements without the approval of the Portfolio’s Board of Trustees. If these arrangements are discontinued in the future, the expense ratios may change without shareholder approval. |
| | |
| TARGET RISK-CONTRIBUTION INVESTMENT PORTFOLIO5 AS OF 6/30/13 |
| Percentage of Investment Portfolio | | |
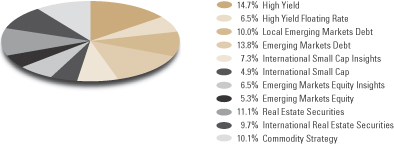
| | 5 | | The tactical fund weightings are set at the beginning of each calendar quarter. The weighting in the chart above reflects the allocations from March 31, 2013 to June 30, 2013. Actual Fund weighting in the Asset Allocation Portfolios may differ from the figures shown above due to rounding, differences in returns of the Underlying Funds, or both. The above figures are not indicative of future allocations. |
37
FUND BASICS
| | |
| OVERALL UNDERLYING FUND WEIGHTINGS6 | | |
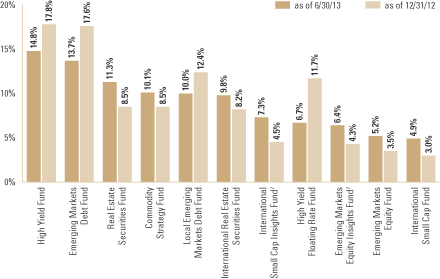
| | 6 | | The Portfolio is actively managed and, as such, its composition may differ over time. The percentage shown for each underlying fund reflects the value of that underlying fund as a percentage of net assets of the Portfolio. Figures in the above graph may not sum to 100% due to rounding and/or the exclusion of other assets and liabilities. |
| | 7 | | Effective at the close of business May 3, 2013, the Goldman Sachs Structured International Small Cap and the Structured Emerging Markets Equity Funds were renamed the Goldman Sachs International Small Cap Insights and Emerging Markets Equity Insights Funds, respectively. |
38
GOLDMAN SACHS BALANCED STRATEGY PORTFOLIO
Schedule of Investments
June 30, 2013 (Unaudited)
| | | | | | | | |
| Shares | | | Description | | Value | |
| | Underlying Funds (Institutional Shares)(a) – 100.1% | |
| | Equity – 34.2% | | | | |
| | 7,099,830 | | | Goldman Sachs International Equity Insights Fund | | $ | 70,146,322 | |
| | 2,288,915 | | | Goldman Sachs Large Cap Value Insights Fund | | | 30,328,121 | |
| | 1,327,866 | | | Goldman Sachs Large Cap Growth Insights Fund | | | 21,723,884 | |
| | 1,710,430 | | | Goldman Sachs Emerging Markets Equity Insights Fund | | | 13,888,692 | |
| | 881,929 | | | Goldman Sachs Large Cap Value Fund | | | 12,955,534 | |
| | 704,925 | | | Goldman Sachs Small Cap Equity Insights Fund | | | 11,060,271 | |
| | 765,454 | | | Goldman Sachs Strategic Growth Fund | | | 9,353,844 | |
| | 735,655 | | | Goldman Sachs International Small Cap Insights Fund | | | 6,466,410 | |
| | 266,986 | | | Goldman Sachs Real Estate Securities Fund | | | 4,370,556 | |
| | 698,855 | | | Goldman Sachs International Real Estate Securities Fund | | | 4,339,891 | |
| | | | | | | | |
| | | | | | | 184,633,525 | |
| | |
| | Fixed Income – 51.1% | | | | |
| | 14,247,857 | | | Goldman Sachs Global Income Fund | | | 183,797,358 | |
| | 2,466,684 | | | Goldman Sachs Short Duration Government Fund | | | 25,061,512 | |
| | 3,389,541 | | | Goldman Sachs High Yield Fund | | | 24,370,801 | |
| | 3,008,822 | | | Goldman Sachs Commodity Strategy Fund | | | 16,157,372 | |
| | 1,253,325 | | | Goldman Sachs Emerging Markets Debt Fund | | | 15,415,903 | |
| | 1,189,460 | | | Goldman Sachs Local Emerging Markets Debt Fund | | | 10,538,615 | |
| | | | | | | | |
| | | | | | | 275,341,561 | |
| | |
| | Dynamic – 14.8% | | | | |
| | 7,404,867 | | | Goldman Sachs Dynamic Allocation Fund | | | 79,676,374 | |
| | |
| TOTAL UNDERLYING FUNDS
(INSTITUTIONAL SHARES) – 100.1%
| | | | |
| | (Cost $526,896,889) | | $ | 539,651,460 | |
| | |
| LIABILITIES IN EXCESS OF
OTHER ASSETS – (0.1)% | | | (747,259 | ) |
| | |
| | NET ASSETS – 100.0% | | $ | 538,904,201 | |
| | |
| | |
| The percentage shown for each investment category reflects the value of the respective investment in that category as a percentage of net assets. |
(a) | | Represents Affiliated Funds. |
| | |
| The accompanying notes are an integral part of these financial statements. | | 39 |
GOLDMAN SACHS EQUITY GROWTH STRATEGY PORTFOLIO
Schedule of Investments
June 30, 2013 (Unaudited)
| | | | | | |
Shares | | Description | | Value | |
| Underlying Funds (Institutional Shares)(a) – 100.2% | |
| Equity – 97.2% | | | | |
| 14,235,266 | | Goldman Sachs International
Equity Insights Fund | | $ | 140,644,431 | |
| 3,594,791 | | Goldman Sachs Large Cap
Value Insights Fund | | | 47,630,982 | |
| 2,689,396 | | Goldman Sachs Large Cap
Growth Insights Fund | | | 43,998,520 | |
| 4,329,492 | | Goldman Sachs Emerging
Markets Equity Insights
Fund | | | 35,155,474 | |
| 1,383,929 | | Goldman Sachs Large Cap
Value Fund | | | 20,329,914 | |
| 1,273,723 | | Goldman Sachs Small Cap
Equity Insights Fund | | | 19,984,708 | |
| 1,550,903 | | Goldman Sachs Strategic
Growth Fund | | | 18,952,038 | |
| 1,244,877 | | Goldman Sachs International
Small Cap Insights Fund | | | 10,942,467 | |
| 451,524 | | Goldman Sachs Real Estate
Securities Fund | | | 7,391,453 | |
| 1,182,133 | | Goldman Sachs International
Real Estate Securities Fund | | | 7,341,045 | |
| | | | | | |
| | | | | 352,371,032 | |
| |
| Fixed Income – 3.0% | | | | |
| 2,036,012 | | Goldman Sachs Commodity
Strategy Fund | | | 10,933,386 | |
| |
| TOTAL UNDERLYING FUNDS (INSTITUTIONAL SHARES) – 100.2% | | | | |
| (Cost $303,378,288) | | $ | 363,304,418 | |
| |
| | | | | | | | | | |
Principal Amount | | Interest
Rate | | Maturity
Date | | | Value | |
| Short-term Investment(b) – 0.0% | | | | | |
| Repurchase Agreement – 0.0% | | | | | |
Joint Repurchase Agreement Account II | | | | | |
| $100,000 | | 0.158% | | | 07/01/13 | | | $ | 100,000 | |
| (Cost $100,000) | | | | | | | | |
| |
| TOTAL INVESTMENTS – 100.2% | | | | | |
| (Cost $303,478,288) | | | | | | $ | 363,404,418 | |
| |
LIABILITIES IN EXCESS OF
OTHER ASSETS – (0.2)% | | | | (713,663 | ) |
| |
| NET ASSETS – 100.0% | | | $ | 362,690,755 | |
| |
| | |
| The percentage shown for each investment category reflects the value of the respective investment in that category as a percentage of net assets. |
(a) | | Represents Affiliated Funds. |
(b) | | Joint repurchase agreement was entered into on June 28, 2013. Additional information appears on page 45. |
| | |
| 40 | | The accompanying notes are an integral part of these financial statements. |
GOLDMAN SACHS GROWTH AND INCOME STRATEGY PORTFOLIO
Schedule of Investments
June 30, 2013 (Unaudited)
| | | | | | | | |
| Shares | | | Description | | Value | |
| | Underlying Funds (Institutional Shares)(a) – 100.1% | |
| | Equity – 55.1% | |
| | 21,204,739 | | | Goldman Sachs International Equity Insights Fund | | $ | 209,502,825 | |
| | 6,554,203 | | | Goldman Sachs Large Cap Value Insights Fund | | | 86,843,194 | |
| | 4,304,592 | | | Goldman Sachs Large Cap Growth Insights Fund | | | 70,423,122 | |
| | 6,014,943 | | | Goldman Sachs Emerging Markets Equity Insights Fund | | | 48,841,339 | |
| | 2,523,403 | | | Goldman Sachs Large Cap Value Fund | | | 37,068,790 | |
| | 2,481,227 | | | Goldman Sachs Strategic Growth Fund | | | 30,320,598 | |
| | 1,697,845 | | | Goldman Sachs Small Cap Equity Insights Fund | | | 26,639,184 | |
| | 2,057,019 | | | Goldman Sachs International Small Cap Insights Fund | | | 18,081,199 | |
| | 746,414 | | | Goldman Sachs Real Estate Securities Fund | | | 12,218,797 | |
| | 1,953,868 | | | Goldman Sachs International Real Estate Securities Fund | | | 12,133,519 | |
| | | | | | | | |
| | | | | | | 552,072,567 | |
| | |
| | Fixed Income – 30.2% | | | | |
| | 11,628,934 | | | Goldman Sachs Global Income Fund | | | 150,013,247 | |
| | 5,731,192 | | | Goldman Sachs Short Duration Government Fund | | | 58,228,906 | |
| | 4,910,999 | | | Goldman Sachs High Yield Fund | | | 35,310,080 | |
| | 5,608,622 | | | Goldman Sachs Commodity Strategy Fund | | | 30,118,300 | |
| | 1,513,672 | | | Goldman Sachs Emerging Markets Debt Fund | | | 18,618,168 | |
| | 1,077,815 | | | Goldman Sachs Local Emerging Markets Debt Fund | | | 9,549,440 | |
| | | | | | | | |
| | | | | | | 301,838,141 | |
| | |
| | Dynamic – 14.8% | | | | |
| | 13,805,045 | | | Goldman Sachs Dynamic Allocation Fund | | | 148,542,279 | |
| | |
| TOTAL UNDERLYING FUNDS
(INSTITUTIONAL SHARES) – 100.1% | | | | |
| | (Cost $924,733,396) | | $ | 1,002,452,987 | |
| | |
| | | | | | | | | | | | |
Principal
Amount | | | Interest
Rate | | Maturity
Date | | | Value | |
| | Short-term Investment(b) – 0.0% | | | | | |
| | Repurchase Agreement – 0.0% | | | | | |
| Joint Repurchase Agreement Account II | | | | | |
| $ | 300,000 | | | 0.158% | | | 07/01/13 | | | $ | 300,000 | |
| | (Cost $300,000) | | | | | | | | |
| | |
| | TOTAL INVESTMENTS – 100.1% | | | | | |
| | (Cost $925,033,396) | | | | | | $ | 1,002,752,987 | |
| | |
| LIABILITIES IN EXCESS OF
OTHER ASSETS – (0.1)% |
| | | (1,500,560 | ) |
| | |
| | NET ASSETS – 100.0% | | | $ | 1,001,252,427 | |
| | |
| | |
| The percentage shown for each investment category reflects the value of the respective investment in that category as a percentage of net assets. |
(a) | | Represents Affiliated Funds. |
(b) | | Joint repurchase agreement was entered into on June 28, 2013. Additional information appears on page 45. |
| | |
| The accompanying notes are an integral part of these financial statements. | | 41 |
GOLDMAN SACHS GROWTH STRATEGY PORTFOLIO
Schedule of Investments
June 30, 2013 (Unaudited)
| | | | | | | | |
| Shares | | | Description | | Value | |
| | Underlying Funds (Institutional Shares)(a) – 100.1% | |
| | Equity – 74.2% | |
| | 24,604,539 | | | Goldman Sachs International Equity Insights Fund | | $ | 243,092,842 | |
| | 5,182,242 | | | Goldman Sachs Large Cap Growth Insights Fund | | | 84,781,483 | |
| | 6,273,170 | | | Goldman Sachs Large Cap Value Insights Fund | | | 83,119,500 | |
| | 7,515,053 | | | Goldman Sachs Emerging Markets Equity Insights Fund | | | 61,022,233 | |
| | 2,987,642 | | | Goldman Sachs Strategic Growth Fund | | | 36,508,987 | |
| | 2,419,516 | | | Goldman Sachs Large Cap Value Fund | | | 35,542,694 | |
| | 2,123,647 | | | Goldman Sachs Small Cap Equity Insights Fund | | | 33,320,025 | |
| | 2,312,409 | | | Goldman Sachs International Small Cap Insights Fund | | | 20,326,071 | |
| | 838,908 | | | Goldman Sachs Real Estate Securities Fund | | | 13,732,916 | |
| | 2,196,183 | | | Goldman Sachs International Real Estate Securities Fund | | | 13,638,293 | |
| | | | | | | | |
| | | | | | | 625,085,044 | |
| | |
| | Fixed Income – 11.0% | | | | |
| | 4,200,366 | | | Goldman Sachs Short Duration Government Fund | | | 42,675,722 | |
| | 4,728,366 | | | Goldman Sachs Commodity Strategy Fund | | | 25,391,328 | |
| | 2,953,694 | | | Goldman Sachs High Yield Fund | | | 21,237,062 | |
| | 243,804 | | | Goldman Sachs Global Income Fund | | | 3,145,068 | |
| | | | | | | | |
| | | | | | | 92,449,180 | |
| | |
| | Dynamic – 14.9% | | | | |
| | 11,641,116 | | | Goldman Sachs Dynamic Allocation Fund | | | 125,258,405 | |
| | |
| TOTAL UNDERLYING FUNDS
(INSTITUTIONAL SHARES) – 100.1%
| | | | |
| | (Cost $744,405,549) | | $ | 842,792,629 | |
| | |
Principal Amount | | | Interest
Rate | | Maturity
Date | | | Value | |
| | Short-term Investment(b) – 0.1% | | | | | |
| | Repurchase Agreement – 0.1% | | | | | |
| Joint Repurchase Agreement Account II | | | | | |
| $ | 300,000 | | | 0.158% | | | 07/01/13 | | | $ | 300,000 | |
| | (Cost $300,000) | | | | | | | | |
| | |
| | TOTAL INVESTMENTS – 100.2% | | | | | |
| | (Cost $744,705,549) | | | | | | $ | 843,092,629 | |
| | |
| LIABILITIES IN EXCESS OF
OTHER ASSETS – (0.2)% |
| | | (1,434,196 | ) |
| | |
| | NET ASSETS – 100.0% | | | $ | 841,658,433 | |
| | |
| | |
| The percentage shown for each investment category reflects the value of the respective investment in that category as a percentage of net assets. |
(a) | | Represents Affiliated Funds. |
(b) | | Joint repurchase agreement was entered into on June 28, 2013. Additional information appears on page 45. |
| | |
| 42 | | The accompanying notes are an integral part of these financial statements. |
GOLDMAN SACHS INCOME STRATEGIES PORTFOLIO
Schedule of Investments
June 30, 2013 (Unaudited)
| | | | | | | | |
| Shares | | | Description | | Value | |
| | Underlying Funds (Institutional Shares)(a) – 99.7% | |
| | Equity – 35.1% | |
| | 385,740 | | | Goldman Sachs Real Estate Securities Fund | | $ | 6,314,556 | |
| | 920,659 | | | Goldman Sachs International Real Estate Securities Fund | | | 5,717,292 | |
| | | | | | | | |
| | | | | | | 12,031,848 | |
| | |
| | Fixed Income – 64.6% | | | | |
| | 1,013,100 | | | Goldman Sachs High Yield Fund | | | 7,284,186 | |
| | 520,289 | | | Goldman Sachs Emerging Markets Debt Fund | | | 6,399,551 | |
| | 427,884 | | | Goldman Sachs High Yield Floating Rate Fund | | | 4,291,678 | |
| | 473,592 | | | Goldman Sachs Local Emerging Markets Debt Fund | | | 4,196,029 | |
| | | | | | | | |
| | | | | | | 22,171,444 | |
| | |
| TOTAL UNDERLYING FUNDS
(INSTITUTIONAL SHARES) – 99.7% | | | | |
| | (Cost $35,099,873) | | $ | 34,203,292 | |
| | |
| OTHER ASSETS IN EXCESS OF
LIABILITIES – 0.3% | | | 117,861 | |
| | |
| | NET ASSETS – 100.0% | | $ | 34,321,153 | |
| | |
| | |
| The percentage shown for each investment category reflects the value of the respective investment in that category as a percentage of net assets. |
(a) | | Represents Affiliated Funds. |
| | |
| The accompanying notes are an integral part of these financial statements. | | 43 |
GOLDMAN SACHS SATELLITE STRATEGIES PORTFOLIO
Schedule of Investments
June 30, 2013 (Unaudited)
| | | | | | | | |
| Shares | | | Description | | Value | |
| | Underlying Funds (Institutional Shares)(a) – 100.2% | |
| | Equity – 44.9% | |
| | 9,393,585 | | | Goldman Sachs Real Estate Securities Fund | | $ | 153,772,990 | |
| | 21,538,810 | | | Goldman Sachs International Real Estate Securities Fund | | | 133,756,009 | |
| | 11,430,635 | | | Goldman Sachs International Small Cap Insights Fund | | | 100,475,280 | |
| | 10,722,920 | | | Goldman Sachs Emerging Markets Equity Insights Fund | | | 87,070,110 | |
| | 4,850,628 | | | Goldman Sachs Emerging Markets Equity Fund | | | 71,110,198 | |
| | 3,919,497 | | | Goldman Sachs International Small Cap Fund | | | 66,709,846 | |
| | | | | | | | |
| | | | | | | 612,894,433 | |
| | |
| | Fixed Income – 55.3% | | | | |
| | 28,094,875 | | | Goldman Sachs High Yield Fund | | | 202,002,150 | |
| | 15,208,516 | | | Goldman Sachs Emerging Markets Debt Fund | | | 187,064,744 | |
| | 25,731,953 | | | Goldman Sachs Commodity Strategy Fund | | | 138,180,589 | |
| | 15,403,443 | | | Goldman Sachs Local Emerging Markets Debt Fund | | | 136,474,507 | |
| | 9,043,180 | | | Goldman Sachs High Yield Floating Rate Fund | | | 90,703,099 | |
| | | | | | | | |
| | | | | | | 754,425,089 | |
| | |
| TOTAL UNDERLYING FUNDS
(INSTITUTIONAL SHARES) – 100.2% | | | | |
| | (Cost $1,339,614,792) | | $ | 1,367,319,522 | |
| | |
| LIABILITIES IN EXCESS OF
OTHER ASSETS – (0.2)% | | | (3,272,641 | ) |
| | |
| | NET ASSETS – 100.0% | | $ | 1,364,046,881 | |
| | |
| | |
| The percentage shown for each investment category reflects the value of the respective investment in that category as a percentage of net assets. |
(a) | | Represents Affiliated Funds. |
| | |
| 44 | | The accompanying notes are an integral part of these financial statements. |
GOLDMAN SACHS FUND OF FUNDS PORTFOLIOS
Schedule of Investments
June 30, 2013 (Unaudited)
|
| ADDITIONAL INVESTMENT INFORMATION |
JOINT REPURCHASE AGREEMENT ACCOUNT II — At June 30, 2013, certain Portfolios had undivided interests in the Joint Repurchase Agreement Account II, with a maturity date of July 1, 2013, as follows:
| | | | | | | | | | | | |
| Portfolio | | Principal
Amount | | | Maturity
Value | | | Collateral
Allocation
Value | |
Equity Growth Strategy | | $ | 100,000 | | | $ | 100,001 | | | $ | 102,656 | |
Growth and Income Strategy | | | 300,000 | | | | 300,004 | | | | 307,968 | |
Growth Strategy | | | 300,000 | | | | 300,004 | | | | 307,968 | |
REPURCHASE AGREEMENTS — At June 30, 2013, the Principal Amounts of certain Portfolios’ interest in the Joint Repurchase Agreement Account II were as follows:
| | | | | | | | | | | | | | | | |
| Counterparty | | Interest Rate | | | Equity Growth
Strategy | | | Growth and Income
Strategy | | | Growth
Strategy | |
BNP Paribas Securities Co. | | | 0.140 | % | | $ | 13,469 | | | $ | 40,408 | | | $ | 40,408 | |
Deutsche Bank Securities, Inc. | | | 0.250 | | | | 10,177 | | | | 30,531 | | | | 30,531 | |
Morgan Stanley & Co. LLC | | | 0.150 | | | | 3,020 | | | | 9,060 | | | | 9,060 | |
TD Securities (USA) LLC | | | 0.140 | | | | 13,469 | | | | 40,408 | | | | 40,408 | |
Wells Fargo Securities LLC | | | 0.150 | | | | 59,865 | | | | 179,593 | | | | 179,593 | |
| TOTAL | | | | | | $ | 100,000 | | | $ | 300,000 | | | $ | 300,000 | |
At June 30, 2013, the Joint Repurchase Agreement Account II was fully collateralized by:
| | | | | | | | |
| Issuer | | Interest Rates | | | Maturity Dates | |
Federal Farm Credit Bank | | | 0.183% to 5.200 | % | | | 07/03/13 to 04/17/20 | |
Federal Home Loan Mortgage Corp. | | | 0.350 to 6.500 | | | | 01/07/14 to 07/01/43 | |
Federal National Mortgage Association | | | 0.202 to 6.625 | | | | 09/17/13 to 07/01/43 | |
Government National Mortgage Association | | | 2.000 to 7.000 | | | | 08/20/27 to 06/20/43 | |
Tennessee Valley Authority | | | 3.500 to 6.250 | | | | 08/01/13 to 12/15/42 | |
U.S. Treasury Bills | | | 0.000 | | | | 07/11/13 to 05/29/14 | |
U.S. Treasury Bonds | | | 2.750 to 7.625 | | | | 08/15/23 to 05/15/43 | |
U.S. Treasury Inflation Protected Securities | | | 0.125 to 2.500 | | | | 04/15/14 to 01/15/29 | |
U.S. Treasury Notes | | | 0.125 to 11.250 | | | | 06/30/13 to 05/15/23 | |
| | |
| The accompanying notes are an integral part of these financial statements. | | 45 |
GOLDMAN SACHS FUND OF FUNDS PORTFOLIOS
Statements of Assets and Liabilities
June 30, 2013 (Unaudited)
| | | | | | |
| | | | | Balanced Strategy Portfolio | |
| | Assets: | | | | |
| | Investments in Affiliated Underlying Funds, at value (cost $526,896,889, $303,378,288, $924,733,396, $744,405,549, $35,099,873 and $1,339,614,792) | | $ | 539,651,460 | |
| | Repurchase agreement, at value which equals cost | | | — | |
| | Cash | | | — | |
| | Receivables: | | | | |
| | Investments sold | | | 33,469,966 | |
| | Dividends | | | 845,273 | |
| | Portfolio shares sold | | | 791,646 | |
| | Reimbursement from investment adviser | | | 37,492 | |
| | Other assets | | | 2,943 | |
| | Total assets | | | 574,798,780 | |
| | | | | | |
| | Liabilities: | | | | |
| | Due to custodian | | | 46,540 | |
| | Payables: | | | | |
| | Investments purchased | | | 34,071,273 | |
| | Portfolio shares redeemed | | | 1,410,838 | |
| | Amounts owed to affiliates | | | 242,784 | |
| | Distributions payable | | | — | |
| | Accrued expenses | | | 123,144 | |
| | Total liabilities | | | 35,894,579 | |
| | | | | | |
| | Net Assets: | | | | |
| | Paid-in capital | | | 586,529,290 | |
| | Undistributed (distributions in excess of) net investment income (loss) | | | (5,065 | ) |
| | Accumulated net realized loss | | | (60,374,595 | ) |
| | Net unrealized gain (loss) | | | 12,754,571 | |
| | | NET ASSETS | | $ | 538,904,201 | |
| | | Net Assets: | |
| | | Class A | | $ | 195,961,375 | |
| | | Class B | | | 14,833,640 | |
| | | Class C | | | 75,602,582 | |
| | | Institutional | | | 241,018,894 | |
| | | Service | | | 1,867,187 | |
| | | Class IR | | | 1,831,790 | |
| | | Class R | | | 7,788,733 | |
| | | Total Net Assets | | $ | 538,904,201 | |
| | | Shares Outstanding $0.001 par value (unlimited shares authorized): | |
| | | Class A | | | 18,502,208 | |
| | | Class B | | | 1,399,360 | |
| | | Class C | | | 7,137,734 | |
| | | Institutional | | | 22,745,292 | |
| | | Service | | | 175,781 | |
| | | Class IR | | | 173,476 | |
| | | Class R | | | 738,422 | |
| | | Net asset value, offering and redemption price per share:(a) | |
| | | Class A | | | $10.59 | |
| | | Class B | | | 10.60 | |
| | | Class C | | | 10.59 | |
| | | Institutional | | | 10.60 | |
| | | Service | | | 10.62 | |
| | | Class IR | | | 10.56 | |
| | | Class R | | | 10.55 | |
| | | | | | |
| | (a) | | Maximum public offering price per share for Class A Shares of the Balanced Strategy, Equity Growth Strategy, Growth and Income Strategy, Growth Strategy, Income Strategies and Satellite Strategies Portfolios is $11.21, $13.23, $11.85, $12.20, $9.05 and $8.32, respectively. At redemption, Class B and Class C Shares may be subject to a contingent deferred sales charge, assessed on the amount equal to the lesser of the current net asset value or the original purchase price of the shares. |
| | |
| 46 | | The accompanying notes are an integral part of these financial statements. |
GOLDMAN SACHS FUND OF FUNDS PORTFOLIOS
| | | | | | | | | | | | | | | | | | | | | | | | | | | | |
| | | Equity Growth
Strategy Portfolio | | | | | Growth and Income
Strategy Portfolio | | | | | Growth Strategy Portfolio | | | | | Income Strategies Portfolio | | | | | Satellite Strategies Portfolio | |
| | | | | | | | | | | | | | | | | | | | | | | | | | | | |
| | $ | 363,304,418 | | | | | $ | 1,002,452,987 | | | | | $ | 842,792,629 | | | | | $ | 34,203,292 | | | | | $ | 1,367,319,522 | |
| | | 100,000 | | | | | | 300,000 | | | | | | 300,000 | | | | | | — | | | | | | — | |
| | | 96,570 | | | | | | 7,052 | | | | | | 26,284 | | | | | | — | | | | | | — | |
| | | | | | | | | | | | | | | | | | | | | | | | | | | | |
| | | 6,799,178 | | | | | | 64,630,793 | | | | | | 28,405,137 | | | | | | 2,092,466 | | | | | | 77,310,766 | |
| | | 455,126 | | | | | | 1,420,095 | | | | | | 930,067 | | | | | | 194,477 | | | | | | 5,374,144 | |
| | | 1,201,064 | | | | | | 675,050 | | | | | | 1,175,687 | | | | | | 246,497 | | | | | | 2,320,556 | |
| | | 37,166 | | | | | | 41,053 | | | | | | 48,434 | | | | | | 29,467 | | | | | | 54,546 | |
| | | 1,903 | | | | | | 4,752 | | | | | | 4,148 | | | | | | 172 | | | | | | 8,124 | |
| | | 371,995,425 | | | | | | 1,069,531,782 | | | | | | 873,682,386 | | | | | | 36,766,371 | | | | | | 1,452,387,658 | |
| | | | | | | | | | | | | | | | | | | | | | | | | | | | |
| | | | | | | | | | | | | | | | | | | | | | | | | | | | |
| | | — | | | | | | — | | | | | | — | | | | | | 107,317 | | | | | | 1,341,858 | |
| | | | | | | | | | | | | | | | | | | | | | | | | | | | |
| | | 7,069,968 | | | | | | 65,558,681 | | | | | | 28,653,720 | | | | | | 2,212,816 | | | | | | 77,976,974 | |
| | | 1,890,996 | | | | | | 1,991,495 | | | | | | 2,648,319 | | | | | | 46,467 | | | | | | 8,440,470 | |
| | | 217,878 | | | | | | 546,182 | | | | | | 517,663 | | | | | | 19,813 | | | | | | 413,366 | |
| | | — | | | | | | — | | | | | | — | | | | | | — | | | | | | 29,613 | |
| | | 125,828 | | | | | | 182,997 | | | | | | 204,251 | | | | | | 58,805 | | | | | | 138,496 | |
| | | 9,304,670 | | | | | | 68,279,355 | | | | | | 32,023,953 | | | | | | 2,445,218 | | | | | | 88,340,777 | |
| | | | | | | | | | | | | | | | | | | | | | | | | | | | |
| | | | | | | | | | | | | | | | | | | | | | | | | | | | |
| | | 628,877,354 | | | | | | 1,659,224,438 | | | | | | 1,579,265,653 | | | | | | 36,897,150 | | | | | | 1,390,580,610 | |
| | | (540,874 | ) | | | | | 2,131 | | | | | | (1,021,775 | ) | | | | | 61,132 | | | | | | 484,407 | |
| | | (325,571,855 | ) | | | | | (735,693,733 | ) | | | | | (834,972,525 | ) | | | | | (1,740,548 | ) | | | | | (54,722,866 | ) |
| | | 59,926,130 | | | | | | 77,719,591 | | | | | | 98,387,080 | | | | | | (896,581 | ) | | | | | 27,704,730 | |
| | | $ | 362,690,755 | | | | | $ | 1,001,252,427 | | | | | $ | 841,658,433 | | | | | $ | 34,321,153 | | | | | $ | 1,364,046,881 | |
| | | | | | | | | | | | | | | | | | | | | | | | | | | | | |
| | | $ | 138,426,847 | | | | | $ | 440,495,793 | | | | | $ | 372,962,497 | | | | | $ | 11,933,058 | | | | | $ | 259,611,768 | |
| | | | 16,089,256 | | | | | | 50,020,833 | | | | | | 50,302,878 | | | | | | — | | | | | | — | |
| | | | 98,927,577 | | | | | | 193,552,660 | | | | | | 212,817,138 | | | | | | 11,369,086 | | | | | | 125,618,054 | |
| | | | 102,143,185 | | | | | | 307,108,264 | | | | | | 195,413,083 | | | | | | 8,272,902 | | | | | | 852,075,975 | |
| | | | 567,237 | | | | | | 3,876,361 | | | | | | 3,284,926 | | | | | | — | | | | | | 30,443,017 | |
| | | | 1,748,084 | | | | | | 2,327,027 | | | | | | 2,342,929 | | | | | | 2,598,088 | | | | | | 92,029,886 | |
| | | | 4,788,569 | | | | | | 3,871,489 | | | | | | 4,534,982 | | | | | | 148,019 | | | | | | 4,268,181 | |
| | | $ | 362,690,755 | | | | | $ | 1,001,252,427 | | | | | $ | 841,658,433 | | | | | $ | 34,321,153 | | | | | $ | 1,364,046,881 | |
| | | | | | | | | | | | | | | | | | | | | | | | | | | | | |
| | | | 11,076,874 | | | | | | 39,337,168 | | | | | | 32,335,885 | | | | | | 1,395,361 | | | | | | 33,012,982 | |
| | | | 1,341,413 | | | | | | 4,498,459 | | | | | | 4,349,777 | | | | | | — | | | | | | — | |
| | | | 8,292,231 | | | | | | 17,464,477 | | | | | | 18,579,600 | | | | | | 1,322,999 | | | | | | 16,055,942 | |
| | | | 8,090,714 | | | | | | 27,341,107 | | | | | | 16,921,116 | | | | | | 972,644 | | | | | | 108,483,819 | |
| | | | 45,588 | | | | | | 346,775 | | | | | | 285,959 | | | | | | — | | | | | | 3,887,869 | |
| | | | 141,331 | | | | | | 208,636 | | | | | | 205,390 | | | | | | 304,270 | | | | | | 11,717,579 | |
| | | | 387,265 | | | | | | 347,346 | | | | | | 403,038 | | | | | | 17,244 | | | | | | 544,701 | |
| | | | | | | | | | | | | | | | | | | | | | | | | | | | | |
| | | | $12.50 | | | | | | $11.20 | | | | | | $11.53 | | | | | | $8.55 | | | | | | $7.86 | |
| | | | 11.99 | | | | | | 11.12 | | | | | | 11.56 | | | | | | — | | | | | | — | |
| | | | 11.93 | | | | | | 11.08 | | | | | | 11.45 | | | | | | 8.59 | | | | | | 7.82 | |
| | | | 12.62 | | | | | | 11.23 | | | | | | 11.55 | | | | | | 8.51 | | | | | | 7.85 | |
| | | | 12.44 | | | | | | 11.18 | | | | | | 11.49 | | | | | | — | | | | | | 7.83 | |
| | | | 12.37 | | | | | | 11.15 | | | | | | 11.41 | | | | | | 8.54 | | | | | | 7.85 | |
| | | | 12.37 | | | | | | 11.15 | | | | | | 11.25 | | | | | | 8.58 | | | | | | 7.84 | |
| | |
| The accompanying notes are an integral part of these financial statements. | | 47 |
GOLDMAN SACHS FUND OF FUNDS PORTFOLIOS
Statements of Operations
For the Six Months Ended June 30, 2013 (Unaudited)
| | | | | | |
| | | | | Balanced Strategy Portfolio | |
| | Investment income: | | | | |
| | Dividends from Affiliated Underlying Funds | | $ | 4,607,578 | |
| | Interest | | | 153 | |
| | Total investment income | | | 4,607,731 | |
| | | | | | |
| | Expenses: | | | | |
| | Distribution and Service fees(a) | | | 764,078 | |
| | Management fees | | | 427,997 | |
| | Transfer Agent fees(a) | | | 350,943 | |
| | Printing and mailing costs | | | 48,442 | |
| | Registration fees | | | 46,904 | |
| | Professional fees | | | 32,520 | |
| | Custody, accounting and administrative services | | | 23,094 | |
| | Trustee fees | | | 9,387 | |
| | Service Share fees — Shareholder Administration Plan | | | 2,634 | |
| | Service Share fees — Service Plan | | | 2,634 | |
| | Other | | | 7,494 | |
| | Total expenses | | | 1,716,127 | |
| | Less — expense reimbursements | | | (156,428 | ) |
| | Net expenses | | | 1,559,699 | |
| | NET INVESTMENT INCOME (LOSS) | | | 3,048,032 | |
| | | | | | |
| | Realized and unrealized gain (loss): | | | | |
| | Net realized gain from Affiliated Underlying Funds | | | 18,276,897 | |
| | Net change in unrealized gain (loss) on Affiliated Underlying Funds | | | (14,647,005 | ) |
| | Net realized and unrealized gain (loss) | | | 3,629,892 | |
| | NET INCREASE (DECREASE) IN NET ASSETS RESULTING FROM OPERATIONS | | $ | 6,677,924 | |
| | (a) | | Class specific Distribution and Service and Transfer Agent fees were as follows: |
| | | | | | | | | | | | | | | | | | | | | | | | | | | | | | | | | | | | | | | | | | | | |
| | | Distribution and Service Fees | | | Transfer Agent Fees | |
Portfolio | | Class A | | | Class B | | | Class C | | | Class R | | | Class A | | | Class B | | | Class C | | | Institutional | | | Service | | | Class IR | | | Class R | |
Balanced Strategy | | $ | 262,951 | | | $ | 84,561 | | | $ | 396,021 | | | $ | 20,545 | | | $ | 199,843 | | | $ | 16,067 | | | $ | 75,244 | | | $ | 50,562 | | | $ | 421 | | | $ | 999 | | | $ | 7,807 | |
Equity Growth Strategy | | | 182,264 | | | | 87,006 | | | | 514,364 | | | | 12,517 | | | | 138,521 | | | | 16,531 | | | | 97,729 | | | | 19,578 | | | | 124 | | | | 490 | | | | 4,757 | |
Growth and Income Strategy | | | 593,951 | | | | 279,154 | | | | 1,029,495 | | | | 10,388 | | | | 451,403 | | | | 53,040 | | | | 195,604 | | | | 58,526 | | | | 792 | | | | 1,529 | | | | 3,947 | |
Growth Strategy | | | 490,586 | | | | 276,892 | | | | 1,123,360 | | | | 12,527 | | | | 372,845 | | | | 52,609 | | | | 213,439 | | | | 38,395 | | | | 653 | | | | 1,366 | | | | 4,761 | |
Income Strategies | | | 16,239 | | | | — | | | | 59,308 | | | | 360 | | | | 12,341 | | | | — | | | | 11,268 | | | | 1,649 | | | | — | | | | 2,044 | | | | 137 | |
Satellite Strategies | | | 328,546 | | | | — | | | | 671,669 | | | | 8,970 | | | | 249,695 | | | | — | | | | 127,617 | | | | 174,103 | | | | 7,274 | | | | 86,088 | | | | 3,408 | |
| | |
| 48 | | The accompanying notes are an integral part of these financial statements. |
GOLDMAN SACHS FUND OF FUNDS PORTFOLIOS
| | | | | | | | | | | | | | | | | | | | | | | | | | | | |
| | | Equity Growth
Strategy Portfolio | | | | | Growth and Income
Strategy Portfolio | | | | | Growth Strategy Portfolio | | | | | Income Strategies
Portfolio | | | | | Satellite Strategies
Portfolio | |
| | | | | | | | | | | | | | | | | | | | | | | | | | | | |
| | $ | 649,212 | | | | | $ | 5,450,790 | | | | | $ | 1,981,483 | | | | | $ | 806,608 | | | | | $ | 23,439,187 | |
| | | 62 | | | | | | 371 | | | | | | 176 | | | | | | 5 | | | | | | 585 | |
| | | 649,274 | | | | | | 5,451,161 | | | | | | 1,981,659 | | | | | | 806,613 | | | | | | 23,439,772 | |
| | | | | | | | | | | | | | | | | | | | | | | | | | | | |
| | | | | | | | | | | | | | | | | | | | | | | | | | | | |
| | | 796,151 | | | | | | 1,912,988 | | | | | | 1,903,365 | | | | | | 75,907 | | | | | | 1,009,185 | |
| | | 277,589 | | | | | | 779,434 | | | | | | 655,658 | | | | | | 21,942 | | | | | | 866,922 | |
| | | 277,730 | | | | | | 764,841 | | | | | | 684,068 | | | | | | 27,439 | | | | | | 648,185 | |
| | | 56,580 | | | | | | 92,730 | | | | | | 119,613 | | | | | | 30,425 | | | | | | 82,149 | |
| | | 43,758 | | | | | | 51,590 | | | | | | 44,434 | | | | | | 37,120 | | | | | | 89,435 | |
| | | 32,520 | | | | | | 32,520 | | | | | | 32,520 | | | | | | 41,322 | | | | | | 28,841 | |
| | | 20,084 | | | | | | 28,359 | | | | | | 21,229 | | | | | | 18,209 | | | | | | 22,850 | |
| | | 9,104 | | | | | | 10,025 | | | | | | 9,735 | | | | | | 7,915 | | | | | | 10,100 | |
| | | 777 | | | | | | 4,949 | | | | | | 4,082 | | | | | | — | | | | | | 45,462 | |
| | | 777 | | | | | | 4,949 | | | | | | 4,082 | | | | | | — | | | | | | 45,462 | |
| | | 5,497 | | | | | | 12,604 | | | | | | 10,812 | | | | | | 2,721 | | | | | | 8,529 | |
| | | 1,520,567 | | | | | | 3,694,989 | | | | | | 3,489,598 | | | | | | 263,000 | | | | | | 2,857,120 | |
| | | (160,141 | ) | | | | | (207,043 | ) | | | | | (220,858 | ) | | | | | (135,941 | ) | | | | | (171,991 | ) |
| | | 1,360,426 | | | | | | 3,487,946 | | | | | | 3,268,740 | | | | | | 127,059 | | | | | | 2,685,129 | |
| | | (711,152 | ) | | | | | 1,963,215 | | | | | | (1,287,081 | ) | | | | | 679,554 | | | | | | 20,754,643 | |
| | | | | | | | | | | | | | | | | | | | | | | | | | | | |
| | | | | | | | | | | | | | | | | | | | | | | | | | | | |
| | | 19,820,920 | | | | | | 50,083,646 | | | | | | 50,143,616 | | | | | | 460,778 | | | | | | 1,704,868 | |
| | | 3,528,847 | | | | | | (25,435,845 | ) | | | | | (11,100,111 | ) | | | | | (1,897,729 | ) | | | | | (66,446,045 | ) |
| | | 23,349,767 | | | | | | 24,647,801 | | | | | | 39,043,505 | | | | | | (1,436,951 | ) | | | | | (64,741,177 | ) |
| | $ | 22,638,615 | | | | | $ | 26,611,016 | | | | | $ | 37,756,424 | | | | | $ | (757,397 | ) | | | | $ | (43,986,534 | ) |
| | |
| The accompanying notes are an integral part of these financial statements. | | 49 |
GOLDMAN SACHS FUND OF FUNDS PORTFOLIOS
Statements of Changes in Net Assets
| | | | | | | | | | |
| | | | | Balanced Strategy Portfolio | |
| | | | | For the
Six Months Ended
June 30, 2013
(Unaudited) | | | For the
Fiscal Year Ended
December 31, 2012 | |
| | From operations: | | | | | | | | |
| | Net investment income (loss) | | $ | 3,048,032 | | | $ | 9,476,497 | |
| | Net realized gain | | | 18,276,897 | | | | 33,122,874 | |
| | Net change in unrealized gain (loss) | | | (14,647,005 | ) | | | 12,556,803 | |
| | Net increase in net assets resulting from operations | | | 6,677,924 | | | | 55,156,174 | |
| | | | | | | | | | |
| | Distributions to shareholders: | | | | | | | | |
| | From net investment income | | | | | | | | |
| | Class A Shares | | | (1,152,711 | ) | | | (6,275,335 | ) |
| | Class B Shares | | | (25,914 | ) | | | (341,597 | ) |
| | Class C Shares | | | (141,047 | ) | | | (1,552,743 | ) |
| | Institutional Shares | | | (1,945,124 | ) | | | (6,879,203 | ) |
| | Service Shares | | | (10,219 | ) | | | (52,231 | ) |
| | Class IR Shares | | | (7,630 | ) | | | (25,133 | ) |
| | Class R Shares | | | (35,298 | ) | | | (195,480 | ) |
| | Total distributions to shareholders | | | (3,317,943 | ) | | | (15,321,722 | ) |
| | | | | | | | | | |
| | From share transactions: | | | | | | | | |
| | Proceeds from sales of shares | | | 53,673,195 | | | | 210,335,373 | |
| | Reinvestment of distributions | | | 3,211,707 | | | | 14,561,935 | |
| | Cost of shares redeemed | | | (99,014,978 | ) | | | (294,150,887 | ) |
| | Net decrease in net assets resulting from share transactions | | | (42,130,076 | ) | | | (69,253,579 | ) |
| | TOTAL DECREASE | | | (38,770,095 | ) | | | (29,419,127 | ) |
| | | | | | | | | | |
| | Net assets: | | | | | | | | |
| | Beginning of period | | | 577,674,296 | | | | 607,093,423 | |
| | End of period | | $ | 538,904,201 | | | $ | 577,674,296 | |
| | Undistributed (distributions in excess of) net investment income (loss) | | $ | (5,065 | ) | | $ | 264,846 | |
| | |
| 50 | | The accompanying notes are an integral part of these financial statements. |
GOLDMAN SACHS FUND OF FUNDS PORTFOLIOS
| | | | | | | | | | | | | | | | | | | | | | |
| | Equity Growth Strategy Portfolio | | | | | Growth and Income Strategy Portfolio | |
| | | For the
Six Months Ended
June 30, 2013
(Unaudited) | | | | | For the Fiscal Year Ended
December 31, 2012 | | | | | For the Six Months Ended
June 30, 2013
(Unaudited) | | | | | For the Fiscal Year Ended
December 31, 2012 | |
| | | | | | | | | | | | | | | | | | | | | | |
| | $ | (711,152 | ) | | | | $ | 6,420,570 | | | | | $ | 1,963,215 | | | | | $ | 16,821,975 | |
| | | 19,820,920 | | | | | | 15,991,669 | | | | | | 50,083,646 | | | | | | 68,314,839 | |
| | | 3,528,847 | | | | | | 38,066,544 | | | | | | (25,435,845 | ) | | | | | 46,984,908 | |
| | | 22,638,615 | | | | | | 60,478,783 | | | | | | 26,611,016 | | | | | | 132,121,722 | |
| | | | | | | | | | | | | | | | | | | | | | |
| | | | | | | | | | | | | | | | | | | | | | |
| | | | | | | | | | | | | | | | | | | | | | |
| | | — | | | | | | (2,673,271 | ) | | | | | (940,764 | ) | | | | | (12,556,074 | ) |
| | | — | | | | | | (215,276 | ) | | | | | — | | | | | | (1,076,859 | ) |
| | | — | | | | | | (1,287,853 | ) | | | | | — | | | | | | (3,900,980 | ) |
| | | — | | | | | | (2,169,434 | ) | | | | | (1,246,792 | ) | | | | | (6,653,749 | ) |
| | | — | | | | | | (5,760 | ) | | | | | (6,180 | ) | | | | | (92,004 | ) |
| | | — | | | | | | (11,010 | ) | | | | | (5,659 | ) | | | | | (41,840 | ) |
| | | — | | | | | | (86,405 | ) | | | | | (3,635 | ) | | | | | (89,148 | ) |
| | | — | | | | | | (6,449,009 | ) | | | | | (2,203,030 | ) | | | | | (24,410,654 | ) |
| | | | | | | | | | | | | | | | | | | | | | |
| | | | | | | | | | | | | | | | | | | | | | |
| | | 22,964,487 | | | | | | 74,093,950 | | | | | | 85,603,302 | | | | | | 212,615,443 | |
| | | — | | | | | | 5,985,711 | | | | | | 2,129,000 | | | | | | 22,511,989 | |
| | | (49,446,817 | ) | | | | | (162,490,004 | ) | | | | | (148,588,348 | ) | | | | | (528,521,025 | ) |
| | | (26,482,330 | ) | | | | | (82,410,343 | ) | | | | | (60,856,046 | ) | | | | | (293,393,593 | ) |
| | | (3,843,715 | ) | | | | | (28,380,569 | ) | | | | | (36,448,060 | ) | | | | | (185,682,525 | ) |
| | | | | | | | | | | | | | | | | | | | | | |
| | | | | | | | | | | | | | | | | | | | | | |
| | | 366,534,470 | | | | | | 394,915,039 | | | | | | 1,037,700,487 | | | | | | 1,223,383,012 | |
| | $ | 362,690,755 | | | | | $ | 366,534,470 | | | | | $ | 1,001,252,427 | | | | | $ | 1,037,700,487 | |
| | $ | (540,874 | ) | | | | $ | 170,278 | | | | | $ | 2,131 | | | | | $ | 241,946 | |
| | |
| The accompanying notes are an integral part of these financial statements. | | 51 |
GOLDMAN SACHS FUND OF FUNDS PORTFOLIOS
Statements of Changes in Net Assets
| | | | | | | | | | |
| | | | | Growth Strategy Portfolio | |
| | | | | For the Six Months Ended
June 30, 2013
(Unaudited) | | | For the Fiscal Year Ended
December 31, 2012 | |
| | From operations: | | | | | | | | |
| | Net investment income (loss) | | $ | (1,287,081 | ) | | $ | 13,519,853 | |
| | Net realized gain (loss) | | | 50,143,616 | | | | 42,151,721 | |
| | Net change in unrealized gain (loss) | | | (11,100,111 | ) | | | 70,599,360 | |
| | Net increase (decrease) in net assets resulting from operations | | | 37,756,424 | | | | 126,270,934 | |
| | | | | | | | | | |
| | Distributions to shareholders: | | | | | | | | |
| | From net investment income | | | | | | | | |
| | Class A Shares | | | — | | | | (8,486,632 | ) |
| | Class B Shares | | | — | | | | (788,283 | ) |
| | Class C Shares | | | — | | | | (3,234,948 | ) |
| | Institutional Shares | | | — | | | | (4,515,835 | ) |
| | Service Shares | | | — | | | | (68,320 | ) |
| | Class IR Shares | | | — | | | | (37,449 | ) |
| | Class R Shares | | | — | | | | (102,502 | ) |
| | From net realized gains | | | | | | | | |
| | Class A Shares | | | — | | | | — | |
| | Class C Shares | | | — | | | | — | |
| | Institutional Shares | | | — | | | | — | |
| | Service Shares | | | — | | | | — | |
| | Class IR Shares | | | — | | | | — | |
| | Class R Shares | | | — | | | | — | |
| | Total distributions to shareholders | | | — | | | | (17,233,969 | ) |
| | | | | | | | | | |
| | From share transactions: | | | | | | | | |
| | Proceeds from sales of shares | | | 51,801,412 | | | | 151,847,016 | |
| | Reinvestment of distributions | | | — | | | | 15,909,495 | |
| | Cost of shares redeemed | | | (110,978,919 | ) | | | (404,557,570 | ) |
| | Net increase (decrease) in net assets resulting from share transactions | | | (59,177,507 | ) | | | (236,801,059 | ) |
| | TOTAL INCREASE (DECREASE) | | | (21,421,083 | ) | | | (127,764,094 | ) |
| | | | | | | | | | |
| | Net assets: | | | | | | | | |
| | Beginning of period | | | 863,079,516 | | | | 990,843,610 | |
| | End of period | | $ | 841,658,433 | | | $ | 863,079,516 | |
| | Undistributed net investment income (loss) | | $ | (1,021,775 | ) | | $ | 265,306 | |
| | |
| 52 | | The accompanying notes are an integral part of these financial statements. |
GOLDMAN SACHS FUND OF FUNDS PORTFOLIOS
| | | | | | | | | | | | | | | | | | | | | | |
| | Income Strategies Portfolio | | | | | Satellite Strategies Portfolio | |
| | | For the Six Months Ended
June 30, 2013
(Unaudited) | | | | | For the Fiscal Year Ended
December 31, 2012 | | | | | For the Six Months Ended
June 30, 2013
(Unaudited) | | | | | For the Fiscal Year Ended
December 31, 2012 | |
| | | | | | | | | | | | | | | | | | | | | | |
| | $ | 679,554 | | | | | $ | 1,214,151 | | | | | $ | 20,754,643 | | | | | $ | 50,676,032 | |
| | | 460,778 | | | | | | 2,013,486 | | | | | | 1,704,868 | | | | | | (949 | ) |
| | | (1,897,729 | ) | | | | | 1,479,030 | | | | | | (66,446,045 | ) | | | | | 123,599,202 | |
| | | (757,397 | ) | | | | | 4,706,667 | | | | | | (43,986,534 | ) | | | | | 174,274,285 | |
| | | | | | | | | | | | | | | | | | | | | | |
| | | | | | | | | | | | | | | | | | | | | | |
| | | | | | | | | | | | | | | | | | | | | | |
| | | (241,552 | ) | | | | | (683,029 | ) | | | | | (3,648,828 | ) | | | | | (9,936,450 | ) |
| | | — | | | | | | — | | | | | | — | | | | | | — | |
| | | (175,048 | ) | | | | | (396,098 | ) | | | | | (1,346,340 | ) | | | | | (4,409,370 | ) |
| | | (179,777 | ) | | | | | (239,468 | ) | | | | | (13,811,093 | ) | | | | | (34,291,638 | ) |
| | | — | | | | | | — | | | | | | (449,545 | ) | | | | | (1,461,078 | ) |
| | | (43,849 | ) | | | | | (92,298 | ) | | | | | (1,392,713 | ) | | | | | (3,116,530 | ) |
| | | (2,539 | ) | | | | | (4,251 | ) | | | | | (47,468 | ) | | | | | (109,742 | ) |
| | | | | | | | | | | | | | | | | | | | | | |
| | | — | | | | | | — | | | | | | — | | | | | | (745,491 | ) |
| | | — | | | | | | — | | | | | | — | | | | | | (390,399 | ) |
| | | — | | | | | | — | | | | | | — | | | | | | (2,389,754 | ) |
| | | — | | | | | | — | | | | | | — | | | | | | (111,879 | ) |
| | | — | | | | | | — | | | | | | — | | | | | | (219,387 | ) |
| | | — | | | | | | — | | | | | | — | | | | | | (8,278 | ) |
| | | (642,765 | ) | | | | | (1,415,144 | ) | | | | | (20,695,987 | ) | | | | | (57,189,996 | ) |
| | | | | | | | | | | | | | | | | | | | | | |
| | | | | | | | | | | | | | | | | | | | | | |
| | | 7,745,598 | | | | | | 12,371,781 | | | | | | 331,135,889 | | | | | | 476,033,523 | |
| | | 587,415 | | | | | | 1,293,921 | | | | | | 15,838,727 | | | | | | 43,851,790 | |
| | | (6,030,707 | ) | | | | | (21,935,315 | ) | | | | | (216,727,144 | ) | | | | | (336,307,957 | ) |
| | | 2,302,306 | | | | | | (8,269,613 | ) | | | | | 130,247,472 | | | | | | 183,577,356 | |
| | | 902,144 | | | | | | (4,978,090 | ) | | | | | 65,564,951 | | | | | | 300,661,645 | |
| | | | | | | | | | | | | | | | | | | | | | |
| | | | | | | | | | | | | | | | | | | | | | |
| | | 33,419,009 | | | | | | 38,397,099 | | | | | | 1,298,481,930 | | | | | | 997,820,285 | |
| | $ | 34,321,153 | | | | | $ | 33,419,009 | | | �� | | $ | 1,364,046,881 | | | | | $ | 1,298,481,930 | |
| | $ | 61,132 | | | | | $ | 24,343 | | | | | $ | 484,407 | | | | | $ | 425,751 | |
| | |
| The accompanying notes are an integral part of these financial statements. | | 53 |
GOLDMAN SACHS BALANCED STRATEGY PORTFOLIO
Financial Highlights
Selected Data for a Share Outstanding Throughout Each Period
| | | | | | | | | | | | | | | | | | | | | | | | | | | | | | |
| | | | | | | | Income (loss) from
investment operations | | | Distributions
to shareholders | |
| | | Year - Share Class | | Net asset
value,
beginning
of period | | | Net investment income(a)(b) | | | Net realized and unrealized gain (loss) | | | Total from investment operations | | | From net investment income | | | From net realized gains | | | Total
distributions | |
| FOR THE SIX MONTHS ENDED JUNE 30, (UNAUDITED) | | | | | |
| | 2013 - A | | $ | 10.56 | | | $ | 0.05 | | | $ | 0.04 | | | $ | 0.09 | | | $ | (0.06 | ) | | $ | — | | | $ | (0.06 | ) |
| | 2013 - B | | | 10.56 | | | | 0.01 | | | | 0.05 | | | | 0.06 | | | | (0.02 | ) | | | — | | | | (0.02 | ) |
| | 2013 - C | | | 10.56 | | | | 0.01 | | | | 0.04 | | | | 0.05 | | | | (0.02 | ) | | | — | | | | (0.02 | ) |
| | 2013 - Institutional | | | 10.56 | | | | 0.08 | | | | 0.04 | | | | 0.12 | | | | (0.08 | ) | | | — | | | | (0.08 | ) |
| | 2013 - Service | | | 10.59 | | | | 0.05 | | | | 0.03 | | | | 0.08 | | | | (0.05 | ) | | | — | | | | (0.05 | ) |
| | 2013 - IR | | | 10.53 | | | | 0.07 | | | | 0.03 | | | | 0.10 | | | | (0.07 | ) | | | — | | | | (0.07 | ) |
| | 2013 - R | | | 10.51 | | | | 0.04 | | | | 0.05 | | | | 0.09 | | | | (0.05 | ) | | | — | | | | (0.05 | ) |
| | | | | | | | | | | | | | | | | | | | | | | | | | | | | | |
| FOR THE FISCAL YEARS ENDED DECEMBER 31, | | | | | | | | | |
| | 2012 - A | | | 9.86 | | | | 0.16 | | | | 0.82 | | | | 0.98 | | | | (0.28 | ) | | | — | | | | (0.28 | ) |
| | 2012 - B | | | 9.86 | | | | 0.08 | | | | 0.82 | | | | 0.90 | | | | (0.20 | ) | | | — | | | | (0.20 | ) |
| | 2012 - C | | | 9.86 | | | | 0.09 | | | | 0.81 | | | | 0.90 | | | | (0.20 | ) | | | — | | | | (0.20 | ) |
| | 2012 - Institutional | | | 9.87 | | | | 0.23 | | | | 0.79 | | | | 1.02 | | | | (0.33 | ) | | | — | | | | (0.33 | ) |
| | 2012 - Service | | | 9.88 | | | | 0.15 | | | | 0.83 | | | | 0.98 | | | | (0.27 | ) | | | — | | | | (0.27 | ) |
| | 2012 - IR | | | 9.83 | | | | 0.22 | | | | 0.79 | | | | 1.01 | | | | (0.31 | ) | | | — | | | | (0.31 | ) |
| | 2012 - R | | | 9.82 | | | | 0.15 | | | | 0.80 | | | | 0.95 | | | | (0.26 | ) | | | — | | | | (0.26 | ) |
| | 2011 - A | | | 10.22 | | | | 0.15 | | | | (0.34 | ) | | | (0.19 | ) | | | (0.17 | ) | | | — | | | | (0.17 | ) |
| | 2011 - B | | | 10.22 | | | | 0.07 | | | | (0.34 | ) | | | (0.27 | ) | | | (0.09 | ) | | | — | | | | (0.09 | ) |
| | 2011 - C | | | 10.22 | | | | 0.08 | | | | (0.35 | ) | | | (0.27 | ) | | | (0.09 | ) | | | — | | | | (0.09 | ) |
| | 2011 - Institutional | | | 10.23 | | | | 0.20 | | | | (0.35 | ) | | | (0.15 | ) | | | (0.21 | ) | | | — | | | | (0.21 | ) |
| | 2011 - Service | | | 10.25 | | | | 0.14 | | | | (0.35 | ) | | | (0.21 | ) | | | (0.16 | ) | | | — | | | | (0.16 | ) |
| | 2011 - IR | | | 10.21 | | | | 0.24 | | | | (0.42 | ) | | | (0.18 | ) | | | (0.20 | ) | | | — | | | | (0.20 | ) |
| | 2011 - R | | | 10.18 | | | | 0.14 | | | | (0.35 | ) | | | (0.21 | ) | | | (0.15 | ) | | | — | | | | (0.15 | ) |
| | 2010 - A | | | 9.65 | | | | 0.21 | | | | 0.60 | | | | 0.81 | | | | (0.24 | ) | | | — | | | | (0.24 | ) |
| | 2010 - B | | | 9.65 | | | | 0.13 | | | | 0.60 | | | | 0.73 | | | | (0.16 | ) | | | — | | | | (0.16 | ) |
| | 2010 - C | | | 9.65 | | | | 0.13 | | | | 0.60 | | | | 0.73 | | | | (0.16 | ) | | | — | | | | (0.16 | ) |
| | 2010 - Institutional | | | 9.66 | | | | 0.25 | | | | 0.60 | | | | 0.85 | | | | (0.28 | ) | | | — | | | | (0.28 | ) |
| | 2010 - Service | | | 9.67 | | | | 0.21 | | | | 0.60 | | | | 0.81 | | | | (0.23 | ) | | | — | | | | (0.23 | ) |
| | 2010 - IR | | | 9.64 | | | | 0.25 | | | | 0.58 | | | | 0.83 | | | | (0.26 | ) | | | — | | | | (0.26 | ) |
| | 2010 - R | | | 9.62 | | | | 0.24 | | | | 0.54 | | | | 0.78 | | | | (0.22 | ) | | | — | | | | (0.22 | ) |
| | 2009 - A | | | 8.39 | | | | 0.36 | | | | 1.29 | | | | 1.65 | | | | (0.39 | ) | | | — | | | | (0.39 | ) |
| | 2009 - B | | | 8.39 | | | | 0.29 | | | | 1.29 | | | | 1.58 | | | | (0.32 | ) | | | — | | | | (0.32 | ) |
| | 2009 - C | | | 8.39 | | | | 0.29 | | | | 1.29 | | | | 1.58 | | | | (0.32 | ) | | | — | | | | (0.32 | ) |
| | 2009 - Institutional | | | 8.39 | | | | 0.40 | | | | 1.29 | | | | 1.69 | | | | (0.42 | ) | | | — | | | | (0.42 | ) |
| | 2009 - Service | | | 8.41 | | | | 0.33 | | | | 1.31 | | | | 1.64 | | | | (0.38 | ) | | | — | | | | (0.38 | ) |
| | 2009 - IR | | | 8.38 | | | | 0.51 | | | | 1.16 | | | | 1.67 | | | | (0.41 | ) | | | — | | | | (0.41 | ) |
| | 2009 - R | | | 8.38 | | | | 0.46 | | | | 1.16 | | | | 1.62 | | | | (0.38 | ) | | | — | | | | (0.38 | ) |
| | 2008 - A | | | 11.08 | | | | 0.30 | | | | (2.54 | ) | | | (2.24 | ) | | | (0.30 | ) | | | (0.15 | ) | | | (0.45 | ) |
| | 2008 - B | | | 11.08 | | | | 0.22 | | | | (2.53 | ) | | | (2.31 | ) | | | (0.23 | ) | | | (0.15 | ) | | | (0.38 | ) |
| | 2008 - C | | | 11.08 | | | | 0.22 | | | | (2.53 | ) | | | (2.31 | ) | | | (0.23 | ) | | | (0.15 | ) | | | (0.38 | ) |
| | 2008 - Institutional | | | 11.09 | | | | 0.35 | | | | (2.56 | ) | | | (2.21 | ) | | | (0.34 | ) | | | (0.15 | ) | | | (0.49 | ) |
| | 2008 - Service | | | 11.10 | | | | 0.30 | | | | (2.55 | ) | | | (2.25 | ) | | | (0.29 | ) | | | (0.15 | ) | | | (0.44 | ) |
| | 2008 - IR | | | 11.07 | | | | 0.32 | | | | (2.53 | ) | | | (2.21 | ) | | | (0.33 | ) | | | (0.15 | ) | | | (0.48 | ) |
| | 2008 - R | | | 11.07 | | | | 0.34 | | | | (2.60 | ) | | | (2.26 | ) | | | (0.28 | ) | | | (0.15 | ) | | | (0.43 | ) |
| | (a) | | Calculated based on the average shares outstanding methodology. |
| | (b) | | Recognition of net investment income by the Portfolio is affected by the timing of declaration of dividends by the Underlying Funds in which the Portfolio invests. |
| | (c) | | Assumes investment at the net asset value at the beginning of the period, reinvestment of all dividends and distributions, a complete redemption of the investment at the net asset value at the end of the period and no sales or redemption charges. Total returns would be reduced if a sales or redemption charge was taken into account. Returns do not reflect the deduction of taxes that a shareholder would pay on Portfolio distributions or the redemption of Portfolio shares. Total returns for periods less than one full year are not annualized. |
| | (d) | | Expense ratios exclude the expenses of the Underlying Funds in which the Portfolio invests. |
| | (e) | | The Portfolio’s portfolio turnover rate is calculated in accordance with regulatory requirements, without regard to transactions involving short term investments and certain derivatives. If such transactions were included, the Portfolio’s portfolio turnover rate may be higher. |
| | |
| 54 | | The accompanying notes are an integral part of these financial statements. |
GOLDMAN SACHS BALANCED STRATEGY PORTFOLIO
| | | | | | | | | | | | | | | | | | | | | | | | | | | | | | | | |
| | | | | | | | | | | | | | | | | | | | | | | | | | | | | | |
| | | Net asset value, end of period | | | | | Total
return(c) | | | | | Net assets,
end of
period (in 000s) | | | | | Ratio of
net expenses
to average
net assets(d) | | | | Ratio of
total expenses
to average
net assets(d) | | | | Ratio of
net investment
income to average net assets(b) | | | | Portfolio turnover rate(e) |
| | | | | | | | | | | | | | | | | | | | | | | | | | | | | | | | |
| | | $10.59 | | | | | | 0.85 | % | | | | $ | 195,961 | | | | | 0.59%(f) | | | | 0.65%(f) | | | | 1.02%(f) | | | | 20% |
| | | 10.60 | | | | | | 0.54 | | | | | | 14,834 | | | | | 1.34(f) | | | | 1.40(f) | | | | 0.27(f) | | | | 20 |
| | | 10.59 | | | | | | 0.46 | | | | | | 75,603 | | | | | 1.34(f) | | | | 1.40(f) | | | | 0.27(f) | | | | 20 |
| | | 10.60 | | | | | | 1.15 | | | | | | 241,019 | | | | | 0.19(f) | | | | 0.25(f) | | | | 1.42(f) | | | | 20 |
| | | 10.62 | | | | | | 0.78 | | | | | | 1,867 | | | | | 0.69(f) | | | | 0.75(f) | | | | 0.91(f) | | | | 20 |
| | | 10.56 | | | | | | 0.99 | | | | | | 1,832 | | | | | 0.34(f) | | | | 0.40(f) | | | | 1.28(f) | | | | 20 |
| | | 10.55 | | | | | | 0.82 | | | | | | 7,789 | | | | | 0.84(f) | | | | 0.90(f) | | | | 0.77(f) | | | | 20 |
| | | | | | | | | | | | | | | | | | | | | | | | | | | | | | | | |
| | | | | | | | | | | | | | | | | | | | | | | | | | | | | | | | |
| | | 10.56 | | | | | | 9.96 | | | | | | 219,919 | | | | | 0.59 | | | | 0.65 | | | | 1.55 | | | | 66 |
| | | 10.56 | | | | | | 9.14 | | | | | | 17,959 | | | | | 1.35 | | | | 1.40 | | | | 0.81 | | | | 66 |
| | | 10.56 | | | | | | 9.16 | | | | | | 81,123 | | | | | 1.34 | | | | 1.40 | | | | 0.87 | | | | 66 |
| | | 10.56 | | | | | | 10.32 | | | | | | 247,494 | | | | | 0.19 | | | | 0.25 | | | | 2.23 | | | | 66 |
| | | 10.59 | | | | | | 9.95 | | | | | | 2,022 | | | | | 0.69 | | | | 0.75 | | | | 1.48 | | | | 66 |
| | | 10.53 | | | | | | 10.29 | | | | | | 920 | | | | | 0.34 | | | | 0.40 | | | | 2.14 | | | | 66 |
| | | 10.51 | | | | | | 9.66 | | | | | | 8,237 | | | | | 0.84 | | | | 0.90 | | | | 1.49 | | | | 66 |
| | | 9.86 | | | | | | (1.88 | ) | | | | | 327,283 | | | | | 0.59 | | | | 0.64 | | | | 1.49 | | | | 38 |
| | | 9.86 | | | | | | (2.65 | ) | | | | | 23,444 | | | | | 1.34 | | | | 1.39 | | | | 0.72 | | | | 38 |
| | | 9.86 | | | | | | (2.64 | ) | | | | | 94,041 | | | | | 1.34 | | | | 1.39 | | | | 0.73 | | | | 38 |
| | | 9.87 | | | | | | (1.48 | ) | | | | | 151,822 | | | | | 0.19 | | | | 0.24 | | | | 1.96 | | | | 38 |
| | | 9.88 | | | | | | (2.09 | ) | | | | | 2,466 | | | | | 0.69 | | | | 0.74 | | | | 1.36 | | | | 38 |
| | | 9.83 | | | | | | (1.79 | ) | | | | | 750 | | | | | 0.34 | | | | 0.39 | | | | 2.38 | | | | 38 |
| | | 9.82 | | | | | | (2.11 | ) | | | | | 7,288 | | | | | 0.84 | | | | 0.89 | | | | 1.38 | | | | 38 |
| | | 10.22 | | | | | | 8.46 | | | | | | 427,998 | | | | | 0.59 | | | | 0.64 | | | | 2.15 | | | | 38 |
| | | 10.22 | | | | | | 7.62 | | | | | | 32,659 | | | | | 1.34 | | | | 1.39 | | | | 1.36 | | | | 38 |
| | | 10.22 | | | | | | 7.64 | | | | | | 126,032 | | | | | 1.34 | | | | 1.39 | | | | 1.34 | | | | 38 |
| | | 10.23 | | | | | | 8.89 | | | | | | 147,670 | | | | | 0.19 | | | | 0.24 | | | | 2.57 | | | | 38 |
| | | 10.25 | | | | | | 8.44 | | | | | | 3,971 | | | | | 0.69 | | | | 0.74 | | | | 2.14 | | | | 38 |
| | | 10.21 | | | | | | 8.74 | | | | | | 771 | | | | | 0.34 | | | | 0.39 | | | | 2.55 | | | | 38 |
| | | 10.18 | | | | | | 8.21 | | | | | | 5,063 | | | | | 0.84 | | | | 0.89 | | | | 2.47 | | | | 38 |
| | | 9.65 | | | | | | 19.94 | | | | | | 444,114 | | | | | 0.59 | | | | 0.65 | | | | 4.03 | | | | 58 |
| | | 9.65 | | | | | | 19.03 | | | | | | 37,883 | | | | | 1.34 | | | | 1.40 | | | | 3.27 | | | | 58 |
| | | 9.65 | | | | | | 19.05 | | | | | | 144,726 | | | | | 1.34 | | | | 1.40 | | | | 3.26 | | | | 58 |
| | | 9.66 | | | | | | 20.53 | | | | | | 140,770 | | | | | 0.19 | | | | 0.25 | | | | 4.43 | | | | 58 |
| | | 9.67 | | | | | | 19.75 | | | | | | 3,710 | | | | | 0.69 | | | | 0.75 | | | | 3.74 | | | | 58 |
| | | 9.64 | | | | | | 20.28 | | | | | | 32 | | | | | 0.34 | | | | 0.40 | | | | 5.65 | | | | 58 |
| | | 9.62 | | | | | | 19.66 | | | | | | 848 | | | | | 0.84 | | | | 0.90 | | | | 5.01 | | | | 58 |
| | | 8.39 | | | | | | (20.35 | ) | | | | | 368,640 | | | | | 0.59 | | | | 0.65 | | | | 2.97 | | | | 52 |
| | | 8.39 | | | | | | (20.96 | ) | | | | | 34,376 | | | | | 1.34 | | | | 1.40 | | | | 2.15 | | | | 52 |
| | | 8.39 | | | | | | (20.96 | ) | | | | | 130,433 | | | | | 1.34 | | | | 1.40 | | | | 2.15 | | | | 52 |
| | | 8.39 | | | | | | (20.10 | ) | | | | | 155,233 | | | | | 0.19 | | | | 0.25 | | | | 3.54 | | | | 52 |
| | | 8.41 | | | | | | (20.42 | ) | | | | | 4,433 | | | | | 0.69 | | | | 0.75 | | | | 2.93 | | | | 52 |
| | | 8.38 | | | | | | (20.17 | ) | | | | | 8 | | | | | 0.34 | | | | 0.40 | | | | 3.15 | | | | 52 |
| | | 8.38 | | | | | | (20.57 | ) | | | | | 22 | | | | | 0.84 | | | | 0.90 | | | | 3.52 | | | | 52 |
| | |
| The accompanying notes are an integral part of these financial statements. | | 55 |
GOLDMAN SACHS EQUITY GROWTH STRATEGY PORTFOLIO
Financial Highlights
Selected Data for a Share Outstanding Throughout Each Period
| | | | | | | | | | | | | | | | | | | | | | | | | | | | | | |
| | | | | | | | Income (loss) from
investment operations | | | Distributions
to shareholders | |
| | | Year - Share Class | | Net asset
value,
beginning
of period | | | Net
investment
income
(loss)(a)(b) | | | Net realized
and unrealized
gain (loss) | | | Total from
investment
operations | | | From net
investment
income | | | From net
realized
gains | | | Total
distributions | |
| | FOR THE SIX MONTHS ENDED JUNE 30, (UNAUDITED) | |
| | 2013 - A | | $ | 11.75 | | | $ | (0.02 | ) | | $ | 0.77 | | | $ | 0.75 | | | $ | — | | | $ | — | | | $ | — | |
| | 2013 - B | | | 11.32 | | | | (0.06 | ) | | | 0.73 | | | | 0.67 | | | | — | | | | — | | | | — | |
| | 2013 - C | | | 11.26 | | | | (0.06 | ) | | | 0.73 | | | | 0.67 | | | | — | | | | — | | | | — | |
| | 2013 - Institutional | | | 11.85 | | | | 0.01 | | | | 0.76 | | | | 0.77 | | | | — | | | | — | | | | — | |
| | 2013 - Service | | | 11.71 | | | | (0.02 | ) | | | 0.75 | | | | 0.73 | | | | — | | | | — | | | | — | |
| | 2013 - IR | | | 11.62 | | | | — | (g) | | | 0.75 | | | | 0.75 | | | | — | | | | — | | | | — | |
| | 2013 - R | | | 11.64 | | | | (0.03 | ) | | | 0.76 | | | | 0.73 | | | | — | | | | — | | | | — | |
| | | | | | | | | | | | | | | | | | | | | | | | | | | | | | |
| | FOR THE FISCAL YEARS ENDED DECEMBER 31, | |
| | 2012 - A | | | 10.23 | | | | 0.21 | | | | 1.53 | | | | 1.74 | | | | (0.22 | ) | | | — | | | | (0.22 | ) |
| | 2012 - B | | | 9.87 | | | | 0.11 | | | | 1.48 | | | | 1.59 | | | | (0.14 | ) | | | — | | | | (0.14 | ) |
| | 2012 - C | | | 9.82 | | | | 0.12 | | | | 1.46 | | | | 1.58 | | | | (0.14 | ) | | | — | | | | (0.14 | ) |
| | 2012 - Institutional | | | 10.33 | | | | 0.28 | | | | 1.52 | | | | 1.80 | | | | (0.28 | ) | | | — | | | | (0.28 | ) |
| | 2012 - Service | | | 10.14 | | | | 0.16 | | | | 1.55 | | | | 1.71 | | | | (0.14 | ) | | | — | | | | (0.14 | ) |
| | 2012 - IR | | | 10.13 | | | | 0.24 | | | | 1.51 | | | | 1.75 | | | | (0.26 | ) | | | — | | | | (0.26 | ) |
| | 2012 - R | | | 10.16 | | | | 0.20 | | | | 1.49 | | | | 1.69 | | | | (0.21 | ) | | | — | | | | (0.21 | ) |
| | 2011 - A | | | 11.33 | | | | 0.20 | | | | (1.05 | ) | | | (0.85 | ) | | | (0.25 | ) | | | — | | | | (0.25 | ) |
| | 2011 - B | | | 10.93 | | | | 0.11 | | | | (1.01 | ) | | | (0.90 | ) | | | (0.16 | ) | | | — | | | | (0.16 | ) |
| | 2011 - C | | | 10.88 | | | | 0.11 | | | | (1.01 | ) | | | (0.90 | ) | | | (0.16 | ) | | | — | | | | (0.16 | ) |
| | 2011 - Institutional | | | 11.45 | | | | 0.25 | | | | (1.07 | ) | | | (0.82 | ) | | | (0.30 | ) | | | — | | | | (0.30 | ) |
| | 2011 - Service | | | 11.22 | | | | 0.16 | | | | (1.02 | ) | | | (0.86 | ) | | | (0.22 | ) | | | — | | | | (0.22 | ) |
| | 2011 - IR | | | 11.23 | | | | 0.27 | | | | (1.08 | ) | | | (0.81 | ) | | | (0.29 | ) | | | — | | | | (0.29 | ) |
| | 2011 - R | | | 11.26 | | | | 0.21 | | | | (1.08 | ) | | | (0.87 | ) | | | (0.23 | ) | | | — | | | | (0.23 | ) |
| | 2010 - A | | | 10.24 | | | | 0.19 | | | | 1.11 | | | | 1.30 | | | | (0.21 | ) | | | — | | | | (0.21 | ) |
| | 2010 - B | | | 9.88 | | | | 0.11 | | | | 1.06 | | | | 1.17 | | | | (0.12 | ) | | | — | | | | (0.12 | ) |
| | 2010 - C | | | 9.84 | | | | 0.10 | | | | 1.06 | | | | 1.16 | | | | (0.12 | ) | | | — | | | | (0.12 | ) |
| | 2010 - Institutional | | | 10.35 | | | | 0.27 | | | | 1.08 | | | | 1.35 | | | | (0.25 | ) | | | — | | | | (0.25 | ) |
| | 2010 - Service | | | 10.14 | | | | 0.17 | | | | 1.10 | | | | 1.27 | | | | (0.19 | ) | | | — | | | | (0.19 | ) |
| | 2010 - IR | | | 10.16 | | | | 0.24 | | | | 1.07 | | | | 1.31 | | | | (0.24 | ) | | | — | | | | (0.24 | ) |
| | 2010 - R | | | 10.22 | | | | 0.41 | | | | 0.85 | | | | 1.26 | | | | (0.22 | ) | | | — | | | | (0.22 | ) |
| | 2009 - A | | | 8.04 | | | | 0.16 | | | | 2.19 | | | | 2.35 | | | | (0.15 | ) | | | — | | | | (0.15 | ) |
| | 2009 - B | | | 7.77 | | | | 0.09 | | | | 2.10 | | | | 2.19 | | | | (0.08 | ) | | | — | | | | (0.08 | ) |
| | 2009 - C | | | 7.73 | | | | 0.09 | | | | 2.10 | | | | 2.19 | | | | (0.08 | ) | | | — | | | | (0.08 | ) |
| | 2009 - Institutional | | | 8.12 | | | | 0.19 | | | | 2.23 | | | | 2.42 | | | | (0.19 | ) | | | — | | | | (0.19 | ) |
| | 2009 - Service | | | 7.96 | | | | 0.15 | | | | 2.17 | | | | 2.32 | | | | (0.14 | ) | | | — | | | | (0.14 | ) |
| | 2009 - IR | | | 7.98 | | | | 0.84 | | | | 1.53 | | | | 2.37 | | | | (0.19 | ) | | | — | | | | (0.19 | ) |
| | 2009 - R | | | 8.01 | | | | 0.27 | | | | 2.09 | | | | 2.36 | | | | (0.15 | ) | | | — | | | | (0.15 | ) |
| | 2008 - A | | | 15.63 | | | | 0.19 | | | | (6.87 | ) | | | (6.68 | ) | | | (0.25 | ) | | | (0.66 | ) | | | (0.91 | ) |
| | 2008 - B | | | 15.10 | | | | 0.10 | | | | (6.61 | ) | | | (6.51 | ) | | | (0.16 | ) | | | (0.66 | ) | | | (0.82 | ) |
| | 2008 - C | | | 15.03 | | | | 0.10 | | | | (6.58 | ) | | | (6.48 | ) | | | (0.16 | ) | | | (0.66 | ) | | | (0.82 | ) |
| | 2008 - Institutional | | | 15.81 | | | | 0.26 | | | | (6.98 | ) | | | (6.72 | ) | | | (0.31 | ) | | | (0.66 | ) | | | (0.97 | ) |
| | 2008 - Service | | | 15.50 | | | | 0.19 | | | | (6.83 | ) | | | (6.64 | ) | | | (0.24 | ) | | | (0.66 | ) | | | (0.90 | ) |
| | 2008 - IR | | | 15.57 | | | | 0.24 | | | | (6.88 | ) | | | (6.64 | ) | | | (0.29 | ) | | | (0.66 | ) | | | (0.95 | ) |
| | 2008 - R | | | 15.57 | | | | 0.19 | | | | (6.87 | ) | | | (6.68 | ) | | | (0.22 | ) | | | (0.66 | ) | | | (0.88 | ) |
| | (a) | | Calculated based on the average shares outstanding methodology. |
| | (b) | | Recognition of net investment income by the Portfolio is affected by the timing of declaration of dividends by the Underlying Funds in which the Portfolio invests. |
| | (c) | | Assumes investment at the net asset value at the beginning of the period, reinvestment of all dividends and distributions, a complete redemption of the investment at the net asset value at the end of the period and no sales or redemption charges. Total returns would be reduced if a sales or redemption charge was taken into account. Returns do not reflect the deduction of taxes that a shareholder would pay on Portfolio distributions or the redemption of Portfolio shares. Total returns for periods less than one full year are not annualized. |
| | (d) | | Expense ratios exclude the expenses of the Underlying Funds in which the Portfolio invests. |
| | (e) | | The Portfolio’s portfolio turnover rate is calculated in accordance with regulatory requirements, without regard to transactions involving short term investments and certain derivatives. If such transactions were included, the Portfolio’s portfolio turnover rate may be higher. |
| | (g) | | Amount is less than $0.005 per share. |
| | |
| 56 | | The accompanying notes are an integral part of these financial statements. |
GOLDMAN SACHS EQUITY GROWTH STRATEGY PORTFOLIO
| | | | | | | | | | | | | | | | | | | | | | | | | | | | | | | | | | | | | | | | |
| | | | | | | | | | | | | | | | | | | | | | | | | | | | | | | | | | |
| | | Net asset
value, end
of period | | | | | Total
return(c) | | | | | Net assets,
end of
period
(in 000s) | | | | | Ratio of
net expenses
to average
net assets(d) | | | | | Ratio of
total expenses
to average
net assets(d) | | | | | Ratio of
net investment
income (loss)
to average
net assets(b) | | | | | Portfolio
turnover
rate(e) | |
| |
| | $ | 12.50 | | | | | | 6.38 | % | | | | $ | 138,427 | | | | | | 0.59 | %(f) | | | | | 0.68 | %(f) | | | | | (0.25 | )%(f) | | | | | 9 | % |
| | | 11.99 | | | | | | 5.92 | | | | | | 16,089 | | | | | | 1.34 | (f) | | | | | 1.43 | (f) | | | | | (1.01 | )(f) | | | | | 9 | |
| | | 11.93 | | | | | | 5.95 | | | | | | 98,928 | | | | | | 1.34 | (f) | | | | | 1.43 | (f) | | | | | (1.00 | )(f) | | | | | 9 | |
| | | 12.62 | | | | | | 6.50 | | | | | | 102,143 | | | | | | 0.19 | (f) | | | | | 0.28 | (f) | | | | | 0.17 | (f) | | | | | 9 | |
| | | 12.44 | | | | | | 6.23 | | | | | | 567 | | | | | | 0.69 | (f) | | | | | 0.78 | (f) | | | | | (0.36 | )(f) | | | | | 9 | |
| | | 12.37 | | | | | | 6.45 | | | | | | 1,748 | | | | | | 0.34 | (f) | | | | | 0.43 | (f) | | | | | 0.07 | (f) | | | | | 9 | |
| | | 12.37 | | | | | | 6.27 | | | | | | 4,789 | | | | | | 0.84 | (f) | | | | | 0.93 | (f) | | | | | (0.50 | )(f) | | | | | 9 | |
| | | | | | | | | | | | | | | | | | | | | | | | | | | | | | | | | | | | | | | | |
| |
| | | 11.75 | | | | | | 16.95 | | | | | | 147,814 | | | | | | 0.59 | | | | | | 0.68 | | | | | | 1.85 | | | | | | 23 | |
| | | 11.32 | | | | | | 16.05 | | | | | | 17,941 | | | | | | 1.34 | | | | | | 1.43 | | | | | | 1.06 | | | | | | 23 | |
| | | 11.26 | | | | | | 16.10 | | | | | | 102,156 | | | | | | 1.34 | | | | | | 1.43 | | | | | | 1.10 | | | | | | 23 | |
| | | 11.85 | | | | | | 17.45 | | | | | | 92,696 | | | | | | 0.19 | | | | | | 0.26 | | | | | | 2.45 | | | | | | 23 | |
| | | 11.71 | | | | | | 16.85 | | | | | | 488 | | | | | | 0.70 | | | | | | 0.78 | | | | | | 1.43 | | | | | | 23 | |
| | | 11.62 | | | | | | 17.30 | | | | | | 494 | | | | | | 0.34 | | | | | | 0.42 | | | | | | 2.20 | | | | | | 23 | |
| | | 11.64 | | | | | | 16.59 | | | | | | 4,946 | | | | | | 0.84 | | | | | | 0.92 | | | | | | 1.79 | | | | | | 23 | |
| | | 10.23 | | | | | | (7.52 | ) | | | | | 208,169 | | | | | | 0.59 | | | | | | 0.66 | | | | | | 1.77 | | | | | | 18 | |
| | | 9.87 | | | | | | (8.26 | ) | | | | | 20,844 | | | | | | 1.34 | | | | | | 1.41 | | | | | | 1.03 | | | | | | 18 | |
| | | 9.82 | | | | | | (8.28 | ) | | | | | 112,247 | | | | | | 1.34 | | | | | | 1.41 | | | | | | 1.05 | | | | | | 18 | |
| | | 10.33 | | | | | | (7.16 | ) | | | | | 46,797 | | | | | | 0.19 | | | | | | 0.26 | | | | | | 2.20 | | | | | | 18 | |
| | | 10.14 | | | | | | (7.63 | ) | | | | | 1,246 | | | | | | 0.69 | | | | | | 0.76 | | | | | | 1.39 | | | | | | 18 | |
| | | 10.13 | | | | | | (7.25 | ) | | | | | 539 | | | | | | 0.34 | | | | | | 0.41 | | | | | | 2.45 | | | | | | 18 | |
| | | 10.16 | | | | | | (7.71 | ) | | | | | 5,073 | | | | | | 0.84 | | | | | | 0.91 | | | | | | 1.91 | | | | | | 18 | |
| | | 11.33 | | | | | | 12.66 | | | | | | 296,969 | | | | | | 0.59 | | | | | | 0.66 | | | | | | 1.79 | | | | | | 27 | |
| | | 10.93 | | | | | | 11.89 | | | | | | 29,225 | | | | | | 1.34 | | | | | | 1.41 | | | | | | 1.09 | | | | | | 27 | |
| | | 10.88 | | | | | | 11.83 | | | | | | 158,142 | | | | | | 1.34 | | | | | | 1.41 | | | | | | 1.04 | | | | | | 27 | |
| | | 11.45 | | | | | | 13.09 | | | | | | 59,900 | | | | | | 0.19 | | | | | | 0.26 | | | | | | 2.52 | | | | | | 27 | |
| | | 11.22 | | | | | | 12.53 | | | | | | 3,540 | | | | | | 0.69 | | | | | | 0.76 | | | | | | 1.61 | | | | | | 27 | |
| | | 11.23 | | | | | | 12.89 | | | | | | 553 | | | | | | 0.34 | | | | | | 0.41 | | | | | | 2.36 | | | | | | 27 | |
| | | 11.26 | | | | | | 12.34 | | | | | | 4,389 | | | | | | 0.84 | | | | | | 0.91 | | | | | | 3.90 | | | | | | 27 | |
| | | 10.24 | | | | | | 29.26 | | | | | | 340,567 | | | | | | 0.59 | | | | | | 0.67 | | | | | | 1.81 | | | | | | 34 | |
| | | 9.88 | | | | | | 28.22 | | | | | | 33,103 | | | | | | 1.34 | | | | | | 1.42 | | | | | | 1.01 | | | | | | 34 | |
| | | 9.84 | | | | | | 28.39 | | | | | | 182,232 | | | | | | 1.34 | | | | | | 1.42 | | | | | | 1.02 | | | | | | 34 | |
| | | 10.35 | | | | | | 29.81 | | | | | | 50,926 | | | | | | 0.19 | | | | | | 0.27 | | | | | | 2.22 | | | | | | 34 | |
| | | 10.14 | | | | | | 29.22 | | | | | | 4,770 | | | | | | 0.69 | | | | | | 0.77 | | | | | | 1.76 | | | | | | 34 | |
| | | 10.16 | | | | | | 29.70 | | | | | | 320 | | | | | | 0.34 | | | | | | 0.42 | | | | | | 8.65 | | | | | | 34 | |
| | | 10.22 | | | | | | 29.56 | | | | | | 285 | | | | | | 0.84 | | | | | | 0.92 | | | | | | 2.92 | | | | | | 34 | |
| | | 8.04 | | | | | | (42.52 | ) | | | | | 300,859 | | | | | | 0.59 | | | | | | 0.66 | | | | | | 1.43 | | | | | | 22 | |
| | | 7.77 | | | | | | (42.91 | ) | | | | | 31,403 | | | | | | 1.34 | | | | | | 1.41 | | | | | | 0.80 | | | | | | 22 | |
| | | 7.73 | | | | | | (42.93 | ) | | | | | 170,281 | | | | | | 1.34 | | | | | | 1.41 | | | | | | 0.76 | | | | | | 22 | |
| | | 8.12 | | | | | | (42.28 | ) | | | | | 39,471 | | | | | | 0.19 | | | | | | 0.26 | | | | | | 2.01 | | | | | | 22 | |
| | | 7.96 | | | | | | (42.59 | ) | | | | | 4,069 | | | | | | 0.69 | | | | | | 0.76 | | | | | | 1.48 | | | | | | 22 | |
| | | 7.98 | | | | | | (42.41 | ) | | | | | 6 | | | | | | 0.34 | | | | | | 0.41 | | | | | | 1.87 | | | | | | 22 | |
| | | 8.01 | | | | | | (42.64 | ) | | | | | 6 | | | | | | 0.84 | | | | | | 0.91 | | | | | | 1.43 | | | | | | 22 | |
| | |
| The accompanying notes are an integral part of these financial statements. | | 57 |
GOLDMAN SACHS GROWTH AND INCOME STRATEGY PORTFOLIO
Financial Highlights
Selected Data for a Share Outstanding Throughout Each Period
| | | | | | | | | | | | | | | | | | | | | | | | | | | | | | |
| | | | | | | | Income (loss) from
investment operations | | | Distributions
to shareholders | |
| | | Year - Share Class | | Net asset
value,
beginning
of period | | | Net
investment
income
(loss)(a)(b) | | | Net realized
and unrealized
gain (loss) | | | Total from
investment
operations | | | From net
investment
income | | | From net
realized
gains | | | Total
distributions | |
| FOR THE SIX MONTHS ENDED JUNE 30, (UNAUDITED) | | | | | |
| | 2013 - A | | $ | 10.95 | | | $ | 0.03 | | | $ | 0.24 | | | $ | 0.27 | | | $ | (0.02 | ) | | $ | — | | | $ | (0.02 | ) |
| | 2013 - B | | | 10.89 | | | | (0.02 | ) | | | 0.25 | | | | 0.23 | | | | — | | | | — | | | | — | |
| | 2013 - C | | | 10.85 | | | | (0.02 | ) | | | 0.25 | | | | 0.23 | | | | — | | | | — | | | | — | |
| | 2013 - Institutional | | | 10.98 | | | | 0.05 | | | | 0.25 | | | | 0.30 | | | | (0.05 | ) | | | — | | | | (0.05 | ) |
| | 2013 - Service | | | 10.92 | | | | 0.02 | | | | 0.26 | | | | 0.28 | | | | (0.02 | ) | | | — | | | | (0.02 | ) |
| | 2013 - IR | | | 10.91 | | | | 0.04 | | | | 0.24 | | | | 0.28 | | | | (0.04 | ) | | | — | | | | (0.04 | ) |
| | 2013 - R | | | 10.90 | | | | 0.01 | | | | 0.25 | | | | 0.26 | | | | (0.01 | ) | | | — | | | | (0.01 | ) |
| | | | | | | | | | | | | | | | | | | | | | | | | | | | | | |
| | FOR THE FISCAL YEARS ENDED DECEMBER 31, | |
| | 2012 - A | | | 9.98 | | | | 0.17 | | | | 1.07 | | | | 1.24 | | | | (0.27 | ) | | | — | | | | (0.27 | ) |
| | 2012 - B | | | 9.95 | | | | 0.09 | | | | 1.05 | | | | 1.14 | | | | (0.20 | ) | | | — | | | | (0.20 | ) |
| | 2012 - C | | | 9.92 | | | | 0.09 | | | | 1.04 | | | | 1.13 | | | | (0.20 | ) | | | — | | | | (0.20 | ) |
| | 2012 - Institutional | | | 10.02 | | | | 0.24 | | | | 1.03 | | | | 1.27 | | | | (0.31 | ) | | | — | | | | (0.31 | ) |
| | 2012 - Service | | | 9.97 | | | | 0.17 | | | | 1.04 | | | | 1.21 | | | | (0.26 | ) | | | — | | | | (0.26 | ) |
| | 2012 - IR | | | 9.95 | | | | 0.20 | | | | 1.05 | | | | 1.25 | | | | (0.29 | ) | | | — | | | | (0.29 | ) |
| | 2012 - R | | | 9.94 | | | | 0.16 | | | | 1.04 | | | | 1.20 | | | | (0.24 | ) | | | — | | | | (0.24 | ) |
| | 2011 - A | | | 10.55 | | | | 0.17 | | | | (0.53 | ) | | | (0.36 | ) | | | (0.21 | ) | | | — | | | | (0.21 | ) |
| | 2011 - B | | | 10.53 | | | | 0.10 | | | | (0.54 | ) | | | (0.44 | ) | | | (0.14 | ) | | | — | | | | (0.14 | ) |
| | 2011 - C | | | 10.49 | | | | 0.10 | | | | (0.53 | ) | | | (0.43 | ) | | | (0.14 | ) | | | — | | | | (0.14 | ) |
| | 2011 - Institutional | | | 10.59 | | | | 0.22 | | | | (0.54 | ) | | | (0.32 | ) | | | (0.25 | ) | | | — | | | | (0.25 | ) |
| | 2011 - Service | | | 10.53 | | | | 0.17 | | | | (0.53 | ) | | | (0.36 | ) | | | (0.20 | ) | | | — | | | | (0.20 | ) |
| | 2011 - IR | | | 10.52 | | | | 0.40 | | | | (0.73 | ) | | | (0.33 | ) | | | (0.24 | ) | | | — | | | | (0.24 | ) |
| | 2011 - R | | | 10.52 | | | | 0.18 | | | | (0.57 | ) | | | (0.39 | ) | | | (0.19 | ) | | | — | | | | (0.19 | ) |
| | 2010 - A | | | 9.81 | | | | 0.22 | | | | 0.76 | | | | 0.98 | | | | (0.24 | ) | | | — | | | | (0.24 | ) |
| | 2010 - B | | | 9.79 | | | | 0.15 | | | | 0.76 | | | | 0.91 | | | | (0.17 | ) | | | — | | | | (0.17 | ) |
| | 2010 - C | | | 9.76 | | | | 0.15 | | | | 0.75 | | | | 0.90 | | | | (0.17 | ) | | | — | | | | (0.17 | ) |
| | 2010 - Institutional | | | 9.84 | | | | 0.27 | | | | 0.77 | | | | 1.04 | | | | (0.29 | ) | | | — | | | | (0.29 | ) |
| | 2010 - Service | | | 9.79 | | | | 0.23 | | | | 0.75 | | | | 0.98 | | | | (0.24 | ) | | | — | | | | (0.24 | ) |
| | 2010 - IR | | | 9.79 | | | | 0.27 | | | | 0.73 | | | | 1.00 | | | | (0.27 | ) | | | — | | | | (0.27 | ) |
| | 2010 - R | | | 9.78 | | | | 0.30 | | | | 0.67 | | | | 0.97 | | | | (0.23 | ) | | | — | | | | (0.23 | ) |
| | 2009 - A | | | 8.11 | | | | 0.35 | | | | 1.71 | | | | 2.06 | | | | (0.36 | ) | | | — | | | | (0.36 | ) |
| | 2009 - B | | | 8.10 | | | | 0.29 | | | | 1.70 | | | | 1.99 | | | | (0.30 | ) | | | — | | | | (0.30 | ) |
| | 2009 - C | | | 8.07 | | | | 0.28 | | | | 1.71 | | | | 1.99 | | | | (0.30 | ) | | | — | | | | (0.30 | ) |
| | 2009 - Institutional | | | 8.14 | | | | 0.34 | | | | 1.76 | | | | 2.10 | | | | (0.40 | ) | | | — | | | | (0.40 | ) |
| | 2009 - Service | | | 8.10 | | | | 0.32 | | | | 1.72 | | | | 2.04 | | | | (0.35 | ) | | | — | | | | (0.35 | ) |
| | 2009 - IR | | | 8.10 | | | | 0.28 | | | | 1.79 | | | | 2.07 | | | | (0.38 | ) | | | — | | | | (0.38 | ) |
| | 2009 - R | | | 8.10 | | | | 0.75 | | | | 1.28 | | | | 2.03 | | | | (0.35 | ) | | | — | | | | (0.35 | ) |
| | 2008 - A | | | 12.88 | | | | 0.28 | | | | (4.38 | ) | | | (4.10 | ) | | | (0.32 | ) | | | (0.35 | ) | | | (0.67 | ) |
| | 2008 - B | | | 12.85 | | | | 0.20 | | | | (4.36 | ) | | | (4.16 | ) | | | (0.24 | ) | | | (0.35 | ) | | | (0.59 | ) |
| | 2008 - C | | | 12.81 | | | | 0.20 | | | | (4.35 | ) | | | (4.15 | ) | | | (0.24 | ) | | | (0.35 | ) | | | (0.59 | ) |
| | 2008 - Institutional | | | 12.92 | | | | 0.33 | | | | (4.39 | ) | | | (4.06 | ) | | | (0.37 | ) | | | (0.35 | ) | | | (0.72 | ) |
| | 2008 - Service | | | 12.86 | | | | 0.29 | | | | (4.39 | ) | | | (4.10 | ) | | | (0.31 | ) | | | (0.35 | ) | | | (0.66 | ) |
| | 2008 - IR | | | 12.87 | | | | 0.33 | | | | (4.40 | ) | | | (4.07 | ) | | | (0.35 | ) | | | (0.35 | ) | | | (0.70 | ) |
| | 2008 - R | | | 12.87 | | | | 0.26 | | | | (4.38 | ) | | | (4.12 | ) | | | (0.30 | ) | | | (0.35 | ) | | | (0.65 | ) |
| | (a) | | Calculated based on the average shares outstanding methodology. |
| | (b) | | Recognition of net investment income by the Portfolio is affected by the timing of declaration of dividends by the Underlying Funds in which the Portfolio invests. |
| | (c) | | Assumes investment at the net asset value at the beginning of the period, reinvestment of all dividends and distributions, a complete redemption of the investment at the net asset value at the end of the period and no sales or redemption charges. Total returns would be reduced if a sales or redemption charge was taken into account. Returns do not reflect the deduction of taxes that a shareholder would pay on Portfolio distributions or the redemption of Portfolio shares. Total returns for periods less than one full year are not annualized. |
| | (d) | | Expense ratios exclude the expenses of the Underlying Funds in which the Portfolio invests. |
| | (e) | | The Portfolio’s portfolio turnover rate is calculated in accordance with regulatory requirements, without regard to transactions involving short term investments and certain derivatives. If such transactions were included, the Portfolio’s portfolio turnover rate may be higher. |
| | |
| 58 | | The accompanying notes are an integral part of these financial statements. |
GOLDMAN SACHS GROWTH AND INCOME STRATEGY PORTFOLIO
| | | | | | | | | | | | | | | | | | | | | | | | | | | | | | | | | | | | | | | | |
| | | | | | | | | | | | | | | | | | | | | | | | | | | | | | | | | | |
| | | Net asset
value, end
of period | | | | | Total
return(c) | | | | | Net assets,
end of
period
(in 000s) | | | | | Ratio of
net expenses
to average
net assets(d) | | | | | Ratio of
total expenses
to average
net assets(d) | | | | | Ratio of
net investment
income (loss)
to average
net assets(b) | | | | | Portfolio
turnover
rate(e) | |
| | | | | | | | | | | | | | | | | | | | | | | | | | | | | | | | | | | | | | | | |
| | $ | 11.20 | | | | | | 2.49 | % | | | | $ | 440,496 | | | | | | 0.59 | %(f) | | | | | 0.63 | %(f) | | | | | 0.45 | %(f) | | | | | 21 | % |
| | | 11.12 | | | | | | 2.11 | | | | | | 50,021 | | | | | | 1.34 | (f) | | | | | 1.38 | (f) | | | | | (0.30 | )(f) | | | | | 21 | |
| | | 11.08 | | | | | | 2.12 | | | | | | 193,553 | | | | | | 1.34 | (f) | | | | | 1.38 | (f) | | | | | (0.30 | )(f) | | | | | 21 | |
| | | 11.23 | | | | | | 2.70 | | | | | | 307,108 | | | | | | 0.19 | (f) | | | | | 0.23 | (f) | | | | | 0.86 | (f) | | | | | 21 | |
| | | 11.18 | | | | | | 2.54 | | | | | | 3,876 | | | | | | 0.69 | (f) | | | | | 0.73 | (f) | | | | | 0.36 | (f) | | | | | 21 | |
| | | 11.15 | | | | | | 2.55 | | | | | | 2,327 | | | | | | 0.34 | (f) | | | | | 0.38 | (f) | | | | | 0.72 | (f) | | | | | 21 | |
| | | 11.15 | | | | | | 2.38 | | | | | | 3,871 | | | | | | 0.84 | (f) | | | | | 0.88 | (f) | | | | | 0.21 | (f) | | | | | 21 | |
| | | | | | | | | | | | | | | | | | | | | | | | | | | | | | | | | | | | | | | | |
| | | | | | | | | | | | | | | | | | | | | | | | | | | | | | | | | | | | | | | | |
| | | 10.95 | | | | | | 12.40 | | | | | | 491,921 | | | | | | 0.59 | | | | | | 0.63 | | | | | | 1.61 | | | | | | 47 | |
| | | 10.89 | | | | | | 11.49 | | | | | | 58,399 | | | | | | 1.35 | | | | | | 1.38 | | | | | | 0.86 | | | | | | 47 | |
| | | 10.85 | | | | | | 11.42 | | | | | | 210,201 | | | | | | 1.34 | | | | | | 1.38 | | | | | | 0.89 | | | | | | 47 | |
| | | 10.98 | | | | | | 12.69 | | | | | | 267,744 | | | | | | 0.19 | | | | | | 0.22 | | | | | | 2.21 | | | | | | 47 | |
| | | 10.92 | | | | | | 12.13 | | | | | | 3,848 | | | | | | 0.69 | | | | | | 0.73 | | | | | | 1.59 | | | | | | 47 | |
| | | 10.91 | | | | | | 12.62 | | | | | | 1,519 | | | | | | 0.34 | | | | | | 0.38 | | | | | | 1.90 | | | | | | 47 | |
| | | 10.90 | | | | | | 12.12 | | | | | | 4,068 | | | | | | 0.84 | | | | | | 0.88 | | | | | | 1.54 | | | | | | 47 | |
| | | 9.98 | | | | | | (3.46 | ) | | | | | 750,376 | | | | | | 0.59 | | | | | | 0.62 | | | | | | 1.62 | | | | | | 35 | |
| | | 9.95 | | | | | | (4.18 | ) | | | | | 72,331 | | | | | | 1.34 | | | | | | 1.37 | | | | | | 0.90 | | | | | | 35 | |
| | | 9.92 | | | | | | (4.10 | ) | | | | | 250,381 | | | | | | 1.34 | | | | | | 1.37 | | | | | | 0.91 | | | | | | 35 | |
| | | 10.02 | | | | | | (3.04 | ) | | | | | 140,119 | | | | | | 0.19 | | | | | | 0.22 | | | | | | 2.12 | | | | | | 35 | |
| | | 9.97 | | | | | | (3.48 | ) | | | | | 4,073 | | | | | | 0.69 | | | | | | 0.72 | | | | | | 1.57 | | | | | | 35 | |
| | | 9.95 | | | | | | (3.18 | ) | | | | | 1,719 | | | | | | 0.34 | | | | | | 0.37 | | | | | | 3.99 | | | | | | 35 | |
| | | 9.94 | | | | | | (3.77 | ) | | | | | 4,384 | | | | | | 0.84 | | | | | | 0.87 | | | | | | 1.68 | | | | | | 35 | |
| | | 10.55 | | | | | | 10.12 | | | | | | 1,097,565 | | | | | | 0.59 | | | | | | 0.62 | | | | | | 2.24 | | | | | | 31 | |
| | | 10.53 | | | | | | 9.35 | | | | | | 102,328 | | | | | | 1.34 | | | | | | 1.37 | | | | | | 1.51 | | | | | | 31 | |
| | | 10.49 | | | | | | 9.27 | | | | | | 353,844 | | | | | | 1.34 | | | | | | 1.37 | | | | | | 1.46 | | | | | | 31 | |
| | | 10.59 | | | | | | 10.64 | | | | | | 154,835 | | | | | | 0.19 | | | | | | 0.22 | | | | | | 2.69 | | | | | | 31 | |
| | | 10.53 | | | | | | 10.04 | | | | | | 5,918 | | | | | | 0.69 | | | | | | 0.72 | | | | | | 2.27 | | | | | | 31 | |
| | | 10.52 | | | | | | 10.34 | | | | | | 210 | | | | | | 0.34 | | | | | | 0.37 | | | | | | 2.75 | | | | | | 31 | |
| | | 10.52 | | | | | | 9.96 | | | | | | 3,314 | | | | | | 0.84 | | | | | | 0.87 | | | | | | 3.02 | | | | | | 31 | |
| | | 9.81 | | | | | | 25.87 | | | | | | 1,272,519 | | | | | | 0.59 | | | | | | 0.63 | | | | | | 4.04 | | | | | | 40 | |
| | | 9.79 | | | | | | 24.84 | | | | | | 116,466 | | | | | | 1.34 | | | | | | 1.38 | | | | | | 3.31 | | | | | | 40 | |
| | | 9.76 | | | | | | 24.92 | | | | | | 424,560 | | | | | | 1.34 | | | | | | 1.38 | | | | | | 3.23 | | | | | | 40 | |
| | | 9.84 | | | | | | 26.27 | | | | | | 162,453 | | | | | | 0.19 | | | | | | 0.23 | | | | | | 3.95 | | | | | | 40 | |
| | | 9.79 | | | | | | 25.63 | | | | | | 6,124 | | | | | | 0.69 | | | | | | 0.73 | | | | | | 3.69 | | | | | | 40 | |
| | | 9.79 | | | | | | 25.99 | | | | | | 39 | | | | | | 0.34 | | | | | | 0.38 | | | | | | 2.94 | | | | | | 40 | |
| | | 9.78 | | | | | | 25.50 | | | | | | 583 | | | | | | 0.84 | | | | | | 0.88 | | | | | | 8.02 | | | | | | 40 | |
| | | 8.11 | | | | | | (31.94 | ) | | | | | 1,214,344 | | | | | | 0.59 | | | | | | 0.63 | | | | | | 2.49 | | | | | | 39 | |
| | | 8.10 | | | | | | (32.40 | ) | | | | | 107,669 | | | | | | 1.34 | | | | | | 1.38 | | | | | | 1.79 | | | | | | 39 | |
| | | 8.07 | | | | | | (32.42 | ) | | | | | 441,004 | | | | | | 1.34 | | | | | | 1.38 | | | | | | 1.76 | | | | | | 39 | |
| | | 8.14 | | | | | | (31.63 | ) | | | | | 285,106 | | | | | | 0.19 | | | | | | 0.23 | | | | | | 2.90 | | | | | | 39 | |
| | | 8.10 | | | | | | (31.98 | ) | | | | | 8,051 | | | | | | 0.69 | | | | | | 0.73 | | | | | | 2.60 | | | | | | 39 | |
| | | 8.10 | | | | | | (31.79 | ) | | | | | 7 | | | | | | 0.34 | | | | | | 0.38 | | | | | | 2.89 | | | | | | 39 | |
| | | 8.10 | | | | | | (32.12 | ) | | | | | 22 | | | | | | 0.84 | | | | | | 0.88 | | | | | | 2.29 | | | | | | 39 | |
| | |
| The accompanying notes are an integral part of these financial statements. | | 59 |
GOLDMAN SACHS GROWTH STRATEGY PORTFOLIO
Financial Highlights
Selected Data for a Share Outstanding Throughout Each Period
| | | | | | | | | | | | | | | | | | | | | | | | | | | | | | |
| | | | | | | | Income (loss) from
investment operations | | | Distributions
to shareholders | |
| | | Year - Share Class | | Net asset
value,
beginning
of period | | | Net
investment
income (loss)(a) | | | Net realized
and unrealized
gain (loss) | | | Total from
investment
operations | | | From net
investment
income | | | From net
realized
gains | | | Total
distributions | |
| FOR THE SIX MONTHS ENDED JUNE 30, (UNAUDITED) | |
| | 2013 - A | | $ | 11.05 | | | $ | (0.01 | )(e) | | $ | 0.49 | | | $ | 0.48 | | | $ | — | | | $ | — | | | $ | — | |
| | 2013 - B | | | 11.12 | | | | (0.05 | )(e) | | | 0.49 | | | | 0.44 | | | | — | | | | — | | | | — | |
| | 2013 - C | | | 11.02 | | | | (0.05 | )(e) | | | 0.48 | | | | 0.43 | | | | — | | | | — | | | | — | |
| | 2013 - Institutional | | | 11.04 | | | | 0.02 | (e) | | | 0.49 | | | | 0.51 | | | | — | | | | — | | | | — | |
| | 2013 - Service | | | 11.01 | | | | (0.01 | )(e) | | | 0.49 | | | | 0.48 | | | | — | | | | — | | | | — | |
| | 2013 - IR | | | 10.91 | | | | 0.01 | (e) | | | 0.49 | | | | 0.50 | | | | — | | | | — | | | | — | |
| | 2013 - R | | | 10.80 | | | | (0.02 | )(e) | | | 0.47 | | | | 0.45 | | | | — | | | | — | | | | — | |
| | | | | | | | | | | | | | | | | | | | | | | | | | | | | | |
| FOR THE FISCAL YEARS ENDED DECEMBER 31, | |
| | 2012 - A | | | 9.86 | | | | 0.18 | (e) | | | 1.25 | | | | 1.43 | | | | (0.24 | ) | | | — | | | | (0.24 | ) |
| | 2012 - B | | | 9.92 | | | | 0.10 | (e) | | | 1.25 | | | | 1.35 | | | | (0.15 | ) | | | — | | | | (0.15 | ) |
| | 2012 - C | | | 9.83 | | | | 0.10 | (e) | | | 1.25 | | | | 1.35 | | | | (0.16 | ) | | | — | | | | (0.16 | ) |
| | 2012 - Institutional | | | 9.87 | | | | 0.23 | (e) | | | 1.24 | | | | 1.47 | | | | (0.30 | ) | | | — | | | | (0.30 | ) |
| | 2012 - Service | | | 9.83 | | | | 0.17 | (e) | | | 1.25 | | | | 1.42 | | | | (0.24 | ) | | | — | | | | (0.24 | ) |
| | 2012 - IR | | | 9.75 | | | | 0.22 | (e) | | | 1.22 | | | | 1.44 | | | | (0.28 | ) | | | — | | | | (0.28 | ) |
| | 2012 - R | | | 9.65 | | | | 0.17 | (e) | | | 1.21 | | | | 1.38 | | | | (0.23 | ) | | | — | | | | (0.23 | ) |
| | 2011 - A | | | 10.75 | | | | 0.19 | (e) | | | (0.84 | ) | | | (0.65 | ) | | | (0.24 | ) | | | — | | | | (0.24 | ) |
| | 2011 - B | | | 10.80 | | | | 0.11 | (e) | | | (0.85 | ) | | | (0.74 | ) | | | (0.14 | ) | | | — | | | | (0.14 | ) |
| | 2011 - C | | | 10.70 | | | | 0.11 | (e) | | | (0.83 | ) | | | (0.72 | ) | | | (0.15 | ) | | | — | | | | (0.15 | ) |
| | 2011 - Institutional | | | 10.77 | | | | 0.22 | (e) | | | (0.83 | ) | | | (0.61 | ) | | | (0.29 | ) | | | — | | | | (0.29 | ) |
| | 2011 - Service | | | 10.72 | | | | 0.18 | (e) | | | (0.84 | ) | | | (0.66 | ) | | | (0.23 | ) | | | — | | | | (0.23 | ) |
| | 2011 - IR | | | 10.65 | | | | 0.30 | (e) | | | (0.92 | ) | | | (0.62 | ) | | | (0.28 | ) | | | — | | | | (0.28 | ) |
| | 2011 - R | | | 10.55 | | | | 0.20 | (e) | | | (0.87 | ) | | | (0.67 | ) | | | (0.23 | ) | | | — | | | | (0.23 | ) |
| | 2010 - A | | | 9.87 | | | | 0.22 | (e) | | | 0.91 | | | | 1.13 | | | | (0.25 | ) | | | — | | | | (0.25 | ) |
| | 2010 - B | | | 9.91 | | | | 0.14 | (e) | | | 0.91 | | | | 1.05 | | | | (0.16 | ) | | | — | | | | (0.16 | ) |
| | 2010 - C | | | 9.83 | | | | 0.14 | (e) | | | 0.89 | | | | 1.03 | | | | (0.16 | ) | | | — | | | | (0.16 | ) |
| | 2010 - Institutional | | | 9.89 | | | | 0.28 | (e) | | | 0.90 | | | | 1.18 | | | | (0.30 | ) | | | — | | | | (0.30 | ) |
| | 2010 - Service | | | 9.85 | | | | 0.21 | (e) | | | 0.90 | | | | 1.11 | | | | (0.24 | ) | | | — | | | | (0.24 | ) |
| | 2010 - IR | | | 9.79 | | | | 0.26 | (e) | | | 0.88 | | | | 1.14 | | | | (0.28 | ) | | | — | | | | (0.28 | ) |
| | 2010 - R | | | 9.71 | | | | 0.27 | (e) | | | 0.82 | | | | 1.09 | | | | (0.25 | ) | | | — | | | | (0.25 | ) |
| | 2009 - A | | | 7.87 | | | | 0.24 | (e) | | | 2.00 | | | | 2.24 | | | | (0.24 | ) | | | — | | | | (0.24 | ) |
| | 2009 - B | | | 7.90 | | | | 0.17 | (e) | | | 2.01 | | | | 2.18 | | | | (0.17 | ) | | | — | | | | (0.17 | ) |
| | 2009 - C | | | 7.83 | | | | 0.16 | (e) | | | 2.01 | | | | 2.17 | | | | (0.17 | ) | | | — | | | | (0.17 | ) |
| | 2009 - Institutional | | | 7.88 | | | | 0.27 | (e) | | | 2.02 | | | | 2.29 | | | | (0.28 | ) | | | — | | | | (0.28 | ) |
| | 2009 - Service | | | 7.84 | | | | 0.19 | (e) | | | 2.04 | | | | 2.23 | | | | (0.22 | ) | | | — | | | | (0.22 | ) |
| | 2009 - IR | | | 7.81 | | | | 0.88 | (e) | | | 1.38 | | | | 2.26 | | | | (0.28 | ) | | | — | | | | (0.28 | ) |
| | 2009 - R | | | 7.78 | | | | 0.60 | (e) | | | 1.59 | | | | 2.19 | | | | (0.26 | ) | | | — | | | | (0.26 | ) |
| | 2008 - A | | | 14.35 | | | | 0.28 | | | | (5.95 | ) | | | (5.67 | ) | | | (0.31 | ) | | | (0.50 | ) | | | (0.81 | ) |
| | 2008 - B | | | 14.34 | | | | 0.18 | | | | (5.91 | ) | | | (5.73 | ) | | | (0.21 | ) | | | (0.50 | ) | | | (0.71 | ) |
| | 2008 - C | | | 14.22 | | | | 0.17 | | | | (5.85 | ) | | | (5.68 | ) | | | (0.21 | ) | | | (0.50 | ) | | | (0.71 | ) |
| | 2008 - Institutional | | | 14.41 | | | | 0.31 | | | | (5.97 | ) | | | (5.66 | ) | | | (0.37 | ) | | | (0.50 | ) | | | (0.87 | ) |
| | 2008 - Service | | | 14.29 | | | | 0.27 | | | | (5.93 | ) | | | (5.66 | ) | | | (0.29 | ) | | | (0.50 | ) | | | (0.79 | ) |
| | 2008 - IR | | | 14.29 | | | | 0.30 | | | | (5.93 | ) | | | (5.63 | ) | | | (0.35 | ) | | | (0.50 | ) | | | (0.85 | ) |
| | 2008 - R | | | 14.29 | | | | 0.27 | | | | (5.94 | ) | | | (5.67 | ) | | | (0.34 | ) | | | (0.50 | ) | | | (0.84 | ) |
| | (a) | | Recognition of net investment income by the Portfolio is affected by the timing of declaration of dividends by the Underlying Funds in which the Portfolio invests. |
| | (b) | | Assumes investment at the net asset value at the beginning of the period, reinvestment of all dividends and distributions, a complete redemption of the investment at the net asset value at the end of the period and no sales or redemption charges. Total returns would be reduced if a sales or redemption charge was taken into account. Returns do not reflect the deduction of taxes that a shareholder would pay on Portfolio distributions or the redemption of Portfolio shares. Total returns for periods less than one full year are not annualized. |
| | (c) | | Expense ratios exclude the expenses of the Underlying Funds in which the Portfolio invests. |
| | (d) | | The Portfolio’s portfolio turnover rate is calculated in accordance with regulatory requirements, without regard to transactions involving short term investments and certain derivatives. If such transactions were included, the Portfolio’s portfolio turnover rate may be higher. |
| | (e) | | Calculated based on the average shares outstanding methodology. |
| | |
| 60 | | The accompanying notes are an integral part of these financial statements. |
GOLDMAN SACHS GROWTH STRATEGY PORTFOLIO
| | | | | | | | | | | | | | | | | | | | | | | | | | | | | | | | | | | | | | | | |
| | | | | | | | | | | | | | | | | | | | | | | | | | | | | | | | | | |
| | | Net asset
value, end
of period | | | | | Total
return(b) | | | | | Net assets,
end of
period
(in 000s) | | | | | Ratio of
net expenses
to average
net assets(c) | | | | | Ratio of
total expenses
to average
net assets(c) | | | | | Ratio of
net investment
income (loss)
to average
net assets(a) | | | | | Portfolio
turnover
rate(d) | |
| | | | |
| | $ | 11.53 | | | | | | 4.34 | % | | | | $ | 372,962 | | | | | | 0.59 | %(f) | | | | | 0.64 | %(f) | | | | | (0.14 | )%(f) | | | | | 13 | % |
| | | 11.56 | | | | | | 3.96 | | | | | | 50,303 | | | | | | 1.34 | (f) | | | | | 1.39 | (f) | | | | | (0.90 | )(f) | | | | | 13 | |
| | | 11.45 | | | | | | 3.90 | | | | | | 212,817 | | | | | | 1.34 | (f) | | | | | 1.39 | (f) | | | | | (0.89 | )(f) | | | | | 13 | |
| | | 11.55 | | | | | | 4.62 | | | | | | 195,413 | | | | | | 0.19 | (f) | | | | | 0.24 | (f) | | | | | 0.27 | (f) | | | | | 13 | |
| | | 11.49 | | | | | | 4.36 | | | | | | 3,285 | | | | | | 0.69 | (f) | | | | | 0.74 | (f) | | | | | (0.23 | )(f) | | | | | 13 | |
| | | 11.41 | | | | | | 4.58 | | | | | | 2,343 | | | | | | 0.34 | (f) | | | | | 0.39 | (f) | | | | | 0.12 | (f) | | | | | 13 | |
| | | 11.25 | | | | | | 4.17 | | | | | | 4,535 | | | | | | 0.84 | (f) | | | | | 0.89 | (f) | | | | | (0.40 | )(f) | | | | | 13 | |
| | | | | | | | | | | | | | | | | | | | | | | | | | | | | | | | | | | | | | | | |
| | | | |
| | | 11.05 | | | | | | 14.49 | | | | | | 398,487 | | | | | | 0.59 | | | | | | 0.64 | | | | | | 1.65 | | | | | | 47 | |
| | | 11.12 | | | | | | 13.64 | | | | | | 57,388 | | | | | | 1.34 | | | | | | 1.39 | | | | | | 0.90 | | | | | | 47 | |
| | | 11.02 | | | | | | 13.72 | | | | | | 224,471 | | | | | | 1.34 | | | | | | 1.39 | | | | | | 0.92 | | | | | | 47 | |
| | | 11.04 | | | | | | 14.89 | | | | | | 173,180 | | | | | | 0.19 | | | | | | 0.23 | | | | | | 2.10 | | | | | | 47 | |
| | | 11.01 | | | | | | 14.42 | | | | | | 3,185 | | | | | | 0.69 | | | | | | 0.74 | | | | | | 1.60 | | | | | | 47 | |
| | | 10.91 | | | | | | 14.79 | | | | | | 1,483 | | | | | | 0.34 | | | | | | 0.38 | | | | | | 2.05 | | | | | | 47 | |
| | | 10.80 | | | | | | 14.31 | | | | | | 4,885 | | | | | | 0.84 | | | | | | 0.88 | | | | | | 1.64 | | | | | | 47 | |
| | | 9.86 | | | | | | (6.08 | ) | | | | | 562,262 | | | | | | 0.59 | | | | | | 0.63 | | | | | | 1.73 | | | | | | 35 | |
| | | 9.92 | | | | | | (6.82 | ) | | | | | 68,563 | | | | | | 1.34 | | | | | | 1.38 | | | | | | 0.98 | | | | | | 35 | |
| | | 9.83 | | | | | | (6.77 | ) | | | | | 257,778 | | | | | | 1.34 | | | | | | 1.38 | | | | | | 0.99 | | | | | | 35 | |
| | | 9.87 | | | | | | (5.69 | ) | | | | | 92,807 | | | | | | 0.19 | | | | | | 0.23 | | | | | | 2.08 | | | | | | 35 | |
| | | 9.83 | | | | | | (6.18 | ) | | | | | 3,644 | | | | | | 0.69 | | | | | | 0.73 | | | | | | 1.65 | | | | | | 35 | |
| | | 9.75 | | | | | | (5.85 | ) | | | | | 1,376 | | | | | | 0.34 | | | | | | 0.38 | | | | | | 2.90 | | | | | | 35 | |
| | | 9.65 | | | | | | (6.39 | ) | | | | | 4,413 | | | | | | 0.84 | | | | | | 0.88 | | | | | | 1.88 | | | | | | 35 | |
| | | 10.75 | | | | | | 11.46 | | | | | | 789,340 | | | | | | 0.59 | | | | | | 0.63 | | | | | | 2.16 | | | | | | 28 | |
| | | 10.80 | | | | | | 10.63 | | | | | | 97,344 | | | | | | 1.34 | | | | | | 1.38 | | | | | | 1.39 | | | | | | 28 | |
| | | 10.70 | | | | | | 10.52 | | | | | | 373,504 | | | | | | 1.34 | | | | | | 1.38 | | | | | | 1.37 | | | | | | 28 | |
| | | 10.77 | | | | | | 11.90 | | | | | | 115,999 | | | | | | 0.19 | | | | | | 0.23 | | | | | | 2.78 | | | | | | 28 | |
| | | 10.72 | | | | | | 11.30 | | | | | | 6,647 | | | | | | 0.69 | | | | | | 0.73 | | | | | | 2.14 | | | | | | 28 | |
| | | 10.65 | | | | | | 11.66 | | | | | | 675 | | | | | | 0.34 | | | | | | 0.38 | | | | | | 2.61 | | | | | | 28 | |
| | | 10.55 | | | | | | 11.20 | | | | | | 3,588 | | | | | | 0.84 | | | | | | 0.88 | | | | | | 2.73 | | | | | | 28 | |
| | | 9.87 | | | | | | 28.55 | | | | | | 902,200 | | | | | | 0.59 | | | | | | 0.64 | | | | | | 2.73 | | | | | | 39 | |
| | | 9.91 | | | | | | 27.64 | | | | | | 114,216 | | | | | | 1.34 | | | | | | 1.39 | | | | | | 1.97 | | | | | | 39 | |
| | | 9.83 | | | | | | 27.74 | | | | | | 444,309 | | | | | | 1.34 | | | | | | 1.39 | | | | | | 1.92 | | | | | | 39 | |
| | | 9.89 | | | | | | 29.12 | | | | | | 106,456 | | | | | | 0.19 | | | | | | 0.24 | | | | | | 3.16 | | | | | | 39 | |
| | | 9.85 | | | | | | 28.48 | | | | | | 7,182 | | | | | | 0.69 | | | | | | 0.74 | | | | | | 2.29 | | | | | | 39 | |
| | | 9.79 | | | | | | 29.00 | | | | | | 546 | | | | | | 0.34 | | | | | | 0.39 | | | | | | 9.20 | | | | | | 39 | |
| | | 9.71 | | | | | | 28.27 | | | | | | 1,184 | | | | | | 0.84 | | | | | | 0.89 | | | | | | 6.30 | | | | | | 39 | |
| | | 7.87 | | | | | | (39.31 | ) | | | | | 853,210 | | | | | | 0.59 | | | | | | 0.64 | | | | | | 1.95 | | | | | | 33 | |
| | | 7.90 | | | | | | (39.76 | ) | | | | | 111,318 | | | | | | 1.34 | | | | | | 1.39 | | | | | | 1.25 | | | | | | 33 | |
| | | 7.83 | | | | | | (39.77 | ) | | | | | 465,634 | | | | | | 1.34 | | | | | | 1.39 | | | | | | 1.21 | | | | | | 33 | |
| | | 7.88 | | | | | | (39.09 | ) | | | | | 97,798 | | | | | | 0.19 | | | | | | 0.24 | | | | | | 2.63 | | | | | | 33 | |
| | | 7.84 | | | | | | (39.38 | ) | | | | | 8,881 | | | | | | 0.69 | | | | | | 0.74 | | | | | | 1.79 | | | | | | 33 | |
| | | 7.81 | | | | | | (39.21 | ) | | | | | 6 | | | | | | 0.34 | | | | | | 0.39 | | | | | | 2.39 | | | | | | 33 | |
| | | 7.78 | | | | | | (39.44 | ) | | | | | 32 | | | | | | 0.84 | | | | | | 0.89 | | | | | | 2.18 | | | | | | 33 | |
| | |
| The accompanying notes are an integral part of these financial statements. | | 61 |
GOLDMAN SACHS INCOME STRATEGIES PORTFOLIO
Financial Highlights
Selected Data for a Share Outstanding Throughout Each Period
| | | | | | | | | | | | | | | | | | | | | | | | | | | | | | |
| | | | | | | | Income (loss) from
investment operations | | | Distributions to
shareholders | |
| | | Year - Share Class | |
Net asset
value,
beginning
of period | | | Net
investment
income(a)(b) | | | Net realized
and unrealized
gain (loss) | | | Total from
investment
operations | | | From net
investment
income | | | From net
realized
gains | | | Total
distributions | |
| FOR THE SIX MONTHS ENDED JUNE 30, (UNAUDITED) | |
| | 2013 - A | | $ | 8.90 | | | $ | 0.18 | | | $ | (0.36 | ) | | $ | (0.18 | ) | | $ | (0.17 | ) | | $ | — | | | $ | (0.17 | ) |
| | 2013 - C | | | 8.94 | | | | 0.14 | | | | (0.36 | ) | | | (0.22 | ) | | | (0.13 | ) | | | — | | | | (0.13 | ) |
| | 2013 - Institutional | | | 8.86 | | | | 0.20 | | | | (0.37 | ) | | | (0.17 | ) | | | (0.18 | ) | | | — | | | | (0.18 | ) |
| | 2013 - IR | | | 8.89 | | | | 0.19 | | | | (0.36 | ) | | | (0.17 | ) | | | (0.18 | ) | | | — | | | | (0.18 | ) |
| | 2013 - R | | | 8.93 | | | | 0.17 | | | | (0.36 | ) | | | (0.19 | ) | | | (0.16 | ) | | | — | | | | (0.16 | ) |
| | | | | | | | | | | | | | | | | | | | | | | | | | | | | | |
| FOR THE FISCAL YEARS ENDED DECEMBER 31, | |
| | 2012 - A | | | 8.12 | | | | 0.29 | | | | 0.85 | | | | 1.14 | | | | (0.36 | ) | | | — | | | | (0.36 | ) |
| | 2012 - C | | | 8.16 | | | | 0.24 | | | | 0.84 | | | | 1.08 | | | | (0.30 | ) | | | — | | | | (0.30 | ) |
| | 2012 - Institutional | | | 8.10 | | | | 0.34 | | | | 0.82 | | | | 1.16 | | | | (0.40 | ) | | | — | | | | (0.40 | ) |
| | 2012 - IR | | | 8.11 | | | | 0.33 | | | | 0.84 | | | | 1.17 | | | | (0.39 | ) | | | — | | | | (0.39 | ) |
| | 2012 - R | | | 8.15 | | | | 0.30 | | | | 0.82 | | | | 1.12 | | | | (0.34 | ) | | | — | | | | (0.34 | ) |
| | 2011 - A | | | 8.58 | | | | 0.28 | | | | (0.43 | ) | | | (0.15 | ) | | | (0.31 | ) | | | — | | | | (0.31 | ) |
| | 2011 - C | | | 8.62 | | | | 0.22 | | | | (0.43 | ) | | | (0.21 | ) | | | (0.25 | ) | | | — | | | | (0.25 | ) |
| | 2011 - Institutional | | | 8.56 | | | | 0.31 | | | | (0.42 | ) | | | (0.11 | ) | | | (0.35 | ) | | | — | | | | (0.35 | ) |
| | 2011 - IR | | | 8.57 | | | | 0.30 | | | | (0.42 | ) | | | (0.12 | ) | | | (0.34 | ) | | | — | | | | (0.34 | ) |
| | 2011 - R | | | 8.61 | | | | 0.27 | | | | (0.44 | ) | | | (0.17 | ) | | | (0.29 | ) | | | — | | | | (0.29 | ) |
| | 2010 - A | | | 7.96 | | | | 0.33 | | | | 0.63 | | | | 0.96 | | | | (0.34 | ) | | | — | | | | (0.34 | ) |
| | 2010 - C | | | 8.00 | | | | 0.27 | | | | 0.63 | | | | 0.90 | | | | (0.28 | ) | | | — | | | | (0.28 | ) |
| | 2010 - Institutional | | | 7.95 | | | | 0.35 | | | | 0.64 | | | | 0.99 | | | | (0.38 | ) | | | — | | | | (0.38 | ) |
| | 2010 - IR | | | 7.95 | | | | 0.37 | | | | 0.61 | | | | 0.98 | | | | (0.36 | ) | | | — | | | | (0.36 | ) |
| | 2010 - R | | | 7.99 | | | | 0.31 | | | | 0.63 | | | | 0.94 | | | | (0.32 | ) | | | — | | | | (0.32 | ) |
| | 2009 - A | | | 6.57 | | | | 0.39 | | | | 1.37 | | | | 1.76 | | | | (0.37 | ) | | | — | | | | (0.37 | ) |
| | 2009 - C | | | 6.56 | | | | 0.33 | | | | 1.37 | | | | 1.70 | | | | (0.26 | ) | | | — | | | | (0.26 | ) |
| | 2009 - Institutional | | | 6.57 | | | | 0.40 | | | | 1.40 | | | | 1.80 | | | | (0.42 | ) | | | — | | | | (0.42 | ) |
| | 2009 - IR | | | 6.57 | | | | 0.39 | | | | 1.38 | | | | 1.77 | | | | (0.39 | ) | | | — | | | | (0.39 | ) |
| | 2009 - R | | | 6.57 | | | | 0.36 | | | | 1.39 | | | | 1.75 | | | | (0.33 | ) | | | — | | | | (0.33 | ) |
| | 2008 - A | | | 9.75 | | | | 0.35 | | | | (2.92 | ) | | | (2.57 | ) | | | (0.39 | )(g) | | | (0.22 | ) | | | (0.61 | ) |
| | 2008 - C | | | 9.74 | | | | 0.29 | | | | (2.92 | ) | | | (2.63 | ) | | | (0.33 | )(g) | | | (0.22 | ) | | | (0.55 | ) |
| | 2008 - Institutional | | | 9.75 | | | | 0.38 | | | | (2.92 | ) | | | (2.54 | ) | | | (0.42 | )(g) | | | (0.22 | ) | | | (0.64 | ) |
| | 2008 - IR | | | 9.75 | | | | 0.37 | | | | (2.92 | ) | | | (2.55 | ) | | | (0.41 | )(g) | | | (0.22 | ) | | | (0.63 | ) |
| | 2008 - R | | | 9.75 | | | | 0.33 | | | | (2.91 | ) | | | (2.58 | ) | | | (0.38 | )(g) | | | (0.22 | ) | | | (0.60 | ) |
| | (a) | | Calculated based on the average shares outstanding methodology. |
| | (b) | | Recognition of net investment income by the Portfolio is affected by the timing of declaration of dividends by the Underlying Funds in which the Portfolio invests. |
| | (c) | | Assumes investment at the net asset value at the beginning of the period, reinvestment of all dividends and distributions, a complete redemption of the investment at the net asset value at the end of the period and no sales or redemption charges. Total returns would be reduced if a sales or redemption charge was taken into account. Returns do not reflect the deduction of taxes that a shareholder would pay on Portfolio distributions or the redemption of Portfolio shares. Total returns for periods less than one full year are not annualized. |
| | (d) | | Expense ratios exclude the expenses of the Underlying Funds in which the Portfolio invests. |
| | (e) | | The Portfolio’s portfolio turnover rate is calculated in accordance with regulatory requirements, without regard to transactions involving short term investments and certain derivatives. If such transactions were included, the Portfolio’s portfolio turnover rate may be higher. |
| | (g) | | Includes a distribution from capital of $0.03 per share. |
| | |
| 62 | | The accompanying notes are an integral part of these financial statements. |
GOLDMAN SACHS INCOME STRATEGIES PORTFOLIO
| | | | | | | | | | | | | | | | | | | | | | | | | | | | | | | | | | | | | | | | |
| | | | | | | | | | | | | | | | | | | | | | | | | | | | | | | | | | |
| | | Net asset
value, end
of period | | | | | Total
return(c) | | | | | Net assets,
end of
period
(in 000s) | | | | | Ratio of
net expenses
to average
net assets(d) | | | | | Ratio of
total expenses
to average
net assets(d) | | | | | Ratio of
net investment
income
to average
net assets(b) | | | | | Portfolio
turnover
rate(e) | |
| | | | |
| | $ | 8.55 | | | | | | (2.12 | )% | | | | $ | 11,933 | | | | | | 0.57 | %(f) | | | | | 1.34 | %(f) | | | | | 3.96 | %(f) | | | | | 28 | % |
| | | 8.59 | | | | | | (2.48 | ) | | | | | 11,369 | | | | | | 1.32 | (f) | | | | | 2.09 | (f) | | | | | 3.23 | (f) | | | | | 28 | |
| | | 8.51 | | | | | | (1.93 | ) | | | | | 8,273 | | | | | | 0.17 | (f) | | | | | 0.95 | (f) | | | | | 4.40 | (f) | | | | | 28 | |
| | | 8.54 | | | | | | (2.00 | ) | | | | | 2,598 | | | | | | 0.32 | (f) | | | | | 1.10 | (f) | | | | | 4.31 | (f) | | | | | 28 | |
| | | 8.58 | | | | | | (2.23 | ) | | | | | 148 | | | | | | 0.82 | (f) | | | | | 1.60 | (f) | | | | | 3.76 | (f) | | | | | 28 | |
| | | | | | | | | | | | | | | | | | | | | | | | | | | | | | | | | | | | | | | | |
| | | | |
| | | 8.90 | | | | | | 14.22 | | | | | | 13,366 | | | | | | 0.57 | | | | | | 1.23 | | | | | | 3.42 | | | | | | 111 | |
| | | 8.94 | | | | | | 13.31 | | | | | | 12,195 | | | | | | 1.32 | | | | | | 1.99 | | | | | | 2.79 | | | | | | 111 | |
| | | 8.86 | | | | | | 14.46 | | | | | | 5,527 | | | | | | 0.17 | | | | | | 0.80 | | | | | | 3.97 | | | | | | 111 | |
| | | 8.89 | | | | | | 14.53 | | | | | | 2,197 | | | | | | 0.32 | | | | | | 1.00 | | | | | | 3.85 | | | | | | 111 | |
| | | 8.93 | | | | | | 13.88 | | | | | | 134 | | | | | | 0.82 | | | | | | 1.51 | | | | | | 3.42 | | | | | | 111 | |
| | | 8.12 | | | | | | (1.78 | ) | | | | | 18,278 | | | | | | 0.57 | | | | | | 1.18 | | | | | | 3.34 | | | | | | 51 | |
| | | 8.16 | | | | | | (2.50 | ) | | | | | 10,732 | | | | | | 1.32 | | | | | | 1.93 | | | | | | 2.59 | | | | | | 51 | |
| | | 8.10 | | | | | | (1.39 | ) | | | | | 8,125 | | | | | | 0.17 | | | | | | 0.78 | | | | | | 3.69 | | | | | | 51 | |
| | | 8.11 | | | | | | (1.54 | ) | | | | | 1,179 | | | | | | 0.32 | | | | | | 0.93 | | | | | | 3.57 | | | | | | 51 | |
| | | 8.15 | | | | | | (2.01 | ) | | | | | 83 | | | | | | 0.82 | | | | | | 1.43 | | | | | | 3.12 | | | | | | 51 | |
| | | 8.58 | | | | | | 12.36 | | | | | | 14,054 | | | | | | 0.57 | | | | | | 1.44 | | | | | | 4.00 | | | | | | 70 | |
| | | 8.62 | | | | | | 11.46 | | | | | | 8,130 | | | | | | 1.32 | | | | | | 2.19 | | | | | | 3.31 | | | | | | 70 | |
| | | 8.56 | | | | | | 12.83 | | | | | | 7,614 | | | | | | 0.17 | | | | | | 1.04 | | | | | | 4.31 | | | | | | 70 | |
| | | 8.57 | | | | | | 12.66 | | | | | | 501 | | | | | | 0.32 | | | | | | 1.19 | | | | | | 4.49 | | | | | | 70 | |
| | | 8.61 | | | | | | 12.00 | | | | | | 45 | | | | | | 0.82 | | | | | | 1.69 | | | | | | 3.78 | | | | | | 70 | |
| | | 7.96 | | | | | | 27.39 | | | | | | 10,619 | | | | | | 0.57 | | | | | | 1.76 | | | | | | 5.44 | | | | | | 34 | |
| | | 8.00 | | | | | | 26.53 | | | | | | 4,674 | | | | | | 1.32 | | | | | | 2.51 | | | | | | 4.64 | | | | | | 34 | |
| | | 7.95 | | | | | | 27.92 | | | | | | 9,708 | | | | | | 0.17 | | | | | | 1.36 | | | | | | 5.73 | | | | | | 34 | |
| | | 7.95 | | | | | | 27.73 | | | | | | 9 | | | | | | 0.32 | | | | | | 1.51 | | | | | | 5.57 | | | | | | 34 | |
| | | 7.99 | | | | | | 27.23 | | | | | | 9 | | | | | | 0.82 | | | | | | 2.01 | | | | | | 5.07 | | | | | | 34 | |
| | | 6.57 | | | | | | (26.81 | ) | | | | | 5,305 | | | | | | 0.57 | | | | | | 2.17 | | | | | | 4.03 | | | | | | 98 | |
| | | 6.56 | | | | | | (27.36 | ) | | | | | 3,188 | | | | | | 1.32 | | | | | | 2.92 | | | | | | 3.33 | | | | | | 98 | |
| | | 6.57 | | | | | | (26.59 | ) | | | | | 7,541 | | | | | | 0.17 | | | | | | 1.77 | | | | | | 4.38 | | | | | | 98 | |
| | | 6.57 | | | | | | (26.75 | ) | | | | | 7 | | | | | | 0.32 | | | | | | 1.92 | | | | | | 4.25 | | | | | | 98 | |
| | | 6.57 | | | | | | (27.01 | ) | | | | | 7 | | | | | | 0.82 | | | | | | 2.42 | | | | | | 3.74 | | | | | | 98 | |
| | |
| The accompanying notes are an integral part of these financial statements. | | 63 |
GOLDMAN SACHS SATELLITE STRATEGIES PORTFOLIO
Financial Highlights
Selected Data for a Share Outstanding Throughout Each Period
| | | | | | | | | | | | | | | | | | | | | | | | | | | | | | |
| | | | | | | | Income (loss) from
investment operations | | | Distributions
to shareholders | |
| | | Year - Share Class | |
Net asset
value,
beginning
of period | | | Net
investment
income(a) | | | Net realized
and unrealized
gain (loss) | | | Total from
investment
operations | | | From net
investment
income | | | From net
realized
gains | | | Total
distributions | |
| | FOR THE SIX MONTHS ENDED JUNE 30, (UNAUDITED) | |
| | 2013 - A | | $ | 8.22 | | | $ | 0.11 | (e) | | $ | (0.36 | ) | | $ | (0.25 | ) | | $ | (0.11 | ) | | $ | — | | | $ | (0.11 | ) |
| | 2013 - C | | | 8.18 | | | | 0.08 | (e) | | | (0.36 | ) | | | (0.28 | ) | | | (0.08 | ) | | | — | | | | (0.08 | ) |
| | 2013 - Institutional | | | 8.21 | | | | 0.13 | (e) | | | (0.36 | ) | | | (0.23 | ) | | | (0.13 | ) | | | — | | | | (0.13 | ) |
| | 2013 - Service | | | 8.19 | | | | 0.11 | (e) | | | (0.36 | ) | | | (0.25 | ) | | | (0.11 | ) | | | — | | | | (0.11 | ) |
| | 2013 - IR | | | 8.21 | | | | 0.12 | (e) | | | (0.36 | ) | | | (0.24 | ) | | | (0.12 | ) | | | — | | | | (0.12 | ) |
| | 2013 - R | | | 8.19 | | | | 0.10 | (e) | | | (0.35 | ) | | | (0.25 | ) | | | (0.10 | ) | | | — | | | | (0.10 | ) |
| | | | | | | | | | | | | | | | | | | | | | | | | | | | | | |
| | FOR THE FISCAL YEARS ENDED DECEMBER 31, | |
| | 2012 - A | | | 7.39 | | | | 0.33 | (e) | | | 0.86 | | | | 1.19 | | | | (0.34 | ) | | | (0.02 | ) | | | (0.36 | ) |
| | 2012 - C | | | 7.36 | | | | 0.26 | (e) | | | 0.86 | | | | 1.12 | | | | (0.28 | ) | | | (0.02 | ) | | | (0.30 | ) |
| | 2012 - Institutional | | | 7.38 | | | | 0.36 | (e) | | | 0.86 | | | | 1.22 | | | | (0.37 | ) | | | (0.02 | ) | | | (0.39 | ) |
| | 2012 - Service | | | 7.36 | | | | 0.32 | (e) | | | 0.87 | | | | 1.19 | | | | (0.34 | ) | | | (0.02 | ) | | | (0.36 | ) |
| | 2012 - IR | | | 7.38 | | | | 0.35 | (e) | | | 0.86 | | | | 1.21 | | | | (0.36 | ) | | | (0.02 | ) | | | (0.38 | ) |
| | 2012 - R | | | 7.37 | | | | 0.31 | (e) | | | 0.86 | | | | 1.17 | | | | (0.33 | ) | | | (0.02 | ) | | | (0.35 | ) |
| | 2011 - A | | | 7.95 | | | | 0.28 | (e) | | | (0.53 | ) | | | (0.25 | ) | | | (0.28 | ) | | | (0.03 | ) | | | (0.31 | ) |
| | 2011 - C | | | 7.92 | | | | 0.23 | (e) | | | (0.53 | ) | | | (0.30 | ) | | | (0.23 | ) | | | (0.03 | ) | | | (0.26 | ) |
| | 2011 - Institutional | | | 7.94 | | | | 0.32 | (e) | | | (0.53 | ) | | | (0.21 | ) | | | (0.32 | ) | | | (0.03 | ) | | | (0.35 | ) |
| | 2011 - Service | | | 7.92 | | | | 0.28 | (e) | | | (0.53 | ) | | | (0.25 | ) | | | (0.28 | ) | | | (0.03 | ) | | | (0.31 | ) |
| | 2011 - IR | | | 7.94 | | | | 0.32 | (e) | | | (0.54 | ) | | | (0.22 | ) | | | (0.31 | ) | | | (0.03 | ) | | | (0.34 | ) |
| | 2011 - R | | | 7.93 | | | | 0.26 | (e) | | | (0.52 | ) | | | (0.26 | ) | | | (0.27 | ) | | | (0.03 | ) | | | (0.30 | ) |
| | 2010 - A | | | 7.34 | | | | 0.40 | | | | 0.62 | | | | 1.02 | | | | (0.41 | ) | | | — | | | | (0.41 | ) |
| | 2010 - C | | | 7.31 | | | | 0.34 | | | | 0.63 | | | | 0.97 | | | | (0.36 | ) | | | — | | | | (0.36 | ) |
| | 2010 - Institutional | | | 7.33 | | | | 0.42 | | | | 0.63 | | | | 1.05 | | | | (0.44 | ) | | | — | | | | (0.44 | ) |
| | 2010 - Service | | | 7.31 | | | | 0.38 | | | | 0.63 | | | | 1.01 | | | | (0.40 | ) | | | — | | | | (0.40 | ) |
| | 2010 - IR | | | 7.34 | | | | 0.42 | | | | 0.61 | | | | 1.03 | | | | (0.43 | ) | | | — | | | | (0.43 | ) |
| | 2010 - R | | | 7.32 | | | | 0.41 | | | | 0.59 | | | | 1.00 | | | | (0.39 | ) | | | — | | | | (0.39 | ) |
| | 2009 - A | | | 5.58 | | | | 0.36 | (e) | | | 1.69 | | | | 2.05 | | | | (0.27 | ) | | | (0.02 | ) | | | (0.29 | ) |
| | 2009 - C | | | 5.56 | | | | 0.31 | (e) | | | 1.69 | | | | 2.00 | | | | (0.23 | ) | | | (0.02 | ) | | | (0.25 | ) |
| | 2009 - Institutional | | | 5.57 | | | | 0.42 | (e) | | | 1.66 | | | | 2.08 | | | | (0.30 | ) | | | (0.02 | ) | | | (0.32 | ) |
| | 2009 - Service | | | 5.56 | | | | 0.53 | (e) | | | 1.51 | | | | 2.04 | | | | (0.27 | ) | | | (0.02 | ) | | | (0.29 | ) |
| | 2009 - IR | | | 5.58 | | | | 0.96 | (e) | | | 1.11 | | | | 2.07 | | | | (0.29 | ) | | | (0.02 | ) | | | (0.31 | ) |
| | 2009 - R | | | 5.57 | | | | 0.50 | (e) | | | 1.53 | | | | 2.03 | | | | (0.26 | ) | | | (0.02 | ) | | | (0.28 | ) |
| | 2008 - A | | | 10.18 | | | | 0.28 | (e) | | | (4.51 | ) | | | (4.23 | ) | | | (0.33 | ) | | | (0.04 | ) | | | (0.37 | ) |
| | 2008 - C | | | 10.15 | | | | 0.23 | (e) | | | (4.51 | ) | | | (4.28 | ) | | | (0.27 | ) | | | (0.04 | ) | | | (0.31 | ) |
| | 2008 - Institutional | | | 10.17 | | | | 0.35 | (e) | | | (4.55 | ) | | | (4.20 | ) | | | (0.36 | ) | | | (0.04 | ) | | | (0.40 | ) |
| | 2008 - Service (Commenced August 29, 2008) | | | 9.30 | | | | 0.13 | (e) | | | (3.60 | ) | | | (3.47 | ) | | | (0.23 | ) | | | (0.04 | ) | | | (0.27 | ) |
| | 2008 - IR | | | 10.17 | | | | 0.27 | (e) | | | (4.47 | ) | | | (4.20 | ) | | | (0.35 | ) | | | (0.04 | ) | | | (0.39 | ) |
| | 2008 - R | | | 10.17 | | | | 0.29 | (e) | | | (4.54 | ) | | | (4.25 | ) | | | (0.31 | ) | | | (0.04 | ) | | | (0.35 | ) |
| | (a) | | Recognition of net investment income by the Portfolio is affected by the timing of declaration of dividends by the Underlying Funds in which the Portfolio invests. |
| | (b) | | Assumes investment at the net asset value at the beginning of the period, reinvestment of all dividends and distributions, a complete redemption of the investment at the net asset value at the end of the period and no sales or redemption charges. Total returns would be reduced if a sales or redemption charge was taken into account. Returns do not reflect the deduction of taxes that a shareholder would pay on Portfolio distributions or the redemption of Portfolio shares. Total returns for periods less than one full year are not annualized. |
| | (c) | | Expense ratios exclude the expenses of the Underlying Funds in which the Portfolio invests. |
| | (d) | | The Portfolio’s portfolio turnover rate is calculated in accordance with regulatory requirements, without regard to transactions involving short term investments and certain derivatives. If such transactions were included, the Portfolio’s portfolio turnover rate may be higher. |
| | (e) | | Calculated based on the average shares outstanding methodology. |
| | (g) | | The ratio is not annualized as the Portfolio’s income for the fiscal year ended December 31, 2008 did not correlate to the income earned during the class’ period of operation due to timing of income recognition. |
| | |
| 64 | | The accompanying notes are an integral part of these financial statements. |
GOLDMAN SACHS SATELLITE STRATEGIES PORTFOLIO
| | | | | | | | | | | | | | | | | | | | | | | | | | | | | | | | | | | | | | | | |
| | | | | | | | | | | | | | | | | | | | | | | | | | | | | | | | | | |
| | | Net asset
value, end
of period | | | | | Total
return(b) | | | | | Net assets,
end of
period
(in 000s) | | | | | Ratio of
net expenses
to average
net assets(c) | | | | | Ratio of
total expenses
to average net
assets(c) | | | | | Ratio of
net investment
income
to average
net assets(a) | | | | | Portfolio
turnover
rate(d) | |
| | | | |
| | $ | 7.86 | | | | | | (3.04 | )% | | | | $ | 259,612 | | | | | | 0.57 | %(f) | | | | | 0.60 | %(f) | | | | | 2.78 | %(f) | | | | | 20 | % |
| | | 7.82 | | | | | | (3.42 | ) | | | | | 125,618 | | | | | | 1.32 | (f) | | | | | 1.35 | (f) | | | | | 2.02 | (f) | | | | | 20 | |
| | | 7.85 | | | | | | (2.85 | ) | | | | | 852,076 | | | | | | 0.17 | (f) | | | | | 0.20 | (f) | | | | | 3.18 | (f) | | | | | 20 | |
| | | 7.83 | | | | | | (3.11 | ) | | | | | 30,443 | | | | | | 0.67 | (f) | | | | | 0.70 | (f) | | | | | 2.64 | (f) | | | | | 20 | |
| | | 7.85 | | | | | | (2.92 | ) | | | | | 92,030 | | | | | | 0.32 | (f) | | | | | 0.35 | (f) | | | | | 3.04 | (f) | | | | | 20 | |
| | | 7.84 | | | | | | (3.04 | ) | | | | | 4,268 | | | | | | 0.82 | (f) | | | | | 0.85 | (f) | | | | | 2.55 | (f) | | | | | 20 | |
| | | | | | | | | | | | | | | | | | | | | | | | | | | | | | | | | | | | | | | | |
| | | | |
| | | 8.22 | | | | | | 16.30 | | | | | | 250,407 | | | | | | 0.57 | | | | | | 0.60 | | | | | | 4.13 | | | | | | 14 | |
| | | 8.18 | | | | | | 15.37 | | | | | | 130,446 | | | | | | 1.32 | | | | | | 1.35 | | | | | | 3.32 | | | | | | 14 | |
| | | 8.21 | | | | | | 16.77 | | | | | | 803,541 | | | | | | 0.17 | | | | | | 0.20 | | | | | | 4.56 | | | | | | 14 | |
| | | 8.19 | | | | | | 16.26 | | | | | | 37,068 | | | | | | 0.67 | | | | | | 0.70 | | | | | | 4.04 | | | | | | 14 | |
| | | 8.21 | | | | | | 16.60 | | | | | | 74,216 | | | | | | 0.32 | | | | | | 0.35 | | | | | | 4.37 | | | | | | 14 | |
| | | 8.19 | | | | | | 15.96 | | | | | | 2,804 | | | | | | 0.82 | | | | | | 0.85 | | | | | | 3.86 | | | | | | 14 | |
| | | 7.39 | | | | | | (3.17 | ) | | | | | 201,416 | | | | | | 0.57 | | | | | | 0.61 | | | | | | 3.59 | | | | | | 35 | |
| | | 7.36 | | | | | | (3.88 | ) | | | | | 117,790 | | | | | | 1.32 | | | | | | 1.36 | | | | | | 2.88 | | | | | | 35 | |
| | | 7.38 | | | | | | (2.77 | ) | | | | | 590,521 | | | | | | 0.17 | | | | | | 0.21 | | | | | | 4.07 | | | | | | 35 | |
| | | 7.36 | | | | | | (3.26 | ) | | | | | 28,306 | | | | | | 0.67 | | | | | | 0.71 | | | | | | 3.54 | | | | | | 35 | |
| | | 7.38 | | | | | | (2.91 | ) | | | | | 58,940 | | | | | | 0.32 | | | | | | 0.36 | | | | | | 4.12 | | | | | | 35 | |
| | | 7.37 | | | | | | (3.42 | ) | | | | | 846 | | | | | | 0.82 | | | | | | 0.86 | | | | | | 3.33 | | | | | | 35 | |
| | | 7.95 | | | | | | 14.20 | | | | | | 212,886 | | | | | | 0.57 | | | | | | 0.63 | | | | | | 5.78 | | | | | | 18 | |
| | | 7.92 | | | | | | 13.48 | | | | | | 101,615 | | | | | | 1.32 | | | | | | 1.38 | | | | | | 5.17 | | | | | | 18 | |
| | | 7.94 | | | | | | 14.66 | | | | | | 442,808 | | | | | | 0.17 | | | | | | 0.23 | | | | | | 6.30 | | | | | | 18 | |
| | | 7.92 | | | | | | 14.17 | | | | | | 22,401 | | | | | | 0.67 | | | | | | 0.73 | | | | | | 5.97 | | | | | | 18 | |
| | | 7.94 | | | | | | 14.34 | | | | | | 19,947 | | | | | | 0.32 | | | | | | 0.38 | | | | | | 6.21 | | | | | | 18 | |
| | | 7.93 | | | | | | 14.01 | | | | | | 761 | | | | | | 0.82 | | | | | | 0.88 | | | | | | 6.13 | | | | | | 18 | |
| | | 7.34 | | | | | | 37.31 | | | | | | 131,389 | | | | | | 0.57 | | | | | | 0.71 | | | | | | 5.66 | | | | | | 58 | |
| | | 7.31 | | | | | | 36.29 | | | | | | 50,972 | | | | | | 1.32 | | | | | | 1.46 | | | | | | 4.81 | | | | | | 58 | |
| | | 7.33 | | | | | | 37.89 | | | | | | 242,969 | | | | | | 0.17 | | | | | | 0.31 | | | | | | 6.37 | | | | | | 58 | |
| | | 7.31 | | | | | | 37.17 | | | | | | 11,311 | | | | | | 0.67 | | | | | | 0.81 | | | | | | 7.60 | | | | | | 58 | |
| | | 7.34 | | | | | | 37.70 | | | | | | 6,331 | | | | | | 0.32 | | | | | | 0.46 | | | | | | 13.43 | | | | | | 58 | |
| | | 7.32 | | | | | | 36.96 | | | | | | 160 | | | | | | 0.82 | | | | | | 0.96 | | | | | | 7.44 | | | | | | 58 | |
| | | 5.58 | | | | | | (41.99 | ) | | | | | 57,958 | | | | | | 0.57 | | | | | | 0.84 | | | | | | 3.27 | | | | | | 50 | |
| | | 5.56 | | | | | | (42.43 | ) | | | | | 26,696 | | | | | | 1.32 | | | | | | 1.59 | | | | | | 2.67 | | | | | | 50 | |
| | | 5.57 | | | | | | (41.81 | ) | | | | | 54,327 | | | | | | 0.17 | | | | | | 0.44 | | | | | | 4.24 | | | | | | 50 | |
| | | 5.56 | | | | | | (37.37 | ) | | | | | 222 | | | | | | 0.67 | (f) | | | | | 0.94 | (f) | | | | | 2.20 | (g) | | | | | 50 | |
| | | 5.58 | | | | | | (41.79 | ) | | | | | 4 | | | | | | 0.32 | | | | | | 0.59 | | | | | | 2.92 | | | | | | 50 | |
| | | 5.57 | | | | | | (42.16 | ) | | | | | 21 | | | | | | 0.82 | | | | | | 1.09 | | | | | | 3.55 | | | | | | 50 | |
| | |
| The accompanying notes are an integral part of these financial statements. | | 65 |
GOLDMAN SACHS FUND OF FUNDS PORTFOLIOS
Notes to Financial Statements
June 30, 2013 (Unaudited)
Goldman Sachs Trust (the “Trust”) is a Delaware statutory trust registered under the Investment Company Act of 1940, as amended (the “Act”), as an open-end management investment company. The following table lists those series of the Trust that are included in this report (collectively, the “Portfolios” or individually a “Portfolio”), along with their corresponding share classes and respective diversification status under the Act:
| | | | |
| Portfolio | | Share Classes Offered* | | Diversified/
Non-diversified |
Balanced Strategy, Equity Growth Strategy, Growth and Income Strategy, and Growth Strategy | | A, B, C, Institutional, Service, IR, R | | Diversified |
Income Strategies | | A, C, Institutional, IR, R | | Diversified |
Satellite Strategies | | A, C, Institutional, Service, IR, R | | Diversified |
| * | | Class B Shares are generally no longer available for purchase by current or prospective investors. |
Class A Shares are sold with a front-end sales charge of up to 5.50%. Class B Shares were sold with a contingent deferred sales charge (“CDSC”) that declines from 5.00% to zero, depending upon the period of time the shares are held. Class C Shares are sold with a CDSC of 1.00%, which is imposed on redemptions made within 12 months of purchase. Institutional, Service, Class IR and Class R Shares are not subject to a sales charge.
Goldman Sachs Asset Management, L.P. (“GSAM”), an affiliate of Goldman, Sachs & Co. (“Goldman Sachs”), serves as investment adviser to the Portfolios pursuant to a management agreement (the “Agreement”) with the Trust.
The Portfolios are expected to invest primarily in a combination of domestic and international equity and fixed income underlying funds (“Underlying Funds”) which are registered under the Act, for which GSAM or Goldman Sachs Asset Management International (“GSAMI”), also an affiliate of Goldman Sachs, act as investment advisers.
|
| 2. SIGNIFICANT ACCOUNTING POLICIES |
The financial statements have been prepared in accordance with accounting principles generally accepted in the United States of America (“GAAP”) and require management to make estimates and assumptions that may affect the reported amounts and disclosures. Actual results may differ from those estimates and assumptions.
A. Investment Valuation — The Portfolios’ valuation policy, as well as the Underlying Funds, is to value investments at fair value.
B. Investment Income and Investments — Investment income includes interest income and dividend income, net of any foreign withholding taxes, less any amounts reclaimable. Interest income is accrued daily and adjusted for amortization of premiums and accretion of discounts. Dividend income is recognized on ex-dividend date or, for certain foreign securities, as soon as such information is obtained subsequent to the ex-dividend date. Capital gain distributions received from Underlying Funds are recognized on ex-dividend date. Investment transactions are reflected on trade date. Realized gains and losses are calculated using identified cost. Investment transactions are recorded on the following business day for daily net asset value (“NAV”) calculations. Any foreign capital gains tax is accrued daily based upon net unrealized gains, and is payable upon sale of such investments.
C. Class Allocations and Expenses — Investment income, realized and unrealized gain (loss), and non-class specific expenses of each Portfolio are allocated daily based upon the proportion of net assets of each class. Class specific expenses, where applicable, are borne by the respective share classes and include Distribution and Service, Transfer Agent and Service and Shareholder Administration fees. Non-class specific expenses directly incurred by a Portfolio are charged to that Portfolio, while
66
GOLDMAN SACHS FUND OF FUNDS PORTFOLIOS
|
| 2. SIGNIFICANT ACCOUNTING POLICIES (continued) |
such expenses incurred by the Trust are allocated across the respective Funds on a straight-line and/or pro-rata basis depending upon the nature of the expenses.
Expenses included in the accompanying financial statements reflect the expenses of each Portfolio and do not include any expenses associated with the Underlying Funds. Because the Underlying Funds have varied expense and fee levels and the Portfolios may own different proportions of the Underlying Funds at different times, the amount of fees and expenses incurred indirectly by each Portfolio will vary.
D. Federal Taxes and Distributions to Shareholders — It is each Portfolio’s policy to comply with the requirements of the Internal Revenue Code of 1986, as amended (the “Code”), applicable to regulated investment companies (mutual funds) and to distribute each year substantially all of its investment company taxable income and capital gains to its shareholders. Accordingly, the Portfolios are not required to make any provisions for the payment of federal income tax. Distributions to shareholders are recorded on the ex-dividend date. Income and capital gains distributions, if any, are declared and paid according to the following schedule:
| | | | | | |
| Portfolio | | | | Income Distributions
Declared/Paid | | Capital Gains Distributions
Declared/Paid |
Balanced Strategy, Growth and Income Strategy and Satellite Strategies | | | | Quarterly | | Annually |
Equity Growth Strategy and Growth Strategy | | | | Annually | | Annually |
Income Strategies | | | | Monthly | | Annually |
Net capital losses are carried forward to future fiscal years and may be used to the extent allowed by the Code to offset any future capital gains. Utilization of capital loss carryforwards will reduce the requirement of future capital gains distributions.
Under the Regulated Investment Company Modernization Act of 2010, the Funds are permitted to carry forward capital losses incurred in taxable years beginning after December 22, 2010 for an unlimited period. However, any losses incurred during those future taxable years will be required to be utilized prior to the losses incurred in pre-enactment taxable years. As a result of this ordering rule, pre-enactment capital loss carryforwards may be more likely to expire unused. Additionally, post-enactment capital losses that are carried forward will retain their character as either short-term or long-term capital losses rather than being considered all short-term as under previous law.
The characterization of distributions to shareholders for financial reporting purposes is determined in accordance with federal income tax rules, which may differ from GAAP. The source of each Portfolio’s distributions may be shown in the accompanying financial statements as either from net investment income, net realized gain or capital. Certain components of the Portfolios’ net assets on the Statements of Assets and Liabilities reflect permanent GAAP/tax differences based on the appropriate tax character.
|
| 3. INVESTMENTS AND FAIR VALUE MEASUREMENTS |
The fair value of a financial instrument is the amount that would be received to sell an asset or paid to transfer a liability in an orderly transaction between market participants at the measurement date (i.e., the exit price). GAAP establishes a fair value hierarchy that prioritizes the inputs to valuation techniques used to measure fair value. The hierarchy gives the highest priority to unadjusted quoted prices in active markets for identical assets or liabilities (Level 1 measurements) and the lowest priority to unobservable inputs (Level 3 measurements). The levels used for classifying investments are not necessarily an indication of the risk associated with investing in these investments. The three levels of the fair value hierarchy are described below:
Level 1 — Unadjusted quoted prices in active markets that are accessible at the measurement date for identical, unrestricted assets or liabilities;
Level 2 — Quoted prices in markets that are not active or financial instruments for which significant inputs are observable (including, but not limited to, quoted prices for similar investments, interest rates, foreign exchange rates, volatility and credit spreads), either directly or indirectly;
67
GOLDMAN SACHS FUND OF FUNDS PORTFOLIOS
Notes to Financial Statements (continued)
June 30, 2013 (Unaudited)
|
| 3. INVESTMENTS AND FAIR VALUE MEASUREMENTS (continued) |
Level 3 — Prices or valuations that require significant unobservable inputs (including GSAM’s assumptions in determining fair value measurement).
The Trustees have adopted Valuation Procedures that govern the valuation of the portfolio investments held by the Portfolios, including investments for which market quotations are not readily available. The Trustees have delegated to GSAM day-to-day responsibility for implementing and maintaining internal controls and procedures related to the valuation of the Portfolios’ portfolio investments. To assess the continuing appropriateness of pricing sources and methodologies, GSAM regularly performs price verification procedures and issues challenges as necessary to third party pricing vendors or brokers, and any differences are reviewed in accordance with the Valuation Procedures.
A. Level 1 and Level 2 Fair Value Investments — The valuation techniques and significant inputs used in determining the fair values for investments classified as Level 1 and Level 2 are as follows:
Underlying Funds — Investments in the Underlying Funds are valued at the NAV per share of the Institutional Share class of each Underlying Fund on the day of valuation. Because each Portfolio invests primarily in other mutual funds that fluctuate in value, the Portfolios’ shares will correspondingly fluctuate in value.
The Underlying Funds may invest in debt securities which, if market quotations are readily available, are valued daily on the basis of quotations supplied by dealers or an independent pricing service approved by the Trustees. The pricing services may use valuation models or matrix pricing, which consider: (i) yield or price with respect to bonds that are considered comparable in characteristics such as rating, interest rate and maturity date or (ii) quotations from securities dealers to determine current value. Short-term debt obligations that mature in sixty days or less and that do not exhibit signs of credit deterioration are valued at amortized cost, which approximates fair value. With the exception of treasury securities, which are generally classified as Level 1, these investments are generally classified as Level 2 of the fair value hierarchy.
The Underlying Funds may invest in equity securities and investment companies. Investments in equity securities and investment companies traded on a United States (“U.S.”) securities exchange or the NASDAQ system, or those located on certain foreign exchanges, including but not limited to the Americas, are valued daily at their last sale price or official closing price on the principal exchange or system on which they are traded. If no sale occurs, equity securities and exchange traded investment companies are valued at the last bid price for long positions and at the last ask price for short positions. Investments in investment companies (other than those that are exchange traded) are valued at the NAV on the valuation date. To the extent these investments are actively traded, they are classified as Level 1 of the fair value hierarchy.
Unlisted equity securities for which market quotations are available are valued at the last sale price on the valuation date, or if no sale occurs, at the last bid price. Securities traded on certain foreign securities exchanges are valued daily at fair value determined by an independent fair value service (if available) under Valuation Procedures approved by the Trustees and consistent with applicable regulatory guidance. The independent fair value service takes into account multiple factors including, but not limited to, movements in the securities markets, certain depositary receipts, futures contracts and foreign currency exchange rates that have occurred subsequent to the close of the foreign securities exchange. These investments are generally classified as Level 2 of the fair value hierarchy.
Short Term Investments — Short-term investments having a maturity of 60 days or less are generally valued at amortized cost which approximates fair market value. These investments are classified as Level 2 of the fair value hierarchy.
Repurchase Agreements — Repurchase agreements involve the purchase of securities subject to the seller’s agreement to repurchase the securities at a mutually agreed upon date and price, under the terms of a Master Repurchase Agreement (“MRA”). During the term of a repurchase agreement, the value of the underlying securities held as collateral on behalf of a Portfolio, including accrued interest, is required to exceed the value of the repurchase agreement, including accrued interest. The underlying securities for all repurchase agreements are held at the Portfolios’ custodian or designated sub-custodians under tri-party repurchase agreements.
In December 2011, the Financial Accounting Standards Board (“FASB”) issued an Accounting Standards Update (“ASU”) No. 2011-11: Disclosures about Offsetting Assets and Liabilities (“netting”) on the Statements of Assets and
68
GOLDMAN SACHS FUND OF FUNDS PORTFOLIOS
|
| 3. INVESTMENTS AND FAIR VALUE MEASUREMENTS (continued) |
Liabilities that are subject to master netting arrangements or similar agreements. ASU 2011-11 was amended by ASU No. 2013-01, clarifying which investments and transactions are subject to the netting disclosure. The scope of the disclosure requirements is limited to derivative instruments, repurchase agreements and reverse repurchase agreements, and securities borrowing and securities lending transactions. This information is intended to enable users of the Portfolios’ financial statements to evaluate the effect or potential effect of netting arrangements on the Portfolios’ financial position. The ASU is effective for financial statements with fiscal years beginning on or after January 1, 2013, and interim periods within those fiscal years. The Portfolios adopted the disclosure requirement on netting for the current reporting period. Since these amended principles require additional disclosures concerning offsetting and related arrangements, adoption did not affect the Portfolios’ financial condition or results of operations.
For financial reporting purposes, the Portfolios do not offset financial assets and financial liabilities that are subject to master netting arrangements or similar agreements on the Statement of Assets and Liabilities.
A MRA governs transactions between a Portfolio and select counterparties. A MRA contains provisions for, among other things, initiation, income payments, events of default, and maintenance of securities for repurchase agreements. A MRA also permits offsetting with collateral to create one single net payment in the event of default or similar events, including the bankruptcy or insolvency of a counterparty.
If the seller defaults, a Portfolio could suffer a loss to the extent that the proceeds from the sale of the underlying securities and other collateral held by the Portfolio are less than the repurchase price and the Portfolio’s costs associated with delay and enforcement of the repurchase agreement. In addition, in the event of default or insolvency of the seller, a court could determine that a Portfolio’s interest in the collateral is not enforceable resulting in additional losses to the Portfolio.
At June 30, 2013, the Portfolios’ investments in repurchase agreements were all subject to enforceable Master Repurchase Agreements. Repurchase agreements on a gross and net basis were as follows:
| | | | | | | | | | | | |
| | | |
| Repurchase Agreements | | Equity Growth
Strategy | | | Growth and Income
Strategy | | | Growth Strategy | |
Total gross amount presented in Statements of Assets and Liabilities | | $ | 100,000 | | | $ | 300,000 | | | $ | 300,000 | |
Non-cash Collateral offsetting(1) | | | (100,000 | ) | | | (300,000 | ) | | | (300,000 | ) |
Net Amount(2) | | $ | — | | | $ | — | | | $ | — | |
| | (1) | | At June 30, 2013 the value of the collateral received from each seller exceeded the value of the related repurchase agreements. |
| | (2) | | Net amount represents the net amount due from the counterparty in the event of a default based on the contractual set-off rights under the agreement. |
Pursuant to exemptive relief granted by the Securities and Exchange Commission and terms and conditions contained therein, the Portfolios, together with other funds of the Trust and registered investment companies having management agreements with GSAM or its affiliates, may transfer uninvested cash into joint accounts, the daily aggregate balance of which is invested in one or more repurchase agreements. Under these joint accounts, the Portfolios maintain pro-rata credit exposure to the underlying repurchase agreements’ counterparties. With the exception of certain transaction fees, the Portfolios are not subject to any expenses in relation to these investments.
B. Level 3 Fair Value Investments — To the extent that the aforementioned significant inputs are unobservable, or if quotations are not readily available, or if GSAM believes that such quotations do not accurately reflect fair value, the fair value of the Portfolios’ investments may be determined under Valuation Procedures approved by the Trustees. GSAM, consistent with its procedures and applicable regulatory guidance, may make an adjustment to the most recent valuation prices of either domestic or foreign securities in light of significant events to reflect what it believes to be the fair value of the securities at the time of determining a Portfolio’s NAV. Significant events which could affect a large number of securities in a particular market may include, but are not limited to: significant fluctuations in U.S. or foreign markets; market dislocations; market disruptions; or unscheduled market closings. Significant events which could also affect a single issuer may include, but are not limited to: corporate actions such as reorganizations, mergers and buy-outs; ratings downgrades; and bankruptcies.
69
GOLDMAN SACHS FUND OF FUNDS PORTFOLIOS
Notes to Financial Statements (continued)
June 30, 2013 (Unaudited)
|
| 3. INVESTMENTS AND FAIR VALUE MEASUREMENTS (continued) |
C. Fair Value Hierarchy — The following is a summary of the Portfolios’ investments classified in the fair value hierarchy as of June 30, 2013:
| | | | | | | | | | | | |
| | | |
| BALANCED STRATEGY | | | | | | | | | | | | |
| | | |
| Investment Type | | Level 1 | | | Level 2 | | | Level 3 | |
| Assets | | | | | | | | | | | | |
Equity Underlying Funds | | $ | 184,633,525 | | | $ | — | | | $ | — | |
Fixed Income Underlying Funds | | | 275,341,561 | | | | — | | | | — | |
Dynamic Underlying Funds | | | 79,676,374 | | | | — | | | | — | |
| Total | | $ | 539,651,460 | | | $ | — | | | $ | — | |
| | | |
| EQUITY GROWTH STRATEGY | | | | | | | | | | | | |
| | | |
| Investment Type | | Level 1 | | | Level 2 | | | Level 3 | |
| Assets | | | | | | | | | | | | |
Equity Underlying Funds | | $ | 352,371,032 | | | $ | — | | | $ | — | |
Fixed Income Underlying Funds | | | 10,933,386 | | | | — | | | | — | |
Short-term Investments | | | — | | | | 100,000 | | | | — | |
| Total | | $ | 363,304,418 | | | $ | 100,000 | | | $ | — | |
| | | |
| GROWTH AND INCOME STRATEGY | | | | | | | | | | | | |
| | | |
| Investment Type | | Level 1 | | | Level 2 | | | Level 3 | |
| Assets | | | | | | | | | | | | |
Equity Underlying Funds | | $ | 552,072,567 | | | $ | — | | | $ | — | |
Fixed Income Underlying Funds | | | 301,838,141 | | | | — | | | | — | |
Dynamic Underlying Funds | | | 148,542,279 | | | | — | | | | — | |
Short-term Investments | | | — | | | | 300,000 | | | | — | |
| Total | | $ | 1,002,452,987 | | | $ | 300,000 | | | $ | — | |
| | | |
| GROWTH STRATEGY | | | | | | | | | | | | |
| | | |
| Investment Type | | Level 1 | | | Level 2 | | | Level 3 | |
| Assets | | | | | | | | | | | | |
Equity Underlying Funds | | $ | 625,085,044 | | | $ | — | | | $ | — | |
Fixed Income Underlying Funds | | | 92,449,180 | | | | — | | | | — | |
Dynamic Underlying Funds | | | 125,258,405 | | | | — | | | | — | |
Short-term Investments | | | — | | | | 300,000 | | | | — | |
| Total | | $ | 842,792,629 | | | $ | 300,000 | | | $ | — | |
70
GOLDMAN SACHS FUND OF FUNDS PORTFOLIOS
|
| 3. INVESTMENTS AND FAIR VALUE MEASUREMENTS (continued) |
| | | | | | | | | | | | |
| | | |
| INCOME STRATEGIES | | | | | | | | | | | | |
| | | |
| Investment Type | | Level 1 | | | Level 2 | | | Level 3 | |
| Assets | | | | | | | | | | | | |
Equity Underlying Funds | | $ | 12,031,848 | | | $ | — | | | $ | — | |
Fixed Income Underlying Funds | | | 22,171,444 | | | | — | | | | — | |
| Total | | $ | 34,203,292 | | | $ | — | | | $ | — | |
| | | |
| SATELLITE STRATEGIES | | | | | | | | | | | | |
| | | |
| Investment Type | | Level 1 | | | Level 2 | | | Level 3 | |
| Assets | | | | | | | | | | | | |
Equity Underlying Funds | | $ | 612,894,433 | | | $ | — | | | $ | — | |
Fixed Income Underlying Funds | | | 754,425,089 | | | | — | | | | — | |
| Total | | $ | 1,367,319,522 | | | $ | — | | | $ | — | |
For further information regarding security characteristics, see the Schedules of Investments.
|
| 4. AGREEMENTS AND AFFILIATED TRANSACTIONS |
A. Management Agreement — Under the Agreement, GSAM manages the Portfolios, subject to the general supervision of the Trustees.
As compensation for the services rendered pursuant to the Agreement, the assumption of the expenses related thereto and administration of the Portfolios’ business affairs, including providing facilities, GSAM is entitled to a management fee, accrued daily and paid monthly, equal to an annual percentage rate of average daily net assets of 0.124% for the Income Strategies and Satellite Strategies Portfolios and 0.15% for each of the other Portfolios.
B. Distribution and Service Plans — The Trust, on behalf of each Portfolio, has adopted Distribution and Service Plans (the “Plans”). Under the Plans, Goldman Sachs, which serves as distributor (the “Distributor”), is entitled to a fee accrued daily and paid monthly, for distribution services and personal and account maintenance services, which may then be paid by Goldman Sachs to authorized dealers, at the following annual rates calculated on a Portfolio’s average daily net assets of each respective share class:
| | | | | | | | | | | | | | | | |
| | | Distribution and Service Plan Rates | |
| | | Class A* | | | Class B | | | Class C | | | Class R* | |
Distribution Plan | | | 0.25 | % | | | 0.75 | % | | | 0.75 | % | | | 0.50 | % |
Service Plan | | | — | | | | 0.25 | | | | 0.25 | | | | — | |
| * | | With respect to Class A and Class R Shares, the Distributor at its discretion may use compensation for distribution services paid under the Distribution Plan to compensate service organizations for personal and account maintenance services and expenses as long as such total compensation does not exceed the maximum cap on “service fees” imposed by the Financial Industry Regulatory Authority. |
71
GOLDMAN SACHS FUND OF FUNDS PORTFOLIOS
Notes to Financial Statements (continued)
June 30, 2013 (Unaudited)
|
| 4. AGREEMENTS AND AFFILIATED TRANSACTIONS (continued) |
C. Distribution Agreement — Goldman Sachs, as Distributor of the shares of the Portfolios pursuant to a Distribution Agreement, may retain a portion of the Class A front end sales charge and Class B and Class C Shares’ CDSC. During the six months ended June 30, 2013, Goldman Sachs advised that it retained the following amounts. There were no amounts retained for Class B during this period.
| | | | | | | | | | |
| | | | | Front End
Sales Charge | | | Contingent Deferred
Sales Charge | |
| Portfolio | | | | Class A | | | Class C | |
Balanced Strategy | | | | $ | 10,789 | | | $ | 9 | |
Equity Growth Strategy | | | | | 9,376 | | | | 189 | |
Growth and Income Strategy | | | | | 25,180 | | | | 307 | |
Growth Strategy | | | | | 23,942 | | | | 129 | |
Income Strategies | | | | | 5,036 | | | | — | |
Satellite Strategies | | | | | 51,645 | | | | — | |
D. Service Plan and Shareholder Administration Plan — The Trust, on behalf of each Portfolio that offers Service Shares, has adopted a Service Plan and a Shareholder Administration Plan. These plans allow for service organizations to provide varying levels of personal and account maintenance and shareholder administration services to their customers who are beneficial owners of such shares. The Service Plan and Shareholder Administration Plan each provide for compensation to the service organizations which is accrued daily and paid monthly at an annual rate of 0.25% (0.50% in aggregate) of the average daily net assets of the Service Shares.
E. Transfer Agency Agreement — Goldman Sachs also serves as the transfer agent of the Portfolios for a fee pursuant to the Transfer Agency Agreement. The fees charged for such transfer agency services are accrued daily and paid monthly at annual rates as follows: 0.19% of the average daily net assets of Class A, Class B, Class C, Class IR and Class R Shares; and 0.04% of the average daily net assets of Institutional and Service Shares.
F. Other Expense Agreements and Affiliated Transactions — GSAM has agreed to limit certain “Other Expense” of the Portfolios (excluding transfer agent fees and expenses, service fees and shareholder administration fees (as applicable), taxes, interest, brokerage fees, litigation, indemnification, shareholder meetings and other extraordinary expenses) to the extent such expenses exceed, on an annual basis, a percentage rate of the average daily net assets of each Portfolio. Such Other Expense reimbursements, if any, are accrued daily and paid monthly and are disclosed in the Statement of Operations for the six months ended June 30, 2013. In addition, the Portfolios are not obligated to reimburse GSAM for prior fiscal year expense reimbursements, if any. The Other Expense limitations as an annual percentage rate of average daily net assets are 0.01% for the Income Strategies and Satellite Strategies Portfolios and 0.004% for each other Portfolio. These Other Expense limitations will remain in place through at least April 30, 2014, and prior to such date GSAM may not terminate the arrangements without the approval of the Trustees. In addition, the Portfolios have entered into certain offset arrangements with the custodian and the transfer agent, which may result in a reduction of the Portfolios’ expenses and are received irrespective of the application of the “Other Expense” limitations described above.
72
GOLDMAN SACHS FUND OF FUNDS PORTFOLIOS
|
| 4. AGREEMENTS AND AFFILIATED TRANSACTIONS (continued) |
As of June 30, 2013, the amounts owed to affiliates of the Portfolios were as follows:
| | | | | | | | | | | | | | | | | | |
| Portfolio | | | | Management Fees | | | Distribution and Service Fees | | | Transfer
Agent Fees | | | Total | |
Balanced Strategy | | | | $ | 67,391 | | | $ | 120,211 | | | $ | 55,182 | | | $ | 242,784 | |
Equity Growth Strategy | | | | | 45,403 | | | | 127,726 | | | | 44,749 | | | | 217,878 | |
Growth and Income Strategy | | | | | 125,820 | | | | 299,716 | | | | 120,646 | | | | 546,182 | |
Growth Strategy | | | | | 105,755 | | | | 302,605 | | | | 109,303 | | | | 517,663 | |
Income Strategies | | | | | 3,496 | | | | 11,986 | | | | 4,331 | | | | 19,813 | |
Satellite Strategies | | | | | 142,999 | | | | 163,774 | | | | 106,593 | | | | 413,366 | |
G. Line of Credit Facility — As of June 30, 2013, the Portfolios participated in a $780,000,000 committed, unsecured revolving line of credit facility (the “facility”) together with other funds of the Trust and registered investment companies having management agreements with GSAM or its affiliates (“Other Borrowers”). Pursuant to the terms of the facility, the Portfolios and Other Borrowers could increase the credit amount by an additional $220,000,000, for a total of up to $1,000,000,000. This facility is to be used solely for temporary or emergency purposes, which may include the funding of redemptions. The interest rate on borrowings is based on the federal funds rate. The facility also requires a fee to be paid by the Portfolios based on the amount of the commitment that has not been utilized. For the six months ended June 30, 2013, the Portfolios did not have any borrowings under the facility. Prior to May 8, 2013, the committed amount available through the facility was $630,000,000.
H. Other Transactions with Affiliates — The Portfolios invest primarily in the Institutional Shares of the Underlying Funds. These Underlying Funds are considered to be affiliated with the Portfolios. The tables below show the transactions in and earnings from investments in these affiliated Funds for the six months ended June 30, 2013 (in thousands):
| | | | | | | | | | | | | | | | | | | | | | | | | | | | |
| | | | | | | |
| Balanced Strategy Portfolio | | | | | | | | | | | | | | | | | | | | | | | | | | | | |
| Underlying Funds | | Market
Value
12/31/2012 | | | Purchases
at Cost* | | | Proceeds
from Sales | | | Net
Realized
Gain (Loss) | | | Change in
Unrealized
Gain (Loss) | | | Market
Value
6/30/2013 | | | Dividend
Income | |
Goldman Sachs Commodity Strategy Fund | | $ | 17,021 | | | $ | 2,282 | | | $ | (2,012 | ) | | $ | 142 | | | $ | (1,276 | ) | | $ | 16,157 | | | $ | — | |
Goldman Sachs Dynamic Allocation Fund | | | 87,442 | | | | 3,052 | | | | (11,042 | ) | | | 521 | | | | (297 | ) | | | 79,676 | | | | — | |
Goldman Sachs Emerging Markets Debt Fund | | | 5,718 | | | | 14,216 | | | | (3,011 | ) | | | 117 | | | | (1,624 | ) | | | 15,416 | | | | 269 | |
Goldman Sachs Emerging Markets Equity Insights Fund | | | 36,233 | | | | 1,644 | | | | (20,263 | ) | | | (178 | ) | | | (3,547 | ) | | | 13,889 | | | | — | |
Goldman Sachs Global Income Fund | | | 180,959 | | | | 32,098 | | | | (25,866 | ) | | | 1,955 | | | | (5,349 | ) | | | 183,797 | | | | 2,344 | |
Goldman Sachs High Yield Fund | | | 25,773 | | | | 2,180 | | | | (3,199 | ) | | | 911 | | | | (1,294 | ) | | | 24,371 | | | | 832 | |
Goldman Sachs International Equity Insights Fund | | | 51,111 | | | | 30,759 | | | | (14,440 | ) | | | 1,263 | | | | 1,453 | | | | 70,146 | | | | — | |
Goldman Sachs International Real Estate Securities Fund | | | 4,735 | | | | 267 | | | | (640 | ) | | | 198 | | | | (220 | ) | | | 4,340 | | | | 60 | |
Goldman Sachs International Small Cap Insights Fund | | | 7,045 | | | | 244 | | | | (1,294 | ) | | | 603 | | | | (132 | ) | | | 6,466 | | | | — | |
Goldman Sachs Large Cap Growth Insights Fund | | | 25,586 | | | | 6,210 | | | | (13,189 | ) | | | 3,700 | | | | (583 | ) | | | 21,724 | | | | — | |
Goldman Sachs Large Cap Value Fund | | | 14,529 | | | | 2,011 | | | | (5,611 | ) | | | 1,631 | | | | 396 | | | | 12,956 | | | | — | |
Goldman Sachs Large Cap Value Insights Fund | | | 33,503 | | | | 5,336 | | | | (13,143 | ) | | | 4,285 | | | | 347 | | | | 30,328 | | | | 276 | |
Goldman Sachs Local Emerging Markets Debt Fund | | | 25,819 | | | | 5,285 | | | | (17,817 | ) | | | (999 | ) | | | (1,750 | ) | | | 10,538 | | | | 629 | |
Goldman Sachs Real Estate Securities Fund | | | 4,677 | | | | 220 | | | | (752 | ) | | | 425 | | | | (199 | ) | | | 4,371 | | | | 57 | |
Goldman Sachs Short Duration Government Fund | | | 28,841 | | | | 5,583 | | | | (9,203 | ) | | | 545 | | | | (704 | ) | | | 25,062 | | | | 141 | |
Goldman Sachs Small Cap Equity Insights Fund | | | 17,091 | | | | 546 | | | | (8,851 | ) | | | 1,898 | | | | 376 | | | | 11,060 | | | | — | |
Goldman Sachs Strategic Growth Fund | | | 12,041 | | | | 3,097 | | | | (6,800 | ) | | | 1,260 | | | | (244 | ) | | | 9,354 | | | | — | |
Total | | $ | 578,124 | | | $ | 115,030 | | | $ | (157,133 | ) | | $ | 18,277 | | | $ | (14,647 | ) | | $ | 539,651 | | | $ | 4,608 | |
| * | | Includes reinvestment of distributions. |
73
GOLDMAN SACHS FUND OF FUNDS PORTFOLIOS
Notes to Financial Statements (continued)
June 30, 2013 (Unaudited)
|
| 4. AGREEMENTS AND AFFILIATED TRANSACTIONS (continued) |
| | | | | | | | | | | | | | | | | | | | | | | | | | | | |
| | | | | | | |
| Equity Growth Strategy Portfolio | | | | | | | | | | | | | | | | | | | | | | | | | | | | |
| Underlying Funds | | Market
Value
12/31/2012 | | | Purchases
at Cost* | | | Proceeds
from Sales | | | Net
Realized
Gain (Loss) | | | Change in
Unrealized
Gain (Loss) | | | Market
Value
6/30/2013 | | | Dividend
Income | |
Goldman Sachs Commodity Strategy Fund | | $ | 10,643 | | | $ | 1,990 | | | $ | (969 | ) | | $ | 57 | | | $ | (788 | ) | | $ | 10,933 | | | $ | — | |
Goldman Sachs Emerging Markets Equity Insights Fund | | | 39,925 | | | | 2,574 | | | | (3,453 | ) | | | 724 | | | | (4,614 | ) | | | 35,156 | | | | — | |
Goldman Sachs International Equity Insights Fund | | | 128,064 | | | | 18,770 | | | | (12,384 | ) | | | 2,432 | | | | 3,762 | | | | 140,644 | | | | — | |
Goldman Sachs International Real Estate Securities Fund | | | 7,413 | | | | 650 | | | | (646 | ) | | | 132 | | | | (208 | ) | | | 7,341 | | | | 100 | |
Goldman Sachs International Small Cap Insights Fund | | | 11,027 | | | | 276 | | | | (1,060 | ) | | | 366 | | | | 333 | | | | 10,942 | | | | — | |
Goldman Sachs Large Cap Growth Insights Fund | | | 50,021 | | | | 545 | | | | (12,845 | ) | | | 5,666 | | | | 612 | | | | 43,999 | | | | — | |
Goldman Sachs Large Cap Value Fund | | | 23,323 | | | | 255 | | | | (6,590 | ) | | | 1,941 | | | | 1,401 | | | | 20,330 | | | | — | |
Goldman Sachs Large Cap Value Insights Fund | | | 53,822 | | | | 1,057 | | | | (14,729 | ) | | | 6,166 | | | | 1,315 | | | | 47,631 | | | | 460 | |
Goldman Sachs Real Estate Securities Fund | | | 7,319 | | | | 391 | | | | (646 | ) | | | 339 | | | | (12 | ) | | | 7,391 | | | | 89 | |
Goldman Sachs Small Cap Equity Insights Fund | | | 12,506 | | | | 6,932 | | | | (1,208 | ) | | | 568 | | | | 1,187 | | | | 19,985 | | | | — | |
Goldman Sachs Strategic Growth Fund | | | 23,132 | | | | 234 | | | | (6,385 | ) | | | 1,430 | | | | 541 | | | | 18,952 | | | | — | |
Total | | $ | 367,195 | | | $ | 33,674 | | | $ | (60,915 | ) | | $ | 19,821 | | | $ | 3,529 | | | $ | 363,304 | | | $ | 649 | |
| * | | Includes reinvestment of distributions. |
| | | | | | | | | | | | | | | | | | | | | | | | | | | | |
| | | | | | | |
| Growth and Income Strategy Portfolio | | | | | | | | | | | | | | | | | | | | | | | | | | | | |
| Underlying Funds | | Market
Value
12/31/2012 | | | Purchases
at Cost* | | | Proceeds
from Sales | | | Net
Realized
Gain (Loss) | | | Change in
Unrealized
Gain (Loss) | | | Market
Value
6/30/2013 | | | Dividend
Income | |
Goldman Sachs Commodity Strategy Fund | | $ | 30,395 | | | $ | 4,788 | | | $ | (3,010 | ) | | $ | 205 | | | $ | (2,260 | ) | | $ | 30,118 | | | $ | — | |
Goldman Sachs Dynamic Allocation Fund | | | 156,308 | | | | 7,284 | | | | (15,049 | ) | | | 605 | | | | (606 | ) | | | 148,542 | | | | — | |
Goldman Sachs Emerging Markets Debt Fund | | | — | | | | 28,295 | | | | (7,647 | ) | | | (513 | ) | | | (1,517 | ) | | | 18,618 | | | | 311 | |
Goldman Sachs Emerging Markets Equity Insights Fund | | | 92,055 | | | | 3,139 | | | | (36,871 | ) | | | 3,439 | | | | (12,921 | ) | | | 48,841 | | | | — | |
Goldman Sachs Global Income Fund | | | 138,554 | | | | 48,457 | | | | (34,655 | ) | | | 2,637 | | | | (4,980 | ) | | | 150,013 | | | | 1,689 | |
Goldman Sachs High Yield Fund | | | 35,790 | | | | 3,642 | | | | (3,527 | ) | | | 273 | | | | (868 | ) | | | 35,310 | | | | 1,167 | |
Goldman Sachs International Equity Insights Fund | | | 175,512 | | | | 58,485 | | | | (33,190 | ) | | | 8,216 | | | | 480 | | | | 209,503 | | | | — | |
Goldman Sachs International Real Estate Securities Fund | | | 12,699 | | | | 806 | | | | (1,250 | ) | | | 314 | | | | (435 | ) | | | 12,134 | | | | 167 | |
Goldman Sachs International Small Cap Insights Fund | | | 18,890 | | | | 593 | | | | (2,615 | ) | | | 1,164 | | | | 49 | | | | 18,081 | | | | — | |
Goldman Sachs Large Cap Growth Insights Fund | | | 75,422 | | | | 12,021 | | | | (26,412 | ) | | | 9,912 | | | | (520 | ) | | | 70,423 | | | | — | |
Goldman Sachs Large Cap Value Fund | | | 38,851 | | | | 5,379 | | | | (12,620 | ) | | | 3,698 | | | | 1,761 | | | | 37,069 | | | | — | |
Goldman Sachs Large Cap Value Insights Fund | | | 89,590 | | | | 14,424 | | | | (29,592 | ) | | | 12,558 | | | | (137 | ) | | | 86,843 | | | | 776 | |
Goldman Sachs Local Emerging Markets Debt Fund | | | 35,785 | | | | 9,300 | | | | (31,432 | ) | | | (2,447 | ) | | | (1,656 | ) | | | 9,550 | | | | 895 | |
Goldman Sachs Real Estate Securities Fund | | | 12,539 | | | | 548 | | | | (1,432 | ) | | | 897 | | | | (333 | ) | | | 12,219 | | | | 153 | |
Goldman Sachs Short Duration Government Fund | | | 55,372 | | | | 11,335 | | | | (8,127 | ) | | | (15 | ) | | | (336 | ) | | | 58,229 | | | | 293 | |
Goldman Sachs Small Cap Equity Insights Fund | | | 36,810 | | | | 1,143 | | | | (16,313 | ) | | | 5,941 | | | | (942 | ) | | | 26,639 | | | | — | |
Goldman Sachs Strategic Growth Fund | | | 35,189 | | | | 6,443 | | | | (14,296 | ) | | | 3,200 | | | | (215 | ) | | | 30,321 | | | | — | |
Total | | $ | 1,039,761 | | | $ | 216,082 | | | $ | (278,038 | ) | | $ | 50,084 | | | $ | (25,436 | ) | | $ | 1,002,453 | | | $ | 5,451 | |
| * | | Includes reinvestment of distributions. |
74
GOLDMAN SACHS FUND OF FUNDS PORTFOLIOS
|
| 4. AGREEMENTS AND AFFILIATED TRANSACTIONS (continued) |
| | | | | | | | | | | | | | | | | | | | | | | | | | | | |
| | | | | | | |
| Growth Strategy Portfolio | | | | | | | | | | | | | | | | | | | | | | | | | | | | |
| Underlying Funds | | Market
Value
12/31/2012 | | | Purchases
at Cost* | | | Proceeds
from Sales | | | Net
Realized
Gain (Loss) | | | Change in
Unrealized
Gain (Loss) | | | Market
Value
6/30/2013 | | | Dividend
Income | |
Goldman Sachs Commodity Strategy Fund | | $ | 25,092 | | | $ | 4,244 | | | $ | (2,215 | ) | | $ | 160 | | | $ | (1,890 | ) | | $ | 25,391 | | | $ | — | |
Goldman Sachs Dynamic Allocation Fund | | | 129,066 | | | | 7,272 | | | | (11,075 | ) | | | 464 | | | | (469 | ) | | | 125,258 | | | | — | |
Goldman Sachs Emerging Markets Equity Insights Fund | | | 109,586 | | | | 1,297 | | | | (40,286 | ) | | | 6,701 | | | | (16,276 | ) | | | 61,022 | | | | — | |
Goldman Sachs Global Income Fund | | | — | | | | 3,147 | | | | (2 | ) | | | — | | | | — | | | | 3,145 | | | | — | |
Goldman Sachs High Yield Fund | | | 21,107 | | | | 2,330 | | | | (1,845 | ) | | | 538 | | | | (893 | ) | | | 21,237 | | | | 695 | |
Goldman Sachs International Equity Insights Fund | | | 226,963 | | | | 39,219 | | | | (34,240 | ) | | | 8,349 | | | | 2,802 | | | | 243,093 | | | | — | |
Goldman Sachs International Real Estate Securities Fund | | | 13,980 | | | | 972 | | | | (1,181 | ) | | | 271 | | | | (404 | ) | | | 13,638 | | | | 186 | |
Goldman Sachs International Small Cap Insights Fund | | | 20,796 | | | | 352 | | | | (2,167 | ) | | | 964 | | | | 381 | | | | 20,326 | | | | — | |
Goldman Sachs Large Cap Growth Insights Fund | | | 82,366 | | | | 9,793 | | | | (17,947 | ) | | | 8,094 | | | | 2,476 | | | | 84,782 | | | | — | |
Goldman Sachs Large Cap Value Fund | | | 39,994 | | | | 497 | | | | (10,734 | ) | | | 3,227 | | | | 2,559 | | | | 35,543 | | | | — | |
Goldman Sachs Large Cap Value Insights Fund | | | 92,024 | | | | 1,951 | | | | (23,796 | ) | | | 10,300 | | | | 2,641 | | | | 83,120 | | | | 791 | |
Goldman Sachs Real Estate Securities Fund | | | 20,359 | | | | 471 | | | | (8,107 | ) | | | 4,754 | | | | (3,744 | ) | | | 13,733 | | | | 216 | |
Goldman Sachs Short Duration Government Fund | | | 9,177 | | | | 35,344 | | | | (1,699 | ) | | | (4 | ) | | | (142 | ) | | | 42,676 | | | | 93 | |
Goldman Sachs Small Cap Equity Insights Fund | | | 35,593 | | | | 459 | | | | (7,571 | ) | | | 3,867 | | | | 972 | | | | 33,320 | | | | — | |
Goldman Sachs Strategic Growth Fund | | | 38,287 | | | | 5,650 | | | | (10,724 | ) | | | 2,409 | | | | 887 | | | | 36,509 | | | | — | |
Total | | $ | 864,390 | | | $ | 112,998 | | | $ | (173,589 | ) | | $ | 50,094 | | | $ | (11,100 | ) | | $ | 842,793 | | | $ | 1,981 | |
| * | | Includes reinvestment of distributions. |
| | | | | | | | | | | | | | | | | | | | | | | | | | | | |
| | | | | | | |
| Income Strategies Portfolio | | | | | | | | | | | | | | | | | | | | | | | | | | | | |
| Underlying Funds | | Market
Value
12/31/2012 | | | Purchases
at Cost* | | | Proceeds
from Sales | | | Net
Realized
Gain (Loss) | | | Change in
Unrealized
Gain (Loss) | | | Market
Value
6/30/2013 | | | Dividend
Income | |
Goldman Sachs Emerging Markets Debt Fund | | $ | 7,698 | | | $ | 1,488 | | | $ | (1,986 | ) | | $ | 20 | | | $ | (820 | ) | | $ | 6,400 | | | $ | 176 | |
Goldman Sachs High Yield Floating Rate Fund | | | 6,655 | | | | 1,177 | | | | (3,549 | ) | | | 13 | | | | (4 | ) | | | 4,292 | | | | 126 | |
Goldman Sachs High Yield Fund | | | 8,604 | | | | 1,572 | | | | (2,776 | ) | | | 46 | | | | (162 | ) | | | 7,284 | | | | 285 | |
Goldman Sachs International Real Estate Securities Fund | | | 3,545 | | | | 2,818 | | | | (525 | ) | | | 120 | | | | (241 | ) | | | 5,717 | | | | 66 | |
Goldman Sachs Local Emerging Markets Debt Fund | | | 4,089 | | | | 1,085 | | | | (519 | ) | | | 22 | | | | (481 | ) | | | 4,196 | | | | 102 | |
Goldman Sachs Real Estate Securities Fund | | | 3,207 | | | | 3,580 | | | | (523 | ) | | | 240 | | | | (190 | ) | | | 6,314 | | | | 52 | |
Total | | $ | 33,798 | | | $ | 11,720 | | | $ | (9,878 | ) | | $ | 461 | | | $ | (1,898 | ) | | $ | 34,203 | | | $ | 807 | |
| * | | Includes reinvestment of distributions. |
| | | | | | | | | | | | | | | | | | | | | | | | | | | | |
| | | | | | | |
| Satellite Strategies Portfolio | | | | | | | | | | | | | | | | | | | | | | | | | | | | |
| Underlying Funds | | Market
Value
12/31/2012 | | | Purchases
at Cost* | | | Proceeds
from Sales | | | Net
Realized
Gain (Loss) | | | Change in
Unrealized
Gain (Loss) | | | Market
Value
6/30/2013 | | | Dividend
Income | |
Goldman Sachs Commodity Strategy Fund | | $ | 110,445 | | | $ | 41,726 | | | $ | (5,286 | ) | | $ | (771 | ) | | $ | (7,933 | ) | | $ | 138,181 | | | $ | — | |
Goldman Sachs Emerging Markets Debt Fund | | | 228,215 | | | | 38,637 | | | | (55,516 | ) | | | 600 | | | | (24,871 | ) | | | 187,065 | | | | 5,337 | |
Goldman Sachs Emerging Markets Equity Fund | | | 45,540 | | | | 37,371 | | | | (3,243 | ) | | | (587 | ) | | | (7,971 | ) | | | 71,110 | | | | — | |
Goldman Sachs Emerging Markets Equity Insights Fund | | | 56,352 | | | | 44,906 | | | | (5,403 | ) | | | (460 | ) | | | (8,325 | ) | | | 87,070 | | | | — | |
Goldman Sachs High Yield Floating Rate Fund | | | 152,247 | | | | 25,667 | | | | (87,507 | ) | | | 911 | | | | (615 | ) | | | 90,703 | | | | 2,927 | |
Goldman Sachs High Yield Fund | | | 231,391 | | | | 38,635 | | | | (64,686 | ) | | | 477 | | | | (3,815 | ) | | | 202,002 | | | | 7,974 | |
Goldman Sachs International Real Estate Securities Fund | | | 106,788 | | | | 40,191 | | | | (10,773 | ) | | | 275 | | | | (2,725 | ) | | | 133,756 | | | | 1,713 | |
Goldman Sachs International Small Cap Fund | | | 38,556 | | | | 29,197 | | | | (2,646 | ) | | | 198 | | | | 1,405 | | | | 66,710 | | | | — | |
Goldman Sachs International Small Cap Insights Fund | | | 58,170 | | | | 44,820 | | | | (4,992 | ) | | | (42 | ) | | | 2,519 | | | | 100,475 | | | | — | |
Goldman Sachs Local Emerging Markets Debt Fund | | | 160,306 | | | | 24,812 | | | | (31,542 | ) | | | (459 | ) | | | (16,642 | ) | | | 136,475 | | | | 3,959 | |
Goldman Sachs Real Estate Securities Fund | | | 110,597 | | | | 51,810 | | | | (12,724 | ) | | | 1,563 | | | | 2,527 | | | | 153,773 | | | | 1,529 | |
Total | | $ | 1,298,607 | | | $ | 417,772 | | | $ | (284,318 | ) | | $ | 1,705 | | | $ | (66,446 | ) | | $ | 1,367,320 | | | $ | 23,439 | |
| * | | Includes reinvestment of distributions. |
75
GOLDMAN SACHS FUND OF FUNDS PORTFOLIOS
Notes to Financial Statements (continued)
June 30, 2013 (Unaudited)
|
| 5. PORTFOLIO SECURITIES TRANSACTIONS |
The cost of purchases and proceeds from sales of the Underlying Funds for the six months ended June 30, 2013, were as follows:
| | | | | | | | | | |
| Portfolio | | | | Purchases | | | Sales | |
Balanced Strategy | | | | $ | 115,030,029 | | | $ | 157,132,862 | |
Equity Growth Strategy | | | | | 33,674,374 | | | | 60,915,111 | |
Growth and Income Strategy | | | | | 216,082,330 | | | | 278,038,202 | |
Growth Strategy | | | | | 112,997,743 | | | | 173,589,283 | |
Income Strategies | | | | | 11,720,754 | | | | 9,878,304 | |
Satellite Strategies | | | | | 417,772,161 | | | | 284,318,358 | |
As of the Portfolios’ most recent fiscal year end, December 31, 2012, the Portfolios’ capital loss carryforwards on a tax basis were as follows:
| | | | | | | | | | | | | | | | | | | | | | | | |
| | | Balanced
Strategy | | | Equity Growth
Strategy | | | Growth and
Income Strategy | | | Growth Strategy | | | Income
Strategies | | | Satellite
Strategies | |
Capital loss carryforwards:(1) | | | | | | | | | | | | | | | | | | | | | | | | |
Expiring 2016 | | $ | — | | | $ | (46,668,527 | ) | | $ | (142,648,691 | ) | | $ | (144,662,145 | ) | | $ | (312,738 | ) | | $ | — | |
Expiring 2017 | | | (25,785,531 | ) | | | (109,415,161 | ) | | | (358,977,420 | ) | | | (372,899,651 | ) | | | (111,832 | ) | | | — | |
Expiring 2018 | | | (29,917,437 | ) | | | (76,608,179 | ) | | | (187,607,636 | ) | | | (181,275,105 | ) | | | (1,112,940 | ) | | | — | |
Perpetual Short-term | | | — | | | | — | | | | — | | | | — | | | | — | | | | (234,643 | ) |
Perpetual Long-term | | | — | | | | (46,445,052 | ) | | | (8,129,328 | ) | | | (84,452,371 | ) | | | — | | | | (3,785,353 | ) |
Total capital loss carryforwards | | $ | (55,702,968 | ) | | $ | (279,136,919 | ) | | $ | (697,363,075 | ) | | $ | (783,289,272 | ) | | $ | (1,537,510 | ) | | $ | (4,019,996 | ) |
| (1) | | With the exception of perpetual capital loss carryforwards, expiration occurs on December 31 of the year indicated. |
As of June 30, 2013, the Portfolios’ aggregate security unrealized gains and losses based on cost for U.S. federal income tax purposes were as follows:
| | | | | | | | | | | | | | | | | | | | | | | | |
| | | Balanced
Strategy | | | Equity
Growth
Strategy | | | Growth and
Income
Strategy | | | Growth
Strategy | | | Income
Strategies | | | Satellite
Strategies | |
Tax Cost | | $ | 549,844,470 | | | $ | 369,733,750 | | | $ | 1,013,446,768 | | | $ | 846,531,484 | | | $ | 35,763,674 | | | $ | 1,392,016,725 | |
Gross unrealized gain | | | 18,303,514 | | | | 60,207,970 | | | | 84,834,225 | | | | 101,809,302 | | | | 81,509 | | | | 47,139,049 | |
Gross unrealized loss | | | (28,496,524 | ) | | | (66,537,302 | ) | | | (95,528,006 | ) | | | (105,248,157 | ) | | | (1,641,891 | ) | | | (71,836,252 | ) |
Net unrealized security loss | | $ | (10,193,010 | ) | | $ | (6,329,332 | ) | | $ | (10,693,781 | ) | | $ | (3,438,855 | ) | | $ | (1,560,382 | ) | | $ | (24,697,203 | ) |
The difference between GAAP-basis and tax-basis unrealized gains (losses) is attributable primarily to wash sales.
GSAM has reviewed the Portfolios’ tax positions for all open tax years (the current and prior three years, as applicable) and has concluded that no provision for income tax is required in the Portfolios’ financial statements. Such open tax years remain subject to examination and adjustment by tax authorities.
76
GOLDMAN SACHS FUND OF FUNDS PORTFOLIOS
The Portfolios’ risks include, but are not limited to, the following:
Investments in the Underlying Funds — The investments of a Portfolio are concentrated in the Underlying Funds, and the Portfolio’s investment performance is directly related to the investment performance of the Underlying Funds it holds. A Portfolio is subject to the risk factors associated with the investments of the Underlying Funds in direct proportion to the amount of assets allocated to each. A Portfolio that has a relative concentration of its portfolio in a single Underlying Fund may be more susceptible to adverse developments affecting that Underlying Fund, and may be more susceptible to losses because of these developments.
Liquidity Risk — An Underlying Fund may make investments that are illiquid or that may become less liquid in response to market developments or adverse investor perceptions. Illiquid investments may be more difficult to value. Liquidity risk may also refer to the risk that a Portfolio will not be able to pay redemption proceeds within the allowable time period because of unusual market conditions, an unusually high volume of redemption requests, or other reasons. To meet redemption requests, a Portfolio may be forced to sell investments at an unfavorable time and/or under unfavorable conditions.
Market and Credit Risks — In the normal course of business, the Portfolios and the Underlying Funds trade financial instruments and enter into financial transactions where risk of potential loss exists due to changes in the market (market risk). Additionally, the Portfolios and the Underlying Funds may also be exposed to credit risk in the event that an issuer fails to perform or that an institution or entity with which the Portfolios and the Underlying Funds have unsettled or open transactions defaults.
Investing in foreign markets by the Underlying Funds may involve special risks and considerations not typically associated with investing in the U.S. These risks include revaluation of currencies, high rates of inflation, repatriation restrictions on income and capital, and adverse political and economic developments. Moreover, securities issued in these markets may be less liquid, be subject to government ownership controls, have delayed settlements and their prices may be more volatile than those of comparable securities in the U.S.
Under the Trust’s organizational documents, its Trustees, officers, employees and agents are indemnified, to the extent permitted by the Act and state law, against certain liabilities that may arise out of performance of their duties to the Portfolios. Additionally, in the course of business, the Portfolios enter into contracts that contain a variety of indemnification clauses. The Portfolios’ maximum exposure under these arrangements is unknown, as this would involve future claims that may be made against the Portfolios that have not yet occurred. However, GSAM believes the risk of loss under these arrangements to be remote.
Subsequent events after the Statement of Assets and Liabilities date have been evaluated through the date the financial statements were issued. GSAM has concluded that there is no impact requiring adjustment or disclosure in the financial statements.
77
GOLDMAN SACHS FUND OF FUNDS PORTFOLIOS
Notes to Financial Statements (continued)
June 30, 2013 (Unaudited)
|
| 10. SUMMARY OF SHARE TRANSACTIONS |
Share activity is as follows:
| | | | | | | | | | | | | | | | |
| |
| | | Balanced Strategy Portfolio | |
| | | For the Six Months Ended
June 30, 2013
(Unaudited) | | | For the Fiscal Year Ended
December 31, 2012 | |
| | | | |
| | | Shares | | | Dollars | | | Shares | | | Dollars | |
| | | | |
| Class A Shares | | | | | | | | | | | | | | | | |
Shares sold | | | 1,165,516 | | | $ | 12,653,970 | | | | 3,933,626 | | | $ | 40,835,144 | |
Reinvestment of distributions | | | 102,836 | | | | 1,105,693 | | | | 577,879 | | | | 6,035,036 | |
Shares converted from Class B(a) | | | 26,672 | | | | 289,999 | | | | 32,785 | | | | 343,670 | |
Shares redeemed | | | (3,623,745 | ) | | | (39,343,155 | ) | | | (16,916,989 | ) | | | (176,900,717 | ) |
| | | | (2,328,721 | ) | | | (25,293,493 | ) | | | (12,372,699 | ) | | | (129,686,867 | ) |
| Class B Shares | | | | | | | | | | | | | | | | |
Shares sold | | | 22,238 | | | | 239,701 | | | | 57,213 | | | | 591,472 | |
Reinvestment of distributions | | | 2,195 | | | | 23,787 | | | | 29,947 | | | | 313,775 | |
Shares converted to Class A(a) | | | (26,696 | ) | | | (289,999 | ) | | | (32,816 | ) | | | (343,670 | ) |
Shares redeemed | | | (298,540 | ) | | | (3,251,266 | ) | | | (731,211 | ) | | | (7,607,861 | ) |
| | | | (300,803 | ) | | | (3,277,777 | ) | | | (676,867 | ) | | | (7,046,284 | ) |
| Class C Shares | | | | | | | | | | | | | | | | |
Shares sold | | | 403,615 | | | | 4,349,003 | | | | 780,030 | | | | 8,055,984 | |
Reinvestment of distributions | | | 9,932 | | | | 107,347 | | | | 110,702 | | | | 1,159,929 | |
Shares redeemed | | | (960,202 | ) | | | (10,398,912 | ) | | | (2,744,930 | ) | | | (28,326,703 | ) |
| | | | (546,655 | ) | | | (5,942,562 | ) | | | (1,854,198 | ) | | | (19,110,790 | ) |
| Institutional Shares | | | | | | | | | | | | | | | | |
Shares sold | | | 3,117,347 | | | | 33,710,179 | | | | 14,683,558 | | | | 155,603,066 | |
Reinvestment of distributions | | | 179,398 | | | | 1,929,608 | | | | 651,608 | | | | 6,815,401 | |
Shares redeemed | | | (3,981,140 | ) | | | (43,519,786 | ) | | | (7,293,625 | ) | | | (75,796,293 | ) |
| | | | (684,395 | ) | | | (7,879,999 | ) | | | 8,041,541 | | | | 86,622,174 | |
| Service Shares | | | | | | | | | | | | | | | | |
Shares sold | | | 30,037 | | | | 322,582 | | | | 37,770 | | | | 396,112 | |
Reinvestment of distributions | | | 305 | | | | 3,292 | | | | 1,638 | | | | 17,183 | |
Shares redeemed | | | (45,594 | ) | | | (496,082 | ) | | | (97,888 | ) | | | (1,007,108 | ) |
| | | | (15,252 | ) | | | (170,208 | ) | | | (58,480 | ) | | | (593,813 | ) |
| Class IR Shares | | | | | | | | | | | | | | | | |
Shares sold | | | 97,166 | | | | 1,036,308 | | | | 54,761 | | | | 574,134 | |
Reinvestment of distributions | | | 713 | | | | 7,630 | | | | 2,406 | | | | 25,133 | |
Shares redeemed | | | (11,822 | ) | | | (127,942 | ) | | | (46,007 | ) | | | (466,633 | ) |
| | | | 86,057 | | | | 915,996 | | | | 11,160 | | | | 132,634 | |
| Class R Shares | | | | | | | | | | | | | | | | |
Shares sold | | | 125,521 | | | | 1,361,452 | | | | 411,741 | | | | 4,279,461 | |
Reinvestment of distributions | | | 3,204 | | | | 34,350 | | | | 18,768 | | | | 195,478 | |
Shares redeemed | | | (173,703 | ) | | | (1,877,835 | ) | | | (389,385 | ) | | | (4,045,572 | ) |
| | | | (44,978 | ) | | | (482,033 | ) | | | 41,124 | | | | 429,367 | |
NET DECREASE | | | (3,834,747 | ) | | $ | (42,130,076 | ) | | | (6,868,419 | ) | | $ | (69,253,579 | ) |
| (a) | | Class B Shares automatically convert into Class A Shares on or about the fifteenth day of the last month of the calendar quarter that is eight years after the initial purchase date of either the Portfolio or another Goldman Sachs Fund. |
78
GOLDMAN SACHS FUND OF FUNDS PORTFOLIOS
| | | | | | | | | | | | | | | | | | | | | | | | | | | | | | |
| |
| Equity Growth Strategy Portfolio | | | Growth and Income Strategy Portfolio | |
For the Six Months Ended June 30, 2013
(Unaudited) | | | For the Fiscal Year Ended
December 31, 2012 | | | For the Six Months Ended June 30, 2013
(Unaudited) | | | For the Fiscal Year Ended
December 31, 2012 | |
| Shares | | | Dollars | | | Shares | | | Dollars | | | Shares | | | Dollars | | | Shares | | | Dollars | |
| | | | | | | | | | | | | | | | | | | | | | | | | | | | | | |
| | 597,406 | | | $ | 7,453,544 | | | | 1,712,604 | | | $ | 19,068,788 | | | | 1,829,589 | | | $ | 20,831,304 | | | | 5,259,273 | | | $ | 56,005,716 | |
| | — | | | | — | | | | 215,902 | | | | 2,502,308 | | | | 77,964 | | | | 881,857 | | | | 1,096,426 | | | | 11,822,273 | |
| | 26,604 | | | | 337,865 | | | | 44,832 | | | | 507,534 | | | | 28,473 | | | | 326,668 | | | | 56,774 | | | | 612,952 | |
| | (2,122,654 | ) | | | (26,462,245 | ) | | | (9,742,606 | ) | | | (111,273,376 | ) | | | (7,537,118 | ) | | | (86,000,109 | ) | | | (36,646,662 | ) | | | (392,855,985 | ) |
| | (1,498,644 | ) | | | (18,670,836 | ) | | | (7,769,268 | ) | | | (89,194,746 | ) | | | (5,601,092 | ) | | | (63,960,280 | ) | | | (30,234,189 | ) | | | (324,415,044 | ) |
| | | | | | | | | | | | | | | | | | | | | | | | | | | | | | |
| | 9,143 | | | | 107,179 | | | | 16,707 | | | | 180,936 | | | | 21,102 | | | | 238,888 | | | | 56,317 | | | | 602,114 | |
| | — | | | | — | | | | 16,643 | | | | 185,739 | | | | — | | | | — | | | | 86,515 | | | | 932,633 | |
| | (27,686 | ) | | | (337,865 | ) | | | (46,652 | ) | | | (507,534 | ) | | | (28,673 | ) | | | (326,668 | ) | | | (57,078 | ) | | | (612,952 | ) |
| | (224,404 | ) | | | (2,694,030 | ) | | | (514,353 | ) | | | (5,552,346 | ) | | | (857,412 | ) | | | (9,736,776 | ) | | | (1,993,536 | ) | | | (21,191,369 | ) |
| | (242,947 | ) | | | (2,924,716 | ) | | | (527,655 | ) | | | (5,693,205 | ) | | | (864,983 | ) | | | (9,824,556 | ) | | | (1,907,782 | ) | | | (20,269,574 | ) |
| | | | | | | | | | | | | | | | | | | | | | | | | | | | | | |
| | 284,767 | | | | 3,398,003 | | | | 558,348 | | | | 5,972,796 | | | | 487,703 | | | | 5,496,756 | | | | 1,003,911 | | | | 10,600,725 | |
| | — | | | | — | | | | 96,609 | | | | 1,072,361 | | | | — | | | | — | | | | 281,256 | | | | 3,023,508 | |
| | (1,062,618 | ) | | | (12,672,534 | ) | | | (3,011,929 | ) | | | (32,210,930 | ) | | | (2,392,961 | ) | | | (26,982,652 | ) | | | (7,165,780 | ) | | | (75,670,099 | ) |
| | (777,851 | ) | | | (9,274,531 | ) | | | (2,356,972 | ) | | | (25,165,773 | ) | | | (1,905,258 | ) | | | (21,485,896 | ) | | | (5,880,613 | ) | | | (62,045,866 | ) |
| | | | | | | | | | | | | | | | | | | | | | | | | | | | | | |
| | 757,883 | | | | 9,631,278 | | | | 3,988,978 | | | | 47,431,667 | | | | 4,997,474 | | | | 57,304,663 | | | | 13,056,683 | | | | 143,453,189 | |
| | — | | | | — | | | | 181,874 | | | | 2,124,288 | | | | 109,034 | | | | 1,235,996 | | | | 606,382 | | | | 6,573,369 | |
| | (488,925 | ) | | | (6,056,503 | ) | | | (877,736 | ) | | | (10,054,599 | ) | | | (2,145,411 | ) | | | (24,548,548 | ) | | | (3,272,864 | ) | | | (35,044,709 | ) |
| | 268,958 | | | | 3,574,775 | | | | 3,293,116 | | | | 39,501,356 | | | | 2,961,097 | | | | 33,992,111 | | | | 10,390,201 | | | | 114,981,849 | |
| | | | | | | | | | | | | | | | | | | | | | | | | | | | | | |
| | 16,843 | | | | 204,406 | | | | 9,864 | | | | 110,367 | | | | 11,429 | | | | 128,642 | | | | 18,592 | | | | 197,535 | |
| | — | | | | — | | | | 312 | | | | 3,600 | | | | 168 | | | | 1,893 | | | | 2,711 | | | | 29,218 | |
| | (12,893 | ) | | | (160,159 | ) | | | (91,468 | ) | | | (1,035,249 | ) | | | (17,085 | ) | | | (194,112 | ) | | | (77,694 | ) | | | (821,634 | ) |
| | 3,950 | | | | 44,247 | | | | (81,292 | ) | | | (921,282 | ) | | | (5,488 | ) | | | (63,577 | ) | | | (56,391 | ) | | | (594,881 | ) |
| | | | | | | | | | | | | | | | | | | | | | | | | | | | | | |
| | 145,032 | | | | 1,803,435 | | | | 13,660 | | | | 154,991 | | | | 90,448 | | | | 1,020,675 | | | | 42,856 | | | | 450,817 | |
| | — | | | | — | | | | 961 | | | | 11,010 | | | | 502 | | | | 5,659 | | | | 3,895 | | | | 41,840 | |
| | (46,237 | ) | | | (572,246 | ) | | | (25,302 | ) | | | (280,030 | ) | | | (21,635 | ) | | | (246,665 | ) | | | (80,277 | ) | | | (853,706 | ) |
| | 98,795 | | | | 1,231,189 | | | | (10,681 | ) | | | (114,029 | ) | | | 69,315 | | | | 779,669 | | | | (33,526 | ) | | | (361,049 | ) |
| | | | | | | | | | | | | | | | | | | | | | | | | | | | | | |
| | 29,590 | | | | 366,642 | | | | 106,325 | | | | 1,174,405 | | | | 50,993 | | | | 582,374 | | | | 123,865 | | | | 1,305,347 | |
| | — | | | | — | | | | 7,527 | | | | 86,405 | | | | 319 | | | | 3,595 | | | | 8,286 | | | | 89,148 | |
| | (67,057 | ) | | | (829,100 | ) | | | (188,562 | ) | | | (2,083,474 | ) | | | (77,280 | ) | | | (879,486 | ) | | | (199,761 | ) | | | (2,083,523 | ) |
| | (37,467 | ) | | | (462,458 | ) | | | (74,710 | ) | | | (822,664 | ) | | | (25,968 | ) | | | (293,517 | ) | | | (67,610 | ) | | | (689,028 | ) |
| | (2,185,206 | ) | | $ | (26,482,330 | ) | | | (7,527,462 | ) | | $ | (82,410,343 | ) | | | (5,372,377 | ) | | $ | (60,856,046 | ) | | | (27,789,910 | ) | | $ | (293,393,593 | ) |
79
GOLDMAN SACHS FUND OF FUNDS PORTFOLIOS
Notes to Financial Statements (continued)
June 30, 2013 (Unaudited)
|
| 10. SUMMARY OF SHARE TRANSACTIONS (continued) |
Share activity is as follows:
| | | | | | | | | | | | | | | | |
| | | Growth Strategy Portfolio | |
| | | | |
| | | For the Six Months Ended June 30, 2013
(Unaudited) | | | For the Fiscal Year Ended December 31, 2012 | |
| | | | |
| | | Shares | | | Dollars | | | Shares | | | Dollars | |
| | | | |
| Class A Shares | | | | | | | | | | | | | | | | |
Shares sold | | | 1,353,946 | | | $ | 15,779,967 | | | | 4,524,141 | | | $ | 48,010,421 | |
Reinvestment of distributions | | | — | | | | — | | | | 735,486 | | | | 8,024,155 | |
Shares converted from Class B(a) | | | 79,637 | | | | 938,033 | | | | 165,244 | | | | 1,789,555 | |
Shares redeemed | | | (5,151,214 | ) | | | (59,904,800 | ) | | | (26,401,820 | ) | | | (283,650,983 | ) |
| | | | (3,717,631 | ) | | | (43,186,800 | ) | | | (20,976,949 | ) | | | (225,826,852 | ) |
| Class B Shares | | | | | | | | | | | | | | | | |
Shares sold | | | 11,767 | | | | 135,942 | | | | 41,473 | | | | 446,018 | |
Reinvestment of distributions | | | — | | | | — | | | | 61,894 | | | | 679,586 | |
Shares converted to Class A(a) | | | (79,348 | ) | | | (938,033 | ) | | | (164,941 | ) | | | (1,789,555 | ) |
Shares redeemed | | | (742,014 | ) | | | (8,679,804 | ) | | | (1,690,961 | ) | | | (18,103,674 | ) |
| | | | (809,595 | ) | | | (9,481,895 | ) | | | (1,752,535 | ) | | | (18,767,625 | ) |
| Class C Shares | | | | | | | | | | | | | | | | |
Shares sold | | | 572,832 | | | | 6,582,775 | | | | 971,482 | | | | 10,285,943 | |
Reinvestment of distributions | | | — | | | | — | | | | 239,178 | | | | 2,602,249 | |
Shares redeemed | | | (2,367,829 | ) | | | (27,412,311 | ) | | | (7,056,110 | ) | | | (74,807,781 | ) |
| | | | (1,794,997 | ) | | | (20,829,536 | ) | | | (5,845,450 | ) | | | (61,919,589 | ) |
| Institutional Shares | | | | | | | | | | | | | | | | |
Shares sold | | | 2,351,170 | | | | 27,061,383 | | | | 8,162,443 | | | | 90,871,380 | |
Reinvestment of distributions | | | — | | | | — | | | | 406,918 | | | | 4,439,471 | |
Shares redeemed | | | (1,110,102 | ) | | | (12,924,098 | ) | | | (2,294,790 | ) | | | (24,640,673 | ) |
| | | | 1,241,068 | | | | 14,137,285 | | | | 6,274,571 | | | | 70,670,178 | |
| Service Shares | | | | | | | | | | | | | | | | |
Shares sold | | | 11,912 | | | | 138,581 | | | | 26,065 | | | | 278,076 | |
Reinvestment of distributions | | | — | | | | — | | | | 2,231 | | | | 24,255 | |
Shares redeemed | | | (15,190 | ) | | | (174,233 | ) | | | (109,702 | ) | | | (1,174,857 | ) |
| | | | (3,278 | ) | | | (35,652 | ) | | | (81,406 | ) | | | (872,526 | ) |
| Class IR Shares | | | | | | | | | | | | | | | | |
Shares sold | | | 147,463 | | | | 1,694,787 | | | | 57,362 | | | | 600,189 | |
Reinvestment of distributions | | | — | | | | — | | | | 3,474 | | | | 37,449 | |
Shares redeemed | | | (77,968 | ) | | | (901,289 | ) | | | (66,073 | ) | | | (688,295 | ) |
| | | | 69,495 | | | | 793,498 | | | | (5,237 | ) | | | (50,657 | ) |
| Class R Shares | | | | | | | | | | | | | | | | |
Shares sold | | | 36,223 | | | | 407,977 | | | | 130,742 | | | | 1,354,989 | |
Reinvestment of distributions | | | — | | | | — | | | | 9,599 | | | | 102,330 | |
Shares redeemed | | | (85,720 | ) | | | (982,384 | ) | | | (145,012 | ) | | | (1,491,307 | ) |
| | | | (49,497 | ) | | | (574,407 | ) | | | (4,671 | ) | | | (33,988 | ) |
NET INCREASE (DECREASE) | | | (5,064,435 | ) | | $ | (59,177,507 | ) | | | (22,391,677 | ) | | $ | (236,801,059 | ) |
| (a) | | Class B Shares automatically convert into Class A Shares on or about the fifteenth day of the last month of the calendar quarter that is eight years after the initial purchase date of either the Portfolio or another Goldman Sachs Fund. |
80
GOLDMAN SACHS FUND OF FUNDS PORTFOLIOS
| | | | | | | | | | | | | | | | | | | | | | | | | | | | | | |
| Income Strategies Portfolio | | | Satellite Strategies Portfolio | |
For the Six Months Ended
June 30, 2013
(Unaudited) | | | For the Fiscal Year Ended December 31, 2012 | | | For the Six Months Ended June 30, 2013
(Unaudited) | | | For the Fiscal Year Ended December 31, 2012 | |
| Shares | | | Dollars | | | Shares | | | Dollars | | | Shares | | | Dollars | | | Shares | | | Dollars | |
| | | | | | | | | | | | | | | | | | | | | | | | | | | | | | |
| | 218,959 | | | $ | 1,966,830 | | | | 485,438 | | | $ | 4,173,414 | | | | 6,851,001 | | | $ | 56,613,009 | | | | 12,330,734 | | | $ | 98,039,375 | |
| | 25,200 | | | | 224,097 | | | | 74,144 | | | | 643,554 | | | | 420,889 | | | | 3,391,613 | | | | 1,255,091 | | | | 10,088,097 | |
| | — | | | | — | | | | — | | | | — | | | | — | | | | — | | | | — | | | | — | |
| | (350,385 | ) | | | (3,148,081 | ) | | | (1,308,030 | ) | | | (11,339,758 | ) | | | (4,716,824 | ) | | | (38,969,260 | ) | | | (10,372,327 | ) | | | (81,969,213 | ) |
| | (106,226 | ) | | | (957,154 | ) | | | (748,448 | ) | | | (6,522,790 | ) | | | 2,555,066 | | | | 21,035,362 | | | | 3,213,498 | | | | 26,158,259 | |
| | | | | | | | | | | | | | | | | | | | | | | | | | | | | | |
| | — | | | | — | | | | — | | | | — | | | | — | | | | — | | | | — | | | | — | |
| | — | | | | — | | | | — | | | | — | | | | — | | | | — | | | | — | | | | — | |
| | — | | | | — | | | | — | | | | — | | | | — | | | | — | | | | — | | | | — | |
| | — | | | | — | | | | — | | | | — | | | | — | | | | — | | | | — | | | | — | |
| | — | | | | — | | | | — | | | | — | | | | — | | | | — | | | | — | | | | — | |
| | | | | | | | | | | | | | | | | | | | | | | | | | | | | | |
| | 97,403 | | | | 880,099 | | | | 294,007 | | | | 2,551,527 | | | | 2,051,089 | | | | 16,963,882 | | | | 3,304,807 | | | | 26,190,653 | |
| | 17,696 | | | | 157,929 | | | | 40,276 | | | | 352,901 | | | | 129,966 | | | | 1,042,090 | | | | 458,838 | | | | 3,674,917 | |
| | (155,653 | ) | | | (1,400,701 | ) | | | (285,675 | ) | | | (2,459,446 | ) | | | (2,072,684 | ) | | | (16,840,040 | ) | | | (3,827,184 | ) | | | (30,168,139 | ) |
| | (40,554 | ) | | | (362,673 | ) | | | 48,608 | | | | 444,982 | | | | 108,371 | | | | 1,165,932 | | | | (63,539 | ) | | | (302,569 | ) |
| | | | | | | | | | | | | | | | | | | | | | | | | | | | | | |
| | 450,681 | | | | 4,039,920 | | | | 504,326 | | | | 4,382,796 | | | | 26,589,217 | | | | 220,867,207 | | | | 39,139,939 | | | | 310,588,324 | |
| | 18,007 | | | | 159,283 | | | | 23,522 | | | | 202,461 | | | | 1,221,651 | | | | 9,834,361 | | | | 3,255,593 | | | | 26,137,541 | |
| | (120,115 | ) | | | (1,079,680 | ) | | | (906,323 | ) | | | (7,693,132 | ) | | | (17,176,429 | ) | | | (141,360,779 | ) | | | (24,523,197 | ) | | | (194,498,187 | ) |
| | 348,573 | | | | 3,119,523 | | | | (378,475 | ) | | | (3,107,875 | ) | | | 10,634,439 | | | | 89,340,789 | | | | 17,872,335 | | | | 142,227,678 | |
| | | | | | | | | | | | | | | | | | | | | | | | | | | | | | |
| | — | | | | — | | | | — | | | | — | | | | 342,498 | | | | 2,823,173 | | | | 1,420,141 | | | | 11,138,323 | |
| | — | | | | — | | | | — | | | | — | | | | 16,813 | | | | 135,564 | | | | 63,122 | | | | 504,915 | |
| | — | | | | — | | | | — | | | | — | | | | (999,516 | ) | | | (8,129,467 | ) | | | (799,675 | ) | | | (6,316,606 | ) |
| | — | | | | — | | | | — | | | | — | | | | (640,205 | ) | | | (5,170,730 | ) | | | 683,588 | | | | 5,326,632 | |
| | | | | | | | | | | | | | | | | | | | | | | | | | | | | | |
| | 96,881 | | | | 838,779 | | | | 138,200 | | | | 1,181,458 | | | | 3,815,581 | | | | 31,593,197 | | | | 3,397,105 | | | | 27,008,671 | |
| | 4,917 | | | | 43,567 | | | | 10,438 | | | | 90,754 | | | | 172,558 | | | | 1,388,214 | | | | 414,768 | | | | 3,328,300 | |
| | (44,775 | ) | | | (400,172 | ) | | | (46,742 | ) | | | (398,911 | ) | | | (1,308,435 | ) | | | (10,770,943 | ) | | | (2,756,573 | ) | | | (21,937,655 | ) |
| | 57,023 | | | | 482,174 | | | | 101,896 | | | | 873,301 | | | | 2,679,704 | | | | 22,210,468 | | | | 1,055,300 | | | | 8,399,316 | |
| | | | | | | | | | | | | | | | | | | | | | | | | | | | | | |
| | 2,219 | | | | 19,970 | | | | 9,405 | | | | 82,586 | | | | 274,620 | | | | 2,275,421 | | | | 391,012 | | | | 3,068,177 | |
| | 284 | | | | 2,539 | | | | 485 | | | | 4,251 | | | | 5,867 | | | | 46,885 | | | | 14,739 | | | | 118,020 | |
| | (231 | ) | | | (2,073 | ) | | | (5,047 | ) | | | (44,068 | ) | | | (78,024 | ) | | | (656,655 | ) | | | (178,360 | ) | | | (1,418,157 | ) |
| | 2,272 | | | | 20,436 | | | | 4,843 | | | | 42,769 | | | | 202,463 | | | | 1,665,651 | | | | 227,391 | | | | 1,768,040 | |
| | 261,088 | | | $ | 2,302,306 | | | | (971,576 | ) | | $ | (8,269,613 | ) | | | 15,539,838 | | | $ | 130,247,472 | | | | 22,988,573 | | | $ | 183,577,356 | |
81
GOLDMAN SACHS FUND OF FUNDS PORTFOLIOS
Portfolio Expenses — Six Month Period Ended June 30, 2013 (Unaudited)
As a shareholder of Class A, Class B, Class C, Institutional, Service, Class IR or Class R Shares of a Portfolio, you incur two types of costs: (1) transaction costs, including sales charges on purchase payments (with respect to Class A Shares), contingent deferred sales charges on redemptions (with respect to Class B and Class C Shares), and (2) ongoing costs, including management fees; distribution and service (12b-1) fees (with respect to Class A, Class B, Class C and Class R Shares); and other Portfolio expenses. This Example is intended to help you understand your ongoing costs (in dollars) of investing in Class A, Class B, Class C, Institutional, Service, Class IR or Class R Shares of the Portfolios and to compare these costs with the ongoing costs of investing in other mutual funds.
The Example is based on an investment of $1,000 invested at the beginning of the period and held for the entire period from January 1, 2013 through June 30, 2013.
Actual Expenses — The first line under each share class in the table below provides information about actual account values and actual expenses. You may use the information in this line, together with the amount you invested, to estimate the expenses that you paid over the period. Simply divide your account value by $1,000 (for example, an $8,600 account value divided by $1,000=8.6), then multiply the result by the number in the first line under the heading entitled “Expenses Paid” to estimate the expenses you paid on your account during this period.
Hypothetical Example for Comparison Purposes — The second line under each share class in the table below provides information about hypothetical account values and hypothetical expenses based on the Portfolios’ actual net expense ratios and an assumed rate of return of 5% per year before expenses, which is not the Portfolios’ actual return. The hypothetical account values and expenses may not be used to estimate the actual ending account balance or expenses you paid for the period. You may use this information to compare the ongoing costs of investing in the Portfolios and other funds. To do so, compare this 5% hypothetical example with the 5% hypothetical examples that appear in the shareholder reports of the other funds.
Please note that the expenses shown in the table are meant to highlight your ongoing costs only and do not reflect any transactional costs, such as sales charges, redemption fees, or exchange fees and do not include expenses of Underlying Funds in which the Portfolios invest. Therefore, the second line of the table is useful in comparing ongoing costs only, and will not help you determine the relative total costs of owning different funds. In addition, if these transactional costs were included, your costs would have been higher.
| | | | | | | | | | | | | | | | | | | | | | | | | | | | | | | | | | | | |
| | | Balanced Strategy Portfolio | | | Equity Growth Strategy Portfolio | | | Growth and Income Strategy Portfolio | |
| Share Class | | Beginning
Account Value
1/1/13 | | | Ending
Account Value
6/30/13 | | | Expenses
Paid for the
6 months ended
6/30/13* | | | Beginning
Account Value
1/1/13 | | | Ending
Account Value
6/30/13 | | | Expenses
Paid for the 6 months ended
6/30/13* | | | Beginning
Account Value 1/1/13 | | | Ending Account Value 6/30/13 | | | Expenses
Paid for the
6 months ended
6/30/13* | |
| Class A | | | | | | | | | | | | | | | | | | | | | | | | | | | | | | | | | | | | |
Actual | | $ | 1,000.00 | | | $ | 1,008.50 | | | $ | 2.94 | | | $ | 1,000.00 | | | $ | 1,063.80 | | | $ | 3.02 | | | $ | 1,000.00 | | | $ | 1,024.90 | | | $ | 2.96 | |
Hypothetical 5% return | | | 1,000.00 | | | | 1,021.87 | + | | | 2.96 | | | | 1,000.00 | | | | 1,021.87 | + | | | 2.96 | | | | 1,000.00 | | | | 1,021.87 | + | | | 2.96 | |
| Class B | | | | | | | | | | | | | | | | | | | | | | | | | | | | | | | | | | | | |
Actual | | | 1,000.00 | | | | 1,005.40 | | | | 6.66 | | | | 1,000.00 | | | | 1,059.20 | | | | 6.84 | | | | 1,000.00 | | | | 1,021.10 | | | | 6.72 | |
Hypothetical 5% return | | | 1,000.00 | | | | 1,018.15 | + | | | 6.71 | | | | 1,000.00 | | | | 1,018.15 | + | | | 6.71 | | | | 1,000.00 | | | | 1,018.15 | + | | | 6.71 | |
| Class C | | | | | | | | | | | | | | | | | | | | | | | | | | | | | | | | | | | | |
Actual | | | 1,000.00 | | | | 1,004.60 | | | | 6.66 | | | | 1,000.00 | | | | 1,059.50 | | | | 6.84 | | | | 1,000.00 | | | | 1,021.20 | | | | 6.72 | |
Hypothetical 5% return | | | 1,000.00 | | | | 1,018.15 | + | | | 6.71 | | | | 1,000.00 | | | | 1,018.15 | + | | | 6.71 | | | | 1,000.00 | | | | 1,018.15 | + | | | 6.71 | |
| Institutional | | | | | | | | | | | | | | | | | | | | | | | | | | | | | | | | | | | | |
Actual | | | 1,000.00 | | | | 1,011.50 | | | | 0.95 | | | | 1,000.00 | | | | 1,065.00 | | | | 0.97 | | | | 1,000.00 | | | | 1,027.00 | | | | 0.95 | |
Hypothetical 5% return | | | 1,000.00 | | | | 1,023.85 | + | | | 0.95 | | | | 1,000.00 | | | | 1,023.85 | + | | | 0.95 | | | | 1,000.00 | | | | 1,023.85 | + | | | 0.95 | |
| Service | | | | | | | | | | | | | | | | | | | | | | | | | | | | | | | | | | | | |
Actual | | | 1,000.00 | | | | 1,007.80 | | | | 3.43 | | | | 1,000.00 | | | | 1,062.30 | | | | 3.53 | | | | 1,000.00 | | | | 1,025.40 | | | | 3.47 | |
Hypothetical 5% return | | | 1,000.00 | | | | 1,021.37 | + | | | 3.46 | | | | 1,000.00 | | | | 1,021.37 | + | | | 3.46 | | | | 1,000.00 | | | | 1,021.37 | + | | | 3.46 | |
| Class IR | | | | | | | | | | | | | | | | | | | | | | | | | | | | | | | | | | | | |
Actual | | | 1,000.00 | | | | 1,009.90 | | | | 1.69 | | | | 1,000.00 | | | | 1,064.50 | | | | 1.74 | | | | 1,000.00 | | | | 1,025.50 | | | | 1.71 | |
Hypothetical 5% return | | | 1,000.00 | | | | 1,023.11 | + | | | 1.71 | | | | 1,000.00 | | | | 1,023.11 | + | | | 1.71 | | | | 1,000.00 | | | | 1,023.11 | + | | | 1.71 | |
| Class R | | | | | | | | | | | | | | | | | | | | | | | | | | | | | | | | | | | | |
Actual | | | 1,000.00 | | | | 1,008.20 | | | | 4.18 | | | | 1,000.00 | | | | 1,062.70 | | | | 4.30 | | | | 1,000.00 | | | | 1,023.80 | | | | 4.22 | |
Hypothetical 5% return | | | 1,000.00 | | | | 1,020.63 | + | | | 4.21 | | | | 1,000.00 | | | | 1,020.63 | + | | | 4.21 | | | | 1,000.00 | | | | 1,020.63 | + | | | 4.21 | |
82
GOLDMAN SACHS FUND OF FUNDS PORTFOLIOS
Portfolio Expenses — Six Month Period Ended June 30, 2013 (Unaudited) (continued)
| | | | | | | | | | | | | | | | | | | | | | | | | | | | | | | | | | | | |
| | | Growth Strategy Portfolio | | | Income Strategies Portfolio | | | Satellite Strategies Portfolio | |
| Share Class | | Beginning
Account Value
1/1/13 | | | Ending
Account Value
6/30/13 | | | Expenses
Paid for the
6 months ended
6/30/13* | | | Beginning
Account Value
1/1/13 | | | Ending
Account Value
6/30/13 | | | Expenses
Paid for the
6 months ended
6/30/13* | | | Beginning
Account
Value
1/1/13 | | | Ending
Account Value
6/30/13 | | | Expenses
Paid for the
6 months ended
6/30/13* | |
| Class A | | | | | | | | | | | | | | | | | | | | | | | | | | | | | | | | | | | | |
Actual | | $ | 1,000.00 | | | $ | 1,043.40 | | | $ | 2.99 | | | $ | 1,000.00 | | | $ | 978.80 | | | $ | 2.80 | | | $ | 1,000.00 | | | $ | 969.60 | | | $ | 2.78 | |
Hypothetical 5% return | | | 1,000.00 | | | | 1,021.87 | + | | | 2.96 | | | | 1,000.00 | | | | 1,021.97 | + | | | 2.86 | | | | 1,000.00 | | | | 1,021.97 | + | | | 2.86 | |
| Class B | | | | | | | | | | | | | | | | | | | | | | | | | | | | | | | | | | | | |
Actual | | | 1,000.00 | | | | 1,039.60 | | | | 6.78 | | | | N/A | | | | N/A | | | | N/A | | | | N/A | | | | N/A | | | | N/A | |
Hypothetical 5% return | | | 1,000.00 | | | | 1,018.15 | + | | | 6.71 | | | | N/A | | | | N/A | | | | N/A | | | | N/A | | | | N/A | | | | N/A | |
| Class C | | | | | | | | | | | | | | | | | | | | | | | | | | | | | | | | | | | | |
Actual | | | 1,000.00 | | | | 1,039.00 | | | | 6.77 | | | | 1,000.00 | | | | 975.20 | | | | 6.46 | | | | 1,000.00 | | | | 965.80 | | | | 6.43 | |
Hypothetical 5% return | | | 1,000.00 | | | | 1,018.15 | + | | | 6.71 | | | | 1,000.00 | | | | 1,018.25 | + | | | 6.61 | | | | 1,000.00 | | | | 1,018.25 | + | | | 6.61 | |
| Institutional | | | | | | | | | | | | | | | | | | | | | | | | | | | | | | | | | | | | |
Actual | | | 1,000.00 | | | | 1,046.20 | | | | 0.96 | | | | 1,000.00 | | | | 980.70 | | | | 0.83 | | | | 1,000.00 | | | | 971.50 | | | | 0.83 | |
Hypothetical 5% return | | | 1,000.00 | | | | 1,023.85 | + | | | 0.95 | | | | 1,000.00 | | | | 1,023.95 | + | | | 0.85 | | | | 1,000.00 | | | | 1,023.95 | + | | | 0.85 | |
| Service | | | | | | | | | | | | | | | | | | | | | | | | | | | | | | | | | | | | |
Actual | | | 1,000.00 | | | | 1,043.60 | | | | 3.50 | | | | N/A | | | | N/A | | | | N/A | | | | 1,000.00 | | | | 968.90 | | | | 3.27 | |
Hypothetical 5% return | | | 1,000.00 | | | | 1,021.37 | + | | | 3.46 | | | | N/A | | | | N/A | | | | N/A | | | | 1,000.00 | | | | 1,021.47 | + | | | 3.36 | |
| Class IR | | | | | | | | | | | | | | | | | | | | | | | | | | | | | | | | | | | | |
Actual | | | 1,000.00 | | | | 1,045.80 | | | | 1.72 | | | | 1,000.00 | | | | 980.00 | | | | 1.57 | | | | 1,000.00 | | | | 970.80 | | | | 1.56 | |
Hypothetical 5% return | | | 1,000.00 | | | | 1,023.11 | + | | | 1.71 | | | | 1,000.00 | | | | 1,023.21 | + | | | 1.61 | | | | 1,000.00 | | | | 1,023.21 | + | | | 1.61 | |
| Class R | | | | | | | | | | | | | | | | | | | | | | | | | | | | | | | | | | | | |
Actual | | | 1,000.00 | | | | 1,041.70 | | | | 4.25 | | | | 1,000.00 | | | | 977.70 | | | | 4.02 | | | | 1,000.00 | | | | 969.60 | | | | 4.00 | |
Hypothetical 5% return | | | 1,000.00 | | | | 1,020.63 | + | | | 4.21 | | | | 1,000.00 | | | | 1,020.73 | + | | | 4.11 | | | | 1,000.00 | | | | 1,020.73 | + | | | 4.11 | |
| * | | Expenses for each share class are calculated using each Portfolio’s annualized net expense ratio for each class, which represents the ongoing expenses as a percentage of net assets for the six months ended June 30, 2013. Expenses are calculated by multiplying the annualized net expense ratio by the average account value for the period; then multiplying the result by the number of days in the most recent fiscal half year; and then dividing that result by the number of days in the fiscal year. The annualized net expense ratios for the period were as follows: |
| | | | | | | | | | | | | | | | | | | | | | | | | | | | |
| Portfolio | | Class A | | | Class B | | | Class C | | | Institutional | | | Service | | | Class IR | | | Class R | |
Balanced Strategy | | | 0.59 | % | | | 1.34 | % | | | 1.34 | % | | | 0.19 | % | | | 0.69 | % | | | 0.34 | % | | | 0.84 | % |
Equity Growth Strategy | | | 0.59 | | | | 1.34 | | | | 1.34 | | | | 0.19 | | | | 0.69 | | | | 0.34 | | | | 0.84 | |
Growth and Income Strategy | | | 0.59 | | | | 1.34 | | | | 1.34 | | | | 0.19 | | | | 0.69 | | | | 0.34 | | | | 0.84 | |
Growth Strategy | | | 0.59 | | | | 1.34 | | | | 1.34 | | | | 0.19 | | | | 0.69 | | | | 0.34 | | | | 0.84 | |
Income Strategies | | | 0.57 | | | | N/A | | | | 1.32 | | | | 0.17 | | | | N/A | | | | 0.32 | | | | 0.82 | |
Satellite Strategies | | | 0.57 | | | | N/A | | | | 1.32 | | | | 0.17 | | | | 0.67 | | | | 0.32 | | | | 0.82 | |
| + | | Hypothetical expenses are based on each Portfolio’s actual annualized net expense ratios and an assumed rate of return of 5% per year before expenses. |
83
GOLDMAN SACHS FUND OF FUNDS PORTFOLIOS
Statement Regarding Basis for Approval of Management Agreement (Unaudited)
Background
The Goldman Sachs Balanced Strategy, Goldman Sachs Equity Growth Strategy, Goldman Sachs Growth and Income Strategy, Goldman Sachs Growth Strategy, Goldman Sachs Income Strategies and Goldman Sachs Satellite Strategies Portfolios (the “Portfolios”) are investment portfolios of Goldman Sachs Trust (the “Trust”). The Board of Trustees oversees the management of the Trust and reviews the investment performance and expenses of the Portfolios at regularly scheduled meetings held during the year. In addition, the Board of Trustees determines annually whether to approve the continuance of the Trust’s investment management agreement (the “Management Agreement”) with Goldman Sachs Asset Management, L.P. (the “Investment Adviser”) on behalf of the Portfolios.
The Management Agreement was most recently approved for continuation until June 30, 2014 by the Board of Trustees, including those Trustees who are not parties to the Management Agreement or “interested persons” (as defined in the Investment Company Act of 1940, as amended) of any party thereto (the “Independent Trustees”), at a meeting held on June 12-13, 2013 (the “Annual Meeting”).
The review process undertaken by the Trustees spans the course of the year and culminates with the Annual Meeting. To assist the Trustees in their deliberations, the Trustees have established a Contract Review Committee (the “Committee”), comprised of the Independent Trustees. The Committee held four meetings over the course of the year since the Management Agreement was last approved. At those Committee meetings, regularly scheduled Board or other committee meetings and/or the Annual Meeting, the Board, or the Independent Trustees, as applicable, considered matters relating to the Management Agreement, including:
| | (a) | | the nature and quality of the advisory, administrative and other services provided to the Portfolios and the underlying funds in which they invest (“Underlying Funds”) by the Investment Adviser and its affiliates, including information about: |
| | (i) | | the structure, staff and capabilities of the Investment Adviser and its portfolio management teams; |
| | (ii) | | the groups within the Investment Adviser and its affiliates that support the portfolio management teams or provide other types of necessary services, including fund services groups (e.g., accounting and financial reporting, tax, shareholder services and operations), controls and risk management groups (e.g., legal, compliance, valuation oversight, credit risk management, internal audit, compliance testing, market risk analysis, finance and strategy and central funding), sales and distribution support groups and others (e.g., information technology and training); |
| | (iii) | | trends in headcount; |
| | (iv) | | the Investment Adviser’s financial resources and ability to hire and retain talented personnel and strengthen its operations; and |
| | (v) | | the parent company’s support of the Investment Adviser and its mutual fund business, as expressed by the firm’s senior management; |
| | (b) | | information on the investment performance of the Portfolios and Underlying Funds, including comparisons to the performance of similar mutual funds, as provided by a third party mutual fund data provider engaged as part of the contract review process (the “Outside Data Provider”), benchmark performance indices, and (for Balanced Strategy Portfolio) a comparable institutional composite managed by the Investment Adviser, and general investment outlooks in the markets in which the Portfolios and Underlying Funds invest; |
| | (c) | | the terms of the Management Agreement and agreements with affiliated service providers entered into by the Trust on behalf of the Portfolios; |
| | (d) | | expense information for the Portfolios, including: |
| | (i) | | the relative management fee and expense levels of the Portfolios as compared to those of comparable funds managed by other advisers, as provided by the Outside Data Provider; |
| | (ii) | | each Portfolio’s expense trends over time; and |
| | (iii) | | to the extent the Investment Adviser manages institutional accounts or collective investment vehicles having investment objectives and policies similar to those of a Portfolio, comparative information on the advisory fees charged and services provided to those accounts by the Investment Adviser; |
| | (e) | | with respect to the extensive investment performance and expense comparison data provided by the Outside Data Provider, its processes in producing that data for the Portfolios; |
| | (f) | | the undertakings of the Investment Adviser to limit certain expenses of the Portfolios and Underlying Funds that exceed specified levels; |
| | (g) | | information relating to the profitability of the Management Agreement and the transfer agency and distribution and service arrangements of each of the Portfolios and the Trust as a whole to the Investment Adviser and its affiliates; |
| | (h) | | whether each Portfolio’s existing management fee schedule adequately addressed any economies of scale; |
84
GOLDMAN SACHS FUND OF FUNDS PORTFOLIOS
Statement Regarding Basis for Approval of Management Agreement (Unaudited) (continued)
| | (i) | | a summary of the “fall-out” benefits derived by the Investment Adviser and its affiliates from their relationships with the Portfolios and/or the Underlying Funds, including the fees received by the Investment Adviser’s affiliates from the Portfolios and/or the Underlying Funds for transfer agency, securities lending, portfolio trading, distribution and other services; |
| | (j) | | a summary of potential benefits derived by the Portfolios and/or the Underlying Funds as a result of their relationship with the Investment Adviser; |
| | (k) | | with respect to the Underlying Funds, applicable information regarding commissions paid by the Underlying Equity Funds and broker oversight, an update on the Investment Adviser’s soft dollars practices, other information regarding portfolio trading and how the Investment Adviser carries out its duty to seek best execution; |
| | (l) | | portfolio manager ownership of Portfolio shares; the manner in which portfolio manager compensation is determined; and the number and types of accounts managed by the portfolio managers; |
| | (m) | | the nature and quality of the services provided to the Portfolios and Underlying Funds by their unaffiliated service providers, and the Investment Adviser’s general oversight and evaluation (including reports on due diligence) of those service providers as part of the administration services provided under the Management Agreement; and |
| | (n) | | the Investment Adviser’s processes and policies addressing various types of potential conflicts of interest; its approach to risk management; the annual review of the effectiveness of the Portfolios’ compliance program; and periodic compliance reports. |
The Trustees also received an overview of the Portfolios’ distribution arrangements. They received information regarding the Portfolios’ assets, share purchase and redemption activity and the payment of Rule 12b-1 distribution and service fees by the Portfolios and the payment of non-Rule 12b-1 shareholder service and/or administration fees by the Service Shares of each Portfolio except Income Strategies Portfolio. Information was also provided to the Trustees relating to revenue sharing payments made by and services provided by the Investment Adviser and its affiliates to intermediaries that promote the sale, distribution and/or servicing of Portfolio shares.
The presentations made at the Board and Committee meetings and at the Annual Meeting encompassed the Portfolios and other mutual fund portfolios for which the Board of Trustees has responsibility. In evaluating the Management Agreement at the Annual Meeting, the Trustees relied upon their knowledge, resulting from their meetings and other interactions throughout the year, of the Investment Adviser, its affiliates, their services and the Portfolios. In conjunction with these meetings, the Trustees received written materials and oral presentations on the topics covered, and were advised by their independent legal counsel regarding their responsibilities and other regulatory requirements related to the approval and continuation of mutual fund investment management agreements under applicable law. In addition, the Investment Adviser and its affiliates provided the Independent Trustees with a written response to a formal request for information sent on behalf of the Independent Trustees by their independent legal counsel. During the course of their deliberations, the Independent Trustees met in executive sessions with their independent legal counsel, without representatives of the Investment Adviser or its affiliates present. The Independent Trustees also discussed the broad range of other investment choices that are available to Portfolio investors, including the availability of comparable funds managed by other advisers.
Nature, Extent and Quality of the Services Provided Under the Management Agreement
As part of their review, the Trustees considered the nature, extent and quality of the services provided by the Investment Adviser. In this regard, the Trustees considered both the investment advisory services and non-advisory services that are provided to the Portfolios and the Underlying Funds by the Investment Adviser and its affiliates. The Trustees noted the transition in the leadership and changes in personnel of various of the Investment Adviser’s portfolio management teams that had occurred in recent periods, and the ongoing recruitment efforts aimed at bringing high quality investment talent to the Investment Adviser. The Trustees concluded that the Investment Adviser continued to commit substantial financial and operational resources to the Portfolios and expressed confidence that the Investment Adviser would continue to do so in the future. The Trustees also recognized that the Investment Adviser had made significant commitments to address regulatory compliance requirements applicable to the Portfolios and the Investment Adviser.
Investment Performance
The Trustees also considered the investment performance of the Portfolios and the Underlying Funds. In this regard, they compared the investment performance of each Portfolio to its peers using rankings and ratings compiled by the Outside Data Provider as of December 31, 2012, and updated performance information prepared by the Investment Adviser using the peer groups identified by the Outside Data Provider as of March 31, 2013. The information on each Portfolio’s investment performance
85
GOLDMAN SACHS FUND OF FUNDS PORTFOLIOS
Statement Regarding Basis for Approval of Management Agreement (Unaudited) (continued)
was provided for the one-, three-, five- and ten-year periods ending on the applicable dates, to the extent that each Portfolio had been in existence for those periods. The Trustees also reviewed each Portfolio’s investment performance over time (including on a year-by-year basis) relative to its performance benchmark. In addition, they considered the investment performance trends of the Portfolios over time, and reviewed the investment performance of each Portfolio in light of its investment objective and policies and market conditions. The Trustees also received information comparing the Balanced Strategy Portfolio’s performance to that of a comparable institutional composite managed by the Investment Adviser.
In addition, the Trustees considered materials prepared and presentations made by the Investment Adviser’s senior management and portfolio management personnel, in which Portfolio performance was assessed. The Trustees also considered the Investment Adviser’s periodic reports with respect to the Portfolios’ risk profiles, and how the Investment Adviser’s approach to risk monitoring and management influences portfolio management.
The Trustees observed that the Balanced Strategy Portfolio’s Class A Shares had placed in the top half of the Portfolio’s peer group for the one- and ten-year periods, and in the fourth quartile for the three- and five-year periods, and had outperformed the Portfolio’s benchmark index for the one-year period, and underperformed for the three-, five-, and ten-year periods ended March 31, 2013. The Trustees further observed that the Equity Growth Strategy Portfolio’s Class A Shares had placed in the third quartile of the Portfolio’s peer group for the one-, three-, five-, and ten-year periods, and had outperformed the Portfolio’s benchmark index for the one-year period, and underperformed for the three-, five-, and ten-year periods ended March 31, 2013. They noted that the Growth and Income Strategy Portfolio’s Class A Shares had placed in the second quartile of the Portfolio’s peer group for the one-year period, in the third quartile for the three- and five-year periods, and in the fourth quartile for the ten-year period, and had outperformed the Portfolio’s benchmark index for the one-year period, and underperformed for the three-, five-, and ten-year periods ended March 31, 2013. They observed that the Growth Strategy Portfolio’s Class A Shares had placed in the first quartile of the Portfolio’s peer group for the one-year period, in the third quartile for the three- and ten-year periods, and in the fourth quartile for the five-year period, and had underperformed the Portfolio’s benchmark index for the one-, three-, five-, and ten-year periods ended March 31, 2013. They noted that the Income Strategies Portfolio’s Class A Shares had placed in the top half of the Portfolio’s peer group for the one-, three-, and five-year periods, and had outperformed the Portfolio’s benchmark index for the one- and three-year periods and underperformed for the five-year period ended March 31, 2013. The Trustees noted that the Satellite Strategies Portfolio’s Class A Shares placed in the top half of the Portfolio’s peer group for the one- and three-year periods, and in the fourth quartile for the five-year period, and had outperformed the Portfolio’s benchmark index for the three-year period and underperformed for the one- and five-year periods ended March 31, 2013. The Trustees noted that the Portfolios had certain significant differences from their peer groups and benchmark indices that caused the peer groups and benchmark indices to be imperfect bases for performance comparison. They observed that, in 2011, the Investment Adviser had made a significant effort to enhance the senior management of the portfolio management team, particularly with the addition of certain key hires.
Costs of Services Provided and Competitive Information
The Trustees considered the contractual terms of the Management Agreement and the fee rates payable by each Portfolio thereunder. In this regard, the Trustees considered information on the services rendered by the Investment Adviser to the Portfolios, which included both advisory and administrative services that were directed to the needs and operations of the Portfolios as registered mutual funds.
In particular, the Trustees reviewed analyses prepared by the Outside Data Provider regarding the expense rankings of the Portfolios. The analyses provided a comparison of the Portfolios’ management fees to those of relevant peer groups and category universes; an expense analysis which compared each Portfolio’s overall net and gross expenses to a peer group and a category universe; and a five-year history comparing each Portfolio’s net expenses to the peer and category medians. The analyses also compared each Portfolio’s transfer agency, custody, and distribution fees, other expenses and fee waivers/reimbursements to those of the peer group and category medians. The Trustees concluded that the comparisons provided by the Outside Data Provider were useful in evaluating the reasonableness of the management fees and total expenses paid by the Portfolios.
In addition, the Trustees considered the Investment Adviser’s undertakings to limit certain expenses of the Portfolios and the Underlying Funds that exceed specified levels, and to waive portions of management fees paid by certain Underlying Funds. They also considered, to the extent that the Investment Adviser manages institutional accounts or collective investment vehicles having investment objectives and policies similar to those of the Portfolios, comparative fee information for services provided by the Investment Adviser to those accounts, and information that indicated that services provided to the Portfolios differed in various significant respects from the services provided to institutional accounts, which generally operated under less stringent legal and regulatory structures, required fewer services from the Investment Adviser to a smaller number of client contact points, were less time-intensive and paid lower fees.
86
GOLDMAN SACHS FUND OF FUNDS PORTFOLIOS
Statement Regarding Basis for Approval of Management Agreement (Unaudited) (continued)
In addition, the Trustees noted that shareholders are able to redeem their Portfolio shares at any time if they believe that the Portfolio fees and expenses are too high or if they are dissatisfied with the performance of the Portfolio.
Profitability
The Trustees reviewed the Investment Adviser’s revenues and pre-tax profit margins with respect to the Trust and each of the Portfolios. In this regard the Trustees noted that they had received, among other things, profitability analyses and summaries, revenue and expense schedules by Portfolio and by function (i.e., investment management, transfer agency and distribution and service) and the Investment Adviser’s expense allocation methodology. They observed that the profitability and expense figures are substantially similar to those used by the Investment Adviser for many internal purposes, including compensation decisions among various business groups, and are thus subject to a vigorous internal debate about how certain revenue and expenses should be allocated. The Trustees also reviewed the report of the internal audit group within the Goldman Sachs organization, which included an assessment of the reasonableness and consistency of the Investment Adviser’s expense allocation methodology and an evaluation of the accuracy of the Investment Adviser’s profitability analysis calculations. Profitability data for the Trust and each Portfolio were provided for 2012 and 2011, and the Trustees considered this information in relation to the Investment Adviser’s overall profitability. The Trustees considered the Investment Adviser’s revenues and pre-tax profit margins both in absolute terms and in comparison to information on the reported pre-tax profit margins earned by certain other asset management firms.
Economies of Scale
The Trustees considered information that had been provided regarding the Investment Adviser’s profitability. The Trustees noted that the Portfolios themselves do not have breakpoints in their management fee schedules, but that the benefits of the breakpoints in the management fee schedules of certain Underlying Funds, when reached, would pass through to the shareholders in the Portfolios at the specified asset levels. The Trustees considered the amounts of assets in the Portfolios; the Portfolios’ recent purchase and redemption activity; the information provided by the Investment Adviser relating to the costs of the services provided by the Investment Adviser and its affiliates and the profits realized by them; information comparing the fee rates charged by the Investment Adviser with fee rates charged to other funds in the peer groups; and the Investment Adviser’s undertakings to limit certain expenses of the Portfolios and Underlying Funds that exceed specified levels. They also considered the services provided to the Portfolios under the Management Agreement and the fees and expenses borne by the Underlying Funds, and concluded that the management fees payable by the Portfolios were not duplicative of the management fees paid at the Underlying Fund level.
Other Benefits to the Investment Adviser and Its Affiliates
The Trustees also considered the other benefits derived by the Investment Adviser and its affiliates from their relationship with the Portfolios and/or the Underlying Funds as stated above, including: (a) transfer agency fees received by Goldman, Sachs & Co. (“Goldman Sachs”); (b) brokerage and futures commissions earned by Goldman Sachs for executing securities and futures transactions on behalf of certain Underlying Funds; (c) research received by the Investment Adviser from broker-dealers in exchange for executing certain transactions on behalf of certain Underlying Funds; (d) trading efficiencies resulting from aggregation of orders of the Underlying Funds with those for other funds or accounts managed by the Investment Adviser; (e) fees earned by Goldman Sachs Agency Lending, an affiliate of the Investment Adviser, as securities lending agent for certain Underlying Funds (and fees earned by the Investment Adviser for managing the portfolio in which those Underlying Funds’ cash collateral is invested); (f) the Investment Adviser’s ability to leverage the infrastructure designed to service the Portfolios on behalf of its other clients; (g) the Investment Adviser’s ability to cross-market other products and services to Portfolio shareholders; (h) Goldman Sachs’ retention of certain fees as Portfolio Distributor; (i) the Investment Adviser’s ability to negotiate better pricing with custodians on behalf of its other clients, as a result of the relationship with the Portfolios and Underlying Funds; and (j) the possibility that the working relationship between the Investment Adviser and the Portfolios’ and Underlying Funds’ third party service providers may cause those service providers to be open to doing business with other areas of Goldman Sachs. In the course of considering the foregoing, the Independent Trustees requested and received further information quantifying certain of these fall-out benefits. In looking at the benefits to Goldman Sachs Agency Lending and the Investment Adviser from the securities lending program, they noted that those participating Underlying Funds also benefited from their participation in the securities lending program.
87
GOLDMAN SACHS FUND OF FUNDS PORTFOLIOS
Statement Regarding Basis for Approval of Management Agreement (Unaudited) (continued)
Other Benefits to the Portfolios and Their Shareholders
The Trustees also noted that the Portfolios and/or the Underlying Funds receive certain potential benefits as a result of their relationship with the Investment Adviser, including: (a) trading efficiencies resulting from aggregation of orders of the Underlying Funds with those of other funds or accounts managed by the Investment Adviser; (b) improved servicing from vendors because of the volume of business generated by the Investment Adviser and its affiliates; (c) with respect to the Underlying Funds, improved servicing from broker-dealers because of the volume of business generated by the Investment Adviser and its affiliates; (d) with respect to certain Underlying Funds, the Investment Adviser’s ability to negotiate favorable terms with derivatives counterparties as a result of the size and reputation of the Goldman Sachs organization; (e) the Investment Adviser’s knowledge and experience gained from managing other accounts and products; (f) the Investment Adviser’s ability to hire and retain qualified personnel to provide services to the Portfolios and Underlying Funds because of the reputation of the Goldman Sachs organization; (g) the Portfolios’ and Underlying Funds’ access, through the Investment Adviser, to certain firmwide resources (e.g., proprietary risk management systems and databases), subject to certain restrictions; and (h) the Portfolios’ access to certain affiliated distribution channels. The Trustees noted the competitive nature of the mutual fund marketplace, and noted further that many of the Portfolios’ shareholders invested in the Portfolios in part because of the Portfolios’ relationship with the Investment Adviser and that those shareholders have a general expectation that the relationship will continue.
Conclusion
In connection with their consideration of the Management Agreement, the Trustees gave weight to each of the factors described above, but did not identify any particular factor as controlling their decision. After deliberation and consideration of all of the information provided, including the factors described above, the Trustees concluded, in the exercise of their business judgment, that the management fees paid by each of the Portfolios were reasonable in light of the services provided to it by the Investment Adviser, the Investment Adviser’s costs and each Portfolio’s current and reasonably foreseeable asset levels. The Trustees unanimously concluded that the Investment Adviser’s continued management likely would benefit each Portfolio and its shareholders and that the Management Agreement should be approved and continued with respect to each Portfolio until June 30, 2014.
88
FUNDS PROFILE
Goldman Sachs Funds

Goldman Sachs is a premier financial services firm, known since 1869 for creating thoughtful and customized investment solutions in complex global markets.
Today, the Investment Management Division of Goldman Sachs serves a diverse set of clients worldwide, including private institutions, public entities and individuals. With approximately $739.4 billion in assets under management as of June 30, 2013, Goldman Sachs Asset Management (“GSAM”) has portfolio management teams located around the world and our investment professionals bring firsthand knowledge of local markets to every investment decision. GSAM’s assets under management includes assets managed by Goldman Sachs Asset Management, L.P. and its Investment Advisory Affiliates.
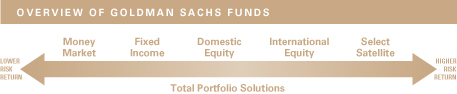
Money Market1
Financial Square FundsSM
| n | | Financial Square Tax-Exempt Funds |
| n | | Financial Square Federal Fund |
| n | | Financial Square Government Fund |
| n | | Financial Square Money Market Fund |
| n | | Financial Square Prime Obligations Fund |
| n | | Financial Square Treasury Instruments Fund |
| n | | Financial Square Treasury Obligations Fund |
Fixed Income
Short Duration and Government
| n | | High Quality Floating Rate Fund |
| n | | Short Duration Government Fund |
| n | | Short Duration Income Fund |
| n | | Inflation Protected Securities Fund |
Multi-Sector
| n | | Core Plus Fixed Income Fund |
Municipal and Tax-Free
| n | | High Yield Municipal Fund |
| n | | Short Duration Tax-Free Fund |
Single Sector
| n | | Investment Grade Credit Fund |
| n | | High Yield Floating Rate Fund |
| n | | Emerging Markets Debt Fund |
| n | | Local Emerging Markets Debt Fund |
| n | | Dynamic Emerging Markets Debt Fund |
Corporate Credit
Fundamental Equity
| n | | Small/Mid Cap Growth Fund |
| n | | Flexible Cap Growth Fund |
| n | | Concentrated Growth Fund |
| n | | Technology Tollkeeper Fund |
| n | | Growth Opportunities Fund |
| n | | Rising Dividend Growth Fund |
Structured Equity
| n | | Structured Tax-Managed Equity Fund |
| n | | Structured International Tax-Managed Equity Fund |
| n | | U.S. Equity Dividend and Premium Fund |
| n | | International Equity Dividend and Premium Fund |
Equity Insights2
| n | | Small Cap Equity Insights Fund |
| n | | U.S. Equity Insights Fund |
| n | | Small Cap Growth Insights Fund |
| n | | Large Cap Growth Insights Fund |
| n | | Large Cap Value Insights Fund |
| n | | Small Cap Value Insights Fund |
| n | | International Small Cap Insights Fund |
| n | | International Equity Insights Fund |
| n | | Emerging Markets Equity Insights Fund |
Fundamental Equity International
| n | | Strategic International Equity Fund |
| n | | Concentrated International Equity Fund |
| n | | International Small Cap Fund |
| n | | Emerging Markets Equity Fund |
| n | | BRIC Fund (Brazil, Russia, India, China) |
Select Satellite3
| n | | Real Estate Securities Fund |
| n | | International Real Estate Securities Fund |
| n | | Commodity Strategy Fund |
| n | | Dynamic Allocation Fund |
| n | | Absolute Return Tracker Fund |
| n | | Managed Futures Strategy Fund |
| n | | MLP Energy Infrastructure Fund |
| n | | Multi-Manager Alternatives Fund |
| n | | Retirement Portfolio Completion Fund |
| n | | Income Strategies Portfolio |
Total Portfolio Solutions3
| n | | Balanced Strategy Portfolio |
| n | | Growth and Income Strategy Portfolio |
| n | | Growth Strategy Portfolio |
| n | | Equity Growth Strategy Portfolio |
| n | | Satellite Strategies Portfolio |
| n | | Enhanced Dividend Global Equity Portfolio |
| n | | Tax Advantaged Global Equity Portfolio |
| 1 | | An investment in a money market fund is neither insured nor guaranteed by the Federal Deposit Insurance Corporation (“FDIC”) or any other government agency. Although the Funds seek to preserve the value of your investment at $1.00 per share, it is possible to lose money by investing in the Funds. |
| 2 | | Effective at the close of business May 3, 2013, the Goldman Sachs Structured Large Cap Growth, Structured Large Cap Value, Structured Small Cap Equity, Structured Small Cap Growth, Structured Small Cap Value, Structured U.S. Equity, Structured Emerging Markets Equity, Structured International Equity and Structured International Small Cap Funds were renamed the Goldman Sachs Large Cap Growth Insights, Large Cap Value Insights, Small Cap Equity Insights, Small Cap Growth Insights, Small Cap Value Insights, U.S. Equity Insights, Emerging Markets Equity Insights, International Equity Insights and International Small Cap Insights Funds respectively. |
| 3 | | Individual Funds within the Total Portfolio Solutions and Select Satellite categories will have various placement on the risk/return spectrum and may have greater or lesser risk than that indicated by the placement of the general Total Portfolio Solutions or Select Satellite category. |
Financial Square FundsSM is a registered service mark of Goldman, Sachs & Co.
| | |
TRUSTEES Ashok N. Bakhru, Chairman Donald C. Burke John P. Coblentz, Jr. Diana M. Daniels Joseph P. LoRusso James A. McNamara Jessica Palmer Alan A. Shuch Richard P. Strubel | | OFFICERS James A. McNamara, President George F. Travers, Principal Financial Officer Caroline L. Kraus, Secretary Scott M. McHugh, Treasurer |
| |
GOLDMAN, SACHS & CO. Distributor and Transfer Agent | | GOLDMAN SACHS ASSET MANAGEMENT, L.P. Investment Adviser |
Visit our web site at www.goldmansachsfunds.com to obtain the most recent month-end returns.
Goldman Sachs Asset Management, L.P., 200 West Street, New York, New York 10282
The portfolio risk management process includes an effort to monitor and manage risk, but does not imply low risk.
The reports concerning the Portfolios included in this shareholder report may contain certain forward-looking statements about the factors that may affect the performance of the Portfolios in the future. These statements are based on Portfolio management’s predictions and expectations concerning certain future events and their expected impact on the Portfolios, such as performance of the economy as a whole and of specific industry sectors, changes in the levels of interest rates, the impact of developing world events, and other factors that may influence the future performance of the Portfolios. Management believes these forward-looking statements to be reasonable, although they are inherently uncertain and difficult to predict. Actual events may cause adjustments in portfolio management strategies from those currently expected to be employed.
A description of the policies and procedures that the Portfolios use to determine how to vote proxies relating to portfolio securities and information regarding how a Portfolio voted proxies relating to portfolio securities during the most recent 12-month period ended June 30 is available (i) without charge, upon request by calling 1-800-526-7384 (for Retail Shareholders) or 1-800-621-2550 (for Institutional Shareholders); and (ii) on the Securities and Exchange Commission web site at http://www.sec.gov.
The Funds file their complete schedule of portfolio holdings with the Securities and Exchange Commission (“SEC”) for the first and third quarters of each fiscal year on Form N-Q. The Funds’ Forms N-Q are available on the SEC’s web site at http://www.sec.gov within 60 days after the Funds’ first and third fiscal quarters. When available, the Funds’ Forms N-Q may be reviewed and copied at the SEC’s Public Reference Room in Washington, D.C. and information on the operation of the Public Reference Room may also be obtained by calling 1-800-SEC-0330. Forms N-Q may be obtained upon request and without charge by calling 1-800-526-7384 (for Retail Shareholders) or 1-800-621-2550 (for Institutional Shareholders).
The Global Industry Classification Standard (GICS) was developed by and is the exclusive property and a service mark of Morgan Stanley Capital International Inc. (MSCI) and Standard & Poor’s, a division of The McGraw-Hill Companies, Inc. (S&P) and is licensed for use by Goldman Sachs. Neither MSCI, S&P nor any other party involved in making or compiling the GICS or any GICS classifications makes any express or implied warranties or representations with respect to such standard or classification (or the results to be obtained by the use thereof), and all such parties hereby expressly disclaim all warranties of originality, accuracy, completeness, merchantability or fitness for a particular purpose with respect to any of such standard or classification. Without limiting any of the foregoing, in no event shall MSCI, S&P, any of their affiliates or any third party involved in making or compiling the GICS or any GICS classifications have any liability for any direct, indirect, special, punitive, consequential or any other damages (including lost profits) even if notified of the possibility of such damages.
Holdings and allocations shown are as of June 30, 2013 and may not be representative of future investments. Fund holdings should not be relied on in making investment decisions and should not be construed as research or investment advice regarding particular securities. Current and future holdings are subject to risk.
This material is not authorized for distribution to prospective investors unless preceded or accompanied by a current Prospectus or summary prospectus, if applicable. Investors should consider a Fund’s objective, risks, and charges and expenses, and read the summary prospectus, if available, and/or the Prospectus carefully before investing or sending money. The summary prospectus, if available, and the Prospectus contain this and other information about a Fund and may be obtained from your Authorized Institution or from Goldman, Sachs & Co. by calling (retail – 1-800-526-7384) (institutional – 1-800-621-2550).
© 2013 Goldman Sachs. All rights reserved. 107385.MF.MED.TMPL/8/2013/FFSAR13/105.3k
| | The information required by this Item is only required in an annual report on this Form N-CSR. |
| ITEM 3. | AUDIT COMMITTEE FINANCIAL EXPERT. |
| | The information required by this Item is only required in an annual report on this Form N-CSR. |
| ITEM 4. | PRINCIPAL ACCOUNTANT FEES AND SERVICES. |
| | The information required by this Item is only required in an annual report on this Form N-CSR. |
| ITEM 5. | AUDIT COMMITTEE OF LISTED REGISTRANTS. |
| ITEM 6. | SCHEDULE OF INVESTMENTS. |
| | Schedule of Investments is included as part of the Report to Stockholders filed under Item 1. |
| ITEM 7. | DISCLOSURE OF PROXY VOTING POLICIES AND PROCEDURES FOR CLOSED-END MANAGEMENT INVESTMENT COMPANIES. |
| ITEM 8. | PORTFOLIO MANAGERS OF CLOSED-END MANAGEMENT INVESTMENT COMPANIES. |
| ITEM 9. | PURCHASES OF EQUITY SECURITIES BY CLOSED-END MANAGEMENT INVESTMENT COMPANY AND AFFILIATED PURCHASERS. |
| ITEM 10. | SUBMISSION OF MATTERS TO A VOTE OF SECURITY HOLDERS. |
| | There have been no material changes to the procedures by which shareholders may recommend nominees to the registrant’s board of trustees. |
| ITEM 11. | CONTROLS AND PROCEDURES. |
| | (a) | The registrant’s principal executive and principal financial officers, or persons performing similar functions have concluded that the registrant’s disclosure controls and procedures (as defined in Rule 30a-3(c) under the Investment Company Act of 1940, as amended (the “1940 Act”)) are effective as of a date within 90 days of the filing of this report that includes the disclosure required by this paragraph, based on the evaluation of these controls and procedures required by Rule 30a-3(b) under the 1940 Act and 15d-15(b) under the Securities Exchange Act of 1934, as amended. |
| | (b) | There were no changes in the registrant’s internal control over financial reporting (as defined in Rule 30a-3(d) under the 1940 Act) that occurred during the registrant’s second fiscal quarter of the period covered by this report that have materially affected, or are reasonably likely to materially affect, the registrant’s internal control over financial reporting. |
| | | | |
| (a)(1) | | The information required by this Item is only required in connection with an annual report on this Form N-CSR. |
| | |
| (a)(2) | | Exhibit 99.CERT | | Certifications pursuant to Section 302 of the Sarbanes-Oxley Act of 2002 filed herewith. |
| | |
| (b) | | Exhibit 99.906CERT | | Certifications pursuant to Section 906 of the Sarbanes-Oxley Act of 2002 filed herewith. |
SIGNATURES
Pursuant to the requirements of the Securities Exchange Act of 1934 and the Investment Company Act of 1940, the registrant has duly caused this report to be signed on its behalf by the undersigned, thereunto duly authorized.
| | | | |
| | | | Goldman Sachs Trust |
| | |
| By: | | | | /s/ James A. McNamara |
| | | | James A. McNamara |
| | | | President/Principal Executive Officer |
| | | | Goldman Sachs Trust |
| | |
| Date: | | | | August 13, 2013 |
Pursuant to the requirements of the Securities Exchange Act of 1934 and the Investment Company Act of 1940, this report has been signed below by the following persons on behalf of the registrant and in the capacities and on the dates indicated.
| | | | |
| By: | | | | /s/ James A. McNamara |
| | | | James A. McNamara |
| | | | President/Principal Executive Officer |
| | | | Goldman Sachs Trust |
| | |
| Date: | | | | August 13, 2013 |
| | |
| By: | | | | /s/ George F. Travers |
| | | | George F. Travers |
| | | | Principal Financial Officer |
| | | | Goldman Sachs Trust |
| | |
| Date: | | | | August 14, 2013 |