UNITED STATES
SECURITIES AND EXCHANGE COMMISSION
Washington, D.C. 20549
FORM N-CSR
CERTIFIED SHAREHOLDER REPORT OF REGISTERED
MANAGEMENT INVESTMENT COMPANIES
Investment Company Act file number 811-05349
Goldman Sachs Trust
(Exact name of registrant as specified in charter)
71 South Wacker Drive,
Chicago, Illinois 60606
(Address of principal executive offices) (Zip code)
| | |
Copies to: |
Caroline Kraus | | Geoffrey R.T. Kenyon, Esq. |
Goldman, Sachs & Co. | | Dechert LLP |
200 West Street | | 100 Oliver Street |
New York, New York 10282 | | 40th Floor |
| | Boston, MA 02110-2605 |
(Name and address of agents for service)
Registrant’s telephone number, including area code: (312) 655-4400
Date of fiscal year end: December 31
Date of reporting period: June 30, 2013
| ITEM 1. | REPORTS TO STOCKHOLDERS. |
| | The Semi-Annual Report to Stockholders is filed herewith. |
Goldman Sachs Funds

| | | | |
| | |
| Semi-Annual Report | | | | June 30, 2013 |
| | |
| | | | Select Satellite Funds |
| | | | Absolute Return Tracker |
| | | | Commodity Strategy |
| | | | Dynamic Allocation |
| | | | Managed Futures Strategy |
| | | | International Real Estate Securities |
| | | | Real Estate Securities |

Goldman Sachs Select Satellite Funds
| n | | ABSOLUTE RETURN TRACKER |
| n | | MANAGED FUTURES STRATEGY |
| n | | INTERNATIONAL REAL ESTATE SECURITIES |
| | | | |
TABLE OF CONTENTS | | | | |
| |
Principal Investment Strategies and Risks | | | 1 | |
| |
Portfolio Management Discussions and Performance Summaries | | | 4 | |
| |
Schedules of Investments | | | 37 | |
| |
Financial Statements | | | 52 | |
| |
Financial Highlights | | | 58 | |
| |
Notes to Financial Statements | | | 70 | |
| |
Other Information | | | 103 | |
| | | | |
| | | |
| NOT FDIC-INSURED | | May Lose Value | | No Bank Guarantee |
GOLDMAN SACHS SELECT SATELLITE FUNDS
Principal Investment Strategies and Risks
This is not a complete list of risks that may affect the Funds. For additional information concerning the risks applicable to the Funds, please see the Funds’ Prospectuses.
The Goldman Sachs Absolute Return Tracker Fund seeks to deliver long-term total return consistent with investment results that approximate the return and risk patterns of a diversified universe of hedge funds. The Fund’s Investment Adviser believes that hedge funds derive a large portion of their returns from exposure to sources of market risk (“Market Exposures”). The Fund uses a quantitative methodology in combination with a qualitative overlay to seek to identify the Market Exposures that approximate the return and risk patterns of specific hedge fund sub-strategies.
The Fund intends to invest in securities and other financial instruments that provide short and/or long exposure to the Market Exposures. However, from time to time, regulatory constraints or other considerations may prevent the Fund from precisely replicating the returns of the Market Exposures. The Fund does not intend to outperform market returns, even during periods of sustained increases in the prices of stocks and bonds. Derivative instruments may involve a high degree of financial risk. These risks include the risk that a small movement in the price of the underlying security or benchmark may result in a disproportionately large movement, unfavorable or favorable, in the price of the derivative instrument; the risk of default by a counterparty; and liquidity risk. Over-the-counter transactions are subject to less government regulation and supervision. The Fund may also hold significant amounts of U.S. Treasury or short-term instruments. The Fund is subject to the risk that exposure to the commodities markets may subject the Fund to greater volatility than investments in traditional securities. Foreign and emerging markets investments may be more volatile and less liquid than U.S. securities and are subject to the risks of currency fluctuations and adverse economic or political developments. At times, the Fund may be unable to sell certain of its illiquid investments without a substantial drop in price, if at all. The Fund is subject to the risks associated with short selling of securities, which involves leverage of the Fund’s assets and presents various other risks. The Fund may be obligated to cover its short position at a higher price than the short price, resulting in a loss. Losses on short sales are potentially unlimited as a loss occurs when the value of a security sold short increases. The Fund is not appropriate for all investors. The Investment Adviser’s use of quantitative models to execute the Fund’s investment strategy may fail to produce the intended result. Different investment styles (e.g., “quantitative”) tend to shift in and out of favor, and at times the Fund may underperform other funds that invest in similar asset classes.
The Goldman Sachs Commodity Strategy Fund seeks to maintain substantial economic exposure to the performance of the commodities markets. The Fund primarily gains exposure to the commodities markets by investing in a wholly-owned subsidiary of the Fund organized as a company under the laws of the Cayman Islands (the “Subsidiary”). The Subsidiary primarily obtains its commodity exposure by investing in commodity-linked swaps (which may include total return swaps). The Subsidiary also invests in other instruments, including fixed income securities, either as investments or to serve as margin or collateral for its swap positions. The Fund is subject to the risk that exposure to the commodities markets may subject the Fund to greater volatility than investments in traditional securities. Derivative instruments may involve a high degree of financial risk. These risks include the risk that a small movement in the price of the underlying security or benchmark may result in a disproportionately large movement, unfavorable or favorable, in the price of the derivative instrument; the risk of default by a counterparty; and liquidity risk. The Fund’s borrowing and use of derivates result in leverage, which can make the Fund more volatile. Over-the-counter transactions are subject to less government regulation and supervision. The Fund may hold significant amounts of U.S. Treasury or short-term investments. Investments in fixed income securities are subject to the risks associated with debt securities generally, including credit, liquidity and interest rate risk. Investments in mortgage-backed securities are subject to prepayment risk, the risk that in a declining interest rate environment the Fund’s underlying mortgages may be prepaid, causing the Fund to have to reinvest at lower interest rates. Foreign investments may be more volatile and less liquid than U.S. securities and are subject to the risks of
1
GOLDMAN SACHS SELECT SATELLITE FUNDS
currency fluctuations and adverse economic or political developments. At times, the Fund may be unable to sell certain of its illiquid investments without a substantial drop in price, if at all. The Fund is “non-diversified” and may invest more of its assets in fewer issuers than “diversified” funds. Accordingly, the Fund may be more susceptible to adverse developments affecting any single issuer held in its portfolio and to greater losses resulting from these developments.
The Goldman Sachs Dynamic Allocation Fund invests primarily in exchange-traded funds (“ETFs”) and derivative instruments, including futures and swaps, that provide exposure to a broad spectrum of asset classes, including but not limited to equities (both in U.S. and non-U.S. companies), fixed income (U.S. and non-U.S., investment grade and high yield) and commodities. Derivative instruments may involve a high degree of financial risk. These risks include the risk that a small movement in the price of the underlying security or benchmark may result in a disproportionately large movement, unfavorable or favorable, in the price of the derivative instrument; risk of default by a counterparty; and liquidity risk. The Fund’s borrowing and use of derivatives result in leverage, which can make the Fund more volatile. Over-the-counter transactions are subject to less government regulation and supervision. The Fund may also hold significant amounts of U.S. Treasury or short-term instruments. The Fund’s equity investments are subject to market risk, which means that the value of its investments may go up or down in response to the prospects of individual companies, particular sectors and/or general economic conditions. The Fund’s fixed income investments are subject to the risks associated with debt securities generally, including credit, liquidity and interest rate risk. High yield, lower rated investments involve greater price volatility and present greater risks than higher rated fixed income securities. The Fund is subject to the risk that exposure to the commodities markets may subject the Fund to greater volatility than investments in traditional securities. Foreign and emerging markets investments may be more volatile and less liquid than investments in U.S. securities and are subject to the risks of currency fluctuations and adverse economic or political developments. At times, the Fund may be unable to sell certain of its illiquid investments without a substantial drop in price, if at all. The Fund’s investments in other investment companies (including ETFs) subject it to additional expenses. The Fund is “non-diversified” and may invest more of its assets in fewer issuers than “diversified” funds. Accordingly, the Fund may be more susceptible to adverse developments affecting any single issuer held in its portfolio and to greater losses resulting from these developments.
The Goldman Sachs Managed Futures Strategy Fund implements a trend-following strategy that takes long and/or short positions in a wide range of asset classes, including equities, fixed income, currencies, and commodities, to seek long-term absolute return. Investments in fixed income securities are subject to the risks associated with debt securities generally, including credit, liquidity, interest rate, call, and extension risk. The Fund’s equity investments are subject to market risk, which means that the value of its investments may go up or down in response to the prospects of individual companies, particular industry sectors and/ or general economic conditions. Different investment styles tend to shift in and out of favor, and at times the Fund may underperform other funds that invest in similar asset classes. Managed futures strategies have historically offered the potential for stronger performance in extreme bull and bear markets and weaker performance in range-bound and sharply reversing markets. Foreign and emerging markets investments may be more volatile and less liquid than investments in U.S. securities and will be subject to the risks of currency fluctuation and adverse economic or political developments. The Fund is subject to the risk that exposure to the commodities markets may subject the Fund to greater volatility than investments in traditional securities. Derivative investments may involve a high degree of financial risk. These risks include the risk that a small movement in the price of the underlying security or benchmark may result in a disproportionately large movement, unfavorable or favorable, in the price of the derivative instrument; risk of default by a counterparty; and liquidity risk. At times, the Fund may be unable to sell certain of its illiquid investments without a substantial drop in price, if at all. Over-the-counter transactions are subject to less government regulation and supervision. The Fund’s borrowing and use of derivatives may result in leverage, which can make the Fund more volatile. The tax treatment of commodity-linked derivative
2
GOLDMAN SACHS SELECT SATELLITE FUNDS
instruments may be adversely affected by future legislation or regulatory developments. The Fund is “non-diversified” and may invest more of its assets in fewer issuers than “diversified” funds. Accordingly, the Fund may be more susceptible to adverse developments affecting any single issuer held in its portfolio and to greater losses resulting from these developments.
The Goldman Sachs International Real Estate Securities Fund invests primarily in a portfolio of equity investments in issuers that are primarily engaged in or related to the real estate industry outside the United States, including real estate investment trusts (“REITs”). Investing in REITs involves certain unique risks in addition to those risks associated with investing in the real estate industry in general. REITs whose underlying properties are concentrated in a particular industry or geographic region are also subject to risks affecting such industries and regions. The securities of REITs involve greater risks than those associated with larger, more established companies and may be subject to more abrupt or erratic price movements because of interest rate changes, economic conditions and other factors. Foreign and emerging markets investments may be more volatile and less liquid than U.S. securities and are subject to the risks of currency fluctuations and adverse economic or political developments. Because the Fund concentrates its investments in the real estate industry, the Fund is subject to greater risk of loss as a result of adverse economic, business or other developments affecting this industry than if its investments were more diversified across different industries, and its performance may be substantially different from that of the broader stock market. The Fund is “non-diversified” and may invest more of its assets in fewer issuers than “diversified” funds. Accordingly, the Fund may be more susceptible to adverse developments affecting any single issuer held in its portfolio and to greater losses resulting from these developments.
The Goldman Sachs Real Estate Securities Fund invests primarily in a portfolio of equity investments in issuers that are primarily engaged in or related to the real estate industry outside the United States, including real estate investment trusts (“REITs”). Investing in REITs involves certain unique risks in addition to those risks associated with investing in the real estate industry in general. REITs whose underlying properties are concentrated in a particular industry or geographic region are also subject to risks affecting such industries and regions. The securities of REITs involve greater risks than those associated with larger, more established companies and may be subject to more abrupt or erratic price movements because of interest rate changes, economic conditions and other factors. Foreign and emerging markets investments may be more volatile and less liquid than U.S. securities and are subject to the risks of currency fluctuations and adverse economic or political developments. Because the Fund concentrates its investments in the real estate industry, the Fund is subject to greater risk of loss as a result of adverse economic, business or other developments affecting this industry than if its investments were more diversified across different industries, and its performance may be substantially different from that of the broader stock market. The Fund is “non-diversified” and may invest more of its assets in fewer issuers than “diversified” funds. Accordingly, the Fund may be more susceptible to adverse developments affecting any single issuer held in its portfolio and to greater losses resulting from these developments.
3
PORTFOLIO RESULTS
Goldman Sachs Absolute Return Tracker Fund
Investment Objective
The Fund’s investment objective is to seek to deliver long-term total return consistent with investment results that approximate the return and risk patterns of a diversified universe of hedge funds. The Fund’s Investment Adviser believes that hedge funds derive a large portion of their returns from exposure to sources of market risk (“Market Exposures”). The Fund uses a quantitative methodology in combination with a qualitative overlay to seek to identify the Market Exposures that approximate the return and risk patterns of specific hedge fund sub-strategies.
Portfolio Management Discussion and Analysis
Below, the Goldman Sachs Quantitative Investment Strategies Team discusses the Goldman Sachs Absolute Return Tracker Fund’s (the “Fund”) performance and positioning for the six-month period ended June 30, 2013 (“the Reporting Period”).(a)
| Q | | How did the Fund perform during the Reporting Period? |
| A | | During the Reporting Period, the Fund’s Class A, C, Institutional, IR and R Shares generated cumulative total returns, without sales charges, of 1.34%, 0.92%, 1.65%, 1.55% and 1.24%, respectively. These returns compare to the 3.16% cumulative total returns of the Fund’s benchmark, the HFRX Global Hedge Fund Index(b), during the same time period. |
| Q | | What economic and market factors most influenced the hedge fund asset class as a whole during the Reporting Period? |
| A | | Hedge funds, as measured by the HFRX Global Hedge Fund Index, overall generated positive absolute returns during the Reporting Period. |
| | During the Reporting Period, hedge funds were affected predominantly by the performance of global equities and global bonds. Global developed market equities had strong performance during the first quarter of 2013 but pulled back in the second calendar quarter on concerns around slowing global economic growth. The exception was the S&P 500 Index, as representative of the U.S. equity market, which performed well during both quarters of the Reporting Period. Emerging market equities performed poorly during the |
| (a) | | Effective as of June 28, 2013, the Fund made certain enhancements to its investment process. These enhancements are described below. |
| (b) | | The HFRX Global Hedge Fund Index is a trademark of Hedge Fund Research, Inc. (“HFR”). HFR has not participated in the formation of the Fund. HFR does not endorse or approve the Fund or make any recommendation with respect to investing in the Fund. |
| | Reporting Period, primarily based on slowing economic growth in China. Global bonds fell in both quarters of the Reporting Period, particularly following Federal Reserve (“Fed”) Chair Bernanke’s mid-May 2013 “tapering” comments, which fueled fears about rising interest rates. A decline in precious metals prices negatively impacted hedge fund performance overall. |
| Q | | What key factors were responsible for the Fund’s performance during the Reporting Period? |
| A | | We believe hedge funds derive a large portion of their returns from exposure to sources of market risk, such as equity, fixed income and commodity asset classes, rather than manager skill. (The component of hedge fund return that is attributable to market risk exposure, rather than manager skill, is referred to as the “beta” component.) We selected the Fund’s investments using a quantitative algorithm (or methodology) that seeks to identify the beta component of hedge fund returns and gain exposure to these sources of market risk and their related returns. The Fund invests in securities and other financial instruments that provide short or long exposure to market factors that represent these sources of market risk and return (the “Component Market Factors”). The Component Market Factors include but are not limited to U.S. and non-U.S. equity indices (“Equities”); fixed income indices (“Fixed Income”); credit indices (“Credit”); commodity indices (“Commodities”) and volatility indices (“Volatility”). |
4
PORTFOLIO RESULTS
| | During the Reporting Period, Equities were the primary driver of performance. Positioning in Fixed Income also contributed positively to the Fund’s absolute returns during the Reporting Period. Positioning in Commodities detracted. |
| | On an absolute basis, the Fund’s biggest positive contributors were long exposures to the S&P 500 Index, the Russell 2000 Index and the TOPIX (Tokyo Stock Price Index). The Fund’s largest detractors from absolute returns were long exposures to the S&P GSCI® Precious Metals Index and the MSCI Emerging Markets Index. |
| Q | | How was the Fund positioned within the Equities category during the Reporting Period? |
| A | | Throughout the Reporting Period, the Fund maintained a net long exposure to global equities, which contributed positively to the Fund’s results overall. The Fund’s long exposure to the S&P 500 Index was the primary driver of the Fund’s positive returns, as U.S. equities performed well, with the S&P 500 Index up 13.82% for the Reporting Period. Long exposure via underlying indices to international equities contributed modestly, with long exposure to developed market equities contributing to performance and long exposure to emerging market equities detracting. |
| Q | | How did developments within the Fixed Income category affect the Fund’s absolute return? |
| A | | The yield on the 10-year U.S. Treasury rose approximately 66 basis points (a basis point is 1/100th of a percentage point) during the Reporting Period. Much of that increase came following Fed Chair Bernanke’s May 22 comments when he signaled the Fed may “taper” asset purchases. In turn, volatility heightened in June in both the equity and bond markets. The yield on the 10-year U.S. Treasury surged from 2.03% to 2.52% from May 22 to June 30. |
| | The Fund maintained its net short position in the 10-year U.S. Treasury throughout the Reporting Period. As interest rates rose, such positioning contributed modestly to the Fund’s absolute return. Please note that a short exposure to this Component Market Factor of the Fund usually generates positive results when 10-year Treasury note prices decline and their yields rise and vice versa. |
| Q | | Was the Fund positioned net long or short in the Commodities category during the Reporting Period? |
| A | | The Fund held a net long exposure in the Commodities category during the Reporting Period via a position in precious metals, as measured by the S&P GSCI® Precious Metals Index. The Fund’s exposure to precious metals detracted from its performance, as the S&P GSCI® Precious Metals Index posted a decline of 28.42% for the Reporting Period. Despite economic growth remaining lackluster at best elsewhere in the world, robust domestic economic data suggested the U.S. retains solid economic momentum in spite of the substantial fiscal tightening that occurred during the Reporting Period. The combination of Fed Chair Bernanke’s comments, which were interpreted as relatively hawkish, and a strengthening U.S. dollar caused gold prices to decline, while assets considered more risky, such as equities, trended higher. During the Reporting Period, gold and silver declined 27.22% and 35.99%, respectively, as measured by the S&P GSCI® Gold Index and S&P GSCI® Silver Index, respectively. |
| Q | | How did other Component Market Factors affect the Fund’s results? |
| A | | Other Component Market Factors, including Credit and Volatility, have not been statistically significant factors in explaining hedge fund performance for some time now. As a result, they were not part of the Fund during the Reporting Period. |
| Q | | Was the Fund invested in any other asset classes during the Reporting Period? |
| A | | The Fund had a net long exposure to cash throughout the Reporting Period. Given that short-term interest rates were anchored at extremely low levels, such positioning contributed modestly but positively to the Fund’s performance. |
5
PORTFOLIO RESULTS
| Q | | How did the Fund use derivatives and similar instruments during the Reporting Period? |
| A | | During the Reporting Period, the Fund used exchange-traded index futures contracts to gain exposure to U.S. large-cap and small-cap equities, non-U.S. developed market equities including those in Europe, the U.K. and Japan, and the 10-year U.S. Treasury Index. The Fund used commodity index-linked structured notes to gain exposure to the S&P GSCI® Precious Metals Index. The Fund used currency forward contracts to gain exposure to select currencies of non-U.S. developed markets, including the pound, euro and yen. The Fund used a swap to gain exposure to emerging market equities. |
| Q | | Were there any changes made in the Fund’s investment strategy during the Reporting Period? |
| A | | Although certain enhancements were made to the Fund’s quantitative methodologies after the Reporting Period, as discussed below, there were no changes made in the Fund’s investment strategy during the Reporting Period. That said, within the Fund’s portfolio, the Fund’s long exposure to equities gradually increased during the Reporting Period overall. The Fund’s short exposure to fixed income also increased gradually. The Fund gradually became less long precious metals. The Fund’s exposure to currencies remained fairly consistent throughout the Reporting Period. Each of these changes was made as a result of our analysis of the hedge fund industry’s returns. No active decisions were made based on any economic or financial market outlooks. |
| Q | | How was the Fund positioned at the end of the Reporting Period? |
| A | | At the end of the Reporting Period, the Fund was positioned long in Equities and Commodities (precious metals) and short in Fixed Income. The Fund also had net long positions in currencies, cash and cash equivalents at the end of the Reporting Period. |
| Q | | Were there any changes to the Fund’s portfolio management team during the Reporting Period? |
| A | | After 33 years of distinguished service, Don Mulvihill, CIO of Customized Beta Strategies within the Quantitative Investment Strategies (“QIS”) team, decided to retire from the firm at the end of June 2013. Gary Chropuvka assumed Mr. Mulvihill’s role as Head of the Customized Beta Strategies business, overseeing the team’s tax-efficient, rules-based and customized beta investment strategies. Mr. Chropuvka brings extensive experience having joined QIS in 1999 with Mr. Mulvihill to manage the team’s tax-efficient investment strategies. All of Mr. Mulvihill’s direct investment responsibilities were performed within a co-lead or team leadership structure and follow processes that provide continuity in day-to-day investment decision-making in each portfolio. |
| Q | | What is the Fund’s tactical view and strategy going forward? |
| A | | We continuously attempt to make enhancements to the investment process we use in the Fund. As part of the Fund’s evolution, we have decided to increase the granularity of our process. That is, instead of replicating the broad hedge fund universe, effective the end of June 2013, we will now be replicating individual hedge fund sub-strategies. Though the Fund has been successful in replicating the hedge fund industry, our hope is these enhancements to our quantitative methodology will allow us to track the hedge fund industry even more closely. For additional details, please see the Fund’s prospectus dated April 30, 2013 which was updated to reflect these enhancements with a supplement dated June 14, 2013. |
6
FUND BASICS
Absolute Return Tracker Fund
as of June 30, 2013
| | | | | | | | | | |
| | PERFORMANCE REVIEW | |
| | | January 1, 2013–June 30, 2013 | | Fund Total Return (based on NAV)1 | | | HFRX Global Hedge Fund Index2 | |
| | Class A | | | 1.34 | % | | | 3.16 | % |
| | Class C | | | 0.92 | | | | 3.16 | |
| | Institutional | | | 1.65 | | | | 3.16 | |
| | Class IR | | | 1.55 | | | | 3.16 | |
| | | Class R | | | 1.24 | | | | 3.16 | |
| | 1 | | The net asset value (“NAV”) represents the net assets of the class of the Fund (ex-dividend) divided by the total number of shares of the class outstanding. The Fund’s performance reflects the reinvestment of dividends and other distributions. The Fund’s performance does not reflect the deduction of any applicable sales charges. |
| | 2 | | The HFRX Global Hedge Fund Index is designed to be representative of the overall composition of the hedge fund universe. It is comprised of all eligible hedge fund strategies, including but not limited to convertible arbitrage, distressed securities, equity hedge, equity market neutral, event driven, macro, merger arbitrage, and relative value arbitrage. The strategies are asset weighted based on the distribution of assets in the hedge fund industry. The index is investable through products managed by HFR Asset Management, LLC that track HFRX Indices. The HFRX Global Hedge Fund Index is a trademark of Hedge Fund Research, Inc. (“HFR”). HFR has not participated in the formation of the Fund. HFR does not endorse or approve the Fund or make any recommendation with respect to investing in the Fund. |
| | | | | | | | | | | | |
| | STANDARDIZED TOTAL RETURNS3 |
| | | For the period ended 6/30/13 | | One Year | | | Five Years | | Since Inception | | Inception Date |
| | Class A | | | -2.43 | % | | -2.04% | | -2.50% | | 5/30/08 |
| | Class C | | | 1.49 | | | -1.65 | | -2.15 | | 5/30/08 |
| | Institutional | | | 3.72 | | | -0.50 | | -1.00 | | 5/30/08 |
| | Class IR | | | 3.52 | | | -0.65 | | -1.15 | | 5/30/08 |
| | | Class R | | | 3.01 | | | -1.17 | | -1.66 | | 5/30/08 |
| | 3 | | The Standardized Total Returns are average annual total returns as of the most recent calendar quarter-end. They assume reinvestment of all distributions at NAV. These returns reflect a maximum initial sales charge of 5.5% for Class A Shares, and the assumed contingent deferred sales charge for Class C Shares (1% if redeemed within 12 months of purchase). Because Institutional, Class IR and Class R Shares do not involve a sales charge, such a charge is not applied to their Standardized Total Returns. |
The returns set forth in the tables above represent past performance. Past performance does not guarantee future results. The Fund’s investment return and principal value will fluctuate so that an investor’s shares, when redeemed, may be worth more or less than their original cost. Current performance may be lower or higher than the performance quoted above. Please visit our web site at www.goldmansachsfunds.com to obtain the most recent month-end returns. Performance reflects applicable fee waivers and/or expense limitations in effect during the periods shown. In their absence, performance would be reduced. Returns do not reflect the deduction of taxes that a shareholder would pay on Fund distributions or the redemption of Fund shares.
7
FUND BASICS
| | | | | | | | | | |
| | EXPENSE RATIOS4 | | | | | | | | |
| | | | | Net Expense Ratio (Current) | | | Gross Expense Ratio (Before Waivers) | |
| | Class A | | | 1.55 | % | | | 1.59 | % |
| | Class C | | | 2.30 | | | | 2.34 | |
| | Institutional | | | 1.15 | | | | 1.19 | |
| | Class IR | | | 1.30 | | | | 1.34 | |
| | | Class R | | | 1.80 | | | | 1.84 | |
| | 4 | | The expense ratios of the Fund, both current (net of applicable fee waivers and/or expense limitations) and before waivers (gross of applicable fee waivers and/or expense limitations) are as set forth above according to the most recent publicly available Prospectus for the Fund and may differ from the expense ratios disclosed in the Financial Highlights in this report. The Fund’s waivers and/or expense limitations will remain in place through at least April 30, 2014, and prior to such date the Investment Adviser may not terminate the arrangements without the approval of the Fund’s Board of Trustees. If these arrangements are discontinued in the future, the expense ratios may change without shareholder approval. |
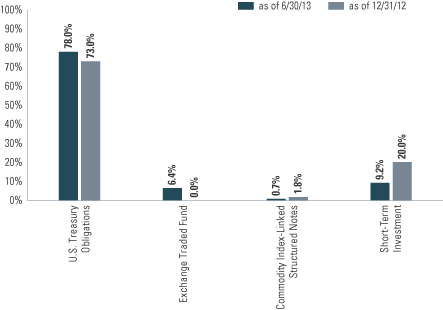
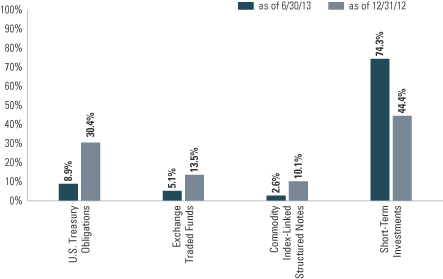
| | 5 | | The percentage shown for each investment category reflects the value of investments in that category as a percentage of net assets. Figures in the above graph may not sum to 100% due to the exclusion of other assets and liabilities. Short-term investments represent investments in repurchase agreements. Underlying sector allocations of exchange traded funds (“ETFs”) held by the Fund are not reflected in the graph above. Consequently, the Fund’s overall sector allocations may differ from the percentages contained in the graph above. The above graph depicts the Fund’s investments but may not represent the Fund’s market exposure due to the exclusion of certain derivatives, if any, as listed in the Additional Investment Information section of the Schedule of Investments. |
8
GOLDMAN SACHS COMMODITY STRATEGY FUND
What Differentiates the Goldman Sachs Commodity Investment Process?
At Goldman Sachs Asset Management, L.P. (“GSAM”), the goal of our commodity investment process is to provide consistent, strong performance by actively managing our portfolios within a research-intensive, risk-managed framework.
Goldman Sachs’ Commodity Investment Process
Our commodity investment process emphasizes the importance of both short-term, tactical opportunities and long-term investment views. Our team-based approach to managing the Fund ensures continuity and idea sharing among some of the industry’s most experienced fixed income specialists. We pursue strong, consistent performance across commodity markets through:

The Goldman Sachs Commodity Strategy Fund primarily gains exposure to the performance of the commodity markets through investment in a wholly-owned subsidiary of the Fund organized as a company under the laws of the Cayman Islands (the “Subsidiary”). The Subsidiary invests primarily in commodity-linked swaps (which may include total return swaps), as well as other commodity-linked securities and derivative instruments that provide exposure to the performance of the commodities markets, and in fixed income and debt instruments. The Fund’s portfolio is designed to provide exposure that corresponds to the investment return of assets that trade in the commodity markets without direct investment in physical commodities.
The Fund implements enhanced cash strategies that capitalize on GSAM’s global fixed income expertise. The Fixed Income Team will employ the full spectrum of capabilities offered, including bottom-up strategies (credit, mortgages, governments /municipals, high yield, and emerging markets debt) and top-down strategies (duration, cross-sector, currency and country) in an attempt to enhance the return of the Fund.

A Commodity Fund that:
| n | | Provides exposure to the commodity markets without direct investment in physical commodities |
| n | | Utilizes commodity-linked swaps that provide economic exposure to movements in commodity prices |
9
PORTFOLIO RESULTS
Goldman Sachs Commodity Strategy Fund
Investment Objective
The Fund seeks long-term total return.
Portfolio Management Discussion and Analysis
Below, the Goldman Sachs Commodities Team discusses the Goldman Sachs Commodity Strategy Fund’s (the “Fund”) performance and positioning for the six-month period ended June 30, 2013 (the “Reporting Period”).
| Q | | How did the Fund perform during the Reporting Period? |
| A | | During the Reporting Period, the Fund’s Class A, C, Institutional, IR and R Shares generated cumulative total returns, without sales charges, of -6.63%, -7.14%, -6.61%, -6.60% and -6.85%, respectively. These returns compare to the -5.41% cumulative total return of the Fund’s benchmark, the S&P GSCI® Total Return Index, formerly the Goldman Sachs Commodity Index (the “S&P GSCI®”), during the same period. |
| Q | | What economic and market factors most influenced the commodities markets as a whole during the Reporting Period? |
| A | | Commodities markets, as measured by the S&P GSCI®, faced a challenging Reporting Period, wherein every subsector and most individual commodities generated negative returns as impacted by three primary factors. |
| | The first was China and its impact on industrial metals. During the Reporting Period, concerns that slowing economic growth in China, the largest user of industrial metals, would dampen demand impacted not only the industrial metals subsector but weighed on virtually all commodities. The Chinese government’s plans to rebalance the economy in such a way that growth is driven more by higher household income and consumption and less by investment funded by rising government and government-related debt was widely interpreted to mean that Chinese infrastructure spending is likely to slow. In turn, such a slowdown, many believed, would significantly impact the overall demand for industrial metals. |
| | The second factor influencing the commodities markets as a whole was U.S. Federal Reserve (“Fed”) policy and its impact on precious metals. In the U.S., improving trends in the labor market, despite the substantial fiscal tightening that occurred during the Reporting Period and the hawkish interpretation of Fed Chair Bernanke’s comments, supported the idea the Fed will likely begin “tapering” its quantitative easing program in the next few months and could stop its asset purchases completely by mid-2014. In response, assets traditionally considered safe havens, such as gold and silver, saw their prices decline steeply during the latter part of the Reporting Period accompanied by large outflows from precious metals-related exchange-traded funds. |
| | The third major factor impacting the commodities markets during the Reporting Period was the strength of the U.S. dollar. While the resilience of the U.S. economy is a distinct positive, it was accompanied during the Reporting Period by an increase in interest rates, which supported the U.S. dollar. The U.S. Dollar Index (“DXY”) rallied 4.22% versus a basket of global currencies during the Reporting Period. (The DXY is a measure of the general international value of the U.S. dollar as calculated by averaging the exchange rates between the U.S. dollar and six major world currencies.) All else being equal, a rallying U.S. dollar is a headwind for dollar-denominated assets like commodities, whose value in U.S. dollar terms declines as the currency strengthens. |
| Q | | Which commodity subsectors were strongest during the Reporting Period? |
| A | | As mentioned earlier, all commodity subsectors, as measured by the S&P GSCI®, posted negative returns during the Reporting Period. That said, during the Reporting Period, the energy component of the S&P GSCI® was the least poorly performing subsector, posting a return of -2.39%. The S&P GSCI® Energy Index was supported by West Texas Intermediate (“WTI”) crude oil, which was up 2.75% and outperformed Brent crude oil during the Reporting Period, as measured by the S&P GSCI® Crude Oil Index. During the |
10
PORTFOLIO RESULTS
| | Reporting Period, the Brent premium over WTI narrowed to $6 per barrel from more than $19 per barrel at the start of 2013. WTI’s outperformance was driven by ongoing expectations of a relief in elevated crude oil inventories at Cushing, Oklahoma, the delivery point for the WTI futures contract. Some of this outperformance was offset by Brent crude oil, which fell 4.94% during the Reporting Period, as measured by the S&P GSCI® Brent Crude Oil Index, on disappointing economic growth data, especially out of China. |
| Q | | Which commodity subsectors were weakest during the Reporting Period? |
| A | | The precious metals subsector was the weakest during the Reporting Period, with the S&P GSCI® Precious Metals Index returning -28.42%. Gold and silver declined 27.22% and 35.99%, respectively, as measured by the S&P GSCI® Gold Index and S&P GSCI® Silver Index, respectively. Despite economic growth remaining lackluster at best elsewhere in the world, robust domestic economic data suggested the U.S. retains solid economic momentum in spite of the substantial fiscal tightening that occurred during the Reporting Period. In combination with Fed Chair Bernanke’s comments, which were interpreted as relatively hawkish, as well as the strengthening U.S. dollar, gold prices declined, while assets considered more risky, such as equities, trended higher. |
| | Briefly, the remaining commodities subsectors performed as follows — the S&P GSCI® Industrials Metals Index returned -16.27%; the S&P GSCI® Agriculture Index returned -9.03%; and the S&P GSCI® Livestock Index returned -5.20% during the Reporting Period. |
| Q | | What key factors were responsible for the Fund’s performance during the Reporting Period? |
| A | | During the Reporting Period, the Fund generated returns that underperformed the S&P GSCI®. Both our enhanced roll-timing strategies via exposure to commodity index-linked swaps and our enhanced cash management strategy detracted from results during the Reporting Period. |
| Q | | How did the Fund’s enhanced roll-timing strategies impact performance during the Reporting Period? |
| A | | Our enhanced roll-timing strategies detracted from the Fund’s performance via exposure to commodity index swaps. We employ an approach whereby we do not take active views on individual commodities but rather gain Fund exposure to commodities through investments whose performance is linked to commodity indices. |
| | We often implement commodity roll-timing strategies by deviating from the S&P GSCI® roll convention, which typically calls for rolling forward exposure at the front, or near-month, end of the futures curve on a monthly basis. The roll occurs during business days 5 through 9. To the extent our team believes fundamental or technical developments will impact the futures roll-timing decision, we will incorporate those views into the portfolio by electing to roll positions earlier, later, forward or in different weights versus the S&P GSCI® roll. Roll-timing strategies employed may include 1) alternative roll date modifications, which avoid the market impact of plain vanilla S&P GSCI® rolls during business days 5 to 9; 2) forward exposure roll modifications, which avoid the market impact of plain vanilla S&P GSCI® rolls and move exposure out the curve to mitigate the returns impact often associated with persistent contango; and 3) seasonal roll modifications, which attempt to take advantage of seasonal relationships in commodity markets to seek to increase returns. (Contango is defined as a common market condition in which futures prices get progressively higher in the distant delivery months, often reflecting carrying costs. In other words, the nearby contract is trading at a lower price than the futures contract, such that one is rolling each month at a higher price.) During most of the Reporting Period, we employed a forward roll-timing strategy that rolled commodity exposures underlying the S&P GSCI® a few months out on the futures curve instead of rolling at the very front of the futures curve. |
| | Our six-month deferred positioning within WTI crude oil was the primary driver of the Fund’s underperformance during the Reporting Period. As mentioned earlier, WTI rallied 2.75% during the Reporting Period, as measured by the S&P GSCI® Crude Oil Index. At the same time, the WTI futures curve also strengthened materially, moving from a state of contango to backwardation as deferred WTI futures underperformed nearby futures. (Backwardation is a market condition in which a futures price is lower in the distant delivery months than in the near delivery months.) The primary reason for this curve move was the expectations for significant inventory draws at Cushing, Oklahoma, the delivery point for the WTI futures contract, based on expansion of the infrastructure connecting the midcontinent and the U.S. Gulf Coast. More recently, concerns of a light |
11
PORTFOLIO RESULTS
| | sweet crude oil shortage in the U.S. midcontinent also contributed to the move in the WTI futures curve. Light sweet crude oil is what is deliverable into the NYMEX (New York Mercantile Exchange) WTI futures contract. The supply glut in Cushing, Oklahoma had been created by increased production flowing to the Midwest from Canada, North Dakota and Texas. This increased production flow had more than offset flows out of the midcontinent to the Gulf Coast due to the lack of connectivity between refineries and the midcontinent. |
| | Conversely, deferred positioning in natural gas offset, though modestly, some of the underperformance from the Fund’s deferred positioning in WTI crude oil, as longer-dated futures outperformed nearby futures during the Reporting Period, leading our deferred futures position to outperform. |
| Q | | How did you implement the Fund’s enhanced cash management strategy? |
| A | In addition to seeking value through management of the commodities portion of the Fund’s portfolio, we also attempt to add a modest amount of excess return through thoughtful management of collateral held in the Fund. The cash portion of the Fund’s portfolio is typically allocated to high-grade collateral that includes U.S. Treasury securities, agency debentures, mortgage-backed securities and short-term fixed income instruments. During the Reporting Period, we favored high quality government and agency securities for the Fund’s collateral allocation. However, our out-of-benchmark allocations implemented via our enhanced cash management strategy detracted from Fund performance during the Reporting Period. |
| | Holdings in U.S. Treasury inflation-protected securities (“TIPS”) detracted most from the Fund’s performance. TIPS sold off on the Fed’s announcement it may start scaling back its quantitative easing program, a large asset purchase program, later in 2013. The announcement sent both nominal interest rates and real interest rates higher. In turn, the increase in rates pressured the prices of TIPS, which were held in the Fund, lower. Real interest rates and inflation expectations are two of the most important inputs to the prices of TIPS. (Real interest rates are interest rates that have been adjusted to remove the effects of inflation to reflect the real cost of funds to the borrower, and the real yield to the lender. The real interest rate of an investment is calculated as the amount by which the nominal interest rate is higher than the inflation rate.) |
| Q | | How did the Fund use derivatives and similar instruments during the Reporting Period? |
| A | | As mentioned earlier in some detail, the Fund used commodity index-linked total return swaps in implementing our enhanced roll-timing strategies in order to gain exposure to the commodities markets. In implementing our enhanced cash management strategy, the Fund used futures, interest rate swaps and forward sale contracts, which are agency mortgage-backed derivatives used in purchasing a future issuance of agency mortgage-backed securities. |
| Q | | Did you make any changes in the Fund’s strategy or allocations during the Reporting Period? |
| A | | The Fund continued to hold exposure to the commodities markets primarily in the form of swaps linked to the S&P GSCI®. During the Reporting Period, we did not make any significant adjustments to the Fund, maintaining our six months deferred position in WTI crude oil and natural gas, with the remaining commodities in the same contract as the S&P GSCI®. |
| | Our forward positioning in WTI crude oil was driven by what might be considered an idiosyncratic issue in the U.S. midcontinent, where we believed high oil inventories at the physical delivery point of the NYMEX WTI futures contract, namely Cushing, Oklahoma, would likely weigh on the front of the WTI crude oil futures curve. In this environment, we would expect the deferred futures contract to outperform nearby futures. Despite the market expectation for significant inventory draws at Cushing, at the end of the Reporting Period, we remained skeptical of the magnitude and duration of these draws. |
| | In natural gas, the Fund was in the deferred part of the futures curve in order to reduce the impact on the portfolio of rolling futures. |
| Q | | How was the Fund positioned at the end of the Reporting Period? |
| A | | At the end of the Reporting Period, the Fund’s overall commodity positioning was generally in line with the weightings of the S&P GSCI®. The Fund, at the end of the Reporting Period, held exposure to the commodities underlying the S&P GSCI® through plain vanilla swaps in the Subsidiary and held no deferred commodity exposure. (The |
12
PORTFOLIO RESULTS
| | Subsidiary has the same objective as the Fund but unlike the Fund may invest without limitation in commodity index-linked securities, such as swaps and futures, that provide exposure to the performance of the commodity markets.) |
| | The cash portion of the Fund’s portfolio was allocated across various fixed income sectors, with an emphasis on the higher quality, lower volatility segments of the market, such as U.S. government and government-sponsored bonds. |
| Q | | What is the Fund’s view and strategy going forward? |
| A | | We believe there is significant uncertainty regarding the global macroeconomic environment in 2013. We expect the U.S. will likely continue to experience modest economic growth underpinned by a strengthening housing market. However, we are less optimistic about the outlook for economic growth in Europe and Asia. Given this view, we expect commodity returns to be primarily driven by supply and demand dynamics specific to each market. |
13
FUND BASICS
Commodity Strategy Fund
as of June 30, 2013

| | | | | | | | | | |
| | PERFORMANCE REVIEW | |
| | | January 1, 2013–June 30, 2013 | | Fund Total Return
(based on NAV)1 | | | S&P GSCI2 | |
| | Class A | | | -6.63 | % | | | -5.41 | % |
| | Class C | | | -7.14 | | | | -5.41 | |
| | Institutional | | | -6.61 | | | | -5.41 | |
| | Class IR | | | -6.60 | | | | -5.41 | |
| | | Class R | | | -6.85 | | | | -5.41 | |
| | 1 | | The net asset value (“NAV”) represents the net assets of the class of the Fund (ex-dividend) divided by the total number of shares of the class outstanding. The Fund’s performance reflects the reinvestment of dividends and other distributions. The Fund’s performance does not reflect the deduction of any applicable sales charges. |
| | 2 | | The S&P GSCI is an unmanaged composite index of commodity sector returns, representing an unleveraged, long-only investment in commodity futures that is broadly diversified across the spectrum of commodities. Individual components qualify for inclusion in the GSCI on the basis of liquidity and are weighted by their respective world production quantities. The figures for the Index do not include any deduction for fees, expenses or taxes. It is not possible to invest directly in an index. |
| | | | | | | | | | | | |
| | STANDARDIZED TOTAL RETURNS3 |
| | | For the period ended 6/30/13 | | One Year | | | Five Years | | Since Inception | | Inception Date |
| | Class A | | | -4.46 | % | | -16.73% | | -5.63% | | 3/30/07 |
| | Class C | | | -1.76 | | | -16.63 | | -5.67 | | 3/30/07 |
| | Institutional | | | 0.27 | | | -15.82 | | -4.67 | | 3/30/07 |
| | Class IR | | | 0.21 | | | -15.75 | | -7.97 | | 11/30/07 |
| | | Class R | | | -0.19 | | | -16.17 | | -8.43 | | 11/30/07 |
| | 3 | | The Standardized Total Returns are average annual total returns as of the most recent calendar quarter-end. They assume reinvestment of all distributions at NAV. These returns reflect a maximum initial sales charge of 4.5% for Class A Shares and the assumed contingent deferred sales charge for Class C Shares (1% if redeemed within 12 months of purchase). Because Institutional, Class IR and Class R Shares do not involve a sales charge, such a charge is not applied to their Standardized Total Returns. |
The returns set forth in the tables above represent past performance. Past performance does not guarantee future results. The Fund’s investment return and principal value will fluctuate so that an investor’s shares, when redeemed, may be worth more or less than their original cost. Current performance may be lower or higher than the performance quoted above. Please visit our web site at www.goldmansachsfunds. com to obtain the most recent month-end returns. Performance reflects applicable fee waivers and/or expense limitations in effect during the periods shown. In their absence, performance would be reduced. Returns do not reflect the deduction of taxes that a shareholder would pay on Fund distributions or the redemption of Fund shares.
14
FUND BASICS
| | | | | | | | | | |
| | EXPENSE RATIOS4 | |
| | | | | Net Expense Ratio (Current) | | | Gross Expense Ratio (Before Waivers) | |
| | Class A | | | 0.98 | % | | | 1.13 | % |
| | Class C | | | 1.73 | | | | 1.88 | |
| | Institutional | | | 0.64 | | | | 0.79 | |
| | Class IR | | | 0.73 | | | | 0.88 | |
| | | Class R | | | 1.23 | | | | 1.38 | |
| | 4 | | The expense ratios of the Fund, both current (net of applicable fee waivers and/or expense limitations) and before waivers (gross of applicable fee waivers and/or expense limitations) are as set forth above according to the most recent publicly available Prospectus for the Fund and may differ from the expense ratios disclosed in the Financial Highlights in this report. The Fund’s waivers and/or expense limitations will remain in place through at least April 30, 2014, and prior to such date the Investment Adviser may not terminate the arrangements without the approval of the Fund’s Board of Trustees. If these arrangements are discontinued in the future, the expense ratios may change without shareholder approval. |
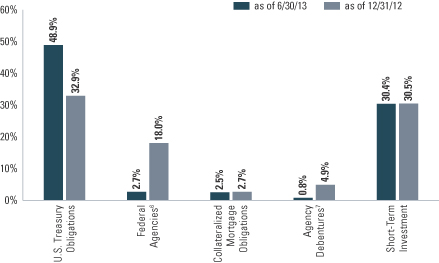
| | 5 | | The percentage shown for each investment category reflects the value of investments in that category as a percentage of net assets. Short-term investments represent investment in investment companies other than those that are exchange traded. Figures in the above graph may not sum to 100% due to the exclusion of other assets and liabilities. The above graph depicts the Fund’s investments but may not represent the Fund’s market exposure due to the exclusion of certain derivatives, if any, as listed in the Additional Investment Information section of the Schedule of Investments. |
| | 6 | | “Federal Agencies” are mortgage-backed securities guaranteed by the Government National Mortgage Association (“GNMA”), Federal National Mortgage Association (“FNMA”) and Federal Home Loan Mortgage Corp. (“FHLMC”). GNMA instruments are backed by the full faith and credit of the United States Government. |
| | 7 | | “Agency Debentures” include agency securities offered by companies such as FNMA and FHLMC, which operate under a government charter. While they are required to report to a government regulator, their assets are not explicitly guaranteed by the government and they otherwise operate like any other publicly traded company. |
15
PORTFOLIO RESULTS
Goldman Sachs Dynamic Allocation Fund
Investment Objective
The Fund seeks long-term capital appreciation.
Portfolio Management Discussion and Analysis
Below, the Goldman Sachs Quantitative Investment Strategies Team discusses the Goldman Sachs Dynamic Allocation Fund’s (the “Fund”) performance and positioning for the six-month period ended June 30, 2013 (the “Reporting Period”).
| Q | | How did the Fund perform during the Reporting Period? |
| A | | During the Reporting Period, the Fund’s Class A, C, Institutional, IR and R Shares generated cumulative total returns, without sales charges, of -0.47%, -0.86%, -0.19%, -0.28% and -0.56%, respectively. These returns compare to the 0.14%, 6.40% and -1.17% cumulative total returns of the Fund’s benchmarks, the Bank of America Merrill Lynch USD LIBOR 1-Month Constant Maturity Index (LUS1) (the “LIBOR 1-Month Index”), the Morgan Stanley Capital International All Country World Index Investable Market Index (net, unhedged) (“MSWI ACWI IMI”) and the Barclays Global Aggregate Bond Index (USD, hedged) (“Barclays Bond Index”), respectively, during the same time period. The Dynamic Allocation Fund Composite Index, comprised of the MSWI ACWI IMI (60%) and Barclays Bond Index (40%), returned 3.35% during the same period. |
| | The Fund’s overall annualized volatility was 8.5% during the Reporting Period, while the overall annualized volatility of the S&P® 500 Index during the same time period was 12.13%. |
| Q | | What strategic, risk-based factors were responsible for the Fund’s performance during the Reporting Period? |
| A | | The Fund seeks to achieve its investment objective by investing primarily in exchange-traded funds (“ETFs”), futures, swaps and other derivatives that provide exposure to a broad spectrum of asset classes, including but not limited to equities (both in U.S. and non-U.S. companies), fixed income (U.S. and non-U.S., investment grade and high yield) and commodities. Our team manages the Fund dynamically by changing its allocations to these asset classes based on our tactical views and in response to changing market conditions. Our team uses a disciplined, rigorous and quantitative approach, in combination with a qualitative overlay, in allocating to the asset classes in which the Fund invests. Allocations are adjusted within the Fund at least monthly based on continuous analysis to help determine which investments are relatively attractive and provide the best opportunities for growth in any given period of time. Since the markets represented by each investment are constantly changing, so are the Fund’s allocations. |
| | Overall, the Fund’s return from strategic, risk-based allocations was relatively flat for the Reporting Period. The Fund’s strategic, risk-based allocations to U.S. equities and developed market non-U.S. equities contributed most to its performance. These positive contributors were largely offset by strategic, risk-based allocations to commodities, emerging market equities and U.S. fixed income, which detracted. |
| Q | | How did the Goldman Sachs Market Sentiment Indicator factor into risk allocation decisions that were made during the Reporting Period? |
| A | | The Goldman Sachs Market Sentiment Indicator (“MSI”) is a proprietary tool that analyzes how the markets will potentially respond to future global changes in financial, economic and sociopolitical events. With the help of the MSI, the Fund seeks to mitigate risk in unstable markets by reducing volatility. |
16
PORTFOLIO RESULTS
| | The MSI was triggered at the tail end of May 2013, prompting us to rein in exposures across the entirety of the Fund’s portfolio. Not surprisingly, as most risky assets sold off during May 2013, the MSI had detected heightened levels of overall market distress, hence leading us to pull back on the Fund’s overall volatility level. During June 2013, we twice moved to further reduce overall portfolio risk, such that the Fund’s overall risk target at the end of June was approximately 40% lower than before the MSI was triggered. |
| Q | | What tactical allocation decisions were the primary contributors to and detractors from performance during the Reporting Period? |
| A | | For the Reporting Period overall, the Fund’s tactical allocations contributed positively, albeit modestly, to its performance. The Fund’s top tactical positive contributors to results were underweighted positions in emerging market equities and U.S. fixed income. Only partially offsetting these positive contributors were the Fund’s underweighted positions in U.S. large-cap equities and commodities, which detracted. |
| Q | | How did the Fund use derivatives and similar instruments during the Reporting Period? |
| A | | The Fund invested in futures and credit default swaps to achieve exposure to equities (both in U.S. and non-U.S. companies) and fixed income (U.S. and non-U.S., investment grade and high yield) during the Reporting Period. The Fund also used commodity index-linked structured notes to gain exposure to commodities. |
| Q | | What changes did you make within the Fund during the Reporting Period? |
| A | | As mentioned earlier, we moved to rein in exposures across the entirety of the Fund’s portfolio, as our MSI was triggered at the tail end of May. Overall, we saw a reduction in exposure across fixed income and commodities in the portfolio. We moved to reduce exposures in both asset classes during the Reporting Period not only because of their heightened risk but also because, from a return forecasting perspective, our tactical positioning was leading us to reduce exposure in fixed income and commodities, driven largely by poor momentum. For example, the Fund’s exposure to U.S. Treasury inflation-protected securities (“TIPS”) peaked during the Reporting Period at just above 50% of the Fund’s total net assets in February 2013 but since dropped to approximately 11% of total net assets at the end of June 2013. The Fund’s commodities allocation similarly decreased from a nearly 40% allocation at the beginning of 2013 to approximately 11% of the Fund’s total net assets at the end of the Reporting Period. |
| | Even within equities, we were making exposure adjustments rather rapidly. We were favoring U.S. equities by the fourth quarter of 2012, topping out Fund exposure during the Reporting Period at approximately 45% of the Fund’s total net assets by the latter half of the first quarter of 2013. Since then, we trimmed that position slightly, as markets appeared to level off and as risk levels rose. By the end of June 2013, the Fund’s overall U.S. equity exposure declined to under 15% of total net assets. The Fund’s exposure to emerging markets was also reined in, wherein we maintained less than half the exposure the Fund had at the beginning of the second quarter of 2013 by the end of the Reporting Period. By the end of June 2013, the Fund maintained less than 2% of its total net assets in emerging market equities. |
| Q | | What is the Fund’s tactical asset allocation view and strategy for the months ahead? |
| A | | At the end of June 2013, the Fund’s largest overweight on a tactical basis was in U.S. fixed income, a view driven by supportive macroeconomic conditions, strong momentum and attractive valuations. Conversely, we were bearish on developed non-U.S. fixed income due to what we considered to be less supportive macroeconomic conditions and weak momentum. |
| | We continue to believe the Fund’s dynamic allocation approach is important because it can adapt to changing markets, seeking what we believe are the best opportunities for investment and attempting to mitigate risk when the markets become unstable. There is no guarantee that the Fund’s dynamic management strategy will cause it to achieve its investment objective. |
17
FUND BASICS
Dynamic Allocation Fund
as of June 30, 2013
| | | | | | | | | | | | | | | | | | | | | | |
| | PERFORMANCE REVIEW | |
| | | January 1, 2013–
June 30, 2013 | | Fund Total
Return
(based on NAV)1 | | | BofA Merrill
Lynch USD
LIBOR
1-Month Index2 | | | MSCI All
Country
World Index
Investable
Market Index3 | | | Barclays
Global
Aggregate
Bond Index4 | | | Dynamic
Allocation Fund
Composite
Index5 | |
| | Class A | | | -0.47 | % | | | 0.14 | % | | | 6.40 | % | | | -1.17 | % | | | 3.35 | % |
| | Class C | | | -0.86 | | | | 0.14 | | | | 6.40 | | | | -1.17 | | | | 3.35 | |
| | Institutional | | | -0.19 | | | | 0.14 | | | | 6.40 | | | | -1.17 | | | | 3.35 | |
| | Class IR | | | -0.28 | | | | 0.14 | | | | 6.40 | | | | -1.17 | | | | 3.35 | |
| | | Class R | | | -0.56 | | | | 0.14 | | | | 6.40 | | | | -1.17 | | | | 3.35 | |
| | 1 | | The net asset value (“NAV”) represents the net assets of the class of the Fund (ex-dividend) divided by the total number of shares of the class outstanding. The Fund’s performance reflects the reinvestment of dividends and other distributions. The Fund’s performance does not reflect the deduction of any applicable sales charges. |
| | 2 | | The Bank of America Merrill Lynch USD 1-Month LIBOR Constant Maturity Index tracks the performance of a synthetic asset paying Libor to a stated maturity. The Index is based on the assumed purchase at par of a synthetic instrument having exactly its stated maturity and with a coupon equal to that day’s fixing rate. That issue is assumed to be sold the following business day (priced at a yield equal to the current day fixing rate) and rolled into a new instrument. The Index figures do not reflect any deduction for fees, expenses or taxes. It is not possible to invest directly in an index. |
| | 3 | | The MSCI All Country World Index Investable Market Index (“MSCI ACWI IMI Index”) is a free float-adjusted market capitalization weighted index that is designed to measure the equity market performance of developed and emerging markets. The MSCI ACWI IMI Index consists of 45 country indices comprising 24 developed and 21 emerging market country indices. The developed market country indices included are: Australia, Austria, Belgium, Canada, Denmark, Finland, France, Germany, Greece, Hong Kong, Ireland, Israel, Italy, Japan, Netherlands, New Zealand, Norway, Portugal, Singapore, Spain, Sweden, Switzerland, the United Kingdom and the United States. The emerging market country indices included are: Brazil, Chile, China, Colombia, Czech Republic, Egypt, Hungary, India, Indonesia, Korea, Malaysia, Mexico, Morocco, Peru, Philippines, Poland, Russia, South Africa, Taiwan, Thailand, and Turkey. The Index figures do not reflect any deduction for fees, expenses or taxes. It is not possible to invest directly in an index. |
| | 4 | | The Barclays Global Aggregate Bond Index provides a broad-based measure of the global investment-grade fixed income markets. The three major components of this index are the U.S. Aggregate, the Pan-European Aggregate, and the Asian-Pacific Aggregate Indices. The index also includes Eurodollar and Euro-Yen corporate bonds, Canadian government, agency and corporate securities, and USD investment grade 144A securities. The Index figures do not reflect any deduction for fees, expenses or taxes. It is not possible to invest directly in an index. |
| | 5 | | The Dynamic Allocation Fund Composite Index is comprised 60% of the MSCI ACWI IMI Index and 40% of the Barclays Global Aggregate Bond Index. |
18
FUND BASICS
| | | | | | | | | | |
| | STANDARDIZED TOTAL RETURNS6 |
| | | For the period ended 6/30/13 | | One Year | | | Since Inception | | Inception Date |
| | Class A | | | -1.62 | % | | 1.91% | | 1/5/10 |
| | Class C | | | 2.39 | | | 2.83 | | 1/5/10 |
| | Institutional | | | 4.65 | | | 4.01 | | 1/5/10 |
| | Class IR | | | 4.48 | | | 3.85 | | 1/5/10 |
| | | Class R | | | 3.96 | | | 3.34 | | 1/5/10 |
| | 6 | | The Standardized Total Returns are average annual total returns as of the most recent calendar quarter-end. They assume reinvestment of all distributions at NAV. These returns reflect a maximum initial sales charge of 5.5% for Class A Shares and the assumed contingent deferred sales charge for Class C Shares (1% if redeemed within 12 months of purchase). Because Institutional, Class IR and Class R Shares do not involve a sales charge, such a charge is not applied to their Standardized Total Returns. |
The returns set forth in the tables above represent past performance. Past performance does not guarantee future results. The Fund’s investment return and principal value will fluctuate so that an investor’s shares, when redeemed, may be worth more or less than their original cost. Current performance may be lower or higher than the performance quoted above. Please visit our web site at www.goldmansachsfunds.com to obtain the most recent month-end returns. Performance reflects applicable fee waivers and/or expense limitations in effect during the periods shown. In their absence, performance would be reduced. Returns do not reflect the deduction of taxes that a shareholder would pay on Fund distributions or the redemption of Fund shares.
| | | | | | | | | | |
| | EXPENSE RATIOS7 | |
| | | | | Net Expense Ratio (Current) | | | Gross Expense Ratio (Before Waivers) | |
| | Class A | | | 1.42 | % | | | 1.52 | % |
| | Class C | | | 2.17 | | | | 2.27 | |
| | Institutional | | | 1.01 | | | | 1.11 | |
| | Class IR | | | 1.18 | | | | 1.28 | |
| | | Class R | | | 1.68 | | | | 1.78 | |
| | 7 | | The expense ratios of the Fund, both current (net of applicable fee waivers and/or expense limitations) and before waivers (gross of applicable fee waivers and/or expense limitations) are as set forth above according to the most recent publicly available Prospectus for the Fund and may differ from the expense ratios disclosed in the Financial Highlights in this report. The Fund’s waivers and/or expense limitations will remain in place through at least April 30, 2014, and prior to such date the Investment Adviser may not terminate the arrangements without the approval of the Fund’s Board of Trustees. If these arrangements are discontinued in the future, the expense ratios may change without shareholder approval. |
19
FUND BASICS
| | 8 | | The Fund is actively managed and, as such, its composition may differ over time. The percentage shown for each investment category reflects the value of investments in that category as a percentage of net assets. Figures in the above graph may not sum to 100% due to the exclusion of other assets and liabilities. Underlying sector allocations of exchange traded funds (“ETFs”) held by the Fund are not reflected in the graph above. Consequently, the Fund’s overall sector allocations may differ from the percentages contained in the graph above. Short-term investments represent investment in investment companies other than those that are exchange traded. The above graph depicts the Fund’s investments but may not represent the Fund’s market exposure due to the exclusion of certain derivatives, if any, as listed in the Additional Investment Information section of the Schedule of Investments. |
20
PORTFOLIO RESULTS
Goldman Sachs Managed Futures Strategy Fund
Investment Objective
The Fund seeks to generate long-term absolute return.
Portfolio Management Discussion and Analysis
Below, the Goldman Sachs Quantitative Investment Strategies Team discusses the Goldman Sachs Managed Futures Strategy Fund’s (the “Fund”) performance and positioning for the six-month period ended June 30, 2013 (the “Reporting Period”).
| Q | | How did the Fund perform during the Reporting Period? |
| A | | During the Reporting Period, the Fund’s Class A, C, Institutional, IR and R Shares generated cumulative total returns, without sales charges, of -9.48%, -9.83%, -9.36%, -9.37% and -9.69%, respectively. These returns compare to the 0.14% cumulative total return of the Fund’s benchmark, the Bank of America Merrill Lynch USD LIBOR 1-Month Constant Maturity Index (LUS1) (the “LIBOR 1-Month Index”), during the same time period. |
| | The Fund’s overall annualized volatility was 8.44% during the Reporting Period, while the overall annualized volatility of the S&P® 500 Index during the same time period was 12.13%. |
| Q | | What were the primary contributors to and detractors from the Fund’s performance during the Reporting Period? |
| A | | The Fund implements a trend-following strategy that takes long and/or short positions in a wide range of asset classes, including equities, fixed income and currencies, among others, to seek long-term absolute return. The Fund seeks to achieve its investment objective by investing primarily in a portfolio of equities, equity index futures, bonds, bond futures, equity swaps, interest rate swaps, currency forwards and non-deliverable forwards, options, exchange-traded funds (“ETFs”) and structured securities. As a result of the Fund’s use of derivatives, the Fund may also hold significant amounts of U.S. Treasuries or short-term investments. The Fund’s investments are made without restriction as to issuer capitalization, country, currency, maturity or credit rating. Negative Fund performance for the Reporting Period overall can be attributed to the latter half of the second calendar quarter, i.e., mostly to May and June 2013. |
| | During the first quarter of 2013, a strong surge in equity market returns resulted in positive contributions from various long positions in global equity markets. This was offset, however, by long positions in fixed income securities, which detracted from performance. |
| | The second calendar quarter got off to a good start with short-term and medium-term fixed income positions contributing to relative returns in April 2013. Developed market equity long positions contributed too, albeit to a lesser extent. |
| | The latter part of the second calendar quarter proved to be challenging on the heels of Federal Reserve (“Fed”) Chair Bernanke’s Congressional testimony on May 22, 2013 and subsequent “tapering” language at the Fed meeting on June 19, 2013. Moreover, heightened volatility across equity and fixed income markets coincided with a sell-off in more risky assets globally, particularly in emerging market securities. In May 2013, positions in fixed income securities as well as long-term yield curve, or slope, movements hurt the Fund’s performance. Within fixed income, exposure to U.S. and Canadian bonds particularly detracted. In June 2013, the two major detractors from Fund performance were its long positions in developed market equities and our yield curve steepening bias. Long positions in emerging market equities and short-term interest rates also detracted, but to a lesser extent. Among developed market equities, the Fund’s long positions in Italy and Sweden detracted most from performance. Among emerging market equities, the |
21
PORTFOLIO RESULTS
| | Fund’s long positions in South Africa and Turkey detracted most. Positive performance from short positions in the equity markets of Chile and South Korea did help in June 2013, but not enough to offset the detractors. The Fund’s yield curve steepening view hurt most in the Eurozone and the U.K. |
| Q | | How did the Fund use derivatives and similar instruments during the Reporting Period? |
| A | | The Fund used derivatives, including futures, swaps and forwards, to implement long and short positions. The Fund invested in futures and currency forwards to achieve exposure to equities (both in U.S. and non-U.S. companies) and currencies (U.S. and non-U.S. currencies), respectively. The Fund used interest rate swaps and currency forwards to achieve exposure to fixed income. |
| Q | | What changes did you make within the Fund during the Reporting Period? |
| A | | At the start of the Reporting Period, the Fund held long positions in all asset classes in the Fund’s investment universe, with especially meaningful exposures in developed market and emerging market equities along with short-term and medium-term bonds. The Fund held a relatively small positive exposure to developed market currencies. As developed market currencies declined throughout the Reporting Period, we quickly moved to a net short Fund position in this asset class by February 2013, which was then maintained through the remainder of the Reporting Period. We similarly moved to rein in the Fund’s exposures in emerging market currencies and emerging market equities, eventually moving to short positions in both asset classes by the end of the second calendar quarter. |
| Q | | What is the Fund’s tactical asset allocation view and strategy for the months ahead? |
| A | | At the end of June 2013, the Fund had net long exposures to developed market equities and short-term interest rates, while maintaining short exposure to emerging market equities, developed market and emerging market currencies, and medium-term and long-term fixed income. |
| | Going into the second half of 2013, we intend to continue to be short global currencies and emerging market equities in the Fund. We also expect to maintain the Fund’s short positions in medium-term and long-term bonds. At the end of the Reporting Period, we favored less risky assets, such as developed market equities and short-term bonds. |
| | We intend to continue to seek to identify price trends in various asset classes over short-, medium- and long-term horizons via a proprietary investment model. Upon identifying a trend in a given instrument or asset, the Fund will take a long or short position in the instrument or asset. Long positions benefit from an increase in price of the underlying instrument or asset, while short positions benefit from a decrease in price of the underlying instrument or asset. The size of the Fund’s position in an instrument or asset is primarily related to the strength of the overall trend identified by the investment model. We continue to believe that the Fund’s trend-following strategy is important because it can adapt to changing markets, seeking what we believe are the best opportunities for investment and attempting to mitigate risk when the markets become unstable. There is no guarantee that the Fund’s trend-following strategy will cause it to achieve its investment objective. |
22
FUND BASICS
Managed Futures Strategy Fund
as of June 30, 2013
| | | | | | | | | | |
| | PERFORMANCE REVIEW | |
| | | January 1, 2013–June 30, 2013 | | Fund Total Return
(based on NAV)1 | | | BofA Merrill Lynch USD LIBOR
1-Month Index2 | |
| | Class A | | | -9.48 | % | | | 0.14 | % |
| | Class C | | | -9.83 | | | | 0.14 | |
| | Institutional | | | -9.36 | | | | 0.14 | |
| | Class IR | | | -9.37 | | | | 0.14 | |
| | | Class R | | | -9.69 | | | | 0.14 | |
| | 1 | | The net asset value (“NAV”) represents the net assets of the class of the Fund (ex-dividend) divided by the total number of shares of the class outstanding. The Fund’s performance reflects the reinvestment of dividends and other distributions. The Fund’s performance does not reflect the deduction of any applicable sales charges. |
| | 2 | | The Bank of America Merrill Lynch US Dollar 1-Month LIBOR Constant Maturity Index tracks the performance of a synthetic asset paying Libor to a stated maturity. The Index is based on the assumed purchase at par of a synthetic instrument having exactly its stated maturity and with a coupon equal to that day’s fixing rate. That issue is assumed to be sold the following business day (priced at a yield equal to the current day fixing rate) and rolled into a new instrument. The Index figures do not reflect any deduction for fees, expenses or taxes. It is not possible to invest directly in an index. |
| | | | | | | | | | |
| | STANDARDIZED TOTAL RETURNS3 |
| | | For the period ended 6/30/13 | | One Year | | | Since Inception | | Inception Date |
| | Class A | | | -4.60 | % | | -7.37% | | 2/29/12 |
| | Class C | | | -0.89 | | | -4.14 | | 2/29/12 |
| | Institutional | | | 1.27 | | | -3.08 | | 2/29/12 |
| | Class IR | | | 1.16 | | | -3.16 | | 2/29/12 |
| | | Class R | | | 0.63 | | | -3.69 | | 2/29/12 |
| | 3 | | The Standardized Total Returns are cumulative total returns as of the most recent calendar quarter-end. They assume reinvestment of all distributions at NAV. These returns reflect a maximum initial sales charge of 5.5% for Class A Shares and the assumed contingent deferred sales charge for Class C Shares (1% if redeemed within 12 months of purchase). Because Institutional, Class IR and Class R Shares do not involve a sales charge, such a charge is not applied to their Standardized Total Returns. |
The returns set forth in the tables above represent past performance. Past performance does not guarantee future results. The Fund’s investment return and principal value will fluctuate so that an investor’s shares, when redeemed, may be worth more or less than their original cost. Current performance may be lower or higher than the performance quoted above. Please visit our web site at www.goldmansachsfunds.com to obtain the most recent month-end returns. Performance reflects applicable fee waivers and/or expense limitations in effect during the periods shown. In their absence, performance would be reduced. Returns do not reflect the deduction of taxes that a shareholder would pay on Fund distributions or the redemption of Fund shares.
23
FUND BASICS
| | | | | | | | | | |
| | EXPENSE RATIOS4 | |
| | | | | Net Expense Ratio (Current) | | | Gross Expense Ratio (Before Waivers) | |
| | Class A | | | 1.44 | % | | | 5.89 | % |
| | Class C | | | 2.15 | | | | 5.39 | |
| | Institutional | | | 1.06 | | | | 5.27 | |
| | Class IR | | | 1.20 | | | | 3.89 | |
| | | Class R | | | 1.72 | | | | 6.07 | |
| | 4 | | The expense ratios of the Fund, both current (net of applicable fee waivers and/or expense limitations) and before waivers (gross of applicable fee waivers and/or expense limitations) are as set forth above according to the most recent publicly available Prospectus for the Fund and may differ from the expense ratios disclosed in the Financial Highlights in this report. The Fund’s waivers and/or expense limitations will remain in place through at least April 30, 2014, and prior to such date the Investment Adviser may not terminate the arrangements without the approval of the Fund’s Board of Trustees. If these arrangements are discontinued in the future, the expense ratios may change without shareholder approval. |
The Fund sector allocation graph is not shown due to no security holdings as of June 30, 2013. The Fund is actively managed and, as such, its composition may differ over time. Generally, the graph depicts the Fund’s investments but may not represent the Fund’s market exposure due to the exclusion of certain derivatives, if any, as listed in the Additional Investment Information section of the Schedule of Investments.
24
GOLDMAN SACHS REAL ESTATE SECURITIES FUNDS
What Differentiates the Goldman Sachs Real Estate Securities Investment Process?
The Goldman Sachs International Real Estate Securities and Real Estate Securities Funds seek to generate long-term growth of capital and dividend income by investing primarily in real estate industry companies, including REITs, on an international or domestic basis, respectively. REITs which offer daily liquidity have historically strong returns, low volatility and low correlation to traditional asset classes.
Goldman Sachs’ Real Estate Securities Investment Process

Buy high quality companies.
We seek to purchase those companies that combine the best market exposures, management teams, capital structures and growth prospects.
Buy at a reasonable price.
We seek to consistently select securities that are trading at discounts to their intrinsic value.
Diversification reduces risk.
We seek to diversify the portfolio holdings based on property type and geographic markets to manage risk without compromising returns.

Team Based:
Portfolio decisions are made by the entire team.
Continuous Scrutiny:
Market, industry and company developments are reviewed daily.
Fundamental Analysis:
Portfolio holdings are determined by the risk/reward characteristics of an issuer and the team’s conviction in the overall business and management’s ability to create value.

Real estate securities portfolio that:
| n | | is a high quality portfolio that is strategically positioned for long-term growth potential |
| n | | is a result of bottom-up stock selection with a focus on long-term investing |
25
PORTFOLIO RESULTS
Goldman Sachs International Real Estate Securities Fund
Investment Objective
The Fund seeks total return comprised of long-term growth of capital and dividend income.
Portfolio Management Discussion and Analysis
Below, the Goldman Sachs Real Estate Securities Investment Team discusses the Goldman Sachs International Real Estate Securities Fund’s (the “Fund”) performance and positioning for the six-month period ended June 30, 2013 (the “Reporting Period”).
| Q | | How did the Fund perform during the Reporting Period? |
| A | | During the Reporting Period, the Fund’s Class A, C, Institutional and IR Shares generated cumulative total returns, without sales charges, of -0.12%, -0.59%, 0.15% and 0.06%, respectively. These returns compare to the -0.95% cumulative total return of the Fund’s benchmark, the FTSE EPRA/NAREIT Developed ex-US Real Estate Index (with dividends reinvested) (the “Real Estate Index”) during the same period. |
| Q | | What economic and market factors most influenced the international real estate securities market as a whole during the Reporting Period? |
| A | | For the Reporting Period overall, the international real estate securities market, as measured by the Real Estate Index, underperformed the broad international equity market, as measured by the MSCI EAFE® Index (net), by just more than five percentage points. However, such performance masks what proved to be two distinct quarters. |
| | During the first quarter of 2013, the Real Estate Index gained 4.9%. The Japanese real estate equity market led returns for the quarter, as the yen weakened to its lowest level against the U.S. dollar since mid-2009 on expectations the new head of the Bank of Japan would aggressively pursue a 2% inflation target. Asset-based companies, in particular real estate developers and real estate investment trusts (“REITs”), rallied strongly in anticipation of an end to the country’s deflation. Australia also performed well, as many Australian REITs delivered solid December 2012 earnings, and the overall stability of tenancy and expansive growth driven by a continuous development pipeline added to the sector’s strong performance. China real estate broadly underperformed the |
| | Real Estate Index during the quarter, as markets began to reflect growing concern over potential new regulation and tightening measures, especially after the governor of China’s central bank made hawkish statements regarding inflation. Europe, including the United Kingdom, also underperformed the Real Estate Index as a result of the banking crisis in Cyprus, inconclusive elections in Italy and general economic weakness in the region. |
| | The Real Estate Index fell 5.6% during the second quarter of 2013. These months were marred by currency weakness outside of the U.S. as a result of Federal Reserve (“Fed”) Chair Bernanke’s comment about “tapering” the quantitative easing program in the U.S. and anticipation of “tapering” itself. Apart from the relatively resilient Pan-European REIT markets, REIT markets in Asia-Pacific were negatively affected by a perceived limitation of the Bank of Japan’s loosening of monetary policy following the rapid share price surge during the first quarter of 2013. Also, concerns about further economic slowdown and systemic instability of the banking system in China impacted the Asia-Pacific REIT markets. As a result, REIT valuations were adjusted downward on multiple scenarios of more moderate rental growth, a temporary halt of REITs’ acquisitive growth and overcoming higher funding costs in the mid- to long-term. |
| | From a regional perspective, the Asia ex-Pacific real estate securities markets were the best performers for the Reporting Period overall. All other regions’ real estate markets posted negative returns, but the North American, emerging markets and Pacific regions were weakest. Europe posted negative returns but still outpaced the Real Estate Index. On an individual country basis, the Japanese real estate securities market performed best for the Reporting Period overall, followed by the United Kingdom. The weakest countries on a relative basis were Singapore and Canada. |
26
PORTFOLIO RESULTS
| Q | | What key factors were responsible for the Fund’s performance during the Reporting Period? |
| A | | The Fund outperformed the Real Estate Index during the Reporting Period due primarily to an underweight position and security selection in Singapore, security selection in China and exposure to Malaysia, which contributed positively to results. There were no significant detractors from the Fund’s performance during the Reporting Period from a country perspective, though Australia contributed the least. |
| Q | | What were some of the Fund’s best-performing individual holdings? |
| A | | During the Reporting Period, a position in Mitsui Fudosan, a diversified Japanese developer, was the best-performing individual holding for the Fund. Mitsui Fudosan, one of Japan’s major commercial real estate landlords, was re-rated due to prospects of a rental up-cycle and an end to deflation in Japan. While rental demand and vacancies had yet to show significant improvement in the region, a diminishing supply of new office space in central Tokyo was widely expected to help support strong pricing in the industry. |
| | Another top contributor to the Fund’s relative results during the Reporting Period was UEM Sunrise, a large-cap integrated property and land developer in Malaysia. Besides other locations throughout the country, UEM Sunrise has the majority of its “landbank” in Iskandar, which is closer to Singapore. The past few quarters have seen the company’s investment in infrastructure and commercial facilities — such as factories, industrial warehouses, shopping outlets, private schools and condominium blocks — over the past few years starting to generate returns. During the Reporting Period, UEM Sunrise signed several landmark joint venture developments with Singapore-based companies and it successfully launched several project sales. A further catalyst to UEM Sunrise’s performance arose in early May 2013 when Malaysia’s general election was concluded in favor of the incumbent political party. The implication was positive to both the country’s economy and Iskandar in that the existing economic plans and recent stability were anticipated to stay in place longer. |
| Q | | Which positions detracted significantly from the Fund’s performance during the Reporting Period? |
| A | | Having an underweight position in Sumitomo Realty & Development was a major detractor from the Fund’s results relative to the Real Estate Index during the Reporting Period, as the Japanese developer of primarily office buildings and condominiums performed well. |
| | Hang Lung Properties, an upscale shopping center developer and landlord in several large Chinese cities, was a top detractor from the Fund’s results during the Reporting Period. Hang Lung Properties’ stock underperformed the Real Estate Index after the company reported yearly results in December 2012 that suggest several retailers in China were showing deteriorating business outlooks and margin pressure. We sold out of the Fund’s position in Hang Lung Properties prior to another sharp fall in its stock in late May 2013. |
| Q | | How did the Fund use derivatives and similar instruments during the Reporting Period? |
| A | | The Fund did not use derivatives during the Reporting Period. |
| Q | | Did the Fund make any significant purchases or sales during the Reporting Period? |
| A | | During the Reporting Period, we initiated a Fund position in Hong Kong beer distributor Kingway Brewery Holdings, which recently signed an agreement with China Resources to dispose of its entire brewery factory with the exception of one large piece of prime land in Shenzhen. We believe this is a highly valuable transition for the company and think the move will turn Kingway Brewery Holdings into a pure- play commercial real estate developer with prime land in Shenzhen over the next three to four years. |
| | We added to the Fund’s position in diversified Japanese developer Mitsui Fudosan. We believe Mitsui Fudosan has a good brand name in the condominium development business that can be supported by the Japanese government’s policy to encourage home purchase by the end of 2013 due to a goods and services tax hike expected beginning in 2014. Further, Mitsui Fudosan has a large number of affiliated listed REITs, which allow the company to quickly and effectively redeploy capital in a rising rental market. |
| | In addition to the sale of Hang Lung Properties, mentioned earlier, we sold the Fund’s position in CapitaLand. During 2012, CapitaLand, which focused on hospitality and real estate financial services in Singapore, was a strong performer and a top contributor to the Fund’s returns. Its stock subsequently re-priced to a more reasonable valuation as concerns over sales volumes and pricing in the Singapore housing market, the overall Chinese housing market and the Chinese shopping mall business subsided. As concerns increased about further economic slowdown and systemic instability of the banking system in China, we eliminated |
27
PORTFOLIO RESULTS
| | the Fund’s position in CapitaLand in favor of higher conviction names. |
| Q | | Were there any changes made in the Fund’s investment strategy during the Reporting Period? |
| A | | In constructing the Fund’s portfolio, we focus on picking securities rather than on making regional, country or subsector bets. We seek to outpace the benchmark index by overweighting stocks that we expect to outperform and underweighting those that we think may lag. Consequently, changes in its regional or subsector weights are generally the direct result of individual stock selection or of real estate securities’ appreciation or depreciation. That said, during the Reporting Period, the Fund’s exposure to Hong Kong, Australia, the United Kingdom, China and Malaysia increased relative to the Real Estate Index, and its exposure to Continental Europe, Canada and Singapore decreased relative to the Real Estate Index. |
| Q | | How was the Fund positioned relative to its benchmark index at the end of the Reporting Period? |
| A | | From a country perspective, the Fund was overweighted relative to the Real Estate Index in China, Malaysia and the United Kingdom and underweighted relative to the Real Estate Index in Singapore, Continental Europe, Canada and Japan at the end of the Reporting Period. The Fund was rather neutrally weighted compared to the Real Estate Index in most other constituent countries of the Real Estate Index at the end of June 2013. |
| Q | | What is the Fund’s tactical view and strategy for the months ahead? |
| A | | We believe the macro environment progressively improved during the Reporting Period, with investors gaining further confidence in a U.S. economic recovery and Euro-related issues calming for the time being. Key economic data from the U.S. and Europe have been strong relative to that in the emerging markets, with the economic growth largely being led by the developed markets. As many international REITs derive a majority of their overall value from developed markets, we are constructive in our view on the broad-based recovery we have seen to date. |
| | From a fundamentals perspective, occupancy remained rather stable during the Reporting Period, and real estate landlords and investors globally continued to have good access to debt funding at reasonable rates, despite some liquidity concerns and a possible further economic slowdown in China. Fund flows globally continued to support REITs, and we believe rents and valuations in high quality properties may well rise and certain REITs may continue to grow internally, especially those whose portfolios are positioned in stronger markets. However, we are cognizant of REIT markets that could be more vulnerable to swings in the macro environment — that is, capital market, foreign currency and/ or economic conditions — than others. We believe REITs positioned in these markets or those with lower quality portfolios will likely have more difficulty if funding costs increase materially. In our view, there remains adequate liquidity produced by central bank action that continues to flow into real estate among other real assets. At the end of the Reporting Period, interest rates remained subdued, and inflation appeared to be under control. We believe real estate still provided a comfortable level of excess income above long-term government bonds in most markets. Private and public real estate vehicles internationally also remained active in acquisition in a prudent manner at the end of the Reporting Period, in our view. |
| | Of course, while the international real estate sector had many positive attributes at the end of the Reporting Period, the market environment at the end of the Reporting Period had its risks as well. Macroeconomic and political events can swing sentiment dramatically, and the broader direction of some economies over the near term was still unclear. |
| | As fundamental, bottom-up investors, we believe we are seeing opportunities that go beyond the headline risks associated with certain regions. We intend to continue to focus our approach on those companies that have recapitalized their balance sheets and that possess quality attributes, such as a robust business model, a high quality asset exposure and a strong management team with a sound reinvestment strategy. |
28
FUND BASICS
International Real Estate Securities Fund
as of June 30, 2013
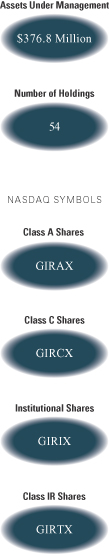
| | | | | | | | | | |
| | PERFORMANCE REVIEW | |
| | | January 1, 2013– June 30, 2013 | | Fund Total Return
(based on NAV)1 | | | FTSE EPRA/NAREIT Developed
ex-US Real Estate Index (Gross)2 | |
| | Class A | | | -0.12 | % | | | -0.95 | % |
| | Class C | | | -0.59 | | | | -0.95 | |
| | Institutional | | | 0.15 | | | | -0.95 | |
| | | Class IR | | | 0.06 | | | | -0.95 | |
| | 1 | | The net asset value (“NAV”) represents the net assets of the class of the Fund (ex-dividend) divided by the total number of shares of the class outstanding. The Fund’s performance reflects the reinvestment of dividends and other distributions. The Fund’s performance does not reflect the deduction of any applicable sales charges. |
| | 2 | | The FTSE EPRA/NAREIT Developed ex-US Real Estate Index (gross, with dividends reinvested) is a market capitalization weighted index comprised of REITs and non-REITs within the international (global ex U.S.) real estate securities market. The market capitalization for each constituent is adjusted for free float. It is not possible to invest directly in an index. |
| | | | | | | | | | | | |
| | STANDARDIZED TOTAL RETURNS3 |
| | | For the period ended 6/30/13 | | One Year | | | Five Year | | Since Inception | | Inception Date |
| | Class A | | | 12.94 | % | | -0.90% | | -1.19% | | 7/31/06 |
| | Class C | | | 17.64 | | | -0.48 | | -1.09 | | 7/31/06 |
| | Institutional | | | 20.03 | | | 0.36 | | -0.18 | | 7/31/06 |
| | | Class IR | | | 19.96 | | | 0.55 | | -4.19 | | 11/30/07 |
| | 3 | | The Standardized Total Returns are average annual total returns as of the most recent calendar quarter-end. They assume reinvestment of all distributions at NAV. These returns reflect a maximum initial sales charge of 5.5% for Class A Shares and the assumed contingent deferred sales charge for Class C Shares (1% if redeemed within 12 months of purchase). Because Institutional and Class IR Shares do not involve a sales charge, such a charge is not applied to their Standardized Total Returns. |
The returns set forth in the tables above represent past performance. Past performance does not guarantee future results. The Fund’s investment return and principal value will fluctuate so that an investor’s shares, when redeemed, may be worth more or less than their original cost. Current performance may be lower or higher than the performance quoted above. Please visit our web site at www.goldmansachsfunds. com to obtain the most recent month-end returns. Performance reflects applicable fee waivers and/or expense limitations in effect during the periods shown. In their absence, performance would be reduced. Returns do not reflect the deduction of taxes that a shareholder would pay on Fund distributions or the redemption of Fund shares.
| | | | | | | | | | |
| | EXPENSE RATIOS4 | |
| | | | | Net Expense Ratio (Current) | | | Gross Expense Ratio (Before Waivers) | |
| | Class A | | | 1.45 | % | | | 1.63 | % |
| | Class C | | | 2.20 | | | | 2.37 | |
| | Institutional | | | 1.05 | | | | 1.22 | |
| | | Class IR | | | 1.20 | | | | 1.36 | |
| | 4 | | The expense ratios of the Fund, both current (net of applicable fee waivers and/or expense limitations) and before waivers (gross of applicable fee waivers and/or expense limitations) are as set forth above according to the most recent publicly available Prospectus for the Fund and may differ from the expense ratios disclosed in the Financial Highlights in this report. The Fund’s waivers and/or expense limitations will remain in place through at least April 30, 2014, and prior to such date the Investment Adviser may not terminate the arrangements without the approval of the Fund’s Board of Trustees. If these arrangements are discontinued in the future, the expense ratios may change without shareholder approval. |
29
FUND BASICS
| | | | | | | | | | |
| | TOP TEN HOLDINGS AS OF 6/30/135 |
| | | Holding | | % of Total
Net Assets | | | Line of Business | | Country |
| | Mitsui Fudosan Co. Ltd. | | | 8.0 | % | | Office | | Japan |
| | Sun Hung Kai Properties Ltd. | | | 6.2 | | | Diversified | | Hong Kong |
| | Mitsubishi Estate Co. Ltd. | | | 5.9 | | | Diversified | | Japan |
| | Unibail-Rodamco SE (REIT) | | | 5.8 | | | Diversified | | Netherlands |
| | The Link Real Estate Investment | | | 3.7 | | | Retail | | Hong Kong |
| | Trust (REIT) | | | | | | | | |
| | Henderson Land Development Co. Ltd. | | | 3.1 | | | Diversified | | Hong Kong |
| | British Land Co. PLC (REIT) | | | 2.9 | | | Diversified | | United Kingdom |
| | Westfield Group (REIT) | | | 2.9 | | | Retail | | Australia |
| | Shimao Property Holdings Ltd. | | | 2.8 | | | Diversified | | China |
| | | Cache Logistics Trust (REIT) | | | 2.6 | | | Industrial | | Singapore |
| | 5 | | The top 10 holdings may not be representative of the Fund’s future investments. |
|
| FUND VS. BENCHMARK COUNTRY ALLOCATION6 |
| As of June 30, 2013 |
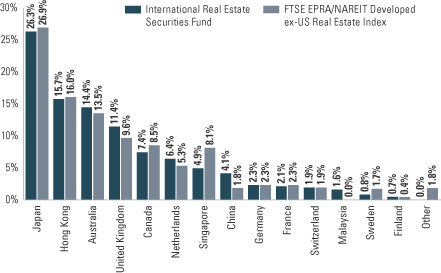
| | 6 | | The Fund is actively managed and, as such, its composition may differ over time. Consequently, the Fund’s overall country allocations may differ from percentages contained in the graph above. The percentage shown for each investment category reflects the value of investments in that category as a percentage of market value. The graph depicts the Fund’s investments but may not represent the Fund’s market exposure due to the exclusion of certain derivatives, if any, as listed in the Additional Investment Information section of the Schedule of Investments. |
30
PORTFOLIO RESULTS
Goldman Sachs Real Estate Securities Fund
Investment Objective
The Fund seeks total return comprised of long-term growth of capital and dividend income.
Portfolio Management Discussion and Analysis
Below, the Goldman Sachs Real Estate Securities Investment Team discusses the Goldman Sachs Real Estate Securities Fund’s (the “Fund”) performance and positioning for the six-month period ended June 30, 2013 (the “Reporting Period”).
| Q | | How did the Fund perform during the Reporting Period? |
| A | | During the Reporting Period, the Fund’s Class A, B, C, Institutional, Service, IR and R Shares generated cumulative total returns, without sales charges, of 5.47%, 5.13%, 5.07%, 5.67%, 5.44%, 5.60% and 5.37%, respectively. These returns compare to the 5.89% cumulative total return of the Fund’s benchmark, the Wilshire Real Estate Securities Index (with dividends reinvested) (the “Wilshire Index”) during the same period. |
| Q | | What economic and market factors most influenced the U.S. real estate securities market as a whole during the Reporting Period? |
| A | | U.S. equity markets reflected a number of improving economic indicators during the Reporting Period, including increasing housing prices and an improving employment picture. Strong retail sales suggested consumers may have been feeling the effects of better housing and labor market conditions. U.S. equity markets rallied strongly until late May 2013 when concerns over Federal Reserve (“Fed”) “tapering” of its quantitative easing program drove interest rates higher and hurt higher yielding sectors of the market. However, it appears that real estate investment trusts (“REITs”) were able to withstand a moderate rise in interest rates, especially given the improving economic environment, as cash flows continued to increase. The U.S. real estate securities market, as measured by the Wilshire Index, lagged the broad equity market, as measured by the S&P 500 Index, but still produced solid positive absolute returns. |
| | Within the Wilshire Index, the strongest subsectors during the Reporting Period were leisure and self storage. Leisure — or lodging — performed best, as it is the most economically- sensitive sector in the Wilshire Index and thus performed well during these months when risk aversion was rather low. Conversely, the retail and office subsectors, while still posting positive absolute returns, were the weakest performers within the Wilshire Index during the Reporting Period. These subsectors were muted by macroeconomic and interest rate concerns that heightened toward the end of the Reporting Period. |
| Q | | What key factors were responsible for the Fund’s performance during the Reporting Period? |
| A | | The Fund closely tracked the Wilshire Index during the Reporting Period due primarily to effective individual stock selection in the leisure, retail and industrial subsectors, which contributed positively to relative returns. Offsetting such contributors was stock selection in the multifamily and office subsectors, which detracted from relative returns. Having an underweighted exposure to the self storage subsector, which, as indicated earlier, was one of the strongest performing subsectors in the Wilshire Index during the Reporting Period, also dampened results. |
| Q | | What were some of the Fund’s best-performing individual holdings? |
| A | | Strategic Hotels & Resorts was a top contributor to the Fund’s performance during the Reporting Period. Shares of the high-end hotel operator benefited from better than expected results, in which the company showed strong revenue per available room (“RevPAR”), a critical measure for performance in the industry. In addition, the stock moved higher on takeout speculation. At the end of the Reporting Period, we believed its stock was trading below the private value of its assets and this disconnect was the result of its Chief Executive Officer’s resignation late in 2012. We further believed this valuation gap should close over time. |
| | Shares of Weingarten Realty Investors, which owns large- scale shopping centers, advanced as investors gained confidence in its move in 2012 to shed its industrial assets and increase its focus on the retail segment. Expectations for a |
31
PORTFOLIO RESULTS
| | broader economic recovery and a strong leasing environment supported Weingarten Realty Investors’ strong performance as well. So, too, did the fact that Weingarten Realty Investors has a large number of assets in Texas, which benefited during the Reporting Period from a strong economic rebound in that state driven by job growth in the energy sector. Despite its move higher, we continued to believe at the end of the Reporting Period that Weingarten Realty Investors had an underappreciated asset base in geographically diverse locations and healthy internal growth. Moreover, we found Weingarten Realty Investors’ valuation attractive, especially when compared to other shopping center REITs. |
| Q | | What were some of the Fund’s weakest-performing individual holdings? |
| A | | Digital Realty Trust owns a diversified portfolio of data centers with high barriers to entry and high quality tenants. In our view, there are strong secular trends driving growth in demand for these data centers, and we believe the company has an attractive acquisitions platform with proven track record, best-in-class operating platform and consistent access to capital. However, during the Reporting Period, its stock came under pressure due in part to concerns about supply and demand in some of its larger markets, such as Northern California and Virginia. We maintained the position at the end of the Reporting Period because we think concerns brought up in the market were misplaced and misunderstood and that the supply/demand imbalance in some markets is in the process of working itself out. |
| | The stock of wireless tower company American Tower was a strong performer relative to the Wilshire Index in 2012, as were several other tower companies. American Tower and its peers were then trading near the top end of their historical multiple ranges, but they subsequently gave up a bit of performance during the Reporting Period on fears demand for tower space was peaking. Also, the wireless tower industry as a whole was pressured by rising interest rate concerns, similar to the REIT sector broadly. At the end of the Reporting Period, we did not believe demand was peaking in the U.S., as carriers continued to spend to upgrade their networks. We further believed demand would continue to be strong over the next two to three years due to continued increases in data usage over mobile devices, voice-over LTE (long term evolution), public safety network deployment and more. We believed American Tower’s international exposure offered it enhanced growth prospects over the coming years, as many of these countries are three to five years behind the U.S. in terms of cell site deployment and network capabilities. |
| | While rising interest rates will likely impact American Tower and real estate overall going forward, at the end of the Reporting Period we viewed American Tower as well positioned from a balance sheet perspective, with low overall leverage and a long duration of most fixed rate debt. |
| Q | | How did the Fund use derivatives and similar instruments during the Reporting Period? |
| A | | The Fund did not use derivatives during the Reporting Period. |
| Q | | Did the Fund make any significant purchases or sales during the Reporting Period? |
| A | | In the retail subsector, we initiated a Fund position in Taubman Centers, which we consider to be one of the highest quality mall companies with a strong balance sheet and a good management team. Its stock had underperformed due to its growing development pipeline, including properties in South Korea and China. At the time of our purchase, the market did not view these Asian developments too favorably given low initial returns relative to the higher risk they pose. However, we believed most of the bad news was priced in, and the stock looked attractive to us on a relative basis. |
| | Also in the retail subsector, we established a Fund position in community shopping center REIT Federal Realty Investment Trust. We perceived it to be a high quality company that had underperformed. We believed it would perform well in a choppy market given its strong balance sheet, access to low cost debt and the fact it had never done a dilutive equity issuance during the downturn. |
| | We eliminated the Fund’s position in Kimco Realty, which owns neighborhood and community shopping centers. During the second quarter of 2013, its stock reached a multi-year high as the company successfully executed on its strategy to focus on its core business and shed lower income-producing assets. The company also benefited from a recovery in shopping center leasing, and we exited the position as the stock reached our price target. |
| | We trimmed the Fund’s position in Health Care REIT. Its stock had outperformed its peers and the industry during the Reporting Period, and the valuation gap between it and larger-cap peers had closed. Additionally, after strong performance during the second quarter of 2013 and the Reporting Period overall, we wanted to shift to an underweight exposure to the health care subsector. We thus took profits in Health Care REIT and rotated the capital into names with what we considered to be higher upside potential. |
32
PORTFOLIO RESULTS
| Q | | Were there any changes made in the Fund’s investment strategy during the Reporting Period? |
| A | | In constructing the Fund’s portfolio, we focus on picking securities rather than on making real estate subsector bets. We seek to outpace the benchmark index by overweighting stocks that we expect to outperform and underweighting those that we think may lag. Consequently, changes in its real estate subsector weights are generally the direct result of individual stock selection or of real estate securities’ appreciation or depreciation. That said, during the Reporting Period, the Fund’s exposure to the industrial subsector and to what is termed the “other” subsector increased relative to the Wilshire Index and its exposure to the office, health care and diversified subsectors decreased relative to the Wilshire Index. |
| Q | | How was the Fund positioned relative to its benchmark index at the end of the Reporting Period? |
| A | | From a subsector perspective, the Fund had an overweighted exposure compared to the Wilshire Index in the “other” subsector at the end of the Reporting Period. The Fund was underweighted compared to its benchmark index in the diversified, health care and retail subsectors and was rather neutrally weighted in the remaining real estate subsectors within the Wilshire Index. |
| Q | | What is the Fund’s tactical view and strategy for the months ahead? |
| A | | The recent increase in U.S. Treasury yields has seen the resurfacing of the question “What happens to REITS when interest rates increase?” Given the yield aspect of REITs and the price move lower toward the end of the Reporting Period, many are quick to believe interest rate sensitivity is high. However, we believe it is important to note 1) sensitivity depends on the path of the interest rate hike, both in terms of drivers and time horizon and 2) unlike bonds, REIT returns are comprised of both yield and growth. |
| | We believe the potential negatives of rising interest rates are two-fold — other yield alternatives become more attractive on a relative basis and cost of capital increases. However, while the cost of capital increased slightly toward the end of the Reporting Period, it remained attractive versus the long-term cost, in our view. Additionally, unlike bonds, we believe REIT cash flows should grow over the next few years. |
| | At the end of the Reporting Period, the main drivers of commercial real estate — supply, demand and the financing environment — were healthy, in our view, and had the potential, we believe, to remain so. The U.S. economy, population growth and household formation, the key drivers of demand for commercial real estate, have continued to improve. Employment data has been improving since 2009. The resulting improvement in demand against a backdrop of limited new construction should continue, we believe, to translate to increased occupancies, rents and, ultimately, cash flows. This positive fundamental backdrop — combined with the fact that payout ratios were at record lows at the end of the Reporting Period — gave us confidence that cash flows may continue to accelerate and, therefore, could potentially provide a hedge against inflation and a rising interest environment. (Payout ratio is the percentage of earnings that cover a dividend.) |
| | Although a spike in interest rates over a very short period of time is negative for REITs, as was the case in June 2013, we believe interest rates should move up rather steadily over the next few months. Assuming this is the case and assuming rates are rising for the right reason — that is, economic growth, then the asset class has historically performed well. Rising dividends, stemming from strong underlying fundamentals, could potentially help to offset the negative implications to cost of capital and relative yield alternatives becoming more attractive. For this reason, REITs’ correlation to fixed income has been low over the long term. |
| | We continue to believe that REITs can offer attractive risk-adjusted returns — relative to bonds in particular, given there are potential yield, diversification, inflation hedge and valuation benefits of REITs that we believe the market will grow to appreciate. |
| | As fundamental, bottom-up investors, we intend to continue to focus our approach on those companies that have recapitalized their balance sheets and that possess quality attributes, such as a robust business model, a high quality asset exposure and a strong management team. |
33
FUND BASICS
Real Estate Securities Fund
as of June 30, 2013
| | | | | | | | | | |
| | PERFORMANCE REVIEW | |
| | | January 1, 2013–June 30, 2013 | | Fund Total Return
(based on NAV)1 | | | Wilshire Real Estate
Securities Index (Gross)2 | |
| | Class A | | | 5.47 | % | | | 5.89 | % |
| | Class B | | | 5.13 | | | | 5.89 | |
| | Class C | | | 5.07 | | | | 5.89 | |
| | Institutional | | | 5.67 | | | | 5.89 | |
| | Service | | | 5.44 | | | | 5.89 | |
| | Class IR | | | 5.60 | | | | 5.89 | |
| | | Class R | | | 5.37 | | | | 5.89 | |
| | 1 | | The net asset value (“NAV”) represents the net assets of the class of the Fund (ex-dividend) divided by the total number of shares of the class outstanding. The Fund’s performance reflects the reinvestment of dividends and other distributions. The Fund’s performance does not reflect the deduction of any applicable sales charges. |
| | 2 | | The Wilshire Real Estate Securities Index (gross, with dividends reinvested) is an unmanaged market capitalization-weighted index comprised of publicly traded REITs and real estate operating companies. The figures do not reflect any fees or expenses. It is not possible to invest directly in an index. |
| | | | | | | | | | | | | | |
| | STANDARDIZED TOTAL RETURNS3 |
| | | For the period ended 6/30/13 | | One Year | | | Five Years | | Ten Years | | Since Inception | | Inception Date |
| | Class A | | | 1.06 | % | | 4.66% | | 9.48% | | 9.36% | | 7/27/98 |
| | Class B | | | 1.14 | | | 4.69 | | 9.44 | | 9.34 | | 7/27/98 |
| | Class C | | | 5.15 | | | 5.08 | | 9.30 | | 8.99 | | 7/27/98 |
| | Institutional | | | 7.37 | | | 6.31 | | 10.57 | | 10.24 | | 7/27/98 |
| | Service | | | 6.82 | | | 5.74 | | 10.00 | | 9.70 | | 7/27/98 |
| | Class IR | | | 7.21 | | | 6.12 | | N/A | | 3.64 | | 11/30/07 |
| | | Class R | | | 6.72 | | | 5.62 | | N/A | | 3.14 | | 11/30/07 |
| | 3 | | The Standardized Total Returns are average annual total returns as of the most recent calendar quarter-end. They assume reinvestment of all distributions at NAV. These returns reflect a maximum initial sales charge of 5.5% for Class A Shares, the assumed contingent deferred sales charge for Class B Shares (5% maximum declining to 0% after six years) and the assumed contingent deferred sales charge for Class C Shares (1% if redeemed within 12 months of purchase). Class B Shares convert automatically to Class A Shares on or about the fifteenth day of the last month of the calendar year that is eight years after purchase. Returns for Class B Shares for the period after the conversion reflect the performance of Class A Shares. Because Institutional, Service, Class IR and Class R Shares do not involve a sales charge, such a charge is not applied to their Standardized Total Returns. The Fund’s Class B Shares are no longer available for purchase by new or existing shareholders (although current Class B shareholders may continue to reinvest income and capital gains distributions into Class B Shares, and Class B shareholders may continue to exchange their shares for Class B Shares of certain other Goldman Sachs Funds). |
The returns set forth in the tables above represent past performance. Past performance does not guarantee future results. The Fund’s investment return and principal value will fluctuate so that an investor’s shares, when redeemed, may be worth more or less than their original cost. Current performance may be lower or higher than the performance quoted above. Please visit our web site at www.goldmansachsfunds.com to obtain the most recent month-end returns. Performance reflects applicable fee waivers and/or expense limitations in effect during the periods shown. In their absence, performance would be reduced. Returns do not reflect the deduction of taxes that a shareholder would pay on Fund distributions or the redemption of Fund shares.
34
FUND BASICS
| | | | | | | | | | |
| | EXPENSE RATIOS4 | |
| | | | | Net Expense Ratio (Current) | | | Gross Expense Ratio (Before Waivers) | |
| | Class A | | | 1.39 | % | | | 1.51 | % |
| | Class B | | | 2.14 | | | | 2.26 | |
| | Class C | | | 2.14 | | | | 2.26 | |
| | Institutional | | | 0.99 | | | | 1.11 | |
| | Service | | | 1.49 | | | | 1.61 | |
| | Class IR | | | 1.14 | | | | 1.26 | |
| | | Class R | | | 1.64 | | | | 1.76 | |
| | 4 | | The expense ratios of the Fund, both current (net of applicable fee waivers and/or expense limitations) and before waivers (gross of applicable fee waivers and/or expense limitations) are as set forth above according to the most recent publicly available Prospectus for the Fund and may differ from the expense ratios disclosed in the Financial Highlights in this report. The Fund’s waivers and/or expense limitations will remain in place through at least April 30, 2014, and prior to such date the Investment Adviser may not terminate the arrangements without the approval of the Fund’s Board of Trustees. If these arrangements are discontinued in the future, the expense ratios may change without shareholder approval. |
| | | | | | | | |
| | TOP TEN HOLDINGS AS OF 6/30/135 |
| | | Holding | | % of Total Net Assets | | | Subsectors |
| | Simon Property Group, Inc. (REIT) | | | 11.7 | % | | Retail |
| | Public Storage (REIT) | | | 5.9 | | | Self Storage |
| | AvalonBay Communities, Inc. (REIT) | | | 5.6 | | | Multifamily |
| | Ventas, Inc. (REIT) | | | 5.0 | | | Health Care |
| | Boston Properties, Inc. (REIT) | | | 4.9 | | | Commercial |
| | Prologis, Inc. (REIT) | | | 4.1 | | | Commercial |
| | SL Green Realty Corp. (REIT) | | | 3.1 | | | Commercial |
| | Digital Realty Trust, Inc. (REIT) | | | 3.0 | | | Commercial |
| | HCP, Inc. (REIT) | | | 2.9 | | | Health Care |
| | | Camden Property Trust (REIT) | | | 2.6 | | | Multifamily |
| | 5 | | The top 10 holdings may not be representative of the Fund’s future investments. |
35
FUND BASICS
|
| FUND VS. BENCHMARK SECTOR ALLOCATION6 |
| As of June 30, 2013 |
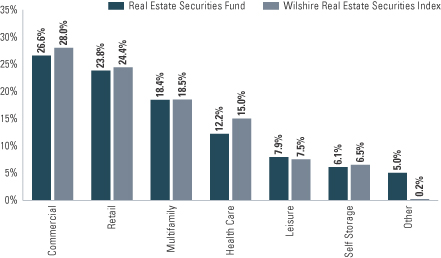
| | 6 | | The Fund is actively managed and, as such, its composition may differ over time. Consequently, the Fund’s overall industry sector allocations may differ from percentages contained in the graph above. The graph categorizes investments using Global Industry Classification Standard (“GICS”), however, the sector classifications used by the portfolio management team may differ from GICS. The percentage shown for each investment category reflects the value of investments in that category as a percentage of market value. The graph depicts the Fund’s investments but may not represent the Fund’s market exposure due to the exclusion of certain derivatives, if any, as listed in the Additional Investment Information section of the Schedule of Investments. |
36
GOLDMAN SACHS ABSOLUTE RETURN TRACKER FUND
Schedule of Investments
June 30, 2013 (Unaudited)
| | | | | | | | | | | | | | |
Principal Amount | | | Interest
Rate | | | Maturity Date | | | Value | |
| | | | | | | | | | | | | | |
| | Commodity Index Linked Structured Notes(a)(b)(c)(d)(e) – 0.7% | |
| JPMorgan Chase Bank, N.A. | | | | | |
| $ | 5,360,000 | | | | 0.174 | % | | | 05/16/14 | | | $ | 3,318,912 | |
| | 2,910,000 | | | | 0.174 | | | | 05/19/14 | | | | 1,790,523 | |
| | 440,000 | | | | 0.173 | | | | 06/23/14 | | | | 287,672 | |
| | 3,490,000 | | | | 0.176 | | | | 07/21/14 | | | | 2,969,292 | |
| UBS AG | | | | | |
| | 2,660,000 | | | | 0.045 | | | | 07/28/14 | | | | 2,777,067 | |
| | |
| TOTAL COMMODITY INDEX
LINKED STRUCTURED NOTES |
| | | | |
| | (Cost $14,860,000) | | | $ | 11,143,466 | |
| | |
| | | | | | | | |
| Shares | | | Description | | Value | |
| | | | | | | | |
| | Exchange Traded Fund –6.4% | |
| | 2,550,327 | | | Vanguard FTSE Emerging Markets Fund | | | | |
| | (Cost $100,274,437) | | $ | 98,901,681 | |
| | |
| | | | | | | | | | | | | | |
Principal Amount | | | Interest
Rate | | | Maturity
Date | | | Value | |
| | U.S. Treasury Obligations(f) – 78.0% | |
| United States Treasury Bills | | | | | |
| $ | 725,570,000 | | | | 0.000 | %(g) | | | 10/17/13 | | | $ | 725,450,266 | |
| | 475,706,000 | | | | 0.000 | | | | 10/24/13 | | | | 475,622,419 | |
| | |
| TOTAL U.S. TREASURY
OBLIGATIONS |
| | | | |
| | (Cost $1,200,972,450) | | | $ | 1,201,072,685 | |
| | |
| TOTAL INVESTMENTS BEFORE
REPURCHASE AGREEMENT |
| | | | |
| | (Cost $1,316,106,887) | | | $ | 1,311,117,832 | |
| | |
| | | | | | | | | | | | | | |
| | Repurchase Agreement(h) – 9.2% | |
| Barclays Capital, Inc. | | | | | |
| $ | 141,500,000 | | | | 0.100 | % | | | 07/01/13 | | | $ | 141,500,000 | |
| Market Value: $141,501,179 | |
| Collateralized by United States Treasury Note, 0.750%, due
03/31/18. The aggregate market value of the collateral
including accrued interest was $144,330,051. |
|
| | (Cost $141,500,000) | | | | | |
| | |
| | TOTAL INVESTMENTS – 94.3% | | | | | |
| | (Cost $1,457,606,887) | | | $ | 1,452,617,832 | |
| | |
| OTHER ASSETS IN EXCESS OF
LIABILITIES – 5.7% |
| | | 87,841,760 | |
| | |
| | NET ASSETS – 100.0% | | | $ | 1,540,459,592 | |
| | |
| | |
| The percentage shown for each investment category reflects the value of investments in that category as a percentage of net assets. |
(a) | | Variable rate security. Interest rate disclosed is that which is in effect at June 30, 2013. |
(b) | | Security is linked to the S&P GSCI Precious Metals Total Return Index (the “GSCI Precious Metals Index”). The GSCI Precious Metals Index represents an unleveraged, long-only investment in commodity futures. The GSCI Precious Metals Index is a part of a series of sub-indices calculated by Standard and Poor’s that represents components of the S&P GSCI from a number of commodity sectors. The GSCI Precious Metals Index comprises gold and silver. |
(c) | | Exempt from registration under Rule 144A of the Securities Act of 1933. Under procedures approved by the Board of Trustees, such securities have been determined to be liquid by the investment adviser and may be resold, normally to qualified institutional buyers in transactions exempt from registration. Total market value of Rule 144A securities amounts to $11,143,466, which represents approximately 0.7% of net assets as of June 30, 2013. |
(d) | | These Structured Notes take into consideration a leverage factor of 300% on the return of the underlying linked index. |
(e) | | Interest rate disclosed is contingent upon LIBOR as of June 30, 2013 minus a spread. |
(f) | | Issued with a zero coupon. Income is recognized through the accretion of discount. |
(g) | | All or a portion of security is segregated as collateral for initial margin requirements on futures transactions. |
(h) | | Unless noted, all repurchase agreements were entered into on June 30, 2013. |
| | |
|
Currency Abbreviations: |
EUR | | —Euro |
GBP | | —British Pound |
JPY | | —Japanese Yen |
USD | | —United States Dollar |
|
| | |
| The accompanying notes are an integral part of these financial statements. | | 37 |
GOLDMAN SACHS ABSOLUTE RETURN TRACKER FUND
Schedule of Investments (continued)
June 30, 2013 (Unaudited)
|
| ADDITIONAL INVESTMENT INFORMATION |
FORWARD FOREIGN CURRENCY EXCHANGE CONTRACTS — At June 30, 2013, the Fund had the following forward foreign currency exchange contracts:
FORWARD FOREIGN CURRENCY EXCHANGE CONTRACTS WITH UNREALIZED GAIN
| | | | | | | | | | | | |
| Counterparty | | Contracts to Buy/Sell | | Settlement
Date | | Current Value | | | Unrealized
Gain | |
UBS AG | | USD/EUR | | 09/18/13 | | $ | 2,552,131 | | | $ | 62,695 | |
| | USD/GBP | | 09/18/13 | | | 3,313,920 | | | | 107,315 | |
| | | USD/JPY | | 09/18/13 | | | 6,354,450 | | | | 197,403 | |
| TOTAL | | | | | | $ | 367,413 | |
FORWARD FOREIGN CURRENCY EXCHANGE CONTRACTS WITH UNREALIZED LOSS
| | | | | | | | | | | | |
| Counterparty | | Contracts to
Buy/Sell | | Settlement
Date | | Current
Value | | | Unrealized
Loss | |
UBS AG | | EUR/USD | | 09/18/13 | | $ | 45,860,244 | | | $ | (902,263 | ) |
| | GBP/USD | | 09/18/13 | | | 53,592,781 | | | | (1,269,042 | ) |
| | | JPY/USD | | 09/18/13 | | | 54,068,292 | | | | (1,450,400 | ) |
| TOTAL | | | | | | $ | (3,621,705 | ) |
FUTURES CONTRACTS — At June 30, 2013, the Fund had the following futures contracts:
| | | | | | | | | | | | | | |
| Type | | Number of
Contracts
Long (Short) | | | Expiration Date | | Current Value | | | Unrealized
Gain (Loss) | |
EURO STOXX 50 Index | | | 1,280 | | | September 2013 | | $ | 43,285,590 | | | $ | (1,379,272 | ) |
FTSE 100 Index | | | 541 | | | September 2013 | | | 50,698,913 | | | | (964,310 | ) |
Russell 2000 Mini Index | | | 1,040 | | | September 2013 | | | 101,368,800 | | | | 947,630 | |
S&P 500 E-mini Index | | | 3,695 | | | September 2013 | | | 295,470,675 | | | | (2,443,372 | ) |
TSE TOPIX Index | | | 444 | | | September 2013 | | | 50,631,579 | | | | 768,391 | |
10 Year U.S. Treasury Notes | | | (862 | ) | | September 2013 | | | (109,096,875 | ) | | | 2,477,047 | |
| TOTAL | | | | | | | | | | | | $ | (593,886 | ) |
| | |
| 38 | | The accompanying notes are an integral part of these financial statements. |
GOLDMAN SACHS COMMODITY STRATEGY FUND
Consolidated Schedule of Investments
June 30, 2013 (Unaudited)
| | | | | | | | | | | | | | |
Principal
Amount | | | Interest
Rate | | | Maturity
Date | | | Value | |
| | Mortgage-Backed Obligations – 6.0% | |
| | Collateralized Mortgage Obligations – 2.5% | |
| | Agency Multi-Family – 1.1% | |
| FHLMC Multifamily Structured Pass-Through Certificates
Series K011, Class A2 |
|
| $ | 5,500,000 | | | | 4.084 | % | | | 11/25/20 | | | $ | 5,898,443 | |
| FHLMC Multifamily Structured Pass-Through Certificates
Series KF01, Class A(a) |
|
| | 5,511,963 | | | | 0.543 | | | | 04/25/19 | | | | 5,455,174 | |
| | | | | | | | | | | | | | |
| | | | | | | | | | | | | 11,353,617 | |
| | |
| | Regular Floater(a) – 1.4% | |
| FDIC Guaranteed Notes Trust Series 2010-S1, Class 1A(b) | |
| | 325,155 | | | | 0.744 | | | | 02/25/48 | | | | 325,710 | |
| FHLMC REMIC Series 3371, Class FA | |
| | 840,548 | | | | 0.793 | | | | 09/15/37 | | | | 844,682 | |
| FNMA REMIC Series 2007-91, Class FB | |
| | 1,614,386 | | | | 0.793 | | | | 10/25/37 | | | | 1,630,801 | |
| National Credit Union Administration Guaranteed Notes
Series 2010-A1, Class A |
|
| | 810,172 | | | | 0.543 | | | | 12/07/20 | | | | 812,424 | |
| National Credit Union Administration Guaranteed Notes
Series 2010-R1, Class 1A |
|
| | 909,370 | | | | 0.643 | | | | 10/07/20 | | | | 913,349 | |
| National Credit Union Administration Guaranteed Notes
Series 2010-R2, Class 1A |
|
| | 1,383,501 | | | | 0.563 | | | | 11/06/17 | | | | 1,387,068 | |
| National Credit Union Administration Guaranteed Notes
Series 2011-R2, Class 1A |
|
| | 2,620,935 | | | | 0.593 | | | | 02/06/20 | | | | 2,629,023 | |
| National Credit Union Administration Guaranteed Notes
Series 2011-R3, Class 1A |
|
| | 1,926,664 | | | | 0.592 | | | | 03/11/20 | | | | 1,932,685 | |
| National Credit Union Administration Guaranteed Notes
Series 2011-R4, Class 1A |
|
| | 1,947,720 | | | | 0.573 | | | | 03/06/20 | | | | 1,951,296 | |
| National Credit Union Administration Guaranteed Notes
Series 2011-R5, Class 1A |
|
| | 1,691,044 | | | | 0.573 | | | | 04/06/20 | | | | 1,694,148 | |
| National Credit Union Administration Guaranteed Notes
Series 2011-R6, Class 1A |
|
| | 1,123,344 | | | | 0.573 | | | | 05/07/20 | | | | 1,124,968 | |
| | | | | | | | | | | | | | |
| | | | | | | | | | | | | 15,246,154 | |
| | |
| | Sequential Fixed Rate – 0.0% | |
| National Credit Union Administration Guaranteed Notes
Series 2010-R1, Class 2A |
|
| | 169,330 | | | | 1.840 | | | | 10/07/20 | | | | 171,315 | |
| | |
| TOTAL COLLATERALIZED
MORTGAGE OBLIGATIONS |
| | $ | 26,771,086 | |
| | |
| | Federal Agencies – 3.5% | |
| | Adjustable Rate FNMA(a) – 0.3% | |
| $ | 1,870,750 | | | | 2.550 | % | | | 05/01/33 | | | $ | 1,991,458 | |
| | 1,111,870 | | | | 2.440 | | | | 10/01/36 | | | | 1,186,538 | |
| | | | | | | | | | | | | | |
| | | | | | | | | | | | | 3,177,996 | |
| | |
| | Mortgage-Backed Obligations – (continued) | |
| | FHLMC – 0.9% | |
| $ | 942 | | | | 5.000 | % | | | 09/01/16 | | | $ | 994 | |
| | 9,215 | | | | 5.000 | | | | 11/01/16 | | | | 9,732 | |
| | 1,320 | | | | 5.000 | | | | 12/01/16 | | | | 1,394 | |
| | 15,835 | | | | 5.000 | | | | 01/01/17 | | | | 16,725 | |
| | 13,065 | | | | 5.000 | | | | 01/01/18 | | | | 13,781 | |
| | 142,037 | | | | 5.000 | | | | 02/01/18 | | | | 149,836 | |
| | 102,165 | | | | 5.000 | | | | 03/01/18 | | | | 107,948 | |
| | 62,125 | | | | 5.000 | | | | 04/01/18 | | | | 65,697 | |
| | 40,667 | | | | 5.000 | | | | 05/01/18 | | | | 43,017 | |
| | 30,730 | | | | 5.000 | | | | 06/01/18 | | | | 32,497 | |
| | 64,718 | | | | 5.000 | | | | 07/01/18 | | | | 68,545 | |
| | 21,024 | | | | 5.000 | | | | 08/01/18 | | | | 22,238 | |
| | 8,136 | | | | 5.000 | | | | 10/01/18 | | | | 8,622 | |
| | 16,608 | | | | 5.000 | | | | 11/01/18 | | | | 17,623 | |
| | 1,880 | | | | 5.000 | | | | 02/01/19 | | | | 1,991 | |
| | 292,379 | | | | 5.500 | | | | 01/01/20 | | | | 314,494 | |
| | 8,600,000 | | | | 4.000 | | | | 06/01/25 | | | | 9,001,109 | |
| | | | | | | | | | | | | | |
| | | | | | | | | | | | | 9,876,243 | |
| | |
| | FNMA – 2.3% | |
| | 73,520 | | | | 5.000 | | | | 03/01/18 | | | | 78,284 | |
| | 249,248 | | | | 5.000 | | | | 04/01/18 | | | | 265,400 | |
| | 3,804 | | | | 5.500 | | | | 01/01/19 | | | | 4,144 | |
| | 70,339 | | | | 5.500 | | | | 02/01/19 | | | | 76,435 | |
| | 63,082 | | | | 5.500 | | | | 03/01/19 | | | | 68,728 | |
| | 45,452 | | | | 5.500 | | | | 04/01/19 | | | | 49,520 | |
| | 30,296 | | | | 5.500 | | | | 05/01/19 | | | | 33,008 | |
| | 118,727 | | | | 5.500 | | | | 06/01/19 | | | | 129,352 | |
| | 390,540 | | | | 5.500 | | | | 07/01/19 | | | | 425,369 | |
| | 363,658 | | | | 5.500 | | | | 08/01/19 | | | | 396,007 | |
| | 299,415 | | | | 5.500 | | | | 09/01/19 | | | | 325,965 | |
| | 82,085 | | | | 5.500 | | | | 10/01/19 | | | | 89,431 | |
| | 107,955 | | | | 5.500 | | | | 11/01/19 | | | | 117,616 | |
| | 159,296 | | | | 5.500 | | | | 12/01/19 | | | | 173,552 | |
| | 9,704 | | | | 5.500 | | | | 01/01/20 | | | | 10,573 | |
| | 7,394 | | | | 5.500 | | | | 06/01/20 | | | | 7,984 | |
| | 1,896,740 | | | | 5.500 | | | | 07/01/20 | | | | 2,056,392 | |
| | 40,808 | | | | 6.000 | | | | 01/01/23 | | | | 44,745 | |
| | 8,449,001 | | | | 4.000 | | | | 09/01/26 | | | | 8,898,467 | |
| | 6,056 | | | | 6.000 | | | | 09/01/38 | | | | 6,568 | |
| | 30,337 | | | | 4.000 | | | | 08/01/39 | | | | 31,591 | |
| | 22,825 | | | | 4.000 | | | | 01/01/40 | | | | 23,780 | |
| | 22,478 | | | | 4.000 | | | | 08/01/40 | | | | 23,419 | |
| | 379,666 | | | | 4.500 | | | | 08/01/40 | | | | 402,085 | |
| | 68,405 | | | | 4.000 | | | | 10/01/40 | | | | 71,269 | |
| | 420,195 | | | | 4.000 | | | | 11/01/40 | | | | 437,788 | |
| | 132,254 | | | | 4.000 | | | | 12/01/40 | | | | 137,791 | |
| | 84,434 | | | | 4.000 | | | | 01/01/41 | | | | 87,969 | |
| | 106,343 | | | | 4.000 | | | | 02/01/41 | | | | 110,819 | |
| | 167,090 | | | | 4.000 | | | | 03/01/41 | | | | 174,123 | |
| | 33,813 | | | | 4.000 | | | | 05/01/41 | | | | 35,236 | |
| | 724,423 | | | | 6.000 | | | | 05/01/41 | | | | 787,725 | |
| | 182,377 | | | | 4.000 | | | | 08/01/41 | | | | 190,053 | |
| | 375,591 | | | | 4.500 | | | | 08/01/41 | | | | 398,113 | |
| | 97,052 | | | | 4.000 | | | | 09/01/41 | | | | 101,137 | |
| | 728,958 | | | | 4.500 | | | | 09/01/41 | | | | 772,668 | |
| | |
| | |
| The accompanying notes are an integral part of these financial statements. | | 39 |
GOLDMAN SACHS COMMODITY STRATEGY FUND
Consolidated Schedule of Investments (continued)
June 30, 2013 (Unaudited)
| | | | | | | | | | | | | | |
Principal
Amount | | | Interest
Rate | | | Maturity
Date | | | Value | |
| | Mortgage-Backed Obligations – (continued) | |
| | FNMA – (continued) | |
| $ | 40,779 | | | | 4.000 | % | | | 10/01/41 | | | $ | 42,495 | |
| | 97,606 | | | | 4.500 | | | | 10/01/41 | | | | 103,459 | |
| | 14,033 | | | | 4.000 | | | | 11/01/41 | | | | 14,623 | |
| | 106,524 | | | | 4.000 | | | | 01/01/42 | | | | 111,380 | |
| | 46,290 | | | | 4.000 | | | | 02/01/42 | | | | 48,401 | |
| | 1,000,000 | | | | 4.000 | | | | TBA-30yr | (c) | | | 1,042,109 | |
| | 2,000,000 | | | | 4.500 | | | | TBA-30yr | (c) | | | 2,117,344 | |
| | 1,000,000 | | | | 3.000 | | | | TBA-30yr | (c) | | | 977,813 | |
| | 3,000,000 | | | | 6.000 | | | | TBA-30yr | (c) | | | 3,263,203 | |
| | | | | | | | | | | | | | |
| | | | | | | | | | | | | 24,763,933 | |
| | |
| | TOTAL FEDERAL AGENCIES | | | $ | 37,818,172 | |
| | |
| | TOTAL MORTGAGE-BACKED OBLIGATIONS | |
| | (Cost $65,184,047) | | | $ | 64,589,258 | |
| | |
| | | | | | | | | | | | | | |
| | Asset-Backed Securities – 0.0% | |
| | Home Equity – 0.0% | |
| GMAC Mortgage Corp. Loan Trust Series 2007-HE3, Class 1A1 | |
| $ | 120,463 | | | | 7.000 | % | | | 09/25/37 | | | $ | 115,856 | |
| GMAC Mortgage Corp. Loan Trust Series 2007-HE3, Class 2A1 | |
| | 175,445 | | | | 7.000 | | | | 09/25/37 | | | | 164,305 | |
| | |
| | TOTAL ASSET-BACKED SECURITIES | |
| | (Cost $296,463) | | | $ | 280,161 | |
| | |
| | | | | | | | | | | | | | |
| | U.S. Treasury Obligations – 48.9% | |
| United States Treasury Bonds | |
| $ | 2,500,000 | | | | 3.125 | % | | | 02/15/42 | | | $ | 2,339,200 | |
| | 1,700,000 | | | | 3.125 | | | | 02/15/43 | | | | 1,585,624 | |
| | 3,400,000 | | | | 2.875 | | | | 05/15/43 | | | | 3,008,218 | |
| United States Treasury Inflation-Protected Securities | |
| | 50,389,188 | | | | 1.875 | | | | 07/15/13 | | | | 50,467,795 | |
| | 140,444,136 | | | | 2.000 | | | | 01/15/14 | | | | 142,484,789 | |
| | 48,125,250 | | | | 1.250 | | | | 04/15/14 | | | | 48,817,291 | |
| | 51,071,454 | | | | 2.000 | | | | 07/15/14 | | | | 52,763,451 | |
| | 20,093,535 | | | | 1.625 | | | | 01/15/15 | | | | 20,906,721 | |
| | 37,298,664 | | | | 1.875 | | | | 07/15/15 | | | | 39,658,924 | |
| | 7,023,662 | | | | 2.500 | | | | 07/15/16 | | | | 7,774,351 | |
| United States Treasury Notes | |
| | 20,200,000 | | | | 0.375 | (d) | | | 07/31/13 | | | | 20,204,037 | |
| | 25,500,000 | | | | 0.500 | | | | 10/15/13 | | | | 25,527,797 | |
| | 49,800,000 | | | | 2.750 | | | | 10/31/13 | | | | 50,235,750 | |
| | 4,900,000 | | | | 0.875 | | | | 01/31/17 | | | | 4,892,013 | |
| | 3,200,000 | | | | 0.625 | | | | 09/30/17 | | | | 3,128,160 | |
| | 7,500,000 | | | | 0.750 | | | | 02/28/18 | | | | 7,314,600 | |
| | 6,600,000 | | | | 0.750 | | | | 03/31/18 | | | | 6,422,394 | |
| | 6,500,000 | | | | 0.625 | | | | 04/30/18 | | | | 6,279,910 | |
| | 9,000,000 | | | | 1.000 | | | | 05/31/18 | | | | 8,842,860 | |
| | 6,000,000 | | | | 1.375 | | | | 06/30/18 | | | | 5,995,800 | |
| | 5,500,000 | | | | 1.250 | | | | 02/29/20 | | | | 5,293,530 | |
| | 4,800,000 | | | | 1.125 | | | | 04/30/20 | | | | 4,563,648 | |
| | 4,500,000 | | | | 1.375 | | | | 05/31/20 | | | | 4,341,780 | |
| | |
| | U.S. Treasury Obligations – (continued) | |
| United States Treasury Notes (continued) | |
| $ | 3,600,000 | | | | 1.875 | % | | | 06/30/20 | | | $ | 3,586,068 | |
| | |
| | TOTAL U.S. TREASURY OBLIGATIONS | |
| | (Cost $529,939,115) | | | $ | 526,434,711 | |
| | |
| | | | | | | | |
| Shares | | Rate | | | Value | |
| Short-Term Investment(a) – 30.4% | |
JPMorgan U.S. Government Money Market Fund — Capital Shares | |
| 327,600,662 | | | 0.010 | % | | $ | 327,600,662 | |
| (Cost $327,600,662) | | | | | |
| |
| TOTAL INVESTMENTS – 85.3% | |
| (Cost $923,020,287) | | | $ | 918,904,792 | |
| |
OTHER ASSETS IN EXCESS OF LIABILITIES – 14.7% | | | | 158,982,639 | |
| |
| NET ASSETS – 100.0% | | | $ | 1,077,887,431 | |
| |
| | |
| The percentage shown for each investment category reflects the value of investments in that category as a percentage of net assets. |
(a) | | Variable rate security. Interest rate disclosed is that which is in effect at June 30, 2013. |
(b) | | Exempt from registration under Rule 144A of the Securities Act of 1933. Under procedures approved by the Board of Trustees, such securities have been determined to be liquid by the investment adviser and may be resold, normally to qualified institutional buyers in transactions exempt from registration. Total market value of Rule 144A securities amounts to $325,710, which represents approximately 0.0% of net assets as of June 30, 2013. |
(c) | | TBA (To Be Announced) Securities are purchased/sold on a forward commitment basis with an approximate principal amount and no defined maturity date. The actual principal and maturity date will be determined upon settlement when the specific mortgage pools are assigned. Total market value of TBA securities (excluding forward sales contracts, if any) amounts to $7,400,469 which represents approximately 0.7% of net assets as of June 30, 2013. |
(d) | | All or a portion of security is segregated as collateral for initial margin requirements on futures transactions. |
| | |
|
Investment Abbreviations: |
FDIC | | —Federal Deposit Insurance Corp. |
FHLMC | | —Federal Home Loan Mortgage Corp. |
FNMA | | —Federal National Mortgage Association |
LIBOR | | —London Interbank Offered Rate |
REMIC | | —Real Estate Mortgage Investment Conduit |
|
| | |
| 40 | | The accompanying notes are an integral part of these financial statements. |
GOLDMAN SACHS COMMODITY STRATEGY FUND
|
| ADDITIONAL INVESTMENT INFORMATION |
FORWARD SALES CONTRACTS — At June 30, 2013, the Fund had the following forward sales contracts:
| | | | | | | | | | | | | | |
| Description | | Interest
Rate | | Maturity
Date(c) | | Settlement
Date | | Principal Amount | | | Value | |
FNMA (Proceeds Receivable: $1,068,125) | | 4.500% | | TBA-30yr | | 08/12/13 | | $ | (1,000,000 | ) | | $ | (1,056,641 | ) |
FUTURES CONTRACTS — At June 30, 2013, the Fund had the following futures contracts:
| | | | | | | | | | | | | | |
| Type | | Number of
Contracts Long (Short) | | | Expiration Date | | Current Value | | | Unrealized
Gain (Loss) | |
U.S. Long Bond | | | (88 | ) | | September 2013 | | $ | (11,954,250 | ) | | $ | 422,461 | |
U.S. Ultra Long Treasury Bonds | | | 60 | | | September 2013 | | | 8,838,750 | | | | (321,447 | ) |
2 Year U.S. Treasury Notes | | | (598 | ) | | September 2013 | | | (131,560,000 | ) | | | 159,843 | |
5 Year U.S. Treasury Notes | | | (198 | ) | | September 2013 | | | (23,967,281 | ) | | | 224,101 | |
10 Year U.S. Treasury Notes | | | 23 | | | September 2013 | | | 2,910,938 | | | | (65,983 | ) |
| TOTAL | | | | | | | | | | | | $ | 418,975 | |
SWAP CONTRACTS — At June 30, 2013, the Fund had the following swap contracts:
CENTRALLY CLEARED INTEREST RATE SWAP CONTRACTS
| | | | | | | | | | | | | | | | | | |
| | | | | | Rates Exchanged | | Market Value | |
Notional Amount (000’s) | | | Termination
Date | | Payments Received | | | Payments Made | | Upfront
Payments
Made (Received) | | | Unrealized
Gain (Loss) | |
| $ | 14,000 | (a) | | 12/18/18 | | | 3 Month LIBOR | | | 1.000% | | $ | 214,803 | | | $ | 362,109 | |
| | 31,100 | (a) | | 12/18/20 | | | 3 Month LIBOR | | | 1.500 | | | 668,947 | | | | 1,150,748 | |
| | 3,700 | (a) | | 12/18/28 | | | 3 Month LIBOR | | | 2.500 | | | 151,203 | | | | 215,462 | |
| | 100 | | | 06/19/43 | | | 2.750% | | | 3 Month LIBOR | | | (9,852 | ) | | | (3,781 | ) |
| | 2,600 | (a) | | 12/18/43 | | | 3 Month LIBOR | | | 3.000 | | | 2,967 | | | | 260,478 | |
| | TOTAL | | | | | | | | | | | $ | 1,028,068 | | | $ | 1,985,016 | |
| | (a) | | Represents forward starting interest rate swaps whose effective dates of commencement of accruals and cash flows occur subsequent to June 30, 2013. |
| | |
| The accompanying notes are an integral part of these financial statements. | | 41 |
GOLDMAN SACHS COMMODITY STRATEGY FUND
Consolidated Schedule of Investments (continued)
June 30, 2013 (Unaudited)
|
| ADDITIONAL INVESTMENT INFORMATION (continued) |
OVER THE COUNTER INTEREST RATE SWAP CONTRACTS
| | | | | | | | | | | | | | | | | | | | |
| | | | | | | | | Rates Exchanged | | Market Value | |
| Counterparty | | Notional
Amount
(000’s) | | | Termination
Date | | | Payments Received | | Payments
Made | | Upfront
Payments
Made (Received) | | | Unrealized
Gain (Loss) | |
Credit Suisse International | | $ | 21,000 | | | | 05/31/17 | | | 3 Month LIBOR | | 0.700% | | $ | (20,177 | ) | | $ | 385,775 | |
TOTAL RETURN SWAP CONTRACTS ON COMMODITY INDICES(a)
| | | | | | | | | | | | | | | | | | |
| Counterparty | | Referenced Obligation | | Notional
Amount
(000’s) | | | Rate
Paid | | | Termination
Date | | | Unrealized
Gain (Loss)(b) | |
Deutsche Bank AG | | S&P GSCI Excess Return Index | | $ | 9,126 | | | | 0.370 | % | | | 10/09/13 | | | $ | (22,980 | ) |
| | | | | 10,469 | | | | 0.250 | | | | 10/09/13 | | | | (26,363 | ) |
| | | | | 13,542 | | | | 0.250 | | | | 10/09/13 | | | | (34,102 | ) |
| | | | | 288,630 | | | | 0.250 | | | | 10/09/13 | | | | (726,822 | ) |
Merrill Lynch International | | S&P GSCI Excess Return Index | | | 295,273 | | | | 0.250 | | | | 12/20/13 | | | | (3,155,394 | ) |
UBS AG | | S&P GSCI Excess Return Index | | | 476,651 | | | | 0.270 | | | | 06/16/14 | | | | (16,501,326 | ) |
| TOTAL | | | | | | | | | | | | | | | | $ | (20,466,987 | ) |
| | (a) | | The Fund receives quarterly payments based on any positive monthly return of the Referenced Obligation. The Fund makes payments on any negative monthly return of such Referenced Obligation. |
| | (b) | | There are no upfront payments on the swap contracts listed above, therefore the unrealized gains (losses) on the swap contracts are equal to their market value. |
| | |
| 42 | | The accompanying notes are an integral part of these financial statements. |
GOLDMAN SACHS DYNAMIC ALLOCATION FUND
Schedule of Investments
June 30, 2013 (Unaudited)
| | | | | | | | | | | | | | |
Principal
Amount | | | Interest
Rate | | | Maturity
Date | | | Value | |
| | | | | | | | | | | | | | |
| | Commodity Index Linked Structured Notes(a)(b)(c)(d)(e) – 2.6% | |
| Canadian Imperial Bank of Commerce | |
| $ | 35,100,000 | | | | 0.043 | % | | | 03/10/14 | | | $ | 21,400,470 | |
| | UBS AG | | | | | | | | | | | | | |
| | 2,080,000 | | | | 0.093 | | | | 01/14/14 | | | | 1,256,917 | |
| | 15,200,000 | | | | 0.095 | | | | 05/05/14 | | | | 10,321,790 | |
| | |
| TOTAL COMMODITY INDEX LINKED
STRUCTURED NOTES |
| | | | |
| | (Cost $52,380,000) | | | $ | 32,979,177 | |
| | |
| | | | | | | | |
| Shares | | | Description | | Value | |
| | | | | | | | |
| | Exchange Traded Funds – 5.1% | |
| | 544,368 | | | iShares MSCI Emerging Markets Index Fund | | $ | 20,996,274 | |
| | 439,438 | | | iShares Russell 2000 Index Fund | | | 42,695,796 | |
| | |
| | TOTAL EXCHANGE TRADED FUNDS | | | | |
| | (Cost $54,658,483) | | $ | 63,692,070 | |
| | |
| | | | | | | | | | | | | | |
Principal
Amount | | | Interest
Rate | | | Maturity
Date | | | Value | |
| | | | | | | | | | | | | | |
| | U.S. Treasury Obligation(f) – 8.9% | |
| United States Treasury Inflation Indexed Notes | |
| $ | 115,357,374 | | | | 0.125 | % | | | 01/15/23 | | | $ | 111,950,871 | |
| | (Cost $122,472,661) | | | | | |
| | |
| | | | | | | | |
| Shares | | Rate | | | Value | |
| | | | | | | | |
| Short-Term Investment(a) – 74.3% | |
JPMorgan U.S. Government Money Market Fund — Capital Shares | |
| 934,776,452 | | | 0.010 | % | | $ | 934,776,452 | |
| (Cost $934,776,452) | |
| |
| TOTAL INVESTMENTS – 90.9% | | | | | |
| (Cost $1,164,287,596) | | | $ | 1,143,398,570 | |
| |
OTHER ASSETS IN EXCESS OF LIABILITIES – 9.1% | | | | 114,167,893 | |
| |
| NET ASSETS – 100.0% | | | $ | 1,257,566,463 | |
| |
| | |
| The percentage shown for each investment category reflects the value of investments in that category as a percentage of net assets. |
(a) | | Variable rate security. Interest rate disclosed is that which is in effect at June 30, 2013. |
(b) | | These Structured Notes take into consideration a leverage factor of 300% on the return of the underlying linked index. |
(c) | | Security is linked to the Dow Jones-UBS Commodity Index Total Return (the “DJ-UBSCI Total Return”). The DJ-UBSCI Total Return is a composite of commodity sector returns, representing an unleveraged, long-only investment in commodity futures that is diversified across the spectrum of commodities. The DJ-UBSCI Total Return is composed of nineteen commodities in eight diverse sectors: energy, petroleum, precious metals, industrial metals, grains, livestock, softs, and agriculture. |
(d) | | Interest rate disclosed is contingent upon LIBOR as of June 30, 2013 minus a spread. |
(e) | | Exempt from registration under Rule 144A of the Securities Act of 1933. Under procedures approved by the Board of Trustees, such securities have been determined to be liquid by the investment adviser and may be resold, normally to qualified institutional buyers in transactions exempt from registration. Total market value of Rule 144A securities amounts to $32,979,177, which represents approximately 2.6% of net assets as of June 30, 2013. |
(f) | | All or a portion of security is segregated as collateral for initial margin requirements on futures transactions. |
| | |
| The accompanying notes are an integral part of these financial statements. | | 43 |
GOLDMAN SACHS DYNAMIC ALLOCATION FUND
Schedule of Investments (continued)
June 30, 2013 (Unaudited)
|
| ADDITIONAL INVESTMENT INFORMATION |
FUTURES CONTRACTS — At June 30, 2013, the Fund had the following futures contracts:
| | | | | | | | | | | | | | |
| Type | | Number of
Contracts
Long (Short) | | | Expiration
Date | | Current
Value | | | Unrealized
Gain (Loss) | |
Amsterdam Index | | | 200 | | | July 2013 | | $ | 17,952,357 | | | $ | 449,905 | |
CAC 40 Index | | | 184 | | | July 2013 | | | 8,944,262 | | | | (241,243 | ) |
DAX Index | | | 185 | | | September 2013 | | | 47,959,375 | | | | (1,495,121 | ) |
Euro-Bund | | | (695 | ) | | September 2013 | | | (128,025,607 | ) | | | (938,278 | ) |
FTSE 100 Index | | | 325 | | | September 2013 | | | 30,456,833 | | | | (665,294 | ) |
FTSE/MIB Index | | | (162 | ) | | September 2013 | | | (16,091,284 | ) | | | (225,583 | ) |
Hang Seng Index | | | 17 | | | July 2013 | | | 2,271,730 | | | | 88,365 | |
IBEX 35 Index | | | (182 | ) | | July 2013 | | | (18,167,647 | ) | | | (414,968 | ) |
Long Gilt | | | 605 | | | September 2013 | | | 102,967,553 | | | | (3,714,143 | ) |
MSCI Singapore Index | | | (86 | ) | | July 2013 | | | (4,795,645 | ) | | | (69,313 | ) |
OMX Stockholm 30 Index | | | (1,181 | ) | | July 2013 | | | (20,256,859 | ) | | | (335,068 | ) |
S&P 500 E-mini Index | | | 1,848 | | | September 2013 | | | 147,775,320 | | | | (840,498 | ) |
S&P/TSX 60 Index | | | (90 | ) | | September 2013 | | | (11,857,374 | ) | | | (117,038 | ) |
SPI 200 Index | | | 12 | | | September 2013 | | | 1,308,447 | | | | 15,553 | |
TSE TOPIX Index | | | 511 | | | September 2013 | | | 58,271,930 | | | | 864,226 | |
10 Year Australian Bonds | | | 48 | | | September 2013 | | | 5,197,132 | | | | 46,167 | |
10 Year Canadian Government Bonds | | | 68 | | | September 2013 | | | 8,496,606 | | | | (274,042 | ) |
10 Year Japanese Government Bonds | | | 25 | | | September 2013 | | | 35,969,954 | | | | 131,635 | |
10 Year U.S. Treasury Notes | | | 2,903 | | | September 2013 | | | 367,410,938 | | | | (7,410,491 | ) |
| TOTAL | | | | | | | | | | | | $ | (15,145,229 | ) |
SWAP CONTRACTS — At June 30, 2013, the Fund had the following swap contracts:
CENTRALLY CLEARED CREDIT DEFAULT SWAP CONTRACTS
| | | | | | | | | | | | | | | | | | | | | | | | |
| | | | | | | | | | | | | | | Market Value | |
| Referenced Obligation | | Notional Amount
(000’s) | | | Rates Received
(Paid) | | | Termination
Date | | | Credit
Spread at
June 30,
2013(a) | | | Upfront
Payments
Made (Received) | | | Unrealized
Gain (Loss) | |
Protection Purchased: | | | | | | | | | | | | | | | | | | | | | | | | |
Markit CDX Emerging Markets Index | | $ | 7,300 | | | | 5.000 | % | | | 06/20/18 | | | | 3.200 | % | | $ | (363,695 | ) | | $ | (232,297 | ) |
Protection Sold: | | | | | | | | | | | | | | | | | | | | | | | | |
Markit CDX Emerging Markets Index | | | 53,500 | | | | (5.000 | ) | | | 06/20/18 | | | | 3.200 | | | | 4,890,212 | | | | (522,322 | ) |
| TOTAL | | | | | | | | | | | | | | | | | | $ | 4,526,517 | | | $ | (754,619 | ) |
| | (a) | | Credit spread on the Referenced Obligation, together with the period of expiration, are indicators of payment/performance risk. The likelihood of a credit event occurring which would require a fund to make a payment or otherwise be required to perform under the swap contract is generally greater as the credit spread and term of the swap contract increase. |
| | |
| 44 | | The accompanying notes are an integral part of these financial statements. |
GOLDMAN SACHS INTERNATIONAL REAL ESTATE SECURITIES FUND
Schedule of Investments
June 30, 2013 (Unaudited)
| | | | | | | | |
Shares | | | Description | | Value | |
| | | | | | | | |
| | Common Stocks – 98.6% | |
| | Australia – 14.2% | |
| | 2,463,900 | | | CFS Retail Property Trust Group (REIT) (Retail) | | $ | 4,492,106 | |
| | 436,411 | | | Charter Hall Group (REIT) (Diversified) | | | 1,539,491 | |
| | 7,303,865 | | | Commonwealth Property Office Fund (REIT) (Office) | | | 7,320,030 | |
| | 2,195,233 | | | GPT Group (REIT) (Diversified) | | | 7,708,170 | |
| | 4,874,639 | | | Mirvac Group (REIT) (Diversified) | | | 7,136,461 | |
| | 2,271,791 | | | Stockland (REIT) (Diversified) | | | 7,228,534 | |
| | 1,025,533 | | | Westfield Group (REIT) (Retail) | | | 10,741,056 | |
| | 2,662,049 | | | Westfield Retail Trust (REIT) (Retail) | | | 7,528,512 | |
| | | | | | | | |
| | | | | | | 53,694,360 | |
| | |
| | Canada – 7.3% | |
| | 106,300 | | | Allied Properties Real Estate Investment Trust (REIT) (Office) | | | 3,235,393 | |
| | 31,400 | | | Boardwalk Real Estate Investment Trust (REIT) (Residential) | | | 1,740,331 | |
| | 170,400 | | | Brookfield Office Properties, Inc. (Office) | | | 2,833,789 | |
| | 130,200 | | | Calloway Real Estate Investment Trust (REIT) (Retail) | | | 3,182,887 | |
| | 71,700 | | | Canadian Apartment Properties Real Estate Investment Trust (REIT) (Residential) | | | 1,544,171 | |
| | 48,900 | | | Canadian Real Estate Investment Trust (REIT) (Diversified) | | | 2,024,907 | |
| | 110,100 | | | Dundee Real Estate Investment Trust Series A (REIT) (Office) | | | 3,417,005 | |
| | 175,300 | | | H&R Real Estate Investment Trust (REIT) (Diversified) | | | 3,673,683 | |
| | 236,800 | | | RioCan Real Estate Investment Trust (REIT) (Retail) | | | 5,689,775 | |
| | | | | | | | |
| | | | | | | 27,341,941 | |
| | |
| | China – 4.0% | |
| | 39,270,000 | | | Shenzhen International Holdings Ltd. (Industrial) | | | 4,836,837 | |
| | 5,294,000 | | | Shimao Property Holdings Ltd. (Diversified) | | | 10,413,961 | |
| | | | | | | | |
| | | | | | | 15,250,798 | |
| | |
| | Finland – 0.7% | |
| | 806,882 | | | Citycon Oyj (Retail) | | | 2,507,188 | |
| | |
| | France – 2.1% | |
| | 198,631 | | | Klepierre (REIT) (Retail) | | | 7,827,930 | |
| | 134 | | | Societe Immobiliere de Location pour l’Industrie et le Commerce (REIT) (Office) | | | 13,846 | |
| | | | | | | | |
| | | | | | | 7,841,776 | |
| | |
| | Germany – 2.2% | |
| | 68,943 | | | Deutsche Euroshop AG (Retail) | | | 2,739,983 | |
| | 336,924 | | | Deutsche Wohnen AG (Residential) | | | 5,711,715 | |
| | | | | | | | |
| | | | | | | 8,451,698 | |
| | |
| | | | | | | | |
| | Common Stocks – (continued) | |
| | Hong Kong – 15.5% | |
| | 1,956,500 | | | Henderson Land Development Co. Ltd. (Diversified) | | $ | 11,619,418 | |
| | 349,000 | | | Hongkong Land Holdings Ltd. (Office) | | | 2,391,394 | |
| | 19,456,000 | | | Kingway Brewery Holdings Ltd. (Retail) | | | 7,010,870 | |
| | 1,809,475 | | | Sun Hung Kai Properties Ltd. (Diversified) | | | 23,237,357 | |
| | 2,874,000 | | | The Link Real Estate Investment Trust (REIT) (Retail) | | | 14,104,669 | |
| | | | | | | | |
| | | | | | | 58,363,708 | |
| | |
| | Japan – 25.9% | |
| | 3,049 | | | Advance Residence Investment Corp. (REIT) (Residential) | | | 6,610,190 | |
| | 829,000 | | | Mitsubishi Estate Co. Ltd. (Diversified) | | | 22,071,196 | |
| | 1,025,000 | | | Mitsui Fudosan Co. Ltd. (Office) | | | 30,135,050 | |
| | 423 | | | Nippon Building Fund, Inc. (REIT) (Office) | | | 4,898,976 | |
| | 390 | | | Nippon Prologis Real Estate Investment Trust, Inc. (REIT) (Office) | | | 3,384,128 | |
| | 328,100 | | | Nomura Real Estate Holdings, Inc. (Diversified) | | | 7,247,634 | |
| | 7,745 | | | Orix JREIT, Inc. (REIT) (Office) | | | 8,840,073 | |
| | 2,064,000 | | | Sapporo Holdings Ltd. (Diversified) | | | 7,574,752 | |
| | 5,202 | | | United Urban Investment Corp. (REIT) (Diversified) | | | 7,022,732 | |
| | | | | | | | |
| | | | | | | 97,784,731 | |
| | |
| | Malaysia – 1.6% | |
| | 6,013,500 | | | UEM Sunrise Bhd (Diversified) | | | 5,916,193 | |
| | |
| | Netherlands – 6.3% | |
| | 51,932 | | | Corio NV (REIT) (Retail) | | | 2,066,801 | |
| | 93,247 | | | Unibail-Rodamco SE (REIT) (Diversified) | | | 21,717,720 | �� |
| | | | | | | | |
| | | | | | | 23,784,521 | |
| | |
| | Singapore – 4.8% | |
| | 9,855,000 | | | Cache Logistics Trust (REIT) (Industrial) | | | 9,694,910 | |
| | 8,252,000 | | | Keppel Real Estate Investment Trust (REIT) (Office) | | | 8,412,567 | |
| | | | | | | | |
| | | | | | | 18,107,477 | |
| | |
| | Sweden – 0.8% | |
| | 298,924 | | | Fabege AB (Diversified) | | | 2,940,322 | |
| | |
| | Switzerland – 1.9% | |
| | 83,423 | | | PSP Swiss Property AG (Registered) (Office)* | | | 7,223,772 | |
| | |
| | United Kingdom – 11.3% | |
| | 496,754 | | | Big Yellow Group PLC (REIT) (Industrial) | | | 2,912,205 | |
| | |
| | |
| The accompanying notes are an integral part of these financial statements. | | 45 |
GOLDMAN SACHS INTERNATIONAL REAL ESTATE SECURITIES FUND
Schedule of Investments (continued)
June 30, 2013 (Unaudited)
| | | | | | | | |
Shares | | | Description | | Value | |
| | | | | | | | |
| | Common Stocks – (continued) | |
| | United Kingdom – (continued) | |
| | 1,255,908 | | | British Land Co. PLC (REIT) (Diversified) | | $ | 10,819,133 | |
| | 999,527 | | | Capital & Counties Properties PLC (Retail) | | | 4,975,804 | |
| | 120,164 | | | Derwent London PLC (REIT) (Office) | | | 4,200,268 | |
| | 537,523 | | | Great Portland Estates PLC (REIT) (Office) | | | 4,338,118 | |
| | 1,151,537 | | | Hammerson PLC (REIT) (Retail) | | | 8,538,275 | |
| | 287,911 | | | Land Securities Group PLC (REIT) (Diversified) | | | 3,866,858 | |
| | 498,499 | | | Unite Group PLC (Residential) | | | 2,750,116 | |
| | | | | | | | |
| | | | | | | 42,400,777 | |
| | |
| | TOTAL INVESTMENTS – 98.6% | | | | |
| | (Cost $316,856,093) | | $ | 371,609,262 | |
| | |
| OTHER ASSETS IN EXCESS OF
LIABILITIES – 1.4% | | | 5,171,336 | |
| | |
| | NET ASSETS – 100.0% | | $ | 376,780,598 | |
| | |
| | |
| The percentage shown for each investment category reflects the value of investments in that category as a percentage of net assets. |
* | | Non-income producing security. |
| | |
|
Investment Abbreviation: |
REIT | | —Real Estate Investment Trust |
|
| | |
| 46 | | The accompanying notes are an integral part of these financial statements. |
GOLDMAN SACHS MANAGED FUTURES STRATEGY FUND
Schedule of Investments
June 30, 2013 (Unaudited)
| | | | | | | | |
| | | | | | |
Value | |
| | | | | | | | |
No reportable securities. | |
| |
| TOTAL INVESTMENTS – 0.0% | | $ | — | |
| |
OTHER ASSETS IN EXCESS OF
LIABILITIES – 100.0% | | | 27,472,717 | |
| |
| NET ASSETS – 100.0% | | $ | 27,472,717 | |
| |
|
| ADDITIONAL INVESTMENT INFORMATION |
FORWARD FOREIGN CURRENCY EXCHANGE CONTRACTS — At June 30, 2013, the Fund had the following forward foreign currency exchange contracts:
FORWARD FOREIGN CURRENCY EXCHANGE CONTRACTS WITH UNREALIZED GAIN
| | | | | | | | | | | | | | |
| Counterparty | | Contracts to
Buy/Sell | | Settlement
Date | | | Current
Value | | | Unrealized
Gain | |
Morgan Stanley Co., Inc. | | BRL/USD | | | 07/02/13 | | | $ | 313,711 | | | $ | 3,067 | |
| | CLP/USD | | | 09/23/13 | | | | 19,422 | | | | 132 | |
| | COP/USD | | | 09/18/13 | | | | 68,146 | | | | 488 | |
| | HUF/USD | | | 09/18/13 | | | | 245,194 | | | | 387 | |
| | IDR/USD | | | 09/18/13 | | | | 139,653 | | | | 4,429 | |
| | INR/USD | | | 09/18/13 | | | | 33,054 | | | | 159 | |
| | KRW/USD | | | 09/23/13 | | | | 17,440 | | | | 193 | |
| | NZD/USD | | | 09/18/13 | | | | 46,233 | | | | 249 | |
| | RUB/USD | | | 09/18/13 | | | | 15,027 | | | | 21 | |
| | TRY/USD | | | 09/18/13 | | | | 30,726 | | | | 179 | |
| | USD/AUD | | | 09/18/13 | | | | 445,522 | | | | 12,863 | |
| | USD/BRL | | | 07/02/13 | | | | 537,791 | | | | 25,840 | |
| | USD/CAD | | | 09/18/13 | | | | 894,915 | | | | 28,187 | |
| | USD/CHF | | | 09/18/13 | | | | 174,811 | | | | 3,671 | |
| | USD/CLP | | | 09/23/13 | | | | 155,375 | | | | 1,187 | |
| | USD/COP | | | 09/18/13 | | | | 420,231 | | | | 5,619 | |
| | USD/CZK | | | 09/18/13 | | | | 380,426 | | | | 8,549 | |
| | USD/EUR | | | 09/18/13 | | | | 1,668,000 | | | | 29,804 | |
| | USD/GBP | | | 09/18/13 | | | | 1,558,151 | | | | 43,411 | |
| | USD/HUF | | | 09/18/13 | | | | 17,514 | | | | 96 | |
| | USD/IDR | | | 09/18/13 | | | | 576,067 | | | | 11,180 | |
| | USD/INR | | | 09/18/13 | | | | 347,063 | | | | 4,588 | |
| | USD/JPY | | | 09/18/13 | | | | 433,828 | | | | 10,947 | |
| | USD/KRW | | | 09/23/13 | | | | 191,843 | | | | 4,973 | |
| | USD/MXN | | | 09/18/13 | | | | 95,786 | | | | 605 | |
| | USD/MYR | | | 09/18/13 | | | | 225,605 | | | | 2,573 | |
| | USD/NOK | | | 09/18/13 | | | | 369,359 | | | | 17,802 | |
| | USD/NZD | | | 09/18/13 | | | | 254,284 | | | | 4,601 | |
| | USD/PLN | | | 09/18/13 | | | | 314,456 | | | | 2,627 | |
| | USD/RUB | | | 09/18/13 | | | | 90,163 | | | | 1,158 | |
| | USD/SEK | | | 09/18/13 | | | | 570,697 | | | | 11,885 | |
| | USD/TRY | | | 09/18/13 | | | | 271,409 | | | | 5,416 | |
| | |
| The accompanying notes are an integral part of these financial statements. | | 47 |
GOLDMAN SACHS MANAGED FUTURES STRATEGY FUND
Schedule of Investments (continued)
June 30, 2013 (Unaudited)
|
| ADDITIONAL INVESTMENT INFORMATION (continued) |
FORWARD FOREIGN CURRENCY EXCHANGE CONTRACTS WITH UNREALIZED GAIN (continued)
| | | | | | | | | | | | | | |
| Counterparty | | Contracts to
Buy/Sell | | Settlement
Date | | | Current
Value | | | Unrealized
Gain | |
| | | ZAR/USD | | | 09/18/13 | | | $ | 42,001 | | | $ | 429 | |
| TOTAL | | | | | | | $ | 247,315 | |
FORWARD FOREIGN CURRENCY EXCHANGE CONTRACTS WITH UNREALIZED LOSS
| | | | | | | | | | | | | | |
| Counterparty | | Contracts to
Buy/Sell | | Settlement
Date | | | Current
Value | | | Unrealized
Loss | |
Morgan Stanley Co., Inc. | | AUD/USD | | | 09/18/13 | | | $ | 127,292 | | | $ | (1,130 | ) |
| | BRL/USD | | | 07/02/13 | | | | 224,080 | | | | (15,254 | ) |
| | CAD/USD | | | 09/18/13 | | | | 313,172 | | | | (4,770 | ) |
| | CHF/USD | | | 09/18/13 | | | | 190,704 | | | | (4,589 | ) |
| | CLP/USD | | | 09/23/13 | | | | 19,422 | | | | (374 | ) |
| | CZK/USD | | | 09/18/13 | | | | 360,403 | | | | (13,328 | ) |
| | EUR/USD | | | 09/18/13 | | | | 2,070,352 | | | | (48,231 | ) |
| | GBP/USD | | | 09/18/13 | | | | 1,112,748 | | | | (31,050 | ) |
| | HUF/USD | | | 09/18/13 | | | | 17,514 | | | | (246 | ) |
| | IDR/USD | | | 09/18/13 | | | | 34,913 | | | | (339 | ) |
| | INR/USD | | | 09/18/13 | | | | 16,527 | | | | (779 | ) |
| | JPY/USD | | | 09/18/13 | | | | 209,273 | | | | (7,460 | ) |
| | MXN/USD | | | 09/18/13 | | | | 191,573 | | | | (1,941 | ) |
| | MYR/USD | | | 09/18/13 | | | | 244,406 | | | | (7,638 | ) |
| | NOK/USD | | | 09/18/13 | | | | 229,823 | | | | (13,570 | ) |
| | PLN/USD | | | 09/18/13 | | | | 323,441 | | | | (9,987 | ) |
| | RUB/USD | | | 09/18/13 | | | | 105,190 | | | | (1,284 | ) |
| | SEK/USD | | | 09/18/13 | | | | 1,065,690 | | | | (32,658 | ) |
| | TRY/USD | | | 09/18/13 | | | | 10,242 | | | | (191 | ) |
| | USD/BRL | | | 08/02/13 | | | | 240,271 | | | | (2,252 | ) |
| | USD/CLP | | | 09/23/13 | | | | 38,844 | | | | (515 | ) |
| | USD/HUF | | | 09/18/13 | | | | 35,028 | | | | (375 | ) |
| | USD/IDR | | | 09/18/13 | | | | 87,282 | | | | (959 | ) |
| | USD/KRW | | | 09/23/13 | | | | 52,321 | | | | (597 | ) |
| | USD/MXN | | | 09/18/13 | | | | 76,629 | | | | (2,147 | ) |
| | USD/MYR | | | 09/18/13 | | | | 131,603 | | | | (1,225 | ) |
| | USD/NOK | | | 09/18/13 | | | | 65,663 | | | | (207 | ) |
| | USD/RUB | | | 09/18/13 | | | | 75,135 | | | | (150 | ) |
| | USD/SEK | | | 09/18/13 | | | | 401,900 | | | | (1,770 | ) |
| | | USD/ZAR | | | 09/18/13 | | | | 238,007 | | | | (7,257 | ) |
| TOTAL | | | | | | | $ | (212,273 | ) |
| | |
| 48 | | The accompanying notes are an integral part of these financial statements. |
GOLDMAN SACHS MANAGED FUTURES STRATEGY FUND
|
| ADDITIONAL INVESTMENT INFORMATION (continued) |
FUTURES CONTRACTS — At June 30, 2013, the Fund had the following futures contracts:
| | | | | | | | | | | | | | |
| Type | | Number of
Contracts
Long (Short) | | | Expiration
Date | | Current Value | | | Unrealized
Gain (Loss) | |
Amsterdam Index | | | 6 | | | July 2013 | | $ | 538,571 | | | $ | (8,614 | ) |
BIST 30 Index | | | 6 | | | August 2013 | | | 28,667 | | | | 979 | |
CAC 40 Index | | | 9 | | | July 2013 | | | 437,491 | | | | (14,907 | ) |
DAX Index | | | 3 | | | September 2013 | | | 777,720 | | | | (24,295 | ) |
DJIA Mini-e-CBOT | | | 16 | | | September 2013 | | | 1,185,920 | | | | (6,905 | ) |
FTSE 100 Index | | | 6 | | | September 2013 | | | 562,280 | | | | (11,121 | ) |
FTSE/JSE Top 40 Index | | | 18 | | | September 2013 | | | 633,775 | | | | (28,433 | ) |
FTSE/MIB Index | | | 4 | | | September 2013 | | | 397,316 | | | | (20,582 | ) |
Hang Seng Index | | | (2 | ) | | July 2013 | | | (267,262 | ) | | | (12,349 | ) |
H-Shares Index | | | (14 | ) | | July 2013 | | | (834,291 | ) | | | (25,874 | ) |
IBEX 35 Index | | | 2 | | | July 2013 | | | 199,644 | | | | (8,698 | ) |
KOSPI 200 Index | | | (11 | ) | | September 2013 | | | (1,165,448 | ) | | | 48,624 | |
MSCI Taiwan Index | | | 30 | | | July 2013 | | | 838,500 | | | | 31,237 | |
NASDAQ 100 E-mini Index | | | 17 | | | September 2013 | | | 986,425 | | | | (4,688 | ) |
Nikkei 225 Index | | | 2 | | | September 2013 | | | 275,862 | | | | 2,755 | |
OMX Stockholm 30 Index | | | 28 | | | July 2013 | | | 480,264 | | | | (16,405 | ) |
Russell 2000 Mini Index | | | 9 | | | September 2013 | | | 877,230 | | | | 7,792 | |
S&P 500 E-mini Index | | | 13 | | | September 2013 | | | 1,039,545 | | | | (5,756 | ) |
S&P/TSX 60 Index | | | (1 | ) | | September 2013 | | | (131,749 | ) | | | (2,805 | ) |
SET 50 Index | | | 1 | | | September 2013 | | | 31,453 | | | | 2,112 | |
SGX S&P CNX Nifty Index | | | (16 | ) | | July 2013 | | | (186,464 | ) | | | (7,473 | ) |
TSE TOPIX Index | | | 2 | | | September 2013 | | | 228,070 | | | | 3,383 | |
| TOTAL | | | | | | | | | | | | $ | (102,023 | ) |
SWAP CONTRACTS — At June 30, 2013, the Fund had the following swap contracts:
CENTRALLY CLEARED INTEREST RATE SWAP CONTRACTS
| | | | | | | | | | | | | | | | | | | | |
| | | | Rates Exchanged | | Market Value | |
Notional Amount (000’s)(a) | | | Termination
Date | | | Payments Received | | Payments Made | | Upfront Payments
Made (Received) | | | Unrealized
Gain (Loss) | |
| GBP | | | 38,770 | | | | 09/18/14 | | | 0.750% | | 6 Month LIBOR | | $ | 122,758 | | | $ | (107,527 | ) |
| SEK | | | 371,700 | | | | 09/18/14 | | | 1.250 | | 3 Month STIBOR | | | 119,240 | | | | (188,430 | ) |
| $ | | | 2,000 | | | | 09/18/18 | | | 3 Month LIBOR | | 1.500% | | | (15,689 | ) | | | 34,358 | |
| CAD | | | 3,430 | | | | 09/18/18 | | | 3 Month CDOR | | 2.250 | | | (41,457 | ) | | | 55,511 | |
| CHF | | | 4,620 | | | | 09/18/18 | | | 6 Month LIBOR | | 0.750 | | | (13,352 | ) | | | 35,330 | |
| EUR | | | 30 | | | | 09/18/18 | | | 1.250 | | 6 Month EURIBOR | | | (162 | ) | | | 57 | |
| GBP | | | 920 | | | | 09/18/18 | | | 6 Month LIBOR | | 1.500 | | | 6,176 | | | | 4,323 | |
| JPY | | | 856,890 | | | | 09/18/18 | | | 6 Month LIBOR | | 0.500 | | | 20,372 | | | | (3,144 | ) |
| SEK | | | 6,820 | | | | 09/18/18 | | | 3 Month STIBOR | | 2.000 | | | 16,623 | | | | (3,622 | ) |
| $ | | | 900 | | | | 09/18/23 | | | 2.500 | | 3 Month LIBOR | | | 1,094 | | | | (24,228 | ) |
| EUR | | | 4,280 | | | | 09/18/23 | | | 1.750 | | 6 Month EURIBOR | | | 99,693 | | | | (264,051 | ) |
| GBP | | | 2,950 | | | | 09/18/23 | | | 6 Month LIBOR | | 2.250 | | | 112,504 | | | | 43,927 | |
| JPY | | | 581,940 | | | | 09/18/23 | | | 6 Month LIBOR | | 1.000 | | | 17,952 | | | | 16,494 | |
| $ | | | 440 | | | | 09/18/43 | | | 3 Month LIBOR | | 3.250 | | | (19,412 | ) | | | 39,065 | |
| EUR | | | 1,840 | | | | 09/18/43 | | | 6 Month EURIBOR | | 2.500 | | | 14,407 | | | | (1,217 | ) |
| | |
| The accompanying notes are an integral part of these financial statements. | | 49 |
GOLDMAN SACHS MANAGED FUTURES STRATEGY FUND
Schedule of Investments (continued)
June 30, 2013 (Unaudited)
|
| ADDITIONAL INVESTMENT INFORMATION (continued) |
CENTRALLY CLEARED INTEREST RATE SWAP CONTRACTS (continued)
| | | | | | | | | | | | | | | | | | | | | | |
| | | | Rates Exchanged | | Market Value | |
Notional Amount (000’s)(a) | | | Termination
Date | | | Payments Received | | | Payments Made | | Upfront Payments
Made (Received) | | | Unrealized
Gain (Loss) | |
| GBP | | | 1,390 | | | | 09/18/43 | | | | 3.250 | % | | 6 Month LIBOR | | $ | (952 | ) | | $ | (47,569 | ) |
| JPY | | | 239,400 | | | | 09/18/43 | | | | 1.750 | | | 6 Month LIBOR | | | (26,156 | ) | | | (98,482 | ) |
| TOTAL | | $ | 413,639 | | | $ | (509,205 | ) |
| | (a) | | Represents forward starting interest rate swaps whose effective dates of commencement of accruals and cash flows occur subsequent to June 30, 2013. |
| | |
|
Investment Abbreviations: |
CDOR | | —Canadian Dollar Offered Rate |
EURIBOR | | —Euro Interbank Offered Rate |
LIBOR | | —London Interbank Offered Rate |
STIBOR | | —Stockholm Interbank Offered Rate |
|
Currency Abbreviations: |
AUD | | —Australian Dollar |
BRL | | —Brazilian Real |
CAD | | —Canadian Dollar |
CHF | | —Swiss Franc |
CLP | | —Chilean Peso |
COP | | —Colombian Peso |
CZK | | —Czech Koruna |
EUR | | —Euro |
GBP | | —British Pound |
HUF | | —Hungarian Forint |
IDR | | —Indonesian Rupiah |
INR | | —Indian Rupee |
JPY | | —Japanese Yen |
KRW | | —South Korean Won |
MXN | | —Mexican Peso |
MYR | | —Malaysian Ringgit |
NOK | | —Norwegian Krone |
NZD | | —New Zealand Dollar |
PLN | | —Polish Zloty |
RUB | | —Russian Ruble |
SEK | | —Swedish Krona |
TRY | | —Turkish Lira |
USD | | —United States Dollar |
ZAR | | —South African Rand |
|
| | |
| 50 | | The accompanying notes are an integral part of these financial statements. |
GOLDMAN SACHS REAL ESTATE SECURITIES FUND
Schedule of Investments
June 30, 2013 (Unaudited)
| | | | | | | | |
| Shares | | | Description | |
Value | |
| | | | | | | | |
| | Common Stocks – 96.4% | | | | |
| | Commercial – 25.6% | |
| | 150,387 | | | Alexandria Real Estate Equities, Inc. (REIT) | | $ | 9,883,434 | |
| | 249,738 | | | Boston Properties, Inc. (REIT) | | | 26,339,867 | |
| | 262,623 | | | Digital Realty Trust, Inc. (REIT) | | | 16,020,003 | |
| | 197,767 | | | Highwoods Properties, Inc. (REIT) | | | 7,042,483 | |
| | 153,419 | | | Kilroy Realty Corp. (REIT) | | | 8,132,741 | |
| | 193,368 | | | Liberty Property Trust (REIT) | | | 7,146,881 | |
| | 588,598 | | | Prologis, Inc. (REIT) | | | 22,201,916 | |
| | 95,816 | | | PS Business Parks, Inc. (REIT) | | | 6,915,041 | |
| | 189,489 | | | SL Green Realty Corp. (REIT) | | | 16,711,035 | |
| | 312,658 | | | Terreno Realty Corp. (REIT) | | | 5,793,553 | |
| | 139,760 | | | Vornado Realty Trust (REIT) | | | 11,579,116 | |
| | | | | | | | |
| | | | | | | 137,766,070 | |
| | |
| | Health Care – 11.8% | | | | |
| | 139,031 | | | Emeritus Corp.* | | | 3,222,739 | |
| | 346,456 | | | HCP, Inc. (REIT) | | | 15,742,961 | |
| | 182,060 | | | Health Care Real Estate Investment Trust, Inc. (REIT) | | | 12,203,482 | |
| | 452,789 | | | Healthcare Trust of America, Inc. Class A (REIT) | | | 5,084,820 | |
| | 390,281 | | | Ventas, Inc. (REIT) | | | 27,108,918 | |
| | | | | | | | |
| | | | | | | 63,362,920 | |
| | |
| | Leisure – 7.6% | | | | |
| | 466,261 | | | Chesapeake Lodging Trust (REIT) | | | 9,693,566 | |
| | 362,456 | | | LaSalle Hotel Properties (REIT) | | | 8,952,663 | |
| | 275,283 | | | Pebblebrook Hotel Trust (REIT) | | | 7,116,066 | |
| | 249,920 | | | RLJ Lodging Trust (REIT) | | | 5,620,701 | |
| | 1,056,605 | | | Strategic Hotels & Resorts, Inc. (REIT)* | | | 9,361,520 | |
| | | | | | | | |
| | | | | | | 40,744,516 | |
| | |
| | Multifamily – 17.7% | | | | |
| | 221,760 | | | AvalonBay Communities, Inc. (REIT) | | | 29,917,642 | |
| | 209,648 | | | BRE Properties, Inc. (REIT) | | | 10,486,593 | |
| | 200,571 | | | Camden Property Trust (REIT) | | | 13,867,479 | |
| | 79,415 | | | Equity Lifestyle Properties, Inc. (REIT) | | | 6,241,225 | |
| | 212,473 | | | Equity Residential (REIT) | | | 12,336,182 | |
| | 78,323 | | | Essex Property Trust, Inc. (REIT) | | | 12,447,091 | |
| | 198,388 | | | Post Properties, Inc. (REIT) | | | 9,818,222 | |
| | | | | | | | |
| | | | | | | 95,114,434 | |
| | |
| | Other – 4.8% | | | | |
| | 102,355 | | | American Tower Corp. (REIT) | | | 7,489,315 | |
| | 210,767 | | | Blackstone Mortgage Trust, Inc. Class A (REIT) | | | 5,205,945 | |
| | 171,368 | | | CBRE Group, Inc. Class A* | | | 4,003,157 | |
| | 157,822 | | | Toll Brothers, Inc.* | | | 5,149,732 | |
| | 141,725 | | | Weyerhaeuser Co. (REIT) | | | 4,037,745 | |
| | | | | | | | |
| | | | | | | 25,885,894 | |
| | |
| | Common Stocks – (continued) | |
| | Retail – 23.0% | | | | |
| | 236,800 | | | Acadia Realty Trust (REIT) | | $ | 5,846,592 | |
| | 326,884 | | | CBL & Associates Properties, Inc. (REIT) | | | 7,001,855 | |
| | 655,617 | | | DDR Corp. (REIT) | | | 10,916,023 | |
| | 100,937 | | | Federal Realty Investment Trust (REIT) | | | 10,465,148 | |
| | 398,479 | | | Simon Property Group, Inc. (REIT) | | | 62,927,804 | |
| | 146,804 | | | Taubman Centers, Inc. (REIT) | | | 11,032,321 | |
| | 74,780 | | | The Macerich Co. (REIT) | | | 4,559,336 | |
| | 346,492 | | | Weingarten Realty Investors (REIT) | | | 10,661,559 | |
| | | | | | | | |
| | | | | | | 123,410,638 | |
| | |
| | Self Storage – 5.9% | | | | |
| | 205,256 | | | Public Storage (REIT) | | | 31,471,902 | |
| | |
| | TOTAL INVESTMENTS – 96.4% | | $ | 517,756,374 | |
| | (Cost $411,386,463) | | | | |
| | |
| OTHER ASSETS IN EXCESS OF
LIABILITIES – 3.6% | | | 19,494,128 | |
| | |
| | NET ASSETS – 100.0% | | $ | 537,250,502 | |
| | |
| | |
| The percentage shown for each investment category reflects the value of investments in that category as a percentage of net assets. |
* | | Non-income producing security. |
| | |
|
Investment Abbreviation: |
REIT | | —Real Estate Investment Trust |
|
| | |
| The accompanying notes are an integral part of these financial statements. | | 51 |
GOLDMAN SACHS SELECT SATELLITE FUNDS
Statements of Assets and Liabilities
June 30, 2013 (Unaudited)
| | | | | | |
| | | | | Absolute Return
Tracker Fund | |
| | Assets: | |
| | Investments, at value (cost $1,316,106,887, $923,020,287, $1,164,287,596, $316,856,093, $0 and $411,386,463) | | $ | 1,311,117,832 | |
| | Repurchase Agreement, at value which equals cost | | | 141,500,000 | |
| | Cash | | | 83,696,991 | |
| | Foreign currencies, at value (cost $165,204, $1,180,615 and $468,316 for Absolute Return Tracker, International Real Estate Securities and Managed Futures Strategy Funds) | | | 161,956 | |
| | Receivables: | | | | |
| | Fund shares sold | | | 8,755,871 | |
| | Collateral on certain derivative contracts(b) | | | 3,260,000 | |
| | Investments sold on an extended-settlement basis | | | 1,927,932 | |
| | Investments sold | | | 1,862,084 | |
| | Unrealized gain on forward foreign currency exchange contracts | | | 367,413 | |
| | Reimbursement from investment adviser | | | 31,469 | |
| | Variation margin on certain derivative contracts | | | — | |
| | Dividends and interest | | | — | |
| | Foreign tax reclaims | | | — | |
| | Unrealized gain on swap contracts | | | — | |
| | Other assets | | | 4,765 | |
| | Total assets | | | 1,552,686,313 | |
| | | | | | |
| Liabilities: | | | | |
| | Payables: | | | | |
| | Unrealized loss on forward foreign currency exchange contracts | | | 3,621,705 | |
| | Fund shares redeemed | | | 3,149,947 | |
| | Investments purchased on an extended-settlement basis | | | 2,660,000 | |
| | Amounts owed to affiliates | | | 1,530,093 | |
| | Variation margin on certain derivative contracts | | | 1,051,554 | |
| | Unrealized loss on swap contracts | | | — | |
| | Investments purchased | | | — | |
| | Forward sale contracts, at value (proceeds receivable $1,068,125 for Commodity Strategy Fund) | | | — | |
| | Collateral on certain derivative contracts | | | — | |
| | Upfront payments received on swap contracts | | | — | |
| | Accrued expenses | | | 213,422 | |
| | Total liabilities | | | 12,226,721 | |
| | | | | | |
| | Net Assets: | |
| | Paid-in capital | | | 1,508,880,327 | |
| | Undistributed (distributions in excess of) net investment loss | | | (12,372,382 | ) |
| | Accumulated net realized gain (loss) | | | 52,712,946 | |
| | Net unrealized gain (loss) | | | (8,761,299 | ) |
| | | NET ASSETS | | $ | 1,540,459,592 | |
| | | Net Assets: | | | | |
| | | Class A | | $ | 110,195,442 | |
| | | Class B | | | — | |
| | | Class C | | | 30,109,556 | |
| | | Institutional | | | 1,381,420,838 | |
| | | Service | | | — | |
| | | Class IR | | | 16,963,793 | |
| | | Class R | | | 1,769,963 | |
| | | Total Net Assets | | $ | 1,540,459,592 | |
| | | Shares outstanding $0.001 par value (unlimited shares authorized): | | | | |
| | | Class A | | | 12,144,524 | |
| | | Class B | | | — | |
| | | Class C | | | 3,447,227 | |
| | | Institutional | | | 149,388,588 | |
| | | Service | | | — | |
| | | Class IR | | | 1,848,033 | |
| | | Class R | | | 197,531 | |
| | | Net asset value, offering and redemption price per share:(c) | | | | |
| | | Class A | | | $9.07 | |
| | | Class B | | | — | |
| | | Class C | | | 8.73 | |
| | | Institutional | | | 9.25 | |
| | | Service | | | — | |
| | | Class IR | | | 9.18 | |
| | | Class R | | | 8.96 | |
| | (a) | | Statement of Assets and Liabilities for Commodity Strategy Fund is consolidated and includes the balances of Goldman Sachs Cayman Commodity Fund, Ltd. (wholly-owned subsidiary). Accordingly, all interfund balances and transactions have been eliminated. |
| | (b) | | Segregated for initial margin on swap transactions for the Dynamic Allocation and Commodity Strategy Funds, and on futures and swap transactions of $786,541 and $251,934, respectively, for the Managed Futures Strategy Fund. |
| | (c) | | Maximum public offering price per share for Class A shares of the Absolute Return Tracker, Commodity Strategy, Dynamic Allocation, International Real Estate Securities, Managed Futures Strategy and Real Estate Securities Funds is $9.60, $5.60, $11.27, $6.75, $10.11 and $17.06, respectively. At redemption, Class B and Class C Shares may be subject to a contingent deferred sales charge assessed on the amount equal to the lesser of the current NAV or the original purchase price of the shares. |
| | |
| 52 | | The accompanying notes are an integral part of these financial statements. |
GOLDMAN SACHS SELECT SATELLITE FUNDS
| | | | | | | | | | | | | | | | | | | | | | | | | | | | |
| | | Commodity
Strategy Fund(a) | | | | | Dynamic Allocation
Fund | | | | | International Real Estate
Securities Fund | | | | | Managed Futures Strategy Fund | | | | | Real Estate
Securities Fund | |
| | | | | | | | | | | | | | | | | | | | | | | | | | | | |
| | $ | 918,904,792 | | | | | $ | 1,143,398,570 | | | | | $ | 371,609,262 | | | | | $ | — | | | | | $ | 517,756,374 | |
| | | — | | | | | | — | | | | | | — | | | | | | — | | | | | | — | |
| | | 95,883,715 | | | | | | — | | | | | | 2,690,427 | | | | | | 29,096,383 | | | | | | 2,099,407 | |
| | | — | | | | | | — | | | | | | 997,870 | | | | | | 468,307 | | | | | | — | |
| | | | | | | | | | | | | | | | | | | | | | | | | | | | |
| | | 14,310,738 | | | | | | 1,986,607 | | | | | | 15,441,142 | | | | | | 79,082 | | | | | | 25,785,331 | |
| | | 103,423,887 | | | | | | 8,132,198 | | | | | | — | | | | | | 1,038,475 | | | | | | — | |
| | | 7,540,195 | | | | | | 22,780,581 | | | | | | — | | | | | | — | | | | | | — | |
| | | — | | | | | | 86,193,645 | | | | | | 937,442 | | | | | | — | | | | | | 8,068,727 | |
| | | — | | | | | | — | | | | | | — | | | | | | 247,315 | | | | | | — | |
| | | 40,259 | | | | | | 42,801 | | | | | | 44,710 | | | | | | 48,184 | | | | | | 43,348 | |
| | | 61,499 | | | | | | 78,292 | | | | | | — | | | | | | — | | | | | | — | |
| | | 3,440,889 | | | | | | 341,309 | | | | | | 1,914,817 | | | | | | — | | | | | | 1,675,841 | |
| | | — | | | | | | — | | | | | | 106,624 | | | | | | — | | | | | | — | |
| | | 385,775 | | | | | | — | | | | | | — | | | | | | — | | | | | | — | |
| | | 6,718 | | | | | | 10,382 | | | | | | 2,158 | | | | | | 277 | | | | | | 1,679 | |
| | | 1,143,998,467 | | | | | | 1,262,964,385 | | | | | | 393,744,452 | | | | | | 30,978,023 | | | | | | 555,430,707 | |
| | | | | | | | | | | | | | | | | | | | | | | | | | | | |
| | | | | | | | | | | | | | | | | | | | | | | | | | | | |
| | | | | | | | | | | | | | | | | | | | | | | | | | | | |
| | | — | | | | | | — | | | | | | — | | | | | | 212,273 | | | | | | — | |
| | | 10,800,187 | | | | | | 4,111,833 | | | | | | 786,032 | | | | | | 3,086,323 | | | | | | 1,006,018 | |
| | | 22,894,703 | | | | | | — | | | | | | — | | | | | | — | | | | | | — | |
| | | 589,927 | | | | | | 1,095,155 | | | | | | 322,290 | | | | | | 28,475 | | | | | | 457,895 | |
| | | 29,393 | | | | | | — | | | | | | — | | | | | | 76,335 | | | | | | — | |
| | | 20,466,987 | | | | | | — | | | | | | — | | | | | | — | | | | | | — | |
| | | 9,555,239 | | | | | | — | | | | | | 15,734,684 | | | | | | — | | | | | | 16,604,239 | |
| | | 1,056,641 | | | | | | — | | | | | | — | | | | | | — | | | | | | — | |
| | | 300,000 | | | | | | — | | | | | | — | | | | | | — | | | | | | — | |
| | | 20,177 | | | | | | — | | | | | | — | | | | | | — | | | | | | — | |
| | | 397,782 | | | | | | 190,934 | | | | | | 120,848 | | | | | | 101,900 | | | | | | 112,053 | |
| | | 66,111,036 | | | | | | 5,397,922 | | | | | | 16,963,854 | | | | | | 3,505,306 | | | | | | 18,180,205 | |
| | | | | | | | | | | | | | | | | | | | | | | | | | | | |
| | | | | | | | | | | | | | | | | | | | | | | | | | | | |
| | | 1,252,354,347 | | | | | | 1,237,445,219 | | | | | | 951,362,236 | | | | | | 29,892,548 | | | | | | 500,449,731 | |
| | | (7,622,967 | ) | | | | | (6,026,849 | ) | | | | | (24,796,310 | ) | | | | | (372,100 | ) | | | | | (918,349 | ) |
| | | (145,062,717 | ) | | | | | 62,760,378 | | | | | | (604,342,676 | ) | | | | | (1,481,507 | ) | | | | | (68,650,791 | ) |
| | | (21,781,232 | ) | | | | | (36,612,285 | ) | | | | | 54,557,348 | | | | | | (566,224 | ) | | | | | 106,369,911 | |
| | | $ | 1,077,887,431 | | | | | $ | 1,257,566,463 | | | | | $ | 376,780,598 | | | | | $ | 27,472,717 | | | | | $ | 537,250,502 | |
| | | | | | | | | | | | | | | | | | | | | | | | | | | | | |
| | | $ | 308,830,576 | | | | | $ | 251,129,007 | | | | | $ | 14,342,288 | | | | | $ | 833,336 | | | | | $ | 60,505,375 | |
| | | | — | | | | | | — | | | | | | — | | | | | | — | | | | | | 1,111,692 | |
| | | | 11,955,469 | | | | | | 79,808,598 | | | | | | 2,563,679 | | | | | | 723,830 | | | | | | 13,121,383 | |
| | | | 750,265,769 | | | | | | 860,628,192 | | | | | | 357,109,309 | | | | | | 24,859,516 | | | | | | 457,206,447 | |
| | | | — | | | | | | — | | | | | | — | | | | | | — | | | | | | 3,756,322 | |
| | | | 5,251,282 | | | | | | 65,989,456 | | | | | | 2,765,322 | | | | | | 989,008 | | | | | | 941,276 | |
| | | | 1,584,335 | | | | | | 11,210 | | | | | | — | | | | | | 67,027 | | | | | | 608,007 | |
| | | $ | 1,077,887,431 | | | | | $ | 1,257,566,463 | | | | | $ | 376,780,598 | | | | | $ | 27,472,717 | | | | | $ | 537,250,502 | |
| | | | | | | | | | | | | | | | | | | | | | | | | | | | | |
| | | | 57,764,737 | | | | | | 23,572,087 | | | | | | 2,248,653 | | | | | | 87,285 | | | | | | 3,753,319 | |
| | | | — | | | | | | — | | | | | | — | | | | | | — | | | | | | 69,288 | |
| | | | 2,298,076 | | | | | | 7,666,024 | | | | | | 402,194 | | | | | | 76,633 | | | | | | 831,735 | |
| | | | 139,670,451 | | | | | | 80,015,922 | | | | | | 57,525,061 | | | | | | 2,591,564 | | | | | | 27,930,400 | |
| | | | — | | | | | | — | | | | | | — | | | | | | — | | | | | | 231,601 | |
| | | | 975,865 | | | | | | 6,151,314 | | | | | | 437,690 | | | | | | 103,280 | | | | | | 58,227 | |
| | | | 299,081 | | | | | | 1,057 | | | | | | — | | | | | | 7,047 | | | | | | 37,842 | |
| | | | | | | | | | | | | | | | | | | | | | | | | | | | | |
| | | | $5.35 | | | | | | $10.65 | | | | | | $ 6.38 | | | | | | $9.55 | | | | | | $16.12 | |
| | | | — | | | | | | — | | | | | | — | | | | | | — | | | | | | 16.04 | |
| | | | 5.20 | | | | | | 10.41 | | | | | | 6.37 | | | | | | 9.45 | | | | | | 15.78 | |
| | | | 5.37 | | | | | | 10.76 | | | | | | 6.21 | | | | | | 9.59 | | | | | | 16.37 | |
| | | | — | | | | | | — | | | | | | — | | | | | | — | | | | | | 16.22 | |
| | | | 5.38 | | | | | | 10.73 | | | | | | 6.32 | | | | | | 9.58 | | | | | | 16.17 | |
| | | | 5.30 | | | | | | 10.61 | | | | | | — | | | | | | 9.51 | | | | | | 16.07 | |
| | |
| The accompanying notes are an integral part of these financial statements. | | 53 |
GOLDMAN SACHS SELECT SATELLITE FUNDS
Statements of Operations
For the Six Months Ended June 30, 2013 (Unaudited)
| | | | | | |
| | | | |
Absolute Return
Tracker Fund | |
| | Investment income: | | | | |
| | Dividends (net of foreign taxes withheld of $0, $0, $0, $524,622, $0 and $22,201) | | $ | 1,314,890 | |
| | Interest | | | 751,024 | |
| | Total investment income | | | 2,065,914 | |
| | | | | | |
| | Expenses: | | | | |
| | Management fees | | | 8,508,586 | |
| | Transfer Agent fees(b) | | | 433,871 | |
| | Distribution and Service fees(b) | | | 319,513 | |
| | Printing and mailing costs | | | 91,432 | |
| | Custody, accounting and administrative services | | | 60,386 | |
| | Registration fees | | | 47,298 | |
| | Audit fees | | | 29,928 | |
| | Legal fees | | | 28,383 | |
| | Trustee fees | | | 9,766 | |
| | Amortization of offering costs | | | — | |
| | Service share fees — Service Plan | | | — | |
| | Service share fees — Shareholder Administration Plan | | | — | |
| | Other | | | 20,085 | |
| | Total expenses | | | 9,549,248 | |
| | Less — expense reductions | | | (226,671 | ) |
| | Net expenses | | | 9,322,577 | |
| | NET INVESTMENT INCOME (LOSS) | | | (7,256,663 | ) |
| | | | | | |
| | Realized and unrealized gain (loss): | | | | |
| | Net realized gain (loss) from: | | | | |
| | Investments | | | (10,132,201 | ) |
| | Futures contracts | | | 71,899,491 | |
| | Swap contracts | | | (4,659,354 | ) |
| | Forward foreign currency exchange contracts | | | (9,346,101 | ) |
| | Foreign currency transactions | | | 1,126,699 | |
| | Net change in unrealized gain (loss) on: | | | | |
| | Investments | | | (7,199,204 | ) |
| | Futures contracts | | | (4,504,515 | ) |
| | Swap contracts | | | (3,819,563 | ) |
| | Forward foreign currency exchange contracts | | | (2,169,270 | ) |
| | Foreign currency translation | | | 190,195 | |
| | Net realized and unrealized gain (loss) | | | 31,386,177 | |
| | NET INCREASE (DECREASE) IN NET ASSETS RESULTING FROM OPERATIONS | | $ | 24,129,514 | |
| | (a) | | Statement of Operations for Commodity Strategy Fund is consolidated and includes the balances of Goldman Sachs Cayman Commodity Fund, Ltd. (wholly-owned subsidiary). Accordingly, all interfund balances and transactions have been eliminated. |
| | (b) | | Class specific Distribution and Service, and Transfer Agent fees were as follows: |
| | | | | | | | | | | | | | | | | | | | | | | | | | | | | | | | | | | | | | | | | | | | |
| | | Distribution and Service Fees | | | Transfer Agent Fees | |
Fund | | Class A | | | Class B | | | Class C | | | Class R | | | Class A | | | Class B | | | Class C | | | Institutional | | | Service | | | Class IR | | | Class R | |
Absolute Return Tracker | | $ | 148,609 | | | $ | — | | | $ | 166,484 | | | $ | 4,420 | | | $ | 112,943 | | | $ | — | | | $ | 31,632 | | | $ | 272,250 | | | $ | — | | | $ | 15,366 | | | $ | 1,680 | |
Commodity Strategy | | | 418,295 | | | | — | | | | 66,158 | | | | 3,770 | | | | 217,511 | | | | — | | | | 8,601 | | | | 152,150 | | | | — | | | | 4,292 | | | | 980 | |
Dynamic Allocation | | | 345,073 | | | | — | | | | 401,550 | | | | 29 | | | | 262,257 | | | | — | | | | 76,295 | | | | 176,988 | | | | — | | | | 61,410 | | | | 11 | |
International Real Estate Securities | | | 23,210 | | | | — | | | | 12,865 | | | | — | | | | 17,640 | | | | — | | | | 2,444 | | | | 67,441 | | | | — | | | | 2,929 | | | | — | |
Managed Futures Strategy | | | 828 | | | | — | | | | 2,895 | | | | 103 | | | | 629 | | | | — | | | | 551 | | | | 5,919 | | | | — | | | | 890 | | | | 39 | |
Real Estate Securities | | | 82,008 | | | | 6,473 | | | | 65,920 | | | | 1,426 | | | | 62,326 | | | | 1,230 | | | | 12,525 | | | | 83,477 | | | | 927 | | | | 674 | | | | 542 | |
| | |
| 54 | | The accompanying notes are an integral part of these financial statements. |
GOLDMAN SACHS SELECT SATELLITE FUNDS
| | | | | | | | | | | | | | | | | | | | | | | | | | | | |
| | | Commodity
Strategy Fund(a) | | | | | Dynamic
Allocation Fund | | | | | International Real Estate Securities Fund | | | | | Managed Futures
Strategy Fund | | | | | Real Estate
Securities Fund | |
| | | | | | | | | | | | | | | | | | | | | | | | | | | | |
| | $ | — | | | | | $ | 207,217 | | | | | $ | 7,108,401 | | | | | $ | — | | | | | $ | 7,189,593 | |
| | | — | | | | | | — | | | | | | — | | | | | | — | | | | | | — | |
| | | — | | | | | | 207,217 | | | | | | 7,108,401 | | | | | | — | | | | | | 7,189,593 | |
| | | | | | | | | | | | | | | | | | | | | | | | | | | | |
| | | | | | | | | | | | | | | | | | | | | | | | | | | | |
| | | 2,791,801 | | | | | | 5,735,410 | | | | | | 1,897,479 | | | | | | 159,097 | | | | | | 2,516,911 | |
| | | 383,534 | | | | | | 576,961 | | | | | | 90,454 | | | | | | 8,028 | | | | | | 161,701 | |
| | | 488,223 | | | | | | 746,652 | | | | | | 36,075 | | | | | | 3,826 | | | | | | 155,827 | |
| | | 152,701 | | | | | | 101,043 | | | | | | 28,753 | | | | | | 33,511 | | | | | | 34,332 | |
| | | 80,732 | | | | | | 55,585 | | | | | | 108,975 | | | | | | — | | | | | | 46,580 | |
| | | 75,972 | | | | | | 26,774 | | | | | | 26,973 | | | | | | 36,638 | | | | | | 34,683 | |
| | | 51,396 | | | | | | 34,614 | | | | | | 19,860 | | | | | | 33,385 | | | | | | 26,860 | |
| | | 17,202 | | | | | | 21,527 | | | | | | 15,279 | | | | | | 40,354 | | | | | | 16,370 | |
| | | 9,242 | | | | | | 9,502 | | | | | | 8,516 | | | | | | 7,522 | | | | | | 8,648 | |
| | | — | | | | | | — | | | | | | — | | | | | | 57,055 | | | | | | — | |
| | | — | | | | | | — | | | | | | — | | | | | | — | | | | | | 5,795 | |
| | | — | | | | | | — | | | | | | — | | | | | | — | | | | | | 5,795 | |
| | | 251,175 | | | | | | 12,936 | | | | | | 8,647 | | | | | | 11,777 | | | | | | 14,504 | |
| | | 4,301,978 | | | | | | 7,321,004 | | | | | | 2,241,011 | | | | | | 391,193 | | | | | | 3,028,006 | |
| | | (172,651 | ) | | | | | (183,238 | ) | | | | | (203,273 | ) | | | | | (208,365 | ) | | | | | (221,321 | ) |
| | | 4,129,327 | | | | | | 7,137,766 | | | | | | 2,037,738 | | | | | | 182,828 | | | | | | 2,806,685 | |
| | | (4,129,327 | ) | | | | | (6,930,549 | ) | | | | | 5,070,663 | | | | | | (182,828 | ) | | | | | 4,382,908 | |
| | | | | | | | | | | | | | | | | | | | | | | | | | | | |
| | | | | | | | | | | | | | | | | | | | | | | | | | | | |
| | | | | | | | | | | | | | | | | | | | | | | | | | | | |
| | | (757,106 | ) | | | | | (8,274,653 | ) | | | | | 18,383,000 | | | | | | — | | | | | | 27,754,235 | |
| | | (1,553,728 | ) | | | | | 65,712,933 | | | | | | — | | | | | | (306,245 | ) | | | | | — | |
| | | (54,448,250 | ) | | | | | 7,679,750 | | | | | | — | | | | | | (1,049,598 | ) | | | | | — | |
| | | — | | | | | | — | | | | | | — | | | | | | 50,411 | | | | | | — | |
| | | (52 | ) | | | | | (127,640 | ) | | | | | (201,052 | ) | | | | | (180,477 | ) | | | | | — | |
| | | | | | | | | | | | | | | | | | | | | | | | | | | | |
| | | (3,671,158 | ) | | | | | (35,833,796 | ) | | | | | (24,359,799 | ) | | | | | — | | | | | | (6,946,684 | ) |
| | | 97,525 | | | | | | (16,754,620 | ) | | | | | — | | | | | | (189,301 | ) | | | | | — | |
| | | (13,762,198 | ) | | | | | (9,279,128 | ) | | | | | — | | | | | | (1,433,407 | ) | | | | | — | |
| | | — | | | | | | — | | | | | | — | | | | | | (13,440 | ) | | | | | — | |
| | | — | | | | | | 260,706 | | | | | | (54,815 | ) | | | | | 10,604 | | | | | | — | |
| | | (74,094,967 | ) | | | | | 3,383,552 | | | | | | (6,232,666 | ) | | | | | (3,111,453 | ) | | | | | 20,807,551 | |
| | $ | (78,224,294 | ) | | | | $ | (3,546,997 | ) | | | | $ | (1,162,003 | ) | | | | $ | (3,294,281 | ) | | | | $ | 25,190,459 | |
| | |
| The accompanying notes are an integral part of these financial statements. | | 55 |
GOLDMAN SACHS SELECT SATELLITE FUNDS
Statements of Changes in Net Assets
| | | | | | | | | | | | | | | | | | | | |
| | | | | Absolute Return Tracker Fund | | | | | Commodity Strategy Fund(a) | |
| | | | | For the Six Months Ended
June 30, 2013
(Unaudited) | | | For the Fiscal Year Ended
December 31, 2012 | | | | | For the Six Months Ended
June 30, 2013
(Unaudited) | | | For the Fiscal Year Ended December 31, 2012 | |
| | From operations: | |
| | Net investment income (loss) | | $ | (7,256,663 | ) | | $ | (19,303,126 | ) | | | | $ | (4,129,327 | ) | | $ | (4,556,495 | ) |
| | Net realized gain (loss) | | | 48,888,534 | | | | 56,285,824 | | | | | | (56,759,136 | ) | | | (29,009,287 | ) |
| | Net change in unrealized gain (loss) | | | (17,502,357 | ) | | | 6,577,679 | | | | | | (17,335,831 | ) | | | 12,581,125 | |
| | Net increase (decrease) in net assets resulting from operations | | | 24,129,514 | | | | 43,560,377 | | | | | | (78,224,294 | ) | | | (20,984,657 | ) |
| | | | | | | | | | | | | | | | | | | | |
| | Distributions to shareholders: | |
| | From net investment income | | | | | | | | | | | | | | | | | | |
| | Class A Shares | | | — | | | | — | | | | | | — | | | | (1,459,480 | ) |
| | Class B Shares | | | — | | | | — | | | | | | — | | | | — | |
| | Class C Shares | | | — | | | | — | | | | | | — | | | | (76,187 | ) |
| | Institutional Shares | | | — | | | | — | | | | | | — | | | | (5,948,169 | ) |
| | Service Shares | | | — | | | | — | | | | | | — | | | | — | |
| | Class IR Shares | | | — | | | | — | | | | | | — | | | | (102,825 | ) |
| | Class R Shares | | | — | | | | — | | | | | | — | | | | (7,629 | ) |
| | From net realized gains | | | | | | | | | | | | | | | | | | |
| | Class A Shares | | | — | | | | (654,319 | ) | | | | | — | | | | — | |
| | Class C Shares | | | — | | | | (189,601 | ) | | | | | — | | | | — | |
| | Institutional Shares | | | — | | | | (6,367,015 | ) | | | | | — | | | | — | |
| | Class IR Shares | | | — | | | | (83,548 | ) | | | | | — | | | | — | |
| | Class R Shares | | | — | | | | (9,466 | ) | | | | | — | | | | — | |
| | Total distributions to shareholders | | | — | | | | (7,303,949 | ) | | | | | — | | | | (7,594,290 | ) |
| | | | | | | | | | | | | | | | | | | | |
| | From share transactions: | |
| | Proceeds from sales of shares | | | 312,193,961 | | | | 1,047,546,607 | | | | | | 289,485,685 | | | | 954,172,315 | |
| | Reinvestment of distributions | | | — | | | | 6,262,420 | | | | | | — | | | | 6,091,115 | |
| | Cost of shares redeemed | | | (341,309,239 | ) | | | (1,430,996,579 | ) | | | | | (251,919,837 | ) | | | (722,661,244 | ) |
| | Cost of shares redeemed in connection with in-kind redemptions | | | — | | | | — | | | | | | — | | | | — | |
| | Net increase (decrease) in net assets resulting from share transactions | | | (29,115,278 | ) | | | (377,187,552 | ) | | | | | 37,565,848 | | | | 237,602,186 | |
| | TOTAL INCREASE (DECREASE) | | | (4,985,764 | ) | | | (340,931,124 | ) | | | | | (40,658,446 | ) | | | 209,023,239 | |
| | | | | | | | | | | | | | | | | | | | |
| | Net assets: | |
| | Beginning of period | | | 1,545,445,356 | | | | 1,886,376,480 | | | | | | 1,118,545,877 | | | | 909,522,638 | |
| | End of period | | $ | 1,540,459,592 | | | $ | 1,545,445,356 | | | | | $ | 1,077,887,431 | | | $ | 1,118,545,877 | |
| | Undistributed (distributions in excess of) net investment income (loss) | | $ | (12,372,382 | ) | | $ | (5,115,719 | ) | | | | $ | (7,622,967 | ) | | $ | (3,493,640 | ) |
| | (a) | | Statement of Changes in Net Assets for Commodity Strategy Fund is consolidated and includes the balances of Goldman Sachs Cayman Commodity Fund, Ltd. (wholly-owned subsidiary). Accordingly, all interfund balances and transactions have been eliminated. |
| | (b) | | Commenced operations on February 29, 2012. |
| | (c) | | Includes cash received in connection with in-kind redemption of $3,219,329. |
| | |
| 56 | | The accompanying notes are an integral part of these financial statements. |
GOLDMAN SACHS SELECT SATELLITE FUNDS
| | | | | | | | | | | | | | | | | | | | | | | | | | | | | | | | | | | | | | | | | | | | | | |
| | Dynamic Allocation Fund | | | | | International Real Estate Securities Fund | | | | | Managed Futures Strategy Fund | | | | | Real Estate Securities Fund | |
| | | For the Six Months Ended
June 30, 2013
(Unaudited) | | | | | For the Fiscal
Year Ended
December 31, 2012 | | | | | For the Six Months Ended
June 30, 2013
(Unaudited) | | | | | For the Fiscal
Year Ended
December 31, 2012 | | | | | For the Six Months Ended
June 30, 2013
(Unaudited) | | | | | For the Period Ended December 31, 2012(b) | | | | | For the Six Months Ended
June 30, 2013
(Unaudited) | | | | | For the Fiscal Year Ended December 31, 2012 | |
| | | | | | | | | | | | | | | | | | | | | | | | | | | | | | | | | | | | | | | | | | | | | | |
| | $ | (6,930,549 | ) | | | | $ | (4,711,140 | ) | | | | $ | 5,070,663 | | | | | $ | 6,911,845 | | | | | $ | (182,828 | ) | | | | $ | (76,218 | ) | | | | $ | 4,382,908 | | | | | $ | 5,958,090 | |
| | | 64,990,390 | | | | | | 60,773,373 | | | | | | 18,181,948 | | | | | | 7,866,100 | | | | | | (1,485,909 | ) | | | | | (405,847 | ) | | | | | 27,754,235 | | | | | | 100,389,794 | |
| | | (61,606,838 | ) | | | | | 21,704,734 | | | | | | (24,414,614 | ) | | | | | 93,457,753 | | | | | | (1,625,544 | ) | | | | | 1,059,320 | | | | | | (6,946,684 | ) | | | | | (25,848,242 | ) |
| | | (3,546,997 | ) | | | | | 77,766,967 | | | | | | (1,162,003 | ) | | | | | 108,235,698 | | | | | | (3,294,281 | ) | | | | | 577,255 | | | | | | 25,190,459 | | | | | | 80,499,642 | |
| | | | | | | | | | | | | | | | | | | | | | | | | | | | | | | | | | | | | | | | | | | | | | |
| | | | | | | | | | | | | | | | | | | | | | | | | | | | | | | | | | | | | | | | | | | | | | |
| | | | | | | | | | | | | | | | | | | | | | | | | | | | | | | | | | | | | | | | | | | | | | |
| | | — | | | | | | — | | | | | | (160,394 | ) | | | | | (2,519,620 | ) | | | | | — | | | | | | — | | | | | | (648,492 | ) | | | | | (2,094,578 | ) |
| | | — | | | | | | — | | | | | | — | | | | | | — | | | | | | — | | | | | | — | | | | | | (7,372 | ) | | | | | (14,038 | ) |
| | | — | | | | | | — | | | | | | (20,669 | ) | | | | | (177,343 | ) | | | | | — | | | | | | — | | | | | | (88,387 | ) | | | | | (106,331 | ) |
| | | — | | | | | | (2,059,633 | ) | | | | | (4,832,737 | ) | | | | | (27,127,070 | ) | | | | | — | | | | | | — | | | | | | (5,114,104 | ) | | | | | (5,474,218 | ) |
| | | — | | | | | | — | | | | | | — | | | | | | — | | | | | | — | | | | | | — | | | | | | (43,493 | ) | | | | | (66,818 | ) |
| | | — | | | | | | (40,089 | ) | | | | | (35,903 | ) | | | | | (156,779 | ) | | | | | — | | | | | | — | | | | | | (8,535 | ) | | | | | (9,312 | ) |
| | | — | | | | | | — | | | | | | — | | | | | | — | | | | | | — | | | | | | — | | | | | | (5,261 | ) | | | | | (4,383 | ) |
| | | | | | | | | | | | | | | | | | | | | | | | | | | | | | | | | | | | | | | | | | | | | | |
| | | — | | | | | | (10,711,521 | ) | | | | | — | | | | | | — | | | | | | — | | | | | | — | | | | | | — | | | | | | — | |
| | | — | | | | | | (2,686,509 | ) | | | | | — | | | | | | — | | | | | | — | | | | | | — | | | | | | — | | | | | | — | |
| | | — | | | | | | (28,608,911 | ) | | | | | — | | | | | | — | | | | | | — | | | | | | — | | | | | | — | | | | | | — | |
| | | — | | | | | | (2,067,937 | ) | | | | | — | | | | | | — | | | | | | — | | | | | | — | | | | | | — | | | | | | — | |
| | | — | | | | | | (390 | ) | | | | | — | | | | | | — | | | | | | — | | | | | | — | | | | | | — | | | | | | — | |
| | | — | | | | | | (46,174,990 | ) | | | | | (5,049,703 | ) | | | | | (29,980,812 | ) | | | | | — | | | | | | — | | | | | | (5,915,644 | ) | | | | | (7,769,678 | ) |
| | | | | | | | | | | | | | | | | | | | | | | | | | | | | | | | | | | | | | | | | | | | | | |
| | | | | | | | | | | | | | | | | | | | | | | | | | | | | | | | | | | | | | | | | | | | | | |
| | | 211,521,476 | | | | | | 1,121,329,903 | | | | | | 74,077,234 | | | | | | 138,448,760 | | | | | | 21,794,281 | | | | | | 20,162,434 | | | | | | 120,218,086 | | | | | | 228,360,144 | |
| | | — | | | | | | 45,126,447 | | | | | | 4,754,552 | | | | | | 28,004,514 | | | | | | — | | | | | | — | | | | | | 5,557,099 | | | | | | 7,240,511 | |
| | | (231,639,227 | ) | | | | | (394,784,975 | ) | | | | | (37,671,923 | ) | | | | | (171,333,616 | ) | | | | | (11,459,753 | ) | | | | | (307,219 | ) | | | | | (72,201,947 | ) | | | | | (284,801,107 | ) |
| | | — | | | | | | — | | | | | | — | | | | | | — | | | | | | — | | | | | | — | | | | | | — | | | | | | (146,308,330 | )(c) |
| | | (20,117,751 | ) | | | | | 771,671,375 | | | | | | 41,159,863 | | | | | | (4,880,342 | ) | | | | | 10,334,528 | | | | | | 19,855,215 | | | | | | 53,573,238 | | | | | | (195,508,782 | ) |
| | | (23,664,748 | ) | | | | | 803,263,352 | | | | | | 34,948,157 | | | | | | 73,374,544 | | | | | | 7,040,247 | | | | | | 20,432,470 | | | | | | 72,848,053 | | | | | | (122,778,818 | ) |
| | | | | | | | | | | | | | | | | | | | | | | | | | | | | | | | | | | | | | | | | | | | | | |
| | | | | | | | | | | | | | | | | | | | | | | | | | | | | | | | | | | | | | | | | | | | | | |
| | | 1,281,231,211 | | | | | | 477,967,859 | | | | | | 341,832,441 | | | | | | 268,457,897 | | | | | | 20,432,470 | | | | | | — | | | | | | 464,402,449 | | | | | | 587,181,267 | |
| | $ | 1,257,566,463 | | | | | $ | 1,281,231,211 | | | | | $ | 376,780,598 | | | | | $ | 341,832,441 | | | | | $ | 27,472,717 | | | | | $ | 20,432,470 | | | | | $ | 537,250,502 | | | | | $ | 464,402,449 | |
| | $ | (6,026,849 | ) | | | | $ | 903,700 | | | | | $ | (24,796,310 | ) | | | | $ | (24,817,270 | ) | | | | $ | (372,100 | ) | | | | $ | (189,272 | ) | | | | $ | (918,349 | ) | | | | $ | 614,387 | |
| | |
| The accompanying notes are an integral part of these financial statements. | | 57 |
GOLDMAN SACHS ABSOLUTE RETURN TRACKER FUND
Financial Highlights
Selected Data for a Share Outstanding Throughout Each Period
| | | | | | | | | | | | | | | | | | | | | | | | | | | | | | |
| | | | | | | | Income (loss) from
investment operations | | | Distributions
to shareholders | |
| | | Year - Share Class | |
Net asset
value,
beginning
of period | | | Net
investment
income (loss)(a) | | | Net realized
and unrealized
gain (loss) | | | Total from
investment
operations | | | From net
investment
income | | | From net
realized
gains | | | Total
distributions | |
| FOR THE SIX MONTHS ENDED JUNE 30, (UNAUDITED) | |
| | 2013 - A | | $ | 8.95 | | | $ | (0.06 | ) | | $ | 0.18 | | | $ | 0.12 | | | $ | — | | | $ | — | | | $ | — | |
| | 2013 - C | | | 8.65 | | | | (0.09 | ) | | | 0.17 | | | | 0.08 | | | | — | | | | — | | | | — | |
| | 2013 - Institutional | | | 9.10 | | | | (0.04 | ) | | | 0.19 | | | | 0.15 | | | | — | | | | — | | | | — | |
| | 2013 - IR | | | 9.04 | | | | (0.05 | ) | | | 0.19 | | | | 0.14 | | | | — | | | | — | | | | — | |
| | 2013 - R | | | 8.85 | | | | (0.07 | ) | | | 0.18 | | | | 0.11 | | | | — | | | | — | | | | — | |
| | | | | | | | | | | | | | | | | | | | | | | | | | | | | | |
| FOR THE FISCAL YEARS ENDED DECEMBER 31, | |
| | 2012 - A | | | 8.79 | | | | (0.13 | ) | | | 0.33 | | | | 0.20 | | | | — | | | | (0.04 | ) | | | (0.04 | ) |
| | 2012 - C | | | 8.56 | | | | (0.19 | ) | | | 0.32 | | | | 0.13 | | | | — | | | | (0.04 | ) | | | (0.04 | ) |
| | 2012 - Institutional | | | 8.90 | | | | (0.09 | ) | | | 0.33 | | | | 0.24 | | | | — | | | | (0.04 | ) | | | (0.04 | ) |
| | 2012 - IR | | | 8.86 | | | | (0.11 | ) | | | 0.33 | | | | 0.22 | | | | — | | | | (0.04 | ) | | | (0.04 | ) |
| | 2012 - R | | | 8.72 | | | | (0.15 | ) | | | 0.32 | | | | 0.17 | | | | — | | | | (0.04 | ) | | | (0.04 | ) |
| | 2011 - A | | | 9.25 | | | | (0.12 | ) | | | (0.23 | ) | | | (0.35 | ) | | | — | | | | (0.11 | ) | | | (0.11 | ) |
| | 2011 - C | | | 9.08 | | | | (0.18 | ) | | | (0.23 | ) | | | (0.41 | ) | | | — | | | | (0.11 | ) | | | (0.11 | ) |
| | 2011 - Institutional | | | 9.34 | | | | (0.08 | ) | | | (0.25 | ) | | | (0.33 | ) | | | — | | | | (0.11 | ) | | | (0.11 | ) |
| | 2011 - IR | | | 9.31 | | | | (0.09 | ) | | | (0.25 | ) | | | (0.34 | ) | | | — | | | | (0.11 | ) | | | (0.11 | ) |
| | 2011 - R | | | 9.20 | | | | (0.14 | ) | | | (0.23 | ) | | | (0.37 | ) | | | — | | | | (0.11 | ) | | | (0.11 | ) |
| | 2010 - A | | | 9.06 | | | | (0.13 | ) | | | 0.38 | | | | 0.25 | | | | — | | | | (0.06 | ) | | | (0.06 | ) |
| | 2010 - C | | | 8.96 | | | | (0.19 | ) | | | 0.37 | | | | 0.18 | | | | — | | | | (0.06 | ) | | | (0.06 | ) |
| | 2010 - Institutional | | | 9.11 | | | | (0.09 | ) | | | 0.38 | | | | 0.29 | | | | — | | | | (0.06 | ) | | | (0.06 | ) |
| | 2010 - IR | | | 9.09 | | | | (0.10 | ) | | | 0.38 | | | | 0.28 | | | | — | | | | (0.06 | ) | | | (0.06 | ) |
| | 2010 - R | | | 9.03 | | | | (0.14 | ) | | | 0.37 | | | | 0.23 | | | | — | | | | (0.06 | ) | | | (0.06 | ) |
| | 2009 - A | | | 8.58 | | | | (0.12 | ) | | | 0.62 | | | | 0.50 | | | | (0.01 | ) | | | (0.01 | ) | | | (0.02 | ) |
| | 2009 - C | | | 8.54 | | | | (0.19 | ) | | | 0.62 | | | | 0.43 | | | | — | | | | (0.01 | ) | | | (0.01 | ) |
| | 2009 - Institutional | | | 8.60 | | | | (0.08 | ) | | | 0.62 | | | | 0.54 | | | | (0.02 | ) | | | (0.01 | ) | | | (0.03 | ) |
| | 2009 - IR | | | 8.59 | | | | (0.11 | ) | | | 0.64 | | | | 0.53 | | | | (0.02 | ) | | | (0.01 | ) | | | (0.03 | ) |
| | 2009 - R | | | 8.57 | | | | (0.14 | ) | | | 0.61 | | | | 0.47 | | | | — | | | | (0.01 | ) | | | (0.01 | ) |
| | | | | | | | | | | | | | | | | | | | | | | | | | | | | | |
| | FOR THE PERIOD ENDED DECEMBER 31, | |
| | 2008 - A (Commenced May 30, 2008) | | | 10.00 | | | | 0.01 | | | | (1.43 | ) | | | (1.42 | ) | | | — | | | | — | | | | — | |
| | 2008 - C (Commenced May 30, 2008) | | | 10.00 | | | | (0.03 | ) | | | (1.43 | ) | | | (1.46 | ) | | | — | | | | — | | | | — | |
| | 2008 - Institutional (Commenced May 30, 2008) | | | 10.00 | | | | 0.04 | | | | (1.44 | ) | | | (1.40 | ) | | | — | | | | — | | | | — | |
| | 2008 - IR (Commenced May 30, 2008) | | | 10.00 | | | | 0.04 | | | | (1.45 | ) | | | (1.41 | ) | | | — | | | | — | | | | — | |
| | 2008 - R (Commenced May 30, 2008) | | | 10.00 | | | | 0.01 | | | | (1.44 | ) | | | (1.43 | ) | | | — | | | | — | | | | — | |
| | (a) | | Calculated based on the average shares outstanding methodology. |
| | (b) | | Assumes investment at the net asset value at the beginning of the period, reinvestment of all distributions, a complete redemption of the investment at the net asset value at the end of the period and no sales or redemption charges. Total returns would be reduced if a sales or redemption charge was taken into account. Returns do not reflect the deduction of taxes that a shareholder would pay on Fund distributions or the redemption of Fund shares. Total returns for periods less than one full year are not annualized. |
| | (c) | | The Fund's portfolio turnover rate is calculated in accordance with regulatory requirements, without regard to transactions involving short term investments and certain derivatives. If such transactions were included, the Fund's portfolio turnover rate may be higher. |
| | |
| 58 | | The accompanying notes are an integral part of these financial statements. |
GOLDMAN SACHS ABSOLUTE RETURN TRACKER FUND
| | | | | | | | | | | | | | | | | | | | | | | | | | | | | | | | | | | | | | | | | | | | | | | |
| | | | | | | | | | | | | | | | | | | | | | | | | | | |
| | | Net asset
value, end of period | | | | Total
return(b) | | | | Net assets, end of period (in 000s) | | | | Ratio of net expenses to average net assets | | | | Ratio of
total expenses
to average
net assets | | | | Ratio of net investment income (loss)
to average
net assets | | | | Portfolio
turnover
rate(c) |
| | | | | | | | | | | | | | | | | | | | | | | | | | | | | | | | | | | | | | | | | | | | | | | |
| | | $ | 9.07 | | | | | | | 1.34 | % | | | | | $ | 110,195 | | | | | | | 1.56 | %(d) | | | | | | 1.59 | %(d) | | | | | | (1.30 | )%(d) | | | | | | 81 | % |
| | | | 8.73 | | | | | | | 0.92 | | | | | | | 30,110 | | | | | | | 2.31 | (d) | | | | | | 2.34 | (d) | | | | | | (2.06 | )(d) | | | | | | 81 | |
| | | | 9.25 | | | | | | | 1.65 | | | | | | | 1,381,421 | | | | | | | 1.16 | (d) | | | | | | 1.19 | (d) | | | | | | (0.89 | )(d) | | | | | | 81 | |
| | | | 9.18 | | | | | | | 1.55 | | | | | | | 16,964 | | | | | | | 1.31 | (d) | | | | | | 1.34 | (d) | | | | | | (1.03 | )(d) | | | | | | 81 | |
| | | | 8.96 | | | | | | | 1.24 | | | | | | | 1,770 | | | | | | | 1.81 | (d) | | | | | | 1.84 | (d) | | | | | | (1.54 | )(d) | | | | | | 81 | |
| | | | | | | | | | | | | | | | | | | | | | | | | | | | | | | | | | | | | | | | | | | | | | | |
| | | | | | | | | | | | | | | | | | | | | | | | | | | | | | | | | | | | | | | | | | | | | | | |
| | | | 8.95 | | | | | | | 2.30 | | | | | | | 133,654 | | | | | | | 1.55 | | | | | | | 1.59 | | | | | | | (1.44 | ) | | | | | | 79 | |
| | | | 8.65 | | | | | | | 1.55 | | | | | | | 37,525 | | | | | | | 2.30 | | | | | | | 2.34 | | | | | | | (2.19 | ) | | | | | | 79 | |
| | | | 9.10 | | | | | | | 2.72 | | | | | | | 1,355,193 | | | | | | | 1.15 | | | | | | | 1.19 | | | | | | | (1.04 | ) | | | | | | 79 | |
| | | | 9.04 | | | | | | | 2.51 | | | | | | | 17,085 | | | | | | | 1.30 | | | | | | | 1.34 | | | | | | | (1.19 | ) | | | | | | 79 | |
| | | | 8.85 | | | | | | | 1.98 | | | | | | | 1,988 | | | | | | | 1.80 | | | | | | | 1.84 | | | | | | | (1.69 | ) | | | | | | 79 | |
| | | | 8.79 | | | | | | | (3.77 | ) | | | | | | 493,429 | | | | | | | 1.56 | | | | | | | 1.59 | | | | | | | (1.31 | ) | | | | | | 105 | |
| | | | 8.56 | | | | | | | (4.50 | ) | | | | | | 60,598 | | | | | | | 2.31 | | | | | | | 2.34 | | | | | | | (2.06 | ) | | | | | | 105 | |
| | | | 8.90 | | | | | | | (3.51 | ) | | | | | | 1,314,751 | | | | | | | 1.16 | | | | | | | 1.19 | | | | | | | (0.88 | ) | | | | | | 105 | |
| | | | 8.86 | | | | | | | (3.63 | ) | | | | | | 16,341 | | | | | | | 1.31 | | | | | | | 1.34 | | | | | | | (1.02 | ) | | | | | | 105 | |
| | | | 8.72 | | | | | | | (4.00 | ) | | | | | | 1,258 | | | | | | | 1.81 | | | | | | | 1.84 | | | | | | | (1.54 | ) | | | | | | 105 | |
| | | | 9.25 | | | | | | | 2.73 | | | | | | | 490,567 | | | | | | | 1.59 | | | | | | | 1.63 | | | | | | | (1.39 | ) | | | | | | 132 | |
| | | | 9.08 | | | | | | | 1.98 | | | | | | | 78,423 | | | | | | | 2.34 | | | | | | | 2.38 | | | | | | | (2.13 | ) | | | | | | 132 | |
| | | | 9.34 | | | | | | | 3.16 | | | | | | | 786,120 | | | | | | | 1.19 | | | | | | | 1.23 | | | | | | | (0.97 | ) | | | | | | 132 | |
| | | | 9.31 | | | | | | | 3.05 | | | | | | | 5,206 | | | | | | | 1.34 | | | | | | | 1.38 | | | | | | | (1.12 | ) | | | | | | 132 | |
| | | | 9.20 | | | | | | | 2.52 | | | | | | | 895 | | | | | | | 1.84 | | | | | | | 1.88 | | | | | | | (1.60 | ) | | | | | | 132 | |
| | | | 9.06 | | | | | | | 5.75 | | | | | | | 322,502 | | | | | | | 1.60 | | | | | | | 1.86 | | | | | | | (1.36 | ) | | | | | | 126 | |
| | | | 8.96 | | | | | | | 5.01 | | | | | | | 47,012 | | | | | | | 2.35 | | | | | | | 2.61 | | | | | | | (2.13 | ) | | | | | | 126 | |
| | | | 9.11 | | | | | | | 6.28 | | | | | | | 305,992 | | | | | | | 1.20 | | | | | | | 1.46 | | | | | | | (0.93 | ) | | | | | | 126 | |
| | | | 9.09 | | | | | | | 6.15 | | | | | | | 1,642 | | | | | | | 1.35 | | | | | | | 1.61 | | | | | | | (1.18 | ) | | | | | | 126 | |
| | | | 9.03 | | | | | | | 5.46 | | | | | | | 31 | | | | | | | 1.85 | | | | | | | 2.11 | | | | | | | (1.60 | ) | | | | | | 126 | |
| | | | | | | | | | | | | | | | | | | | | | | | | | | | | | | | | | | | | | | | | | | | | | | |
| | | | | | | | | | | | | | | | | | | | | | | | | | | | | | | | | | | | | | | | | | | | | | | |
| | | | 8.58 | | | | | | | (14.20 | ) | | | | | | 41,900 | | | | | | | 1.60 | (d) | | | | | | 3.58 | (d) | | | | | | 0.08 | (d) | | | | | | 331 | |
| | | | 8.54 | | | | | | | (14.60 | ) | | | | | | 2,985 | | | | | | | 2.35 | (d) | | | | | | 4.33 | (d) | | | | | | (0.68 | )(d) | | | | | | 331 | |
| | | | 8.60 | | | | | | | (14.00 | ) | | | | | | 72,903 | | | | | | | 1.20 | (d) | | | | | | 3.18 | (d) | | | | | | 0.72 | (d) | | | | | | 331 | |
| | | | 8.59 | | | | | | | (14.10 | ) | | | | | | 9 | | | | | | | 1.35 | (d) | | | | | | 3.33 | (d) | | | | | | 0.98 | (d) | | | | | | 331 | |
| | | | 8.57 | | | | | | | (14.30 | ) | | | | | | 9 | | | | | | | 1.85 | (d) | | | | | | 3.83 | (d) | | | | | | 0.48 | (d) | | | | | | 331 | |
| | |
| The accompanying notes are an integral part of these financial statements. | | 59 |
GOLDMAN SACHS COMMODITY STRATEGY FUND
Financial Highlights
Selected Data for a Share Outstanding Throughout Each Period
| | | | | | | | | | | | | | | | | | | | | | | | | | | | | | |
| | | | | | | | Income (loss) from
investment operations | | | Distributions
to shareholders | |
| | | Year - Share Class | | Net asset
value,
beginning
of period | | | Net
investment
income (loss)(a) | | | Net realized
and unrealized
gain (loss) | | | Total from
investment
operations | | | From net
investment
income | | | From net
realized
gains | | | Total
distributions | |
| | FOR THE SIX MONTHS ENDED JUNE 30, (UNAUDITED) | |
| | 2013 - A | | $ | 5.73 | | | $ | (0.03 | ) | | $ | (0.35 | ) | | $ | (0.38 | ) | | $ | — | | | $ | — | | | $ | — | |
| | 2013 - C | | | 5.60 | | | | (0.05 | ) | | | (0.35 | ) | | | (0.40 | ) | | | — | | | | — | | | | — | |
| | 2013 - Institutional | | | 5.75 | | | | (0.02 | ) | | | (0.36 | ) | | | (0.38 | ) | | | — | | | | — | | | | — | |
| | 2013 - IR | | | 5.76 | | | | (0.02 | ) | | | (0.36 | ) | | | (0.38 | ) | | | — | | | | — | | | | — | |
| | 2013 - R | | | 5.69 | | | | (0.03 | ) | | | (0.36 | ) | | | (0.39 | ) | | | — | | | | — | | | | — | |
| | | | | | | | | | | | | | | | | | | | | | | | | | | | | | |
| | FOR THE FISCAL YEARS ENDED DECEMBER 31, | |
| | 2012 - A | | | 5.88 | | | | (0.03 | ) | | | (0.08 | ) | | | (0.11 | ) | | | (0.04 | ) | | | — | | | | (0.04 | ) |
| | 2012 - C | | | 5.78 | | | | (0.08 | ) | | | (0.07 | ) | | | (0.15 | ) | | | (0.03 | ) | | | — | | | | (0.03 | ) |
| | 2012 - Institutional | | | 5.89 | | | | (0.02 | ) | | | (0.07 | ) | | | (0.09 | ) | | | (0.05 | ) | | | — | | | | (0.05 | ) |
| | 2012 - IR | | | 5.91 | | | | (0.03 | ) | | | (0.07 | ) | | | (0.10 | ) | | | (0.05 | ) | | | — | | | | (0.05 | ) |
| | 2012 - R | | | 5.85 | | | | (0.05 | ) | | | (0.07 | ) | | | (0.12 | ) | | | (0.04 | ) | | | — | | | | (0.04 | ) |
| | 2011 - A | | | 6.03 | | | | (0.04 | ) | | | 0.01 | | | | (0.03 | ) | | | (0.12 | ) | | | — | | | | (0.12 | ) |
| | 2011 - C | | | 5.95 | | | | (0.08 | ) | | | 0.01 | | | | (0.07 | ) | | | (0.10 | ) | | | — | | | | (0.10 | ) |
| | 2011 - Institutional | | | 6.04 | | | | (0.02 | ) | | | — | | | | (0.02 | ) | | | (0.13 | ) | | | — | | | | (0.13 | ) |
| | 2011 - IR | | | 6.05 | | | | (0.02 | ) | | | 0.01 | | | | (0.01 | ) | | | (0.13 | ) | | | — | | | | (0.13 | ) |
| | 2011 - R | | | 6.01 | | | | (0.05 | ) | | | 0.01 | | | | (0.04 | ) | | | (0.12 | ) | | | — | | | | (0.12 | ) |
| | 2010 - A | | | 6.19 | | | | (0.02 | ) | | | 0.52 | | | | 0.50 | | | | (0.66 | ) | | | — | | | | (0.66 | ) |
| | 2010 - C | | | 6.14 | | | | (0.06 | ) | | | 0.51 | | | | 0.45 | | | | (0.64 | ) | | | — | | | | (0.64 | ) |
| | 2010 - Institutional | | | 6.19 | | | | — | (e) | | | 0.52 | | | | 0.52 | | | | (0.67 | ) | | | — | | | | (0.67 | ) |
| | 2010 - IR | | | 6.20 | | | | (0.01 | ) | | | 0.53 | | | | 0.52 | | | | (0.67 | ) | | | — | | | | (0.67 | ) |
| | 2010 - R | | | 6.18 | | | | (0.04 | ) | | | 0.52 | | | | 0.48 | | | | (0.65 | ) | | | — | | | | (0.65 | ) |
| | 2009 - A | | | 5.40 | | | | 0.02 | | | | 0.91 | | | | 0.93 | | | | (0.14 | ) | | | — | | | | (0.14 | ) |
| | 2009 - C | | | 5.38 | | | | (0.02 | ) | | | 0.90 | | | | 0.88 | | | | (0.12 | ) | | | — | | | | (0.12 | ) |
| | 2009 - Institutional | | | 5.43 | | | | 0.04 | | | | 0.88 | | | | 0.92 | | | | (0.16 | ) | | | — | | | | (0.16 | ) |
| | 2009 - IR | | | 5.40 | | | | 0.05 | | | | 0.90 | | | | 0.95 | | | | (0.15 | ) | | | — | | | | (0.15 | ) |
| | 2009 - R | | | 5.40 | | | | — | (e) | | | 0.92 | | | | 0.92 | | | | (0.14 | ) | | | — | | | | (0.14 | ) |
| | 2008 - A | | | 12.22 | | | | 0.20 | | | | (6.19 | ) | | | (5.99 | ) | | | (0.21 | )(f) | | | (0.62 | ) | | | (0.83 | ) |
| | 2008 - C | | | 12.20 | | | | 0.11 | | | | (6.18 | ) | | | (6.07 | ) | | | (0.13 | )(f) | | | (0.62 | ) | | | (0.75 | ) |
| | 2008 - Institutional | | | 12.26 | | | | 0.25 | | | | (6.21 | ) | | | (5.96 | ) | | | (0.25 | )(f) | | | (0.62 | ) | | | (0.87 | ) |
| | 2008 - IR | | | 12.21 | | | | 0.23 | | | | (6.18 | ) | | | (5.95 | ) | | | (0.24 | )(f) | | | (0.62 | ) | | | (0.86 | ) |
| | 2008 - R | | | 12.21 | | | | 0.17 | | | | (6.18 | ) | | | (6.01 | ) | | | (0.18 | )(f) | | | (0.62 | ) | | | (0.80 | ) |
| | (a) | | Calculated based on the average shares outstanding methodology. |
| | (b) | | Assumes investment at the net asset value at the beginning of the period, reinvestment of all distributions, a complete redemption of the investment at the net asset value at the end of the period and no sales or redemption charges. Total returns would be reduced if a sales or redemption charge was taken into account. Returns do not reflect the deduction of taxes that a shareholder would pay on Fund distributions or the redemption of Fund shares. Total returns for periods less than one full year are not annualized. |
| | (c) | | The Fund's portfolio turnover rate is calculated in accordance with regulatory requirements, without regard to transactions involving short term investments and certain derivatives. If such transactions were included, the Fund's portfolio turnover rate may be higher. |
| | (e) | | Amount is less than $0.005 per share. |
| | (f) | | Includes distribution of capital of less than $0.005 per share. |
| | |
| 60 | | The accompanying notes are an integral part of these financial statements. |
GOLDMAN SACHS COMMODITY STRATEGY FUND
| | | | | | | | | | | | | | | | | | | | | | | | | | | | | | | | | | | | | | | | | | | | | | | |
| | | | | | | | | | | | | | | | | | | | | | | | | | | |
| | | Net asset
value, end
of period | | | | Total
return(b) | | | | Net assets,
end of
period
(in 000s) | | | | Ratio of
net expenses
to average
net assets | | | | Ratio of
total expenses
to average
net assets | | | | Ratio of
net investment
income (loss)
to average
net assets | | | | Portfolio
turnover
rate(c) |
| | | | | | | | | | | | | | | | | | | | | | | | | | | | | | | | | | | | | | | | | | | | | | | |
| | | $ | 5.35 | | | | | | | (6.63 | )% | | | | | $ | 308,831 | | | | | | | 0.92 | %(d) | | | | | | 0.95 | %(d) | | | | | | (0.99 | )%(d) | | | | | | 131 | % |
| | | | 5.20 | | | | | | | (7.14 | ) | | | | | | 11,955 | | | | | | | 1.67 | (d) | | | | | | 1.70 | (d) | | | | | | (1.71 | )(d) | | | | | | 131 | |
| | | | 5.37 | | | | | | | (6.61 | ) | | | | | | 750,266 | | | | | | | 0.58 | (d) | | | | | | 0.61 | (d) | | | | | | (0.61 | )(d) | | | | | | 131 | |
| | | | 5.38 | | | | | | | (6.60 | ) | | | | | | 5,251 | | | | | | | 0.67 | (d) | | | | | | 0.70 | (d) | | | | | | (0.70 | )(d) | | | | | | 131 | |
| | | | 5.30 | | | | | | | (6.85 | ) | | | | | | 1,584 | | | | | | | 1.17 | (d) | | | | | | 1.20 | (d) | | | | | | (1.18 | )(d) | | | | | | 131 | |
| | | | | | | | | | | | | | | | | | | | | | | | | | | | | | | | | | | | | | | | | | | | | | | |
| | | | | | | | | | | | | | | | | | | | | | | | | | | | | | | | | | | | | | | | | | | | | | | |
| | | | 5.73 | | | | | | | (1.91 | ) | | | | | | 353,082 | | | | | | | 0.92 | | | | | | | 0.96 | | | | | | | (0.59 | ) | | | | | | 690 | |
| | | | 5.60 | | | | | | | (2.64 | ) | | | | | | 13,994 | | | | | | | 1.67 | | | | | | | 1.71 | | | | | | | (1.39 | ) | | | | | | 690 | |
| | | | 5.75 | | | | | | | (1.57 | ) | | | | | | 742,974 | | | | | | | 0.58 | | | | | | | 0.62 | | | | | | | (0.29 | ) | | | | | | 690 | |
| | | | 5.76 | | | | | | | (1.81 | ) | | | | | | 7,045 | | | | | | | 0.67 | | | | | | | 0.71 | | | | | | | (0.45 | ) | | | | | | 690 | |
| | | | 5.69 | | | | | | | (2.14 | ) | | | | | | 1,450 | | | | | | | 1.17 | | | | | | | 1.21 | | | | | | | (0.86 | ) | | | | | | 690 | |
| | | | 5.88 | | | | | | | (0.56 | ) | | | | | | 205,561 | | | | | | | 0.92 | | | | | | | 0.95 | | | | | | | (0.61 | ) | | | | | | 581 | |
| | | | 5.78 | | | | | | | (1.26 | ) | | | | | | 15,273 | | | | | | | 1.67 | | | | | | | 1.70 | | | | | | | (1.36 | ) | | | | | | 581 | |
| | | | 5.89 | | | | | | | (0.41 | ) | | | | | | 668,618 | | | | | | | 0.58 | | | | | | | 0.61 | | | | | | | (0.27 | ) | | | | | | 581 | |
| | | | 5.91 | | | | | | | (0.28 | ) | | | | | | 19,007 | | | | | | | 0.67 | | | | | | | 0.70 | | | | | | | (0.37 | ) | | | | | | 581 | |
| | | | 5.85 | | | | | | | (0.83 | ) | | | | | | 1,063 | | | | | | | 1.17 | | | | | | | 1.20 | | | | | | | (0.87 | ) | | | | | | 581 | |
| | | | 6.03 | | | | | | | 8.46 | | | | | | | 145,288 | | | | | | | 0.92 | | | | | | | 0.96 | | | | | | | (0.34 | ) | | | | | | 162 | |
| | | | 5.95 | | | | | | | 7.70 | | | | | | | 11,455 | | | | | | | 1.67 | | | | | | | 1.71 | | | | | | | (1.10 | ) | | | | | | 162 | |
| | | | 6.04 | | | | | | | 8.85 | | | | | | | 641,978 | | | | | | | 0.58 | | | | | | | 0.62 | | | | | | | (0.02 | ) | | | | | | 162 | |
| | | | 6.05 | | | | | | | 8.79 | | | | | | | 6,957 | | | | | | | 0.67 | | | | | | | 0.71 | | | | | | | (0.23 | ) | | | | | | 162 | |
| | | | 6.01 | | | | | | | 8.20 | | | | | | | 459 | | | | | | | 1.17 | | | | | | | 1.21 | | | | | | | (0.63 | ) | | | | | | 162 | |
| | | | 6.19 | | | | | | | 17.12 | | | | | | | 111,685 | | | | | | | 0.92 | | | | | | | 1.04 | | | | | | | 0.37 | | | | | | | 104 | |
| | | | 6.14 | | | | | | | 16.15 | | | | | | | 5,669 | | | | | | | 1.67 | | | | | | | 1.79 | | | | | | | (0.35 | ) | | | | | | 104 | |
| | | | 6.19 | | | | | | | 16.84 | | | | | | | 475,318 | | | | | | | 0.58 | | | | | | | 0.70 | | | | | | | 0.65 | | | | | | | 104 | |
| | | | 6.20 | | | | | | | 17.76 | | | | | | | 67 | | | | | | | 0.68 | | | | | | | 0.79 | | | | | | | 0.81 | | | | | | | 104 | |
| | | | 6.18 | | | | | | | 17.07 | | | | | | | 109 | | | | | | | 1.17 | | | | | | | 1.29 | | | | | | | 0.01 | | | | | | | 104 | |
| | | | 5.40 | | | | | | | (49.23 | ) | | | | | | 40,118 | | | | | | | 0.92 | | | | | | | 1.06 | | | | | | | 1.62 | | | | | | | 279 | |
| | | | 5.38 | | | | | | | (49.66 | ) | | | | | | 2,208 | | | | | | | 1.67 | | | | | | | 1.81 | | | | | | | 0.91 | | | | | | | 279 | |
| | | | 5.43 | | | | | | | (48.96 | ) | | | | | | 127,630 | | | | | | | 0.58 | | | | | | | 0.72 | | | | | | | 1.97 | | | | | | | 279 | |
| | | | 5.40 | | | | | | | (49.14 | ) | | | | | | 17 | | | | | | | 0.67 | | | | | | | 0.81 | | | | | | | 1.90 | | | | | | | 279 | |
| | | | 5.40 | | | | | | | (49.39 | ) | | | | | | 9 | | | | | | | 1.17 | | | | | | | 1.31 | | | | | | | 1.43 | | | | | | | 279 | |
| | |
| The accompanying notes are an integral part of these financial statements. | | 61 |
GOLDMAN SACHS DYNAMIC ALLOCATION FUND
Financial Highlights
Selected Data for a Share Outstanding Throughout Each Period
| | | | | | | | | | | | | | | | | | | | | | | | | | | | | | |
| | | | | | | | Income (loss) from
investment operations | | | Distributions
to shareholders | |
| | | Year - Share Class | | Net asset
value,
beginning
of period | | | Net
investment
income (loss)(a) | | | Net realized
and unrealized
gain (loss) | | | Total from
investment
operations | | | From net
investment
income | | | From net
realized
gains | | | Total
distributions | |
| | FOR THE SIX MONTHS ENDED JUNE 30, (UNAUDITED) | |
| | 2013 - A | | $ | 10.70 | | | $ | (0.07 | ) | | $ | 0.02 | | | $ | (0.05 | ) | | $ | — | | | $ | — | | | $ | — | |
| | 2013 - C | | | 10.50 | | | | (0.11 | ) | | | 0.02 | | | | (0.09 | ) | | | — | | | | — | | | | — | |
| | 2013 - Institutional | | | 10.78 | | | | (0.05 | ) | | | 0.03 | | | | (0.02 | ) | | | — | | | | — | | | | — | |
| | 2013 - IR | | | 10.76 | | | | (0.06 | ) | | | 0.03 | | | | (0.03 | ) | | | — | | | | — | | | | — | |
| | 2013 - R | | | 10.67 | | | | (0.08 | ) | | | 0.02 | | | | (0.06 | ) | | | — | | | | — | | | | — | |
| | | | | | | | | | | | | | | | | | | | | | | | | | | | | | |
| | FOR THE FISCAL YEARS ENDED DECEMBER 31, | |
| | 2012 - A | | | 10.29 | | | | (0.07 | ) | | | 0.86 | | | | 0.79 | | | | — | | | | (0.38 | ) | | | (0.38 | ) |
| | 2012 - C | | | 10.18 | | | | (0.14 | ) | | | 0.84 | | | | 0.70 | | | | — | | | | (0.38 | ) | | | (0.38 | ) |
| | 2012 - Institutional | | | 10.35 | | | | (0.04 | ) | | | 0.88 | | | | 0.84 | | | | (0.03 | ) | | | (0.38 | ) | | | (0.41 | ) |
| | 2012 - IR | | | 10.33 | | | | (0.03 | ) | | | 0.85 | | | | 0.82 | | | | (0.01 | ) | | | (0.38 | ) | | | (0.39 | ) |
| | 2012 - R | | | 10.28 | | | | (0.09 | ) | | | 0.86 | | | | 0.77 | | | | — | | | | (0.38 | ) | | | (0.38 | ) |
| | 2011 - A | | | 10.54 | | | | (0.03 | ) | | | (0.15 | ) | | | (0.18 | ) | | | (0.04 | ) | | | (0.03 | ) | | | (0.07 | ) |
| | 2011 - C | | | 10.47 | | | | (0.13 | ) | | | (0.12 | ) | | | (0.25 | ) | | | (0.01 | ) | | | (0.03 | ) | | | (0.04 | ) |
| | 2011 - Institutional | | | 10.59 | | | | 0.01 | | | | (0.16 | ) | | | (0.15 | ) | | | (0.06 | ) | | | (0.03 | ) | | | (0.09 | ) |
| | 2011 - IR | | | 10.57 | | | | (0.02 | ) | | | (0.14 | ) | | | (0.16 | ) | | | (0.05 | ) | | | (0.03 | ) | | | (0.08 | ) |
| | 2011 - R | | | 10.52 | | | | (0.05 | ) | | | (0.16 | ) | | | (0.21 | ) | | | — | | | | (0.03 | ) | | | (0.03 | ) |
| | | | | | | | | | | | | | | | | | | | | | | | | | | | | | |
| | FOR THE PERIOD ENDED DECEMBER 31, | |
| | 2010 - A (Commenced January 5, 2010) | | | 10.00 | | | | (0.04 | ) | | | 0.77 | | | | 0.73 | | | | — | | | | (0.19 | ) | | | (0.19 | ) |
| | 2010 - C (Commenced January 5, 2010) | | | 10.00 | | | | (0.11 | ) | | | 0.77 | | | | 0.66 | | | | — | | | | (0.19 | ) | | | (0.19 | ) |
| | 2010 - Institutional (Commenced January 5, 2010) | | | 10.00 | | | | (0.01 | ) | | | 0.79 | | | | 0.78 | | | | — | | | | (0.19 | ) | | | (0.19 | ) |
| | 2010 - IR (Commenced January 5, 2010) | | | 10.00 | | | | (0.04 | ) | | | 0.80 | | | | 0.76 | | | | — | | | | (0.19 | ) | | | (0.19 | ) |
| | 2010 - R (Commenced January 5, 2010) | | | 10.00 | | | | (0.07 | ) | | | 0.78 | | | | 0.71 | | | | — | | | | (0.19 | ) | | | (0.19 | ) |
| | (a) | | Calculated based on the average shares outstanding methodology. |
| | (b) | | Assumes investment at the net asset value at the beginning of the period, reinvestment of all distributions, a complete redemption of the investment at the net asset value at the end of the period and no sales or redemption charges. Total returns would be reduced if a sales or redemption charge was taken into account. Returns do not reflect the deduction of taxes that a shareholder would pay on Fund distributions or the redemption of Fund shares. Total returns for periods less than one full year are not annualized. |
| | (c) | | The Fund's portfolio turnover rate is calculated in accordance with regulatory requirements, without regard to transactions involving short term investments and certain derivatives. If such transactions were included, the Fund's portfolio turnover rate may be higher. |
| | |
| 62 | | The accompanying notes are an integral part of these financial statements. |
GOLDMAN SACHS DYNAMIC ALLOCATION FUND
| | | | | | | | | | | | | | | | | | | | | | | | | | | | | | | | | | | | | | | | | | | | | | | | | | | | | | | | | | | | | | | | | | | | | | | | |
| | | | | | | | | | | | | | | | | | | | | | | | | | | | | | | | | | | | | |
| | | Net asset
value, end
of period | | | | Total
return(b) | | | | Net assets,
end of
period
(in 000s) | | | | Ratio of
net expenses
to average
net assets
(including
interest and
dividend
expense for
securities
sold short) | | | | Ratio of
net expenses
to average
net assets
(excluding
interest and
dividend
expense for
securities
sold short) | | | | Ratio of
total expenses
to average
net assets
(including
interest and
dividend
expense for
securities
sold short) | | | | Ratio of
total expenses
to average
net assets
(excluding
interest and
dividend
expense for
securities
sold short) | | | | Ratio of
net investment
income (loss)
to average
net assets | | | | Portfolio
turnover
rate
(including
securities
sold short)(c) | | Portfolio
turnover
rate
(excluding
securities
sold short)(c) |
| | | | | | | | | | | | | | | | | | | | | | | | | | | | | | | | | | | | | | | | | | | | | | | | | | | | | | | | | | | | | | | | | | | | |
| | | $ | 10.65 | | | | | | | (0.47 | )% | | | | | $ | 251,129 | | | | | | | 1.33 | %(d) | | | | | | 1.33 | %(d) | | | | | | 1.36 | %(d) | | | | | | 1.36 | %(d) | | | | | | (1.34 | )%(d) | | | | | | 147 | % | | | | 147 | % |
| | | | 10.41 | | | | | | | (0.86 | ) | | | | | | 79,809 | | | | | | | 2.08 | (d) | | | | | | 2.08 | (d) | | | | | | 2.11 | (d) | | | | | | 2.11 | (d) | | | | | | (2.04 | )(d) | | | | | | 147 | | | | | 147 | |
| | | | 10.76 | | | | | | | (0.19 | ) | | | | | | 860,628 | | | | | | | 0.93 | (d) | | | | | | 0.93 | (d) | | | | | | 0.96 | (d) | | | | | | 0.96 | (d) | | | | | | (0.89 | )(d) | | | | | | 147 | | | | | 147 | |
| | | | 10.73 | | | | | | | (0.28 | ) | | | | | | 65,989 | | | | | | | 1.08 | (d) | | | | | | 1.08 | (d) | | | | | | 1.11 | (d) | | | | | | 1.11 | (d) | | | | | | (1.02 | )(d) | | | | | | 147 | | | | | 147 | |
| | | | 10.61 | | | | | | | (0.56 | ) | | | | | | 11 | | | | | | | 1.58 | (d) | | | | | | 1.58 | (d) | | | | | | 1.59 | (d) | | | | | | 1.59 | (d) | | | | | | (1.55 | )(d) | | | | | | 147 | | | | | 147 | |
| | | | | | | | | | | | | | | | | | | | | | | | | | | | | | | | | | | | | | | | | | | | | | | | | | | | | | | | | | | | | | | | | | | | |
| | | | | | | | | | | | | | | | | | | | | | | | | | | | | | | | | | | | | | | | | | | | | | | | | | | | | | | | | | | | | | | | | | | | |
| | | | 10.70 | | | | | | | 7.66 | | | | | | | 291,432 | | | | | | | 1.38 | | | | | | | 1.38 | | | | | | | 1.38 | | | | | | | 1.38 | | | | | | | (0.61 | ) | | | | | | 177 | | | | | 177 | |
| | | | 10.50 | | | | | | | 6.86 | | | | | | | 76,580 | | | | | | | 2.13 | | | | | | | 2.13 | | | | | | | 2.13 | | | | | | | 2.13 | | | | | | | (1.32 | ) | | | | | | 177 | | | | | 177 | |
| | | | 10.78 | | | | | | | 8.06 | | | | | | | 853,273 | | | | | | | 0.97 | | | | | | | 0.97 | | | | | | | 0.97 | | | | | | | 0.97 | | | | | | | (0.37 | ) | | | | | | 177 | | | | | 177 | |
| | | | 10.76 | | | | | | | 7.89 | | | | | | | 59,935 | | | | | | | 1.13 | | | | | | | 1.13 | | | | | | | 1.14 | | | | | | | 1.14 | | | | | | | (0.31 | ) | | | | | | 177 | | | | | 177 | |
| | | | 10.67 | | | | | | | 7.48 | | | | | | | 11 | | | | | | | 1.63 | | | | | | | 1.63 | | | | | | | 1.64 | | | | | | | 1.64 | | | | | | | (0.84 | ) | | | | | | 177 | | | | | 177 | |
| | | | 10.29 | | | | | | | (1.72 | ) | | | | | | 165,877 | | | | | | | 1.39 | | | | | | | 1.39 | | | | | | | 1.47 | | | | | | | 1.47 | | | | | | | (0.32 | ) | | | | | | 297 | | | | | 297 | |
| | | | 10.18 | | | | | | | (2.43 | ) | | | | | | 56,025 | | | | | | | 2.14 | | | | | | | 2.14 | | | | | | | 2.22 | | | | | | | 2.22 | | | | | | | (1.22 | ) | | | | | | 297 | | | | | 297 | |
| | | | 10.35 | | | | | | | (1.38 | ) | | | | | | 199,083 | | | | | | | 0.99 | | | | | | | 0.99 | | | | | | | 1.07 | | | | | | | 1.07 | | | | | | | 0.08 | | | | | | | 297 | | | | | 297 | |
| | | | 10.33 | | | | | | | (1.47 | ) | | | | | | 56,972 | | | | | | | 1.14 | | | | | | | 1.14 | | | | | | | 1.22 | | | | | | | 1.22 | | | | | | | (0.22 | ) | | | | | | 297 | | | | | 297 | |
| | | | 10.28 | | | | | | | (2.04 | ) | | | �� | | | 10 | | | | | | | 1.64 | | | | | | | 1.64 | | | | | | | 1.72 | | | | | | | 1.72 | | | | | | | (0.49 | ) | | | | | | 297 | | | | | 297 | |
| | | | | | | | | | | | | | | | | | | | | | | | | | | | | | | | | | | | | | | | | | | | | | | | | | | | | | | | | | | | | | | | | | | | |
| | | | | | | | | | | | | | | | | | | | | | | | | | | | | | | | | | | | | | | | | | | | | | | | | | | | | | | | | | | | | | | | | | | | |
| | | | 10.54 | | | | | | | 7.29 | | | | | | | 43,222 | | | | | | | 1.41 | (d) | | | | | | 1.39 | (d) | | | | | | 2.13 | (d) | | | | | | 2.11 | (d) | | | | | | (0.39 | )(d) | | | | | | 180 | | | | | 175 | |
| | | | 10.47 | | | | | | | 6.59 | | | | | | | 8,567 | | | | | | | 2.16 | (d) | | | | | | 2.14 | (d) | | | | | | 2.88 | (d) | | | | | | 2.86 | (d) | | | | | | (1.06 | )(d) | | | | | | 180 | | | | | 175 | |
| | | | 10.59 | | | | | | | 7.80 | | | | | | | 84,928 | | | | | | | 1.01 | (d) | | | | | | 0.99 | (d) | | | | | | 1.73 | (d) | | | | | | 1.71 | (d) | | | | | | (0.14 | )(d) | | | | | | 180 | | | | | 175 | |
| | | | 10.57 | | | | | | | 7.60 | | | | | | | 23,477 | | | | | | | 1.16 | (d) | | | | | | 1.14 | (d) | | | | | | 1.88 | (d) | | | | | | 1.86 | (d) | | | | | | (0.38 | )(d) | | | | | | 180 | | | | | 175 | |
| | | | 10.52 | | | | | | | 7.10 | | | | | | | 11 | | | | | | | 1.66 | (d) | | | | | | 1.64 | (d) | | | | | | 2.38 | (d) | | | | | | 2.36 | (d) | | | | | | (0.66 | )(d) | | | | | | 180 | | | | | 175 | |
| | |
| The accompanying notes are an integral part of these financial statements. | | 63 |
GOLDMAN SACHS INTERNATIONAL REAL ESTATE SECURITIES FUND
Financial Highlights
Selected Data for a Share Outstanding Throughout Each Period
| | | | | | | | | | | | | | | | | | | | | | | | | | | | | | |
| | | | | | | | Income (loss) from
investment operations | | | Distributions
to shareholders | |
| | | Year - Share Class | | Net asset
value,
beginning
of period | | | Net
investment
income(a) | | | Net realized
and unrealized
gain (loss) | | | Total from
investment
operations | | | From net
investment
income | | | From
capital | | | Total
distributions | |
| | FOR THE SIX MONTHS ENDED JUNE 30, (UNAUDITED) | |
| | 2013 - A | | $ | 6.46 | | | $ | 0.07 | | | $ | (0.08 | ) | | $ | (0.01 | ) | | $ | (0.07 | ) | | $ | — | | | $ | (0.07 | ) |
| | 2013 - C | | | 6.46 | | | | 0.06 | | | | (0.10 | ) | | | (0.04 | ) | | | (0.05 | ) | | | — | | | | (0.05 | ) |
| | 2013 - Institutional | | | 6.29 | | | | 0.09 | | | | (0.08 | ) | | | 0.01 | | | | (0.09 | ) | | | — | | | | (0.09 | ) |
| | 2013 - IR | | | 6.40 | | | | 0.09 | | | | (0.09 | ) | | | — | (e) | | | (0.08 | ) | | | — | | | | (0.08 | ) |
| | | | | | | | | | | | | | | | | | | | | | | | | | | | | | |
| | FOR THE FISCAL YEARS ENDED DECEMBER 31, | |
| | 2012 - A | | | 4.94 | | | | 0.12 | | | | 1.95 | | | | 2.07 | | | | (0.55 | ) | | | — | | | | (0.55 | ) |
| | 2012 - C | | | 4.95 | | | | 0.07 | | | | 1.96 | | | | 2.03 | | | | (0.52 | ) | | | — | | | | (0.52 | ) |
| | 2012 - Institutional | | | 4.84 | | | | 0.14 | | | | 1.91 | | | | 2.05 | | | | (0.60 | ) | | | — | | | | (0.60 | ) |
| | 2012 - IR | | | 4.92 | | | | 0.14 | | | | 1.93 | | | | 2.07 | | | | (0.59 | ) | | | — | | | | (0.59 | ) |
| | 2011 - A | | | 6.32 | | | | 0.13 | | | | (1.34 | ) | | | (1.21 | ) | | | (0.17 | ) | | | — | | | | (0.17 | ) |
| | 2011 - C | | | 6.34 | | | | 0.08 | | | | (1.35 | ) | | | (1.27 | ) | | | (0.12 | ) | | | — | | | | (0.12 | ) |
| | 2011 - Institutional | | | 6.20 | | | | 0.15 | | | | (1.32 | ) | | | (1.17 | ) | | | (0.19 | ) | | | — | | | | (0.19 | ) |
| | 2011 - IR | | | 6.30 | | | | 0.15 | | | | (1.35 | ) | | | (1.20 | ) | | | (0.18 | ) | | | — | | | | (0.18 | ) |
| | 2010 - A | | | 6.01 | | | | 0.22 | | | | 0.51 | | | | 0.73 | | | | (0.42 | ) | | | — | | | | (0.42 | ) |
| | 2010 - C | | | 5.98 | | | | 0.16 | | | | 0.54 | | | | 0.70 | | | | (0.34 | ) | | | — | | | | (0.34 | ) |
| | 2010 - Institutional | | | 5.92 | | | | 0.25 | | | | 0.49 | | | | 0.74 | | | | (0.46 | ) | | | — | | | | (0.46 | ) |
| | 2010 - IR | | | 6.00 | | | | 0.27 | | | | 0.48 | | | | 0.75 | | | | (0.45 | ) | | | — | | | | (0.45 | ) |
| | 2009 - A | | | 5.14 | | | | 0.14 | (f) | | | 1.56 | | | | 1.70 | | | | (0.81 | ) | | | (0.02 | ) | | | (0.83 | ) |
| | 2009 - C | | | 5.10 | | | | 0.10 | (f) | | | 1.54 | | | | 1.64 | | | | (0.74 | ) | | | (0.02 | ) | | | (0.76 | ) |
| | 2009 - Institutional | | | 5.10 | | | | 0.16 | (f) | | | 1.53 | | | | 1.69 | | | | (0.85 | ) | | | (0.02 | ) | | | (0.87 | ) |
| | 2009 - IR | | | 5.14 | | | | 0.15 | (f) | | | 1.56 | | | | 1.71 | | | | (0.83 | ) | | | (0.02 | ) | | | (0.85 | ) |
| | 2008 - A | | | 10.85 | | | | 0.15 | | | | (5.77 | ) | | | (5.62 | ) | | | — | | | | (0.09 | ) | | | (0.09 | ) |
| | 2008 - C | | | 10.80 | | | | 0.10 | | | | (5.73 | ) | | | (5.63 | ) | | | — | | | | (0.07 | ) | | | (0.07 | ) |
| | 2008 - Institutional | | | 10.84 | | | | 0.19 | | | | (5.82 | ) | | | (5.63 | ) | | | — | | | | (0.11 | ) | | | (0.11 | ) |
| | 2008 - IR | | | 10.81 | | | | 0.17 | | | | (5.74 | ) | | | (5.57 | ) | | | — | | | | (0.10 | ) | | | (0.10 | ) |
| | (a) | | Calculated based on the average shares outstanding methodology. |
| | (b) | | Assumes investment at the net asset value at the beginning of the period, reinvestment of all distributions, a complete redemption of the investment at the net asset value at the end of the period and no sales or redemption charges. Total returns would be reduced if a sales or redemption charge was taken into account. Returns do not reflect the deduction of taxes that a shareholder would pay on Fund distributions or the redemption of Fund shares. Total returns for periods less than one full year are not annualized. |
| | (c) | | The Fund's portfolio turnover rate is calculated in accordance with regulatory requirements, without regard to transactions involving short term investments and certain derivatives. If such transactions were included, the Fund's portfolio turnover rate may be higher. |
| | (e) | | Amount is less than $0.005 per share. |
| | (f) | | Reflects income recognized from special dividends which amounted to $0.01 per share and 0.15% of average net assets. |
| | |
| 64 | | The accompanying notes are an integral part of these financial statements. |
GOLDMAN SACHS INTERNATIONAL REAL ESTATE SECURITIES FUND
| | | | | | | | | | | | | | | | | | | | | | | | | | | | | | | | | | | | | | | | | | | | | | | |
| | | | | | | | | | | | | | | | | | | | | | | | | | | |
| | | Net asset
value, end
of period | | | | Total
return(b) | | | | Net assets,
end of
period
(in 000s) | | | | Ratio of
net expenses
to average
net assets | | | | Ratio of
total expenses
to average
net assets | | | | Ratio of
net investment
income
to average
net assets | | | | Portfolio
turnover
rate(c) |
| | | | | | | | | | | | | | | | | | | | | | | | | | | | | | | | | | | | | | | | | | | | | | | |
| | | $ | 6.38 | | | | | | | (0.12 | )% | | | | | $ | 14,342 | | | | | | | 1.50 | %(d) | | | | | | 1.61 | %(d) | | | | | | 2.18 | %(d) | | | | | | 27 | % |
| | | | 6.37 | | | | | | | (0.59 | ) | | | | | | 2,564 | | | | | | | 2.25 | (d) | | | | | | 2.36 | (d) | | | | | | 1.71 | (d) | | | | | | 27 | |
| | | | 6.21 | | | | | | | 0.15 | | | | | | | 357,109 | | | | | | | 1.10 | (d) | | | | | | 1.21 | (d) | | | | | | 2.85 | (d) | | | | | | 27 | |
| | | | 6.32 | | | | | | | 0.06 | | | | | | | 2,765 | | | | | | | 1.25 | (d) | | | | | | 1.36 | (d) | | | | | | 2.79 | (d) | | | | | | 27 | |
| | | | | | | | | | | | | | | | | | | | | | | | | | | | | | | | | | | | | | | | | | | | | | | |
| | | | | | | | | | | | | | | | | | | | | | | | | | | | | | | | | | | | | | | | | | | | | | | |
| | | | 6.46 | | | | | | | 42.31 | | | | | | | 23,019 | | | | | | | 1.52 | | | | | | | 1.63 | | | | | | | 2.01 | | | | | | | 55 | |
| | | | 6.46 | | | | | | | 41.43 | | | | | | | 2,253 | | | | | | | 2.27 | | | | | | | 2.37 | | | | | | | 1.23 | | | | | | | 55 | |
| | | | 6.29 | | | | | | | 42.78 | | | | | | | 314,518 | | | | | | | 1.12 | | | | | | | 1.22 | | | | | | | 2.35 | | | | | | | 55 | |
| | | | 6.40 | | | | | | | 42.62 | | | | | | | 2,043 | | | | | | | 1.27 | | | | | | | 1.36 | | | | | | | 2.25 | | | | | | | 55 | |
| | | | 4.94 | | | | | | | (19.46 | ) | | | | | | 83,295 | | | | | | | 1.53 | | | | | | | 1.64 | | | | | | | 2.15 | | | | | | | 67 | |
| | | | 4.95 | | | | | | | (20.20 | ) | | | | | | 1,980 | | | | | | | 2.28 | | | | | | | 2.39 | | | | | | | 1.37 | | | | | | | 67 | |
| | | | 4.84 | | | | | | | (19.14 | ) | | | | | | 183,167 | | | | | | | 1.13 | | | | | | | 1.24 | | | | | | | 2.56 | | | | | | | 67 | |
| | | | 4.92 | | | | | | | (19.26 | ) | | | | | | 16 | | | | | | | 1.28 | | | | | | | 1.39 | | | | | | | 2.59 | | | | | | | 67 | |
| | | | 6.32 | | | | | | | 12.73 | | | | | | | 140,955 | | | | | | | 1.53 | | | | | | | 1.62 | | | | | | | 3.74 | | | | | | | 69 | |
| | | | 6.34 | | | | | | | 12.08 | | | | | | | 3,157 | | | | | | | 2.28 | | | | | | | 2.37 | | | | | | | 2.78 | | | | | | | 69 | |
| | | | 6.20 | | | | | | | 13.10 | | | | | | | 238,149 | | | | | | | 1.13 | | | | | | | 1.22 | | | | | | | 4.19 | | | | | | | 69 | |
| | | | 6.30 | | | | | | | 13.07 | | | | | | | 10 | | | | | | | 1.28 | | | | | | | 1.37 | | | | | | | 4.46 | | | | | | | 69 | |
| | | | 6.01 | | | | | | | 33.46 | | | | | | | 128,398 | | | | | | | 1.53 | | | | | | | 1.62 | | | | | | | 2.48 | (f) | | | | | | 115 | |
| | | | 5.98 | | | | | | | 32.47 | | | | | | | 4,370 | | | | | | | 2.28 | | | | | | | 2.37 | | | | | | | 1.79 | (f) | | | | | | 115 | |
| | | | 5.92 | | | | | | | 33.46 | | | | | | | 206,999 | | | | | | | 1.13 | | | | | | | 1.22 | | | | | | | 2.82 | (f) | | | | | | 115 | |
| | | | 6.00 | | | | | | | 33.74 | | | | | | | 6 | | | | | | | 1.28 | | | | | | | 1.37 | | | | | | | 2.70 | (f) | | | | | | 115 | |
| | | | 5.14 | | | | | | | (52.04 | ) | | | | | | 127,811 | | | | | | | 1.53 | | | | | | | 1.60 | | | | | | | 1.77 | | | | | | | 96 | |
| | | | 5.10 | | | | | | | (52.33 | ) | | | | | | 5,175 | | | | | | | 2.28 | | | | | | | 2.35 | | | | | | | 1.20 | | | | | | | 96 | |
| | | | 5.10 | | | | | | | (52.25 | ) | | | | | | 162,396 | | | | | | | 1.13 | | | | | | | 1.20 | | | | | | | 2.21 | | | | | | | 96 | |
| | | | 5.14 | | | | | | | (51.78 | ) | | | | | | 5 | | | | | | | 1.28 | | | | | | | 1.35 | | | | | | | 2.11 | | | | | | | 96 | |
| | |
| The accompanying notes are an integral part of these financial statements. | | 65 |
GOLDMAN SACHS MANAGED FUTURES STRATEGY FUND
Financial Highlights
Selected Data for a Share Outstanding Throughout Each Period
| | | | | | | | | | | | | | | | | | |
| | | | | | | | Income (loss) from
investment operations | |
| | | Year - Share Class | | Net asset
value,
beginning
of period | | | Net
investment
loss(a) | | | Net realized
and unrealized
gain (loss) | | | Total from
investment
operations | |
| | FOR THE SIX MONTHS ENDED JUNE 30, (UNAUDITED) | |
| | 2013 - A | | $ | 10.56 | | | $ | (0.08 | ) | | $ | (0.93 | ) | | $ | (1.01 | ) |
| | 2013 - C | | | 10.48 | | | | (0.11 | ) | | | (0.92 | ) | | | (1.03 | ) |
| | 2013 - Institutional | | | 10.59 | | | | (0.06 | ) | | | (0.94 | ) | | | (1.00 | ) |
| | 2013 - IR | | | 10.58 | | | | (0.06 | ) | | | (0.94 | ) | | | (1.00 | ) |
| | 2013 - R | | | 10.53 | | | | (0.09 | ) | | | (0.93 | ) | | | (1.02 | ) |
| | | | | | | | | | | | | | | | | | |
| | FOR THE PERIOD ENDED DECEMBER 31, | |
| | 2012 - A (Commenced February 29, 2012) | | | 10.00 | | | | (0.20 | ) | | | 0.76 | | | | 0.56 | |
| | 2012 - C (Commenced February 29, 2012) | | | 10.00 | | | | (0.19 | ) | | | 0.67 | | | | 0.48 | |
| | 2012 - Institutional (Commenced February 29, 2012) | | | 10.00 | | | | (0.09 | ) | | | 0.68 | | | | 0.59 | |
| | 2012 - IR (Commenced February 29, 2012) | | | 10.00 | | | | (0.10 | ) | | | 0.68 | | | | 0.58 | |
| | 2012 - R (Commenced February 29, 2012) | | | 10.00 | | | | (0.14 | ) | | | 0.67 | | | | 0.53 | |
| | (a) | | Calculated based on the average shares outstanding methodology. |
| | (b) | | Assumes investment at the net asset value at the beginning of the period, reinvestment of all distributions, a complete redemption of the investment at the net asset value at the end of the period and no sales or redemption charges. Total returns would be reduced if a sales or redemption charge was taken into account. Returns do not reflect the deduction of taxes that a shareholder would pay on Fund distributions or the redemption of Fund shares. Total returns for periods less than one full year are not annualized. |
| | (d) | | The Fund's portfolio turnover rate is calculated in accordance with regulatory requirements, without regard to transactions involving short term investments and certain derivatives. If such transactions were included, the Fund's portfolio turnover rate may be higher. |
| | |
| 66 | | The accompanying notes are an integral part of these financial statements. |
GOLDMAN SACHS MANAGED FUTURES STRATEGY FUND
| | | | | | | | | | | | | | | | | | | | | | | | | | | | | | | | | | | | | | | | |
| | | | | | | | | | | | | | | | | | | | | | | | | | | | | | | | | | |
| | | Net asset
value, end
of period | | | | | Total
return(b) | | | | | Net assets,
end of
period
(in 000s) | | | | | Ratio of
net expenses
to average
net assets(c) | | | | | Ratio of
total expenses
to average
net assets(c) | | | | | Ratio of
net investment
loss
to average
net assets(c) | | | | | Portfolio
turnover
rate(d) | |
| | | | | | | | | | | | | | | | | | | | | | | | | | | | | | | | | | | | | | | | |
| | $ | 9.55 | | | | | | (9.48 | )% | | | | $ | 833 | | | | | | 1.46 | % | | | | | 2.68 | % | | | | | (1.51 | )% | | | | | — | % |
| | | 9.45 | | | | | | (9.83 | ) | | | | | 724 | | | | | | 2.20 | | | | | | 3.37 | | | | | | (2.25 | ) | | | | | — | |
| | | 9.59 | | | | | | (9.36 | ) | | | | | 24,860 | | | | | | 1.06 | | | | | | 2.19 | | | | | | (1.11 | ) | | | | | — | |
| | | 9.58 | | | | | | (9.37 | ) | | | | | 989 | | | | | | 1.20 | | | | | | 2.26 | | | | | | (1.26 | ) | | | | | — | |
| | | 9.51 | | | | | | (9.69 | ) | | | | | 67 | | | | | | 1.70 | | | | | | 2.88 | | | | | | (1.74 | ) | | | | | — | |
| | | | | | | | | | | | | | | | | | | | | | | | | | | | | | | | | | | | | | | | |
| | | | | | | | | | | | | | | | | | | | | | | | | | | | | | | | | | | | | | | | |
| | | 10.56 | | | | | | 5.50 | | | | | | 272 | | | | | | 1.44 | | | | | | 8.63 | | | | | | (1.47 | ) | | | | | — | |
| | | 10.48 | | | | | | 4.80 | | | | | | 339 | | | | | | 2.15 | | | | | | 7.43 | | | | | | (2.18 | ) | | | | | — | |
| | | 10.59 | | | | | | 5.80 | | | | | | 19,401 | | | | | | 1.06 | | | | | | 8.04 | | | | | | (1.09 | ) | | | | | — | |
| | | 10.58 | | | | | | 5.70 | | | | | | 410 | | | | | | 1.20 | | | | | | 5.65 | | | | | | (1.21 | ) | | | | | — | |
| | | 10.53 | | | | | | 5.30 | | | | | | 11 | | | | | | 1.72 | | | | | | 8.98 | | | | | | (1.75 | ) | | | | | — | |
| | |
| The accompanying notes are an integral part of these financial statements. | | 67 |
GOLDMAN SACHS REAL ESTATE SECURITIES FUND
Financial Highlights
Selected Data for a Share Outstanding Throughout Each Period
| | | | | | | | | | | | | | | | | | | | | | | | | | | | | | | | | | |
| | | | | | | | Income (loss) from
investment operations | | | Distributions
to shareholders | |
| | | Year - Share Class | | Net asset
value,
beginning
of period | | | Net
investment
income(a) | | | Net realized
and unrealized
gain (loss) | | | Total from
investment
operations | | | From net
investment
income | | | From net
realized
gains | | | From
capital | | | Total
distributions | |
| | FOR THE SIX MONTHS ENDED JUNE 30, (UNAUDITED) | |
| | 2013 - A | | $ | 15.44 | | | $ | 0.14 | | | $ | 0.71 | | | $ | 0.85 | | | $ | (0.17 | ) | | $ | — | | | $ | — | | | $ | (0.17 | ) |
| | 2013 - B | | | 15.36 | | | | 0.07 | | | | 0.71 | | | | 0.78 | | | | (0.10 | ) | | | — | | | | — | | | | (0.10 | ) |
| | 2013 - C | | | 15.12 | | | | 0.08 | | | | 0.69 | | | | 0.77 | | | | (0.11 | ) | | | — | | | | — | | | | (0.11 | ) |
| | 2013 - Institutional | | | 15.68 | | | | 0.18 | | | | 0.71 | | | | 0.89 | | | | (0.20 | ) | | | — | | | | — | | | | (0.20 | ) |
| | 2013 - Service | | | 15.53 | | | | 0.13 | | | | 0.72 | | | | 0.85 | | | | (0.16 | ) | | | — | | | | — | | | | (0.16 | ) |
| | 2013 - IR | | | 15.49 | | | | 0.17 | | | | 0.70 | | | | 0.87 | | | | (0.19 | ) | | | — | | | | — | | | | (0.19 | ) |
| | 2013 - R | | | 15.39 | | | | 0.13 | | | | 0.70 | | | | 0.83 | | | | (0.15 | ) | | | — | | | | — | | | | (0.15 | ) |
| | | | | | | | | | | | | | | | | | | | | | | | | | | | | | | | | | |
| | FOR THE FISCAL YEARS ENDED DECEMBER 31, | |
| | 2012 - A | | | 13.48 | | | | 0.12 | | | | 2.05 | | | | 2.17 | | | | (0.21 | ) | | | — | | | | — | | | | (0.21 | ) |
| | 2012 - B | | | 13.43 | | | | 0.03 | | | | 2.02 | | | | 2.05 | | | | (0.12 | ) | | | — | | | | — | | | | (0.12 | ) |
| | 2012 - C | | | 13.22 | | | | 0.04 | | | | 1.99 | | | | 2.03 | | | | (0.13 | ) | | | — | | | | — | | | | (0.13 | ) |
| | 2012 - Institutional | | | 13.67 | | | | 0.21 | | | | 2.05 | | | | 2.26 | | | | (0.25 | ) | | | — | | | | — | | | | (0.25 | ) |
| | 2012 - Service | | | 13.57 | | | | 0.14 | | | | 2.02 | | | | 2.16 | | | | (0.20 | ) | | | — | | | | — | | | | (0.20 | ) |
| | 2012 - IR | | | 13.51 | | | | 0.19 | | | | 2.03 | | | | 2.22 | | | | (0.24 | ) | | | — | | | | — | | | | (0.24 | ) |
| | 2012 - R | | | 13.45 | | | | 0.13 | | | | 2.00 | | | | 2.13 | | | | (0.19 | ) | | | — | | | | — | | | | (0.19 | ) |
| | 2011 - A | | | 12.47 | | | | 0.13 | | | | 1.08 | | | | 1.21 | | | | (0.20 | ) | | | — | | | | — | | | | (0.20 | ) |
| | 2011 - B | | | 12.45 | | | | 0.02 | | | | 1.08 | | | | 1.10 | | | | (0.12 | ) | | | — | | | | — | | | | (0.12 | ) |
| | 2011 - C | | | 12.26 | | | | 0.03 | | | | 1.06 | | | | 1.09 | | | | (0.13 | ) | | | — | | | | — | | | | (0.13 | ) |
| | 2011 - Institutional | | | 12.62 | | | | 0.18 | | | | 1.11 | | | | 1.29 | | | | (0.24 | ) | | | — | | | | — | | | | (0.24 | ) |
| | 2011 - Service | | | 12.55 | | | | 0.11 | | | | 1.10 | | | | 1.21 | | | | (0.19 | ) | | | — | | | | — | | | | (0.19 | ) |
| | 2011 - IR | | | 12.50 | | | | 0.20 | | | | 1.04 | | | | 1.24 | | | | (0.23 | ) | | | — | | | | — | | | | (0.23 | ) |
| | 2011 - R | | | 12.44 | | | | 0.10 | | | | 1.08 | | | | 1.18 | | | | (0.17 | ) | | | — | | | | — | | | | (0.17 | ) |
| | 2010 - A | | | 9.99 | | | | 0.10 | | | | 2.58 | | | | 2.68 | | | | (0.20 | ) | | | — | | | | — | | | | (0.20 | ) |
| | 2010 - B | | | 9.98 | | | | 0.01 | | | | 2.59 | | | | 2.60 | | | | (0.13 | ) | | | — | | | | — | | | | (0.13 | ) |
| | 2010 - C | | | 9.84 | | | | 0.02 | | | | 2.54 | | | | 2.56 | | | | (0.14 | ) | | | — | | | | — | | | | (0.14 | ) |
| | 2010 - Institutional | | | 10.09 | | | | 0.15 | | | | 2.61 | | | | 2.76 | | | | (0.23 | ) | | | — | | | | — | | | | (0.23 | ) |
| | 2010 - Service | | | 10.05 | | | | 0.09 | | | | 2.60 | | | | 2.69 | | | | (0.19 | ) | | | — | | | | — | | | | (0.19 | ) |
| | 2010 - IR | | | 10.00 | | | | 0.18 | | | | 2.54 | | | | 2.72 | | | | (0.22 | ) | | | — | | | | — | | | | (0.22 | ) |
| | 2010 - R | | | 9.97 | | | | 0.08 | | | | 2.57 | | | | 2.65 | | | | (0.18 | ) | | | — | | | | — | | | | (0.18 | ) |
| | 2009 - A | | | 8.25 | | | | 0.21 | | | | 1.75 | | | | 1.96 | | | | (0.22 | ) | | | — | | | | — | | | | (0.22 | ) |
| | 2009 - B | | | 8.25 | | | | 0.16 | | | | 1.74 | | | | 1.90 | | | | (0.17 | ) | | | — | | | | — | | | | (0.17 | ) |
| | 2009 - C | | | 8.15 | | | | 0.16 | | | | 1.71 | | | | 1.87 | | | | (0.18 | ) | | | — | | | | — | | | | (0.18 | ) |
| | 2009 - Institutional | | | 8.34 | | | | 0.25 | | | | 1.75 | | | | 2.00 | | | | (0.25 | ) | | | — | | | | — | | | | (0.25 | ) |
| | 2009 - Service | | | 8.31 | | | | 0.21 | | | | 1.74 | | | | 1.95 | | | | (0.21 | ) | | | — | | | | — | | | | (0.21 | ) |
| | 2009 - IR | | | 8.27 | | | | 0.24 | | | | 1.73 | | | | 1.97 | | | | (0.24 | ) | | | — | | | | — | | | | (0.24 | ) |
| | 2009 - R | | | 8.25 | | | | 0.20 | | | | 1.73 | | | | 1.93 | | | | (0.21 | ) | | | — | | | | — | | | | (0.21 | ) |
| | 2008 - A | | | 15.50 | | | | 0.22 | | | | (6.50 | ) | | | (6.28 | ) | | | (0.26 | ) | | | (0.59 | ) | | | (0.12 | ) | | | (0.97 | ) |
| | 2008 - B | | | 15.51 | | | | 0.11 | | | | (6.49 | ) | | | (6.38 | ) | | | (0.20 | ) | | | (0.59 | ) | | | (0.09 | ) | | | (0.88 | ) |
| | 2008 - C | | | 15.34 | | | | 0.11 | | | | (6.42 | ) | | | (6.31 | ) | | | (0.20 | ) | | | (0.59 | ) | | | (0.09 | ) | | | (0.88 | ) |
| | 2008 - Institutional | | | 15.61 | | | | 0.29 | | | | (6.55 | ) | | | (6.26 | ) | | | (0.29 | ) | | | (0.59 | ) | | | (0.13 | ) | | | (1.01 | ) |
| | 2008 - Service | | | 15.59 | | | | 0.23 | | | | (6.55 | ) | | | (6.32 | ) | | | (0.26 | ) | | | (0.59 | ) | | | (0.11 | ) | | | (0.96 | ) |
| | 2008 - IR | | | 15.50 | | | | 0.27 | | | | (6.50 | ) | | | (6.23 | ) | | | (0.29 | ) | | | (0.59 | ) | | | (0.12 | ) | | | (1.00 | ) |
| | 2008 - R | | | 15.50 | | | | 0.22 | | | | (6.53 | ) | | | (6.31 | ) | | | (0.24 | ) | | | (0.59 | ) | | | (0.11 | ) | | | (0.94 | ) |
| | (a) | | Calculated based on the average shares outstanding methodology. |
| | (b) | | Assumes investment at the net asset value at the beginning of the period, reinvestment of all distributions, a complete redemption of the investment at the net asset value at the end of the period and no sales or redemption charges. Total returns would be reduced if a sales or redemption charge was taken into account. Returns do not reflect the deduction of taxes that a shareholder would pay on Fund distributions or the redemption of Fund shares. Total returns for periods less than one full year are not annualized. |
| | (c) | | The Fund's portfolio turnover rate is calculated in accordance with regulatory requirements, without regard to transactions involving short term investments and certain derivatives. If such transactions were included, the Fund's portfolio turnover rate may be higher. |
| | |
| 68 | | The accompanying notes are an integral part of these financial statements. |
GOLDMAN SACHS REAL ESTATE SECURITIES FUND
| | | | | | | | | | | | | | | | | | | | | | | | | | | | | | | | | | | | | | | | | | | | | | | |
| | | | | | | | | | | | | | | | | | | | | | | | | | | |
| | | Net asset
value, end
of period | | | | Total
return(b) | | | | Net assets,
end of
period
(in 000s) | | | | Ratio of
net expenses
to average
net assets | | | | Ratio of
total expenses
to average
net assets | | | | Ratio of
net investment
income
to average
net assets | | | | Portfolio
turnover
rate(c) |
| | | | | | | | | | | | | | | | | | | | | | | | | | | | | | | | | | | | | | | | | | | | | | | |
| | | $ | 16.12 | | | | | | | 5.47 | % | | | | | $ | 60,505 | | | | | | | 1.43 | %(d) | | | | | | 1.51 | %(d) | | | | | | 1.73 | %(d) | | | | | | 35 | % |
| | | | 16.04 | | | | | | | 5.13 | | | | | | | 1,112 | | | | | | | 2.18 | (d) | | | | | | 2.26 | (d) | | | | | | 0.92 | (d) | | | | | | 35 | |
| | | | 15.78 | | | | | | | 5.07 | | | | | | | 13,121 | | | | | | | 2.18 | (d) | | | | | | 2.26 | (d) | | | | | | 1.01 | (d) | | | | | | 35 | |
| | | | 16.37 | | | | | | | 5.67 | | | | | | | 457,206 | | | | | | | 1.02 | (d) | | | | | | 1.11 | (d) | | | | | | 2.20 | (d) | | | | | | 35 | |
| | | | 16.22 | | | | | | | 5.44 | | | | | | | 3,756 | | | | | | | 1.53 | (d) | | | | | | 1.61 | (d) | | | | | | 1.59 | (d) | | | | | | 35 | |
| | | | 16.17 | | | | | | | 5.60 | | | | | | | 941 | | | | | | | 1.17 | (d) | | | | | | 1.26 | (d) | | | | | | 2.12 | (d) | | | | | | 35 | |
| | | | 16.07 | | | | | | | 5.37 | | | | | | | 608 | | | | | | | 1.67 | (d) | | | | | | 1.76 | (d) | | | | | | 1.54 | (d) | | | | | | 35 | |
| | | | | | | | | | | | | | | | | | | | | | | | | | | | | | | | | | | | | | | | | | | | | | | |
| | | | | | | | | | | | | | | | | | | | | | | | | | | | | | | | | | | | | | | | | | | | | | | |
| | | | 15.44 | | | | | | | 16.11 | | | | | | | 63,171 | | | | | | | 1.44 | | | | | | | 1.51 | | | | | | | 0.80 | | | | | | | 40 | |
| | | | 15.36 | | | | | | | 15.26 | | | | | | | 1,434 | | | | | | | 2.19 | | | | | | | 2.26 | | | | | | | 0.19 | | | | | | | 40 | |
| | | | 15.12 | | | | | | | 15.34 | | | | | | | 12,403 | | | | | | | 2.19 | | | | | | | 2.26 | | | | | | | 0.25 | | | | | | | 40 | |
| | | | 15.68 | | | | | | | 16.59 | | | | | | | 381,641 | | | | | | | 1.04 | | | | | | | 1.11 | | | | | | | 1.40 | | | | | | | 40 | |
| | | | 15.53 | | | | | | | 15.93 | | | | | | | 4,694 | | | | | | | 1.54 | | | | | | | 1.61 | | | | | | | 0.91 | | | | | | | 40 | |
| | | | 15.49 | | | | | | | 16.45 | | | | | | | 540 | | | | | | | 1.19 | | | | | | | 1.26 | | | | | | | 1.26 | | | | | | | 40 | |
| | | | 15.39 | | | | | | | 15.90 | | | | | | | 521 | | | | | | | 1.69 | | | | | | | 1.76 | | | | | | | 0.88 | | | | | | | 40 | |
| | | | 13.48 | | | | | | | 9.79 | | | | | | | 166,917 | | | | | | | 1.44 | | | | | | | 1.51 | | | | | | | 0.98 | | | | | | | 46 | |
| | | | 13.43 | | | | | | | 8.89 | | | | | | | 1,850 | | | | | | | 2.19 | | | | | | | 2.26 | | | | | | | 0.13 | | | | | | | 46 | |
| | | | 13.22 | | | | | | | 8.91 | | | | | | | 10,954 | | | | | | | 2.19 | | | | | | | 2.26 | | | | | | | 0.22 | | | | | | | 46 | |
| | | | 13.67 | | | | | | | 10.32 | | | | | | | 402,103 | | | | | | | 1.04 | | | | | | | 1.11 | | | | | | | 1.38 | | | | | | | 46 | |
| | | | 13.57 | | | | | | | 9.71 | | | | | | | 4,670 | | | | | | | 1.54 | | | | | | | 1.61 | | | | | | | 0.83 | | | | | | | 46 | |
| | | | 13.51 | | | | | | | 9.99 | | | | | | | 443 | | | | | | | 1.19 | | | | | | | 1.26 | | | | | | | 1.57 | | | | | | | 46 | |
| | | | 13.45 | | | | | | | 9.51 | | | | | | | 245 | | | | | | | 1.69 | | | | | | | 1.76 | | | | | | | 0.74 | | | | | | | 46 | |
| | | | 12.47 | | | | | | | 27.07 | | | | | | | 161,065 | | | | | | | 1.44 | | | | | | | 1.50 | | | | | | | 0.95 | | | | | | | 59 | |
| | | | 12.45 | | | | | | | 26.18 | | | | | | | 2,923 | | | | | | | 2.19 | | | | | | | 2.25 | | | | | | | 0.13 | | | | | | | 59 | |
| | | | 12.26 | | | | | | | 26.18 | | | | | | | 10,907 | | | | | | | 2.19 | | | | | | | 2.25 | | | | | | | 0.21 | | | | | | | 59 | |
| | | | 12.62 | | | | | | | 27.67 | | | | | | | 373,776 | | | | | | | 1.04 | | | | | | | 1.10 | | | | | | | 1.33 | | | | | | | 59 | |
| | | | 12.55 | | | | | | | 26.99 | | | | | | | 5,345 | | | | | | | 1.54 | | | | | | | 1.60 | | | | | | | 0.83 | | | | | | | 59 | |
| | | | 12.50 | | | | | | | 27.39 | | | | | | | 90 | | | | | | | 1.19 | | | | | | | 1.25 | | | | | | | 1.50 | | | | | | | 59 | |
| | | | 12.44 | | | | | | | 26.80 | | | | | | | 237 | | | | | | | 1.69 | | | | | | | 1.75 | | | | | | | 0.78 | | | | | | | 59 | |
| | | | 9.99 | | | | | | | 25.12 | | | | | | | 138,409 | | | | | | | 1.44 | | | | | | | 1.55 | | | | | | | 2.76 | | | | | | | 114 | |
| | | | 9.98 | | | | | | | 24.20 | | | | | | | 4,058 | | | | | | | 2.19 | | | | | | | 2.30 | | | | | | | 2.08 | | | | | | | 114 | |
| | | | 9.84 | | | | | | | 24.09 | | | | | | | 8,192 | | | | | | | 2.19 | | | | | | | 2.30 | | | | | | | 2.08 | | | | | | | 114 | |
| | | | 10.09 | | | | | | | 25.48 | | | | | | | 356,025 | | | | | | | 1.04 | | | | | | | 1.15 | | | | | | | 3.18 | | | | | | | 114 | |
| | | | 10.05 | | | | | | | 24.84 | | | | | | | 5,589 | | | | | | | 1.54 | | | | | | | 1.65 | | | | | | | 2.73 | | | | | | | 114 | |
| | | | 10.00 | | | | | | | 25.39 | | | | | | | 7 | | | | | | | 1.19 | | | | | | | 1.30 | | | | | | | 3.07 | | | | | | | 114 | |
| | | | 9.97 | | | | | | | 24.81 | | | | | | | 116 | | | | | | | 1.69 | | | | | | | 1.80 | | | | | | | 2.44 | | | | | | | 114 | |
| | | | 8.25 | | | | | | | (40.89 | ) | | | | | | 129,634 | | | | | | | 1.44 | | | | | | | 1.51 | | | | | | | 1.60 | | | | | | | 39 | |
| | | | 8.25 | | | | | | | (41.29 | ) | | | | | | 4,742 | | | | | | | 2.19 | | | | | | | 2.26 | | | | | | | 0.81 | | | | | | | 39 | |
| | | | 8.15 | | | | | | | (41.27 | ) | | | | | | 7,208 | | | | | | | 2.19 | | | | | | | 2.26 | | | | | | | 0.90 | | | | | | | 39 | |
| | | | 8.34 | | | | | | | (40.54 | ) | | | | | | 247,916 | | | | | | | 1.04 | | | | | | | 1.11 | | | | | | | 2.19 | | | | | | | 39 | |
| | | | 8.31 | | | | | | | (40.88 | ) | | | | | | 4,389 | | | | | | | 1.54 | | | | | | | 1.61 | | | | | | | 1.72 | | | | | | | 39 | |
| | | | 8.27 | | | | | | | (40.64 | ) | | | | | | 6 | | | | | | | 1.19 | | | | | | | 1.26 | | | | | | | 2.04 | | | | | | | 39 | |
| | | | 8.25 | | | | | | | (41.00 | ) | | | | | | 7 | | | | | | | 1.69 | | | | | | | 1.76 | | | | | | | 1.76 | | | | | | | 39 | |
| | |
| The accompanying notes are an integral part of these financial statements. | | 69 |
GOLDMAN SACHS SELECT SATELLITE FUNDS
Notes to Financial Statements
June 30, 2013 (Unaudited)
Goldman Sachs Trust (the “Trust”) is a Delaware statutory trust registered under the Investment Company Act of 1940, as amended (the “Act”), as an open-end management investment company. The following table lists those series of the Trust that are included in this report (collectively, the “Funds” or individually a “Fund”), along with their corresponding share classes and respective diversification status under the Act:
| | | | |
| Fund | | Share Classes Offered* | | Diversified/
Non-diversified |
Absolute Return Tracker | | A, C, Institutional, IR and R | | Diversified |
Commodity Strategy, Dynamic Allocation and Managed Futures Strategy | | A, C, Institutional, IR and R | | Non-diversified |
International Real Estate Securities | | A, C, Institutional and IR | | Non-diversified |
Real Estate Securities | | A, B, C, Institutional, Service, IR and R | | Non-diversified |
| * | | Class B Shares are generally no longer available for purchase by current or prospective investors. |
Class A Shares of the Absolute Return Tracker, Dynamic Allocation, International Real Estate Securities, Managed Futures Strategy and Real Estate Securities Funds are sold with a front-end sales charge of up to 5.50%. Class A Shares of the Commodity Strategy Fund are sold with a front-end sales charge of up to 4.50%. Class B Shares were sold with a contingent deferred sales charge (“CDSC”) that declines from 5.00% to zero, depending upon the period of time the shares are held. Class C Shares are sold with a CDSC of 1.00%, which is imposed on redemptions made within 12 months of purchase. Institutional, Service, Class IR and Class R Shares are not subject to a sales charge.
Goldman Sachs Asset Management, L.P. (“GSAM”), an affiliate of Goldman, Sachs & Co. (“Goldman Sachs”), serves as investment adviser to the Funds pursuant to management agreements (the “Agreements”) with the Trust.
|
| 2. SIGNIFICANT ACCOUNTING POLICIES |
The financial statements have been prepared in accordance with accounting principles generally accepted in the United States of America (“GAAP”) and require management to make estimates and assumptions that may affect the reported amounts and disclosures. Actual results may differ from those estimates and assumptions.
A. Basis for Consolidation for the Commodity Strategy Fund — Goldman Sachs Cayman Commodity Fund, Ltd. (the “Subsidiary”), a Cayman Islands exempted company, was incorporated on April 2, 2009 and is currently a wholly-owned subsidiary of the Commodity Strategy Fund. The Subsidiary acts as an investment vehicle for the Fund to enable the Fund to gain exposure to certain types of commodity-linked derivative instruments. The Fund is the sole shareholder of the Subsidiary pursuant to a subscription agreement dated as of June 17, 2009, and it is intended that the Fund will remain the sole shareholder and will continue to control the Subsidiary. Under the Articles of Association of the Subsidiary, shares issued by the Subsidiary confer upon a shareholder the right to vote at general meetings of the Subsidiary and certain rights in connection with any winding-up or repayment of capital, as well as the right to participate in the profits or assets of the Subsidiary. All inter-fund balances and transactions have been eliminated in consolidation. As of June 30, 2013, the Fund’s net assets were $1,077,887,431, of which $176,875,848, or 16%, represented the Subsidiary’s net assets.
B. Investment Valuation — The Funds’ valuation policy is to value investments at fair value.
C. Investment Income and Investments — Investment income includes interest income and dividend income, net of any foreign withholding taxes, less any amounts reclaimable. Interest income is accrued daily and adjusted for amortization of
70
GOLDMAN SACHS SELECT SATELLITE FUNDS
|
| 2. SIGNIFICANT ACCOUNTING POLICIES (continued) |
premiums and accretion of discounts. Dividend income is recognized on ex-dividend date or, for certain foreign securities, as soon as such information is obtained subsequent to the ex-dividend date. Investment transactions are reflected on trade date. Realized gains and losses are calculated using identified cost. Investment transactions are recorded on the following business day for daily net asset value (“NAV”) calculations. Any foreign capital gains tax is accrued daily based upon net unrealized gains, and is payable upon sale of such investments. Distributions received from the Funds’ investments in United States (“U.S.”) real estate investment trusts (“REITs”) may be characterized as ordinary income, net capital gain or a return of capital. A return of capital is recorded by the Funds as a reduction to the cost basis of the REIT.
For derivative contracts, realized gains and losses are recorded upon settlement of the contract. Upfront payments are made or received upon entering into a swap agreement and are reflected as such in the Statement of Assets and Liabilities. Upfront payments are recognized over the contract’s term/event as realized gains or losses, with the exception of forward starting interest rate swaps whose realized gains or losses are recognized from the effective start date. For securities with paydown provisions, principal payments received are treated as a proportionate reduction to the cost basis of the securities and excess or shortfall amounts are recorded as gains or losses. For treasury inflation protected securities (“TIPS”), adjustments to principal due to inflation/deflation are reflected as increases/decreases to interest income with a corresponding adjustment to cost.
D. Class Allocations and Expenses — Investment income, realized and unrealized gain (loss), and non-class specific expenses of each Fund are allocated daily based upon the proportion of net assets of each class. Class specific expenses, where applicable, are borne by the respective share classes and include Distribution and Service, Transfer Agent and Service and Shareholder Administration fees. Non-class specific expenses directly incurred by a Fund are charged to that Fund, while such expenses incurred by the Trust are allocated across the respective Funds on a straight-line and/or pro-rata basis depending upon the nature of the expenses.
E. Offering and Organization Costs — Offering costs paid in connection with the offering of shares of the Managed Futures Strategy Fund were amortized on a straight-line basis over 12 months from the date of commencement of operations. Organization costs paid in connection with the organization of the Managed Futures Strategy Fund were expensed on the first day of operations.
F. Federal Taxes and Distributions to Shareholders — It is each Fund’s policy to comply with the requirements of the Internal Revenue Code of 1986, as amended (the “Code”), applicable to regulated investment companies (mutual funds) and to distribute each year substantially all of its investment company taxable income and capital gains to its shareholders. Accordingly, the Funds are not required to make any provisions for the payment of federal income tax. Distributions to shareholders are recorded on the ex-dividend date. Income and capital gains distributions, if any, are declared and paid according to the following schedule:
| | | | | | |
| Fund | | | | Income Distributions
Declared/Paid | | Capital Gains Distributions
Declared/Paid |
Absolute Return Tracker, Dynamic Allocation and
Managed Futures Strategy | | | | Annually | | Annually |
Real Estate Securities | | | | Quarterly | | Annually |
Commodity Strategy and International Real Estate Securities | | | | Semi-Annually | | Annually |
Net capital losses are carried forward to future fiscal years and may be used to the extent allowed by the Code to offset any future capital gains. Utilization of capital loss carryforwards will reduce the requirement of future capital gains distributions.
The Subsidiary is classified as a controlled foreign corporation under the Code. Therefore, the Commodity Strategy Fund is required to increase its taxable income by its share of the Subsidiary’s income. Net losses of the Subsidiary cannot be deducted by the Fund in the current period nor carried forward to offset taxable income in future periods.
71
GOLDMAN SACHS SELECT SATELLITE FUNDS
Notes to Financial Statements (continued)
June 30, 2013 (Unaudited)
|
| 2. SIGNIFICANT ACCOUNTING POLICIES (continued) |
Under the Regulated Investment Company Modernization Act of 2010, the Funds are permitted to carry forward capital losses incurred in taxable years beginning after December 22, 2010 for an unlimited period. However, any losses incurred during those future taxable years will be required to be utilized prior to the losses incurred in pre-enactment taxable years. As a result of this ordering rule, pre-enactment capital loss carryforwards may be more likely to expire unused. Additionally, post-enactment capital losses that are carried forward will retain their character as either short-term or long-term capital losses rather than being considered all short-term as under previous law.
The characterization of distributions to shareholders for financial reporting purposes is determined in accordance with federal income tax rules, which may differ from GAAP. The source of each Fund’s distributions may be shown in the accompanying financial statements as either from net investment income, net realized gain or capital. Certain components of the Funds’ net assets on the Statements of Assets and Liabilities reflect permanent GAAP/tax differences based on the appropriate tax character.
G. Foreign Currency Translation — The accounting records and reporting currency of the Funds are maintained in U.S. dollars. Assets and liabilities denominated in foreign currencies are translated into U.S. dollars using the current exchange rates at the close of each business day. The effect of changes in foreign currency exchange rates on investments is included within net realized and unrealized gain (loss) on investments. Changes in the value of other assets and liabilities as a result of fluctuations in foreign exchange rates are included in the Statements of Operations within net change in unrealized gain (loss) on foreign currency transactions. Transactions denominated in foreign currencies are translated into U.S. dollars on the date the transaction occurred, the effects of which are included within net realized gain (loss) on foreign currency transactions.
H. In-Kind Transactions — The Funds may allow investors, under certain circumstances, to purchase shares with securities instead of cash. In addition, the Trust reserves the right to redeem an investor’s shares by distributing securities instead of cash. These are known as in-kind transactions. Securities included as part of in-kind purchases and redemptions of Fund shares are valued in the same manner as they are valued for purposes of computing a Fund’s NAV, in accordance with the Funds’ Valuation Procedures, and such valuations are as of the date the trade is submitted pursuant to the procedures specified in the Funds’ prospectus.
|
| 3. INVESTMENTS AND FAIR VALUE MEASUREMENTS |
The fair value of a financial instrument is the amount that would be received to sell an asset or paid to transfer a liability in an orderly transaction between market participants at the measurement date (i.e., the exit price). GAAP establishes a fair value hierarchy that prioritizes the inputs to valuation techniques used to measure fair value. The hierarchy gives the highest priority to unadjusted quoted prices in active markets for identical assets or liabilities (Level 1 measurements) and the lowest priority to unobservable inputs (Level 3 measurements). The levels used for classifying investments are not necessarily an indication of the risk associated with investing in these investments. The three levels of the fair value hierarchy are described below:
Level 1 — Unadjusted quoted prices in active markets that are accessible at the measurement date for identical, unrestricted assets or liabilities;
Level 2 — Quoted prices in markets that are not active or financial instruments for which significant inputs are observable (including, but not limited to, quoted prices for similar investments, interest rates, foreign exchange rates, volatility and credit spreads), either directly or indirectly;
Level 3 — Prices or valuations that require significant unobservable inputs (including GSAM’s assumptions in determining fair value measurement).
The Trustees have adopted Valuation Procedures that govern the valuation of the portfolio investments held by the Funds, including investments for which market quotations are not readily available. The Trustees have delegated to GSAM day-to-day responsibility for implementing and maintaining internal controls and procedures related to the valuation of the Funds’ portfolio
72
GOLDMAN SACHS SELECT SATELLITE FUNDS
|
| 3. INVESTMENTS AND FAIR VALUE MEASUREMENTS (continued) |
investments. To assess the continuing appropriateness of pricing sources and methodologies, GSAM regularly performs price verification procedures and issues challenges as necessary to third party pricing vendors or brokers, and any differences are reviewed in accordance with the Valuation Procedures.
A. Level 1 and Level 2 Fair Value Investments — The valuation techniques and significant inputs used in determining the fair values for investments classified as Level 1 and Level 2 are as follows:
Equity Securities — Equity securities and investment companies traded on a U.S. securities exchange or the NASDAQ system, or those located on certain foreign exchanges, including but not limited to the Americas, are valued daily at their last sale price or official closing price on the principal exchange or system on which they are traded. If no sale occurs, equity securities and exchange traded investment companies are valued at the last bid price for long positions and at the last ask price for short positions. Investments in investment companies (other than those that are exchange traded) are valued at the NAV on the valuation date. To the extent these investments are actively traded, they are classified as Level 1 of the fair value hierarchy.
Unlisted equity securities for which market quotations are available are valued at the last sale price on the valuation date, or if no sale occurs, at the last bid price. Securities traded on certain foreign securities exchanges are valued daily at fair value determined by an independent fair value service (if available) under Valuation Procedures approved by the Trustees and consistent with applicable regulatory guidance. The independent fair value service takes into account multiple factors including, but not limited to, movements in the securities markets, certain depositary receipts, futures contracts and foreign currency exchange rates that have occurred subsequent to the close of the foreign securities exchange. These investments are generally classified as Level 2 of the fair value hierarchy.
Debt Securities — Debt securities for which market quotations are readily available are valued daily on the basis of quotations supplied by dealers or an independent pricing service approved by the Trustees. The pricing services may use valuation models or matrix pricing, which consider: (i) yield or price with respect to bonds that are considered comparable in characteristics such as rating, interest rate and maturity date or (ii) quotations from securities dealers to determine current value. Short-term debt obligations that mature in sixty days or less and that do not exhibit signs of credit deterioration are valued at amortized cost, which approximates fair value. With the exception of treasury securities, which are generally classified as Level 1, these investments are generally classified as Level 2 of the fair value hierarchy.
i. Commodity Index-Linked Structured Notes — The value of a commodity index-linked structured note is based on the price movements of a commodity index. The value of these notes will rise and fall in response to changes in the underlying commodity index. These notes are often leveraged, increasing the volatility of each note’s value relative to the change in the underlying linked index. Commodity index-linked investments may be more volatile and less liquid than the underlying index, and their value may be affected by the performance of commodities as well as other factors including liquidity, quality, maturity and other economic variables. These notes are subject to prepayment, credit and interest rate risks. These notes have an automatic redemption feature if the underlying index declines from the purchase date by the amount specified in the agreement. A Fund has the option to request prepayment from the issuer at any time. Interim payments received (paid) are recorded as net realized gains (losses), and at maturity, or when a structured note is sold, a Fund records a realized gain or loss.
ii. Mortgage-Backed and Asset-Backed Securities — Mortgage-backed securities represent direct or indirect participations in, or are collateralized by and payable from, mortgage loans secured by residential and/or commercial real estate property. Asset-backed securities include securities whose principal and interest payments are collateralized by pools of other assets or receivables. The value of certain mortgage-backed and asset-backed securities (including adjustable rate mortgage loans) may be particularly sensitive to changes in prevailing interest rates. The value of these securities may also fluctuate in response to the market’s perception of the creditworthiness of the issuers.
73
GOLDMAN SACHS SELECT SATELLITE FUNDS
Notes to Financial Statements (continued)
June 30, 2013 (Unaudited)
|
| 3. INVESTMENTS AND FAIR VALUE MEASUREMENTS (continued) |
Asset-backed securities may present credit risks that are not presented by mortgage-backed securities because they generally do not have the benefit of a security interest in collateral that is comparable to mortgage assets. Some asset-backed securities may only have a subordinated claim on collateral.
Stripped mortgage-backed securities are usually structured with two different classes: one that receives substantially all interest payments (interest-only, or “IO” and/or high coupon rate with relatively low principal amount, or “IOette”), and the other that receives substantially all principal payments (principal-only, or “PO”) from a pool of mortgage loans. Little to no principal will be received at the maturity of an IO; as a result, periodic adjustments are recorded to reduce the cost of the security until maturity. These adjustments are included in interest income.
iii. Mortgage Dollar Rolls — Mortgage dollar rolls are transactions whereby a Fund sells mortgage-backed securities and simultaneously contracts with the same counterparty to repurchase similar securities on a specified future date. During the settlement period, a Fund will not be entitled to accrue interest and receive principal payments on the securities sold.
iv. Treasury Inflation Protected Securities — TIPS are treasury securities in which the principal amount is adjusted daily to keep pace with inflation, as measured by the U.S. Consumer Pricing Index for Urban Consumers. The repayment of the original bond principal upon maturity is guaranteed by the full faith and credit of the U.S. Government.
v. When-Issued Securities and Forward Commitments — When-issued securities, including TBA (“To Be Announced”) securities, are securities that are authorized but not yet issued in the market and purchased in order to secure what is considered to be an advantageous price or yield to a Fund. A forward commitment involves entering into a contract to purchase or sell securities, typically on an extended settlement basis, for a fixed price at a future date. The purchase of securities on a when-issued or forward commitment basis involves a risk of loss if the value of the security to be purchased declines before the settlement date. Conversely, the sale of securities on a forward commitment basis involves the risk that the value of the securities sold may increase before the settlement date. Although a Fund will generally purchase securities on a when-issued or forward commitment basis with the intention of acquiring the securities for its portfolio, the Fund may dispose of when-issued securities or forward commitments prior to settlement which may result in a realized gain or loss.
Derivative Contracts — A derivative is an instrument whose value is derived from underlying assets, indices, reference rates or a combination of these factors.
Exchange-traded derivatives, including futures contracts, typically fall within Level 1 of the fair value hierarchy. Over-the-counter (“OTC”) derivatives are valued using market transactions and other market evidence, including market-based inputs to models, calibration to market-clearing transactions, broker or dealer quotations, or other alternative pricing sources. Where models are used, the selection of a particular model to value an OTC derivative depends upon the contractual terms of, and specific risks inherent in, the instrument, as well as the availability of pricing information in the market. Valuation models require a variety of inputs, including contractual terms, market prices, yield curves, credit curves, measures of volatility, voluntary and involuntary prepayment rates, loss severity rates and correlations of such inputs. For OTC derivatives that trade in liquid markets, model inputs can generally be verified and model selection does not involve significant management judgment. OTC derivatives are classified within Level 2 of the fair value hierarchy when significant inputs are corroborated by market evidence.
i. Forward Foreign Currency Exchange Contracts — In a forward foreign currency contract, a Fund agrees to receive or deliver a fixed quantity of one currency for another, at a pre-determined price at a future date. All forward foreign currency exchange contracts are marked-to-market daily at the applicable forward rate.
ii. Futures Contracts — Futures contracts are contracts to buy or sell a standardized quantity of a specified commodity or security and are valued based on exchanged settlement prices or independent market quotes. Futures contracts are valued at the last settlement price, or in the absence of a sale, the last bid price for long positions and at the last ask price for short positions, at the end of each day on the board of trade or exchange upon which they are traded. Upon entering into a futures contract, a Fund deposits cash or securities in an account on behalf of the broker in an amount sufficient to meet the initial
74
GOLDMAN SACHS SELECT SATELLITE FUNDS
|
| 3. INVESTMENTS AND FAIR VALUE MEASUREMENTS (continued) |
margin requirement. Subsequent payments are made or received by the Fund equal to the daily change in the contract value and are recorded as variation margin receivable or payable with a corresponding offset to unrealized gains or losses.
iii. Swap Contracts — Bilateral swap contracts are agreements in which a Fund and a counterparty agree to exchange periodic payments on a specified notional amount or make a net payment upon termination. Bilateral swap transactions are privately negotiated in the OTC market and payments are settled through direct payments between a Fund and the counterparty. By contrast, certain swap transactions are subject to mandatory central clearing. These swaps are executed through a derivatives clearing member (“DCM”), acting in an agency capacity, and submitted to a central counterparty (“CCP”) (“centrally cleared swaps”), in which case all payments are settled with the CCP through the DCM. Swaps are marked-to-market daily using pricing vendor quotations, counterparty or clearinghouse prices or model prices, and the change in value, if any, is recorded as an unrealized gain or loss. Upon entering into a swap contract, a Fund is required to satisfy an initial margin requirement by delivering cash or securities to the counterparty (or in some cases, segregated in a triparty account on behalf of the counterparty), which can be adjusted by any mark-to-market gains or losses pursuant to bilateral or centrally cleared arrangements. For centrally cleared swaps the daily change in valuation, if any, is recorded as a receivable or payable for variation margin.
An interest rate swap is an agreement that obligates two parties to exchange a series of cash flows at specified intervals, based upon or calculated by reference to changes in interest rates on a specified notional principal amount. The payment flows are usually netted against each other, with the difference being paid by one party to the other.
A credit default swap is an agreement that involves one party (the buyer of protection) making a stream of payments to another party (the seller of protection) in exchange for the right to receive protection on a reference security or obligation. A Fund may use credit default swaps to provide a measure of protection against defaults of the reference security or obligation or to take a short position with respect to the likelihood of default. A Fund’s investment in credit default swaps may involve greater risks than if the Fund had invested in the referenced obligation directly. Credit events are contract specific but may include bankruptcy, failure to pay, restructuring and obligation acceleration. If a Fund buys protection through a credit default swap and no credit event occurs, its payments are limited to the periodic payments previously made to the counterparty. Upon the occurrence of a specified credit event, a Fund, as a buyer of credit protection, is entitled to receive an amount equal to the notional amount of the swap and deliver to the seller the defaulted reference obligation in a physically settled trade. A Fund may also receive a net settlement amount in the form of cash or securities equal to the notional amount of the swap reduced by the recovery value of the reference obligation in cash settled trade.
As a seller of protection, a Fund generally receives a payment stream throughout the term of the swap, provided that there is no credit event. In addition, if a Fund sells protection through a credit default swap, the Fund could suffer a loss because the value of the referenced obligation may be less than the premium payments received. Upon the occurrence of a specified credit event, a Fund, as a seller of credit protection, may be required to take possession of the defaulted reference obligation and pay the buyer an amount equal to the notional amount of the swap in a physically settled trade. A Fund may also pay a net settlement amount in the form of cash or securities equal to the notional amount of the swap reduced by the recovery value of the reference obligation in a cash settled trade. Recovery values are at times established through the credit event auction process in which market participants are ensured that a transparent price has been set for the defaulted security or obligation. In addition, a Fund is entitled to a return of any assets, which have been pledged as collateral to the counterparty.
The maximum potential amount of future payments (undiscounted) that a Fund as seller of protection could be required to make under a credit default swap would be an amount equal to the notional amount of the agreement. These potential amounts would be partially offset by any recovery values of the respective referenced obligations or net amounts received from a settlement of a credit default swap for the same reference security or obligation where the Fund bought credit protection.
75
GOLDMAN SACHS SELECT SATELLITE FUNDS
Notes to Financial Statements (continued)
June 30, 2013 (Unaudited)
|
| 3. INVESTMENTS AND FAIR VALUE MEASUREMENTS (continued) |
A total return swap is an agreement that gives a Fund the right to receive the appreciation in the value of a specified security, index or other instrument in return for a fee paid to the counterparty, which will typically be an agreed upon interest rate. If the underlying asset declines in value over the term of the swap, the Fund may also be required to pay the dollar value of that decline to the counterparty.
Short Term Investments — Short-term investments having a maturity of 60 days or less are generally valued at amortized cost which approximates fair market value. These investments are classified as Level 2 of the fair value hierarchy.
i. Repurchase Agreements — Repurchase agreements involve the purchase of securities subject to the seller’s agreement to repurchase the securities at a mutually agreed upon date and price, under the terms of a Master Repurchase Agreement (“MRA”). During the term of a repurchase agreement, the value of the underlying securities held as collateral on behalf of a Fund, including accrued interest, is required to exceed the value of the repurchase agreement, including accrued interest. The underlying securities for all repurchase agreements are held at the Funds’ custodian or designated sub-custodians under tri-party repurchase agreements.
In December 2011, the Financial Accounting Standards Board (“FASB”) issued an Accounting Standards Update (“ASU”) No. 2011-11: Disclosures about Offsetting Assets and Liabilities (“netting”) on the Statements of Assets and Liabilities that are subject to master netting arrangements or similar agreements. ASU 2011-11 was amended by ASU No. 2013-01, clarifying which investments and transactions are subject to the netting disclosure. The scope of the disclosure requirements is limited to derivative instruments, repurchase agreements and reverse repurchase agreements, and securities borrowing and securities lending transactions. This information is intended to enable users of the Funds’ financial statements to evaluate the effect or potential effect of netting arrangements on the Funds’ financial position. The ASU is effective for financial statements with fiscal years beginning on or after January 1, 2013, and interim periods within those fiscal years. The Funds adopted the disclosure requirement on netting for the current reporting period. Since these amended principles require additional disclosures concerning offsetting and related arrangements, adoption did not affect the Funds’ financial condition or result of operations.
For financial reporting purposes, the Funds do not offset financial assets and financial liabilities that are subject to master netting arrangements or similar agreements on the Statements of Assets and Liabilities.
A MRA governs transactions between a Fund and select counterparties. A MRA contains provisions for, among other things, initiation, income payments, events of default and maintenance of securities for repurchase agreements. A MRA also permits offsetting with collateral to create one single net payment in the event of default or similar events, including the bankruptcy or insolvency of a counterparty.
If the seller defaults, a Fund could suffer a loss to the extent that the proceeds from the sale of the underlying securities and other collateral held by the Fund are less than the repurchase price and the Fund’s costs associated with delay and enforcement of the repurchase agreement. In addition, in the event of default or insolvency of the seller, a court could determine that a Fund’s interest in the collateral is not enforceable resulting in additional losses to the Fund.
At June 30, 2013, the Absolute Return Tracker Fund’s investment in a repurchase agreement was subject to enforceable MRAs. The repurchase agreement on a net basis was as follows:
| | | | |
| Repurchase Agreement | | | |
Total gross amount presented in Statements of Assets and Liabilities | | $ | 141,500,000 | |
Non-cash Collateral offsetting(1) | | | (141,500,000 | ) |
Net Amount(2) | | $ | — | |
| (1) | | At June 30, 2013 the value of the collateral received from the seller exceeded the value of the related repurchase agreement. |
| (2) | | Net amount represents the net amount due from the counterparty in the event of a default based on the contractual set-off rights under the agreement. |
76
GOLDMAN SACHS SELECT SATELLITE FUNDS
|
| 3. INVESTMENTS AND FAIR VALUE MEASUREMENTS (continued) |
Pursuant to exemptive relief granted by the Securities and Exchange Commission and terms and conditions contained therein, the Funds, together with other funds of the Trust and registered investment companies having management agreements with GSAM or its affiliates, may transfer uninvested cash into joint accounts, the daily aggregate balance of which is invested in one or more repurchase agreements. Under these joint accounts, the Funds maintain pro-rata credit exposure to the underlying repurchase agreements’ counterparties. With the exception of certain transaction fees, the Funds are not subject to any expenses in relation to these investments.
B. Level 3 Fair Value Investments — To the extent that the aforementioned significant inputs are unobservable, or if quotations are not readily available, or if GSAM believes that such quotations do not accurately reflect fair value, the fair value of the Funds’ investments may be determined under Valuation Procedures approved by the Trustees. GSAM, consistent with its procedures and applicable regulatory guidance, may make an adjustment to the most recent valuation prices of either domestic or foreign securities in light of significant events to reflect what it believes to be the fair value of the securities at the time of determining a Fund’s NAV. Significant events which could affect a large number of securities in a particular market may include, but are not limited to: significant fluctuations in U.S. or foreign markets; market dislocations; market disruptions; or unscheduled market closings. Significant events which could also affect a single issuer may include, but are not limited to: corporate actions such as reorganizations, mergers and buy-outs; ratings downgrades; and bankruptcies.
C. Fair Value Hierarchy — The following is a summary of the Funds’ investments and derivatives classified in the fair value hierarchy as of June 30, 2013:
| | | | | | | | | | | | |
| | | |
| ABSOLUTE RETURN TRACKER | | | | | | | | | | | | |
| | | |
| Investment Type | | Level 1 | | | Level 2 | | | Level 3 | |
| Assets | | | | | | | | | | | | |
Fixed Income | | | | | | | | | | | | |
Commodity Index Linked Structured Notes | | $ | — | | | $ | 11,143,466 | | | $ | — | |
U.S. Treasury Obligations and/or Other U.S. Government Agencies | | | 1,201,072,685 | | | | — | | | | — | |
Common Stock and/or Other Equity Investments | | | 98,901,681 | | | | — | | | | — | |
Repurchase Agreement | | | — | | | | 141,500,000 | | | | — | |
| Total | | $ | 1,299,974,366 | | | $ | 152,643,466 | | | $ | — | |
| | | |
| Derivative Type | | | | | | | | | |
| Assets(a) | | | | | | | | | | | | |
Futures Contracts | | $ | 4,193,068 | | | $ | — | | | $ | — | |
Forward Foreign Currency Exchange Contracts | | | — | | | | 367,413 | | | | — | |
| Total | | $ | 4,193,068 | | | $ | 367,413 | | | $ | — | |
| Liabilities(a) | | | | | | | | | | | | |
Futures Contracts | | $ | (4,786,954 | ) | | $ | — | | | $ | — | |
Forward Foreign Currency Exchange Contracts | | | — | | | | (3,621,705 | ) | | | — | |
| Total | | $ | (4,786,954 | ) | | $ | (3,621,705 | ) | | $ | — | |
77
GOLDMAN SACHS SELECT SATELLITE FUNDS
Notes to Financial Statements (continued)
June 30, 2013 (Unaudited)
|
| 3. INVESTMENTS AND FAIR VALUE MEASUREMENTS (continued) |
| | | | | | | | | | | | |
| | | |
| COMMODITY STRATEGY | | | | | | | | | | | | |
| | | |
| Investment Type | | Level 1 | | | Level 2 | | | Level 3 | |
| Assets | | | | | | | | | | | | |
Fixed Income | | | | | | | | | | | | |
Mortgage-Backed Obligations | | $ | — | | | $ | 64,589,258 | | | $ | — | |
U.S. Treasury Obligations and/or Other U.S. Government Agencies | | | 526,434,711 | | | | — | | | | — | |
Asset-Backed Securities | | | — | | | | 280,161 | | | | — | |
Short-Term Investment | | | 327,600,662 | | | | — | | | | — | |
| Total | | $ | 854,035,373 | | | $ | 64,869,419 | | | $ | — | |
| Liabilities | | | | | | | | | | | | |
Fixed Income | | | | | | | | | | | | |
Mortgage-Backed Obligations — Forward Sales Contracts | | $ | — | | | $ | (1,056,641 | ) | | $ | — | |
| | | |
| Derivative Type | | | | | | | | | |
| Assets(a) | | | | | | | | | | | | |
Futures Contracts | | $ | 806,405 | | | $ | — | | | $ | — | |
Interest Rate Swap Contracts | | | — | | | | 2,374,572 | | | | — | |
| Total | | $ | 806,405 | | | $ | 2,374,572 | | | $ | — | |
| Liabilities(a) | | | | | | | | | | | | |
Futures Contracts | | $ | (387,430 | ) | | $ | — | | | $ | — | |
Interest Rate Swap Contracts | | | — | | | | (3,781 | ) | | | — | |
Total Return Swap Contracts | | | — | | | | (20,466,987 | ) | | | — | |
| Total | | $ | (387,430 | ) | | $ | (20,470,768 | ) | | $ | — | |
78
GOLDMAN SACHS SELECT SATELLITE FUNDS
|
| 3. INVESTMENTS AND FAIR VALUE MEASUREMENTS (continued) |
| | | | | | | | | | | | |
| | | |
| DYNAMIC ALLOCATION | | | | | | | | | | | | |
| | | |
| Investment Type | | Level 1 | | | Level 2 | | | Level 3 | |
| Assets | | | | | | | | | | | | |
Fixed Income | | | | | | | | | | | | |
Commodity Index Linked Structured Notes | | $ | — | | | $ | 32,979,177 | | | $ | — | |
U.S. Treasury Obligations and/or Other U.S. Government Agencies | | | 111,950,871 | | | | — | | | | — | |
Common Stock and/or Other Equity Investments | | | 63,692,070 | | | | — | | | | — | |
Short-Term Investment | | | 934,776,452 | | | | — | | | | — | |
| Total | | $ | 1,110,419,393 | | | $ | 32,979,177 | | | $ | — | |
| | | |
| Derivative Type | | | | | | | | | |
| Assets(a) | | | | | | | | | | | | |
Futures Contracts | | $ | 1,595,851 | | | $ | — | | | $ | — | |
| Liabilities(a) | | | | | | | | | | | | |
Futures Contracts | | $ | (16,741,080 | ) | | $ | — | | | $ | — | |
Credit Default Swap Contracts | | | — | | | | (754,619 | ) | | | — | |
| Total | | $ | (16,741,080 | ) | | $ | (754,619 | ) | | $ | — | |
| | | |
| INTERNATIONAL REAL ESTATE SECURITIES | | | | | | | | | | | | |
| | | |
| Investment Type | | Level 1 | | | Level 2 | | | Level 3 | |
| Assets | | | | | | | | | | | | |
Common Stock and/or Other Equity Investments | | | | | | | | | | | | |
North and South America | | $ | 27,341,941 | | | $ | — | | | $ | — | |
Other | | | — | | | | 344,267,321 | (b) | | | — | |
| Total | | $ | 27,341,941 | | | $ | 344,267,321 | | | $ | — | |
79
GOLDMAN SACHS SELECT SATELLITE FUNDS
Notes to Financial Statements (continued)
June 30, 2013 (Unaudited)
|
| 3. INVESTMENTS AND FAIR VALUE MEASUREMENTS (continued) |
| | | | | | | | | | | | |
| | | |
| MANAGED FUTURES STRATEGY | | | | | | | | | | | | |
| | | |
| Derivative Type | | Level 1 | | | Level 2 | | | Level 3 | |
| Assets(a) | | | | | | | | | | | | |
Futures Contracts | | $ | 96,882 | | | $ | — | | | $ | — | |
Forward Foreign Currency Exchange Contracts | | | — | | | | 247,315 | | | | — | |
Interest Rate Swap Contracts | | | — | | | | 229,065 | | | | — | |
| Total | | $ | 96,882 | | | $ | 476,380 | | | $ | — | |
| Liabilities(a) | | | | | | | | | | | | |
Futures Contracts | | $ | (198,905 | ) | | $ | — | | | $ | — | |
Forward Foreign Currency Exchange Contracts | | | — | | | | (212,273 | ) | | | — | |
Interest Rate Swap Contracts | | | — | | | | (738,270 | ) | | | — | |
| Total | | $ | (198,905 | ) | | $ | (950,543 | ) | | $ | — | |
| | | |
| REAL ESTATE SECURITIES | | | | | | | | | | | | |
| | | |
| Investment Type | | Level 1 | | | Level 2 | | | Level 3 | |
| Assets | | | | | | | | | | | | |
Common Stock and/or Other Equity Investments | | $ | 517,756,374 | | | $ | — | | | $ | — | |
| (a) | | Amount shown represents unrealized gain (loss) at period end. |
| (b) | | To adjust for the time difference between local market close and the calculation of net asset value, the Funds utilize fair value model prices for international equities provided by an independent fair value service resulting in a Level 2 classification. |
For further information regarding security characteristics, see the Schedules of Investments.
80
GOLDMAN SACHS SELECT SATELLITE FUNDS
|
| 4. INVESTMENTS IN DERIVATIVES |
The following tables set forth, by certain risk types, the gross value of derivative contracts as of June 30, 2013. These instruments were used to meet the Funds’ investment objectives and to obtain and/or manage exposure related to the risks below. The values in the tables below exclude the effects of cash collateral received or posted pursuant to these derivative contracts, and therefore are not representative of the Funds’ net exposure.
| | | | | | | | | | | | |
| | | |
| ABSOLUTE RETURN TRACKER | | | | | | | | | | |
| Risk | | Statements of Assets and Liabilities | | Assets | | | Statements of Assets and Liabilities | | Liabilities | |
Currency | | Receivable for unrealized gain on forward foreign currency exchange contracts | | $ | 367,413 | | | Payable for unrealized loss on forward foreign currency exchange contracts | | $ | (3,621,705) | |
Equity | | Receivable for unrealized gain on futures variation margin | | | 1,716,021 | (a) | | Payable for unrealized loss on futures variation margin | | | (4,786,954) | (a) |
Interest rate | | Receivable for unrealized gain on futures variation margin | | | 2,477,047 | (a) | | — | | | — | |
| Total | | | | $ | 4,560,481 | | | | | $ | (8,408,659) | |
| | | |
| COMMODITY STRATEGY | | | | | | | | | | |
| Risk | | Statements of Assets and Liabilities | | Assets | | | Statements of Assets and Liabilities | | Liabilities | |
Commodity | | — | | $ | — | | | Payable for unrealized loss on swap contracts | | $ | (20,466,987) | (b) |
Interest rate | | Receivable for unrealized gain on swap contracts, Receivable for unrealized gain on futures variation margin | | | 3,180,977 | (a) | | Payable for unrealized loss on swap contracts, Payable for unrealized loss on futures variation margin | | | (391,211) | (a)(b) |
| Total | | | | $ | 3,180,977 | | | | | $ | (20,858,198) | |
| | | |
| DYNAMIC ALLOCATION | | | | | | | | | | |
| Risk | | Statements of Assets and Liabilities | | Assets | | | Statements of Assets and Liabilities | | Liabilities | |
Credit | | — | | $ | — | | | Payable for unrealized loss on swap contracts | | $ | (754,619) | (b) |
Equity | | Receivable for unrealized gain on futures variation margin | | | 1,418,049 | (a) | | Payable for unrealized loss on futures variation margin | | | (4,404,126) | (a) |
Interest rate | | Receivable for unrealized gain on futures variation margin | | | 177,802 | (a) | | Payable for unrealized loss on futures variation margin | | | (12,336,954) | (a) |
| Total | | | | $ | 1,595,851 | | | | | $ | (17,495,699) | |
81
GOLDMAN SACHS SELECT SATELLITE FUNDS
Notes to Financial Statements (continued)
June 30, 2013 (Unaudited)
|
| 4. INVESTMENTS IN DERIVATIVES (continued) |
| | | | | | | | | | | | |
| | | |
| MANAGED FUTURES STRATEGY | | | | | | | | | | |
| Risk | | Statements of Assets and Liabilities | | Assets | | | Statements of Assets and Liabilities | | Liabilities | |
Currency | | Receivable for unrealized gain on forward foreign currency exchange contracts | | $ | 247,315 | | | Payable for unrealized loss on forward foreign currency exchange contracts | | $ | (212,273) | |
Equity | | Receivable for unrealized gain on futures variation margin | | | 96,882 | (a) | | Payable for unrealized loss on futures variation margin | | | (198,905) | (a) |
Interest rate | | Receivable for unrealized gain on swap contracts | | | 229,065 | | | Payable for unrealized loss on swap contracts | | | (738,270) | (b) |
| Total | | | | $ | 573,262 | | | | | $ | (1,149,448) | |
| (a) | | Includes unrealized gain (loss) on futures contracts and centrally cleared swap contracts described in the Additional Investment Information sections of the Schedules of Investments. Only current day’s variation margin is reported within the Statements of Assets and Liabilities. |
| (b) | | Aggregate of amounts include $20,470,768, $754,619 and $738,270 for the Commodity Strategy, Dynamic Allocation and Managed Futures Strategy Funds, respectively, which represent the payments to be made pursuant to bilateral agreements should counterparties exercise their “right to terminate” provisions based on, among others, the Funds’ performance, their failure to pay on its obligations or failure to pledge collateral. Such amounts do not include incremental charges directly associated with the close-out of the agreements. They also do not reflect the fair value of any assets pledged as collateral which, through the daily margining process, substantially offsets the aforementioned amounts and for which the Funds are entitled to a full return. |
The following tables set forth, by certain risk types, the Funds’ gains (losses) related to these derivatives and their indicative volumes for the six months ended June 30, 2013. These gains (losses) should be considered in the context that these derivative contracts may have been executed to economically hedge certain investments, and accordingly, certain gains (losses) on such derivative contracts may offset certain (losses) gains attributable to investments. These gains (losses) are included in “Net realized gain (loss)” or “Net change in unrealized gain (loss)” on the Statements of Operations:
| | | | | | | | | | | | | | |
| | | |
| ABSOLUTE RETURN TRACKER | | | | | | | | | | | | |
| Risk | | Statements of Operations | | Net Realized Gain (Loss) | | | Net Change in
Unrealized Gain (Loss) | | | Average
Number of
Contracts(a) | |
| Currency | | Net realized gain (loss) from forward foreign currency exchange contracts/Net change in unrealized gain (loss) on forward foreign currency exchange contracts | | $ | (9,346,101 | ) | | $ | (2,169,270 | ) | | | 6 | |
| Equity | | Net realized gain (loss) from futures contracts and swap contracts/Net change in unrealized gain (loss) on futures contracts and swap contracts | | | 67,076,466 | | | | (10,424,309 | ) | | | 6,727 | |
Interest
rate | | Net realized gain (loss) from futures contracts/Net change in unrealized gain (loss) on futures contracts | | | 163,671 | | | | 2,100,231 | | | | 739 | |
| Total | | | | $ | 57,894,036 | | | $ | (10,493,348 | ) | | | 7,472 | |
82
GOLDMAN SACHS SELECT SATELLITE FUNDS
|
| 4. INVESTMENTS IN DERIVATIVES (continued) |
| | | | | | | | | | | | | | |
| | | |
| COMMODITY STRATEGY | | | | | | | | | | | | |
| Risk | | Statements of Operations | | Net Realized
Gain (Loss) | | | Net Change in
Unrealized
Gain (Loss) | | | Average
Number of
Contracts(a) | |
| Commodity | | Net realized gain (loss) from swap contracts/Net change in unrealized gain (loss) on swap contracts | | $ | (55,503,255 | ) | | $ | (15,796,849 | ) | | | 7 | |
| Interest rate | | Net realized gain (loss) from futures contracts and swap contracts/Net change in unrealized gain (loss) on futures contracts and swap contracts | | | (498,723 | ) | | | 2,132,176 | | | | 1,841 | |
| Total | | | | $ | (56,001,978 | ) | | $ | (13,664,673 | ) | | | 1,848 | |
| | | |
| DYNAMIC ALLOCATION | | | | | | | | | | | | |
| Risk | | Statements of Operations | | Net Realized
Gain (Loss) | | | Net Change in
Unrealized
Gain (Loss) | | | Average
Number of
Contracts(a) | |
| Credit | | Net realized gain (loss) from swap contracts/Net change in unrealized gain (loss) on swap contracts | | $ | 7,679,750 | | | $ | (9,279,128 | ) | | | 1 | |
| Equity | | Net realized gain (loss) from futures contracts/Net change in unrealized gain (loss) on futures contracts | | | 66,900,412 | | | | (2,507,612 | ) | | | 6,567 | |
| Interest rate | | Net realized gain (loss) from futures contracts/Net change in unrealized gain (loss) on futures contracts | | | (1,187,479 | ) | | | (14,247,008 | ) | | | 3,096 | |
| Total | | | | $ | 73,392,683 | | | $ | (26,033,748 | ) | | | 9,664 | |
| | | |
| MANAGED FUTURES STRATEGY | | | | | | | | | | | | |
| Risk | | Statements of Operations | | Net Realized
Gain (Loss) | | | Net Change in
Unrealized
Gain (Loss) | | | Average
Number of
Contracts(a) | |
| Currency | | Net realized gain (loss) from forward foreign currency exchange contracts/Net change in unrealized gain (loss) on forward foreign currency exchange contracts | | $ | 50,411 | | | $ | (13,440 | ) | | | 45 | |
| Equity | | Net realized gain (loss) from futures contracts/Net change in unrealized gain (loss) on futures contracts | | | (306,245 | ) | | | (189,301 | ) | | | 546 | |
| Interest rate | | Net realized gain (loss) from swap contracts/Net change in unrealized gain (loss) on swap contracts | | | (1,049,598 | ) | | | (1,433,407 | ) | | | 19 | |
| Total | | | | $ | (1,305,432 | ) | | $ | (1,636,148 | ) | | | 610 | |
| (a) | | Average number of contracts is based on the average of month end balances for the six months ended June 30, 2013. |
83
GOLDMAN SACHS SELECT SATELLITE FUNDS
Notes to Financial Statements (continued)
June 30, 2013 (Unaudited)
|
| 4. INVESTMENTS IN DERIVATIVES (continued) |
In order to better define its contractual rights and to secure rights that will help a Fund mitigate its counterparty risk, a Fund may enter into an International Swaps and Derivatives Association, Inc. Master Agreement (“ISDA Master Agreement”) or similar agreement with its derivatives counterparties. An ISDA Master Agreement is a bilateral agreement between a Fund and a counterparty that governs OTC derivatives, including foreign exchange contracts, and typically contains, among other things, collateral posting terms and netting provisions in the event of a default and/or termination event. The provisions of the ISDA Master Agreement typically permit a single net payment in the event of a default (close-out netting) or similar event, including the bankruptcy or insolvency of the counterparty.
Collateral and margin requirements differ between exchange traded derivatives and OTC derivatives. Margin requirements are established by the broker or clearing house for exchange-traded and centrally cleared derivatives (financial futures contracts, options and centrally cleared swaps) pursuant to governing agreements for those instrument types. Brokers can ask for margin in excess of the minimum in certain circumstances. Collateral terms are contract-specific for OTC derivatives (foreign currency exchange contracts, options and certain swaps). For derivatives traded under an ISDA Master Agreement, the collateral requirements are typically calculated by netting the marked to market amount for each transaction under such agreement and comparing that amount to the value of any collateral currently pledged by a Fund and the counterparty. Additionally, a Fund may be required to post additional collateral to the counterparty in the form of initial margin, the terms of which would be outlined in the confirmation of the OTC transaction.
For financial reporting purposes, cash collateral that has been pledged to cover obligations of a Fund and cash collateral received from the counterparty, if any, is reported separately on the Statements of Assets and Liabilities as receivables/payables for collateral on certain derivative contracts. Non-cash collateral pledged by a Fund, if any, is noted in the Schedules of Investments. Generally, the amount of collateral due from or to a counterparty must exceed a minimum transfer amount threshold (e.g., $250,000) before a transfer is required to be made. To the extent amounts due to a Fund from its counterparties are not fully collateralized, contractually or otherwise, the Fund bears the risk of loss from counterparty nonperformance. A Fund attempts to mitigate counterparty risk by only entering into agreements with counterparties that it believes to be of good standing and by monitoring the financial stability of those counterparties.
Additionally, the netting of assets and liabilities and the offsetting of collateral pledged or received are based on contractual netting/set-off provisions in the ISDA Master Agreement or similar agreements. However, in the event of a default or insolvency of a counterparty, a court could determine that such rights are not enforceable due the restrictions or prohibitions against the right of setoff that may be imposed due to a particular jurisdiction’s bankruptcy or insolvency laws.
84
GOLDMAN SACHS SELECT SATELLITE FUNDS
|
| 4. INVESTMENTS IN DERIVATIVES (continued) |
The following tables set forth the Funds’ net exposure for derivative instruments that are subject to enforceable master netting arrangements or similar agreements as of June 30, 2013:
| | | | | | | | | | | | |
| | | |
ABSOLUTE RETURN TRACKER Offsetting of Derivatives Assets: | | | | | | | | | | | | |
| Derivatives | | Gross Amount of
Recognized Assets | | | Gross Amounts Offset in
the Statement of Assets
and Liabilities | | | Net Amounts of Assets
Presented in the
Statement of Assets and
Liabilities | |
Over the Counter: | | | | | | | | | | | | |
Forward Currency Contracts | | $ | 367,413 | | | $ | — | | | $ | 367,413 | |
| | | | | | | | | | | | | | | | |
|
| Derivative Assets and Collateral received by Counterparty: | |
| | | | Gross Amounts Available for Offset
but Not Netted in the
Statement of Assets and Liabilities | | | | |
| Counterparty | | Net Amounts of Assets in
the Statement of Assets and
Liabilities | | | Financial
Instruments | | | Cash Collateral Received | | | Net Amount(1) | |
UBS AG | | $ | 367,413 | | | $ | (367,413 | ) | | $ | — | | | $ | — | |
| (1) | | Net amount represents the net amount due from the counterparty in the event of a default based on the contractual set-off rights under the agreement. |
85
GOLDMAN SACHS SELECT SATELLITE FUNDS
Notes to Financial Statements (continued)
June 30, 2013 (Unaudited)
|
| 4. INVESTMENTS IN DERIVATIVES (continued) |
| | | | | | | | | | | | |
| | | |
| Offsetting of Derivatives Liabilities: | | | | | | | | | | | | |
| Derivatives | | Gross Amount of
Recognized Liabilities | | | Gross Amounts Offset in
the Statement of Assets
and Liabilities | | | Net Amounts of Liabilities
Presented in the
Statement of Assets and
Liabilities | |
Over the Counter: | | | | | | | | | | | | |
Forward Currency Contracts | | $ | 3,621,705 | | | $ | — | | | $ | 3,621,705 | |
Exchange Traded: | | | | | | | | | | | | |
Futures Contracts | | | 1,051,554 | | | | — | | | | 1,051,554 | |
Total | | $ | 4,673,259 | | | $ | — | | | $ | 4,673,259 | |
| | | | | | | | | | | | | | | | |
| | |
| Derivative Liabilities and Collateral Pledged by Counterparty: | | | | | | | | | |
| | �� | | Gross Amounts Available for Offset
but Not Netted in the
Statement of Assets and Liabilities | | | | |
| Counterparty | | Net Amounts of Liabilities in
the Statement of Assets and
Liabilities | | | Financial
Instruments | | | Cash Collateral Pledged | | | Net
Amount(2) | |
Goldman Sachs & Co.* | | $ | 1,051,554 | | | $ | (1,051,554 | ) | | $ | — | | | $ | — | |
UBS AG | | | 3,621,705 | | | | (367,413 | ) | | | (3,254,292 | ) | | | — | |
Total | | $ | 4,673,259 | | | $ | (1,418,967 | ) | | $ | (3,254,292 | ) | | $ | — | |
| * | | Exchange Traded Futures — Goldman Sachs & Co. as Futures Commission Merchant |
| (2) | | Net amount represents the net amount due to the counterparty in the event of a default based on the contractual set-off rights under the agreement. |
86
GOLDMAN SACHS SELECT SATELLITE FUNDS
|
| 4. INVESTMENTS IN DERIVATIVES (continued) |
| | | | | | | | | | | | |
| | | |
COMMODITY STRATEGY Offsetting of Derivatives Assets: | | | | | | | | | | | | |
| Derivatives | | Gross Amount of
Recognized Assets | | | Gross Amounts Offset in
the Statement of Assets
and Liabilities | | | Net Amounts of Assets
Presented in the
Statement of Assets and
Liabilities | |
Over the Counter: | | | | | | | | | | | | |
Swap Contracts | | $ | 385,775 | | | $ | — | | | $ | 385,775 | |
Exchange Traded: | | | | | | | | | | | | |
Futures Contracts | | | 61,499 | | | | — | | | | 61,499 | |
Total | | $ | 447,274 | | | $ | — | | | $ | 447,274 | |
| | | | | | | | | | | | | | | | |
|
| Derivative Assets and Collateral received by Counterparty: | |
| | | | Gross Amounts Available for
Offset but Not Netted in the
Statement of Assets and Liabilities | | | | |
| Counterparty | | Net Amounts of Assets in
the Statement of Assets and
Liabilities | | | Financial
Instruments | | | Cash Collateral Received | | | Net Amount(1) | |
Credit Suisse International | | $ | 385,775 | | | $ | — | | | $ | (300,000 | ) | | $ | 85,775 | |
Goldman Sachs & Co.* | | | 61,499 | | | | — | | | | — | | | | 61,499 | |
Total | | $ | 447,274 | | | $ | — | | | $ | (300,000 | ) | | $ | 147,274 | |
| * | | Exchange Traded Futures — Goldman Sachs & Co. as Futures Commission Merchant |
| (1) | | Net amount represents the net amount due from the counterparty in the event of a default based on the contractual set-off rights under the agreement. |
87
GOLDMAN SACHS SELECT SATELLITE FUNDS
Notes to Financial Statements (continued)
June 30, 2013 (Unaudited)
|
| 4. INVESTMENTS IN DERIVATIVES (continued) |
| | | | | | | | | | | | |
| | | |
Offsetting of Derivatives Liabilities: | | | | | | | | | | | | |
| Derivatives | | Gross Amount of
Recognized Liabilities | | | Gross Amounts Offset in
the Statement of Assets
and Liabilities | | | Net Amounts of Liabilities
Presented in the
Statement of Assets and
Liabilities | |
Over the Counter: | | | | | | | | | | | | |
Swap Contracts | | $ | 20,466,987 | | | $ | — | | | $ | 20,466,987 | |
Centrally Cleared: | | | | | | | | | | | | |
Swap Contracts | | | 29,393 | | | | — | | | | 29,393 | |
Total | | $ | 20,496,380 | | | $ | — | | | $ | 20,496,380 | |
| | | | | | | | | | | | | | | | |
| | |
| Derivative Liabilities and Collateral Pledged by Counterparty: | | | | | | | | | |
| | | | Gross Amounts Available for
Offset but Not Netted in the
Statement of Assets and Liabilities | | | | |
| Counterparty | | Net Amounts of Liabilities in
the Statement of Assets and
Liabilities | | | Financial
Instruments | | | Cash Collateral Pledged | | | Net Amount(2) | |
Centrally Cleared | | $ | 29,393 | | | $ | — | | | $ | (29,393 | ) | | $ | — | |
Deutsche Bank AG | | | 810,267 | | | | — | | | | (810,267 | ) | | | — | |
Merrill Lynch International | | | 3,155,394 | | | | — | | | | (3,155,394 | ) | | | — | |
UBS AG | | | 16,501,326 | | | | — | | | | (16,501,326 | ) | | | — | |
Total | | $ | 20,496,380 | | | $ | — | | | $ | (20,496,380 | ) | | $ | — | |
| (2) | | Net amount represents the net amount due to the counterparty in the event of a default based on the contractual set-off rights under the agreement. |
88
GOLDMAN SACHS SELECT SATELLITE FUNDS
|
| 4. INVESTMENTS IN DERIVATIVES (continued) |
| | | | | | | | | | | | |
| | | |
DYNAMIC ALLOCATION Offsetting of Derivatives Assets: | | | | | | | | | | | | |
| Derivatives | | Gross Amount of
Recognized Assets | | | Gross Amounts Offset in
the Statement of Assets
and Liabilities | | | Net Amounts of Assets
Presented in the
Statement of Assets and
Liabilities | |
Centrally Cleared:
Swap Contracts | | $ | 8,770 | | | $ | — | | | $ | 8,770 | |
Exchange Traded: | | | | | | | | | | | | |
Futures Contracts | | | 69,522 | | | | — | | | | 69,522 | |
| Total | | | $78,292 | | | $ | — | | | | $78,292 | |
| | | | | | | | | | | | | | | | |
|
| Derivative Assets and Collateral received by Counterparty: | |
| | | | Gross Amounts Available for
Offset but Not Netted in the
Statement of Assets and Liabilities | | | | |
| Counterparty | | Net Amounts of Assets in
the Statement of Assets and
Liabilities | | | Financial
Instruments | | | Cash Collateral Received | | | Net Amount(1) | |
Centrally Cleared | | $ | 8,770 | | | $ | — | | | $ | — | | | $ | 8,770 | |
Goldman Sachs & Co.* | | | 69,522 | | | | — | | | | — | | | | 69,522 | |
| Total | | $ | 78,292 | | | $ | — | | | $ | — | | | $ | 78,292 | |
| * | | Exchange Traded Futures — Goldman Sachs & Co. as Futures Commission Merchant |
| (1) | | Net amount represents the net amount due from the counterparty in the event of a default based on the contractual set-off rights under the agreement. |
| | | | | | | | | | | | |
|
MANAGED FUTURES STRATEGY Offsetting of Derivatives Assets: | |
| Derivatives | | Gross Amount of
Recognized Assets | | | Gross Amounts Offset in
the Statement of Assets
and Liabilities | | | Net Amounts of Assets
Presented in the
Statement of Assets and
Liabilities | |
Over the Counter: | | | | | | | | | | | | |
Forward Currency Contracts | | $ | 247,315 | | | $ | — | | | $ | 247,315 | |
| | | | | | | | | | | | | | | | |
|
| Derivative Assets and Collateral received by Counterparty: | |
| | | | Gross Amounts Available for Offset
but Not Netted in the
Statement of Assets and Liabilities | | | | |
| Counterparty | | Net Amounts of Assets in
the Statement of Assets and
Liabilities | | | Financial
Instruments | | | Cash Collateral Received | | | Net Amount(1) | |
Morgan Stanley Co., Inc. | | $ | 247,315 | | | $ | (212,273 | ) | | $ | — | | | $ | 35,042 | |
| (1) | | Net amount represents the net amount due from the counterparty in the event of a default based on the contractual set-off rights under the agreement. |
89
GOLDMAN SACHS SELECT SATELLITE FUNDS
Notes to Financial Statements (continued)
June 30, 2013 (Unaudited)
|
| 4. INVESTMENTS IN DERIVATIVES (continued) |
| | | | | | | | | | | | |
|
Offsetting of Derivatives Liabilities: | |
| Derivatives | | Gross Amount of
Recognized Liabilities | | | Gross Amounts Offset in the
Statement of Assets and
Liabilities | | | Net Amounts of Liabilities
Presented in the
Statement of Assets and
Liabilities | |
Over the Counter: | | | | | | | | | | | | |
Forward Currency Contracts | | $ | 212,273 | | | $ | — | | | $ | 212,273 | |
Centrally Cleared: | | | | | | | | | | | | |
Swap Contracts | | | 43,739 | | | | — | | | | 43,739 | |
Exchange Traded: | | | | | | | | | | | | |
Futures Contracts | | | 32,596 | | | | — | | | | 32,596 | |
Total | | $ | 288,608 | | | $ | — | | | $ | 288,608 | |
| | | | | | | | | | | | | | | | |
| | |
| Derivative Liabilities and Collateral Pledged by Counterparty: | | | | | | | | | |
| | | | Gross Amounts Available for Offset
but Not Netted in the
Statement of Assets and Liabilities | | | | |
| Counterparty | | Net Amounts of Liabilities in
the Statement of Assets and
Liabilities | | | Financial
Instruments | | | Cash Collateral Pledged | | | Net Amount(2) | |
Centrally Cleared | | $ | 43,739 | | | $ | — | | | $ | (43,739 | ) | | $ | — | |
Credit Suisse Securities LLC* | | | 32,596 | | | | — | | | | (32,596 | ) | | | — | |
Morgan Stanley Co., Inc. | | | 212,273 | | | | (212,273 | ) | | | — | | | | — | |
Total | | $ | 288,608 | | | $ | (212,273 | ) | | $ | (76,335 | ) | | $ | — | |
| * | | Exchange Traded Futures — Credit Suisse Securities LLC as Futures Commission Merchant |
| (2) | | Net amount represents the net amount due to the counterparty in the event of a default based on the contractual set-off rights under the agreement. |
90
GOLDMAN SACHS SELECT SATELLITE FUNDS
|
| 5. AGREEMENTS AND AFFILIATED TRANSACTIONS |
A. Management Agreement — Under the Agreement, GSAM manages the Funds, subject to the general supervision of the Trustees.
As compensation for the services rendered pursuant to the Agreement, the assumption of the expenses related thereto and administration of the Funds’ business affairs, including providing facilities, GSAM is entitled to a management fee, accrued daily and paid monthly, equal to an annual percentage rate of each Fund’s average daily net assets.
For the six months ended June 30, 2013, contractual and effective net management fees with GSAM were at the following rates:
| | | | | | | | | | | | | | | | | | | | | | | | | | | | | | |
| | | | | Contractual Management Fee Rate | | | Effective Net
Management
Fee Rate | |
| Fund | | | | First
$1 billion | | | Next
$1 billion | | | Next
$3 billion | | | Next
$3 billion | | | Over
$8 billion | | | Effective
Rate | | |
Absolute Return Tracker | | | | | 1.15 | % | | | 1.04 | % | | | 0.99 | % | | | 0.97 | % | | | 0.95 | % | | | 1.11 | % | | | 1.11 | % |
Commodity Strategy | | | | | 0.50 | | | | 0.50 | | | | 0.45 | | | | 0.43 | | | | 0.42 | | | | 0.50 | | | | 0.50 | (1) |
Dynamic Allocation | | | | | 0.90 | | | | 0.81 | | | | 0.77 | | | | 0.75 | | | | 0.74 | | | | 0.88 | | | | 0.86 | (2) |
International Real Estate Securities | | | | | 1.05 | | | | 1.05 | | | | 0.95 | | | | 0.90 | | | | 0.88 | | | | 1.05 | | | | 1.02 | (2) |
Managed Futures Strategy | | | | | 1.00 | | | | 0.90 | | | | 0.86 | | | | 0.84 | | | | 0.82 | | | | 1.00 | | | | 1.00 | |
Real Estate Securities | | | | | 1.00 | | | | 0.90 | | | | 0.86 | | | | 0.84 | | | | 0.82 | | | | 1.00 | | | | 0.98 | (2) |
| (1) | | Reflects combined management fees paid to GSAM under the Agreement and the Subsidiary Agreement (as defined below) after the waivers. |
| (2) | | GSAM has agreed to waive a portion of its management fee in order to achieve net management rates, as defined in the Funds’ most recent prospectuses. These waivers will be effective through at least April 30, 2014, and prior to such date GSAM may not terminate the arrangement without approval of the Trustees. The Effective Net Management Rates above are calculated based on management rates before and after the waivers had been adjusted, if applicable. |
GSAM also provides management services to the Subsidiary pursuant to a Subsidiary Management Agreement (the “Subsidiary Agreement”) and is entitled to a management fee accrued daily and paid monthly, equal to an annual percentage rate of 0.50% of the Subsidiary’s average daily net assets. In consideration of the Subsidiary’s management fee, and for as long as the Subsidiary Agreement remains in effect, GSAM has contractually agreed to waive irrevocably a portion of the Commodity Strategy Fund’s management fee in an amount equal to the management fee paid to GSAM by the Subsidiary under the Subsidiary Agreement. For the six months ended June 30, 2013, GSAM waived $492,407 of the Fund’s management fee.
B. Distribution and Service Plans — The Trust, on behalf of each Fund, has adopted Distribution and Service Plans (the “Plans”). Under the Plans, Goldman Sachs, which serves as distributor (the “Distributor”), is entitled to a fee accrued daily and paid monthly, for distribution services and personal and account maintenance services, which may then be paid by Goldman Sachs to authorized dealers, at the following annual rates calculated on a Fund’s average daily net assets of each respective share class:
| | | | | | | | | | | | | | | | |
| | | Distribution and Service Plan Rates | |
| | | Class A* | | | Class B | | | Class C | | | Class R* | |
Distribution Plan | | | 0.25 | % | | | 0.75 | % | | | 0.75 | % | | | 0.50 | % |
Service Plan | | | — | | | | 0.25 | | | | 0.25 | | | | — | |
| * | | With respect to Class A and Class R Shares, the Distributor at its discretion may use compensation for distribution services paid under the Distribution Plan to compensate service organizations for personal and account maintenance services and expenses as long as such total compensation does not exceed the maximum cap on “service fees” imposed by the Financial Industry Regulatory Authority. |
C. Distribution Agreement — Goldman Sachs, as Distributor of the shares of the Funds pursuant to a Distribution Agreement, may retain a portion of the Class A front end sales charge and Class B and Class C Shares’ CDSC. During the six months ended June 30, 2013, Goldman Sachs advised that it retained front end sales charges of $2,644, $31,519, $21,420, $514, $857 and $6.709
91
GOLDMAN SACHS SELECT SATELLITE FUNDS
Notes to Financial Statements (continued)
June 30, 2013 (Unaudited)
|
| 5. AGREEMENTS AND AFFILIATED TRANSACTIONS (continued) |
for the Absolute Return Tracker, Commodity Strategy, Dynamic Allocation, International Real Estate Securities, Managed Futures Strategy and Real Estate Securities Funds, respectively. Goldman Sachs retained no contingent deferred sales charges.
D. Service Plan and Shareholder Administration Plan —The Trust, on behalf of each Fund that offers Service Shares, has adopted a Service Plan and a Shareholder Administration Plan. These plans allow for service organizations to provide varying levels of personal and account maintenance and shareholder administration services to their customers who are beneficial owners of such shares. The Service Plan and Shareholder Administration Plan each provide for compensation to the service organizations which is accrued daily and paid monthly at an annual rate of 0.25% (0.50% in aggregate) of the average daily net assets of the Service Shares.
E. Transfer Agency Agreement — Goldman Sachs also serves as the transfer agent of the Funds for a fee pursuant to Transfer Agency Agreement. The fees charged for such transfer agency services are accrued daily and paid monthly at annual rates as follows: 0.19% (except for the Commodity Strategy Fund, which charges at an annual rate of 0.13%) of the average daily net assets of Class A, Class B, Class C, Class IR and Class R Shares; and 0.04% of the average daily net assets of Institutional and Service Shares.
F. Other Expense Agreements and Affiliated Transactions — GSAM has agreed to limit certain “Other Expense” of the Funds (excluding transfer agent fees and expenses, service fees and shareholder administration fees (as applicable), taxes, interest, brokerage fees, litigation, indemnification, shareholder meetings and other extraordinary expenses) to the extent such expenses exceed, on an annual basis, a percentage rate of the average daily net assets of each Fund. Such Other Expense reimbursements, if any, are accrued daily and paid monthly. In addition, the Funds are not obligated to reimburse GSAM for prior fiscal year expense reimbursements, if any. The Other Expense limitations as an annual percentage rate of average daily net assets for the Absolute Return Tracker, Commodity Strategy, Dynamic Allocation, International Real Estate Securities, Managed Futures Strategy and Real Estate Securities Funds are 0.014%, 0.044%, 0.004%, 0.004%, 0.104% and 0.004%, respectively. Prior to April 30, 2013, the Other Expense limitations for Dynamic Allocation and International Real Estate Securities Funds were 0.054% and 0.064%, respectively. These Other Expense limitations will remain in place through at least April 30, 2014, and prior to such date GSAM may not terminate the arrangements without the approval of the Trustees. The subsidiary also pays certain other expenses, including service and custody fees. GSAM has agreed to reduce or limit the Subsidiary’s expenses (excluding management fees) to 0.004% of the Subsidiary’s average daily net assets. In addition, the Funds have entered into certain offset arrangements with the custodian and the transfer agent, which may result in a reduction of the Funds’ expenses and are received irrespective of the application of the “Other Expense” limitations described above.
For the six months ended June 30, 2013, these expense reductions, including any fee waivers and Other Expense reimbursements, were as follows:
| | | | | | | | | | | | | | | | | | |
| Fund | | | | Management
Fee Waiver | | | Other Expense
Reimbursement | | | Custody Fee
Credits | | | Total Expense
Reductions | |
Absolute Return Tracker | | | | $ | — | | | $ | 180,069 | | | $ | 46,602 | | | $ | 226,671 | |
Commodity Strategy | | | | | — | | | | 150,207 | | | | 22,444 | | | | 172,651 | |
Dynamic Allocation | | | | | 101,916 | | | | 81,322 | | | | — | | | | 183,238 | |
International Real Estate Securities | | | | | 60,642 | | | | 139,850 | | | | 2,781 | | | | 203,273 | |
Managed Futures Strategy | | | | | — | | | | 195,151 | | | | 13,214 | | | | 208,365 | |
Real Estate Securities | | | | | 45,115 | | | | 171,912 | | | | 4,294 | | | | 221,321 | |
92
GOLDMAN SACHS SELECT SATELLITE FUNDS
|
| 5. AGREEMENTS AND AFFILIATED TRANSACTIONS (continued) |
As of June 30, 2013, the amounts owed to affiliates of the Funds were as follows:
| | | | | | | | | | | | | | | | | | |
| Fund | | | | Management
Fees | | | Distribution and
Service Fees | | | Transfer Agent
Fees | | | Total | |
Absolute Return Tracker | | | | $ | 1,410,407 | | | $ | 49,047 | | | $ | 70,639 | | | $ | 1,530,093 | |
Commodity Strategy | | | | | 451,644 | | | | 76,910 | | | | 61,373 | | | | 589,927 | |
Dynamic Allocation | | | | | 882,482 | | | | 120,115 | | | | 92,558 | | | | 1,095,155 | |
International Real Estate Securities | | | | | 302,625 | | | | 5,183 | | | | 14,482 | | | | 322,290 | |
Managed Futures Strategy | | | | | 26,282 | | | | 800 | | | | 1,393 | | | | 28,475 | |
Real Estate Securities | | | | | 404,729 | | | | 26,498 | | | | 26,668 | | | | 457,895 | |
G. Line of Credit Facility — As of June 30, 2013, the Funds participated in a $780,000,000 committed, unsecured revolving line of credit facility (the “facility”) together with other funds of the Trust and registered investment companies having management agreements with GSAM or its affiliates (“Other Borrowers”). Pursuant to the terms of the facility, the Funds and Other Borrowers could increase the credit amount by an additional $220,000,000, for a total of up to $1,000,000,000. This facility is to be used solely for temporary or emergency purposes, which may include the funding of redemptions. The interest rate on borrowings is based on the federal funds rate. The facility also requires a fee to be paid by the Funds based on the amount of the commitment that has not been utilized. For the six months ended June 30, 2013, the Funds did not have any borrowings under the facility. Prior to May 8, 2013, the committed amount available through the facility was $630,000,000.
H. Other Transactions with Affiliates — For the six months ended June 30, 2013, Goldman Sachs earned $21,339 and $130,706 in brokerage commissions from portfolio transactions, including futures transactions executed with Goldman Sachs as the Futures Commission Merchant, on behalf of the Absolute Return Tracker and Dynamic Allocation Funds, respectively.
As of June 30, 2013, the following Goldman Sachs Fund of Funds Portfolios were the beneficial owners of 5% or more of total outstanding shares of the following Funds:
| | | | | | | | | | | | | | | | | | |
| Fund | | | | Goldman Sachs
Balanced
Strategy Portfolio | | | Goldman Sachs
Growth and Income
Strategy Portfolio | | | Goldman Sachs
Growth Strategy
Portfolio | | | Goldman Sachs
Satellite Strategies
Portfolio | |
Commodity Strategy | | | | | — | % | | | — | % | | | — | % | | | 12 | % |
Dynamic Allocation | | | | | 6 | | | | 12 | | | | 10 | | | | — | |
International Real Estate Securities | | | | | — | | | | — | | | | — | | | | 34 | |
Real Estate Securities | | | | | — | | | | — | | | | — | | | | 27 | |
As of June 30, 2013, the Goldman Sachs Group, Inc. was the beneficial owner of approximately 100% of the Class R Shares of the Dynamic Allocation Fund and 27% and 14% of the Institutional Class and Class R Shares of the Managed Futures Strategy Fund.
93
GOLDMAN SACHS SELECT SATELLITE FUNDS
Notes to Financial Statements (continued)
June 30, 2013 (Unaudited)
|
| 6. PORTFOLIO SECURITIES TRANSACTIONS |
The cost of purchases and proceeds from sales and maturities of long-term securities for the six months ended June 30, 2013, were as follows:
| | | | | | | | | | | | | | | | | | |
| Fund | | | | Purchases of
U.S. Government and Agency Obligations | | | Purchases (Excluding U.S. Government and
Agency Obligations) | | | Sales and Maturities of U.S. Government
and Agency Obligations | | | Sales and Maturities
(Excluding U.S. Government and
Agency
Obligations) | |
Absolute Return Tracker | | | | $ | — | | | $ | 126,317,349 | | | $ | — | | | $ | 27,237,354 | |
Commodity Strategy | | | | | 617,201,987 | | | | — | | | | 772,339,065 | | | | 2,021,237 | |
Dynamic Allocation | | | | | 645,928,990 | | | | 330,569,880 | | | | 902,138,566 | | | | 513,062,708 | |
International Real Estate Securities | | | | | — | | | | 137,591,178 | | | | — | | | | 96,133,661 | |
Managed Futures Strategy | | | | | — | | | | — | | | | — | | | | — | |
Real Estate Securities | | | | | — | | | | 214,245,781 | | | | — | | | | 171,936,222 | |
As of the Funds’ most recent fiscal year end, December 31, 2012, the Funds’ capital loss carryforwards and certain timing differences, on a tax-basis were as follows:
| | | | | | | | | | | | | | | | | | | | | | | | |
| | | Absolute Return Tracker | | | Commodity
Strategy | | | Dynamic
Allocation | | | International Real
Estate Securities | | | Managed Futures
Strategy | | | Real Estate
Securities | |
Capital loss carryforwards:(1) | | | | | | | | | | | | | | | | | | | | | | | | |
Expiring 2016 | | $ | — | | | $ | (16,303,834 | ) | | $ | — | | | $ | (336,773,705 | ) | | $ | — | | | $ | — | |
Expiring 2017 | | | — | | | | (67,560,179 | ) | | | — | | | | (239,206,981 | ) | | | — | | | | (95,282,307 | ) |
Expiring 2018 | | | — | | | | — | | | | — | | | | (18,621,372 | ) | | | — | | | | — | |
Perpetual Short-term | | | — | | | | — | | | | — | | | | (3,961,851 | ) | | | — | | | | — | |
Perpetual Long-term | | | — | | | | (1,356,793 | ) | | | — | | | | (6,547,426 | ) | | | — | | | | — | |
Total capital loss carryforwards | | $ | — | | | $ | (85,220,806 | ) | | $ | — | | | $ | (605,111,335 | ) | | $ | — | | | $ | (95,282,307 | ) |
Timing differences (Qualified Late Year Loss Deferral/certain REIT dividends/straddle loss deferral) | | $ | (2,564,221 | ) | | $ | (2,761,325 | ) | | $ | (69,762 | ) | | $ | — | | | $ | (142,231 | ) | | $ | 467,167 | |
| (1) | | With the exception of perpetual capital loss carryfoward, expiration occurs on December 31 of the year indicated. |
94
GOLDMAN SACHS SELECT SATELLITE FUNDS
|
| 7. TAX INFORMATION (continued) |
As of June 30, 2013, the Funds’ aggregate security unrealized gains and losses based on cost for U.S. federal income tax purposes were as follows:
| | | | | | | | | | | | | | | | | | | | |
| | | Absolute
Return Tracker | | | Commodity
Strategy | | | Dynamic
Allocation | | | International Real
Estate Securities | | | Real Estate
Securities | |
Tax cost | | $ | 1,457,606,886 | | | $ | 923,020,286 | | | $ | 1,169,294,014 | | | $ | 362,162,306 | | | $ | 412,361,962 | |
Gross unrealized gain | | | 217,303 | | | | 138,483 | | | | 9,033,587 | | | | 62,365,520 | | | | 109,983,946 | |
Gross unrealized loss | | | (5,206,357 | ) | | | (4,253,977 | ) | | | (34,929,031 | ) | | | (52,918,564 | ) | | | (4,589,534 | ) |
Net unrealized security gain (loss) | | $ | (4,989,054 | ) | | $ | (4,115,494 | ) | | $ | (25,895,444 | ) | | $ | 9,446,956 | | | $ | 105,394,412 | |
As of June 30, 2013, the Managed Futures Strategy Fund did not have any aggregate security unrealized gains, losses or cost for U.S. federal income tax purposes.
The difference between GAAP-basis and tax-basis unrealized gains (losses) is attributable primarily to wash sales, net mark to market gains (losses) on regulated futures and foreign currency contracts, and differences related to the tax treatment of swap transactions, underlying fund investments, passive foreign investment companies and real estate investment trust investments.
GSAM has reviewed the Funds’ tax positions for all open tax years (the current and prior three years, as applicable) and has concluded that no provision for income tax is required in the Funds’ financial statements. Such open tax years remain subject to examination and adjustment by tax authorities.
The Funds’ risks include, but are not limited to, the following:
Foreign Custody Risk — A Fund that invests in foreign securities may hold such securities and foreign currency with foreign banks, agents, and securities depositories appointed by the Fund’s custodian (each a “Foreign Custodian”). In some countries, Foreign Custodians may be subject to little or no regulatory oversight or independent evaluation of their operations. Further, the laws of certain countries may place limitations on a Fund’s ability to recover its assets if a Foreign Custodian enters into bankruptcy. Investments in emerging markets may be subject to greater custody risks than investments in more developed markets. Custody services in emerging market countries are often undeveloped and may be less regulated than in more developed countries, and thus may not afford the same level of investor protection as would apply in developed countries.
Shareholder Concentration Risk — Certain funds, accounts, individuals or Goldman Sachs affiliates may from time to time own (beneficially or of record) or control a significant percentage of the Funds’ shares. Redemptions by these entities of their holdings in the Funds may impact the Funds’ liquidity and NAV. These redemptions may also force the Funds to sell securities.
Investments in Other Investment Companies — As a shareholder of another investment company, including an exchange traded fund (“ETF”), a Fund will directly bear its proportionate share of any management fees and other expenses paid by such other investment companies, in addition to the fees and expenses regularly borne by the Fund. ETFs are subject to risks that do not apply to conventional mutual funds, including but not limited to the following: (i) the market price of the ETF’s shares may trade at a premium or a discount to their NAV; and (ii) an active trading market for an ETF’s shares may not develop or be maintained.
Liquidity Risk — The Funds may make investments that are illiquid or that may become less liquid in response to market developments or adverse investor perceptions. Illiquid investments may be more difficult to value. Liquidity risk may also refer to the risk that a Fund will not be able to pay redemption proceeds within the allowable time period because of unusual market conditions, an unusually high volume of redemption requests, or other reasons. To meet redemption requests, a Fund may be forced to sell investments at an unfavorable time and/or under unfavorable conditions.
Market and Credit Risks — In the normal course of business, the Funds trade financial instruments and enter into financial transactions where risk of potential loss exists due to changes in the market (market risk). Additionally, the Funds may also be
95
GOLDMAN SACHS SELECT SATELLITE FUNDS
Notes to Financial Statements (continued)
June 30, 2013 (Unaudited)
|
| 8. OTHER RISKS (continued) |
exposed to credit risk in the event that an issuer fails to perform or that an institution or entity with which the Funds have unsettled or open transactions defaults.
Investing in foreign markets may involve special risks and considerations not typically associated with investing in the U.S. These risks include revaluation of currencies, high rates of inflation, repatriation restrictions on income and capital, and adverse political and economic developments. Moreover, securities issued in these markets may be less liquid, be subject to government ownership controls, have delayed settlements and their prices may be more volatile than those of comparable securities in the U.S.
Non-Diversification Risk — The Funds (except for the Absolute Return Tracker Fund) are non-diversified, meaning that they are permitted to invest a larger percentage of their assets in fewer issuers than diversified mutual funds. Thus, each Fund (except for the Absolute Return Tracker Fund) may be more susceptible to adverse developments affecting any single issuer held in its portfolio, and may be more susceptible to greater losses because of these developments.
Portfolio Concentration Risk — The Real Estate Securities Fund and the International Real Estate Securities Fund invest primarily in securities of issuers (non-U.S. issuers, in the case of International Real Estate Securities Fund) that are primarily engaged in or related to the real estate industry, and each Fund has a policy of concentrating its investments in the real estate industry. Therefore, investments in the Funds are subject to certain risks associated with the real estate industry in general. Such risks include, but are not limited to, declines in property values, increases in property taxes, operating expenses, interest rates or competition, zoning changes, and losses from casualty and condemnation.
Under the Trust’s organizational documents, its Trustees, officers, employees and agents are indemnified, to the extent permitted by the Act and state law, against certain liabilities that may arise out of performance of their duties to the Funds. Additionally, in the course of business, the Funds enter into contracts that contain a variety of indemnification clauses. The Funds’ maximum exposure under these arrangements is unknown, as this would involve future claims that may be made against the Funds that have not yet occurred. However, GSAM believes the risk of loss under these arrangements to be remote.
Subsequent events after the Statements of Assets and Liabilities date have been evaluated through the date the financial statements were issued. Other than the item discussed below, GSAM has concluded that there is no impact requiring adjustment or disclosure in the financial statements.
GSAM is subject to registration as a commodity pool operator (CPO) under the Commodity Exchange Act with respect to the Absolute Return Tracker Fund, Commodity Strategy Fund, Dynamic Allocation Fund, and Managed Futures Strategy Fund. The Commodity Futures Trading Commission (CFTC) on August 13, 2013, issued a final rule with respect to certain compliance obligations for CPOs of investment companies registered under the Act that will affect recordkeeping, reporting and disclosure requirements with respect to these Funds’. Compliance with these obligations will be required beginning when these Funds’ file their next post-effective amendment that is an annual update to their registration statement on Form N-1A with the Securities and Exchange Commission.
96
GOLDMAN SACHS SELECT SATELLITE FUNDS
|
| 11. SUMMARY OF SHARE TRANSACTIONS |
Share activity is as follows:
| | | | | | | | | | | | | | | | |
| | | Absolute Return Tracker Fund | |
| | | | |
| | | For the Six Months Ended
June 30, 2013
(Unaudited) | | | For the Fiscal Year Ended
December 31, 2012 | |
| | | | |
| | | Shares | | | Dollars | | | Shares | | | Dollars | |
| | | | |
| Class A Shares | | | | | | | | | | | | | | | | |
Shares sold | | | 1,524,377 | | | $ | 13,881,184 | | | | 5,799,170 | | | $ | 51,720,261 | |
Reinvestment of distributions | | | — | | | | — | | | | 69,913 | | | | 622,236 | |
Shares redeemed | | | (4,316,501 | ) | | | (39,272,459 | ) | | | (47,062,301 | ) | | | (416,390,523 | ) |
| | | | (2,792,124 | ) | | | (25,391,275 | ) | | | (41,193,218 | ) | | | (364,048,026 | ) |
| Class C Shares | | | | | | | | | | | | | | | | |
Shares sold | | | 188,120 | | | | 1,655,627 | | | | 496,983 | | | | 4,310,655 | |
Reinvestment of distributions | | | — | | | | — | | | | 15,930 | | | | 136,994 | |
Shares redeemed | | | (1,081,201 | ) | | | (9,486,620 | ) | | | (3,251,764 | ) | | | (28,145,312 | ) |
| | | | (893,081 | ) | | | (7,830,993 | ) | | | (2,738,851 | ) | | | (23,697,663 | ) |
| Institutional Shares | | | | | | | | | | | | | | | | |
Shares sold | | | 31,470,732 | | | | 291,835,007 | | | | 108,536,759 | | | | 979,643,830 | |
Reinvestment of distributions | | | — | | | | — | | | | 597,812 | | | | 5,410,200 | |
Shares redeemed | | | (30,985,860 | ) | | | (287,118,329 | ) | | | (107,880,698 | ) | | | (975,600,856 | ) |
| | | | 484,872 | | | | 4,716,678 | | | | 1,253,873 | | | | 9,453,174 | |
| Class IR Shares | | | | | | | | | | | | | | | | |
Shares sold | | | 487,826 | | | | 4,503,530 | | | | 1,206,735 | | | | 10,834,748 | |
Reinvestment of distributions | | | — | | | | — | | | | 9,292 | | | | 83,536 | |
Shares redeemed | | | (529,619 | ) | | | (4,871,606 | ) | | | (1,170,411 | ) | | | (10,518,650 | ) |
| | | | (41,793 | ) | | | (368,076 | ) | | | 45,616 | | | | 399,634 | |
| Class R Shares | | | | | | | | | | | | | | | | |
Shares sold | | | 35,334 | | | | 318,613 | | | | 117,771 | | | | 1,037,113 | |
Reinvestment of distributions | | | — | | | | — | | | | 1,074 | | | | 9,454 | |
Shares redeemed | | | (62,467 | ) | | | (560,225 | ) | | | (38,504 | ) | | | (341,238 | ) |
| | | | (27,133 | ) | | | (241,612 | ) | | | 80,341 | | | | 705,329 | |
NET DECREASE | | | (3,269,259 | ) | | $ | (29,115,278 | ) | | | (42,552,239 | ) | | $ | (377,187,552 | ) |
97
GOLDMAN SACHS SELECT SATELLITE FUNDS
Notes to Financial Statements (continued)
June 30, 2013 (Unaudited)
|
| 11. SUMMARY OF SHARE TRANSACTIONS (continued) |
Share activity is as follows:
| | | | | | | | | | | | | | | | |
| | | Commodity Strategy Fund | |
| | | | |
| | | For the Six Months Ended
June 30, 2013 (Unaudited) | | | For the Fiscal Year Ended
December 31, 2012 | |
| | | | |
| | | Shares | | | Dollars | | | Shares | | | Dollars | |
| | | | |
| Class A Shares | | | | | | | | | | | | | | | | |
Shares sold | | | 18,488,468 | | | $ | 104,018,131 | | | | 86,949,603 | | | $ | 494,110,097 | |
Reinvestment of distributions | | | — | | | | — | | | | 176,948 | | | | 1,082,945 | |
Shares redeemed | | | (22,300,892 | ) | | | (124,310,842 | ) | | | (60,493,075 | ) | | | (343,057,022 | ) |
| | | | (3,812,424 | ) | | | (20,292,711 | ) | | | 26,633,476 | | | | 152,136,020 | |
| Class C Shares | | | | | | | | | | | | | | | | |
Shares sold | | | 273,984 | | | | 1,516,546 | | | | 828,244 | | | | 4,728,580 | |
Reinvestment of distributions | | | — | | | | — | | | | 8,718 | | | | 52,398 | |
Shares redeemed | | | (474,814 | ) | | | (2,596,397 | ) | | | (980,921 | ) | | | (5,614,087 | ) |
| | | | (200,830 | ) | | | (1,079,851 | ) | | | (143,959 | ) | | | (833,109 | ) |
| Institutional Shares | | | | | | | | | | | | | | | | |
Shares sold | | | 32,412,230 | | | | 182,475,838 | | | | 78,176,583 | | | | 450,010,812 | |
Reinvestment of distributions | | | — | | | | — | | | | 796,538 | | | | 4,845,401 | |
Shares redeemed | | | (21,925,869 | ) | | | (122,435,432 | ) | | | (63,297,957 | ) | | | (357,400,751 | ) |
| | | | 10,486,361 | | | | 60,040,406 | | | | 15,675,164 | | | | 97,455,462 | |
| Class IR Shares | | | | | | | | | | | | | | | | |
Shares sold | | | 154,775 | | | | 887,540 | | | | 770,720 | | | | 4,605,691 | |
Reinvestment of distributions | | | — | | | | — | | | | 16,753 | | | | 102,742 | |
Shares redeemed | | | (401,018 | ) | | | (2,236,928 | ) | | | (2,782,620 | ) | | | (16,296,923 | ) |
| | | | (246,243 | ) | | | (1,349,388 | ) | | | (1,995,147 | ) | | | (11,588,490 | ) |
| Class R Shares | | | | | | | | | | | | | | | | |
Shares sold | | | 104,652 | | | | 587,630 | | | | 123,733 | | | | 717,135 | |
Reinvestment of distributions | | | — | | | | — | | | | 1,255 | | | | 7,629 | |
Shares redeemed | | | (60,529 | ) | | | (340,238 | ) | | | (51,849 | ) | | | (292,461 | ) |
| | | | 44,123 | | | | 247,392 | | | | 73,139 | | | | 432,303 | |
NET INCREASE | | | 6,270,987 | | | $ | 37,565,848 | | | | 40,242,673 | | | $ | 237,602,186 | |
98
GOLDMAN SACHS SELECT SATELLITE FUNDS
|
| 11. SUMMARY OF SHARE TRANSACTIONS (continued) |
Share activity is as follows:
| | | | | | | | | | | | | | | | |
| | | Dynamic Allocation Fund | |
| | | | |
| | | For the Six Months Ended
June 30, 2013 (Unaudited) | | | For the Fiscal Year Ended
December 31, 2012 | |
| | | | |
| | | Shares | | | Dollars | | | Shares | | | Dollars | |
| | | | |
| Class A Shares | | | | | | | | | | | | | | | | |
Shares sold | | | 4,383,168 | | | $ | 48,356,606 | | | | 23,066,580 | | | $ | 246,528,995 | |
Reinvestment of distributions | | | — | | | | — | | | | 990,630 | | | | 10,649,277 | |
Shares redeemed | | | (8,044,491 | ) | | | (88,886,389 | ) | | | (12,944,302 | ) | | | (139,102,366 | ) |
| | | | (3,661,323 | ) | | | (40,529,783 | ) | | | 11,112,908 | | | | 118,075,906 | |
| Class C Shares | | | | | | | | | | | | | | | | |
Shares sold | | | 1,273,419 | | | | 13,806,779 | | | | 3,066,128 | | | | 32,425,445 | |
Reinvestment of distributions | | | — | | | | — | | | | 239,607 | | | | 2,527,853 | |
Shares redeemed | | | (903,479 | ) | | | (9,750,979 | ) | | | (1,515,614 | ) | | | (16,084,381 | ) |
| | | | 369,940 | | | | 4,055,800 | | | | 1,790,121 | | | | 18,868,917 | |
| Institutional Shares | | | | | | | | | | | | | | | | |
Shares sold | | | 11,996,164 | | | | 133,712,339 | | | | 76,101,937 | | | | 810,055,173 | |
Reinvestment of distributions | | | — | | | | — | | | | 2,750,911 | | | | 29,844,950 | |
Shares redeemed | | | (11,116,457 | ) | | | (123,860,625 | ) | | | (18,950,133 | ) | | | (205,790,147 | ) |
| | | | 879,707 | | | | 9,851,714 | | | | 59,902,715 | | | | 634,109,976 | |
| Class IR Shares | | | | | | | | | | | | | | | | |
Shares sold | | | 1,404,107 | | | | 15,645,752 | | | | 3,003,084 | | | | 32,320,290 | |
Reinvestment of distributions | | | — | | | | — | | | | 194,501 | | | | 2,103,977 | |
Shares redeemed | | | (821,782 | ) | | | (9,141,234 | ) | | | (3,144,552 | ) | | | (33,808,081 | ) |
| | | | 582,325 | | | | 6,504,518 | | | | 53,033 | | | | 616,186 | |
| Class R Shares | | | | | | | | | | | | | | | | |
Reinvestment of distributions | | | — | | | | — | | | | 37 | | | | 390 | |
| | | | — | | | | — | | | | 37 | | | | 390 | |
NET INCREASE (DECREASE) | | | (1,829,351 | ) | | $ | (20,117,751 | ) | | | 72,858,814 | | | $ | 771,671,375 | |
99
GOLDMAN SACHS SELECT SATELLITE FUNDS
Notes to Financial Statements (continued)
June 30, 2013 (Unaudited)
|
| 11. SUMMARY OF SHARE TRANSACTIONS (continued) |
Share activity is as follows:
| | | | | | | | | | | | | | | | |
| | | International Real Estate Securities Fund | |
| | | | |
| | | For the Six Months Ended
June 30, 2013 (Unaudited) | | | For the Fiscal Year Ended
December 31, 2012 | |
| | | | |
| | | Shares | | | Dollars | | | Shares | | | Dollars | |
| | | | |
| Class A Shares | | | | | | | | | | | | | | | | |
Shares sold | | | 229,212 | | | $ | 1,557,052 | | | | 2,766,368 | | | $ | 15,967,330 | |
Reinvestment of distributions | | | 24,559 | | | | 155,212 | | | | 412,850 | | | | 2,497,983 | |
Shares redeemed | | | (1,568,510 | ) | | | (10,408,143 | ) | | | (16,477,262 | ) | | | (102,247,299 | ) |
| | | | (1,314,739 | ) | | | (8,695,879 | ) | | | (13,298,044 | ) | | | (83,781,986 | ) |
| Class C Shares | | | | | | | | | | | | | | | | |
Shares sold | | | 100,410 | | | | 671,520 | | | | 33,219 | | | | 204,080 | |
Reinvestment of distributions | | | 2,757 | | | | 17,424 | | | | 24,516 | | | | 152,434 | |
Shares redeemed | | | (49,739 | ) | | | (334,141 | ) | | | (108,751 | ) | | | (651,388 | ) |
| | | | 53,428 | | | | 354,803 | | | | (51,016 | ) | | | (294,874 | ) |
| Institutional Shares | | | | | | | | | | | | | | | | |
Shares sold | | | 10,770,358 | | | | 69,876,771 | | | | 19,750,248 | | | | 120,346,975 | |
Reinvestment of distributions | | | 739,189 | | | | 4,546,013 | | | | 4,169,333 | | | | 25,197,318 | |
Shares redeemed | | | (3,956,660 | ) | | | (25,664,035 | ) | | | (11,778,209 | ) | | | (68,386,842 | ) |
| | | | 7,552,887 | | | | 48,758,749 | | | | 12,141,372 | | | | 77,157,451 | |
| Class IR Shares | | | | | | | | | | | | | | | | |
Shares sold | | | 300,095 | | | | 1,971,891 | | | | 297,996 | | | | 1,930,375 | |
Reinvestment of distributions | | | 5,735 | | | | 35,903 | | | | 25,334 | | | | 156,779 | |
Shares redeemed | | | (187,212 | ) | | | (1,265,604 | ) | | | (7,483 | ) | | | (48,087 | ) |
| | | | 118,618 | | | | 742,190 | | | | 315,847 | | | | 2,039,067 | |
NET INCREASE (DECREASE) | | | 6,410,194 | | | $ | 41,159,863 | | | | (891,841 | ) | | $ | (4,880,342 | ) |
100
GOLDMAN SACHS SELECT SATELLITE FUNDS
|
| 11. SUMMARY OF SHARE TRANSACTIONS (continued) |
Share activity is as follows:
| | | | | | | | | | | | | | | | |
| | | Managed Futures Strategy Fund | |
| | | | |
| | | For the Six Months Ended
June 30, 2013
(Unaudited) | | | For the Period Ended
December 31, 2012(a) | |
| | | | |
| | | Shares | | | Dollars | | | Shares | | | Dollars | |
| | | | |
| Class A Shares | | | | | | | | | | | | | | | | |
Shares sold | | | 91,904 | | | $ | 960,088 | | | | 32,219 | | | $ | 328,063 | |
Shares redeemed | | | (30,367 | ) | | | (314,000 | ) | | | (6,471 | ) | | | (65,349 | ) |
| | | | 61,537 | | | | 646,088 | | | | 25,748 | | | | 262,714 | |
| Class C Shares | | | | | | | | | | | | | | | | |
Shares sold | | | 51,550 | | | | 538,004 | | | | 33,564 | | | | 346,489 | |
Shares redeemed | | | (7,230 | ) | | | (75,600 | ) | | | (1,251 | ) | | | (12,145 | ) |
| | | | 44,320 | | | | 462,404 | | | | 32,313 | | | | 334,344 | |
| Institutional Shares | | | | | | | | | | | | | | | | |
Shares sold | | | 1,835,691 | | | | 19,281,470 | | | | 1,854,565 | | | | 19,069,171 | |
Shares redeemed | | | (1,076,723 | ) | | | (10,810,673 | ) | | | (21,969 | ) | | | (229,725 | ) |
| | | | 758,968 | | | | 8,470,797 | | | | 1,832,596 | | | | 18,839,446 | |
| Class IR Shares | | | | | | | | | | | | | | | | |
Shares sold | | | 90,891 | | | | 950,755 | | | | 38,809 | | | | 408,705 | |
Shares redeemed | | | (26,420 | ) | | | (259,480 | ) | | | — | | | | — | |
| | | | 64,471 | | | | 691,275 | | | | 38,809 | | | | 408,705 | |
| Class R Shares | | | | | | | | | | | | | | | | |
Shares sold | | | 6,047 | | | | 63,964 | | | | 1,000 | | | | 10,006 | |
| | | | 6,047 | | | | 63,964 | | | | 1,000 | | | | 10,006 | |
NET INCREASE | | | 935,343 | | | $ | 10,334,528 | | | | 1,930,466 | | | $ | 19,855,215 | |
| (a) | | Commenced operations on February 29, 2012. |
101
GOLDMAN SACHS SELECT SATELLITE FUNDS
Notes to Financial Statements (continued)
June 30, 2013 (Unaudited)
|
| 11. SUMMARY OF SHARE TRANSACTIONS (continued) |
Share activity is as follows:
| | | | | | | | | | | | | | | | |
| | | Real Estate Securities Fund | |
| | | | |
| | | For the Six Months Ended
June 30, 2013
(Unaudited) | | | For the Fiscal Year Ended
December 31, 2012 | |
| | | | |
| | | Shares | | | Dollars | | | Shares | | | Dollars | |
| | | | |
| Class A Shares | | | | | | | | | | | | | | | | |
Shares sold | | | 773,170 | | | $ | 12,685,893 | | | | 1,891,447 | | | $ | 27,800,256 | |
Shares converted from Class B(a) | | | 695 | | | | 11,394 | | | | 4,855 | | | | 71,384 | |
Reinvestment of distributions | | | 36,046 | | | | 586,586 | | | | 137,481 | | | | 2,036,290 | |
Shares redeemed | | | (1,147,662 | ) | | | (18,841,097 | ) | | | (10,326,818 | ) | | | (155,753,033 | ) |
| | | | (337,751 | ) | | | (5,557,224 | ) | | | (8,293,035 | ) | | | (125,845,103 | ) |
| Class B Shares | | | | | | | | | | | | | | | | |
Shares sold | | | 2,359 | | | | 37,934 | | | | 7,860 | | | | 116,370 | |
Shares converted to Class A(a) | | | (700 | ) | | | (11,394 | ) | | | (4,881 | ) | | | (71,384 | ) |
Reinvestment of distributions | | | 411 | | | | 6,665 | | | | 873 | | | | 12,921 | |
Shares redeemed | | | (26,134 | ) | | | (427,753 | ) | | | (48,270 | ) | | | (718,398 | ) |
| | | | (24,064 | ) | | | (394,548 | ) | | | (44,418 | ) | | | (660,491 | ) |
| Class C Shares | | | | | | | | | | | | | | | | |
Shares sold | | | 108,979 | | | | 1,770,598 | | | | 185,182 | | | | 2,698,822 | |
Reinvestment of distributions | | | 4,651 | | | | 74,063 | | | | 5,953 | | | | 86,752 | |
Shares redeemed | | | (102,438 | ) | | | (1,660,181 | ) | | | (199,058 | ) | | | (2,900,568 | ) |
| | | | 11,192 | | | | 184,480 | | | | (7,923 | ) | | | (114,994 | ) |
| Institutional Shares | | | | | | | | | | | | | | | | |
Shares sold | | | 6,238,991 | | | | 104,197,186 | | | | 12,673,739 | | | | 194,004,890 | |
Reinvestment of distributions | | | 294,427 | | | | 4,863,781 | | | | 335,081 | | | | 5,069,012 | |
Shares redeemed | | | (2,945,181 | ) | | | (48,969,006 | ) | | | (14,279,454 | ) | | | (121,321,618 | ) |
Shares redeemed in connection with in-kind | | | — | | | | — | | | | (3,807,650 | ) | | | (146,308,330 | )(b) |
| | | | 3,588,237 | | | | 60,091,961 | | | | (5,078,284 | ) | | | (68,556,046 | ) |
| Service Shares | | | | | | | | | | | | | | | | |
Shares sold | | | 53,054 | | | | 872,313 | | | | 195,931 | | | | 2,954,987 | |
Reinvestment of distributions | | | 746 | | | | 12,208 | | | | 1,459 | | | | 21,841 | |
Shares redeemed | | | (124,384 | ) | | | (2,095,754 | ) | | | (239,449 | ) | | | (3,580,318 | ) |
| | | | (70,584 | ) | | | (1,211,233 | ) | | | (42,059 | ) | | | (603,490 | ) |
| Class IR Shares | | | | | | | | | | | | | | | | |
Shares sold | | | 29,231 | | | | 490,165 | | | | 20,166 | | | | 300,736 | |
Reinvestment of distributions | | | 524 | | | | 8,535 | | | | 625 | | | | 9,312 | |
Shares redeemed | | | (6,372 | ) | | | (104,479 | ) | | | (18,720 | ) | | | (282,476 | ) |
| | | | 23,383 | | | | 394,221 | | | | 2,071 | | | | 27,572 | |
| Class R Shares | | | | | | | | | | | | | | | | |
Shares sold | | | 10,062 | | | | 163,997 | | | | 32,162 | | | | 484,083 | |
Reinvestment of distributions | | | 324 | | | | 5,261 | | | | 294 | | | | 4,383 | |
Shares redeemed | | | (6,373 | ) | | | (103,677 | ) | | | (16,837 | ) | | | (244,696 | ) |
| | | | 4,013 | | | | 65,581 | | | | 15,619 | | | | 243,770 | |
NET INCREASE (DECREASE) | | | 3,194,426 | | | $ | 53,573,238 | | | | (13,448,029 | ) | | $ | (195,508,782 | ) |
| (a) | | Class B Shares automatically convert into Class A Shares on or about the fifteenth day of the last month of the calendar quarter that is eight years after the initial purchase date of either the Fund or another Goldman Sachs Fund. |
| (b) | | Includes cash received in connection with in-kind redemption of $3,219,329. |
102
Fund Expenses — Six Month Period Ended June 30, 2013 (Unaudited)
As a shareholder of Class A, Class B, Class C, Institutional, Service, Class IR or Class R Shares of a Fund you incur two types of costs: (1) transaction costs, including sales charges on purchase payments (with respect to Class A Shares) and contingent deferred sales charges on redemptions (with respect to Class B and Class C Shares); and (2) ongoing costs, including management fees; distribution and service (12b-1) fees (with respect to Class A, Class B, Class C and Class R Shares); and other Fund expenses. This example is intended to help you understand your ongoing costs (in dollars) of investing in Class A, Class B, Class C, Institutional, Service, Class IR and Class R Shares of the Funds and to compare these costs with the ongoing costs of investing in other mutual funds.
The example is based on an investment of $1,000 invested at the beginning of the period and held for the entire period from January 1, 2013 through June 30, 2013.
Actual Expenses — The first line under each share class in the table below provides information about actual account values and actual expenses. You may use the information in this line, together with the amount you invested, to estimate the expenses that you paid over the period. Simply divide your account value by $1,000 (for example, an $8,600 account value divided by $1,000=8.6), then multiply the result by the number in the first line under the heading entitled “Expenses Paid” to estimate the expenses you paid on your account during this period.
Hypothetical Example for Comparison Purposes — The second line under each share class in the table below provides information about hypothetical account values and hypothetical expenses based on the Funds’ actual net expense ratio and an assumed rate of return of 5% per year before expenses, which is not the Funds’ actual return. The hypothetical account values and expenses may not be used to estimate the actual ending account balance or expenses you paid for the period. You may use this information to compare the ongoing costs of investing in the Funds and other funds. To do so, compare this 5% hypothetical example with the 5% hypothetical examples that appear in the shareholder reports of the other funds.
Please note that the expenses shown in the table are meant to highlight your ongoing costs only and do not reflect any transactional costs, such as sales charges, redemption fees, or exchange fees. Therefore, the second line of the table is useful in comparing ongoing costs only, and will not help you determine the relative total costs of owning different funds. In addition, if these transactional costs were included, your costs would have been higher.
| | | | | | | | | | | | | | | | | | | | | | | | | | | | | | | | | | | | | | | | | | | | | | | | | | | | | | | | | | | | | | | | | | | | | | | | |
| | | Absolute Return Tracker Fund | | | Commodity Strategy Fund | | | Dynamic Allocation Fund | | | International Real Estate Securities Fund | | | Managed Futures Strategy Fund | | | Real Estate Securities Fund | |
| Share Class | | Beginning
Account
Value
01/01/13 | | | Ending Account Value 06/30/13 | | | Expenses
Paid for the
6 Months Ended
06/30/13* | | | Beginning
Account
Value
01/01/13 | | | Ending Account Value 06/30/13 | | | Expenses
Paid for the
6 Months Ended
06/30/13* | | | Beginning
Account
Value
01/01/13 | | | Ending Account Value 06/30/13 | | | Expenses
Paid for the
6 Months Ended
06/30/13* | | | Beginning
Account
Value
01/01/13 | | | Ending Account Value 06/30/13 | | | Expenses
Paid for the
6 Months Ended
06/30/13* | | | Beginning
Account
Value
01/01/13 | | | Ending Account Value 06/30/13 | | | Expenses
Paid for the
6 Months Ended
06/30/13* | | | Beginning
Account
Value
01/01/13 | | | Ending Account Value 06/30/13 | | | Expenses
Paid for the
6 Months Ended
06/30/13* | |
| Class A | | | | | | | | | | | | | | | | | | | | | | | | | | | | | | | | | | | | | | | | | | | | | | | | | | | | | | | | | | | | | | | | | | | | | | | | |
Actual | | $ | 1,000 | | | $ | 1,013.40 | | | $ | 7.79 | | | $ | 1,000 | | | $ | 933.70 | | | $ | 4.41 | | | $ | 1,000 | | | $ | 995.30 | | | $ | 6.58 | | | $ | 1,000 | | | $ | 998.80 | | | $ | 7.43 | | | $ | 1,000 | | | $ | 905.20 | | | $ | 6.90 | | | $ | 1,000 | | | $ | 1,054.70 | | | $ | 7.29 | |
Hypothetical 5% return | | | 1,000 | | | | 1,017.06 | + | | | 7.80 | | | | 1,000 | | | | 1,020.23 | + | | | 4.61 | | | | 1,000 | | | | 1,018.20 | + | | | 6.66 | | | | 1,000 | | | | 1,017.36 | + | | | 7.50 | | | | 1,000 | | | | 1,017.55 | + | | | 7.30 | | | | 1,000 | | | | 1,017.70 | + | | | 7.15 | |
| Class B | | | | | | | | | | | | | | | | | | | | | | | | | | | | | | | | | | | | | | | | | | | | | | | | | | | | | | | | | | | | | | | | | | | | | | | | |
Actual | | | N/A | | | | N/A | | | | N/A | | | | N/A | | | | N/A | | | | N/A | | | | N/A | | | | N/A | | | | N/A | | | | N/A | | | | N/A | | | | N/A | | | | N/A | | | | N/A | | | | N/A | | | | 1,000 | | | | 1,051.30 | | | | 11.09 | |
Hypothetical 5% return | | | N/A | | | | N/A | | | | N/A | | | | N/A | | | | N/A | | | | N/A | | | | N/A | | | | N/A | | | | N/A | | | | N/A | | | | N/A | | | | N/A | | | | N/A | | | | N/A | | | | N/A | | | | 1,000 | | | | 1,013.98 | + | | | 10.89 | |
| Class C | | | | | | | | | | | | | | | | | | | | | | | | | | | | | | | | | | | | | | | | | | | | | | | | | | | | | | | | | | | | | | | | | | | | | | | | |
Actual | | | 1,000 | | | | 1,009.20 | | | | 11.51 | | | | 1,000 | | | | 928.60 | | | | 7.99 | | | | 1,000 | | | | 991.40 | | | | 10.27 | | | | 1,000 | | | | 994.10 | | | | 11.12 | | | | 1,000 | | | | 901.70 | | | | 10.37 | | | | 1,000 | | | | 1,050.70 | | | | 11.08 | |
Hypothetical 5% return | | | 1,000 | | | | 1,013.34 | + | | | 11.53 | | | | 1,000 | | | | 1,016.51 | + | | | 8.35 | | | | 1,000 | | | | 1,014.48 | + | | | 10.39 | | | | 1,000 | | | | 1,013.64 | + | | | 11.23 | | | | 1,000 | | | | 1,013.88 | + | | | 10.99 | | | | 1,000 | | | | 1,013.98 | + | | | 10.89 | |
| Institutional | | | | | | | | | | | | | | | | | | | | | | | | | | | | | | | | | | | | | | | | | | | | | | | | | | | | | | | | | | | | | | | | | | | | | | | | |
Actual | | | 1,000 | | | | 1,016.50 | | | | 5.80 | | | | 1,000 | | | | 933.90 | | | | 2.78 | | | | 1,000 | | | | 998.10 | | | | 4.61 | | | | 1,000 | | | | 1,001.50 | | | | 5.46 | | | | 1,000 | | | | 906.40 | | | | 5.01 | | | | 1,000 | | | | 1,056.70 | | | | 5.20 | |
Hypothetical 5% return | | | 1,000 | | | | 1,019.04 | + | | | 5.81 | | | | 1,000 | | | | 1,021.92 | + | | | 2.91 | | | | 1,000 | | | | 1,020.18 | + | | | 4.66 | | | | 1,000 | | | | 1,019.34 | + | | | 5.51 | | | | 1,000 | | | | 1,019.54 | + | | | 5.31 | | | | 1,000 | | | | 1,019.74 | + | | | 5.11 | |
| Service | | | | | | | | | | | | | | | | | | | | | | | | | | | | | | | | | | | | | | | | | | | | | | | | | | | | | | | | | | | | | | | | | | | | | | | | |
Actual | | | N/A | | | | N/A | | | | N/A | | | | N/A | | | | N/A | | | | N/A | | | | N/A | | | | N/A | | | | N/A | | | | N/A | | | | N/A | | | | N/A | | | | N/A | | | | N/A | | | | N/A | | | | 1,000 | | | | 1,054.40 | | | | 7.79 | |
Hypothetical 5% return | | | N/A | | | | N/A | | | | N/A | | | | N/A | | | | N/A | | | | N/A | | | | N/A | | | | N/A | | | | N/A | | | | N/A | | | | N/A | | | | N/A | | | | N/A | | | | N/A | | | | N/A | | | | 1,000 | | | | 1,017.21 | + | | | 7.65 | |
| Class IR | | | | | | | | | | | | | | | | | | | | | | | | | | | | | | | | | | | | | | | | | | | | | | | | | | | | | | | | | | | | | | | | | | | | | | | | |
Actual | | | 1,000 | | | | 1,015.50 | | | | 6.55 | | | | 1,000 | | | | 934.00 | | | | 3.21 | | | | 1,000 | | | | 997.20 | | | | 5.35 | | | | 1,000 | | | | 1,000.60 | | | | 6.20 | | | | 1,000 | | | | 906.30 | | | | 5.67 | | | | 1,000 | | | | 1,056.00 | | | | 5.96 | |
Hypothetical 5% return | | | 1,000 | | | | 1,018.30 | + | | | 6.56 | | | | 1,000 | | | | 1,021.47 | + | | | 3.36 | | | | 1,000 | | | | 1,019.44 | + | | | 5.41 | | | | 1,000 | | | | 1,018.60 | + | | | 6.26 | | | | 1,000 | | | | 1,018.84 | + | | | 6.01 | | | | 1,000 | | | | 1,018.99 | + | | | 5.86 | |
| Class R | | | | | | | | | | | | | | | | | | | | | | | | | | | | | | | | | | | | | | | | | | | | | | | | | | | | | | | | | | | | | | | | | | | | | | | | |
Actual | | | 1,000 | | | | 1,012.40 | | | | 9.03 | | | | 1,000 | | | | 931.50 | | | | 5.60 | | | | 1,000 | | | | 994.40 | | | | 7.81 | | | | N/A | | | | N/A | | | | N/A | | | | 1,000 | | | | 903.10 | | | | 8.02 | | | | 1,000 | | | | 1,053.70 | | | | 8.50 | |
Hypothetical 5% return | | | 1,000 | | | | 1,015.82 | + | | | 9.05 | | | | 1,000 | | | | 1,018.99 | + | | | 5.86 | | | | 1,000 | | | | 1,016.96 | + | | | 7.90 | | | | N/A | | | | N/A | | | | N/A | | | | 1,000 | | | | 1,016.36 | + | | | 8.50 | | | | 1,000 | | | | 1,016.51 | + | | | 8.35 | |
| * | | Expenses are calculated using each Fund’s annualized net expense ratio for each class, which represents the ongoing expenses as a percentage of net assets for the six months ended June 30, 2013. Expenses are calculated by multiplying the annualized net expense ratio by the average account value for the period; then multiplying the result by the number of days in the most recent fiscal half year; and then dividing that result by the number of days in the fiscal year. The annualized net expense ratios for the period were as follows: |
| | | | | | | | | | | | | | | | | | | | | | | | | | | | |
| Fund | | Class A | | | Class B | | | Class C | | | Institutional | | | Service | | | Class IR | | | Class R | |
Absolute Return Tracker | | | 1.56 | % | | | N/A | | | | 2.31 | % | | | 1.16 | % | | | N/A | | | | 1.31 | % | | | 1.81 | % |
Commodity Strategy | | | 0.92 | | | | N/A | | | | 1.67 | | | | 0.58 | | | | N/A | | | | 0.67 | | | | 1.17 | |
Dynamic Allocation | | | 1.33 | | | | N/A | | | | 2.08 | | | | 0.93 | | | | N/A | | | | 1.08 | | | | 1.58 | |
International Real Estate Securities | | | 1.50 | | | | N/A | | | | 2.25 | | | | 1.10 | | | | N/A | | | | 1.25 | | | | N/A | |
Managed Futures Strategy | | | 1.46 | | | | N/A | | | | 2.20 | | | | 1.06 | | | | N/A | | | | 1.20 | | | | 1.70 | |
Real Estate Securities | | | 1.43 | | | | 2.18 | | | | 2.18 | | | | 1.02 | | | | 1.53 | | | | 1.17 | | | | 1.67 | |
| + | | Hypothetical expenses are based on each Fund's actual annualized net expense ratios and an assumed rate of return of 5% per year before expenses. |
103
GOLDMAN SACHS SELECT SATELLITE FUNDS
Statement Regarding Basis for Approval of Management Agreement (Unaudited)
Background
The Goldman Sachs Absolute Return Tracker, Goldman Sachs Commodity Strategy, Goldman Sachs Dynamic Allocation, Goldman Sachs International Real Estate Securities, Goldman Sachs Managed Futures Strategy and Goldman Sachs Real Estate Securities Funds (the “Funds”) are investment portfolios of Goldman Sachs Trust (the “Trust”). The Board of Trustees oversees the management of the Trust and reviews the investment performance and expenses of the Funds at regularly scheduled meetings held during the year. In addition, the Board of Trustees determines annually whether to approve the continuance of the Trust’s investment management agreement (the “Management Agreement”) with Goldman Sachs Asset Management, L.P. (the “Investment Adviser”) on behalf of the Funds.
The Management Agreement was most recently approved for continuation until June 30, 2014 by the Board of Trustees, including those Trustees who are not parties to the Management Agreement or “interested persons” (as defined in the Investment Company Act of 1940, as amended) of any party thereto (the “Independent Trustees”), at a meeting held on June 12-13, 2013 (the “Annual Meeting”).
The review process undertaken by the Trustees spans the course of the year and culminates with the Annual Meeting. To assist the Trustees in their deliberations, the Trustees have established a Contract Review Committee (the “Committee”), comprised of the Independent Trustees. The Committee held four meetings over the course of the year since the Management Agreement was last approved. At those Committee meetings, regularly scheduled Board or other committee meetings and/or the Annual Meeting, the Board, or the Independent Trustees, as applicable, considered matters relating to the Management Agreement, including:
| | (a) | | the nature and quality of the advisory, administrative and other services provided to the Funds by the Investment Adviser and its affiliates, including information about: |
| | (i) | | the structure, staff and capabilities of the Investment Adviser and its portfolio management teams; |
| | (ii) | | the groups within the Investment Adviser and its affiliates that support the portfolio management teams or provide other types of necessary services, including fund services groups (e.g., accounting and financial reporting, tax, shareholder services and operations), controls and risk management groups (e.g., legal, compliance, valuation oversight, credit risk management, internal audit, compliance testing, market risk analysis, finance and strategy and central funding), sales and distribution support groups and others (e.g., information technology and training); |
| | (iii) | | trends in headcount; |
| | (iv) | | the Investment Adviser’s financial resources and ability to hire and retain talented personnel and strengthen its operations; and |
| | (v) | | the parent company’s support of the Investment Adviser and its mutual fund business, as expressed by the firm’s senior management; |
| | (b) | | information on the investment performance of the Funds, including comparisons to the performance of similar mutual funds, as provided by a third party mutual fund data provider engaged as part of the contract review process (the “Outside Data Provider”), benchmark performance indices, and (for the Commodity Strategy Fund) a comparable institutional composite managed by the Investment Adviser, and general investment outlooks in the markets in which the Funds invest; |
| | (c) | | the terms of the Management Agreement and agreements with affiliated service providers entered into by the Trust on behalf of the Funds; |
| | (d) | | expense information for the Funds, including: |
| | (i) | | the relative management fee and expense levels of the Funds as compared to those of comparable funds managed by other advisers, as provided by the Outside Data Provider; |
| | (ii) | | each Fund’s (with the exception of the Managed Futures Strategy Fund, which commenced operations in 2012) expense trends over time; and |
| | (iii) | | to the extent the Investment Adviser manages institutional accounts or collective investment vehicles having investment objectives and policies similar to those of the Funds, comparative information on the advisory fees charged and services provided to those accounts by the Investment Adviser; |
| | (e) | | with respect to the extensive investment performance and expense comparison data provided by the Outside Data Provider, its processes in producing that data for the Funds; |
| | (f) | | the undertakings of the Investment Adviser to waive certain fees of the Dynamic Allocation, International Real Estate Securities and Real Estate Securities Funds and limit certain expenses of each of the Funds that exceed specified levels, and a summary of contractual fee reductions made by the Investment Adviser and its affiliates over the past several years with respect to the Funds; |
104
GOLDMAN SACHS SELECT SATELLITE FUNDS
Statement Regarding Basis for Approval of Management Agreement (Unaudited) (continued)
| | (g) | | information relating to the profitability of the Management Agreement and the transfer agency and distribution and service arrangements of each of the Funds and the Trust as a whole to the Investment Adviser and its affiliates; |
| | (h) | | whether each Fund’s existing management fee schedule adequately addressed any economies of scale; |
| | (i) | | a summary of the “fall-out” benefits derived by the Investment Adviser and its affiliates from their relationships with the Funds, including the fees received by the Investment Adviser’s affiliates from the Funds for transfer agency, portfolio trading, distribution and other services; |
| | (j) | | a summary of potential benefits derived by the Funds as a result of their relationship with the Investment Adviser; |
| | (k) | | information regarding commissions paid by the Funds and broker oversight, an update on the Investment Adviser’s soft dollars practices, other information regarding portfolio trading and how the Investment Adviser carries out its duty to seek best execution; |
| | (l) | | portfolio manager ownership of Fund shares; the manner in which portfolio manager compensation is determined; and the number and types of accounts managed by the portfolio managers; |
| | (m) | | the nature and quality of the services provided to the Funds by their unaffiliated service providers, and the Investment Adviser’s general oversight and evaluation (including reports on due diligence) of those service providers as part of the administration services provided under the Management Agreement; and |
| | (n) | | the Investment Adviser’s processes and policies addressing various types of potential conflicts of interest; its approach to risk management; the annual review of the effectiveness of the Funds’ compliance program; and periodic compliance reports. |
The Trustees also received an overview of the Funds’ distribution arrangements. They received information regarding the Funds’ assets, share purchase and redemption activity and the payment of Rule 12b-1 distribution and service fees by the Funds and the payment of non-Rule 12b-1 shareholder service and/or administration fees by the Real Estate Securities Fund’s Service Shares. Information was also provided to the Trustees relating to revenue sharing payments made by and services provided by the Investment Adviser and its affiliates to intermediaries that promote the sale, distribution and/or servicing of Fund shares.
The presentations made at the Board and Committee meetings and at the Annual Meeting encompassed the Funds and other mutual fund portfolios for which the Board of Trustees has responsibility. In evaluating the Management Agreement at the Annual Meeting, the Trustees relied upon their knowledge, resulting from their meetings and other interactions throughout the year, of the Investment Adviser, its affiliates, their services and the Funds. In conjunction with these meetings, the Trustees received written materials and oral presentations on the topics covered, and were advised by their independent legal counsel regarding their responsibilities and other regulatory requirements related to the approval and continuation of mutual fund investment management agreements under applicable law. In addition, the Investment Adviser and its affiliates provided the Independent Trustees with a written response to a formal request for information sent on behalf of the Independent Trustees by their independent legal counsel. During the course of their deliberations, the Independent Trustees met in executive sessions with their independent legal counsel, without representatives of the Investment Adviser or its affiliates present. The Independent Trustees also discussed the broad range of other investment choices that are available to Fund investors, including the availability of comparable funds managed by other advisers.
Nature, Extent and Quality of the Services Provided Under the Management Agreement
As part of their review, the Trustees considered the nature, extent and quality of the services provided by the Investment Adviser. In this regard, the Trustees considered both the investment advisory services and non-advisory services that are provided to the Funds by the Investment Adviser and its affiliates. The Trustees noted the transition in the leadership and changes in personnel of various of the Investment Adviser’s portfolio management teams that had occurred in recent periods, and the ongoing recruitment efforts aimed at bringing high quality investment talent to the Investment Adviser. The Trustees concluded that the Investment Adviser continued to commit substantial financial and operational resources to the Funds and expressed confidence that the Investment Adviser would continue to do so in the future. The Trustees also recognized that the Investment Adviser had made significant commitments to address regulatory compliance requirements applicable to the Funds and the Investment Adviser.
Investment Performance
The Trustees also considered the investment performance of the Funds. In this regard, they compared the investment performance of each Fund (with the exception of the Managed Futures Strategy Fund, which commenced operations in 2012) to its peers using rankings and ratings compiled by the Outside Data Provider as of December 31, 2012, and updated performance information for each Fund (including the Managed Futures Strategy Fund) prepared by the Investment Adviser using the peer groups identified by the Outside Data Provider as of March 31, 2013. The information on each Fund’s investment performance was provided for the one-, three-, five- and ten-year periods ending on the applicable dates, to the extent that each Fund had been in
105
GOLDMAN SACHS SELECT SATELLITE FUNDS
Statement Regarding Basis for Approval of Management Agreement (Unaudited) (continued)
existence for those periods. The Trustees also reviewed each Fund’s investment performance over time (including on a year-by-year basis, with the exception of the Managed Futures Strategy Fund) relative to its performance benchmark. In addition, they considered the investment performance trends of the Funds over time (with the exception of the Managed Futures Strategy Fund), and reviewed the investment performance of each Fund in light of its investment objective and policies and market conditions. The Trustees also received information comparing the Commodity Strategy Fund’s performance to that of a comparable institutional composite managed by the Investment Adviser.
In addition, the Trustees considered materials prepared and presentations made by the Investment Adviser’s senior management and portfolio management personnel, in which Fund performance was assessed. The Trustees also considered the Investment Adviser’s periodic reports with respect to the Funds’ risk profiles, and how the Investment Adviser’s approach to risk monitoring and management influences portfolio management.
The Trustees observed that the Absolute Return Tracker Fund’s Class A Shares had placed in the third quartile of the Fund’s peer group for the one- and three-year periods ended March 31, 2013, and had outperformed the Fund’s benchmark index for the three-year period and underperformed for the one-year period ended March 31, 2013. They observed that the Commodity Strategy Fund’s Class A Shares had placed in the second quartile of the Fund’s peer group for the three-year period and in the third quartile for the one- and five-year periods, and had underperformed the Fund’s benchmark index for the one-, three- and five-year periods ended March 31, 2013. They noted that the Dynamic Allocation Fund’s Class A Shares had placed in the second quartile of the Fund’s peer group for the one-year period and in the fourth quartile for the three-year period, and had outperformed the Fund’s benchmark index for the one- and three-year periods ended March 31, 2013. They considered that the peer group and/or benchmark index of the Absolute Return Tracker, Commodity Strategy and Dynamic Allocation Funds provided imperfect performance comparisons. They also observed that the Investment Adviser had recently been working on enhancements to the Absolute Return Tracker Fund’s investment methodology to reflect exposures that contribute to the performance of each of the major sub-strategies within the hedge fund universe.
The Trustees noted that the International Real Estate Securities Fund’s Class A Shares had placed in the first quartile of the Fund’s peer group for the one-year period, and in the fourth quartile for the three- and five-year periods, and had outperformed the Fund’s benchmark index for the one-year period and underperformed for the three- and five-year periods ended March 31, 2013. They observed that the Real Estate Securities Fund’s Class A Shares had placed in the third quartile of the Fund’s peer group for the one-, five-, and ten-year periods, and in the top half for the three-year period, and had underperformed the Fund’s benchmark index for the one-, three-, five-, and ten-year periods ended March 31, 2013. The Trustees considered that the International Real Estate Fund’s peer group provides an imperfect performance comparison because it is dominated by funds that invest in all countries, while the Fund typically invests in non-U.S. countries. The Trustees also noted that in 2010 and 2011, the Investment Adviser had taken steps to rebuild the portfolio management team.
The Trustees noted that the Managed Futures Strategy Fund had launched on February 29, 2012 and did not yet have a meaningful performance history.
Costs of Services Provided and Competitive Information
The Trustees considered the contractual terms of the Management Agreement and the fee rates payable by each Fund thereunder. In this regard, the Trustees considered information on the services rendered by the Investment Adviser to the Funds, which included both advisory and administrative services that were directed to the needs and operations of the Funds as registered mutual funds.
In particular, the Trustees reviewed analyses prepared by the Outside Data Provider regarding the expense rankings of the Funds. The analyses provided a comparison of the Funds’ management fees and breakpoints to those of relevant peer groups and category universes; an expense analysis which compared each Fund’s overall net and gross expenses to a peer group and a category universe; and a five-year history (or, in the case of a Fund that commenced investment operations within a shorter period, since the year in which it commenced operations), comparing each Fund’s net expenses to the peer and category medians. The analyses also compared each Fund’s transfer agency, custody, and distribution fees, other expenses and fee waivers/reimbursements to those of the peer group and category medians. The Trustees concluded that the comparisons provided by the Outside Data Provider were useful in evaluating the reasonableness of the management fees and total expenses paid by the Funds.
In addition, the Trustees considered the Investment Adviser’s undertakings to waive a portion of its management fee for the Dynamic Allocation, International Real Estate Securities and Real Estate Securities Funds and to limit certain expenses of each of the Funds that exceed specified levels. The Trustees also noted that certain changes were being made to existing fee waiver or expense limitation arrangements of the Dynamic Allocation and Real Estate Securities Funds that would have the effect of lowering total Fund expenses, with such changes taking effect in connection with the Funds’ next annual registration statement update. They also considered, to the extent that the Investment Adviser manages institutional accounts or collective investment
106
GOLDMAN SACHS SELECT SATELLITE FUNDS
Statement Regarding Basis for Approval of Management Agreement (Unaudited) (continued)
vehicles having investment objectives and policies similar to those of the Funds, comparative fee information for services provided by the Investment Adviser to those accounts, and information that indicated that services provided to the Funds differed in various significant respects from the services provided to institutional accounts, which generally operated under less stringent legal and regulatory structures, required fewer services from the Investment Adviser to a smaller number of client contact points, were less time-intensive and paid lower fees.
In addition, the Trustees noted that shareholders are able to redeem their Fund shares at any time if they believe that the Fund fees and expenses are too high or if they are dissatisfied with the performance of the Fund.
Profitability
The Trustees reviewed the Investment Adviser’s revenues and pre-tax profit margins with respect to the Trust and each of the Funds. In this regard the Trustees noted that they had received, among other things, profitability analyses and summaries, revenue and expense schedules by Fund and by function (i.e., investment management, transfer agency and distribution and service) and the Investment Adviser’s expense allocation methodology. They observed that the profitability and expense figures are substantially similar to those used by the Investment Adviser for many internal purposes, including compensation decisions among various business groups, and are thus subject to a vigorous internal debate about how certain revenue and expenses should be allocated. The Trustees also reviewed the report of the internal audit group within the Goldman Sachs organization, which included an assessment of the reasonableness and consistency of the Investment Adviser’s expense allocation methodology and an evaluation of the accuracy of the Investment Adviser’s profitability analysis calculations. Profitability data for the Trust and each Fund were provided for 2012 and 2011 (2012 only for the Managed Futures Strategy Fund), and the Trustees considered this information in relation to the Investment Adviser’s overall profitability. The Trustees considered the Investment Adviser’s revenues and pre-tax profit margins both in absolute terms and in comparison to information on the reported pre-tax profit margins earned by certain other asset management firms.
Economies of Scale
The Trustees considered the information that had been provided regarding the Investment Adviser’s profitability. The Trustees also considered the breakpoints in the fee rate payable under the Management Agreement for each of the Funds at the following annual percentage rates of the average daily net assets of the Funds:
| | | | | | | | | | | | | | | | | | | | | | | | |
| | | Absolute
Return
Tracker
Fund | | | Commodity
Strategy
Fund | | | Dynamic
Allocation
Fund | | | International
Real Estate
Securities
Fund | | | Managed
Futures
Strategy
Fund | | | Real
Estate
Securities
Fund | |
| First $1 billion | | | 1.15 | % | | | 0.50 | % | | | 0.90 | % | | | 1.05 | % | | | 1.00 | % | | | 1.00 | % |
| Next $1 billion | | | 1.04 | | | | 0.50 | | | | 0.81 | | | | 1.05 | | | | 0.90 | | | | 0.90 | |
| Next $3 billion | | | 0.99 | | | | 0.45 | | | | 0.77 | | | | 0.95 | | | | 0.86 | | | | 0.86 | |
| Next $3 billion | | | 0.97 | | | | 0.43 | | | | 0.75 | | | | 0.90 | | | | 0.84 | | | | 0.84 | |
| Over $8 billion | | | 0.95 | | | | 0.42 | | | | 0.74 | | | | 0.88 | | | | 0.82 | | | | 0.82 | |
The Trustees noted that the breakpoints were meant to share potential economies of scale, if any, with the Funds and their shareholders as assets under management reach those asset levels. The Trustees considered the amounts of assets in the Funds; the Funds’ recent share purchase and redemption activity; the information provided by the Investment Adviser relating to the costs of the services provided by the Investment Adviser and its affiliates and their realized profits; information comparing fee rates charged by the Investment Adviser with fee rates charged to other funds in the peer groups; and the Investment Adviser’s undertakings to waive a portion of the management fees of the Dynamic Allocation, International Real Estate Securities and Real Estate Securities Funds and limit certain expenses of each of the Funds that exceed specified levels. Upon reviewing these matters at the Annual Meeting, the Trustees concluded that the fee breakpoints represented a means of assuring that benefits of scalability, if any, would be passed along to shareholders at the specified asset levels. They also noted that the Investment Adviser had passed along savings to shareholders of the Absolute Return Tracker and Dynamic Allocation Funds, which had asset levels above at least the first breakpoint during the prior fiscal year.
Other Benefits to the Investment Adviser and Its Affiliates
The Trustees also considered the other benefits derived by the Investment Adviser and its affiliates from their relationship with the Funds as stated above, including: (a) transfer agency fees received by Goldman, Sachs & Co. (“Goldman Sachs”); (b) brokerage and futures commissions earned by Goldman Sachs for executing securities and futures transactions on behalf of the Funds; (c) research received by the Investment Adviser from broker-dealers in exchange for executing certain transactions on
107
GOLDMAN SACHS SELECT SATELLITE FUNDS
Statement Regarding Basis for Approval of Management Agreement (Unaudited) (continued)
behalf of the International Real Estate Securities and Real Estate Securities Funds; (d) trading efficiencies resulting from aggregation of orders of the Funds with those for other funds or accounts managed by the Investment Adviser; (e) the Investment Adviser’s ability to leverage the infrastructure designed to service the Funds on behalf of its other clients; (f) the Investment Adviser’s ability to cross-market other products and services to Fund shareholders; (g) Goldman Sachs’ retention of certain fees as Fund Distributor; (h) the Investment Adviser’s ability to negotiate better pricing with custodians on behalf of its other clients, as a result of the relationship with the Funds; and (i) the possibility that the working relationship between the Investment Adviser and the Funds’ third party service providers may cause those service providers to be open to doing business with other areas of Goldman Sachs. In the course of considering the foregoing, the Independent Trustees requested and received further information quantifying certain of these fall-out benefits.
Other Benefits to the Funds and Their Shareholders
The Trustees also noted that the Funds receive certain potential benefits as a result of their relationship with the Investment Adviser, including: (a) trading efficiencies resulting from aggregation of orders of the Funds with those of other funds or accounts managed by the Investment Adviser; (b) improved servicing from vendors because of the volume of business generated by the Investment Adviser and its affiliates; (c) improved servicing from broker-dealers because of the volume of business generated by the Investment Adviser and its affiliates; (d) the Investment Adviser’s ability to negotiate favorable terms with derivatives counterparties as a result of the size and reputation of the Goldman Sachs organization; (e) the Investment Adviser’s knowledge and experience gained from managing other accounts and products; (f) the Investment Adviser’s ability to hire and retain qualified personnel to provide services to the Funds because of the reputation of the Goldman Sachs organization; (g) the Funds’ access, through the Investment Adviser, to certain firmwide resources (e.g., proprietary risk management systems and databases), subject to certain restrictions; and (h) the Funds’ access to certain affiliated distribution channels. The Trustees noted the competitive nature of the mutual fund marketplace, and noted further that many of the Funds’ shareholders invested in the Funds in part because of the Funds’ relationship with the Investment Adviser and that those shareholders have a general expectation that the relationship will continue.
Conclusion
In connection with their consideration of the Management Agreement, the Trustees gave weight to each of the factors described above, but did not identify any particular factor as controlling their decision. After deliberation and consideration of all of the information provided, including the factors described above, the Trustees concluded, in the exercise of their business judgment, that the management fees paid by each of the Funds were reasonable in light of the services provided to it by the Investment Adviser, the Investment Adviser’s costs and each Fund’s current and reasonably foreseeable asset levels. The Trustees unanimously concluded that the Investment Adviser’s continued management likely would benefit each Fund and its shareholders and that the Management Agreement should be approved and continued with respect to each Fund until June 30, 2014.
108
FUNDS PROFILE
Goldman Sachs Funds

Goldman Sachs is a premier financial services firm, known since 1869 for creating thoughtful and customized investment solutions in complex global markets.
Today, the Investment Management Division of Goldman Sachs serves a diverse set of clients worldwide, including private institutions, public entities and individuals. With approximately $739.4 billion in assets under management as of June 30, 2013, Goldman Sachs Asset Management (“GSAM”) has portfolio management teams located around the world and our investment professionals bring firsthand knowledge of local markets to every investment decision. GSAM’s assets under management includes assets managed by Goldman Sachs Asset Management, L.P. and its Investment Advisory Affiliates.
|
| OVERVIEW OF GOLDMAN SACHS FUNDS |

Money Market1
Financial Square FundsSM
| n | | Financial Square Tax-Exempt Funds |
| n | | Financial Square Federal Fund |
| n | | Financial Square Government Fund |
| n | | Financial Square Money Market Fund |
| n | | Financial Square Prime Obligations Fund |
| n | | Financial Square Treasury Instruments Fund |
| n | | Financial Square Treasury Obligations Fund |
Fixed Income
Short Duration and Government
| n | | High Quality Floating Rate Fund |
| n | | Short Duration Government Fund |
| n | | Short Duration Income Fund |
| n | | Inflation Protected Securities Fund |
Multi-Sector
| n | | Core Plus Fixed Income Fund |
Municipal and Tax-Free
| n | | High Yield Municipal Fund |
| n | | Short Duration Tax-Free Fund |
Single Sector
| n | | Investment Grade Credit Fund |
| n | | High Yield Floating Rate Fund |
| n | | Emerging Markets Debt Fund |
| n | | Local Emerging Markets Debt Fund |
| n | | Dynamic Emerging Markets Debt Fund |
Corporate Credit
Fundamental Equity
| n | | Small/Mid Cap Growth Fund |
| n | | Flexible Cap Growth Fund |
| n | | Concentrated Growth Fund |
| n | | Technology Tollkeeper Fund |
| n | | Growth Opportunities Fund |
| n | | Rising Dividend Growth Fund |
Structured Equity
| n | | Structured Tax-Managed Equity Fund |
| n | | Structured International Tax-Managed Equity Fund |
| n | | U.S. Equity Dividend and Premium Fund |
| n | | International Equity Dividend and Premium Fund |
Equity Insights2
| n | | Small Cap Equity Insights Fund |
| n | | U.S. Equity Insights Fund |
| n | | Small Cap Growth Insights Fund |
| n | | Large Cap Growth Insights Fund |
| n | | Large Cap Value Insights Fund |
| n | | Small Cap Value Insights Fund |
| n | | International Small Cap Insights Fund |
| n | | International Equity Insights Fund |
| n | | Emerging Markets Equity Insights Fund |
Fundamental Equity International
| n | | Strategic International Equity Fund |
| n | | Concentrated International Equity Fund |
| n | | International Small Cap Fund |
| n | | Emerging Markets Equity Fund |
| n | | BRIC Fund (Brazil, Russia, India, China) |
Select Satellite3
| n | | Real Estate Securities Fund |
| n | | International Real Estate Securities Fund |
| n | | Commodity Strategy Fund |
| n | | Dynamic Allocation Fund |
| n | | Absolute Return Tracker Fund |
| n | | Managed Futures Strategy Fund |
| n | | MLP Energy Infrastructure Fund |
| n | | Multi-Manager Alternatives Fund |
| n | | Retirement Portfolio Completion Fund |
| n | | Income Strategies Portfolio |
Total Portfolio Solutions3
| n | | Balanced Strategy Portfolio |
| n | | Growth and Income Strategy Portfolio |
| n | | Growth Strategy Portfolio |
| n | | Equity Growth Strategy Portfolio |
| n | | Satellite Strategies Portfolio |
| n | | Enhanced Dividend Global Equity Portfolio |
| n | | Tax Advantaged Global Equity Portfolio |
| 1 | | An investment in a money market fund is neither insured nor guaranteed by the Federal Deposit Insurance Corporation (“FDIC”) or any other government agency. Although the Funds seek to preserve the value of your investment at $1.00 per share, it is possible to lose money by investing in the Funds. |
| 2 | | Effective at the close of business May 3, 2013, the Goldman Sachs Structured Large Cap Growth, Structured Large Cap Value, Structured Small Cap Equity, Structured Small Cap Growth, Structured Small Cap Value, Structured U.S. Equity, Structured Emerging Markets Equity, Structured International Equity and Structured International Small Cap Funds were renamed the Goldman Sachs Large Cap Growth Insights, Large Cap Value Insights, Small Cap Equity Insights, Small Cap Growth Insights, Small Cap Value Insights, U.S. Equity Insights, Emerging Markets Equity Insights, International Equity Insights and International Small Cap Insights Funds respectively. |
| 3 | | Individual Funds within the Total Portfolio Solutions and Select Satellite categories will have various placement on the risk/return spectrum and may have greater or lesser risk than that indicated by the placement of the general Total Portfolio Solutions or Select Satellite category. |
Financial Square FundsSM is a registered service mark of Goldman, Sachs & Co.
| | |
TRUSTEES Ashok N. Bakhru, Chairman Donald C. Burke John P. Coblentz, Jr. Diana M. Daniels Joseph P. LoRusso James A. McNamara Jessica Palmer Alan A. Shuch Richard P. Strubel | | OFFICERS James A. McNamara, President George F. Travers, Principal Financial Officer Caroline L. Kraus, Secretary Scott M. McHugh, Treasurer |
| |
GOLDMAN, SACHS & CO. Distributor and Transfer Agent | | GOLDMAN SACHS ASSET MANAGEMENT, L.P. Investment Adviser |
Visit our Web site at www.goldmansachsfunds.com to obtain the most recent month-end returns.
Goldman Sachs Asset Management, L.P. 200 West Street, New York, New York 10282
Economic and market forecasts presented herein reflect our judgment as of the date of this presentation and are subject to change without notice. These forecasts do not take into account the specific investment objectives, restrictions, tax and financial situation or other needs of any specific client. Actual data will vary and may not be reflected here. These forecasts are subject to high levels of uncertainty that may affect actual performance. Accordingly, these forecasts should be viewed as merely representative of a broad range of possible outcomes. These forecasts are estimated, based on assumptions, and are subject to significant revision and may change materially as economic and market conditions change. Goldman Sachs has no obligation to provide updates or changes to these forecasts. Case studies and examples are for illustrative purposes only.
The portfolio risk management process includes an effort to monitor and manage risk, but does not imply low risk.
The reports concerning the Funds included in this shareholder report may contain certain forward-looking statements about the factors that may affect the performance of the Funds in the future. These statements are based on Fund management’s predictions and expectations concerning certain future events and their expected impact on the Funds, such as performance of the economy as a whole and of specific industry sectors, changes in the levels of interest rates, the impact of developing world events, and other factors that may influence the future performance of the Funds. Management believes these forward-looking statements to be reasonable, although they are inherently uncertain and difficult to predict. Actual events may cause adjustments in portfolio management strategies from those currently expected to be employed.
A description of the policies and procedures that the Funds use to determine how to vote proxies relating to portfolio securities and information regarding how a Fund voted proxies relating to portfolio securities during the most recent 12-month period ended June 30 is available (i) without charge, upon request by calling 1-800-526-7384 (for Retail Shareholders) or 1-800-621-2550 (for Institutional Shareholders); and (ii) on the Securities and Exchange Commission web site at http://www.sec.gov.
The Funds file their complete schedule of portfolio holdings with the Securities and Exchange Commission (“SEC”) for the first and third quarters of each fiscal year on Form N-Q. The Funds’ Forms N-Q are available on the SEC’s web site at http://www.sec.gov within 60 days after the Funds’ first and third fiscal quarters. The Funds’ Forms N-Q may be reviewed and copied at the SEC’s Public Reference Room in Washington, D.C. and information on the operation of the Public Reference Room may also be obtained by calling 1-800-SEC-0330. Forms N-Q may be obtained upon request and without charge by calling 1-800-526-7384 (for Retail Shareholders) or 1-800-621-2550 (for Institutional Shareholders).
Holdings and allocations shown are as of June 30, 2013 and may not be representative of future investments. Fund holdings should not be relied on in making investment decisions and should not be construed as research or investment advice regarding particular securities. Current and future holdings are subject to risk.
This material is not authorized for distribution to prospective investors unless preceded or accompanied by a current Prospectus or summary prospectus, if applicable. Investors should consider a Fund’s objective, risks, and charges and expenses, and read the summary prospectus, if available, and/or the Prospectus carefully before investing or sending money. The summary prospectus, if available, and the Prospectus contain this and other information about a Fund and may be obtained from your Authorized Institution or from Goldman, Sachs & Co. by calling (retail – 1-800-526-7384) (institutional – 1-800-621-2550).
© 2013 Goldman Sachs. All rights reserved. 107387.MF.MED.TMPL/8/2013/SELSATSAR13/103k
| | The information required by this Item is only required in an annual report on this Form N-CSR. |
| ITEM 3. | AUDIT COMMITTEE FINANCIAL EXPERT. |
| | The information required by this Item is only required in an annual report on this Form N-CSR. |
| ITEM 4. | PRINCIPAL ACCOUNTANT FEES AND SERVICES. |
| | The information required by this Item is only required in an annual report on this Form N-CSR. |
| ITEM 5. | AUDIT COMMITTEE OF LISTED REGISTRANTS. |
| ITEM 6. | SCHEDULE OF INVESTMENTS. |
| | Schedule of Investments is included as part of the Report to Stockholders filed under Item 1. |
| ITEM 7. | DISCLOSURE OF PROXY VOTING POLICIES AND PROCEDURES FOR CLOSED-END MANAGEMENT INVESTMENT COMPANIES. |
| ITEM 8. | PORTFOLIO MANAGERS OF CLOSED-END MANAGEMENT INVESTMENT COMPANIES. |
| ITEM 9. | PURCHASES OF EQUITY SECURITIES BY CLOSED-END MANAGEMENT INVESTMENT COMPANY AND AFFILIATED PURCHASERS. |
| ITEM 10. | SUBMISSION OF MATTERS TO A VOTE OF SECURITY HOLDERS. |
| | There have been no material changes to the procedures by which shareholders may recommend nominees to the registrant’s board of trustees. |
| ITEM 11. | CONTROLS AND PROCEDURES. |
| | (a) | The registrant’s principal executive and principal financial officers, or persons performing similar functions have concluded that the registrant’s disclosure controls and procedures (as defined in Rule 30a-3(c) under the Investment Company Act of 1940, as amended (the “1940 Act”)) are effective as of a date within 90 days of the filing of this report that includes the disclosure required by this paragraph, based on the evaluation of these controls and procedures required by Rule 30a-3(b) under the 1940 Act and 15d-15(b) under the Securities Exchange Act of 1934, as amended. |
| | (b) | There were no changes in the registrant’s internal control over financial reporting (as defined in Rule 30a-3(d) under the 1940 Act) that occurred during the registrant’s second fiscal quarter of the period covered by this report that have materially affected, or are reasonably likely to materially affect, the registrant’s internal control over financial reporting. |
| | | | |
| (a)(1) | | The information required by this Item is only required in connection with an annual report on this Form N-CSR. |
| | |
| (a)(2) | | Exhibit 99.CERT | | Certifications pursuant to Section 302 of the Sarbanes-Oxley Act of 2002 filed herewith. |
| | |
| (b) | | Exhibit 99.906CERT | | Certifications pursuant to Section 906 of the Sarbanes-Oxley Act of 2002 filed herewith. |
SIGNATURES
Pursuant to the requirements of the Securities Exchange Act of 1934 and the Investment Company Act of 1940, the registrant has duly caused this report to be signed on its behalf by the undersigned, thereunto duly authorized.
| | | | |
| | | | Goldman Sachs Trust |
| | |
| By: | | | | /s/ James A. McNamara |
| | | | James A. McNamara |
| | | | President/Principal Executive Officer |
| | | | Goldman Sachs Trust |
| | |
| Date: | | | | August 13, 2013 |
Pursuant to the requirements of the Securities Exchange Act of 1934 and the Investment Company Act of 1940, this report has been signed below by the following persons on behalf of the registrant and in the capacities and on the dates indicated.
| | | | |
| By: | | | | /s/ James A. McNamara |
| | | | James A. McNamara |
| | | | President/Principal Executive Officer |
| | | | Goldman Sachs Trust |
| | |
| Date: | | | | August 13, 2013 |
| | |
| By: | | | | /s/ George F. Travers |
| | | | George F. Travers |
| | | | Principal Financial Officer |
| | | | Goldman Sachs Trust |
| | |
| Date: | | | | August 14, 2013 |