UNITED STATES
SECURITIES AND EXCHANGE COMMISSION
Washington, D.C. 20549
FORM N-CSR
CERTIFIED SHAREHOLDER REPORT OF REGISTERED
MANAGEMENT INVESTMENT COMPANIES
Investment Company Act file number 811-05349
Goldman Sachs Trust
(Exact name of registrant as specified in charter)
71 South Wacker Drive,
Chicago, Illinois 60606
(Address of principal executive offices) (Zip code)
| | |
Copies to: |
Caroline Kraus | | Geoffrey R.T. Kenyon, Esq. |
Goldman, Sachs & Co. | | Dechert LLP |
200 West Street | | 200 Clarendon Street |
New York, New York 10282 | | 27th Floor |
| | Boston, MA 02116-5021 |
(Name and address of agents for service)
Registrant’s telephone number, including area code: (312) 655-4400
Date of fiscal year end: October 31
Date of reporting period: April 30, 2013
| ITEM 1. | REPORTS TO STOCKHOLDERS. |
| | The Semi-Annual Report to Stockholders is filed herewith. |
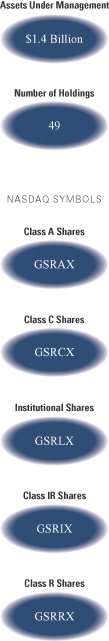
Goldman Sachs Funds

| | | | |
| | |
| Semi-Annual Report | | | | April 30, 2013 |
| | |
| | | | Dividend Focus Funds |
| | | | Income Builder* |
| | | | Rising Dividend Growth |
*Effective at the close of business June 29, 2012, the Goldman Sachs Balanced Fund was renamed the Goldman Sachs Income Builder Fund.

Goldman Sachs Dividend Focus Funds
| | | | |
TABLE OF CONTENTS | | | | |
| |
Principal Investment Strategies and Risks | | | 1 | |
| |
Investment Process — Income Builder | | | 2 | |
| |
Portfolio Management Discussion and Performance Summary — Income Builder | | | 3 | |
| |
Portfolio Management Discussion and Performance Summary — Rising Dividend Growth | | | 14 | |
| |
Schedules of Investments | | | 21 | |
| |
Financial Statements | | | 30 | |
| |
Financial Highlights | | | 34 | |
| |
Notes to Financial Statements | | | 38 | |
| |
Other Information | | | 52 | |
| | | | |
| | | |
| NOT FDIC-INSURED | | May Lose Value | | No Bank Guarantee |
GOLDMAN SACHS DIVIDEND FOCUS FUNDS
Principal Investment Strategies and Risks
This is not a complete list of risks that may affect the Funds. For additional information concerning the risks applicable to the Funds, please see the Funds’ Prospectus.
The Goldman Sachs Income Builder Fund seeks to provide income through investments in fixed income securities (bonds) and high dividend paying equities, preferred equities and other similar securities (stocks), and seeks to provide capital appreciation primarily through equity investments. The Fund’s investments in fixed income securities are subject to the risks associated with debt securities generally, including credit and interest rate risk. High yield, lower rated investments involve greater price volatility and present greater risks, including greater liquidity risk, than higher rated fixed income securities. The Fund’s equity investments will be subject to market risk, which means that the value of the securities in which it invests may go up or down in response to the prospects of individual companies, particular sectors and/or general economic conditions. Foreign and emerging markets investments may be more volatile than investments in U.S. securities and are subject to the risks of currency fluctuations and adverse economic or political developments. Derivative instruments may involve a high degree of financial risk. These risks include the risk that a small movement in the price of the underlying security or benchmark may result in a disproportionately large movement, unfavorable or favorable, in the price of the derivative instrument; the risk of default by a counterparty; and liquidity risk. Different investment styles tend to shift in and out of favor, and at times the Fund may underperform other funds that invest in similar asset classes. Investing in REITs involves certain unique risks in addition to those risks associated with investing in the real estate industry in general. REITs whose underlying properties are concentrated in a particular industry or geographic region are also subject to risks affecting such industries and regions. The securities of REITs involve greater risks than those associated with larger, more established companies and may be subject to more abrupt or erratic price movements because of interest rate changes, economic conditions and other factors. Investments in master limited partnerships (“MLPs”) are subject to certain risks, including risks related to limited control and limited rights to vote, potential conflicts of interest, cash flow risks, dilution risks, limited liquidity and risks related to the general partner’s right to force sales at undesirable times or prices.
The Goldman Sachs Rising Dividend Growth Fund invests primarily in equity investments of dividend paying U.S. and foreign companies with market capitalizations of at least $500 million. The equity investments in which the Fund invests may include common and preferred stocks as well as master limited partnerships (“MLPs”) and real estate investment trusts (“REITs”). The Fund’s equity investments are subject to market risk, which means that the value of the securities in which it invests may go up or down in response to the prospects of individual companies, particular sectors and/or general economic conditions. Different investment styles tend to shift in and out of favor, and the Fund’s emphasis on companies with rising dividend payments could cause the Fund to underperform other funds that invest in similar asset classes but employ different investment styles. Investments in MLPs are subject to certain risks, including risks related to limited control and limited rights to vote, potential conflicts of interest, cash flow risks, dilution risks, limited liquidity and risks related to the general partner’s right to force sales at undesirable times or prices. MLPs are also subject to risks relating to their complex tax structure, including the risk that a distribution received by the Fund from an MLP is treated as a return of capital, which may increase the Fund’s tax liability and require the Fund to restate the character of its distributions and amend shareholder tax reporting previously issued, and the risk that an MLP could lose its tax status as a partnership, resulting in a reduction in the value of the Fund’s investment in the MLP and lower income to the Fund. Many MLPs in which the Fund may invest operate facilities within the energy sector and are also subject to risks affecting the energy sector. The securities of REITs and mid- and small-capitalization companies involve greater risks than those associated with larger, more established companies and may be subject to more abrupt or erratic price movements (in the case of REITs, because of interest rate changes, economic conditions and other factors). REITs whose underlying properties are concentrated in a particular industry or region are also subject to risks affecting such industries and regions. The Fund may also invest in fixed income securities, which are subject to the risks associated with debt securities generally, including credit and interest rate risk. Foreign securities and emerging country securities may be more volatile and less liquid than investments in U.S. securities and are subject to the risks of currency fluctuations and adverse economic and political developments. The Fund’s investments in other investment companies (including ETFs) subject it to additional expenses. The Fund is “non-diversified” and may invest more of its assets in fewer issuers than “diversified” funds. Accordingly, the Fund may be more susceptible to adverse developments affecting any single issuer held in its portfolio and to greater losses resulting from these developments.
1
GOLDMAN SACHS INCOME BUILDER FUND
What Differentiates Goldman Sachs’
Income Builder Fund Investment Process?
Income Builder Fund is a broadly diversified portfolio that seeks to provide income and capital appreciation.
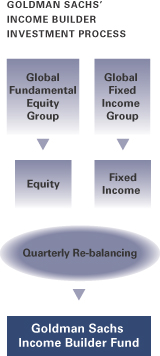

The Goldman Sachs Income Builder Fund provides exposure to the wealth-building opportunities of stocks and the regular income potential of bonds. The Fund invests in both equity and fixed income securities with a focus on yield enhancing strategies to earn a monthly income stream. The Fund seeks to maintain broad exposure to equities with lower than general equity market volatility.

We believe that similar themes can perform differently across asset classes. The Fund can potentially take advantage of these cross-asset class opportunities as it is a dynamic portfolio that allows the flexibility to allocate across equities and fixed income from a top-down perspective, given our views on macro opportunities and valuations.

In our risk management process, we identify, monitor and measure a fund’s risk profile. We consider the risk relative to the benchmark and the fund’s investment goal to seek income stability and capital growth.

The Fund’s portfolio comprises the ideas of two experienced Goldman Sachs investment groups:
Global Fundamental Equity Group: A group of investment professionals averaging over 17 years of investment experience and with a strong commitment to fundamental research.
Global Fixed Income Group: Broad, deep capabilities across global fixed income markets, with a total return investment philosophy.
2
PORTFOLIO RESULTS
Goldman Sachs Income Builder Fund
Investment Objective
The Goldman Sachs Income Builder Fund seeks to provide income and capital appreciation.
Portfolio Management Discussion and Analysis
Below, the Goldman Sachs Fundamental Equity Team (“Fundamental Equity Team”) and the Goldman Sachs Fixed Income Investment Management Team (“Fixed Income Team”) discuss the Goldman Sachs Income Builder Fund’s (the “Fund”) performance and positioning for the six-month period ended April 30, 2013 (the “Reporting Period”).
| Q | | How did the Fund perform during the Reporting Period? |
| A | | During the Reporting Period, the Fund’s Class A, B, C, Institutional and IR Shares generated cumulative total returns, without sales charges, of 9.94%, 9.54%, 9.58%, 10.13% and 10.07%, respectively. These returns compare to the 11.34% cumulative total return of the Fund’s blended benchmark, comprised of the Russell 1000® Value Index (with dividends reinvested) (the “Russell Index”) and the BofA Merrill Lynch BB-B U.S. High Yield Constrained Index (the “BofA Merrill Lynch Index”). The components of the Fund’s blended benchmark generated cumulative total returns of 16.31% and 6.47% for the Russell Index and the BofA Merrill Lynch Index, respectively, during the same period. |
| Q | | What economic and market factors most influenced the equity and fixed income markets as a whole during the Reporting Period? |
| A | | Commitments by global central banks to low interest rates and continued easy monetary policies drove the financial markets during the Reporting Period. The U.S. equity market recorded double-digit gains, while spread sectors, or non-Treasury fixed income sectors, generated rather modest, though generally positive, returns. High yield corporate bonds significantly outperformed the broader U.S. fixed income market. |
| | At the beginning of the Reporting Period, investor sentiment was subdued, dominated by renewed concern about Europe’s financial problems and political uncertainty in the U.S. However, following the November 6th U.S. elections and through the end of 2012, spread sectors rallied on reduced U.S. political uncertainty, signs of growth in the U.S. housing market, a smooth transition of power in China, and a positive trending global Purchasing Managers Index (“PMI”). U.S. equities made only modest gains as the fiscal cliff loomed. |
| | Spread sectors continued to perform well in January 2013, with risk appetite fueled by a last-minute deal on the fiscal cliff. U.S. equities rallied in spite of a wide variation in corporate earnings reports and weaker than expected U.S. economic growth. Still, the U.S. housing market continued to strengthen through the first two months of 2013. Indeed, the Standard & Poor’s/Case-Shiller Home Price Indices rose at the fastest pace since mid-2006 — at an annualized rate of 8.1% in January 2013 and 9.3% in February 2013. The labor picture also improved, with the unemployment rate dropping to 7.7% during February 2013. U.S. stocks continued to advance during February 2013, but the rally in the spread sectors cooled as market volatility increased, primarily on worries about U.S. fiscal policy gridlock. Lawmakers appeared unwilling to reach a compromise on spending cuts and revenue raising measures, which had been held over from the fiscal cliff debate. |
| | In March 2013, tensions resurfaced in the Eurozone, as Cyprus’ bailout by Euro-area finance ministers raised the prospect of a tax on bank deposits, prompting fears of a more widespread run on European banks. Spread sectors briefly stumbled on the news, but the impact overall during March 2013 was modest. Meanwhile, the U.S. equity market continued to rally, even as Congress chose to not act on the automatic federal spending cuts known as the sequester and allowed them to start taking effect. The U.S. housing and labor markets continued to show signs of strength, suggesting the Federal Reserve (the “Fed”) might begin laying the groundwork for policy tightening sooner than previously expected. |
3
PORTFOLIO RESULTS
| | During April 2013, spread sectors and U.S. equities continued to perform well as investors seemed to look past weaker global economic data. The U.S. economy showed further signs of recovery, with both employment and housing market data strong. The Conference Board estimate for consumer confidence in April 2013 significantly exceeded expectations, suggesting consumers might be feeling the effects of improved housing and labor market conditions. |
| Q | | How did the Fund’s asset allocation affect performance during the Reporting Period? |
| A | | As part of its principal investment strategies, the Fund has a baseline allocation of 50% to fixed income securities and 50% to equity securities, though in seeking to meet its investment objective, the Fund has the flexibility to opportunistically tilt the allocation to fixed income and equity securities up to 15% above or below that baseline allocation. The Fund seeks to provide a high and stable income stream with lower volatility than the equity market plus capital appreciation through investing in the highest conviction ideas of the Fixed Income and Fundamental Equity Teams. Because of these stated goals of the Fund, the Teams believe the Fund’s benchmarks should be considered for reference only. |
| | At the beginning of the Reporting Period, the Fund was invested approximately 44% in equities and 55% in fixed income, with the balance in cash and cash equivalents. During the Reporting Period, the Fund’s allocation toward equities rose to 50% and its allocation to fixed income was trimmed to 49%, as bonds became more expensive and the Teams raised the Fund’s exposure to equities. Overall, this had a positive impact on Fund performance, as the equity market performed well. |
| | During the Reporting Period, the Teams added exposure to master limited partnerships (“MLPs”) when they believed MLPs had a great deal of value, which helped the Fund meet its goal of providing a high and stable income stream with lower volatility than the equity market. After MLPs experienced strong performance during the Reporting Period, the Teams became less bullish on them and decreased the Fund’s exposure. |
| Q | | What was the Fund’s 12-month distribution rate* during the Reporting Period? |
| A | | The Fund seeks to provide a high and stable income stream with lower volatility than the equity market by focusing its investments in fixed income securities and high dividend paying equities, preferred equities and other similar securities (stocks). During the Reporting Period, the Fund’s Class A, B, C, Institutional and IR Shares provided attractive 12-month distribution rates of 6.42%, 5.67%, 5.78%, 6.71% and 6.57%, respectively. As of April 30, 2013, the Fund’s 30-day SEC yields (subsidized) for its Class A, B, C, Institutional and IR Shares were 3.16%, 2.61%, 2.61%, 3.75% and 3.60%, respectively. |
| Q | | What key factors had the greatest impact on the performance of the Fund’s equity portfolio during the Reporting Period? |
| A | | Relative to the Russell Index, stock selection had the greatest impact on the Fund’s equity portfolio during the Reporting Period. |
| Q | | Which equity market sectors most significantly affected Fund performance during the Reporting Period? |
| A | | During the Reporting Period, the Fund’s positioning in the financials, information technology and telecommunication services sectors hampered its performance relative to the Russell Index. The Fund’s positioning in the energy, materials and industrials contributed positively to its relative returns. |
| Q | | Which stocks detracted significantly from the Fund’s relative performance during the Reporting Period? |
| A | | The largest detractors from the Fund’s relative returns during the Reporting Period were Apple, M&T Bank and Public Storage. |
| | Apple detracted the most from the Fund’s relative performance. Apple designs, manufactures and markets mobile communication and media devices, personal computing products and portable digital music players worldwide. Apple’s shares moved lower after the company reported a strong fourth quarter of 2012 but provided disappointing guidance for iPhone sales. At the end of the Reporting Period, the Fundamental Equity Team continued to have a positive outlook on Apple and saw a number of potential catalysts that could contribute to additional growth. Despite reduced near-term expectations, the Fundamental |
4
PORTFOLIO RESULTS
| | Equity Team believed the company’s long-term growth potential is still greater than the broader stock market. Apple combines many of the qualities the Fundamental Equity Team considers attractive. In the Team’s view, the company is highly profitable, has consistently grown its earnings, has a strong balance sheet and can potentially increase its dividend. In addition, the Fundamental Equity Team believes Apple’s management team is likely to take a more investor-friendly approach in allocating Apple’s large cash balance. |
| | Another key detractor from the Fund’s relative returns was M&T Bank, a bank holding company that offers a range of retail and commercial banking, trust, wealth management and investment services to customers. Through subsidiaries, M&T Bank also conducts lending activities in various states. The Fund was hampered by its large overweight in M&T Bank, which declined slightly during the Reporting Period. The company’s shares traded lower after M&T Bank and Hudson City Bancorp said it would take longer than previously expected to obtain a regulatory determination on their proposed merger. Because the merger is anticipated to provide additional liquidity and potentially higher earnings, the Fundamental Equity Team expects the deal, when completed, to be positive for M&T Bank over the long term. The Fundamental Equity Team maintains a positive outlook on M&T Bank because of its strong management team, the management team’s focus on driving the bank’s returns and the bank’s multiple streams of recurring revenues. As a result, the Fund remained overweight M&T Bank at the end of the Reporting Period. |
| | The Fund’s position in Public Storage hurt relative performance during the Reporting Period. Public Storage is a real estate investment trust (“REIT”) that engages in the acquisition, development, ownership and operation of self-storage facilities in the U.S. and Europe. The Fundamental Equity Team considers Public Storage one of the highest quality REITs because of its solid profit margins, strong pricing power and the lack of debt on its balance sheet. Moreover, the Fundamental Equity Team believes Public Storage’s stock underperformed many other REITs during the Reporting Period, when riskier asset classes were in favor, because of its high quality. At the end of the Reporting Period, the Fundamental Equity Team continued to have a positive outlook on the company and believed its sound balance sheet and quality management team should allow it to outperform other REITs over the longer term, especially in a more risk-averse market environment. |
| Q | | Which stocks contributed significantly to the Fund’s relative performance during the Reporting Period? |
| A | | Security selection added to the Fund’s relative returns during the Reporting Period, with Walgreen, Exxon Mobil and Alliance Bernstein Holding L.P. providing the strongest positive contributions. |
| | Walgreen was the top contributor to the Fund’s relative performance during the Reporting Period. Walgreen operates the largest drugstore chain in the U.S., with approximately 18% of the market share for drug prescriptions. Express Scripts, one of the largest pharmacy benefit management organizations in the U.S., has an agreement with Walgreen that allows hundreds of thousands of its customers to use Walgreen’s pharmacies for discounts and related benefits from their Express Scripts prescription drug cards. Walgreen also offers its products by mail, by phone and through the Internet. Early in the first quarter of 2013, Walgreen’s share price rose on reports of higher pharmacy sales and prescription drug orders as well as an increase in the percentage of Express Scripts customers using Walgreen pharmacies. The company’s shares were also boosted by the announcement of a long-term distribution agreement with AmerisourceBergen, one of the world’s largest pharmaceutical services companies, which the Fundamental Equity Team believes could boost the growth of both companies. During the Reporting Period, the Fundamental Equity Team’s outlook on Walgreen grew increasingly positive. Though 2012 had been difficult, Walgreen’s fundamental sales would, in the opinion of the Fundamental Equity Team, improve during 2013. Although Walgreen’s dividend yield, which is slightly above 2%, is lower than other stocks held by the Fund, the Fundamental Equity Team believed at the end of the Reporting Period that Walgreen’s potential total return continued to make the stock attractive. |
| | The Fund benefited from an underweighted position relative to the Russell Index in Exxon Mobil, as the company’s share price declined. During the Reporting Period, Exxon Mobil represented a significant portion of the Russell Index, which is a key reason the Fundamental Equity Team maintained the Fund’s relative underweight, although given the goals of the Fund, the Fundamental Equity Team believes the Russell Index should be considered for reference only. Exxon Mobil is engaged in the exploration and production of crude oil and natural gas, the manufacture of petroleum products and the transportation and sale of crude oil, natural gas and |
5
PORTFOLIO RESULTS
| | petroleum products. Despite the Fund’s underweight, the Fundamental Equity Team had a positive outlook on Exxon Mobil because it had increased its exposure to unconventional sources of energy through acquisitions, partnerships (such as its venture with Rosneft to develop reserves in the Arctic) and exploration in oil and gas basins in the Gulf of Mexico. Unconventional sources of energy include oil shale, oil sands, share gas and synthetic crude products and liquids derived from natural gas. Also, the company increased its dividend by 21% in April 2012, and we believe it remains an industry leader in share repurchases, return on capital employed and cash flow generation. |
| | The Fund’s position in investment manager Alliance Bernstein Holding L.P. contributed to relative performance. The investment management company provides retail services comprising retail mutual funds, sub-advisory relationships with mutual funds sponsored by third parties, and separately managed account programs sponsored by various financial intermediaries and other investment vehicles. In keeping with the Fund’s investment process, and especially within the financials sector, the Fundamental Equity Team aims to own the equities of attractive businesses, such as Alliance Bernstein, that pay meaningful dividends. Near the end of the Reporting Period, Alliance Bernstein reported results that were slightly above expectations. Its research revenues rose on increased trading activity, and the company received inflows of institutional assets, with particularly strong support from Asia and the emerging markets. At the end of the Reporting Period, the stock’s dividend yield was above 7%. |
| Q | | Did the equity portion of the Fund make any significant purchases or sales during the Reporting Period? |
| A | | The Fund purchased PG&E during the Reporting Period. PG&E serves about 5.2 million electric customers and almost 4.3 million natural gas customers in Northern and Central California. The utility is also engaged in electricity generation; procurement and transmission; and natural gas procurement, transportation and storage. The Fundamental Equity Team considers many higher-yielding utilities stocks to be of lower quality and therefore concentrated the Fund’s investments in high-quality utilities, like PG&E, that have slightly lower dividend yields. |
| | The Fund also bought Two Harbors Investment, a REIT that focuses on residential mortgage-backed securities, residential mortgage loans, residential real properties and other financial assets. During the Reporting Period, the company made a secondary equity offering, and at the end of the Reporting Period, the stock had a dividend yield above 9%. At the time of purchase, the Fundamental Equity Team had a positive view of the REIT’s management team and believed the stock valuation was fair and the company had a balanced business model (between agency/non agency and mortgage servicing), which positions it well versus its agency-only peers in the Russell Index. During the Reporting Period, the U.S. economy, a key driver of demand for commercial real estate, continued to improve. Also, the unemployment rate, which spiked in 2009, had been steadily declining. In addition, REITs have been benefiting from their ultra-low cost of capital, especially as investors search for better sources of yield amid historically low interest rates. |
| | The Fund exited its position in American Electric Power, one of the largest electric utilities providers in the U.S., as the Fundamental Equity Team’s investment thesis had largely been met. Uncertainties surrounding the company’s transition from a fully regulated utility to an integrated, or hybrid, model of competitive power generation in Ohio served as a significant overhang on its stock price during 2012. American Electric Power received some favorable rulings from Ohio regulators, which increased the likelihood the transition would become complete, sending shares higher during the latter portion of the Reporting Period. The Fundamental Equity Team believed the catalysts previously identified had played out and reallocated the proceeds toward opportunities the Fundamental Equity Team believed had a more favorable risk-reward profile. |
| | The Fundamental Equity Team eliminated the Fund’s position in Chevron, which engages in petroleum operations, chemicals operations, mining operations, power generation and energy services. The Fundamental Equity Team exited the position, as it found more attractive opportunities among other names in the exploration and production industry. Overall, the Fundamental Equity Team favors companies with strong positions in the most prolific and profitable basins in the U.S. that could potentially grow production and reserves more cost effectively. The Fundamental Equity Team also believes these companies must have a strong operational record, low cost structure and strict financial discipline. |
6
PORTFOLIO RESULTS
| Q | | What changes were made to the Fund’s equity weightings during the Reporting Period? |
| A | | During the Reporting Period, the Fundamental Equity Team reduced the Fund’s underweight relative to the Russell Index in the materials sector and increased its underweight in the consumer discretionary, information technology and health care sectors. The Fundamental Equity Team increased the Fund’s overweights in the consumer staples, energy and telecommunication services sectors. In addition, during the Reporting Period, the Fundamental Equity Team shifted the Fund from overweighted allocations to the financials and utilities sectors to underweighted allocations. The Fundamental Equity Team also moved the Fund from an underweighted position in the industrials sector to a neutral position compared to the Russell Index. |
| Q | | Which fixed income market sectors significantly affected the Fund’s performance during the Reporting Period? |
| A | | During the Reporting Period, the Fund’s fixed income portfolio outperformed the BofA Merrill Lynch Index. The Fund’s overweight to the insurance and commercial services industries within the corporate bond sector contributed positively to relative performance. Also advantageous was individual issue selection among emerging markets corporate bonds and among high yield corporate bonds within the packaging and health care industries. The Fund’s overweight to CCC-rated high yield corporate bonds added value. Detracting was the Fund’s overweight relative to the BofA Merrill Lynch Index in the emerging markets corporate bond sector and its underweight in the metals and mining industry. Individual issue selection among high yield corporate bonds in the insurance, energy and media non-cable industries also dampened relative returns. |
| Q | | How did the Fund’s duration and yield curve positioning strategies affect performance during the Reporting Period? |
| A | | During the Reporting Period, the Fund’s duration strategy detracted from Fund returns, particularly in January 2013 and April 2013. Duration is a measure of the Fund’s sensitivity to changes in interest rates. |
| | The Fund held a slightly long duration position relative to the U. S. Treasury yield curve for most of January 2013, which detracted as U.S. Treasury yields increased (and thus prices decreased) on a combination of generally positive global data, concerns over tightening liquidity in Europe and positive risk sentiment. Near the end of January 2013, the Fixed Income Team began to shorten its duration position so that the Fund finished the month with a very slightly short duration position relative to the U.S. Treasury yield curve. |
| | In April 2013, the Fund’s short duration position detracted as U. S. Treasury yields decreased (and thus prices increased). Softer economic data in the U.S., largely the result of fiscal tightening, and disappointing economic data in Europe helped to push interest rates lower during early April 2013. |
| Q | | What changes were made to the Fund’s fixed income weightings during the Reporting Period? |
| A | | During the Reporting Period, the Fixed Income Team decreased the Fund’s exposure overall to corporate bonds, convertible bonds and emerging markets corporate bonds and slightly increased its exposure to bank loans. |
| Q | | How did the Fund use derivatives and similar instruments during the Reporting Period? |
| A | | During the Reporting Period, the Fundamental Equity Team did not use derivatives as part of its active management strategy. In the fixed income portfolio during the Reporting Period, the Fund used U.S. Treasury futures to hedge and manage interest rate exposure. It also used credit default swaps to implement specific credit-related investment strategies. |
7
PORTFOLIO RESULTS
| Q | | What is the Fundamental Equity Team’s tactical view and strategy for the months ahead? |
| A | | With the U.S. equity market trading near its all-time high at the end of the Reporting Period, the Fundamental Equity Team intends to continue to use a bottom-up, fundamental research process to drive its investment decisions for the equity portion of the Fund, rather than sentiment or headlines. Many of the reasons the Fundamental Equity Team began the Reporting Period with a positive outlook on U.S. equities still held true at the end of the Reporting Period. First, corporate balance sheets remained strong, which the Fundamental Equity Team believes provides companies with the ability to generate shareholder value, even in a slow growth economic environment. Second, the S&P® 500 Index was trading below its historical average price-to-earnings (P/E) ratio, while its dividend yield was greater than the yield on the 10-year U.S. Treasury bond. Third, continued strength in the U.S. housing market should, in the view of the Fundamental Equity Team, provide further support to the economy and boost confidence among consumers. |
| | Of course, risks remain. Fiscal policy, in the opinion of the Fundamental Equity Team, is likely to be a drag on U.S. economic growth as 2013 progresses. Furthermore, with fiscal policy unclear, the Fundamental Equity Team believes political headlines, both in the U.S. and overseas, could impact the U.S. equity market. The Fundamental Equity Team has long been cautious regarding companies that have a high degree of U.S. government dependency, whether it is related to sales, subsidies or regulations. The Fundamental Equity Team believes companies with strong business franchises and competitive advantages could provide some degree of stability in an uncertain environment and that deep research resources, a forward-looking investment process and an actively managed portfolio can help investors preserve capital and potentially outperform the equity market over the long term. |
| Q | | What is the Fixed Income Team’s tactical view and strategy for the months ahead? |
| A | | At the end of the Reporting Period, the Fixed Income Team maintained a positive view on the U.S. economy. The Fixed Income Team believes the combination of a robust housing market recovery and increased business investment is likely to generate enough momentum in the private sector to offset the impact of substantial fiscal tightening. Against this backdrop, the Fixed Income Team continues to favor U.S. high yield corporate bonds and has a positive outlook on a country-specific basis on emerging markets debt. |
| | At the end of the Reporting Period, high yield corporate bond spreads (or, the difference in their yields) were at their tightest levels since October 2007. Though the Fixed Income Team was encouraged by signs of sustainable economic growth during the Reporting Period, high yield companies have been demonstrating less willingness to enhance their creditworthiness and appear to be more inclined to engage in shareholder friendly activities. The Fixed Income Team believes the high yield corporate bond market is apt to pause and then experience some period of consolidation before making further gains. |
| | Meanwhile, at the end of the Reporting Period, the Fixed Income Team saw favorable trends among home builders and building products companies but also recognized these industries within the corporate bond sector may have volatile earnings and yields on high quality names are modest. In addition, the Fixed Income Team saw opportunity in consumer products names based on the belief the housing recovery could lead to a modest improvement in employment over the near term. The Fixed Income Team also continued to favor comparatively stable industries within the corporate bond sector, such as cable, wireless and health care, because many companies in these industries have steady earnings streams and moderate growth prospects. At the end of the Reporting Period, the Fixed Income Team saw opportunity in chemical companies, particularly those that could benefit from both a housing rebound and access to cheap inputs (raw materials) driven by low natural gas prices. |
8
FUND BASICS
Income Builder Fund
as of April 30, 2013
| | | | | | | | | | | | | | | | | | |
| | PERFORMANCE REVIEW | |
| | | November 1, 2012–April 30, 2013 | | Fund Total Return
(based on NAV)1 | | | Income Builder
Composite Index2 | | | Russell 1000
Value Index2 | | | BofA Merrill Lynch
BB-B U.S. High
Yield Constrained
Index2 | |
| | Class A | | | 9.94 | % | | | 11.34 | % | | | 16.31 | % | | | 6.47 | % |
| | Class B | | | 9.54 | | | | 11.34 | | | | 16.31 | | | | 6.47 | |
| | Class C | | | 9.58 | | | | 11.34 | | | | 16.31 | | | | 6.47 | |
| | Institutional | | | 10.13 | | | | 11.34 | | | | 16.31 | | | | 6.47 | |
| | | Class IR | | | 10.07 | | | | 11.34 | | | | 16.31 | | | | 6.47 | |
| | 1 | | The net asset value (“NAV”) represents the net assets of the class of the Fund (ex-dividend) divided by the total number of shares of the class outstanding. The Fund’s performance assumes the reinvestment of dividends and other distributions. The Fund’s performance does not reflect the deduction of any applicable sales charges. |
| | 2 | | The Russell 1000 Value Index measures the performance of the large-cap value segment of the U.S. equity universe. It includes those Russell 1000 Index companies with lower price-to-book ratios and lower expected growth values. This index is constructed to provide a comprehensive and unbiased barometer for the large-cap value segment. The Index is completely reconstituted annually to ensure new and growing equities are included and that the represented companies continue to reflect value characteristics. The BofA Merrill Lynch BB-B US High Yield Constrained Index contains all securities in The BofA Merrill Lynch US High Yield Index rated BB1 through B3, based on an average of Moody’s, S&P and Fitch, but caps issuer exposure at 2%. Index constituents are capitalization-weighted, based on their current amount outstanding, provided the total allocation to an individual issuer does not exceed 2%. Issuers that exceed the limit are reduced to 2% and the face value of each of their bonds is adjusted on a pro-rata basis. Similarly, the face values of bonds of all other issuers that fall below the 2% cap are increased on a pro-rata basis. In the event there are fewer than 50 issuers in the Index, each is equally weighted and the face values of their respective bonds are increased or decreased on a pro-rata basis. The Fund’s Income Builder Composite Index consists of the Russell 1000 Value Index (60%) and the BofA Merrill Lynch BB-B U.S. High Yield Constrained Index (40%). The Index figures do not include any deduction for fees, expenses or taxes. It is not possible to invest directly in an index. |
| | | | The returns set forth in the table above represent past performance. Past performance does not guarantee future results. The Fund’s investment return and principal value will fluctuate so that an investor’s shares, when redeemed, may be worth more or less than their original cost. Current performance may be lower or higher than the performance quoted above. Please visit our web site at www.goldmansachsfunds.com to obtain the most recent month-end returns. Performance reflects applicable fee waivers and/or expense limitations in effect during the periods shown. In their absence, performance would be reduced. Returns do not reflect the deduction of taxes that a shareholder would pay on Fund distributions or the redemption of Fund shares. |
9
FUND BASICS
| | | | | | | | | | | | | | |
| | PERFORMANCE REVIEW continued | |
| | | As of April 30, 2013 | | 12-Month
Distribution Rate | | | 30-Day Standardized
Subsidized Yield | | | 30-Day Standardized
Unsubsidized Yield | |
| | Class A | | | 6.42 | % | | | 3.16 | % | | | 2.65 | % |
| | Class B | | | 5.67 | | | | 2.61 | | | | 2.07 | |
| | Class C | | | 5.78 | | | | 2.61 | | | | 2.05 | |
| | Institutional | | | 6.71 | | | | 3.75 | | | | 3.19 | |
| | | Class IR | | | 6.57 | | | | 3.60 | | | | 3.04 | |
| | The | | 12-month distribution rate is calculated by taking the sum of all cash distributions over the past 12 months and dividing by the month end NAV in the last month of the period. Distributions may include interest from fixed income, dividends from equities, short term and long term capital gains, return of capital, and special distributions. Returns of capital distributions may include a return of some or all of the money that an investor invested in Fund shares. Distributions from securities such as MLPs passing through the Fund may also be characterized as returns of capital. Special distributions may include any off-cycle distributions that occur outside of regular interest or dividend payment dates, such as when a company opts to pay a special dividend. The amounts and sources of distribution are not provided for tax reporting purposes. The Fund reports the character of distributions for federal income tax purposes each calendar year on Form 1099-DIV. Distributions will fluctuate over time and a large proportion of the distribution may occur at the end of the year in the form of capital gains. Distributions and market value movements affect the NAV of the Fund and will also affect this calculation. 12-month distribution rate numbers are based on historical distributions and NAVs and are not predictive of future distributions or yields. 12-month distribution rate is calculated to provide a sense of the total cash flow associated with investment in the Fund, but should not be confused with SEC yield, dividend yield or interest yield. |
| | The | | 30-Day Standardized Subsidized Yield of the Fund is calculated by dividing the net investment income per share (as defined by the SEC) earned by the Fund over a 30-day period (ending on the stated month-end date) by the maximum public offering price (“POP”) per share of the Fund on the last day of the period. This number is then annualized. This yield does not necessarily reflect income actually earned and distributed by the Fund and, therefore, may not be correlated with the dividends or other distributions paid to shareholders. The 30-Day Standardized Unsubsidized Yield does not reflect any applicable fee waivers or expense reductions. Absent any expense reimbursement or fee waiver, it may be that the subsidized and unsubsidized yields are the same. |
| | | | The returns set forth in the table above represent past performance. Past performance does not guarantee future results. The Fund’s investment return and principal value will fluctuate so that an investor’s shares, when redeemed, may be worth more or less than their original cost. Current performance may be lower or higher than the performance quoted above. Please visit our web site at www.goldmansachsfunds.com to obtain the most recent month-end returns. Performance reflects applicable fee waivers and/or expense limitations in effect during the periods shown. In their absence, performance would be reduced. Returns do not reflect the deduction of taxes that a shareholder would pay on Fund distributions or the redemption of Fund shares. |
10
FUND BASICS
| | | | | | | | | | | | | | |
| | STANDARDIZED TOTAL RETURNS3 |
| | | For the period ended 3/31/13 | | One Year | | | Five Years | | Ten Years | | Since Inception | | Inception Date |
| | Class A | | | 6.68 | % | | 6.23% | | 7.06% | | 6.86% | | 10/12/94 |
| | Class B | | | 6.79 | | | 6.28 | | 7.00 | | 5.77 | | 5/1/96 |
| | Class C | | | 11.01 | | | 6.64 | | 6.87 | | 3.94 | | 8/15/97 |
| | Institutional | | | 13.35 | | | 7.86 | | 8.20 | | 5.20 | | 8/15/97 |
| | | Class IR | | | 13.20 | | | N/A | | N/A | | 14.36 | | 8/31/10 |
| | 3 | | The Standardized Total Returns are average annual total returns as of the most recent calendar quarter-end. They assume reinvestment of all distributions at NAV. These returns reflect a maximum initial sales charge of 5.5% for Class A Shares, the assumed contingent deferred sales charge for Class B Shares (5% maximum declining to 0% after six years) and the assumed contingent deferred sales charge for Class C Shares (1% if redeemed within 12 months of purchase). Class B Shares convert automatically to Class A Shares on or about the fifteenth day of the last month of the calendar quarter that is eight years after purchase. Returns for Class B Shares for the period after conversion reflect the performance of Class A Shares. Because Institutional and Class IR Shares do not involve a sales charge, such a charge is not applied to their Standardized Total Returns. The Fund’s Class B Shares are no longer available for purchase by new or existing shareholders (although current Class B shareholders may continue to reinvest income and capital gains distributions into Class B Shares, and Class B shareholders may continue to exchange their shares for Class B Shares of certain other Goldman Sachs Funds). |
| | | | The returns set forth in the table above represent past performance. Past performance does not guarantee future results. The Fund’s investment return and principal value will fluctuate so that an investor’s shares, when redeemed, may be worth more or less than their original cost. Current performance may be lower or higher than the performance quoted above. Please visit our web site at www.goldmansachsfunds.com to obtain the most recent month-end returns. Performance reflects applicable fee waivers and/or expense limitations in effect during the periods shown. In their absence, performance would be reduced. Returns do not reflect the deduction of taxes that a shareholder would pay on Fund distributions or the redemption of Fund shares. |
| | | | | | | | | | |
| | EXPENSE RATIOS4 | |
| | | | | Net Expense Ratio (Current) | | | Gross Expense Ratio (Before Waivers) | |
| | Class A | | | 0.95 | % | | | 1.44 | % |
| | Class B | | | 1.70 | | | | 2.19 | |
| | Class C | | | 1.70 | | | | 2.19 | |
| | Institutional | | | 0.55 | | | | 1.04 | |
| | | Class IR | | | 0.70 | | | | 1.19 | |
| | 4 | | The expense ratios of the Fund, both current (net of applicable fee waivers and/or expense limitations) and before waivers (gross of applicable fee waivers and/or expense limitations) are as set forth above according to the most recent publicly available Prospectus for the Fund and may differ from the expense ratios disclosed in the Financial Highlights in this report. The Fund’s waivers and/or expense limitations will remain in place through at least February 28, 2014, and prior to such date the Investment Adviser may not terminate the arrangements without the approval of the Fund’s Board of Trustees. If these arrangements are discontinued in the future, the expense ratios may change without shareholder approval. |
11
FUND BASICS
| | | | | | | | |
| | TOP TEN EQUITY HOLDINGS AS OF 4/30/135 |
| | | Holding | | % of Net Assets | | | Line of Business |
| | General Electric Co. | | | 2.1 | % | | Industrial Conglomerates |
| | AT&T, Inc. | | | 2.0 | | | Diversified Telecommunication Services |
| | JPMorgan Chase & Co. | | | 1.7 | | | Diversified Financial Services |
| | Merck & Co., Inc. | | | 1.5 | | | Pharmaceuticals |
| | Pfizer, Inc. | | | 1.3 | | | Pharmaceuticals |
| | PG&E Corp. | | | 1.3 | | | Multi-Utilities |
| | Exxon Mobil Corp. | | | 1.3 | | | Oil, Gas & Consumable Fuels |
| | Plains All American Pipeline LP | | | 1.1 | | | Oil, Gas & Consumable Fuels |
| | Vodafone Group PLC ADR | | | 1.1 | | | Wireless Telecommunication Services |
| | | The Boeing Co. | | | 1.1 | | | Aerospace & Defense |
| | 5 | | The top 10 holdings may not be representative of the Fund’s future investments. |
|
| FUND’S EQUITY SECTOR ALLOCATIONS VS. BENCHMARK6 |
| As of April 30, 2013 |
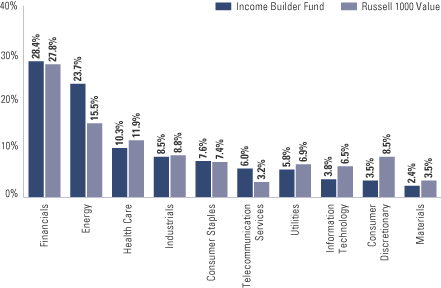
| | 6 | | The Fund is actively managed and, as such, its composition may differ over time. Consequently, the Fund’s overall sector allocations may differ from the percentages contained in the graph above. The graph categorizes investments using Global Industry Classification Standard (“GICS”), however, the sector classifications used by the portfolio management team may differ from GICS. The percentage shown for each investment category reflects the value of investments in that category as a percentage of the total value of the Fund’s equity investments. The graph depicts the Fund’s investments but may not represent the Fund’s market exposure due to the exclusion of certain derivatives, if any, as listed in the Additional Investment Information section of the Schedule of Investments. |
12
FUND BASICS
|
| FUND’S FIXED INCOME FUND COMPOSITION7 |
| As of April 30, 2013 |
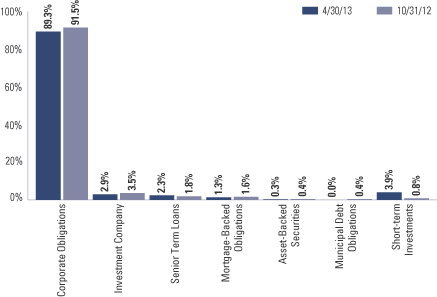
| | 7 | | The percentage shown for each investment category reflects the value of investments in that category as a percentage of the Fund’s fixed income investments. Short-term investments represent repurchase agreements. The graph depicts the Fund’s investments but may not represent the Fund’s market exposure due to the exclusion of certain derivatives, if any, as listed in the Additional Investment Information section of the Schedule of Investments. |
13
PORTFOLIO RESULTS
Goldman Sachs Rising Dividend Growth Fund
Investment Objective
The Fund seeks long-term growth of capital and current income.
Portfolio Management Discussion and Analysis
Below, the portfolio management team of Dividend Assets Capital, LLC, the Fund’s sub-adviser, discusses the Goldman Sachs Rising Dividend Growth Fund’s (the “Fund”) performance and positioning for the six-month period ended April 30, 2013 (the “Reporting Period”).
| Q | | How did the Fund perform during the Reporting Period? |
| A | | During the Reporting Period, the Fund’s Class A, C, Institutional, IR and R Shares generated cumulative total returns, without sales charges, of 11.72%, 11.27%, 11.95%, 11.81% and 11.59%, respectively. These returns compare to the 14.42% cumulative total return of the Fund’s benchmark, the Standard & Poor’s® 500 Index (with dividends reinvested) (the “S&P 500 Index”), during the same time period. |
| Q | | What economic and market factors most influenced the equity markets as a whole during the Reporting Period? |
| A | | During the Reporting Period, the U.S. equity markets faced the headwinds of the presidential election, the budget deficit and resulting sequester, and the slow growth economy both domestically and globally, particularly in Europe. Despite slow economic growth and high volatility, cash-rich corporate balance sheets, combined with record low borrowing costs, improvement in the housing and labor markets, cash on the sidelines and low yields on fixed income assets, enticed investors into the U.S. equity markets. The result was near-market highs at the end of April 2013. |
| | Looking at the economy more closely, U.S. economic growth, though below expectations, rebounded in the first quarter of 2013 after slowing in the fourth quarter of 2012. The shortfall in growth was attributed to a significant drop in the federal government’s spending on defense, resulting in a 2.5% increase in Gross Domestic Product (“GDP”) versus the 3.3% forecast. However, despited a hike in payroll taxes and delayed income tax refunds, consumer spending, which accounts for approximately 70% of GDP, rose 3.2% in the first quarter of 2013, the most in two years, following 1.8% growth in the fourth quarter of 2012. |
| | Housing was no longer a drag on the economy, but rather outperformed the overall economy. Indeed, the March 2013 seasonally adjusted sales of single family homes were up 18.5% over March 2012, and inventory was at a 47-year low. |
| | The U.S. dollar strengthened at a time when exports were already under pressure, due to many global economies, particularly that of the Eurozone, a key export market, weakening further. Given the news out of Cyprus and perhaps Slovenia next, it could, in our view, be several years before significant strength returns in those markets. |
| | At the same time, catastrophes — political, financial, natural and manmade — continued to plague the headlines and the equity markets. Uncertainty often creates volatility. Equity markets abhor uncertainty, but at the end of the Reporting Period, it appeared the U.S. equity markets were remarkably resilient, with volatility levels coming down to pre-recession levels as investors seemed willing to look beyond the “noise” and take on added risk to try to build and protect their wealth and retirement. |
14
PORTFOLIO RESULTS
| Q | | What key factors were responsible for the Fund’s performance during the Reporting Period? |
| A | | The Fund underperformed the S&P 500 Index during the Reporting Period for three primary reasons. First was sector allocation overall. Hurting most was the Fund’s average 7.7% cash position during a Reporting Period when the S&P 500 Index rallied strongly. Second, and similarly, were the Fund’s defensive characteristics. The Fund had a beta, a measure of volatility compared to the broad U.S. equity market, of 0.79, with a correlation to the S&P 500 Index of 0.93% in general. However, the Fund’s correlation was only 0.88 during the days when the market was up, resulting in 66 losing days compared to 63 winning days during the Reporting Period. Third was less robust performance within the large-cap holdings of the Fund, due primarily to lackluster returns from some of the Fund’s energy-related Master Limited Partnerships (“MLPs”), which are not components of the S&P 500 Index. |
| Q | | Which equity market sectors most significantly affected Fund performance? |
| A | | As indicated earlier, cash was the single largest negative affecting Fund performance during the Reporting Period. Of the sectors within the S&P 500 Index, the largest detractors were consumer discretionary, health care and financials. In consumer discretionary, weak stock selection more than offset the positive effect of the Fund’s overweighted allocation to the strongly-performing sector. The smaller-cap holdings within the consumer discretionary sector, where the Fund had exposure, underperformed their larger-cap peers. Both stock selection in and an underweighted exposure to the health care sector, which outpaced the S&P 500 Index during the Reporting Period, hampered results. In financials, having an underweighted allocation to the strongly-performing sector, detracted, more than offsetting the positive impact of effective stock selection within the sector. The Fund’s strategy of only buying the stocks of companies where the dividend has increased every year for at least ten years at an average rate of approximately 10% per year1 limited the Fund’s selections within the financials sector, since investment, commercial and regional banks no longer qualified after the most recent financial meltdown. |
| | Partially offsetting these detractors was the positive contributions made by positioning in the energy, information technology and consumer staples sectors, each driven primarily by effective stock selection. Having an underweighted allocation to information technology, which lagged the S&P 500 Index during the Reporting Period, also helped. In energy, effective stock selection, including selection of several strongly performing energy MLPs, more than offset the detracting effect of being overweight the lagging sector. In information technology, not having a position in Apple, the largest component in the S&P 500 Index information technology sector, contributed most, as Apple’s share price declined significantly during the Reporting Period. In consumer staples, the Fund’s emphasis on faster dividend growers rather than high yielding stocks proved particularly advantageous. |
| Q | | Which stocks detracted significantly from the Fund’s performance during the Reporting Period? |
| A | | Detracting most from the Fund’s results relative to its benchmark index were positions in independent oil and natural gas exploration and production company Linn Energy, precious metals royalties manager Royal Gold and discount retailer Family Dollar Stores. |
| | Linn Energy experienced a challenging operating environment during the Reporting Period. Specifically, the company’s production was negatively affected by the weather, infrastructure-related curtailments and lower than expected oil production. Severe winter weather in February and March 2013 at its mid-continent operations caused significant shut-ins and drilling delays. |
| | Royal Gold, a new purchase for the Fund during the Reporting Period, is the second largest gold royalty publicly-traded company in the U.S. We had established the Fund position because its stock had shown strong positive correlation with gold over the years, with low capital requirements as a gold royalty company. We believed the position would provide some inflation hedge as well as some diversification to the Fund’s portfolio. However, during the Reporting Period, Royal Gold’s share price had a strong correlation with the gold spot price, despite a business more stable than the share price indicated, in our view. Less than anticipated global economic growth along with muted inflation concerns drove a severe sell-off in commodities, especially gold, during the Reporting Period. In turn, the gold spot price corrected dramatically, pulling most of the gold- related stocks along with it. We trimmed much of the Fund’s position in Royal Gold by the end of the Reporting Period. |
15
| | 1 | Dividends are not guaranteed and a company’s future ability to pay dividends may be limited. |
PORTFOLIO RESULTS
| | Family Dollar Stores has been broadening its product line to include more staples, such as food and tobacco, which tend to be lower margin businesses. Following the payroll tax hike and the delay in income tax refunds, Family Dollar Stores’ discretionary business suffered, resulting in margin pressures. We trimmed the Fund’s position in Family Dollar Stores by the end of the Reporting Period. |
| Q | | What were some of the Fund’s best-performing individual stocks? |
| A | | Church & Dwight, a leading household products company with a powerful portfolio of brands, was the strongest contributor to the Fund’s results during the Reporting Period. The company delivered double-digit revenue, earnings and dividend growth, when competitors were struggling to deliver low single-digit results. Church & Dwight’s margins expanded, and the company outperformed its peers. |
| | Another strong contributor to the Fund’s results was Plains All American Pipeline L.P., a midstream energy company primarily focused on the transportation, storage, terminaling and marketing of crude oil, refined products and related petroleum products. (The midstream component of the energy industry is usually defined as those companies providing products or services that help link the supply side, i.e., energy producers, and the demand side, i.e., energy end-users, for any type of energy commodity. Such midstream business can include, but are not limited to, those that process, store, market and transport various energy commodities.) The company’s business tends to be less exposed to commodity risks, as most of its distributable cash flow is fee-based with long-term contracts in place. Additionally, the company’s expansion into railroad assets adds flexibility to its extensive pipeline system over the long term, in our view. |
| | Similarly, Energy Transfer Equity L.P. was a strong contributor to the Fund’s performance during the Reporting Period. Energy Transfer Equity L.P. owns equity interests in Energy Transfer Partners, a limited partnership involved in the natural gas midstream, transportation and storage business, as well as a retail propane business. The acquisition it recently announced of Regency Energy Partners L.P. was widely expected to be beneficial to Enterprise Transfer Partners and its parent, Energy Transfer Equity L.P. The accretion is expected to increase by mid-2017 given what are known as Incentive Distribution Rights (“IDRs”). (IDRs give a limited partnership’s general partner an increasing share in the incremental distributable cash flow the partnership generates. This occurs alongside of per-unit distribution increases to the limited partners. The general partner’s share of incremental distributable cash flow usually starts at 2% and climbs to higher levels such as 20% or 50%.) Energy Transfer Equity L.P. will effectively become a pure general partner, receiving all of its cash flow from its limited partnership/general partner stakes in Energy Transfer Partners and Regency Energy Partners. Energy Transfer Equity L.P.’s distribution growth forecast is from 15% in 2013 to 22% in 2016. |
| Q | | How did the Fund use derivatives during the Reporting Period? |
| | The Fund did not use derivatives during the Reporting Period. |
| Q | | Did the Fund make any significant purchases or sales during the Reporting Period? |
| A | | In addition to those purchases already mentioned, we initiated a Fund position in asset manager T. Rowe Price during the Reporting Period, as we anticipated outflows from money market funds into equity and balanced strategies, and T. Rowe Price offers low costs products. |
| | We also established a Fund position in Genesis Energy L.P., an MLP, as we shifted toward oil assets from natural gas assets. Genesis Energy L.P.’s business primarily relates to owning and operation of crude oil gathering, marketing and pipeline operations, with railroad assets and what we considered to be an impressive distribution record. |
| | During the Reporting Period, we eliminated the Fund’s positions in Coca-Cola and in Fastenal. Coca-Cola’s 10-year trailing dividend growth rate fell below 10%. Fastenal issued a special dividend late in 2012 and cut its regular dividend during the first quarter of 2013, which in both cases meant the company no longer met the Fund’s investment criteria. |
| Q | | Were there any notable changes in the Fund’s weightings during the Reporting Period? |
| | We strive to select stocks in those sectors that we believe have strong potential to outperform the market given anticipated market conditions. During the Reporting Period, the Fund’s exposure to the energy, materials, industrials and financials sectors increased, and its allocations to the consumer discretionary and health care sectors decreased. |
16
PORTFOLIO RESULTS
| Q | | How was the Fund positioned relative to its benchmark index at the end of the Reporting Period? |
| A | | At the end of April 2013, the Fund had overweighted positions relative to the S&P 500 Index in materials, energy (including MLPs) and industrials. On the same date, the Fund had underweighted positions compared to the S&P 500 Index in telecommunication services, consumer staples, health care, information technology and financials and was rather neutrally weighted to the S&P 500 Index in consumer discretionary. The Fund had no exposure to the utilities sector at the end of the Reporting Period. |
| Q | | What is the Fund’s tactical view and strategy for the months ahead? |
| A | | At the end of the Reporting Period, we anticipate the likely rate of economic growth during the second half of 2013 to be positive but nominal, with stabilization of public sector debt remaining a substantial challenge. That said, if April 2013 economic data improves relative to March 2013, then the expectation that the Federal Reserve may start tapering its easing program later this year may cause volatility in the U.S. equity market, particularly among dividend-paying stocks, as the chase for yield may slow. |
| | Even with this view, we intend to stay disciplined to the Fund’s strategy of focusing on companies that increase their dividends on a consistent basis. We also intend to position the Fund to enhance any upside potential capture by reducing its cash position toward the target 5.5% level and to gradually move to more cyclical sectors, such as materials and energy, and to growth stocks where we see multi-year growth opportunities with reasonable valuations. In our view, more defensive stocks currently have valuations at a premium, which raises concerns for us about their ability to grow dividends at accelerated rates. We also intend over the coming months to diversify the Fund’s holdings in energy MLPs by shifting more weight to crude oil and refined product, where we believe we see growth at a profitable level. As long as the price of oil stays above $85 per barrel, we believe the incentives for energy producers will likely keep growing the production levels. In turn, midstream services and transportation energy MLPs should benefit. Going forward, we further intend to focus our research on other industries we expect to benefit from near-term trends. Examples might include financials benefiting from strong equity markets; health care companies benefiting from policy changes and a growing middle class in developing nations; energy and industrials companies benefiting from the build-out of the pipeline infrastructure; and consumer discretionary companies benefiting from increasing consumer confidence and expectations for second-half 2013 GDP expansion. While near-term trends are important, a key driver of our research remains our long-term strategy to invest in companies that are industry leaders with strong brands and growing global exposure that produce or impact essential products and services. |
| | Of course, we continue to monitor domestic and global economies, geopolitical factors, interest rates and equity market fundamentals as we actively manage the Fund, with a focus on income through quality in an effort to offer investors the potential for rising income and competitive total returns with lower volatility. |
17
FUND BASICS
Rising Dividend Growth Fund
as of April 30, 2013
| | | | | | | | | | |
| | PERFORMANCE REVIEW | |
| | | November 1, 2012–April 30, 2013 | | Fund Total Return
(based on NAV)1 | | | S&P 500 Index2 | |
| | Class A | | | 11.72 | % | | | 14.42 | % |
| | Class C | | | 11.27 | | | | 14.42 | |
| | Institutional | | | 11.95 | | | | 14.42 | |
| | Class IR | | | 11.81 | | | | 14.42 | |
| | | Class R | | | 11.59 | | | | 14.42 | |
| | 1 | | The net asset value (“NAV”) represents the net assets of the class of the Fund (ex-dividend) divided by the total number of shares of the class outstanding. The Fund’s performance reflects the reinvestment of dividends and other distributions. The Fund’s performance does not reflect the deduction of any applicable sales charges. |
| | 2 | | The S&P 500 Index is the Standard & Poor’s 500 Composite Index of 500 stocks, an unmanaged index of common stock prices. The Index figures do not reflect any deduction for fees, expenses or taxes. It is not possible to invest directly in an index. |
| | | | | | | | | | | | | | |
| | STANDARDIZED TOTAL RETURNS3 |
| | | For the period ended 3/31/13 | | One Year | | | Five Years | | Since Inception | | | Inception Date |
| | Class A | | | 6.05 | % | | 6.49% | | | 7.13 | % | | 3/23/04 |
| | Class C | | | 10.40 | | | 7.19 | | | 7.46 | | | 4/14/05 |
| | Institutional | | | 12.66 | | | 8.20 | | | 7.13 | | | 3/21/07 |
| | Class IR | | | 12.53 | | | N/A | | | 13.61 | | | 2/27/12 |
| | | Class R | | | 11.96 | | | N/A | | | 12.97 | | | 2/27/12 |
| | 3 | | The Standardized Total Returns are average annual total returns as of the most recent calendar quarter-end. They assume reinvestment of all distributions at NAV. Effective February 27, 2012, the Rising Dividend Growth Fund, a series of Dividend Growth Trust (the “Predecessor Fund”), was reorganized into the Fund. As accounting successor to the Predecessor Fund, the Fund has assumed the Predecessor Fund’s historical performance. These returns reflect a maximum initial sales charge of 5.5% for Class A Shares and the assumed contingent deferred sales charge for Class C Shares (1% if redeemed within 12 months of purchase). Prior to February 27, 2012 (the effective date of the reorganization of the Predecessor Fund into the Fund), the maximum initial sales charge applicable to sales of Class A Shares of the Predecessor Fund was 5.75%, which is not reflected in the average annual total return figures shown. Because Institutional, Class IR and Class R Shares do not involve a sales charge, such a charge is not applied to their Standardized Total Returns. |
| | | | The returns set forth in the tables above represent past performance. Past performance does not guarantee future results. The Fund’s investment return and principal value will fluctuate so that an investor’s shares, when redeemed, may be worth more or less than their original cost. Current performance may be lower or higher than the performance quoted above. Please visit our web site at www.goldmansachsfunds.com to obtain the most recent month-end returns. Performance reflects applicable fee waivers and/or expense limitations in effect during the periods shown. In their absence, performance would be reduced. Returns do not reflect the deduction of taxes that a shareholder would pay on Fund distributions or the redemption of Fund shares. |
18
FUND BASICS
| | | | | | | | | | |
| | EXPENSE RATIOS4 | |
| | | | | Net Expense Ratio (Current) | | | Gross Expense Ratio (Before Waivers) | |
| | Class A | | | 1.20 | % | | | 1.32 | % |
| | Class C | | | 1.95 | | | | 2.07 | |
| | Institutional | | | 0.80 | | | | 0.92 | |
| | Class IR | | | 0.95 | | | | 1.07 | |
| | | Class R | | | 1.45 | | | | 1.57 | |
| | 4 | | The expense ratios of the Fund, both current (net of applicable fee waivers and/or expense limitations) and before waivers (gross of applicable fee waivers and/or expense limitations) are as set forth above according to the most recent publicly available Prospectus for the Fund and may differ from the expense ratios disclosed in the Financial Highlights in this report. The Fund’s waivers and/or expense limitations will remain in place through at least January 28, 2014, and prior to such date the Investment Adviser may not terminate the arrangements without the approval of the Fund’s Board of Trustees. If these arrangements are discontinued in the future, the expense ratios may change without shareholder approval. |
| | | | | | | | |
| | TOP TEN HOLDINGS AS OF 4/30/135 |
| | | Holding | | % of Net Assets | | | Line of Business |
| | VF Corp. | | | 3.2 | % | | Textiles, Apparel & Luxury Goods |
| | International Business Machines Corp. | | | 3.1 | | | IT Services |
| | Novo Nordisk A/S ADR | | | 3.0 | | | Pharmaceuticals |
| | Polaris Industries, Inc. | | | 2.9 | | | Leisure Equipment & Products |
| | T. Rowe Price Group, Inc. | | | 2.8 | | | Capital Markets |
| | Canadian National Railway Co. | | | 2.8 | | | Road & Rail |
| | Roper Industries, Inc. | | | 2.8 | | | Electrical Equipment |
| | EOG Resources, Inc. | | | 2.8 | | | Oil, Gas & Consumable Fuels |
| | Franklin Resources, Inc. | | | 2.8 | | | Capital Markets |
| | | TJX Cos., Inc. | | | 2.7 | | | Specialty Retail |
| | 5 | | The top 10 holdings may not be representative of the Fund’s future investments. |
19
FUND BASICS
|
| FUND VS. BENCHMARK SECTOR ALLOCATION6 |
| As of April 30, 2013 |
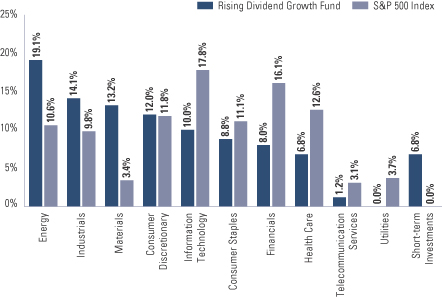
| | 6 | | The Fund is actively managed and, as such, its composition may differ over time. Consequently, the Fund’s overall sector allocations may differ from percentages contained in the graph above. The graph categorizes investments using Global Industry Classification Standard (“GICS”), however, the sector classifications used by the portfolio management team may differ from GICS. The percentage shown for each investment category reflects the value of investments in that category as a percentage of market value. Short-term investments represent Repurchase Agreements. The graph depicts the Fund’s investments but may not represent the Fund’s market exposure due to the exclusion of certain derivatives, if any, as listed in the Additional Investment Information section of the Schedule of Investments. |
20
GOLDMAN SACHS INCOME BUILDER FUND
Schedule of Investments
April 30, 2013 (Unaudited)
| | | | | | | | |
Shares | | | Description | | Value | |
| | | | | | | | |
| | Common Stocks – 47.7% | |
| | Aerospace & Defense – 1.5% | | | | |
| | 10,932 | | | General Dynamics Corp. | | $ | 808,531 | |
| | 22,968 | | | The Boeing Co. | | | 2,099,505 | |
| | | | | | | | |
| | | | | | | 2,908,036 | |
| | |
| | Beverages – 0.5% | | | | |
| | 21,377 | | | The Coca-Cola Co. | | | 904,888 | |
| | |
| | Capital Markets – 1.1% | | | | |
| | 42,685 | | | AllianceBernstein Holding LP | | | 1,011,207 | |
| | 65,692 | | | Ares Capital Corp. | | | 1,192,967 | |
| | | | | | | | |
| | | | | | | 2,204,174 | |
| | |
| | Commercial Banks – 1.7% | | | | |
| | 28,727 | | | HSBC Holdings PLC ADR | | | 1,575,963 | |
| | 18,513 | | | M&T Bank Corp. | | | 1,855,003 | |
| | | | | | | | |
| | | | | | | 3,430,966 | |
| | |
| | Commercial Services & Supplies – 0.8% | | | | |
| | 36,227 | | | Waste Management, Inc. | | | 1,484,582 | |
| | |
| | Communications Equipment – 0.4% | | | | |
| | 37,576 | | | Cisco Systems, Inc. | | | 786,090 | |
| | |
| | Computers & Peripherals – 1.5% | | | | |
| | 3,613 | | | Apple, Inc. | | | 1,599,656 | |
| | 69,467 | | | Hewlett-Packard Co. | | | 1,431,020 | |
| | | | | | | | |
| | | | | | | 3,030,676 | |
| | |
| | Consumer Finance – 1.0% | | | | |
| | 92,808 | | | SLM Corp. | | | 1,916,485 | |
| | |
| | Containers & Packaging – 1.2% | | | | |
| | 25,484 | | | Packaging Corp. of America | | | 1,212,019 | |
| | 52,070 | | | Sealed Air Corp. | | | 1,151,788 | |
| | | | | | | | |
| | | | | | | 2,363,807 | |
| | |
| | Diversified Financial Services – 1.7% | | | | |
| | 66,866 | | | JPMorgan Chase & Co. | | | 3,277,103 | |
| | |
| | Diversified Telecommunication Services – 2.0% | | | | |
| | 102,322 | | | AT&T, Inc. | | | 3,832,982 | |
| | |
| | Electric Utilities – 1.6% | | | | |
| | 18,322 | | | Duke Energy Corp. | | | 1,377,814 | |
| | 54,587 | | | PPL Corp. | | | 1,822,114 | |
| | | | | | | | |
| | | | | | | 3,199,928 | |
| | |
| | Energy Equipment & Services – 0.6% | | | | |
| | 29,062 | | | Halliburton Co. | | | 1,242,982 | |
| | |
| | Food & Staples Retailing – 1.5% | | | | |
| | 11,456 | | | Wal-Mart Stores, Inc. | | | 890,360 | |
| | 40,801 | | | Walgreen Co. | | | 2,020,058 | |
| | | | | | | | |
| | | | | | | 2,910,418 | |
| | |
| | Health Care Providers & Services – 0.9% | | | | |
| | 30,576 | | | Aetna, Inc. | | | 1,756,285 | |
| | |
| | | | | | | | |
| | Common Stocks – (continued) | |
| | Household Products – 0.9% | | | | |
| | 22,290 | | | The Procter & Gamble Co. | | $ | 1,711,203 | |
| | |
| | Industrial Conglomerates – 2.1% | | | | |
| | 181,564 | | | General Electric Co. | | | 4,047,062 | |
| | |
| | Insurance – 2.5% | | | | |
| | 6,735 | | | Everest Re Group Ltd. | | | 909,158 | |
| | 30,854 | | | Prudential Financial, Inc. | | | 1,864,199 | |
| | 14,737 | | | The Travelers Cos., Inc. | | | 1,258,687 | |
| | 19,937 | | | Willis Group Holdings PLC | | | 791,100 | |
| | | | | | | | |
| | | | | | | 4,823,144 | |
| | |
| | Media – 0.9% | | | | |
| | 28,584 | | | Viacom, Inc. Class B | | | 1,829,090 | |
| | |
| | Multi-Utilities – 1.3% | | | | |
| | 51,823 | | | PG&E Corp. | | | 2,510,306 | |
| | |
| | Oil, Gas & Consumable Fuels – 11.4% | | | | |
| | 42,330 | | | BP PLC ADR | | | 1,845,588 | |
| | 30,373 | | | DCP Midstream Partners LP | | | 1,491,922 | |
| | 46,625 | | | El Paso Pipeline Partners LP | | | 1,997,415 | |
| | 24,063 | | | Enbridge Energy Partners LP | | | 717,077 | |
| | 40,122 | | | Energy Transfer Partners LP | | | 1,997,674 | |
| | 32,108 | | | ENI SpA ADR | | | 1,535,084 | |
| | 27,919 | | | Exxon Mobil Corp. | | | 2,484,512 | |
| | 45,147 | | | Linn Energy LLC | | | 1,743,126 | |
| | 32,429 | | | MarkWest Energy Partners LP | | | 2,049,513 | |
| | 10,004 | | | Occidental Petroleum Corp. | | | 892,957 | |
| | 26,009 | | | ONEOK Partners LP | | | 1,407,087 | |
| | 37,669 | | | Plains All American Pipeline LP | | | 2,162,954 | |
| | 16,877 | | | TC Pipelines LP | | | 793,219 | |
| | 28,873 | | | Teekay LNG Partners LP | | | 1,203,715 | |
| | | | | | | | |
| | | | | | | 22,321,843 | |
| | |
| | Pharmaceuticals – 4.3% | | | | |
| | 15,027 | | | Eli Lilly & Co. | | | 832,195 | |
| | 15,157 | | | Johnson & Johnson | | | 1,291,831 | |
| | 60,883 | | | Merck & Co., Inc. | | | 2,861,501 | |
| | 11,627 | | | Novartis AG ADR | | | 857,608 | |
| | 89,039 | | | Pfizer, Inc. | | | 2,588,364 | |
| | | | | | | | |
| | | | | | | 8,431,499 | |
| | |
| | Real Estate Investment Trusts – 2.8% | | | | |
| | 10,085 | | | AvalonBay Communities, Inc. | | | 1,341,708 | |
| | 18,610 | | | Digital Realty Trust, Inc. | | | 1,312,377 | |
| | 4,789 | | | Simon Property Group, Inc. | | | 852,779 | |
| | 168,521 | | | Two Harbors Investment Corp. | | | 2,018,882 | |
| | | | | | | | |
| | | | | | | 5,525,746 | |
| | |
| | Specialty Retail – 0.8% | | | | |
| | 41,920 | | | Lowe’s Cos., Inc. | | | 1,610,566 | |
| | |
| | Thrifts & Mortgage Finance – 0.5% | | | | |
| | 78,942 | | | New York Community Bancorp, Inc. | | | 1,069,664 | |
| | |
| | Tobacco – 1.1% | | | | |
| | 21,576 | | | Philip Morris International, Inc. | | | 2,062,450 | |
| | |
| | |
| The accompanying notes are an integral part of these financial statements. | | 21 |
GOLDMAN SACHS INCOME BUILDER FUND
Schedule of Investments (continued)
April 30, 2013 (Unaudited)
| | | | | | | | |
Shares | | | Description | | Value | |
| | | | | | | | |
| | Common Stocks – (continued) | |
| | Wireless Telecommunication Services – 1.1% | | | | |
| | 69,011 | | | Vodafone Group PLC ADR | | $ | 2,111,047 | |
| | |
| | TOTAL COMMON STOCKS | |
| | (Cost $80,436,667) | | $ | 93,303,022 | |
| | |
| | | | | | | | |
| Shares | | | Rate | | Value | |
| | | | | | | | |
| | Preferred Stocks – 3.1% | |
| | Consumer Finance – 1.2% | | | | |
| Capital One Financial Corp. | |
| | 45,000 | | | 6.000% | | $ | 1,175,400 | |
| CoBank ACB(a)(b) | |
| | 10,000 | | | 6.250 | | | 1,070,000 | |
| | | | | | | | |
| | | | | | | 2,245,400 | |
| | |
| | Real Estate Investment Trusts – 1.9% | | | | |
| PS Business Parks, Inc. | |
| | 23,982 | | | 6.450 | | | 641,039 | |
| Public Storage | |
| | 65,161 | | | 5.750 | | | 1,690,928 | |
| Vornado Realty Trust | |
| | 55,300 | | | 6.625 | | | 1,410,703 | |
| | | | | | | | |
| | | | | | | 3,742,670 | |
| | |
| | TOTAL PREFERRED STOCKS | |
| | (Cost $5,915,799) | | $ | 5,988,070 | |
| | |
| | | | | | | | |
| | | | | | | | | | | | | | |
Principal Amount | | | Interest
Rate | | | Maturity
Date | | | Value | |
| | | | | | | | | | | | | | |
| | Corporate Obligations – 44.0% | |
| | Banks(c) – 2.3% | |
| Barclays Bank PLC(a) | |
| $ | 1,100,000 | | | | 7.750 | % | | | 04/10/23 | | | $ | 1,131,625 | |
| BNP Paribas SA(a)(b) | |
| | 1,000,000 | | | | 5.186 | | | | 06/29/49 | | | | 982,500 | |
| Citigroup, Inc.(a) | |
| | 1,000,000 | | | | 5.900 | | | | 12/29/49 | | | | 1,045,000 | |
| Merrill Lynch & Co., Inc. | |
| | 1,000,000 | | | | 7.750 | | | | 05/14/38 | | | | 1,354,506 | |
| | | | | | | | | | | | | | |
| | | | | | | | | | | | | 4,513,631 | |
| | |
| | Building Materials(b)(c) – 0.7% | |
| HD Supply, Inc. | |
| | 1,300,000 | | | | 7.500 | | | | 07/15/20 | | | | 1,410,500 | |
| | |
| | Chemicals(c) – 1.8% | |
| Ashland, Inc.(b) | |
| | 750,000 | | | | 6.875 | | | | 05/15/43 | | | | 843,750 | |
| Hexion US Finance Corp./Hexion Nova Scotia Finance ULC | |
| | 1,200,000 | | | | 8.875 | | | | 02/01/18 | | | | 1,272,000 | |
| PQ Corp.(b) | |
| | 1,200,000 | | | | 8.750 | | | | 05/01/18 | | | | 1,293,000 | |
| | | | | | | | | | | | | | |
| | | | | | | | | | | | | 3,408,750 | |
| | |
| | | | | | | | | | | | | | |
| | Corporate Obligations – (continued) | |
| | Consumer Cyclical Services – Business(c) – 3.3% | |
| CoreLogic, Inc. | |
| $ | 1,200,000 | | | | 7.250 | % | | | 06/01/21 | | | $ | 1,332,000 | |
| Equinix, Inc. | |
| | 1,250,000 | | | | 5.375 | | | | 04/01/23 | | | | 1,312,500 | |
| First Data Corp.(b) | |
| | 1,750,000 | | | | 8.250 | | | | 01/15/21 | | | | 1,859,375 | |
| Iron Mountain, Inc. | |
| | 500,000 | | | | 5.750 | | | | 08/15/24 | | | | 514,375 | |
| Sabre, Inc.(b) | |
| | 1,250,000 | | | | 8.500 | | | | 05/15/19 | | | | 1,390,625 | |
| | | | | | | | | | | | | | |
| | | | | | | | | | | | | 6,408,875 | |
| | |
| | Consumer Cyclical Services – Rental Equipment(c) – 1.0% | |
| Algeco Scotsman Global Finance PLC(b) | |
| | 1,250,000 | | | | 8.500 | | | | 10/15/18 | | | | 1,349,665 | |
| United Rentals North America, Inc. | |
| | 500,000 | | | | 8.375 | | | | 09/15/20 | | | | 563,750 | |
| | | | | | | | | | | | | | |
| | | | | | | | | | | | | 1,913,415 | |
| | |
| | Consumer Products(c) – 1.9% | |
| Alphabet Holding Co., Inc.(b)(d) | |
| | 1,000,000 | | | | 7.750 | | | | 11/01/17 | | | | 1,047,500 | |
| Avon Products, Inc. | |
| | 1,000,000 | | | | 6.950 | | | | 03/15/43 | | | | 1,154,147 | |
| The Sun Products Corp.(b) | |
| | 1,500,000 | | | | 7.750 | | | | 03/15/21 | | | | 1,556,250 | |
| | | | | | | | | | | | | | |
| | | | | | | | | | | | | 3,757,897 | |
| | |
| | Consumer Products – Industrial(b)(c) – 0.8% | |
| ADS Waste Holdings, Inc. | |
| | 1,500,000 | | | | 8.250 | | | | 10/01/20 | | | | 1,635,000 | |
| | |
| | Electric(c) – 1.7% | |
| Calpine Corp.(b) | |
| | 725,000 | | | | 7.500 | | | | 02/15/21 | | | | 817,438 | |
| DPL, Inc. | |
| | 1,200,000 | | | | 7.250 | | | | 10/15/21 | | | | 1,279,500 | |
| Puget Sound Energy, Inc.(a) | |
| | 50,000 | | | | 6.974 | | | | 06/01/67 | | | | 53,750 | |
| The AES Corp. | |
| | 900,000 | | | | 8.000 | | | | 06/01/20 | | | | 1,093,500 | |
| | 50,000 | | | | 4.875 | | | | 05/15/23 | | | | 51,000 | |
| | | | | | | | | | | | | | |
| | | | | | | | | | | | | 3,295,188 | |
| | |
| | Energy(c) – 2.4% | |
| BG Energy Capital PLC(a) | |
| | 725,000 | | | | 6.500 | | | | 11/30/72 | | | | 800,779 | |
| Halcon Resources Corp.(b) | |
| | 750,000 | | | | 8.875 | | | | 05/15/21 | | | | 802,500 | |
| Linn Energy LLC/Linn Energy Finance Corp. | |
| | 1,000,000 | | | | 7.750 | | | | 02/01/21 | | | | 1,097,500 | |
| Nexen, Inc. | |
| | 5,000 | | | | 6.400 | | | | 05/15/37 | | | | 6,563 | |
| | 50,000 | | | | 7.500 | | | | 07/30/39 | | | | 74,003 | |
| Peabody Energy Corp. | |
| | 1,000,000 | | | | 4.750 | | | | 12/15/41 | | | | 807,333 | |
| | |
| | |
| 22 | | The accompanying notes are an integral part of these financial statements. |
GOLDMAN SACHS INCOME BUILDER FUND
| | | | | | | | | | | | | | |
Principal Amount | | | Interest
Rate | | | Maturity
Date | | | Value | |
| | | | | | | | | | | | | | |
| | Corporate Obligations – (continued) | |
| | Energy(c) – (continued) | |
| Plains Exploration & Production Co. | |
| $ | 50,000 | | | | 6.125 | % | | | 06/15/19 | | | $ | 55,437 | |
| Vanguard Natural Resourses LLC/VNR Finance Corp. | |
| | 1,000,000 | | | | 7.875 | | | | 04/01/20 | | | | 1,090,000 | |
| | | | | | | | | | | | | | |
| | | | | | | | | | | | | 4,734,115 | |
| | |
| | Financial Co. – Non Captive(c) – 0.7% | |
| GE Capital Trust I(a) | |
| | 74,000 | | | | 6.375 | | | | 11/15/67 | | | | 78,625 | |
| Nationstar Mortgage LLC/Nationstar Capital Corp.(b) | |
| | 1,250,000 | | | | 6.500 | | | | 07/01/21 | | | | 1,309,375 | |
| | | | | | | | | | | | | | |
| | | | | | | | | | | | | 1,388,000 | |
| | |
| | Food & Beverage(c) – 2.0% | |
| Bumble Bee Acquisition Corp.(b) | |
| | 980,000 | | | | 9.000 | | | | 12/15/17 | | | | 1,090,250 | |
| Chiquita Brands International, Inc./Chiquita Brands LLC(b) | |
| | 500,000 | | | | 7.875 | | | | 02/01/21 | | | | 535,000 | |
| Constellation Brands, Inc. | |
| | 650,000 | | | | 4.250 | | | | 05/01/23 | | | | 651,890 | |
| US Foods, Inc.(b) | |
| | 1,500,000 | | | | 8.500 | | | | 06/30/19 | | | | 1,638,750 | |
| | | | | | | | | | | | | | |
| | | | | | | | | | | | | 3,915,890 | |
| | |
| | Gaming(c) – 2.6% | |
| Caesars Entertainment Operating Co., Inc. | |
| | 500,000 | | | | 10.000 | | | | 12/15/18 | | | | 307,500 | |
| | 650,000 | | | | 9.000 | (b) | | | 02/15/20 | | | | 641,875 | |
| Caesars Operating Escrow LLC/Caesars Escrow Corp.(b) | |
| | 500,000 | | | | 9.000 | | | | 02/15/20 | | | | 493,750 | |
| CyrusOne LP/CyrusOne Finance Corp.(b) | |
| | 1,000,000 | | | | 6.375 | | | | 11/15/22 | | | | 1,065,000 | |
| Graton Economic Development Authority(b) | |
| | 50,000 | | | | 9.625 | | | | 09/01/19 | | | | 56,500 | |
| MGM Resorts International | |
| | 1,250,000 | | | | 6.625 | | | | 12/15/21 | | | | 1,356,250 | |
| Pinnacle Entertainment, Inc. | |
| | 1,000,000 | | | | 7.750 | | | | 04/01/22 | | | | 1,093,750 | |
| | | | | | | | | | | | | | |
| | | | | | | | | | | | | 5,014,625 | |
| | |
| | Health Care(c) – 1.5% | |
| Community Health Systems, Inc. | |
| | 1,350,000 | | | | 7.125 | | | | 07/15/20 | | | | 1,512,000 | |
| HCA, Inc. | |
| | 750,000 | | | | 5.875 | | | | 03/15/22 | | | | 834,375 | |
| | 500,000 | | | | 5.875 | | | | 05/01/23 | | | | 543,750 | |
| | | | | | | | | | | | | | |
| | | | | | | | | | | | | 2,890,125 | |
| | |
| | Health Care – Medical Products(c) – 1.0% | |
| DJO Finance LLC/DJO Finance Corp. | |
| | 250,000 | | | | 9.750 | | | | 10/15/17 | | | | 263,125 | |
| | 1,500,000 | | | | 9.875 | | | | 04/15/18 | | | | 1,653,750 | |
| | | | | | | | | | | | | | |
| | | | | | | | | | | | | 1,916,875 | |
| | |
| | Health Care – Services(c) – 0.7% | |
| MPT Operating Partnership LP/MPT Finance Corp. | |
| | 1,320,000 | | | | 6.375 | | | | 02/15/22 | | | | 1,432,200 | |
| | |
| | Corporate Obligations – (continued) | |
| | Life Insurance(c) – 1.2% | |
| American General Capital II | |
| $ | 1,000,000 | | | | 8.500 | % | | | 07/01/30 | | | $ | 1,352,500 | |
| MetLife Capital Trust X(b) | |
| | 750,000 | | | | 9.250 | | | | 04/08/38 | | | | 1,050,000 | |
| | | | | | | | | | | | | | |
| | | | | | | | | | | | | 2,402,500 | |
| | |
| | Media – Cable(c) – 2.2% | |
| Cablevision Systems Corp. | |
| | 1,250,000 | | | | 8.000 | | | | 04/15/20 | | | | 1,431,250 | |
| CCO Holdings LLC/CCO Holdings Capital Corp.(b) | |
| | 1,300,000 | | | | 5.750 | | | | 09/01/23 | | | | 1,348,750 | |
| DISH DBS Corp. | |
| | 1,450,000 | | | | 6.750 | | | | 06/01/21 | | | | 1,566,000 | |
| | | | | | | | | | | | | | |
| | | | | | | | | | | | | 4,346,000 | |
| | |
| | Media – Non Cable(b)(c) – 0.7% | |
| Griffey Intermediate, Inc./Griffey Finance Sub LLC | |
| | 1,250,000 | | | | 7.000 | | | | 10/15/20 | | | | 1,265,625 | |
| | |
| | Metals & Mining(c) – 0.5% | |
| ArcelorMittal | |
| | 950,000 | | | | 6.750 | | | | 02/25/22 | | | | 1,042,028 | |
| | |
| | Packaging(c) – 2.4% | |
| Ardagh Packaging Finance PLC(b) | |
| | 1,000,000 | | | | 9.125 | | | | 10/15/20 | | | | 1,125,000 | |
| | 400,000 | | | | 7.000 | | | | 11/15/20 | | | | 420,000 | |
| Reynolds Group Issuer, Inc. | |
| | 300,000 | | | | 9.875 | | | | 08/15/19 | | | | 335,625 | |
| | 200,000 | | | | 5.750 | | | | 10/15/20 | | | | 209,500 | |
| | 1,450,000 | | | | 8.250 | | | | 02/15/21 | | | | 1,540,625 | |
| Sealed Air Corp.(b) | |
| | 1,000,000 | | | | 5.250 | | | | 04/01/23 | | | | 1,030,000 | |
| | | | | | | | | | | | | | |
| | | | | | | | | | | | | 4,660,750 | |
| | |
| | Paper(b)(c) – 0.3% | |
| Sappi Papier Holding GmbH | |
| | 550,000 | | | | 8.375 | | | | 06/15/19 | | | | 616,000 | |
| | |
| | Pipelines – 1.3% | |
| El Paso Natural Gas Co. | |
| | 75,000 | | | | 7.500 | | | | 11/15/26 | | | | 105,371 | |
| Enterprise Products Operating LLC(a)(c) | |
| | 100,000 | | | | 8.375 | | | | 08/01/66 | | | | 114,750 | |
| | 1,000,000 | | | | 7.000 | | | | 06/01/67 | | | | 1,080,000 | |
| Tennessee Gas Pipeline Co. | |
| | 50,000 | | | | 7.500 | | | | 04/01/17 | | | | 61,263 | |
| TransCanada PipeLines Ltd.(a)(c) | |
| | 1,100,000 | | | | 6.350 | | | | 05/15/67 | | | | 1,171,500 | |
| | | | | | | | | | | | | | |
| | | | | | | | | | | | | 2,532,884 | |
| | |
| | Property/Casualty Insurance(c) – 1.5% | |
| Hub International Ltd.(b) | |
| | 1,000,000 | | | | 8.125 | | | | 10/15/18 | | | | 1,075,000 | |
| QBE Capital Funding III Ltd.(a)(b) | |
| | 1,400,000 | | | | 7.250 | | | | 05/24/41 | | | | 1,485,750 | |
| QBE Insurance Group Ltd.(a)(b) | |
| | 225,000 | | | | 5.647 | | | | 07/01/23 | | | | 224,815 | |
| | |
| | |
| The accompanying notes are an integral part of these financial statements. | | 23 |
GOLDMAN SACHS INCOME BUILDER FUND
Schedule of Investments (continued)
April 30, 2013 (Unaudited)
| | | | | | | | | | | | | | |
Principal Amount | | | Interest
Rate | | | Maturity
Date | | | Value | |
| | | | | | | | | | | | | | |
| | Corporate Obligations – (continued) | |
| | Property/Casualty Insurance(c) – (continued) | |
| Transatlantic Holdings, Inc. | |
| $ | 75,000 | | | | 8.000 | % | | | 11/30/39 | | | $ | 107,868 | |
| | | | | | | | | | | | | | |
| | | | | | | | | | | | | 2,893,433 | |
| | |
| | Real Estate(c) – 0.3% | |
| CBRE Services, Inc. | |
| | 600,000 | | | | 5.000 | | | | 03/15/23 | | | | 613,500 | |
| | |
| | Retailers(c) – 1.3% | |
| Burlington Coat Factory Warehouse Corp. | |
| | 1,250,000 | | | | 10.000 | | | | 02/15/19 | | | | 1,400,000 | |
| The Neiman Marcus Group, Inc. | |
| | 1,000,000 | | | | 7.125 | | | | 06/01/28 | | | | 1,027,500 | |
| | | | | | | | | | | | | | |
| | | | | | | | | | | | | 2,427,500 | |
| | |
| | Retailers – Food & Drug(c) – 0.7% | |
| Rite Aid Corp. | |
| | 1,200,000 | | | | 9.250 | | | | 03/15/20 | | | | 1,392,000 | |
| | |
| | Technology – Hardware – 0.2% | |
| Alcatel-Lucent USA, Inc. | |
| | 500,000 | | | | 6.450 | | | | 03/15/29 | | | | 387,500 | |
| | |
| | Technology – Software(b)(c) – 0.5% | |
| Nuance Communications, Inc. | |
| | 1,000,000 | | | | 5.375 | | | | 08/15/20 | | | | 1,030,000 | |
| | |
| | Transportation(c)(d) – 0.1% | |
| Florida East Coast Holdings Corp. | |
| | 264,062 | | | | 10.500 | | | | 08/01/17 | | | | 267,527 | |
| | |
| | Wireless Telecommunications(c) – 4.4% | |
| Crown Castle International Corp. | |
| | 1,000,000 | | | | 5.250 | | | | 01/15/23 | | | | 1,048,750 | |
| Digicel Ltd.(b) | |
| | 750,000 | | | | 7.000 | | | | 02/15/20 | | | | 791,250 | |
| Intelsat Luxembourg SA(b) | |
| | 900,000 | | | | 7.750 | | | | 06/01/21 | | | | 949,500 | |
| | 350,000 | | | | 8.125 | | | | 06/01/23 | | | | 371,875 | |
| MetroPCS Wireless, Inc.(b) | |
| | 600,000 | | | | 6.250 | | | | 04/01/21 | | | | 642,000 | |
| | 900,000 | | | | 6.625 | | | | 04/01/23 | | | | 963,000 | |
| Sprint Capital Corp. | |
| | 500,000 | | | | 6.875 | | | | 11/15/28 | | | | 512,500 | |
| | 850,000 | | | | 8.750 | | | | 03/15/32 | | | | 1,007,250 | |
| Sprint Nextel Corp. | |
| | 700,000 | | | | 6.000 | | | | 11/15/22 | | | | 728,000 | |
| Wind Acquisition Finance SA(b) | |
| | 1,200,000 | | | | 11.750 | | | | 07/15/17 | | | | 1,285,500 | |
| | 200,000 | | | | 6.500 | | | | 04/30/20 | | | | 209,500 | |
| | | | | | | | | | | | | | |
| | | | | | | | | | | | | 8,509,125 | |
| | |
| | Wirelines Telecommunications(c) – 2.0% | |
| Frontier Communications Corp. | |
| | 1,000,000 | | | | 8.125 | | | | 10/01/18 | | | | 1,160,000 | |
| Level 3 Financing, Inc. | |
| | 1,000,000 | | | | 8.125 | | | | 07/01/19 | | | | 1,103,750 | |
| | |
| | | | | | | | | | | | | | |
| | Corporate Obligations – (continued) | |
| | Wirelines Telecommunications(c) – (continued) | |
| Windstream Corp. | |
| $ | 1,150,000 | | | | 7.750 | % | | | 10/15/20 | | | $ | 1,265,000 | |
| | 400,000 | | | | 6.375 | | | | 08/01/23 | | | | 415,000 | |
| | | | | | | | | | | | | | |
| | | | | | | | | | | | | 3,943,750 | |
| | |
| | TOTAL CORPORATE OBLIGATIONS | |
| | (Cost $81,853,349) | | | $ | 85,965,208 | |
| | |
| | | | | | | | | | | | | | |
| | Mortgage-Backed Obligations – 0.6% | |
| | Collateralized Mortgage Obligations – 0.6% | |
| | Adjustable Rate Non-Agency(a) – 0.6% | |
| Countrywide Alternative Loan Trust Series 2005-31, Class 2A1 | |
| $ | 199,875 | | | | 0.500 | % | | | 08/25/35 | | | $ | 160,595 | |
| Countrywide Alternative Loan Trust Series 2005-38, Class A3 | |
| | 225,827 | | | | 0.550 | | | | 09/25/35 | | | | 192,834 | |
| Countrywide Home Loan Mortgage Pass-Through Trust
Series 2004-HYB6, Class A2 |
|
| | 15,970 | | | | 2.916 | | | | 11/20/34 | | | | 15,153 | |
| JPMorgan Alternative Loan Trust Series 2005-A2, Class 1A1 | |
| | 231,264 | | | | 0.460 | | | | 01/25/36 | | | | 204,322 | |
| Merrill Lynch Alternative Note Asset Trust Series 2007-0AR3,
Class A1 |
|
| | 446,353 | | | | 0.390 | | | | 07/25/47 | | | | 304,325 | |
| Structured Adjustable Rate Mortgage Loan Trust Series 2004-06,
Class 3A2 |
|
| | 225,638 | | | | 2.666 | | | | 06/25/34 | | | | 232,896 | |
| Wells Fargo Mortgage Backed Securities Trust
Series 2005-AR16, Class 1A1 |
|
| | 120,895 | | | | 2.736 | | | | 08/25/33 | | | | 125,584 | |
| | | | | | | | | | | | | | |
| | | | | | | | | | | | | 1,235,709 | |
| | |
| | Interest Only(e) – 0.0% | |
| ABN AMRO Mortgage Corp. Series 2003-8, Class A2 | |
| | 1,610 | | | | 5.500 | | | | 06/25/33 | | | | 27 | |
| CS First Boston Mortgage Securities Corp. Series 2003-19,
Class 1A2 |
|
| | 11,255 | | | | 5.250 | | | | 07/25/33 | | | | 604 | |
| CS First Boston Mortgage Securities Corp. Series 2003-AR18,
Class 2X(a) |
|
| | 45,733 | | | | 0.000 | | | | 07/25/33 | | | | — | |
| CS First Boston Mortgage Securities Corp. Series 2003-AR20,
Class 2X(a) |
|
| | 58,539 | | | | 0.605 | | | | 08/25/33 | | | | — | |
| Master Adjustable Rate Mortgages Trust Series 2003-2,
Class 3AX(a) |
|
| | 58,307 | | | | 0.123 | | | | 08/25/33 | | | | 307 | |
| Master Adjustable Rate Mortgages Trust Series 2003-2,
Class 4AX(a) |
|
| | 16,592 | | | | 0.320 | | | | 07/25/33 | | | | 34 | |
| | | | | | | | | | | | | | |
| | | | | | | | | | | | | 972 | |
| | |
| | TOTAL MORTGAGE-BACKED OBLIGATIONS | |
| | (Cost $1,128,353) | | | $ | 1,236,681 | |
| | |
| | |
| 24 | | The accompanying notes are an integral part of these financial statements. |
GOLDMAN SACHS INCOME BUILDER FUND
| | | | | | | | | | | | | | |
Principal Amount | | | Interest
Rate | | | Maturity
Date | | | Value | |
| | | | | | | | | | | | | | |
| | Asset-Backed Securities – 0.1% | |
| | Home Equity – 0.1% | |
| Countrywide Home Equity Loan Trust Series 2003-D, Class A(a) | |
| $ | 27,911 | | | | 0.459 | % | | | 06/15/29 | | | $ | 26,269 | |
| Countrywide Home Equity Loan Trust Series 2004-N, Class 2A(a) | |
| | 106,301 | | | | 0.479 | | | | 02/15/34 | | | | 81,676 | |
| GMAC Mortgage Corp. Loan Trust Series 2007-HE3, Class 1A1 | |
| | 31,250 | | | | 7.000 | | | | 09/25/37 | | | | 29,640 | |
| GMAC Mortgage Corp. Loan Trust Series 2007-HE3, Class 2A1 | |
| | 44,631 | | | | 7.000 | | | | 09/25/37 | | | | 42,155 | |
| | | | | | | | | | | | | | |
| | | | | | | | | | | | | 179,740 | |
| | |
| | Manufactured Housing – 0.0% | |
| Mid-State Trust Series 4, Class A | |
| | 67,384 | | | | 8.330 | | | | 04/01/30 | | | | 71,183 | |
| | |
| | TOTAL ASSET-BACKED SECURITIES | |
| | (Cost $291,798) | | | $ | 250,923 | |
| | |
| | | | | | | | | | | | | | |
| | Senior Term Loans(f) – 1.1% | |
| | Health Care – Services – 0.1% | |
| U.S. Renal Care, Inc. | |
| $ | 191,000 | | | | 10.250 | % | | | 12/27/19 | | | $ | 194,581 | |
| | |
| | Media – Non Cable – 0.5% | |
| Ancestry.com, Inc. | |
| | 1,000,000 | | | | 5.250 | | | | 12/28/18 | | | | 1,011,250 | |
| | |
| | Wireless Telecommunications – 0.5% | |
| Alcatel-Lucent USA, Inc. | |
| | 997,500 | | | | 7.250 | | | | 01/30/19 | | | | 1,021,869 | |
| | |
| | TOTAL SENIOR TERM LOANS | |
| | (Cost $2,222,875) | | | $ | 2,227,700 | |
| | |
| | | | | | | | |
| Shares | | | Description | | Value | |
| | | | | | | | |
| | Investment Company(g) – 1.4% | |
| | Other Diversifier – 1.4% | | | | |
| | 365,947 | | | Goldman Sachs High Yield Fund – Institutional Shares | | $ | 2,748,264 | |
| | (Cost $2,691,735) | |
| | |
| | | | | | | | | | | | |
Principal Amount | | | Interest Rate | | Maturity
Date | | | Value | |
| | Short-term Investment(h) – 1.9% | |
| | Repurchase Agreement – 1.9% | |
| Joint Repurchase Agreement Account II | |
| $ | 3,800,000 | | | 0.169% | | | 05/01/13 | | | $ | 3,800,000 | |
| | (Cost $3,800,000) | | | | | |
| | |
| | TOTAL INVESTMENTS – 99.9% | |
| | (Cost $178,340,576) | | | $ | 195,519,868 | |
| | |
| OTHER ASSETS IN EXCESS OF
LIABILITIES – 0.1% |
| | | 104,596 | |
| | |
| | NET ASSETS – 100.0% | | | $ | 195,624,464 | |
| | |
| | |
| The percentage shown for each investment category reflects the value of investments in that category as a percentage of net assets. |
(a) | | Variable rate security. Interest rate disclosed is that which is in effect at April 30, 2013. |
(b) | | Exempt from registration under Rule 144A of the Securities Act of 1933. Under procedures approved by the Board of Trustees, such securities have been determined to be liquid by the investment adviser and may be resold, normally to qualified institutional buyers in transactions exempt from registration. Total market value of Rule 144A securities amounts to $38,772,168, which represents approximately 19.8% of net assets as of April 30, 2013. |
(c) | | Security with “Call” features with resetting interest rates. Maturity dates disclosed are the final maturity dates. |
(d) | | Pay-in-kind security. |
(e) | | Security with a notional or nominal principal amount. The actual effective yield of this security is different than the stated interest rate. |
(f) | | Senior Term Loans often require prepayments from excess cash flows or permit the borrower to repay at its election. The degree to which borrowers repay, whether as a contractual requirement or at their election, cannot be predicted with accuracy. As a result, the actual remaining maturity may be substantially less than the stated maturities shown. The stated interest rate represents the weighted average interest rate of all contracts within the senior loan facility at April 30, 2013. Senior Term Loans typically have rates of interest which are predetermined either daily, monthly, quarterly or semi-annually by reference to a base lending rate, plus a premium. These base lending rates are primarily the London-Interbank Offered Rate (“LIBOR”), and secondarily the prime rate offered by one or more major United States banks (the “Prime Rate”) and the certificate of deposit (“CD”) rate or other base lending rates used by commercial lenders. |
(g) | | Represents an affiliated issuer. |
(h) | | Joint repurchase agreement was entered into on April 30, 2013. Additional information appears on page 29. |
| | |
|
Investment Abbreviation: |
ADR | | —American Depositary Receipt |
|
| | |
| The accompanying notes are an integral part of these financial statements. | | 25 |
GOLDMAN SACHS INCOME BUILDER FUND
Schedule of Investments (continued)
April 30, 2013 (Unaudited)
|
| ADDITIONAL INVESTMENT INFORMATION |
FUTURES CONTRACTS — At April 30, 2013, the Fund had the following futures contracts:
| | | | | | | | | | | | | | |
| Type | | Number of
Contracts
Long (Short) | | | Expiration
Date | | Current
Value | | | Unrealized
Gain (Loss) | |
Ultra Long U.S. Treasury Bonds | | | (3 | ) | | June 2013 | | $ | (493,031 | ) | �� | $ | (15,247 | ) |
2 Year U.S. Treasury Notes | | | 29 | | | June 2013 | | | 6,398,125 | | | | 6,155 | |
5 Year U.S. Treasury Notes | | | (6 | ) | | June 2013 | | | (747,844 | ) | | | (4,229 | ) |
10 Year U.S. Treasury Notes | | | (92 | ) | | June 2013 | | | (12,269,063 | ) | | | (248,740 | ) |
30 Year U.S. Treasury Bonds | | | (69 | ) | | June 2013 | | | (10,237,875 | ) | | | (407,373 | ) |
| TOTAL | | | | | | | | | | | | $ | (669,434 | ) |
SWAP CONTRACTS — At April 30, 2013, the Fund had outstanding swap contracts with the following terms:
CREDIT DEFAULT SWAP CONTRACTS
| | | | | | | | | | | | | | | | | | | | | | | | | | |
| | | | Market Value | |
| Counterparty | | Referenced
Obligation | | Notional
Amount
(000s) | | �� | Rates Received
(Paid) | | | Termination
Date | | | Credit
Spread at
April 30,
2013(a) | | | Upfront
Payments
Made (Received) | | | Unrealized
Gain (Loss) | |
Protection Purchased: | | | | | | | | | | | | | | | | | | | | | | | | |
Bank of America Securities LLC | | CDX North America Investment Grade Index Series 16 | | $ | 200 | | | | (1.000 | )% | | | 06/20/14 | | | | 0.058 | % | | $ | (836 | ) | | $ | (1,569 | ) |
JPMorgan Securities, Inc. | | CDX North America Investment Grade Index Series 16 | | | 1,700 | | | | (1.000 | ) | | | 06/20/14 | | | | 0.058 | | | | (7,957 | ) | | | (12,493 | ) |
Morgan Stanley & Co. | | CDX North America Investment Grade Index Series 16 | | | 400 | | | | (1.000 | ) | | | 06/20/14 | | | | 0.058 | | | | (1,559 | ) | | | (3,253 | ) |
Protection Sold: | | | | | | | | | | | | | | | | | | | | | | | | |
Bank of America Securities LLC | | CDX North America Investment Grade Index Series 16 | | | 700 | | | | 1.000 | | | | 06/20/16 | | | | 0.388 | | | | 627 | | | | 13,623 | |
Morgan Stanley & Co. | | CDX North America Investment Grade Index Series 16 | | | 800 | | | | 1.000 | | | | 06/20/16 | | | | 0.388 | | | | 685 | | | | 15,601 | |
| TOTAL | | | | | | | | | | | | | | | | | | | | $ | (9,040 | ) | | $ | 11,909 | |
| | (a) | | Credit spread on the Referenced Obligation, together with the term of the swap contract, are indicators of payment/performance risk. The likelihood of a credit event occurring which would require a Fund to make a payment or otherwise be required to perform under the swap contract is generally greater as the credit spread and the term of the swap contract increase. |
| | |
| 26 | | The accompanying notes are an integral part of these financial statements. |
GOLDMAN SACHS RISING DIVIDEND GROWTH FUND
Schedule of Investments
April 30, 2013 (Unaudited)
| | | | | | | | |
Shares | | | Description | | Value | |
| | | | | | | | |
| | Common Stocks – 95.2% | |
| | Capital Markets – 5.6% | | | | |
| | 259,000 | | | Franklin Resources, Inc. | | $ | 40,056,940 | |
| | 565,235 | | | T. Rowe Price Group, Inc. | | | 40,979,538 | |
| | | | | | | | |
| | | | | | | 81,036,478 | |
| | |
| | Chemicals – 13.3% | | | | |
| | 414,900 | | | Ecolab, Inc. | | | 35,108,838 | |
| | 339,900 | | | Monsanto Co. | | | 36,308,118 | |
| | 278,000 | | | Praxair, Inc. | | | 31,775,400 | |
| | 456,900 | | | Rentech Nitrogen Partners LP | | | 16,654,005 | |
| | 196,690 | | | The Sherwin-Williams Co. | | | 36,015,906 | |
| | 558,400 | | | The Valspar Corp. | | | 35,637,088 | |
| | | | | | | | |
| | | | | | | 191,499,355 | |
| | |
| | Commercial Services & Supplies – 1.2% | | | | |
| | 356,800 | | | Mine Safety Appliances Co. | | | 17,126,400 | |
| | |
| | Communications Equipment – 2.2% | | | | |
| | 694,300 | | | Harris Corp. | | | 32,076,660 | |
| | |
| | Electrical Equipment – 2.8% | | | | |
| | 338,000 | | | Roper Industries, Inc. | | | 40,441,700 | |
| | |
| | Food Products – 6.5% | | | | |
| | 679,900 | | | Hormel Foods Corp. | | | 28,059,473 | |
| | 450,600 | | | McCormick & Co., Inc. | | | 32,416,164 | |
| | 452,175 | | | Nestle SA ADR | | | 32,208,425 | |
| | | | | | | | |
| | | | | | | 92,684,062 | |
| | |
| | Health Care Providers & Services – 2.3% | | | | |
| | 743,500 | | | Cardinal Health, Inc. | | | 32,877,570 | |
| | |
| | Hotels, Restaurants & Leisure – 2.1% | | | | |
| | 293,500 | | | McDonald’s Corp. | | | 29,978,090 | |
| | |
| | Household Products – 2.5% | | | | |
| | 562,200 | | | Church & Dwight Co., Inc. | | | 35,918,958 | |
| | |
| | Industrial Conglomerates – 2.5% | | | | |
| | 598,185 | | | Danaher Corp. | | | 36,453,394 | |
| | |
| | Insurance – 2.5% | | | | |
| | 854,500 | | | HCC Insurance Holdings, Inc. | | | 36,401,700 | |
| | |
| | IT Services – 5.6% | | | | |
| | 523,000 | | | Automatic Data Processing, Inc. | | | 35,218,820 | |
| | 223,500 | | | International Business Machines Corp. | | | 45,267,690 | |
| | | | | | | | |
| | | | | | | 80,486,510 | |
| | |
| | Leisure Equipment & Products – 2.9% | | | | |
| | 488,800 | | | Polaris Industries, Inc. | | | 42,129,672 | |
| | |
| | Machinery – 2.4% | | | | |
| | 385,900 | | | Parker Hannifin Corp. | | | 34,179,163 | |
| | |
| | Metals & Mining – 0.2% | | | | |
| | 44,800 | | | Royal Gold, Inc. | | | 2,489,984 | |
| | |
| | Multiline Retail – 0.3% | | | | |
| | 61,100 | | | Family Dollar Stores, Inc. | | | 3,749,707 | |
| | |
| | | | | | | | |
| | Common Stocks – (continued) | |
| | Oil, Gas & Consumable Fuels – 19.5% | | | | |
| | 442,000 | | | El Paso Pipeline Partners LP | | $ | 18,935,280 | |
| | 320,900 | | | Energy Transfer Equity LP | | | 18,830,412 | |
| | 354,900 | | | Enterprise Products Partners LP | | | 21,524,685 | |
| | 330,800 | | | EOG Resources, Inc. | | | 40,079,728 | |
| | 425,725 | | | Genesis Energy LP | | | 20,464,601 | |
| | 610,300 | | | Linn Energy LLC | | | 23,563,683 | |
| | 471,300 | | | Magellan Midstream Partners LP | | | 24,993,039 | |
| | 246,400 | | | MarkWest Energy Partners LP | | | 15,572,480 | |
| | 279,500 | | | ONEOK Partners LP | | | 15,120,950 | |
| | 497,300 | | | Plains All American Pipeline LP | | | 28,554,966 | |
| | 274,600 | | | Sunoco Logistics Partners LP | | | 17,055,406 | |
| | 301,300 | | | Western Gas Partners LP | | | 18,216,598 | |
| | 326,000 | | | Williams Partners LP | | | 17,815,900 | |
| | | | | | | | |
| | | | | | | 280,727,728 | |
| | |
| | Pharmaceuticals – 4.6% | | | | |
| | 242,500 | | | Novo Nordisk A/S ADR | | | 42,832,775 | |
| | 225,512 | | | Roche Holding AG ADR | | | 14,076,459 | |
| | 252,700 | | | Teva Pharmaceutical Industries Ltd. ADR | | | 9,675,883 | |
| | | | | | | | |
| | | | | | | 66,585,117 | |
| | |
| | Road & Rail – 2.8% | | | | |
| | 416,500 | | | Canadian National Railway Co. | | | 40,808,670 | |
| | |
| | Software – 2.4% | | | | |
| | 359,520 | | | FactSet Research Systems, Inc. | | | 33,820,046 | |
| | |
| | Specialty Retail – 3.8% | | | | |
| | 235,200 | | | Ross Stores, Inc. | | | 15,539,664 | |
| | 810,200 | | | TJX Cos., Inc. | | | 39,513,454 | |
| | | | | | | | |
| | | | | | | 55,053,118 | |
| | |
| | Textiles, Apparel & Luxury Goods – 3.2% | | | | |
| | 255,200 | | | VF Corp. | | | 45,481,744 | |
| | |
| | Trading Companies & Distributors – 2.7% | | | | |
| | 155,675 | | | W.W. Grainger, Inc. | | | 38,369,217 | |
| | |
| | Wireless Telecommunication Services – 1.3% | | | | |
| | 598,000 | | | Vodafone Group PLC ADR | | | 18,292,820 | |
| | |
| | TOTAL COMMON STOCKS | |
| | (Cost $1,208,970,898) | | $ | 1,368,667,863 | |
| | |
| | |
| The accompanying notes are an integral part of these financial statements. | | 27 |
GOLDMAN SACHS RISING DIVIDEND GROWTH FUND
Schedule of Investments (continued)
April 30, 2013 (Unaudited)
| | | | | | | | | | | | |
Principal Amount | | Interest
Rate | | | Maturity
Date | | | Value | |
| | | | | | | | | | | | |
| Short-term Investment(a) – 6.9% | |
| Repurchase Agreement – 6.9% | |
Joint Repurchase Agreement Account II | |
| $99,300,000 | | | 0.169 | % | | | 05/01/13 | | | $ | 99,300,000 | |
| (Cost $99,300,000) | |
| |
| TOTAL INVESTMENTS – 102.1% | |
| (Cost $1,308,270,898) | | | $ | 1,467,967,863 | |
| |
LIABILITIES IN EXCESS OF OTHER ASSETS – (2.1)% | | | | (29,905,583 | ) |
| |
| NET ASSETS – 100.0% | | | $ | 1,438,062,280 | |
| |
| | |
| The percentage shown for each investment category reflects the value of investments in that category as a percentage of net assets. |
(a) | | Joint repurchase agreement was entered into on April 30, 2013. Additional information appears on page 29. |
| | |
|
Investment Abbreviation: |
ADR | | —American Depositary Receipt |
|
| | |
| 28 | | The accompanying notes are an integral part of these financial statements. |
GOLDMAN SACHS DIVIDEND FOCUS FUNDS
|
| ADDITIONAL INVESTMENT INFORMATION |
JOINT REPURCHASE AGREEMENT ACCOUNT II — At April 30, 2013, the Funds had undivided interests in the Joint Repurchase Agreement Account II, with a maturity date of May 1, 2013, as follows:
| | | | | | | | | | | | |
| Fund | | Principal
Amount | | | Maturity
Value | | | Collateral
Allocation
Value | |
Income Builder | | $ | 3,800,000 | | | $ | 3,800,018 | | | $ | 3,889,897 | |
Rising Dividend Growth | | | 99,300,000 | | | | 99,300,466 | | | | 101,649,148 | |
REPURCHASE AGREEMENTS — At April 30, 2013, the Principal Amounts of the Funds’ interest in the Joint Repurchase Agreement Account II were as follows:
| | | | | | | | | | | | |
| Counterparty | | Interest
Rate | | | Income
Builder | | | Rising
Dividend
Growth | |
BNP Paribas Securities Co. | | | 0.170 | % | | $ | 1,389,679 | | | $ | 36,314,506 | |
Deutsche Bank Securities, Inc. | | | 0.170 | | | | 926,453 | | | | 24,209,671 | |
Wells Fargo Securities LLC | | | 0.150 | | | | 94,189 | | | | 2,461,317 | |
Wells Fargo Securities LLC | | | 0.170 | | | | 1,389,679 | | | | 36,314,506 | |
| TOTAL | | | | | | $ | 3,800,000 | | | $ | 99,300,000 | |
At April 30, 2013, the Joint Repurchase Agreement Account II was fully collateralized by:
| | | | | | | | |
| Issuer | | Interest Rates | | | Maturity Dates | |
Federal Home Loan Mortgage Corp. | | | 2.500% to 7.000 | % | | | 01/01/24 to 04/01/43 | |
Federal National Mortgage Association | | | 2.000 to 7.000 | | | | 01/01/17 to 05/01/48 | |
Government National Mortgage Association | | | 3.500 to 4.000 | | | | 03/20/25 to 11/20/41 | |
U.S. Treasury Bill | | | 0.000 | | | | 07/05/13 | |
U.S. Treasury Note | | | 3.125 | | | | 08/31/13 | |
| | |
| The accompanying notes are an integral part of these financial statements. | | 29 |
GOLDMAN SACHS DIVIDEND FOCUS FUNDS
Statements of Assets and Liabilities
April 30, 2013 (Unaudited)
| | | | | | | | | | |
| | | | | Income Builder
Fund | | | Rising Dividend
Growth Fund | |
| | Assets: | | | | | | | | |
| | Investments of unaffiliated issuers, at value (cost $175,648,841 and $1,308,270,898) | | $ | 192,771,604 | | | $ | 1,467,967,863 | |
| | Investments of affiliated issuers, at value (cost $2,691,735 and $0) | | | 2,748,264 | | | | — | |
| | Cash | | | 26,698 | | | | 228,056 | |
| | Receivables: | | | | | | | | |
| | Fund shares sold | | | 2,185,261 | | | | 15,386,855 | |
| | Investments sold | | | 1,748,032 | | | | — | |
| | Dividends and interest | | | 1,583,249 | | | | 1,782,312 | |
| | Collateral on certain derivative contracts(a) | | | 400,000 | | | | — | |
| | Reimbursement from investment adviser | | | 63,522 | | | | 86,944 | |
| | Unrealized gain on swap contracts | | | 29,224 | | | | — | |
| | Futures-variation margin | | | 24,891 | | | | — | |
| | Foreign tax reclaims | | | 3,181 | | | | 297,247 | |
| | Upfront payments made on swap contracts | | | 1,312 | | | | — | |
| | Other assets | | | 597 | | | | 29,649 | |
| | Total assets | | | 201,585,835 | | | | 1,485,778,926 | |
| | | | | | | | | | |
| | Liabilities: | | | | | | | | |
| | Payables: | | | | | | | | |
| | Investments purchased | | | 3,783,887 | | | | 45,189,556 | |
| | Investments purchased on an extended settlement basis | | | 1,663,140 | | | | — | |
| | Fund shares redeemed | | | 245,574 | | | | 1,173,905 | |
| | Amounts owed to affiliates | | | 155,096 | | | | 1,180,942 | |
| | Unrealized loss on swap contracts | | | 17,315 | | | | — | |
| | Upfront payments received on swap contracts | | | 10,352 | | | | — | |
| | Accrued expenses | | | 86,007 | | | | 172,243 | |
| | Total liabilities | | | 5,961,371 | | | | 47,716,646 | |
| | | | | | | | | | |
| | Net Assets: | | | | | | | | |
| | Paid-in capital | | | 175,576,957 | | | | 1,295,509,502 | |
| | Distributions in excess of net investment income | | | (18,665 | ) | | | (846,013 | ) |
| | Accumulated net realized gain (loss) | | | 3,544,405 | | | | (16,298,174 | ) |
| | Net unrealized gain | | | 16,521,767 | | | | 159,696,965 | |
| | | NET ASSETS | | $ | 195,624,464 | | | $ | 1,438,062,280 | |
| | | Net Assets: | | | | | | | | |
| | | Class A | | $ | 112,746,358 | | | $ | 523,845,676 | |
| | | Class B | | | 5,106,595 | | | | — | |
| | | Class C | | | 37,283,431 | | | | 190,678,574 | |
| | | Institutional | | | 35,642,514 | | | | 591,653,819 | |
| | | Class IR | | | 4,845,566 | | | | 131,370,294 | |
| | | Class R | | | — | | | | 513,917 | |
| | | Total Net Assets | | $ | 195,624,464 | | | $ | 1,438,062,280 | |
| | | Shares Outstanding $0.001 par value (unlimited shares authorized): | | | | | | | | |
| | | Class A | | | 5,146,085 | | | | 31,106,625 | |
| | | Class B | | | 234,771 | | | | — | |
| | | Class C | | | 1,723,301 | | | | 11,228,573 | |
| | | Institutional | | | 1,599,477 | | | | 34,438,075 | |
| | | Class IR | | | 217,880 | | | | 7,650,518 | |
| | | Class R | | | — | | | | 30,557 | |
| | | Net asset value, offering and redemption price per share:(b) | | | | | | | | |
| | | Class A | | | $21.91 | | | | $16.84 | |
| | | Class B | | | 21.75 | | | | — | |
| | | Class C | | | 21.63 | | | | 16.98 | |
| | | Institutional | | | 22.28 | | | | 17.18 | |
| | | Class IR | | | 22.24 | | | | 17.17 | |
| | | Class R | | | — | | | | 16.82 | |
| | (a) | | Includes restricted cash of $290,000 for the Income Builder Fund relating to initial margin requirements on futures transactions. |
| | (b) | | Maximum public offering price per share for Class A shares of the Income Builder and the Rising Dividend Growth Funds is $23.19 and $17.82, respectively. At redemption, Class B and Class C Shares may be subject to a contingent deferred sales charge, assessed on the amount equal to the lesser of the current net asset value or the original purchase price of the shares. |
| | |
| 30 | | The accompanying notes are an integral part of these financial statements. |
GOLDMAN SACHS DIVIDEND FOCUS FUNDS
Statements of Operations
For the Six Months Ended April 30, 2013 (Unaudited)
| | | | | | | | | | |
| | | | | Income Builder
Fund | | | Rising Dividend
Growth Fund | |
| | Investment income: | |
| | Dividends (net of foreign withholding taxes of $2,501 and $279,829) | | $ | 1,366,874 | | | $ | 11,462,342 | |
| | Dividends — affiliated issuers | | | 76,342 | | | | — | |
| | Interest | | | 2,520,953 | | | | 57,657 | |
| | Total investment income | | | 3,964,169 | | | | 11,519,999 | |
| | | | | | | | | | |
| | Expenses: | |
| | Management fees | | | 492,527 | | | | 3,468,004 | |
| | Distribution and Service fees(a) | | | 273,224 | | | | 1,017,312 | |
| | Transfer Agent fees(a) | | | 127,935 | | | | 599,947 | |
| | Professional fees | | | 64,693 | | | | 51,077 | |
| | Custody, accounting and administrative services | | | 38,893 | | | | 58,164 | |
| | Printing and mailing costs | | | 32,550 | | | | 116,029 | |
| | Registration fees | | | 31,517 | | | | 55,717 | |
| | Trustee fees | | | 8,444 | | | | 11,621 | |
| | Other | | | 4,062 | | | | 16,169 | |
| | Total expenses | | | 1,073,845 | | | | 5,394,040 | |
| | Less — expense reductions | | | (251,176 | ) | | | (243,568 | ) |
| | Net expenses | | | 822,669 | | | | 5,150,472 | |
| | NET INVESTMENT INCOME | | | 3,141,500 | | | | 6,369,527 | |
| | | | | | | | | | |
| | Realized and unrealized gain (loss): | |
| | Capital gain distributions from Affiliated Underlying Funds | | | 23,543 | | | | — | |
| | Net realized gain (loss) from: | | | | | | | | |
| | Investments — unaffiliated issuers | | | 3,633,131 | | | | (7,769,902 | ) |
| | Investments — affiliated issuers | | | 4,215 | | | | — | |
| | Futures contracts | | | (95,131 | ) | | | — | |
| | Swap contracts | | | 286 | | | | — | |
| | Forward foreign currency exchange contracts | | | 3,536 | | | | — | |
| | Foreign currency transactions | | | (287 | ) | | | 829 | |
| | Net change in unrealized gain (loss) on: | | | | | | | | |
| | Investments — unaffiliated issuers | | | 8,695,099 | | | | 110,126,487 | |
| | Investments — affiliated issuers | | | 56,519 | | | | — | |
| | Futures contracts | | | (669,434 | ) | | | — | |
| | Swap contracts | | | 9,502 | | | | — | |
| | Forward foreign currency exchange contracts | | | (934 | ) | | | — | |
| | Net realized and unrealized gain | | | 11,660,045 | | | | 102,357,414 | |
| | NET INCREASE IN NET ASSETS RESULTING FROM OPERATIONS | | $ | 14,801,545 | | | $ | 108,726,941 | |
| | (a) | | Class specific Distribution and Service, and Transfer Agent fees were as follows: |
| | | | | | | | | | | | | | | | | | | | | | | | | | | | | | | | | | | | | | | | |
| | | Distribution and Service Fees | | | Transfer Agent Fees | |
Fund | | Class A | | | Class B | | | Class C | | | Class R | | | Class A | | | Class B | | | Class C | | | Institutional | | | Class IR | | | Class R | |
Income Builder | | $ | 121,270 | | | $ | 26,877 | | | $ | 125,077 | | | $ | — | | | $ | 92,165 | | | $ | 5,107 | | | $ | 23,764 | | | $ | 4,276 | | | $ | 2,623 | | | $ | — | |
Rising Dividend Growth | | | 449,682 | | | | — | | | | 566,943 | | | | 687 | | | | 341,758 | | | | — | | | | 107,719 | | | | 76,234 | | | | 73,975 | | | | 261 | |
| | |
| The accompanying notes are an integral part of these financial statements. | | 31 |
GOLDMAN SACHS DIVIDEND FOCUS FUNDS
Statements of Changes in Net Assets
| | | | | | | | | | |
| | | | Income Builder Fund | |
| | | | | For the Six Months Ended
April 30, 2013
(Unaudited) | | | For the Fiscal Year Ended October 31, 2012 | |
| | From operations: | | | | | | | | |
| | Net investment income | | $ | 3,141,500 | | | $ | 3,293,432 | |
| | Net realized gain | | | 3,569,293 | | | | 11,281,155 | |
| | Net change in unrealized gain | | | 8,090,752 | | | | 684,771 | |
| | Net increase in net assets resulting from operations | | | 14,801,545 | | | | 15,259,358 | |
| | | | | | | | | | |
| | Distributions to shareholders: | | | | | | | | |
| | From net investment income | | | | | | | | |
| | Class A Shares | | | (2,239,246 | ) | | | (2,457,532 | ) |
| | Class B Shares | | | (102,838 | ) | | | (106,851 | ) |
| | Class C Shares | | | (502,495 | ) | | | (246,908 | ) |
| | Institutional Shares | | | (539,839 | ) | | | (289,406 | ) |
| | Class IR Shares | | | (67,003 | ) | | | (43,123 | ) |
| | From net realized gains | | | | | | | | |
| | Class A Shares | | | (2,637,969 | ) | | | — | |
| | Class B Shares | | | (167,366 | ) | | | — | |
| | Class C Shares | | | (586,841 | ) | | | — | |
| | Institutional Shares | | | (487,343 | ) | | | — | |
| | Class IR Shares | | | (47,368 | ) | | | — | |
| | Total distributions to shareholders | | | (7,378,308 | ) | | | (3,143,820 | ) |
| | | | | | | | | | |
| | From share transactions: | | | | | | | | |
| | Proceeds from sales of shares | | | 70,270,939 | | | | 45,937,740 | |
| | Reinvestment of distributions | | | 6,699,377 | | | | 2,919,869 | |
| | Cost of shares redeemed | | | (23,668,098 | ) | | | (43,309,238 | ) |
| | Net increase in net assets resulting from share transactions | | | 53,302,218 | | | | 5,548,371 | |
| | TOTAL INCREASE | | | 60,725,455 | | | | 17,663,909 | |
| | | | | | | | | | |
| | Net assets: | | | | | | | | |
| | Beginning of period | | | 134,899,009 | | | | 117,235,100 | |
| | End of period | | $ | 195,624,464 | | | $ | 134,899,009 | |
| | Undistributed (distributions in excess of) net investment income | | $ | (18,665 | ) | | $ | 291,256 | |
| | |
| 32 | | The accompanying notes are an integral part of these financial statements. |
GOLDMAN SACHS DIVIDEND FOCUS FUNDS
Statements of Changes in Net Assets
| | | | | | | | | | | | | | |
| | | | | Rising Dividend Growth Fund | |
| | | | | For the Six Months Ended
April 30, 2013
(Unaudited) | | | For the Period
October 1, 2012 to
October 31, 2012* | | | For the Fiscal Year Ended
September 30, 2012 | |
| | From operations: | | | | | | | | | | | | |
| | Net investment income (loss) | | $ | 6,369,527 | | | $ | (279,803 | ) | | $ | 1,094,305 | |
| | Net realized loss | | | (7,769,073 | ) | | | (215,486 | ) | | | (3,612,701 | ) |
| | Net change in unrealized gain (loss) | | | 110,126,487 | | | | (7,098,599 | ) | | | 46,236,274 | |
| | Net increase (decrease) in net assets resulting from operations | | | 108,726,941 | | | | (7,593,888 | ) | | | 43,717,878 | |
| | | | | | | | | | | | | | |
| | Distributions to shareholders: | | | | | | | | | | | | |
| | From net investment income | | | | | | | | | | | | |
| | Class A Shares | | | (1,990,939 | ) | | | — | | | | (1,472,425 | ) |
| | Class C Shares | | | (262,311 | ) | | | — | | | | (122,098 | ) |
| | Institutional Shares | | | (2,693,470 | ) | | | — | | | | (1,660,310 | ) |
| | Class IR Shares(a) | | | (493,964 | ) | | | — | | | | (151,309 | ) |
| | Class R Shares(a) | | | (1,242 | ) | | | — | | | | (328 | ) |
| | From capital | | | | | | | | |
| | Class A Shares | | | — | | | | — | | | | (187,727 | ) |
| | Class C Shares | | | — | | | | — | | | | (26,988 | ) |
| | Institutional Shares | | | — | | | | — | | | | (163,779 | ) |
| | Class IR Shares(a) | | | — | | | | — | | | | (21,150 | ) |
| | Class R Shares(a) | | | — | | | | — | | | | (34 | ) |
| | Total distributions to shareholders | | | (5,441,926 | ) | | | — | | | | (3,806,148 | ) |
| | | | | | | | | | | | | | |
| | From share transactions: | | | | | | | | | | | | |
| | Proceeds from sales of shares | | | 843,011,558 | | | | 82,363,067 | | | | 397,177,740 | |
| | Reinvestment of distributions | | | 4,847,875 | | | | — | | | | 3,491,143 | |
| | Cost of shares redeemed | | | (93,235,439 | ) | | | (8,135,310 | ) | | | (61,294,825 | ) |
| | Net increase in net assets resulting from share transactions | | | 754,623,994 | | | | 74,227,757 | | | | 339,374,058 | |
| | TOTAL INCREASE | | | 857,909,009 | | | | 66,633,869 | | | | 379,285,788 | |
| | | | | | | | | | | | | | |
| | Net assets: | | | | | | | | | | | | |
| | Beginning of period | | | 580,153,271 | | | | 513,519,402 | | | | 134,233,614 | |
| | End of period | | $ | 1,438,062,280 | | | $ | 580,153,271 | | | $ | 513,519,402 | |
| | Distributions in excess of net investment income (loss) | | $ | (846,013 | ) | | $ | (1,773,614 | ) | | $ | (1,773,614 | ) |
| | * | | The Fund changed its fiscal year end from September 30 to October 31. |
| | (a) | | Commenced operations on February 27, 2012. |
| | |
| The accompanying notes are an integral part of these financial statements. | | 33 |
GOLDMAN SACHS INCOME BUILDER FUND
Financial Highlights
Selected Data for a Share Outstanding Throughout Each Period
| | | | | | | | | | | | | | | | | | | | | | | | | | | | | | |
| | | | | | | | Income (loss) from
investment operations | | | Distributions
to shareholders | |
| | | Year - Share Class | |
Net asset
value,
beginning
of period | | | Net
investment
income(a) | | | Net realized
and unrealized
gain (loss) | | | Total from
investment
operations | | | From net
investment
income | | | From net
realized
gains | | | Total
distributions | |
| | FOR THE SIX MONTHS ENDED APRIL 30, (UNAUDITED) | |
| | 2013 - A | | $ | 20.99 | | | $ | 0.44 | | | $ | 1.57 | | | $ | 2.01 | | | $ | (0.49 | ) | | $ | (0.60 | ) | | $ | (1.09 | ) |
| | 2013 - B | | | 20.84 | | | | 0.37 | | | | 1.55 | | | | 1.92 | | | | (0.41 | ) | | | (0.60 | ) | | | (1.01 | ) |
| | 2013 - C | | | 20.74 | | | | 0.36 | | | | 1.54 | | | | 1.90 | | | | (0.41 | ) | | | (0.60 | ) | | | (1.01 | ) |
| | 2013 - Institutional | | | 21.33 | | | | 0.49 | | | | 1.59 | | | | 2.08 | | | | (0.53 | ) | | | (0.60 | ) | | | (1.13 | ) |
| | 2013 - IR | | | 21.29 | | | | 0.47 | | | | 1.59 | | | | 2.06 | | | | (0.51 | ) | | | (0.60 | ) | | | (1.11 | ) |
| | | | | | | | | | | | | | | | | | | | | | | | | | | | | | |
| | FOR THE FISCAL YEARS ENDED OCTOBER 31, | |
| | 2012 - A | | | 19.01 | | | | 0.55 | | | | 1.95 | | | | 2.50 | | | | (0.52 | ) | | | — | | | | (0.52 | ) |
| | 2012 - B | | | 18.87 | | | | 0.39 | | | | 1.94 | | | | 2.33 | | | | (0.36 | ) | | | — | | | | (0.36 | ) |
| | 2012 - C | | | 18.79 | | | | 0.42 | | | | 1.90 | | | | 2.32 | | | | (0.37 | ) | | | — | | | | (0.37 | ) |
| | 2012 - Institutional | | | 19.31 | | | | 0.66 | | | | 1.97 | | | | 2.63 | | | | (0.61 | ) | | | — | | | | (0.61 | ) |
| | 2012 - IR | | | 19.28 | | | | 0.57 | | | | 2.02 | | | | 2.59 | | | | (0.58 | ) | | | — | | | | (0.58 | ) |
| | 2011 - A | | | 18.21 | | | | 0.42 | (e) | | | 0.83 | | | | 1.25 | | | | (0.45 | ) | | | — | | | | (0.45 | ) |
| | 2011 - B | | | 18.07 | | | | 0.28 | (e) | | | 0.83 | | | | 1.11 | | | | (0.31 | ) | | | — | | | | (0.31 | ) |
| | 2011 - C | | | 18.01 | | | | 0.26 | (e) | | | 0.84 | | | | 1.10 | | | | (0.32 | ) | | | — | | | | (0.32 | ) |
| | 2011 - Institutional | | | 18.50 | | | | 0.47 | (e) | | | 0.87 | | | | 1.34 | | | | (0.53 | ) | | | — | | | | (0.53 | ) |
| | 2011 - IR | | | 18.48 | | | | 0.40 | (e) | | | 0.90 | | | | 1.30 | | | | (0.50 | ) | | | — | | | | (0.50 | ) |
| | 2010 - A | | | 16.32 | | | | 0.48 | (f) | | | 1.97 | | | | 2.45 | | | | (0.56 | ) | | | — | | | | (0.56 | ) |
| | 2010 - B | | | 16.19 | | | | 0.35 | (f) | | | 1.96 | | | | 2.31 | | | | (0.43 | ) | | | — | | | | (0.43 | ) |
| | 2010 - C | | | 16.14 | | | | 0.34 | (f) | | | 1.97 | | | | 2.31 | | | | (0.44 | ) | | | — | | | | (0.44 | ) |
| | 2010 - Institutional | | | 16.57 | | | | 0.55 | (f) | | | 2.01 | | | | 2.56 | | | | (0.63 | ) | | | — | | | | (0.63 | ) |
| | 2010 - IR (Commenced August 31, 2010) | | | 17.28 | | | | 0.06 | (f) | | | 1.28 | | | | 1.34 | | | | (0.14 | ) | | | — | | | | (0.14 | ) |
| | 2009 - A | | | 14.64 | | | | 0.46 | | | | 1.71 | | | | 2.17 | | | | (0.49 | ) | | | — | | | | (0.49 | ) |
| | 2009 - B | | | 14.53 | | | | 0.35 | | | | 1.69 | | | | 2.04 | | | | (0.38 | ) | | | — | | | | (0.38 | ) |
| | 2009 - C | | | 14.49 | | | | 0.35 | | | | 1.68 | | | | 2.03 | | | | (0.38 | ) | | | — | | | | (0.38 | ) |
| | 2009 - Institutional | | | 14.86 | | | | 0.53 | | | | 1.73 | | | | 2.26 | | | | (0.55 | ) | | | — | | | | (0.55 | ) |
| | | | | | | | | | | | | | | | | | | | | | | | | | | | | | |
| | FOR THE PERIOD SEPTEMBER 1, 2008 TO OCTOBER 31, 2008* | |
| | 2008 - A | | | 17.71 | | | | 0.10 | | | | (2.99 | ) | | | (2.89 | ) | | | (0.18 | ) | | | — | | | | (0.18 | ) |
| | 2008 - B | | | 17.56 | | | | 0.08 | | | | (2.96 | ) | | | (2.88 | ) | | | (0.15 | ) | | | — | | | | (0.15 | ) |
| | 2008 - C | | | 17.52 | | | | 0.08 | | | | (2.96 | ) | | | (2.88 | ) | | | (0.15 | ) | | | — | | | | (0.15 | ) |
| | 2008 - Institutional | | | 17.98 | | | | 0.11 | | | | (3.03 | ) | | | (2.92 | ) | | | (0.20 | ) | | | — | | | | (0.20 | ) |
| | 2008 - Service | | | 17.77 | | | | 0.10 | | | | (3.00 | ) | | | (2.90 | ) | | | (0.18 | ) | | | — | | | | (0.18 | ) |
| | | | | | | | | | | | | | | | | | | | | | | | | | | | | | |
| | FOR THE FISCAL YEAR ENDED AUGUST 31, | |
| | 2008 - A | | | 20.66 | | | | 0.64 | | | | (1.86 | ) | | | (1.22 | ) | | | (0.53 | ) | | | (1.20 | ) | | | (1.73 | ) |
| | 2008 - B | | | 20.50 | | | | 0.50 | | | | (1.86 | ) | | | (1.36 | ) | | | (0.38 | ) | | | (1.20 | ) | | | (1.58 | ) |
| | 2008 - C | | | 20.46 | | | | 0.50 | | | | (1.86 | ) | | | (1.36 | ) | | | (0.38 | ) | | | (1.20 | ) | | | (1.58 | ) |
| | 2008 - Institutional | | | 20.95 | | | | 0.73 | | | | (1.89 | ) | | | (1.16 | ) | | | (0.61 | ) | | | (1.20 | ) | | | (1.81 | ) |
| | 2008 - Service | | | 20.70 | | | | 0.64 | | | | (1.85 | ) | | | (1.21 | ) | | | (0.52 | ) | | | (1.20 | ) | | | (1.72 | ) |
| | * | | The Fund changed its fiscal year end from August 31 to October 31. |
| | (a) | | Calculated based on the average shares outstanding methodology. |
| | (b) | | Assumes investment at the net asset value at the beginning of the period, reinvestment of all dividends and distributions, a complete redemption of the investment at the net asset value at the end of the period and no sales or redemption charges. Total returns would be reduced if a sales or redemption charge was taken into account. Returns do not reflect the deduction of taxes that a shareholder would pay on Fund distributions or the redemption of Fund shares. Total returns for periods less than one full year are not annualized. |
| | (c) | | The Fund’s portfolio turnover rate is calculated in accordance with regulatory requirements, without regard to transactions involving short term investments and certain derivatives. If such transactions were included, the Fund’s portfolio turnover rate may be higher. |
| | (e) | | Reflects income recognized from a special dividend which amounted to $0.08 per share and 0.40% of average net assets. |
| | (f) | | Reflects income recognized from a special dividend which amounted to $0.05 per share and 0.28% of average net assets. |
| | |
| 34 | | The accompanying notes are an integral part of these financial statements. |
GOLDMAN SACHS INCOME BUILDER FUND†
| | | | | | | | | | | | | | | | | | | | | | | | | | | | | | | | | | | | | | | | |
| | | | | | | | | | | | | | | | | | | | | | | | | | | | | | | | | | |
| | | Net asset
value, end
of period | | | | | Total
return(b) | | | | | Net assets,
end of
period
(in 000s) | | | | | Ratio of
net expenses
to average
net assets | | | | | Ratio of
total expenses
to average
net assets | | | | | Ratio of
net investment
income
to average
net assets | | | | | Portfolio
turnover
rate(c) | |
| | | | | | | | | | | | | | | | | | | | | | | | | | | | | | | | | | | | | | | | |
| | $ | 21.91 | | | | | | 9.94 | % | | | | $ | 112,746 | | | | | | 1.00 | %(d) | | | | | 1.32 | %(d) | | | | | 4.25 | %(d) | | | | | 34 | % |
| | | 21.75 | | | | | | 9.54 | | | | | | 5,107 | | | | | | 1.75 | (d) | | | | | 2.07 | (d) | | | | | 3.53 | (d) | | | | | 34 | |
| | | 21.63 | | | | | | 9.58 | | | | | | 37,283 | | | | | | 1.74 | (d) | | | | | 2.08 | (d) | | | | | 3.46 | (d) | | | | | 34 | |
| | | 22.28 | | | | | | 10.13 | | | | | | 35,643 | | | | | | 0.59 | (d) | | | | | 0.94 | (d) | | | | | 4.59 | (d) | | | | | 34 | |
| | | 22.24 | | | | | | 10.07 | | | | | | 4,846 | | | | | | 0.73 | (d) | | | | | 1.09 | (d) | | | | | 4.42 | (d) | | | | | 34 | |
| | | | | | | | | | | | | | | | | | | | | | | | | | | | | | | | | | | | | | | | |
| | | | | | | | | | | | | | | | | | | | | | | | | | | | | | | | | | | | | | | | |
| | | 20.99 | | | | | | 13.26 | | | | | | 95,116 | | | | | | 1.05 | | | | | | 1.44 | | | | | | 2.73 | | | | | | 369 | |
| | | 20.84 | | | | | | 12.38 | | | | | | 5,843 | | | | | | 1.80 | | | | | | 2.19 | | | | | | 1.97 | | | | | | 369 | |
| | | 20.74 | | | | | | 12.39 | | | | | | 18,699 | | | | | | 1.80 | | | | | | 2.21 | | | | | | 2.09 | | | | | | 369 | |
| | | 21.33 | | | | | | 13.74 | | | | | | 13,601 | | | | | | 0.65 | | | | | | 1.06 | | | | | | 3.21 | | | | | | 369 | |
| | | 21.29 | | | | | | 13.55 | | | | | | 1,639 | | | | | | 0.80 | | | | | | 1.19 | | | | | | 2.77 | | | | | | 369 | |
| | | 19.01 | | | | | | 6.95 | | | | | | 94,819 | | | | | | 1.05 | | | | | | 1.38 | | | | | | 2.20 | (e) | | | | | 357 | |
| | | 18.87 | | | | | | 6.16 | | | | | | 6,332 | | | | | | 1.80 | | | | | | 2.13 | | | | | | 1.47 | (e) | | | | | 357 | |
| | | 18.79 | | | | | | 6.13 | | | | | | 9,297 | | | | | | 1.80 | | | | | | 2.13 | | | | | | 1.38 | (e) | | | | | 357 | |
| | | 19.31 | | | | | | 7.33 | | | | | | 6,610 | | | | | | 0.65 | | | | | | 0.98 | | | | | | 2.44 | (e) | | | | | 357 | |
| | | 19.28 | | | | | | 7.09 | | | | | | 177 | | | | | | 0.80 | | | | | | 1.13 | | | | | | 2.06 | (e) | | | | | 357 | |
| | | 18.21 | | | | | | 15.29 | | | | | | 108,710 | | | | | | 1.05 | | | | | | 1.40 | | | | | | 2.75 | (f) | | | | | 238 | |
| | | 18.07 | | | | | | 14.46 | | | | | | 7,991 | | | | | | 1.80 | | | | | | 2.15 | | | | | | 2.03 | (f) | | | | | 238 | |
| | | 18.01 | | | | | | 14.48 | | | | | | 7,665 | | | | | | 1.80 | | | | | | 2.15 | | | | | | 1.99 | (f) | | | | | 238 | |
| | | 18.50 | | | | | | 15.76 | | | | | | 2,919 | | | | | | 0.65 | | | | | | 1.00 | | | | | | 3.14 | (f) | | | | | 238 | |
| | | 18.48 | | | | | | 7.77 | | | | | | 1 | | | | | | 0.80 | (d) | | | | | 1.15 | (d) | | | | | 2.10 | (d)(f) | | | | | 238 | |
| | | 16.32 | | | | | | 15.32 | | | | | | 111,326 | | | | | | 1.05 | | | | | | 1.38 | | | | | | 3.20 | | | | | | 173 | |
| | | 16.19 | | | | | | 14.41 | | | | | | 8,970 | | | | | | 1.80 | | | | | | 2.13 | | | | | | 2.47 | | | | | | 173 | |
| | | 16.14 | | | | | | 14.43 | | | | | | 7,022 | | | | | | 1.80 | | | | | | 2.13 | | | | | | 2.44 | | | | | | 173 | |
| | | 16.57 | | | | | | 15.76 | | | | | | 2,572 | | | | | | 0.65 | | | | | | 0.98 | | | | | | 3.58 | | | | | | 173 | |
| | | | | | | | | | | | | | | | | | | | | | | | | | | | | | | | | | | | | | | | |
| | | | | | | | | | | | | | | | | | | | | | | | | | | | | | | | | | | | | | | | |
| | | 14.64 | | | | | | (16.41 | ) | | | | | 116,915 | | | | | | 1.04 | (d) | | | | | 1.54 | (d) | | | | | 3.72 | (d) | | | | | 58 | |
| | | 14.53 | | | | | | (16.49 | ) | | | | | 10,306 | | | | | | 1.79 | (d) | | | | | 2.29 | (d) | | | | | 2.97 | (d) | | | | | 58 | |
| | | 14.49 | | | | | | (16.52 | ) | | | | | 6,597 | | | | | | 1.79 | (d) | | | | | 2.29 | (d) | | | | | 2.97 | (d) | | | | | 58 | |
| | | 14.86 | | | | | | (16.35 | ) | | | | | 2,433 | | | | | | 0.64 | (d) | | | | | 1.14 | (d) | | | | | 4.10 | (d) | | | | | 58 | |
| | | 14.69 | | | | | | (16.43 | ) | | | | | 1 | | | | | | 0.94 | (d) | | | | | 0.94 | (d) | | | | | 3.75 | (d) | | | | | 58 | |
| | | | | | | | | | | | | | | | | | | | | | | | | | | | | | | | | | | | | | | | |
| | | | | | | | | | | | | | | | | | | | | | | | | | | | | | | | | | | | | | | | |
| | | 17.71 | | | | | | (6.48 | ) | | | | | 148,623 | | | | | | 1.03 | | | | | | 1.29 | | | | | | 3.37 | | | | | | 184 | |
| | | 17.56 | | | | | | (7.21 | ) | | | | | 12,946 | | | | | | 1.78 | | | | | | 2.04 | | | | | | 2.62 | | | | | | 184 | |
| | | 17.52 | | | | | | (7.19 | ) | | | | | 7,835 | | | | | | 1.78 | | | | | | 2.04 | | | | | | 2.63 | | | | | | 184 | |
| | | 17.98 | | | | | | (6.10 | ) | | | | | 2,951 | | | | | | 0.63 | | | | | | 0.89 | | | | | | 3.78 | | | | | | 184 | |
| | | 17.77 | | | | | | (6.41 | ) | | | | | 1 | | | | | | 1.13 | | | | | | 1.39 | | | | | | 3.33 | | | | | | 184 | |
| | |
| The accompanying notes are an integral part of these financial statements. | | 35 |
GOLDMAN SACHS RISING DIVIDEND GROWTH FUND
Financial Highlights
Selected Data for a Share Outstanding Throughout Each Period
| | | | | | | | | | | | | | | | | | | | | | | | | | | | | | | | | | | | | | |
| | | | | | | | Income (loss) from
investment operations | | | Distributions
to shareholders | |
| | | Year - Share Class | |
Net asset
value,
beginning
of period | | | Net
investment
income (loss) | | | Net realized
and unrealized
gain (loss) | | | Total from
investment
operations | | | From net
investment
income | | | From net
realized
gains | | | From
capital | | | In excess of net investment income | | | Total
distributions | |
| | FOR THE SIX MONTHS ENDED APRIL 30, (UNAUDITED) | |
| | 2013 - A | | $ | 15.16 | | | $ | 0.10 | (c) | | $ | 1.67 | | | $ | 1.77 | | | $ | (0.09 | ) | | $ | — | | | $ | — | | | $ | — | | | $ | (0.09 | ) |
| | 2013 - C | | | 15.30 | | | | 0.04 | (c) | | | 1.68 | | | | 1.72 | | | | (0.04 | ) | | | — | | | | — | | | | — | | | | (0.04 | ) |
| | 2013 - Institutional | | | 15.46 | | | | 0.13 | (c) | | | 1.71 | | | | 1.84 | | | | (0.12 | ) | | | — | | | | — | | | | — | | | | (0.12 | ) |
| | 2013 - IR | | | 15.46 | | | | 0.12 | (c) | | | 1.70 | | | | 1.82 | | | | (0.11 | ) | | | — | | | | — | | | | — | | | | (0.11 | ) |
| | 2013 - R | | | 15.15 | | | | 0.08 | (c) | | | 1.67 | | | | 1.75 | | | | (0.08 | ) | | | — | | | | — | | | | — | | | | (0.08 | ) |
| | | | | | | | | | | | | | | | | | | | | | | | | | | | | | | | | | | | | | |
| | FOR THE PERIOD ENDED OCTOBER 1, 2012 TO OCTOBER 31,* | |
| | 2012 - A | | | 15.35 | | | | (0.01 | )(c) | | | (0.18 | ) | | | (0.19 | ) | | | — | | | | — | | | | — | | | | — | | | | — | |
| | 2012 - C | | | 15.50 | | | | (0.02 | )(c) | | | (0.18 | ) | | | (0.20 | ) | | | — | | | | — | | | | — | | | | — | | | | — | |
| | 2012 - Institutional | | | 15.65 | | | | (0.01 | )(c) | | | (0.18 | ) | | | (0.19 | ) | | | — | | | | — | | | | — | | | | — | | | | — | |
| | 2012 - IR | | | 15.65 | | | | (0.01 | )(c) | | | (0.18 | ) | | | (0.19 | ) | | | — | | | | — | | | | — | | | | — | | | | — | |
| | 2012 - R | | | 15.34 | | | | (0.02 | )(c) | | | (0.17 | ) | | | (0.19 | ) | | | — | | | | — | | | | — | | | | — | | | | — | |
| | | | | | | | | | | | | | | | | | | | | | | | | | | | | | | | | | | | | | |
| | FOR THE FISCAL YEARS ENDED SEPTEMBER 30, | |
| | 2012 - A | | | 12.82 | | | | 0.05 | (c) | | | 2.66 | | | | 2.71 | | | | (0.16 | ) | | | — | | | | (0.02 | ) | | | — | | | | (0.18 | ) |
| | 2012 - C | | | 12.97 | | | | (0.07 | )(c) | | | 2.71 | | | | 2.64 | | | | (0.09 | ) | | | — | | | | (0.02 | ) | | | — | | | | (0.11 | ) |
| | 2012 - Institutional | | | 13.06 | | | | 0.11 | (c) | | | 2.71 | | | | 2.82 | | | | (0.21 | ) | | | — | | | | (0.02 | ) | | | — | | | | (0.23 | ) |
| | 2012 - IR (Commenced February 27, 2012) | | | 15.25 | | | | (0.01 | )(c) | | | 0.57 | | | | 0.56 | | | | (0.14 | ) | | | — | | | | (0.02 | ) | | | — | | | | (0.16 | ) |
| | 2012 - R (Commenced February 27, 2012) | | | 14.96 | | | | (0.07 | )(c) | | | 0.57 | | | | 0.50 | | | | (0.10 | ) | | | — | | | | (0.02 | ) | | | — | | | | (0.12 | ) |
| | 2011 - A | | | 12.94 | | | | 0.02 | (c) | | | 0.12 | | | | 0.14 | | | | (0.03 | ) | | | — | | | | (0.15 | ) | | | (0.08 | ) | | | (0.26 | ) |
| | 2011 - C | | | 13.08 | | | | (0.07 | )(c) | | | 0.15 | | | | 0.08 | | | | (0.02 | ) | | | — | | | | (0.11 | ) | | | (0.06 | ) | | | (0.19 | ) |
| | 2011 - Institutional | | | 13.16 | | | | 0.07 | (c) | | | 0.14 | | | | 0.21 | | | | (0.03 | ) | | | — | | | | (0.18 | ) | | | (0.10 | ) | | | (0.31 | ) |
| | 2010 - A | | | 11.07 | | | | 0.01 | | | | 2.05 | | | | 2.06 | | | | (0.01 | ) | | | — | | | | — | | | | (0.18 | ) | | | (0.19 | ) |
| | 2010 - C | | | 11.14 | | | | (0.07 | ) | | | 2.12 | | | | 2.05 | | | | — | (f) | | | — | | | | — | | | | (0.11 | ) | | | (0.11 | ) |
| | 2010 - Institutional | | | 11.25 | | | | 0.10 | | | | 2.05 | | | | 2.15 | | | | (0.01 | ) | | | — | | | | — | | | | (0.23 | ) | | | (0.24 | ) |
| | 2009 - A | | | 11.31 | | | | 0.04 | | | | (0.04 | ) | | | — | | | | (0.06 | ) | | | — | | | | (0.10 | ) | | | (0.08 | ) | | | (0.24 | ) |
| | 2009 - C | | | 11.39 | | | | (0.02 | ) | | | (0.05 | ) | | | (0.07 | ) | | | (0.04 | ) | | | — | | | | (0.08 | ) | | | (0.06 | ) | | | (0.18 | ) |
| | 2009 - Institutional | | | 11.50 | | | | 0.09 | | | | (0.06 | ) | | | 0.03 | | | | (0.07 | ) | | | — | | | | (0.12 | ) | | | (0.09 | ) | | | (0.28 | ) |
| | 2008 - A | | | 13.60 | | | | (0.01 | ) | | | (1.95 | ) | | | (1.96 | ) | | | — | | | | (0.05 | ) | | | (0.27 | ) | | | (0.01 | ) | | | (0.33 | ) |
| | 2008 - C | | | 13.62 | | | | (0.08 | ) | | | (1.95 | ) | | | (2.03 | ) | | | — | | | | (0.05 | ) | | | (0.15 | ) | | | — | (f) | | | (0.20 | ) |
| | 2008 - Institutional | | | 13.85 | | | | 0.09 | | | | (2.00 | ) | | | (1.91 | ) | | | — | | | | (0.05 | ) | | | (0.37 | ) | | | (0.02 | ) | | | (0.44 | ) |
| | * | | The Fund changed its fiscal year end from September 30 to October 31. |
| | (a) | | Assumes investment at the net asset value at the beginning of the period, reinvestment of all dividends and distributions, a complete redemption of the investment at the net asset value at the end of the period and no sales or redemption charges. Total returns would be reduced if a sales or redemption charge was taken into account. Returns do not reflect the deduction of taxes that a shareholder would pay on Fund distributions or the redemption of Fund shares. Total returns for periods less than one full year are not annualized. The Goldman Sachs Rising Dividend Growth Fund’s predecessor was the Rising Dividend Growth Fund (the “Predecessor Fund”). On February 27, 2012, the Predecessor Fund was reorganized as a new series of the Goldman Sachs Trust. Performance prior to February 27, 2012 is that of the Predecessor Fund. Total return information of the Predecessor Fund is provided in the above table because the Predecessor Fund is considered the accounting survivor of the reorganization. |
| | (b) | | The Fund’s portfolio turnover rate is calculated in accordance with regulatory requirements, without regard to transactions involving short term investments and certain derivatives. If such transactions were included, the Fund’s portfolio turnover rate may be higher. |
| | (c) | | Calculated based on the average shares outstanding methodology. |
| | (e) | | Expense ratios include the effect of the operating expenses of the Predecessor Fund prior to Reorganization. |
| | (f) | | Amount is less than $0.005 per share. |
| | |
| 36 | | The accompanying notes are an integral part of these financial statements. |
GOLDMAN SACHS RISING DIVIDEND GROWTH FUND
| | | | | | | | | | | | | | | | | | | | | | | | | | | | | | | | | | | | | | | | |
| | | | | | | | | | | | | | | | | | | | | | | | | | | | | | | | | | |
| | | Net asset
value, end
of period | | | | | Total
return(a) | | | | | Net assets,
end of
period
(in 000s) | | | | | Ratio of
net expenses
to average
net assets | | | | | Ratio of
total expenses
to average
net assets | | | | | Ratio of
net investment
income (loss)
to average
net assets | | | | | Portfolio
turnover
rate(b) | |
| | | | | | | | | | | | | | | | | | | | | | | | | | | | | | | | | | | | | | | | |
| | $ | 16.84 | | | | | | 11.72 | % | | | | $ | 523,846 | | | | | | 1.20 | %(d) | | | | | 1.25 | %(d) | | | | | 1.30 | %(d) | | | | | 8 | % |
| | | 16.98 | | | | | | 11.27 | | | | | | 190,679 | | | | | | 1.95 | (d) | | | | | 2.00 | (d) | | | | | 0.50 | (d) | | | | | 8 | |
| | | 17.18 | | | | | | 11.95 | | | | | | 591,654 | | | | | | 0.80 | (d) | | | | | 0.85 | (d) | | | | | 1.66 | (d) | | | | | 8 | |
| | | 17.17 | | | | | | 11.81 | | | | | | 131,370 | | | | | | 0.95 | (d) | | | | | 1.00 | (d) | | | | | 1.50 | (d) | | | | | 8 | |
| | | 16.82 | | | | | | 11.59 | | | | | | 514 | | | | | | 1.45 | (d) | | | | | 1.50 | (d) | | | | | 0.97 | (d) | | | | | 8 | |
| | | | | | | | | | | | | | | | | | | | | | | | | | | | | | | | | | | | | | | | |
| | | | | | | | | | | | | | | | | | | | | | | | | | | | | | | | | | | | | | | | |
| | | 15.16 | | | | | | (1.24 | ) | | | | | 252,945 | | | | | | 1.20 | (d) | | | | | 1.32 | (d) | | | | | (0.69 | )(d) | | | | | 2 | |
| | | 15.30 | | | | | | (1.29 | ) | | | | | 61,464 | | | | | | 1.94 | (d) | | | | | 2.06 | (d) | | | | | (1.39 | )(d) | | | | | 2 | |
| | | 15.46 | | | | | | (1.21 | ) | | | | | 220,145 | | | | | | 0.80 | (d) | | | | | 0.93 | (d) | | | | | (0.31 | )(d) | | | | | 2 | |
| | | 15.46 | | | | | | (1.21 | ) | | | | | 45,472 | | | | | | 0.95 | (d) | | | | | 1.07 | (d) | | | | | (0.40 | )(d) | | | | | 2 | |
| | | 15.15 | | | | | | (1.24 | ) | | | | | 127 | | | | | | 1.45 | (d) | | | | | 1.57 | (d) | | | | | (0.99 | )(d) | | | | | 2 | |
| | | | | | | | | | | | | | | | | | | | | | | | | | | | | | | | | | | | | | | | |
| | | | | | | | | | | | | | | | | | | | | | | | | | | | | | | | | | | | | | | | |
| | | 15.35 | | | | | | 21.15 | | | | | | 230,319 | | | | | | 1.31 | (e) | | | | | 1.49 | (e) | | | | | 0.35 | (e) | | | | | 18 | |
| | | 15.50 | | | | | | 20.38 | | | | | | 51,158 | | | | | | 2.04 | (e) | | | | | 2.16 | (e) | | | | | (0.45 | )(e) | | | | | 18 | |
| | | 15.65 | | | | | | 21.64 | | | | | | 195,794 | | | | | | 0.93 | (e) | | | | | 1.10 | (e) | | | | | 0.74 | (e) | | | | | 18 | |
| | | 15.65 | | | | | | 3.70 | | | | | | 36,122 | | | | | | 0.95 | (d) | | | | | 1.14 | (d) | | | | | 0.50 | (d) | | | | | 18 | |
| | | 15.34 | | | | | | 3.36 | | | | | | 127 | | | | | | 1.42 | (d) | | | | | 1.60 | (d) | | | | | (0.17 | )(d) | | | | | 18 | |
| | | 12.82 | | | | | | 0.95 | | | | | | 66,336 | | | | | | 1.65 | | | | | | 1.68 | | | | | | 0.12 | | | | | | 52 | |
| | | 12.97 | | | | | | 0.51 | | | | | | 12,332 | | | | | | 2.25 | | | | | | 2.28 | | | | | | (0.48 | ) | | | | | 52 | |
| | | 13.06 | | | | | | 1.47 | | | | | | 55,565 | | | | | | 1.25 | | | | | | 1.28 | | | | | | 0.51 | | | | | | 52 | |
| | | 12.94 | | | | | | 18.69 | | | | | | 46,003 | | | | | | 1.65 | | | | | | 1.86 | | | | | | 0.01 | | | | | | 25 | |
| �� | | 13.08 | | | | | | 18.50 | | | | | | 4,456 | | | | | | 2.25 | | | | | | 2.46 | | | | | | (0.59 | ) | | | | | 25 | |
| | | 13.16 | | | | | | 19.21 | | | | | | 18,092 | | | | | | 1.25 | | | | | | 1.46 | | | | | | 0.41 | | | | | | 25 | |
| | | 11.07 | | | | | | 0.33 | | | | | | 39,998 | | | | | | 1.65 | | | | | | 1.92 | | | | | | 0.51 | | | | | | 39 | |
| | | 11.14 | | | | | | (0.37 | ) | | | | | 3,898 | | | | | | 2.25 | | | | | | 2.52 | | | | | | (0.10 | ) | | | | | 39 | |
| | | 11.25 | | | | | | 0.63 | | | | | | 12,628 | | | | | | 1.25 | | | | | | 1.52 | | | | | | 0.97 | | | | | | 39 | |
| | | 11.31 | | | | | | (14.63 | ) | | | | | 45,894 | | | | | | 1.65 | | | | | | 1.56 | | | | | | (0.05 | ) | | | | | 25 | |
| | | 11.39 | | | | | | (15.04 | ) | | | | | 4,338 | | | | | | 2.25 | | | | | | 2.03 | | | | | | (0.64 | ) | | | | | 25 | |
| | | 11.50 | | | | | | (14.08 | ) | | | | | 11,153 | | | | | | 1.25 | | | | | | 1.44 | | | | | | 0.40 | | | | | | 25 | |
| | |
| The accompanying notes are an integral part of these financial statements. | | 37 |
GOLDMAN SACHS DIVIDEND FOCUS FUNDS
Notes to Financial Statements
April 30, 2013 (Unaudited)
Goldman Sachs Trust (the “Trust”) is a Delaware statutory trust registered under the Investment Company Act of 1940, as amended (the “Act”), as an open-end management investment company. The following table lists those series of the Trust that are included in this report (collectively, the “Funds” or individually a “Fund”), along with their corresponding share classes and respective diversification status under the Act:
| | | | |
| Fund | | Share Classes Offered* | | Diversified/Non-diversified |
Income Builder | | A, B, C, Institutional and IR | | Diversified |
Rising Dividend Growth | | A, C, Institutional, IR and R | | Non-Diversified |
| * | | Class B Shares are generally no longer available for purchase by current or prospective investors. |
Class A Shares are sold with a front-end sales charge of up to 5.50%. Class B Shares were sold with a contingent deferred sales charge (“CDSC”) that declines from 5.00% to zero, depending upon the period of time the shares are held. Class C Shares are sold with CDSC of 1.00% which is imposed on redemptions made within 12 months of purchase.
Goldman Sachs Asset Management, L.P. (“GSAM”), an affiliate of Goldman, Sachs & Co. (“Goldman Sachs”), serves as investment adviser to the Fund pursuant to a management agreement (the “Agreement”) with the Trust.
|
| 2. SIGNIFICANT ACCOUNTING POLICIES |
The financial statements have been prepared in accordance with accounting principles generally accepted in the United States of America (“GAAP”) and require management to make estimates and assumptions that may affect the reported amounts and disclosures. Actual results may differ from those estimates and assumptions.
A. Investment Valuation — The Funds’ valuation policy is to value investments at fair value.
B. Investment Income and Investments — Investment income includes interest income and dividend income, net of any foreign withholding taxes, less any amounts reclaimable. Interest income is accrued daily and adjusted for amortization of premiums and accretion of discounts. Dividend income is recognized on ex-dividend date or, for certain foreign securities, as soon as such information is obtained subsequent to the ex-dividend date. Investment transactions are reflected on trade date. Realized gains and losses are calculated using identified cost. Investment transactions are recorded on the following business day for daily net asset value (“NAV”) calculations. Any foreign capital gains tax is accrued daily based upon net unrealized gains, and is payable upon sale of such investments.
Distributions received from the Funds’ investments in United States (“U.S.”) real estate investment trusts (“REITs”) may be characterized as ordinary income, net capital gain or a return of capital. A return of capital is recorded by the Funds as a reduction to the cost basis of the REIT. Distributions from Master Limited Partnerships (“MLPs”) are generally recorded based on the characterization reported on the MLP’s tax return.
For derivative contracts, realized gains and losses are recorded upon settlement of the contract. Upfront payments are made or received upon entering into a swap agreement and are reflected as a receivable from or payable to the counterparty in the Statement of Assets and Liabilities. Upfront payments are recognized over the contract’s term/event as realized gains or losses, with the exception of forward starting interest rate swaps whose realized gains or losses are recognized from the effective start date. For securities with paydown provisions, principal payments received are treated as a proportionate reduction to the cost basis of the securities and excess or shortfall amounts are recorded as gains or losses.
C. Class Allocations and Expenses — Investment income, realized and unrealized gain (loss), and non-class specific expenses of each Fund are allocated daily based upon the proportion of net assets of each class. Class specific expenses, where applicable, are borne by the respective share classes and include Distribution and Service, Transfer Agent and Service and Shareholder Administration fees. Non-class specific expenses directly incurred by a Fund are charged to that Fund, while such expenses
38
GOLDMAN SACHS DIVIDEND FOCUS FUNDS
|
| 2. SIGNIFICANT ACCOUNTING POLICIES (continued) |
incurred by the Trust are allocated across the respective Funds on a straight-line and/or pro-rata basis depending upon the nature of the expenses.
D. Federal Taxes and Distributions to Shareholders — It is each Fund’s policy to comply with the requirements of the Internal Revenue Code of 1986, as amended (the “Code”), applicable to regulated investment companies (mutual funds) and to distribute each year substantially all of its investment company taxable income and capital gains to its shareholders. Accordingly, the Funds are not required to make any provisions for the payment of federal income tax. Distributions to shareholders are recorded on the ex-dividend date. Income and capital gains distributions, if any, are declared and paid according to the following schedule:
| | | | |
| Fund | | Income Distributions Declared/Paid | | Capital Gains Distributions Declared/Paid |
Income Builder | | Monthly | | Annually |
Rising Dividend Growth | | Quarterly | | Annually |
Net capital losses are carried forward to future fiscal years and may be used to the extent allowed by the Code to offset any future capital gains. Utilization of capital loss carryforwards will reduce the requirement of future capital gains distributions.
Under the Regulated Investment Company Modernization Act of 2010, the Funds are permitted to carry forward capital losses incurred in taxable years beginning after December 22, 2010 for an unlimited period. However, any losses incurred during those future taxable years will be required to be utilized prior to the losses incurred in pre-enactment taxable years. As a result of this ordering rule, pre-enactment capital loss carryforwards may be more likely to expire unused. Additionally, post-enactment capital losses that are carried forward will retain their character as either short-term or long term capital losses rather than being considered all short-term as under previous law.
The characterization of distributions to shareholders for financial reporting purposes is determined in accordance with federal income tax rules, which may differ from GAAP. The source of each Fund’s distributions may be shown in the accompanying financial statements as either from net investment income, net realized gain or capital. Certain components of the Funds’ net assets on the Statements of Assets and Liabilities reflect permanent GAAP/tax differences based on the appropriate tax character.
E. Foreign Currency Translation — The accounting records and reporting currency of the Funds are maintained in U.S. dollars. Assets and liabilities denominated in foreign currencies are translated into U.S. dollars using the current exchange rates at the close of each business day. The effect of changes in foreign currency exchange rates on investments is included within net realized and unrealized gain (loss) on investments. Changes in the value of other assets and liabilities as a result of fluctuations in foreign exchange rates are included in the Statements of Operations within net change in unrealized gain (loss) on foreign currency transactions. Transactions denominated in foreign currencies are translated into U.S. dollars on the date the transaction occurred, the effects of which are included within net realized gain (loss) on foreign currency transactions.
| | |
| 3. INVESTMENTS AND FAIR VALUE MEASUREMENTS | | |
The fair value of a financial instrument is the amount that would be received to sell an asset or paid to transfer a liability in an orderly transaction between market participants at the measurement date (i.e., the exit price). GAAP establishes a fair value hierarchy that prioritizes the inputs to valuation techniques used to measure fair value. The hierarchy gives the highest priority to unadjusted quoted prices in active markets for identical assets or liabilities (Level 1 measurements) and the lowest priority to unobservable inputs (Level 3 measurements). The levels used for classifying investments are not necessarily an indication of the risk associated with investing in these investments. The three levels of the fair value hierarchy are described below:
Level 1 — Unadjusted quoted prices in active markets that are accessible at the measurement date for identical, unrestricted assets or liabilities;
39
GOLDMAN SACHS DIVIDEND FOCUS FUNDS
Notes to Financial Statements (continued)
April 30, 2013 (Unaudited)
|
| 3. INVESTMENTS AND FAIR VALUE MEASUREMENTS (continued) |
Level 2 — Quoted prices in markets that are not active or financial instruments for which significant inputs are observable (including, but not limited to, quoted prices for similar investments, interest rates, foreign exchange rates, volatility and credit spreads), either directly or indirectly;
Level 3 — Prices or valuations that require significant unobservable inputs (including GSAM’s assumptions in determining fair value measurement).
The Trustees have adopted Valuation Procedures that govern the valuation of the portfolio investments held by the Funds, including investments for which market quotations are not readily available. The Trustees have delegated to GSAM day-to-day responsibility for implementing and maintaining internal controls and procedures related to the valuation of the Funds’ portfolio investments. To assess the continuing appropriateness of pricing sources and methodologies, GSAM regularly performs price verification procedures and issues challenges as necessary to third party pricing vendors or brokers, and any differences are reviewed in accordance with the Valuation Procedures.
A. Level 1 and Level 2 Fair Value Investments — The valuation techniques and significant inputs used in determining the fair values for investments classified as Level 1 and Level 2 are as follows:
Equity Securities — Equity securities and investment companies traded on a U.S. securities exchange or the NASDAQ system, or those located on certain foreign exchanges including but not limited to the Americas, are valued daily at their last sale price or official closing price on the principal exchange or system on which they are traded. If no sale occurs, equity securities and exchange traded investment companies are valued at the last bid price for long positions and at the last ask price for short positions. Investments in investment companies (other than those that are exchange traded) are valued at the NAV on the valuation date. To the extent these investments are actively traded, they are classified as Level 1 of the fair value hierarchy.
Unlisted equity securities for which market quotations are available are valued at the last sale price on the valuation date, or if no sale occurs, at the last bid price. Securities traded on certain foreign securities exchanges are valued daily at fair value determined by an independent fair value service (if available) under Valuation Procedures approved by the Trustees and consistent with applicable regulatory guidance. The independent fair value service takes into account multiple factors including, but not limited to, movements in the securities markets, certain depositary receipts, futures contracts and foreign currency exchange rates that have occurred subsequent to the close of the foreign securities exchange. These investments are generally classified as Level 2 of the fair value hierarchy.
Debt Securities — Debt securities for which market quotations are readily available are valued daily on the basis of quotations supplied by dealers or an independent pricing service approved by the Trustees. The pricing services may use valuation models or matrix pricing, which consider: (i) yield or price with respect to bonds that are considered comparable in characteristics such as rating, interest rate and maturity date or (ii) quotations from securities dealers to determine current value. Short-term debt obligations that mature in sixty days or less and that do not exhibit signs of credit deterioration are valued at amortized cost, which approximates fair value. With the exception of treasury securities, which are generally classified as Level 1, these investments are generally classified as Level 2 of the fair value hierarchy.
i. Mortgage-Backed and Asset-Backed Securities — Mortgage-backed securities represent direct or indirect participations in, or are collateralized by and payable from, mortgage loans secured by residential and/or commercial real estate property. Asset-backed securities include securities whose principal and interest payments are collateralized by pools of other assets or receivables. The value of certain mortgage-backed and asset-backed securities (including adjustable rate mortgage loans) may be particularly sensitive to changes in prevailing interest rates. The value of these securities may also fluctuate in response to the market’s perception of the creditworthiness of the issuers.
Asset-backed securities may present credit risks that are not presented by mortgage-backed securities because they generally do not have the benefit of a security interest in collateral that is comparable to mortgage assets. Some asset-backed securities may only have a subordinated claim on collateral.
Stripped mortgage-backed securities are usually structured with two different classes: one that receives substantially all interest payments (interest-only, or “IO” and/or high coupon rate with relatively low principal amount, or “IOette”), and the
40
GOLDMAN SACHS DIVIDEND FOCUS FUNDS
|
| 3. INVESTMENTS AND FAIR VALUE MEASUREMENTS (continued) |
other that receives substantially all principal payments (principal-only, or “PO”) from a pool of mortgage loans. Little to no principal will be received at the maturity of an IO; as a result, periodic adjustments are recorded to reduce the cost of the security until maturity. These adjustments are included in interest income.
ii. Senior Term Loans — Senior term loans (“Loans”) are interests in amounts owed by corporate, governmental, or other borrowers to lenders or lending syndicates. Loans are arranged through private negotiations between the borrower and one or more financial institutions (“Lenders”). A Fund’s investments in Loans are in the form of either participations in Loans (“Participations”) or assignments of all or a portion of Loans from third parties (“Assignments”). With respect to Participations, a Fund has the right to receive payments of principal, interest and any fees to which it is entitled from the Lender selling the Participations and only upon receipt by the Lender of the payments from the borrower. A Fund generally has no right to enforce compliance by the borrower with the terms of the loan agreement with respect to Participations.
Derivative Contracts — A derivative is an instrument whose value is derived from underlying assets, indices, reference rates or a combination of these factors.
Exchange-traded derivatives, including futures contracts, typically fall within Level 1 of the fair value hierarchy. Over-the-counter (“OTC”) derivatives are valued using market transactions and other market evidence, including market-based inputs to models, calibration to market-clearing transactions, broker or dealer quotations, or other alternative pricing sources. Where models are used, the selection of a particular model to value an OTC derivative depends upon the contractual terms of, and specific risks inherent in, the instrument, as well as the availability of pricing information in the market. Valuation models require a variety of inputs, including contractual terms, market prices, yield curves, credit curves, measures of volatility, voluntary and involuntary prepayment rates, loss severity rates and correlations of such inputs. For OTC derivatives that trade in liquid markets, model inputs can generally be verified and model selection does not involve significant management judgment. OTC derivatives are classified within Level 2 of the fair value hierarchy when significant inputs are corroborated by market evidence.
i. Forward Foreign Currency Exchange Contracts — In a forward foreign currency contract, a Fund agrees to receive or deliver a fixed quantity of one currency for another, at a pre-determined price at a future date. All forward foreign currency exchange contracts are marked to market daily at the applicable forward rate.
ii. Futures Contracts — Futures contracts are contracts to buy or sell a standardized quantity of a specified commodity or security and are valued based on exchanged settlement prices or independent market quotes. Futures contracts are valued at the last settlement price, or in the absence of a sale, the last bid price for long positions and at the last ask price for short positions, at the end of each day on the board of trade or exchange upon which they are traded. Upon entering into a futures contract, a Fund deposits cash or securities in an account on behalf of the broker in an amount sufficient to meet the initial margin requirement. Subsequent payments are made or received by the Fund equal to the daily change in the contract value and are recorded as variation margin receivable or payable with a corresponding offset to unrealized gains or losses.
iii. Swap Contracts — Swaps are marked to market daily using pricing vendor quotations, counterparty prices or model prices, and the change in value, if any, is recorded as an unrealized gain or loss.
A credit default swap is an agreement that involves one party (the buyer of protection) making a stream of payments to another party (the seller of protection) in exchange for the right to receive protection on a reference security or obligation. A Fund may use credit default swaps to provide a measure of protection against defaults of the reference security or obligation or to take a short position with respect to the likelihood of default. A Fund’s investment in credit default swaps may involve greater risks than if the Fund had invested in the referenced obligation directly. Credit events are contract specific but may include bankruptcy, failure to pay, restructuring and obligation acceleration. If a Fund buys protection through a credit default swap and no credit event occurs, its payments are limited to the periodic payments previously made to the counterparty. Upon the occurrence of a specified credit event, a Fund, as a buyer of credit protection, is entitled to receive an amount equal to the notional amount of the swap and deliver to the seller the defaulted reference obligation in a physically settled trade. A Fund may also receive a net settlement amount in the form of cash or securities equal to the notional amount of the swap reduced by the recovery value of the reference obligation in cash settled trade.
41
GOLDMAN SACHS DIVIDEND FOCUS FUNDS
Notes to Financial Statements (continued)
April 30, 2013 (Unaudited)
|
| 3. INVESTMENTS AND FAIR VALUE MEASUREMENTS (continued) |
As a seller of protection, a Fund generally receives a payment stream throughout the term of the swap, provided that there is no credit event. In addition, if a Fund sells protection through a credit default swap, the Fund could suffer a loss because the value of the referenced obligation may be less than the premium payments received. Upon the occurrence of a specified credit event, a Fund, as a seller of credit protection, may be required to take possession of the defaulted reference obligation and pay the buyer an amount equal to the notional amount of the swap in a physically settled trade. A Fund may also pay a net settlement amount in the form of cash or securities equal to the notional amount of the swap reduced by the recovery value of the reference obligation in cash settled trade. Recovery values are at times established through the credit event auction process in which market participants are ensured that a transparent price has been set for the defaulted security or obligation. In addition, a Fund is entitled to a return of any assets, which have been pledged as collateral to the counterparty.
The maximum potential amount of future payments (undiscounted) that a Fund as seller of protection could be required to make under a credit default swap would be an amount equal to the notional amount of the agreement. These potential amounts would be partially offset by any recovery values of the respective referenced obligations or net amounts received from a settlement of a credit default swap for the same reference security or obligation where the Fund bought credit protection.
Short Term Investments — Short-term investments having a maturity of 60 days or less are generally valued at amortized cost which approximates fair market value. These investments are classified as Level 2 of the fair value hierarchy.
i. Repurchase Agreements — Repurchase agreements involve the purchase of securities subject to the seller’s agreement to repurchase the securities at a mutually agreed upon date and price. During the term of a repurchase agreement, the value of the underlying securities held as collateral on behalf of a Fund, including accrued interest, is required to exceed the value of the repurchase agreement, including accrued interest. The underlying securities for all repurchase agreements are held at the Funds’ custodian or designated sub-custodians under tri-party repurchase agreements.
Pursuant to exemptive relief granted by the Securities and Exchange Commission (“SEC”) and terms and conditions contained therein, the Funds, together with other funds of the Trust and registered investment companies having management agreements with GSAM or its affiliates, may transfer uninvested cash into joint accounts, the daily aggregate balance of which is invested in one or more repurchase agreements. Under these joint accounts, the Funds maintain pro-rata credit exposure to the underlying repurchase agreements’ counterparties. With the exception of certain transaction fees, the Funds are not subject to any expenses in relation to these investments.
B. Level 3 Fair Value Investments — To the extent that the aforementioned significant inputs are unobservable, or if quotations are not readily available, or if GSAM believes that such quotations do not accurately reflect fair value, the fair value of the Funds’ investments may be determined under Valuation Procedures approved by the Trustees. GSAM, consistent with its procedures and applicable regulatory guidance, may make an adjustment to the most recent valuation prices of either domestic or foreign securities in light of significant events to reflect what it believes to be the fair value of the securities at the time of determining a Fund’s NAV. Significant events which could affect a large number of securities in a particular market may include, but are not limited to: significant fluctuations in U.S. or foreign markets; market dislocations; market disruptions; or unscheduled market closings. Significant events which could also affect a single issuer may include, but are not limited to: corporate actions such as reorganizations, mergers and buy outs; ratings downgrades; and bankruptcies.
42
GOLDMAN SACHS DIVIDEND FOCUS FUNDS
|
| 3. INVESTMENTS AND FAIR VALUE MEASUREMENTS (continued) |
C. Fair Value Hierarchy — The following is a summary of the Funds’ investments and derivatives classified in the fair value hierarchy as of April 30, 2013:
| | | | | | | | | | | | |
| | | |
| INCOME BUILDER | | | | | | | | | | | | |
| | | |
| Investment Type | | Level 1 | | | Level 2 | | | Level 3 | |
| Assets | | | | | | | | | | | | |
Common Stocks | | $ | 93,303,022 | | | $ | — | | | $ | — | |
Preferred Stocks | | | — | | | | 5,988,070 | | | | — | |
Fixed Income | | | | | | | | | | | | |
Corporate Obligations | | | — | | | | 85,965,208 | | | | — | |
Mortgage-Backed Obligations | | | — | | | | 1,236,681 | | | | — | |
Asset-Backed Securities | | | — | | | | 250,923 | | | | — | |
Senior Term Loans | | | — | | | | 2,227,700 | | | | — | |
Investment Companies | | | 2,748,264 | | | | — | | | | — | |
Short-term Investments | | | — | | | | 3,800,000 | | | | — | |
| Total | | $ | 96,051,286 | | | $ | 99,468,582 | | | $ | — | |
| | | |
| Derivative Type | | Level 1 | | | Level 2 | | | Level 3 | |
| Assets(a) | | | | | | | | | | | | |
Futures Contracts | | $ | 6,155 | | | $ | — | | | $ | — | |
Credit Default Swap Contracts | | | — | | | | 29,224 | | | | — | |
| Liabilities(a) | | | | | | | | | | | | |
Futures Contracts | | $ | (675,589 | ) | | $ | — | | | $ | — | |
Credit Default Swap Contracts | | | — | | | | (17,315 | ) | | | — | |
| | | |
| RISING DIVIDEND GROWTH | | | | | | | | | | | | |
| | | |
| Investment Type | | Level 1 | | | Level 2 | | | Level 3 | |
| Assets | | | | | | | | | | | | |
Common Stocks | | $ | 1,368,667,863 | | | $ | — | | | $ | — | |
Short-term Investments | | | — | | | | 99,300,000 | | | | — | |
| (a) | | Amount shown represents unrealized gain (loss) at period end. |
For further information regarding security characteristics, see the Schedules of Investments.
43
GOLDMAN SACHS DIVIDEND FOCUS FUNDS
Notes to Financial Statements (continued)
April 30, 2013 (Unaudited)
|
| 4. INVESTMENTS IN DERIVATIVES |
The following table sets forth, by certain risk types, the gross value of derivative contracts as of April 30, 2013. These instruments were used to meet the Income Builder Fund’s investment objectives and to obtain and/or manage exposure related to the risks below. The values in the table below excludes the effects of cash collateral received or posted pursuant to these derivative contracts, and therefore are not representative of the Fund’s net exposure.
| | | | | | | | | | | | |
| | | |
| Income Builder | | | | | | | | | | |
| Risk | | Statement of Assets and Liabilities | | Assets | | | Statement of Assets and Liabilities | | Liabilities | |
Interest Rate | | Receivable for futures — variation margin | | $ | 6,155 | (a) | | Payable for futures — variation margin | | $ | (675,589) | (a) |
Credit | | Receivable for unrealized gain on swap contracts | | | 29,224 | | | Payable for unrealized loss on swap contracts | | | (17,315) | (b) |
| Total | | $ | 35,379 | | | | | $ | (692,904) | |
| (a) | | Includes unrealized gain (loss) on futures contracts described in the Additional Investment Information sections of the Schedule of Investments. Only current day’s variation margin is reported within the Statement of Assets and Liabilities. |
| (b) | | Amount represents the payments to be made pursuant to bilateral agreements should counterparties exercise their “right to terminate” provisions based on, among others, the Fund’s performance, its failure to pay on its obligations or failure to pledge collateral. Such amount does not include incremental charges directly associated with the close-out of the agreements. It also does not reflect the fair value of any assets pledged as collateral which, through the daily margining process, substantially offsets the aforementioned amounts and for which the Fund is entitled to a full return. |
The following table sets forth, by certain risk types, the Income Builder Fund’s gains (losses) related to these derivatives and their indicative volumes for the six months ended April 30, 2013. These gains (losses) should be considered in the context that these derivative contracts may have been executed to economically hedge certain investments, and accordingly, certain gains (losses) on such derivative contracts may offset certain (losses) gains attributable to investments. These gains (losses) are included in “Net realized gain (loss)” or “Net change in unrealized gain (loss)” on the Statement of Operations:
| | | | | | | | | | | | | | |
| | | |
| Income Builder | | | | | | | | | | | | |
| Risk | | Statement of Operations | | Net Realized Gain (Loss) | | | Net Change in
Unrealized
Gain (Loss) | | | Average
Number of
Contracts(a) | |
| Interest rate | | Net realized gain (loss) from futures contracts/Net change in unrealized gain (loss) on futures contracts | | $ | (95,131 | ) | | $ | (669,434 | ) | | | 97 | |
| Credit | | Net realized gain (loss) from swap contracts/Net change in unrealized gain (loss) on swap contracts | | | 286 | | | | 9,502 | | | | 5 | |
| Currency | | Net realized gain (loss) from forward foreign currency exchange contracts/Net change in unrealized gain (loss) on forward foreign currency exchange contracts | | | 3,536 | | | | (934 | ) | | | 1 | |
| Total | | | | $ | (91,309 | ) | | $ | (660,866 | ) | | | 103 | |
| (a) | | Average number of contracts is based on the average of month end balances for the period ended April 30, 2013. |
44
GOLDMAN SACHS DIVIDEND FOCUS FUNDS
|
| 5. AGREEMENTS AND AFFILIATED TRANSACTIONS |
A. Management Agreement — Under the Agreement, GSAM manages the Funds, subject to the general supervision of the Trustees.
As compensation for the services rendered pursuant to the Agreement, the assumption of the expenses related thereto and administration of the Funds’ business affairs, including providing facilities, GSAM is entitled to a management fee, accrued daily and paid monthly, equal to an annual percentage rate of each Fund’s average daily net assets.
For the six months ended April 30, 2013, contractual and effective net management fees with GSAM were at the following rates:
| | | | | | | | | | | | | | | | | | | | | | | | | | | | | | |
| | | | | Contractual Management Rate | | | | |
| | | | | First $1 billion | | | Next $1 billion | | | Next $3 billion | | | Next $3 billion | | | Over $8 billion | | | Effective Rate | | | Effective Net
Management
Fee Rate | |
Income Builder | | | | | 0.65 | % | | | 0.59 | % | | | 0.56 | % | | | 0.55 | % | | | 0.54 | % | | | 0.65 | % | | | 0.53 | %* |
Rising Dividend Growth | | | | | 0.75 | | | | 0.68 | | | | 0.64 | | | | 0.63 | | | | 0.62 | | | | 0.74 | | | | 0.74 | |
| * | | GSAM has agreed to waive a portion of its management fee in order to achieve net management rates, as defined in the fund’s most recent prospectus. These waivers will be effective through at least February 28, 2014, and prior to such date GSAM may not terminate the arrangement without approval of the Trustees. The Effective Net Management Rates above are calculated based on management rates before and after the waivers had been adjusted, if applicable. |
Dividend Assets Capital, LLC (“DAC”), serves as the sub-adviser to the Rising Dividend Growth Fund (the “Sub-Adviser”). As compensation for its services as Sub-Advisor, DAC is entitled to a fee, payable by GSAM, accrued daily and paid each calendar quarter, equal to an annual rate of 0.20% of the Rising Dividend Growth Fund’s average daily net assets.
B. Distribution and Service Plans — The Trust, on behalf of each Fund, has adopted Distribution and Service Plans (the “Plans”). Under the Plans, Goldman Sachs, which serves as distributor (the “Distributor”), is entitled to a fee, accrued daily and paid monthly, for distribution services and personal and account maintenance services, which may then be paid by Goldman Sachs to authorized dealers, at the following annual rates calculated on a Fund’s average daily net assets of each respective share class:
| | | | | | | | | | | | | | | | |
| | | Distribution and Service Plan Rates | |
| | | Class A* | | | Class B | | | Class C | | | Class R* | |
Distribution Plan | | | 0.25 | % | | | 0.75 | % | | | 0.75 | % | | | 0.50 | % |
Service Plan | | | — | | | | 0.25 | | | | 0.25 | | | | — | |
| * | | With respect to Class A and Class R Shares, the Distributor at its discretion may use compensation for distribution services paid under the Distribution Plan to compensate service organizations for personal and account maintenance services and expenses as long as such total compensation does not exceed the maximum cap on “service fees” imposed by the Financial Industry Regulatory Authority. |
C. Distribution Agreement — Goldman Sachs, as Distributor of the shares of the Funds pursuant to a Distribution Agreement, may retain a portion of the Class A front end sales charge and Class B and Class C Shares’ CDSC. During the six months ended April 30, 2013, Goldman Sachs advised that it retained the following amounts:
| | | | | | | | | | |
| | | | | Front End Sales Charge | | | Contingent Deferred
Sales Charge* | |
| Fund | | | | Class A | | | Class B | |
Income Builder | | | | $ | 41,745 | | | $ | — | |
Rising Dividend Growth | | | | | 309,606 | | | | N/A | |
| * | | Goldman Sachs did not retain any Class C Shares’ CDSC. |
45
GOLDMAN SACHS DIVIDEND FOCUS FUNDS
Notes to Financial Statements (continued)
April 30, 2013 (Unaudited)
|
| 5. AGREEMENTS AND AFFILIATED TRANSACTIONS (continued) |
D. Transfer Agency Agreement — Goldman Sachs also serves as the transfer agent of the Funds for a fee pursuant to a Transfer Agency Agreement. The fees charged for such transfer agency services are accrued daily and paid monthly at annual rates as follows: 0.19% of the average daily net assets of Class A, Class B, Class C, Class IR and Class R Shares; 0.04% of the average daily net assets of Institutional Shares.
E. Other Expense Agreements and Affiliated Transactions — GSAM has agreed to limit certain “Other Expense” of the Funds (excluding transfer agent fees and expenses, taxes, interest, brokerage fees, litigation, indemnification, shareholder meeting and other extraordinary expenses) to the extent such expenses exceed, on an annual basis, a percentage rate of the average daily net assets of each Fund. Such Other Expense reimbursements, if any, are accrued daily and paid monthly. In addition, the Funds are not obligated to reimburse GSAM for prior fiscal year expense reimbursements, if any. The Other Expense limitations as an annual percentage rate of average daily net assets for Income Builder and Rising Dividend Growth are 0.004% and 0.014% respectively. Prior to February 13, 2013, the Other Expense limitation for the Income Builder Fund was 0.064%. These Other Expense reimbursements will remain in place through at least February 28, 2014, and prior to such date GSAM may not terminate the arrangements without the approval of the Trustees. In addition, the Funds have entered into certain offset arrangements with the custodian and the transfer agent, which may result in a reduction of the Funds’ expenses and are received irrespective of the application of the “Other Expense” limitations described above.
For the six months ended April 30, 2013, these expense reductions, including any fee waivers and Other Expense reimbursements, were as follows:
| | | | | | | | | | | | | | | | | | |
| Fund | | | | Management
Fee Waiver | | | Custody Fee
Credits | | | Other Expense
Reimbursements | | | Total Expense
Reductions | |
Income Builder | | | | $ | 97,673 | | | $ | 80 | | | $ | 153,423 | | | $ | 251,176 | |
Rising Dividend Growth | | | | | — | | | | 62 | | | | 243,506 | | | | 243,568 | |
As of April 30, 2013, the amounts owed to affiliates of the Funds were as follows:
| | | | | | | | | | | | | | | | | | |
| Fund | | | | Management
Fees | | | Distribution and
Service Fees | | | Transfer Agent Fees | | | Total | |
Income Builder | | | | $ | 75,775 | | | $ | 54,523 | | | $ | 24,798 | | | $ | 155,096 | |
Rising Dividend Growth | | | | | 796,964 | | | | 243,847 | | | | 140,131 | | | | 1,180,942 | |
F. Line of Credit Facility — As of April 30, 2013, the Funds participated in a $630,000,000 committed, unsecured revolving line of credit facility (the “facility”) together with other funds of the Trust and registered investment companies having management agreements with GSAM or its affiliates (“Other Borrowers”). Pursuant to the terms of the facility, the Funds and Other Borrowers could increase the credit amount by an additional $340,000,000, for a total of up to $970,000,000. This facility is to be used solely for temporary or emergency purposes which may include the funding of redemptions. The interest rate on borrowings is based on the federal funds rate. The facility also requires a fee to be paid by the Funds based on the amount of the commitment that has not been utilized. For the six months ended April 30, 2013, the Funds did not have any borrowings under the facility. Effective May 8, 2013, the committed amount available through the facility increased to $780,000,000.
46
GOLDMAN SACHS DIVIDEND FOCUS FUNDS
|
| 5. AGREEMENTS AND AFFILIATED TRANSACTIONS (continued) |
G. Other Transactions with Affiliates — For the six months ended April 30, 2013, Goldman Sachs earned $643 in brokerage commissions from portfolio transactions, including futures transactions executed with Goldman Sachs as the Futures Commission Merchant, on behalf of the Income Builder Fund.
The Income Builder Fund invests in the Institutional Shares of the Goldman Sachs High Yield Fund. This Underlying Fund is considered to be affiliated with the Fund. The table below shows the transactions in and earnings from investments in this affiliated Fund for the six months ended April 30, 2013:
| | | | | | | | | | | | | | | | | | | | | | | | | | | | | | | | | | |
| Underlying Fund | | | | Market
Value
11/1/2012 | | | Purchases at Cost | | | Proceeds
from Sales | | | Realized
Gain (Loss) | | | Change in Unrealized
Gain (Loss) | | | Market
Value
4/30/2013 | | | Dividend Income | | | Capital Gains
Distributions | |
High Yield Fund | | | | $ | 2,509,120 | | | $ | 2,399,884 | | | $ | (2,221,474 | ) | | $ | 4,215 | | | $ | 56,519 | | | $ | 2,748,264 | | | $ | 76,342 | | | $ | 23,543 | |
| | |
| 6. PORTFOLIO SECURITIES TRANSACTIONS | | |
The cost of purchases and proceeds from sales and maturities of long-term securities for the six months ended April 30, 2013, were as follows:
| | | | | | | | | | |
| Fund | | | | Purchases | | | Sales and Maturities | |
Income Builder | | | | $ | 98,038,770 | | | $ | 51,956,535 | |
Rising Dividend Growth | | | | | 815,247,021 | | | | 73,816,617 | |
As of the Funds’ most recent fiscal year end, October 31, 2012, the Funds’ capital loss carryforwards and certain timing differences on a tax basis were as follows:
| | | | | | | | | | |
| | | | | Income Builder | | | Rising Dividend
Growth | |
Capital loss carryforwards: | | | | | | | | | | |
Expiring 2017(1) | | | | $ | — | | | $ | (3,483,653 | ) |
Perpetual Short-term | | | | | — | | | | (5,039,343 | ) |
Total capital loss carryforwards | | | | $ | — | | | $ | (8,522,996 | ) |
Timing Differences (Distribution Payable) | | | (36,883 | ) | | | — | |
| (1) | | Expiration occurs on October 31 of the year indicated. |
As of April 30, 2013, the Funds’ aggregate security unrealized gains and losses based on cost for U.S. federal income tax purposes were as follows:
| | | | | | | | | | |
| | | | | Income Builder | | | Rising Dividend Growth | |
Tax Cost | | | | $ | 178,052,540 | | | $ | 1,310,050,617 | |
Gross unrealized gain | | | | | 18,097,491 | | | | 161,773,133 | |
Gross unrealized loss | | | | | (630,163 | ) | | | (3,855,887 | ) |
Net unrealized security gain (loss) | | | | $ | 17,467,328 | | | $ | 157,917,246 | |
47
GOLDMAN SACHS DIVIDEND FOCUS FUNDS
Notes to Financial Statements (continued)
April 30, 2013 (Unaudited)
|
| 7. TAX INFORMATION (continued) |
The difference between GAAP-basis and tax-basis unrealized gains (losses) is attributable primarily to wash sales, differences related to the tax treatment of partnership investments, underlying fund investments, and swap transactions.
GSAM has reviewed the Funds’ tax positions for all open tax years (the current and prior three years, as applicable, and has concluded that no provision for income tax is required in the Funds’ financial statements. Such open tax years remain subject to examination and adjustment by tax authorities.
The Fund’s risks include, but are not limited to, the following:
Foreign Custody Risk — A Fund that invests in foreign securities may hold such securities and foreign currency with foreign banks, agents, and securities depositories appointed by the Fund’s custodian (each a “Foreign Custodian”). In some countries, Foreign Custodians may be subject to little or no regulatory oversight or independent evaluation of their operations. Further, the laws of certain countries may place limitations on a Fund’s ability to recover its assets if a Foreign Custodian enters into bankruptcy. Investments in emerging markets may be subject to greater custody risks than investments in more developed markets. Custody services in emerging market countries are often undeveloped and may be less regulated than in more developed countries, and thus may not afford the same level of investor protection as would apply in developed countries.
Investments in Other Investment Companies — As a shareholder of another investment company, a Fund will directly bear its proportionate share of any management fees (unless waived) and other expenses paid by such other investment companies, in addition to the fees and expenses regularly borne by the Fund.
Liquidity Risk — The Funds may make investments that are illiquid or that may become less liquid in response to market developments or adverse investor perceptions. Illiquid investments may be more difficult to value. Liquidity risk may also refer to the risk that a Fund will not be able to pay redemption proceeds within the allowable time period because of unusual market conditions, an unusually high volume of redemption requests, or other reasons. To meet redemption requests, a Fund may be forced to sell investments at an unfavorable time and/or under unfavorable conditions.
Market and Credit Risks — In the normal course of business, the Funds trade financial instruments and enter into financial transactions where risk of potential loss exists due to changes in the market (market risk). Additionally, the Funds may also be exposed to credit risk in the event that an issuer fails to perform or that an institution or entity with which the Funds have unsettled or open transactions defaults.
Investing in foreign markets may involve special risks and considerations not typically associated with investing in the U.S. These risks include revaluation of currencies, high rates of inflation, repatriation restrictions on income and capital, and adverse political and economic developments. Moreover, securities issued in these markets may be less liquid, be subject to government ownership controls, have delayed settlements and their prices may be more volatile than those of comparable securities in the U.S.
Master Limited Partnership Risk — Investments in securities of MLPs involve risks that differ from investments in common stock, including risks related to limited control and limited rights to vote on matters affecting the MLP, risks related to potential conflicts of interest between the MLP and the MLP’s general partner, cash flow risks, dilution risks, limited liquidity and risks related to the general partner’s right to require unit-holders to sell their common units at an undesirable time or price.
Non-Diversification Risk — Rising Dividend Growth Fund is non-diversified, meaning that it is permitted to invest a larger percentage of its assets in fewer issuers than diversified mutual funds. Thus, the Fund may be more susceptible to adverse developments affecting any single issuer held in its portfolio, and may be more susceptible to greater losses because of these developments.
48
GOLDMAN SACHS DIVIDEND FOCUS FUNDS
|
| 8. OTHER RISKS (continued) |
Portfolio Concentration Risk — As a result of a Fund’s ability to invest a large percentage of its assets in obligations of issuers within the same country, state, region, currency or economic sector, an adverse economic, business or political development may affect the value of the Fund’s investments more than if its investments were not so concentrated.
Shareholder Concentration Risk — Certain funds, accounts, individuals or Goldman Sachs affiliates may from time to time own (beneficially or of record) or control a significant percentage of the Funds’ shares. Redemptions by these entities of their holdings in the Funds may impact the Funds’ liquidity and NAV. These redemptions may also force the Funds to sell securities.
Under the Trust’s organizational documents, its Trustees, officers, employees and agents are indemnified, to the extent permitted by the Act and State law, against certain liabilities that may arise out of performance of their duties to the Funds. Additionally, in the course of business, the Funds enter into contracts that contain a variety of indemnification clauses. The Funds’ maximum exposure under these arrangements is unknown, as this would involve future claims that may be made against the Funds that have not yet occurred. However, GSAM believes the risk of loss under these arrangements to be remote.
New Accounting Pronouncement — In December 2011, the Financial Accounting Standards Board issued an Accounting Standards Update No. 2011-11: Disclosure about Offsetting Assets and Liabilities (“ASU”) to enhance disclosures about financial instruments and derivative instruments that are subject to offsetting (“netting”) on the Statements of Assets and Liabilities. This information will enable users of the Funds’ financial statements to evaluate the effect or potential effect of netting arrangements on the Funds’ financial position. The ASU is effective for financial statements with fiscal years beginning on or after January 1, 2013, and interim periods within those fiscal years. At this time, GSAM is evaluating the implications of these changes on the financial statements.
Subsequent events after the Statement of Assets and Liabilities date have been evaluated through the date the financial statements were issued. GSAM has concluded that there is no impact requiring adjustment or disclosure in the financial statements.
49
GOLDMAN SACHS DIVIDEND FOCUS FUNDS
Notes to Financial Statements (continued)
April 30, 2013 (Unaudited)
|
| 12. SUMMARY OF SHARE TRANSACTIONS |
Share activity is as follows:
| | | | | | | | | | | | | | | | | | |
| | | Income Builder Fund | |
| | | |
| | | For the Six Months Ended April 30, 2013 (Unaudited) | | | For the Fiscal Year Ended October 31, 2012 | |
| | | |
| | | Shares | | | Dollars | | | Shares | | | Dollars | |
| | | |
| Class A Shares | | | | | | | | | | | | | | | | | | |
Shares sold | | | | | 1,065,113 | | | $ | 22,669,685 | | | | 1,129,452 | | | $ | 22,669,091 | |
Reinvestment of distributions | | | 227,683 | | | | 4,727,266 | | | | 118,259 | | | | 2,388,299 | |
Shares converted from Class B(a) | | | 4,358 | | | | 92,122 | | | | 10,261 | | | | 205,201 | |
Shares redeemed | | | | | (682,616 | ) | | | (14,306,772 | ) | | | (1,714,766 | ) | | | (34,277,010 | ) |
| | | | | | 614,538 | | | | 13,182,301 | | | | (456,794 | ) | | | (9,014,419 | ) |
| Class B Shares | | | | | | | | | | | | | | | | | | |
Shares sold | | | 16,655 | | | | 348,945 | | | | 61,243 | | | | 1,211,513 | |
Reinvestment of distributions | | | 11,866 | | | | 243,880 | | | | 4,835 | | | | 97,270 | |
Shares converted to Class A(a) | | | (4,391 | ) | | | (92,122 | ) | | | (10,342 | ) | | | (205,201 | ) |
Shares redeemed | | | (69,681 | ) | | | (1,454,547 | ) | | | (111,022 | ) | | | (2,193,078 | ) |
| | | | | | (45,551 | ) | | | (953,844 | ) | | | (55,286 | ) | | | (1,089,496 | ) |
| Class C Shares | | | | | | | | | | | | | | | | | | |
Shares sold | | | | | 850,422 | | | | 17,863,105 | | | | 507,140 | | | | 10,227,404 | |
Reinvestment of distributions | | | | | 42,846 | | | | 876,701 | | | | 9,841 | | | | 198,518 | |
Shares redeemed | | | | | (71,360 | ) | | | (1,496,443 | ) | | | (110,439 | ) | | | (2,177,258 | ) |
| | | | | | 821,908 | | | | 17,243,363 | | | | 406,542 | | | | 8,248,664 | |
| Institutional Shares | | | | | | | | | | | | | | | | | | |
Shares sold | | | | | 1,215,985 | | | | 26,212,469 | | | | 450,431 | | | | 9,337,154 | |
Reinvestment of distributions | | | | | 34,758 | | | | 737,160 | | | | 9,362 | | | | 192,659 | |
Shares redeemed | | | | | (288,900 | ) | | | (6,156,169 | ) | | | (164,423 | ) | | | (3,408,871 | ) |
| | | | | | 961,843 | | | | 20,793,460 | | | | 295,370 | | | | 6,120,942 | |
| Class IR Shares | | | | | | | | | | | | | | | | | | |
Shares sold | | | | | 147,533 | | | | 3,176,735 | | | | 126,555 | | | | 2,492,578 | |
Reinvestment of distributions | | | | | 5,386 | | | | 114,370 | | | | 2,099 | | | | 43,123 | |
Shares redeemed | | | | | (12,023 | ) | | | (254,167 | ) | | | (60,860 | ) | | | (1,253,021 | ) |
| | | | | | 140,896 | | | | 3,036,938 | | | | 67,794 | | | | 1,282,680 | |
NET INCREASE | | | | | 2,493,634 | | | $ | 53,302,218 | | | | 257,626 | | | $ | 5,548,371 | |
| (a) | | Class B Shares automatically convert into Class A Shares on or about the fifteenth day of the last month of the calendar quarter that is eight years after the initial purchase date of either the Fund or another Goldman Sachs Fund. |
50
GOLDMAN SACHS DIVIDEND FOCUS FUNDS
|
| 12. SUMMARY OF SHARE TRANSACTIONS (continued) |
Share activity is as follows:
| | | | | | | | | | | | | | | | | | | | | | | | |
| | | Rising Dividend Growth Fund | |
| | | | |
| | | For the Six Months Ended
April 30, 2013 (Unaudited) | | | For the Period October 1, 2012 to October 31, 2012* | | | For the Fiscal Year Ended September 30, 2012 | |
| | | | |
| | | Shares | | | Dollars | | | Shares | | | Dollars | | | Shares | | | Dollars | |
| | | | |
| Class A Shares | | | | | | | | | | | | | | | | | | | | | | | | |
Shares sold | | | 16,523,467 | | | $ | 264,722,771 | | | | 1,934,520 | | | $ | 29,756,843 | | | | 10,369,528 | | | $ | 153,318,420 | |
Impact on shares converted during reorganization(a) | | | — | | | | — | | | | — | | | | — | | | | 1,199,328 | | | | 17,936,198 | |
Reinvestment of distributions | | | 122,142 | | | | 1,932,713 | | | | — | | | | — | | | | 108,708 | | | | 1,598,895 | |
Shares redeemed | | | (2,222,947 | ) | | | (35,081,972 | ) | | | (253,743 | ) | | | (3,907,164 | ) | | | (1,850,045 | ) | | | (27,269,228 | ) |
| | | | 14,422,662 | | | | 231,573,512 | | | | 1,680,777 | | | | 25,849,679 | | | | 9,827,519 | | | | 145,584,285 | |
| Class C Shares | | | | | | | | | | | | | | | | | | | | | | | | |
Shares sold | | | 7,424,232 | | | | 120,222,382 | | | | 736,424 | | | | 11,434,139 | | | | 3,680,384 | | | | 55,136,246 | |
Impact on shares converted during reorganization(a) | | | — | | | | — | | | | — | | | | — | | | | (1,186,680 | ) | | | (17,936,198 | ) |
Reinvestment of distributions | | | 14,966 | | | | 237,622 | | | | — | | | | — | | | | 9,858 | | | | 145,431 | |
Shares redeemed | | | (228,383 | ) | | | (3,676,830 | ) | | | (19,195 | ) | | | (298,118 | ) | | | (153,805 | ) | | | (2,258,033 | ) |
| | | | 7,210,815 | | | | 116,783,174 | | | | 717,229 | | | | 11,136,021 | | | | 2,349,757 | | | | 35,087,446 | |
| Institutional Shares | | | | | | | | | | | | | | | | | | | | | | | | |
Shares sold | | | 23,111,498 | | | | 376,197,676 | | | | 1,950,001 | | | | 30,815,742 | | | | 10,196,609 | | | | 152,393,963 | |
Reinvestment of distributions | | | 134,692 | | | | 2,182,424 | | | | — | | | | — | | | | 104,834 | | | | 1,574,016 | |
Shares redeemed | | | (3,045,839 | ) | | | (49,763,146 | ) | | | (222,617 | ) | | | (3,513,639 | ) | | | (2,047,008 | ) | | | (30,612,848 | ) |
| | | | 20,200,351 | | | | 328,616,954 | | | | 1,727,384 | | | | 27,302,103 | | | | 8,254,435 | | | | 123,355,131 | |
| Class IR Shares(b) | | | | | | | | | | | | | | | | | | | | | | | | |
Shares sold | | | 4,966,841 | | | | 81,494,421 | | | | 660,073 | | | | 10,354,250 | | | | 2,372,517 | | | | 36,202,517 | |
Reinvestment of distributions | | | 30,407 | | | | 493,894 | | | | — | | | | — | | | | 11,310 | | | | 172,439 | |
Shares redeemed | | | (288,761 | ) | | | (4,694,642 | ) | | | (26,668 | ) | | | (416,389 | ) | | | (75,201 | ) | | | (1,154,716 | ) |
| | | | 4,708,487 | | | | 77,293,673 | | | | 633,405 | | | | 9,937,861 | | | | 2,308,626 | | | | 35,220,240 | |
| Class R Shares(b) | | | | | | | | | | | | | | | | | | | | | | | | |
Shares sold | | | 23,230 | | | | 374,308 | | | | 137 | | | | 2,093 | | | | 8,247 | | | | 126,594 | |
Reinvestment of distributions | | | 78 | | | | 1,222 | | | | — | | | | — | | | | 24 | | | | 362 | |
Shares redeemed | | | (1,159 | ) | | | (18,849 | ) | | | — | | | | — | | | | — | | | | — | |
| | | | 22,149 | | | | 356,681 | | | | 137 | | | | 2,093 | | | | 8,271 | | | | 126,956 | |
NET INCREASE | | | 46,564,464 | | | $ | 754,623,994 | | | | 4,758,932 | | | $ | 74,227,757 | | | | 22,748,608 | | | $ | 339,374,058 | |
| * | | The Fund changed its fiscal year end from September 30 to October 31. |
| (a) | | Class C Shares transferred into Class A Shares on February 27, 2012, as of the close of business on February 24, 2012. |
| (b) | | Commenced operations on February 27, 2012. |
51
GOLDMAN SACHS DIVIDEND FOCUS FUNDS
| | |
Fund Expenses — Six Month Period Ended April 30, 2013 (Unaudited) | | |
As a shareholder of Class A, Class B, Class C, Institutional, Class IR or Class R Shares of a Fund, you incur two types of costs: (1) transaction costs, including sales charges on purchase payments (with respect to Class A Shares), contingent deferred sales charges on redemptions (with respect to Class B and Class C Shares), and (2) ongoing costs, including management fees; distribution and service (12b-1) fees (with respect to Class A, Class B, Class C and Class R Shares); and other Fund expenses. This Example is intended to help you understand your ongoing costs (in dollars) of investing in Class A, Class B, Class C, Institutional, Class IR or Class R Shares of the Funds and to compare these costs with the ongoing costs of investing in other mutual funds.
The Example is based on an investment of $1,000 invested at the beginning of the period and held for the entire period from November 1, 2012 through April 30, 2013.
Actual Expenses — The first line under each share class in the table below provides information about actual account values and actual expenses. You may use the information in this line, together with the amount you invested, to estimate the expenses that you paid over the period. Simply divide your account value by $1,000 (for example, an $8,600 account value divided by $1,000=8.6), then multiply the result by the number in the first line under the heading entitled “Expenses Paid” to estimate the expenses you paid on your account during this period.
Hypothetical Example for Comparison Purposes — The second line under each share class in the table below provides information about hypothetical account values and hypothetical expenses based on the Funds’ actual net expense ratios and an assumed rate of return of 5% per year before expenses, which is not the Funds’ actual return. The hypothetical account values and expenses may not be used to estimate the actual ending account balance or expenses you paid for the period. You may use this information to compare the ongoing costs of investing in the Funds and other funds. To do so, compare this 5% hypothetical example with the 5% hypothetical examples that appear in the shareholder reports of the other funds.
Please note that the expenses shown in the table are meant to highlight your ongoing costs only and do not reflect any transactional costs, such as sales charges, redemption fees, or exchange fees. Therefore, the second line of the table is useful in comparing ongoing costs only, and will not help you determine the relative total costs of owning different funds. In addition, if these transactional costs were included, your costs would have been higher.
| | | | | | | | | | | | | | | | | | | | | | | | |
| | | Income Builder Fund | | | Rising Dividend Growth Fund | |
| Share Class | | Beginning
Account Value
11/1/12 | | | Ending
Account Value
4/30/13 | | | Expenses
Paid for the
6 months
Ended
4/30/13* | | | Beginning
Account Value
11/1/12 | | | Ending
Account Value
4/30/13 | | | Expenses
Paid for the
Period
Ended
4/30/13* | |
| Class A | | | | | | | | | | | | | | | | | | | | | | | | |
Actual | | $ | 1,000.00 | | | $ | 1,099.40 | | | $ | 5.21 | | | $ | 1,000.00 | | | $ | 1,117.20 | | | $ | 6.30 | |
Hypothetical 5% return | | | 1,000.00 | | | | 1,019.84 | + | | | 5.01 | | | | 1,000.00 | | | | 1,018.84 | + | | | 6.01 | |
| Class B | | | | | | | | | | | | | | | | | | | | | | | | |
Actual | | | 1,000.00 | | | | 1,095.40 | | | | 9.09 | | | | N/A | | | | N/A | | | | N/A | |
Hypothetical 5% return | | | 1,000.00 | | | | 1,016.12 | + | | | 8.75 | | | | N/A | | | | N/A | | | | N/A | |
| Class C | | | | | | | | | | | | | | | | | | | | | | | | |
Actual | | | 1,000.00 | | | | 1,095.80 | | | | 9.04 | | | | 1,000.00 | | | | 1,112.70 | | | | 10.21 | |
Hypothetical 5% return | | | 1,000.00 | | | | 1,016.17 | + | | | 8.70 | | | | 1,000.00 | | | | 1,015.12 | + | | | 9.74 | |
| Institutional | | | | | | | | | | | | | | | | | | | | | | | | |
Actual | | | 1,000.00 | | | | 1,101.30 | | | | 3.07 | | | | 1,000.00 | | | | 1,119.50 | | | | 4.20 | |
Hypothetical 5% return | | | 1,000.00 | | | | 1,021.87 | + | | | 2.96 | | | | 1,000.00 | | | | 1,020.83 | + | | | 4.01 | |
| Class IR | | | | | | | | | | | | | | | | | | | | | | | | |
Actual | | | 1,000.00 | | | | 1,100.70 | | | | 3.80 | | | | 1,000.00 | | | | 1,118.10 | | | | 4.99 | |
Hypothetical 5% return | | | 1,000.00 | | | | 1,021.17 | + | | | 3.66 | | | | 1,000.00 | | | | 1,020.08 | + | | | 4.76 | |
| Class R | | | | | | | | | | | | | | | | | | | | | | | | |
Actual | | | N/A | | | | N/A | | | | N/A | | | | 1,000.00 | | | | 1,115.90 | | | | 7.61 | |
Hypothetical 5% return | | | N/A | | | | N/A | | | | N/A | | | | 1,000.00 | | | | 1,017.60 | + | | | 7.25 | |
| | * | | Expenses for each share class are calculated using each Fund’s annualized net expense ratio for each class, which represents the ongoing expenses as a percentage of net assets for the six months ended April 30, 2013. Expenses are calculated by multiplying the annualized net expense ratio by the average account value for the period; then multiplying the result by the number of days in the most recent fiscal half year; and then dividing that result by the number of days in the fiscal year. The annualized net expense ratios for the period were as follows: | |
| | | | | | | | | | | | | | | | | | | | | | | | |
| Fund | | Class A | | | Class B | | | Class C | | | Institutional | | | Class IR | | | Class R | |
Income Builder | | | 1.00 | % | | | 1.75 | % | | | 1.74 | % | | | 0.59 | % | | | 0.73 | % | | | N/A | |
Rising Dividend Growth | | | 1.20 | | | | N/A | | | | 1.95 | | | | 0.80 | | | | 0.95 | | | | 1.45 | % |
| | + | | Hypothetical expenses are based on each Fund’s actual annualized net expense ratios and an assumed rate of return of 5% per year before expenses. | |
52
FUNDS PROFILE
Goldman Sachs Funds

Goldman Sachs is a premier financial services firm, known since 1869 for creating thoughtful and customized investment solutions in complex global markets.
Today, the Investment Management Division of Goldman Sachs serves a diverse set of clients worldwide, including private institutions, public entities and individuals. With approximately $748.1 billion in assets under management as of March 31, 2013, Goldman Sachs Asset Management (“GSAM”) has portfolio management teams located around the world and our investment professionals bring firsthand knowledge of local markets to every investment decision. GSAM’s assets under management includes assets managed by Goldman Sachs Asset Management, L.P. and its Investment Advisory Affiliates.
|
| OVERVIEW OF GOLDMAN SACHS FUNDS |

Money Market1
Financial Square FundsSM
| n | | Financial Square Tax-Exempt Funds |
| n | | Financial Square Federal Fund |
| n | | Financial Square Government Fund |
| n | | Financial Square Money Market Fund |
| n | | Financial Square Prime Obligations Fund |
| n | | Financial Square Treasury Instruments Fund |
| n | | Financial Square Treasury Obligations Fund |
Fixed Income
Short Duration and Government
| n | | High Quality Floating Rate Fund2 |
| n | | Short Duration Government Fund |
| n | | Short Duration Income Fund |
| n | | Inflation Protected Securities Fund |
Multi-Sector
| n | | Core Plus Fixed Income Fund |
Municipal and Tax-Free
| n | | High Yield Municipal Fund |
| n | | Short Duration Tax-Free Fund |
Single Sector
| n | | Investment Grade Credit Fund |
| n | | High Yield Floating Rate Fund |
| n | | Emerging Markets Debt Fund |
| n | | Local Emerging Markets Debt Fund |
Corporate Credit
Fundamental Equity
| n | | Small/Mid Cap Growth Fund |
| n | | Flexible Cap Growth Fund |
| n | | Concentrated Growth Fund |
| n | | Technology Tollkeeper Fund |
| n | | Growth Opportunities Fund |
| n | | Rising Dividend Growth Fund |
Structured Equity
| n | | Structured Tax-Managed Equity Fund |
| n | | Structured International Tax-Managed Equity Fund |
| n | | U.S. Equity Dividend and Premium Fund |
| n | | International Equity Dividend and Premium Fund |
Equity Insights4
| n | | Small Cap Equity Insights Fund |
| n | | U.S. Equity Insights Fund |
| n | | Small Cap Growth Insights Fund |
| n | | Large Cap Growth Insights Fund |
| n | | Large Cap Value Insights Fund |
| n | | Small Cap Value Insights Fund |
| n | | International Small Cap Insights Fund |
| n | | International Equity Insights Fund |
| n | | Emerging Markets Equity Insights Fund |
Fundamental Equity International
| n | | Strategic International Equity Fund |
| n | | Concentrated International Equity Fund |
| n | | International Small Cap Fund |
| n | | Emerging Markets Equity Fund |
| n | | BRIC Fund (Brazil, Russia, India, China) |
Select Satellite5
| n | | Real Estate Securities Fund |
| n | | International Real Estate Securities Fund |
| n | | Commodity Strategy Fund |
| n | | Dynamic Allocation Fund |
| n | | Absolute Return Tracker Fund |
| n | | Managed Futures Strategy Fund |
| n | | MLP Energy Infrastructure Fund |
| n | | Multi-Manager Alternatives Fund |
| n | | Retirement Portfolio Completion Fund |
| n | | Income Strategies Portfolio |
Total Portfolio Solutions5
| n | | Balanced Strategy Portfolio |
| n | | Growth and Income Strategy Portfolio |
| n | | Growth Strategy Portfolio |
| n | | Equity Growth Strategy Portfolio |
| n | | Satellite Strategies Portfolio |
| n | | Enhanced Dividend Global Equity Portfolio |
| n | | Tax Advantaged Global Equity Portfolio |
| 1 | | An investment in a money market fund is neither insured nor guaranteed by the Federal Deposit Insurance Corporation (“FDIC”) or any other government agency. Although the Funds seek to preserve the value of your investment at $1.00 per share, it is possible to lose money by investing in the Funds. |
| 2 | | Effective at the close of business on July 27, 2012, the Goldman Sachs Ultra-Short Duration Government Fund was renamed the Goldman Sachs High Quality Floating Rate Fund. |
| 3 | | Effective at the close of business on June 29, 2012, the Goldman Sachs Balanced Fund was renamed the Goldman Sachs Income Builder Fund. |
| 4 | | Effective at the close of business May 3, 2013, the Goldman Sachs Structured Large Cap Growth, Structured Large Cap Value, Structured Small Cap Equity, Structured Small Cap Growth, Structured Small Cap Value, Structured U.S. Equity, Structured Emerging Markets Equity, Structured International Equity and Structured International Small Cap Funds were renamed the Goldman Sachs Large Cap Growth Insights, Large Cap Value Insights, Small Cap Equity Insights, Small Cap Growth Insights, Small Cap Value Insights, U.S. Equity Insights, Emerging Markets Equity Insights, International Equity Insights and International Small Cap Insights Funds, respectively. |
| 5 | | Individual Funds within the Total Portfolio Solutions and Select Satellite categories will have various placement on the risk/return spectrum and may have greater or lesser risk than that indicated by the placement of the general Total Portfolio Solutions or Select Satellite category. |
Financial Square FundsSM is a registered service mark of Goldman, Sachs & Co.
| | |
TRUSTEES Ashok N. Bakhru, Chairman Donald C. Burke John P. Coblentz, Jr. Diana M. Daniels Joseph P. LoRusso James A. McNamara Jessica Palmer Alan A. Shuch Richard P. Strubel | | OFFICERS James A. McNamara, President George F. Travers, Principal Financial Officer Caroline Kraus, Secretary Scott M. McHugh, Treasurer |
| |
GOLDMAN, SACHS & CO. Distributor and Transfer Agent | | GOLDMAN SACHS ASSET MANAGEMENT, L.P. Investment Adviser |
Visit our web site at www.goldmansachsfunds.com to obtain the most recent month-end returns.
Goldman Sachs Asset Management, L.P., 200 West Street, New York, New York 10282
The reports concerning the Funds included in this shareholder report may contain certain forward-looking statements about the factors that may affect the performance of the Funds in the future. These statements are based on Fund management’s predictions and expectations concerning certain future events and their expected impact on the Funds, such as performance of the economy as a whole and of specific industry sectors, changes in the levels of interest rates, the impact of developing world events, and other factors that may influence the future performance of the Funds. Management believes these forward-looking statements to be reasonable, although they are inherently uncertain and difficult to predict. Actual events may cause adjustments in portfolio management strategies from those currently expected to be employed.
A description of the policies and procedures that the Funds use to determine how to vote proxies relating to portfolio securities and information regarding how a Fund voted proxies relating to portfolio securities during the most recent 12-month period ended June 30 is available (I) without charge, upon request by calling 1-800-526-7384 (for Retail Shareholders) or 1-800-621-2550 (for Institutional Shareholders); and (II) on the Securities and Exchange Commission (“SEC”) web site at http://www.sec.gov.
The Fund files its complete schedule of portfolio holdings with the SEC for the first and third quarters of each fiscal year on Form N-Q. The Fund’s Forms N-Q are available on the SEC’s web site at http://www.sec.gov within 60 days after the Fund’s first and third fiscal quarters. The Fund’s Forms N-Q may be reviewed and copied at the SEC’s Public Reference Room in Washington, D.C. and information on the operation of the Public Reference Room may also be obtained by calling 1-800-SEC-0330. Form N-Q may be obtained upon request and without charge by calling 1-800-526-7384 (for Retail Shareholders) or 1-800-621-2550 (for Institutional Shareholders).
Holdings and allocations shown are as of April 30, 2013 and may not be representative of future investments. Fund holdings should not be relied on in making investment decisions and should not be construed as research or investment advice regarding particular securities. Current and future holdings are subject to risk.
Economic and market forecasts presented herein reflect our judgment as of the date of this presentation and are subject to change without notice. These forecasts do not take into account the specific investment objectives, restrictions, tax and financial situation or other needs of any specific client. Actual data will vary and may not be reflected here. These forecasts are subject to high levels of uncertainty that may affect actual performance. Accordingly, these forecasts should be viewed as merely representative of a broad range of possible outcomes. These forecasts are estimated, based on assumptions, and are subject to significant revision and may change materially as economic and market conditions change. Goldman Sachs has no obligation to provide updates or changes to these forecasts. Case studies and examples are for illustrative purposes only.
The Global Industry Classification Standard (GICS) was developed by and is the exclusive property and a service mark of Morgan Stanley Capital International Inc. (MSCI) and Standard & Poor’s, a division of The McGraw-Hill Companies, Inc. (S&P) and is licensed for use by Goldman Sachs. Neither MSCI, S&P nor any other party involved in making or compiling the GICS or any GICS classifications makes any express or implied warranties or representations with respect to such standard or classification (or the results to be obtained by the use thereof), and all such parties hereby expressly disclaim all warranties of originality, accuracy, completeness, merchantability or fitness for a particular purpose with respect to any of such standard or classification. Without limiting any of the foregoing, in no event shall MSCI, S&P, any of their affiliates or any third party involved in making or compiling the GICS or any GICS classifications have any liability for any direct, indirect, special, punitive, consequential or any other damages (including lost profits) even if notified of the possibility of such damages.
The portfolio risk management process includes an effort to monitor and manage risk, but does not imply low risk.
This material is not authorized for distribution to prospective investors unless preceded or accompanied by a current Prospectus or summary prospectus, if applicable. Investors should consider a Fund’s objective, risks, and charges and expenses, and read the summary prospectus, if available, and/or the Prospectus carefully before investing or sending money. The summary prospectus, if available, and the Prospectus contain this and other information about a Fund and may be obtained from your authorized dealer or from Goldman, Sachs & Co. by calling (retail – 1-800-526-7384) (institutional – 1-800-621-2550).
© 2013 Goldman Sachs. All rights reserved. 102371.MF.MED.TMPL/6/2013 DIVFOSAR13/47.5K
| | The information required by this Item is only required in an annual report on this Form N-CSR. |
| ITEM 3. | AUDIT COMMITTEE FINANCIAL EXPERT. |
| | The information required by this Item is only required in an annual report on this Form N-CSR. |
| ITEM 4. | PRINCIPAL ACCOUNTANT FEES AND SERVICES. |
| | The information required by this Item is only required in an annual report on this Form N-CSR. |
| ITEM 5. | AUDIT COMMITTEE OF LISTED REGISTRANTS. |
| ITEM 6. | SCHEDULE OF INVESTMENTS. |
| | Schedule of Investments is included as part of the Report to Stockholders filed under Item 1. |
| ITEM 7. | DISCLOSURE OF PROXY VOTING POLICIES AND PROCEDURES FOR CLOSED-END MANAGEMENT INVESTMENT COMPANIES. |
| ITEM 8. | PORTFOLIO MANAGERS OF CLOSED-END MANAGEMENT INVESTMENT COMPANIES. |
| ITEM 9. | PURCHASES OF EQUITY SECURITIES BY CLOSED-END MANAGEMENT INVESTMENT COMPANY AND AFFILIATED PURCHASERS. |
| ITEM 10. | SUBMISSION OF MATTERS TO A VOTE OF SECURITY HOLDERS. |
| | There have been no material changes to the procedures by which shareholders may recommend nominees to the registrant’s board of trustees. |
| ITEM 11. | CONTROLS AND PROCEDURES. |
| | (a) | The registrant’s principal executive and principal financial officers, or persons performing similar functions have concluded that the registrant’s disclosure controls and procedures (as defined in Rule 30a-3(c) under the Investment Company Act of 1940, as amended (the “1940 Act”)) are effective as of a date within 90 days of the filing of this report that includes the disclosure required by this paragraph, based on the evaluation of these controls and procedures required by Rule 30a-3(b) under the 1940 Act and 15d-15(b) under the Securities Exchange Act of 1934, as amended. |
| | (b) | There were no changes in the registrant’s internal control over financial reporting (as defined in Rule 30a-3(d) under the 1940 Act) that occurred during the registrant’s second fiscal quarter of the period covered by this report that have materially affected, or are reasonably likely to materially affect, the registrant’s internal control over financial reporting. |
| | | | |
| (a)(1) | | The information required by this Item is only required in connection with an annual report on this Form N-CSR. |
| | |
| (a)(2) | | Exhibit 99.CERT | | Certifications pursuant to Section 302 of the Sarbanes-Oxley Act of 2002 filed herewith. |
| | |
| (b) | | Exhibit 99.906CERT | | Certifications pursuant to Section 906 of the Sarbanes-Oxley Act of 2002 filed herewith. |
SIGNATURES
Pursuant to the requirements of the Securities Exchange Act of 1934 and the Investment Company Act of 1940, the registrant has duly caused this report to be signed on its behalf by the undersigned, thereunto duly authorized.
| | | | |
| | | | Goldman Sachs Trust |
| | |
| By: | | | | /s/ James A. McNamara |
| | | | James A. McNamara |
| | | | President/Principal Executive Officer |
| | | | Goldman Sachs Trust |
| | |
| Date: | | | | June 20, 2013 |
Pursuant to the requirements of the Securities Exchange Act of 1934 and the Investment Company Act of 1940, this report has been signed below by the following persons on behalf of the registrant and in the capacities and on the dates indicated.
| | | | |
| By: | | | | /s/ James A. McNamara |
| | | | James A. McNamara |
| | | | President/Principal Executive Officer |
| | | | Goldman Sachs Trust |
| | |
| Date: | | | | June 20, 2013 |
| | |
| By: | | | | /s/ George F. Travers |
| | | | George F. Travers |
| | | | Principal Financial Officer |
| | | | Goldman Sachs Trust |
| | |
| Date: | | | | June 20, 2013 |