UNITED STATES
SECURITIES AND EXCHANGE COMMISSION
Washington, D.C. 20549
FORM N-CSR
CERTIFIED SHAREHOLDER REPORT OF REGISTERED
MANAGEMENT INVESTMENT COMPANIES
Investment Company Act file number 811-05349
Goldman Sachs Trust
(Exact name of registrant as specified in charter)
71 South Wacker Drive,
Chicago, Illinois 60606
(Address of principal executive offices) (Zip code)
| | |
Copies to: |
Peter V. Bonanno, Esq. | | Geoffrey R.T. Kenyon, Esq. |
Goldman, Sachs & Co. | | Dechert LLP |
200 West Street | | 200 Clarendon Street |
New York, New York 10282 | | 27th Floor |
| | Boston, MA 02116-5021 |
(Name and address of agents for service)
Registrant’s telephone number, including area code: (312) 655-4400
Date of fiscal year end: October 31
Date of reporting period: April 30, 2012
| ITEM 1. | REPORTS TO STOCKHOLDERS. |
| | The Semi-Annual Report to Stockholders is filed herewith. |
Goldman Sachs Funds

| | | | |
| | |
| Semi-Annual Report | | | | April 30, 2012 |
| | |
| | | | Single Country Funds |
| | | | Brazil Equity |
| | | | China Equity |
| | | | India Equity |
| | | | Korea Equity |

Goldman Sachs Single Country Funds
| | | | |
TABLE OF CONTENTS | | | | |
| |
Principal Investment Strategies and Risks | | | 1 | |
| |
Investment Process | | | 4 | |
| |
Portfolio Management Discussions and Performance Summaries | | | 5 | |
| |
Schedule of Investments | | | 29 | |
| |
Financial Statements | | | 36 | |
| |
Financial Highlights | | | 40 | |
| |
Notes to Financial Statements | | | 48 | |
| |
Other Information | | | 64 | |
| | | | |
| | | |
| NOT FDIC-INSURED | | May Lose Value | | No Bank Guarantee |
GOLDMAN SACHS SINGLE COUNTRY FUNDS
Principal Investment Strategies and Risks
This is not a complete list of risks that may affect the Funds. For additional information concerning the risks applicable to the Funds, please see the Funds’ Prospectus.
The Goldman Sachs Brazil Equity Fund invests primarily in a portfolio of equity investments that are tied economically to Brazil or in issuers that participate in the markets of Brazil. The Fund is subject to market risk, which means that the value of the securities in which it invests may go up or down in response to the prospects of individual companies, particular sectors or governments and/or general economic conditions. Foreign and emerging markets securities, including Brazilian securities, may be more volatile and less liquid than U.S. securities and will be subject to the risks of currency fluctuations and adverse economic or political developments. Such securities are also subject to foreign custody risk. Because of its exposure to Brazil, the Fund is subject to greater risk of loss as a result of adverse securities markets, exchange rates and social, political, regulatory or economic events which may occur in Brazil. The Fund may concentrate its investments in a specific industry (only in the event that that industry represents 20% or more of the Fund’s benchmark index at the time of investment), subjecting it to greater risk of loss as a result of adverse economic, business or other developments affecting that industry. Derivative instruments may involve a high degree of financial risk. These risks include the risk that a small movement in the price of the underlying security or benchmark may result in a disproportionately large movement, unfavorable or favorable, in the price of the derivative instrument; the risk of default by a counterparty; and liquidity risk. The securities of small- and mid-capitalization companies involve greater risks than those associated with larger, more established companies and may be subject to more abrupt or erratic price movements. At times, the Fund may be unable to sell certain of its investments without a substantial drop in price, if at all. The Fund is “non-diversified” and may invest more of its assets in fewer issuers than “diversified” mutual funds. Accordingly, the Fund may be more susceptible to adverse developments affecting any single issuer held in its portfolio and to greater losses resulting from these developments.
The Goldman Sachs China Equity Fund invests primarily in a portfolio of equity investments that are tied economically to China or in issuers that participate in the markets of China. The Fund is subject to market risk, which means that the value of the securities in which it invests may go up or down in response to the prospects of individual companies, particular sectors or governments and/or general economic conditions. Foreign and emerging markets securities, including Chinese securities, may be more volatile and less liquid than U.S. securities and will be subject to the risks of currency fluctuations and adverse economic or political developments. Such securities are also subject to foreign custody risk. Because of its exposure to China, the Fund is subject to greater risk of loss as a result of adverse securities markets, exchange rates and social, political, regulatory or economic events which may occur in China. The Fund may concentrate its investments in a specific industry (only in the event that that industry represents 20% or more of the Fund’s benchmark index at the time of investment), subjecting it to greater risk of loss as a result of adverse economic, business or other developments affecting that industry. Derivative instruments may involve a high degree of financial risk. These risks include the risk that a small movement in the price of the underlying security or benchmark may result in a disproportionately large movement, unfavorable or favorable, in the price of the derivative instrument; the risk of default by a counterparty; and liquidity risk. The Fund’s investments in participation notes are subject to the same risks associated with the underlying asset or market, as well as counterparty risk. The securities of small- and mid-capitalization companies involve greater risks than those associated with larger, more established companies and may be subject to more abrupt or erratic price movements. At times, the Fund may be unable to sell certain of its investments without a substantial drop in price, if at all. The Fund is “non-diversified” and may invest more of its assets in fewer issuers than “diversified” mutual funds. Accordingly, the Fund may be more susceptible to adverse developments affecting any single issuer held in its portfolio and to greater losses resulting from these developments.
1
GOLDMAN SACHS SINGLE COUNTRY FUNDS
The Goldman Sachs India Equity Fund invests primarily in a portfolio of equity investments that are tied economically to India or in issuers that participate in the markets of India, primarily by investing in a wholly-owned subsidiary of the Fund organized under the laws of the Republic of Mauritius (the “Subsidiary”). The Subsidiary invests directly in equity investments in India or in issuers that substantially participate in the markets of India, and has the same investment objective and strategies as the Fund. The Fund is subject to market risk, which means that the value of the securities in which it invests may go up or down in response to the prospects of individual companies, particular sectors or governments and/or general economic conditions. Foreign and emerging markets securities, including Indian securities, may be more volatile and less liquid than U.S. securities and will be subject to the risks of currency fluctuations and adverse economic or political developments. Such securities are also subject to foreign custody risk. Because of its exposure to India, the Fund is subject to greater risk of loss as a result of adverse securities markets, exchange rates and social, political, regulatory or economic events which may occur in India. The Fund may concentrate its investments in a specific industry (only in the event that that industry represents 20% or more of the Fund’s benchmark index at the time of investment), subjecting it to greater risk of loss as a result of adverse economic, business or other developments affecting that industry. Derivative instruments may involve a high degree of financial risk. These risks include the risk that a small movement in the price of the underlying security or benchmark may result in a disproportionately large movement, unfavorable or favorable, in the price of the derivative instrument; the risk of default by a counterparty; and liquidity risk. The Fund’s investments in participation notes are subject to the same risks associated with the underlying asset or market, as well as counterparty risk. The securities of small- and mid-capitalization companies involve greater risks than those associated with larger, more established companies and may be subject to more abrupt or erratic price movements. At times, the Fund may be unable to sell certain of its investments without a substantial drop in price, if at all.
By investing in the Subsidiary, the Fund will be exposed to the risks associated with the Subsidiary’s investments. The Fund invests through the Subsidiary to seek to obtain the benefits of favorable tax treatment of its investments pursuant to a treaty between India and the Republic of Mauritius. Any change in the provisions of the treaty or its applicability to the Subsidiary could result in the imposition of withholding and other taxes on the Subsidiary by India, which would reduce the return to the Fund on its investments. The Fund is “non-diversified” and may invest more of its assets in fewer issuers than “diversified” mutual funds. Accordingly, the Fund may be more susceptible to adverse developments affecting any single issuer held in its portfolio and to greater losses resulting from these developments.
The Goldman Sachs Korea Equity Fund invests primarily in a concentrated portfolio of equity investments that are tied economically to Korea or in issuers that participate in the markets of Korea. The Fund is subject to market risk, which means that the value of the securities in which it invests may go up or down in response to the prospects of individual companies, particular sectors or governments and/or general economic conditions. Foreign and emerging markets securities, including Korean securities, may be more volatile and less liquid than U.S. securities and will be subject to the risks of currency fluctuations and adverse economic or political developments. Such securities are also subject to foreign custody risk. Because of its exposure to Korea, the Fund is subject to greater risk of loss as a result of adverse securities markets, exchange rates and social, political, regulatory or economic events which may occur in Korea. The Fund may concentrate its investments in a specific industry (only in the event that that industry represents 20% or more of the Fund’s benchmark index at the time of investment), subjecting it to greater risk of loss as a result of adverse economic, business or other developments affecting that industry. Derivative instruments may involve a high degree of financial risk. These risks include the risk that a small movement in the price of the underlying security or benchmark may result in a disproportionately large movement, unfavorable or favorable, in the price of the derivative instrument; the risk of default by a counterparty; and liquidity risk. The Fund’s investments in participation notes are subject to the same risks associated with the underlying asset or market, as well as counterparty risk. The securities of small- and mid-capitalization companies involve greater risks than those associated with
2
GOLDMAN SACHS SINGLE COUNTRY FUNDS
larger, more established companies and may be subject to more abrupt or erratic price movements. At times, the Fund may be unable to sell certain of its investments without a substantial drop in price, if at all. The Fund is “non-diversified” and may invest more of its assets in fewer issuers than “diversified” mutual funds. Accordingly, the Fund may be more susceptible to adverse developments affecting any single issuer held in its portfolio and to greater losses resulting from these developments.
3
GOLDMAN SACHS SINGLE COUNTRY FUNDS
What Differentiates Goldman Sachs’ Single Country Funds Investment Process?
Goldman Sachs’ Single Country Funds investment process is based on the belief that strong, consistent results are best achieved through expert stock selection, performed by our dedicated Emerging Markets Team that works together on a global scale. Our deep, diverse and experienced team of research analysts and portfolio managers combines local insights with global, industry-specific expertise to identify its best investment ideas

| n | | The Emerging Markets Equity research team, based in London, Shanghai, Hong Kong, Seoul, Singapore, Sao Paulo and Mumbai, focuses on companies with strong or improving business fundamentals, trading at attractive valuations |
| n | | Proprietary, bottom-up research is the key driver of our investment process |
| n | | Analysts collaborate regularly to leverage regional and industry-specific research and insights |

| n | | Members of each local investment team are aligned by sector and are responsible for finding ideas with the best risk-adjusted upside in their respective areas of coverage |
| n | | The decision-making process includes active participation in frequent and regular research meetings |
| n | | The Emerging Markets Equity team benefits from the country and currency expertise of our Global Emerging Markets Debt and Currency teams |

| n | | Security selections are aligned with levels of investment conviction and risk-adjusted upside |
| n | | Continual risk monitoring identifies various risks at the stock and portfolio level and assesses whether they are intended and justified |
| n | | Dedicated portfolio construction team assists in ongoing monitoring and adjustment of the Funds’ portfolios |

Emerging markets equity portfolios that strive to offer:
| | n | | Access to Brazil, China, India and Korea equity markets | |
| | n | | Disciplined approach to stock selection | |
| | n | | Optimal risk/return profiles | |
4
PORTFOLIO RESULTS
Goldman Sachs Brazil Equity Fund
Portfolio Management Discussion and Analysis
Below, the Goldman Sachs Fundamental Emerging Markets Equity Portfolio Management Team discusses the Goldman Sachs Brazil Equity Fund’s (the “Fund”) performance and positioning for the six-month period ended April 30, 2012 (the “Reporting Period”).
| Q | | How did the Fund perform during the Reporting Period? |
| A | | During the Reporting Period, the Fund’s Class A, C, Institutional and IR Shares generated cumulative total returns, without sales charges, of -6.74%, -7.15%, -6.59% and -6.60%, respectively. These returns compare to the -0.75% cumulative total return of the Fund’s benchmark, the MSCI Brazil 10/40 Index (net, total return, unhedged, USD) (the “Index”), during the same time period. |
| Q | | What economic and market factors most influenced Brazil’s equity market as a whole during the Reporting Period? |
| A | | In contrast to the prior fiscal year, when the primary factors impacting the Brazilian equity market were external macroeconomic ones, the main economic and market factors influencing Brazil’s equity market during this Reporting Period were domestic. |
| | | During the Reporting Period, the Brazilian central bank continued an acute monetary easing cycle, having cut its overnight rate from 12.50% to 9.00%. There seemed to be a change in the government and central bank approach to the nation’s inflation target regime in that they appeared to no longer be aiming at the previously stated target of 4.50% but instead using a band of 2.50% to 6.50% in an effort to keep interest rates lower and stimulate economic growth. Furthermore, the communications of the central bank, via its meeting minutes, became ambiguous, making it hard for investors to interpret what may happen to interest rates going forward. That said, at the end of the Reporting Period, the interest rate curve appeared to be pricing in further interest rate cuts, with the overnight rates reaching 8.00%. |
| | | The Brazilian central bank also strongly intervened in the foreign exchange market during the Reporting Period, seemingly in an effort to contain appreciation of the Brazilian real. The government stated that it believes such a strategy will help make its domestic industry more competitive. During the Reporting Period, after many interventions by the Brazilian central bank, the real depreciated by 12% versus the U.S. dollar. |
| | | On the macroeconomic front, industrial production in Brazil was quite sluggish during the Reporting Period, pointing to a slower economy. We expect the first half of 2012 to be weak for the Brazilian economy but for economic activity to recover during the second half of the calendar year. |
| Q | | What key factors were responsible for the Fund’s performance during the Reporting Period? |
| A | | The Fund’s underperformance of the Index during the Reporting Period can be primarily attributed to allocation decisions. Individual stock selection also detracted, though to a lesser degree. |
| Q | | Which stocks detracted significantly from the Fund’s performance during the Reporting Period? |
| A | | Among the stocks that detracted most from the Fund’s results relative to the Index were positions in education company Anhanguera Educacional Participacoes, retailer Magazine Luiza and real estate company PDG Realty—each components of the consumer discretionary sector. Another stock that detracted significantly from the Fund’s performance during the Reporting Period was a position in diversified financials company Itau/Itausa. |
| | | Anhanguera Educacional Participacoes is Brazil’s leading private, for-profit professional education company. During the Reporting Period, the company suffered from larger than expected costs linked to a recent acquisition it made. Despite causing disappointing short-term results, we believed at the end of the Reporting Period that these non-recurring costs are part of the company’s growing pains and should lead to future profitability. |
| | | Similarly, shares of Magazine Luiza, one of the largest household appliance retail chains in Brazil, declined during the Reporting Period as the company incurred non-operating costs from some of its stores and was instructed by its partner bank to increase provisions at its financial arm. Such instruction came despite a good track record of loan repayment. At the end of the Reporting Period, Magazine Luiza continued to be the Fund’s highest conviction name in the Brazilian consumer discretionary sector. We believe the company should exhibit strong growth in the sector going |
5
PORTFOLIO RESULTS
| | forward and benefit from the turnaround of its recent acquisitions, with better margins and lower financing costs. |
| | | PDG Realty, the largest real estate company in Brazil, was another detractor from the Fund’s relative performance during the Reporting Period. Its shares declined due to market expectations of weak fourth calendar quarter results. The company’s results were adversely affected by overrunning costs for some of its projects and goodwill adjustments related to prior acquisitions. The company had weak fourth quarter 2011 results, which included a notable cost overrun on some of its projects. We believe that there might be further cost overruns in future quarters as well. Since superior execution and financial control were main theses for the Fund to invest in this company, given that these attributes had set it apart from other companies in the sector, we decided to sell out of the Fund’s position in PDG Realty. |
| | | The Fund’s overweighted position in Itau/Itausa detracted, as the financials company underperformed along with the broad financials sector. The economic slowdown in Brazil was greater than expected during the Reporting Period, pressuring conditions in terms of default behavior and payment capabilities, thus impacting the financials sector overall. Adding uncertainty to prospects of future profitability of the financials sector—and public-owned banks in particular—were headlines toward the end of the Reporting Period regarding the Brazilian government’s request of banks to reduce credit spreads and to lower lending rates to individuals and corporations. |
| Q | | What were some of the Fund’s best-performing individual stocks? |
| A | | Among the Fund’s best-performing individual stocks relative to the Index were holdings in packaging company Klabin and steel producer Gerdau. |
| | | Klabin, the leading manufacturer of packaging paper and board in Brazil, was the top contributor to the Fund’s performance during the Reporting Period. Its stock rose after the company reported better than expected third quarter 2011 results, which showed increasing revenues. The stock was further supported by weakness in the Brazilian real, as a significant share of the company’s revenues is tied to the U.S. dollar. At the end of the Reporting Period, we believed that Klabin offers strong growth potential over the long term attributable to an aggressive cost cutting program and capacity expansion introduced by the new management of the company. We also think that should the Brazilian |
| | economy grow as anticipated, the company is likely to shift some of its focus to the domestic market, thus improving its revenue mix. |
| | | Gerdau is one of the largest steel producers globally, with approximately 20 metric tons of installed capacity as well as operations in the U.S., Brazil, Latin America and Europe. About half of its earnings come from Brazil and about 40% from the U.S. It produces only long steel used in construction, infrastructure and industry. As the U.S. economy recovered at a somewhat greater pace during the Reporting Period than in the months prior, Gerdau benefited, and its stock, which was at what many considered to be an attractive valuation, recovered. Virtually all of its contracts with store owners are hinged to inflation rates. |
| Q | | Which equity market sectors most significantly affected Fund performance during the Reporting Period? |
| A | | In constructing the Fund’s portfolio, we focus on picking stocks rather than making industry or sector bets and thus all sector weightings are the result of fundamental stock selection. |
| | | The biggest detractors from the Fund’s relative results during the Reporting Period were the financials and consumer discretionary sectors, each due primarily to poor stock selection. Having overweighted allocations to consumer discretionary and financials, each of which lagged the Index, also hurt. Financials suffered initially from weaker than expected fourth quarter 2011 results, wherein nonperforming loans continued to grow. Subsequently, the sector performed poorly as the Brazilian government forced banks in which it owns a large stake, such as Banco do Brasil and Caixa Economica Federal, to reduce the interest rate spread they pass to clients on certain loans. This directly affects banks’ profitability and may compel private banks to reduce their spreads in order to remain competitive. The full impact of these new government policies has not yet been observed, but the uncertainty of such intervention brought a material overhang to the sector during the Reporting Period. In consumer discretionary, overweighted positions in Anhanguera Educacional Participacoes, Magazine Luiza and PDG Realty, each already mentioned, hurt the Fund’s results. |
| | | The sectors that contributed most to the Fund’s performance relative to the Index were materials and health care. In materials, our stock selection was particularly effective, with an overweighted position in Klabin, already discussed, the greatest contributor. In health care, the Fund benefited from our exiting its positions in Amil Participacoes and |
6
PORTFOLIO RESULTS
| | Diagnosticos da America at what proved to be an opportune time. As the economy slowed, the health care sector, closely linked to Gross Domestic Product (“GDP”) growth, suffered. There was also an overhang on the health care sector as a result of news that regulators might be increasingly harsh in enforcing antitrust policies thereby slowing down merger and acquisition activity. Furthermore, Diagnosticos da America, the laboratory diagnostic company which the Fund sold out of early in the Reporting Period, subsequently reported weak results and a change in management, bringing more uncertainty to the company’s stock. |
| Q | | How did the Fund use derivatives and similar instruments during the Reporting Period? |
| A | | While the Fund invested in forward foreign exchange contracts for the purpose of portfolio construction, no derivatives or similar instruments were invested in as a part of the Fund’s active management strategy. |
| Q | | Did the Fund make any significant purchases or sales during the Reporting Period? |
| A | | During the Reporting Period, we established a new Fund position in CCR, a private infrastructure conglomerate. The company’s businesses consist of highway concessions, electronic payment methods, vehicular inspection services and passenger rail transport. Our investment thesis on CCR includes our belief that the company can offer a high dividend yield and its performance is leveraged to GDP growth. |
| | | We added to the Fund’s position in Magazine Luiza on weakness during the Reporting Period. While the company performed poorly during the Reporting Period, we believe it continued to have the most attractive valuation among Brazilian retailers, and it has consistently grown more than its competitors. Despite increased provision in its financial arm, as requested by its partner bank, customers continued to show good default behavior. Further, we believe the company presents strong upside potential in its valuation, and so we took advantage of what we believe to be short-term weakness to increase the Fund’s position in the stock. |
| | | As discussed above, we sold the Fund’s positions in PDG Realty, Amil Participacoes and Diagnosticos da America during the Reporting Period. |
| Q | | Were there any notable changes in the Fund’s weightings during the Reporting Period? |
| A | | During the Reporting Period, we reduced the Fund’s overweighted position in financials as a result of the overhang in the sector discussed earlier. We also reduced the |
| | Fund’s allocation to health care, as a result of regulators being stricter on merger and acquisition activity and several companies struggling to deliver results. We maintained the Fund’s overweighted exposures to materials and consumer discretionary, as we believe these sectors continue to offer attractive valuations and should be poised to benefit from the pick up in economic activity we anticipate for the second half of 2012. |
| Q | | How was the Fund positioned relative to the Index at the end of the Reporting Period? |
| A | | At the end of the Reporting Period, the Fund had overweighted positions relative to the Index in materials and consumer discretionary. On the same date, the Fund had underweighted positions compared to the Index in the consumer staples, telecommunication services, energy, information technology, industrials, utilities, and financials sectors and had no position at all in the health care sector. |
| Q | | What is the Fund’s tactical view and strategy going forward? |
| A | | Despite the delicate scenario in Europe, we believe the world’s economy should see a recovery in the coming months. In our view, economic activity, led by China and the U.S., is likely to pick up in the second half of 2012 and help drive global economic growth. Consequently, we expect commodity prices to remain at high levels and businesses in basic materials to gain from this momentum. |
| | | We expect the Brazilian economy to speed up during the second half of 2012, a reflection of the monetary easing and the government policies implemented to stimulate consumption. We believe inflation in Brazil should close 2012 within the upper limit of the target band. Unemployment in the country reached historical lows during the Reporting Period in a tight labor market. Thus, considering this landscape, it is our view that more cyclical sectors and companies with a strong focus on the domestic market may perform well, including financials and consumer discretionary, which each have a high sensitivity to interest rates. The risk to these sectors, although we do not believe it will materialize, is a possible overheating of the economy that results in higher than expected inflation and potentially the implementation of measures by the government to control it. |
| | | Perhaps most important is that at the end of the Reporting Period, Brazilian equities offered what we considered to be compelling valuations, with equities trading at historical average (that is, a price/earnings ratio of 10x) despite lower interest rates. |
7
FUND BASICS
Brazil Equity Fund
as of April 30, 2012
| | | | | | | | | | |
| | PERFORMANCE REVIEW | |
| | | November 1, 2011–April 30, 2012 | | Fund Total Return (based on NAV)1 | | | MSCI Brazil 10/40 Index2 | |
| | Class A | | | -6.74 | % | | | -0.75 | % |
| | Class C | | | -7.15 | | | | -0.75 | |
| | Institutional | | | -6.59 | | | | -0.75 | |
| | | Class IR | | | -6.60 | | | | -0.75 | |
| | 1 | | The net asset value (“NAV”) represents the net assets of the class of the Fund (ex-dividend) divided by the total number of shares of the class outstanding. The Fund’s performance assumes the reinvestment of dividends and other distributions. The Fund’s performance does not reflect the deduction of any applicable sales charges. |
| | 2 | | The MSCI Brazil 10/40 Index (net, total return, unhedged, USD) offers a representation of the Brazilian market by targeting all companies with a market capitalization within the top 85% of the Brazilian investable equity universe, subject to a global minimum size requirement. It is not possible to invest directly in an index. |
| | | | | | | | |
| | STANDARDIZED TOTAL RETURNS3 | | | |
| | | For the period ended 3/31/12 | | Since Inception | | | Inception Date |
| | Class A | | | -27.50 | % | | 4/29/11 |
| | Class C | | | -24.56 | | | 4/29/11 |
| | Institutional | | | -23.00 | | | 4/29/11 |
| | | Class IR | | | -23.10 | | | 4/29/11 |
| | 3 | | The Standardized Total Returns are cumulative total returns as of the most recent calendar quarter-end. They assume reinvestment of all distributions at NAV. These returns reflect a maximum initial sales charge of 5.5% for Class A Shares and the assumed contingent deferred sales charge for Class C Shares (1% if redeemed within 12 months of purchase). Because Institutional and Class IR Shares do not involve a sales charge, such a charge is not applied to their Standardized Total Returns. |
| | | | The returns represent past performance. Past performance does not guarantee future results. The Fund’s investment return and principal value will fluctuate so that an investor’s shares, when redeemed, may be worth more or less than their original cost. Current performance may be lower or higher than the performance quoted above. Please visit our Website at www.goldmansachsfunds.com to obtain the most recent month-end returns. Performance reflects fee waivers and/or expense limitations in effect. In their absence, performance would be reduced. Returns do not reflect the deduction of taxes that a shareholder would pay on Fund distributions or the redemption of Fund shares. |
8
FUND BASICS
| | | | | | | | | | |
| | EXPENSE RATIOS4 | |
| | | | | Net Expense Ratio (Current) | | | Gross Expense Ratio (Before Waivers) | |
| | Class A | | | 1.90 | % | | | 19.75 | % |
| | Class C | | | 2.65 | | | | 20.50 | |
| | Institutional | | | 1.50 | | | | 19.35 | |
| | | Class IR | | | 1.65 | | | | 19.50 | |
| | 4 | | The expense ratios of the Fund, both current (net of applicable fee waivers and/or expense limitations) and before waivers (gross of applicable fee waivers and/or expense limitations) are as set forth above according to the most recent publicly available Prospectus for the Fund and may differ from the expense ratios disclosed in the Financial Highlights in this report. The Fund’s waivers and/or expense limitations will remain in place through at least February 28, 2013, and prior to such date the investment adviser may not terminate the arrangements without the approval of the Fund’s Board of Trustees. If these arrangements are discontinued in the future, the expense ratios may change without shareholder approval. |
| | | | | | | | |
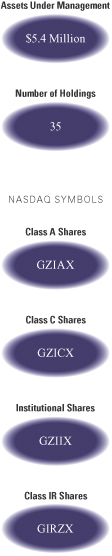
| | TOP TEN HOLDINGS AS OF 4/30/125 |
| | | Holding | | % of Total Net Assets | | | Line of Business |
| | Banco Bradesco SA ADR | | | 6.2 | % | �� | Commercial Banks |
| | Petroleo Brasileiro SA ADR | | | 6.1 | | | Oil, Gas & Consumable Fuels |
| | Companhia Energetica de Minas Gerais | | | 4.8 | | | Electric Utilities |
| | iShares MSCI Brazil Index Fund | | | 4.7 | | | Exchange Traded Fund |
| | Bradespar SA | | | 4.7 | | | Metals & Mining |
| | Klabin SA | | | 4.3 | | | Containers & Packaging |
| | BM&FBOVESPA SA | | | 4.3 | | | Diversified Financial Services |
| | Telefonica Brasil SA | | | 4.2 | | | Diversified Telecommunication
Services |
| | Itausa – Investimentos Itau SA | | | 4.0 | | | Commercial Banks |
| | | Itau Unibanco Holding SA ADR | | | 3.8 | | | Commercial Banks |
| | 5 | | The top 10 holdings may not be representative of the Fund’s future investments. |
9
FUND BASICS
|
| FUND VS. BENCHMARK SECTOR ALLOCATIONS6 |
| As of April 30, 2012 |
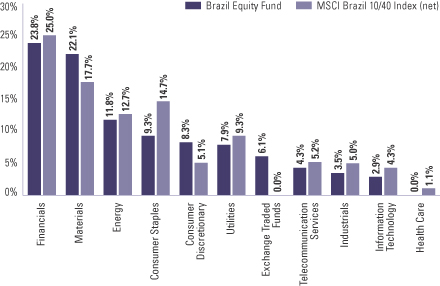
| | 6 | | The Fund is actively managed and, as such, its composition may differ over time. Consequently, the Fund’s overall sector allocations may differ from the percentages contained in the graph above. The above graph categorizes investments using Global Industry Classification Standard (“GICS”), however, the sector classifications used by the portfolio management team may differ from GICS. Underlying sector allocations of Exchange Traded Funds held by the Fund are not reflected in the graph above. The percentage shown for each investment category reflects the value of investments in that category as a percentage of market value. The above graph depicts the Fund’s investments but may not represent the Fund’s market exposure due to the exclusion of certain derivatives, if any, as listed in the Additional Investment Information section of the Schedule of Investments. |
10
PORTFOLIO RESULTS
China Equity Fund
Portfolio Management Discussion and Analysis
Below, the Goldman Sachs Fundamental Emerging Markets Equity Portfolio Management Team discusses the Goldman Sachs China Equity Fund’s (the “Fund”) performance and positioning for the six-month period ended April 30, 2012 (the “Reporting Period”).
| Q | | How did the Fund perform during the Reporting Period? |
| A | | During the Reporting Period, the Fund’s Class A, C, Institutional and IR Shares generated cumulative total returns, without sales charges, of 5.87%, 5.54%, 6.10% and 6.01%, respectively. These returns compare to the 6.85% cumulative total return of the Fund’s benchmark, the MSCI China Index (net, total return, unhedged, USD) (the “Index”), during the same time period. |
| Q | | What economic and market factors most influenced China’s equity market as a whole during the Reporting Period? |
| A | | China’s offshore equity market, as measured by the Index, outperformed both emerging market peers and developed equity markets broadly, as measured by the MSCI Emerging Markets Index and MSCI EAFE Index, respectively. |
| | | During the first half of the Reporting Period, the performance of the Chinese offshore equity market reflected fear of contagion from Europe’s sovereign debt crisis as well as concerns about a slowing domestic and global economy. However, the market rebounded and had a strong rally in January and February 2012, driven primarily by expectations of China’s recovery post the Chinese New Year, positive developments in the European sovereign debt situation and encouraging U.S. economic data. In March, investor sentiment turned weak again following a softer Gross Domestic Product (“GDP”) growth forecast from the Chinese government of 7.5% for 2012, the first time in recent years that such estimates had been under 8%. |
| | | Until March, the closely watched Consumer Price Index (“CPI”), which measures inflation, trended downward, lightening investors’ expectations on further monetary policy easing. However, March CPI data rebounded and surprised the market. A package of measures was announced by the Chinese government to help small and medium enterprises, including tax breaks and easier access to bank loans. The People’s Bank of China announced two reserve requirement ratio cuts of 50 basis points each during the Reporting Period. (A basis point is 1/100th of a percentage point.) |
| | | The annual sessions of the National People’s Congress and Chinese People’s Political Consultative Conference were held between March 5 and March 14, 2012. The government set several working targets this year during the conferences, including CPI of around 4%, registered urban unemployment rate below 4.6%, a deficit of 800 billion yuan and increased volume of total exports and imports by approximately 10%. In addition, Premier Wen commented that China would continue to implement a proactive fiscal policy with increasing spending on areas important to people’s well being as well as a prudent monetary policy with broad money supply increased by 14%. |
| | | The majority of Chinese companies reported their fiscal year 2011 earnings in March. Approximately 30% of them missed market expectations due to demand slowdown during the fourth quarter of 2011 and due to cost increases. In April 2012, the Chinese government announced the nation’s first quarter GDP, which showed that growth had moderated to 8.1%, which was below expectations. Such GDP data supported the likelihood that the country’s monetary policy would remain loose. |
| Q | | What key factors were responsible for the Fund’s performance during the Reporting Period? |
| A | | The Fund’s underperformance of the Index during the Reporting Period can be primarily attributed to individual stock selection. |
| Q | | Which stocks detracted significantly from the Fund’s performance during the Reporting Period? |
| A | | Among the stocks that detracted most from the Fund’s results relative to the Index were positions in telecommunications equipment company ZTE, power generator and electric motor manufacturer Dongfang Electric and coal company China Shenhua Energy. |
| | | Shares of ZTE sold off during the Reporting Period, as the company reported weak results for the second half of 2011 due to a one-off valuation loss on its euro cash holdings following currency depreciation. Investors’ concerns about a potential lawsuit and compensation to wireless equipment |
11
PORTFOLIO RESULTS
| | manufacturer Telefonaktiebolaget LM Ericsson also weighed on the stock during the Reporting Period. |
| | | Dongfang Electric, which is one of the largest enterprises in China involved in the production of power-generation equipment and nuclear energy projects, saw its stock underperform during the Reporting Period. Nuclear equipment orders did not pick up during the first quarter of 2012 contrary to the market’s expectation. The company’s stock also declined as the expectations of power tariff increases diminished. |
| | | China Shenhua Energy, the country’s biggest coal producer, lagged the Index due to its defensive characteristics amid market rotation toward higher volatility names during the second half of the Reporting Period. |
| Q | | What were some of the Fund’s best-performing individual stocks? |
| A | | Among the Fund’s best-performing individual stocks relative to the Index were holdings in China Petroleum & Chemical (“Sinopec”), Guangzhou Pharmaceutical and China Minsheng Bank. |
| | | Sinopec is one of the major petroleum companies in China. The company’s refining efficiency was improving, which helped its fiscal year 2011 earnings. In a related manner, weakness in crude oil prices during the first half of the Reporting Period was viewed as positive, potentially giving the company an opportunity to turn around its refining business. Sinopec’s shares also performed well during the Reporting Period on robust growth for the company in its other business segments, such as chemicals. |
| | | Guangzhou Pharmaceutical is principally engaged in the manufacturing and distribution of Chinese patent medicines, the distribution of western drugs, Chinese pharmaceutical products and medical apparatus as well as the research and development of natural drugs and biological medicines. Trading in the company resumed on March 28, 2012, after being suspended for more than three months. The company announced a merger plan with its sister company, Baiyunshan, which is anticipated to substantially boost earnings per share and return on equity of the new entity. As the market reacted positively to the plan, the company’s shares soared during the Reporting Period. |
| | | China Minsheng Bank, the first bank in China that is majority owned by non-government enterprises, has a relatively high exposure to small and medium enterprise loans. As monetary easing expectations set in during the |
| | Reporting Period, particularly with regard to small and medium enterprise loans, the bank’s shares rallied strongly. |
| Q | | Which equity market sectors most significantly affected Fund performance during the Reporting Period? |
| A | | The biggest detractors from the Fund’s relative results during the Reporting Period were the consumer staples, utilities and industrials sectors, each due primarily to poor stock selection. |
| | | The sectors that contributed most to the Fund’s performance relative to the Index were health care, consumer discretionary and energy, each driven primarily by effective stock selection. |
| Q | | How did the Fund use derivatives and similar instruments during the Reporting Period? |
| A | | During the Reporting Period, we did not use derivatives to hedge positions or as part of an active management strategy. |
| Q | | Did the Fund make any significant purchases or sales during the Reporting Period? |
| A | | We established a Fund position in China CITIC Bank, China’s seventh largest lender in terms of total assets, during the Reporting Period. We believe the stock may benefit from potential monetary policy easing, and the stock, in our view, had an attractive valuation at the time of purchase. |
| | | We added to the Fund’s position in CNOOC, a Chinese producer of crude oil and natural gas, as we believed that being mainly involved in upstream production activities, it would benefit from robust oil prices from the first quarter of 2012. (Upstream production activities generally include those operations stages in the oil and gas industry that involve exploration and production.) |
| | | We trimmed the Fund’s position in Sinopec, China’s largest oil and gas refiner. As mentioned above, weakness in crude oil prices during the first half of the Reporting Period was seen as a positive opportunity for the company to turn around its refining business. However, rising oil prices starting from the first quarter of 2012 were likely, in our view, to have a negative impact on Sinopec’s margins in the refinery sector. We used the proceeds from this reduced position to fund the add-on to the Fund’s position in CNOOC. |
| | | We eliminated the Fund’s position in China Longyuan Power, the largest wind power producer in China, as we were concerned that poorer than expected wind conditions would |
12
PORTFOLIO RESULTS
| | lead to earnings disappointment for the company. We also saw fewer positive catalysts for company growth ahead. |
| Q | | Were there any notable changes in the Fund’s weightings during the Reporting Period? |
| A | | Throughout the Reporting Period, we remained focused on individual stock selection, with sector positioning being a secondary, closely-monitored effect. That said, the Fund’s exposure relative to the Index in financials and information technology increased, and its allocations relative to the Index to utilities and consumer staples decreased. |
| Q | | How was the Fund positioned relative to the Index at the end of the Reporting Period? |
| A | | At the end of the Reporting Period, the Fund had overweighted positions relative to the Index in information technology, materials and energy. On the same date, the Fund had underweighted positions compared to the Index in the financials, consumer staples and telecommunication services sectors, rather neutral exposure relative to the Index in health care, industrials and consumer discretionary, and no position at all in the utilities sector. |
| Q | | What is the Fund’s tactical view and strategy going forward? |
| A | | At the end of the Reporting Period, we maintained our view that China’s offshore equity market presented attractive risk-reward opportunities for long-term investors. In our view, China has experienced a paradigm shift through upgrading of its industrial sector, through a deepening of its sources of growth into domestic consumption and services from fixed assets investments, and through development of its central and western region. This paradigm shift, we believe, augurs well for better sustainability in its economic growth profile. |
| | | In the near term, the trajectory of China’s offshore equity market may remain volatile, as China moves through this economic transition phase, and policy visibility may still be clouded pending changes in leadership across government and corporate platforms. External factors, such as global economic weakness and oil price swings, could also create jitters in China’s offshore equity market in the months ahead. |
| | For 2012, we believe that China’s economy should be on track to achieve high single-digit growth, drawing from robust underlying momentum from domestic-driven activities. We believe these economic activities will likely be most dominant during the second half of 2012. At the margin, improved liquidity conditions and credit |
| | accessibility, as compared with 2011, should, we believe, provide support to corporate activities. |
| | | Of course, there are macro-risks to our view ahead. There may be inflationary pressures from rising oil prices. High profile allegations of corporate governance misconduct can lead to stock price volatility. A contagion effect from global economic weakness also remains a risk. |
| | | Going forward, our strategy is to continue to seek opportunities to add to high quality names that we believe may benefit from China’s next phase of growth. More specifically, going forward, we intend to seek high quality companies with franchise value, resource accessibility, distribution capability and cost competitiveness. In our view, such opportunities are likely to be found most in the industrial, consumer-oriented and information technology sectors. |
13
FUND BASICS
China Equity Fund
as of April 30, 2012
| | | | | | | | | | |
| | PERFORMANCE REVIEW | |
| | | November 1, 2011– April 30, 2012 | | Fund Total Return (based on NAV)1 | | | MSCI China Index2 | |
| | Class A | | | 5.87 | % | | | 6.85 | % |
| | Class C | | | 5.54 | | | | 6.85 | |
| | Institutional | | | 6.10 | | | | 6.85 | |
| | | Class IR | | | 6.01 | | | | 6.85 | |
| | 1 | | The net asset value (“NAV”) represents the net assets of the class of the Fund (ex-dividend) divided by the total number of shares of the class outstanding. The Fund’s performance assumes the reinvestment of dividends and other distributions. The Fund’s performance does not reflect the deduction of any applicable sales charges. |
| | 2 | | The MSCI China Index (net, total return, unhedged, USD) is a free-float adjusted market capitalization weighted index that is designed to measure the equity market performance of China. As of May 31, 2011, the MSCI China Index consisted of 141 constituents. It is not possible to invest directly in an index. |
| | | | | | | | |
| | STANDARDIZED TOTAL RETURNS3 | | | | | | |
| | | For the period ended 3/31/12 | | Since Inception | | | Inception Date |
| | Class A | | | -25.01 | % | | 4/29/11 |
| | Class C | | | -21.91 | | | 4/29/11 |
| | Institutional | | | -20.37 | | | 4/29/11 |
| | | Class IR | | | -20.45 | | | 4/29/11 |
| | 3 | | The Standardized Total Returns are cumulative total returns as of the most recent calendar quarter-end. They assume reinvestment of all distributions at NAV. These returns reflect a maximum initial sales charge of 5.5% for Class A Shares and the assumed contingent deferred sales charge for Class C Shares (1% if redeemed within 12 months of purchase). Because Institutional and Class IR Shares do not involve a sales charge, such a charge is not applied to their Standardized Total Returns. |
| | | | The returns represent past performance. Past performance does not guarantee future results. The Fund’s investment return and principal value will fluctuate so that an investor’s shares, when redeemed, may be worth more or less than their original cost. Current performance may be lower or higher than the performance quoted above. Please visit our Website at www.goldmansachsfunds.com to obtain the most recent month-end returns. Performance reflects fee waivers and/or expense limitations in effect. In their absence, performance would be reduced. Returns do not reflect the deduction of taxes that a shareholder would pay on Fund distributions or the redemption of Fund shares. |
14
FUND BASICS
| | | | | | | | | | |
| | EXPENSE RATIOS4 | | | | | | | | |
| | | | | Net Expense Ratio (Current) | | | Gross Expense Ratio (Before Waivers) | |
| | Class A | | | 1.90 | % | | | 10.09 | % |
| | Class C | | | 2.65 | | | | 10.84 | |
| | Institutional | | | 1.50 | | | | 9.69 | |
| | | Class IR | | | 1.65 | | | | 9.84 | |
| | 4 | | The expense ratios of the Fund, both current (net of applicable fee waivers and/or expense limitations) and before waivers (gross of applicable fee waivers and/or expense limitations) are as set forth above according to the most recent publicly available Prospectus for the Fund and may differ from the expense ratios disclosed in the Financial Highlights in this report. The Fund’s waivers and/or expense limitations will remain in place through at least February 28, 2013, and prior to such date the investment adviser may not terminate the arrangements without the approval of the Fund’s Board of Trustees. If these arrangements are discontinued in the future, the expense ratios may change without shareholder approval. |
| | | | | | | | |
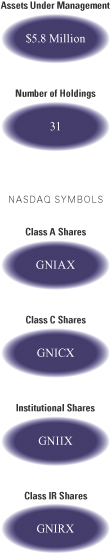
| | TOP TEN HOLDINGS AS OF 4/30/125 |
| | | Holding | | % of Total
Net Assets | | | Line of Business |
| | China Construction Bank Corp. Class H | | | 11.8 | % | | Commercial Banks |
| | China Mobile Ltd. | | | 8.5 | | | Wireless Telecommunication
Services |
| | Industrial and Commercial Bank of China Ltd. Class H | | | 7.7 | | | Commercial Banks |
| | CNOOC Ltd. | | | 7.2 | | | Oil, Gas & Consumable
Fuels |
| | PetroChina Co. Ltd. Class H | | | 6.6 | | | Oil, Gas & Consumable
Fuels |
| | China Pacific Insurance (Group) Co. Ltd. Class H | | | 5.6 | | | Insurance |
| | China Overseas Land & Investment Ltd. | | | 5.1 | | | Real Estate Management &
Development |
| | Tencent Holdings Ltd. | | | 4.9 | | | Internet Software & Services |
| | China Shenhua Energy Co. Ltd. Class H | | | 4.8 | | | Oil, Gas & Consumable
Fuels |
| | | Belle International Holdings Ltd. | | | 3.9 | | | Specialty Retail |
| | 5 | | The top 10 holdings may not be representative of the Fund’s future investments. |
15
FUND BASICS
|
| FUND VS. BENCHMARK SECTOR ALLOCATIONS6 |
| As of April 30, 2012 |
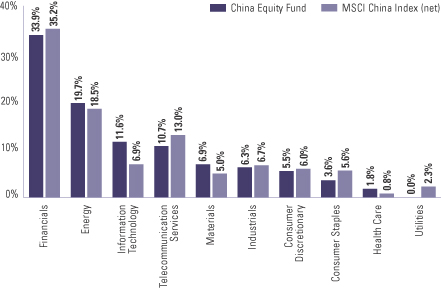
| | 6 | | The Fund is actively managed and, as such, its composition may differ over time. Consequently, the Fund’s overall sector allocations may differ from the percentages contained in the graph above. The above graph categorizes investments using Global Industry Classification Standard (“GICS”), however, the sector classifications used by the portfolio management team may differ from GICS. The percentage shown for each investment category reflects the value of investments in that category as a percentage of market value. The above graph depicts the Fund’s investments but may not represent the Fund’s market exposure due to the exclusion of certain derivatives, if any, as listed in the Additional Investment Information section of the Schedule of Investments. |
16
PORTFOLIO RESULTS
India Equity Fund
Portfolio Management Discussion and Analysis
Below, the Goldman Sachs Fundamental Emerging Markets Equity Portfolio Management Team discusses the Goldman Sachs India Equity Fund’s (the “Fund”) performance and positioning for the six-month period ended April 30, 2012 (the “Reporting Period”).
| Q | | How did the Fund perform during the Reporting Period? |
| A | | During the Reporting Period, the Fund’s Class A, C, Institutional and IR Shares generated cumulative total returns, without sales charges, of -1.26%, -1.61%, -1.14% and -1.15%, respectively. These returns compare to the -9.62% cumulative total return of the Fund’s benchmark, the MSCI India IMI Index (net, total return, unhedged, USD) (the “Index”), during the same time period. |
| Q | | What economic and market factors most influenced India’s equity market as a whole during the Reporting Period? |
| A | | India’s equity market declined during the Reporting Period overall, largely driven by slowing domestic growth estimates and softening leading economic indicators. In addition, the Indian rupee declined to record lows versus the U.S. dollar, particularly depressing fourth quarter 2011 returns when expressed in U.S. dollars. The Indian equity market rebounded somewhat during the first quarter of 2012 amidst growing optimism on the state of the global economy and containment of Europe’s sovereign debt crisis. However, enthusiasm for the Indian equity market during the first calendar quarter was tempered as the nation’s economy grew 6.1% during the fourth quarter of 2011, the slowest rate in three years. A poor showing in recent elections for the current party in power also muted first quarter 2012 market performance. Toward the end of the Reporting Period, the Indian equity market retreated again on concerns over domestic and global economic growth. In April 2012, India’s central bank cut interest rates for the first time in three years in an effort to stem slowing domestic growth. |
| Q | | What key factors were responsible for the Fund’s performance during the Reporting Period? |
| A | | The Fund’s outperformance of the Index during the Reporting Period can be primarily attributed to individual stock selection. |
| Q | | What were some of the Fund’s best-performing individual stocks? |
| A | | Among the Fund’s best-performing individual stocks relative to the Index were holdings in refiner Reliance Industries, pharmaceuticals company Wockhardt and automotive parts manufacturer Bosch India. |
| | | Reliance Industries was the top contributor to the Fund’s results during the Reporting Period, as the Fund had a significantly underweighted position in this company’s underperforming stock. Its shares performed poorly due to the significant downtrend in global refining margins as well as in petrochemical price spreads, which may well adversely impact the company’s earnings. We sold the Fund’s position in Reliance Industries by the end of the Reporting Period. |
| | | Wockhardt’s shares surged during the Reporting Period when the company received approval during the first quarter of 2012 for the marketing and distribution of a nasal spray product in the U.S. market. The news led to improved earnings visibility. |
| | | Bosch is a subsidiary of Robert Bosch Gmbh, a leading auto component manufacturer with dominant presence in diesel engines, automotive accessories and auto electrical components. Bosch’s shares gained significantly during the Reporting Period, as the company has been able to maintain its revenue momentum driven by its diverse customer mix, its technological excellence and monopolistic edge. Positive earnings momentum over the past several quarters also aided its stock’s strong performance. |
| Q | | Which stocks detracted significantly from the Fund’s performance during the Reporting Period? |
| A | | Among the stocks that detracted most from the Fund’s results relative to the Index were positions in commercial bank State Bank of India, state controlled coal miner Coal India and gold financing company Muthoot Finance. |
17
PORTFOLIO RESULTS
| | | The Fund’s underweighted position in State Bank of India detracted from its performance relative to the Index, as its stock performed comparatively well during the Reporting Period. The country’s biggest lender reported better than expected fourth quarter 2011 results on the back of improved net interest margins. Also, management commentary about asset quality stress possibly peaking during the fourth quarter of 2011 supported its share price rally. |
| | | Coal India disappointed as the Indian cabinet approved the Mines and Minerals Development and Regulatory (“MMDR”) bill that requires coal mining companies to share 26% of their 2010 mining profits for development of local areas and as compensation for people affected by coal mining operations damaged by heavy rains. Also, non-executive wage hike negotiations were being carried out with the local mining unions during the Reporting Period, which served as an overhang on Coal India’s stock. There was also a diversion of some e-auction coal to volumes sold under a fuel supply agreement, which created, in the eyes of many, wrong precedent and policy uncertainty. We sold the Fund’s position in Coal India by the end of the Reporting Period. (E-auction coal is coal distributed under electronic route in India, a policy introduced for the benefit of small consumers who cannot enter into long-term contracts due to small requirements.) |
| | | Muthoot Finance, which is not a component of the Index, underperformed the Index during the Reporting Period, and thus the Fund’s position detracted. Muthoot Finance underperformed as the Reserve Bank of India came out with a guideline capping loan to value of loans against gold jewelry to 60%. (Loan to value is the ratio of the fair market value of an asset to the value of the loan that will finance the purchase. Loan to value tells the lender if potential losses due to nonpayment may be recouped by selling the asset.) Investors expected that this would have a negative impact on growth as well as margins for gold loan companies such as Muthoot Finance. We sold the Fund’s position in Muthoot Finance by the end of the Reporting Period. |
| Q | | Which equity market sectors most significantly affected Fund performance during the Reporting Period? |
| A | | The sectors that contributed most to the Fund’s performance relative to the Index were consumer discretionary, financials and information technology, each due primarily to strong stock selection. Having an overweighted allocation to consumer discretionary also boosted results, as the sector significantly outpaced the Index during the Reporting Period. |
| | The only two sectors to detract from the Fund’s relative results during the Reporting Period were utilities and consumer staples. In utilities, underperformance was attributable to poor stock selection. Having an underweighted position in the comparatively strong consumer staples sector detracted from the Fund’s relative results during the Reporting Period. |
| Q | | How did the Fund use derivatives and similar instruments during the Reporting Period? |
| A | | During the Reporting Period, we did not use derivatives to hedge positions or as part of an active management strategy, but we used index futures, on an opportunistic basis, to ensure the Fund remained almost fully exposed to equities following cash inflows or stock sales. |
| Q | | Did the Fund make any significant purchases or sales during the Reporting Period? |
| A | | We initiated a Fund position during the Reporting Period in Blue Dart Express, a courier service and integrated express package distribution company. We liked the company because it has expressed a desire to increase domestic capacity, which could help increase its market share amid economic slowdown concerns. Also, the company was able to register good third quarter 2011 numbers, and we expect this momentum to continue into results of quarters ahead. |
| | | We established a Fund position in HDFC Bank, India’s second largest private bank, which has a track record of generating consistently strong earnings growth over the past ten years. The bank is also the most profitable Indian bank based on return on assets and is expected to generate a compelling return on equity. We believe HDFC Bank should continue to have stronger earnings visibility and less risk on its asset quality than its peers. The stock actually rallied during the Reporting Period because of its solid earnings results and thus proved to be a strong contributor to the Fund’s results. |
| | | We trimmed the Fund’s position in information technology services provider Infosys. Infosys builds software programs and provides back-office support to clients. We reduced the Fund’s holding in Infosys as its earnings guidance for the first quarter of 2012 was disappointing. |
18
PORTFOLIO RESULTS
| | | We eliminated the Fund’s position in Indraprastha Gas, a company involved in gas supply to the domestic and commercial sectors. We sold out of the Fund’s position on the back of reports about a potential cap on compressed natural gas marketing margins earned by gas utilities, including Indraprastha Gas, which, in turn, led to greater uncertainty about the company’s earnings growth trajectory going forward. |
| Q | | Were there any notable changes in the Fund’s weightings during the Reporting Period? |
| A | | Throughout the Reporting Period, we remained focused on individual stock selection, with sector positioning being a secondary, closely-monitored effect. That said, the Fund’s exposure relative to the Index in consumer discretionary, industrials and consumer staples increased, and its allocations relative to the Index to information technology, materials, energy, telecommunication services and utilities decreased. |
| Q | | How was the Fund positioned relative to the Index at the end of the Reporting Period? |
| A | | At the end of the Reporting Period, the Fund had overweighted positions relative to the Index in consumer discretionary, industrials, financials and information technology. On the same date, the Fund had underweighted positions compared to the Index in the utilities, health care and consumer staples sectors, a relatively neutral position compared to the Index in materials, and no positions at all in the energy and telecommunications services sectors. |
| Q | | What is the Fund’s tactical view and strategy going forward? |
| A | | At the end of the Reporting Period, we maintained a positive outlook on India equities. India remains one of the fastest growing economies in the world, driven by favorable demographics, rapidly rising incomes and consumption, and significant spending on transformational infrastructure. In addition, Indian companies overall remained healthy, with high levels of profitability, amongst the highest returns on capital in the world and low levels of leverage. |
| | | We are faced with an uncertain global economic environment. Disorderly efforts to resolve sovereign default crises in Europe, spikes in commodity prices, continued political uncertainty at home and government inaction remain risks to Indian equities. That said, however, we believe Indian equities could prove resilient amidst such conditions for three main reasons. First, India’s economic growth comes primarily from domestic consumption and investment to modernize infrastructure. As a result, it is our view that the Indian economy is relatively more insulated from the global turmoil. Second, the outlook for weak global Gross Domestic Product (“GDP”) growth prevalent at the end of the Reporting Period has reduced pressure on commodity prices and could continue to ease inflationary pressures over the next few months. As a result, we believe the Reserve Bank of India is unlikely to raise interest rates further. Indeed, with inflation showing signs of declining, the Reserve Bank of India may start easing monetary policy, which should help, we believe, in stimulating corporate investments and overall economic growth. Third, with key state assembly elections completed in February 2012, the government of India is now expected to move forward on key economic reforms, which could boost broad investor sentiment. |
19
FUND BASICS
India Equity Fund
as of April 30, 2012
| | | | | | | | | | |
| | PERFORMANCE REVIEW | |
| | | November 1, 2011–April 30, 2012 | | Fund Total Return
(based on NAV)1 | | | MSCI India IMI Index2 | |
| | Class A | | | -1.26 | % | | | -9.62 | % |
| | Class C | | | -1.61 | | | | -9.62 | |
| | Institutional | | | -1.14 | | | | -9.62 | |
| | | Class IR | | | -1.15 | | | | -9.62 | |
| | 1 | | The net asset value (“NAV”) represents the net assets of the class of the Fund (ex-dividend) divided by the total number of shares of the class outstanding. The Fund’s performance assumes the reinvestment of dividends and other distributions. The Fund’s performance does not reflect the deduction of any applicable sales charges. |
| | 2 | | The MSCI India IMI Index (net, total return, unhedged, USD) is a free float-adjusted market capitalization index that is designed to measure equity market performance of India. The IMI (Investable Market Indices) include large, mid cap, small cap and micro cap segments and provide exhaustive coverage of these segments. It is not possible to invest directly in an index. |
| | | | | | | | |
| | STANDARDIZED TOTAL RETURNS3 |
| | | For the period ended 3/31/12 | | Since Inception | | | Inception Date |
| | Class A | | | -16.35 | % | | 6/30/11 |
| | Class C | | | -12.88 | | | 6/30/11 |
| | Institutional | | | -11.20 | | | 6/30/11 |
| | | Class IR | | | -11.30 | | | 6/30/11 |
| | 3 | | The Standardized Total Returns are cumulative total returns as of the most recent calendar quarter-end. They assume reinvestment of all distributions at NAV. These returns reflect a maximum initial sales charge of 5.5% for Class A Shares and the assumed contingent deferred sales charge for Class C Shares (1% if redeemed within 12 months of purchase). Because Institutional and Class IR Shares do not involve a sales charge, such a charge is not applied to their Standardized Total Returns. |
| | | | The returns represent past performance. Past performance does not guarantee future results. The Fund’s investment return and principal value will fluctuate so that an investor’s shares, when redeemed, may be worth more or less than their original cost. Current performance may be lower or higher than the performance quoted above. Please visit our Website at www.goldmansachsfunds.com to obtain the most recent month-end returns. Performance reflects fee waivers and/or expense limitations in effect. In their absence, performance would be reduced. Returns do not reflect the deduction of taxes that a shareholder would pay on Fund distributions or the redemption of Fund shares. |
20
FUND BASICS
| | | | | | | | | | |
| | EXPENSE RATIOS4 | |
| | | | | Net Expense Ratio (Current) | | | Gross Expense Ratio (Before Waivers) | |
| | Class A | | | 1.90 | % | | | 28.76 | % |
| | Class C | | | 2.65 | | | | 29.51 | |
| | Institutional | | | 1.50 | | | | 28.36 | |
| | | Class IR | | | 1.65 | | | | 28.51 | |
| | 4 | | The expense ratios of the Fund, both current (net of applicable fee waivers and/or expense limitations) and before waivers (gross of applicable fee waivers and/or expense limitations) are as set forth above according to the most recent publicly available Prospectus for the Fund and may differ from the expense ratios disclosed in the Financial Highlights in this report. The Fund’s waivers and/or expense limitations will remain in place through at least February 28, 2013, and prior to such date the investment adviser may not terminate the arrangements without the approval of the Fund’s Board of Trustees. If these arrangements are discontinued in the future, the expense ratios may change without shareholder approval. |
| | | | | | | | |
| | TOP TEN HOLDINGS AS OF 4/30/125 | | | | | | |
| | | Holding | | % of Total
Net Assets | | | Line of Business |
| | HDFC Bank Ltd. | | | 9.6 | % | | Commercial Banks |
| | Tata Consultancy Services Ltd. | | | 5.8 | | | IT Services |
| | Cognizant Technology Solutions Corp. Class A | | | 4.0 | | | IT Services |
| | Tata Motors Ltd. Class A | | | 3.9 | | | Automobiles |
| | Bosch Ltd. | | | 3.7 | | | Auto Components |
| | Titan Industries Ltd. | | | 3.0 | | | Textiles, Apparel & |
| | | | | | | | Luxury Goods |
| | Oracle Financial Sevices Software Ltd. | | | 2.9 | | | Software |
| | IndusInd Bank Ltd. | | | 2.6 | | | Commercial Banks |
| | Yes Bank Ltd. | | | 2.5 | | | Commercial Banks |
| | | ICICI Bank Ltd. | | | 2.4 | | | Commercial Banks |
| | 5 | | The top 10 holdings may not be representative of the Fund’s future investments. |
21
FUND BASICS
|
| FUND VS. BENCHMARK SECTOR ALLOCATIONS6 |
| As of April 30, 2012 |
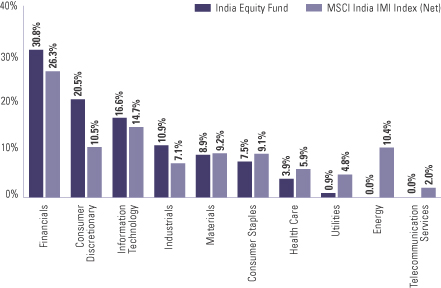
| | 6 | | The Fund is actively managed and, as such, its composition may differ over time. Consequently, the Fund’s overall sector allocations may differ from the percentages contained in the graph above. The above graph categorizes investments using Global Industry Classification Standard (“GICS”), however, the sector classifications used by the portfolio management team may differ from GICS. The percentage shown for each investment category reflects the value of investments in that category as a percentage of market value. The above graph depicts the Fund’s investments but may not represent the Fund’s market exposure due to the exclusion of certain derivatives, if any, as listed in the Additional Investment Information section of the Schedule of Investments. |
22
PORTFOLIO RESULTS
Korea Equity Fund
Portfolio Management Discussion and Analysis
Below, the Goldman Sachs Fundamental Emerging Markets Equity Portfolio Management Team discusses the Goldman Sachs Korea Equity Fund’s (the “Fund”) performance and positioning for the six-month period ended April 30, 2012 (the “Reporting Period”).
| Q | | How did the Fund perform during the Reporting Period? |
| A | | During the Reporting Period, the Fund’s Class A, C, Institutional and IR Shares generated cumulative total returns, without sales charges, of 1.02%, 0.60%, 1.22% and 1.12%, respectively. These returns compare to the 1.81% cumulative total return of the Fund’s benchmark, the Korea Composite Stock Price Index (unhedged, USD) (the “Index”), during the same time period. |
| Q | | What economic and market factors most influenced Korea’s equity market as a whole during the Reporting Period? |
| A | | South Korea’s equity market retreated toward the end of 2011 amidst concerns regarding slowing global economic growth, deterioration in Europe’s sovereign debt crisis and uncertainty over the transfer of power in North Korea following the death of its leader Kim Jong Il. In addition, the won’s depreciation against the U.S. dollar reduced equity market returns expressed in U.S. dollars. South Korean equity market performance then rebounded in the early months of 2012 to reflect a number of positive economic data points announced during the first quarter. These data points included 3.3% Gross Domestic Product (“GDP”) growth in the fourth quarter of 2011 along with strong export trends and increasing industrial production and manufacturers’ confidence. However, increased political uncertainty in Europe, questions about the pace of the U.S. economic recovery and slowing economic momentum in some growth and emerging markets dampened sentiment on the global economy again and hurt export-oriented markets, such as that of South Korea, in April. |
| | | For the Reporting Period overall, information technology stocks led South Korea’s equity market performance, benefiting from strong global trends and merger and acquisition speculation during the Reporting Period. |
| Q | | What key factors were responsible for the Fund’s performance during the Reporting Period? |
| A | | The Fund’s underperformance of the Index during the Reporting Period can be primarily attributed to individual stock selection. |
| Q | | Which stocks detracted significantly from the Fund’s performance during the Reporting Period? |
| A | | Among the stocks that detracted most from the Fund’s results relative to the Index were positions in electronic equipment manufacturer Samsung Electronics, online game developer and distributor JCEntertainment and tool manufacturer Y G-1. |
| | | Samsung Electronics detracted from the Fund’s results as it held an underweighted position in the strongly performing stock. Samsung Electronics had great success with its Galaxy series, and its sales expectations for 2012 were increasing with global fanfare for the series. Despite semiconductor weakness, the top line of Samsung Electronics’ balance sheet was solid thanks to its mobile-related products, including mobile DRAMs (dynamic random access memory, a type of memory that stores each bit of data in a separate capacitor within an integrated circuit), smart phones and tablets. |
| | | JCEntertainment detracted from the Fund’s performance relative to the Index during the Reporting Period, as concerns of potential regulatory risk clouded share price performance. Specifically, the company faced the possibility of a Korean law being enacted that would limit the amount of time teenagers can spend on computer games in order to curtail teenager violence in schools. In our view, this potential risk is low, as the proposed regulation may be too difficult to implement in reality. Even if the proposed regulation is passed and enacted, we feel it should not have a negative impact on JCEntertainment because most of its revenue is generated from casual game users that do not require long hours to play. Furthermore, we believe future revenue may increase as a result of expansion into China and the introduction of a new mobile game called “Rule the Sky.” |
23
PORTFOLIO RESULTS
| | | Y G-1, a manufacturer of end mill, drill and cutting tools, saw its share price decline during the Reporting Period due to dilution from an unexpected bond with warrant issue without proper communication with investors. (A bond with warrant is a standard bond that is issued with attached warrants (that is, long-dated options), which can often be detached and traded separately. By selling the package, the issuer lowers its effective cost of capital. The bond, which can be denominated in one of various currencies and carry a maturity ranging from 1 to 10 years, is typically issued at par value, but its ongoing value with warrants retained depends on the intrinsic value and time value of the warrants. While attached warrants can be issued on a range of references, they are often linked to the price of the issuer.) We began to take profits from this position as our confidence in its management was compromised. |
| Q | | What were some of the Fund’s best-performing individual stocks? |
| A | | Among the Fund’s best-performing individual stocks relative to the Index were holdings in flexible printed circuit boards manufacturer Interflex, specialty chemicals company Wonik Materials and hotel operator Hotel Shilla. |
| | | Shares of Interflex rallied during the Reporting Period in anticipation of stronger than expected fourth quarter 2011 and first quarter 2012 earnings driven, in turn, by global market share gain from its key customers in the smart phone and tablet personal computers fields, namely Samsung Electronics and Apple. Potential customer expansion to Research in Motion or Nokia and an improvement in profitability from a higher utilization rate and product mix improvement further supported Interflex’s share price during the Reporting Period. |
| | | Wonik Materials supplies high purity specialty gases. We bought into the stock via its initial public offering subscription during the Reporting Period but sold out of the position very soon afterwards as it had already reached our target price. |
| | | Hotel Shilla is one of the top two duty free players in South Korea. Its duty free operations have been the beneficiary of surging numbers of Chinese tourists, which led to 30% annual growth in recent years. Furthermore, Hotel Shilla was a beneficiary of the restructuring of Samsung Electronics’ corporate governance, as the hotel operator was expected to be one of Samsung Electronics’ core vendors. |
| Q | | Which equity market sectors most significantly affected Fund performance during the Reporting Period? |
| A | | The biggest detractors from the Fund’s relative results were the information technology, financials and industrials sectors, each due primarily to poor stock selection. |
| | | The sectors that contributed most to the Fund’s performance relative to the Index were materials, telecommunication services and health care. The contribution made by materials can be attributed to both strong stock selection and an underweighted exposure compared to the Index to the poorly performing sector. Similarly, the Fund was underweight relative to the Index in telecommunication services, which added value to its results. The contribution made by health care was due primarily to effective stock selection. |
| Q | | How did the Fund use derivatives and similar instruments during the Reporting Period? |
| A | | During the Reporting Period, we did not use derivatives to hedge positions or as part of an active management strategy. |
| Q | | Did the Fund make any significant purchases or sales during the Reporting Period? |
| A | | We established a Fund position in indoor golf software provider Golfzon as it has a dominant market position and is changing its business structure from hardware sales via its golf simulators to a fee-based business. During the Reporting Period, the company had a 98% market share in South Korea with approximately 4,000 indoor golf courses and earned revenues on a “per play” basis. At the end of the Reporting Period, we had conviction in the company as we believed it should benefit from domestic consumer income growth, as the number of golfers in South Korea is expected to grow with the country crossing the $20,000 GDP per capita mark. We further expect the company to benefit from expansion into other countries, including Japan and Canada. |
24
PORTFOLIO RESULTS
| | | We added to the Fund’s position in food and bioscience company CJ CheilJedang. The bioscience business of the company has become more meaningful for revenues and operating profit due to capacity expansion, price increases, market share gain and agricultural inflation. We believe the company may also benefit as the food business expects a gradual recovery due to lower raw materials costs. Further, the processed food business showed stable growth as single or two-person families become more common in South Korea. This demographic is increasingly dependent on processed food for their convenience. |
| | | As mentioned earlier, we began to take profits from the Fund’s position in Y G-1 during the Reporting Period, as our confidence in its management was compromised due to dilution from an unexpected bond with warrant issue without proper communication with investors. |
| | | We trimmed the Fund’s position in Samsung Fire & Marine Insurance based on our relative valuation analysis. |
| Q | | Were there any notable changes in the Fund’s weightings during the Reporting Period? |
| A | | Throughout the Reporting Period, we remained focused on individual stock selection, with sector positioning being a secondary, closely-monitored effect. That said, the Fund’s exposure relative to the Index in industrials, consumer staples, financials and health care increased, and its allocations relative to the Index to energy, information technology and consumer discretionary decreased. |
| Q | | How was the Fund positioned relative to the Index at the end of the Reporting Period? |
| A | | At the end of the Reporting Period, the Fund had overweighted positions relative to the Index in information technology, consumer discretionary and health care. On the same date, the Fund had underweighted positions compared to the Index in the materials, energy, consumer staples, utilities, industrials and financials sectors, and had no position at all in the telecommunications services sector. |
| Q | | What is the Fund’s tactical view and strategy going forward? |
| A | | At the end of the Reporting Period, it continued to be our view that a bright macroeconomic outlook underpins growth prospects for South Korean companies and that catalysts are in place to drive strong returns in Korean equities. More specifically, we believe the South Korean economy should be poised to join the ranks of the wealthiest nations by 2050. Strong market share in exports to the rapidly growing BRIC (Brazil, Russia, India and China) and other emerging markets will continue to be a significant driver of growth, in our view. Also, many South Korean companies already are or are becoming global leaders. A number of companies have successfully transformed from low cost producers to global leaders through a combination of strategic marketing, increased research and development and an export advantage to the growth markets. At the end of April 2012, the Korean equity market was offering strong corporate fundamentals at what we considered to be attractive valuations. We believe that strong balance sheets and improving profitability of Korean companies was being valued below historical averages and regional peers. |
| | | All that said, in the coming months, we believe there may be short-term headwinds given global macroeconomic events that may hinder the recovery of developed economies. South Korea is, after all, relatively dependent on and more leveraged to the global economy than most peers in the region. However, with the Korean equity market trading at what we consider to be attractive valuations, we believe it remains compelling for longer-term investors who have been looking for an opportunity to gain or increase exposure to this market. |
25
FUND BASICS
Korea Equity Fund
as of April 30, 2012
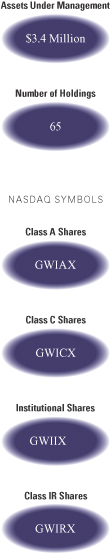
| | | | | | | | | | |
| | PERFORMANCE REVIEW | |
| | | November 1, 2011–April 30, 2012 | | Fund Total Return
(based on NAV)1 | | | Korea Composite
Stock Price Index2 | |
| | Class A | | | 1.02 | % | | | 1.81 | % |
| | Class C | | | 0.60 | | | | 1.81 | |
| | Institutional | | | 1.22 | | | | 1.81 | |
| | | Class IR | | | 1.12 | | | | 1.81 | |
| | 1 | | The net asset value (“NAV”) represents the net assets of the class of the Fund (ex-dividend) divided by the total number of shares of the class outstanding. The Fund’s performance assumes the reinvestment of dividends and other distributions. The Fund’s performance does not reflect the deduction of any applicable sales charges. |
| | 2 | | The Korea Composite Stock Price Index (unhedged, USD) (KOSPI) is a capitalization-weighted index of all common shares on the Korean Stock Exchanges. The KOSPI is a price-only index (i.e., its return does not take into account the dividends paid by its constituents). It is not possible to invest directly in an index. |
| | | | | | | | |
| | STANDARDIZED TOTAL RETURNS3 | | | | | | |
| | | For the period ended 3/31/12 | | Since Inception | | | Inception Date |
| | Class A | | | -6.62 | % | | 5/31/11 |
| | Class C | | | -2.89 | | | 5/31/11 |
| | Institutional | | | -0.91 | | | 5/31/11 |
| | | Class IR | | | -1.11 | | | 5/31/11 |
| | 3 | | The Standardized Total Returns are cumulative total returns as of the most recent calendar quarter-end. They assume reinvestment of all distributions at NAV. These returns reflect a maximum initial sales charge of 5.5% for Class A Shares and the assumed contingent deferred sales charge for Class C Shares (1% if redeemed within 12 months of purchase). Because Institutional and Class IR Shares do not involve a sales charge, such a charge is not applied to their Standardized Total Returns. |
| | | | The returns represent past performance. Past performance does not guarantee future results. The Fund’s investment return and principal value will fluctuate so that an investor’s shares, when redeemed, may be worth more or less than their original cost. Current performance may be lower or higher than the performance quoted above. Please visit our Website at www.goldmansachsfunds.com to obtain the most recent month-end returns. Performance reflects fee waivers and/or expense limitations in effect. In their absence, performance would be reduced. Returns do not reflect the deduction of taxes that a shareholder would pay on Fund distributions or the redemption of Fund shares. |
26
FUND BASICS
| | | | | | | | | | |
| | EXPENSE RATIOS4 | |
| | | | | Net Expense Ratio (Current) | | | Gross Expense Ratio (Before Waivers) | |
| | Class A | | | 1.90 | % | | | 25.48 | % |
| | Class C | | | 2.65 | | | | 26.23 | |
| | Institutional | | | 1.50 | | | | 25.08 | |
| | | Class IR | | | 1.65 | | | | 25.23 | |
| | 4 | | The expense ratios of the Fund, both current (net of applicable fee waivers and/or expense limitations) and before waivers (gross of applicable fee waivers and/or expense limitations) are as set forth above according to the most recent publicly available Prospectus for the Fund and may differ from the expense ratios disclosed in the Financial Highlights in this report. The Fund’s waivers and/or expense limitations will remain in place through at least February 28, 2013, and prior to such date the investment adviser may not terminate the arrangements without the approval of the Fund’s Board of Trustees. If these arrangements are discontinued in the future, the expense ratios may change without shareholder approval. |
| | | | | | | | |
| | TOP TEN HOLDINGS AS OF 4/30/125 |
| | | Holding | | % of Total Net Assets | | | Line of Business |
| | Samsung Electronics Co. Ltd. | | | 13.7 | % | | Semiconductors & Semiconductor
Equipment |
| | Hyundai Motor Co. | | | 6.5 | | | Automobiles |
| | Kia Motors Corp. | | | 5.4 | | | Automobiles |
| | Hynix Semiconductor, Inc. | | | 4.1 | | | Semiconductors & Semiconductor
Equipment |
| | NHN Corp. | | | 4.0 | | | Internet Software & Services |
| | CJ CheilJedang Corp. | | | 3.4 | | | Food Products |
| | Doosan Infracore Co. Ltd. | | | 2.9 | | | Machinery |
| | Hyundai Mobis | | | 2.7 | | | Auto Components |
| | GOLFZON Co. Ltd. | | | 2.6 | | | Software |
| | | Cheil Worldwide, Inc. | | | 2.5 | | | Media |
| | 5 | | The top 10 holdings may not be representative of the Fund’s future investments. |
27
FUND BASICS
|
| FUND VS. BENCHMARK SECTOR ALLOCATIONS6 |
| As of April 30, 2012 |
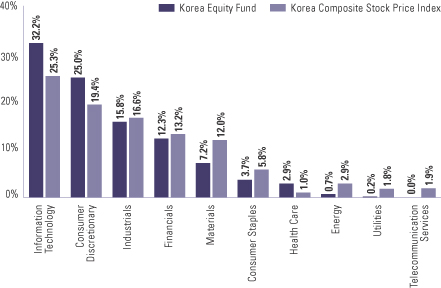
| | 6 | | The Fund is actively managed and, as such, its composition may differ over time. Consequently, the Fund’s overall sector allocations may differ from the percentages contained in the graph above. The above graph categorizes investments using Global Industry Classification Standard (“GICS”), however, the sector classifications used by the portfolio management team may differ from GICS. The percentage shown for each investment category reflects the value of investments in that category as a percentage of market value. The above graph depicts the Fund’s investments but may not represent the Fund’s market exposure due to the exclusion of certain derivatives, if any, as listed in the Additional Investment Information section of the Schedule of Investments. |
28
GOLDMAN SACHS BRAZIL EQUITY FUND
Schedule of Investments
April 30, 2012 (Unaudited)
| | | | | | | | |
Shares | | | Description | | Value | |
| | | | | | | | |
| | Common Stocks – 54.1% | | | | |
| Auto Components – 1.4% | | | | |
| | 9,472 | | | Autometal SA | | $ | 75,879 | |
| | |
| Commercial Banks – 10.0% | | | | |
| | 20,790 | | | Banco Bradesco SA ADR | | | 333,264 | |
| | 13,118 | | | Itau Unibanco Holding SA ADR | | | 205,821 | |
| | | | | | | | |
| | | | | | | 539,085 | |
| | |
| Diversified Consumer Services – 2.8% | | | | |
| | 11,261 | | | Anhanguera Educacional Participacoes SA | | | 149,702 | |
| | |
| Diversified Financial Services – 4.3% | | | | |
| | 40,769 | | | BM&FBOVESPA SA | | | 229,281 | |
| | |
| Electric Utilities – 3.0% | | | | |
| | 23,007 | | | EDP – Energias do Brasil SA | | | 160,891 | |
| | |
| Food Products – 2.2% | | | | |
| | 3,349 | | | BRF – Brasil Foods SA | | | 61,229 | |
| | 3,308 | | | Cosan SA Industria e Comercio | | | 57,443 | |
| | | | | | | | |
| | | | | | | 118,672 | |
| | |
| Household Durables – 1.3% | | | | |
| | 13,345 | | | Direcional Engenharia SA | | | 68,470 | |
| | |
| IT Services – 2.9% | | | | |
| | 9,111 | | | Redecard SA | | | 153,431 | |
| | |
| Metals & Mining – 8.3% | | | | |
| | 7,839 | | | Gerdau SA ADR | | | 73,608 | |
| | 8,994 | | | Vale SA | | | 201,005 | |
| | 7,710 | | | Vale SA ADR | | | 171,162 | |
| | | | | | | | |
| | | | | | | 445,775 | |
| | |
| Multiline Retail* – 2.7% | | | | |
| | 24,038 | | | Magazine Luiza SA | | | 143,510 | |
| | |
| Oil, Gas & Consumable Fuels – 11.7% | | | | |
| | 13,157 | | | OGX Petroleo e Gas Participacoes SA* | | | 91,319 | |
| | 9,359 | | | Petroleo Brasileiro SA | | | 109,933 | |
| | 13,922 | | | Petroleo Brasileiro SA ADR | | | 327,724 | |
| | 4,339 | | | Ultrapar Participacoes SA | | | 98,564 | |
| | | | | | | | |
| | | | | | | 627,540 | |
| | |
| Transportation Infrastructure – 3.5% | | | | |
| | 24,204 | | | CCR SA | | | 187,928 | |
| | |
| | TOTAL COMMON STOCKS | | | | |
| | (Cost $3,156,770) | | $ | 2,900,164 | |
| | |
| | | | | | | | |
| | | | | | | | |
Shares | | | Description | | Value | |
| | | | | | | | |
| | Preferred Stocks – 38.9% | | | | |
| Beverages – 7.0% | | | | |
| | 4,514 | | | Companhia de Bebidas das Americas | | $ | 190,137 | |
| | 4,340 | | | Companhia de Bebidas das Americas ADR | | | 182,193 | |
| | | | | | | | |
| | | | | | | 372,330 | |
| | |
| Chemicals – 0.4% | | | | |
| | 2,989 | | | Braskem SA Class A | | | 21,012 | |
| | |
| Commercial Banks – 9.3% | | | | |
| | 8,085 | | | Banco Bradesco SA | | | 129,918 | |
| | 9,525 | | | Itau Unibanco Holding SA | | | 149,910 | |
| | 45,280 | | | Itausa – Investimentos Itau SA | | | 215,218 | |
| | | | | | | | |
| | | | | | | 495,046 | |
| | |
| Containers & Packaging – 4.3% | | | | |
| | 48,340 | | | Klabin SA | | | 231,790 | |
| | |
| Diversified Telecommunication Services – 4.2% | | | | |
| | 7,900 | | | Telefonica Brasil SA | | | 225,460 | |
| | |
| Electric Utilities – 4.8% | | | | |
| | 13,047 | | | Companhia Energetica de Minas Gerais | | | 258,592 | |
| | |
| Metals & Mining – 8.9% | | | | |
| | 13,849 | | | Bradespar SA | | | 253,564 | |
| | 16,495 | | | Gerdau SA | | | 155,072 | |
| | 5,454 | | | Metalurgica Gerdau SA | | | 66,524 | |
| | | | | | | | |
| | | | | | | 475,160 | |
| | |
| | TOTAL PREFERRED STOCKS | | | | |
| | (Cost $1,991,603) | | $ | 2,079,390 | |
| | |
| | | | | | | | |
| | Exchange Traded Funds – 6.1% | | | | |
| | 2,200 | | | iShares Ibovespa* | | $ | 70,288 | |
| | 4,209 | | | iShares MSCI Brazil Index Fund | | | 253,635 | |
| | |
| | TOTAL EXCHANGE TRADED FUNDS | | | | |
| | (Cost $345,281) | | $ | 323,923 | |
| | |
| | |
| The accompanying notes are an integral part of these financial statements. | | 29 |
GOLDMAN SACHS BRAZIL EQUITY FUND
Schedule of Investments (continued)
April 30, 2012 (Unaudited)
| | | | | | | | | | | | |
| Units | | | Description | | Expiration
Month | | | Value | |
| | | | | | | | | | | | |
| | Rights – 0.0% | | | | | | | | |
| Beverages – 0.0% | | | | | |
| | 11 | | | Companhia de Bebidas das Americas | | | 6/12 | | | $ | 92 | |
| | |
| Commercial Banks – 0.0% | | | | | |
| | 549 | | | Itausa – Investimentos Itau SA | | | 5/12 | | | | 162 | |
| | |
| | TOTAL RIGHTS | | | | | |
| | (Cost $—) | | | $ | 254 | |
| | |
| | TOTAL INVESTMENTS – 99.1% | | | | | |
| | (Cost $5,493,654) | | | $ | 5,303,731 | |
| | |
| OTHER ASSETS IN EXCESS OF
LIABILITIES – 0.9% | | | | | | | 50,243 | |
| | |
| | NET ASSETS – 100.0% | | | | | | $ | 5,353,974 | |
| | |
| | |
| The percentage shown for each investment category reflects the value of investments in that category as a percentage of net assets. |
* | | Non-income producing security. |
| | |
|
Investment Abbreviation: |
ADR | | —American Depositary Receipt |
|
| | |
| 30 | | The accompanying notes are an integral part of these financial statements. |
GOLDMAN SACHS CHINA EQUITY FUND
Schedule of Investments
April 30, 2012 (Unaudited)
| | | | | | | | |
Shares | | | Description | | Value | |
| | | | | | | | |
| | Common Stocks – 99.7% | | | | |
| Auto Components – 1.6% | | | | |
| | 74,000 | | | Minth Group Ltd. | | $ | 93,466 | |
| | |
| Chemicals* – 1.6% | | | | |
| | 132,000 | | | China Bluechemical Ltd. Class H | | | 94,078 | |
| | |
| Commercial Banks – 22.7% | | | | |
| | 203,000 | | | China CITIC Bank Corp. Ltd. Series H | | | 128,625 | |
| | 875,000 | | | China Construction Bank Corp. Class H | | | 679,038 | |
| | 50,000 | | | China Minsheng Banking Corp. Ltd. Class H | | | 51,740 | |
| | 669,000 | | | Industrial and Commercial Bank of China Ltd. Class H | | | 444,506 | |
| | | | | | | | |
| | | | | | | 1,303,909 | |
| | |
| Communications Equipment – 3.3% | | | | |
| | 24,000 | | | AAC Technology Holdings, Inc. | | | 70,475 | |
| | 49,800 | | | ZTE Corp. Class H* | | | 120,234 | |
| | | | | | | | |
| | | | | | | 190,709 | |
| | |
| Construction Materials – 3.0% | | | | |
| | 188,000 | | | China Glass Holdings Ltd.* | | | 27,137 | |
| | 184,000 | | | China Resources Cement Holdings Ltd. | | | 145,309 | |
| | | | | | | | |
| | | | | | | 172,446 | |
| | |
| Diversified Telecommunication Services – 2.2% | | | | |
| | 118,000 | | | China Telecom Corp. Ltd. Class H* | | | 63,242 | |
| | 36,000 | | | China Unicom Hong Kong Ltd. | | | 62,963 | |
| | | | | | | | |
| | | | | | | 126,205 | |
| | |
| Electrical Equipment* – 2.0% | | | | |
| | 42,000 | | | Dongfang Electric Corp. Ltd. Class H | | | 113,859 | |
| | |
| Electronic Equipment, Instruments & Components – 3.4% | |
| | 82,000 | | | Digital China Holdings Ltd. | | | 154,879 | |
| | 4,088 | | | Hollysys Automation Technologies Ltd.* | | | 40,594 | |
| | | | | | | | |
| | | | | | | 195,473 | |
| | |
| Food Products – 3.6% | | | | |
| | 67,000 | | | China Mengniu Dairy Co. Ltd. | | | 206,266 | |
| | |
| Insurance* – 6.0% | | | | |
| | 9,000 | | | China Life Insurance Co. Ltd. | | | 23,963 | |
| | 98,800 | | | China Pacific Insurance (Group) Co. Ltd. Class H | | | 319,952 | |
| | | | | | | | |
| | | | | | | 343,915 | |
| | |
| Internet Software & Services – 4.9% | | | | |
| | 9,000 | | | Tencent Holdings Ltd. | | | 281,554 | |
| | |
| Machinery – 4.3% | | | | |
| | 74,000 | | | China Automation Group Ltd. | | | 20,311 | |
| | 70,000 | | | Haitian International Holdings Ltd. | | | 80,536 | |
| | 99,800 | | | Zoomlion Heavy Industry Science and Technology Co. Ltd. Class H | | | 148,065 | |
| | | | | | | | |
| | | | | | | 248,912 | |
| | |
| | | | | | | | |
Shares | | | Description | | Value | |
| | | | | | | | |
| | Common Stocks – (continued) | | | | |
| Metals & Mining – 2.2% | | | | |
| | 53,000 | | | Jiangxi Copper Co. Ltd. Class H | | $ | 127,459 | |
| | |
| Oil, Gas & Consumable Fuels – 19.6% | | | | |
| | 52,000 | | | China Petroleum and Chemical Corp. (Sinopec) Class H | | | 55,230 | |
| | 63,000 | | | China Shenhua Energy Co. Ltd. Class H* | | | 278,211 | |
| | 197,000 | | | CNOOC Ltd. | | | 416,290 | |
| | 254,000 | | | PetroChina Co. Ltd. Class H | | | 378,891 | |
| | | | | | | | |
| | | | | | | 1,128,622 | |
| | |
| Pharmaceuticals – 1.8% | | | | |
| | 104,000 | | | Guangzhou Pharmaceutical Co. Ltd. Class H | | | 100,847 | |
| | |
| Real Estate Management & Development – 5.1% | | | | |
| | 136,000 | | | China Overseas Land & Investment Ltd. | | | 293,898 | |
| | |
| Specialty Retail – 3.9% | | | | |
| | 115,000 | | | Belle International Holdings Ltd. | | | 224,392 | |
| | |
| Wireless Telecommunication Services – 8.5% | | | | |
| | 44,000 | | | China Mobile Ltd. | | | 486,795 | |
| | |
| | TOTAL INVESTMENTS – 99.7% | | | | |
| | (Cost $5,757,135) | | $ | 5,732,805 | |
| | |
| OTHER ASSETS IN EXCESS OF
LIABILITIES – 0.3% | | | 19,838 | |
| | |
| | NET ASSETS – 100.0% | | $ | 5,752,643 | |
| | |
| | |
| The percentage shown for each investment category reflects the value of investments in that category as a percentage of net assets. |
* | | Non-income producing security. |
| | |
| The accompanying notes are an integral part of these financial statements. | | 31 |
GOLDMAN SACHS INDIA EQUITY FUND
Consolidated Schedule of Investments
April 30, 2012 (Unaudited)
| | | | | | | | |
Shares | | | Description | | Value | |
| | | | | | | | |
| | Common Stocks – 93.7% | | | | |
| Air Freight & Logistics – 2.3% | | | | |
| | 3,670 | | | Blue Dart Express Ltd. | | $ | 137,848 | |
| | |
| Auto Components – 5.3% | | | | |
| | 3,871 | | | Amtek Auto Ltd. | | | 9,328 | |
| | 1,342 | | | Bosch Ltd. | | | 221,167 | |
| | 34,110 | | | Exide Industries Ltd. | | | 83,598 | |
| | | | | | | | |
| | | | | | | 314,093 | |
| | |
| Automobiles – 6.0% | | | | |
| | 2,884 | | | Hero Motocorp Ltd. | | | 122,297 | |
| | 67,603 | | | Tata Motors Ltd. Class A | | | 231,159 | |
| | | | | | | | |
| | | | | | | 353,456 | |
| | |
| Beverages – 0.1% | | | | |
| | 707 | | | United Breweries Ltd. | | | 7,194 | |
| | |
| Chemicals – 1.1% | | | | |
| | 2,199 | | | Akzo Nobel India Ltd. | | | 36,206 | |
| | 8,702 | | | EID Parry India Ltd. | | | 29,613 | |
| | | | | | | | |
| | | | | | | 65,819 | |
| | |
| Commercial Banks – 23.1% | | | | |
| | 11,925 | | | Federal Bank Ltd. | | | 94,710 | |
| | 55,274 | | | HDFC Bank Ltd. | | | 569,158 | |
| | 8,424 | | | ICICI Bank Ltd. | | | 141,031 | |
| | 3,200 | | | ICICI Bank Ltd. ADR | | | 108,448 | |
| | 24,441 | | | IndusInd Bank Ltd. | | | 153,811 | |
| | 4,267 | | | ING Vysya Bank Ltd. | | | 30,862 | |
| | 3,018 | | | State Bank of India | | | 122,123 | |
| | 22,068 | | | Yes Bank Ltd. | | | 146,111 | |
| | | | | | | | |
| | | | | | | 1,366,254 | |
| | |
| Construction Materials – 3.2% | | | | |
| | 2,114 | | | Grasim Industries Ltd. | | | 109,884 | |
| | 29,906 | | | Orient Paper & Industries Ltd. | | | 31,734 | |
| | 56,021 | | | Prism Cement Ltd.* | | | 51,093 | |
| | | | | | | | |
| | | | | | | 192,711 | |
| | |
| Diversified Consumer Services* – 0.1% | | | | |
| | 840 | | | Career Point Infosystems Ltd. | | | 2,981 | |
| | |
| Diversified Financial Services – 1.7% | | | | |
| | 1,438 | | | Crisil Ltd. | | | 28,319 | |
| | 3,291 | | | ICRA Ltd. | | | 70,057 | |
| | | | | | | | |
| | | | | | | 98,376 | |
| | |
| Electric Utilities* – 0.1% | | | | |
| | 22,007 | | | Indiabulls Infrastructure and Power Ltd. | | | 4,372 | |
| | |
| Electronic Equipment, Instruments & Components – 0.7% | |
| | 789 | | | Honeywell Automation India Ltd. | | | 41,055 | |
| | |
| Food Products – 2.5% | | | | |
| | 1,127 | | | Glaxo SmithKline Consumer Healthcare Ltd. | | | 59,894 | |
| | 2,578 | | | Gokul Refoils & Solvent Ltd. | | | 3,943 | |
| | |
| | | | | | | | |
Shares | | | Description | | Value | |
| | | | | | | | |
| | Common Stocks – (continued) | | | | |
| Food Products – (continued) | | | | |
| | 16,209 | | | McLeod Russel India Ltd. | | $ | 86,078 | |
| | | | | | | | |
| | | | | | | 149,915 | |
| | |
| Hotels, Restaurants & Leisure* – 1.0% | | | | |
| | 2,774 | | | Jubilant Foodworks Ltd. | | | 62,329 | |
| | |
| Household Durables – 1.6% | | | | |
| | 1,436 | | | TTK Prestige Ltd. | | | 94,680 | |
| | |
| Independent Power Producers & Energy Traders* – 0.7% | | | | |
| | 162,788 | | | Indiabulls Power Ltd. | | | 42,704 | |
| | |
| IT Services – 11.8% | | | | |
| | 3,209 | | | Cognizant Technology Solutions Corp. Class A* | | | 235,284 | |
| | 1,100 | | | Infosys Ltd. | | | 51,073 | |
| | 1,469 | | | Infosys Ltd. ADR | | | 69,557 | |
| | 14,475 | | | Tata Consultancy Services Ltd. | | | 341,382 | |
| | | | | | | | |
| | | | | | | 697,296 | |
| | |
| Life Sciences Tools & Services – 1.1% | | | | |
| | 4,006 | | | Divi’s Laboratories Ltd. | | | 65,019 | |
| | |
| Machinery – 7.7% | | | | |
| | 3,957 | | | Cummins India Ltd. | | | 36,176 | |
| | 6,704 | | | Elgi Equipments Ltd. | | | 9,942 | |
| | 496 | | | FAG Bearings (India) Ltd. | | | 14,546 | |
| | 3,424 | | | Nesco Ltd. | | | 42,185 | |
| | 10,359 | | | SKF India Ltd. | | | 130,442 | |
| | 10,882 | | | Thermax India Ltd. | | | 91,975 | |
| | 27,706 | | | Timken India Ltd. | | | 128,712 | |
| | | | | | | | |
| | | | | | | 453,978 | |
| | |
| Media – 0.3% | | | | |
| | 4,960 | | | D.B. Corp. Ltd. | | | 19,546 | |
| | |
| Metals & Mining – 4.1% | | | | |
| | 35,421 | | | Gujarat Mineral Development Corp. Ltd. | | | 124,630 | |
| | 720 | | | Maharashtra Seamless Ltd. | | | 5,171 | |
| | 12,984 | | | Tata Steel Ltd. | | | 113,906 | |
| | | | | | | | |
| | | | | | | 243,707 | |
| | |
| Personal Products – 3.3% | | | | |
| | 7,865 | | | Emami Ltd. | | | 68,073 | |
| | 1,123 | | | Gillette India Ltd. | | | 54,704 | |
| | 1,897 | | | Procter & Gamble Hygiene & Healthcare Ltd. | | | 74,281 | |
| | | | | | | | |
| | | | | | | 197,058 | |
| | |
| Pharmaceuticals – 2.6% | | | | |
| | 733 | | | Astrazeneca Pharma India Ltd. | | | 28,853 | |
| | 9,085 | | | Wockhardt Ltd.* | | | 125,570 | |
| | | | | | | | |
| | | | | | | 154,423 | |
| | |
| Professional Services – 0.4% | | | | |
| | 1,527 | | | eClerx Services Ltd. | | | 21,274 | |
| | |
| | |
| 32 | | The accompanying notes are an integral part of these financial statements. |
GOLDMAN SACHS INDIA EQUITY FUND
| | | | | | | | |
Shares | | | Description | | Value | |
| | | | | | | | |
| | Common Stocks – (continued) | | | | |
| Real Estate Management & Development – 3.1% | | | | |
| | 7,460 | | | Indiabulls Real Estate Ltd. | | $ | 8,890 | |
| | 8,210 | | | Phoenix Mills Ltd. | | | 32,654 | |
| | 26,875 | | | Prestige Estates Projects Ltd. | | | 55,913 | |
| | 13,908 | | | Sobha Developers Ltd. | | | 87,114 | |
| | | | | | | | |
| | | | | | | 184,571 | |
| | |
| Software – 3.3% | | | | |
| | 4,237 | | | NIIT Technologies Ltd. | | | 20,894 | |
| | 3,491 | | | Oracle Financial Services Software Ltd.* | | | 173,336 | |
| | | | | | | | |
| | | | | | | 194,230 | |
| | |
| Textiles, Apparel & Luxury Goods – 5.2% | | | | |
| | 12,974 | | | Bombay Dyeing & Manufacturing Co. Ltd. | | | 128,264 | |
| | 40,842 | | | Titan Industries Ltd. | | | 180,236 | |
| | | | | | | | |
| | | | | | | 308,500 | |
| | |
| Tobacco – 1.2% | | | | |
| | 1,903 | | | VST Industries Ltd. | | | 70,772 | |
| | |
| Water Utilities – 0.1% | | | | |
| | 562 | | | VA Tech Wabag Ltd. | | | 4,607 | |
| | |
| | TOTAL COMMON STOCKS | | | | |
| | (Cost $5,136,139) | | $ | 5,548,768 | |
| | |
| | | | | | | | | | | | |
| Units | | | Description | | Expiration
Date | | | Value | |
| | | | | | | | | | | | |
| | Warrants* – 1.4% | | | | | |
| Multi Commodity Exchange of India Ltd. | |
| | 542 | | | | | | 03/07/17 | | | $ | 11,257 | |
| | 3,595 | | | | | | 03/21/22 | | | | 74,666 | |
| | |
| | TOTAL WARRANTS | | | | | |
| | (Cost $103,341) | | | $ | 85,923 | |
| | |
| | TOTAL INVESTMENTS – 95.1% | | | | | |
| | (Cost $5,239,480) | | | $ | 5,634,691 | |
| | |
| OTHER ASSETS IN EXCESS OF
LIABILITIES – 4.9% | | | | | | | 287,303 | |
| | |
| | NET ASSETS – 100.0% | | | $ | 5,921,994 | |
| | |
| | |
| The percentage shown for each investment category reflects the value of investments in that category as a percentage of net assets. |
* | | Non-income producing security. |
| | |
|
Investment Abbreviation: |
ADR— | | American Depositary Receipt |
|
| | |
| ADDITIONAL INVESTMENT INFORMATION | | |
FUTURES CONTRACTS — At April 30, 2012, the Fund had the following futures contracts:
| | | | | | | | | | | | |
| Type | | Number of
Contracts
Long (Short) | | Expiration
Date | | Value | | | Unrealized
Gain (Loss) | |
SGX S&P CNX Nifty Index | | 32 | | May 2012 | | $ | 337,056 | | | $ | 1,786 | |
| | |
| The accompanying notes are an integral part of these financial statements. | | 33 |
GOLDMAN SACHS KOREA EQUITY FUND
Schedule of Investments
April 30, 2012 (Unaudited)
| | | | | | | | |
Shares | | | Description | | Value | |
| | | | | | | | |
| | Common Stocks – 98.1% | |
| Air Freight & Logistics – 0.6% | |
| | 99 | | | Hyundai Glovis Co. Ltd. | | $ | 19,336 | |
| | |
| Auto Components – 4.7% | |
| | 1,070 | | | Hankook Tire Co. Ltd. | | | 45,139 | |
| | 348 | | | Hyundai Mobis | | | 94,088 | |
| | 144 | | | Hyundai Wia Corp. | | | 21,372 | |
| | 20 | | | Nexen Tire Corp. | | | 334 | |
| | | | | | | | |
| | | | | | | 160,933 | |
| | |
| Automobiles – 11.9% | |
| | 950 | | | Hyundai Motor Co. | | | 224,266 | |
| | 2,530 | | | Kia Motors Corp. | | | 185,649 | |
| | | | | | | | |
| | | | | | | 409,915 | |
| | |
| Building Products – 0.6% | |
| | 1,000 | | | Sung Kwang Bend Co. Ltd. | | | 20,398 | |
| | |
| Capital Markets* – 2.8% | |
| | 1,564 | | | Samsung Securities Co. Ltd. | | | 68,773 | |
| | 2,740 | | | Woori Investment & Securities Co. Ltd. | | | 26,844 | |
| | | | | | | | |
| | | | | | | 95,617 | |
| | |
| Chemicals – 4.5% | |
| | 185 | | | Advanced Nano Products Co. Ltd.* | | | 2,550 | |
| | 20 | | | Honam Petrochemical Corp. | | | 4,779 | |
| | 3,830 | | | Huchems Fine Chemical Corp. | | | 76,334 | |
| | 109 | | | Korea Kumho Petrochemical Co. Ltd. | | | 10,172 | |
| | 206 | | | LG Chem Ltd. | | | 51,492 | |
| | 2,083 | | | Shinwha Intertek Corp.* | | | 9,458 | |
| | | | | | | | |
| | | | | | | 154,785 | |
| | |
| Commercial Banks – 6.2% | |
| | 450 | | | Hana Financial Group, Inc. | | | 15,341 | |
| | 1,530 | | | Industrial Bank of Korea | | | 16,800 | |
| | 2,080 | | | KB Financial Group, Inc. | | | 70,373 | |
| | 1,230 | | | Shinhan Financial Group Co. Ltd. | | | 42,689 | |
| | 6,560 | | | Woori Finance Holdings Co. Ltd. | | | 68,634 | |
| | | | | | | | |
| | | | | | | 213,837 | |
| | |
| Construction & Engineering – 1.9% | |
| | 130 | | | Daelim Industrial Co. Ltd. | | | 11,967 | |
| | 35 | | | Doosan Heavy Industries and Construction Co. Ltd. | | | 1,641 | |
| | 380 | | | Hyundai Engineering & Construction Co. Ltd. | | | 23,853 | |
| | 170 | | | KEPCO Engineering & Construction Co., Inc. | | | 10,285 | |
| | 3,010 | | | Kumho Industrial Co. Ltd.* | | | 17,038 | |
| | | | | | | | |
| | | | | | | 64,784 | |
| | |
| Construction Materials – 0.7% | |
| | 640 | | | Hanil Cement Co. Ltd. | | | 25,427 | |
| | |
| Electric Utilities* – 0.2% | |
| | 450 | | | Korea Electric Power Corp. | | | 8,633 | |
| | |
| | | | | | | | |
Shares | | | Description | | Value | |
| | | | | | | | |
| | Common Stocks – (continued) | |
| Electronic Equipment, Instruments & Components – 4.9% | |
| | 970 | | | Interflex Co. Ltd. | | $ | 52,511 | |
| | 2,280 | | | LG Display Co. Ltd.* | | | 50,332 | |
| | 260 | | | Samsung Electro-Mechanics Co. Ltd. | | | 25,011 | |
| | 150 | | | Samsung SDI Co. Ltd. | | | 21,494 | |
| | 1,556 | | | Suprema, Inc. | | | 18,567 | |
| | | | | | | | |
| | | | | | | 167,915 | |
| | |
| Food & Staples Retailing – 0.3% | |
| | 488 | | | CJ Freshway Corp. | | | 10,163 | |
| | |
| Food Products – 3.4% | |
| | 351 | | | CJ CheilJedang Corp. | | | 115,959 | |
| | |
| Hotels, Restaurants & Leisure – 1.6% | |
| | 430 | | | Hana Tour Service, Inc. | | | 17,620 | |
| | 820 | | | Hotel Shilla Co. Ltd. | | | 38,247 | |
| | | | | | | | |
| | | | | | | 55,867 | |
| | |
| Household Durables – 2.3% | |
| | 1,960 | | | Hanssem Co. Ltd. | | | 38,316 | |
| | 320 | | | LG Electronics, Inc. | | | 19,743 | |
| | 1,118 | | | Thinkware Systems Corp.* | | | 22,117 | |
| | | | | | | | |
| | | | | | | 80,176 | |
| | |
| Industrial Conglomerates – 1.4% | |
| | 234 | | | Samsung Techwin Co. Ltd. | | | 14,233 | |
| | 336 | | | SK Holdings Co. Ltd. | | | 35,772 | |
| | | | | | | | |
| | | | | | | 50,005 | |
| | |
| Insurance – 3.1% | |
| | 1,570 | | | Hyundai Marine & Fire Insurance Co. Ltd. | | | 40,132 | |
| | 620 | | | LIG Insurance Co. Ltd. | | | 12,839 | |
| | 154 | | | Samsung Fire & Marine Insurance Co. Ltd. | | | 29,389 | |
| | 130 | | | Samsung Life Insurance Co. Ltd. | | | 11,476 | |
| | 1,430 | | | Tong Yang Life Insurance Co. Ltd. | | | 12,617 | |
| | | | | | | | |
| | | | | | | 106,453 | |
| | |
| Internet Software & Services – 4.2% | |
| | 710 | | | Neowiz Internet Corp.* | | | 7,964 | |
| | 610 | | | NHN Corp. | | | 137,900 | |
| | | | | | | | |
| | | | | | | 145,864 | |
| | |
| Machinery – 8.3% | |
| | 780 | | | BHI Co. Ltd. | | | 17,571 | |
| | 590 | | | Daewoo Shipbuilding & Marine Engineering Co. Ltd. | | | 16,412 | |
| | 5,410 | | | Doosan Infracore Co. Ltd.* | | | 100,353 | |
| | 341 | | | Hyundai Heavy Industries Co. Ltd. | | | 84,739 | |
| | 730 | | | Samsung Heavy Industries Co. Ltd. | | | 26,689 | |
| | 970 | | | TK Corp.* | | | 26,127 | |
| | 1,354 | | | Y G-1 Co. Ltd. | | | 15,305 | |
| | | | | | | | |
| | | | | | | 287,196 | |
| | |
| Marine* – 0.4% | |
| | 1,070 | | | Hanjin Shipping Co. Ltd. | | | 14,602 | |
| | |
| | |
| 34 | | The accompanying notes are an integral part of these financial statements. |
GOLDMAN SACHS KOREA EQUITY FUND
| | | | | | | | |
Shares | | | Description | | Value | |
| | | | | | | | |
| | Common Stocks – (continued) | |
| Media – 3.8% | |
| | 4,980 | | | Cheil Worldwide, Inc. | | $ | 86,414 | |
| | 420 | | | CJ CGV Co. Ltd. | | | 9,847 | |
| | 1,790 | | | KT Skylife Co. Ltd.* | | | 34,502 | |
| | | | | | | | |
| | | | | | | 130,763 | |
| | |
| Metals & Mining – 1.9% | |
| | 289 | | | Hyundai Steel Co. | | | 25,004 | |
| | 105 | | | POSCO | | | 34,784 | |
| | 44 | | | POSCO Chemtech Co. Ltd. | | | 4,914 | |
| | | | | | | | |
| | | | | | | 64,702 | |
| | |
| Oil, Gas & Consumable Fuels – 0.7% | |
| | 440 | | | GS Holdings | | | 22,965 | |
| | |
| Pharmaceuticals – 2.9% | |
| | 326 | | | Green Cross Corp. | | | 38,527 | |
| | 195 | | | Hanmi Pharm Co. Ltd.* | | | 10,351 | |
| | 503 | | | Kolon Life Science, Inc. | | | 20,782 | |
| | 758 | | | Medy-Tox, Inc. | | | 29,009 | |
| | | | | | | | |
| | | | | | | 98,669 | |
| | |
| Semiconductors & Semiconductor Equipment – 18.8% | |
| | 45 | | | Avaco Co. Ltd. | | | 227 | |
| | 5,680 | | | Hynix Semiconductor, Inc.* | | | 139,997 | |
| | 610 | | | Innovation for Creative Devices Co. Ltd.* | | | 12,325 | |
| | 386 | | | Samsung Electronics Co. Ltd. | | | 472,449 | |
| | 2,120 | | | Simm Tech Co. Ltd. | | | 22,357 | |
| | | | | | | | |
| | | | | | | 647,355 | |
| | |
| Software – 3.7% | |
| | 1,471 | | | GOLFZON Co. Ltd. | | | 90,342 | |
| | 1,525 | | | JCEntertainment Corp. | | | 38,943 | |
| | | | | | | | |
| | | | | | | 129,285 | |
| | |
| Trading Companies & Distributors – 2.3% | |
| | 1,160 | | | Samsung C&T Corp. | | | 78,474 | |
| | |
| | TOTAL COMMON STOCKS | |
| | (Cost $3,146,681) | | $ | 3,380,078 | |
| | |
| | | | | |
| | Preferred Stock – 0.3% | |
| Automobiles – 0.3% | |
| | 120 | | | Hyundai Motor Co. | | $ | 8,410 | |
| | (Cost $8,500) | | | | |
| | |
| | | | | | | | | | | | |
| Units | | | Description | | Expiration
Month | | | Value | |
| | | | | | | | | | | | |
| | Right* – 0.0% | |
| Construction & Engineering – 0.0% | |
| | 803 | | | Kumho Industrial Co. Ltd. | | | 5/16 | | | $ | — | |
| | (Cost $—) | | | | | | | | |
| | |
| | TOTAL INVESTMENTS – 98.4% | | | | | | | | |
| | (Cost $3,155,181) | | | | | | $ | 3,388,488 | |
| | |
| OTHER ASSETS IN EXCESS OF
LIABILITIES – 1.6% | | | | | | | 56,543 | |
| | |
| | NET ASSETS – 100.0% | | | | | | $ | 3,445,031 | |
| | |
| | |
| The percentage shown for each investment category reflects the value of investments in that category as a percentage of net assets. |
* | | Non-income producing security. |
| | |
| The accompanying notes are an integral part of these financial statements. | | 35 |
GOLDMAN SACHS SINGLE COUNTRY FUNDS
Statements of Assets and Liabilities
April 30, 2012 (Unaudited)
| | | | | | | | | | | | | | | | | | |
| | | | | Brazil Equity
Fund | | | China Equity
Fund | | | India Equity
Fund(a) | | | Korea Equity
Fund | |
| | Assets: | | | | | | | | | | | | | | | | |
| | Investments, at value (cost $5,493,654, $5,757,135, $5,239,480 and $3,155,181) | | $ | 5,303,731 | | | $ | 5,732,805 | | | $ | 5,634,691 | | | $ | 3,388,488 | |
| | Cash | | | 47,198 | | | | 72,494 | | | | — | | | | 91,040 | |
| | Foreign currencies, at value (cost $7,096, $2,529, $365,286 and $2,546) | | | 7,022 | | | | 2,530 | | | | 359,403 | | | | 2,547 | |
| | Receivables: | | | | | | | | | | | | | | | | |
| | Reimbursement from investment adviser | | | 77,956 | | | | 63,875 | | | | 178,147 | | | | 80,973 | |
| | Dividends | | | 55,538 | | | | 1,587 | | | | 363 | | | | 2,258 | |
| | Investments sold | | | — | | | | 82,870 | | | | 15,099 | | | | 92,796 | |
| | Fund shares sold | | | — | | | | 6,000 | | | | 1,483 | | | | — | |
| | Futures — variation margin(b) | | | — | | | | — | | | | 23,168 | | | | — | |
| | Deferred offering costs | | | — | | | | — | | | | 46,089 | | | | 15,546 | |
| | Total assets | | | 5,491,445 | | | | 5,962,161 | | | | 6,258,443 | | | | 3,673,648 | |
| | | | | | | | | | | | | | | | | | |
| | Liabilities: | | | | | | | | | | | | | | | | |
| | Due to custodian | | | — | | | | — | | | | 1,216 | | | | — | |
| | Payables: | | | | | | | | | | | | | | | | |
| | Amounts owed to affiliates | | | 5,269 | | | | 5,274 | | | | 5,719 | | | | 3,239 | |
| | Investments purchased | | | — | | | | 81,378 | | | | 35,954 | | | | 82,163 | |
| | Accrued expenses and other liabilities | | | 132,202 | | | | 122,866 | | | | 293,560 | | | | 143,215 | |
| | Total liabilities | | | 137,471 | | | | 209,518 | | | | 336,449 | | | | 228,617 | |
| | | | | | | | | | | | | | | | | | |
| | Net Assets: | | | | | | | | | | | | | | | | |
| | Paid-in capital | | | 6,261,550 | | | | 6,609,595 | | | | 5,866,182 | | | | 3,597,160 | |
| | Undistributed (distributions in excess of) net investment income (loss) | | | 81,568 | | | | (39,542 | ) | | | (20,953 | ) | | | 476 | |
| | Accumulated net realized loss | | | (797,787 | ) | | | (793,080 | ) | | | (314,434 | ) | | | (385,960 | ) |
| | Net unrealized gain (loss) | | | (191,357 | ) | | | (24,330 | ) | | | 391,199 | | | | 233,355 | |
| | | NET ASSETS | | $ | 5,353,974 | | | $ | 5,752,643 | | | $ | 5,921,994 | | | $ | 3,445,031 | |
| | | Net Assets: | | | | | | | | | | | | | | | | |
| | | Class A | | $ | 121,666 | | | $ | 19,059 | | | $ | 156,988 | | | $ | 10,753 | |
| | | Class C | | | 16,227 | | | | 14,186 | | | | 22,234 | | | | 9,649 | |
| | | Institutional | | | 5,208,864 | | | | 5,711,160 | | | | 5,734,139 | | | | 3,414,894 | |
| | | Class IR | | | 7,217 | | | | 8,238 | | | | 8,633 | | | | 9,735 | |
| | | Total Net Assets | | $ | 5,353,974 | | | $ | 5,752,643 | | | $ | 5,921,994 | | | $ | 3,445,031 | |
| | | Shares outstanding $0.001 par value (unlimited shares authorized): | | | | | | | | | | | | | | | | |
| | | Class A | | | 16,905 | | | | 2,333 | | | | 18,236 | | | | 1,117 | |
| | | Class C | | | 2,271 | | | | 1,741 | | | | 2,597 | | | | 1,009 | |
| | | Institutional | | | 720,700 | | | | 697,549 | | | | 663,375 | | | | 353,399 | |
| | | Class IR | | | 1,000 | | | | 1,007 | | | | 1,000 | | | | 1,009 | |
| | | Net asset value, offering and redemption price per share:(c) | | | | | | | | | | | | | | | | |
| | | Class A | | | $7.20 | | | | $8.17 | | | | $8.61 | | | | $9.63 | |
| | | Class C | | | 7.14 | | | | 8.15 | | | | 8.56 | | | | 9.56 | |
| | | Institutional | | | 7.23 | | | | 8.19 | | | | 8.64 | | | | 9.66 | |
| | | Class IR | | | 7.22 | | | | 8.18 | | | | 8.63 | | | | 9.65 | |
| | (a) | | Statement of Assets and Liabilities for the India Equity Fund is consolidated and includes the balances of Goldman Sachs Mauritius India Equity Fund, Ltd. (wholly-owned subsidiary). Accordingly, all interfund balances and transactions have been eliminated. |
| | (b) | | Represents restricted cash for India Equity Fund relating to initial margin requirements and collateral on futures transactions. |
| | (c) | | Maximum public offering price per share for Class A shares of the Brazil Equity, China Equity, India Equity, and Korea Equity Funds is $7.62, $8.65, $9.11 and $10.19, respectively. At redemption, Class C shares may be subject to a contingent deferred sales charge, assessed on the amount equal to the lesser of the current net asset value or the original purchase price of the shares. |
| | |
| 36 | | The accompanying notes are an integral part of these financial statements. |
GOLDMAN SACHS SINGLE COUNTRY FUNDS
Statements of Operations
For the Six Months Ended April 30, 2012 (Unaudited)
| | | | | | | | | | | | | | | | | | |
| | | | | Brazil Equity
Fund | | | China Equity
Fund | | | India Equity Fund(a) | | | Korea Equity Fund | |
| | Investment income: | | | | | | | | | | | | | | | | |
| | Dividends (net of foreign withholding taxes of $7,953, $345, $512 and $5,149) | | $ | 114,069 | | | $ | 3,639 | | | $ | 15,944 | | | $ | 26,125 | |
| | | | | |
| | | | | | | | | | | | | | | | | | |
| | | | | | | | | | | | | | | | | | |
| | Expenses: | | | | | | | | | | | | | | | | |
| | Amortization of offering costs | | | 124,494 | | | | 128,272 | | | | 143,082 | | | | 91,266 | |
| | Custody and accounting fees | | | 35,748 | | | | 22,544 | | | | 50,552 | | | | 68,973 | |
| | Professional fees | | | 34,474 | | | | 36,618 | | | | 66,762 | | | | 34,832 | |
| | Management fees | | | 29,096 | | | | 31,560 | | | | 26,918 | | | | 18,709 | �� |
| | Registration fees | | | 27,555 | | | | 27,555 | | | | 27,455 | | | | 27,455 | |
| | Printing and mailing costs | | | 9,536 | | | | 5,466 | | | | 1,794 | | | | 6,726 | |
| | Trustee fees | | | 7,559 | | | | 7,409 | | | | 7,650 | | | | 7,259 | |
| | Transfer Agent fees(b) | | | 1,128 | | | | 1,168 | | | | 1,017 | | | | 704 | |
| | Distribution and Service fees(b) | | | 165 | | | | 60 | | | | 92 | | | | 60 | |
| | Administrative Fees | | | — | | | | — | | | | 23,083 | | | | — | |
| | Other | | | 4,556 | | | | 4,659 | | | | 9,644 | | | | 3,969 | |
| | Total expenses | | | 274,311 | | | | 265,311 | | | | 358,049 | | | | 259,953 | |
| | Less — expense reductions | | | (234,303 | ) | | | (222,096 | ) | | | (321,152 | ) | | | (234,304 | ) |
| | Net expenses | | | 40,008 | | | | 43,215 | | | | 36,897 | | | | 25,649 | |
| | NET INVESTMENT INCOME (LOSS) | | | 74,061 | | | | (39,576 | ) | | | (20,953 | ) | | | 476 | |
| | | | | |
| | | | | | | | | | | | | | | | | | |
| | Realized and unrealized gain (loss): | | | | | | | | | | | | | | | | |
| | Net realized gain (loss) from: | | | | | | | | | | | | | | | | |
| | Investments | | | (308,401 | ) | | | (329,134 | ) | | | (205,592 | ) | | | (187,340 | ) |
| | Futures contracts | | | — | | | | — | | | | 12,509 | | | | — | |
| | Forward foreign currency exchange contracts | | | (20,737 | ) | | | — | | | | — | | | | — | |
| | Foreign currency transactions | | | (11,953 | ) | | | (205 | ) | | | (25,048 | ) | | | (10,871 | ) |
| | Net change in unrealized gain (loss) on: | | | | | | | | | | | | | | | | |
| | Investments | | | 7,106 | | | | 714,664 | | | | 610,877 | | | | 234,592 | |
| | Futures contracts | | | — | | | | — | | | | (3,927 | ) | | | — | |
| | Forward foreign currency exchange contracts | | | 8,648 | | | | — | | | | — | | | | — | |
| | Foreign currency translation | | | (13,512 | ) | | | — | | | | (9,101 | ) | | | 860 | |
| | Net realized and unrealized gain (loss) | | | (338,849 | ) | | | 385,325 | | | | 379,718 | | | | 37,241 | |
| | NET INCREASE (DECREASE) IN NET ASSETS RESULTING FROM OPERATIONS | | $ | (264,788 | ) | | $ | 345,749 | | | $ | 358,765 | | | $ | 37,717 | |
| | (a) | | Statement of Operations for the India Equity Fund is consolidated and includes the balances of Goldman Sachs Mauritius India Equity Fund, Ltd. (wholly-owned subsidiary). Accordingly, all interfund balances and transactions have been eliminated. |
| | (b) | | Class specific Distribution and Service, and Transfer Agent fees were as follows: |
| | | | | | | | | | | | | | | | | | | | | | | | |
| | | Distribution and Service Fees | | | Transfer Agent Fees | |
Fund | | Class A | | | Class C | | | Class A | | | Class C | | | Institutional | | | Class IR | |
Brazil Equity | | $ | 89 | | | $ | 76 | | | $ | 68 | | | $ | 14 | �� | | $ | 1,039 | | | $ | 7 | |
China Equity | | | 14 | | | | 46 | | | | 11 | | | | 9 | | | | 1,141 | | | | 7 | |
India Equity | | | 40 | | | | 52 | | | | 30 | | | | 10 | | | | 969 | | | | 8 | |
Korea Equity | | | 13 | | | | 47 | | | | 10 | | | | 9 | | | | 674 | | | | 11 | |
| | |
| The accompanying notes are an integral part of these financial statements. | | 37 |
GOLDMAN SACHS SINGLE COUNTRY FUNDS
Statements of Changes in Net Assets
| | | | | | | | | | |
| | | | | Brazil Equity Fund | |
| | | | | For the
Six Months Ended
April 30, 2012
(Unaudited) | | | For the
Period Ended
October 31, 2011(b) | |
| | From operations: | | | | | | | | |
| | Net investment income (loss) | | $ | 74,061 | | | $ | 7,840 | |
| | Net realized loss | | | (341,091 | ) | | | (515,450 | ) |
| | Net change in unrealized gain (loss) | | | 2,242 | | | | (193,599 | ) |
| | Net increase (decrease) in net assets resulting from operations | | | (264,788 | ) | | | (701,209 | ) |
| | | | | | | | | | |
| | Distributions to shareholders: | | | | | | | | |
| | From net investment income | | | | | | | | |
| | Class A Shares | | | — | | | | — | |
| | Class C Shares | | | — | | | | — | |
| | Institutional Shares | | | — | | | | — | |
| | Class IR Shares | | | — | | | | — | |
| | From net realized gains | | | | | | | | |
| | Class A Shares | | | — | | | | — | |
| | Class C Shares | | | — | | | | — | |
| | Institutional Shares | | | — | | | | — | |
| | Class IR Shares | | | — | | | | — | |
| | Total distributions to shareholders | | | — | | | | — | |
| | | | | | | | | | |
| | From share transactions: | | | | | | | | |
| | Proceeds from sales of shares | | | 2,908,456 | | | | 4,248,071 | |
| | Reinvestment of distributions | | | — | | | | — | |
| | Cost of shares redeemed | | | (180,517 | ) | | | (656,039 | ) |
| | Net increase (decrease) in net assets resulting from share transactions | | | 2,727,939 | | | | 3,592,032 | |
| | TOTAL INCREASE (DECREASE) | | | 2,463,151 | | | | 2,890,823 | |
| | | | | | | | | | |
| | Net assets: | | | | | | | | |
| | Beginning of period | | | 2,890,823 | | | | — | |
| | End of period | | $ | 5,353,974 | | | $ | 2,890,823 | |
| | Undistributed (distributions in excess of) net investment income (loss) | | $ | 81,568 | | | $ | 7,507 | |
| | (a) | | Statement of Changes in Net Assets for the India Equity Fund is consolidated and includes the balances of Goldman Sachs Mauritius India Equity Fund, Ltd. (wholly-owned subsidiary). Accordingly, all interfund balances and transactions have been eliminated. |
| | (b) | | Commenced operations on April 29, 2011. |
| | (c) | | Commenced operations on June 30, 2011. |
| | (d) | | Commenced operations on May 31, 2011. |
| | |
| 38 | | The accompanying notes are an integral part of these financial statements. |
GOLDMAN SACHS SINGLE COUNTRY FUNDS
| | | | | | | | | | | | | | | | | | | | | | | | | | | | | | | | | | |
| | China Equity Fund | | | | | India Equity(a) | | | | | Korea Equity | |
| | | For the
Six Months Ended
April 30, 2012
(Unaudited) | | | | | For the
Period Ended
October 31, 2011(b) | | | | | For the
Six Months Ended
April 30, 2012
(Unaudited) | | | | | For the
Period Ended
October 31, 2011(c) | | | | | For the
Six Months Ended
April 30, 2012
(Unaudited) | | | | | For the
Period Ended
October 31, 2011(d) | |
| | | | | | | | | | | | | | | | | | | | | | | | | | | | | | | | | | |
| | $ | (39,576 | ) | | | | $ | 40,108 | | | | | $ | (20,953 | ) | | | | $ | 2,123 | | | | | $ | 476 | | | | | $ | (14,455 | ) |
| | | (329,339 | ) | | | | | (463,681 | ) | | | | | (218,131 | ) | | | | | (120,147 | ) | | | | | (198,211 | ) | | | | | (144,230 | ) |
| | | | 714,664 | | | | | | (738,994 | ) | | | | | 597,849 | | | | | | (206,650 | ) | | | | | 235,452 | | | | | | (2,097 | ) |
| | | | 345,749 | | | | | | (1,162,567 | ) | | | | | 358,765 | | | | | | (324,674 | ) | | | | | 37,717 | | | | | | (160,782 | ) |
| | | | | | | | | | | | | | | | | | | | | | | | | | | | | | | | | | |
| | | | | | | | | | | | | | | | | | | | | | | | | | | | | | | | | | |
| | | | | | | | | | | | | | | | | | | | | | | | | | | | | | | | | | |
| | | (45 | ) | | | | | — | | | | | | — | | | | | | — | | | | | | — | | | | | | — | |
| | | (7 | ) | | | | | — | | | | | | — | | | | | | — | | | | | | — | | | | | | — | |
| | | (43,483 | ) | | | | | — | | | | | | — | | | | | | — | | | | | | — | | | | | | — | |
| | | (51 | ) | | | | | — | | | | | | — | | | | | | — | | | | | | — | | | | | | — | |
| | | | | | | | | | | | | | | | | | | | | | | | | | | | | | | | | | |
| | | — | | | | | | — | | | | | | — | | | | | | — | | | | | | (92 | ) | | | | | — | |
| | | — | | | | | | — | | | | | | — | | | | | | — | | | | | | (83 | ) | | | | | — | |
| | | — | | | | | | — | | | | | | — | | | | | | — | | | | | | (29,908 | ) | | | | | — | |
| | | | — | | | | | | — | | | | | | — | | | | | | — | | | | | | (128 | ) | | | | | — | |
| | | | (43,586 | ) | | | | | — | | | | | | — | | | | | | — | | | | | | (30,211 | ) | | | | | — | |
| | | | | | | | | | | | | | | | | | | | | | | | | | | | | | | | | | |
| | | | | | | | | | | | | | | | | | | | | | | | | | | | | | | | | | |
| | | 312,479 | | | | | | 6,970,976 | | | | | | 2,200,387 | | | | | | 4,304,299 | | | | | | 21,011 | | | | | | 3,822,581 | |
| | | 43,586 | | | | | | — | | | | | | — | | | | | | — | | | | | | 30,207 | | | | | | — | |
| | | | (558,675 | ) | | | | | (155,319 | ) | | | | | (445,395 | ) | | | | | (171,388 | ) | | | | | (109,494 | ) | | | | | (165,998 | ) |
| | | | (202,610 | ) | | | | | 6,815,657 | | | | | | 1,754,992 | | | | | | 4,132,911 | | | | | | (58,276 | ) | | | | | 3,656,583 | |
| | | | 99,553 | | | | | | 5,653,090 | | | | | | 2,113,757 | | | | | | 3,808,237 | | | | | | (50,770 | ) | | | | | 3,495,801 | |
| | | | | | | | | | | | | | | | | | | | | | | | | | | | | | | | | | |
| | | | | | | | | | | | | | | | | | | | | | | | | | | | | | | | | | |
| | | | 5,653,090 | | | | | | — | | | | | | 3,808,237 | | | | | | — | | | | | | 3,495,801 | | | | | | — | |
| | | $ | 5,752,643 | | | | | $ | 5,653,090 | | | | | $ | 5,921,994 | | | | | $ | 3,808,237 | | | | | $ | 3,445,031 | | | | | $ | 3,495,801 | |
| | | $ | (39,542 | ) | | | | $ | 43,620 | | | | | $ | (20,953 | ) | | | | $ | — | | | | | $ | 476 | | | | | $ | — | |
| | |
| The accompanying notes are an integral part of these financial statements. | | 39 |
GOLDMAN SACHS BRAZIL EQUITY FUND
Financial Highlights
Selected Data for a Share Outstanding Throughout Each Period
| | | | | | | | | | | | | | | | | | |
| | | | | | | | Income (loss) from
investment operations | |
| | | Year - Share Class | | Net asset
value,
beginning
of period | | | Net
investment
income (loss) | | | Net realized
and unrealized
loss | | | Total from
investment
operations | |
| | FOR THE SIX MONTHS ENDED APRIL 30, (UNAUDITED) | | | | | | | | | | | | | | | | |
| | 2012 - A | | $ | 7.71 | | | $ | 0.06 | | | $ | (0.57 | ) | | $ | (0.51 | ) |
| | 2012 - C | | | 7.68 | | | | 0.06 | | | | (0.60 | ) | | | (0.54 | ) |
| | 2012 - Institutional | | | 7.72 | | | | 0.09 | | | | (0.58 | ) | | | (0.49 | ) |
| | 2012 - IR | | | 7.72 | | | | 0.10 | | | | (0.60 | ) | | | (0.50 | ) |
| | | | | | | | | | | | | | | | | | |
| | FOR THE PERIOD ENDED OCTOBER 31, | | | | | | | | | | | | | | | | |
| | 2011 - A (Commenced April 29, 2011) | | | 10.00 | | | | 0.02 | (c) | | | (2.31 | ) | | | (2.29 | ) |
| | 2011 - C (Commenced April 29, 2011) | | | 10.00 | | | | (0.01 | )(c) | | | (2.31 | ) | | | (2.32 | ) |
| | 2011 - Institutional (Commenced April 29, 2011) | | | 10.00 | | | | 0.03 | (c) | | | (2.31 | ) | | | (2.28 | ) |
| | 2011 - IR (Commenced April 29, 2011) | | | 10.00 | | | | 0.03 | (c) | | | (2.31 | ) | | | (2.28 | ) |
| | (a) | | Assumes investment at the net asset value at the beginning of the period, reinvestment of all dividends and distributions, a complete redemption of the investment at the net asset value at the end of the period and no sales or redemption charges. Total returns would be reduced if a sales or redemption charge was taken into account. Returns do not reflect the deduction of taxes that a shareholder would pay on Fund distributions or the redemption of Fund shares. Total returns for periods less than one full year are not annualized. |
| | (c) | | Calculated based on the average shares outstanding methodology. |
| | |
| 40 | | The accompanying notes are an integral part of these financial statements. |
GOLDMAN SACHS BRAZIL EQUITY FUND
| | | | | | | | | | | | | | | | | | | | | | | | | | | | | | | | | | | | | | | | |
| | | | | | | | | | | | | | | | | | | | | | | | | | | | | | | | | | |
| | | Net asset
value, end
of period | | | | | Total
return(a) | | | | | Net assets,
end of
period
(in 000s) | | | | | Ratio of
net expenses
to average
net assets(b) | | | | | Ratio of
total expenses
to average
net assets(b) | | | | | Ratio of
net investment
income (loss) to average net assets(b) | | | | | Portfolio
turnover
rate | |
| | | | | | | | | | | | | | | | | | | | | | | | | | | | | | | | | | | | | | | | |
| | $ | 7.20 | | | | | | (6.74 | )% | | | | $ | 122 | | | | | | 1.90 | % | | | | | 8.40 | % | | | | | 3.37 | % | | | | | 85 | % |
| | | 7.14 | | | | | | (7.15 | ) | | | | | 16 | | | | | | 2.65 | | | | | | 9.15 | | | | | | 1.67 | | | | | | 85 | |
| | | 7.23 | | | | | | (6.59 | ) | | | | | 5,209 | | | | | | 1.50 | | | | | | 8.00 | | | | | | 2.80 | | | | | | 85 | |
| | | 7.22 | | | | | | (6.60 | ) | | | | | 7 | | | | | | 1.65 | | | | | | 8.15 | | | | | | 2.65 | | | | | | 85 | |
| | | | | | | | | | | | | | | | | | | | | | | | | | | | | | | | | | | | | | | | |
| | | | | | | | | | | | | | | | | | | | | | | | | | | | | | | | | | | | | | | | |
| | | 7.71 | | | | | | (22.80 | ) | | | | | 9 | | | | | | 1.90 | | | | | | 19.75 | | | | | | 0.39 | | | | | | 105 | |
| | | 7.68 | | | | | | (23.10 | ) | | | | | 8 | | | | | | 2.65 | | | | | | 20.50 | | | | | | (0.34 | ) | | | | | 105 | |
| | | 7.72 | | | | | | (22.60 | ) | | | | | 2,867 | | | | | | 1.50 | | | | | | 19.35 | | | | | | 0.71 | | | | | | 105 | |
| | | 7.72 | | | | | | (22.70 | ) | | | | | 8 | | | | | | 1.65 | | | | | | 19.50 | | | | | | 0.68 | | | | | | 105 | |
| | |
| The accompanying notes are an integral part of these financial statements. | | 41 |
GOLDMAN SACHS CHINA EQUITY FUND
Financial Highlights
Selected Data for a Share Outstanding Throughout Each Period
| | | | | | | | | | | | | | | | | | | | | | |
| | | | | | | | Income (loss) from
investment operations | | | | |
| | | Year - Share Class | | Net asset
value,
beginning
of period | | | Net
investment
income (loss)(a) | | | Net realized
and unrealized
gain (loss) | | | Total from
investment
operations | | | Distributions to shareholders
from net
investment
income | |
| | FOR THE SIX MONTHS ENDED APRIL 30, (UNAUDITED) | | | | | | | | | | | | | |
| | 2012 - A | | $ | 7.76 | | | $ | (0.07 | ) | | $ | 0.52 | | | $ | 0.45 | | | $ | (0.04 | ) |
| | 2012 - C | | | 7.73 | | | | (0.10 | ) | | | 0.53 | | | | 0.43 | | | | (0.01 | ) |
| | 2012 - Institutional | | | 7.78 | | | | (0.05 | ) | | | 0.52 | | | | 0.47 | | | | (0.06 | ) |
| | 2012 - IR | | | 7.77 | | | | (0.06 | ) | | | 0.52 | | | | 0.46 | | | | (0.05 | ) |
| | | | | | | | | | | | | | | | | | | | | | |
| | FOR THE PERIOD ENDED OCTOBER 31, | | | | | | | | | | | | | | | | | | | | |
| | 2011 - A (Commenced April 29, 2011) | | | 10.00 | | | | 0.09 | | | | (2.33 | ) | | | (2.24 | ) | | | — | |
| | 2011 - C (Commenced April 29, 2011) | | | 10.00 | | | | 0.06 | | | | (2.33 | ) | | | (2.27 | ) | | | — | |
| | 2011 - Institutional (Commenced April 29, 2011) | | | 10.00 | | | | 0.07 | | | | (2.29 | ) | | | (2.22 | ) | | | — | |
| | 2011 - IR (Commenced April 29, 2011) | | | 10.00 | | | | 0.10 | | | | (2.33 | ) | | | (2.23 | ) | | | — | |
| | (a) | | Calculated based on the average shares outstanding methodology. |
| | (b) | | Assumes investment at the net asset value at the beginning of the period, reinvestment of all dividends and distributions, a complete redemption of the investment at the net asset value at the end of the period and no sales or redemption charges. Total returns would be reduced if a sales or redemption charge was taken into account. Returns do not reflect the deduction of taxes that a shareholder would pay on Fund distributions or the redemption of Fund shares. Total returns for periods less than one full year are not annualized. |
| | |
| 42 | | The accompanying notes are an integral part of these financial statements. |
GOLDMAN SACHS CHINA EQUITY FUND
| | | | | | | | | | | | | | | | | | | | | | | | | | | | | | | | | | | | | | | | |
| | | | | | | | | | | | | | | | | | | | | | | | | | | | | | | | | | |
| | | Net asset
value, end
of period | | | | | Total
return(b) | | | | | Net assets,
end of
period
(in 000s) | | | | | Ratio of
net expenses
to average
net assets(c) | | | | | Ratio of
total expenses
to average
net assets(c) | | | | | Ratio of
net investment
income (loss)
to average
net assets(c) | | | | | Portfolio
turnover
rate | |
| | | | | | | | | | | | | | | | | | | | | | | | | | | | | | | | | | | | | | | | |
| | $ | 8.17 | | | | | | 5.87 | % | | | | $ | 19 | | | | | | 1.90 | % | | | | | 7.39 | % | | | | | (1.78 | )% | | | | | 21 | % |
| | | 8.15 | | | | | | 5.54 | | | | | | 14 | | | | | | 2.65 | | | | | | 8.14 | | | | | | (2.56 | ) | | | | | 21 | |
| | | 8.19 | | | | | | 6.10 | | | | | | 5,711 | | | | | | 1.50 | | | | | | 6.99 | | | | | | (1.38 | ) | | | | | 21 | |
| | | 8.18 | | | | | | 6.01 | | | | | | 8 | | | | | | 1.65 | | | | | | 7.14 | | | | | | (1.52 | ) | | | | | 21 | |
| | | | | | | | | | | | | | | | | | | | | | | | | | | | | | | | | | | | | | | | |
| | | | | | | | | | | | | | | | | | | | | | | | | | | | | | | | | | | | | | | | |
| | | 7.76 | | | | | | (22.40 | ) | | | | | 9 | | | | | | 1.90 | | | | | | 10.09 | | | | | | 2.10 | | | | | | 37 | |
| | | 7.73 | | | | | | (22.70 | ) | | | | | 8 | | | | | | 2.65 | | | | | | 10.84 | | | | | | 1.36 | | | | | | 37 | |
| | | 7.78 | | | | | | (22.20 | ) | | | | | 5,629 | | | | | | 1.50 | | | | | | 9.69 | | | | | | 1.69 | | | | | | 37 | |
| | | 7.77 | | | | | | (22.30 | ) | | | | | 8 | | | | | | 1.65 | | | | | | 9.84 | | | | | | 2.37 | | | | | | 37 | |
| | |
| The accompanying notes are an integral part of these financial statements. | | 43 |
GOLDMAN SACHS INDIA EQUITY FUND
Financial Highlights
Selected Data for a Share Outstanding Throughout Each Period
| | | | | | | | | | | | | | | | | | |
| | | | | | | | Income (loss) from
investment operations | |
| | | Year - Share Class | | Net asset
value,
beginning
of period | | | Net
investment
income (loss)(a) | | | Net realized
and unrealized
loss | | | Total from
investment
operations | |
| | FOR THE SIX MONTHS ENDED APRIL 30, (UNAUDITED) | | | | | | | | | | | | | | | | |
| | 2012 - A | | $ | 8.69 | | | $ | (0.05 | ) | | $ | (0.03 | ) | | $ | (0.08 | ) |
| | 2012 - C | | | 8.67 | | | | (0.08 | ) | | | (0.03 | ) | | | (0.11 | ) |
| | 2012 - Institutional | | | 8.71 | | | | (0.04 | ) | | | (0.03 | ) | | | (0.07 | ) |
| | 2012 - IR | | | 8.70 | | | | (0.04 | ) | | | (0.03 | ) | | | (0.07 | ) |
| | | | | | | | | | | | | | | | | | |
| | FOR THE PERIOD ENDED OCTOBER 31, | | | | | | | | | | | | | | | | |
| | 2011 - A (Commenced June 30, 2011) | | | 10.00 | | | | — | (d) | | | (1.31 | ) | | | (1.31 | ) |
| | 2011 - C (Commenced June 30, 2011) | | | 10.00 | | | | (0.03 | ) | | | (1.30 | ) | | | (1.33 | ) |
| | 2011 - Institutional (Commenced June 30, 2011) | | | 10.00 | | | | 0.01 | | | | (1.30 | ) | | | (1.29 | ) |
| | 2011 - IR (Commenced June 30, 2011) | | | 10.00 | | | | — | (d) | | | (1.30 | ) | | | (1.30 | ) |
| | (a) | | Calculated based on the average shares outstanding methodology. |
| | (b) | | Assumes investment at the net asset value at the beginning of the period, reinvestment of all dividends and distributions, a complete redemption of the investment at the net asset value at the end of the period and no sales or redemption charges. Total returns would be reduced if a sales or redemption charge was taken into account. Returns do not reflect the deduction of taxes that a shareholder would pay on Fund distributions or the redemption of Fund shares. Total returns for periods less than one full year are not annualized. |
| | (d) | | Amount is less than $0.005 per share. |
| | |
| 44 | | The accompanying notes are an integral part of these financial statements. |
GOLDMAN SACHS INDIA EQUITY FUND
| | | | | | | | | | | | | | | | | | | | | | | | | | | | | | | | | | | | | | | | |
| | | | | | | | | | | | | | | | | | | | | | | | | | | | | | | | | | |
| | | Net asset
value, end
of period | | | | | Total
return(b) | | | | | Net assets,
end of
period
(in 000s) | | | | | Ratio of
net expenses
to average
net assets(c) | | | | | Ratio of
total expenses
to average
net assets(c) | | | | | Ratio of
net investment
income (loss)
to average
net assets(c) | | | | | Portfolio
turnover
rate | |
| | | | | | | | | | | | | | | | | | | | | | | | | | | | | | | | | | | | | | | | |
| | $ | 8.61 | | | | | | (1.26 | )% | | | | $ | 157 | | | | | | 1.90 | % | | | | | 12.09 | % | | | | | (1.29 | )% | | | | | 42 | % |
| | | 8.56 | | | | | | (1.61 | ) | | | | | 22 | | | | | | 2.65 | | | | | | 12.84 | | | | | | (2.02 | ) | | | | | 42 | |
| | | 8.64 | | | | | | (1.14 | ) | | | | | 5,734 | | | | | | 1.50 | | | | | | 11.69 | | | | | | (0.85 | ) | | | | | 42 | |
| | | 8.63 | | | | | | (1.15 | ) | | | | | 9 | | | | | | 1.65 | | | | | | 11.84 | | | | | | (0.97 | ) | | | | | 42 | |
| | | | | | | | | | | | | | | | | | | | | | | | | | | | | | | | | | | | | | | | |
| | | | | | | | | | | | | | | | | | | | | | | | | | | | | | | | | | | | | | | | |
| | | 8.69 | | | | | | (12.80 | ) | | | | | 9 | | | | | | 1.90 | | | | | | 31.83 | | | | | | (0.12 | ) | | | | | 18 | |
| | | 8.67 | | | | | | (13.00 | ) | | | | | 9 | | | | | | 2.65 | | | | | | 32.58 | | | | | | (0.88 | ) | | | | | 18 | |
| | | 8.71 | | | | | | (12.60 | ) | | | | | 3,782 | | | | | | 1.50 | | | | | | 31.43 | | | | | | 0.27 | | | | | | 18 | |
| | | 8.70 | | | | | | (12.70 | ) | | | | | 9 | | | | | | 1.65 | | | | | | 31.58 | | | | | | 0.16 | | | | | | 18 | |
| | |
| The accompanying notes are an integral part of these financial statements. | | 45 |
GOLDMAN SACHS KOREA EQUITY FUND
Financial Highlights
Selected Data for a Share Outstanding Throughout Each Period
| | | | | | | | | | | | | | | | | | | | | | |
| | | | | | | | Income (loss) from
investment operations | | | | |
| | | Year - Share Class | | Net asset
value,
beginning
of period | | | Net
investment
income (loss)(a) | | | Net realized
and unrealized
gain (loss) | | | Total from
investment
operations | | | Distributions to shareholders
from net
realized
gains | |
| | FOR THE SIX MONTHS ENDED APRIL 30, (UNAUDITED) | | | | | | | | | | | | | |
| | 2012 - A | | $ | 9.61 | | | $ | (0.02 | ) | | $ | 0.12 | | | $ | 0.10 | | | $ | (0.08 | ) |
| | 2012 - C | | | 9.58 | | | | (0.05 | ) | | | 0.11 | | | | 0.06 | | | | (0.08 | ) |
| | 2012 - Institutional | | | 9.62 | | | | — | (d) | | | 0.12 | | | | 0.12 | | | | (0.08 | ) |
| | 2012 - IR | | | 9.62 | | | | 0.01 | | | | 0.10 | | | | 0.11 | | | | (0.08 | ) |
| | | | | | | | | | | | | | | | | | | | | | |
| | FOR THE PERIOD ENDED OCTOBER 31, | | | | | | | | | | | | | | | | | | | | |
| | 2011 - A (Commenced May 31, 2011) | | | 10.00 | | | | (0.07 | ) | | | (0.32 | ) | | | (0.39 | ) | | | — | |
| | 2011 - C (Commenced May 31, 2011) | | | 10.00 | | | | (0.10 | ) | | | (0.32 | ) | | | (0.42 | ) | | | — | |
| | 2011 - Institutional (Commenced May 31, 2011) | | | 10.00 | | | | (0.06 | ) | | | (0.32 | ) | | | (0.38 | ) | | | — | |
| | 2011 - IR (Commenced May 31, 2011) | | | 10.00 | | | | (0.06 | ) | | | (0.32 | ) | | | (0.38 | ) | | | — | |
| | (a) | | Calculated based on the average shares outstanding methodology. |
| | (b) | | Assumes investment at the net asset value at the beginning of the period, reinvestment of all dividends and distributions, a complete redemption of the investment at the net asset value at the end of the period and no sales or redemption charges. Total returns would be reduced if a sales or redemption charge was taken into account. Returns do not reflect the deduction of taxes that a shareholder would pay on Fund distributions or the redemption of Fund shares. Total returns for periods less than one full year are not annualized. |
| | (d) | | Amount is less than $0.005 per share. |
| | |
| 46 | | The accompanying notes are an integral part of these financial statements. |
GOLDMAN SACHS KOREA EQUITY FUND
| | | | | | | | | | | | | | | | | | | | | | | | | | | | | | | | | | | | | | | | |
| | | | | | | | | | | | | | | | | | | | | | | | | | | | | | | | | | |
| | | Net asset
value, end
of period | | | | | Total
return(b) | | | | | Net assets,
end of
period
(in 000s) | | | | | Ratio of
net expenses
to average
net assets(c) | | | | | Ratio of
total expenses
to average
net assets(c) | | | | | Ratio of
net investment
income (loss)
to average
net assets(c) | | | | | Portfolio
turnover
rate | |
| | | | | | | | | | | | | | | | | | | | | | | | | | | | | | | | | | | | | | | | |
| | $ | 9.63 | | | | | | 1.02 | % | | | | $ | 11 | | | | | | 1.90 | % | | | | | 12.98 | % | | | | | (0.36 | )% | | | | | 86 | % |
| | | 9.56 | | | | | | 0.60 | | | | | | 10 | | | | | | 2.65 | | | | | | 13.73 | | | | | | (1.10 | ) | | | | | 86 | |
| | | 9.66 | | | | | | 1.22 | | | | | | 3,415 | | | | | | 1.50 | | | | | | 12.58 | | | | | | 0.03 | | | | | | 86 | |
| | | 9.65 | | | | | | 1.12 | | | | | | 10 | | | | | | 1.65 | | | | | | 12.73 | | | | | | 0.18 | | | | | | 86 | |
| | | | | | | | | | | | | | | | | | | | | | | | | | | | | | | | | | | | | | | | |
| | | | | | | | | | | | | | | | | | | | | | | | | | | | | | | | | | | | | | | | |
| | | 9.61 | | | | | | (3.80 | ) | | | | | 11 | | | | | | 1.90 | | | | | | 25.48 | | | | | | (1.82 | ) | | | | | 121 | |
| | | 9.58 | | | | | | (4.10 | ) | | | | | 10 | | | | | | 2.65 | | | | | | 26.23 | | | | | | (2.57 | ) | | | | | 121 | |
| | | 9.62 | | | | | | (3.70 | ) | | | | | 3,466 | | | | | | 1.50 | | | | | | 25.08 | | | | | | (1.43 | ) | | | | | 121 | |
| | | 9.62 | | | | | | (3.70 | ) | | | | | 10 | | | | | | 1.65 | | | | | | 25.23 | | | | | | (1.57 | ) | | | | | 121 | |
| | |
| The accompanying notes are an integral part of these financial statements. | | 47 |
GOLDMAN SACHS SINGLE COUNTRY FUNDS
Notes to Financial Statements
April 30, 2012 (Unaudited)
Goldman Sachs Trust (the “Trust”) is a Delaware statutory trust registered under the Investment Company Act of 1940, as amended (“the Act”), as an open-end management investment company. The following table lists those series of the Trust that are included in this report (collectively, the “Funds” or individually a “Fund”), along with their corresponding share classes and respective diversification status under the Act:
| | | | |
| Fund | | Share Classes Offered | | Diversified/
Non-diversified |
All Funds | | A, C, Institutional and IR | | Non-diversified |
Class A Shares are sold with a front-end sales charge of up to 5.50%. Class C Shares are sold with a contingent deferred sales charge (“CDSC”) of 1.00%, which is imposed on redemptions made within 12 months of purchase. Institutional and Class IR Shares are not subject to a sales charge.
Goldman Sachs Asset Management International (“GSAMI”), an affiliate of Goldman, Sachs & Co. (“Goldman Sachs”), serves as investment adviser to the Funds pursuant to a management agreement (the “Agreement”) with the Trust.
| | |
| 2. SIGNIFICANT ACCOUNTING POLICIES | | |
The preparation of financial statements in conformity with accounting principles generally accepted in the United States of America (“GAAP”) requires management to make estimates and assumptions that may affect the amounts and disclosures in the financial statements. Actual results could differ from those estimates and assumptions.
A. Basis for consolidation for the India Equity Fund — Goldman Sachs Mauritius India Equity Fund, Ltd. (the “Subsidiary”), organized in the Republic of Mauritius, was incorporated on March 21, 2011, and is currently a wholly-owned subsidiary of the India Equity Fund. The Subsidiary commenced operations on June 30, 2011. The Subsidiary was formed primarily to gain exposure to a wide selection of Indian companies. The Subsidiary is registered with and regulated by the Mauritius Financial Services Commission. The Subsidiary is advised by GSAMI and has the same investment objective and strategies as the Fund. The Subsidiary has appointed Intercontinental Trust Limited (“the Main Administrator”) to act as Administrator to the Subsidiary. The administration function has been sub-delegated to State Street Bank (“the Administrator’s Agent”). All inter-fund balances and transactions have been eliminated in consolidation. As of April 30, 2012, the Fund owned 100% of the outstanding shares of the Subsidiary and has elected to treat the Subsidiary as a disregarded entity for United States Federal income tax purposes.
B. Investment Valuation — The Funds’ valuation policy is to value investments at fair value.
Equity securities and investment companies traded on a United States (“U.S.”) securities exchange or the NASDAQ system, or those located on certain foreign exchanges including, but not limited to the Americas, are valued daily at their last sale price or official closing price on the principal exchange or system on which they are traded. If no sale occurs, such securities and investment companies are valued at the last bid price for long positions and at the last ask price for short positions. Unlisted equity securities for which market quotations are available are valued at the last sale price on the valuation date, or if no sale occurs, at the last bid price. Such securities traded on certain foreign securities exchanges are valued daily at fair value determined by an independent fair value service (if available) under valuation procedures approved by the trustees and consistent with applicable regulatory guidance. The independent fair value service takes into account multiple factors including, but not limited to, movements in the U.S. securities markets, certain depositary receipts, futures contracts and foreign currency exchange rates that
48
GOLDMAN SACHS SINGLE COUNTRY FUNDS
|
| 2. SIGNIFICANT ACCOUNTING POLICIES (continued) |
have occurred subsequent to the close of the foreign securities exchanges. Investments in investment companies (other than those that are exchange traded) are valued at the net asset value per share (“NAV”) of the investment company on the valuation date.
Debt securities for which market quotations are readily available are valued on the basis of quotations supplied by dealers or furnished by an independent pricing service approved by the trustees. The pricing services may use valuation models or matrix pricing, which consider: (i) yield or price with respect to bonds that are considered comparable in characteristics such as rating, interest rate and maturity date or (ii) quotations from securities dealers to determine current value. Short-term debt obligations that mature in sixty days or less and that do not exhibit signs of credit deterioration are valued at amortized cost, which approximates fair value.
If quotations are not readily available, or if GSAMI believes that such quotations do not accurately reflect fair value, the fair value of the Funds’ investments may be determined under valuation procedures approved by the trustees. GSAMI, consistent with its procedures and applicable regulatory guidance, may make an adjustment to the most recent valuation prices of either domestic or foreign securities in light of significant events to reflect what they believe to be the fair value of the securities at the time of determining a Fund’s NAV. Significant events which could affect a large number of securities in a particular market may include, but are not limited to significant fluctuations in U.S. or foreign markets; market dislocations; market disruptions or unscheduled market closings. Significant events, which could also affect a single issuer, may include, but are not limited to corporate actions such as reorganizations, mergers and buy-outs; ratings downgrades and bankruptcies.
C. Investment Income and Investments — Investment income is comprised of interest income and dividend income, and is recorded net of any foreign withholding taxes, less any amounts reclaimable. Interest income is accrued daily and adjusted for amortization of premiums and accretion of discounts. Dividend income is recognized on ex-dividend date or, for certain foreign securities, as soon as such information is obtained subsequent to the ex-dividend date. Investment transactions are reflected on trade date with realized gains and losses on sales calculated using identified cost. Investment transactions are recorded on the following business day for daily NAV calculations. Any foreign capital gains tax is accrued daily based upon net unrealized gains, and is payable upon sale of such investments.
D. Class Allocations and Expenses — Investment income, realized and unrealized gain (loss), and non-class specific expenses of each Fund are allocated daily based upon the proportion of net assets of each class. Class specific expenses, where applicable, are borne by the respective share classes and include Distribution and Service, and Transfer Agent fees. Non-class specific expenses directly incurred by a Fund are charged to that Fund, while such expenses incurred by the Trust are allocated across the respective Funds on a straight-line and/or pro-rata basis depending upon the nature of the expenses.
E. Offering Costs — Offering costs paid in connection with the offering of shares of the Funds are being amortized on a straight-line basis over 12 months from the date of commencement of operations.
F. Federal Taxes and Distributions to Shareholders — It is each Fund’s policy to comply with the requirements of the Internal Revenue Code of 1986, as amended (the “Code”), applicable to regulated investment companies (mutual funds) and to distribute each year substantially all of its investment company taxable income and capital gains to its shareholders. Accordingly, the Funds are not required to make any provisions for the payment of federal income tax. Distributions to shareholders are recorded on the ex-dividend date. Income and capital gains distributions, if any, are declared and paid annually.
Net capital losses are carried forward to future fiscal years and may be used to the extent allowed by the Code to offset any future capital gains. Utilization of capital loss carryforwards will reduce the requirement of future capital gains distributions.
49
GOLDMAN SACHS SINGLE COUNTRY FUNDS
Notes to Financial Statements (continued)
April 30, 2012 (Unaudited)
|
| 2. SIGNIFICANT ACCOUNTING POLICIES (continued) |
The characterization of distributions to shareholders for financial reporting purposes is determined in accordance with federal income tax rules, which may differ from GAAP. The source of each Fund’s distributions may be shown in the accompanying financial statements as either from net investment income, net realized gain or capital. Certain components of the Funds’ net assets on the Statements of Assets and Liabilities reflect permanent GAAP/tax differences based on the appropriate tax character.
G. Foreign Currency Translation — The accounting records and reporting currency of the Funds are maintained in U.S. dollars. Investments and other assets and liabilities denominated in foreign currencies are translated into U.S. dollars using the current exchange rates at the close of each business day. The effect of changes in foreign currency exchange rates on investments is included within net realized and unrealized gain (loss) on investments. Changes in the value of other assets and liabilities as a result of fluctuations in foreign exchange rates are included in the Statements of Operations within unrealized gain (loss) on foreign currency translations. Transactions denominated in foreign currencies are translated into U.S. dollars on the date the transaction occurred, the effects of which are included within realized gain (loss) on foreign currency transactions.
H. Forward Foreign Currency Exchange Contracts — All forward foreign currency exchange contracts are marked to market daily at the applicable forward rate. Unrealized gains or losses on forward foreign currency exchange contracts are recorded by the Funds on a daily basis, and realized gains or losses are recorded on the settlement date of a contract.
Risks may arise upon entering into these contracts from the potential inability of counterparties to meet the terms of their contracts and from unanticipated movements in the value of a foreign currency relative to the U.S. dollar.
The contractual amounts of forward foreign currency exchange contracts do not necessarily represent the amounts potentially subject to risk, and the overall risk at the portfolio level may be mitigated by any applicable related and offsetting transactions. The Funds must set aside liquid assets, or engage in other appropriate measures to cover their obligations under these contracts.
I. Futures Contracts — Futures contracts are valued at the last settlement price, or in the absence of a sale, the last bid price for long positions and at the last ask price for short positions, at the end of each day on the board of trade or exchange upon which they are traded. Upon entering into a futures contract, the Funds deposit cash or securities in an account on behalf of the broker in an amount sufficient to meet the initial margin requirement. Subsequent payments are made or received by the Funds equal to the daily change in the contract value and are recorded as variation margin receivable or payable with a corresponding offset in unrealized gains or losses. The Funds recognize a realized gain or loss when a contract is closed or expires.
The use of futures contracts involves, to varying degrees, elements of market and counterparty risk which may exceed the amounts recognized in the Statements of Assets and Liabilities. Futures contracts may be illiquid, and exchanges may limit fluctuations in futures contract prices during a single day. Changes in the value of a futures contract may not directly correlate with changes in the value of the underlying securities. These risks may decrease the effectiveness of the Funds’ strategies and potentially result in a loss. The Funds must set aside liquid assets, or engage in other appropriate measures to cover their obligations under these contracts.
J. Repurchase Agreements — The Funds may enter into repurchase agreements which involve the purchase of securities subject to the seller’s agreement to repurchase the securities at a mutually agreed upon date and price. During the term of a repurchase agreement, the value of the underlying securities held as collateral on behalf of the Funds, including accrued interest, is required to exceed the value of the repurchase agreement, including accrued interest. If the seller defaults or becomes insolvent, realization of the collateral by the Funds may be delayed or limited and there may be a decline in the value of the collateral during the period while the Funds seek to assert their rights. The underlying securities for all repurchase agreements are held at the Funds’ custodian or designated sub-custodians under tri-party repurchase agreements.
50
GOLDMAN SACHS SINGLE COUNTRY FUNDS
|
| 2. SIGNIFICANT ACCOUNTING POLICIES (continued) |
Pursuant to exemptive relief granted by the Securities and Exchange Commission (“SEC”) and terms and conditions contained therein, the Funds, together with other registered investment companies having management agreements with GSAM, or its affiliates, may transfer uninvested cash into joint accounts, the daily aggregate balance of which is invested in one or more repurchase agreements. Under these joint accounts, the Funds maintain pro rata credit exposure to the underlying repurchase agreements’ counterparties. With the exception of certain transaction fees, the Funds are not subject to any expenses in relation to these investments.
|
| 3. FAIR VALUE OF INVESTMENTS |
The fair value of a financial instrument is the amount that would be received to sell an asset or paid to transfer a liability in an orderly transaction between market participants at the measurement date (i.e., the exit price). GAAP establishes a fair value hierarchy that prioritizes the inputs to valuation techniques used to measure fair value. The hierarchy gives the highest priority to unadjusted quoted prices in active markets for identical assets or liabilities (Level 1 measurements) and the lowest priority to unobservable inputs (Level 3 measurements). The three levels of the fair value hierarchy are described below:
Level 1 — Unadjusted quoted prices in active markets that are accessible at the measurement date for identical, unrestricted assets or liabilities;
Level 2 — Quoted prices in markets that are not active or financial instruments for which significant inputs are observable (including, but not limited to, quoted prices for similar investments, interest rates, foreign exchange rates, volatility and credit spreads), either directly or indirectly;
Level 3 — Prices or valuations that require significant unobservable inputs (including GSAMI’s assumptions in determining fair value measurement).
The levels used for classifying investments are not necessarily an indication of the risk associated with investing in those investments.
The following is a summary of the Funds’ investments and derivatives categorized in the fair value hierarchy as of April 30, 2012:
| | | | | | | | | | | | |
|
| BRAZIL EQUITY | |
| | | |
| Investment Type | | Level 1 | | | Level 2 | | | Level 3 | |
| Assets | | | | | | | | | | | | |
Common Stock and/or Other Equity Investments | | $ | 3,406,280 | | | $ | 1,897,451 | | | $ | — | |
| | | |
| CHINA EQUITY | | | | | | | | | | | | |
| | | |
| Investment Type | | Level 1 | | | Level 2 | | | Level 3 | |
| Assets | | | | | | | | | | | | |
Common Stock and/or Other Equity Investments | | $ | 103,557 | | | $ | 5,629,248 | (a) | | $ | — | |
51
GOLDMAN SACHS SINGLE COUNTRY FUNDS
Notes to Financial Statements (continued)
April 30, 2012 (Unaudited)
|
| 3. FAIR VALUE OF INVESTMENTS (continued) |
| | | | | | | | | | | | |
| | | |
| INDIA EQUITY | | | | | | | | | | | | |
| | | |
| Investment Type | | Level 1 | | | Level 2 | | | Level 3 | |
| Assets | | | | | | | | | | | | |
Common Stock and/or Other Equity Investments | | $ | 449,495 | | | $ | 5,185,196 | (a) | | $ | — | |
| | | |
| Derivative Type | | | | | | | | | |
| Assets(b) | | | | | | | | | | | | |
Futures Contracts | | $ | 1,786 | | | $ | — | | | $ | — | |
|
| KOREA EQUITY | |
| | | |
| Investment Type | | Level 1 | | | Level 2 | | | Level 3 | |
| Assets | | | | | | | | | | | | |
Common Stock and/or Other Equity Investments | | $ | 50,438 | | | $ | 3,338,050 | (a) | | $ | — | |
| (a) | | To adjust for the time difference between local market close and the calculation of net asset value, the Funds utilize fair value model prices for international equities provided by an independent fair value service resulting in a Level 2 classification. |
| (b) | | Amount shown represents unrealized gain (loss) at period end. |
|
| 4. INVESTMENTS IN DERIVATIVES |
The Funds may make investments in derivative instruments, including, but not limited to options, futures, swaps, swaptions and other derivatives relating to foreign currency transactions. A derivative is an instrument whose value is derived from underlying assets, indices, reference rates or a combination of these factors. Derivative instruments may be privately negotiated contracts (often referred to as over the counter (“OTC”) derivatives) or they may be listed and traded on an exchange. Derivative contracts may involve future commitments to purchase or sell financial instruments or commodities at specified terms on a specified date, or to exchange interest payment streams or currencies based on a notional or contractual amount. Derivative instruments may involve a high degree of financial risk. The use of derivatives also involves the risk of loss if the investment adviser is incorrect in its expectation of the timing or level of fluctuations in securities prices, interest rates or currency prices. Investments in derivative instruments also include the risk of default by the counterparty, the risk that the investment may not be liquid and/or the risk that a small movement in the price of the underlying security or benchmark may result in a disproportionately large movement, unfavorable or favorable, in the price of the derivative instrument.
52
GOLDMAN SACHS SINGLE COUNTRY FUNDS
|
| 4. INVESTMENTS IN DERIVATIVES (continued) |
During the six months ended April 30, 2012, the below Fund entered into certain derivative contract types. These instruments were used to meet the Fund’s investment objectives and to obtain and/or manage exposure related to the risks below. The following table sets forth, by certain risk types, the gross value of these derivative contracts for trading activities as of April 30, 2012. The values in the table below exclude the effects of cash collateral received or posted pursuant to these derivative contracts, and therefore are not representative of the Fund’s net exposure.
| | | | | | | | |
|
| India Equity Fund |
| Risk | | Statement of Assets and Liabilities | | Assets |
Equity | | Unrealized gain on futures variation margin | | $1,786 (a) |
| (a) | | Includes unrealized gain (loss) on futures contracts described in the Additional Investment Information sections of the Schedules of Investments. Only current day’s variation margin is reported within the Statement of Assets and Liabilities. |
The following tables set forth, by certain risk types, the Funds’ gains (losses) related to these derivatives and their indicative volumes for the period ended April 30, 2012. These gains (losses) should be considered in the context that these derivative contracts may have been executed to economically hedge certain investments, and accordingly, certain gains (losses) on such derivative contracts may offset certain (losses) gains attributable to investments. These gains (losses) are included in “Net realized gain (loss)” or “Net change in unrealized gain (loss)” on the Statement of Operations:
| | | | | | | | | | | | | | |
| Brazil Equity Fund | |
| Risk | | Statement of Operations | | Net
Realized
Gain (Loss) | | | Net Change in
Unrealized
Gain (Loss) | | | Average
Number of
Contracts(a) | |
| Currency | | Net realized gain (loss) from forward foreign currency exchange contracts/Net change in unrealized gain (loss) on forward foreign currency exchange contracts | | $ | (20,737 | ) | | $ | 8,648 | | | | 1 | |
| |
| India Equity Fund | |
| Risk | | Statement of Operations | | Net
Realized
Gain (Loss) | | | Net Change in
Unrealized
Gain (Loss) | | | Average
Number of
Contracts(a) | |
| Equity | | Net realized gain (loss) from futures contracts/Net change in unrealized gain (loss) on futures contracts | | $ | 12,509 | | | $ | (3,927 | ) | | | 18 | |
| (a) | | Average number of contracts is based on the average of month end balances for the six months ended April 30, 2012. |
53
GOLDMAN SACHS SINGLE COUNTRY FUNDS
Notes to Financial Statements (continued)
April 30, 2012 (Unaudited)
|
| 5. AGREEMENTS AND AFFILIATED TRANSACTIONS |
A. Management Agreement — Under the Agreement, GSAMI manages the Funds, subject to the general supervision of the trustees.
As compensation for the services rendered pursuant to the Agreement, the assumption of the expenses related thereto and administration of the Funds’ business affairs, including providing facilities, GSAMI is entitled to a management fee accrued daily and paid monthly, equal to an annual percentage rate of each Fund’s average daily net assets.
For the six months ended April 30, 2012, contractual and effective management fees with GSAMI were at the following rates:
| | | | | | | | | | | | | | | | | | | | | | | | |
| | | Contractual Management Rate | |
| Fund | | First
$1 billion | | | Next
$1 billion | | | Next
$3 billion | | | Next
$3 billion | | | Over
$8 billion | | | Effective
Rate | |
Brazil Equity | | | 1.10 | % | | | 0.99 | % | | | 0.94 | % | | | 0.92 | % | | | 0.90 | % | | | 1.10 | % |
China Equity | | | 1.10 | | | | 0.99 | | | | 0.94 | | | | 0.92 | | | | 0.90 | | | | 1.10 | |
India Equity | | | 1.10 | | | | 0.99 | | | | 0.94 | | | | 0.92 | | | | 0.90 | | | | 1.10 | |
Korea Equity | | | 1.10 | | | | 0.99 | | | | 0.94 | | | | 0.92 | | | | 0.90 | | | | 1.10 | |
B. Distribution and Service Plans — The Trust, on behalf of each Fund, has adopted Distribution and Service Plans (the “Plans”). Under the Plans, Goldman Sachs, which serves as distributor (the “Distributor”), is entitled to a fee, accrued daily and paid monthly for distribution services and personal and account maintenance services, which may then be paid by Goldman Sachs to authorized dealers, at the following annual rates calculated on a Fund’s average daily net assets of each respective share class:
| | | | | | | | |
| | | Distribution and Service Plan Rates | |
| | | Class A* | | | Class C | |
Distribution Plan | | | 0.25 | % | | | 0.75 | % |
Service Plan | | | — | | | | 0.25 | |
| * | | With respect to Class A Shares, the Distributor at its discretion may use compensation for distribution services paid under the Distribution Plan to compensate service organizations for personal and account maintenance services and expenses as long as such total compensation does not exceed the maximum cap on “service fees” imposed by the Financial Industry Regulatory Authority. |
54
GOLDMAN SACHS SINGLE COUNTRY FUNDS
|
| 5. AGREEMENTS AND AFFILIATED TRANSACTIONS (continued) |
C. Distribution Agreement — Goldman Sachs, as Distributor of the shares of the Funds pursuant to a Distribution Agreement, may retain a portion of the Class A front end sales charge and Class C CDSC. For the period ended April 30, 2012, Goldman Sachs advised that it retained the following approximate amounts:
| | | | | | |
| | | | | Front End
Sales Charge | |
| Fund | | | | Class A | |
Brazil Equity | | | | $ | 500 | |
China Equity | | | | | — | * |
India Equity | | | | | — | * |
| * | | Amount is less than $50. |
D. Transfer Agency Agreement — Goldman Sachs also serves as the transfer agent of the Funds for a fee pursuant to a Transfer Agency Agreement. The fees charged for such transfer agency services are accrued daily and paid monthly at an annual rate as follows: 0.19% of the average daily net assets for Class A, Class C, and Class IR Shares and 0.04% of the average daily net assets for Institutional Shares.
E. Other Expense Agreements and Affiliated Transactions — GSAMI has agreed to limit certain “Other Expense” of the Funds (excluding management fees, distribution and service fees, transfer agent fees and expenses, taxes, interest, brokerage fees and litigation, indemnification, shareholder meetings and other extraordinary expenses, exclusive of any custody and transfer agent fee credit reductions) to the extent such expenses exceed, on an annual basis, a percentage rate of the average daily net assets of each Fund. Such Other Expense reimbursements, if any, are accrued daily and paid monthly. In addition, the Funds are not obligated to reimburse GSAMI for prior fiscal year expense reimbursements, if any. The Other Expense limitations as an annual percentage rate of average daily net assets of each Fund (other than India Equity Fund) are 0.364%. The Other Expense limitation as an annual percentage rate of average daily net assets of India Equity Fund is 0.110%. However, GSAMI has also agreed to limit the Subsidiary’s expenses to 0.254% of the Subsidiary’s average daily net assets resulting in a combined cap on the India Equity Fund’s Other Expense and “Acquired Fund Fees and Expenses” of 0.364%. These other reimbursements will remain in place through February 28, 2013, and prior to such date GSAMI may not terminate the arrangements without the approval of the trustees. In addition, the Funds have entered into certain offset arrangements with the custodian and the transfer agent, which may result in a reduction of the Funds’ expenses.
55
GOLDMAN SACHS SINGLE COUNTRY FUNDS
Notes to Financial Statements (continued)
April 30, 2012 (Unaudited)
|
| 5. AGREEMENTS AND AFFILIATED TRANSACTIONS (continued) |
For the six months ended April 30, 2012, these expense reductions, including any fee waivers and Other Expense reimbursements were as follows (in thousands):
| | | | | | |
| Fund | | | | Other Expense Reimbursements | |
Brazil Equity | | | | $ | 234 | |
China Equity | | | | | 222 | |
India Equity | | | | | 321 | |
Korea Equity | | | | | 234 | |
As of April 30, 2012, the amounts owed to affiliates of the Funds were as follows (in thousands):
| | | | | | | | | | | | | | | | | | |
| Fund | | | | Management
Fees | | | Distribution
and Service
Fees | | | Transfer
Agent
Fees | | | Total | |
Brazil Equity | | | | $ | 5 | | | $ | — | * | | $ | — | * | | $ | 5 | |
China Equity | | | | | 5 | | | | — | * | | | — | * | | | 5 | |
India Equity | | | | | 6 | | | | — | * | | | — | * | | | 6 | |
Korea Equity | | | | | 3 | | | | — | * | | | — | * | | | 3 | |
| * | | Amount is less than $500. |
F. Other Transactions with Affiliates — For the six months ended April 30, 2012, Goldman Sachs earned approximately $1,500 in brokerage commissions from portfolio transactions, including futures transactions executed with Goldman Sachs as Futures Commission Merchant, on behalf of the India Equity Fund.
As of April 30, 2012, the Goldman Sachs Group, Inc. was the beneficial owner of approximately of 5% or more of outstanding Class A, C, Institutional and Class IR Shares of the following Funds:
| | | | | | | | | | | | | | | | | | |
| Fund | | | | Class A | | | Class C | | | Institutional | | | Class IR | |
Brazil Equity | | | | | 6 | % | | | 44 | % | | | 27 | % | | | 100 | % |
China Equity | | | | | 43 | | | | 57 | | | | 28 | | | | 100 | |
India Equity | | | | | 5 | | | | 39 | | | | 30 | | | | 100 | |
Korea Equity | | | | | 90 | | | | 100 | | | | 56 | | | | 100 | |
56
GOLDMAN SACHS SINGLE COUNTRY FUNDS
|
| 6. PORTFOLIO SECURITIES TRANSACTIONS |
The cost of purchases and proceeds from sales and maturities of long-term securities for the six months ended April 30, 2012, were as follows:
| | | | | | | | | | |
| Fund | | | | Purchases | | | Sales and Maturities | |
Brazil Equity | | | | $ | 6,868,193 | | | $ | 4,228,837 | |
China Equity | | | | | 1,188,898 | | | | 1,551,574 | |
India Equity | | | | | 4,244,611 | | | | 1,912,804 | |
Korea Equity | | | | | 2,874,363 | | | | 2,992,640 | |
As of the Funds’ most recent fiscal year end, October 31, 2011, the Funds’ capital loss carryovers and certain timing differences, on a tax basis were as follows:
| | | | | | | | | | | | | | | | |
| | | Brazil Equity | | | China Equity | | | India Equity | | | Korea Equity | |
Short-term capital loss carryovers | | $ | (182,252 | ) | | $ | (369,960 | ) | | $ | (96,303 | ) | | $ | — | |
As of April 30, 2012, the Funds’ aggregate security unrealized gains and losses based on cost for U.S. federal income tax purposes were as follows:
| | | | | | | | | | | | | | | | |
| | | Brazil Equity | | | China Equity | | | India Equity | | | Korea Equity | |
Tax Cost | | $ | 5,769,239 | | | $ | 5,850,916 | | | $ | 5,239,480 | | | $ | 3,323,682 | |
Gross unrealized gain | | | 234,458 | | | | 320,444 | | | | 595,424 | | | | 391,101 | |
Gross unrealized loss | | | (699,966 | ) | | | (438,555 | ) | | | (200,213 | ) | | | (326,295 | ) |
Net unrealized security gain (loss) | | $ | (465,508 | ) | | $ | (118,111 | ) | | $ | 395,211 | | | $ | 64,806 | |
The difference between GAAP-basis and tax-basis unrealized gains (losses), as of the most recent fiscal year end, is attributable primarily to wash sales, net mark-to-market gains (losses) on foreign currency contracts, and differences related to the tax treatment of passive foreign investment company investments.
GSAMI has reviewed the Funds’ tax positions for all open tax years (the current and prior, as applicable) and has concluded that no provision for income tax is required in the Funds’ financial statements. Such open tax years remain subject to examination and adjustment by tax authorities.
57
GOLDMAN SACHS SINGLE COUNTRY FUNDS
Notes to Financial Statements (continued)
April 30, 2012 (Unaudited)
The Funds’ risks include, but are not limited to, the following:
Foreign Custody Risk — A Fund that invests in foreign securities may hold such securities and foreign currency with foreign banks, agents, and securities depositories appointed by the Fund’s custodian (each a “Foreign Custodian”). In some countries, Foreign Custodians may be subject to little or no regulatory oversight or independent evaluation of their operations. Further, the laws of certain countries may place limitations on a Fund’s ability to recover its assets if a Foreign Custodian enters into bankruptcy. Investments in emerging markets may be subject to greater custody risks than investments in more developed markets. Custody services in emerging market countries are often undeveloped and may be less regulated than in more developed countries, and thus may not afford the same level of investor protection as would apply in developed countries.
Funds’ Shareholder Concentration Risk — Certain funds, accounts, individuals or Goldman Sachs affiliates may from time to time own (beneficially or of record) or control a significant percentage of the Funds’ shares. Redemptions by these entities of their holdings in the Funds may impact the Funds’ liquidity and NAV. These redemptions may also force the Funds to sell securities.
Geographic Risk — The Brazil Equity, China Equity, India Equity and Korea Equity Funds invest primarily in a portfolio of equity investments that are tied economically to Brazil, China, India and Korea, respectively, or in issuers that participate in the markets of these respective countries. The Funds’ investment exposure to these particular countries or regions will subject the Funds to a greater extent than if investments were less concentrated, to the risks of adverse securities markets, exchange rates and social, political, regulatory, economic, or environmental events and natural disasters, which may occur in a given country or region.
Liquidity Risk — The Funds may make investments that may be illiquid or that may become less liquid in response to market developments or adverse investor perceptions. Liquidity risk may also refer to the risk that a Fund will not be able to pay redemption proceeds within the allowable time period because of unusual market conditions, an unusually high volume of redemption requests, or other reasons. To meet redemption requests, a Fund may be forced to sell investments at an unfavorable time and/or under unfavorable conditions.
Market and Credit Risks — In the normal course of business, the Funds trade financial instruments and enter into financial transactions where risk of potential loss exists due to changes in the market (market risk). Additionally, the Funds may also be exposed to credit risk in the event that an issuer fails to perform or that an institution or entity with which the Funds have unsettled or open transaction defaults.
Investing in foreign markets may involve special risks and considerations not typically associated with investing in the U.S. These risks include revaluation of currencies, high rates of inflation, repatriation restrictions on income and capital, and adverse political and economic developments. Moreover, securities issued in these markets may be less liquid, be subject to government ownership controls, have delayed settlements and their prices may be more volatile than those of comparable securities in the U.S.
Non-Diversification Risk — Each Fund is non-diversified and is permitted to invest more of its assets in fewer issuers than a “diversified” mutual fund. Thus, the Funds may be subject to greater risks than a fund that invests in a great number of issuers.
58
GOLDMAN SACHS SINGLE COUNTRY FUNDS
Under the Trust’s organizational documents, its trustees, officers, employees and agents are indemnified, to the extent permitted by the Act, against certain liabilities that may arise out of performance of their duties to the Funds. Additionally, in the course of business, the Funds enter into contracts that contain a variety of indemnification clauses. The Funds’ maximum exposure under these arrangements is unknown, as this would involve future claims that may be made against the Funds that have not yet occurred. However, GSAMI believes the risk of loss under these arrangements to be remote.
New Accounting Pronouncement — In May 2011, Accounting Standards Update 2011-04 (ASU 2011-04), Amendments to Achieve Common Fair Value Measurement and Disclosure Requirements in U.S. GAAP and IFRSs, was issued and is effective for interim and annual periods beginning after December 15, 2011. ASU 2011-04 amends Financial Accounting Standards Board (FASB) Topic 820, Fair Value Measurement. The amendments are the result of the work by the FASB and the International Accounting Standards Board to develop common requirements for measuring fair value and for disclosing information about fair value measurements in accordance with GAAP. GSAMI is currently evaluating the application of ASU 2011-04 and its impact, if any, on the Funds’ financial statements.
In December 2011, Accounting Standards Update 2011-11 (ASU 2011-11), Amendments to Disclosures about Offsetting Assets and Liabilities Requirements in U.S. GAAP and IFRSs, was issued and is effective for interim periods and annual periods beginning on or after January 1, 2013. The amendments are the result of the work by FASB and the International Accounting Standards Board to develop common requirements for disclosing information about offsetting and related arrangements. GSAMI is currently evaluating the application of ASU 2011-11 and its impact, if any on the Funds’ financial statements.
Other Matters — On February 8, 2012, the Commodity Futures Trading Commission (CFTC) adopted amendments to several of its rules relating to commodity pool operators, including Rule 4.5. The Funds currently rely on Rule 4.5’s exclusion from CFTC regulation for regulated investment companies. GSAMI is currently evaluating the amendments and their impact, if any, on the Funds’ financial statements.
Subsequent events after the balance sheet date have been evaluated through the date the financial statements were issued. GSAMI has concluded that there is no impact requiring adjustment or disclosure in the financial statements.
59
GOLDMAN SACHS SINGLE COUNTRY FUNDS
Notes to Financial Statements (continued)
April 30, 2012 (Unaudited)
|
| 12. SUMMARY OF SHARE TRANSACTIONS |
Share activity is as follows:
| | | | | | | | | | | | | | | | | | |
| | | Brazil Equity Fund | |
| | | |
| | | For the Six Months Ended
April 30, 2012 (Unaudited) | | | For the Period Ended
October 31, 2011(a) | |
| | | |
| | | Shares | | | Dollars | | | Shares | | | Dollars | |
| | | |
| Class A Shares | | | | | | | | | | | | | | | | | | |
Shares sold | | | 18,104 | | | $ | 140,828 | | | | 1,112 | | | $ | 11,022 | |
Shares redeemed | | | (2,309 | ) | | | (17,082 | ) | | | (2 | ) | | | (21 | ) |
| | | | 15,795 | | | | 123,746 | | | | 1,110 | | | | 11,001 | |
| Class C Shares | | | | | | | | | | | | | | | | | | |
Shares sold | | | 1,903 | | | | 14,298 | | | | 1,002 | | | | 10,017 | |
Shares redeemed | | | (632 | ) | | | (5,056 | ) | | | (2 | ) | | | (16 | ) |
| | | | 1,271 | | | | 9,242 | | | | 1,000 | | | | 10,001 | |
| Institutional Shares | | | | | | | | | | | | | | | | | | |
Shares sold | | | 371,396 | | | | 2,753,330 | | | | 470,489 | | | | 4,217,015 | |
Shares redeemed | | | (22,241 | ) | | | (158,379 | ) | | | (98,944 | ) | | | (655,985 | ) |
| | | | 349,155 | | | | 2,594,951 | | | | 371,545 | | | | 3,561,030 | |
| Class IR Shares | | | | | | | | | | | | | | | | | | |
Shares sold | | | — | | | | — | | | | 1,002 | | | | 10,017 | |
Shares redeemed | | | — | | | | — | | | | (2 | ) | | | (17 | ) |
| | | | — | | | | — | | | | 1,000 | | | | 10,000 | |
NET INCREASE | | | 366,221 | | | $ | 2,727,939 | | | | 374,655 | | | $ | 3,592,032 | |
| (a) | | Commenced operations on April 29, 2011. |
60
GOLDMAN SACHS SINGLE COUNTRY FUNDS
|
| 12. SUMMARY OF SHARE TRANSACTIONS (continued) |
Share activity is as follows:
| | | | | | | | | | | | | | | | |
| | | China Equity Fund | |
| | | | |
| | | For the Six Months Ended
April 30, 2012
(Unaudited) | | | For the Period Ended
October 31, 2011(a) | |
| | | | |
| | | Shares | | | Dollars | | | Shares | | | Dollars | |
| | | | |
| Class A Shares | | | | | | | | | | | | | | | | |
Shares sold | | | 1,223 | | | $ | 9,982 | | | | 1,107 | | | $ | 11,026 | |
Reinvestment of distributions | | | 6 | | | | 45 | | | | — | | | | — | |
Shares redeemed | | | (1 | ) | | | (5 | ) | | | (2 | ) | | | (26 | ) |
| | | | 1,228 | | | | 10,022 | | | | 1,105 | | | | 11,000 | |
| Class C Shares | | | | | | | | | | | | | | | | |
Shares sold | | | 1,239 | | | | 9,977 | | | | 1,003 | | | | 10,025 | |
Reinvestment of distributions | | | 1 | | | | 7 | | | | — | | | | — | |
Shares redeemed | | | (499 | ) | | | (4,117 | ) | | | (3 | ) | | | (25 | ) |
| | | | 741 | | | | 5,867 | | | | 1,000 | | | | 10,000 | |
| Institutional Shares | | | | | | | | | | | | | | | | |
Shares sold | | | 37,774 | | | | 292,520 | | | | 745,820 | | | | 6,939,915 | |
Reinvestment of distributions | | | 5,916 | | | | 43,483 | | | | — | | | | — | |
Shares redeemed | | | (69,480 | ) | | | (554,553 | ) | | | (22,481 | ) | | | (155,258 | ) |
| | | | (25,790 | ) | | | (218,550 | ) | | | 723,339 | | | | 6,784,657 | |
| Class IR Shares | | | | | | | | | | | | | | | | |
Shares sold | | | — | | | | — | | | | 1,001 | | | | 10,010 | |
Reinvestment of distributions | | | 7 | | | | 51 | | | | — | | | | — | |
Shares redeemed | | | — | | | | — | | | | (1 | ) | | | (10 | ) |
| | | | 7 | | | | 51 | | | | 1,000 | | | | 10,000 | |
NET INCREASE (DECREASE) | | | (23,814 | ) | | $ | (202,610 | ) | | | 726,444 | | | $ | 6,815,657 | |
| (a) | | Commenced operations on April 29, 2011. |
61
GOLDMAN SACHS SINGLE COUNTRY FUNDS
Notes to Financial Statements (continued)
April 30, 2012 (Unaudited)
|
| 12. SUMMARY OF SHARE TRANSACTIONS (continued) |
Share activity is as follows:
| | | | | | | | | | | | | | | | |
| | | India Equity Fund | |
| | | | |
| | | For the Six Months Ended April 30, 2012
(Unaudited) | | | For the Period Ended
October 31, 2011(a) | |
| | | | |
| | | Shares | | | Dollars | | | Shares | | | Dollars | |
| | | | |
| Class A Shares | | | | | | | | | | | | | | | | |
Shares sold | | | 17,459 | | | $ | 153,472 | | | | 1,003 | | | $ | 10,033 | |
Shares redeemed | | | (223 | ) | | | (1,948 | ) | | | (3 | ) | | | (33 | ) |
| | | | 17,236 | | | | 151,524 | | | | 1,000 | | | | 10,000 | |
| Class C Shares | | | | | | | | | | | | | | | | |
Shares sold | | | 2,169 | | | | 18,410 | | | | 1,003 | | | | 10,027 | |
Shares redeemed | | | (572 | ) | | | (5,081 | ) | | | (3 | ) | | | (27 | ) |
| | | | 1,597 | | | | 13,329 | | | | 1,000 | | | | 10,000 | |
| Institutional Shares | | | | | | | | | | | | | | | | |
Shares sold | | | 281,539 | | | | 2,028,505 | | | | 455,267 | | | | 4,274,212 | |
Shares redeemed | | | (52,620 | ) | | | (438,366 | ) | | | (20,811 | ) | | | (171,301 | ) |
| | | | 228,919 | | | | 1,590,139 | | | | 434,456 | | | | 4,102,911 | |
| Class IR Shares | | | | | | | | | | | | | | | | |
Shares sold | | | — | | | | — | | | | 1,003 | | | | 10,027 | |
Shares redeemed | | | — | | | | — | | | | (3 | ) | | | (27 | ) |
| | | | — | | | | — | | | | 1,000 | | | | 10,000 | |
NET INCREASE | | | 247,752 | | | $ | 1,754,992 | | | | 437,456 | | | $ | 4,132,911 | |
| (a) | | Commenced operations on June 30, 2011. |
62
GOLDMAN SACHS SINGLE COUNTRY FUNDS
|
| 12. SUMMARY OF SHARE TRANSACTIONS (continued) |
Share activity is as follows:
| | | | | | | | | | | | | | | | |
| | | Korea Equity Fund | |
| | | | |
| | | For the Six Months Ended April 30, 2012
(Unaudited) | | | For the Period Ended
October 31, 2011(a) | |
| | | | |
| | | Shares | | | Dollars | | | Shares | | | Dollars | |
| | | | |
| Class A Shares | | | | | | | | | | | | | | | | |
Shares sold | | | 1 | | | $ | 6 | | | | 1,109 | | | $ | 11,031 | |
Reinvestment of distributions | | | 10 | | | | 89 | | | | — | | | | — | |
Shares redeemed | | | — | | | | — | | | | (3 | ) | | | (32 | ) |
| | | | 11 | | | | 95 | | | | 1,106 | | | | 10,999 | |
| Class C Shares | | | | | | | | | | | | | | | | |
Shares sold | | | — | | | | — | | | | 1,003 | | | | 10,025 | |
Reinvestment of distributions | | | 9 | | | | 83 | | | | — | | | | — | |
Shares redeemed | | | — | | | | — | | | | (3 | ) | | | (26 | ) |
| | | | 9 | | | | 83 | | | | 1,000 | | | | 9,999 | |
| Institutional Shares | | | | | | | | | | | | | | | | |
Shares sold | | | 1,768 | | | | 16,005 | | | | 379,582 | | | | 3,791,515 | |
Reinvestment of distributions | | | 3,279 | | | | 29,908 | | | | — | | | | — | |
Shares redeemed | | | (11,755 | ) | | | (104,154 | ) | | | (19,475 | ) | | | (165,930 | ) |
| | | | (6,708 | ) | | | (58,241 | ) | | | 360,107 | | | | 3,625,585 | |
| Class IR Shares | | | | | | | | | | | | | | | | |
Shares sold | | | 540 | | | | 5,000 | | | | 1,001 | | | | 10,010 | |
Reinvestment of distributions | | | 14 | | | | 127 | | | | — | | | | — | |
Shares redeemed | | | (545 | ) | | | (5,340 | ) | | | (1 | ) | | | (10 | ) |
| | | | 9 | | | | (213 | ) | | | 1,000 | | | | 10,000 | |
NET INCREASE (DECREASE) | | | (6,679 | ) | | $ | (58,276 | ) | | | 363,213 | | | $ | 3,656,583 | |
| (a) | | Commenced operations on May 31, 2011. |
63
GOLDMAN SACHS SINGLE COUNTRY FUNDS
Fund Expenses — Six Month Period Ended April 30, 2012 (Unaudited)
As a shareholder of Class A, Class C, Institutional, or Class IR Shares of a Fund, you incur two types of costs: (1) transaction costs, including sales charges on purchase payments (with respect to Class A Shares), contingent deferred sales charges on redemptions (with respect to Class C Shares), and (2) ongoing costs, including management fees; distribution and service (12b-1) fees (with respect to Class A and Class C Shares); and other Fund expenses. This Example is intended to help you understand your ongoing costs (in dollars) of investing in Class A, Class C, Institutional, or Class IR Shares of the Funds and to compare these costs with the ongoing costs of investing in other mutual funds.
The Example is based on an investment of $1,000 invested at the beginning of the period and held for the entire period from November 1, 2011 through April 30, 2012.
Actual Expenses — The first line under each share class in the table below provides information about actual account values and actual expenses. You may use the information in this line, together with the amount you invested, to estimate the expenses that you paid over the period. Simply divide your account value by $1,000 (for example, an $8,600 account value divided by $1,000=8.6), then multiply the result by the number in the first line under the heading entitled “Expenses Paid” to estimate the expenses you paid on your account during this period.
Hypothetical Example for Comparison Purposes — The second line under each share class in the table below provides information about hypothetical account values and hypothetical expenses based on the Funds’ actual net expense ratios and an assumed rate of return of 5% per year before expenses, which is not the Funds’ actual return. The hypothetical account values and expenses may not be used to estimate the actual ending account balance or expenses you paid for the period. You may use this information to compare the ongoing costs of investing in the Funds and other funds. To do so, compare this 5% hypothetical example with the 5% hypothetical examples that appear in the shareholder reports of the other funds.
Please note that the expenses shown in the table are meant to highlight your ongoing costs only and do not reflect any transactional costs, such as sales charges, redemption fees, or exchange fees. Therefore, the second line of the table is useful in comparing ongoing costs only, and will not help you determine the relative total costs of owning different funds. In addition, if these transactional costs were included, your costs would have been higher.
| | | | | | | | | | | | | | | | | | | | | | | | | | | | | | | | | | | | | | | | | | | | | | | | |
| | | Brazil Equity Fund | | | China Equity Fund | | | India Equity Fund | | | Korea Equity Fund | |
| Share Class | | Beginning Account Value 11/1/11 | | | Ending Account Value 4/30/12 | | | Expenses Paid for the 6 Months Ended 4/30/12* | | | Beginning Account Value 11/1/11 | | | Ending Account Value 4/30/12 | | | Expenses Paid for the 6 Months Ended 4/30/12* | | | Beginning Account Value 11/1/11 | | | Ending Account Value 4/30/12 | | | Expenses Paid for the 6 Months Ended 4/30/12* | | | Beginning Account Value 11/1/11 | | | Ending Account Value 4/30/12 | | | Expenses Paid for the 6 Months Ended 4/30/12* | |
| Class A | | | | | | | | | | | | | | | | | | | | | | | | | | | | | | | | | | | | | | | | | | | | | | | | |
Actual | | $ | 1,000.00 | | | $ | 932.60 | | | $ | 9.13 | | | $ | 1,000.00 | | | $ | 1,058.70 | | | $ | 9.73 | | | $ | 1,000.00 | | | $ | 987.40 | | | $ | 9.39 | | | $ | 1,000.00 | | | $ | 1,010.20 | | | $ | 9.50 | |
Hypothetical 5% return | | | 1,000.00 | | | | 1,015.42 | + | | | 9.52 | | | | 1,000.00 | | | | 1,015.42 | + | | | 9.52 | | | | 1,000.00 | | | | 1,015.42 | + | | | 9.52 | | | | 1,000.00 | | | | 1,015.42 | + | | | 9.52 | |
| Class C | | | | | | | | | | | | | | | | | | | | | | | | | | | | | | | | | | | | | | | | | | | | | | | | |
Actual | | | 1,000.00 | | | | 928.50 | | | | 12.71 | | | | 1,000.00 | | | | 1,055.40 | | | | 13.54 | | | | 1,000.00 | | | | 983.90 | | | | 13.07 | | | | 1,000.00 | | | | 1,006.00 | | | | 13.22 | |
Hypothetical 5% return | | | 1,000.00 | | | | 1,011.69 | + | | | 13.25 | | | | 1,000.00 | | | | 1,011.69 | + | | | 13.25 | | | | 1,000.00 | | | | 1,011.69 | + | | | 13.25 | | | | 1,000.00 | | | | 1,011.69 | + | | | 13.25 | |
| Institutional | | | | | | | | | | | | | | | | | | | | | | | | | | | | | | | | | | | | | | | | | | | | | | | | |
Actual | | | 1,000.00 | | | | 934.10 | | | | 7.21 | | | | 1,000.00 | | | | 1,061.00 | | | | 7.69 | | | | 1,000.00 | | | | 988.60 | | | | 7.42 | | | | 1,000.00 | | | | 1,012.20 | | | | 7.50 | |
Hypothetical 5% return | | | 1,000.00 | | | | 1,017.40 | + | | | 7.52 | | | | 1,000.00 | | | | 1,017.40 | + | | | 7.52 | | | | 1,000.00 | | | | 1,017.40 | + | | | 7.52 | | | | 1,000.00 | | | | 1,017.40 | + | | | 7.52 | |
| Class IR | | | | | | | | | | | | | | | | | | | | | | | | | | | | | | | | | | | | | | | | | | | | | | | | |
Actual | | | 1,000.00 | | | | 934.00 | | | | 7.93 | | | | 1,000.00 | | | | 1,060.10 | | | | 8.45 | | | | 1,000.00 | | | | 988.50 | | | | 8.16 | | | | 1,000.00 | | | | 1,011.20 | | | | 8.25 | |
Hypothetical 5% return | | | 1,000.00 | | | | 1,016.66 | + | | | 8.27 | | | | 1,000.00 | | | | 1,016.66 | + | | | 8.27 | | | | 1,000.00 | | | | 1,016.66 | + | | | 8.27 | | | | 1,000.00 | | | | 1,016.66 | + | | | 8.27 | |
| * | | Expenses for each share class are calculated using each Fund’s annualized net expense ratio for each class, which represents the ongoing expenses as a percentage of net assets for the six months ended April 30, 2012. Expenses are calculated by multiplying the annualized net expense ratio by the average account value for the period; then multiplying the result by the number of days in the most recent fiscal half year; and then dividing that result by the number of days in the fiscal year. The annualized net expense ratios for the period were as follows: |
| | | | | | | | | | | | | | | | |
| Fund | | Class A | | | Class C | | | Institutional | | | Class IR | |
Brazil Equity | | | 1.90 | % | | | 2.65 | % | | | 1.50 | % | | | 1.65 | % |
China Equity | | | 1.90 | | | | 2.65 | | | | 1.50 | | | | 1.65 | |
India Equity | | | 1.90 | | | | 2.65 | | | | 1.50 | | | | 1.65 | |
Korea Equity | | | 1.90 | | | | 2.65 | | | | 1.50 | | | | 1.65 | |
| + | | Hypothetical expenses are based on each Fund’s actual annualized net expense ratios and an assumed rate of return of 5% per year before expenses. |
64
FUNDS PROFILE
Goldman Sachs Funds

Goldman Sachs is a premier financial services firm, known since 1869 for creating thoughtful and customized investment solutions in complex global markets.
Today, the Investment Management Division of Goldman Sachs serves a diverse set of clients worldwide, including private institutions, public entities and individuals. With $702.0 billion in assets under management as of March 31, 2012, Goldman Sachs Asset Management (“GSAM”) has portfolio management teams located around the world and our investment professionals bring firsthand knowledge of local markets to every investment decision. GSAM’s assets under management includes assets managed by Goldman Sachs Asset Management, LP and its Investment Advisory Affiliates. Additionally, GSAM ranks in the top 10 asset management firms worldwide, based on assets under management.1
|
| OVERVIEW OF GOLDMAN SACHS FUNDS |

Money Market2
Financial Square FundsSM
| n | | Financial Square Tax-Exempt Funds |
| n | | Financial Square Federal Fund |
| n | | Financial Square Government Fund |
| n | | Financial Square Money Market Fund |
| n | | Financial Square Prime Obligations Fund |
| n | | Financial Square Treasury Instruments Fund |
| n | | Financial Square Treasury Obligations Fund |
Fixed Income
Short Duration and Government
| n | | Ultra-Short Duration Govt. Fund |
| n | | Short Duration Government Fund |
| n | | Short Duration Income Fund |
| n | | Inflation Protected Securities Fund |
Multi-Sector
| n | | Core Plus Fixed Income Fund |
Municipal and Tax-Free
| n | | High Yield Municipal Fund |
| n | | Short Duration Tax-Free Fund |
Single Sector
| n | | Investment Grade Credit Fund |
| n | | High Yield Floating Rate Fund |
| n | | Emerging Markets Debt Fund |
| n | | Local Emerging Markets Debt Fund |
Corporate Credit
Fundamental Equity
| n | | Small/Mid Cap Growth Fund |
| n | | Flexible Cap Growth Fund |
| n | | Concentrated Growth Fund |
| n | | Technology Tollkeeper Fund |
| n | | Growth Opportunities Fund |
| n | | Rising Dividend Growth Fund |
Structured Equity
| n | | Structured Small Cap Equity Fund |
| n | | Structured U.S. Equity Fund |
| n | | Structured Small Cap Growth Fund |
| n | | Structured Large Cap Growth Fund |
| n | | Structured Large Cap Value Fund |
| n | | Structured Small Cap Value Fund |
| n | | Structured Tax-Managed Equity Fund |
| n | | Structured International Tax-Managed Equity Fund |
| n | | U.S. Equity Dividend and Premium Fund |
| n | | International Equity Dividend and Premium Fund |
| n | | Structured International Small Cap Fund |
| n | | Structured International Equity Fund |
| n | | Structured Emerging Markets Equity Fund |
Fundamental Equity International
| n | | Strategic International Equity Fund |
| n | | Concentrated International Equity Fund |
| n | | International Small Cap Fund |
| n | | Emerging Markets Equity Fund |
| n | | BRIC Fund (Brazil, Russia, India, China) |
Select Satellite3
| n | | Real Estate Securities Fund |
| n | | International Real Estate Securities Fund |
| n | | Commodity Strategy Fund |
| n | | Dynamic Allocation Fund |
| n | | Absolute Return Tracker Fund |
| n | | Managed Futures Strategy Fund |
Total Portfolio Solutions3
| n | | Balanced Strategy Portfolio |
| n | | Growth and Income Strategy Portfolio |
| n | | Growth Strategy Portfolio |
| n | | Equity Growth Strategy Portfolio |
| n | | Income Strategies Portfolio |
| n | | Satellite Strategies Portfolio |
| n | | Retirement Strategies Portfolios |
| n | | Enhanced Dividend Global Equity Portfolio |
| n | | Tax Advantaged Global Equity Portfolio |
| 1Ranking | | for Goldman Sachs Group, Inc., includes Goldman Sachs Asset Management, Private Wealth Management and Merchant Banking 2010 year-end assets. Ranked 10th in total assets worldwide. Pensions&Investments, June 2011. |
| 2An | | investment in a money market fund is neither insured nor guaranteed by the Federal Deposit Insurance Corporation (“FDIC”) or any other government agency. Although the Funds seek to preserve the value of your investment at $1.00 per share, it is possible to lose money by investing in the Funds. |
| 3Individual | | Funds within the Total Portfolio Solutions and Select Satellite categories will have various placement on the risk/return spectrum and may have greater or lesser risk than that indicated by the placement of the general Total Portfolio Solutions or Select Satellite category. |
| Financial | | Square FundsSM is a registered service mark of Goldman, Sachs & Co. |
| | |
TRUSTEES Ashok N. Bakhru, Chairman Donald C. Burke John P. Coblentz, Jr. Diana M. Daniels Joseph P. LoRusso James A. McNamara Jessica Palmer Alan A. Shuch Richard P. Strubel | | OFFICERS James A. McNamara, President George F. Travers, Principal Financial Officer Peter V. Bonanno, Secretary Scott M. McHugh, Treasurer |
| |
GOLDMAN, SACHS & CO. Distributor and Transfer Agent | | GOLDMAN SACHS ASSET MANAGEMENT INTERNATIONAL Investment Adviser |
Visit our Website at www.goldmansachsfunds.com to obtain the most recent month-end returns.
Goldman Sachs Asset Management, L.P. 200 West Street, New York, New York 10282
The reports concerning the Funds included in this shareholder report may contain certain forward-looking statements about the factors that may affect the performance of the Funds in the future. These statements are based on Fund management’s predictions and expectations concerning certain future events and their expected impact on the Funds, such as performance of the economy as a whole and of specific industry sectors, changes in the levels of interest rates, the impact of developing world events, and other factors that may influence the future performance of the Funds. Management believes these forward-looking statements to be reasonable, although they are inherently uncertain and difficult to predict. Actual events may cause adjustments in portfolio management strategies from those currently expected to be employed.
A description of the policies and procedures that the Funds use to determine how to vote proxies relating to portfolio securities and information regarding how a Fund voted proxies relating to portfolio securities during the most recent 12-month period ended June 30 is available (I) without charge, upon request by calling 1-800-526-7384 (for Retail Shareholders) or 1-800-621-2550 (for Institutional Shareholders); and (II) on the Securities and Exchange Commission Web site at http://www.sec.gov.
The Funds file their complete schedule of portfolio holdings with the Securities and Exchange Commission (“SEC”) for the first and third quarters of each fiscal year on Form N-Q. The Funds’ Forms N-Q will become available on the SEC’s website at http://www.sec.gov within 60 days after the Funds’ first and third fiscal quarters. When available, the Funds’ Forms N-Q may be reviewed and copied at the SEC’s Public Reference Room in Washington, D.C. and information on the operation of the Public Reference Room may also be obtained by calling 1-800-SEC-0330. When available, Form N-Q may be obtained upon request and without charge by calling 1-800-526-7384 (for Retail Shareholders) or 1-800-621-2550 (for Institutional Shareholders).
The Global Industry Classification Standard (GICS) was developed by and is the exclusive property and a service mark of Morgan Stanley Capital International Inc. (MSCI) and Standard & Poor’s, a division of The McGraw-Hill Companies, Inc. (S&P) and is licensed for use by Goldman Sachs. Neither MSCI, S&P nor any other party involved in making or compiling the GICS or any GICS classifications makes any express or implied warranties or representations with respect to such standard or classification (or the results to be obtained by the use thereof), and all such parties hereby expressly disclaim all warranties of originality, accuracy, completeness, merchantability or fitness for a particular purpose with respect to any of such standard or classification. Without limiting any of the foregoing, in no event shall MSCI, S&P, any of their affiliates or any third party involved in making or compiling the GICS or any GICS classifications have any liability for any direct, indirect, special, punitive, consequential or any other damages (including lost profits) even if notified of the possibility of such damages.
The portfolio risk management process includes an effort to monitor and manage risk, but does not imply low risk.
Economic and market forecasts presented herein reflect our judgment as of the date of this presentation and are subject to change without notice. These forecasts do not take into account the specific investment objectives, restrictions, tax and financial situation or other needs of any specific client. Actual data will vary and may not be reflected here. These forecasts are subject to high levels of uncertainty that may affect actual performance. Accordingly, these forecasts should be viewed as merely representative of a broad range of possible outcomes. These forecasts are estimated, based on assumptions, and are subject to significant revision and may change materially as economic and market conditions change. Goldman Sachs has no obligation to provide updates or changes to these forecasts. Case studies and examples are for illustrative purposes only.
Holdings and allocations shown are as of April 30, 2012 and may not be representative of future investments. Fund holdings should not be relied on in making investment decisions and should not be construed as research or investment advice regarding particular securities
This material is not authorized for distribution to prospective investors unless preceded or accompanied by a current Prospectus or summary prospectus, if applicable. Investors should consider a Fund’s objective, risks, and charges and expenses, and read the summary prospectus, if available, and/or the Prospectus carefully before investing or sending money. The summary prospectus, if available, and the Prospectus contain this and other information about a Fund and may be obtained from your authorized dealer or from Goldman, Sachs & Co. by calling (retail – 1-800-526-7384) (institutional – 1-800-621-2550).
© 2012 Goldman Sachs. All rights reserved. 75556.MF.MED.TMPL/6/2012 SCFSAR12/1K
| | The information required by this Item is only required in an annual report on this Form N-CSR. |
| ITEM 3. | AUDIT COMMITTEE FINANCIAL EXPERT. |
| | The information required by this Item is only required in an annual report on this Form N-CSR. |
| ITEM 4. | PRINCIPAL ACCOUNTANT FEES AND SERVICES. |
| | The information required by this Item is only required in an annual report on this Form N-CSR. |
| ITEM 5. | AUDIT COMMITTEE OF LISTED REGISTRANTS. |
| ITEM 6. | SCHEDULE OF INVESTMENTS. |
| | Schedule of Investments is included as part of the Report to Stockholders filed under Item 1. |
| ITEM 7. | DISCLOSURE OF PROXY VOTING POLICIES AND PROCEDURES FOR CLOSED-END MANAGEMENT INVESTMENT COMPANIES. |
| ITEM 8. | PORTFOLIO MANAGERS OF CLOSED-END MANAGEMENT INVESTMENT COMPANIES. |
| ITEM 9. | PURCHASES OF EQUITY SECURITIES BY CLOSED-END MANAGEMENT INVESTMENT COMPANY AND AFFILIATED PURCHASERS. |
| ITEM 10. | SUBMISSION OF MATTERS TO A VOTE OF SECURITY HOLDERS. |
| | There have been no material changes to the procedures by which shareholders may recommend nominees to the registrant’s board of trustees. |
| ITEM 11. | CONTROLS AND PROCEDURES. |
| | (a) | The registrant’s principal executive and principal financial officers, or persons performing similar functions have concluded that the registrant’s disclosure controls and procedures (as defined in Rule 30a-3(c) under the Investment Company Act of 1940, as amended (the “1940 Act”)) are effective as of a date within 90 days of the filing of this report that includes the disclosure required by this paragraph, based on the evaluation of these controls and procedures required by Rule 30a-3(b) under the 1940 Act and 15d-15(b) under the Securities Exchange Act of 1934, as amended. |
| | (b) | There were no changes in the registrant’s internal control over financial reporting (as defined in Rule 30a-3(d) under the 1940 Act) that occurred during the registrant’s second fiscal quarter of the period covered by this report that have materially affected, or are reasonably likely to materially affect, the registrant’s internal control over financial reporting. |
| | | | |
| (a)(1) | | The information required by this Item is only required in connection with an annual report on this Form N-CSR. |
| | |
| (a)(2) | | Exhibit 99.CERT | | Certifications pursuant to Section 302 of the Sarbanes-Oxley Act of 2002 filed herewith. |
| | |
| (b) | | Exhibit 99.906CERT | | Certifications pursuant to Section 906 of the Sarbanes-Oxley Act of 2002 filed herewith. |
SIGNATURES
Pursuant to the requirements of the Securities Exchange Act of 1934 and the Investment Company Act of 1940, the registrant has duly caused this report to be signed on its behalf by the undersigned, thereunto duly authorized.
| | | | |
| | | | Goldman Sachs Trust |
| | |
| By: | | | | /s/ James A. McNamara |
| | | | James A. McNamara |
| | | | President/Principal Executive Officer |
| | | | Goldman Sachs Trust |
| | |
| Date: | | | | June 26, 2012 |
Pursuant to the requirements of the Securities Exchange Act of 1934 and the Investment Company Act of 1940, this report has been signed below by the following persons on behalf of the registrant and in the capacities and on the dates indicated.
| | | | |
| By: | | | | /s/ James A. McNamara |
| | | | James A. McNamara |
| | | | President/Principal Executive Officer |
| | | | Goldman Sachs Trust |
| | |
| Date: | | | | June 26, 2012 |
| | |
| By: | | | | /s/ George F. Travers |
| | | | George F. Travers |
| | | | Principal Financial Officer |
| | | | Goldman Sachs Trust |
| | |
| Date: | | | | June 25, 2012 |