UNITED STATES
SECURITIES AND EXCHANGE COMMISSION
Washington, D.C. 20549
FORM N-CSR
CERTIFIED SHAREHOLDER REPORT OF REGISTERED
MANAGEMENT INVESTMENT COMPANIES
Investment Company Act file number 811-05349
Goldman Sachs Trust
(Exact name of registrant as specified in charter)
71 South Wacker Drive,
Chicago, Illinois 60606
(Address of principal executive offices) (Zip code)
Copies to: | ||
Caroline Kraus | Geoffrey R.T. Kenyon, Esq. | |
Goldman, Sachs & Co. | Dechert LLP | |
200 West Street | 200 Clarendon Street | |
New York, New York 10282 | 27th Floor | |
| Boston, MA 02116-5021 | ||
(Name and address of agents for service)
Registrant’s telephone number, including area code: (312) 655-4400
Date of fiscal year end: March 31
Date of reporting period: September 30, 2012
| ITEM 1. | REPORTS TO STOCKHOLDERS. |
| The Semi-Annual Report to Stockholders is filed herewith. |
Goldman Sachs Funds

| Semi-Annual Report | September 30, 2012 | |||
Municipal Fixed Income Funds | ||||
High Yield Municipal | ||||
Municipal Income | ||||
Short Duration Tax-Free | ||||

Goldman Sachs Municipal Fixed Income Funds
| n | HIGH YIELD MUNICIPAL |
| n | MUNICIPAL INCOME |
| n | SHORT DURATION TAX-FREE |
TABLE OF CONTENTS | ||||
Principal Investment Strategies and Risks | 1 | |||
Investment Process | 2 | |||
Market Review | 3 | |||
Portfolio Management Discussions and Performance Summaries | 5 | |||
Schedules of Investments | 20 | |||
Financial Statements | 78 | |||
Financial Highlights | 82 | |||
Notes to the Financial Statements | 88 | |||
Other Information | 103 | |||
| NOT FDIC-INSURED | May Lose Value | No Bank Guarantee | ||
GOLDMAN SACHS MUNICIPAL FIXED INCOME FUNDS
Principal Investment Strategies and Risks
This is not a complete list of risks that may affect the Funds. For additional information concerning the risks applicable to the Funds, please see the Funds’ Prospectuses.
The Goldman Sachs High Yield Municipal Fund invests primarily in high yield municipal securities that, at the time of purchase, are medium quality or non-investment grade, the interest on which is exempt from regular federal income tax. The Fund’s investments in fixed income securities are subject to the risks associated with debt securities generally, including credit/default risk, interest rate risk, call risk, and extension risk. High yield, lower rated securities involve greater price volatility and present greater risks, including greater liquidity risk, than higher rated fixed income securities. The Fund is subject to the risk that the liquidity of particular issuers or industries, or of all securities within a particular investment category, will shrink or disappear as a result of adverse economic, market or political events or adverse investor perception. At times, the Fund may be unable to sell certain of its investments without a substantial drop in price, if at all. The Fund may be more sensitive to adverse economic, business or political developments if it invests a substantial portion of its assets in bonds of similar projects or in particular types of municipal securities. Because the Fund may invest heavily in investments in particular sectors (for example, specific types of municipal securities) or states, the Fund is subject to greater risk of loss as a result of adverse events affecting those sectors or states than if its investments were not so concentrated. The Fund may invest in securities whose income is subject to the federal alternative minimum tax and state income tax. The Fund may be adversely impacted by changes in tax law rates and policies, and is not suited for IRAs or other tax exempt or deferred accounts. Certain shareholders, including clients or affiliates of the investment adviser, may from time to time own or control a significant percentage of the Fund’s shares. Redemptions by these shareholders of their shares of the Fund may impact the Fund’s liquidity and NAV. The Fund is “non-diversified” and may invest more of its assets in fewer issuers than “diversified” funds. Accordingly, the Fund may be more susceptible to adverse developments affecting any single issuer held in its portfolio and to greater losses resulting from these developments.
The Goldman Sachs Municipal Income Fund invests primarily in municipal securities, the interest on which is exempt from regular federal income tax. The Fund may invest up to 100% of its net assets in private activity bonds, whose income may be subject to the federal alternative minimum tax. Investments in fixed income securities are subject to the risks associated with debt securities generally, including credit/default risk and interest rate risk. At times, the Fund may be unable to sell certain of its investments without a substantial drop in price, if at all. The Fund may be more sensitive to adverse economic, business or political developments if it invests a substantial portion of its assets in bonds of similar projects or in particular types of municipal securities. Because the Fund may invest heavily in investments in particular states and sectors, the Fund is subject to greater risk of loss as a result of adverse events affecting those states and sectors than if its investments were not so concentrated. The Fund may be adversely impacted by changes in tax law rates and policies, and is not suited for IRAs or other tax-exempt or deferred accounts.
The Goldman Sachs Short Duration Tax-Free Fund invests primarily in municipal securities, the interest on which is exempt from regular federal income tax and is not a tax preference item under the federal alternative minimum tax. The Fund may invest up to 20% of its portfolio in private activity bonds whose income may be subject to the federal alternative minimum tax and taxable investments. Investments in fixed income securities are subject to the risks associated with debt securities generally, including credit/default risk and interest rate risk. At times, the Fund may be unable to sell certain of its investments without a substantial drop in price, if at all. The Fund may be more sensitive to adverse economic, business or political developments if it invests a substantial portion of its assets in bonds of similar projects or in particular types of municipal securities. Because the Fund may invest heavily in investments in particular states and sectors, the Fund is subject to greater risk of loss as a result of adverse events affecting those states and sectors than if its investments were not so concentrated. The Fund may be adversely impacted by changes in tax law rates and policies, and is not suited for IRAs or other tax-exempt or deferred accounts.
1
GOLDMAN SACHS MUNICIPAL FIXED INCOME FUNDS
What Differentiates the Goldman Sachs Asset
Management Fixed Income Investment Process?
At Goldman Sachs Asset Management, L.P. (“GSAM”), the goal of our fixed income investment process is to provide consistent, strong performance by actively managing our portfolios within a research-intensive, risk-managed framework.
A key element of our fixed income investment philosophy is to evaluate the broadest global opportunity set to capture relative value across sectors and instruments. Our globally integrated investment process involves managing dynamically along the risk/return spectrum, as we continue to develop value-added strategies through:

| n | Assess relative value among securities and sectors |
| n | Leverage the vast resources of GSAM in selecting securities for each portfolio |

| n | Team approach to decision making |
| n | Manage risk by avoiding significant sector and interest rate bets |
| n | Careful management of yield curve strategies — while closely managing portfolio duration |

Fixed Income portfolios that:
| n | Include domestic investment options, tax-free income opportunities, and access to areas of specialization |
| n | Capitalize on GSAM’s industry-renowned credit research capabilities |
| n | Use a risk-managed framework to seek total return, recognizing the importance of investors’ capital accumulation goals as well as their need for income |
2
MARKET REVIEW
Goldman Sachs Municipal Fixed Income Funds
Market Review
The municipal bond market recorded solid gains during the six months ended September 30, 2012 (the “Reporting Period”) on favorable supply and demand dynamics.
In the broader fixed income market, riskier fixed income assets (i.e., non-U.S. Treasury sectors) began the Reporting Period under pressure, as U.S. economic data weakened in April after a strong start to the year 2012. The performance trend continued in May, as the benchmark 10-year U.S. Treasury yield fell to a new low of 1.56%, and non-U.S. Treasury sectors of the fixed income market continued to perform poorly. Economic data was again a key driver of the weakness in riskier assets, as U.S. payrolls added just 69,000 jobs, less than half the expected gain. Concerns about Europe, and the health of the Spanish banking system in particular, also weighed on investors’ risk appetites.
June marked a turning point for non-U.S. Treasury sectors, although U.S. Treasury yields continued to decline. Developments in Europe were again a key driver of risk sentiment, as Greece held a presidential election that raised concerns about the country potentially exiting the Eurozone, and Spain finally appealed to the European Union for assistance for its banking system. Continued weakness in U.S. and global economic data also weighed on sentiment. As a result, U.S. Treasury yields continued to decline, but non-U.S. Treasury sectors gained ground during the month as Greece elected a pro-Eurozone administration and the European Union agreed to provide support to Spain’s banking system. Even as government bond yields hit new record lows, investors began moving back into higher yielding corporate and emerging market bonds.
Non-U.S. Treasury sectors continued to outperform U.S. Treasuries through the remainder of the Reporting Period, largely as a function of the market searching for yield in an environment of extremely low interest rates. In addition, market expectations for more quantitative easing by the U.S. Federal Reserve (the “Fed”) increased in August in light of minutes from the August 1 Federal Open Market Committee meeting and Fed Chairman Ben Bernanke’s speech at the Fed’s annual conference in Jackson Hole, Wyoming.
In September, the Fed exceeded most expectations for additional quantitative easing with an announcement of open-ended asset purchases, dubbed QE3, and an extension of the likely period of low short-term interest rates from mid-2014 to at least mid-2015. With the Fed holding short-term interest rates at low levels, demand for higher yielding sectors remained strong. Over the course of Reporting Period, the U.S. Treasury yield curve flattened on the short-term end and steepened slightly in the longer maturities.
The Municipal Bond Market
Municipal yields declined during the Reporting Period, generally taking their lead from the U.S. Treasury market, and the municipal yield curve flattened. The yield on a 2-year AAA-rated municipal security fell six basis points to end the Reporting Period at 0.32%. (A basis point is 1/100th of a percentage point.) The yield on a 10-year AAA-rated municipal bond dropped 41 basis points to 1.70%, while the yield on a 30-year AAA-rated municipal security fell 54 basis points to end the Reporting Period at 2.85%.
As municipal yields declined, the ratio between the yields on longer-term municipal bonds and those of comparable-maturity U.S. Treasuries tightened. Intermediate-term and short-term municipal bonds did not keep pace with the rally in U.S. Treasuries, and the ratios between their yields versus those of comparable-maturity U.S. Treasuries widened.
3
MARKET REVIEW
The technical backdrop for municipal bonds remained favorable during the Reporting Period as a result of strong demand and a robust new issuance calendar. Of the new supply, a significant amount was refinancing, as issuers replaced higher-yield debt with debt issued at lower interest rates. There were 91% more refunding bonds issued between January 1, 2012 and September 30, 2012 than there were issued during the same nine-month period in 2011. Between January 1, 2012 and September 30, 2012, new debt issuance was up only 9%.1
Meanwhile, municipal bond funds received more than $40.3 billion in new investment flows from the beginning of 2012 through the end of the Reporting Period. Of that total, approximately $8.1 billion were invested in high-yield municipal bond funds, approximately $10.6 billion flowed into intermediate-term municipal bond funds, and approximately $18.5 billion went into long-term municipal bond funds.2
Looking Ahead
At the end of the Reporting Period, supply and demand conditions for the municipal bond market remained supportive, in our view. Investment flows continued to be robust, and supply had not kept up with demand. In addition, we saw the yield differential between municipal bond and U.S. Treasury securities as attractive. Going forward, we plan to continue positioning our municipal bond portfolios for an extended period of low interest rates.
Still, we believe municipal bond investors face a number of potential risks in the coming months. Though states appear to have made progress with their fiscal challenges, their steady revenue growth since the second quarter of 2010 seems to be slowing. Meanwhile, in our opinion, municipal governments are showing significant weakness. Additionally, we believe that pension reform could be a source of negative headlines in the months ahead. Going forward, we will continue to monitor developments in Washington, D.C., especially those relating to the potential expiration of the Bush era tax cuts and the tax-exempt status of municipal bonds.
| 1 | Source: Bond Buyer as of September 30, 2012. |
| 2 | Data courtesy of AMG/Lipper. |
4
PORTFOLIO RESULTS
Goldman Sachs High Yield Municipal Fund
Investment Objective
The Fund seeks a high level of current income that is exempt from regular federal income tax and may also consider the potential for capital appreciation.
Portfolio Management Discussion and Analysis
Below, the Goldman Sachs Municipal Fixed Income Investment Management Team discusses the Goldman Sachs High Yield Municipal Fund’s (the “Fund”) performance and positioning for the six-month period ended September 30, 2012 (the “Reporting Period”).
| Q | How did the Fund perform during the Reporting Period? |
| A | During the Reporting Period, the Fund’s Class A, B, C, Institutional and IR Shares generated cumulative total returns, without sales charges, of 7.09%, 6.57%, 6.69%, 7.12% and 7.10%, respectively. These returns compare to the 6.52% cumulative total return of the Fund’s benchmark, the High Yield Municipal Fund Composite Index (“High Yield Municipal Composite”), during the same time period. |
| The High Yield Municipal Composite is comprised 40% of the Barclays Aggregate Municipal Bond Index (with dividends reinvested) and 60% of the Barclays High Yield Municipal Bond Index (with dividends reinvested), which generated cumulative total returns of 4.24% and 8.06%, respectively, during the Reporting Period. |
| Q | What key factors were responsible for the Fund’s performance during the Reporting Period? |
| A | The Fund’s credit quality positioning added to relative returns during the Reporting Period. The Fund’s duration and yield curve strategy also enhanced performance. |
| Q | Which municipal bond market sectors most significantly affected Fund performance? |
| A | During the first half of the Reporting Period, the Fund benefited from its exposure to lower credit-quality bonds, which generally outperformed higher credit-quality bonds, as investors sought securities with higher yields. The Fund was slightly hampered by its position in higher quality issues, including state-appropriation debt and higher education bonds. |
| In the second half of the Reporting Period, issue selection among AA-rated and unrated bonds contributed positively. In addition, the Fund’s exposure to higher yielding issues, such as hospital bonds, special assessment bonds and tobacco bonds, enhanced performance. |
| For the Reporting Period overall, the Fund benefited from its exposure to zero coupon bonds. |
| Q | How did duration and yield curve positioning decisions affect the Fund’s performance? |
| A | The Fund’s longer duration position relative to the High Yield Municipal Composite contributed positively to performance as yields declined during the Reporting Period. Duration is a measure of the Fund’s sensitivity to changes in interest rates. |
| Our yield curve positioning strategy also enhanced the Fund’s relative returns. The Fund’s overweighted exposure to maturities of 20 years and longer added to results, as longer maturities outperformed shorter maturities during the Reporting Period. Yields on longer maturity municipal bonds declined more than those on shorter maturity municipal bonds, and the yield curve flattened. The Fund’s yield curve positioning was particularly advantageous during May when concerns about Europe’s financial problems sparked a strong rally in riskier assets. Yield curve indicates the spectrum of maturities within a particular sector. |
| Q | How did the Fund use derivatives and similar instruments during the Reporting Period? |
| A | The Fund used municipal credit default swaps as we sought to capture the upside potential of select securities that were trading below what we considered their intrinsic value. |
5
PORTFOLIO RESULTS
| Also during the Reporting Period, the Fund used municipal inverse variable rate securities to take advantage of the steepness of the municipal yield curve, wherein yields on shorter-term maturity municipal bonds were lower than those on longer-term maturity municipal bonds. These securities have an inverse relationship to short-term interest rates — the interest rate they pay generally increases as short-term interest rates fall and vice versa — and they therefore have the potential to increase or decrease the Fund’s income. |
| Q | What changes did you make in the Fund’s weightings and investments during the Reporting Period? |
| A | During the Reporting Period, we increased the Fund’s exposure to select corporate-backed municipal bonds. As a result of heightened volatility, we selectively trimmed the Fund’s exposure to Puerto Rico bonds. |
| Q | How was the Fund positioned relative to its benchmark index at the end of the Reporting Period? |
| A | At the end of the Reporting Period, the Fund was overweight the hospital sector and underweight the tobacco sector compared to the High Yield Municipal Composite. The Fund continued to have an overweight relative to the High Yield Municipal Composite in the 20-year to 30-year portion of the municipal yield curve. The Fund’s credit quality improved during the Reporting Period, but it remained underweight high quality municipal bonds and pre-refunded municipal bonds at the end of the Reporting Period. Pre-refunding, also known as advance refunding, is a procedure in which a municipality issues a second bond at a lower interest rate, and uses the proceeds from the sale of the second bond to invest in “escrow collateral” for the first bond. The escrow collateral is typically in Treasury securities. Pre-refunded municipal bonds no longer represent the credit risk profile of the original borrower, and given the high credit quality of the escrow collateral, they often increase in value — sometimes significantly. |
| Q | What is the Fund’s tactical view and strategy for the months ahead? |
| A | At the end of the Reporting Period, our outlook for the municipal market — and the high yield municipal market in particular — was positive because of favorable supply and demand dynamics and the difference in yields among various municipal credits, which we considered attractive. We intend to maintain our unconstrained approach in which we focus on seeking attractive risk/return opportunities across all maturities along the municipal bond yield curve and inclusive of all credit qualities. Based on shifts in interest rates, we intend to maintain an appropriate duration target relative to the High Yield Municipal Composite. |
6
FUND BASICS
High Yield Municipal Fund
as of September 30, 2012
| PERFORMANCE REVIEW |
| April 1, 2012– September 30, 2012 | Fund Total Return (based on NAV)1 | High Yield Municipal Fund Composite Index2 | Barclays High Yield Municipal Bond Index3 | Barclays Aggregate Municipal Bond index4 | 30-Day Subsidized | 30-Day Standardized Unsubsidized Yield5 | 30-Day Taxable Equivalent Yield6 | |||||||||||||||||||||||
| Class A | 7.09 | % | 6.52 | % | 8.06 | % | 4.24 | % | 3.52 | % | 3.46 | % | 5.42 | % | ||||||||||||||||
| Class B | 6.57 | 6.52 | 8.06 | 4.24 | 2.94 | 2.88 | 4.52 | |||||||||||||||||||||||
| Class C | 6.69 | 6.52 | 8.06 | 4.24 | 2.94 | 2.88 | 4.52 | |||||||||||||||||||||||
| Institutional | 7.12 | 6.52 | 8.06 | 4.24 | 3.97 | 3.96 | 6.11 | |||||||||||||||||||||||
| Class IR | 7.10 | 6.52 | 8.06 | 4.24 | 3.93 | 3.87 | 6.05 | |||||||||||||||||||||||
| 1 | The net asset value (“NAV”) represents the net assets of the class of the Fund (ex-dividend) divided by the total number of shares of the class outstanding. The Fund’s performance assumes the reinvestment of dividends and other distributions. The Fund’s performance does not reflect the deduction of any applicable sales charges. |
| 2 | The High Yield Municipal Fund Composite Index is comprised of the Barclays Aggregate Municipal Bond Index (40%) (with dividends reinvested) and the Barclays High Yield Municipal Bond Index (60%) (with dividends reinvested). |
| 3 | The Barclays High Yield Municipal Bond Index is an unmanaged index made up of bonds that are non-investment grade, unrated, or rated below Ba1 by Moody’s Investors Service with a remaining maturity of at least one year. The Index does not include any deduction for fees, expenses or taxes. It is not possible to invest directly in an index. |
| 4 | The Barclays Aggregate Municipal Bond Index is an unmanaged broad-based total return index composed of approximately 40,000 investment grade, fixed rate, and tax-exempt issues, with a remaining maturity of at least one year. The Index does not reflect any deduction for fees, expenses or taxes. It is not possible to invest directly in an index. |
| 5 | The 30-Day Standardized Subsidized Yield of the Fund is calculated by dividing the net investment income per share (as defined by securities industry regulations) earned by the Fund over a 30-day period (ending on the stated month-end date) by the maximum public offering price (“POP”) per share of the Fund on the last day of the period. This number is then annualized. This yield does not necessarily reflect income actually earned and distributed by the Fund and, therefore, may not be correlated with the dividends or other distributions paid to shareholders. The 30-Day Standardized Unsubsidized Yield does not reflect any applicable expense reductions. |
| 6 | The 30-Day Taxable Equivalent Yield of the Fund is calculated by dividing the current 30-Day Standardized Subsidized Yield by 1 minus the highest 2011 federal income tax rate of 35%. |
The returns set forth in the table above represent past performance. Past performance does not guarantee future results. The Fund’s investment return and principal value will fluctuate so that an investor’s shares, when redeemed, may be worth more or less than their original cost. Current performance may be lower or higher than the performance quoted above. Please visit our web site at www.goldmansachsfunds.com to obtain the most recent month-end returns. Performance reflects fee waivers and/or expense limitations in effect. In their absence, performance would be reduced. Returns do not reflect the deduction of taxes that a shareholder would pay on Fund distributions or the redemption of Fund shares. |
7
FUND BASICS
| STANDARDIZED TOTAL RETURNS7 | ||||||||||||||
| For the period ended 9/30/12 | One Year | Five Years | Ten Years | Since Inception | Inception Date | |||||||||
| Class A | 7.62 | % | 1.49% | 3.41% | 4.41% | 4/3/00 | ||||||||
| Class B | 6.67 | 1.26 | 3.25 | 4.28 | 4/3/00 | |||||||||
| Class C | 10.83 | 1.67 | 3.12 | 4.01 | 4/3/00 | |||||||||
| Institutional | 13.02 | 2.77 | 4.26 | 5.17 | 4/3/00 | |||||||||
| Class IR | 12.99 | N/A | N/A | 9.59 | 7/30/10 | |||||||||
| 7 | The Standardized Total Returns are average annual total returns as of the most recent calendar quarter-end. They assume reinvestment of all distributions at NAV. These returns reflect a maximum initial sales charge of 4.5% for Class A Shares, the assumed contingent deferred sales charge for Class B Shares (5% maximum declining to 0% after six years) and the assumed contingent deferred sales charge for Class C Shares (1% if redeemed within 12 months of purchase). Class B Shares convert automatically to Class A Shares on or about the fifteenth day of the last month of the calendar quarter that is eight years after purchase. Returns for Class B Shares for the period after conversion reflect the performance of Class A Shares. Because Institutional and Class IR Shares do not involve a sales charge, such a charge is not applied to their Standardized Total Returns. The Fund’s Class B Shares are no longer available for purchase by new or existing shareholders (although current Class B shareholders may continue to reinvest income and capital gains distributions into Class B Shares, and Class B shareholders may continue to exchange their shares for Class B Shares of certain other Goldman Sachs Funds). The Fund will charge a 2% redemption fee on the redemption of shares (including by exchange) held for 60 calendar days or less. The performance figures do not reflect the deduction of the redemption fee. If reflected, the redemption fee would reduce the performance quoted. |
| The returns set forth in the table above represent past performance. Past performance does not guarantee future results. The Fund’s investment return and principal value will fluctuate so that an investor’s shares, when redeemed, may be worth more or less than their original cost. Current performance may be lower or higher than the performance quoted above. Please visit our web site at www.goldmansachsfunds.com to obtain the most recent month-end returns. Performance reflects fee waivers and/or expense limitations in effect. In their absence, performance would be reduced. Returns do not reflect the deduction of taxes that a shareholder would pay on Fund distributions or the redemption of Fund shares. |
| EXPENSE RATIOS8 | ||||||||||
| Net Expense Ratio (Current) | Gross Expense Ratio (Before Waivers) | |||||||||
| Class A | 0.86 | % | 0.93 | % | ||||||
| Class B | 1.61 | 1.68 | ||||||||
| Class C | 1.61 | 1.68 | ||||||||
| Institutional | 0.57 | 0.59 | ||||||||
| Class IR | 0.61 | 0.68 | ||||||||
| 8 | The expense ratios of the Fund, both current (net of applicable fee waivers and/or expense limitations) and before waivers (gross of applicable fee waivers and/or expense limitations) are as set forth above according to the most recent publicly available Prospectus for the Fund and may differ from the expense ratios disclosed in the Financial Highlights in this report. The Fund’s waivers and/or expense limitations will remain in place through at least July 27, 2013, and prior to such date the investment adviser may not terminate the arrangements without the approval of the Fund’s Board of Trustees. If these arrangements are discontinued in the future, the expense ratios may change without shareholder approval. |
8
FUND BASICS
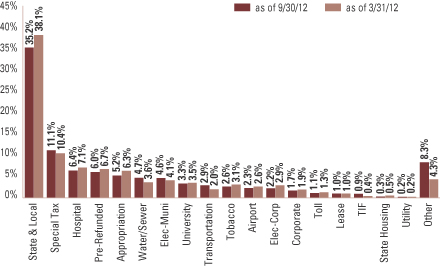
| SECTOR ALLOCATION9 |
| Percentage of Market Value |
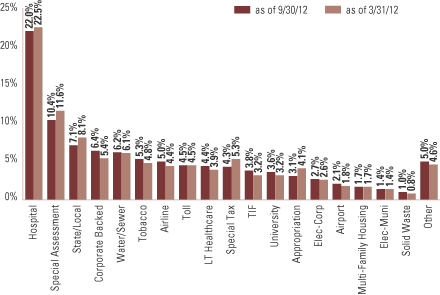
| 9 | The percentage shown for each investment category reflects the value of investments in that category as a percentage of market value. The above graph depicts the Fund’s investments but may not represent the Fund’s market exposure due to the exclusion of derivatives, if any, as listed in the Additional Investment Information section of the Schedule of Investments. |
9
PORTFOLIO RESULTS
Goldman Sachs Municipal Income Fund
Investment Objective
The Fund seeks a high level of current income that is exempt from regular federal income tax, consistent with preservation of capital.
Portfolio Management Discussion and Analysis
Below, the Goldman Sachs Municipal Fixed Income Investment Management Team discusses the Goldman Sachs Municipal Income Fund’s (the “Fund”) performance and positioning for the six-month period ended September 30, 2012 (the “Reporting Period”).
| Q | How did the Fund perform during the Reporting Period? |
| A | During the Reporting Period, the Fund’s Class A, B, C, Institutional, Service and IR Shares generated cumulative total returns, without sales charges, of 4.87%, 4.48%, 4.48%, 5.11%, 4.80% and 5.00%, respectively. These returns compare to the 4.24% cumulative total return of the Fund’s benchmark, the Barclays Aggregate Municipal Bond Index (the “Index”), during the same time period. |
| Q | What key factors were responsible for the Fund’s performance during the Reporting Period? |
| A | The Fund’s duration and yield curve strategy contributed positively to relative performance during the Reporting Period. Sector and issue selection also enhanced results. The Fund’s credit quality positioning added value as well. |
| Q | Which municipal bond market sectors most significantly affected Fund performance? |
| A | In the first half of the Reporting Period, the Fund benefited from its holdings of multi-family housing bonds, tobacco bonds and dedicated tax-backed securities. Its focus on lower-quality investment grade bonds, specifically A-rated and BBB-rated securities, added to results. The Fund’s exposure to California and Puerto Rico municipal securities was advantageous, however its investments in state general obligation (“GO”) bonds overall detracted slightly. The Fund’s allocation to water and sewer bonds was also a modest drag on performance. |
| During the second half of the Reporting Period, as spread, or non-U.S. Treasury, sectors rallied, the Fund benefited from its positions in traditionally higher yielding segments of the municipal bond market, such as tobacco and hospital bonds. Exposure to California municipal securities also continued to add value. |
| For the Reporting Period as a whole, the Fund benefited from its exposure to zero coupon bonds. |
| Q | How did duration and yield curve positioning decisions affect the Fund’s performance? |
| A | The Fund’s long duration position relative to the Index added to performance as yields declined during the Reporting Period. Duration is a measure of the Fund’s sensitivity to changes in interest rates. |
| Our yield curve positioning strategy also enhanced relative results. The Fund’s overweighted exposure to maturities of 12 years and longer contributed to performance, as yields declined and the yield curve flattened during the Reporting Period. Yield curve indicates the spectrum of maturities within a particular sector. |
| Q | How did the Fund use derivatives and similar instruments during the Reporting Period? |
| A | In seeking to achieve its investment objective, and as market conditions warranted during the Reporting Period, the Fund used municipal inverse variable rate securities to take advantage of changes in interest rates. These securities have an inverse relationship to short-term interest rates — the interest rate they pay generally increases as short-term interest rates fall — and they therefore have the potential to increase the Fund’s income. |
10
PORTFOLIO RESULTS
| Q | What changes did you make in the Fund’s weightings and investments during the Reporting Period? |
| A | During the Reporting Period, we increased the Fund’s exposure to California municipal securities and its allocations to airport bonds and water and sewer bonds. We reduced the Fund’s exposure to BBB-rated securities. |
| Q | How was the Fund positioned relative to its benchmark index at the end of the Reporting Period? |
| A | At the end of the Reporting Period, the Fund was overweight lower credit quality investment grade municipal bonds and bonds with maturities of 13 months and less relative to the Index. It held overweighted allocations relative to the Index in bonds issued in California, Illinois and Puerto Rico. The Fund was overweight bonds in the hospital and airport sectors. Compared to the Index, the Fund was underweight state and local GO bonds and pre-refunded municipal bonds at the end of the Reporting Period. |
| Q | What is the Fund’s tactical view and strategy for the months ahead? |
| A | We intend to continue managing the Fund to seek opportunities along the entire municipal bond yield curve and across the spectrum of investment grade credits. We will continue to monitor the changing dynamic between agencies and municipals, seeking to keep the Fund invested in the most tax-efficient manner. Based on shifts in interest rates, we intend to maintain an appropriate duration target relative to the Index. |
11
FUND BASICS
Municipal Income Fund
as of September 30, 2012
| PERFORMANCE REVIEW |
| April 1, 2012– September 30, 2012 | Fund Total Return (based on NAV)1 | Barclays Aggregate Municipal Bond Index2 | 30-Day Standardized Subsidized Yield3 | 30-Day Standardized Unsubsidized Yield3 | 30-Day Taxable Equivalent Yield4 | |||||||||||||||||
| Class A | 4.87 | % | 4.24 | % | 2.28 | % | 2.07 | % | 3.51 | % | ||||||||||||
| Class B | 4.48 | 4.24 | 1.63 | 1.41 | 2.51 | |||||||||||||||||
| Class C | 4.48 | 4.24 | 1.62 | 1.41 | 2.49 | |||||||||||||||||
| Institutional | 5.11 | 4.24 | 2.70 | 2.48 | 4.15 | |||||||||||||||||
| Service | 4.80 | 4.24 | 2.18 | 1.97 | 3.35 | |||||||||||||||||
| Class IR | 5.00 | 4.24 | 2.62 | 2.40 | 4.03 | |||||||||||||||||
| 1 | The net asset value (“NAV”) represents the net assets of the class of the Fund (ex-dividend) divided by the total number of shares of the class outstanding. The Fund’s performance assumes the reinvestment of dividends and other distributions. The Fund’s performance does not reflect the deduction of any applicable sales charges. |
| 2 | The Barclays Aggregate Municipal Bond Index is an unmanaged broad-based total return index composed of approximately 40,000 investment grade, fixed rate, and tax-exempt issues, with a remaining maturity of at least one year. The Index figures do not reflect any deduction for fees, expenses or taxes. It is not possible to invest directly in an index. |
| 3 | The 30-Day Standardized Subsidized Yield of the Fund is calculated by dividing the net investment income per share (as defined by securities industry regulations) earned by the Fund over a 30-day period (ending on the stated month-end date) by the maximum public offering price (“POP”) per share of the Fund on the last day of the period. This number is then annualized. This yield does not necessarily reflect income actually earned and distributed by the Fund and, therefore, may not be correlated with the dividends or other distributions paid to shareholders. The 30-Day Standardized Unsubsidized Yield does not reflect any applicable expense reductions. |
| 4 | The 30-Day Taxable Equivalent Yield of the Fund is calculated by dividing the current 30-Day Standardized Subsidized Yield by 1 minus the highest 2011 federal income tax rate of 35%. |
The returns set forth in the table above represent past performance. Past performance does not guarantee future results. The Fund’s investment return and principal value will fluctuate so that an investor’s shares, when redeemed, may be worth more or less than their original cost. Current performance may be lower or higher than the performance quoted above. Please visit our web site at www.goldmansachsfunds.com to obtain the most recent month-end returns. Performance reflects fee waivers and/or expense limitations in effect. In their absence, performance would be reduced. Returns do not reflect the deduction of taxes that a shareholder would pay on Fund distributions or the redemption of Fund shares. |
12
FUND BASICS
| STANDARDIZED TOTAL RETURNS5 | ||||||||||||||
| For the period ended 9/30/12 | One Year | Five Years | Ten Years | Since Inception | Inception Date | |||||||||
| Class A | 6.94 | % | 4.85% | 4.22% | 5.00% | 7/20/93 | ||||||||
| Class B | 5.13 | 4.46 | 3.98 | 4.95 | 5/1/96 | |||||||||
| Class C | 9.24 | 4.85 | 3.83 | 4.21 | 8/15/97 | |||||||||
| Institutional | 11.47 | 6.01 | 5.00 | 5.38 | 8/15/97 | |||||||||
| Service | 10.91 | 5.44 | 4.46 | 4.88 | 7/20/93 | |||||||||
| Class IR | 11.38 | N/A | N/A | 7.93 | 7/30/10 | |||||||||
| 5 | The Standardized Total Returns are average annual total returns as of the most recent calendar quarter-end. They assume reinvestment of all distributions at NAV. These returns reflect a maximum initial sales charge of 3.75% for Class A Shares, the assumed contingent deferred sales charge for Class B Shares (5% maximum declining to 0% after six years) and the assumed contingent deferred sales charge for Class C Shares (1% if redeemed within 12 months of purchase). Class B Shares convert automatically to Class A Shares on or about the fifteenth day of the last month of the calendar quarter that is eight years after purchase. Returns for Class B Shares for the period after conversion reflect the performance of Class A Shares. Prior to July 29, 2009, the maximum initial sales charge applicable to Class A Shares of the Fund was 4.5%, which is not reflected in the figures shown. Because Institutional Shares, Service Shares and Class IR Shares do not involve a sales charge, such a charge is not applied to their Standardized Total Returns. The Fund’s Class B Shares are no longer available for purchase by new or existing shareholders (although current Class B shareholders may continue to reinvest income and capital gains distributions into Class B Shares, and Class B shareholders may continue to exchange their shares for Class B Shares of certain other Goldman Sachs Funds). |
| The returns set forth in the table above represent past performance. Past performance does not guarantee future results. The Fund’s investment return and principal value will fluctuate so that an investor’s shares, when redeemed, may be worth more or less than their original cost. Current performance may be lower or higher than the performance quoted above. Please visit our web site at www.goldmansachsfunds.com to obtain the most recent month-end returns. Performance reflects fee waivers and/or expense limitations in effect. In their absence, performance would be reduced. Returns do not reflect the deduction of taxes that a shareholder would pay on Fund distributions or the redemption of Fund shares. |
| EXPENSE RATIOS6 | ||||||||||
| Net Expense Ratio (Current) | Gross Expense Ratio (Before Waivers) | |||||||||
| Class A | 0.78 | % | 0.99 | % | ||||||
| Class B | 1.53 | 1.74 | ||||||||
| Class C | 1.53 | 1.74 | ||||||||
| Institutional | 0.44 | 0.65 | ||||||||
| Service | 0.94 | 1.15 | ||||||||
| Class IR | 0.53 | 0.74 | ||||||||
| 6 | The expense ratios of the Fund, both current (net of applicable fee waivers and/or expense limitations) and before waivers (gross of applicable fee waivers and/or expense limitations) are as set forth above according to the most recent publicly available Prospectus for the Fund and may differ from the expense ratios disclosed in the Financial Highlights in this report. The Fund’s waivers and/or expense limitations will remain in place through at least July 27, 2013, and prior to such date the investment adviser may not terminate the arrangements without the approval of the Fund’s Board of Trustees. If these arrangements are discontinued in the future, the expense ratios may change without shareholder approval. |
13
FUND BASICS
| SECTOR ALLOCATION7 | ||
| Percentage of Market Value |
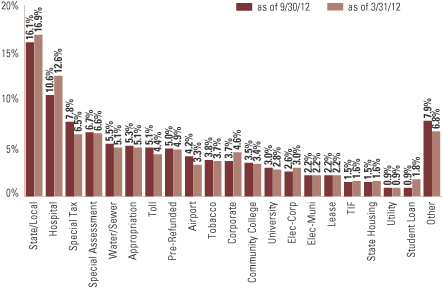
| 7 | The percentage shown for each investment category reflects the value of investments in that category as a percentage of market value. The above graph depicts the Fund’s investments but may not represent the Fund’s market exposure due to the exclusion of derivatives, if any, as listed in the Additional Investment Information section of the Schedule of Investments. |
14
PORTFOLIO RESULTS
Goldman Sachs Short Duration Tax-Free Fund
Investment Objective
The Fund seeks a high level of current income, consistent with relatively low volatility of principal, that is exempt from regular federal income tax.
Portfolio Management Discussion and Analysis
Below, the Goldman Sachs Municipal Fixed Income Investment Management Team discusses the Goldman Sachs Short Duration Tax-Free Fund’s (the “Fund”) performance and positioning for the six-month period ended September 30, 2012 (the “Reporting Period”).
| Q | How did the Fund perform during the Reporting Period? |
| A | During the Reporting Period, the Fund’s Class A, B, C, Institutional, Service and IR Shares generated cumulative total returns, without sales charges, of 1.25%, 0.94%, 1.05%, 1.42%, 1.17% and 1.38%, respectively. These returns compare to the 0.83% cumulative total return of the Fund’s benchmark, the Barclays 1-3 Year Municipal Bond Index (with dividends reinvested) (the “Index”), during the same time period. |
| Q | What key factors were responsible for the Fund’s performance during the Reporting Period? |
| A | State and sector selection contributed positively to relative performance during the Reporting Period. The Fund’s credit quality positioning also enhanced results. Our yield curve strategy added value as well. |
| Q | Which municipal bond market sectors most significantly affected Fund performance? |
| A | During the Reporting Period overall, the Fund benefited from its allocation to lower rated credits, particularly A-rated and BBB-rated securities. Also, as yields declined, the Fund’s investments in zero coupon bonds boosted relative returns. |
| In addition, during the first half of the Reporting Period, the Fund’s exposure to Florida and Michigan municipal securities added to relative returns, though investments overall in state general obligation (“GO”) bonds detracted slightly. The Fund’s allocation to water and sewer bonds was a modest drag on performance. |
| During the second half of the Reporting Period, the Fund’s exposure to Illinois and Michigan municipal bonds contributed positively. |
| Q | How did duration and yield curve positioning decisions affect the Fund’s performance? |
| A | The Fund’s duration position did not have a meaningful impact on relative performance during the Reporting Period. Duration is a measure of the Fund’s sensitivity to changes in interest rates. |
| Our yield curve positioning strategy enhanced relative results. The Fund’s overweighted exposure to maturities of five years and longer contributed to performance, as yields declined and the yield curve flattened during the Reporting Period. Yield curve indicates the spectrum of maturities within a particular sector. |
| Q | How did the Fund use derivatives and similar instruments during the Reporting Period? |
| A | In seeking to achieve its investment objective, and as market conditions warranted during the Reporting Period, the Fund used municipal inverse variable rate securities to take advantage of changes in interest rates. These securities have an inverse relationship to short-term interest rates — the interest rate they pay generally increases as short-term interest rates fall — and they therefore have the potential to increase the Fund’s income. |
| Q | What changes did you make in the Fund’s weightings and investments during the Reporting Period? |
| A | During the Reporting Period, we sold part of the Fund’s position in zero coupon bonds to capture profits. As a result of heightened volatility, we slightly reduced the Fund’s exposure to Puerto Rico bonds. We increased the Fund’s exposure to the five-year to seven-year portion of the municipal bond yield curve. |
15
PORTFOLIO RESULTS
| Q | How was the Fund positioned relative to its benchmark index at the end of Reporting Period? |
| A | At the end of the Reporting Period, the Fund was overweight lower credit quality investment grade municipal bonds and bonds with maturities of 13 months and less relative to the Index. It held overweighted allocations relative to the Index in bonds issued in Illinois and Florida. Compared to the Index, the Fund was underweight California GO bonds and pre-refunded municipal bonds at the end of the Reporting Period. |
| Q | What is the Fund’s tactical view and strategy for the months ahead? |
| A | We intend to continue managing the Fund to seek opportunities in the short-term end of the municipal bond yield curve, including investment grade credits. We will continue to monitor the changing dynamic between agencies and municipals, seeking to keep the Fund invested in the most tax-efficient manner. Based on shifts in interest rates, we intend to maintain an appropriate duration target relative to the Index. We may adjust the Fund’s duration position if we see a broad change in interest rates. |
16
FUND BASICS
Short Duration Tax-Free Fund
as of September 30, 2012
| PERFORMANCE REVIEW |
| April 1, 2012– September 30, 2012 | Fund Total Return (based on NAV)1 | Barclays 1-3 Year Municipal Bond Index2 | 30-Day Standardized Subsidized Yield3 | 30-Day Standardized Unsubsidized Yield3 | 30-Day Taxable Equivalent Yield4 | |||||||||||||||||
| Class A | 1.25 | % | 0.83 | % | 0.63 | % | 0.60 | % | 0.97 | % | ||||||||||||
| Class B | 0.94 | 0.83 | 0.05 | -0.13 | 0.08 | |||||||||||||||||
| Class C | 1.05 | 0.83 | 0.25 | -0.13 | 0.38 | |||||||||||||||||
| Institutional | 1.42 | 0.83 | 0.98 | 0.95 | 1.51 | |||||||||||||||||
| Service | 1.17 | 0.83 | 0.50 | 0.47 | 0.77 | |||||||||||||||||
| Class IR | 1.38 | 0.83 | 0.89 | 0.86 | 1.37 | |||||||||||||||||
| 1 | The net asset value (“NAV”) represents the net assets of the class of the Fund (ex-dividend) divided by the total number of shares of the class outstanding. The Fund’s performance reflects the reinvestment of dividends and other distributions. The Fund’s performance does not reflect the deduction of any applicable sales charges. |
| 2 | The Barclays 1-3 Year Municipal Bond Index, an unmanaged index, represents investment grade municipal bonds with maturities greater than one year and less than 4 years, and does not reflect any deduction for fees, expenses or taxes. It is not possible to invest directly in an index. |
| 3 | The 30-Day Standardized Subsidized Yield of the Fund is calculated by dividing the net investment income per share (as defined by securities industry regulations) earned by the Fund over a 30-day period (ending on the stated month-end date) by the maximum public offering price (“POP”) per share of the Fund on the last day of the period. This number is then annualized. This yield does not necessarily reflect income actually earned and distributed by the Fund and, therefore, may not be correlated with the dividends or other distributions paid to shareholders. The 30-Day Standardized Unsubsidized Yield does not reflect any applicable expense reductions. |
| 4 | The 30-Day Taxable Equivalent Yield of the Fund is calculated by dividing the current 30-Day Standardized Subsidized Yield by 1 minus the highest 2011 federal income tax rate of 35%. |
The returns set forth in the table above represent past performance. Past performance does not guarantee future results. The Fund’s investment return and principal value will fluctuate so that an investor’s shares, when redeemed, may be worth more or less than their original cost. Current performance may be lower or higher than the performance quoted above. Please visit our web site at www.goldmansachsfunds.com to obtain the most recent month-end returns. Performance reflects fee waivers and/or expense limitations in effect. In their absence, performance would be reduced. Returns do not reflect the deduction of taxes that a shareholder would pay on Fund distributions or the redemption of Fund shares. |
17
FUND BASICS
| STANDARDIZED TOTAL RETURNS5 | ||||||||||||||
| For the period ended 9/30/12 | One Year | Five Years | Ten Years | Since Inception | Inception Date | |||||||||
| Class A | 1.02 | % | 2.89% | 2.37% | 3.15% | 5/1/97 | ||||||||
| Class B | -0.08 | 2.58 | 2.01 | 2.92 | 5/1/97 | |||||||||
| Class C | 1.48 | 2.57 | 1.83 | 2.45 | 8/15/97 | |||||||||
| Institutional | 2.80 | 3.53 | 2.89 | 3.74 | 10/1/92 | |||||||||
| Service | 2.39 | 3.03 | 2.38 | 3.25 | 9/20/94 | |||||||||
| Class IR | 2.70 | N/A | N/A | 2.38 | 7/30/10 | |||||||||
| 5 | The Standardized Total Returns are average annual total returns as of the most recent calendar quarter-end. They assume reinvestment of all distributions at NAV. These returns reflect a maximum initial sales charge of 1.5% for Class A Shares, the assumed contingent deferred sales charge for Class B Shares (2% maximum declining to 0% after three years) and the assumed contingent deferred sales charge for Class C Shares (0.65% if redeemed within 12 months of purchase). Class B Shares convert automatically to Class A Shares on or about the fifteenth day of the last month of the calendar quarter that is eight years after purchase. Returns for Class B Shares for the period after conversion reflect the performance of Class A Shares. Prior to July 29, 2009, the maximum initial sales charge applicable to Class A Shares of the Fund was 2.0%, which is not reflected in the figures shown. Because Institutional, Service and Class IR Shares do not involve a sales charge, such a charge is not applied to their Standardized Total Returns. The Fund’s Class B Shares are no longer available for purchase by new or existing shareholders (although current Class B shareholders may continue to reinvest income and gains distributions into Class B Shares, and Class B shareholders may continue to exchange their shares for Class B Shares of certain other Goldman Sachs Funds). |
| The returns set forth in the table above represent past performance. Past performance does not guarantee future results. The Fund’s investment return and principal value will fluctuate so that an investor’s shares, when redeemed, may be worth more or less than their original cost. Current performance may be lower or higher than the performance quoted above. Please visit our web site at www.goldmansachsfunds.com to obtain the most recent month-end returns. Performance reflects fee waivers and/or expense limitations in effect. In their absence, performance would be reduced. Returns do not reflect the deduction of taxes that a shareholder would pay on Fund distributions or the redemption of Fund shares. |
| EXPENSE RATIOS6 | ||||||||||
| Net Expense Ratio (Current) | Gross Expense Ratio (Before Waivers) | |||||||||
| Class A | 0.73 | % | 0.77 | % | ||||||
| Class B | 1.33 | 1.52 | ||||||||
| Class C | 1.13 | 1.52 | ||||||||
| Institutional | 0.39 | 0.43 | ||||||||
| Service | 0.89 | 0.93 | ||||||||
| Class IR | 0.48 | 0.52 | ||||||||
| 6 | The expense ratios of the Fund, both current (net of applicable fee waivers and/or expense limitations) and before waivers (gross of applicable fee waivers and/or expense limitations) are as set forth above according to the most recent publicly available Prospectus for the Fund and may differ from the expense ratios disclosed in the Financial Highlights in this report. The Fund’s waivers and/or expense limitations will remain in place through at least July 27, 2013, and prior to such date the investment adviser may not terminate the arrangements without the approval of the Fund’s Board of Trustees. If these arrangements are discontinued in the future, the expense ratios may change without shareholder approval. |
18
FUND BASICS
| SECTOR ALLOCATION7 | ||
| Percentage of Market Value |
| 7 | The percentage shown for each investment category reflects the value of investments in that category as a percentage of market value. The above graph depicts the Fund’s investments but may not represent the Fund’s market exposure due to the exclusion of derivatives, if any, as listed in the Additional Investment Information section of the Schedule of Investments. |
19
GOLDMAN SACHS HIGH YIELD MUNICIPAL FUND
Schedule of Investments
September 30, 2012 (Unaudited)
Principal Amount | Interest Rate | Maturity Date | Value | |||||||||||
| State-Specific Municipal Debt Obligations – 96.5% | ||||||||||||||
| Alabama – 2.1% |
| ||||||||||||
| Alabama Special Care Facilities Financing Authority RB for | | ||||||||||||
| $ | 6,875,000 | 14.080 | % | 11/03/16 | $ | 10,104,600 | ||||||||
| Alexander City Special Care Facilities Financing Authority | | ||||||||||||
| 3,405,000 | 5.375 | 12/01/16 | 3,665,142 | |||||||||||
| 4,425,000 | 5.500 | 12/01/21 | 4,633,506 | |||||||||||
| 5,775,000 | 5.625 | 12/01/26 | 6,002,131 | |||||||||||
| 16,515,000 | 5.750 | 12/01/36 | 16,998,889 | |||||||||||
| Courtland Industrial Development Board PCRB Refunding for | | ||||||||||||
| 1,000,000 | 5.000 | 06/01/25 | 1,030,560 | |||||||||||
| Infirmary Health System Special Care Facilities Financing | | ||||||||||||
| 7,500,000 | 5.250 | 02/01/30 | 8,080,050 | |||||||||||
| Prattville Alabama Industrial Development Board Environmental | | ||||||||||||
| 3,185,000 | 4.750 | 12/01/30 | 3,185,574 | |||||||||||
| Selma Industrial Development Board Gulf Opportunity Zone | | ||||||||||||
| 2,250,000 | 5.375 | 12/01/35 | 2,454,570 | |||||||||||
| Sylacauga Health Care Authority RB for Coosa Valley Medical | | ||||||||||||
| 7,600,000 | 6.000 | 08/01/25 | 7,677,748 | |||||||||||
| 15,000,000 | 6.000 | 08/01/35 | 15,052,500 | |||||||||||
|
| |||||||||||||
| 78,885,270 | ||||||||||||||
|
| |||||||||||||
| Arizona – 2.5% |
| ||||||||||||
| Apache County IDA PCRB for Tucson Electric Power Company | | ||||||||||||
| 7,000,000 | 4.500 | 03/01/30 | 7,311,150 | |||||||||||
| Arizona Health Facilities Authority Hospital RB for Phoenix | | ||||||||||||
| 39,070,000 | 1.180 | 02/02/15 | 38,704,696 | |||||||||||
| City of Tempe IDA RB Refunding for Friendship Village | | ||||||||||||
| 1,325,000 | 6.250 | 12/01/46 | 1,428,271 | |||||||||||
| City of Tempe Industrial Development Authority RB Refunding | | ||||||||||||
| 1,250,000 | 6.250 | 12/01/42 | 1,349,312 | |||||||||||
| Maricopa County Arizona Pollution Control Corp. PCRB | | ||||||||||||
| 8,800,000 | 7.250 | 02/01/40 | 10,422,104 | |||||||||||
| Maricopa County Arizona Pollution Control Corp. PCRB | | ||||||||||||
| 5,000,000 | 6.250 | 01/01/38 | 5,671,150 | |||||||||||
| Pima County IDA RB for Tucson Electric Power Co. Project | | ||||||||||||
| 7,850,000 | 5.750 | 09/01/29 | 8,369,121 | |||||||||||
|
| |||||||||||||
| State-Specific Municipal Debt Obligations – (continued) | ||||||||||||||
| Arizona – (continued) |
| ||||||||||||
| Pima County IDA RB for Tucson Electric Power Co. Project | | ||||||||||||
| $ | 7,485,000 | 5.250 | % | 10/01/40 | $ | 8,125,117 | ||||||||
| Pima County IDA RB Refunding for Tucson Electric Power Co. | | ||||||||||||
| 5,350,000 | 4.500 | 06/01/30 | 5,592,943 | |||||||||||
| University Medical Center Corp. RB Series 2009 (BBB+/Baa1) |
| ||||||||||||
| 500,000 | 6.250 | 07/01/29 | 583,895 | |||||||||||
| 1,000,000 | 6.500 | 07/01/39 | 1,163,760 | |||||||||||
| University Medical Center Corp. RB Series 2011 (GO OF CORP) | | ||||||||||||
| 3,500,000 | 6.000 | 07/01/39 | 4,059,615 | |||||||||||
|
| |||||||||||||
| 92,781,134 | ||||||||||||||
|
| |||||||||||||
| California – 14.9% |
| ||||||||||||
| ABC Unified School District GO Bonds Series 2001 C | | ||||||||||||
| 1,600,000 | 0.000 | 08/01/26 | 889,648 | |||||||||||
| Alameda County Oakland Unified School District GO Bonds for | | ||||||||||||
| 2,800,000 | 5.500 | 08/01/32 | 3,099,964 | |||||||||||
| Alvord Unified School District GO Bonds Capital Appreciation | | ||||||||||||
| 1,210,000 | 0.000 | 08/01/36 | 341,510 | |||||||||||
| Anaheim Public Financing Authority RB Capital Appreciation for | | ||||||||||||
| 855,000 | 0.000 | 09/01/29 | 384,622 | |||||||||||
| Anaheim Redevelopment Agency Tax Allocation Refunding for | | ||||||||||||
| 1,725,000 | 5.000 | 02/01/22 | 1,881,216 | |||||||||||
| 3,875,000 | 5.000 | 02/01/24 | 4,174,615 | |||||||||||
| Bakersfield School District GO Bonds Capital Appreciation for | | ||||||||||||
| 600,000 | 0.000 | 05/01/37 | 208,254 | |||||||||||
| 5,250,000 | 0.000 | 05/01/42 | 1,794,188 | |||||||||||
| 7,380,000 | 0.000 | 05/01/47 | 2,471,931 | |||||||||||
| Calaveras Unified School District GO Bonds for Capital | | ||||||||||||
| 1,055,000 | 0.000 | 08/01/25 | 599,124 | |||||||||||
| California Health Facilities Financing Authority RB for California | | ||||||||||||
| 5,870,000 | 5.250 | 11/15/46 | 6,209,638 | |||||||||||
| California Health Facilities Financing Authority RB for | | ||||||||||||
| 1,000,000 | 5.000 | 11/15/34 | 1,068,740 | |||||||||||
| California Municipal Finance Authority COPS for Community | | ||||||||||||
| 19,500,000 | 5.500 | 02/01/39 | 20,595,120 | |||||||||||
| California Public Works Board Lease RB for various Judicial | | ||||||||||||
| 3,000,000 | 5.000 | 12/01/31 | 3,278,610 | |||||||||||
| California State Various Purpose Refunding (A-/A1) |
| ||||||||||||
| 20,000,000 | 5.000 | 04/01/42 | 22,167,000 | |||||||||||
|
| |||||||||||||
| 20 | The accompanying notes are an integral part of these financial statements. |
GOLDMAN SACHS HIGH YIELD MUNICIPAL FUND
Principal Amount | Interest Rate | Maturity Date | Value | |||||||||||
| State-Specific Municipal Debt Obligations – (continued) | ||||||||||||||
| California – (continued) |
| ||||||||||||
| California Statewide Communities Development Authority RB | | ||||||||||||
| $ | 2,000,000 | 5.400 | % | 11/01/27 | $ | 2,127,780 | ||||||||
| 11,850,000 | 5.500 | 11/01/38 | 12,263,209 | |||||||||||
| California Statewide Communities Development Authority RB | | ||||||||||||
| 6,000,000 | 6.625 | 08/01/29 | 7,604,760 | |||||||||||
| California Statewide Financing Authority Tobacco Settlement RB | | ||||||||||||
| 35,000,000 | 0.000 | 06/01/46 | 1,767,500 | |||||||||||
| California Various Purpose GO Bonds Series 2011 (A-/A1) |
| ||||||||||||
| 10,000,000 | 5.000 | 09/01/41 | 11,034,800 | |||||||||||
| Capistrano Unified School District Special Tax for Capital | | ||||||||||||
| 7,000,000 | 0.000 | 09/01/33 | 2,283,190 | |||||||||||
| City of Davis Redevelopment Agency Tax Allocation for Davis | | ||||||||||||
| 750,000 | 6.500 | 12/01/26 | 874,417 | |||||||||||
| 2,830,000 | 7.000 | 12/01/36 | 3,356,154 | |||||||||||
| City of Goleta Redevelopment Agency Tax Allocation for Goleta | | ||||||||||||
| 670,000 | 7.750 | 12/01/31 | 724,283 | |||||||||||
| 5,000,000 | 8.000 | 06/01/44 | 5,408,600 | |||||||||||
| City of Palo Alto Limited Obligation Refunding Improvement | | ||||||||||||
| 600,000 | 5.000 | 09/02/30 | 654,330 | |||||||||||
| Coronado Community Development Agency Tax Allocation for | | ||||||||||||
| 175,000 | 5.000 | 09/01/20 | 186,242 | |||||||||||
| El Dorado County Community Facilities District No. 1992-1 | | ||||||||||||
| 700,000 | 4.000 | 09/01/31 | 693,560 | |||||||||||
| Encinitas Community Facilities District No.1 Special Tax | | ||||||||||||
| 775,000 | 5.000 | 09/01/29 | 840,518 | |||||||||||
| 2,000,000 | 4.000 | 09/01/30 | 1,964,780 | |||||||||||
| Fontana Public Financing Authority Tax Allocation for North | | ||||||||||||
| 1,540,000 | 5.250 | 09/01/20 | 1,543,942 | |||||||||||
| Fullerton Public Financing Authority Tax Allocation Series 2005 | | ||||||||||||
| 200,000 | 5.000 | 09/01/27 | 203,512 | |||||||||||
| Golden State Tobacco Securitization Corp. California Tobacco | | ||||||||||||
| 125,785,000 | 0.000 | 06/01/47 | 9,543,308 | |||||||||||
| Golden State Tobacco Securitization Corp. California Tobacco | | ||||||||||||
| 307,000,000 | 0.000 | 06/01/47 | 6,431,650 | |||||||||||
|
| |||||||||||||
| State-Specific Municipal Debt Obligations – (continued) | ||||||||||||||
| California – (continued) |
| ||||||||||||
| Golden State Tobacco Securitization Corp. California Tobacco | | ||||||||||||
| $ | 1,590,000 | 5.125 | % | 06/01/47 | $ | 1,219,784 | ||||||||
| Golden State Tobacco Securitization Corp. California Tobacco | | ||||||||||||
| 23,400,000 | 5.000 | 06/01/45 | 23,989,914 | |||||||||||
| Golden State Tobacco Securitization Corp. California Tobacco | | ||||||||||||
| 15,535,000 | 5.000 | 06/01/35 | 15,938,444 | |||||||||||
| 13,190,000 | 5.000 | 06/01/38 | 13,492,315 | |||||||||||
| Golden State Tobacco Securitization Corp. California Tobacco | | ||||||||||||
| 150,000 | 5.000 | 06/01/45 | 153,172 | |||||||||||
| Golden State Tobacco Securitization Corp. California Tobacco | | ||||||||||||
| 32,135,000 | 5.750 | 06/01/47 | 27,285,828 | |||||||||||
| Golden State Tobacco Securitization Corp. California Tobacco | | ||||||||||||
| 20,805,000 | 5.000 | 06/01/45 | 21,245,026 | |||||||||||
| Golden State Tobacco Securitization Corp. Enhanced Tobacco | | ||||||||||||
| 220,000 | 5.000 | 06/01/45 | 224,321 | |||||||||||
| Hartnell Community College District GO Bonds Capital | | ||||||||||||
| 50,000,000 | 0.000 | 08/01/49 | 3,841,000 | |||||||||||
| Inland Empire Tobacco Securitization Authority RB Turbo Asset- | | ||||||||||||
| 101,195,000 | 0.000 | 06/01/36 | 8,795,869 | |||||||||||
| Inland Empire Tobacco Securitization Authority RB Turbo Asset- | | ||||||||||||
| 211,235,000 | 0.000 | 06/01/47 | 7,441,809 | |||||||||||
| Inland Empire Tobacco Securitization Authority RB Turbo Asset- | | ||||||||||||
| 260,660,000 | 0.000 | 06/01/57 | 3,091,428 | |||||||||||
| Lake Elsinore Unified School District Community Facilities | | ||||||||||||
| 1,435,000 | 5.050 | 09/01/30 | 1,440,324 | |||||||||||
| 690,000 | 5.050 | 09/01/35 | 690,338 | |||||||||||
| Lemoore Redevelopment Agency Tax Allocation for Lemoore | | ||||||||||||
| 665,000 | 6.625 | 08/01/24 | 715,580 | |||||||||||
| 1,000,000 | 7.250 | 08/01/31 | 1,094,150 | |||||||||||
| 9,315,000 | 7.375 | 08/01/40 | 10,194,895 | |||||||||||
| Los Angeles County GO Bonds for Westside Union School | | ||||||||||||
| 49,925,000 | 0.000 | 08/01/50 | 6,876,170 | |||||||||||
|
| |||||||||||||
| The accompanying notes are an integral part of these financial statements. | 21 |
GOLDMAN SACHS HIGH YIELD MUNICIPAL FUND
Schedule of Investments (continued)
September 30, 2012 (Unaudited)
Principal Amount | Interest Rate | Maturity Date | Value | |||||||||||
| State-Specific Municipal Debt Obligations – (continued) | ||||||||||||||
| California – (continued) |
| ||||||||||||
| Los Angeles County Sanitation Districts Financing Authority RB | | ||||||||||||
| $ | 4,000,000 | 4.500 | % | 10/01/42 | $ | 4,097,000 | ||||||||
| Los Angeles Regional Airports Improvement Corp. Lease RB | | ||||||||||||
| 32,425,000 | 7.500 | 12/01/24 | 32,125,069 | |||||||||||
| Los Angeles Unified School District GO Bonds Refunding | | ||||||||||||
| 13,745,000 | 4.500 | 01/01/28 | 14,935,180 | |||||||||||
| Lynwood Redevelopment Agency Tax Allocation for Housing | | ||||||||||||
| 1,625,000 | 6.750 | 09/01/26 | 1,833,618 | |||||||||||
| 1,500,000 | 7.000 | 09/01/31 | 1,699,665 | |||||||||||
| 875,000 | 7.250 | 09/01/38 | 999,565 | |||||||||||
| Madera County Unified School District GO Bonds Capital | | ||||||||||||
| 2,740,000 | 0.000 | 08/01/26 | 1,389,728 | |||||||||||
| 2,590,000 | 0.000 | 08/01/27 | 1,239,911 | |||||||||||
| 1,395,000 | 0.000 | 08/01/28 | 630,582 | |||||||||||
| Merced City School District GO Bonds Capital Appreciation for | | ||||||||||||
| 1,330,000 | 0.000 | 08/01/27 | 671,756 | |||||||||||
| Merced-Union High School District Election of 2008 GO Bonds | | ||||||||||||
| 3,750,000 | 0.000 | 08/01/35 | 1,172,100 | |||||||||||
| Monrovia Unified School District GO Bonds for Capital | | ||||||||||||
| 1,000,000 | 0.000 | 08/01/24 | 612,340 | |||||||||||
| M-S-R Energy Authority Gas RB Series 2009 A (A-/NR) |
| ||||||||||||
| 8,250,000 | 6.500 | 11/01/39 | 10,708,748 | |||||||||||
| M-S-R Energy Authority Gas RB Series 2009 B (A-/NR) |
| ||||||||||||
| 2,000,000 | 6.500 | 11/01/39 | 2,596,060 | |||||||||||
| M-S-R Energy Authority Gas RB Series 2009 C (A-/NR) |
| ||||||||||||
| 10,000,000 | 6.125 | 11/01/29 | 12,096,200 | |||||||||||
| 13,500,000 | 6.500 | 11/01/39 | 17,523,405 | |||||||||||
| Mt. Diablo Unified School District GO Bonds Capital | | ||||||||||||
| 7,000,000 | 0.000 | 08/01/30 | 4,979,170 | |||||||||||
| Murrieta Community Facilities District No. 3 Special Tax for | | ||||||||||||
| 1,615,000 | 5.200 | 09/01/35 | 1,615,371 | |||||||||||
| Natomas Unified School District GO Bonds Refunding | | ||||||||||||
| 1,435,000 | 4.000 | 09/01/23 | 1,521,789 | |||||||||||
| 1,545,000 | 4.000 | 09/01/24 | 1,621,076 | |||||||||||
| 1,665,000 | 4.000 | 09/01/25 | 1,725,689 | |||||||||||
| 1,735,000 | 4.000 | 09/01/26 | 1,772,025 | |||||||||||
| 1,400,000 | 4.000 | 09/01/27 | 1,419,432 | |||||||||||
|
| |||||||||||||
| State-Specific Municipal Debt Obligations – (continued) | ||||||||||||||
| California – (continued) |
| ||||||||||||
| New Haven Unified School District GO Bonds Refunding for | | ||||||||||||
| $ | 860,000 | 0.000 | % | 08/01/25 | $ | 503,960 | ||||||||
| 1,105,000 | 0.000 | 08/01/26 | 607,794 | |||||||||||
| 5,550,000 | 0.000 | 08/01/30 | 2,458,428 | |||||||||||
| 7,830,000 | 0.000 | 08/01/32 | 3,080,870 | |||||||||||
| 7,000,000 | 0.000 | 08/01/34 | 2,428,090 | |||||||||||
| Palomar Pomerado Health COPS Series 2009 (BB+/Baa3) |
| ||||||||||||
| 16,450,000 | 6.750 | 11/01/39 | 18,470,225 | |||||||||||
| Palomar Pomerado Health COPS Series 2010 (BB+/Baa3) |
| ||||||||||||
| 7,000,000 | 6.000 | 11/01/41 | 7,551,810 | |||||||||||
| Palomar Pomerado Health GO Bonds Capital Appreciation for | | ||||||||||||
| 10,750,000 | 0.000 | 08/01/38 | 9,303,803 | |||||||||||
| Placer Union High School District GO Bonds for Capital | | ||||||||||||
| 1,805,000 | 0.000 | 08/01/25 | 1,071,105 | |||||||||||
| Poway Unified School District Community Facilities District | | ||||||||||||
| 250,000 | 4.600 | 09/01/35 | 248,588 | |||||||||||
| 1,500,000 | 5.000 | 09/01/42 | 1,524,555 | |||||||||||
| Riverside County Redevelopment Agency Tax Allocation for | | ||||||||||||
| 2,220,000 | 0.000 | 10/01/33 | 586,702 | |||||||||||
| 2,220,000 | 0.000 | 10/01/35 | 503,230 | |||||||||||
| 1,840,000 | 0.000 | 10/01/37 | 360,419 | |||||||||||
| 5,000,000 | 0.000 | 10/01/38 | 915,250 | |||||||||||
| 8,425,000 | 0.000 | 10/01/39 | 1,433,429 | |||||||||||
| 13,395,000 | 0.000 | 10/01/40 | 2,122,706 | |||||||||||
| 7,275,000 | 0.000 | 10/01/41 | 1,076,409 | |||||||||||
| 6,000,000 | 0.000 | 10/01/42 | 826,320 | |||||||||||
| Riverside County Redevelopment Agency Tax Allocation for | | ||||||||||||
| 1,225,000 | 6.500 | 10/01/25 | 1,366,193 | |||||||||||
| 1,950,000 | 6.750 | 10/01/30 | 2,182,791 | |||||||||||
| San Bernardino City Unified School District GO Bonds Capital | | ||||||||||||
| 1,420,000 | 0.000 | 08/01/25 | 739,621 | |||||||||||
| San Diego Unified School District GO Bonds for Election of 2008 | | ||||||||||||
| 30,265,000 | 0.000 | 07/01/44 | 6,137,439 | |||||||||||
| San Diego Unified School District GO Bonds Refunding | | ||||||||||||
| 10,000,000 | 0.000 | 07/01/30 | 4,611,500 | |||||||||||
| 3,000,000 | 0.000 | 07/01/31 | 1,295,580 | |||||||||||
| San Francisco City & County Public Utilities Commission Water | | ||||||||||||
| 13,210,000 | 4.000 | 11/01/31 | 14,233,907 | |||||||||||
|
| |||||||||||||
| 22 | The accompanying notes are an integral part of these financial statements. |
GOLDMAN SACHS HIGH YIELD MUNICIPAL FUND
Principal Amount | Interest Rate | Maturity Date | Value | |||||||||||
| State-Specific Municipal Debt Obligations – (continued) | ||||||||||||||
| California – (continued) |
| ||||||||||||
| San Francisco City & County Redevelopment Financing | | ||||||||||||
| $ | 500,000 | 6.750 | % | 08/01/33 | $ | 587,630 | ||||||||
| 2,000,000 | 6.750 | 08/01/41 | 2,305,000 | |||||||||||
| San Francisco City & County Redevelopment Financing | | ||||||||||||
| 435,000 | 6.625 | 08/01/27 | 490,523 | |||||||||||
| San Francisco City & County Redevelopment Financing | | ||||||||||||
| 750,000 | 6.250 | 08/01/28 | 817,170 | |||||||||||
| 555,000 | 6.375 | 08/01/29 | 605,333 | |||||||||||
| 305,000 | 6.500 | 08/01/31 | 331,163 | |||||||||||
| 1,000,000 | 6.625 | 08/01/39 | 1,088,110 | |||||||||||
| San Francisco City & County Redevelopment Financing | | ||||||||||||
| 1,000,000 | 7.000 | 08/01/33 | 1,134,780 | |||||||||||
| 1,500,000 | 7.000 | 08/01/41 | 1,691,280 | |||||||||||
| San Juan Unified School District GO Bonds for Capital | | ||||||||||||
| 1,580,000 | 0.000 | 08/01/24 | 976,503 | |||||||||||
| 1,595,000 | 0.000 | 08/01/25 | 929,981 | |||||||||||
| San Marcos Unified School District GO Bonds Capital | | ||||||||||||
| 3,500,000 | 0.000 | 08/01/47 | 595,630 | |||||||||||
| Santa Monica Redevelopment Agency Tax Allocation for | | ||||||||||||
| 2,000,000 | 5.000 | 07/01/42 | 2,198,900 | |||||||||||
| Santa Monica Redevelopment Agency Tax Allocation for | | ||||||||||||
| 2,000,000 | 5.000 | 07/01/32 | 2,264,460 | |||||||||||
| Santee Community Development Commission Tax Allocation for | | ||||||||||||
| 1,000,000 | 7.000 | 08/01/31 | 1,128,240 | |||||||||||
| 2,000,000 | 7.000 | 08/01/41 | 2,236,340 | |||||||||||
| Simi Valley Community Development Agency Tax Allocation | | ||||||||||||
| 525,000 | 5.250 | 09/01/19 | 541,138 | |||||||||||
| Stockton Unified School District GO Bonds Capital Appreciation | | ||||||||||||
| 13,025,000 | 0.000 | 08/01/39 | 2,898,844 | |||||||||||
| 17,470,000 | 0.000 | 08/01/44 | 2,902,291 | |||||||||||
| 14,850,000 | 0.000 | 08/01/45 | 2,331,747 | |||||||||||
| 17,405,000 | 0.000 | 08/01/46 | 2,574,548 | |||||||||||
| 690,000 | 0.000 | 08/01/47 | 96,455 | |||||||||||
| 14,015,000 | 0.000 | 08/01/48 | 1,851,662 | |||||||||||
|
| |||||||||||||
| State-Specific Municipal Debt Obligations – (continued) | ||||||||||||||
| California – (continued) |
| ||||||||||||
| Stockton Unified School District GO Bonds Election of 2005 | | ||||||||||||
| $ | 1,690,000 | 5.000 | % | 08/01/20 | $ | 1,799,309 | ||||||||
| 1,165,000 | 5.000 | 08/01/21 | 1,233,456 | |||||||||||
| 525,000 | 5.000 | 08/01/22 | 549,927 | |||||||||||
| 2,540,000 | 5.000 | 08/01/23 | 2,660,599 | |||||||||||
| Temecula Public Financing Authority Community Facilities | | ||||||||||||
| 3,515,000 | 5.000 | 09/01/34 | 3,625,758 | |||||||||||
| Temecula Redevelopment Agency Tax Allocation for Housing | | ||||||||||||
| 1,000,000 | 6.750 | 08/01/31 | 1,131,210 | |||||||||||
| 2,100,000 | 7.000 | 08/01/39 | 2,399,838 | |||||||||||
| Tobacco Securitization Authority Southern California Tobacco | | ||||||||||||
| 7,470,000 | 5.125 | 06/01/46 | 5,937,380 | |||||||||||
| Tobacco Securitization Authority Southern California Tobacco | | ||||||||||||
| 2,235,000 | 5.000 | 06/01/37 | 1,818,508 | |||||||||||
| Union City Community Redevelopment Agency Tax Allocation | | ||||||||||||
| 1,500,000 | 6.875 | 12/01/33 | 1,702,200 | |||||||||||
| Upland Community Facilities District No. 2003-2 Special Tax | | ||||||||||||
| 1,000,000 | 5.000 | 09/01/34 | 1,032,310 | |||||||||||
| Walnut Public Financing Authority Tax Allocation for Walnut | | ||||||||||||
| 550,000 | 5.375 | 09/01/19 | 551,017 | |||||||||||
| West Hollywood Community Development Commission Tax | | ||||||||||||
| 1,000,000 | 7.250 | 09/01/31 | 1,124,160 | |||||||||||
| 5,000,000 | 7.500 | 09/01/42 | 5,666,550 | |||||||||||
| William S. Hart Union High School District Election of 2008 GO | | ||||||||||||
| 7,000,000 | 0.000 | 08/01/35 | 2,302,860 | |||||||||||
| 3,325,000 | 0.000 | 08/01/36 | 1,027,425 | |||||||||||
| Wiseburn School District GO Unltd Bonds Capital Appreciation | | ||||||||||||
| 8,775,000 | 0.000 | 08/01/33 | 3,240,871 | |||||||||||
|
| |||||||||||||
| 561,408,391 | ||||||||||||||
|
| |||||||||||||
| Colorado – 2.0% |
| ||||||||||||
| Colorado Health Facilities Authority RB for Covenant Retirement | | ||||||||||||
| 9,050,000 | 5.000 | 12/01/35 | 9,329,283 | |||||||||||
| Colorado Health Facilities Authority RB for Covenant Retirement | | ||||||||||||
| 3,500,000 | 4.500 | 12/01/33 | 3,448,130 | |||||||||||
| 3,500,000 | 5.000 | 12/01/33 | 3,670,380 | |||||||||||
|
| |||||||||||||
| The accompanying notes are an integral part of these financial statements. | 23 |
GOLDMAN SACHS HIGH YIELD MUNICIPAL FUND
Schedule of Investments (continued)
September 30, 2012 (Unaudited)
Principal Amount | Interest Rate | Maturity Date | Value | |||||||||||
| State-Specific Municipal Debt Obligations – (continued) | ||||||||||||||
| Colorado – (continued) |
| ||||||||||||
| Colorado Health Facilities Authority RB for The Evangelical | | ||||||||||||
| $ | 16,110,000 | 5.000 | % | 12/01/42 | $ | 17,058,235 | ||||||||
| Colorado Regional Transportation District Tax-Exempt Private | | ||||||||||||
| 12,860,000 | 6.000 | 01/15/41 | 14,881,335 | |||||||||||
| Cross Creek Metropolitan District No. 2 GO Bonds Refunding | | ||||||||||||
| 4,500,000 | 3.500 | 12/01/12 | 3,577,410 | |||||||||||
| Denver Colorado City & County Special Facilities Airport RB | | ||||||||||||
| 9,000,000 | 5.750 | 10/01/32 | 9,335,250 | |||||||||||
| E-470 Public Highway Authority RB Series 2004 A (NATL-RE) | | ||||||||||||
| 15,000,000 | 0.000 | 09/01/28 | 6,720,750 | |||||||||||
| 4,100,000 | 0.000 | 09/01/34 | 1,243,448 | |||||||||||
| E-470 Public Highway Authority RB Series 2004 B (NATL-RE) | | ||||||||||||
| 1,715,000 | 0.000 | 09/01/28 | 733,351 | |||||||||||
| E-470 Public Highway Authority RB Series 2010 A | | ||||||||||||
| 4,000,000 | 0.000 | 09/01/40 | 819,840 | |||||||||||
| Park Meadows Business Improvement District RB Series 2007 | | ||||||||||||
| 475,000 | 5.300 | 12/01/27 | 502,830 | |||||||||||
| 720,000 | 5.350 | 12/01/31 | 755,295 | |||||||||||
| Vista Ridge Metropolitan District GO Bonds Refunding Limited | | ||||||||||||
| 1,725,000 | 6.625 | 12/01/40 | 1,306,273 | |||||||||||
|
| |||||||||||||
| 73,381,810 | ||||||||||||||
|
| |||||||||||||
| Connecticut – 0.3% |
| ||||||||||||
| West Haven Connecticut GO Bonds Series 2012 (AGM) | | ||||||||||||
| 3,495,000 | 5.000 | 08/01/21 | 3,992,653 | |||||||||||
| 2,095,000 | 5.000 | 08/01/22 | 2,393,663 | |||||||||||
| 2,000,000 | 5.000 | 08/01/23 | 2,272,520 | |||||||||||
| 1,000,000 | 5.000 | 08/01/25 | 1,128,220 | |||||||||||
|
| |||||||||||||
| 9,787,056 | ||||||||||||||
|
| |||||||||||||
| Delaware – 0.2% |
| ||||||||||||
| Bridgeville Delaware Special Obligation Special Tax for Heritage | | ||||||||||||
| 6,501,000 | 5.450 | 07/01/35 | 5,009,736 | |||||||||||
| Delaware Economic Development Authority Gas Facilities RB | | ||||||||||||
| 3,000,000 | 5.400 | 02/01/31 | 3,352,350 | |||||||||||
|
| |||||||||||||
| 8,362,086 | ||||||||||||||
|
| |||||||||||||
| State-Specific Municipal Debt Obligations – (continued) | ||||||||||||||
| District of Columbia – 1.7% |
| ||||||||||||
| District of Columbia Tax Increment RB Refunding Gallery Place | | ||||||||||||
| $ | 3,725,000 | 5.000 | % | 06/01/29 | $ | 4,150,991 | ||||||||
| 3,910,000 | 5.000 | 06/01/30 | 4,344,753 | |||||||||||
| Metropolitan Washington DC Airports Authority Dulles Toll | | ||||||||||||
| 25,000,000 | 0.000 | 10/01/41 | 24,918,000 | |||||||||||
| Metropolitan Washington DC Airports Authority Dulles Toll | | ||||||||||||
| 37,100,000 | 0.000 | 10/01/44 | 31,610,684 | |||||||||||
|
| |||||||||||||
| 65,024,428 | ||||||||||||||
|
| |||||||||||||
| Florida – 14.0% |
| ||||||||||||
| Aberdeen Community Development District Special Assessment | | ||||||||||||
| 1,810,000 | 5.250 | 11/01/15 | 950,250 | |||||||||||
| Amelia National Community Development District Special | | ||||||||||||
| 4,295,000 | 6.300 | 05/01/35 | 3,679,956 | |||||||||||
| Amelia National Community Development District Special | | ||||||||||||
| 1,690,000 | 5.375 | 05/01/37 | 1,176,341 | |||||||||||
| Arborwood Community Development District RB Capital | | ||||||||||||
| 8,925,000 | 5.500 | 05/01/36 | 8,994,794 | |||||||||||
| Arborwood Community Development District RB Capital | | ||||||||||||
| 570,000 | 5.100 | 05/01/14 | 479,330 | |||||||||||
| Arborwood Community Development District Special | | ||||||||||||
| 17,510,000 | 5.500 | 05/01/36 | 2,976,700 | |||||||||||
| Arborwood Community Development District Special | | ||||||||||||
| 230,000 | 5.250 | 05/01/36 | 234,425 | |||||||||||
| Arborwood Community Development District Special | | ||||||||||||
| 26,175,000 | 5.350 | 05/01/36 | 19,194,128 | |||||||||||
| Arborwood Community Development District Special | | ||||||||||||
| 4,660,000 | 5.500 | 05/01/14 | 2,863,787 | |||||||||||
| Bellalago Educational Facilities Benefits District Special | | ||||||||||||
| 1,870,000 | 5.850 | 05/01/22 | 1,901,079 | |||||||||||
| 8,000,000 | 6.000 | 05/01/33 | 8,138,960 | |||||||||||
|
| |||||||||||||
| 24 | The accompanying notes are an integral part of these financial statements. |
GOLDMAN SACHS HIGH YIELD MUNICIPAL FUND
Principal Amount | Interest Rate | Maturity Date | Value | |||||||||||
| State-Specific Municipal Debt Obligations – (continued) | ||||||||||||||
| Florida – (continued) |
| ||||||||||||
| Bellalago Educational Facilities Benefits District Special | | ||||||||||||
| $ | 12,150,000 | 5.800 | % | 05/01/34 | $ | 12,324,595 | ||||||||
| Bluewaters Community Development District Special Assessment | | ||||||||||||
| 470,000 | 6.000 | 05/01/35 | 492,541 | |||||||||||
| Brevard County Health Facilities Authority RB for Health First, | | ||||||||||||
| 4,750,000 | 7.000 | 04/01/39 | 5,844,732 | |||||||||||
| Bridgewater Community Development District Special | | ||||||||||||
| 3,140,000 | 6.000 | 05/01/35 | 3,175,231 | |||||||||||
| Bridgewater Community Development District Special | | ||||||||||||
| 9,140,000 | 7.210 | 05/01/35 | 8,891,483 | |||||||||||
| Broward County Florida Airport Exempt Facility RB for Learjet, | | ||||||||||||
| 2,000,000 | 7.500 | 11/01/20 | 2,133,000 | |||||||||||
| Capital Trust Agency Fixed Rate Air Cargo RB for Aero Miami | | ||||||||||||
| 8,540,000 | 5.350 | 07/01/29 | 8,890,567 | |||||||||||
| Century Parc Community Development District Special | | ||||||||||||
| 200,000 | 3.500 | 11/01/20 | 203,524 | |||||||||||
| 210,000 | 3.750 | 11/01/21 | 211,607 | |||||||||||
| 215,000 | 3.875 | 11/01/22 | 217,141 | |||||||||||
| 225,000 | 4.000 | 11/01/23 | 229,122 | |||||||||||
| 235,000 | 4.150 | 11/01/24 | 238,149 | |||||||||||
| 245,000 | 4.250 | 11/01/25 | 249,241 | |||||||||||
| 1,705,000 | 4.500 | 11/01/31 | 1,749,006 | |||||||||||
| CityPlace Community Development District Special Assessment | | ||||||||||||
| 2,250,000 | 5.000 | 05/01/26 | 2,549,633 | |||||||||||
| Concord Station Community Development District Special | | ||||||||||||
| 730,000 | 5.000 | 05/01/15 | 725,948 | |||||||||||
| Concorde Estates Community Development District Special | | ||||||||||||
| 4,065,000 | 5.850 | 05/01/35 | 4,331,705 | |||||||||||
| Concorde Estates Community Development District Special | | ||||||||||||
| 2,545,000 | 0.000 | 05/01/35 | 1,703,521 | |||||||||||
| Concorde Estates Community Development District Special | | ||||||||||||
| 6,860,000 | 0.000 | 05/01/17 | 4,687,301 | |||||||||||
| Cory Lakes Community Development District Special | | ||||||||||||
| 260,000 | 8.375 | 05/01/17 | 278,062 | |||||||||||
| Cory Lakes Community Development District Special | | ||||||||||||
| 325,000 | 8.375 | 05/01/17 | 347,578 | |||||||||||
| Crossings at Fleming Island Community Development District | | ||||||||||||
| 2,860,000 | 7.050 | 05/01/15 | 2,767,279 | |||||||||||
|
| |||||||||||||
Principal Amount | Interest Rate | Maturity Date | Value | |||||||||||
| State-Specific Municipal Debt Obligations – (continued) | ||||||||||||||
| Florida – (continued) |
| ||||||||||||
| Cutler Cay Community Development District Special Assessment | | ||||||||||||
| $ | 3,740,000 | 6.300 | % | 05/01/34 | $ | 3,922,288 | ||||||||
| Durbin Crossing Community Development District Special | | ||||||||||||
| 41,975,000 | 5.500 | 05/01/37 | 37,372,021 | |||||||||||
| Durbin Crossing Community Development District Special | | ||||||||||||
| 1,595,000 | 6.830 | 11/01/15 | 1,630,249 | |||||||||||
| Escambia County Health Facilities Authority Health Care | | ||||||||||||
| 27,950,000 | 6.000 | 08/15/36 | 31,649,182 | |||||||||||
| Florida Higher Educational Facilities Financing Authority RB for | | ||||||||||||
| 11,180,000 | 5.250 | 11/01/36 | 11,709,261 | |||||||||||
| Florida Higher Educational Facilities Financing Authority RB | | ||||||||||||
| 1,500,000 | 5.000 | 04/01/27 | 1,629,885 | |||||||||||
| 1,035,000 | 5.000 | 04/01/32 | 1,103,455 | |||||||||||
| Florida Higher Educational Facilities Financing Authority RB | | ||||||||||||
| 600,000 | 5.000 | 04/01/32 | 650,958 | |||||||||||
| 5,620,000 | 5.250 | 04/01/42 | 6,151,821 | |||||||||||
| Forest Creek Community Development District RB for Capital | | ||||||||||||
| 550,000 | 7.000 | 11/01/13 | 545,820 | |||||||||||
| Hammocks Community Development District Special Assessment | | ||||||||||||
| 150,000 | 6.960 | 11/01/15 | 154,020 | |||||||||||
| Harbour Isles Community Development District Special | | ||||||||||||
| 2,955,000 | 6.125 | 05/01/35 | 3,015,725 | |||||||||||
| Heritage Harbour Market Place Community Development District | | ||||||||||||
| 7,925,000 | 5.600 | 05/01/36 | 7,220,864 | |||||||||||
| Heritage Harbour South Community Development District RB for | | ||||||||||||
| 1,040,000 | 6.200 | 05/01/35 | 1,089,764 | |||||||||||
| Heritage Isle At Viera Community Development District Special | | ||||||||||||
| 6,655,000 | 5.550 | 05/01/37 | 5,891,272 | |||||||||||
| Heritage Lake Park Community Development District Special | | ||||||||||||
| 2,440,000 | 5.700 | 05/01/36 | 2,421,114 | |||||||||||
| Hillsborough County IDA RB for Health Facilities RMKT | | ||||||||||||
| 4,980,000 | 8.000 | 08/15/19 | 7,113,332 | |||||||||||
| Killarney Community Development District Special Assessment | | ||||||||||||
| 2,395,000 | 6.000 | 05/01/35 | 1,077,750 | |||||||||||
|
| |||||||||||||
| The accompanying notes are an integral part of these financial statements. | 25 |
GOLDMAN SACHS HIGH YIELD MUNICIPAL FUND
Schedule of Investments (continued)
September 30, 2012 (Unaudited)
Principal Amount | Interest Rate | Maturity Date | Value | |||||||||||
| State-Specific Municipal Debt Obligations – (continued) | ||||||||||||||
| Florida – (continued) |
| ||||||||||||
| Killarney Community Development District Special Assessment | | ||||||||||||
| $ | 1,750,000 | 5.125 | % | 05/01/16 | $ | 787,500 | ||||||||
| Lakeland Hospital RB for Florida Southern College Project | | ||||||||||||
| 1,500,000 | 5.000 | 09/01/42 | 1,588,920 | |||||||||||
| Lakewood Ranch Stewardship District Special Assessment for | | ||||||||||||
| 3,655,000 | 7.210 | 11/01/20 | 3,703,685 | |||||||||||
| Lakewood Ranch Stewardship District Special Assessment for | | ||||||||||||
| 8,665,000 | 6.770 | 11/01/20 | 8,522,027 | |||||||||||
| Lakewood Ranch Stewardship District Special Assessment RB for | | ||||||||||||
| 19,760,000 | 8.000 | 05/01/40 | 21,999,994 | |||||||||||
| Lee County IDA Health Care Facilities RB for Shell Point/ | | ||||||||||||
| 19,960,000 | 5.125 | 11/15/36 | 19,727,466 | |||||||||||
| Lee County IDA Health Care Facilities RB Refunding for Shell | | ||||||||||||
| 2,600,000 | 6.500 | 11/15/31 | 2,859,220 | |||||||||||
| Lee County IDA Health Care Facilities RB Refunding for Shell | | ||||||||||||
| 1,000,000 | 5.000 | 11/15/13 | 1,031,030 | |||||||||||
| 2,245,000 | 5.000 | 11/15/15 | 2,400,376 | |||||||||||
| 4,000,000 | 5.000 | 11/15/22 | 4,136,240 | |||||||||||
| 10,000,000 | 5.000 | 11/15/29 | 10,024,000 | |||||||||||
| Live Oak Community Development District No. 2 Special | | ||||||||||||
| 8,240,000 | 5.850 | 05/01/35 | 8,322,153 | |||||||||||
| Live Oak Community Development District No. 2 Special | | ||||||||||||
| 3,220,000 | 7.360 | 11/01/20 | 3,511,088 | |||||||||||
| Longleaf Community Development District Special Assessment | | ||||||||||||
| 5,215,000 | 5.400 | 05/01/30 | 4,501,223 | |||||||||||
| Longleaf Community Development District Special Assessment | | ||||||||||||
| 2,635,000 | 5.375 | 05/01/30 | 1,714,489 | |||||||||||
| Marsh Harbour Community Development District Special | | ||||||||||||
| 2,790,000 | 5.450 | 05/01/36 | 2,862,596 | |||||||||||
| Meadow Pointe IV Community Development District Capital | | ||||||||||||
| 1,140,000 | 0.000 | 05/01/20 | 995,437 | |||||||||||
| Meadow Pointe IV Community Development District RB for | | ||||||||||||
| 1,910,000 | 5.250 | 05/01/15 | 744,900 | |||||||||||
| Meadow Pointe IV Community Development District RB for | | ||||||||||||
| 1,380,000 | 6.150 | 11/01/14 | 14 | |||||||||||
| Meadow Pointe IV Community Development District RB for | | ||||||||||||
| 445,000 | 0.000 | 05/01/36 | 360,348 | |||||||||||
|
| |||||||||||||
| State-Specific Municipal Debt Obligations – (continued) | ||||||||||||||
| Florida – (continued) |
| ||||||||||||
| Meadow Pointe IV Community Development District RB for | | ||||||||||||
| $ | 850,000 | 0.000 | % | 05/01/38 | $ | 662,465 | ||||||||
| Meadow Pointe IV Community Development District Special | | ||||||||||||
| 1,410,000 | 5.250 | 05/01/15 | 14 | |||||||||||
| Mediterra South Community Development District RB Refunding | | ||||||||||||
| 295,000 | 4.000 | 05/01/19 | 300,463 | |||||||||||
| 305,000 | 4.200 | 05/01/20 | 312,354 | |||||||||||
| 325,000 | 4.400 | 05/01/21 | 333,639 | |||||||||||
| 335,000 | 4.500 | 05/01/22 | 343,137 | |||||||||||
| 350,000 | 4.650 | 05/01/23 | 358,971 | |||||||||||
| 1,250,000 | 5.100 | 05/01/31 | 1,282,337 | |||||||||||
| Miami Beach Health Facilities Authority Hospital RB for Mount | | ||||||||||||
| 1,849,000 | 6.750 | 11/15/14 | 2,097,062 | |||||||||||
| 11,751,000 | 6.750 | 11/15/29 | 12,922,457 | |||||||||||
| Miami Beach Health Facilities Authority Hospital RB for Mount | | ||||||||||||
| 2,000,000 | 5.000 | 11/15/29 | 2,180,620 | |||||||||||
| Miami-Dade County Florida Expressway Authority RB | | ||||||||||||
| 8,000,000 | 5.000 | 07/01/42 | 8,962,080 | |||||||||||
| New River Community Development District Special Assessment | | ||||||||||||
| 2,120,000 | 0.000 | 05/01/38 | 1,552,921 | |||||||||||
| New River Community Development District Special Assessment | | ||||||||||||
| 5,340,000 | 0.000 | 05/01/38 | 2,403,000 | |||||||||||
| New River Community Development District Special Assessment | | ||||||||||||
| 2,915,000 | 0.000 | 05/01/15 | 2,729,868 | |||||||||||
| New River Community Development District Special Assessment | | ||||||||||||
| 4,185,000 | 0.000 | 05/01/18 | 1,883,250 | |||||||||||
| New River Community Development District Special Assessment | | ||||||||||||
| 545,000 | 5.350 | 05/01/38 | 5 | |||||||||||
| New River Community Development District Special Assessment | | ||||||||||||
| 3,260,000 | 5.000 | 05/01/13 | 33 | |||||||||||
| Orange County Health Facilities Authority RB Refunding for | | ||||||||||||
| 1,100,000 | 5.375 | 07/01/20 | 1,123,936 | |||||||||||
| Orlando Florida Community Redevelopment Agency Tax | | ||||||||||||
| 1,305,000 | 5.000 | 04/01/19 | 1,489,371 | |||||||||||
| 1,375,000 | 5.000 | 04/01/20 | 1,573,220 | |||||||||||
| 1,445,000 | 5.000 | 04/01/21 | 1,650,970 | |||||||||||
| 1,680,000 | 5.000 | 04/01/24 | 1,884,960 | |||||||||||
| 1,765,000 | 5.000 | 04/01/25 | 1,957,738 | |||||||||||
| 1,005,000 | 5.000 | 04/01/26 | 1,103,731 | |||||||||||
|
| |||||||||||||
| 26 | The accompanying notes are an integral part of these financial statements. |
GOLDMAN SACHS HIGH YIELD MUNICIPAL FUND
Principal Amount | Interest Rate | Maturity Date | Value | |||||||||||
| State-Specific Municipal Debt Obligations – (continued) | ||||||||||||||
| Florida – (continued) |
| ||||||||||||
| Overoaks Community Development District RB for Capital | | ||||||||||||
| $ | 1,075,000 | 6.125 | % | 05/01/35 | $ | 1,150,089 | ||||||||
| Overoaks Community Development District RB for Capital | | ||||||||||||
| 1,475,000 | 6.125 | 05/01/35 | 1,291,864 | |||||||||||
| Overoaks Community Development District RB for Capital | | ||||||||||||
| 3,375,000 | 5.125 | 05/01/17 | 3,174,525 | |||||||||||
| Overoaks Community Development District Special Assessment | | ||||||||||||
| 1,200,000 | 5.125 | 05/01/16 | 12,000 | |||||||||||
| 210,000 | 6.125 | 05/01/35 | 2,100 | |||||||||||
| Parklands Lee Community Development District Special | | ||||||||||||
| 3,205,000 | 5.800 | 05/01/35 | 3,268,203 | |||||||||||
| Parklands West Community Development District Special | | ||||||||||||
| 2,500,000 | 5.650 | 05/01/32 | 2,570,625 | |||||||||||
| Paseo Community Development District Capital Improvement | | ||||||||||||
| 30,590,000 | 0.000 | 05/01/36 | 10,787,258 | |||||||||||
| Paseo Community Development District Capital Improvement | | ||||||||||||
| 2,200,000 | 5.400 | 05/01/36 | 2,279,728 | |||||||||||
| Paseo Community Development District RB for Capital | | ||||||||||||
| 6,355,000 | 5.400 | 05/01/36 | 64 | |||||||||||
| Pelican Marsh Community Development District Special | | ||||||||||||
| 805,000 | 4.875 | 05/01/22 | 800,403 | |||||||||||
| 1,370,000 | 5.375 | 05/01/31 | 1,365,945 | |||||||||||
| Pine Island Community Development District Utility System | | ||||||||||||
| 1,355,000 | 5.300 | 11/01/15 | 704,600 | |||||||||||
| Reunion East Community Development District Special | | ||||||||||||
| 9,860,000 | 7.200 | 05/01/22 | 9,984,433 | |||||||||||
| Reunion East Community Development District Special | | ||||||||||||
| 4,670,000 | 7.200 | 05/01/22 | 1,868,000 | |||||||||||
| River Hall Community Development District Special Assessment | | ||||||||||||
| 5,470,000 | 5.450 | 05/01/36 | 4,952,319 | |||||||||||
| Sandy Creek Community Development District Special | | ||||||||||||
| 2,330,000 | 5.500 | 05/01/15 | 2,256,605 | |||||||||||
| Sarasota County Public Hospital District RB for Sarasota | | ||||||||||||
| 1,500,000 | 5.625 | 07/01/39 | 1,652,985 | |||||||||||
| Seven Oaks Community Development District II Special | | ||||||||||||
| 930,000 | 7.500 | 05/01/16 | 933,655 | |||||||||||
|
| |||||||||||||
| State-Specific Municipal Debt Obligations – (continued) | ||||||||||||||
| Florida – (continued) |
| ||||||||||||
| South Kendall Community Development District Special | | ||||||||||||
| $ | 1,890,000 | 6.200 | % | 11/01/40 | $ | 2,175,730 | ||||||||
| South-Dade Venture Community Development District Special | | ||||||||||||
| 1,020,000 | 5.000 | 05/01/26 | 1,049,692 | |||||||||||
| 1,500,000 | 5.125 | 05/01/33 | 1,540,500 | |||||||||||
| Southern Hills Plantation I Community Development District | | ||||||||||||
| 4,570,000 | 5.800 | 05/01/35 | 4,239,452 | |||||||||||
| Southern Hills Plantation I Community Development District | | ||||||||||||
| 3,455,000 | 0.000 | 05/01/35 | 2,335,062 | |||||||||||
| Southern Hills Plantation II Community Development District | | ||||||||||||
| 3,265,000 | 5.850 | 05/01/34 | 1,799,407 | |||||||||||
| St. Petersburg Health Facilities Authority RB Refunding for All | | ||||||||||||
| 5,835,000 | 6.500 | 11/15/39 | 7,063,968 | |||||||||||
| Sterling Hill Community Development District RB for Capital | | ||||||||||||
| 455,000 | 5.500 | 11/01/15 | 273,000 | |||||||||||
| Stonelake Ranch Community Development District Special | | ||||||||||||
| 3,065,000 | 5.900 | 05/01/34 | 3,065,552 | |||||||||||
| Sumter Landing Community Development District Recreational | | ||||||||||||
| 2,500,000 | 5.125 | 10/01/38 | 2,533,325 | |||||||||||
| Venetian Community Development District Capital Improvement | | ||||||||||||
| 500,000 | 5.500 | 05/01/34 | 508,915 | |||||||||||
| 750,000 | 6.125 | 05/01/42 | 763,815 | |||||||||||
| Venetian Community Development District Capital Improvement | | ||||||||||||
| 1,500,000 | 5.000 | 05/01/23 | 1,509,015 | |||||||||||
| 2,500,000 | 5.500 | 05/01/34 | 2,544,575 | |||||||||||
| Verona Walk Community Development District RB for Capital | | ||||||||||||
| 1,215,000 | 5.850 | 05/01/35 | 1,225,862 | |||||||||||
| Village Center Community Development District Recreational | | ||||||||||||
| 5,780,000 | 5.000 | 11/01/32 | 5,834,216 | |||||||||||
| Village Center Community Development District Recreational | | ||||||||||||
| 1,875,000 | 5.125 | 11/01/36 | 1,902,338 | |||||||||||
| Village Center Community Development District Recreational | | ||||||||||||
| 1,090,000 | 8.250 | 01/01/17 | 1,094,829 | |||||||||||
| Village Center Community Development District Recreational | | ||||||||||||
| 1,600,000 | 7.375 | 01/01/19 | 1,607,856 | |||||||||||
|
| |||||||||||||
| The accompanying notes are an integral part of these financial statements. | 27 |
GOLDMAN SACHS HIGH YIELD MUNICIPAL FUND
Schedule of Investments (continued)
September 30, 2012 (Unaudited)
Principal Amount | Interest Rate | Maturity Date | Value | |||||||||||
| State-Specific Municipal Debt Obligations – (continued) | ||||||||||||||
| Florida – (continued) |
| ||||||||||||
| Village Center Community Development District Recreational | | ||||||||||||
| $ | 4,005,000 | 6.350 | % | 01/01/18 | $ | 4,202,687 | ||||||||
| Village Center Community Development District Recreational | | ||||||||||||
| 3,230,000 | 5.875 | 01/01/15 | 3,512,948 | |||||||||||
| Village Community Development District No. 8 Special | | ||||||||||||
| 9,560,000 | 6.375 | 05/01/38 | 11,532,610 | |||||||||||
| Village Community Development District No. 8 Special | | ||||||||||||
| 9,635,000 | 6.125 | 05/01/39 | 11,326,424 | |||||||||||
| Village Community Development District No. 9 Special | | ||||||||||||
| 5,985,000 | 7.000 | 05/01/41 | 6,938,111 | |||||||||||
| Village Community Development District No. 9 Special | | ||||||||||||
| 2,250,000 | 5.500 | 05/01/42 | 2,432,520 | |||||||||||
| Villasol Community Development District RB Series 2003 A | | ||||||||||||
| 3,755,000 | 6.600 | 05/01/34 | 2,091,197 | |||||||||||
| Waters Edge Community Development District Capital | | ||||||||||||
| 16,000 | 5.350 | 05/01/39 | 15,514 | |||||||||||
| Waters Edge Community Development District Capital | | ||||||||||||
| 1,145,000 | 0.000 | 05/01/39 | 610,067 | |||||||||||
| Waters Edge Community Development District Special | | ||||||||||||
| 180,000 | 5.000 | 11/01/12 | 2 | |||||||||||
| West Villages Improvement District Special Assessment Unit of | | ||||||||||||
| 11,745,000 | 5.500 | 05/01/37 | 5,050,350 | |||||||||||
|
| |||||||||||||
| 525,915,745 | ||||||||||||||
|
| |||||||||||||
| Georgia – 2.2% |
| ||||||||||||
| Atlanta Tax Allocation for Beltline Project RMKT 12/15/09 | | ||||||||||||
| 8,340,000 | 7.500 | 01/01/31 | 9,827,189 | |||||||||||
| Atlanta Tax Allocation for Eastside Project Series 2005 B | | ||||||||||||
| 1,085,000 | 5.400 | 01/01/20 | 1,185,135 | |||||||||||
| 1,750,000 | 5.600 | 01/01/30 | 1,883,297 | |||||||||||
| Chatham County Hospital Authority RB for Hospital | | ||||||||||||
| 5,675,000 | 5.500 | 01/01/14 | 6,033,149 | |||||||||||
| Clayton County Development Authority Special Facilities RB for | | ||||||||||||
| 8,000,000 | 8.750 | 06/01/29 | 9,883,360 | |||||||||||
| Clayton County Development Authority Special Facilities RB for | | ||||||||||||
| 8,750,000 | 9.000 | 06/01/35 | 9,805,600 | |||||||||||
| Fulton County Development Authority RB for Tuff Caub LLC | | ||||||||||||
| 2,380,000 | 5.250 | 11/01/28 | 2,263,309 | |||||||||||
|
| |||||||||||||
| State-Specific Municipal Debt Obligations – (continued) | ||||||||||||||
| Georgia – (continued) |
| ||||||||||||
| Fulton County Residential Care Facilities RB for Canterbury | | ||||||||||||
| $ | 1,750,000 | 6.125 | % | 02/15/34 | $ | 1,788,202 | ||||||||
| Marietta Development Authority University Facilities RB | | ||||||||||||
| 2,500,000 | 7.000 | 06/15/39 | 2,649,775 | |||||||||||
| Milledgeville & Baldwin County Development Authority Student | | ||||||||||||
| 46,820,000 | 0.959 | 10/01/33 | 33,930,454 | |||||||||||
| Richmond County Development Authority Environmental | | ||||||||||||
| 5,000,000 | 5.000 | 08/01/30 | 5,003,200 | |||||||||||
|
| |||||||||||||
| 84,252,670 | ||||||||||||||
|
| |||||||||||||
| Guam – 1.0% |
| ||||||||||||
| Guam Government Department of Education COPS for John F. | | ||||||||||||
| 2,500,000 | 6.625 | 12/01/30 | 2,744,700 | |||||||||||
| 3,355,000 | 6.875 | 12/01/40 | 3,680,133 | |||||||||||
| Guam Government Limited Obligation GO Bonds Section 30 | | ||||||||||||
| 2,400,000 | 5.375 | 12/01/24 | 2,657,112 | |||||||||||
| 3,000,000 | 5.625 | 12/01/29 | 3,354,240 | |||||||||||
| 2,750,000 | 5.750 | 12/01/34 | 3,096,143 | |||||||||||
| Guam Power Authority RB Series 2010 A (BBB/Baa3) |
| ||||||||||||
| 11,705,000 | 5.500 | 10/01/40 | 12,227,862 | |||||||||||
| Guam Waterworks Authority RB for Water & Wastewater System | | ||||||||||||
| 9,785,000 | 5.625 | 07/01/40 | 10,372,589 | |||||||||||
|
| |||||||||||||
| 38,132,779 | ||||||||||||||
|
| |||||||||||||
| Idaho – 0.6% |
| ||||||||||||
| Madison County Hospital Revenue COPS Series 2006 (BB+/NR) |
| ||||||||||||
| 1,000,000 | 5.250 | 09/01/20 | 1,047,760 | |||||||||||
| 4,645,000 | 5.250 | 09/01/26 | 4,788,623 | |||||||||||
| 1,500,000 | 5.250 | 09/01/30 | 1,524,810 | |||||||||||
| 15,285,000 | 5.250 | 09/01/37 | 15,429,291 | |||||||||||
|
| |||||||||||||
| 22,790,484 | ||||||||||||||
|
| |||||||||||||
| Illinois – 5.2% |
| ||||||||||||
| Chicago Illinois Board of Education GO Bonds Refunding | | ||||||||||||
| 8,965,000 | 5.500 | 12/01/29 | 11,699,056 | |||||||||||
| Chicago Illinois O’Hare International Airport Special Facility RB | | ||||||||||||
| 16,400,000 | 5.500 | 12/01/30 | 10,769,060 | |||||||||||
| Chicago Illinois Second Lien Water RB Project Series 2012 | | ||||||||||||
| 4,000,000 | 5.000 | 11/01/42 | 4,556,760 | |||||||||||
| Cook County Illinois Recovery Zone Facility RB for Navistar | | ||||||||||||
| 8,520,000 | 6.500 | 10/15/40 | 8,848,616 | |||||||||||
|
| |||||||||||||
| 28 | The accompanying notes are an integral part of these financial statements. |
GOLDMAN SACHS HIGH YIELD MUNICIPAL FUND
Principal Amount | Interest Rate | Maturity Date | Value | |||||||||||
| State-Specific Municipal Debt Obligations – (continued) | ||||||||||||||
| Illinois – (continued) |
| ||||||||||||
| Du Page County Special Service Area No. 31 Special Tax for | | ||||||||||||
| $ | 134,000 | 5.400 | % | 03/01/16 | $ | 138,797 | ||||||||
| 1,450,000 | 5.625 | 03/01/36 | 1,443,374 | |||||||||||
| Illinois Finance Authority RB for Friendship Village Schaumburg | | ||||||||||||
| 1,340,000 | 5.000 | 02/15/15 | 1,377,841 | |||||||||||
| 6,025,000 | 5.375 | 02/15/25 | 6,075,791 | |||||||||||
| 4,000,000 | 5.625 | 02/15/37 | 4,015,920 | |||||||||||
| Illinois Finance Authority RB for Midwest Regional Medical | | ||||||||||||
| 34,585,000 | 6.750 | 10/01/46 | 31,963,803 | |||||||||||
| Illinois Finance Authority RB Refunding for Christian Homes, | | ||||||||||||
| 4,500,000 | 5.750 | 05/15/31 | 4,689,990 | |||||||||||
| Illinois Finance Authority RB Refunding for Christian Homes, | | ||||||||||||
| 1,250,000 | 6.125 | 05/15/27 | 1,379,688 | |||||||||||
| Illinois Finance Authority RB Refunding for OSF Healthcare | | ||||||||||||
| 18,115,000 | 6.000 | 05/15/39 | 20,523,571 | |||||||||||
| Illinois Finance Authority RB Refunding for Proctor Hospital | | ||||||||||||
| 5,600,000 | 5.125 | 01/01/25 | 5,603,696 | |||||||||||
| Illinois Finance Authority Recovery Zone Facility RB for | | ||||||||||||
| 13,000,000 | 6.500 | 10/15/40 | 13,501,410 | |||||||||||
| Illinois Finance Authority Student Housing RB for MJH | | ||||||||||||
| 15,000 | 4.500 | 06/01/14 | 2,250 | |||||||||||
| 2,150,000 | 5.000 | 06/01/24 | 322,500 | |||||||||||
| 4,000,000 | 5.375 | 06/01/35 | 600,000 | |||||||||||
| Illinois Finance Authority Water Facilities RB Capital | | ||||||||||||
| 2,000,000 | 5.250 | 10/01/39 | 2,110,020 | |||||||||||
| Illinois Finance Authority Water Facilities RB for American | | ||||||||||||
| 10,500,000 | 5.250 | 05/01/40 | 11,104,170 | |||||||||||
| Illinois GO Bonds Refunding Series 2012 (A+/A2) |
| ||||||||||||
| 2,000,000 | 5.000 | 08/01/25 | 2,245,800 | |||||||||||
| Illinois GO Bonds Series 2012 (A+/A2) |
| ||||||||||||
| 1,000,000 | 5.000 | 03/01/37 | 1,090,040 | |||||||||||
| Lincolnshire Special Service Area No. 1 Special Tax for | | ||||||||||||
| 2,438,000 | 6.250 | 03/01/34 | 2,470,645 | |||||||||||
| Metropolitan Pier & Exposition Authority RB for McCormick | | ||||||||||||
| 20,000,000 | 11.410 | 12/15/40 | 23,699,600 | |||||||||||
| Ottawa Illinois Health Care Facilities RB Refunding for Ottawa | | ||||||||||||
| 1,900,000 | 5.125 | 08/15/14 | 2,067,523 | |||||||||||
| Plano Special Service Area No. 5 Special Tax for Lakewood | | ||||||||||||
| 4,567,000 | 6.000 | 03/01/36 | 3,918,760 | |||||||||||
|
| |||||||||||||
| State-Specific Municipal Debt Obligations – (continued) | ||||||||||||||
| Illinois – (continued) |
| ||||||||||||
| Quad Cities Regional Economic Development Authority RB for | | ||||||||||||
| $ | 840,000 | 4.750 | % | 10/01/29 | $ | 876,691 | ||||||||
| 1,010,000 | 4.750 | 10/01/32 | 1,041,633 | |||||||||||
| Southwestern Illinois Development Authority RB Capital | | ||||||||||||
| 15,000,000 | 5.750 | 08/01/42 | 14,829,900 | |||||||||||
| Volo Village Special Service Area No. 6 Special Tax for | | ||||||||||||
| 4,082,000 | 5.750 | 03/01/36 | 3,959,254 | |||||||||||
|
| |||||||||||||
| 196,926,159 | ||||||||||||||
|
| |||||||||||||
| Indiana – 1.1% |
| ||||||||||||
| Anderson Indiana Economic Development RB Refunding & | | ||||||||||||
| 1,355,000 | 5.000 | 10/01/24 | 1,198,850 | |||||||||||
| 1,500,000 | 5.000 | 10/01/32 | 1,185,135 | |||||||||||
| Delaware County Hospital Authority RB for Cardinal Health | | ||||||||||||
| 3,250,000 | 5.250 | 08/01/36 | 3,409,153 | |||||||||||
| Indiana Finance Authority Environmental Improvement RB | | ||||||||||||
| 9,750,000 | 6.000 | 12/01/26 | 10,331,685 | |||||||||||
| Indiana Finance Authority Hospital RB for Indiana University | | ||||||||||||
| 2,000,000 | 5.125 | 03/01/38 | 2,153,380 | |||||||||||
| Indiana Finance Authority Midwestern Disaster Relief RB for | | ||||||||||||
| 5,000,000 | 5.000 | 06/01/39 | 5,286,200 | |||||||||||
| Indiana Health Facility Financing Authority RB for Ascension | | ||||||||||||
| 1,195,000 | 29.010 | 05/01/15 | 2,379,663 | |||||||||||
| Indianapolis Airport Authority Special Facilities RB for United | | ||||||||||||
| 7,737,197 | 6.500 | 11/15/31 | 403,417 | |||||||||||
| Rockport Indiana RB Refunding for AK Steel Corp. Project | | ||||||||||||
| 14,000,000 | 7.000 | 06/01/28 | 14,671,580 | |||||||||||
| Vigo County Hospital Authority RB for Vigo Union Hospital, | | ||||||||||||
| 2,000,000 | 5.500 | 09/01/27 | 2,073,780 | |||||||||||
|
| |||||||||||||
| 43,092,843 | ||||||||||||||
|
| |||||||||||||
| Iowa – 0.5% |
| ||||||||||||
| Coralville Iowa COPS Series 2006 D (NR/Baa2) |
| ||||||||||||
| 2,250,000 | 5.250 | 06/01/26 | 2,261,723 | |||||||||||
| Iowa Finance Authority Midwestern Disaster Area RB for Alcoa, | | ||||||||||||
| 15,000,000 | 4.750 | 08/01/42 | 15,163,500 | |||||||||||
|
| |||||||||||||
| The accompanying notes are an integral part of these financial statements. | 29 |
GOLDMAN SACHS HIGH YIELD MUNICIPAL FUND
Schedule of Investments (continued)
September 30, 2012 (Unaudited)
Principal Amount | Interest Rate | Maturity Date | Value | |||||||||||
| State-Specific Municipal Debt Obligations – (continued) | ||||||||||||||
| Iowa – (continued) |
| ||||||||||||
| Pottawattamie County RB Refunding for Christian Homes, Inc. | | ||||||||||||
| $ | 1,355,000 | 5.750 | % | 05/15/31 | $ | 1,417,926 | ||||||||
|
| |||||||||||||
| 18,843,149 | ||||||||||||||
|
| |||||||||||||
| Kentucky – 0.8% |
| ||||||||||||
| Kentucky Economic Development Finance Authority Health | | ||||||||||||
| 1,720,000 | 0.000 | 10/01/22 | 1,122,059 | |||||||||||
| Kentucky Economic Development Finance Authority Hospital RB | | ||||||||||||
| 8,000,000 | 6.375 | 06/01/40 | 9,486,160 | |||||||||||
| 9,000,000 | 6.500 | 03/01/45 | 10,720,170 | |||||||||||
| Kentucky Economic Development Finance Authority RB | | ||||||||||||
| 2,340,000 | 17.740 | 11/11/14 | 3,096,031 | |||||||||||
| Louisville & Jefferson County Metro Government Health System | | ||||||||||||
| 6,815,000 | 5.000 | 10/01/30 | 7,198,207 | |||||||||||
|
| |||||||||||||
| 31,622,627 | ||||||||||||||
|
| |||||||||||||
| Louisiana – 1.3% |
| ||||||||||||
| Louisiana Local Government Environmental Facilities and | | ||||||||||||
| 5,000,000 | 6.500 | 11/01/35 | 5,825,350 | |||||||||||
| Louisiana Local Government Environmental Facilities and | | ||||||||||||
| 20,015,000 | 6.000 | 10/01/44 | 22,716,225 | |||||||||||
| New Orleans Aviation Board Gulf Opportunity Zone RB for | | ||||||||||||
| 7,470,000 | 6.500 | 01/01/40 | 8,343,691 | |||||||||||
| New Orleans GO Bonds Refunding Series 2012 (BBB/A3) |
| ||||||||||||
| 1,765,000 | 5.000 | 12/01/32 | 1,972,052 | |||||||||||
| St. Charles Parish Gulf Opportunity Zone RB for Valero Energy | | ||||||||||||
| 7,500,000 | 4.000 | 06/01/22 | 8,144,400 | |||||||||||
|
| |||||||||||||
| 47,001,718 | ||||||||||||||
|
| |||||||||||||
| Maryland – 1.1% |
| ||||||||||||
| Baltimore Maryland Convention Center Hotel RB | | ||||||||||||
| 600,000 | 5.000 | 09/01/16 | 627,696 | |||||||||||
| Baltimore Maryland Special Obligation Tax Allocation for | | ||||||||||||
| 4,454,000 | 6.250 | 09/01/33 | 4,639,242 | |||||||||||
| Baltimore Maryland Special Obligation Tax Allocation for | | ||||||||||||
| 2,616,000 | 6.500 | 07/01/31 | 2,699,267 | |||||||||||
| Baltimore Maryland Special Obligation Tax Allocation for | | ||||||||||||
| 3,663,000 | 7.000 | 07/01/33 | 3,813,733 | |||||||||||
|
| |||||||||||||
| State-Specific Municipal Debt Obligations – (continued) | ||||||||||||||
| Maryland – (continued) |
| ||||||||||||
| Frederick County Maryland Educational Facilities RB for Mount | | ||||||||||||
| $ | 2,590,000 | 5.000 | % | 09/01/30 | $ | 2,547,757 | ||||||||
| Maryland State Economic Development Corp. Port Facilities RB | | ||||||||||||
| 5,000,000 | 5.750 | 09/01/25 | 5,443,150 | |||||||||||
| Maryland State Health & Higher Educational Facilities Authority | | ||||||||||||
| 9,500,000 | 5.750 | 07/01/38 | 10,378,845 | |||||||||||
| Maryland State Health & Higher Educational Facilities Authority | | ||||||||||||
| 7,530,000 | 5.500 | 07/01/42 | 7,969,827 | |||||||||||
| Maryland State Health & Higher Educational Facilities Authority | | ||||||||||||
| 2,100,000 | 5.000 | 07/01/31 | 2,303,511 | |||||||||||
|
| |||||||||||||
| 40,423,028 | ||||||||||||||
|
| |||||||||||||
| Massachusetts – 0.8% |
| ||||||||||||
| Massachusetts State Development Finance Agency RB for | | ||||||||||||
| 2,010,000 | 5.625 | 04/01/19 | 2,012,131 | |||||||||||
| 2,000,000 | 5.625 | 04/01/29 | 2,000,600 | |||||||||||
| Massachusetts State Health & Educational Facilities Authority RB | | ||||||||||||
| 5,000,000 | 5.250 | 07/01/30 | 5,035,100 | |||||||||||
| Massachusetts State Health & Educational Facilities Authority RB | | ||||||||||||
| 8,660,000 | 8.000 | 10/01/39 | 10,168,485 | |||||||||||
| Massachusetts State Health & Educational Facilities Authority RB | | ||||||||||||
| 10,000,000 | 5.750 | 07/01/39 | 11,213,100 | |||||||||||
|
| |||||||||||||
| 30,429,416 | ||||||||||||||
|
| |||||||||||||
| Michigan – 6.3% |
| ||||||||||||
| Detroit Michigan GO Bonds Series 2003 A (XLCA) (B/B3) |
| ||||||||||||
| 1,845,000 | 5.250 | 04/01/15 | 1,825,092 | |||||||||||
| 2,935,000 | 5.250 | 04/01/18 | 2,759,986 | |||||||||||
| Detroit Michigan School District GO Bonds for School Building | | ||||||||||||
| 3,500,000 | 6.000 | 05/01/20 | 4,281,270 | |||||||||||
| 3,000,000 | 6.000 | 05/01/21 | 3,701,700 | |||||||||||
| Detroit Michigan Sewage Disposal System RB Refunding Senior | | ||||||||||||
| 14,555,000 | 0.909 | 07/01/32 | 11,272,265 | |||||||||||
| Detroit Michigan Water Supply System RB Senior Lien | | ||||||||||||
| 1,705,000 | 5.000 | 07/01/41 | 1,760,975 | |||||||||||
| Detroit Michigan Water Supply System Revenue Senior Lien | | ||||||||||||
| 50,005,000 | 5.250 | 07/01/41 | 53,208,820 | |||||||||||
| Flint Michigan Hospital Building Authority RB Refunding for | | ||||||||||||
| 1,460,000 | 5.375 | 07/01/20 | 1,462,132 | |||||||||||
|
| |||||||||||||
| 30 | The accompanying notes are an integral part of these financial statements. |
GOLDMAN SACHS HIGH YIELD MUNICIPAL FUND
Principal Amount | Interest Rate | Maturity Date | Value | |||||||||||
| State-Specific Municipal Debt Obligations – (continued) | ||||||||||||||
| Michigan – (continued) |
| ||||||||||||
| Flint Michigan Hospital Building Authority RB Refunding for | | ||||||||||||
| $ | 3,630,000 | 5.375 | % | 07/01/28 | $ | 3,631,743 | ||||||||
| Michigan Finance Authority RB for Detroit School District | | ||||||||||||
| 10,010,000 | 5.000 | 11/01/32 | 10,717,006 | |||||||||||
| Michigan Finance Authority RB for Rols Railroad II | | ||||||||||||
| 13,885,000 | 13.841 | 01/01/18 | 24,110,053 | |||||||||||
| Michigan Tobacco Settlement Finance Authority RB for Capital | | ||||||||||||
| 196,775,000 | 0.000 | 06/01/52 | 3,140,529 | |||||||||||
| Michigan Tobacco Settlement Finance Authority RB for Capital | | ||||||||||||
| 70,100,000 | 0.000 | 06/01/52 | 1,407,608 | |||||||||||
| Monroe County Hospital Finance Authority RB Refunding for | | ||||||||||||
| 4,000,000 | 5.375 | 06/01/26 | 4,228,640 | |||||||||||
| 8,800,000 | 5.500 | 06/01/35 | 9,141,528 | |||||||||||
| Oakland County Economic Development Corp. Limited | | ||||||||||||
| 10,000,000 | 7.000 | 08/01/40 | 10,649,600 | |||||||||||
| Royal Oak Hospital Finance Authority RB for William Beaumont | | ||||||||||||
| 40,000,000 | 8.250 | 09/01/39 | 51,496,400 | |||||||||||
| Wayne County Airport Authority RB Refunding for Detroit | | ||||||||||||
| 9,000,000 | 5.000 | 12/01/21 | 10,223,640 | |||||||||||
| 11,000,000 | 5.000 | 12/01/22 | 12,375,000 | |||||||||||
| Wayne County Airport Authority RB Refunding for Detroit | | ||||||||||||
| 5,000,000 | 5.000 | 12/01/37 | 5,483,900 | |||||||||||
| 4,500,000 | 5.000 | 12/01/42 | 4,907,835 | |||||||||||
| Wayne County Michigan Stadium Authority RB Series 2012 | | ||||||||||||
| 5,850,000 | 5.000 | 10/01/26 | 6,454,832 | |||||||||||
|
| |||||||||||||
| 238,240,554 | ||||||||||||||
|
| |||||||||||||
| Minnesota – 0.4% |
| ||||||||||||
| Duluth Economic Development Authority Health Care Facilities | | ||||||||||||
| 7,500,000 | 7.250 | 06/15/32 | 7,584,450 | |||||||||||
| Duluth Economic Development Authority Health Care Facilities | | ||||||||||||
| 2,500,000 | 5.750 | 06/15/32 | 2,568,975 | |||||||||||
| 3,750,000 | 6.000 | 06/15/39 | 3,877,725 | |||||||||||
|
| |||||||||||||
| 14,031,150 | ||||||||||||||
|
| |||||||||||||
| State-Specific Municipal Debt Obligations – (continued) | ||||||||||||||
| Mississippi – 0.1% |
| ||||||||||||
| Mississippi Hospital Equipment & Facilities Authority RB | | ||||||||||||
| $ | 2,985,000 | 5.250 | % | 12/01/21 | $ | 3,204,637 | ||||||||
| 1,825,000 | 5.250 | 12/01/26 | 1,923,714 | |||||||||||
|
| |||||||||||||
| 5,128,351 | ||||||||||||||
|
| |||||||||||||
| Missouri – 0.1% |
| ||||||||||||
| Branson Regional Airport Transportation Development District | | ||||||||||||
| 1,535,000 | 6.000 | 07/01/37 | 337,700 | |||||||||||
| Branson Regional Airport Transportation Development District | | ||||||||||||
| 7,750,000 | 6.000 | 07/01/25 | 1,705,000 | |||||||||||
| Missouri State Development Finance Board Infrastructure | | ||||||||||||
| 1,000,000 | 5.000 | 06/01/35 | 1,048,390 | |||||||||||
| Stone Canyon Community Improvement District RB for Public | | ||||||||||||
| 1,250,000 | 5.750 | 04/01/27 | 837,500 | |||||||||||
| Strother Interchange Transportation Development District-Lees | | ||||||||||||
| 675,000 | 5.000 | 05/01/24 | 664,490 | |||||||||||
|
| |||||||||||||
| 4,593,080 | ||||||||||||||
|
| |||||||||||||
| Montana – 0.1% |
| ||||||||||||
| Montana Board of Investments RB for Yellowstone Energy LP | | ||||||||||||
| 3,520,000 | 7.000 | 12/31/19 | 3,521,514 | |||||||||||
|
| |||||||||||||
| Nevada – 0.8% |
| ||||||||||||
| Clark County Improvement District No. 142 Local Improvement | | ||||||||||||
| 2,385,000 | 4.000 | 08/01/22 | 2,373,385 | |||||||||||
| 1,795,000 | 4.000 | 08/01/23 | 1,774,717 | |||||||||||
| Henderson Local Improvement District No. T-16 Special | | ||||||||||||
| 1,735,000 | 4.800 | 03/01/15 | 1,688,433 | |||||||||||
| 1,995,000 | 4.900 | 03/01/17 | 1,899,080 | |||||||||||
| 2,465,000 | 5.000 | 03/01/20 | 2,282,911 | |||||||||||
| 2,480,000 | 5.100 | 03/01/21 | 2,278,698 | |||||||||||
| 1,280,000 | 5.100 | 03/01/22 | 1,154,394 | |||||||||||
| 3,505,000 | 5.125 | 03/01/25 | 3,028,495 | |||||||||||
| Henderson Local Improvement District No. T-17 Special | | ||||||||||||
| 1,335,000 | 5.000 | 09/01/25 | 1,329,914 | |||||||||||
| Las Vegas Local Improvement District No. 607 Series 2004 | | ||||||||||||
| 1,250,000 | 5.900 | 06/01/17 | 1,283,675 | |||||||||||
| 1,290,000 | 5.900 | 06/01/18 | 1,315,090 | |||||||||||
| 475,000 | 6.000 | 06/01/19 | 482,453 | |||||||||||
| 4,730,000 | 6.250 | 06/01/24 | 4,803,741 | |||||||||||
|
| |||||||||||||
| The accompanying notes are an integral part of these financial statements. | 31 |
GOLDMAN SACHS HIGH YIELD MUNICIPAL FUND
Schedule of Investments (continued)
September 30, 2012 (Unaudited)
Principal Amount | Interest Rate | Maturity Date | Value | |||||||||||
| State-Specific Municipal Debt Obligations – (continued) | ||||||||||||||
| Nevada – (continued) |
| ||||||||||||
| North Las Vegas Local Improvement District No. 60 Special | | ||||||||||||
| $ | 55,000 | 5.100 | % | 12/01/22 | $ | 55,544 | ||||||||
| Reno Health Facility RB for Catholic Healthcare West | | ||||||||||||
| 5,665,000 | 5.250 | 07/01/31 | 6,074,126 | |||||||||||
|
| |||||||||||||
| 31,824,656 | ||||||||||||||
|
| |||||||||||||
| New Hampshire – 0.5% |
| ||||||||||||
| Manchester New Hampshire General Airport RB Refunding | | ||||||||||||
| 2,800,000 | 5.000 | 01/01/18 | 3,153,696 | |||||||||||
| 3,000,000 | 5.000 | 01/01/19 | 3,395,790 | |||||||||||
| 2,580,000 | 5.000 | 01/01/20 | 2,915,426 | |||||||||||
| New Hampshire Health & Education Facilities Authority RB for | | ||||||||||||
| 1,000,000 | 5.500 | 07/01/25 | 1,059,110 | |||||||||||
| 1,400,000 | 5.875 | 07/01/34 | 1,482,810 | |||||||||||
| New Hampshire Health & Education Facilities Authority RB for | | ||||||||||||
| 1,050,000 | 5.250 | 06/01/26 | 1,070,212 | |||||||||||
| 4,185,000 | 5.250 | 06/01/36 | 4,219,317 | |||||||||||
|
| |||||||||||||
| 17,296,361 | ||||||||||||||
|
| |||||||||||||
| New Jersey – 3.5% |
| ||||||||||||
| New Jersey Economic Development Authority Cigarette Tax RB | | ||||||||||||
| 2,500,000 | 5.000 | 06/15/26 | 2,747,750 | |||||||||||
| 1,000,000 | 5.000 | 06/15/28 | 1,089,760 | |||||||||||
| 1,000,000 | 5.000 | 06/15/29 | 1,085,550 | |||||||||||
| New Jersey Economic Development Authority Energy Facilities | | ||||||||||||
| 1,000,000 | 4.750 | 06/15/32 | 1,002,250 | |||||||||||
| 1,000,000 | 5.000 | 06/15/37 | 1,012,200 | |||||||||||
| 1,000,000 | 5.125 | 06/15/43 | 1,017,910 | |||||||||||
| New Jersey Economic Development Authority RB for School | | ||||||||||||
| 1,640,000 | 5.000 | 09/01/34 | 1,833,553 | |||||||||||
| New Jersey Economic Development Authority Special Facilities | | ||||||||||||
| 7,500,000 | 5.500 | 04/01/28 | 7,354,500 | |||||||||||
| New Jersey Economic Development Authority Special Facilities | | ||||||||||||
| 5,500,000 | 5.125 | 09/15/23 | 5,586,955 | |||||||||||
| 8,500,000 | 5.250 | 09/15/29 | 8,665,240 | |||||||||||
| New Jersey Economic Development Authority Special Facilities | | ||||||||||||
| 8,800,000 | 5.750 | 09/15/27 | 8,826,136 | |||||||||||
| New Jersey Health Care Facilities Financing Authority RB for St. | | ||||||||||||
| 32,380,000 | 6.625 | 07/01/38 | 37,547,200 | |||||||||||
|
| |||||||||||||
| State-Specific Municipal Debt Obligations – (continued) | ||||||||||||||
| New Jersey – (continued) |
| ||||||||||||
| New Jersey Health Care Facilities Financing Authority RB for | | ||||||||||||
| $ | 8,980,000 | 5.250 | % | 07/01/30 | $ | 9,424,510 | ||||||||
| New Jersey Health Care Facilities Financing Authority RB for | | ||||||||||||
| 15,840,000 | 5.250 | 07/01/23 | 16,926,941 | |||||||||||
| New Jersey Transportation Trust Fund Authority for | | ||||||||||||
| 7,000,000 | 5.000 | 06/15/42 | 7,927,220 | |||||||||||
| Newark New Jersey Housing Authority RB for South Ward | | ||||||||||||
| 2,000,000 | 6.750 | 12/01/38 | 2,518,180 | |||||||||||
| Tobacco Settlement Financing Corp. RB for Capital Appreciation | | ||||||||||||
| 164,600,000 | 0.000 | 06/01/41 | 7,988,038 | |||||||||||
| Tobacco Settlement Financing Corp. RB Senior Asset-Backed | | ||||||||||||
| 12,000,000 | 4.750 | 06/01/34 | 9,853,800 | |||||||||||
|
| |||||||||||||
| 132,407,693 | ||||||||||||||
|
| |||||||||||||
| New Mexico – 0.7% |
| ||||||||||||
| Farmington New Mexico PCRB Refunding for Public Service Co. | | ||||||||||||
| 3,620,000 | 4.875 | 04/01/33 | 3,749,125 | |||||||||||
| Farmington New Mexico PCRB Refunding for Public Service Co. | | ||||||||||||
| 6,925,000 | 4.875 | 04/01/33 | 7,172,015 | |||||||||||
| Farmington New Mexico PCRB Refunding for Public Service Co. | | ||||||||||||
| 14,000,000 | 5.900 | 06/01/40 | 15,583,260 | |||||||||||
|
| |||||||||||||
| 26,504,400 | ||||||||||||||
|
| |||||||||||||
| New York – 1.3% |
| ||||||||||||
| Chautauqua County Industrial Development Agency Exempt | | ||||||||||||
| 1,500,000 | 5.875 | 04/01/42 | 1,686,135 | |||||||||||
| Nassau County GO Revenue Anticipation Notes Series 2012 A | | ||||||||||||
| 18,250,000 | 2.000 | 03/29/13 | 18,388,882 | |||||||||||
| New York City Industrial Development Agency PILOT RB for | | ||||||||||||
| 515,000 | 5.000 | 01/01/39 | 523,817 | |||||||||||
| New York City Industrial Development Agency PILOT RB for | | ||||||||||||
| 1,000,000 | 6.125 | 01/01/29 | 1,187,340 | |||||||||||
| 3,000,000 | 6.375 | 01/01/39 | 3,511,020 | |||||||||||
| 5,000,000 | 6.500 | 01/01/46 | 5,846,750 | |||||||||||
|
| |||||||||||||
| 32 | The accompanying notes are an integral part of these financial statements. |
GOLDMAN SACHS HIGH YIELD MUNICIPAL FUND
Principal Amount | Interest Rate | Maturity Date | Value | |||||||||||
| State-Specific Municipal Debt Obligations – (continued) | ||||||||||||||
| New York – (continued) |
| ||||||||||||
| New York City Municipal Water Finance Authority Water & | | ||||||||||||
| $ | 10,000,000 | 5.000 | % | 06/15/44 | $ | 11,398,600 | ||||||||
| Newburgh New York GO Serial Bonds Series 2012 A (NR/Ba1) |
| ||||||||||||
| 1,565,000 | 5.750 | 06/15/35 | 1,596,316 | |||||||||||
| Troy City Capital Resource Corp. RB for Rensselaer Polytechnic | | ||||||||||||
| 5,000,000 | 5.125 | 09/01/40 | 5,524,350 | |||||||||||
|
| |||||||||||||
| 49,663,210 | ||||||||||||||
|
| |||||||||||||
| North Carolina – 0.3% |
| ||||||||||||
| Charlotte Special Facilities RB Refunding for Charlotte/Douglas | | ||||||||||||
| 6,860,000 | 5.600 | 07/01/27 | 6,402,438 | |||||||||||
| Columbus County Industrial Facilities and Pollution Control | | ||||||||||||
| 1,000,000 | 5.700 | 05/01/34 | 1,112,220 | |||||||||||
| North Carolina Medical Care Commission Retirement Facilities | | ||||||||||||
| 500,000 | 5.250 | 09/01/21 | 512,570 | |||||||||||
| North Carolina Medical Care Commission Retirement Facilities | | ||||||||||||
| 1,500,000 | 5.250 | 10/01/24 | 1,543,035 | |||||||||||
|
| |||||||||||||
| 9,570,263 | ||||||||||||||
|
| |||||||||||||
| Ohio – 5.8% |
| ||||||||||||
| Bowling Green City Student Housing RB for CFP I LLC – | | ||||||||||||
| 7,000,000 | 6.000 | 06/01/45 | 7,645,120 | |||||||||||
| Buckeye Ohio Tobacco Settlement Financing Authority RB | | ||||||||||||
| 16,500,000 | 5.125 | 06/01/24 | 13,885,080 | |||||||||||
| 44,000,000 | 5.875 | 06/01/30 | 36,275,360 | |||||||||||
| 2,000,000 | 5.875 | 06/01/47 | 1,608,380 | |||||||||||
| 49,150,000 | 6.500 | 06/01/47 | �� | 43,318,352 | ||||||||||
| Cleveland Airport Special RB for Continental Airlines, Inc. | | ||||||||||||
| 30,450,000 | 5.375 | 09/15/27 | 30,448,477 | |||||||||||
| Cleveland Airport Special RB Refunding for Continental Airlines, | | ||||||||||||
| 7,465,000 | 5.700 | 12/01/19 | 7,467,687 | |||||||||||
| Cleveland Airport System RB Refunding Series 2012 A | | ||||||||||||
| 8,500,000 | 5.000 | 01/01/29 | 9,513,370 | |||||||||||
| 3,250,000 | 5.000 | 01/01/31 | 3,583,418 | |||||||||||
| Cleveland Airport System RB Refunding Series 2012 A (AGM) | | ||||||||||||
| 6,900,000 | 5.000 | 01/01/30 | 7,705,299 | |||||||||||
|
| |||||||||||||
| State-Specific Municipal Debt Obligations – (continued) | ||||||||||||||
| Ohio – (continued) |
| ||||||||||||
| Hamilton County Health Care RB Refunding for Life Enriching | | ||||||||||||
| $ | 15,540,000 | 5.000 | % | 01/01/27 | $ | 15,993,302 | ||||||||
| 15,000,000 | 5.000 | 01/01/37 | 15,320,700 | |||||||||||
| Jeffrey Place New Community Authority RB for Jeffrey Place | | ||||||||||||
| 800,000 | 5.000 | 12/01/22 | 699,240 | |||||||||||
| 1,000,000 | 5.000 | 12/01/32 | 784,660 | |||||||||||
| Lorain County Port Authority Recovery Zone Facility RB for | | ||||||||||||
| 8,730,000 | 6.750 | 12/01/40 | 9,650,404 | |||||||||||
| Ohio State Solid Waste Disposal RB for USG Corp. Project | | ||||||||||||
| 6,000,000 | 5.600 | 08/01/32 | 5,663,640 | |||||||||||
| Ohio State Solid Waste Disposal RB for USG Corp. Project | | ||||||||||||
| 7,050,000 | 5.650 | 03/01/33 | 6,674,165 | |||||||||||
|
| |||||||||||||
| 216,236,654 | ||||||||||||||
|
| |||||||||||||
| Oklahoma – 0.2% |
| ||||||||||||
| Oklahoma Development Finance Authority RB for Great Plains | | ||||||||||||
| 4,725,000 | 5.000 | 12/01/27 | 4,778,203 | |||||||||||
| Weatherford Hospital Authority RB Series 2006 (NR/NR) |
| ||||||||||||
| 2,200,000 | 6.000 | 05/01/25 | 2,255,044 | |||||||||||
| 865,000 | 6.000 | 05/01/31 | 871,479 | |||||||||||
|
| |||||||||||||
| 7,904,726 | ||||||||||||||
|
| |||||||||||||
| Oregon – 0.2% |
| ||||||||||||
| Forest Grove Oregon Student Housing RB for Oak Tree | | ||||||||||||
| 4,750,000 | 5.500 | 03/01/37 | 4,861,625 | |||||||||||
| Oregon Facilities Authority Student Housing RB for | | ||||||||||||
| 1,500,000 | 5.000 | 07/01/44 | 1,611,195 | |||||||||||
| Portland Oregon Multi-Family Housing RB for Pacific Tower | | ||||||||||||
| 2,390,000 | 7.000 | 12/01/34 | 2,391,553 | |||||||||||
|
| |||||||||||||
| 8,864,373 | ||||||||||||||
|
| |||||||||||||
| Pennsylvania – 5.4% |
| ||||||||||||
| Allegheny County Higher Education Building Authority RB for | | ||||||||||||
| 1,500,000 | 5.000 | 09/01/30 | 1,634,505 | |||||||||||
| 1,000,000 | 5.000 | 09/01/35 | 1,073,500 | |||||||||||
| Allegheny County Hospital Development Authority RB for West | | ||||||||||||
| 78,845,000 | 5.000 | 11/15/28 | 60,135,081 | |||||||||||
| 21,390,000 | 5.375 | 11/15/40 | 16,222,604 | |||||||||||
| Allegheny County IDA Environmental Improvement RB | | ||||||||||||
| 1,200,000 | 6.750 | 11/01/24 | 1,332,120 | |||||||||||
|
| |||||||||||||
| The accompanying notes are an integral part of these financial statements. | 33 |
GOLDMAN SACHS HIGH YIELD MUNICIPAL FUND
Schedule of Investments (continued)
September 30, 2012 (Unaudited)
Principal Amount | Interest Rate | Maturity Date | Value | |||||||||||
| State-Specific Municipal Debt Obligations – (continued) | ||||||||||||||
| Pennsylvania – (continued) |
| ||||||||||||
| Allentown Area Hospital Authority RB for Sacred Heart Hospital | | ||||||||||||
| $ | 4,730,000 | 6.000 | % | 11/15/16 | $ | 4,728,439 | ||||||||
| Allentown Neighborhood Improvement Zone Development | | ||||||||||||
| 10,000,000 | 5.000 | 05/01/42 | 10,361,600 | |||||||||||
| Chester Economic Development Authority RB Series 2004 | | ||||||||||||
| 8,640,000 | 7.000 | 03/01/19 | 9,234,173 | |||||||||||
| City of Philadelphia GO Bonds Series 2011 (BBB+/A2) |
| ||||||||||||
| 4,000,000 | 6.000 | 08/01/36 | 4,661,440 | |||||||||||
| City of Pittsburgh GO Bonds Series 2012 B (BBB/A1) |
| ||||||||||||
| 4,380,000 | 5.000 | 09/01/26 | 5,097,532 | |||||||||||
| Clairton Municipal Authority Sewer RB Series 2012 B (BBB/NR) |
| ||||||||||||
| 1,000,000 | 5.000 | 12/01/37 | 1,032,940 | |||||||||||
| 1,000,000 | 5.000 | 12/01/42 | 1,029,660 | |||||||||||
| Dauphin County General Authority Health System RB for | | ||||||||||||
| 7,690,000 | 5.000 | 06/01/42 | 8,294,434 | |||||||||||
| Geisinger Authority Health System RB for Geisinger Health | | ||||||||||||
| 48,250,000 | 1.068 | 05/01/37 | 36,807,995 | |||||||||||
| Montgomery County IDA RB for Whitemarsh Continuing Care | | ||||||||||||
| 1,775,000 | 5.300 | 02/01/13 | 1,789,963 | |||||||||||
| 2,000,000 | 6.125 | 02/01/28 | 2,037,260 | |||||||||||
| Pennsylvania Economic Development Financing Authority | | ||||||||||||
| 2,750,000 | 5.000 | 11/01/41 | 2,957,267 | |||||||||||
| Pennsylvania Economic Development Financing Authority | | ||||||||||||
| 7,400,000 | 6.250 | 01/01/32 | 8,452,650 | |||||||||||
| Pennsylvania Economic Development Financing Authority Solid | | ||||||||||||
| 3,000,000 | 6.000 | 06/01/31 | 2,973,150 | |||||||||||
| Pennsylvania Economic Development Financing Authority | | ||||||||||||
| 1,000,000 | 7.500 | 05/01/20 | 1,123,180 | |||||||||||
| Pennsylvania Economic Development Financing Authority | | ||||||||||||
| 2,500,000 | 8.000 | 05/01/29 | 2,889,600 | |||||||||||
| Pennsylvania State Higher Educational Facilities Authority RB | | ||||||||||||
| 4,000,000 | 5.000 | 05/01/42 | 4,318,640 | |||||||||||
| Philadelphia Authority Industrial Development RB for Please | | ||||||||||||
| 3,000,000 | 5.250 | 09/01/26 | 2,893,680 | |||||||||||
| 3,000,000 | 5.250 | 09/01/31 | 2,805,300 | |||||||||||
|
| |||||||||||||
| State-Specific Municipal Debt Obligations – (continued) | ||||||||||||||
| Pennsylvania – (continued) |
| ||||||||||||
| Philadelphia Hospitals & Higher Education Facilities Authority | | ||||||||||||
| $ | 10,000,000 | 5.625 | % | 07/01/42 | $ | 10,603,300 | ||||||||
|
| |||||||||||||
| 204,490,013 | ||||||||||||||
|
| |||||||||||||
| Puerto Rico – 6.3% |
| ||||||||||||
| Puerto Rico Commonwealth Aqueduct & Sewer Authority RB | | ||||||||||||
| 59,485,000 | 6.000 | 07/01/38 | 62,843,523 | |||||||||||
| 38,845,000 | 6.000 | 07/01/44 | 40,918,935 | |||||||||||
| Puerto Rico Commonwealth Aqueduct & Sewer Authority RB | | ||||||||||||
| 1,710,000 | 6.000 | 07/01/44 | 1,801,297 | |||||||||||
| Puerto Rico Commonwealth Aqueduct & Sewer Authority RB | | ||||||||||||
| 13,500,000 | 5.250 | 07/01/42 | 13,601,250 | |||||||||||
| Puerto Rico Commonwealth GO Bonds Refunding for Public | | ||||||||||||
| 8,780,000 | 6.000 | 07/01/39 | 9,286,957 | |||||||||||
| Puerto Rico Commonwealth GO Bonds Refunding for Public | | ||||||||||||
| 7,555,000 | 5.500 | 07/01/27 | 8,040,862 | |||||||||||
| 2,545,000 | 5.000 | 07/01/41 | 2,544,796 | |||||||||||
| Puerto Rico Electric Power Authority RB Refunding | | ||||||||||||
| 9,700,000 | 5.250 | 07/01/26 | 10,268,129 | |||||||||||
| Puerto Rico Electric Power Authority RB Series 2010 XX | | ||||||||||||
| 25,000,000 | 5.250 | 07/01/40 | 25,331,250 | |||||||||||
| Puerto Rico Public Buildings Authority RB Refunding for | | ||||||||||||
| 2,000,000 | 6.250 | 07/01/23 | 2,308,360 | |||||||||||
| Puerto Rico Public Buildings Authority RB Refunding for | | ||||||||||||
| 1,000,000 | 6.125 | 07/01/23 | 1,148,010 | |||||||||||
| Puerto Rico Sales Tax Financing Corp. RB First Subseries 2009 A | | ||||||||||||
| 21,550,000 | 6.000 | 08/01/42 | 23,951,963 | |||||||||||
| Puerto Rico Sales Tax Financing Corp. RB First Subseries 2010 A | | ||||||||||||
| 10,000,000 | 0.000 | 08/01/36 | 2,519,400 | |||||||||||
| Puerto Rico Sales Tax Financing Corp. RB First Subseries 2010 C | | ||||||||||||
| 25,000,000 | 0.000 | 08/01/39 | 5,078,750 | |||||||||||
| Puerto Rico Sales Tax Financing Corp. RB First Subseries 2011 | | ||||||||||||
| 7,000,000 | 5.000 | 08/01/43 | 7,272,930 | |||||||||||
| Puerto Rico Sales Tax Financing Corp. RB for Capital | | ||||||||||||
| 12,750,000 | 0.000 | 08/01/32 | 13,002,195 | |||||||||||
|
| |||||||||||||
| 34 | The accompanying notes are an integral part of these financial statements. |
GOLDMAN SACHS HIGH YIELD MUNICIPAL FUND
Principal Amount | Interest Rate | Maturity Date | Value | |||||||||||
| State-Specific Municipal Debt Obligations – (continued) | ||||||||||||||
| Puerto Rico – (continued) |
| ||||||||||||
| Puerto Rico Sales Tax Financing Corp. RB for Capital | | ||||||||||||
| $ | 10,000,000 | 0.000 | % | 08/01/33 | $ | 8,592,700 | ||||||||
|
| |||||||||||||
| 238,511,307 | ||||||||||||||
|
| |||||||||||||
| Rhode Island – 0.1% |
| ||||||||||||
| Tobacco Settlement Financing Corp. RB Asset-Backed Bonds | | ||||||||||||
| 85,300,000 | 0.000 | 06/01/52 | 2,577,766 | |||||||||||
|
| |||||||||||||
| South Carolina – 0.6% |
| ||||||||||||
| Lancaster County Assessment RB for Edgewater Improvement | | ||||||||||||
| 3,984,000 | 6.875 | 11/01/35 | 3,887,069 | |||||||||||
| South Carolina Jobs – Economic Development Authority Hospital | | ||||||||||||
| 4,000,000 | 6.500 | 08/01/39 | 4,894,120 | |||||||||||
| York County Industrial RB Exempt Facility Hoechst Celanese | | ||||||||||||
| 12,280,000 | 5.700 | 01/01/24 | 12,009,963 | |||||||||||
|
| |||||||||||||
| 20,791,152 | ||||||||||||||
|
| |||||||||||||
| South Dakota – 0.1% |
| ||||||||||||
| South Dakota State Health & Educational Facilities Authority RB | | ||||||||||||
| 5,000,000 | 5.000 | 11/01/40 | 5,277,750 | |||||||||||
|
| |||||||||||||
| Tennessee – 0.9% |
| ||||||||||||
| Blount County Health & Educational Facilities Board RB | | ||||||||||||
| 1,675,000 | 5.125 | 04/01/23 | 1,717,160 | |||||||||||
| Chattanooga Health Educational & Housing Facility Board RB | | ||||||||||||
| 350,000 | 5.000 | 10/01/15 | 374,049 | |||||||||||
| 6,710,000 | 5.000 | 10/01/25 | 6,926,263 | |||||||||||
| 7,500,000 | 5.125 | 10/01/35 | 7,598,475 | |||||||||||
| Johnson City Health & Educational Board Retirement Facilities | | ||||||||||||
| 1,000,000 | 6.250 | 02/15/32 | 1,009,140 | |||||||||||
| Johnson City Health & Educational Board Retirement Facilities | | ||||||||||||
| 1,500,000 | 5.000 | 08/15/42 | 1,582,395 | |||||||||||
| Johnson City Health & Educational Facilities Board RB for | | ||||||||||||
| 5,500,000 | 6.500 | 07/01/38 | 6,556,990 | |||||||||||
| Knox County Tennessee Health, Educational & Housing Facilities | | ||||||||||||
| 2,000,000 | 5.250 | 04/01/36 | 2,110,320 | |||||||||||
| Memphis Health Educational & Housing Facility Board RB for | | ||||||||||||
| 8,680,000 | 5.750 | 04/01/25 | 5,204,528 | |||||||||||
|
| |||||||||||||
| State-Specific Municipal Debt Obligations – (continued) | ||||||||||||||
| Tennessee – (continued) |
| ||||||||||||
| Shelby County Health Educational & Housing Facilities Board | | ||||||||||||
| $ | 2,000,000 | 5.625 | % | 09/01/26 | $ | 2,063,860 | ||||||||
|
| |||||||||||||
| 35,143,180 | ||||||||||||||
|
| |||||||||||||
| Texas – 5.3% |
| ||||||||||||
| Alliance Airport Authority Special Facilities RB Refunding for | | ||||||||||||
| 17,000,000 | 5.750 | 12/01/29 | 11,121,230 | |||||||||||
| Austin Texas Convention Center Enterprises, Inc. RB Third Tier | | ||||||||||||
| 185,000 | 9.750 | 01/01/26 | 187,912 | |||||||||||
| Austin Texas Convention Center Enterprises, Inc. RB Third Tier | | ||||||||||||
| 8,975,000 | 9.750 | 01/01/26 | 9,115,369 | |||||||||||
| Bexar County Texas Health Facilities Development Corp. RB for | | ||||||||||||
| 3,250,000 | 6.200 | 07/01/45 | 3,661,970 | |||||||||||
| Brazos River Authority PCRB for TXU Energy Co. LLC Project | | ||||||||||||
| 12,740,000 | 5.000 | 03/01/41 | 1,256,928 | |||||||||||
| Brazos River Authority PCRB Refunding for TXU Energy Co. | | ||||||||||||
| 9,275,000 | 6.750 | 10/01/38 | 1,181,913 | |||||||||||
| Dallas County Flood Control District No.1 GO Bonds Refunding | | ||||||||||||
| 6,000,000 | 7.250 | 04/01/32 | 6,078,000 | |||||||||||
| Dallas-Fort Worth International Airport Facilities Improvement | | ||||||||||||
| 9,230,000 | 6.000 | 11/01/14 | 6,049,065 | |||||||||||
| Dallas-Fort Worth International Airport Facilities Improvement | | ||||||||||||
| 13,245,000 | 6.150 | 01/01/16 | 13,260,232 | |||||||||||
| Houston Airport System RB Refunding Sub Lien Series 2012 A | | ||||||||||||
| 5,045,000 | 5.000 | 07/01/28 | 5,745,448 | |||||||||||
| Houston Airport System Special Facilities RB for Continental | | ||||||||||||
| 1,000,000 | 5.700 | 07/15/29 | 1,002,680 | |||||||||||
| Houston Airport System Special Facilities RB for Continental | | ||||||||||||
| 4,000,000 | 6.625 | 07/15/38 | 4,466,160 | |||||||||||
| Matagorda County Texas Navigation District No. 1 PCRB | | ||||||||||||
| 5,200,000 | 6.300 | 11/01/29 | 6,054,152 | |||||||||||
| Mesquite Texas Health Facilities Development Corp. RB for | | ||||||||||||
| 5,165,000 | 5.625 | 02/15/35 | 5,298,929 | |||||||||||
| North Texas Tollway Authority RB First Tier Series 2009 A | | ||||||||||||
| 25,585,000 | 6.250 | 01/01/39 | 29,314,014 | |||||||||||
|
| |||||||||||||
| The accompanying notes are an integral part of these financial statements. | 35 |
GOLDMAN SACHS HIGH YIELD MUNICIPAL FUND
Schedule of Investments (continued)
September 30, 2012 (Unaudited)
Principal Amount | Interest Rate | Maturity Date | Value | |||||||||||
| State-Specific Municipal Debt Obligations – (continued) | ||||||||||||||
| Texas – (continued) |
| ||||||||||||
| North Texas Tollway Authority RB Refunding Toll Second Tier | | ||||||||||||
| $ | 53,205,000 | 5.750 | % | 01/01/38 | $ | 58,013,668 | ||||||||
| Port Corpus Christi Authority of Nueces County PCRB for | | ||||||||||||
| 5,000,000 | 6.700 | 11/01/30 | 5,055,250 | |||||||||||
| Port of Bay City Authority of Matagorda County RB for Hoechst | | ||||||||||||
| 1,870,000 | 6.500 | 05/01/26 | 1,871,795 | |||||||||||
| Sabine River Authority Texas PCRB Refunding for TXU Electric | | ||||||||||||
| 5,950,000 | 5.200 | 05/01/28 | 609,875 | |||||||||||
| Sabine River Authority Texas PCRB Refunding for TXU Electric | | ||||||||||||
| 7,110,000 | 6.450 | 06/01/21 | 888,892 | |||||||||||
| Tarrant County Cultural Education Facilities Finance Corp. RB | | ||||||||||||
| 4,180,000 | 5.125 | 05/15/37 | 4,207,922 | |||||||||||
| Texas Private Activity Bond Surface Transportation Corp. RB | | ||||||||||||
| 7,500,000 | 6.875 | 12/31/39 | 9,021,675 | |||||||||||
| Tomball Hospital Authority RB Refunding Series 2005 (ETM) | | ||||||||||||
| 250,000 | 5.000 | 07/01/15 | 281,355 | |||||||||||
| Tomball Hospital Authority RB Refunding Series 2005 | | ||||||||||||
| 14,500,000 | 5.000 | 07/01/15 | 16,318,590 | |||||||||||
|
| |||||||||||||
| 200,063,024 | ||||||||||||||
|
| |||||||||||||
| U.S. Virgin Islands – 0.1% |
| ||||||||||||
| Virgin Islands Public Finance Authority RB Senior Lien | | ||||||||||||
| 2,000,000 | 6.000 | 10/01/39 | 2,238,080 | |||||||||||
|
| |||||||||||||
| Utah – 0.8% |
| ||||||||||||
| Carbon County Solid Waste Disposal RB Refunding for | | ||||||||||||
| 26,852,000 | 7.100 | 08/15/23 | 30,541,465 | |||||||||||
|
| |||||||||||||
| Vermont – 0.1% |
| ||||||||||||
| Vermont Economic Development Authority Mortgage RB for | | ||||||||||||
| 1,300,000 | 5.250 | 05/01/26 | 1,327,105 | |||||||||||
| Vermont Educational & Health Buildings Financing Agency RB | | ||||||||||||
| 2,250,000 | 5.000 | 10/01/42 | 2,468,857 | |||||||||||
|
| |||||||||||||
| 3,795,962 | ||||||||||||||
|
| |||||||||||||
| Virginia – 0.8% |
| ||||||||||||
| Albemarle County IDA RB Refunding Westminster-Canterbury | | ||||||||||||
| 1,000,000 | 5.000 | 01/01/31 | 1,020,220 | |||||||||||
|
| |||||||||||||
| State-Specific Municipal Debt Obligations – (continued) | ||||||||||||||
| Virginia – (continued) |
| ||||||||||||
| Mosaic District Community Development Authority RB | | ||||||||||||
| $ | 3,580,000 | 6.250 | % | 03/01/21 | $ | 4,092,656 | ||||||||
| 2,000,000 | 6.625 | 03/01/26 | 2,270,800 | |||||||||||
| 7,000,000 | 6.875 | 03/01/36 | 7,912,380 | |||||||||||
| Norfolk Redevelopment & Housing Authority First Mortgage for | | ||||||||||||
| 500,000 | 6.000 | 01/01/25 | 503,635 | |||||||||||
| 1,100,000 | 6.125 | 01/01/35 | 1,107,392 | |||||||||||
| Suffolk IDA Retirement Facilities RB Refunding First Mortgage | | ||||||||||||
| 725,000 | 5.150 | 09/01/24 | 753,021 | |||||||||||
| 1,000,000 | 5.300 | 09/01/31 | 1,016,880 | |||||||||||
| Virginia Beach Development Authority Residential Care | | ||||||||||||
| 500,000 | 5.000 | 11/01/22 | 518,880 | |||||||||||
| Virginia Small Business Financing Authority Senior Lien RB for | | ||||||||||||
| 4,250,000 | 5.500 | 01/01/42 | 4,677,083 | |||||||||||
| Washington County IDA RB for Mountain States Health Alliance | | ||||||||||||
| 4,000,000 | 7.750 | 07/01/38 | 4,966,120 | |||||||||||
|
| |||||||||||||
| 28,839,067 | ||||||||||||||
|
| |||||||||||||
| Washington – 1.2% |
| ||||||||||||
| Port of Seattle Industrial Development Corporation Special | | ||||||||||||
| 4,000,000 | 5.000 | 04/01/30 | 4,012,960 | |||||||||||
| Puttable Floating Option Tax-Exempt Receipts (RITES) GO | | ||||||||||||
| 3,955,000 | 16.108 | 12/14/17 | 6,999,599 | |||||||||||
| Puttable Floating Option Tax-Exempt Receipts (RITES) GO | | ||||||||||||
| 4,150,000 | 16.115 | 12/14/17 | 7,234,363 | |||||||||||
| Skagit County Public Hospital District No. 1 RB for Skagit Valley | | ||||||||||||
| 3,000,000 | 5.250 | 12/01/25 | 3,392,490 | |||||||||||
| 4,000,000 | 5.750 | 12/01/35 | 4,346,640 | |||||||||||
| Washington Health Care Facilities Authority RB for Kadlec | | ||||||||||||
| 3,000,000 | 5.000 | 12/01/42 | 3,066,180 | |||||||||||
| Washington Health Care Facilities Authority RB for MultiCare | | ||||||||||||
| 750,000 | 6.000 | 08/15/39 | 874,485 | |||||||||||
| Washington Health Care Facilities Authority RB for MultiCare | | ||||||||||||
| 1,750,000 | 6.000 | 08/15/39 | 2,040,465 | |||||||||||
| Washington Health Care Facilities Authority RB for Swedish | | ||||||||||||
| 8,505,000 | 6.250 | 05/15/21 | 11,792,097 | |||||||||||
|
| |||||||||||||
| 43,759,279 | ||||||||||||||
|
| |||||||||||||
| 36 | The accompanying notes are an integral part of these financial statements. |
GOLDMAN SACHS HIGH YIELD MUNICIPAL FUND
Principal Amount | Interest Rate | Maturity Date | Value | |||||||||||
| State-Specific Municipal Debt Obligations – (continued) | ||||||||||||||
| West Virginia – 0.3% |
| ||||||||||||
| West Virginia Economic Development Authority Solid Waste | | ||||||||||||
| $ | 4,000,000 | 5.375 | % | 12/01/38 | $ | 4,408,800 | ||||||||
| West Virginia Higher Education Policy Commission RB | | ||||||||||||
| 5,000,000 | 4.000 | 04/01/34 | 5,200,450 | |||||||||||
|
| |||||||||||||
| 9,609,250 | ||||||||||||||
|
| |||||||||||||
| Wisconsin – 1.9% |
| ||||||||||||
| Kaukauna Wisconsin Environmental Improvement RB for | | ||||||||||||
| 6,510,000 | 5.250 | 06/01/29 | 6,653,676 | |||||||||||
| Public Finance Authority Senior Airport Facilities RB Refunding | | ||||||||||||
| 3,000,000 | 5.000 | 07/01/42 | 3,015,870 | |||||||||||
| Wisconsin State Health & Educational Facilities Authority RB for | | ||||||||||||
| 1,500,000 | 6.100 | 05/01/34 | 1,588,275 | |||||||||||
| Wisconsin State Health & Educational Facilities Authority RB for | | ||||||||||||
| 5,825,000 | 5.125 | 05/15/29 | 6,029,457 | |||||||||||
| Wisconsin State Health & Educational Facilities Authority RB for | | ||||||||||||
| 2,200,000 | 5.000 | 05/15/36 | 2,243,582 | |||||||||||
| Wisconsin State Health & Educational Facilities Authority RB for | | ||||||||||||
| 3,000,000 | 5.100 | 03/01/25 | 3,110,670 | |||||||||||
| 3,800,000 | 5.250 | 03/01/35 | 3,872,086 | |||||||||||
| Wisconsin State Health & Educational Facilities Authority RB for | | ||||||||||||
| 2,000,000 | 5.250 | 08/15/31 | 2,091,560 | |||||||||||
| 27,365,000 | 5.250 | 08/15/34 | 28,597,793 | |||||||||||
| Wisconsin State Health & Educational Facilities Authority RB | | ||||||||||||
| 1,275,000 | 5.650 | 08/01/21 | 1,301,482 | |||||||||||
| 2,385,000 | 5.800 | 08/01/29 | 2,402,840 | |||||||||||
| Wisconsin State Health & Educational Facilities Authority RB | | ||||||||||||
| 10,220,000 | 5.125 | 08/15/30 | 10,649,955 | |||||||||||
|
| |||||||||||||
| 71,557,246 | ||||||||||||||
|
| |||||||||||||
| | TOTAL STATE-SPECIFIC MUNICIPAL DEBT OBLIGATIONS | | ||||||||||||
| (Cost $3,481,316,635) | $ | 3,632,042,319 | ||||||||||||
|
| |||||||||||||
Principal Amount | Interest Rate | Maturity Date | Value | |||||||||||
| Other Municipal Debt Obligations – 1.4% | ||||||||||||||
| Municipal Mortgage & Equity LLC Tax-Exempt Special Purpose | | ||||||||||||
| $ | 7,000,000 | 9.640 | % | 06/30/50 | $ | 6,650,000 | ||||||||
| Municipal Mortgage & Equity LLC Tax-Exempt Special Purpose | | ||||||||||||
| 4,000,000 | 5.200 | 09/30/14 | 3,280,840 | |||||||||||
| Municipal Mortgage & Equity LLC Tax-Exempt Special Purpose | | ||||||||||||
| 3,000,000 | 5.400 | 09/30/14 | 2,085,630 | |||||||||||
| 3,000,000 | 5.800 | 09/30/19 | 2,146,350 | |||||||||||
| Municipal Mortgage & Equity LLC Tax-Exempt Special Purpose | | ||||||||||||
| 6,000,000 | 4.900 | 09/30/14 | 5,460,060 | |||||||||||
| Municipal Mortgage & Equity LLC Tax-Exempt Special Purpose | | ||||||||||||
| 13,000,000 | 9.750 | 06/29/49 | 11,700,260 | |||||||||||
| Municipal Mortgage & Equity LLC Tax-Exempt Special Purpose | | ||||||||||||
| 6,000,000 | 5.900 | 09/30/20 | 3,542,280 | |||||||||||
| Municipal Mortgage & Equity LLC Tax-Exempt Special Purpose | | ||||||||||||
| 8,000,000 | 5.125 | 09/30/15 | 7,200,080 | |||||||||||
| Municipal Mortgage & Equity LLC Tax-Exempt Special Purpose | | ||||||||||||
| 8,000,000 | 5.300 | 09/30/15 | 5,882,080 | |||||||||||
| Municipal Mortgage & Equity LLC Tax-Exempt Special Purpose | | ||||||||||||
| 4,000,000 | 4.950 | 11/29/49 | 4,000,000 | |||||||||||
| Municipal Mortgage & Equity LLC Tax-Exempt Special Purpose | | ||||||||||||
| 3,000,000 | 5.500 | 09/30/15 | 2,025,720 | |||||||||||
|
| |||||||||||||
| 53,973,300 | ||||||||||||||
|
| |||||||||||||
| | TOTAL OTHER MUNICIPAL DEBT OBLIGATIONS | | ||||||||||||
| (Cost $63,770,838) | $ | 53,973,300 | ||||||||||||
|
| |||||||||||||
| Shares | Description | Value | ||||
| Common Stock – 0.0% | ||||||
| 280 | Delta Air Lines, Inc.(j) | $ | 2,565 | |||
| (Cost $0 ) | ||||||
| ||||||
Principal Amount | Interest Rate | Maturity Date | Value | |||||||||||
| Corporate Bond – 0.1% | ||||||||||||||
| Capital Goods – 0.1% |
| ||||||||||||
| Navistar International Corp. |
| ||||||||||||
| $ | 2,000,000 | 8.250 | % | 11/01/21 | $ | 1,900,000 | ||||||||
| (Cost $1,846,303 ) | ||||||||||||||
|
| |||||||||||||
| The accompanying notes are an integral part of these financial statements. | 37 |
GOLDMAN SACHS HIGH YIELD MUNICIPAL FUND
Schedule of Investments (continued)
September 30, 2012 (Unaudited)
Principal Amount | Interest Rate | Maturity Date | Value | |||||||||||
| Short-Term Investments — 0.6% | ||||||||||||||
| Alaska – 0.0% |
| ||||||||||||
| Valdez Alaska Marine Terminal VRDN RB Refunding for | | ||||||||||||
| $ | 1,000,000 | 0.200 | % | 10/01/12 | $ | 1,000,000 | ||||||||
|
| |||||||||||||
| Illinois – 0.1% |
| ||||||||||||
| Chicago Illinois GO VRDN Project Series 2003 B-2 RMKT | | ||||||||||||
| 600,000 | 0.200 | 10/01/12 | 600,000 | |||||||||||
| Chicago Illinois GO VRDN Refunding Project RMKT 03/18/09 | | ||||||||||||
| 1,300,000 | 0.210 | 10/01/12 | 1,300,000 | |||||||||||
| Chicago Illinois GO VRDN Refunding RMKT 04/18/12 | | ||||||||||||
| 1,200,000 | 0.200 | 10/01/12 | 1,200,000 | |||||||||||
|
| |||||||||||||
| 3,100,000 | ||||||||||||||
|
| |||||||||||||
| Maryland – 0.0% |
| ||||||||||||
| Montgomery County VRDN GO Bonds Refunding for | | ||||||||||||
| 1,250,000 | 0.200 | 10/01/12 | 1,250,000 | |||||||||||
|
| |||||||||||||
| Massachusetts – 0.0% |
| ||||||||||||
| Massachusetts State Health & Educational Facilities Authority | | ||||||||||||
| 1,200,000 | 0.180 | 10/01/12 | 1,200,000 | |||||||||||
|
| |||||||||||||
| Missouri – 0.1% |
| ||||||||||||
| Missouri State Health & Educational Facilities Authority VRDN | | ||||||||||||
| 1,200,000 | 0.190 | 10/01/12 | 1,200,000 | |||||||||||
| Missouri State Health & Educational Facilities Authority VRDN | | ||||||||||||
| 1,000,000 | 0.200 | 10/01/12 | 1,000,000 | |||||||||||
|
| |||||||||||||
| 2,200,000 | ||||||||||||||
|
| |||||||||||||
| New York – 0.2% |
| ||||||||||||
| New York City Municipal Water Finance Authority Water & | | ||||||||||||
| 6,400,000 | 0.200 | 10/01/12 | 6,400,000 | |||||||||||
| New York City VRDN GO Bonds Fiscal 1994 Subseries A-7 | | ||||||||||||
| 1,000,000 | 0.170 | 10/01/12 | 1,000,000 | |||||||||||
|
| |||||||||||||
| 7,400,000 | ||||||||||||||
|
| |||||||||||||
| Rhode Island – 0.0% |
| ||||||||||||
| Rhode Island State Industrial Facilities Corp. Marine Terminal | | ||||||||||||
| 1,000,000 | 0.200 | 10/01/12 | 1,000,000 | |||||||||||
|
| |||||||||||||
Principal Amount | Interest Rate | Maturity Date | Value | |||||||||||
| Short-Term Investments — (continued) | ||||||||||||||
| Texas – 0.1% |
| ||||||||||||
| Lower Neches Valley Authority Industrial Development Corp. | | ||||||||||||
| $ | 300,000 | 0.180 | % | 10/01/12 | $ | 300,000 | ||||||||
| Lower Neches Valley Authority Industrial Development Corp. | | ||||||||||||
| 300,000 | 0.180 | 10/01/12 | 300,000 | |||||||||||
| Texas Water Development Board VRDN RB Refunding State | | ||||||||||||
| 2,185,000 | 0.220 | 10/01/12 | 2,185,000 | |||||||||||
|
| |||||||||||||
| 2,785,000 | ||||||||||||||
|
| |||||||||||||
| Virginia – 0.1% |
| ||||||||||||
| Virginia College Building Authority Educational Facilities VRDN | | ||||||||||||
| 2,140,000 | 0.210 | 10/01/12 | 2,140,000 | |||||||||||
|
| |||||||||||||
| TOTAL SHORT-TERM INVESTMENTS | ||||||||||||||
| (Cost $22,075,000) | $ | 22,075,000 | ||||||||||||
|
| |||||||||||||
| TOTAL INVESTMENTS – 98.6% | ||||||||||||||
| (Cost $3,569,008,776) | $ | 3,709,993,184 | ||||||||||||
|
| |||||||||||||
| OTHER ASSETS IN EXCESS OF | | 53,298,359 | |||||||||||
|
| |||||||||||||
| NET ASSETS – 100.0% | $ | 3,763,291,543 | ||||||||||||
|
| |||||||||||||
| The percentage shown for each investment category reflects the value of investments in that category as a percentage of net assets. | ||
(a) | Inverse floating rate security. Interest rate disclosed is that which is in effect at September 30, 2012. | |
(b) | Security with “Put” features and resetting interest rates. Maturity dates disclosed are the puttable dates. Interest rate disclosed is that which is in effect at September 30, 2012. | |
(c) | Exempt from registration under Rule 144A of the Securities Act of 1933. Under procedures approved by the Board of Trustees, such securities have been determined to be liquid by the investment adviser and may be resold, normally to qualified institutional buyers in transactions exempt from registration. Total market value of Rule 144A securities amounts to $139,748,989, which represents approximately 3.7% of net assets as of September 30, 2012. | |
(d) | Issued with a zero coupon. Income is recognized through the accretion of discount. | |
(e) | Zero coupon bond until next reset date. | |
(f) | Security is currently in default. | |
(g) | Variable rate security. Except for floating rate notes (for which final maturity is disclosed), maturity date disclosed is the next interest reset date. Interest rate disclosed is that which is in effect at September 30, 2012. | |
(h) | Pre-refunded security. Maturity date disclosed is pre-refunding date. | |
(i) | When-issued security. | |
(j) | Non-income producing security. | |
| 38 | The accompanying notes are an integral part of these financial statements. |
GOLDMAN SACHS HIGH YIELD MUNICIPAL FUND
Security ratings disclosed, if any, are issued by either Standard & Poor’s, Moody’s Investor Service or Fitch and are unaudited. A brief description of the ratings is available in the Fund’s Statement of Additional Information.
| ||
Investment Abbreviations: | ||
AGC-ICC | —Agency Insured Custody Certificate | |
AGM | — Insured by Assured Guaranty Municipal Corp. | |
AMBAC | — Insured by American Municipal Bond Assurance Corp. | |
AMT | —Alternative Minimum Tax | |
ASSURED GTY | —Insured by Assured Guaranty | |
BNY | —Insured by the Bank of New York Mellon Corp. | |
COMWLTH GTD | —Commonwealth Guaranteed | |
COPS | —Certificates of Participation | |
ETM | —Escrowed to Maturity | |
FGIC | —Insured by Financial Guaranty Insurance Co. | |
FHA INS | —Insured by Federal Housing Administration | |
GO | —General Obligation | |
GO OF AUTH | —General Obligation of Authority | |
GO OF CORP | —General Obligation of Corporation | |
GO OF CITY | —General Obligation of City | |
GO OF INSTN | —General Obligation of Institution | |
IDA | —Industrial Development Authority | |
LIBOR | —London Interbank Offered Rate | |
LIQ | —Liquidity Agreement | |
LOC | —Letter of Credit | |
MUN GOVT GTD | —Municipal Government Guaranteed | |
NATL-RE | —Insured by National Public Finance Guarantee Corp. | |
NATL-RE FGIC | —Insured by National Public Finance Guarantee Corp., which re-insures Financial Guaranty Insurance Co. | |
NR | —Not Rated | |
PCRB | —Pollution Control Revenue Bond | |
PILOT | —Payment in Lieu of Taxes | |
Q-SBLF | —Qualified School Board Loan Fund | |
Radian | —Insured by Radian Asset Assurance | |
Radian IBCC | —Insured by Radian Asset Insurance Bond Custodial Certificate | |
RB | —Revenue Bond | |
RITES | —Residual Interest Tax Exempt Securities | |
RMKT | —Remarketed | |
ST APPROP | —State Appropriation | |
TCRS | —Transferable Custodial Receipts | |
VRDN | —Variable Rate Demand Notes | |
WR | —Withdrawn Rating | |
XLCA | —Insured by XL Capital Assurance, Inc. | |
| ||
| The accompanying notes are an integral part of these financial statements. | 39 |
GOLDMAN SACHS HIGH YIELD MUNICIPAL FUND
Schedule of Investments (continued)
September 30, 2012 (Unaudited)
| ADDITIONAL INVESTMENT INFORMATION |
SWAP CONTRACTS — At September 30, 2012, the Fund had the following swap contracts:
CREDIT DEFAULT SWAP CONTRACTS
| Counterparty | Referenced Obligation | Notional Amount (000’s) | Rates Received (Paid) | Termination Date | Credit Spread at | Unrealized Gain (Loss)(b) | ||||||||||||||||
Protection Sold: | ||||||||||||||||||||||
JPMorgan Chase Bank, N.A. | California State Various | $ | 10,000 | 1.700 | % | 06/20/21 | 1.920 | % | $ | (140,120 | ) | |||||||||||
Illinois State GO Bonds | 10,000 | 1.830 | 06/20/21 | 2.294 | (283,049 | ) | ||||||||||||||||
| TOTAL | $ | (423,169 | ) | |||||||||||||||||||
| (a) | Credit spread on the Referenced Obligation, together with the period of expiration, are indicators of payment/performance risk. The likelihood of a credit event occurring which would require a fund to make a payment or otherwise be required to perform under the swap contract is generally greater as the credit spread and term of the swap contract increase. |
| (b) | There are no upfront payments on the swap contracts listed above, therefore the unrealized gains (losses) on the swap contracts are equal to their market value. |
| 40 | The accompanying notes are an integral part of these financial statements. |
GOLDMAN SACHS MUNICIPAL INCOME FUND
Schedule of Investments
September 30, 2012 (Unaudited)
| Principal Amount | Interest Rate | Maturity Date | Value | |||||||||||
| State-Specific Municipal Debt Obligations – 93.9% | ||||||||||||||
| Alabama – 1.1% |
| ||||||||||||
| Alabama Special Care Facilities Financing Authority RB for | | ||||||||||||
| $ | 1,000,000 | 14.080 | % | 10/11/12 | $ | 1,469,760 | ||||||||
| Alabama State Port Authority RB for Docks Facilities Series 2010 | | ||||||||||||
| 2,500,000 | 5.750 | 10/01/30 | 2,857,450 | |||||||||||
| Alexander City Special Care Facilities Financing Authority | | ||||||||||||
| 1,780,000 | 5.750 | 12/01/36 | 1,832,154 | |||||||||||
| Health Care Authority RB for Baptist Health Series 2006 D | | ||||||||||||
| 575,000 | 5.000 | 11/15/17 | 624,312 | |||||||||||
| 100,000 | 5.000 | 11/15/21 | 106,458 | |||||||||||
|
| |||||||||||||
| 6,890,134 | ||||||||||||||
|
| |||||||||||||
| Alaska – 0.2% |
| ||||||||||||
| Anchorage Alaska Water RB Refunding Series 2004 (NATL-RE) | | ||||||||||||
| 1,000,000 | 5.125 | 05/01/14 | 1,075,720 | |||||||||||
|
| |||||||||||||
| Arizona – 1.3% |
| ||||||||||||
| Arizona Health Facilities Authority Hospital RB for Phoenix | | ||||||||||||
| 2,170,000 | 1.180 | 02/02/15 | 2,149,710 | |||||||||||
| Maricopa County Arizona Pollution Control Corp. PCRB | | ||||||||||||
| 2,200,000 | 7.250 | 02/01/40 | 2,605,526 | |||||||||||
| Navajo County Arizona Pollution Control Corp. PCRB Refunding | | ||||||||||||
| 2,000,000 | 5.500 | 06/01/14 | 2,146,840 | |||||||||||
| Northern Arizona University RB Series 2003 (FGIC) (A+/A1)(d) |
| ||||||||||||
| 1,235,000 | 5.500 | 06/01/14 | 1,340,679 | |||||||||||
|
| |||||||||||||
| 8,242,755 | ||||||||||||||
|
| |||||||||||||
| Arkansas – 0.1% |
| ||||||||||||
| Arkansas State Development Finance Authority RB for Single | | ||||||||||||
| 505,000 | 5.500 | 07/01/23 | 546,440 | |||||||||||
|
| |||||||||||||
| California – 23.0% |
| ||||||||||||
| Bay Area Toll Authority California Toll Building Authority RB | | ||||||||||||
| 4,000,000 | 5.500 | 04/01/43 | 4,531,240 | |||||||||||
| California Educational Facilities Authority RB for California | | ||||||||||||
| 5,000,000 | 5.000 | 11/01/39 | 5,626,500 | |||||||||||
| California Health Facilities Financing Authority RB for | | ||||||||||||
| 1,000,000 | 6.500 | 10/01/33 | 1,227,020 | |||||||||||
|
| |||||||||||||
| | Principal Amount | | | Interest Rate | | | Maturity Date | | Value | |||||
| State-Specific Municipal Debt Obligations – (continued) | ||||||||||||||
| California – (continued) |
| ||||||||||||
| California Infrastructure & Economic Development Bank RB for | | ||||||||||||
| $ | 1,000,000 | 5.750 | % | 09/01/23 | $ | 1,033,320 | ||||||||
| California State Public Works Board Lease RB for UCLA | | ||||||||||||
| 2,000,000 | 5.375 | 11/01/12 | 2,008,080 | |||||||||||
| California State Various Purpose GO Bonds Series 2009 (A-/A1) |
| ||||||||||||
| 5,000,000 | 5.250 | 10/01/25 | 5,856,350 | |||||||||||
| 5,000,000 | 6.500 | 04/01/33 | 6,318,700 | |||||||||||
| 2,750,000 | 6.000 | 04/01/38 | 3,278,247 | |||||||||||
| California State Various Purpose GO Bonds Series 2010 (A-/A1) |
| ||||||||||||
| 1,250,000 | 6.000 | 03/01/33 | 1,552,875 | |||||||||||
| 1,500,000 | 5.500 | 03/01/40 | 1,730,250 | |||||||||||
| California Statewide Communities Development Authority RB for | | ||||||||||||
| 1,435,000 | 5.750 | 08/15/38 | 1,559,615 | |||||||||||
| California Statewide Communities Development Authority RB for | | ||||||||||||
| 2,000,000 | 6.000 | 08/15/42 | 2,383,580 | |||||||||||
| California Statewide Community Development Authority | | ||||||||||||
| 155,000 | 5.250 | 10/01/19 | 164,207 | |||||||||||
| Chabot-Las Positas Community College District GO for Capital | | ||||||||||||
| 6,340,000 | 0.000 | 08/01/35 | 1,946,634 | |||||||||||
| Citrus Community College District GO Bonds Capital | | ||||||||||||
| 6,500,000 | 0.000 | 06/01/34 | 2,416,765 | |||||||||||
| Eastern California Municipal Water District Community Facilities | | ||||||||||||
| 385,000 | 5.000 | 09/01/36 | 369,931 | |||||||||||
| Eastern California Municipal Water District Community Facilities | | ||||||||||||
| 355,000 | 5.000 | 09/01/36 | 353,513 | |||||||||||
| Foothill-De Anza California Community College District GO | | ||||||||||||
| 6,000,000 | 5.000 | 08/01/27 | 6,940,980 | |||||||||||
| Golden State Tobacco Securitization Corp. California Tobacco | | ||||||||||||
| 18,000,000 | 0.000 | 06/01/47 | 1,365,660 | |||||||||||
| Golden State Tobacco Securitization Corp. California Tobacco | | ||||||||||||
| 19,500,000 | 0.000 | 06/01/47 | 408,525 | |||||||||||
| Golden State Tobacco Securitization Corp. California Tobacco | | ||||||||||||
| 350,000 | 7.875 | 06/01/13 | 367,713 | |||||||||||
|
| |||||||||||||
| The accompanying notes are an integral part of these financial statements. | 41 |
GOLDMAN SACHS MUNICIPAL INCOME FUND
Schedule of Investments (continued)
September 30, 2012 (Unaudited)
| | Principal Amount | | | Interest Rate | | | Maturity Date | | Value | |||||
| State-Specific Municipal Debt Obligations – (continued) | ||||||||||||||
| California – (continued) |
| ||||||||||||
| Golden State Tobacco Securitization Corp. California Tobacco | | ||||||||||||
| $ | 650,000 | 7.875 | % | 06/01/13 | $ | 682,897 | ||||||||
| Golden State Tobacco Securitization Corp. California Tobacco | | ||||||||||||
| 5,000,000 | 5.000 | 06/01/33 | 4,065,600 | |||||||||||
| Golden State Tobacco Securitization Corp. California Tobacco | | ||||||||||||
| 3,500,000 | 5.000 | 06/01/35 | 3,611,440 | |||||||||||
| Golden State Tobacco Securitization Corp. California Tobacco | | ||||||||||||
| 1,150,000 | 5.000 | 06/01/29 | 1,151,254 | |||||||||||
| Golden State Tobacco Securitization Corp. California Tobacco | | ||||||||||||
| 3,300,000 | 5.750 | 06/01/47 | 2,802,030 | |||||||||||
| Golden State Tobacco Securitization Corp. California Tobacco | | ||||||||||||
| 5,000,000 | 5.000 | 06/01/45 | 5,105,750 | |||||||||||
| Hacienda La Puente California Unified School District GO Bonds | | ||||||||||||
| 1,200,000 | 5.250 | 08/01/13 | 1,249,992 | |||||||||||
| Lake Elsinore California Unified School District Community | | ||||||||||||
| 595,000 | 5.000 | 09/01/25 | 597,207 | |||||||||||
| Los Angeles Community College District GO Bonds for 2008 | | ||||||||||||
| 5,000,000 | 5.250 | 08/01/39 | 5,802,150 | |||||||||||
| Los Angeles Department of Airports RB Refunding for Los | | ||||||||||||
| 3,000,000 | 5.000 | 05/15/35 | 3,412,320 | |||||||||||
| Los Angeles Unified School District GO Bonds Refunding | | ||||||||||||
| 2,500,000 | 4.000 | 07/01/20 | 2,911,600 | |||||||||||
| Menifee Union School District Riverside County GO Bonds | | ||||||||||||
| 2,000,000 | 0.000 | 08/01/37 | 579,800 | |||||||||||
| 4,500,000 | 0.000 | 08/01/38 | 1,237,950 | |||||||||||
| 4,500,000 | 0.000 | 08/01/39 | 1,168,380 | |||||||||||
| Merced City School District GO Bonds Capital Appreciation for | | ||||||||||||
| 1,205,000 | 0.000 | 08/01/26 | 639,036 | |||||||||||
| M-S-R Energy Authority Gas RB Series 2009 A (A-/NR) |
| ||||||||||||
| 1,750,000 | 6.500 | 11/01/39 | 2,271,552 | |||||||||||
| M-S-R Energy Authority Gas RB Series 2009 C (A-/NR) |
| ||||||||||||
| 3,500,000 | 6.125 | 11/01/29 | 4,233,670 | |||||||||||
| Mt. Diablo Unified School District GO Bonds Capital | | ||||||||||||
| 10,000,000 | 0.000 | 08/01/35 | 6,789,800 | |||||||||||
|
| |||||||||||||
| | Principal Amount | | | Interest Rate | | | Maturity Date | | Value | |||||
| State-Specific Municipal Debt Obligations – (continued) | ||||||||||||||
| California – (continued) |
| ||||||||||||
| Palomar Pomerado Health COPS Series 2009 (BB+/Baa3) |
| ||||||||||||
| $ | 2,500,000 | 6.750 | % | 11/01/39 | $ | 2,807,025 | ||||||||
| Palomar Pomerado Health GO Bonds Capital Appreciation for | | ||||||||||||
| 2,150,000 | 0.000 | 08/01/31 | 925,038 | |||||||||||
| 4,150,000 | 0.000 | 08/01/32 | 1,684,319 | |||||||||||
| 3,500,000 | 0.000 | 08/01/33 | 1,338,155 | |||||||||||
| Palomar Pomerado Health GO Bonds Capital Appreciation for | | ||||||||||||
| 6,450,000 | 0.000 | 08/01/38 | 5,582,281 | |||||||||||
| Port of Oakland RB Refunding Senior Lien Series 2012 P (AMT) | | ||||||||||||
| 3,500,000 | 5.000 | 05/01/33 | 3,908,905 | |||||||||||
| Sacramento County Sanitation District Financing Authority RB | | ||||||||||||
| 3,000,000 | 0.810 | 12/01/35 | 2,220,480 | |||||||||||
| San Diego Community College District GO Bonds for Election of | | ||||||||||||
| 3,000,000 | 5.000 | 05/01/15 | 3,357,660 | |||||||||||
| San Diego Community College District GO Bonds Refunding | | ||||||||||||
| 2,575,000 | 5.000 | 08/01/27 | 3,178,271 | |||||||||||
| San Diego County Water Authority COPS Series 2008 A (AGM) | | ||||||||||||
| 5,000,000 | 5.000 | 05/01/33 | 5,499,200 | |||||||||||
| San Diego Public Facilities Financing Authority Water RB | | ||||||||||||
| 2,500,000 | 5.000 | 08/01/31 | 2,993,350 | |||||||||||
| San Diego Unified School District GO Bonds for Election of 2008 | | ||||||||||||
| 5,000,000 | 0.000 | 07/01/39 | 1,334,650 | |||||||||||
| San Francisco City & County GO Bonds for Earthquake Safety & | | ||||||||||||
| 3,930,000 | 3.000 | 06/15/22 | 4,151,495 | |||||||||||
| San Joaquin Hills Transportation Corridor Agency RB Refunding | | ||||||||||||
| 1,605,000 | 0.000 | 01/15/26 | 801,136 | |||||||||||
| Temecula Valley Unified School District Community Facilities | | ||||||||||||
| 1,865,000 | 5.000 | 09/01/37 | 1,851,777 | |||||||||||
| Torrance California COPS for Refunding & Public Improvement | | ||||||||||||
| 310,000 | 5.250 | 06/01/34 | 318,159 | |||||||||||
| Vernon California Redevelopment Agency Tax Allocation for | | ||||||||||||
| 725,000 | 5.250 | 09/01/19 | 747,635 | |||||||||||
|
| |||||||||||||
| 42 | The accompanying notes are an integral part of these financial statements. |
GOLDMAN SACHS MUNICIPAL INCOME FUND
| | Principal Amount | | | Interest Rate | | | Maturity Date | | Value | |||||
| State-Specific Municipal Debt Obligations – (continued) | ||||||||||||||
| California – (continued) |
| ||||||||||||
| West Contra Costa Unified School District GO Bonds Capital | | ||||||||||||
| $ | 1,175,000 | 0.000 | % | 08/01/25 | $ | 657,295 | ||||||||
|
| |||||||||||||
| 143,108,964 | ||||||||||||||
|
| |||||||||||||
| Colorado – 1.3% |
| ||||||||||||
| Colorado Health Facilities Authority Hospital RB for Poudre | | ||||||||||||
| 800,000 | 5.000 | 03/01/25 | 847,080 | |||||||||||
| Colorado Health Facilities Authority RB for Covenant Retirement | | ||||||||||||
| 1,150,000 | 5.000 | 12/01/35 | 1,185,489 | |||||||||||
| E-470 Public Highway Authority RB for Capital Appreciation | | ||||||||||||
| 5,000,000 | 0.000 | 09/01/27 | 2,280,550 | |||||||||||
| E-470 Public Highway Authority RB Series 2010 A | | ||||||||||||
| 6,000,000 | 0.000 | 09/01/40 | 1,229,760 | |||||||||||
| West Metro Fire Protection District GO Bonds Series 2006 A | | ||||||||||||
| 2,200,000 | 5.250 | 12/01/26 | 2,531,540 | |||||||||||
|
| |||||||||||||
| 8,074,419 | ||||||||||||||
|
| |||||||||||||
| District of Columbia – 1.2% |
| ||||||||||||
| District of Columbia Tobacco Settlement Financing Corp. RB | | ||||||||||||
| 490,000 | 6.250 | 05/15/24 | 501,064 | |||||||||||
| District of Columbia Tobacco Settlement Financing Corp. RB | | ||||||||||||
| 1,000,000 | 6.500 | 05/15/33 | 1,142,500 | |||||||||||
| District of Columbia Water & Sewer Authority RB Public Utility | | ||||||||||||
| 5,000,000 | 6.000 | 10/01/35 | 6,115,050 | |||||||||||
|
| |||||||||||||
| 7,758,614 | ||||||||||||||
|
| |||||||||||||
| Florida – 9.5% |
| ||||||||||||
| Arbor Greene Community Development District Special | | ||||||||||||
| 1,495,000 | 5.000 | 05/01/19 | 1,625,708 | |||||||||||
| Bluewaters Community Development District Special Assessment | | ||||||||||||
| 2,325,000 | 6.000 | 05/01/35 | 2,436,507 | |||||||||||
| Bridgewater Wesley Chapel Community Development District | | ||||||||||||
| 2,180,000 | 5.750 | 05/01/35 | 2,197,178 | |||||||||||
| Citizens Property Insurance Corp. RB Senior Secured for High | | ||||||||||||
| 3,650,000 | 5.500 | 06/01/17 | 4,265,354 | |||||||||||
| Coconut Cay Community Development District Special | | ||||||||||||
| 905,000 | 5.375 | 05/01/36 | 911,770 | |||||||||||
| Coral Gables Health Facilities Authority RB for Baptist Health | | ||||||||||||
| 1,000,000 | 5.250 | 08/15/14 | 1,091,480 | |||||||||||
|
| |||||||||||||
| | Principal Amount | | | Interest Rate | | | Maturity Date | | Value | |||||
| State-Specific Municipal Debt Obligations – (continued) | ||||||||||||||
| Florida – (continued) |
| ||||||||||||
| Covington Park Florida Community Development District Special | | ||||||||||||
| $ | 490,000 | 5.000 | % | 05/01/21 | $ | 499,344 | ||||||||
| Crossings At Fleming Island Community Development District | | ||||||||||||
| 125,000 | 4.750 | 10/01/36 | 117,176 | |||||||||||
| Crossings At Fleming Island Community Development District | | ||||||||||||
| 1,240,000 | 5.800 | 05/01/16 | 1,240,322 | |||||||||||
| Diamond Hill Community Development District Tax Allocation | | ||||||||||||
| 1,505,000 | 6.000 | 05/01/34 | 1,521,886 | |||||||||||
| Florida State Municipal Power Agency RB Series 2009 A | | ||||||||||||
| 1,000,000 | 6.250 | 10/01/31 | 1,201,590 | |||||||||||
| Greater Orlando Aviation Authority RB Refunding Series 2012 A | | ||||||||||||
| 2,000,000 | 5.000 | 10/01/21 | 2,365,160 | |||||||||||
| Hamal Florida Community Development District Special | | ||||||||||||
| 2,755,000 | 5.375 | 05/01/22 | 2,879,526 | |||||||||||
| High Ridge Quantum Community Development District Special | | ||||||||||||
| 1,750,000 | 5.750 | 05/01/35 | 1,764,665 | |||||||||||
| Hollywood Community Redevelopment Agency RB for Beach | | ||||||||||||
| 300,000 | 5.625 | 03/01/24 | 308,997 | |||||||||||
| Keys Cove Community Development District Special Assessment | | ||||||||||||
| 2,270,000 | 5.875 | 05/01/35 | 2,378,869 | |||||||||||
| Lee County IDA Health Care Facilities RB Refunding for Shell | | ||||||||||||
| 2,500,000 | 5.000 | 11/15/13 | 2,577,575 | |||||||||||
| Longleaf Community Development District Special Assessment | | ||||||||||||
| 1,185,000 | 5.375 | 05/01/30 | 771,032 | |||||||||||
| Meadow Pointe III Community Development District RB for | | ||||||||||||
| 895,000 | 6.000 | 05/01/35 | 905,570 | |||||||||||
| Miami Special Obligation Non-Ad Valorem RB Refunding | | ||||||||||||
| 1,200,000 | 6.000 | 02/01/30 | 1,418,832 | |||||||||||
| 1,500,000 | 6.000 | 02/01/31 | 1,767,600 | |||||||||||
| Miami-Dade County Florida Aviation RB RMKT 03/17/08 | | ||||||||||||
| 500,000 | 5.250 | 10/01/13 | 521,740 | |||||||||||
| 425,000 | 5.250 | 10/01/14 | 460,313 | |||||||||||
| 575,000 | 5.250 | 10/01/16 | 656,374 | |||||||||||
| Miami-Dade County Florida Expressway Authority RB Series | | ||||||||||||
| 1,000,000 | 5.250 | 07/01/26 | 1,052,060 | |||||||||||
|
| |||||||||||||
| The accompanying notes are an integral part of these financial statements. | 43 |
GOLDMAN SACHS MUNICIPAL INCOME FUND
Schedule of Investments (continued)
September 30, 2012 (Unaudited)
| | Principal Amount | | | Interest Rate | | | Maturity Date | | Value | |||||
| State-Specific Municipal Debt Obligations – (continued) | ||||||||||||||
| Florida – (continued) |
| ||||||||||||
| North Sumter County Utility Dependent District RB Series 2010 | | ||||||||||||
| $ | 1,250,000 | 5.375 | % | 10/01/40 | $ | 1,379,200 | ||||||||
| Pentathlon Community Development District Special Assessment | | ||||||||||||
| 1,330,000 | 4.500 | 11/01/33 | 1,377,082 | |||||||||||
| Port Everglades Authority RB for Port Facilities Series 1986 | | ||||||||||||
| 1,620,000 | 7.125 | 11/01/16 | 1,838,992 | |||||||||||
| Sail Harbour Community Development District Special | | ||||||||||||
| 910,000 | 5.500 | 05/01/36 | 939,793 | |||||||||||
| Sonoma Bay Community Development District Special | | ||||||||||||
| 605,000 | 5.450 | 05/01/36 | 623,422 | |||||||||||
| St. Petersburg Health Facilities Authority RB Refunding for All | | ||||||||||||
| 2,000,000 | 6.500 | 11/15/39 | 2,421,240 | |||||||||||
| Sumter Landing Florida Community Development District | | ||||||||||||
| 250,000 | 4.625 | 10/01/30 | 251,770 | |||||||||||
| Tampa Palms Open Space & Transportation Community | | ||||||||||||
| 1,395,000 | 4.500 | 05/01/18 | 1,541,684 | |||||||||||
| Thousand Oaks Community Development District Special | | ||||||||||||
| 890,000 | 5.350 | 05/01/35 | 904,623 | |||||||||||
| Trails at Monterey Community Development District Special | | ||||||||||||
| 1,210,000 | 4.500 | 05/01/33 | 1,235,471 | |||||||||||
| Verona Walk Community Development District RB for Capital | | ||||||||||||
| 4,385,000 | 5.850 | 05/01/35 | 4,424,202 | |||||||||||
| Village Community Development District No. 5 Special | | ||||||||||||
| 2,240,000 | 6.100 | 05/01/34 | 2,311,680 | |||||||||||
| Village Community Development District No. 6 Special | | ||||||||||||
| 1,775,000 | 5.250 | 05/01/37 | 1,850,331 | |||||||||||
| Villagewalk of Bonita Springs Community Development District | | ||||||||||||
| 985,000 | 5.600 | 05/01/36 | 1,002,031 | |||||||||||
|
| |||||||||||||
| 59,038,149 | ||||||||||||||
|
| |||||||||||||
| Georgia – 1.0% |
| ||||||||||||
| Atlanta Airport RB Refunding Series 2012 C (AMT) (A+/A1) |
| ||||||||||||
| 1,250,000 | 5.000 | 01/01/27 | 1,404,287 | |||||||||||
| Chatham County Hospital Authority RB for Hospital | | ||||||||||||
| 365,000 | 5.500 | 01/01/14 | 388,035 | |||||||||||
|
| |||||||||||||
| | Principal Amount | | | Interest Rate | | | Maturity Date | | Value | |||||
| State-Specific Municipal Debt Obligations – (continued) | ||||||||||||||
| Georgia – (continued) |
| ||||||||||||
| Metropolitan Atlanta Rapid Transit Authority Sales Tax RB | | ||||||||||||
| $ | 4,075,000 | 5.250 | % | 07/01/36 | $ | 4,668,361 | ||||||||
|
| |||||||||||||
| 6,460,683 | ||||||||||||||
|
| |||||||||||||
| Guam – 0.4% |
| ||||||||||||
| Guam Government Limited Obligation GO Bonds Section 30 | | ||||||||||||
| 600,000 | 5.375 | 12/01/24 | 664,278 | |||||||||||
| 850,000 | 5.625 | 12/01/29 | 950,368 | |||||||||||
| 750,000 | 5.750 | 12/01/34 | 844,403 | |||||||||||
|
| |||||||||||||
| 2,459,049 | ||||||||||||||
|
| |||||||||||||
| Idaho – 0.2% |
| ||||||||||||
| Idaho Health Facilities Authority RB for St. Luke’s Health | | ||||||||||||
| 1,000,000 | 6.750 | 11/01/37 | 1,190,380 | |||||||||||
|
| |||||||||||||
| Illinois – 4.1% |
| ||||||||||||
| Chicago Illinois O’Hare International Airport RB Refunding | | ||||||||||||
| 490,000 | 5.250 | 01/01/34 | 502,015 | |||||||||||
| Chicago Illinois Sales Tax RB Series 2011 A (AAA/Aa3) |
| ||||||||||||
| 2,000,000 | 5.000 | 01/01/41 | 2,246,860 | |||||||||||
| Chicago Illinois Tax Allocation Junior Lien for Near South | | ||||||||||||
| 705,000 | 6.250 | 11/15/13 | 707,051 | |||||||||||
| Illinois Finance Authority RB for Edward Hospital RMKT | | ||||||||||||
| 350,000 | 6.250 | 02/01/33 | 401,520 | |||||||||||
| Illinois Finance Authority RB Refunding for Proctor Hospital | | ||||||||||||
| 400,000 | 5.125 | 01/01/25 | 400,264 | |||||||||||
| Illinois Finance Authority Solid Waste Disposal RB for Waste | | ||||||||||||
| 400,000 | 5.050 | 08/01/29 | 418,396 | |||||||||||
| Illinois Municipal Electric Agency RB Power Supply System | | ||||||||||||
| 4,020,000 | 5.250 | 02/01/22 | 4,548,228 | |||||||||||
| Illinois State GO Bonds Prerefunded (NATL-RE) (BBB/A2)(d) |
| ||||||||||||
| 1,525,000 | 5.000 | 06/01/13 | 1,572,504 | |||||||||||
| Illinois State GO Bonds Series 2012 A (A/A2) |
| ||||||||||||
| 2,500,000 | 4.000 | 01/01/26 | 2,579,925 | |||||||||||
| Illinois State GO Bonds Unrefunded (NATL-RE) (A/A2) |
| ||||||||||||
| 975,000 | 5.000 | 06/01/19 | 1,001,998 | |||||||||||
| Lake County Illinois Community Consolidated School District | | ||||||||||||
| 2,725,000 | 9.000 | 11/01/16 | 3,449,959 | |||||||||||
| Railsplitter Tobacco Settlement Authority Tobacco Settlement RB | | ||||||||||||
| 1,125,000 | 6.000 | 06/01/28 | 1,317,004 | |||||||||||
| Round Lake Illinois Lakewood Grove Special Service Area No. 1 | | ||||||||||||
| 2,320,000 | 5.500 | 03/01/32 | 2,561,976 | |||||||||||
|
| |||||||||||||
| 44 | The accompanying notes are an integral part of these financial statements. |
GOLDMAN SACHS MUNICIPAL INCOME FUND
| | Principal Amount | | | Interest Rate | | | Maturity Date | | Value | |||||
| State-Specific Municipal Debt Obligations – (continued) | ||||||||||||||
| Illinois – (continued) |
| ||||||||||||
| Southwestern Illinois Development Authority RB Capital | | ||||||||||||
| $ | 6,500,000 | 0.000 | % | 12/01/25 | $ | 3,970,720 | ||||||||
|
| |||||||||||||
| 25,678,420 | ||||||||||||||
|
| |||||||||||||
| Indiana – 1.6% |
| ||||||||||||
| Delaware County Hospital Authority RB for Cardinal Health | | ||||||||||||
| 2,000,000 | 5.250 | 08/01/36 | 2,097,940 | |||||||||||
| Indiana Health Facility Financing Authority RB for Ascension | | ||||||||||||
| 205,000 | 29.010 | 10/11/12 | 408,227 | |||||||||||
| Indiana State Educational Facilities Authority RB for Earlham | | ||||||||||||
| 325,000 | 4.950 | 10/15/12 | 325,491 | |||||||||||
| Indianapolis Indiana Airport Authority RB Refunding Special | | ||||||||||||
| 640,000 | 5.100 | 01/15/17 | 730,931 | |||||||||||
| Indianapolis Indiana Gas Utility RB Second Lien Series 2008 A | | ||||||||||||
| 3,500,000 | 5.000 | 08/15/13 | 3,636,325 | |||||||||||
| Jasper County PCRB Refunding for Northern RMKT 08/25/08 | | ||||||||||||
| 650,000 | 5.850 | 04/01/19 | 756,496 | |||||||||||
| Mitchell Multi School Building Corp. RB Refunding for First | | ||||||||||||
| 275,000 | 4.650 | 07/05/13 | 283,827 | |||||||||||
| Princeton Indiana Sewer Works RB Refunding Series 2003 | | ||||||||||||
| 275,000 | 4.500 | 05/01/13 | 275,792 | |||||||||||
| Vanderburgh County Indiana Redevelopment Commission Tax | | ||||||||||||
| 1,400,000 | 5.250 | 02/01/31 | 1,472,114 | |||||||||||
|
| |||||||||||||
| 9,987,143 | ||||||||||||||
|
| |||||||||||||
| Iowa – 0.5% |
| ||||||||||||
| Coralville Iowa COPS Series 2006 D (NR/Baa2) |
| ||||||||||||
| 1,325,000 | 5.250 | 06/01/22 | 1,364,432 | |||||||||||
| Tobacco Settlement Authority of Iowa RB Asset-Backed Bonds | | ||||||||||||
| 1,875,000 | 5.375 | 06/01/38 | 1,681,819 | |||||||||||
|
| |||||||||||||
| 3,046,251 | ||||||||||||||
|
| |||||||||||||
| Kentucky – 1.9% |
| ||||||||||||
| Kentucky Economic Development Finance Authority RB for | | ||||||||||||
| 3,000,000 | 5.000 | 02/01/40 | 3,214,350 | |||||||||||
| Kentucky Economic Development Finance Authority RB | | ||||||||||||
| 470,000 | 17.740 | 10/11/12 | 621,852 | |||||||||||
|
| |||||||||||||
| | Principal Amount | | | Interest Rate | | | Maturity Date | | Value | |||||
| State-Specific Municipal Debt Obligations – (continued) | ||||||||||||||
| Kentucky – (continued) |
| ||||||||||||
| Kentucky Economic Development Finance Authority System RB | | ||||||||||||
| $ | 1,085,000 | 6.000 | % | 10/01/13 | $ | 1,156,274 | ||||||||
| Kentucky Economic Development Finance Authority System RB | | ||||||||||||
| 2,165,000 | 6.000 | 10/01/18 | 2,270,414 | |||||||||||
| Louisville & Jefferson County Metropolitan Government RB for | | ||||||||||||
| 3,750,000 | 6.125 | 02/01/18 | 4,812,037 | |||||||||||
|
| |||||||||||||
| 12,074,927 | ||||||||||||||
|
| |||||||||||||
| Louisiana – 1.4% |
| ||||||||||||
| De Soto Parish Louisiana Environmental Improvement RB | | ||||||||||||
| 675,000 | 5.000 | 11/01/18 | 719,273 | |||||||||||
| De Soto Parish Louisiana Environmental Improvement RB | | ||||||||||||
| 2,560,000 | 4.750 | 03/01/19 | 2,674,330 | |||||||||||
| East Baton Rouge Parish Louisiana Sales Tax RB for Road and | | ||||||||||||
| 1,230,000 | 5.250 | 08/01/28 | 1,476,086 | |||||||||||
| Louisiana State Offshore Terminal Authority Deepwater Port RB | | ||||||||||||
| 1,000,000 | 5.250 | 09/01/15 | 1,035,090 | |||||||||||
| New Orleans Louisiana Aviation Board RB Refunding for | | ||||||||||||
| 1,350,000 | 6.000 | 01/01/23 | 1,600,101 | |||||||||||
| Tobacco Settlement Financing Corp. RB for Asset-Backed Bonds | | ||||||||||||
| 1,220,000 | 5.875 | 05/15/39 | 1,247,670 | |||||||||||
|
| |||||||||||||
| 8,752,550 | ||||||||||||||
|
| |||||||||||||
| Maryland – 1.4% |
| ||||||||||||
| Baltimore Maryland Special Obligation Tax Allocation for | | ||||||||||||
| 1,088,000 | 6.500 | 07/01/31 | 1,122,631 | |||||||||||
| Frederick County Maryland Special Tax Unrefunded Balance for | | ||||||||||||
| 255,000 | 5.600 | 07/01/20 | 255,171 | |||||||||||
| 555,000 | 5.700 | 07/01/29 | 555,194 | |||||||||||
| Maryland State Health & Higher Educational Facilities Authority | | ||||||||||||
| 500,000 | 5.375 | 08/15/24 | 535,045 | |||||||||||
| 750,000 | 5.500 | 08/15/33 | 789,217 | |||||||||||
|
| |||||||||||||
| The accompanying notes are an integral part of these financial statements. | 45 |
GOLDMAN SACHS MUNICIPAL INCOME FUND
Schedule of Investments (continued)
September 30, 2012 (Unaudited)
| | Principal Amount | | | Interest Rate | | | Maturity Date | | Value | |||||
| State-Specific Municipal Debt Obligations – (continued) | ||||||||||||||
| Maryland – (continued) |
| ||||||||||||
| Maryland State Industrial Development Financing Authority RB | | ||||||||||||
| $ | 2,000,000 | 5.250 | % | 12/01/12 | $ | 2,010,260 | ||||||||
| 1,025,000 | 5.375 | 12/01/14 | 1,075,092 | |||||||||||
| 500,000 | 5.625 | 12/01/16 | 542,600 | |||||||||||
| Maryland State Transportation Authority RB Refunding | | ||||||||||||
| 1,500,000 | 5.000 | 03/01/19 | 1,756,140 | |||||||||||
|
| |||||||||||||
| 8,641,350 | ||||||||||||||
|
| |||||||||||||
| Massachusetts – 2.0% |
| ||||||||||||
| Massachusetts Bay Transportation Authority Assessment RB | | ||||||||||||
| 1,000,000 | 5.000 | 07/01/14 | 1,081,160 | |||||||||||
| Massachusetts Development Finance Agency RB for Harvard | | ||||||||||||
| 5,000,000 | 5.250 | 02/01/34 | 6,095,000 | |||||||||||
| Massachusetts Educational Financing Authority RB Series 2008 | | ||||||||||||
| 1,850,000 | 6.350 | 01/01/30 | 2,055,554 | |||||||||||
| Massachusetts State Health & Educational Facilities Authority RB | | ||||||||||||
| 3,000,000 | 5.750 | 07/01/31 | 3,252,450 | |||||||||||
|
| |||||||||||||
| 12,484,164 | ||||||||||||||
|
| |||||||||||||
| Michigan – 0.8% |
| ||||||||||||
| Michigan Finance Authority Revenue for Rol Railroad II | | ||||||||||||
| 2,780,000 | 13.881 | 01/01/18 | 4,827,220 | |||||||||||
|
| |||||||||||||
| Minnesota – 0.8% |
| ||||||||||||
| Minneapolis Minnesota Health Care System RB for Fairview | | ||||||||||||
| 1,500,000 | 6.750 | 11/15/32 | 1,829,010 | |||||||||||
| St. Paul Minnesota Housing & Redevelopment Authority RB for | | ||||||||||||
| 2,900,000 | 5.250 | 05/15/36 | 3,045,203 | |||||||||||
|
| |||||||||||||
| 4,874,213 | ||||||||||||||
|
| |||||||||||||
| Mississippi – 0.2% |
| ||||||||||||
| Mississippi Development Bank Special Obligation RB for Hinds | | ||||||||||||
| 1,095,000 | 5.375 | 10/01/33 | 1,269,959 | |||||||||||
|
| |||||||||||||
| Missouri – 0.9% |
| ||||||||||||
| Missouri State Development Finance Board Infrastructure | | ||||||||||||
| 270,000 | 4.750 | 06/01/25 | 285,968 | |||||||||||
| 4,125,000 | 5.000 | 06/01/35 | 4,324,609 | |||||||||||
| Missouri State Health & Educational Facilities Authority RB for | | ||||||||||||
| 1,000,000 | 5.500 | 10/01/15 | 1,117,320 | |||||||||||
|
| |||||||||||||
| 5,727,897 | ||||||||||||||
|
| |||||||||||||
| | Principal Amount | | | Interest Rate | | | Maturity Date | | Value | |||||
| State-Specific Municipal Debt Obligations – (continued) | ||||||||||||||
| Nevada – 0.6% |
| ||||||||||||
| Clark County Nevada Industrial Development RB for Southwest | | ||||||||||||
| $ | 765,000 | 5.450 | % | 03/01/13 | $ | 780,017 | ||||||||
| Clark County Nevada School District GO Bonds Refunding | | ||||||||||||
| 800,000 | 5.500 | 06/15/13 | 828,600 | |||||||||||
| North Las Vegas Local Improvement District No. 60 Special | | ||||||||||||
| 620,000 | 4.850 | 12/01/15 | 639,003 | |||||||||||
| 1,375,000 | 5.100 | 12/01/22 | 1,388,612 | |||||||||||
|
| |||||||||||||
| 3,636,232 | ||||||||||||||
|
| |||||||||||||
| New Hampshire – 0.4% |
| ||||||||||||
| New Hampshire Municipal Bond Bank RB Series 2003 | | ||||||||||||
| 1,000,000 | 5.250 | 08/15/13 | 1,043,440 | |||||||||||
| New Hampshire State Business Finance Authority RB for Waste | | ||||||||||||
| 1,250,000 | 5.200 | 05/01/27 | 1,441,413 | |||||||||||
|
| |||||||||||||
| 2,484,853 | ||||||||||||||
|
| |||||||||||||
| New Jersey – 4.8% |
| ||||||||||||
| New Jersey Economic Development Authority RB for School | | ||||||||||||
| 360,000 | 5.000 | 09/01/34 | 402,487 | |||||||||||
| New Jersey Economic Development Authority RB for School | | ||||||||||||
| 1,000,000 | 6.000 | 12/15/34 | 1,174,710 | |||||||||||
| New Jersey Economic Development Authority RB Refunding for | | ||||||||||||
| 4,000,000 | 5.500 | 12/15/29 | 4,690,080 | |||||||||||
| New Jersey Economic Development Authority Water Facilities | | ||||||||||||
| 2,000,000 | 5.600 | 11/01/34 | 2,212,860 | |||||||||||
| New Jersey Health Care Facilities Financing Authority RB for | | ||||||||||||
| 600,000 | 5.000 | 07/01/24 | 620,460 | |||||||||||
| 175,000 | 5.500 | 07/01/30 | 181,379 | |||||||||||
| New Jersey Health Care Facilities Financing Authority RB for | | ||||||||||||
| 2,500,000 | 6.625 | 07/01/38 | 2,898,950 | |||||||||||
| New Jersey State Higher Education Assistance Authority RB for | | ||||||||||||
| 3,000,000 | 6.125 | 06/01/30 | 3,289,680 | |||||||||||
| New Jersey State Housing and Mortgage Finance Agency RB for | | ||||||||||||
| 575,000 | 6.150 | 10/01/23 | 652,366 | |||||||||||
| New Jersey State Turnpike Authority RB Refunding | | ||||||||||||
| 1,810,000 | 5.000 | 01/01/28 | 2,162,443 | |||||||||||
| New Jersey State Turnpike Authority RB Series 2009 G (A+/A3) |
| ||||||||||||
| 1,650,000 | 5.000 | 01/01/18 | 1,957,577 | |||||||||||
|
| |||||||||||||
| 46 | The accompanying notes are an integral part of these financial statements. |
GOLDMAN SACHS MUNICIPAL INCOME FUND
| | Principal Amount | | | Interest Rate | | | Maturity Date | | Value | |||||
| State-Specific Municipal Debt Obligations – (continued) | ||||||||||||||
| New Jersey – (continued) |
| ||||||||||||
| New Jersey Transportation Trust Fund Authority RB for | | ||||||||||||
| $ | 4,810,000 | 5.500 | % | 06/15/41 | $ | 5,636,117 | ||||||||
| Tobacco Settlement Financing Corp. RB for Capital Appreciation | | ||||||||||||
| 11,250,000 | 0.000 | 06/01/41 | 545,963 | |||||||||||
| Tobacco Settlement Financing Corp. RB Series 2003 | | ||||||||||||
| 300,000 | 6.750 | 06/01/13 | 313,017 | |||||||||||
| Tobacco Settlement Financing Corp. RB Series 2007 1-A (B-/B1) |
| ||||||||||||
| 3,015,000 | 4.625 | 06/01/26 | 2,799,307 | |||||||||||
|
| |||||||||||||
| 29,537,396 | ||||||||||||||
|
| |||||||||||||
| New Mexico – 0.6% |
| ||||||||||||
| Farmington New Mexico PCRB Refunding for Public Service Co. | | ||||||||||||
| 2,500,000 | 5.900 | 06/01/40 | 2,782,725 | |||||||||||
| Santa Fe County New Mexico RB for Gross Receipts Series 2008 | | ||||||||||||
| 1,000,000 | 5.250 | 06/01/31 | 1,138,060 | |||||||||||
|
| |||||||||||||
| 3,920,785 | ||||||||||||||
|
| |||||||||||||
| New York – 4.0% |
| ||||||||||||
| Erie County New York Industrial Development Agency RB for | | ||||||||||||
| 6,500,000 | 5.750 | 05/01/26 | 7,686,185 | |||||||||||
| 4,500,000 | 5.750 | 05/01/29 | 5,300,505 | |||||||||||
| New York City GO Bonds Series 2006 A (AA/Aa2) |
| ||||||||||||
| 400,000 | 5.000 | 08/01/18 | 463,860 | |||||||||||
| New York City Industrial Development Agency RB for | | ||||||||||||
| 2,045,000 | 5.000 | 11/01/12 | 2,052,260 | |||||||||||
| New York Mortgage Agency RB for Homeowner Mortgage | | ||||||||||||
| 900,000 | 4.800 | 10/01/23 | 909,315 | |||||||||||
| New York State Dormitory Authority RB for North Shore | | ||||||||||||
| 1,500,000 | 5.500 | 11/01/14 | 1,638,120 | |||||||||||
| New York State Dormitory Authority RB for Personal Income | | ||||||||||||
| 3,500,000 | 5.000 | 03/15/42 | 4,016,355 | |||||||||||
| New York State Environmental Facilities Corp. State Clean | | ||||||||||||
| 175,000 | 5.250 | 11/15/20 | 176,011 | |||||||||||
| Tobacco Settlement Financing Corp. RB Asset-Backed Bonds | | ||||||||||||
| 2,600,000 | 5.500 | 06/01/19 | 2,692,040 | |||||||||||
|
| |||||||||||||
| 24,934,651 | ||||||||||||||
|
| |||||||||||||
| North Carolina – 0.8% |
| ||||||||||||
| Charlotte North Carolina Water and Sewer System RB | | ||||||||||||
| 2,000,000 | 5.000 | 07/01/38 | 2,373,200 | |||||||||||
|
| |||||||||||||
| | Principal Amount | | | Interest Rate | | | Maturity Date | | Value | |||||
| State-Specific Municipal Debt Obligations – (continued) | ||||||||||||||
| North Carolina – (continued) |
| ||||||||||||
| North Carolina Eastern Municipal Power Agency Power System | | ||||||||||||
| $ | 1,350,000 | 5.375 | % | 01/01/13 | $ | 1,367,023 | ||||||||
| North Carolina Eastern Municipal Power Agency Power System | | ||||||||||||
| 500,000 | 6.000 | 01/01/19 | 585,150 | |||||||||||
| North Carolina Municipal Power Agency No. 1 Catawba Electric | | ||||||||||||
| 145,000 | 5.500 | 01/01/13 | 146,855 | |||||||||||
| North Carolina Municipal Power Agency No. 1 Catawba Electric | | ||||||||||||
| 305,000 | 5.500 | 01/01/13 | 308,840 | |||||||||||
|
| |||||||||||||
| 4,781,068 | ||||||||||||||
|
| |||||||||||||
| Ohio – 0.3% |
| ||||||||||||
| Buckeye Ohio Tobacco Settlement Financing Authority RB | | ||||||||||||
| 440,000 | 5.125 | 06/01/24 | 370,269 | |||||||||||
| 2,000,000 | 5.875 | 06/01/30 | 1,648,880 | |||||||||||
|
| |||||||||||||
| 2,019,149 | ||||||||||||||
|
| |||||||||||||
| Oklahoma – 0.1% |
| ||||||||||||
| Oklahoma Development Finance Authority RB for Great Plains | | ||||||||||||
| 240,000 | 5.000 | 12/01/27 | 242,702 | |||||||||||
| 140,000 | 5.125 | 12/01/36 | 140,651 | |||||||||||
|
| |||||||||||||
| 383,353 | ||||||||||||||
|
| |||||||||||||
| Oregon – 0.9% |
| ||||||||||||
| Deschutes County Oregon Hospital Facilities Authority RB | | ||||||||||||
| 1,500,000 | 8.250 | 01/01/38 | 1,925,565 | |||||||||||
| Klamath Falls Oregon Intercommunity Hospital Authority RB | | ||||||||||||
| 745,000 | 6.125 | 09/01/22 | 753,866 | |||||||||||
| Oregon State GO Bonds Refunding for Oregon University System | | ||||||||||||
| 2,100,000 | 5.000 | 08/01/27 | 2,612,862 | |||||||||||
|
| |||||||||||||
| 5,292,293 | ||||||||||||||
|
| |||||||||||||
| Pennsylvania – 0.9% |
| ||||||||||||
| Mifflin County Pennsylvania School District GO Bonds Series | | ||||||||||||
| 2,000,000 | 7.500 | 09/01/26 | 2,499,300 | |||||||||||
| Montgomery County Pennsylvania Higher Education & Health | | ||||||||||||
| 150,000 | 5.375 | 11/15/14 | 165,612 | |||||||||||
| Pennsylvania Economic Development Financing Authority PCRB | | ||||||||||||
| 2,500,000 | 4.000 | 10/01/23 | 2,625,675 | |||||||||||
|
| |||||||||||||
| The accompanying notes are an integral part of these financial statements. | 47 |
GOLDMAN SACHS MUNICIPAL INCOME FUND
Schedule of Investments (continued)
September 30, 2012 (Unaudited)
| | Principal Amount | | | Interest Rate | | | Maturity Date | | Value | |||||
| State-Specific Municipal Debt Obligations – (continued) | ||||||||||||||
| Pennsylvania – (continued) |
| ||||||||||||
| St. Mary Hospital Authority RB Refunding for Catholic Health | | ||||||||||||
| $ | 225,000 | 5.375 | % | 11/15/14 | $ | 247,412 | ||||||||
|
| |||||||||||||
| 5,537,999 | ||||||||||||||
|
| |||||||||||||
| Puerto Rico – 5.1% |
| ||||||||||||
| Puerto Rico Commonwealth Aqueduct & Sewer Authority RB | | ||||||||||||
| 3,635,000 | 6.125 | 07/01/24 | 4,165,419 | |||||||||||
| 2,000,000 | 6.000 | 07/01/38 | 2,112,920 | |||||||||||
| 2,500,000 | 6.000 | 07/01/44 | 2,633,475 | |||||||||||
| Puerto Rico Commonwealth GO Bonds Refunding for Public | | ||||||||||||
| 3,000,000 | 6.500 | 07/01/37 | 3,328,860 | |||||||||||
| Puerto Rico Commonwealth GO Bonds Refunding | | ||||||||||||
| 2,000,000 | 6.000 | 07/01/27 | 2,179,780 | |||||||||||
| Puerto Rico Commonwealth Highway & Transportation Authority | | ||||||||||||
| 900,000 | 5.250 | 07/01/18 | 921,411 | |||||||||||
| Puerto Rico Sales Tax Financing Corp. RB First Subseries 2010 C | | ||||||||||||
| 2,500,000 | 6.000 | 08/01/39 | 2,818,725 | |||||||||||
| Puerto Rico Sales Tax Financing Corp. RB for Capital | | ||||||||||||
| 13,000,000 | 0.000 | 08/01/32 | 13,257,140 | |||||||||||
|
| |||||||||||||
| 31,417,730 | ||||||||||||||
|
| |||||||||||||
| South Carolina – 0.9% |
| ||||||||||||
| City of Columbia Waterworks and Sewer System RB | | ||||||||||||
| 2,500,000 | 5.000 | 02/01/41 | 2,887,850 | |||||||||||
| Georgetown County South Carolina Environmental RB for | | ||||||||||||
| 2,500,000 | 5.000 | 08/01/30 | 2,501,600 | |||||||||||
|
| |||||||||||||
| 5,389,450 | ||||||||||||||
|
| |||||||||||||
| South Dakota – 0.1% |
| ||||||||||||
| South Dakota Health & Educational Facilities Authority RB for | | ||||||||||||
| 500,000 | 5.500 | 07/01/35 | 551,055 | |||||||||||
| 300,000 | 5.250 | 07/01/38 | 323,526 | |||||||||||
|
| |||||||||||||
| 874,581 | ||||||||||||||
|
| |||||||||||||
| Tennessee – 1.3% |
| ||||||||||||
| Johnson City Tennessee Health & Educational Facilities Board | | ||||||||||||
| 1,775,000 | 5.500 | 07/01/36 | 1,882,459 | |||||||||||
| Knox County Tennessee Health, Educational & Housing Facilities | | ||||||||||||
| 2,700,000 | 5.250 | 04/01/36 | 2,848,932 | |||||||||||
|
| |||||||||||||
| | Principal Amount | | | Interest Rate | | | Maturity Date | | Value | |||||
| State-Specific Municipal Debt Obligations – (continued) | ||||||||||||||
| Tennessee – (continued) |
| ||||||||||||
| Metropolitan Government Nashville & Davidson County | | ||||||||||||
| $ | 1,000,000 | 4.850 | % | 06/01/25 | $ | 1,024,220 | ||||||||
| Sullivan County Tennessee Health, Educational & Housing | | ||||||||||||
| 2,100,000 | 5.250 | 09/01/36 | 2,194,101 | |||||||||||
|
| |||||||||||||
| 7,949,712 | ||||||||||||||
|
| |||||||||||||
| Texas – 11.7% |
| ||||||||||||
| Arlington Permanent Improvement GO Bonds Refunding | | ||||||||||||
| 1,185,000 | 3.000 | 08/15/19 | 1,307,067 | |||||||||||
| Dallas County Utility & Reclamation District GO Bonds | | ||||||||||||
| 2,675,000 | 5.375 | 02/15/29 | 2,875,224 | |||||||||||
| Dallas-Fort Worth International Airport Joint RB Refunding | | ||||||||||||
| 2,500,000 | 5.000 | 11/01/27 | 2,889,225 | |||||||||||
| Grand Prairie Texas Independent School District GO Bonds | | ||||||||||||
| 1,000,000 | 5.375 | 02/15/13 | 1,018,920 | |||||||||||
| Hidalgo County Health Services RB for Mission Hospital, Inc. | | ||||||||||||
| 700,000 | 5.000 | 08/15/19 | 715,652 | |||||||||||
| Houston Airport System RB Refunding Senior Lien | | ||||||||||||
| 10,000,000 | 5.500 | 07/01/34 | 11,434,500 | |||||||||||
| Houston Utilities System RB Refunding First Lien Series 2004 A | | ||||||||||||
| 1,000,000 | 5.250 | 05/15/25 | 1,063,810 | |||||||||||
| Lower Colorado River Authority RB Prerefunded Series 2008 | | ||||||||||||
| 100,000 | 5.750 | 05/15/15 | 113,968 | |||||||||||
| Lower Colorado River Authority RB Unrefunded Balance | | ||||||||||||
| 4,900,000 | 5.750 | 05/15/37 | 5,331,984 | |||||||||||
| Matagorda County Texas Navigation District No. 1 PCRB | | ||||||||||||
| 1,300,000 | 6.300 | 11/01/29 | 1,513,538 | |||||||||||
| Matagorda County Texas Navigation District No. 1 PCRB | | ||||||||||||
| 2,500,000 | 5.200 | 05/01/30 | 2,671,825 | |||||||||||
| Mesquite Texas Health Facilities Development Corp. RB for | | ||||||||||||
| 150,000 | 5.500 | 02/15/25 | 156,580 | |||||||||||
| 235,000 | 5.625 | 02/15/35 | 241,094 | |||||||||||
| Mission Economic Development Corp. RB for Waste | | ||||||||||||
| 1,000,000 | 6.000 | 08/01/13 | 1,043,400 | |||||||||||
|
| |||||||||||||
| 48 | The accompanying notes are an integral part of these financial statements. |
GOLDMAN SACHS MUNICIPAL INCOME FUND
| | Principal Amount | | | Interest Rate | | | Maturity Date | | Value | |||||
| State-Specific Municipal Debt Obligations – (continued) | ||||||||||||||
| Texas – (continued) |
| ||||||||||||
| North Texas Tollway Authority RB Convertible Capital | | ||||||||||||
| $ | 1,000,000 | 0.000 | % | 09/01/43 | $ | 732,500 | ||||||||
| North Texas Tollway Authority RB First Tier Series 2009 A | | ||||||||||||
| 2,500,000 | 6.250 | 01/01/24 | 3,013,100 | |||||||||||
| 1,100,000 | 6.250 | 01/01/39 | 1,260,325 | |||||||||||
| North Texas Tollway Authority RB Special Project System | | ||||||||||||
| 1,000,000 | 5.500 | 09/01/41 | 1,194,190 | |||||||||||
| 1,000,000 | 6.000 | 09/01/41 | 1,250,790 | |||||||||||
| North Texas Tollway Authority System RB Refunding for Capital | | ||||||||||||
| 6,000,000 | 0.000 | 01/01/43 | 6,579,360 | |||||||||||
| North Texas Tollway Authority System RB Refunding for First | | ||||||||||||
| 5,000,000 | 5.750 | 01/01/40 | 5,657,200 | |||||||||||
| Pharr-San Juan-Alamo Independent School District Unlimited | | ||||||||||||
| 1,420,000 | 5.500 | 02/01/27 | 1,643,551 | |||||||||||
| 1,000,000 | 5.500 | 02/01/29 | 1,154,260 | |||||||||||
| 1,670,000 | 5.500 | 02/01/31 | 1,920,099 | |||||||||||
| Port of Houston Authority Harris County Unlimited Tax GO | | ||||||||||||
| 3,000,000 | 6.125 | 10/01/33 | 3,501,900 | |||||||||||
| Round Rock Texas Independent School District Unlimited Tax | | ||||||||||||
| 2,730,000 | 5.250 | 08/01/34 | 3,243,813 | |||||||||||
| Schertz Texas GO Bonds Series 2006 (NATL-RE) (AA/Baa2) |
| ||||||||||||
| 1,715,000 | 5.250 | 02/01/25 | 1,898,796 | |||||||||||
| 1,900,000 | 5.250 | 02/01/27 | 2,090,703 | |||||||||||
| Tarrant County Cultural Education Facilities Finance Corp. RB | | ||||||||||||
| 425,000 | 5.125 | 05/15/37 | 427,839 | |||||||||||
| Texas Municipal Gas Acquisition & Supply Corp. I RB Senior | | ||||||||||||
| 3,000,000 | 6.250 | 12/15/26 | 3,674,280 | |||||||||||
| Tomball Hospital Authority RB Refunding Series 2005 | | ||||||||||||
| 900,000 | 5.000 | 07/01/15 | 1,012,878 | |||||||||||
|
| |||||||||||||
| 72,632,371 | ||||||||||||||
|
| |||||||||||||
| U.S. Virgin Islands – 0.3% |
| ||||||||||||
| Virgin Islands Public Finance Authority RB Senior Lien | | ||||||||||||
| 1,750,000 | 5.250 | 10/01/16 | 1,882,055 | |||||||||||
|
| |||||||||||||
| Utah – 0.6% |
| ||||||||||||
| Utah Housing Corp. Single Family Mortgage RB Series 2008 B-1 | | ||||||||||||
| 2,005,000 | 5.875 | 07/01/39 | 2,112,648 | |||||||||||
| Utah Housing Corp. Single Family Mortgage RB Series 2008 B-1 | | ||||||||||||
| 1,570,000 | 5.900 | 07/01/36 | 1,637,149 | |||||||||||
|
| |||||||||||||
| 3,749,797 | ||||||||||||||
|
| |||||||||||||
| | Principal Amount | | | Interest Rate | | | Maturity Date | | Value | |||||
| State-Specific Municipal Debt Obligations – (continued) | ||||||||||||||
| Virginia – 1.1% |
| ||||||||||||
| Bristol Virginia Utilities System RB Refunding Series 2003 | | ||||||||||||
| $ | 1,850,000 | 5.250 | % | 07/15/13 | $ | 1,922,631 | ||||||||
| Virginia Small Business Financing Authority Senior Lien RB for | | ||||||||||||
| 750,000 | 5.500 | 01/01/42 | 825,367 | |||||||||||
| Virginia State Housing Development Authority RB Series 2008 E | | ||||||||||||
| 2,770,000 | 6.250 | 07/01/31 | 3,071,847 | |||||||||||
| Washington County Virginia IDA RB for Mountain States Health | | ||||||||||||
| 1,000,000 | 7.750 | 07/01/38 | 1,241,530 | |||||||||||
|
| |||||||||||||
| 7,061,375 | ||||||||||||||
|
| |||||||||||||
| Washington – 3.6% |
| ||||||||||||
| Energy Northwest Columbia Generating Station Electric RB | | ||||||||||||
| 1,460,000 | 5.000 | 07/01/32 | 1,741,824 | |||||||||||
| Puttable Floating Option Tax-Exempt Receipts (RITES) GO | | ||||||||||||
| 700,000 | 16.108 | 12/14/17 | 1,238,867 | |||||||||||
| Puttable Floating Option Tax-Exempt Receipts (RITES) GO | | ||||||||||||
| 730,000 | 16.115 | 12/14/17 | 1,272,550 | |||||||||||
| Skagit County Washington Public Hospital District No. 2 GO | | ||||||||||||
| 2,000,000 | 5.000 | 12/01/30 | 2,074,980 | |||||||||||
| Tacoma Washington GO Bonds Series 2004 (NATL-RE) | | ||||||||||||
| 2,000,000 | 5.000 | 12/01/30 | 2,126,680 | |||||||||||
| Tobacco Settlement Authority of Washington RB Asset-Backed | | ||||||||||||
| 3,165,000 | 6.625 | 06/01/32 | 3,288,435 | |||||||||||
| University of Washington RB Refunding Series 2012 A | | ||||||||||||
| 2,500,000 | 5.000 | 07/01/29 | 3,042,300 | |||||||||||
| Washington State GO Bonds Series 1992 B & AT-7 (AA+/Aa1) |
| ||||||||||||
| 500,000 | 6.400 | 06/01/17 | 585,655 | |||||||||||
| Washington State Health Care Facilities Authority RB for | | ||||||||||||
| 250,000 | 6.000 | 08/15/39 | 291,495 | |||||||||||
| Washington State Health Care Facilities Authority RB for | | ||||||||||||
| 250,000 | 6.000 | 08/15/39 | 291,495 | |||||||||||
| Washington State Health Care Facilities Authority RB for | | ||||||||||||
| 3,000,000 | 6.500 | 11/15/14 | 3,390,090 | |||||||||||
| Washington State Health Care Facilities Authority RB for | | ||||||||||||
| 3,000,000 | 6.000 | 08/15/37 | 3,289,170 | |||||||||||
|
| |||||||||||||
| 22,633,541 | ||||||||||||||
|
| |||||||||||||
| The accompanying notes are an integral part of these financial statements. | 49 |
GOLDMAN SACHS MUNICIPAL INCOME FUND
Schedule of Investments (continued)
September 30, 2012 (Unaudited)
| | Principal Amount | | | Interest Rate | | | Maturity Date | | Value | |||||
| State-Specific Municipal Debt Obligations – (continued) | ||||||||||||||
| West Virginia – 0.5% |
| ||||||||||||
| Monongalia County Building Commission RB for Monongalia | | ||||||||||||
| $ | 2,000,000 | 5.250 | % | 07/01/25 | $ | 2,149,900 | ||||||||
| West Virginia Hospital Finance Authority Hospital RB Refunding | | ||||||||||||
| 1,000,000 | 5.500 | 06/01/39 | 1,094,240 | |||||||||||
|
| |||||||||||||
| 3,244,140 | ||||||||||||||
|
| |||||||||||||
| Wisconsin – 0.4% |
| ||||||||||||
| Wisconsin State Health & Educational Facilities Authority RB for | | ||||||||||||
| 375,000 | 5.125 | 05/15/29 | 388,163 | |||||||||||
| Wisconsin State Health & Educational Facilities Authority RB for | | ||||||||||||
| 100,000 | 5.000 | 05/15/36 | 101,981 | |||||||||||
| Wisconsin State Health & Educational Facilities Authority RB for | | ||||||||||||
| 1,750,000 | 5.250 | 08/15/31 | 1,830,115 | |||||||||||
|
| |||||||||||||
| 2,320,259 | ||||||||||||||
|
| |||||||||||||
| | TOTAL STATE-SPECIFIC MUNICIPAL DEBT OBLIGATIONS | | ||||||||||||
| (Cost $524,718,756) | $ | 583,892,191 | ||||||||||||
|
| |||||||||||||
| Other Municipal Debt Obligation – 0.2% | ||||||||||||||
| Municipal Mortgage & Equity LLC Tax-Exempt Special Purpose | | ||||||||||||
| $ | 2,000,000 | 5.500 | % | 09/30/15 | $ | 1,350,480 | ||||||||
| (Cost $2,000,000 ) | ||||||||||||||
|
| |||||||||||||
| Short-Term Investments – 3.6% | ||||||||||||||
| Illinois – 0.8% |
| ||||||||||||
| Chicago Illinois GO VRDN Project Series 2003 B-1 RMKT | | ||||||||||||
| $ | 1,500,000 | 0.210 | % | 10/01/12 | $ | 1,500,000 | ||||||||
| Chicago Illinois GO VRDN Project Series 2003 B-2 RMKT | | ||||||||||||
| 1,000,000 | 0.200 | 10/01/12 | 1,000,000 | |||||||||||
| Chicago Illinois GO VRDN Project Series 2003 B-3 RMKT | | ||||||||||||
| 1,000,000 | 0.200 | 10/01/12 | 1,000,000 | |||||||||||
| Chicago Illinois GO VRDN Refunding RMKT 04/18/12 | | ||||||||||||
| 1,500,000 | 0.200 | 10/01/12 | 1,500,000 | |||||||||||
|
| |||||||||||||
| 5,000,000 | ||||||||||||||
|
| |||||||||||||
| Mississippi – 1.5% |
| ||||||||||||
| Jackson County Port Facility VRDN RB Refunding for Chevron | | ||||||||||||
| 5,000,000 | 0.180 | 10/01/12 | 5,000,000 | |||||||||||
|
| |||||||||||||
| | Principal Amount | | | Interest Rate | | | Maturity Date | | Value | |||||
| Short-Term Investments –(continued) | ||||||||||||||
| Mississippi – (continued) |
| ||||||||||||
| Mississippi Business Finance Corp. Gulf Opportunity Zone | | ||||||||||||
| $ | 4,500,000 | 0.190 | % | 10/01/12 | $ | 4,500,000 | ||||||||
|
| |||||||||||||
| 9,500,000 | ||||||||||||||
|
| |||||||||||||
| Missouri – 0.2% |
| ||||||||||||
| Missouri State Health & Educational Facilities Authority VRDN | | ||||||||||||
| 1,000,000 | 0.200 | 10/01/12 | 1,000,000 | |||||||||||
| Missouri State Health & Educational Facilities Authority VRDN | | ||||||||||||
| 200,000 | 0.200 | 10/01/12 | 200,000 | |||||||||||
|
| |||||||||||||
| 1,200,000 | ||||||||||||||
|
| |||||||||||||
| New York – 0.5% |
| ||||||||||||
| New York City Municipal Water Finance Authority Water & | | ||||||||||||
| 2,600,000 | 0.200 | 10/01/12 | 2,600,000 | |||||||||||
| New York City VRDN GO Bonds Fiscal Subseries 2012 G-5 | | ||||||||||||
| 290,000 | 0.180 | 10/01/12 | 290,000 | |||||||||||
|
| |||||||||||||
| 2,890,000 | ||||||||||||||
|
| |||||||||||||
| Texas – 0.4% |
| ||||||||||||
| Lower Neches Valley Authority Industrial Development Corp. | | ||||||||||||
| 1,000,000 | 0.200 | 10/01/12 | 1,000,000 | |||||||||||
| Lower Neches Valley Authority Industrial Development Corp. | | ||||||||||||
| 300,000 | 0.180 | 10/01/12 | 300,000 | |||||||||||
| Lower Neches Valley Authority Industrial Development Corp. | | ||||||||||||
| 1,000,000 | 0.180 | 10/01/12 | 1,000,000 | |||||||||||
| Texas Water Development Board VRDN RB Refunding State | | ||||||||||||
| 415,000 | 0.220 | 10/01/12 | 415,000 | |||||||||||
|
| |||||||||||||
| 2,715,000 | ||||||||||||||
|
| |||||||||||||
| Virginia – 0.2% |
| ||||||||||||
| Virginia College Building Authority Educational Facilities VRDN | | ||||||||||||
| 1,000,000 | 0.210 | 10/01/12 | 1,000,000 | |||||||||||
|
| |||||||||||||
| TOTAL SHORT-TERM INVESTMENTS | ||||||||||||||
| (Cost $22,305,000) | $ | 22,305,000 | ||||||||||||
|
| |||||||||||||
| TOTAL INVESTMENTS – 97.7% | ||||||||||||||
| (Cost $549,023,756) | $ | 607,547,671 | ||||||||||||
|
| |||||||||||||
| OTHER ASSETS IN EXCESS OF | | 14,606,879 | |||||||||||
|
| |||||||||||||
| NET ASSETS – 100.0% | $ | 622,154,550 | ||||||||||||
|
| |||||||||||||
| 50 | The accompanying notes are an integral part of these financial statements. |
GOLDMAN SACHS MUNICIPAL INCOME FUND
| The percentage shown for each investment category reflects the value of investments in that category as a percentage of net assets. | ||
(a) | Inverse floating rate security. Interest rate disclosed is that which is in effect at September 30, 2012. | |
(b) | Security with “Put” features and resetting interest rates. Maturity dates disclosed are the puttable dates. Interest rate disclosed is that which is in effect at September 30, 2012. | |
(c) | Exempt from registration under Rule 144A of the Securities Act of 1933. Under procedures approved by the Board of Trustees, such securities have been determined to be liquid by the investment adviser and may be resold, normally to qualified institutional buyers in transactions exempt from registration. Total market value of Rule 144A securities amounts to $11,188,956, which represents approximately 1.8% of net assets as of September 30, 2012. | |
(d) | Pre-refunded security. Maturity date disclosed is pre-refunding date. | |
(e) | Issued with a zero coupon. Income is recognized through the accretion of discount. | |
(f) | Zero coupon bond until next reset date. | |
(g) | When-issued security. | |
(h) | Variable rate security. Except for floating rate notes (for which final maturity is disclosed), maturity date disclosed is the next interest reset date. Interest rate disclosed is that which is in effect at September 30, 2012. | |
(i) | Security is currently in default. | |
Security ratings disclosed, if any, are issued by either Standard & Poor’s, Moody’s Investor Service or Fitch and are unaudited. A brief description of the ratings is available in the Fund’s Statement of Additional Information.
| ||
Investment Abbreviations: | ||
ACA | —Insured by American Capital Access | |
AGM | —Insured by Assured Guaranty Municipal Corp. | |
AGM-CR | —Insured by Assured Guaranty Municipal Corp. Insured Custodial Receipts | |
AMBAC | —Insured by American Municipal Bond Assurance Corp. | |
AMT | —Alternative Minimum Tax | |
ASSURED GTY | —Insured by Assured Guaranty | |
BNY | —Insured by the Bank of New York Mellon Corp. | |
CAL MTG INS | —Insured by California Mortgage Insurance | |
COPS | —Certificates of Participation | |
CRA | —Community Reinvestment Act | |
ETM | —Escrowed to Maturity | |
FGIC | —Insured by Financial Guaranty Insurance Co. | |
FNMA | —Federal National Mortgage Association | |
GARB | —General Airport Revenue Bond | |
GNMA | —Government National Mortgage Association | |
GO | —General Obligation | |
GO OF AUTH | —General Obligation of Authority | |
GO OF DIST | —General Obligation of District | |
GO OF INSTN | —General Obligation of Institution | |
IDA | —Industrial Development Authority | |
NATL-RE | —Insured by National Public Finance Guarantee Corp. | |
NATL-RE FGIC | —Insured by National Public Finance Guarantee Corp., which re-insures Financial Guaranty Insurance Co. | |
NATL-RE-IBC | —Insured by National Public Finance Guarantee Corp. - Insured Bond Certificates | |
NR | —Not Rated | |
PCRB | —Pollution Control Revenue Bond | |
PSF-GTD | —Guaranteed by Permanent School Fund | |
Radian | —Insured by Radian Asset Assurance | |
RB | —Revenue Bond | |
RITES | —Residual Interest Tax Exempt Securities | |
RMKT | —Remarketed | |
ST AID WITHHLDG | —State Aid Withholding | |
ST APPROP | —State Appropriation | |
TCRS | —Transferable Custodial Receipts | |
VRDN | —Variable Rate Demand Notes | |
WR | —Withdrawn Rating | |
XLCA | —Insured by XL Capital Assurance, Inc. | |
| ||
| The accompanying notes are an integral part of these financial statements. | 51 |
GOLDMAN SACHS SHORT DURATION TAX-FREE FUND
Schedule of Investments
September 30, 2012 (Unaudited)
| Principal Amount | Interest Rate | Maturity Date | Value | |||||||||||
| State-Specific Municipal Debt Obligations – 93.8% | ||||||||||||||
| Alabama – 1.2% |
| ||||||||||||
| Alabama 21st Century Authority Tobacco Settlement RB | | ||||||||||||
| $ | 2,435,000 | 5.000 | % | 06/01/17 | $ | 2,842,351 | ||||||||
| 1,500,000 | 5.000 | 06/01/18 | 1,775,835 | |||||||||||
| Alabama Federal Aid Highway Finance Authority Refunding for | | ||||||||||||
| 11,400,000 | 4.000 | 03/01/17 | 12,951,426 | |||||||||||
| Alabama State GO Bonds Series 2007 A (AGM) (AA/Aa1) |
| ||||||||||||
| 5,000,000 | 5.000 | 08/01/17 | 5,982,000 | |||||||||||
| Birmingham Waterworks & Sewer Board RB Series 2002 B | | ||||||||||||
| 5,000,000 | 5.000 | 01/01/13 | 5,058,500 | |||||||||||
| Courtland Industrial Development Board RB Refunding for | | ||||||||||||
| 1,415,000 | 5.000 | 11/01/13 | 1,477,388 | |||||||||||
| Infirmary Health System Special Care Facilities Financing | | ||||||||||||
| 1,000,000 | 5.000 | 02/01/13 | 1,011,470 | |||||||||||
| Tuscaloosa Alabama Public Educational Building Authority RB | | ||||||||||||
| 2,345,000 | 3.000 | 08/15/13 | 2,376,986 | |||||||||||
| 2,795,000 | 3.500 | 08/15/14 | 2,883,881 | |||||||||||
| 3,300,000 | 4.000 | 08/15/15 | 3,497,142 | |||||||||||
| 3,850,000 | 3.000 | 08/15/16 | 4,007,118 | |||||||||||
|
| |||||||||||||
| 43,864,097 | ||||||||||||||
|
| |||||||||||||
| Alaska – 0.2% |
| ||||||||||||
| Northern Tobacco Securitization Corp. RB Asset-Backed Bonds | | ||||||||||||
| 6,740,000 | 4.625 | 06/01/23 | 6,752,941 | |||||||||||
|
| |||||||||||||
| Arizona – 2.1% |
| ||||||||||||
| Arizona Health Facilities Authority Hospital RB for Banner | | ||||||||||||
| 2,150,000 | 1.119 | 01/01/37 | 1,610,479 | |||||||||||
| Arizona Health Facilities Authority Hospital RB for Phoenix | | ||||||||||||
| 4,500,000 | 1.180 | 02/02/15 | 4,457,925 | |||||||||||
| Arizona Health Facilities Authority Hospital RB for Phoenix | | ||||||||||||
| 10,000,000 | 1.180 | 02/02/15 | 9,797,800 | |||||||||||
| Arizona Health Facilities Authority Hospital RB Refunding for | | ||||||||||||
| 1,000,000 | 2.000 | 02/01/15 | 1,009,550 | |||||||||||
| Arizona Transportation Board Refunding for Grant Anticipation | | ||||||||||||
| 8,195,000 | 4.000 | 07/01/15 | 8,952,218 | |||||||||||
| 7,235,000 | 4.000 | 07/01/16 | 8,121,505 | |||||||||||
| Gilbert Arizona Street & Highway User RB Refunding | | ||||||||||||
| 3,000,000 | 5.000 | 07/01/19 | 3,624,000 | |||||||||||
|
| |||||||||||||
| Principal Amount | Interest Rate | Maturity Date | Value | |||||||||||
| State-Specific Municipal Debt Obligations – (continued) | ||||||||||||||
| Arizona – (continued) |
| ||||||||||||
| Glendale City Senior Lien Water & Sewer RB Refunding | | ||||||||||||
| $ | 1,000,000 | 4.000 | % | 07/01/15 | $ | 1,088,970 | ||||||||
| 1,000,000 | 4.000 | 07/01/16 | 1,117,800 | |||||||||||
| 1,500,000 | 5.000 | 07/01/17 | 1,771,215 | |||||||||||
| 4,825,000 | 3.000 | 07/01/18 | 5,260,794 | |||||||||||
| Maricopa County Arizona Pollution Control Corp. PCRB | | ||||||||||||
| 5,000,000 | 4.000 | 06/01/15 | 5,222,050 | |||||||||||
| Maricopa County Arizona Pollution Control Corp. PCRB | | ||||||||||||
| 4,500,000 | 6.000 | 05/01/14 | 4,849,065 | |||||||||||
| Maricopa County Arizona Pollution Control Corp. PCRB | | ||||||||||||
| 1,000,000 | 6.000 | 05/01/14 | 1,077,570 | |||||||||||
| Maricopa County Community College District GO Bonds | | ||||||||||||
| 5,000,000 | 3.000 | 07/01/13 | 5,104,850 | |||||||||||
| Maricopa County Phoenix High School District No. 210 School | | ||||||||||||
| 3,800,000 | 5.000 | 07/01/17 | 4,399,754 | |||||||||||
| Navajo County Arizona Pollution Control Corp. PCRB Refunding | | ||||||||||||
| 2,000,000 | 1.250 | 05/30/14 | 2,007,200 | |||||||||||
| Navajo County Arizona Pollution Control Corp. PCRB Refunding | | ||||||||||||
| 3,000,000 | 5.500 | 06/01/14 | 3,220,260 | |||||||||||
| Phoenix Arizona GO Bonds Refunding Series 2009 C | | ||||||||||||
| 4,000,000 | 2.500 | 07/01/13 | 4,068,680 | |||||||||||
| Scottsdale Arizona GO Bonds for Projects of 1999 and 2000 | | ||||||||||||
| 3,900,000 | 5.000 | 07/01/14 | 4,217,967 | |||||||||||
|
| |||||||||||||
| 80,979,652 | ||||||||||||||
|
| |||||||||||||
| Arkansas – 0.2% |
| ||||||||||||
| Arkansas Development Finance Authority State Park Facilities | | ||||||||||||
| 1,550,000 | 2.000 | 01/01/14 | 1,572,971 | |||||||||||
| 1,985,000 | 2.000 | 01/01/15 | 2,030,278 | |||||||||||
| 1,720,000 | 2.000 | 01/01/16 | 1,764,204 | |||||||||||
| 2,065,000 | 2.000 | 01/01/17 | 2,122,758 | |||||||||||
| 1,885,000 | 3.000 | 01/01/18 | 2,022,134 | |||||||||||
|
| |||||||||||||
| 9,512,345 | ||||||||||||||
|
| |||||||||||||
| California – 13.7% |
| ||||||||||||
| Abag Finance Authority RB for Sharp Health Care Series 2011 A | | ||||||||||||
| 3,000,000 | 5.000 | 08/01/16 | 3,393,900 | |||||||||||
|
| |||||||||||||
| 52 | The accompanying notes are an integral part of these financial statements. |
GOLDMAN SACHS SHORT DURATION TAX-FREE FUND
Principal Amount | Interest Rate | Maturity Date | Value | |||||||||||
| State-Specific Municipal Debt Obligations – (continued) | ||||||||||||||
| California – (continued) |
| ||||||||||||
| Alameda Corridor Transportation Authority Tax-Exempt Lien RB | | ||||||||||||
| $ | 7,790,000 | 0.000 | % | 10/01/12 | $ | 7,790,000 | ||||||||
| Anaheim Redevelopment Agency Tax Allocation Refunding for | | ||||||||||||
| 50,000 | 5.000 | 02/01/24 | 53,866 | |||||||||||
| Bonita Canyon Public Facilities Financing Authority Special Tax | | ||||||||||||
| 580,000 | 2.000 | 09/01/13 | 585,087 | |||||||||||
| 500,000 | 2.250 | 09/01/14 | 506,940 | |||||||||||
| 465,000 | 3.000 | 09/01/15 | 479,280 | |||||||||||
| 650,000 | 3.000 | 09/01/16 | 670,364 | |||||||||||
| 735,000 | 3.000 | 09/01/17 | 756,337 | |||||||||||
| 1,000,000 | 3.250 | 09/01/18 | 1,028,190 | |||||||||||
| Buena Park Community Redevelopment Agency Tax Allocation | | ||||||||||||
| 25,000 | 4.300 | 09/01/16 | 26,342 | |||||||||||
| Burbank Public Financing Authority RB Unrefunded for Golden | | ||||||||||||
| 985,000 | 5.250 | 12/01/18 | 1,014,402 | |||||||||||
| 230,000 | 5.250 | 12/01/19 | 236,279 | |||||||||||
| California Community College Financing Authority Tax and | | ||||||||||||
| 10,000,000 | 2.500 | 06/28/13 | 10,094,900 | |||||||||||
| California Health Facilities Financing Authority RB for Catholic | | ||||||||||||
| 2,500,000 | 5.000 | 07/01/14 | 2,669,750 | |||||||||||
| California Health Facilities Financing Authority RB for | | ||||||||||||
| 8,000,000 | 1.980 | 07/01/17 | 8,006,320 | |||||||||||
| California Health Facilities Financing Authority RB Refunding | | ||||||||||||
| 5,000,000 | 1.450 | 03/15/17 | 5,077,950 | |||||||||||
| California Health Facilities Financing Authority RB Refunding | | ||||||||||||
| 5,000,000 | 5.000 | 10/16/14 | 5,386,300 | |||||||||||
| California Infrastructure & Economic Development Bank RB | | ||||||||||||
| 14,250,000 | 0.048 | 04/01/15 | 14,262,397 | |||||||||||
| California State Department of Water Resources Power Supply | | ||||||||||||
| 10,885,000 | 5.000 | 05/01/13 | 11,185,208 | |||||||||||
| 8,000,000 | 5.000 | 05/01/14 | 8,590,080 | |||||||||||
| 15,585,000 | 4.000 | 05/01/16 | 17,498,994 | |||||||||||
| California State Economic Recovery GO Bonds Refunding | | ||||||||||||
| 40,940,000 | 5.000 | 07/01/14 | 43,935,170 | |||||||||||
| California State Economic Recovery GO Bonds Series 2004 A | | ||||||||||||
| 255,000 | 5.250 | 07/01/14 | 276,945 | |||||||||||
|
| |||||||||||||
Principal Amount | Interest Rate | Maturity Date | Value | |||||||||||
| State-Specific Municipal Debt Obligations – (continued) | ||||||||||||||
| California – (continued) |
| ||||||||||||
| California State Economic Recovery GO Bonds Series 2004 A | | ||||||||||||
| $ | 2,650,000 | 5.250 | % | 07/01/14 | $ | 2,876,575 | ||||||||
| California State Economic Recovery GO Bonds Unrefunded | | ||||||||||||
| 890,000 | 5.250 | 07/01/14 | 966,095 | |||||||||||
| California State GO Bonds Refunding Series 2005 (A-/A1) |
| ||||||||||||
| 3,000,000 | 5.000 | 05/01/14 | 3,208,440 | |||||||||||
| California State GO Bonds Series 1993 (FGIC-TCRS) (A-/A1) |
| ||||||||||||
| 4,150,000 | 4.750 | 09/01/23 | 4,195,692 | |||||||||||
| California State GO Bonds Series 2004 (A-/A1) |
| ||||||||||||
| 2,000,000 | 4.125 | 04/01/13 | 2,038,180 | |||||||||||
| California State Public Works Board Lease RB for Department of | | ||||||||||||
| 4,185,000 | 5.250 | 06/01/14 | 4,494,523 | |||||||||||
| California State Public Works Board Lease RB for Various | | ||||||||||||
| 11,685,000 | 2.000 | 12/01/14 | 11,906,431 | |||||||||||
| California State Revenue Anticipation Notes Series 2012 A-2 | | ||||||||||||
| 20,000,000 | 2.500 | 06/20/13 | 20,318,000 | |||||||||||
| California State Various Purpose GO Bonds Refunding | | ||||||||||||
| 2,405,000 | 5.000 | 09/01/18 | 2,905,120 | |||||||||||
| California State Various Purpose GO Bonds Series 2005 (A-/A1) |
| ||||||||||||
| 3,850,000 | 5.000 | 03/01/13 | 3,925,075 | |||||||||||
| California State Various Purpose GO Bonds Series 2006 (A-/A1) |
| ||||||||||||
| 2,500,000 | 5.000 | 03/01/14 | 2,655,775 | |||||||||||
| California State Various Purpose GO Bonds Series 2012 | | ||||||||||||
| 6,000,000 | 5.000 | 09/01/19 | 7,312,080 | |||||||||||
| California Statewide Communities Development Authority RB | | ||||||||||||
| 15,775,000 | 4.000 | 06/15/13 | 16,183,888 | |||||||||||
| 41,405,000 | 5.000 | 06/15/13 | 42,767,639 | |||||||||||
| California Statewide Communities Development Authority RB | | ||||||||||||
| 5,000,000 | 5.000 | 04/01/14 | 5,319,850 | |||||||||||
| Carson Redevelopment Agency Project Area No. 1 Tax | | ||||||||||||
| 275,000 | 5.500 | 10/01/15 | 297,171 | |||||||||||
| Carson Redevelopment Agency Tax Allocation Refunding | | ||||||||||||
| 100,000 | 4.000 | 10/01/12 | 100,000 | |||||||||||
| Cerritos Public Financing Authority Tax Allocation | | ||||||||||||
| 1,275,000 | 5.000 | 11/01/14 | 1,340,446 | |||||||||||
| Colton Public Financing Authority Tax Allocation Series 1998 A | | ||||||||||||
| 125,000 | 5.000 | 08/01/18 | 125,035 | |||||||||||
| Corona Redevelopment Agency Tax Allocation Refunding for | | ||||||||||||
| 500,000 | 5.000 | 09/01/16 | 517,390 | |||||||||||
|
| |||||||||||||
| The accompanying notes are an integral part of these financial statements. | 53 |
GOLDMAN SACHS SHORT DURATION TAX-FREE FUND
Schedule of Investments (continued)
September 30, 2012 (Unaudited)
| Principal Amount | Interest Rate | Maturity Date | Value | |||||||||||
| State-Specific Municipal Debt Obligations – (continued) | ||||||||||||||
| California – (continued) |
| ||||||||||||
| El Cajon Redevelopment Agency Tax Allocation Refunding | | ||||||||||||
| $ | 100,000 | 4.000 | % | 10/01/12 | $ | 100,000 | ||||||||
| 30,000 | 4.000 | 10/01/18 | 30,670 | |||||||||||
| El Monte City School District GO Bonds BANS for Capital | | ||||||||||||
| 13,300,000 | 0.000 | 09/01/15 | 12,508,118 | |||||||||||
| Emeryville Public Financing Authority Redevelopment | | ||||||||||||
| 150,000 | 4.800 | 09/01/15 | 150,189 | |||||||||||
| Fairfield-Suisun Unified School District Public Financing | | ||||||||||||
| 250,000 | 5.000 | 08/15/14 | 261,275 | |||||||||||
| Fontana Public Financing Authority Tax Allocation Revenue for | | ||||||||||||
| 750,000 | 5.500 | 09/01/13 | 752,693 | |||||||||||
| Fontana Redevelopment Agency Tax Allocation Refunding for | | ||||||||||||
| 880,000 | 5.500 | 10/01/17 | 880,889 | |||||||||||
| Fullerton City Public Financing Authority Tax Allocation RB | | ||||||||||||
| 325,000 | 4.500 | 09/01/14 | 339,407 | |||||||||||
| Glendale Redevelopment Agency Tax Allocation for Central | | ||||||||||||
| 25,000 | 4.000 | 12/01/12 | 25,078 | |||||||||||
| Golden State Tobacco Securitization Corp. California Tobacco | | ||||||||||||
| 2,000,000 | 6.750 | 06/01/13 | 2,086,360 | |||||||||||
| Golden State Tobacco Securitization Corp. California Tobacco | | ||||||||||||
| 18,670,000 | 4.500 | 06/01/27 | 16,293,682 | |||||||||||
| Golden State Tobacco Securitization Corp. California Tobacco | | ||||||||||||
| 7,000,000 | 5.500 | 06/01/13 | 7,244,510 | |||||||||||
| Golden State Tobacco Securitization Corp. California Tobacco | | ||||||||||||
| 5,000,000 | 5.000 | 06/01/13 | 5,158,150 | |||||||||||
| Golden State Tobacco Securitization Corp. California Tobacco | | ||||||||||||
| 550,000 | 5.000 | 06/01/14 | 584,265 | |||||||||||
| Irvine City Limited Obligation Improvement Bond Reassessment | | ||||||||||||
| 1,215,000 | 4.000 | 09/02/17 | 1,343,170 | |||||||||||
| 1,250,000 | 4.000 | 09/02/18 | 1,397,650 | |||||||||||
| 1,900,000 | 4.000 | 09/02/19 | 2,093,857 | |||||||||||
|
| |||||||||||||
| Principal Amount | Interest Rate | Maturity Date | Value | |||||||||||
| State-Specific Municipal Debt Obligations – (continued) | ||||||||||||||
| California – (continued) |
| ||||||||||||
| Irvine City Limited Obligation Improvement Bond Series 2011 | | ||||||||||||
| $ | 225,000 | 3.000 | % | 09/02/13 | $ | 229,871 | ||||||||
| 300,000 | 3.000 | 09/02/14 | 311,343 | |||||||||||
| 300,000 | 3.000 | 09/02/15 | 310,995 | |||||||||||
| 500,000 | 3.000 | 09/02/16 | 517,495 | |||||||||||
| 400,000 | 3.250 | 09/02/17 | 413,808 | |||||||||||
| 750,000 | 3.625 | 09/02/18 | 775,733 | |||||||||||
| Irvine Public Facilities & Infrastructure Authority Assessment RB | | ||||||||||||
| 1,070,000 | 2.000 | 09/02/13 | 1,077,169 | |||||||||||
| 635,000 | 3.000 | 09/02/15 | 655,619 | |||||||||||
| 1,285,000 | 3.000 | 09/02/16 | 1,327,726 | |||||||||||
| 1,325,000 | 3.000 | 09/02/17 | 1,359,768 | |||||||||||
| 600,000 | 3.000 | 09/02/18 | 608,784 | |||||||||||
| Lake Elsinore School Financing Authority RB Refunding | | ||||||||||||
| 3,435,000 | 2.000 | 09/01/13 | 3,461,072 | |||||||||||
| 3,180,000 | 2.000 | 09/01/14 | 3,197,840 | |||||||||||
| 1,370,000 | 2.000 | 09/01/15 | 1,368,068 | |||||||||||
| Los Alamitos Unified School District GO Bonds for School | | ||||||||||||
| 1,750,000 | 0.000 | 09/01/16 | 1,633,450 | |||||||||||
| Los Angeles Community Redevelopment Agency Tax Allocation | | ||||||||||||
| 540,000 | 5.500 | 07/01/17 | 583,616 | |||||||||||
| Los Angeles County Metropolitan Transportation Authority Sales | | ||||||||||||
| 10,000,000 | 5.000 | 07/01/17 | 11,977,200 | |||||||||||
| Los Angeles County Metropolitan Transportation Authority Sales | | ||||||||||||
| 2,385,000 | 4.000 | 07/01/13 | 2,451,661 | |||||||||||
| Los Angeles County Schools Pooled Financing Program Tax and | | ||||||||||||
| 11,275,000 | 2.000 | 01/31/13 | 11,332,390 | |||||||||||
| Los Angeles Unified School District GO Bonds Refunding | | ||||||||||||
| 3,080,000 | 3.000 | 07/01/13 | 3,143,664 | |||||||||||
| 3,735,000 | 3.000 | 07/01/14 | 3,908,976 | |||||||||||
| Los Angeles Unified School District GO Bonds Series 2003 A | | ||||||||||||
| 2,000,000 | 5.000 | 07/01/13 | 2,071,060 | |||||||||||
| Los Angeles Unified School District GO Bonds Series 2006 F | | ||||||||||||
| 1,805,000 | 5.000 | 07/01/17 | 2,097,157 | |||||||||||
| Metropolitan Water District of Southern California Water RB | | ||||||||||||
| 24,640,000 | 0.530 | 05/01/15 | 24,650,102 | |||||||||||
| Milpitas California Redevelopment Agency Tax Allocation for | | ||||||||||||
| 1,300,000 | 5.250 | 09/01/17 | 1,351,311 | |||||||||||
|
| |||||||||||||
| 54 | The accompanying notes are an integral part of these financial statements. |
GOLDMAN SACHS SHORT DURATION TAX-FREE FUND
| Principal Amount | Interest Rate | Maturity Date | Value | |||||||||||
| State-Specific Municipal Debt Obligations – (continued) | ||||||||||||||
| California – (continued) |
| ||||||||||||
| Miramar Ranch North California Special Tax Refunding for | | ||||||||||||
| $ | 1,230,000 | 3.000 | % | 09/01/14 | $ | 1,279,298 | ||||||||
| 1,000,000 | 3.000 | 09/01/16 | 1,060,680 | |||||||||||
| 1,895,000 | 4.000 | 09/01/17 | 2,101,385 | |||||||||||
| 3,080,000 | 4.000 | 09/01/19 | 3,433,584 | |||||||||||
| Modesto Irrigation District RB for Electric System Series 2011 A | | ||||||||||||
| 1,000,000 | 5.000 | 07/01/17 | 1,172,710 | |||||||||||
| Moreno Valley Unified School District Tax and Revenue | | ||||||||||||
| 6,000,000 | 2.500 | 10/01/12 | 6,000,900 | |||||||||||
| Mountain View California Shoreline Regional Park Community | | ||||||||||||
| 125,000 | 4.000 | 08/01/14 | 130,658 | |||||||||||
| 570,000 | 4.000 | 08/01/15 | 601,179 | |||||||||||
| 300,000 | 4.000 | 08/01/16 | 320,055 | |||||||||||
| 225,000 | 4.000 | 08/01/17 | 241,312 | |||||||||||
| 350,000 | 5.000 | 08/01/18 | 393,932 | |||||||||||
| Murrieta Public Financing Authority Special Tax RB Refunding | | ||||||||||||
| 1,965,000 | 5.000 | 09/01/18 | 2,237,978 | |||||||||||
| 1,000,000 | 5.000 | 09/01/19 | 1,142,070 | |||||||||||
| Natomas Unified School District GO Bonds Refunding | | ||||||||||||
| 590,000 | 3.000 | 09/01/14 | 610,455 | |||||||||||
| 620,000 | 3.000 | 09/01/15 | 649,649 | |||||||||||
| 890,000 | 3.000 | 09/01/16 | 936,707 | |||||||||||
| Northern California Power Agency Capital Facilities RB | | ||||||||||||
| 1,790,000 | 3.000 | 08/01/13 | 1,822,864 | |||||||||||
| 1,235,000 | 4.000 | 08/01/14 | 1,295,935 | |||||||||||
| 1,705,000 | 3.000 | 08/01/15 | 1,776,968 | |||||||||||
| Oakland Redevelopment Agency Senior Tax Allocation | | ||||||||||||
| 220,000 | 5.500 | 02/01/14 | 227,102 | |||||||||||
| Oakland Redevelopment Agency Subordinated Tax Allocation for | | ||||||||||||
| 300,000 | 5.500 | 09/01/18 | 304,245 | |||||||||||
| Ontario Redevelopment Financing Authority RB for Center City | | ||||||||||||
| 500,000 | 5.250 | 08/01/14 | 501,225 | |||||||||||
| Oxnard Community Development Commission Tax Allocation | | ||||||||||||
| 120,000 | 5.000 | 09/01/16 | 136,091 | |||||||||||
| Palm Desert Financing Authority RB Tax Allocation for Project | | ||||||||||||
| 700,000 | 5.250 | 04/01/20 | 732,690 | |||||||||||
| Palm Desert Financing Authority Tax Allocation RB Refunding | | ||||||||||||
| 100,000 | 5.000 | 10/01/20 | 105,133 | |||||||||||
|
| |||||||||||||
| Principal Amount | Interest Rate | Maturity Date | Value | |||||||||||
| State-Specific Municipal Debt Obligations – (continued) | ||||||||||||||
| California – (continued) |
| ||||||||||||
| Palo Alto Limited Obligation Refunding & Improvement for | | ||||||||||||
| $ | 385,000 | 3.000 | % | 09/02/18 | $ | 396,373 | ||||||||
| Pinole Redevelopment Agency Tax Allocation for Vista | | ||||||||||||
| 100,000 | 4.500 | 08/01/18 | 100,108 | |||||||||||
| Pittsburgh Redevelopment Agency Tax Allocation for Los | | ||||||||||||
| 240,000 | 5.600 | 08/01/14 | 242,383 | |||||||||||
| Pittsburgh Redevelopment Agency Tax Allocation for Los | | ||||||||||||
| 500,000 | 5.000 | 08/01/16 | 509,335 | |||||||||||
| Pittsburgh Redevelopment Agency Tax Allocation Refunding for | | ||||||||||||
| 1,000,000 | 5.250 | 08/01/13 | 1,015,090 | |||||||||||
| Port of Oakland RB Refunding Intermediate Lien Series 2007 B | | ||||||||||||
| 400,000 | 5.000 | 11/01/15 | 444,504 | |||||||||||
| Poway Redevelopment Agency Tax Allocation for Paguay | | ||||||||||||
| 1,845,000 | 5.250 | 06/15/18 | 1,880,313 | |||||||||||
| Rancho Cucamonga Redevelopment Agency Set Aside Allocation | | ||||||||||||
| 150,000 | 5.500 | 09/01/17 | 164,061 | |||||||||||
| Richmond California Wastewater RB Refunding Series 2006 A | | ||||||||||||
| 255,000 | 5.000 | 08/01/14 | 272,462 | |||||||||||
| Roseville Finance Authority Special Tax Revenue Refunding | | ||||||||||||
| 1,855,000 | 3.000 | 09/01/17 | 1,954,688 | |||||||||||
| Sacramento County Sanitation District Financing Authority RB | | ||||||||||||
| 2,250,000 | 0.810 | 12/01/35 | 1,665,360 | |||||||||||
| Salida Area Public Facilities Financing Agency Community | | ||||||||||||
| 445,000 | 3.000 | 09/01/13 | 452,561 | |||||||||||
| 465,000 | 3.000 | 09/01/14 | 475,783 | |||||||||||
| 715,000 | 3.000 | 09/01/15 | 732,260 | |||||||||||
| 1,470,000 | 3.000 | 09/01/16 | 1,517,731 | |||||||||||
| 1,515,000 | 3.000 | 09/01/17 | 1,556,148 | |||||||||||
| 1,310,000 | 3.000 | 09/01/18 | 1,332,034 | |||||||||||
| San Bernardino Joint Powers Financing Authority Tax Allocation | | ||||||||||||
| 550,000 | 5.750 | 10/01/12 | 550,000 | |||||||||||
| 500,000 | 5.750 | 10/01/13 | 515,215 | |||||||||||
| San Diego Public Facilities Financing Authority RB Refunding | | ||||||||||||
| 1,000,000 | 5.000 | 05/15/13 | 1,029,180 | |||||||||||
|
| |||||||||||||
| The accompanying notes are an integral part of these financial statements. | 55 |
GOLDMAN SACHS SHORT DURATION TAX-FREE FUND
Schedule of Investments (continued)
September 30, 2012 (Unaudited)
| Principal Amount | Interest Rate | Maturity Date | Value | |||||||||||
| State-Specific Municipal Debt Obligations – (continued) | ||||||||||||||
| California – (continued) |
| ||||||||||||
| San Diego Redevelopment Agency Tax Allocation for Centre | | ||||||||||||
| $ | 655,000 | 5.000 | % | 09/01/13 | $ | 672,220 | ||||||||
| 1,450,000 | 5.250 | 09/01/21 | 1,572,859 | |||||||||||
| 665,000 | 5.250 | 09/01/23 | 715,227 | |||||||||||
| San Diego Redevelopment Agency Tax Allocation for Centre | | ||||||||||||
| 115,000 | 5.250 | 09/01/15 | 121,239 | |||||||||||
| 150,000 | 5.250 | 09/01/16 | 157,705 | |||||||||||
| 300,000 | 5.000 | 09/01/17 | 313,104 | |||||||||||
| San Francisco City & County Airport Commission San Francisco | | ||||||||||||
| 4,455,000 | 5.000 | 05/01/17 | 5,211,192 | |||||||||||
| San Francisco City & County GO Bonds for Clean & Safe | | ||||||||||||
| 2,750,000 | 4.000 | 06/15/19 | 3,261,747 | |||||||||||
| San Francisco City & County GO Bonds Refunding | | ||||||||||||
| 22,215,000 | 5.000 | 06/15/13 | 22,958,758 | |||||||||||
| San Francisco City & County Redevelopment Agency Tax | | ||||||||||||
| 250,000 | 4.500 | 08/01/13 | 253,362 | |||||||||||
| 200,000 | 5.000 | 08/01/14 | 207,272 | |||||||||||
| San Francisco City & County Redevelopment Financing | | ||||||||||||
| 250,000 | 5.250 | 08/01/17 | 256,778 | |||||||||||
| San Francisco City & County Redevelopment Financing | | ||||||||||||
| 1,150,000 | 5.000 | 08/01/14 | 1,209,673 | |||||||||||
| San Jacinto Redevelopment Agency Tax Allocation for | | ||||||||||||
| 160,000 | 3.900 | 08/01/17 | 164,739 | |||||||||||
| San Luis & Delta-Mendota Water Authority RB for DHCCP | | ||||||||||||
| 3,000,000 | 4.500 | 03/01/14 | 3,130,320 | |||||||||||
| San Marcos Public Financing Authority Special Tax RB | | ||||||||||||
| 1,000,000 | 1.000 | 09/01/13 | 1,003,170 | |||||||||||
| 1,050,000 | 1.500 | 09/01/14 | 1,052,961 | |||||||||||
| 930,000 | 1.750 | 09/01/15 | 931,051 | |||||||||||
| 620,000 | 2.000 | 09/01/16 | 619,299 | |||||||||||
| 1,260,000 | 2.250 | 09/01/17 | 1,257,077 | |||||||||||
| 1,000,000 | 4.000 | 09/01/19 | 1,076,860 | |||||||||||
| San Mateo Union High School District GO BANS Series 2012 | | ||||||||||||
| 5,000,000 | 0.000 | 02/15/15 | 4,900,650 | |||||||||||
| San Mateo Union High School District GO Bond Anticipation | | ||||||||||||
| 4,500,000 | 0.000 | 02/15/15 | 4,410,585 | |||||||||||
| Seaside City Redevelopment Agency Tax Allocation RB for | | ||||||||||||
| 100,000 | 4.250 | 08/01/13 | 101,381 | |||||||||||
|
| |||||||||||||
| Principal Amount | Interest Rate | Maturity Date | Value | |||||||||||
| State-Specific Municipal Debt Obligations – (continued) | ||||||||||||||
| California – (continued) |
| ||||||||||||
| Simi Valley Community Development Agency Tax Allocation | | ||||||||||||
| $ | 600,000 | 5.250 | % | 09/01/18 | $ | 619,002 | ||||||||
| Stockton Public Financing Authority Special Assessment | | ||||||||||||
| 65,000 | 4.375 | 09/02/14 | 65,478 | |||||||||||
| Temecula Public Financing Authority for Wolf Creek Community | | ||||||||||||
| 780,000 | 2.000 | 09/01/13 | 787,269 | |||||||||||
| 585,000 | 2.000 | 09/01/14 | 590,821 | |||||||||||
| 830,000 | 2.000 | 09/01/15 | 834,208 | |||||||||||
| 825,000 | 3.000 | 09/01/16 | 852,885 | |||||||||||
| 600,000 | 3.000 | 09/01/17 | 615,732 | |||||||||||
| Tobacco Securitization Authority of Northern California Tobacco | | ||||||||||||
| 1,570,000 | 4.750 | 06/01/23 | 1,496,555 | |||||||||||
|
| |||||||||||||
| 516,485,820 | ||||||||||||||
|
| |||||||||||||
| Colorado – 0.1% |
| ||||||||||||
| Denver Colorado Airport System RB Series 2009 A (A+/A1) |
| ||||||||||||
| 750,000 | 5.000 | 11/15/12 | 754,132 | |||||||||||
| E-470 Public Highway Authority RB Senior Series 1997 A | | ||||||||||||
| 4,125,000 | 5.750 | 09/01/13 | 4,298,374 | |||||||||||
|
| |||||||||||||
| 5,052,506 | ||||||||||||||
|
| |||||||||||||
| Connecticut – 1.9% |
| ||||||||||||
| Connecticut State GO Bonds for Economic Recovery | | ||||||||||||
| 10,000,000 | 5.000 | 01/01/13 | 10,117,000 | |||||||||||
| Connecticut State GO Bonds Refunding Series 2004 B | | ||||||||||||
| 4,325,000 | 5.000 | 12/01/13 | 4,560,929 | |||||||||||
| Connecticut State GO Bonds Refunding Series 2006 E (AA/Aa3) |
| ||||||||||||
| 5,250,000 | 5.000 | 12/15/17 | 6,218,625 | |||||||||||
| Connecticut State Health & Educational Facilities Authority RB | | ||||||||||||
| 1,000,000 | 4.000 | 07/01/14 | 1,050,490 | |||||||||||
| 1,695,000 | 4.000 | 07/01/15 | 1,806,599 | |||||||||||
| 1,830,000 | 4.000 | 07/01/16 | 1,982,713 | |||||||||||
| 1,000,000 | 2.000 | 07/01/17 | 1,004,050 | |||||||||||
| 1,260,000 | 4.000 | 07/01/18 | 1,386,013 | |||||||||||
| Connecticut State Health & Educational Facilities Authority RB | | ||||||||||||
| 19,345,000 | 5.000 | 02/12/15 | 21,364,037 | |||||||||||
| New Haven GO Bonds Refunding Series 2012 A (A-/A1) |
| ||||||||||||
| 4,090,000 | 5.000 | 11/01/16 | 4,676,833 | |||||||||||
| Trumbull GO Bonds Series 2012 (AA/Aa2) |
| ||||||||||||
| 1,070,000 | 2.000 | 09/01/14 | 1,102,977 | |||||||||||
| 820,000 | 2.000 | 09/01/15 | 853,317 | |||||||||||
| 1,070,000 | 2.000 | 09/01/16 | 1,123,992 | |||||||||||
|
| |||||||||||||
| 56 | The accompanying notes are an integral part of these financial statements. |
GOLDMAN SACHS SHORT DURATION TAX-FREE FUND
| Principal Amount | Interest Rate | Maturity Date | Value | |||||||||||
| State-Specific Municipal Debt Obligations – (continued) | ||||||||||||||
| Connecticut – (continued) |
| ||||||||||||
| University of Connecticut GO Bonds Refunding Series 2011 A | | ||||||||||||
| $ | 2,415,000 | 5.000 | % | 02/15/15 | $ | 2,667,923 | ||||||||
| 4,730,000 | 4.000 | 02/15/16 | 5,258,483 | |||||||||||
| West Haven GO Refunding Bonds Series 2012 (AGM) (AA-/Aa3) |
| ||||||||||||
| 555,000 | 3.000 | 08/01/15 | 569,558 | |||||||||||
| 2,000,000 | 4.000 | 08/01/17 | 2,153,520 | |||||||||||
| 2,100,000 | 4.000 | 08/01/18 | 2,276,904 | |||||||||||
| West Haven GO Refunding Bonds Series 2012 (BBB/Baa1) |
| ||||||||||||
| 500,000 | 4.000 | 08/01/14 | 519,775 | |||||||||||
|
| |||||||||||||
| 70,693,738 | ||||||||||||||
|
| |||||||||||||
| Delaware – 0.1% |
| ||||||||||||
| Delaware Municipal Electric Corp. RB Series 2011 (A/A2) |
| ||||||||||||
| 1,215,000 | 4.000 | 07/01/15 | 1,305,190 | |||||||||||
| Sussex County Delaware GO Bonds Refunding Series 2012 A | | ||||||||||||
| 865,000 | 3.000 | 09/15/17 | 954,519 | |||||||||||
| Sussex County Delaware GO Bonds Refunding Series 2012 B | | ||||||||||||
| 1,435,000 | 4.000 | 09/15/17 | 1,652,890 | |||||||||||
|
| |||||||||||||
| 3,912,599 | ||||||||||||||
|
| |||||||||||||
| District of Columbia – 0.1% |
| ||||||||||||
| District of Columbia GO Bonds Series 2004 A (AGM) | | ||||||||||||
| 3,000,000 | 5.000 | 06/01/15 | 3,364,920 | |||||||||||
|
| |||||||||||||
| Florida – 5.8% |
| ||||||||||||
| Alachua County Health Facilities Authority RB for Shands | | ||||||||||||
| 920,000 | 3.000 | 12/01/12 | 922,401 | |||||||||||
| Century Parc Community Development District Special | | ||||||||||||
| 170,000 | 1.500 | 11/01/13 | 170,435 | |||||||||||
| 175,000 | 2.125 | 11/01/14 | 176,118 | |||||||||||
| 175,000 | 2.250 | 11/01/15 | 176,246 | |||||||||||
| 180,000 | 2.500 | 11/01/16 | 181,672 | |||||||||||
| 185,000 | 2.750 | 11/01/17 | 187,633 | |||||||||||
| 190,000 | 3.000 | 11/01/18 | 192,639 | |||||||||||
| 195,000 | 3.250 | 11/01/19 | 198,709 | |||||||||||
| Citizens Property Insurance Corp. Senior Secured RB for High- | | ||||||||||||
| 2,000,000 | 5.000 | 06/01/13 | 2,059,860 | |||||||||||
| 7,500,000 | 5.000 | 06/01/14 | 8,001,900 | |||||||||||
| 2,800,000 | 5.000 | 06/01/15 | 3,063,116 | |||||||||||
| Citizens Property Insurance Corp. Senior Secured RB Refunding | | ||||||||||||
| 4,515,000 | 5.000 | 03/01/13 | 4,599,656 | |||||||||||
| CityPlace Community Development District Special Assessment | | ||||||||||||
| 500,000 | 5.000 | 05/01/13 | 511,580 | |||||||||||
| 885,000 | 5.000 | 05/01/15 | 963,491 | |||||||||||
| 615,000 | 5.000 | 05/01/17 | 694,741 | |||||||||||
| 1,375,000 | 5.000 | 05/01/18 | 1,566,730 | |||||||||||
| 1,890,000 | 5.000 | 05/01/19 | 2,163,823 | |||||||||||
|
| |||||||||||||
| Principal Amount | Interest Rate | Maturity Date | Value | |||||||||||
| State-Specific Municipal Debt Obligations – (continued) | ||||||||||||||
| Florida – (continued) |
| ||||||||||||
| Escambia County Florida Health Facilities Authority Health Care | | ||||||||||||
| $ | 1,980,000 | 5.000 | % | 08/15/13 | $ | 2,054,468 | ||||||||
| 2,240,000 | 5.000 | 08/15/14 | 2,405,267 | |||||||||||
| 2,365,000 | 5.000 | 08/15/15 | 2,607,602 | |||||||||||
| Florida Higher Educational Facilities Financing Authority RB for | | ||||||||||||
| 100,000 | 3.000 | 04/01/14 | 102,658 | |||||||||||
| 150,000 | 4.000 | 04/01/15 | 158,732 | |||||||||||
| 825,000 | 3.000 | 04/01/17 | 853,099 | |||||||||||
| 500,000 | 5.000 | 04/01/18 | 563,800 | |||||||||||
| 500,000 | 5.000 | 04/01/19 | 564,590 | |||||||||||
| Florida Hurricane Catastrophe Fund Finance Corp. RB | | ||||||||||||
| 8,000,000 | 5.000 | 07/01/13 | 8,277,520 | |||||||||||
| Florida Hurricane Catastrophe Fund Finance Corp. RB | | ||||||||||||
| 13,305,000 | 5.000 | 07/01/15 | 14,799,551 | |||||||||||
| Florida State Board of Education GO Bonds for Public Education | | ||||||||||||
| 3,195,000 | 3.000 | 06/01/13 | 3,254,299 | |||||||||||
| Florida State Board of Education GO Bonds Refunding for Public | | ||||||||||||
| 18,055,000 | 5.000 | 06/01/18 | 21,997,851 | |||||||||||
| 7,280,000 | 5.000 | 06/01/19 | 9,003,758 | |||||||||||
| Florida State Department of Transportation Turnpike RB | | ||||||||||||
| 3,650,000 | 5.000 | 07/01/17 | 3,814,432 | |||||||||||
| Florida State Municipal Power Agency RB for St. Lucie Project | | ||||||||||||
| 2,845,000 | 5.000 | 10/01/13 | 2,971,261 | |||||||||||
| 2,985,000 | 5.000 | 10/01/14 | 3,205,413 | |||||||||||
| Florida State Municipal Power Agency RB for Stanton II Project | | ||||||||||||
| 420,000 | 4.000 | 10/01/12 | 420,000 | |||||||||||
| 250,000 | 4.000 | 10/01/14 | 262,790 | |||||||||||
| Florida State Municipal Power Agency RB for Stanton Project | | ||||||||||||
| 885,000 | 4.000 | 10/01/12 | 885,000 | |||||||||||
| 415,000 | 5.000 | 10/01/13 | 433,841 | |||||||||||
| 890,000 | 5.000 | 10/01/14 | 952,256 | |||||||||||
| Florida State Municipal Power Agency RB for Tri-City Project | | ||||||||||||
| 265,000 | 3.000 | 10/01/12 | 265,000 | |||||||||||
| 290,000 | 3.000 | 10/01/13 | 297,126 | |||||||||||
| 290,000 | 3.000 | 10/01/14 | 300,898 | |||||||||||
| Florida State Municipal Power Agency RB Refunding for Stanton | | ||||||||||||
| 1,030,000 | 4.250 | 10/01/12 | 1,030,000 | |||||||||||
| Halifax Hospital Medical Center RB Refunding & Improvement | | ||||||||||||
| 1,255,000 | 5.000 | 06/01/13 | 1,291,796 | |||||||||||
| 855,000 | 5.000 | 06/01/14 | 912,952 | |||||||||||
|
| |||||||||||||
| The accompanying notes are an integral part of these financial statements. | 57 |
GOLDMAN SACHS SHORT DURATION TAX-FREE FUND
Schedule of Investments (continued)
September 30, 2012 (Unaudited)
| Principal Amount | Interest Rate | Maturity Date | Value | |||||||||||
| State-Specific Municipal Debt Obligations – (continued) | ||||||||||||||
| Florida – (continued) |
| ||||||||||||
| Highlands County Florida Health Facilities Authority RB | | ||||||||||||
| $ | 2,000,000 | 5.000 | % | 11/15/13 | $ | 2,097,540 | ||||||||
| 1,000,000 | 5.000 | 11/15/15 | 1,117,520 | |||||||||||
| Hillsborough County Aviation Authority RB for Tampa | | ||||||||||||
| 3,050,000 | 5.000 | 10/01/13 | 3,190,971 | |||||||||||
| Jacksonville Florida Special RB Series 2010 B-1 (AA-/Aa2) |
| ||||||||||||
| 4,415,000 | 5.000 | 10/01/14 | 4,800,474 | |||||||||||
| JEA Florida Electric System RB Refunding Series 2009-3A | | ||||||||||||
| 2,275,000 | 5.000 | 10/01/13 | 2,382,266 | |||||||||||
| JEA Florida Electric System RB Refunding Subseries 2009 C | | ||||||||||||
| 2,000,000 | 5.000 | 10/01/14 | 2,129,180 | |||||||||||
| Lake County School Board COPS for Master Lease Program | | ||||||||||||
| 855,000 | 5.000 | 06/01/14 | 909,729 | |||||||||||
| Lakeland Hospital RB for Lakeland Regional Health System | | ||||||||||||
| 5,020,000 | 5.000 | 11/15/16 | 5,686,556 | |||||||||||
| 6,315,000 | 5.000 | 11/15/17 | 7,275,069 | |||||||||||
| 6,250,000 | 5.000 | 11/15/18 | 7,273,438 | |||||||||||
| Manatee County Florida Public Utilities RB Refunding | | ||||||||||||
| 1,180,000 | 4.000 | 10/01/16 | 1,313,859 | �� | ||||||||||
| Mediterra South Community Development District Capital | | ||||||||||||
| 240,000 | 2.400 | 05/01/13 | 240,463 | |||||||||||
| 250,000 | 2.900 | 05/01/14 | 251,457 | |||||||||||
| 255,000 | 3.100 | 05/01/15 | 257,392 | |||||||||||
| 265,000 | 3.400 | 05/01/16 | 268,387 | |||||||||||
| 275,000 | 3.600 | 05/01/17 | 279,293 | |||||||||||
| 285,000 | 3.800 | 05/01/18 | 290,016 | |||||||||||
| Miami Beach Health Facilities Authority Hospital RB Refunding | | ||||||||||||
| 5,525,000 | 3.000 | 11/15/13 | 5,641,743 | |||||||||||
| 1,750,000 | 4.000 | 11/15/17 | 1,905,155 | |||||||||||
| 2,220,000 | 4.000 | 11/15/18 | 2,405,126 | |||||||||||
| Miami Special Obligation Refunding Series 2011 A (AGM) | | ||||||||||||
| 830,000 | 5.000 | 02/01/17 | 927,600 | |||||||||||
| Miami-Dade County School Board COPS Series 2011 B (A/A1)(c) |
| ||||||||||||
| 3,000,000 | 5.000 | 05/01/16 | 3,307,020 | |||||||||||
| Miami-Dade County School Board COPS Series 2012 A (A/A1)(c) |
| ||||||||||||
| 7,595,000 | 5.000 | 08/01/16 | 8,436,146 | |||||||||||
| Miami-Dade County Water and Sewer System RB Refunding | | ||||||||||||
| 1,500,000 | 5.000 | 10/01/13 | 1,570,875 | |||||||||||
|
| |||||||||||||
| Principal Amount | Interest Rate | Maturity Date | Value | |||||||||||
| State-Specific Municipal Debt Obligations – (continued) | ||||||||||||||
| Florida – (continued) |
| ||||||||||||
| Orlando Florida Community Redevelopment Agency Tax | | ||||||||||||
| $ | 255,000 | 2.000 | % | 04/01/13 | $ | 256,810 | ||||||||
| 300,000 | 3.000 | 04/01/14 | 308,244 | |||||||||||
| 580,000 | 5.000 | 04/01/15 | 629,074 | |||||||||||
| 1,130,000 | 4.000 | 04/01/16 | 1,212,637 | |||||||||||
| 1,180,000 | 5.000 | 04/01/17 | 1,326,568 | |||||||||||
| 1,245,000 | 5.000 | 04/01/18 | 1,414,133 | |||||||||||
| Osceola County School Board COPS for Harter Educational | | ||||||||||||
| 2,495,000 | 5.000 | 06/01/14 | 2,677,035 | |||||||||||
| Palm Beach County School Board COPS Refunding | | ||||||||||||
| 2,085,000 | 5.000 | 08/01/17 | 2,336,201 | |||||||||||
| Palm Beach County School Board COPS Refunding | | ||||||||||||
| 3,000,000 | 5.000 | 08/01/16 | 3,437,340 | |||||||||||
| Polk County Florida RB Refunding for Capital Improvement | | ||||||||||||
| 1,000,000 | 3.000 | 12/01/15 | 1,041,400 | |||||||||||
| Port St. Lucie Florida Utility System RB Series 2003 (NATL-RE) | | ||||||||||||
| 3,650,000 | 0.000 | 09/01/13 | 1,264,324 | |||||||||||
| Sarasota County School Board COPS for Master Lease Program | | ||||||||||||
| 1,000,000 | 3.000 | 07/01/13 | 1,019,230 | |||||||||||
| 1,400,000 | 3.000 | 07/01/14 | 1,459,458 | |||||||||||
| 1,400,000 | 3.000 | 07/01/15 | 1,453,928 | |||||||||||
| South Florida Water Management District Leasing Corp. COPS | | ||||||||||||
| 12,375,000 | 5.000 | 10/01/17 | 14,188,061 | |||||||||||
| South-Dade Venture Community Development District Special | | ||||||||||||
| 280,000 | 2.250 | 05/01/13 | 280,319 | |||||||||||
| 290,000 | 3.000 | 05/01/14 | 291,464 | |||||||||||
| 295,000 | 3.250 | 05/01/15 | 298,275 | |||||||||||
| 305,000 | 3.500 | 05/01/16 | 309,096 | |||||||||||
| 320,000 | 3.750 | 05/01/17 | 325,520 | |||||||||||
| 330,000 | 4.000 | 05/01/18 | 335,940 | |||||||||||
| 345,000 | 4.125 | 05/01/19 | 353,687 | |||||||||||
| 375,000 | 4.375 | 05/01/21 | 384,019 | |||||||||||
| 390,000 | 4.500 | 05/01/22 | 400,374 | |||||||||||
| Tampa Bay Water Utility System RB Refunding for Regulation of | | ||||||||||||
| 5,145,000 | 5.000 | 10/01/13 | 5,388,101 | |||||||||||
| Tampa Tax Allocation RB Refunding Cigarette – H. Lee Moffitt | | ||||||||||||
| 400,000 | 3.000 | 09/01/15 | 421,596 | |||||||||||
| 560,000 | 3.000 | 09/01/16 | 595,963 | |||||||||||
| 425,000 | 4.000 | 09/01/17 | 473,837 | |||||||||||
|
| |||||||||||||
| 58 | The accompanying notes are an integral part of these financial statements. |
GOLDMAN SACHS SHORT DURATION TAX-FREE FUND
| Principal Amount | Interest Rate | Maturity Date | Value | |||||||||||
| State-Specific Municipal Debt Obligations – (continued) | ||||||||||||||
| Florida – (continued) |
| ||||||||||||
| Trails at Monterey Community Development District Special | | ||||||||||||
| $ | 95,000 | 1.750 | % | 05/01/13 | $ | 95,120 | ||||||||
| 95,000 | 2.125 | 05/01/14 | 95,286 | |||||||||||
| 100,000 | 2.250 | 05/01/15 | 100,299 | |||||||||||
| 105,000 | 2.500 | 05/01/16 | 105,428 | |||||||||||
| 105,000 | 2.750 | 05/01/17 | 105,811 | |||||||||||
| 110,000 | 3.000 | 05/01/18 | 110,730 | |||||||||||
| 110,000 | 3.250 | 05/01/19 | 111,169 | |||||||||||
| 115,000 | 3.500 | 05/01/20 | 115,990 | |||||||||||
| 115,000 | 3.750 | 05/01/21 | 115,922 | |||||||||||
| 125,000 | 3.875 | 05/01/22 | 126,044 | |||||||||||
| 125,000 | 4.000 | 05/01/23 | 126,505 | |||||||||||
| 135,000 | 4.125 | 05/01/24 | 136,866 | |||||||||||
| 140,000 | 4.150 | 05/01/25 | 141,876 | |||||||||||
| 145,000 | 4.250 | 05/01/26 | 147,510 | |||||||||||
|
| |||||||||||||
| 218,991,175 | ||||||||||||||
|
| |||||||||||||
| Georgia – 3.6% |
| ||||||||||||
| Albany-Dougherty County Hospital Authority RB for Regional | | ||||||||||||
| 850,000 | 5.700 | 09/01/13 | 853,145 | |||||||||||
| Burke County Development Authority Pollution Control RB for | | ||||||||||||
| 6,000,000 | 1.250 | 05/01/15 | 6,034,980 | |||||||||||
| Carroll City-County Hospital Authority Revenue Anticipation | | ||||||||||||
| 1,530,000 | 4.000 | 07/01/16 | 1,689,334 | |||||||||||
| Chatham County Hospital Authority RB for Hospital Improvement | | ||||||||||||
| 1,400,000 | 5.500 | 01/01/14 | 1,488,354 | |||||||||||
| Clayton County & Clayton County Water Authority Water and | | ||||||||||||
| 1,000,000 | 4.000 | 05/01/13 | 1,021,990 | |||||||||||
| Cobb County Water and Sewer Improvement RB Series 2009 | | ||||||||||||
| 1,025,000 | 5.000 | 07/01/13 | 1,061,736 | |||||||||||
| 1,000,000 | 4.500 | 07/01/14 | 1,073,020 | |||||||||||
| Cobb County-Marietta Water Authority RB Series 2009 | | ||||||||||||
| 1,500,000 | 5.000 | 11/01/13 | 1,576,635 | |||||||||||
| 2,850,000 | 5.000 | 11/01/14 | 3,122,859 | |||||||||||
| DeKalb County School District GO Bonds Series 2007 | | ||||||||||||
| 10,000,000 | 5.000 | 02/01/13 | 10,157,500 | |||||||||||
| DeKalb County Water and Sewerage RB Second Resolution | | ||||||||||||
| 200,000 | 2.000 | 10/01/14 | 204,338 | |||||||||||
| 1,500,000 | 5.000 | 10/01/16 | 1,734,375 | |||||||||||
| Douglas County School District GO Bonds Refunding | | ||||||||||||
| 2,985,000 | 4.000 | 04/01/17 | 3,398,781 | |||||||||||
|
| |||||||||||||
| Principal Amount | Interest Rate | Maturity Date | Value | |||||||||||
| State-Specific Municipal Debt Obligations – (continued) | ||||||||||||||
| Georgia – (continued) |
| ||||||||||||
| East Point Building Authority RB for Water and Sewer Project | | ||||||||||||
| $ | 750,000 | 5.000 | % | 02/01/13 | $ | 757,313 | ||||||||
| Fulton County Development Authority RB Refunding for | | ||||||||||||
| 1,010,000 | 4.000 | 06/01/18 | 1,127,907 | |||||||||||
| Gainesville Georgia School District GO Bonds Series 2011 | | ||||||||||||
| 2,595,000 | 3.000 | 12/01/14 | 2,695,452 | |||||||||||
| 2,500,000 | 4.000 | 12/01/15 | 2,710,775 | |||||||||||
| Georgia State GO Bonds Refunding Series 2005 B (AAA/Aaa) |
| ||||||||||||
| 7,950,000 | 5.000 | 07/01/17 | 8,965,771 | |||||||||||
| Georgia State GO Bonds Refunding Series 2009 E (AAA/Aaa) |
| ||||||||||||
| 2,220,000 | 4.000 | 07/01/13 | 2,283,048 | |||||||||||
| Georgia State GO Bonds Refunding Series 2011 E-2 (AAA/Aaa) |
| ||||||||||||
| 9,325,000 | 4.000 | 09/01/16 | 10,595,252 | |||||||||||
| 11,495,000 | 4.000 | 09/01/17 | 13,365,351 | |||||||||||
| Gwinnett County School District Sales Tax GO Bonds | | ||||||||||||
| 15,765,000 | 4.500 | 10/01/17 | 18,666,233 | |||||||||||
| Henry County School District GO Bonds Series 2012 | | ||||||||||||
| 4,000,000 | 2.000 | 12/01/15 | 4,169,960 | |||||||||||
| Jackson County School District GO Bonds Refunding Series 2012 | | ||||||||||||
| 3,030,000 | 5.000 | 03/01/17 | 3,574,703 | |||||||||||
| 4,215,000 | 5.000 | 03/01/18 | 5,100,867 | |||||||||||
| Marietta Georgia GO Bonds Refunding Series 2009 A (AA+/Aa2) |
| ||||||||||||
| 1,000,000 | 2.500 | 02/01/13 | 1,007,560 | |||||||||||
| 1,000,000 | 5.000 | 02/01/14 | 1,061,820 | |||||||||||
| Municipal Electric Authority RB for Combustion Turbine Project | | ||||||||||||
| 8,260,000 | 5.250 | 11/01/12 | 8,292,627 | |||||||||||
| Municipal Electric Authority RB Subseries 2010 B (A/A2) |
| ||||||||||||
| 2,355,000 | 3.000 | 01/01/13 | 2,369,413 | |||||||||||
| 1,685,000 | 3.000 | 01/01/14 | 1,734,842 | |||||||||||
| Public Gas Partners, Inc. RB Series 2009 A (A+/A2) |
| ||||||||||||
| 6,130,000 | 5.000 | 10/01/15 | 6,845,800 | |||||||||||
| Richmond County Board of Education GO Bonds for Sales Tax | | ||||||||||||
| 2,500,000 | 5.000 | 10/01/16 | 2,931,350 | |||||||||||
| 2,000,000 | 3.000 | 10/01/17 | 2,196,440 | |||||||||||
| Thomas County School District Sales Tax GO Bonds Series 2012 | | ||||||||||||
| 2,655,000 | 4.000 | 03/01/17 | 3,005,221 | |||||||||||
|
| |||||||||||||
| 136,874,752 | ||||||||||||||
|
| |||||||||||||
| Guam – 0.4% |
| ||||||||||||
| Guam Education Financing Foundation COPS for Public School | | ||||||||||||
| 1,030,000 | 5.000 | 10/01/12 | 1,030,000 | |||||||||||
| Guam Government Limited Obligation RB for Section 30 | | ||||||||||||
| 1,000,000 | 5.000 | 12/01/13 | 1,036,470 | |||||||||||
|
| |||||||||||||
| The accompanying notes are an integral part of these financial statements. | 59 |
GOLDMAN SACHS SHORT DURATION TAX-FREE FUND
Schedule of Investments (continued)
September 30, 2012 (Unaudited)
| Principal Amount | Interest Rate | Maturity Date | Value | |||||||||||
| State-Specific Municipal Debt Obligations – (continued) | ||||||||||||||
| Guam – (continued) |
| ||||||||||||
| Guam Power Authority RB Subseries 2010 A (BBB-/Ba1) |
| ||||||||||||
| $ | 11,680,000 | 6.500 | % | 10/01/12 | $ | 11,680,000 | ||||||||
|
| |||||||||||||
| 13,746,470 | ||||||||||||||
|
| |||||||||||||
| Hawaii – 0.3% |
| ||||||||||||
| Hawaii State GO Bonds Refunding Series 2003 DT (AA/Aa2) |
| ||||||||||||
| 4,000,000 | 4.000 | 11/01/14 | 4,299,400 | |||||||||||
| Hawaii State GO Bonds Series 2003 DA (NATL-RE) | | ||||||||||||
| 3,745,000 | 5.250 | 09/01/13 | 3,915,997 | |||||||||||
| Hawaii State Highway RB Series 2011 A (AA+/Aa2) |
| ||||||||||||
| 750,000 | 3.000 | 01/01/14 | 774,562 | |||||||||||
| Honolulu City and County GO Bonds Series 2004 B (NATL-RE) | | ||||||||||||
| 3,600,000 | 5.000 | 07/01/15 | 3,879,684 | |||||||||||
|
| |||||||||||||
| 12,869,643 | ||||||||||||||
|
| |||||||||||||
| Idaho – 0.3% |
| ||||||||||||
| Boise City Independent School District GO Bonds Refunding | | ||||||||||||
| 1,000,000 | 3.000 | 08/01/17 | 1,107,480 | |||||||||||
| 2,085,000 | 4.000 | 08/01/18 | 2,449,854 | |||||||||||
| 6,135,000 | 4.000 | 08/01/19 | 7,248,993 | |||||||||||
|
| |||||||||||||
| 10,806,327 | ||||||||||||||
|
| |||||||||||||
| Illinois – 8.1% |
| ||||||||||||
| Berwyn Illinois GO Bonds Refunding Series 2004 (AMBAC) | | ||||||||||||
| 200,000 | 5.000 | 12/01/12 | 201,038 | |||||||||||
| Chicago Illinois Board of Education GO Bonds Refunding Capital | | ||||||||||||
| 2,500,000 | 0.000 | 12/01/15 | 2,384,650 | |||||||||||
| Chicago Illinois GO Bonds for City Colleges of Chicago Capital | | ||||||||||||
| 2,000,000 | 0.000 | 01/01/14 | 1,969,960 | |||||||||||
| Chicago Illinois GO Bonds Refunding Series 2005 A (AGM) | | ||||||||||||
| 5,000,000 | 5.000 | 01/01/15 | 5,449,750 | |||||||||||
| Chicago Illinois Midway Airport Second Lien RB Series 2010 B | | ||||||||||||
| 3,750,000 | 5.000 | 01/01/15 | 4,048,050 | |||||||||||
| Chicago Illinois O'Hare International Airport RB Series 2008 A | | ||||||||||||
| 6,275,000 | 5.000 | 01/01/15 | 6,756,355 | |||||||||||
| Chicago Illinois Public Building Commission RB Refunding | | ||||||||||||
| 1,000,000 | 5.000 | 03/01/15 | 1,087,540 | |||||||||||
| Chicago Illinois Tax Allocation Junior Lien for Near South | | ||||||||||||
| 1,525,000 | 6.250 | 11/15/13 | 1,529,438 | |||||||||||
| Chicago Illinois Water RB Refunding Second Lien Project | | ||||||||||||
| 500,000 | 4.000 | 11/01/16 | 561,495 | |||||||||||
| 400,000 | 5.000 | 11/01/19 | 490,060 | |||||||||||
| 1,000,000 | 5.000 | 11/01/20 | 1,235,330 | |||||||||||
|
| |||||||||||||
| Principal Amount | Interest Rate | Maturity Date | Value | |||||||||||
| State-Specific Municipal Debt Obligations – (continued) | ||||||||||||||
| Illinois – (continued) |
| ||||||||||||
| Illinois Educational Facilities Authority RB for University of | | ||||||||||||
| $ | 3,000,000 | 3.375 | % | 02/03/14 | $ | 3,122,970 | ||||||||
| Illinois Educational Facilities Authority RB for University of | | ||||||||||||
| 2,000,000 | 1.875 | 02/12/15 | 2,050,600 | |||||||||||
| Illinois Finance Authority Gas Supply RB Refunding for The | | ||||||||||||
| 2,250,000 | 2.125 | 07/01/14 | 2,293,650 | |||||||||||
| Illinois Finance Authority RB for Art Institute of Chicago | | ||||||||||||
| 5,250,000 | 4.000 | 07/01/15 | 5,373,585 | |||||||||||
| Illinois Finance Authority RB for Northwestern University | | ||||||||||||
| 10,500,000 | 1.200 | 03/01/13 | 10,541,370 | |||||||||||
| Illinois Finance Authority RB Refunding for Advocate Health | | ||||||||||||
| 5,110,000 | 3.000 | 04/01/13 | 5,175,306 | |||||||||||
| Illinois Finance Authority RB Refunding for Resurrection Health | | ||||||||||||
| 1,750,000 | 5.000 | 05/15/13 | 1,796,760 | |||||||||||
| 5,000,000 | 5.000 | 05/15/14 | 5,320,700 | |||||||||||
| 4,400,000 | 5.250 | 05/15/15 | 4,834,896 | |||||||||||
| Illinois Health Facilities Authority RB for Advocate Health Care | | ||||||||||||
| 1,610,000 | 4.375 | 07/01/14 | 1,709,498 | |||||||||||
| Illinois State Build Illinois Sales Tax RB Junior Obligation | | ||||||||||||
| 5,050,000 | 5.000 | 06/15/14 | 5,437,739 | |||||||||||
| Illinois State Build Illinois Sales Tax RB Series 2011 (AAA/NR) |
| ||||||||||||
| 2,375,000 | 4.000 | 06/15/17 | 2,695,459 | |||||||||||
| Illinois State GO Bonds First Series 2001 (AGM) (AA-/Aa3) |
| ||||||||||||
| 1,900,000 | 5.500 | 05/01/15 | 2,112,914 | |||||||||||
| Illinois State GO Bonds Refunding Series 2006 (A/A2) |
| ||||||||||||
| 7,750,000 | 5.000 | 01/01/15 | 8,419,910 | |||||||||||
| Illinois State GO Bonds Refunding Series 2009 A (A/A2) |
| ||||||||||||
| 16,000,000 | 4.000 | 09/01/20 | 17,084,000 | |||||||||||
| Illinois State GO Bonds Refunding Series 2010 (A/A2) |
| ||||||||||||
| 5,020,000 | 5.000 | 01/01/17 | 5,710,953 | |||||||||||
| 11,800,000 | 5.000 | 01/01/18 | 13,598,320 | |||||||||||
| 15,890,000 | 5.000 | 01/01/20 | 18,472,442 | |||||||||||
| Illinois State GO Bonds Refunding Series 2010 (AGM) | | ||||||||||||
| 6,725,000 | 5.000 | 01/01/15 | 7,309,470 | |||||||||||
| Illinois State GO Bonds Refunding Series 2012 (A/A2) |
| ||||||||||||
| 16,375,000 | 3.000 | 08/01/13 | 16,707,249 | |||||||||||
| 6,250,000 | 5.000 | 08/01/16 | 7,080,625 | |||||||||||
| 7,025,000 | 5.000 | 08/01/19 | 8,212,084 | |||||||||||
| Illinois State GO Bonds Series 2002 (NATL-RE) (A/A2) |
| ||||||||||||
| 2,710,000 | 5.500 | 08/01/15 | 3,040,241 | |||||||||||
| Illinois State GO Bonds Series 2003 (NATL-RE) (A/A2)(a) |
| ||||||||||||
| 3,200,000 | 5.000 | 06/01/13 | 3,300,768 | |||||||||||
| 5,000,000 | 5.000 | 06/01/13 | 5,157,450 | |||||||||||
| Illinois State GO Bonds Series 2003 A (A/A2) |
| ||||||||||||
| 7,525,000 | 5.000 | 10/01/16 | 7,834,353 | |||||||||||
|
| |||||||||||||
| 60 | The accompanying notes are an integral part of these financial statements. |
GOLDMAN SACHS SHORT DURATION TAX-FREE FUND
| Principal Amount | Interest Rate | Maturity Date | Value | |||||||||||
| State-Specific Municipal Debt Obligations – (continued) | ||||||||||||||
| Illinois – (continued) |
| ||||||||||||
| Illinois State GO Bonds Series 2003 A (NR/NR)(a) |
| ||||||||||||
| $ | 4,235,000 | 5.000 | % | 10/01/13 | $ | 4,433,367 | ||||||||
| Illinois State GO Bonds Series 2007 B (A/A2) |
| ||||||||||||
| 4,000,000 | 4.250 | 01/01/14 | 4,164,880 | |||||||||||
| Illinois State GO Bonds Series 2012 (A/A2) |
| ||||||||||||
| 6,000,000 | 4.000 | 03/01/15 | 6,414,360 | |||||||||||
| Illinois State GO Bonds Series 2012 A (A/A2) |
| ||||||||||||
| 2,000,000 | 4.000 | 01/01/14 | 2,076,280 | |||||||||||
| Illinois Unemployment Insurance Fund Building Receipts RB | | ||||||||||||
| 7,500,000 | 5.000 | 12/15/17 | 8,880,300 | |||||||||||
| Metropolitan Pier & Exposition Authority RB Refunding for | | ||||||||||||
| 3,000,000 | 0.000 | 06/15/15 | 2,843,820 | |||||||||||
| Quad Cities Regional Economic Development Authority RB for | | ||||||||||||
| 840,000 | 3.000 | 10/01/17 | 867,997 | |||||||||||
| Railsplitter Tobacco Settlement Authority Tobacco Settlement RB | | ||||||||||||
| 5,110,000 | 4.000 | 06/01/13 | 5,223,391 | |||||||||||
| 5,030,000 | 5.000 | 06/01/15 | 5,520,727 | |||||||||||
| 11,350,000 | 4.125 | 06/01/16 | 12,394,540 | |||||||||||
| 4,000,000 | 5.000 | 06/01/16 | 4,493,800 | |||||||||||
| 10,000,000 | 5.000 | 06/01/17 | 11,362,000 | |||||||||||
| Regional Transportation Authority Illinois Refunding | | ||||||||||||
| 5,000,000 | 4.000 | 06/01/13 | 5,119,400 | |||||||||||
| 13,420,000 | 5.000 | 06/01/16 | 15,287,661 | |||||||||||
| 13,545,000 | 5.000 | 06/01/17 | 15,857,809 | |||||||||||
|
| |||||||||||||
| 305,047,310 | ||||||||||||||
|
| |||||||||||||
| Indiana – 1.1% |
| ||||||||||||
| Anderson School Building Corp. RB for First Mortgage | | ||||||||||||
| 1,750,000 | 5.000 | 07/15/13 | 1,815,293 | |||||||||||
| Delaware County Indiana Hospital Authority RB Refunding for | | ||||||||||||
| 2,545,000 | 5.000 | 08/01/13 | 2,629,316 | |||||||||||
| 1,085,000 | 5.500 | 08/01/17 | 1,262,159 | |||||||||||
| 4,535,000 | 5.625 | 08/01/18 | 5,396,468 | |||||||||||
| Duneland School Building Corp. RB Refunding for First | | ||||||||||||
| 1,070,000 | 4.000 | 02/01/13 | 1,082,712 | |||||||||||
| Indiana Bond Bank RB for State Revenue Funding Program | | ||||||||||||
| 4,000,000 | 5.000 | 02/01/13 | 4,062,720 | |||||||||||
| Indiana Finance Authority Hospital RB for University Health | | ||||||||||||
| 2,365,000 | 3.000 | 03/01/14 | 2,434,484 | |||||||||||
| 2,000,000 | 4.000 | 03/01/15 | 2,138,600 | |||||||||||
| Indiana Health Facility Financing Authority RB for Ascension | | ||||||||||||
| 4,575,000 | 1.600 | 02/01/17 | 4,607,482 | |||||||||||
|
| |||||||||||||
| Principal Amount | Interest Rate | Maturity Date | Value | |||||||||||
| State-Specific Municipal Debt Obligations – (continued) | ||||||||||||||
| Indiana – (continued) |
| ||||||||||||
| Indiana Health Facility Financing Authority RB for Ascension | | ||||||||||||
| $ | 1,500,000 | 1.700 | % | 09/01/14 | $ | 1,531,590 | ||||||||
| Indiana Health Facility Financing Authority RB for Ascension | | ||||||||||||
| 1,500,000 | 5.000 | 08/01/13 | 1,554,150 | |||||||||||
| Indiana Health Facility Financing Authority RB for Ascension | | ||||||||||||
| 850,000 | 29.010 | 05/01/15 | 1,692,647 | |||||||||||
| Indiana Health Facility Financing Authority RB for Ascension | | ||||||||||||
| 2,950,000 | 1.500 | 08/01/14 | 2,999,265 | |||||||||||
| Indianapolis Thermal Energy System First Lien RB Refunding | | ||||||||||||
| 3,905,000 | 5.000 | 10/01/15 | 4,321,898 | |||||||||||
| Jasper County PCRB Refunding for Northern Indiana Public | | ||||||||||||
| 2,500,000 | 5.200 | 06/01/13 | 2,568,800 | |||||||||||
| Rockport Indiana PCRB Refunding for Michigan Power Co. | | ||||||||||||
| 2,500,000 | 6.250 | 06/02/14 | 2,702,550 | |||||||||||
|
| |||||||||||||
| 42,800,134 | ||||||||||||||
|
| |||||||||||||
| Iowa – 0.1% |
| ||||||||||||
| State University of Iowa Athletic Facilities RB Series 2010 S.U.I. | | ||||||||||||
| 450,000 | 2.500 | 07/01/15 | 470,223 | |||||||||||
| State University of Iowa RB Refunding for University’s Utility | | ||||||||||||
| 1,000,000 | 3.000 | 11/01/12 | 1,002,200 | |||||||||||
| 1,185,000 | 3.000 | 11/01/13 | 1,218,358 | |||||||||||
|
| |||||||||||||
| 2,690,781 | ||||||||||||||
|
| |||||||||||||
| Kansas – 1.4% |
| ||||||||||||
| Kansas Department of Transportation Highway RB Refunding | | ||||||||||||
| 10,000,000 | 0.410 | 09/01/14 | 10,012,700 | |||||||||||
| Kansas Department of Transportation Highway RB Refunding | | ||||||||||||
| 9,000,000 | 0.480 | 09/01/15 | 9,004,410 | |||||||||||
| Kansas Development Finance Authority Hospital RB for | | ||||||||||||
| 1,000,000 | 4.000 | 11/15/12 | 1,004,330 | |||||||||||
| 2,390,000 | 4.000 | 11/15/13 | 2,481,394 | |||||||||||
| Kansas Development Finance Authority Hospital RB for | | ||||||||||||
| 355,000 | 3.500 | 11/15/12 | 356,331 | |||||||||||
| 200,000 | 5.000 | 11/15/13 | 209,870 | |||||||||||
| 225,000 | 5.000 | 11/15/14 | 243,455 | |||||||||||
| Kansas Development Finance Authority RB for Public Water | | ||||||||||||
| 4,455,000 | 5.000 | 04/01/13 | 4,561,296 | |||||||||||
|
| |||||||||||||
| The accompanying notes are an integral part of these financial statements. | 61 |
GOLDMAN SACHS SHORT DURATION TAX-FREE FUND
Schedule of Investments (continued)
September 30, 2012 (Unaudited)
| Principal Amount | Interest Rate | Maturity Date | Value | |||||||||||
| State-Specific Municipal Debt Obligations – (continued) | ||||||||||||||
| Kansas – (continued) |
| ||||||||||||
| Kansas Development Finance Authority RB for University of | | ||||||||||||
| $ | 1,000,000 | 3.000 | % | 11/01/14 | $ | 1,048,210 | ||||||||
| Olathe Health Facilities RB for Medical Center Series 2012 B | | ||||||||||||
| 3,000,000 | 2.000 | 03/01/17 | 3,022,710 | |||||||||||
| Overland Park City Kansas GO Bonds for Internal Improvement | | ||||||||||||
| 2,065,000 | 4.250 | 09/01/13 | 2,141,095 | |||||||||||
| Wichita GO Bonds Temporary Notes Renewal and Improvement | | ||||||||||||
| 15,000,000 | 0.300 | 08/15/13 | 15,000,900 | |||||||||||
| Wyandotte County/Kansas City Unified Government RB for | | ||||||||||||
| 2,340,000 | 3.500 | 09/01/16 | 2,558,158 | |||||||||||
|
| |||||||||||||
| 51,644,859 | ||||||||||||||
|
| |||||||||||||
| Kentucky – 0.5% |
| ||||||||||||
| Kentucky Economic Development Finance Authority RB | | ||||||||||||
| 940,000 | 17.740 | 11/11/14 | 1,243,705 | |||||||||||
| Kentucky State Property and Buildings Refunding Series 2011 A | | ||||||||||||
| 1,325,000 | 5.000 | 08/01/16 | 1,533,820 | |||||||||||
| 5,000,000 | 4.000 | 08/01/17 | 5,684,950 | |||||||||||
| Louisville/Jefferson County Metro Government GO Bonds | | ||||||||||||
| 2,875,000 | 3.000 | 10/01/14 | 3,005,726 | |||||||||||
| Louisville/Jefferson County PCRB for Louisville Gas & Electric | | ||||||||||||
| 5,000,000 | 1.650 | 04/03/17 | 5,035,300 | |||||||||||
| Western Kentucky University RB for General Recipients Series | | ||||||||||||
| 1,080,000 | 3.000 | 09/01/13 | 1,101,222 | |||||||||||
|
| |||||||||||||
| 17,604,723 | ||||||||||||||
|
| |||||||||||||
| Louisiana – 1.8% |
| ||||||||||||
| Baton Rouge Louisiana Public Improvement Sales Tax RB | | ||||||||||||
| 450,000 | 3.000 | 08/01/14 | 466,258 | |||||||||||
| 500,000 | 3.000 | 08/01/15 | 526,520 | |||||||||||
| DeSoto Parish Louisiana PCRB Refunding for International Paper | | ||||||||||||
| 1,240,000 | 5.000 | 10/01/12 | 1,240,000 | |||||||||||
| East Baton Rouge Parish Louisiana RB Refunding for Public | | ||||||||||||
| 4,405,000 | 5.000 | 02/01/14 | 4,719,297 | |||||||||||
| Greater New Orleans Expressway Commission RB Refunding | | ||||||||||||
| 225,000 | 2.750 | 11/01/12 | 225,281 | |||||||||||
| 100,000 | 2.750 | 11/01/13 | 101,752 | |||||||||||
| 205,000 | 2.750 | 11/01/14 | 210,138 | |||||||||||
| Louisiana Citizens Property Insurance Corp. RB Series 2006 B | | ||||||||||||
| 2,700,000 | 5.000 | 06/01/16 | 3,069,495 | |||||||||||
|
| |||||||||||||
| State-Specific Municipal Debt Obligations – (continued) | ||||||||||||||
| Louisiana – (continued) |
| ||||||||||||
| Louisiana Local Government Environmental Facilities & | | ||||||||||||
| $ | 1,250,000 | 3.000 | % | 12/01/16 | $ | 1,341,575 | ||||||||
| Louisiana Local Government Environmental Facilities & | | ||||||||||||
| 370,000 | 3.000 | 04/01/13 | 373,752 | |||||||||||
| Louisiana Local Government Environmental Facilities & | | ||||||||||||
| 1,500,000 | 0.000 | 10/01/15 | 1,430,100 | |||||||||||
| Louisiana Local Government Environmental Facilities & | | ||||||||||||
| 1,315,000 | 3.000 | 08/01/15 | 1,395,346 | |||||||||||
| Louisiana Public Facilities Authority RB for Hurricane Recovery | | ||||||||||||
| 8,250,000 | 5.000 | 06/01/20 | 9,163,357 | |||||||||||
| Louisiana State Gasoline and Fuels Tax RB Second Lien RMKT | | ||||||||||||
| 5,000,000 | 0.930 | 06/01/13 | 5,007,400 | |||||||||||
| Louisiana State Offshore Terminal Authority Deepwater Port RB | | ||||||||||||
| 3,000,000 | 1.375 | 10/01/16 | 3,002,910 | |||||||||||
| Louisiana State Offshore Terminal Authority Deepwater Port RB | | ||||||||||||
| 4,750,000 | 1.875 | 10/01/13 | 4,800,492 | |||||||||||
| Louisiana State Offshore Terminal Authority Deepwater Port RB | | ||||||||||||
| 4,845,000 | 2.100 | 10/01/14 | 4,936,474 | |||||||||||
| Morehouse Parish Louisiana PCRB Refunding for International | | ||||||||||||
| 3,520,000 | 5.250 | 11/15/13 | 3,690,509 | |||||||||||
| New Orleans Audubon Commission for Aquarium Tax Bonds | | ||||||||||||
| 500,000 | 5.000 | 10/01/16 | 559,760 | |||||||||||
| 2,825,000 | 5.000 | 10/01/17 | 3,220,161 | |||||||||||
| New Orleans GO Bonds Refunding Series 2012 (BBB/A3) |
| ||||||||||||
| 1,295,000 | 3.000 | 12/01/14 | 1,350,219 | |||||||||||
| 1,805,000 | 4.000 | 12/01/15 | 1,963,046 | |||||||||||
| 4,145,000 | 4.000 | 12/01/16 | 4,577,323 | |||||||||||
| 4,030,000 | 4.000 | 12/01/17 | 4,498,770 | |||||||||||
| New Orleans Regional Transit Authority Sales Tax RB | | ||||||||||||
| 500,000 | 4.000 | 12/01/15 | 543,295 | |||||||||||
| 610,000 | 4.000 | 12/01/16 | 676,234 | |||||||||||
| St. Tammany Parish Hospital Service District No. 1 RB | | ||||||||||||
| 1,190,000 | 2.000 | 07/01/13 | 1,195,700 | |||||||||||
| 1,390,000 | 2.000 | 07/01/14 | 1,400,717 | |||||||||||
| 1,800,000 | 2.300 | 07/01/15 | 1,827,360 | |||||||||||
|
| |||||||||||||
| 62 | The accompanying notes are an integral part of these financial statements. |
GOLDMAN SACHS SHORT DURATION TAX-FREE FUND
| Principal Amount | Interest Rate | Maturity Date | Value | |||||||||||
| State-Specific Municipal Debt Obligations – (continued) | ||||||||||||||
| Louisiana – (continued) |
| ||||||||||||
| Terrebonne Parish Louisiana Hospital Service District No. 1 RB | | ||||||||||||
| $ | 500,000 | 4.000 | % | 04/01/13 | $ | 506,855 | ||||||||
| 420,000 | 4.000 | 04/01/16 | 451,748 | |||||||||||
| Tobacco Settlement Financing Corp. RB Asset-Backed Bonds | | ||||||||||||
| 115,000 | 5.500 | 05/15/30 | 117,793 | |||||||||||
|
| |||||||||||||
| 68,589,637 | ||||||||||||||
|
| |||||||||||||
| Maine – 0.2% |
| ||||||||||||
| Finance Authority of Maine Solid Waste Disposal RB for Waste | | ||||||||||||
| 3,125,000 | 3.800 | 11/01/15 | 3,409,437 | |||||||||||
| Maine State Housing Authority Mortgage Purchase Bonds | | ||||||||||||
| 2,700,000 | 1.350 | 11/15/14 | 2,713,500 | |||||||||||
| 2,455,000 | 1.700 | 11/15/15 | 2,479,624 | |||||||||||
|
| |||||||||||||
| 8,602,561 | ||||||||||||||
|
| |||||||||||||
| Maryland – 3.6% |
| ||||||||||||
| Anne Arundel County Maryland GO Bonds for Consolidated | | ||||||||||||
| 2,345,000 | 4.000 | 04/01/13 | 2,389,250 | |||||||||||
| Baltimore County Maryland GO Bonds 71st Issue for | | ||||||||||||
| 1,420,000 | 5.000 | 02/01/14 | 1,508,764 | |||||||||||
| Baltimore County Maryland GO Bonds 74th Issue for | | ||||||||||||
| 6,650,000 | 4.000 | 02/01/14 | 6,977,579 | |||||||||||
| 2,500,000 | 4.000 | 02/01/16 | 2,795,450 | |||||||||||
| 9,000,000 | 5.000 | 02/01/17 | 10,697,670 | |||||||||||
| Baltimore County Maryland GO Bonds Refunding for Pension | | ||||||||||||
| 3,575,000 | 5.000 | 08/01/13 | 3,717,142 | |||||||||||
| Calvert County Maryland GO Bonds Refunding Series 2011 | | ||||||||||||
| 1,455,000 | 2.000 | 07/15/14 | 1,498,694 | |||||||||||
| Carroll County Maryland Consolidated Public Improvement and | | ||||||||||||
| 2,075,000 | 5.000 | 11/01/17 | 2,529,757 | |||||||||||
| 3,055,000 | 4.000 | 11/01/18 | 3,631,815 | |||||||||||
| 1,635,000 | 4.000 | 11/01/19 | 1,958,223 | |||||||||||
| Charles County Maryland GO Bonds Refunding Series 2011 (AA/Aa1) |
| ||||||||||||
| 2,365,000 | 4.000 | 11/01/15 | 2,621,319 | |||||||||||
| 1,115,000 | 4.000 | 11/01/16 | 1,271,356 | |||||||||||
| 5,405,000 | 4.000 | 11/01/17 | 6,302,068 | |||||||||||
| Harford County Maryland GO Bonds for Consolidated Public | | ||||||||||||
| 1,170,000 | 2.250 | 07/01/16 | 1,236,011 | |||||||||||
|
| |||||||||||||
| Principal Amount | Interest Rate | Maturity Date | Value | |||||||||||
| State-Specific Municipal Debt Obligations – (continued) | ||||||||||||||
| Maryland – (continued) |
| ||||||||||||
| Maryland State GO Bonds Refunding for State and Local | | ||||||||||||
| $ | 55,465,000 | 4.500 | % | 08/01/18 | $ | 67,127,071 | ||||||||
| Maryland State GO Bonds Refunding Series 2004 (AAA/Aaa) |
| ||||||||||||
| 5,000,000 | 5.000 | 02/01/13 | 5,079,250 | |||||||||||
| Maryland State Health & Higher Educational Facilities Authority | | ||||||||||||
| 2,325,000 | 4.000 | 08/15/15 | 2,516,115 | |||||||||||
| 3,445,000 | 4.000 | 08/15/16 | 3,775,479 | |||||||||||
| Maryland State Transportation Authority Grant and Revenue | | ||||||||||||
| 4,500,000 | 5.250 | 03/01/15 | 5,038,200 | |||||||||||
| Montgomery County Maryland GO Bonds Refunding for | | ||||||||||||
| 5,000,000 | 5.000 | 11/01/13 | 5,256,550 | |||||||||||
|
| |||||||||||||
| 137,927,763 | ||||||||||||||
|
| |||||||||||||
| Massachusetts – 0.6% |
| ||||||||||||
| Massachusetts State Department of Transportation Senior RB for | | ||||||||||||
| 4,000,000 | 5.000 | 01/01/15 | 4,347,640 | |||||||||||
| Massachusetts State Development Finance Agency RB for Boston | | ||||||||||||
| 4,000,000 | 2.875 | 10/01/14 | 4,165,520 | |||||||||||
| Massachusetts State Development Finance Agency RB for | | ||||||||||||
| 400,000 | 5.000 | 07/01/15 | 447,600 | |||||||||||
| 300,000 | 5.000 | 07/01/16 | 345,546 | |||||||||||
| Massachusetts State Development Finance Agency Resource | | ||||||||||||
| 260,000 | 5.625 | 01/01/14 | 261,953 | |||||||||||
| Massachusetts State GO Bonds Consolidated Loan Series 2004 A | | ||||||||||||
| 5,000,000 | 5.000 | 08/01/14 | 5,415,550 | |||||||||||
| Massachusetts State GO Bonds Consolidated Loan Series 2004 D | | ||||||||||||
| 3,475,000 | 5.000 | 12/01/14 | 3,812,249 | |||||||||||
| Massachusetts State GO Bonds Refunding Series 2010 A | | ||||||||||||
| 2,500,000 | 0.710 | 02/01/14 | 2,505,975 | |||||||||||
| Massachusetts State Health & Educational Facilities Authority RB | | ||||||||||||
| 3,005,000 | 1.700 | 11/01/16 | 3,079,133 | |||||||||||
|
| |||||||||||||
| 24,381,166 | ||||||||||||||
|
| |||||||||||||
| Michigan – 2.7% |
| ||||||||||||
| Detroit Michigan Water Supply System RB Senior Lien | | ||||||||||||
| 3,000,000 | 5.000 | 07/01/16 | 3,260,910 | |||||||||||
|
| |||||||||||||
| The accompanying notes are an integral part of these financial statements. | 63 |
GOLDMAN SACHS SHORT DURATION TAX-FREE FUND
Schedule of Investments (continued)
September 30, 2012 (Unaudited)
| Principal Amount | Interest Rate | Maturity Date | Value | |||||||||||
| State-Specific Municipal Debt Obligations – (continued) | ||||||||||||||
| Michigan – (continued) |
| ||||||||||||
| Detroit Michigan Water Supply System RB Senior Lien | | ||||||||||||
| $ | 1,100,000 | 5.000 | % | 07/01/13 | $ | 1,132,450 | ||||||||
| 1,700,000 | 5.000 | 07/01/14 | 1,801,728 | |||||||||||
| 700,000 | 5.000 | 07/01/15 | 757,155 | |||||||||||
| 500,000 | 5.000 | 07/01/16 | 546,460 | |||||||||||
| 1,295,000 | 5.000 | 07/01/17 | 1,433,449 | |||||||||||
| Detroit Wayne County Stadium Authority RB Refunding | | ||||||||||||
| 500,000 | 5.000 | 10/01/14 | 528,780 | |||||||||||
| 1,100,000 | 5.000 | 10/01/18 | 1,224,344 | |||||||||||
| Kent Hospital Finance Authority RB Refunding for Spectrum | | ||||||||||||
| 6,850,000 | 4.250 | 01/15/14 | 7,092,833 | |||||||||||
| Michigan Finance Authority RB for Detroit School District | | ||||||||||||
| 7,500,000 | 5.250 | 06/01/17 | 8,444,100 | |||||||||||
| Michigan Finance Authority RB for Local Government Loan | | ||||||||||||
| 5,185,000 | 4.000 | 11/01/18 | 5,706,974 | |||||||||||
| 5,395,000 | 4.000 | 11/01/19 | 5,905,906 | |||||||||||
| Michigan Finance Authority RB Refunding for Detroit School | | ||||||||||||
| 750,000 | 4.000 | 06/01/14 | 782,145 | |||||||||||
| 1,375,000 | 4.000 | 06/01/17 | 1,472,694 | |||||||||||
| Michigan Finance Authority RB Refunding for Unemployment | | ||||||||||||
| 4,000,000 | 5.000 | 07/01/23 | 4,294,760 | |||||||||||
| Michigan State Building Authority RB Refunding for Facilities | | ||||||||||||
| 7,580,000 | 5.250 | 10/15/14 | 7,945,735 | |||||||||||
| Michigan State GO Bonds Refunding for Environmental Program | | ||||||||||||
| 10,025,000 | 5.000 | 11/01/19 | 11,188,702 | |||||||||||
| Michigan State Hospital Finance Authority RB for Ascension | | ||||||||||||
| 3,875,000 | 2.000 | 08/01/14 | 3,972,030 | |||||||||||
| Michigan State Hospital Finance Authority RB Refunding for | | ||||||||||||
| 3,000,000 | 2.000 | 05/30/18 | 3,105,870 | |||||||||||
| Michigan State Hospital Finance Authority RB Refunding for | | ||||||||||||
| 1,000,000 | 3.000 | 11/15/12 | 1,002,510 | |||||||||||
| Michigan State Strategic Fund Limited Obligation RB Refunding | | ||||||||||||
| 2,500,000 | 5.250 | 08/01/14 | 2,722,025 | |||||||||||
| Michigan State Trunk Line Fund Bonds Series 2011 (AA+/Aa2) |
| ||||||||||||
| 550,000 | 3.000 | 11/15/14 | 580,228 | |||||||||||
| Rochester Community School District GO Refunding Series 2012 | | ||||||||||||
| 875,000 | 4.000 | 05/01/18 | 990,115 | |||||||||||
| 700,000 | 4.000 | 05/01/19 | 793,261 | |||||||||||
|
| |||||||||||||
| State-Specific Municipal Debt Obligations – (continued) | ||||||||||||||
| Michigan – (continued) |
| ||||||||||||
| Royal Oak Hospital Finance Authority RB for William Beaumont | | ||||||||||||
| $ | 2,000,000 | 6.250 | % | 09/01/14 | $ | 2,156,200 | ||||||||
| Wayne County Airport Authority Airport RB Refunding for | | ||||||||||||
| 5,000,000 | 5.000 | 12/01/14 | 5,467,100 | |||||||||||
| 10,000,000 | 5.000 | 12/01/15 | 11,268,200 | |||||||||||
| Wayne County Airport Authority Airport RB Refunding for | | ||||||||||||
| 1,270,000 | 5.000 | 12/01/18 | 1,510,868 | |||||||||||
| 1,385,000 | 5.000 | 12/01/19 | 1,635,574 | |||||||||||
| Wyandotte Electric RB Refunding Series 2009 A | | ||||||||||||
| 3,235,000 | 4.000 | 10/01/12 | 3,235,000 | |||||||||||
|
| |||||||||||||
| 101,958,106 | ||||||||||||||
|
| |||||||||||||
| Minnesota – 1.5% |
| ||||||||||||
| Minneapolis Minnesota Convention Center GO Bonds Refunding | | ||||||||||||
| 7,980,000 | 2.000 | 12/01/17 | 8,551,129 | |||||||||||
| Minneapolis Minnesota Special School District Refunding | | ||||||||||||
| 3,525,000 | 2.000 | 02/01/13 | 3,545,903 | |||||||||||
| 3,520,000 | 2.000 | 02/01/14 | 3,587,901 | |||||||||||
| Minnesota State COPS for Technology System Lease Purchase | | ||||||||||||
| 8,575,000 | 4.000 | 06/01/14 | 9,012,239 | |||||||||||
| Minnesota State Higher Education Facilities Authority RB for | | ||||||||||||
| 1,000,000 | 2.500 | 10/01/13 | 1,014,710 | |||||||||||
| 950,000 | 3.000 | 10/01/14 | 985,701 | |||||||||||
| Minnesota State Trunk Highway GO Bonds Series 2012 B | | ||||||||||||
| 11,700,000 | 5.000 | 08/01/17 | 14,102,595 | |||||||||||
| Minnesota State Various Purpose GO Bonds Series 2009 D | | ||||||||||||
| 9,445,000 | 5.000 | 08/01/13 | 9,817,322 | |||||||||||
| Osseo Independent School District No. 279 GO Bonds Refunding | | ||||||||||||
| 3,820,000 | 3.000 | 02/01/13 | 3,855,411 | |||||||||||
| Watertown Independent School District No. 111 GO Refunding | | ||||||||||||
| 1,620,000 | 3.000 | 02/01/16 | 1,730,727 | |||||||||||
| 1,000,000 | 3.000 | 02/01/17 | 1,084,490 | |||||||||||
|
| |||||||||||||
| 57,288,128 | ||||||||||||||
|
| |||||||||||||
| Mississippi – 0.3% |
| ||||||||||||
| DeSoto County Mississippi GO Bonds Refunding Series 2009 | | ||||||||||||
| 250,000 | 3.000 | 11/01/12 | 250,460 | |||||||||||
| 700,000 | 3.000 | 11/01/13 | 718,018 | |||||||||||
|
| |||||||||||||
| 64 | The accompanying notes are an integral part of these financial statements. |
GOLDMAN SACHS SHORT DURATION TAX-FREE FUND
| Principal Amount | Interest Rate | Maturity Date | Value | |||||||||||
| State-Specific Municipal Debt Obligations – (continued) | ||||||||||||||
| Mississippi – (continued) |
| ||||||||||||
| Greenville Public School District RB Refunding Series 2009 | | ||||||||||||
| $ | 605,000 | 4.000 | % | 08/01/13 | $ | 619,919 | ||||||||
| Mississippi State GO Bonds for Capital Improvement Series 2002 | | ||||||||||||
| 5,000,000 | 5.000 | 11/01/12 | 5,018,550 | |||||||||||
| Ocean Springs School District GO Bonds Series 2009 (AA-/NR) |
| ||||||||||||
| 1,135,000 | 4.000 | 05/01/13 | 1,158,222 | |||||||||||
| University Education Building Corp. RB Refunding | | ||||||||||||
| 1,790,000 | 3.000 | 10/01/13 | 1,824,082 | |||||||||||
|
| |||||||||||||
| 9,589,251 | ||||||||||||||
|
| |||||||||||||
| Missouri – 0.9% |
| ||||||||||||
| Curators University of Missouri System Facilities Unrefunded-RB | | ||||||||||||
| 5,070,000 | 5.000 | 11/01/17 | 5,765,959 | |||||||||||
| Kansas City GO Bonds Refunding & Improvement Series 2012 A | | ||||||||||||
| 5,000,000 | 2.000 | 02/01/15 | 5,179,250 | |||||||||||
| 7,600,000 | 2.000 | 02/01/16 | 7,955,148 | |||||||||||
| Missouri State Board of Public Buildings RB Series 2003 A | | ||||||||||||
| 3,425,000 | 5.000 | 10/15/13 | 3,591,695 | |||||||||||
| Missouri State Board of Public Buildings Special Obligation | | ||||||||||||
| 400,000 | 5.000 | 10/15/14 | 419,296 | |||||||||||
| St. Louis Board of Education GO Bonds Refunding for Missouri | | ||||||||||||
| 2,595,000 | 5.250 | 04/01/16 | 2,896,746 | |||||||||||
| St. Louis Board of Education GO Bonds Refunding for Missouri | | ||||||||||||
| 5,980,000 | 5.000 | 04/01/17 | 6,639,953 | |||||||||||
| St. Louis Missouri Airport Revenue Refunding for Lambert-St. | | ||||||||||||
| 2,000,000 | 5.000 | 07/01/14 | 2,141,940 | |||||||||||
| 1,000,000 | 5.000 | 07/01/15 | 1,106,850 | |||||||||||
|
| |||||||||||||
| 35,696,837 | ||||||||||||||
|
| |||||||||||||
| Montana – 0.3% |
| ||||||||||||
| Montana State Department of Transportation Refunding Grant | | ||||||||||||
| 1,600,000 | 2.000 | 06/01/17 | 1,685,408 | |||||||||||
| 2,000,000 | 3.000 | 06/01/17 | 2,198,020 | |||||||||||
| 1,750,000 | 3.000 | 06/01/18 | 1,930,985 | |||||||||||
| 800,000 | 4.000 | 06/01/18 | 926,504 | |||||||||||
| 1,790,000 | 3.000 | 06/01/19 | 1,975,122 | |||||||||||
| 1,440,000 | 4.000 | 06/01/19 | 1,680,293 | |||||||||||
|
| |||||||||||||
| 10,396,332 | ||||||||||||||
|
| |||||||||||||
| State-Specific Municipal Debt Obligations – (continued) | ||||||||||||||
| Nevada – 1.0% |
| ||||||||||||
| Clark County Improvement District Refunding for Special | | ||||||||||||
| $ | 1,865,000 | 2.000 | % | 08/01/13 | $ | 1,874,157 | ||||||||
| 3,000,000 | 3.000 | 08/01/14 | 3,052,440 | |||||||||||
| 3,195,000 | 3.000 | 08/01/15 | 3,225,193 | |||||||||||
| 3,410,000 | 3.000 | 08/01/16 | 3,422,174 | |||||||||||
| 4,115,000 | 4.000 | 08/01/17 | 4,272,234 | |||||||||||
| Clark County McCarran International Airport RB Refunding for | | ||||||||||||
| 3,000,000 | 5.000 | 07/01/16 | 3,394,920 | |||||||||||
| Clark County School District GO Bonds Refunding Series 2004 A | | ||||||||||||
| 3,000,000 | 5.000 | 06/15/16 | 3,217,590 | |||||||||||
| Clark County School District Limited Tax GO Bonds Refunding | | ||||||||||||
| 3,450,000 | 5.000 | 12/15/13 | 3,644,511 | |||||||||||
| Las Vegas City Limited Tax GO Bonds Medium-Term Various | | ||||||||||||
| 1,000,000 | 2.000 | 12/01/15 | 1,035,150 | |||||||||||
| 2,700,000 | 4.000 | 12/01/16 | 3,023,433 | |||||||||||
| 2,810,000 | 4.000 | 12/01/17 | 3,112,693 | |||||||||||
| Las Vegas Valley Water District GO Bonds Refunding | | ||||||||||||
| 5,000,000 | 5.000 | 06/01/13 | 5,157,450 | |||||||||||
| North Las Vegas Nevada Local Improvement Special Assessment | | ||||||||||||
| 590,000 | 4.700 | 12/01/12 | 591,410 | |||||||||||
| 520,000 | 4.800 | 12/01/14 | 531,643 | |||||||||||
|
| |||||||||||||
| 39,554,998 | ||||||||||||||
|
| |||||||||||||
| New Hampshire – 0.4% |
| ||||||||||||
| Manchester New Hampshire General Airport RB Refunding | | ||||||||||||
| 5,105,000 | 5.000 | 01/01/13 | 5,149,056 | |||||||||||
| 5,240,000 | 5.000 | 01/01/14 | 5,461,862 | |||||||||||
| New Hampshire Health & Education Facilities Authority RB for | | ||||||||||||
| 2,900,000 | 3.250 | 08/01/13 | 2,951,446 | |||||||||||
|
| |||||||||||||
| 13,562,364 | ||||||||||||||
|
| |||||||||||||
| New Jersey – 3.9% |
| ||||||||||||
| Atlantic County Utilities Authority Sewer RB Refunding | | ||||||||||||
| 4,000,000 | 5.000 | 01/15/13 | 4,050,280 | |||||||||||
| Bergen County New Jersey GO Bonds for General Improvement | | ||||||||||||
| 1,730,000 | 2.000 | 12/01/13 | 1,765,275 | |||||||||||
| 1,275,000 | 2.000 | 12/01/14 | 1,316,055 | |||||||||||
| 1,320,000 | 2.000 | 12/01/15 | 1,378,621 | |||||||||||
| 1,725,000 | 2.000 | 12/01/16 | 1,819,720 | |||||||||||
| 2,355,000 | 2.000 | 12/01/17 | 2,487,798 | |||||||||||
| 2,500,000 | 2.000 | 12/01/18 | 2,638,250 | |||||||||||
|
| |||||||||||||
| The accompanying notes are an integral part of these financial statements. | 65 |
GOLDMAN SACHS SHORT DURATION TAX-FREE FUND
Schedule of Investments (continued)
September 30, 2012 (Unaudited)
| Principal Amount | Interest Rate | Maturity Date | Value | |||||||||||
| State-Specific Municipal Debt Obligations – (continued) | ||||||||||||||
| New Jersey – (continued) |
| ||||||||||||
| Brick Township GO Bonds for General Improvements | | ||||||||||||
| $ | 2,140,000 | 2.000 | % | 08/15/16 | $ | 2,249,290 | ||||||||
| Gloucester County New Jersey GO Bonds Refunding Series 2011 | | ||||||||||||
| 325,000 | 2.000 | 10/01/14 | 333,482 | |||||||||||
| 660,000 | 2.000 | 10/01/15 | 682,988 | |||||||||||
| 1,245,000 | 3.000 | 10/01/17 | 1,359,652 | |||||||||||
| Monmouth County GO Bonds Refunding Series 2010 C | | ||||||||||||
| 5,425,000 | 4.000 | 03/01/16 | 6,050,719 | |||||||||||
| Montgomery Township GO Bonds Refunding Series 2012 | | ||||||||||||
| 2,320,000 | 3.000 | 08/01/16 | 2,510,194 | |||||||||||
| New Jersey COPS for Equipment Lease Purchase Agreement | | ||||||||||||
| 2,000,000 | 5.000 | 06/15/13 | 2,055,640 | |||||||||||
| New Jersey Economic Development Authority RB for School | | ||||||||||||
| 2,000,000 | 5.000 | 09/01/14 | 2,151,440 | |||||||||||
| New Jersey Economic Development Authority RB for School | | ||||||||||||
| 2,695,000 | 5.250 | 06/15/13 | 2,789,568 | |||||||||||
| New Jersey Economic Development Authority RB for School | | ||||||||||||
| 3,905,000 | 5.000 | 03/01/15 | 4,337,596 | |||||||||||
| New Jersey Economic Development Authority RB for School | | ||||||||||||
| 3,685,000 | 5.250 | 12/15/14 | 4,034,191 | |||||||||||
| New Jersey Economic Development Authority RB for School | | ||||||||||||
| 5,000,000 | 5.000 | 09/01/15 | 5,561,700 | |||||||||||
| New Jersey Economic Development Authority RB Refunding for | | ||||||||||||
| 1,300,000 | 5.000 | 03/01/13 | 1,325,571 | |||||||||||
| New Jersey Economic Development Authority RB Refunding for | | ||||||||||||
| 7,500,000 | 5.000 | 12/15/16 | 8,727,450 | |||||||||||
| New Jersey Educational Facilities Authority RB for Rider | | ||||||||||||
| 1,240,000 | 5.000 | 07/01/17 | 1,427,563 | |||||||||||
| 1,265,000 | 4.000 | 07/01/18 | 1,399,444 | |||||||||||
| New Jersey Health Care Facilities Financing Authority RB for | | ||||||||||||
| 500,000 | 4.000 | 07/01/13 | 512,755 | |||||||||||
| 1,000,000 | 5.000 | 07/01/14 | 1,072,240 | |||||||||||
| 1,000,000 | 5.000 | 07/01/15 | 1,108,290 | |||||||||||
| 2,000,000 | 5.000 | 07/01/16 | 2,283,740 | |||||||||||
| New Jersey Health Care Facilities Financing Authority RB | | ||||||||||||
| 4,875,000 | 3.000 | 07/01/13 | 4,959,923 | |||||||||||
|
| |||||||||||||
| State-Specific Municipal Debt Obligations – (continued) | ||||||||||||||
| New Jersey – (continued) |
| ||||||||||||
| New Jersey Health Care Facilities Financing Authority RB | | ||||||||||||
| $ | 1,900,000 | 4.000 | % | 01/01/13 | $ | 1,912,673 | ||||||||
| 4,680,000 | 3.500 | 01/01/16 | 4,926,542 | |||||||||||
| New Jersey State GO Bonds Refunding Series 2010 Q (AA-/Aa3) |
| ||||||||||||
| 10,000,000 | 5.000 | 08/15/15 | 11,279,200 | |||||||||||
| 5,000,000 | 5.000 | 08/15/16 | 5,820,800 | |||||||||||
| New Jersey State Turnpike Authority RB Series 2012 B (A+/A3) |
| ||||||||||||
| 10,000,000 | 5.000 | 01/01/19 | 12,105,200 | |||||||||||
| New Jersey Transportation Trust Fund Authority RB for | | ||||||||||||
| 5,285,000 | 5.750 | 12/15/12 | 5,342,712 | |||||||||||
| New Jersey Transportation Trust Fund Authority RB for | | ||||||||||||
| 6,800,000 | 5.500 | 12/15/16 | 8,129,808 | |||||||||||
| New Jersey Transportation Trust Fund Authority RB for | | ||||||||||||
| 1,500,000 | 5.000 | 06/15/15 | 1,665,795 | |||||||||||
| 1,000,000 | 5.000 | 06/15/16 | 1,146,500 | |||||||||||
| Newark Housing Authority RB for South Ward Police Facility | | ||||||||||||
| 1,000,000 | 3.500 | 12/01/12 | 1,003,560 | |||||||||||
| 1,235,000 | 3.500 | 12/01/13 | 1,263,306 | |||||||||||
| Somerset County New Jersey GO Bonds Series 2009 A (AAA/Aaa) |
| ||||||||||||
| 3,320,000 | 2.000 | 08/01/13 | 3,369,667 | |||||||||||
| Sussex County New Jersey GO Bonds for General Improvement | | ||||||||||||
| 2,665,000 | 2.000 | 08/15/14 | 2,735,143 | |||||||||||
| Tobacco Settlement Financing Corp. RB Series 2003 (AA+/Aaa)(a) |
| ||||||||||||
| 1,750,000 | 6.750 | 06/01/13 | 1,825,932 | |||||||||||
| Tobacco Settlement Financing Corp. RB Series 2007 1-A (B/B1) |
| ||||||||||||
| 9,590,000 | 4.500 | 06/01/23 | 9,250,610 | |||||||||||
| Union County New Jersey GO Bonds Refunding for General | | ||||||||||||
| 4,195,000 | 4.000 | 03/01/14 | 4,403,617 | |||||||||||
|
| |||||||||||||
| 148,570,500 | ||||||||||||||
|
| |||||||||||||
| New Mexico – 1.2% |
| ||||||||||||
| Albuquerque New Mexico GO Bonds Series 2009 A (AAA/Aa1) |
| ||||||||||||
| 4,000,000 | 3.000 | 07/01/13 | 4,083,560 | |||||||||||
| Farmington New Mexico PCRB Refunding for Southern | | ||||||||||||
| 10,000,000 | 2.875 | 04/01/15 | 10,367,800 | |||||||||||
| New Mexico State Severance Tax RB Refunding Series 2011 A-2 | | ||||||||||||
| 5,000,000 | 5.000 | 07/01/16 | 5,817,400 | |||||||||||
| 12,625,000 | 5.000 | 07/01/18 | 15,484,689 | |||||||||||
| New Mexico State Severance Tax RB Series 2010 A (AA/Aa1) |
| ||||||||||||
| 2,000,000 | 5.000 | 07/01/17 | 2,394,400 | |||||||||||
| New Mexico State Severance Tax RB Series 2011 A-1 (AA/Aa1) |
| ||||||||||||
| 5,475,000 | 5.000 | 07/01/17 | 6,554,670 | |||||||||||
|
| |||||||||||||
| 44,702,519 | ||||||||||||||
|
| |||||||||||||
| 66 | The accompanying notes are an integral part of these financial statements. |
GOLDMAN SACHS SHORT DURATION TAX-FREE FUND
| Principal Amount | Interest Rate | Maturity Date | Value | |||||||||||
| State-Specific Municipal Debt Obligations – (continued) | ||||||||||||||
| New York – 11.1% |
| ||||||||||||
| Albany County Airport Authority RB Refunding Series 2010 A | | ||||||||||||
| $ | 1,625,000 | 5.000 | % | 12/15/15 | $ | 1,820,439 | ||||||||
| Albany County GO Serial Bonds Series 2010 (AA/Aa3) |
| ||||||||||||
| 1,920,000 | 2.000 | 06/01/14 | 1,967,904 | |||||||||||
| 1,640,000 | 3.000 | 06/01/15 | 1,729,462 | |||||||||||
| 1,385,000 | 3.000 | 06/01/16 | 1,486,396 | |||||||||||
| Marlboro Central School District GO Serial Bonds Series 2010 | | ||||||||||||
| 890,000 | 3.000 | 10/15/12 | 890,739 | |||||||||||
| 870,000 | 3.000 | 10/15/13 | 890,201 | |||||||||||
| 950,000 | 4.000 | 10/15/14 | 1,003,865 | |||||||||||
| 990,000 | 4.000 | 10/15/15 | 1,068,329 | |||||||||||
| Metropolitan Transportation Authority New York RB Refunding | | ||||||||||||
| 1,000,000 | 5.000 | 11/15/15 | 1,131,670 | |||||||||||
| 730,000 | 4.000 | 11/15/16 | 820,615 | |||||||||||
| Metropolitan Transportation Authority RB Series 2008 (A/A2)(c) |
| ||||||||||||
| 2,940,000 | 5.000 | 11/15/12 | 2,955,229 | |||||||||||
| Metropolitan Transportation Authority RB Series 2011 D (A/A2) |
| ||||||||||||
| 725,000 | 3.000 | 11/15/13 | 746,968 | |||||||||||
| 1,000,000 | 4.000 | 11/15/15 | 1,100,900 | |||||||||||
| Monroe County GO Bonds Refunding Series 2012 (BBB+/A3) |
| ||||||||||||
| 1,500,000 | 5.000 | 03/01/13 | 1,527,180 | |||||||||||
| 1,000,000 | 5.000 | 03/01/15 | 1,085,790 | |||||||||||
| 3,000,000 | 5.000 | 03/01/16 | 3,340,440 | |||||||||||
| Monroe County Industrial Development Agency Civic Facilities | | ||||||||||||
| 515,000 | 5.000 | 08/01/13 | 532,325 | |||||||||||
| Nassau County GO Revenue Anticipation Notes Series 2012 A | | ||||||||||||
| 7,250,000 | 2.000 | 03/29/13 | 7,305,173 | |||||||||||
| Nassau County New York GO Bonds Refunding Series 2009 E | | ||||||||||||
| 3,000,000 | 4.000 | 06/01/13 | 3,063,960 | |||||||||||
| New York City GO Bonds Series 2009 E (AA/Aa2) |
| ||||||||||||
| 9,340,000 | 3.000 | 08/01/13 | 9,555,380 | |||||||||||
| New York City GO Bonds Series 2009 H-1 (AA/Aa2) |
| ||||||||||||
| 2,500,000 | 4.000 | 03/01/13 | 2,539,225 | |||||||||||
| New York City GO Bonds Series 2010 A (AA/Aa2) |
| ||||||||||||
| 1,200,000 | 3.000 | 08/01/16 | 1,305,960 | |||||||||||
| New York City GO Bonds Series 2010 B (AA/Aa2) |
| ||||||||||||
| 6,770,000 | 5.000 | 08/01/15 | 7,630,467 | |||||||||||
| New York City Prerefunded Refunding Series 2009 C (ETM) | | ||||||||||||
| 560,000 | 5.000 | 08/01/13 | 581,935 | |||||||||||
| New York City Tax Exempt GO Bonds Subseries 2009 H-1 | | ||||||||||||
| 5,000,000 | 5.000 | 03/01/15 | 5,552,600 | |||||||||||
| New York City Transitional Finance Authority RB Future Tax | | ||||||||||||
| 1,075,000 | 5.000 | 11/01/12 | 1,079,031 | |||||||||||
| New York City Transitional Finance Authority RB Future Tax | | ||||||||||||
| 1,675,000 | 5.000 | 11/01/12 | 1,681,214 | |||||||||||
|
| |||||||||||||
| State-Specific Municipal Debt Obligations – (continued) | ||||||||||||||
| New York – (continued) |
| ||||||||||||
| New York City Transitional Finance Authority RB Future Tax | | ||||||||||||
| $ | 12,285,000 | 3.000 | % | 11/01/12 | $ | 12,312,027 | ||||||||
| New York City Transitional Finance Authority RB Future Tax | | ||||||||||||
| 4,965,000 | 3.000 | 11/01/12 | 4,975,724 | |||||||||||
| New York City Transitional Finance Authority RB Future Tax | | ||||||||||||
| 4,885,000 | 5.000 | 11/01/15 | 5,553,952 | |||||||||||
| 10,650,000 | 5.000 | 11/01/17 | 12,853,698 | |||||||||||
| 5,000,000 | 5.000 | 11/01/18 | 6,159,850 | |||||||||||
| 22,790,000 | 5.000 | 11/01/19 | 28,544,019 | |||||||||||
| New York City Unrefunded Refunding Series 2009 C (AA/Aa2) |
| ||||||||||||
| 6,440,000 | 5.000 | 08/01/13 | 6,694,960 | |||||||||||
| New York State Bridge Authority General RB Refunding | | ||||||||||||
| 3,145,000 | 3.000 | 01/01/14 | 3,249,194 | |||||||||||
| 2,000,000 | 4.000 | 01/01/15 | 2,159,760 | |||||||||||
| New York State Dormitory Authority Lease RB for Municipal | | ||||||||||||
| 4,825,000 | 5.000 | 01/15/14 | 5,101,086 | |||||||||||
| New York State Dormitory Authority North Shore-Long Island | | ||||||||||||
| 2,215,000 | 4.000 | 05/01/17 | 2,466,358 | |||||||||||
| New York State Dormitory Authority Personal Income Tax RB | | ||||||||||||
| 21,935,000 | 3.000 | 02/15/14 | 22,741,988 | |||||||||||
| 7,095,000 | 5.000 | 02/15/15 | 7,855,868 | |||||||||||
| New York State Dormitory Authority RB for State University | | ||||||||||||
| 2,715,000 | 5.500 | 05/15/13 | 2,802,939 | |||||||||||
| New York State Dormitory Authority Tax Exempt General | | ||||||||||||
| 8,375,000 | 5.000 | 08/15/17 | 10,063,903 | |||||||||||
| New York State Energy Research & Development Authority | | ||||||||||||
| 5,000,000 | 2.250 | 10/15/15 | 5,171,050 | |||||||||||
| New York State Energy Research & Development Authority | | ||||||||||||
| 8,000,000 | 2.250 | 12/01/15 | 8,285,040 | |||||||||||
| New York State GO Bonds Refunding Series 2009 C (AA/Aa2) |
| ||||||||||||
| 27,085,000 | 3.000 | 02/01/13 | 27,334,182 | |||||||||||
| 23,075,000 | 3.000 | 02/01/15 | 24,491,344 | |||||||||||
| New York State Tax Exempt GO Bonds Series 2011 E (AA/Aa2) |
| ||||||||||||
| 6,950,000 | 5.000 | 12/15/17 | 8,469,409 | |||||||||||
| New York State Thruway Authority RB for General Highway and | | ||||||||||||
| 6,440,000 | 5.000 | 04/01/17 | 7,597,332 | |||||||||||
| New York State Thruway Authority RB for Local Highway and | | ||||||||||||
| 4,560,000 | 4.000 | 04/01/13 | 4,644,451 | |||||||||||
| 2,730,000 | 5.000 | 04/01/14 | 2,918,206 | |||||||||||
|
| |||||||||||||
| The accompanying notes are an integral part of these financial statements. | 67 |
GOLDMAN SACHS SHORT DURATION TAX-FREE FUND
Schedule of Investments (continued)
September 30, 2012 (Unaudited)
| Principal Amount | Interest Rate | Maturity Date | Value | |||||||||||
| State-Specific Municipal Debt Obligations – (continued) | ||||||||||||||
| New York – (continued) |
| ||||||||||||
| New York State Urban Development Corp. RB for State Personal | | ||||||||||||
| $ | 1,060,000 | 5.000 | % | 03/15/13 | $ | 1,082,970 | ||||||||
| New York State Urban Development Corp. RB for State Personal | | ||||||||||||
| 8,000,000 | 5.000 | 03/15/16 | 9,209,040 | |||||||||||
| New York State Urban Development Corp. RB for State Personal | | ||||||||||||
| 21,775,000 | 5.000 | 01/01/14 | 23,019,877 | |||||||||||
| Suffolk County New York Public Improvement Series 2011 A | | ||||||||||||
| 4,520,000 | 3.000 | 05/15/15 | 4,768,510 | |||||||||||
| Suffolk County New York Refunding Serial Bonds Series 2012 A | | ||||||||||||
| 1,000,000 | 3.000 | 04/01/13 | 1,012,280 | |||||||||||
| 3,275,000 | 4.000 | 04/01/14 | 3,440,420 | |||||||||||
| 2,000,000 | 4.000 | 04/01/15 | 2,154,140 | |||||||||||
| Suffolk County New York Refunding Serial Bonds Series 2012 B | | ||||||||||||
| 680,000 | 3.000 | 10/01/13 | 696,497 | |||||||||||
| 2,310,000 | 4.000 | 10/01/14 | 2,466,918 | |||||||||||
| 2,000,000 | 4.000 | 10/01/16 | 2,220,260 | |||||||||||
| 1,000,000 | 4.000 | 10/01/17 | 1,118,330 | |||||||||||
| Suffolk County New York Tax Anticipation Notes Series 2012 III | | ||||||||||||
| 23,000,000 | 2.000 | 09/12/13 | 23,350,290 | |||||||||||
| Suffolk Tobacco Asset Securitization Corp. RB Tobacco | | ||||||||||||
| 370,000 | 4.000 | 06/01/17 | 397,983 | |||||||||||
| 490,000 | 4.000 | 06/01/18 | 528,024 | |||||||||||
| 575,000 | 5.000 | 06/01/19 | 653,988 | |||||||||||
| 620,000 | 5.000 | 06/01/20 | 707,017 | |||||||||||
| Tobacco Settlement Financing Corp. RB Asset-Backed Bonds for | | ||||||||||||
| 30,000,000 | 5.000 | 06/01/17 | 35,421,300 | |||||||||||
| Tobacco Settlement Financing Corp. RB Asset-Backed Bonds | | ||||||||||||
| 12,500,000 | 5.500 | 06/01/19 | 12,942,500 | |||||||||||
| Yonkers New York GO Bonds Series 2011 A (BBB+/Baa1) |
| ||||||||||||
| 2,000,000 | 5.000 | 10/01/13 | 2,068,020 | |||||||||||
| 2,020,000 | 5.000 | 10/01/14 | 2,147,300 | |||||||||||
| 2,000,000 | 5.000 | 10/01/15 | 2,184,540 | |||||||||||
| 2,000,000 | 5.000 | 10/01/16 | 2,230,880 | |||||||||||
|
| |||||||||||||
| 420,660,821 | ||||||||||||||
|
| |||||||||||||
| North Carolina – 2.9% |
| ||||||||||||
| Centennial Authority RB Refunding Series 2009 | | ||||||||||||
| 3,190,000 | 5.000 | 09/01/13 | 3,298,875 | |||||||||||
| Charlotte North Carolina Douglas International Airport RB | | ||||||||||||
| 1,220,000 | 2.250 | 07/01/14 | 1,251,647 | |||||||||||
| Charlotte North Carolina GO Bonds Refunding Series 2009 B | | ||||||||||||
| 6,010,000 | 5.000 | 06/01/13 | 6,201,298 | |||||||||||
|
| |||||||||||||
| State-Specific Municipal Debt Obligations – (continued) | ||||||||||||||
| North Carolina – (continued) |
| ||||||||||||
| Charlotte-Mecklenburg Hospital Authority RB Refunding for | | ||||||||||||
| $ | 740,000 | 4.000 | % | 01/15/13 | $ | 747,748 | ||||||||
| Durham North Carolina Utility System Revenue Refunding | | ||||||||||||
| 500,000 | 3.000 | 06/01/14 | 522,435 | |||||||||||
| 300,000 | 4.000 | 06/01/16 | 337,809 | |||||||||||
| North Carolina Eastern Municipal Power Agency Power System | | ||||||||||||
| 1,000,000 | 5.000 | 01/01/14 | 1,053,430 | |||||||||||
| North Carolina Eastern Municipal Power Agency Power System | | ||||||||||||
| 5,500,000 | 5.000 | 01/01/16 | 6,230,730 | |||||||||||
| North Carolina Eastern Municipal Power Agency Power System | | ||||||||||||
| 6,000,000 | 5.000 | 01/01/15 | 6,581,940 | |||||||||||
| 1,500,000 | 5.000 | 01/01/16 | 1,705,500 | |||||||||||
| 4,535,000 | 5.000 | 01/01/17 | 5,278,695 | |||||||||||
| 3,000,000 | 5.000 | 01/01/19 | 3,607,740 | |||||||||||
| North Carolina Eastern Municipal Power Agency Power System | | ||||||||||||
| 1,500,000 | 3.200 | 01/01/13 | 1,509,495 | |||||||||||
| 500,000 | 5.000 | 01/01/13 | 505,360 | |||||||||||
| North Carolina Eastern Municipal Power Agency Power System | | ||||||||||||
| 500,000 | 3.000 | 01/01/13 | 502,925 | |||||||||||
| 3,000,000 | 3.000 | 01/01/14 | 3,086,070 | |||||||||||
| North Carolina Eastern Municipal Power Agency Power System | | ||||||||||||
| 5,235,000 | 2.000 | 01/01/15 | 5,367,341 | |||||||||||
| 1,815,000 | 3.000 | 01/01/16 | 1,928,183 | |||||||||||
| 2,000,000 | 3.000 | 01/01/18 | 2,165,460 | |||||||||||
| 1,275,000 | 5.000 | 01/01/18 | 1,517,671 | |||||||||||
| 2,000,000 | 3.000 | 01/01/19 | 2,153,380 | |||||||||||
| 1,000,000 | 5.000 | 01/01/19 | 1,202,580 | |||||||||||
| North Carolina GO Bonds Refunding Series 2005 B (AAA/Aaa) |
| ||||||||||||
| 16,925,000 | 5.000 | 04/01/17 | 20,230,791 | |||||||||||
| North Carolina Grant and Revenue Anticipation Vehicle Bonds | | ||||||||||||
| 6,000,000 | 4.000 | 03/01/18 | 6,820,380 | |||||||||||
| North Carolina Infrastructure Finance Corp. COPS Capital | | ||||||||||||
| 6,490,000 | 5.000 | 02/01/14 | 6,883,099 | |||||||||||
| North Carolina Municipal Power Agency No. 1 Catawba Electric | | ||||||||||||
| 1,000,000 | 5.500 | 01/01/14 | 1,062,590 | |||||||||||
| North Carolina Municipal Power Agency No. 1 Catawba Electric | | ||||||||||||
| 5,395,000 | 5.250 | 01/01/13 | 5,461,412 | |||||||||||
| North Carolina Turnpike Authority Monroe Connector System | | ||||||||||||
| 3,000,000 | 4.000 | 07/01/14 | 3,179,970 | |||||||||||
| Wake County GO Bonds Refunding Series 2009 D (AAA/Aaa) |
| ||||||||||||
| 10,000,000 | 4.000 | 02/01/13 | 10,125,800 | |||||||||||
|
| |||||||||||||
| 68 | The accompanying notes are an integral part of these financial statements. |
GOLDMAN SACHS SHORT DURATION TAX-FREE FUND
| Principal Amount | Interest Rate | Maturity Date | Value | |||||||||||
| State-Specific Municipal Debt Obligations – (continued) | ||||||||||||||
| North Carolina – (continued) |
| ||||||||||||
| Winston-Salem North Carolina Water and Sewer System RB | | ||||||||||||
| $ | 985,000 | 3.000 | % | 06/01/15 | $ | 1,048,661 | ||||||||
|
| |||||||||||||
| 111,569,015 | ||||||||||||||
|
| |||||||||||||
| Ohio – 1.5% |
| ||||||||||||
| Akron City Ohio Jedd RB Refunding Series 2011 (AA-/NR) |
| ||||||||||||
| 470,000 | 4.000 | 12/01/14 | 498,816 | |||||||||||
| 1,000,000 | 4.000 | 12/01/15 | 1,086,260 | |||||||||||
| 1,425,000 | 5.000 | 12/01/16 | 1,635,373 | |||||||||||
| 1,740,000 | 5.000 | 12/01/17 | 2,040,393 | |||||||||||
| Bowling Green Ohio City Student Housing RB for CFP I LLC | | ||||||||||||
| 2,595,000 | 4.000 | 06/01/16 | 2,783,942 | |||||||||||
| Buckeye Ohio Tobacco Settlement Financing Authority RB | | ||||||||||||
| 13,745,000 | 5.125 | 06/01/24 | 11,566,692 | |||||||||||
| 3,415,000 | 5.375 | 06/01/24 | 2,940,554 | |||||||||||
| Cincinnati Ohio City School District GO Bonds for Classroom | | ||||||||||||
| 5,000,000 | 5.000 | 12/01/13 | 5,272,750 | |||||||||||
| Cleveland Ohio Airport System RB Series 2009 C (A-/Baa1) |
| ||||||||||||
| 5,000,000 | 4.000 | 01/01/13 | 5,033,600 | |||||||||||
| New Albany Community Authority RB Refunding Series 2012 C | | ||||||||||||
| 1,100,000 | 4.000 | 10/01/17 | 1,220,098 | |||||||||||
| 800,000 | 4.000 | 10/01/18 | 895,240 | |||||||||||
| Ohio Housing Finance Agency Single Family Prerefunded | | ||||||||||||
| 1,500,000 | 0.000 | 01/15/14 | 1,346,730 | |||||||||||
| Ohio State Air Quality Development Authority PCRB Refunding | | ||||||||||||
| 3,000,000 | 2.250 | 09/15/16 | 3,005,640 | |||||||||||
| Ohio State GO Bonds for Highway Capital Improvement | | ||||||||||||
| 7,620,000 | 3.000 | 05/01/14 | 7,936,230 | |||||||||||
| Ohio State GO Bonds Refunding for Higher Education | | ||||||||||||
| 2,450,000 | 5.000 | 08/01/13 | 2,547,216 | |||||||||||
| Ohio State Higher Education Facility Commission RB for University | | ||||||||||||
| 4,100,000 | 3.750 | 01/15/13 | 4,136,490 | |||||||||||
| Ohio State RB for Mental Health Capital Facilities | | ||||||||||||
| 1,320,000 | 4.000 | 12/01/13 | 1,372,787 | |||||||||||
| Ohio State Water Development Authority Solid Waste Disposal | | ||||||||||||
| 2,000,000 | 2.625 | 01/02/13 | 2,000,000 | |||||||||||
|
| |||||||||||||
| 57,318,811 | ||||||||||||||
|
| |||||||||||||
| Oklahoma – 1.4% |
| ||||||||||||
| Norman Oklahoma GO Bonds Series 2012 B (NR/Aa2) |
| ||||||||||||
| 3,750,000 | 0.050 | 03/01/15 | 3,695,363 | |||||||||||
|
| |||||||||||||
| State-Specific Municipal Debt Obligations – (continued) | ||||||||||||||
| Oklahoma – (continued) |
| ||||||||||||
| Oklahoma County Independent School District No. 12 Combined | | ||||||||||||
| $ | 4,020,000 | 2.000 | % | 03/01/13 | $ | 4,049,386 | ||||||||
| 4,745,000 | 2.250 | 03/01/14 | 4,868,370 | |||||||||||
| Oklahoma County Independent School District No. 12 Combined | | ||||||||||||
| 4,845,000 | 0.050 | 03/01/14 | 4,821,163 | |||||||||||
| 3,765,000 | 2.000 | 03/01/16 | 3,933,597 | |||||||||||
| 5,470,000 | 2.000 | 03/01/17 | 5,756,354 | |||||||||||
| Oklahoma County Independent School District No. 52 GO Bonds for | | ||||||||||||
| 2,160,000 | 2.000 | 01/01/14 | 2,203,934 | |||||||||||
| 1,860,000 | 2.000 | 01/01/15 | 1,906,184 | |||||||||||
| 2,160,000 | 2.000 | 01/01/17 | 2,227,651 | |||||||||||
| Oklahoma Development Finance Authority RB for Master | | ||||||||||||
| 1,340,000 | 5.000 | 06/01/13 | 1,378,203 | |||||||||||
| Oklahoma Development Finance Authority Solid Waste Disposal | | ||||||||||||
| 3,000,000 | 2.250 | 06/02/14 | 3,059,220 | |||||||||||
| Tulsa County Industrial Authority RB for Capital Improvement | | ||||||||||||
| 10,965,000 | 4.000 | 05/15/16 | 12,155,251 | |||||||||||
| Tulsa Oklahoma GO Bonds Refunding Series 2009 A (AA/Aa1) |
| ||||||||||||
| 1,015,000 | 3.000 | 03/01/13 | 1,026,794 | |||||||||||
| Tulsa Oklahoma GO Bonds Refunding Series 2009 B (AA/Aa1) |
| ||||||||||||
| 1,985,000 | 3.000 | 03/01/13 | 2,008,066 | |||||||||||
| Tulsa Oklahoma GO Bonds Series 2009 (AA/Aa1) |
| ||||||||||||
| 1,000,000 | 5.000 | 10/01/14 | 1,091,290 | |||||||||||
|
| |||||||||||||
| 54,180,826 | ||||||||||||||
|
| |||||||||||||
| Oregon – 0.7% |
| ||||||||||||
| Clackamas County Hospital Facility Authority RB Legacy Health | | ||||||||||||
| 2,000,000 | 5.000 | 07/15/14 | 2,130,360 | |||||||||||
| Gilliam County Oregon Solid Waste Disposal RB for Waste | | ||||||||||||
| 5,000,000 | 2.000 | 09/02/14 | 5,133,000 | |||||||||||
| Klamath Falls Oregon Intercommunity Hospital Authority RB | | ||||||||||||
| 325,000 | 5.800 | 09/01/14 | 329,267 | |||||||||||
| 175,000 | 5.900 | 09/01/15 | 177,272 | |||||||||||
| Lake Oswego Oregon GO Bonds Series 2009 A (AAA/Aa1) |
| ||||||||||||
| 1,575,000 | 3.000 | 12/01/13 | 1,624,250 | |||||||||||
| North Clackamas School District No. 12 GO Bonds Refunding | | ||||||||||||
| 3,000,000 | 5.000 | 06/15/13 | 3,100,440 | |||||||||||
|
| |||||||||||||
| The accompanying notes are an integral part of these financial statements. | 69 |
GOLDMAN SACHS SHORT DURATION TAX-FREE FUND
Schedule of Investments (continued)
September 30, 2012 (Unaudited)
| Principal Amount | Interest Rate | Maturity Date | Value | |||||||||||
| State-Specific Municipal Debt Obligations – (continued) | ||||||||||||||
| Oregon – (continued) |
| ||||||||||||
| Oregon Coast Community College District GO Bonds Refunding | | ||||||||||||
| $ | 1,050,000 | 2.000 | % | 06/15/15 | $ | 1,088,735 | ||||||||
| 1,120,000 | 2.000 | 06/15/16 | 1,173,088 | |||||||||||
| 790,000 | 2.000 | 06/15/17 | 830,645 | |||||||||||
| 1,165,000 | 2.000 | 06/15/18 | 1,222,108 | |||||||||||
| 1,445,000 | 3.000 | 06/15/19 | 1,595,280 | |||||||||||
| 1,245,000 | 3.000 | 06/15/20 | 1,366,998 | |||||||||||
| Oregon State Facilities Authority RB Refunding for Legacy | | ||||||||||||
| 500,000 | 5.000 | 03/15/13 | 510,235 | |||||||||||
| 500,000 | 5.000 | 03/15/14 | 528,790 | |||||||||||
| Oregon State Facilities Authority RB Refunding for Legacy | | ||||||||||||
| 500,000 | 5.000 | 05/01/15 | 550,095 | |||||||||||
| 2,000,000 | 5.000 | 05/01/16 | 2,265,360 | |||||||||||
| Oregon State GO Bonds Refunding for Oregon University System | | ||||||||||||
| 1,175,000 | 3.000 | 08/01/17 | 1,306,612 | |||||||||||
| 1,120,000 | 3.000 | 08/01/18 | 1,258,656 | |||||||||||
|
| |||||||||||||
| 26,191,191 | ||||||||||||||
|
| |||||||||||||
| Pennsylvania – 1.3% |
| ||||||||||||
| Allegheny County Higher Education Building Authority RB for | | ||||||||||||
| 750,000 | 5.000 | 09/01/18 | 858,188 | |||||||||||
| Allegheny County Redevelopment Authority Tax Increment | | ||||||||||||
| 1,300,000 | 4.250 | 12/15/12 | 1,307,982 | |||||||||||
| 1,345,000 | 4.250 | 12/15/13 | 1,389,439 | |||||||||||
| 1,050,000 | 4.250 | 12/15/15 | 1,110,785 | |||||||||||
| 645,000 | 4.250 | 12/15/17 | 682,887 | |||||||||||
| Carbon County Hospital Authority RB Refunding for Gnaden | | ||||||||||||
| 790,000 | 5.400 | 11/15/14 | 809,055 | |||||||||||
| Chester County Health & Education Facilities Authority RB for | | ||||||||||||
| 1,775,000 | 4.000 | 05/15/14 | 1,865,152 | |||||||||||
| Pennsylvania Economic Development Financing Authority Solid | | ||||||||||||
| 2,500,000 | 2.625 | 12/03/12 | 2,509,800 | |||||||||||
| Pennsylvania Higher Educational Facilities Authority RB for La | | ||||||||||||
| 285,000 | 3.000 | 05/01/15 | 296,725 | |||||||||||
| 390,000 | 3.000 | 05/01/16 | 408,630 | |||||||||||
| 440,000 | 3.000 | 05/01/17 | 461,120 | |||||||||||
| 1,165,000 | 5.000 | 05/01/18 | 1,333,354 | |||||||||||
| 1,000,000 | 5.000 | 05/01/19 | 1,150,750 | |||||||||||
| Pennsylvania State Commonwealth GO Bonds for City of | | ||||||||||||
| 6,455,000 | 5.000 | 09/01/14 | 6,943,773 | |||||||||||
|
| |||||||||||||
| State-Specific Municipal Debt Obligations – (continued) | ||||||||||||||
| Pennsylvania – (continued) |
| ||||||||||||
| Pennsylvania State Commonwealth GO Bonds for City of | | ||||||||||||
| $ | 625,000 | 4.000 | % | 09/01/15 | $ | 670,075 | ||||||||
| 600,000 | 4.000 | 09/01/16 | 653,424 | |||||||||||
| 500,000 | 3.000 | 09/01/17 | 527,835 | |||||||||||
| 550,000 | 4.000 | 09/01/17 | 606,353 | |||||||||||
| Pennsylvania State Commonwealth GO Bonds Refunding | | ||||||||||||
| 1,850,000 | 5.500 | 02/01/13 | 1,882,171 | |||||||||||
| Pennsylvania State Commonwealth RB for Harrisburg Area | | ||||||||||||
| 1,305,000 | 4.000 | 10/01/15 | 1,385,975 | |||||||||||
| Pennsylvania State Department of General Services COPS | | ||||||||||||
| 250,000 | 5.000 | 11/01/12 | 250,817 | |||||||||||
| Pennsylvania State University Bonds Refunding Series 2002 | | ||||||||||||
| 1,000,000 | 5.250 | 08/15/15 | 1,127,070 | |||||||||||
| Philadelphia GO Bonds Series 2011 (AGM) (AA-/Aa3) |
| ||||||||||||
| 1,460,000 | 5.000 | 08/01/16 | 1,661,641 | |||||||||||
| Philadelphia Hospitals & Higher Education Facilities Authority | | ||||||||||||
| 1,500,000 | 5.000 | 07/01/15 | 1,584,495 | |||||||||||
| 1,500,000 | 5.000 | 07/01/16 | 1,600,500 | |||||||||||
| 2,000,000 | 5.000 | 07/01/17 | 2,146,280 | |||||||||||
| Philadelphia School District GO Bonds Refunding Series 2005 A | | ||||||||||||
| 1,000,000 | 5.000 | 08/01/13 | 1,037,550 | |||||||||||
| Pittsburgh Water & Sewer Authority RB Refunding Subordinate | | ||||||||||||
| 6,000,000 | 1.400 | 09/01/15 | 6,006,780 | |||||||||||
| Red Lion Area School District GO Bonds RMKT 10/01/09 | | ||||||||||||
| 1,000,000 | 4.000 | 05/01/13 | 1,020,690 | |||||||||||
| Southeastern Pennsylvania Transportation Authority RB | | ||||||||||||
| 3,000,000 | 3.000 | 03/01/14 | 3,092,850 | |||||||||||
| University of Pittsburgh RB for University Capital Project RMKT | | ||||||||||||
| 2,000,000 | 5.500 | 09/15/13 | 2,084,280 | |||||||||||
|
| |||||||||||||
| 48,466,426 | ||||||||||||||
|
| |||||||||||||
| Puerto Rico – 1.8% |
| ||||||||||||
| Government Development Bank for Puerto Rico RB Refunding | | ||||||||||||
| 11,365,000 | 4.750 | 12/01/15 | 11,548,204 | |||||||||||
| Government Development Bank for Puerto Rico Senior Notes RB | | ||||||||||||
| 2,645,000 | 5.000 | 12/01/15 | 2,859,774 | |||||||||||
| Puerto Rico Commonwealth Aqueduct & Sewer Authority RB | | ||||||||||||
| 14,595,000 | 5.000 | 07/01/17 | 15,991,304 | |||||||||||
| 7,285,000 | 5.000 | 07/01/19 | 7,904,152 | |||||||||||
|
| |||||||||||||
| 70 | The accompanying notes are an integral part of these financial statements. |
GOLDMAN SACHS SHORT DURATION TAX-FREE FUND
| Principal Amount | Interest Rate | Maturity Date | Value | |||||||||||
| State-Specific Municipal Debt Obligations – (continued) | ||||||||||||||
| Puerto Rico – (continued) |
| ||||||||||||
| Puerto Rico Commonwealth GO Bonds Refunding for Public | | ||||||||||||
| $ | 825,000 | 5.000 | % | 07/01/14 | $ | 880,275 | ||||||||
| Puerto Rico Commonwealth Highway & Transportation Authority | | ||||||||||||
| 2,100,000 | 5.000 | 07/01/24 | 2,170,413 | |||||||||||
| Puerto Rico Electric Power Authority Power RB Refunding | | ||||||||||||
| 1,000,000 | 5.000 | 07/01/31 | 1,031,020 | |||||||||||
| Puerto Rico Electric Power Authority Power RB Refunding | | ||||||||||||
| 835,000 | 4.000 | 07/01/14 | 869,176 | |||||||||||
| Puerto Rico Electric Power Authority Power RB Refunding | | ||||||||||||
| 2,000,000 | 5.000 | 07/01/16 | 2,194,880 | |||||||||||
| Puerto Rico Electric Power Authority RB Refunding LIBOR | | ||||||||||||
| 20,825,000 | 1.009 | 07/01/12 | 14,036,883 | |||||||||||
| Puerto Rico Electric Power Authority RB Refunding Series 1999 | | ||||||||||||
| 500,000 | 5.000 | 07/01/13 | 515,510 | |||||||||||
| Puerto Rico Municipal Finance Agency GO Bonds Series 2002 A | | ||||||||||||
| 1,125,000 | 5.250 | 08/01/16 | 1,128,037 | |||||||||||
| Puerto Rico Public Buildings Authority RB for Government | | ||||||||||||
| 2,250,000 | 5.500 | 07/01/16 | 2,466,945 | |||||||||||
| Puerto Rico Public Buildings Authority RB for Government | | ||||||||||||
| 3,940,000 | 5.000 | 07/01/14 | 4,140,822 | |||||||||||
|
| |||||||||||||
| 67,737,395 | ||||||||||||||
|
| |||||||||||||
| Rhode Island – 0.0% |
| ||||||||||||
| Tobacco Settlement Financing Corp. RB Asset-Backed Bonds | | ||||||||||||
| 890,000 | 6.000 | 06/01/23 | 891,486 | |||||||||||
|
| |||||||||||||
| South Carolina – 1.9% |
| ||||||||||||
| Beaufort-Jasper South Carolina Water & Sewer Authority | | ||||||||||||
| 1,255,000 | 4.000 | 03/01/13 | 1,274,741 | |||||||||||
| 2,400,000 | 5.000 | 03/01/14 | 2,548,152 | |||||||||||
| Clemson University RB Refunding Series 2012 (AA/Aa2) |
| ||||||||||||
| 5,770,000 | 2.000 | 05/01/16 | 6,013,725 | |||||||||||
| 4,440,000 | 2.000 | 05/01/17 | 4,648,325 | |||||||||||
| 5,000,000 | 2.000 | 05/01/18 | 5,228,950 | |||||||||||
| Columbia City South Carolina Waterworks and Sewer System RB | | ||||||||||||
| 1,205,000 | 4.000 | 02/01/15 | 1,298,098 | |||||||||||
| Columbia City South Carolina Waterworks and Sewer System RB | | ||||||||||||
| 1,020,000 | 3.000 | 02/01/15 | 1,075,284 | |||||||||||
| 1,025,000 | 3.000 | 02/01/16 | 1,096,104 | |||||||||||
| Florence County South Carolina Hospital RB for McLeod | | ||||||||||||
| 1,125,000 | 3.000 | 11/01/12 | 1,126,946 | |||||||||||
| 1,905,000 | 4.000 | 11/01/16 | 2,110,226 | |||||||||||
|
| |||||||||||||
| State-Specific Municipal Debt Obligations – (continued) | ||||||||||||||
| South Carolina – (continued) |
| ||||||||||||
| Georgetown County South Carolina School District GO Bonds | | ||||||||||||
| $ | 6,455,000 | 3.000 | % | 03/01/13 | $ | 6,529,491 | ||||||||
| 4,330,000 | 5.000 | 03/01/16 | 4,984,999 | |||||||||||
| 5,895,000 | 5.000 | 03/01/17 | 7,016,759 | |||||||||||
| 5,500,000 | 5.000 | 03/01/19 | 6,851,240 | |||||||||||
| Oconee County PCRB Refunding for Duke Power Co. Project | | ||||||||||||
| 6,000,000 | 3.600 | 02/01/17 | 6,510,240 | |||||||||||
| Richland County South Carolina GO Bonds Series 2009 A | | ||||||||||||
| 1,585,000 | 5.000 | 03/01/13 | 1,616,446 | |||||||||||
| Richland County South Carolina GO Bonds Series 2012 A (ST | | ||||||||||||
| 2,000,000 | 4.000 | 03/01/17 | 2,291,820 | |||||||||||
| Richland County South Carolina School District No. 2 GO Bonds | | ||||||||||||
| 1,615,000 | 3.000 | 03/01/13 | 1,633,637 | |||||||||||
| 1,595,000 | 3.000 | 03/01/14 | 1,655,132 | |||||||||||
| South Carolina Jobs-Economic Development Authority Hospital | | ||||||||||||
| 1,080,000 | 3.500 | 08/01/13 | 1,104,905 | |||||||||||
| 1,000,000 | 5.000 | 08/01/14 | 1,073,200 | |||||||||||
| Western Carolina Regional Sewer Authority RB Refunding for | | ||||||||||||
| 2,200,000 | 5.000 | 03/01/15 | 2,434,718 | |||||||||||
|
| |||||||||||||
| 70,123,138 | ||||||||||||||
|
| |||||||||||||
| South Dakota – 0.0% |
| ||||||||||||
| South Dakota State Health & Educational Facilities Authority RB | | ||||||||||||
| 1,250,000 | 4.250 | 11/01/14 | 1,328,525 | |||||||||||
|
| |||||||||||||
| Tennessee – 0.7% |
| ||||||||||||
| Johnson City Health & Educational Facilities Board Hospital RB for | | ||||||||||||
| 890,000 | 5.000 | 07/01/15 | 970,661 | |||||||||||
| Maury County Tennessee GO Bonds Series 2006 (XLCA) | | ||||||||||||
| 2,180,000 | 3.600 | 04/01/14 | 2,286,863 | |||||||||||
| Memphis Tennessee Electric System RB Subseries 2003 A | | ||||||||||||
| 6,000,000 | 5.000 | 12/01/13 | 6,327,300 | |||||||||||
| Metropolitan Government Nashville & Davidson County Health | | ||||||||||||
| 5,000,000 | 4.500 | 10/01/12 | 5,000,000 | |||||||||||
| Metropolitan Nashville Airport Authority Airport Improvement | | ||||||||||||
| 3,285,000 | 4.000 | 07/01/13 | 3,365,581 | |||||||||||
| Sevier County Public Building Authority RB for Local | | ||||||||||||
| 5,000,000 | 5.000 | 06/01/14 | 5,337,200 | |||||||||||
|
| |||||||||||||
| The accompanying notes are an integral part of these financial statements. | 71 |
GOLDMAN SACHS SHORT DURATION TAX-FREE FUND
Schedule of Investments (continued)
September 30, 2012 (Unaudited)
| Principal Amount | Interest Rate | Maturity Date | Value | |||||||||||
| State-Specific Municipal Debt Obligations – (continued) | ||||||||||||||
| Tennessee – (continued) |
| ||||||||||||
| Sevierville Public Building Authority RB for Local Government | | ||||||||||||
| $ | 1,500,000 | 4.000 | % | 06/01/14 | $ | 1,589,565 | ||||||||
|
| |||||||||||||
| 24,877,170 | ||||||||||||||
|
| |||||||||||||
| Texas – 6.5% |
| ||||||||||||
| Collin & Denton County Texas GO Bonds Refunding Series 2011 | | ||||||||||||
| 3,335,000 | 5.000 | 02/15/16 | 3,831,748 | |||||||||||
| Collin County Texas GO Bonds Refunding Limited Tax | | ||||||||||||
| 1,105,000 | 3.000 | 02/15/13 | 1,116,492 | |||||||||||
| 1,135,000 | 3.000 | 02/15/14 | 1,176,598 | |||||||||||
| Collin County Texas GO Bonds Refunding Series 2009 A | | ||||||||||||
| 1,385,000 | 5.000 | 02/15/13 | 1,409,556 | |||||||||||
| 550,000 | 3.000 | 02/15/14 | 570,009 | |||||||||||
| Dallas County Limited Tax GO Notes Series 2011 (AAA/Aaa) |
| ||||||||||||
| 3,855,000 | 5.000 | 02/15/18 | 4,687,988 | |||||||||||
| Dallas Texas Independent School District GO Bonds Refunding | | ||||||||||||
| 2,000,000 | 5.000 | 02/15/13 | 2,035,240 | |||||||||||
| Dallas Waterworks and Sewer System RB Refunding | | ||||||||||||
| 3,155,000 | 5.000 | 10/01/18 | 3,899,927 | |||||||||||
| 1,500,000 | 5.000 | 10/01/19 | 1,881,315 | |||||||||||
| Dallas-Fort Worth International Airport Joint RB Refunding | | ||||||||||||
| 2,500,000 | 4.000 | 11/01/13 | 2,598,075 | |||||||||||
| 2,000,000 | 4.000 | 11/01/14 | 2,143,220 | |||||||||||
| Dallas-Fort Worth International Airport Joint RB Refunding | | ||||||||||||
| 750,000 | 4.000 | 11/01/16 | 832,373 | |||||||||||
| 250,000 | 4.000 | 11/01/17 | 281,620 | |||||||||||
| Dallas-Fort Worth International Airport Joint RB Refunding | | ||||||||||||
| 8,045,000 | 3.000 | 11/01/13 | 8,274,122 | |||||||||||
| 1,750,000 | 5.000 | 11/01/18 | 2,097,760 | |||||||||||
| Del Mar College District Limited Tax Refunding Bonds | | ||||||||||||
| 510,000 | 3.000 | 08/15/14 | 534,633 | |||||||||||
| 1,145,000 | 4.000 | 08/15/15 | 1,255,813 | |||||||||||
| Fort Bend County Texas GO Bonds Unlimited Tax Road | | ||||||||||||
| 800,000 | 4.000 | 03/01/13 | 812,584 | |||||||||||
| 500,000 | 4.000 | 03/01/14 | 525,665 | |||||||||||
| Fort Worth Texas General Purpose GO Bonds Series 2009 | | ||||||||||||
| 4,260,000 | 4.000 | 03/01/13 | 4,327,010 | |||||||||||
| Fort Worth Texas GO Bonds Refunding and Improvement | | ||||||||||||
| 2,000,000 | 4.000 | 03/01/19 | 2,331,120 | |||||||||||
| 2,500,000 | 5.000 | 03/01/19 | 3,067,200 | |||||||||||
|
| |||||||||||||
| State-Specific Municipal Debt Obligations – (continued) | ||||||||||||||
| Texas – (continued) |
| ||||||||||||
| Garland Independent School District Unlimited Tax Refunding | | ||||||||||||
| $ | 1,930,000 | 0.000 | % | 02/15/17 | $ | 1,845,331 | ||||||||
| Gulf Coast Waste Disposal Authority Environmental Facilities | | ||||||||||||
| 5,000,000 | 2.300 | 09/03/13 | 5,085,000 | |||||||||||
| Harris County Texas Cultural Education Facilities Finance Corp. RB | | ||||||||||||
| 1,680,000 | 3.500 | 10/01/13 | 1,729,258 | |||||||||||
| Harris County Texas Cultural Education Facilities Finance Corp. | | ||||||||||||
| 3,000,000 | 5.000 | 06/01/13 | 3,085,110 | |||||||||||
| Harris County Texas Cultural Education Facilities Finance Corp. | | ||||||||||||
| 1,000,000 | 5.000 | 11/15/12 | 1,005,360 | |||||||||||
| Harris County Texas GO Bonds Refunding for Permanent | | ||||||||||||
| 1,000,000 | 4.000 | 10/01/13 | 1,037,630 | |||||||||||
| Harris County Texas Spring Independent School District | | ||||||||||||
| 3,040,000 | 3.000 | 08/15/16 | 3,317,218 | |||||||||||
| 2,250,000 | 4.000 | 08/15/17 | 2,595,307 | |||||||||||
| Harrison County Texas Health Facilities Development Corp. | | ||||||||||||
| 500,000 | 4.000 | 07/01/13 | 509,700 | |||||||||||
| 855,000 | 4.000 | 07/01/14 | 889,243 | |||||||||||
| 930,000 | 4.000 | 07/01/15 | 981,448 | |||||||||||
| 2,005,000 | 4.500 | 07/01/16 | 2,179,615 | |||||||||||
| Hockley County Texas GO Bonds Series 2009 (ASSURED GTY) | | ||||||||||||
| 1,050,000 | 4.000 | 02/15/13 | 1,061,256 | |||||||||||
| Houston Public Improvement GO Bonds Refunding | | ||||||||||||
| 7,315,000 | 5.375 | 03/01/14 | 7,836,267 | |||||||||||
| Houston Texas Water and Sewer System Junior Lien RB Forward | | ||||||||||||
| 5,500,000 | 5.750 | 12/01/12 | 5,548,510 | |||||||||||
| Houston Texas Water and Sewer System Junior Lien RB | | ||||||||||||
| 7,775,000 | 5.000 | 12/01/12 | 7,834,168 | |||||||||||
| 3,855,000 | 5.125 | 12/01/12 | 3,885,107 | |||||||||||
| Houston Utilities System RB Refunding First Lien Series 2012 C | | ||||||||||||
| 8,000,000 | 0.780 | 08/01/16 | 8,002,560 | |||||||||||
| Houston Utilities System RB Refunding Series 2012 (AA/NR)(c) |
| ||||||||||||
| 4,500,000 | 0.730 | 06/01/15 | 4,503,825 | |||||||||||
| Klein Texas Independent School District GO Bonds Refunding | | ||||||||||||
| 2,050,000 | 4.250 | 08/15/14 | 2,196,616 | |||||||||||
|
| |||||||||||||
| 72 | The accompanying notes are an integral part of these financial statements. |
GOLDMAN SACHS SHORT DURATION TAX-FREE FUND
| Principal Amount | Interest Rate | Maturity Date | Value | |||||||||||
| State-Specific Municipal Debt Obligations – (continued) | ||||||||||||||
| Texas – (continued) |
| ||||||||||||
| Leander Independent School District Unlimited Tax GO Bonds | | ||||||||||||
| $ | 1,500,000 | 0.000 | % | 08/15/13 | $ | 1,496,760 | ||||||||
| 2,000,000 | 0.000 | 08/15/14 | 1,980,340 | |||||||||||
| 1,000,000 | 0.000 | 08/15/15 | 984,940 | |||||||||||
| Longview Independent School District Unlimited Tax GO Bonds | | ||||||||||||
| 1,000,000 | 0.000 | 02/15/13 | 999,190 | |||||||||||
| Lower Colorado River Authority RB Refunding Series 2008 | | ||||||||||||
| 5,000 | 5.500 | 05/15/14 | 5,418 | |||||||||||
| Lower Colorado River Authority RB Series 2008 (ETM) (NR/A1)(a) |
| ||||||||||||
| 205,000 | 5.500 | 05/15/14 | 222,144 | |||||||||||
| Lower Colorado River Authority RB Unrefunded Series 2012 | | ||||||||||||
| 2,240,000 | 5.500 | 05/15/14 | 2,420,858 | |||||||||||
| Lubbock Health Facilities Development Corp. RB for St. Joseph | | ||||||||||||
| 3,300,000 | 5.000 | 07/01/17 | 3,823,677 | |||||||||||
| Mansfield Independent School District VRDN GO Bonds | | ||||||||||||
| 6,000,000 | 1.750 | 08/01/17 | 6,200,040 | |||||||||||
| Midland Texas COPS GO Bonds Series 2007 (NATL-RE) | | ||||||||||||
| 1,155,000 | 4.000 | 03/01/13 | 1,173,168 | |||||||||||
| 1,255,000 | 4.000 | 03/01/14 | 1,319,055 | |||||||||||
| Mission Economic Development Corp. Solid Waste Disposal RB | | ||||||||||||
| 4,000,000 | 3.750 | 06/01/15 | 4,310,040 | |||||||||||
| North East Independent School District GO Bonds Series 2004 | | ||||||||||||
| 7,890,000 | 5.000 | 08/01/14 | 8,553,312 | |||||||||||
| North East Independent School District GO Bonds Unrefunded | | ||||||||||||
| 5,570,000 | 5.000 | 08/01/15 | 6,048,964 | |||||||||||
| North Texas Tollway Authority System RB Refunding First Tier | | ||||||||||||
| 5,100,000 | 5.750 | 01/01/16 | 5,830,881 | |||||||||||
| North Texas Tollway Authority System RB Refunding First Tier | | ||||||||||||
| 4,200,000 | 5.000 | 01/01/13 | 4,249,140 | |||||||||||
| North Texas Tollway Authority System RB Refunding First Tier | | ||||||||||||
| 3,000,000 | 5.000 | 01/01/19 | 3,512,310 | |||||||||||
| Northside Texas Independent School District GO Bonds for | | ||||||||||||
| 8,000,000 | 1.000 | 05/31/16 | 8,005,680 | |||||||||||
| Northside Texas Independent School District Unlimited Tax | | ||||||||||||
| 6,885,000 | 1.350 | 06/01/14 | 6,966,794 | |||||||||||
| Plano Texas Independent School District Unlimited Tax GO | | ||||||||||||
| 4,000,000 | 5.000 | 02/15/15 | 4,433,960 | |||||||||||
|
| |||||||||||||
| Principal Amount | Interest Rate | Maturity Date | Value | |||||||||||
| State-Specific Municipal Debt Obligations – (continued) | ||||||||||||||
| Texas – (continued) |
| ||||||||||||
| Point Isabel Independent School District Unlimited Tax GO Bonds | | ||||||||||||
| $ | 1,000,000 | 0.000 | % | 02/01/13 | $ | 999,280 | ||||||||
| Sam Rayburn Municipal Power Agency RB Refunding | | ||||||||||||
| 1,700,000 | 5.000 | 10/01/15 | 1,885,725 | |||||||||||
| 2,315,000 | 5.000 | 10/01/19 | 2,719,963 | |||||||||||
| Spring Branch Independent School District Unlimited Tax GO | | ||||||||||||
| 1,000,000 | 4.750 | 02/01/14 | 1,014,760 | |||||||||||
| Sugar Land Texas GO Bonds Refunding for Fort Bend County | | ||||||||||||
| 1,815,000 | 3.000 | 02/15/14 | 1,881,520 | |||||||||||
| 1,240,000 | 3.000 | 02/15/15 | 1,309,824 | |||||||||||
| Tarrant County Limited Tax GO Bonds Series 2008 (AAA/Aaa) |
| ||||||||||||
| 3,110,000 | 5.000 | 07/15/13 | 3,227,278 | |||||||||||
| Tarrant Regional Water District RB Prerefunded Refunding and | | ||||||||||||
| 1,275,000 | 5.375 | 03/01/13 | 1,302,311 | |||||||||||
| Tarrant Regional Water District RB Refunding and Improvement | | ||||||||||||
| 4,850,000 | 5.375 | 03/01/15 | 4,945,739 | |||||||||||
| Texas Municipal Gas Acquisition & Supply Corp. RB for Senior | | ||||||||||||
| 10,360,000 | 5.625 | 12/15/17 | 11,465,205 | |||||||||||
| Texas State Public Finance Authority Unemployment | | ||||||||||||
| 16,725,000 | 4.000 | 07/01/15 | 18,337,792 | |||||||||||
| 7,355,000 | 5.000 | 07/01/16 | 8,400,881 | |||||||||||
| Tyler Texas Independent School District Series 2011 (PSF-GTD) | | ||||||||||||
| 1,485,000 | 1.150 | 08/15/14 | 1,493,078 | |||||||||||
| University of North Texas Financing System RB Series 2009 A | | ||||||||||||
| 1,195,000 | 5.000 | 04/15/13 | 1,225,556 | |||||||||||
|
| |||||||||||||
| 247,564,180 | ||||||||||||||
|
| |||||||||||||
| U.S. Virgin Islands – 0.2% |
| ||||||||||||
| Virgin Islands Public Finance Authority Senior Lien RB | | ||||||||||||
| 1,045,000 | 5.000 | 10/01/12 | 1,045,000 | |||||||||||
| Virgin Islands Public Finance Authority Senior Lien RB | | ||||||||||||
| 2,500,000 | 5.000 | 10/01/13 | 2,588,325 | |||||||||||
| Virgin Islands Water & Power Authority Electric System RB | | ||||||||||||
| 1,285,000 | 4.000 | 07/01/13 | 1,303,774 | |||||||||||
| 480,000 | 4.000 | 07/01/14 | 494,112 | |||||||||||
| 680,000 | 4.750 | 07/01/15 | 723,295 | |||||||||||
|
| |||||||||||||
| 6,154,506 | ||||||||||||||
|
| |||||||||||||
| The accompanying notes are an integral part of these financial statements. | 73 |
GOLDMAN SACHS SHORT DURATION TAX-FREE FUND
Schedule of Investments (continued)
September 30, 2012 (Unaudited)
| Principal Amount | Interest Rate | Maturity Date | Value | |||||||||||
| State-Specific Municipal Debt Obligations – (continued) | ||||||||||||||
| Utah – 0.7% |
| ||||||||||||
| Box Elder School District GO Bonds for Utah School Bond | | ||||||||||||
| $ | 2,510,000 | 3.000 | % | 07/15/13 | $ | 2,564,969 | ||||||||
| Centerville Utah Sales Tax RB Series 2009 (ASSURED GTY) | | ||||||||||||
| 1,340,000 | 4.000 | 05/01/14 | 1,402,122 | |||||||||||
| Utah Associated Municipal Power Systems RB for Horse Butte | | ||||||||||||
| 500,000 | 5.000 | 09/01/14 | 539,445 | |||||||||||
| 610,000 | 5.000 | 09/01/15 | 680,388 | |||||||||||
| 750,000 | 5.000 | 09/01/16 | 860,115 | |||||||||||
| 500,000 | 5.000 | 09/01/17 | 584,360 | |||||||||||
| 500,000 | 5.000 | 09/01/18 | 595,200 | |||||||||||
| 500,000 | 5.000 | 09/01/19 | 597,430 | |||||||||||
| Utah State GO Bonds Series 2009 A (AAA/Aaa) |
| ||||||||||||
| 5,850,000 | 5.000 | 07/01/14 | 6,330,168 | |||||||||||
| Utah State GO Bonds Series 2009 B (AAA/Aaa) |
| ||||||||||||
| 7,450,000 | 4.000 | 07/01/14 | 7,931,941 | |||||||||||
| Utah State University RB Refunding for Student Fee and Housing | | ||||||||||||
| 1,615,000 | 4.000 | 12/01/12 | 1,624,852 | |||||||||||
| 1,575,000 | 3.000 | 12/01/14 | 1,638,724 | |||||||||||
|
| |||||||||||||
| 25,349,714 | ||||||||||||||
|
| |||||||||||||
| Vermont – 0.1% |
| ||||||||||||
| Vermont Educational & Health Buildings Financing Agency RB | | ||||||||||||
| 1,250,000 | 3.000 | 10/01/15 | 1,319,387 | |||||||||||
| 1,420,000 | 4.000 | 10/01/16 | 1,564,102 | |||||||||||
| 1,680,000 | 4.000 | 10/01/17 | 1,871,083 | |||||||||||
|
| |||||||||||||
| 4,754,572 | ||||||||||||||
|
| |||||||||||||
| Virginia – 1.4% |
| ||||||||||||
| Fairfax County Virginia Economic Development Authority | | ||||||||||||
| 500,000 | 4.150 | 10/01/13 | 512,180 | |||||||||||
| Louisa IDA Pollution Control RB Refunding for Electric and | | ||||||||||||
| 6,250,000 | 1.500 | 12/01/14 | 6,358,375 | |||||||||||
| Newport News Virginia GO Bonds Series 2009 B (AA/Aa1) |
| ||||||||||||
| 4,315,000 | 3.000 | 09/01/13 | 4,424,515 | |||||||||||
| Smyth County Virginia IDA Hospital RB for Mountain States | | ||||||||||||
| 3,330,000 | 5.000 | 07/01/14 | 3,535,228 | |||||||||||
| Tobacco Settlement Financing Corp. RB Asset-Backed Bonds | | ||||||||||||
| 8,765,000 | 5.625 | 06/01/15 | 9,963,438 | |||||||||||
| Virginia Beach Virginia GO Bonds for Public Improvement | | ||||||||||||
| 1,000,000 | 3.000 | 06/01/13 | 1,018,620 | |||||||||||
| Virginia Beach Virginia GO Bonds Refunding for Public | | ||||||||||||
| 1,455,000 | 5.000 | 05/01/13 | 1,495,478 | |||||||||||
|
| |||||||||||||
| State-Specific Municipal Debt Obligations – (continued) | ||||||||||||||
| Virginia – (continued) |
| ||||||||||||
| Virginia College Building Authority Educational Facilities RB for | | ||||||||||||
| $ | 105,000 | 5.000 | % | 02/01/13 | $ | 106,646 | ||||||||
| Virginia College Building Authority Educational Facilities RB | | ||||||||||||
| 2,395,000 | 5.000 | 02/01/13 | 2,432,889 | |||||||||||
| Virginia State Housing Development Authority Homeownership | | ||||||||||||
| 3,015,000 | 2.500 | 03/01/15 | 3,101,319 | |||||||||||
| Virginia State Housing Development Authority Homeownership | | ||||||||||||
| 1,900,000 | 2.200 | 03/01/17 | 1,959,850 | |||||||||||
| Virginia State Public School Authority School Financing 1997 | | ||||||||||||
| 3,000,000 | 4.500 | 08/01/13 | 3,106,620 | |||||||||||
| Virginia State Public School Authority School Financing 1997 | | ||||||||||||
| 6,185,000 | 5.000 | 08/01/14 | 6,710,911 | |||||||||||
| Wise County Virginia Industrial Development Authority Solid | | ||||||||||||
| 5,000,000 | 2.375 | 11/01/15 | 5,155,500 | |||||||||||
| York County Economic Development Authority Electricity and | | ||||||||||||
| 2,000,000 | 4.050 | 05/01/14 | 2,085,600 | |||||||||||
|
| |||||||||||||
| 51,967,169 | ||||||||||||||
|
| |||||||||||||
| Washington – 1.3% |
| ||||||||||||
| Seattle Washington Water System RB Refunding Series 2012 | | ||||||||||||
| 12,990,000 | 5.000 | 09/01/19 | 16,186,059 | |||||||||||
| Tobacco Settlement Authority of Washington RB Asset-Backed | | ||||||||||||
| 2,730,000 | 6.500 | 06/01/26 | 2,842,995 | |||||||||||
| Washington State GO Bonds Refunding Series R – 2012 A | | ||||||||||||
| 13,560,000 | 5.000 | 07/01/18 | 16,614,390 | |||||||||||
| Washington State GO Bonds Series 2005 D (AGM) (AA+/Aa1)(a) |
| ||||||||||||
| 10,000,000 | 5.000 | 01/01/15 | 11,031,500 | |||||||||||
| Washington State Various Purpose GO Bonds Refunding | | ||||||||||||
| 3,500,000 | 5.000 | 01/01/13 | 3,541,020 | |||||||||||
|
| |||||||||||||
| 50,215,964 | ||||||||||||||
|
| |||||||||||||
| West Virginia – 0.5% |
| ||||||||||||
| Kanawha Putnam County Huntington Compound RB for Single | | ||||||||||||
| 10,125,000 | 0.000 | 12/01/16 | 9,790,065 | |||||||||||
| Mason County Pollution Control RB for Appalachian Power Co. | | ||||||||||||
| 5,300,000 | 2.000 | 10/01/14 | 5,405,470 | |||||||||||
|
| |||||||||||||
| 74 | The accompanying notes are an integral part of these financial statements. |
GOLDMAN SACHS SHORT DURATION TAX-FREE FUND
| Principal Amount | Interest Rate | Maturity Date | Value | |||||||||||
| State-Specific Municipal Debt Obligations – (continued) | ||||||||||||||
| West Virginia – (continued) |
| ||||||||||||
| Princeton West Virginia Hospitals RB Refunding Princeton | | ||||||||||||
| $ | 500,000 | 5.000 | % | 05/01/17 | $ | 552,600 | ||||||||
| 1,445,000 | �� | 5.000 | 05/01/18 | 1,611,233 | ||||||||||
| 1,565,000 | 5.000 | 05/01/19 | 1,753,520 | |||||||||||
|
| |||||||||||||
| 19,112,888 | ||||||||||||||
|
| |||||||||||||
| Wisconsin – 0.2% |
| ||||||||||||
| Kenosha City Promissory Notes GO Bonds for Capital | | ||||||||||||
| 1,500,000 | 0.000 | 09/01/15 | 1,439,880 | |||||||||||
| Milwaukee Wisconsin GO Bonds Series 2010 N-1 (AA/Aa2) |
| ||||||||||||
| 4,050,000 | 5.000 | 02/01/16 | 4,633,321 | |||||||||||
|
| |||||||||||||
| 6,073,201 | ||||||||||||||
|
| |||||||||||||
| | TOTAL STATE-SPECIFIC MUNICIPAL DEBT OBLIGATIONS | | ||||||||||||
| (Cost $3,485,123,070) | $ | 3,549,051,952 | ||||||||||||
|
| |||||||||||||
| Other Municipal Debt Obligation – 0.1% | ||||||||||||||
| Municipal Mortgage & Equity LLC Tax-Exempt Special Purpose | | ||||||||||||
| $ | 2,000,000 | 4.950 | % | 09/30/13 | $ | 2,000,000 | ||||||||
| (Cost $2,000,000) | ||||||||||||||
|
| |||||||||||||
| Short-Term Investments – 3.9% | ||||||||||||||
| Alabama – 0.1% |
| ||||||||||||
| Mobile County Industrial Development Authority PCRB VRDN | | ||||||||||||
| $ | 3,200,000 | 0.200 | % | 10/01/12 | $ | 3,200,000 | ||||||||
|
| |||||||||||||
| Alaska – 0.2% |
| ||||||||||||
| Valdez Alaska Marine Terminal VRDN RB Refunding for | | ||||||||||||
| 1,250,000 | 0.200 | 10/01/12 | 1,250,000 | |||||||||||
| Valdez Alaska Marine Terminal VRDN RB Refunding for | | ||||||||||||
| 7,000,000 | 0.200 | 10/01/12 | 7,000,000 | |||||||||||
|
| |||||||||||||
| 8,250,000 | ||||||||||||||
|
| |||||||||||||
| California – 0.3% |
| ||||||||||||
| Metropolitan Water District of Southern California VRDN RB | | ||||||||||||
| 3,940,000 | 0.530 | 10/01/12 | 3,941,615 | |||||||||||
| Metropolitan Water District of Southern California Waterworks | | ||||||||||||
| 4,000,000 | 0.150 | 10/01/12 | 4,000,000 | |||||||||||
|
| |||||||||||||
| 7,941,615 | ||||||||||||||
|
| |||||||||||||
| Principal Amount | Interest Rate | Maturity Date | Value | |||||||||||
| Short-Term Investments – (continued) | ||||||||||||||
| Illinois – 0.3% |
| ||||||||||||
| Chicago Illinois GO VRDN Project Series 2003 B-2 RMKT | | ||||||||||||
| $ | 7,900,000 | 0.200 | % | 10/01/12 | $ | 7,900,000 | ||||||||
| Chicago Illinois GO VRDN Project Series 2003 B-3 RMKT | | ||||||||||||
| 1,000,000 | 0.200 | 10/01/12 | 1,000,000 | |||||||||||
| Illinois Finance Authority Solid Waste Disposal RB for Waste | | ||||||||||||
| 4,000,000 | 0.550 | 04/01/13 | 4,000,000 | |||||||||||
|
| |||||||||||||
| 12,900,000 | ||||||||||||||
|
| |||||||||||||
| Louisiana – 0.0% |
| ||||||||||||
| East Baton Rouge Parish Louisiana VRDN PCRB Refunding for | | ||||||||||||
| 1,890,000 | 0.180 | 10/01/12 | 1,890,000 | |||||||||||
|
| |||||||||||||
| Maryland – 0.0% |
| ||||||||||||
| Montgomery County GO VRDN Bonds Refunding for Public | | ||||||||||||
| 1,000,000 | 0.200 | 10/01/12 | 1,000,000 | |||||||||||
|
| |||||||||||||
| Massachusetts – 0.3% |
| ||||||||||||
| Massachusetts State Health & Educational Facilities Authority | | ||||||||||||
| 1,775,000 | 0.200 | 10/01/12 | 1,775,000 | |||||||||||
| Massachusetts State Health & Educational Facilities Authority | | ||||||||||||
| 8,050,000 | 0.200 | 10/01/12 | 8,050,000 | |||||||||||
| Massachusetts State Health & Educational Facilities Authority | | ||||||||||||
| 1,000,000 | 0.180 | 10/01/12 | 1,000,000 | |||||||||||
|
| |||||||||||||
| 10,825,000 | ||||||||||||||
|
| |||||||||||||
| Mississippi – 0.9% |
| ||||||||||||
| Jackson County Port Facility VRDN RB Refunding for Chevron | | ||||||||||||
| 5,000,000 | 0.180 | 10/01/12 | 5,000,000 | |||||||||||
| Mississippi Business Finance Corp. Gulf Opportunity Zone | | ||||||||||||
| 5,830,000 | 0.190 | 10/01/12 | 5,830,000 | |||||||||||
| Mississippi Business Finance Corp. Gulf Opportunity Zone | | ||||||||||||
| 4,500,000 | 0.190 | 10/01/12 | 4,500,000 | |||||||||||
| Mississippi Business Finance Corp. Gulf Opportunity Zone | | ||||||||||||
| 5,020,000 | 0.190 | 10/01/12 | 5,020,000 | |||||||||||
| Mississippi Business Finance Corp. Gulf Opportunity Zone | | ||||||||||||
| 4,000,000 | 0.190 | 10/01/12 | 4,000,000 | |||||||||||
|
| |||||||||||||
| The accompanying notes are an integral part of these financial statements. | 75 |
GOLDMAN SACHS SHORT DURATION TAX-FREE FUND
Schedule of Investments (continued)
September 30, 2012 (Unaudited)
| Principal Amount | Interest Rate | Maturity Date | Value | |||||||||||
| Short-Term Investments – (continued) | ||||||||||||||
| Mississippi – (continued) |
| ||||||||||||
| Mississippi Business Finance Corp. Gulf Opportunity Zone | | ||||||||||||
| $ | 2,000,000 | 0.200 | % | 10/01/12 | $ | 2,000,000 | ||||||||
| Mississippi Business Finance Corp. Gulf Opportunity Zone | | ||||||||||||
| 7,600,000 | 0.200 | 10/01/12 | 7,600,000 | |||||||||||
|
| |||||||||||||
| 33,950,000 | ||||||||||||||
|
| |||||||||||||
| Missouri – 0.0% |
| ||||||||||||
| Missouri State Health & Educational Facilities Authority VRDN | | ||||||||||||
| 1,000,000 | 0.190 | 10/01/12 | 1,000,000 | |||||||||||
|
| |||||||||||||
| New York – 1.3% |
| ||||||||||||
| New York City Municipal Water Finance Authority Water & | | ||||||||||||
| 2,800,000 | 0.200 | 10/01/12 | 2,800,000 | |||||||||||
| New York City Municipal Water Finance Authority Water & | | ||||||||||||
| 4,400,000 | 0.200 | 10/01/12 | 4,400,000 | |||||||||||
| New York City Municipal Water Finance Authority Water & Sewer | | ||||||||||||
| 2,150,000 | 0.200 | 10/01/12 | 2,150,000 | |||||||||||
| New York City Transitional Finance Authority VRDN RB for | | ||||||||||||
| 5,835,000 | 0.220 | 10/01/12 | 5,835,000 | |||||||||||
| New York City VRDN GO Bonds Subseries 1993 A-7 (LOC – | | ||||||||||||
| 2,200,000 | 0.170 | 10/01/12 | 2,200,000 | |||||||||||
| New York City VRDN GO Bonds Subseries 1993 B-3 (LOC – | | ||||||||||||
| 2,400,000 | 0.170 | 10/01/12 | 2,400,000 | |||||||||||
| 2,500,000 | 0.170 | 10/01/12 | 2,500,000 | |||||||||||
| New York City VRDN GO Bonds Subseries 1993 E-5 | | ||||||||||||
| 3,300,000 | 0.170 | 10/01/12 | 3,300,000 | |||||||||||
| New York City VRDN GO Bonds Subseries 2008 L-4 (LOC – | | ||||||||||||
| 3,500,000 | 0.190 | 10/01/12 | 3,500,000 | |||||||||||
| New York City VRDN GO Bonds Subseries 2012 G-5 | | ||||||||||||
| 5,210,000 | 0.180 | 10/01/12 | 5,210,000 | |||||||||||
| Triborough Bridge Tunnel Authority VRDN RB General | | ||||||||||||
| 5,300,000 | 0.200 | 10/01/12 | 5,300,000 | |||||||||||
| Triborough Bridge Tunnel Authority VRDN RB General | | ||||||||||||
| 7,500,000 | 0.200 | 10/01/12 | 7,500,000 | |||||||||||
|
| |||||||||||||
| Short-Term Investments – (continued) | ||||||||||||||
| New York – (continued) |
| ||||||||||||
| Triborough Bridge Tunnel Authority VRDN RB General | | ||||||||||||
| $ | 1,245,000 | 0.200 | % | 10/01/12 | $ | 1,245,000 | ||||||||
|
| |||||||||||||
| 48,340,000 | ||||||||||||||
|
| |||||||||||||
| Rhode Island – 0.0% |
| ||||||||||||
| Rhode Island State Industrial Facilities Corp. Marine Terminal | | ||||||||||||
| 1,000,000 | 0.200 | 10/01/12 | 1,000,000 | |||||||||||
|
| |||||||||||||
| Texas – 0.4% |
| ||||||||||||
| Houston Higher Education Finance Corp. VRDN RB for Rice | | ||||||||||||
| 1,600,000 | 0.180 | 10/01/12 | 1,600,000 | |||||||||||
| Lower Neches Valley Authority Industrial Development Corp. | | ||||||||||||
| 2,500,000 | 0.200 | 10/01/12 | 2,500,000 | |||||||||||
| Lower Neches Valley Authority Industrial Development Corp. | | ||||||||||||
| 8,050,000 | 0.180 | 10/01/12 | 8,050,000 | |||||||||||
| Lower Neches Valley Authority Industrial Development | | ||||||||||||
| 1,900,000 | 0.180 | 10/01/12 | 1,900,000 | |||||||||||
| Texas Water Development Board VRDN RB Refunding State | | ||||||||||||
| 1,320,000 | 0.220 | 10/01/12 | 1,320,000 | |||||||||||
|
| |||||||||||||
| 15,370,000 | ||||||||||||||
|
| |||||||||||||
| Virginia – 0.1% |
| ||||||||||||
| Virginia College Building Authority Educational Facilities VRDN | | ||||||||||||
| 2,600,000 | 0.210 | 10/01/12 | 2,600,000 | |||||||||||
|
| |||||||||||||
| TOTAL SHORT-TERM INVESTMENTS | ||||||||||||||
| (Cost $148,266,888) | $ | 148,266,615 | ||||||||||||
|
| |||||||||||||
| TOTAL INVESTMENTS – 97.8% | ||||||||||||||
| (Cost $3,635,389,958) | $ | 3,699,318,567 | ||||||||||||
|
| |||||||||||||
| OTHER ASSETS IN EXCESS OF | | 83,947,289 | |||||||||||
|
| |||||||||||||
| NET ASSETS – 100.0% | $ | 3,783,265,856 | ||||||||||||
|
| |||||||||||||
| 76 | The accompanying notes are an integral part of these financial statements. |
GOLDMAN SACHS SHORT DURATION TAX-FREE FUND
| The percentage shown for each investment category reflects the value of investments in that category as a percentage of net assets. | ||
(a) | Pre-refunded security. Maturity date disclosed is pre-refunding date. | |
(b) | Variable rate security. Except for floating rate notes (for which final maturity is disclosed), maturity date disclosed is the next interest reset date. Interest rate disclosed is that which is in effect at September 30, 2012. | |
(c) | Security with “Put” features and resetting interest rates. Maturity dates disclosed are the puttable dates. Interest rate disclosed is that which is in effect at September 30, 2012. | |
(d) | Issued with a zero coupon. Income is recognized through the accretion of discount. | |
(e) | When-issued security. | |
(f) | Inverse floating rate security. Interest rate disclosed is that which is in effect at September 30, 2012. | |
(g) | Exempt from registration under Rule 144A of the Securities Act of 1933. Under procedures approved by the Board of Trustees, such securities have been determined to be liquid by the investment adviser and may be resold, normally to qualified institutional buyers in transactions exempt from registration. Total market value of Rule 144A securities amounts to $2,000,000, which represents approximately 0.1% of net assets as of September 30, 2012. | |
| Security ratings disclosed, if any, are issued by either Standard & Poor’s, Moody's Investor Service or Fitch and are unaudited. A brief description of the ratings is available in the Fund’s Statement of Additional Information. | ||
| ||
Investment Abbreviations: | ||
ACA | —Insured by American Capital Access | |
AGC | —Insured by ACE Guaranty Corp. | |
AGC-ICC | —Agency Insured Custody Certificate | |
AGM | —Insured by Assured Guaranty Municipal Corp. | |
AGM-CR | —Insured by Assured Guaranty Municipal Corp. Insured Custodial Receipts | |
AMBAC | —Insured by American Municipal Bond Assurance Corp. | |
AMT | —Alternative Minimum Tax | |
ASSURED GTY | —Insured by Assured Guaranty | |
BANS | —Bond Anticipation Notes | |
CITY APPROP | —City Appropriation | |
CNTY GTD | —County Guaranteed | |
COMWLTH GTD | —Commonwealth Guaranteed | |
COPS | —Certificates of Participation | |
ETM | —Escrowed to Maturity | |
FGIC | —Insured by Financial Guaranty Insurance Co. | |
FHA | —Federal Housing Administration | |
GO | —General Obligation | |
GO OF AUTH | —General Obligation of Authority | |
GO OF CITY | —General Obligation of City | |
GO OF PARTICIPANTS | —General Obligation of Participants | |
GO OF UNIV | —General Obligation of University | |
IDA | —Industrial Development Authority | |
LIBOR | —London Interbank Offered Rate | |
LIQ | —Liquidity Agreement | |
LOC | —Letter of Credit | |
MUN GOVT GTD | —Municipal Government Guaranteed | |
NATL-RE | —Insured by National Public Finance Guarantee Corp. | |
NATL-RE FGIC | —Insured by National Public Finance Guarantee Corp., which re-insures Financial Guaranty Insurance Co. | |
NATL-RE-IBC | —Insured by National Public Finance Guarantee Corp. - Insured Bond Certificates | |
NR | —Not Rated | |
PCRB | —Pollution Control Revenue Bond | |
PRIV MTGS | —Private Mortgages | |
PSF-GTD | —Guaranteed by Permanent School Fund | |
Q-SBLF | —Qualified School Board Loan Fund | |
RB | —Revenue Bond | |
RMKT | —Remarketed | |
SCH BD GTY | —School Bond Guaranty | |
SCSDE | —South Carolina State Department of Education | |
SD CRED PROG | —School District Credit Program | |
ST AID DIR DEP | —State Aid Direct Deposit | |
ST AID WITHHLDG | —State Aid Withholding | |
ST APPROP | —State Appropriation | |
TCRS | —Transferable Custodial Receipts | |
VA | —Veterans Administration | |
VRDN | —Variable Rate Demand Notes | |
WR | —Withdrawn Rating | |
XLCA | —Insured by XL Capital Assurance, Inc. | |
| ||
| The accompanying notes are an integral part of these financial statements. | 77 |
GOLDMAN SACHS MUNICIPAL FIXED INCOME FUNDS
Statements of Assets and Liabilities
September 30, 2012 (Unaudited)
| High Yield Municipal Fund | Municipal Income Fund | Short Duration Tax-Free Fund | ||||||||||||
| Assets: | ||||||||||||||
Investments, at value (cost $3,569,008,776, $549,023,756 and $3,635,389,958) | $ | 3,709,993,184 | $ | 607,547,671 | $ | 3,699,318,567 | ||||||||
Cash | 18,067,841 | 6,559,136 | 26,486,911 | |||||||||||
Receivables: | ||||||||||||||
Interest and dividends, net of allowances | 57,045,854 | 8,238,388 | 35,643,722 | |||||||||||
Fund shares sold | 8,494,046 | 1,485,937 | 40,323,755 | |||||||||||
Investments sold | 6,187,620 | — | 13,197,917 | |||||||||||
Investments sold on an extended-settlement basis | 380,000 | 6,220,000 | 11,190,000 | |||||||||||
Collateral on certain derivative contracts | 370,000 | — | — | |||||||||||
Reimbursement from investment adviser | 37,064 | 35,335 | 55,137 | |||||||||||
Other assets | 6,400 | 9,644 | 7,270 | |||||||||||
| Total assets | 3,800,582,009 | 630,096,111 | 3,826,223,279 | |||||||||||
| Liabilities: | ||||||||||||||
Payables: | ||||||||||||||
Investments purchased on an extended-settlement basis | 20,672,265 | 3,881,255 | 15,648,266 | |||||||||||
Fund shares redeemed | 12,627,170 | 1,238,060 | 20,852,538 | |||||||||||
Amounts owed to affiliates | 1,916,519 | 350,856 | 1,490,415 | |||||||||||
Income distribution | 821,311 | 263,216 | 843,865 | |||||||||||
Investments purchased | 654,673 | 2,144,868 | 4,000,000 | |||||||||||
Unrealized loss on swap contracts | 423,169 | — | — | |||||||||||
Accrued expenses | 175,359 | 63,306 | 122,339 | |||||||||||
| Total liabilities | 37,290,466 | 7,941,561 | 42,957,423 | |||||||||||
| Net Assets: | ||||||||||||||
Paid-in capital | 4,963,701,296 | 600,990,922 | 3,719,554,747 | |||||||||||
Undistributed net investment income | 46,862,298 | 1,517,363 | 1,236,762 | |||||||||||
Accumulated net realized loss | (1,387,833,290 | ) | (38,877,650 | ) | (1,454,262 | ) | ||||||||
Net unrealized gain | 140,561,239 | 58,523,915 | 63,928,609 | |||||||||||
| NET ASSETS | $ | 3,763,291,543 | $ | 622,154,550 | $ | 3,783,265,856 | ||||||||
Net Assets: | ||||||||||||||
Class A | $ | 361,539,176 | $ | 355,785,652 | $ | 1,045,186,709 | ||||||||
Class B | 10,357,925 | 5,198,293 | 24,238 | |||||||||||
Class C | 107,646,259 | 27,900,054 | 55,823,168 | |||||||||||
Institutional | 3,279,722,610 | 230,172,072 | 2,662,438,158 | |||||||||||
Service | — | 41,897 | 2,312,763 | |||||||||||
Class IR | 4,025,573 | 3,056,582 | 17,480,820 | |||||||||||
Total Net Assets | $ | 3,763,291,543 | $ | 622,154,550 | $ | 3,783,265,856 | ||||||||
Shares outstanding $0.001 par value (unlimited shares authorized): | ||||||||||||||
Class A | 38,790,642 | 21,973,776 | 97,879,145 | |||||||||||
Class B | 1,111,194 | 321,071 | 2,272 | |||||||||||
Class C | 11,550,253 | 1,722,861 | 5,228,116 | |||||||||||
Institutional | 351,854,462 | 14,220,622 | 249,422,481 | |||||||||||
Service | — | 2,575 | 216,772 | |||||||||||
Class IR | 431,800 | 189,040 | 1,637,873 | |||||||||||
Net asset value, offering and redemption price per share:(a) | ||||||||||||||
Class A | $9.32 | $16.19 | $10.68 | |||||||||||
Class B | 9.32 | 16.19 | 10.67 | |||||||||||
Class C | 9.32 | 16.19 | 10.68 | |||||||||||
Institutional | 9.32 | 16.19 | 10.67 | |||||||||||
Service | — | 16.27 | 10.67 | |||||||||||
Class IR | 9.32 | 16.17 | 10.67 | |||||||||||
| (a) | Maximum public offering price per share for Class A Shares of the High Yield Municipal, Municipal Income and Short Duration Tax-Free Funds is $9.76, $16.82 and $10.84, respectively. At redemption, Class B and Class C Shares may be subject to a contingent deferred sales charge assessed on the amount equal to the lesser of the current NAV or the original purchase price of the shares. |
| 78 | The accompanying notes are an integral part of these financial statements. |
GOLDMAN SACHS MUNICIPAL FIXED INCOME FUNDS
Statements of Operations
For the Six Months Ended September 30, 2012 (Unaudited)
| High Yield Municipal Fund | Municipal Income Fund | Short Duration Tax-Free Fund | ||||||||||||
| Investment income: | ||||||||||||||
Interest, net of allowances | $ | 100,236,025 | $ | 14,462,689 | $ | 35,812,491 | ||||||||
| Expenses: | ||||||||||||||
Management fees | 9,492,966 | 1,685,450 | 6,218,400 | |||||||||||
Distribution and Service fees(a) | 1,020,016 | 602,217 | 1,485,948 | |||||||||||
Transfer Agent fees(a) | 932,965 | 296,619 | 1,153,280 | |||||||||||
Custody and accounting fees | 116,663 | 32,288 | 111,808 | |||||||||||
Registration fees | 58,918 | 57,097 | 61,106 | |||||||||||
Professional fees | 57,454 | 42,179 | 41,810 | |||||||||||
Printing and mailing costs | 32,300 | 19,672 | 34,189 | |||||||||||
Trustee fees | 11,890 | 8,002 | 11,877 | |||||||||||
Service share fees — Service Plan | — | 61 | 5,678 | |||||||||||
Service share fees — Shareholder Administration Plan | — | 61 | 5,678 | |||||||||||
Other | 42,882 | 10,330 | 34,007 | |||||||||||
| Total expenses | 11,766,054 | 2,753,976 | 9,163,781 | |||||||||||
Less — expense reductions | (369,740 | ) | (617,612 | ) | (627,650 | ) | ||||||||
| Net expenses | 11,396,314 | 2,136,364 | 8,536,131 | |||||||||||
| NET INVESTMENT INCOME | 88,839,711 | 12,326,325 | 27,276,360 | |||||||||||
| Realized and unrealized gain (loss): | ||||||||||||||
Net realized gain (loss) from: | ||||||||||||||
Investments | (3,118,708 | ) | (447,597 | ) | 6,421,585 | |||||||||
Swap contracts | 180,423 | — | — | |||||||||||
Net change in unrealized gain on: | ||||||||||||||
Investments | 160,769,483 | 17,726,990 | 12,964,626 | |||||||||||
Swap contracts | 41,812 | — | — | |||||||||||
| Net realized and unrealized gain | 157,873,010 | 17,279,393 | 19,386,211 | |||||||||||
| NET INCREASE IN NET ASSETS RESULTING FROM OPERATIONS | $ | 246,712,721 | $ | 29,605,718 | $ | 46,662,571 | ||||||||
| (a) | Class specific Distribution and Service, and Transfer Agent fees were as follows: |
| Distribution and Service Fees | Transfer Agent Fees | |||||||||||||||||||||||||||||||||||
Fund | Class A | Class B | Class C | Class A | Class B | Class C | Institutional | Service | Class IR | |||||||||||||||||||||||||||
High Yield Municipal | $ | 444,907 | $ | 56,322 | $ | 518,787 | $ | 231,351 | $ | 7,322 | $ | 67,442 | $ | 624,540 | $ | — | $ | 2,310 | ||||||||||||||||||
Municipal Income | 439,962 | 27,171 | 135,084 | 228,780 | 3,532 | 17,561 | 45,217 | 10 | 1,519 | |||||||||||||||||||||||||||
Short Duration Tax-Free | 1,217,450 | 144 | 268,354 | 633,072 | 19 | 34,886 | 475,270 | 909 | 9,124 | |||||||||||||||||||||||||||
| The accompanying notes are an integral part of these financial statements. | 79 |
GOLDMAN SACHS MUNICIPAL FIXED INCOME FUNDS
Statements of Changes in Net Assets
| High Yield Municipal Fund | ||||||||||
| For the Six Months Ended September 30, 2012 (Unaudited) | For the Fiscal Year Ended March 31, 2012 | |||||||||
| From operations: | ||||||||||
Net investment income | $ | 88,839,711 | $ | 180,655,698 | ||||||
Net realized gain (loss) | (2,938,285 | ) | (75,623,947 | ) | ||||||
Net change in unrealized gain | 160,811,295 | 408,376,520 | ||||||||
| Net increase in net assets resulting from operations | 246,712,721 | 513,408,271 | ||||||||
| Distributions to shareholders: | ||||||||||
From net investment income | ||||||||||
Class A Shares | (8,021,425 | ) | (17,144,055 | ) | ||||||
Class B Shares | (211,685 | ) | (574,804 | ) | ||||||
Class C Shares | (1,946,874 | ) | (4,259,466 | ) | ||||||
Institutional Shares | (74,794,069 | ) | (150,607,737 | ) | ||||||
Service Shares | — | — | ||||||||
Class IR Shares | (84,158 | ) | (94,950 | ) | ||||||
| Total distributions to shareholders | (85,058,211 | ) | (172,681,012 | ) | ||||||
| From share transactions: | ||||||||||
Proceeds from sales of shares | 399,164,293 | 641,524,125 | ||||||||
Reinvestment of distributions | 79,891,160 | 159,220,985 | ||||||||
Cost of shares redeemed | (298,238,237 | )(a) | (808,921,612 | )(b) | ||||||
| Net increase (decrease) in net assets resulting from share transactions | 180,817,216 | (8,176,502 | ) | |||||||
| TOTAL INCREASE | 342,471,726 | 332,550,757 | ||||||||
| Net assets: | ||||||||||
Beginning of period | 3,420,819,817 | 3,088,269,060 | ||||||||
End of period | $ | 3,763,291,543 | $ | 3,420,819,817 | ||||||
| Undistributed net investment income | $ | 46,862,298 | $ | 43,080,798 | ||||||
| (a) | Net of $18,553 of redemption fees. |
| (b) | Net of $94,111 of redemption fees. |
| 80 | The accompanying notes are an integral part of these financial statements. |
GOLDMAN SACHS MUNICIPAL FIXED INCOME FUNDS
| Municipal Income Fund | Short Duration Tax-Free Fund | |||||||||||||||||||||
| For the Six Months Ended September 30, 2012 (Unaudited) | For the Fiscal Year Ended March 31, 2012 | For the Six Months Ended September 30, 2012 (Unaudited) | For the Fiscal Year Ended March 31, 2012 | |||||||||||||||||||
| $ | 12,326,325 | $ | 25,531,631 | $ | 27,276,360 | $ | 52,693,925 | |||||||||||||||
| (447,597 | ) | (1,286,773 | ) | 6,421,585 | 346,010 | |||||||||||||||||
| 17,726,990 | 57,914,303 | 12,964,626 | 41,810,988 | |||||||||||||||||||
| 29,605,718 | 82,159,161 | 46,662,571 | 94,850,923 | |||||||||||||||||||
| (6,622,780 | ) | (14,206,265 | ) | (6,586,562 | ) | (14,062,879 | ) | |||||||||||||||
| (82,036 | ) | (211,306 | ) | (109 | ) | (627 | ) | |||||||||||||||
| (406,958 | ) | (838,129 | ) | (255,434 | ) | (547,548 | ) | |||||||||||||||
| (4,637,979 | ) | (9,757,565 | ) | (20,093,426 | ) | (37,218,616 | ) | |||||||||||||||
| (885 | ) | (3,260 | ) | (27,850 | ) | (179,393 | ) | |||||||||||||||
| (46,194 | ) | (25,471 | ) | (111,472 | ) | (55,328 | ) | |||||||||||||||
| (11,796,832 | ) | (25,041,996 | ) | (27,074,853 | ) | (52,064,391 | ) | |||||||||||||||
| 74,057,092 | 158,087,648 | 1,305,431,866 | 2,234,832,473 | |||||||||||||||||||
| 10,039,135 | 20,641,589 | 21,952,708 | 38,813,816 | |||||||||||||||||||
| (83,960,799 | ) | (210,274,490 | ) | (771,238,349 | ) | (1,519,686,302 | ) | |||||||||||||||
| 135,428 | (31,545,253 | ) | 556,146,225 | 753,959,987 | ||||||||||||||||||
| 17,944,314 | 25,571,912 | 575,733,943 | 796,746,519 | |||||||||||||||||||
| 604,210,236 | 578,638,324 | 3,207,531,913 | 2,410,785,394 | |||||||||||||||||||
| $ | 622,154,550 | $ | 604,210,236 | $ | 3,783,265,856 | $ | 3,207,531,913 | |||||||||||||||
| $ | 1,517,363 | $ | 987,870 | $ | 1,236,762 | $ | 1,035,255 | |||||||||||||||
| The accompanying notes are an integral part of these financial statements. | 81 |
GOLDMAN SACHS HIGH YIELD MUNICIPAL FUND
Financial Highlights
Selected Data for a Share Outstanding Throughout Each Period
| Income (loss) from investment operations | Distributions to shareholders | |||||||||||||||||||||||||||||
| Year - Share Class | Net asset value, beginning of period | Net investment income(a) | Net realized and unrealized gain (loss) | Total from investment operations | From net investment income | From net realized gains | Total distributions | |||||||||||||||||||||||
| FOR THE SIX MONTHS ENDED SEPTEMBER 30, (UNAUDITED) | ||||||||||||||||||||||||||||||
2012 - A | $ | 8.90 | $ | 0.22 | $ | 0.41 | $ | 0.63 | $ | (0.21 | ) | $ | — | $ | (0.21 | ) | ||||||||||||||
2012 - B | 8.91 | 0.18 | 0.40 | 0.58 | (0.17 | ) | — | (0.17 | ) | |||||||||||||||||||||
2012 - C | 8.90 | 0.18 | 0.41 | 0.59 | (0.17 | ) | — | (0.17 | ) | |||||||||||||||||||||
2012 - Institutional | 8.91 | 0.23 | 0.40 | 0.63 | (0.22 | ) | — | (0.22 | ) | |||||||||||||||||||||
2012 - IR | 8.91 | 0.23 | 0.40 | 0.63 | (0.22 | ) | — | (0.22 | ) | |||||||||||||||||||||
| FOR THE FISCAL YEARS ENDED MARCH 31, | ||||||||||||||||||||||||||||||
2012 - A | 8.00 | 0.46 | 0.88 | 1.34 | (0.44 | ) | — | (0.44 | ) | |||||||||||||||||||||
2012 - B | 8.00 | 0.40 | 0.88 | 1.28 | (0.37 | ) | — | (0.37 | ) | |||||||||||||||||||||
2012 - C | 8.00 | 0.40 | 0.88 | 1.28 | (0.38 | ) | — | (0.38 | ) | |||||||||||||||||||||
2012 - Institutional | 8.00 | 0.49 | 0.88 | 1.37 | (0.46 | ) | — | (0.46 | ) | |||||||||||||||||||||
2012 - IR | 8.00 | 0.47 | 0.90 | 1.37 | (0.46 | ) | — | (0.46 | ) | |||||||||||||||||||||
2011 - A | 8.45 | 0.46 | (0.47 | ) | (0.01 | ) | (0.44 | ) | — | (0.44 | ) | |||||||||||||||||||
2011 - B | 8.45 | 0.40 | (0.47 | ) | (0.07 | ) | (0.38 | ) | — | (0.38 | ) | |||||||||||||||||||
2011 - C | 8.45 | 0.40 | (0.47 | ) | (0.07 | ) | (0.38 | ) | — | (0.38 | ) | |||||||||||||||||||
2011 - Institutional | 8.45 | 0.49 | (0.47 | ) | 0.02 | (0.47 | ) | — | (0.47 | ) | ||||||||||||||||||||
2011 - IR (Commenced July 30, 2010) | 8.57 | 0.33 | (0.58 | ) | (0.25 | ) | (0.32 | ) | — | (0.32 | ) | |||||||||||||||||||
2010 - A | 7.00 | 0.48 | 1.43 | 1.91 | (0.46 | ) | — | (0.46 | ) | |||||||||||||||||||||
2010 - B | 7.00 | 0.42 | 1.43 | 1.85 | (0.40 | ) | — | (0.40 | ) | |||||||||||||||||||||
2010 - C | 7.00 | 0.42 | 1.43 | 1.85 | (0.40 | ) | — | (0.40 | ) | |||||||||||||||||||||
2010 - Institutional | 7.00 | 0.50 | 1.44 | 1.94 | (0.49 | ) | — | (0.49 | ) | |||||||||||||||||||||
2009 - A | 9.77 | 0.50 | (2.78 | ) | (2.28 | ) | (0.49 | ) | — | (0.49 | ) | |||||||||||||||||||
2009 - B | 9.77 | 0.43 | (2.78 | ) | (2.35 | ) | (0.42 | ) | — | (0.42 | ) | |||||||||||||||||||
2009 - C | 9.77 | 0.43 | (2.78 | ) | (2.35 | ) | (0.42 | ) | — | (0.42 | ) | |||||||||||||||||||
2009 - Institutional | 9.77 | 0.53 | (2.78 | ) | (2.25 | ) | (0.52 | ) | — | (0.52 | ) | |||||||||||||||||||
| FOR THE PERIOD NOVEMBER 1, 2007 TO MARCH 31, 2008* | ||||||||||||||||||||||||||||||
2008 - A | 10.78 | 0.22 | (1.02 | ) | (0.80 | ) | (0.21 | ) | — | (0.21 | ) | |||||||||||||||||||
2008 - B | 10.78 | 0.18 | (1.01 | ) | (0.83 | ) | (0.18 | ) | — | (0.18 | ) | |||||||||||||||||||
2008 - C | 10.78 | 0.18 | (1.01 | ) | (0.83 | ) | (0.18 | ) | — | (0.18 | ) | |||||||||||||||||||
2008 - Institutional | 10.78 | 0.23 | (1.01 | ) | (0.78 | ) | (0.23 | ) | — | (0.23 | ) | |||||||||||||||||||
| FOR THE FISCAL YEAR ENDED OCTOBER 31, | ||||||||||||||||||||||||||||||
2007 - A | 11.57 | 0.51 | (0.76 | ) | (0.25 | ) | (0.50 | ) | (0.04 | ) | (0.54 | ) | ||||||||||||||||||
2007 - B | 11.57 | 0.43 | (0.76 | ) | (0.33 | ) | (0.42 | ) | (0.04 | ) | (0.46 | ) | ||||||||||||||||||
2007 - C | 11.57 | 0.42 | (0.75 | ) | (0.33 | ) | (0.42 | ) | (0.04 | ) | (0.46 | ) | ||||||||||||||||||
2007 - Institutional | 11.57 | 0.55 | (0.76 | ) | (0.21 | ) | (0.54 | ) | (0.04 | ) | (0.58 | ) | ||||||||||||||||||
| * | The Fund changed its fiscal year end from October 31 to March 31. |
| (a) | Calculated based on the average shares outstanding methodology. |
| (b) | Assumes investment at the net asset value at the beginning of the period, reinvestment of all distributions, a complete redemption of the investment at the net asset value at the end of the period and no sales or redemption charges. Total returns would be reduced if a sales or redemption charge was taken into account. Returns do not reflect the deduction of taxes that a shareholder would pay on Fund distributions or the redemption of Fund shares. Total returns for periods less than one full year are not annualized. |
| (c) | The Fund’s portfolio turnover rate is calculated in accordance with regulatory requirements, without regard to transactions involving short term investments and certain derivatives. If such transactions were included, the Fund’s portfolio turnover rate may be higher. |
| (d) | Annualized. |
| 82 | The accompanying notes are an integral part of these financial statements. |
GOLDMAN SACHS HIGH YIELD MUNICIPAL FUND
| Net asset value, end of period | Total return(b) | Net assets, end of period (in 000s) | Ratio of to average net assets | Ratio of to average net assets | Ratio of total expenses to average net assets (including interest expense and fees) | Ratio of net assets | Ratio of net investment income to average net assets | Portfolio turnover rate(c) | ||||||||||||||||||||||||||||||||||||||||||||
| $ | 9.32 | 7.09 | % | $ | 361,539 | 0.86 | %(d) | 0.86 | %(d) | 0.92 | %(d) | 0.92 | %(d) | 4.70 | %(d) | 11 | % | |||||||||||||||||||||||||||||||||||
| 9.32 | 6.57 | 10,358 | 1.61 | (d) | 1.61 | (d) | 1.67 | (d) | 1.67 | (d) | 3.96 | (d) | 11 | |||||||||||||||||||||||||||||||||||||||
| 9.32 | 6.69 | 107,646 | 1.61 | (d) | 1.61 | (d) | 1.67 | (d) | 1.67 | (d) | 3.95 | (d) | 11 | |||||||||||||||||||||||||||||||||||||||
| 9.32 | 7.12 | 3,279,723 | 0.57 | (d) | 0.57 | (d) | 0.58 | (d) | 0.58 | (d) | 4.98 | (d) | 11 | |||||||||||||||||||||||||||||||||||||||
| 9.32 | 7.10 | 4,026 | 0.61 | (d) | 0.61 | (d) | 0.67 | (d) | 0.67 | (d) | 4.93 | (d) | 11 | |||||||||||||||||||||||||||||||||||||||
| 8.90 | 17.08 | 348,577 | 0.88 | 0.88 | 0.94 | 0.94 | 5.42 | 27 | ||||||||||||||||||||||||||||||||||||||||||||
| 8.91 | 16.33 | 11,505 | 1.63 | 1.63 | 1.69 | 1.69 | 4.70 | 27 | ||||||||||||||||||||||||||||||||||||||||||||
| 8.90 | 16.21 | 99,817 | 1.63 | 1.63 | 1.69 | 1.69 | 4.67 | 27 | ||||||||||||||||||||||||||||||||||||||||||||
| 8.91 | 17.55 | 2,957,868 | 0.58 | 0.58 | 0.60 | 0.60 | 5.72 | 27 | ||||||||||||||||||||||||||||||||||||||||||||
| 8.91 | 17.50 | 3,054 | 0.63 | 0.63 | 0.69 | 0.69 | 5.49 | 27 | ||||||||||||||||||||||||||||||||||||||||||||
| 8.00 | (0.24 | ) | 326,886 | 0.91 | 0.91 | 0.93 | 0.93 | 5.46 | 28 | |||||||||||||||||||||||||||||||||||||||||||
| 8.00 | (0.99 | ) | 14,113 | 1.66 | 1.66 | 1.68 | 1.68 | 4.70 | 28 | |||||||||||||||||||||||||||||||||||||||||||
| 8.00 | (0.87 | ) | 96,011 | 1.66 | 1.66 | 1.68 | 1.68 | 4.71 | 28 | |||||||||||||||||||||||||||||||||||||||||||
| 8.00 | 0.09 | 2,650,808 | 0.57 | 0.57 | 0.59 | 0.59 | 5.80 | 28 | ||||||||||||||||||||||||||||||||||||||||||||
| 8.00 | (3.06 | ) | 451 | 0.66 | (d) | 0.66 | (d) | 0.68 | (d) | 0.68 | (d) | 6.08 | (d) | 28 | ||||||||||||||||||||||||||||||||||||||
| 8.45 | 27.93 | 438,134 | 0.91 | 0.91 | 0.94 | 0.94 | 6.15 | 31 | ||||||||||||||||||||||||||||||||||||||||||||
| 8.45 | 26.99 | 21,083 | 1.66 | 1.66 | 1.69 | 1.69 | 5.33 | 31 | ||||||||||||||||||||||||||||||||||||||||||||
| 8.45 | 26.84 | 118,070 | 1.66 | 1.66 | 1.69 | 1.69 | 5.28 | 31 | ||||||||||||||||||||||||||||||||||||||||||||
| 8.45 | 28.37 | 3,108,202 | 0.57 | 0.57 | 0.60 | 0.60 | 6.18 | 31 | ||||||||||||||||||||||||||||||||||||||||||||
| 7.00 | (23.97 | ) | 1,049,054 | 0.91 | 0.91 | 0.93 | 0.93 | 5.76 | 57 | |||||||||||||||||||||||||||||||||||||||||||
| 7.00 | (24.55 | ) | 22,705 | 1.66 | 1.66 | 1.68 | 1.68 | 5.08 | 57 | |||||||||||||||||||||||||||||||||||||||||||
| 7.00 | (24.55 | ) | 94,113 | 1.66 | 1.66 | 1.68 | 1.68 | 5.09 | 57 | |||||||||||||||||||||||||||||||||||||||||||
| 7.00 | (23.71 | ) | 868,537 | 0.57 | 0.57 | 0.59 | 0.59 | 6.08 | 57 | |||||||||||||||||||||||||||||||||||||||||||
| 9.77 | (7.45 | ) | 2,787,779 | 0.91 | (d) | 0.90 | (d) | 0.93 | (d) | 0.92 | (d) | 5.07 | (d) | 16 | ||||||||||||||||||||||||||||||||||||||
| 9.77 | (7.74 | ) | 44,026 | 1.66 | (d) | 1.65 | (d) | 1.68 | (d) | 1.67 | (d) | 4.30 | (d) | 16 | ||||||||||||||||||||||||||||||||||||||
| 9.77 | (7.74 | ) | 162,459 | 1.66 | (d) | 1.65 | (d) | 1.68 | (d) | 1.67 | (d) | 4.31 | (d) | 16 | ||||||||||||||||||||||||||||||||||||||
| 9.77 | (7.32 | ) | 2,578,017 | 0.57 | (d) | 0.56 | (d) | 0.59 | (d) | 0.58 | (d) | 5.42 | (d) | 16 | ||||||||||||||||||||||||||||||||||||||
| 10.78 | (2.27 | ) | 3,984,269 | 1.00 | 0.91 | 1.02 | 0.93 | 4.50 | 56 | |||||||||||||||||||||||||||||||||||||||||||
| 10.78 | (3.00 | ) | 53,384 | 1.75 | 1.66 | 1.77 | 1.68 | 3.76 | 56 | |||||||||||||||||||||||||||||||||||||||||||
| 10.78 | (3.00 | ) | 200,199 | 1.75 | 1.66 | 1.77 | 1.68 | 3.76 | 56 | |||||||||||||||||||||||||||||||||||||||||||
| 10.78 | (1.92 | ) | 3,738,472 | 0.64 | 0.55 | 0.66 | 0.57 | 4.86 | 56 | |||||||||||||||||||||||||||||||||||||||||||
| The accompanying notes are an integral part of these financial statements. | 83 |
GOLDMAN SACHS MUNICIPAL INCOME FUND
Financial Highlights
Selected Data for a Share Outstanding Throughout Each Period
| Income (loss) from investment operations | ||||||||||||||||||||||
| Year - Share Class | Net asset value, beginning of period | Net investment income(a) | Net realized and unrealized gain (loss) | Total from investment operations | Distributions to shareholders from net investment income | |||||||||||||||||
| FOR THE SIX MONTHS ENDED SEPTEMBER 30, (UNAUDITED) | ||||||||||||||||||||||
2012 - A | $ | 15.73 | $ | 0.31 | $ | 0.45 | $ | 0.76 | $ | (0.30 | ) | |||||||||||
2012 - B | 15.73 | 0.26 | 0.44 | 0.70 | (0.24 | ) | ||||||||||||||||
2012 - C | 15.73 | 0.25 | 0.45 | 0.70 | (0.24 | ) | ||||||||||||||||
2012 - Institutional | 15.72 | 0.34 | 0.46 | 0.80 | (0.33 | ) | ||||||||||||||||
2012 - Service | 15.80 | 0.30 | 0.46 | 0.76 | (0.29 | ) | ||||||||||||||||
2012 - IR | 15.71 | 0.33 | 0.45 | 0.78 | (0.32 | ) | ||||||||||||||||
| FOR THE FISCAL YEARS ENDED MARCH 31, | ||||||||||||||||||||||
2012 - A | 14.25 | 0.65 | 1.47 | 2.12 | (0.64 | ) | ||||||||||||||||
2012 - B | 14.25 | 0.54 | 1.46 | 2.00 | (0.52 | ) | ||||||||||||||||
2012 - C | 14.25 | 0.54 | 1.46 | 2.00 | (0.52 | ) | ||||||||||||||||
2012 - Institutional | 14.25 | 0.70 | 1.46 | 2.16 | (0.69 | ) | ||||||||||||||||
2012 - Service | 14.32 | 0.63 | 1.47 | 2.10 | (0.62 | ) | ||||||||||||||||
2012 - IR | 14.26 | 0.68 | 1.44 | 2.12 | (0.67 | ) | ||||||||||||||||
2011 - A | 14.83 | 0.63 | (0.59 | ) | 0.04 | (0.62 | ) | |||||||||||||||
2011 - B | 14.83 | 0.52 | (0.59 | ) | (0.07 | ) | (0.51 | ) | ||||||||||||||
2011 - C | 14.84 | 0.52 | (0.60 | ) | (0.08 | ) | (0.51 | ) | ||||||||||||||
2011 - Institutional | 14.83 | 0.68 | (0.59 | ) | 0.09 | (0.67 | ) | |||||||||||||||
2011 - Service | 14.91 | 0.61 | (0.60 | ) | 0.01 | (0.60 | ) | |||||||||||||||
2011 - IR (Commenced July 30, 2010) | 15.06 | 0.45 | (0.80 | ) | (0.35 | ) | (0.45 | ) | ||||||||||||||
2010 - A | 13.39 | 0.64 | 1.43 | 2.07 | (0.63 | ) | ||||||||||||||||
2010 - B | 13.40 | 0.53 | 1.43 | 1.96 | (0.53 | ) | ||||||||||||||||
2010 - C | 13.40 | 0.53 | 1.44 | 1.97 | (0.53 | ) | ||||||||||||||||
2010 - Institutional | 13.39 | 0.69 | 1.43 | 2.12 | (0.68 | ) | ||||||||||||||||
2010 - Service | 13.47 | 0.61 | 1.44 | 2.05 | (0.61 | ) | ||||||||||||||||
2009 - A | 14.64 | 0.63 | (1.25 | ) | (0.62 | ) | (0.63 | ) | ||||||||||||||
2009 - B | 14.64 | 0.53 | (1.24 | ) | (0.71 | ) | (0.53 | ) | ||||||||||||||
2009 - C | 14.64 | 0.53 | (1.24 | ) | (0.71 | ) | (0.53 | ) | ||||||||||||||
2009 - Institutional | 14.64 | 0.68 | (1.25 | ) | (0.57 | ) | (0.68 | ) | ||||||||||||||
2009 - Service | 14.72 | 0.62 | (1.26 | ) | (0.64 | ) | (0.61 | ) | ||||||||||||||
| FOR THE PERIOD NOVEMBER 1, 2007 TO MARCH 31, 2008* | ||||||||||||||||||||||
2008 - A | 15.23 | 0.26 | (0.59 | ) | (0.33 | ) | (0.26 | ) | ||||||||||||||
2008 - B | 15.24 | 0.21 | (0.60 | ) | (0.39 | ) | (0.21 | ) | ||||||||||||||
2008 - C | 15.24 | 0.21 | (0.60 | ) | (0.39 | ) | (0.21 | ) | ||||||||||||||
2008 - Institutional | 15.23 | 0.28 | (0.59 | ) | (0.31 | ) | (0.28 | ) | ||||||||||||||
2008 - Service | 15.32 | 0.25 | (0.60 | ) | (0.35 | ) | (0.25 | ) | ||||||||||||||
| FOR THE FISCAL YEAR ENDED OCTOBER 31, | ||||||||||||||||||||||
2007 - A | 15.80 | 0.62 | (0.57 | ) | 0.05 | (0.62 | ) | |||||||||||||||
2007 - B | 15.81 | 0.51 | (0.58 | ) | (0.07 | ) | (0.50 | ) | ||||||||||||||
2007 - C | 15.81 | 0.51 | (0.58 | ) | (0.07 | ) | (0.50 | ) | ||||||||||||||
2007 - Institutional | 15.80 | 0.68 | (0.57 | ) | 0.11 | (0.68 | ) | |||||||||||||||
2007 - Service | 15.90 | 0.60 | (0.58 | ) | 0.02 | (0.60 | ) | |||||||||||||||
| * | The Fund changed its fiscal year end from October 31 to March 31. |
| (a) | Calculated based on the average shares outstanding methodology. |
| (b) | Assumes investment at the net asset value at the beginning of the period, reinvestment of all distributions, a complete redemption of the investment at the net asset value at the end of the period and no sales or redemption charges. Total returns would be reduced if a sales or redemption charge was taken into account. Returns do not reflect the deduction of taxes that a shareholder would pay on Fund distributions or the redemption of Fund shares. Total returns for periods less than one full year are not annualized. |
| (c) | The Fund’s portfolio turnover rate is calculated in accordance with regulatory requirements, without regard to transactions involving short term investments and certain derivatives. If such transactions were included, the Fund’s portfolio turnover rate may be higher. |
| (d) | Annualized. |
| 84 | The accompanying notes are an integral part of these financial statements. |
GOLDMAN SACHS MUNICIPAL INCOME FUND
| Net asset value, end of period | Total return(b) | Net assets, end of period (in 000s) | Ratio of net expenses to average net assets (including interest expense and fees) | Ratio of net expenses to average net assets (excluding interest expense and fees) | Ratio of total expenses to average net assets (including interest expense and fees) | Ratio of total expenses to average net assets (excluding interest expense and fees) | Ratio of net investment income to average net assets | Portfolio turnover rate(c) | ||||||||||||||||||||||||||||||||||||||||||||
| $ | 16.19 | 4.87 | % | $ | 355,786 | 0.78 | %(d) | 0.78 | %(d) | 0.98 | %(d) | 0.98 | %(d) | 3.92 | %(d) | 7 | % | |||||||||||||||||||||||||||||||||||
| 16.19 | 4.48 | 5,198 | 1.53 | (d) | 1.53 | (d) | 1.73 | (d) | 1.73 | (d) | 3.18 | (d) | 7 | |||||||||||||||||||||||||||||||||||||||
| 16.19 | 4.48 | 27,900 | 1.53 | (d) | 1.53 | (d) | 1.73 | (d) | 1.73 | (d) | 3.18 | (d) | 7 | |||||||||||||||||||||||||||||||||||||||
| 16.19 | 5.11 | 230,172 | 0.44 | (d) | 0.44 | (d) | 0.64 | (d) | 0.64 | (d) | 4.26 | (d) | 7 | |||||||||||||||||||||||||||||||||||||||
| 16.27 | 4.80 | 42 | 0.94 | (d) | 0.94 | (d) | 1.14 | (d) | 1.14 | (d) | 3.78 | (d) | 7 | |||||||||||||||||||||||||||||||||||||||
| 16.17 | 5.00 | 3,057 | 0.53 | (d) | 0.53 | (d) | 0.73 | (d) | 0.73 | (d) | 4.10 | (d) | 7 | |||||||||||||||||||||||||||||||||||||||
| 15.73 | 15.09 | 348,890 | 0.81 | 0.81 | 0.99 | 0.99 | 4.32 | 9 | ||||||||||||||||||||||||||||||||||||||||||||
| 15.73 | 14.24 | 5,644 | 1.56 | 1.56 | 1.74 | 1.74 | 3.58 | 9 | ||||||||||||||||||||||||||||||||||||||||||||
| 15.73 | 14.24 | 26,448 | 1.56 | 1.56 | 1.74 | 1.74 | 3.56 | 9 | ||||||||||||||||||||||||||||||||||||||||||||
| 15.72 | 15.41 | 221,617 | 0.47 | 0.47 | 0.65 | 0.65 | 4.66 | 9 | ||||||||||||||||||||||||||||||||||||||||||||
| 15.80 | 14.86 | 84 | 0.97 | 0.97 | 1.15 | 1.15 | 4.15 | 9 | ||||||||||||||||||||||||||||||||||||||||||||
| 15.71 | 15.15 | 1,527 | 0.56 | 0.56 | 0.74 | 0.74 | 4.43 | 9 | ||||||||||||||||||||||||||||||||||||||||||||
| 14.25 | 0.20 | 326,083 | 0.88 | 0.88 | 0.98 | 0.98 | 4.26 | 14 | ||||||||||||||||||||||||||||||||||||||||||||
| 14.25 | (0.55 | ) | 6,264 | 1.63 | 1.63 | 1.73 | 1.73 | 3.51 | 14 | |||||||||||||||||||||||||||||||||||||||||||
| 14.25 | (0.61 | ) | 23,443 | 1.63 | 1.63 | 1.73 | 1.73 | 3.52 | 14 | |||||||||||||||||||||||||||||||||||||||||||
| 14.25 | 0.55 | 222,650 | 0.54 | 0.54 | 0.64 | 0.64 | 4.62 | 14 | ||||||||||||||||||||||||||||||||||||||||||||
| 14.32 | (0.03 | ) | 75 | 1.04 | 1.04 | 1.14 | 1.14 | 4.05 | 14 | |||||||||||||||||||||||||||||||||||||||||||
| 14.26 | (2.40 | ) | 123 | 0.63 | (d) | 0.63 | (d) | 0.73 | (d) | 0.73 | (d) | 4.74 | (d) | 14 | ||||||||||||||||||||||||||||||||||||||
| 14.83 | 15.73 | 398,646 | 0.88 | 0.88 | 0.98 | 0.98 | 4.42 | 20 | ||||||||||||||||||||||||||||||||||||||||||||
| 14.83 | 14.77 | 9,480 | 1.63 | 1.63 | 1.73 | 1.73 | 3.69 | 20 | ||||||||||||||||||||||||||||||||||||||||||||
| 14.84 | 14.86 | 26,645 | 1.63 | 1.63 | 1.73 | 1.73 | 3.67 | 20 | ||||||||||||||||||||||||||||||||||||||||||||
| 14.83 | 16.12 | 200,596 | 0.54 | 0.54 | 0.64 | 0.64 | 4.77 | 20 | ||||||||||||||||||||||||||||||||||||||||||||
| 14.91 | 15.44 | 207 | 1.04 | 1.04 | 1.14 | 1.14 | 4.25 | 20 | ||||||||||||||||||||||||||||||||||||||||||||
| 13.39 | (4.28 | ) | 333,034 | 0.88 | 0.88 | 0.98 | 0.98 | 4.55 | 49 | |||||||||||||||||||||||||||||||||||||||||||
| 13.40 | (4.92 | ) | 10,305 | 1.63 | 1.63 | 1.73 | 1.73 | 3.80 | 49 | |||||||||||||||||||||||||||||||||||||||||||
| 13.40 | (4.92 | ) | 19,978 | 1.63 | 1.63 | 1.73 | 1.73 | 3.82 | 49 | |||||||||||||||||||||||||||||||||||||||||||
| 13.39 | (3.95 | ) | 187,838 | 0.54 | 0.54 | 0.64 | 0.64 | 4.89 | 49 | |||||||||||||||||||||||||||||||||||||||||||
| 13.47 | (4.39 | ) | 231 | 1.04 | 1.04 | 1.14 | 1.14 | 4.39 | 49 | |||||||||||||||||||||||||||||||||||||||||||
| 14.64 | (2.18 | ) | 402,238 | 0.89 | (d) | 0.88 | (d) | 1.01 | (d) | 1.00 | (d) | 4.19 | (d) | 19 | ||||||||||||||||||||||||||||||||||||||
| 14.64 | (2.55 | ) | 11,646 | 1.64 | (d) | 1.63 | (d) | 1.76 | (d) | 1.75 | (d) | 3.44 | (d) | 19 | ||||||||||||||||||||||||||||||||||||||
| 14.64 | (2.55 | ) | 20,474 | 1.64 | (d) | 1.63 | (d) | 1.76 | (d) | 1.75 | (d) | 3.46 | (d) | 19 | ||||||||||||||||||||||||||||||||||||||
| 14.64 | (2.04 | ) | 245,843 | 0.55 | (d) | 0.54 | (d) | 0.67 | (d) | 0.66 | (d) | 4.53 | (d) | 19 | ||||||||||||||||||||||||||||||||||||||
| 14.72 | (2.29 | ) | 582 | 1.05 | (d) | 1.04 | (d) | 1.17 | (d) | 1.16 | (d) | 4.03 | (d) | 19 | ||||||||||||||||||||||||||||||||||||||
| 15.23 | 0.31 | 381,697 | 0.96 | 0.90 | 1.07 | 1.01 | 3.99 | 31 | ||||||||||||||||||||||||||||||||||||||||||||
| 15.24 | (0.43 | ) | 12,210 | 1.71 | 1.65 | 1.82 | 1.76 | 3.24 | 31 | |||||||||||||||||||||||||||||||||||||||||||
| 15.24 | (0.43 | ) | 14,783 | 1.71 | 1.65 | 1.82 | 1.76 | 3.24 | 31 | |||||||||||||||||||||||||||||||||||||||||||
| 15.23 | 0.67 | 289,188 | 0.60 | 0.54 | 0.71 | 0.65 | 4.37 | 31 | ||||||||||||||||||||||||||||||||||||||||||||
| 15.32 | 0.13 | 606 | 1.10 | 1.04 | 1.21 | 1.15 | 3.85 | 31 | ||||||||||||||||||||||||||||||||||||||||||||
| The accompanying notes are an integral part of these financial statements. | 85 |
GOLDMAN SACHS SHORT DURATION TAX-FREE FUND
Financial Highlights
Selected Data for a Share Outstanding Throughout Each Period
| Income (loss) from investment operations | ||||||||||||||||||||||
| Year - Share Class | Net asset value, beginning of period | Net investment income(a) | Net realized and unrealized gain (loss) | Total from investment operations | Distributions to shareholders from net investment income | |||||||||||||||||
| FOR THE SIX MONTHS ENDED SEPTEMBER 30, (UNAUDITED) | ||||||||||||||||||||||
2012 - A | $ | 10.62 | $ | 0.07 | $ | 0.06 | $ | 0.13 | $ | (0.07 | ) | |||||||||||
2012 - B | 10.61 | 0.04 | 0.06 | 0.10 | (0.04 | ) | ||||||||||||||||
2012 - C | 10.62 | 0.05 | 0.06 | 0.11 | (0.05 | ) | ||||||||||||||||
2012 - Institutional | 10.61 | 0.09 | 0.06 | 0.15 | (0.09 | ) | ||||||||||||||||
2012 - Service | 10.61 | 0.07 | 0.05 | 0.12 | (0.06 | ) | ||||||||||||||||
2012 - IR | 10.61 | 0.08 | 0.07 | 0.15 | (0.09 | ) | ||||||||||||||||
| FOR THE FISCAL YEARS ENDED MARCH 31, | ||||||||||||||||||||||
2012 - A | 10.44 | 0.18 | 0.18 | 0.36 | (0.18 | ) | ||||||||||||||||
2012 - B | 10.43 | 0.12 | 0.18 | 0.30 | (0.12 | ) | ||||||||||||||||
2012 - C | 10.44 | 0.14 | 0.18 | 0.32 | (0.14 | ) | ||||||||||||||||
2012 - Institutional | 10.44 | 0.22 | 0.17 | 0.39 | (0.22 | ) | ||||||||||||||||
2012 - Service | 10.43 | 0.17 | 0.17 | 0.34 | (0.16 | ) | ||||||||||||||||
2012 - IR | 10.44 | 0.19 | 0.19 | 0.38 | (0.21 | ) | ||||||||||||||||
2011 - A | 10.46 | 0.18 | (0.02 | ) | 0.16 | (0.18 | ) | |||||||||||||||
2011 - B | 10.45 | 0.12 | (0.03 | ) | 0.09 | (0.11 | ) | |||||||||||||||
2011 - C | 10.46 | 0.12 | (0.02 | ) | 0.10 | (0.12 | ) | |||||||||||||||
2011 - Institutional | 10.46 | 0.22 | (0.03 | ) | 0.19 | (0.21 | ) | |||||||||||||||
2011 - Service | 10.46 | 0.17 | (0.04 | ) | 0.13 | (0.16 | ) | |||||||||||||||
2011 - IR (Commenced July 30, 2010) | 10.56 | 0.14 | (0.12 | ) | 0.02 | (0.14 | ) | |||||||||||||||
2010 - A | 10.25 | 0.19 | 0.23 | 0.42 | (0.21 | ) | ||||||||||||||||
2010 - B | 10.24 | 0.15 | 0.20 | 0.35 | (0.14 | ) | ||||||||||||||||
2010 - C | 10.25 | 0.12 | 0.22 | 0.34 | (0.13 | ) | ||||||||||||||||
2010 - Institutional | 10.25 | 0.22 | 0.23 | 0.45 | (0.24 | ) | ||||||||||||||||
2010 - Service | 10.24 | 0.15 | 0.26 | 0.41 | (0.19 | ) | ||||||||||||||||
2009 - A | 10.25 | 0.30 | — | (e) | 0.30 | (0.30 | ) | |||||||||||||||
2009 - B | 10.24 | 0.25 | (0.01 | ) | 0.24 | (0.24 | ) | |||||||||||||||
2009 - C | 10.25 | 0.22 | 0.01 | 0.23 | (0.23 | ) | ||||||||||||||||
2009 - Institutional | 10.25 | 0.34 | — | (e) | 0.34 | (0.34 | ) | |||||||||||||||
2009 - Service | 10.24 | 0.29 | — | (e) | 0.29 | (0.29 | ) | |||||||||||||||
| FOR THE PERIOD NOVEMBER 1, 2007 TO MARCH 31, 2008* | ||||||||||||||||||||||
2008 - A | 10.16 | 0.14 | 0.09 | 0.23 | (0.14 | ) | ||||||||||||||||
2008 - B | 10.15 | 0.11 | 0.09 | 0.20 | (0.11 | ) | ||||||||||||||||
2008 - C | 10.16 | 0.11 | 0.09 | 0.20 | (0.11 | ) | ||||||||||||||||
2008 - Institutional | 10.16 | 0.15 | 0.09 | 0.24 | (0.15 | ) | ||||||||||||||||
2008 - Service | 10.15 | 0.13 | 0.09 | 0.22 | (0.13 | ) | ||||||||||||||||
| FOR THE FISCAL YEAR ENDED OCTOBER 31, | ||||||||||||||||||||||
2007 - A | 10.20 | 0.33 | (0.04 | ) | 0.29 | (0.33 | ) | |||||||||||||||
2007 - B | 10.19 | 0.27 | (0.04 | ) | 0.23 | (0.27 | ) | |||||||||||||||
2007 - C | 10.20 | 0.26 | (0.05 | ) | 0.21 | (0.25 | ) | |||||||||||||||
2007 - Institutional | 10.19 | 0.37 | (0.04 | ) | 0.33 | (0.36 | ) | |||||||||||||||
2007 - Service | 10.19 | 0.32 | (0.05 | ) | 0.27 | (0.31 | ) | |||||||||||||||
| * | The Fund changed its fiscal year end from October 31 to March 31. |
| (a) | Calculated based on the average shares outstanding methodology. |
| (b) | Assumes investment at the net asset value at the beginning of the period, reinvestment of all distributions, a complete redemption of the investment at the net asset value at the end of the period and no sales or redemption charges. Total returns would be reduced if a sales or redemption charge was taken into account. Returns do not reflect the deduction of taxes that a shareholder would pay on Fund distributions or the redemption of Fund shares. Total returns for periods less than one full year are not annualized. |
| (c) | The Fund’s portfolio turnover rate is calculated in accordance with regulatory requirements, without regard to transactions involving short term investments and certain derivatives. If such transactions were included, the Fund’s portfolio turnover rate may be higher. |
| (d) | Annualized. |
| (e) | Amount is less than $0.005 per share. |
| 86 | The accompanying notes are an integral part of these financial statements. |
Net asset of period | Total return(b) | Net assets, end of period (in 000s) | Ratio of net expenses to average net assets | Ratio of total expenses to average net assets | Ratio of to average net assets | Portfolio turnover rate(c) | ||||||||||||||||||||||||||||||||||
| $ | 10.68 | 1.25 | % | $ | 1,045,187 | 0.73 | %(d) | 0.76 | %(d) | 1.36 | %(d) | 10 | % | |||||||||||||||||||||||||||
| 10.67 | 0.94 | 24 | 1.33 | (d) | 1.51 | (d) | 0.77 | (d) | 10 | |||||||||||||||||||||||||||||||
| 10.68 | 1.05 | 55,823 | 1.13 | (d) | 1.51 | (d) | 0.96 | (d) | 10 | |||||||||||||||||||||||||||||||
| 10.67 | 1.42 | 2,662,438 | 0.39 | (d) | 0.42 | (d) | 1.70 | (d) | 10 | |||||||||||||||||||||||||||||||
| 10.67 | 1.17 | 2,313 | 0.89 | (d) | 0.92 | (d) | 1.24 | (d) | 10 | |||||||||||||||||||||||||||||||
| 10.67 | 1.38 | 17,481 | 0.48 | (d) | 0.51 | (d) | 1.59 | (d) | 10 | |||||||||||||||||||||||||||||||
| 10.62 | 3.46 | 945,940 | 0.73 | 0.77 | 1.72 | 24 | ||||||||||||||||||||||||||||||||||
| 10.61 | 2.84 | 31 | 1.33 | 1.52 | 1.16 | 24 | ||||||||||||||||||||||||||||||||||
| 10.62 | 3.05 | 48,865 | 1.13 | 1.52 | 1.32 | 24 | ||||||||||||||||||||||||||||||||||
| 10.61 | 3.72 | 2,195,766 | 0.39 | 0.43 | 2.05 | 24 | ||||||||||||||||||||||||||||||||||
| 10.61 | 3.31 | 6,362 | 0.89 | 0.93 | 1.63 | 24 | ||||||||||||||||||||||||||||||||||
| 10.61 | 3.62 | 10,568 | 0.48 | 0.52 | 1.83 | 24 | ||||||||||||||||||||||||||||||||||
| 10.44 | 1.52 | 775,171 | 0.73 | 0.77 | 1.71 | 34 | ||||||||||||||||||||||||||||||||||
| 10.43 | 0.91 | 91 | 1.33 | 1.52 | 1.10 | 34 | ||||||||||||||||||||||||||||||||||
| 10.44 | 0.94 | 41,115 | 1.31 | 1.53 | 1.14 | 34 | ||||||||||||||||||||||||||||||||||
| 10.44 | 1.86 | 1,576,602 | 0.39 | 0.43 | 2.05 | 34 | ||||||||||||||||||||||||||||||||||
| 10.43 | 1.26 | 17,730 | 0.89 | 0.93 | 1.57 | 34 | ||||||||||||||||||||||||||||||||||
| 10.44 | 0.17 | 77 | 0.48 | (d) | 0.52 | (d) | 1.97 | (d) | 34 | |||||||||||||||||||||||||||||||
| 10.46 | 4.09 | 982,297 | 0.73 | 0.79 | 1.84 | 11 | ||||||||||||||||||||||||||||||||||
| 10.45 | 3.47 | 314 | 1.33 | 1.54 | 1.42 | 11 | ||||||||||||||||||||||||||||||||||
| 10.46 | 3.31 | 41,959 | 1.48 | 1.54 | 1.14 | 11 | ||||||||||||||||||||||||||||||||||
| 10.46 | 4.44 | 1,291,972 | 0.39 | 0.45 | 2.16 | 11 | ||||||||||||||||||||||||||||||||||
| 10.46 | 4.01 | 43,518 | 0.89 | 0.95 | 1.39 | 11 | ||||||||||||||||||||||||||||||||||
| 10.25 | 3.02 | 303,446 | 0.73 | 0.85 | 2.96 | 33 | ||||||||||||||||||||||||||||||||||
| 10.24 | 2.41 | 450 | 1.33 | 1.60 | 2.41 | 33 | ||||||||||||||||||||||||||||||||||
| 10.25 | 2.25 | 17,373 | 1.48 | 1.60 | 2.18 | 33 | ||||||||||||||||||||||||||||||||||
| 10.25 | 3.37 | 260,054 | 0.39 | 0.51 | 3.31 | 33 | ||||||||||||||||||||||||||||||||||
| 10.24 | 2.85 | 54 | 0.89 | 1.01 | 2.82 | 33 | ||||||||||||||||||||||||||||||||||
| 10.25 | 2.24 | 162,590 | 0.73 | (d) | 0.95 | (d) | 3.21 | (d) | 19 | |||||||||||||||||||||||||||||||
| 10.24 | 1.99 | 633 | 1.33 | (d) | 1.70 | (d) | 2.65 | (d) | 19 | |||||||||||||||||||||||||||||||
| 10.25 | 1.93 | 6,742 | 1.48 | (d) | 1.70 | (d) | 2.48 | (d) | 19 | |||||||||||||||||||||||||||||||
| 10.25 | 2.39 | 192,500 | 0.39 | (d) | 0.61 | (d) | 3.57 | (d) | 19 | |||||||||||||||||||||||||||||||
| 10.24 | 2.18 | 51 | 0.89 | (d) | 1.11 | (d) | 3.06 | (d) | 19 | |||||||||||||||||||||||||||||||
| 10.16 | 2.86 | 126,888 | 0.75 | 0.89 | 3.27 | 52 | ||||||||||||||||||||||||||||||||||
| 10.15 | 2.25 | 988 | 1.35 | 1.64 | 2.67 | 52 | ||||||||||||||||||||||||||||||||||
| 10.16 | 2.10 | 4,549 | 1.50 | 1.64 | 2.54 | 52 | ||||||||||||||||||||||||||||||||||
| 10.16 | 3.34 | 207,801 | 0.39 | 0.53 | 3.66 | 52 | ||||||||||||||||||||||||||||||||||
| 10.15 | 2.72 | 50 | 0.89 | 1.03 | 3.14 | 52 | ||||||||||||||||||||||||||||||||||
| The accompanying notes are an integral part of these financial statements. | 87 |
GOLDMAN SACHS MUNICIPAL FIXED INCOME FUNDS
Notes to Financial Statements
September 30, 2012 (Unaudited)
| 1. ORGANIZATION |
Goldman Sachs Trust (the “Trust”) is a Delaware statutory trust registered under the Investment Company Act of 1940, as amended (the “Act”), as an open-end management investment company. The following table lists those series of the Trust that are included in this report (collectively, the “Funds” or individually a “Fund”), along with their corresponding share classes and respective diversification status under the Act:
| Fund | Share Classes Offered* | Diversified/ Non-diversified | ||
High Yield Municipal | A, B, C, Institutional and IR | Non-diversified | ||
Municipal Income and Short Duration Tax-Free | A, B, C, Institutional, Service and IR | Diversified |
| * | Class B Shares are generally no longer available for purchase by current or prospective investors. |
Class A Shares of the High Yield Municipal, Municipal Income and Short Duration Tax-Free Funds are sold with a front-end sales charge of up to 4.50%, 3.75% and 1.50%, respectively. Class B Shares of High Yield Municipal, Municipal Income and Short Duration Tax-Free Funds were sold with a contingent deferred sales charge (“CDSC”) that declines from 5.00% to zero, 5.00% to zero, and 2.00% to zero, respectively, depending upon the period of time that shares are held. Class C Shares of High Yield Municipal, Municipal Income and Short Duration Tax-Free Funds are sold with a CDSC of 1.00%, 1.00% and 0.65%, respectively, which is imposed on redemptions made within 12 months of purchase. Institutional, Service and Class IR Shares are not subject to a sales charge.
Goldman Sachs Asset Management, L.P. (“GSAM”), an affiliate of Goldman, Sachs & Co. (“Goldman Sachs”), serves as investment adviser to the Funds pursuant to management agreements (the “Agreements”) with the Trust.
| 2. SIGNIFICANT ACCOUNTING POLICIES |
The financial statements have been prepared in accordance with accounting principles generally accepted in the United States of America (“GAAP”) and require management to make estimates and assumptions that may affect the reported amounts and disclosures. Actual results may differ from those estimates and assumptions.
A. Investment Valuation — The Funds’ valuation policy is to value investments at fair value.
B. Investment Income and Investments — Investment income includes interest income and dividend income, net of any foreign withholding taxes, less any amounts reclaimable. Interest income is accrued daily and adjusted for amortization of premiums and accretion of discounts. Dividend income is recognized on ex-dividend date or, for certain foreign securities, as soon as such information is obtained subsequent to the ex-dividend date. Investment transactions are reflected on trade date. Realized gains and losses are calculated using identified cost. Investment transactions are recorded on the following business day for daily net asset value (“NAV”) calculations. Any foreign capital gains tax is accrued daily based upon net unrealized gains, and is payable upon sale of such investments.
88
GOLDMAN SACHS MUNICIPAL FIXED INCOME FUNDS
| 2. SIGNIFICANT ACCOUNTING POLICIES (continued) |
For derivatives, realized gains and losses are recorded upon termination of the contract or upon receipt of cash. Upfront payments on swaps are recorded as realized gains or losses and are recognized over the contract’s term/event, with realized gain or losses on forward starting interest rate swaps recognized from the effective start date. For securities with paydown provisions, principal payments received are treated as a proportionate reduction to the cost basis of the securities and excess amounts are recorded as gains. For treasury inflation protected securities (“TIPS”), adjustments to principal due to inflation/deflation are reflected as increases/decreases to interest income with a corresponding adjustment to cost.
C. Class Allocations and Expenses — Investment income, realized and unrealized gain (loss), and non-class specific expenses of each Fund are allocated daily based upon the proportion of net assets of each class. Class specific expenses, where applicable, are borne by the respective share classes and include Distribution and Service, Transfer Agent and Service and Shareholder Administration fees. Non-class specific expenses directly incurred by a Fund are charged to that Fund, while such expenses incurred by the Trust are allocated across the respective Funds on a straight-line and/or pro-rata basis depending upon the nature of the expenses.
D. Redemption Fees — A 2% redemption fee is imposed on the redemption of shares (including by exchange) of the High Yield Municipal Fund held for 60 calendar days or less. For this purpose, the High Yield Municipal Fund uses a first-in first-out method so that shares held longest will be treated as being redeemed first and shares held shortest will be treated as being redeemed last. Redemption fees are reimbursed to the Fund and are reflected as a reduction in share redemptions. Redemption fees are credited to Paid-in Capital and are allocated to each share class of the Fund on a pro-rata basis.
E. Federal Taxes and Distributions to Shareholders — It is each Fund’s policy to comply with the requirements of the Internal Revenue Code of 1986, as amended (the “Code”), applicable to regulated investment companies (mutual funds) and to distribute each year substantially all of its investment company taxable income and capital gains to its shareholders. Accordingly, the Funds are not required to make any provisions for the payment of federal income tax. Distributions to shareholders are recorded on the ex-dividend date. Income distributions, if any, are declared daily and paid monthly, and capital gains distributions, if any, are declared and paid annually.
Net capital losses are carried forward to future fiscal years and may be used to the extent allowed by the Code to offset any future capital gains. Utilization of capital loss carryforwards will reduce the requirement of future capital gains distributions.
The characterization of distributions to shareholders for financial reporting purposes is determined in accordance with federal income tax rules, which may differ from GAAP. The source of each Fund’s distributions may be shown in the accompanying financial statements as either from net investment income, net realized gain or capital. Certain components of the Funds’ net assets on the Statements of Assets and Liabilities reflect permanent GAAP/tax differences based on the appropriate tax character.
| 3. INVESTMENTS AND FAIR VALUE MEASUREMENTS |
The fair value of a financial instrument is the amount that would be received to sell an asset or paid to transfer a liability in an orderly transaction between market participants at the measurement date (i.e., the exit price). GAAP establishes a fair value hierarchy that prioritizes the inputs to valuation techniques used to measure fair value. The hierarchy gives the highest priority to
89
GOLDMAN SACHS MUNICIPAL FIXED INCOME FUNDS
Notes to Financial Statements (continued)
September 30, 2012 (Unaudited)
| 3. INVESTMENTS AND FAIR VALUE MEASUREMENTS (continued) |
unadjusted quoted prices in active markets for identical assets or liabilities (Level 1 measurements) and the lowest priority to unobservable inputs (Level 3 measurements). The levels used for classifying investments are not necessarily an indication of the risk associated with investing in these investments. The three levels of the fair value hierarchy are described below:
Level 1 — Unadjusted quoted prices in active markets that are accessible at the measurement date for identical, unrestricted assets or liabilities;
Level 2 — Quoted prices in markets that are not active or financial instruments for which significant inputs are observable (including, but not limited to, quoted prices for similar investments, interest rates, foreign exchange rates, volatility and credit spreads), either directly or indirectly;
Level 3 — Prices or valuations that require significant unobservable inputs (including GSAM’s assumptions in determining fair value measurement).
A. Level 1 and Level 2 Fair Value Investments — The valuation techniques and significant inputs used in determining the fair values for investments classified as Level 1 and Level 2 are as follows:
Equity Securities — Equity securities and investment companies traded on a United States (“U.S.”) securities exchange or the NASDAQ system, or those located on certain foreign exchanges including, but not limited to the Americas, are valued daily at their last sale price or official closing price on the principal exchange or system on which they are traded. If no sale occurs, equity securities and exchange traded investment companies are valued at the last bid price for long positions and at the last ask price for short positions. Investments in investment companies (other than those that are exchange traded) are valued at the NAV on the valuation date. To the extent these investments are actively traded, they are classified as Level 1 of the fair value hierarchy.
Unlisted equity securities for which market quotations are available are valued at the last sale price on the valuation date, or if no sale occurs, at the last bid price. Securities traded on certain foreign securities exchanges are valued daily at fair value determined by an independent fair value service (if available) under valuation procedures approved by the trustees and consistent with applicable regulatory guidance. The independent fair value service takes into account multiple factors including, but not limited to, movements in the securities markets, certain depositary receipts, futures contracts and foreign currency exchange rates that have occurred subsequent to the close of the foreign securities exchange. Investments applying these valuation adjustments are classified as Level 2 of the fair value hierarchy.
Debt Securities — Debt securities, for which market quotations are readily available, are valued daily on the basis of quotations supplied by dealers or an independent pricing service approved by the trustees. The pricing services may use valuation models or matrix pricing, which consider: (i) yield or price with respect to bonds that are considered comparable in characteristics such as rating, interest rate and maturity date or (ii) quotations from securities dealers to determine current value. Short-term debt obligations that mature in sixty days or less and that do not exhibit signs of credit deterioration are valued at amortized cost, which approximates fair value. With the exception of treasury securities, which are generally classified as Level 1, these investments are generally classified as Level 2 of the fair value hierarchy.
i. Inverse Floaters — The Funds may invest in inverse floating rate debt securities (“inverse floaters”). The interest rate on inverse floaters resets in the opposite direction from the market rate of interest to which the inverse floaters are indexed. An
90
GOLDMAN SACHS MUNICIPAL FIXED INCOME FUNDS
| 3. INVESTMENTS AND FAIR VALUE MEASUREMENTS (continued) |
inverse floater may be considered to be leveraged to the extent that its interest rate varies by a magnitude that exceeds the magnitude of the change in the index rate of interest. The higher the degree of leverage of an inverse floater, the greater the volatility of its market value.
ii. When-Issued Securities and Forward Commitments — When-issued securities, including TBA (“To Be Announced”) securities, are securities that are authorized but not yet issued in the market and purchased in order to secure what is considered to be an advantageous price or yield to the Fund. A forward commitment involves entering into a contract to purchase or sell securities, typically on an extended settlement basis, for a fixed price at a future date. The purchase of securities on a when-issued or forward commitment basis involves a risk of loss if the value of the security to be purchased declines before the settlement date. Conversely, the sale of securities on a forward commitment basis involves the risk that the value of the securities sold may increase before the settlement date. Although the Funds will generally purchase securities on a when-issued or forward commitment basis with the intention of acquiring the securities for their portfolios, the Funds may dispose of when-issued securities or forward commitments prior to settlement which may result in a realized gain or loss.
Derivative Contracts — A derivative is an instrument whose value is derived from underlying assets, indices, reference rates or a combination of these factors.
Exchange-traded derivatives, including futures contracts, typically fall within Level 1 of the fair value hierarchy. Over-the-counter (“OTC”) derivatives are valued using market transactions and other market evidence, including market-based inputs to models, calibration to market-clearing transactions, broker or dealer quotations, or other alternative pricing. Where models are used, the selection of a particular model to value an OTC derivative depends upon the contractual terms of, and specific risks inherent in, the instrument, as well as the availability of pricing information in the market. Valuation models require a variety of inputs, including contractual terms, market prices, yield curves, credit curves, measures of volatility, voluntary and involuntary prepayment rates, loss severity rates and correlations of such inputs. For OTC derivatives that trade in liquid markets, model inputs can generally be verified and model selection does not involve significant management judgment. OTC derivatives are classified within Level 2 of the fair value hierarchy when significant inputs are corroborated by market evidence.
Swap Contracts — Swaps are marked to market daily using pricing vendor quotations, counterparty prices or model prices, and the change in value, if any, is recorded as an unrealized gain or loss.
A credit default swap is an agreement that involves one party making a stream of payments to another party in exchange for the right to receive protection on a reference security or obligation. A Fund may use credit default swaps to provide a measure of protection against defaults of the reference security or obligation or to take a short position with respect to the likelihood of default. A Fund’s investment in credit default swaps may involve greater risks than if the Fund had invested in the referenced obligation directly. Credit events are contract specific but may include bankruptcy, failure to pay, restructuring and obligation acceleration. If a Fund buys protection through a credit default swap and no credit event occurs, its payments are limited to the periodic payments previously made to the counterparty. Upon the occurrence of a specified credit event, a Fund, as a buyer of credit protection, is entitled to receive an amount equal to the notional amount of the swap and deliver to the seller the defaulted reference obligation in a physically settled trade. A Fund may also receive a net settlement amount in the form of cash or securities equal to the notional amount of the swap reduced by the recovery value of the reference obligation in cash settled trade.
91
GOLDMAN SACHS MUNICIPAL FIXED INCOME FUNDS
Notes to Financial Statements (continued)
September 30, 2012 (Unaudited)
| 3. INVESTMENTS AND FAIR VALUE MEASUREMENTS (continued) |
As a seller of protection, a Fund generally receives a payment stream throughout the term of the swap, provided that there is no credit event. In addition, if the Fund sells protection through a credit default swap, the Fund could suffer a loss because the value of the referenced obligation may be less than the premium payments received. Upon the occurrence of a specified credit event, a Fund, as a seller of credit protection, may be required to take possession of the defaulted reference obligation and pay the buyer an amount equal to the notional amount of the swap in a physically settled trade. A Fund may also pay a net settlement amount in the form of cash or securities equal to the notional amount of the swap reduced by the recovery value of the reference obligation in cash settled trade. Recovery values are at times established through the credit event auction process in which market participants are ensured that a transparent price has been set for the defaulted security or obligation. In addition, a Fund is entitled to a return of any assets, which have been pledged as collateral to the counterparty.
The maximum potential amount of future payments (undiscounted) that the Funds as sellers of protection could be required to make under a credit default swap would be an amount equal to the notional amount of the agreement. These potential amounts would be partially offset by any recovery values of the respective referenced obligations or net amounts received from a settlement of a credit default swap for the same reference security or obligation where the Funds bought credit protection.
B. Level 3 Fair Value Investments — The valuation techniques and significant inputs used in determining the fair values for investments classified as Level 3 are as follows:
To the extent that the aforementioned significant inputs are unobservable, or if quotations are not readily available, or if GSAM believes that such quotations do not accurately reflect fair value, the fair value of the Funds’ investments may be determined under valuation procedures approved by the trustees. GSAM, consistent with its procedures and applicable regulatory guidance, may make an adjustment to the most recent valuation prices of either domestic or foreign securities in light of significant events to reflect what it believes to be the fair value of the securities at the time of determining a Fund’s NAV. Significant events which could affect a large number of securities in a particular market may include, but are not limited to: significant fluctuations in U.S. or foreign markets; market dislocations; market disruptions or unscheduled market closings. Significant events which could also affect a single issuer, may include, but are not limited to: corporate actions such as reorganizations, mergers and buy-outs; ratings downgrades; and bankruptcies.
92
GOLDMAN SACHS MUNICIPAL FIXED INCOME FUNDS
| 3. INVESTMENTS AND FAIR VALUE MEASUREMENTS (continued) |
C. Fair Value Hierarchy — The following is a summary of the Funds’ investments and derivatives classified in the fair value hierarchy as of September 30, 2012:
| HIGH YIELD MUNICIPAL | ||||||||||||
| Investment Type | Level 1 | Level 2 | Level 3 | |||||||||
| Assets | ||||||||||||
Common Stock and/or Other Equity Investments | $ | 2,565 | $ | — | $ | — | ||||||
Corporate Bonds | — | 1,900,000 | — | |||||||||
Municipal Debt Obligations | — | 3,686,015,619 | — | |||||||||
Short-term Investments | — | 22,075,000 | — | |||||||||
| Total | $ | 2,565 | $ | 3,709,990,619 | $ | — | ||||||
| Derivative Type | ||||||||||||
| Liabilities(a) | ||||||||||||
Credit Default Swap Contracts | $ | — | $ | (423,169 | ) | $ | — | |||||
| MUNICIPAL INCOME FUND | ||||||||||||
| Investment Type | Level 1 | Level 2 | Level 3 | |||||||||
| Assets | ||||||||||||
Municipal Debt Obligations | $ | — | $ | 585,242,671 | $ | — | ||||||
Short-term Investments | — | 22,305,000 | — | |||||||||
| Total | $ | — | $ | 607,547,671 | $ | — | ||||||
| SHORT DURATION TAX-FREE | ||||||||||||
| Investment Type | Level 1 | Level 2 | Level 3 | |||||||||
| Assets | ||||||||||||
Municipal Debt Obligations | $ | — | $ | 3,551,051,952 | $ | — | ||||||
Short-term Investments | — | 148,266,615 | — | |||||||||
| Total | $ | — | $ | 3,699,318,567 | $ | — | ||||||
| (a) | Amount shown represents unrealized gain (loss) at period end. |
93
GOLDMAN SACHS MUNICIPAL FIXED INCOME FUNDS
Notes to Financial Statements (continued)
September 30, 2012 (Unaudited)
| 4. INVESTMENTS IN DERIVATIVES |
The following table sets forth, by certain risk types, the gross value of derivative contracts as of September 30, 2012. These instruments were used to meet the High Yield Municipal Fund’s investment objectives and to obtain and/or manage exposure related to the risks below. The value in the tables below exclude the effects of cash collateral received or posted pursuant to these derivative contracts, and therefore are not representative of the Fund’s net exposure.
| Risk | Statements of Assets and Liabilities | Liabilities(a) | ||
Credit | Payable for unrealized loss on swap contracts | $(423,169) |
| (a) | Amount represents the payments to be made pursuant to bilateral agreements should counterparties exercise their “right to terminate” provisions based on, among others, the Fund’s performance, its failure to pay on its obligations or failure to pledge collateral. Such amounts do not include incremental charges directly associated with the close-out of the agreements. They also do not reflect the fair value of any assets pledged as collateral which, through the daily margining process, substantially offsets the aforementioned amounts and for which the Fund is entitled to a full return. |
The following table sets forth, by certain risk types, the High Yield Municipal Fund’s gains (losses) related to these derivatives and their indicative volumes for the six months ended September 30, 2012. These gains (losses) should be considered in the context that these derivative contracts may have been executed to economically hedge certain investments, and accordingly, certain gains (losses) on such derivative contracts may offset certain (losses) gains attributable to investments. These gains (losses) are included in “Net realized gain (loss)” or “Net change in unrealized gain (loss)” on the Statements of Operations:
| Risk | Statements of Operations | Net Realized Gain (Loss) | Net Change in Unrealized Gain (Loss) | Average Number of Contracts(a) | ||||||||
| Credit | Net realized gain (loss) from swap contracts/Net change in unrealized gain (loss) on swap contracts | $180,423 | $ | 41,812 | 2 | |||||||
| (a) | Average number of contracts is based on the average of month end balances for the period ended September 30, 2012. |
| 5. AGREEMENTS AND AFFILIATED TRANSACTIONS |
A. Management Agreements — Under the Agreements, GSAM manages the Funds, subject to the general supervision of the trustees.
As compensation for the services rendered pursuant to the Agreements, the assumption of the expenses related thereto and administration of the Funds’ business affairs, including providing facilities, GSAM is entitled to a management fee, accrued daily and paid monthly, equal to an annual percentage rate of each Fund’s average daily net assets.
94
GOLDMAN SACHS MUNICIPAL FIXED INCOME FUNDS
| 5. AGREEMENTS AND AFFILIATED TRANSACTIONS (continued) |
For the six months ended September 30, 2012, contractual and effective net management fees with GSAM were at the following rates:
| Contractual Management Fee Rate | Effective Net Management Fee Rate | |||||||||||||||||||||||
| Fund | First $1 billion | Next $1 billion | Next $3 billion | Next $3 billion | Over $8 billion | Effective Rate | ||||||||||||||||||
High Yield Municipal | 0.55% | 0.55% | 0.50 | % | 0.48% | 0.47 | % | 0.53 | % | 0.53 | % | |||||||||||||
Municipal Income | 0.55 | 0.50 | 0.48 | 0.47 | 0.46 | 0.55 | 0.40 | * | ||||||||||||||||
Short Duration Tax-Free | 0.40 | 0.36 | 0.34 | 0.33 | 0.32 | 0.36 | 0.35 | * | ||||||||||||||||
| * | GSAM agreed to waive a portion of its management fee in order to achieve the effective net management rate of shown above through at least July 27, 2013. Prior to such date GSAM may not terminate the arrangement without the approval of the trustees. |
B. Distribution and Service Plans — The Trust, on behalf of each Fund, has adopted Distribution and Service Plans (the “Plans”). Under the Plans, Goldman Sachs, which serves as distributor (the “Distributor”), is entitled to a fee accrued daily and paid monthly, for distribution services and personal and account maintenance services, which may then be paid by Goldman Sachs to authorized dealers, at the following annual rates calculated on a Fund’s average daily net assets of each respective share class:
| Distribution and Service Plan Rates | ||||||||||||||
| Class A* | Class B | Class C | ||||||||||||
Distribution Plan | 0.25 | % | 0.75 | % | 0.75 | % | ||||||||
Service Plan | — | 0.25 | 0.25 | |||||||||||
| * | With respect to Class A Shares, the Distributor at its discretion may use compensation for distribution services paid under the Distribution Plan to compensate service organizations for personal and account maintenance services and expenses as long as such total compensation does not exceed the maximum cap on “service fees” imposed by the Financial Industry Regulatory Authority. |
For the six months ended September 30, 2012, Goldman Sachs agreed to waive a portion of the distribution and service fees equal to 0.15% and 0.35% as an annual percentage rate of the average daily net assets attributable to Class B Shares and Class C Shares, respectively, of the Short Duration Tax-Free Fund. These arrangements will remain in place through at least July 27, 2013. Prior to such date, Goldman Sachs may not terminate these arrangements without the approval of the trustees.
C. Distribution Agreement — Goldman Sachs, as Distributor of the shares of the Funds pursuant to a Distribution Agreement, may retain a portion of the Class A front end sales charge and Class B and Class C CDSC. During the six months ended September 30, 2012, Goldman Sachs advised that it retained front end sales charges of approximately $46,000, $27,200 and $7,700 for the High Yield Municipal, Municipal Income and Short Duration Tax-Free Funds, respectively. Goldman Sachs retained no contingent deferred sales charges.
95
GOLDMAN SACHS MUNICIPAL FIXED INCOME FUNDS
Notes to Financial Statements (continued)
September 30, 2012 (Unaudited)
| 5. AGREEMENTS AND AFFILIATED TRANSACTIONS (continued) |
D. Service Plan and Shareholder Administration Plan — The Trust, on behalf of each Fund that offers Service Shares, has adopted a Service Plan and a Shareholder Administration Plan. These plans allow for service organizations to provide varying levels of personal and account maintenance and shareholder administration services to their customers who are beneficial owners of such shares. The Service Plan and Shareholder Administration Plan each provide for compensation to the service organizations which is accrued daily and paid monthly at an annual rate as follows: 0.25% (0.50% in aggregate) of the average daily net assets of the Service Shares.
E. Transfer Agency Agreement — Goldman Sachs also serves as the transfer agent of the Funds for a fee pursuant to a Transfer Agency Agreement. The fees charged for such transfer agency services are accrued daily and paid monthly at annual rates as follows: 0.13% of the average daily net assets of Class A, Class B, Class C and Class IR Shares and 0.04% of the average daily net assets of Institutional and Service Shares. Goldman Sachs agreed to waive a portion of the transfer agency fee equal to 0.05% as an annual percentage rate of the average daily net assets attributable to Class A, Class B, Class C and Class IR Shares of the High Yield Municipal Fund. This arrangement will remain in effect through at least July 27, 2013. Prior to such date, Goldman Sachs may not terminate the arrangement without the approval of the trustees.
F. Other Expense Agreements and Affiliated Transactions — GSAM has agreed to limit certain “Other Expense” of the Funds (excluding management fees, distribution and service fees, transfer agent fees and expenses, service fees and shareholder administration fees (as applicable), taxes, interest, brokerage fees, acquired fund fees and expenses, litigation, indemnification, shareholder meetings and other extraordinary expenses, exclusive of any custody and transfer agent fee reductions) to the extent such expenses exceed, on an annual basis, a percentage rate of the average daily net assets of each Fund. Such Other Expense reimbursements, if any, are accrued daily and paid monthly. In addition, the Funds are not obligated to reimburse GSAM for prior fiscal year expense reimbursements, if any. The Other Expense limitation as an annual percentage rate of average daily net assets for each Fund is 0.004%. These Other Expense reimbursements will remain in place through at least July 27, 2013, and prior to such date GSAM may not terminate the arrangements without the approval of the trustees. In addition, the Funds have entered into certain offset arrangements with the custodian and the transfer agent, which may result in a reduction of the Funds’ expenses.
For the six months ended September 30, 2012, these expense reductions, including any fee waivers and Other Expense reimbursements, were as follows (in thousands):
| Fee Waivers | ||||||||||||||||||||||||||||||
| Fund | Management Fee | Class B Distribution and Service Fee | Class C Distribution and Service Fee | Transfer Agent Fee(a) | Other Expense | Custody Fee Credits | Total Expense Reductions | |||||||||||||||||||||||
High Yield Municipal | $ | — | $ | — | $ | — | $ | 119 | $ | 248 | $ | 3 | $ | 370 | ||||||||||||||||
Municipal Income | 460 | — | — | — | 157 | 1 | 618 | |||||||||||||||||||||||
Short Duration Tax-Free | 300 | — | (b) | 94 | — | 226 | 8 | 628 | ||||||||||||||||||||||
| (a) | Applicable to Class A, B, C and IR Shares. |
| (b) | Amount rounds to less than $1,000. |
96
GOLDMAN SACHS MUNICIPAL FIXED INCOME FUNDS
| 5. AGREEMENTS AND AFFILIATED TRANSACTIONS (continued) |
As of September 30, 2012, the amounts owed to affiliates of the Funds were as follows (in thousands):
| Fund | Management Fees | Distribution and Service Fees | Transfer Agent Fees | Total | ||||||||||||||
High Yield Municipal | $ | 1,609 | $ | 170 | $ | 138 | $ | 1,917 | ||||||||||
Municipal Income | 202 | 100 | 49 | 351 | ||||||||||||||
Short Duration Tax-Free | 1,048 | 240 | 202 | 1,490 | ||||||||||||||
G. Line of Credit Facility — As of September 30, 2012, the Funds participated in a $630,000,000 committed, unsecured revolving line of credit facility (the “facility”) together with other funds of the Trust and registered investment companies having management agreements with GSAM or its affiliates (“Other Borrowers”). Pursuant to the terms of the facility, the Funds and Other Borrowers could increase the credit amount by an additional $340,000,000, for a total of up to $970,000,000. This facility is to be used solely for temporary or emergency purposes. The interest rate on borrowings is based on the federal funds rate. The facility also requires a fee to be paid by the Funds based on the amount of the commitment that has not been utilized. For the six months ended September 30, 2012, the Funds did not have any borrowings under the facility. Prior to May 8, 2012, the amount available through the facility was $580,000,000.
| 6. PORTFOLIO SECURITIES TRANSACTIONS |
The cost of purchases and proceeds from sales and maturities of long-term securities for the six months ended September 30, 2012, were as follows:
| Fund | Purchases | Sales and Maturities | ||||||||
High Yield Municipal | $ | 542,637,089 | $ | 385,027,921 | ||||||
Municipal Income | 38,910,893 | 49,418,697 | ||||||||
Short Duration Tax-Free | 746,185,105 | 327,577,701 | ||||||||
97
GOLDMAN SACHS MUNICIPAL FIXED INCOME FUNDS
Notes to Financial Statements (continued)
September 30, 2012 (Unaudited)
| 7. TAX INFORMATION |
As of the Funds’ most recent fiscal year end, March 31, 2012, the Funds’ capital loss carryforwards and certain timing differences, on a tax-basis were as follows:
| High Yield Municipal | Municipal Income | Short Duration Tax-Free | ||||||||||
Capital loss carryforwards:(1) | ||||||||||||
Expiring 2013 | $ | — | $ | — | $ | (345,706 | ) | |||||
Expiring 2014 | — | — | (4,730,013 | ) | ||||||||
Expiring 2015 | (2,478,411 | ) | (3,036,076 | ) | (2,044,683 | ) | ||||||
Expiring 2016 | (220,731,177 | ) | (5,753,929 | ) | — | |||||||
Expiring 2017 | (553,071,659 | ) | (13,220,467 | ) | (12,792 | ) | ||||||
Expiring 2018 | (431,124,617 | ) | (11,494,807 | ) | (451,870 | ) | ||||||
Expiring 2019 | (11,174,752 | ) | (704,599 | ) | — | |||||||
Perpetual Short-term | (7,011,601 | ) | (1,962,129 | ) | — | |||||||
Perpetual Long-term | (56,051,166 | ) | (821,574 | ) | — | |||||||
Total capital loss carryforwards | $ | (1,281,643,383 | ) | $ | (36,993,581 | ) | $ | (7,585,064 | ) | |||
Timing differences (post-October losses/income distribution payable/defaulted bond income) | $ | (89,379,927 | ) | $ | (1,775,489 | ) | $ | (1,252,374 | ) | |||
| (1) | Except for perpetual capital loss carryforward, expiration occurs on March 31 of the year indicated. |
As of September 30, 2012, the Funds’ aggregate security unrealized gains and losses based on cost for U.S. federal income tax purposes were as follows:
| High Yield Municipal | Municipal Income | Short Duration Tax-Free | ||||||||||
Tax cost | $ | 3,567,669,127 | $ | 548,784,410 | $ | 3,634,607,590 | ||||||
Gross unrealized gain | 431,666,174 | 66,054,504 | 69,138,854 | |||||||||
Gross unrealized loss | (289,342,117 | ) | (7,291,243 | ) | (4,427,877 | ) | ||||||
Net unrealized security gain | $ | 142,324,057 | $ | 58,763,261 | $ | 64,710,977 | ||||||
The difference between GAAP-basis and tax-basis unrealized gains (losses), as of the most recent fiscal year end, is attributable primarily to wash sales, differences in the tax treatment of partnership investments, swap transactions, premium amortization and the accretion of market discount.
GSAM has reviewed the Funds’ tax positions for all open tax years (the current and prior three years, as applicable) and has concluded that no provision for income tax is required in the Funds’ financial statements. Such open tax years remain subject to examination and adjustment by tax authorities.
98
GOLDMAN SACHS MUNICIPAL FIXED INCOME FUNDS
| 8. OTHER RISKS |
The Funds’ risks include, but are not limited to, the following:
Shareholder Concentration Risk — Certain funds, accounts, individuals or Goldman Sachs affiliates may from time to time own (beneficially or of record) or control a significant percentage of the Funds’ shares. Redemptions by these entities of their holdings in the Funds may impact the Funds’ liquidity and NAV. These redemptions may also force the Funds to sell securities.
Liquidity Risk — The Funds may make investments that may be illiquid or that may become less liquid in response to market developments or adverse investor perceptions. Liquidity risk may also refer to the risk that a Fund will not be able to pay redemption proceeds within the allowable time period because of unusual market conditions, an unusually high volume of redemption requests, or other reasons. To meet redemption requests, a Fund may be forced to sell investments at an unfavorable time and/or under unfavorable conditions.
Market and Credit Risks — In the normal course of business, the Funds trade financial instruments and enter into financial transactions where risk of potential loss exists due to changes in the market (market risk). Additionally, the Funds may also be exposed to credit risk in the event that an issuer fails to perform or that an institution or entity with which the Funds have unsettled or open transaction defaults.
Non-Diversification Risk — High Yield Municipal Fund is non-diversified and is permitted to invest more of its assets in fewer issuers than a “diversified” mutual fund. Thus, the Fund may be subject to greater risks than a fund that invests in a greater number of issuers.
Portfolio Concentration Risk — As a result of certain of the Funds’ ability to invest a large percentage of their assets in obligations of issuers within the same country, state, region, currency or economic sector, an adverse economic, business or political development may affect the value of the Funds’ investments more than if their investments were not so concentrated.
| 9. INDEMNIFICATIONS |
Under the Trust’s organizational documents, its trustees, officers, employees and agents are indemnified, to the extent permitted by the Act, against certain liabilities that may arise out of performance of their duties to the Funds. Additionally, in the course of business, the Funds enter into contracts that contain a variety of indemnification clauses. The Funds’ maximum exposure under these arrangements is unknown, as this would involve future claims that may be made against the Funds that have not yet occurred. However, GSAM believes the risk of loss under these arrangements to be remote.
| 10. OTHER MATTERS |
Other — On February 8, 2012, the Commodity Futures Trading Commission (CFTC) adopted amendments to several of its rules relating to commodity pool operators, including Rule 4.5. The Funds currently rely on Rule 4.5’s exclusion from CFTC regulation for regulated investment companies. GSAM is currently evaluating the amendments and their impact, if any, on the Funds’ financial statements.
| 11. SUBSEQUENT EVENTS |
Subsequent events after the balance sheet date have been evaluated through the date the financial statements were issued. GSAM has concluded that there is no impact requiring adjustment or disclosure in the financial statements.
99
GOLDMAN SACHS MUNICIPAL FIXED INCOME FUNDS
Notes to Financial Statements (continued)
September 30, 2012 (Unaudited)
| 12. SUMMARY OF SHARE TRANSACTIONS |
Share activity is as follows:
| High Yield Municipal Fund | ||||||||||||||||
|
| |||||||||||||||
For the Six Months Ended (Unaudited) | For the Fiscal Year Ended March 31, 2012 | |||||||||||||||
|
| |||||||||||||||
| Shares | Dollars | Shares | Dollars | |||||||||||||
|
| |||||||||||||||
| Class A Shares | ||||||||||||||||
Shares sold | 3,632,866 | $ | 33,265,067 | 7,569,764 | $ | 64,466,270 | ||||||||||
Shares converted from Class B(a) | 9,613 | 88,033 | 36,911 | 311,197 | ||||||||||||
Reinvestment of distributions | 785,450 | 7,224,590 | 1,710,718 | 14,569,164 | ||||||||||||
Shares redeemed | (4,781,512 | ) | (43,710,907 | ) | (11,019,821 | ) | (93,359,709 | ) | ||||||||
| (353,583 | ) | (3,133,217 | ) | (1,702,428 | ) | (14,013,078 | ) | |||||||||
| Class B Shares | ||||||||||||||||
Shares sold | 13,314 | 122,516 | 38,872 | 329,078 | ||||||||||||
Shares converted to Class A(a) | (9,606 | ) | (88,033 | ) | (36,911 | ) | (311,197 | ) | ||||||||
Reinvestment of distributions | 20,290 | 186,517 | 58,885 | 500,202 | ||||||||||||
Shares redeemed | (204,553 | ) | (1,878,953 | ) | (532,563 | ) | (4,511,548 | ) | ||||||||
| (180,555 | ) | (1,657,953 | ) | (471,717 | ) | (3,993,465 | ) | |||||||||
| Class C Shares | ||||||||||||||||
Shares sold | 1,050,918 | 9,646,705 | 1,602,757 | 13,707,600 | ||||||||||||
Reinvestment of distributions | 162,583 | 1,495,429 | 364,384 | 3,101,437 | ||||||||||||
Shares redeemed | (873,086 | ) | (7,997,419 | ) | (2,755,449 | ) | (23,279,054 | ) | ||||||||
| 340,415 | 3,144,715 | (788,308 | ) | (6,470,017 | ) | |||||||||||
| Institutional Shares | ||||||||||||||||
Shares sold | 38,699,668 | 355,085,498 | 65,544,688 | 559,965,320 | ||||||||||||
Reinvestment of distributions | 7,706,961 | 70,900,466 | 16,554,797 | 140,955,182 | ||||||||||||
Shares redeemed | (26,677,770 | ) | (244,339,264 | ) | (81,189,293 | ) | (687,060,328 | ) | ||||||||
| 19,728,859 | 181,646,700 | 910,192 | 13,860,174 | |||||||||||||
| Class IR Shares | ||||||||||||||||
Shares sold | 113,687 | 1,044,507 | 358,216 | 3,055,857 | ||||||||||||
Reinvestment of distributions | 9,141 | 84,158 | 11,047 | 95,000 | ||||||||||||
Shares redeemed | (33,859 | ) | (311,694 | ) | (82,810 | ) | (710,973 | ) | ||||||||
| 88,969 | 816,971 | 286,453 | 2,439,884 | |||||||||||||
NET INCREASE (DECREASE) | 19,624,105 | $ | 180,817,216 | (1,765,808 | ) | $ | (8,176,502 | ) | ||||||||
| (a) | Class B Shares automatically convert into Class A Shares on or about the fifteenth day of the last month of the calendar quarter that is eight years after the initial purchase date of either the Fund or another Goldman Sachs Fund. |
100
GOLDMAN SACHS MUNICIPAL FIXED INCOME FUNDS
| 12. SUMMARY OF SHARE TRANSACTIONS (continued) |
Share activity is as follows:
| Municipal Income Fund | ||||||||||||||||
|
| |||||||||||||||
For the Six Months Ended September 30, 2012 (Unaudited) | For the Fiscal Year Ended March 31, 2012 | |||||||||||||||
|
| |||||||||||||||
| Shares | Dollars | Shares | Dollars | |||||||||||||
|
| |||||||||||||||
| Class A Shares | ||||||||||||||||
Shares sold | 2,429,042 | $ | 38,906,278 | 6,152,118 | $ | 92,306,959 | ||||||||||
Shares converted from Class B(a) | 2,605 | 41,581 | 6,985 | 105,391 | ||||||||||||
Reinvestment of distributions | 399,003 | 6,403,135 | 882,604 | 13,324,956 | ||||||||||||
Shares redeemed | (3,040,466 | ) | (48,649,407 | ) | (7,740,886 | ) | (115,999,039 | ) | ||||||||
| (209,816 | ) | (3,298,413 | ) | (699,179 | ) | (10,261,733 | ) | |||||||||
| Class B Shares | ||||||||||||||||
Shares sold | 10,549 | 168,875 | 35,673 | 543,578 | ||||||||||||
Shares converted to Class A(a) | (2,605 | ) | (41,581 | ) | (6,985 | ) | (105,391 | ) | ||||||||
Reinvestment of distributions | 4,212 | 67,556 | 11,442 | 172,451 | ||||||||||||
Shares redeemed | (49,977 | ) | (799,723 | ) | (120,827 | ) | (1,828,773 | ) | ||||||||
| (37,821 | ) | (604,873 | ) | (80,697 | ) | (1,218,135 | ) | |||||||||
| Class C Shares | ||||||||||||||||
Shares sold | 234,565 | 3,758,331 | 332,495 | 5,052,669 | ||||||||||||
Reinvestment of distributions | 19,577 | 314,150 | 42,806 | 646,374 | ||||||||||||
Shares redeemed | (212,632 | ) | (3,409,531 | ) | (338,799 | ) | (5,063,974 | ) | ||||||||
| 41,510 | 662,950 | 36,502 | 635,069 | |||||||||||||
| Institutional Shares | ||||||||||||||||
Shares sold | 1,834,646 | 29,323,190 | 3,881,621 | 58,583,866 | ||||||||||||
Reinvestment of distributions | 199,970 | 3,207,731 | 429,169 | 6,471,539 | ||||||||||||
Shares redeemed | (1,909,907 | ) | (30,585,288 | ) | (5,844,145 | ) | (87,118,120 | ) | ||||||||
| 124,709 | 1,945,633 | (1,533,355 | ) | (22,062,715 | ) | |||||||||||
| Service Shares | ||||||||||||||||
Reinvestment of distributions | 23 | 369 | 50 | 763 | ||||||||||||
Shares redeemed | (2,768 | ) | (44,232 | ) | (1 | ) | (10 | ) | ||||||||
| (2,745 | ) | (43,863 | ) | 49 | 753 | |||||||||||
| Class IR Shares | ||||||||||||||||
Shares sold | 118,355 | 1,900,418 | 104,537 | 1,600,576 | ||||||||||||
Reinvestment of distributions | 2,877 | 46,194 | 1,663 | 25,506 | ||||||||||||
Shares redeemed | (29,395 | ) | (472,618 | ) | (17,598 | ) | (264,574 | ) | ||||||||
| 91,837 | 1,473,994 | 88,602 | 1,361,508 | |||||||||||||
NET INCREASE (DECREASE) | 7,674 | $ | 135,428 | (2,188,078 | ) | $ | (31,545,253 | ) | ||||||||
| (a) | Class B Shares automatically convert into Class A Shares on or about the fifteenth day of the last month of the calendar quarter that is eight years after the initial purchase date of either the Fund or another Goldman Sachs Fund. |
101
GOLDMAN SACHS MUNICIPAL FIXED INCOME FUNDS
Notes to Financial Statements (continued)
September 30, 2012 (Unaudited)
| 12. SUMMARY OF SHARE TRANSACTIONS (continued) |
Share activity is as follows:
| Short Duration Tax-Free Fund | ||||||||||||||||
|
| |||||||||||||||
For the Six Months Ended September 30, 2012 (Unaudited) | For the Fiscal Year Ended March 31, 2012 | |||||||||||||||
|
| |||||||||||||||
| Shares | Dollars | Shares | Dollars | |||||||||||||
|
| |||||||||||||||
| Class A Shares | ||||||||||||||||
Shares sold | 32,057,492 | $ | 341,620,451 | 62,696,479 | $ | 662,858,683 | ||||||||||
Reinvestment of distributions | 584,468 | 6,229,063 | 1,236,986 | 13,081,697 | ||||||||||||
Shares redeemed | (23,861,136 | ) | (254,247,916 | ) | (49,070,446 | ) | (518,590,784 | ) | ||||||||
| 8,780,824 | 93,601,598 | 14,863,019 | 157,349,596 | |||||||||||||
| Class B Shares | ||||||||||||||||
Shares sold | 1 | 14 | — | — | ||||||||||||
Reinvestment of distributions | 10 | 109 | 59 | 620 | ||||||||||||
Shares redeemed | (653 | ) | (6,949 | ) | (5,823 | ) | (61,402 | ) | ||||||||
| (642 | ) | (6,826 | ) | (5,764 | ) | (60,782 | ) | |||||||||
| Class C Shares | ||||||||||||||||
Shares sold | 1,235,664 | 13,161,961 | 1,945,490 | 20,599,647 | ||||||||||||
Reinvestment of distributions | 16,305 | 173,740 | 35,815 | 378,632 | ||||||||||||
Shares redeemed | (626,913 | ) | (6,680,986 | ) | (1,316,149 | ) | (13,907,779 | ) | ||||||||
| 625,056 | 6,654,715 | 665,156 | 7,070,500 | |||||||||||||
| Institutional Shares | ||||||||||||||||
Shares sold | 88,493,182 | 942,478,709 | 145,317,302 | 1,535,420,674 | ||||||||||||
Reinvestment of distributions | 1,446,542 | 15,410,516 | 2,375,614 | 25,118,208 | ||||||||||||
Shares redeemed | (47,414,557 | ) | (504,751,168 | ) | (91,840,122 | ) | (969,823,249 | ) | ||||||||
| 42,525,167 | 453,138,057 | 55,852,794 | 590,715,633 | |||||||||||||
| Service Shares | ||||||||||||||||
Reinvestment of distributions | 2,612 | 27,813 | 17,001 | 179,330 | ||||||||||||
Shares redeemed | (385,638 | ) | (4,103,754 | ) | (1,116,621 | ) | (11,787,762 | ) | ||||||||
| (383,026 | ) | (4,075,941 | ) | (1,099,620 | ) | (11,608,432 | ) | |||||||||
| Class IR Shares | ||||||||||||||||
Shares sold | 767,470 | 8,170,731 | 1,503,618 | 15,953,469 | ||||||||||||
Reinvestment of distributions | 10,463 | 111,467 | 5,207 | 55,329 | ||||||||||||
Shares redeemed | (135,962 | ) | (1,447,576 | ) | (520,271 | ) | (5,515,326 | ) | ||||||||
| 641,971 | 6,834,622 | 988,554 | 10,493,472 | |||||||||||||
NET INCREASE | 52,189,350 | $ | 556,146,225 | 71,264,139 | $ | 753,959,987 | ||||||||||
102
GOLDMAN SACHS MUNICIPAL FIXED INCOME FUNDS
Fund Expenses — Six Month Period Ended September 30, 2012 (Unaudited)
As a shareholder of Class A, Class B, Class C, Institutional, Service or Class IR Shares of a Fund you incur two types of costs: (1) transaction costs, including sales charges on purchase payments (with respect to Class A Shares) and contingent deferred sales charges on redemptions (with respect to Class B and Class C Shares); and redemption fees (with respect to Class A, Class B, Class C, Institutional, Service and Class IR Shares, if any); and (2) ongoing costs, including management fees; distribution and service (12b-1) fees (with respect to Class A, Class B and Class C Shares); and other Fund expenses. This example is intended to help you understand your ongoing costs (in dollars) of investing in Class A, Class B, Class C, Institutional, Service and Class IR Shares of the Funds and to compare these costs with the ongoing costs of investing in other mutual funds.
The example is based on an investment of $1,000 invested at the beginning of the period and held for the entire period from April 1, 2012 through September 30, 2012.
Actual Expenses — The first line under each share class in the table below provides information about actual account values and actual expenses. You may use the information in this line, together with the amount you invested, to estimate the expenses that you paid over the period. Simply divide your account value by $1,000 (for example, an $8,600 account value divided by $1,000=8.6), then multiply the result by the number in the first line under the heading entitled “Expenses Paid” to estimate the expenses you paid on your account during this period.
Hypothetical Example for Comparison Purposes — The second line under each share class in the table below provides information about hypothetical account values and hypothetical expenses based on the Funds’ actual net expense ratio and an assumed rate of return of 5% per year before expenses, which is not the Funds’ actual return. The hypothetical account values and expenses may not be used to estimate the actual ending account balance or expenses you paid for the period. You may use this information to compare the ongoing costs of investing in the Funds and other funds. To do so, compare this 5% hypothetical example with the 5% hypothetical examples that appear in the shareholder reports of the other funds.
Please note that the expenses shown in the table are meant to highlight your ongoing costs only and do not reflect any transactional costs, such as sales charges, redemption fees, or exchange fees. Therefore, the second line of the table is useful in comparing ongoing costs only, and will not help you determine the relative total costs of owning different funds. In addition, if these transactional costs were included, your costs would have been higher.
| High Yield Municipal Fund | Municipal Income Fund | Short Duration Tax-Free Fund | ||||||||||||||||||||||||||||||||||
| Share Class | Beginning Account Value 4/01/12 | Ending Account Value 9/30/12 | Expenses Paid for the 6 Months Ended 9/30/12* | Beginning Account | Ending Account Value 9/30/12 | Expenses Paid for the 6 Months Ended 9/30/12* | Beginning Account Value 4/01/12 | Ending Account Value 9/30/12 | Expenses Paid for the 6 Months Ended 9/30/12* | |||||||||||||||||||||||||||
| Class A | ||||||||||||||||||||||||||||||||||||
Actual | $ | 1,000 | $ | 1,070.90 | $ | 4.46 | $ | 1,000 | $ | 1,048.70 | $ | 4.01 | $ | 1,000 | $ | 1,012.50 | $ | 3.68 | ||||||||||||||||||
Hypothetical 5% return | 1,000 | 1.020.76 | + | 4.36 | 1,000 | 1,021.16 | + | 3.95 | 1,000 | 1,021.41 | + | 3.70 | ||||||||||||||||||||||||
| Class B | ||||||||||||||||||||||||||||||||||||
Actual | 1,000 | 1,065.70 | 8.34 | 1,000 | 1,044.80 | 7.84 | 1,000 | 1,009.40 | 6.70 | |||||||||||||||||||||||||||
Hypothetical 5% return | 1,000 | 1,017.00 | + | 8.14 | 1,000 | 1,017.40 | + | 7.74 | 1,000 | 1,018.40 | + | 6.73 | ||||||||||||||||||||||||
| Class C | ||||||||||||||||||||||||||||||||||||
Actual | 1,000 | 1,066.90 | 8.34 | 1,000 | 1,044.80 | 7.84 | 1,000 | 1,010.50 | 5.70 | |||||||||||||||||||||||||||
Hypothetical 5% return | 1,000 | 1,017.00 | + | 8.14 | 1,000 | 1,017.40 | + | 7.74 | 1,000 | 1,019.40 | + | 5.72 | ||||||||||||||||||||||||
| Institutional | ||||||||||||||||||||||||||||||||||||
Actual | 1,000 | 1,071.20 | 2.96 | 1,000 | 1,051.10 | 2.26 | 1,000 | 1,014.20 | 1.97 | |||||||||||||||||||||||||||
Hypothetical 5% return | 1,000 | 1,022.21 | + | 2.89 | 1,000 | 1,022.86 | + | 2.23 | 1,000 | 1,023.11 | + | 1.98 | ||||||||||||||||||||||||
| Service | ||||||||||||||||||||||||||||||||||||
Actual | N/A | N/A | N/A | 1,000 | 1,048.00 | 4.83 | 1,000 | 1,011.70 | 4.49 | |||||||||||||||||||||||||||
Hypothetical 5% return | N/A | N/A | N/A | 1,000 | 1,020.36 | + | 4.76 | 1,000 | 1,020.61 | + | 4.51 | |||||||||||||||||||||||||
| Class IR | ||||||||||||||||||||||||||||||||||||
Actual | 1,000 | 1,071.00 | 3.17 | 1,000 | 1,050.00 | 2.72 | 1,000 | 1,013.80 | 2.42 | |||||||||||||||||||||||||||
Hypothetical 5% return | 1,000 | 1,022.01 | + | 3.09 | 1,000 | 1,022.41 | + | 2.69 | 1,000 | 1,022.66 | + | 2.43 | ||||||||||||||||||||||||
| * | Expenses are calculated using each Fund’s annualized net expense ratio for each class, which represents the ongoing expenses as a percentage of net assets for the six months ended September 30, 2012. Expenses are calculated by multiplying the annualized net expense ratio by the average account value for the period; then multiplying the result by the number of days in the most recent fiscal half year; and then dividing that result by the number of days in the fiscal year. The annualized net expense ratios for the period were as follows: |
| Fund | Class A | Class B | Class C | Institutional | Service | Class IR | ||||||||||||||||||
High Yield Municipal | 0.86 | % | 1.61 | % | 1.61 | % | 0.57 | % | N/A | 0.61 | % | |||||||||||||
Municipal Income | 0.78 | 1.53 | 1.53 | 0.44 | 0.94 | % | 0.53 | |||||||||||||||||
Short Duration Tax-Free | 0.73 | 1.33 | 1.13 | 0.39 | 0.89 | 0.48 | ||||||||||||||||||
| + | Hypothetical expenses are based on each Fund’s actual annualized net expense ratios and an assumed rate of return of 5% per year before expenses. |
103
GOLDMAN SACHS MUNICIPAL FIXED INCOME FUNDS
Statement Regarding Basis for Approval of Management Agreements (Unaudited)
Background
The Goldman Sachs High Yield Municipal, Goldman Sachs Municipal Income and Goldman Sachs Short Duration Tax-Free Funds (the “Funds”) are investment portfolios of Goldman Sachs Trust (the “Trust”). The Board of Trustees oversees the management of the Trust and reviews the investment performance and expenses of the Funds at regularly scheduled meetings held during the year. In addition, the Board of Trustees determines annually whether to approve the continuance of the Trust’s investment management agreements (the “Management Agreements”) with Goldman Sachs Asset Management, L.P. (the “Investment Adviser”) on behalf of the Funds.
The Management Agreements were most recently approved for continuation until June 30, 2013 by the Board of Trustees, including those Trustees who are not parties to the Management Agreements or “interested persons” (as defined in the Investment Company Act of 1940, as amended) of any party thereto (the “Independent Trustees”), at a meeting held on June 13, 2012 (the “Annual Meeting”).
The review process undertaken by the Trustees spans the course of the year and culminates with the Annual Meeting. To assist the Trustees in their deliberations, the Trustees have established a Contract Review Committee (the “Committee”), comprised of the Independent Trustees. The Committee held three meetings over the course of the year since the Management Agreements were last approved. At those Committee meetings, regularly scheduled Board meetings and/or the Annual Meeting, the Board, or the Independent Trustees, as applicable, considered matters relating to the Management Agreements, including:
| (a) | the nature and quality of the advisory, administrative and other services provided to the Funds by the Investment Adviser and its affiliates, including information about: |
| (i) | the structure, staff and capabilities of the Investment Adviser and its portfolio management teams; |
| (ii) | the groups within the Investment Adviser and its affiliates that support the portfolio management teams or provide other types of necessary services, including fund services groups (e.g., accounting and financial reporting, tax, shareholder services and operations), controls and risk management groups (e.g., legal, compliance, valuation oversight, credit risk management, internal audit, compliance testing, market risk analysis, finance and strategy and central funding), sales and distribution support groups and others (e.g., information technology and training); |
| (iii) | trends in headcount; |
| (iv) | the Investment Adviser’s financial resources and ability to hire and retain talented personnel and strengthen its operations; and |
| (v) | the parent company’s support of the Investment Adviser and its mutual fund business, as expressed by the firm’s senior management; |
| (b) | information on the investment performance of the Funds, including comparisons to the performance of similar mutual funds, as provided by a third party mutual fund data provider engaged as part of the contract review process (the “Outside Data Provider”), and benchmark performance indices, and general investment outlooks in the markets in which the Funds invest; |
| (c) | the terms of the Management Agreements and agreements with affiliated service providers entered into by the Trust on behalf of the Funds; |
| (d) | expense information for the Funds, including: |
| (i) | the relative management fee and expense levels of the Funds as compared to those of comparable funds managed by other advisers, as provided by the Outside Data Provider; |
| (ii) | each Fund’s expense trends over time; and |
| (iii) | to the extent the Investment Adviser manages institutional accounts or collective investment vehicles having investment objectives and policies similar to those of the Funds, comparative information on the advisory fees charged and services provided to those accounts by the Investment Adviser; |
| (e) | with respect to the extensive investment performance and expense comparison data provided by the Outside Data Provider, its processes in producing that data for the Funds; |
| (f) | the Investment Adviser’s undertakings to waive certain management fees (with respect to the Municipal Income and Short Duration Tax-Free Funds) and limit certain expenses of each of the Funds that exceed specified levels; the undertakings of Goldman, Sachs & Co. (“Goldman Sachs”), the Funds’ affiliated distributor and transfer agent, to waive a portion of the distribution and service fees paid by the Short Duration Tax-Free Fund’s Class B and Class C Shares and a portion of the transfer agency fees paid by the High Yield Municipal Fund’s Class A, Class B, Class C and Class IR Shares; and a summary of contractual fee reductions made by the Investment Adviser and its affiliates over the past several years with respect to the Funds; |
104
GOLDMAN SACHS MUNICIPAL FIXED INCOME FUNDS
Statement Regarding Basis for Approval of Management Agreements (Unaudited) (continued)
| (g) | information relating to the profitability of the Management Agreements and the transfer agency and distribution and service arrangements of each of the Funds and the Trust as a whole to the Investment Adviser and its affiliates; |
| (h) | whether each Fund’s existing management fee schedule adequately addressed any economies of scale; |
| (i) | a summary of the “fall-out” benefits derived by the Investment Adviser and its affiliates from their relationships with the Funds, including the fees received by the Investment Adviser’s affiliates from the Funds for transfer agency, portfolio trading, distribution and other services; |
| (j) | a summary of potential benefits derived by the Funds as a result of their relationship with the Investment Adviser; |
| (k) | information regarding portfolio trading and how the Investment Adviser carries out its duty to seek best execution; |
| (l) | portfolio manager ownership of Fund shares; the manner in which portfolio manager compensation is determined; and the number and types of accounts managed by the portfolio managers; |
| (m) | the nature and quality of the services provided to the Funds by their unaffiliated service providers, and the Investment Adviser’s general oversight and evaluation (including reports on due diligence) of those service providers as part of the administration services provided under the Management Agreements; and |
| (n) | the Investment Adviser’s processes and policies addressing various types of potential conflicts of interest; its approach to risk management; the annual review of the effectiveness of the Funds’ compliance program; and compliance reports. |
The Trustees also received an overview of the Funds’ distribution arrangements. They received information regarding the Funds’ assets, share purchase and redemption activity and the payment of Rule 12b-1 distribution and service fees by the Funds and the payment of non-Rule 12b-1 shareholder service and/or administration fees by the Municipal Income and Short Duration Tax-Free Funds’ Service Shares. Information was also provided to the Trustees relating to revenue sharing payments made by and services provided by the Investment Adviser and its affiliates to intermediaries that promote the sale, distribution and/or servicing of Fund shares.
The presentations made at the Board and Committee meetings and at the Annual Meeting encompassed the Funds and other mutual fund portfolios for which the Board of Trustees has responsibility. In evaluating the Management Agreements at the Annual Meeting, the Trustees relied upon their knowledge, resulting from their meetings and other interactions throughout the year, of the Investment Adviser, its affiliates, their services and the Funds. In conjunction with these meetings, the Trustees received written materials and oral presentations on the topics covered, and were advised by their independent legal counsel regarding their responsibilities and other regulatory requirements related to the approval and continuation of mutual fund investment management agreements under applicable law. In addition, the Investment Adviser and its affiliates provided the Independent Trustees with a written response to a formal request for information sent on behalf of the Independent Trustees by their independent legal counsel. During the course of their deliberations, the Independent Trustees met in executive sessions with their independent legal counsel, without representatives of the Investment Adviser or its affiliates present. The Independent Trustees also discussed the broad range of other investment choices that are available to Fund investors, including the availability of comparable funds managed by other advisers.
Nature, Extent and Quality of the Services Provided Under the Management Agreements
As part of their review, the Trustees considered the nature, extent and quality of the services provided by the Investment Adviser. In this regard, the Trustees considered both the investment advisory services, and the other, non-advisory services, that are provided to the Funds by the Investment Adviser and its affiliates. The Trustees noted the transition in the leadership and changes in personnel of various of the Investment Adviser’s portfolio management teams that had occurred in recent periods, and the potential benefit to the Funds of the ongoing recruitment efforts aimed at bringing high quality investment talent to the Investment Adviser. The Independent Trustees concluded that the Investment Adviser continued to commit substantial financial and operational resources to the Funds and expressed confidence that the Investment Adviser would continue to do so in the future. The Trustees also observed that the Investment Adviser had made significant commitments to address regulatory compliance requirements applicable to the Funds and the Investment Adviser.
Investment Performance
The Trustees also considered the investment performance of the Funds and the Investment Adviser. In this regard, they compared the investment performance of each Fund to its peers using rankings and ratings compiled by the Outside Data Provider as of December 31, 2011, and updated performance information prepared by the Investment Adviser using the peer groups identified by the Outside Data Provider as of March 31, 2012. The information on each Fund’s investment performance was provided for the one-, three-, five- and ten-year periods ending on the applicable dates. The Trustees also reviewed each Fund’s investment performance over time on a year-by-year basis relative to its performance benchmark. In addition, they considered the
105
GOLDMAN SACHS MUNICIPAL FIXED INCOME FUNDS
Statement Regarding Basis for Approval of Management Agreements (Unaudited) (continued)
investment performance trends of the Funds over time, and reviewed the investment performance of each Fund in light of its investment objective and policies, market conditions and credit and duration parameters.
In addition, the Trustees considered materials prepared and presentations made by the Investment Adviser’s senior management and portfolio management personnel, in which Fund performance was assessed. The Trustees also considered the Investment Adviser’s periodic reports with respect to the Funds’ risk profiles, and how the Investment Adviser’s approach to risk monitoring and management influences portfolio management.
The Independent Trustees observed that the High Yield Municipal Fund had placed in the top half of its peer group for the one- and three-year periods, had placed in the bottom half of its peer group for the five- and ten-year periods, outperformed its benchmark index for the one- and three-year periods and underperformed its benchmark index for the five- and ten-year periods ended March 31, 2012. They noted that the Short Duration Tax-Free Fund had placed in the top half of its peer group during the five-year period and had placed in the bottom half of its peer group during the one-, three-, and ten-year periods ended March 31, 2012. They observed that the Municipal Income Fund had placed in the top half of its peer group during the one-, three-, and ten-year periods and in the third quartile of its peer group during the five-year period ended March 31, 2012. The Independent Trustees observed that each of the Short Duration Tax-Free Fund and the Municipal Income Fund outperformed its respective benchmark index during the one- and three-year periods and underperformed its respective benchmark index during the five- and ten-year periods ended March 31, 2012.
Costs of Services Provided and Competitive Information
The Trustees considered the contractual fee rates payable by each Fund under its respective Management Agreement. In this regard, the Trustees considered information on the services rendered by the Investment Adviser to the Funds, which included both advisory and administrative services that were directed to the needs and operations of the Funds as registered mutual funds.
In particular, the Trustees reviewed analyses prepared by the Outside Data Provider regarding the expense rankings of the Funds. The analyses provided a comparison of the Funds’ management fees and breakpoints to those of relevant peer groups and category universes; an expense analysis which compared each Fund’s overall net and gross expenses to a peer group and a category universe; and a five-year history comparing each Fund’s net expenses to the peer and category medians. The analyses also compared each Fund’s transfer agency, custody, and distribution fees, other expenses and fee waivers/reimbursements to those of other funds in the peer group and the peer group and category medians. The Trustees concluded that the comparisons provided by the Outside Data Provider were useful in evaluating the reasonableness of the management fees and total expenses paid by the Funds.
In addition, the Trustees considered the Investment Adviser’s undertakings to waive a portion of its management fees (with respect to the Municipal Income and Short Duration Tax-Free Funds) and to limit certain expenses of each of the Funds that exceed specified levels, as well as Goldman Sachs’ undertakings to waive a portion of the distribution and service fees paid by the Short Duration Tax-Free Fund’s Class B and Class C Shares and to waive a portion of the transfer agency fees paid by the High Yield Municipal Fund’s Class A, Class B, Class C and Class IR Shares. They also considered, to the extent that the Investment Adviser manages institutional accounts or collective investment vehicles having investment objectives and policies similar to those of the Funds, comparative fee information for services provided by the Investment Adviser to those accounts, and information that indicated that services provided to the Funds differed in various significant respects from the services provided to institutional accounts, which generally operated under less stringent legal and regulatory structures, required fewer services from the Investment Adviser to a smaller number of client contact points, were less time-intensive and paid lower fees. By contrast, the Trustees noted that the Investment Adviser provides substantial administrative services to the Funds under the terms of the Management Agreements.
In addition, the Trustees noted that shareholders are able to redeem their Fund shares at any time if they believe that the Fund fees and expenses are too high or if they are dissatisfied with the performance of the Fund.
Profitability
The Trustees reviewed the Investment Adviser’s revenues and pre-tax profit margins with respect to the Trust and each of the Funds. In this regard the Trustees noted that they had received, among other things, profitability analyses and summaries, revenue and expense schedules by Fund and by function (i.e., investment management, transfer agency and distribution and service) and the Investment Adviser’s expense allocation methodology. They observed that the profitability and expense figures are substantially similar to those used by the Investment Adviser for many internal purposes, including compensation decisions among various business groups, and are thus subject to a vigorous internal debate about how certain revenue and expenses should be allocated. The Trustees also reviewed the report of the internal audit group within the Goldman Sachs organization, which included an assessment
106
GOLDMAN SACHS MUNICIPAL FIXED INCOME FUNDS
Statement Regarding Basis for Approval of Management Agreements (Unaudited) (continued)
of the reasonableness and consistency of the Investment Adviser’s expense allocation methodology and an evaluation of the accuracy of the Investment Adviser’s profitability analysis calculations. Profitability data for the Trust and each Fund were provided for 2011 and 2010, and the Trustees considered this information in relation to the Investment Adviser’s overall profitability. The Trustees considered the Investment Adviser’s revenues and pre-tax profit margins both in absolute terms and in comparison to information on the reported pre-tax profit margins earned by certain other asset management firms.
Economies of Scale
The Trustees considered the information that had been provided regarding the Investment Adviser’s profitability. The Trustees also considered the breakpoints in the fee rate payable under the Management Agreements for each of the Funds at the following annual percentage rates of the average daily net assets of the Funds:
| Average Daily Net Assets | High Yield Municipal Fund | Municipal Income Fund | Short Duration Tax-Free Fund | |||||||||
| First $1 billion | 0.55 | % | 0.55 | % | 0.40 | % | ||||||
| Next $1 billion | 0.55 | 0.50 | 0.36 | |||||||||
| Next $3 billion | 0.50 | 0.48 | 0.34 | |||||||||
| Next $3 billion | 0.48 | 0.47 | 0.33 | |||||||||
| Over $8 billion | 0.47 | 0.46 | 0.32 | |||||||||
The Trustees noted that the breakpoints were meant to share potential economies of scale, if any, with the Funds and their shareholders as assets under management reach those asset levels. The Trustees considered the amounts of assets in the Funds; the Funds’ recent share purchase and redemption activity; the information provided by the Investment Adviser relating to the costs of the services provided by the Investment Adviser and its affiliates and their realized profits; information comparing fee rates charged by the Investment Adviser with fee rates charged to other funds in the peer groups; and the Investment Adviser’s undertakings to waive a portion of its management fees (with respect to the Municipal Income and Short Duration Tax-Free Funds) and to limit certain expenses of each of the Funds that exceed specified levels. Upon reviewing these matters at the Annual Meeting, the Trustees concluded that the fee breakpoints represented a means of assuring that benefits of scalability, if any, would be passed along to shareholders at the specified asset levels. They also noted that the Investment Adviser had passed along savings to shareholders of the High Yield Municipal and Short Duration Tax-Free Funds, which had asset levels above at least the first breakpoint during the prior fiscal year.
Other Benefits to the Investment Adviser and Its Affiliates
The Trustees also considered the other benefits derived by the Investment Adviser and its affiliates from their relationship with the Funds as stated above, including: (a) transfer agency fees received by Goldman Sachs; (b) futures commissions earned by Goldman Sachs for executing futures transactions on behalf of the Funds; (c) trading efficiencies resulting from aggregation of orders of the Funds with those for other funds or accounts managed by the Investment Adviser; (d) the Investment Adviser’s ability to leverage the infrastructure designed to service the Funds on behalf of its other clients; (e) the Investment Adviser’s ability to cross-market other products and services to Fund shareholders; (f) Goldman Sachs’ retention of certain fees as Fund Distributor; (g) the Investment Adviser’s ability to negotiate better pricing with custodians on behalf of its other clients, as a result of the relationship with the Funds; and (h) the possibility that the working relationship between the Investment Adviser and the Funds’ third party service providers may cause those service providers to be open to doing business with other areas of Goldman Sachs. In the course of considering the foregoing, the Independent Trustees requested and received further information quantifying certain of these fall-out benefits.
Other Benefits to the Funds and Their Shareholders
The Trustees also noted that the Funds receive certain potential benefits as a result of their relationship with the Investment Adviser, including: (a) trading efficiencies resulting from aggregation of orders of the Funds with those of other funds or accounts managed by the Investment Adviser; (b) improved servicing and pricing from vendors because of the volume of business generated by the Investment Adviser and its affiliates; (c) improved servicing from broker-dealers because of the volume of business generated by the Investment Adviser and its affiliates; (d) the Investment Adviser’s ability to negotiate favorable terms with derivatives counterparties as a result of the size and reputation of the Goldman Sachs organization; (e) the Investment Adviser’s
107
GOLDMAN SACHS MUNICIPAL FIXED INCOME FUNDS
Statement Regarding Basis for Approval of Management Agreements (Unaudited) (continued)
knowledge and experience gained from managing other accounts and products; (f) the Investment Adviser’s ability to hire and retain qualified personnel to provide services to the Funds because of the reputation of the Goldman Sachs organization; (g) the Funds’ access, through the Investment Adviser, to certain firmwide resources (e.g., proprietary risk management systems and databases), subject to certain restrictions; and (h) the Funds’ access to certain affiliated distribution channels. The Trustees noted the competitive nature of the mutual fund marketplace, and noted further that many of the Funds’ shareholders invested in the Funds in part because of the Funds’ relationship with the Investment Adviser and that those shareholders have a general expectation that the relationship will continue.
Conclusion
In connection with their consideration of the Management Agreements, the Trustees gave weight to each of the factors described above, but did not identify any particular factor as controlling their decision. After deliberation and consideration of all of the information provided, including the factors described above, the Trustees concluded, in the exercise of their business judgment, that the management fees paid by each of the Funds were reasonable in light of the services provided to it by the Investment Adviser, the Investment Adviser’s costs and each Fund’s current and reasonably foreseeable asset levels. The Trustees unanimously concluded that the Investment Adviser’s continued management likely would benefit each Fund and its shareholders and that the Management Agreements should be approved and continued with respect to each applicable Fund until June 30, 2013.
108
FUNDS PROFILE
Goldman Sachs Funds

Goldman Sachs is a premier financial services firm, known since 1869 for creating thoughtful and customized investment solutions in complex global markets.
Today, the Investment Management Division of Goldman Sachs serves a diverse set of clients worldwide, including private institutions, public entities and individuals. With approximately $735.5 billion in assets under management as of September 30, 2012, Goldman Sachs Asset Management (“GSAM”) has portfolio management teams located around the world and our investment professionals bring firsthand knowledge of local markets to every investment decision. GSAM’s assets under management includes assets managed by Goldman Sachs Asset Management, LP and its Investment Advisory Affiliates.
| OVERVIEW OF GOLDMAN SACHS FUNDS |

Money Market1
Financial Square FundsSM
| n | Financial Square Tax-Exempt Funds |
| n | Financial Square Government Fund |
| n | Financial Square Money Market Fund |
| n | Financial Square Prime Obligations Fund |
| n | Financial Square Treasury Instruments Fund |
| n | Financial Square Treasury Obligations Fund |
Fixed Income
Short Duration and Government
| n | Enhanced Income Fund |
| n | High Quality Floating Rate Fund2 |
| n | Short Duration Government Fund |
| n | Short Duration Income Fund |
| n | Government Income Fund |
| n | Inflation Protected Securities Fund |
Multi-Sector
| n | Core Fixed Income Fund |
| n | Core Plus Fixed Income Fund |
| n | Global Income Fund |
| n | Strategic Income Fund |
Municipal and Tax-Free
| n | High Yield Municipal Fund |
| n | Municipal Income Fund |
| n | Short Duration Tax-Free Fund |
Single Sector
| n | Investment Grade Credit Fund |
| n | U.S. Mortgages Fund |
| n | High Yield Fund |
| n | High Yield Floating Rate Fund |
| n | Emerging Markets Debt Fund |
| n | Local Emerging Markets Debt Fund |
Corporate Credit
| n | Credit Strategies Fund |
Fundamental Equity
| n | Growth and Income Fund |
| n | Small Cap Value Fund |
| n | Mid Cap Value Fund |
| n | Large Cap Value Fund |
| n | Capital Growth Fund |
| n | Strategic Growth Fund |
| n | Focused Growth Fund |
| n | Small/Mid Cap Growth Fund |
| n | Flexible Cap Growth Fund |
| n | Concentrated Growth Fund |
| n | Technology Tollkeeper Fund |
| n | Growth Opportunities Fund |
| n | Rising Dividend Growth Fund |
| n | U.S. Equity Fund |
| n | Income Builder Fund3 |
Structured Equity
| n | Structured Small Cap Equity Fund |
| n | Structured U.S. Equity Fund |
| n | Structured Small Cap Growth Fund |
| n | Structured Large Cap Growth Fund |
| n | Structured Large Cap Value Fund |
| n | Structured Small Cap Value Fund |
| n | Structured Tax-Managed Equity Fund |
| n | Structured International Tax-Managed Equity Fund |
| n | U.S. Equity Dividend and Premium Fund |
| n | International Equity Dividend and Premium Fund |
| n | Structured International Small Cap Fund |
| n | Structured International Equity Fund |
| n | Structured Emerging Markets Equity Fund |
Fundamental Equity International4
| n | Strategic International Equity Fund |
| n | Concentrated International Equity Fund |
| n | International Small Cap Fund |
| n | Asia Equity Fund |
| n | Emerging Markets Equity Fund |
| n | BRIC Fund (Brazil, Russia, India, China) |
| n | N-11 Equity Fund |
| n | Brazil Equity Fund |
| n | China Equity Fund |
| n | Korea Equity Fund |
| n | India Equity Fund |
Select Satellite5
| n | Real Estate Securities Fund |
| n | International Real Estate Securities Fund |
| n | Commodity Strategy Fund |
| n | Dynamic Allocation Fund |
| n | Absolute Return Tracker Fund |
| n | Managed Futures Strategy Fund |
| n | Retirement Portfolio Completion Fund |
Total Portfolio Solutions5
| n | Balanced Strategy Portfolio |
| n | Growth and Income Strategy Portfolio |
| n | Growth Strategy Portfolio |
| n | Equity Growth Strategy Portfolio |
| n | Income Strategies Portfolio |
| n | Satellite Strategies Portfolio |
| n | Retirement Strategies Portfolios6 |
| n | Enhanced Dividend Global Equity Portfolio |
| n | Tax Advantaged Global Equity Portfolio |
| 1 | An investment in a money market fund is neither insured nor guaranteed by the Federal Deposit Insurance Corporation (“FDIC”) or any other government agency. Although the Funds seek to preserve the value of your investment at $1.00 per share, it is possible to lose money by investing in the Funds. |
| 2 | Effective at the close of business on July 27, 2012, the Goldman Sachs Ultra-Short Duration Government Fund was renamed the Goldman Sachs High Quality Floating Rate Fund. |
| 3 | Effective at the close of business on June 29, 2012, the Goldman Sachs Balanced Fund was renamed the Goldman Sachs Income Builder Fund. |
| 4 | Since October 18, 2012, shares of the Goldman Sachs Brazil Equity, India Equity and Korea Equity Funds (each, a “Fund,” and collectively, the “Funds”) have not been available for purchase by investors. Each Fund will be liquidated pursuant to a Board-approved Plan of Liquidation on or about November 30, 2012 (the “Liquidation Date”). At any time prior to the Liquidation Date, shareholders may redeem their shares of the Funds and receive the net asset value thereof in cash or in kind, as provided in the Prospectus. |
| 5 | Individual Funds within the Total Portfolio Solutions and Select Satellite categories will have various placement on the risk/return spectrum and may have greater or lesser risk than that indicated by the placement of the general Total Portfolio Solutions or Select Satellite category. |
| 6 | Since July 28, 2012, shares of each of the Goldman Sachs Retirement Strategy Portfolios (the “Portfolios”) have not been available for purchase except to participants within certain Retirement Plans (as defined in the Prospectus). As of the close of business on December 6, 2012, shares of the Portfolios will no longer be available for purchase by any investors. |
Financial Square FundsSM is a registered service mark of Goldman, Sachs & Co.
TRUSTEES Ashok N. Bakhru, Chairman Donald C. Burke John P. Coblentz, Jr. Diana M. Daniels Joseph P. LoRusso James A. McNamara Jessica Palmer Alan A. Shuch Richard P. Strubel | OFFICERS James A. McNamara, President George F. Travers, Principal Financial Officer Caroline Kraus, Secretary Scott M. McHugh, Treasurer | |
GOLDMAN, SACHS & CO. Distributor and Transfer Agent | GOLDMAN SACHS ASSET MANAGEMENT, L.P. Investment Adviser | |
Visit our Web site at www.goldmansachsfunds.com to obtain the most recent month-end returns.
Goldman Sachs Asset Management, L.P. 200 West Street, New York, New York 10282
The reports concerning the Funds included in this shareholder report may contain certain forward-looking statements about the factors that may affect the performance of the Funds in the future. These statements are based on Fund management’s predictions and expectations concerning certain future events and their expected impact on the Funds, such as performance of the economy as a whole and of specific industry sectors, changes in the levels of interest rates, the impact of developing world events, and other factors that may influence the future performance of the Funds. Management believes these forward-looking statements to be reasonable, although they are inherently uncertain and difficult to predict. Actual events may cause adjustments in portfolio management strategies from those currently expected to be employed.
A description of the policies and procedures that the Funds use to determine how to vote proxies relating to portfolio securities and information regarding how a Fund voted proxies relating to portfolio securities during the most recent 12-month period ended June 30 is available (I) without charge, upon request by calling 1-800-526-7384 (for Retail Shareholders) or 1-800-621-2550 (for Institutional Shareholders); and (II) on the Securities and Exchange Commission (“SEC”) web site at http://www.sec.gov.
The Funds file their complete schedule of portfolio holdings with the SEC for the first and third quarters of each fiscal year on Form N-Q. The Funds’ Forms N-Q are available on the SEC’s web site at http://www.sec.gov within 60 days after the Funds’ first and third fiscal quarters. The Funds’ Forms N-Q may be reviewed and copied at the SEC’s Public Reference Room in Washington, D.C. and information on the operation of the Public Reference Room may be obtained by calling 1-800-SEC-0330. Forms N-Q may be obtained upon request and without charge by calling 1-800-526-7384 (for Retail Shareholders) or 1-800-621-2550 (for Institutional Shareholders).
IRS Circular 230 Disclosure: Goldman Sachs does not provide legal, tax or accounting advice. Any statement contained in this communication (including any attachments) concerning U.S. tax matters is not intended or written to be used, and cannot be used, for the purpose of avoiding penalties imposed on the relevant taxpayer. Clients of Goldman Sachs should obtain their own independent tax advice based on their particular circumstances.
Holdings and allocations shown are as of September 30, 2012 and may not be representative of future investments. Fund holdings should not be relied on in making investment decisions and should not be construed as research or investment advice regarding particular securities.
This material is not authorized for distribution to prospective investors unless preceded or accompanied by a current Prospectus or summary prospectus, if applicable. Investors should consider a Fund’s objective, risks, and charges and expenses, and read the summary prospectus, if available, and/or the Prospectus carefully before investing or sending money. The summary prospectus, if available, and the Prospectus contain this and other information about a Fund and may be obtained from your authorized dealer or from Goldman, Sachs & Co. by calling (retail – 1-800-526-7384) (institutional – 1-800-621-2550).
© 2012 Goldman Sachs. All rights reserved. 86268.MF.MED.TMPL /11/2012 TFFISAR12 / 24.7K
| ITEM 2. | CODE OF ETHICS. |
| The information required by this Item is only required in an annual report on this Form N-CSR. |
| ITEM 3. | AUDIT COMMITTEE FINANCIAL EXPERT. |
| The information required by this Item is only required in an annual report on this Form N-CSR. |
| ITEM 4. | PRINCIPAL ACCOUNTANT FEES AND SERVICES. |
| The information required by this Item is only required in an annual report on this Form N-CSR. |
| ITEM 5. | AUDIT COMMITTEE OF LISTED REGISTRANTS. |
| Not applicable. |
| ITEM 6. | SCHEDULE OF INVESTMENTS. |
| Schedule of Investments is included as part of the Report to Stockholders filed under Item 1. |
| ITEM 7. | DISCLOSURE OF PROXY VOTING POLICIES AND PROCEDURES FOR CLOSED-END MANAGEMENT INVESTMENT COMPANIES. |
| Not applicable. |
| ITEM 8. | PORTFOLIO MANAGERS OF CLOSED-END MANAGEMENT INVESTMENT COMPANIES. |
| Not applicable. |
| ITEM 9. | PURCHASES OF EQUITY SECURITIES BY CLOSED-END MANAGEMENT INVESTMENT COMPANY AND AFFILIATED PURCHASERS. |
| Not applicable. |
| ITEM 10. | SUBMISSION OF MATTERS TO A VOTE OF SECURITY HOLDERS. |
| There have been no material changes to the procedures by which shareholders may recommend nominees to the registrant’s board of trustees. |
| ITEM 11. | CONTROLS AND PROCEDURES. |
| (a) | The registrant’s principal executive and principal financial officers, or persons performing similar functions have concluded that the registrant’s disclosure controls and procedures (as defined in Rule 30a-3(c) under the Investment Company Act of 1940, as amended (the “1940 Act”)) are effective as of a date within 90 days of the filing of this report that includes the disclosure required by this paragraph, based on the evaluation of these controls and procedures required by Rule 30a-3(b) under the 1940 Act and 15d-15(b) under the Securities Exchange Act of 1934, as amended. |
| (b) | There were no changes in the registrant’s internal control over financial reporting (as defined in Rule 30a-3(d) under the 1940 Act) that occurred during the registrant’s second fiscal quarter of the period covered by this report that have materially affected, or are reasonably likely to materially affect, the registrant’s internal control over financial reporting. |
| ITEM 12. | EXHIBITS. |
| (a)(1) | The information required by this Item is only required in connection with an annual report on this Form N-CSR. | |||
| (a)(2) | Exhibit 99.CERT | Certifications pursuant to Section 302 of the Sarbanes-Oxley Act of 2002 filed herewith. | ||
| (b) | Exhibit 99.906CERT | Certifications pursuant to Section 906 of the Sarbanes-Oxley Act of 2002 filed herewith. | ||
SIGNATURES
Pursuant to the requirements of the Securities Exchange Act of 1934 and the Investment Company Act of 1940, the registrant has duly caused this report to be signed on its behalf by the undersigned, thereunto duly authorized.
| Goldman Sachs Trust | ||||
| By: | /s/ James A. McNamara | |||
| James A. McNamara | ||||
| President/Principal Executive Officer | ||||
| Goldman Sachs Trust | ||||
| Date: | November 19, 2012 | |||
Pursuant to the requirements of the Securities Exchange Act of 1934 and the Investment Company Act of 1940, this report has been signed below by the following persons on behalf of the registrant and in the capacities and on the dates indicated.
| By: | /s/ James A. McNamara | |||
| James A. McNamara | ||||
| President/Principal Executive Officer | ||||
| Goldman Sachs Trust | ||||
| Date: | November 19, 2012 | |||
| By: | /s/ George F. Travers | |||
| George F. Travers | ||||
| Principal Financial Officer | ||||
| Goldman Sachs Trust | ||||
| Date: | November 16, 2012 | |||