UNITED STATES
SECURITIES AND EXCHANGE COMMISSION
Washington, D.C. 20549
FORM N-CSR
CERTIFIED SHAREHOLDER REPORT OF REGISTERED
MANAGEMENT INVESTMENT COMPANIES
Investment Company Act file number 811-05349
Goldman Sachs Trust
(Exact name of registrant as specified in charter)
71 South Wacker Drive,
Chicago, Illinois 60606
(Address of principal executive offices) (Zip code)
Copies to: | ||
Caroline Kraus | Geoffrey R.T. Kenyon, Esq. | |
Goldman, Sachs & Co. | Dechert LLP | |
200 West Street | 200 Clarendon Street | |
New York, New York 10282 | 27th Floor | |
| Boston, MA 02116-5021 | ||
(Name and address of agents for service)
Registrant’s telephone number, including area code: (312) 655-4400
Date of fiscal year end: August 31
Date of reporting period: February 28, 2013
| ITEM 1. | REPORTS TO STOCKHOLDERS. |
| The Semi-Annual Report to Stockholders is filed herewith. |
Goldman Sachs Funds

| Semi-Annual Report | February 28, 2013 | |||
Fundamental Equity Value Funds | ||||
Growth and Income | ||||
Large Cap Value | ||||
Mid Cap Value | ||||
Small Cap Value | ||||

Goldman Sachs Fundamental Equity Value Funds
| n | GROWTH AND INCOME |
| n | LARGE CAP VALUE |
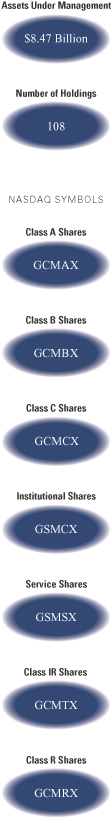
| n | MID CAP VALUE |
| n | SMALL CAP VALUE |
TABLE OF CONTENTS | ||||
Principal Investment Strategies and Risks | 1 | |||
Investment Process | 2 | |||
Market Review | 3 | |||
Portfolio Management Discussions and Performance Summaries | 5 | |||
Schedules of Investments | 31 | |||
Financial Statements | 44 | |||
Financial Highlights | 50 | |||
Notes to Financial Statements | 58 | |||
Other Information | 72 | |||
| NOT FDIC-INSURED | May Lose Value | No Bank Guarantee | ||
GOLDMAN SACHS FUNDAMENTAL EQUITY VALUE FUNDS
Principal Investment Strategies and Risks
This is not a complete list of risks that may affect the Funds. For additional information concerning the risks applicable to the Funds, please see the Funds’ Prospectus.
The Goldman Sachs Growth and Income Fund invests primarily in large-capitalization U.S. equity investments. The Fund’s equity investments are subject to market risk, which means that the value of the securities in which it invests may go up or down in response to the prospects of individual companies, particular sectors and/or general economic conditions. Different investment styles (e.g., “value”) tend to shift in and out of favor, and at times the Fund may underperform other funds that invest in similar asset classes.
The Goldman Sachs Large Cap Value Fund invests primarily in large-capitalization U.S. equity investments. The Fund’s equity investments are subject to market risk, which means that the value of the securities in which it invests may go up or down in response to the prospects of individual companies, particular sectors and/or general economic conditions. Different investment styles (e.g., “value”) tend to shift in and out of favor, and at times the Fund may underperform other funds that invest in similar asset classes.
The Goldman Sachs Mid Cap Value Fund invests primarily in mid-capitalization U.S. equity investments. The Fund’s equity investments are subject to market risk, which means that the value of the securities in which it invests may go up or down in response to the prospects of individual companies, particular sectors and/or general economic conditions. The securities of small- and mid-capitalization companies involve greater risks than those associated with larger, more established companies and may be subject to more abrupt or erratic price movements. Different investment styles (e.g., “value”) tend to shift in and out of favor, and at times the Fund may underperform other funds that invest in similar asset classes.
The Goldman Sachs Small Cap Value Fund invests primarily in small-capitalization U.S. equity investments. The Fund’s equity investments are subject to market risk, which means that the value of the securities in which it invests may go up or down in response to the prospects of individual companies, particular sectors and/or general economic conditions. The securities of small- and mid-capitalization companies involve greater risks than those associated with larger, more established companies and may be subject to more abrupt or erratic price movements. Different investment styles (e.g., “value”) tend to shift in and out of favor, and at times the Fund may underperform other funds that invest in similar asset classes.
1
GOLDMAN SACHS FUNDAMENTAL EQUITY VALUE FUNDS
What Differentiates the Goldman Sachs Fundamental Equity Value Investment Process?
Goldman Sachs’ Fundamental Equity Value Team believes that all successful investing should thoughtfully weigh two important attributes of a stock: price and prospects. Through independent fundamental research, the Team seeks to identify and invest in quality businesses that are selling at compelling valuations.


At the heart of our value investment philosophy is a belief in the rigorous analysis of business fundamentals. Our approach may include:
| n | Meetings with management teams and on-site company visits |
| n | Industry-specific, proprietary financial and valuation models |
| n | Assessment of management quality |
| n | Analysis of each company’s competitive position and industry dynamics |
| n | Interviews with competitors, suppliers and customers |

We seek to invest in companies when we believe:
| n | Market uncertainty exists |
| n | Their economic value is not recognized by the market |

We seek to buy companies with quality characteristics. For us, this means companies that have:
| n | Sustainable operating earnings, or competitive advantage |
| n | Excellent stewardship of capital |
| n | Capability to earn above their cost of capital |
| n | Strong or improving balance sheets and cash flow |

Value portfolios that strive to offer:
| n | Capital appreciation potential as each company’s true value is recognized in the marketplace |
| n | Investment style consistency |
2
MARKET REVIEW
Goldman Sachs Fundamental Equity Value Funds
Market Review
Overall, U.S. equities advanced for the six months ended February 28, 2013 (the “Reporting Period”) with broad sector participation. The Standard & Poor’s 500® Index (the “S&P 500 Index”) ended the Reporting Period with a gain of 8.95%, and the Russell 3000® Index generated a return of 9.97%.
As the Reporting Period began in September 2012, U.S. equities were in the midst of a rally that had begun in the summer of 2012 following assurance of ongoing easy monetary policy from the Federal Reserve Board (the “Fed”) and the European Central Bank. However, the U.S. equity market then pulled back in October 2012 on some cautious corporate earnings guidance and uncertainty surrounding the U.S. presidential election. Also pressuring the U.S. equity market was the worst storm in decades battering the East Coast.
The U.S. equity market subsequently regained momentum in November 2012, as election day largely preserved the status quo in the White House and Congress and economic data continued to show signs of improvement. More specifically, the U.S. reported better than expected third calendar quarter Gross Domestic Product growth of 2%, the 13th consecutive quarter of economic expansion, and the unemployment rate dropped to 7.8%, the lowest rate seen since January 2009. U.S. manufacturing activity increased, and the housing market showed further signs of improvement, as construction of new homes hit a four-year high. In December 2012, further clarification from the Fed, tying its low interest rate policy, in part, to the condition that unemployment drop to 6.5% or lower, helped to offset increasing worries about the then-looming fiscal cliff of tax increases and spending cuts. Following weeks of tense negotiations and technically falling off the fiscal cliff for one day, the U.S. Congress finally reached an agreement averting the full force of tax increases that were scheduled to take effect on January 1, 2013. While spending cuts and other important fiscal issues were not truly addressed but merely postponed, the passage of The American Taxpayer Relief Act (ATRA) of 2012 did resolve some lingering uncertainties.
The U.S. equity market rally picked up steam in the first two months of 2013, with the S&P 500 Index reaching a five-year high and then a new record level and the Dow Jones Industrial Average hitting the 14,000 milestone. Further strengthening in home prices and improving U.S. employment data lifted markets, despite the realization that no deal would be reached in Washington D.C. to avoid the sequester, or automatic spending cuts, scheduled by the federal government to go into effect on March 1, 2013.
For the Reporting Period overall, mid-cap companies performed best with small-cap companies close behind. While generating solid positive returns, large-cap stocks followed at some distance. Value stocks significantly outpaced growth stocks across the capitalization spectrum. (All as measured by Russell Investments indices.) Within the S&P 500 Index, nine of ten sectors made gains during the Reporting Period. The consistent and persistent commitment to accommodative monetary policy from the U.S. Fed and other central banks throughout the Reporting Period drove market leading returns in the financials sector. On optimism about the economy and improved consumer confidence, the industrials, health care and consumer discretionary sectors also posted double-digit gains. The information technology sector was the only one to decline during the Reporting Period, largely due to some weaker than expected corporate earnings reports.
3
MARKET REVIEW
Looking Ahead
With the U.S. equity market trading near all-time highs at the end of the Reporting Period, we continue to use our bottom-up, fundamental research process to drive our investment decisions for the Funds rather than sentiment or headlines. Even after a strong start to 2013, many of the reasons we began the Reporting Period constructive on U.S. equities still held true at the end of the Reporting Period. First, corporate balance sheets remained strong, which we believe provides companies with the ability to generate shareholder value, even in a slow-growth economic environment. Second, the S&P 500 Index was trading below its historical average price to earnings (P/E) ratio, while its dividend yield was greater than the yield on the 10-year U.S. Treasury bond. Third, continued strength in the U.S. housing recovery should, in our view, provide further support to the economy and boost confidence among consumers.
Of course, risks remain. Fiscal policy will likely be a drag on U.S. economic growth as 2013 progresses. Further, with the ultimate direction of fiscal policy still unclear, there is the potential for political headlines, in both the U.S. and overseas, to impact the U.S. equity market. We have long been cautious regarding companies that have a high degree of government dependency, whether it is related to sales, subsidies or regulations.
We believe companies with strong business franchises and competitive advantages may provide some degree of stability against an uncertain backdrop. As always, deep research resources, a forward-looking investment process and truly actively managed portfolios are keys, in our view, to both preserving capital and outperforming the market over the long term.
4
PORTFOLIO RESULTS
Goldman Sachs Growth and Income Fund
Portfolio Composition
Under normal circumstances, the Fund invests at least 65% of its total assets in equity investments that the Goldman Sachs Value Investment Team considers to have favorable prospects for capital appreciation and/or dividend-paying ability. Although the Fund will invest primarily in publicly traded U.S. securities, including preferred and convertible securities, it may invest up to 25% of its total assets in foreign securities, including securities of issuers in emerging countries and securities quoted in foreign currencies. The Fund may also invest up to 35% of its total assets in fixed income securities, such as government, corporate and bank debt obligations, that offer the potential to further the Fund’s investment objective of long-term capital appreciation and growth of income.
Portfolio Management Discussion and Analysis
Below, the Goldman Sachs Fundamental Equity Value Investment Team discusses the Goldman Sachs Growth and Income Fund’s (the “Fund”) performance and positioning for the six-month period ended February 28, 2013 (the “Reporting Period”).
| Q | How did the Fund perform during the Reporting Period? |
| A | During the Reporting Period, the Fund’s Class A, B, C, Institutional, Service, IR and R Shares generated cumulative total returns, without sales charges, of 12.38%, 11.95%, 11.98%, 12.64%, 12.37%, 12.54% and 12.29%, respectively. These returns compare to the 13.15% cumulative total return of the Fund’s benchmark, the Russell 1000® Value Index (with dividends reinvested) (the “Russell Index”), during the same period. |
| Q | What key factors were responsible for the Fund’s performance during the Reporting Period? |
| A | The Fund generated double-digit absolute gains, but stock selection overall detracted from its performance relative to the Russell Index during the Reporting Period. |
| Q | Which equity market sectors most significantly affected Fund performance? |
| A | Detracting from the Fund’s performance most relative to the Russell Index was stock selection in the energy, consumer staples and health care sectors. Effective stock selection in the financials, telecommunication services and materials sectors helped the Fund’s relative results most. |
| Q | Which stocks detracted significantly from the Fund’s performance during the Reporting Period? |
| A | Detracting most from the Fund’s results relative to its benchmark index were positions in independent oil and gas exploration and production company Devon Energy, diversified banking institution Citigroup and computer memory device manufacturer EMC. |
The Fund’s stock selection in the energy sector detracted from performance during the Reporting Period, largely driven by Devon Energy, a North America-focused independent energy company engaged in the exploration, development and production of oil, natural gas and natural gas liquids (“NGLs”). During the Reporting Period, shares of Devon Energy fell along with the broader energy sector due to a decline in oil prices. The company has shifted production and resources toward oil and NGLs over time. As a result, its shares fell further after it reported third calendar quarter production levels that missed expectations due to operating issues. The market was also disappointed by Devon Energy’s forecast for flat overall production in 2013. We trimmed the Fund’s position in Devon Energy but maintained the holding, as we do not agree with the market’s negative assessment. At the end of the Reporting Period, we recognized our investment thesis may take longer to play out than originally expected, however we believed the value of Devon’s Energy’s large North American asset base was not fully recognized at its then-current market price. While natural gas output may fall, higher margin oil production |
5
PORTFOLIO RESULTS
should increase, which should lead to a more favorable production mix in our view. Further, Devon Energy’s management is reviewing a number of strategic options, including the creation of a master limited partnership with assets from the company’s midstream business. (The midstream component of the energy industry is usually defined as those companies providing products or services that help link the supply side, i.e. energy producers, and the demand side, i.e. energy end-users, for any type of energy commodity. Such midstream business can include, but are not limited to, those that process, store, market and transport various energy commodities.) We believe the company’s management is taking the right steps to bring out the value within its large asset base. We believe the company maintains a strong balance sheet, which, along with its joint venture partnerships, may help speed up the development of its oil properties. In addition, we believe its cash flow should increase in 2013, as the company projects to spend significantly less on acquiring new acreage. |
| A newly established, underweighted position in Citigroup hurt the Fund’s relative results. During the Reporting Period, Citigroup announced that Vikram Pandit stepped down as the company’s chief executive officer and as a member of its Board. The company also announced that its president and chief operating officer John P. Havens had resigned. Further, Citigroup announced plans to eliminate 11,000 jobs worldwide, about 4% of its total staff, in a move to save as much as $1.1 billion a year in expenses. The move was anticipated to initially result in pre-tax charges of $1 billion to fourth quarter 2012 earnings. Besides the job cuts, the reorganization was expected to reduce annual revenues by less than $300 million. As a result of all of these changes, Citigroup’s shares rose significantly during the Reporting Period, but the Fund held an underweighted position in the stock thus making Citigroup a significant detractor. |
| Shares of EMC declined during the Reporting Period primarily due to less than anticipated earnings. Such earnings weakness was attributable to investor concerns that the company lost market share and to a sluggish macro and potentially weak spending environment in 2013. EMC was also negatively impacted in January 2013 by disappointing quarterly results and guidance from VMware, in which EMC holds an approximately 80% stake. However, EMC’s high-end and mid-tier storage products continued to record consistent growth and were gaining market share. We added to the Fund’s position in EMC for this reason and because we believe that concerns over the company’s data storage business stem from the macro environment late in 2012 and that such concerns were overblown. At the end of the Reporting Period, we did not see any company specific issues. While governments’ technology budgets may be tightened in 2013, the company’s management expected strong global information technology spending by corporations to offset any weakness. Long-term, we also believe the outlook is favorable for information storage and virtualization. At the end of the Reporting Period, we believed EMC had a strong balance sheet and was trading below its average price to earnings ratio of recent years. As an industry leader in information storage, we found shares of the company to be attractively valued. |
| Q | What were some of the Fund’s best-performing individual stocks? |
| A | The Fund benefited most relative to the Russell Index from positions in diversified banking institution JPMorgan Chase, home improvement retailer Lowe’s and oil services firm Halliburton. |
| In the financials sector, the Fund’s holding in JPMorgan Chase contributed positively to performance during the Reporting Period. Its stock improved as concerns surrounding the company’s multi-billion trading loss and other litigation risks subsided and as the company reported better than expected third calendar quarter results. In addition, the company’s management discussed returning value to shareholders and assured investors the company was on track to meet Basel III capital requirements. (Basel III is a global regulatory standard relating to banks’ capital adequacy and liquidity.) By the end of the Reporting Period, we had trimmed the Fund’s position in JPMorgan Chase, taking profits, but maintained the holding, as we continued to have conviction in JPMorgan Chase’s management team and believed the company would benefit from what we considered to be its strong balance sheet, resilient business model and robust capital generating franchises. |
Lowe’s strong performance, which began during the summer of 2012, continued through the Reporting Period. The company reported earnings that exceeded analysts’ expectations. Same store sales and margins, key operating metrics, showed improvement, and its management continued to focus on improving execution at its core business. We trimmed the Fund’s position in Lowe’s during the Reporting Period, taking profits. However, we maintained the holding because, in our view, Lowe’s can reduce its cost of goods sold, which could lead to further |
6
PORTFOLIO RESULTS
margin expansion. The improving U.S. housing market could provide another tailwind for the company, since Lowe’s has leverage to big-ticket items, such as appliances, needed to complete newly constructed homes. Lowe’s continues to aggressively repurchase its shares, which we believe lends further support to a potential scenario of continued earnings growth. |
| A position in Halliburton contributed to the Fund’s relative performance during the Reporting Period. Halliburton reported strong fourth calendar quarter results, largely driven by growth in its international business. Halliburton’s operations are split rather evenly between North America and international markets. In addition, rig efficiency positively impacted Halliburton’s business, given that it can grow revenue if rig counts stabilize or decrease. The company continued to be impacted by higher guar costs, but we believe a widely expected moderation in guar prices later in the calendar year sets it up well for 2013. (Guar is a plant, whose seeds are used as a controlling agent in oil wells to facilitate easy drilling and prevent fluid loss.) Also, progress in the Macondo litigations supported the company’s stock during the Reporting Period. (Macondo was the well involved in the Gulf of Mexico disaster.) We trimmed the Fund’s position in Halliburton during the Reporting Period, taking profits, but maintained the holding. Ultimately, we feel costs and capital expenditure reduction should lead to better free cash flow generation for Halliburton and an increased potential for dividends and share buybacks. |
| Q | How did the Fund use derivatives and similar instruments during the Reporting Period? |
| A | During the Reporting Period, we did not use derivatives as part of an active management strategy. |
| Q | Did the Fund make any significant purchases or sales during the Reporting Period? |
| A | We initiated a Fund position in diversified health care benefits company Aetna during the Reporting Period. We believe that in an environment in which there is a huge and growing focus on controlling health care costs and in which utilization continues to be muted, managed care should be a sector that benefits. We further believe it is a positive that Aetna has a diversified book of business with low exposure to individual and small group markets, enabling it to adjust to expected regulatory headwinds in 2014. We feel that Aetna may well benefit from a growing revenue base, which could help to offset margin pressure from selling, general, and administrative (“SGA”) expense leverage. Further, in our view, Aetna has a shareholder-friendly management team, committed to $1 billion in share repurchases in 2014 and 2015, and the company also recently raised its dividend. |
| We established a Fund position in DTE Energy, which is a diversified energy company with approximately 80% of its business in the regulated utilities segment. Among its unregulated businesses, we believe the highest growth opportunity may be found in the midstream pipeline business. We view this stock as a pure infrastructure investment with limited, if any, commodities risk. At the time of purchase, we viewed the stock as trading at a slight discount to pure-play gas distribution companies. |
| Conversely, we eliminated the Fund’s position in Chevron, which engages in petroleum operations, chemicals operations, mining operations, power generation and energy services. We closed the position in Chevron as conviction grew in other names in the exploration and production industry. During the Reporting Period, we continued to be focused on companies that we consider to have strong positions in the most prolific and profitable basins in the U.S. and that we believe can grow production and reserves cost effectively. In our view, these companies also need to have a strong operational record, low cost structure and strict financial discipline. |
| We exited the Fund’s position in American Electric Power, one of the largest electric utilities providers in the U.S., as our investment thesis had largely been met. Uncertainties surrounding the company’s transition from a fully regulated utility to an integrated, or hybrid, model of competitive power generation in Ohio served as a significant overhang on its stock price during 2012. American Electric Power received some favorable rulings from Ohio regulators, which increased the likelihood the transition would become complete, sending shares higher during the latter portion of the Reporting Period. We believed the catalysts we had identified had played out and decided to put the proceeds toward opportunities that we believed had a more favorable risk-reward profile. |
7
PORTFOLIO RESULTS
| Q | Were there any notable changes in the Fund’s weightings during the Reporting Period? |
| A | In constructing the Fund’s portfolio, we focus on picking stocks rather than on making industry or sector bets. We seek to outpace the benchmark index by overweighting stocks that we expect to outperform and underweighting those that we think may lag. Consequently, changes in its sector weights are generally the direct result of individual stock selection or of stock appreciation or depreciation. That said, during the Reporting Period, the Fund’s allocations compared to the benchmark index in consumer discretionary, materials and telecommunication services increased. The Fund’s exposure to consumer staples, energy, information technology and utilities decreased compared to the Russell Index. |
| Q | How was the Fund positioned relative to its benchmark index at the end of February 2013? |
| A | At the end of February 2013, the Fund had overweighted positions relative to the Russell Index in the health care, information technology and consumer discretionary sectors. On the same date, the Fund had underweighted positions compared to the Russell Index in financials, energy and materials and was rather neutrally weighted relative to the Russell Index in consumer staples, industrials, telecommunication services and utilities. |
8
FUND BASICS
Growth and Income Fund
as of February 28, 2013
| PERFORMANCE REVIEW |
| September 1, 2012–February 28, 2013 | Fund Total Return (based on NAV)1 | Russell 1000 Value Index2 | ||||||||
| Class A | 12.38 | % | 13.15 | % | ||||||
| Class B | 11.95 | 13.15 | ||||||||
| Class C | 11.98 | 13.15 | ||||||||
| Institutional | 12.64 | 13.15 | ||||||||
| Service | 12.37 | 13.15 | ||||||||
| Class IR | 12.54 | 13.15 | ||||||||
| Class R | 12.29 | 13.15 | ||||||||
| 1 | The net asset value (“NAV”) represents the net assets of the class of the Fund (ex-dividend) divided by the total number of shares of the class outstanding. The Fund’s performance reflects the reinvestment of dividends and other distributions. The Fund’s performance does not reflect the deduction of any applicable sales charges. |
| 2 | The unmanaged Russell 1000 Value Index (with dividends reinvested) is a market capitalization weighted index of the 1,000 largest U.S. companies with lower price-to-book ratios and lower forecasted growth values. The Index figures do not reflect any deduction of fees, expenses or taxes. It is not possible to invest directly in an index. |
| STANDARDIZED TOTAL RETURNS3 |
| For the period ended 12/31/12 | One Year | Five Years | Ten Years | Since Inception | Inception Date | |||||||||||
| Class A | 12.99 | % | -2.36% | 5.28% | 5.79 | % | 2/5/93 | |||||||||
| Class B | 13.61 | -2.40 | 5.23 | 3.85 | 5/1/96 | |||||||||||
| Class C | 17.64 | -1.99 | 5.09 | 1.07 | 8/15/97 | |||||||||||
| Institutional | 20.02 | -0.88 | 6.29 | 4.55 | 6/3/96 | |||||||||||
| Service | 19.42 | -1.36 | 5.77 | 4.14 | 3/6/96 | |||||||||||
| Class IR | 19.81 | -1.02 | N/A | -1.07 | 11/30/07 | |||||||||||
| Class R | 19.26 | -1.49 | N/A | -1.55 | 11/30/07 | |||||||||||
| 3 | The Standardized Total Returns are average annual total returns as of the most recent calendar quarter-end. They assume reinvestment of all distributions at NAV. These returns reflect a maximum initial sales charge of 5.5% for Class A Shares and the assumed contingent deferred sales charge for Class B Shares (5% maximum declining to 0% after six years) and the assumed contingent deferred sales charge for Class C Shares (1% if redeemed within 12 months of purchase). Class B Shares convert automatically to Class A Shares on or about the fifteenth day of the last month of the calendar quarter that is eight years after purchase. Returns for Class B Shares for the period after conversion reflect the performance of Class A Shares. Because Institutional, Service, Class IR and Class R Shares do not involve a sales charge, such a charge is not applied to their Standardized Total Returns. The Fund’s Class B Shares are no longer available for purchase by new or existing shareholders (although current Class B shareholders may continue to reinvest income and capital gains distributions into Class B Shares, and Class B shareholders may continue to exchange their shares for Class B Shares of certain other Goldman Sachs Funds). |
| The returns set forth in the tables above represent past performance. Past performance does not guarantee future results. The Fund’s investment return and principal value will fluctuate so that an investor’s shares, when redeemed, may be worth more or less than their original cost. Current performance may be lower or higher than the performance quoted above. Please visit our web site at www.goldmansachsfunds.com to obtain the most recent month-end returns. Performance reflects applicable fee waivers and/or expense limitations in effect during the periods shown. In their absence, performance would be reduced. Returns do not reflect the deduction of taxes that a shareholder would pay on Fund distributions or the redemption of Fund shares. |
9
FUND BASICS
| EXPENSE RATIOS4 |
| Net Expense Ratio (Current) | Gross Expense Ratio (Before Waivers) | |||||||||
| Class A | 1.19 | % | 1.22 | % | ||||||
| Class B | 1.94 | 1.97 | ||||||||
| Class C | 1.94 | 1.97 | ||||||||
| Institutional | 0.79 | 0.82 | ||||||||
| Service | 1.29 | 1.32 | ||||||||
| Class IR | 0.94 | 0.97 | ||||||||
| Class R | 1.44 | 1.47 | ||||||||
| 4 | The expense ratios of the Fund, both current (net of applicable fee waivers and/or expense limitations) and before waivers (gross of applicable fee waivers and/or expense limitations) are as set forth above according to the most recent publicly available Prospectus for the Fund and may differ from the expense ratios disclosed in the Financial Highlights in this report. The Fund’s waivers and/or expense limitations will remain in place through at least December 29, 2013, and prior to such date the investment adviser may not terminate the arrangements without the approval of the Fund’s Board of Trustees. If these arrangements are discontinued in the future, the expense ratios may change without shareholder approval. |
| TOP TEN HOLDINGS AS OF 2/28/135 |
| Holding | % of Net Assets | Line of Business | ||||||
| JPMorgan Chase & Co. | 4.6 | % | Diversified Financial Services | |||||
| General Electric Co. | 4.3 | Industrial Conglomerates | ||||||
| Exxon Mobil Corp. | 4.2 | Oil, Gas & Consumable Fuels | ||||||
| AT&T, Inc. | 3.2 | Diversified Telecommunication Services | ||||||
| Pfizer, Inc. | 3.1 | Pharmaceuticals | ||||||
| Merck & Co., Inc. | 2.9 | Pharmaceuticals | ||||||
| Devon Energy Corp. | 2.4 | Oil, Gas & Consumable Fuels | ||||||
| Lowe’s Cos., Inc. | 2.1 | Specialty Retail | ||||||
| The Boeing Co. | 2.1 | Aerospace & Defense | ||||||
| Walgreen Co. | 2.1 | Food & Staples Retailing | ||||||
| 5 | The top 10 holdings may not be representative of the Fund’s future investments. |
10
FUND BASICS
| FUND VS. BENCHMARK SECTOR ALLOCATIONS6 | ||
| As of February 28, 2013 |
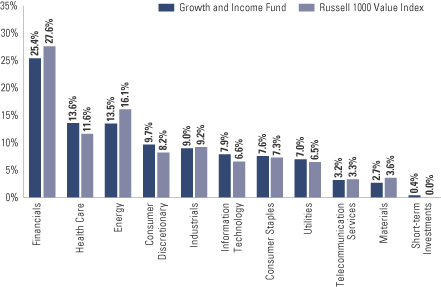
| 6 | The Fund is actively managed and, as such, its composition may differ over time. Consequently, the Fund’s overall sector allocations may differ from percentages contained in the graph above. The above graph categorizes investments using Global Industry Classification Standard (“GICS”), however, the sector classifications used by the portfolio management team may differ from GICS. The percentage shown for each investment category reflects the value of investments in that category as a percentage of market value. Short-term investments represent repurchase agreements. The above graph depicts the Fund’s investments but may not represent the Fund’s market exposure due to the exclusion of certain derivatives, if any, as listed in the Additional Investment Information section of the Schedule of Investments. |
11
PORTFOLIO RESULTS
Goldman Sachs Large Cap Value Fund
Portfolio Composition
The Fund invests, under normal circumstances, at least 80% of its net assets in a diversified portfolio of equity investments in large-cap issuers with public stock market capitalizations within the range of the market capitalization of companies constituting the Russell 1000® Value Index at the time of investment. The Fund seeks its investment objective of long-term capital appreciation by investing in value opportunities that the Goldman Sachs Value Investment Team defines as companies with identifiable competitive advantages whose intrinsic value is not reflected in the stock price. Although the Fund will invest primarily in publicly traded U.S. securities, including preferred and convertible securities, it may invest up to 25% of its net assets in foreign securities, including securities quoted in foreign currencies. The Fund may also invest up to 20% of its net assets in fixed income securities, such as government, corporate and bank debt obligations.
Portfolio Management Discussion and Analysis
Below, the Goldman Sachs Fundamental Equity Value Investment Team discusses the Goldman Sachs Large Cap Value Fund’s (the “Fund”) performance and positioning for the six-month period ended February 28, 2013 (the “Reporting Period”).
| Q | How did the Fund perform during the Reporting Period? |
| A | During the Reporting Period, the Fund’s Class A, B, C, Institutional, Service, IR and R Shares generated cumulative total returns, without sales charges, of 12.39%, 11.90%, 11.90%, 12.53%, 12.34%, 12.51% and 12.27%, respectively. These returns compare to the 13.15% cumulative total return of the Fund’s benchmark, the Russell 1000® Value Index (with dividends reinvested) (the “Russell Index”), during the same period. |
| Q | What key factors were responsible for the Fund’s performance during the Reporting Period? |
| A | The Fund generated double-digit absolute gains, but stock selection overall detracted from its performance relative to the Russell Index during the Reporting Period. |
| Q | Which equity market sectors most significantly affected Fund performance? |
| A | Detracting from the Fund’s performance most relative to the Russell Index was stock selection in the energy, information technology and consumer staples sectors. Effective stock selection in the financials, telecommunication services and materials sectors helped the Fund’s relative results most. |
| Q | Which stocks detracted significantly from the Fund’s performance during the Reporting Period? |
| A | Detracting most from the Fund’s results relative to its benchmark index were positions in independent oil and gas exploration and production company Devon Energy, computer memory device manufacturer EMC and diversified banking institution Citigroup. |
The Fund’s stock selection in the energy sector detracted from performance during the Reporting Period, largely driven by Devon Energy, a North America-focused independent energy company engaged in the exploration, development and production of oil, natural gas and natural gas liquids (“NGLs”). During the Reporting Period, shares of Devon Energy fell along with the broader energy sector due to a decline in oil prices. The company has shifted production and resources toward oil and NGLs over time. As a result, its shares fell further after it reported third calendar quarter production levels that missed expectations due to operating issues. The market was also disappointed by Devon Energy’s forecast for flat overall production in 2013. We trimmed the Fund’s position in Devon Energy but maintained the holding, as we do not agree with the market’s negative assessment. At the end of the Reporting Period, we recognized our investment thesis may take longer to play out than originally expected, however we believed the value of Devon’s Energy’s large North American asset base was not |
12
PORTFOLIO RESULTS
fully recognized at its then-current market price. While natural gas output may fall, higher margin oil production should increase, which should lead to a more favorable production mix in our view. Further, Devon Energy’s management is reviewing a number of strategic options, including the creation of a master limited partnership with assets from the company’s midstream business. (The midstream component of the energy industry is usually defined as those companies providing products or services that help link the supply side, i.e. energy producers, and the demand side, i.e. energy end-users, for any type of energy commodity. Such midstream business can include, but are not limited to, those that process, store, market and transport various energy commodities.) We believe the company’s management is taking the right steps to bring out the value within its large asset base. We believe the company maintains a strong balance sheet, which, along with its joint venture partnerships, may help speed up the development of its oil properties. In addition, we believe its cash flow should increase in 2013, as the company projects to spend significantly less on acquiring new acreage. |
| Shares of EMC declined during the Reporting Period primarily due to less than anticipated earnings. Such earnings weakness was attributable to investor concerns that the company lost market share and to a sluggish macro and potentially weak spending environment in 2013. EMC was also negatively impacted in January 2013 by disappointing quarterly results and guidance from VMware, in which EMC holds an approximately 80% stake. However, EMC’s high-end and mid-tier storage products continued to record consistent growth and were gaining market share. We added to the Fund’s position in EMC for this reason and because we believe that concerns over the company’s data storage business stem from the macro environment late in 2012 and that such concerns were overblown. At the end of the Reporting Period, we did not see any company specific issues. While governments’ technology budgets may be tightened in 2013, the company’s management expected strong global information technology spending by corporations to offset any weakness. Long-term, we also believe the outlook is favorable for information storage and virtualization. At the end of the Reporting Period, we believed EMC had a strong balance sheet and was trading below its average price to earnings ratio of recent years. As an industry leader in information storage, we found shares of the company to be attractively valued. |
| A newly established, underweighted position in Citigroup hurt the Fund’s relative results. During the Reporting Period, Citigroup announced that Vikram Pandit stepped down as the company’s chief executive officer and as a member of its Board. The company also announced that its president and chief operating officer John P. Havens had resigned. Further, Citigroup announced plans to eliminate 11,000 jobs worldwide, about 4% of its total staff, in a move to save as much as $1.1 billion a year in expenses. The move was anticipated to initially results in pre-tax charges of $1 billion to fourth quarter 2012 earnings. Besides the job cuts, the reorganization was expected to reduce annual revenues by less than $300 million. As a result of all of these changes, Citigroup’s shares rose significantly during the Reporting Period, but the Fund held an underweighted position in the stock thus making Citigroup a significant detractor. |
| Q | What were some of the Fund’s best-performing individual stocks? |
| A | The Fund benefited most relative to the Russell Index from positions in diversified banking institutions JPMorgan Chase and Bank of America and in home improvement retailer Lowe’s. |
| In the financials sector, the Fund’s holding in JPMorgan Chase contributed positively to performance during the Reporting Period. Its stock improved as concerns surrounding the company’s multi-billion trading loss and other litigation risks subsided and as the company reported better than expected third calendar quarter results. In addition, the company’s management discussed returning value to shareholders and assured investors the company was on track to meet Basel III capital requirements. (Basel III is a global regulatory standard relating to banks’ capital adequacy and liquidity.) By the end of the Reporting Period, we had trimmed the Fund’s position in JPMorgan Chase, taking profits, but maintained the holding, as we continued to have conviction in JPMorgan Chase’s management team and believed the company would benefit from what we considered to be its strong balance sheet, resilient business model and robust capital generating franchises. |
A position in Bank of America also contributed strongly to the Fund’s results during the Reporting Period. The company made progress on legacy, or long-standing, issues, particularly relating to its mortgage business, and recent settlements reduced litigation risks. Bank of America also increased its capital adequacy ratios over the past few years, |
13
PORTFOLIO RESULTS
which should allow, we believe, the company to invest more capital back into its businesses as the need to build additional reserves decreases. On the expense side, Bank of America lowered its funding costs and closed less profitable banking centers. Should its management continue to take steps to reduce expenses as anticipated, we believe additional cost savings could benefit the company’s earnings over the coming years. We believe earnings improvement seen in 2012 may well continue in 2013, and we believe the company should also benefit from its high exposure to the improving housing market. Thus we trimmed the Fund’s position in Bank of America, taking profits, but maintained the holding. |
| Lowe’s strong performance, which began during the summer of 2012, continued through the Reporting Period. The company reported earnings that exceeded analysts’ expectations. Same store sales and margins, key operating metrics, showed improvement, and its management continued to focus on improving execution at its core business. We trimmed the Fund’s position in Lowe’s during the Reporting Period, taking profits. However, we maintained the holding because, in our view, Lowe’s can reduce its cost of goods sold, which could lead to further margin expansion. The improving U.S. housing market could provide another tailwind for the company, since Lowe’s has leverage to big-ticket items, such as appliances, needed to complete newly constructed homes. Lowe’s continues to aggressively repurchase its shares, which we believe lends further support to a potential scenario of continued earnings growth. |
| Q | How did the Fund use derivatives and similar instruments during the Reporting Period? |
| A | During the Reporting Period, we did not use derivatives as part of an active management strategy. |
| Q | Did the Fund make any significant purchases or sales during the Reporting Period? |
| A | We initiated a Fund position in diversified health care benefits company Aetna during the Reporting Period. We believe that in an environment in which there is a huge and growing focus on controlling health care costs and in which utilization continues to be muted, managed care should be a sector that benefits. We further believe it is a positive that Aetna has a diversified book of business with low exposure to individual and small group markets, enabling it to adjust to expected regulatory headwinds in 2014. We feel that Aetna may well benefit from a growing revenue base, which could help to offset margin pressure from selling, general, and administrative (“SGA”) expense leverage. Further, in our view, Aetna has a shareholder-friendly management team, committed to $1 billion in share repurchases in 2014 and 2015, and the company also recently raised its dividend. |
| We established a Fund position in CF Industries. CF Industries is the largest North American producer of nitrogen and phosphate fertilizer, holding approximately 40% of the share of the North American nitrogen market, and is the number-two worldwide producer overall. We believe the market had underestimated the sustainability of the company’s earnings power, including its non-natural gas-related earnings power attributable to its distribution and infrastructure assets, which are close to its end markets. We believe CF Industries may also benefit from low cost U.S. shale gas, given that natural gas is the primary raw material for nitrogen fertilizers. Further, in our view, the company’s strong balance sheet coupled with strong cash flow increases its management’s flexibility for share buybacks or capital expenditure. |
| Conversely, we eliminated the Fund’s position in Chevron, which engages in petroleum operations, chemicals operations, mining operations, power generation and energy services. We closed the position in Chevron as conviction grew in other names in the exploration and production industry. During the Reporting Period, we continued to be focused on companies that we consider to have strong positions in the most prolific and profitable basins in the U.S. and that we believe can grow production and reserves cost effectively. In our view, these companies also need to have a strong operational record, low cost structure and strict financial discipline. |
| We exited the Fund’s position in J.M. Smucker, as its stock approached our price target. J.M. Smucker, famous for its jams and jellies, is also a well positioned company in the high margin coffee business, and its shares appreciated during the Reporting Period largely due to declining coffee prices. As our investment thesis had played out, in our view, we decided to sell the position, taking profits, in favor of names with what we believed to have a more favorable risk-reward profile. |
14
PORTFOLIO RESULTS
| Q | Were there any notable changes in the Fund’s weightings during the Reporting Period? |
| A | In constructing the Fund’s portfolio, we focus on picking stocks rather than on making industry or sector bets. We seek to outpace the benchmark index by overweighting stocks that we expect to outperform and underweighting those that we think may lag. Consequently, changes in its sector weights are generally the direct result of individual stock selection or of stock appreciation or depreciation. That said, during the Reporting Period, the Fund’s allocations compared to the benchmark index in industrials and telecommunication services increased. The Fund’s exposure to consumer staples, energy, financials, information technology and utilities decreased compared to the Russell Index. |
| Q | How was the Fund positioned relative to its benchmark index at the end of February 2013? |
| A | At the end of February 2013, the Fund had overweighted positions relative to the Russell Index in the information technology, consumer discretionary and health care sectors. On the same date, the Fund had underweighted positions compared to the Russell Index in financials, energy, materials and utilities and was rather neutrally weighted relative to the Russell Index in consumer staples, industrials and telecommunication services. |
15
FUND BASICS
Large Cap Value Fund
as of February 28, 2013
| PERFORMANCE REVIEW |
| September 1, 2012–February 28, 2013 | Fund Total Return (based on NAV)1 | Russell 1000 Value Index2 | ||||||||
| Class A | 12.39 | % | 13.15 | % | ||||||
| Class B | 11.90 | 13.15 | ||||||||
| Class C | 11.90 | 13.15 | ||||||||
| Institutional | 12.53 | 13.15 | ||||||||
| Service | 12.34 | 13.15 | ||||||||
| Class IR | 12.51 | 13.15 | ||||||||
| Class R | 12.27 | 13.15 | ||||||||
| 1 | The net asset value (“NAV”) represents the net assets of the class of the Fund (ex-dividend) divided by the total number of shares of the class outstanding. The Fund’s performance reflects the reinvestment of dividends and other distributions. The Fund’s performance does not reflect the deduction of any applicable sales charges. |
| 2 | The unmanaged Russell 1000 Value Index (with dividends reinvested) is a market capitalization weighted index of the 1,000 largest U.S. companies with lower price-to-book ratios and lower forecasted growth values. The Index figures do not reflect any deduction of fees, expenses or taxes. It is not possible to invest directly in an index. |
| STANDARDIZED TOTAL RETURNS3 |
| For the period ended 12/31/12 | One Year | Five Years | Ten Years | Since Inception | Inception Date | |||||||||||||||
| Class A | 12.57 | % | -1.84 | % | 5.79 | % | 3.69 | % | 12/15/99 | |||||||||||
| Class B | 13.24 | -1.86 | 5.75 | 3.65 | 12/15/99 | |||||||||||||||
| Class C | 17.27 | -1.47 | 5.59 | 3.35 | 12/15/99 | |||||||||||||||
| Institutional | 19.56 | -0.34 | 6.81 | 4.53 | 12/15/99 | |||||||||||||||
| Service | 19.05 | -0.83 | 6.29 | 4.06 | 12/15/99 | |||||||||||||||
| Class IR | 19.43 | -0.47 | N/A | -0.42 | 11/30/07 | |||||||||||||||
| Class R | 18.81 | -0.96 | N/A | -0.89 | 11/30/07 | |||||||||||||||
| 3 | The Standardized Total Returns are average annual total returns as of the most recent calendar quarter-end. They assume reinvestment of all distributions at NAV. These returns reflect a maximum initial sales charge of 5.5% for Class A Shares and the assumed contingent deferred sales charge for Class B Shares (5% maximum declining to 0% after six years) and the assumed contingent deferred sales charge for Class C Shares (1% if redeemed within 12 months of purchase). Class B Shares convert automatically to Class A Shares on or about the fifteenth day of the last month of the calendar quarter that is eight years after purchase. Returns for Class B Shares for the period after conversion reflect the performance of Class A Shares. Because Institutional, Service, Class IR and Class R Shares do not involve a sales charge, such a charge is not applied to their Standardized Total Returns. The Fund’s Class B Shares are no longer available for purchase by new or existing shareholders (although current Class B shareholders may continue to reinvest income and capital gains distributions into Class B Shares, and Class B shareholders may continue to exchange their shares for Class B Shares of certain other Goldman Sachs Funds). |
| The returns set forth in the tables above represent past performance. Past performance does not guarantee future results. The Fund’s investment return and principal value will fluctuate so that an investor’s shares, when redeemed, may be worth more or less than their original cost. Current performance may be lower or higher than the performance quoted above. Please visit our web site at www.goldmansachsfunds.com to obtain the most recent month-end returns. Performance reflects applicable fee waivers and/or expense limitations in effect during the periods shown. In their absence, performance would be reduced. Returns do not reflect the deduction of taxes that a shareholder would pay on Fund distributions or the redemption of Fund shares. |
16
FUND BASICS
| EXPENSE RATIOS4 |
| Net Expense Ratio (Current) | Gross Expense Ratio (Before Waivers) | |||||||||
| Class A | 1.19 | % | 1.19 | % | ||||||
| Class B | 1.94 | 1.94 | ||||||||
| Class C | 1.94 | 1.94 | ||||||||
| Institutional | 0.79 | 0.79 | ||||||||
| Service | 1.29 | 1.29 | ||||||||
| Class IR | 0.94 | 0.94 | ||||||||
| Class R | 1.44 | 1.44 | ||||||||
| 4 | The expense ratios of the Fund, both current (net of applicable fee waivers and/or expense limitations) and before waivers (gross of applicable fee waivers and/or expense limitations) are as set forth above according to the most recent publicly available Prospectus for the Fund and may differ from the expense ratios disclosed in the Financial Highlights in this report. The Fund’s waivers and/or expense limitations will remain in place through at least December 29, 2013, and prior to such date the investment adviser may not terminate the arrangements without the approval of the Fund’s Board of Trustees. If these arrangements are discontinued in the future, the expense ratios may change without shareholder approval. |
| TOP TEN HOLDINGS AS OF 2/28/135 |
| Holding | % of Net Assets | Line of Business | ||||||
| Exxon Mobil Corp. | 4.5 | Oil, Gas & Consumable Fuels | ||||||
| General Electric Co. | 4.2 | Industrial Conglomerates | ||||||
| JPMorgan Chase & Co. | 4.0 | Diversified Financial Services | ||||||
| AT&T, Inc. | 3.1 | Diversified Telecommunication Services | ||||||
| Pfizer, Inc. | 3.0 | Pharmaceuticals | ||||||
| Merck & Co., Inc. | 2.9 | Pharmaceuticals | ||||||
| Devon Energy Corp. | 2.5 | Oil, Gas & Consumable Fuels | ||||||
| Bank of America Corp. | 2.3 | Diversified Financial Services | ||||||
| Prudential Financial, Inc. | 2.2 | Insurance | ||||||
| The Boeing Co. | 2.1 | Aerospace & Defense | ||||||
| 5 | The top 10 holdings may not be representative of the Fund’s future investments. |
17
FUND BASICS
| FUND VS. BENCHMARK SECTOR ALLOCATIONS6 | ||
| As of February 28, 2013 |
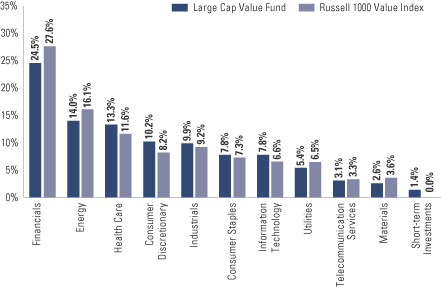
| 6 | The Fund is actively managed and, as such, its composition may differ over time. Consequently, the Fund’s overall sector allocations may differ from percentages contained in the graph above. The above graph categorizes investments using Global Industry Classification Standard (“GICS”), however, the sector classifications used by the portfolio management team may differ from GICS. The percentage shown for each investment category reflects the value of investments in that category as a percentage of market value. Short-term investments represent repurchase agreements. The above graph depicts the Fund’s investments but may not represent the Fund’s market exposure due to the exclusion of certain derivatives, if any, as listed in the Additional Investment Information section of the Schedule of Investments. |
18
PORTFOLIO RESULTS
Goldman Sachs Mid Cap Value Fund
Portfolio Composition
The Fund invests, under normal circumstances, at least 80% of its net assets in a diversified portfolio of equity investments in mid-cap issuers with public stock market capitalizations within the range of the market capitalization of companies constituting the Russell Midcap® Value Index at the time of investment. The Fund seeks its investment objective of long-term capital appreciation by investing in mid-cap U.S. equity investments that are believed to be undervalued or undiscovered by the marketplace. Although the Fund will invest primarily in publicly traded U.S. securities, it may invest up to 25% of its net assets in foreign securities, including securities of issuers in emerging countries and securities quoted in foreign currencies. The Fund may also invest in the aggregate up to 20% of its net assets in companies with public stock market capitalizations outside the range of companies constituting the Russell Midcap® Value Index at the time of investment and in fixed income securities, such as government, corporate and bank debt obligations.
Portfolio Management Discussion and Analysis
Below, the Goldman Sachs Fundamental Equity Value Investment Team discusses the Goldman Sachs Mid Cap Value Fund’s (the “Fund”) performance and positioning for the six-month period ended February 28, 2013 (the “Reporting Period”).
| Q | How did the Fund perform during the Reporting Period? |
| A | During the Reporting Period, the Fund’s Class A, B, C, Institutional, Service, IR and R Shares generated cumulative total returns, without sales charges, of 14.06%, 13.66%, 13.64%, 14.31%, 14.04%, 14.24% and 13.92%, respectively. These returns compare to the 16.14% cumulative total return of the Fund’s benchmark, the Russell Midcap® Value Index (with dividends reinvested) (the “Russell Index”), during the same period. |
| Q | What key factors were responsible for the Fund’s performance during the Reporting Period? |
| A | The Fund generated double-digit absolute gains, but stock selection overall detracted from its performance relative to the Russell Index during the Reporting Period. |
| Q | Which equity market sectors most significantly affected Fund performance? |
| A | Detracting from the Fund’s performance most relative to the Russell Index was stock selection in the industrials, consumer staples and consumer discretionary sectors. Effective stock selection in the financials, telecommunication services and materials sectors helped the Fund’s relative results most. |
| Q | Which stocks detracted significantly from the Fund’s performance during the Reporting Period? |
| A | Detracting most from the Fund’s results relative to its benchmark index were positions in aerostructures manufacturer Spirit Aerosystems Holdings, semiconductor company Altera and biotechnology company Vertex Pharmaceuticals. |
| Shares of Spirit Aerosystems Holdings, the largest independent supplier of aerostructures to Boeing, came under pressure after the company announced in late October 2012 that it would pay certain charges for the third calendar quarter, citing higher than expected costs in the Boeing 787 and other programs. We sold the Fund’s position in Spirit Aerosystems Holdings by the end of the Reporting Period. |
Altera is a global semiconductor company and a leading manufacturer and marketer of high density programmable logic devices (“PLDs”). The company provided fourth calendar quarter revenue guidance that was lower than expected, but we felt this was a one-time issue and so we added to the Fund’s position in Altera. Altera then reported fourth quarter of 2012 results and provided guidance for the first quarter of 2013 that missed expectations. We believe the factors leading to the soft results were transitory, and we further believe the uncertainty and macro weakness at the |
19
PORTFOLIO RESULTS
end of 2012 caused capital purchases to be deferred. We believe demand should rise during the second half of 2013 as capital expenditures in the semiconductor industry increase against a more favorable macro environment. At the end of the Reporting Period, we continued to find the stock attractive as PLDs continued to take market share. Also, the company, in our view, maintained a strong balance sheet with a large net cash position. In addition to using that cash to make capital investments in its business, Altera raised its dividend at a 26% annualized rate over the past three years and increased its stock repurchase program in July 2012. |
| In October 2012, shares of Vertex Pharmaceuticals, a new position for the Fund during the Reporting Period, declined after a mid-stage study on the firm’s cystic fibrosis drug Kaleydeco did not meet investors’ expectations. Its shares continued to decline in November 2012 after a rival firm announced that a viable alternative to Vertex Pharmaceuticals’ hepatitis C drug Incivek cleared phase three trials. Its company management also announced third calendar quarter earnings that showed slowing Incivek sales and reimbursement for Kaleydeco in the European Union. Despite these setbacks, at the end of the Reporting Period, we continued to believe the company had an attractive risk-reward profile with high upside potential. Already a market share leader in the treatment of hepatitis C, we believe Vertex Pharmaceuticals has the potential for margin and multiple expansion through further market penetration and pricing power. Further, in our view, the company maintains its first-mover advantage in cystic fibrosis treatments given its differentiated product pipeline. Holding more than $1 billion in cash, the company is sufficiently capitalized, in our view, to fund the development of its pipeline. |
| Q | What were some of the Fund’s best-performing individual stocks? |
| A | The Fund benefited most relative to the Russell Index from positions in global exchange NASDAQ OMX Group, packaging manufacturer Sealed Air and apparel and footwear company PVH. |
| Shares of NASDAQ OMX Group rose in late 2012 as the firm announced it had entered into an agreement with Thomson Reuters to acquire its investor relations, public relations and multimedia solutions businesses, which provide insight, analytics and communications solutions to more than 7,000 clients worldwide. In early 2013, reports that NASDAQ OMX Group was in preliminary talks to go private sent its shares higher. We trimmed the Fund’s position in the company’s shares but maintained the holding because at the end of the Reporting Period we believed NASDAQ OMX maintained solid operating margins via cost discipline and still had levers to pull if the revenue environment persists. Execution on longer-term expense initiatives should be, in our view, a tailwind for margins in 2013, and buyback opportunities at attractive valuations could be another catalyst. We believe this remains a quality company with growing platform leverage to increasing electronic trading. |
| Sealed Air is a global provider of protective packaging for food, beverages and facility sanitation products. The company reported strong fourth calendar quarter results and met forward guidance and net debt expectations, sending its shares higher. We believe Sealed Air is a stable business that has traded near trough valuations due to a combination of missed execution, macro headwinds and one-time charges. We added to the Fund’s position in Sealed Air during the Reporting Period, as we continued to see significant upside in the company and because we believe its essentially new and better-incentivized management team should be able beat expectations if the company deleverages its balance sheet and maintains stable margins in its packaging business as we expect. |
| PVH is an apparel company whose portfolio of brands includes Calvin Klein, Tommy Hilfiger, Van Heusen and IZOD, amongst others. Its shares performed well during the Reporting Period after the company announced its strategic acquisition of rival Warnaco Group. Warnaco Group had licensed Calvin Klein’s jeans from PVH, which bought Calvin Klein’s company from the designer in 2003. Analysts, including ours, believe the deal should be substantially accretive to earnings per share upon completion, as it will give the company full control of the Calvin Klein brand and expand PVH’s presence in Europe, Asia and Latin America. PVH’s stock also performed well as both the Tommy Hilfiger and Calvin Klein brands continued to demonstrate high growth both in the U.S. and in international markets. |
20
PORTFOLIO RESULTS
| Q | How did the Fund use derivatives and similar instruments during the Reporting Period? |
| A | During the Reporting Period, we did not use derivatives as part of an active management strategy. |
| Q | Did the Fund make any significant purchases or sales during the Reporting Period? |
| A | During the Reporting Period, we initiated a Fund position in Southwestern Energy, an independent energy company engaged in natural gas and oil exploration, development and production. It is focused on creating and capturing additional value through its natural gas gathering and marketing businesses, which it refers to as midstream services. We also gained confidence in the company’s Marcellus Shale production as its infrastructure came on stream. We believe Marcellus Shale production and costs could well drive Southwestern Energy’s valuation but that the stock also has resilience on the downside. Further, in our view, Southwestern Energy has a disciplined management team, improving free cash flow and other potential catalysts as 2013 unfolds. |
| We established a Fund position in CF Industries. CF Industries is the largest North American producer nitrogen and phosphate fertilizer, holding approximately 40% of the share of the North American nitrogen market, and is the number-two worldwide producer overall. We believe the market had underestimated the sustainability of the company’s earnings power, including its non-natural gas-related earnings power attributable to its distribution and infrastructure assets, which are close to its end markets. We believe CF Industries may also benefit from low cost U.S. shale gas, given that natural gas is the primary raw material for nitrogen fertilizers. Further, in our view, the company’s strong balance sheet coupled with strong cash flow increases its management’s flexibility for share buybacks or capital expenditure. |
| Conversely, we exited the Fund’s position in J.M. Smucker, as its stock approached our price target. J.M. Smucker, famous for its jams and jellies, is also a well positioned company in the high margin coffee business, and its shares appreciated during the Reporting Period largely due to declining coffee prices. As our investment thesis had played out, in our view, we decided to sell the position, taking profits, in favor of names with what we believed to have a more favorable risk-reward profile. |
| We eliminated the Fund’s position in Host Hotels & Resorts, which operates as a self-managed and self-administered real estate investment trust (“REIT”). Host Hotels & Resorts increased its quarterly dividend on two separate occasions during the Reporting Period, but we sold the Fund’s position in the REIT in favor of REITs in which we had higher conviction. The stock had strong performance to start 2013, but we favored names that we considered to be well positioned to benefit from the U.S. housing recovery. |
| Q | Were there any notable changes in the Fund’s weightings during the Reporting Period? |
| A | In constructing the Fund’s portfolio, we focus on picking stocks rather than on making industry or sector bets. We seek to outpace the benchmark index by overweighting stocks that we expect to outperform and underweighting those that we think may lag. Consequently, changes in its sector weights are generally the direct result of individual stock selection or of stock appreciation or depreciation. That said, during the Reporting Period, the Fund’s allocations compared to the benchmark index in consumer discretionary, energy, health care and industrials increased. The Fund’s exposure to the consumer staples, financials, information technology, telecommunication serves and utilities sectors decreased compared to the Russell Index. |
| Q | How was the Fund positioned relative to its benchmark index at the end of February 2013? |
| A | At the end of February 2013, the Fund had an overweighted position relative to the Russell Index in the consumer discretionary sector. On the same date, the Fund had an underweighted position compared to the Russell Index in financials and was rather neutrally weighted relative to the Russell Index in consumer staples, energy, health care, industrials, information technology, materials and utilities. The Fund had no position in the telecommunication services sector as of February 28, 2013. |
21
FUND BASICS
Mid Cap Value Fund
as of February 28, 2013
| PERFORMANCE REVIEW |
| September 1, 2012–February 28, 2013 | Fund Total Return (based on NAV)1 | Russell Midcap Value Index2 | ||||||||
| Class A | 14.06 | % | 16.14 | % | ||||||
| Class B | 13.66 | 16.14 | ||||||||
| Class C | 13.64 | 16.14 | ||||||||
| Institutional | 14.31 | 16.14 | ||||||||
| Service | 14.04 | 16.14 | ||||||||
| Class IR | 14.24 | 16.14 | ||||||||
| Class R | 13.92 | 16.14 | ||||||||
| 1 | The net asset value (“NAV”) represents the net assets of the class of the Fund (ex-dividend) divided by the total number of shares of the class outstanding. The Fund’s performance reflects the reinvestment of dividends and other distributions. The Fund’s performance does not reflect the deduction of any applicable sales charges. |
| 2 | The Russell Midcap Value Index (with dividends reinvested) is an unmanaged index of common stock prices that measures the performance of those Russell Midcap companies with lower price-to-book ratios and lower forecasted growth values. The Index figures do not reflect any deduction for fees, expenses or taxes. It is not possible to invest directly in an index. |
| STANDARDIZED TOTAL RETURNS3 |
| For the period ended 12/31/12 | One Year | Five Years | Ten Years | Since Inception | Inception Date | |||||||||||||||
| Class A | 11.51 | % | 1.69 | % | 8.80 | % | 7.64 | % | 8/15/97 | |||||||||||
| Class B | 12.12 | 1.70 | 8.75 | 7.63 | 8/15/97 | |||||||||||||||
| Class C | 16.14 | 2.08 | 8.60 | 7.25 | 8/15/97 | |||||||||||||||
| Institutional | 18.48 | 3.26 | 9.86 | 10.75 | 8/1/95 | |||||||||||||||
| Service | 17.88 | 2.75 | 9.33 | 8.09 | 7/18/97 | |||||||||||||||
| Class IR | 18.29 | 3.09 | N/A | 3.27 | 11/30/07 | |||||||||||||||
| Class R | 17.71 | N/A | N/A | 14.84 | 1/6/09 | |||||||||||||||
| 3 | The Standardized Total Returns are average annual total returns as of the most recent calendar quarter-end. They assume reinvestment of all distributions at NAV. These returns reflect a maximum initial sales charge of 5.5% for Class A Shares and the assumed contingent deferred sales charge for Class B Shares (5% maximum declining to 0% after six years) and the assumed contingent deferred sales charge for Class C Shares (1% if redeemed within 12 months of purchase). Class B Shares convert automatically to Class A Shares on or about the fifteenth day of the last month of the calendar quarter that is eight years after purchase. Returns for Class B Shares for the period after conversion reflect the performance of Class A Shares. Because Institutional, Service, Class IR and Class R Shares do not involve a sales charge, such a charge is not applied to their Standardized Total Returns. The Fund’s Class B Shares are no longer available for purchase by new or existing shareholders (although current Class B shareholders may continue to reinvest income and capital gains distributions into Class B Shares, and Class B shareholders may continue to exchange their shares for Class B Shares of certain other Goldman Sachs Funds). |
| The returns set forth in the tables above represent past performance. Past performance does not guarantee future results. The Fund’s investment return and principal value will fluctuate so that an investor’s shares, when redeemed, may be worth more or less than their original cost. Current performance may be lower or higher than the performance quoted above. Please visit our web site at www.goldmansachsfunds.com to obtain the most recent month-end returns. Performance reflects applicable fee waivers and/or expense limitations in effect during the periods shown. In their absence, performance would be reduced. Returns do not reflect the deduction of taxes that a shareholder would pay on Fund distributions or the redemption of Fund shares. |
22
FUND BASICS
| EXPENSE RATIOS4 |
| Net Expense Ratio (Current) | Gross Expense Ratio (Before Waivers) | |||||||||
| Class A | 1.15 | % | 1.15 | % | ||||||
| Class B | 1.90 | 1.90 | ||||||||
| Class C | 1.90 | 1.90 | ||||||||
| Institutional | 0.75 | 0.75 | ||||||||
| Service | 1.25 | 1.25 | ||||||||
| Class IR | 0.90 | 0.90 | ||||||||
| Class R | 1.40 | 1.40 | ||||||||
| 4The | expense ratios of the Fund, both current (net of applicable fee waivers and/or expense limitations) and before waivers (gross of applicable fee waivers and/or expense limitations) are as set forth above according to the most recent publicly available Prospectus for the Fund and may differ from the expense ratios disclosed in the Financial Highlights in this report. The Fund’s waivers and/or expense limitations will remain in place through at least December 29, 2013, and prior to such date the investment adviser may not terminate the arrangements without the approval of the Fund’s Board of Trustees. If these arrangements are discontinued in the future, the expense ratios may change without shareholder approval. |
| TOP TEN HOLDINGS AS OF 2/28/135 |
| Holding | % of Net Assets | Line of Business | ||||||
| M&T Bank Corp. | 1.9 | % | Commercial Banks | |||||
| Invesco Ltd. | 1.8 | Capital Markets | ||||||
| Aetna, Inc. | 1.7 | Health Care Providers & Services | ||||||
| Lam Research Corp. | 1.7 | Semiconductors & Semiconductor | ||||||
| Equipment | ||||||||
| Principal Financial Group, Inc. | 1.7 | Insurance | ||||||
| SLM Corp. | 1.6 | Consumer Finance | ||||||
| Constellation Brands, Inc. Class A | 1.5 | Beverages | ||||||
| Ventas, Inc. | 1.5 | Real Estate Investment Trusts | ||||||
| AvalonBay Communities, Inc. | 1.5 | Real Estate Investment Trusts | ||||||
| Range Resources Corp. | 1.4 | Oil, Gas & Consumable Fuels | ||||||
| 5 | The top 10 holdings may not be representative of the Fund’s future investments. |
23
FUND BASICS
| FUND VS. BENCHMARK SECTOR ALLOCATIONS6 | ||
| As of February 28, 2013 |
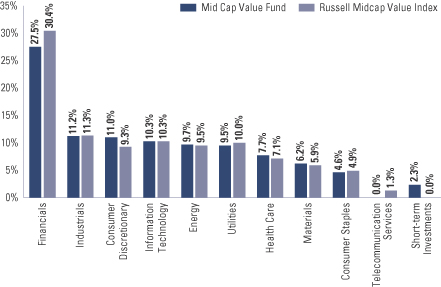
| 6 | The Fund is actively managed and, as such, its composition may differ over time. Consequently, the Fund’s overall sector allocations may differ from percentages contained in the graph above. The above graph categorizes investments using Global Industry Classification Standard (“GICS”), however, the sector classifications used by the portfolio management team may differ from GICS. The percentage shown for each investment category reflects the value of investments in that category as a percentage of market value. Short-term investments represent repurchase agreements. The above graph depicts the Fund’s investments but may not represent the Fund’s market exposure due to the exclusion of certain derivatives, if any, as listed in the Additional Investment Information section of the Schedule of Investments. |
24
PORTFOLIO RESULTS
Goldman Sachs Small Cap Value Fund
Portfolio Composition
The Fund invests, under normal circumstances, at least 80% of its net assets in a diversified portfolio of equity investments in small-cap issuers with public stock market capitalizations within the range of the market capitalization of companies constituting the Russell 2000® Value Index at the time of investment. Under normal circumstances, the Fund’s investment horizon for ownership of stocks will be two to three years. The Fund seeks its investment objective of long-term capital appreciation by investing in small-cap U.S. equity investments that are believed to be undervalued or undiscovered by the marketplace. Although the Fund will invest primarily in publicly traded U.S. securities, it may invest up to 25% of its net assets in foreign securities, including securities of issuers in emerging countries and securities quoted in foreign currencies. The Fund may also invest in the aggregate up to 20% of its net assets in companies with public stock market capitalizations outside the range of companies constituting the Russell 2000® Value Index at the time of investment and in fixed income securities, such as government, corporate and bank debt obligations.
Portfolio Management Discussion and Analysis
Below, the Goldman Sachs Fundamental Equity Value Investment Team discusses the Goldman Sachs Small Cap Value Fund’s (the “Fund”) performance and positioning for the six-month period ended February 28, 2013 (the “Reporting Period”).
| Q | How did the Fund perform during the Reporting Period? |
| A | During the Reporting Period, the Fund’s Class A, B, C, Institutional, Service, IR and R Shares generated cumulative total returns, without sales charges, of 12.58%, 12.14%, 12.15%, 12.79%, 12.50%, 12.70% and 12.41%, respectively. These returns compare to the 14.56% cumulative total return of the Fund’s benchmark, the Russell 2000® Value Index (with dividends reinvested) (the “Russell Index”), during the same period. |
| Q | What key factors were responsible for the Fund’s performance during the Reporting Period? |
| A | The Fund generated double-digit absolute gains, but stock selection overall detracted from its performance relative to the Russell Index during the Reporting Period. |
| Q | Which equity market sectors most significantly affected Fund performance? |
| A | Detracting from the Fund’s relative results most was stock selection in the consumer discretionary, financials and industrials sectors. Effective stock selection in the health care, materials and information technology sectors helped the Fund’s performance most relative to the Russell Index. |
| Q | Which stocks detracted significantly from the Fund’s performance during the Reporting Period? |
| A | Detracting most from the Fund’s results relative to its benchmark index were positions in oil and gas exploration and production company Approach Resources, commercial bank Texas Capital Bancshares and food and personal care products company Hain Celestial Group. |
| Approach Resources is engaged in the exploration, development, production and acquisition of oil and gas properties with a focus on oil and natural gas reserves in oil shale and tight sands. Its properties are primarily located in the Permian Basin in West Texas. Its shares declined following the announcement of weak third calendar quarter results due to costs that remained elevated. In addition, its production levels were below market expectations due to downtime at a natural gas processing facility, and the company also increased spending on infrastructure. Further, the company decreased yearly earnings guidance, reflecting higher than expected costs for the entire year. We added to the Fund’s position in Approach Resources during the Reporting Period, as we remained positive on the company going forward. We expect the company to embark on a horizontal Wolfcamp drilling program*, which could significantly improve company reserves, profitability and production growth. |
| *Horizontal | drilling is the drilling of an oil or natural gas well at an angle to the vertical, so the well runs parallel to the formation containing the oil or gas. Production from the resulting well, known as a horizontal hole, is often three to five times greater than that from a vertically drilled well. The Wolfcamp shale is located in West Texas. |
25
PORTFOLIO RESULTS
| Texas Capital Bancshares provides commercial banking services to its customers in Texas, with a concentration on middle-market commercial businesses and successful professionals and entrepreneurs. The company reported fourth calendar quarter results that reflected solid loan growth, but its shares traded lower due to a rare earnings per share miss. Its net interest margin declined due to the addition of lower yielding loans in its portfolio. We added to the Fund’s position in Texas Capital Bancshares during the Reporting Period, as we continued to like its position in Texas. We believe oil and gas lending may well continue to be strong and net interest margin securities should be supported by warehouse lending. We also believe the company should continue to gain market share in its core businesses. |
| Hain Celestial Group manufactures, markets, distributes and sells natural and organic products. The company re-affirmed weak guidance in mid-October 2012 when it was expected to raise guidance instead. Uncertainty also arose after a change in its management team early in the fourth calendar quarter. Hain Celestial Group also announced the closing of the acquisition of BluePrint, a nationally recognized brand in the raw juice category based in New York City. Hain Celestial Group’s shares traded lower, as investors questioned the difficulty of the integration. We added to the Fund’s position in the company on weakness, as we continued to believe Hain Celestial Group is a diversified way to capitalize on the trends of healthier eating, increased fitness and an aging population. In our view, the company has remained focused on improving margins, and we view its acquisition strategy positively. |
| Q | What were some of the Fund’s best-performing individual stocks? |
| A | The Fund benefited most relative to the Russell Index from positions in consumer loan company Ocwen Financial, wire and cable products manufacturer Belden and polymer manufacturer PolyOne. |
| Ocwen Financial, which specializes in the servicing of non-prime residential loans, performed well during the Reporting Period, as the company announced third calendar quarter earnings that demonstrated strong growth in servicing revenues from boarding new portfolios. In addition, its management announced its intent to acquire a portion of mortgage service and origination company Residential Capital out of bankruptcy. We believe the deal gives the company the opportunity to leverage its recent acquisition of Homeward Residential Holdings, a prime and subprime mortgage servicing company. We also believe the pipeline to acquire additional servicing portfolios is robust, and, while we trimmed the Fund’s position in the company, taking profits, we kept a holding in Ocwen Financial, as we maintain conviction in what we consider to be the company’s unique low-cost business model, its commitment to capital efficiency and its above-average return profile. |
| Belden, through its subsidiaries, designs, manufactures and markets cable, connectivity and networking products for industrial automation, enterprise, education, health care, entertainment, broadcast, sound and security, transportation, infrastructure, consumer electronics and other industries. During the Reporting Period, the company repositioned its product portfolio, which we viewed as a positive. The company also divested a slow-growing consumer electronics business in China during the Reporting Period in an effort to transform into a higher-margin business. Further, Belden reported strong fourth calendar quarter performance, divested its Thermax and Raydex cable business and increased its share repurchase program by $200 million. We trimmed the Fund’s position in Belden during the Reporting Period, taking profits. |
| PolyOne provides specialized polymer materials, services and solutions with operations in specialty polymer formulations, color and additive systems, polymer distribution and specialty vinyl resins. Its shares rose as the company announced strong third calendar quarter earnings, highlighted by its intent to acquire specialty chemical company Spartech, as PolyOne transitions from a commodity to a specialty chemicals company. We believe the deal should be accretive to earnings and provides access to new technologies in aerospace, security, packaging and health care markets. We trimmed the Fund’s position in PolyOne, taking profits, but maintained a holding in the company, as we continue to believe it has potential for margin expansion through operational efficiencies and supply chain improvements. |
| Q | How did the Fund use derivatives and similar instruments during the Reporting Period? |
| A | During the Reporting Period, we did not use derivatives as part of an active management strategy. |
26
PORTFOLIO RESULTS
| Q | Did the Fund make any significant purchases or sales during the Reporting Period? |
| A | During the Reporting Period, we initiated a Fund position in Moog, a designer, manufacturer and integrator of precision motion and fluid controls systems for a range of applications. In particular, Moog has leverage to the aerospace market and auto industry, which we believe have positive outlooks. In our view, Moog stands to benefit from these markets, especially should economic activity increase. |
| We established a Fund position in Marriott Vacations Worldwide during the Reporting Period. Marriott Vacations Worldwide is the second-largest timeshare developer globally. We believe that shares of the spinout from Marriott International were attractively valued at our time of purchase and have the potential going forward to outperform their peer group. We have conviction in the company given what we consider to be its strong competitive position in a niche market, attractive free cash flow profile, well capitalized balance sheet and heightened focus on growing its most profitable business opportunities. Furthermore, Marriott Vacations Worldwide should continue to benefit, in our view, from its loyalty program, which has helped profitably increase its market share. |
| Conversely, we exited the Fund’s position in Amerigroup. At the end of 2012, Amerigroup was acquired by WellPoint, one of the nation’s leading managed care companies. Upon the acquisition, we rotated funds into companies where we had a higher conviction. While the prospect of a holding being acquired is not the only reason we will purchase a stock for the Fund, we sometimes find that the portfolio can benefit from the market similarly recognizing and appreciating the quality characteristics we look for in our investments. |
| We eliminated the Fund’s position in Darling International, a provider of cooking oil and bakery waste recycling and recovery solutions. The company reported third calendar quarter results that were below expectations, as both its revenue and earnings per share declined. The company’s management attributed the weakness to lower finished product pricing and decreased raw materials volumes. We sold the Fund’s position in Darling International in favor of other names in which we had higher conviction and believed to have a more favorable risk-reward profile. |
| Q | Were there any notable changes in the Fund’s weightings during the Reporting Period? |
| A | In constructing the Fund’s portfolio, we focus on picking stocks rather than on making industry or sector bets. We seek to outpace the benchmark index by overweighting stocks that we expect to outperform and underweighting those that we think may lag. Consequently, changes in its sector weights are generally the direct result of individual stock selection or of stock appreciation or depreciation. That said, during the Reporting Period, the Fund’s allocations compared to the benchmark index in information technology and materials increased. The Fund’s exposure to the consumer discretionary, consumer staples, financials, health care and industrials sectors decreased compared to the Russell Index. |
| Q | How was the Fund positioned relative to its benchmark index at the end of February 2013? |
| A | At the end of February 2013, the Fund was underweighted in financials and consumer discretionary and was rather neutrally weighted to the other eight sectors in the Russell Index. |
27
FUND BASICS
Small Cap Value Fund
as of February 28, 2013
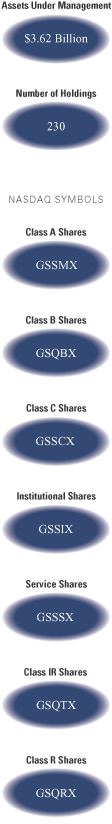
| PERFORMANCE REVIEW |
| September 1, 2012–February 28, 2013 | Fund Total Return (based on NAV)1 | Russell 2000 Value Index2 | ||||||||
| Class A | 12.58 | % | 14.56 | % | ||||||
| Class B | 12.14 | 14.56 | ||||||||
| Class C | 12.15 | 14.56 | ||||||||
| Institutional | 12.79 | 14.56 | ||||||||
| Service | 12.50 | 14.56 | ||||||||
| Class IR | 12.70 | 14.56 | ||||||||
| Class R | 12.41 | 14.56 | ||||||||
| 1 | The net asset value (“NAV”) represents the net assets of the class of the Fund (ex-dividend) divided by the total number of shares of the class outstanding. The Fund’s performance reflects the reinvestment of dividends and other distributions. The Fund’s performance does not reflect the deduction of any applicable sales charges. |
| 2 | The Russell 2000 Value Index (with dividends reinvested) is an unmanaged index of common stock prices that measures the performance of those Russell 2000 companies with lower price-to-book ratios and lower forecasted growth values. The Index figures do not reflect any deduction for fees, expenses or taxes. It is not possible to invest directly in an index. |
| STANDARDIZED TOTAL RETURNS3 |
| For the period ended 12/31/12 | One Year | Five Years | Ten Years | Since Inception | Inception Date | |||||||||||||||
| Class A | 9.67 | % | 5.20 | % | 9.62 | % | 9.83 | % | 10/22/92 | |||||||||||
| Class B | 9.88 | 5.27 | 9.57 | 8.76 | 5/1/96 | |||||||||||||||
| Class C | 14.11 | 5.62 | 9.43 | 7.50 | 8/15/97 | |||||||||||||||
| Institutional | 16.49 | 6.84 | 10.69 | 8.74 | 8/15/97 | |||||||||||||||
| Service | 15.91 | 6.31 | 10.14 | 8.21 | 8/15/97 | |||||||||||||||
| Class IR | 16.31 | 6.67 | N/A | 6.26 | 11/30/07 | |||||||||||||||
| Class R | 15.71 | 6.16 | N/A | 5.75 | 11/30/07 | |||||||||||||||
| 3 | The Standardized Total Returns are average annual total returns as of the most recent calendar quarter-end. They assume reinvestment of all distributions at NAV. These returns reflect a maximum initial sales charge of 5.5% for Class A Shares and the assumed contingent deferred sales charge for Class B Shares (5% maximum declining to 0% after six years) and the assumed contingent deferred sales charge for Class C Shares (1% if redeemed within 12 months of purchase). Class B Shares convert automatically to Class A Shares on or about the fifteenth day of the last month of the calendar quarter that is eight years after purchase. Returns for Class B Shares for the period after conversion reflect the performance of Class A Shares. Because Institutional, Service, Class IR and Class R Shares do not involve a sales charge, such a charge is not applied to their Standardized Total Returns. The Fund’s Class B Shares are no longer available for purchase by new or existing shareholders (although current Class B shareholders may continue to reinvest income and capital gains distributions into Class B Shares, and Class B shareholders may continue to exchange their shares for Class B Shares of certain other Goldman Sachs Funds). |
| The returns set forth in the tables above represent past performance. Past performance does not guarantee future results. The Fund’s investment return and principal value will fluctuate so that an investor’s shares, when redeemed, may be worth more or less than their original cost. Current performance may be lower or higher than the performance quoted above. Please visit our web site at www.goldmansachsfunds.com to obtain the most recent month-end returns. Performance reflects applicable fee waivers and/or expense limitations in effect during the periods shown. In their absence, performance would be reduced. Returns do not reflect the deduction of taxes that a shareholder would pay on Fund distributions or the redemption of Fund shares. |
28
FUND BASICS
| EXPENSE RATIOS4 |
| Net Expense Ratio (Current) | Gross Expense Ratio (Before Waivers) | |||||||||
| Class A | 1.36 | % | 1.44 | % | ||||||
| Class B | 2.11 | 2.19 | ||||||||
| Class C | 2.11 | 2.19 | ||||||||
| Institutional | 0.96 | 1.04 | ||||||||
| Service | 1.46 | 1.54 | ||||||||
| Class IR | 1.11 | 1.19 | ||||||||
| Class R | 1.61 | 1.69 | ||||||||
| 4 | The expense ratios of the Fund, both current (net of applicable fee waivers and/or expense limitations) and before waivers (gross of applicable fee waivers and/or expense limitations) are as set forth above according to the most recent publicly available Prospectus for the Fund and may differ from the expense ratios disclosced in the Financial Highlights in this report. The Fund’s waivers and/or expense limitations will remain in place through at least December 29, 2013, and prior to such date the investment adviser may not terminate the arrangements without the approval of the Fund’s Board of Trustees. If these arrangements are discontinued in the future, the expense ratios may change without shareholder approval. |
| TOP TEN HOLDINGS AS OF 2/28/135 |
| Holding | % of Net Assets | Line of Business | ||||||
| iShares Russell 2000 Value Index Fund | 1.6 | % | Wireless Telecommunication Services | |||||
| Southwest Gas Corp. | 1.6 | Gas Utilities | ||||||
| El Paso Electric Co. | 1.2 | Electric Utilities | ||||||
| HealthSouth Corp. | 1.1 | Health Care Providers & Services | ||||||
| American Equity Investment Life Holding Co. | 1.0 | Insurance | ||||||
| Cleco Corp. | 1.0 | Electric Utilities | ||||||
| IDACORP, Inc. | 1.0 | Electric Utilities | ||||||
| Ocwen Financial Corp. | 1.0 | Thrifts & Mortgage Finance | ||||||
| Approach Resources, Inc. | 0.9 | Oil, Gas & Consumable Fuels | ||||||
| Dril-Quip, Inc. | 0.9 | Energy Equipment & Services | ||||||
| 5 | The top 10 holdings may not be representative of the Fund’s future investments. |
29
FUND BASICS
| FUND VS. BENCHMARK SECTOR ALLOCATIONS6 | ||
| As of February 28, 2013 |
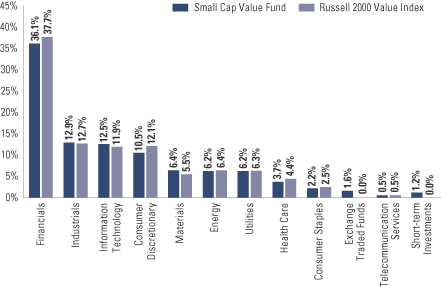
| 6 | The Fund is actively managed and, as such, its composition may differ over time. Consequently, the Fund’s overall sector allocations may differ from percentages contained in the graph above. The above graph categorizes investments using Global Industry Classification Standard (“GICS”), however, the sector classifications used by the portfolio management team may differ from GICS. Underlying sector allocations of Exchange Traded Funds held by the Fund are not reflected in the graph above. The percentage shown for each investment category reflects the value of investments in that category as a percentage of market value. Short-term investments represent repurchase agreements. The above graph depicts the Fund’s investments but may not represent the Fund’s market exposure due to the exclusion of certain derivatives, if any, as listed in the Additional Investment Information section of the Schedule of Investments. |
30
GOLDMAN SACHS GROWTH AND INCOME FUND
Schedule of Investments
February 28, 2013 (Unaudited)
Shares | Description | Value | ||||||
| Common Stocks – 98.5% | ||||||||
| Aerospace & Defense – 3.3% | ||||||||
| 44,161 | General Dynamics Corp. | $ | 3,001,623 | |||||
| 75,493 | Textron, Inc. | 2,177,973 | ||||||
| 118,448 | The Boeing Co. | 9,108,652 | ||||||
|
| |||||||
| 14,288,248 | ||||||||
|
| |||||||
| Automobiles* – 0.6% | ||||||||
| 93,261 | General Motors Co. | 2,532,036 | ||||||
|
| |||||||
| Beverages – 2.9% | ||||||||
| 70,821 | Anheuser-Busch InBev NV ADR | 6,656,466 | ||||||
| 44,275 | Constellation Brands, Inc. Class A* | 1,958,726 | ||||||
| 30,661 | Diageo PLC ADR | 3,670,428 | ||||||
|
| |||||||
| 12,285,620 | ||||||||
|
| |||||||
| Biotechnology* – 1.3% | ||||||||
| 117,564 | Vertex Pharmaceuticals, Inc. | 5,504,347 | ||||||
|
| |||||||
| Building Products – 0.7% | ||||||||
| 161,430 | Masco Corp. | 3,109,142 | ||||||
|
| |||||||
| Capital Markets – 1.1% | ||||||||
| 200,324 | Morgan Stanley, Inc. | 4,517,306 | ||||||
|
| |||||||
| Chemicals – 2.7% | ||||||||
| 24,120 | CF Industries Holdings, Inc. | 4,844,020 | ||||||
| 56,129 | Eastman Chemical Co. | 3,913,875 | ||||||
| 47,668 | LyondellBasell Industries NV Class A | 2,794,298 | ||||||
|
| |||||||
| 11,552,193 | ||||||||
|
| |||||||
| Commercial Banks – 3.6% | ||||||||
| 62,474 | Comerica, Inc. | 2,147,856 | ||||||
| 66,488 | HSBC Holdings PLC ADR | 3,686,095 | ||||||
| 179,462 | SunTrust Banks, Inc. | 4,951,356 | ||||||
| 131,267 | U.S. Bancorp | 4,460,453 | ||||||
|
| |||||||
| 15,245,760 | ||||||||
|
| |||||||
| Communications Equipment – 2.1% | ||||||||
| 250,359 | Cisco Systems, Inc. | 5,219,985 | ||||||
| 182,042 | Juniper Networks, Inc.* | 3,764,629 | ||||||
|
| |||||||
| 8,984,614 | ||||||||
|
| |||||||
| Computers & Peripherals* – 1.5% | ||||||||
| 276,850 | EMC Corp. | 6,370,319 | ||||||
|
| |||||||
| Consumer Finance – 1.4% | ||||||||
| 320,789 | SLM Corp. | 6,085,367 | ||||||
|
| |||||||
| Diversified Financial Services – 7.4% | ||||||||
| 691,588 | Bank of America Corp. | 7,766,533 | ||||||
| 103,621 | Citigroup, Inc. | 4,348,974 | ||||||
| 399,996 | JPMorgan Chase & Co. | 19,567,804 | ||||||
|
| |||||||
| 31,683,311 | ||||||||
|
| |||||||
| Diversified Telecommunication Services – 3.2% | ||||||||
| 379,619 | AT&T, Inc. | 13,632,118 | ||||||
|
| |||||||
| Electric Utilities – 4.8% | ||||||||
| 108,869 | Duke Energy Corp. | 7,539,178 | ||||||
| 106,293 | Exelon Corp. | 3,294,020 | ||||||
|
| |||||||
Shares | Description | Value | ||||||
| Common Stocks – (continued) | ||||||||
| Electric Utilities – (continued) | ||||||||
| 105,675 | Northeast Utilities | $ | 4,386,569 | |||||
| 176,270 | PPL Corp. | 5,432,642 | ||||||
|
| |||||||
| 20,652,409 | ||||||||
|
| |||||||
| Energy Equipment & Services – 2.9% | ||||||||
| 206,181 | Halliburton Co. | 8,558,574 | ||||||
| 75,144 | Transocean Ltd.* | 3,930,031 | ||||||
|
| |||||||
| 12,488,605 | ||||||||
|
| |||||||
| Food & Staples Retailing – 2.1% | ||||||||
| 215,947 | Walgreen Co. | 8,840,870 | ||||||
|
| |||||||
| Food Products – 0.9% | ||||||||
| 144,005 | Mondelez International, Inc. Class A | 3,981,738 | ||||||
|
| |||||||
| Health Care Equipment & Supplies – 1.2% | ||||||||
| 52,124 | C.R. Bard, Inc. | 5,152,457 | ||||||
|
| |||||||
| Health Care Providers & Services – 3.0% | ||||||||
| 130,123 | Aetna, Inc. | 6,140,505 | ||||||
| 127,816 | UnitedHealth Group, Inc. | 6,831,765 | ||||||
|
| |||||||
| 12,972,270 | ||||||||
|
| |||||||
| Hotels, Restaurants & Leisure* – 1.7% | ||||||||
| 10,441 | Chipotle Mexican Grill, Inc. | 3,307,604 | ||||||
| 303,749 | MGM Resorts International | 3,793,825 | ||||||
|
| |||||||
| 7,101,429 | ||||||||
|
| |||||||
| Industrial Conglomerates – 4.3% | ||||||||
| 803,030 | General Electric Co. | 18,646,357 | ||||||
|
| |||||||
| Insurance – 8.0% | ||||||||
| 184,075 | American International Group, Inc.* | 6,996,691 | ||||||
| 54,787 | Everest Re Group Ltd. | 6,827,008 | ||||||
| 142,877 | Prudential Financial, Inc. | 7,939,675 | ||||||
| 205,599 | The Hartford Financial Services Group, Inc. | 4,854,192 | ||||||
| 97,622 | The Travelers Cos., Inc. | 7,850,761 | ||||||
|
| |||||||
| 34,468,327 | ||||||||
|
| |||||||
| Internet Software & Services* – 1.1% | ||||||||
| 5,912 | Google, Inc. Class A | 4,736,694 | ||||||
|
| |||||||
| Media – 4.3% | ||||||||
| 100,232 | CBS Corp. Class B | 4,349,066 | ||||||
| 63,208 | DIRECTV* | 3,044,729 | ||||||
| 41,264 | DISH Network Corp. Class A | 1,435,987 | ||||||
| 64,858 | Liberty Global, Inc. Class A* | 4,468,068 | ||||||
| 86,358 | Viacom, Inc. Class B | 5,048,489 | ||||||
|
| |||||||
| 18,346,339 | ||||||||
|
| |||||||
| Multi-Utilities – 1.5% | ||||||||
| 97,097 | DTE Energy Co. | 6,486,080 | ||||||
|
| |||||||
| Oil, Gas & Consumable Fuels – 10.5% | ||||||||
| 123,977 | BP PLC ADR | 5,008,671 | ||||||
| 55,104 | ConocoPhillips | 3,193,277 | ||||||
| 189,924 | Devon Energy Corp. | 10,305,276 | ||||||
|
| |||||||
| The accompanying notes are an integral part of these financial statements. | 31 |
GOLDMAN SACHS GROWTH AND INCOME FUND
Schedule of Investments (continued)
February 28, 2013 (Unaudited)
Shares | Description | Value | ||||||
| Common Stocks – (continued) | ||||||||
| Oil, Gas & Consumable Fuels – (continued) | ||||||||
| 198,978 | Exxon Mobil Corp. | $ | 17,818,480 | |||||
| 52,111 | Occidental Petroleum Corp. | 4,290,298 | ||||||
| 132,099 | Southwestern Energy Co.* | 4,527,033 | ||||||
|
| |||||||
| 45,143,035 | ||||||||
|
| |||||||
| Pharmaceuticals – 8.1% | ||||||||
| 78,489 | Eli Lilly & Co. | 4,290,209 | ||||||
| 59,396 | Johnson & Johnson | 4,520,629 | ||||||
| 294,060 | Merck & Co., Inc. | 12,565,184 | ||||||
| 481,889 | Pfizer, Inc. | 13,189,302 | ||||||
|
| |||||||
| 34,565,324 | ||||||||
|
| |||||||
| Real Estate Investment Trusts – 3.4% | ||||||||
| 42,347 | American Tower Corp. | 3,286,127 | ||||||
| 29,882 | AvalonBay Communities, Inc. | 3,730,170 | ||||||
| 464,286 | MFA Financial, Inc. | 4,122,860 | ||||||
| 22,934 | Simon Property Group, Inc. | 3,643,295 | ||||||
|
| |||||||
| 14,782,452 | ||||||||
|
| |||||||
| Road & Rail – 0.6% | ||||||||
| 32,493 | Norfolk Southern Corp. | 2,373,614 | ||||||
|
| |||||||
| Semiconductors & Semiconductor Equipment – 2.5% | ||||||||
| 155,624 | Altera Corp. | 5,512,202 | ||||||
| 125,814 | Lam Research Corp.* | 5,321,932 | ||||||
|
| |||||||
| 10,834,134 | ||||||||
|
| |||||||
| Software* – 0.6% | ||||||||
| 67,494 | Adobe Systems, Inc. | 2,652,514 | ||||||
|
| |||||||
| Specialty Retail – 3.1% | ||||||||
| 71,558 | Bed Bath & Beyond, Inc.* | 4,060,916 | ||||||
| 240,646 | Lowe’s Cos., Inc. | 9,180,645 | ||||||
|
| |||||||
| 13,241,561 | ||||||||
|
| |||||||
| Thrifts & Mortgage Finance – 0.4% | ||||||||
| 127,452 | New York Community Bancorp, Inc. | 1,720,602 | ||||||
|
| |||||||
| Tobacco – 1.7% | ||||||||
| 79,158 | Philip Morris International, Inc. | 7,262,747 | ||||||
|
| |||||||
| TOTAL COMMON STOCKS | ||||||||
| (Cost $374,899,872) | $ | 422,239,939 | ||||||
|
| |||||||
| Shares | Interest Rate | Maturity Date | Value | |||||||||
| Convertible Preferred Stock(a) – 0.6% | ||||||||||||
| Electric Utilities – 0.6% | ||||||||||||
| PPL Corp. |
| ||||||||||
| 47,256 | 8.750% | 05/01/14 | $ | 2,592,464 | ||||||||
| (Cost $2,362,800) | ||||||||||||
|
| |||||||||||
| Principal Amount | Interest Rate | Maturity Date | Value | |||||||||
| Short-term Investment(b) – 0.5% | ||||||||||||
| Repurchase Agreement – 0.5% | ||||||||||||
| Joint Repurchase Agreement Account II |
| ||||||||||
| $ | 1,900,000 | 0.191% | 03/01/13 | $ | 1,900,000 | |||||||
| (Cost $1,900,000) | ||||||||||||
|
| |||||||||||
| TOTAL INVESTMENTS – 99.6% | ||||||||||||
| (Cost $379,162,672) | $ | 426,732,403 | ||||||||||
|
| |||||||||||
| | OTHER ASSETS IN EXCESS OF LIABILITIES – 0.4% | | 1,786,769 | |||||||||
|
| |||||||||||
| NET ASSETS – 100.0% | $ | 428,519,172 | ||||||||||
|
| |||||||||||
| The percentage shown for each investment category reflects the value of investments in that category as a percentage of net assets. | ||
* | Non-income producing security. | |
(a) | Security with “Call” features with resetting interest rates. Maturity dates disclosed are the final maturity dates. | |
(b) | Joint repurchase agreement was entered into on February 28, 2013. Additional information appears on pages 42-43. | |
| ||
Investment Abbreviation: | ||
ADR | —American Depositary Receipt | |
| ||
| 32 | The accompanying notes are an integral part of these financial statements. |
GOLDMAN SACHS LARGE CAP VALUE FUND
Schedule of Investments
February 28, 2013 (Unaudited)
Shares | Description | Value | ||||||
| Common Stocks – 97.5% | ||||||||
| Aerospace & Defense – 3.3% | ||||||||
| 147,323 | General Dynamics Corp. | $ | 10,013,544 | |||||
| 249,602 | Textron, Inc. | 7,201,018 | ||||||
| 394,026 | The Boeing Co. | 30,300,600 | ||||||
|
| |||||||
| 47,515,162 | ||||||||
|
| |||||||
| Automobiles* – 1.4% | ||||||||
| 707,856 | General Motors Co. | 19,218,290 | ||||||
|
| |||||||
| Beverages – 2.8% | ||||||||
| 237,077 | Anheuser-Busch InBev NV ADR | 22,282,867 | ||||||
| 148,178 | Constellation Brands, Inc. Class A* | 6,555,395 | ||||||
| 94,259 | Diageo PLC ADR | 11,283,745 | ||||||
|
| |||||||
| 40,122,007 | ||||||||
|
| |||||||
| Biotechnology* – 1.2% | ||||||||
| 369,093 | Vertex Pharmaceuticals, Inc. | 17,280,934 | ||||||
|
| |||||||
| Building Products – 0.7% | ||||||||
| 531,109 | Masco Corp. | 10,229,159 | ||||||
|
| |||||||
| Capital Markets – 1.0% | ||||||||
| 650,155 | Morgan Stanley, Inc. | 14,660,995 | ||||||
|
| |||||||
| Chemicals – 2.6% | ||||||||
| 96,231 | CF Industries Holdings, Inc. | 19,326,072 | ||||||
| 142,291 | Eastman Chemical Co. | 9,921,951 | ||||||
| 126,797 | LyondellBasell Industries NV Class A | 7,432,840 | ||||||
|
| |||||||
| 36,680,863 | ||||||||
|
| |||||||
| Commercial Banks – 2.7% | ||||||||
| 204,693 | Comerica, Inc. | 7,037,345 | ||||||
| 595,577 | SunTrust Banks, Inc. | 16,431,970 | ||||||
| 429,635 | U.S. Bancorp | 14,598,997 | ||||||
|
| |||||||
| 38,068,312 | ||||||||
|
| |||||||
| Commercial Services & Supplies – 1.0% | ||||||||
| 391,909 | Waste Management, Inc. | 14,626,044 | ||||||
|
| |||||||
| Communications Equipment* – 1.2% | ||||||||
| 859,386 | Juniper Networks, Inc. | 17,772,103 | ||||||
|
| |||||||
| Computers & Peripherals* – 1.9% | ||||||||
| 1,204,654 | EMC Corp. | 27,719,089 | ||||||
|
| |||||||
| Consumer Finance – 1.6% | ||||||||
| 1,177,540 | SLM Corp. | 22,337,934 | ||||||
|
| |||||||
| Diversified Financial Services – 8.5% | ||||||||
| 2,889,216 | Bank of America Corp. | 32,445,896 | ||||||
| 440,690 | Citigroup, Inc. | 18,495,759 | ||||||
| 79,829 | IntercontinentalExchange, Inc.* | 12,359,126 | ||||||
| 1,167,998 | JPMorgan Chase & Co. | 57,138,462 | ||||||
|
| |||||||
| 120,439,243 | ||||||||
|
| |||||||
| Diversified Telecommunication Services – 3.1% | ||||||||
| 1,213,210 | AT&T, Inc. | 43,566,371 | ||||||
|
| |||||||
| Common Stocks – (continued) | ||||||||
| Electric Utilities – 3.8% | ||||||||
| 359,561 | Duke Energy Corp. | $ | 24,899,599 | |||||
| 351,054 | Exelon Corp. | 10,879,164 | ||||||
| 582,321 | PPL Corp. | 17,947,133 | ||||||
|
| |||||||
| 53,725,896 | ||||||||
|
| |||||||
| Energy Equipment & Services – 2.9% | ||||||||
| 673,826 | Halliburton Co. | 27,970,517 | ||||||
| 251,473 | Transocean Ltd.* | 13,152,038 | ||||||
|
| |||||||
| 41,122,555 | ||||||||
|
| |||||||
| Food & Staples Retailing – 2.1% | ||||||||
| 718,231 | Walgreen Co. | 29,404,377 | ||||||
|
| |||||||
| Food Products – 1.2% | ||||||||
| 635,598 | Mondelez International, Inc. Class A | 17,574,285 | ||||||
|
| |||||||
| Health Care Equipment & Supplies – 1.2% | ||||||||
| 170,597 | C.R. Bard, Inc. | 16,863,514 | ||||||
|
| |||||||
| Health Care Providers & Services – 2.9% | ||||||||
| 427,540 | Aetna, Inc. | 20,175,613 | ||||||
| 392,513 | UnitedHealth Group, Inc. | 20,979,820 | ||||||
|
| |||||||
| 41,155,433 | ||||||||
|
| |||||||
| Hotels, Restaurants & Leisure* – 1.8% | ||||||||
| 34,493 | Chipotle Mexican Grill, Inc. | 10,927,037 | ||||||
| 1,184,173 | MGM Resorts International | 14,790,321 | ||||||
|
| |||||||
| 25,717,358 | ||||||||
|
| |||||||
| Industrial Conglomerates – 4.2% | ||||||||
| 2,577,579 | General Electric Co. | 59,851,384 | ||||||
|
| |||||||
| Insurance – 7.8% | ||||||||
| 609,425 | American International Group, Inc.* | 23,164,244 | ||||||
| 150,232 | Everest Re Group Ltd. | 18,720,410 | ||||||
| 558,339 | Prudential Financial, Inc. | 31,026,898 | ||||||
| 692,356 | The Hartford Financial Services Group, Inc. | 16,346,525 | ||||||
| 273,700 | The Travelers Cos., Inc. | 22,010,954 | ||||||
|
| |||||||
| 111,269,031 | ||||||||
|
| |||||||
| Internet Software & Services* – 1.1% | ||||||||
| 19,550 | Google, Inc. Class A | 15,663,460 | ||||||
|
| |||||||
| Media – 4.3% | ||||||||
| 331,396 | CBS Corp. Class B | 14,379,272 | ||||||
| 208,068 | DIRECTV* | 10,022,636 | ||||||
| 139,526 | DISH Network Corp. Class A | 4,855,505 | ||||||
| 218,608 | Liberty Global, Inc. Class A* | 15,059,905 | ||||||
| 282,544 | Viacom, Inc. Class B | 16,517,522 | ||||||
|
| |||||||
| 60,834,840 | ||||||||
|
| |||||||
| Multi-Utilities – 1.5% | ||||||||
| 323,033 | DTE Energy Co. | 21,578,604 | ||||||
|
| |||||||
| The accompanying notes are an integral part of these financial statements. | 33 |
GOLDMAN SACHS LARGE CAP VALUE FUND
Schedule of Investments (continued)
February 28, 2013 (Unaudited)
Shares | Description | Value | ||||||
| Common Stocks – (continued) | ||||||||
| Oil, Gas & Consumable Fuels – 11.0% | ||||||||
| 401,590 | BP PLC ADR | $ | 16,224,236 | |||||
| 182,335 | ConocoPhillips | 10,566,313 | ||||||
| 654,111 | Devon Energy Corp. | 35,492,063 | ||||||
| 710,957 | Exxon Mobil Corp. | 63,666,200 | ||||||
| 172,367 | Occidental Petroleum Corp. | 14,190,975 | ||||||
| 463,149 | Southwestern Energy Co.* | 15,872,116 | ||||||
|
| |||||||
| 156,011,903 | ||||||||
|
| |||||||
| Pharmaceuticals – 7.8% | ||||||||
| 236,695 | Eli Lilly & Co. | 12,937,749 | ||||||
| 190,547 | Johnson & Johnson | 14,502,532 | ||||||
| 982,505 | Merck & Co., Inc. | 41,982,439 | ||||||
| 1,536,539 | Pfizer, Inc. | 42,055,072 | ||||||
|
| |||||||
| 111,477,792 | ||||||||
|
| |||||||
| Real Estate Investment Trusts – 2.7% | ||||||||
| 137,082 | American Tower Corp. | 10,637,563 | ||||||
| 112,063 | AvalonBay Communities, Inc. | 13,988,824 | ||||||
| 86,462 | Simon Property Group, Inc. | 13,735,354 | ||||||
|
| |||||||
| 38,361,741 | ||||||||
|
| |||||||
| Road & Rail – 0.5% | ||||||||
| 104,965 | Norfolk Southern Corp. | 7,667,693 | ||||||
|
| |||||||
| Semiconductors & Semiconductor Equipment – 2.5% | ||||||||
| 513,934 | Altera Corp. | 18,203,542 | ||||||
| 415,487 | Lam Research Corp.* | 17,575,100 | ||||||
|
| |||||||
| 35,778,642 | ||||||||
|
| |||||||
| Software* – 0.9% | ||||||||
| 329,674 | Adobe Systems, Inc. | 12,956,188 | ||||||
|
| |||||||
| Specialty Retail – 2.7% | ||||||||
| 247,790 | Bed Bath & Beyond, Inc.* | 14,062,083 | ||||||
| 627,230 | Lowe’s Cos., Inc. | 23,928,824 | ||||||
|
| |||||||
| 37,990,907 | ||||||||
|
| |||||||
| Tobacco – 1.6% | ||||||||
| 250,892 | Philip Morris International, Inc. | 23,019,341 | ||||||
|
| |||||||
| TOTAL COMMON STOCKS | ||||||||
| (Cost $1,175,036,511) | $ | 1,388,261,450 | ||||||
|
| |||||||
| Principal Amount | Interest Rate | Maturity Date | Value | |||||||||
| Short-term Investment(a) – 1.4% | ||||||||||||
| Repurchase Agreement – 1.4% | ||||||||||||
| Joint Repurchase Agreement Account II |
| ||||||||||
| $ | 19,400,000 | 0.191% | 03/01/13 | $ | 19,400,000 | |||||||
| (Cost $19,400,000) | ||||||||||||
|
| |||||||||||
| TOTAL INVESTMENTS – 98.9% | ||||||||||||
| (Cost $1,194,436,511) | $ | 1,407,661,450 | ||||||||||
|
| |||||||||||
| | OTHER ASSETS IN EXCESS OF LIABILITIES – 1.1% | | 15,659,115 | |||||||||
|
| |||||||||||
| NET ASSETS – 100.0% | $ | 1,423,320,565 | ||||||||||
|
| |||||||||||
| The percentage shown for each investment category reflects the value of investments in that category as a percentage of net assets. | ||
* | Non-income producing security. | |
(a) | Joint repurchase agreement was entered into on February 28, 2013. Additional information appears on pages 42-43. | |
| ||
Investment Abbreviation: | ||
ADR | —American Depositary Receipt | |
| ||
| 34 | The accompanying notes are an integral part of these financial statements. |
GOLDMAN SACHS MID CAP VALUE FUND
Schedule of Investments
February 28, 2013 (Unaudited)
Shares | Description | Value | ||||||
| Common Stocks – 97.2% | ||||||||
| Aerospace & Defense – 1.1% | ||||||||
| 1,010,200 | BE Aerospace, Inc.* | $ | 53,146,622 | |||||
| 675,933 | Rockwell Collins, Inc. | 40,630,333 | ||||||
|
| |||||||
| 93,776,955 | ||||||||
|
| |||||||
| Auto Components* – 1.3% | ||||||||
| 1,460,131 | Delphi Automotive PLC | 61,106,482 | ||||||
| 831,778 | TRW Automotive Holdings Corp. | 48,817,051 | ||||||
|
| |||||||
| 109,923,533 | ||||||||
|
| |||||||
| Beverages – 3.1% | ||||||||
| 2,253,418 | Coca-Cola Enterprises, Inc. | 80,627,296 | ||||||
| 2,942,553 | Constellation Brands, Inc. Class A* | 130,178,545 | ||||||
| 1,097,581 | Monster Beverage Corp.* | 55,351,010 | ||||||
|
| |||||||
| 266,156,851 | ||||||||
|
| |||||||
| Biotechnology* – 0.6% | ||||||||
| 1,004,653 | Vertex Pharmaceuticals, Inc. | 47,037,853 | ||||||
|
| |||||||
| Building Products – 2.7% | ||||||||
| 1,728,206 | Fortune Brands Home & Security, Inc.* | 59,709,517 | ||||||
| 1,294,537 | Lennox International, Inc. | 76,468,301 | ||||||
| 2,332,717 | Owens Corning, Inc.* | 90,532,747 | ||||||
|
| |||||||
| 226,710,565 | ||||||||
|
| |||||||
| Capital Markets – 2.9% | ||||||||
| 806,822 | Ameriprise Financial, Inc. | 55,372,194 | ||||||
| 5,713,203 | Invesco Ltd. | 153,056,708 | ||||||
| 1,129,483 | Lazard Ltd. Class A | 40,548,440 | ||||||
|
| |||||||
| 248,977,342 | ||||||||
|
| |||||||
| Chemicals – 2.6% | ||||||||
| 1,131,262 | Axiall Corp. | 64,006,804 | ||||||
| 1,339,382 | Celanese Corp. Series A | 62,750,047 | ||||||
| 466,957 | CF Industries Holdings, Inc. | 93,778,974 | ||||||
|
| |||||||
| 220,535,825 | ||||||||
|
| |||||||
| Commercial Banks – 4.1% | ||||||||
| 2,210,421 | CIT Group, Inc.* | 92,528,223 | ||||||
| 1,606,147 | First Republic Bank | 58,544,058 | ||||||
| 1,566,851 | M&T Bank Corp. | 159,959,819 | ||||||
| 1,685,055 | Zions Bancorp. | 40,677,228 | ||||||
|
| |||||||
| 351,709,328 | ||||||||
|
| |||||||
| Commercial Services & Supplies – 0.5% | ||||||||
| 1,219,638 | Waste Connections, Inc. | 41,723,816 | ||||||
|
| |||||||
| Communications Equipment* – 1.9% | ||||||||
| 5,130,064 | Juniper Networks, Inc. | 106,089,723 | ||||||
| 6,327,914 | Polycom, Inc. | 57,647,297 | ||||||
|
| |||||||
| 163,737,020 | ||||||||
|
| |||||||
| Computers & Peripherals* – 0.9% | ||||||||
| 2,169,668 | NetApp, Inc. | 73,399,868 | ||||||
|
| |||||||
| Consumer Finance – 1.6% | ||||||||
| 7,143,546 | SLM Corp. | 135,513,068 | ||||||
|
| |||||||
| Common Stocks – (continued) | ||||||||
| Containers & Packaging – 1.4% | ||||||||
| 1,101,642 | Packaging Corp. of America | $ | 46,026,603 | |||||
| 3,116,312 | Sealed Air Corp. | 69,213,289 | ||||||
|
| |||||||
| 115,239,892 | ||||||||
|
| |||||||
| Diversified Financial Services – 1.3% | ||||||||
| 3,502,526 | The NASDAQ OMX Group, Inc. | 110,889,973 | ||||||
|
| |||||||
| Electric Utilities – 5.2% | ||||||||
| 2,606,283 | Northeast Utilities | 108,186,807 | ||||||
| 3,183,822 | NV Energy, Inc. | 62,912,323 | ||||||
| 793,838 | OGE Energy Corp. | 45,971,158 | ||||||
| 3,715,191 | PPL Corp. | 114,502,187 | ||||||
| 3,723,451 | Xcel Energy, Inc. | 106,863,044 | ||||||
|
| |||||||
| 438,435,519 | ||||||||
|
| |||||||
| Electrical Equipment – 2.1% | ||||||||
| 627,754 | Hubbell, Inc. Class B | 58,324,624 | ||||||
| 754,530 | Rockwell Automation, Inc. | 68,164,240 | ||||||
| 1,563,267 | Sensata Technologies Holding NV* | 50,790,545 | ||||||
|
| |||||||
| 177,279,409 | ||||||||
|
| |||||||
| Electronic Equipment, Instruments & Components – 0.5% | ||||||||
| 641,720 | Amphenol Corp. Class A | 45,472,279 | ||||||
|
| |||||||
| Energy Equipment & Services* – 1.7% | ||||||||
| 1,821,598 | Cameron International Corp. | �� | 116,072,225 | |||||
| 319,010 | Oil States International, Inc. | 24,292,611 | ||||||
|
| |||||||
| 140,364,836 | ||||||||
|
| |||||||
| Food Products* – 0.5% | ||||||||
| 848,016 | The Hain Celestial Group, Inc. | 46,428,876 | ||||||
|
| |||||||
| Gas Utilities – 0.5% | ||||||||
| 1,677,812 | Questar Corp. | 39,445,360 | ||||||
|
| |||||||
| Health Care Equipment & Supplies* – 2.4% | ||||||||
| 14,478,467 | Boston Scientific Corp. | 106,995,871 | ||||||
| 4,479,558 | Hologic, Inc. | 97,788,751 | ||||||
|
| |||||||
| 204,784,622 | ||||||||
|
| |||||||
| Health Care Providers & Services – 2.5% | ||||||||
| 3,119,832 | Aetna, Inc. | 147,224,872 | ||||||
| 1,383,304 | AmerisourceBergen Corp. | 65,291,949 | ||||||
|
| |||||||
| 212,516,821 | ||||||||
|
| |||||||
| Hotels, Restaurants & Leisure – 2.4% | ||||||||
| 201,356 | Chipotle Mexican Grill, Inc.* | 63,787,567 | ||||||
| 7,518,313 | MGM Resorts International* | 93,903,729 | ||||||
| 717,284 | Starwood Hotels & Resorts Worldwide, Inc. | 43,273,744 | ||||||
|
| |||||||
| 200,965,040 | ||||||||
|
| |||||||
| Household Durables – 1.9% | ||||||||
| 2,253,103 | Toll Brothers, Inc.* | 76,875,874 | ||||||
| 778,908 | Whirlpool Corp. | 87,977,659 | ||||||
|
| |||||||
| 164,853,533 | ||||||||
|
| |||||||
| The accompanying notes are an integral part of these financial statements. | 35 |
GOLDMAN SACHS MID CAP VALUE FUND
Schedule of Investments (continued)
February 28, 2013 (Unaudited)
Shares | Description | Value | ||||||
| Common Stocks – (continued) | ||||||||
| Household Products – 0.8% | ||||||||
| 1,155,362 | Church & Dwight Co., Inc. | $ | 71,586,230 | |||||
|
| |||||||
| Independent Power Producers & Energy Traders* – 1.0% | ||||||||
| 4,531,997 | Calpine Corp. | 83,388,745 | ||||||
|
| |||||||
| Industrial Conglomerates – 0.8% | ||||||||
| 963,723 | Carlisle Cos., Inc. | 65,407,880 | ||||||
|
| |||||||
| Insurance – 8.0% | ||||||||
| 920,046 | Everest Re Group Ltd. | 114,646,932 | ||||||
| 41,919 | Markel Corp.* | 20,265,740 | ||||||
| 803,537 | PartnerRe Ltd. | 71,707,642 | ||||||
| 4,414,369 | Principal Financial Group, Inc. | 139,538,204 | ||||||
| 2,661,659 | The Hartford Financial Services Group, Inc. | 62,841,769 | ||||||
| 2,560,408 | W.R. Berkley Corp. | 106,256,932 | ||||||
| 1,161,384 | Willis Group Holdings PLC | 44,225,503 | ||||||
| 4,027,395 | XL Group PLC | 115,344,593 | ||||||
|
| |||||||
| 674,827,315 | ||||||||
|
| |||||||
| Internet & Catalog Retail* – 0.8% | ||||||||
| 3,427,650 | Liberty Interactive Corp. Class A | 71,569,332 | ||||||
|
| |||||||
| IT Services – 0.9% | ||||||||
| 2,049,991 | Fidelity National Information Services, Inc. | 77,182,161 | ||||||
|
| |||||||
| Life Sciences Tools & Services* – 0.8% | ||||||||
| 1,238,131 | Life Technologies Corp. | 71,972,555 | ||||||
|
| |||||||
| Machinery – 4.0% | ||||||||
| 1,429,543 | Dover Corp. | 104,856,979 | ||||||
| 266,329 | Flowserve Corp. | 42,745,805 | ||||||
| 706,447 | Lincoln Electric Holdings, Inc. | 39,596,354 | ||||||
| 1,087,965 | Stanley Black & Decker, Inc. | 85,622,846 | ||||||
| 1,242,057 | Timken Co. | 67,468,536 | ||||||
|
| |||||||
| 340,290,520 | ||||||||
|
| |||||||
| Media – 1.4% | ||||||||
| 675,805 | Charter Communications, Inc. Class A* | 58,382,794 | ||||||
| 895,634 | Scripps Networks Interactive Class A | 56,469,724 | ||||||
|
| |||||||
| 114,852,518 | ||||||||
|
| |||||||
| Metals & Mining – 1.8% | ||||||||
| 1,631,116 | Carpenter Technology Corp. | 77,037,609 | ||||||
| 1,081,250 | Reliance Steel & Aluminum Co. | 72,000,437 | ||||||
|
| |||||||
| 149,038,046 | ||||||||
|
| |||||||
| Multi-Utilities – 2.9% | ||||||||
| 2,917,944 | CMS Energy Corp. | 77,646,490 | ||||||
| 1,515,994 | SCANA Corp. | 74,041,147 | ||||||
| 1,176,641 | Sempra Energy | 91,495,604 | ||||||
|
| |||||||
| 243,183,241 | ||||||||
|
| |||||||
| Multiline Retail – 1.0% | ||||||||
| 2,015,778 | Macy’s, Inc. | 82,848,476 | ||||||
|
| |||||||
| Common Stocks – (continued) | ||||||||
| Oil, Gas & Consumable Fuels – 8.0% | ||||||||
| 736,037 | Concho Resources, Inc.* | $ | 66,213,888 | |||||
| 1,213,165 | HollyFrontier Corp. | 68,179,873 | ||||||
| 1,454,042 | Marathon Petroleum Corp. | 120,511,001 | ||||||
| 1,468,837 | Peabody Energy Corp. | 31,668,126 | ||||||
| 610,581 | Pioneer Natural Resources Co. | 76,817,196 | ||||||
| 1,589,044 | Range Resources Corp. | 122,038,579 | ||||||
| 2,979,282 | Southwestern Energy Co.* | 102,099,994 | ||||||
| 1,531,509 | Tesoro Corp. | 86,132,066 | ||||||
|
| |||||||
| 673,660,723 | ||||||||
|
| |||||||
| Paper & Forest Products – 0.4% | ||||||||
| 781,566 | International Paper Co. | 34,396,720 | ||||||
|
| |||||||
| Pharmaceuticals* – 1.3% | ||||||||
| 3,824,893 | Mylan, Inc. | 113,255,082 | ||||||
|
| |||||||
| Real Estate Investment Trusts – 9.5% | ||||||||
| 1,282,053 | Alexandria Real Estate Equities, Inc. | 91,205,250 | ||||||
| 990,208 | AvalonBay Communities, Inc. | 123,607,665 | ||||||
| 800,301 | Camden Property Trust | 55,332,811 | ||||||
| 1,293,753 | Digital Realty Trust, Inc. | 86,655,576 | ||||||
| 40,748 | Equity Lifestyle Properties, Inc. | 3,002,720 | ||||||
| 4,048,200 | Kimco Realty Corp. | 88,129,314 | ||||||
| 2,409,687 | Liberty Property Trust | 93,471,759 | ||||||
| 6,650,332 | MFA Financial, Inc. | 59,054,948 | ||||||
| 2,077,731 | Tanger Factory Outlet Centers, Inc. | 73,323,127 | ||||||
| 1,798,019 | Ventas, Inc. | 127,263,785 | ||||||
|
| |||||||
| 801,046,955 | ||||||||
|
| |||||||
| Semiconductors & Semiconductor Equipment – 4.2% | ||||||||
| 3,403,812 | Altera Corp. | 120,563,021 | ||||||
| 1,905,035 | Avago Technologies Ltd. | 65,190,298 | ||||||
| 3,414,339 | Lam Research Corp.* | 144,426,539 | ||||||
| 3,680,064 | ON Semiconductor Corp.* | 29,440,512 | ||||||
|
| |||||||
| 359,620,370 | ||||||||
|
| |||||||
| Software* – 1.8% | ||||||||
| 1,645,911 | Adobe Systems, Inc. | 64,684,302 | ||||||
| 3,734,737 | PTC, Inc. | 86,421,814 | ||||||
|
| |||||||
| 151,106,116 | ||||||||
|
| |||||||
| Specialty Retail – 1.1% | ||||||||
| 166,298 | AutoZone, Inc.* | 63,218,185 | ||||||
| 512,266 | PetSmart, Inc. | 33,353,639 | ||||||
|
| |||||||
| 96,571,824 | ||||||||
|
| |||||||
| Textiles, Apparel & Luxury Goods – 1.0% | ||||||||
| 701,699 | PVH Corp. | 85,502,023 | ||||||
|
| |||||||
| TOTAL COMMON STOCKS | ||||||||
| (Cost $6,723,512,599) | $ | 8,237,185,016 | ||||||
|
| |||||||
| 36 | The accompanying notes are an integral part of these financial statements. |
GOLDMAN SACHS MID CAP VALUE FUND
| Principal Amount | Interest Rate | Maturity Date | Value | |||||||||
| Short-term Investment(a) – 2.3% | ||||||||||||
| Repurchase Agreement – 2.3% | ||||||||||||
| Joint Repurchase Agreement Account II |
| ||||||||||
| $ | 193,100,000 | 0.191% | 03/01/13 | $ | 193,100,000 | |||||||
| (Cost $193,100,000) | ||||||||||||
|
| |||||||||||
| TOTAL INVESTMENTS – 99.5% | ||||||||||||
| (Cost $6,916,612,599) | $ | 8,430,285,016 | ||||||||||
|
| |||||||||||
| | OTHER ASSETS IN EXCESS OF LIABILITIES – 0.5% | | 40,344,120 | |||||||||
|
| |||||||||||
| NET ASSETS – 100.0% | $ | 8,470,629,136 | ||||||||||
|
| |||||||||||
| The percentage shown for each investment category reflects the value of investments in that category as a percentage of net assets. | ||
* | Non-income producing security. | |
(a) | Joint repurchase agreement was entered into on February 28, 2013. Additional information appears on pages 42-43. | |
| The accompanying notes are an integral part of these financial statements. | 37 |
GOLDMAN SACHS SMALL CAP VALUE FUND
Schedule of Investments
February 28, 2013 (Unaudited)
Shares | Description | Value | ||||||
| Common Stocks – 97.1% | ||||||||
| Aerospace & Defense – 1.9% | ||||||||
| 360,463 | AAR Corp. | $ | 6,333,335 | |||||
| 475,514 | Moog, Inc. Class A* | 21,379,109 | ||||||
| 280,990 | Teledyne Technologies, Inc.* | 20,675,244 | ||||||
| 282,765 | Triumph Group, Inc. | 20,757,779 | ||||||
|
| |||||||
| 69,145,467 | ||||||||
|
| |||||||
| Air Freight & Logistics – 0.6% | ||||||||
| 590,199 | Forward Air Corp. | 22,262,306 | ||||||
|
| |||||||
| Auto Components – 1.2% | ||||||||
| 1,785,585 | American Axle & Manufacturing Holdings, Inc.* | 22,587,650 | ||||||
| 402,145 | Dana Holding Corp. | 6,727,886 | ||||||
| 364,808 | Tenneco, Inc.* | 12,925,148 | ||||||
|
| |||||||
| 42,240,684 | ||||||||
|
| |||||||
| Biotechnology* – 0.4% | ||||||||
| 512,998 | Myriad Genetics, Inc. | 13,040,409 | ||||||
|
| |||||||
| Building Products – 0.7% | ||||||||
| 216,843 | A.O. Smith Corp. | 15,510,780 | ||||||
| 252,999 | Universal Forest Products, Inc. | 10,266,699 | ||||||
|
| |||||||
| 25,777,479 | ||||||||
|
| |||||||
| Capital Markets – 2.8% | ||||||||
| 188,338 | Cohen & Steers, Inc. | 6,209,504 | ||||||
| 971,862 | E*TRADE Financial Corp.* | 10,408,642 | ||||||
| 366,377 | Golub Capital BDC, Inc. | 6,019,574 | ||||||
| 203,546 | Manning & Napier, Inc. | 3,040,977 | ||||||
| 391,587 | New Mountain Finance Corp. | 5,963,870 | ||||||
| 802,176 | PennantPark Investment Corp. | 9,305,241 | ||||||
| 102,044 | Piper Jaffray Cos., Inc.* | 3,935,837 | ||||||
| 347,270 | Solar Capital Ltd. | 8,508,115 | ||||||
| 206,334 | Solar Senior Capital Ltd. | 3,883,206 | ||||||
| 708,896 | Stifel Financial Corp.* | 24,485,251 | ||||||
| 394,977 | Walter Investment Management Corp.* | 18,137,344 | ||||||
|
| |||||||
| 99,897,561 | ||||||||
|
| |||||||
| Chemicals – 3.8% | ||||||||
| 327,508 | Axiall Corp. | 18,530,402 | ||||||
| 73,936 | Cytec Industries, Inc. | 5,352,227 | ||||||
| 635,962 | H.B. Fuller Co. | 25,991,767 | ||||||
| 456,448 | Methanex Corp. | 16,696,868 | ||||||
| 91,303 | Minerals Technologies, Inc. | 3,674,033 | ||||||
| 1,314,077 | PolyOne Corp. | 29,947,815 | ||||||
| 132,144 | Quaker Chemical Corp. | 7,586,387 | ||||||
| 206,880 | W.R. Grace & Co.* | 14,808,470 | ||||||
| 168,553 | Westlake Chemical Corp. | 14,532,640 | ||||||
|
| |||||||
| 137,120,609 | ||||||||
|
| |||||||
| Commercial Banks – 11.8% | ||||||||
| 966,187 | BancorpSouth, Inc. | 14,782,661 | ||||||
| 773,635 | Bank of the Ozarks, Inc. | 29,699,848 | ||||||
| 389,777 | Banner Corp. | 11,580,275 | ||||||
|
| |||||||
| Common Stocks – (continued) | ||||||||
| Commercial Banks – (continued) | ||||||||
| 1,324,511 | Boston Private Financial Holdings, Inc. | $ | 12,092,785 | |||||
| 255,295 | Bridge Capital Holdings* | 3,885,590 | ||||||
| 681,014 | CoBiz, Inc. | 5,645,606 | ||||||
| 548,305 | Community Bank System, Inc. | 15,829,565 | ||||||
| 765,005 | F.N.B. Corp. | 8,690,457 | ||||||
| 398,777 | First Financial Bankshares, Inc. | 17,785,454 | ||||||
| 904,004 | First Midwest Bancorp, Inc. | 11,300,050 | ||||||
| 864,574 | Glacier Bancorp, Inc. | 15,078,170 | ||||||
| 277,608 | Heritage Financial Corp. | 3,844,871 | ||||||
| 352,756 | Home Bancshares, Inc. | 11,940,791 | ||||||
| 341,310 | Independent Bank Corp. | 10,816,114 | ||||||
| 232,263 | Lakeland Financial Corp. | 5,741,541 | ||||||
| 831,649 | MB Financial, Inc. | 19,718,398 | ||||||
| 598,089 | Pinnacle Financial Partners, Inc.* | 12,984,512 | ||||||
| 1,205,868 | PrivateBancorp, Inc. | 21,597,096 | ||||||
| 621,696 | Prosperity Bancshares, Inc. | 28,685,053 | ||||||
| 310,971 | Sandy Spring Bancorp, Inc. | 6,020,399 | ||||||
| 327,389 | SCBT Financial Corp. | 15,590,264 | ||||||
| 135,546 | Sierra Bancorp | 1,716,012 | ||||||
| 444,243 | Signature Bank* | 32,993,928 | ||||||
| 82,999 | Simmons First National Corp. Class A | 2,086,595 | ||||||
| 224,501 | Southcoast Financial Corp.* | 1,084,340 | ||||||
| 743,783 | Sterling Financial Corp. | 15,753,324 | ||||||
| 148,441 | Summit State Bank | 1,346,360 | ||||||
| 731,673 | Texas Capital Bancshares, Inc.* | 30,920,501 | ||||||
| 149,664 | The First of Long Island Corp. | 4,275,900 | ||||||
| 311,219 | TriCo Bancshares | 5,306,284 | ||||||
| 612,119 | UMB Financial Corp. | 27,906,505 | ||||||
| 121,594 | Union First Market Bankshares Corp. | 2,206,931 | ||||||
| 874,730 | Webster Financial Corp. | 19,261,555 | ||||||
|
| |||||||
| 428,167,735 | ||||||||
|
| |||||||
| Commercial Services & Supplies – 0.9% | ||||||||
| 534,931 | G&K Services, Inc. Class A | 22,290,575 | ||||||
| 302,803 | Waste Connections, Inc. | 10,358,890 | ||||||
|
| |||||||
| 32,649,465 | ||||||||
|
| |||||||
| Communications Equipment – 0.8% | ||||||||
| 554,301 | ADTRAN, Inc. | 12,383,085 | ||||||
| 610,235 | Digi International, Inc.* | 6,016,917 | ||||||
| 283,306 | Plantronics, Inc. | 11,434,230 | ||||||
|
| |||||||
| 29,834,232 | ||||||||
|
| |||||||
| Computers & Peripherals* – 0.6% | ||||||||
| 916,903 | Electronics for Imaging, Inc. | 21,143,783 | ||||||
|
| |||||||
| Construction & Engineering – 1.1% | ||||||||
| 1,440,721 | Comfort Systems USA, Inc. | 17,980,198 | ||||||
| 153,292 | Michael Baker Corp. | 3,715,798 | ||||||
| 554,938 | MYR Group, Inc.* | 12,880,111 | ||||||
| 365,879 | Primoris Services Corp. | 6,860,231 | ||||||
|
| |||||||
| 41,436,338 | ||||||||
|
| |||||||
| 38 | The accompanying notes are an integral part of these financial statements. |
GOLDMAN SACHS SMALL CAP VALUE FUND
Shares | Description | Value | ||||||
| Common Stocks – (continued) | ||||||||
| Consumer Finance* – 0.3% | ||||||||
| 218,686 | First Cash Financial Services, Inc. | $ | 11,570,676 | |||||
|
| |||||||
| Containers & Packaging – 0.1% | ||||||||
| 564,816 | Boise, Inc. | 4,851,769 | ||||||
|
| |||||||
| Diversified Consumer Services – 0.4% | ||||||||
| 949,934 | Service Corp. International | 14,761,974 | ||||||
|
| |||||||
| Diversified Financial Services – 0.4% | ||||||||
| 361,634 | MarketAxess Holdings, Inc. | 14,125,424 | ||||||
|
| |||||||
| Diversified Telecommunication Services* – 0.5% | ||||||||
| 1,851,597 | Premiere Global Services, Inc. | 19,756,540 | ||||||
|
| |||||||
| Electric Utilities – 3.9% | ||||||||
| 234,499 | ALLETE, Inc. | 11,021,453 | ||||||
| 820,136 | Cleco Corp. | �� | 36,332,025 | |||||
| 1,304,222 | El Paso Electric Co. | 43,495,804 | ||||||
| 774,754 | IDACORP, Inc. | 36,173,264 | ||||||
| 341,542 | UNS Energy Corp. | 16,059,305 | ||||||
|
| |||||||
| 143,081,851 | ||||||||
|
| |||||||
| Electrical Equipment – 1.4% | ||||||||
| 147,387 | Acuity Brands, Inc. | 10,041,476 | ||||||
| 580,026 | Belden, Inc. | 29,210,110 | ||||||
| 654,550 | Thermon Group Holdings, Inc.* | 13,418,275 | ||||||
|
| |||||||
| 52,669,861 | ||||||||
|
| |||||||
| Electronic Equipment, Instruments & Components – 3.3% | ||||||||
| 421,108 | Anixter International, Inc. | 29,022,763 | ||||||
| 756,435 | Checkpoint Systems, Inc.* | 8,971,319 | ||||||
| 222,985 | Coherent, Inc. | 12,879,614 | ||||||
| 229,448 | Littelfuse, Inc. | 15,182,574 | ||||||
| 1,347,771 | Newport Corp.* | 22,036,056 | ||||||
| 516,550 | ScanSource, Inc.* | 15,501,666 | ||||||
| 376,454 | SYNNEX Corp.* | 14,354,191 | ||||||
|
| |||||||
| 117,948,183 | ||||||||
|
| |||||||
| Energy Equipment & Services – 3.5% | ||||||||
| 403,342 | Dril-Quip, Inc.* | 33,166,813 | ||||||
| 1,056,050 | Forum Energy Technologies, Inc.* | 28,175,414 | ||||||
| 312,289 | Gulfmark Offshore, Inc. Class A | 11,154,963 | ||||||
| 236,191 | Lufkin Industries, Inc. | 15,300,453 | ||||||
| 3,354,394 | Newpark Resources, Inc.* | 29,552,211 | ||||||
| 955,913 | TETRA Technologies, Inc.* | 8,823,077 | ||||||
|
| |||||||
| 126,172,931 | ||||||||
|
| |||||||
| Food & Staples Retailing – 0.9% | ||||||||
| 177,700 | Casey’s General Stores, Inc. | 10,056,043 | ||||||
| 493,921 | Susser Holdings Corp.* | 21,870,822 | ||||||
|
| |||||||
| 31,926,865 | ||||||||
|
| |||||||
| Food Products* – 0.5% | ||||||||
| 362,331 | The Hain Celestial Group, Inc. | 19,837,622 | ||||||
|
| |||||||
| Gas Utilities – 1.6% | ||||||||
| 1,297,511 | Southwest Gas Corp. | 58,777,248 | ||||||
|
| |||||||
| Common Stocks – (continued) | ||||||||
| Health Care Equipment & Supplies – 0.8% | ||||||||
| 372,854 | Orthofix International NV* | $ | 13,892,540 | |||||
| 235,028 | West Pharmaceutical Services, Inc. | 14,200,392 | ||||||
|
| |||||||
| 28,092,932 | ||||||||
|
| |||||||
| Health Care Providers & Services* – 1.7% | ||||||||
| 417,295 | Acadia Healthcare Co., Inc. | 11,358,770 | ||||||
| 1,634,712 | HealthSouth Corp. | 39,429,253 | ||||||
| 312,501 | Team Health Holdings, Inc. | 10,465,659 | ||||||
|
| |||||||
| 61,253,682 | ||||||||
|
| |||||||
| Hotels, Restaurants & Leisure – 1.2% | ||||||||
| 12,313 | DineEquity, Inc.* | 860,555 | ||||||
| 483,422 | Marriott Vacations Worldwide Corp.* | 19,945,992 | ||||||
| 140,107 | Six Flags Entertainment Corp. | 9,360,549 | ||||||
| 275,525 | Vail Resorts, Inc. | 15,220,001 | ||||||
|
| |||||||
| 45,387,097 | ||||||||
|
| |||||||
| Household Durables – 1.4% | ||||||||
| 169,233 | Harman International Industries, Inc. | 7,183,941 | ||||||
| 145,639 | M.D.C. Holdings, Inc. | 5,596,906 | ||||||
| 590,463 | Meritage Homes Corp.* | 23,907,847 | ||||||
| 1,612,886 | Standard Pacific Corp.* | 13,128,892 | ||||||
|
| |||||||
| 49,817,586 | ||||||||
|
| |||||||
| Independent Power Producers & Energy Traders – 0.2% | ||||||||
| 374,813 | NRG Energy, Inc. | 8,995,512 | ||||||
|
| |||||||
| Industrial Conglomerates – 1.0% | ||||||||
| 403,316 | Carlisle Cos., Inc. | 27,373,057 | ||||||
| 300,355 | Raven Industries, Inc. | 8,479,022 | ||||||
|
| |||||||
| 35,852,079 | ||||||||
|
| |||||||
| Insurance – 4.8% | ||||||||
| 914,886 | Alterra Capital Holdings Ltd. | 28,032,107 | ||||||
| 2,650,765 | American Equity Investment Life Holding Co. | 36,792,618 | ||||||
| 540,615 | Aspen Insurance Holdings Ltd. | 19,386,454 | ||||||
| 86,280 | Enstar Group Ltd.* | 10,814,335 | ||||||
| 920,435 | Maiden Holdings Ltd. | 9,277,985 | ||||||
| 2,299,113 | Meadowbrook Insurance Group, Inc. | 16,162,764 | ||||||
| 622,482 | ProAssurance Corp. | 29,188,181 | ||||||
| 101,877 | RLI Corp. | 7,023,400 | ||||||
| 878,110 | Tower Group, Inc. | 16,376,752 | ||||||
|
| |||||||
| 173,054,596 | ||||||||
|
| |||||||
| Internet & Catalog Retail – 0.2% | ||||||||
| 116,947 | HSN, Inc. | 6,256,664 | ||||||
|
| |||||||
| IT Services – 0.6% | ||||||||
| 1,231,952 | Convergys Corp. | 20,438,084 | ||||||
|
| |||||||
| Leisure Equipment & Products – 1.3% | ||||||||
| 444,064 | Arctic Cat, Inc.* | 16,132,845 | ||||||
| 494,136 | Brunswick Corp. | 18,006,316 | ||||||
| 163,408 | Polaris Industries, Inc. | 14,276,957 | ||||||
|
| |||||||
| 48,416,118 | ||||||||
|
| |||||||
| The accompanying notes are an integral part of these financial statements. | 39 |
GOLDMAN SACHS SMALL CAP VALUE FUND
Schedule of Investments (continued)
February 28, 2013 (Unaudited)
Shares | Description | Value | ||||||
| Common Stocks – (continued) | ||||||||
| Life Sciences Tools & Services – 0.9% | ||||||||
| 605,982 | ICON PLC* | $ | 18,882,399 | |||||
| 404,335 | PerkinElmer, Inc. | 13,816,127 | ||||||
|
| |||||||
| 32,698,526 | ||||||||
|
| |||||||
| Machinery – 3.0% | ||||||||
| 507,327 | Altra Holdings, Inc. | 13,058,597 | ||||||
| 264,573 | Barnes Group, Inc. | 7,040,288 | ||||||
| 297,503 | CIRCOR International, Inc. | 12,399,925 | ||||||
| 340,506 | Crane Co. | 18,312,413 | ||||||
| 1,431,462 | Edwards Group Ltd. ADR* | 10,263,583 | ||||||
| 365,289 | Graco, Inc. | 21,223,291 | ||||||
| 326,347 | RBC Bearings, Inc.* | 16,265,134 | ||||||
| 355,335 | Twin Disc, Inc. | 8,492,506 | ||||||
|
| |||||||
| 107,055,737 | ||||||||
|
| |||||||
| Metals & Mining – 2.0% | ||||||||
| 389,272 | Carpenter Technology Corp. | 18,385,316 | ||||||
| 144,470 | Coeur d’Alene Mines Corp.* | 2,746,375 | ||||||
| 1,004,997 | Commercial Metals Co. | 16,391,501 | ||||||
| 444,750 | Kaiser Aluminum Corp. | 27,236,490 | ||||||
| 234,061 | Olympic Steel, Inc. | 4,838,041 | ||||||
| 121,213 | Schnitzer Steel Industries, Inc. Class A | 3,467,904 | ||||||
|
| |||||||
| 73,065,627 | ||||||||
|
| |||||||
| Multi-Utilities – 0.4% | ||||||||
| 133,026 | Black Hills Corp. | 5,532,551 | ||||||
| 190,816 | NorthWestern Corp. | 7,438,008 | ||||||
|
| |||||||
| 12,970,559 | ||||||||
|
| |||||||
| Oil, Gas & Consumable Fuels – 2.8% | ||||||||
| 1,340,427 | Approach Resources, Inc.* | 33,175,568 | ||||||
| 442,093 | Diamondback Energy, Inc.* | 10,039,932 | ||||||
| 2,185,996 | Rex Energy Corp.* | 29,467,226 | ||||||
| 196,806 | Rosetta Resources, Inc.* | 9,580,516 | ||||||
| 231,357 | Western Refining, Inc. | 8,303,403 | ||||||
| 249,383 | World Fuel Services Corp. | 9,484,036 | ||||||
|
| |||||||
| 100,050,681 | ||||||||
|
| |||||||
| Paper & Forest Products – 0.5% | ||||||||
| 640,126 | KapStone Paper and Packaging Corp. | 17,052,957 | ||||||
|
| |||||||
| Personal Products* – 0.7% | ||||||||
| 372,213 | Elizabeth Arden, Inc. | 14,479,086 | ||||||
| 498,670 | Prestige Brands Holdings, Inc. | 11,863,359 | ||||||
|
| |||||||
| 26,342,445 | ||||||||
|
| |||||||
| Professional Services* – 0.3% | ||||||||
| 557,084 | TrueBlue, Inc. | 10,801,859 | ||||||
|
| |||||||
| Real Estate Investment Trusts – 12.1% | ||||||||
| 701,982 | Acadia Realty Trust | 18,897,355 | ||||||
| 329,594 | American Campus Communities, Inc. | 14,897,649 | ||||||
| 854,845 | CBL & Associates Properties, Inc. | 19,439,175 | ||||||
|
| |||||||
| Common Stocks – (continued) | ||||||||
| Real Estate Investment Trusts – (continued) | ||||||||
| 717,278 | Coresite Realty Corp. | $ | 23,239,807 | |||||
| 1,712,474 | CubeSmart | 25,241,867 | ||||||
| 1,866,267 | CYS Investments, Inc. | 22,133,927 | ||||||
| 994,662 | DuPont Fabros Technology, Inc. | 23,036,372 | ||||||
| 642,881 | EPR Properties | 31,366,164 | ||||||
| 492,777 | Highwoods Properties, Inc. | 17,986,360 | ||||||
| 1,100,343 | Hudson Pacific Properties, Inc. | 24,834,742 | ||||||
| 937,197 | LaSalle Hotel Properties | 23,795,432 | ||||||
| 613,614 | LTC Properties, Inc. | 23,667,092 | ||||||
| 3,492,081 | MFA Financial, Inc. | 31,009,679 | ||||||
| 329,850 | Mid-America Apartment Communities, Inc. | 22,904,784 | ||||||
| 534,794 | National Retail Properties, Inc. | 18,423,653 | ||||||
| 474,914 | OMEGA Healthcare Investors, Inc. | 13,292,843 | ||||||
| 773,035 | Pebblebrook Hotel Trust | 18,483,267 | ||||||
| 442,796 | PS Business Parks, Inc. | 32,762,476 | ||||||
| 1,344,307 | Strategic Hotels & Resorts, Inc.* | 9,786,555 | ||||||
| 1,822,351 | Two Harbors Investment Corp. | 23,435,434 | ||||||
|
| |||||||
| 438,634,633 | ||||||||
|
| |||||||
| Real Estate Management & Development – 0.3% | ||||||||
| 710,300 | Kennedy-Wilson Holdings, Inc. | 11,414,521 | ||||||
|
| |||||||
| Road & Rail – 0.4% | ||||||||
| 1,020,378 | Heartland Express, Inc. | 13,846,529 | ||||||
|
| |||||||
| Semiconductors & Semiconductor Equipment – 4.1% | ||||||||
| 579,163 | Advanced Energy Industries, Inc.* | 10,448,100 | ||||||
| 596,973 | Cabot Microelectronics Corp. | 20,398,567 | ||||||
| 1,812,783 | Fairchild Semiconductor International, Inc.* | 25,850,286 | ||||||
| 199,665 | Hittite Microwave Corp.* | 12,942,285 | ||||||
| 2,080,732 | Intersil Corp. Class A | 17,665,415 | ||||||
| 703,107 | Micrel, Inc. | 7,396,686 | ||||||
| 742,034 | MKS Instruments, Inc. | 20,138,803 | ||||||
| 992,117 | Semtech Corp.* | 30,329,017 | ||||||
| 115,823 | Ultratech, Inc.* | 4,746,426 | ||||||
|
| |||||||
| 149,915,585 | ||||||||
|
| |||||||
| Software – 3.2% | ||||||||
| 1,153,143 | Mentor Graphics Corp.* | 20,422,163 | ||||||
| 604,438 | Monotype Imaging Holdings, Inc. | 12,693,198 | ||||||
| 489,394 | NetScout Systems, Inc.* | 12,445,289 | ||||||
| 229,614 | Progress Software Corp.* | 5,170,907 | ||||||
| 1,194,603 | PTC, Inc.* | 27,643,114 | ||||||
| 839,874 | SS&C Technologies Holdings, Inc.* | 21,257,211 | ||||||
| 468,808 | Verint System, Inc.* | 16,019,169 | ||||||
|
| |||||||
| 115,651,051 | ||||||||
|
| |||||||
| Specialty Retail – 3.1% | ||||||||
| 632,564 | Aaron’s, Inc. | 17,262,672 | ||||||
| 303,289 | Asbury Automotive Group, Inc.* | 10,239,037 | ||||||
| 238,572 | Cabela’s, Inc.* | 12,069,357 | ||||||
| 428,156 | Chico’s FAS, Inc. | 7,270,089 | ||||||
| 249,223 | Francesca’s Holdings Corp.* | 6,342,725 | ||||||
| 304,213 | GNC Acquisition Holdings, Inc. Class A | 12,472,733 | ||||||
|
| |||||||
| 40 | The accompanying notes are an integral part of these financial statements. |
GOLDMAN SACHS SMALL CAP VALUE FUND
Shares | Description | Value | ||||||
| Common Stocks – (continued) | ||||||||
| Specialty Retail – (continued) | ||||||||
| 242,605 | Monro Muffler Brake, Inc. | $ | 8,988,515 | |||||
| 1,446,205 | OfficeMax, Inc. | 17,311,074 | ||||||
| 528,127 | Shoe Carnival, Inc. | 10,261,508 | ||||||
| 181,693 | Vitamin Shoppe, Inc.* | 9,547,967 | ||||||
|
| |||||||
| 111,765,677 | ||||||||
|
| |||||||
| Textiles, Apparel & Luxury Goods* – 1.7% | ||||||||
| 268,710 | Carter’s, Inc. | 15,157,931 | ||||||
| 555,407 | Hanesbrands, Inc. | 22,016,334 | ||||||
| 586,100 | Steven Madden Ltd. | 25,841,149 | ||||||
|
| |||||||
| 63,015,414 | ||||||||
|
| |||||||
| Thrifts & Mortgage Finance – 3.5% | ||||||||
| 767,762 | Brookline Bancorp, Inc. | 6,986,634 | ||||||
| 468,000 | Dime Community Bancshares | 6,650,280 | ||||||
| 664,315 | Flushing Financial Corp. | 10,496,177 | ||||||
| 682,236 | Home Loan Servicing Solutions Ltd. | 15,391,244 | ||||||
| 878,144 | Ocwen Financial Corp.* | 34,616,437 | ||||||
| 585,107 | Oritani Financial Corp. | 8,606,924 | ||||||
| 829,554 | Provident Financial Services, Inc. | 12,435,014 | ||||||
| 1,058,463 | Radian Group, Inc. | 9,325,059 | ||||||
| 753,974 | ViewPoint Financial Group, Inc. | 15,720,358 | ||||||
| 116,653 | WSFS Financial Corp. | 5,541,018 | ||||||
|
| |||||||
| 125,769,145 | ||||||||
|
| |||||||
| Trading Companies & Distributors – 1.5% | ||||||||
| 391,987 | Applied Industrial Technologies, Inc. | 17,016,156 | ||||||
| 660,028 | Kaman Corp. | 23,034,977 | ||||||
| 185,478 | Watsco, Inc. | 14,443,172 | ||||||
|
| |||||||
| 54,494,305 | ||||||||
|
| |||||||
| TOTAL COMMON STOCKS | ||||||||
| (Cost $2,785,041,432) | $ | 3,520,306,613 | ||||||
|
| |||||||
| Exchange Traded Fund – 1.6% | ||||||||
| 734,438 | iShares Russell 2000 Value Index Fund | |||||||
| (Cost $52,538,371) | $ | 59,394,001 | ||||||
|
| |||||||
| Investment Company – 0.2% | ||||||||
| Capital Markets – 0.2% | ||||||||
| 402,644 | THL Credit, Inc. | |||||||
| (Cost $5,708,844) | $ | 6,184,612 | ||||||
|
| |||||||
| Units | Description | Expiration Date | Value | |||||||
| Warrant* – 0.0% | ||||||||||
Magnum Hunter Resources Corp. |
| |||||||||
| 112,819 | 10/14/13 | $ | 15,795 | |||||||
| (Cost $—) | ||||||||||
| ||||||||||
| Principal Amount | Interest Rate | Maturity Date | Value | |||||||||
| Short-term Investment(a) – 1.2% | ||||||||||||
| Repurchase Agreement – 1.2% | ||||||||||||
| Joint Repurchase Agreement Account II |
| ||||||||||
| $ | 42,000,000 | 0.191% | 03/01/13 | $ | 42,000,000 | |||||||
| (Cost $42,000,000) | ||||||||||||
|
| |||||||||||
| TOTAL INVESTMENTS – 100.1% | ||||||||||||
| (Cost $2,885,288,647) | $ | 3,627,901,021 | ||||||||||
|
| |||||||||||
| | LIABILITIES IN EXCESS OF OTHER ASSETS – (0.1)% | | (3,788,076 | ) | ||||||||
|
| |||||||||||
| NET ASSETS – 100.0% | $ | 3,624,112,945 | ||||||||||
|
| |||||||||||
| The percentage shown for each investment category reflects the value of investments in that category as a percentage of net assets. | ||
* | Non-income producing security. | |
(a) | Joint repurchase agreement was entered into on February 28, 2013. Additional information appears on pages 42-43. | |
| ||
Investment Abbreviation: | ||
ADR | —American Depositary Receipt | |
| ||
| The accompanying notes are an integral part of these financial statements. | 41 |
GOLDMAN SACHS FUNDAMENTAL EQUITY VALUE FUNDS
Schedule of Investments(continued)
February 28, 2013 (Unaudited)
| ADDITIONAL INVESTMENT INFORMATION |
JOINT REPURCHASE AGREEMENT ACCOUNT II — At February 28, 2013, the Funds had undivided interests in the Joint Repurchase Agreement Account II, with a maturity date of March 1, 2013, as follows:
| Fund | Principal Amount | Maturity Value | Collateral Allocation Value | |||||||||
Growth and Income | $ | 1,900,000 | $ | 1,900,010 | $ | 1,947,090 | ||||||
Large Cap Value | 19,400,000 | 19,400,103 | 19,880,817 | |||||||||
Mid Cap Value | 193,100,000 | 193,100,025 | 197,885,863 | |||||||||
Small Cap Value | 42,000,000 | 42,000,223 | 43,040,944 | |||||||||
REPURCHASE AGREEMENTS — At February 28, 2013, the Principal Amounts of the Funds’ interest in the Joint Repurchase Agreement Account II were as follows:
| Counterparty | Interest Rate | Growth and Income | Large Cap Value | Mid Cap Value | Small Cap Value | |||||||||||||||
BNP Paribas Securities Co. | 0.190 | % | $ | 523,838 | $ | 5,348,663 | $ | 53,238,494 | $ | 11,579,579 | ||||||||||
Credit Suisse Securities LLC | 0.160 | 71,270 | 727,709 | 7,243,332 | 1,575,453 | |||||||||||||||
Deutsche Bank Securities, Inc. | 0.200 | 396,193 | 4,045,336 | 40,265,685 | 8,757,943 | |||||||||||||||
JPMorgan Securities LLC | 0.200 | 146,105 | 1,491,804 | 14,848,832 | 3,229,679 | |||||||||||||||
Wells Fargo Securities LLC | 0.190 | 762,594 | 7,786,488 | 77,503,657 | 16,857,346 | |||||||||||||||
| TOTAL | $ | 1,900,000 | $ | 19,400,000 | $ | 193,100,000 | $ | 42,000,000 | ||||||||||||
| 42 | The accompanying notes are an integral part of these financial statements. |
GOLDMAN SACHS FUNDAMENTAL EQUITY VALUE FUNDS
| ADDITIONAL INVESTMENT INFORMATION (continued) |
At February 28, 2013, the Joint Repurchase Agreement Account II was fully collateralized by:
| Issuer | Interest Rates | Maturity Dates | ||||||
Federal Home Loan Mortgage Corp. | 2.000 to 4.500 | % | 04/01/26 to 02/01/43 | |||||
Federal National Mortgage Association | 2.000 to 5.000 | 12/01/22 to 01/01/43 | ||||||
Government National Mortgage Association | 3.000 to 6.500 | 07/20/26 to 02/20/43 | ||||||
U.S. Treasury Notes | 1.750 to 3.125 | 09/30/13 to 10/31/18 | ||||||
| The accompanying notes are an integral part of these financial statements. | 43 |
GOLDMAN SACHS FUNDAMENTAL EQUITY VALUE FUNDS
Statements of Assets and Liabilities
February 28, 2013 (Unaudited)
| Growth and Income Fund | ||||||
| Assets: | ||||||
Investments, at value (cost $379,162,672, $1,194,436,511, $6,916,612,599 and $2,885,288,647) | $ | 426,732,403 | ||||
Cash | 508,093 | |||||
Receivables: | ||||||
Investments sold | 5,414,575 | |||||
Dividends and interest | 1,013,470 | |||||
Fund shares sold | 59,295 | |||||
Foreign tax reclaims | 22,131 | |||||
Reimbursement from investment adviser | 12,928 | |||||
Other assets | 3,494 | |||||
| Total assets | 433,766,389 | |||||
| Liabilities: | ||||||
Payables: | ||||||
Investments purchased | 3,613,007 | |||||
Fund shares redeemed | 1,129,420 | |||||
Amounts owed to affiliates | 398,057 | |||||
Accrued expenses | 106,733 | |||||
| Total liabilities | 5,247,217 | |||||
| Net Assets: | ||||||
Paid-in capital | 640,888,096 | |||||
Distributions in excess of net investment income | (358,231 | ) | ||||
Accumulated net realized gain (loss) | (259,580,424 | ) | ||||
Net unrealized gain | 47,569,731 | |||||
| NET ASSETS | $ | 428,519,172 | ||||
Net Assets: | ||||||
Class A | $ | 374,405,879 | ||||
Class B | 16,662,773 | |||||
Class C | 21,680,121 | |||||
Institutional | 13,679,162 | |||||
Service | 542,165 | |||||
Class IR | 954,606 | |||||
Class R | 594,466 | |||||
Total Net Assets | $ | 428,519,172 | ||||
Shares Outstanding $0.001 par value (unlimited shares authorized): | ||||||
Class A | 15,508,819 | |||||
Class B | 716,316 | |||||
Class C | 937,488 | |||||
Institutional | 557,923 | |||||
Service | 22,468 | |||||
Class IR | 39,613 | |||||
Class R | 24,709 | |||||
Net asset value, offering and redemption price per share:(a) | ||||||
Class A | $24.14 | |||||
Class B | 23.26 | |||||
Class C | 23.13 | |||||
Institutional | 24.52 | |||||
Service | 24.13 | |||||
Class IR | 24.10 | |||||
Class R | 24.06 | |||||
| (a) | Maximum public offering price per share for Class A Shares of the Growth and Income, Large Cap Value, Mid Cap Value and Small Cap Value Funds is $25.54, $14.26, $44.78 and $48.13, respectively. At redemption, Class B and Class C Shares may be subject to a contingent deferred sales charge assessed on the amount equal to the lesser of the current NAV or the original purchase price of the shares. |
| 44 | The accompanying notes are an integral part of these financial statements. |
GOLDMAN SACHS FUNDAMENTAL EQUITY VALUE FUNDS
Large Cap Value Fund | Mid Cap Value Fund | Small Cap Value Fund | ||||||||||||||
| $ | 1,407,661,450 | $ | 8,430,285,016 | $ | 3,627,901,021 | |||||||||||
| 5,304,498 | 72,170 | 67,567 | ||||||||||||||
| 29,251,556 | 110,412,503 | 42,035,199 | ||||||||||||||
| 3,296,091 | 10,109,600 | 2,081,280 | ||||||||||||||
| 2,059,600 | 41,143,686 | 5,780,344 | ||||||||||||||
| — | — | — | ||||||||||||||
| — | — | — | ||||||||||||||
| 10,668 | 66,986 | 28,026 | ||||||||||||||
| 1,447,583,863 | 8,592,089,961 | 3,677,893,437 | ||||||||||||||
| 21,292,826 | 62,613,834 | 41,833,346 | ||||||||||||||
| 1,809,751 | 52,420,066 | 8,634,616 | ||||||||||||||
| 1,028,217 | 5,887,136 | 3,021,735 | ||||||||||||||
| 132,504 | 539,789 | 290,795 | ||||||||||||||
| 24,263,298 | 121,460,825 | 53,780,492 | ||||||||||||||
| 1,612,646,758 | 6,711,218,114 | 2,803,141,692 | ||||||||||||||
| (1,089,617 | ) | (3,395,798 | ) | (2,773,372 | ) | |||||||||||
| (401,461,515 | ) | 249,134,403 | 81,132,251 | |||||||||||||
| 213,224,939 | 1,513,672,417 | 742,612,374 | ||||||||||||||
| $ | 1,423,320,565 | $ | 8,470,629,136 | $ | 3,624,112,945 | |||||||||||
| $377,485,444 | $ | 3,324,012,363 | $ | 940,019,051 | ||||||||||||
| 7,940,181 | 24,342,951 | 3,577,860 | ||||||||||||||
| 35,141,531 | 165,158,841 | 61,624,605 | ||||||||||||||
| 871,334,271 | 4,554,020,761 | 2,393,376,454 | ||||||||||||||
| 2,810,152 | 303,873,731 | 125,085,200 | ||||||||||||||
| 122,575,820 | 81,120,268 | 40,860,145 | ||||||||||||||
| 6,033,166 | 18,100,221 | 59,569,630 | ||||||||||||||
| $1,423,320,565 | $ | 8,470,629,136 | $ | 3,624,112,945 | ||||||||||||
| 28,001,572 | 78,539,702 | 20,670,782 | ||||||||||||||
| 601,845 | 597,244 | 92,140 | ||||||||||||||
| 2,685,819 | 4,091,766 | 1,596,612 | ||||||||||||||
| 64,145,336 | 106,816,398 | 49,975,653 | ||||||||||||||
| 209,287 | 7,254,454 | 2,808,970 | ||||||||||||||
| 9,175,333 | 1,935,312 | 902,899 | ||||||||||||||
| 454,710 | 432,277 | 1,324,865 | ||||||||||||||
| $13.48 | $42.32 | $45.48 | ||||||||||||||
| 13.19 | 40.76 | 38.83 | ||||||||||||||
| 13.08 | 40.36 | 38.60 | ||||||||||||||
| 13.58 | 42.63 | 47.89 | ||||||||||||||
| 13.43 | 41.89 | 44.53 | ||||||||||||||
| 13.36 | 41.92 | 45.25 | ||||||||||||||
| 13.27 | 41.87 | 44.96 | ||||||||||||||
| The accompanying notes are an integral part of these financial statements. | 45 |
GOLDMAN SACHS FUNDAMENTAL EQUITY VALUE FUNDS
Statements of Operations
For the Six Months Ended February 28, 2013 (Unaudited)
| Growth and Income Fund | ||||||
| Investment income: | ||||||
Dividends (net of foreign withholding taxes of $2,860, $9,398, $0 and $6,157) | $ | 5,213,217 | ||||
Interest | 4,914 | |||||
| Total investment income | 5,218,131 | |||||
| Expenses: | ||||||
Management fees | 1,499,434 | |||||
Distribution and Service fees(a) | 660,573 | |||||
Transfer Agent fees(a) | 394,873 | |||||
Printing and mailing costs | 55,866 | |||||
Professional fees | 48,864 | |||||
Custody, accounting and administrative services | 48,166 | |||||
Registration fees | 43,529 | |||||
Trustee fees | 7,925 | |||||
Service Share fees — Shareholder Administration Plan | 668 | |||||
Service Share fees — Service Plan | 668 | |||||
Other | 6,170 | |||||
| Total expenses | 2,766,736 | |||||
Less — expense reductions | (95,043 | ) | ||||
| Net expenses | 2,671,693 | |||||
| NET INVESTMENT INCOME | 2,546,438 | |||||
| Realized and unrealized gain: | ||||||
Net realized gain from: | ||||||
Investments (including commission recapture of $40,149, $166,519, $594,257 and $0) | 32,012,342 | |||||
Net change in unrealized gain on: |
| |||||
Investments — unaffiliated issuers | 15,632,326 | |||||
| Net realized and unrealized gain | 47,644,668 | |||||
| NET INCREASE IN NET ASSETS RESULTING FROM OPERATIONS | $ | 50,191,106 | ||||
| (a) | Class specific Distribution and Service, and Transfer Agent fees were as follows: |
| Distribution and Service Fees | Transfer Agent Fees | |||||||||||||||||||||||||||||||||||||||||||
Fund | Class A | Class B | Class C | Class R | Class A | Class B | Class C | Institutional | Service | Class IR | Class R | |||||||||||||||||||||||||||||||||
Growth and Income | $ | 464,964 | $ | 87,521 | $ | 106,084 | $ | 2,004 | $ | 353,372 | $ | 16,629 | $ | 20,156 | $ | 3,124 | $ | 107 | $ | 723 | $ | 762 | ||||||||||||||||||||||
Large Cap Value | 489,913 | 40,017 | 172,559 | 14,132 | 372,334 | 7,603 | 32,787 | 177,700 | 634 | 104,333 | 5,370 | |||||||||||||||||||||||||||||||||
Mid Cap Value | 3,912,287 | 135,839 | 791,929 | 38,010 | 2,973,338 | 25,810 | 150,467 | 825,239 | 54,316 | 69,046 | 14,444 | |||||||||||||||||||||||||||||||||
Small Cap Value | 1,087,358 | 18,028 | 294,667 | 124,135 | 826,392 | 3,425 | 55,987 | 414,082 | 24,338 | 28,420 | 47,171 | |||||||||||||||||||||||||||||||||
| 46 | The accompanying notes are an integral part of these financial statements. |
GOLDMAN SACHS FUNDAMENTAL EQUITY VALUE FUNDS
| Large Cap Value Fund | Mid Cap Value Fund | Small Cap Value Fund | ||||||||||||||
| $ | 15,933,668 | $ | 72,469,709 | $ | 40,502,729 | |||||||||||
| 11,504 | 106,331 | 86,738 | ||||||||||||||
| 15,945,172 | 72,576,040 | 40,589,467 | ||||||||||||||
| 5,248,542 | 26,787,239 | 15,410,205 | ||||||||||||||
| 716,621 | 4,878,065 | 1,524,188 | ||||||||||||||
| 700,761 | 4,112,660 | 1,399,815 | ||||||||||||||
| 61,550 | 333,269 | 145,993 | ||||||||||||||
| 48,084 | 56,763 | 44,401 | ||||||||||||||
| 62,306 | 193,413 | 108,407 | ||||||||||||||
| 71,783 | 100,889 | 90,748 | ||||||||||||||
| 11,253 | 16,719 | 14,187 | ||||||||||||||
| 3,964 | 339,477 | 152,114 | ||||||||||||||
| 3,964 | 339,477 | 152,114 | ||||||||||||||
| 21,060 | 80,940 | 45,295 | ||||||||||||||
| 6,949,888 | 37,238,911 | 19,087,467 | ||||||||||||||
| (644 | ) | (540 | ) | (500,427 | ) | |||||||||||
| 6,949,244 | 37,238,371 | 18,587,040 | ||||||||||||||
| 8,995,928 | 35,337,669 | 22,002,427 | ||||||||||||||
| 121,194,851 | 465,607,224 | 127,136,257 | ||||||||||||||
| 39,616,663 | 558,699,381 | 245,597,437 | ||||||||||||||
| 160,811,514 | 1,024,306,605 | 372,733,694 | ||||||||||||||
| $ | 169,807,442 | $ | 1,059,644,274 | $ | 394,736,121 | |||||||||||
| The accompanying notes are an integral part of these financial statements. | 47 |
GOLDMAN SACHS FUNDAMENTAL EQUITY VALUE FUNDS
Statements of Changes in Net Assets
| Growth and Income Fund | ||||||||||
| For the Six Months Ended February 28, 2013 (Unaudited) | For the Fiscal Year Ended August 31, 2012 | |||||||||
| From operations: | ||||||||||
Net investment income | $ | 2,546,438 | $ | 7,659,984 | ||||||
Net realized gain | 32,012,342 | 8,456,400 | ||||||||
Net change in unrealized gain | 15,632,326 | 48,225,916 | ||||||||
| Net increase in net assets resulting from operations | 50,191,106 | 64,342,300 | ||||||||
| Distributions to shareholders: | ||||||||||
From net investment income | ||||||||||
Class A Shares | (3,420,772 | ) | (5,857,460 | ) | ||||||
Class B Shares | (104,954 | ) | (173,005 | ) | ||||||
Class C Shares | (127,004 | ) | (154,724 | ) | ||||||
Institutional Shares | (160,690 | ) | (345,348 | ) | ||||||
Service Shares | (4,531 | ) | (8,353 | ) | ||||||
Class IR Shares | (8,833 | ) | (12,058 | ) | ||||||
Class R Shares | (6,641 | ) | (7,160 | ) | ||||||
From net realized gains | ||||||||||
Class A Shares | — | — | ||||||||
Class B Shares | — | — | ||||||||
Class C Shares | — | — | ||||||||
Institutional Shares | — | — | ||||||||
Service Shares | — | — | ||||||||
Class IR Shares | — | — | ||||||||
Class R Shares | — | — | ||||||||
| Total distributions to shareholders | (3,833,425 | ) | (6,558,108 | ) | ||||||
| From share transactions: | ||||||||||
Proceeds from sales of shares | 12,868,445 | 23,344,241 | ||||||||
Proceeds received in connection with in-kind transactions | — | — | ||||||||
Reinvestment of distributions | 3,723,746 | 6,385,178 | ||||||||
Cost of shares redeemed | (68,490,453 | ) | (254,299,220 | ) | ||||||
| Net increase (decrease) in net assets resulting from share transactions | (51,898,262 | ) | (224,569,801 | ) | ||||||
| TOTAL INCREASE (DECREASE) | (5,540,581 | ) | (166,785,609 | ) | ||||||
| Net assets: | ||||||||||
Beginning of period | 434,059,753 | 600,845,362 | ||||||||
End of period | $ | 428,519,172 | $ | 434,059,753 | ||||||
| Undistributed (distributions in excess of) net investment income | $ | (358,231 | ) | $ | 928,756 | |||||
| 48 | The accompanying notes are an integral part of these financial statements. |
GOLDMAN SACHS FUNDAMENTAL EQUITY VALUE FUNDS
| Large Cap Value Fund | Mid Cap Value Fund | Small Cap Value Fund | ||||||||||||||||||||||||||||||||
| For the Six Months Ended February 28, 2013 (Unaudited) | For the Fiscal Year Ended | For the Six Months Ended February 28, 2013 (Unaudited) | For the Fiscal Year Ended | For the Six Months Ended February 28, 2013 (Unaudited) | For the Fiscal Year Ended August 31, 2012 | |||||||||||||||||||||||||||||
| $ | 8,995,928 | $ | 28,718,695 | $ | 35,337,669 | $ | 81,928,460 | $ | 22,002,427 | $ | 25,532,554 | |||||||||||||||||||||||
| 121,194,851 | 54,138,352 | 465,607,224 | 143,497,268 | 127,136,257 | 129,015,121 | |||||||||||||||||||||||||||||
| 39,616,663 | 168,957,005 | 558,699,381 | 675,138,478 | 245,597,437 | 292,849,802 | |||||||||||||||||||||||||||||
| 169,807,442 | 251,814,052 | 1,059,644,274 | 900,564,206 | 394,736,121 | 447,397,477 | |||||||||||||||||||||||||||||
| (4,249,526 | ) | (5,892,943 | ) | (27,315,683 | ) | (15,458,917 | ) | (9,074,191 | ) | (1,625,934 | ) | |||||||||||||||||||||||
| (28,592 | ) | (23,482 | ) | — | — | (7,694 | ) | — | ||||||||||||||||||||||||||
| (146,312 | ) | (94,147 | ) | (231,058 | ) | — | (347,142 | ) | — | |||||||||||||||||||||||||
| (13,701,820 | ) | (22,919,405 | ) | (51,149,774 | ) | (34,773,711 | ) | (29,648,112 | ) | (9,560,273 | ) | |||||||||||||||||||||||
| (27,510 | ) | (72,710 | ) | (2,062,564 | ) | (1,123,227 | ) | (1,352,600 | ) | (33,075 | ) | |||||||||||||||||||||||
| (1,568,373 | ) | (1,450,900 | ) | (795,012 | ) | (420,583 | ) | (410,127 | ) | (77,291 | ) | |||||||||||||||||||||||
| (50,353 | ) | (57,649 | ) | (114,948 | ) | (33,437 | ) | (453,112 | ) | (37,590 | ) | |||||||||||||||||||||||
| — | — | — | — | (43,582,618 | ) | (14,836,434 | ) | |||||||||||||||||||||||||||
| — | — | — | — | (219,902 | ) | (167,580 | ) | |||||||||||||||||||||||||||
| — | — | — | — | (3,526,097 | ) | (1,175,006 | ) | |||||||||||||||||||||||||||
| — | — | — | — | (101,314,401 | ) | (27,687,278 | ) | |||||||||||||||||||||||||||
| — | — | — | — | (6,454,974 | ) | (1,362,780 | ) | |||||||||||||||||||||||||||
| — | — | — | — | (1,509,568 | ) | (270,226 | ) | |||||||||||||||||||||||||||
| — | — | — | — | (2,499,193 | ) | (551,209 | ) | |||||||||||||||||||||||||||
| (19,772,486 | ) | (30,511,236 | ) | (81,669,039 | ) | (51,809,875 | ) | (200,399,731 | ) | (57,384,676 | ) | |||||||||||||||||||||||
| 108,059,995 | 364,695,633 | 1,037,841,468 | 1,606,054,000 | 760,694,940 | 931,251,116 | |||||||||||||||||||||||||||||
| — | 9,725,593 | — | — | — | — | |||||||||||||||||||||||||||||
| 18,297,680 | 26,223,781 | 74,417,355 | 44,786,515 | 193,341,319 | 53,841,246 | |||||||||||||||||||||||||||||
| (327,990,978 | ) | (1,281,130,727 | ) | (1,223,270,232 | ) | (2,334,727,202 | ) | (556,087,436 | ) | (921,063,280 | ) | |||||||||||||||||||||||
| (201,633,303 | ) | (880,485,720 | ) | (111,011,409 | ) | (683,886,687 | ) | 397,948,823 | 64,029,082 | |||||||||||||||||||||||||
| (51,598,347 | ) | (659,182,904 | ) | 866,963,826 | 164,867,644 | 592,285,213 | 454,041,883 | |||||||||||||||||||||||||||
| 1,474,918,912 | 2,134,101,816 | 7,603,665,310 | 7,438,797,666 | 3,031,827,732 | 2,577,785,849 | |||||||||||||||||||||||||||||
| $ | 1,423,320,565 | $ | 1,474,918,912 | $ | 8,470,629,136 | $ | 7,603,665,310 | $ | 3,624,112,945 | $ | 3,031,827,732 | |||||||||||||||||||||||
| $ | (1,089,617 | ) | $ | 9,686,941 | $ | (3,395,798 | ) | $ | 42,935,572 | $ | (2,773,372 | ) | $ | 16,517,179 | ||||||||||||||||||||
| The accompanying notes are an integral part of these financial statements. | 49 |
GOLDMAN SACHS GROWTH AND INCOME FUND
Financial Highlights
Selected Data for a Share Outstanding Throughout Each Period
| Income (loss) from investment operations | Distributions to shareholders | |||||||||||||||||||||||||||||
| Year - Share Class | Net asset value, beginning of period | Net investment income(a) | Net realized and unrealized gain (loss) | Total from investment operations | From net investment income | From net realized gains | Total distributions | |||||||||||||||||||||||
| FOR THE SIX MONTHS ENDED FEBRUARY 28, (UNAUDITED) | ||||||||||||||||||||||||||||||
2013 - A | $ | 21.68 | $ | 0.14 | $ | 2.53 | $ | 2.67 | $ | (0.21 | ) | $ | — | $ | (0.21 | ) | ||||||||||||||
2013 - B | 20.90 | 0.05 | 2.44 | 2.49 | (0.13 | ) | — | (0.13 | ) | |||||||||||||||||||||
2013 - C | 20.78 | 0.05 | 2.43 | 2.48 | (0.13 | ) | — | (0.13 | ) | |||||||||||||||||||||
2013 - Institutional | 22.01 | 0.19 | 2.57 | 2.76 | (0.25 | ) | — | (0.25 | ) | |||||||||||||||||||||
2013 - Service | 21.66 | 0.13 | 2.53 | 2.66 | (0.19 | ) | — | (0.19 | ) | |||||||||||||||||||||
2013 - IR | 21.64 | 0.18 | 2.51 | 2.69 | (0.23 | ) | — | (0.23 | ) | |||||||||||||||||||||
2013 - R | 21.60 | 0.11 | 2.53 | 2.64 | (0.18 | ) | — | (0.18 | ) | |||||||||||||||||||||
| FOR THE FISCAL YEARS ENDED AUGUST 31, | ||||||||||||||||||||||||||||||
2012 - A | 19.04 | 0.32 | (e) | 2.58 | 2.90 | (0.26 | ) | — | (0.26 | ) | ||||||||||||||||||||
2012 - B | 18.38 | 0.17 | (e) | 2.48 | 2.65 | (0.13 | ) | — | (0.13 | ) | ||||||||||||||||||||
2012 - C | 18.28 | 0.16 | (e) | 2.48 | 2.64 | (0.14 | ) | — | (0.14 | ) | ||||||||||||||||||||
2012 - Institutional | 19.33 | 0.41 | (e) | 2.61 | 3.02 | (0.34 | ) | — | (0.34 | ) | ||||||||||||||||||||
2012 - Service | 19.04 | 0.30 | (e) | 2.56 | 2.86 | (0.24 | ) | — | (0.24 | ) | ||||||||||||||||||||
2012 - IR | 19.02 | 0.36 | (e) | 2.58 | 2.94 | (0.32 | ) | — | (0.32 | ) | ||||||||||||||||||||
2012 - R | 18.99 | 0.26 | (e) | 2.57 | 2.83 | (0.22 | ) | — | (0.22 | ) | ||||||||||||||||||||
2011 - A | 17.84 | 0.21 | 1.21 | 1.42 | (0.22 | ) | — | (0.22 | ) | |||||||||||||||||||||
2011 - B | 17.25 | 0.06 | 1.16 | 1.22 | (0.09 | ) | — | (0.09 | ) | |||||||||||||||||||||
2011 - C | 17.16 | 0.05 | 1.17 | 1.22 | (0.10 | ) | — | (0.10 | ) | |||||||||||||||||||||
2011 - Institutional | 18.12 | 0.30 | 1.21 | 1.51 | (0.30 | ) | — | (0.30 | ) | |||||||||||||||||||||
2011 - Service | 17.83 | 0.20 | 1.20 | 1.40 | (0.19 | ) | — | (0.19 | ) | |||||||||||||||||||||
2011 - IR | 17.82 | 0.33 | 1.14 | 1.47 | (0.27 | ) | — | (0.27 | ) | |||||||||||||||||||||
2011 - R | 17.79 | 0.16 | 1.21 | 1.37 | (0.17 | ) | — | (0.17 | ) | |||||||||||||||||||||
2010 - A | 17.65 | 0.22 | (f) | 0.18 | 0.40 | (0.21 | ) | — | (0.21 | ) | ||||||||||||||||||||
2010 - B | 17.06 | 0.08 | (f) | 0.19 | 0.27 | (0.08 | ) | — | (0.08 | ) | ||||||||||||||||||||
2010 - C | 16.98 | 0.07 | (f) | 0.19 | 0.26 | (0.08 | ) | — | (0.08 | ) | ||||||||||||||||||||
2010 - Institutional | 17.91 | 0.30 | (f) | 0.20 | 0.50 | (0.29 | ) | — | (0.29 | ) | ||||||||||||||||||||
2010 - Service | 17.63 | 0.20 | (f) | 0.20 | 0.40 | (0.20 | ) | — | (0.20 | ) | ||||||||||||||||||||
2010 - IR | 17.63 | 0.26 | (f) | 0.20 | 0.46 | (0.27 | ) | — | (0.27 | ) | ||||||||||||||||||||
2010 - R | 17.60 | 0.16 | (f) | 0.21 | 0.37 | (0.18 | ) | — | (0.18 | ) | ||||||||||||||||||||
2009 - A | 23.10 | 0.32 | (5.31 | ) | (4.99 | ) | (0.42 | ) | (0.04 | ) | (0.46 | ) | ||||||||||||||||||
2009 - B | 22.35 | 0.19 | (5.15 | ) | (4.96 | ) | (0.29 | ) | (0.04 | ) | (0.33 | ) | ||||||||||||||||||
2009 - C | 22.24 | 0.19 | (5.11 | ) | (4.92 | ) | (0.30 | ) | (0.04 | ) | (0.34 | ) | ||||||||||||||||||
2009 - Institutional | 23.45 | 0.37 | (5.37 | ) | (5.00 | ) | (0.50 | ) | (0.04 | ) | (0.54 | ) | ||||||||||||||||||
2009 - Service | 23.09 | 0.30 | (5.31 | ) | (5.01 | ) | (0.41 | ) | (0.04 | ) | (0.45 | ) | ||||||||||||||||||
2009 - IR | 23.08 | 0.36 | (5.30 | ) | (4.94 | ) | (0.47 | ) | (0.04 | ) | (0.51 | ) | ||||||||||||||||||
2009 - R | 23.08 | 0.21 | (5.24 | ) | (5.03 | ) | (0.41 | ) | (0.04 | ) | (0.45 | ) | ||||||||||||||||||
2008 - A | 30.01 | 0.46 | (3.51 | ) | (3.05 | ) | (0.46 | ) | (3.40 | ) | (3.86 | ) | ||||||||||||||||||
2008 - B | 29.15 | 0.26 | (3.41 | ) | (3.15 | ) | (0.25 | ) | (3.40 | ) | (3.65 | ) | ||||||||||||||||||
2008 - C | 29.03 | 0.26 | (3.39 | ) | (3.13 | ) | (0.26 | ) | (3.40 | ) | (3.66 | ) | ||||||||||||||||||
2008 - Institutional | 30.41 | 0.55 | (3.54 | ) | (2.99 | ) | (0.57 | ) | (3.40 | ) | (3.97 | ) | ||||||||||||||||||
2008 - Service | 30.00 | 0.43 | (3.50 | ) | (3.07 | ) | (0.44 | ) | (3.40 | ) | (3.84 | ) | ||||||||||||||||||
2008 - IR (Commenced November 30,2007) | 29.78 | 0.36 | (3.25 | ) | (2.89 | ) | (0.41 | ) | (3.40 | ) | (3.81 | ) | ||||||||||||||||||
2008 - R (Commenced November 30, 2007) | 29.78 | 0.28 | (3.24 | ) | (2.96 | ) | (0.34 | ) | (3.40 | ) | (3.74 | ) | ||||||||||||||||||
| (a) | Calculated based on the average shares outstanding methodology. |
| (b) | Assumes investment at the net asset value at the beginning of the period, reinvestment of all dividends and distributions, a complete redemption of the investment at the net asset value at the end of the period and no sales or redemption charges. Total returns would be reduced if a sales or redemption charge was taken into account. Returns do not reflect the deduction of taxes that a shareholder would pay on Fund distributions or the redemption of Fund shares. Total returns for periods less than one full year are not annualized. |
| (c) | The Fund’s portfolio turnover rate is calculated in accordance with regulatory requirements, without regard to transactions involving short term investments and certain derivatives. If such transactions were included, the Fund’s portfolio turnover rate may be higher. |
| (d) | Annualized. |
| (e) | Reflects income recognized from special dividends which amounted to $0.06 per share and 0.28% of average net assets. |
| (f) | Reflects income recognized from special dividends which amounted to $0.04 per share and 0.21% of average net assets. |
| 50 | The accompanying notes are an integral part of these financial statements. |
GOLDMAN SACHS GROWTH AND INCOME FUND
| Net asset value, end of period | Total return(b) | Net assets, end of period (in 000s) | Ratio of net expenses to average net assets | Ratio of total expenses to average net assets | Ratio of net investment income to average net assets | Portfolio turnover rate(c) | ||||||||||||||||||||||||||||||||||
| $ | 24.14 | 12.38 | % | $ | 374,406 | 1.19 | %(d) | 1.24 | %(d) | 1.24 | %(d) | 44 | % | |||||||||||||||||||||||||||
| 23.26 | 11.96 | 16,663 | 1.94 | (d) | 1.99 | (d) | 0.49 | (d) | 44 | |||||||||||||||||||||||||||||||
| 23.13 | 11.98 | 21,680 | 1.94 | (d) | 1.99 | (d) | 0.49 | (d) | 44 | |||||||||||||||||||||||||||||||
| 24.52 | 12.64 | 13,679 | 0.79 | (d) | 0.84 | (d) | 1.65 | (d) | 44 | |||||||||||||||||||||||||||||||
| 24.13 | 12.37 | 542 | 1.29 | (d) | 1.34 | (d) | 1.12 | (d) | 44 | |||||||||||||||||||||||||||||||
| 24.10 | 12.54 | 955 | 0.94 | (d) | 0.99 | (d) | 1.55 | (d) | 44 | |||||||||||||||||||||||||||||||
| 24.06 | 12.29 | 594 | 1.44 | (d) | 1.49 | (d) | 0.96 | (d) | 44 | |||||||||||||||||||||||||||||||
| 21.68 | 15.36 | 374,273 | 1.19 | 1.22 | 1.63 | (e) | 115 | |||||||||||||||||||||||||||||||||
| 20.90 | 14.49 | 19,213 | 1.94 | 1.97 | 0.90 | (e) | 115 | |||||||||||||||||||||||||||||||||
| 20.78 | 14.49 | 20,726 | 1.94 | 1.97 | 0.85 | (e) | 115 | |||||||||||||||||||||||||||||||||
| 22.01 | 15.81 | 18,001 | 0.79 | 0.82 | 2.06 | (e) | 115 | |||||||||||||||||||||||||||||||||
| 21.66 | 15.16 | 566 | 1.29 | 1.32 | 1.50 | (e) | 115 | |||||||||||||||||||||||||||||||||
| 21.64 | 15.61 | 480 | 0.94 | 0.97 | 1.78 | (e) | 115 | |||||||||||||||||||||||||||||||||
| 21.60 | 14.99 | 801 | 1.44 | 1.47 | 1.31 | (e) | 115 | |||||||||||||||||||||||||||||||||
| 19.04 | 7.82 | 505,502 | 1.19 | 1.21 | 1.02 | 60 | ||||||||||||||||||||||||||||||||||
| 18.38 | 7.04 | 27,327 | 1.94 | 1.96 | 0.28 | 60 | ||||||||||||||||||||||||||||||||||
| 18.28 | 7.06 | 21,860 | 1.94 | 1.96 | 0.27 | 60 | ||||||||||||||||||||||||||||||||||
| 19.33 | 8.20 | 44,224 | 0.79 | 0.81 | 1.48 | 60 | ||||||||||||||||||||||||||||||||||
| 19.04 | 7.77 | 646 | 1.29 | 1.31 | 0.95 | 60 | ||||||||||||||||||||||||||||||||||
| 19.02 | 8.16 | 696 | 0.94 | 0.96 | 1.77 | 60 | ||||||||||||||||||||||||||||||||||
| 18.99 | 7.65 | 591 | 1.44 | 1.46 | 0.75 | 60 | ||||||||||||||||||||||||||||||||||
| 17.84 | 2.30 | 625,385 | 1.17 | 1.18 | 1.15 | (f) | 93 | |||||||||||||||||||||||||||||||||
| 17.25 | 1.55 | 38,763 | 1.92 | 1.93 | 0.41 | (f) | 93 | |||||||||||||||||||||||||||||||||
| 17.16 | 1.52 | 24,908 | 1.92 | 1.93 | 0.40 | (f) | 93 | |||||||||||||||||||||||||||||||||
| 18.12 | 2.74 | 468,009 | 0.77 | 0.78 | 1.54 | (f) | 93 | |||||||||||||||||||||||||||||||||
| 17.83 | 2.21 | 1,625 | 1.27 | 1.28 | 1.06 | (f) | 93 | |||||||||||||||||||||||||||||||||
| 17.82 | 2.55 | 65 | 0.92 | 0.93 | 1.37 | (f) | 93 | |||||||||||||||||||||||||||||||||
| 17.79 | 2.04 | 498 | 1.42 | 1.43 | 0.87 | (f) | 93 | |||||||||||||||||||||||||||||||||
| 17.65 | (21.36 | ) | 791,636 | 1.18 | 1.21 | 1.97 | 78 | |||||||||||||||||||||||||||||||||
| 17.06 | (22.00 | ) | 53,176 | 1.93 | 1.96 | 1.23 | 78 | |||||||||||||||||||||||||||||||||
| 16.98 | (21.95 | ) | 29,421 | 1.93 | 1.96 | 1.22 | 78 | |||||||||||||||||||||||||||||||||
| 17.91 | (21.09 | ) | 347,526 | 0.78 | 0.81 | 2.29 | 78 | |||||||||||||||||||||||||||||||||
| 17.63 | (21.48 | ) | 2,709 | 1.28 | 1.31 | 1.85 | 78 | |||||||||||||||||||||||||||||||||
| 17.63 | (21.17 | ) | 7 | 0.93 | 0.96 | 2.20 | 78 | |||||||||||||||||||||||||||||||||
| 17.60 | (21.58 | ) | 297 | 1.43 | 1.46 | 1.33 | 78 | |||||||||||||||||||||||||||||||||
| 23.10 | (11.57 | ) | 1,245,353 | 1.16 | 1.16 | 1.77 | 69 | |||||||||||||||||||||||||||||||||
| 22.35 | (12.26 | ) | 91,496 | 1.91 | 1.91 | 1.03 | 69 | |||||||||||||||||||||||||||||||||
| 22.24 | (12.24 | ) | 46,177 | 1.91 | 1.91 | 1.02 | 69 | |||||||||||||||||||||||||||||||||
| 23.45 | (11.22 | ) | 87,766 | 0.76 | 0.76 | 2.07 | 69 | |||||||||||||||||||||||||||||||||
| 23.09 | (11.65 | ) | 1,929 | 1.26 | 1.26 | 1.67 | 69 | |||||||||||||||||||||||||||||||||
| 23.08 | (11.10 | ) | 9 | 0.91 | (d) | 0.91 | (d) | 1.96 | (d) | 69 | ||||||||||||||||||||||||||||||
| 23.08 | (11.36 | ) | 9 | 1.41 | (d) | 1.41 | (d) | 1.53 | (d) | 69 | ||||||||||||||||||||||||||||||
| The accompanying notes are an integral part of these financial statements. | 51 |
GOLDMAN SACHS LARGE CAP VALUE FUND
Financial Highlights
Selected Data for a Share Outstanding Throughout Each Period
| Income (loss) from investment operations | Distributions to shareholders | |||||||||||||||||||||||||||||
| Year - Share Class | Net asset value, beginning of period | Net investment income (loss)(a) | Net realized and unrealized gain (loss) | Total from investment operations | From net investment income | From net realized gains | Total distributions | |||||||||||||||||||||||
| FOR THE SIX MONTHS ENDED FEBRUARY 28, (UNAUDITED) | ||||||||||||||||||||||||||||||
2013 - A | $ | 12.13 | $ | 0.06 | $ | 1.43 | $ | 1.49 | $ | (0.14 | ) | $ | — | $ | (0.14 | ) | ||||||||||||||
2013 - B | 11.83 | 0.02 | 1.38 | 1.40 | (0.04 | ) | — | (0.04 | ) | |||||||||||||||||||||
2013 - C | 11.74 | 0.02 | 1.37 | 1.39 | (0.05 | ) | — | (0.05 | ) | |||||||||||||||||||||
2013 - Institutional | 12.26 | 0.09 | 1.43 | 1.52 | (0.20 | ) | — | (0.20 | ) | |||||||||||||||||||||
2013 - Service | 12.06 | 0.06 | 1.42 | 1.48 | (0.11 | ) | — | (0.11 | ) | |||||||||||||||||||||
2013 - IR | 12.05 | 0.08 | 1.41 | 1.49 | (0.18 | ) | — | (0.18 | ) | |||||||||||||||||||||
2013 - R | 11.93 | 0.05 | 1.40 | 1.45 | (0.11 | ) | — | (0.11 | ) | |||||||||||||||||||||
| FOR THE FISCAL YEARS ENDED AUGUST 31, | ||||||||||||||||||||||||||||||
2012 - A | 10.70 | 0.15 | (e) | 1.41 | 1.56 | (0.13 | ) | — | (0.13 | ) | ||||||||||||||||||||
2012 - B | 10.41 | 0.06 | (e) | 1.39 | 1.45 | (0.03 | ) | — | (0.03 | ) | ||||||||||||||||||||
2012 - C | 10.33 | 0.06 | (e) | 1.38 | 1.44 | (0.03 | ) | — | (0.03 | ) | ||||||||||||||||||||
2012 - Institutional | 10.82 | 0.20 | (e) | 1.42 | 1.62 | (0.18 | ) | — | (0.18 | ) | ||||||||||||||||||||
2012 - Service | 10.64 | 0.14 | (e) | 1.40 | 1.54 | (0.12 | ) | — | (0.12 | ) | ||||||||||||||||||||
2012 - IR | 10.64 | 0.17 | (e) | 1.41 | 1.58 | (0.17 | ) | — | (0.17 | ) | ||||||||||||||||||||
2012 - R | 10.54 | 0.11 | (e) | 1.40 | 1.51 | (0.12 | ) | — | (0.12 | ) | ||||||||||||||||||||
2011 - A | 9.90 | 0.07 | 0.80 | 0.87 | (0.07 | ) | — | (0.07 | ) | |||||||||||||||||||||
2011 - B | 9.64 | (0.01 | ) | 0.78 | 0.77 | — | — | — | ||||||||||||||||||||||
2011 - C | 9.57 | (0.01 | ) | 0.77 | 0.76 | — | — | — | ||||||||||||||||||||||
2011 - Institutional | 10.01 | 0.12 | 0.81 | 0.93 | (0.12 | ) | — | (0.12 | ) | |||||||||||||||||||||
2011 - Service | 9.85 | 0.06 | 0.79 | 0.85 | (0.06 | ) | — | (0.06 | ) | |||||||||||||||||||||
2011 - IR | 9.85 | 0.10 | 0.79 | 0.89 | (0.10 | ) | — | (0.10 | ) | |||||||||||||||||||||
2011 - R | 9.77 | 0.05 | 0.78 | 0.83 | (0.06 | ) | — | (0.06 | ) | |||||||||||||||||||||
2010 - A | 9.81 | 0.07 | (f) | 0.12 | 0.19 | (0.10 | ) | — | (0.10 | ) | ||||||||||||||||||||
2010 - B | 9.56 | (0.01 | )(f) | 0.11 | 0.10 | (0.02 | ) | — | (0.02 | ) | ||||||||||||||||||||
2010 - C | 9.49 | (0.01 | )(f) | 0.12 | 0.11 | (0.03 | ) | — | (0.03 | ) | ||||||||||||||||||||
2010 - Institutional | 9.92 | 0.11 | (f) | 0.11 | 0.22 | (0.13 | ) | — | (0.13 | ) | ||||||||||||||||||||
2010 - Service | 9.76 | 0.06 | (f) | 0.12 | 0.18 | (0.09 | ) | — | (0.09 | ) | ||||||||||||||||||||
2010 - IR | 9.76 | 0.10 | (f) | 0.11 | 0.21 | (0.12 | ) | — | (0.12 | ) | ||||||||||||||||||||
2010 - R | 9.72 | 0.03 | (f) | 0.14 | 0.17 | (0.12 | ) | — | (0.12 | ) | ||||||||||||||||||||
2009 - A | 12.37 | 0.10 | (2.56 | ) | (2.46 | ) | (0.10 | ) | — | (0.10 | ) | |||||||||||||||||||
2009 - B | 11.99 | 0.03 | (2.45 | ) | (2.42 | ) | (0.01 | ) | — | (0.01 | ) | |||||||||||||||||||
2009 - C | 11.92 | 0.03 | (2.45 | ) | (2.42 | ) | (0.01 | ) | — | (0.01 | ) | |||||||||||||||||||
2009 - Institutional | 12.52 | 0.13 | (2.58 | ) | (2.45 | ) | (0.15 | ) | — | (0.15 | ) | |||||||||||||||||||
2009 - Service | 12.30 | 0.09 | (2.54 | ) | (2.45 | ) | (0.09 | ) | — | (0.09 | ) | |||||||||||||||||||
2009 - IR | 12.33 | 0.12 | (2.54 | ) | (2.42 | ) | (0.15 | ) | — | (0.15 | ) | |||||||||||||||||||
2009 - R | 12.31 | 0.09 | (2.56 | ) | (2.47 | ) | (0.12 | ) | — | (0.12 | ) | |||||||||||||||||||
2008 - A | 14.95 | 0.15 | (1.61 | ) | (1.46 | ) | (0.12 | ) | (1.00 | ) | (1.12 | ) | ||||||||||||||||||
2008 - B | 14.54 | 0.05 | (1.57 | ) | (1.52 | ) | (0.03 | ) | (1.00 | ) | (1.03 | ) | ||||||||||||||||||
2008 - C | 14.46 | 0.05 | (1.56 | ) | (1.51 | ) | (0.03 | ) | (1.00 | ) | (1.03 | ) | ||||||||||||||||||
2008 - Institutional | 15.12 | 0.21 | (1.63 | ) | (1.42 | ) | (0.18 | ) | (1.00 | ) | (1.18 | ) | ||||||||||||||||||
2008 - Service | 14.88 | 0.13 | (1.59 | ) | (1.46 | ) | (0.12 | ) | (1.00 | ) | (1.12 | ) | ||||||||||||||||||
2008 - IR (Commenced November 30, 2007) | 14.89 | 0.10 | (1.47 | ) | (1.37 | ) | (0.19 | ) | (1.00 | ) | (1.19 | ) | ||||||||||||||||||
2008 - R (Commenced November 30, 2007) | 14.89 | 0.09 | (1.49 | ) | (1.40 | ) | (0.18 | ) | (1.00 | ) | (1.18 | ) | ||||||||||||||||||
| (a) | Calculated based on the average shares outstanding methodology. |
| (b) | Assumes investment at the net asset value at the beginning of the period, reinvestment of all dividends and distributions, a complete redemption of the investment at the net asset value at the end of the period and no sales or redemption charges. Total returns would be reduced if a sales or redemption charge was taken into account. Returns do not reflect the deduction of taxes that a shareholder would pay on Fund distributions or the redemption of Fund shares. Total returns for periods less than one full year are not annualized. |
| (c) | The Fund’s portfolio turnover rate is calculated in accordance with regulatory requirements, without regard to transactions involving short term investments and certain derivatives. If such transactions were included, the Fund’s portfolio turnover rate may be higher. |
| (d) | Annualized. |
| (e) | Reflects income recognized from special dividends which amounted to $0.02 per share and 0.21% of average net assets. |
| (f) | Reflects income recognized from special dividends which amounted to $0.02 per share and 0.22% of average net assets. |
| 52 | The accompanying notes are an integral part of these financial statements. |
GOLDMAN SACHS LARGE CAP VALUE FUND
| Net asset value, end of period | Total return(b) | Net assets, (in 000s) | Ratio of net expenses to average net assets | Ratio of total expenses to average net assets | Ratio of net investment income (loss) to average net assets | Portfolio turnover rate(c) | ||||||||||||||||||||||||||||||||||
| $ | 13.48 | 12.39 | % | $ | 377,485 | 1.21 | %(d) | 1.21 | %(d) | 1.01 | %(d) | 50 | % | |||||||||||||||||||||||||||
| 13.19 | 11.90 | 7,940 | 1.96 | (d) | 1.96 | (d) | 0.26 | (d) | 50 | |||||||||||||||||||||||||||||||
| 13.08 | 11.90 | 35,142 | 1.96 | (d) | 1.96 | (d) | 0.26 | (d) | 50 | |||||||||||||||||||||||||||||||
| 13.58 | 12.53 | 871,334 | 0.81 | (d) | 0.81 | (d) | 1.40 | (d) | 50 | |||||||||||||||||||||||||||||||
| 13.43 | 12.34 | 2,810 | 1.30 | (d) | 1.30 | (d) | 0.91 | (d) | 50 | |||||||||||||||||||||||||||||||
| 13.36 | 12.51 | 122,576 | 0.96 | (d) | 0.96 | (d) | 1.26 | (d) | 50 | |||||||||||||||||||||||||||||||
| 13.27 | 12.27 | 6,033 | 1.46 | (d) | 1.46 | (d) | 0.75 | (d) | 50 | |||||||||||||||||||||||||||||||
| 12.13 | 14.69 | 418,274 | 1.19 | 1.19 | 1.31 | (e) | 123 | |||||||||||||||||||||||||||||||||
| 11.83 | 13.87 | 8,320 | 1.94 | 1.94 | 0.56 | (e) | 123 | |||||||||||||||||||||||||||||||||
| 11.74 | 13.89 | 34,854 | 1.94 | 1.94 | 0.55 | (e) | 123 | |||||||||||||||||||||||||||||||||
| 12.26 | 15.19 | 900,661 | 0.79 | 0.79 | 1.75 | (e) | 123 | |||||||||||||||||||||||||||||||||
| 12.06 | 14.63 | 3,424 | 1.29 | 1.29 | 1.23 | (e) | 123 | |||||||||||||||||||||||||||||||||
| 12.05 | 14.99 | 103,975 | 0.94 | 0.94 | 1.52 | (e) | 123 | |||||||||||||||||||||||||||||||||
| 11.93 | 14.38 | 5,411 | 1.44 | 1.44 | 1.02 | (e) | 123 | |||||||||||||||||||||||||||||||||
| 10.70 | 8.75 | 555,309 | 1.17 | 1.17 | 0.63 | 76 | ||||||||||||||||||||||||||||||||||
| 10.41 | 7.99 | 11,360 | 1.92 | 1.92 | (0.11 | ) | 76 | |||||||||||||||||||||||||||||||||
| 10.33 | 7.94 | 43,479 | 1.92 | 1.92 | (0.11 | ) | 76 | |||||||||||||||||||||||||||||||||
| 10.82 | 9.18 | 1,418,409 | 0.77 | 0.77 | 1.04 | 76 | ||||||||||||||||||||||||||||||||||
| 10.64 | 8.56 | 6,374 | 1.27 | 1.27 | 0.54 | 76 | ||||||||||||||||||||||||||||||||||
| 10.64 | 8.99 | 93,853 | 0.92 | 0.92 | 0.89 | 76 | ||||||||||||||||||||||||||||||||||
| 10.54 | 8.44 | 5,318 | 1.42 | 1.42 | 0.39 | 76 | ||||||||||||||||||||||||||||||||||
| 9.90 | 1.87 | 616,533 | 1.17 | 1.17 | 0.67 | (f) | 108 | |||||||||||||||||||||||||||||||||
| 9.64 | 1.02 | 14,485 | 1.92 | 1.92 | (0.05 | )(f) | 108 | |||||||||||||||||||||||||||||||||
| 9.57 | 1.10 | 53,186 | 1.92 | 1.92 | (0.07 | )(f) | 108 | |||||||||||||||||||||||||||||||||
| 10.01 | 2.22 | 1,648,589 | 0.77 | 0.77 | 1.06 | (f) | 108 | |||||||||||||||||||||||||||||||||
| 9.85 | 1.83 | 6,149 | 1.27 | 1.27 | 0.58 | (f) | 108 | |||||||||||||||||||||||||||||||||
| 9.85 | 2.12 | 80,471 | 0.92 | 0.92 | 0.92 | (f) | 108 | |||||||||||||||||||||||||||||||||
| 9.77 | 1.71 | 3,578 | 1.42 | 1.42 | 0.31 | (f) | 108 | |||||||||||||||||||||||||||||||||
| 9.81 | (19.76 | ) | 632,096 | 1.19 | 1.19 | 1.08 | 88 | |||||||||||||||||||||||||||||||||
| 9.56 | (20.22 | ) | 20,429 | 1.94 | 1.94 | 0.34 | 88 | |||||||||||||||||||||||||||||||||
| 9.49 | (20.32 | ) | 60,130 | 1.94 | 1.94 | 0.34 | 88 | |||||||||||||||||||||||||||||||||
| 9.92 | (19.38 | ) | 1,636,325 | 0.79 | 0.79 | 1.48 | 88 | |||||||||||||||||||||||||||||||||
| 9.76 | (19.80 | ) | 7,974 | 1.29 | 1.29 | 0.97 | 88 | |||||||||||||||||||||||||||||||||
| 9.76 | (19.46 | ) | 74,396 | 0.94 | 0.94 | 1.33 | 88 | |||||||||||||||||||||||||||||||||
| 9.72 | (19.94 | ) | 185 | 1.44 | 1.44 | 0.98 | 88 | |||||||||||||||||||||||||||||||||
| 12.37 | (10.55 | ) | 830,475 | 1.17 | 1.17 | 1.11 | 81 | |||||||||||||||||||||||||||||||||
| 11.99 | (11.24 | ) | 32,884 | 1.92 | 1.92 | 0.37 | 81 | |||||||||||||||||||||||||||||||||
| 11.92 | (11.26 | ) | 91,900 | 1.92 | 1.92 | 0.36 | 81 | |||||||||||||||||||||||||||||||||
| 12.52 | (10.19 | ) | 1,808,728 | 0.77 | 0.77 | 1.50 | 81 | |||||||||||||||||||||||||||||||||
| 12.30 | (10.65 | ) | 8,044 | 1.27 | 1.27 | 0.99 | 81 | |||||||||||||||||||||||||||||||||
| 12.33 | (10.10 | ) | 88,528 | 0.92 | (d) | 0.92 | (d) | 1.20 | (d) | 81 | ||||||||||||||||||||||||||||||
| 12.31 | (10.29 | ) | 9 | 1.42 | (d) | 1.42 | (d) | 0.94 | (d) | 81 | ||||||||||||||||||||||||||||||
| The accompanying notes are an integral part of these financial statements. | 53 |
GOLDMAN SACHS MID CAP VALUE FUND
Financial Highlights
Selected Data for a Share Outstanding Throughout Each Period
| Income (loss) from investment operations | Distributions to shareholders | |||||||||||||||||||||||||||||
| Year - Share Class | Net asset value, beginning of period | Net investment income (loss)(a) | Net realized and unrealized gain (loss) | Total from investment operations | From net investment income | From net realized gains | Total distributions | |||||||||||||||||||||||
| FOR THE SIX MONTHS ENDED FEBRUARY 28, (UNAUDITED) | ||||||||||||||||||||||||||||||
2013 - A | $ | 37.43 | $ | 0.14 | $ | 5.09 | $ | 5.23 | $ | (0.34 | ) | $ | — | $ | (0.34 | ) | ||||||||||||||
2013 - B | 35.86 | — | (e) | 4.90 | 4.90 | — | — | — | ||||||||||||||||||||||
2013 - C | 35.57 | (0.01 | ) | 4.85 | 4.84 | (0.05 | ) | — | (0.05 | ) | ||||||||||||||||||||
2013 - Institutional | 37.77 | 0.22 | 5.13 | 5.35 | (0.49 | ) | — | (0.49 | ) | |||||||||||||||||||||
2013 - Service | 37.02 | 0.12 | 5.04 | 5.16 | (0.29 | ) | — | (0.29 | ) | |||||||||||||||||||||
2013 - IR | 37.12 | �� | 0.18 | 5.06 | 5.24 | (0.44 | ) | — | (0.44 | ) | ||||||||||||||||||||
2013 - R | 37.04 | 0.09 | 5.03 | 5.12 | (0.29 | ) | — | (0.29 | ) | |||||||||||||||||||||
| FOR THE FISCAL YEARS ENDED AUGUST 31, | ||||||||||||||||||||||||||||||
2012 - A | 33.41 | 0.31 | (f) | 3.88 | 4.19 | (0.17 | ) | — | (0.17 | ) | ||||||||||||||||||||
2012 - B | 32.09 | 0.04 | (f) | 3.73 | 3.77 | — | — | — | ||||||||||||||||||||||
2012 - C | 31.83 | 0.05 | (f) | 3.69 | 3.74 | — | — | — | ||||||||||||||||||||||
2012 - Institutional | 33.74 | 0.46 | (f) | 3.89 | 4.35 | (0.32 | ) | — | (0.32 | ) | ||||||||||||||||||||
2012 - Service | 33.06 | 0.27 | (f) | 3.83 | 4.10 | (0.14 | ) | — | (0.14 | ) | ||||||||||||||||||||
2012 - IR | 33.18 | 0.41 | (f) | 3.82 | 4.23 | (0.29 | ) | — | (0.29 | ) | ||||||||||||||||||||
2012 - R | 33.14 | 0.25 | (f) | 3.81 | 4.06 | (0.16 | ) | — | (0.16 | ) | ||||||||||||||||||||
2011 - A | 29.10 | 0.17 | (g) | 4.27 | 4.44 | (0.13 | ) | — | (0.13 | ) | ||||||||||||||||||||
2011 - B | 28.06 | (0.09 | )(g) | 4.12 | 4.03 | — | — | — | ||||||||||||||||||||||
2011 - C | 27.83 | (0.09 | )(g) | 4.09 | 4.00 | — | — | — | ||||||||||||||||||||||
2011 - Institutional | 29.37 | 0.31 | (g) | 4.32 | 4.63 | (0.26 | ) | — | (0.26 | ) | ||||||||||||||||||||
2011 - Service | 28.80 | 0.13 | (g) | 4.24 | 4.37 | (0.11 | ) | — | (0.11 | ) | ||||||||||||||||||||
2011 - IR | 28.93 | 0.22 | (g) | 4.28 | 4.50 | (0.25 | ) | — | (0.25 | ) | ||||||||||||||||||||
2011 - R | 28.96 | 0.06 | (g) | 4.27 | 4.33 | (0.15 | ) | — | (0.15 | ) | ||||||||||||||||||||
2010 - A | 26.29 | 0.16 | (h) | 2.93 | 3.09 | (0.28 | ) | — | (0.28 | ) | ||||||||||||||||||||
2010 - B | 25.36 | (0.05 | )(h) | 2.83 | 2.78 | (0.08 | ) | — | (0.08 | ) | ||||||||||||||||||||
2010 - C | 25.17 | (0.05 | )(h) | 2.81 | 2.76 | (0.10 | ) | — | (0.10 | ) | ||||||||||||||||||||
2010 - Institutional | 26.52 | 0.28 | (h) | 2.95 | 3.23 | (0.38 | ) | — | (0.38 | ) | ||||||||||||||||||||
2010 - Service | 26.02 | 0.13 | (h) | 2.91 | 3.04 | (0.26 | ) | — | (0.26 | ) | ||||||||||||||||||||
2010 - IR | 26.16 | 0.16 | (h) | 2.99 | 3.15 | (0.38 | ) | — | (0.38 | ) | ||||||||||||||||||||
2010 - R | 26.26 | 0.02 | (h) | 3.00 | 3.02 | (0.32 | ) | — | (0.32 | ) | ||||||||||||||||||||
2009 - A | 33.11 | 0.24 | (6.77 | ) | (6.53 | ) | (0.29 | ) | — | (0.29 | ) | |||||||||||||||||||
2009 - B | 31.77 | 0.06 | (6.45 | ) | (6.39 | ) | (0.02 | ) | — | (0.02 | ) | |||||||||||||||||||
2009 - C | 31.54 | 0.06 | (6.40 | ) | (6.34 | ) | (0.03 | ) | — | (0.03 | ) | |||||||||||||||||||
2009 - Institutional | 33.47 | 0.33 | (6.86 | ) | (6.53 | ) | (0.42 | ) | — | (0.42 | ) | |||||||||||||||||||
2009 - Service | 32.78 | 0.21 | (6.70 | ) | (6.49 | ) | (0.27 | ) | — | (0.27 | ) | |||||||||||||||||||
2009 - IR | 33.01 | 0.23 | (6.71 | ) | (6.48 | ) | (0.37 | ) | — | (0.37 | ) | |||||||||||||||||||
2009 - R (Commenced January 6, 2009) | 22.89 | 0.04 | 3.33 | 3.37 | — | — | — | |||||||||||||||||||||||
2008 - A | 39.84 | 0.28 | (2.61 | ) | (2.33 | ) | (0.19 | ) | (4.21 | ) | (4.40 | ) | ||||||||||||||||||
2008 - B | 38.47 | 0.01 | (2.50 | ) | (2.49 | ) | — | (4.21 | ) | (4.21 | ) | |||||||||||||||||||
2008 - C | 38.23 | 0.01 | (2.49 | ) | (2.48 | ) | — | (4.21 | ) | (4.21 | ) | |||||||||||||||||||
2008 - Institutional | 40.24 | 0.42 | (2.62 | ) | (2.20 | ) | (0.36 | ) | (4.21 | ) | (4.57 | ) | ||||||||||||||||||
2008 - Service | 39.49 | 0.24 | (2.57 | ) | (2.33 | ) | (0.17 | ) | (4.21 | ) | (4.38 | ) | ||||||||||||||||||
2008 - IR (Commenced November 30, 2007) | 39.32 | 0.25 | (1.98 | ) | (1.73 | ) | (0.37 | ) | (4.21 | ) | (4.58 | ) | ||||||||||||||||||
| (a) | Calculated based on the average shares outstanding methodology. |
| (b) | Assumes investment at the net asset value at the beginning of the period, reinvestment of all dividends and distributions, a complete redemption of the investment at the net asset value at the end of the period and no sales or redemption charges. Total returns would be reduced if a sales or redemption charge was taken into account. Returns do not reflect the deduction of taxes that a shareholder would pay on Fund distributions or the redemption of Fund shares. Total returns for periods less than one full year are not annualized. |
| (c) | The Fund’s portfolio turnover rate is calculated in accordance with regulatory requirements, without regard to transactions involving short term investments and certain derivatives. If such transactions were included, the Fund’s portfolio turnover rate may be higher. |
| (d) | Annualized. |
| (e) | Amount is less than $0.005 per share. |
| (f) | Reflects income recognized from special dividends which amounted to $0.09 per share and 0.25% of average net assets. |
| (g) | Reflects Income recognized from special dividends which amounted to $0.03 per share and 0.07% of average net assets. |
| (h) | Reflects Income recognized from special dividends which amounted to $0.09 per share and 0.31% of average net assets. |
| 54 | The accompanying notes are an integral part of these financial statements. |
GOLDMAN SACHS MID CAP VALUE FUND
Net asset value, end of period | Total return(b) | Net assets, end of period (in 000s) | Ratio of net expenses to average net assets | Ratio of total expenses to average net assets | Ratio of net assets | Portfolio turnover rate(c) | ||||||||||||||||||||||||||||||||||
| $ | 42.32 | 14.06 | % | $ | 3,324,012 | 1.15 | %(d) | 1.15 | %(d) | 0.72 | %(d) | 44 | % | |||||||||||||||||||||||||||
| 40.76 | 13.66 | 24,343 | 1.90 | (d) | 1.90 | (d) | (0.02 | )(d) | 44 | |||||||||||||||||||||||||||||||
| 40.36 | 13.64 | 165,159 | 1.90 | (d) | 1.90 | (d) | (0.04 | )(d) | 44 | |||||||||||||||||||||||||||||||
| 42.63 | 14.31 | 4,554,021 | 0.75 | (d) | 0.75 | (d) | 1.11 | (d) | 44 | |||||||||||||||||||||||||||||||
| 41.89 | 14.04 | 303,874 | 1.25 | (d) | 1.25 | (d) | 0.61 | (d) | 44 | |||||||||||||||||||||||||||||||
| 41.92 | 14.24 | 81,120 | 0.90 | (d) | 0.90 | (d) | 0.95 | (d) | 44 | |||||||||||||||||||||||||||||||
| 41.87 | 13.92 | 18,100 | 1.39 | (d) | 1.39 | (d) | 0.45 | (d) | 44 | |||||||||||||||||||||||||||||||
| 37.43 | 12.56 | 3,074,173 | 1.15 | 1.15 | 0.91 | (f) | 80 | |||||||||||||||||||||||||||||||||
| 35.86 | 11.71 | 31,728 | 1.90 | 1.90 | 0.14 | (f) | 80 | |||||||||||||||||||||||||||||||||
| 35.57 | 11.72 | 160,062 | 1.90 | 1.90 | 0.16 | (f) | 80 | |||||||||||||||||||||||||||||||||
| 37.77 | 12.96 | 3,985,625 | 0.75 | 0.75 | 1.31 | (f) | 80 | |||||||||||||||||||||||||||||||||
| 37.02 | 12.41 | 268,412 | 1.25 | 1.25 | 0.81 | (f) | 80 | |||||||||||||||||||||||||||||||||
| 37.12 | 12.83 | 70,409 | 0.90 | 0.90 | 1.20 | (f) | 80 | |||||||||||||||||||||||||||||||||
| 37.04 | 12.28 | 13,255 | 1.40 | 1.40 | 0.73 | (f) | 80 | |||||||||||||||||||||||||||||||||
| 33.41 | 15.22 | 3,278,879 | 1.16 | 1.16 | 0.47 | (g) | 77 | |||||||||||||||||||||||||||||||||
| 32.09 | 14.36 | 44,088 | 1.91 | 1.91 | (0.25 | )(g) | 77 | |||||||||||||||||||||||||||||||||
| 31.83 | 14.37 | 166,559 | 1.91 | 1.91 | (0.28 | )(g) | 77 | |||||||||||||||||||||||||||||||||
| 33.74 | 15.73 | 3,633,400 | 0.76 | 0.76 | 0.86 | (g) | 77 | |||||||||||||||||||||||||||||||||
| 33.06 | 15.16 | 269,370 | 1.26 | 1.26 | 0.37 | (g) | 77 | |||||||||||||||||||||||||||||||||
| 33.18 | 15.51 | 40,531 | 0.91 | 0.91 | 0.62 | (g) | 77 | |||||||||||||||||||||||||||||||||
| 33.14 | 14.94 | 5,972 | 1.41 | 1.41 | 0.18 | (g) | 77 | |||||||||||||||||||||||||||||||||
| 29.10 | 11.84 | 2,819,867 | 1.16 | 1.16 | 0.54 | (h) | 104 | |||||||||||||||||||||||||||||||||
| 28.06 | 10.98 | 56,681 | 1.91 | 1.91 | (0.16 | )(h) | 104 | |||||||||||||||||||||||||||||||||
| 27.83 | 10.98 | 147,697 | 1.91 | 1.91 | (0.19 | )(h) | 104 | |||||||||||||||||||||||||||||||||
| 29.37 | 12.26 | 2,710,882 | 0.76 | 0.76 | 0.93 | (h) | 104 | |||||||||||||||||||||||||||||||||
| 28.80 | 11.74 | 232,356 | 1.26 | 1.26 | 0.44 | (h) | 104 | |||||||||||||||||||||||||||||||||
| 28.93 | 12.10 | 1,764 | 0.91 | 0.91 | 0.54 | (h) | 104 | |||||||||||||||||||||||||||||||||
| 28.96 | 11.56 | 1,862 | 1.41 | 1.41 | 0.06 | (h) | 104 | |||||||||||||||||||||||||||||||||
| 26.29 | (19.49 | ) | 2,630,467 | 1.19 | 1.19 | 1.03 | 114 | |||||||||||||||||||||||||||||||||
| 25.36 | (20.10 | ) | 72,920 | 1.94 | 1.94 | 0.30 | 114 | |||||||||||||||||||||||||||||||||
| 25.17 | (20.07 | ) | 149,393 | 1.94 | 1.94 | 0.29 | 114 | |||||||||||||||||||||||||||||||||
| 26.52 | (19.18 | ) | 2,136,745 | 0.79 | 0.79 | 1.42 | 114 | |||||||||||||||||||||||||||||||||
| 26.02 | (19.60 | ) | 200,421 | 1.29 | 1.29 | 0.93 | 114 | |||||||||||||||||||||||||||||||||
| 26.16 | (19.33 | ) | 145 | 0.94 | 0.94 | 0.97 | 114 | |||||||||||||||||||||||||||||||||
| 26.26 | 14.72 | 63 | 1.44 | (d) | 1.44 | (d) | 0.28 | (d) | 114 | |||||||||||||||||||||||||||||||
| 33.11 | (6.50 | ) | 3,611,466 | 1.16 | 1.16 | 0.78 | 85 | |||||||||||||||||||||||||||||||||
| 31.77 | (7.20 | ) | 128,844 | 1.91 | 1.91 | 0.03 | 85 | |||||||||||||||||||||||||||||||||
| 31.54 | (7.22 | ) | 235,637 | 1.91 | 1.91 | 0.03 | 85 | |||||||||||||||||||||||||||||||||
| 33.47 | (6.11 | ) | 2,469,463 | 0.76 | 0.76 | 1.18 | 85 | |||||||||||||||||||||||||||||||||
| 32.78 | (6.59 | ) | 257,906 | 1.26 | 1.26 | 0.67 | 85 | |||||||||||||||||||||||||||||||||
| 33.01 | (5.12 | ) | 9 | 0.91 | (d) | 0.91 | (d) | 1.03 | (d) | 85 | ||||||||||||||||||||||||||||||
| The accompanying notes are an integral part of these financial statements. | 55 |
GOLDMAN SACHS SMALL CAP VALUE FUND
Financial Highlights
Selected Data for a Share Outstanding Throughout Each Period
| Income (loss) from investment operations | Distributions to shareholders | |||||||||||||||||||||||||||||
| Year - Share Class | Net asset value, beginning of period | Net investment income (loss)(a) | Net realized and unrealized gain (loss) | Total from investment operations | From net investment income | From net realized gains | Total distributions | |||||||||||||||||||||||
| FOR THE SIX MONTHS ENDED FEBRUARY 28, (UNAUDITED) | ||||||||||||||||||||||||||||||
2013 - A | $ | 43.11 | $ | 0.25 | (d) | $ | 4.88 | $ | 5.13 | $ | (0.48 | ) | $ | (2.28 | ) | $ | (2.76 | ) | ||||||||||||
2013 - B | 36.96 | 0.08 | (d) | 4.15 | 4.23 | (0.08 | ) | (2.28 | ) | (2.36 | ) | |||||||||||||||||||
2013 - C | 36.89 | 0.08 | (d) | 4.14 | 4.22 | (0.23 | ) | (2.28 | ) | (2.51 | ) | |||||||||||||||||||
2013 - Institutional | 45.36 | 0.35 | (d) | 5.13 | 5.48 | (0.67 | ) | (2.28 | ) | (2.95 | ) | |||||||||||||||||||
2013 - Service | 42.30 | 0.22 | (d) | 4.77 | 4.99 | (0.48 | ) | (2.28 | ) | (2.76 | ) | |||||||||||||||||||
2013 - IR | 43.00 | 0.29 | (d) | 4.86 | 5.15 | (0.62 | ) | (2.28 | ) | (2.90 | ) | |||||||||||||||||||
2013 - R | 42.65 | 0.18 | (d) | 4.82 | 5.00 | (0.41 | ) | (2.28 | ) | (2.69 | ) | |||||||||||||||||||
| FOR THE FISCAL YEARS ENDED AUGUST 31, | ||||||||||||||||||||||||||||||
2012 - A | 37.73 | 0.27 | (f) | 5.86 | 6.13 | (0.08 | ) | (0.67 | ) | (0.75 | ) | |||||||||||||||||||
2012 - B | 32.61 | (0.02 | )(f) | 5.04 | 5.02 | — | (0.67 | ) | (0.67 | ) | ||||||||||||||||||||
2012 - C | 32.55 | (0.03 | )(f) | 5.04 | 5.01 | — | (0.67 | ) | (0.67 | ) | ||||||||||||||||||||
2012 - Institutional | 39.65 | 0.46 | (f) | 6.15 | 6.61 | (0.23 | ) | (0.67 | ) | (0.90 | ) | |||||||||||||||||||
2012 - Service | 37.01 | 0.23 | (f) | 5.75 | 5.98 | (0.02 | ) | (0.67 | ) | (0.69 | ) | |||||||||||||||||||
2012 - IR | 37.65 | 0.36 | (f) | 5.85 | 6.21 | (0.19 | ) | (0.67 | ) | (0.86 | ) | |||||||||||||||||||
2012 - R | 37.39 | 0.17 | (f) | 5.81 | 5.98 | (0.05 | ) | (0.67 | ) | (0.72 | ) | |||||||||||||||||||
2011 - A | 31.29 | 0.10 | (g) | 6.43 | 6.53 | (0.09 | ) | — | (0.09 | ) | ||||||||||||||||||||
2011 - B | 27.19 | (0.14 | )(g) | 5.56 | 5.42 | — | — | — | ||||||||||||||||||||||
2011 - C | 27.14 | (0.17 | )(g) | 5.58 | 5.41 | — | — | — | ||||||||||||||||||||||
2011 - Institutional | 32.86 | 0.26 | (g) | 6.75 | 7.01 | (0.22 | ) | — | (0.22 | ) | ||||||||||||||||||||
2011 - Service | 30.71 | 0.05 | (g) | 6.32 | 6.37 | (0.07 | ) | — | (0.07 | ) | ||||||||||||||||||||
2011 - IR | 31.24 | 0.15 | (g) | 6.45 | 6.60 | (0.19 | ) | — | (0.19 | ) | ||||||||||||||||||||
2011 - R | 31.08 | (0.04 | )(g) | 6.43 | 6.39 | (0.08 | ) | — | (0.08 | ) | ||||||||||||||||||||
2010 - A | 28.58 | 0.09 | (h) | 2.79 | 2.88 | (0.17 | ) | — | (0.17 | ) | ||||||||||||||||||||
2010 - B | 24.88 | (0.13 | )(h) | 2.44 | 2.31 | — | — | — | ||||||||||||||||||||||
2010 - C | 24.85 | (0.13 | )(h) | 2.43 | 2.30 | (0.01 | ) | — | (0.01 | ) | ||||||||||||||||||||
2010 - Institutional | 29.99 | 0.23 | (h) | 2.91 | 3.14 | (0.27 | ) | — | (0.27 | ) | ||||||||||||||||||||
2010 - Service | 28.05 | 0.05 | (h) | 2.76 | 2.81 | (0.15 | ) | — | (0.15 | ) | ||||||||||||||||||||
2010 - IR | 28.55 | 0.16 | (h) | 2.79 | 2.95 | (0.26 | ) | — | (0.26 | ) | ||||||||||||||||||||
2010 - R | 28.53 | (0.01 | )(h) | 2.80 | 2.79 | (0.24 | ) | — | (0.24 | ) | ||||||||||||||||||||
2009 - A | 34.71 | 0.18 | (6.18 | ) | (6.00 | ) | (0.09 | ) | (0.04 | ) | (0.13 | ) | ||||||||||||||||||
2009 - B | 30.31 | (0.01 | ) | (5.38 | ) | (5.39 | ) | — | (0.04 | ) | (0.04 | ) | ||||||||||||||||||
2009 - C | 30.27 | (0.01 | ) | (5.37 | ) | (5.38 | ) | — | (0.04 | ) | (0.04 | ) | ||||||||||||||||||
2009 - Institutional | 36.43 | 0.29 | (6.47 | ) | (6.18 | ) | (0.22 | ) | (0.04 | ) | (0.26 | ) | ||||||||||||||||||
2009 - Service | 34.02 | 0.15 | (6.03 | ) | (5.88 | ) | (0.05 | ) | (0.04 | ) | (0.09 | ) | ||||||||||||||||||
2009 - IR | 34.71 | 0.14 | (6.08 | ) | (5.94 | ) | (0.18 | ) | (0.04 | ) | (0.22 | ) | ||||||||||||||||||
2009 - R | 34.61 | (0.01 | ) | (6.01 | ) | (6.02 | ) | (0.02 | ) | (0.04 | ) | (0.06 | ) | |||||||||||||||||
2008 - A | 44.74 | 0.05 | (2.64 | ) | (2.59 | ) | — | (7.44 | ) | (7.44 | ) | |||||||||||||||||||
2008 - B | 40.33 | (0.20 | ) | (2.38 | ) | (2.58 | ) | — | (7.44 | ) | (7.44 | ) | ||||||||||||||||||
2008 - C | 40.29 | (0.21 | ) | (2.37 | ) | (2.58 | ) | — | (7.44 | ) | (7.44 | ) | ||||||||||||||||||
2008 - Institutional | 46.46 | 0.20 | (2.74 | ) | (2.54 | ) | (0.05 | ) | (7.44 | ) | (7.49 | ) | ||||||||||||||||||
2008 - Service | 44.04 | — | (i) | (2.58 | ) | (2.58 | ) | — | (7.44 | ) | (7.44 | ) | ||||||||||||||||||
2008 - IR (Commenced November 30, 2007) | 42.18 | 0.09 | (0.06 | ) | 0.03 | (0.06 | ) | (7.44 | ) | (7.50 | ) | |||||||||||||||||||
2008 - R (Commenced November 30, 2007) | 42.18 | (0.03 | ) | (0.06 | ) | (0.09 | ) | (0.04 | ) | (7.44 | ) | (7.48 | ) | |||||||||||||||||
| (a) | Calculated based on the average shares outstanding methodology. |
| (b) | Assumes investment at the net asset value at the beginning of the period, reinvestment of all dividends and distributions, a complete redemption of the investment at the net asset value at the end of the period and no sales or redemption charges. Total returns would be reduced if a sales or redemption charge was taken into account. Returns do not reflect the deduction of taxes that a shareholder would pay on Fund distributions or the redemption of Fund shares. Total returns for periods less than one full year are not annualized. |
| (c) | The Fund’s portfolio turnover rate is calculated in accordance with regulatory requirements, without regard to transactions involving short term investments and certain derivatives. If such transactions were included, the Fund’s portfolio turnover rate may be higher. |
| (d) | Reflects income recognized from special dividends which amounted to $0.20 per share and 0.90% of average net assets. |
| (e) | Annualized. |
| (f) | Reflects income recognized from special dividends which amounted to $0.17 per share and 0.41% of average net assets. |
| (g) | Reflects Income recognized from special dividends which amounted to $0.06 per share and 0.16% of average net assets. |
| (h) | Reflects income recognized from special dividends which amounted to $0.05 per share and 0.14% of average net assets. |
| (i) | Amount is less than $0.005 per share. |
| 56 | The accompanying notes are an integral part of these financial statements. |
GOLDMAN SACHS SMALL CAP VALUE FUND
| Net asset value, end of period | Total return(b) | Net assets, end of period (in 000s) | Ratio of net expenses to average net assets | Ratio of total expenses to average net assets | Ratio of net investment income (loss) to average net assets | Portfolio turnover rate(c) | ||||||||||||||||||||||||||||||||||
| $ | 45.48 | 12.58 | % | $ | 940,019 | 1.40 | %(e) | 1.43 | %(e) | 1.16 | %(d)(e) | 26 | % | |||||||||||||||||||||||||||
| 38.83 | 12.14 | 3,578 | 2.15 | (e) | 2.18 | (e) | 0.43 | (d)(e) | 26 | |||||||||||||||||||||||||||||||
| 38.60 | 12.15 | 61,625 | 2.15 | (e) | 2.18 | (e) | 0.41 | (d)(e) | 26 | |||||||||||||||||||||||||||||||
| 47.89 | 12.79 | 2,393,376 | 1.00 | (e) | 1.03 | (e) | 1.52 | (d)(e) | 26 | |||||||||||||||||||||||||||||||
| 44.53 | 12.50 | 125,085 | 1.50 | (e) | 1.53 | (e) | 1.06 | (d)(e) | 26 | |||||||||||||||||||||||||||||||
| 45.25 | 12.70 | 40,860 | 1.15 | (e) | 1.18 | (e) | 1.32 | (d)(e) | 26 | |||||||||||||||||||||||||||||||
| 44.96 | 12.41 | 59,570 | 1.65 | (e) | 1.68 | (e) | 0.86 | (d)(e) | 26 | |||||||||||||||||||||||||||||||
| 43.11 | 16.43 | 931,473 | 1.41 | 1.44 | 0.68 | (f) | 50 | |||||||||||||||||||||||||||||||||
| 36.96 | 15.59 | 3,973 | 2.16 | 2.19 | (0.04 | )(f) | 50 | |||||||||||||||||||||||||||||||||
| 36.89 | 15.59 | 58,926 | 2.16 | 2.19 | (0.07 | )(f) | 50 | |||||||||||||||||||||||||||||||||
| 45.36 | 16.91 | 1,852,215 | 1.01 | 1.04 | 1.07 | (f) | 50 | |||||||||||||||||||||||||||||||||
| 42.30 | 16.33 | 115,385 | 1.51 | 1.54 | 0.57 | (f) | 50 | |||||||||||||||||||||||||||||||||
| 43.00 | 16.74 | 24,332 | 1.16 | 1.19 | 0.90 | (f) | 50 | |||||||||||||||||||||||||||||||||
| 42.65 | 16.17 | 45,525 | 1.66 | 1.69 | 0.42 | (f) | 50 | |||||||||||||||||||||||||||||||||
| 37.73 | 20.85 | 827,768 | 1.45 | 1.46 | 0.25 | (g) | 46 | |||||||||||||||||||||||||||||||||
| 32.61 | 19.93 | 9,700 | 2.20 | 2.21 | (0.43 | )(g) | 46 | |||||||||||||||||||||||||||||||||
| 32.55 | 19.93 | 58,293 | 2.20 | 2.21 | (0.49 | )(g) | 46 | |||||||||||||||||||||||||||||||||
| 39.65 | 21.33 | 1,568,115 | 1.05 | 1.06 | 0.62 | (g) | 46 | |||||||||||||||||||||||||||||||||
| 37.01 | 20.74 | 76,841 | 1.55 | 1.56 | 0.14 | (g) | 46 | |||||||||||||||||||||||||||||||||
| 37.65 | 21.12 | 11,801 | 1.20 | 1.21 | 0.38 | (g) | 46 | |||||||||||||||||||||||||||||||||
| 37.39 | 20.56 | 25,269 | 1.70 | 1.71 | (0.10 | )(g) | 46 | |||||||||||||||||||||||||||||||||
| 31.29 | 10.11 | 670,228 | 1.48 | 1.48 | 0.28 | (h) | 56 | |||||||||||||||||||||||||||||||||
| 27.19 | 9.28 | 14,521 | 2.23 | 2.23 | (0.45 | )(h) | 56 | |||||||||||||||||||||||||||||||||
| 27.14 | 9.27 | 52,143 | 2.23 | 2.23 | (0.47 | )(h) | 56 | |||||||||||||||||||||||||||||||||
| 32.86 | 10.53 | 943,868 | 1.08 | 1.08 | 0.67 | (h) | 56 | |||||||||||||||||||||||||||||||||
| 30.71 | 10.05 | 58,064 | 1.58 | 1.58 | 0.17 | (h) | 56 | |||||||||||||||||||||||||||||||||
| 31.24 | 10.39 | 3,660 | 1.23 | 1.23 | 0.48 | (h) | 56 | |||||||||||||||||||||||||||||||||
| 31.08 | 9.83 | 8,869 | 1.73 | 1.73 | (0.03 | )(h) | 56 | |||||||||||||||||||||||||||||||||
| 28.58 | (17.20 | ) | 586,680 | 1.50 | 1.50 | 0.72 | 55 | |||||||||||||||||||||||||||||||||
| 24.88 | (17.76 | ) | 24,984 | 2.25 | 2.25 | (0.01 | ) | 55 | ||||||||||||||||||||||||||||||||
| 24.85 | (17.75 | ) | 48,935 | 2.25 | 2.25 | (0.03 | ) | 55 | ||||||||||||||||||||||||||||||||
| 29.99 | (16.78 | ) | 746,624 | 1.10 | 1.10 | 1.10 | 55 | |||||||||||||||||||||||||||||||||
| 28.05 | (17.24 | ) | 44,935 | 1.60 | 1.60 | 0.60 | 55 | |||||||||||||||||||||||||||||||||
| 28.55 | (16.95 | ) | 266 | 1.25 | 1.25 | 0.57 | 55 | |||||||||||||||||||||||||||||||||
| 28.53 | (17.35 | ) | 445 | 1.75 | 1.75 | (0.02 | ) | 55 | ||||||||||||||||||||||||||||||||
| 34.71 | (5.66 | ) | 756,153 | 1.48 | 1.48 | 0.11 | 51 | |||||||||||||||||||||||||||||||||
| 30.31 | (6.36 | ) | 41,450 | 2.23 | 2.23 | (0.63 | ) | 51 | ||||||||||||||||||||||||||||||||
| 30.27 | (6.36 | ) | 64,587 | 2.23 | 2.23 | (0.63 | ) | 51 | ||||||||||||||||||||||||||||||||
| 36.43 | (5.30 | ) | 690,912 | 1.08 | 1.08 | 0.50 | 51 | |||||||||||||||||||||||||||||||||
| 34.02 | (5.74 | ) | 61,956 | 1.58 | 1.58 | 0.01 | 51 | |||||||||||||||||||||||||||||||||
| 34.71 | 0.20 | 10 | 1.23 | (e) | 1.23 | (e) | 0.39 | (e) | 51 | |||||||||||||||||||||||||||||||
| 34.61 | (0.11 | ) | 10 | 1.73 | (e) | 1.73 | (e) | (0.07 | )(e) | 51 | ||||||||||||||||||||||||||||||
| The accompanying notes are an integral part of these financial statements. | 57 |
GOLDMAN SACHS FUNDAMENTAL EQUITY VALUE FUNDS
Notes to Financial Statements
February 28, 2013 (Unaudited)
| 1. ORGANIZATION |
Goldman Sachs Trust (the “Trust”) is a Delaware statutory trust registered under the Investment Company Act of 1940, as amended (the “Act”), as an open-end management investment company. The following table lists those series of the Trust that are included in this report (collectively, the “Funds” or individually a “Fund”), along with their corresponding share classes and respective diversification status under the Act:
| Fund | Share Classes Offered* | Diversified/ Non-diversified | ||
All Funds | A, B, C, Institutional, Service, IR and R | Diversified |
| * | Class B Shares are generally no longer available for purchase by current or prospective investors. |
Class A Shares are sold with a front-end sales charge of up to 5.50%. Class B Shares were sold with a contingent deferred sales charge (“CDSC”) that declines from 5.00% to zero, depending upon the period of time the shares are held. Class C Shares are sold with a CDSC of 1.00%, which is imposed on redemptions made within 12 months of purchase. Institutional, Service, Class IR and Class R Shares are not subject to a sales charge.
Goldman Sachs Asset Management, L.P. (“GSAM”), an affiliate of Goldman, Sachs & Co. (“Goldman Sachs”), serves as investment adviser to the Funds pursuant to a management agreement (the “Agreement”) with the Trust.
| 2. SIGNIFICANT ACCOUNTING POLICIES |
The financial statements have been prepared in accordance with accounting principles generally accepted in the United States of America (“GAAP”) and require management to make estimates and assumptions that may affect the reported amounts and disclosures. Actual results may differ from those estimates and assumptions.
A. Investment Valuation — The Funds’ valuation policy is to value investments at fair value.
B. Investment Income and Investments — Investment income includes interest income and dividend income, net of any foreign withholding taxes, less any amounts reclaimable. Interest income is accrued daily and adjusted for amortization of premiums and accretion of discounts. Dividend income is recognized on ex-dividend date or, for certain foreign securities, as soon as such information is obtained subsequent to the ex-dividend date. Investment transactions are reflected on trade date. Realized gains and losses are calculated using identified cost. Investment transactions are recorded on the following business day for daily net asset value (“NAV”) calculations. Any foreign capital gains tax is accrued daily based upon net unrealized gains, and is payable upon sale of such investments. Distributions received from the Funds’ investments in U.S. real estate investment trusts (“REITs”) may be characterized as ordinary income, net capital gain or a return of capital. A return of capital is recorded by the Funds as a reduction to the cost basis of the REIT.
C. Class Allocations and Expenses — Investment income, realized and unrealized gain (loss), and non-class specific expenses of each Fund are allocated daily based upon the proportion of net assets of each class. Class specific expenses, where applicable, are borne by the respective share classes and include Distribution and Service, Transfer Agent and Service and Shareholder Administration fees. Non-class specific expenses directly incurred by a Fund are charged to that Fund, while such expenses incurred by the Trust are allocated across the respective Funds on a straight-line and/or pro-rata basis depending upon the nature of the expenses.
D. Federal Taxes and Distributions to Shareholders — It is each Fund’s policy to comply with the requirements of the Internal Revenue Code of 1986, as amended (the “Code”), applicable to regulated investment companies (mutual funds) and to distribute each year substantially all of its investment company taxable income and capital gains to its shareholders. Accordingly, the Funds are not required to make any provisions for the payment of federal income tax. Distributions to shareholders are
58
GOLDMAN SACHS FUNDAMENTAL EQUITY VALUE FUNDS
| 2. SIGNIFICANT ACCOUNTING POLICIES (continued) |
recorded on the ex-dividend date. Income and capital gains distributions, if any, are declared and paid according to the following schedule:
| Fund | Income Distributions Declared/Paid | Capital Gains Distributions Declared/Paid | ||||
Growth and Income | Quarterly | Annually | ||||
Large Cap Value, Mid Cap Value and Small Cap Value | Annually | Annually |
Net capital losses are carried forward to future fiscal years and may be used to the extent allowed by the Code to offset any future capital gains. Utilization of capital loss carryforwards will reduce the requirement of future capital gains distributions.
Under the Regulated Investment Company Modernization Act of 2010, the Funds are permitted to carry forward capital losses incurred in taxable years beginning after December 22, 2010 for an unlimited period. However, any losses incurred during those future taxable years will be required to be utilized prior to the losses incurred in pre-enactment taxable years. As a result of this ordering rule, pre-enactment capital loss carryforwards may be more likely to expire unused. Additionally, post-enactment capital losses that are carried forward will retain their character as either short-term or long term capital losses rather than being considered all short-term as under previous law.
The characterization of distributions to shareholders for financial reporting purposes is determined in accordance with federal income tax rules, which may differ from GAAP. The source of each Fund’s distributions may be shown in the accompanying financial statements as either from net investment income, net realized gain or capital. Certain components of the Funds’ net assets on the Statements of Assets and Liabilities reflect permanent GAAP/tax differences based on the appropriate tax character.
E. In-Kind Transactions — The Funds may allow investors, under certain circumstances, to purchase shares with securities instead of cash. In addition, the Trust reserves the right to redeem an investor’s shares by distributing securities instead of cash. These are known as in-kind transactions. Securities included as part of in-kind purchases and redemptions of Fund shares are valued in the same manner as they are valued for purposes of computing a Fund’s NAV, in accordance with the Funds’ Valuation Procedures, and such valuations are as of the date the trade is submitted pursuant to the procedures specified in the Funds’ prospectus.
F. Commission Recapture — GSAM, on behalf of certain Funds, may direct portfolio trades, subject to seeking best execution, to various brokers who have agreed to rebate a portion of the commissions generated. Such rebates are made directly to the Funds as cash payments and are included in the net realized gain (loss) from investments on the Statements of Operations.
| 3. INVESTMENTS AND FAIR VALUE MEASUREMENTS |
The fair value of a financial instrument is the amount that would be received to sell an asset or paid to transfer a liability in an orderly transaction between market participants at the measurement date (i.e., the exit price). GAAP establishes a fair value hierarchy that prioritizes the inputs to valuation techniques used to measure fair value. The hierarchy gives the highest priority to unadjusted quoted prices in active markets for identical assets or liabilities (Level 1 measurements) and the lowest priority to unobservable inputs (Level 3 measurements). The levels used for classifying investments are not necessarily an indication of the risk associated with investing in these investments. The three levels of the fair value hierarchy are described below:
Level 1 — Unadjusted quoted prices in active markets that are accessible at the measurement date for identical, unrestricted assets or liabilities;
Level 2 — Quoted prices in markets that are not active or financial instruments for which significant inputs are observable (including, but not limited to, quoted prices for similar investments, interest rates, foreign exchange rates, volatility and credit spreads), either directly or indirectly;
Level 3 — Prices or valuations that require significant unobservable inputs (including GSAM’s assumptions in determining fair value measurement).
59
GOLDMAN SACHS FUNDAMENTAL EQUITY VALUE FUNDS
Notes to Financial Statements (continued)
February 28, 2013 (Unaudited)
| 3. INVESTMENTS AND FAIR VALUE MEASUREMENTS (continued) |
The Trustees have adopted Valuation Procedures that govern the valuation of the portfolio investments held by the Funds, including investments for which market quotations are not readily available. The Trustees have delegated to GSAM day-to-day responsibility for implementing and maintaining internal controls and procedures related to the valuation of the Funds’ portfolio investments. To assess the continuing appropriateness of pricing sources and methodologies, GSAM regularly performs price verification procedures and issues challenges as necessary to third party pricing vendors or brokers, and any differences are reviewed in accordance with the Valuation Procedures.
A. Level 1 and Level 2 Fair Value Investments — The valuation techniques and significant inputs used in determining the fair values for investments classified as Level 1 and Level 2 are as follows:
Equity Securities — Equity securities and investment companies traded on a United States (“U.S.”) securities exchange or the NASDAQ system, or those located on certain foreign exchanges including, but not limited to the Americas, are valued daily at their last sale price or official closing price on the principal exchange or system on which they are traded. If no sale occurs, equity securities and exchange traded investment companies are valued at the last bid price for long positions and at the last ask price for short positions. Investments in investment companies (other than those that are exchange traded) are valued at the daily NAV on the valuation date. To the extent these investments are actively traded, they are classified as Level 1 of the fair value hierarchy.
Unlisted equity securities for which market quotations are available are valued at the last sale price on the valuation date, or if no sale occurs, at the last bid price. Securities traded on certain foreign securities exchanges are valued daily at fair value determined by an independent fair value service (if available) under Valuation Procedures approved by the Trustees and consistent with applicable regulatory guidance. The independent fair value service takes into account multiple factors including, but not limited to, movements in the securities markets, certain depositary receipts, futures contracts and foreign currency exchange rates that have occurred subsequent to the close of the foreign securities exchange. Investments applying these valuation adjustments are classified as Level 2 of the fair value hierarchy.
Debt Securities — Debt securities for which market quotations are readily available are valued daily on the basis of quotations supplied by dealers or an independent pricing service approved by the Trustees. The pricing services may use valuation models or matrix pricing, which consider: (i) yield or price with respect to bonds that are considered comparable in characteristics such as rating, interest rate and maturity date or (ii) quotations from securities dealers to determine current value. Short-term debt obligations that mature in sixty days or less and that do not exhibit signs of credit deterioration are valued at amortized cost, which approximates fair value. With the exception of treasury securities, which are generally classified as Level 1, these investments are generally classified as Level 2 of the fair value hierarchy.
Investment Company — Investments in investment companies (other than those that are exchange traded) are valued at the NAV on the valuation date and are classified as Level 1 of the fair value hierarchy.
Short-Term Investments — Short-term investments having a maturity of 60 days or less are generally valued at amortized cost which approximates fair market value. These investments are classified as Level 2 of the fair value hierarchy.
Repurchase Agreements — Repurchase agreements involve the purchase of securities subject to the seller’s agreement to repurchase the securities at a mutually agreed upon date and price. During the term of a repurchase agreement, the value of the underlying securities held as collateral on behalf of the Funds, including accrued interest, is required to exceed the value of the repurchase agreement, including accrued interest. The underlying securities for all repurchase agreements are held at the Funds’ custodian or designated sub-custodians under tri-party repurchase agreements.
Pursuant to exemptive relief granted by the Securities and Exchange Commission and terms and conditions contained therein, the Funds, together with other funds of the Trust and registered investment companies having management agreements with GSAM, or its affiliates, may transfer uninvested cash into joint accounts, the daily aggregate balance of which is invested in one or more repurchase agreements. Under these joint accounts, the Funds maintain pro-rata credit exposure to the underlying repurchase agreements’ counterparties. With the exception of certain transaction fees, the Funds are not subject to any expenses in relation to these investments.
60
GOLDMAN SACHS FUNDAMENTAL EQUITY VALUE FUNDS
| 3. INVESTMENTS AND FAIR VALUE MEASUREMENTS (continued) |
B. Level 3 Fair Value Investments — To the extent that the aforementioned significant inputs are unobservable, or if quotations are not readily available, or if GSAM believes that such quotations do not accurately reflect fair value, the fair value of the Funds’ investments may be determined under Valuation Procedures approved by the Trustees. GSAM, consistent with its procedures and applicable regulatory guidance, may make an adjustment to the most recent valuation prices of either domestic or foreign securities in light of significant events to reflect what it believes to be the fair value of the securities at the time of determining a Fund’s NAV. Significant events which could affect a large number of securities in a particular market may include, but are not limited to: significant fluctuations in U.S. or foreign markets; market dislocations; market disruptions; or unscheduled market closings. Significant events which could also affect a single issuer, may include, but are not limited to: corporate actions such as reorganizations, mergers and buy outs, ratings downgrades; and bankruptcies.
C. Fair Value Hierarchy — The following is a summary of the Funds’ investments classified in the fair value hierarchy as of February 28, 2013:
| GROWTH AND INCOME | ||||||||||||
| Investment Type | Level 1 | Level 2 | Level 3 | |||||||||
| Assets | ||||||||||||
Common Stock | $ | 422,239,939 | $ | — | $ | — | ||||||
Preferred Stock | — | 2,592,464 | — | |||||||||
Short-term Investments | — | 1,900,000 | — | |||||||||
| Total | $ | 422,239,939 | $ | 4,492,464 | $ | — | ||||||
| LARGE CAP VALUE | ||||||||||||
| Investment Type | Level 1 | Level 2 | Level 3 | |||||||||
| Assets | ||||||||||||
Common Stock | $ | 1,388,261,450 | $ | — | $ | — | ||||||
Short-term Investments | — | 19,400,000 | — | |||||||||
| Total | $ | 1,388,261,450 | $ | 19,400,000 | $ | — | ||||||
| MID CAP VALUE | ||||||||||||
| Investment Type | Level 1 | Level 2 | Level 3 | |||||||||
| Assets | ||||||||||||
Common Stock | $ | 8,237,185,016 | $ | — | $ | — | ||||||
Short-term Investments | — | 193,100,000 | — | |||||||||
| Total | $ | 8,237,185,016 | $ | 193,100,000 | $ | — | ||||||
61
GOLDMAN SACHS FUNDAMENTAL EQUITY VALUE FUNDS
Notes to Financial Statements (continued)
February 28, 2013 (Unaudited)
3. INVESTMENTS AND FAIR VALUE MEASUREMENTS (continued) |
| SMALL CAP VALUE | ||||||||||||
| Investment Type | Level 1 | Level 2 | Level 3 | |||||||||
| Assets | ||||||||||||
Common Stock and/or Other Equity Investments | $ | 3,579,700,614 | $ | 15,795 | $ | — | ||||||
Investment Company | 6,184,612 | — | — | |||||||||
Short-term Investments | — | 42,000,000 | — | |||||||||
| Total | $ | 3,585,885,226 | $ | 42,015,795 | $ | — | ||||||
For further information regarding security characteristics, see the Schedules of Investments.
| 4. AGREEMENTS AND AFFILIATED TRANSACTIONS |
A. Management Agreement — Under the Agreement, GSAM manages the Funds, subject to the general supervision of the Trustees.
As compensation for the services rendered pursuant to the Agreement, the assumption of the expenses related thereto and administration of the Funds’ business affairs, including providing facilities, GSAM is entitled to a management fee, accrued daily and paid monthly, equal to an annual percentage rate of each Fund’s average daily net assets.
For the six months ended February 28, 2013, contractual and effective net management fees with GSAM were at the following rates:
| Contractual Management Rate | ||||||||||||||||||||||||||||||
| Fund | First $1 billion | Next $1 billion | Next $3 billion | Next $3 billion | Over $8 billion | Effective Rate | Effective Net Management Rate | |||||||||||||||||||||||
Growth and Income | 0.70 | % | 0.63 | % | 0.60 | % | 0.59 | % | 0.58 | % | 0.70 | 0.70 | ||||||||||||||||||
Large Cap Value | 0.75 | 0.68 | 0.65 | 0.64 | 0.63 | 0.73 | 0.73 | |||||||||||||||||||||||
Mid Cap Value | 0.75 | 0.75 | 0.68 | 0.65 | 0.64 | 0.69 | 0.69 | |||||||||||||||||||||||
Small Cap Value | 1.00 | 1.00 | 0.90 | 0.86 | 0.84 | 0.96 | 0.93 | # | ||||||||||||||||||||||
| # | Effective December 28, 2012, GSAM agreed to waive a portion of its management fees in order to achieve an effective net management fee rate of no higher than 0.93% as an annual percentage rate of the daily net assets of the Small Cap Value Fund (achieved by applying this rate to the first $2 billion in Fund assets, and the lower contractual rates thereafter) through at least December 29, 2013. Prior to such date GSAM may not terminate the arrangement without the approval of the Trustees. Prior to December 28, 2012 GSAM agreed to waive a portion of its management fees in order to achieve an effective net management fee rate of 0.96% as an annual percentage rate of the daily net assets of the Small Cap Value Fund. Where the application of the above contractual management fee breakpoint schedule would result in a lower management fee rate, the breakpoint schedule will be applied to the Fund’s assets. |
62
GOLDMAN SACHS FUNDAMENTAL EQUITY VALUE FUNDS
| 4. AGREEMENTS AND AFFILIATED TRANSACTIONS (continued) |
B. Distribution and Service Plans — The Trust, on behalf of each Fund, has adopted Distribution and Service Plans (the “Plans”). Under the Plans, Goldman Sachs, which serves as distributor (the “Distributor”), is entitled to a fee, accrued daily and paid monthly for distribution services and personal and account maintenance services, which may then be paid by Goldman Sachs to authorized dealers, at the following annual rates calculated on a Fund’s average daily net assets of each respective share class:
| Distribution and Service Plan Rates | ||||||||||||||||
| Class A* | Class B | Class C | Class R* | |||||||||||||
Distribution Plan | 0.25 | % | 0.75 | % | 0.75 | % | 0.50 | % | ||||||||
Service Plan | — | 0.25 | 0.25 | — | ||||||||||||
| * | With respect to Class A and Class R Shares, the Distributor at its discretion may use compensation for distribution services paid under the Distribution Plan to compensate service organizations for personal and account maintenance services and expenses as long as such total compensation does not exceed the maximum cap on “service fees” imposed by the Financial Industry Regulatory Authority. |
C. Distribution Agreement — Goldman Sachs, as Distributor of the shares of the Funds pursuant to a Distribution Agreement, may retain a portion of the Class A front end sales charge and Class B and Class C Shares’ CDSC. During the six months ended February 28, 2013, Goldman Sachs advised that it retained the following approximate amounts:
| Front End Sales Charge | Contingent Deferred Sales Charge | |||||||||||||
| Fund | Class A | Class B | Class C | |||||||||||
Growth and Income | $ | 14,700 | $ | — | $ | — | ||||||||
Large Cap Value | 6,700 | — | — | * | ||||||||||
Mid Cap Value | 14,100 | — | 1,500 | |||||||||||
Small Cap Value | 7,400 | — | — | * | ||||||||||
| * | Amount is less than $50. |
D. Service Plan and Shareholder Administration Plan — The Trust, on behalf of each Fund that offers Service Shares, has adopted a Service Plan and a Shareholder Administration Plan. These plans allow for service organizations to provide varying levels of personal and account maintenance and shareholder administration services to their customers who are beneficial owners of such shares. The Service Plan and Shareholder Administration Plan each provide for compensation to the service organizations which is accrued daily and paid monthly at an annual rate of 0.25% (0.50% in aggregate) of the average daily net assets of the Service Shares.
E. Transfer Agency Agreement — Goldman Sachs also serves as the transfer agent of the Funds for a fee pursuant to a Transfer Agency Agreement. The fees charged for such transfer agency services are accrued daily and paid monthly at annual rates as follows: 0.19% of the average daily net assets of Class A, Class B, Class C, Class IR and Class R Shares; and 0.04% of the average daily net assets of Institutional and Service Shares.
63
GOLDMAN SACHS FUNDAMENTAL EQUITY VALUE FUNDS
Notes to Financial Statements (continued)
February 28, 2013 (Unaudited)
| 4. AGREEMENTS AND AFFILIATED TRANSACTIONS (continued) |
F. Other Expense Agreements and Affiliated Transactions — GSAM has agreed to limit certain “Other Expense” of the Funds (excluding management fees, distribution and service fees, acquired fund fees and expenses, transfer agent fees and expenses, service fees and shareholder administration fees, taxes, interest, brokerage fees, litigation, indemnification, shareholder meeting and other extraordinary expenses) to the extent such expenses exceed, on an annual basis, a percentage rate of the average daily net assets of each Fund. Such Other Expense reimbursements, if any, are accrued daily and paid monthly. In addition, the Funds are not obligated to reimburse GSAM for prior fiscal year expense reimbursements, if any. The Other Expense limitations as an annual percentage rate of average daily net assets for Growth and Income, Large Cap Value, Mid Cap Value and Small Cap Value Funds are 0.054%, 0.064%, 0.104% and 0.004%, respectively. Prior to December 28, 2012, the Other Expense reimbursement for the Small Cap Value Fund was 0.064%. These Other Expense reimbursements will remain in place through at least December 29, 2013, and prior to such date GSAM may not terminate the arrangements without the approval of the Trustees. In addition, the Funds have entered into certain offset arrangements with the custodian and the transfer agent, which may result in a reduction of the Funds’ expenses and are received irrespective of the application of the “Other Expense” limitations described above.
For the six months ended February 28, 2013, these expense reductions, including any fee waivers and Other Expense reimbursements, were as follows:
| Fund | Management Fee Waiver | Custody Fee Credits | Other Expense Reimbursements | Total Expense Reductions | ||||||||||||||
Growth and Income | $ | — | $ | 193 | $ | 94,850 | $ | 95,043 | ||||||||||
Large Cap Value | — | 644 | — | 644 | ||||||||||||||
Mid Cap Value | — | 540 | — | 540 | ||||||||||||||
Small Cap Value | 500,274 | 153 | — | 500,427 | ||||||||||||||
As of February 28, 2013, the amounts owed to affiliates of the Funds were as follows:
| Fund | Management Fees | Distribution and Service Fees | Transfer Agent Fees | Total | ||||||||||||||
Growth and Income | $ | 233,236 | $ | 103,136 | $ | 61,685 | $ | 398,057 | ||||||||||
Large Cap Value | 810,875 | 109,229 | 108,113 | 1,028,217 | ||||||||||||||
Mid Cap Value | 4,418,671 | 792,949 | 675,516 | 5,887,136 | ||||||||||||||
Small Cap Value | 2,533,428 | 251,571 | 236,736 | 3,021,735 | ||||||||||||||
G. Line of Credit Facility — As of February 28, 2013, the Funds participated in a $630,000,000 committed, unsecured revolving line of credit facility (the “facility”) together with other funds of the Trust and registered investment companies having management agreements with GSAM or its affiliates (“Other Borrowers”). Pursuant to the terms of the facility, the Funds and Other Borrowers could increase the credit amount by an additional $340,000,000, for a total of up to $970,000,000. This facility is to be used solely for temporary or emergency purposes, which may include the funding of redemptions. The interest rate on borrowings is based on the federal funds rate. The facility also requires a fee to be paid by the Funds based on the amount of the commitment that has not been utilized. For the six months ended February 28, 2013, the Funds did not have any borrowings under the facility.
64
GOLDMAN SACHS FUNDAMENTAL EQUITY VALUE FUNDS
4. AGREEMENTS AND AFFILIATED TRANSACTIONS (continued) |
H. Other Transactions with Affiliates — For the six months ended February 28, 2013, Goldman Sachs earned approximately $4,800, $3,900, $161,100 and $45,400 in brokerage commissions from portfolio transactions on behalf of the Growth and Income, Large Cap Value, Mid Cap Value and Small Cap Value Funds, respectively.
An investment by the Funds representing greater than 5% of the voting securities of an issuer makes that issuer an affiliated person (as defined by the Act) of such Fund. The following table provides information about the investment by the Small Cap Value Fund in shares of issuers of which the Fund is an affiliate for the six months ended February 28, 2013:
| Name of Affiliated Issuer | Number of Shares Held Beginning of Period | Shares Bought | Shares Sold | Number of Shares Held End of Period | Value at End of Period | Dividend Income | ||||||||||||||||||
| Meadowbrook Insurance Group, Inc.(a) | 2,695,979 | 28,301 | (425,167 | ) | 2,299,113 | $ | 16,162,764 | $ | 50,286 | |||||||||||||||
| (a) | Issuer was no longer affiliated as of February 28, 2013. |
As of February 28, 2013, the Goldman Sachs Profit Sharing Master Trust was the beneficial owner of approximately 7% of total outstanding shares of the Large Cap Value Fund.
| 5. PORTFOLIO SECURITIES TRANSACTIONS |
The cost of purchases and proceeds from sales and maturities of long-term securities for the six months ended February 28, 2013, were as follows:
| Fund | Purchases | Sales and Maturities | ||||||||
Growth and Income | $ | 185,597,846 | $ | 245,657,903 | ||||||
Large Cap Value | 719,347,902 | 958,730,322 | ||||||||
Mid Cap Value | 3,417,806,297 | 3,665,985,677 | ||||||||
Small Cap Value | 1,038,289,260 | 811,455,437 | ||||||||
| 6. TAX INFORMATION |
As of the Funds’ most recent fiscal year end, August 31, 2012, the Funds’ capital loss carryforwards and certain timing differences on a tax-basis were as follows:
| Growth and Income | Large Cap Value | Mid Cap Value | Small Cap Value | |||||||||||||
Capital loss carryforwards: (1) | ||||||||||||||||
Expiring 2017 | $ | (36,401,396 | ) | $ | (112,370,584 | ) | $ | — | $ | — | ||||||
Expiring 2018 | (248,746,287 | ) | (368,308,699 | ) | (98,927,465 | ) | — | |||||||||
Total capital loss carryforwards | $ | (285,147,683 | ) | $ | (480,679,283 | ) | $ | (98,927,465 | ) | $ | — | |||||
| (1) | Expiration occurs on August 31 of the year indicated. |
65
GOLDMAN SACHS FUNDAMENTAL EQUITY VALUE FUNDS
Notes to Financial Statements (continued)
February 28, 2013 (Unaudited)
| 6. TAX INFORMATION (continued) |
As of February 28, 2013, the Funds’ aggregate security unrealized gains and losses based on cost for U.S. federal income tax purposes were as follows:
| Growth and Income | Large Cap Value | Mid Cap Value | Small Cap Value | �� | ||||||||||||
Tax Cost | $ | 385,607,760 | $ | 1,236,413,592 | $ | 6,945,042,190 | $ | 2,893,788,853 | ||||||||
Gross unrealized gain | 53,350,416 | 226,805,447 | 1,595,266,748 | 795,705,628 | ||||||||||||
Gross unrealized loss | (12,225,773 | ) | (55,557,589 | ) | (110,023,922 | ) | (61,593,460 | ) | ||||||||
Net unrealized security gain | $ | 41,124,643 | $ | 171,247,858 | $ | 1,485,242,826 | $ | 734,112,168 | ||||||||
The difference between GAAP-basis and tax-basis unrealized gains (losses), as of the most recent fiscal year end, is attributable primarily to wash sales, differences related to the tax treatment of partnerships, underlying fund investments, and real estate investment trusts.
GSAM has reviewed the Funds’ tax positions for all open tax years (the current and prior three years, as applicable) and has concluded that no provision for income tax is required in the Funds’ financial statements. Such open tax years remain subject to examination and adjustment by tax authorities.
| 7. OTHER RISKS |
The Funds’ risks include, but are not limited to, the following:
Investments in Other Investment Companies — As a shareholder of another investment company, including an exchange traded fund (“ETF”), a Fund will directly bear its proportionate share of any management fees and other expenses paid by such other investment companies, in addition to the fees and expenses regularly borne by the Fund. ETFs are subject to risks that do not apply to conventional mutual funds, including but not limited to the following: (i) the market price of the ETF’s shares may trade at a premium or a discount to their NAV; and (ii) an active trading market for an ETF’s shares may not develop or be maintained.
Liquidity Risk — The Funds may make investments that are illiquid or that may become less liquid in response to market developments or adverse investor perceptions. Illiquid investments may be more difficult to value. Liquidity risk may also refer to the risk that a Fund will not be able to pay redemption proceeds within the allowable time period because of unusual market conditions, an unusually high volume of redemption requests, or other reasons. To meet redemption requests, a Fund may be forced to sell investments at an unfavorable time and/or under unfavorable conditions.
Market and Credit Risks — In the normal course of business, the Funds trade financial instruments and enter into financial transactions where risk of potential loss exists due to changes in the market (market risk). Additionally, the Funds may also be exposed to credit risk in the event that an issuer fails to perform or that an institution or entity with which the Funds have unsettled or open transactions defaults.
Shareholder Concentration Risk — Certain funds, accounts, individuals or Goldman Sachs affiliates may from time to time own (beneficially or of record) or control a significant percentage of the Funds’ shares. Redemptions by these entities of their holdings in the Funds, may impact the Funds’ liquidity and NAV. These redemptions may also force the Funds to sell securities.
66
GOLDMAN SACHS FUNDAMENTAL EQUITY VALUE FUNDS
| 8. INDEMNIFICATIONS |
Under the Trust’s organizational documents, its Trustees, officers, employees and agents are indemnified, to the extent permitted by the Act, against certain liabilities that may arise out of performance of their duties to the Funds. Additionally, in the course of business, the Funds enter into contracts that contain a variety of indemnification clauses. The Funds’ maximum exposure under these arrangements is unknown, as this would involve future claims that may be made against the Funds that have not yet occurred. However, GSAM believes the risk of loss under these arrangements to be remote.
| 9. OTHER MATTERS |
New Accounting Pronouncement — In December 2011, the Financial Accounting Standards Board issued an Accounting Standards Update (“ASU”) to enhance disclosures about financial instruments and derivative instruments that are subject to offsetting (“netting”) on the Statement of Assets and Liabilities. This information will enable users of the Funds’ financial statements to evaluate the effect or potential effect of netting arrangements on the Funds’ financial position. The ASU is effective for financial statements with fiscal years beginning on or after January 1, 2013, and interim periods within those fiscal years. At this time, GSAM is evaluating the implications of these changes on the financial statements.
| 10. SUBSEQUENT EVENTS |
Subsequent events after the Statement of Assets and Liabilities date have been evaluated through the date the financial statements were issued. GSAM has concluded that there is no impact requiring adjustment or disclosure in the financial statements.
67
GOLDMAN SACHS FUNDAMENTAL EQUITY VALUE FUNDS
Notes to Financial Statements (continued)
February 28, 2013 (Unaudited)
| 11. SUMMARY OF SHARE TRANSACTIONS |
Share activity is as follows:
| Growth and Income Fund | ||||||||||||||||
|
| |||||||||||||||
For the Six Months Ended (Unaudited) | For the Fiscal Year Ended August 31, 2012 | |||||||||||||||
|
| |||||||||||||||
| Shares | Dollars | Shares | Dollars | |||||||||||||
|
| |||||||||||||||
| Class A Shares | ||||||||||||||||
Shares sold | 399,697 | $ | 9,169,928 | 937,725 | $ | 18,566,942 | ||||||||||
Reinvestment of distributions | 149,690 | 3,334,317 | 298,343 | 5,724,104 | ||||||||||||
Shares converted from Class B(a) | 39,413 | 893,482 | 125,757 | 2,497,649 | ||||||||||||
Shares redeemed | (2,345,707 | ) | (53,640,106 | ) | (10,638,861 | ) | (209,304,248 | ) | ||||||||
| (1,756,907 | ) | (40,242,379 | ) | (9,277,036 | ) | (182,515,553 | ) | |||||||||
| Class B Shares | ||||||||||||||||
Shares sold | 9,004 | 200,974 | 23,181 | 442,805 | ||||||||||||
Reinvestment of distributions | 4,785 | 102,716 | 9,213 | 168,584 | ||||||||||||
Shares converted to Class A(a) | (40,873 | ) | (893,482 | ) | (130,299 | ) | (2,497,649 | ) | ||||||||
Shares redeemed | (176,004 | ) | (3,880,888 | ) | (469,311 | ) | (8,943,088 | ) | ||||||||
| (203,088 | ) | (4,470,680 | ) | (567,216 | ) | (10,829,348 | ) | |||||||||
| Class C Shares | ||||||||||||||||
Shares sold | 61,894 | 1,360,268 | 114,672 | 2,203,145 | ||||||||||||
Reinvestment of distributions | 5,309 | 113,291 | 7,597 | 138,706 | ||||||||||||
Shares redeemed | (127,295 | ) | (2,808,724 | ) | (320,442 | ) | (6,124,971 | ) | ||||||||
| (60,092 | ) | (1,335,165 | ) | (198,173 | ) | (3,783,120 | ) | |||||||||
| Institutional Shares | ||||||||||||||||
Shares sold | 56,377 | 1,328,351 | 75,873 | 1,490,112 | ||||||||||||
Reinvestment of distributions | 6,861 | 155,291 | 16,952 | 331,003 | ||||||||||||
Shares redeemed | (323,143 | ) | (7,333,835 | ) | (1,562,346 | ) | (28,893,757 | ) | ||||||||
| (259,905 | ) | (5,850,193 | ) | (1,469,521 | ) | (27,072,642 | ) | |||||||||
| Service Shares | ||||||||||||||||
Shares sold | 1,234 | 28,480 | 5,075 | 100,320 | ||||||||||||
Reinvestment of distributions | 119 | 2,657 | 185 | 3,562 | ||||||||||||
Shares redeemed | (5,025 | ) | (113,028 | ) | (13,031 | ) | (265,615 | ) | ||||||||
| (3,672 | ) | (81,891 | ) | (7,771 | ) | (161,733 | ) | |||||||||
| Class IR Shares | ||||||||||||||||
Shares sold | 28,882 | 639,457 | 11,070 | 218,625 | ||||||||||||
Reinvestment of distributions | 398 | 8,833 | 622 | 12,059 | ||||||||||||
Shares redeemed | (11,834 | ) | (266,691 | ) | (26,108 | ) | (554,138 | ) | ||||||||
| 17,446 | 381,599 | (14,416 | ) | (323,454 | ) | |||||||||||
| Class R Shares | ||||||||||||||||
Shares sold | 6,229 | 140,987 | 16,611 | 322,292 | ||||||||||||
Reinvestment of distributions | 299 | 6,641 | 373 | 7,160 | ||||||||||||
Shares redeemed | (18,880 | ) | (447,181 | ) | (11,048 | ) | (213,403 | ) | ||||||||
| (12,352 | ) | (299,553 | ) | 5,936 | 116,049 | |||||||||||
NET DECREASE | (2,278,570 | ) | $ | (51,898,262 | ) | (11,528,197 | ) | $ | (224,569,801 | ) | ||||||
| (a) | Class B Shares automatically convert into Class A Shares on or about the fifteenth day of the last month of the calendar quarter that is eight years after the initial purchase date of either the Fund or another Goldman Sachs Fund. |
68
GOLDMAN SACHS FUNDAMENTAL EQUITY VALUE FUNDS
| 11. SUMMARY OF SHARE TRANSACTIONS (continued) |
Share activity is as follows:
| Large Cap Value Fund | ||||||||||||||||
|
| |||||||||||||||
| For the Six Months Ended February 28, 2013 (Unaudited) | For the Fiscal Year Ended August 31, 2012 | |||||||||||||||
|
| |||||||||||||||
| Shares | Dollars | Shares | Dollars | |||||||||||||
|
| |||||||||||||||
| Class A Shares | ||||||||||||||||
Shares sold | 1,926,673 | $ | 24,642,341 | 5,422,960 | $ | 60,185,598 | ||||||||||
Reinvestment of distributions | 335,643 | 4,155,213 | 536,440 | 5,755,999 | ||||||||||||
Shares converted from Class B(a) | 18,898 | 240,055 | 65,542 | 734,723 | ||||||||||||
Shares redeemed | (8,752,294 | ) | (110,668,197 | ) | (23,442,209 | ) | (259,981,563 | ) | ||||||||
| (6,471,080 | ) | (81,630,588 | ) | (17,417,267 | ) | (193,305,243 | ) | |||||||||
| Class B Shares | ||||||||||||||||
Shares sold | 5,146 | 64,404 | 36,532 | 399,872 | ||||||||||||
Reinvestment of distributions | 2,036 | 24,686 | 1,912 | 20,108 | ||||||||||||
Shares converted to Class A(a) | (19,342 | ) | (240,055 | ) | (67,102 | ) | (734,723 | ) | ||||||||
Shares redeemed | (89,454 | ) | (1,118,463 | ) | (358,983 | ) | (3,860,278 | ) | ||||||||
| (101,614 | ) | (1,269,428 | ) | (387,641 | ) | (4,175,021 | ) | |||||||||
| Class C Shares | ||||||||||||||||
Shares sold | 143,982 | 1,804,609 | 248,596 | 2,646,855 | ||||||||||||
Reinvestment of distributions | 9,196 | 110,598 | 6,609 | 69,002 | ||||||||||||
Shares redeemed | (436,485 | ) | (5,397,249 | ) | (1,493,617 | ) | (15,812,760 | ) | ||||||||
| (283,307 | ) | (3,482,042 | ) | (1,238,412 | ) | (13,096,903 | ) | |||||||||
| Institutional Shares | ||||||||||||||||
Shares sold | 5,274,967 | 68,213,392 | 25,271,146 | 283,547,658 | ||||||||||||
Shares sold in connection with in-kind | — | — | 808,445 | 9,725,593 | ||||||||||||
Reinvestment of distributions | 993,277 | 12,376,232 | 1,741,436 | 18,824,923 | ||||||||||||
Shares redeemed | (15,604,435 | ) | (202,089,695 | ) | (85,399,607 | ) | (975,861,742 | ) | ||||||||
| (9,336,191 | ) | (121,500,071 | ) | (57,578,580 | ) | (663,763,568 | ) | |||||||||
| Service Shares | ||||||||||||||||
Shares sold | 43,209 | 548,242 | 104,634 | 1,177,645 | ||||||||||||
Reinvestment of distributions | 991 | 12,226 | 4,236 | 45,200 | ||||||||||||
Shares redeemed | (118,807 | ) | (1,521,142 | ) | (423,788 | ) | (4,847,990 | ) | ||||||||
| (74,607 | ) | (960,674 | ) | (314,918 | ) | (3,625,145 | ) | |||||||||
| Class IR Shares | ||||||||||||||||
Shares sold | 898,914 | 11,653,148 | 1,313,645 | 14,906,611 | ||||||||||||
Reinvestment of distributions | 127,926 | 1,568,372 | 136,363 | 1,450,900 | ||||||||||||
Shares redeemed | (479,602 | ) | (6,040,811 | ) | (1,640,814 | ) | (18,273,395 | ) | ||||||||
| 547,238 | 7,180,709 | (190,806 | ) | (1,915,884 | ) | |||||||||||
| Class R Shares | ||||||||||||||||
Shares sold | 89,365 | 1,133,859 | 163,741 | 1,831,394 | ||||||||||||
Reinvestment of distributions | 4,131 | 50,353 | 5,454 | 57,649 | ||||||||||||
Shares redeemed | (92,197 | ) | (1,155,421 | ) | (220,320 | ) | (2,492,999 | ) | ||||||||
| 1,299 | 28,791 | (51,125 | ) | (603,956 | ) | |||||||||||
NET DECREASE | (15,718,262 | ) | $ | (201,633,303 | ) | (77,178,749 | ) | $ | (880,485,720 | ) | ||||||
| (a) | Class B Shares automatically convert into Class A Shares on or about the fifteenth day of the last month of the calendar quarter that is eight years after the initial purchase date of either the Fund or another Goldman Sachs Fund. |
69
GOLDMAN SACHS FUNDAMENTAL EQUITY VALUE FUNDS
Notes to Financial Statements (continued)
February 28, 2013 (Unaudited)
| 11. SUMMARY OF SHARE TRANSACTIONS (continued) |
Share activity is as follows:
| Mid Cap Value Fund | ||||||||||||||||
|
| |||||||||||||||
| For the Six Months Ended February 28, 2013 (Unaudited) | For the Fiscal Year Ended August 31, 2012 | |||||||||||||||
|
| |||||||||||||||
| Shares | Dollars | Shares | Dollars | |||||||||||||
|
| |||||||||||||||
| Class A Shares | ||||||||||||||||
Shares sold | 11,387,267 | $ | 442,502,958 | 17,201,900 | $ | 597,035,091 | ||||||||||
Reinvestment of distributions | 675,423 | 25,672,793 | 428,917 | 14,445,924 | ||||||||||||
Shares converted from Class B(a) | 18,912 | 734,164 | 45,869 | 1,584,959 | ||||||||||||
Shares redeemed | (15,679,424 | ) | (616,418,662 | ) | (33,676,205 | ) | (1,168,160,883 | ) | ||||||||
| (3,597,822 | ) | (147,508,747 | ) | (15,999,519 | ) | (555,094,909 | ) | |||||||||
| Class B Shares | ||||||||||||||||
Shares sold | 5,329 | 206,071 | 27,798 | 921,396 | ||||||||||||
Shares converted to Class A(a) | (19,666 | ) | (734,164 | ) | (47,710 | ) | (1,584,959 | ) | ||||||||
Shares redeemed | (273,179 | ) | (10,279,160 | ) | (469,048 | ) | (15,568,789 | ) | ||||||||
| (287,516 | ) | (10,807,253 | ) | (488,960 | ) | (16,232,352 | ) | |||||||||
| Class C Shares | ||||||||||||||||
Shares sold | 88,993 | 3,359,571 | 463,933 | 15,298,266 | ||||||||||||
Reinvestment of distributions | 4,858 | 176,407 | — | — | ||||||||||||
Shares redeemed | (502,504 | ) | (18,702,422 | ) | (1,196,350 | ) | (39,884,513 | ) | ||||||||
| (408,653 | ) | (15,166,444 | ) | (732,417 | ) | (24,586,247 | ) | |||||||||
| Institutional Shares | ||||||||||||||||
Shares sold | 12,881,256 | 517,218,270 | 25,262,472 | 878,886,389 | ||||||||||||
Reinvestment of distributions | 1,198,035 | 45,824,836 | 854,024 | 28,942,873 | ||||||||||||
Shares redeemed | (12,774,351 | ) | (507,208,937 | ) | (28,308,053 | ) | (992,924,322 | ) | ||||||||
| 1,304,940 | 55,834,169 | (2,191,557 | ) | (85,095,060 | ) | |||||||||||
| Service Shares | ||||||||||||||||
Shares sold | 1,295,454 | 52,011,364 | 1,984,847 | 68,044,642 | ||||||||||||
Reinvestment of distributions | 48,877 | 1,839,232 | 28,360 | 945,534 | ||||||||||||
Shares redeemed | (1,339,798 | ) | (51,983,771 | ) | (2,912,298 | ) | (101,930,100 | ) | ||||||||
| 4,533 | 1,866,825 | (899,091 | ) | (32,939,924 | ) | |||||||||||
| Class IR Shares | ||||||||||||||||
Shares sold | 437,324 | 17,215,892 | 1,057,885 | 37,201,473 | ||||||||||||
Reinvestment of distributions | 20,977 | 789,139 | 12,560 | 418,746 | ||||||||||||
Shares redeemed | (419,574 | ) | (16,122,589 | ) | (395,242 | ) | (13,768,036 | ) | ||||||||
| 38,727 | 1,882,442 | 675,203 | 23,852,183 | |||||||||||||
| Class R Shares | ||||||||||||||||
Shares sold | 137,079 | 5,327,342 | 248,840 | 8,666,743 | ||||||||||||
Reinvestment of distributions | 3,055 | 114,948 | 1,001 | 33,438 | ||||||||||||
Shares redeemed | (65,766 | ) | (2,554,691 | ) | (72,109 | ) | (2,490,559 | ) | ||||||||
| 74,368 | 2,887,599 | 177,732 | 6,209,622 | |||||||||||||
NET DECREASE | (2,871,423 | ) | $ | (111,011,409 | ) | (19,458,609 | ) | $ | (683,886,687 | ) | ||||||
| (a) | Class B Shares automatically convert into Class A Shares on or about the fifteenth day of the last month of the calendar quarter that is eight years after the initial purchase date of either the Fund or another Goldman Sachs Fund. |
70
GOLDMAN SACHS FUNDAMENTAL EQUITY VALUE FUNDS
| 11. SUMMARY OF SHARE TRANSACTIONS (continued) |
Share activity is as follows:
| Small Cap Value Fund | ||||||||||||||||
|
| |||||||||||||||
| For the Six Months Ended February 28, 2013 (Unaudited) | For the Fiscal Year Ended August 31, 2012 | |||||||||||||||
|
| |||||||||||||||
| Shares | Dollars | Shares | Dollars | |||||||||||||
|
| |||||||||||||||
| Class A Shares | ||||||||||||||||
Shares sold | 3,195,908 | $ | 139,992,963 | 5,176,204 | $ | 206,634,546 | ||||||||||
Reinvestment of distributions | 1,215,857 | 49,974,775 | 410,906 | 15,799,327 | ||||||||||||
Shares converted from Class B(a) | 1,573 | 68,166 | 21,708 | 870,433 | ||||||||||||
Shares redeemed | (5,347,834 | ) | (234,346,757 | ) | (5,944,572 | ) | (240,634,013 | ) | ||||||||
| (934,496 | ) | (44,310,853 | ) | (335,754 | ) | (17,329,707 | ) | |||||||||
| Class B Shares | ||||||||||||||||
Shares sold | 1,838 | 68,708 | 8,661 | 294,184 | ||||||||||||
Reinvestment of distributions | 6,145 | 216,119 | 4,683 | 155,139 | ||||||||||||
Shares converted to Class A(a) | (1,837 | ) | (68,166 | ) | (25,214 | ) | (870,433 | ) | ||||||||
Shares redeemed | (21,500 | ) | (797,730 | ) | (178,108 | ) | (6,096,801 | ) | ||||||||
| (15,354 | ) | (581,069 | ) | (189,978 | ) | (6,517,911 | ) | |||||||||
| Class C Shares | ||||||||||||||||
Shares sold | 121,190 | 4,476,978 | 196,463 | 6,791,182 | ||||||||||||
Reinvestment of distributions | 88,703 | 3,101,075 | 28,497 | 942,678 | ||||||||||||
Shares redeemed | (210,695 | ) | (7,861,181 | ) | (418,413 | ) | (14,413,866 | ) | ||||||||
| (802 | ) | (283,128 | ) | (193,453 | ) | (6,680,006 | ) | |||||||||
| Institutional Shares | ||||||||||||||||
Shares sold | 12,101,410 | 558,853,492 | 14,920,610 | 623,688,939 | ||||||||||||
Reinvestment of distributions | 2,959,104 | 127,959,330 | 860,708 | 34,720,939 | ||||||||||||
Shares redeemed | (5,917,145 | ) | (271,951,744 | ) | (14,494,885 | ) | (615,408,467 | ) | ||||||||
| 9,143,369 | 414,861,078 | 1,286,433 | 43,001,411 | |||||||||||||
| Service Shares | ||||||||||||||||
Shares sold | 573,382 | 24,532,382 | 1,389,886 | 55,401,591 | ||||||||||||
Reinvestment of distributions | 179,280 | 7,218,191 | 34,088 | 1,286,847 | ||||||||||||
Shares redeemed | (671,693 | ) | (29,160,043 | ) | (772,364 | ) | (30,484,547 | ) | ||||||||
| 80,969 | 2,590,530 | 651,610 | 26,203,891 | |||||||||||||
| Class IR Shares | ||||||||||||||||
Shares sold | 412,733 | 18,096,793 | 401,917 | 16,010,378 | ||||||||||||
Reinvestment of distributions | 46,957 | 1,919,695 | 9,078 | 347,517 | ||||||||||||
Shares redeemed | (122,602 | ) | (5,328,801 | ) | (158,586 | ) | (6,397,608 | ) | ||||||||
| 337,088 | 14,687,687 | 252,409 | 9,960,287 | |||||||||||||
| Class R Shares | ||||||||||||||||
Shares sold | 338,927 | 14,673,624 | 566,255 | 22,430,296 | ||||||||||||
Reinvestment of distributions | 72,604 | 2,952,134 | 15,454 | 588,799 | ||||||||||||
Shares redeemed | (154,154 | ) | (6,641,180 | ) | (190,028 | ) | (7,627,978 | ) | ||||||||
| 257,377 | 10,984,578 | 391,681 | 15,391,117 | |||||||||||||
NET INCREASE | 8,868,151 | $ | 397,948,823 | 1,862,948 | $ | 64,029,082 | ||||||||||
| (a) | Class B Shares automatically convert into Class A Shares on or about the fifteenth day of the last month of the calendar quarter that is eight years after the initial purchase date of either the Fund or another Goldman Sachs Fund. |
71
GOLDMAN SACHS FUNDAMENTAL EQUITY VALUE FUNDS
Fund Expenses — Six Month Period Ended February 28, 2013 (Unaudited)
As a shareholder of Class A, Class B, Class C, Institutional, Service, Class IR or Class R Shares of a Fund, you incur two types of costs: (1) transaction costs, including sales charges on purchase payments (with respect to Class A Shares), contingent deferred sales charges on redemptions (with respect to Class B and Class C Shares), and (2) ongoing costs, including management fees; distribution and service (12b-1) fees (with respect to Class A, Class B, Class C and Class R Shares); and other Fund expenses. This Example is intended to help you understand your ongoing costs (in dollars) of investing in Class A, Class B, Class C, Institutional, Service, Class IR or Class R Shares of the Funds and to compare these costs with the ongoing costs of investing in other mutual funds.
The Example is based on an investment of $1,000 invested at the beginning of the period and held for the entire period from September 1, 2012 through February 28, 2013.
Actual Expenses — The first line under each share class in the table below provides information about actual account values and actual expenses. You may use the information in this line, together with the amount you invested, to estimate the expenses that you paid over the period. Simply divide your account value by $1,000 (for example, an $8,600 account value divided by $1,000=8.6), then multiply the result by the number in the first line under the heading entitled “Expenses Paid” to estimate the expenses you paid on your account during this period.
Hypothetical Example for Comparison Purposes — The second line under each share class in the table below provides information about hypothetical account values and hypothetical expenses based on the Funds’ actual net expense ratios and an assumed rate of return of 5% per year before expenses, which is not the Funds’ actual return. The hypothetical account values and expenses may not be used to estimate the actual ending account balance or expenses you paid for the period. You may use this information to compare the ongoing costs of investing in the Funds and other funds. To do so, compare this 5% hypothetical example with the 5% hypothetical examples that appear in the shareholder reports of the other funds.
Please note that the expenses shown in the table are meant to highlight your ongoing costs only and do not reflect any transactional costs, such as sales charges, redemption fees, or exchange fees. Therefore, the second line of the table is useful in comparing ongoing costs only, and will not help you determine the relative total costs of owning different funds. In addition, if these transactional costs were included, your costs would have been higher.
| Growth and Income Fund | Large Cap Value Fund | Mid Cap Value Fund | Small Cap Value Fund | |||||||||||||||||||||||||||||||||||||||||||||
| Share Class | Beginning Account Value 9/1/12 | Ending Account Value 2/28/13 | Expenses Paid for the 6 months ended 2/28/13* | Beginning Account Value 9/1/12 | Ending Account Value 2/28/13 | Expenses Paid for the 6 months ended 2/28/13* | Beginning Account Value 9/1/12 | Ending Account Value 2/28/13 | Expenses Paid for the 6 months ended 2/28/13* | Beginning Account Value 9/1/12 | Ending Account Value 2/28/13 | Expenses Paid for the 6 months ended 2/28/13* | ||||||||||||||||||||||||||||||||||||
| Class A | ||||||||||||||||||||||||||||||||||||||||||||||||
Actual | $ | 1,000.00 | $ | 1,123.80 | $ | 6.27 | $ | 1,000.00 | $ | 1,123.90 | $ | 6.37 | $ | 1,000.00 | $ | 1,140.60 | $ | 6.10 | $ | 1,000.00 | $ | 1,125.80 | $ | 7.38 | ||||||||||||||||||||||||
Hypothetical 5% return | 1,000.00 | 1,018.89 | + | 5.96 | 1,000.00 | 1,018.79 | + | 6.06 | 1,000.00 | 1,019.09 | + | 5.76 | 1,000.00 | 1,017.85 | + | 7.00 | ||||||||||||||||||||||||||||||||
| Class B | ||||||||||||||||||||||||||||||||||||||||||||||||
Actual | 1,000.00 | 1,119.60 | 10.20 | 1,000.00 | 1,119.00 | 10.30 | 1,000.00 | 1,136.60 | 10.07 | 1,000.00 | 1,121.40 | 11.31 | ||||||||||||||||||||||||||||||||||||
Hypothetical 5% return | 1,000.00 | 1,015.17 | + | 9.69 | 1,000.00 | 1,015.08 | + | 9.79 | 1,000.00 | 1,015.37 | + | 9.49 | 1,000.00 | 1,014.13 | + | 10.74 | ||||||||||||||||||||||||||||||||
| Class C | ||||||||||||||||||||||||||||||||||||||||||||||||
Actual | 1,000.00 | 1,119.80 | 10.20 | 1,000.00 | 1,119.00 | 10.30 | 1,000.00 | 1,136.40 | 10.06 | 1,000.00 | 1,121.50 | 11.31 | ||||||||||||||||||||||||||||||||||||
Hypothetical 5% return | 1,000.00 | 1,015.17 | + | 9.69 | 1,000.00 | 1,015.08 | + | 9.79 | 1,000.00 | 1,015.37 | + | 9.49 | 1,000.00 | 1,014.13 | + | 10.74 | ||||||||||||||||||||||||||||||||
| Institutional | ||||||||||||||||||||||||||||||||||||||||||||||||
Actual | 1,000.00 | 1,126.40 | 4.17 | 1,000.00 | 1,125.30 | 4.27 | 1,000.00 | 1,143.10 | 3.99 | 1,000.00 | 1,127.90 | 5.28 | ||||||||||||||||||||||||||||||||||||
Hypothetical 5% return | 1,000.00 | 1,020.88 | + | 3.96 | 1,000.00 | 1,020.78 | + | 4.06 | 1,000.00 | 1,021.08 | + | 3.76 | 1,000.00 | 1,019.84 | + | 5.01 | ||||||||||||||||||||||||||||||||
| Service | �� | |||||||||||||||||||||||||||||||||||||||||||||||
Actual | 1,000.00 | 1,123.70 | 6.79 | 1,000.00 | 1,123.40 | 6.84 | 1,000.00 | 1,140.40 | 6.63 | 1,000.00 | 1,125.00 | 7.90 | ||||||||||||||||||||||||||||||||||||
Hypothetical 5% return | 1,000.00 | 1,018.40 | + | 6.46 | 1,000.00 | 1,018.35 | + | 6.51 | 1,000.00 | 1,018.60 | + | 6.26 | 1,000.00 | 1,017.36 | + | 7.50 | ||||||||||||||||||||||||||||||||
| Class IR | ||||||||||||||||||||||||||||||||||||||||||||||||
Actual | 1,000.00 | 1,125.40 | 4.95 | 1,000.00 | 1,125.10 | 5.06 | 1,000.00 | 1,142.40 | 4.78 | 1,000.00 | 1,127.00 | 6.06 | ||||||||||||||||||||||||||||||||||||
Hypothetical 5% return | 1,000.00 | 1,020.13 | + | 4.71 | 1,000.00 | 1,020.03 | + | 4.81 | 1,000.00 | 1,020.33 | + | 4.51 | 1,000.00 | 1,019.09 | + | 5.76 | ||||||||||||||||||||||||||||||||
| Class R | ||||||||||||||||||||||||||||||||||||||||||||||||
Actual | 1,000.00 | 1,122.90 | 7.58 | 1,000.00 | 1,122.70 | 7.68 | 1,000.00 | 1,139.20 | 7.37 | 1,000.00 | 1,124.10 | 8.69 | ||||||||||||||||||||||||||||||||||||
Hypothetical 5% return | 1,000.00 | 1,017.65 | + | 7.20 | 1,000.00 | 1,017.56 | + | 7.30 | 1,000.00 | 1,017.90 | + | 6.95 | 1,000.00 | 1,016.61 | + | 8.25 | ||||||||||||||||||||||||||||||||
| * | Expenses for each share class are calculated using each Fund’s annualized net expense ratio for each class, which represents the ongoing expenses as a percentage of net assets for the six months ended February 28, 2013. Expenses are calculated by multiplying the annualized net expense ratio by the average account value for the period; then multiplying the result by the number of days in the most recent fiscal half year; and then dividing that result by the number of days in the fiscal year. The annualized net expense ratios for the period were as follows: |
| Fund | Class A | Class B | Class C | Institutional | Service | Class IR | Class R | |||||||||||||||||||||
Growth and Income | 1.19 | % | 1.94 | % | 1.94 | % | 0.79 | % | 1.29 | % | 0.94 | % | 1.44 | % | ||||||||||||||
Large Cap Value | 1.21 | 1.96 | 1.96 | 0.81 | 1.30 | 0.96 | 1.46 | |||||||||||||||||||||
Mid Cap Value | 1.15 | 1.90 | 1.90 | 0.75 | 1.25 | 0.90 | 1.39 | |||||||||||||||||||||
Small Cap Value | 1.40 | 2.15 | 2.15 | 1.00 | 1.50 | 1.15 | 1.65 | |||||||||||||||||||||
| + | Hypothetical expenses are based on each Fund’s actual annualized net expense ratios and an assumed rate of return of 5% per year before expenses. |
72
FUNDS PROFILE
Goldman Sachs Funds

Goldman Sachs is a premier financial services firm, known since 1869 for creating thoughtful and customized investment solutions in complex global markets.
Today, the Investment Management Division of Goldman Sachs serves a diverse set of clients worldwide, including private institutions, public entities and individuals. With approximately $742.4 billion in assets under management as of December 31, 2012, Goldman Sachs Asset Management (“GSAM”) has portfolio management teams located around the world and our investment professionals bring firsthand knowledge of local markets to every investment decision. GSAM’s assets under management includes assets managed by Goldman Sachs Asset Management, LP and its Investment Advisory Affiliates.
| OVERVIEW OF GOLDMAN SACHS FUNDS |

Money Market1
Financial Square FundsSM
| n | Financial Square Tax-Exempt Funds |
| n | Financial Square Federal Fund |
| n | Financial Square Government Fund |
| n | Financial Square Money Market Fund |
| n | Financial Square Prime Obligations Fund |
| n | Financial Square Treasury Instruments Fund |
| n | Financial Square Treasury Obligations Fund |
Fixed Income
Short Duration and Government
| n | Enhanced Income Fund |
| n | High Quality Floating Rate Fund2 |
| n | Short Duration Government Fund |
| n | Short Duration Income Fund |
| n | Government Income Fund |
| n | Inflation Protected Securities Fund |
Multi-Sector
| n | Core Fixed Income Fund |
| n | Core Plus Fixed Income Fund |
| n | Global Income Fund |
| n | Strategic Income Fund |
| n | World Bond Fund |
Municipal and Tax-Free
| n | High Yield Municipal Fund |
| n | Municipal Income Fund |
| n | Short Duration Tax-Free Fund |
| n | Single Sector |
| n | Investment Grade Credit Fund |
| n | U.S. Mortgages Fund |
| n | High Yield Fund |
| n | High Yield Floating Rate Fund |
| n | Emerging Markets Debt Fund |
| n | Local Emerging Markets Debt Fund |
Corporate Credit
| n | Credit Strategies Fund |
Fundamental Equity
| n | Growth and Income Fund |
| n | Small Cap Value Fund |
| n | Mid Cap Value Fund |
| n | Large Cap Value Fund |
| n | Capital Growth Fund |
| n | Strategic Growth Fund |
| n | Focused Growth Fund |
| n | Small/Mid Cap Growth Fund |
| n | Flexible Cap Growth Fund |
| n | Concentrated Growth Fund |
| n | Technology Tollkeeper Fund |
| n | Growth Opportunities Fund |
| n | Rising Dividend Growth Fund |
| n | U.S. Equity Fund |
| n | Income Builder Fund3 |
Structured Equity
| n | Structured Small Cap Equity Fund |
| n | Structured U.S. Equity Fund |
| n | Structured Small Cap Growth Fund |
| n | Structured Large Cap Growth Fund |
| n | Structured Large Cap Value Fund |
| n | Structured Small Cap Value Fund |
| n | Structured Tax-Managed Equity Fund |
| n | Structured International Tax-Managed Equity Fund |
| n | U.S. Equity Dividend and Premium Fund |
| n | International Equity Dividend and Premium Fund |
| n | Structured International Small Cap Fund |
| n | Structured International Equity Fund |
| n | Structured Emerging Markets Equity Fund |
Fundamental Equity International
| n | Strategic International Equity Fund |
| n | Concentrated International Equity Fund |
| n | International Small Cap Fund |
| n | Asia Equity Fund |
| n | Emerging Markets Equity Fund |
| n | BRIC Fund (Brazil, Russia, India, China) |
| n | N-11 Equity Fund |
| n | China Equity Fund |
Select Satellite4
| n | Real Estate Securities Fund |
| n | International Real Estate Securities Fund |
| n | Commodity Strategy Fund |
| n | Dynamic Allocation Fund |
| n | Absolute Return Tracker Fund |
| n | Managed Futures Strategy Fund |
| n | Retirement Portfolio Completion Fund |
| n | Income Strategies Portfolio |
Total Portfolio Solutions4
| n | Balanced Strategy Portfolio |
| n | Growth and Income Strategy Portfolio |
| n | Growth Strategy Portfolio |
| n | Equity Growth Strategy Portfolio |
| n | Satellite Strategies Portfolio |
| n | Enhanced Dividend Global Equity Portfolio |
| n | Tax Advantaged Global Equity Portfolio |
| 1 | An investment in a money market fund is neither insured nor guaranteed by the Federal Deposit Insurance Corporation (“FDIC”) or any other government agency. Although the Funds seek to preserve the value of your investment at $1.00 per share, it is possible to lose money by investing in the Funds. |
| 2 | Effective at the close of business on July 27, 2012, the Goldman Sachs Ultra-Short Duration Government Fund was renamed the Goldman Sachs High Quality Floating Rate Fund. |
| 3 | Effective at the close of business on June 29, 2012, the Goldman Sachs Balanced Fund was renamed the Goldman Sachs Income Builder Fund. |
| 4 | Individual Funds within the Total Portfolio Solutions and Select Satellite categories will have various placement on the risk/return spectrum and may have greater or lesser risk than that indicated by the placement of the general Total Portfolio Solutions or Select Satellite category. |
Financial Square FundsSM is a registered service mark of Goldman, Sachs & Co.
TRUSTEES Ashok N. Bakhru, Chairman Donald C. Burke John P. Coblentz, Jr. Diana M. Daniels Joseph P. LoRusso James A. McNamara Jessica Palmer Alan A. Shuch Richard P. Strubel | OFFICERS James A. McNamara, President George F. Travers, Principal Financial Officer Caroline Kraus, Secretary Scott M. McHugh, Treasurer | |
GOLDMAN, SACHS & CO. Distributor and Transfer Agent | GOLDMAN SACHS ASSET MANAGEMENT, L.P. Investment Adviser | |
Visit our Web site at www.goldmansachsfunds.com to obtain the most recent month-end returns.
Goldman Sachs Asset Management, L.P. 200 West Street, New York, New York 10282
The reports concerning the Funds included in this shareholder report may contain certain forward-looking statements about the factors that may affect the performance of the Funds in the future. These statements are based on Fund management’s predictions and expectations concerning certain future events and their expected impact on the Funds, such as performance of the economy as a whole and of specific industry sectors, changes in the levels of interest rates, the impact of developing world events, and other factors that may influence the future performance of the Funds. Management believes these forward-looking statements to be reasonable, although they are inherently uncertain and difficult to predict. Actual events may cause adjustments in portfolio management strategies from those currently expected to be employed.
A description of the policies and procedures that the Funds use to determine how to vote proxies relating to portfolio securities and information regarding how a Fund voted proxies relating to portfolio securities during the most recent 12-month period ended June 30 is available (I) without charge, upon request by calling 1-800-526-7384 (for Retail Shareholders) or 1-800-621-2550 (for Institutional Shareholders); and (II) on the Securities and Exchange Commission Web site at http://www.sec.gov.
The Funds file their complete schedule of portfolio holdings with the Securities and Exchange Commission (“SEC”) for the first and third quarters of each fiscal year on Form N-Q. The Funds’ Forms N-Q are available on the SEC’s Web site at http://www.sec.gov within 60 days after the Funds’ first and third fiscal quarters. The Funds’ Forms N-Q may be reviewed and copied at the SEC’s Public Reference Room in Washington, D.C. and information on the operation of the Public Reference Room may also be obtained by calling 1-800-SEC-0330. Form N-Q may be obtained upon request and without charge by calling 1-800-526-7384 (for Retail Shareholders) or 1-800-621-2550 (for Institutional Shareholders).
The Global Industry Classification Standard (GICS) was developed by and is the exclusive property and a service mark of Morgan Stanley Capital International Inc. (MSCI) and Standard & Poor’s, a division of The McGraw-Hill Companies, Inc. (S&P) and is licensed for use by Goldman Sachs. Neither MSCI, S&P nor any other party involved in making or compiling the GICS or any GICS classifications makes any express or implied warranties or presentations with respect to such standard or classification (or the results to be obtained by the use thereof), and all such parties hereby expressly disclaim all warranties of originality, accuracy, completeness, merchantability or fitness for a particular purpose with respect to any of such standard or classification. Without limiting any of the foregoing, in no event shall MSCI, S&P, any of their affiliates or any third party involved in making or compiling the GICS or any GICS classifications have any liability for any direct, indirect, special, punitive, consequential or any other damages (including lost profits) even if notified of the possibility of such damages.
Holdings and allocations shown are as of February 28, 2013 and may not be representative of future investments. Fund holdings should not be relied on in making investment decisions and should not be construed as research or investment advice regarding particular securities.
Economic and market forecasts presented herein reflect our judgment as of the date of this presentation and are subject to change without notice. These forecasts do not take into account the specific investment objectives, restrictions, tax and financial situation or other needs of any specific client. Actual data will vary and may not be reflected here. These forecasts are subject to high levels of uncertainty that may affect actual performance. Accordingly, these forecasts should be viewed as merely representative of a broad range of possible outcomes. These forecasts are estimated, based on assumptions, and are subject to significant revision and may change materially as economic and market conditions change. Goldman Sachs has no obligation to provide updates or changes to these forecasts. Case studies and examples are for illustrative purposes only.
This material is not authorized for distribution to prospective investors unless preceded or accompanied by a current Prospectus or summary prospectus, if applicable. Investors should consider a Fund’s objective, risks, and charges and expenses, and read the summary prospectus, if available, and/or the Prospectus carefully before investing or sending money. The summary prospectus, if available, and the Prospectus contain this and other information about a Fund and may be obtained from your authorized dealer or from Goldman, Sachs & Co. by calling (retail – 1-800-526-7384) (institutional – 1-800-621-2550).
© 2013 Goldman Sachs. All rights reserved. 97269.MF.MED.TMPL/4/2013 EQVALSAR13 / 289k
| ITEM 2. | CODE OF ETHICS. |
| The information required by this Item is only required in an annual report on this Form N-CSR. |
| ITEM 3. | AUDIT COMMITTEE FINANCIAL EXPERT. |
| The information required by this Item is only required in an annual report on this Form N-CSR. |
| ITEM 4. | PRINCIPAL ACCOUNTANT FEES AND SERVICES. |
| The information required by this Item is only required in an annual report on this Form N-CSR. |
| ITEM 5. | AUDIT COMMITTEE OF LISTED REGISTRANTS. |
| Not applicable. |
| ITEM 6. | SCHEDULE OF INVESTMENTS. |
| Schedule of Investments is included as part of the Report to Stockholders filed under Item 1. |
| ITEM 7. | DISCLOSURE OF PROXY VOTING POLICIES AND PROCEDURES FOR CLOSED-END MANAGEMENT INVESTMENT COMPANIES. |
| Not applicable. |
| ITEM 8. | PORTFOLIO MANAGERS OF CLOSED-END MANAGEMENT INVESTMENT COMPANIES. |
| Not applicable. |
| ITEM 9. | PURCHASES OF EQUITY SECURITIES BY CLOSED-END MANAGEMENT INVESTMENT COMPANY AND AFFILIATED PURCHASERS. |
| Not applicable. |
| ITEM 10. | SUBMISSION OF MATTERS TO A VOTE OF SECURITY HOLDERS. |
| There have been no material changes to the procedures by which shareholders may recommend nominees to the registrant’s board of trustees. |
| ITEM 11. | CONTROLS AND PROCEDURES. |
| (a) | The registrant’s principal executive and principal financial officers, or persons performing similar functions have concluded that the registrant’s disclosure controls and procedures (as defined in Rule 30a-3(c) under the Investment Company Act of 1940, as amended (the “1940 Act”)) are effective as of a date within 90 days of the filing of this report that includes the disclosure required by this paragraph, based on the evaluation of these controls and procedures required by Rule 30a-3(b) under the 1940 Act and 15d-15(b) under the Securities Exchange Act of 1934, as amended. |
| (b) | There were no changes in the registrant’s internal control over financial reporting (as defined in Rule 30a-3(d) under the 1940 Act) that occurred during the registrant’s second fiscal quarter of the period covered by this report that have materially affected, or are reasonably likely to materially affect, the registrant’s internal control over financial reporting. |
| ITEM 12. | EXHIBITS. |
| (a)(1) | The information required by this Item is only required in connection with an annual report on this Form N-CSR. | |||
| (a)(2) | Exhibit 99.CERT | Certifications pursuant to Section 302 of the Sarbanes-Oxley Act of 2002 filed herewith. | ||
| (b) | Exhibit 99.906CERT | Certifications pursuant to Section 906 of the Sarbanes-Oxley Act of 2002 filed herewith. | ||
SIGNATURES
Pursuant to the requirements of the Securities Exchange Act of 1934 and the Investment Company Act of 1940, the registrant has duly caused this report to be signed on its behalf by the undersigned, thereunto duly authorized.
| Goldman Sachs Trust | ||||
| By: | /s/ James A. McNamara | |||
| James A. McNamara | ||||
| President/Principal Executive Officer | ||||
| Goldman Sachs Trust | ||||
| Date: | April 18, 2013 | |||
Pursuant to the requirements of the Securities Exchange Act of 1934 and the Investment Company Act of 1940, this report has been signed below by the following persons on behalf of the registrant and in the capacities and on the dates indicated.
| By: | /s/ James A. McNamara | |||
| James A. McNamara | ||||
| President/Principal Executive Officer | ||||
| Goldman Sachs Trust | ||||
| Date: | April 18, 2013 | |||
| By: | /s/ George F. Travers | |||
| George F. Travers | ||||
| Principal Financial Officer | ||||
| Goldman Sachs Trust | ||||
| Date: | April 18, 2013 | |||