UNITED STATES
SECURITIES AND EXCHANGE COMMISSION
Washington, D.C. 20549
FORM N-CSR
CERTIFIED SHAREHOLDER REPORT OF REGISTERED
MANAGEMENT INVESTMENT COMPANIES
Investment Company Act file number 811-05349
Goldman Sachs Trust
(Exact name of registrant as specified in charter)
71 South Wacker Drive,
Chicago, Illinois 60606
(Address of principal executive offices) (Zip code)
Copies to: | ||
Caroline Kraus | Geoffrey R.T. Kenyon, Esq. | |
Goldman, Sachs & Co. | Dechert LLP | |
200 West Street | 200 Clarendon Street | |
New York, New York 10282 | 27th Floor | |
| Boston, MA 02116-5021 | ||
(Name and address of agents for service)
Registrant’s telephone number, including area code: (312) 655-4400
Date of fiscal year end: October 31
Date of reporting period: April 30, 2013
| ITEM 1. | REPORTS TO STOCKHOLDERS. |
| The Semi-Annual Report to Stockholders is filed herewith. |
Goldman Sachs Funds

| Semi-Annual Report | April 30, 2013 | |||
Fundamental Emerging Markets Equity Funds | ||||
Asia Equity | ||||
BRIC | ||||
China Equity | ||||
Emerging Markets Equity | ||||
N-11 Equity | ||||

Goldman Sachs Fundamental
Emerging Markets Equity Funds
| n | ASIA EQUITY |
| n | BRIC |
| n | CHINA EQUITY |
| n | EMERGING MARKETS EQUITY |
| n | N-11 EQUITY |
TABLE OF CONTENTS | ||||
Principal Investment Strategies and Risks | 1 | |||
Investment Process | 3 | |||
Market Review | 4 | |||
Portfolio Management Discussions and Performance Summaries | 7 | |||
Schedules of Investments | 37 | |||
Financial Statements | 52 | |||
Financial Highlights | 58 | |||
Notes to Financial Statements | 68 | |||
Other Information | 84 | |||
| NOT FDIC-INSURED | May Lose Value | No Bank Guarantee | ||
GOLDMAN SACHS FUNDAMENTAL EMERGING MARKETS EQUITY FUNDS
Principal Investment Strategies and Risks
This is not a complete list of risks that may affect the Funds. For additional information concerning the risks applicable to the Funds, please see the Funds’ Prospectuses.
The Goldman Sachs Asia Equity Fund invests primarily in a diversified portfolio of equity investments in Asian issuers (excluding Japanese issuers). The Fund is subject to market risk, which means that the value of the securities in which it invests may go up or down in response to the prospects of individual companies, particular sectors and/or general economic conditions. Foreign and emerging markets investments may be more volatile than investments in U.S. securities and are subject to the risks of currency fluctuations and adverse economic or political developments. Because of its exposure to Asian issuers, the Fund is subject to greater risk of loss as a result of adverse securities markets, exchange rates and social, political, regulatory or economic events that may occur in Asian countries. The securities of mid- and small-capitalization companies involve greater risks than those associated with larger, more established companies and may be subject to more abrupt or erratic price movements. At times, the Fund may be unable to sell certain of its illiquid investments without a substantial drop in price, if at all.
The Goldman Sachs BRIC Fund invests primarily in a portfolio of equity investments in Brazil, Russia, India and China (“BRIC countries”) or in issuers that participate in the markets of the BRIC countries. The Fund is subject to market risk, which means that the value of the securities in which it invests may go up or down in response to the prospects of individual companies, particular sectors and/ or general economic conditions. Foreign and emerging markets investments may be more volatile than investments in U.S. securities and are subject to the risks of currency fluctuations and adverse economic or political developments. Because of its exposure to the BRIC countries, the Fund is subject to greater risk of loss as a result of adverse securities markets, exchange rates and social, political, regulatory or economic events that may occur in those countries. Because the Fund may invest heavily in specific sectors, the Fund is subject to greater risk of loss as a result of adverse economic, business or other developments affecting such sectors. At times, the Fund may be unable to sell certain of its illiquid investments without a substantial drop in price, if at all. The Fund is “non-diversified” and may invest a larger percentage of its assets in fewer issuers than “diversified” mutual funds. Accordingly, the Fund may be more susceptible to adverse developments affecting any single issuer held in its portfolio and to greater losses resulting from these developments.
The Goldman Sachs China Equity Fund invests primarily in a portfolio of equity investments that are tied economically to China or in issuers that participate in the markets of China. The Fund is subject to market risk, which means that the value of the securities in which it invests may go up or down in response to the prospects of individual companies, particular sectors or governments and/or general economic conditions. Foreign and emerging markets investments, including Chinese securities, may be more volatile and less liquid than U.S. securities and are subject to the risks of currency fluctuations and adverse economic or political developments. Because of its exposure to China, the Fund is subject to greater risk of loss as a result of adverse securities markets, exchange rates and social, political, regulatory or economic events which may occur in China. Because the Fund may invest heavily in specific sectors, the Fund is subject to greater risk of loss as a result of adverse economic, business or other developments affecting such sectors. The Fund may concentrate its investments in a specific industry (only in the event that that industry represents 20% or more of the Fund’s benchmark index at the time of investment), subjecting it to greater risk of loss as a result of adverse economic, business or other developments affecting that industry. The securities of mid- and small-capitalization companies involve greater risks than those associated with larger, more established companies and may be subject
1
GOLDMAN SACHS FUNDAMENTAL EMERGING MARKETS EQUITY FUNDS
to more abrupt or erratic price movements. At times, the Fund may be unable to sell certain of its illiquid investments without a substantial drop in price, if at all. The Fund is “non-diversified” and may invest a larger percentage of its assets in fewer issuers than “diversified” mutual funds. Accordingly, the Fund may be more susceptible to adverse developments affecting any single issuer held in its portfolio and to greater losses resulting from these developments.
The Goldman Sachs Emerging Markets Equity Fund invests primarily in a diversified portfolio of equity investments in emerging country issuers. The Fund is subject to market risk, which means that the value of the securities in which it invests may go up or down in response to the prospects of individual companies, particular sectors and/or general economic conditions. Foreign and emerging markets investments may be more volatile than investments in U.S. securities and are subject to the risks of currency fluctuations and adverse economic or political developments. The securities markets of emerging countries have less government regulation and are subject to less extensive accounting and financial reporting requirements than the markets of more developed countries. Because the Fund may invest heavily in specific sectors, the Fund is subject to greater risk of loss as a result of adverse economic, business or other developments affecting such sectors. At times, the Fund may be unable to sell certain of its illiquid investments without a substantial drop in price, if at all.
The Goldman Sachs N-11 Equity Fund invests primarily in a portfolio of equity investments that are tied economically to the “N-11 countries” or in issuers that participate in the markets of the following N-11 countries: Bangladesh, Egypt, Indonesia, Mexico, Nigeria, Pakistan, Philippines, South Korea, Turkey and Vietnam. While Iran is among the N-11 countries, the Fund will not invest in issuers organized under the laws of Iran, or domiciled in Iran, or in certain other issuers as necessary to comply with U.S. economic sanctions against Iran. The Fund is subject to market risk, which means that the value of the securities in which it invests may go up or down in response to the prospects of individual companies, particular sectors and/or general economic conditions. Foreign and emerging markets investments may be more volatile than investments in U.S. securities and are subject to the risks of currency fluctuations and adverse economic or political developments. Such securities are also subject to foreign custody risk. Because of its exposure to the N-11 countries, the Fund is subject to greater risk of loss as a result of adverse securities markets, exchange rates and social, political, regulatory or economic events that may occur in those countries. The N-11 countries generally have smaller economies or less developed capital markets than traditional emerging markets countries, and, as a result, the risks of investing in these countries are magnified. Because the Fund may invest heavily in specific sectors, the Fund is subject to greater risk of loss as a result of adverse economic, business or other developments affecting such sectors. At times, the Fund may be unable to sell certain of its illiquid investments without a substantial drop in price, if at all. The Fund is “non-diversified” and may invest a larger percentage of its assets in fewer issuers than “diversified” mutual funds. Accordingly, the Fund may be more susceptible to adverse developments affecting any single issuer held in its portfolio and to greater losses resulting from these developments.
Changes Made to the Team’s Management
Effective June 10, 2013, Gabriella Antici, Head of Latin America Equity and a co-portfolio manager for the BRIC and Emerging Markets Equity Funds, is no longer with the Firm.
2
GOLDMAN SACHS FUNDAMENTAL EMERGING MARKETS EQUITY FUNDS
What Differentiates Goldman Sachs’ Fundamental Emerging Markets Equity Investment Process?
Goldman Sachs’ Fundamental Emerging Markets Equity investment process is based on the belief that strong, consistent results are best achieved through expert stock selection, performed by our dedicated Emerging Markets Team that works together on a global scale. Our deep, diverse and experienced team of research analysts and portfolio managers combines local insights with global, industry-specific expertise to identify its best investment ideas.


| n | The Emerging Markets Equity research team, based in the United States, United Kingdom, Japan, China, Korea, Singapore, Brazil, India, and Australia focuses on long- term business and management quality |
| n | Proprietary, bottom-up research is the key driver of our investment process |
| n | Analysts collaborate regularly to leverage regional and industry-specific research and insights |

| n | Members of each local investment team are aligned by sector and are responsible for finding ideas with the best risk-adjusted upside in their respective areas of coverage |
| n | The decision-making process includes active participation in frequent and regular research meetings |
| n | The Emerging Market Equity team benefits from the country and currency expertise of our Global Emerging Markets Debt and Currency teams |

| n | Security selections are aligned with levels of investment conviction and risk-adjusted upside |
| n | Continual risk monitoring identifies various risks at the stock and portfolio level and assesses whether they are intended and justified |
| n | Dedicated portfolio construction team assists in ongoing monitoring and adjustment of the Funds |

Emerging markets equity portfolios that strive to offer:
| n | Access to markets across emerging markets |
| n | Disciplined approach to stock selection |
| n | Optimal risk/return profiles |
3
MARKET REVIEW
Goldman Sachs Fundamental Emerging Markets Equity Funds
Market Review
Emerging markets equities advanced during the six-month period ended April 30, 2013 (the “Reporting Period”). The MSCI Emerging Markets Index (net, unhedged) (the “MSCI EM Index”) posted a return of 5.29%.* While generating solid positive absolute returns, emerging markets equities lagged developed markets equities, as measured by the MSCI EAFE Index, as concerns over slowing economic growth in several regions weighed on many of the larger growth and emerging markets during the Reporting Period. In turn, a number of countries’ central banks began to cut interest rates in an effort to boost economic growth.
Improving economic data for China lifted the Chinese equity markets and others in the region toward the end of 2012, but those same markets pulled back in 2013 on fears of new regulation and tightening measures in China. China’s equity market lagged the MSCI EM Index for the Reporting Period overall, but Asia was still the best performing region during the Reporting Period, with many markets significantly outperforming the MSCI EM Index. The Philippine equity market, which received its first investment grade rating for its debt from Fitch, posted the strongest returns during the Reporting Period. Thailand, Indonesia and Taiwan also notably outperformed. Outside of Asia, the only country components of the MSCI EM Index to post double-digit gains were Turkey and Mexico. Weakness in the South Korean equity market reflected disappointment that the Bank of Korea did not cut interest rates amidst lackluster economic growth projections and worries about the effects of the weak yen on South Korea’s exports. North Korea’s provocations drew additional concern. The Russian equity market was also particularly weak during the Reporting Period, reflecting economic growth concerns, which, in turn, weakened the ruble. The Economic Development Ministry significantly reduced its forecast for Russian GDP growth for 2013 to 2.4%. Generating negative returns during the Reporting Period were some smaller equity markets, including those of Egypt, Czech Republic, Colombia and South Africa.
During the Reporting Period, financials was the best performing sector in the MSCI EM Index, as a number of countries cut interest rates. The consumer staples and information technology sectors also significantly outperformed. The materials and energy sectors were the only ones within the MSCI EM Index to generate negative returns during the Reporting Period, primarily reflecting weaker commodity prices, which, in turn, declined on concerns over slowing economic growth, particularly in China.
Looking Ahead
During the Reporting Period, developed markets equities outperformed emerging markets equities by a significant margin. Part of this outperformance was on the back of the structural shift in policy stance in Japan, which buoyed its market, but it was also related to the steadily improving outlook for economic growth in the U.S. While challenges do still exist in developed markets — as evidenced by impact of the Cyprus banking crisis and the re-emergence of concerns around the long-term sustainability of the euro — positive momentum in the U.S. real estate market and evidence that structural labor reforms in peripheral Europe have started to take hold have helped support an improved economic growth outlook.
| *All | index returns are expressed in U.S. dollar terms. |
4
MARKET REVIEW
Despite this improving macroeconomic backdrop, growth and emerging market equities lagged, as corporate earnings failed to meet expectations. With the improving macroeconomic cycle, we are looking for a turn in the earnings cycle across the growth and emerging market universe and some positive earnings momentum going forward. We believe that as we see further improvements in economic growth expectations — in particular as we see more evidence of China rebalancing toward a more sustainable, consumption-oriented economy, we may well start to see earnings follow suit. Heading into the remainder of 2013, we expect our stock selection to continue to reflect two key themes.
First, we have sought to position the Funds’ portfolios for a cyclical recovery across the growth and emerging markets. While the MSCI EM Index rallied strongly in 2012, this performance was to a large extent driven by defensive sectors, particularly health care and consumer staples. At the end of the Reporting Period, we believed the majority of stocks in defensive sectors were fairly valued and offered little earnings upside. Instead, we prefer to be overweight cyclicals, particularly within the information technology, industrials and consumer discretionary sectors, where we are finding companies trading at what we consider to be attractive valuations given their earnings outlooks. As long as the U.S. economy continues to deliver some growth, China’s macroeconomic data continues to improve and Europe’s debt crisis does not further deteriorate, we believe cyclical sectors should likely have positive earnings momentum in 2013 overall. Within the information technology sector, we like companies in South Korea, Taiwan and India that have strong competitive advantages in their industries and are well positioned to benefit from a cyclical uptick in demand for their services and the structural growth of smart phones and tablets. Within industrials, we like companies we believe were oversold last year on the back of downward earnings revisions and concerns about weakening global demand and industrial activity. We think this negative news was already priced in at the end of the Reporting Period, and these stocks can benefit incrementally from cyclical stabilization.
The second theme we expect to implement in our stock selection process over the near term is that we intend to seek exposure to secular growth linked to growth and emerging markets consumption. We continue to believe domestic consumption should be one of the key investment opportunities of this decade, with three billion people in the growth markets alone expected to enter the middle and high income classes by 2050, as large and young populations join the workforce and have more discretionary income.1 We like consumer names across the BRIC (Brazil, Russia, India and China) and N-112 markets that are market share leaders with strong management teams that we believe are able to deliver earnings growth and returns to shareholders. In addition, we like financials in growth and emerging markets able to capture the benefits of increasing credit penetration and growth of the domestic financials sectors.
| 1 | Source: Goldman Sachs Global ECS (Economics, Commodities and Strategy) Research, February 2011. Change in the number of people with incomes above $6,000 in 2007 PPP (purchasing power parity). Middle income class: $6,000 - $30,000. High income: over $30,000. |
| 2 | The Next Eleven, known also as the N-11, are the eleven countries — Bangladesh, Egypt, Indonesia, Iran, Mexico, Nigeria, Pakistan, Philippines, Turkey, South Korea and Vietnam — we have identified as having a high potential of becoming, along with the BRICs, the world’s largest economies in the 21st century. |
5
MARKET REVIEW
Despite the fact that growth and emerging markets equities outperformed developed markets equities in 2012, performance during the first four months of 2013 meant that the MSCI EM Index was trading at a significant discount to its long-term average and relative to developed markets at the end of the Reporting Period. We believe this offers an attractive entry point for investors. As bottom-up fundamental investors, we constantly look across a broad range of sectors, countries and market capitalizations in order to identify the most compelling investment opportunities trading at attractive valuations. In particular, we look for companies with improving balance sheets and sustainable competitive advantages that we believe are able to withstand inflationary pressures on their margins while taking advantage of secular growth themes in growth and emerging markets. Finally, we seek to invest in companies with strong corporate governance track records, especially with respect to their treatment of minority shareholders.
As always, we maintain our focus on seeking high-quality equity investments trading at compelling valuations and intend to stay true to our long-term discipline as we seek to navigate potentially volatile markets ahead.
6
PORTFOLIO RESULTS
Goldman Sachs Asia Equity Fund
Portfolio Management Discussion and Analysis
Below, the Goldman Sachs Fundamental Asia ex Japan Equity Portfolio Management Team discusses the Goldman Sachs Asia Equity Fund’s (the “Fund”) performance and positioning for the six-month period ended April 30, 2013 (the “Reporting Period”).
| Q | How did the Fund perform during the Reporting Period? |
| A | During the Reporting Period, the Fund’s Class A, B, C and Institutional Shares generated cumulative total returns, without sales charges, of 7.19%, 6.79%, 6.79% and 7.43%, respectively. These returns compare to the 7.34% cumulative total return of the Fund’s benchmark, the MSCI All Country Asia ex-Japan Index (net, USD, unhedged, with dividends reinvested) (the “Index”), during the same time period. |
| Q | What key factors were responsible for the Fund’s performance during the Reporting Period? |
| A | The Fund’s performance relative to the Index during the Reporting Period can be primarily attributed to individual stock selection. From a country perspective, stock selection was strongest in South Korea, Indonesia and Thailand. Partially offsetting these positives was weak stock selection in China, Taiwan and India. |
| Q | What were some of the Fund’s best-performing individual stocks? |
| A | The Fund benefited most relative to the Index from holdings in Airports of Thailand, KT Skylife and Nong Shim Holdings. |
| The top individual stock contributor to the Fund’s results during the Reporting Period was airport developer and operator Airports of Thailand. Its strong share price performance was driven by robust air travel demand, as passenger throughput and aircraft movement exceeded expectations. At the end of the Reporting Period, we expected sustained strong traffic growth, underpinned by buoyant tourism as well as a booming domestic economy, which, in turn, is anticipated to boost purchasing power of Thai consumers. |
| Another significant contributor was KT Skylife, which provides digital satellite broadcasting services to customers in South Korea. The company posted strong returns during the Reporting Period given that satellite+IPTV service has been the only growth segment in the South Korean telecommunication industry of late. (IPTV is Internet protocol television, a system through which television services are delivered using the Internet protocol suite over a packet-switched network, such as the Internet, instead of being delivered through traditional terrestrial, satellite signal and cable television formats.) KT Skylife also attained almost 500,000 new subscribers in 2012, which equals 18% of existing subscribers in the nation and a 50% share of total new subscribers in the industry within South Korea. At the end of the Reporting Period, we expected the company to have higher operating leverage in calendar year 2013 but also at least a 50% increase in fee income from television home- shopping companies. |
| Nong Shim Holdings is an investment holding company. The company, through its subsidiaries, produces foods, manufactures packaging materials and provides engineering and advertising services. The company performed well during the Reporting Period as many expected operating margin improvement in calendar year 2013 due to market share gain and consequent savings in fixed and marketing costs. Also, penetration of its premium products sped up and was expected to reach 10% at year-end 2013, which is often regarded as an inflection point of full-scale consumer recognition. Flour prices were expected to go up at the end of the Reporting Period, and we believe the company could pass the increase on as early as the second half of this year. Raw material cost inflation has been a good reason for product price hikes, the single most important catalyst for share price appreciation of food and beverage industry participants. |
| Q | Which stocks detracted significantly from the Fund’s performance during the Reporting Period? |
| A | Detracting most from the Fund’s results relative to the Index were positions in insurance company Samsung Fire & Marine Insurance, cement producer China National Building Material and information technology products distributor Digital China Holdings. |
7
PORTFOLIO RESULTS
| During the Reporting Period, fierce competition among insurers to earn higher and more premiums meant incurring heavy up-front agent fees, which in turn, resulted in worse than expected earnings during the fourth quarter of 2012. Samsung Fire & Marine Insurance, the largest non-life insurer as measured by premiums, underperformed second-tier companies in securing new customers due primarily to its less aggressive marketing policy. Also, the company’s loss ratio increased both from seasonal effects and from certain structural issues inherent within the South Korean auto insurance business segment. Finally, industry competition increased. With the wall between life and non-life insurers getting lower, life insurers are coming up with more competitive products to penetrate the market traditionally dominated by non-life insurers. We sold the Fund’s position in Samsung Fire & Marine Insurance by the end of the Reporting Period. |
| China National Building Material is one of the largest cement producers in China. Its stock performed poorly during the Reporting Period given that its gearing ratio stayed high at the end of 2012. (Gearing ratio is a general term describing a financial ratio that compares some form of owner’s equity, or capital, to borrowed funds. Gearing is a measure of financial leverage, demonstrating the degree to which a firm’s activities are funded by owner’s funds versus creditor’s funds.) Also, a rumored anti-trust investigation weakened the market’s confidence on the company’s ability to raise its prices. At the end of the Reporting Period, we still believed cement prices would improve in eastern and southwestern China on demand recovery and on more disciplined competition. |
| Digital China Holdings, through its subsidiaries, distributes foreign brand information technology products and provides system integration services in China. The company also develops and distributes networking products. Its share price declined during the Reporting Period for two primary reasons. First, the stock fell in January 2013 after the company’s chairman sold some shares to repay a bank loan he had used to complete a management buy-out, as the loan was due that same month. Second, the share price corrected further in February 2013 on the announcement by China’s Ministry of Finance that Digital China Holdings would not be allowed to bid on government projects for three years. We trimmed the Fund’s position in Digital China Holdings, but held the position, carefully monitoring the company to see if the Ministry of Finance ban has a broader business impact than suggested at the end of the Reporting Period. |
| Q | Which equity market sectors most significantly affected Fund performance during the Reporting Period? |
| A | The sectors that contributed most positively to the Fund’s performance relative to the Index were consumer staples, consumer discretionary and energy, each due primarily to effective stock selection. Having an overweight allocation to consumer discretionary, which outpaced the Index during the Reporting Period, also added value. The biggest detractors from the Fund’s relative results during the Reporting Period were the financials, materials and information technology sectors, each due primarily to poor stock selection. |
| Q | How did the Fund use derivatives and similar instruments during the Reporting Period? |
| A | During the Reporting Period, we did not use derivatives to hedge positions or as part of an active management strategy, but we used index futures on an opportunistic basis to ensure the Fund remained almost fully exposed to equities following cash inflows or stock sales. |
| Q | Did the Fund make any significant purchases or sales during the Reporting Period? |
| A | We established a Fund position in ENN Energy, a natural gas distributor in China, during the Reporting Period. We believe an investment in the company is a way to participate in the rising consumption of natural gas, which provides a clean energy solution for China. With its franchise in 110 cities and its plans for further expansion, we believe ENN Energy offers attractive growth prospects and an improving operating cash flow position. |
| We added to the Fund’s position in integrated oil and natural gas company PetroChina, as we expect its losses from imported gas may have peaked in 2012 as import volume growth appears to have slowed and more gas is being supplied to Southern China, including Hong Kong, where prices are comparatively more market driven. We see more opportunities for market-based pricing of natural gas to be introduced, at least in certain regions, in 2013 should inflation stay low and China’s import requirement for natural gas increase to approximately 20%, as we anticipate*. We also expect the refining segment of the company’s business to show improvement in 2013. |
8
| *The | economic and market forecasts presented herein have been generated by GSAM for informational purposes as of the date of this presentation. There can be no assurance that the forecasts will be achieved. Please see additional disclosures at the end of this presentation. |
PORTFOLIO RESULTS
| In addition to the sale of Samsung Fire & Marine Insurance, already mentioned, we trimmed the Fund’s position in CNOOC, a Chinese producer of crude oil and natural gas primarily involved in upstream production activities. (Upstream production activities generally include those operations stages in the oil and gas industry that involve exploration and production.) We reduced the Fund’s position in the stock, as we expected the company’s operating margin to be pressured by a relatively flat oil price environment amid rising costs. Also, we felt the US$15 billion deal with Calgary oil and gas producer Nexen, though likely a long-term positive for boosting its reserves and production growth, could bring about near-term uncertainties, as the earnings per share accretion is small and thus successful execution and integration is key. |
| Q | Were there any notable changes in the Fund’s weightings during the Reporting Period? |
| A | Most sector weights are usually established within a relatively narrow range from the Index, as our team prefers to make decisions at the individual stock level, where we believe we can generate more added value. That said, during the Reporting Period, the Fund’s exposure to information technology, industrials and utilities increased and its allocations to financials, health care and materials decreased. |
| Similarly, allocations to countries are directly the result of various stock selection decisions. During the Reporting Period, the Fund’s allocations to Indonesia, Thailand and the Philippines increased, and its exposure to Taiwan, Singapore and Malaysia decreased. |
| Q | How was the Fund positioned relative to the Index at the end of the Reporting Period? |
| A | At the end of the Reporting Period, the Fund had overweighted exposure to Indonesia, China and Thailand compared to the Index. On the same date, the Fund had underweighted exposure relative to the Index to Hong Kong, Taiwan, India, Malaysia and Singapore and was relatively neutrally weighted compared to the Index in the Philippines and South Korea. |
| From a sector allocation perspective, the Fund had overweighted positions relative to the Index in the information technology, industrials and consumer discretionary sectors at the end of the Reporting Period. On the same date, the Fund had underweighted positions compared to the Index in the financials, materials, consumer staples and health care sectors and was relatively neutrally weighted compared to the Index in telecommunication services, energy and utilities. |
| As always, we remained focused on individual stock selection, with sector and country positioning being a secondary, closely-monitored effect. |
9
FUND BASICS
Asia Equity Fund
as of April 30, 2013
| PERFORMANCE REVIEW | ||||||||||
| November 1, 2012–April 30, 2013 | Fund Total Return (based on NAV)1 | MSCI AC (All Country) Asia ex Japan Index2 | ||||||||
| Class A | 7.19 | % | 7.34 | % | ||||||
| Class B | 6.79 | 7.34 | ||||||||
| Class C | 6.79 | 7.34 | ||||||||
| Institutional | 7.43 | 7.34 | ||||||||
| 1 | The net asset value (“NAV”) represents the net assets of the class of the Fund (ex-dividend) divided by the total number of shares of the class outstanding. The Fund’s performance assumes the reinvestment of dividends and other distributions. The Fund’s performance does not reflect the deduction of any applicable sales charges. |
| 2 | The MSCI AC (All Country) Asia ex Japan Index (net, USD, unhedged, with dividends reinvested) is a free float-adjusted market capitalization weighted index that is designed to measure the equity market performance of Asia, excluding Japan. The MSCI AC Asia ex Japan Index consists of the following 10 developed and emerging market country indices: China, Hong Kong, India, Indonesia, Korea, Malaysia, Philippines, Singapore, Taiwan, and Thailand. This index is net of dividends reinvested after deduction of withholding taxes, using a tax rate applicable to non-resident institutional investors who do not benefit from double taxation treaties. This series approximates the minimum possible dividend reinvestment. The dividend is reinvested after deduction of withholding tax, applying the rate to nonresident individuals who do not benefit from double taxation treaties. MSCI Barra uses withholding tax rates applicable to Luxembourg holding companies, as Luxembourg applies the highest rates. It is not possible to invest directly in an index. |
| STANDARDIZED TOTAL RETURNS3 | ||||||||||||||
| For the period ended 3/31/13 | One Year | Five Years | Ten Years | Since Inception | Inception Date | |||||||||
| Class A | -3.12 | % | -2.01% | 11.24% | 1.95% | 7/08/94 | ||||||||
| Class B | -3.22 | -2.04 | 11.21 | 0.90 | 5/01/96 | |||||||||
| Class C | 0.79 | -1.65 | 11.05 | 1.12 | 8/15/97 | |||||||||
| Institutional | 2.97 | -0.50 | 12.40 | 1.93 | 2/02/96 | |||||||||
| 3 | The Standardized Total Returns are average annual total returns as of the most recent calendar quarter-end. They assume reinvestment of all distributions at NAV. These returns reflect a maximum initial sales charge of 5.5% for Class A Shares, the assumed contingent deferred sales charge for Class B Shares (5% maximum declining to 0% after six years) and the assumed contingent deferred sales charge for Class C Shares (1% if redeemed within 12 months of purchase). Class B Shares convert automatically to Class A Shares on or about the fifteenth day of the last month of the calendar quarter that is eight years after purchase. Returns for Class B Shares for the period after conversion reflect the performance of Class A Shares. Because Institutional Shares do not involve a sales charge, such a charge is not applied to their Standardized Total Returns. The Fund’s Class B Shares are no longer available for purchase by new or existing shareholders (although current Class B shareholders may continue to reinvest income and capital gains distributions into Class B Shares, and Class B shareholders may continue to exchange their shares for Class B Shares of certain other Goldman Sachs Funds). |
The returns set forth in the tables above represent past performance. Past performance does not guarantee future results. The Fund’s investment return and principal value will fluctuate so that an investor’s shares, when redeemed, may be worth more or less than their original cost. Current performance may be lower or higher than the performance quoted above. Please visit our web site at www.goldmansachsfunds.com to obtain the most recent month-end returns. Performance reflects applicable fee waivers and/or expense limitations in effect during the periods shown. In their absence, performance would be reduced. Returns do not reflect the deduction of taxes that a shareholder would pay on Fund distributions or the redemption of Fund shares.
10
FUND BASICS
| EXPENSE RATIOS4 | ||||||||||
| Net Expense Ratio (Current) | Gross Expense Ratio (Before Waivers) | |||||||||
| Class A | 1.78 | % | 2.24 | % | ||||||
| Class B | 2.53 | 2.98 | ||||||||
| Class C | 2.53 | 2.97 | ||||||||
| Institutional | 1.38 | 1.79 | ||||||||
| 4 | The expense ratios of the Fund, both current (net of applicable fee waivers and/or expense limitations) and before waivers (gross of applicable fee waivers and/or expense limitations) are as set forth above according to the most recent publicly available Prospectus for the Fund and may differ from the expense ratios disclosed in the Financial Highlights in this report. The Fund’s waivers and/or expense limitations will remain in place through at least February 28, 2014, and prior to such date the Investment Adviser may not terminate the arrangements without the approval of the Fund’s Board of Trustees. If these arrangements are discontinued in the future, the expense ratios may change without shareholder approval. |
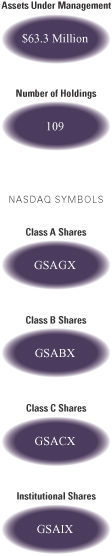
| TOP TEN HOLDINGS AS OF 4/30/135 | ||||||||||
| Holding | % of Total Net Assets | Line of Business | Country | |||||||
| Samsung Electronics Co. Ltd. | 5.6 | % | Semiconductors & Semiconductor Equipment | South Korea | ||||||
| Taiwan Semiconductor Manufacturing Co. Ltd. | 4.5 | Semiconductors & Semiconductor Equipment | Taiwan | |||||||
| DBS Group Holdings Ltd. | 2.7 | Banks | Singapore | |||||||
| China Construction Bank Corp. Class H | 2.5 | Banks | China | |||||||
| SK Hynix, Inc. | 2.2 | Semiconductors & Semiconductor Equipment | South Korea | |||||||
| Industrial & Commercial Bank of China Ltd. Class H | 2.1 | Banks | China | |||||||
| Singapore Telecommunications Ltd. | 2.0 | Telecommunication Services | Singapore | |||||||
| Tencent Holdings Ltd. | 1.8 | Software & Services | China | |||||||
| KT Skylife Co. Ltd. | 1.7 | Media | South Korea | |||||||
| China Mobile Ltd. | 1.7 | Telecommunication Services | Hong Kong | |||||||
| 5 | The top 10 holdings may not be representative of the Fund’s future investments. |
11
FUND BASICS
| FUND VS. BENCHMARK SECTOR ALLOCATIONS6 |
| As of April 30, 2013 |
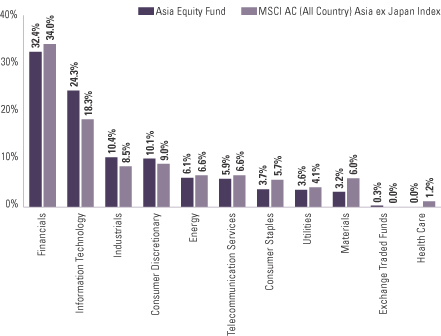
| 6 | The Fund is actively managed and, as such, its composition may differ over time. Consequently, the Fund’s overall sector allocations may differ from percentages contained in the graph above. The graph categorizes investments using Global Industry Classification Standard (“GICS”), however, the sector classifications used by the portfolio management team may differ from GICS. Underlying sector allocations of exchange traded funds held by the Fund are not reflected in the graph above. The percentage shown for each investment category reflects the value of investments in that category as a percentage of market value. The graph depicts the Fund’s investments but may not represent the Fund’s market exposure due to the exclusion of certain derivatives, if any, as listed in the Additional Investment Information section of the Schedule of Investments. |
12
PORTFOLIO RESULTS
Goldman Sachs BRIC Fund
Portfolio Management Discussion and Analysis
Below, the Goldman Sachs Fundamental Emerging Markets Equity Portfolio Management Team discusses the Goldman Sachs BRIC Fund’s (the “Fund”) performance and positioning for the six-month period ended April 30, 2013 (the “Reporting Period”).
| Q | How did the Fund perform during the Reporting Period? |
| A | During the Reporting Period, the Fund’s Class A, C, Institutional and IR Shares generated cumulative total returns, without sales charges, of 1.53%, 1.16%, 1.77% and 1.61%, respectively. These returns compare to the 3.90% cumulative total return of the Fund’s benchmark, the MSCI BRIC Index (net, unhedged) (the “Index”), during the same period. |
| Q | What key factors were responsible for the Fund’s performance during the Reporting Period? |
| A | The Fund underperformed the Index during the Reporting Period. While the Fund did benefit from effective stock selection in Russia, such positives were not enough to completely offset the detracting effect of its weak stock selection in China, Brazil and India. |
| Q | Which stocks detracted significantly from the Fund’s performance during the Reporting Period? |
| A | Detracting most from the Fund’s results relative to the Index were positions in Brazilian energy company Petroleo Brasileiro (“Petrobras”), Brazilian appliance retailer Magazine Luiza and Chinese information technology products distributor Digital China Holdings. |
| Leading Brazilian integrated energy company Petrobras saw its shares decline during the Reporting Period. Investors were disappointed, as increases in official set prices were lower than desired. Further, Petrobras had been selling imported fuel at a loss in its domestic market due to capacity constraints at its domestic refineries. Price increases implemented during the Reporting Period were seen as likely not to be sufficient to make Petrobras’ refining segment profitable. We trimmed the Fund’s position in the stock by the end of the Reporting Period. |
| Magazine Luiza, one of the largest household appliance retail chains in Brazil, performed poorly, as the company reported weaker than expected fourth quarter 2012 numbers. While the company reported strong sales growth, its margins were disappointing on the back of additional promotional activities the company undertook to stimulate sales growth. Further, benefits of the integration of the company’s acquisitions were not reflected in its fourth quarter 2012 results, which the market was expecting. Finally, a decline in February 2013 retail sales in Brazil broadly raised concerns about the impact of the macro environment on Magazine Luiza’s profitability going forward. |
| Digital China Holdings, through its subsidiaries, distributes foreign brand information technology products and provides system integration services in China. The company also develops and distributes networking products. Its share price declined during the Reporting Period for two primary reasons. First, the stock fell in January 2013 after the company’s chairman sold some shares to repay a bank loan he had used to complete a management buy-out, as the loan was due that same month. Second, the share price corrected further in February 2013 on the announcement by China’s Ministry of Finance that Digital China Holdings would not be allowed to bid on government projects for three years. We trimmed the Fund’s position in Digital China Holdings, carefully monitoring the company to see if the Ministry of Finance ban has a broader business impact than suggested at the end of the Reporting Period. |
13
PORTFOLIO RESULTS
| Q | What were some of the Fund’s best-performing individual stocks? |
| A | The strongest contributors to the Fund’s performance during the Reporting Period were Russian retailer Magnit, Brazilian building materials manufacturer Duratex and Chinese automaker Great Wall Motor. |
| Magnit, one of the largest retailers in Russia, was the top contributor to the Fund’s performance during the Reporting Period. The Fund’s overweighted position in Magnit contributed to relative returns, as the company reported stronger than expected fourth quarter 2012 results, which, in turn, prompted positive earnings revisions for the company. In addition, Magnit’s strong results improved the investor outlook for the Russian consumer sector broadly. Further, Magnit’s first quarter 2013 results were better than expected, as the company continued to deliver top-line growth. Also, its earnings before taxes, interest, depreciation and amortization (“EBITDA”) margin appeared to be stabilizing at levels significantly higher than initially anticipated by the market. Magnit’s management appeared optimistic about the company’s growth ahead and was guiding for more than 20% revenue growth for the next five years. For our team, Magnit continued, at the end of the Reporting Period, to be one of our highest conviction names in the consumer sector, as we believe the company’s strong margins are sustainable ahead, and we expect the company to continue enjoying healthy revenue growth coupled with increased investment over the remainder of 2013. |
| Duratex, a Brazilian company that specializes in the manufacture of wooden paneling for use in furniture and flooring and of metal and china fittings for use in bathrooms, was also a strong contributor to the Fund’s results. Its stock performed well following good fourth quarter 2012 results, as impressive wood board sales volumes helped drive earnings above market expectations. Further, its management guided for strong sales volume for the start of 2013, meaning upward revisions in consensus earnings. The company’s wood division is typically a late-cycle play on housing construction, as its products are purchased when new houses are sold. As such, we believe the construction boom seen in Brazil over the last few years can continue to be supportive of Duratex’s earnings prospects going forward. |
| Great Wall Motor is a local-brand automaker specializing in niche sports utility vehicles based in China. During the Reporting Period, its share price rose on the announcement of its preliminary fiscal year 2012 results, which beat consensus. At the same time, the company’s first quarter 2013 vehicle sales continued to grow. Investors bid up the company’s share price, incorporating another year of attractive earnings. |
| Q | Which equity market sectors most significantly affected Fund performance during the Reporting Period? |
| A | Relative to the Index, weak stock selection in the energy, industrials and financials sectors detracted most from the Fund’s performance during the Reporting Period. The key drivers of underperformance in the energy sector were the Fund’s positions in Petrobras, the Brazilian state-controlled energy company mentioned earlier, and Rosneft, the Russian oil major. Within the industrials sector, the Fund’s holdings in Zoomlion Heavy Industries, a Chinese construction machinery manufacturer, and Zhuzhou CSR Times, a Chinese company engaged in the manufacture of electrical components for the rail industry, detracted most from performance during the Reporting Period. In financials, the Fund’s holdings in Itau, one of the largest banks in Brazil, and in Credit Analysis and Research, a credit rating company in India, detracted most from returns. |
| Conversely, the only two sectors to contribute positively to the Fund’s performance were materials and consumer staples, where stock selection proved particularly effective. Notable contributors within materials were Brazilian building materials manufacturer Duratex, already mentioned, and Brazilian pulp and paper producer Klabin. Within consumer staples, the Fund’s holdings in two Russian retailers, Magnit and Dixy, as well as its holding in Indian spiritmaker United Spirits, were the largest contributors. |
14
PORTFOLIO RESULTS
| Q | How did the Fund use derivatives and similar instruments during the Reporting Period? |
| A | During the Reporting Period, the Fund gained exposure to select stocks through equity-linked notes and participatory notes. We used index futures on an opportunistic basis to ensure the Fund remained almost fully exposed to equities following cash inflows or stock sales. |
| Q | Did the Fund make any significant purchases or sales during the Reporting Period? |
| A | We elected to change the Fund’s positioning within the energy sector in China during the Reporting Period. We initiated a Fund position in PetroChina, the largest oil and gas producer in China, and sold out of the Fund’s position in CNOOC, the third largest national oil company. We initiated the position in PetroChina, as we expect its losses from imported gas may have peaked in 2012 as import volume growth appears to have slowed and more gas is being supplied to Southern China, including Hong Kong, where prices are comparatively more market driven. We believe more opportunities for market-based pricing of natural gas may be introduced, at least in certain regions, in 2013 should inflation stay low and China’s import requirement for natural gas increase to approximately 20%*, as we anticipate. We also expect the refining segment of the company’s business to show improvement in 2013. We decided to sell out of the Fund’s position in CNOOC, as we believe its lack of production growth, combined with relatively stable oil prices and escalating costs, is likely to increase operating margin pressures for the company. |
| Within the financials sector in China, we sold out of the Fund’s position in Shimao Property, a Chinese real estate developer, as the stock had performed well. We initiated a position in Agricultural Bank of China (“ABC”), one of the four state-owned banks in China. ABC has the largest number of branches domestically with 24,000 outlets and has an approximately 10% market share in loans and deposits. In our view, the bank provides exposure into development of China’s rural and hinterland, with its fast expanding business in the central and eastern regions of China. Also, with what we consider to be supportive financial ratios in terms of low loan-to-deposit ratio, we believe its net interest margin is more defensible than its peers. The bank has accumulated its non-performing loan coverage ratio to 300%, providing us with an added comfort factor. |
| Q | Were there any notable changes in the Fund’s weightings during the Reporting Period? |
| A | Most sector weights are usually established within a narrow range from the Index, as our team prefers to make decisions at the individual stock level, where we believe we can generate more added value. That said, during the Reporting Period, the Fund’s exposure relative to the Index in information technology, telecommunication services and utilities increased, and its allocations relative to the Index to consumer discretionary, energy, materials, consumer staples and financials decreased. |
| Resulting from various stock selection decisions, the Fund’s exposure relative to the Index to Russia and Brazil increased, and its allocation relative to the Index to China decreased. |
| Q | How was the Fund positioned relative to the Index at the end of the Reporting Period? |
| A | At the end of the Reporting Period, the Fund had overweighted exposure to Russia and Brazil and underweighted exposure to China and India relative to the Index. |
| From a sector perspective, the Fund had overweighted allocations to information technology, consumer discretionary and financials compared to the Index at the end of the Reporting Period. On the same date, the Fund had underweighted exposure to the consumer staples, utilities and energy sectors and was rather neutrally weighted relative to the Index in the industrials, materials and telecommunication services sectors. The Fund had no exposure to the health care sector at the end of the Reporting Period. |
| As always, we remained focused on individual stock selection, with sector and country positioning being a secondary, closely-monitored effect. |
15
| *The | economic and market forecasts presented herein have been generated by GSAM for informational purposes as of the date of this presentation. There can be no assurance that the forecasts will be achieved. Please see additional disclosures at the end of this presentation. |
FUND BASICS
BRIC Fund
as of April 30, 2013
| PERFORMANCE REVIEW | ||||||||||
| November 1, 2012–April 30, 2013 | Fund Total Return (based on NAV)1 | MSCI BRIC Index2 | ||||||||
| Class A | 1.53 | % | 3.90 | % | ||||||
| Class C | 1.16 | 3.90 | ||||||||
| Institutional | 1.77 | 3.90 | ||||||||
| Class IR | 1.61 | 3.90 | ||||||||
| 1 | The net asset value (“NAV”) represents the net assets of the class of the Fund (ex-dividend) divided by the total number of shares of the class outstanding. The Fund’s performance assumes the reinvestment of dividends and other distributions. The Fund’s performance does not reflect the deduction of any applicable sales charges. |
| 2 | The MSCI BRIC Index (net, unhedged, USD) is a free float-adjusted market capitalization weighted index that is designed to measure the equity market performance of the following four emerging market country indices: Brazil, Russia, India and China. This series approximates the minimum possible dividend reinvestment. The dividend is reinvested after deduction of withholding tax, applying the rate to non-resident individuals who do not benefit from double taxation treaties. MSCI Barra uses withholding tax rates applicable to Luxembourg holding companies, as Luxembourg applies the highest rates. It is not possible to invest directly in an index. |
| STANDARDIZED TOTAL RETURNS3 | ||||||||||||||||||
| For the period ended 3/31/13 | One Year | Five Years | Since Inception | Inception Date | ||||||||||||||
| Class A | -7.50 | % | -5.40 | % | 3.71 | % | 6/30/06 | |||||||||||
| Class C | -3.83 | -5.04 | 3.79 | 6/30/06 | ||||||||||||||
| Institutional | -1.78 | -3.96 | 4.99 | 6/30/06 | ||||||||||||||
| Class IR | -1.92 | N/A | -2.33 | 8/31/10 | ||||||||||||||
| 3 | The Standardized Total Returns are average annual total returns as of the most recent calendar quarter-end. They assume reinvestment of all distributions at NAV. These returns reflect a maximum initial sales charge of 5.5% for Class A Shares and the assumed contingent deferred sales charge for Class C Shares (1% if redeemed within 12 months of purchase). Because Institutional and Class IR Shares do not involve a sales charge, such a charge is not applied to their Standardized Total Returns. |
The returns set forth in the tables above represent past performance. Past performance does not guarantee future results. The Fund’s investment return and principal value will fluctuate so that an investor’s shares, when redeemed, may be worth more or less than their original cost. Current performance may be lower or higher than the performance quoted above. Please visit our web site at www.goldmansachsfunds.com to obtain the most recent month-end returns. Performance reflects applicable fee waivers and/or expense limitations in effect during the periods shown. In their absence, performance would be reduced. Returns do not reflect the deduction of taxes that a shareholder would pay on Fund distributions or the redemption of Fund shares.
16
FUND BASICS
| EXPENSE RATIOS4 | ||||||||||
| Net Expense Ratio (Current) | Gross Expense Ratio (Before Waivers) | |||||||||
| Class A | 1.70 | % | 1.96 | % | ||||||
| Class C | 2.45 | 2.71 | ||||||||
| Institutional | 1.30 | 1.56 | ||||||||
| Class IR | 1.45 | 1.71 | ||||||||
| 4 | The expense ratios of the Fund, both current (net of applicable fee waivers and/or expense limitations) and before waivers (gross of applicable fee waivers and/or expense limitations) are as set forth above according to the most recent publicly available Prospectus for the Fund and may differ from the expense ratios disclosed in the Financial Highlights in this report. The Fund’s waivers and/or expense limitations will remain in place through at least February 28, 2014, and prior to such date the Investment Adviser may not terminate the arrangements without the approval of the Fund’s Board of Trustees. If these arrangements are discontinued in the future, the expense ratios may change without shareholder approval. |
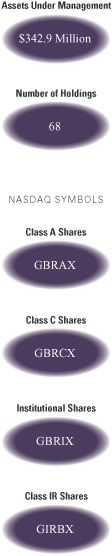
| TOP TEN HOLDINGS AS OF 4/30/135 | ||||||||||
| Holding | % of Total Net Assets | Line of Business | Country | |||||||
| OAO Lukoil ADR | 4.0 | % | Energy | Russia | ||||||
| China Mobile Ltd. | 3.8 | Telecommunication Services | Hong Kong | |||||||
| Petroleo Brasileiro SA ADR | 3.6 | Energy | Brazil | |||||||
| Tencent Holdings Ltd. | 3.5 | Software & Services | China | |||||||
| Sberbank of Russia | 3.4 | Banks | Russia | |||||||
| Banco Bradesco SA Preference Shares | 3.3 | Banks | Brazil | |||||||
| PetroChina Co. Ltd. Class H | 3.3 | Energy | China | |||||||
| China Construction Bank Corp. Class H | 2.8 | Banks | China | |||||||
| Itau Unibanco Holding SA Preference Shares | 2.8 | Banks | Brazil | |||||||
| China Petroleum & Chemical Corp. Class H | 2.6 | Energy | China | |||||||
| 5 | The top 10 holdings may not be representative of the Fund’s future investments. |
17
FUND BASICS
| FUND VS. BENCHMARK SECTOR ALLOCATIONS6 |
| As of April 30, 2013 |
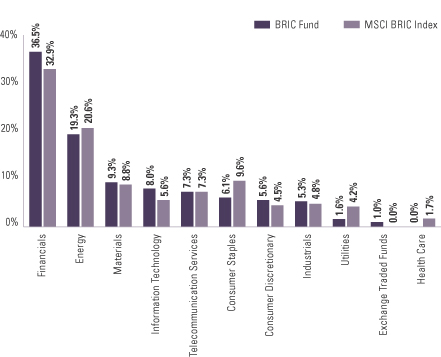
| 6 | The Fund is actively managed and, as such, its composition may differ over time. Consequently, the Fund’s overall sector allocations may differ from percentages contained in the graph above. The graph categorizes investments using Global Industry Classification Standard (“GICS”), however, the sector classifications used by the portfolio management team may differ from GICS. Underlying sector allocations of exchange traded funds held by the Fund are not reflected in the graph above. The percentage shown for each investment category reflects the value of investments in that category as a percentage of market value. The graph depicts the Fund’s investments but may not represent the Fund’s market exposure due to the exclusion of certain derivatives, if any, as listed in the Additional Investment Information section of the Schedule of Investments. |
18
PORTFOLIO RESULTS
China Equity Fund
Portfolio Management Discussion and Analysis
Below, the Goldman Sachs Fundamental Emerging Markets Equity Portfolio Management Team discusses the Goldman Sachs China Equity Fund’s (the “Fund”) performance and positioning for the six-month period ended April 30, 2013 (the “Reporting Period”).
| Q | How did the Fund perform during the Reporting Period? |
| A | During the Reporting Period, the Fund’s Class A, C, Institutional and IR Shares generated cumulative total returns, without sales charges, of 1.33%, 1.14%, 1.68% and 1.53%, respectively. These returns compare to the 3.09% cumulative total return of the Fund’s benchmark, the MSCI China Index (net, total return, unhedged, USD) (the “Index”), during the same time period. |
| Q | What economic and market factors most influenced China’s equity market as a whole during the Reporting Period? |
| A | China’s offshore equity market, as measured by the Index, underperformed both emerging market peers and developed equity markets broadly, as measured by the MSCI Emerging Markets Index and MSCI EAFE Index, respectively. The health care, energy and materials sectors declined most during the Reporting Period, attributable primarily to heightened economic growth concerns. Conversely, utilities stocks in the Index performed particularly well, posting robust double-digit gains, as investors sought defensive names with good earnings visibility. |
| China’s offshore equity market was volatile during the Reporting Period with interplay between fears of slowing domestic and global economic growth and expectations of policy easing. Headline inflation within China stayed steady at about 2.0% during the Reporting Period, except during the start of the Lunar New Year in February 2013, which, in turn, eased tightening concerns from the hawkish statement made by the central bank governor regarding inflation that same month. Also of note, China’s top securities regulator sped up the broadening of the financing channel for qualified foreign institutional investors (“QFII”), aiming to boost the domestic capital market. The accelerated QFII license and quota approvals helped drive positive investor sentiment on market liquidity. |
| In November 2012, China completed its once-in-a-decade leadership transition, removing some political uncertainty. As stated by the new Premier Li Keqiang, economic growth from urbanization and domestic consumption is set to be a key focus of China’s government for the next decade. The annual sessions of the Chinese People’s Political Consultative Conference and the National People’s Congress were held between March 3 and March 5, 2013. The government set several working targets during the conferences for 2013, including inflation of about 3.5%, Gross Domestic Product (“GDP”) growth at 7.5%, a deficit of 1.2 trillion yuan consisting of 850 billion yuan in central government deficit and 350 billion yuan in local government bonds, and increased volume of total exports and imports of approximately 8%. At the end of the Reporting Period, equity market consensus expected monetary policy to become less accommodative — though significant tightening was also considered unlikely — and fiscal policy to remain proactive and support household consumption in the months to come. |
| Q | What key factors were responsible for the Fund’s performance during the Reporting Period? |
| A | The Fund’s underperformance of the Index during the Reporting Period can be primarily attributed to individual stock selection. |
| Q | Which stocks detracted significantly from the Fund’s performance during the Reporting Period? |
| A | Among the stocks that detracted most from the Fund’s results relative to the Index were positions in cement producer China National Building Material, construction machinery manufacturer Zoomlion Heavy Industry and dairy producer China Mengniu Dairy. |
China National Building Material, a new position for the Fund during the Reporting Period, is one of the largest cement producers in China. Its stock performed poorly during the Reporting Period given that its gearing ratio stayed high at the end of 2012. (Gearing ratio is a general term describing a financial ratio that compares some form of owner’s equity, or capital, to borrowed funds. Gearing is a measure of financial leverage, demonstrating the degree to which a firm’s activities are funded by owner’s funds versus creditor’s funds.) Also, a rumored anti-trust investigation weakened the market’s confidence on the company’s ability to raise its prices. At the end of the Reporting Period, we still |
19
PORTFOLIO RESULTS
believed cement prices would improve in eastern and southwestern China on demand recovery and on more disciplined competition. |
| Zoomlion Heavy Industry, a construction machinery manufacturer in China, detracted, generating negative returns due primarily to weakened market sentiment toward a strong cyclical recovery during the first half of 2013. The company’s decision to significantly tighten terms of sales and receivables during the fourth quarter of 2012 also pointed to potentially poorer fiscal year 2012 results, further dampening investor sentiment toward the company. We trimmed the Fund’s position in the company given our view that momentum of economic recovery in calendar year 2013 may not be as robust as earlier expected. However, we held the position, as we still believe this is a quality company with a strong brand franchise in the industrial equipment industry. |
| China Mengniu Dairy, the nation’s leading dairy producer, reported during March 2013 a set of poor results for its fiscal year 2012, which, though expected, led to a decline in its share price. The poor 2012 results were both an overhang following the December 2011 M1 scandal, wherein a substance known as aflatoxin M1 that has been linked to liver cancer was found to have tainted the company’s milk, and a consequence of 2012 being the first of the company’s restructuring years. However, as the new leadership at China Mengniu Dairy started communicating with investors and distributors about the rationales of its restructuring, the investor community appeared to be generally receptive to the management’s vision and strategy, and the stock performed comparatively well, outpacing on a relative basis the declining overall equity market in China during the month of March, despite the reporting of its poor fiscal year 2012 results. We actually added to the Fund’s position in the company on weakness. |
| Q | What were some of the Fund’s best-performing individual stocks? |
| A | Among the Fund’s best-performing individual stocks relative to the Index were holdings in Great Wall Motor, CNOOC and Huaneng Power International. |
| Great Wall Motor is a local-brand automaker specializing in niche sports utility vehicles. During the Reporting Period, its share price rose on the announcement of its preliminary fiscal year 2012 results, which beat consensus. At the same time, the company’s first quarter 2013 vehicle sales continued to grow. Investors bid up the company’s share price, incorporating another year of attractive earnings. |
| The Fund’s underweighted position in CNOOC, a Chinese producer of crude oil and natural gas, proved to be a strong contributor to its relative results. CNOOC’s stock underperformed during the Reporting Period, as the market was concerned about the production growth prospects of offshore China, which, per the company’s guidance, was anticipated to be rather flat in 2013. This, along with broadly flat oil prices yet escalating costs, was widely thought to likely lead to rising operating margin pressure for the company. CNOOC’s stock price thus declined during the Reporting Period, and we further trimmed the Fund’s position. |
| Huaneng Power International is one of the largest independent power producers in China. Its stock surged during the Reporting Period, as it is believed to be one of the major beneficiaries of weak coal prices. The market also looked during the Reporting Period to more defensive names with relatively steady earnings. |
| Q | Which equity market sectors most significantly affected Fund performance during the Reporting Period? |
| A | The biggest detractors from the Fund’s relative results during the Reporting Period were the materials, industrials and consumer staples sectors, each due primarily to poor stock selection. Having an overweighted position in industrials, which lagged the Index during the Reporting Period, also hurt. |
| The sectors that contributed most positively to the Fund’s performance relative to the Index were consumer discretionary, energy and utilities, each driven by effective stock selection. Having an overweighted exposure to utilities, which, as mentioned, was the best performing sector in the Index by a wide margin during the Reporting Period, also helped. |
| Q | How did the Fund use derivatives and similar instruments during the Reporting Period? |
| A | During the Reporting Period, we did not use derivatives to hedge positions or as part of an active management strategy. |
| Q | Did the Fund make any significant purchases or sales during the Reporting Period? |
| A | In addition to the purchase of China National Building Material, already mentioned, we initiated a Fund position in Agricultural Bank of China (“ABC”), one of the four state-owned banks in China. ABC has the largest number of branches domestically with 24,000 outlets and has an |
20
PORTFOLIO RESULTS
approximately 10% market share in loans and deposits. In our view, the bank provides an exposure into development of China’s rural and hinterland, with its fast expanding business in the central and eastern regions of China. Also, with what we consider to be supportive financial ratios in terms of low loan-to-deposit ratio, we believe its net interest margin is more defensible than its peers. The bank has accumulated its non-performing loan coverage ratio to 300%, providing us with an added comfort factor. |
| We also established a Fund position during the Reporting Period in New China Life Insurance, a pure life insurance company. We viewed its price/equity value ratio of 1.1x as attractive versus its peers’ same ratio of 1.4x, and we expect the discount to close over time. We also expect New China Life Insurance’s earnings to be comparatively more sensitive to domestic equity market performance, providing the Fund with a proxy play to China’s A share, or domestic equity, market. |
| In addition to our trimming of the Fund’s positions in Zoomlion Heavy Industry and CNOOC, mentioned earlier, we eliminated the Fund’s position in China Life Insurance, the nation’s biggest insurer. We believe its stock price fully reflected expectations of improvement in investment return, while concerns were building about continued lackluster premium growth during the first half of 2013. Further, we believed China Life Insurance was facing company-specific policy surrender pressures. |
| Q | Were there any notable changes in the Fund’s weightings during the Reporting Period? |
| A | Throughout the Reporting Period, we remained focused on individual stock selection, with sector positioning being a secondary, closely-monitored effect. That said, the Fund’s exposure relative to the Index in industrials, utilities, information technology and energy increased, and its allocations relative to the Index to financials, health care, materials and consumer discretionary decreased. |
| Q | How was the Fund positioned relative to the Index at the end of the Reporting Period? |
| A | At the end of the Reporting Period, the Fund had overweighted positions relative to the Index in information technology, industrials, energy and utilities. On the same date, the Fund had underweighted positions compared to the Index in the financials, telecommunication services, consumer staples and materials sectors and rather neutral exposure relative to the Index in consumer discretionary. |
| Q | What is the Fund’s tactical view and strategy going forward? |
| A | At the end of the Reporting Period, with leadership handover largely completed in China, we expected to see sequential recovery in levels of economic activities over the remainder of 2013. We believe the pace of improvement may remain moderate during the first half of the calendar year, as policy objective appeared to be more pro-growth sustainability than pro-GDP escalation. We expect China’s next phase of economic development to be focused on: 1) industrial upgrading; 2) deepening its sources of growth into consumption and services from fixed assets investments; and 3) strategic infrastructure development of its central and western regions. During the next 12 months or so, we expect macro policies to include an accommodative monetary stance, regulatory actions to contain excessive assets speculation and selective industry pricing reform or liberalization. |
| In contrast to China’s sometimes indiscriminate expansion in the past, we believe more targeted investments are likely to be made going forward in the areas of urbanization, digitization, energy efficiency and environmental conservation. In our view, equity beneficiaries of these trends may well include transport infrastructure companies, consumer companies with strong brand franchise, companies along the sustainable energy food chain and industrial companies with self-owned technology. Against this backdrop, we expect corporate winners and losers to be differentiated by their respective franchise strength, product and/or technology innovation, cost efficiency and management execution ability. |
| In our view, China’s offshore equity market presents attractive risk-reward opportunities for long-term investors who are able to align their investment time frame with China’s new economic era. As China progresses through its next phase of economic and industry reform, its offshore equity market may experience periodic volatility, and external risk factors, such as unfavorable geopolitical development and health-related outbreaks, that may tamper negatively with investor sentiment. That said, we continue to look for what we consider to be reasonably priced investment opportunities in companies with strong earnings growth visibility and management quality. |
21
FUND BASICS
China Equity Fund
as of April 30, 2013
| PERFORMANCE REVIEW | ||||||||||
| November 1, 2012–April 30, 2013 | Fund Total Return (based on NAV)1 | MSCI China Index2 | ||||||||
| Class A | 1.33 | % | 3.09 | % | ||||||
| Class C | 1.14 | 3.09 | ||||||||
| Institutional | 1.68 | 3.09 | ||||||||
| Class IR | 1.53 | 3.09 | ||||||||
| 1 | The net asset value (“NAV”) represents the net assets of the class of the Fund (ex-dividend) divided by the total number of shares of the class outstanding. The Fund’s performance assumes the reinvestment of dividends and other distributions. The Fund’s performance does not reflect the deduction of any applicable sales charges. |
| 2 | The MSCI China Index (net, total return, unhedged, USD) is a free-float adjusted market capitalization weighted index that is designed to measure the equity market performance of China. As of December 31, 2012, the MSCI China Index consisted of 148 constituents. It is not possible to invest directly in an index. |
| STANDARDIZED TOTAL RETURNS3 | ||||||||||||
| For the period ended 3/31/13 | One Year | Since Inception | Inception Date | |||||||||
| Class A | -1.57 | % | -12.04 | % | 4/29/11 | |||||||
| Class C | 2.33 | -10.07 | 4/29/11 | |||||||||
| Institutional | 4.53 | -9.09 | 4/29/11 | |||||||||
| Class IR | 4.38 | -9.20 | 4/29/11 | |||||||||
| 3 | The Standardized Total Returns are average annual total returns as of the most recent calendar quarter-end. They assume reinvestment of all distributions at NAV. These returns reflect a maximum initial sales charge of 5.5% for Class A Shares and the assumed contingent deferred sales charge for Class C Shares (1% if redeemed within 12 months of purchase). Because Institutional and Class IR Shares do not involve a sales charge, such a charge is not applied to their Standardized Total Returns. |
The returns set forth in the tables above represent past performance. Past performance does not guarantee future results. The Fund’s investment return and principal value will fluctuate so that an investor’s shares, when redeemed, may be worth more or less than their original cost. Current performance may be lower or higher than the performance quoted above. Please visit our web site at www.goldmansachsfunds.com to obtain the most recent month-end returns. Performance reflects applicable fee waivers and/or expense limitations in effect during the periods shown. In their absence, performance would be reduced. Returns do not reflect the deduction of taxes that a shareholder would pay on Fund distributions or the redemption of Fund shares.
22
FUND BASICS
| EXPENSE RATIOS4 | ||||||||||
| Net Expense Ratio (Current) | Gross Expense Ratio (Before Waivers) | |||||||||
| Class A | 1.89 | % | 4.83 | % | ||||||
| Class C | 2.64 | 4.98 | ||||||||
| Institutional | 1.50 | 4.66 | ||||||||
| Class IR | 1.65 | 5.06 | ||||||||
| 4 | The expense ratios of the Fund, both current (net of applicable fee waivers and/or expense limitations) and before waivers (gross of applicable fee waivers and/or expense limitations) are as set forth above according to the most recent publicly available Prospectus for the Fund and may differ from the expense ratios disclosed in the Financial Highlights in this report. The Fund’s waivers and/or expense limitations will remain in place through at least February 28, 2014, and prior to such date the Investment Adviser may not terminate the arrangements without the approval of the Fund’s Board of Trustees. If these arrangements are discontinued in the future, the expense ratios may change without shareholder approval. |
| TOP TEN HOLDINGS AS OF 4/30/135 | ||||||||
| Holding | % of Total Net Assets | Line of Business | ||||||
| China Construction Bank Corp. Class H | 10.9 | % | Commercial Banks | |||||
| Tencent Holdings Ltd. | 8.8 | Internet Software & Services | ||||||
| Industrial and Commercial Bank of China Ltd. Class H | 7.1 | Commercial Banks | ||||||
| China Petroleum and Chemical Corp. (Sinopec) Class H | 6.3 | Oil, Gas, & Consumable Fuels | ||||||
| PetroChina Co. Ltd. Class H | 6.2 | Oil, Gas, & Consumable Fuels | ||||||
| China Mobile Ltd. | 5.9 | Wireless Telecommunication Services | ||||||
| Shimao Property Holdings, Ltd. | 4.2 | Real Estate Management & Development | ||||||
| Agricultural Bank of China Ltd. Class H | 4.1 | Commercial Banks | ||||||
| Great Wall Motor Co. Ltd. Class H | 3.0 | Automobiles | ||||||
| Huaneng Power International Inc. Class H | 3.0 | Independent Power Producers & Energy Traders | ||||||
| 5 | The top 10 holdings may not be representative of the Fund’s future investments. |
23
FUND BASICS
| FUND VS. BENCHMARK SECTOR ALLOCATIONS6 |
| As of April 30, 2013 |
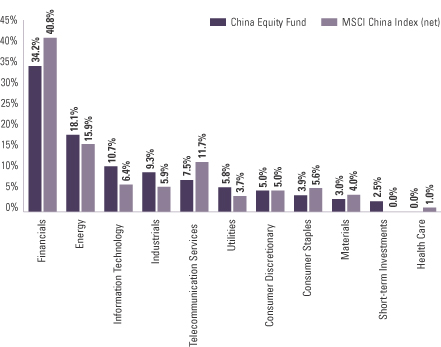
| 6 | The Fund is actively managed and, as such, its composition may differ over time. Consequently, the Fund’s overall sector allocations may differ from percentages contained in the graph above. The above graph categorizes investments using Global Industry Classification Standard (“GICS”), however, the sector classifications used by the portfolio management team may differ from GICS. The percentage shown for each investment category reflects the value of investments in that category as a percentage of market value. Short-term investments represent Repurchase Agreements. The above graph depicts the Fund’s investments but may not represent the Fund’s market exposure due to the exclusion of certain derivatives, if any, as listed in the Additional Investment Information section of the Schedule of Investments. |
24
PORTFOLIO RESULTS
Goldman Sachs Emerging Markets Equity Fund
Portfolio Management Discussion and Analysis
Below, the Goldman Sachs Fundamental Emerging Markets Equity Portfolio Management Team discusses the Goldman Sachs Emerging Markets Equity Fund’s (the “Fund”) performance and positioning for the six-month period ended April 30, 2013 (the “Reporting Period”).
| Q | How did the Fund perform during the Reporting Period? |
| A | During the Reporting Period, the Fund’s Class A, B, C, Institutional, Service and IR Shares generated cumulative total returns, without sales charges, of 5.13%, 4.73%, 4.77%, 5.39%, 5.15% and 5.34%, respectively. These returns compare to the 5.29% cumulative total return of the Fund’s benchmark, the MSCI Emerging Markets Index (net, unhedged) (the “Index”), during the same period. |
| Q | What key factors were responsible for the Fund’s performance during the Reporting Period? |
| A | The Fund generally performed in line with the Index during the Reporting Period. While the Fund benefited from effective stock selection in Turkey, South Korea and Russia, such positives were virtually offset by the detracting effect of its weak stock selection in China, Taiwan and Brazil. |
| Q | Which stocks detracted significantly from the Fund’s performance during the Reporting Period? |
| A | Detracting most from the Fund’s results relative to the Index were positions in Brazilian energy company Petroleo Brasileiro (“Petrobras”), South African gold producer Anglogold Ashanti and Egyptian construction company Orascom Construction Industries. |
| Leading Brazilian integrated energy company Petrobras saw its shares decline during the Reporting Period. Investors were disappointed, as increases in official set prices were lower than desired. Further, Petrobras had been selling imported fuel at a loss in its domestic market due to capacity constraints at its domestic refineries. Price increases implemented during the Reporting Period were seen as likely not to be sufficient to make Petrobras’ refining segment profitable. We trimmed the Fund’s position in the stock by the end of the Reporting Period. |
| Anglogold Ashanti, one of South Africa’s top gold producers, performed poorly, along with many other gold miners, on the back of a decline in gold bullion prices during the Reporting Period. Further pressuring the stock were market concerns that labor unrest in South Africa could prevent the company from reaching its production targets. |
| Orascom Construction Industries detracted from the Fund’s returns, as Egypt’s lack of progress on its International Monetary Fund loan, its unstable political climate and its deteriorating economic conditions impacted the Egyptian equity market broadly. In addition, an ongoing tax claim by the Egyptian government on a transaction that took place in 2007 weighed on the company’s share price and further undermined investor confidence in Egypt. |
| Q | What were some of the Fund’s best-performing individual stocks? |
| A | The strongest contributors to the Fund’s performance during the Reporting Period were Airports of Thailand, Magnit and Turk Traktor. |
| The top individual stock contributor to the Fund’s results during the Reporting Period was airport developer and operator Airports of Thailand. Its strong share price performance was driven by robust air travel demand, as passenger throughput and aircraft movement exceeded expectations. At the end of the Reporting Period, we expected sustained strong traffic growth, underpinned by buoyant tourism as well as a booming domestic economy, which, in turn, is anticipated to boost purchasing power of Thai consumers. |
Magnit, one of the largest retailers in Russia, was also a significant positive contributor to the Fund’s performance during the Reporting Period. The Fund’s overweighted position in Magnit contributed to relative returns, as the company reported stronger than expected fourth quarter 2012 results, which, in turn, prompted positive earnings revisions for the company. In addition, Magnit’s strong results improved the investor outlook for the Russian consumer |
25
PORTFOLIO RESULTS
sector broadly. Further, Magnit’s first quarter 2013 results were better than expected, as the company continued to deliver top-line growth. Also, its earnings before taxes, interest, depreciation and amortization (“EBITDA”) margin appeared to be stabilizing at levels significantly higher than initially anticipated by the market. Magnit’s management appeared optimistic about the company’s growth ahead and was guiding for more than 20% revenue growth for the next five years. For our team, Magnit continued, at the end of the Reporting Period, to be one of our highest conviction names in the consumer sector, as we believe the company’s strong margins are sustainable ahead, and we expect the company to continue enjoying healthy revenue growth coupled with increased investment over the remainder of 2013. |
| Turk Traktor, Turkey’s largest manufacturer and distributor of tractors, was one of the strongest contributors to the Fund’s relative results, performing well as the demand outlook for Turk Traktor’s products improved, a view that got reflected in its share price. |
| Q | Which equity market sectors most significantly affected Fund performance during the Reporting Period? |
| A | Relative to the Index, weak stock selection within the financials, information technology and energy sectors detracted most from the Fund’s performance during the Reporting Period. Underperformance in the financials sector was mainly driven by positioning within the commercial banks industry, with a position in Credit Analysis & Research, a credit rating agency in India, the largest individual detractor within the sector. In information technology, holdings within the electronic equipment instruments and components industry detracted most from relative returns, with Hon Hai Precision, a Taiwanese contract manufacturing company, and Digital China, a Chinese distributor of information technology products and services, particularly disappointing. Positions in Petrobras, the Brazilian state-controlled energy company, and Rosneft, the Russian oil major, were the most significant detractors among the Fund’s energy holdings. |
| Conversely, strong stock selection within the industrials, materials and consumer staples sectors contributed most positively to the Fund’s performance. The Fund’s holdings in Airports of Thailand and Turk Traktor, each already mentioned, were the two greatest positive contributors within the industrials sectors. In materials, positioning in Duratex, a Brazilian company that specializes in the manufacture of wooden paneling for use in furniture and flooring and of metal and china fittings for use in bathrooms, and in Fibria Celulose, a Brazilian pulp producer, were particularly notable contributors. In consumer staples, the Fund’s holding in Magnit, already mentioned, was an outstanding performer. |
| Q | How did the Fund use derivatives and similar instruments during the Reporting Period? |
| A | During the Reporting Period, the Fund used equity-linked notes and participatory notes to gain exposure to select stocks. We used index futures on an opportunistic basis to ensure the Fund remained almost fully exposed to equities following cash inflows or stock sales. |
| Q | Did the Fund make any significant purchases or sales during the Reporting Period? |
| A | We elected to change the Fund’s positioning within the energy sector in China during the Reporting Period. We initiated a Fund position in PetroChina, the largest oil and gas producer in China, and sold out of the Fund’s position in CNOOC, the third largest national oil company. We initiated the position in PetroChina, as we expect its losses from imported gas may have peaked in 2012 as import volume growth appears to have slowed and more gas is being supplied to Southern China, including Hong Kong, where prices are comparatively more market driven. We see more opportunities for market-based pricing of natural gas to be introduced, at least in certain regions, in 2013 should inflation stay low and China’s import requirement for natural gas increase to approximately 20%, as we anticipate. We also expect the refining segment of the company’s business to show improvement in 2013. We decided to sell out of the Fund’s position in CNOOC, as we believe its lack of production growth, combined with relatively stable oil prices and escalating costs, is likely to increase operating margin pressures for the company. |
Similarly, we elected to change the Fund’s positioning within the financials sector in India during the Reporting Period. We initiated a Fund position in Axis Bank, funding the purchase through the sale of the Fund’s position in ICICI Bank. In our view, Axis Bank has demonstrated a strong ability to maintain asset quality and strong earnings growth. We decided to initiate the position in Axis Bank, as we believed its valuations were pricing in the risk of its predominantly corporate loan book, while not recognizing its strong liability |
26
PORTFOLIO RESULTS
franchise. We sold the Fund’s position in ICICI Bank because we had less conviction in this name. |
| Q | Were there any notable changes in the Fund’s weightings during the Reporting Period? |
| A | Most sector weights are usually established within a narrow range from the Index, as our team prefers to make decisions at the individual stock level, where we believe we can generate more added value. That said, during the Reporting Period, the Fund’s exposure relative to the Index to information technology, industrials and utilities increased, and its allocations relative to the Index to consumer discretionary, materials and health care decreased. |
| Similarly, allocations to countries are directly the result of various stock selection decisions. As such, the Fund’s exposure relative to the Index in South Korea, India and Russia increased, and its allocations relative to the Index to China, Taiwan and South Africa decreased. |
| Q | How was the Fund positioned relative to the Index at the end of the Reporting Period? |
| A | At the end of the Reporting Period, the Fund had overweighted exposures to Brazil, India, Russia, Turkey, South Korea and Mexico and underweighted exposures to China, South Africa, Taiwan, Indonesia and Thailand relative to the Index. On the same date, the Fund was relatively neutrally weighted to the Index in the remaining components of the Index, with the exceptions of Chile, Colombia, Czech Republic, Hungary, Malaysia, Morocco, Peru and Poland, where the Fund had no exposure at all at the end of the Reporting Period. |
| From a sector allocation perspective, the Fund had overweighted positions relative to the Index in information technology and industrials at the end of the Reporting Period. The Fund had underweighted positions compared to the Index in the telecommunication services, consumer staples, financials, energy, utilities and materials sectors and rather neutral positions relative to the Index in the consumer discretionary and health care sectors at the end of the Reporting Period. |
| As always, we remained focused on individual stock selection, with sector and country positioning being a secondary, closely-monitored effect. |
27
FUND BASICS
Emerging Markets Equity Fund
as of April 30, 2013
| PERFORMANCE REVIEW | ||||||||||
| November 1, 2012–April 30, 2013 | Fund Total Return (based on NAV)1 | MSCI Emerging Markets Index2 | ||||||||
| Class A | 5.13 | % | 5.29 | % | ||||||
| Class B | 4.73 | 5.29 | ||||||||
| Class C | 4.77 | 5.29 | ||||||||
| Institutional | 5.39 | 5.29 | ||||||||
| Service | 5.15 | 5.29 | ||||||||
| Class IR | 5.34 | 5.29 | ||||||||
| 1 | The net asset value (“NAV”) represents the net assets of the class of the Fund (ex-dividend) divided by the total number of shares of the class outstanding. The Fund’s performance assumes the reinvestment of dividends and other distributions. The Fund’s performance does not reflect the deduction of any applicable sales charges. |
| 2 | The MSCI Emerging Markets Index (net, unhedged, USD) is a free float-adjusted market capitalization index that is designed to measure equity market performance of emerging markets. As of December 31, 2012 the MSCI Emerging Markets Index consisted of the following 21 emerging market country indices: Brazil, Chile, China, Colombia, Czech Republic, Egypt, Hungary, India, Indonesia, Korea, Malaysia, Mexico, Morocco, Peru, Philippines, Poland, Russia, South Africa, Taiwan, Thailand, and Turkey. This Index offers an exhaustive representation of the emerging markets by targeting all companies with a market capitalization within the top 85% of their investable equity universe, subject to a global minimum size requirement. It is based on the Global Investable Market Indices methodology. This series approximates the minimum possible dividend reinvestment. The dividend is reinvested after deduction of withholding tax, applying the rate to non-resident individuals who do not benefit from double taxation treaties. MSCI Barra uses withholding tax rates applicable to Luxembourg holding companies, as Luxembourg applies the highest rates. It is not possible to invest directly in an index. |
| STANDARDIZED TOTAL RETURNS3 | ||||||||||||||||||||
| For the period ended 3/31/13 | One Year | Five Years | Ten Years | Since Inception | Inception Date | |||||||||||||||
| Class A | -4.52 | % | -2.27 | % | 14.22 | % | 6.47 | % | 12/15/97 | |||||||||||
| Class B | -4.78 | -2.30 | 14.22 | 6.59 | 12/15/97 | |||||||||||||||
| Class C | -0.78 | -1.91 | 14.04 | 6.19 | 12/15/97 | |||||||||||||||
| Institutional | 1.38 | -0.77 | 15.37 | 7.42 | 12/15/97 | |||||||||||||||
| Service | 0.83 | -1.26 | 14.78 | 6.75 | 12/15/97 | |||||||||||||||
| Class IR | 1.19 | N/A | N/A | 3.05 | 8/31/10 | |||||||||||||||
| 3 | The Standardized Total Returns are average annual total returns as of the most recent calendar quarter-end. They assume reinvestment of all distributions at NAV. These returns reflect a maximum initial sales charge of 5.5% for Class A Shares, the assumed contingent deferred sales charge for Class B Shares (5% maximum declining to 0% after six years) and the assumed contingent deferred sales charge for Class C Shares (1% if redeemed within 12 months of purchase). Class B Shares convert automatically to Class A Shares on or about the fifteenth day of the last month of the calendar quarter that is eight years after purchase. Returns for Class B Shares for the period after conversion reflect the performance of Class A Shares. Because Institutional, Service and Class IR Shares do not involve a sales charge, such a charge is not applied to their Standardized Total Returns. The Fund’s Class B Shares are no longer available for purchase by new or existing shareholders (although current Class B shareholders may continue to reinvest income and capital gains distributions into Class B Shares, and Class B shareholders may continue to exchange their shares for Class B Shares of certain other Goldman Sachs Funds). |
The returns set forth in the tables above represent past performance. Past performance does not guarantee future results. The Fund’s investment return and principal value will fluctuate so that an investor’s shares, when redeemed, may be worth more or less than their original cost. Current performance may be lower or higher than the performance quoted above. Please visit our web site at www.goldmansachsfunds.com to obtain the most recent month-end returns. Performance reflects applicable fee waivers and/or expense limitations in effect during the periods shown. In their absence, performance would be reduced. Returns do not reflect the deduction of taxes that a shareholder would pay on Fund distributions or the redemption of Fund shares.
28
FUND BASICS
| EXPENSE RATIOS4 | ||||||||||
| Net Expense Ratio (Current) | Gross Expense Ratio (Before Waivers) | |||||||||
| Class A | 1.76 | % | 1.94 | % | ||||||
| Class B | 2.51 | 2.69 | ||||||||
| Class C | 2.51 | 2.69 | ||||||||
| Institutional | 1.36 | 1.54 | ||||||||
| Service | 1.85 | 2.03 | ||||||||
| Class IR | 1.50 | 1.68 | ||||||||
| 4 | The expense ratios of the Fund, both current (net of applicable fee waivers and/or expense limitations) and before waivers (gross of applicable fee waivers and/or expense limitations) are as set forth above according to the most recent publicly available Prospectus for the Fund and may differ from the expense ratios disclosed in the Financial Highlights in this report. The Fund’s waivers and/or expense limitations will remain in place through at least February 28, 2014, and prior to such date the Investment Adviser may not terminate the arrangements without the approval of the Fund’s Board of Trustees. If these arrangements are discontinued in the future, the expense ratios may change without shareholder approval. |
| TOP TEN HOLDINGS AS OF 4/30/135 | ||||||||||
| Holding | % of Total Net Assets | Line of Business | Country | |||||||
| Samsung Electronics Co. Ltd. | 4.8 | % | Semiconductors & Semiconductor Equipment | South Korea | ||||||
| iShares MSCI Emerging Markets Index Fund | 4.2 | Exchange Traded Fund | United States | |||||||
| Taiwan Semiconductor Manufacturing Co. Ltd. | 2.9 | Semiconductors & Semiconductor Equipment | Taiwan | |||||||
| OAO Lukoil ADR | 2.3 | Energy | Russia | |||||||
| Sberbank of Russia ADR | 2.0 | Banks | Russia | |||||||
| PetroChina Co. Ltd. Class H | 1.9 | Energy | China | |||||||
| Tencent Holdings Ltd. | 1.7 | Software & Services | China | |||||||
| Hon Hai Precision Industry Co. Ltd. | 1.7 | Technology Hardware & Equipment | Taiwan | |||||||
| KT Skylife Co. Ltd. | 1.7 | Media | South Korea | |||||||
| OAO Rosneft GDR | 1.7 | Energy | Russia | |||||||
| 5 | The top 10 holdings may not be representative of the Fund’s future investments. |
29
FUND BASICS
| FUND VS. BENCHMARK SECTOR ALLOCATIONS6 |
| As of April 30, 2013 |
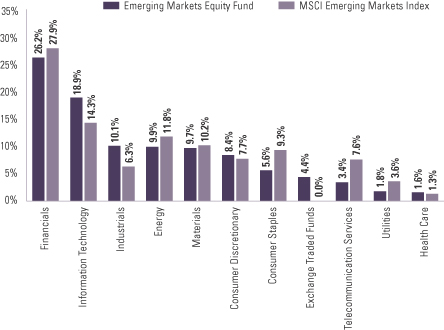
| 6 | The Fund is actively managed and, as such, its composition may differ over time. Consequently, the Fund’s overall sector allocations may differ from percentages contained in the graph above. The graph categorizes investments using Global Industry Classification Standard (“GICS”), however, the sector classifications used by the portfolio management team may differ from GICS. Underlying sector allocations of exchange traded funds held by the Fund are not reflected in the graph above. The percentage shown for each investment category reflects the value of investments in that category as a percentage of market value. The graph depicts the Fund’s investments but may not represent the Fund’s market exposure due to the exclusion of certain derivatives, if any, as listed in the Additional Investment Information section of the Schedule of Investments. |
30
PORTFOLIO RESULTS
Goldman Sachs N-11 Equity Fund
Portfolio Management Discussion and Analysis
Below, the Goldman Sachs Fundamental Emerging Markets Equity Portfolio Management Team discusses the Goldman Sachs N-11 Equity Fund’s (the “Fund”) performance and positioning for the six-month period ended April 30, 2013 (the “Reporting Period”).
| Q | How did the Fund perform during the Reporting Period? |
| A | During the Reporting Period, the Fund’s Class A, C, Institutional and IR Shares generated cumulative total returns, without sales charges, of 12.10%, 11.71%, 12.30% and 12.15%, respectively. These returns compare to the 10.97% cumulative total return of the Fund’s benchmark, the MSCI GDP Weighted Next 11 ex-Iran Index (net, unhedged) (the “Index”), during the same period. |
| Q | What key factors were responsible for the Fund’s performance during the Reporting Period? |
| A | The Fund outperformed the Index during the Reporting Period. The Fund benefited most from effective positioning in Turkey, Indonesia and Mexico, which more than offset the detracting effect of its weak stock selection in Egypt and Bangladesh. |
| Q | What were some of the Fund’s best-performing individual stocks? |
| A | The strongest contributors to the Fund’s performance during the Reporting Period were Engro Foods, Alliance Global and Promotora y Operadora de Infraestructura (“Pinfra”). |
| Engro Foods, one of the largest dairy producers in Pakistan, performed well after the company reported strong earnings momentum, thereby attracting the attention of foreign investors. Engro Foods’ market share in the rapidly developing dairy segment has been growing rather steadily, which helped the company expand its margins. At the end of the Reporting Period, we believed Engro Foods could maintain strong earnings growth potential given the low penetration of processed dairy products in Pakistan and rising urbanization and disposable incomes in the nation, which we view as likely to drive the switch to processed milk. |
| Alliance Global, a conglomerate based in the Philippines with businesses in real estate development, food and beverage, and gaming and tourism was another strong contributor to the Fund’s results during the Reporting Period. We believe the company’s exposure to growing domestic and Association of Southeast Asian Nations (“ASEAN”) consumption, driven by rising affluence of the middle class, resulted in the strong performance of the company’s stock. At the end of the Reporting Period, we remained positive about the company’s ability to gain market share in its domestic liquor business and based on increased contribution from its gaming division as the ASEAN population becomes more mobile, thus driving regional demand for tourism. |
| Pinfra, a Mexican infrastructure construction and operation company, also performed well during the Reporting Period. Pinfra is, in our opinion, a direct investment in Mexican Gross Domestic Product (“GDP”) growth, on which we remain constructive. We particularly view prospects for Mexico’s GDP growth favorably given potential improvements in the U.S. economy and as a beneficiary of a supportive reform agenda under new President Nieto. Finally, we have seen clear improvements, in our view, in the quality of Pinfra’s management team and believe it can continue to drive the business forward in the months ahead. |
| Q | Which stocks detracted significantly from the Fund’s performance during the Reporting Period? |
| A | Detracting most from the Fund’s results relative to the Index were positions in Turkiye Vakiflar Bankasi (“Vakif Bank”), Talaat Moustafa Group (“TMG”) Holding and Global Mediacom. |
| Vakif Bank is the seventh largest bank in Turkey in terms of its asset size. During the Reporting Period, the Fund held an underweighted position in Vakif Bank, as we felt there were higher quality names to own in the sector. However, such positioning detracted, as the stock performed well, especially since the start of 2013. At the end of the Reporting Period, we continued to feel that given the outperformance of the Turkish financials sector, there were better places to deploy the Fund’s capital within the portfolio. |
TMG Holding, an Egyptian real estate developer whose primary activity is the development of residential cities and community complexes, detracted. The company came under pressure from persistent uncertainty surrounding the near-term outlook for the Egyptian economy broadly, especially given the apparent lack of clarity that continues to exist |
31
PORTFOLIO RESULTS
following the Arab spring uprisings. During the Reporting Period, the company reported relatively solid earnings, especially amidst the more challenging economic and political environment, but such earnings did come in below consensus estimates. In particular, TMG Holding’s gross margins were considerably lower than expected on new unit sales, and there was evidence of a decline in sales on the back of delays in property deliveries. |
| Global Mediacom is the largest and the only integrated media, broadcasting, entertainment and telecommunication group in Indonesia with operations that encompass content production, content distribution, television and radio broadcasting, newspaper, magazine, tabloids, telecommunication operator, mobile content aggregator, value added services provider and IT system integrator. During the Reporting Period, its shares fell largely on its announcement of a non-preemptive rights issue as a means of raising capital. (A preemptive right is the right belonging to existing shareholders of a corporation to avoid involuntary dilution of their ownership stake by giving them the chance to buy a proportional interest of any future issuance of common stock. A pre-emptive offering is an offering made to existing shareholders pro rata to their existing holdings. Non-preemptive offerings are offers of shares to either existing or potential new shareholders that do not relate to the number of shares already held.) |
| Q | Which equity market sectors most significantly affected Fund performance during the Reporting Period? |
| A | Strong stock selection within consumer staples, industrials and materials contributed most positively to the Fund’s performance. In consumer staples, the Fund’s holdings within the food and beverage industry performed particularly well, with Pakistani food and dairy producer Engro Foods, already mentioned, and Turkish food manufacturer Ulker boosting results. In industrials, the Fund’s holdings in the capital goods industry helped most, with Filipino conglomerate Alliance Global, already mentioned, the most notable contributor. The Fund’s holding in Turkish miner Koza Metal was an outstanding performer in the materials sector. |
| Conversely, relative to the Index, weak stock selection within the financials and energy sectors detracted most from the Fund’s performance during the Reporting Period. Having an underweighted allocation to the financials sector, which outpaced the Index during the Reporting Period, also hurt. Notable individual drivers of underperformance in the financials sector were holdings in the insurance and real estate industries and underweight positions in certain banking stocks. Within the real estate industry, the Fund’s holding in Egyptian developer TMG Holding, already mentioned, disappointed, while the Fund’s underweight position in Turkish bank Vakif Bank, also mentioned earlier, detracted, as the stock rallied strongly. In energy, the Fund’s position in Indonesian coal miner Bukit Asam performed most poorly. |
| Q | How did the Fund use derivatives and similar instruments during the Reporting Period? |
| A | During the Reporting Period, the Fund gained exposure to select stocks through equity-linked notes and participatory notes. We used index futures on an opportunistic basis to ensure the Fund remained almost fully exposed to equities following cash inflows or stock sales. |
| Q | Did the Fund make any significant purchases or sales during the Reporting Period? |
| A | During the Reporting Period, we elected to change the Fund’s positioning within the consumer staples sector in Mexico. We initiated a Fund position in Arca Continental, a Coca-Cola bottler and snack producer in Mexico. We believe Arca Continental may benefit from stronger profit growth driven by its improving margins, higher volume and pricing — as well as from delivery of synergies following acquisitions made prior to the Reporting Period. In addition, we expect the company’s earnings to benefit from a strong domestic currency. We reduced the Fund’s position in Grupo Bimbo, a Mexican baking company, as we see other consumer names that we believe to have better valuations and earnings growth prospects. |
| Similarly, we changed the Fund’s positioning in Indonesia during the Reporting Period. We sold the Fund’s position in Gudang Garam, a cigarette manufacturer, as we believe the company has a structurally disadvantaged product mix. We added to the Fund’s position in Kalbe Farma, an Indonesian pharmaceutical company, as we believe it should benefit from increasing health care expenditure domestically. At the end of the Reporting Period, Indonesia’s drug expenditure per capita was quite low relative to its regional peers. We believe a new law proposing a doubling of the government’s health care expenditure to approximately 5% of GDP should result in higher earnings for pharmaceutical companies. We also believe Kalbe Farma has an attractive product portfolio, exposure to high-growth categories and a strong distribution network. |
32
PORTFOLIO RESULTS
| Q | Were there any notable changes in the Fund’s weightings during the Reporting Period? |
| A | Most sector weights are usually established within a narrow range from the Index, as our team prefers to make decisions at the individual stock level, where we believe we can generate more added value. That said, during the Reporting Period, the Fund’s exposure relative to the Index to consumer discretionary and utilities increased, and its allocations relative to the Index to financials, energy and materials decreased. |
| Similarly, allocations to countries are directly the result of various stock selection decisions. As such, the Fund’s allocations relative to the Index to Mexico increased, and its exposure relative to the Index in Egypt, Turkey and Nigeria decreased. |
| Q | How was the Fund positioned relative to the Index at the end of the Reporting Period? |
| A | At the end of the Reporting Period, the Fund had modestly overweighted allocations relative to the Index to South Korea and the United Kingdom, modestly underweighted exposures relative to the Index to Turkey, Nigeria and Egypt and was relatively neutrally weighted to the Index in the remaining country components of the Index. It should be noted that the United Kingdom position refers to a Turkish-headquartered energy company that is listed in the United Kingdom. |
| From a sector allocation perspective, the Fund had overweighted positions relative to the Index in consumer discretionary and utilities at the end of the Reporting Period. The Fund had underweighted positions compared to the Index in the financials, consumer staples, industrials and materials sectors and rather neutral positions relative to the Index in the health care, information technology, energy and telecommunication services sectors at the end the Reporting Period. |
| As always, we remained focused on individual stock selection, with sector and country positioning being a secondary, closely-monitored effect. |
33
FUND BASICS
N-11 Equity Fund
as of April 30, 2013
| PERFORMANCE REVIEW | ||||||||||
| November 1, 2012–April 30, 2013 | Fund Total Return (based on NAV)1 | MSCI GDP Weighted Next 11 ex Iran Index2 | ||||||||
| Class A | 12.10 | % | 10.97 | % | ||||||
| Class C | 11.71 | 10.97 | ||||||||
| Institutional | 12.30 | 10.97 | ||||||||
| Class IR | 12.15 | 10.97 | ||||||||
| 1 | The net asset value (“NAV”) represents the net assets of the class of the Fund (ex-dividend) divided by the total number of shares of the class outstanding. The Fund’s performance assumes the reinvestment of dividends and other distributions. The Fund’s performance does not reflect the deduction of any applicable sales charges. |
| 2 | The Fund’s benchmark index is the MSCI GDP Weighted Next 11 ex Iran Index (net, unhedged). The MSCI GDP Weighted N-11 ex Iran Index comprises the following 10 emerging and frontier market indices: Bangladesh, Egypt, Indonesia, Mexico, Nigeria, Pakistan, Philippines, South Korea, Turkey and Vietnam. The index is designed to reflect the performance of the N-11 ex Iran countries based on the size of each country’s economy rather than the size of its equity market, by using country weights based on a country’s gross domestic product (GDP). Each country is divided into large- and mid-cap segments and provides exhaustive coverage of these size segments by targeting a coverage range around 85% of free float-adjusted market capitalization in that market. It is not possible to invest directly in an index. |
| STANDARDIZED TOTAL RETURNS3 | ||||||||||
| For the period ended 3/31/13 | One Year | Since Inception | Inception Date | |||||||
| Class A | 10.37 | % | 4.31% | 2/28/11 | ||||||
| Class C | 15.02 | 6.33 | 2/28/11 | |||||||
| Institutional | 17.27 | 7.56 | 2/28/11 | |||||||
| Class IR | 17.10 | 7.43 | 2/28/11 | |||||||
| 3 | The Standardized Total Returns are average annual total returns as of the most recent calendar quarter-end. They assume reinvestment of all distributions at NAV. These returns reflect a maximum initial sales charge of 5.5% for Class A Shares and the assumed contingent deferred sales charge for Class C Shares (1% if redeemed within 12 months of purchase). Because Institutional and Class IR Shares do not involve a sales charge, such a charge is not applied to their Standardized Total Returns. |
The returns set forth in the tables above represent past performance. Past performance does not guarantee future results. The Fund’s investment return and principal value will fluctuate so that an investor’s shares, when redeemed, may be worth more or less than their original cost. Current performance may be lower or higher than the performance quoted above. Please visit our web site at www.goldmansachsfunds.com to obtain the most recent month-end returns. Performance reflects applicable fee waivers and/or expense limitations in effect during the periods shown. In their absence, performance would be reduced. Returns do not reflect the deduction of taxes that a shareholder would pay on Fund distributions or the redemption of Fund shares.
34
FUND BASICS
| EXPENSE RATIOS4 | ||||||||||
| Net Expense Ratio (Current) | Gross Expense Ratio (Before Waivers) | |||||||||
| Class A | 1.73 | % | 2.35 | % | ||||||
| Class C | 2.48 | 3.12 | ||||||||
| Institutional | 1.33 | 1.94 | ||||||||
| Class IR | 1.48 | 2.05 | ||||||||
| 4 | The expense ratios of the Fund, both current (net of applicable fee waivers and/or expense limitations) and before waivers (gross of applicable fee waivers and/or expense limitations) are as set forth above according to the most recent publicly available Prospectus for the Fund and may differ from the expense ratios disclosed in the Financial Highlights in this report. The Fund’s waivers and/or expense limitations will remain in place through at least February 28, 2014, and prior to such date the Investment Adviser may not terminate the arrangements without the approval of the Fund’s Board of Trustees. If these arrangements are discontinued in the future, the expense ratios may change without shareholder approval. |
| TOP TEN HOLDINGS AS OF 4/30/135 | ||||||||||
| Holding | % of Total Net Assets | Line of Business | Country | |||||||
| Samsung Electronics Co. Ltd. | 5.5 | % | Semiconductors & Semiconductor Equipment | South Korea | ||||||
| America Movil SAB de CV Series L ADR | 4.2 | Telecommunication Services | Mexico | |||||||
| Turkiye Garanti Bankasi AS | 2.5 | Banks | Turkey | |||||||
| Fomento Economico Mexicano SAB de CV ADR | 2.4 | Food, Beverage & Tobacco | Mexico | |||||||
| PT Astra International Tbk | 2.2 | Automobiles & Components | Indonesia | |||||||
| PT Telekomunikasi Indonesia (Persero) Tbk | 2.2 | Telecommunication Services | Indonesia | |||||||
| PT Bank Central Asia Tbk | 2.0 | Banks | Indonesia | |||||||
| Turkiye Halk Bankasi AS | 1.8 | Banks | Turkey | |||||||
| Akbank TAS | 1.8 | Banks | Turkey | |||||||
| Wal-Mart de Mexico SAB de CV Series V | 1.8 | Food & Staples Retailing | Mexico | |||||||
| 5 | The top 10 holdings may not be representative of the Fund’s future investments. |
35
FUND BASICS
| FUND VS. BENCHMARK SECTOR ALLOCATIONS6 |
| As of April 30, 2013 |
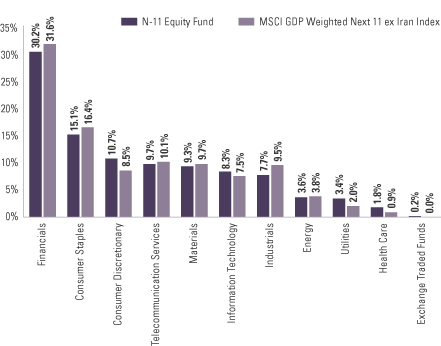
| 6 | The Fund is actively managed and, as such, its composition may differ over time. Consequently, the Fund’s overall sector allocations may differ from percentages contained in the graph above. The graph categorizes investments using Global Industry Classification Standard (“GICS”), however, the sector classifications used by the portfolio management team may differ from GICS. Underlying sector allocations of exchange traded funds held by the Fund are not reflected in the graph above. The percentage shown for each investment category reflects the value of investments in that category as a percentage of market value. The graph depicts the Fund’s investments but may not represent the Fund’s market exposure due to the exclusion of certain derivatives, if any, as listed in the Additional Investment Information section of the Schedule of Investments. |
36
GOLDMAN SACHS ASIA EQUITY FUND
Schedule of Investments
April 30, 2013 (Unaudited)
| Shares | Description | Value | ||||||
| Common Stocks – 95.3% | ||||||||
| China – 20.3% | ||||||||
| 1,296,000 | Agricultural Bank of China Ltd. Class H (Banks) | $ | 621,034 | |||||
| 801,000 | China Citic Bank Corp. Ltd. Class H (Banks) | 451,936 | ||||||
| 1,920,110 | China Construction Bank Corp. Class H (Banks) | 1,611,569 | ||||||
| 95,900 | China International Marine Containers Group Co. Ltd. Class H (Capital Goods)* | 153,545 | ||||||
| 428,000 | China National Building Material Co. Ltd. Class H (Materials) | 506,708 | ||||||
| 234,000 | China Oilfield Services Ltd. Class H (Energy) | 462,615 | ||||||
| 182,000 | China Pacific Insurance Group Co. Ltd. Class H (Insurance) | 655,972 | ||||||
| 820,000 | China Petroleum & Chemical Corp. Class H (Energy) | 904,923 | ||||||
| 114,000 | China Shenhua Energy Co. Ltd. Class H (Energy) | 404,228 | ||||||
| 74,000 | CNOOC Ltd. (Energy) | 138,607 | ||||||
| 140,000 | ENN Energy Holdings Ltd. (Utilities) | 810,539 | ||||||
| 554,000 | Foxconn International Holdings Ltd. (Technology Hardware & Equipment)* | 214,214 | ||||||
| 101,000 | Great Wall Motor Co. Ltd. Class H (Automobiles & Components) | 438,843 | ||||||
| 23,915 | Hollysys Automation Technologies Ltd. (Technology Hardware & Equipment)* | 287,937 | ||||||
| 352,000 | Huaneng Power International, Inc. Class H (Utilities) | 407,850 | ||||||
| 1,900,635 | Industrial & Commercial Bank of China Ltd. Class H (Banks) | 1,339,768 | ||||||
| 103,000 | Jiangxi Copper Co. Ltd. Class H (Materials) | 201,048 | ||||||
| 154,730 | New China Life Insurance Co. Ltd. Class H (Insurance) | 576,647 | ||||||
| 742,000 | PetroChina Co. Ltd. Class H (Energy) | 945,775 | ||||||
| 33,200 | Tencent Holdings Ltd. (Software & Services) | 1,145,342 | ||||||
| 162,000 | Zhuzhou CSR Times Electric Co. Ltd. Class H (Capital Goods) | 449,078 | ||||||
| 130,400 | Zoomlion Heavy Industry Science and Technology Co. Ltd. Class H (Capital Goods) | 130,885 | ||||||
|
| |||||||
| 12,859,063 | ||||||||
|
| |||||||
| Hong Kong – 14.1% | ||||||||
| 230,636 | AIA Group Ltd. (Insurance) | 1,025,975 | ||||||
| 312,000 | Belle International Holdings Ltd. (Retailing) | 510,068 | ||||||
| 31,000 | Cheung Kong Holdings Ltd. (Real Estate) | 467,843 | ||||||
| 79,000 | Cheung Kong Infrastructure Holdings Ltd. (Utilities) | 573,714 | ||||||
| 95,500 | China Mobile Ltd. (Telecommunication Services) | 1,050,368 | ||||||
|
| |||||||
| Common Stocks – (continued) | ||||||||
| Hong Kong – (continued) | ||||||||
| 56,000 | China Overseas Land & Investment Ltd. (Real Estate) | $ | 170,983 | |||||
| 280,000 | China Unicom Hong Kong Ltd. (Telecommunication Services) | 403,730 | ||||||
| 200,000 | Digital China Holdings Ltd. (Technology Hardware & Equipment) | 252,505 | ||||||
| 148,000 | Galaxy Entertainment Group Ltd. (Consumer Services)* | 664,433 | ||||||
| 102,000 | Hang Lung Properties Ltd. (Real Estate) | 397,156 | ||||||
| 62,431 | Henderson Land Development Co. Ltd. (Real Estate) | 453,034 | ||||||
| 19,500 | Hong Kong Exchanges and Clearing Ltd. (Diversified Financials) | 328,878 | ||||||
| 69,000 | Hutchison Whampoa Ltd. (Capital Goods) | 750,667 | ||||||
| 396,000 | Kingway Brewery Holdings Ltd. (Food, Beverage & Tobacco) | 157,769 | ||||||
| 1,960,000 | Peace Mark Holdings Ltd. (Consumer Durables & Apparel)* | — | ||||||
| 1,570,000 | Shenzhen International Holdings Ltd. (Transportation) | 204,654 | ||||||
| 356,500 | Shimao Property Holdings Ltd. (Real Estate) | 769,388 | ||||||
| 29,555 | Sun Hung Kai Properties Ltd. (Real Estate) | 427,368 | ||||||
| 56,000 | The Link REIT (REIT) | 317,453 | ||||||
|
| |||||||
| 8,925,986 | ||||||||
|
| |||||||
| India – 6.9% | ||||||||
| 7,065 | Axis Bank Ltd. (Banks) | 196,146 | ||||||
| 1,052 | Bosch Ltd. (Automobiles & Components) | 173,870 | ||||||
| 28,253 | Credit Analysis & Research Ltd. (Diversified Financials) | 377,161 | ||||||
| 8,183 | Exide Industries Ltd. (Automobiles & Components) | 20,197 | ||||||
| 2,624 | Grasim Industries Ltd. GDR (Materials) | 145,031 | ||||||
| 22,923 | HCL Technologies Ltd. (Software & Services) | 306,666 | ||||||
| 57,518 | HDFC Bank Ltd. (Banks) | 730,322 | ||||||
| 7,621 | Hero Motocorp Ltd. (Automobiles & Components) | 232,841 | ||||||
| 45,663 | IndusInd Bank Ltd. (Banks) | 396,677 | ||||||
| 93,351 | Mahindra & Mahindra Financial Services Ltd. (Diversified Financials) | �� | 395,792 | |||||
| 2,553 | Oracle Financial Services Software Ltd. (Software & Services)* | 124,629 | ||||||
| 83,968 | Prestige Estates Projects Ltd. (Real Estate) | 261,442 | ||||||
| 23,024 | Thermax Ltd. (Capital Goods) | 245,347 | ||||||
| 37,180 | Titan Industries Ltd. (Consumer Durables & Apparel) | 187,001 | ||||||
|
| |||||||
| The accompanying notes are an integral part of these financial statements. | 37 |
GOLDMAN SACHS ASIA EQUITY FUND
Schedule of Investments (continued)
April 30, 2013 (Unaudited)
| Shares | Description | Value | ||||||
| Common Stocks – (continued) | ||||||||
| India – (continued) | ||||||||
| 2,226 | TTK Prestige Ltd. (Consumer Durables & Apparel) | $ | 144,294 | |||||
| 11,231 | United Spirits Ltd. (Food, Beverage & Tobacco) | 460,903 | ||||||
|
| |||||||
| 4,398,319 | ||||||||
|
| |||||||
| Indonesia – 5.9% | ||||||||
| 711,000 | PT Bank Mandiri (Persero) Tbk (Banks) | 769,181 | ||||||
| 1,348,857 | PT Bank Negara Indonesia (Persero) Tbk (Banks) | 750,154 | ||||||
| 1,907,500 | PT Media Nusantara Citra Tbk (Media) | 614,032 | ||||||
| 3,104,000 | PT MNC Sky Vision Tbk (Media)* | 758,693 | ||||||
| 693,000 | PT Telekomunikasi Indonesia (Persero) Tbk (Telecommunication Services) | 834,915 | ||||||
|
| |||||||
| 3,726,975 | ||||||||
|
| |||||||
| Malaysia – 4.0% | ||||||||
| 193,400 | CIMB Group Holdings Berhad (Banks) | 492,349 | ||||||
| 138,820 | Genting Berhad (Consumer Services) | 479,433 | ||||||
| 350,100 | MMC Corp. Berhad (Capital Goods) | 293,236 | ||||||
| 150,800 | Sime Darby Berhad (Capital Goods) | 468,083 | ||||||
| 148,900 | Tenaga Nasional Berhad (Utilities) | 384,198 | ||||||
| 492,900 | UEM Land Holdings Berhad (Real Estate)* | 406,799 | ||||||
|
| |||||||
| 2,524,098 | ||||||||
|
| |||||||
| Philippines – 1.6% | ||||||||
| 865,500 | LT Group, Inc. (Food, Beverage & Tobacco)* | 510,973 | ||||||
| 435,100 | Petron Corp. (Energy) | 162,774 | ||||||
| 44,860 | San Miguel Pure Foods Co., Inc. (Food, Beverage & Tobacco) | 319,559 | ||||||
|
| |||||||
| 993,306 | ||||||||
|
| |||||||
| Singapore – 6.6% | ||||||||
| 125,230 | DBS Group Holdings Ltd. (Banks) | 1,708,296 | ||||||
| 143,000 | SembCorp Industries Ltd. (Capital Goods) | 581,104 | ||||||
| 401,000 | Singapore Telecommunications Ltd. (Telecommunication Services) | 1,280,916 | ||||||
| 530,000 | Tat Hong Holdings Ltd. (Capital Goods) | 641,816 | ||||||
|
| |||||||
| 4,212,132 | ||||||||
|
| |||||||
| South Korea – 18.8% | ||||||||
| 16,150 | Hana Financial Group, Inc. (Banks) | 517,223 | ||||||
| 24,730 | KB Financial Group, Inc. (Banks) | 808,730 | ||||||
| 17,000 | Kia Motors Corp. (Automobiles & Components) | 847,979 | ||||||
| 27,600 | KT Skylife Co. Ltd. (Media) | 1,067,743 | ||||||
| 4,168 | Kumho Petro Chemical Co. Ltd. (Materials) | 361,851 | ||||||
| 1,108 | LG Chem Ltd. (Materials) | 262,216 | ||||||
| 3,610 | LG Display Co. Ltd. (Technology Hardware & Equipment)* | 98,782 | ||||||
|
| |||||||
| Common Stocks – (continued) | ||||||||
| South Korea – (continued) | ||||||||
| 3,033 | NCSoft Corp. (Software & Services) | $ | 457,808 | |||||
| 800 | NHN Corp. (Software & Services) | 215,749 | ||||||
| 1,452 | NongShim Co. Ltd. (Food, Beverage & Tobacco) | 442,518 | ||||||
| 10,770 | Samsung C&T Corp. (Capital Goods) | 578,113 | ||||||
| 2,581 | Samsung Electronics Co. Ltd. (Semiconductors & Semiconductor Equipment) | 3,569,576 | ||||||
| 5,040 | Samsung Life Insurance Co. Ltd. (Insurance) | 496,787 | ||||||
| 8,203 | Samsung Techwin Co. Ltd. (Capital Goods) | 510,216 | ||||||
| 1,974 | SK Holdings Co. Ltd. (Capital Goods) | 284,908 | ||||||
| 50,890 | SK Hynix, Inc. (Semiconductors & Semiconductor Equipment)* | 1,386,057 | ||||||
|
| |||||||
| 11,906,256 | ||||||||
|
| |||||||
| Taiwan – 12.3% | ||||||||
| 143,000 | Epistar Corp. (Semiconductors & Semiconductor Equipment) | 252,500 | ||||||
| 396,273 | Hon Hai Precision Industry Co. Ltd. (Technology Hardware & Equipment) | 1,024,278 | ||||||
| 81,000 | MediaTek, Inc. (Semiconductors & Semiconductor Equipment) | 988,488 | ||||||
| 658,195 | Mega Financial Holding Co. Ltd. (Banks) | 508,099 | ||||||
| 199,000 | Nan Ya Plastics Corp. (Materials) | 397,062 | ||||||
| 59,899 | PChome Online, Inc. (Software & Services) | 271,582 | ||||||
| 60,000 | President Chain Store Corp. (Food & Staples Retailing) | 370,338 | ||||||
| 117,268 | Radiant Opto-Electronics Corp. (Semiconductors & Semiconductor Equipment) | 477,341 | ||||||
| 59,000 | Taiwan Fertilizer Co. Ltd. (Materials) | 141,304 | ||||||
| 764,338 | Taiwan Semiconductor Manufacturing Co. Ltd. (Semiconductors & Semiconductor Equipment) | 2,836,788 | ||||||
| 26,000 | TPK Holding Co. Ltd. (Technology Hardware & Equipment) | 528,968 | ||||||
|
| |||||||
| 7,796,748 | ||||||||
|
| |||||||
| Thailand – 4.2% | ||||||||
| 206,100 | Airports of Thailand PCL (Transportation) | 1,014,957 | ||||||
| 125,200 | Bangkok Bank PCL NVDR (Banks) | 966,136 | ||||||
| 130,253 | PTT Exploration & Production PCL (Energy) | 685,177 | ||||||
|
| |||||||
| 2,666,270 | ||||||||
|
| |||||||
| United States – 0.6% | ||||||||
| 5,579 | Cognizant Technology Solutions Corp. Class A (Software & Services)* | 361,519 | ||||||
|
| |||||||
| TOTAL COMMON STOCKS | ||||||||
| (Cost $51,179,695) | $ | 60,370,672 | ||||||
|
| |||||||
| 38 | The accompanying notes are an integral part of these financial statements. |
GOLDMAN SACHS ASIA EQUITY FUND
| Shares | Description | Value | ||||||
| Exchange Traded Fund – 0.3% | ||||||||
| Thailand – 0.3% | ||||||||
| 438,500 | BTS Rail Mass Transit Growth Infrastructure Fund, Class F* | $ | 180,779 | |||||
| (Cost $163,248) | ||||||||
|
| |||||||
| Notional Shares | Description | Maturity Date | Value | |||||||||
| Participation Notes – 0.6% | ||||||||||||
| India – 0.6% | ||||||||||||
| 10,481 | Axis Bank Ltd. (Issuer Citigroup) (Banks)*(a) | 02/14 | $ | 290,984 | ||||||||
| 24,002 | Exide Industries Ltd. (Issuer UBS AG) (Automobiles & Components) | 03/16 | 59,240 | |||||||||
|
| |||||||||||
| TOTAL PARTICIPATTION NOTES | ||||||||||||
| (Cost $321,717) | $ | 350,224 | ||||||||||
|
| |||||||||||
| TOTAL INVESTMENTS – 96.2% | ||||||||||||
| (Cost $51,664,660) | $ | 60,901,675 | ||||||||||
|
| |||||||||||
| | OTHER ASSETS IN EXCESS OF LIABILITIES – 3.8% | | 2,429,063 | |||||||||
|
| |||||||||||
| NET ASSETS – 100.0% | $ | 63,330,738 | ||||||||||
|
| |||||||||||
| The percentage shown for each investment category reflects the value of investments in that category as a percentage of net assets. | ||
* | Non-income producing security. | |
(a) | Exempt from registration under Rule 144A of the Securities Act of 1933. Under procedures approved by the Board of Trustees, such securities have been determined to be liquid by the investment adviser and may be resold, normally to qualified institutional buyers in transactions exempt from registration. Total market value of Rule 144A securities amounts to $290,984, which represents approximately 0.5% of net assets as of April 30, 2013. | |
| ||
Investment Abbreviations: | ||
GDR | —Global Depositary Receipt | |
NVDR | —Non-Voting Depositary Receipt | |
REIT | —Real Estate Investment Trust | |
| ||
| The accompanying notes are an integral part of these financial statements. | 39 |
GOLDMAN SACHS BRIC FUND
Schedule of Investments
April 30, 2013 (Unaudited)
| Shares | Description | Value | ||||||
| Common Stocks – 87.5% | ||||||||
| Brazil – 23.1% | ||||||||
| 73,170 | Abril Educacao SA (Consumer Services) | $ | 1,572,565 | |||||
| 182,000 | Alupar Investimento SA (Utilities)* | 1,645,573 | ||||||
| 515,643 | Banco do Brasil SA (Banks) | 6,476,625 | ||||||
| 756,081 | BB Seguridade Participacoes SA (Insurance)* | 6,443,174 | ||||||
| 1,164,243 | BM&FBovespa SA (Diversified Financials) | 8,082,637 | ||||||
| 284,294 | CETIP SA – Mercados Organizados (Diversified Financials) | 3,390,356 | ||||||
| 114,650 | Cia Hering (Retailing) | 2,343,714 | ||||||
| 482,791 | Direcional Engenharia SA (Real Estate)* | 3,839,163 | ||||||
| 889,029 | Duratex SA (Materials) | 6,722,985 | ||||||
| 451,236 | Fibria Celulose SA (Materials)* | 4,812,883 | ||||||
| 331,500 | Iochpe-Maxion SA (Capital Goods) | 4,001,362 | ||||||
| 771,495 | Magazine Luiza SA (Retailing) | 2,760,917 | ||||||
| 142,019 | Mills Estruturas e Servicos de Engenharia SA (Capital Goods) | 2,331,788 | ||||||
| 644,076 | Petroleo Brasileiro SA ADR (Energy) | 12,334,055 | ||||||
| 146,209 | Transmissora Alianca de Energia Eletrica SA (Utilities) | 1,682,235 | ||||||
| 248,006 | Vale SA (Materials) | 4,245,511 | ||||||
| 383,723 | Vale SA ADR (Materials) | 6,557,826 | ||||||
|
| |||||||
| 79,243,369 | ||||||||
|
| |||||||
| China – 26.7% | ||||||||
| 16,727,800 | Agricultural Bank of China Ltd. Class H (Banks) | 8,015,850 | ||||||
| 10,359,000 | China Citic Bank Corp. Ltd. Class H (Banks) | 5,844,700 | ||||||
| 11,588,360 | China Construction Bank Corp. Class H (Banks) | 9,726,233 | ||||||
| 3,492,000 | China Oilfield Services Ltd. Class H (Energy) | 6,903,640 | ||||||
| 1,868,800 | China Pacific Insurance Group Co. Ltd. Class H (Insurance) | 6,735,604 | ||||||
| 8,110,000 | China Petroleum & Chemical Corp. Class H (Energy) | 8,949,909 | ||||||
| 382,000 | ENN Energy Holdings Ltd. (Utilities) | 2,211,614 | ||||||
| 932,500 | Great Wall Motor Co. Ltd. Class H (Automobiles & Components) | 4,051,691 | ||||||
| 273,787 | Hollysys Automation Technologies Ltd. (Technology Hardware & Equipment)* | 3,296,395 | ||||||
| 11,657,050 | Industrial & Commercial Bank of China Ltd. Class H (Banks) | 8,217,117 | ||||||
| 8,758,000 | PetroChina Co. Ltd. Class H (Energy) | 11,163,204 | ||||||
| 347,200 | Tencent Holdings Ltd. (Software & Services) | 11,977,797 | ||||||
| 1,605,000 | Zhuzhou CSR Times Electric Co. Ltd. Class H (Capital Goods) | 4,449,196 | ||||||
|
| |||||||
| 91,542,950 | ||||||||
|
| |||||||
| Common Stocks – (continued) | ||||||||
| Hong Kong – 6.6% | ||||||||
| 1,180,000 | China Mobile Ltd. (Telecommunication Services) | $ | 12,978,366 | |||||
| 4,436,000 | China Unicom Hong Kong Ltd. (Telecommunication Services) | 6,396,239 | ||||||
| 2,450,000 | Digital China Holdings Ltd. (Technology Hardware & Equipment) | 3,093,191 | ||||||
|
| |||||||
| 22,467,796 | ||||||||
|
| |||||||
| India – 12.9% | ||||||||
| 50,926 | Axis Bank Ltd. (Banks) | 1,413,860 | ||||||
| 16,892 | Bosch Ltd. (Automobiles & Components) | 2,791,833 | ||||||
| 207,734 | Credit Analysis & Research Ltd. (Diversified Financials) | 2,773,128 | ||||||
| 86,732 | CRISIL Ltd. (Diversified Financials) | 1,441,728 | ||||||
| 37,863 | Grasim Industries Ltd. GDR (Materials) | 2,092,726 | ||||||
| 287,026 | HCL Technologies Ltd. (Software & Services) | 3,839,862 | ||||||
| 630,940 | HDFC Bank Ltd. (Banks) | 8,011,221 | ||||||
| 90,542 | Hero Motocorp Ltd. (Automobiles & Components) | 2,766,292 | ||||||
| 320,689 | IndusInd Bank Ltd. (Banks) | 2,785,840 | ||||||
| 724,329 | Mahindra & Mahindra Financial Services Ltd. (Diversified Financials) | 3,071,026 | ||||||
| 45,376 | Oracle Financial Services Software Ltd. (Software & Services)* | 2,215,106 | ||||||
| 620,024 | Prestige Estates Projects Ltd. (Real Estate) | 1,930,501 | ||||||
| 342,872 | Thermax Ltd. (Capital Goods) | 3,653,695 | ||||||
| 525,100 | Titan Industries Ltd. (Consumer Durables & Apparel) | 2,641,049 | ||||||
| 71,710 | United Spirits Ltd. (Food, Beverage & Tobacco) | 2,942,872 | ||||||
|
| |||||||
| 44,370,739 | ||||||||
|
| |||||||
| Russia – 17.4% | ||||||||
| 150,407 | DIXY Group OJSC (Food & Staples Retailing)* | 1,929,831 | ||||||
| 248,620 | Globaltrans Investment PLC GDR (Transportation) | 3,530,404 | ||||||
| 38,026 | Magnit OJSC (Food & Staples Retailing) | 8,156,948 | ||||||
| 649,848 | OAO Gazprom ADR (Energy) | 5,175,369 | ||||||
| 214,831 | OAO Lukoil ADR (Energy) | 13,659,809 | ||||||
| 1,033,757 | OAO Rosneft GDR (Energy) | 7,090,060 | ||||||
| 15,598 | OJSC Magnit GDR (Food & Staples Retailing) | 797,063 | ||||||
| 252,405 | OJSC Mobile Telesystems ADR (Telecommunication Services) | 5,224,784 | ||||||
| 146,754 | Polymetal International PLC (Materials) | 1,595,647 | ||||||
| 3,668,523 | Sberbank of Russia (Banks) | 11,706,323 | ||||||
| 62,210 | Sberbank of Russia ADR (Banks) | 802,927 | ||||||
|
| |||||||
| 59,669,165 | ||||||||
|
| |||||||
| 40 | The accompanying notes are an integral part of these financial statements. |
GOLDMAN SACHS BRIC FUND
Shares | Description | Value | ||||||||||
| Common Stocks – (continued) | ||||||||||||
| United States – 0.8% | ||||||||||||
| 41,525 | Cognizant Technology Solutions Corp. Class A (Software & Services)* | $ | 2,690,820 | |||||||||
|
| |||||||||||
| TOTAL COMMON STOCKS | $ | 299,984,839 | ||||||||||
| (Cost $289,930,965) | ||||||||||||
|
| |||||||||||
| Preferred Stocks – 9.7% | ||||||||||||
| Brazil – 9.7% | ||||||||||||
| 687,876 | Banco Bradesco SA Preference Shares (Banks) | 11,311,312 | ||||||||||
| 161,508 | Companhia de Bebidas das Americas Preference Shares (Food, Beverage & Tobacco) | 6,683,925 | ||||||||||
| 574,286 | Itau Unibanco Holding SA Preference Shares (Banks) | 9,655,869 | ||||||||||
| 826,807 | Klabin SA Preference Shares (Materials) | 5,628,445 | ||||||||||
|
| |||||||||||
| TOTAL PREFERRED STOCKS | ||||||||||||
| (Cost $29,583,583) | $ | 33,279,551 | ||||||||||
|
| |||||||||||
| Exchange Traded Fund – 1.0% | ||||||||||||
| United States – 1.0% | ||||||||||||
| 78,697 | iShares MSCI Emerging Markets Index Fund | |||||||||||
| (Cost $3,328,875) | $ | 3,406,793 | ||||||||||
|
| |||||||||||
| Notional Shares | Description | Maturity Date | Value | |||||||||
| Participation Note – 0.6% | ||||||||||||
| India – 0.6% | ||||||||||||
| 73,124 | Axis Bank Ltd. (Issuer Citigroup) (Banks)*(a) | 02/14 | $ | 2,030,143 | ||||||||
| (Cost $1,910,253) | ||||||||||||
|
| |||||||||||
| TOTAL INVESTMENTS – 98.8% | ||||||||||||
| (Cost $324,753,676) | $ | 338,701,326 | ||||||||||
|
| |||||||||||
|
| OTHER ASSETS IN EXCESS OF LIABILITIES – 1.2% |
| 4,166,469 | |||||||||
|
| |||||||||||
| NET ASSETS – 100.0% | $ | 342,867,795 | ||||||||||
|
| |||||||||||
| The percentage shown for each investment category reflects the value of investments in that category as a percentage of net assets. | ||
* | Non-income producing security. | |
(a) | Exempt from registration under Rule 144A of the Securities Act of 1933. Under procedures approved by the Board of Trustees, such securities have been determined to be liquid by the investment adviser and may be resold, normally to qualified institutional buyers in transactions exempt from registration. Total market value of Rule 144A securities amounts to $2,030,143, which represents approximately 0.6% of net assets as of April 30, 2013. | |
| ||
Investment Abbreviations: | ||
ADR | —American Depositary Receipt | |
GDR | —Global Depositary Receipt | |
| ||
| The accompanying notes are an integral part of these financial statements. | 41 |
GOLDMAN SACHS CHINA EQUITY FUND
Schedule of Investments
April 30, 2013 (Unaudited)
| Shares | Description | Value | ||||||
| Common Stocks – 97.4% | ||||||||
| Automobiles – 3.0% | ||||||||
| 139,000 | Great Wall Motor Co. Ltd. Class H | $ | 603,952 | |||||
|
| |||||||
| Beverages – 1.2% | ||||||||
| 614,000 | Kingway Brewery Holdings Ltd. | 244,621 | ||||||
|
| |||||||
| Commercial Banks – 23.5% | ||||||||
| 1,725,000 | Agricultural Bank of China Ltd. Class H | 826,608 | ||||||
| 494,000 | China CITIC Bank Corp. Ltd. Series H | 278,722 | ||||||
| 2,602,000 | China Construction Bank Corp. Class H | 2,183,886 | ||||||
| 2,018,000 | Industrial and Commercial Bank of China Ltd. Class H | 1,422,497 | ||||||
|
| |||||||
| 4,711,713 | ||||||||
|
| |||||||
| Construction & Engineering* – 1.2% | ||||||||
| 341,000 | China Machinery Engineering Corp. Class H | 248,437 | ||||||
|
| |||||||
| Construction Materials – 2.6% | ||||||||
| 436,000 | China National Building Material Co. Ltd. Class H | 516,179 | ||||||
|
| |||||||
| Diversified Telecommunication Services – 1.6% | ||||||||
| 226,000 | China Unicom Hong Kong Ltd. | 325,868 | ||||||
|
| |||||||
| Electrical Equipment – 2.4% | ||||||||
| 176,000 | Zhuzhou CSR Times Electric Co. Ltd. Class H | 487,886 | ||||||
|
| |||||||
| Electronic Equipment, Instruments & Components – 1.9% | ||||||||
| 122,000 | Digital China Holdings Ltd. | 154,028 | ||||||
| 18,919 | Hollysys Automation Technologies Ltd.* | 227,785 | ||||||
|
| |||||||
| 381,813 | ||||||||
|
| |||||||
| Energy Equipment & Services – 2.5% | ||||||||
| 248,000 | China Oilfield Services Ltd. Class H | 490,292 | ||||||
|
| |||||||
| Food Products – 1.4% | ||||||||
| 98,000 | China Mengniu Dairy Co. Ltd. | 275,859 | ||||||
|
| |||||||
| Gas Utilities – 2.8% | ||||||||
| 98,000 | ENN Energy Holdings Ltd. | 567,377 | ||||||
|
| |||||||
| Independent Power Producers & Energy Traders – 3.0% | ||||||||
| 518,000 | Huaneng Power International Inc. Class H | 600,188 | ||||||
|
| |||||||
| Insurance – 5.4% | ||||||||
| 153,400 | China Pacific Insurance (Group) Co. Ltd. Class H | 552,890 | ||||||
| 143,000 | New China Life Insurance Co., Ltd. | 532,932 | ||||||
|
| |||||||
| 1,085,822 | ||||||||
|
| |||||||
| Internet Software & Services – 8.8% | ||||||||
| 51,000 | Tencent Holdings Ltd. | 1,759,410 | ||||||
|
| |||||||
| Machinery – 3.6% | ||||||||
| 151,200 | China International Marine Containers Co., Ltd.* | 242,086 | ||||||
|
| |||||||
| Common Stocks – (continued) | ||||||||
| Machinery – (continued) | ||||||||
| 187,000 | Haitian International Holdings Ltd. | $ | 320,015 | |||||
| 58,400 | Zhengzhou Coal Mining Machinery Group Co. Ltd. Class H* | 45,694 | ||||||
| 112,800 | Zoomlion Heavy Industry Science and Technology Co. Ltd. Class H | 113,219 | ||||||
|
| |||||||
| 721,014 | ||||||||
|
| |||||||
| Metals & Mining – 0.4% | ||||||||
| 43,000 | Jiangxi Copper Co. Ltd. Class H | 83,933 | ||||||
|
| |||||||
| Oil, Gas & Consumable Fuels – 15.7% | ||||||||
| 1,136,000 | China Petroleum and Chemical Corp. (Sinopec) Class H | 1,253,648 | ||||||
| 137,500 | China Shenhua Energy Co. Ltd. Class H | 487,556 | ||||||
| 81,000 | CNOOC Ltd. | 151,719 | ||||||
| 978,000 | PetroChina Co. Ltd. Class H | 1,246,587 | ||||||
|
| |||||||
| 3,139,510 | ||||||||
|
| |||||||
| Personal Products – 1.3% | ||||||||
| 25,000 | Hengan International Group Co. Ltd. | 258,796 | ||||||
|
| |||||||
| Real Estate Management & Development – 5.2% | ||||||||
| 66,000 | China Overseas Land & Investment Ltd. | 201,515 | ||||||
| 389,500 | Shimao Property Holdings, Ltd. | 840,607 | ||||||
|
| |||||||
| 1,042,122 | ||||||||
|
| |||||||
| Specialty Retail – 2.0% | ||||||||
| 241,000 | Belle International Holdings Ltd. | 393,995 | ||||||
|
| |||||||
| Transportation Infrastructure – 2.0% | ||||||||
| 3,038,500 | Shenzhen International Holdings Ltd. | 396,078 | ||||||
|
| |||||||
| Wireless Telecommunication Services – 5.9% | ||||||||
| 107,500 | China Mobile Ltd. | 1,182,351 | ||||||
|
| |||||||
| TOTAL COMMON STOCKS – 97.4% | ||||||||
| (Cost $18,686,482) | $ | 19,517,216 | ||||||
|
| |||||||
| 42 | The accompanying notes are an integral part of these financial statements. |
GOLDMAN SACHS CHINA EQUITY FUND
Principal Amount | Interest Rate | Maturity Date | Value | |||||||||||
| Short-term Investments(a) – 2.5% | ||||||||||||||
| Repurchase Agreement – 2.5% | ||||||||||||||
| Joint Repurchase Agreement Account II |
| ||||||||||||
| $ | 500,000 | 0.169 | % | 05/01/13 | $ | 500,000 | ||||||||
| (Cost $500,000) | ||||||||||||||
|
| |||||||||||||
| TOTAL INVESTMENTS – 99.9% | ||||||||||||||
| (Cost $19,186,482) | $ | 20,017,216 | ||||||||||||
|
| |||||||||||||
|
| OTHER ASSETS IN EXCESS OF LIABILITIES – 0.1% |
| 26,351 | |||||||||||
|
| |||||||||||||
| NET ASSETS 100.0% | $ | 20,043,567 | ||||||||||||
|
| |||||||||||||
| The percentage shown for each investment category reflects the value of investments in that category as a percentage of net assets. | ||
* | Non-income producing security. | |
(a) | Joint repurchase agreement was entered into on April 30, 2013. Additional information appears on page 71. | |
| The accompanying notes are an integral part of these financial statements. | 43 |
GOLDMAN SACHS EMERGING MARKETS EQUITY FUND
Schedule of Investments
April 30, 2013 (Unaudited)
| Shares | Description | Value | ||||||
| Common Stocks – 89.5% | ||||||||
| Brazil – 12.8% | ||||||||
| 95,444 | Abril Educacao SA (Consumer Services) | $ | 2,051,277 | |||||
| 237,900 | Alupar Investimento SA (Utilities)* | 2,150,999 | ||||||
| 393,559 | Banco do Brasil SA (Banks) | 4,943,215 | ||||||
| 882,825 | BB Seguridade Participacoes SA (Insurance)* | 7,523,262 | ||||||
| 546,641 | BM&FBovespa SA (Diversified Financials) | 3,794,999 | ||||||
| 234,083 | CETIP SA – Mercados Organizados (Diversified Financials) | 2,791,563 | ||||||
| 131,699 | Cia Hering (Retailing) | 2,692,235 | ||||||
| 218,750 | Direcional Engenharia SA (Real Estate)* | 1,739,504 | ||||||
| 818,649 | Duratex SA (Materials) | 6,190,755 | ||||||
| 495,358 | Fibria Celulose SA (Materials)* | 5,283,488 | ||||||
| 358,600 | Iochpe-Maxion SA (Capital Goods) | 4,328,472 | ||||||
| 508,767 | Magazine Luiza SA (Retailing) | 1,820,703 | ||||||
| 178,583 | Mills Estruturas e Servicos de Engenharia SA (Capital Goods) | 2,932,126 | ||||||
| 224,239 | Petroleo Brasileiro SA ADR (Energy) | 4,294,177 | ||||||
| 197,258 | Transmissora Alianca de Energia Eletrica SA (Utilities) | 2,269,588 | ||||||
| 287,063 | Vale SA ADR (Materials) | 4,905,907 | ||||||
|
| |||||||
| 59,712,270 | ||||||||
|
| |||||||
| China – 12.9% | ||||||||
| 13,991,000 | Agricultural Bank of China Ltd. Class H (Banks) | 6,704,394 | ||||||
| 7,623,000 | China Citic Bank Corp. Ltd. Class H (Banks) | 4,301,009 | ||||||
| 2,776,420 | China Construction Bank Corp. Class H (Banks) | 2,330,279 | ||||||
| 3,458,000 | China Oilfield Services Ltd. Class H (Energy) | 6,836,422 | ||||||
| 1,373,200 | China Pacific Insurance Group Co. Ltd. Class H (Insurance) | 4,949,342 | ||||||
| 6,884,000 | China Petroleum & Chemical Corp. Class H (Energy) | 7,596,939 | ||||||
| 476,000 | ENN Energy Holdings Ltd. (Utilities) | 2,755,833 | ||||||
| 101,146 | Hollysys Automation Technologies Ltd. (Technology Hardware & Equipment)* | 1,217,798 | ||||||
| 3,939,505 | Industrial & Commercial Bank of China Ltd. Class H (Banks) | 2,776,978 | ||||||
| 6,816,000 | PetroChina Co. Ltd. Class H (Energy) | 8,687,874 | ||||||
| 232,300 | Tencent Holdings Ltd. (Software & Services) | 8,013,946 | ||||||
| 1,477,000 | Zhuzhou CSR Times Electric Co. Ltd. Class H (Capital Goods) | 4,094,369 | ||||||
|
| |||||||
| 60,265,183 | ||||||||
|
| |||||||
| Hong Kong – 1.7% | ||||||||
| 344,000 | China Mobile Ltd. (Telecommunication Services) | 3,783,523 | ||||||
|
| |||||||
| �� | ||||||||
| Common Stocks – (continued) | ||||||||
| Hong Kong – (continued) | ||||||||
| 1,904,000 | China Unicom Hong Kong Ltd. (Telecommunication Services) | $ | 2,745,365 | |||||
| 1,078,000 | Digital China Holdings Ltd. (Technology Hardware & Equipment) | 1,361,004 | ||||||
|
| |||||||
| 7,889,892 | ||||||||
|
| |||||||
| India – 8.7% | ||||||||
| 53,503 | Axis Bank Ltd. (Banks) | 1,485,405 | ||||||
| 202,393 | Credit Analysis & Research Ltd. (Diversified Financials) | 2,701,829 | ||||||
| 42,074 | Grasim Industries Ltd. GDR (Materials) | 2,325,472 | ||||||
| 304,300 | HCL Technologies Ltd. (Software & Services) | 4,070,955 | ||||||
| 513,438 | HDFC Bank Ltd. (Banks) | 6,519,266 | ||||||
| 82,309 | Hero Motocorp Ltd. (Automobiles & Components) | 2,514,752 | ||||||
| 486,015 | IndusInd Bank Ltd. (Banks) | 4,222,035 | ||||||
| 725,720 | Mahindra & Mahindra Financial Services Ltd. (Diversified Financials) | 3,076,924 | ||||||
| 61,941 | Oracle Financial Services Software Ltd. (Software & Services)* | 3,023,755 | ||||||
| 644,466 | Prestige Estates Projects Ltd. (Real Estate) | 2,006,603 | ||||||
| 290,839 | Thermax Ltd. (Capital Goods) | 3,099,223 | ||||||
| 589,724 | Titan Industries Ltd. (Consumer Durables & Apparel) | 2,966,082 | ||||||
| 68,202 | United Spirits Ltd. (Food, Beverage & Tobacco) | 2,798,909 | ||||||
|
| |||||||
| 40,811,210 | ||||||||
|
| |||||||
| Indonesia – 1.9% | ||||||||
| 2,607,500 | PT Bank Mandiri (Persero) Tbk (Banks) | 2,820,871 | ||||||
| 3,548,500 | PT Bank Negara Indonesia (Persero) Tbk (Banks) | 1,973,466 | ||||||
| 17,131,000 | PT MNC Sky Vision Tbk (Media)* | 4,187,231 | ||||||
|
| |||||||
| 8,981,568 | ||||||||
|
| |||||||
| Mexico – 7.0% | ||||||||
| 233,711 | America Movil SAB de CV Series L ADR (Telecommunication Services) | 4,996,741 | ||||||
| 1,581,900 | Genomma Lab Internacional SAB de CV Class B (Pharmaceuticals, Biotechnology & Life Sciences)* | 3,421,155 | ||||||
| 1,662,300 | Grupo Sanborns SA de CV (Retailing)* | 3,874,315 | ||||||
| 372,300 | Infraestructura Energetica Nova SAB de CV (Utilities)* | 1,269,382 | ||||||
| 2,274,400 | Macquarie Mexico Real Estate Management SA de CV (REIT)* | 5,491,991 | ||||||
| 933,568 | Mexichem SAB de CV (Materials) | 4,758,450 | ||||||
| 1,748,600 | Organizacion Cultiba SAB de CV (Food, Beverage & Tobacco)* | 5,169,922 | ||||||
|
| |||||||
| 44 | The accompanying notes are an integral part of these financial statements. |
GOLDMAN SACHS EMERGING MARKETS EQUITY FUND
| Shares | Description | Value | ||||||
| Common Stocks – (continued) | ||||||||
| Mexico – (continued) | ||||||||
| 431,000 | Promotora y Operadora de Infraestructura SAB de CV (Capital Goods)* | $ | 3,842,415 | |||||
|
| |||||||
| 32,824,371 | ||||||||
|
| |||||||
| Netherlands – 0.7% | ||||||||
| 102,747 | OCI NV (Capital Goods)* | 3,082,410 | ||||||
|
| |||||||
| Philippines – 0.5% | ||||||||
| 316,140 | San Miguel Pure Foods Co., Inc. (Food, Beverage & Tobacco) | 2,252,018 | ||||||
|
| |||||||
| Russia – 10.1% | ||||||||
| 186,201 | DIXY Group OJSC (Food & Staples Retailing)* | 2,389,094 | ||||||
| 286,758 | Globaltrans Investment PLC GDR (Transportation) | 4,071,964 | ||||||
| 29,515 | Magnit OJSC (Food & Staples Retailing) | 6,331,255 | ||||||
| 169,846 | OAO Lukoil ADR (Energy) | 10,799,484 | ||||||
| 1,133,537 | OAO Rosneft GDR (Energy) | 7,774,404 | ||||||
| 17,800 | OJSC Magnit GDR (Food & Staples Retailing) | 909,587 | ||||||
| 210,981 | OJSC Mobile Telesystems ADR (Telecommunication Services) | 4,367,307 | ||||||
| 111,915 | Polymetal International PLC (Materials) | 1,216,845 | ||||||
| 738,957 | Sberbank of Russia ADR (Banks) | 9,537,513 | ||||||
|
| |||||||
| 47,397,453 | ||||||||
|
| |||||||
| South Africa – 3.5% | ||||||||
| 315,772 | JSE Ltd. (Diversified Financials) | 2,699,026 | ||||||
| 1,292,431 | Nampak Ltd. (Materials) | 4,752,067 | ||||||
| 1,666,590 | Netcare Ltd. (Health Care Equipment & Services) | 3,788,760 | ||||||
| 1,408,330 | PPC Ltd. (Materials) | 5,149,307 | ||||||
|
| |||||||
| 16,389,160 | ||||||||
|
| |||||||
| South Korea – 15.4% | ||||||||
| 168,730 | Hana Financial Group, Inc. (Banks) | 5,403,778 | ||||||
| 19,733 | Hyundai Motor Co. (Automobiles & Components) | 3,583,181 | ||||||
| 149,364 | Kia Motors Corp. (Automobiles & Components) | 7,450,445 | ||||||
| 204,140 | KT Skylife Co. Ltd. (Media) | 7,897,431 | ||||||
| 38,603 | Kumho Petro Chemical Co. Ltd. (Materials) | 3,351,373 | ||||||
| 93,888 | Samsung C&T Corp. (Capital Goods) | 5,039,732 | ||||||
| 16,198 | Samsung Electronics Co. Ltd. (Semiconductors & Semiconductor Equipment) | 22,402,165 | ||||||
| 56,390 | Samsung Life Insurance Co. Ltd. (Insurance) | 5,558,303 | ||||||
| 76,448 | Samsung Techwin Co. Ltd. (Capital Goods) | 4,754,964 | ||||||
|
| |||||||
| Common Stocks – (continued) | ||||||||
| South Korea – (continued) | ||||||||
| 245,180 | SK Hynix, Inc. (Semiconductors & Semiconductor Equipment)* | $ | 6,677,807 | |||||
|
| |||||||
| 72,119,179 | ||||||||
|
| |||||||
| Taiwan – 7.9% | ||||||||
| 3,073,058 | Hon Hai Precision Industry Co. Ltd. (Technology Hardware & Equipment) | 7,943,172 | ||||||
| 553,000 | MediaTek, Inc. (Semiconductors & Semiconductor Equipment) | 6,748,570 | ||||||
| 3,858,545 | Mega Financial Holding Co. Ltd. (Banks) | 2,978,634 | ||||||
| 1,419,580 | Radiant Opto-Electronics Corp. (Semiconductors & Semiconductor Equipment) | 5,778,416 | ||||||
| 3,640,883 | Taiwan Semiconductor Manufacturing Co. Ltd. (Semiconductors & Semiconductor Equipment) | 13,512,888 | ||||||
|
| |||||||
| 36,961,680 | ||||||||
|
| |||||||
| Thailand – 1.3% | ||||||||
| 1,260,500 | Airports of Thailand PCL (Transportation) | 6,207,441 | ||||||
|
| |||||||
| Turkey – 4.5% | ||||||||
| 198,862 | Anadolu Efes Biracilik Ve Malt Sanayii AS (Food, Beverage & Tobacco) | 3,305,537 | ||||||
| 3,287,571 | Emlak Konut Gayrimenkul Yatirim Ortakligi AS (REIT)* | 5,638,620 | ||||||
| 211,196 | Pegasus Hava Tasimaciligi AS (Transportation)* | 2,155,843 | ||||||
| 902,903 | TAV Havalimanlari Holding AS (Transportation) | 6,377,299 | ||||||
| 311,709 | Turkiye Halk Bankasi AS (Banks) | 3,403,627 | ||||||
|
| |||||||
| 20,880,926 | ||||||||
|
| |||||||
| United States – 0.6% | ||||||||
| 46,681 | Cognizant Technology Solutions Corp. Class A (Software & Services)* | 3,024,929 | ||||||
|
| |||||||
| TOTAL COMMON STOCKS | ||||||||
| (Cost $381,993,064) | $ | 418,799,690 | ||||||
|
| |||||||
| Investment Companies – 0.1% | ||||||||
| Thailand – 0.1% | ||||||||
| 961,500 | BTS Rail Mass Transit Growth Infrastructure Fund, Class F | $ | 396,393 | |||||
| (Cost $357,954) | ||||||||
|
| |||||||
| The accompanying notes are an integral part of these financial statements. | 45 |
GOLDMAN SACHS EMERGING MARKETS EQUITY FUND
Schedule of Investments (continued)
April 30, 2013 (Unaudited)
| Shares | Description | Value | ||||||
| Preferred Stocks – 4.8% | ||||||||
| Brazil – 3.9% | ||||||||
| 420,296 | Banco Bradesco SA Preference Shares (Banks) | $ | 6,911,273 | |||||
| 65,189 | Companhia de Bebidas das Americas Preference Shares (Food, Beverage & Tobacco) | 2,697,813 | ||||||
| 288,283 | Itau Unibanco Holding SA Preference Shares (Banks) | 4,847,102 | ||||||
| 564,007 | Klabin SA Preference Shares (Materials) | 3,839,448 | ||||||
|
| |||||||
| 18,295,636 | ||||||||
|
| |||||||
| South Korea – 0.9% | ||||||||
| 5,325 | Samsung Electronics Co. Ltd. Preference Shares (Semiconductors & Semiconductor Equipment) | 4,219,670 | ||||||
|
| |||||||
| TOTAL PREFERRED STOCKS | ||||||||
| (Cost $16,759,369) | $ | 22,515,306 | ||||||
|
| |||||||
| Exchange Traded Funds – 4.3% | ||||||||
| United States – 4.2% | ||||||||
| 459,258 | iShares MSCI Emerging Markets Index Fund | 19,881,279 | ||||||
| (Cost $19,822,106) | ||||||||
|
| |||||||
Notional Shares | Description | Maturity Date | Value | |||||||||
| Participation Notes – 0.6% | ||||||||||||
| India – 0.6% | ||||||||||||
| 86,040 | Axis Bank Ltd. (Issuer Citigroup) (Banks)*(a) | 02/14 | $ | 2,388,730 | ||||||||
| 9,763 | Credit Analysis & Research Ltd. (Issuer Citigroup) (Diversified Financials)*(a) | 02/14 | 130,331 | |||||||||
| 7,977 | Credit Analysis & Research Ltd. (Issuer Morgan Stanley) (Diversified Financials)*(a) | 12/17 | 106,488 | |||||||||
|
| |||||||||||
| TOTAL PARTICIPATION NOTES | ||||||||||||
| (Cost $2,531,110) | $ | 2,625,549 | ||||||||||
|
| |||||||||||
| TOTAL INVESTMENTS – 99.2% | ||||||||||||
| (Cost $421,463,603) | $ | 464,218,217 | ||||||||||
|
| |||||||||||
| | OTHER ASSETS IN EXCESS OF LIABILITIES – 0.8% | | 3,878,827 | |||||||||
|
| |||||||||||
| NET ASSETS – 100.0% | $ | 468,097,044 | ||||||||||
|
| |||||||||||
| The percentage shown for each investment category reflects the value of investments in that category as a percentage of net assets. | ||
* | Non-income producing security. | |
(a) | Exempt from registration under Rule 144A of the Securities Act of 1933. Under procedures approved by the Board of Trustees, such securities have been determined to be liquid by the investment adviser and may be resold, normally to qualified institutional buyers in transactions exempt from registration. Total market value of Rule 144A securities amounts to $2,625,549, which represents approximately 0.6% of net assets as of April 30, 2013. | |
| ||
Investment Abbreviations: | ||
ADR | —American Depositary Receipt | |
GDR | —Global Depositary Receipt | |
REIT | —Real Estate Investment Trust | |
| ||
| 46 | The accompanying notes are an integral part of these financial statements. |
GOLDMAN SACHS N-11 EQUITY FUND
Schedule of Investments
April 30, 2013 (Unaudited)
| Shares | Description | Value | ||||||
| Common Stocks – 98.2% | ||||||||
| Bangladesh – 1.5% | ||||||||
| 844,400 | Bangladesh Export Import Co. Ltd. (Capital Goods)* | $ | 472,331 | |||||
| 457,400 | GrameenPhone Ltd. (Telecommunication Services) | 843,947 | ||||||
| 2,245,413 | Islami Bank Bangladesh Ltd. (Banks) | 1,023,037 | ||||||
| 2,237,000 | National Bank Ltd. (Banks)* | 473,545 | ||||||
| 498,850 | Power Grid Co. of Bangladesh Ltd. (Utilities) | 333,188 | ||||||
| 1,272,425 | Prime Bank Ltd. (Banks) | 496,269 | ||||||
| 415,880 | Square Pharmaceuticals Ltd. (Pharmaceuticals, Biotechnology & Life Sciences) | 957,733 | ||||||
| 139,800 | Summit Power Ltd. (Utilities)* | 57,395 | ||||||
| 625,775 | Titas Gas Transmission & Distribution Co. Ltd. (Energy) | 566,568 | ||||||
| 146,300 | Unique Hotel & Resorts Ltd. (Consumer Services) | 130,449 | ||||||
|
| |||||||
| 5,354,462 | ||||||||
|
| |||||||
| Egypt – 2.4% | ||||||||
| 570,952 | Commercial International Bank Egypt SAE (Banks) | 2,518,718 | ||||||
| 85,998 | Commercial International Bank Egypt SAE GDR (Banks) | 374,092 | ||||||
| 351,168 | Egyptian Financial Group-Hermes Holding (Diversified Financials)* | 504,425 | ||||||
| 459,718 | Egyptian Kuwaiti Holding Co. SAE (Diversified Financials) | 537,870 | ||||||
| 1,651,247 | Orascom Telecom Holding SAE (Telecommunication Services)* | 1,113,427 | ||||||
| 225,153 | Orascom Telecom Holding SAE GDR (Telecommunication Services)* | 759,594 | ||||||
| 2,149,678 | Talaat Moustafa Group (Real Estate)* | 1,223,499 | ||||||
| 916,377 | Telecom Egypt Co. (Telecommunication Services) | 1,669,083 | ||||||
|
| |||||||
| 8,700,708 | ||||||||
|
| |||||||
| France – 0.1% | ||||||||
| 41,356 | Maurel & Prom Nigeria SA (Energy)* | 192,416 | ||||||
|
| |||||||
| Indonesia – 16.3% | ||||||||
| 10,734,000 | PT Astra International Tbk (Automobiles & Components) | 8,121,852 | ||||||
| 6,727,500 | PT Bank Central Asia Tbk (Banks) | 7,446,469 | ||||||
| 5,887,500 | PT Bank Mandiri (Persero) Tbk (Banks) | 6,369,273 | ||||||
| 5,429,000 | PT Bank Negara Indonesia (Persero) Tbk (Banks) | 3,019,288 | ||||||
| 4,119,500 | PT Bank Rakyat Indonesia (Persero) Tbk (Banks) | 3,989,839 | ||||||
| 10,762,500 | PT Global Mediacom Tbk (Media) | 2,410,797 | ||||||
| 902,000 | PT Indocement Tunggal Prakarsa Tbk (Materials) | 2,454,380 | ||||||
|
| |||||||
| Common Stocks – (continued) | ||||||||
| Indonesia – (continued) | ||||||||
| 3,597,000 | PT Indofood Sukses Makmur Tbk (Food, Beverage & Tobacco) | $ | 2,722,565 | |||||
| 3,600,935 | PT Jasa Marga Persero Tbk (Transportation) | 2,484,987 | ||||||
| 24,647,500 | PT Kalbe Farma Tbk (Pharmaceuticals, Biotechnology & Life Sciences) | 3,530,448 | ||||||
| 2,086,000 | PT Media Nusantara Citra Tbk (Media) | 671,492 | ||||||
| 5,708,000 | PT Perusahaan Gas Negara Persero Tbk (Utilities) | 3,671,539 | ||||||
| 898,500 | PT Semen Indonesia (Persero) Tbk (Materials) | 1,702,862 | ||||||
| 1,022,000 | PT Tambang Batubara Bukit Asam (Persero) Tbk (Energy) | 1,604,000 | ||||||
| 6,670,000 | PT Telekomunikasi Indonesia (Persero) Tbk (Telecommunication Services) | 8,035,906 | ||||||
| 540,500 | PT Unilever Indonesia Tbk (Household & Personal Products) | 1,460,400 | ||||||
|
| |||||||
| 59,696,097 | ||||||||
|
| |||||||
| Jersey – 0.2% | ||||||||
| 65,161 | Genel Energy PLC (Energy)* | 902,421 | ||||||
|
| |||||||
| Mexico – 22.9% | ||||||||
| 898,900 | Alfa SAB de CV Class A (Capital Goods) | 2,087,659 | ||||||
| 604,200 | Alpek SA de CV (Materials) | 1,442,043 | ||||||
| 725,948 | America Movil SAB de CV Series L ADR (Telecommunication Services) | 15,520,768 | ||||||
| 298,900 | Arca Continental SAB de CV (Food, Beverage & Tobacco) | 2,465,089 | ||||||
| 525,846 | Cemex SAB de CV ADR (Materials)* | 5,915,767 | ||||||
| 111,543 | Coca-Cola Femsa SAB de CV Series L (Food, Beverage & Tobacco) | 1,801,712 | ||||||
| 142,400 | El Puerto de Liverpool SAB de CV (Retailing) | 1,800,773 | ||||||
| 77,600 | Fomento Economico Mexicano SAB de CV ADR (Food, Beverage & Tobacco) | 8,799,064 | ||||||
| 847,700 | Genomma Lab Internacional SAB de CV Class B (Pharmaceuticals, Biotechnology & Life Sciences)* | 1,833,310 | ||||||
| 122,500 | Grupo Bimbo SAB de CV Series A (Food, Beverage & Tobacco) | 398,604 | ||||||
| 783,915 | Grupo Financiero Banorte SAB de CV Class O (Banks) | 5,911,175 | ||||||
| 190,700 | Grupo Financiero Inbursa SAB de CV Class O (Banks) | 558,799 | ||||||
| 169,388 | Grupo Financiero Santander Mexico SAB de CV Class B ADR (Banks)* | 2,735,616 | ||||||
| 1,765,279 | Grupo Mexico SAB de CV Series B (Materials) | 6,318,327 | ||||||
|
| |||||||
| The accompanying notes are an integral part of these financial statements. | 47 |
GOLDMAN SACHS N-11 EQUITY FUND
Schedule of Investments (continued)
April 30, 2013 (Unaudited)
| Shares | Description | Value | ||||||
| Common Stocks – (continued) | ||||||||
| Mexico – (continued) | ||||||||
| 769,400 | Grupo Sanborns SA de CV (Retailing)* | $ | 1,793,237 | |||||
| 176,418 | Grupo Televisa SAB ADR (Media) | 4,466,904 | ||||||
| 17,395 | Industrias Penoles SAB de CV (Materials) | 726,283 | ||||||
| 495,600 | Infraestructura Energetica Nova SAB de CV (Utilities)* | 1,689,782 | ||||||
| 564,600 | Kimberly-Clark de Mexico SAB de CV Class A (Household & Personal Products) | 1,958,521 | ||||||
| 745,500 | Macquarie Mexico Real Estate Management SA de CV (REIT) * | 1,800,158 | ||||||
| 712,170 | Mexichem SAB de CV (Materials) | 3,629,971 | ||||||
| 599,600 | Organizacion Cultiba SAB de CV (Food, Beverage & Tobacco)* | 1,772,781 | ||||||
| 215,300 | Promotora y Operadora de Infraestructura SAB de CV (Capital Goods)* | 1,919,424 | ||||||
| 2,024,777 | Wal-Mart de Mexico SAB de CV Series V (Food & Staples Retailing) | 6,443,374 | ||||||
|
| |||||||
| 83,789,141 | ||||||||
|
| |||||||
| Netherlands – 0.7% | ||||||||
| 85,599 | OCI NV (Capital Goods)* | 2,567,970 | ||||||
|
| |||||||
| Nigeria – 5.6% | ||||||||
| 13,976,851 | Access Bank PLC (Banks) | 864,265 | ||||||
| 763,561 | Cadbury Nigeria PLC (Food, Beverage & Tobacco) | 155,660 | ||||||
| 1,643,534 | Dangote Cement PLC (Materials) | 1,685,142 | ||||||
| 2,808,180 | Dangote Flour Mills PLC (Food, Beverage & Tobacco) | 161,915 | ||||||
| 2,935,592 | Dangote Sugar Refinery PLC (Food, Beverage & Tobacco) | 139,162 | ||||||
| 16,962,280 | FBN Holdings PLC (Banks)* | 2,004,804 | ||||||
| 16,052,070 | Guaranty Trust Bank PLC (Banks) | 2,622,747 | ||||||
| 907,560 | Guinness Nigeria PLC (Food, Beverage & Tobacco) | 1,523,782 | ||||||
| 1,711,583 | Lafarge Cement WAPCO Nigeria PLC (Materials) | 834,126 | ||||||
| 502,948 | Nestle Nigeria PLC (Food, Beverage & Tobacco) | 2,833,061 | ||||||
| 3,893,720 | Nigerian Breweries PLC (Food, Beverage & Tobacco) | 4,065,863 | ||||||
| 1,356,476 | PZ Cussons Nigeria PLC (Household & Personal Products) | 347,704 | ||||||
| 1,189,423 | Unilever Nigeria PLC (Household & Personal Products) | 413,212 | ||||||
| 14,519,431 | United Bank for Africa PLC (Banks)* | 633,157 | ||||||
| 18,837,271 | Zenith Bank PLC (Banks) | 2,402,688 | ||||||
|
| |||||||
| 20,687,288 | ||||||||
|
| |||||||
| Pakistan – 3.6% | ||||||||
| 523,233 | Engro Corp. Ltd. (Materials)* | 715,435 | ||||||
|
| |||||||
| Common Stocks – (continued) | ||||||||
| Pakistan – (continued) | ||||||||
| 710,907 | Engro Foods Ltd. (Food, Beverage & Tobacco)* | $ | 1,037,401 | |||||
| 1,428,500 | Fatima Fertilizer Co. Ltd. (Materials) | 340,786 | ||||||
| 118,300 | Fauji Fertilizer Co. Ltd. (Materials) | 134,305 | ||||||
| 1,824,000 | HUB Power Co. (Utilities) | 999,711 | ||||||
| 257,900 | Lucky Cement Ltd. (Materials) | 454,873 | ||||||
| 1,067,564 | MCB Bank Ltd. (Banks) | 2,363,686 | ||||||
| 2,223,400 | Oil & Gas Development Co. Ltd. (Energy) | 4,613,568 | ||||||
| 326,200 | Pakistan Oilfields Ltd. (Energy) | 1,560,430 | ||||||
| 484,600 | Pakistan Petroleum Ltd. (Energy) | 892,752 | ||||||
| 229,500 | United Bank Ltd. (Banks) | 208,407 | ||||||
|
| |||||||
| 13,321,354 | ||||||||
|
| |||||||
| Philippines – 5.3% | ||||||||
| 532,880 | Aboitiz Equity Ventures, Inc. (Capital Goods) | 738,275 | ||||||
| 621,100 | Aboitiz Power Corp. (Utilities) | 562,853 | ||||||
| 4,507,800 | Alliance Global Group, Inc. (Capital Goods) | 2,599,044 | ||||||
| 105,220 | Ayala Corp. (Diversified Financials) | 1,640,202 | ||||||
| 2,809,700 | Ayala Land, Inc. (Real Estate) | 2,218,944 | ||||||
| 399,216 | Bank of the Philippine Islands (Banks) | 996,994 | ||||||
| 316,760 | BDO Unibank, Inc. (Banks)* | 706,262 | ||||||
| 2,950,900 | Energy Development Corp. (Utilities) | 467,192 | ||||||
| 20,270 | Globe Telecom, Inc. (Telecommunication Services) | 704,418 | ||||||
| 331,600 | Jollibee Foods Corp. (Consumer Services) | 1,035,847 | ||||||
| 1,225,200 | LT Group, Inc. (Food, Beverage & Tobacco)* | 723,332 | ||||||
| 460,760 | Metropolitan Bank & Trust (Banks) | 1,394,619 | ||||||
| 4,030 | Philippine Long Distance Telephone Co. (Telecommunication Services) | 297,852 | ||||||
| 131,770 | San Miguel Corp. (Capital Goods) | 387,265 | ||||||
| 47,006 | SM Investments Corp. (Capital Goods) | 1,308,640 | ||||||
| 1,643,000 | SM Prime Holdings, Inc. (Real Estate) | 799,504 | ||||||
| 917,290 | Universal Robina Corp. (Food, Beverage & Tobacco) | 2,647,639 | ||||||
|
| |||||||
| 19,228,882 | ||||||||
|
| |||||||
| South Korea – 18.7% | ||||||||
| 1,800 | CJ CheilJedang Corp. (Food, Beverage & Tobacco) | 532,976 | ||||||
| 2,530 | E-Mart Co. Ltd. (Food & Staples Retailing) | 494,231 | ||||||
| 12,940 | GS Holdings (Energy) | 641,275 | ||||||
| 84,100 | Hana Financial Group, Inc. (Banks) | 2,693,402 | ||||||
| 6,280 | Hana Tour Service, Inc. (Consumer Services) | 405,312 | ||||||
| 2,267 | Hyundai Mobis (Automobiles & Components) | 515,446 | ||||||
|
| |||||||
| 48 | The accompanying notes are an integral part of these financial statements. |
GOLDMAN SACHS N-11 EQUITY FUND
| Shares | Description | Value | ||||||
| Common Stocks – (continued) | ||||||||
| South Korea – (continued) | ||||||||
| 25,484 | Hyundai Motor Co. (Automobiles & Components) | $ | 4,627,466 | |||||
| 6,064 | Hyundai Wia Corp. (Automobiles & Components) | 783,626 | ||||||
| 100,110 | KB Financial Group, Inc. (Banks) | 3,273,835 | ||||||
| 71,290 | Kia Motors Corp. (Automobiles & Components) | 3,556,026 | ||||||
| 65,040 | Korea Electric Power Corp. (Utilities)* | 1,875,249 | ||||||
| 49,780 | KT Skylife Co. Ltd. (Media) | 1,925,807 | ||||||
| 23,845 | Kumho Petro Chemical Co. Ltd. (Materials) | 2,070,137 | ||||||
| 3,486 | LG Chem Ltd. (Materials) | 824,987 | ||||||
| 49,070 | LG Display Co. Ltd. (Technology Hardware & Equipment)* | 1,342,726 | ||||||
| 11,630 | LG Electronics, Inc. (Consumer Durables & Apparel) | 932,179 | ||||||
| 13,976 | NCSoft Corp. (Software & Services) | 2,109,569 | ||||||
| 4,678 | NongShim Co. Ltd. (Food, Beverage & Tobacco) | 1,425,687 | ||||||
| 4,731 | POSCO (Materials) | 1,359,818 | ||||||
| 46,760 | Samsung C&T Corp. (Capital Goods) | 2,509,989 | ||||||
| 14,607 | Samsung Electronics Co. Ltd. (Semiconductors & Semiconductor Equipment) | 20,201,780 | ||||||
| 10,739 | Samsung Fire & Marine Insurance Co. Ltd. (Insurance) | 2,210,008 | ||||||
| 26,310 | Samsung Life Insurance Co. Ltd. (Insurance) | 2,593,349 | ||||||
| 33,540 | Samsung Techwin Co. Ltd. (Capital Goods) | 2,086,143 | ||||||
| 13,510 | Shinhan Financial Group Co. Ltd. (Banks) | 467,947 | ||||||
| 9,680 | SK Holdings Co. Ltd. (Capital Goods) | 1,397,115 | ||||||
| 133,680 | SK Hynix, Inc. (Semiconductors & Semiconductor Equipment)* | 3,640,954 | ||||||
| 7,701 | SK Telecom Co. Ltd. (Telecommunication Services) | 1,355,568 | ||||||
| 5,573 | S-Oil Corp. (Energy) | 449,279 | ||||||
|
| |||||||
| 68,301,886 | ||||||||
|
| |||||||
| Turkey – 19.1% | ||||||||
| 1,234,423 | Akbank TAS (Banks) | 6,499,821 | ||||||
| 277,119 | Anadolu Efes Biracilik Ve Malt Sanayii AS (Food, Beverage & Tobacco) | 4,606,345 | ||||||
| 420,418 | Arcelik AS (Consumer Durables & Apparel) | 3,275,382 | ||||||
| 1,143,333 | Asya Katilim Bankasi AS (Banks)* | 1,386,367 | ||||||
| 317,191 | Aygaz AS (Utilities) | 1,726,536 | ||||||
| 55,990 | BIM Birlesik Magazalar AS (Food & Staples Retailing) | 2,876,392 | ||||||
| 67,344 | Coca-Cola Icecek AS (Food, Beverage & Tobacco) | 1,880,708 | ||||||
|
| |||||||
| Common Stocks – (continued) | ||||||||
| Turkey – (continued) | ||||||||
| 1,990,806 | Dogan Sirketler Grubu Holding AS (Capital Goods)* | $ | 1,346,204 | |||||
| 1,270,932 | Emlak Konut Gayrimenkul Yatirim Ortakligi AS (REIT)* | 2,179,817 | ||||||
| 175,724 | Ford Otomotiv Sanayi AS (Automobiles & Components) | 2,443,505 | ||||||
| 800,425 | Haci Omer Sabanci Holding AS (Diversified Financials) | 4,989,105 | ||||||
| 531,567 | KOC Holding AS (Capital Goods) | 3,223,249 | ||||||
| 84,330 | Pegasus Hava Tasimaciligi AS (Transportation)* | 860,822 | ||||||
| 338,373 | TAV Havalimanlari Holding AS (Transportation) | 2,389,964 | ||||||
| 50,144 | Tupras Turkiye Petrol Rafinerileri AS (Energy) | 1,401,381 | ||||||
| 494,033 | Turk Hava Yollari (Transportation)* | 2,058,392 | ||||||
| 324,043 | Turk Telekomunikasyon AS (Telecommunication Services) | 1,537,167 | ||||||
| 545,409 | Turkcell Iletisim Hizmetleri AS (Telecommunication Services)* | 3,396,021 | ||||||
| 1,649,498 | Turkiye Garanti Bankasi AS (Banks) | 9,126,538 | ||||||
| 597,410 | Turkiye Halk Bankasi AS (Banks) | 6,523,267 | ||||||
| 1,095,152 | Turkiye Is Bankasi Class C (Banks) | 4,236,040 | ||||||
| 205,800 | Turkiye Vakiflar Bankasi T.A.O Class D (Banks) | 736,425 | ||||||
| 413,616 | Yapi ve Kredi Bankasi AS (Banks) | 1,285,420 | ||||||
|
| |||||||
| 69,984,868 | ||||||||
|
| |||||||
| Vietnam – 1.8% | ||||||||
| 713,710 | Bank for Foreign Trade of Vietnam JSC (Banks) | 932,439 | ||||||
| 65,810 | Bao Viet Holdings (Insurance) | 147,383 | ||||||
| 471,910 | HAGL JSC (Diversified Financials)* | 508,803 | ||||||
| 228,370 | Masan Group Corp. (Food, Beverage & Tobacco)* | 1,187,160 | ||||||
| 178,020 | PetroVietnam Drilling and Well Services JSC (Energy) | 338,325 | ||||||
| 349,750 | Petrovietnam Fertilizer & Chemicals JSC (Materials) | 704,784 | ||||||
| 382,170 | PetroVietnam Gas JSC (Utilities) | 967,960 | ||||||
| 265,440 | Saigon Thuong Tin Commercial JSB (Banks)* | 273,937 | ||||||
| 356,310 | Vietnam Joint Stock Commercial Bank for Industry and Trade (Banks)* | 313,240 | ||||||
| 462,003 | Vingroup JSC (Real Estate)* | 1,367,773 | ||||||
|
| |||||||
| 6,741,804 | ||||||||
|
| |||||||
| TOTAL COMMON STOCKS | ||||||||
| (Cost $321,993,020) | $ | 359,469,297 | ||||||
|
| |||||||
| The accompanying notes are an integral part of these financial statements. | 49 |
GOLDMAN SACHS N-11 EQUITY FUND
Schedule of Investments (continued)
April 30, 2013 (Unaudited)
| Shares | Description | Value | ||||||
| Preferred Stock – 0.8% | ||||||||
| South Korea – 0.8% | ||||||||
| 3,484 | Samsung Electronics Co. Ltd. Preference Shares (Semiconductors & Semiconductor Equipment) | $ | 2,760,813 | |||||
| (Cost $2,579,562) | ||||||||
|
| |||||||
| Exchange Traded Fund – 0.2% | ||||||||
| Indonesia – 0.2% | ||||||||
| 22,583 | iShares MSCI Indonesia Investable Market Index Fund | $ | 803,277 | |||||
| (Cost $790,555) | ||||||||
|
| |||||||
Notional Shares | Description | Maturity Date | Value | |||||||||
| Participation Note – 0.0% | ||||||||||||
| Bangladesh – 0.0% | ||||||||||||
| 46,750 | Power Grid Co. of Bangladesh Ltd. (Issuer Deutsche Bank AG) (Utilities)*(a) | 02/21 | $ | 31,225 | ||||||||
| (Cost $43,920) | ||||||||||||
|
| |||||||||||
| Units | Description | Expiration Month | Value | |||||||||
| Right – 0.0% | ||||||||||||
| Vietnam – 0.0% | ||||||||||||
| 272,410 | HAGL JSC (Diversified Financials)* | 05/13 | $ | 32,711 | ||||||||
| (Cost $0) | ||||||||||||
|
| |||||||||||
| TOTAL INVESTMENTS – 99.2% | ||||||||||||
| (Cost $325,407,057) | $ | 363,097,323 | ||||||||||
|
| |||||||||||
|
| OTHER ASSETS IN EXCESS OF LIABILITIES – 0.8% |
| 3,028,117 | |||||||||
|
| |||||||||||
| NET ASSETS – 100.0% | $ | 366,125,440 | ||||||||||
|
| |||||||||||
| The percentage shown for each investment category reflects the value of investments in that category as a percentage of net assets. | ||
* | Non-income producing security. | |
(a) | Exempt from registration under Rule 144A of the Securities Act of 1933. Under procedures approved by the Board of Trustees, such securities have been determined to be liquid by the investment adviser and may be resold, normally to qualified institutional buyers in transactions exempt from registration. Total market value of Rule 144A securities amounts to $31,225, which represents approximately 0.0% of net assets as of April 30, 2013. | |
| ||
Investment Abbreviations: | ||
ADR | —American Depositary Receipt | |
GDR | —Global Depositary Receipt | |
REIT | —Real Estate Investment Trust | |
| ||
| 50 | The accompanying notes are an integral part of these financial statements. |
GOLDMAN SACHS N-11 EQUITY FUND
| ADDITIONAL INVESTMENT INFORMATION |
FUTURES CONTRACTS — At April 30, 2013, the Fund had the following futures contracts:
| Type | Number of Contracts Long (Short) | Expiration Date | Current Value | Unrealized Gain (Loss) | ||||||||||
BIST 30 Index | 137 | June 2013 | $ | 807,939 | $ | 6,962 | ||||||||
KOSPI 200 Index | 10 | June 2013 | 1,167,484 | 13,500 | ||||||||||
Mexican Stock Exchange Price and Quotation Index | 21 | June 2013 | 730,727 | 5,353 | ||||||||||
| TOTAL | $ | 25,815 | ||||||||||||
| The accompanying notes are an integral part of these financial statements. | 51 |
GOLDMAN SACHS FUNDAMENTAL EMERGING MARKETS EQUITY FUNDS
Statements of Assets and Liabilities
April 30, 2013 (Unaudited)
| Asia Equity Fund | ||||||
| Assets: | ||||||
Investments, at value (cost $51,664,660, $324,753,676, $19,186,482, $421,463,603 and $325,407,057) | $ | 60,901,675 | ||||
Cash | 1,811,655 | |||||
Foreign currencies, at value (cost $51,110, $72,324, $0, $500,159 and $412,096) | 51,257 | |||||
Receivables: | ||||||
Investments sold | 575,733 | |||||
Fund shares sold | 121,241 | |||||
Dividends | 95,580 | |||||
Reimbursement from investment adviser | 21,120 | |||||
Collateral on certain derivative contracts(a) | — | |||||
Foreign tax reclaims | — | |||||
Other assets | 11,520 | |||||
| Total assets | 63,589,781 | |||||
| Liabilities: | ||||||
Due to custodian | — | |||||
Payables: | ||||||
Investments purchased | — | |||||
Foreign capital gains taxes | 103,269 | |||||
Amounts owed to affiliates | 60,041 | |||||
Fund shares redeemed | 4,654 | |||||
Futures variation margin | — | |||||
Accrued expenses | 91,079 | |||||
| Total liabilities | 259,043 | |||||
| Net Assets: | ||||||
Paid-in capital | 77,945,195 | |||||
Undistributed (distributions in excess of) net investment income (loss) | (466,395 | ) | ||||
Accumulated net realized loss | (23,276,989 | ) | ||||
Net unrealized gain | 9,128,927 | |||||
| NET ASSETS | $ | 63,330,738 | ||||
Net Assets: | ||||||
Class A | $ | 14,998,538 | ||||
Class B | 767,043 | |||||
Class C | 2,673,214 | |||||
Institutional | 44,891,943 | |||||
Service | — | |||||
Class IR | — | |||||
Total Net Assets | $ | 63,330,738 | ||||
Shares outstanding $0.001 par value (unlimited shares authorized): | ||||||
Class A | 791,722 | |||||
Class B | 42,516 | |||||
Class C | 149,911 | |||||
Institutional | 2,266,323 | |||||
Service | — | |||||
Class IR | — | |||||
Net asset value, offering and redemption price per share:(b) | ||||||
Class A | $18.94 | |||||
Class B | 18.04 | |||||
Class C | 17.83 | |||||
Institutional | 19.81 | |||||
Service | — | |||||
Class IR | — | |||||
| (a) | Represents segregated cash on deposit with counterparty for the N-11 Equity Fund relating to initial margin requests on futures transactions. |
| (b) | Maximum public offering price per share for Class A shares of the Asia Equity, BRIC, China Equity, Emerging Markets Equity, and N-11 Equity Funds is $20.04, $13.56, $8.77, $16.25, and $12.31, respectively. At redemption, Class B and Class C Shares may be subject to a contingent deferred sales charge assessed on the amount equal to the lesser of the current NAV or the original purchase price of the shares. |
| 52 | The accompanying notes are an integral part of these financial statements. |
GOLDMAN SACHS FUNDAMENTAL EMERGING MARKETS EQUITY FUNDS
| BRIC Fund | China Equity Fund | Emerging Markets Equity Fund | N-11 Equity Fund | |||||||||||||||||||
| $ | 338,701,326 | $ | 20,017,216 | $ | 464,218,217 | $ | 363,097,323 | |||||||||||||||
| 1,878,459 | 67,984 | — | 5,047,554 | |||||||||||||||||||
| 72,376 | — | 502,758 | 411,764 | |||||||||||||||||||
| 13,426,086 | — | 17,788,852 | 1,699,031 | |||||||||||||||||||
| 173,219 | — | 15,449,070 | 3,886,535 | |||||||||||||||||||
| 877,233 | — | 623,472 | 871,177 | |||||||||||||||||||
| — | 40,303 | — | 158,261 | |||||||||||||||||||
| — | — | — | 215,529 | |||||||||||||||||||
| — | — | 7,707 | 363 | |||||||||||||||||||
| 2,248 | 76 | 14,038 | 1,078 | |||||||||||||||||||
| 355,130,947 | 20,125,579 | 498,604,114 | 375,388,615 | |||||||||||||||||||
| — | — | 595,499 | — | |||||||||||||||||||
| 9,354,778 | — | 28,147,306 | 8,252,674 | |||||||||||||||||||
| — | — | 451,230 | 177,190 | |||||||||||||||||||
| 406,382 | 16,784 | 421,652 | 375,925 | |||||||||||||||||||
| 2,255,136 | — | 661,445 | 267,502 | |||||||||||||||||||
| — | — | — | 35,448 | |||||||||||||||||||
| 246,856 | 65,228 | 229,938 | 154,436 | |||||||||||||||||||
| 12,263,152 | 82,012 | 30,507,070 | 9,263,175 | |||||||||||||||||||
| 565,619,473 | 20,694,490 | 910,832,431 | 333,563,950 | |||||||||||||||||||
| (668,003 | ) | (102,621 | ) | (1,453,810 | ) | 971,389 | ||||||||||||||||
| (235,989,218 | ) | (1,379,036 | ) | (483,440,245 | ) | (5,973,345 | ) | |||||||||||||||
| 13,905,543 | 830,734 | 42,158,668 | 37,563,446 | |||||||||||||||||||
| $ | 342,867,795 | $ | 20,043,567 | $ | 468,097,044 | $ | 366,125,440 | |||||||||||||||
| $109,614,274 | $ | 98,322 | $ | 38,961,171 | $ | 89,232,879 | ||||||||||||||||
| — | — | 4,196,648 | — | |||||||||||||||||||
| 69,347,839 | 45,006 | 14,069,222 | 16,340,308 | |||||||||||||||||||
| 162,146,159 | 19,891,794 | 391,864,169 | 235,568,232 | |||||||||||||||||||
| — | — | 18,746,319 | — | |||||||||||||||||||
| 1,759,523 | 8,445 | 259,515 | 24,984,021 | |||||||||||||||||||
| $342,867,795 | $ | 20,043,567 | $ | 468,097,044 | $ | 366,125,440 | ||||||||||||||||
| 8,555,386 | 11,854 | 2,536,540 | 7,671,907 | |||||||||||||||||||
| — | — | 300,580 | — | |||||||||||||||||||
| 5,659,386 | 5,449 | 1,000,372 | 1,427,538 | |||||||||||||||||||
| 12,401,176 | 2,386,007 | 23,965,169 | 20,132,792 | |||||||||||||||||||
| — | — | 1,258,117 | — | |||||||||||||||||||
| 133,768 | 1,014 | 15,935 | 2,140,291 | |||||||||||||||||||
| $12.81 | $8.29 | $15.36 | $11.63 | |||||||||||||||||||
| — | — | 13.96 | — | |||||||||||||||||||
| 12.25 | 8.26 | 14.06 | 11.45 | |||||||||||||||||||
| 13.08 | 8.34 | 16.35 | 11.70 | |||||||||||||||||||
| — | — | 14.90 | — | |||||||||||||||||||
| 13.15 | 8.33 | 16.29 | 11.67 | |||||||||||||||||||
| The accompanying notes are an integral part of these financial statements. | 53 |
GOLDMAN SACHS FUNDAMENTAL EMERGING MARKETS EQUITY FUNDS
Statements of Operations
For the Six Months Ended April 30, 2013 (Unaudited)
| Asia Equity Fund | ||||||
| Investment income: | ||||||
Dividends (net of foreign taxes withheld of $26,851, $34,416, $0, $202,124 and $357,591) | $ | 289,124 | ||||
| Expenses: | ||||||
Management fees | 312,205 | |||||
Custody, accounting and administrative services | 130,137 | |||||
Professional fees | 40,387 | |||||
Distribution and Service fees(a) | 36,140 | |||||
Registration fees | 35,060 | |||||
Transfer Agent fees(a) | 26,269 | |||||
Printing and mailing costs | 15,444 | |||||
Trustee fees | 9,962 | |||||
Service share fees — Service Plan | — | |||||
Service share fees — Shareholder Administration Plan | — | |||||
Other | 13,953 | |||||
| Total expenses | 619,557 | |||||
Less — expense reductions | (175,118 | ) | ||||
| Net expenses | 444,439 | |||||
| NET INVESTMENT INCOME (LOSS) | (155,315 | ) | ||||
| Realized and unrealized gain (loss): | ||||||
Net realized gain (loss) from: | ||||||
Investments | 2,632,256 | |||||
Futures contracts | 15,130 | |||||
Foreign currency transactions | (12,022 | ) | ||||
Net change in unrealized gain (loss) on: | ||||||
Investments (including the effects of the net change in the foreign capital gains tax liability of $56,901, $0, $0, $291,798 and $103,116) | 2,002,474 | |||||
Futures contracts | 3,939 | |||||
Foreign currency translation | (24,529 | ) | ||||
| Net realized and unrealized gain | 4,617,248 | |||||
| NET INCREASE IN NET ASSETS RESULTING FROM OPERATIONS | $ | 4,461,933 | ||||
| (a) | Class specific Distribution and Service, and Transfer Agent fees were as follows: |
| Distribution and Service Fees | Transfer Agent Fees | |||||||||||||||||||||||||||||||||||
Fund | Class A | Class B | Class C | Class A | Class B | Class C | Institutional | Service | Class IR | |||||||||||||||||||||||||||
Asia Equity | $ | 18,578 | $ | 3,998 | $ | 13,564 | $ | 14,119 | $ | 760 | $ | 2,577 | $ | 8,813 | $ | — | $ | — | ||||||||||||||||||
BRIC | 158,015 | — | 388,821 | 120,093 | — | 73,876 | 33,942 | — | 2,167 | |||||||||||||||||||||||||||
China Equity | 95 | — | 190 | 73 | — | 36 | 2,565 | — | 8 | |||||||||||||||||||||||||||
Emerging Markets Equity | 49,337 | 23,097 | 74,636 | 37,497 | 4,388 | 14,181 | 69,500 | 3,595 | 260 | |||||||||||||||||||||||||||
N-11 Equity | 72,079 | — | 53,600 | 54,780 | — | 10,184 | 34,069 | — | 15,188 | |||||||||||||||||||||||||||
| 54 | The accompanying notes are an integral part of these financial statements. |
GOLDMAN SACHS FUNDAMENTAL EMERGING MARKETS EQUITY FUNDS
| BRIC Fund | China Equity Fund | Emerging Markets Equity Fund | N-11 Equity Fund | |||||||||||||||||||
| $ | 2,642,107 | $ | 154 | $ | 2,655,699 | $ | 2,938,038 | |||||||||||||||
| 2,445,078 | 71,225 | 2,548,572 | 1,655,624 | |||||||||||||||||||
| 277,302 | 40,476 | 408,137 | 408,196 | |||||||||||||||||||
| 50,417 | 38,753 | 47,570 | 54,972 | |||||||||||||||||||
| 546,836 | 285 | 147,070 | 125,679 | |||||||||||||||||||
| 37,054 | 32,810 | 36,913 | 50,469 | |||||||||||||||||||
| 230,078 | 2,682 | 129,421 | 114,221 | |||||||||||||||||||
| 30,718 | 10,578 | 43,929 | 24,241 | |||||||||||||||||||
| 8,758 | 9,885 | 8,792 | 10,164 | |||||||||||||||||||
| — | — | 22,467 | — | |||||||||||||||||||
| — | — | 22,467 | — | |||||||||||||||||||
| 19,714 | 1,431 | 22,545 | 7,725 | |||||||||||||||||||
| 3,645,955 | 208,125 | 3,437,883 | 2,451,291 | |||||||||||||||||||
| (336,828 | ) | (110,383 | ) | (302,255 | ) | (521,977 | ) | |||||||||||||||
| 3,309,127 | 97,742 | 3,135,628 | 1,929,314 | |||||||||||||||||||
| (667,020 | ) | (97,588 | ) | (479,929 | ) | 1,008,724 | ||||||||||||||||
| 21,152,869 | (204,186 | ) | 15,043,774 | 2,020,531 | ||||||||||||||||||
| — | 39 | (31,662 | ) | 4,079 | ||||||||||||||||||
| (66,828 | ) | (45 | ) | (51,061 | ) | 139,811 | ||||||||||||||||
| | (14,074,288 | ) | 354,523 | 5,776,475 | 23,460,055 | |||||||||||||||||
| — | — | 20,635 | 24,991 | |||||||||||||||||||
| (418 | ) | — | (54,493 | ) | (25,344 | ) | ||||||||||||||||
| 7,011,335 | 150,331 | 20,703,668 | 25,624,123 | |||||||||||||||||||
| $ | 6,344,315 | $ | 52,743 | $ | 20,223,739 | $ | 26,632,847 | |||||||||||||||
| The accompanying notes are an integral part of these financial statements. | 55 |
GOLDMAN SACHS FUNDAMENTAL EMERGING MARKETS EQUITY FUNDS
Statements of Changes in Net Assets
| Asia Equity Fund | BRIC Fund | |||||||||||||||||||
| For the Six Months Ended April 30, 2013 (Unaudited) | For the Fiscal Year Ended October 31, 2012 | For the Six Months Ended April 30, 2013 (Unaudited) | For the Fiscal Year Ended October 31, 2012 | |||||||||||||||||
| From operations: | ||||||||||||||||||||
Net investment income (loss) | $ | (155,315 | ) | $ | 525,888 | $ | (667,020 | ) | $ | 3,429,196 | ||||||||||
Net realized gain (loss) | 2,635,364 | (2,890,252 | ) | 21,086,041 | (44,159,436 | ) | ||||||||||||||
Net change in unrealized gain (loss) | 1,981,884 | 4,364,664 | (14,074,706 | ) | 17,008,691 | |||||||||||||||
| Net increase (decrease) in net assets resulting from operations | 4,461,933 | 2,000,300 | 6,344,315 | (23,721,549 | ) | |||||||||||||||
| Distributions to shareholders: | ||||||||||||||||||||
From net investment income | ||||||||||||||||||||
Class A Shares | (95,521 | ) | (164,466 | ) | (1,017,354 | ) | — | |||||||||||||
Class B Shares | (2,425 | ) | — | — | — | |||||||||||||||
Class C Shares | (12,432 | ) | — | — | — | |||||||||||||||
Institutional Shares | (646,294 | ) | (229,346 | ) | (2,044,696 | ) | — | |||||||||||||
Service Shares | — | — | — | — | ||||||||||||||||
Class IR Shares | — | — | (25,542 | ) | — | |||||||||||||||
| Total distributions to shareholders | (756,672 | ) | (393,812 | ) | (3,087,592 | ) | — | |||||||||||||
| From share transactions: | ||||||||||||||||||||
Proceeds from sales of shares | 2,546,514 | 27,771,924 | 35,414,960 | 105,848,840 | ||||||||||||||||
Reinvestment of distributions | 747,985 | 382,672 | 2,829,897 | — | ||||||||||||||||
Cost of shares redeemed | (6,663,254 | ) | (37,909,268 | ) | (87,759,847 | ) | (254,972,502 | ) | ||||||||||||
| Net increase (decrease) in net assets resulting from share transactions | (3,368,755 | ) | (9,754,672 | ) | (49,514,990 | ) | (149,123,662 | ) | ||||||||||||
| TOTAL INCREASE (DECREASE) | 336,506 | (8,148,184 | ) | (46,258,267 | ) | (172,845,211 | ) | |||||||||||||
| Net assets: | ||||||||||||||||||||
Beginning of period | 62,994,232 | 71,142,416 | 389,126,062 | 561,971,273 | ||||||||||||||||
End of period | $ | 63,330,738 | $ | 62,994,232 | $ | 342,867,795 | $ | 389,126,062 | ||||||||||||
| Undistributed (distributions in excess of) net investment income (loss) | $ | (466,395 | ) | $ | 445,592 | $ | (668,003 | ) | $ | 3,086,609 | ||||||||||
| 56 | The accompanying notes are an integral part of these financial statements. |
GOLDMAN SACHS FUNDAMENTAL EMERGING MARKETS EQUITY FUNDS
| China Equity Fund | Emerging Markets Equity Fund | N-11 Equity Fund | ||||||||||||||||||||||||||||||||
| For the Six Months Ended April 30, 2013 (Unaudited) | For the Fiscal Year Ended October 31, 2012 | For the Six Months Ended April 30, 2013 (Unaudited) | For the Fiscal Year Ended October 31, 2012 | For the Six Months Ended April 30, 2013 (Unaudited) | For the Fiscal Year Ended October 31, 2012 | |||||||||||||||||||||||||||||
| $ | (97,588 | ) | $ | 74,482 | $ | (479,929 | ) | $ | 2,652,251 | $ | 1,008,724 | $ | 378,752 | |||||||||||||||||||||
| (204,192 | ) | (711,405 | ) | 14,961,051 | (8,797,086 | ) | 2,164,421 | (5,955,678 | ) | |||||||||||||||||||||||||
| 354,523 | 1,215,205 | 5,742,617 | 4,815,759 | 23,459,702 | 16,731,368 | |||||||||||||||||||||||||||||
| 52,743 | 578,282 | 20,223,739 | (1,329,076 | ) | 26,632,847 | 11,154,442 | ||||||||||||||||||||||||||||
| (340 | ) | (45 | ) | (190,220 | ) | — | (20,076 | ) | — | |||||||||||||||||||||||||
| — | — | — | — | — | — | |||||||||||||||||||||||||||||
| (41 | ) | (7 | ) | — | — | — | — | |||||||||||||||||||||||||||
| (87,132 | ) | (43,483 | ) | (2,931,010 | ) | (1,112,635 | ) | (369,180 | ) | — | ||||||||||||||||||||||||
| — | — | (77,760 | ) | — | — | — | ||||||||||||||||||||||||||||
| (58 | ) | (51 | ) | (1,945 | ) | (1,097 | ) | (27,660 | ) | — | ||||||||||||||||||||||||
| (87,571 | ) | (43,586 | ) | (3,200,935 | ) | (1,113,732 | ) | (416,916 | ) | — | ||||||||||||||||||||||||
| 13,232,580 | 3,327,137 | 113,639,426 | 74,097,897 | 208,128,330 | 117,432,028 | |||||||||||||||||||||||||||||
| 87,571 | 43,586 | 2,915,644 | 1,017,714 | 412,564 | — | |||||||||||||||||||||||||||||
| (1,667,791 | ) | (1,132,474 | ) | (50,428,571 | ) | (131,118,019 | ) | (32,094,622 | ) | (31,173,449 | ) | |||||||||||||||||||||||
| 11,652,360 | 2,238,249 | 66,126,499 | (56,002,408 | ) | 176,446,272 | 86,258,579 | ||||||||||||||||||||||||||||
| 11,617,532 | 2,772,945 | 83,149,303 | (58,445,216 | ) | 202,662,203 | 97,413,021 | ||||||||||||||||||||||||||||
| 8,426,035 | 5,653,090 | 384,947,741 | 443,392,957 | 163,463,237 | 66,050,216 | |||||||||||||||||||||||||||||
| $ | 20,043,567 | $ | 8,426,035 | $ | 468,097,044 | $ | 384,947,741 | $ | 366,125,440 | $ | 163,463,237 | |||||||||||||||||||||||
| $ | (102,621 | ) | $ | 82,538 | $ | (1,453,810 | ) | $ | 2,227,054 | $ | 971,389 | $ | 379,581 | |||||||||||||||||||||
| The accompanying notes are an integral part of these financial statements. | 57 |
GOLDMAN SACHS ASIA EQUITY FUND
Financial Highlights
Selected Data for a Share Outstanding Throughout Each Period
| Income (loss) from investment operations | Distributions to shareholders | |||||||||||||||||||||||||||||||||
| Period - Share Class | value, beginning | Net investment income (loss)(a) | Net realized and unrealized gain (loss) | Total from investment operations | From net investment income | From net realized gains | Total distributions | Increase from regulatory settlements | ||||||||||||||||||||||||||
| FOR THE SIX MONTHS ENDED APRIL 30, (UNAUDITED) | ||||||||||||||||||||||||||||||||||
2013 - A | $ | 17.78 | $ | (0.07 | ) | $ | 1.35 | $ | 1.28 | $ | (0.12 | ) | $ | — | $ | (0.12 | ) | $ | — | |||||||||||||||
2013 - B | 16.94 | (0.13 | ) | 1.28 | 1.15 | (0.05 | ) | — | (0.05 | ) | — | |||||||||||||||||||||||
2013 - C | 16.77 | (0.13 | ) | 1.27 | 1.14 | (0.08 | ) | — | (0.08 | ) | — | |||||||||||||||||||||||
2013 - Institutional | 18.71 | (0.03 | ) | 1.41 | 1.38 | (0.28 | ) | — | (0.28 | ) | — | |||||||||||||||||||||||
| FOR THE FISCAL YEARS ENDED OCTOBER 31, | ||||||||||||||||||||||||||||||||||
2012 - A | 17.33 | 0.11 | 0.41 | 0.52 | (0.07 | ) | — | (0.07 | ) | — | ||||||||||||||||||||||||
2012 - B | 16.56 | (0.03 | ) | 0.41 | 0.38 | — | — | — | — | |||||||||||||||||||||||||
2012 - C | 16.39 | (0.03 | ) | 0.41 | 0.38 | — | — | — | — | |||||||||||||||||||||||||
2012 - Institutional | 18.24 | 0.19 | 0.43 | 0.62 | (0.15 | ) | — | (0.15 | ) | — | ||||||||||||||||||||||||
2011 - A | 19.14 | 0.12 | (1.69 | ) | (1.57 | ) | (0.24 | ) | — | (0.24 | ) | — | ||||||||||||||||||||||
2011 - B | 18.28 | (0.03 | ) | (1.60 | ) | (1.63 | ) | (0.09 | ) | — | (0.09 | ) | — | |||||||||||||||||||||
2011 - C | 18.12 | (0.03 | ) | (1.59 | ) | (1.62 | ) | (0.11 | ) | — | (0.11 | ) | — | |||||||||||||||||||||
2011 - Institutional | 20.12 | 0.23 | (1.80 | ) | (1.57 | ) | (0.31 | ) | — | (0.31 | ) | — | ||||||||||||||||||||||
2010 - A | 15.39 | 0.07 | (e) | 3.84 | 3.91 | (0.16 | ) | — | (0.16 | ) | — | |||||||||||||||||||||||
2010 - B | 14.75 | (0.06 | )(e) | 3.68 | 3.62 | (0.09 | ) | — | (0.09 | ) | — | |||||||||||||||||||||||
2010 - C | 14.64 | (0.05 | )(e) | 3.64 | 3.59 | (0.11 | ) | — | (0.11 | ) | — | |||||||||||||||||||||||
2010 - Institutional | 16.16 | 0.14 | (e) | 4.03 | 4.17 | (0.21 | ) | — | (0.21 | ) | — | |||||||||||||||||||||||
2009 - A | 10.11 | 0.12 | 5.32 | 5.44 | (0.22 | ) | (0.02 | ) | (0.24 | ) | 0.08 | |||||||||||||||||||||||
2009 - B | 9.58 | 0.02 | 5.11 | 5.13 | (0.02 | ) | (0.02 | ) | (0.04 | ) | 0.08 | |||||||||||||||||||||||
2009 - C | 9.51 | 0.02 | 5.07 | 5.09 | (0.02 | ) | (0.02 | ) | (0.04 | ) | 0.08 | |||||||||||||||||||||||
2009 - Institutional | 10.70 | 0.17 | 5.59 | 5.76 | (0.36 | ) | (0.02 | ) | (0.38 | ) | 0.08 | |||||||||||||||||||||||
| FOR THE PERIOD SEPTEMBER 1, 2008 TO OCTOBER 31, 2008* | ||||||||||||||||||||||||||||||||||
2008 - A | 16.87 | 0.02 | (6.78 | ) | (6.76 | ) | — | — | — | — | ||||||||||||||||||||||||
2008 - B | 16.00 | — | (g) | (6.42 | ) | (6.42 | ) | — | — | — | — | |||||||||||||||||||||||
2008 - C | 15.88 | — | (g) | (6.37 | ) | (6.37 | ) | — | — | — | — | |||||||||||||||||||||||
2008 - Institutional | 17.84 | 0.03 | (7.17 | ) | (7.14 | ) | — | — | — | — | ||||||||||||||||||||||||
| FOR THE FISCAL YEAR ENDED AUGUST 31, | ||||||||||||||||||||||||||||||||||
2008 - A | 22.13 | 0.14 | (4.35 | ) | (4.21 | ) | (0.15 | ) | (0.93 | ) | (1.08 | ) | 0.03 | |||||||||||||||||||||
2008 - B | 21.13 | (0.02 | ) | (4.14 | ) | (4.16 | ) | (0.07 | ) | (0.93 | ) | (1.00 | ) | 0.03 | ||||||||||||||||||||
2008 - C | 21.01 | (0.04 | ) | (4.09 | ) | (4.13 | ) | (0.10 | ) | (0.93 | ) | (1.03 | ) | 0.03 | ||||||||||||||||||||
2008 - Institutional | 23.31 | 0.22 | (4.58 | ) | (4.36 | ) | (0.21 | ) | (0.93 | ) | (1.14 | ) | 0.03 | |||||||||||||||||||||
| * | The Fund changed its fiscal year end from August 31 to October 31. |
| (a) | Calculated based on the average shares outstanding methodology. |
| (b) | Assumes investment at the net asset value at the beginning of the period, reinvestment of all distributions, a complete redemption of the investment at the net asset value at the end of the period and no sales or redemption charges. Total returns would be reduced if a sales or redemption charge was taken into account. Returns do not reflect the deduction of taxes that a shareholder would pay on Fund distributions or the redemption of Fund shares. Total returns for periods less than one full year are not annualized. |
| (c) | The Fund’s portfolio turnover rate is calculated in accordance with regulatory requirements, without regard to transactions involving short term investments and certain derivatives. If such transactions were included, the Fund’s portfolio turnover rate may be higher. |
| (d) | Annualized. |
| (e) | Reflects income recognized from non-recurring special dividends which amounted to $0.02 per share and 0.10% of average net assets. |
| (f) | Total returns reflects the impact of payments for regulatory settlements entitled to be received during the period and recorded as an increase to capital by the Fund. Excluding such payments, the total return would have been: |
| Class A | Class B | Class C | Institutional | |||||||||||||
For the Fiscal Year Ended October 31, 2009 | 55.33 | % | 54.06 | % | 54.16 | % | 55.93 | % | ||||||||
For the Fiscal Year Ended August 31, 2008 | (20.59 | ) | (21.23 | ) | (21.21 | ) | (20.27 | ) | ||||||||
| (g) | Amount is less than $0.005 per share. |
| 58 | The accompanying notes are an integral part of these financial statements. |
GOLDMAN SACHS ASIA EQUITY FUND
| Net asset value, end of period | Total return(b) | Net assets, end of period (in 000s) | Ratio of net expenses to average net assets | Ratio of total expenses to average net assets | Ratio of net investment income (loss) to average net assets | Portfolio turnover rate(c) | ||||||||||||||||||||||||||||||||||
| $ | 18.94 | 7.19 | % | $ | 14,999 | 1.66 | %(d) | 2.22 | %(d) | (0.74 | )%(d) | 35 | % | |||||||||||||||||||||||||||
| 18.04 | 6.79 | 767 | 2.41 | (d) | 2.97 | (d) | (1.48 | )(d) | 35 | |||||||||||||||||||||||||||||||
| 17.83 | 6.79 | 2,673 | 2.41 | (d) | 2.97 | (d) | (1.48 | )(d) | 35 | |||||||||||||||||||||||||||||||
| 19.81 | 7.43 | 44,892 | 1.26 | (d) | 1.82 | (d) | (0.34 | )(d) | 35 | |||||||||||||||||||||||||||||||
| 17.78 | 3.05 | 15,136 | 1.60 | 2.24 | 0.66 | 83 | ||||||||||||||||||||||||||||||||||
| 16.94 | 2.29 | 829 | 2.35 | 2.98 | (0.20 | ) | 83 | |||||||||||||||||||||||||||||||||
| 16.77 | 2.31 | 2,684 | 2.35 | 2.97 | (0.18 | ) | 83 | |||||||||||||||||||||||||||||||||
| 18.71 | 3.50 | 44,345 | 1.20 | 1.79 | 1.03 | 83 | ||||||||||||||||||||||||||||||||||
| 17.33 | (8.33 | ) | 39,688 | 1.60 | 2.17 | 0.61 | 107 | |||||||||||||||||||||||||||||||||
| 16.56 | (8.95 | ) | 1,164 | 2.35 | 2.92 | (0.18 | ) | 107 | ||||||||||||||||||||||||||||||||
| 16.39 | (9.00 | ) | 3,219 | 2.35 | 2.92 | (0.18 | ) | 107 | ||||||||||||||||||||||||||||||||
| 18.24 | (7.94 | ) | 27,071 | 1.20 | 1.77 | 1.15 | 107 | |||||||||||||||||||||||||||||||||
| 19.14 | 25.59 | 47,238 | 1.60 | 2.32 | 0.40 | (e) | 85 | |||||||||||||||||||||||||||||||||
| 18.28 | 24.66 | 1,622 | 2.35 | 3.07 | (0.38 | )(e) | 85 | |||||||||||||||||||||||||||||||||
| 18.12 | 24.53 | 4,986 | 2.35 | 3.07 | (0.32 | )(e) | 85 | |||||||||||||||||||||||||||||||||
| 20.12 | 26.05 | 24,864 | 1.20 | 1.92 | (0.82 | )(e) | 85 | |||||||||||||||||||||||||||||||||
| 15.39 | 55.89 | (f) | 43,833 | 1.60 | 2.36 | 0.97 | 117 | |||||||||||||||||||||||||||||||||
| 14.75 | 54.55 | (f) | 1,807 | 2.35 | 3.11 | 0.19 | 117 | |||||||||||||||||||||||||||||||||
| 14.64 | 54.64 | (f) | 4,160 | 2.35 | 3.11 | 0.20 | 117 | |||||||||||||||||||||||||||||||||
| 16.16 | 56.48 | (f) | 20,575 | 1.20 | 1.96 | 1.35 | 117 | |||||||||||||||||||||||||||||||||
| 10.11 | (40.07 | ) | 37,075 | 1.60 | (d) | 2.44 | (d) | 0.97 | (d) | 7 | ||||||||||||||||||||||||||||||
| 9.58 | (40.13 | ) | 1,218 | 2.35 | (d) | 3.19 | (d) | 0.23 | (d) | 7 | ||||||||||||||||||||||||||||||
| 9.51 | (40.11 | ) | 2,245 | 2.35 | (d) | 3.19 | (d) | 0.21 | (d) | 7 | ||||||||||||||||||||||||||||||
| 10.70 | (40.02 | ) | 18,789 | 1.20 | (d) | 2.04 | (d) | 1.45 | (d) | 7 | ||||||||||||||||||||||||||||||
| 16.87 | (20.36 | )(f) | 74,240 | 1.60 | 1.77 | 0.63 | 47 | |||||||||||||||||||||||||||||||||
| 16.00 | (21 | )(f) | 2,432 | 2.35 | 2.52 | (0.10 | ) | 47 | ||||||||||||||||||||||||||||||||
| 15.88 | (20.98 | )(f) | 4,276 | 2.35 | 2.52 | (0.18 | ) | 47 | ||||||||||||||||||||||||||||||||
| 17.84 | (20.04 | )(f) | 41,334 | 1.20 | 1.37 | 0.95 | 47 | |||||||||||||||||||||||||||||||||
| The accompanying notes are an integral part of these financial statements. | 59 |
GOLDMAN SACHS BRIC FUND
Financial Highlights
Selected Data for a Share Outstanding Throughout Each Period
| Income (loss) from investment operations | Distributions to shareholders | |||||||||||||||||||||||||||||
| Period - Share Class | Net asset value, beginning of period | Net | Net realized and unrealized gain (loss) | Total from investment operations | From net investment income | From net realized gains | Total distributions | |||||||||||||||||||||||
| FOR THE SIX MONTHS ENDED APRIL 30, (UNAUDITED) | ||||||||||||||||||||||||||||||
2013 - A | $ | 12.71 | $ | (0.03 | ) | $ | 0.23 | $ | 0.20 | $ | (0.10 | ) | $ | — | $ | (0.10 | ) | |||||||||||||
2013 - C | 12.11 | (0.07 | ) | 0.21 | 0.14 | — | — | — | ||||||||||||||||||||||
2013 - Institutional | 13.01 | — | (d) | 0.23 | 0.23 | (0.16 | ) | — | (0.16 | ) | ||||||||||||||||||||
2013 - IR | 13.08 | (0.01 | ) | 0.22 | 0.21 | (0.14 | ) | — | (0.14 | ) | ||||||||||||||||||||
| FOR THE FISCAL YEARS ENDED OCTOBER 31, | ||||||||||||||||||||||||||||||
2012 - A | 13.13 | 0.09 | (0.51 | ) | (0.42 | ) | — | — | — | |||||||||||||||||||||
2012 - C | 12.60 | — | (d) | (0.49 | ) | (0.49 | ) | — | — | — | ||||||||||||||||||||
2012 - Institutional | 13.38 | 0.15 | (0.52 | ) | (0.37 | ) | — | — | — | |||||||||||||||||||||
2012 - IR | 13.47 | 0.15 | (0.54 | ) | (0.39 | ) | — | — | — | |||||||||||||||||||||
2011 - A | 15.78 | 0.03 | (2.68 | ) | (2.65 | ) | — | — | — | |||||||||||||||||||||
2011 - C | 15.26 | (0.06 | ) | (2.60 | ) | (2.66 | ) | — | — | — | ||||||||||||||||||||
2011 - Institutional | 16.04 | 0.18 | (2.81 | ) | (2.63 | ) | (0.03 | ) | — | (0.03 | ) | |||||||||||||||||||
2011 - IR | 16.19 | 0.03 | (2.72 | ) | (2.69 | ) | (0.03 | ) | — | (0.03 | ) | |||||||||||||||||||
2010 - A | 13.12 | (0.03 | )(f) | 2.69 | 2.66 | — | — | — | ||||||||||||||||||||||
2010 - C | 12.79 | (0.13 | )(f) | 2.60 | 2.47 | — | — | — | ||||||||||||||||||||||
2010 - Institutional | 13.29 | 0.05 | (f) | 2.70 | 2.75 | — | — | — | ||||||||||||||||||||||
2010 - IR (Commenced August 31, 2010) | 14.12 | (0.02 | )(f) | 2.09 | 2.07 | — | — | — | ||||||||||||||||||||||
2009 - A | 7.39 | 0.02 | 5.71 | 5.73 | — | — | — | |||||||||||||||||||||||
2009 - C | 7.26 | (0.05 | ) | 5.58 | 5.53 | — | — | — | ||||||||||||||||||||||
2009 - Institutional | 7.46 | 0.05 | 5.78 | 5.83 | — | — | — | |||||||||||||||||||||||
| FOR THE PERIOD SEPTEMBER 1, 2008 TO OCTOBER 31, 2008* | ||||||||||||||||||||||||||||||
2008 - A | 14.21 | 0.02 | (6.84 | ) | (6.82 | ) | — | — | — | |||||||||||||||||||||
2008 - C | 13.97 | — | (d) | (6.71 | ) | (6.71 | ) | — | — | — | ||||||||||||||||||||
2008 - Institutional | �� | 14.32 | 0.03 | (6.89 | ) | (6.86 | ) | — | — | — | ||||||||||||||||||||
| FOR THE FISCAL YEAR ENDED AUGUST 31, | ||||||||||||||||||||||||||||||
2008 - A | 16.29 | (0.03 | ) | (1.11 | ) | (1.14 | ) | (0.01 | ) | (0.93 | ) | (0.94 | ) | |||||||||||||||||
2008 - C | 16.14 | (0.15 | ) | (1.09 | ) | (1.24 | ) | — | (0.93 | ) | (0.93 | ) | ||||||||||||||||||
2008 - Institutional | 16.37 | 0.04 | (1.13 | ) | (1.09 | ) | (0.03 | ) | (0.93 | ) | (0.96 | ) | ||||||||||||||||||
| * | The Fund changed its fiscal year end from August 31 to October 31. |
| (a) | Calculated based on the average shares outstanding methodology. |
| (b) | Assumes investment at the net asset value at the beginning of the period, reinvestment of all distributions, a complete redemption of the investment at the net asset value at the end of the period and no sales or redemption charges. Total returns would be reduced if a sales or redemption charge was taken into account. Returns do not reflect the deduction of taxes that a shareholder would pay on Fund distributions or the redemption of Fund shares. Total returns for periods less than one full year are not annualized. |
| (c) | The Fund’s portfolio turnover rate is calculated in accordance with regulatory requirements, without regard to transactions involving short term investments and certain derivatives. If such transactions were included, the Fund’s portfolio turnover rate may be higher. |
| (d) | Amount is less than $0.005 per share. |
| (e) | Annualized. |
| (f) | Reflects income recognized from non-recurring special dividends which amounted to $0.02 per share and 0.12% of average net assets. |
| 60 | The accompanying notes are an integral part of these financial statements. |
GOLDMAN SACHS BRIC FUND
| Net asset value, end of period | Total return(b) | Net assets, (in 000s) | Ratio of net expenses to average net assets | Ratio of total expenses to average net assets | Ratio of net assets | Portfolio turnover rate(c) | ||||||||||||||||||||||||||||||||||
| $ | 12.81 | 1.53 | % | $ | 109,614 | 1.79 | %(e) | 1.96 | %(e) | (0.41 | )%(e) | 52 | % | |||||||||||||||||||||||||||
| 12.25 | 1.16 | 69,348 | 2.53 | (e) | 2.71 | (e) | (1.14 | )(e) | 52 | |||||||||||||||||||||||||||||||
| 13.08 | 1.77 | 162,146 | 1.38 | (e) | 1.57 | (e) | 0.04 | (e) | 52 | |||||||||||||||||||||||||||||||
| 13.15 | 1.61 | 1,760 | 1.53 | (e) | 1.71 | (e) | (0.18 | )(e) | 52 | |||||||||||||||||||||||||||||||
| 12.71 | (3.19 | ) | 140,354 | 1.82 | 1.96 | 0.69 | 82 | |||||||||||||||||||||||||||||||||
| 12.11 | (3.88 | ) | 81,879 | 2.57 | 2.71 | (0.02 | ) | 82 | ||||||||||||||||||||||||||||||||
| 13.01 | (2.76 | ) | 164,600 | 1.42 | 1.56 | 1.20 | 82 | |||||||||||||||||||||||||||||||||
| 13.08 | (2.89 | ) | 2,292 | 1.57 | 1.71 | 1.19 | 82 | |||||||||||||||||||||||||||||||||
| 13.13 | (16.79 | ) | 227,178 | 1.86 | 1.92 | 0.16 | 91 | |||||||||||||||||||||||||||||||||
| 12.60 | (17.43 | ) | 114,773 | 2.61 | 2.67 | (0.41 | ) | 91 | ||||||||||||||||||||||||||||||||
| 13.38 | (16.45 | ) | 219,820 | 1.46 | 1.52 | 1.15 | 91 | |||||||||||||||||||||||||||||||||
| 13.47 | (16.66 | ) | 200 | 1.60 | 1.66 | 0.18 | 91 | |||||||||||||||||||||||||||||||||
| 15.78 | 20.27 | 474,512 | 1.89 | 1.92 | (0.22 | )(f) | 87 | |||||||||||||||||||||||||||||||||
| 15.26 | 19.31 | 178,404 | 2.64 | 2.67 | (0.96 | )(f) | 87 | |||||||||||||||||||||||||||||||||
| 16.04 | 20.69 | 158,912 | 1.49 | 1.52 | 0.36 | (f) | 87 | |||||||||||||||||||||||||||||||||
| 16.19 | 14.66 | 23 | 1.64 | (e) | 1.67 | (e) | (0.83 | )(e)(f) | 87 | |||||||||||||||||||||||||||||||
| 13.12 | 77.54 | 367,897 | 1.97 | 2.00 | 0.19 | 117 | ||||||||||||||||||||||||||||||||||
| 12.79 | 76.17 | 141,614 | 2.72 | 2.75 | (0.54 | ) | 117 | |||||||||||||||||||||||||||||||||
| 13.29 | 78.15 | 30,269 | 1.57 | 1.60 | 0.46 | 117 | ||||||||||||||||||||||||||||||||||
| 7.39 | (47.99 | ) | 179,052 | 1.97 | (e) | 2.10 | (e) | 1.03 | (e) | 14 | ||||||||||||||||||||||||||||||
| 7.26 | (48.03 | ) | 77,810 | 2.72 | (e) | 2.85 | (e) | 0.23 | (e) | 14 | ||||||||||||||||||||||||||||||
| 7.46 | (47.91 | ) | 18,058 | 1.57 | (e) | 1.70 | (e) | 1.70 | (e) | 14 | ||||||||||||||||||||||||||||||
| 14.21 | (8.49 | ) | 431,746 | 1.90 | 1.93 | (0.14 | ) | 72 | ||||||||||||||||||||||||||||||||
| 13.97 | (9.18 | ) | 169,711 | 2.65 | 2.68 | (0.88 | ) | 72 | ||||||||||||||||||||||||||||||||
| 14.32 | (8.17 | ) | 46,769 | 1.50 | 1.53 | 0.21 | 72 | |||||||||||||||||||||||||||||||||
| The accompanying notes are an integral part of these financial statements. | 61 |
GOLDMAN SACHS CHINA EQUITY FUND
Financial Highlights
Selected Data for a Share Outstanding Throughout Each Period
| Income (loss) from investment operations | ||||||||||||||||||||||
| Period - Share Class | Net asset value, beginning of period | Net investment income | Net realized and unrealized gain (loss) | Total from investment operations | Distributions to shareholder from net investment income | |||||||||||||||||
| FOR THE SIX MONTHS ENDED APRIL 30, (UNAUDITED) | ||||||||||||||||||||||
2013 - A | $ | 8.24 | $ | (0.08 | ) | $ | 0.19 | $ | 0.11 | $ | (0.06 | ) | ||||||||||
2013 - C | 8.18 | (0.11 | ) | 0.20 | 0.09 | (0.01 | ) | |||||||||||||||
2013 - Institutional | 8.27 | (0.06 | ) | 0.20 | 0.14 | (0.07 | ) | |||||||||||||||
2013 - IR | 8.26 | (0.07 | ) | 0.20 | 0.13 | (0.06 | ) | |||||||||||||||
| FOR THE FISCAL YEAR ENDED OCTOBER 31, | ||||||||||||||||||||||
2012 - A | 7.76 | 0.11 | 0.41 | 0.52 | (0.04 | ) | ||||||||||||||||
2012 - C | 7.73 | 0.06 | 0.40 | 0.46 | (0.01 | ) | ||||||||||||||||
2012 - Institutional | 7.78 | 0.09 | 0.46 | 0.55 | (0.06 | ) | ||||||||||||||||
2012 - IR | 7.77 | 0.08 | 0.46 | 0.54 | (0.05 | ) | ||||||||||||||||
| FOR THE PERIOD ENDED OCTOBER 31, | ||||||||||||||||||||||
2011 - A (Commenced April 29, 2011) | 10.00 | 0.09 | (2.33 | ) | (2.24 | ) | — | |||||||||||||||
2011 - C (Commenced April 29, 2011) | 10.00 | 0.06 | (2.33 | ) | (2.27 | ) | — | |||||||||||||||
2011 - Institutional (Commenced April 29, 2011) | 10.00 | 0.07 | (2.29 | ) | (2.22 | ) | — | |||||||||||||||
2011 - IR (Commenced April 29, 2011) | 10.00 | 0.10 | (2.33 | ) | (2.23 | ) | — | |||||||||||||||
| (a) | Calculated based on the average shares outstanding methodology. |
| (b) | Assumes investment at the net asset value at the beginning of the period, reinvestment of all dividends and distributions, a complete redemption of the investment at the net asset value at the end of the period and no sales or redemption charges. Total returns would be reduced if a sales or redemption charge was taken into account. Returns do not reflect the deduction of taxes that a shareholder would pay on Fund distributions or the redemption of Fund shares. Total returns for periods less than one full year are not annualized. |
| (c) | The Fund’s portfolio turnover rate is calculated in accordance with regulatory requirements, without regard to transactions involving short term investments and certain derivatives. If such transactions were included, the Fund’s portfolio turnover rate may be higher. |
| (d) | Annualized. |
| 62 | The accompanying notes are an integral part of these financial statements. |
GOLDMAN SACHS CHINA EQUITY FUND
| Net asset value, end of period | Total return(b) | Net assets, end of period (in 000s) | Ratio of net expenses to average net assets | Ratio of total expenses to average net assets | Ratio of net investment income (loss) to average net assets | Portfolio turnover rate(c) | ||||||||||||||||||||||||||||||||
| $8.29 | 1.33 | % | $ | 98 | 1.90 | %(d) | 3.45 | %(d) | (1.90 | )%(d) | 39 | |||||||||||||||||||||||||||
| 8.26 | 1.14 | 45 | 2.65 | (d) | 4.25 | (d) | (2.65 | )(d) | 39 | |||||||||||||||||||||||||||||
| 8.34 | 1.68 | 19,892 | 1.50 | (d) | 3.21 | (d) | (1.50 | )(d) | 39 | |||||||||||||||||||||||||||||
| 8.33 | 1.53 | 8 | 1.69 | (d) | 3.36 | (d) | (1.68 | )(d) | 39 | |||||||||||||||||||||||||||||
| 8.24 | 6.75 | 21 | 1.89 | 6.89 | 1.36 | 57 | ||||||||||||||||||||||||||||||||
| 8.18 | 5.91 | 25 | 2.64 | 7.04 | 0.80 | 57 | ||||||||||||||||||||||||||||||||
| 8.27 | 7.12 | 8,371 | 1.50 | 6.72 | 1.20 | 57 | ||||||||||||||||||||||||||||||||
| 8.26 | 7.03 | 8 | 1.65 | 7.12 | 1.01 | 57 | ||||||||||||||||||||||||||||||||
| 7.76 | (22.40 | ) | 9 | 1.90 | (d) | 10.09 | (d) | 2.10 | (d) | 37 | ||||||||||||||||||||||||||||
| 7.73 | (22.70 | ) | 8 | 2.65 | (d) | 10.84 | (d) | 1.36 | (d) | 37 | ||||||||||||||||||||||||||||
| 7.78 | (22.20 | ) | 5,629 | 1.50 | (d) | 9.69 | (d) | 1.69 | (d) | 37 | ||||||||||||||||||||||||||||
| 7.77 | (22.30 | ) | 8 | 1.65 | (d) | 9.84 | (d) | 2.37 | (d) | 37 | ||||||||||||||||||||||||||||
| The accompanying notes are an integral part of these financial statements. | 63 |
GOLDMAN SACHS EMERGING MARKETS EQUITY FUND
Financial Highlights
Selected Data for a Share Outstanding Throughout Each Period
| Income (loss) from investment operations | Distributions to shareholders | |||||||||||||||||||||||||||||
| Period - Share Class | Net asset value, beginning of period | Net | Net realized and unrealized gain (loss) | Total from investment operations | From net investment income | From net realized gains | Total distributions | |||||||||||||||||||||||
| FOR THE SIX MONTHS ENDED APRIL 30, (UNAUDITED) | ||||||||||||||||||||||||||||||
2013 - A | $ | 14.68 | $ | (0.04 | ) | $ | 0.79 | $ | 0.75 | $ | (0.07 | ) | $ | — | $ | (0.07 | ) | |||||||||||||
2013 - B | 13.33 | (0.09 | ) | 0.72 | 0.63 | — | — | — | ||||||||||||||||||||||
2013 - C | 13.42 | �� | (0.09 | ) | 0.73 | 0.64 | — | — | — | |||||||||||||||||||||
2013 - Institutional | 15.65 | (0.01 | ) | 0.85 | 0.84 | (0.14 | ) | — | (0.14 | ) | ||||||||||||||||||||
2013 - Service | 14.24 | (0.05 | ) | 0.78 | 0.73 | (0.07 | ) | — | (0.07 | ) | ||||||||||||||||||||
2013 - IR | 15.58 | (0.02 | ) | 0.85 | 0.83 | (0.12 | ) | — | (0.12 | ) | ||||||||||||||||||||
| FOR THE FISCAL YEARS ENDED OCTOBER 31, | ||||||||||||||||||||||||||||||
2012 - A | 14.66 | 0.06 | (0.04 | ) | 0.02 | — | — | — | ||||||||||||||||||||||
2012 - B | 13.41 | (0.05 | ) | (0.03 | ) | (0.08 | ) | — | — | — | ||||||||||||||||||||
2012 - C | 13.51 | (0.05 | ) | (0.04 | ) | (0.09 | ) | — | — | — | ||||||||||||||||||||
2012 - Institutional | 15.63 | 0.12 | (0.05 | ) | 0.07 | (0.05 | ) | — | (0.05 | ) | ||||||||||||||||||||
2012 - Service | 14.24 | 0.05 | (0.05 | ) | — | (e) | — | — | — | |||||||||||||||||||||
2012 - IR | 15.59 | 0.12 | (0.07 | ) | 0.05 | (0.06 | ) | — | (0.06 | ) | ||||||||||||||||||||
2011 - A | 16.38 | 0.04 | (1.73 | ) | (1.69 | ) | (0.03 | ) | — | (0.03 | ) | |||||||||||||||||||
2011 - B | 15.09 | (0.08 | ) | (1.58 | ) | (1.66 | ) | (0.02 | ) | — | (0.02 | ) | ||||||||||||||||||
2011 - C | 15.20 | (0.07 | ) | (1.60 | ) | (1.67 | ) | (0.02 | ) | — | (0.02 | ) | ||||||||||||||||||
2011 - Institutional | 17.48 | 0.11 | (1.84 | ) | (1.73 | ) | (0.12 | ) | — | (0.12 | ) | |||||||||||||||||||
2011 - Service | 15.95 | 0.02 | (1.68 | ) | (1.66 | ) | (0.05 | ) | — | (0.05 | ) | |||||||||||||||||||
2011 - IR | 17.56 | 0.02 | (1.87 | ) | (1.85 | ) | (0.12 | ) | — | (0.12 | ) | |||||||||||||||||||
2010 - A | 13.37 | (0.02 | )(f) | 3.03 | 3.01 | — | — | — | ||||||||||||||||||||||
2010 - B | 12.41 | (0.10 | )(f) | 2.78 | 2.68 | — | — | — | ||||||||||||||||||||||
2010 - C | 12.50 | (0.10 | )(f) | 2.80 | 2.70 | — | — | — | ||||||||||||||||||||||
2010 - Institutional | 14.22 | 0.07 | (f) | 3.20 | 3.27 | (0.01 | ) | — | (0.01 | ) | ||||||||||||||||||||
2010 - Service | 13.03 | (0.01 | )(f) | 2.93 | 2.92 | — | — | — | ||||||||||||||||||||||
2010 - IR (Commenced August 31, 2010) | 15.24 | (0.01 | )(f) | 2.33 | 2.32 | — | — | — | ||||||||||||||||||||||
2009 - A | 11.97 | 0.15 | 4.64 | 4.79 | (0.26 | ) | (3.13 | ) | (3.39 | ) | ||||||||||||||||||||
2009 - B | 11.30 | 0.07 | 4.31 | 4.38 | (0.14 | ) | (3.13 | ) | (3.27 | ) | ||||||||||||||||||||
2009 - C | 11.31 | 0.07 | 4.34 | 4.41 | (0.09 | ) | (3.13 | ) | (3.22 | ) | ||||||||||||||||||||
2009 - Institutional | 12.60 | 0.21 | 4.93 | 5.14 | (0.39 | ) | (3.13 | ) | (3.52 | ) | ||||||||||||||||||||
2009 - Service | 11.80 | 0.15 | 4.51 | 4.66 | (0.30 | ) | (3.13 | ) | (3.43 | ) | ||||||||||||||||||||
| FOR THE PERIOD SEPTEMBER 1, 2008 TO OCTOBER 31, 2008* | ||||||||||||||||||||||||||||||
2008 - A | 20.13 | 0.05 | (8.21 | ) | (8.16 | ) | — | — | — | |||||||||||||||||||||
2008 - B | 19.03 | 0.02 | (7.75 | ) | (7.73 | ) | — | — | — | |||||||||||||||||||||
2008 - C | 19.04 | 0.02 | (7.75 | ) | (7.73 | ) | — | — | — | |||||||||||||||||||||
2008 - Institutional | 21.18 | 0.06 | (8.64 | ) | (8.58 | ) | — | — | — | |||||||||||||||||||||
2008 - Service | 19.85 | 0.04 | (8.09 | ) | (8.05 | ) | — | — | — | |||||||||||||||||||||
| FOR THE FISCAL YEAR ENDED AUGUST 31, | ||||||||||||||||||||||||||||||
2008 - A | 26.74 | 0.14 | (2.87 | ) | (2.73 | ) | (0.04 | ) | (3.84 | ) | (3.88 | ) | ||||||||||||||||||
2008 - B | 25.61 | (0.03 | ) | (2.71 | ) | (2.74 | ) | — | (3.84 | ) | (3.84 | ) | ||||||||||||||||||
2008 - C | 25.62 | (0.04 | ) | (2.70 | ) | (2.74 | ) | — | (3.84 | ) | (3.84 | ) | ||||||||||||||||||
2008 - Institutional | 27.91 | 0.25 | (3.04 | ) | (2.79 | ) | (0.10 | ) | (3.84 | ) | (3.94 | ) | ||||||||||||||||||
2008 - Service | 26.48 | 0.16 | (2.88 | ) | (2.72 | ) | (0.07 | ) | (3.84 | ) | (3.91 | ) | ||||||||||||||||||
| * | The Fund changed its fiscal year end from August 31 to October 31. |
| (a) | Calculated based on the average shares outstanding methodology. |
| (b) | Assumes investment at the net asset value at the beginning of the period, reinvestment of all distributions, a complete redemption of the investment at the net asset value at the end of the period and no sales or redemption charges. Total returns would be reduced if a sales or redemption charge was taken into account. Returns do not reflect the deduction of taxes that a shareholder would pay on Fund distributions or the redemption of Fund shares. Total returns for periods less than one full year are not annualized. |
| (c) | The Fund’s portfolio turnover rate is calculated in accordance with regulatory requirements, without regard to transactions involving short term investments and certain derivatives. If such transactions were included, the Fund’s portfolio turnover rate may be higher. |
| (d) | Annualized. |
| (e) | Amount is less than $0.005 per share. |
| (f) | Reflects income recognized from non-recurring special dividends which amounted to $0.02 per share and 0.12% of average net assets. |
| 64 | The accompanying notes are an integral part of these financial statements. |
GOLDMAN SACHS EMERGING MARKETS EQUITY FUND
| Net asset value, end of period | Total return(b) | Net assets, period | Ratio of net expenses to average net assets | Ratio of total expenses to average net assets | Ratio of to average net assets | Portfolio turnover rate(c) | ||||||||||||||||||||||||||||||||||
| $ | 15.36 | 5.13 | % | $ | 38,961 | 1.76 | %(d) | 1.90 | %(d) | (0.51 | )%(d) | 68 | % | |||||||||||||||||||||||||||
| 13.96 | 4.73 | 4,197 | 2.51 | (d) | 2.65 | (d) | (1.27 | )(d) | 68 | |||||||||||||||||||||||||||||||
| 14.06 | 4.77 | 14,069 | 2.51 | (d) | 2.65 | (d) | (1.28 | )(d) | 68 | |||||||||||||||||||||||||||||||
| 16.35 | 5.39 | 391,864 | 1.36 | (d) | 1.51 | (d) | (0.11 | )(d) | 68 | |||||||||||||||||||||||||||||||
| 14.90 | 5.15 | 18,746 | 1.86 | (d) | 2.00 | (d) | (0.62 | )(d) | 68 | |||||||||||||||||||||||||||||||
| 16.29 | 5.34 | 260 | 1.51 | (d) | 1.65 | (d) | (0.27 | )(d) | 68 | |||||||||||||||||||||||||||||||
| 14.68 | 0.14 | 38,889 | 1.82 | 1.94 | 0.39 | 119 | ||||||||||||||||||||||||||||||||||
| 13.33 | (0.59 | ) | 4,788 | 2.57 | 2.69 | (0.37 | ) | 119 | ||||||||||||||||||||||||||||||||
| 13.42 | (0.66 | ) | 15,418 | 2.57 | 2.69 | (0.35 | ) | 119 | ||||||||||||||||||||||||||||||||
| 15.65 | 0.49 | 310,167 | 1.41 | 1.54 | 0.80 | 119 | ||||||||||||||||||||||||||||||||||
| 14.24 | 0.00 | 15,446 | 1.91 | 2.03 | 0.36 | 119 | ||||||||||||||||||||||||||||||||||
| 15.58 | 0.35 | 240 | 1.55 | 1.68 | 0.78 | 119 | ||||||||||||||||||||||||||||||||||
| 14.66 | (10.33 | ) | 51,221 | 1.90 | 1.93 | 0.24 | 121 | |||||||||||||||||||||||||||||||||
| 13.41 | (11.02 | ) | 6,841 | 2.65 | 2.68 | (0.53 | ) | 121 | ||||||||||||||||||||||||||||||||
| 13.51 | (11.01 | ) | 18,896 | 2.65 | 2.68 | (0.49 | ) | 121 | ||||||||||||||||||||||||||||||||
| 15.63 | (9.98 | ) | 351,982 | 1.50 | 1.53 | 0.61 | 121 | |||||||||||||||||||||||||||||||||
| 14.24 | (10.43 | ) | 14,432 | 2.00 | 2.03 | 0.15 | 121 | |||||||||||||||||||||||||||||||||
| 15.59 | (10.21 | ) | 21 | 1.65 | 1.68 | 0.16 | 121 | |||||||||||||||||||||||||||||||||
| 16.38 | 22.51 | 68,118 | 1.91 | 1.91 | (0.16 | )(f) | 147 | |||||||||||||||||||||||||||||||||
| 15.09 | 21.60 | 10,335 | 2.66 | 2.66 | (0.75 | )(f) | 147 | |||||||||||||||||||||||||||||||||
| 15.20 | 21.60 | 23,226 | 2.66 | 2.66 | (0.73 | )(f) | 147 | |||||||||||||||||||||||||||||||||
| 17.48 | 23.04 | 472,994 | 1.51 | 1.51 | 0.43 | (f) | 147 | |||||||||||||||||||||||||||||||||
| 15.95 | 22.41 | 13,954 | 2.01 | 2.01 | (0.10 | )(f) | 147 | |||||||||||||||||||||||||||||||||
| 17.56 | 15.22 | 1 | 1.66 | (d) | 1.66 | (d) | (0.09 | )(d)(f) | 147 | |||||||||||||||||||||||||||||||
| 13.37 | 58.12 | 256,648 | 1.89 | 1.89 | 1.43 | 179 | ||||||||||||||||||||||||||||||||||
| 12.41 | 56.96 | 10,350 | 2.64 | 2.64 | 0.73 | 179 | ||||||||||||||||||||||||||||||||||
| 12.50 | 57.03 | 17,637 | 2.64 | 2.64 | 0.70 | 179 | ||||||||||||||||||||||||||||||||||
| 14.22 | 58.76 | 347,017 | 1.49 | 1.49 | 1.88 | 179 | ||||||||||||||||||||||||||||||||||
| 13.03 | 57.99 | 10,273 | 1.99 | 1.99 | 1.38 | 179 | ||||||||||||||||||||||||||||||||||
| 11.97 | (40.54 | ) | 263,099 | 1.86 | (d) | 1.90 | (d) | 1.81 | (d) | 20 | ||||||||||||||||||||||||||||||
| 11.30 | (40.62 | ) | 7,919 | 2.61 | (d) | 2.65 | (d) | 1.01 | (d) | 20 | ||||||||||||||||||||||||||||||
| 11.31 | (40.65 | ) | 11,612 | 2.61 | (d) | 2.65 | (d) | 1.04 | (d) | 20 | ||||||||||||||||||||||||||||||
| 12.60 | (40.51 | ) | 522,606 | 1.46 | (d) | 1.50 | (d) | 2.19 | (d) | 20 | ||||||||||||||||||||||||||||||
| 11.80 | (40.55 | ) | 3,701 | 1.96 | (d) | 2.00 | (d) | 1.77 | (d) | 20 | ||||||||||||||||||||||||||||||
| 20.13 | (13.92 | ) | 522,595 | 1.84 | 1.84 | 0.55 | 91 | |||||||||||||||||||||||||||||||||
| 19.03 | (14.55 | ) | 14,677 | 2.59 | 2.59 | (0.16 | ) | 91 | ||||||||||||||||||||||||||||||||
| 19.04 | (14.58 | ) | 22,596 | 2.59 | 2.59 | (0.19 | ) | 91 | ||||||||||||||||||||||||||||||||
| 21.18 | (13.57 | ) | 986,258 | 1.44 | 1.44 | 0.95 | 91 | |||||||||||||||||||||||||||||||||
| 19.85 | (14.03 | ) | 7,472 | 1.94 | 1.94 | 0.63 | 91 | |||||||||||||||||||||||||||||||||
| The accompanying notes are an integral part of these financial statements. | 65 |
GOLDMAN SACHS N-11 EQUITY FUND
Financial Highlights
Selected Data for a Share Outstanding Throughout Each Period
| Income (loss) from investment operations | ||||||||||||||||||||||
| Period - Share Class | Net asset value, beginning of period | Net investment income (loss)(a) | Net realized and unrealized gain (loss) | Total from investment operations | Distributions to shareholders from net investment income | |||||||||||||||||
| FOR THE SIX MONTHS ENDED APRIL 30, (UNAUDITED) | ||||||||||||||||||||||
2013 - A | $ | 10.38 | $ | 0.03 | $ | 1.23 | $ | 1.26 | $ | (0.01 | ) | |||||||||||
2013 - C | 10.25 | (0.01 | ) | 1.21 | 1.20 | — | ||||||||||||||||
2013 - Institutional | 10.45 | 0.05 | 1.23 | 1.28 | (0.03 | ) | ||||||||||||||||
2013 - IR | 10.42 | 0.05 | 1.22 | 1.27 | (0.02 | ) | ||||||||||||||||
| FOR THE FISCAL YEAR ENDED OCTOBER 31, | ||||||||||||||||||||||
2012 - A | 9.57 | 0.01 | 0.80 | 0.81 | — | |||||||||||||||||
2012 - C | 9.52 | (0.06 | ) | 0.79 | 0.73 | — | ||||||||||||||||
2012 - Institutional | 9.60 | 0.05 | 0.80 | 0.85 | — | |||||||||||||||||
2012 - IR | 9.59 | 0.02 | 0.81 | 0.83 | — | |||||||||||||||||
| FOR THE PERIOD ENDED OCTOBER 31, | ||||||||||||||||||||||
2011 - A (Commenced February 28, 2011) | 10.00 | (0.03 | ) | (0.40 | ) | (0.43 | ) | — | ||||||||||||||
2011 - C (Commenced February 28, 2011) | 10.00 | (0.08 | ) | (0.40 | ) | (0.48 | ) | — | ||||||||||||||
2011 - Institutional (Commenced February 28, 2011) | 10.00 | 0.02 | (0.42 | ) | (0.40 | ) | — | |||||||||||||||
2011 - IR (Commenced February 28, 2011) | 10.00 | (0.02 | ) | (0.39 | ) | (0.41 | ) | — | ||||||||||||||
| (a) | Calculated based on the average shares outstanding methodology. |
| (b) | Assumes investment at the net asset value at the beginning of the period, reinvestment of all distributions, a complete redemption of the investment at the net asset value at the end of the period and no sales or redemption charges. Total returns would be reduced if a sales or redemption charge was taken into account. Returns do not reflect the deduction of taxes that a shareholder would pay on Fund distributions or the redemption of Fund shares. Total returns for periods less than one full year are not annualized. |
| (c) | The Fund’s portfolio turnover rate is calculated in accordance with regulatory requirements, without regard to transactions involving short term investments and certain derivatives. If such transactions were included, the Fund’s portfolio turnover rate may be higher. |
| (d) | Annualized. |
| 66 | The accompanying notes are an integral part of these financial statements. |
GOLDMAN SACHS N-11 EQUITY FUND
| Net asset value, end of period | Total return(b) | Net assets, end of period (in 000s) | Ratio of net expenses to average net assets | Ratio of total expenses to average net assets | Ratio of net investment income (loss) to average net assets | Portfolio turnover rate(c) | ||||||||||||||||||||||||||||||||||
| $ | 11.63 | 12.10 | % | $ | 89,233 | 1.76 | %(d) | 2.18 | %(d) | 0.59 | %(d) | 24 | % | |||||||||||||||||||||||||||
| 11.45 | 11.71 | 16,340 | 2.51 | (d) | 2.92 | (d) | (0.18 | )(d) | 24 | |||||||||||||||||||||||||||||||
| 11.70 | 12.30 | 235,568 | 1.36 | (d) | 1.77 | (d) | 0.91 | (d) | 24 | |||||||||||||||||||||||||||||||
| 11.67 | 12.15 | 24,984 | 1.51 | (d) | 1.93 | (d) | 0.86 | (d) | 24 | |||||||||||||||||||||||||||||||
| 10.38 | 8.33 | 35,417 | 1.79 | 2.35 | 0.09 | 90 | ||||||||||||||||||||||||||||||||||
| 10.25 | 7.53 | 6,720 | 2.54 | 3.12 | (0.57 | ) | 90 | |||||||||||||||||||||||||||||||||
| 10.45 | 8.83 | 111,826 | 1.39 | 1.94 | 0.52 | 90 | ||||||||||||||||||||||||||||||||||
| 10.42 | 8.73 | 9,500 | 1.54 | 2.05 | 0.22 | 90 | ||||||||||||||||||||||||||||||||||
| 9.57 | (4.20 | ) | 18,335 | 1.82 | (d) | 3.92 | (d) | (0.40 | )(d) | 73 | ||||||||||||||||||||||||||||||
| 9.52 | (4.70 | ) | 3,528 | 2.57 | (d) | 4.67 | (d) | (1.29 | )(d) | 73 | ||||||||||||||||||||||||||||||
| 9.60 | (4.00 | ) | 42,740 | 1.42 | (d) | 3.52 | (d) | 0.24 | (d) | 73 | ||||||||||||||||||||||||||||||
| 9.59 | (4.10 | ) | 1,448 | 1.57 | (d) | 3.67 | (d) | (0.28 | )(d) | 73 | ||||||||||||||||||||||||||||||
| The accompanying notes are an integral part of these financial statements. | 67 |
GOLDMAN SACHS FUNDAMENTAL EMERGING MARKETS EQUITY FUNDS
Notes to Financial Statements
April 30, 2013 (Unaudited)
| 1. ORGANIZATION |
Goldman Sachs Trust (the “Trust”) is a Delaware statutory trust registered under the Investment Company Act of 1940, as amended (the “Act”), as an open-end management investment company. The following table lists those series of the Trust that are included in this report (collectively, the “Funds” or individually a “Fund”), along with their corresponding share classes and respective diversification status under the Act:
| Fund | Share Classes Offered* | Diversified/ Non-diversified | ||
Asia Equity | A, B, C and Institutional | Diversified | ||
BRIC, China Equity and N-11 Equity | A, C, Institutional and IR | Non-diversified | ||
Emerging Markets Equity | A, B, C, Institutional, Service and IR | Diversified |
| * | Class B Shares are generally no longer available for purchase by current or prospective investors. |
Class A Shares are sold with a front-end sales charge of up to 5.50%. Class B Shares were sold with a contingent deferred sales charge (“CDSC”) that declines from 5.00% to zero, depending upon the period of time the shares are held. Class C Shares are sold with a CDSC of 1.00%, which is imposed on redemptions made within 12 months of purchase. Institutional, Service and Class IR Shares are not subject to a sales charge.
Goldman Sachs Asset Management International (“GSAMI”), an affiliate of Goldman, Sachs & Co. (“Goldman Sachs”), serves as investment adviser to the Funds pursuant to a management agreement (the “Agreement”) with the Trust.
| 2. SIGNIFICANT ACCOUNTING POLICIES |
The financial statements have been prepared in accordance with accounting principles generally accepted in the United States of America (“GAAP”) and require management to make estimates and assumptions that may affect the reported amounts and disclosures. Actual results may differ from those estimates and assumptions.
A. Investment Valuation — The Funds’ valuation policy is to value investments at fair value.
B. Investment Income and Investments — Investment income includes interest income and dividend income, net of any foreign withholding taxes, less any amounts reclaimable. Interest income is accrued daily and adjusted for amortization of premiums and accretion of discounts. Dividend income is recognized on ex-dividend date or, for certain foreign securities, as soon as such information is obtained subsequent to the ex-dividend date. Investment transactions are reflected on trade date. Realized gains and losses are calculated using identified cost. Investment transactions are recorded on the following business day for daily net asset value (“NAV”) calculations. Any foreign capital gains tax is accrued daily based upon net unrealized gains, and is payable upon sale of such investments.
For derivative contracts, realized gains and losses are recorded upon settlement of the contract. Upfront payments are made or received upon entering into a swap agreement and are reflected as a receivable from or payable to the counterparty in the Statement of Assets and Liabilities. Upfront payments are recognized over the contract’s term/event as realized gains or losses, with the exception of forward starting interest rate swaps whose realized gains or losses are recognized from the effective start date. For securities with paydown provisions, principal payments received are treated as a proportionate reduction to the cost basis of the securities and excess or shortfall amounts are recorded as gains or losses. For treasury inflation protected securities (“TIPS”), adjustments to principal due to inflation/deflation are reflected as increases/decreases to interest income with a corresponding adjustment to cost.
C. Class Allocations and Expenses — Investment income, realized and unrealized gain (loss), and non-class specific expenses of each Fund are allocated daily based upon the proportion of net assets of each class. Class specific expenses, where applicable, are borne by the respective share classes and include Distribution and Service, Transfer Agent and Service and Shareholder Administration fees. Non-class specific expenses directly incurred by a Fund are charged to that Fund, while such expenses
68
GOLDMAN SACHS FUNDAMENTAL EMERGING MARKETS EQUITY FUNDS
| 2. SIGNIFICANT ACCOUNTING POLICIES (continued) |
incurred by the Trust are allocated across the respective Funds on a straight-line and/or pro-rata basis depending upon the nature of the expenses.
D. Federal Taxes and Distributions to Shareholders — It is each Fund’s policy to comply with the requirements of the Internal Revenue Code of 1986, as amended (the “Code”), applicable to regulated investment companies (mutual funds) and to distribute each year substantially all of its investment company taxable income and capital gains to its shareholders. Accordingly, the Funds are not required to make any provisions for the payment of federal income tax. Distributions to shareholders are recorded on the ex-dividend date. Income and capital gains distributions, if any, are declared and paid annually.
Net capital losses are carried forward to future fiscal years and may be used to the extent allowed by the Code to offset any future capital gains. Utilization of capital loss carryforwards will reduce the requirement of future capital gains distributions.
Under the Regulated Investment Company Modernization Act of 2010, the Funds are permitted to carry forward capital losses incurred in taxable years beginning after December 22, 2010 for an unlimited period. However, any losses incurred during those future taxable years will be required to be utilized prior to the losses incurred in pre-enactment taxable years. As a result of this ordering rule, pre-enactment capital loss carryforwards may be more likely to expire unused. Additionally, post-enactment capital losses that are carried forward will retain their character as either short-term or long term capital losses rather than being considered all short-term as under previous law.
The characterization of distributions to shareholders for financial reporting purposes is determined in accordance with federal income tax rules, which may differ from GAAP. The source of each Fund’s distributions may be shown in the accompanying financial statements as either from net investment income, net realized gain or capital. Certain components of the Funds’ net assets on the Statements of Assets and Liabilities reflect permanent GAAP/tax differences based on the appropriate tax character.
E. Foreign Currency Translation — The accounting records and reporting currency of the Funds are maintained in United States (“U.S.”) dollars. Assets and liabilities denominated in foreign currencies are translated into U.S. dollars using the current exchange rates at the close of each business day. The effect of changes in foreign currency exchange rates on investments is included within net realized and unrealized gain (loss) on investments. Changes in the value of other assets and liabilities as a result of fluctuations in foreign exchange rates are included in the Statements of Operations within net change in unrealized gain (loss) on foreign currency transactions. Transactions denominated in foreign currencies are translated into U.S. dollars on the date the transaction occurred, the effects of which are included within net realized gain (loss) on foreign currency transactions.
| 3. INVESTMENTS AND FAIR VALUE MEASUREMENTS |
The fair value of a financial instrument is the amount that would be received to sell an asset or paid to transfer a liability in an orderly transaction between market participants at the measurement date (i.e., the exit price). GAAP establishes a fair value hierarchy that prioritizes the inputs to valuation techniques used to measure fair value. The hierarchy gives the highest priority to unadjusted quoted prices in active markets for identical assets or liabilities (Level 1 measurements) and the lowest priority to unobservable inputs (Level 3 measurements). The levels used for classifying investments are not necessarily an indication of the risk associated with investing in these investments. The three levels of the fair value hierarchy are described below:
Level 1 — Unadjusted quoted prices in active markets that are accessible at the measurement date for identical, unrestricted assets or liabilities;
Level 2 — Quoted prices in markets that are not active or financial instruments for which significant inputs are observable (including, but not limited to, quoted prices for similar investments, interest rates, foreign exchange rates, volatility and credit spreads), either directly or indirectly;
Level 3 — Prices or valuations that require significant unobservable inputs (including GSAMI’s assumptions in determining fair value measurement).
The Trustees have adopted Valuation Procedures that govern the valuation of the portfolio investments held by the Funds, including investments for which market quotations are not readily available. The Trustees have delegated to GSAMI day-to-day
69
GOLDMAN SACHS FUNDAMENTAL EMERGING MARKETS EQUITY FUNDS
Notes to Financial Statements (continued)
April 30, 2013 (Unaudited)
| 3. INVESTMENTS AND FAIR VALUE MEASUREMENTS (continued) |
responsibility for implementing and maintaining internal controls and procedures related to the valuation of the Funds’ portfolio investments. To assess the continuing appropriateness of pricing sources and methodologies, GSAMI regularly performs price verification procedures and issues challenges as necessary to third party pricing vendors or brokers, and any differences are reviewed in accordance with the Valuation Procedures.
A. Level 1 and Level 2 Fair Value Investments — The valuation techniques and significant inputs used in determining the fair values for investments classified as Level 1 and Level 2 are as follows:
Equity Securities — Equity securities and investment companies traded on a U.S. securities exchange or the NASDAQ system, or those located on certain foreign exchanges, including but not limited to the Americas, are valued daily at their last sale price or official closing price on the principal exchange or system on which they are traded. If no sale occurs, equity securities and exchange traded investment companies are valued at the last bid price for long positions and at the last ask price for short positions. Investments in investment companies (other than those that are exchange traded) are valued at the NAV on the valuation date. To the extent these investments are actively traded, they are classified as Level 1 of the fair value hierarchy.
Unlisted equity securities for which market quotations are available are valued at the last sale price on the valuation date, or if no sale occurs, at the last bid price. Securities traded on certain foreign securities exchanges are valued daily at fair value determined by an independent fair value service (if available) under Valuation Procedures approved by the Trustees and consistent with applicable regulatory guidance. The independent fair value service takes into account multiple factors including, but not limited to, movements in the securities markets, certain depositary receipts, futures contracts and foreign currency exchange rates that have occurred subsequent to the close of the foreign securities exchange. These investments are generally classified as Level 2 of the fair value hierarchy.
Debt Securities — Debt securities for which market quotations are readily available are valued daily on the basis of quotations supplied by dealers or an independent pricing service approved by the Trustees. The pricing services may use valuation models or matrix pricing, which consider: (i) yield or price with respect to bonds that are considered comparable in characteristics such as rating, interest rate and maturity date or (ii) quotations from securities dealers to determine current value. Short-term debt obligations that mature in sixty days or less and that do not exhibit signs of credit deterioration are valued at amortized cost, which approximates fair value. With the exception of treasury securities, which are generally classified as Level 1, these investments are generally classified as Level 2 of the fair value hierarchy.
i. Structured Notes — The values of structured notes are based on the price movements of a reference security or index. Upon termination, a Fund will receive a payment from the issuer based on the value of the referenced security (notional amount multiplied by price of the referenced security) and record a realized gain or loss.
Derivative Contracts — A derivative is an instrument whose value is derived from underlying assets, indices, reference rates or a combination of these factors.
Exchange-traded derivatives, including futures contracts, typically fall within Level 1 of the fair value hierarchy. Over-the-counter (“OTC”) derivatives are valued using market transactions and other market evidence, including market-based inputs to models, calibration to market-clearing transactions, broker or dealer quotations, or other alternative pricing sources. Where models are used, the selection of a particular model to value an OTC derivative depends upon the contractual terms of, and specific risks inherent in, the instrument, as well as the availability of pricing information in the market. Valuation models require a variety of inputs, including contractual terms, market prices, yield curves, credit curves, measures of volatility, voluntary and involuntary prepayment rates, loss severity rates and correlations of such inputs. For OTC derivatives that trade in liquid markets, model inputs can generally be verified and model selection does not involve significant management judgment. OTC derivatives are classified within Level 2 of the fair value hierarchy when significant inputs are corroborated by market evidence.
i. Futures Contracts — Futures contracts are contracts to buy or sell a standardized quantity of a specified commodity or security and are valued based on exchanged settlement prices or independent market quotes. Futures contracts are valued at the last settlement price, or in the absence of a sale, the last bid price for long positions and at the last ask price for short
70
GOLDMAN SACHS FUNDAMENTAL EMERGING MARKETS EQUITY FUNDS
| 3. INVESTMENTS AND FAIR VALUE MEASUREMENTS (continued) |
positions, at the end of each day on the board of trade or exchange upon which they are traded. Upon entering into a futures contract, a Fund deposits cash or securities in an account on behalf of the broker in an amount sufficient to meet the initial margin requirement. Subsequent payments are made or received by the Fund equal to the daily change in the contract value and are recorded as variation margin receivable or payable with a corresponding offset in unrealized gains or losses.
Short Term Investments — Short-term investments having a maturity of 60 days or less are generally valued at amortized cost which approximates fair market value. These investments are classified as Level 2 of the fair value hierarchy.
i. Repurchase Agreements — Repurchase agreements involve the purchase of securities subject to the seller’s agreement to repurchase the securities at a mutually agreed upon date and price. During the term of a repurchase agreement, the value of the underlying securities held as collateral on behalf of the Funds, including accrued interest, is required to exceed the value of the repurchase agreement, including accrued interest. The underlying securities for all repurchase agreements are held at the Funds’ custodian or designated sub-custodians under tri-party repurchase agreements.
Pursuant to exemptive relief granted by the Securities and Exchange Commission and terms and conditions contained therein, the Funds, together with other funds of the Trust and registered investment companies having management agreements with Goldman Sachs Asset Management, L.P. (“GSAM”) or its affiliates, may transfer uninvested cash into joint accounts, the daily aggregate balance of which is invested in one or more repurchase agreements. Under these joint accounts, the Funds maintain pro-rata credit exposure to the underlying repurchase agreements’ counterparties. With the exception of certain transaction fees, the Funds are not subject to any expenses in relation to these investments.
B. Level 3 Fair Value Investments — To the extent that the aforementioned significant inputs are unobservable, or if quotations are not readily available, or if GSAMI believes that such quotations do not accurately reflect fair value, the fair value of the Funds’ investments may be determined under Valuation Procedures approved by the Trustees. GSAMI, consistent with its procedures and applicable regulatory guidance, may make an adjustment to the most recent valuation prices of either domestic or foreign securities in light of significant events to reflect what it believes to be the fair value of the securities at the time of determining a Fund’s NAV. Significant events which could affect a large number of securities in a particular market may include, but are not limited to: significant fluctuations in U.S. or foreign markets; market dislocations; market disruptions; or unscheduled market closings. Significant events which could also affect a single issuer may include, but are not limited to: corporate actions such as reorganizations, mergers and buy-outs; ratings downgrades; and bankruptcies.
C. Fair Value Hierarchy — The following is a summary of the Funds’ investments and derivatives classified in the fair value hierarchy as of April 30, 2013:
| ASIA EQUITY | ||||||||||||
| Investment Type | Level 1 | Level 2 | Level 3 | |||||||||
| Assets | ||||||||||||
| Common Stock and/or Other Equity Investments | ||||||||||||
North and South America | $ | 361,519 | $ | — | $ | — | ||||||
Other | 468,715 | 60,071,441 | (a) | — | ||||||||
| Total | $ | 830,234 | $ | 60,071,441 | $ | — | ||||||
71
GOLDMAN SACHS FUNDAMENTAL EMERGING MARKETS EQUITY FUNDS
Notes to Financial Statements (continued)
April 30, 2013 (Unaudited)
| 3. INVESTMENTS AND FAIR VALUE MEASUREMENTS (continued) |
| BRIC | ||||||||||||
| Investment Type | Level 1 | Level 2 | Level 3 | |||||||||
| Assets | ||||||||||||
| Common Stock and/or Other Equity Investments | ||||||||||||
North and South America | $ | 47,731,528 | $ | 70,889,005 | $ | — | ||||||
Other | 8,521,179 | 211,559,614 | (a) | — | ||||||||
| Total | $ | 56,252,707 | $ | 282,448,619 | $ | — | ||||||
| CHINA EQUITY | ||||||||||||
| Investment Type | Level 1 | Level 2 | Level 3 | |||||||||
| Assets | ||||||||||||
Common Stock and/or Other Equity Investments | $ | 547,799 | $ | 18,969,417 | (a) | $ | — | |||||
Short Term Investments | — | 500,000 | — | |||||||||
| Total | $ | 547,799 | $ | 19,469,417 | $ | — | ||||||
| EMERGING MARKETS EQUITY | ||||||||||||
| Investment Type | Level 1 | Level 2 | Level 3 | |||||||||
| Assets | ||||||||||||
| Common Stock and/or Other Equity Investments | ||||||||||||
North and South America | $ | 90,740,905 | $ | 42,997,580 | $ | — | ||||||
Other | 5,981,497 | 324,498,235 | (a) | — | ||||||||
| Total | $ | 96,722,402 | $ | 367,495,815 | $ | — | ||||||
| N-11 EQUITY | ||||||||||||
| Investment Type | Level 1 | Level 2 | Level 3 | |||||||||
| Assets | ||||||||||||
| Common Stock and/or Other Equity Investments | ||||||||||||
North and South America | $ | 83,789,141 | $ | — | $ | — | ||||||
Other | 803,277 | 278,504,905 | (a) | — | ||||||||
| Total | $ | 84,592,418 | $ | 278,504,905 | $ | — | ||||||
| Derivative Type | ||||||||||||
| Assets(b) | ||||||||||||
Futures Contracts | $ | 25,815 | $ | — | $ | — | ||||||
| (a) | To adjust for the time difference between local market close and the calculation of net asset value, the Funds utilize fair value model prices for international equities provided by an independent fair value service resulting in a Level 2 classification. |
| (b) | Amount shown represents unrealized gain at period end. |
For further information regarding security characteristics, see the Schedules of Investments.
72
GOLDMAN SACHS FUNDAMENTAL EMERGING MARKETS EQUITY FUNDS
| 4. INVESTMENTS IN DERIVATIVES |
The following table sets forth, by certain risk types, the gross value of derivative contracts as of April 30, 2013. These instruments were used to meet the Fund’s investment objectives and to obtain and/or manage exposure related to the risk below. The value in the table below excludes the effects of cash collateral received or posted pursuant to these derivative contracts, and therefore are not representative of the Fund’s net exposure:
| Fund | Risk | Statements of Assets and Liabilities | Assets | |||||
| N-11 Equity | Equity | Receivable for unrealized gain on futures variation margin | $ | 25,815 | (a) | |||
| (a) | Includes unrealized gain (loss) on futures contracts described in the Additional Investment Information sections of the Schedule of Investments. Only current day’s variation margin is reported within the Statement of Assets and Liabilities. |
The following table sets forth, by certain risk types, the Funds’ gains (losses) related to these derivatives and their indicative volumes for the six months ended April 30, 2013. These gains (losses) should be considered in the context that these derivative contracts may have been executed to economically hedge certain investments, and accordingly, certain gains (losses) on such derivative contracts may offset certain (losses) gains attributable to investments. These gains (losses) are included in “Net realized gain (loss)” or “Net change in unrealized gain (loss)” on the Statements of Operations:
| Fund | Risk | Statements of Operations | Net Realized Gain (Loss) | Net Change in Gain (Loss) | Average Number of Contracts(a) | |||||||||||
Asia Equity | Equity | Net realized gain (loss) from futures contracts/Net change in unrealized gain (loss) on futures contracts | $ | 15,130 | $ | 3,939 | 2 | |||||||||
China Equity | Equity | Net realized gain (loss) from futures contracts/Net change in unrealized gain (loss) on futures contracts | 39 | — | 1 | |||||||||||
Emerging Markets Equity | Equity | Net realized gain (loss) from futures contracts/Net change in unrealized gain (loss) on futures contracts | (31,662 | ) | 20,635 | — | ||||||||||
N-11 Equity | Equity | Net realized gain (loss) from futures contracts/Net change in unrealized gain (loss) on futures contracts | 4,079 | 24,991 | 56 | |||||||||||
| (a) | Average number of contracts is based on the average of month end balances for the six months ended April 30, 2013. |
| 5. AGREEMENTS AND AFFILIATED TRANSACTIONS |
A. Management Agreement — Under the Agreement, GSAMI manages the Funds, subject to the general supervision of the Trustees.
As compensation for the services rendered pursuant to the Agreement, the assumption of the expenses related thereto and administration of the Funds’ business affairs, including providing facilities, GSAMI is entitled to a management fee, accrued daily and paid monthly, equal to an annual percentage rate of each Fund’s average daily net assets.
73
GOLDMAN SACHS FUNDAMENTAL EMERGING MARKETS EQUITY FUNDS
Notes to Financial Statements (continued)
April 30, 2013 (Unaudited)
| 5. AGREEMENTS AND AFFILIATED TRANSACTIONS (continued) |
For the six months ended April 30, 2013, contractual and effective net management fees with GSAMI were at the following rates:
| Contractual Management Fee Rate | Effective Net Management Fee | |||||||||||||||||||||||||||||
| Fund | First $1 billion | Next $1 billion | Next $3 billion | Next $3 billion | Over $8 billion | Effective Rate | ||||||||||||||||||||||||
Asia Equity | 1.00 | % | 0.90 | % | 0.86 | % | 0.84 | % | 0.82 | % | 1.00 | % | 1.00 | % | ||||||||||||||||
BRIC | 1.30 | 1.30 | 1.17 | 1.11 | 1.09 | 1.30 | 1.12 | * | ||||||||||||||||||||||
China Equity | 1.10 | 0.99 | 0.94 | 0.92 | 0.90 | 1.10 | 1.10 | |||||||||||||||||||||||
Emerging Markets Equity | 1.20 | 1.20 | 1.08 | 1.03 | 1.01 | 1.20 | 1.06 | * | ||||||||||||||||||||||
N-11 Equity | 1.30 | 1.30 | 1.24 | 1.21 | 1.19 | 1.30 | 1.16 | * | ||||||||||||||||||||||
| * | Effective February 28, 2013, GSAMI agreed to waive a portion of its management fee in order to achieve effective net management fee rates of 1.04%, 1.02%, and 1.13% for the BRIC, Emerging Markets Equity and N-11 Equity Funds, respectively, through at least February 28, 2014. Prior to such date GSAMI may not terminate the arrangements without the approval of the Trustees. Prior to February 28, 2013, GSAMI agreed to waive a portion of its management fee in order to achieve effective net management fee rates of 1.16%, 1.08%, and 1.19% for the BRIC, Emerging Markets Equity and N-11 Equity Funds, respectively. |
B. Distribution and Service Plans — The Trust, on behalf of each Fund, has adopted Distribution and Service Plans (the “Plans”). Under the Plans, Goldman Sachs, which serves as distributor (the “Distributor”), is entitled to a fee accrued daily and paid monthly, for distribution services and personal and account maintenance services, which may then be paid by Goldman Sachs to authorized dealers, at the following annual rates calculated on a Fund’s average daily net assets of each respective share class:
| Distribution and Service Plan Rates | ||||||||||||
| Class A* | Class B | Class C | ||||||||||
Distribution Plan | 0.25 | % | 0.75 | % | 0.75 | % | ||||||
Service Plan | — | 0.25 | 0.25 | |||||||||
| * | With respect to Class A Shares, the Distributor at its discretion may use compensation for distribution services paid under the Distribution Plan to compensate service organizations for personal and account maintenance services and expenses as long as such total compensation does not exceed the maximum cap on “service fees” imposed by the Financial Industry Regulatory Authority. |
C. Distribution Agreement — Goldman Sachs, as Distributor of the shares of the Funds pursuant to a Distribution Agreement, may retain a portion of the Class A front end sales charge and Class B and Class C Shares’ CDSC. During the six months ended April 30, 2013, Goldman Sachs advised that it retained the following amounts:
| Front End Sales Charge | Contingent Deferred Sales Charge | |||||||||||||
| Fund | Class A | Class B | Class C | |||||||||||
Asia Equity | $ | 2,420 | $ | — | $ | — | ||||||||
BRIC | 8,421 | N/A | 81 | |||||||||||
China Equity | 47 | N/A | — | |||||||||||
Emerging Markets Equity | 2,584 | — | 2 | |||||||||||
N-11 Equity | 21,465 | N/A | — | |||||||||||
D. Service Plan and Shareholder Administration Plan — The Trust, on behalf of each Fund that offers Service Shares, has adopted a Service Plan and a Shareholder Administration Plan. These plans allow for service organizations to provide varying
74
GOLDMAN SACHS FUNDAMENTAL EMERGING MARKETS EQUITY FUNDS
| 5. AGREEMENTS AND AFFILIATED TRANSACTIONS (continued) |
levels of personal and account maintenance and shareholder administration services to their customers who are beneficial owners of such shares. The Service Plan and Shareholder Administration Plan each provide for compensation to the service organizations which is accrued daily and paid monthly at an annual rate of 0.25% (0.50% in aggregate) of the average daily net assets of the Service Shares.
E. Transfer Agency Agreement — Goldman Sachs also serves as the transfer agent of the Funds for a fee pursuant to a Transfer Agency Agreement. The fees charged for such transfer agency services are accrued daily and paid monthly at annual rates as follows: 0.19% of the average daily net assets of Class A, Class B, Class C and Class IR Shares; and 0.04% of the average daily net assets of Institutional and Service Shares.
F. Other Expense Agreements and Affiliated Transactions — GSAMI has agreed to limit certain “Other Expense” of the Funds (excluding transfer agent fees and expenses, service fees and shareholder administration fees (as applicable), taxes, interest, brokerage fees, litigation, indemnification, shareholder meeting and other extraordinary expenses) to the extent such expenses exceed, on an annual basis, a percentage rate of the average daily net assets of each Fund. Such Other Expense reimbursements, if any, are accrued daily and paid monthly. In addition, the Funds are not obligated to reimburse GSAMI for prior fiscal year expense reimbursements, if any. The Other Expense limitations as an annual percentage rate of average daily net assets for the Asia Equity, BRIC, China Equity, Emerging Markets Equity and N-11 Equity Funds are 0.344%, 0.264%, 0.364, 0.354% and 0.164%, respectively. Prior to February 28, 2013, the Other Expense limitation for the Asia Equity Fund was 0.164%. These Other Expense reimbursements will remain in place through at least February 28, 2014, and prior to such date GSAMI may not terminate the arrangements without the approval of the Trustees. In addition, the Funds have entered into certain offset arrangements with the custodian and the transfer agent, which may result in a reduction of the Funds’ expenses and are received irrespective of the application of the “Other Expense” limitations described above.
For the six months ended April 30, 2013, these expense reductions, including any fee waivers and Other Expense reimbursements, were as follows:
| Fund | Management Fee Waiver | Other Expense | Custody Fee Credits | Total Expense | ||||||||||||||
Asia Equity | $ | — | $ | 174,851 | $ | 267 | $ | 175,118 | ||||||||||
BRIC | 335,779 | — | 1,049 | 336,828 | ||||||||||||||
China Equity | — | 110,363 | 20 | 110,383 | ||||||||||||||
Emerging Markets Equity | 300,089 | — | 2,166 | 302,255 | ||||||||||||||
N-11 Equity | 173,812 | 346,344 | 1,821 | 521,977 | ||||||||||||||
As of April 30, 2013, the amounts owed to affiliates of the Funds were as follows:
| Fund | Management Fees | Distribution and Service | Transfer Agent | Total | ||||||||||||||
Asia Equity | $ | 50,138 | $ | 5,704 | $ | 4,199 | $ | 60,041 | ||||||||||
BRIC | 293,117 | 79,671 | 33,594 | 406,382 | ||||||||||||||
China Equity | 16,124 | 55 | 605 | 16,784 | ||||||||||||||
Emerging Markets Equity | 370,089 | 30,061 | 21,502 | 421,652 | ||||||||||||||
N-11 Equity | 320,718 | 29,094 | 26,113 | 375,925 | ||||||||||||||
75
GOLDMAN SACHS FUNDAMENTAL EMERGING MARKETS EQUITY FUNDS
Notes to Financial Statements (continued)
April 30, 2013 (Unaudited)
| 5. AGREEMENTS AND AFFILIATED TRANSACTIONS (continued) |
G. Line of Credit Facility — As of April 30, 2013, the Funds participated in a $630,000,000 committed, unsecured revolving line of credit facility (the “facility”) together with other funds of the Trust and registered investment companies having management agreements with GSAMI or its affiliates (“Other Borrowers”). Pursuant to the terms of the facility, the Funds and Other Borrowers could increase the credit amount by an additional $340,000,000, for a total of up to $970,000,000. This facility is to be used solely for temporary or emergency purposes, which may include the funding of redemptions. The interest rate on borrowings is based on the federal funds rate. The facility also requires a fee to be paid by the Funds based on the amount of the commitment that has not been utilized. For the six months ended April 30, 2013, the Funds did not have any borrowings under the facility. Effective May 8, 2013, the committed amount available through the facility increased to $780,000,000.
H. Other Transactions with Affiliates — For the six months ended April 30, 2013, Goldman Sachs earned $190 and $138 in brokerage commissions from portfolio transactions, including futures transactions executed with Goldman Sachs as the Futures Commission Merchant, on behalf of the Asia Equity and Emerging Markets Equity Funds, respectively.
As of April 30, 2013, the Goldman Sachs Satellite Strategies Portfolio was the beneficial owner of 11% or more of the total outstanding shares of the Emerging Markets Equity Fund.
As of April 30, 2013, the Goldman Sachs Group, Inc. was the beneficial owner of approximately 9%, 18% and 100% of the Class A, Class C, and Class IR Shares of the China Equity Fund, respectively.
| 6. PORTFOLIO SECURITIES TRANSACTIONS |
The cost of purchases and proceeds from sales and maturities of long-term securities for the six months ended April 30, 2013, were as follows:
| Fund | Purchases | Sales and Maturities | ||||||||
Asia Equity | $ | 22,082,707 | $ | 28,221,065 | ||||||
BRIC | 194,955,770 | 252,194,038 | ||||||||
China Equity | 15,982,130 | 5,005,070 | ||||||||
Emerging Markets Equity | 355,202,046 | 290,843,528 | ||||||||
N-11 Equity | 235,426,491 | 61,002,711 | ||||||||
| 7. TAX INFORMATION |
As of the Funds’ most recent fiscal year end, October 31, 2012, the Funds’ capital loss carryforwards on a tax-basis were as follows:
| Asia Equity | BRIC | China Equity | Emerging Markets Equity | N-11 Equity | ||||||||||||||||||
Capital loss carryforwards: | ||||||||||||||||||||||
Expiring 2016(1) | $ | — | $ | (46,894,391 | ) | $ | — | $ | (30,277,067 | ) | $ | — | ||||||||||
Expiring 2017(1) | (22,045,430 | ) | (151,677,917 | ) | — | (445,745,035 | ) | — | ||||||||||||||
Perpetual Long-term | (252,349 | ) | (19,084,950 | ) | (267,435 | ) | (1,615,301 | ) | (1,295,504 | ) | ||||||||||||
Perpetual Short-term | (2,662,713 | ) | (25,959,552 | ) | (733,030 | ) | (11,695,635 | ) | (4,310,677 | ) | ||||||||||||
Total capital loss carryforwards | $ | (24,960,492 | ) | $ | (243,616,810 | ) | $ | (1,000,465 | ) | $ | (489,333,038 | ) | $ | (5,606,181 | ) | |||||||
| (1) | Expiration occurs on October 31 of the year indicated. |
76
GOLDMAN SACHS FUNDAMENTAL EMERGING MARKETS EQUITY FUNDS
| 7. TAX INFORMATION (continued) |
As of April 30, 2013, the Funds’ aggregate security unrealized gains and losses based on cost for U.S. federal income tax purposes were as follows:
| Asia Equity | BRIC | China Equity | Emerging Markets Equity | N-11 Equity | ||||||||||||||||||
Tax cost | $ | 52,877,643 | $ | 338,212,125 | $ | 19,360,861 | $ | 430,531,860 | $ | 327,938,642 | ||||||||||||
Gross unrealized gain | 13,870,584 | 36,153,401 | 1,381,379 | 58,744,658 | 46,234,980 | |||||||||||||||||
Gross unrealized loss | (5,846,552 | ) | (35,664,200 | ) | (725,024 | ) | (25,058,301 | ) | (11,076,299 | ) | ||||||||||||
Net unrealized security gain | $ | 8,024,032 | $ | 489,201 | $ | 656,355 | $ | 33,686,357 | $ | 35,158,681 | ||||||||||||
The difference between GAAP-basis and tax-basis unrealized gains (losses) is attributable primarily to wash sales and differences related to the tax treatment of passive foreign investment company investments.
GSAMI has reviewed the Funds’ tax positions for all open tax years (the current and prior three years, as applicable) and has concluded that no provision for income tax is required in the Funds’ financial statements. Such open tax years remain subject to examination and adjustment by tax authorities.
| 8. OTHER RISKS |
The Funds’ risks include, but are not limited to, the following:
Foreign Custody Risk — A Fund that invests in foreign securities may hold such securities and foreign currency with foreign banks, agents, and securities depositories appointed by the Fund’s custodian (each a “Foreign Custodian”). In some countries, Foreign Custodians may be subject to little or no regulatory oversight or independent evaluation of their operations. Further, the laws of certain countries may place limitations on a Fund’s ability to recover its assets if a Foreign Custodian enters into bankruptcy. Investments in emerging markets may be subject to greater custody risks than investments in more developed markets. Custody services in emerging market countries are often undeveloped and may be less regulated than in more developed countries, and thus may not afford the same level of investor protection as would apply in developed countries.
Shareholder Concentration Risk — Certain funds, accounts, individuals or Goldman Sachs affiliates may from time to time own (beneficially or of record) or control a significant percentage of the Funds’ shares. Redemptions by these entities of their holdings in the Funds may impact the Funds’ liquidity and NAV. These redemptions may also force the Funds to sell securities.
Geographic Risk — Concentration of the investments of a Fund in issuers located in a particular country or region will subject the Fund, to a greater extent than if investments were less concentrated, to the risks of adverse securities markets, exchange rates and social, political, regulatory or economic events which may occur in a given country or region. The Asia Equity Fund invests primarily in equity investments in Asian issuers. The BRIC Fund invests primarily in equity investments in Brazil, Russia, India and China issuers. The China Equity Fund invests primarily in equity investments in China. The N-11 Equity Fund invests primarily in equity investments in the N-11 countries, and may invest up to 50% of its assets in any one N-11 country.
Investments in Other Investment Companies — As a shareholder of another investment company, including an exchange traded fund (“ETF”), a Fund will directly bear its proportionate share of any management fees and other expenses paid by such other investment companies, in addition to the fees and expenses regularly borne by the Fund. ETFs are subject to risks that do not apply to conventional mutual funds, including but not limited to the following: (i) the market price of the ETF’s shares may trade at a premium or a discount to their NAV; and (ii) an active trading market for an ETF’s shares may not develop or be maintained.
Liquidity Risk — The Funds may make investments that are illiquid or that may become less liquid in response to market developments or adverse investor perceptions. Illiquid investments may be more difficult to value. Liquidity risk may also refer to the risk that a Fund will not be able to pay redemption proceeds within the allowable time period because of unusual market
77
GOLDMAN SACHS FUNDAMENTAL EMERGING MARKETS EQUITY FUNDS
Notes to Financial Statements (continued)
April 30, 2013 (Unaudited)
| 8. OTHER RISKS (continued) |
conditions, an unusually high volume of redemption requests, or other reasons. To meet redemption requests, a Fund may be forced to sell investments at an unfavorable time and/or under unfavorable conditions.
Market and Credit Risks — In the normal course of business, the Funds trade financial instruments and enter into financial transactions where risk of potential loss exists due to changes in the market (market risk). Additionally, the Funds may also be exposed to credit risk in the event that an issuer fails to perform or that an institution or entity with which the Funds have unsettled or open transaction defaults.
Investing in foreign markets may involve special risks and considerations not typically associated with investing in the U.S. These risks include revaluation of currencies, high rates of inflation, repatriation restrictions on income and capital, and adverse political and economic developments. Moreover, securities issued in these markets may be less liquid, be subject to government ownership controls, have delayed settlements and their prices may be more volatile than those of comparable securities in the U.S.
Non-Diversification Risk — The BRIC, China Equity and N-11 Equity Funds are non-diversified, meaning that they are permitted to invest a larger percentage of their assets in fewer issuers than “diversified” mutual funds. Thus, a Fund may be more susceptible to adverse developments affecting any single issuer held in its portfolio, and may be more susceptible to greater losses because of these developments.
| 9. INDEMNIFICATIONS |
Under the Trust’s organizational documents, its Trustees, officers, employees and agents are indemnified, to the extent permitted by the Act and State law, against certain liabilities that may arise out of performance of their duties to the Funds. Additionally, in the course of business, the Funds enter into contracts that contain a variety of indemnification clauses. The Funds’ maximum exposure under these arrangements is unknown, as this would involve future claims that may be made against the Funds that have not yet occurred. However, GSAMI believes the risk of loss under these arrangements to be remote.
| 10. OTHER MATTERS |
New Accounting Pronouncement — In December 2011, the Financial Accounting Standards Board issued an Accounting Standards Update No. 2011-11: Disclosures about offsetting Assets and Liabilities (“ASU”) to enhance disclosures about financial instruments and derivative instruments that are subject to offsetting (“netting”) on the Statements of Assets and Liabilities. This information will enable users of the Funds’ financial statements to evaluate the effect or potential effect of netting arrangements on the Funds’ financial position. The ASU is effective for financial statements with fiscal years beginning on or after January 1, 2013, and interim periods within those fiscal years. At this time, GSAMI is evaluating the implications of these changes on the financial statements.
| 11. SUBSEQUENT EVENTS |
Subsequent events after the Statement of Assets and Liabilities date have been evaluated through the date the financial statements were issued. GSAMI has concluded that there is no impact requiring adjustment or disclosure in the financial statements.
78
GOLDMAN SACHS FUNDAMENTAL EMERGING MARKETS EQUITY FUNDS
| 12. SUMMARY OF SHARE TRANSACTIONS |
Share activity is as follows:
| Asia Equity Fund | ||||||||||||||||
|
| |||||||||||||||
For the Six Months Ended April 30, 2013 (Unaudited) | For the Fiscal Year Ended October 31, 2012 | |||||||||||||||
|
| |||||||||||||||
| Shares | Dollars | Shares | Dollars | |||||||||||||
|
| |||||||||||||||
| Class A Shares | ||||||||||||||||
Shares sold | 30,779 | $ | 567,708 | 545,177 | $ | 9,346,039 | ||||||||||
Shares converted from Class B(a) | 439 | 8,078 | 1,680 | 28,015 | ||||||||||||
Reinvestment of distributions | 5,101 | 94,117 | 9,943 | 160,777 | ||||||||||||
Shares redeemed | (95,859 | ) | (1,757,471 | ) | (1,995,478 | ) | (33,619,430 | ) | ||||||||
| (59,540 | ) | (1,087,568 | ) | (1,438,678 | ) | (24,084,599 | ) | |||||||||
| Class B Shares | ||||||||||||||||
Shares sold | 41 | 713 | 103 | 1,785 | ||||||||||||
Shares converted to Class A(a) | (460 | ) | (8,078 | ) | (1,757 | ) | (28,015 | ) | ||||||||
Reinvestment of distributions | 93 | 1,635 | — | — | ||||||||||||
Shares redeemed | (6,104 | ) | (108,868 | ) | (19,693 | ) | (317,227 | ) | ||||||||
| (6,430 | ) | (114,598 | ) | (21,347 | ) | (343,457 | ) | |||||||||
| Class C Shares | ||||||||||||||||
Shares sold | 9,374 | 162,457 | 17,474 | 282,677 | ||||||||||||
Reinvestment of distributions | 607 | 10,581 | — | — | ||||||||||||
Shares redeemed | (20,160 | ) | (354,829 | ) | (53,771 | ) | (875,759 | ) | ||||||||
| (10,179 | ) | (181,791 | ) | (36,297 | ) | (593,082 | ) | |||||||||
| Institutional Shares | ||||||||||||||||
Shares sold | 93,397 | 1,815,636 | 1,041,457 | 18,141,423 | ||||||||||||
Reinvestment of distributions | 33,315 | 641,652 | 13,091 | 221,895 | ||||||||||||
Shares redeemed | (230,646 | ) | (4,442,086 | ) | (168,164 | ) | (3,096,852 | ) | ||||||||
| (103,934 | ) | (1,984,798 | ) | 886,384 | 15,266,466 | |||||||||||
NET DECREASE | (180,083 | ) | $ | (3,368,755 | ) | (609,938 | ) | $ | (9,754,672 | ) | ||||||
| (a) | Class B Shares automatically convert into Class A Shares on or about the fifteenth day of the last month of the calendar quarter that is eight years after the initial purchase date of either the Fund or another Goldman Sachs Fund. |
79
GOLDMAN SACHS FUNDAMENTAL EMERGING MARKETS EQUITY FUNDS
Notes to Financial Statements (continued)
April 30, 2013 (Unaudited)
| 12. SUMMARY OF SHARE TRANSACTIONS (continued) |
Share activity is as follows:
| BRIC Fund | ||||||||||||||||
|
| |||||||||||||||
For the Six Months Ended (Unaudited) | For the Fiscal Year Ended October 31, 2012 | |||||||||||||||
|
| |||||||||||||||
| Shares | Dollars | Shares | Dollars | |||||||||||||
|
| |||||||||||||||
| Class A Shares | ||||||||||||||||
Shares sold | 531,766 | $ | 7,136,590 | 2,556,156 | $ | 32,849,258 | ||||||||||
Reinvestment of distributions | 69,332 | 906,863 | — | — | ||||||||||||
Shares redeemed | (3,088,337 | ) | (40,531,714 | ) | (8,818,548 | ) | (110,184,382 | ) | ||||||||
| (2,487,239 | ) | (32,488,261 | ) | (6,262,392 | ) | (77,335,124 | ) | |||||||||
| Class C Shares | �� | |||||||||||||||
Shares sold | 167,477 | 2,131,186 | 445,293 | 5,395,270 | ||||||||||||
Shares redeemed | (1,268,503 | ) | (15,778,941 | ) | (2,791,028 | ) | (33,298,416 | ) | ||||||||
| (1,101,026 | ) | (13,647,755 | ) | (2,345,735 | ) | (27,903,146 | ) | |||||||||
| Institutional Shares | ||||||||||||||||
Shares sold | 1,917,490 | 25,866,104 | 4,895,097 | 63,765,469 | ||||||||||||
Reinvestment of distributions | 142,348 | 1,897,492 | — | — | ||||||||||||
Shares redeemed | (2,312,511 | ) | (30,606,029 | ) | (8,668,487 | ) | (109,742,620 | ) | ||||||||
| (252,673 | ) | (2,842,433 | ) | (3,773,390 | ) | (45,977,151 | ) | |||||||||
| Class IR Shares | ||||||||||||||||
Shares sold | 20,826 | 281,080 | 298,139 | 3,838,843 | ||||||||||||
Reinvestment of distributions | 1,903 | 25,542 | — | — | ||||||||||||
Shares redeemed | (64,260 | ) | (843,163 | ) | (137,719 | ) | (1,747,084 | ) | ||||||||
| (41,531 | ) | (536,541 | ) | 160,420 | 2,091,759 | |||||||||||
NET DECREASE | (3,882,469 | ) | $ | (49,514,990 | ) | (12,221,097 | ) | $ | (149,123,662 | ) | ||||||
80
GOLDMAN SACHS FUNDAMENTAL EMERGING MARKETS EQUITY FUNDS
| 12. SUMMARY OF SHARE TRANSACTIONS (continued) |
Share activity is as follows:
| China Equity Fund | ||||||||||||||||
|
| |||||||||||||||
For the Six Months Ended (Unaudited) | For the Fiscal Year Ended October 31, 2012 | |||||||||||||||
|
| |||||||||||||||
| Shares | Dollars | Shares | Dollars | |||||||||||||
|
| |||||||||||||||
| Class A Shares | ||||||||||||||||
Shares sold | 12,327 | $ | 106,057 | 1,444 | $ | 11,639 | ||||||||||
Reinvestment of distributions | 40 | 340 | 6 | 45 | ||||||||||||
Shares redeemed | (3,067 | ) | (27,715 | ) | (1 | ) | (5 | ) | ||||||||
| 9,300 | 78,682 | 1,449 | 11,679 | |||||||||||||
| Class C Shares | ||||||||||||||||
Shares sold | 2,344 | 20,947 | 2,599 | 19,978 | ||||||||||||
Reinvestment of distributions | 5 | 41 | 1 | 7 | ||||||||||||
Shares redeemed | (1 | ) | (5 | ) | (499 | ) | (4,117 | ) | ||||||||
| 2,348 | 20,983 | 2,101 | 15,868 | |||||||||||||
| Institutional Shares | ||||||||||||||||
Shares sold | 1,564,191 | 13,105,576 | 429,161 | 3,295,520 | ||||||||||||
Reinvestment of distributions | 10,263 | 87,132 | 5,916 | 43,483 | ||||||||||||
Shares redeemed | (200,499 | ) | (1,640,071 | ) | (146,363 | ) | (1,128,352 | ) | ||||||||
| 1,373,955 | 11,552,637 | 288,714 | 2,210,651 | |||||||||||||
| Class IR Shares | ||||||||||||||||
Reinvestment of distributions | 7 | 58 | 7 | 51 | ||||||||||||
| 7 | 58 | 7 | 51 | |||||||||||||
NET INCREASE | 1,385,610 | $ | 11,652,360 | 292,271 | $ | 2,238,249 | ||||||||||
81
GOLDMAN SACHS FUNDAMENTAL EMERGING MARKETS EQUITY FUNDS
Notes to Financial Statements (continued)
April 30, 2013 (Unaudited)
| 12. SUMMARY OF SHARE TRANSACTIONS (continued) |
Share activity is as follows:
| Emerging Markets Equity Fund | ||||||||||||||||
|
| |||||||||||||||
For the Six Months Ended (Unaudited) | For the Fiscal Year Ended October 31, 2012 | |||||||||||||||
|
| |||||||||||||||
| Shares | Dollars | Shares | Dollars | |||||||||||||
|
| |||||||||||||||
| Class A Shares | ||||||||||||||||
Shares sold | 298,916 | $ | 4,618,052 | 599,634 | $ | 8,627,318 | ||||||||||
Shares converted from Class B(a) | 4,011 | 61,563 | 4,257 | 62,338 | ||||||||||||
Reinvestment of distributions | 12,073 | 184,480 | — | — | ||||||||||||
Shares redeemed | (428,415 | ) | (6,550,814 | ) | (1,448,562 | ) | (20,789,324 | ) | ||||||||
| (113,415 | ) | (1,686,719 | ) | (844,671 | ) | (12,099,668 | ) | |||||||||
| Class B Shares | ||||||||||||||||
Shares sold | 762 | 10,840 | 4,120 | 56,443 | ||||||||||||
Shares converted to Class A(a) | (4,406 | ) | (61,563 | ) | (4,668 | ) | (62,338 | ) | ||||||||
Shares redeemed | (55,076 | ) | (765,743 | ) | (150,344 | ) | (1,978,371 | ) | ||||||||
| (58,720 | ) | (816,466 | ) | (150,892 | ) | (1,984,266 | ) | |||||||||
| Class C Shares | ||||||||||||||||
Shares sold | 62,739 | 892,615 | 184,616 | 2,478,998 | ||||||||||||
Shares redeemed | (210,999 | ) | (2,958,016 | ) | (434,921 | ) | (5,683,789 | ) | ||||||||
| (148,260 | ) | (2,065,401 | ) | (250,305 | ) | (3,204,791 | ) | |||||||||
| Institutional Shares | ||||||||||||||||
Shares sold | 6,192,282 | 101,224,404 | 3,740,868 | 57,119,248 | ||||||||||||
Reinvestment of distributions | 163,167 | 2,651,459 | 70,112 | 1,016,617 | ||||||||||||
Shares redeemed | (2,204,058 | ) | (35,925,341 | ) | (6,518,534 | ) | (98,132,129 | ) | ||||||||
| 4,151,391 | 67,950,522 | (2,707,554 | ) | (39,996,264 | ) | |||||||||||
| Service Shares | ||||||||||||||||
Shares sold | 444,567 | 6,768,088 | 391,357 | 5,503,512 | ||||||||||||
Reinvestment of distributions | 5,243 | 77,760 | — | — | ||||||||||||
Shares redeemed | (276,022 | ) | (4,112,956 | ) | (320,412 | ) | (4,436,383 | ) | ||||||||
| 173,788 | 2,732,892 | 70,945 | 1,067,129 | |||||||||||||
| Class IR Shares | ||||||||||||||||
Shares sold | 7,667 | 125,427 | 20,573 | 312,378 | ||||||||||||
Reinvestment of distributions | 120 | 1,945 | 76 | 1,097 | ||||||||||||
Shares redeemed | (7,235 | ) | (115,701 | ) | (6,605 | ) | (98,023 | ) | ||||||||
| 552 | 11,671 | 14,044 | 215,452 | |||||||||||||
NET INCREASE (DECREASE) | 4,005,336 | $ | 66,126,499 | (3,868,433 | ) | $ | (56,002,408 | ) | ||||||||
| (a) | Class B Shares automatically convert into Class A Shares on or about the fifteenth day of the last month of the calendar quarter that is eight years after the initial purchase date of either the Fund or another Goldman Sachs Fund. |
82
GOLDMAN SACHS FUNDAMENTAL EMERGING MARKETS EQUITY FUNDS
| 12. SUMMARY OF SHARE TRANSACTIONS (continued) |
Share activity is as follows:
| N-11 Equity Fund | ||||||||||||||||
|
| |||||||||||||||
For the Six Months Ended (Unaudited) | For the Fiscal Year Ended October 31, 2012 | |||||||||||||||
|
| |||||||||||||||
| Shares | Dollars | Shares | Dollars | |||||||||||||
|
| |||||||||||||||
| Class A Shares | ||||||||||||||||
Shares sold | 4,761,575 | $ | 53,422,137 | 2,613,742 | $ | 25,619,951 | ||||||||||
Reinvestment of distributions | 1,844 | 19,768 | — | — | ||||||||||||
Shares redeemed | (503,147 | ) | (5,633,519 | ) | (1,117,207 | ) | (10,505,870 | ) | ||||||||
| 4,260,272 | 47,808,386 | 1,496,535 | 15,114,081 | |||||||||||||
| Class C Shares | ||||||||||||||||
Shares sold | 884,914 | 9,769,358 | 400,833 | 3,890,827 | ||||||||||||
Shares redeemed | (112,927 | ) | (1,249,716 | ) | (115,730 | ) | (1,104,340 | ) | ||||||||
| 771,987 | 8,519,642 | 285,103 | 2,786,487 | |||||||||||||
| Institutional Shares | ||||||||||||||||
Shares sold | 11,517,990 | 129,825,089 | 8,116,894 | 79,017,265 | ||||||||||||
Reinvestment of distributions | 33,935 | 365,136 | — | — | ||||||||||||
Shares redeemed | (2,120,947 | ) | (23,822,443 | ) | (1,867,572 | ) | (17,953,814 | ) | ||||||||
| 9,430,978 | 106,367,782 | 6,249,322 | 61,063,451 | |||||||||||||
| Class IR Shares | ||||||||||||||||
Shares sold | 1,349,205 | 15,111,746 | 923,792 | 8,903,985 | ||||||||||||
Reinvestment of distributions | 2,575 | 27,660 | — | — | ||||||||||||
Shares redeemed | (122,790 | ) | (1,388,944 | ) | (163,436 | ) | (1,609,425 | ) | ||||||||
| 1,228,990 | 13,750,462 | 760,356 | 7,294,560 | |||||||||||||
NET INCREASE | 15,692,227 | $ | 176,446,272 | 8,791,316 | $ | 86,258,579 | ||||||||||
83
GOLDMAN SACHS FUNDAMENTAL EMERGING MARKETS EQUITY FUNDS
Fund Expenses — Six Month Period Ended April 30, 2013 (Unaudited)
As a shareholder of Class A, Class B, Class C, Institutional, Service or Class IR Shares of a Fund you incur two types of costs: (1) transaction costs, including sales charges on purchase payments (with respect to Class A Shares) and contingent deferred sales charges on redemptions (with respect to Class B and Class C Shares); and (2) ongoing costs, including management fees; distribution and service (12b-1) fees (with respect to Class A, Class B and Class C Shares); and other Fund expenses. This example is intended to help you understand your ongoing costs (in dollars) of investing in Class A, Class B, Class C, Institutional, Service and Class IR Shares of the Funds and to compare these costs with the ongoing costs of investing in other mutual funds.
The example is based on an investment of $1,000 invested at the beginning of the period and held for the entire period from November 1, 2012 through April 30, 2013.
Actual Expenses — The first line under each share class in the table below provides information about actual account values and actual expenses. You may use the information in this line, together with the amount you invested, to estimate the expenses that you paid over the period. Simply divide your account value by $1,000 (for example, an $8,600 account value divided by $1,000=8.6), then multiply the result by the number in the first line under the heading entitled “Expenses Paid” to estimate the expenses you paid on your account during this period.
Hypothetical Example for Comparison Purposes — The second line under each share class in the table below provides information about hypothetical account values and hypothetical expenses based on the Funds’ actual net expense ratio and an assumed rate of return of 5% per year before expenses, which is not the Funds’ actual return. The hypothetical account values and expenses may not be used to estimate the actual ending account balance or expenses you paid for the period. You may use this information to compare the ongoing costs of investing in the Funds and other funds. To do so, compare this 5% hypothetical example with the 5% hypothetical examples that appear in the shareholder reports of the other funds.
Please note that the expenses shown in the table are meant to highlight your ongoing costs only and do not reflect any transactional costs, such as sales charges, redemption fees, or exchange fees. Therefore, the second line of the table is useful in comparing ongoing costs only, and will not help you determine the relative total costs of owning different funds. In addition, if these transactional costs were included, your costs would have been higher.
| Asia Equity Fund | BRIC Fund | China Equity Fund | Emerging Markets Equity Fund | N-11 Equity Fund | ||||||||||||||||||||||||||||||||||||||||||||||||||||||||
| Share Class | Beginning Account Value 11/01/12 | Ending Account Value 04/30/13 | Expenses Paid for the 6 Months Ended 04/30/13* | Beginning Account Value 11/01/12 | Ending Account Value 04/30/13 | Expenses Paid for the 6 Months Ended 04/30/13* | Beginning Account Value 11/01/12 | Ending Account Value 04/30/13 | Expenses Paid for the 6 Months Ended 04/30/13* | Beginning Account Value 11/01/12 | Ending Account Value 04/30/13 | Expenses Paid for the 6 Months Ended 04/30/13* | Beginning Account Value 11/01/12 | Ending Account Value 04/30/13 | Expenses Paid for the 6 Months Ended 04/30/13* | |||||||||||||||||||||||||||||||||||||||||||||
| Class A | ||||||||||||||||||||||||||||||||||||||||||||||||||||||||||||
Actual | $ | 1,000 | $ | 1,071.90 | $ | 8.53 | $ | 1,000 | $ | 1,015.30 | $ | 8.94 | $ | 1,000 | $ | 1,013.30 | $ | 9.48 | $ | 1,000 | $ | 1,051.30 | $ | 8.95 | $ | 1,000 | $ | 1,121.00 | $ | 9.26 | ||||||||||||||||||||||||||||||
Hypothetical 5% return | 1,000 | 1,016.56 | + | 8.30 | 1,000 | 1,015.92 | + | 8.95 | 1,000 | 1,015.37 | + | 9.49 | 1,000 | 1,016.07 | + | 8.80 | 1,000 | 1,016.07 | + | 8.80 | ||||||||||||||||||||||||||||||||||||||||
| Class B | ||||||||||||||||||||||||||||||||||||||||||||||||||||||||||||
Actual | 1,000 | 1,067.90 | 12.36 | N/A | N/A | N/A | N/A | N/A | N/A | 1,000 | 1,047.30 | 12.74 | N/A | N/A | N/A | |||||||||||||||||||||||||||||||||||||||||||||
Hypothetical 5% return | 1,000 | 1,012.84 | + | 12.03 | N/A | N/A | N/A | N/A | N/A | N/A | 1,000 | 1,012.35 | + | 12.52 | N/A | N/A | N/A | |||||||||||||||||||||||||||||||||||||||||||
| Class C | ||||||||||||||||||||||||||||||||||||||||||||||||||||||||||||
Actual | 1,000 | 1,067.90 | 12.36 | 1,000 | 1,011.60 | 12.62 | 1,000 | 1,011.40 | 13.22 | 1,000 | 1,047.70 | 12.74 | 1,000 | 1,117.10 | 13.18 | |||||||||||||||||||||||||||||||||||||||||||||
Hypothetical 5% return | 1,000 | 1,012.84 | + | 12.03 | 1,000 | 1,012.25 | + | 12.62 | 1,000 | 1,011.65 | + | 13.22 | 1,000 | 1,012.35 | + | 12.52 | 1,000 | 1,012.35 | + | 12.52 | ||||||||||||||||||||||||||||||||||||||||
| Institutional | ||||||||||||||||||||||||||||||||||||||||||||||||||||||||||||
Actual | 1,000 | 1,074.30 | 6.48 | 1,000 | 1,017.70 | 6.90 | 1,000 | 1,016.80 | 7.50 | 1,000 | 1,053.90 | 6.93 | 1,000 | 1,123.00 | 7.16 | |||||||||||||||||||||||||||||||||||||||||||||
Hypothetical 5% return | 1,000 | 1,018.55 | + | 6.31 | 1,000 | 1,017.95 | + | 6.90 | 1,000 | 1,017.36 | + | 7.50 | 1,000 | 1,018.05 | + | 6.81 | 1,000 | 1,018.05 | + | 6.81 | ||||||||||||||||||||||||||||||||||||||||
| Service | ||||||||||||||||||||||||||||||||||||||||||||||||||||||||||||
Actual | N/A | N/A | N/A | N/A | N/A | N/A | N/A | N/A | N/A | 1,000 | 1,051.50 | 9.46 | N/A | N/A | N/A | |||||||||||||||||||||||||||||||||||||||||||||
Hypothetical 5% return | N/A | N/A | N/A | N/A | N/A | N/A | N/A | N/A | N/A | 1,000 | 1,015.57 | + | 9.30 | N/A | N/A | N/A | ||||||||||||||||||||||||||||||||||||||||||||
| Class IR | ||||||||||||||||||||||||||||||||||||||||||||||||||||||||||||
Actual | N/A | N/A | N/A | 1,000 | 1,016.10 | 7.65 | 1,000 | 1,015.30 | 8.44 | 1,000 | 1,053.40 | 7.69 | 1,000 | 1,121.50 | 7.94 | |||||||||||||||||||||||||||||||||||||||||||||
Hypothetical 5% return | N/A | N/A | N/A | 1,000 | 1,017.21 | + | 7.65 | 1,000 | 1,016.41 | + | 8.45 | 1,000 | 1,017.31 | + | 7.55 | 1,000 | 1,017.31 | + | 7.55 | |||||||||||||||||||||||||||||||||||||||||
| * | Expenses are calculated using each Fund’s annualized net expense ratio for each class, which represents the ongoing expenses as a percentage of net assets for the six months ended April 30, 2013. Expenses are calculated by multiplying the annualized net expense ratio by the average account value for the period; then multiplying the result by the number of days in the most recent fiscal half year; and then dividing that result by the number of days in the fiscal year. The annualized net expense ratios for the period were as follows: |
| Fund | Class A | Class B | Class C | Institutional | Service | Class IR | ||||||||||||||||||
Asia Equity | 1.66 | % | 2.41 | % | 2.41 | % | 1.26 | % | N/A | N/A | ||||||||||||||
BRIC | 1.79 | N/A | 2.53 | 1.38 | N/A | 1.53 | % | |||||||||||||||||
China Equity | 1.90 | N/A | 2.65 | 1.50 | N/A | 1.69 | ||||||||||||||||||
Emerging Markets Equity | 1.76 | 2.51 | 2.51 | 1.36 | 1.86 | % | 1.51 | |||||||||||||||||
N-11 Equity | 1.76 | N/A | 2.51 | 1.36 | N/A | 1.51 | ||||||||||||||||||
| + | Hypothetical expenses are based on each Fund's actual annualized net expense ratios and an assumed rate of return of 5% per year before expenses. |
84
FUNDS PROFILE
Goldman Sachs Funds

Goldman Sachs is a premier financial services firm, known since 1869 for creating thoughtful and customized investment solutions in complex global markets.
Today, the Investment Management Division of Goldman Sachs serves a diverse set of clients worldwide, including private institutions, public entities and individuals. With approximately $748.1 billion in assets under management as of March 31, 2013, Goldman Sachs Asset Management (“GSAM”) has portfolio management teams located around the world and our investment professionals bring firsthand knowledge of local markets to every investment decision. GSAM’s assets under management includes assets managed by Goldman Sachs Asset Management, L.P. and its Investment Advisory Affiliates.
| OVERVIEW OF GOLDMAN SACHS FUNDS |

Money Market1
Financial Square FundsSM
| n | Financial Square Tax-Exempt Funds |
| n | Financial Square Federal Fund |
| n | Financial Square Government Fund |
| n | Financial Square Money Market Fund |
| n | Financial Square Prime Obligations Fund |
| n | Financial Square Treasury Instruments Fund |
| n | Financial Square Treasury Obligations Fund |
Fixed Income
Short Duration and Government
| n | Enhanced Income Fund |
| n | High Quality Floating Rate Fund2 |
| n | Short Duration Government Fund |
| n | Short Duration Income Fund |
| n | Government Income Fund |
| n | Inflation Protected Securities Fund |
Multi-Sector
| n | Core Fixed Income Fund |
| n | Core Plus Fixed Income Fund |
| n | Global Income Fund |
| n | Strategic Income Fund |
| n | World Bond Fund |
Municipal and Tax-Free
| n | High Yield Municipal Fund |
| n | Municipal Income Fund |
| n | Short Duration Tax-Free Fund |
Single Sector
| n | Investment Grade Credit Fund |
| n | U.S. Mortgages Fund |
| n | High Yield Fund |
| n | High Yield Floating Rate Fund |
| n | Emerging Markets Debt Fund |
| n | Local Emerging Markets Debt Fund |
Corporate Credit
| n | Credit Strategies Fund |
Fundamental Equity
| n | Growth and Income Fund |
| n | Small Cap Value Fund |
| n | Mid Cap Value Fund |
| n | Large Cap Value Fund |
| n | Capital Growth Fund |
| n | Strategic Growth Fund |
| n | Focused Growth Fund |
| n | Small/Mid Cap Growth Fund |
| n | Flexible Cap Growth Fund |
| n | Concentrated Growth Fund |
| n | Technology Tollkeeper Fund |
| n | Growth Opportunities Fund |
| n | Rising Dividend Growth Fund |
| n | U.S. Equity Fund |
| n | Income Builder Fund3 |
Structured Equity
| n | Structured Tax-Managed Equity Fund |
| n | Structured International Tax-Managed Equity Fund |
| n | U.S. Equity Dividend and Premium Fund |
| n | International Equity Dividend and Premium Fund |
Equity Insights4
| n | Small Cap Equity Insights Fund |
| n | U.S. Equity Insights Fund |
| n | Small Cap Growth Insights Fund |
| n | Large Cap Growth Insights Fund |
| n | Large Cap Value Insights Fund |
| n | Small Cap Value Insights Fund |
| n | International Small Cap Insights Fund |
| n | International Equity Insights Fund |
| n | Emerging Markets Equity Insights Fund |
Fundamental Equity International
| n | Strategic International Equity Fund |
| n | Concentrated International Equity Fund |
| n | International Small Cap Fund |
| n | Asia Equity Fund |
| n | Emerging Markets Equity Fund |
| n | BRIC Fund (Brazil, Russia, India, China) |
| n | N-11 Equity Fund |
| n | China Equity Fund |
Select Satellite5
| n | Real Estate Securities Fund |
| n | International Real Estate Securities Fund |
| n | Commodity Strategy Fund |
| n | Dynamic Allocation Fund |
| n | Absolute Return Tracker Fund |
| n | Managed Futures Strategy Fund |
| n | MLP Energy Infrastructure Fund |
| n | Multi-Manager Alternatives Fund |
| n | Retirement Portfolio Completion Fund |
| n | Income Strategies Portfolio |
Total Portfolio Solutions5
| n | Balanced Strategy Portfolio |
| n | Growth and Income Strategy Portfolio |
| n | Growth Strategy Portfolio |
| n | Equity Growth Strategy Portfolio |
| n | Satellite Strategies Portfolio |
| n | Enhanced Dividend Global Equity Portfolio |
| n | Tax Advantaged Global Equity Portfolio |
| 1 | An investment in a money market fund is neither insured nor guaranteed by the Federal Deposit Insurance Corporation (“FDIC”) or any other government agency. Although the Funds seek to preserve the value of your investment at $1.00 per share, it is possible to lose money by investing in the Funds. |
| 2 | Effective at the close of business on July 27, 2012, the Goldman Sachs Ultra-Short Duration Government Fund was renamed the Goldman Sachs High Quality Floating Rate Fund. |
| 3 | Effective at the close of business on June 29, 2012, the Goldman Sachs Balanced Fund was renamed the Goldman Sachs Income Builder Fund. |
| 4 | Effective at the close of business May 3, 2013, the Goldman Sachs Structured Large Cap Growth, Structured Large Cap Value, Structured Small Cap Equity, Structured Small Cap Growth, Structured Small Cap Value, Structured U.S. Equity, Structured Emerging Markets Equity, Structured International Equity and Structured International Small Cap Funds were renamed the Goldman Sachs Large Cap Growth Insights, Large Cap Value Insights, Small Cap Equity Insights, Small Cap Growth Insights, Small Cap Value Insights, U.S. Equity Insights, Emerging Markets Equity Insights, International Equity Insights and International Small Cap Insights Funds respectively. |
| 5 | Individual Funds within the Total Portfolio Solutions and Select Satellite categories will have various placement on the risk/return spectrum and may have greater or lesser risk than that indicated by the placement of the general Total Portfolio Solutions or Select Satellite category. |
Financial Square FundsSM is a registered service mark of Goldman, Sachs & Co.
TRUSTEES Ashok N. Bakhru, Chairman Donald C. Burke John P. Coblentz, Jr. Diana M. Daniels Joseph P. LoRusso James A. McNamara Jessica Palmer Alan A. Shuch Richard P. Strubel | OFFICERS James A. McNamara, President George F. Travers, Principal Financial Officer Caroline Kraus, Secretary Scott M. McHugh, Treasurer | |
GOLDMAN, SACHS & CO. Distributor and Transfer Agent | GOLDMAN SACHS ASSET MANAGEMENT INTERNATIONAL Investment Adviser | |
Visit our web site at www.goldmansachsfunds.com to obtain the most recent month-end returns.
Goldman Sachs Asset Management, L.P., 200 West Street, New York, New York 10282
The reports concerning the Funds included in this shareholder report may contain certain forward-looking statements about the factors that may affect the performance of the Funds in the future. These statements are based on Fund management’s predictions and expectations concerning certain future events and their expected impact on the Funds, such as performance of the economy as a whole and of specific industry sectors, changes in the levels of interest rates, the impact of developing world events, and other factors that may influence the future performance of the Funds. Management believes these forward-looking statements to be reasonable, although they are inherently uncertain and difficult to predict. Actual events may cause adjustments in portfolio management strategies from those currently expected to be employed.
A description of the policies and procedures that the Funds use to determine how to vote proxies relating to portfolio securities and information regarding how a Fund voted proxies relating to portfolio securities during the most recent 12-month period ended June 30 is available (I) without charge, upon request by calling 1-800-526-7384 (for Retail Shareholders) or 1-800-621-2550 (for Institutional Shareholders); and (II) on the Securities and Exchange Commission (“SEC”) web site at http://www.sec.gov.
The Funds file their complete schedule of portfolio holdings with the SEC for the first and third quarters of each fiscal year on Form N-Q. The Funds’ Forms N-Q are available on the SEC’s web site at http://www.sec.gov within 60 days after the Funds’ first and third fiscal quarters. The Funds’ Forms N-Q may be reviewed and copied at the SEC’s Public Reference Room in Washington, D.C. and information on the operation of the Public Reference Room may be obtained by calling 1-800-SEC-0330. Forms N-Q may be obtained upon request and without charge by calling 1-800-526-7384 (for Retail Shareholders) or 1-800-621-2550 (for Institutional Shareholders).
Holdings and allocations shown are as of April 30, 2013 and may not be representative of future investments. Fund holdings should not be relied on in making investment decisions and should not be construed as research or investment advice regarding particular securities. Current and future holdings are subject to risk.
Economic and market forecasts presented herein reflect our judgment as of the date of this presentation and are subject to change without notice. These forecasts do not take into account the specific investment objectives, restrictions, tax and financial situation or other needs of any specific client. Actual data will vary and may not be reflected here. These forecasts are subject to high levels of uncertainty that may affect actual performance. Accordingly, these forecasts should be viewed as merely representative of a broad range of possible outcomes. These forecasts are estimated, based on assumptions, and are subject to significant revision and may change materially as economic and market conditions change. Goldman Sachs has no obligation to provide updates or changes to these forecasts. Case studies and examples are for illustrative purposes only.
The Global Industry Classification Standard (GICS) was developed by and is the exclusive property and a service mark of Morgan Stanley Capital International Inc. (MSCI) and Standard & Poor’s, a division of The McGraw-Hill Companies, Inc. (S&P) and is licensed for use by Goldman Sachs. Neither MSCI, S&P nor any other party involved in making or compiling the GICS or any GICS classifications makes any express or implied warranties or representations with respect to such standard or classification (or the results to be obtained by the use thereof), and all such parties hereby expressly disclaim all warranties of originality, accuracy, completeness, merchantability or fitness for a particular purpose with respect to any of such standard or classification. Without limiting any of the foregoing, in no event shall MSCI, S&P, any of their affiliates or any third party involved in making or compiling the GICS or any GICS classifications have any liability for any direct, indirect, special, punitive, consequential or any other damages (including lost profits) even if notified of the possibility of such damages.
The portfolio risk management process includes an effort to monitor and manage risk, but does not imply low risk.
This material is not authorized for distribution to prospective investors unless preceded or accompanied by a current Prospectus or summary prospectus, if applicable. Investors should consider a Fund’s objective, risks, and charges and expenses, and read the summary prospectus, if available, and/or the Prospectus carefully before investing or sending money. The summary prospectus, if available, and the Prospectus contain this and other information about a Fund and may be obtained from your authorized dealer or from Goldman, Sachs & Co. by calling (retail – 1-800-526-7384) (institutional – 1-800-621-2550).
© 2013 Goldman Sachs. All rights reserved. 102246.MF.MED.TMPL. / 6/2013 EMESAR13 / 31.5K
| ITEM 2. | CODE OF ETHICS. |
| The information required by this Item is only required in an annual report on this Form N-CSR. |
| ITEM 3. | AUDIT COMMITTEE FINANCIAL EXPERT. |
| The information required by this Item is only required in an annual report on this Form N-CSR. |
| ITEM 4. | PRINCIPAL ACCOUNTANT FEES AND SERVICES. |
| The information required by this Item is only required in an annual report on this Form N-CSR. |
| ITEM 5. | AUDIT COMMITTEE OF LISTED REGISTRANTS. |
| Not applicable. |
| ITEM 6. | SCHEDULE OF INVESTMENTS. |
| Schedule of Investments is included as part of the Report to Stockholders filed under Item 1. |
| ITEM 7. | DISCLOSURE OF PROXY VOTING POLICIES AND PROCEDURES FOR CLOSED-END MANAGEMENT INVESTMENT COMPANIES. |
| Not applicable. |
| ITEM 8. | PORTFOLIO MANAGERS OF CLOSED-END MANAGEMENT INVESTMENT COMPANIES. |
| Not applicable. |
| ITEM 9. | PURCHASES OF EQUITY SECURITIES BY CLOSED-END MANAGEMENT INVESTMENT COMPANY AND AFFILIATED PURCHASERS. |
| Not applicable. |
| ITEM 10. | SUBMISSION OF MATTERS TO A VOTE OF SECURITY HOLDERS. |
| There have been no material changes to the procedures by which shareholders may recommend nominees to the registrant’s board of trustees. |
| ITEM 11. | CONTROLS AND PROCEDURES. |
| (a) | The registrant’s principal executive and principal financial officers, or persons performing similar functions have concluded that the registrant’s disclosure controls and procedures (as defined in Rule 30a-3(c) under the Investment Company Act of 1940, as amended (the “1940 Act”)) are effective as of a date within 90 days of the filing of this report that includes the disclosure required by this paragraph, based on the evaluation of these controls and procedures required by Rule 30a-3(b) under the 1940 Act and 15d-15(b) under the Securities Exchange Act of 1934, as amended. |
| (b) | There were no changes in the registrant’s internal control over financial reporting (as defined in Rule 30a-3(d) under the 1940 Act) that occurred during the registrant’s second fiscal quarter of the period covered by this report that have materially affected, or are reasonably likely to materially affect, the registrant’s internal control over financial reporting. |
| ITEM 12. | EXHIBITS. |
| (a)(1) | The information required by this Item is only required in connection with an annual report on this Form N-CSR. | |||
| (a)(2) | Exhibit 99.CERT | Certifications pursuant to Section 302 of the Sarbanes-Oxley Act of 2002 filed herewith. | ||
| (b) | Exhibit 99.906CERT | Certifications pursuant to Section 906 of the Sarbanes-Oxley Act of 2002 filed herewith. | ||
SIGNATURES
Pursuant to the requirements of the Securities Exchange Act of 1934 and the Investment Company Act of 1940, the registrant has duly caused this report to be signed on its behalf by the undersigned, thereunto duly authorized.
| Goldman Sachs Trust | ||||
| By: | /s/ James A. McNamara | |||
| James A. McNamara | ||||
| President/Principal Executive Officer | ||||
| Goldman Sachs Trust | ||||
| Date: | June 20, 2013 | |||
Pursuant to the requirements of the Securities Exchange Act of 1934 and the Investment Company Act of 1940, this report has been signed below by the following persons on behalf of the registrant and in the capacities and on the dates indicated.
| By: | /s/ James A. McNamara | |||
| James A. McNamara | ||||
| President/Principal Executive Officer | ||||
| Goldman Sachs Trust | ||||
| Date: | June 20, 2013 | |||
| By: | /s/ George F. Travers | |||
| George F. Travers | ||||
| Principal Financial Officer | ||||
| Goldman Sachs Trust | ||||
| Date: | June 20, 2013 | |||